MCI(P) 067/01/2021 Semi Annual Report and Unaudited Financial Statements for the period 1 January 2021 - 30 June 2021

Welcome message from author
This document is posted to help you gain knowledge. Please leave a comment to let me know what you think about it! Share it to your friends and learn new things together.
Transcript
Fund Name Investment Objectives Risk Category Launch Date Current Fund Size Mgmt Fee Benchmark Index
Performance bid-bid basisFund Manager Sub-Manager3 mths 6 mths 1 year 3 years
(Annualised)5 years
(Annualised)10 years
(Annualised)Since inception
(Total return)Since inception
(Annualised)
GLOBAL EQUITYGreatLink Global Technology Fund
To achieve long-term capital growth through investment in global technology stocks.
Higher Risk / Narrowly Focused
15-Jan-01 $385.49 mil 1.60% p.a. MSCI All Country World Custom Technology Index with Net Dividends Reinvested, converted into Singapore dollars
8.01 12.66 37.05 26.26 27.35 20.52 161.26 4.81 Lion Global Investors Ltd Wellington Management Singapore Pte Ltd
GreatLink Global Real Estate Securities Fund
To provide investors with medium to long term capital appreciation and to make regular income distributions by investing globally in (a) equities securities of companies that derive a substantial part of their revenue from the ownership, management and/or development of real estate and (b) Real Estate Investment Trusts (REITS) listed or traded in a regulated market.
Higher Risk / Narrowly Focused
8-Jun-05 $442.40 mil 1.60% p.a. FTSE EPRA/NAREIT Developed Index Net TRI
9.15 17.27 24.65 7.20 5.48 7.25 92.84 4.17 Lion Global Investors Ltd PGIM Inc
GreatLink Global Emerging Markets Equity Fund
To achieve long-term capital growth through investment principally in areas experiencing rapid economic growth which include countries in Latin America, Emerging Asia, Africa, Eastern Europe (including Russia) and the Middle East.
Higher Risk / Narrowly Focused
23-Jan-13 $203.21 mil 1.60% p.a. MSCI Emerging Markets Free Net of Luxembourg Tax Index
3.47 9.46 46.76 14.05 14.16 - 117.22 9.64 FIL Fund Management Limited
-
GreatLink Multi-Theme Equity Fund
To achieve capital growth over the long term (at least five consecutive years). Higher Risk / Broadly Diversified
26-Jan-21 $2.54 mil 1.25% p.a MSCI All Country World Index 5.30 - - - - - 4.53 - BlackRock (Luxembourg) S.A
-
NON-EQUITY
GreatLink Cash Fund To generate a return comparable to S$ time deposits. Lower Risk / Broadly Diversified
26-Apr-96 $38.60 mil 0.30% p.a. 1-month SIBOR less 0.25% 0.22 0.30 0.75 1.29 1.15 0.90 41.89 1.40 Lion Global Investors Ltd -
GreatLink Short Duration Bond Fund
To provide total return of capital growth and income over the medium to long term, through an actively managed portfolio of Singapore and international bonds, high quality interest rate securities and other related securities.
Low to Medium Risk / Narrowly Focused
25-Mar-02 $197.56 mil 0.50% p.a. 3-month SIBOR 0.13 0.72 3.34 3.58 2.82 2.50 62.84 2.56 Lion Global Investors Ltd -
GreatLink Global Bond Fund
To achieve excess return relative to the index while minimising volatility of return relative to the index.
Low to Medium Risk / Broadly Diversified
15-Jan-02 $417.78 mil 0.85% p.a. Barclays Global Aggregate Bond Index 50% Hedged into SGD
1.36 -1.97 -0.77 3.61 2.36 3.02 88.74 3.32 Lion Global Investors Ltd PIMCO
GreatLink Income Bond Fund
To provide income by investing primarily in debt securities. Medium to High Risk / Broadly Diversified
22-Mar-21 $16.81 mil 1.00% p.a Bloomberg Barclays US Aggregate Index (Total Return Gross) hedged to SGD
0.74 - - - - - 1.03 - JPMorgan Asset Management (Europe) S.à r.l.
-
ASIAN EQUITY
GreatLink Asia High Dividend Equity Fund
To provide long term capital growth by investing primarily in equities or equity-linked securities (including, but not limited to, preference shares, real estate investment trusts, depository receipts) of companies in the Asia Pacific (ex Japan) region that offer attractive dividend yields and sustainable dividend payments.
Higher Risk / Narrowly Focused
10-Jul-00 $61.30 mil 1.50% p.a. MSCI AC Asia Pacific ex Japan Index
1.48 6.43 29.91 9.81 9.89 5.33 48.92 1.92 Lion Global Investors Ltd -
GreatLink Asia Pacific Equity Fund
To achieve medium to long-term capital growth from a diversified portfolio of Asian-Pacific equities excluding Japanese equities.
Higher Risk / Narrowly Focused
26-Apr-96 $782.43 mil 1.50% p.a. MSCI AC Asia Pacific ex Japan Index (Gross)
3.19 5.27 35.96 12.85 13.10 4.88 268.11 5.31 Aberdeen Standard Investments (Asia) Limited
-
GreatLink Far East Ex Japan Equities Fund
To maximise capital growth through investing primarily in equities of companies based in China, Hong Kong, Indonesia, South Korea, Malaysia, Philippines, Singapore, Taiwan and Thailand, and also in other Asia Pacific regions except Japan.
Higher Risk / Narrowly Focused
25-Mar-02 $82.75 mil 1.50% p.a. MSCI AC Far East Ex Japan Index with Net Dividends Reinvested
1.82 6.82 34.34 14.09 15.46 7.27 294.11 7.38 Lion Global Investors Ltd -
GreatLink ASEAN Growth Fund
To achieve long-term capital appreciation by investing in equities in the economies of the ASEAN region.
Higher Risk / Narrowly Focused
26-Apr-96 $262.28 mil 1.50% p.a. MSCI AC ASEAN Index with Net Dividends Reinvested
0.87 5.48 17.57 0.28 3.14 1.98 230.32 4.86 Lion Global Investors Ltd -
GreatLink Lion Japan Growth Fund
To provide long-term capital growth of assets by investing primarily in quoted or listed securities in any Recognised Stock Exchange or OTC market in Japan.
Higher Risk / Narrowly Focused
9-Jan-07 $14.01 mil 1.50% p.a. TOPIX Total Return Index, in SGD-Hedged terms
0.69 7.04 31.09 9.85 14.54 8.41 37.58 2.23 Lion Global Investors Ltd -
GreatLink China Growth Fund
To provide capital growth in excess of the MSCI Golden Dragon (Net TR) index after fees have been deducted over a three to five year period by investing at least two-thirds of its assets in equities and equity related securties of companies in People’s Republic of China, Hong Kong SAR and Taiwan.
Higher Risk / Narrowly Focused
9-Jan-07 $368.14 mil 1.50% p.a. MSCI Golden Dragon Index with Net Dividends Reinvested
5.75 10.10 40.55 18.66 21.31 10.52 178.74 7.34 Schroder Investment Management (Hong Kong) Ltd
-
GreatLink Lion India Fund
To achieve medium to long-term capital appreciation by investing in Indian equities and equity related instruments.
Higher Risk / Narrowly Focused
9-Jan-07 $82.57 mil 1.50% p.a. MSCI India with Net Dividends Reinvested, in SGD terms
6.97 14.05 48.47 7.26 8.52 3.89 63.16 3.44 Lion Global Investors Ltd -
GreatLink Singapore Equities Fund
To achieve medium to long-term capital growth from a portfolio of Singapore equities.
Higher Risk / Narrowly Focused
25-Mar-02 $235.80 mil 1.50% p.a. Straits Times Index 1.66 11.74 25.81 3.16 6.35 2.02 157.58 5.03 Aberdeen Standard Investments (Asia) Limited
-
GreatLink Lion Vietnam Fund
To achieve medium to long-term capital appreciation by investing in equity and equity-linked instruments of companies with assets in Vietnam or companies outside Vietnam but with earnings derived from Vietnam and the Indo-China Region (which includes, but is not limited to Cambodia and Laos).
Higher Risk / Narrowly Focused
1-Feb-08 $19.49 mil 1.50% p.a. FTSE Vietnam Index 18.57 27.71 71.11 13.68 18.72 12.28 37.79 2.42 Lion Global Investors Ltd -
GREATLINK FUNDS SUMMARY as at 30 June 2021
For disclaimer, please refer to page 6.
Annual Report and Audited Financial StatementsFor the year ended 31 December 2018
The Great Eastern Life Assurance Company Limited (Registration No. 1908 00011G)
1 Pickering Street #01-01 Great Eastern Centre Singapore 048659
MCI
(P) 0
67/0
1/20
21
Semi Annual Report and Unaudited Financial Statementsfor the period 1 January 2021 - 30 June 2021
GREATLINK FUNDS SUMMARY as at 30 June 2021
Printed by Ho Printing Singapore Pte Ltd
The Great Eastern Life Assurance Company Limited (Reg. No. 1908 00011G)
1 Pickering Street #01-01 Great Eastern Centre Singapore 048659www.greateasternlife.com
contents
For disclaimer, please refer to page 6.
Fund Name Investment Objectives Risk Category Launch Date Current Fund Size Mgmt Fee Benchmark Index
Performance bid-bid basisFund Manager Sub-Manager3 mths 6 mths 1 year 3 years
(Annualised)5 years
(Annualised)10 years
(Annualised)Since inception
(Total return)Since inception
(Annualised)
GREATLINK LIFESTYLE PORTFOLIOS
GreatLink Lifestyle Dynamic Portfolio
To achieve medium to long term capital appreciation for the investor Higher Risk / Broadly Diversified
25-Mar-02 $51.66 mil 1.58% p.a. Composite of Underlying Funds' Benchmarks
6.03 11.18 40.35 15.37 14.55 8.24 138.74 4.62 Lion Global Investors Ltd -
GreatLink Lifestyle Progressive Portfolio
To achieve medium to long term capital appreciation for the investor Higher Risk / Broadly Diversified
25-Mar-02 $139.53 mil 1.43% p.a. Composite of Underlying Funds' Benchmarks
5.11 8.91 32.19 13.21 12.09 7.27 159.79 5.08 Lion Global Investors Ltd -
GreatLink Lifestyle Balanced Portfolio
To achieve medium to long term capital appreciation for the investor Medium to High Risk / Broadly Diversified
25-Mar-02 $622.22 mil 1.27% p.a. Composite of Underlying Funds' Benchmarks
4.17 6.05 23.43 10.77 9.80 6.32 141.79 4.69 Lion Global Investors Ltd -
GreatLink Lifestyle Steady Portfolio
To achieve medium to long term capital appreciation for the investor Medium to High Risk / Broadly Diversified
25-Mar-02 $51.23 mil 1.10% p.a. Composite of Underlying Funds' Benchmarks
3.16 3.16 14.48 8.32 7.28 5.08 116.32 4.09 Lion Global Investors Ltd -
GreatLink Lifestyle Secure Portfolio
To achieve medium to long term capital appreciation for the investor Medium to High Risk / Broadly Diversified
25-Mar-02 $115.47 mil 0.92% p.a. Composite of Underlying Funds' Benchmarks
2.13 1.26 7.82 6.13 4.87 3.97 112.00 3.98 Lion Global Investors Ltd -
BALANCED
GreatLink Global Supreme Fund
To maximise total returns in S$ terms over the longer term by investing in a balanced but diversified portfolio of equities and debt securities of the major stock & bond markets around the world.
Medium to High Risk / Broadly Diversified
1-Jul-99 $461.09 mil 1.35% p.a. 50% MSCI World Net & 50% FTSE World Gov Bond Index (unhedged)
4.44 6.29 15.62 7.85 7.65 6.57 132.95 3.92 Lion Global Investors Ltd Equity: Acadian Asset Management,
Capital Group, INTECH, Fixed Income:
Brandywine, PIMCO
GreatLink Global Optimum Fund
To provide long-term total return in excess of the custom benchmark while managing the overall risk of the portfolio.
Medium to High Risk / Broadly Diversified
23-May-01 $32.42 mil 1.35% p.a. 40% MSCI World, net & 60% FTSE World Government Bond Index (unhedged)
3.10 3.84 13.13 7.67 6.84 5.19 67.97 2.61 Lion Global Investors Ltd Equity: AllianceBernstein (Singapore)
Ltd Fixed Income:
Loomis, Sayles & Company, L.P.
GreatLink Income Focus Fund
To provide regular income and long term capital growth by investing primarily in a portfolio of income generating securities globally.
Higher Risk / Broadly Diversified
24-Jul-07 $59.70 mil 1.35% p.a. Composite of Underlying Funds' Benchmark
2.88 6.44 21.06 6.30 5.92 3.81 21.28 1.39 JPMorgan Asset Management (Europe) S.à r.l.
-
GreatLink Lion Asian Balanced Fund
To provide long-term total returns consistently in excess of the custom benchmark while managing the overall risk of the portfolio by investing into the equity markets of Asia Pacific (ex Japan) as well as primarily in bonds and other debt securities denominated in Singapore Dollars.
Medium to High Risk / Narrowly Focused
1-Feb-08 $78.82 mil 1.35% p.a. 50% MSCI AC Asia Pacific ex Japan Index (Gross) + 50% JP Morgan Singapore Government Bond Index
2.41 1.15 16.89 8.63 7.96 3.84 47.89 2.96 Lion Global Investors Ltd Aberdeen Standard Investments (Asia) Limited
GreatLink Diversified Growth Portfolio
To generate capital appreciation over the long term by investing primarily in a diversified portfolio of active funds and exchange-traded funds (ETFs).
Higher Risk / Broadly Diversified
18-Apr-19 $11.21 mil 0.50% p.a. N.A. 3.97 7.79 23.08 - - - 29.68 12.53 Lion Global Investors Ltd -
Great Eastern - Lion Dynamic Balanced Fund
To maximize potential risk-adjusted returns by investing into equities, government bonds, investment grade bonds, high yield bonds, emerging market bonds, commodities and alternatives via allocation to exchange-traded funds (ETFs).
Medium to High Risk / Broadly Diversified
27-Sep-20 $0.92 mil 0.80% p.a. N.A. 3.46 -0.21 - - - - 0.84 - Great Eastern Life Assurance Co Ltd
Lion Global Investors Ltd
Great Eastern - Lion Dynamic Growth Fund
To achieve long-term capital appreciation by investing into equities, government bonds, investment grade bonds, high yield bonds, emerging market bonds, commodities and alternatives via allocation to funds and exchange-trade funds (ETFs).
Higher Risk / Broadly Diversified
27-Sep-20 $4.59 mil 1.40% p.a. N.A. 4.86 3.81 - - - - 9.05 - Great Eastern Life Assurance Co Ltd
Lion Global Investors Ltd
GLOBAL EQUITY
GreatLink Global Equity Fund
To seek long-term capital appreciation by investing primarily in equity securities of companies that are domiciled anywhere in the world.
Higher Risk / Broadly Diversified
1-Aug-00 $85.46 mil 1.60% p.a. MSCI World Index (Net Total Return)
7.64 15.88 31.81 10.46 13.06 11.01 70.53 2.59 Goldman Sachs Asset Management Fund Services Ltd
-
GreatLink Global Perspective Fund
To seek long-term growth of capital by investing in common stocks of companies located around the world.
Higher Risk / Broadly Diversified
25-Mar-02 $183.39 mil 1.60% p.a. MSCI AC World Index with Net Dividends Reinvested
8.04 11.92 38.84 18.20 14.85 9.11 103.58 3.76 Capital Group -
GreatLink Global Thematic Fund
To seek long-term growth of capital by investing in a global universe of companies in multiple industries that are positively exposed to environmentally- or socially-oriented sustainable investment themes.
Higher Risk / Broadly Diversified
15-Aug-01 $45.81 mil 1.60% p.a. MSCI AC World Index 6.81 11.57 37.57 19.98 19.25 12.07 169.05 5.11 AllianceBernstein (Singapore) Ltd.
-
GreatLink Global Equity Alpha Fund
To provide capital growth in excess of the MSCI World (Net TR) index after fees have been deducted over a three to five year period by investing in equity securities and equity related securities of companies worldwide.
Higher Risk / Broadly Diversified
25-Mar-02 $179.23 mil 1.60% p.a. MSCI World Index with Net Dividends Reinvested
9.06 17.57 39.64 15.92 15.61 10.21 88.74 3.35 Schroder Investment Management Ltd
-
GreatLink European Equity Fund
To achieve long-term capital growth and income through investment primarily in listed equity, of issuers domiciled and/or having their principal place of business in European countries.
Higher Risk / Narrowly Focused
10-Jul-00 $21.88 mil 1.60% p.a. MSCI Europe Index with Net Dividends Reinvested
4.82 9.83 29.98 4.81 7.54 6.08 30.53 1.28 Capital Group -
Message 1
Investment Outlook 2
Announcement 4
Disclaimer 6
Lifestyle Portfolios 7
Balanced 13
Global Equity 20
Asian Equity 29
Non-Equity 38
Funds Information 42
Soft Dollar Commissions 113
Capital Account 116
Statement Of Assets & Liabilities 122
Notes To The Accounts 128
1
MESSAGE
Mess
age
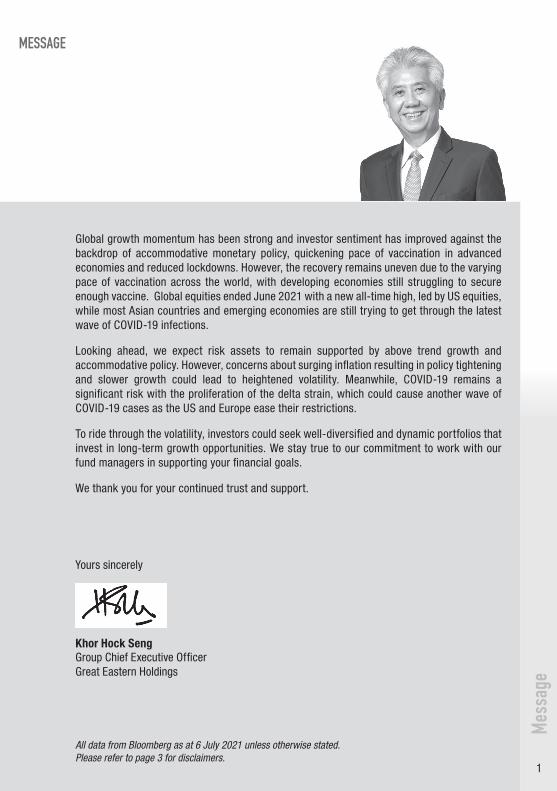
Global growth momentum has been strong and investor sentiment has improved against the backdrop of accommodative monetary policy, quickening pace of vaccination in advanced economies and reduced lockdowns. However, the recovery remains uneven due to the varying pace of vaccination across the world, with developing economies still struggling to secure enough vaccine. Global equities ended June 2021 with a new all-time high, led by US equities, while most Asian countries and emerging economies are still trying to get through the latest wave of COVID-19 infections.
Looking ahead, we expect risk assets to remain supported by above trend growth and accommodative policy. However, concerns about surging inflation resulting in policy tightening and slower growth could lead to heightened volatility. Meanwhile, COVID-19 remains a significant risk with the proliferation of the delta strain, which could cause another wave of COVID-19 cases as the US and Europe ease their restrictions.
To ride through the volatility, investors could seek well-diversified and dynamic portfolios that invest in long-term growth opportunities. We stay true to our commitment to work with our fund managers in supporting your financial goals.
We thank you for your continued trust and support.
Yours sincerely
Khor Hock SengGroup Chief Executive OfficerGreat Eastern Holdings
All data from Bloomberg as at 6 July 2021 unless otherwise stated.Please refer to page 3 for disclaimers.
2
Inve
stm
ent O
utlo
ok
INVESTMENT OUTLOOK
Investment OutlookGlobal economic recovery will be led by the services sector in developed markets as higher vaccination rates allows them to move towards normalization of economic activities. In the US, business investment and consumption will be the main engines of the next phase of the economic recovery process. The build-up of savings, improvement in service sectors and job gains will provide the key support for consumption spending. In China, growth should stabilize. While consumption has moderated due to the tightening of credit conditions, strong export growth is expected to lift the capital expenditure cycle and private investment.
In terms of inflation, the improvement in demand, together with supply constraints are putting upward pressure on input prices. Given the Average Inflation Targeting (AIT) framework and a clear focus on maximum employment, the Federal Reserve (Fed) will remain accommodative and overlook the near term inflationary pressures. A dovish and supportive European Central Bank should cap the increase in yields despite improving growth outlook.
Monetary and fiscal policies and ample liquidity are still supportive of risk assets. Despite the high equities valuation, this is unlikely to lead to a major correction as earnings momentum remains strong.
Some of the key risks include new COVID-19 variants that could overrun vaccination efforts, particularly in emerging markets where vaccination progress is slower vs developed markets. If US inflation overshoots 2.5%, it may bring forward expectations of Fed tightening.
Markets may continue to remain choppy going forward. While the global recovery is expected to gain more traction and become more broad-based as the rate of vaccination increases, much of that is already priced into the markets and the fading out of fiscal stimulus and monetary stimulus could be a potential headwind for the markets going forward. In addition, the spread of the Delta variant of the virus is also dampening the re-opening outlook for Asia. Going forward, the focus will likely return to the earnings front. In China, A-shares have corrected quite significantly, and valuations have now come down to quite reasonable levels. Policy normalization has started in China ahead of the rest of the world, and this should stabilize in the near term. On the regulatory front, much of the risk seems to have been priced into the stock market, and any relaxation from the worst-case scenario would be a reprieve for the market.
3
Inve
stm
ent O
utlo
ok
INVESTMENT OUTLOOK
While Japan has lagged significantly behind its developed country peers in its COVID-19 vaccination roll-out, the rate of vaccination has picked up in recent weeks, intending to complete vaccination of its elderly by end-July 2021 and all applicants by October-November 2021. While the Tokyo Olympics starting in late July 2021 may create concerns of another infection spike, Japan is likely to move ahead to a full re-opening of its economy by the end of 2021. In the meantime, the re-opening of the US and European economies will provide a tailwind for the global economy and corporate earnings in Japan. On the political front, there will be some uncertainty as the next general election is due by October 2021 but the approval rating of the current government under Prime Minister Yoshihide Suga remains low.
Disclaimer: The report is accurate at time of writing on 6 July 2021. Past performance is not necessarily indicative of future performances. Any opinion or view presented is subject to change without notice. The document is intended for information purposes only, and is not intended as an offer or solicitation for the purchase or sale of any financial instrument.
The information provided may contain projections or other forward looking statements regarding future events or future financial performance of countries, markets or companies, and such prediction or forecast is not necessarily indicative of the future or likely performance of the fund.
4
ANNOUNCEMENTAn
noun
cem
ent
Announcement Change of Fund Name - GreatLink Global Thematic Fund (the “Fund”)
Fund Name prior to 5 October 2021 New Name effective 5 October 2021
GreatLink Global Thematic Fund GreatLink Sustainable Global Thematic Fund
GreatLink Global Thematic Fund invests all or substantially into Luxembourg-registered AB SICAV I – Sustainable Global Thematic Portfolio Class S1X (“Underlying Fund”) managed by Alliance Bernstein.
The rationale of changing the fund name is to align with the Underlying Fund and to better reflect the investment strategy that focuses on Environmental, Social and Governance (ESG) aspects which benefit investors over the long term.
Change of Risk Classification - GreatLink Lifestyle Secure Portfolio
There is a change in the risk classification of GreatLink Lifestyle Secure Portfolio (“the Fund”) effective 5 October 2021. The Fund invests in proportion of 20% equities and 80% bonds.
In accordance with the CPF Board’s risk rating methodology, the Fund’s risk classification will be revised from “Medium to High Risk/ Broadly Diversified” to “Low to Medium Risk/ Broadly Diversified”
ANNOUNCEMENT
Fund Dividends (pay-out) via PayNow (NRIC)
In our efforts to streamline and make the payment of fund dividends (pay-out) faster and more efficient, we are pleased to inform that we will be defaulting all fund dividends previously on cheque payment method to PayNow. If you have a PayNow account linked to your NRIC number (not mobile number), you will receive your fund dividends (if any) directly in your bank account linked to PayNow via NRIC.
If you have yet to register for PayNow via NRIC, please do so at your preferred Bank’s Internet Banking portal. If you only have PayNow via mobile number and not NRIC, you will continue to receive your fund dividends via cheque.
If you have previously opted for Direct Credit for your fund dividends, this will remain unchanged and you will continue to receive the fund dividends into the bank account previously applied for Direct Credit.
5
Anno
unce
men
t

This disclaimer applies to the fund factsheets that follow.DISCLAIMER: The fact sheets on GreatLink Funds are compiled by The Great Eastern Life Assurance Company Limited (GELS). The information presented is for informational use only. A product summary and a Product Highlights Sheet in relation to the funds may be obtained through GELS, its Financial Representatives or its appointed distributors. Potential investors should read the product summary and the Product Highlights Sheet before deciding whether to invest in the funds. Returns on the units of the funds are not guaranteed. The value of the units in the funds and the income accruing to the units, if any, may fall or rise. The fees and charges payable through deduction of premium or cancellation of units are excluded in the calculation of fund returns. Past returns, and any other economic or market predictions, projections or forecasts, are not necessarily indicative of future or likely performance.
Investors should refer to the Product Summary for the GreatLink Funds available for investment under their Investment-Linked Policy (ILP).
Fund Factsheet
Fund
Fac
tshe
et D
iscla
imer
6

7
Inception Date 25 March 2002Dealing Frequency DailyFund Currency SGDBid Offer Spread 5.0%Fund Manager Lion Global Investors LtdFund Management Fee^ Dynamic 1.58% p.a. Progressive 1.43% p.a. Balanced 1.27% p.a. Steady 1.10% p.a. Secure 0.92% p.a.Benchmark Composite of Constituent Funds’ Benchmarks
^ These are weighted average fund management charge which could be used as an indicative fund management charge for the
Lifestyle Portfolios.
GREATLINK LIFESTYLE PORTFOLIOS (ASSET ALLOCATION)GreatLink Constituent Funds Secure Steady Balanced Progressive DynamicGreatLink Short Duration Bond Fund 20% 10% 5% 0% 0%GreatLink Global Bond Fund 60% 50% 35% 20% 0%GreatLink Global Equity Alpha Fund 5% 10% 15% 20% 25%GreatLink Global Perspective Fund 5% 10% 15% 20% 25%GreatLink Asia Pacific Equity Fund 10% 20% 15% 20% 25%GreatLink Global Emerging Markets Equity Fund 0% 0% 15% 20% 25%
Source: Great Eastern Life
FUND OBJECTIVE
The investment objectives of the 5 Lifestyle Portfolios are to achieve medium to long term capital appreciation for the investor. The investment policies for the GreatLink Lifestyle Secure Portfolio, GreatLink Lifestyle Steady Portfolio, GreatLink Lifestyle Balanced Portfolio, and GreatLink Lifestyle Progressive Portfolio are to invest the assets of each of these Lifestyle Portfolios in equities and bonds in the proportion of approximately 20:80, 40:60, 60:40, 80:20 respectively. The investment policy for GreatLink Lifestyle Dynamic Portfolio is to invest the assets only in equities (or in one or more different mutual fund(s) and unit trust(s) reflecting an underlying investment in equities). A separate portfolio account is maintained for each Lifestyle Portfolio which is invested in accordance with the investment objective applicable to the Lifestyle Portfolio to which such portfolio relates. Each individual Lifestyle Portfolio is invested in some of the underlying GreatLink Funds as shown in the table below. However, the asset proportion may vary, depending on market conditions.
GREATLINK LIFESTYLE PORTFOLIOS report as at 30 June 2021
FUND FACTS
Life
style
Por
tfolio
s
For disclaimer, please refer to page 6.
8
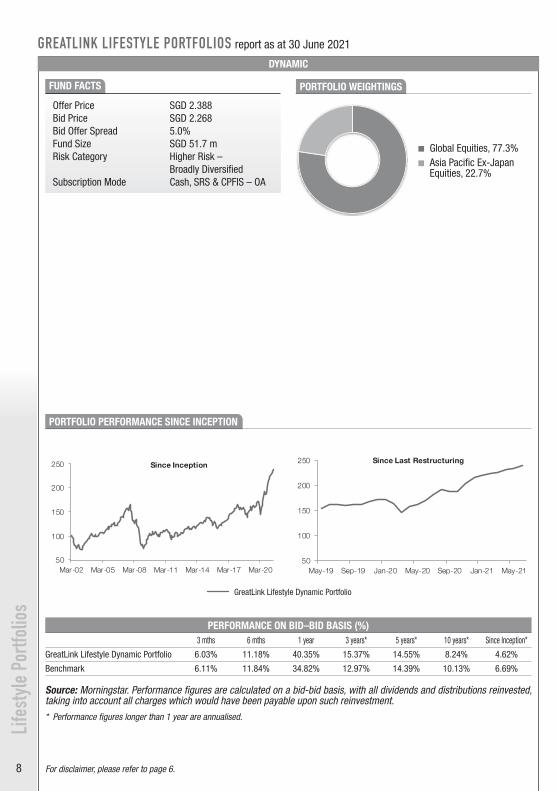
Offer Price SGD 2.388 Bid Price SGD 2.268Bid Offer Spread 5.0%Fund Size SGD 51.7 m Risk Category Higher Risk –
Broadly Diversified Subscription Mode Cash, SRS & CPFIS – OA
DYNAMIC
PERFORMANCE ON BID–BID BASIS (%)3 mths 6 mths 1 year 3 years* 5 years* 10 years* Since Inception*
GreatLink Lifestyle Dynamic Portfolio 6.03% 11.18% 40.35% 15.37% 14.55% 8.24% 4.62%
Benchmark 6.11% 11.84% 34.82% 12.97% 14.39% 10.13% 6.69%
Source: Morningstar. Performance figures are calculated on a bid-bid basis, with all dividends and distributions reinvested, taking into account all charges which would have been payable upon such reinvestment.* Performance figures longer than 1 year are annualised.
PORTFOLIO WEIGHTINGS
GREATLINK LIFESTYLE PORTFOLIOS report as at 30 June 2021
FUND FACTS
PORTFOLIO PERFORMANCE SINCE INCEPTION
Life
style
Por
tfolio
s
Global Equities, 77.3% Asia Pacific Ex-Japan
Equities, 22.7%
GreatLink Lifestyle Dynamic Portfolio
For disclaimer, please refer to page 6.
GREATLINK
as at 30 June 2021
Fund InformationOffer Price SGD 2.388Bid Price SGD 2.268Bid Offer Spread 5.0%Fund Size SGD 51.7 mRisk Category Higher Risk - Broadly DiversifiedSubscription Mode Cash, SRS & CPFIS – OA
Performance Chart
3 mths 6 mths 1 Year 3 Years* 5 Years* 10 Years*
6.03% 11.18% 40.35% 15.37% 14.55% 8.24%
6.11% 11.84% 34.82% 12.97% 14.39% 10.13%
Top 10 Holdings
LIFESTYLE DYNAMIC PORTFOLIO
The information provided herein is subject to our disclaimer set out on Page 1 of this document. Page 2 of 6
GREATLINK ASIA PACIFIC EQUITY FUND 22.7%
Source: Morningstar. Performance figures are calculated on a bid-bid basis, with all dividends and distributions reinvested, taking into account all charges which would have been payable upon such reinvestment.* Performance figures longer than 1 year are annualised.
GREATLINK GLOBAL EQUITY APLHA FUND 26.8%GREATLINK GLOBAL PERSPECTIVE FUND 25.5%GREATLINK GLOBAL EMERGING MARKETS EQUITY FUND 25.0%
Since Inception*GreatLink Lifestyle Dynamic Portfolio 4.62%
Benchmark 6.69%
50
100
150
200
250
Mar-02 Mar-05 Mar-08 Mar-11 Mar-14 Mar-17 Mar-20
Since Inception
GreatLink Lifestyle Dynamic Portfolio
Global Equities, 77.3%
Asia Pacific Ex-JapanEquities, 22.7%
50
100
150
200
250
May-19 Sep-19 Jan-20 May-20 Sep-20 Jan-21 May-21
Since Last Restructuring
DYNAMIC
9
Life
style
Por
tfolio
s
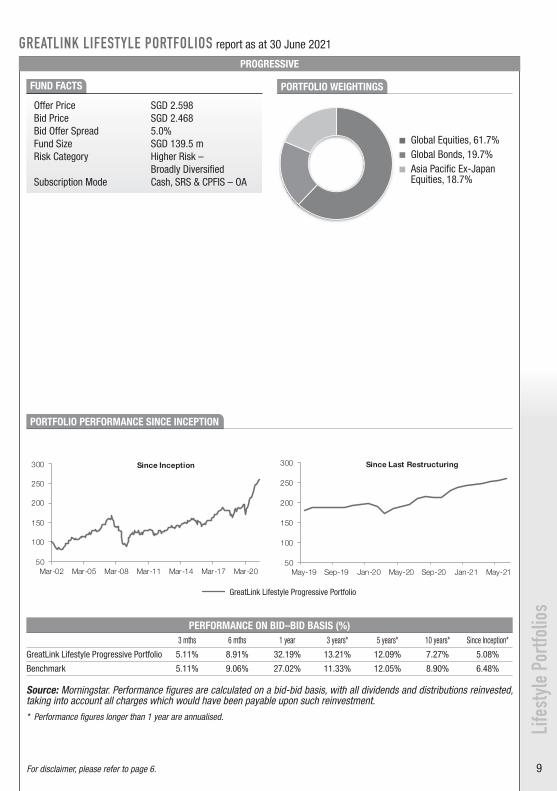
PERFORMANCE ON BID–BID BASIS (%)3 mths 6 mths 1 year 3 years* 5 years* 10 years* Since Inception*
GreatLink Lifestyle Progressive Portfolio 5.11% 8.91% 32.19% 13.21% 12.09% 7.27% 5.08%
Benchmark 5.11% 9.06% 27.02% 11.33% 12.05% 8.90% 6.48%
Source: Morningstar. Performance figures are calculated on a bid-bid basis, with all dividends and distributions reinvested, taking into account all charges which would have been payable upon such reinvestment.* Performance figures longer than 1 year are annualised.
GREATLINK LIFESTYLE PORTFOLIOS report as at 30 June 2021
Offer Price SGD 2.598 Bid Price SGD 2.468Bid Offer Spread 5.0%Fund Size SGD 139.5 m Risk Category Higher Risk –
Broadly Diversified Subscription Mode Cash, SRS & CPFIS – OA
PROGRESSIVE
PORTFOLIO WEIGHTINGSFUND FACTS
PORTFOLIO PERFORMANCE SINCE INCEPTION
Global Equities, 61.7% Global Bonds, 19.7% Asia Pacific Ex-Japan
Equities, 18.7%
GreatLink Lifestyle Progressive Portfolio
For disclaimer, please refer to page 6.
GREATLINKLIFESTYLE PROGRESSIVE PORTFOLIOas at 30 June 2021
Fund InformationOffer Price SGD 2.598Bid Price SGD 2.468Bid Offer Spread 5.0%Fund Size SGD 139.5 mRisk Category Higher Risk - Broadly DiversifiedSubscription Mode Cash, SRS & CPFIS – OA
Performance Chart
3 mths 6 mths 1 Year 3 Years* 5 Years* 10 Years*
5.11% 8.91% 32.19% 13.21% 12.09% 7.27%
5.11% 9.06% 27.02% 11.33% 12.05% 8.90%
Top 10 Holdings
The information provided herein is subject to our disclaimer set out on Page 1 of this document. Page 3 of 6
GREATLINK GLOBAL BOND FUND 19.7%GREATLINK ASIA PACIFIC EQUITY FUND 18.7%GREATLINK GLOBAL EMERGING MARKETS EQUITY FUND 18.6%
Benchmark 6.48%
Source: Morningstar. Performance figures are calculated on a bid-bid basis, with all dividends and distributions reinvested, taking into account all charges which would have been payable upon such reinvestment.* Performance figures longer than 1 year are annualised.
GREATLINK GLOBAL EQUITY APLHA FUND 22.2%GREATLINK GLOBAL PERSPECTIVE FUND 20.8%
Since Inception*GreatLink Lifestyle Progressive Portfolio 5.08%
50
100
150
200
250
300
Mar-02 Mar-05 Mar-08 Mar-11 Mar-14 Mar-17 Mar-20
Since Inception
GreatLink Lifestyle Progressive Portfolio
Global Equities, 61.7%
Global Bonds, 19.7%
Asia Pacific Ex-JapanEquities, 18.7%
PROGRESSIVE
50
100
150
200
250
300
May-19 Sep-19 Jan-20 May-20 Sep-20 Jan-21 May-21
Since Last RestructuringGREATLINKLIFESTYLE PROGRESSIVE PORTFOLIOas at 30 June 2021
Fund InformationOffer Price SGD 2.598Bid Price SGD 2.468Bid Offer Spread 5.0%Fund Size SGD 139.5 mRisk Category Higher Risk - Broadly DiversifiedSubscription Mode Cash, SRS & CPFIS – OA
Performance Chart
3 mths 6 mths 1 Year 3 Years* 5 Years* 10 Years*
5.11% 8.91% 32.19% 13.21% 12.09% 7.27%
5.11% 9.06% 27.02% 11.33% 12.05% 8.90%
Top 10 Holdings
The information provided herein is subject to our disclaimer set out on Page 1 of this document. Page 3 of 6
GREATLINK GLOBAL BOND FUND 19.7%GREATLINK ASIA PACIFIC EQUITY FUND 18.7%GREATLINK GLOBAL EMERGING MARKETS EQUITY FUND 18.6%
Benchmark 6.48%
Source: Morningstar. Performance figures are calculated on a bid-bid basis, with all dividends and distributions reinvested, taking into account all charges which would have been payable upon such reinvestment.* Performance figures longer than 1 year are annualised.
GREATLINK GLOBAL EQUITY APLHA FUND 22.2%GREATLINK GLOBAL PERSPECTIVE FUND 20.8%
Since Inception*GreatLink Lifestyle Progressive Portfolio 5.08%
50
100
150
200
250
300
Mar-02 Mar-05 Mar-08 Mar-11 Mar-14 Mar-17 Mar-20
Since Inception
GreatLink Lifestyle Progressive Portfolio
Global Equities, 61.7%
Global Bonds, 19.7%
Asia Pacific Ex-JapanEquities, 18.7%
PROGRESSIVE
50
100
150
200
250
300
May-19 Sep-19 Jan-20 May-20 Sep-20 Jan-21 May-21
Since Last Restructuring
10
Life
style
Por
tfolio
s
BALANCED
PORTFOLIO WEIGHTINGSFUND FACTS
PORTFOLIO PERFORMANCE SINCE INCEPTION
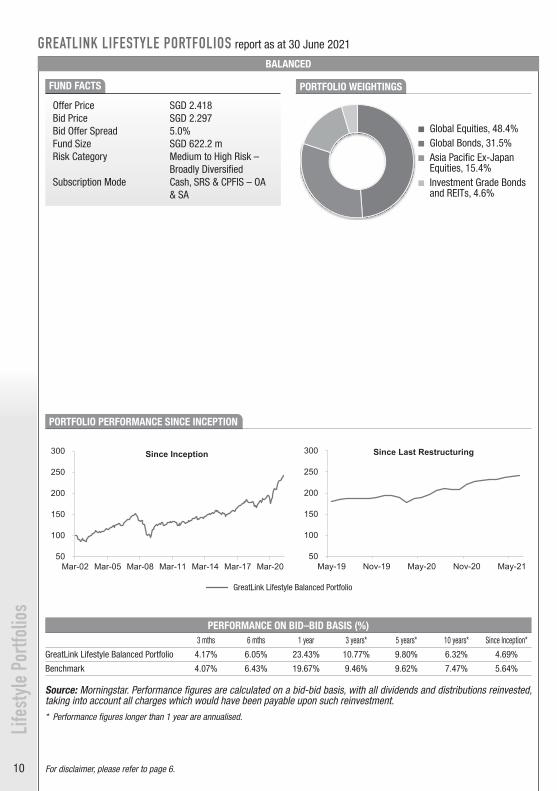
Offer Price SGD 2.418 Bid Price SGD 2.297Bid Offer Spread 5.0%Fund Size SGD 622.2 mRisk Category Medium to High Risk –
Broadly Diversified Subscription Mode Cash, SRS & CPFIS – OA
& SA
PERFORMANCE ON BID–BID BASIS (%)3 mths 6 mths 1 year 3 years* 5 years* 10 years* Since Inception*
GreatLink Lifestyle Balanced Portfolio 4.17% 6.05% 23.43% 10.77% 9.80% 6.32% 4.69%
Benchmark 4.07% 6.43% 19.67% 9.46% 9.62% 7.47% 5.64%
Source: Morningstar. Performance figures are calculated on a bid-bid basis, with all dividends and distributions reinvested, taking into account all charges which would have been payable upon such reinvestment.* Performance figures longer than 1 year are annualised.
Global Equities, 48.4% Global Bonds, 31.5% Asia Pacific Ex-Japan
Equities, 15.4% Investment Grade Bonds
and REITs, 4.6%
GreatLink Lifestyle Balanced Portfolio
GREATLINK LIFESTYLE PORTFOLIOS report as at 30 June 2021
For disclaimer, please refer to page 6.
GREATLINK
as at 30 June 2021
Fund InformationOffer Price SGD 2.418Bid Price SGD 2.297Bid Offer Spread 5.0%Fund Size SGD 622.2 mRisk Category Medium to High Risk - Broadly DiversifiedSubscription Mode Cash, SRS & CPFIS – OA & SA
Performance Chart
3 mths 6 mths 1 Year 3 Years* 5 Years* 10 Years*
4.17% 6.05% 23.43% 10.77% 9.80% 6.32%
4.07% 6.43% 19.67% 9.46% 9.62% 7.47%
Top 10 Holdings
LIFESTYLE BALANCED PORTFOLIO
The information provided herein is subject to our disclaimer set out on Page 1 of this document. Page 4 of 6
GreatLink Lifestyle Balanced Portfolio 4.69%
Benchmark 5.64%
Source: Morningstar. Performance figures are calculated on a bid-bid basis, with all dividends and distributions reinvested, taking into account all charges which would have been payable upon such reinvestment.* Performance figures longer than 1 year are annualised.
GREATLINK GLOBAL BOND FUND 31.5%
GREATLINK ASIA PACIFIC EQUITY FUND 15.4%GREATLINK SHORT DURATION BOND FUND 4.6%
GREATLINK GLOBAL EQUITY APLHA FUND 16.5%GREATLINK GLOBAL PERSPECTIVE FUND 16.1%GREATLINK GLOBAL EMERGING MARKETS EQUITY FUND 15.9%
Since Inception*
50
100
150
200
250
300
Mar-02 Mar-05 Mar-08 Mar-11 Mar-14 Mar-17 Mar-20
Since Inception
GreatLink Lifestyle Balanced Portfolio
Global Equities, 48.4%
Global Bonds, 31.5%
Asia Pacific Ex-JapanEquities, 15.4%Investment Grade Bondsand REITs, 4.6%
BALANCED
50
100
150
200
250
300
May-19 Oct-19 Mar-20 Aug-20 Jan-21 Jun-21
Since Last Restructuring
50
100
150
200
250
300
Mar-02 Mar-05 Mar-08 Mar-11 Mar-14 Mar-17 Mar-20
Since Inception
GreatLink Lifestyle Balanced Portfolio
50
100
150
200
250
300
May-19 Nov-19 May-20 Nov-20 May-21
Since Last Restructuring

11
STEADY
PORTFOLIO WEIGHTINGSFUND FACTS
Life
style
Por
tfolio
s
PORTFOLIO PERFORMANCE SINCE INCEPTION
PERFORMANCE ON BID–BID BASIS (%)3 mths 6 mths 1 year 3 years* 5 years* 10 years* Since Inception*
GreatLink Lifestyle Steady Portfolio 3.16% 3.16% 14.48% 8.32% 7.28% 5.08% 4.09%
Benchmark 2.93% 3.80% 12.57% 7.60% 7.28% 6.11% 4.77%
Source: Morningstar. Performance figures are calculated on a bid-bid basis, with all dividends and distributions reinvested, taking into account all charges which would have been payable upon such reinvestment.* Performance figures longer than 1 year are annualised.
Offer Price SGD 2.164 Bid Price SGD 2.055Bid Offer Spread 5.0%Fund Size SGD 51.2 mRisk Category Medium to High Risk –
Broadly Diversified Subscription Mode Cash, SRS & CPFIS – OA
& SA
Global Bonds, 46.8% Global Equities, 22.4% Asia Pacific Ex-Japan
Equities, 21.2% Investment Grade Bonds
and REITs, 9.6%
GreatLink Lifestyle Steady Portfolio
GREATLINK LIFESTYLE PORTFOLIOS report as at 30 June 2021
For disclaimer, please refer to page 6.
GREATLINK
as at 30 June 2021
Fund InformationOffer Price SGD 2.164Bid Price SGD 2.055Bid Offer Spread 5.0%Fund Size SGD 51.2 mRisk Category Medium to High Risk - Broadly DiversifiedSubscription Mode Cash, SRS & CPFIS – OA & SA
Performance Chart
3 mths 6 mths 1 Year 3 Years* 5 Years* 10 Years*
3.16% 3.16% 14.48% 8.32% 7.28% 5.08%
2.93% 3.80% 12.57% 7.60% 7.28% 6.11%
Top 10 Holdings
LIFESTYLE STEADY PORTFOLIO
The information provided herein is subject to our disclaimer set out on Page 1 of this document. Page 5 of 6
GREATLINK GLOBAL EQUITY APLHA FUND 11.4%GREATLINK GLOBAL PERSPECTIVE FUND 11.1%GREATLINK SHORT DURATION BOND FUND 9.6%
Benchmark 4.77%
Source: Morningstar. Performance figures are calculated on a bid-bid basis, with all dividends and distributions reinvested, taking into account all charges which would have been payable upon such reinvestment.* Performance figures longer than 1 year are annualised.
GREATLINK GLOBAL BOND FUND 46.8%GREATLINK ASIA PACIFIC EQUITY FUND 21.2%
Since Inception*
GreatLink Lifestyle Steady Portfolio 4.09%
50
100
150
200
250
Mar-02 Mar-05 Mar-08 Mar-11 Mar-14 Mar-17 Mar-20
Since Inception
GreatLink Lifestyle Steady Portfolio
Global Bonds, 46.8%
Global Equities, 22.4%
Asia Pacific Ex-JapanEquities, 21.2%Investment Grade Bonds andREITs, 9.6%
STEADY
50
100
150
200
250
May-19 Oct-19 Mar-20 Aug-20 Jan-21 Jun-21
Since Last RestructuringGREATLINK
as at 30 June 2021
Fund InformationOffer Price SGD 2.164Bid Price SGD 2.055Bid Offer Spread 5.0%Fund Size SGD 51.2 mRisk Category Medium to High Risk - Broadly DiversifiedSubscription Mode Cash, SRS & CPFIS – OA & SA
Performance Chart
3 mths 6 mths 1 Year 3 Years* 5 Years* 10 Years*
3.16% 3.16% 14.48% 8.32% 7.28% 5.08%
2.93% 3.80% 12.57% 7.60% 7.28% 6.11%
Top 10 Holdings
LIFESTYLE STEADY PORTFOLIO
The information provided herein is subject to our disclaimer set out on Page 1 of this document. Page 5 of 6
GREATLINK GLOBAL EQUITY APLHA FUND 11.4%GREATLINK GLOBAL PERSPECTIVE FUND 11.1%GREATLINK SHORT DURATION BOND FUND 9.6%
Benchmark 4.77%
Source: Morningstar. Performance figures are calculated on a bid-bid basis, with all dividends and distributions reinvested, taking into account all charges which would have been payable upon such reinvestment.* Performance figures longer than 1 year are annualised.
GREATLINK GLOBAL BOND FUND 46.8%GREATLINK ASIA PACIFIC EQUITY FUND 21.2%
Since Inception*
GreatLink Lifestyle Steady Portfolio 4.09%
50
100
150
200
250
Mar-02 Mar-05 Mar-08 Mar-11 Mar-14 Mar-17 Mar-20
Since Inception
GreatLink Lifestyle Steady Portfolio
Global Bonds, 46.8%
Global Equities, 22.4%
Asia Pacific Ex-JapanEquities, 21.2%Investment Grade Bonds andREITs, 9.6%
STEADY
50
100
150
200
250
May-19 Oct-19 Mar-20 Aug-20 Jan-21 Jun-21
Since Last Restructuring

12
Life
style
Por
tfolio
s
SECURE
PORTFOLIO PERFORMANCE SINCE INCEPTION
PORTFOLIO WEIGHTINGSFUND FACTS
GREATLINK LIFESTYLE PORTFOLIOS report as at 30 June 2021
Offer Price SGD 2.120 Bid Price SGD 2.014Bid Offer Spread 5.0%Fund Size SGD 115.5 m Risk Category Medium to High Risk –
Broadly Diversified Subscription Mode Cash, SRS & CPFIS – OA
& SA
PERFORMANCE ON BID–BID BASIS (%)3 mths 6 mths 1 year 3 years* 5 years* 10 years* Since Inception*
GreatLink Lifestyle Secure Portfolio 2.13% 1.26% 7.82% 6.13% 4.87% 3.97% 3.98%
Benchmark 1.89% 1.38% 6.03% 5.42% 4.70% 4.40% 4.04%
Source: Morningstar. Performance figures are calculated on a bid-bid basis, with all dividends and distributions reinvested, taking into account all charges which would have been payable upon such reinvestment.* Performance figures longer than 1 year are annualised.
Global Bonds, 58.9% Investment Grade Bonds
and REITs, 20.0% Global Equities, 11.1% Asia Pacific Ex-Japan
Equities, 10.0%
GreatLink Lifestyle Secure Portfolio
For disclaimer, please refer to page 6.
GREATLINK
as at 30 June 2021
Fund InformationOffer Price SGD 2.120Bid Price SGD 2.014Bid Offer Spread 5.0%Fund Size SGD 115.5 mRisk Category Medium to High Risk - Broadly DiversifiedSubscription Mode Cash, SRS & CPFIS – OA & SA
Performance Chart
3 mths 6 mths 1 Year 3 Years* 5 Years* 10 Years*
2.13% 1.26% 7.82% 6.13% 4.87% 3.97%
1.89% 1.38% 6.03% 5.42% 4.70% 4.40%
Top 10 Holdings
LIFESTYLE SECURE PORTFOLIO
GreatLink Lifestyle Secure Portfolio 3.98%
Benchmark 4.04%
Source: Morningstar. Performance figures are calculated on a bid-bid basis, with all dividends and distributions reinvested, taking into account all charges which would have been payable upon such reinvestment.* Performance figures longer than 1 year are annualised.
GREATLINK GLOBAL BOND FUND 58.9%
Since Inception*
GREATLINK GLOBAL PERSPECTIVE FUND 5.4%
GREATLINK SHORT DURATION BOND FUND 20.0%GREATLINK ASIA PACIFIC EQUITY FUND 10.0%GREATLINK GLOBAL EQUITY APLHA FUND 5.7%
The information provided herein is subject to our disclaimer set out on Page 1 of this document. Page 6 of 6
50
100
150
200
250
Mar-02 Mar-05 Mar-08 Mar-11 Mar-14 Mar-17 Mar-20
Since Inception
GreatLink Lifestyle Secure Portfolio
Global Bonds, 58.9%
Investment Grade Bondsand REITs, 20.0%Global Equities, 11.1%
Asia Pacific Ex-JapanEquities, 10.0%
SECURE
50
100
150
200
250
May-19 Sep-19 Jan-20 May-20 Sep-20 Jan-21 May-21
Since Last RestructuringGREATLINK
as at 30 June 2021
Fund InformationOffer Price SGD 2.120Bid Price SGD 2.014Bid Offer Spread 5.0%Fund Size SGD 115.5 mRisk Category Medium to High Risk - Broadly DiversifiedSubscription Mode Cash, SRS & CPFIS – OA & SA
Performance Chart
3 mths 6 mths 1 Year 3 Years* 5 Years* 10 Years*
2.13% 1.26% 7.82% 6.13% 4.87% 3.97%
1.89% 1.38% 6.03% 5.42% 4.70% 4.40%
Top 10 Holdings
LIFESTYLE SECURE PORTFOLIO
GreatLink Lifestyle Secure Portfolio 3.98%
Benchmark 4.04%
Source: Morningstar. Performance figures are calculated on a bid-bid basis, with all dividends and distributions reinvested, taking into account all charges which would have been payable upon such reinvestment.* Performance figures longer than 1 year are annualised.
GREATLINK GLOBAL BOND FUND 58.9%
Since Inception*
GREATLINK GLOBAL PERSPECTIVE FUND 5.4%
GREATLINK SHORT DURATION BOND FUND 20.0%GREATLINK ASIA PACIFIC EQUITY FUND 10.0%GREATLINK GLOBAL EQUITY APLHA FUND 5.7%
The information provided herein is subject to our disclaimer set out on Page 1 of this document. Page 6 of 6
50
100
150
200
250
Mar-02 Mar-05 Mar-08 Mar-11 Mar-14 Mar-17 Mar-20
Since Inception
GreatLink Lifestyle Secure Portfolio
Global Bonds, 58.9%
Investment Grade Bondsand REITs, 20.0%Global Equities, 11.1%
Asia Pacific Ex-JapanEquities, 10.0%
SECURE
50
100
150
200
250
May-19 Sep-19 Jan-20 May-20 Sep-20 Jan-21 May-21
Since Last Restructuring

13
GREATLINK
as at 30 June 2021
Portfolio Weightings
Top 10 Holdings
GLOBAL SUPREME FUND
AMAZON.COM INC 1.1%
APPLE INC 1.3%
FRANCE O.A.T. FIXED COUPON 0 MATURITY 20260225 1.3%
NYKREDIT FIXED COUPON 1.000000 MATURITY 20501001 1.2%
MICROSOFT CORP 1.5%
POLAND GOVT BOND FIXED COUPON 4.000000 MATURITY 20231025 1.4%
TESORERIA PESOS FIXED COUPON 4.000000 MATURITY 20230301 1.4%
2.9%
US TREASURY FRN FLOATING COUPON .084006320 MATURITY 20230430 2.4%
The information provided herein is subject to our disclaimer set out at the end of this document. Page 2 of 2
JAPAN GOVT 20-YR FIXED COUPON 1.500000 MATURITY 20340320 1.5%
DISCLAIMER: GreatLink Global Supreme Fund is an investment-linked policy (ILP) fund offered by The Great Eastern Life AssuranceCompany Limited ("Great Eastern") and is only available under Great Eastern Investment-Linked Policies. This factsheet is compiled byGreat Eastern. The information presented is for informational use only. A product summary and a Product Highlights Sheet in relation to theFund may be obtained through Great Eastern or its financial representatives. Potential investors should read the product summary and theProduct Highlights Sheet before deciding whether to invest in the Fund. Returns on the units of the Fund are not guaranteed. The value ofthe units in the Fund and the income accruing to the units, if any, may fall or rise. The fees and charges payable through deduction ofpremium or cancellation of units are excluded in the calculation of fund returns. Past returns, and any other economic or market predictions,projections or forecasts targeted by the fund are not necessarily indicative of future or likely performance of the fund. This advertisementhas not been reviewed by the Monetary Authority of Singapore.
The Great Eastern Life Assurance Company Limited (Reg No. 1908 00011G)1 Pickering Street, #01-01 Great Eastern Centre, Singapore 048659Product Enquiry: +65 6248 2211 / greateasternlife.com
US TREASURY FRN FLOATING COUPON .099006320 MATURITY 20230131
United States of America, 44.6%
Europe ex-UK, 29.1%
United Kingdom, 9.1%
Japan, 6.6%
Cash & Cash Equivalents, 5.7%
Asia Pacific ex-Japan, 4.4%
Other, 0.6%
GREATLINK GLOBAL SUPREME FUND report as at 30 June 2021
Inception Date 1 July 1999Dealing Frequency DailyFund Currency SGDSubscription Mode Cash, SRS & CPFIS – OA & SARisk Category Medium to High Risk – Broadly
DiversifiedBenchmark 50% MSCI World Net & 50%
FTSE World Gov Bond Index (unhedged)
Offer Price SGD 2.330 Bid Price SGD 2.213 Bid Offer Spread 5.0%Fund Size SGD 461.1 m Fund Manager Lion Global Investors LtdSub Managers Equity:
Acadian Asset Management, Capital Group, INTECH
Fixed Income: Brandywine, PIMCO
Fund Management Fee 1.35% p.a.
PORTFOLIO PERFORMANCE SINCE INCEPTION
FUND FACTS FUND OBJECTIVE
The Fund's objective is to maximize total returns in Singapore Dollar terms over the longer term by investing in a balanced but diversified portfolio of equities and debt securities of the major stock markets and bond markets around the world. It shall invest in a broad mix of global equities and bonds in a wide range of industries and companies in various countries. The allocation for each asset class will be actively managed and altered constantly in such a way that seeks to maximize the overall risk-adjusted performance of the Fund. The Fund’s asset allocation split is 50% global equities and 50% global bonds.
Bala
nced
Fun
dsPERFORMANCE ON BID–BID BASIS (%)3 mths 6 mths 1 year 3 years* 5 years* 10 years* Since Inception*
GreatLink Global Supreme Fund 4.44% 6.29% 15.62% 7.85% 7.65% 6.57% 3.92%
Benchmark 4.38% 5.63% 14.42% 9.09% 8.33% 7.18% 4.32%
Source: Morningstar. Performance figures are calculated on a bid-bid basis, with all dividends and distributions reinvested, taking into account all charges which would have been payable upon such reinvestment.* Performance figures longer than 1 year are annualised.
PORTFOLIO WEIGHTINGS
United States of America, 44.6%
Europe ex-UK, 29.1% United Kingdom, 9.1% Japan, 6.6% Cash & Cash Equivalents,
5.7% Asia Pacific Ex-Japan,
4.4% Other, 0.6%
GreatLink Global Supreme Fund
For disclaimer, please refer to page 6.
GREATLINK
as at 30 June 2021
Fund Objective
Fund Information
Performance Chart
3 mths 6 mths 1 Year 3 Years* 5 Years* 10 Years*
4.44% 6.29% 15.62% 7.85% 7.65% 6.57%
4.38% 5.63% 14.42% 9.09% 8.33% 7.18%
GLOBAL SUPREME FUND
Risk Category
SGD 2.330SGD 2.2135.0%SGD 461.1 mLion Global Investors Ltd
Equity: Acadian Asset Management,Capital Group, INTECH,Fixed Income:Brandywine, PIMCO
Inception DateDealing FrequencyFund CurrencySubscription Mode
Fund Manager
Sub Managers
1 July, 1999DailySGD
1.35% p.a.
Offer PriceBid PriceBid Offer SpreadFund Size
Fund Management Fee
Cash, SRS & CPFIS – OA & SA
Medium to High Risk - Broadly Diversified
50% MSCI World Net & 50% FTSE World Gov Bond Index (unhedged)
The information provided herein is subject to our disclaimer set out at the end of this document. Page 1 of 2
Source: Morningstar. Performance figures are calculated on a bid-bid basis, with all dividends and distributions reinvested, taking into account allcharges which would have been payable upon such reinvestment.* Performance figures longer than 1 year are annualised.
Benchmark
The Fund's objective is to maximize total returns in Singapore Dollar terms over the longer term by investing in a balanced butdiversified portfolio of equities and debt securities of the major stock markets and bond markets around the world. It shallinvest in a broad mix of global equities and bonds in a wide range of industries and companies in various countries. Theallocation for each asset class will be actively managed and altered constantly in such a way that seeks to maximize the overallrisk-adjusted performance of the Fund. The Fund’s asset allocation split is 50% global equities and 50% global bonds.
Since Inception*
GreatLink Global Supreme Fund 3.92%
Benchmark 4.32%
50
100
150
200
250
Jul-99 Jul-02 Jul-05 Jul-08 Jul-11 Jul-14 Jul-17 Jul-20
GreatLink Global Supreme Fund
14
GREATLINK
as at 30 June 2021
Fund Objective
Fund Information
Performance Chart
3 mths 6 mths 1 Year 3 Years* 5 Years* 10 Years*
3.10% 3.84% 13.13% 7.67% 6.84% 5.19%
3.70% 3.83% 10.78% 7.94% 7.01% 6.24%
The information provided herein is subject to our disclaimer set out at the end of this document. Page 1 of 2
Benchmark 40% MSCI World, net & 60% FTSE World Government Bond Index (unhedged)^
Fund Management Fee 1.35% p.a.
Since Inception*
GreatLink Global Optimum Fund 2.61%
Benchmark 4.29%
Source: Morningstar. Performance figures are calculated on a bid-bid basis, with all dividends and distributions reinvested, taking into account allcharges which would have been payable upon such reinvestment.* Performance figures longer than 1 year are annualised.^ Benchmark: 40% MSCI World, gross & 60% Citigroup World Government Bond Index, unhedged from launch till 14 May 2007, 40% MSCIWorld, net & 60% Citigroup World Government Bond Index^^, unhedged with effect from 15 May 2007. ^^ The rebranded name of Citigroup World Government Bond Index is FTSE World Government Bond Index.
Subscription Mode Cash & SRS Fund Size SGD 32.4 m
Risk Category Medium to High Risk - Broadly Diversified
Fund Manager Lion Global Investors Ltd
Sub Managers
Equity:AllianceBernstein (Singapore) LtdFixed Income:Loomis, Sayles & Company, L.P.
GLOBAL OPTIMUM FUND
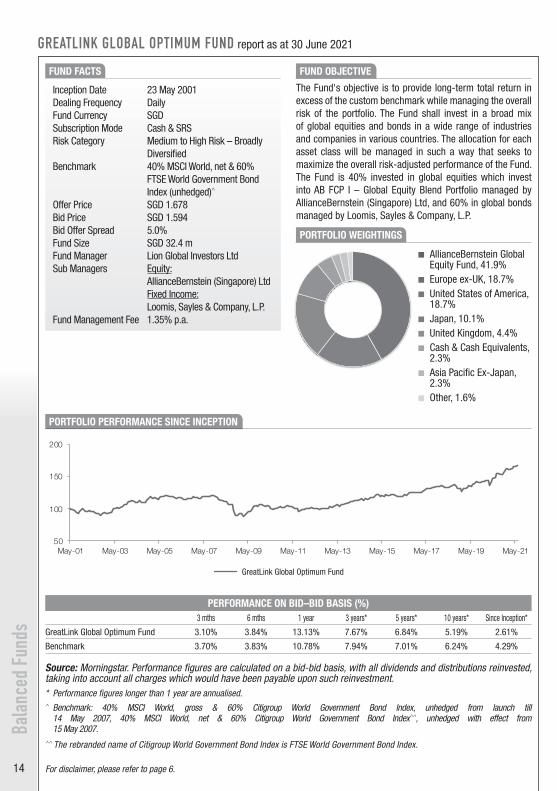
The Fund's objective is to provide long-term total return in excess of the custom benchmark while managing the overall risk ofthe portfolio. The Fund shall invest in a broad mix of global equities and bonds in a wide range of industries and companies invarious countries. The allocation for each asset class will be managed in such a way that seeks to maximize the overall risk-adjusted performance of the Fund. The Fund is 40% invested in global equities which invest into AB FCP I – Global EquityBlend Portfolio managed by AllianceBernstein (Singapore) Ltd, and 60% in global bonds managed by Loomis, Sayles &Company, L.P.
Inception Date 23 May, 2001 Offer Price SGD 1.678Dealing Frequency Daily Bid Price SGD 1.594Fund Currency SGD Bid Offer Spread 5.0%
50
100
150
200
May-01 May-03 May-05 May-07 May-09 May-11 May-13 May-15 May-17 May-19 May-21
GreatLink Global Optimum Fund
Bala
nced
Fun
dsGREATLINK GLOBAL OPTIMUM FUND report as at 30 June 2021
PORTFOLIO WEIGHTINGS
FUND FACTS
PORTFOLIO PERFORMANCE SINCE INCEPTION
FUND OBJECTIVE
The Fund's objective is to provide long-term total return in excess of the custom benchmark while managing the overall risk of the portfolio. The Fund shall invest in a broad mix of global equities and bonds in a wide range of industries and companies in various countries. The allocation for each asset class will be managed in such a way that seeks to maximize the overall risk-adjusted performance of the Fund. The Fund is 40% invested in global equities which invest into AB FCP I – Global Equity Blend Portfolio managed by AllianceBernstein (Singapore) Ltd, and 60% in global bonds managed by Loomis, Sayles & Company, L.P.
Inception Date 23 May 2001Dealing Frequency DailyFund Currency SGDSubscription Mode Cash & SRSRisk Category Medium to High Risk – Broadly
DiversifiedBenchmark 40% MSCI World, net & 60%
FTSE World Government Bond Index (unhedged)^
Offer Price SGD 1.678 Bid Price SGD 1.594 Bid Offer Spread 5.0%Fund Size SGD 32.4 m Fund Manager Lion Global Investors LtdSub Managers Equity:
AllianceBernstein (Singapore) Ltd Fixed Income: Loomis, Sayles & Company, L.P.
Fund Management Fee 1.35% p.a.
PERFORMANCE ON BID–BID BASIS (%)3 mths 6 mths 1 year 3 years* 5 years* 10 years* Since Inception*
GreatLink Global Optimum Fund 3.10% 3.84% 13.13% 7.67% 6.84% 5.19% 2.61%
Benchmark 3.70% 3.83% 10.78% 7.94% 7.01% 6.24% 4.29%
Source: Morningstar. Performance figures are calculated on a bid-bid basis, with all dividends and distributions reinvested, taking into account all charges which would have been payable upon such reinvestment.* Performance figures longer than 1 year are annualised.^ Benchmark: 40% MSCI World, gross & 60% Citigroup World Government Bond Index, unhedged from launch till
14 May 2007, 40% MSCI World, net & 60% Citigroup World Government Bond Index^^, unhedged with effect from 15 May 2007.
^^ The rebranded name of Citigroup World Government Bond Index is FTSE World Government Bond Index.
AllianceBernstein Global Equity Fund, 41.9%
Europe ex-UK, 18.7% United States of America,
18.7% Japan, 10.1% United Kingdom, 4.4% Cash & Cash Equivalents,
2.3% Asia Pacific Ex-Japan,
2.3% Other, 1.6%
GreatLink Global Optimum Fund
For disclaimer, please refer to page 6.
GREATLINK
as at 30 June 2021
Portfolio Weightings
Top 10 Holdings
FRANCE O.A.T. FIXED COUPON 4.500000 MATURITY 20410425 1.4%
DISCLAIMER: GreatLink Global Optimum Fund is an investment-linked policy (ILP) fund offered by The Great Eastern Life AssuranceCompany Limited ("Great Eastern") and is only available under Great Eastern Investment-Linked Policies. This factsheet is compiled byGreat Eastern. The information presented is for informational use only. A product summary and a Product Highlights Sheet in relation to theFund may be obtained through Great Eastern or its financial representatives. Potential investors should read the product summary and theProduct Highlights Sheet before deciding whether to invest in the Fund. Returns on the units of the Fund are not guaranteed. The value ofthe units in the Fund and the income accruing to the units, if any, may fall or rise. The fees and charges payable through deduction ofpremium or cancellation of units are excluded in the calculation of fund returns. Past returns, and any other economic or market predictions,projections or forecasts targeted by the fund are not necessarily indicative of future or likely performance of the fund. This advertisementhas not been reviewed by the Monetary Authority of Singapore.
The Great Eastern Life Assurance Company Limited (Reg No. 1908 00011G)1 Pickering Street, #01-01 Great Eastern Centre, Singapore 048659Product Enquiry: +65 6248 2211 / greateasternlife.com
The information provided herein is subject to our disclaimer set out at the end of this document. Page 2 of 2
US TREASURY N/B FIXED COUPON .125000 MATURITY 20220430 1.5%
US TREASURY N/B FIXED COUPON .250000 MATURITY 20250831 1.5%
BTPS FIXED COUPON 5.250000 MATURITY 20291101 1.5%
BTPS FIXED COUPON 1.350000 MATURITY 20300401 1.6%
SPANISH GOV'T FIXED COUPON 1.450000 MATURITY 20271031 1.6%
US TREASURY N/B FIXED COUPON .125000 MATURITY 20220831 1.5%
AB GLOBAL EQTY BLEND 41.9%
JAPAN GOVT 20-YR FIXED COUPON 2.100000 MATURITY 20301220 2.6%
US TREASURY N/B FIXED COUPON .125000 MATURITY 20220731 1.6%
GLOBAL OPTIMUM FUND
AllianceBernstein Global Equity Fund, 41.9%
Europe ex-UK, 18.7%
United States of America, 18.7%
Japan, 10.1%
United Kingdom, 4.4%
Cash & Cash Equivalents, 2.3%
Asia Pacific ex-Japan, 2.3%
Other, 1.6%

15
PORTFOLIO WEIGHTINGS#
GREATLINK INCOME FOCUS FUND report as at 30 June 2021
FUND FACTS FUND OBJECTIVEThe Fund aims to provide regular income and long term capital growth by investing primarily in a portfolio of income generating securities globally. This Fund invests all or substantially into JPMorgan Investment Funds - Global Income Fund (SGD-Hedged) and JPMorgan Funds – Asia Pacific Income Fund (SGD-Hedged) (“Underlying Funds”), both managed by JPMorgan Asset Management (Europe) S.à r.l.
PORTFOLIO PERFORMANCE SINCE INCEPTION
Bala
nced
Fun
ds
Inception Date 24 July 2007Dealing Frequency DailyFund Currency SGDSubscription Mode Cash & SRSRisk Category Higher Risk - Broadly
DiversifiedBenchmark^+ Composite of Underlying Funds'
BenchmarkFund Management Fee 1.35% p.a.Offer Price SGD 0.917 Bid Price SGD 0.871 Bid Offer Spread 5.0%Fund Size SGD 59.7 m Fund Manager JPMorgan Asset Management
(Europe) S.à r.l.Underlying Funds JPMorgan Investment Funds(Fund Size) - Global Income Fund (USD 27,878.5 m) JPMorgan Funds - Asia Pacific
Income Fund (USD 2,204.6 m)
PERFORMANCE ON BID–BID BASIS (%)3 mths 6 mths 1 year 3 years* 5 years* 10 years* Since Inception* Since Restructuring*
GreatLink Income Focus Fund 2.88% 6.44% 21.06% 6.30% 5.92% 3.81% 1.39% 5.16%
Benchmark 3.46% 4.81% 20.00% 9.13% 8.87% 5.89% 5.17% 7.44%
Source: Morningstar. Performance figures are calculated on a bid-bid basis, with all dividends and distributions reinvested, taking into account all charges which would have been payable upon such reinvestment.* Performance figures longer than 1 year are annualised.^ Composite benchmark comprises of ‘Barclays US High Yield 2% Issuer Cap Index (Total Return Gross) hedged to SGD, MSCI World Index (Total
Return Net) hedged to SGD, Barclays Global Credit Index (Total Return Gross) hedged to SGD, MSCI All Country Asia Pacific ex Japan Index (Total Return Net), J.P.Morgan Asia Credit Index (Total Return Gross)’.
# Information refers to 50% of JPMorgan Investment Funds - Global Income Fund and 50% of JPMorgan Funds – Asia Pacific Income Fund.+ Since inception to 30 April 2014: benchmark was 12-month Singapore Interbank Bid Rate + 2.5%. From 1 May 2014 to 15 October 2014:
benchmark was 12-month Singapore Inter-Bank Offer Rate (SIBOR) + 2.25%. Effective 16 October 2014, the benchmark is the new composite benchmark.
Equities, 46.0% High Yield Bonds, 23.2% Investment Grade Bonds, 11.8% Preferred Equity, 5.0% REITs, 3.8% Non-Agency Securitized, 2.8% Cash, 2.8% GIF Options Overlay, 2.1% Emerging MArkets Debt, 1.1% Strategic Beta Global
Infrastructure, 1.0% Convertible Bonds, 0.5%
GreatLink Income Focus Fund
For disclaimer, please refer to page 6.
GREATLINKINCOME FOCUS FUNDas at 30 June 2021
Fund Objective
Fund Information
Performance Chart
3 mths 6 mths 1 Year 3 Years* 5 Years* 10 Years* Since Inception*
Since Restructuring*
2.88% 6.44% 21.06% 6.30% 5.92% 3.81% 1.39% 5.16%
3.46% 4.81% 20.00% 9.13% 8.87% 5.89% 5.17% 7.44%
Benchmark^+ Composite of Underlying Funds' Benchmark
Underlying Funds(Fund Size)
JPMorgan Investment Funds - Global Income Fund(USD 27,878.5m) JPMorgan Funds - Asia Pacific Income Fund(USD 2,204.6m)
The information provided herein is subject to our disclaimer set out at the end of this document. Page 1 of 2
Fund Management Fee 1.35% p.a.
GreatLink Income Focus Fund
Benchmark
Source: Morningstar. Performance figures are calculated on a bid-bid basis, with all dividends and distributions reinvested, taking into account all charges which would have been payable upon such reinvestment.* Performance figures longer than 1 year are annualised.^ Composite benchmark comprises of ‘Barclays US High Yield 2% Issuer Cap Index (Total Return Gross) hedged to SGD, MSCI World Index (Total Return Net) hedged to SGD, Barclays Global Credit Index (Total Return Gross) hedged to SGD, MSCI All Country Asia Pacific ex Japan Index (Total Return Net), J.P.Morgan Asia Credit Index (Total Return Gross)’.
Subscription Mode Cash & SRS Fund Size SGD 59.7 m
Fund ManagerJPMorgan Asset Management (Europe) S.à r.l.
Risk Category Higher Risk - Broadly Diversified
The Fund aims to provide regular income and long term capital growth by investing primarily in a portfolio of income generating securities globally. This Fund invests all or substantially into JPMorgan Investment Funds - Global Income Fund (SGD-Hedged)and JPMorgan Funds – Asia Pacific Income Fund (SGD-Hedged) (“Underlying Funds”), both managed by JPMorgan AssetManagement (Europe) S.à r.l.
Inception Date 24 July, 2007 Offer Price SGD 0.917Dealing Frequency Daily Bid Price SGD 0.871Fund Currency SGD Bid Offer Spread 5.0%
60
80
100
120
140
Jul-07 Jul-09 Jul-11 Jul-13 Jul-15 Jul-17 Jul-19
GreatLink Income Focus Fund
Since Inception
60
80
100
120
140
160
Oct-14 Oct-15 Oct-16 Oct-17 Oct-18 Oct-19 Oct-20
Since Restructuring
GREATLINKINCOME FOCUS FUNDas at 30 June 2021
Portfolio Weightings#
Top 10 Holdings# As At 31 May 2021° Dividend History**
3.4% 2.125%
2.8% 2.125%1.0% 2.125%1.0% 2.125%0.9% 2.125%0.8% 2.125%0.7% 2.125%
0.7% 2.125%
0.7% 2.125%0.7% 2.125%
2.125%
May 2016
November 2016May 2017November 2017
HONG KONG EXCHANGES & CLEARING LTD.
TAIWAN SEMICONDUCTOR MANUFACTURING CO., LTD.SAMSUNG ELECTRONICS CO., LTD.RIO TINTO LIMITEDDBS GROUP HOLDINGS LTDINFOSYS LIMITED May 2018
November 2018
May 2020November 2020
PING AN INSURANCE (GROUP) COMPANY OF CHINA, LTD.
CLP HOLDINGS LIMITED
TRANSURBAN GROUP LTD.
May 2019
November 2019
The information provided herein is subject to our disclaimer set out at the end of this document. Page 2 of 2
CHINA CONSTRUCTION BANK CORPORATION
** Dividend distributions are not guaranteed and are made at the Manager’s discretion
+ Since inception to 30 April 2014: benchmark was 12-month Singapore Interbank Bid Rate + 2.5%. From 1 May 2014 to 15 October 2014: benchmark was 12-month Singapore Inter-Bank Offer Rate (SIBOR) + 2.25%. Effective 16 October 2014, the benchmark is the new composite benchmark.
# Information refers to 50% of JPMorgan Investment Funds - Global Income Fund and 50% of JPMorgan Funds – Asia Pacific Income Fund.° JPMorgan Asset Management imposes a 30-day embargo on their holdings, hence there is a 1-month lag.
May 2021
DISCLAIMER: GreatLink Income Focus Fund is an investment-linked policy (ILP) fund offered by The Great Eastern Life AssuranceCompany Limited ("Great Eastern") and is only available under Great Eastern Investment-Linked Policies. This factsheet is compiled byGreat Eastern. The information presented is for informational use only. A product summary and a Product Highlights Sheet in relation to theFund may be obtained through Great Eastern or its financial representatives. Potential investors should read the product summary and theProduct Highlights Sheet before deciding whether to invest in the Fund. Returns on the units of the Fund are not guaranteed. The value ofthe units in the Fund and the income accruing to the units, if any, may fall or rise. The fees and charges payable through deduction ofpremium or cancellation of units are excluded in the calculation of fund returns. Past returns, and any other economic or market predictions,projections or forecasts targeted by the fund are not necessarily indicative of future or likely performance of the fund. This advertisementhas not been reviewed by the Monetary Authority of Singapore.
The Great Eastern Life Assurance Company Limited (Reg No. 1908 00011G)1 Pickering Street, #01-01 Great Eastern Centre, Singapore 048659Product Enquiry: +65 6248 2211 / greateasternlife.com
Equities, 46.0%High Yield Bonds, 23.2%Investment Grade Bonds, 11.8%Preferred Equity, 5.0%REITs, 3.8%Non-Agency Securitized, 2.8%Cash, 2.8%GIF Options Overlay, 2.1%Emerging Markets Debt, 1.1%Strategic Beta Global Infrastructure, 1.0%Convertible Bonds, 0.5%
16
Bala
nced
Fun
dsGREATLINK LION ASIAN BALANCED FUND report as at 30 June 2021
PORTFOLIO PERFORMANCE SINCE INCEPTION
PORTFOLIO WEIGHTINGS#
FUND FACTS FUND OBJECTIVE
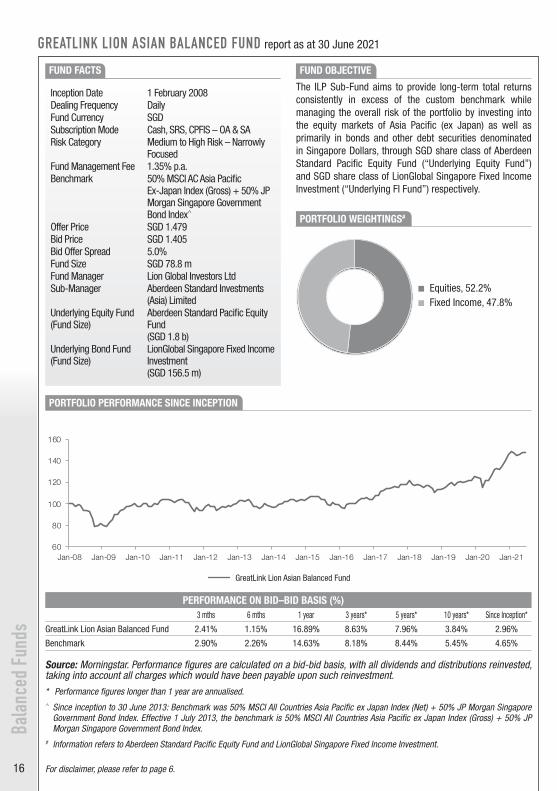
The ILP Sub-Fund aims to provide long-term total returns consistently in excess of the custom benchmark while managing the overall risk of the portfolio by investing into the equity markets of Asia Pacific (ex Japan) as well as primarily in bonds and other debt securities denominated in Singapore Dollars, through SGD share class of Aberdeen Standard Pacific Equity Fund (“Underlying Equity Fund”) and SGD share class of LionGlobal Singapore Fixed Income Investment (“Underlying FI Fund”) respectively.
Inception Date 1 February 2008Dealing Frequency DailyFund Currency SGDSubscription Mode Cash, SRS, CPFIS – OA & SARisk Category Medium to High Risk – Narrowly
FocusedFund Management Fee 1.35% p.a.Benchmark 50% MSCI AC Asia Pacific
Ex-Japan Index (Gross) + 50% JP Morgan Singapore Government Bond Index^
Offer Price SGD 1.479Bid Price SGD 1.405Bid Offer Spread 5.0%Fund Size SGD 78.8 mFund Manager Lion Global Investors LtdSub-Manager Aberdeen Standard Investments
(Asia) Limited Underlying Equity Fund(Fund Size)
Aberdeen Standard Pacific Equity Fund(SGD 1.8 b)
Underlying Bond Fund (Fund Size)
LionGlobal Singapore Fixed Income Investment (SGD 156.5 m)
PERFORMANCE ON BID–BID BASIS (%)3 mths 6 mths 1 year 3 years* 5 years* 10 years* Since Inception*
GreatLink Lion Asian Balanced Fund 2.41% 1.15% 16.89% 8.63% 7.96% 3.84% 2.96%
Benchmark 2.90% 2.26% 14.63% 8.18% 8.44% 5.45% 4.65%
Source: Morningstar. Performance figures are calculated on a bid-bid basis, with all dividends and distributions reinvested, taking into account all charges which would have been payable upon such reinvestment.* Performance figures longer than 1 year are annualised.^ Since inception to 30 June 2013: Benchmark was 50% MSCI All Countries Asia Pacific ex Japan Index (Net) + 50% JP Morgan Singapore
Government Bond Index. Effective 1 July 2013, the benchmark is 50% MSCI All Countries Asia Pacific ex Japan Index (Gross) + 50% JP Morgan Singapore Government Bond Index.
# Information refers to Aberdeen Standard Pacific Equity Fund and LionGlobal Singapore Fixed Income Investment.
Equities, 52.2% Fixed Income, 47.8%
GreatLink Lion Asian Balanced Fund
For disclaimer, please refer to page 6.
GREATLINK
as at 30 June 2021
Fund Objective
Fund Information
Performance Chart
3 mths 6 mths 1 Year 3 Years* 5 Years* 10 Years*
2.41% 1.15% 16.89% 8.63% 7.96% 3.84%
2.90% 2.26% 14.63% 8.18% 8.44% 5.45%
GreatLink Lion Asian Balanced Fund
2.96%
Benchmark 4.65%
The information provided herein is subject to our disclaimer set out at the end of this document. Page 1 of 2
Source: Morningstar. Performance figures are calculated on a bid-bid basis, with all dividends and distributions reinvested, taking into account allcharges which would have been payable upon such reinvestment.* Performance figures longer than 1 year are annualised.^ Since inception to 30 June 2013: Benchmark was 50% MSCI All Countries Asia Pacific ex Japan Index (Net) + 50% JP Morgan SingaporeGovernment Bond Index. Effective 1 July 2013, the benchmark is 50% MSCI All Countries Asia Pacific ex Japan Index (Gross) + 50% JP MorganSingapore Government Bond Index.
Benchmark50% MSCI AC Asia Pacific ex Japan Index (Gross) + 50% JP Morgan Singapore Government Bond Index^
Underlying Equity Fund (Fund Size)
Aberdeen Standard Pacific Equity Fund(SGD 1.8 b)
Since Inception*
Fund Management Fee 1.35% p.a. Underlying Bond Fund (Fund Size)
LionGlobal Singapore Fixed Income Investment (SGD 156.5 m)
Subscription Mode Cash, SRS, CPFIS – OA & SA Fund Size SGD 78.8 m
Risk Category Medium to High Risk - Narrowly Focused
Fund Manager Lion Global Investors Ltd
Sub Managers Aberdeen Standard Investments (Asia) Limited
LION ASIAN BALANCED FUND
The ILP Sub-Fund aims to provide long-term total returns consistently in excess of the custom benchmark while managing theoverall risk of the portfolio by investing into the equity markets of Asia Pacific (ex Japan) as well as primarily in bonds and otherdebt securities denominated in Singapore Dollars, through SGD share class of Aberdeen Standard Pacific Equity Fund(“Underlying Equity Fund”) and SGD share class of LionGlobal Singapore Fixed Income Investment (“Underlying FI Fund”)respectively.
Inception Date 1 February, 2008 Offer Price SGD 1.479Dealing Frequency Daily Bid Price SGD 1.405Fund Currency SGD Bid Offer Spread 5.0%
60
80
100
120
140
160
Jan-08 Jan-09 Jan-10 Jan-11 Jan-12 Jan-13 Jan-14 Jan-15 Jan-16 Jan-17 Jan-18 Jan-19 Jan-20 Jan-21
GreatLink Lion Asian Balanced Fund
GREATLINK
as at 30 June 2021
Portfolio Weightings#
Top 10 Holdings#
8.0%
TOP 5 EQUITY HOLDINGS OF ABERDEEN STANDARD PACIFIC EQUITY FUND
TOP 5 BOND HOLDINGS OF LION GLOBAL INVESTORS FIXED INCOME INVESTMENT
ALIBABA GROUP HOLDING 3.6%# Information refers to Aberdeen Standard Pacific Equity Fund and LionGlobal Singapore Fixed Income Investment.
SINGAPORE GOVERNMENT 2.75% 01/03/2046 4.2%
SINGAPORE (REPUBLIC OF) 2.875% 01/07/2029 4.2%
TSMC 9.2%
SINGAPORE GOVERNMENT 2.25% 01/08/2036 6.5%
SINGAPORE (GOVT OF) 3.5% 01/03/2027 4.4%
SINGAPORE (GOVT OF) 2.875% 01/09/2030
DISCLAIMER: GreatLink Lion Asian Balanced Fund is an investment-linked policy (ILP) fund offered by The Great Eastern Life AssuranceCompany Limited ("Great Eastern") and is only available under Great Eastern Investment-Linked Policies. This factsheet is compiled byGreat Eastern. The information presented is for informational use only. A product summary and a Product Highlights Sheet in relation to theFund may be obtained through Great Eastern or its financial representatives. Potential investors should read the product summary and theProduct Highlights Sheet before deciding whether to invest in the Fund. Returns on the units of the Fund are not guaranteed. The value ofthe units in the Fund and the income accruing to the units, if any, may fall or rise. The fees and charges payable through deduction ofpremium or cancellation of units are excluded in the calculation of fund returns. Past returns, and any other economic or market predictions,projections or forecasts targeted by the fund are not necessarily indicative of future or likely performance of the fund. This advertisementhas not been reviewed by the Monetary Authority of Singapore.
The Great Eastern Life Assurance Company Limited (Reg No. 1908 00011G)1 Pickering Street, #01-01 Great Eastern Centre, Singapore 048659Product Enquiry: +65 6248 2211 / greateasternlife.com
The information provided herein is subject to our disclaimer set out at the end of this document. Page 2 of 2
SAMSUNG ELECTRONICS (PREF) 8.6%
TENCENT HOLDINGS 7.5%
AIA GROUP 5.0%
LION ASIAN BALANCED FUND
Equities, 52.2% Fixed Income, 47.8%
17
GREATLINK
as at 30 June 2021
Fund Objective
Fund Information
Performance Chart
3 mths 6 mths 1 Year 3 Years* 5 Years* 10 Years*
3.97% 7.79% 23.08% - - -
Since Inception*
GreatLink Diversified Growth Portfolio °
12.53%
The information provided herein is subject to our disclaimer set out at the end of this document. Page 1 of 3
Source: Morningstar. Performance figures are calculated on a bid-bid basis, with all dividends and distributions reinvested, taking into account allcharges which would have been payable upon such reinvestment. * Performance figures longer than 1 year are annualised.^ As each of the active funds and ETFs has their own respective benchmarks, there is no suitable composite benchmark that best represent theperformance of these benchmarks.
Lion Global Investors Ltd
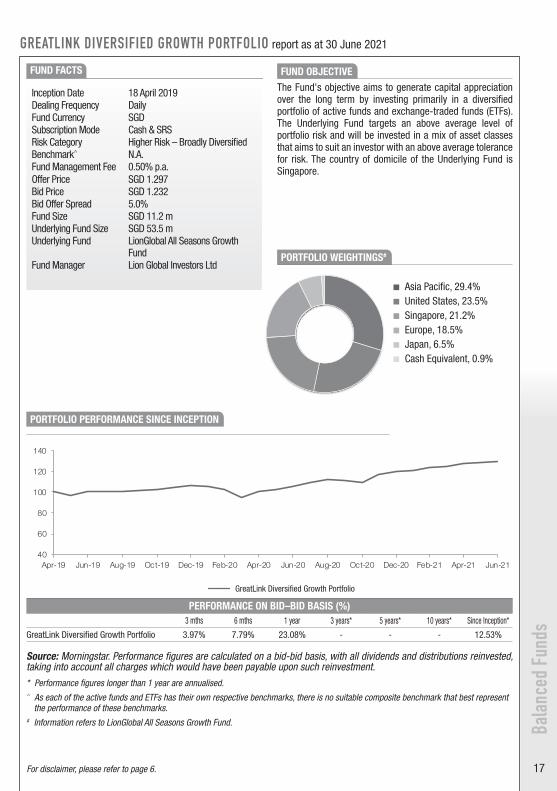
SGD 53.5 m
Benchmark ^ N.A. Underlying Fund LionGlobal All Seasons Growth Fund
Fund Management Fee 0.50% p.a. Fund Manager
Subscription Mode Cash & SRS Fund Size SGD 11.2 m
Risk Category Higher Risk - Broadly Diversified Underlying Fund Size
Dealing Frequency Daily Bid Price SGD 1.232Fund Currency SGD Bid Offer Spread 5.0%
DIVERSIFIED GROWTH PORTFOLIO
The Fund's objective aims to generate capital appreciation over the long term by investing primarily in a diversified portfolio ofactive funds and exchange-traded funds (ETFs). The Underlying Fund targets an above average level of portfolio risk and will be invested in a mix of asset classes that aims to suit an investor with an above average tolerance for risk. The country of domicile of the Underlying Fund is Singapore.
Inception Date 18 April, 2019 Offer Price SGD 1.297
40
60
80
100
120
140
Apr-19 Jun-19 Aug-19 Oct-19 Dec-19 Feb-20 Apr-20 Jun-20 Aug-20 Oct-20 Dec-20 Feb-21 Apr-21 Jun-21
GreatLink Diversified Growth Portfolio
PERFORMANCE ON BID–BID BASIS (%)3 mths 6 mths 1 year 3 years* 5 years* 10 years* Since Inception*
GreatLink Diversified Growth Portfolio 3.97% 7.79% 23.08% - - - 12.53%
Source: Morningstar. Performance figures are calculated on a bid-bid basis, with all dividends and distributions reinvested, taking into account all charges which would have been payable upon such reinvestment.* Performance figures longer than 1 year are annualised.^ As each of the active funds and ETFs has their own respective benchmarks, there is no suitable composite benchmark that best represent
the performance of these benchmarks.# Information refers to LionGlobal All Seasons Growth Fund.
GREATLINK DIVERSIFIED GROWTH PORTFOLIO report as at 30 June 2021
FUND FACTS
PORTFOLIO PERFORMANCE SINCE INCEPTION
PORTFOLIO WEIGHTINGS#
FUND OBJECTIVE The Fund's objective aims to generate capital appreciation over the long term by investing primarily in a diversified portfolio of active funds and exchange-traded funds (ETFs). The Underlying Fund targets an above average level of portfolio risk and will be invested in a mix of asset classes that aims to suit an investor with an above average tolerance for risk. The country of domicile of the Underlying Fund is Singapore.
Inception Date 18 April 2019Dealing Frequency DailyFund Currency SGDSubscription Mode Cash & SRS Risk Category Higher Risk – Broadly DiversifiedBenchmark^ N.A.Fund Management Fee 0.50% p.a.Offer Price SGD 1.297Bid Price SGD 1.232Bid Offer Spread 5.0%Fund Size SGD 11.2 mUnderlying Fund Size SGD 53.5 mUnderlying Fund LionGlobal All Seasons Growth
FundFund Manager Lion Global Investors Ltd
Asia Pacific, 29.4% United States, 23.5% Singapore, 21.2% Europe, 18.5% Japan, 6.5% Cash Equivalent, 0.9%
GreatLink Diversified Growth Portfolio
Bala
nced
Fun
ds
For disclaimer, please refer to page 6.
GREATLINK
as at 30 June 2021
Portfolio Weightings#
Top 10 Holdings#
The information provided herein is subject to our disclaimer set out at the end of this document. Page 2 of 3
# Information refers to LionGlobal All Seasons Growth Fund.
LIONGLOBAL ASIA BOND FD SGDH 8.3%
LYXOR CORE STOXX EUROPE 600 DR ETF 7.4%
LIONGLOBAL JAPAN GROWTH FUND 6.5%
LIONGLOBAL SHORT DURATION BOND FUND 11.3%
DB X - TRACKERS EURO STOXX 50 UCITS ETF DR 11.1%
LIONGLOBAL TEAM FUND SINGAPORE FIXED INCOME INVESTMENT 9.9%
LIONGLOBAL ASIA PACIFIC FUND S$ 21.1%
VANGUARD S&P 500 UCITS ETF 23.5%
DIVERSIFIED GROWTH PORTFOLIO
Asia Pacific, 29.4%
United States, 23.5%
Singapore, 21.2%
Europe, 18.5%
Japan, 6.5%
Cash Equivalent, 0.9%
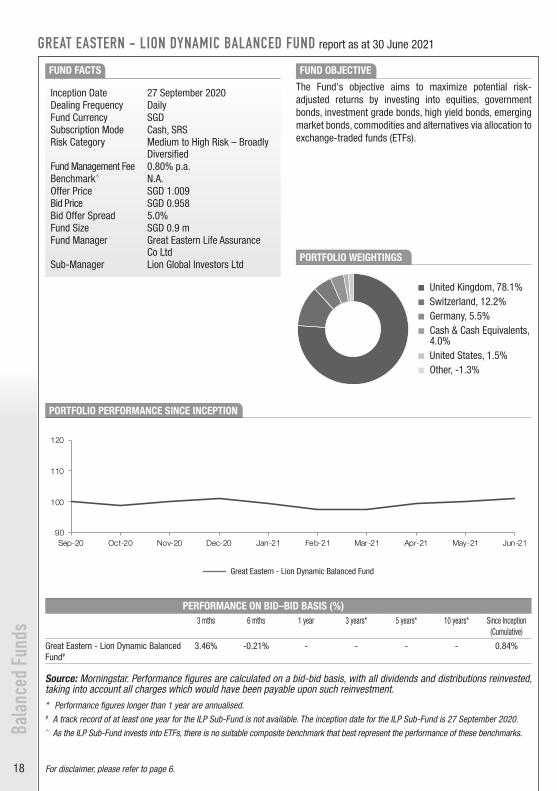
18
GREAT EASTERN - LION DYNAMIC BALANCED FUND report as at 30 June 2021
PORTFOLIO PERFORMANCE SINCE INCEPTION
FUND FACTS FUND OBJECTIVE
The Fund's objective aims to maximize potential risk-adjusted returns by investing into equities, government bonds, investment grade bonds, high yield bonds, emerging market bonds, commodities and alternatives via allocation to exchange-traded funds (ETFs).
Inception Date 27 September 2020Dealing Frequency DailyFund Currency SGDSubscription Mode Cash, SRSRisk Category Medium to High Risk – Broadly
DiversifiedFund Management Fee 0.80% p.a.Benchmark^ N.A.Offer Price SGD 1.009Bid Price SGD 0.958Bid Offer Spread 5.0%Fund Size SGD 0.9 mFund Manager Great Eastern Life Assurance
Co LtdSub-Manager Lion Global Investors Ltd
PERFORMANCE ON BID–BID BASIS (%)3 mths 6 mths 1 year 3 years* 5 years* 10 years* Since Inception
(Cumulative)
Great Eastern - Lion Dynamic Balanced Fund#
3.46% -0.21% - - - - 0.84%
Source: Morningstar. Performance figures are calculated on a bid-bid basis, with all dividends and distributions reinvested, taking into account all charges which would have been payable upon such reinvestment.* Performance figures longer than 1 year are annualised.# A track record of at least one year for the ILP Sub-Fund is not available. The inception date for the ILP Sub-Fund is 27 September 2020.^ As the ILP Sub-Fund invests into ETFs, there is no suitable composite benchmark that best represent the performance of these benchmarks.
PORTFOLIO WEIGHTINGS
United Kingdom, 78.1% Switzerland, 12.2% Germany, 5.5% Cash & Cash Equivalents,
4.0% United States, 1.5% Other, -1.3%
Great Eastern - Lion Dynamic Balanced Fund
Bala
nced
Fun
ds
GREAT EASTERN - LION
as at 30 June 2021
Fund Objective
Fund Information
Performance Chart
3 mths 6 mths 1 Year 3 Years* 5 Years* 10 Years*
3.46% -0.21% - - - -
The Fund's objective aims to maximize potential risk-adjusted returns by investing into equities, government bonds,investment grade bonds, high yield bonds, emerging market bonds, commodities and alternatives via allocation to exchange-traded funds (ETFs).
Inception Date 27 September, 2020 Offer Price SGD 1.009Dealing Frequency Daily Bid Price SGD 0.958Fund Currency SGD Bid Offer Spread 5.0%Subscription Mode Cash & SRS Fund Size SGD 0.9 m
Risk Category Medium to High Risk - Broadly DiversifiedFund Manager Great Eastern Life Assurance
Co Ltd
Sub Manager Lion Global Investors Ltd
Benchmark ^ N.A. Fund Management Fee 0.80% p.a.
Since Inception(Cumulative)
Great Eastern - Lion Dynamic Balanced Fund #
0.84%
The information provided herein is subject to our disclaimer set out at the end of this document. Page 1 of 3
Source: Morningstar. Performance figures are calculated on a bid-bid basis, with all dividends and distributions reinvested, taking into account allcharges which would have been payable upon such reinvestment.* Performance figures longer than 1 year are annualised.# A track record of at least one year for the ILP Sub-Fund is not available. The inception date for the ILP Sub-Fund is 27 September 2020.^ As the ILP Sub-Fund invests into ETFs, there is no suitable composite benchmark that best represent the performance of these benchmarks.
DYNAMIC BALANCED FUND
90
100
110
120
Sep-20 Oct-20 Nov-20 Dec-20 Jan-21 Feb-21 Mar-21 Apr-21 May-21 Jun-21
Great Eastern - Lion Dynamic Balanced Fund
GREAT EASTERN - LION
as at 30 June 2021
Portfolio Weightings
Top 10 Holdings
13.9%
The information provided herein is subject to our disclaimer set out at the end of this document. Page 2 of 3
INVESCO PHYSICAL GOLD ETC 5.3%
ISHARES USD HIGH YIELD CORP BOND UCITS ETF 5.1%
ISHARES J.P. MORGAN USD EM BOND UCITS ETF 4.3%
DYNAMIC BALANCED FUND
ISHARES CORE MSCI JAPAN IMI UCITS ETF 1.5%
ISHARES USD TREASURY BOND 3-7YR UCITS ETF 12.2%
ISHARES CORE EURO STOXX 50 UCITS ETF DE 5.5%
ISHARES CORE MSCI EM IMI UCITS ETF 5.3%
ISHARES USD CORP BOND UCITS ETF 24.5%
ISHARES USD TREASURY BOND 1-3YR UCITS ETF 19.7%
ISHARES CORE S&P 500 UCITS ETF
United Kingdom, 78.1%
Switzerland, 12.2%
Germany, 5.5%
Cash & Cash Equivalents, 4.0%
United States, 1.5%
Other, -1.3%
For disclaimer, please refer to page 6.

19
PERFORMANCE ON BID–BID BASIS (%)3 mths 6 mths 1 year 3 years* 5 years* 10 years* Since Inception
(Cumulative)
Great Eastern - Lion Dynamic Growth Fund#
4.86% 3.81% - - - - 9.05%
Source: Morningstar. Performance figures are calculated on a bid-bid basis, with all dividends and distributions reinvested, taking into account all charges which would have been payable upon such reinvestment.* Performance figures longer than 1 year are annualised.# A track record of at least one year for the ILP Sub-Fund is not available. The inception date for the ILP Sub-Fund is 27 September 2020.^ As each of the funds and ETFs has their own respective benchmarks, there is no suitable composite benchmark that best represent the
performance of these benchmarks.
GREAT EASTERN - LION DYNAMIC GROWTH FUND report as at 30 June 2021
FUND FACTS
PORTFOLIO PERFORMANCE SINCE INCEPTION
PORTFOLIO WEIGHTINGS
FUND OBJECTIVE The Fund's objective aims to achieve long-term capital appreciation by investing into equities, government bonds, investment grade bonds, high yield bonds, emerging market bonds, commodities and alternatives via allocation to funds and exchange-trade funds (ETFs).
Inception Date 27 September 2020Dealing Frequency DailyFund Currency SGDSubscription Mode Cash & SRS Risk Category Higher Risk – Broadly
DiversifiedFund Management Fee 1.40% p.a.Benchmark^ N.A.Offer Price SGD 1.091Bid Price SGD 1.036Bid Offer Spread 5.0%Fund Size SGD 4.6 mFund Manager Great Eastern Life Assurance Co
Ltd Sub-Manager Lion Global Investors Ltd
Luxembourg, 54.4% United Kingdom, 29.5% Singapore, 8.2% Switzerland, 5.4% Cash & Cash Equivalents,
3.8% Other, -1.2%
Great Eastern - Lion Dynamic Growth Fund
Bala
nced
Fun
ds
GREAT EASTERN - LION
as at 30 June 2021
Fund Objective
Fund Information
Performance Chart
3 mths 6 mths 1 Year 3 Years* 5 Years* 10 Years*
4.86% 3.81% - - - -
The Fund's objective aims to achieve long-term capital appreciation by investing into equities, government bonds, investmentgrade bonds, high yield bonds, emerging market bonds, commodities and alternatives via allocation to funds and exchange-trade funds (ETFs).
Inception Date 27 September, 2020 Offer Price SGD 1.091Dealing Frequency Daily Bid Price SGD 1.036Fund Currency SGD Bid Offer Spread 5.0%Subscription Mode Cash & SRS Fund Size SGD 4.6 m
Risk Category Higher Risk - Broadly DiversifiedFund Manager Great Eastern Life Assurance
Co Ltd
Sub Manager Lion Global Investors Ltd
Benchmark ^ N.A. Fund Management Fee 1.40% p.a.
Since Inception(Cumulative)
Great Eastern - Lion Dynamic Growth Fund #
9.05%
The information provided herein is subject to our disclaimer set out at the end of this document. Page 1 of 3
Source: Morningstar. Performance figures are calculated on a bid-bid basis, with all dividends and distributions reinvested, taking into account allcharges which would have been payable upon such reinvestment.* Performance figures longer than 1 year are annualised.# A track record of at least one year for the ILP Sub-Fund is not available. The inception date for the ILP Sub-Fund is 27 September 2020.^ As the ILP Sub-Fund invests into ETFs and funds, there is no suitable composite benchmark that best represent the performance of thesebenchmarks.
DYNAMIC GROWTH FUND
90
100
110
120
Sep-20 Oct-20 Nov-20 Dec-20 Jan-21 Feb-21 Mar-21 Apr-21 May-21 Jun-21
Great Eastern - Lion Dynamic Growth Fund
GREAT EASTERN - LION
as at 30 June 2021
Portfolio Weightings
Top 10 Holdings
CAPITAL GROUP NEW PERSPECTIVE FUND LUX 24.8%
4.9%
ALLIANCEBERNSTEIN SUSTAINABLE GLOBAL THEMATIC PORTFOLIO 24.6%
ISHARES USD HIGH YIELD CORP BOND UCITS ETF 9.9%
ISHARES USD TREASURY BOND 7-10YR UCITS ETF 7.5%
DYNAMIC GROWTH FUND
The information provided herein is subject to our disclaimer set out at the end of this document. Page 2 of 3
INVESCO PHYSICAL GOLD ETC 3.7%
ISHARES USD TREASURY BOND 1-3YR UCITS ETF 3.5%
SCHRODER ISF GREATER CHINA 3.1%
LIONGLOBAL SHORT DURATION BOND FUND 6.6%
ISHARES USD TREASURY BOND 3-7YR UCITS ETF 5.4%
ISHARES J.P. MORGAN USD EM BOND UCITS ETF
Luxembourg, 54.4%
United Kingdom, 29.5%
Singapore, 8.2%
Switzerland, 5.4%
Cash & Cash Equivalents, 3.8%
Other, -1.2%
For disclaimer, please refer to page 6.
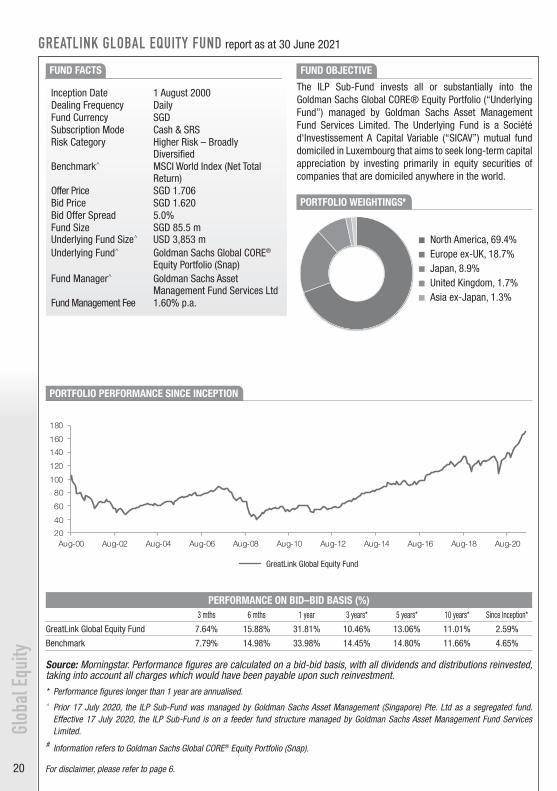
20
Glob
al E
quity
GREATLINK GLOBAL EQUITY FUND report as at 30 June 2021
PORTFOLIO PERFORMANCE SINCE INCEPTION
FUND FACTS FUND OBJECTIVE
The ILP Sub-Fund invests all or substantially into the Goldman Sachs Global CORE® Equity Portfolio (“Underlying Fund”) managed by Goldman Sachs Asset Management Fund Services Limited. The Underlying Fund is a Société d'Investissement A Capital Variable (“SICAV”) mutual fund domiciled in Luxembourg that aims to seek long-term capital appreciation by investing primarily in equity securities of companies that are domiciled anywhere in the world.
Inception Date 1 August 2000Dealing Frequency DailyFund Currency SGDSubscription Mode Cash & SRSRisk Category Higher Risk – Broadly
DiversifiedBenchmark^ MSCI World Index (Net Total
Return)Offer Price SGD 1.706Bid Price SGD 1.620Bid Offer Spread 5.0%Fund Size SGD 85.5 mUnderlying Fund Size^ USD 3,853 m
Underlying Fund^ Goldman Sachs Global CORE® Equity Portfolio (Snap)
Fund Manager^ Goldman Sachs Asset Management Fund Services Ltd
Fund Management Fee 1.60% p.a.
PERFORMANCE ON BID–BID BASIS (%)3 mths 6 mths 1 year 3 years* 5 years* 10 years* Since Inception*
GreatLink Global Equity Fund 7.64% 15.88% 31.81% 10.46% 13.06% 11.01% 2.59%
Benchmark 7.79% 14.98% 33.98% 14.45% 14.80% 11.66% 4.65%
Source: Morningstar. Performance figures are calculated on a bid-bid basis, with all dividends and distributions reinvested, taking into account all charges which would have been payable upon such reinvestment.* Performance figures longer than 1 year are annualised.^ Prior 17 July 2020, the ILP Sub-Fund was managed by Goldman Sachs Asset Management (Singapore) Pte. Ltd as a segregated fund.
Effective 17 July 2020, the ILP Sub-Fund is on a feeder fund structure managed by Goldman Sachs Asset Management Fund Services Limited.
# Information refers to Goldman Sachs Global CORE® Equity Portfolio (Snap).
GreatLink Global Equity Fund
For disclaimer, please refer to page 6.
GREATLINK
as at 30 June 2021
Fund Objective
Fund Information
1.60% p.a.
Performance Chart
3 mths 6 mths 1 Year 3 Years* 5 Years* 10 Years*
7.64% 15.88% 31.81% 10.46% 13.06% 11.01%
7.79% 14.98% 33.98% 14.45% 14.80% 11.66%
Source: Morningstar. Performance figures are calculated on a bid-bid basis, with all dividends and distributions reinvested, taking into account allcharges which would have been payable upon such reinvestment.* Performance figures longer than 1 year are annualised.^ Prior 17 July 2020, the ILP Sub-Fund was managed by Goldman Sachs Asset Management (Singapore) Pte. Ltd as a segregated fund. Effective17 July 2020, the ILP Sub-Fund is on a feeder fund structure managed by Goldman Sachs Asset Management Fund Services Limited.
The information provided herein is subject to our disclaimer set out at the end of this document. Page 1 of 2
Benchmark ^ MSCI World Index (Net Total Return) Underlying Fund ^Goldman Sachs Global CORE® Equity Portfolio (Snap)
Since Inception*
GreatLink Global Equity Fund 2.59%
Benchmark 4.65%
Fund Management Fee Fund Manager ^Goldman Sachs Asset Management Fund Services Ltd
Subscription Mode Cash & SRS Fund Size SGD 85.5 m
Risk Category Higher Risk - Broadly Diversified Underlying Fund Size ^ USD 3,853 m
GLOBAL EQUITY FUND
The ILP Sub-Fund invests all or substantially into the Goldman Sachs Global CORE® Equity Portfolio (“Underlying Fund”)managed by Goldman Sachs Asset Management Fund Services Limited. The Underlying Fund is a Société d'Investissement ACapital Variable (“SICAV”) mutual fund domiciled in Luxembourg that aims to seek long-term capital appreciation by investingprimarily in equity securities of companies that are domiciled anywhere in the world.
Inception Date 1 August, 2000 Offer Price SGD 1.706Dealing Frequency Daily Bid Price SGD 1.620Fund Currency SGD Bid Offer Spread 5.0%
20406080
100120140160180
Aug-00 Aug-02 Aug-04 Aug-06 Aug-08 Aug-10 Aug-12 Aug-14 Aug-16 Aug-18 Aug-20
GreatLink Global Equity Fund
PORTFOLIO WEIGHTINGS#
North America, 69.4% Europe ex-UK, 18.7% Japan, 8.9% United Kingdom, 1.7% Asia ex-Japan, 1.3%
GREATLINK
as at 30 June 2021
Portfolio Weightings#
Top 10 Holdings#
ADIDAS AG 1.2%# Information refers to Goldman Sachs Global CORE® Equity Portfolio (Snap).
DISCLAIMER: GreatLink Global Equity Fund is an investment-linked policy (ILP) fund offered by The Great Eastern Life AssuranceCompany Limited ("Great Eastern") and is only available under Great Eastern Investment-Linked Policies. This factsheet is compiled byGreat Eastern. The information presented is for informational use only. A product summary and a Product Highlights Sheet in relation to theFund may be obtained through Great Eastern or its financial representatives. Potential investors should read the product summary and theProduct Highlights Sheet before deciding whether to invest in the Fund. Returns on the units of the Fund are not guaranteed. The value ofthe units in the Fund and the income accruing to the units, if any, may fall or rise. The fees and charges payable through deduction ofpremium or cancellation of units are excluded in the calculation of fund returns. Past returns, and any other economic or market predictions,projections or forecasts targeted by the fund are not necessarily indicative of future or likely performance of the fund. This advertisementhas not been reviewed by the Monetary Authority of Singapore.
The Great Eastern Life Assurance Company Limited (Reg No. 1908 00011G)1 Pickering Street, #01-01 Great Eastern Centre, Singapore 048659Product Enquiry: +65 6248 2211 / greateasternlife.com
FACEBOOK INC 2.6%
AMAZON.COM INC 1.8%
JOHNSON & JOHNSON 1.6%
APPLE INC 4.6%
MICROSOFT CORP 3.8%
ALPHABET INC-CL C
The information provided herein is subject to our disclaimer set out at the end of this document. Page 2 of 2
PAYPAL HOLDINGS INC 1.4%
WALMART INC 1.2%
HCA HEALTHCARE INC 1.2%
3.6%
GLOBAL EQUITY FUND
North America, 69.4%
Europe ex-UK, 18.7%
Japan, 8.9%
United Kingdom, 1.7%
Asia ex-Japan, 1.3%
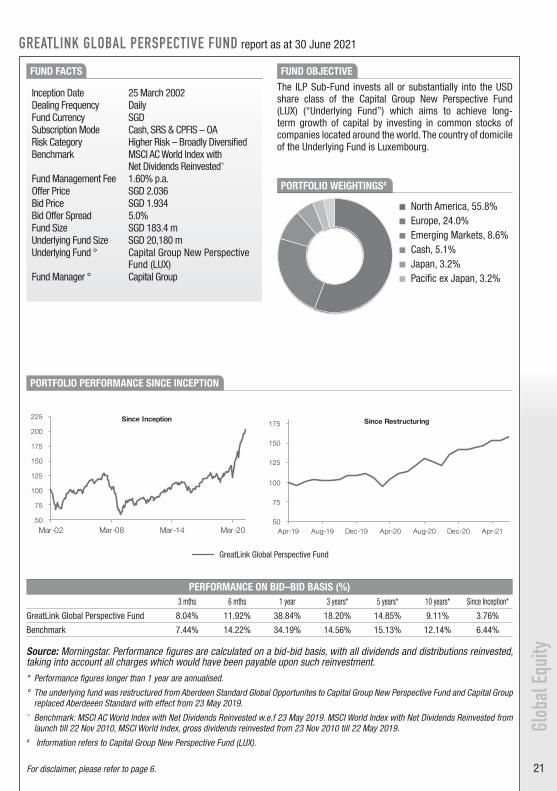
21
GREATLINK
as at 30 June 2021
Portfolio Weightings#
Top 10 Holdings#
TSMC 3.0%
AMAZON.COM 3.0%
ALPHABET 2.5%
DISCLAIMER: GreatLink Global Perspective Fund is an investment-linked policy (ILP) fund offered by The Great Eastern Life AssuranceCompany Limited ("Great Eastern") and is only available under Great Eastern Investment-Linked Policies. This factsheet is compiled byGreat Eastern. The information presented is for informational use only. A product summary and a Product Highlights Sheet in relation to theFund may be obtained through Great Eastern or its financial representatives. Potential investors should read the product summary and theProduct Highlights Sheet before deciding whether to invest in the Fund. Returns on the units of the Fund are not guaranteed. The value ofthe units in the Fund and the income accruing to the units, if any, may fall or rise. The fees and charges payable through deduction ofpremium or cancellation of units are excluded in the calculation of fund returns. Past returns, and any other economic or market predictions,projections or forecasts targeted by the fund are not necessarily indicative of future or likely performance of the fund. This advertisementhas not been reviewed by the Monetary Authority of Singapore.
The Great Eastern Life Assurance Company Limited (Reg No. 1908 00011G)1 Pickering Street, #01-01 Great Eastern Centre, Singapore 048659Product Enquiry: +65 6248 2211 / greateasternlife.com
The information provided herein is subject to our disclaimer set out at the end of this document. Page 2 of 2
ASML 2.4%
PAYPAL HOLDINGS INC 1.9%
JPMORGAN CHASE 1.4%
VALE 1.2%# Information refers to Capital Group New Perspective Fund (LUX).
3.0%
TESLA INC 5.1%
MICROSOFT 3.3%
GLOBAL PERSPECTIVE FUND
North America, 55.8%
Europe, 24.0%
Emerging Markets, 8.6%
Cash , 5.1%
Japan, 3.2%
Pacific ex Japan, 3.2%
Glob
al E
quity
GREATLINK GLOBAL PERSPECTIVE FUND report as at 30 June 2021
PORTFOLIO PERFORMANCE SINCE INCEPTION
PORTFOLIO WEIGHTINGS#
FUND FACTS FUND OBJECTIVE The ILP Sub-Fund invests all or substantially into the USD share class of the Capital Group New Perspective Fund (LUX) (“Underlying Fund”) which aims to achieve long-term growth of capital by investing in common stocks of companies located around the world. The country of domicile of the Underlying Fund is Luxembourg.
PERFORMANCE ON BID–BID BASIS (%)3 mths 6 mths 1 year 3 years* 5 years* 10 years* Since Inception*
GreatLink Global Perspective Fund 8.04% 11.92% 38.84% 18.20% 14.85% 9.11% 3.76%
Benchmark 7.44% 14.22% 34.19% 14.56% 15.13% 12.14% 6.44%
Source: Morningstar. Performance figures are calculated on a bid-bid basis, with all dividends and distributions reinvested, taking into account all charges which would have been payable upon such reinvestment.* Performance figures longer than 1 year are annualised.
° The underlying fund was restructured from Aberdeen Standard Global Opportunites to Capital Group New Perspective Fund and Capital Group replaced Aberdeeen Standard with effect from 23 May 2019.
^ Benchmark: MSCI AC World Index with Net Dividends Reinvested w.e.f 23 May 2019. MSCI World Index with Net Dividends Reinvested from launch till 22 Nov 2010, MSCI World Index, gross dividends reinvested from 23 Nov 2010 till 22 May 2019.
# Information refers to Capital Group New Perspective Fund (LUX).
Inception Date 25 March 2002Dealing Frequency DailyFund Currency SGDSubscription Mode Cash, SRS & CPFIS – OARisk Category Higher Risk – Broadly DiversifiedBenchmark MSCI AC World Index with
Net Dividends Reinvested^
Fund Management Fee 1.60% p.a.Offer Price SGD 2.036Bid Price SGD 1.934Bid Offer Spread 5.0%Fund Size SGD 183.4 mUnderlying Fund Size SGD 20,180 mUnderlying Fund ° Capital Group New Perspective
Fund (LUX)Fund Manager ° Capital Group
North America, 55.8% Europe, 24.0% Emerging Markets, 8.6% Cash, 5.1% Japan, 3.2% Pacific ex Japan, 3.2%
GreatLink Global Perspective Fund
For disclaimer, please refer to page 6.
GREATLINK
as at 30 June 2021
Fund Objective
Fund Information
Performance Chart
3 mths 6 mths 1 Year 3 Years* 5 Years* 10 Years*
8.04% 11.92% 38.84% 18.20% 14.85% 9.11%
7.44% 14.22% 34.19% 14.56% 15.13% 12.14%
GreatLink Global Perspective Fund
3.76%
Benchmark 6.44%
The information provided herein is subject to our disclaimer set out at the end of this document. Page 1 of 2
Source: Morningstar. Performance figures are calculated on a bid-bid basis, with all dividends and distributions reinvested, taking into account allcharges which would have been payable upon such reinvestment.* Performance figures longer than 1 year are annualised.° The underlying fund was restructured from Aberdeen Standard Global Opportunites to Capital Group New Perspective Fund and Capital Groupreplaced Aberdeeen Standard with effect from 23 May 2019.^ Benchmark: MSCI AC World Index with Net Dividends Reinvested w.e.f 23 May 2019. MSCI World Index with Net Dividends Reinvested fromlaunch till 22 Nov 2010, MSCI World Index, gross dividends reinvested from 23 Nov 2010 till 22 May 2019.
Benchmark MSCI AC World Index with Net Dividends Reinvested^ Underlying Fund ° Capital Group New
Perspective Fund (LUX)
Since Inception*
Fund Management Fee 1.60% p.a. Fund Manager ° Capital Group
Subscription Mode Cash, SRS & CPFIS – OA Fund Size SGD 183.4 m
Risk Category Higher Risk - Broadly Diversified Underlying Fund Size SGD 20,180 m
GLOBAL PERSPECTIVE FUND
The ILP Sub-Fund invests all or substantially into the USD share class of the Capital Group New Perspective Fund (LUX)(“Underlying Fund”) which aims to achieve long-term growth of capital by investing in common stocks of companies locatedaround the world. The country of domicile of the Underlying Fund is Luxembourg.
Inception Date 25 March, 2002 Offer Price SGD 2.036Dealing Frequency Daily Bid Price SGD 1.934Fund Currency SGD Bid Offer Spread 5.0%
50
75
100
125
150
175
200
225
Mar-02 Mar-08 Mar-14 Mar-20
GreatLink Global Perspective Fund
Since Inception
50
75
100
125
150
175
Apr-19 Aug-19 Dec-19 Apr-20 Aug-20 Dec-20 Apr-21
Since Restructuring
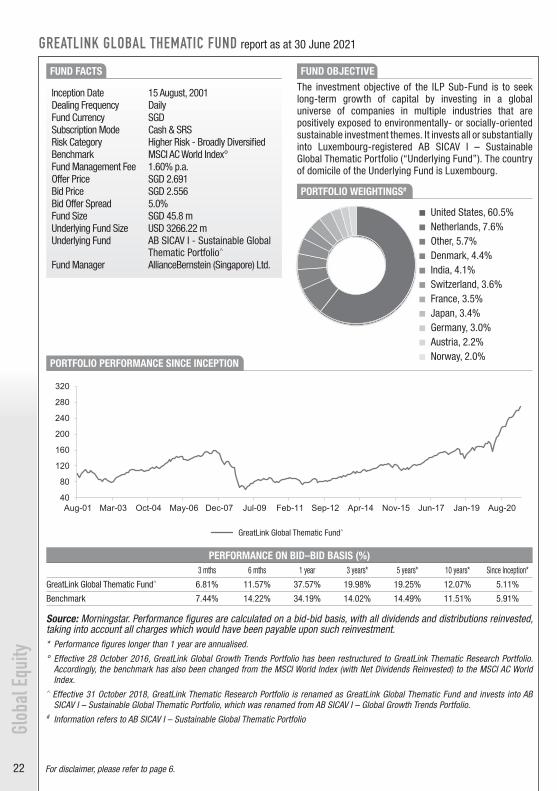
22
40
80
120
160
200
240
280
320
Aug-01 Mar-03 Oct-04 May-06 Dec-07 Jul-09 Feb-11 Sep-12 Apr-14 Nov-15 Jun-17 Jan-19 Aug-20
GreatLink Global Thematic Fund^
GREATLINK
as at 30 June 2021
Portfolio Weightings#
Top 10 Holdings#
DANAHER 2.2%
LUMENTUM 2.2%
APOLLO HOSPITALS ENTERPRISE 2.1%
The information provided herein is subject to our disclaimer set out at the end of this document. Page 2 of 2
TREX 2.1%
APTIV 2.1%# Information refers to AB SICAV I – Sustainable Global Thematic Portfolio
DISCLAIMER: GreatLink Global Thematic Fund is an investment-linked policy (ILP) fund offered by The Great Eastern Life AssuranceCompany Limited ("Great Eastern") and is only available under Great Eastern Investment-Linked Policies. This factsheet is compiled byGreat Eastern. The information presented is for informational use only. A product summary and a Product Highlights Sheet in relation to theFund may be obtained through Great Eastern or its financial representatives. Potential investors should read the product summary and theProduct Highlights Sheet before deciding whether to invest in the Fund. Returns on the units of the Fund are not guaranteed. The value ofthe units in the Fund and the income accruing to the units, if any, may fall or rise. The fees and charges payable through deduction ofpremium or cancellation of units are excluded in the calculation of fund returns. Past returns, and any other economic or market predictions,projections or forecasts targeted by the fund are not necessarily indicative of future or likely performance of the fund. This advertisementhas not been reviewed by the Monetary Authority of Singapore.
The Great Eastern Life Assurance Company Limited (Reg No. 1908 00011G)1 Pickering Street, #01-01 Great Eastern Centre, Singapore 048659Product Enquiry: +65 6248 2211 / greateasternlife.com
WASTE MANAGEMENT 2.4%
MSCI 2.3%
FLEX 2.3%
SVB FINANCIAL GROUP 2.6%
LABCORP 2.9%
GLOBAL THEMATIC FUND
United States, 60.5%Netherlands, 7.6%Other, 5.7%Denmark, 4.4%India, 4.1%Switzerland, 3.6%France, 3.5%Japan, 3.4%Germany, 3.0%Austria, 2.2%Norway, 2.0%
Glob
al E
quity
GREATLINK GLOBAL THEMATIC FUND report as at 30 June 2021
PORTFOLIO PERFORMANCE SINCE INCEPTION
FUND FACTS FUND OBJECTIVE The investment objective of the ILP Sub-Fund is to seek long-term growth of capital by investing in a global universe of companies in multiple industries that are positively exposed to environmentally- or socially-oriented sustainable investment themes. It invests all or substantially into Luxembourg-registered AB SICAV I – Sustainable Global Thematic Portfolio (“Underlying Fund”). The country of domicile of the Underlying Fund is Luxembourg. PORTFOLIO WEIGHTINGS#
PERFORMANCE ON BID–BID BASIS (%)3 mths 6 mths 1 year 3 years* 5 years* 10 years* Since Inception*
GreatLink Global Thematic Fund^ 6.81% 11.57% 37.57% 19.98% 19.25% 12.07% 5.11%
Benchmark 7.44% 14.22% 34.19% 14.02% 14.49% 11.51% 5.91%
Source: Morningstar. Performance figures are calculated on a bid-bid basis, with all dividends and distributions reinvested, taking into account all charges which would have been payable upon such reinvestment.* Performance figures longer than 1 year are annualised.
° Effective 28 October 2016, GreatLink Global Growth Trends Portfolio has been restructured to GreatLink Thematic Research Portfolio. Accordingly, the benchmark has also been changed from the MSCI World Index (with Net Dividends Reinvested) to the MSCI AC World Index.
^ Effective 31 October 2018, GreatLink Thematic Research Portfolio is renamed as GreatLink Global Thematic Fund and invests into AB SICAV I – Sustainable Global Thematic Portfolio, which was renamed from AB SICAV I – Global Growth Trends Portfolio.
# Information refers to AB SICAV I – Sustainable Global Thematic Portfolio
Inception Date 15 August, 2001Dealing Frequency DailyFund Currency SGDSubscription Mode Cash & SRSRisk Category Higher Risk - Broadly DiversifiedBenchmark MSCI AC World Index°Fund Management Fee 1.60% p.a.Offer Price SGD 2.691Bid Price SGD 2.556Bid Offer Spread 5.0%Fund Size SGD 45.8 mUnderlying Fund Size USD 3266.22 mUnderlying Fund AB SICAV I - Sustainable Global
Thematic Portfolio^
Fund Manager AllianceBernstein (Singapore) Ltd.
United States, 60.5% Netherlands, 7.6% Other, 5.7% Denmark, 4.4% India, 4.1% Switzerland, 3.6% France, 3.5% Japan, 3.4% Germany, 3.0% Austria, 2.2% Norway, 2.0%
GreatLink Global Thematic Fund^
For disclaimer, please refer to page 6.

23
Glob
al E
quity
GREATLINK GLOBAL EQUITY ALPHA FUND report as at 30 June 2021
PORTFOLIO WEIGHTINGS#
FUND FACTS
PORTFOLIO PERFORMANCE SINCE INCEPTION
FUND OBJECTIVE
The Fund invests all or substantially into the USD share class of the Schroder International Selection Fund Global Equity Alpha* (“Underlying Fund”) managed by Schroder Investment Management Limited. The fund objective is to provide capital growth in excess of the MSCI World (Net TR) index after fees have been deducted over a three to five year period by investing in equity and equity related securities of companies worldwide. In order to achieve the objective, Schroder Investment Management Limited will invest in a select portfolio of securities, which it believes offer the best potential for future growth. The country of domicile of the Underlying Fund is Luxembourg and its base currency is the US Dollar.
PERFORMANCE ON BID–BID BASIS (%)3 mths 6 mths 1 year 3 years* 5 years* 10 years* Since Inception*
GreatLink Global Equity Alpha Fund 9.06% 17.57% 39.64% 15.92% 15.61% 10.21% 3.35%
Benchmark 7.79% 14.98% 33.98% 14.45% 14.80% 11.66% 6.34%
Source: Morningstar. Performance figures are calculated on a bid-bid basis, with all dividends and distributions reinvested, taking into account all charges which would have been payable upon such reinvestment.* Performance figures longer than 1 year are annualised.
^ Benchmark: MSCI World Index, gross dividends reinvested from launch till 14 May 2007, MSCI World Index, net dividends reinvested wef 15 May 2007.
# Information refers to Schroder International Selection Fund – Global Equity Alpha
Inception Date 25 March 2002Dealing Frequency DailyFund Currency SGDSubscription Mode Cash, SRS & CPFIS – OARisk Category Higher Risk - Broadly DiversifiedBenchmark MSCI World Index with Net
Dividends Reinvested^
Fund Management Fee 1.60% p.a.Offer Price SGD 1.888Bid Price SGD 1.793Bid Offer Spread 5.0%Fund Size SGD 179.2 mUnderlying Fund Size USD 2541.0 mUnderlying Fund Schroder International Selection
Fund - Global Equity AlphaFund Manager Schroder Investment Management
Ltd ('Schroders') Americas, 65.4% Europe ex-UK/Middle
East, 18.9% Emerging Markets, 7.1% United Kingdom, 5.1% Liquid Assets, 1.8% Pacific ex-Japan, 1.6%
GreatLink Global Equity Alpha Fund
For disclaimer, please refer to page 6.
GREATLINK
as at 30 June 2021
Fund Objective
Fund Information
Performance Chart
3 mths 6 mths 1 Year 3 Years* 5 Years* 10 Years*
9.06% 17.57% 39.64% 15.92% 15.61% 10.21%
7.79% 14.98% 33.98% 14.45% 14.80% 11.66%
Since Inception*
GreatLink Global Equity Alpha Fund
3.35%
Benchmark 6.34%
The information provided herein is subject to our disclaimer set out at the end of this document. Page 1 of 2
Source: Morningstar. Performance figures are calculated on a bid-bid basis, with all dividends and distributions reinvested, taking into account allcharges which would have been payable upon such reinvestment.* Performance figures longer than 1 year are annualised.^ Benchmark: MSCI World Index, gross dividends reinvested from launch till 14 May 2007, MSCI World Index, net dividends reinvested wef 15 May2007.
Benchmark MSCI World Index with Net Dividends Reinvested^ Underlying Fund
Schroder International Selection Fund - Global Equity Alpha
Fund Management Fee 1.60% p.a. Fund ManagerSchroder Investment Management Ltd ('Schroders')
Subscription Mode Cash, SRS & CPFIS – OA Fund Size SGD 179.2 m
Risk Category Higher Risk - Broadly Diversified Underlying Fund Size USD 2541.0 m
GLOBAL EQUITY ALPHA FUND
The Fund invests all or substantially into the USD share class of the Schroder International Selection Fund Global Equity Alpha*(“Underlying Fund”) managed by Schroder Investment Management Limited. The fund objective is to provide capital growth inexcess of the MSCI World (Net TR) index after fees have been deducted over a three to five year period by investing in equityand equity related securities of companies worldwide. In order to achieve the objective, Schroder Investment ManagementLimited will invest in a select portfolio of securities, which it believes offer the best potential for future growth. The country ofdomicile of the Underlying Fund is Luxembourg and its base currency is the US Dollar.
Inception Date 25 March, 2002 Offer Price SGD 1.888Dealing Frequency Daily Bid Price SGD 1.793Fund Currency SGD Bid Offer Spread 5.0%
406080
100120140160180200
Mar-02 Mar-04 Mar-06 Mar-08 Mar-10 Mar-12 Mar-14 Mar-16 Mar-18 Mar-20GreatLink Global Equity Alpha Fund
GREATLINK
as at 30 June 2021
Portfolio Weightings#
Top 10 Holdings#
The information provided herein is subject to our disclaimer set out at the end of this document. Page 2 of 2
ROYAL DUTCH SHELL PLC 2.5%
EQUINOR ASA 2.5%# Information refers to Schroder International Selection Fund – Global Equity Alpha
DISCLAIMER: GreatLink Global Equity Alpha Fund is an investment-linked policy (ILP) fund offered by The Great Eastern Life AssuranceCompany Limited ("Great Eastern") and is only available under Great Eastern Investment-Linked Policies. This factsheet is compiled byGreat Eastern. The information presented is for informational use only. A product summary and a Product Highlights Sheet in relation to theFund may be obtained through Great Eastern or its financial representatives. Potential investors should read the product summary and theProduct Highlights Sheet before deciding whether to invest in the Fund. Returns on the units of the Fund are not guaranteed. The value ofthe units in the Fund and the income accruing to the units, if any, may fall or rise. The fees and charges payable through deduction ofpremium or cancellation of units are excluded in the calculation of fund returns. Past returns, and any other economic or market predictions,projections or forecasts targeted by the fund are not necessarily indicative of future or likely performance of the fund. This advertisementhas not been reviewed by the Monetary Authority of Singapore.
The Great Eastern Life Assurance Company Limited (Reg No. 1908 00011G)1 Pickering Street, #01-01 Great Eastern Centre, Singapore 048659Product Enquiry: +65 6248 2211 / greateasternlife.com
DIAGEO PLC 2.9%
AMAZON.COM INC 2.7%
AMERICAN EXPRESS CO 2.6%
JPMORGAN CHASE & CO 4.2%
FACEBOOK INC 3.7%
VISA INC 3.5%
MICROSOFT CORP 4.4%
ALPHABET INC 5.2%
GLOBAL EQUITY ALPHA FUND
Americas, 65.4%
Europe ex-UK/Middle East, 18.9%
Emerging Markets, 7.1%
United Kingdom, 5.1%
Liquid Assets, 1.8%
Pacific ex-Japan, 1.6%
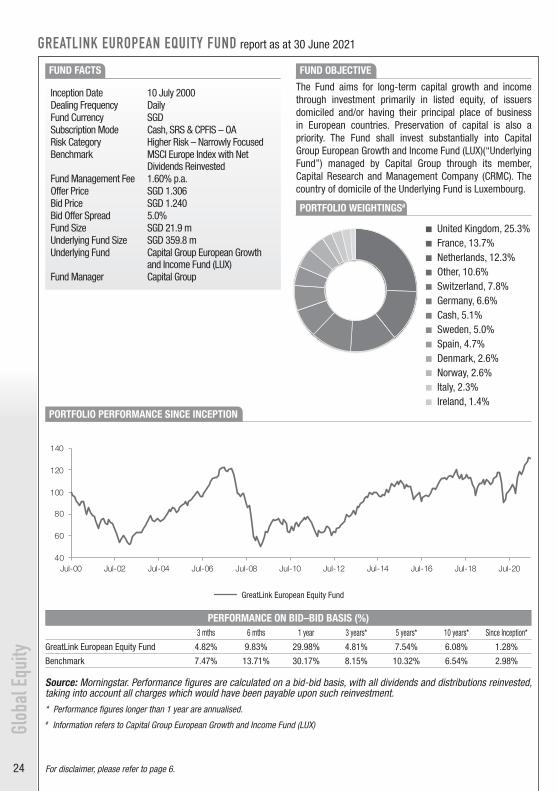
24
Glob
al E
quity
GREATLINK EUROPEAN EQUITY FUND report as at 30 June 2021
PORTFOLIO WEIGHTINGS#
FUND FACTS FUND OBJECTIVE
The Fund aims for long-term capital growth and income through investment primarily in listed equity, of issuers domiciled and/or having their principal place of business in European countries. Preservation of capital is also a priority. The Fund shall invest substantially into Capital Group European Growth and Income Fund (LUX)(“Underlying Fund”) managed by Capital Group through its member, Capital Research and Management Company (CRMC). The country of domicile of the Underlying Fund is Luxembourg.
PERFORMANCE ON BID–BID BASIS (%)3 mths 6 mths 1 year 3 years* 5 years* 10 years* Since Inception*
GreatLink European Equity Fund 4.82% 9.83% 29.98% 4.81% 7.54% 6.08% 1.28%
Benchmark 7.47% 13.71% 30.17% 8.15% 10.32% 6.54% 2.98%
Source: Morningstar. Performance figures are calculated on a bid-bid basis, with all dividends and distributions reinvested, taking into account all charges which would have been payable upon such reinvestment.* Performance figures longer than 1 year are annualised.# Information refers to Capital Group European Growth and Income Fund (LUX)
Inception Date 10 July 2000Dealing Frequency DailyFund Currency SGDSubscription Mode Cash, SRS & CPFIS – OARisk Category Higher Risk – Narrowly FocusedBenchmark MSCI Europe Index with Net
Dividends ReinvestedFund Management Fee 1.60% p.a.Offer Price SGD 1.306Bid Price SGD 1.240Bid Offer Spread 5.0%Fund Size SGD 21.9 mUnderlying Fund Size SGD 359.8 mUnderlying Fund Capital Group European Growth
and Income Fund (LUX)Fund Manager Capital Group
PORTFOLIO PERFORMANCE SINCE INCEPTION
United Kingdom, 25.3% France, 13.7% Netherlands, 12.3% Other, 10.6% Switzerland, 7.8% Germany, 6.6% Cash, 5.1% Sweden, 5.0% Spain, 4.7% Denmark, 2.6%
Norway, 2.6% Italy, 2.3% Ireland, 1.4%
GreatLink European Equity Fund
For disclaimer, please refer to page 6.
GREATLINK
as at 30 June 2021
Fund Objective
Fund Information
Performance Chart
3 mths 6 mths 1 Year 3 Years* 5 Years* 10 Years*
4.82% 9.83% 29.98% 4.81% 7.54% 6.08%
7.47% 13.71% 30.17% 8.15% 10.32% 6.54%
Since Inception*
GreatLink European Equity Fund 1.28%
Benchmark 2.98%
The information provided herein is subject to our disclaimer set out at the end of this document. Page 1 of 2
Source: Morningstar. Performance figures are calculated on a bid-bid basis, with all dividends and distributions reinvested, taking into account allcharges which would have been payable upon such reinvestment.* Performance figures longer than 1 year are annualised.
Benchmark MSCI Europe Index with Net Dividends Reinvested Underlying Fund
Capital Group European Growth and Income Fund (LUX)
Fund Management Fee 1.60% p.a. Fund Manager Capital Group
Subscription Mode Cash, SRS & CPFIS – OA Fund Size SGD 21.9 m
Risk Category Higher Risk - Narrowly Focused Underlying Fund Size SGD 359.8 m
EUROPEAN EQUITY FUND
The Fund aims for long-term capital growth and income through investment primarily in listed equity, of issuers domiciledand/or having their principal place of business in European countries. Preservation of capital is also a priority. The Fund shallinvest substantially into Capital Group European Growth and Income Fund (LUX)(“Underlying Fund”) managed by Capital Group through its member, Capital Research and Management Company (CRMC). The country of domicile of the Underlying Fund isLuxembourg.
Inception Date 10 July, 2000 Offer Price SGD 1.306Dealing Frequency Daily Bid Price SGD 1.240Fund Currency SGD Bid Offer Spread 5.0%
40
60
80
100
120
140
Jul-00 Jul-02 Jul-04 Jul-06 Jul-08 Jul-10 Jul-12 Jul-14 Jul-16 Jul-18 Jul-20GreatLink European Equity Fund
GREATLINK
as at 30 June 2021
Portfolio Weightings#
Top 10 Holdings#
The information provided herein is subject to our disclaimer set out at the end of this document. Page 2 of 2
DNB BANK ASA 2.1%
ROYAL DUTCH SHELL 2.1%# Information refers to Capital Group European Growth and Income Fund (LUX)
DISCLAIMER: GreatLink European Equity Fund is an investment-linked policy (ILP) fund offered by The Great Eastern Life AssuranceCompany Limited ("Great Eastern") and is only available under Great Eastern Investment-Linked Policies. This factsheet is compiled byGreat Eastern. The information presented is for informational use only. A product summary and a Product Highlights Sheet in relation to theFund may be obtained through Great Eastern or its financial representatives. Potential investors should read the product summary and theProduct Highlights Sheet before deciding whether to invest in the Fund. Returns on the units of the Fund are not guaranteed. The value ofthe units in the Fund and the income accruing to the units, if any, may fall or rise. The fees and charges payable through deduction ofpremium or cancellation of units are excluded in the calculation of fund returns. Past returns, and any other economic or market predictions,projections or forecasts targeted by the fund are not necessarily indicative of future or likely performance of the fund. This advertisementhas not been reviewed by the Monetary Authority of Singapore.
The Great Eastern Life Assurance Company Limited (Reg No. 1908 00011G)1 Pickering Street, #01-01 Great Eastern Centre, Singapore 048659Product Enquiry: +65 6248 2211 / greateasternlife.com
CHEMICAL WORKS OF GEDEON RICHTER PLC 2.9%
ING GROEP NV 2.7%
NOVARTIS 2.2%
PROSUS N.V. CLASS N 3.2%
AIRBUS SE 3.0%
IMPERIAL BRANDS 2.9%
AVAST PLC 3.4%
RIO TINTO 3.9%
EUROPEAN EQUITY FUND
United Kingdom, 25.3%France, 13.7%Netherlands, 12.3%Other, 10.6%Switzerland, 7.8%Germany, 6.6%Cash, 5.1%Sweden, 5.0%Spain, 4.7%Denmark, 2.6%Norway, 2.6%Italy, 2.3%Ireland, 1.4%
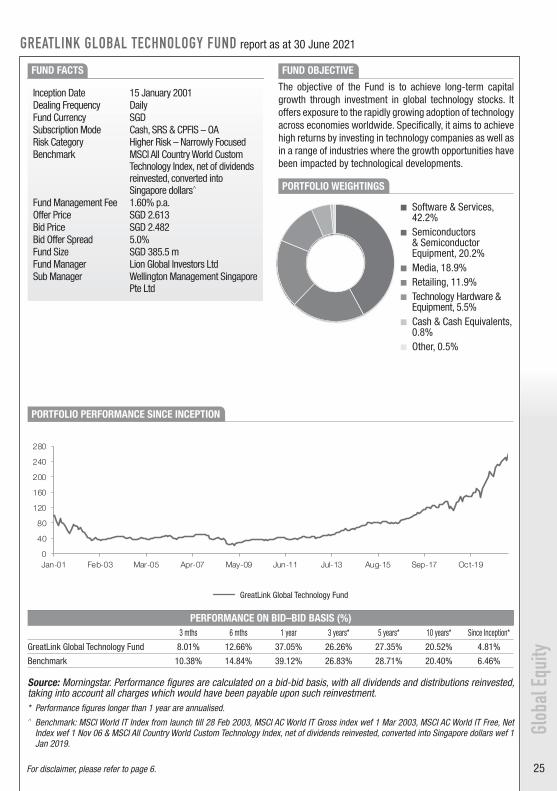
25
Glob
al E
quity
GREATLINK GLOBAL TECHNOLOGY FUND report as at 30 June 2021
FUND FACTS FUND OBJECTIVE
The objective of the Fund is to achieve long-term capital growth through investment in global technology stocks. It offers exposure to the rapidly growing adoption of technology across economies worldwide. Specifically, it aims to achieve high returns by investing in technology companies as well as in a range of industries where the growth opportunities have been impacted by technological developments. PORTFOLIO WEIGHTINGS
PERFORMANCE ON BID–BID BASIS (%)3 mths 6 mths 1 year 3 years* 5 years* 10 years* Since Inception*
GreatLink Global Technology Fund 8.01% 12.66% 37.05% 26.26% 27.35% 20.52% 4.81%
Benchmark 10.38% 14.84% 39.12% 26.83% 28.71% 20.40% 6.46%
Source: Morningstar. Performance figures are calculated on a bid-bid basis, with all dividends and distributions reinvested, taking into account all charges which would have been payable upon such reinvestment.* Performance figures longer than 1 year are annualised.^ Benchmark: MSCI World IT Index from launch till 28 Feb 2003, MSCI AC World IT Gross index wef 1 Mar 2003, MSCI AC World IT Free, Net
Index wef 1 Nov 06 & MSCI All Country World Custom Technology Index, net of dividends reinvested, converted into Singapore dollars wef 1 Jan 2019.
Inception Date 15 January 2001Dealing Frequency DailyFund Currency SGDSubscription Mode Cash, SRS & CPFIS – OARisk Category Higher Risk – Narrowly FocusedBenchmark MSCI All Country World Custom
Technology Index, net of dividends reinvested, converted into Singapore dollars^
Fund Management Fee 1.60% p.a.Offer Price SGD 2.613Bid Price SGD 2.482Bid Offer Spread 5.0%Fund Size SGD 385.5 mFund Manager Lion Global Investors LtdSub Manager Wellington Management Singapore
Pte Ltd
PORTFOLIO PERFORMANCE SINCE INCEPTION
Software & Services, 42.2%
Semiconductors & Semiconductor Equipment, 20.2%
Media, 18.9% Retailing, 11.9% Technology Hardware &
Equipment, 5.5% Cash & Cash Equivalents,
0.8% Other, 0.5%
GreatLink Global Technology Fund
For disclaimer, please refer to page 6.
GREATLINK
as at 30 June 2021
Fund Objective
Fund Information
Performance Chart
3 mths 6 mths 1 Year 3 Years* 5 Years* 10 Years*
8.01% 12.66% 37.05% 26.26% 27.35% 20.52%
10.38% 14.84% 39.12% 26.83% 28.71% 20.40%
The objective of the Fund is to achieve long-term capital growth through investment in global technology stocks. It offersexposure to the rapidly growing adoption of technology across economies worldwide. Specifically, it aims to achieve highreturns by investing in technology companies as well as in a range of industries where the growth opportunities have beenimpacted by technological developments.
Inception Date 15 January, 2001 Offer Price SGD 2.613Dealing Frequency Daily Bid Price SGD 2.482Fund Currency SGD Bid Offer Spread 5.0%
Fund Size SGD 385.5 mRisk Category Higher Risk - Narrowly Focused Fund Manager Lion Global Investors Ltd
BenchmarkMSCI All Country World Custom Technology Index with Net Dividends Reinvested, converted into Singapore dollars^
Fund Management Fee 1.60% p.a.
Subscription Mode Cash, SRS & CPFIS – OA
Since Inception*
GreatLink Global Technology Fund
4.81%
Benchmark 6.46%
The information provided herein is subject to our disclaimer set out at the end of this document. Page 1 of 2
Source: Morningstar. Performance figures are calculated on a bid-bid basis, with all dividends and distributions reinvested, taking into account allcharges which would have been payable upon such reinvestment.* Performance figures longer than 1 year are annualised.^ Benchmark: MSCI World IT Index from launch till 28 Feb 2003, MSCI AC World IT Gross index wef 1 Mar 2003, MSCI AC World IT Free, Net Index wef 1 Nov 06 & MSCI All Country World Custom Technology Index, net of dividends reinvested, converted into Singapore dollars wef 1 Jan 2019.
GLOBAL TECHNOLOGY FUND
Wellington Management Singapore Pte Ltd Sub Manager
0
40
80
120
160
200
240
280
Jan-01 Feb-03 Mar-05 Apr-07 May-09 Jun-11 Jul-13 Aug-15 Sep-17 Oct-19GreatLink Global Technology Fund
GREATLINK
as at 30 June 2021
Portfolio Weightings
Top 10 Holdings
MICROSOFT CORP 8.6%
AMAZON.COM INC 9.1%
GLOBAL PAYMENTS INC 3.3%
ALPHABET INC-A 7.3%
FACEBOOK INC-A 4.8%
MARVELL TECHNOLOGY INC 4.1%
GLOBAL TECHNOLOGY FUND
The information provided herein is subject to our disclaimer set out at the end of this document. Page 2 of 2
PAYPAL HOLDINGS INC 3.3%
VISA INC-CLASS A 2.5%
DISCLAIMER: GreatLink Global Techonology Fund is an investment-linked policy (ILP) fund offered by The Great Eastern Life AssuranceCompany Limited ("Great Eastern") and is only available under Great Eastern Investment-Linked Policies. This factsheet is compiled byGreat Eastern. The information presented is for informational use only. A product summary and a Product Highlights Sheet in relation to theFund may be obtained through Great Eastern or its financial representatives. Potential investors should read the product summary and theProduct Highlights Sheet before deciding whether to invest in the Fund. Returns on the units of the Fund are not guaranteed. The value ofthe units in the Fund and the income accruing to the units, if any, may fall or rise. The fees and charges payable through deduction ofpremium or cancellation of units are excluded in the calculation of fund returns. Past returns, and any other economic or market predictions,projections or forecasts targeted by the fund are not necessarily indicative of future or likely performance of the fund. This advertisementhas not been reviewed by the Monetary Authority of Singapore.
The Great Eastern Life Assurance Company Limited (Reg No. 1908 00011G)1 Pickering Street, #01-01 Great Eastern Centre, Singapore 048659Product Enquiry: +65 6248 2211 / greateasternlife.com
SALESFORCE.COM INC 3.9%
ADVANCED MICRO DEVICES INC 3.6%
Software & Services, 42.2%
Semiconductors & Semiconductor Equipment, 20.2%
Media, 18.9%
Retailing, 11.9%
Technology Hardware & Equipment, 5.5%
Cash & Cash Equivalents, 0.8%
Other, 0.5%

26
GREATLINK
as at 30 June 2021
Portfolio Weightings
Top 10 Holdings Dividend History*
4.8% 4.25%
4.7% 4.25%
2.9% 4.00%
2.8% 3.50%
2.3% 4.50%
2.0% 4.00%
2.0% 4.00%
1.9% 4.50%
1.8% 4.25%
1.7% 4.50%
4.00%
4.00%
4.00%
4.50%
3.50%
Year 2009
Year 2010
Page 2 of 2The information provided herein is subject to our disclaimer set out at the end of this document.
DISCLAIMER: GreatLink Global Real Estate Securities Fund is an investment-linked policy (ILP) fund offered by The Great Eastern LifeAssurance Company Limited ("Great Eastern") and is only available under Great Eastern Investment-Linked Policies. This factsheet iscompiled by Great Eastern. The information presented is for informational use only. A product summary and a Product Highlights Sheet inrelation to the Fund may be obtained through Great Eastern or its financial representatives. Potential investors should read the productsummary and the Product Highlights Sheet before deciding whether to invest in the Fund. Returns on the units of the Fund are notguaranteed. The value of the units in the Fund and the income accruing to the units, if any, may fall or rise. The fees and charges payablethrough deduction of premium or cancellation of units are excluded in the calculation of fund returns. Past returns, and any other economicor market predictions, projections or forecasts targeted by the fund are not necessarily indicative of future or likely performance of the fund.This advertisement has not been reviewed by the Monetary Authority of Singapore.
The Great Eastern Life Assurance Company Limited (Reg No. 1908 00011G)1 Pickering Street, #01-01 Great Eastern Centre, Singapore 048659Product Enquiry: +65 6248 2211 / greateasternlife.com
Year 2019
GLOBAL REAL ESTATE SECURITIES FUND
Year 2018
Year 2012
Year 2011
Year 2013
UDR INC
SUN HUNG KAI PROPERTIES LTD
Year 2006
Year 2007
Year 2008
Year 2020
Year 2017
* Dividend distributions are not guaranteedand are made at the Manager’s discretion
Year 2015
PROLOGIS INC
WELLTOWER INC
ESSEX PROPERTY TRUST INC
SIMON PROPERTY GROUP INC
CAMDEN PROPERTY TRUST
EQUITY RESIDENTIAL
SEGRO PLC
DIGITAL REALTY TRUST INC
Year 2014
Year 2016
United States of America, 58.2%
Asia Pacific ex-Japan, 12.9%
Japan, 11.9%
Europe ex-UK, 10.7%
United Kingdom, 6.2%
Cash & Cash Equivalents, 0.4%
Other, -0.2%
Glob
al E
quity
United State of America, 58.2%
Asia Pacific ex-Japan, 12.9%
Japan, 11.9% Europe ex-UK, 10.7% United Kingdom, 6.2% Cash & Cash Equivalents,
0.4% Other, -0.2%
PORTFOLIO WEIGHTINGS
GREATLINK GLOBAL REAL ESTATE SECURITIES FUND report as at 30 June 2021
FUND FACTS FUND OBJECTIVE The investment objective of the Fund is to seek to provide investors with medium to long term capital appreciation and to make regular income distributions by investing globally in (a) equity securities of companies that derive a substantial part of their revenue from the ownership, management and/or development of real estate and (b) Real Estate Investment Trusts (REITs) listed or traded in a regulated market.
Inception Date 8 June 2005Dealing Frequency DailyFund Currency SGDSubscription Mode Cash, SRS & CPFIS – OARisk Category Higher Risk – Narrowly FocusedBenchmark FTSE EPRA/NAREIT Developed
Index Net TRI^
Fund Management Fee 1.60% p.a.Offer Price SGD 1.030Bid Price SGD 0.978Bid Offer Spread 5.0%Fund Size SGD 442.4 mFund Manager Lion Global Investors LtdSub Manager PGIM Inc
PORTFOLIO PERFORMANCE SINCE INCEPTION
PERFORMANCE ON BID–BID BASIS (%)3 mths 6 mths 1 year 3 years* 5 years* 10 years* Since Inception*
GreatLink Global Real Estate Securities Fund
9.15% 17.27% 24.65% 7.20% 5.48% 7.25% 4.17%
Benchmark 9.22% 17.47% 28.68% 5.89% 4.92% 7.54% 4.30%
Source: Morningstar. Performance figures are calculated on a bid-bid basis, with all dividends and distributions reinvested, taking into account all charges which would have been payable upon such reinvestment.* Performance figures longer than 1 year are annualised.^ Benchmark was changed on 1 October 2016 from S&P Citigroup BMI World Property Index, Net Total Return Index to FTSE EPRA/NAREIT
Developed Index Net TRI.
GreatLink Global Real Estate Securities Fund
For disclaimer, please refer to page 6.
GREATLINK
as at 30 June 2021
Fund Objective
Fund Information
Performance Chart
3 mths 6 mths 1 Year 3 Years* 5 Years* 10 Years*
9.15% 17.27% 24.65% 7.20% 5.48% 7.25%
9.22% 17.47% 28.68% 5.89% 4.92% 7.54%
Fund Manager
Dealing Frequency Daily Bid Price SGD 0.978Fund Currency SGD Bid Offer Spread 5.0%Subscription Mode Cash, SRS & CPFIS – OA Fund Size SGD 442.4 mRisk Category
Benchmark FTSE EPRA/NAREIT Developed Index Net TRI
The investment objective of the Fund is to seek to provide investors with medium to long term capital appreciation and tomake regular income distributions by investing globally in (a) equity securities of companies that derive a substantial part oftheir revenue from the ownership, management and/or development of real estate and (b) Real Estate Investment Trusts(REITs) listed or traded in a regulated market.
Inception Date 8 June, 2005 Offer Price SGD 1.030
Page 1 of 2
Fund Management Fee 1.60% p.a. Sub Manager PGIM Inc
Since Inception*
GreatLink Global Real Estate Securities Fund
4.17%
Benchmark 4.30%
The information provided herein is subject to our disclaimer set out at the end of this document.
Source: Morningstar. Performance figures are calculated on a bid-bid basis, with all dividends and distributions reinvested, taking into account allcharges which would have been payable upon such reinvestment.* Performance figures longer than 1 year are annualised.^ Benchmark was changed on 1 October 2016 from S&P Citigroup BMI World Property Index, Net Total Return Index to FTSE EPRA/NAREITDeveloped Index Net TRI.
Lion Global Investors Ltd
GLOBAL REAL ESTATE SECURITIES FUND
Higher Risk - Narrowly Focused
40
80
120
160
200
Jun-05 Feb-07 Oct-08 Jun-10 Feb-12 Oct-13 Jun-15 Feb-17 Oct-18 Jun-20GreatLink Global Real Estate Securities Fund

27
GREATLINK GLOBAL EMERGING MARKETS EQUITY FUND report as at 30 June 2021
FUND FACTS
PORTFOLIO PERFORMANCE SINCE INCEPTION
FUND OBJECTIVE
This ILP Sub-Fund invests all or substantially into the Fidelity Funds - Emerging Markets Fund (SR-ACC-SGD) (“Underlying Fund”) managed by FIL Fund Management Limited. The ILP Sub-Fund invests principally in areas experiencing rapid economic growth including countries in Latin America, Emerging Asia, Africa, Eastern Europe (including Russia) and the Middle East. These regions include emerging markets. The Underlying Fund may invest its net assets directly in China A and B Shares. The country of domicile of the Underlying Fund is Luxembourg. PORTFOLIO WEIGHTINGS#
PERFORMANCE ON BID–BID BASIS (%)3 mths 6 mths 1 year 3 years* 5 years* Since Inception*
GreatLink Global Emerging MarketsEquity Fund
3.47% 9.46% 46.76% 14.05% 14.16% 9.64%
Benchmark 5.09% 9.28% 35.77% 10.75% 13.00% 6.50%
Source: Morningstar. Performance figures are calculated on a bid-bid basis, with all dividends and distributions reinvested, taking into account all charges which would have been payable upon such reinvestment.* Performance figures longer than 1 year are annualised.# Information refers to Fidelity Funds – Emerging Markets Fund SR-ACC-SGD
Inception Date 23 January 2013Dealing Frequency DailyFund Currency SGDSubscription Mode Cash, SRS & CPFIS – OARisk Category Higher Risk – Narrowly FocusedBenchmark MSCI Emerging Markets Free Net
of Luxembourg Tax IndexFund Management Fee 1.60% p.a.Offer Price SGD 2.168Bid Price SGD 2.059Bid Offer Spread 5.0%Fund Size SGD 203.2 mUnderlying Fund Size SGD 9,414 mUnderlying Fund Fidelity Funds – Emerging
Markets FundFund Manager FIL Fund Management Limited
('Fidelity')
China, 32.5% Taiwan, 13.2% India, 12.7% Korea (South), 11.9% Russia, 7.2% South Africa, 6.3% Hong Kong, 5.3% Others, 3.1% Mexico, 2.5% Kazakhstan, 2.5%
Canada, 1.7% Cash, 1.1%
GreatLink Global Emerging Markets Equity Fund
Glob
al E
quity
For disclaimer, please refer to page 6.
GREATLINK
as at 30 June 2021
Fund Objective
Fund Information
Performance Chart
3 mths 6 mths 1 Year 3 Years* 5 Years*
3.47% 9.46% 46.76% 14.05% 14.16%
5.09% 9.28% 35.77% 10.75% 13.00%
GLOBAL EMERGING MARKETS EQUITY FUND
Subscription Mode Cash, SRS & CPFIS – OA Fund Size
Dealing Frequency Daily Bid Price
6.50%
The information provided herein is subject to our disclaimer set out at the end of this document. Page 1 of 2
Since Inception*
GreatLink Global Emerging Markets Equity Fund
9.64%
Benchmark
Source: Morningstar. Performance figures are calculated on a bid-bid basis, with all dividends and distributions reinvested, taking into account allcharges which would have been payable upon such reinvestment.* Performance figures longer than 1 year are annualised.
Underlying Fund Size SGD 9,414 m
Fidelity Funds – Emerging Markets Fund
Fund Management Fee 1.60% p.a. Fund Manager FIL Fund Management Limited ('Fidelity')
Benchmark MSCI Emerging Markets Free Net of Luxembourg Tax Index Underlying Fund
This ILP Sub-Fund invests all or substantially into the Fidelity Funds - Emerging Markets Fund (SR-ACC-SGD) (“UnderlyingFund”) managed by FIL Fund Management Limited. The ILP Sub-Fund invests principally in areas experiencing rapid economicgrowth including countries in Latin America, Emerging Asia, Africa, Eastern Europe (including Russia) and the Middle East.These regions include emerging markets. The Underlying Fund may invest its net assets directly in China A and B Shares. Thecountry of domicile of the Underlying Fund is Luxembourg.
Inception Date 23 January, 2013 Offer Price SGD 2.168
SGD 203.2 m
Risk Category Higher Risk - Narrowly Focused
SGD 2.059Fund Currency SGD Bid Offer Spread 5.0%
80100120140160180200220240
Jan-13 Jan-14 Jan-15 Jan-16 Jan-17 Jan-18 Jan-19 Jan-20 Jan-21 GreatLink Global Emerging Markets Equity Fund
GREATLINK
as at 30 June 2021
Portfolio Weightings#
Top 10 Holdings#
GLOBAL EMERGING MARKETS EQUITY FUND
ANTA SPORTS PRODUCTS LTD 3.2%# Information refers to Fidelity Funds – Emerging Markets Fund SR-ACC-SGD
DISCLAIMER: GreatLink Global Emerging Markets Equity Fund is an investment-linked policy (ILP) fund offered by The Great Eastern LifeAssurance Company Limited ("Great Eastern") and is only available under Great Eastern Investment-Linked Policies. This factsheet iscompiled by Great Eastern. The information presented is for informational use only. A product summary and a Product Highlights Sheet inrelation to the Fund may be obtained through Great Eastern or its financial representatives. Potential investors should read the productsummary and the Product Highlights Sheet before deciding whether to invest in the Fund. Returns on the units of the Fund are notguaranteed. The value of the units in the Fund and the income accruing to the units, if any, may fall or rise. The fees and charges payablethrough deduction of premium or cancellation of units are excluded in the calculation of fund returns. Past returns, and any other economicor market predictions, projections or forecasts targeted by the fund are not necessarily indicative of future or likely performance of the fund.This advertisement has not been reviewed by the Monetary Authority of Singapore.
The Great Eastern Life Assurance Company Limited (Reg No. 1908 00011G)1 Pickering Street, #01-01 Great Eastern Centre, Singapore 048659Product Enquiry: +65 6248 2211 / greateasternlife.com
The information provided herein is subject to our disclaimer set out at the end of this document. Page 2 of 2
AIA GROUP LTD 3.9%
INFOSYS LTD 3.4%
SK HYNIX INC 3.2%
HDFC BANK LTD 5.1%
CHINA MENGNIU DAIRY CO 4.9%
NASPERS LTD 3.9%
TAIWAN SEMICONDUCTOR MFG CO LTD 9.4%
SAMSUNG ELECTRONICS CO LTD 8.6%
ALIBABA GROUP HOLDING LTD 5.2%
China, 32.5%Taiwan, 13.2%India, 12.7%Korea (South), 11.9%Russia, 7.2%South Africa, 6.3%Hong Kong, 5.3%Others, 3.1%Mexico, 2.5%Kazakhstan, 2.5%Canada, 1.7%Cash, 1.1%
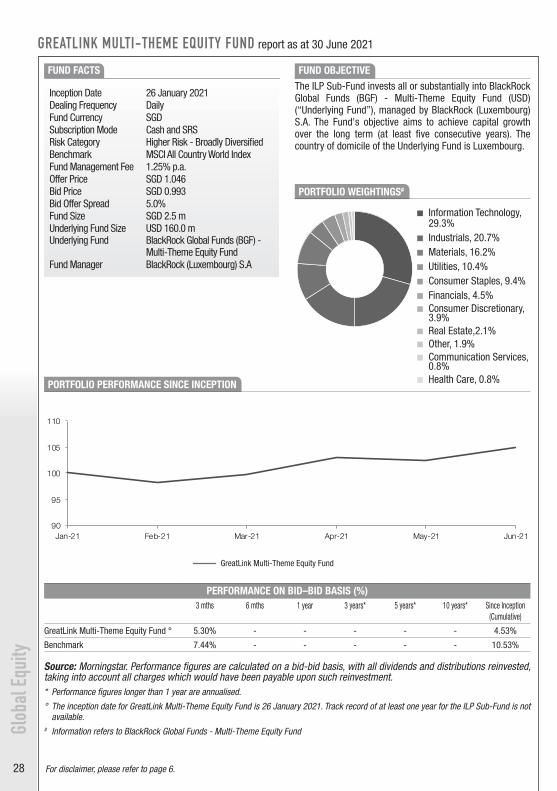
28
Glob
al E
quity
PORTFOLIO WEIGHTINGS#
GREATLINK MULTI-THEME EQUITY FUND report as at 30 June 2021
FUND FACTS FUND OBJECTIVE The ILP Sub-Fund invests all or substantially into BlackRock Global Funds (BGF) - Multi-Theme Equity Fund (USD) (“Underlying Fund”), managed by BlackRock (Luxembourg) S.A. The Fund's objective aims to achieve capital growth over the long term (at least five consecutive years). The country of domicile of the Underlying Fund is Luxembourg.
Inception Date 26 January 2021Dealing Frequency DailyFund Currency SGDSubscription Mode Cash and SRS Risk Category Higher Risk - Broadly DiversifiedBenchmark MSCI All Country World IndexFund Management Fee 1.25% p.a.Offer Price SGD 1.046Bid Price SGD 0.993Bid Offer Spread 5.0%Fund Size SGD 2.5 mUnderlying Fund Size Underlying Fund
USD 160.0 m BlackRock Global Funds (BGF) - Multi-Theme Equity Fund
Fund Manager BlackRock (Luxembourg) S.A
PORTFOLIO PERFORMANCE SINCE INCEPTION
PERFORMANCE ON BID–BID BASIS (%)3 mths 6 mths 1 year 3 years* 5 years* 10 years* Since Inception
(Cumulative)
GreatLink Multi-Theme Equity Fund ° 5.30% - - - - - 4.53%
Benchmark 7.44% - - - - - 10.53%
Source: Morningstar. Performance figures are calculated on a bid-bid basis, with all dividends and distributions reinvested, taking into account all charges which would have been payable upon such reinvestment.* Performance figures longer than 1 year are annualised.
° The inception date for GreatLink Multi-Theme Equity Fund is 26 January 2021. Track record of at least one year for the ILP Sub-Fund is not available.
# Information refers to BlackRock Global Funds - Multi-Theme Equity Fund
GreatLink Multi-Theme Equity Fund
For disclaimer, please refer to page 6.
GREATLINK
as at 30 June 2021
Fund Objective
Fund Information
Performance Chart
3 mths 6 mths 1 Year 3 Years* 5 Years* 10 Years*
5.30% - - - - -
7.44% - - - - -
Since Inception(Cumulative)
GreatLink Multi-Theme Equity Fund °
4.53%
Source: Morningstar. Performance figures are calculated on a bid-bid basis, with all dividends and distributions reinvested, taking into account allcharges which would have been payable upon such reinvestment.* Performance figures longer than 1 year are annualised.° The inception date for GreatLink Multi-Theme Equity Fund is 26 January 2021. Track record of at least one year for the ILP Sub-Fund is notavailable.
The information provided herein is subject to our disclaimer set out at the end of this document. Page 1 of 2
14.27% Benchmark
Benchmark MSCI All Country World Index Underlying FundBlackRock Global Funds (BGF) - Multi-Theme Equity Fund
Fund Management Fee 1.25% p.a Fund Manager BlackRock (Luxembourg) S.A
Subscription Mode Cash & SRS Fund Size SGD 2.5 m
Risk Category Higher Risk - Broadly Diversified Underlying Fund Size USD 160.0 m
Dealing Frequency Daily Bid Price SGD 0.993Fund Currency SGD Bid Offer Spread 5.0%
MULTI-THEME EQUITY FUND
The ILP Sub-Fund invests all or substantially into BlackRock Global Funds (BGF) - Multi-Theme Equity Fund (USD) (“UnderlyingFund”), managed by BlackRock (Luxembourg) S.A. The Fund's objective aims to achieve capital growth over the long term (atleast five consecutive years). The country of domicile of the Underlying Fund is Luxembourg.
Inception Date 26 January, 2021 Offer Price SGD 1.046
90
95
100
105
110
Jan-21 Feb-21 Mar-21 Apr-21 May-21 Jun-21
GreatLink Multi-Theme Equity Fund
GREATLINK
as at 30 June 2021
Portfolio Weightings#
Top 10 Holdings#
BGF NUTRITION FUND X2 USD 3.0%# Information refers to BlackRock Global Funds - Multi-Theme Equity Fund
DISCLAIMER: GreatLink Multi-Theme Equity Fund is an investment-linked policy (ILP) fund offered by The Great Eastern Life AssuranceCompany Limited ("Great Eastern") and is only available under Great Eastern Investment-Linked Policies. This factsheet is compiled byGreat Eastern. The information presented is for informational use only. A product summary and a Product Highlights Sheet in relation to theFund may be obtained through Great Eastern or its financial representatives. Potential investors should read the product summary and theProduct Highlights Sheet before deciding whether to invest in the Fund. Returns on the units of the Fund are not guaranteed. The value ofthe units in the Fund and the income accruing to the units, if any, may fall or rise. The fees and charges payable through deduction ofpremium or cancellation of units are excluded in the calculation of fund returns. Past returns, and any other economic or market predictions,projections or forecasts targeted by the fund are not necessarily indicative of future or likely performance of the fund. This advertisementhas not been reviewed by the Monetary Authority of Singapore.
The Great Eastern Life Assurance Company Limited (Reg No. 1908 00011G)1 Pickering Street, #01-01 Great Eastern Centre, Singapore 048659Product Enquiry: +65 6248 2211 / greateasternlife.com
The information provided herein is subject to our disclaimer set out at the end of this document. Page 2 of 2
ISHARES DIGITAL SECURITY UCI USD_A 8.6%
ISHARES S&P GLOBAL TIMBER & FOREST 7.0%
BGF FUTURE OF TRANSP FD X2 USD 3.9%
BGF CIRC EC FD X2 USD 11.8%
BGF FINTECH FUND X2 USD 9.8%
ISH AUTO & RBOT ETF USD ACC 8.6%
ISH GLBL WTER ETF $ DIST 14.0%
MULTI-THEME EQUITY FUND
ISHARES AGRIBUSINESS UCITS ETF 14.6%
BGF SUSTAINABLE ENERGY X2 USD 14.1%
Information Technology, 29.3%Industrials, 20.7%Materials, 16.2%Utilities, 10.4%Consumer Staples, 9.4%Financials, 4.5%Consumer Discretionary, 3.9%Real Estate, 2.1%Other, 1.9%Communication Services, 0.8%Health Care, 0.8%
Information Technology, 29.3%
Industrials, 20.7% Materials, 16.2% Utilities, 10.4% Consumer Staples, 9.4% Financials, 4.5% Consumer Discretionary,
3.9% Real Estate,2.1% Other, 1.9% Communication Services,
0.8% Health Care, 0.8%

29
Asia
n Eq
uity
GREATLINK ASIA HIGH DIVIDEND EQUITY FUND report as at 30 June 2021
FUND FACTS FUND OBJECTIVE
This Fund constituted in Singapore aims to provide long term capital growth by investing primarily in equities or equity-linked securities (including, but not limited to, preference shares, real estate investment trusts, depository receipts) of companies in the Asia Pacific (ex Japan) region that offer attractive dividend yields and sustainable dividend payments.
Inception Date 10 July 2000Dealing Frequency DailyFund Currency SGDSubscription Mode Cash & SRSRisk Category Higher Risk – Narrowly FocusedBenchmark MSCI AC Asia Pacific Ex-Japan
Index^
Fund Management Fee 1.50% p.a.Offer Price SGD 1.188Bid Price SGD 1.128Bid Offer Spread 5.0%Fund Size SGD 61.3 mUnderlying Fund Size SGD 83.3 mUnderlying Fund ° LionGlobal Asia High Dividend
Equity Fund Fund Manager Lion Global Investors Ltd
China, 35.1% Korea, South, 12.6% Taiwan, 12.5% Australia, 11.7% Hong Kong, 8.9% Cash Equivalent, 7.8% India, 7.0% Singapore, 2.3% Indonesia, 1.1% Thailand, 1.0%
PORTFOLIO WEIGHTINGS#
PORTFOLIO PERFORMANCE SINCE INCEPTION
PERFORMANCE ON BID–BID BASIS (%)3 mths 6 mths 1 year 3 years* 5 years* 10 years* Since Inception* Since Restructuring*
GreatLink Asia High Dividend Equity Fund
1.48% 6.43% 29.91% 9.81% 9.89% 5.33% 1.92% 6.24%
Benchmark 4.06% 8.66% 34.25% 11.34% 13.87% 8.54% 3.97% 9.55%
Source: Morningstar. Performance figures are calculated on a bid-bid basis, with all dividends and distributions reinvested, taking into account all charges which would have been payable upon such reinvestment.* Performance figures longer than 1 year are annualised.^ MSCI AC Asia Pacific Index from launch till 31 Oct 2001, MSCI AC Asia Pacific (Free) Index wef 1 Nov 2001 (subsequently named MSCI AC
Asia Pacific Index on 30 Jan 2004) till 12 July 2015. With effect from 13 July 2015, the benchmark is changed to MSCI AC Asia Pacific ex Japan Index.
° Underlying fund is changed from LGlobal Funds - Asia High Dividend Equity Fund to LionGlobal Asia High Dividend Equity Fund wef 12 Nov 2020.
# Information refers to LionGlobal Asia High Dividend Equity Fund
GreatLink Asia High Dividend Equity Fund
GREATLINK
as at 30 June 2021
Fund Objective
Fund Information
Performance Chart
3 mths 6 mths 1 Year 3 Years* 5 Years* 10 Years* Since Inception*
Since Restructuring*
1.48% 6.43% 29.91% 9.81% 9.89% 5.33% 1.92% 6.24%
4.06% 8.66% 34.25% 11.34% 13.87% 8.54% 3.97% 9.55%
Subscription Mode
Dealing Frequency Daily Bid Price SGD 1.128Fund Currency SGD Bid Offer Spread
Cash & SRS Fund Size SGD 61.3 m5.0%
This Fund constituted in Singapore aims to provide long term capital growth by investing primarily in equities or equity-linkedsecurities (including, but not limited to, preference shares, real estate investment trusts, depository receipts) of companies inthe Asia Pacific (ex Japan) region that offer attractive dividend yields and sustainable dividend payments.
Inception Date 10 July, 2000 Offer Price SGD 1.188
Underlying Fund ° LionGlobal Asia High Dividend Equity Fund
Risk Category Higher Risk - Narrowly Focused
MSCI AC Asia Pacific ex Japan Index^Benchmark
SGD 83.3 m
Benchmark
GreatLink Asia High Dividend Equity Fund
ASIA HIGH DIVIDEND EQUITY FUND
Underlying Fund Size
Fund Management Fee 1.50% p.a. Fund Manager Lion Global Investors Ltd
Source: Morningstar. Performance figures are calculated on a bid-bid basis, with all dividends and distributions reinvested, taking into account allcharges which would have been payable upon such reinvestment.* Performance figures longer than 1 year are annualised.^ MSCI AC Asia Pacific Index from launch till 31 Oct 2001, MSCI AC Asia Pacific (Free) Index wef 1 Nov 2001 (subsequently named MSCI AC AsiaPacific Index on 30 Jan 2004) till 12 July 2015. With effect from 13 July 2015, the benchmark is changed to MSCI AC Asia Pacific ex Japan Index.° Underlying fund is changed from LGlobal Funds – Asia High Dividend Equity Fund wef 12 Nov 2020.
The information provided herein is subject to our disclaimer set out at the end of this document. Page 1 of 3
40
60
80
100
120
140
160
Jul-00 Jul-04 Jul-08 Jul-12 Jul-16 Jul-20
GreatLink Asia High Dividend Equity Fund
40
60
80
100
120
140
160
Jul-15 Jul-16 Jul-17 Jul-18 Jul-19 Jul-20
Since Inception Since Restructuring
GREATLINK
as at 30 June 2021
Portfolio Weightings#
Top 10 Holdings# Dividend History*
7.7% June 2017 1.105%
6.4% September 2017 1.132%
5.7% December 2017 1.112%
5.0% March 2018 0.908%
2.9% June 2018 0.905%
2.4% September 2018 0.887%
2.1% December 2018 0.910%
1.8% March 2019 0.885%
1.8% June 2019 0.845%
1.7% September 2019 0.864%
December 2019 0.843%
March 2020 0.924%
June 2020 0.772%
September 2020 0.844%
December 2020 0.435%
0.757%
0.751%
The information provided herein is subject to our disclaimer set out at the end of this document.
TENCENT HOLDINGS LTD ORD HKD0.00002
BHP BILLITON LTD ORD NPV
March 2021
June 2021
# Information refers to LionGlobal Asia High Dividend Equity Fund
* Dividend distributions are not guaranteed andare made at the Manager’s discretion
Page 2 of 3
TAIWAN SEMICONDUCTOR MANUFACTURING CO LTD ORD TWD10SAMSUNG ELECTRONICS CO LTD ORD KRW100
ALIBABA GROUP HOLDING LTD ORD USD.000003125
AIA GROUP LTD ORD USD1
NATIONAL AUSTRALIA BANK LTD ORD NPV
ICICI BANK LTD ORD INR10
SUN HUNG KAI PROPERTIES LTD ORD NPV
MEITUAN ORD USD0.00001
ASIA HIGH DIVIDEND EQUITY FUND
China, 35.1%Korea, South, 12.6%Taiwan, 12.5%Australia, 11.7%Hong Kong, 8.9%Cash Equivalent, 7.8%India, 7.0%Singapore, 2.3%Indonesia, 1.1%Thailand, 1.0%
For disclaimer, please refer to page 6.
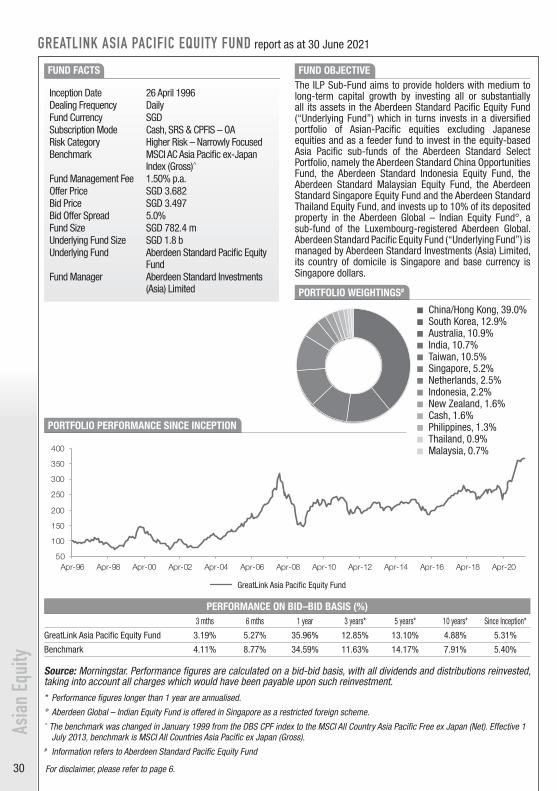
30
Asia
n Eq
uity
For disclaimer, please refer to page 6.
GREATLINK
as at 30 June 2021
Fund Objective
Fund Information
Performance Chart
3 mths 6 mths 1 Year 3 Years* 5 Years* 10 Years*
3.19% 5.27% 35.96% 12.85% 13.10% 4.88%
4.11% 8.77% 34.59% 11.63% 14.17% 7.91%
The ILP Sub-Fund aims to provide holders with medium to long-term capital growth by investing all or substantially all itsassets in the Aberdeen Standard Pacific Equity Fund (“Underlying Fund”) which in turns invests in a diversified portfolio of Asian-Pacific equities excluding Japanese equities and as a feeder fund to invest in the equity-based Asia Pacific sub-funds of theAberdeen Standard Select Portfolio, namely the Aberdeen Standard China Opportunities Fund, the Aberdeen StandardIndonesia Equity Fund, the Aberdeen Standard Malaysian Equity Fund, the Aberdeen Standard Singapore Equity Fund and theAberdeen Standard Thailand Equity Fund, and invests up to 10% of its deposited property in the Aberdeen Global – IndianEquity Fund°, a sub-fund of the Luxembourg-registered Aberdeen Global. Aberdeen Standard Pacific Equity Fund (“UnderlyingFund”) is managed by Aberdeen Standard Investments (Asia) Limited, its country of domicile is Singapore and base currency is Singapore dollars.
Inception Date 26 April, 1996 Offer Price SGD 3.682Dealing Frequency Daily Bid Price SGD 3.497Fund Currency SGD Bid Offer Spread 5.0%Subscription Mode Cash, SRS & CPFIS – OA Fund Size SGD 782.4 m
Risk Category Higher Risk - Narrowly Focused Underlying Fund Size SGD 1.8 b
Benchmark MSCI AC Asia Pacific ex Japan Index (Gross)^ Underlying Fund Aberdeen Standard Pacific Equity Fund
Fund Management Fee 1.50% p.a. Fund Manager Aberdeen Standard Investments (Asia) Limited
Since Inception*
GreatLink Asia Pacific Equity Fund
5.31%
Benchmark 5.40%
The information provided herein is subject to our disclaimer set out at the end of this document. Page 1 of 2
Source: Morningstar. Performance figures are calculated on a bid-bid basis, with all dividends and distributions reinvested, taking into account allcharges which would have been payable upon such reinvestment.* Performance figures longer than 1 year are annualised.° Aberdeen Global – Indian Equity Fund is offered in Singapore as a restricted foreign scheme.^ The benchmark was changed in January 1999 from the DBS CPF index to the MSCI All Country Asia Pacific Free ex Japan (Net). Effective 1 July2013, benchmark is MSCI All Countries Asia Pacific ex Japan (Gross).
ASIA PACIFIC EQUITY FUND
50
100
150
200
250
300
350
400
Apr-96 Apr-98 Apr-00 Apr-02 Apr-04 Apr-06 Apr-08 Apr-10 Apr-12 Apr-14 Apr-16 Apr-18 Apr-20GreatLink Asia Pacific Equity Fund
PORTFOLIO WEIGHTINGS#
GREATLINK ASIA PACIFIC EQUITY FUND report as at 30 June 2021
FUND FACTS FUND OBJECTIVE The ILP Sub-Fund aims to provide holders with medium to long-term capital growth by investing all or substantially all its assets in the Aberdeen Standard Pacific Equity Fund (“Underlying Fund”) which in turns invests in a diversified portfolio of Asian-Pacific equities excluding Japanese equities and as a feeder fund to invest in the equity-based Asia Pacific sub-funds of the Aberdeen Standard Select Portfolio, namely the Aberdeen Standard China Opportunities Fund, the Aberdeen Standard Indonesia Equity Fund, the Aberdeen Standard Malaysian Equity Fund, the Aberdeen Standard Singapore Equity Fund and the Aberdeen Standard Thailand Equity Fund, and invests up to 10% of its deposited property in the Aberdeen Global – Indian Equity Fund°, a sub-fund of the Luxembourg-registered Aberdeen Global. Aberdeen Standard Pacific Equity Fund (“Underlying Fund”) is managed by Aberdeen Standard Investments (Asia) Limited, its country of domicile is Singapore and base currency is Singapore dollars.
Inception Date 26 April 1996Dealing Frequency DailyFund Currency SGDSubscription Mode Cash, SRS & CPFIS – OARisk Category Higher Risk – Narrowly FocusedBenchmark MSCI AC Asia Pacific ex-Japan
Index (Gross)^
Fund Management Fee 1.50% p.a.Offer Price SGD 3.682Bid Price SGD 3.497Bid Offer Spread 5.0%Fund Size SGD 782.4 mUnderlying Fund Size SGD 1.8 bUnderlying Fund Aberdeen Standard Pacific Equity
Fund Fund Manager Aberdeen Standard Investments
(Asia) Limited
PORTFOLIO PERFORMANCE SINCE INCEPTION
PERFORMANCE ON BID–BID BASIS (%)3 mths 6 mths 1 year 3 years* 5 years* 10 years* Since Inception*
GreatLink Asia Pacific Equity Fund 3.19% 5.27% 35.96% 12.85% 13.10% 4.88% 5.31%
Benchmark 4.11% 8.77% 34.59% 11.63% 14.17% 7.91% 5.40%
Source: Morningstar. Performance figures are calculated on a bid-bid basis, with all dividends and distributions reinvested, taking into account all charges which would have been payable upon such reinvestment.* Performance figures longer than 1 year are annualised.
° Aberdeen Global – Indian Equity Fund is offered in Singapore as a restricted foreign scheme.^ The benchmark was changed in January 1999 from the DBS CPF index to the MSCI All Country Asia Pacific Free ex Japan (Net). Effective 1 July 2013, benchmark is MSCI All Countries Asia Pacific ex Japan (Gross).# Information refers to Aberdeen Standard Pacific Equity Fund
GreatLink Asia Pacific Equity Fund
China/Hong Kong, 39.0% South Korea, 12.9% Australia, 10.9% India, 10.7% Taiwan, 10.5% Singapore, 5.2% Netherlands, 2.5% Indonesia, 2.2% New Zealand, 1.6% Cash, 1.6% Philippines, 1.3% Thailand, 0.9% Malaysia, 0.7%
GREATLINK
as at 30 June 2021
Portfolio Weightings#
Top 10 Holdings#
SAMSUNG ELECTRONICS (PREF) 8.6%
TSMC 9.2%
ASIA PACIFIC EQUITY FUND
7.5%
AIA GROUP 5.0%
ALIBABA GROUP HOLDING 3.6%
The information provided herein is subject to our disclaimer set out at the end of this document. Page 2 of 2
HOUSING DEVELOPMENT FINANCE 2.2%
COCHLEAR LTD 2.2%# Information refers to Aberdeen Standard Pacific Equity Fund
DISCLAIMER: GreatLink Asia Pacific Equity Fund is an investment-linked policy (ILP) fund offered by The Great Eastern Life AssuranceCompany Limited ("Great Eastern") and is only available under Great Eastern Investment-Linked Policies. This factsheet is compiled byGreat Eastern. The information presented is for informational use only. A product summary and a Product Highlights Sheet in relation to theFund may be obtained through Great Eastern or its financial representatives. Potential investors should read the product summary and theProduct Highlights Sheet before deciding whether to invest in the Fund. Returns on the units of the Fund are not guaranteed. The value ofthe units in the Fund and the income accruing to the units, if any, may fall or rise. The fees and charges payable through deduction ofpremium or cancellation of units are excluded in the calculation of fund returns. Past returns, and any other economic or market predictions,projections or forecasts targeted by the fund are not necessarily indicative of future or likely performance of the fund. This advertisementhas not been reviewed by the Monetary Authority of Singapore.
The Great Eastern Life Assurance Company Limited (Reg No. 1908 00011G)1 Pickering Street, #01-01 Great Eastern Centre, Singapore 048659Product Enquiry: +65 6248 2211 / greateasternlife.com
CSL 3.2%
NEW INDIA INVESTMENT TRUST 2.6%
BHP GROUP 2.3%
TENCENT HOLDINGS
China/Hong Kong, 39.0%South Korea, 12.9%Australia, 10.9%India, 10.7%Taiwan, 10.5%Singapore, 5.2%Netherlands, 2.5%Indonesia, 2.2%New Zealand, 1.6%Cash, 1.6%Philippines, 1.3%Thailand, 0.9%Malaysia, 0.7%

31
Asia
n Eq
uity
For disclaimer, please refer to page 6.
GREATLINK
as at 30 June 2021
Portfolio Weightings
Top 10 Holdings
8.3%
The information provided herein is subject to our disclaimer set out at the end of this document. Page 2 of 3
MEITUAN-B 2.3%
HONG KONG EXCHANGES & CLEARING LTD 2.2%
TECHTRONIC INDUSTRIES CO LTD 1.9%
FAR EAST EX JAPAN EQUITIES FUND
KB FINANCIAL GROUP INC 1.9%
TENCENT HOLDINGS LTD 8.2%
AIA GROUP LTD 3.1%
DBS GROUP HOLDINGS LTD 2.5%
TAIWAN SEMICONDUCTOR MANUFACTURING CO LTD 10.3%
SAMSUNG ELECTRONICS CO LTD 8.3%
ALIBABA GROUP HOLDING LTD
Hong Kong, 41.5%Taiwan, Province of China, 15.4%Korea, Republic of, 14.0%China, 10.4%Cash & Cash Equivalents, 8.7%United States, 3.2%Singapore, 3.1%Australia, 1.2%Indonesia, 1.2%Thailand, 1.0%Other, 0.3%
Hong Kong, 41.5% Taiwan, Province of
China, 15.4% Korea, Republic of, 14.0% China, 10.4% Cash & Cash Equivalents,
8.7% United States, 3.2% Singapore, 3.1% Australia, 1.2% Indonesia, 1.2%
Thailand, 1.0% Other, 0.3%
GREATLINK FAR EAST EX JAPAN EQUITIES FUND report as at 30 June 2021
PORTFOLIO WEIGHTINGS
FUND FACTS
PORTFOLIO PERFORMANCE SINCE INCEPTION
FUND OBJECTIVE
The Fund's objective is to maximize capital growth through investing primarily in equities of companies based in China, Hong Kong, Indonesia, South Korea, Malaysia, Philippines, Singapore, Taiwan, Thailand, and also in other Asia Pacific regions except Japan.
PERFORMANCE ON BID–BID BASIS (%)3 mths 6 mths 1 year 3 years* 5 years* 10 years* Since Inception*
GreatLink Far East Ex-Japan Equities Fund
1.82% 6.82% 34.34% 14.09% 15.46% 7.27% 7.38%
Benchmark 3.25% 7.49% 32.82% 11.68% 14.76% 8.18% 8.12%
Source: Morningstar. Performance figures are calculated on a bid-bid basis, with all dividends and distributions reinvested, taking into account all charges which would have been payable upon such reinvestment.* Performance figures longer than 1 year are annualised.
Inception Date 25 March 2002Dealing Frequency DailyFund Currency SGDSubscription Mode Cash & SRSRisk Category Higher Risk – Narrowly FocusedBenchmark MSCI AC Far East Ex-Japan Index
with Net Dividends ReinvestedFund Management Fee 1.50% p.a.Offer Price SGD 3.942Bid Price SGD 3.744Bid Offer Spread 5.0%Fund Size SGD 82.8 mFund Manager Lion Global Investors Ltd
GreatLink Far East Ex Japan Equities Fund
GREATLINK
as at 30 June 2021
Fund Objective
Fund Information
Performance Chart
3 mths 6 mths 1 Year 3 Years* 5 Years* 10 Years*
1.82% 6.82% 34.34% 14.09% 15.46% 7.27%
3.25% 7.49% 32.82% 11.68% 14.76% 8.18%
The Fund's objective is to maximize capital growth through investing primarily in equities of companies based in China, HongKong, Indonesia, South Korea, Malaysia, Philippines, Singapore, Taiwan, Thailand, and also in other Asia Pacific regions exceptJapan.
Inception Date 25 March, 2002 Offer Price SGD 3.942Dealing Frequency Daily Bid Price SGD 3.744Fund Currency SGD Bid Offer Spread 5.0%
Benchmark MSCI AC Far East Ex Japan Index with Net Dividends Reinvested
Fund Management Fee 1.50% p.a.
Subscription Mode Cash & SRS Fund Size SGD 82.8 mRisk Category Higher Risk - Narrowly Focused Fund Manager Lion Global Investors Ltd
Since Inception*
GreatLink Far East Ex Japan Equities Fund
7.38%
Benchmark 8.12%
The information provided herein is subject to our disclaimer set out at the end of this document. Page 1 of 3
Source: Morningstar. Performance figures are calculated on a bid-bid basis, with all dividends and distributions reinvested, taking into account allcharges which would have been payable upon such reinvestment.* Performance figures longer than 1 year are annualised.
FAR EAST EX JAPAN EQUITIES FUND
50100150200250300350400450
Mar-02 Mar-04 Mar-06 Mar-08 Mar-10 Mar-12 Mar-14 Mar-16 Mar-18 Mar-20
GreatLink Far East Ex Japan Equities Fund

32
Asia
n Eq
uity
For disclaimer, please refer to page 6.
GREATLINK ASEAN GROWTH FUND report as at 30 June 2021
FUND FACTS FUND OBJECTIVE
The Fund's objective is to achieve long term capital appreciation by investing in equities in the economies of the ASEAN region.
PORTFOLIO WEIGHTINGS
PERFORMANCE ON BID–BID BASIS (%)3 mths 6 mths 1 year 3 years* 5 years* 10 years* Since Inception*
GreatLink ASEAN Growth Fund 0.87% 5.48% 17.57% 0.28% 3.14% 1.98% 4.86%
Benchmark -1.72% -0.12% 8.92% -0.22% 2.54% 2.16% 2.01%
Source: Morningstar. Performance figures are calculated on a bid-bid basis, with all dividends and distributions reinvested, taking into account all charges which would have been payable upon such reinvestment.* Performance figures longer than 1 year are annualised.^ Composite of MSCI Singapore/Malaysia/Philippines/Thailand and Indonesia (Net) from launch till 28 February 2011, then MSCI AC South East
Asia Index with Net Dividends Reinvested, from 1 March 2011 to 28 February 2017. From 1 March 2017, the benchmark has been renamed to MSCI AC ASEAN Index with Net Dividends Reinvested.
Inception Date 26 April 1996Dealing Frequency DailyFund Currency SGDSubscription Mode Cash & SRSRisk Category Higher Risk – Narrowly FocusedBenchmark MSCI AC ASEAN Index with Net
Dividends Reinvested^
Offer Price SGD 3.304Bid Price SGD 3.138Bid Offer Spread 5.0%Fund Size SGD 262.3 mFund Manager Lion Global Investors LtdFund Management Fee 1.50% p.a.
PORTFOLIO PERFORMANCE SINCE INCEPTION
Singapore, 35.1% Thailand, 23.7% Indonesia, 19.6% Philippines, 9.4% Malaysia, 8.9% Cash & Cash Equivalents,
2.0% Other, 1.4%
GreatLink ASEAN Growth Fund
GREATLINK
as at 30 June 2021
Fund Objective
Fund Information
Performance Chart
3 mths 6 mths 1 Year 3 Years* 5 Years* 10 Years*
0.87% 5.48% 17.57% 0.28% 3.14% 1.98%
-1.72% -0.12% 8.92% -0.22% 2.54% 2.16%
The information provided herein is subject to our disclaimer set out at the end of this document. Page 1 of 3
Benchmark MSCI AC ASEAN Index with Net Dividends Reinvested^
Fund Management Fee 1.50% p.a.
Since Inception*
GreatLink ASEAN Growth Fund 4.86%
Benchmark 2.01%
Source: Morningstar. Performance figures are calculated on a bid-bid basis, with all dividends and distributions reinvested, taking into account allcharges which would have been payable upon such reinvestment.* Performance figures longer than 1 year are annualised.^ Composite of MSCI Singapore/Malaysia/Philippines/Thailand and Indonesia (Net) from launch till 28 February 2011, then MSCI AC South East AsiaIndex with Net Dividends Reinvested, from 1 March 2011 to 28 February 2017. From 1 March 2017, the benchmark has been renamed to MSCI ACASEAN Index with Net Dividends Reinvested.
Subscription Mode Cash & SRS Fund Size SGD 262.3 mRisk Category Higher Risk - Narrowly Focused Fund Manager Lion Global Investors Ltd
ASEAN GROWTH FUND
The Fund's objective is to achieve long term capital appreciation by investing in equities in the economies of the ASEAN region.
Inception Date 26 April, 1996 Offer Price SGD 3.304Dealing Frequency Daily Bid Price SGD 3.138Fund Currency SGD Bid Offer Spread 5.0%
050
100150200250300350400
Apr-96 Apr-98 Apr-00 Apr-02 Apr-04 Apr-06 Apr-08 Apr-10 Apr-12 Apr-14 Apr-16 Apr-18 Apr-20GreatLink ASEAN Growth Fund
GREATLINK
as at 30 June 2021
Portfolio Weightings
Top 10 Holdings
KEPPEL CORP LTD 2.1%
The information provided herein is subject to our disclaimer set out at the end of this document. Page 2 of 3
CP ALL PCL-NVDR 2.6%
SEMBCORP INDUSTRIES LTD 2.5%
PTT PCL-NVDR 2.2%
BANK RAKYAT INDONESIA PERSERO TBK PT 3.1%
NANOFILM TECHNOLOGIES INTERNATIONAL LTD 2.6%
TELKOM INDONESIA PERSERO TBK PT 2.6%
DBS GROUP HOLDINGS LTD 8.9%
UNITED OVERSEAS BANK LTD 5.6%
BANK CENTRAL ASIA TBK PT 3.4%
ASEAN GROWTH FUND
Singapore, 35.1%
Thailand, 23.7%
Indonesia, 19.6%
Philippines, 9.4%
Malaysia, 8.9%
Cash & Cash Equivalents, 2.0%
Other, 1.4%
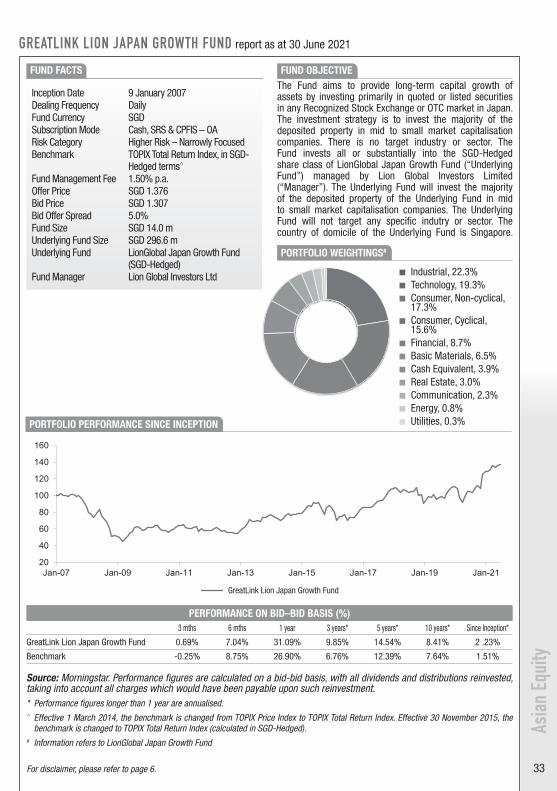
33
GREATLINK
as at 30 June 2021
Portfolio Weightings#
Top 10 Holdings#
MIZUHO FINANCIAL GROUP INC ORD NPV 2.0%
SHIN-ETSU CHEMICAL CO LTD ORD NPV 2.0%
HITACHI LTD ORD NPV 1.9%
# Information refers to LionGlobal Japan Growth Fund
The information provided herein is subject to our disclaimer set out at the end of this document. Page 2 of 3
RECRUIT HOLDINGS CO LTD ORD NPV 1.7%
DAIICHI SANKYO CO LTD ORD NPV 1.6%
NINTENDO CO LTD ORD NPV 1.5%
FUJI ELECTRIC CO LTD ORD NPV 1.5%
DENSO CORP ORD NPV 2.2%
SONY GROUP CORP ORD NPV 3.2%
KEYENCE CORP ORD JPY50 2.5%
LION JAPAN GROWTH FUND
Industrial, 22.3%Technology, 19.3%Consumer, Non-Cyclical, 17.3%Consumer, Cyclical, 15.6%Financial, 8.7%Basic Materials, 6.5%Cash Equivalent, 3.9%Real Estate, 3.0%Communications, 2.3%Energy, 0.8%Utilities, 0.3%
20
40
60
80
100
120
140
160
Jan-07 Jan-09 Jan-11 Jan-13 Jan-15 Jan-17 Jan-19 Jan-21GreatLink Lion Japan Growth Fund
Asia
n Eq
uity
For disclaimer, please refer to page 6.
Industrial, 22.3% Technology, 19.3% Consumer, Non-cyclical,
17.3% Consumer, Cyclical,
15.6% Financial, 8.7% Basic Materials, 6.5% Cash Equivalent, 3.9% Real Estate, 3.0% Communication, 2.3% Energy, 0.8% Utilities, 0.3%
GREATLINK LION JAPAN GROWTH FUND report as at 30 June 2021
FUND FACTS
PORTFOLIO PERFORMANCE SINCE INCEPTION
FUND OBJECTIVE The Fund aims to provide long-term capital growth of assets by investing primarily in quoted or listed securities in any Recognized Stock Exchange or OTC market in Japan. The investment strategy is to invest the majority of the deposited property in mid to small market capitalisation companies. There is no target industry or sector. The Fund invests all or substantially into the SGD-Hedged share class of LionGlobal Japan Growth Fund (“Underlying Fund”) managed by Lion Global Investors Limited (“Manager”). The Underlying Fund will invest the majority of the deposited property of the Underlying Fund in mid to small market capitalisation companies. The Underlying Fund will not target any specific indutry or sector. The country of domicile of the Underlying Fund is Singapore.
Inception Date 9 January 2007Dealing Frequency DailyFund Currency SGDSubscription Mode Cash, SRS & CPFIS – OARisk Category Higher Risk – Narrowly FocusedBenchmark TOPIX Total Return Index, in SGD-
Hedged terms^
Fund Management Fee 1.50% p.a.Offer Price SGD 1.376Bid Price SGD 1.307Bid Offer Spread 5.0%Fund Size SGD 14.0 mUnderlying Fund Size SGD 296.6 mUnderlying Fund LionGlobal Japan Growth Fund
(SGD-Hedged)Fund Manager Lion Global Investors Ltd
PORTFOLIO WEIGHTINGS#
PERFORMANCE ON BID–BID BASIS (%)3 mths 6 mths 1 year 3 years* 5 years* 10 years* Since Inception*
GreatLink Lion Japan Growth Fund 0.69% 7.04% 31.09% 9.85% 14.54% 8.41% 2 .23%
Benchmark -0.25% 8.75% 26.90% 6.76% 12.39% 7.64% 1.51%
Source: Morningstar. Performance figures are calculated on a bid-bid basis, with all dividends and distributions reinvested, taking into account all charges which would have been payable upon such reinvestment.* Performance figures longer than 1 year are annualised.^ Effective 1 March 2014, the benchmark is changed from TOPIX Price Index to TOPIX Total Return Index. Effective 30 November 2015, the
benchmark is changed to TOPIX Total Return Index (calculated in SGD-Hedged).# Information refers to LionGlobal Japan Growth Fund
GreatLink Lion Japan Growth Fund

34
40
80
120
160
200
240
280
320
Jan-07 Jan-09 Jan-11 Jan-13 Jan-15 Jan-17 Jan-19 Jan-21GreatLink China Growth Fund
For disclaimer, please refer to page 6.
Asia
n Eq
uity
GREATLINK CHINA GROWTH FUND report as at 30 June 2021
FUND FACTS
PORTFOLIO PERFORMANCE SINCE INCEPTION
FUND OBJECTIVE
The Fund aims to provide capital growth in excess of the MSCI Golden Dragon (Net TR) index after fees have been deducted over a three to five year period by investing at least two-thirds of its assets in equities and equity related securties of companies in People's Republic of China, Hong Kong SAR and Taiwan. The Fund may invest directly in China B-Shares and China H-Shares and may invest less than 30% of its assets (on a net basis) directly or indirectly through derivatives in China A-Shares through Shanghai-Hong Kong Stock Connect and Shenzhen-Hong Kong Stock Connect, the Renminbi Qualified Institutional Investor (RQFII) Scheme and Regulated Markets. The Fund may also invest up to one-third of its assets directly or indirectly in other securities (including other asset classes), countries, regions, industries or currencies, Investment Funds, warrants and Money Market Investments, and hold cash. The Fund may use derivatives with the aim of reducing risk or managing the fund more efficiently.
Inception Date 9 January 2007Dealing Frequency DailyFund Currency SGDSubscription Mode Cash, SRS & CPFIS - OARisk Category Higher Risk – Narrowly FocusedBenchmark MSCI Golden Dragon Index with
Net Dividends ReinvestedFund Management Fee 1.50% p.a.Offer Price SGD 2.788Bid Price SGD 2.648Bid Offer Spread 5.0%Fund Size SGD 368.1 mUnderlying Fund Size USD 4459.2 mUnderlying Fund Schroder International Selection
Fund - Greater ChinaFund Manager Schroder Investment Management
(Hong Kong) Ltd ('Schroders')
PERFORMANCE ON BID–BID BASIS (%)3 mths 6 mths 1 year 3 years* 5 years* 10 years* Since Inception*
GreatLink China Growth Fund 5.75% 10.10% 40.55% 18.66% 21.31% 10.52% 7.34%
Benchmark 3.49% 8.29% 31.03% 13.04% 16.94% 9.80% 7.01%
Source: Morningstar. Performance figures are calculated on a bid-bid basis, with all dividends and distributions reinvested, taking into account all charges which would have been payable upon such reinvestment.* Performance figures longer than 1 year are annualised.# Information refers to Schroder International Selection Fund - Greater China
GreatLink China Growth Fund
PORTFOLIO WEIGHTINGS#
Portfolio Weightings#
Top 10 Holdings#
# Information refers to Schroder International Selection Fund – Greater China
DISCLAIMER: GreatLink China Growth Fund is an investment-linked policy (ILP) fund offered by The Great Eastern Life AssuranceCompany Limited ("Great Eastern") and is only available under Great Eastern Investment-Linked Policies. This factsheet is compiled byGreat Eastern. The information presented is for informational use only. A product summary and a Product Highlights Sheet in relation to theFund may be obtained through Great Eastern or its financial representatives. Potential investors should read the product summary and theProduct Highlights Sheet before deciding whether to invest in the Fund. Returns on the units of the Fund are not guaranteed. The value ofthe units in the Fund and the income accruing to the units, if any, may fall or rise. The fees and charges payable through deduction ofpremium or cancellation of units are excluded in the calculation of fund returns. Past returns, and any other economic or market predictions,projections or forecasts targeted by the fund are not necessarily indicative of future or likely performance of the fund. This advertisementhas not been reviewed by the Monetary Authority of Singapore.
The Great Eastern Life Assurance Company Limited (Reg No. 1908 00011G)1 Pickering Street, #01-01 Great Eastern Centre, Singapore 048659Product Enquiry: +65 6248 2211 / greateasternlife.com
The information provided herein is subject to our disclaimer set out at the end of this document. Page 2 of 2
LI NING CO LTD 2.0%
CHINA PACIFIC INSURANCE GROUP CO LTD 1.9%
THUNDER SOFTWARE TECHNOLOGY CO LTD 1.8%
HSBC HOLDINGS PLC 2.5%
AIA GROUP LTD 2.5%
SANDS CHINA LTD 2.2%
ALIBABA GROUP HOLDING LTD 7.7%
TENCENT HOLDINGS LTD 3.7%
MEDIATEK INC 3.6%
TAIWAN SEMICONDUCTOR MANUFACTURING CO LTD 9.3%
Information Technology, 29.5%Consumer Discretionary, 22.7%Materials, 13.0%Financials, 8.1%Industrials, 7.9%Health Care, 6.9%Communication Services, 4.2%Real Estate, 3.1%Liquid Assets, 2.3%Consumer Staples, 1.6%Derivatives, 0.5%Utilities, 0.3%Other, 0.1%
Information Technology, 29.5% Consumer Discretionary, 22.7% Materials, 13.0% Financials, 8.1% Industrials, 7.9% Health Care, 6.9% Communication Services, 4.2% Real Estate, 3.1% Liquid Assets, 2.3% Consumer Staples, 1.6% Derivatives, 0.5% Utilities, 0.3% Others, 0.1%
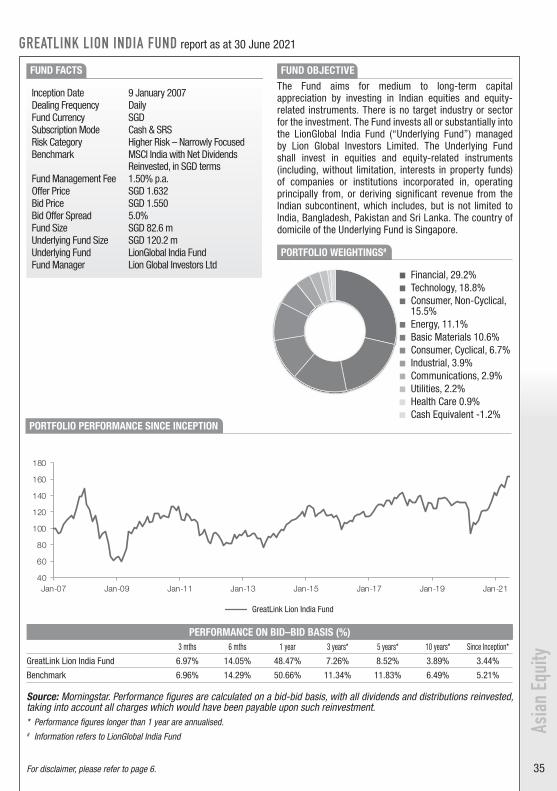
35For disclaimer, please refer to page 6.
Asia
n Eq
uity
Financial, 29.2% Technology, 18.8% Consumer, Non-Cyclical,
15.5% Energy, 11.1% Basic Materials 10.6% Consumer, Cyclical, 6.7% Industrial, 3.9% Communications, 2.9% Utilities, 2.2% Health Care 0.9% Cash Equivalent -1.2%
GREATLINK LION INDIA FUND report as at 30 June 2021
PORTFOLIO WEIGHTINGS#
FUND FACTS FUND OBJECTIVE The Fund aims for medium to long-term capital appreciation by investing in Indian equities and equity-related instruments. There is no target industry or sector for the investment. The Fund invests all or substantially into the LionGlobal India Fund (“Underlying Fund”) managed by Lion Global Investors Limited. The Underlying Fund shall invest in equities and equity-related instruments (including, without limitation, interests in property funds) of companies or institutions incorporated in, operating principally from, or deriving significant revenue from the Indian subcontinent, which includes, but is not limited to India, Bangladesh, Pakistan and Sri Lanka. The country of domicile of the Underlying Fund is Singapore.
PORTFOLIO PERFORMANCE SINCE INCEPTION
Inception Date 9 January 2007Dealing Frequency DailyFund Currency SGDSubscription Mode Cash & SRSRisk Category Higher Risk – Narrowly FocusedBenchmark MSCI India with Net Dividends
Reinvested, in SGD termsFund Management Fee 1.50% p.a.Offer Price SGD 1.632Bid Price SGD 1.550Bid Offer Spread 5.0%Fund Size SGD 82.6 mUnderlying Fund Size SGD 120.2 mUnderlying Fund LionGlobal India FundFund Manager Lion Global Investors Ltd
PERFORMANCE ON BID–BID BASIS (%)3 mths 6 mths 1 year 3 years* 5 years* 10 years* Since Inception*
GreatLink Lion India Fund 6.97% 14.05% 48.47% 7.26% 8.52% 3.89% 3.44%
Benchmark 6.96% 14.29% 50.66% 11.34% 11.83% 6.49% 5.21%
Source: Morningstar. Performance figures are calculated on a bid-bid basis, with all dividends and distributions reinvested, taking into account all charges which would have been payable upon such reinvestment.* Performance figures longer than 1 year are annualised.# Information refers to LionGlobal India Fund
GreatLink Lion India Fund
GREATLINK
as at 30 June 2021
Fund Objective
Fund Information
Performance Chart
3 mths 6 mths 1 Year 3 Years* 5 Years* 10 Years*
6.97% 14.05% 48.47% 7.26% 8.52% 3.89%
6.96% 14.29% 50.66% 11.34% 11.83% 6.49%
Since Inception*
GreatLink Lion India Fund 3.44%
Benchmark 5.21%
The information provided herein is subject to our disclaimer set out at the end of this document. Page 1 of 3
Source: Morningstar. Performance figures are calculated on a bid-bid basis, with all dividends and distributions reinvested, taking into account allcharges which would have been payable upon such reinvestment.* Performance figures longer than 1 year are annualised.
Benchmark MSCI India with Net Dividends Reinvested, in SGD terms Underlying Fund LionGlobal India Fund
Fund Management Fee 1.50% p.a. Fund Manager Lion Global Investors Ltd
Subscription Mode Cash & SRS Fund Size SGD 82.6 m
Risk Category Higher Risk - Narrowly Focused Underlying Fund Size SGD 120.2 m
LION INDIA FUND
The Fund aims for medium to long-term capital appreciation by investing in Indian equities and equity-related instruments.There is no target industry or sector for the investment. The Fund invests all or substantially into the LionGlobal India Fund(“Underlying Fund”) managed by Lion Global Investors Limited. The Underlying Fund shall invest in equities and equity-relatedinstruments (including, without limitation, interests in property funds) of companies or institutions incorporated in, operatingprincipally from, or deriving significant revenue from the Indian subcontinent, which includes, but is not limited to India,Bangladesh, Pakistan and Sri Lanka. The country of domicile of the Underlying Fund is Singapore.
Inception Date 9 January, 2007 Offer Price SGD 1.632Dealing Frequency Daily Bid Price SGD 1.550Fund Currency SGD Bid Offer Spread 5.0%
40
60
80
100
120
140
160
180
Jan-07 Jan-09 Jan-11 Jan-13 Jan-15 Jan-17 Jan-19 Jan-21GreatLink Lion India Fund
GREATLINK
as at 30 June 2021
Portfolio Weightings#
Top 10 Holdings#
The information provided herein is subject to our disclaimer set out at the end of this document. Page 2 of 3
TATA CONSULTANCY SERVICES LTD ORD INR1 (DMT) 3.2%
MAHINDRA & MAHINDRA LTD ORD INR5 (DEMAT) 3.1%# Information refers to LionGlobal India Fund
3.4%
ICICI BANK LTD ORD INR10 7.6%
HOUSING DEVELOPMENT FINANCE CORP ORD INR2 7.3%
AXIS BANK LTD ORD INR2 (DMT) 4.0%
HINDALCO INDUSTRIES LTD ORD INR1 (DEMAT) 3.8%
HINDUSTAN UNILEVER LTD ORD INR1 3.8%
HCL TECHNOLOGIES LTD ORD INR2 (DEMAT)(NSE)
RELIANCE INDUSTRIES LTD ORD INR10 (DMT) 9.4%
INFOSYS LTD ORD INR5 (DMT) 11.0%
LION INDIA FUND
Financial, 29.2%Technology, 18.8%Consumer, Non-Cyclical, 15.1%Energy, 11.1%Basic Materials, 10.6%Consumer, Cyclical, 6.7%Industrial, 3.9%Communications, 2.9%Utilities, 2.2%Health Care, 0.9%Cash Equivalent, -1.2%
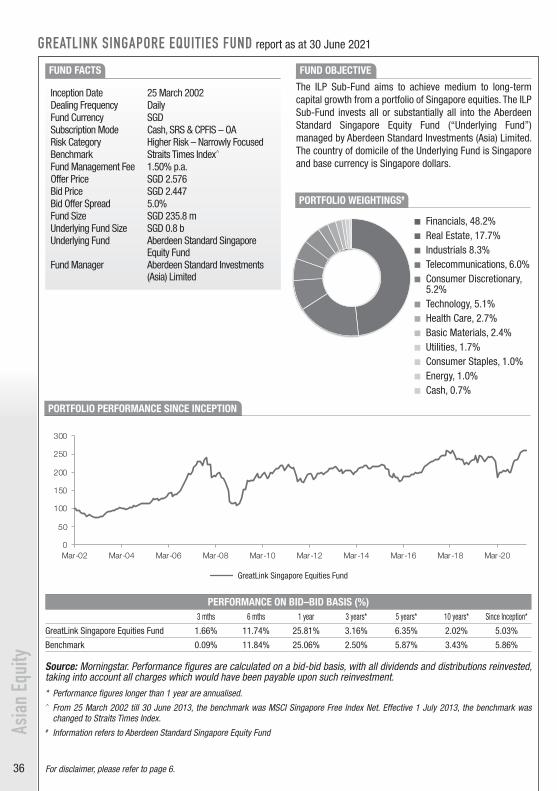
36
GREATLINK
as at 30 June 2021
Portfolio Weightings#
Top 10 Holdings#
The information provided herein is subject to our disclaimer set out at the end of this document. Page 2 of 2
COMFORTDELGRO 2.9%
NANOFILM TECHNOLOGIES 2.4%# Information refers to Aberdeen Standard Singapore Equity Fund
DISCLAIMER: GreatLink Singapore Equities Fund is an investment-linked policy (ILP) fund offered by The Great Eastern Life AssuranceCompany Limited ("Great Eastern") and is only available under Great Eastern Investment-Linked Policies. This factsheet is compiled byGreat Eastern. The information presented is for informational use only. A product summary and a Product Highlights Sheet in relation to theFund may be obtained through Great Eastern or its financial representatives. Potential investors should read the product summary and theProduct Highlights Sheet before deciding whether to invest in the Fund. Returns on the units of the Fund are not guaranteed. The value ofthe units in the Fund and the income accruing to the units, if any, may fall or rise. The fees and charges payable through deduction ofpremium or cancellation of units are excluded in the calculation of fund returns. Past returns, and any other economic or market predictions,projections or forecasts targeted by the fund are not necessarily indicative of future or likely performance of the fund. This advertisementhas not been reviewed by the Monetary Authority of Singapore.
The Great Eastern Life Assurance Company Limited (Reg No. 1908 00011G)1 Pickering Street, #01-01 Great Eastern Centre, Singapore 048659Product Enquiry: +65 6248 2211 / greateasternlife.com
VENTURE CORPORATION 4.3%
CAPITALAND MALL TRUST 3.6%
ST ENGINEERING 3.2%
UOB 11.2%
CAPITALAND 6.4%
SINGAPORE TELECOM 6.0%
OCBC 15.7%
DBS GROUP 19.5%
SINGAPORE EQUITIES FUND
Financials, 48.2%Real Estate, 17.7%Industrials, 8.3%Telecommunications, 6.0%Consumer Discretionary, 5.2%Technology, 5.1%Health Care, 2.7%Basic Materials, 2.4%Utilities, 1.7%Consumer Staples, 1.0%Energy, 1.0%Cash, 0.7%
GREATLINK
as at 30 June 2021
Fund Objective
Fund Information
Performance Chart
3 mths 6 mths 1 Year 3 Years* 5 Years* 10 Years*
1.66% 11.74% 25.81% 3.16% 6.35% 2.02%
0.09% 11.84% 25.06% 2.50% 5.87% 3.43%
Since Inception*
GreatLink Singapore Equities Fund
5.03%
Benchmark 5.86%
The information provided herein is subject to our disclaimer set out at the end of this document. Page 1 of 2
Source: Morningstar. Performance figures are calculated on a bid-bid basis, with all dividends and distributions reinvested, taking into account allcharges which would have been payable upon such reinvestment.* Performance figures longer than 1 year are annualised.^ From 25 March 2002 till 30 June 2013, the benchmark was MSCI Singapore Free Index Net. Effective 1 July 2013, the benchmark was changedto Straits Times Index.
Benchmark Straits Times Index^ Underlying Fund Aberdeen Standard Singapore Equity Fund
Fund Management Fee 1.50% p.a. Fund Manager Aberdeen Standard Investments (Asia) Limited
Subscription Mode Cash, SRS & CPFIS – OA Fund Size SGD 235.8 m
Risk Category Higher Risk - Narrowly Focused Underlying Fund Size SGD 0.8 b
Dealing Frequency Daily Bid Price SGD 2.447Fund Currency SGD Bid Offer Spread 5.0%
SINGAPORE EQUITIES FUND
The ILP Sub-Fund aims to achieve medium to long-term capital growth from a portfolio of Singapore equities. The ILP Sub-Fund invests all or substantially all into the Aberdeen Standard Singapore Equity Fund (“Underlying Fund”) managed byAberdeen Standard Investments (Asia) Limited. The country of domicile of the Underlying Fund is Singapore and base currency is Singapore dollars.
Inception Date 25 March, 2002 Offer Price SGD 2.576
0
50
100
150
200
250
300
Mar-02 Mar-04 Mar-06 Mar-08 Mar-10 Mar-12 Mar-14 Mar-16 Mar-18 Mar-20GreatLink Singapore Equities Fund
FUND OBJECTIVE
The ILP Sub-Fund aims to achieve medium to long-term capital growth from a portfolio of Singapore equities. The ILP Sub-Fund invests all or substantially all into the Aberdeen Standard Singapore Equity Fund (“Underlying Fund”) managed by Aberdeen Standard Investments (Asia) Limited. The country of domicile of the Underlying Fund is Singapore and base currency is Singapore dollars.
Financials, 48.2% Real Estate, 17.7% Industrials 8.3% Telecommunications, 6.0% Consumer Discretionary,
5.2% Technology, 5.1% Health Care, 2.7% Basic Materials, 2.4% Utilities, 1.7% Consumer Staples, 1.0% Energy, 1.0% Cash, 0.7%
PORTFOLIO WEIGHTINGS#
GREATLINK SINGAPORE EQUITIES FUND report as at 30 June 2021
FUND FACTS
PERFORMANCE ON BID–BID BASIS (%)3 mths 6 mths 1 year 3 years* 5 years* 10 years* Since Inception*
GreatLink Singapore Equities Fund 1.66% 11.74% 25.81% 3.16% 6.35% 2.02% 5.03%
Benchmark 0.09% 11.84% 25.06% 2.50% 5.87% 3.43% 5.86%
Source: Morningstar. Performance figures are calculated on a bid-bid basis, with all dividends and distributions reinvested, taking into account all charges which would have been payable upon such reinvestment.* Performance figures longer than 1 year are annualised.^ From 25 March 2002 till 30 June 2013, the benchmark was MSCI Singapore Free Index Net. Effective 1 July 2013, the benchmark was
changed to Straits Times Index.# Information refers to Aberdeen Standard Singapore Equity Fund
Inception Date 25 March 2002Dealing Frequency DailyFund Currency SGDSubscription Mode Cash, SRS & CPFIS – OARisk Category Higher Risk – Narrowly FocusedBenchmark Straits Times Index^
Fund Management Fee 1.50% p.a.Offer Price SGD 2.576Bid Price SGD 2.447Bid Offer Spread 5.0%Fund Size SGD 235.8 mUnderlying Fund Size SGD 0.8 bUnderlying Fund Aberdeen Standard Singapore
Equity FundFund Manager Aberdeen Standard Investments
(Asia) Limited
PORTFOLIO PERFORMANCE SINCE INCEPTION
GreatLink Singapore Equities Fund
For disclaimer, please refer to page 6.
Asia
n Eq
uity

37For disclaimer, please refer to page 6.
Asia
n Eq
uity
GREATLINK LION VIETNAM FUND report as at 30 June 2021
FUND FACTS FUND OBJECTIVE
The ILP Sub-Fund invests all or substantially into the SGD share class of LionGlobal Vietnam Fund (“Underlying Fund”) managed by Lion Global Investors Limited. The Underlying Fund aims to provide medium to long term capital appreciation by investing in equity and equity-linked instruments of companies with assets in Vietnam or companies outside Vietnam but with earnings derived from Vietnam and the Indo-China Region (which includes, but is not limited to Cambodia and Laos). The country of domicile of the Underlying Fund is Singapore.
Inception Date 1 February 2008Dealing Frequency DailyFund Currency SGDSubscription Mode Cash & SRSRisk Category Higher Risk – Narrowly FocusedBenchmark FTSE Vietnam Index^
Fund Management Fee 1.50% p.a.Offer Price SGD 1.378Bid Price SGD 1.309Bid Offer Spread 5.0%Fund Size SGD 19.5 mUnderlying Fund Size SGD 166.5 mUnderlying Fund LionGlobal Vietnam FundFund Manager Lion Global Investors Ltd
PORTFOLIO PERFORMANCE SINCE INCEPTION
PERFORMANCE ON BID–BID BASIS (%)3 mths 6 mths 1 year 3 years* 5 years* 10 years* Since Inception*
GreatLink Lion Vietnam Fund 18.57% 27.71% 71.11% 13.68% 18.72% 12.28% 2.42%
Benchmark 21.47% 30.96% 66.69% 13.88% 15.52% 8.81% -1.64%
Source: Morningstar. Performance figures are calculated on a bid-bid basis, with all dividends and distributions reinvested, taking into account all charges which would have been payable upon such reinvestment.* Performance figures longer than 1 year are annualised.^ Benchmark was changed from Vietnam Stock Index to FTSE Vietnam Index wef 1 May 2012.# Information refers to LionGlobal Vietnam Fund
GreatLink Lion Vietnam Fund
Real Estate, 25.2% Consumer, Non-Cyclical,
16.8% Basic Materials, 15.0% Financial, 11.9% Technology, 10.1% Consumer, Cyclical, 8.3% Industrial, 6.6% Cash Equivalent, 4.3%
Utilities, 1.0% Energy, 0.9%
PORTFOLIO WEIGHTINGS#
GREATLINK
as at 30 June 2021
Fund Objective
Fund Information
Performance Chart
3 mths 6 mths 1 Year 3 Years* 5 Years* 10 Years*
18.57% 27.71% 71.11% 13.68% 18.72% 12.28%
21.47% 30.96% 66.69% 13.88% 15.52% 8.81%
Since Inception*
The information provided herein is subject to our disclaimer set out at the end of this document. Page 1 of 3
Risk Category Higher Risk - Narrowly Focused Underlying Fund Size SGD 166.5 m
Source: Morningstar. Performance figures are calculated on a bid-bid basis, with all dividends and distributions reinvested, taking into account all charges which would have been payable upon such reinvestment.* Performance figures longer than 1 year are annualised.^ Benchmark was changed from Vietnam Stock Index to FTSE Vietnam Index wef 1 May 2012.
Benchmark FTSE Vietnam Index^ Underlying Fund LionGlobal Vietnam Fund
Fund Management Fee 1.50% p.a. Fund Manager Lion Global Investors Ltd
GreatLink Lion Vietnam Fund
Benchmark
Bid Offer Spread 5.0%Subscription Mode Cash & SRS Fund Size SGD 19.5 m
2.42%
-1.64%
LION VIETNAM FUND
The ILP Sub-Fund invests all or substantially into the SGD share class of LionGlobal Vietnam Fund (“Underlying Fund”)managed by Lion Global Investors Limited. The Underlying Fund aims to provide medium to long term capital appreciation byinvesting in equity and equity-linked instruments of companies with assets in Vietnam or companies outside Vietnam but withearnings derived from Vietnam and the Indo-China Region (which includes, but is not limited to Cambodia and Laos). Thecountry of domicile of the Underlying Fund is Singapore.
Inception Date 1 February, 2008 Offer Price SGD 1.378Dealing Frequency Daily Bid Price SGD 1.309Fund Currency SGD
20
40
60
80
100
120
140
Feb-08 Feb-10 Feb-12 Feb-14 Feb-16 Feb-18 Feb-20GreatLink Lion Vietnam Fund
GREATLINK
as at 30 June 2021
Portfolio Weightings#
Top 10 Holdings#
16.2%
15.0%
8.9%
8.3%
7.9%
6.8%
5.7%
5.2%
3.6%
3.3%
The information provided herein is subject to our disclaimer set out at the end of this document.
VINHOMES JSC ORD VND10
HOA PHAT GROUP JSC ORD VND10000
Page 2 of 3
# Information refers to LionGlobal Vietnam Fund
VIETNAM DAIRY PRODUCTS JOINT STOCK COMAPNY ORD VND10000
MOBILE WORLD INVESTMENT CORP ORD VND10000
MASAN GROUP CORP ORD VND10000
FPT CORP ORD VND10000
JSC BANK FOR FOREIGN TRADE OF VIETNAM ORD VND10000
VINCOM RETAIL JSC ORD VND10000
AIRPORTS CORP OF VIETNAM JSC ORD VND10000
DIGIWORLD CORP ORD VND10000
LION VIETNAM FUND
Real Estate, 25.2%
Consumer, Non-Cyclical, 16.8%
Basic Materials, 15.0%
Financial, 11.9%
Technology, 10.1%
Consumer, Cyclical, 8.3%
Industrial, 6.6%
Cash Equivalent, 4.3%
Utilities, 1.0%
Energy, 0.9%
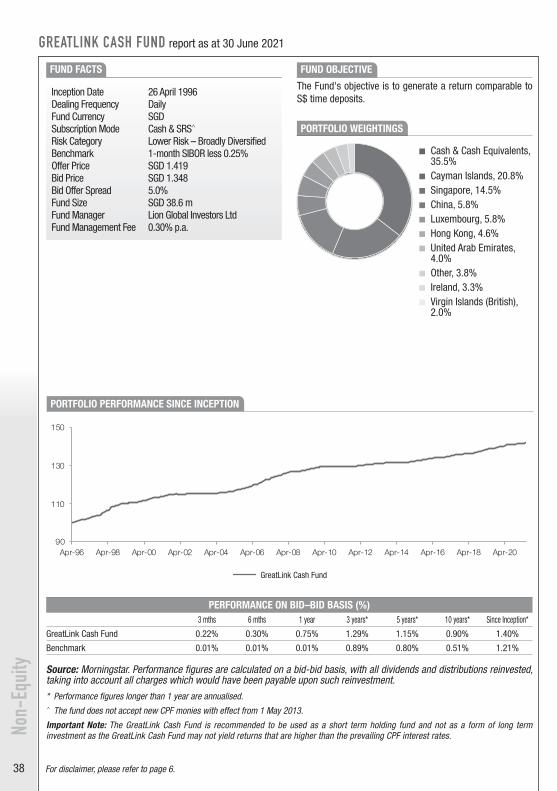
38
GREATLINK
as at 30 June 2021
Portfolio Weightings
Top 10 Holdings
KEPPEL CORP LTD FIXED COUPON 3.145000 MATURITY 20220214 3.3%
The information provided herein is subject to our disclaimer set out at the end of this document. Page 2 of 3
QIIB SR SUKUK LT FLOATING COUPON 1.667250 MATURITY 20220930 3.5%
KEPPEL LAND LTD FIXED COUPON 3.800000 MATURITY 20220608 3.3%
ASCENDAS REAL ES FIXED COUPON 4.000000 MATURITY 20220203 3.3%
EMIRATES NBD FIXED COUPON 4.750000 MATURITY 20220218 4.0%
BOC AVIATION FIXED COUPON 3.000000 MATURITY 20220523 3.9%
ABQ FINANCE FIXED COUPON 3.500000 MATURITY 20220222 3.5%
ANHUI INVEST FIXED COUPON 4.875000 MATURITY 20211018 5.8%
DOOSAN POWER SYS VARIABLE COUPON 3.750000 MATURITY 20481025 5.8%
LINK 2019 CB FIXED COUPON 1.600000 MATURITY 20240403 4.1%
CASH FUND
Cash & Cash Equivalents, 35.5%Cayman Islands, 20.8%
Singapore, 14.5%China, 5.8%
Luxembourg, 5.8%Hong Kong, 4.6%United Arab Emirates, 4.0%
Other, 3.8%Ireland, 3.3%
Virgin Islands (British), 2.0%
GREATLINK
as at 30 June 2021
Fund Objective
Fund Information
Performance Chart
3 mths 6 mths 1 Year 3 Years* 5 Years* 10 Years*
0.22% 0.30% 0.75% 1.29% 1.15% 0.90%
0.01% 0.01% 0.01% 0.89% 0.80% 0.51%
The information provided herein is subject to our disclaimer set out at the end of this document. Page 1 of 3
Benchmark 1-month SIBOR less 0.25% Fund Management Fee 0.30% p.a.
Since Inception*
GreatLink Cash Fund 1.40%
Benchmark 1.21%
Source: Morningstar. Performance figures are calculated on a bid-bid basis, with all dividends and distributions reinvested, taking into account allcharges which would have been payable upon such reinvestment.* Performance figures longer than 1 year are annualized.^ The fund does not accept new CPF monies with effect from 1 May 2013.
Important Note: The GreatLink Cash Fund is recommended to be used as a short term holding fund and not as a form of long term investment as the GreatLink CashFund may not yield returns that are higher than the prevailing CPF interest rates.
Subscription Mode Cash & SRS^ Fund Size SGD 38.6 mRisk Category Lower Risk - Broadly Diversified Fund Manager Lion Global Investors Ltd
CASH FUND
The Fund's objective is to generate a return comparable to S$ time deposits.
Inception Date 26 April, 1996 Offer Price SGD 1.419Dealing Frequency Daily Bid Price SGD 1.348Fund Currency SGD Bid Offer Spread 5.0%
90
110
130
150
Apr-96 Apr-98 Apr-00 Apr-02 Apr-04 Apr-06 Apr-08 Apr-10 Apr-12 Apr-14 Apr-16 Apr-18 Apr-20
GreatLink Cash Fund
Cash & Cash Equivalents, 35.5%
Cayman Islands, 20.8% Singapore, 14.5% China, 5.8% Luxembourg, 5.8% Hong Kong, 4.6% United Arab Emirates,
4.0% Other, 3.8% Ireland, 3.3% Virgin Islands (British),
2.0%
GREATLINK CASH FUND report as at 30 June 2021
FUND FACTS FUND OBJECTIVE
The Fund's objective is to generate a return comparable to S$ time deposits.
PORTFOLIO WEIGHTINGS
PERFORMANCE ON BID–BID BASIS (%)3 mths 6 mths 1 year 3 years* 5 years* 10 years* Since Inception*
GreatLink Cash Fund 0.22% 0.30% 0.75% 1.29% 1.15% 0.90% 1.40%
Benchmark 0.01% 0.01% 0.01% 0.89% 0.80% 0.51% 1.21%
Source: Morningstar. Performance figures are calculated on a bid-bid basis, with all dividends and distributions reinvested, taking into account all charges which would have been payable upon such reinvestment.* Performance figures longer than 1 year are annualised.^ The fund does not accept new CPF monies with effect from 1 May 2013.
Important Note: The GreatLink Cash Fund is recommended to be used as a short term holding fund and not as a form of long term investment as the GreatLink Cash Fund may not yield returns that are higher than the prevailing CPF interest rates.
Inception Date 26 April 1996Dealing Frequency DailyFund Currency SGDSubscription Mode Cash & SRS^
Risk Category Lower Risk – Broadly DiversifiedBenchmark 1-month SIBOR less 0.25% Offer Price SGD 1.419Bid Price SGD 1.348Bid Offer Spread 5.0%Fund Size SGD 38.6 mFund Manager Lion Global Investors LtdFund Management Fee 0.30% p.a.
PORTFOLIO PERFORMANCE SINCE INCEPTION
GreatLink Cash Fund
For disclaimer, please refer to page 6.
Non-
Equi
ty
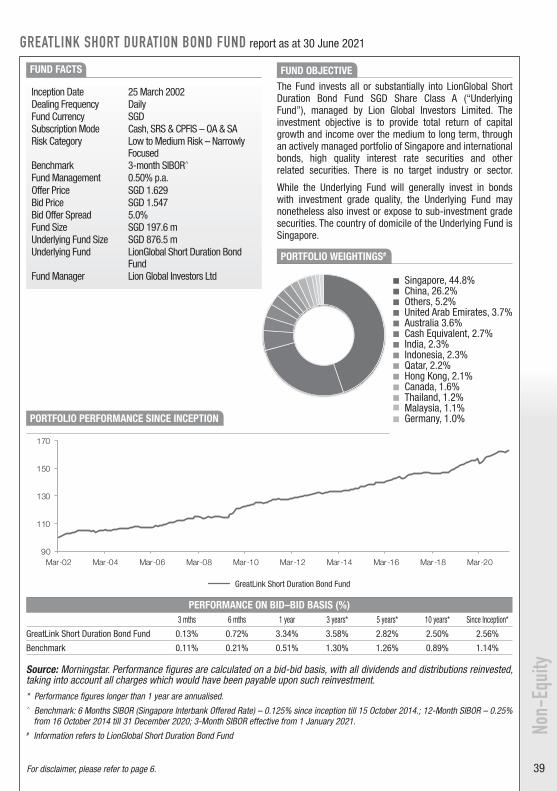
39
Non-
Equi
ty
For disclaimer, please refer to page 6.
GREATLINK
as at 30 June 2021
Portfolio Weightings#
Top 10 Holdings#
SINGAPORE (GOVT OF) 2.75% 01/07/2023 1.3%# Information refers to LionGlobal Short Duration Bond Fund
The information provided herein is subject to our disclaimer set out at the end of this document. Page 2 of 3
KEPPEL LAND LTD (SER MTN) (REG S) ( BR) 2% 28/05/2026 1.4%
MAS BILL (SER 84) ZCP 24/09/2021 1.4%
ALLGREEN TREASURY PTE (REG S) (BR) 3.15% 16/01/2025 1.4%
PT PELABUHAN INDO II (REG S) 4.25% 05/05/2025 1.5%
MAPLETREE TREASURY SVCS (SER EMTN) (REG S) (REG) 1.2% 14/12/2023 1.5%
AUSNET SERVICES HOLDINGS PTY LTD (REG) (REG S) FRN 07/09/2076 1.4%
LEND LEASE RETAIL INVEST SER MTN (REG S) (BR) 3.28% 03/09/2021 1.7%
WEIBO CORP CONV 1.25% 15/11/2022 1.7%
MANULIFE FINANCIAL CORP (REG S) (REG) VAR 21/11/2029 1.6%
SHORT DURATION BOND FUND
Singapore, 44.8%China, 26.2%Others, 5.2%United Arab Emirates, 3.7%Australia, 3.6%Cash Equivalent, 2.7%India, 2.3%Indonesia, 2.3%Qatar, 2.2%Hong Kong, 2.1%Canada, 1.6%Thailand, 1.2%Malaysia, 1.1%Germany, 1.0%
GREATLINK
as at 30 June 2021
Fund Objective
Fund Information
Performance Chart
3 mths 6 mths 1 Year 3 Years* 5 Years* 10 Years*
0.13% 0.72% 3.34% 3.58% 2.82% 2.50%
0.11% 0.21% 0.51% 1.30% 1.26% 0.89% Benchmark 1.14%
The information provided herein is subject to our disclaimer set out at the end of this document. Page 1 of 3
Source: Morningstar. Performance figures are calculated on a bid-bid basis, with all dividends and distributions reinvested, taking into account allcharges which would have been payable upon such reinvestment. * Performance figures longer than 1 year are annualised.^ Benchmark: 6 Months SIBOR (Singapore Interbank Offered Rate) – 0.125% since inception till 15 October 2014.; 12-Month SIBOR – 0.25% from16 October 2014 till 31 December 2020; 3-Month SIBOR effective from 1 January 2021.
Since Inception*
GreatLink Short Duration Bond Fund
2.56%
Benchmark 3-month SIBOR^ Underlying Fund LionGlobal Short Duration Bond Fund
Fund Management Fee 0.50% p.a. Fund Manager Lion Global Investors Ltd
Subscription Mode Cash, SRS & CPFIS – OA & SA Fund Size SGD 197.6 m
Risk Category Low to Medium Risk - Narrowly Focused Underlying Fund Size SGD 876.5 m
SHORT DURATION BOND FUND
The Fund invests all or substantially into LionGlobal Short Duration Bond Fund SGD Share Class A (“Underlying Fund”),managed by Lion Global Investors Limited. The investment objective is to provide total return of capital growth and incomeover the medium to long term, through an actively managed portfolio of Singapore and international bonds, high qualityinterest rate securities and other related securities. There is no target industry or sector.While the Underlying Fund will generally invest in bonds with investment grade quality, the Underlying Fund may nonethelessalso invest or expose to sub-investment grade securities. The country of domicile of the Underlying Fund is Singapore.
Inception Date 25 March, 2002 Offer Price SGD 1.629Dealing Frequency Daily Bid Price SGD 1.547Fund Currency SGD Bid Offer Spread 5.0%
90
110
130
150
170
Mar-02 Mar-04 Mar-06 Mar-08 Mar-10 Mar-12 Mar-14 Mar-16 Mar-18 Mar-20 GreatLink Short Duration Bond Fund
PERFORMANCE ON BID–BID BASIS (%)3 mths 6 mths 1 year 3 years* 5 years* 10 years* Since Inception*
GreatLink Short Duration Bond Fund 0.13% 0.72% 3.34% 3.58% 2.82% 2.50% 2.56%
Benchmark 0.11% 0.21% 0.51% 1.30% 1.26% 0.89% 1.14%
Source: Morningstar. Performance figures are calculated on a bid-bid basis, with all dividends and distributions reinvested, taking into account all charges which would have been payable upon such reinvestment.* Performance figures longer than 1 year are annualised.^ Benchmark: 6 Months SIBOR (Singapore Interbank Offered Rate) – 0.125% since inception till 15 October 2014.; 12-Month SIBOR – 0.25%
from 16 October 2014 till 31 December 2020; 3-Month SIBOR effective from 1 January 2021. # Information refers to LionGlobal Short Duration Bond Fund
GREATLINK SHORT DURATION BOND FUND report as at 30 June 2021
FUND FACTS
PORTFOLIO PERFORMANCE SINCE INCEPTION
PORTFOLIO WEIGHTINGS#
FUND OBJECTIVE The Fund invests all or substantially into LionGlobal Short Duration Bond Fund SGD Share Class A (“Underlying Fund”), managed by Lion Global Investors Limited. The investment objective is to provide total return of capital growth and income over the medium to long term, through an actively managed portfolio of Singapore and international bonds, high quality interest rate securities and other related securities. There is no target industry or sector. While the Underlying Fund will generally invest in bonds with investment grade quality, the Underlying Fund may nonetheless also invest or expose to sub-investment grade securities. The country of domicile of the Underlying Fund is Singapore.
Inception Date 25 March 2002Dealing Frequency DailyFund Currency SGDSubscription Mode Cash, SRS & CPFIS – OA & SARisk Category Low to Medium Risk – Narrowly
FocusedBenchmark 3-month SIBOR^
Fund Management 0.50% p.a.Offer Price SGD 1.629Bid Price SGD 1.547Bid Offer Spread 5.0%Fund Size SGD 197.6 mUnderlying Fund Size SGD 876.5 mUnderlying Fund LionGlobal Short Duration Bond
FundFund Manager Lion Global Investors Ltd
GreatLink Short Duration Bond Fund
Singapore, 44.8% China, 26.2% Others, 5.2% United Arab Emirates, 3.7% Australia 3.6% Cash Equivalent, 2.7% India, 2.3% Indonesia, 2.3% Qatar, 2.2% Hong Kong, 2.1% Canada, 1.6% Thailand, 1.2%
Malaysia, 1.1% Germany, 1.0%

40
Non-
Equi
ty
For disclaimer, please refer to page 6.
Europe ex-UK, 54.1% United State of America,
20.0% United Kingdom, 15.6% Cash & Cash Equivalent,
7.1% Japan, 4.3% Asia Pacific ex-Japan,
1.8% Other, -2.9%
GREATLINK GLOBAL BOND FUND report as at 30 June 2021
FUND FACTS
PORTFOLIO PERFORMANCE SINCE INCEPTION
FUND OBJECTIVE
The Fund's objective is to achieve excess return relative to the index while minimizing volatility of return relative to the benchmark. The Fund is a diverse, actively managed portfolio of global fixed–income securities. The Fund invests primarily in a diversified portfolio of investment grade bonds denominated in major world currencies.
PERFORMANCE ON BID–BID BASIS (%)3 mths 6 mths 1 year 3 years* 5 years* 10 years* Since Inception*
GreatLink Global Bond Fund 1.36% -1.97% -0.77% 3.61% 2.36% 3.02% 3.32%
Benchmark 1.18% -1.51% -0.51% 4.00% 2.48% 3.42% 3.45%
Source: Morningstar. Performance figures are calculated on a bid-bid basis, with all dividends and distributions reinvested, taking into account all charges which would have been payable upon such reinvestment.* Performance figures longer than 1 year are annualised.
Inception Date 15 January 2002Dealing Frequency DailyFund Currency SGDSubscription Mode Cash, SRS & CPFIS – OA & SARisk Category Low to Medium Risk – Broadly
DiversifiedBenchmark Barclays Global Aggregate Bond
Index 50% Hedged into SGDFund Management Fee 0.85% p.a.Offer Price SGD 1.888Bid Price SGD 1.793Bid Offer Spread 5.0%Fund Size SGD 417.8 mFund Manager Lion Global Investors LtdSub Manager PIMCO
PORTFOLIO WEIGHTINGS
GreatLink Global Bond Fund
GREATLINK
as at 30 June 2021
Fund Objective
Fund Information
Performance Chart
3 mths 6 mths 1 Year 3 Years* 5 Years* 10 Years*
1.36% -1.97% -0.77% 3.61% 2.36% 3.02%
1.18% -1.51% -0.51% 4.00% 2.48% 3.42%
Since Inception*
GreatLink Global Bond Fund 3.32%
Benchmark 3.45%
The information provided herein is subject to our disclaimer set out at the end of this document. Page 1 of 2
Source: Morningstar. Performance figures are calculated on a bid-bid basis, with all dividends and distributions reinvested, taking into account allcharges which would have been payable upon such reinvestment. * Performance figures longer than 1 year are annualised.
Benchmark Barclays Global Aggregate Bond Index 50% Hedged into SGD Sub Manager PIMCO
Fund Management Fee 0.85% p.a.
Subscription Mode Cash, SRS & CPFIS – OA & SA Fund Size SGD 417.8 m
Risk Category Low to Medium Risk - Broadly Diversified Fund Manager Lion Global Investors Ltd
GLOBAL BOND FUND
The Fund's objective is to achieve excess return relative to the index while minimizing volatility of return relative to thebenchmark. The Fund is a diverse, actively managed portfolio of global fixed–income securities. The Fund invests primarily in adiversified portfolio of investment grade bonds denominated in major world currencies.
Inception Date 15 January, 2002 Offer Price SGD 1.888Dealing Frequency Daily Bid Price SGD 1.793Fund Currency SGD Bid Offer Spread 5.0%
90
110
130
150
170
190
210
Jan-02 Jan-04 Jan-06 Jan-08 Jan-10 Jan-12 Jan-14 Jan-16 Jan-18 Jan-20 GreatLink Global Bond Fund
GREATLINK
as at 30 June 2021
Portfolio Weightings
Top 10 Holdings
The information provided herein is subject to our disclaimer set out at the end of this document. Page 2 of 2
G2SF 2.5 8/20 FIXED COUPON 2.500000 MATURITY 1.3%
BTPS FIXED COUPON .250000 MATURITY 20280315 1.3%
DISCLAIMER: GreatLink Global Bond Fund is an investment-linked policy (ILP) fund offered by The Great Eastern Life AssuranceCompany Limited ("Great Eastern") and is only available under Great Eastern Investment-Linked Policies. This factsheet is compiled byGreat Eastern. The information presented is for informational use only. A product summary and a Product Highlights Sheet in relation to theFund may be obtained through Great Eastern or its financial representatives. Potential investors should read the product summary and theProduct Highlights Sheet before deciding whether to invest in the Fund. Returns on the units of the Fund are not guaranteed. The value ofthe units in the Fund and the income accruing to the units, if any, may fall or rise. The fees and charges payable through deduction ofpremium or cancellation of units are excluded in the calculation of fund returns. Past returns, and any other economic or market predictions,projections or forecasts targeted by the fund are not necessarily indicative of future or likely performance of the fund. This advertisementhas not been reviewed by the Monetary Authority of Singapore.
The Great Eastern Life Assurance Company Limited (Reg No. 1908 00011G)1 Pickering Street, #01-01 Great Eastern Centre, Singapore 048659Product Enquiry: +65 6248 2211 / greateasternlife.com
SPANISH GOV'T FIXED COUPON 5.150000 MATURITY 20281031 1.5%
SPANISH GOV'T FIXED COUPON 1.450000 MATURITY 20271031 1.5%
EUROPEAN UNION FIXED COUPON 0 MATURITY 20260706 1.4%
JAPAN GOVT 30-YR FIXED COUPON .700000 MATURITY 20481220 1.8%
JAPAN GOVT 20-YR FIXED COUPON 1.500000 MATURITY 20340320 1.6%
BTPS I/L FIXED COUPON 1.300000 MATURITY 20280515 1.5%
FNCL 3 7/20 FIXED COUPON 3.000000 MATURITY 2.3%
NYKREDIT FIXED COUPON 1.000000 MATURITY 20501001 3.7%
GLOBAL BOND FUND
Europe ex-UK, 54.1%
United States of America, 20.0%
United Kingdom, 15.6%
Cash & Cash Equivalents, 7.1%
Japan, 4.3%
Asia Pacific ex-Japan, 1.8%
Other, -2.9%

41
Non-
Equi
ty
For disclaimer, please refer to page 6.
PERFORMANCE ON BID–BID BASIS (%)3 mths 6 mths 1 year 3 years* 5 years* 10 years* Since Inception
(Cumulative)
GreatLink Income Bond Fund ° 0.74% - - - - - 1.03%
Benchmark 1.87% - - - - - 1.86%
Source: Morningstar. Performance figures are calculated on a bid-bid basis, with all dividends and distributions reinvested, taking into account all charges which would have been payable upon such reinvestment.* Performance figures longer than 1 year are annualised.
° The inception date for GreatLink Income Bond Fund is 22 March 2021. Track record of at least one year for the ILP Sub-Fund is not available.# Information refers to JPMorgan Funds - Income Fund
PORTFOLIO PERFORMANCE SINCE INCEPTION
GreatLink Income Bond Fund
GREATLINKINCOME BOND FUNDas at 30 June 2021
Fund Objective
Fund Information
Performance Chart
3 mths 6 mths 1 Year 3 Years* 5 Years* 10 Years*
0.75% - - - - -
1.87% - - - - -
The ILP Sub-Fund invests all or substantially into the SGD-Hedged share class of JPMorgan Funds – Income Fund (“Underlying Fund”), managed by JPMorgan Asset Management (Europe) S.àr.l. The investment objective aims to provide income byinvesting primarily in debt securities. The country of domicile of the Underlying Fund is Luxembourg.
Inception Date 22 March, 2021 Offer Price SGD 0.995Dealing Frequency Daily Bid Price SGD 0.945Fund Currency SGD Bid Offer Spread 5.0%Subscription Mode Cash & SRS Fund Size SGD 16.8 m
Risk Category Medium to High Risk - Broadly Diversified Fund ManagerJPMorgan Asset Management (Europe) S.à r.l.
Benchmark Bloomberg Barclays US Aggregate Index (Total Return Gross) hedged to SGD Underlying Funds
(Fund Size)
JPMorgan Funds - Income Fund(USD 10,324.9m) Fund Management Fee 1.00% p.a
GreatLink Income Bond Fund °
Benchmark
Source: Morningstar. Performance figures are calculated on a bid-bid basis, with all dividends and distributions reinvested, taking into account allcharges which would have been payable upon such reinvestment.* Performance figures longer than 1 year are annualised.° The inception date for GreatLink Multi-Theme Equity Fund is 22 March 2021. Track record of at least one year for the ILP Sub-Fund is notavailable.
The information provided herein is subject to our disclaimer set out at the end of this document. Page 1 of 2
Since Inception(cumulative)
0.64%
1.86%
90
95
100
105
110
Mar-21 Apr-21 May-21 Jun-21
GreatLink Income Bond Fund
FUND OBJECTIVE The ILP Sub-Fund invests all or substantially into the SGD-Hedged share class of JPMorgan Funds – Income Fund (“Underlying Fund”), managed by JPMorgan Asset Management (Europe) S.àr.l. The investment objective aims to provide income by investing primarily in debt securities. The country of domicile of the Underlying Fund is Luxembourg.
GREATLINK INCOME BOND FUND report as at 30 June 2021
FUND FACTS
PORTFOLIO WEIGHTINGS#
Inception Date 22 March 2021Dealing Frequency DailyFund Currency SGDSubscription Mode Cash & SRS Risk Category Medium to High Risk - Broadly
DiversifiedBenchmark Bloomberg Barclays US Aggregate
Index (Total Return Gross) hedged to SGD
Fund Management Fee 1.00% p.aOffer Price SGD 0.995Bid Price SGD 0.945Bid Offer Spread 5.0%Fund Size SGD 16.8 mFund Manager JPMorgan Asset Management
(Europe) S.à r.l.Underlying Fund Size USD 10,324.9 mUnderlying Fund JPMorgan Funds - Income Fund
HY Corporate, 28.8% Agency MBS, 26.6% CMBS, 17.0% Net Liquidity, 7.1% IGS Corporate, 7.1% Non-agency MBS, 6.0% Others, 5.8% EM Sovereigns & Quasi
Sovereigns, 5.0% ABS, 4.5%
GREATLINKINCOME BOND FUNDas at 30 June 2021
Portfolio Weightings#
Top 10 Holdings# As At 31 May 2021° Dividend History**
3.7% 0.389%
2.2% 0.387%
1.0% 0.387%
0.4% 0.389%
0.4%
0.4%
0.4%
0.4%
0.4%
0.4%
# Information refers to JPMorgan Funds - Income Fund° JPMorgan Asset Management imposes a 30-day embargo on their holdings, hence there is a 1-month lag.
DISCLAIMER: GreatLink Income Bond Fund is an investment-linked policy (ILP) fund offered by The Great Eastern Life AssuranceCompany Limited ("Great Eastern") and is only available under Great Eastern Investment-Linked Policies. This factsheet is compiled byGreat Eastern. The information presented is for informational use only. A product summary and a Product Highlights Sheet in relation to theFund may be obtained through Great Eastern or its financial representatives. Potential investors should read the product summary and theProduct Highlights Sheet before deciding whether to invest in the Fund. Returns on the units of the Fund are not guaranteed. The value ofthe units in the Fund and the income accruing to the units, if any, may fall or rise. The fees and charges payable through deduction ofpremium or cancellation of units are excluded in the calculation of fund returns. Past returns, and any other economic or market predictions,projections or forecasts targeted by the fund are not necessarily indicative of future or likely performance of the fund. This advertisementhas not been reviewed by the Monetary Authority of Singapore.
The Great Eastern Life Assurance Company Limited (Reg No. 1908 00011G)1 Pickering Street, #01-01 Great Eastern Centre, Singapore 048659Product Enquiry: +65 6248 2211 / greateasternlife.com
DISH NETWORK CORP
FEDERAL HOME LOAN MORTGAGE CORPORATION-FHR 4957 DY
** Dividend distributions are not guaranteed and are made at the Manager’s discretion
GOVERNMENT NATIONAL MORTGAGE ASSOCIATION-G2 MA7255
March 2021
GOVERNMENT NATIONAL MORTGAGE ASSOCIATION-G2 MA6995
April 2021
JPMIF - GLOBAL HIGH YIELD BOND FUND May 2021
The information provided herein is subject to our disclaimer set out at the end of this document. Page 2 of 2
CHARTER COMMUNICATIONS INC-
FEDERAL HOME LOAN MORTGAGE CORPORATION-FHR 4798 HZ
T-MOBILE US, INC.
FEDERAL HOME LOAN MORTGAGE CORPORATION-FHR 4858 LY
FEDERAL NATIONAL MORTGAGE ASSOCIATION-CAS 2017-C01 1B1
June 2021
HY Corporate, 28.8%
Agency MBS, 26.6%
CMBS , 17.0%
Net Liquidity, 7.2%
IG Corporate, 7.1%
Non-agency MBS, 6.0%
Others, 5.8%
EM Sovereigns & Quasi Sovereigns, 5.0%
ABS, 4.5%
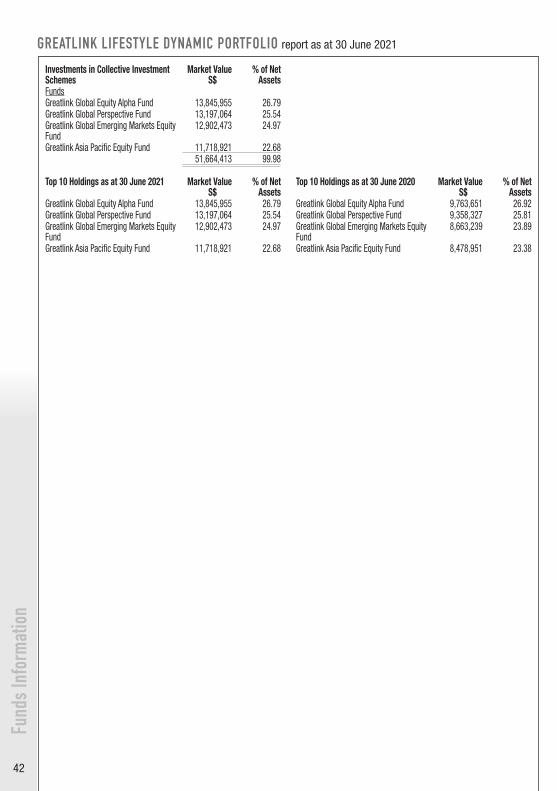
42
Fund
s Inf
orm
atio
nGREATLINK LIFESTYLE DYNAMIC PORTFOLIO report as at 30 June 2021
Investments in Collective Investment Schemes
Market ValueS$
% of NetAssets
FundsGreatlink Global Equity Alpha Fund 13,845,955 26.79 Greatlink Global Perspective Fund 13,197,064 25.54 Greatlink Global Emerging Markets Equity Fund
12,902,473 24.97
Greatlink Asia Pacific Equity Fund 11,718,921 22.68 51,664,413 99.98
Top 10 Holdings as at 30 June 2020 Market ValueS$
% of Net Assets
Greatlink Global Equity Alpha Fund 9,763,651 26.92 Greatlink Global Perspective Fund 9,358,327 25.81 Greatlink Global Emerging Markets Equity Fund
8,663,239 23.89
Greatlink Asia Pacific Equity Fund 8,478,951 23.38
Top 10 Holdings as at 30 June 2021 Market ValueS$
% of NetAssets
Greatlink Global Equity Alpha Fund 13,845,955 26.79 Greatlink Global Perspective Fund 13,197,064 25.54 Greatlink Global Emerging Markets Equity Fund
12,902,473 24.97
Greatlink Asia Pacific Equity Fund 11,718,921 22.68
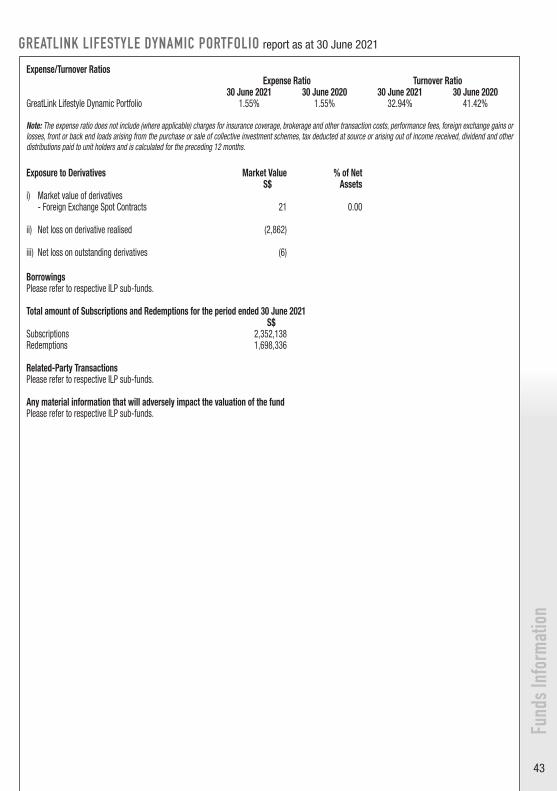
43
Fund
s Inf
orm
atio
n
GREATLINK LIFESTYLE DYNAMIC PORTFOLIO report as at 30 June 2021
Expense/Turnover RatiosExpense Ratio Turnover Ratio
30 June 2021 30 June 2020 30 June 2021 30 June 2020GreatLink Lifestyle Dynamic Portfolio 1.55% 1.55% 32.94% 41.42%
Note: The expense ratio does not include (where applicable) charges for insurance coverage, brokerage and other transaction costs, performance fees, foreign exchange gains or losses, front or back end loads arising from the purchase or sale of collective investment schemes, tax deducted at source or arising out of income received, dividend and other distributions paid to unit holders and is calculated for the preceding 12 months.
Exposure to Derivatives Market Value % of NetS$ Assets
i) Market value of derivatives - Foreign Exchange Spot Contracts 21 0.00
ii) Net loss on derivative realised (2,862)
iii) Net loss on outstanding derivatives (6)
BorrowingsPlease refer to respective ILP sub-funds.
Total amount of Subscriptions and Redemptions for the period ended 30 June 2021S$
Subscriptions 2,352,138 Redemptions 1,698,336
Related-Party TransactionsPlease refer to respective ILP sub-funds.
Any material information that will adversely impact the valuation of the fundPlease refer to respective ILP sub-funds.

44
Fund
s Inf
orm
atio
nGREATLINK LIFESTYLE PROGRESSIVE PORTFOLIO report as at 30 June 2021
Investments in Collective Investment Schemes
Market ValueS$
% of NetAssets
FundsGreatlink Global Equity Alpha Fund 30,986,315 22.21Greatlink Global Perspective Fund 29,072,965 20.84Greatlink Global Bond Fund 27,422,455 19.65Greatlink Asia Pacific Equity Fund 26,066,389 18.68Greatlink Global Emerging Markets Equity Fund
25,986,777 18.62
139,534,901 100.00
Top 10 Holdings as at 30 June 2020 Market ValueS$
% of Net Assets
Greatlink Global Equity Alpha Fund 22,427,428 21.68Greatlink Global Perspective Fund 21,544,358 20.83Greatlink Global Bond Fund 20,011,522 19.35Greatlink Global Emerging Markets Equity Fund
19,876,759 19.22
Greatlink Asia Pacific Equity Fund 19,568,737 18.92
Top 10 Holdings as at 30 June 2021 Market ValueS$
% of NetAssets
Greatlink Global Equity Alpha Fund 30,986,315 22.21Greatlink Global Perspective Fund 29,072,966 20.84Greatlink Global Bond Fund 27,422,455 19.65Greatlink Global Emerging Markets Equity Fund
26,066,389 18.68
Greatlink Asia Pacific Equity Fund 25,986,777 18.62
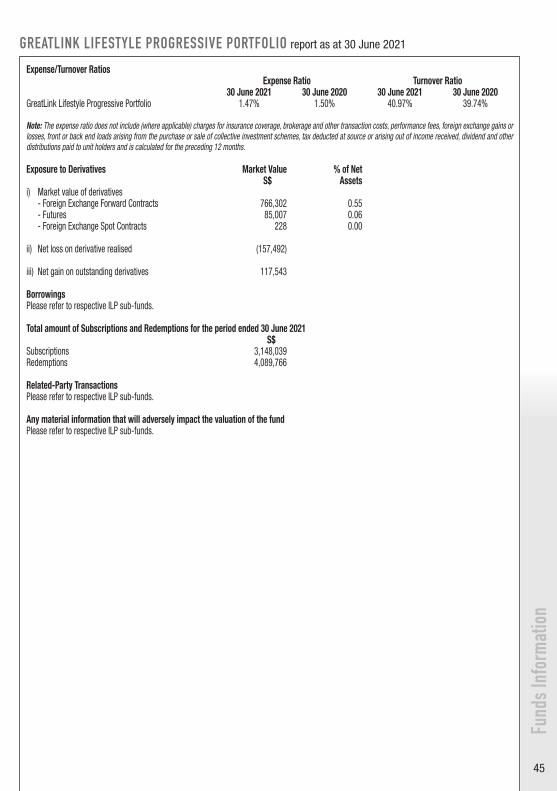
45
Fund
s Inf
orm
atio
n
GREATLINK LIFESTYLE PROGRESSIVE PORTFOLIO report as at 30 June 2021
Expense/Turnover RatiosExpense Ratio Turnover Ratio
30 June 2021 30 June 2020 30 June 2021 30 June 2020GreatLink Lifestyle Progressive Portfolio 1.47% 1.50% 40.97% 39.74%
Note: The expense ratio does not include (where applicable) charges for insurance coverage, brokerage and other transaction costs, performance fees, foreign exchange gains or losses, front or back end loads arising from the purchase or sale of collective investment schemes, tax deducted at source or arising out of income received, dividend and other distributions paid to unit holders and is calculated for the preceding 12 months.
Exposure to Derivatives Market Value % of NetS$ Assets
i) Market value of derivatives - Foreign Exchange Forward Contracts 766,302 0.55 - Futures 85,007 0.06 - Foreign Exchange Spot Contracts 228 0.00
ii) Net loss on derivative realised (157,492)
iii) Net gain on outstanding derivatives 117,543
BorrowingsPlease refer to respective ILP sub-funds.
Total amount of Subscriptions and Redemptions for the period ended 30 June 2021S$
Subscriptions 3,148,039 Redemptions 4,089,766
Related-Party TransactionsPlease refer to respective ILP sub-funds.
Any material information that will adversely impact the valuation of the fundPlease refer to respective ILP sub-funds.

46
The GreatLink Lifestyle Balanced Portfolio invested more than 30% of its assets in the GreatLink Global Bond Fund. The following are the top 10 holdings in the GreatLink Global Bond:
Top 10 Holdings of Underlying Fund as at 30 June 2021
Market ValueS$
% of NetAssets
Nykredit 1.000 Maturity 20501001 15,426,351 3.69FNCL 3 7/20 3.000 Maturity 9,670,977 2.31Japan Goverment 30-Yr 0.700 Maturity 20481220
7,381,617 1.77
Japan Goverment 20-Yr 1.500 Maturity 20340320
6,689,060 1.60
BTPS I/L 1.300 Maturity 20280515 6,373,870 1.53Spanish Goverment 5.150 Maturity 20281031
6,119,054 1.46
Spanish Goverment 1.450 Maturity 20271031
6,105,431 1.46
European Union 0.000 Maturity 20260706 5,851,620 1.40G2SF 2.5 8/20 2.500 Maturity 5,556,166 1.33BTPS 0.250 Maturity 20280315 5,368,054 1.28
Top 10 Holdings of Underlying Fund as at 30 June 2020
Market ValueS$
% of Net Assets
G2SF 2.5 8/20 2.500 Maturity 15,828,699 4.28Nykredit 1.000 Maturity 20501001 13,429,881 3.63FNCL 3 8/13 3.000 Maturity 10,121,599 2.74TSY INFL IX N/B 0.750 Maturity 20280715 7,763,951 2.10Japan Government 20-Yr 1.500 Maturity 20340320
7,191,142 1.95
Japan Government 30-Yr 0.700 Maturity 20481220
6,547,859 1.77
Spanish Government 5.150 Maturity 20281031
6,150,402 1.66
FR ZT1952 4.000 Maturity 20490501 4,644,390 1.26FNCL 2.5 9/20 2.500 Maturity 4,637,216 1.25Spanish Government 1.450 Maturity 20271031
4,625,887 1.25
Fund
s Inf
orm
atio
nGREATLINK LIFESTYLE BALANCED PORTFOLIO report as at 30 June 2021
Investments in Collective Investment Schemes
Market ValueS$
% of NetAssets
FundsGreatlink Global Bond Fund 196,296,897 31.54Greatlink Global Equity Alpha Fund 102,646,899 16.50Greatlink Global Perspective Fund 99,986,351 16.07Greatlink Global Emerging Markets Equity Fund
98,742,699 15.87
Greatlink Asia Pacific Equity Fund 95,679,398 15.38Greatlink Short Duration Bond Fund 28,865,006 4.64
622,217,250 100.00
Top 10 Holdings as at 30 June 2021 Market ValueS$
% of NetAssets
Greatlink Global Bond Fund 196,296,897 31.54Greatlink Global Equity Alpha Fund 102,646,899 16.50Greatlink Global Perspective Fund 99,986,351 16.07Greatlink Global Emerging Markets Equity Fund
98,742,699 15.87
Greatlink Asia Pacific Equity Fund 95,679,398 15.38Greatlink Short Duration Bond Fund 28,865,006 4.64
Top 10 Holdings as at 30 June 2020 Market ValueS$
% of Net Assets
Greatlink Global Bond Fund 165,171,291 34.49Greatlink Global Perspective Fund 77,013,154 16.08Greatlink Global Equity Alpha Fund 76,360,860 15.94Greatlink Asia Pacific Equity Fund 68,976,083 14.40Greatlink Global Emerging Markets Equity Fund
68,755,498 14.36
Greatlink Short Duration Bond Fund 22,653,593 4.73
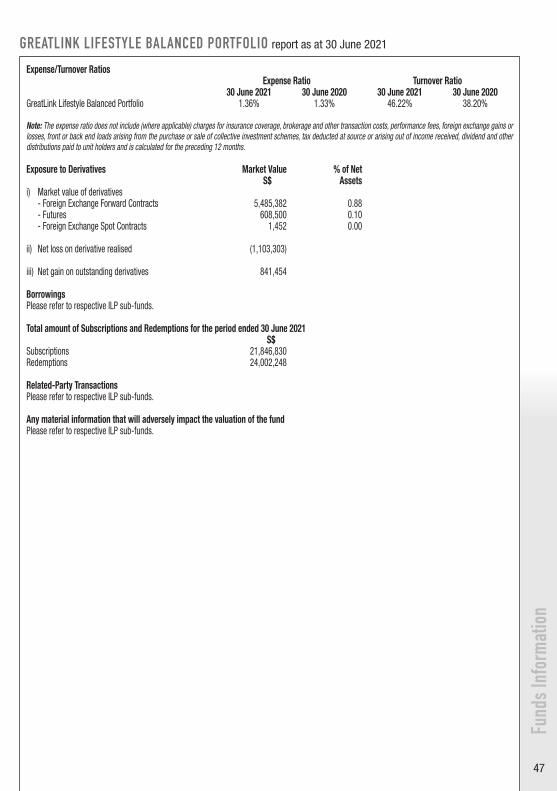
47
Fund
s Inf
orm
atio
n
GREATLINK LIFESTYLE BALANCED PORTFOLIO report as at 30 June 2021
Expense/Turnover RatiosExpense Ratio Turnover Ratio
30 June 2021 30 June 2020 30 June 2021 30 June 2020GreatLink Lifestyle Balanced Portfolio 1.36% 1.33% 46.22% 38.20%
Note: The expense ratio does not include (where applicable) charges for insurance coverage, brokerage and other transaction costs, performance fees, foreign exchange gains or losses, front or back end loads arising from the purchase or sale of collective investment schemes, tax deducted at source or arising out of income received, dividend and other distributions paid to unit holders and is calculated for the preceding 12 months.
Exposure to Derivatives Market Value % of NetS$ Assets
i) Market value of derivatives - Foreign Exchange Forward Contracts 5,485,382 0.88 - Futures 608,500 0.10 - Foreign Exchange Spot Contracts 1,452 0.00
ii) Net loss on derivative realised (1,103,303)
iii) Net gain on outstanding derivatives 841,454
BorrowingsPlease refer to respective ILP sub-funds.
Total amount of Subscriptions and Redemptions for the period ended 30 June 2021S$
Subscriptions 21,846,830 Redemptions 24,002,248
Related-Party TransactionsPlease refer to respective ILP sub-funds.
Any material information that will adversely impact the valuation of the fundPlease refer to respective ILP sub-funds.

48
Fund
s Inf
orm
atio
nGREATLINK LIFESTYLE STEADY PORTFOLIO report as at 30 June 2021
Investments in Collective Investment Schemes
Market ValueS$
% of NetAssets
FundsGreatlink Global Bond Fund 23,968,093 46.79Greatlink Asia Pacific Equity Fund 10,838,509 21.16Greatlink Global Equity Alpha Fund 5,821,856 11.37Greatlink Global Perspective Fund 5,667,875 11.06Greatlink Short Duration Bond Fund 4,930,304 9.62
51,226,637 100.00
The GreatLink Lifestyle Steady Portfolio invested more than 30% of its assets in the GreatLink Global Bond Fund. The following are the top 10 holdings in the GreatLink Global Bond:
Top 10 Holdings as at 30 June 2021 Market ValueS$
% of NetAssets
Greatlink Global Bond Fund 23,968,093 46.79Greatlink Asia Pacific Equity Fund 10,838,509 21.16Greatlink Global Equity Alpha Fund 5,821,856 11.37Greatlink Global Perspective Fund 5,667,875 11.06Greatlink Short Duration Bond Fund 4,930,304 9.62
Top 10 Holdings as at 30 June 2020 Market ValueS$
% of Net Assets
Greatlink Global Bond Fund 19,058,868 49.46Greatlink Asia Pacific Equity Fund 7,522,110 19.52Greatlink Global Perspective Fund 4,167,349 10.82Greatlink Global Equity Alpha Fund 4,107,679 10.66Greatlink Short Duration Bond Fund 3,675,769 9.54
Top 10 Holdings of Underlying Fund as at 30 June 2021
Market ValueS$
% of NetAssets
Nykredit 1.000 Maturity 20501001 15,426,351 3.69 FNCL 3 7/20 3.000 Maturity 9,670,977 2.31 Japan Goverment 30-Yr 0.700 Maturity 20481220
7,381,617 1.77
Japan Goverment 20-Yr 1.500 Maturity 20340320
6,689,060 1.60
BTPS I/L 1.300 Maturity 20280515 6,373,870 1.53 Spanish Goverment 5.150 Maturity 20281031
6,119,054 1.46
Spanish Goverment 1.450 Maturity 20271031
6,105,431 1.46
European Union 0.000 Maturity 20260706 5,851,620 1.40 G2SF 2.5 8/20 2.500 Maturity 5,556,166 1.33 BTPS 0.250 Maturity 20280315 5,368,054 1.28
Top 10 Holdings of Underlying Fund as at 30 June 2020
Market ValueS$
% of Net Assets
G2SF 2.5 8/20 2.500 Maturity 15,828,699 4.28Nykredit 1.000 Maturity 20501001 13,429,881 3.63FNCL 3 8/13 3.000 Maturity 10,121,599 2.74TSY INFL IX N/B 0.750 Maturity 20280715 7,763,951 2.10Japan Government 20-Yr 1.500 Maturity 20340320
7,191,142 1.95
Japan Government 30-Yr 0.700 Maturity 20481220
6,547,859 1.77
Spanish Government 5.150 Maturity 20281031
6,150,402 1.66
FR ZT1952 4.000 Maturity 20490501 4,644,390 1.26FNCL 2.5 9/20 2.500 Maturity 4,637,216 1.25Spanish Government 1.450 Maturity 20271031
4,625,887 1.25

49
Fund
s Inf
orm
atio
n
GREATLINK LIFESTYLE STEADY PORTFOLIO report as at 30 June 2021
Expense/Turnover RatiosExpense Ratio Turnover Ratio
30 June 2021 30 June 2020 30 June 2021 30 June 2020GreatLink Lifestyle Steady Portfolio 1.17% 1.14% 51.30% 33.92%
Note: The expense ratio does not include (where applicable) charges for insurance coverage, brokerage and other transaction costs, performance fees, foreign exchange gains or losses, front or back end loads arising from the purchase or sale of collective investment schemes, tax deducted at source or arising out of income received, dividend and other distributions paid to unit holders and is calculated for the preceding 12 months.
Exposure to Derivatives Market Value % of NetS$ Assets
i) Market value of derivatives - Foreign Exchange Forward Contracts 669,772 1.31 - Futures 74,299 0.15 - Foreign Exchange Spot Contracts 167 0.00
ii) Net loss on derivative realised (133,312)
iii) Net gain on outstanding derivatives 102,745
BorrowingsPlease refer to respective ILP sub-funds.
Total amount of Subscriptions and Redemptions for the period ended 30 June 2021S$
Subscriptions 6,327,624 Redemptions 3,971,792
Related-Party TransactionsPlease refer to respective ILP sub-funds.
Any material information that will adversely impact the valuation of the fundPlease refer to respective ILP sub-funds.
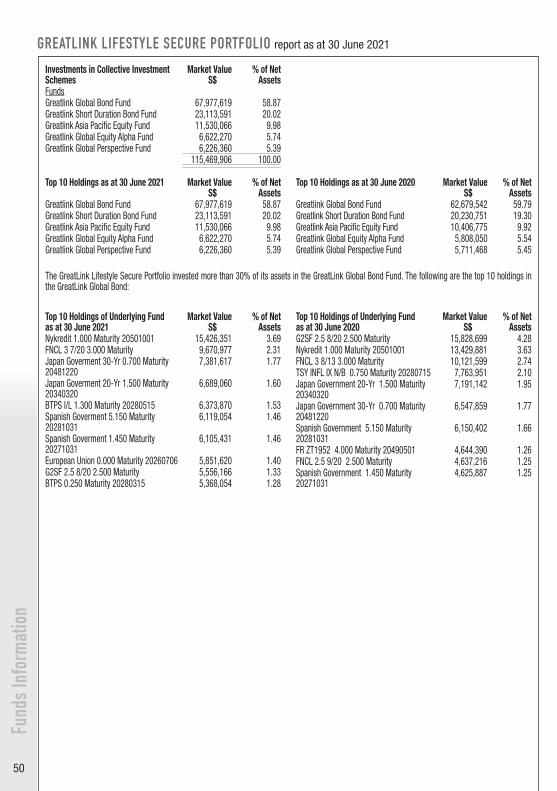
50
Fund
s Inf
orm
atio
nGREATLINK LIFESTYLE SECURE PORTFOLIO report as at 30 June 2021
The GreatLink Lifestyle Secure Portfolio invested more than 30% of its assets in the GreatLink Global Bond Fund. The following are the top 10 holdings in the GreatLink Global Bond:
Investments in Collective Investment Schemes
Market ValueS$
% of NetAssets
FundsGreatlink Global Bond Fund 67,977,619 58.87 Greatlink Short Duration Bond Fund 23,113,591 20.02 Greatlink Asia Pacific Equity Fund 11,530,066 9.98 Greatlink Global Equity Alpha Fund 6,622,270 5.74 Greatlink Global Perspective Fund 6,226,360 5.39
115,469,906 100.00
Top 10 Holdings as at 30 June 2021 Market ValueS$
% of NetAssets
Greatlink Global Bond Fund 67,977,619 58.87Greatlink Short Duration Bond Fund 23,113,591 20.02Greatlink Asia Pacific Equity Fund 11,530,066 9.98Greatlink Global Equity Alpha Fund 6,622,270 5.74Greatlink Global Perspective Fund 6,226,360 5.39
Top 10 Holdings as at 30 June 2020 Market ValueS$
% of Net Assets
Greatlink Global Bond Fund 62,679,542 59.79Greatlink Short Duration Bond Fund 20,230,751 19.30Greatlink Asia Pacific Equity Fund 10,406,775 9.92Greatlink Global Equity Alpha Fund 5,808,050 5.54Greatlink Global Perspective Fund 5,711,468 5.45
Top 10 Holdings of Underlying Fund as at 30 June 2021
Market ValueS$
% of NetAssets
Nykredit 1.000 Maturity 20501001 15,426,351 3.69 FNCL 3 7/20 3.000 Maturity 9,670,977 2.31 Japan Goverment 30-Yr 0.700 Maturity 20481220
7,381,617 1.77
Japan Goverment 20-Yr 1.500 Maturity 20340320
6,689,060 1.60
BTPS I/L 1.300 Maturity 20280515 6,373,870 1.53 Spanish Goverment 5.150 Maturity 20281031
6,119,054 1.46
Spanish Goverment 1.450 Maturity 20271031
6,105,431 1.46
European Union 0.000 Maturity 20260706 5,851,620 1.40 G2SF 2.5 8/20 2.500 Maturity 5,556,166 1.33 BTPS 0.250 Maturity 20280315 5,368,054 1.28
Top 10 Holdings of Underlying Fund as at 30 June 2020
Market ValueS$
% of Net Assets
G2SF 2.5 8/20 2.500 Maturity 15,828,699 4.28Nykredit 1.000 Maturity 20501001 13,429,881 3.63FNCL 3 8/13 3.000 Maturity 10,121,599 2.74TSY INFL IX N/B 0.750 Maturity 20280715 7,763,951 2.10Japan Government 20-Yr 1.500 Maturity 20340320
7,191,142 1.95
Japan Government 30-Yr 0.700 Maturity 20481220
6,547,859 1.77
Spanish Government 5.150 Maturity 20281031
6,150,402 1.66
FR ZT1952 4.000 Maturity 20490501 4,644,390 1.26FNCL 2.5 9/20 2.500 Maturity 4,637,216 1.25Spanish Government 1.450 Maturity 20271031
4,625,887 1.25

51
Fund
s Inf
orm
atio
n
GREATLINK LIFESTYLE SECURE PORTFOLIO report as at 30 June 2021
Expense/Turnover RatiosExpense Ratio Turnover Ratio
30 June 2021 30 June 2020 30 June 2021 30 June 2020GreatLink Lifestyle Secure Portfolio 0.89% 0.98% 58.34% 34.47%
Note: The expense ratio does not include (where applicable) charges for insurance coverage, brokerage and other transaction costs, performance fees, foreign exchange gains or losses, front or back end loads arising from the purchase or sale of collective investment schemes, tax deducted at source or arising out of income received, dividend and other distributions paid to unit holders and is calculated for the preceding 12 months.
Exposure to Derivatives Market Value % of NetS$ Assets
i) Market value of derivatives - Foreign Exchange Forward Contracts 1,899,588 1.65 - Futures 210,724 0.18 - Foreign Exchange Spot Contracts 458 0.00
ii) Net loss on derivative realised (376,007)
iii) Net gain on outstanding derivatives 291,407
BorrowingsPlease refer to respective ILP sub-funds.
Total amount of Subscriptions and Redemptions for the period ended 30 June 2021S$
Subscriptions 12,949,995 Redemptions 18,159,391
Related-Party TransactionsPlease refer to respective ILP sub-funds.
Any material information that will adversely impact the valuation of the fundPlease refer to respective ILP sub-funds.
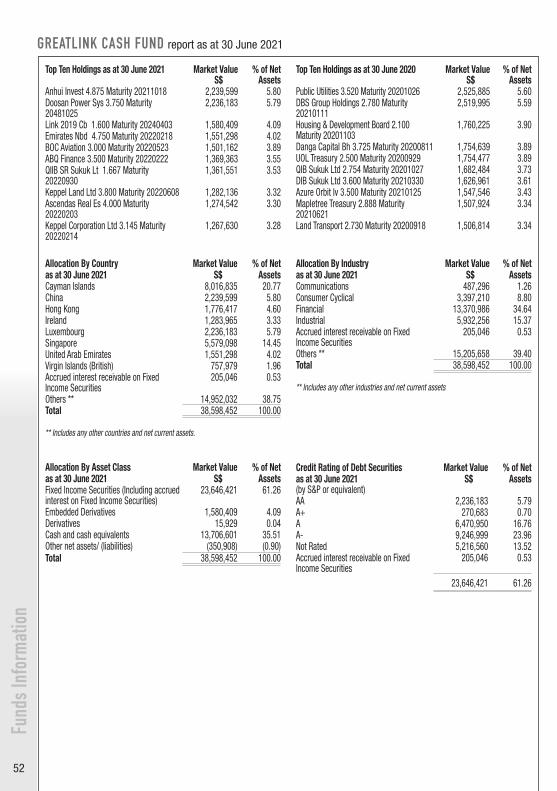
52
Fund
s Inf
orm
atio
nGREATLINK CASH FUND report as at 30 June 2021
Top Ten Holdings as at 30 June 2020 Market ValueS$
% of Net Assets
Public Utilities 3.520 Maturity 20201026 2,525,885 5.60 DBS Group Holdings 2.780 Maturity 20210111
2,519,995 5.59
Housing & Development Board 2.100 Maturity 20201103
1,760,225 3.90
Danga Capital Bh 3.725 Maturity 20200811 1,754,639 3.89 UOL Treasury 2.500 Maturity 20200929 1,754,477 3.89 QIB Sukuk Ltd 2.754 Maturity 20201027 1,682,484 3.73 DIB Sukuk Ltd 3.600 Maturity 20210330 1,626,961 3.61 Azure Orbit Iv 3.500 Maturity 20210125 1,547,546 3.43 Mapletree Treasury 2.888 Maturity 20210621
1,507,924 3.34
Land Transport 2.730 Maturity 20200918 1,506,814 3.34
Top Ten Holdings as at 30 June 2021 Market ValueS$
% of NetAssets
Anhui Invest 4.875 Maturity 20211018 2,239,599 5.80 Doosan Power Sys 3.750 Maturity 20481025
2,236,183 5.79
Link 2019 Cb 1.600 Maturity 20240403 1,580,409 4.09 Emirates Nbd 4.750 Maturity 20220218 1,551,298 4.02 BOC Aviation 3.000 Maturity 20220523 1,501,162 3.89 ABQ Finance 3.500 Maturity 20220222 1,369,363 3.55 QIIB SR Sukuk Lt 1.667 Maturity 20220930
1,361,551 3.53
Keppel Land Ltd 3.800 Maturity 20220608 1,282,136 3.32 Ascendas Real Es 4.000 Maturity 20220203
1,274,542 3.30
Keppel Corporation Ltd 3.145 Maturity 20220214
1,267,630 3.28
Allocation By Industry Market Value % of Netas at 30 June 2021 S$ AssetsCommunications 487,296 1.26 Consumer Cyclical 3,397,210 8.80 Financial 13,370,986 34.64 Industrial 5,932,256 15.37 Accrued interest receivable on Fixed Income Securities
205,046 0.53
Others ** 15,205,658 39.40 Total 38,598,452 100.00
** Includes any other industries and net current assets
Allocation By Country Market Value % of Netas at 30 June 2021 S$ AssetsCayman Islands 8,016,835 20.77 China 2,239,599 5.80 Hong Kong 1,776,417 4.60 Ireland 1,283,965 3.33 Luxembourg 2,236,183 5.79 Singapore 5,579,098 14.45 United Arab Emirates 1,551,298 4.02 Virgin Islands (British) 757,979 1.96 Accrued interest receivable on Fixed Income Securities
205,046 0.53
Others ** 14,952,032 38.75 Total 38,598,452 100.00
** Includes any other countries and net current assets.
Allocation By Asset Class Market Value % of Netas at 30 June 2021 S$ AssetsFixed Income Securities (Including accrued interest on Fixed Income Securities)
23,646,421 61.26
Embedded Derivatives 1,580,409 4.09 Derivatives 15,929 0.04 Cash and cash equivalents 13,706,601 35.51 Other net assets/ (liabilities) (350,908) (0.90)Total 38,598,452 100.00
Credit Rating of Debt Securities Market Value % of Netas at 30 June 2021 (by S&P or equivalent)
S$ Assets
AA 2,236,183 5.79 A+ 270,683 0.70 A 6,470,950 16.76 A- 9,246,999 23.96 Not Rated 5,216,560 13.52 Accrued interest receivable on Fixed Income Securities
205,046 0.53
23,646,421 61.26
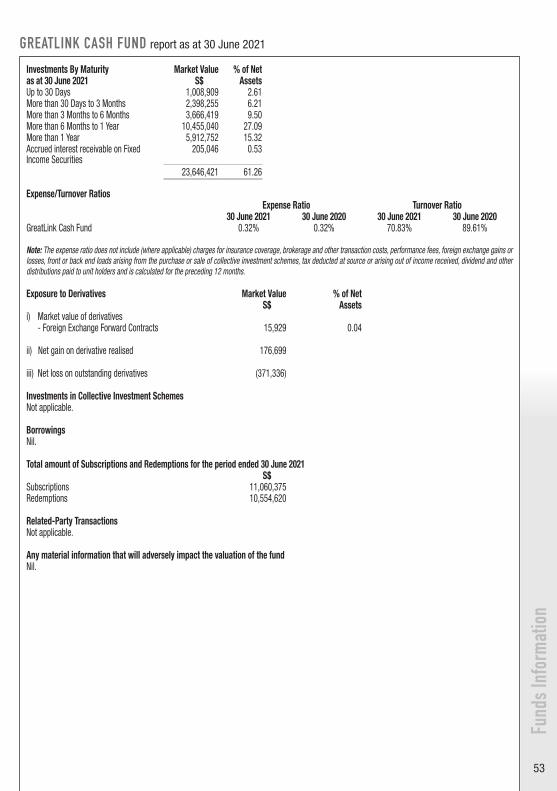
53
Fund
s Inf
orm
atio
n
GREATLINK CASH FUND report as at 30 June 2021
Expense/Turnover RatiosExpense Ratio Turnover Ratio
30 June 2021 30 June 2020 30 June 2021 30 June 2020GreatLink Cash Fund 0.32% 0.32% 70.83% 89.61%
Note: The expense ratio does not include (where applicable) charges for insurance coverage, brokerage and other transaction costs, performance fees, foreign exchange gains or losses, front or back end loads arising from the purchase or sale of collective investment schemes, tax deducted at source or arising out of income received, dividend and other distributions paid to unit holders and is calculated for the preceding 12 months.
Exposure to Derivatives Market Value % of NetS$ Assets
i) Market value of derivatives - Foreign Exchange Forward Contracts 15,929 0.04
ii) Net gain on derivative realised 176,699
iii) Net loss on outstanding derivatives (371,336)
Investments in Collective Investment SchemesNot applicable.
Borrowings Nil.
Total amount of Subscriptions and Redemptions for the period ended 30 June 2021S$
Subscriptions 11,060,375 Redemptions 10,554,620
Related-Party TransactionsNot applicable.
Any material information that will adversely impact the valuation of the fundNil.
Investments By Maturity Market Value % of Netas at 30 June 2021 S$ AssetsUp to 30 Days 1,008,909 2.61 More than 30 Days to 3 Months 2,398,255 6.21 More than 3 Months to 6 Months 3,666,419 9.50 More than 6 Months to 1 Year 10,455,040 27.09 More than 1 Year 5,912,752 15.32 Accrued interest receivable on Fixed Income Securities
205,046 0.53
23,646,421 61.26

54
Fund
s Inf
orm
atio
nGREATLINK ASEAN GROWTH FUND report as at 30 June 2021
Top Ten Holdings as at 30 June 2020 Market ValueS$
% of Net Assets
DBS Group Holdings Ltd 16,096,558 7.24 United Overseas Bank Ltd 11,546,495 5.20 Bank Central Asia Tbk PT 10,852,994 4.88 Bank Rakyat Indonesia Persero Tbk PT 7,599,548 3.42 CP All PCL-NVDR 6,682,612 3.01 Airports Of Thailand PCL 5,573,998 2.51 Singapore Telecommunications Ltd 5,422,086 2.44 Wilmar International Ltd 4,804,114 2.16 Ascendas Real Estate Investment Trust 4,702,441 2.12 Malayan Banking Bhd 4,612,965 2.08
Top Ten Holdings as at 30 June 2021 Market ValueS$
% of NetAssets
DBS Group Holdings Ltd 23,284,740 8.88 United Overseas Bank Ltd 14,737,049 5.62 Bank Central Asia Tbk PT 8,920,415 3.40 Bank Rakyat Indonesia Persero Tbk PT 8,066,873 3.08 Nanofilm Technologies International Ltd 6,799,365 2.59 Telkom Indonesia Persero Tbk PT 6,782,098 2.59 CP All PCL-NVDR 6,754,133 2.58 Sembcorp Industries Ltd 6,519,724 2.49 PTT PCL-NVDR 5,880,624 2.24 Keppel Corporation Ltd 5,556,426 2.12
Allocation By Industry Market Value % of Netas at 30 June 2021 S$ AssetsBasic Materials 6,161,879 2.35 Communications 21,315,727 8.13 Consumer Cyclical 21,682,498 8.27 Consumer Non-Cyclical 32,766,209 12.49 Energy 18,022,017 6.87 Financial 102,414,490 39.05 Industrial 44,320,087 16.90 Technology 3,702,864 1.41 Others ** 11,890,283 4.53 Total 262,276,055 100.00
** Includes any other industries and net current assets
Allocation By Country Market Value % of Netas at 30 June 2021 S$ AssetsIndonesia 51,315,602 19.57 Malaysia 23,331,205 8.90 Philippines 24,654,832 9.40 Singapore 92,076,915 35.11 Thailand 62,181,055 23.71 Others ** 8,716,446 3.31 Total 262,276,055 100.00
** Includes any other countries and net current assets.
Allocation By Asset Class Market Value % of Netas at 30 June 2021 S$ AssetsEquities 255,209,932 97.31 Embedded Derivatives 256,472 0.10 Derivatives (2,864) 0.00 Cash and cash equivalents 5,159,208 1.97 Other net assets/ (liabilities) 1,653,307 0.62 Total 262,276,055 100.00
Credit Rating of Debt Securities Market Value % of Netas at 30 June 2021 S$ AssetsNot applicable.
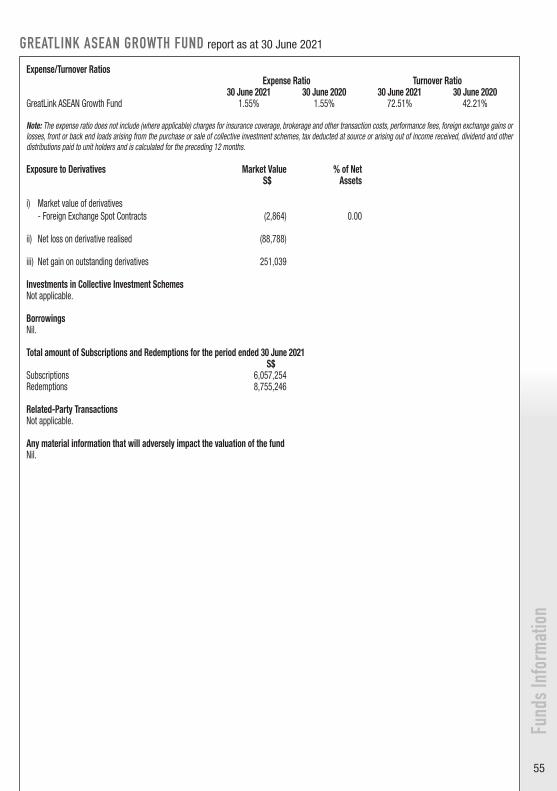
55
Fund
s Inf
orm
atio
n
GREATLINK ASEAN GROWTH FUND report as at 30 June 2021
Expense/Turnover RatiosExpense Ratio Turnover Ratio
30 June 2021 30 June 2020 30 June 2021 30 June 2020GreatLink ASEAN Growth Fund 1.55% 1.55% 72.51% 42.21%
Note: The expense ratio does not include (where applicable) charges for insurance coverage, brokerage and other transaction costs, performance fees, foreign exchange gains or losses, front or back end loads arising from the purchase or sale of collective investment schemes, tax deducted at source or arising out of income received, dividend and other distributions paid to unit holders and is calculated for the preceding 12 months.
Exposure to Derivatives Market Value % of NetS$ Assets
i) Market value of derivatives - Foreign Exchange Spot Contracts (2,864) 0.00
ii) Net loss on derivative realised (88,788)
iii) Net gain on outstanding derivatives 251,039
Investments in Collective Investment SchemesNot applicable.
Borrowings Nil.
Total amount of Subscriptions and Redemptions for the period ended 30 June 2021S$
Subscriptions 6,057,254 Redemptions 8,755,246
Related-Party TransactionsNot applicable.
Any material information that will adversely impact the valuation of the fundNil.
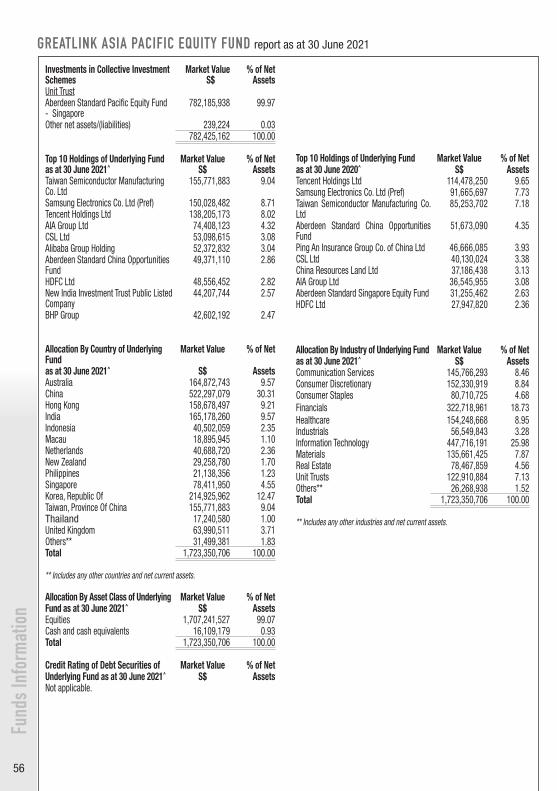
56
Fund
s Inf
orm
atio
nGREATLINK ASIA PACIFIC EQUITY FUND report as at 30 June 2021
Investments in Collective Investment Schemes
Market ValueS$
% of NetAssets
Unit TrustAberdeen Standard Pacific Equity Fund - Singapore
782,185,938 99.97
Other net assets/(liabilities) 239,224 0.03 782,425,162 100.00
Top 10 Holdings of Underlying Fund as at 30 June 2021^
Market ValueS$
% of NetAssets
Taiwan Semiconductor Manufacturing Co. Ltd
155,771,883 9.04
Samsung Electronics Co. Ltd (Pref) 150,028,482 8.71Tencent Holdings Ltd 138,205,173 8.02AIA Group Ltd 74,408,123 4.32CSL Ltd 53,098,615 3.08Alibaba Group Holding 52,372,832 3.04Aberdeen Standard China Opportunities Fund
49,371,110 2.86
HDFC Ltd 48,556,452 2.82New India Investment Trust Public Listed Company
44,207,744 2.57
BHP Group 42,602,192 2.47
Allocation By Country of Underlying Fund
Market Value % of Net
as at 30 June 2021^ S$ AssetsAustralia 164,872,743 9.57China 522,297,079 30.31Hong Kong 158,678,497 9.21India 165,178,260 9.57Indonesia 40,502,059 2.35Macau 18,895,945 1.10Netherlands 40,688,720 2.36New Zealand 29,258,780 1.70Philippines 21,138,356 1.23Singapore 78,411,950 4.55Korea, Republic Of 214,925,962 12.47Taiwan, Province Of China 155,771,883 9.04Thailand 17,240,580 1.00United Kingdom 63,990,511 3.71Others** 31,499,381 1.83Total 1,723,350,706 100.00
** Includes any other countries and net current assets.
Allocation By Asset Class of Underlying Market Value % of NetFund as at 30 June 2021^ S$ AssetsEquities 1,707,241,527 99.07 Cash and cash equivalents 16,109,179 0.93 Total 1,723,350,706 100.00
Credit Rating of Debt Securities of Market Value % of NetUnderlying Fund as at 30 June 2021^ S$ AssetsNot applicable.
Top 10 Holdings of Underlying Fund Market Value % of Netas at 30 June 2020^ S$ AssetsTencent Holdings Ltd 114,478,250 9.65 Samsung Electronics Co. Ltd (Pref) 91,665,697 7.73 Taiwan Semiconductor Manufacturing Co. Ltd
85,253,702 7.18
Aberdeen Standard China Opportunities Fund
51,673,090 4.35
Ping An Insurance Group Co. of China Ltd 46,666,085 3.93 CSL Ltd 40,130,024 3.38 China Resources Land Ltd 37,186,438 3.13 AIA Group Ltd 36,545,955 3.08 Aberdeen Standard Singapore Equity Fund 31,255,462 2.63 HDFC Ltd 27,947,820 2.36
Allocation By Industry of Underlying Fund Market Value % of Netas at 30 June 2021^ S$ AssetsCommunication Services 145,766,293 8.46 Consumer Discretionary 152,330,919 8.84 Consumer Staples 80,710,725 4.68 Financials 322,718,961 18.73 Healthcare 154,248,668 8.95 Industrials 56,549,843 3.28 Information Technology 447,716,191 25.98 Materials 135,661,425 7.87 Real Estate 78,467,859 4.56 Unit Trusts 122,910,884 7.13 Others** 26,268,938 1.52 Total 1,723,350,706 100.00
** Includes any other industries and net current assets.
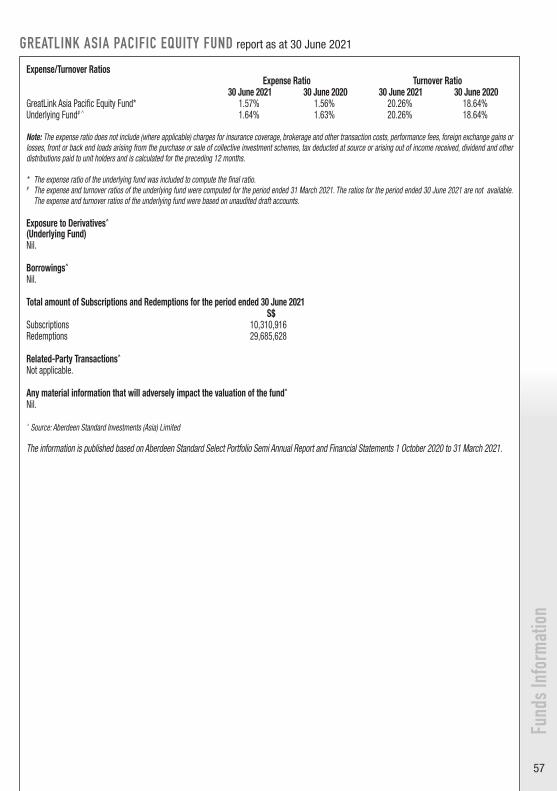
57
Fund
s Inf
orm
atio
n
GREATLINK ASIA PACIFIC EQUITY FUND report as at 30 June 2021
Expense/Turnover RatiosExpense Ratio Turnover Ratio
30 June 2021 30 June 2020 30 June 2021 30 June 2020GreatLink Asia Pacific Equity Fund* 1.57% 1.56% 20.26% 18.64%Underlying Fund# ^ 1.64% 1.63% 20.26% 18.64%
Note: The expense ratio does not include (where applicable) charges for insurance coverage, brokerage and other transaction costs, performance fees, foreign exchange gains or losses, front or back end loads arising from the purchase or sale of collective investment schemes, tax deducted at source or arising out of income received, dividend and other distributions paid to unit holders and is calculated for the preceding 12 months.
* The expense ratio of the underlying fund was included to compute the final ratio.# The expense and turnover ratios of the underlying fund were computed for the period ended 31 March 2021. The ratios for the period ended 30 June 2021 are not available.
The expense and turnover ratios of the underlying fund were based on unaudited draft accounts.
Exposure to Derivatives^
(Underlying Fund)Nil.
Borrowings^
Nil.
Total amount of Subscriptions and Redemptions for the period ended 30 June 2021S$
Subscriptions 10,310,916 Redemptions 29,685,628
Related-Party Transactions^
Not applicable.
Any material information that will adversely impact the valuation of the fund^
Nil.
^ Source: Aberdeen Standard Investments (Asia) Limited
The information is published based on Aberdeen Standard Select Portfolio Semi Annual Report and Financial Statements 1 October 2020 to 31 March 2021.
58
Fund
s Inf
orm
atio
nGREATLINK GLOBAL SUPREME FUND report as at 30 June 2021
Top Ten Holdings as at 30 June 2020 Market ValueS$
% of Net Assets
Japan Government 20-Yr 1.500 Maturity 20340320
8,202,823 2.03
Microsoft Corporation 7,237,066 1.79 US Treasury FRN 0.264 Maturity 20220430 6,917,778 1.72 FNCL 2.5 9/20 2.500 Maturity 6,361,681 1.58 Amazon.Com Inc. 6,181,001 1.53 Nykredit 1.000 Maturity 20501001 5,677,332 1.41 Slovenia 5.250 Maturity 20240218 5,010,961 1.24 Apple Inc. 4,645,370 1.15 Mexican Bonos 8.500 Maturity 20290531 4,062,487 1.01 UK TSY GILT 1.500 Maturity 20210122 3,459,402 0.86
Top Ten Holdings as at 30 June 2021 Market ValueS$
% of NetAssets
US Treasury FRN 0.099 Maturity 20230131 13,267,321 2.88 US Treasury FRN 0.084 Maturity 20230430 10,890,346 2.36 Japan Govt 20-Yr 1.500 Maturity 20340320
6,994,264 1.52
MICROSOFT CORPORATION 6,784,362 1.47 Poland Government Bond 4.000 Maturity 20231025
6,292,264 1.36
Tesoreria Pesos 4.000 Maturity 20230301 6,260,301 1.36 Apple Inc. 6,176,057 1.34 France O.A.T. 0.000 Maturity 20260225 6,019,668 1.31 Nykredit 1.000 Maturity 20501001 5,739,847 1.24 Amazon.Com Inc. 4,984,955 1.08
Allocation By Industry Market Value % of Netas at 30 June 2021 S$ AssetsAsset Backed Securities 4,988,607 1.08 Basic Materials 12,530,326 2.72 Communications 32,340,554 7.01 Consumer Cyclical 27,616,655 5.99 Consumer Non-Cyclical 56,921,720 12.35 Energy 6,029,306 1.31 Financial 68,476,214 14.85 Government 133,304,967 28.91 Industrial 25,242,479 5.47 Mortgage Securities 16,180,577 3.51 Technology 46,778,728 10.15 Utilities 6,334,625 1.37 Accrued interest receivable on Fixed Income Securities
1,034,476 0.22
Others** 23,306,459 5.06 Total 461,085,693 100.00
** Includes any other industries and net current assets
Allocation By Country Market Value % of Netas at 30 June 2021 S$ AssetsAustralia 7,055,397 1.53 Belgium 7,028,158 1.52 Canada 7,611,291 1.65 Chile 6,260,301 1.36 Denmark 18,729,656 4.06 Finland 5,110,172 1.11 France 20,308,890 4.40 Germany 12,579,993 2.73 Italy 11,483,869 2.49 Japan 30,503,008 6.62 Mexico 8,890,099 1.93 Netherlands 9,185,703 1.99 Poland 6,690,684 1.45 Slovenia 5,911,434 1.28 Spain 13,923,506 3.02 Sweden 5,466,558 1.19 Switzerland 11,356,014 2.46 United Kingdom 42,133,839 9.14 United States 178,008,086 38.61 Accrued interest receivable on Fixed Income Securities
1,034,476 0.22
Others** 51,814,559 11.24 Total 461,085,693 100.00
** Includes any other countries and net current assets
Allocation By Asset Class Market Value % of Netas at 30 June 2021 S$ AssetsEquities 235,306,803 51.03Fixed Income Securities (Include accrued interest on Fixed Income Securities)
202,991,423 44.03
Embedded Derivatives 10,592 0.00 Derivatives 66,027 0.01 Cash and cash equivalents 26,115,427 5.66 Other net assets/ (liabilities) (3,404,579) (0.73)Total 461,085,693 100.00
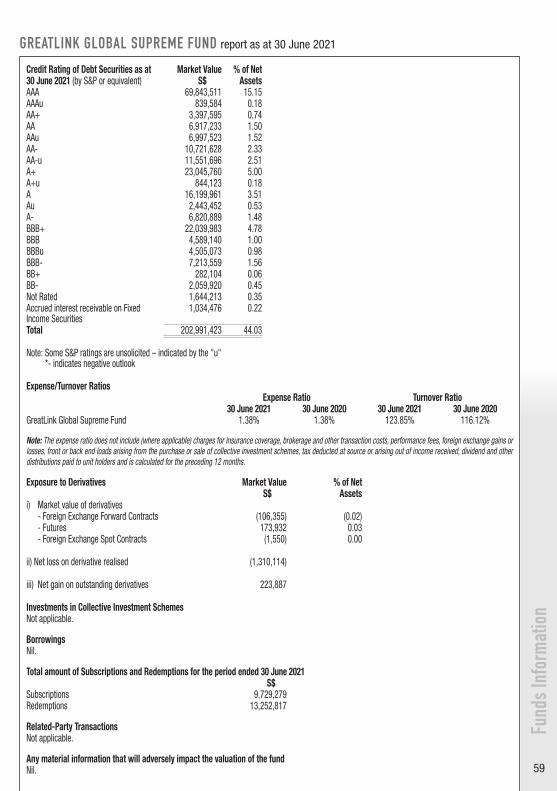
59
Fund
s Inf
orm
atio
n
GREATLINK GLOBAL SUPREME FUND report as at 30 June 2021
Expense/Turnover RatiosExpense Ratio Turnover Ratio
30 June 2021 30 June 2020 30 June 2021 30 June 2020GreatLink Global Supreme Fund 1.38% 1.38% 123.85% 116.12%
Note: The expense ratio does not include (where applicable) charges for insurance coverage, brokerage and other transaction costs, performance fees, foreign exchange gains or losses, front or back end loads arising from the purchase or sale of collective investment schemes, tax deducted at source or arising out of income received, dividend and other distributions paid to unit holders and is calculated for the preceding 12 months.
Exposure to Derivatives Market Value % of NetS$ Assets
i) Market value of derivatives- Foreign Exchange Forward Contracts (106,355) (0.02)- Futures 173,932 0.03 - Foreign Exchange Spot Contracts (1,550) 0.00
ii) Net loss on derivative realised (1,310,114)
iii) Net gain on outstanding derivatives 223,887
Investments in Collective Investment SchemesNot applicable.
Borrowings Nil.
Total amount of Subscriptions and Redemptions for the period ended 30 June 2021S$
Subscriptions 9,729,279 Redemptions 13,252,817
Related-Party TransactionsNot applicable.
Any material information that will adversely impact the valuation of the fundNil.
Credit Rating of Debt Securities as at Market Value % of Net30 June 2021 (by S&P or equivalent) S$ AssetsAAA 69,843,511 15.15 AAAu 839,584 0.18 AA+ 3,397,595 0.74 AA 6,917,233 1.50 AAu 6,997,523 1.52 AA- 10,721,628 2.33 AA-u 11,551,696 2.51 A+ 23,045,760 5.00 A+u 844,123 0.18 A 16,199,961 3.51 Au 2,443,452 0.53 A- 6,820,889 1.48 BBB+ 22,039,983 4.78 BBB 4,589,140 1.00 BBBu 4,505,073 0.98 BBB- 7,213,559 1.56 BB+ 282,104 0.06 BB- 2,059,920 0.45 Not Rated 1,644,213 0.35 Accrued interest receivable on Fixed Income Securities
1,034,476 0.22
Total 202,991,423 44.03
Note: Some S&P ratings are unsolicited – indicated by the "u" *- indicates negative outlook
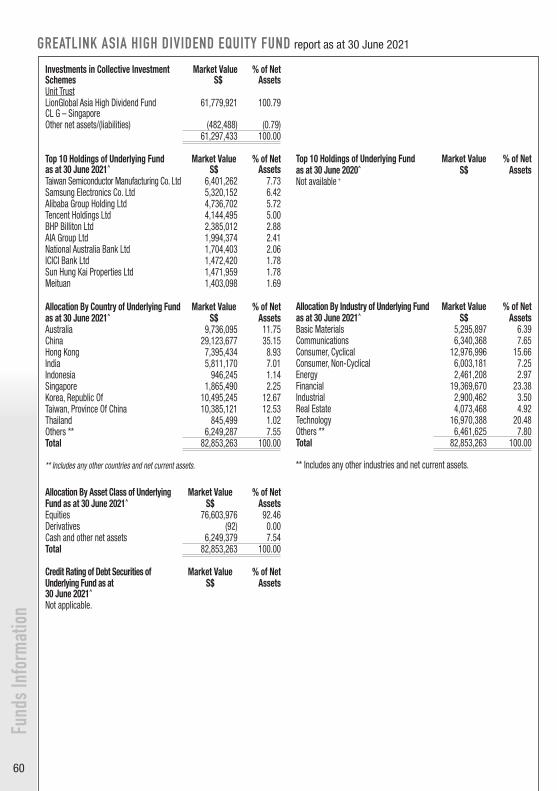
60
GREATLINK ASIA HIGH DIVIDEND EQUITY FUND report as at 30 June 2021
Investments in Collective Investment Schemes
Market ValueS$
% of NetAssets
Unit TrustLionGlobal Asia High Dividend Fund CL G – Singapore
61,779,921 100.79
Other net assets/(liabilities) (482,488) (0.79) 61,297,433 100.00
Top 10 Holdings of Underlying Fund as at 30 June 2021^
Market ValueS$
% of NetAssets
Taiwan Semiconductor Manufacturing Co. Ltd 6,401,262 7.73Samsung Electronics Co. Ltd 5,320,152 6.42Alibaba Group Holding Ltd 4,736,702 5.72Tencent Holdings Ltd 4,144,495 5.00BHP Billiton Ltd 2,385,012 2.88AIA Group Ltd 1,994,374 2.41National Australia Bank Ltd 1,704,403 2.06ICICI Bank Ltd 1,472,420 1.78Sun Hung Kai Properties Ltd 1,471,959 1.78Meituan 1,403,098 1.69
Allocation By Country of Underlying Fund Market Value % of Netas at 30 June 2021^ S$ AssetsAustralia 9,736,095 11.75China 29,123,677 35.15Hong Kong 7,395,434 8.93India 5,811,170 7.01Indonesia 946,245 1.14Singapore 1,865,490 2.25Korea, Republic Of 10,495,245 12.67Taiwan, Province Of China 10,385,121 12.53Thailand 845,499 1.02Others ** 6,249,287 7.55Total 82,853,263 100.00
** Includes any other countries and net current assets.
Allocation By Asset Class of Underlying Market Value % of NetFund as at 30 June 2021^ S$ AssetsEquities 76,603,976 92.46 Derivatives (92) 0.00 Cash and other net assets 6,249,379 7.54 Total 82,853,263 100.00
Credit Rating of Debt Securities of Market Value % of NetUnderlying Fund as at 30 June 2021^
S$ Assets
Not applicable.
Top 10 Holdings of Underlying Fund Market Value % of Netas at 30 June 2020^ S$ AssetsNot available +
Allocation By Industry of Underlying Fund Market Value % of Netas at 30 June 2021^ S$ AssetsBasic Materials 5,295,897 6.39Communications 6,340,368 7.65Consumer, Cyclical 12,976,996 15.66Consumer, Non-Cyclical 6,003,181 7.25Energy 2,461,208 2.97Financial 19,369,670 23.38Industrial 2,900,462 3.50Real Estate 4,073,468 4.92Technology 16,970,388 20.48Others ** 6,461,625 7.80Total 82,853,263 100.00
** Includes any other industries and net current assets.
Fund
s Inf
orm
atio
n
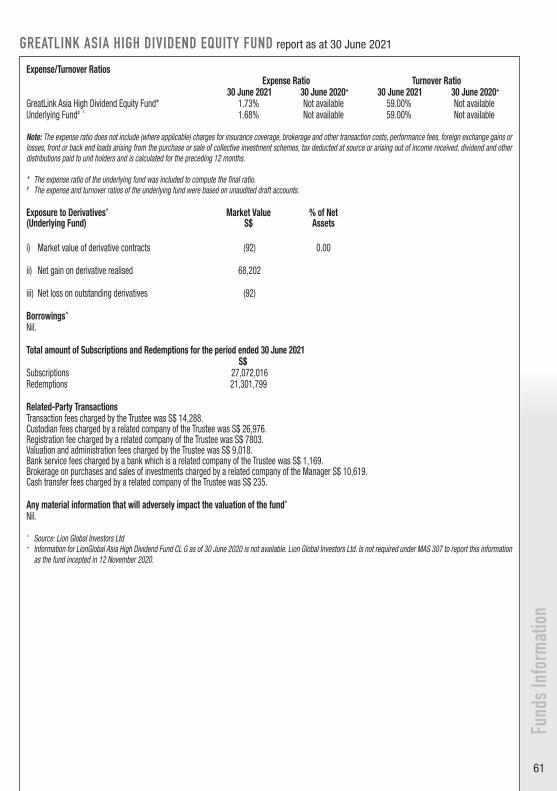
61
GREATLINK ASIA HIGH DIVIDEND EQUITY FUND report as at 30 June 2021
Expense/Turnover RatiosExpense Ratio Turnover Ratio
30 June 2021 30 June 2020+ 30 June 2021 30 June 2020+
GreatLink Asia High Dividend Equity Fund* 1.73% Not available 59.00% Not available Underlying Fund# ^ 1.68% Not available 59.00% Not available
Note: The expense ratio does not include (where applicable) charges for insurance coverage, brokerage and other transaction costs, performance fees, foreign exchange gains or losses, front or back end loads arising from the purchase or sale of collective investment schemes, tax deducted at source or arising out of income received, dividend and other distributions paid to unit holders and is calculated for the preceding 12 months.
* The expense ratio of the underlying fund was included to compute the final ratio.# The expense and turnover ratios of the underlying fund were based on unaudited draft accounts.
Exposure to Derivatives^
(Underlying Fund)Market Value
S$% of Net Assets
i) Market value of derivative contracts (92) 0.00
ii) Net gain on derivative realised 68,202
iii) Net loss on outstanding derivatives (92)
Borrowings^
Nil.
Total amount of Subscriptions and Redemptions for the period ended 30 June 2021S$
Subscriptions 27,072,016 Redemptions 21,301,799
Related-Party TransactionsTransaction fees charged by the Trustee was S$ 14,288.Custodian fees charged by a related company of the Trustee was S$ 26,976.Registration fee charged by a related company of the Trustee was S$ 7803.Valuation and administration fees charged by the Trustee was S$ 9,018.Bank service fees charged by a bank which is a related company of the Trustee was S$ 1,169.Brokerage on purchases and sales of investments charged by a related company of the Manager S$ 10,619.Cash transfer fees charged by a related company of the Trustee was S$ 235.
Any material information that will adversely impact the valuation of the fund^
Nil.
^ Source: Lion Global Investors Ltd+ Information for LionGlobal Asia High Dividend Fund CL G as of 30 June 2020 is not available. Lion Global Investors Ltd. Is not required under MAS 307 to report this information
as the fund incepted in 12 November 2020.
Fund
s Inf
orm
atio
n
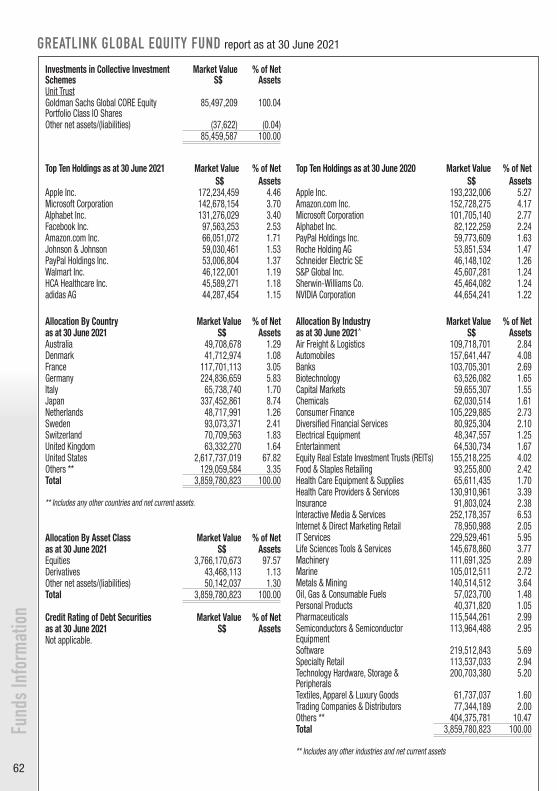
62
Fund
s Inf
orm
atio
nGREATLINK GLOBAL EQUITY FUND report as at 30 June 2021
Top Ten Holdings as at 30 June 2020 Market ValueS$
% of Net Assets
Apple Inc. 193,232,006 5.27 Amazon.com Inc. 152,728,275 4.17 Microsoft Corporation 101,705,140 2.77 Alphabet Inc. 82,122,259 2.24 PayPal Holdings Inc. 59,773,609 1.63 Roche Holding AG 53,851,534 1.47 Schneider Electric SE 46,148,102 1.26 S&P Global Inc. 45,607,281 1.24 Sherwin-Williams Co. 45,464,082 1.24 NVIDIA Corporation 44,654,241 1.22
Top Ten Holdings as at 30 June 2021 Market ValueS$
% of NetAssets
Apple Inc. 172,234,459 4.46 Microsoft Corporation 142,678,154 3.70 Alphabet Inc. 131,276,029 3.40 Facebook Inc. 97,563,253 2.53 Amazon.com Inc. 66,051,072 1.71 Johnson & Johnson 59,030,461 1.53 PayPal Holdings Inc. 53,006,804 1.37 Walmart Inc. 46,122,001 1.19 HCA Healthcare Inc. 45,589,271 1.18 adidas AG 44,287,454 1.15
Allocation By Country Market Value % of Netas at 30 June 2021 S$ AssetsAustralia 49,708,678 1.29 Denmark 41,712,974 1.08 France 117,701,113 3.05 Germany 224,836,659 5.83 Italy 65,738,740 1.70 Japan 337,452,861 8.74 Netherlands 48,717,991 1.26 Sweden 93,073,371 2.41 Switzerland 70,709,563 1.83 United Kingdom 63,332,270 1.64 United States 2,617,737,019 67.82 Others ** 129,059,584 3.35 Total 3,859,780,823 100.00
** Includes any other countries and net current assets.
Allocation By Asset Class Market Value % of Netas at 30 June 2021 S$ AssetsEquities 3,766,170,673 97.57 Derivatives 43,468,113 1.13 Other net assets/(liabilities) 50,142,037 1.30 Total 3,859,780,823 100.00
Credit Rating of Debt Securities Market Value % of Netas at 30 June 2021 S$ AssetsNot applicable.
Allocation By Industry Market Value % of Netas at 30 June 2021^ S$ AssetsAir Freight & Logistics 109,718,701 2.84 Automobiles 157,641,447 4.08 Banks 103,705,301 2.69 Biotechnology 63,526,082 1.65 Capital Markets 59,655,307 1.55 Chemicals 62,030,514 1.61 Consumer Finance 105,229,885 2.73 Diversified Financial Services 80,925,304 2.10 Electrical Equipment 48,347,557 1.25 Entertainment 64,530,734 1.67 Equity Real Estate Investment Trusts (REITs) 155,218,225 4.02 Food & Staples Retailing 93,255,800 2.42 Health Care Equipment & Supplies 65,611,435 1.70 Health Care Providers & Services 130,910,961 3.39 Insurance 91,803,024 2.38 Interactive Media & Services 252,178,357 6.53 Internet & Direct Marketing Retail 78,950,988 2.05 IT Services 229,529,461 5.95 Life Sciences Tools & Services 145,678,860 3.77 Machinery 111,691,325 2.89 Marine 105,012,511 2.72 Metals & Mining 140,514,512 3.64 Oil, Gas & Consumable Fuels 57,023,700 1.48 Personal Products 40,371,820 1.05 Pharmaceuticals 115,544,261 2.99 Semiconductors & Semiconductor Equipment
113,964,488 2.95
Software 219,512,843 5.69 Specialty Retail 113,537,033 2.94 Technology Hardware, Storage & Peripherals
200,703,380 5.20
Textiles, Apparel & Luxury Goods 61,737,037 1.60 Trading Companies & Distributors 77,344,189 2.00 Others ** 404,375,781 10.47 Total 3,859,780,823 100.00
** Includes any other industries and net current assets
Investments in Collective Investment Schemes
Market ValueS$
% of NetAssets
Unit TrustGoldman Sachs Global CORE Equity Portfolio Class IO Shares
85,497,209 100.04
Other net assets/(liabilities) (37,622) (0.04) 85,459,587 100.00
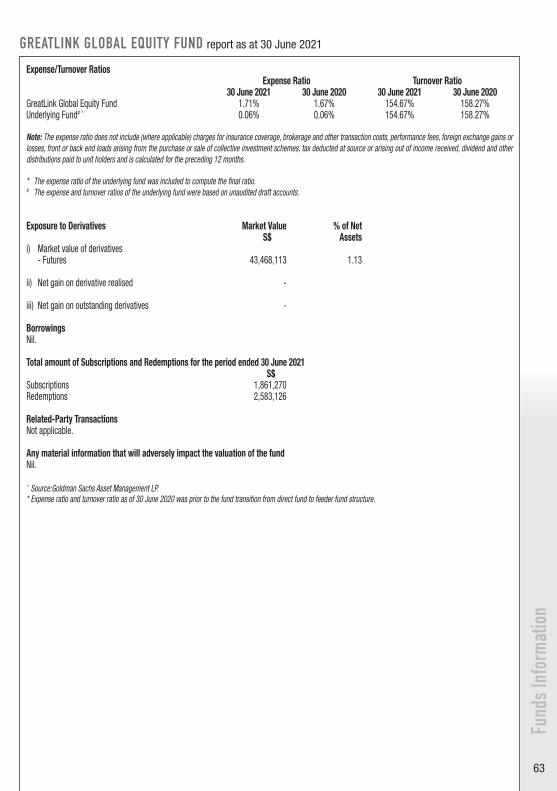
63
GREATLINK GLOBAL EQUITY FUND report as at 30 June 2021
Expense/Turnover RatiosExpense Ratio Turnover Ratio
30 June 2021 30 June 2020 30 June 2021 30 June 2020GreatLink Global Equity Fund 1.71% 1.67% 154.67% 158.27%Underlying Fund# ^ 0.06% 0.06% 154.67% 158.27%
Note: The expense ratio does not include (where applicable) charges for insurance coverage, brokerage and other transaction costs, performance fees, foreign exchange gains or losses, front or back end loads arising from the purchase or sale of collective investment schemes, tax deducted at source or arising out of income received, dividend and other distributions paid to unit holders and is calculated for the preceding 12 months.
* The expense ratio of the underlying fund was included to compute the final ratio.# The expense and turnover ratios of the underlying fund were based on unaudited draft accounts.
Exposure to Derivatives Market Value % of NetS$ Assets
i) Market value of derivatives - Futures 43,468,113 1.13
ii) Net gain on derivative realised -
iii) Net gain on outstanding derivatives -
Borrowings Nil.
Total amount of Subscriptions and Redemptions for the period ended 30 June 2021S$
Subscriptions 1,861,270 Redemptions 2,583,126
Related-Party TransactionsNot applicable.
Any material information that will adversely impact the valuation of the fundNil.
^ Source:Goldman Sachs Asset Management LP. * Expense ratio and turnover ratio as of 30 June 2020 was prior to the fund transition from direct fund to feeder fund structure.
Fund
s Inf
orm
atio
n
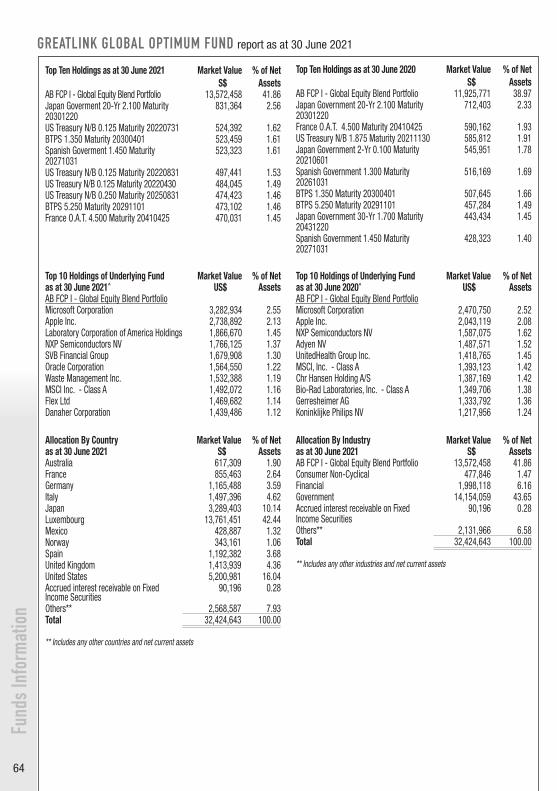
64
Allocation By Country Market Value % of Netas at 30 June 2021 S$ AssetsAustralia 617,309 1.90 France 855,463 2.64 Germany 1,165,488 3.59 Italy 1,497,396 4.62 Japan 3,289,403 10.14 Luxembourg 13,761,451 42.44 Mexico 428,887 1.32 Norway 343,161 1.06 Spain 1,192,382 3.68 United Kingdom 1,413,939 4.36 United States 5,200,981 16.04 Accrued interest receivable on Fixed Income Securities
90,196 0.28
Others** 2,568,587 7.93 Total 32,424,643 100.00
** Includes any other countries and net current assets
Allocation By Industry Market Value % of Netas at 30 June 2021 S$ AssetsAB FCP I - Global Equity Blend Portfolio 13,572,458 41.86 Consumer Non-Cyclical 477,846 1.47 Financial 1,998,118 6.16 Government 14,154,059 43.65 Accrued interest receivable on Fixed Income Securities
90,196 0.28
Others** 2,131,966 6.58 Total 32,424,643 100.00
** Includes any other industries and net current assets
Fund
s Inf
orm
atio
nGREATLINK GLOBAL OPTIMUM FUND report as at 30 June 2021
Top Ten Holdings as at 30 June 2021 Market ValueS$
% of Net Assets
AB FCP I - Global Equity Blend Portfolio 13,572,458 41.86 Japan Goverment 20-Yr 2.100 Maturity 20301220
831,364 2.56
US Treasury N/B 0.125 Maturity 20220731 524,392 1.62 BTPS 1.350 Maturity 20300401 523,459 1.61 Spanish Goverment 1.450 Maturity 20271031
523,323 1.61
US Treasury N/B 0.125 Maturity 20220831 497,441 1.53 US Treasury N/B 0.125 Maturity 20220430 484,045 1.49 US Treasury N/B 0.250 Maturity 20250831 474,423 1.46 BTPS 5.250 Maturity 20291101 473,102 1.46 France O.A.T. 4.500 Maturity 20410425 470,031 1.45
Top Ten Holdings as at 30 June 2020 Market ValueS$
% of NetAssets
AB FCP I - Global Equity Blend Portfolio 11,925,771 38.97 Japan Government 20-Yr 2.100 Maturity 20301220
712,403 2.33
France O.A.T. 4.500 Maturity 20410425 590,162 1.93 US Treasury N/B 1.875 Maturity 20211130 585,812 1.91 Japan Government 2-Yr 0.100 Maturity 20210601
545,951 1.78
Spanish Government 1.300 Maturity 20261031
516,169 1.69
BTPS 1.350 Maturity 20300401 507,645 1.66 BTPS 5.250 Maturity 20291101 457,284 1.49 Japan Government 30-Yr 1.700 Maturity 20431220
443,434 1.45
Spanish Government 1.450 Maturity 20271031
428,323 1.40
Top 10 Holdings of Underlying Fund Market Value % of Netas at 30 June 2021^ US$ AssetsAB FCP I - Global Equity Blend PortfolioMicrosoft Corporation 3,282,934 2.55 Apple Inc. 2,738,892 2.13 Laboratory Corporation of America Holdings 1,866,670 1.45 NXP Semiconductors NV 1,766,125 1.37 SVB Financial Group 1,679,908 1.30 Oracle Corporation 1,564,550 1.22 Waste Management Inc. 1,532,388 1.19 MSCI Inc. - Class A 1,492,072 1.16 Flex Ltd 1,469,682 1.14 Danaher Corporation 1,439,486 1.12
Top 10 Holdings of Underlying Fund Market Value % of Netas at 30 June 2020^ US$ AssetsAB FCP I - Global Equity Blend PortfolioMicrosoft Corporation 2,470,750 2.52 Apple Inc. 2,043,119 2.08 NXP Semiconductors NV 1,587,075 1.62 Adyen NV 1,487,571 1.52 UnitedHealth Group Inc. 1,418,765 1.45 MSCI, Inc. - Class A 1,393,123 1.42 Chr Hansen Holding A/S 1,387,169 1.42 Bio-Rad Laboratories, Inc. - Class A 1,349,706 1.38 Gerresheimer AG 1,333,792 1.36 Koninklijke Philips NV 1,217,956 1.24
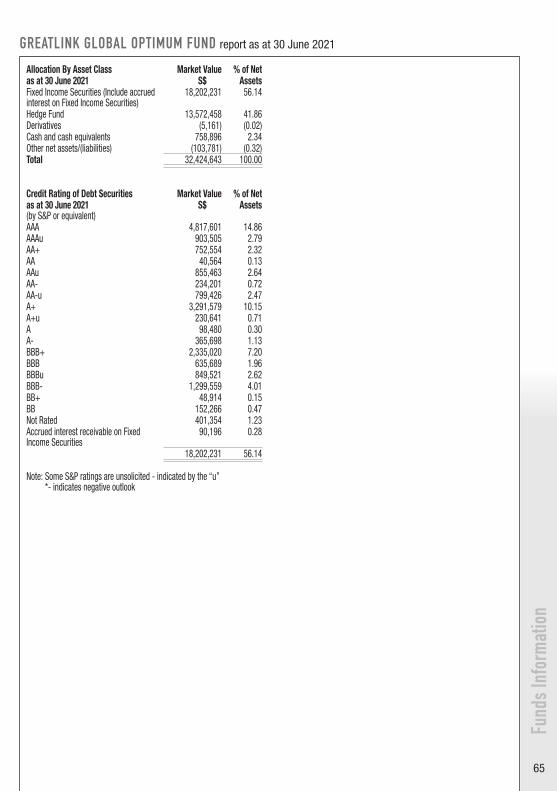
65
Fund
s Inf
orm
atio
n
GREATLINK GLOBAL OPTIMUM FUND report as at 30 June 2021
Allocation By Asset Class Market Value % of Netas at 30 June 2021 S$ AssetsFixed Income Securities (Include accrued interest on Fixed Income Securities)
18,202,231 56.14
Hedge Fund 13,572,458 41.86 Derivatives (5,161) (0.02)Cash and cash equivalents 758,896 2.34 Other net assets/(liabilities) (103,781) (0.32)Total 32,424,643 100.00
Credit Rating of Debt Securities Market Value % of Netas at 30 June 2021 (by S&P or equivalent)
S$ Assets
AAA 4,817,601 14.86 AAAu 903,505 2.79 AA+ 752,554 2.32 AA 40,564 0.13 AAu 855,463 2.64 AA- 234,201 0.72 AA-u 799,426 2.47 A+ 3,291,579 10.15 A+u 230,641 0.71 A 98,480 0.30 A- 365,698 1.13 BBB+ 2,335,020 7.20 BBB 635,689 1.96 BBBu 849,521 2.62 BBB- 1,299,559 4.01 BB+ 48,914 0.15 BB 152,266 0.47 Not Rated 401,354 1.23 Accrued interest receivable on Fixed Income Securities
90,196 0.28
18,202,231 56.14
Note: Some S&P ratings are unsolicited - indicated by the “u” *- indicates negative outlook
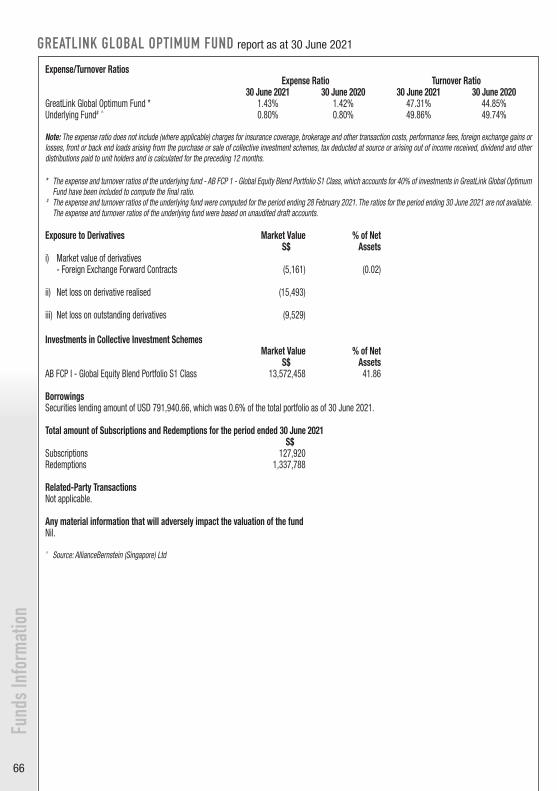
66
Fund
s Inf
orm
atio
nGREATLINK GLOBAL OPTIMUM FUND report as at 30 June 2021
Expense/Turnover RatiosExpense Ratio Turnover Ratio
30 June 2021 30 June 2020 30 June 2021 30 June 2020GreatLink Global Optimum Fund * 1.43% 1.42% 47.31% 44.85%Underlying Fund# ^ 0.80% 0.80% 49.86% 49.74%
Note: The expense ratio does not include (where applicable) charges for insurance coverage, brokerage and other transaction costs, performance fees, foreign exchange gains or losses, front or back end loads arising from the purchase or sale of collective investment schemes, tax deducted at source or arising out of income received, dividend and other distributions paid to unit holders and is calculated for the preceding 12 months.
* The expense and turnover ratios of the underlying fund - AB FCP 1 - Global Equity Blend Portfolio S1 Class, which accounts for 40% of investments in GreatLink Global Optimum Fund have been included to compute the final ratio.
# The expense and turnover ratios of the underlying fund were computed for the period ending 28 February 2021. The ratios for the period ending 30 June 2021 are not available. The expense and turnover ratios of the underlying fund were based on unaudited draft accounts.
Exposure to Derivatives Market Value % of NetS$ Assets
i) Market value of derivatives - Foreign Exchange Forward Contracts (5,161) (0.02)
ii) Net loss on derivative realised (15,493)
iii) Net loss on outstanding derivatives (9,529)
Investments in Collective Investment SchemesMarket Value % of Net
S$ AssetsAB FCP I - Global Equity Blend Portfolio S1 Class 13,572,458 41.86
Borrowings Securities lending amount of USD 791,940.66, which was 0.6% of the total portfolio as of 30 June 2021.
Total amount of Subscriptions and Redemptions for the period ended 30 June 2021S$
Subscriptions 127,920 Redemptions 1,337,788
Related-Party TransactionsNot applicable.
Any material information that will adversely impact the valuation of the fundNil.
^ Source: AllianceBernstein (Singapore) Ltd
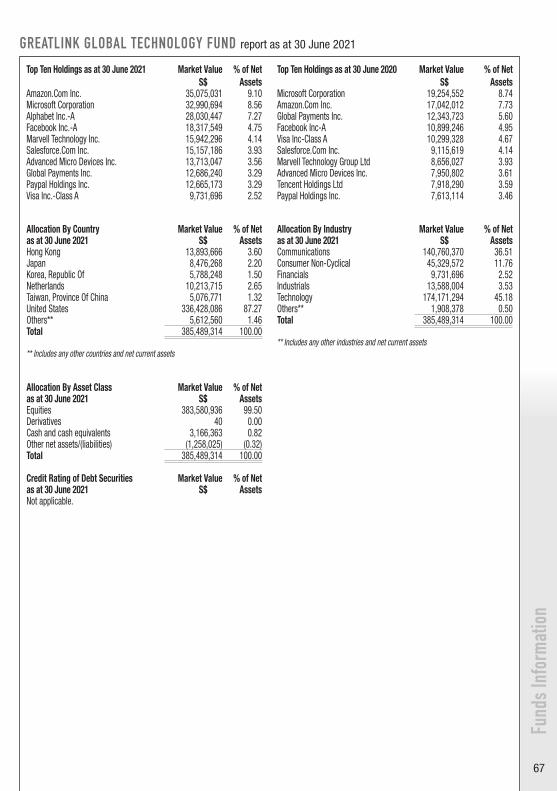
67
Fund
s Inf
orm
atio
n
GREATLINK GLOBAL TECHNOLOGY FUND report as at 30 June 2021
Top Ten Holdings as at 30 June 2020 Market Value S$
% of Net Assets
Microsoft Corporation 19,254,552 8.74 Amazon.Com Inc. 17,042,012 7.73 Global Payments Inc. 12,343,723 5.60 Facebook Inc-A 10,899,246 4.95 Visa Inc-Class A 10,299,328 4.67 Salesforce.Com Inc. 9,115,619 4.14 Marvell Technology Group Ltd 8,656,027 3.93 Advanced Micro Devices Inc. 7,950,802 3.61 Tencent Holdings Ltd 7,918,290 3.59 Paypal Holdings Inc. 7,613,114 3.46
Top Ten Holdings as at 30 June 2021 Market Value S$
% of NetAssets
Amazon.Com Inc. 35,075,031 9.10 Microsoft Corporation 32,990,694 8.56 Alphabet Inc.-A 28,030,447 7.27 Facebook Inc.-A 18,317,549 4.75 Marvell Technology Inc. 15,942,296 4.14 Salesforce.Com Inc. 15,157,186 3.93 Advanced Micro Devices Inc. 13,713,047 3.56 Global Payments Inc. 12,686,240 3.29 Paypal Holdings Inc. 12,665,173 3.29 Visa Inc.-Class A 9,731,696 2.52
Allocation By Country Market Value % of Netas at 30 June 2021 S$ AssetsHong Kong 13,893,666 3.60 Japan 8,476,268 2.20 Korea, Republic Of 5,788,248 1.50 Netherlands 10,213,715 2.65 Taiwan, Province Of China 5,076,771 1.32 United States 336,428,086 87.27 Others** 5,612,560 1.46 Total 385,489,314 100.00
** Includes any other countries and net current assets
Allocation By Asset Class Market Value % of Netas at 30 June 2021 S$ AssetsEquities 383,580,936 99.50 Derivatives 40 0.00 Cash and cash equivalents 3,166,363 0.82 Other net assets/(liabilities) (1,258,025) (0.32)Total 385,489,314 100.00
Credit Rating of Debt Securities Market Value % of Netas at 30 June 2021 S$ AssetsNot applicable.
Allocation By Industry Market Value % of Netas at 30 June 2021 S$ AssetsCommunications 140,760,370 36.51 Consumer Non-Cyclical 45,329,572 11.76 Financials 9,731,696 2.52 Industrials 13,588,004 3.53 Technology 174,171,294 45.18 Others** 1,908,378 0.50 Total 385,489,314 100.00
** Includes any other industries and net current assets
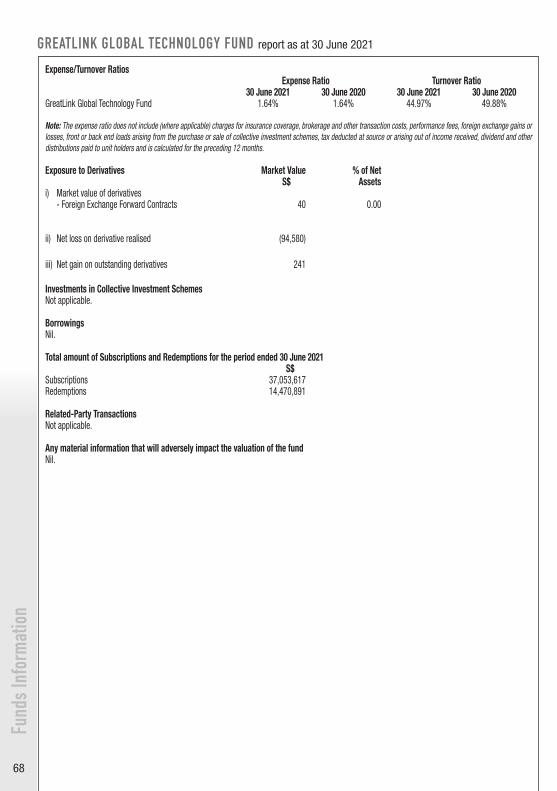
68
Fund
s Inf
orm
atio
nGREATLINK GLOBAL TECHNOLOGY FUND report as at 30 June 2021
Expense/Turnover RatiosExpense Ratio Turnover Ratio
30 June 2021 30 June 2020 30 June 2021 30 June 2020GreatLink Global Technology Fund 1.64% 1.64% 44.97% 49.88%
Note: The expense ratio does not include (where applicable) charges for insurance coverage, brokerage and other transaction costs, performance fees, foreign exchange gains or losses, front or back end loads arising from the purchase or sale of collective investment schemes, tax deducted at source or arising out of income received, dividend and other distributions paid to unit holders and is calculated for the preceding 12 months.
Exposure to Derivatives Market Value % of NetS$ Assets
i) Market value of derivatives - Foreign Exchange Forward Contracts 40 0.00
ii) Net loss on derivative realised (94,580)
iii) Net gain on outstanding derivatives 241
Investments in Collective Investment SchemesNot applicable.
Borrowings Nil.
Total amount of Subscriptions and Redemptions for the period ended 30 June 2021S$
Subscriptions 37,053,617 Redemptions 14,470,891
Related-Party TransactionsNot applicable.
Any material information that will adversely impact the valuation of the fundNil.
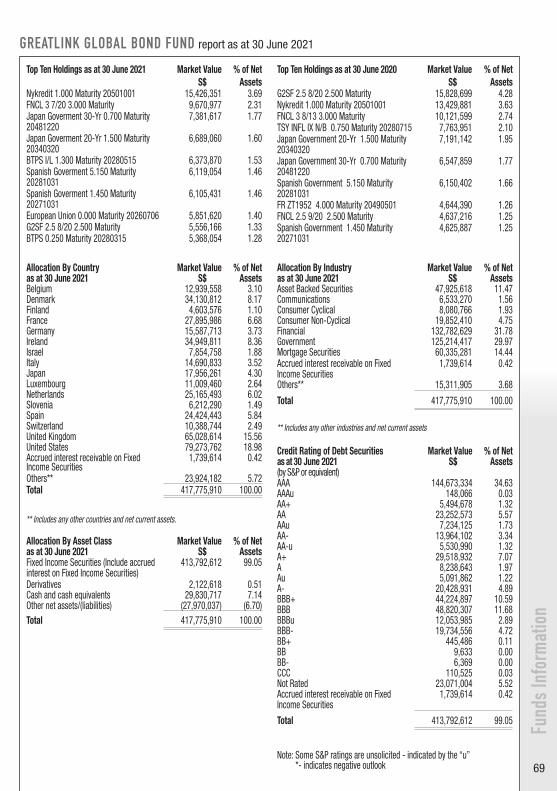
69
Fund
s Inf
orm
atio
n
GREATLINK GLOBAL BOND FUND report as at 30 June 2021
Top Ten Holdings as at 30 June 2020 Market Value S$
% of Net Assets
G2SF 2.5 8/20 2.500 Maturity 15,828,699 4.28 Nykredit 1.000 Maturity 20501001 13,429,881 3.63 FNCL 3 8/13 3.000 Maturity 10,121,599 2.74 TSY INFL IX N/B 0.750 Maturity 20280715 7,763,951 2.10 Japan Government 20-Yr 1.500 Maturity 20340320
7,191,142 1.95
Japan Government 30-Yr 0.700 Maturity 20481220
6,547,859 1.77
Spanish Government 5.150 Maturity 20281031
6,150,402 1.66
FR ZT1952 4.000 Maturity 20490501 4,644,390 1.26 FNCL 2.5 9/20 2.500 Maturity 4,637,216 1.25 Spanish Government 1.450 Maturity 20271031
4,625,887 1.25
Top Ten Holdings as at 30 June 2021 Market Value S$
% of NetAssets
Nykredit 1.000 Maturity 20501001 15,426,351 3.69 FNCL 3 7/20 3.000 Maturity 9,670,977 2.31 Japan Goverment 30-Yr 0.700 Maturity 20481220
7,381,617 1.77
Japan Goverment 20-Yr 1.500 Maturity 20340320
6,689,060 1.60
BTPS I/L 1.300 Maturity 20280515 6,373,870 1.53 Spanish Goverment 5.150 Maturity 20281031
6,119,054 1.46
Spanish Goverment 1.450 Maturity 20271031
6,105,431 1.46
European Union 0.000 Maturity 20260706 5,851,620 1.40 G2SF 2.5 8/20 2.500 Maturity 5,556,166 1.33 BTPS 0.250 Maturity 20280315 5,368,054 1.28
Allocation By Country Market Value % of Netas at 30 June 2021 S$ AssetsBelgium 12,939,558 3.10 Denmark 34,130,812 8.17 Finland 4,603,576 1.10 France 27,895,986 6.68 Germany 15,587,713 3.73 Ireland 34,949,811 8.36 Israel 7,854,758 1.88 Italy 14,690,833 3.52 Japan 17,956,261 4.30 Luxembourg 11,009,460 2.64 Netherlands 25,165,493 6.02 Slovenia 6,212,290 1.49 Spain 24,424,443 5.84 Switzerland 10,388,744 2.49 United Kingdom 65,028,614 15.56 United States 79,273,762 18.98 Accrued interest receivable on Fixed Income Securities
1,739,614 0.42
Others** 23,924,182 5.72 Total 417,775,910 100.00
Allocation By Industry Market Value % of Netas at 30 June 2021 S$ AssetsAsset Backed Securities 47,925,618 11.47 Communications 6,533,270 1.56 Consumer Cyclical 8,080,766 1.93 Consumer Non-Cyclical 19,852,410 4.75 Financial 132,782,629 31.78 Government 125,214,417 29.97 Mortgage Securities 60,335,281 14.44 Accrued interest receivable on Fixed Income Securities
1,739,614 0.42
Others** 15,311,905 3.68
Total 417,775,910 100.00
** Includes any other industries and net current assets
** Includes any other countries and net current assets.
Allocation By Asset Class Market Value % of Netas at 30 June 2021 S$ AssetsFixed Income Securities (Include accrued interest on Fixed Income Securities)
413,792,612 99.05
Derivatives 2,122,618 0.51 Cash and cash equivalents 29,830,717 7.14 Other net assets/(liabilities) (27,970,037) (6.70)Total 417,775,910 100.00
Credit Rating of Debt Securities Market Value % of Netas at 30 June 2021 (by S&P or equivalent)
S$ Assets
AAA 144,673,334 34.63 AAAu 148,066 0.03 AA+ 5,494,678 1.32 AA 23,252,573 5.57 AAu 7,234,125 1.73 AA- 13,964,102 3.34 AA-u 5,530,990 1.32 A+ 29,518,932 7.07 A 8,238,643 1.97 Au 5,091,862 1.22 A- 20,428,931 4.89 BBB+ 44,224,897 10.59 BBB 48,820,307 11.68 BBBu 12,053,985 2.89 BBB- 19,734,556 4.72 BB+ 445,486 0.11 BB 9,633 0.00 BB- 6,369 0.00 CCC 110,525 0.03 Not Rated 23,071,004 5.52 Accrued interest receivable on Fixed Income Securities
1,739,614 0.42
Total 413,792,612 99.05
Note: Some S&P ratings are unsolicited - indicated by the “u” *- indicates negative outlook
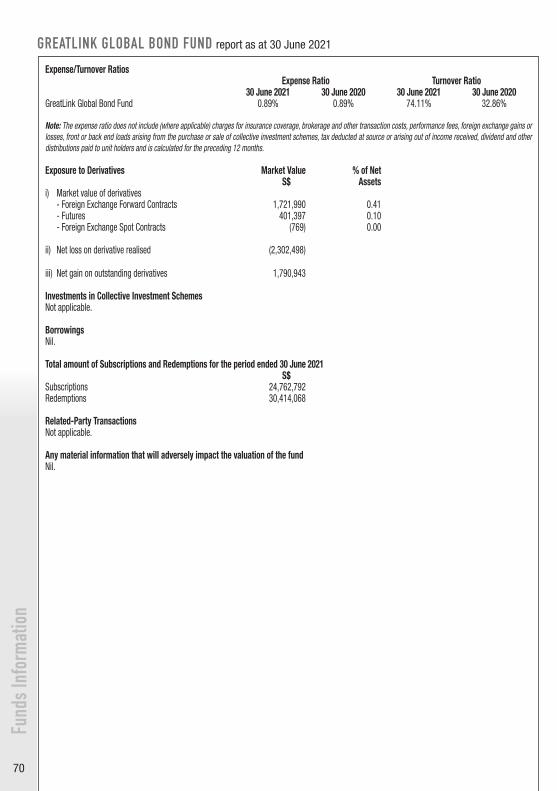
70
Fund
s Inf
orm
atio
nGREATLINK GLOBAL BOND FUND report as at 30 June 2021
Expense/Turnover RatiosExpense Ratio Turnover Ratio
30 June 2021 30 June 2020 30 June 2021 30 June 2020GreatLink Global Bond Fund 0.89% 0.89% 74.11% 32.86%
Note: The expense ratio does not include (where applicable) charges for insurance coverage, brokerage and other transaction costs, performance fees, foreign exchange gains or losses, front or back end loads arising from the purchase or sale of collective investment schemes, tax deducted at source or arising out of income received, dividend and other distributions paid to unit holders and is calculated for the preceding 12 months.
Exposure to Derivatives Market Value % of NetS$ Assets
i) Market value of derivatives - Foreign Exchange Forward Contracts 1,721,990 0.41 - Futures 401,397 0.10 - Foreign Exchange Spot Contracts (769) 0.00
ii) Net loss on derivative realised (2,302,498)
iii) Net gain on outstanding derivatives 1,790,943
Investments in Collective Investment SchemesNot applicable.
Borrowings Nil.
Total amount of Subscriptions and Redemptions for the period ended 30 June 2021S$
Subscriptions 24,762,792 Redemptions 30,414,068
Related-Party TransactionsNot applicable.
Any material information that will adversely impact the valuation of the fundNil.
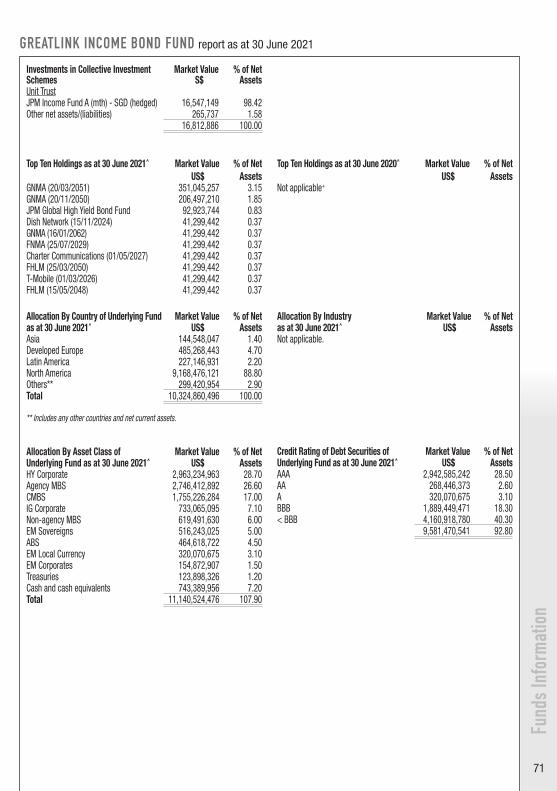
71
Fund
s Inf
orm
atio
n
GREATLINK INCOME BOND FUND report as at 30 June 2021
Top Ten Holdings as at 30 June 2020^ Market Value US$
% of Net Assets
Not applicable+
Top Ten Holdings as at 30 June 2021^ Market Value US$
% of NetAssets
GNMA (20/03/2051) 351,045,257 3.15GNMA (20/11/2050) 206,497,210 1.85JPM Global High Yield Bond Fund 92,923,744 0.83Dish Network (15/11/2024) 41,299,442 0.37GNMA (16/01/2062) 41,299,442 0.37FNMA (25/07/2029) 41,299,442 0.37Charter Communications (01/05/2027) 41,299,442 0.37FHLM (25/03/2050) 41,299,442 0.37T-Mobile (01/03/2026) 41,299,442 0.37FHLM (15/05/2048) 41,299,442 0.37
Allocation By Country of Underlying Fund Market Value % of Netas at 30 June 2021^ US$ AssetsAsia 144,548,047 1.40Developed Europe 485,268,443 4.70Latin America 227,146,931 2.20North America 9,168,476,121 88.80Others** 299,420,954 2.90Total 10,324,860,496 100.00
** Includes any other countries and net current assets.
Allocation By Asset Class of Market Value % of NetUnderlying Fund as at 30 June 2021^ US$ AssetsHY Corporate 2,963,234,963 28.70 Agency MBS 2,746,412,892 26.60 CMBS 1,755,226,284 17.00 IG Corporate 733,065,095 7.10 Non-agency MBS 619,491,630 6.00 EM Sovereigns 516,243,025 5.00 ABS 464,618,722 4.50 EM Local Currency 320,070,675 3.10 EM Corporates 154,872,907 1.50 Treasuries 123,898,326 1.20 Cash and cash equivalents 743,389,956 7.20 Total 11,140,524,476 107.90
Credit Rating of Debt Securities of Market Value % of NetUnderlying Fund as at 30 June 2021^ US$ AssetsAAA 2,942,585,242 28.50AA 268,446,373 2.60A 320,070,675 3.10BBB 1,889,449,471 18.30< BBB 4,160,918,780 40.30
9,581,470,541 92.80
Allocation By Industry Market Value % of Netas at 30 June 2021^ US$ AssetsNot applicable.
Investments in Collective Investment Schemes
Market ValueS$
% of NetAssets
Unit TrustJPM Income Fund A (mth) - SGD (hedged) 16,547,149 98.42 Other net assets/(liabilities) 265,737 1.58
16,812,886 100.00
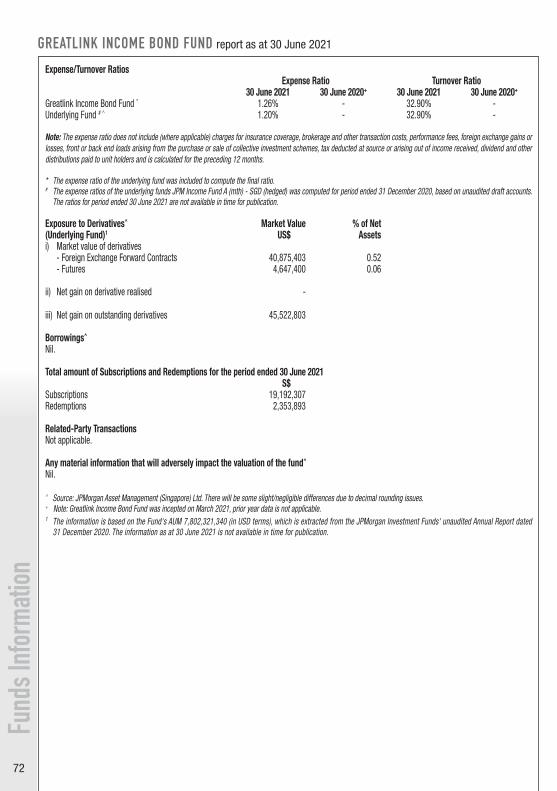
Fund
s Inf
orma
tion
72
Expense/Turnover RatiosExpense Ratio Turnover Ratio
30 June 2021 30 June 2020+ 30 June 2021 30 June 2020+
Greatlink Income Bond Fund * 1.26% - 32.90% -Underlying Fund # ^ 1.20% - 32.90% -
Note: The expense ratio does not include (where applicable) charges for insurance coverage, brokerage and other transaction costs, performance fees, foreign exchange gains or losses, front or back end loads arising from the purchase or sale of collective investment schemes, tax deducted at source or arising out of income received, dividend and other distributions paid to unit holders and is calculated for the preceding 12 months.
* The expense ratio of the underlying fund was included to compute the final ratio. # The expense ratios of the underlying funds JPM Income Fund A (mth) - SGD (hedged) was computed for period ended 31 December 2020, based on unaudited draft accounts.
The ratios for period ended 30 June 2021 are not available in time for publication.
Exposure to Derivatives^ Market Value % of Net(Underlying Fund)1 US$ Assetsi) Market value of derivatives
- Foreign Exchange Forward Contracts 40,875,403 0.52 - Futures 4,647,400 0.06
ii) Net gain on derivative realised -
iii) Net gain on outstanding derivatives 45,522,803
Borrowings^
Nil.
Total amount of Subscriptions and Redemptions for the period ended 30 June 2021S$
Subscriptions 19,192,307 Redemptions 2,353,893
Related-Party TransactionsNot applicable.
Any material information that will adversely impact the valuation of the fund^
Nil.
^ Source: JPMorgan Asset Management (Singapore) Ltd. There will be some slight/negligible differences due to decimal rounding issues.+ Note: Greatlink Income Bond Fund was incepted on March 2021, prior year data is not applicable.1 The information is based on the Fund's AUM 7,802,321,340 (in USD terms), which is extracted from the JPMorgan Investment Funds' unaudited Annual Report dated
31 December 2020. The information as at 30 June 2021 is not available in time for publication.
GREATLINK INCOME BOND FUND report as at 30 June 2021
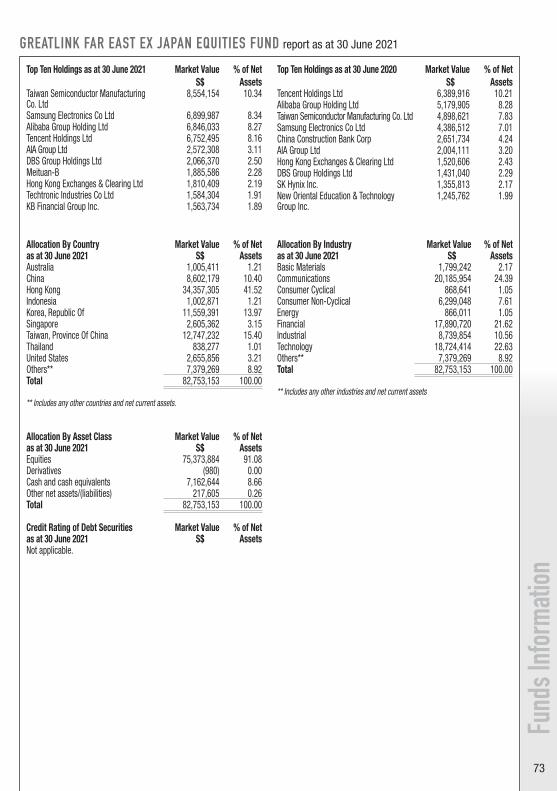
Fund
s Inf
orma
tion
73
GREATLINK FAR EAST EX JAPAN EQUITIES FUND report as at 30 June 2021
Top Ten Holdings as at 30 June 2020 Market Value S$
% of Net Assets
Tencent Holdings Ltd 6,389,916 10.21 Alibaba Group Holding Ltd 5,179,905 8.28 Taiwan Semiconductor Manufacturing Co. Ltd 4,898,621 7.83 Samsung Electronics Co Ltd 4,386,512 7.01 China Construction Bank Corp 2,651,734 4.24 AIA Group Ltd 2,004,111 3.20 Hong Kong Exchanges & Clearing Ltd 1,520,606 2.43 DBS Group Holdings Ltd 1,431,040 2.29 SK Hynix Inc. 1,355,813 2.17 New Oriental Education & Technology Group Inc.
1,245,762 1.99
Top Ten Holdings as at 30 June 2021 Market Value S$
% of NetAssets
Taiwan Semiconductor Manufacturing Co. Ltd
8,554,154 10.34
Samsung Electronics Co Ltd 6,899,987 8.34 Alibaba Group Holding Ltd 6,846,033 8.27 Tencent Holdings Ltd 6,752,495 8.16 AIA Group Ltd 2,572,308 3.11 DBS Group Holdings Ltd 2,066,370 2.50 Meituan-B 1,885,586 2.28 Hong Kong Exchanges & Clearing Ltd 1,810,409 2.19 Techtronic Industries Co Ltd 1,584,304 1.91 KB Financial Group Inc. 1,563,734 1.89
Allocation By Country Market Value % of Netas at 30 June 2021 S$ AssetsAustralia 1,005,411 1.21 China 8,602,179 10.40 Hong Kong 34,357,305 41.52 Indonesia 1,002,871 1.21 Korea, Republic Of 11,559,391 13.97 Singapore 2,605,362 3.15 Taiwan, Province Of China 12,747,232 15.40 Thailand 838,277 1.01 United States 2,655,856 3.21 Others** 7,379,269 8.92 Total 82,753,153 100.00
** Includes any other countries and net current assets.
Allocation By Asset Class Market Value % of Netas at 30 June 2021 S$ AssetsEquities 75,373,884 91.08 Derivatives (980) 0.00 Cash and cash equivalents 7,162,644 8.66 Other net assets/(liabilities) 217,605 0.26 Total 82,753,153 100.00
Credit Rating of Debt Securities Market Value % of Netas at 30 June 2021 S$ AssetsNot applicable.
Allocation By Industry Market Value % of Netas at 30 June 2021 S$ AssetsBasic Materials 1,799,242 2.17 Communications 20,185,954 24.39 Consumer Cyclical 868,641 1.05 Consumer Non-Cyclical 6,299,048 7.61 Energy 866,011 1.05 Financial 17,890,720 21.62 Industrial 8,739,854 10.56 Technology 18,724,414 22.63 Others** 7,379,269 8.92 Total 82,753,153 100.00
** Includes any other industries and net current assets
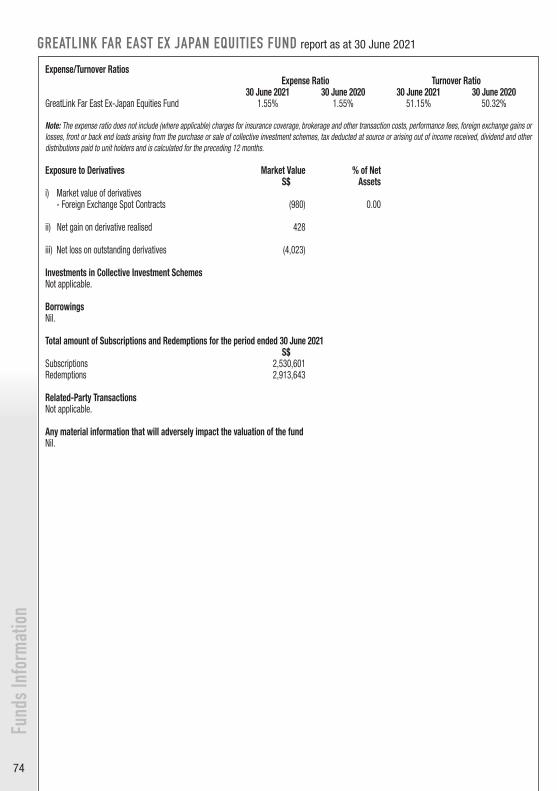
74
Fund
s Inf
orm
atio
nGREATLINK FAR EAST EX JAPAN EQUITIES FUND report as at 30 June 2021
Expense/Turnover RatiosExpense Ratio Turnover Ratio
30 June 2021 30 June 2020 30 June 2021 30 June 2020GreatLink Far East Ex-Japan Equities Fund 1.55% 1.55% 51.15% 50.32%
Note: The expense ratio does not include (where applicable) charges for insurance coverage, brokerage and other transaction costs, performance fees, foreign exchange gains or losses, front or back end loads arising from the purchase or sale of collective investment schemes, tax deducted at source or arising out of income received, dividend and other distributions paid to unit holders and is calculated for the preceding 12 months.
Exposure to Derivatives Market Value % of NetS$ Assets
i) Market value of derivatives- Foreign Exchange Spot Contracts (980) 0.00
ii) Net gain on derivative realised 428
iii) Net loss on outstanding derivatives (4,023)
Investments in Collective Investment SchemesNot applicable.
Borrowings Nil.
Total amount of Subscriptions and Redemptions for the period ended 30 June 2021S$
Subscriptions 2,530,601 Redemptions 2,913,643
Related-Party TransactionsNot applicable.
Any material information that will adversely impact the valuation of the fundNil.

75
Credit Rating of Debt Securities of Market Value % of NetUnderlying Fund as at 30 June 2021^ S$ AssetsNot applicable.
Fund
s Inf
orm
atio
n
GREATLINK SINGAPORE EQUITIES FUND report as at 30 June 2021
Investments in Collective Investment Schemes
Market Value S$
% of Net Assets
Unit TrustAberdeen Standard Singapore Equity Fund - Singapore
236,044,059 100.10
Other net assets/(liabilities) (241,054) (0.10) 235,803,005 100.00
Top 10 Holdings of Underlying Fund Market Value % of Netas at 30 June 2021^ S$ AssetsDBS Group Holdings 151,269,570 18.41 Oversea-Chinese Banking Corporation Ltd 123,122,680 14.99 United Overseas Bank Ltd 77,299,039 9.41 CapitaLand Ltd 59,830,917 7.28 Singapore Telecommunications Ltd 42,760,902 5.21 Venture Corporation Ltd 41,684,680 5.07 Singapore Technologies Engineering Ltd 33,150,580 4.04 CapitaLand Mall Trust 29,995,042 3.65 ComfortDelGro Corporation 24,620,847 3.00 Nanofilm Technologies International Ltd 19,441,000 2.37
Allocation By Country of Underlying Fund Market Value % of Netas at 30 June 2021^ S$ AssetsHong Kong 10,311,427 1.25 Malaysia 12,234,288 1.49 Singapore 793,866,426 96.64 Others** 5,055,192 0.62 Total 821,467,333 100.00
** Includes any other countries and net current assets
Allocation By Asset Class of Underlying Market Value % of NetFund as at 30 June 2021^ S$ AssetsEquities 816,412,141 99.38 Cash and cash equivalents 5,055,192 0.62 Total 821,467,333 100.00
Top 10 Holdings of Underlying Fund Market Value % of Netas at 30 June 2020^ S$ AssetsOversea-Chinese Banking Corporation Ltd 82,283,144 14.39 DBS Group Holdings 76,976,271 13.46 CapitaLand Ltd 37,217,865 6.51 Keppel Corporation Ltd 37,096,654 6.49 United Overseas Bank Ltd 36,785,921 6.43 Singapore Telecommunications Ltd 32,649,058 5.71 Venture Corporation Ltd 29,469,969 5.15 Singapore Technologies Engineering Ltd 24,123,840 4.22 City Developments Ltd 21,612,848 3.78 IHH Healthcare Bhd 17,156,064 3.00
Allocation By Industry of Underlying Fund Market Value % of Netas at 30 June 2021^ S$ AssetsBasic Materials 19,441,000 2.37 Consumer Discretionary 42,889,306 5.22 Consumer Staples 10,719,632 1.30 Energy 8,295,476 1.01 Financials 369,212,567 44.95 Healthcare 20,758,108 2.53 Industrials 94,332,447 11.48 Real Estate 155,527,606 18.93 Technology 32,805,388 3.99 Telecommunications 49,817,595 6.06 Utilities 12,613,016 1.54 Others** 5,055,192 0.62 Total 821,467,333 100.00
** Includes any other industries and net current assets.
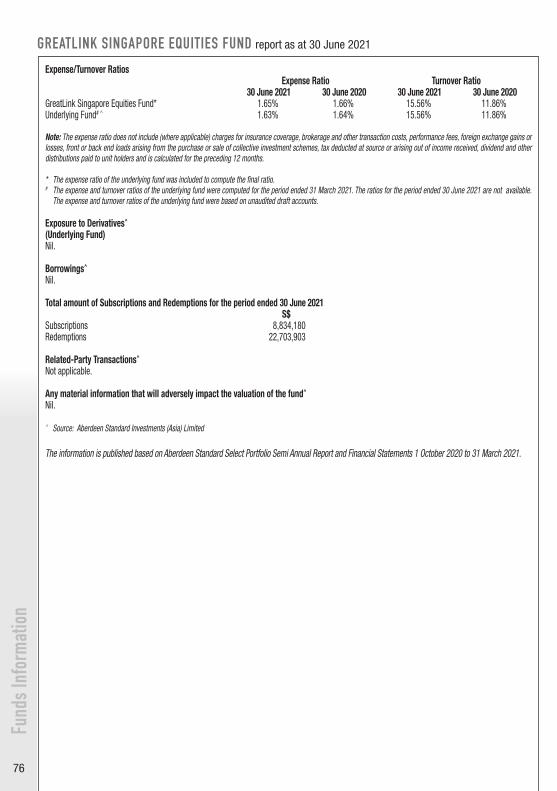
76
Fund
s Inf
orm
atio
nGREATLINK SINGAPORE EQUITIES FUND report as at 30 June 2021
Expense/Turnover RatiosExpense Ratio Turnover Ratio
30 June 2021 30 June 2020 30 June 2021 30 June 2020GreatLink Singapore Equities Fund* 1.65% 1.66% 15.56% 11.86%Underlying Fund# ^ 1.63% 1.64% 15.56% 11.86%
Note: The expense ratio does not include (where applicable) charges for insurance coverage, brokerage and other transaction costs, performance fees, foreign exchange gains or losses, front or back end loads arising from the purchase or sale of collective investment schemes, tax deducted at source or arising out of income received, dividend and other distributions paid to unit holders and is calculated for the preceding 12 months.
* The expense ratio of the underlying fund was included to compute the final ratio.# The expense and turnover ratios of the underlying fund were computed for the period ended 31 March 2021. The ratios for the period ended 30 June 2021 are not available.
The expense and turnover ratios of the underlying fund were based on unaudited draft accounts.
Exposure to Derivatives^
(Underlying Fund)Nil.
Borrowings^
Nil.
Total amount of Subscriptions and Redemptions for the period ended 30 June 2021S$
Subscriptions 8,834,180 Redemptions 22,703,903
Related-Party Transactions^
Not applicable.
Any material information that will adversely impact the valuation of the fund^
Nil.
^ Source: Aberdeen Standard Investments (Asia) Limited
The information is published based on Aberdeen Standard Select Portfolio Semi Annual Report and Financial Statements 1 October 2020 to 31 March 2021.
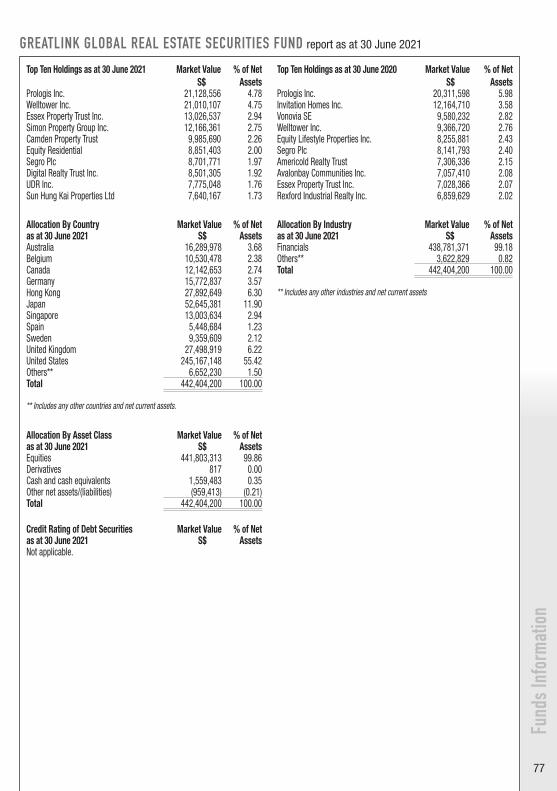
77
Fund
s Inf
orm
atio
n
GREATLINK GLOBAL REAL ESTATE SECURITIES FUND report as at 30 June 2021
Top Ten Holdings as at 30 June 2020 Market Value S$
% of Net Assets
Prologis Inc. 20,311,598 5.98 Invitation Homes Inc. 12,164,710 3.58 Vonovia SE 9,580,232 2.82 Welltower Inc. 9,366,720 2.76 Equity Lifestyle Properties Inc. 8,255,881 2.43 Segro Plc 8,141,793 2.40 Americold Realty Trust 7,306,336 2.15 Avalonbay Communities Inc. 7,057,410 2.08 Essex Property Trust Inc. 7,028,366 2.07 Rexford Industrial Realty Inc. 6,859,629 2.02
Top Ten Holdings as at 30 June 2021 Market Value S$
% of NetAssets
Prologis Inc. 21,128,556 4.78 Welltower Inc. 21,010,107 4.75 Essex Property Trust Inc. 13,026,537 2.94 Simon Property Group Inc. 12,166,361 2.75 Camden Property Trust 9,985,690 2.26 Equity Residential 8,851,403 2.00 Segro Plc 8,701,771 1.97 Digital Realty Trust Inc. 8,501,305 1.92 UDR Inc. 7,775,048 1.76 Sun Hung Kai Properties Ltd 7,640,167 1.73
Allocation By Country Market Value % of Netas at 30 June 2021 S$ AssetsAustralia 16,289,978 3.68 Belgium 10,530,478 2.38 Canada 12,142,653 2.74 Germany 15,772,837 3.57 Hong Kong 27,892,649 6.30 Japan 52,645,381 11.90 Singapore 13,003,634 2.94 Spain 5,448,684 1.23 Sweden 9,359,609 2.12 United Kingdom 27,498,919 6.22 United States 245,167,148 55.42 Others** 6,652,230 1.50 Total 442,404,200 100.00
** Includes any other countries and net current assets.
Allocation By Asset Class Market Value % of Netas at 30 June 2021 S$ AssetsEquities 441,803,313 99.86 Derivatives 817 0.00 Cash and cash equivalents 1,559,483 0.35 Other net assets/(liabilities) (959,413) (0.21)Total 442,404,200 100.00
Credit Rating of Debt Securities Market Value % of Netas at 30 June 2021 S$ AssetsNot applicable.
Allocation By Industry Market Value % of Netas at 30 June 2021 S$ AssetsFinancials 438,781,371 99.18 Others** 3,622,829 0.82 Total 442,404,200 100.00
** Includes any other industries and net current assets

78
Fund
s Inf
orm
atio
nGREATLINK GLOBAL REAL ESTATE SECURITIES FUND report as at 30 June 2021
Expense/Turnover RatiosExpense Ratio Turnover Ratio
30 June 2021 30 June 2020 30 June 2021 30 June 2020GreatLink Global Real Estate Securities Fund 1.66% 1.67% 161.52% 179.97%
Note: The expense ratio does not include (where applicable) charges for insurance coverage, brokerage and other transaction costs, performance fees, foreign exchange gains or losses, front or back end loads arising from the purchase or sale of collective investment schemes, tax deducted at source or arising out of income received, dividend and other distributions paid to unit holders and is calculated for the preceding 12 months.
Exposure to Derivatives Market Value % of NetS$ Assets
i) Market value of derivatives - Foreign Exchange Spot Contracts 817 0.00
ii) Net loss on derivative realised (27,671)
iii) Net gain on outstanding derivatives 1,163
Investments in Collective Investment SchemesNot applicable.
Borrowings Nil.
Total amount of Subscriptions and Redemptions for the period ended 30 June 2021S$
Subscriptions 9,259,603 Redemptions 65,366,571
Related-Party TransactionsNot applicable.
Any material information that will adversely impact the valuation of the fundNil.
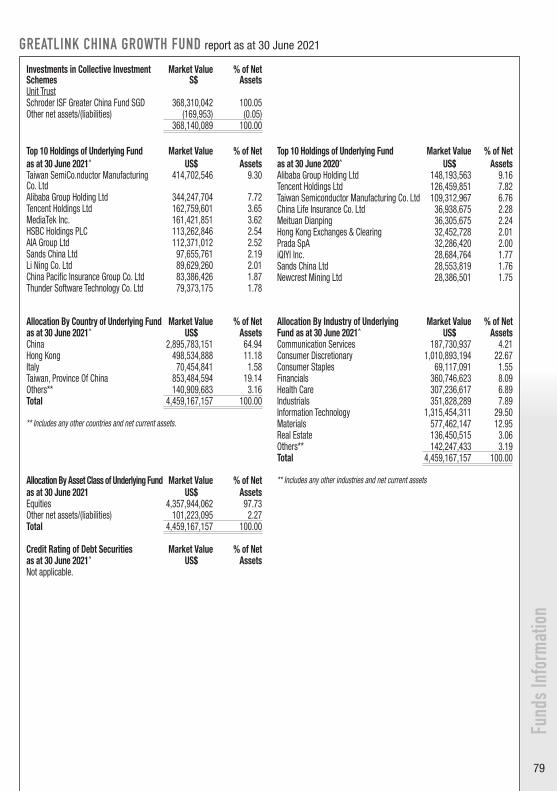
79
GREATLINK CHINA GROWTH FUND report as at 30 June 2021
Top 10 Holdings of Underlying Fund as at 30 June 2020^
Market Value US$
% of Net Assets
Alibaba Group Holding Ltd 148,193,563 9.16 Tencent Holdings Ltd 126,459,851 7.82 Taiwan Semiconductor Manufacturing Co. Ltd 109,312,967 6.76 China Life Insurance Co. Ltd 36,938,675 2.28 Meituan Dianping 36,305,675 2.24 Hong Kong Exchanges & Clearing 32,452,728 2.01 Prada SpA 32,286,420 2.00 iQIYI Inc. 28,684,764 1.77 Sands China Ltd 28,553,819 1.76 Newcrest Mining Ltd 28,386,501 1.75
Top 10 Holdings of Underlying Fundas at 30 June 2021^
Market Value US$
% of NetAssets
Taiwan SemiCo.nductor Manufacturing Co. Ltd
414,702,546 9.30
Alibaba Group Holding Ltd 344,247,704 7.72 Tencent Holdings Ltd 162,759,601 3.65 MediaTek Inc. 161,421,851 3.62 HSBC Holdings PLC 113,262,846 2.54 AIA Group Ltd 112,371,012 2.52 Sands China Ltd 97,655,761 2.19 Li Ning Co. Ltd 89,629,260 2.01 China Pacific Insurance Group Co. Ltd 83,386,426 1.87 Thunder Software Technology Co. Ltd 79,373,175 1.78
Investments in Collective Investment Schemes
Market ValueS$
% of NetAssets
Unit TrustSchroder ISF Greater China Fund SGD 368,310,042 100.05Other net assets/(liabilities) (169,953) (0.05)
368,140,089 100.00
Allocation By Country of Underlying Fund Market Value % of Netas at 30 June 2021^ US$ AssetsChina 2,895,783,151 64.94 Hong Kong 498,534,888 11.18 Italy 70,454,841 1.58 Taiwan, Province Of China 853,484,594 19.14 Others** 140,909,683 3.16 Total 4,459,167,157 100.00
** Includes any other countries and net current assets.
Allocation By Asset Class of Underlying Fund Market Value % of Netas at 30 June 2021 US$ AssetsEquities 4,357,944,062 97.73 Other net assets/(liabilities) 101,223,095 2.27 Total 4,459,167,157 100.00
Credit Rating of Debt Securities Market Value % of Netas at 30 June 2021^ US$ AssetsNot applicable.
Allocation By Industry of Underlying Market Value % of NetFund as at 30 June 2021^ US$ AssetsCommunication Services 187,730,937 4.21 Consumer Discretionary 1,010,893,194 22.67 Consumer Staples 69,117,091 1.55 Financials 360,746,623 8.09 Health Care 307,236,617 6.89 Industrials 351,828,289 7.89 Information Technology 1,315,454,311 29.50 Materials 577,462,147 12.95 Real Estate 136,450,515 3.06 Others** 142,247,433 3.19 Total 4,459,167,157 100.00
** Includes any other industries and net current assets
Fund
s Inf
orm
atio
n

80
Expense/Turnover RatiosExpense Ratio Turnover Ratio
30 June 2021 30 June 2020 30 June 2021 30 June 2020GreatLink China Growth Fund* 1.62% 1.62% 88.18% 87.70%Underlying Fund# ^ 1.70% 1.70% 88.18% 87.70%
Note: The expense ratio does not include (where applicable) charges for insurance coverage, brokerage and other transaction costs, performance fees, foreign exchange gains or losses, front or back end loads arising from the purchase or sale of collective investment schemes, tax deducted at source or arising out of income received, dividend and other distributions paid to unit holders and is calculated for the preceding 12 months. * The expense ratio of the underlying fund was included to compute the final ratio.# The expense and turnover ratios of the underlying fund were based on audited accounts.
Exposure to Derivatives^
(Underlying Fund)Nil.
Borrowings^ Nil.
Total amount of Subscriptions and Redemptions for the period ended 30 June 2021S$
Subscriptions 35,816,599 Redemptions 6,664,140
Related-Party Transactions^
Not applicable.
Any material information that will adversely impact the valuation of the fund^
Nil.
^ Source: Schroder Investment Management Ltd.
GREATLINK CHINA GROWTH FUND report as at 30 June 2021
Fund
s Inf
orm
atio
n

81
Fund
s Inf
orm
atio
n
GREATLINK EUROPEAN EQUITY FUND report as at 30 June 2021
Investments in Collective Investment Schemes
Market ValueS$
% of NetAssets
Unit TrustCapital Group European Growth and Income Fund (LUX)
21,853,300 99.90
Other net assets/(liabilities) 22,261 0.10 21,875,561 100.00
Top 10 Holdings of Underlying Fund Market Value % of Netas at 30 June 2021^ Eur € AssetsRio Tinto PLC 8,856,989 3.92Avast PLC 7,587,083 3.36Prosus NV 7,212,414 3.19Airbus SE 6,672,964 2.95Imperial Brands PLC 6,659,839 2.95Richter Gedeon NYRT 6,541,996 2.90ING Groep NV 6,101,267 2.70Novartis AG 4,995,110 2.21DNB ASA 4,770,168 2.11Royal Dutch Shell PLC 4,693,859 2.08
Allocation By Country of Underlying Fund Market Value % of Netas at 30 June 2021^ Eur € AssetsBelgium 269,269 0.12Denmark 5,801,352 2.57Finland 67,132 0.03France 31,004,789 13.72Germany 14,941,699 6.61Greece 1,821,840 0.81Hungary 6,727,189 2.98Ireland 3,252,026 1.44Italy 5,121,000 2.27Netherlands 26,491,065 11.72Norway 5,880,810 2.60Russian Federation 7,375,673 3.26Spain 10,513,905 4.65Sweden 11,267,732 4.99Switzerland 17,593,255 7.79United Kingdom 57,153,063 25.30United States 7,664,293 3.39Others** 12,990,397 5.75Total 225,936,489 100.00
** Includes any other countries and net current assets.
Allocation By Asset Class of Underlying Market Value % of NetFund as at 30 June 2021^ Eur € AssetsEquities 212,946,092 94.25Fixed Income Securities 1,329,127 0.59Cash and cash equivalents 11,661,270 5.16Total 225,936,489 100.00
Credit Rating of Debt Securities of Market Value % of NetUnderlying Fund as at 30 June 2021^ Eur € AssetsBB 1,329,127 0.59
1,329,127 0.59
Top 10 Holdings of Underlying Fund Market Value % of Netas at 30 June 2020^ Eur € AssetsNovartis AG 8,693,720 4.14Imperial Brands PLC 8,657,929 4.12E.ON SE 8,083,988 3.85Taylor Wimpey PLC 6,743,345 3.21National Grid PLC 5,892,274 2.81Kering SA 5,757,733 2.74GVC Holdings PLC 5,748,576 2.74TAG Immobilien AG 5,551,576 2.64Prosus NV 5,541,098 2.64Deutsche Post AG 5,447,243 2.59
Allocation By Industry of Underlying Fund Market Value % of Netas at 30 June 2021^ Eur € AssetsCommunication Services 12,014,101 5.32Consumer Discretionary 32,764,245 14.50Consumer Staples 24,441,682 10.82Energy 5,146,356 2.28Financials 35,765,201 15.83Health Care 32,422,224 14.35Industrials 22,345,831 9.89Information Technology 16,769,129 7.42Materials 14,355,452 6.35Real Estate 3,761,371 1.67Utilities 13160500.13 5.82Others** 12,990,397 5.75Total 225,936,489 100.00
** Includes any other industries and net current assets.
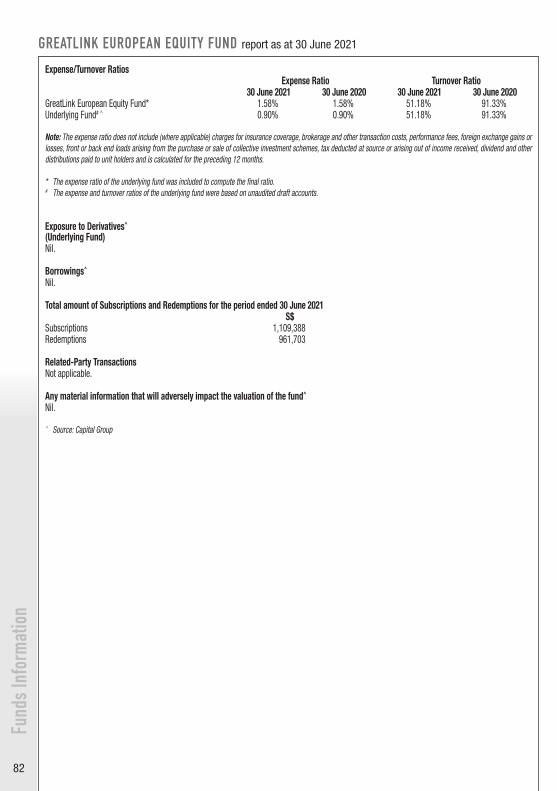
82
Fund
s Inf
orm
atio
nGREATLINK EUROPEAN EQUITY FUND report as at 30 June 2021
Expense/Turnover RatiosExpense Ratio Turnover Ratio
30 June 2021 30 June 2020 30 June 2021 30 June 2020GreatLink European Equity Fund* 1.58% 1.58% 51.18% 91.33%Underlying Fund# ^ 0.90% 0.90% 51.18% 91.33%
Note: The expense ratio does not include (where applicable) charges for insurance coverage, brokerage and other transaction costs, performance fees, foreign exchange gains or losses, front or back end loads arising from the purchase or sale of collective investment schemes, tax deducted at source or arising out of income received, dividend and other distributions paid to unit holders and is calculated for the preceding 12 months.
* The expense ratio of the underlying fund was included to compute the final ratio. # The expense and turnover ratios of the underlying fund were based on unaudited draft accounts.
Exposure to Derivatives^
(Underlying Fund)Nil.
Borrowings^
Nil.
Total amount of Subscriptions and Redemptions for the period ended 30 June 2021S$
Subscriptions 1,109,388 Redemptions 961,703
Related-Party TransactionsNot applicable.
Any material information that will adversely impact the valuation of the fund^
Nil.
^ Source: Capital Group
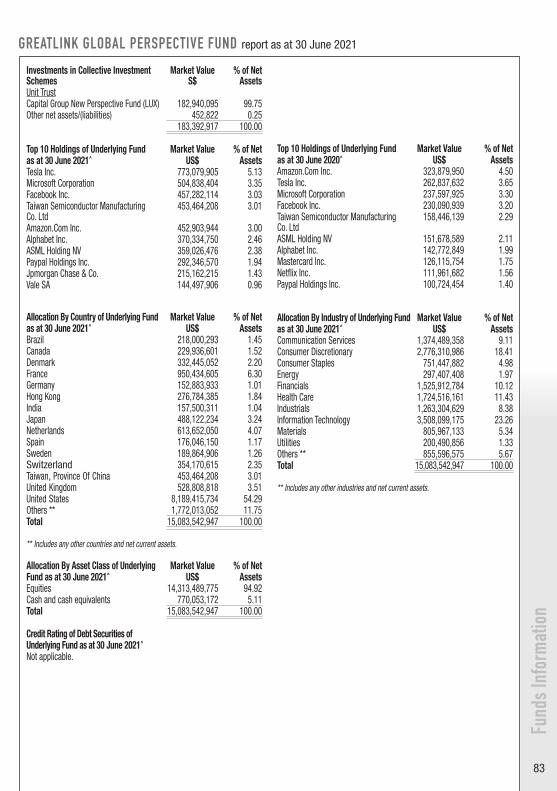
83
Fund
s Inf
orm
atio
n
GREATLINK GLOBAL PERSPECTIVE FUND report as at 30 June 2021
Investments in Collective Investment Schemes
Market Value S$
% of Net Assets
Unit TrustCapital Group New Perspective Fund (LUX) 182,940,095 99.75Other net assets/(liabilities) 452,822 0.25
183,392,917 100.00
Top 10 Holdings of Underlying Fund Market Value % of Netas at 30 June 2021^ US$ AssetsTesla Inc. 773,079,905 5.13Microsoft Corporation 504,838,404 3.35Facebook Inc. 457,282,114 3.03Taiwan Semiconductor Manufacturing Co. Ltd
453,464,208 3.01
Amazon.Com Inc. 452,903,944 3.00Alphabet Inc. 370,334,750 2.46ASML Holding NV 359,026,476 2.38Paypal Holdings Inc. 292,346,570 1.94Jpmorgan Chase & Co. 215,162,215 1.43Vale SA 144,497,906 0.96
Allocation By Country of Underlying Fund Market Value % of Netas at 30 June 2021^ US$ AssetsBrazil 218,000,293 1.45Canada 229,936,601 1.52Denmark 332,445,052 2.20France 950,434,605 6.30Germany 152,883,933 1.01Hong Kong 276,784,385 1.84India 157,500,311 1.04Japan 488,122,234 3.24Netherlands 613,652,050 4.07Spain 176,046,150 1.17Sweden 189,864,906 1.26Switzerland 354,170,615 2.35Taiwan, Province Of China 453,464,208 3.01United Kingdom 528,808,818 3.51United States 8,189,415,734 54.29Others ** 1,772,013,052 11.75Total 15,083,542,947 100.00
** Includes any other countries and net current assets.
Allocation By Asset Class of Underlying Market Value % of NetFund as at 30 June 2021^ US$ AssetsEquities 14,313,489,775 94.92Cash and cash equivalents 770,053,172 5.11Total 15,083,542,947 100.00
Credit Rating of Debt Securities of Underlying Fund as at 30 June 2021^
Not applicable.
Top 10 Holdings of Underlying Fund Market Value % of Netas at 30 June 2020^ US$ AssetsAmazon.Com Inc. 323,879,950 4.50Tesla Inc. 262,837,632 3.65Microsoft Corporation 237,597,925 3.30Facebook Inc. 230,090,939 3.20Taiwan Semiconductor Manufacturing Co. Ltd
158,446,139 2.29
ASML Holding NV 151,678,589 2.11Alphabet Inc. 142,772,849 1.99Mastercard Inc. 126,115,754 1.75Netflix Inc. 111,961,682 1.56Paypal Holdings Inc. 100,724,454 1.40
Allocation By Industry of Underlying Fund Market Value % of Netas at 30 June 2021^ US$ AssetsCommunication Services 1,374,489,358 9.11Consumer Discretionary 2,776,310,986 18.41Consumer Staples 751,447,882 4.98Energy 297,407,408 1.97Financials 1,525,912,784 10.12Health Care 1,724,516,161 11.43Industrials 1,263,304,629 8.38Information Technology 3,508,099,175 23.26Materials 805,967,133 5.34Utilities 200,490,856 1.33Others ** 855,596,575 5.67Total 15,083,542,947 100.00
** Includes any other industries and net current assets.
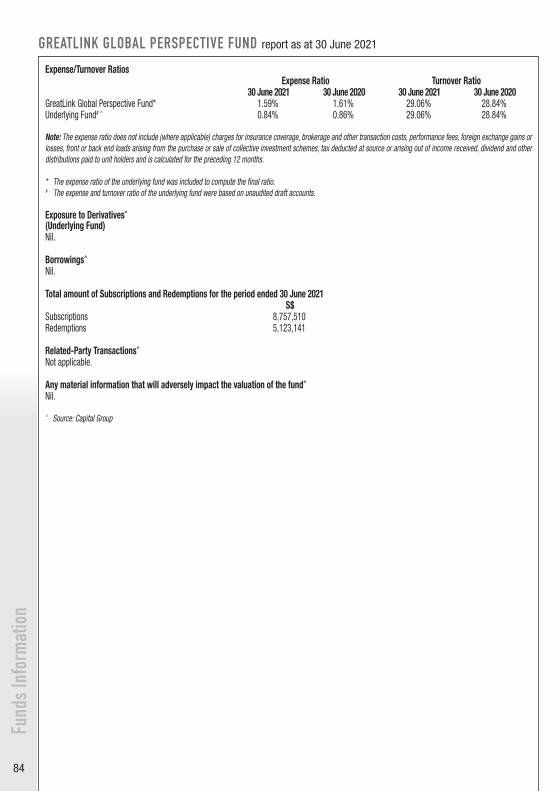
84
Fund
s Inf
orm
atio
nGREATLINK GLOBAL PERSPECTIVE FUND report as at 30 June 2021
Expense/Turnover RatiosExpense Ratio Turnover Ratio
30 June 2021 30 June 2020 30 June 2021 30 June 2020GreatLink Global Perspective Fund* 1.59% 1.61% 29.06% 28.84%Underlying Fund# ^ 0.84% 0.86% 29.06% 28.84%
Note: The expense ratio does not include (where applicable) charges for insurance coverage, brokerage and other transaction costs, performance fees, foreign exchange gains or losses, front or back end loads arising from the purchase or sale of collective investment schemes, tax deducted at source or arising out of income received, dividend and other distributions paid to unit holders and is calculated for the preceding 12 months.
* The expense ratio of the underlying fund was included to compute the final ratio. # The expense and turnover ratio of the underlying fund were based on unaudited draft accounts. Exposure to Derivatives^ (Underlying Fund)Nil.
Borrowings^
Nil.
Total amount of Subscriptions and Redemptions for the period ended 30 June 2021 S$
Subscriptions 8,757,510 Redemptions 5,123,141
Related-Party Transactions^
Not applicable.
Any material information that will adversely impact the valuation of the fund^
Nil.
^ Source: Capital Group

85
Fund
s Inf
orm
atio
n
GREATLINK GLOBAL THEMATIC FUND report as at 30 June 2021
Investments in Collective Investment Schemes
Market Value S$
% of Net Assets
Unit TrustAB SICAV I - Sustainable Global Thematic Portfolio S1X Class
45,734,449 99.84
Other net assets/(liabilities) 73,743 0.16 45,808,192 100.00
Top 10 Holdings of Underlying Fund Market Value % of Netas at 30 June 2021^ US$ AssetsLaboratory Corp. of America Holdings 93,622,118 2.87SVB Financial Group 84,255,142 2.58Waste Management Inc. 76,856,355 2.35MSCI Inc. - Class A 74,834,322 2.29Flex Ltd 73,711,373 2.26Danaher Corporation 72,196,888 2.21Lumentum Holdings Inc. 70,597,919 2.16Apollo Hospitals Enterprise Ltd 69,642,526 2.13Trex Co. Inc. 69,392,760 2.12Aptiv PLC 68,877,376 2.11
Allocation By Country of Underlying Fund Market Value % of Netas at 30 June 2021^ US$ AssetsAustria 68,220,233 2.09Denmark 137,428,145 4.21France 108,142,628 3.31Germany 94,845,732 2.90Hong Kong 43,329,711 1.33India 128,095,531 3.92Japan 106,934,596 3.27Netherlands 236,139,948 7.23Norway 62,905,156 1.93Switzerland 113,171,576 3.46United Kingdom 36,229,133 1.11United States 1,889,345,599 57.84Others** 241,550,093 7.40Total 3,266,338,081 100.00
** Includes any other countries and net current assets.
Allocation By Asset Class of Underlying Market Value % of NetFund as at 30 June 2021^ US$ AssetsEquities 3,123,755,316 95.63Derivatives 6,124,871 0.19Other net assets/(liabilities) 136,457,894 4.18Total 3,266,338,081 100.00
Credit Rating of Debt Securities of Market Value % of NetUnderlying Fund as at 30 June 2021^ US$ AssetsNot applicable.
Top 10 Holdings of Underlying Fund Market Value % of Netas at 30 June 2020^ US$ AssetsAdyen NV 26,123,155 2.94MSCI Inc. - Class A 24,464,574 2.75Chr Hansen Holding A/S 24,360,003 2.74Bio-Rad Laboratories Inc. - Class A 23,702,120 2.66Gerresheimer AG 23,422,652 2.63Koninklijke Philips NV 21,388,462 2.40West Pharmaceutical Services Inc. 20,362,980 2.29Infineon Technologies AG 19,811,106 2.23Vestas Wind Systems A/S 19,621,001 2.21Tecan Group AG 19,390,951 2.18
Allocation By Industry of Underlying Fund Market Value % of Netas at 30 June 2021^ US$ AssetsConsumer Discretionary 219,539,607 6.72Consumer Staples 34,226,667 1.05Financials 419,632,604 12.85Health Care 600,060,791 18.37Industrials 653,721,820 20.01Information Technology 977,699,550 29.93Materials 111,389,831 3.41Utilities 107,484,446 3.29Others** 142,582,765 4.37Total 3,266,338,081 100.00
** Includes any other industries and net current assets.
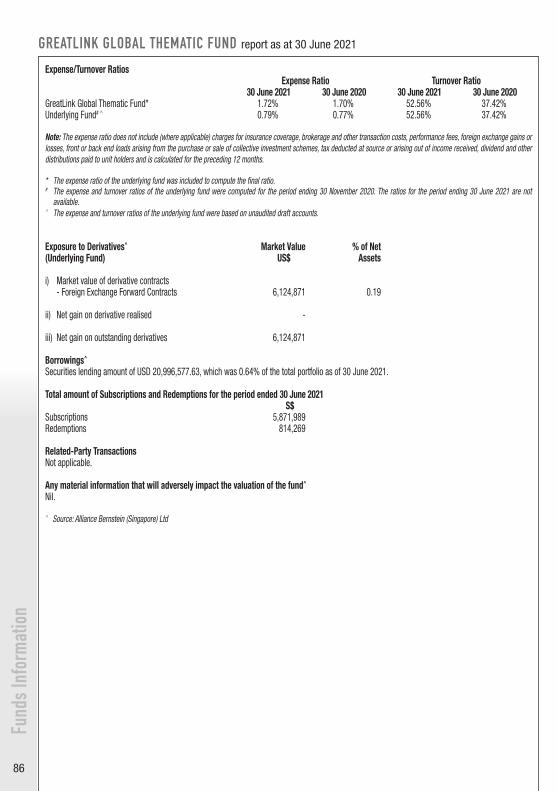
86
Fund
s Inf
orm
atio
nGREATLINK GLOBAL THEMATIC FUND report as at 30 June 2021
Expense/Turnover RatiosExpense Ratio Turnover Ratio
30 June 2021 30 June 2020 30 June 2021 30 June 2020GreatLink Global Thematic Fund* 1.72% 1.70% 52.56% 37.42%Underlying Fund# ^ 0.79% 0.77% 52.56% 37.42%
Note: The expense ratio does not include (where applicable) charges for insurance coverage, brokerage and other transaction costs, performance fees, foreign exchange gains or losses, front or back end loads arising from the purchase or sale of collective investment schemes, tax deducted at source or arising out of income received, dividend and other distributions paid to unit holders and is calculated for the preceding 12 months.
* The expense ratio of the underlying fund was included to compute the final ratio. # The expense and turnover ratios of the underlying fund were computed for the period ending 30 November 2020. The ratios for the period ending 30 June 2021 are not
available. ^ The expense and turnover ratios of the underlying fund were based on unaudited draft accounts.
Exposure to Derivatives^ Market Value % of Net(Underlying Fund) US$ Assets
i) Market value of derivative contracts - Foreign Exchange Forward Contracts 6,124,871 0.19
ii) Net gain on derivative realised -
iii) Net gain on outstanding derivatives 6,124,871
Borrowings^
Securities lending amount of USD 20,996,577.63, which was 0.64% of the total portfolio as of 30 June 2021.
Total amount of Subscriptions and Redemptions for the period ended 30 June 2021S$
Subscriptions 5,871,989 Redemptions 814,269
Related-Party TransactionsNot applicable.
Any material information that will adversely impact the valuation of the fund^
Nil.
^ Source: Alliance Bernstein (Singapore) Ltd

87
GREATLINK GLOBAL EQUITY ALPHA FUND report as at 30 June 2021
Investments in Collective Investment Schemes
Market Value S$
% of Net Assets
Unit TrustSchroders ISF Global Equity Alpha Fund - Singapore
178,778,374 99.75
Other net assets/(liabilities) 449,138 0.25 179,227,512 100.00
Top 10 Holdings of Underlying Fund Market Value % of Netas at 30 June 2021^ US$ AssetsAlphabet Inc. 132,895,142 5.23Microsoft Corporation 111,042,404 4.37JPMorgan Chase & Co. 105,960,372 4.17Facebook Inc. 95,034,002 3.74Visa Inc. 89,443,767 3.52Diageo PLC 72,418,959 2.85Amazon.Com Inc. 68,861,536 2.71American Express Co. 64,795,911 2.55Royal Dutch Shell PLC 63,525,403 2.50Equinor ASA 62,763,098 2.47
Allocation By Country of Underlying Fund Market Value % of Netas at 30 June 2021^ US$ AssetsAustria 49,803,916 1.96China 45,738,290 1.80France 48,279,306 1.90Germany 141,788,699 5.58Hong Kong 40,402,156 1.59India 44,975,985 1.77Korea, Republic Of 32,525,006 1.28Netherlands 63,525,403 2.50Norway 62,763,098 2.47Switzerland 96,558,612 3.80Taiwan 33,033,209 1.30United Kingdom 130,354,126 5.13United States 1,662,586,838 65.43Others** 88,681,461 3.49Total 2,541,016,105 100.00
** Includes any other countries and net current assets.
Allocation By Asset Class of Underlying Market Value % of NetFund as at 30 June 2021^ US$ AssetsEquities 2,495,277,815 98.20Other net assets/(liabilities) 45,738,290 1.80Total 2,541,016,105 100.00
Credit Rating of Debt Securities of Market Value % of NetUnderlying Fund as at 30 June 2021^ US$ AssetsNot applicable.
Top 10 Holdings of Underlying Fund Market Value % of Netas at 30 June 2020^ US$ AssetsMicrosoft Corporation 63,929,554 4.75Alphabet Inc. 62,529,388 4.65Visa Inc. 60,122,684 4.47Amazon.Com Inc. 58,222,183 4.33Adobe Inc. 53,046,851 3.94Facebook Inc. 46,162,181 3.43UnitedHealth Group Inc. 38,555,827 2.87Danone S.A. 33,266,557 2.47JPMorgan Chase & Co. 32,552,634 2.42Intuit Inc. 32,121,277 2.39
Allocation By Industry of Underlying Fund Market Value % of Netas at 30 June 2021^ US$ AssetsCommunication Services 331,094,398 13.03Consumer Discretionary 425,874,299 16.76Consumer Staples 212,683,048 8.37Energy 126,288,500 4.97Financials 368,447,335 14.50Health Care 301,110,408 11.85Industrials 348,627,410 13.72Information Technology 381,152,416 15.00Others** 45,738,291 1.80Total 2,541,016,105 100.00
** Includes any other industries and net current assets.
Fund
s Inf
orm
atio
n
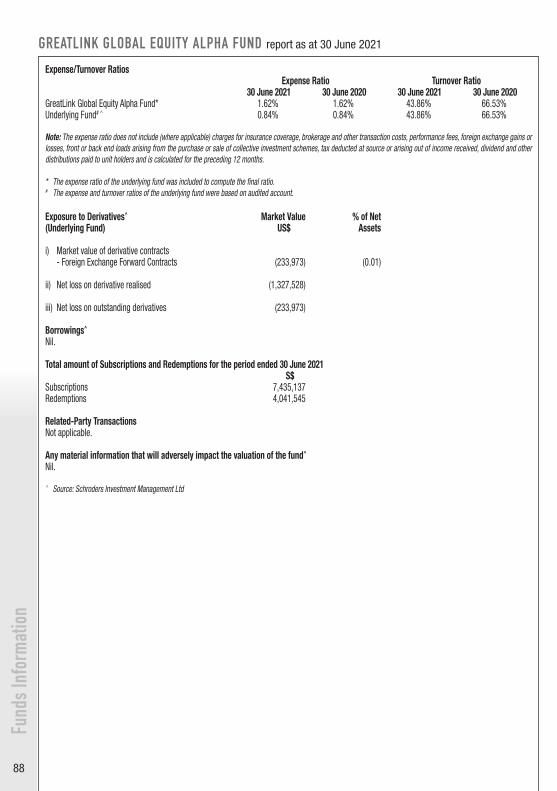
88
GREATLINK GLOBAL EQUITY ALPHA FUND report as at 30 June 2021
Expense/Turnover RatiosExpense Ratio Turnover Ratio
30 June 2021 30 June 2020 30 June 2021 30 June 2020GreatLink Global Equity Alpha Fund* 1.62% 1.62% 43.86% 66.53%Underlying Fund# ^ 0.84% 0.84% 43.86% 66.53%
Note: The expense ratio does not include (where applicable) charges for insurance coverage, brokerage and other transaction costs, performance fees, foreign exchange gains or losses, front or back end loads arising from the purchase or sale of collective investment schemes, tax deducted at source or arising out of income received, dividend and other distributions paid to unit holders and is calculated for the preceding 12 months. * The expense ratio of the underlying fund was included to compute the final ratio.# The expense and turnover ratios of the underlying fund were based on audited account.
Exposure to Derivatives^ Market Value % of Net(Underlying Fund) US$ Assets
i) Market value of derivative contracts - Foreign Exchange Forward Contracts (233,973) (0.01)
ii) Net loss on derivative realised (1,327,528)
iii) Net loss on outstanding derivatives (233,973)
Borrowings^
Nil.
Total amount of Subscriptions and Redemptions for the period ended 30 June 2021S$
Subscriptions 7,435,137 Redemptions 4,041,545
Related-Party TransactionsNot applicable.
Any material information that will adversely impact the valuation of the fund^
Nil.
^ Source: Schroders Investment Management Ltd
Fund
s Inf
orm
atio
n

89
GREATLINK SHORT DURATION BOND FUND report as at 30 June 2021
Investments in Collective Investment Schemes
Market Value S$ % of Net Assets
Unit TrustLionGlobal Short Duration Bond Fund CL A - Singapore
196,636,146 99.53
Other net assets/(liabilities) 922,438 0.47 197,558,584 100.00
Top 10 Holdings of Underlying Fund Market Value % of Netas at 30 June 2021^ S$ AssetsLendlease Retail Investments 3 Private Ltd Series MTN 3.28% due 03/09/2021
15,042,750 1.72
Weibo Corporation 1.25% due 15/11/2022 15,009,700 1.72Manulife Financial Corporation Var due 21/11/2029
14,105,745 1.61
PT Pelabuhan Indonesia II TBK 4.25% due 05/05/2025
13,269,774 1.52
Mapletree Treasury Services Ltd Series EMTN 1.2% due 14/12/2023
13,013,455 1.49
Ausnet Services Holdings Private Ltd FRN due 07/09/2076
12,326,073 1.41
Keppel Land Ltd Series MTN 2% due 28/05/2026
12,028,140 1.38
MAS Bill (Ser 84) ZCP 24/09/2021 11,992,260 1.37Allgreen Treasury Private Ltd 3.15% due 16/01/2025
11,918,378 1.36
Government of Singapore 2.75% due 01/07/2023
11,181,500 1.28
Allocation By Country of Underlying Fund Market Value % of Netas at 30 June 2021^ S$ AssetsAustralia 31,536,283 3.61Canada 14,105,745 1.62China 229,815,102 26.31Germany 9,008,280 1.03Hong Kong 18,127,009 2.07India 20,461,006 2.34Indonesia 20,046,892 2.30Malaysia 9,530,316 1.09Qatar 19,499,777 2.23Singapore 392,983,887 44.99Korea, Republic Of 14,022,172 1.61Thailand 10,847,146 1.24United Arab Emirates 33,260,933 3.81Accrued interest receivable on debt securities 6,568,370 0.75
Others** 43,695,513 5.00Total 873,508,431 100.00
** Includes any other countries and net current assets
Allocation By Asset Class of Underlying Market Value % of NetFund as at 30 June 2021^ S$ AssetsEquities 22,196 0.00Debt Securities (Include accrued interest on Debt Securities)
869,540,003 99.55
Derivatives (2,885,874) (0.33)Cash and cash equivalents 6,832,106 0.78Total 873,508,431 100.00
Top 10 Holdings of Underlying Fund Market Value % of Netas at 30 June 2020^ S$ AssetsMinor International PLC Var Perpetual 9,819,060 1.81IOI Investment Berhad Series EMTN 4.375% due 27/06/2022
9,285,631 1.71
Wing Tai Holdings Ltd Series MTN 4% due 07/10/2021
9,089,550 1.67
LB Baden-Wuerttemberg Series EMTN Var due 18/05/2027
8,572,860 1.58
Lend Lease Retail Investments 3 Private Ltd Series MTN 3.28% due 03/09/2021
8,065,920 1.48
Allgreen Treasury Private Ltd 3.15% due 16/01/2025
7,970,040 1.47
Manulife Financial Corporation Var due 25/05/2026
7,823,160 1.44
US Treasury 1.375% due 31/01/2025 7,620,428 1.40Government of Singapore 2.75% due 01/07/2023
7,495,600 1.38
United Overseas Bank Ltd Series EMTN Var due 16/09/2026
7,263,720 1.34
Allocation By Industry of Underlying Fund Market Value % of Netas at 30 June 2021^ S$ AssetsBasic Materials 36,277,991 4.15Communications 27,133,906 3.11Consumer, Cyclical 18,222,230 2.08Consumer, Non-cyclical 19,216,790 2.20Energy 9,944,345 1.14Financial 225,012,092 25.76Industrial 115,910,145 13.27Real Estate 315,310,462 36.10Sovereign 62,038,840 7.10Utilities 31,522,154 3.61Accrued interest receivable on debt securities
6,568,370 0.75
Others** 6,351,106 0.73Total 873,508,431 100.00** Includes any other industries and net current assets.
Credit Rating of Debt Securities of Market Value % of NetUnderlying Fund as at 30 June 2021^ S$ AssetsAaa 15,825,950 1.81Aa2 2,164,529 0.25Aa3 1,891,553 0.22A1 19,554,485 2.24A2 30,047,886 3.44A3 46,104,689 5.28Baa1 29,202,833 3.34Baa2 113,930,449 13.04BBB 6,309,401 0.72Baa3 86,160,410 9.86BB+ 2,016,300 0.23Ba2 1,376,125 0.16Ba3 4,635,953 0.53B1 1,324,037 0.15Unrated 502,427,033 57.53Accrued interest on debt securities 6,568,370 0.75
869,540,003 99.55
Fund
s Inf
orm
atio
n
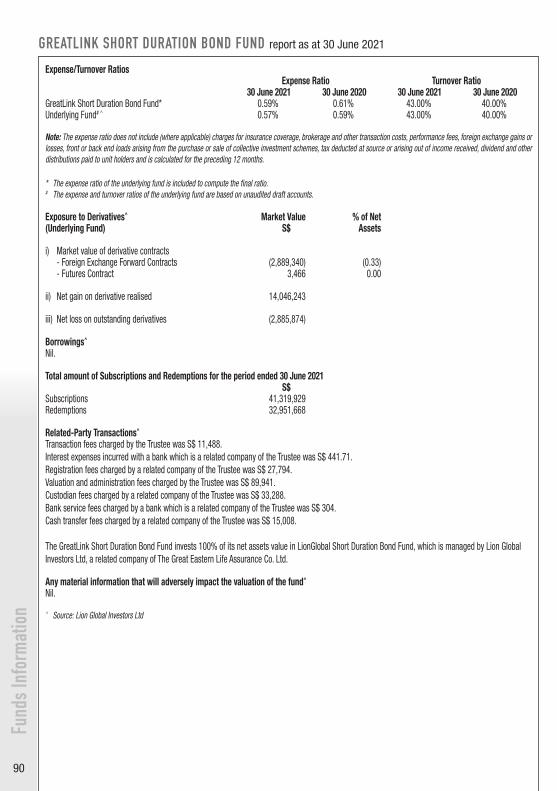
90
GREATLINK SHORT DURATION BOND FUND report as at 30 June 2021
Expense/Turnover RatiosExpense Ratio Turnover Ratio
30 June 2021 30 June 2020 30 June 2021 30 June 2020GreatLink Short Duration Bond Fund* 0.59% 0.61% 43.00% 40.00%Underlying Fund# ^ 0.57% 0.59% 43.00% 40.00%
Note: The expense ratio does not include (where applicable) charges for insurance coverage, brokerage and other transaction costs, performance fees, foreign exchange gains or losses, front or back end loads arising from the purchase or sale of collective investment schemes, tax deducted at source or arising out of income received, dividend and other distributions paid to unit holders and is calculated for the preceding 12 months. * The expense ratio of the underlying fund is included to compute the final ratio.# The expense and turnover ratios of the underlying fund are based on unaudited draft accounts.
Exposure to Derivatives^ Market Value % of Net(Underlying Fund) S$ Assets
i) Market value of derivative contracts - Foreign Exchange Forward Contracts (2,889,340) (0.33) - Futures Contract 3,466 0.00
ii) Net gain on derivative realised 14,046,243
iii) Net loss on outstanding derivatives (2,885,874)
Borrowings^
Nil.
Total amount of Subscriptions and Redemptions for the period ended 30 June 2021S$
Subscriptions 41,319,929 Redemptions 32,951,668
Related-Party Transactions^
Transaction fees charged by the Trustee was S$ 11,488.Interest expenses incurred with a bank which is a related company of the Trustee was S$ 441.71.Registration fees charged by a related company of the Trustee was S$ 27,794.Valuation and administration fees charged by the Trustee was S$ 89,941.Custodian fees charged by a related company of the Trustee was S$ 33,288.Bank service fees charged by a bank which is a related company of the Trustee was S$ 304.Cash transfer fees charged by a related company of the Trustee was S$ 15,008. The GreatLink Short Duration Bond Fund invests 100% of its net assets value in LionGlobal Short Duration Bond Fund, which is managed by Lion Global Investors Ltd, a related company of The Great Eastern Life Assurance Co. Ltd.
Any material information that will adversely impact the valuation of the fund^
Nil.
^ Source: Lion Global Investors Ltd
Fund
s Inf
orm
atio
n

91
Fund
s Inf
orm
atio
n
GREATLINK LION JAPAN GROWTH FUND report as at 30 June 2021
Investments in Collective Investment Schemes
Market Value S$
% of Net Assets
Unit TrustLionGlobal Japan Growth Fund SGD-Hedged
13,988,384 99.85
Other net assets/(liabilities) 20,736 0.15 14,009,120 100.00
Top 10 Holdings of Underlying Fund Market Value % of Netas at 30 June 2021^ S$ AssetsSony Corporation 9,613,966 3.24Keyence Corporation 7,401,795 2.49Denso Corporation 6,572,112 2.21Mizuho Financial Group Inc. 6,000,501 2.02Shin-Etsu Chemical Company Ltd 5,963,093 2.01Hitachi Ltd 5,754,744 1.94Recruit Holdings Company Ltd 5,054,659 1.70Daiichi Sankyo Company Ltd 4,837,165 1.63Nintendo Company Ltd 4,460,893 1.50Fuji Electric Company Ltd 4,406,212 1.48
Allocation By Country of Underlying Fund Market Value % of Netas at 30 June 2021^ S$ AssetsJapan 285,510,234 96.13Others** 11,485,534 3.87Total 296,995,768 100.00
** Includes any other countries and net current assets.
Allocation By Asset Class of Underlying Market Value % of NetFund as at 30 June 2021^ S$ AssetsEquities 285,510,234 96.13 Derivatives 54,293 0.02 Cash and cash equivalents 11,431,241 3.85 Total 296,995,768 100.00
Credit Rating of Debt Securities of Market Value % of NetUnderlying Fund as at 30 June 2021^
S$ Assets
Not applicable.
Top 10 Holdings of Underlying Fund Market Value % of Netas at 30 June 2020^ S$ AssetsSony Corporation 7,724,473 3.10Keyence Corporation 7,453,162 2.99Daiichi Sankyo Company Ltd 6,080,630 2.44Daikin Industries Ltd 4,953,872 1.99Orix Corporation 4,937,158 1.98Mizuho Financial Group Inc. 4,750,602 1.90Olympus Corporation 4,688,612 1.88Shin-Etsu Chemical Company Ltd 4,674,216 1.87Denso Corporation 4,349,954 1.74Murata Manufacturing Company Ltd 4,222,419 1.69
Allocation By Industry of Underlying Fund Market Value % of Netas at 30 June 2021^ S$ AssetsBasic Materials 19,401,529 6.53Communications 6,833,600 2.30Consumer, Cyclical 46,143,111 15.54Consumer, Non-cyclical 51,328,284 17.28Financial 25,750,774 8.67Industrial 66,433,874 22.37Real Estate 8,915,858 3.00Technology 57,319,375 19.30Others** 14,869,363 5.01Total 296,995,768 100.00
** Includes any other industries and net current assets.
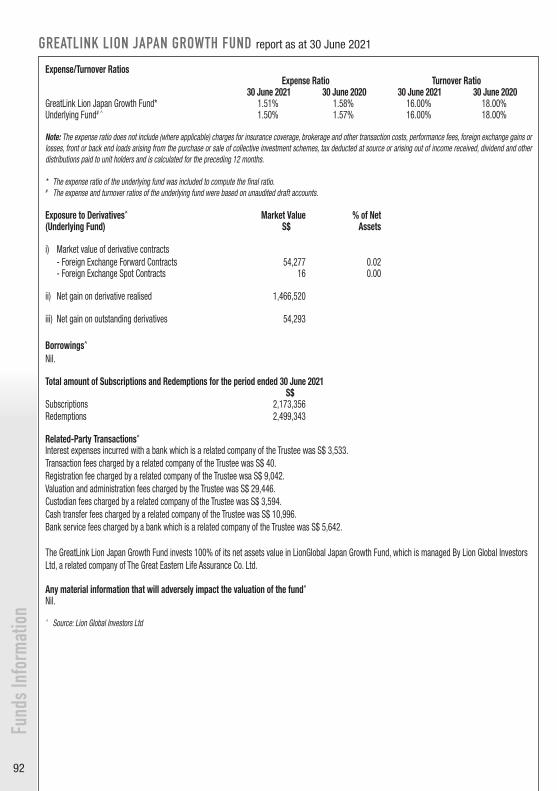
92
Fund
s Inf
orm
atio
nGREATLINK LION JAPAN GROWTH FUND report as at 30 June 2021
Expense/Turnover RatiosExpense Ratio Turnover Ratio
30 June 2021 30 June 2020 30 June 2021 30 June 2020GreatLink Lion Japan Growth Fund* 1.51% 1.58% 16.00% 18.00%Underlying Fund# ^ 1.50% 1.57% 16.00% 18.00%
Note: The expense ratio does not include (where applicable) charges for insurance coverage, brokerage and other transaction costs, performance fees, foreign exchange gains or losses, front or back end loads arising from the purchase or sale of collective investment schemes, tax deducted at source or arising out of income received, dividend and other distributions paid to unit holders and is calculated for the preceding 12 months.
* The expense ratio of the underlying fund was included to compute the final ratio.# The expense and turnover ratios of the underlying fund were based on unaudited draft accounts.
Exposure to Derivatives^ Market Value % of Net(Underlying Fund) S$ Assets
i) Market value of derivative contracts - Foreign Exchange Forward Contracts 54,277 0.02 - Foreign Exchange Spot Contracts 16 0.00
ii) Net gain on derivative realised 1,466,520
iii) Net gain on outstanding derivatives 54,293
Borrowings^
Nil.
Total amount of Subscriptions and Redemptions for the period ended 30 June 2021S$
Subscriptions 2,173,356 Redemptions 2,499,343
Related-Party Transactions^
Interest expenses incurred with a bank which is a related company of the Trustee was S$ 3,533.Transaction fees charged by a related company of the Trustee was S$ 40.Registration fee charged by a related company of the Trustee wsa S$ 9,042.Valuation and administration fees charged by the Trustee was S$ 29,446.Custodian fees charged by a related company of the Trustee was S$ 3,594.Cash transfer fees charged by a related company of the Trustee was S$ 10,996.Bank service fees charged by a bank which is a related company of the Trustee was S$ 5,642.
The GreatLink Lion Japan Growth Fund invests 100% of its net assets value in LionGlobal Japan Growth Fund, which is managed By Lion Global Investors Ltd, a related company of The Great Eastern Life Assurance Co. Ltd. Any material information that will adversely impact the valuation of the fund^
Nil.
^ Source: Lion Global Investors Ltd
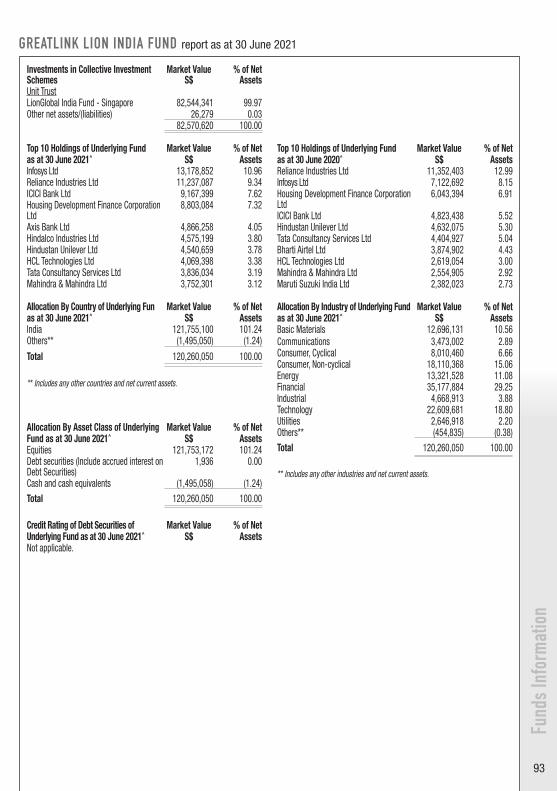
93
GREATLINK LION INDIA FUND report as at 30 June 2021
Investments in Collective Investment Schemes
Market Value S$
% of Net Assets
Unit TrustLionGlobal India Fund - Singapore 82,544,341 99.97Other net assets/(liabilities) 26,279 0.03
82,570,620 100.00
Top 10 Holdings of Underlying Fund Market Value % of Netas at 30 June 2021^ S$ AssetsInfosys Ltd 13,178,852 10.96Reliance Industries Ltd 11,237,087 9.34ICICI Bank Ltd 9,167,399 7.62Housing Development Finance Corporation Ltd
8,803,084 7.32
Axis Bank Ltd 4,866,258 4.05Hindalco Industries Ltd 4,575,199 3.80Hindustan Unilever Ltd 4,540,659 3.78HCL Technologies Ltd 4,069,398 3.38Tata Consultancy Services Ltd 3,836,034 3.19Mahindra & Mahindra Ltd 3,752,301 3.12
Allocation By Country of Underlying Fun Market Value % of Netas at 30 June 2021^ S$ AssetsIndia 121,755,100 101.24Others** (1,495,050) (1.24)
Total 120,260,050 100.00
** Includes any other countries and net current assets.
Allocation By Asset Class of Underlying Market Value % of NetFund as at 30 June 2021^ S$ AssetsEquities 121,753,172 101.24 Debt securities (Include accrued interest on Debt Securities)
1,936 0.00
Cash and cash equivalents (1,495,058) (1.24)
Total 120,260,050 100.00
Credit Rating of Debt Securities of Market Value % of NetUnderlying Fund as at 30 June 2021^ S$ AssetsNot applicable.
Top 10 Holdings of Underlying Fund Market Value % of Netas at 30 June 2020^ S$ AssetsReliance Industries Ltd 11,352,403 12.99Infosys Ltd 7,122,692 8.15Housing Development Finance Corporation Ltd
6,043,394 6.91
ICICI Bank Ltd 4,823,438 5.52Hindustan Unilever Ltd 4,632,075 5.30Tata Consultancy Services Ltd 4,404,927 5.04Bharti Airtel Ltd 3,874,902 4.43HCL Technologies Ltd 2,619,054 3.00Mahindra & Mahindra Ltd 2,554,905 2.92Maruti Suzuki India Ltd 2,382,023 2.73
Allocation By Industry of Underlying Fund Market Value % of Netas at 30 June 2021^ S$ AssetsBasic Materials 12,696,131 10.56Communications 3,473,002 2.89Consumer, Cyclical 8,010,460 6.66Consumer, Non-cyclical 18,110,368 15.06Energy 13,321,528 11.08Financial 35,177,884 29.25Industrial 4,668,913 3.88Technology 22,609,681 18.80Utilities 2,646,918 2.20Others** (454,835) (0.38)Total 120,260,050 100.00
** Includes any other industries and net current assets.
Fund
s Inf
orm
atio
n

94
GREATLINK LION INDIA FUND report as at 30 June 2021
Expense/Turnover RatiosExpense Ratio Turnover Ratio
30 June 2021 30 June 2020 30 June 2021 30 June 2020GreatLink Lion India Fund* 1.81% 1.61% 32.00% 91.00%Underlying Fund# ^ 1.53% 1.33% 32.00% 91.00%
Note: The expense ratio does not include (where applicable) charges for insurance coverage, brokerage and other transaction costs, performance fees, foreign exchange gains or losses, front or back end loads arising from the purchase or sale of collective investment schemes, tax deducted at source or arising out of income received, dividend and other distributions paid to unit holders and is calculated for the preceding 12 months.
* The expense ratio of the underlying fund was included to compute the final ratio.# The expense and turnover ratios of the underlying fund were based on unaudited draft accounts.
Exposure to Derivatives^ Market Value % of Net(Underlying Fund) S$ Assets
i) Market value of derivative contracts - -
ii) Net loss on derivative realised (13,420)
iii) Net gain on outstanding derivatives -
Borrowings^
Nil.
Total amount of Subscriptions and Redemptions for the period ended 30 June 2021S$
Subscriptions 1,164,423 Redemptions 3,483,223
Related-Party TransactionsInterest expenses incurred with a bank which is a related company of the Trustee was S$ 28.Bank service fees charged by a bank which is a related company of the Trustee was S$ 839.Transaction fees charged by a related company of the Trustee was S$ 28,313.Registration fees charged by a related company of the Trustee was S$17,331.Custodian fees charged by a related company of the Trustee was S$ 35,341.Valuation and administration fees charged by a related company of the Trustee was S$107,566.Cash transfer fees charged by a related company of the Trustee was S$ 14,087. The GreatLink Lion India Fund invests 100% of its net assets value in LionGlobal India Fund, which is managed By Lion Global Investors Ltd, a related company of The Great Eastern Life Assurance Co. Ltd.
Any material information that will adversely impact the valuation of the fund^
Nil.
^ Source: Lion Global Investors Ltd
Fund
s Inf
orm
atio
n
PENDING

95
Fund
s Inf
orm
atio
n
GREATLINK INCOME FOCUS FUND report as at 30 June 2021
Investments in Collective Investment Schemes
Market Value S$
% of Net Assets
Unit TrustJPMorgan Investment Funds – Global Income Fund (SGD-Hedged)
29,793,531 49.91
JPMorgan Funds – Asia Pacific Income Fund (SGD-Hedged)
29,754,130 49.84
Other net assets/(liabilities) 148,555 0.25 59,696,216 100.00
Top 10 Holdings of Underlying Fund Market Value % of Netas at 30 June 2021^ US$ AssetsJPMorgan Global Income Fund SGD-HRBC RTY Covered Call Note 07/21 306,662,972 1.10UBS RTY Covered Call Note 08/21 306,662,972 1.10BC RTY Covered Call Note 09/21 278,784,520 1.00CITI RTY Covered Call Note 08/21 278,784,520 1.00Prologis Inc. 139,392,260 0.50Taiwan Semiconductor Manufacturing Co. Ltd 139,392,260 0.50Roche Holding AG 139,392,260 0.50Samsung Electronics Co. Ltd 139,392,260 0.50Coca-Cola Co./The 111,513,808 0.40Sprint Corporation 111,513,808 0.40
JPMorgan Asia Pacific Income Fund SGD-HTaiwan Semiconductor Manufacturing Co. Ltd 138,891,176 6.30Samsung Electronics Co. Ltd 119,049,580 5.40Infosys Ltd 44,092,437 2.00Rio Tinto Group 41,887,815 1.90DBS Bank Ltd 41,887,815 1.90Ping An Insurance Group Co. of China Ltd 30,864,706 1.40China Construction Bank Corporation 30,864,706 1.40Hong Kong Exchanges & Clearing Ltd 28,660,084 1.30CLP Holdings Ltd 28,660,084 1.30BHP Group Ltd 26,455,462 1.20
Top 10 Holdings of Underlying Fund Market Value % of Netas at 30 June 2020^ US$ AssetsJPMorgan Global Income Fund SGD-HTaiwan Semiconductor Manufacturing Co. Ltd
215,909,248 0.80
Prologis Inc. 188,920,592 0.70Roche Holding AG 161,931,936 0.60Coca-Cola Co./The 134,943,280 0.50Verizon Communications Inc. 134,943,280 0.50AbbVie Inc. 134,943,280 0.50Merck & Co. Inc. 107,954,624 0.40Sprint Corporation 107,954,624 0.40Bristol-Myers Squibb 107,954,624 0.40Iberdrola 107,954,624 0.40
JPMorgan Asia Pacific Income Fund SGD-HSamsung Electronics Co. Ltd 82,052,818 4.80Taiwan Semiconductor Manufacturing Co. Ltd
75,215,083 4.40
CLP Holdings Ltd 54,701,879 3.20Hong Kong Exchanges & Clearing 46,154,710 2.70Brambles Ltd 32,479,240 1.90Ping An Insurance Group Co. of China Ltd 30,769,807 1.80Mapletree Logistics Trust 25,641,506 1.50China Mobile Ltd 25,641,506 1.50Tata Consultancy Services Ltd 23,932,072 1.40China Merchants Bank 20,513,204 1.20
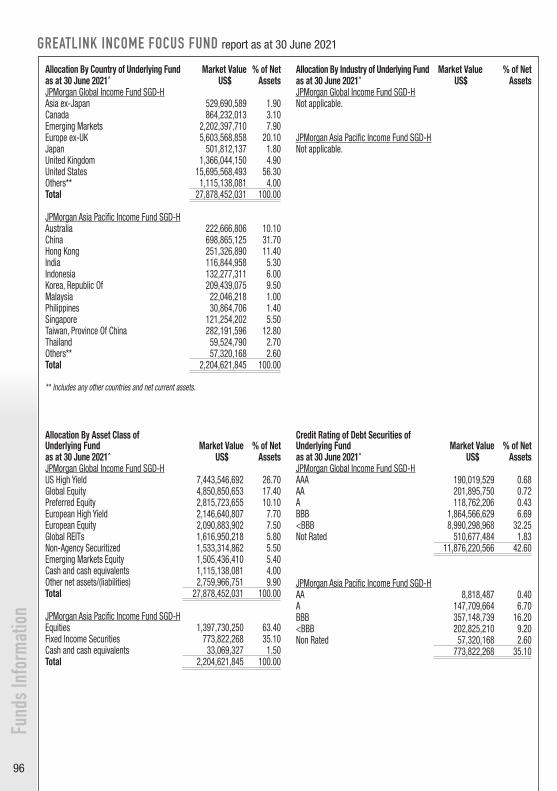
96
Fund
s Inf
orm
atio
nGREATLINK INCOME FOCUS FUND report as at 30 June 2021
Credit Rating of Debt Securities of Underlying Fund Market Value % of Netas at 30 June 2021^ US$ AssetsJPMorgan Global Income Fund SGD-HAAA 190,019,529 0.68AA 201,895,750 0.72A 118,762,206 0.43BBB 1,864,566,629 6.69<BBB 8,990,298,968 32.25Not Rated 510,677,484 1.83
11,876,220,566 42.60
JPMorgan Asia Pacific Income Fund SGD-HAA 8,818,487 0.40A 147,709,664 6.70BBB 357,148,739 16.20<BBB 202,825,210 9.20Non Rated 57,320,168 2.60
773,822,268 35.10
Allocation By Country of Underlying Fund Market Value % of Netas at 30 June 2021^ US$ AssetsJPMorgan Global Income Fund SGD-HAsia ex-Japan 529,690,589 1.90Canada 864,232,013 3.10Emerging Markets 2,202,397,710 7.90Europe ex-UK 5,603,568,858 20.10Japan 501,812,137 1.80United Kingdom 1,366,044,150 4.90United States 15,695,568,493 56.30Others** 1,115,138,081 4.00Total 27,878,452,031 100.00
JPMorgan Asia Pacific Income Fund SGD-HAustralia 222,666,806 10.10China 698,865,125 31.70Hong Kong 251,326,890 11.40India 116,844,958 5.30Indonesia 132,277,311 6.00Korea, Republic Of 209,439,075 9.50Malaysia 22,046,218 1.00Philippines 30,864,706 1.40Singapore 121,254,202 5.50Taiwan, Province Of China 282,191,596 12.80Thailand 59,524,790 2.70Others** 57,320,168 2.60Total 2,204,621,845 100.00
** Includes any other countries and net current assets.
Allocation By Industry of Underlying Fund Market Value % of Netas at 30 June 2021^ US$ AssetsJPMorgan Global Income Fund SGD-HNot applicable.
JPMorgan Asia Pacific Income Fund SGD-HNot applicable.
Allocation By Asset Class of Underlying Fund Market Value % of Netas at 30 June 2021^ US$ AssetsJPMorgan Global Income Fund SGD-HUS High Yield 7,443,546,692 26.70 Global Equity 4,850,850,653 17.40 Preferred Equity 2,815,723,655 10.10 European High Yield 2,146,640,807 7.70 European Equity 2,090,883,902 7.50 Global REITs 1,616,950,218 5.80 Non-Agency Securitized 1,533,314,862 5.50 Emerging Markets Equity 1,505,436,410 5.40 Cash and cash equivalents 1,115,138,081 4.00 Other net assets/(liabilities) 2,759,966,751 9.90 Total 27,878,452,031 100.00
JPMorgan Asia Pacific Income Fund SGD-HEquities 1,397,730,250 63.40 Fixed Income Securities 773,822,268 35.10 Cash and cash equivalents 33,069,327 1.50 Total 2,204,621,845 100.00

97
Fund
s Inf
orm
atio
n
GREATLINK INCOME FOCUS FUND report as at 30 June 2021
Expense/Turnover RatiosExpense Ratio Turnover Ratio
30 June 2021 30 June 2020 30 June 2021 30 June 2020GreatLink Income Focus Fund* 1.62% 1.62% 59.53% 61.35%Underlying Fund - JPMorgan Global Income Fund SGD-H# ^
1.42% 1.43% 67.46% 55.98%
Underlying Fund - JPMorgan Asia Pacific Income Fund SGD-H# ^
1.78% 1.78% 51.59% 66.71%
Note: The expense ratio does not include (where applicable) charges for insurance coverage, brokerage and other transaction costs, performance fees, foreign exchange gains or losses, front or back end loads arising from the purchase or sale of collective investment schemes, tax deducted at source or arising out of income received, dividend and other distributions paid to unit holders and is calculated for the preceding 12 months.
* The expense ratio of the underlying fund was included to compute the final ratio.# The expense ratios of the underlying funds JPMorgan Global Income fund SGD-H and JPMorgan Asia Pacific Income Fund SGH-H were computed for period ended 31 December
2020, based on audited accounts and unaudited draft accounts respectively. The ratios for period ended 30 June 2021 are not available in time for publication.
Exposure to Derivatives^ Market Value % of Net(Underlying Fund) Eur€ Assets
JPMorgan Global Income Fund SGD-H¹i) Market value of derivative contracts - Foreign Exchange Forward Contracts 135,334,686 0.57 - Futures 3,010,705 0.01
ii) Net gain on derivative realised -
iii) Net gain on outstanding derivatives 138,345,391
Market Value % of Net US$ Assets
JPMorgan Asia Pacific Income Fund SGD-H²i) Market value of derivative contracts - Foreign Exchange Forward Contracts 12,612,027 0.68
ii) Net gain on derivative realised -
iii) Net gain on outstanding derivatives 12,612,027
Borrowings^
Nil.
Total amount of Subscriptions and Redemptions for the period ended 30 June 2021S$
Subscriptions 31,832,595 Redemptions 26,136,584
Related-Party TransactionsNot applicable.
Any material information that will adversely impact the valuation of the fund^
Nil.
^ Source: JPMorgan Asset Management (Singapore) Ltd . There will be some slight/negligible differences due to decimal rounding issues.1 The information is based on the Fund's AUM 23,605,756,651 (in EUR terms), which is extracted from the JPMorgan Investment Funds' audited Semi-Annual Report dated 31
December 2020. The information as at 30 June 2021 is not available in time for publication.2 The information is based on the Fund's AUM 1,849,985,354 (in USD terms), which is extracted from the JPMorgan Investment Funds' unaudited Annual Report dated 31
December 2020. The information as at 30 June 2021 is not available in time for publication.
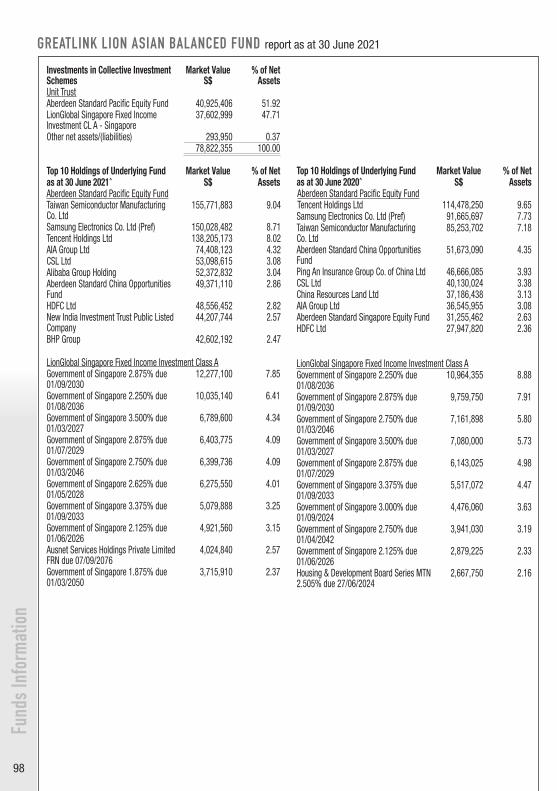
98
GREATLINK LION ASIAN BALANCED FUND report as at 30 June 2021
Top 10 Holdings of Underlying Fund Market Value % of Netas at 30 June 2020^ S$ AssetsAberdeen Standard Pacific Equity Fund Tencent Holdings Ltd 114,478,250 9.65 Samsung Electronics Co. Ltd (Pref) 91,665,697 7.73 Taiwan Semiconductor Manufacturing Co. Ltd
85,253,702 7.18
Aberdeen Standard China Opportunities Fund
51,673,090 4.35
Ping An Insurance Group Co. of China Ltd 46,666,085 3.93 CSL Ltd 40,130,024 3.38 China Resources Land Ltd 37,186,438 3.13 AIA Group Ltd 36,545,955 3.08 Aberdeen Standard Singapore Equity Fund 31,255,462 2.63 HDFC Ltd 27,947,820 2.36
LionGlobal Singapore Fixed Income Investment Class AGovernment of Singapore 2.250% due 01/08/2036
10,964,355 8.88
Government of Singapore 2.875% due 01/09/2030
9,759,750 7.91
Government of Singapore 2.750% due 01/03/2046
7,161,898 5.80
Government of Singapore 3.500% due 01/03/2027
7,080,000 5.73
Government of Singapore 2.875% due 01/07/2029
6,143,025 4.98
Government of Singapore 3.375% due 01/09/2033
5,517,072 4.47
Government of Singapore 3.000% due 01/09/2024
4,476,060 3.63
Government of Singapore 2.750% due 01/04/2042
3,941,030 3.19
Government of Singapore 2.125% due 01/06/2026
2,879,225 2.33
Housing & Development Board Series MTN 2.505% due 27/06/2024
2,667,750 2.16
Investments in Collective Investment Schemes
Market Value S$
% of Net Assets
Unit TrustAberdeen Standard Pacific Equity Fund 40,925,406 51.92LionGlobal Singapore Fixed Income Investment CL A - Singapore
37,602,999 47.71
Other net assets/(liabilities) 293,950 0.37 78,822,355 100.00
Top 10 Holdings of Underlying Fund Market Value % of Netas at 30 June 2021^ S$ AssetsAberdeen Standard Pacific Equity FundTaiwan Semiconductor Manufacturing Co. Ltd
155,771,883 9.04
Samsung Electronics Co. Ltd (Pref) 150,028,482 8.71 Tencent Holdings Ltd 138,205,173 8.02 AIA Group Ltd 74,408,123 4.32 CSL Ltd 53,098,615 3.08 Alibaba Group Holding 52,372,832 3.04 Aberdeen Standard China Opportunities Fund
49,371,110 2.86
HDFC Ltd 48,556,452 2.82 New India Investment Trust Public Listed Company
44,207,744 2.57
BHP Group 42,602,192 2.47
LionGlobal Singapore Fixed Income Investment Class AGovernment of Singapore 2.875% due 01/09/2030
12,277,100 7.85
Government of Singapore 2.250% due 01/08/2036
10,035,140 6.41
Government of Singapore 3.500% due 01/03/2027
6,789,600 4.34
Government of Singapore 2.875% due 01/07/2029
6,403,775 4.09
Government of Singapore 2.750% due 01/03/2046
6,399,736 4.09
Government of Singapore 2.625% due 01/05/2028
6,275,550 4.01
Government of Singapore 3.375% due 01/09/2033
5,079,888 3.25
Government of Singapore 2.125% due 01/06/2026
4,921,560 3.15
Ausnet Services Holdings Private Limited FRN due 07/09/2076
4,024,840 2.57
Government of Singapore 1.875% due 01/03/2050
3,715,910 2.37
Fund
s Inf
orm
atio
n
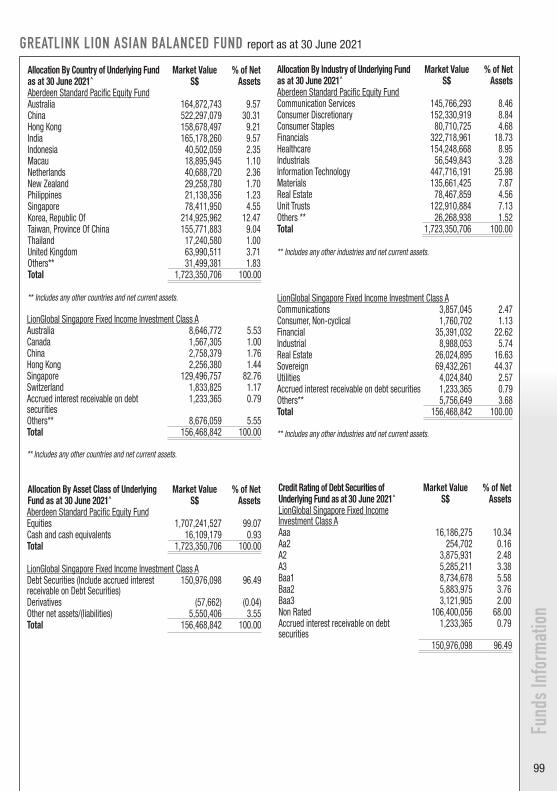
99
GREATLINK LION ASIAN BALANCED FUND report as at 30 June 2021
Allocation By Country of Underlying Fund Market Value % of Netas at 30 June 2021^ S$ AssetsAberdeen Standard Pacific Equity FundAustralia 164,872,743 9.57 China 522,297,079 30.31 Hong Kong 158,678,497 9.21 India 165,178,260 9.57 Indonesia 40,502,059 2.35 Macau 18,895,945 1.10 Netherlands 40,688,720 2.36 New Zealand 29,258,780 1.70 Philippines 21,138,356 1.23 Singapore 78,411,950 4.55 Korea, Republic Of 214,925,962 12.47 Taiwan, Province Of China 155,771,883 9.04 Thailand 17,240,580 1.00 United Kingdom 63,990,511 3.71 Others** 31,499,381 1.83 Total 1,723,350,706 100.00
** Includes any other countries and net current assets.
LionGlobal Singapore Fixed Income Investment Class AAustralia 8,646,772 5.53Canada 1,567,305 1.00China 2,758,379 1.76Hong Kong 2,256,380 1.44Singapore 129,496,757 82.76Switzerland 1,833,825 1.17Accrued interest receivable on debt securities
1,233,365 0.79
Others** 8,676,059 5.55Total 156,468,842 100.00
** Includes any other countries and net current assets.
Allocation By Asset Class of Underlying Market Value % of NetFund as at 30 June 2021^ S$ AssetsAberdeen Standard Pacific Equity FundEquities 1,707,241,527 99.07 Cash and cash equivalents 16,109,179 0.93 Total 1,723,350,706 100.00
LionGlobal Singapore Fixed Income Investment Class ADebt Securities (Include accrued interest receivable on Debt Securities)
150,976,098 96.49
Derivatives (57,662) (0.04)Other net assets/(liabilities) 5,550,406 3.55Total 156,468,842 100.00
Allocation By Industry of Underlying Fund Market Value % of Netas at 30 June 2021^ S$ AssetsAberdeen Standard Pacific Equity FundCommunication Services 145,766,293 8.46 Consumer Discretionary 152,330,919 8.84 Consumer Staples 80,710,725 4.68 Financials 322,718,961 18.73 Healthcare 154,248,668 8.95 Industrials 56,549,843 3.28 Information Technology 447,716,191 25.98 Materials 135,661,425 7.87 Real Estate 78,467,859 4.56 Unit Trusts 122,910,884 7.13 Others ** 26,268,938 1.52 Total 1,723,350,706 100.00
** Includes any other industries and net current assets.
LionGlobal Singapore Fixed Income Investment Class ACommunications 3,857,045 2.47Consumer, Non-cyclical 1,760,702 1.13Financial 35,391,032 22.62Industrial 8,988,053 5.74Real Estate 26,024,895 16.63Sovereign 69,432,261 44.37Utilities 4,024,840 2.57Accrued interest receivable on debt securities 1,233,365 0.79Others** 5,756,649 3.68Total 156,468,842 100.00
** Includes any other industries and net current assets.
Credit Rating of Debt Securities of Market Value % of NetUnderlying Fund as at 30 June 2021^ S$ AssetsLionGlobal Singapore Fixed Income Investment Class AAaa 16,186,275 10.34Aa2 254,702 0.16A2 3,875,931 2.48A3 5,285,211 3.38Baa1 8,734,678 5.58Baa2 5,883,975 3.76Baa3 3,121,905 2.00Non Rated 106,400,056 68.00Accrued interest receivable on debt securities
1,233,365 0.79
150,976,098 96.49
Fund
s Inf
orm
atio
n

100
GREATLINK LION ASIAN BALANCED FUND report as at 30 June 2021
Fund
s Inf
orm
atio
n
Expense/Turnover RatiosExpense Ratio Turnover Ratio
30 June 2021 30 June 2020 30 June 2021 30 June 2020GreatLink Lion Asian Balanced Fund * 1.31% 1.39% 24.13% 14.32%Underlying Fund - Aberdeen Standard Pacific Equity Fund# ^
1.64% 1.63% 20.26% 18.64%
Underlying Fund - LionGlobal Singapore Fixed Income Investment Class A# ^
0.60% 0.67% 28.00% 10.00%
Note: The expense ratio does not include (where applicable) charges for insurance coverage, brokerage and other transaction costs, performance fees, foreign exchange gains or losses, front or back end loads arising from the purchase or sale of collective investment schemes, tax deducted at source or arising out of income received, dividend and other distributions paid to unit holders and is calculated for the preceding 12 months.
* The expense and turnover ratios of the two underlying funds based on 50% of investments into each underlying fund were included to compute the final ratio.# The expense and turnover ratios of the underlying fund - Aberdeen Pacific Equity were computed for the period ended 31 March 2021 based on unaudited accounts. The ratios
for the period ended 30 June 2021 are not available. The expense and turnover ratios of the underlying fund - LionGlobal Singapore Fixed Income Investment Class A were based on unaudited draft accounts.
Exposure to Derivatives^ Market Value % of Net(Underlying Fund) S$ AssetsAberdeen Standard Pacific EquityNil.
LionGlobal Singapore Fixed Income Investment Class Ai) Market value of derivative contracts
- Foreign exchange forward contracts (57,662) (0.04)
ii) Net gain on derivative realised 3,499
iii) Net gain on outstanding derivatives 57,662
Borrowings^
Nil.
Total amount of Subscriptions and Redemptions for the period ended 30 June 2021S$
Subscriptions 7,404,710 Redemptions 3,384,950
Related-Party TransactionsThe GreatLink Lion Asian Balanced Fund invests 52.17% of its net assets value in Aberdeen Standard Pacific Equity Fund and 47.83% of its net assets in LionGlobal Singapore Fixed Income Investment Class A, which is managed by Lion Global Investors Ltd, a related company of The Great Eastern Life Assurance Co. Ltd.
LionGlobal Singapore Fixed Income Investment Class ATransaction fees charged by the Trustee was S$ 2,333.Registration fees charged by a related company of the Trustee was S$ 21,568.Custodian fees charged by a related company of the Trustee was S$ 5,839.Valuation and administration fees charged by a related company of the Trustee was S$ 9,354.Bank service fees charged by a bank which is a related company of the Trustee was S$ 546.Cash transfer fees charged by a related company of the Trustee was S$ 7,579.
Any material information that will adversely impact the valuation of the fund^
Nil.
^ Source: Aberdeen Standard Investments (Asia) Limited, Lion Global Investors Ltd
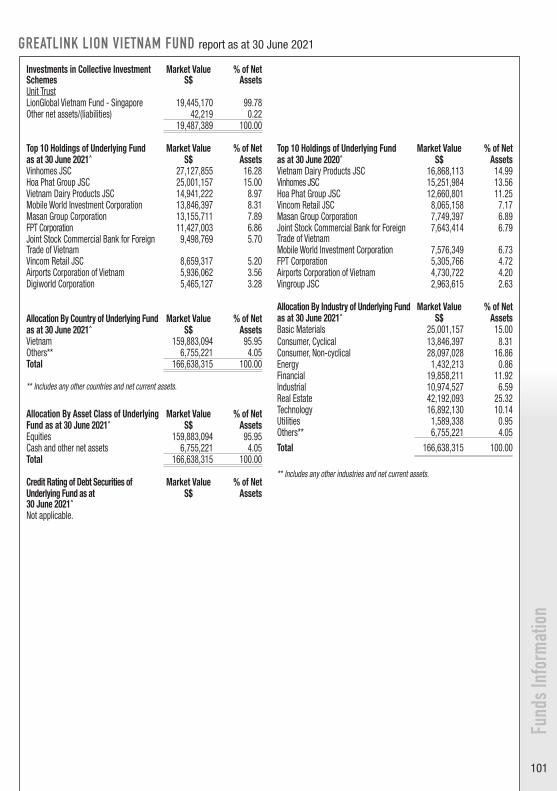
101
Fund
s Inf
orm
atio
n
GREATLINK LION VIETNAM FUND report as at 30 June 2021
Investments in Collective Investment Schemes
Market Value S$
% of Net Assets
Unit TrustLionGlobal Vietnam Fund - Singapore 19,445,170 99.78 Other net assets/(liabilities) 42,219 0.22
19,487,389 100.00
Top 10 Holdings of Underlying Fund Market Value % of Netas at 30 June 2021^ S$ AssetsVinhomes JSC 27,127,855 16.28Hoa Phat Group JSC 25,001,157 15.00Vietnam Dairy Products JSC 14,941,222 8.97Mobile World Investment Corporation 13,846,397 8.31Masan Group Corporation 13,155,711 7.89FPT Corporation 11,427,003 6.86Joint Stock Commercial Bank for Foreign Trade of Vietnam
9,498,769 5.70
Vincom Retail JSC 8,659,317 5.20Airports Corporation of Vietnam 5,936,062 3.56Digiworld Corporation 5,465,127 3.28
Allocation By Country of Underlying Fund Market Value % of Netas at 30 June 2021^ S$ AssetsVietnam 159,883,094 95.95Others** 6,755,221 4.05Total 166,638,315 100.00
** Includes any other countries and net current assets.
Allocation By Asset Class of Underlying Market Value % of NetFund as at 30 June 2021^ S$ AssetsEquities 159,883,094 95.95Cash and other net assets 6,755,221 4.05Total 166,638,315 100.00
Credit Rating of Debt Securities of Market Value % of NetUnderlying Fund as at 30 June 2021^
S$ Assets
Not applicable.
Top 10 Holdings of Underlying Fund Market Value % of Netas at 30 June 2020^ S$ AssetsVietnam Dairy Products JSC 16,868,113 14.99Vinhomes JSC 15,251,984 13.56Hoa Phat Group JSC 12,660,801 11.25Vincom Retail JSC 8,065,158 7.17Masan Group Corporation 7,749,397 6.89Joint Stock Commercial Bank for Foreign Trade of Vietnam
7,643,414 6.79
Mobile World Investment Corporation 7,576,349 6.73FPT Corporation 5,305,766 4.72Airports Corporation of Vietnam 4,730,722 4.20Vingroup JSC 2,963,615 2.63
Allocation By Industry of Underlying Fund Market Value % of Netas at 30 June 2021^ S$ AssetsBasic Materials 25,001,157 15.00Consumer, Cyclical 13,846,397 8.31Consumer, Non-cyclical 28,097,028 16.86Energy 1,432,213 0.86Financial 19,858,211 11.92Industrial 10,974,527 6.59Real Estate 42,192,093 25.32Technology 16,892,130 10.14Utilities 1,589,338 0.95Others** 6,755,221 4.05Total 166,638,315 100.00
** Includes any other industries and net current assets.

102
Fund
s Inf
orm
atio
nGREATLINK LION VIETNAM FUND report as at 30 June 2021
Expense/Turnover RatiosExpense Ratio Turnover Ratio
30 June 2021 30 June 2020 30 June 2021 30 June 2020GreatLink Lion Vietnam Fund* 1.74% 1.80% 1.00% 5.00%Underlying Fund# ^ 1.72% 1.78% 1.00% 5.00%
Note: The expense ratio does not include (where applicable) charges for insurance coverage, brokerage and other transaction costs, performance fees, foreign exchange gains or losses, front or back end loads arising from the purchase or sale of collective investment schemes, tax deducted at source or arising out of income received, dividend and other distributions paid to unit holders and is calculated for the preceding 12 months.
# The expense and turnover ratios of the underlying fund were based on unaudited draft accounts.
Exposure to Derivatives^ Market Value % of Net(Underlying Fund) S$ Assets
i) Market value of derivative contracts - -
ii) Net loss on derivative realised (18,653)
iii) Net gain on outstanding derivatives
- Borrowings^
Nil.
Total amount of Subscriptions and Redemptions for the period ended 30 June 2021S$
Subscriptions 2,919,981 Redemptions 1,191,761
Related-Party Transactions Transaction fees charged by the Trustee was S$ 1,104.Registration fee charged by a related company of the Trustee was S$ 17,476.Valuation and administration fees charged by the Trustee was S$ 15,231.Custodian fees charged by a related company of the Trustee was S$ 47,397.Cash transfer fees charged by a related company of the Trustee was S$ 40,023.Bank service fees charged by a bank which is a related company of the Trustee was S$ 406.Cash and bank balances placed with a financial institution related to the Trustee was S$7,465,302.
The GreatLink Lion Vietnam Fund invests 100% of its net assets value in LionGlobal Vietnam Fund, which is managed By Lion Global Investors Ltd, a related company of The Great Eastern Life Assurance Co. Ltd.
Any material information that will adversely impact the valuation of the fund^
Nil.
^ Source: Lion Global Investors Ltd
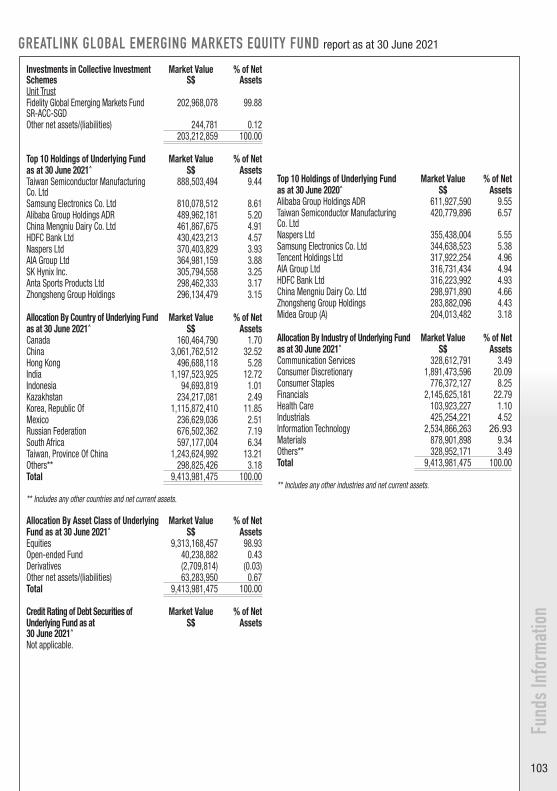
103
Fund
s Inf
orm
atio
n
GREATLINK GLOBAL EMERGING MARKETS EQUITY FUND report as at 30 June 2021
Investments in Collective Investment Schemes
Market Value S$
% of Net Assets
Unit TrustFidelity Global Emerging Markets Fund SR-ACC-SGD
202,968,078 99.88
Other net assets/(liabilities) 244,781 0.12 203,212,859 100.00
Top 10 Holdings of Underlying Fund Market Value % of Netas at 30 June 2021^ S$ AssetsTaiwan Semiconductor Manufacturing Co. Ltd
888,503,494 9.44
Samsung Electronics Co. Ltd 810,078,512 8.61Alibaba Group Holdings ADR 489,962,181 5.20China Mengniu Dairy Co. Ltd 461,867,675 4.91HDFC Bank Ltd 430,423,213 4.57Naspers Ltd 370,403,829 3.93AIA Group Ltd 364,981,159 3.88SK Hynix Inc. 305,794,558 3.25Anta Sports Products Ltd 298,462,333 3.17Zhongsheng Group Holdings 296,134,479 3.15
Allocation By Country of Underlying Fund Market Value % of Netas at 30 June 2021^ S$ AssetsCanada 160,464,790 1.70China 3,061,762,512 32.52Hong Kong 496,688,118 5.28India 1,197,523,925 12.72Indonesia 94,693,819 1.01Kazakhstan 234,217,081 2.49Korea, Republic Of 1,115,872,410 11.85Mexico 236,629,036 2.51Russian Federation 676,502,362 7.19South Africa 597,177,004 6.34Taiwan, Province Of China 1,243,624,992 13.21Others** 298,825,426 3.18Total 9,413,981,475 100.00
** Includes any other countries and net current assets.
Allocation By Asset Class of Underlying Market Value % of NetFund as at 30 June 2021^ S$ AssetsEquities 9,313,168,457 98.93 Open-ended Fund 40,238,882 0.43 Derivatives (2,709,814) (0.03)Other net assets/(liabilities) 63,283,950 0.67 Total 9,413,981,475 100.00
Credit Rating of Debt Securities of Market Value % of NetUnderlying Fund as at 30 June 2021^
S$ Assets
Not applicable.
Top 10 Holdings of Underlying Fund Market Value % of Netas at 30 June 2020^ S$ AssetsAlibaba Group Holdings ADR 611,927,590 9.55Taiwan Semiconductor Manufacturing Co. Ltd
420,779,896 6.57
Naspers Ltd 355,438,004 5.55Samsung Electronics Co. Ltd 344,638,523 5.38Tencent Holdings Ltd 317,922,254 4.96AIA Group Ltd 316,731,434 4.94HDFC Bank Ltd 316,223,992 4.93China Mengniu Dairy Co. Ltd 298,971,890 4.66Zhongsheng Group Holdings 283,882,096 4.43Midea Group (A) 204,013,482 3.18
Allocation By Industry of Underlying Fund Market Value % of Netas at 30 June 2021^ S$ AssetsCommunication Services 328,612,791 3.49Consumer Discretionary 1,891,473,596 20.09Consumer Staples 776,372,127 8.25Financials 2,145,625,181 22.79Health Care 103,923,227 1.10Industrials 425,254,221 4.52Information Technology 2,534,866,263 26.93Materials 878,901,898 9.34Others** 328,952,171 3.49Total 9,413,981,475 100.00
** Includes any other industries and net current assets.

104
Fund
s Inf
orm
atio
nGREATLINK GLOBAL EMERGING MARKETS EQUITY FUND report as at 30 June 2021
Expense/Turnover RatiosExpense Ratio Turnover Ratio
30 June 2021 30 June 2020 30 June 2021 30 June 2020GreatLink Global Emerging Markets Equity Fund* 1.74% 1.75% 36.70% 49.01%Underlying Fund# ^ 1.72% 1.72% 36.70% 49.01%
Note: The expense ratio does not include (where applicable) charges for insurance coverage, brokerage and other transaction costs, performance fees, foreign exchange gains or losses, front or back end loads arising from the purchase or sale of collective investment schemes, tax deducted at source or arising out of income received, dividend and other distributions paid to unit holders and is calculated for the preceding 12 months.
* The expense ratio of the underlying fund was included to compute the final ratio. # The expense and turnover ratios of the underlying fund were computed for the period ended 30 April 2021. The ratios for the period ended 30 June 2021 are not available.^ The expense and turnover ratios of the underlying fund were based on audited accounts.
Exposure to Derivatives^ Market Value % of Net(Underlying Fund) S$ Assets
i) Market value of derivative contracts - Foreign Exchange Forward Contracts (2,709,814) (0.03)
ii) Net loss on derivative realised (1,516,480)
iii) Net loss on outstanding derivatives (2,709,814)
Borrowings^
Bank overdrafts of $1,938,838.29 which is less than 1% of the underlying fund's NAV as of 30 June 2021.
Total amount of Subscriptions and Redemptions for the period ended 30 June 2021S$
Subscriptions 13,516,398 Redemptions 8,914,373
Related-Party Transactions^
Not applicable.
Any material information that will adversely impact the valuation of the fund^
Nil.
^ Source: FIL Fund Management Limited
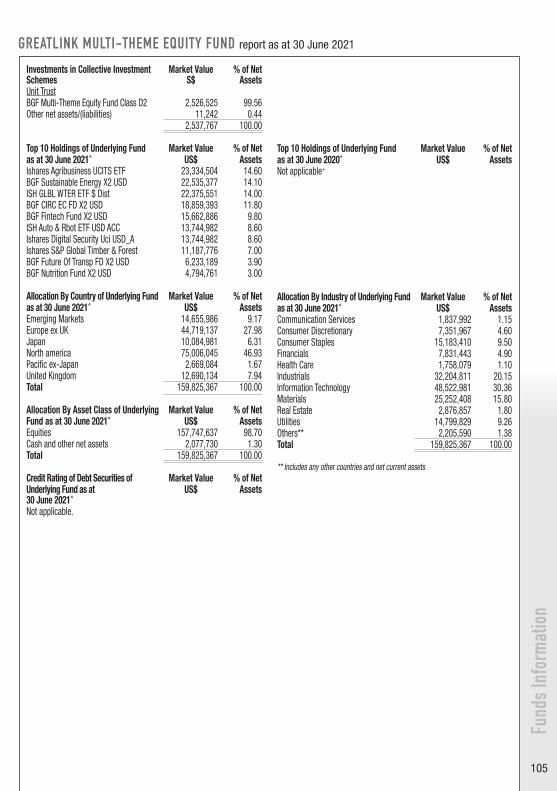
105
Fund
s Inf
orm
atio
n
GREATLINK MULTI-THEME EQUITY FUND report as at 30 June 2021
Investments in Collective Investment Schemes
Market Value S$
% of Net Assets
Unit TrustBGF Multi-Theme Equity Fund Class D2 2,526,525 99.56 Other net assets/(liabilities) 11,242 0.44
2,537,767 100.00
Top 10 Holdings of Underlying Fund Market Value % of Netas at 30 June 2021^ US$ AssetsIshares Agribusiness UCITS ETF 23,334,504 14.60BGF Sustainable Energy X2 USD 22,535,377 14.10ISH GLBL WTER ETF $ Dist 22,375,551 14.00BGF CIRC EC FD X2 USD 18,859,393 11.80BGF Fintech Fund X2 USD 15,662,886 9.80ISH Auto & Rbot ETF USD ACC 13,744,982 8.60Ishares Digital Security Uci USD_A 13,744,982 8.60Ishares S&P Global Timber & Forest 11,187,776 7.00BGF Future Of Transp FD X2 USD 6,233,189 3.90BGF Nutrition Fund X2 USD 4,794,761 3.00
Allocation By Country of Underlying Fund Market Value % of Netas at 30 June 2021^ US$ AssetsEmerging Markets 14,655,986 9.17Europe ex UK 44,719,137 27.98Japan 10,084,981 6.31North america 75,006,045 46.93Pacific ex-Japan 2,669,084 1.67United Kingdom 12,690,134 7.94Total 159,825,367 100.00
Allocation By Asset Class of Underlying Market Value % of NetFund as at 30 June 2021^ US$ AssetsEquities 157,747,637 98.70Cash and other net assets 2,077,730 1.30 Total 159,825,367 100.00
Credit Rating of Debt Securities of Market Value % of NetUnderlying Fund as at 30 June 2021^
US$ Assets
Not applicable.
Top 10 Holdings of Underlying Fund Market Value % of Netas at 30 June 2020^ US$ AssetsNot applicable+
Allocation By Industry of Underlying Fund Market Value % of Netas at 30 June 2021^ US$ AssetsCommunication Services 1,837,992 1.15Consumer Discretionary 7,351,967 4.60Consumer Staples 15,183,410 9.50Financials 7,831,443 4.90Health Care 1,758,079 1.10Industrials 32,204,811 20.15Information Technology 48,522,981 30.36Materials 25,252,408 15.80Real Estate 2,876,857 1.80Utilities 14,799,829 9.26Others** 2,205,590 1.38Total 159,825,367 100.00
** Includes any other countries and net current assets
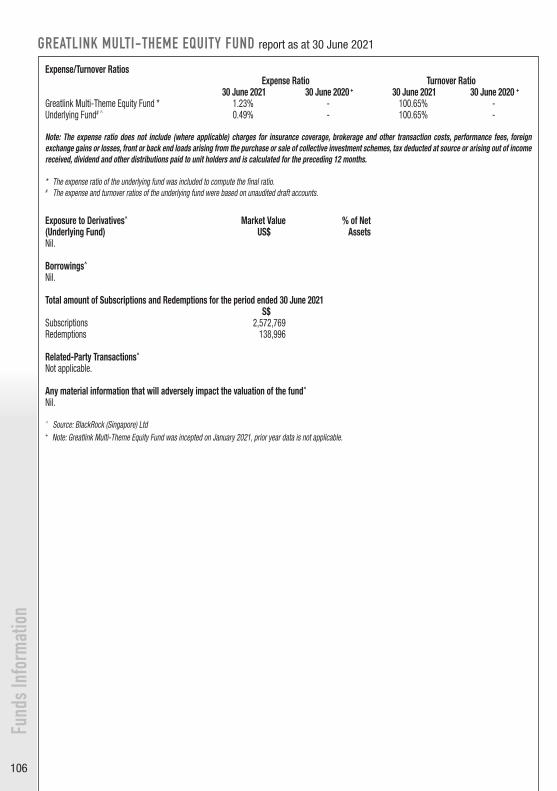
106
Fund
s Inf
orm
atio
n
Expense/Turnover RatiosExpense Ratio Turnover Ratio
30 June 2021 30 June 2020 + 30 June 2021 30 June 2020 +Greatlink Multi-Theme Equity Fund * 1.23% - 100.65% -Underlying Fund# ^ 0.49% - 100.65% -
Note: The expense ratio does not include (where applicable) charges for insurance coverage, brokerage and other transaction costs, performance fees, foreign exchange gains or losses, front or back end loads arising from the purchase or sale of collective investment schemes, tax deducted at source or arising out of income received, dividend and other distributions paid to unit holders and is calculated for the preceding 12 months. * The expense ratio of the underlying fund was included to compute the final ratio. # The expense and turnover ratios of the underlying fund were based on unaudited draft accounts.
Exposure to Derivatives^ Market Value % of Net(Underlying Fund) US$ AssetsNil.
Borrowings^
Nil.
Total amount of Subscriptions and Redemptions for the period ended 30 June 2021S$
Subscriptions 2,572,769 Redemptions 138,996
Related-Party Transactions^
Not applicable.
Any material information that will adversely impact the valuation of the fund^
Nil.
^ Source: BlackRock (Singapore) Ltd+ Note: Greatlink Multi-Theme Equity Fund was incepted on January 2021, prior year data is not applicable.
GREATLINK MULTI-THEME EQUITY FUND report as at 30 June 2021
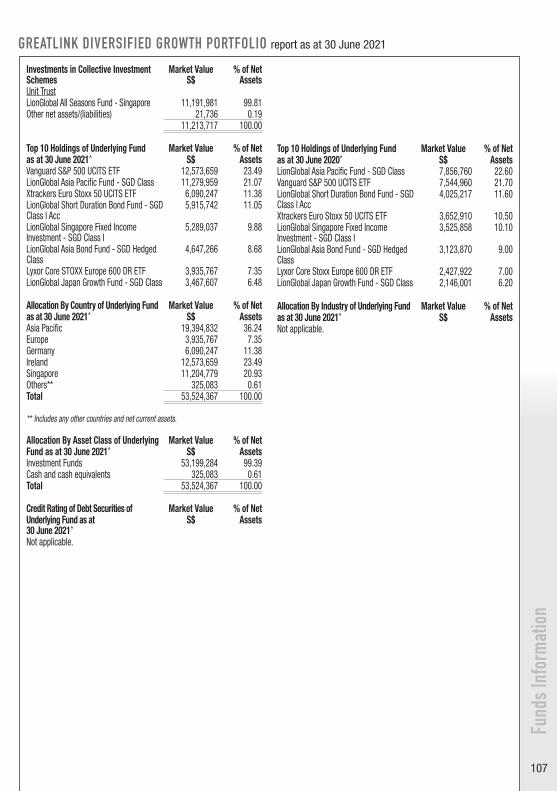
107
Fund
s Inf
orm
atio
n
GREATLINK DIVERSIFIED GROWTH PORTFOLIO report as at 30 June 2021
Investments in Collective Investment Schemes
Market Value S$
% of Net Assets
Unit TrustLionGlobal All Seasons Fund - Singapore 11,191,981 99.81 Other net assets/(liabilities) 21,736 0.19
11,213,717 100.00
Top 10 Holdings of Underlying Fund Market Value % of Netas at 30 June 2021^ S$ AssetsVanguard S&P 500 UCITS ETF 12,573,659 23.49LionGlobal Asia Pacific Fund - SGD Class 11,279,959 21.07Xtrackers Euro Stoxx 50 UCITS ETF 6,090,247 11.38LionGlobal Short Duration Bond Fund - SGD Class I Acc
5,915,742 11.05
LionGlobal Singapore Fixed Income Investment - SGD Class I
5,289,037 9.88
LionGlobal Asia Bond Fund - SGD Hedged Class
4,647,266 8.68
Lyxor Core STOXX Europe 600 DR ETF 3,935,767 7.35LionGlobal Japan Growth Fund - SGD Class 3,467,607 6.48
Allocation By Country of Underlying Fund Market Value % of Netas at 30 June 2021^ S$ AssetsAsia Pacific 19,394,832 36.24Europe 3,935,767 7.35Germany 6,090,247 11.38Ireland 12,573,659 23.49Singapore 11,204,779 20.93Others** 325,083 0.61Total 53,524,367 100.00
** Includes any other countries and net current assets.
Allocation By Asset Class of Underlying Market Value % of NetFund as at 30 June 2021^ S$ AssetsInvestment Funds 53,199,284 99.39Cash and cash equivalents 325,083 0.61Total 53,524,367 100.00
Credit Rating of Debt Securities of Market Value % of NetUnderlying Fund as at 30 June 2021^
S$ Assets
Not applicable.
Top 10 Holdings of Underlying Fund Market Value % of Netas at 30 June 2020^ S$ AssetsLionGlobal Asia Pacific Fund - SGD Class 7,856,760 22.60Vanguard S&P 500 UCITS ETF 7,544,960 21.70LionGlobal Short Duration Bond Fund - SGD Class I Acc
4,025,217 11.60
Xtrackers Euro Stoxx 50 UCITS ETF 3,652,910 10.50LionGlobal Singapore Fixed Income Investment - SGD Class I
3,525,858 10.10
LionGlobal Asia Bond Fund - SGD Hedged Class
3,123,870 9.00
Lyxor Core Stoxx Europe 600 DR ETF 2,427,922 7.00LionGlobal Japan Growth Fund - SGD Class 2,146,001 6.20
Allocation By Industry of Underlying Fund Market Value % of Netas at 30 June 2021^ S$ AssetsNot applicable.

108
Fund
s Inf
orm
atio
n
Expense/Turnover RatiosExpense Ratio Turnover Ratio
30 June 2021 30 June 2020 30 June 2021 30 June 2020GreatLink Diversified Growth Fund#* 0.70% 0.77% 7.00% 10.00%Underlying Fund# ^ 0.42% 0.49% 7.00% 10.00%
Note: The expense ratio does not include (where applicable) charges for insurance coverage, brokerage and other transaction costs, performance fees, foreign exchange gains or losses, front or back end loads arising from the purchase or sale of collective investment schemes, tax deducted at source or arising out of income received, dividend and other distributions paid to unit holders and is calculated for the preceding 12 months.
* The expense ratio of the underlying fund was included to compute the final ratio. # The expense and turnover ratios of the underlying fund were based on unaudited draft accounts.
Exposure to Derivatives^ Market Value % of Net(Underlying Fund) S$ Assets
i) Market value of derivative contracts - -
ii) Net gain on derivative realised 2,194
iii) Net gain on outstanding derivatives -
Borrowings^
Nil.
Total amount of Subscriptions and Redemptions for the period ended 30 June 2021S$
Subscriptions 3,384,306 Redemptions 322,422
Related-Party Transactions^
Transaction fees charged by the Trustee was S$ 455.Custodian fees charged by a related company of the Trustee was S$ 1,095.Registration fee charged by a related company of the Trustee was S$ 1,189.Valuation and administration fees charged by the Trustee was S$ 4,855.Bank service fees charged by a bank which is a related company of the Trustee was S$ 373.Cash transfer fees charged by a related company of the Trustee was S$ 908.
The GreatLink Diversified Growth Portfolio invests 100% of its net assets value in LionGlobal All Seasons Fund, which is managed By Lion Global Investors Ltd, a related company of The Great Eastern Life Assurance Co. Ltd.
Any material information that will adversely impact the valuation of the fund^
Nil.
^ Source: Lion Global Investors Ltd
GREATLINK DIVERSIFIED GROWTH PORTFOLIO report as at 30 June 2021
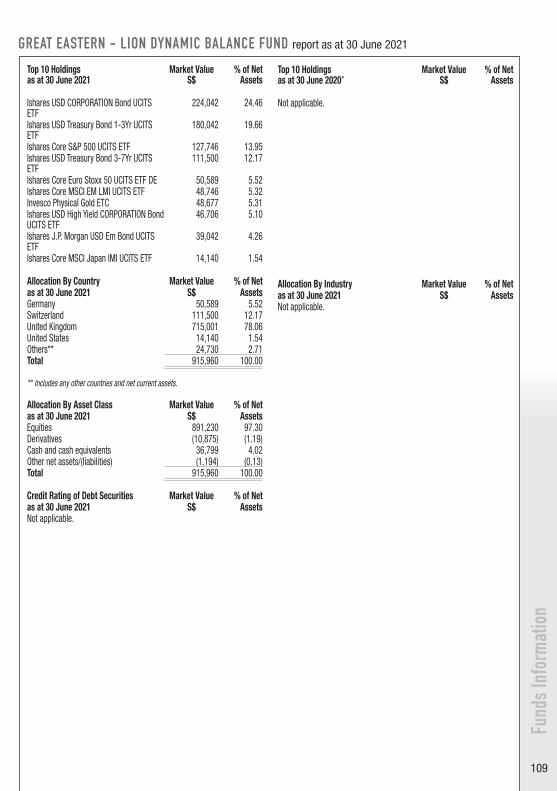
109
Fund
s Inf
orm
atio
n
Top 10 Holdings as at 30 June 2021
Market ValueS$
% of NetAssets
Ishares USD CORPORATION Bond UCITS ETF
224,042 24.46
Ishares USD Treasury Bond 1-3Yr UCITS ETF
180,042 19.66
Ishares Core S&P 500 UCITS ETF 127,746 13.95 Ishares USD Treasury Bond 3-7Yr UCITS ETF
111,500 12.17
Ishares Core Euro Stoxx 50 UCITS ETF DE 50,589 5.52 Ishares Core MSCI EM LMI UCITS ETF 48,746 5.32 Invesco Physical Gold ETC 48,677 5.31 Ishares USD High Yield CORPORATION Bond UCITS ETF
46,706 5.10
Ishares J.P. Morgan USD Em Bond UCITS ETF
39,042 4.26
Ishares Core MSCI Japan IMI UCITS ETF 14,140 1.54
Allocation By Country Market Value % of Netas at 30 June 2021 S$ AssetsGermany 50,589 5.52 Switzerland 111,500 12.17 United Kingdom 715,001 78.06 United States 14,140 1.54 Others** 24,730 2.71 Total 915,960 100.00
** Includes any other countries and net current assets.
Allocation By Asset Class Market Value % of Netas at 30 June 2021 S$ AssetsEquities 891,230 97.30 Derivatives (10,875) (1.19)Cash and cash equivalents 36,799 4.02 Other net assets/(liabilities) (1,194) (0.13)Total 915,960 100.00
Credit Rating of Debt Securities Market Value % of Netas at 30 June 2021 S$ AssetsNot applicable.
Top 10 Holdings as at 30 June 2020^
Market ValueS$
% of NetAssets
Not applicable.
Allocation By Industry Market Value % of Netas at 30 June 2021 S$ AssetsNot applicable.
GREAT EASTERN - LION DYNAMIC BALANCE FUND report as at 30 June 2021

110
Fund
s Inf
orm
atio
nGREAT EASTERN - LION DYNAMIC BALANCE FUND report as at 30 June 2021
Expense/Turnover RatiosExpense Ratio Turnover Ratio
30 June 2021 30 June 2020^ 30 June 2021 30 June 2020^
Great Eastern - Lion Dynamic Balanced Fund 0.69% - 70.10% -
Note: The expense ratio does not include (where applicable) charges for insurance coverage, brokerage and other transaction costs, performance fees, foreign exchange gains or losses, front or back end loads arising from the purchase or sale of collective investment schemes, tax deducted at source or arising out of income received, dividend and other distributions paid to unit holders and is calculated for the preceding 12 months.
Exposure to Derivatives Market Value % of NetS$ Assets
i) Market value of derivative contracts - Foreign Exchange Forward Contracts (10,875) (1.19)
ii) Net gain on derivative realised 4,169
iii) Net loss on outstanding derivatives (17,811)
Investments in Collective Investment SchemesNot applicable.
BorrowingsNil.
Total amount of Subscriptions and Redemptions for the year ended 30 June 2021S$
Subscriptions 566,805 Redemptions 398,207
Related-Party TransactionsNot applicable.
Any material information that will adversely impact the valuation of the fundNil.
^ Note: Great Eastern - Lion Dynamic Balanced Fund was incepted on September 2020, prior year data is not applicable.

111
Fund
s Inf
orm
atio
n
GREAT EASTERN - LION DYNAMIC GROWTH FUND report as at 30 June 2021
Top 10 Holdings Market Value % of Netas at 30 June 2021 S$ AssetsCapital Group New Perspective Fund LUX 1,138,892 24.80 Alliancebernstein Sustainable Global Thematic Portfolio
1,131,599 24.64
Ishares USD High Yield Corp Bond Ucits ETF 454,232 9.89 Ishares USD Treasury Bond 7-10Yr Ucits ETF
342,313 7.45
Lionglobal Short Duration Bond Fund 301,126 6.56 Ishares USD Treasury Bond 3-7Yr Ucits ETF 247,255 5.38 Ishares J.P. Morgan USD Em Bond Ucits ETF
222,838 4.85
Invesco Physical Gold ETC 171,289 3.73 Ishares USD Treasury Bond 1-3Yr Ucits ETF 162,038 3.53 Schroder ISF Greater China 141,761 3.09
Allocation By Country Market Value % of Netas at 30 June 2021 S$ AssetsLuxembourg 2,499,003 54.42 Singapore 375,159 8.17 Switzerland 247,255 5.38 United Kingdom 1,352,709 29.46 Others** 118,007 2.57 Total 4,592,133 100.00
** Includes any other countries and net current assets.
Allocation By Asset Class Market Value % of Netas at 30 June 2021 S$ AssetsEquities 4,474,126 97.43 Derivatives (51,994) (1.13)Cash and cash equivalents 173,413 3.78 Other net assets/(liabilities) (3,412) (0.08)Total 4,592,133 100.00
Credit Rating of Debt Securities Market Value % of Netas at 30 June 2021 S$ AssetsNot applicable.
Top 10 Holdings Market Value % of Netas at 30 June 2020^ S$ AssetsNot applicable.
Allocation By Industry Market Value % of Netas at 30 June 2021 S$ AssetsNot applicable.
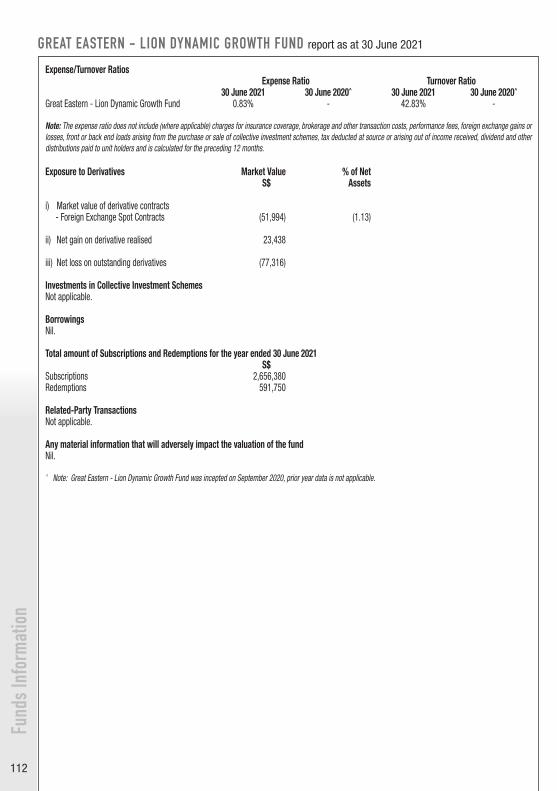
112
Fund
s Inf
orm
atio
nGREAT EASTERN - LION DYNAMIC GROWTH FUND report as at 30 June 2021
Expense/Turnover RatiosExpense Ratio Turnover Ratio
30 June 2021 30 June 2020^ 30 June 2021 30 June 2020^
Great Eastern - Lion Dynamic Growth Fund 0.83% - 42.83% -
Note: The expense ratio does not include (where applicable) charges for insurance coverage, brokerage and other transaction costs, performance fees, foreign exchange gains or losses, front or back end loads arising from the purchase or sale of collective investment schemes, tax deducted at source or arising out of income received, dividend and other distributions paid to unit holders and is calculated for the preceding 12 months.
Exposure to Derivatives Market Value % of NetS$ Assets
i) Market value of derivative contracts - Foreign Exchange Spot Contracts (51,994) (1.13)
ii) Net gain on derivative realised 23,438
iii) Net loss on outstanding derivatives (77,316)
Investments in Collective Investment SchemesNot applicable.
BorrowingsNil.
Total amount of Subscriptions and Redemptions for the year ended 30 June 2021S$
Subscriptions 2,656,380 Redemptions 591,750
Related-Party TransactionsNot applicable.
Any material information that will adversely impact the valuation of the fundNil.
^ Note: Great Eastern - Lion Dynamic Growth Fund was incepted on September 2020, prior year data is not applicable.
113
Soft
Dolla
r Com
miss
ions
Funds managed by Lion Global Investors LtdThe soft dollar commissions from various brokers for the period were utilised on research and advisory services, economic and political analyses, portfolio analyses, market analyses, data and quotation analyses and computer hardware and software used for and in support of the investment process of fund managers. Goods and services received were for the benefit of the scheme and there was no churning of trades. These brokers also execute trades for other funds managed by the managers. The trades are conducted on best available terms and in accordance with best practices.
Fund managed by AllianceBernstein (Singapore) Ltd ** For the period ended 30 June 2021, the Investment Manager and any Affiliated Sub-Investment Manager, if applicable, does receive and has entered into soft-dollar commissions/arrangements with brokers relating to portfolios of the Underlying Fund that invest in equity securities, in respect of which certain goods and services used to support the investment decision making process were received. The soft commission arrangements were entered into on the basis that the execution of transactions on behalf of the Underlying Fund will be consistent with best execution standards and brokerage rates will not be in excess of customary institutional full-service brokerage rates. Additionally, due to the nature of the investment strategy of certain Portfolios, including where the Investment Manager delegates investment management services to AllianceBernstein Limited and CPH Capital Fondsmæglerselskab A/S, all costs associated with soft commission arrangements may be “unbundled,” if required by applicable law, and borne by the Investment Manager or its Affiliated Sub-Investment Manager with the exception of Arya European Alpha Portfolio, which is charged a separate expense for costs associated with soft commission arrangements. The goods and services received include specialist industry, company and consumer research, portfolio and market analysis and computer software used for the delivery of such services. The nature of the goods and services received is such that the benefits provided under the arrangement must be those which assist in the provision of investment services to the Underlying Fund and may contribute to an improvement in the Underlying Fund’s performance. For the avoidance of doubt, such goods and services do not include travel, accommodations, entertainment, general administrative goods or services, general office equipment or premises, membership fees, employees’ salaries or direct money payments. Disclosure of soft commission arrangements will be made in the Financial Reports of the Underlying Fund.
** AllianceBernstein (Singapore) Ltd has confirmed that their Investment Professionals are strictly prohibited from engaging in any portfolio or market manipulative practices, including, but not limited to churning of trade. The Investment Manager will not enter into unnecessary trades in order to qualify for soft-dollar commissions/arrangements.
Fund managed by JPMorgan Asset Management (Singapore) Ltd ** The Investment Managers may enter into commission sharing arrangements only where there is a direct and identifiable benefit to the clients of the Investment Managers, including the SICAV, and where the Investment Managers are satisfied that the transactions generating the shared commissions are made in good faith, in strict compliance with applicable regulatory requirements and in the best interests of the SICAV and the Shareholders. Any such arrangements must be made by the Investment Manager on terms commensurate with best market practice. Depending on local regulation, an Investment Manager can pay for research or execution services using soft commissions or other similar arrangements.
From 1 January 2018, where JPMorgan Asset Management (UK) Limited is the investment manager, all costs associated with the purchase of external research in relation to Soft Commission are being paid directly by JPMorgan Asset Management (UK) Limited.
** JPMorgan Asset Management (Singapore) Limited has confirmed that their Investment Professionals are strictly prohibited from engaging in any portfolio or market manipulative practices, including, but not limited to churning of trade. The Investment Manager will not enter into unnecessary trades in order to qualify for soft-dollar commissions/arrangements.
Fund managed by Schroders Investment Management (Singapore) Ltd In the management of the Fund, the Manager may accept soft dollar commissions from, or enter into soft dollar arrangements with, stockbrokers who execute trades on behalf of the Fund and the soft dollars received are restricted to the following kinds of services: (i) research, analysis or price information;(ii) performance measurement;(iii) portfolio valuations; and(iv) administration services.
The Manager may not receive or enter into soft dollar commissions or arrangements unless (a) such soft dollar commissions or arrangements shall reasonably assist the Manager in their management of the Fund, (b) best execution is carried out for the transactions, and (c) that no unnecessary trades are entered into in order to qualify for such soft dollar commissions or arrangements. The Manager shall not receive goods and services such as travel, accommodation and entertainment.
SOFT DOLLAR COMMISSIONS report as at 30 June 2021
114
Soft
Dolla
r Com
miss
ions
SOFT DOLLAR COMMISSIONS report as at 30 June 2021
Fund managed by Capital International, Inc.Capital Group is committed to providing best-in-class investment management services for our clients. Our investment professionals – who make up one of the world’s largest and most experienced in-house investment research groups – employ a fundamental, bottom-up research approach to investing. Third-party research complements our proprietary research effort by making available the differing perspectives of, and information from, other firms. These services are critical components of the complex mosaic driving our investment decisions and, consequently, client outcomes.
We take seriously our responsibility to act in the best interests of our clients and to treat all clients fairly. We are extremely focused on maximizing the value we obtain for research costs incurred on behalf of clients. For this reason, we have developed a robust research evaluation process which helps ascertain the services we need and value the services we use.
As of 1 January 2019, Capital Group has decided to bear the costs of all third-party investment research services for all client accounts it advises, including for Capital Group European Growth & Income Fund (LUX) and Capital Group Capital New Perspective Fund (LUX), the fund in which Great Eastern is currently invested.
Fund managed by Aberdeen Standard Investments (Asia) LimitedNil.
Fund managed by Goldman Sachs (Singapore) Pte Ltd Nil. Fund managed by FIL Fund Management Limited The Investment Manager and any of its delegates may effect transactions by or through the agency of another person with whom the Investment Manager and any of its delegates have an arrangement under which that party will from time to time provide to or procure for the Investment Manager and any of its delegates goods, services or other benefits (such as research and advisory services, where permitted by regulation only), the nature of which is such that their provision can reasonably be expected to benefit the Fund as a whole and may contribute to an improvement in the performance of the Fund and that of the Investment Manager or any of its delegates in providing services to the Fund and for which no direct payment is made but instead the Investment Manager and any of its delegates undertake to place business with that party. For the avoidance of doubt, such goods and services do not include travel, accommodation, entertainment, general administrative goods or services, general office equipment or premises, membership fees, employee salaries or direct money payments.The Investment Manager and any of its delegates shall not retain the benefit of any cash commission rebate (being repayment of a cash commission made by a broker or dealer to the Investment Manager and/or any delegates) paid or payable from any such broker or dealer in respect of any business placed with such broker or dealer by the Investment Manager or any of its delegates for or on behalf the Fund. Any such cash commission rebate from any such broker or dealer will be held by the Investment Manager and any of its delegates for the account of the Fund. Brokerage rates will not be excessive of customary brokerage rates. All transactions will be done with best execution.
With respect to Fidelity Global Emerging Markets Fund SR-ACC-SGD that is included under the CPF Investment Scheme, a broker or dealer with whom the Investment Manager and/or any sub-manager has an arrangement as described above may execute trades for other collective Investment schemes managed by the Investment Manager and/or any sub-manager. The Investment Manager confirms that the trades were executed in accordance with the Investment Manager’s best execution policy and there was no churning of trades.
Fund managed by BlackRock Group ** Pursuant to EU Directive 2014/65/EU on markets in financial instruments referred to as ""MiFID II"", BlackRock Group will no longer pay for external research via client trading commissions for its MiFID II-impacted funds (“MIFID II-impacted funds”). The BlackRock Group shall meet such research costs out of its own resources. MiFID II-impacted funds are those which have appointed a BlackRock Group MiFID firm as investment adviser or where investment management has been delegated by such firm to an overseas affiliate. Funds which have directly appointed an overseas affiliate of the BlackRock Group within a third country (i.e. outside the European Union) to perform portfolio management are not in-scope for the purposes of MiFID II and will be subject to the local laws and market practices governing external research in the applicable jurisdiction of the relevant affiliate. This means that costs of external research may continue to be met out of the assets of such funds. A list of such funds is available on request from the Management Company.
Soft
Dolla
r Com
miss
ions
115
Where investments are made in non-BlackRock Group funds, they will continue to be subject to the external manager’s approach to paying for external research in each case. This approach may be different from that of the BlackRock Group and may include the collection of a research charge alongside trading commissions in accordance with applicable laws and market practice. This means that the costs of external research may continue to be met out of the assets within the Underlying fund. Where permitted by applicable regulation (excluding, for the avoidance of doubt, any Funds which are in scope for MiFID II), certain BlackRock Group companies acting as investment adviser to the Underlying Fund may accept commissions generated when trading equities with certain brokers in certain jurisdictions. Commissions may be reallocated to purchase eligible research services. Such arrangements may benefit one Fund over another because research can be used for a broader range of clients than just those whose trading funded it. BlackRock Group has a Use of Commissions Policy designed to ensure only eligible services are purchased and excess commissions are reallocated to an eligible service provider where appropriate.
To the extent that investment advisers within the BlackRock Group are permitted to receive trading commissions or soft dollar commissions, with respect to the Underlying Fund (or portion of the Underlying Fund) for which they provide investment management and advice, they may select brokers (including, without limitation, brokers who are affiliated with the BlackRock Group or PNC Group) that furnish the BlackRock Group, directly or through third-party or correspondent relationships, with research or execution services which provide, in BlackRock Group’s view, lawful and appropriate assistance to each applicable BlackRock Group company in the investment decision-making or trade execution processes and the nature of which is that their provision can reasonably be expected to benefit the Underlying Fund as a whole and may contribute to an improvement in the Underlying Funds’ performance. Such research or execution services may include, without limitation and to the extent permitted by applicable law: research reports on companies, industries and securities; economic and financial information and analysis; and quantitative analytical software. Research or execution services obtained in this manner may be used in servicing not only the account from which commissions were used to pay for the services, but also other BlackRock Group client accounts. For the avoidance of doubt, such goods and services do not include travel, accommodation, entertainment, general administrative goods and services, general office equipment, computer hardware or premises, membership fees, employee salaries or direct money payments. To the extent that BlackRock uses its clients’ commission dollars to obtain research or execution services, BlackRock Group companies will not have to pay for those products and services themselves. BlackRock Group companies may receive research or execution services that are bundled with the trade execution, clearing and/or settlement services provided by a particular broker-dealer. To the extent that each BlackRock Group company receives research or execution services on this basis, many of the same potential conflicts related to receipt of these services through third party arrangements exist. For example, the research effectively will be paid by client commissions that also will be used to pay for the execution, clearing and settlement services provided by the broker-dealer and will not be paid by that BlackRock Group company. Each BlackRock Group company may endeavour, subject to best execution, to execute trades through brokers who, pursuant to such arrangements, provide research or execution services in order to ensure the continued receipt of research or execution services that BlackRock Group company believes are useful in their investment decision-making or trade execution process. Each BlackRock Group company may pay, or be deemed to have paid, commission rates higher than it could have otherwise paid in order to obtain research or execution services if that BlackRock Group company determines in good faith that the commission paid is reasonable in relation to the value of the research or execution services provided. BlackRock Group believes that using commission dollars to obtain the research or execution services enhances its investment research and trading processes, thereby increasing the prospect for higher investment returns. BlackRock Group may from time to time choose to alter or choose not to engage in the above described arrangements to varying degrees, without notice to BlackRock Group clients, to the extent permitted by applicable law.
SOFT DOLLAR COMMISSIONS report as at 30 June 2021
** The Investment Manager may, subject to applicable regulation and best execution, execute trades through brokers who, pursuant to such arrangements, provide research or execution services in order to ensure the continued receipt of research or execution services that the Investment Manager believes are useful in their investment decision-making or trade execution process. The Investment Manager confirmed that it is expected to comply with all applicable anti-fraud or market manipulation rules.
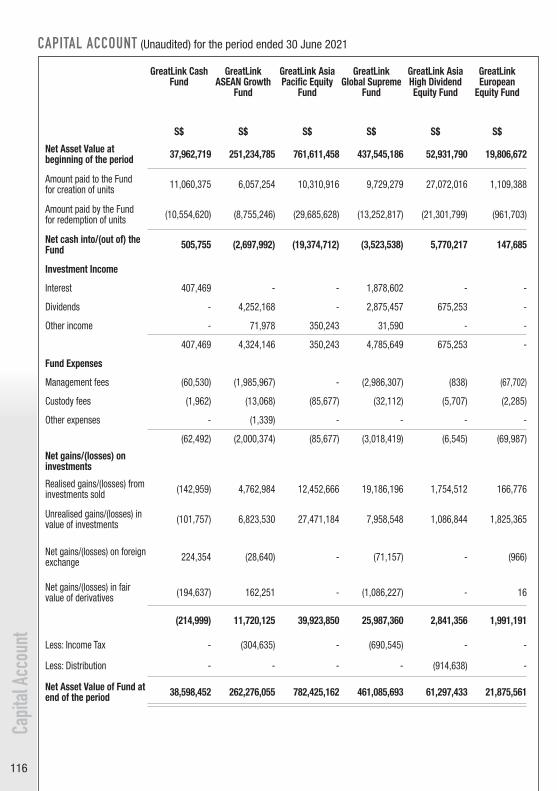
116
CAPITAL ACCOUNT (Unaudited) for the period ended 30 June 2021
Capit
al Ac
coun
t
GreatLink Cash Fund
GreatLink ASEAN Growth
Fund
GreatLink Asia Pacific Equity
Fund
GreatLink Global Supreme
Fund
GreatLink Asia High Dividend Equity Fund
GreatLink European
Equity Fund
S$ S$ S$ S$ S$ S$
Net Asset Value at beginning of the period 37,962,719 251,234,785 761,611,458 437,545,186 52,931,790 19,806,672
Amount paid to the Fund for creation of units 11,060,375 6,057,254 10,310,916 9,729,279 27,072,016 1,109,388
Amount paid by the Fund for redemption of units (10,554,620) (8,755,246) (29,685,628) (13,252,817) (21,301,799) (961,703)
Net cash into/(out of) the Fund 505,755 (2,697,992) (19,374,712) (3,523,538) 5,770,217 147,685
Investment Income
Interest 407,469 - - 1,878,602 - -
Dividends - 4,252,168 - 2,875,457 675,253 -
Other income - 71,978 350,243 31,590 - -
407,469 4,324,146 350,243 4,785,649 675,253 -
Fund Expenses
Management fees (60,530) (1,985,967) - (2,986,307) (838) (67,702)
Custody fees (1,962) (13,068) (85,677) (32,112) (5,707) (2,285)
Other expenses - (1,339) - - - -
(62,492) (2,000,374) (85,677) (3,018,419) (6,545) (69,987)
Net gains/(losses) on investments
Realised gains/(losses) from investments sold (142,959) 4,762,984 12,452,666 19,186,196 1,754,512 166,776
Unrealised gains/(losses) in value of investments (101,757) 6,823,530 27,471,184 7,958,548 1,086,844 1,825,365
Net gains/(losses) on foreign exchange 224,354 (28,640) - (71,157) - (966)
Net gains/(losses) in fair value of derivatives (194,637) 162,251 - (1,086,227) - 16
(214,999) 11,720,125 39,923,850 25,987,360 2,841,356 1,991,191
Less: Income Tax - (304,635) - (690,545) - -
Less: Distribution - - - - (914,638) -
Net Asset Value of Fund at end of the period 38,598,452 262,276,055 782,425,162 461,085,693 61,297,433 21,875,561
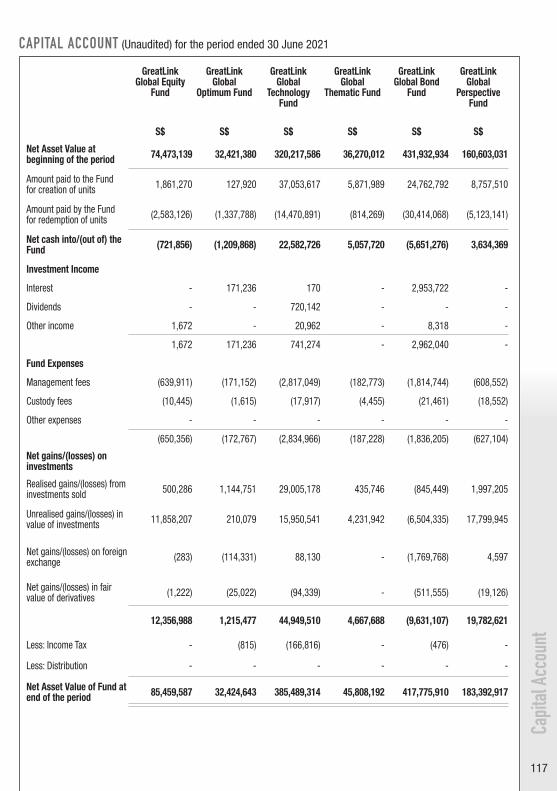
117
CAPITAL ACCOUNT (Unaudited) for the period ended 30 June 2021
Capit
al Ac
coun
t
GreatLink Global Equity
Fund
GreatLink Global
Optimum Fund
GreatLink Global
Technology Fund
GreatLink Global
Thematic Fund
GreatLink Global Bond
Fund
GreatLink Global
Perspective Fund
S$ S$ S$ S$ S$ S$
Net Asset Value at beginning of the period 74,473,139 32,421,380 320,217,586 36,270,012 431,932,934 160,603,031
Amount paid to the Fund for creation of units 1,861,270 127,920 37,053,617 5,871,989 24,762,792 8,757,510
Amount paid by the Fund for redemption of units (2,583,126) (1,337,788) (14,470,891) (814,269) (30,414,068) (5,123,141)
Net cash into/(out of) the Fund (721,856) (1,209,868) 22,582,726 5,057,720 (5,651,276) 3,634,369
Investment Income
Interest - 171,236 170 - 2,953,722 -
Dividends - - 720,142 - - -
Other income 1,672 - 20,962 - 8,318 -
1,672 171,236 741,274 - 2,962,040 -
Fund Expenses
Management fees (639,911) (171,152) (2,817,049) (182,773) (1,814,744) (608,552)
Custody fees (10,445) (1,615) (17,917) (4,455) (21,461) (18,552)
Other expenses - - - - - -
(650,356) (172,767) (2,834,966) (187,228) (1,836,205) (627,104)
Net gains/(losses) on investments
Realised gains/(losses) from investments sold 500,286 1,144,751 29,005,178 435,746 (845,449) 1,997,205
Unrealised gains/(losses) in value of investments 11,858,207 210,079 15,950,541 4,231,942 (6,504,335) 17,799,945
Net gains/(losses) on foreign exchange (283) (114,331) 88,130 - (1,769,768) 4,597
Net gains/(losses) in fair value of derivatives (1,222) (25,022) (94,339) - (511,555) (19,126)
12,356,988 1,215,477 44,949,510 4,667,688 (9,631,107) 19,782,621
Less: Income Tax - (815) (166,816) - (476) -
Less: Distribution - - - - - -
Net Asset Value of Fund at end of the period 85,459,587 32,424,643 385,489,314 45,808,192 417,775,910 183,392,917
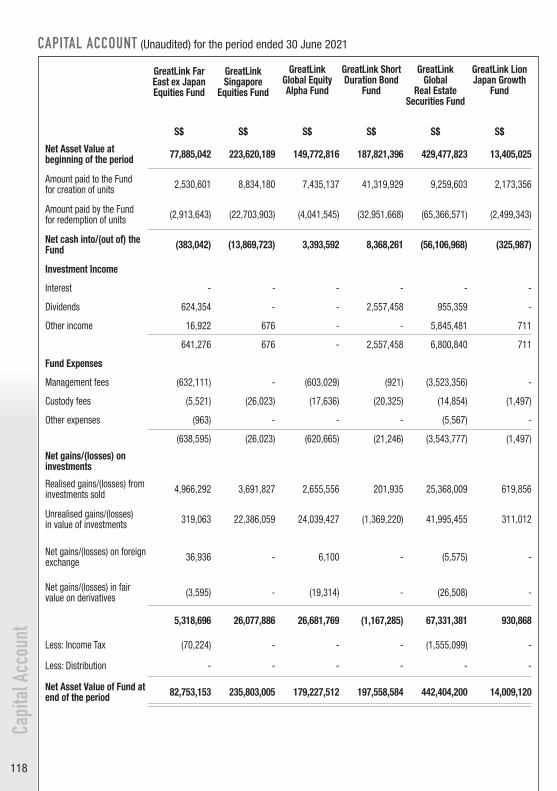
118
CAPITAL ACCOUNT (Unaudited) for the period ended 30 June 2021
Capi
tal A
ccou
nt
GreatLink Far East ex Japan Equities Fund
GreatLink Singapore
Equities Fund
GreatLink Global Equity Alpha Fund
GreatLink Short Duration Bond
Fund
GreatLink Global
Real Estate Securities Fund
GreatLink Lion Japan Growth
Fund
S$ S$ S$ S$ S$ S$
Net Asset Value at beginning of the period 77,885,042 223,620,189 149,772,816 187,821,396 429,477,823 13,405,025
Amount paid to the Fund for creation of units 2,530,601 8,834,180 7,435,137 41,319,929 9,259,603 2,173,356
Amount paid by the Fund for redemption of units (2,913,643) (22,703,903) (4,041,545) (32,951,668) (65,366,571) (2,499,343)
Net cash into/(out of) the Fund (383,042) (13,869,723) 3,393,592 8,368,261 (56,106,968) (325,987)
Investment Income
Interest - - - - - -
Dividends 624,354 - - 2,557,458 955,359 -
Other income 16,922 676 - - 5,845,481 711
641,276 676 - 2,557,458 6,800,840 711
Fund Expenses
Management fees (632,111) - (603,029) (921) (3,523,356) -
Custody fees (5,521) (26,023) (17,636) (20,325) (14,854) (1,497)
Other expenses (963) - - - (5,567) -
(638,595) (26,023) (620,665) (21,246) (3,543,777) (1,497)
Net gains/(losses) on investments
Realised gains/(losses) from investments sold 4,966,292 3,691,827 2,655,556 201,935 25,368,009 619,856
Unrealised gains/(losses) in value of investments 319,063 22,386,059 24,039,427 (1,369,220) 41,995,455 311,012
Net gains/(losses) on foreign exchange 36,936 - 6,100 - (5,575) -
Net gains/(losses) in fair value on derivatives (3,595) - (19,314) - (26,508) -
5,318,696 26,077,886 26,681,769 (1,167,285) 67,331,381 930,868
Less: Income Tax (70,224) - - - (1,555,099) -
Less: Distribution - - - - - -
Net Asset Value of Fund at end of the period 82,753,153 235,803,005 179,227,512 197,558,584 442,404,200 14,009,120
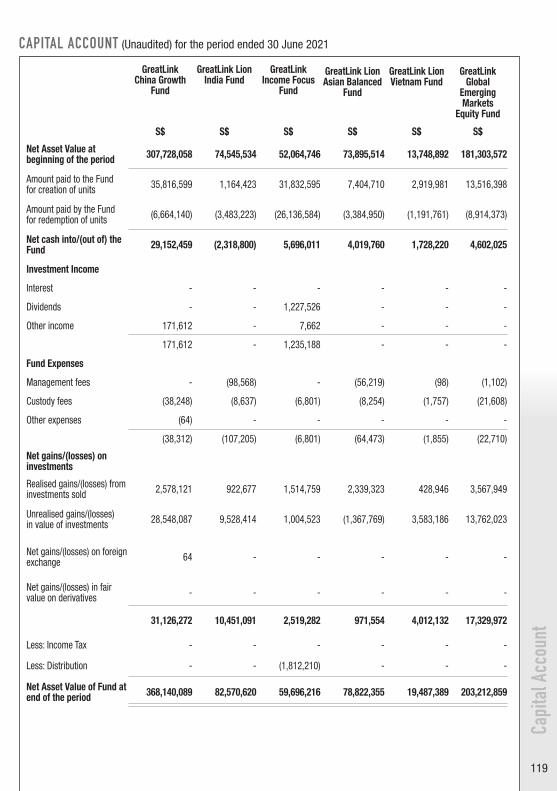
119
CAPITAL ACCOUNT (Unaudited) for the period ended 30 June 2021
Capi
tal A
ccou
nt
GreatLink China Growth
Fund
GreatLink Lion India Fund
GreatLink Income Focus
Fund
GreatLink Lion Asian Balanced
Fund
GreatLink Lion Vietnam Fund
GreatLink Global
Emerging Markets
Equity Fund
S$ S$ S$ S$ S$ S$
Net Asset Value at beginning of the period 307,728,058 74,545,534 52,064,746 73,895,514 13,748,892 181,303,572
Amount paid to the Fund for creation of units 35,816,599 1,164,423 31,832,595 7,404,710 2,919,981 13,516,398
Amount paid by the Fund for redemption of units (6,664,140) (3,483,223) (26,136,584) (3,384,950) (1,191,761) (8,914,373)
Net cash into/(out of) the Fund 29,152,459 (2,318,800) 5,696,011 4,019,760 1,728,220 4,602,025
Investment Income
Interest - - - - - -
Dividends - - 1,227,526 - - -
Other income 171,612 - 7,662 - - -
171,612 - 1,235,188 - - -
Fund Expenses
Management fees - (98,568) - (56,219) (98) (1,102)
Custody fees (38,248) (8,637) (6,801) (8,254) (1,757) (21,608)
Other expenses (64) - - - - -
(38,312) (107,205) (6,801) (64,473) (1,855) (22,710)
Net gains/(losses) on investments
Realised gains/(losses) from investments sold 2,578,121 922,677 1,514,759 2,339,323 428,946 3,567,949
Unrealised gains/(losses) in value of investments 28,548,087 9,528,414 1,004,523 (1,367,769) 3,583,186 13,762,023
Net gains/(losses) on foreign exchange 64 - - - - -
Net gains/(losses) in fair value on derivatives - - - - - -
31,126,272 10,451,091 2,519,282 971,554 4,012,132 17,329,972
Less: Income Tax - - - - - -
Less: Distribution - - (1,812,210) - - -
Net Asset Value of Fund at end of the period 368,140,089 82,570,620 59,696,216 78,822,355 19,487,389 203,212,859

120
CAPITAL ACCOUNT (Unaudited) for the period ended 30 June 2021
Capi
tal A
ccou
nt
GreatLink Diversified Growth
Portfolio
GreatLink Multi Theme-Equity
Fund
Great Eastern -Lion DynamicBalanced Fund
Great Eastern -Lion DynamicGrowth Fund
GreatLink Income Bond Fund
S$ S$ S$ S$ S$
Net Asset Value at beginning of the period 7,479,058 - 750,273 2,381,278 -
Amount paid to the Fund for creation of units 3,384,306 2,572,769 566,805 2,656,380 19,192,307
Amount paid by the Fund for redemption of units (322,422) (138,996) (398,207) (591,750) (2,353,893)
Net cash into/(out of) the Fund 3,061,884 2,433,773 168,598 2,064,630 16,838,414
Investment Income
Interest - - 5 - -
Dividends - - 5,838 15,021 75,475
Other income - - - - -
- 5,843 15,021 75,475
Fund Expenses
Management fees (11,510) (5,521) (3,078) (15,512) (852)
Custody fees (1,010) (170) (143) (280) (558)
Other expenses - - - (3) -
(12,520) (5,691) (3,221) (15,795) (1,410)
Net gains/(losses) on investments
Realised gains/(losses) from investments sold 41,138 4,075 (18,285) (14,809) 6,132
Unrealised gains/(losses) in value of investments 644,157 105,798 27,100 215,203 (5,126)
Net gains/(losses) on foreign exchange - (91) (706) 483 -
Net gains/(losses) in fair value on derivatives - (97) (13,642) (53,878) -
685,295 109,685 (5,533) 146,999 1,006
Less: Income Tax - - - - -
Less: Distribution - - - - (100,599)
Net Asset Value of Fund at end of the period
11,213,717 2,537,767 915,960 4,592,133 16,812,886
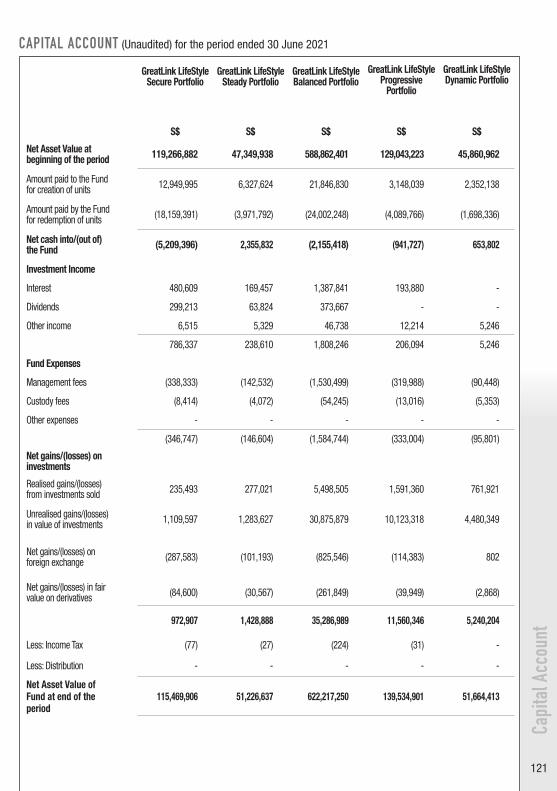
121
Capi
tal A
ccou
nt
GreatLink LifeStyle Secure Portfolio
GreatLink LifeStyle Steady Portfolio
GreatLink LifeStyle Balanced Portfolio
GreatLink LifeStyle Progressive
Portfolio
GreatLink LifeStyle Dynamic Portfolio
S$ S$ S$ S$ S$
Net Asset Value at beginning of the period 119,266,882 47,349,938 588,862,401 129,043,223 45,860,962
Amount paid to the Fund for creation of units 12,949,995 6,327,624 21,846,830 3,148,039 2,352,138
Amount paid by the Fund for redemption of units (18,159,391) (3,971,792) (24,002,248) (4,089,766) (1,698,336)
Net cash into/(out of) the Fund (5,209,396) 2,355,832 (2,155,418) (941,727) 653,802
Investment Income
Interest 480,609 169,457 1,387,841 193,880 -
Dividends 299,213 63,824 373,667 - -
Other income 6,515 5,329 46,738 12,214 5,246
786,337 238,610 1,808,246 206,094 5,246
Fund Expenses
Management fees (338,333) (142,532) (1,530,499) (319,988) (90,448)
Custody fees (8,414) (4,072) (54,245) (13,016) (5,353)
Other expenses - - - - -
(346,747) (146,604) (1,584,744) (333,004) (95,801)
Net gains/(losses) on investments
Realised gains/(losses) from investments sold 235,493 277,021 5,498,505 1,591,360 761,921
Unrealised gains/(losses) in value of investments 1,109,597 1,283,627 30,875,879 10,123,318 4,480,349
Net gains/(losses) on foreign exchange (287,583) (101,193) (825,546) (114,383) 802
Net gains/(losses) in fair value on derivatives (84,600) (30,567) (261,849) (39,949) (2,868)
972,907 1,428,888 35,286,989 11,560,346 5,240,204
Less: Income Tax (77) (27) (224) (31) -
Less: Distribution - - - - -
Net Asset Value of Fund at end of the period
115,469,906 51,226,637 622,217,250 139,534,901 51,664,413
CAPITAL ACCOUNT (Unaudited) for the period ended 30 June 2021
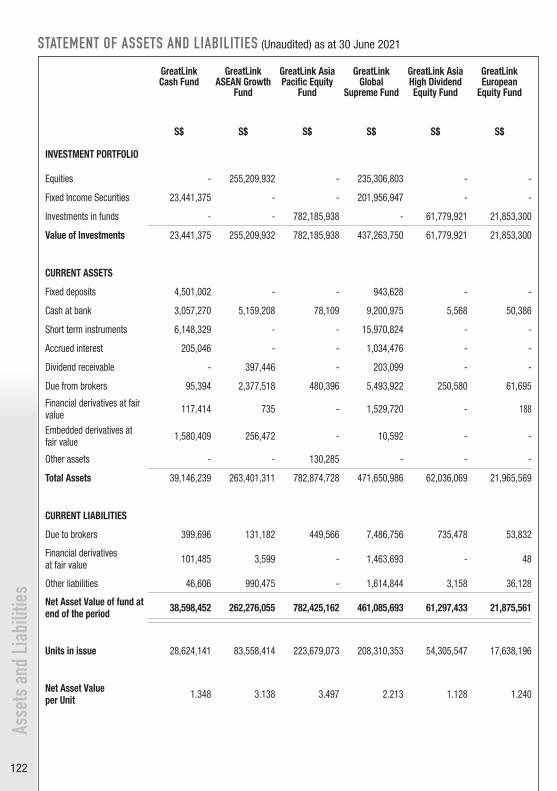
122
STATEMENT OF ASSETS AND LIABILITIES (Unaudited) as at 30 June 2021
Asse
ts a
nd L
iabi
litie
s
GreatLink Cash Fund
GreatLink ASEAN Growth
Fund
GreatLink Asia Pacific Equity
Fund
GreatLink Global
Supreme Fund
GreatLink Asia High Dividend Equity Fund
GreatLink European
Equity Fund
S$ S$ S$ S$ S$ S$
INVESTMENT PORTFOLIO
Equities - 255,209,932 - 235,306,803 - -
Fixed Income Securities 23,441,375 - - 201,956,947 - -
Investments in funds - - 782,185,938 - 61,779,921 21,853,300
Value of Investments 23,441,375 255,209,932 782,185,938 437,263,750 61,779,921 21,853,300
CURRENT ASSETS
Fixed deposits 4,501,002 - - 943,628 - -
Cash at bank 3,057,270 5,159,208 78,109 9,200,975 5,568 50,386
Short term instruments 6,148,329 - - 15,970,824 - -
Accrued interest 205,046 - - 1,034,476 - -
Dividend receivable - 397,446 - 203,099 - -
Due from brokers 95,394 2,377,518 480,396 5,493,922 250,580 61,695
Financial derivatives at fair value 117,414 735 - 1,529,720 - 188
Embedded derivatives at fair value 1,580,409 256,472 - 10,592 - -
Other assets - - 130,285 - - -
Total Assets 39,146,239 263,401,311 782,874,728 471,650,986 62,036,069 21,965,569
CURRENT LIABILITIES
Due to brokers 399,696 131,182 449,566 7,486,756 735,478 53,832
Financial derivativesat fair value 101,485 3,599 - 1,463,693 - 48
Other liabilities 46,606 990,475 - 1,614,844 3,158 36,128
Net Asset Value of fund at end of the period 38,598,452 262,276,055 782,425,162 461,085,693 61,297,433 21,875,561
Units in issue 28,624,141 83,558,414 223,679,073 208,310,353 54,305,547 17,638,196
Net Asset Valueper Unit 1.348 3.138 3.497 2.213 1.128 1.240
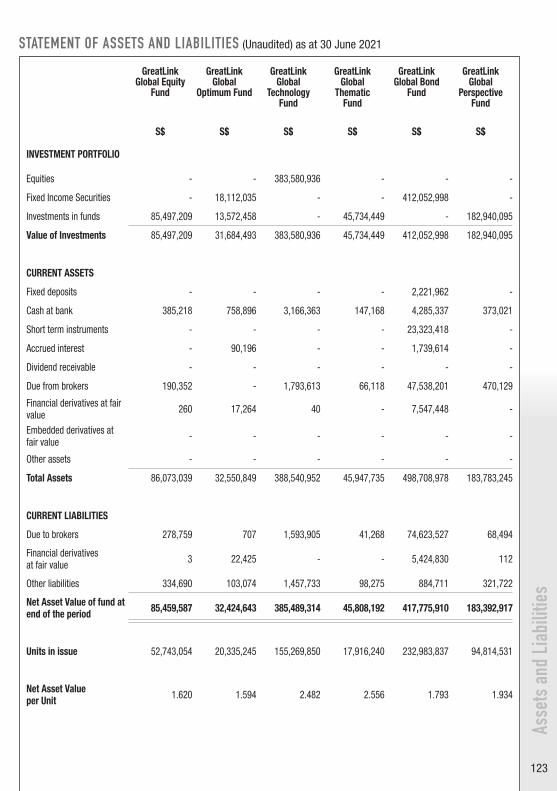
123
STATEMENT OF ASSETS AND LIABILITIES (Unaudited) as at 30 June 2021
Asse
ts a
nd L
iabi
litie
s
GreatLink Global Equity
Fund
GreatLink Global
Optimum Fund
GreatLink Global
Technology Fund
GreatLink Global
Thematic Fund
GreatLink Global Bond
Fund
GreatLink Global
Perspective Fund
S$ S$ S$ S$ S$ S$
INVESTMENT PORTFOLIO
Equities - - 383,580,936 - - -
Fixed Income Securities - 18,112,035 - - 412,052,998 -
Investments in funds 85,497,209 13,572,458 - 45,734,449 - 182,940,095
Value of Investments 85,497,209 31,684,493 383,580,936 45,734,449 412,052,998 182,940,095
CURRENT ASSETS
Fixed deposits - - - - 2,221,962 -
Cash at bank 385,218 758,896 3,166,363 147,168 4,285,337 373,021
Short term instruments - - - - 23,323,418 -
Accrued interest - 90,196 - - 1,739,614 -
Dividend receivable - - - - - -
Due from brokers 190,352 - 1,793,613 66,118 47,538,201 470,129
Financial derivatives at fair value 260 17,264 40 - 7,547,448 -
Embedded derivatives at fair value - - - - - -
Other assets - - - - - -
Total Assets 86,073,039 32,550,849 388,540,952 45,947,735 498,708,978 183,783,245
CURRENT LIABILITIES
Due to brokers 278,759 707 1,593,905 41,268 74,623,527 68,494
Financial derivativesat fair value 3 22,425 - - 5,424,830 112
Other liabilities 334,690 103,074 1,457,733 98,275 884,711 321,722
Net Asset Value of fund at end of the period 85,459,587 32,424,643 385,489,314 45,808,192 417,775,910 183,392,917
Units in issue 52,743,054 20,335,245 155,269,850 17,916,240 232,983,837 94,814,531
Net Asset Valueper Unit 1.620 1.594 2.482 2.556 1.793 1.934

124
STATEMENT OF ASSETS AND LIABILITIES (Unaudited) as at 30 June 2021
Asse
ts a
nd L
iabi
litie
s
GreatLink Far East ex Japan Equities Fund
GreatLink Singapore
Equities Fund
GreatLink Global Equity Alpha Fund
GreatLink Short Duration
Bond Fund
GreatLink Global
Real Estate Securities
Fund
GreatLink Lion Japan Growth
Fund
S$ S$ S$ S$ S$ S$
INVESTMENT PORTFOLIO
Equities 75,373,884 - - - 441,803,313 -
Fixed Income Securities - - - - - -
Investments in funds - 236,044,059 178,778,374 196,636,146 - 13,988,384
Value of Investments 75,373,884 236,044,059 178,778,374 196,636,146 441,803,313 13,988,384
CURRENT ASSETS
Fixed deposits - - - - - -
Cash at bank 7,162,644 24,354 521,508 18,864 1,559,483 1,964
Short term instruments - - - - - -
Accrued interest - - - - - -
Dividend receivable 70,920 - - - 1,172,370 -
Due from brokers 493,908 845,000 355,674 1,583,246 2,680,662 90,211
Financial derivatives at fair value - - - - 2,640 -
Embedded derivatives at fair value - - - - - -
Other assets - - - - - -
Total Assets 83,101,356 236,913,413 179,655,556 198,238,256 447,218,468 14,080,559
CURRENT LIABILITIES
Due to brokers 39,424 1,097,799 102,868 668,792 3,065,643 71,044
Financial derivativesat fair value 980 - 168 - 1,823 -
Other liabilities 307,799 12,609 325,008 10,880 1,746,802 395
Net Asset Value of fund at end of the period 82,753,153 235,803,005 179,227,512 197,558,584 442,404,200 14,009,120
Units in issue 22,099,401 96,362,814 99,924,591 127,640,949 452,058,831 10,717,892
Net Asset Valueper Unit 3.744 2.447 1.793 1.547 0.978 1.307
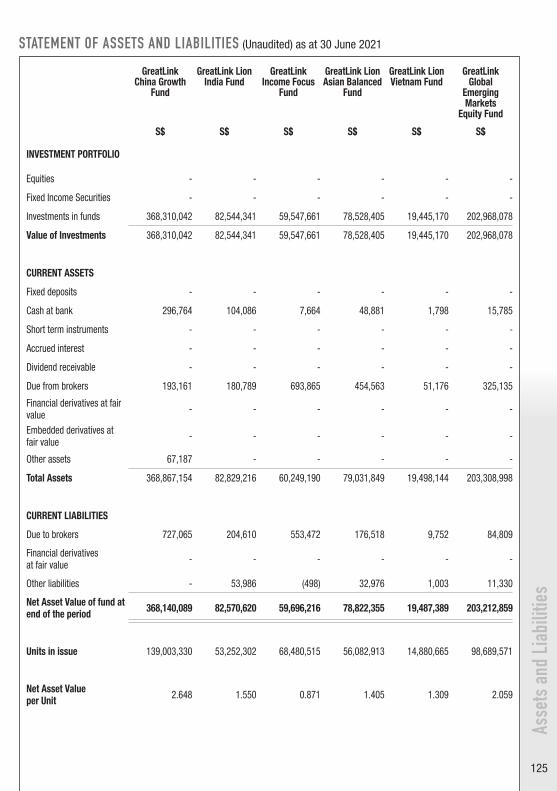
125
STATEMENT OF ASSETS AND LIABILITIES (Unaudited) as at 30 June 2021
Asse
ts a
nd L
iabi
litie
s
GreatLink China Growth
Fund
GreatLink Lion India Fund
GreatLink Income Focus
Fund
GreatLink Lion Asian Balanced
Fund
GreatLink Lion Vietnam Fund
GreatLink Global
Emerging Markets
Equity Fund
S$ S$ S$ S$ S$ S$
INVESTMENT PORTFOLIO
Equities - - - - - -
Fixed Income Securities - - - - - -
Investments in funds 368,310,042 82,544,341 59,547,661 78,528,405 19,445,170 202,968,078
Value of Investments 368,310,042 82,544,341 59,547,661 78,528,405 19,445,170 202,968,078
CURRENT ASSETS
Fixed deposits - - - - - -
Cash at bank 296,764 104,086 7,664 48,881 1,798 15,785
Short term instruments - - - - - -
Accrued interest - - - - - -
Dividend receivable - - - - - -
Due from brokers 193,161 180,789 693,865 454,563 51,176 325,135
Financial derivatives at fair value - - - - - -
Embedded derivatives at fair value - - - - - -
Other assets 67,187 - - - - -
Total Assets 368,867,154 82,829,216 60,249,190 79,031,849 19,498,144 203,308,998
CURRENT LIABILITIES
Due to brokers 727,065 204,610 553,472 176,518 9,752 84,809
Financial derivativesat fair value - - - - - -
Other liabilities - 53,986 (498) 32,976 1,003 11,330
Net Asset Value of fund at end of the period 368,140,089 82,570,620 59,696,216 78,822,355 19,487,389 203,212,859
Units in issue 139,003,330 53,252,302 68,480,515 56,082,913 14,880,665 98,689,571
Net Asset Valueper Unit 2.648 1.550 0.871 1.405 1.309 2.059
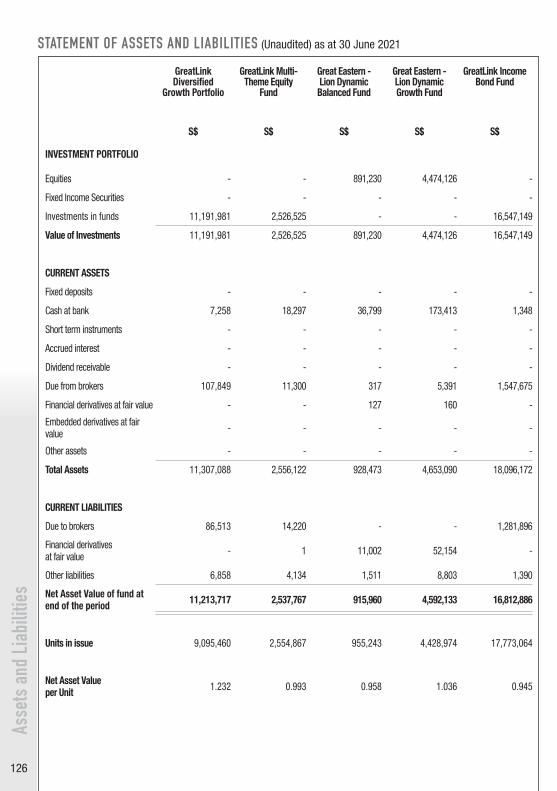
126
GreatLink Diversified
Growth Portfolio
GreatLink Multi-Theme Equity
Fund
Great Eastern -Lion DynamicBalanced Fund
Great Eastern -Lion DynamicGrowth Fund
GreatLink Income Bond Fund
S$ S$ S$ S$ S$
INVESTMENT PORTFOLIO
Equities - - 891,230 4,474,126 -
Fixed Income Securities - - - - -
Investments in funds 11,191,981 2,526,525 - - 16,547,149
Value of Investments 11,191,981 2,526,525 891,230 4,474,126 16,547,149
CURRENT ASSETS
Fixed deposits - - - - -
Cash at bank 7,258 18,297 36,799 173,413 1,348
Short term instruments - - - - -
Accrued interest - - - - -
Dividend receivable - - - - -
Due from brokers 107,849 11,300 317 5,391 1,547,675
Financial derivatives at fair value - - 127 160 -
Embedded derivatives at fair value - - - - -
Other assets - - - - -
Total Assets 11,307,088 2,556,122 928,473 4,653,090 18,096,172
CURRENT LIABILITIES
Due to brokers 86,513 14,220 - - 1,281,896
Financial derivativesat fair value - 1 11,002 52,154 -
Other liabilities 6,858 4,134 1,511 8,803 1,390
Net Asset Value of fund at end of the period 11,213,717 2,537,767 915,960 4,592,133 16,812,886
Units in issue 9,095,460 2,554,867 955,243 4,428,974 17,773,064
Net Asset Valueper Unit 1.232 0.993 0.958 1.036 0.945
STATEMENT OF ASSETS AND LIABILITIES (Unaudited) as at 30 June 2021
Asse
ts a
nd L
iabi
litie
s
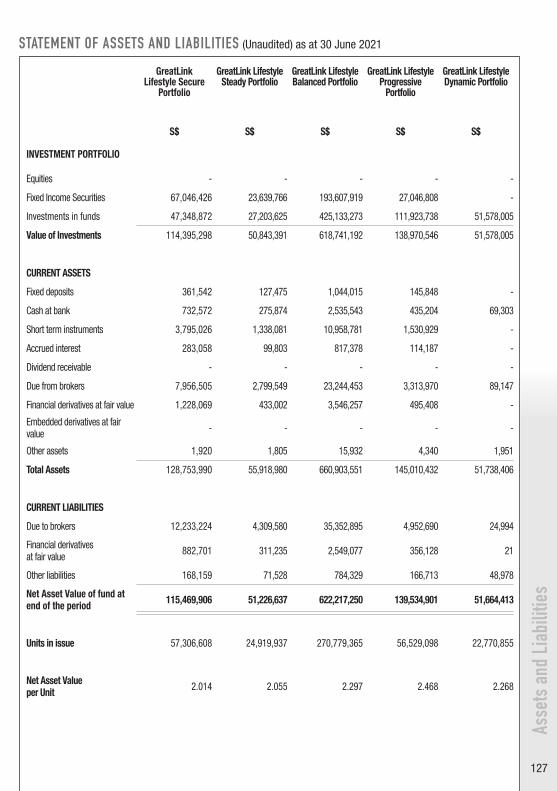
127
GreatLink Lifestyle Secure
Portfolio
GreatLink Lifestyle Steady Portfolio
GreatLink Lifestyle Balanced Portfolio
GreatLink Lifestyle Progressive
Portfolio
GreatLink Lifestyle Dynamic Portfolio
S$ S$ S$ S$ S$
INVESTMENT PORTFOLIO
Equities - - - - -
Fixed Income Securities 67,046,426 23,639,766 193,607,919 27,046,808 -
Investments in funds 47,348,872 27,203,625 425,133,273 111,923,738 51,578,005
Value of Investments 114,395,298 50,843,391 618,741,192 138,970,546 51,578,005
CURRENT ASSETS
Fixed deposits 361,542 127,475 1,044,015 145,848 -
Cash at bank 732,572 275,874 2,535,543 435,204 69,303
Short term instruments 3,795,026 1,338,081 10,958,781 1,530,929 -
Accrued interest 283,058 99,803 817,378 114,187 -
Dividend receivable - - - - -
Due from brokers 7,956,505 2,799,549 23,244,453 3,313,970 89,147
Financial derivatives at fair value 1,228,069 433,002 3,546,257 495,408 -
Embedded derivatives at fair value - - - - -
Other assets 1,920 1,805 15,932 4,340 1,951
Total Assets 128,753,990 55,918,980 660,903,551 145,010,432 51,738,406
CURRENT LIABILITIES
Due to brokers 12,233,224 4,309,580 35,352,895 4,952,690 24,994
Financial derivativesat fair value 882,701 311,235 2,549,077 356,128 21
Other liabilities 168,159 71,528 784,329 166,713 48,978
Net Asset Value of fund at end of the period 115,469,906 51,226,637 622,217,250 139,534,901 51,664,413
Units in issue 57,306,608 24,919,937 270,779,365 56,529,098 22,770,855
Net Asset Valueper Unit 2.014 2.055 2.297 2.468 2.268
STATEMENT OF ASSETS AND LIABILITIES (Unaudited) as at 30 June 2021
Asse
ts a
nd L
iabi
litie
s
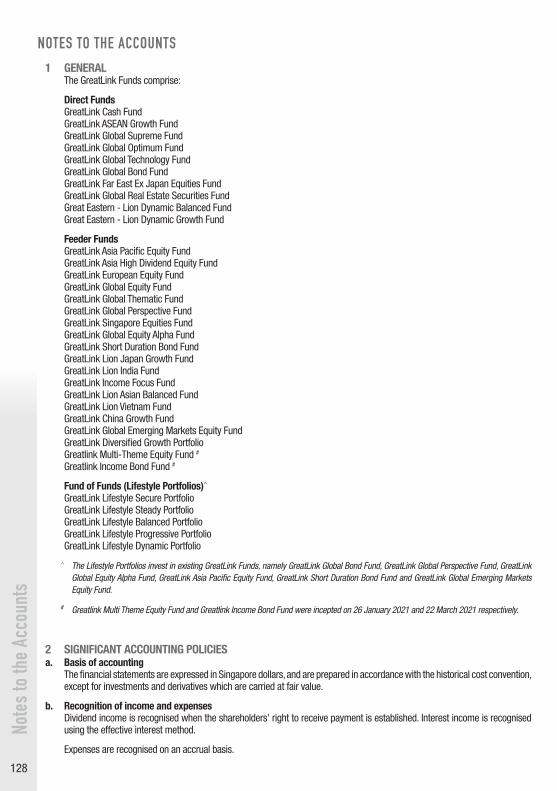
128
Note
s to
the
Acco
unts
NOTES TO THE ACCOUNTS
1 GENERALThe GreatLink Funds comprise:
Direct FundsGreatLink Cash Fund GreatLink ASEAN Growth Fund GreatLink Global Supreme Fund GreatLink Global Optimum Fund GreatLink Global Technology Fund GreatLink Global Bond Fund GreatLink Far East Ex Japan Equities Fund GreatLink Global Real Estate Securities Fund Great Eastern - Lion Dynamic Balanced Fund Great Eastern - Lion Dynamic Growth Fund
Feeder FundsGreatLink Asia Pacific Equity Fund GreatLink Asia High Dividend Equity Fund GreatLink European Equity Fund GreatLink Global Equity Fund GreatLink Global Thematic Fund GreatLink Global Perspective Fund GreatLink Singapore Equities Fund GreatLink Global Equity Alpha Fund GreatLink Short Duration Bond Fund GreatLink Lion Japan Growth Fund GreatLink Lion India Fund GreatLink Income Focus Fund GreatLink Lion Asian Balanced Fund GreatLink Lion Vietnam Fund GreatLink China Growth Fund GreatLink Global Emerging Markets Equity Fund GreatLink Diversified Growth Portfolio Greatlink Multi-Theme Equity Fund # Greatlink Income Bond Fund #
Fund of Funds (Lifestyle Portfolios)^
GreatLink Lifestyle Secure Portfolio GreatLink Lifestyle Steady Portfolio GreatLink Lifestyle Balanced Portfolio GreatLink Lifestyle Progressive Portfolio GreatLink Lifestyle Dynamic Portfolio
^ The Lifestyle Portfolios invest in existing GreatLink Funds, namely GreatLink Global Bond Fund, GreatLink Global Perspective Fund, GreatLink Global Equity Alpha Fund, GreatLink Asia Pacific Equity Fund, GreatLink Short Duration Bond Fund and GreatLink Global Emerging Markets Equity Fund.
# Greatlink Multi Theme Equity Fund and Greatlink Income Bond Fund were incepted on 26 January 2021 and 22 March 2021 respectively.
2 SIGNIFICANT ACCOUNTING POLICIESa. Basis of accounting The financial statements are expressed in Singapore dollars, and are prepared in accordance with the historical cost convention,
except for investments and derivatives which are carried at fair value.
b. Recognition of income and expenses Dividend income is recognised when the shareholders' right to receive payment is established. Interest income is recognised
using the effective interest method.
Expenses are recognised on an accrual basis.

NOTES TO THE ACCOUNTS
c. Investments All purchases of investments are recognised on their trade dates, i.e., the date the commitment exists to purchase the
investments. The investments are initially recorded at fair value (or cost representing fair value on trade date) which would include transaction costs directly attributable to the acquisition of the investments. After initial recognition, the unrealised gains or losses on remeasurement to fair value are taken to the capital account. Fair value is determined by using open market valuation at the year-end date. The closing price has been adopted for all investments except for quoted equity investments. For equity investments traded on exchanges, fair value is derived from the last traded price on the respective exchange.
Certain investments have been valued using valuation techniques based on assumptions that are supported by prices from observable current market transactions. The valuation of these investments have either been provided by brokers or counterparties or valued using internal models.
d. Realised gains/losses from sale of investments All sales of investments are recognised on their trade dates i.e., the date the fund commits to sell the investments.
Realised gains/losses from sale of investments are taken to the Capital Account.
e. Foreign currency transactions Foreign currency transactions are translated into Singapore dollars at exchange rates prevailing at the transaction dates and
foreign currency monetary assets and liabilities are translated at the approximate rates ruling at year end. Differences on exchange are included in the Capital Account.
f. Derivative financial instruments All derivatives including embedded derivatives are carried at fair value. All fair value changes on derivatives are taken to the
Capital Account. The closing price has been adopted for the valuation of derivatives.
3 DERIVATIVES The GreatLink Funds enter into derivative contracts for the purposes of hedging foreign currency and interest risk exposures,
and efficient portfolio management. The derivative contracts traded include foreign exchange forward contracts, foreign exchange spot contracts, futures and rights.
Notional Amount
Fair ValueAsset
Fair Value(Liability)
S$ S$ S$Foreign exchange forward contractsGreatLink Cash Fund 19,474,152 117,414 (101,485)GreatLink Global Supreme Fund 181,938,515 1,162,198 (1,268,553)GreatLink European Equity Fund 44,940 188 - GreatLink Global Optimum Fund 2,551,166 17,264 (22,425)GreatLink Global Bond Fund 1,275,902,233 6,698,225 (4,976,235)Great Eastern - Lion Dynamic Balanced Fund 957,349 127 (11,002)Great Eastern - Lion Dynamic Growth Fund 4,137,861 160 (52,154)
Futures purchasedGreatLink Global Supreme Fund 82,835,088 366,832 (192,900)GreatLink Global Bond Fund 257,190,269 848,230 (446,833)
Foreign exchange spot contractsGreatLink ASEAN Growth Fund 1,380,250 735 (3,599)GreatLink Global Supreme Fund 1,736,874 690 (2,240)GreatLink Global Equity Fund 9,511 - (48)GreatLink Global Technology Fund 13,738 40 - GreatLink Global Bond Fund 181,748,239 993 (1,762)GreatLink Global Perspective Fund 68,494 - (112)GreatLink Far East Ex Japan Equities Fund 165,344 - (980)GreatLink Global Equity Alpha Fund 102,868 - (168)GreatLink Global Real Estate Securities Fund 1,265,048 2,640 (1,823)GreatLink Multi-Theme Equity Fund 750 - (1)
Note
s to
the
Acco
unts
129

4 MANAGEMENT FEES Management fees are payable to The Great Eastern Life Assurance Company Limited and its related company, Lion Global
Investors Limited.
5 DISTRIBUTION TO POLICY HOLDERS GreatLink Asia High Dividend Equity Fund and GreatLink Income Focus Fund and GreatLink Income Bond Fund have made
distributions of $914,638, $1,812,21 and $100,599 respectively to policyholders during the financial period.
No other sub-fund made any distribution to policyholders for the period ended 30 June 2021.
NOTES TO THE ACCOUNTS
130
Note
s to
the
Acco
unts

(This page is intentionally left blank)

(This page is intentionally left blank)
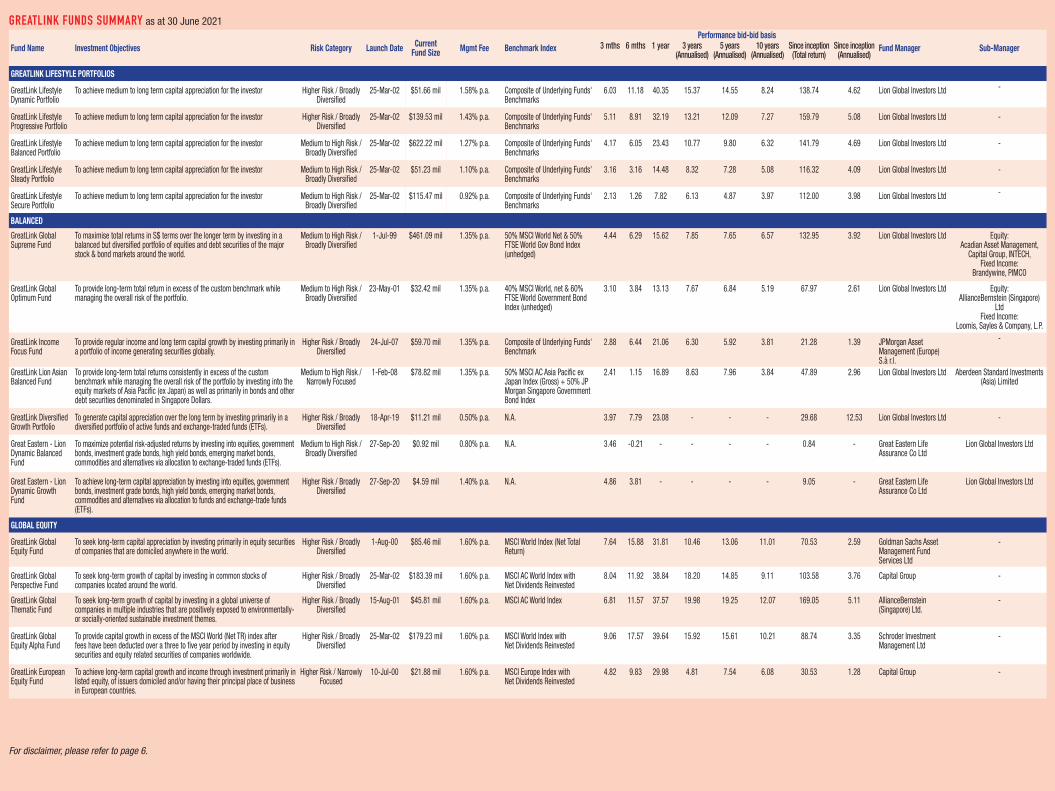
GREATLINK FUNDS SUMMARY as at 30 June 2021
Printed by Ho Printing Singapore Pte Ltd
The Great Eastern Life Assurance Company Limited (Reg. No. 1908 00011G)
1 Pickering Street #01-01 Great Eastern Centre Singapore 048659www.greateasternlife.com
contents
For disclaimer, please refer to page 6.
Fund Name Investment Objectives Risk Category Launch Date Current Fund Size Mgmt Fee Benchmark Index
Performance bid-bid basisFund Manager Sub-Manager3 mths 6 mths 1 year 3 years
(Annualised)5 years
(Annualised)10 years
(Annualised)Since inception
(Total return)Since inception
(Annualised)
GREATLINK LIFESTYLE PORTFOLIOS
GreatLink Lifestyle Dynamic Portfolio
To achieve medium to long term capital appreciation for the investor Higher Risk / Broadly Diversified
25-Mar-02 $51.66 mil 1.58% p.a. Composite of Underlying Funds' Benchmarks
6.03 11.18 40.35 15.37 14.55 8.24 138.74 4.62 Lion Global Investors Ltd -
GreatLink Lifestyle Progressive Portfolio
To achieve medium to long term capital appreciation for the investor Higher Risk / Broadly Diversified
25-Mar-02 $139.53 mil 1.43% p.a. Composite of Underlying Funds' Benchmarks
5.11 8.91 32.19 13.21 12.09 7.27 159.79 5.08 Lion Global Investors Ltd -
GreatLink Lifestyle Balanced Portfolio
To achieve medium to long term capital appreciation for the investor Medium to High Risk / Broadly Diversified
25-Mar-02 $622.22 mil 1.27% p.a. Composite of Underlying Funds' Benchmarks
4.17 6.05 23.43 10.77 9.80 6.32 141.79 4.69 Lion Global Investors Ltd -
GreatLink Lifestyle Steady Portfolio
To achieve medium to long term capital appreciation for the investor Medium to High Risk / Broadly Diversified
25-Mar-02 $51.23 mil 1.10% p.a. Composite of Underlying Funds' Benchmarks
3.16 3.16 14.48 8.32 7.28 5.08 116.32 4.09 Lion Global Investors Ltd -
GreatLink Lifestyle Secure Portfolio
To achieve medium to long term capital appreciation for the investor Medium to High Risk / Broadly Diversified
25-Mar-02 $115.47 mil 0.92% p.a. Composite of Underlying Funds' Benchmarks
2.13 1.26 7.82 6.13 4.87 3.97 112.00 3.98 Lion Global Investors Ltd -
BALANCED
GreatLink Global Supreme Fund
To maximise total returns in S$ terms over the longer term by investing in a balanced but diversified portfolio of equities and debt securities of the major stock & bond markets around the world.
Medium to High Risk / Broadly Diversified
1-Jul-99 $461.09 mil 1.35% p.a. 50% MSCI World Net & 50% FTSE World Gov Bond Index (unhedged)
4.44 6.29 15.62 7.85 7.65 6.57 132.95 3.92 Lion Global Investors Ltd Equity: Acadian Asset Management,
Capital Group, INTECH, Fixed Income:
Brandywine, PIMCO
GreatLink Global Optimum Fund
To provide long-term total return in excess of the custom benchmark while managing the overall risk of the portfolio.
Medium to High Risk / Broadly Diversified
23-May-01 $32.42 mil 1.35% p.a. 40% MSCI World, net & 60% FTSE World Government Bond Index (unhedged)
3.10 3.84 13.13 7.67 6.84 5.19 67.97 2.61 Lion Global Investors Ltd Equity: AllianceBernstein (Singapore)
Ltd Fixed Income:
Loomis, Sayles & Company, L.P.
GreatLink Income Focus Fund
To provide regular income and long term capital growth by investing primarily in a portfolio of income generating securities globally.
Higher Risk / Broadly Diversified
24-Jul-07 $59.70 mil 1.35% p.a. Composite of Underlying Funds' Benchmark
2.88 6.44 21.06 6.30 5.92 3.81 21.28 1.39 JPMorgan Asset Management (Europe) S.à r.l.
-
GreatLink Lion Asian Balanced Fund
To provide long-term total returns consistently in excess of the custom benchmark while managing the overall risk of the portfolio by investing into the equity markets of Asia Pacific (ex Japan) as well as primarily in bonds and other debt securities denominated in Singapore Dollars.
Medium to High Risk / Narrowly Focused
1-Feb-08 $78.82 mil 1.35% p.a. 50% MSCI AC Asia Pacific ex Japan Index (Gross) + 50% JP Morgan Singapore Government Bond Index
2.41 1.15 16.89 8.63 7.96 3.84 47.89 2.96 Lion Global Investors Ltd Aberdeen Standard Investments (Asia) Limited
GreatLink Diversified Growth Portfolio
To generate capital appreciation over the long term by investing primarily in a diversified portfolio of active funds and exchange-traded funds (ETFs).
Higher Risk / Broadly Diversified
18-Apr-19 $11.21 mil 0.50% p.a. N.A. 3.97 7.79 23.08 - - - 29.68 12.53 Lion Global Investors Ltd -
Great Eastern - Lion Dynamic Balanced Fund
To maximize potential risk-adjusted returns by investing into equities, government bonds, investment grade bonds, high yield bonds, emerging market bonds, commodities and alternatives via allocation to exchange-traded funds (ETFs).
Medium to High Risk / Broadly Diversified
27-Sep-20 $0.92 mil 0.80% p.a. N.A. 3.46 -0.21 - - - - 0.84 - Great Eastern Life Assurance Co Ltd
Lion Global Investors Ltd
Great Eastern - Lion Dynamic Growth Fund
To achieve long-term capital appreciation by investing into equities, government bonds, investment grade bonds, high yield bonds, emerging market bonds, commodities and alternatives via allocation to funds and exchange-trade funds (ETFs).
Higher Risk / Broadly Diversified
27-Sep-20 $4.59 mil 1.40% p.a. N.A. 4.86 3.81 - - - - 9.05 - Great Eastern Life Assurance Co Ltd
Lion Global Investors Ltd
GLOBAL EQUITY
GreatLink Global Equity Fund
To seek long-term capital appreciation by investing primarily in equity securities of companies that are domiciled anywhere in the world.
Higher Risk / Broadly Diversified
1-Aug-00 $85.46 mil 1.60% p.a. MSCI World Index (Net Total Return)
7.64 15.88 31.81 10.46 13.06 11.01 70.53 2.59 Goldman Sachs Asset Management Fund Services Ltd
-
GreatLink Global Perspective Fund
To seek long-term growth of capital by investing in common stocks of companies located around the world.
Higher Risk / Broadly Diversified
25-Mar-02 $183.39 mil 1.60% p.a. MSCI AC World Index with Net Dividends Reinvested
8.04 11.92 38.84 18.20 14.85 9.11 103.58 3.76 Capital Group -
GreatLink Global Thematic Fund
To seek long-term growth of capital by investing in a global universe of companies in multiple industries that are positively exposed to environmentally- or socially-oriented sustainable investment themes.
Higher Risk / Broadly Diversified
15-Aug-01 $45.81 mil 1.60% p.a. MSCI AC World Index 6.81 11.57 37.57 19.98 19.25 12.07 169.05 5.11 AllianceBernstein (Singapore) Ltd.
-
GreatLink Global Equity Alpha Fund
To provide capital growth in excess of the MSCI World (Net TR) index after fees have been deducted over a three to five year period by investing in equity securities and equity related securities of companies worldwide.
Higher Risk / Broadly Diversified
25-Mar-02 $179.23 mil 1.60% p.a. MSCI World Index with Net Dividends Reinvested
9.06 17.57 39.64 15.92 15.61 10.21 88.74 3.35 Schroder Investment Management Ltd
-
GreatLink European Equity Fund
To achieve long-term capital growth and income through investment primarily in listed equity, of issuers domiciled and/or having their principal place of business in European countries.
Higher Risk / Narrowly Focused
10-Jul-00 $21.88 mil 1.60% p.a. MSCI Europe Index with Net Dividends Reinvested
4.82 9.83 29.98 4.81 7.54 6.08 30.53 1.28 Capital Group -
Message 1
Investment Outlook 2
Announcement 4
Disclaimer 6
Lifestyle Portfolios 7
Balanced 13
Global Equity 20
Asian Equity 29
Non-Equity 38
Funds Information 42
Soft Dollar Commissions 113
Capital Account 116
Statement Of Assets & Liabilities 122
Notes To The Accounts 128
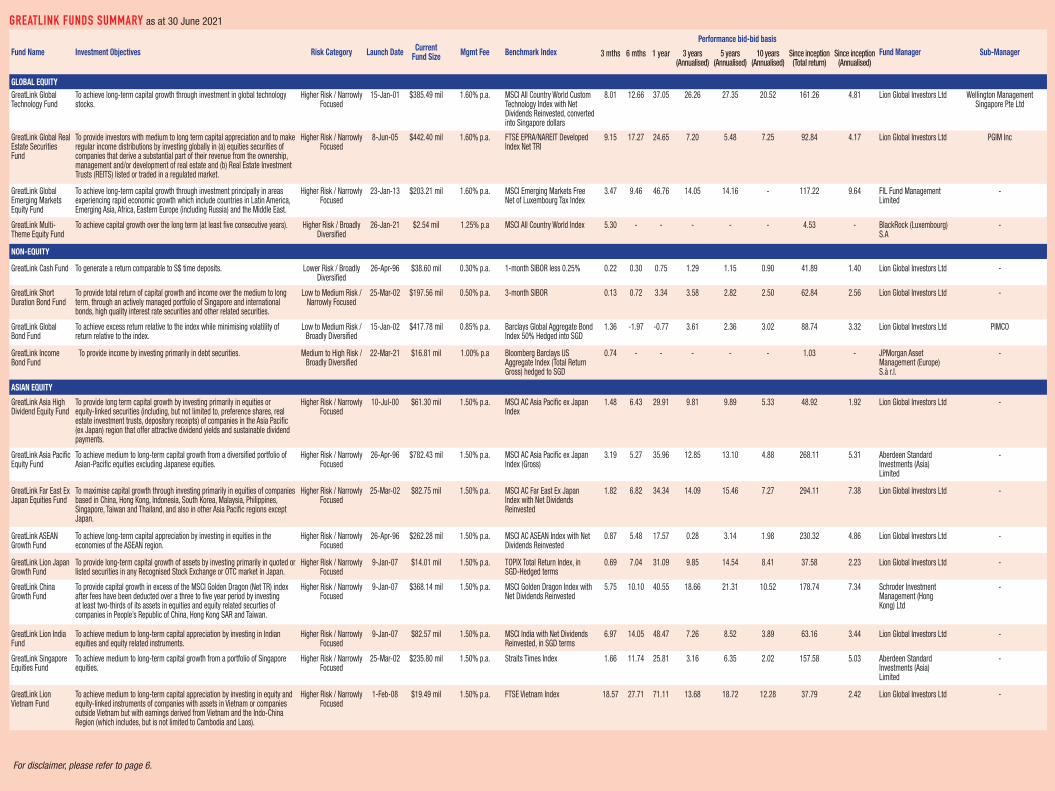
Fund Name Investment Objectives Risk Category Launch Date Current Fund Size Mgmt Fee Benchmark Index
Performance bid-bid basisFund Manager Sub-Manager3 mths 6 mths 1 year 3 years
(Annualised)5 years
(Annualised)10 years
(Annualised)Since inception
(Total return)Since inception
(Annualised)
GLOBAL EQUITYGreatLink Global Technology Fund
To achieve long-term capital growth through investment in global technology stocks.
Higher Risk / Narrowly Focused
15-Jan-01 $385.49 mil 1.60% p.a. MSCI All Country World Custom Technology Index with Net Dividends Reinvested, converted into Singapore dollars
8.01 12.66 37.05 26.26 27.35 20.52 161.26 4.81 Lion Global Investors Ltd Wellington Management Singapore Pte Ltd
GreatLink Global Real Estate Securities Fund
To provide investors with medium to long term capital appreciation and to make regular income distributions by investing globally in (a) equities securities of companies that derive a substantial part of their revenue from the ownership, management and/or development of real estate and (b) Real Estate Investment Trusts (REITS) listed or traded in a regulated market.
Higher Risk / Narrowly Focused
8-Jun-05 $442.40 mil 1.60% p.a. FTSE EPRA/NAREIT Developed Index Net TRI
9.15 17.27 24.65 7.20 5.48 7.25 92.84 4.17 Lion Global Investors Ltd PGIM Inc
GreatLink Global Emerging Markets Equity Fund
To achieve long-term capital growth through investment principally in areas experiencing rapid economic growth which include countries in Latin America, Emerging Asia, Africa, Eastern Europe (including Russia) and the Middle East.
Higher Risk / Narrowly Focused
23-Jan-13 $203.21 mil 1.60% p.a. MSCI Emerging Markets Free Net of Luxembourg Tax Index
3.47 9.46 46.76 14.05 14.16 - 117.22 9.64 FIL Fund Management Limited
-
GreatLink Multi-Theme Equity Fund
To achieve capital growth over the long term (at least five consecutive years). Higher Risk / Broadly Diversified
26-Jan-21 $2.54 mil 1.25% p.a MSCI All Country World Index 5.30 - - - - - 4.53 - BlackRock (Luxembourg) S.A
-
NON-EQUITY
GreatLink Cash Fund To generate a return comparable to S$ time deposits. Lower Risk / Broadly Diversified
26-Apr-96 $38.60 mil 0.30% p.a. 1-month SIBOR less 0.25% 0.22 0.30 0.75 1.29 1.15 0.90 41.89 1.40 Lion Global Investors Ltd -
GreatLink Short Duration Bond Fund
To provide total return of capital growth and income over the medium to long term, through an actively managed portfolio of Singapore and international bonds, high quality interest rate securities and other related securities.
Low to Medium Risk / Narrowly Focused
25-Mar-02 $197.56 mil 0.50% p.a. 3-month SIBOR 0.13 0.72 3.34 3.58 2.82 2.50 62.84 2.56 Lion Global Investors Ltd -
GreatLink Global Bond Fund
To achieve excess return relative to the index while minimising volatility of return relative to the index.
Low to Medium Risk / Broadly Diversified
15-Jan-02 $417.78 mil 0.85% p.a. Barclays Global Aggregate Bond Index 50% Hedged into SGD
1.36 -1.97 -0.77 3.61 2.36 3.02 88.74 3.32 Lion Global Investors Ltd PIMCO
GreatLink Income Bond Fund
To provide income by investing primarily in debt securities. Medium to High Risk / Broadly Diversified
22-Mar-21 $16.81 mil 1.00% p.a Bloomberg Barclays US Aggregate Index (Total Return Gross) hedged to SGD
0.74 - - - - - 1.03 - JPMorgan Asset Management (Europe) S.à r.l.
-
ASIAN EQUITY
GreatLink Asia High Dividend Equity Fund
To provide long term capital growth by investing primarily in equities or equity-linked securities (including, but not limited to, preference shares, real estate investment trusts, depository receipts) of companies in the Asia Pacific (ex Japan) region that offer attractive dividend yields and sustainable dividend payments.
Higher Risk / Narrowly Focused
10-Jul-00 $61.30 mil 1.50% p.a. MSCI AC Asia Pacific ex Japan Index
1.48 6.43 29.91 9.81 9.89 5.33 48.92 1.92 Lion Global Investors Ltd -
GreatLink Asia Pacific Equity Fund
To achieve medium to long-term capital growth from a diversified portfolio of Asian-Pacific equities excluding Japanese equities.
Higher Risk / Narrowly Focused
26-Apr-96 $782.43 mil 1.50% p.a. MSCI AC Asia Pacific ex Japan Index (Gross)
3.19 5.27 35.96 12.85 13.10 4.88 268.11 5.31 Aberdeen Standard Investments (Asia) Limited
-
GreatLink Far East Ex Japan Equities Fund
To maximise capital growth through investing primarily in equities of companies based in China, Hong Kong, Indonesia, South Korea, Malaysia, Philippines, Singapore, Taiwan and Thailand, and also in other Asia Pacific regions except Japan.
Higher Risk / Narrowly Focused
25-Mar-02 $82.75 mil 1.50% p.a. MSCI AC Far East Ex Japan Index with Net Dividends Reinvested
1.82 6.82 34.34 14.09 15.46 7.27 294.11 7.38 Lion Global Investors Ltd -
GreatLink ASEAN Growth Fund
To achieve long-term capital appreciation by investing in equities in the economies of the ASEAN region.
Higher Risk / Narrowly Focused
26-Apr-96 $262.28 mil 1.50% p.a. MSCI AC ASEAN Index with Net Dividends Reinvested
0.87 5.48 17.57 0.28 3.14 1.98 230.32 4.86 Lion Global Investors Ltd -
GreatLink Lion Japan Growth Fund
To provide long-term capital growth of assets by investing primarily in quoted or listed securities in any Recognised Stock Exchange or OTC market in Japan.
Higher Risk / Narrowly Focused
9-Jan-07 $14.01 mil 1.50% p.a. TOPIX Total Return Index, in SGD-Hedged terms
0.69 7.04 31.09 9.85 14.54 8.41 37.58 2.23 Lion Global Investors Ltd -
GreatLink China Growth Fund
To provide capital growth in excess of the MSCI Golden Dragon (Net TR) index after fees have been deducted over a three to five year period by investing at least two-thirds of its assets in equities and equity related securties of companies in People’s Republic of China, Hong Kong SAR and Taiwan.
Higher Risk / Narrowly Focused
9-Jan-07 $368.14 mil 1.50% p.a. MSCI Golden Dragon Index with Net Dividends Reinvested
5.75 10.10 40.55 18.66 21.31 10.52 178.74 7.34 Schroder Investment Management (Hong Kong) Ltd
-
GreatLink Lion India Fund
To achieve medium to long-term capital appreciation by investing in Indian equities and equity related instruments.
Higher Risk / Narrowly Focused
9-Jan-07 $82.57 mil 1.50% p.a. MSCI India with Net Dividends Reinvested, in SGD terms
6.97 14.05 48.47 7.26 8.52 3.89 63.16 3.44 Lion Global Investors Ltd -
GreatLink Singapore Equities Fund
To achieve medium to long-term capital growth from a portfolio of Singapore equities.
Higher Risk / Narrowly Focused
25-Mar-02 $235.80 mil 1.50% p.a. Straits Times Index 1.66 11.74 25.81 3.16 6.35 2.02 157.58 5.03 Aberdeen Standard Investments (Asia) Limited
-
GreatLink Lion Vietnam Fund
To achieve medium to long-term capital appreciation by investing in equity and equity-linked instruments of companies with assets in Vietnam or companies outside Vietnam but with earnings derived from Vietnam and the Indo-China Region (which includes, but is not limited to Cambodia and Laos).
Higher Risk / Narrowly Focused
1-Feb-08 $19.49 mil 1.50% p.a. FTSE Vietnam Index 18.57 27.71 71.11 13.68 18.72 12.28 37.79 2.42 Lion Global Investors Ltd -
GREATLINK FUNDS SUMMARY as at 30 June 2021
For disclaimer, please refer to page 6.
Annual Report and Audited Financial StatementsFor the year ended 31 December 2018
The Great Eastern Life Assurance Company Limited (Registration No. 1908 00011G)
1 Pickering Street #01-01 Great Eastern Centre Singapore 048659
MCI
(P) 0
67/0
1/20
21
Semi Annual Report and Unaudited Financial Statementsfor the period 1 January 2021 - 30 June 2021
Related Documents