DSV A/S, Hovedgaden 630, 2640 Hedehusene, Denmark, tel. +45 43 20 30 40, CVR No. 58233528, www.dsv.com. DSV Group We provide and manage supply chain solutions for thousands of companies every day – from the small family run business to the large global corporation. Our reach is global, yet our presence is local and close to our customers. More than 75,000 employees in more than 90 countries work passionately to deliver great customer experiences and high-quality services. Read more at www.dsv.com 9 February 2022 2021 ANNUAL REPORT Company Announcement No. 941 “2021 has been a good – but also challenging – year for DSV. With the acquisition of Agility’s Global Integrated Logistics business (GIL) we have once again executed on our growth strategy. We are proud that GIL is now part of DSV, and the integration is progressing well. Supply chain disruptions, port congestion and record-high freight rates have been major themes during 2021, and our teams have worked hard to find solutions and move the cargo for our customers. Under these difficult market conditions, we are pleased to deliver a strong set of financial results for 2021,” says Jens Bjørn Andersen, Group CEO. Selected financial highlights for 2021 (1 January - 31 December 2021) (DKKm) Q4 2021 Q4 2020 2021 2020 Revenue 61,302 31,716 182,306 115,932 Gross profit 11,674 7,212 37,615 28,534 EBIT before special items 5,113 2,616 16,223 9,520 Special items 324 685 478 2,164 Operating margin 8.3% 8.2% 8.9% 8.2% Conversion ratio 43.8% 36.3% 43.1% 33.4% Adjusted earnings 11,847 6,146 Adjusted free cash flow 8,659 8,746 Diluted adjusted earnings per share of DKK 1 50.9 26.5 Proposed dividend per share (DKK) 5.50 4.00 EBIT before special items Air & Sea 4,011 1,790 12,768 7,026 Road 513 420 1,857 1,390 Solutions 748 456 1,775 1,161 Q4 2021 results For Q4 2021, revenue amounted to DKK 61,302 million (Q4 2020: DKK 31,716 million). The growth of 89.8% (in constant currencies) was driven by increased activity, higher freight rates and the impact from the GIL acquisition. Q4 2021 was the first full quarter with GIL after the closing of the transaction in August 2021. For Q4 2021, gross profit came to DKK 11,674 million (Q4 2020: DKK 7,212 million). The growth in gross profit was 58.4% (in constant currencies) for the Group and was driven by higher activity across all divisions. In Air & Sea, the extraordinary freight markets with tight capacity and high rates had a positive impact on the gross profit. EBIT before special items was DKK 5,113 million for Q4 2021 (Q4 2020: DKK 2,616 million), a growth of 90.2% (in constant currencies). All three divisions contributed to the growth, driven by organic growth in gross profit, improved conversion ratio and a positive contribution from GIL. EBIT before special items for the full-year 2021 was DKK 16,223 million. This was slightly above the guidance range of DKK 15,250-16,000 million.

Welcome message from author
This document is posted to help you gain knowledge. Please leave a comment to let me know what you think about it! Share it to your friends and learn new things together.
Transcript
DSV A/S, Hovedgaden 630, 2640 Hedehusene, Denmark, tel. +45 43 20 30 40, CVR No. 58233528, www.dsv.com.
DSV Group
We provide and manage supply chain solutions for thousands of companies every day – from the small family run business to the large global
corporation. Our reach is global, yet our presence is local and close to our customers. More than 75,000 employees in more than 90 countries work
passionately to deliver great customer experiences and high-quality services. Read more at www.dsv.com
9 February 2022
2021 ANNUAL REPORT
Company Announcement No. 941
“2021 has been a good – but also challenging – year for DSV. With the acquisition of Agility’s Global Integrated Logistics business (GIL) we have once again executed on our growth strategy. We are proud that GIL is now part of DSV, and the integration is progressing well. Supply chain disruptions, port congestion and record-high freight rates have been major themes during 2021, and our teams have worked hard to find solutions and move the cargo for our customers. Under these difficult market conditions, we are pleased to deliver a strong set of financial results for 2021,” says Jens Bjørn Andersen, Group CEO.
Selected financial highlights for 2021 (1 January - 31 December 2021)
(DKKm) Q4 2021 Q4 2020 2021 2020
Revenue 61,302 31,716 182,306 115,932
Gross profit 11,674 7,212 37,615 28,534
EBIT before special items 5,113 2,616 16,223 9,520
Special items 324 685 478 2,164
Operating margin 8.3% 8.2% 8.9% 8.2%
Conversion ratio 43.8% 36.3% 43.1% 33.4%
Adjusted earnings 11,847 6,146
Adjusted free cash flow 8,659 8,746
Diluted adjusted earnings per share of DKK 1 50.9 26.5
Proposed dividend per share (DKK) 5.50 4.00
EBIT before special items
Air & Sea 4,011 1,790 12,768 7,026
Road 513 420 1,857 1,390
Solutions 748 456 1,775 1,161
Q4 2021 results
For Q4 2021, revenue amounted to DKK 61,302 million (Q4 2020: DKK 31,716 million). The growth of 89.8% (in constant
currencies) was driven by increased activity, higher freight rates and the impact from the GIL acquisition. Q4 2021 was the
first full quarter with GIL after the closing of the transaction in August 2021.
For Q4 2021, gross profit came to DKK 11,674 million (Q4 2020: DKK 7,212 million). The growth in gross profit was 58.4%
(in constant currencies) for the Group and was driven by higher activity across all divisions. In Air & Sea, the extraordinary
freight markets with tight capacity and high rates had a positive impact on the gross profit.
EBIT before special items was DKK 5,113 million for Q4 2021 (Q4 2020: DKK 2,616 million), a growth of 90.2% (in constant
currencies). All three divisions contributed to the growth, driven by organic growth in gross profit, improved conversion ratio
and a positive contribution from GIL. EBIT before special items for the full-year 2021 was DKK 16,223 million. This was
slightly above the guidance range of DKK 15,250-16,000 million.
DSV A/S, Hovedgaden 630, 2640 Hedehusene, Denmark, tel. +45 43 20 30 40, CVR No. 58233528, www.dsv.com.
DSV Group
We provide and manage supply chain solutions for thousands of companies every day – from the small family run business to the large global
corporation. Our reach is global, yet our presence is local and close to our customers. More than 75,000 employees in more than 90 countries work
passionately to deliver great customer experiences and high-quality services. Read more at www.dsv.com
Outlook for 2022
• EBIT before special items is expected to be in the range of DKK 18,000-20,000 million.
• The effective tax rate of the Group is expected to be approximately 23%.
The 2022 outlook assumes a global economic growth around 4% and similar growth levels in the transport markets. We
expect that the current situation with congestion, tight capacity and high rate levels will continue well into 2022. A gradual
reduction of the congestion could start in the second half of the year.
Due to the volatile and unpredictable transport markets, the assumptions that our outlook for 2022 rely on are more
uncertain than they would normally be.
Furthermore, we assume that the integration of GIL will continue as planned, and we expect special items in the level of
DKK 1,000 million related to the integration in 2022.
Dividend
The Board of Directors proposes ordinary dividends of DKK 5.50 per share for 2021 (2020: DKK 4.00 per share).
New share buyback programme
A separate company announcement about a new share buyback programme of DKK 2,500 million will be issued today. The
programme starts 9 February 2022 and will run until 26 April 2022.
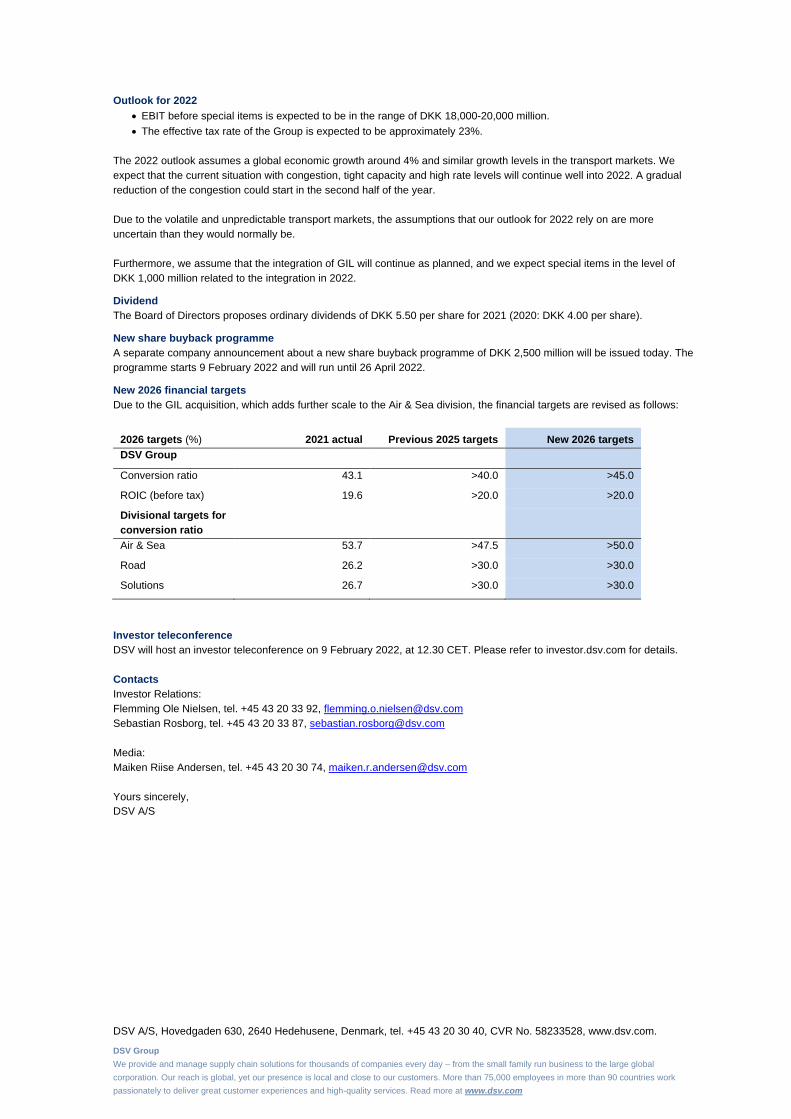
New 2026 financial targets
Due to the GIL acquisition, which adds further scale to the Air & Sea division, the financial targets are revised as follows:
2026 targets (%) 2021 actual Previous 2025 targets New 2026 targets
DSV Group
Conversion ratio 43.1 >40.0 >45.0
ROIC (before tax) 19.6 >20.0 >20.0
Divisional targets for
conversion ratio
Air & Sea 53.7 >47.5 >50.0
Road 26.2 >30.0 >30.0
Solutions 26.7 >30.0 >30.0
Investor teleconference
DSV will host an investor teleconference on 9 February 2022, at 12.30 CET. Please refer to investor.dsv.com for details.
Contacts
Investor Relations:
Flemming Ole Nielsen, tel. +45 43 20 33 92, [email protected]
Sebastian Rosborg, tel. +45 43 20 33 87, [email protected]
Media:
Maiken Riise Andersen, tel. +45 43 20 30 74, [email protected]
Yours sincerely,
DSV A/S
DSV Annual Report 20 21
Keeping supply chains flowing in a world of change
Tel. +45 43 20 30 40Email. [email protected] no. 58 23 35 28
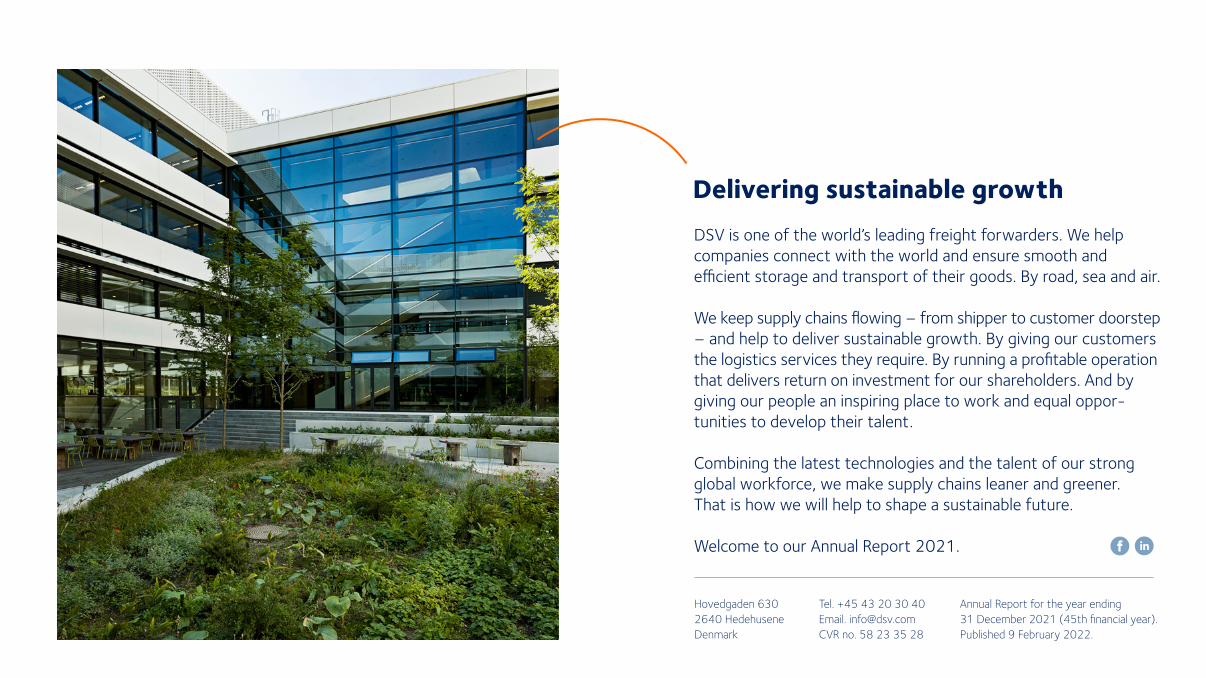
DSV is one of the world’s leading freight forwarders. We help companies connect with the world and ensure smooth and efficient storage and transport of their goods. By road, sea and air.
We keep supply chains flowing – from shipper to customer doorstep – and help to deliver sustainable growth. By giving our customers the logistics services they require. By running a profitable operation that delivers return on investment for our shareholders. And by giving our people an inspiring place to work and equal opportunities to develop their talent.
Combining the latest technologies and the talent of our strong global workforce, we make supply chains leaner and greener. That is how we will help to shape a sustainable future.
Welcome to our Annual Report 2021.
Delivering sustainable growth
Hovedgaden 6302640 HedehuseneDenmark
Annual Report for the year ending 31 December 2021 (45th financial year). Published 9 February 2022.
ContentsManagement’s commentary
IntroductionLetter from our CEO. . . . . . . . . . . . . . . . . . . . . . . . . . . . . . . . 4Highlights 2021. . . . . . . . . . . . . . . . . . . . . . . . . . . . . . . . . . . . 6GIL - our latest acquisition . . . . . . . . . . . . . . . . . . . . . . . . . . 8Five-year overview. . . . . . . . . . . . . . . . . . . . . . . . . . . . . . . . . 9
Strategy and financial targetsOur corporate purpose and strategy . . . . . . . . . . . . . . . . . 10Sustainable logistics for a fast-changing world . . . . . . . . 12Our business model. . . . . . . . . . . . . . . . . . . . . . . . . . . . . . . . 14 Industry and market trends . . . . . . . . . . . . . . . . . . . . . . . . . 15A responsive approach to technology and digitalisation . . 17Outlook for 2022 and long-term financial targets . . . . . 18Capital structure and allocation . . . . . . . . . . . . . . . . . . . . . 19
Page 8In August, we acquired Agility's Global Integrated Logistics business
Financial and non-financial performanceFinancial review . . . . . . . . . . . . . . . . . . . . . . . . . . . . . . . . . . 20Non-financial review. . . . . . . . . . . . . . . . . . . . . . . . . . . . . . . 23Air & Sea . . . . . . . . . . . . . . . . . . . . . . . . . . . . . . . . . . . . . . . . . 25Road . . . . . . . . . . . . . . . . . . . . . . . . . . . . . . . . . . . . . . . . . . . . 28Solutions . . . . . . . . . . . . . . . . . . . . . . . . . . . . . . . . . . . . . . . . . 30
Corporate governance and shareholder informationRisk management . . . . . . . . . . . . . . . . . . . . . . . . . . . . . . . . . 32Corporate governance . . . . . . . . . . . . . . . . . . . . . . . . . . . . . 38Board of Directors. . . . . . . . . . . . . . . . . . . . . . . . . . . . . . . . . 41Shareholder information. . . . . . . . . . . . . . . . . . . . . . . . . . . . 42
Other informationQuarterly financial highlights . . . . . . . . . . . . . . . . . . . . . . . . 44
Financial statementsConsolidated financial statements Income statement . . . . . . . . . . . . . . . . . . . . . . . . . . . . . . . . . 46Statement of comprehensive income . . . . . . . . . . . . . . . . 46Cash flow statement. . . . . . . . . . . . . . . . . . . . . . . . . . . . . . . 47Balance sheet . . . . . . . . . . . . . . . . . . . . . . . . . . . . . . . . . . . . . 48Statement of changes in equity . . . . . . . . . . . . . . . . . . . . . 49Notes to the consolidated financial statements . . . . . . . . 50Definition of key figures and ratios. . . . . . . . . . . . . . . . . . . 85Group company overview . . . . . . . . . . . . . . . . . . . . . . . . . . 86
StatementsManagement’s statement . . . . . . . . . . . . . . . . . . . . . . . . . . 94Independent Auditor’s reports . . . . . . . . . . . . . . . . . . . . . . 95
Parent Company financial statementsParent Company financial statements . . . . . . . . . . . . . . . . 99Page 13
In 2021, we launched a new industry-leading
Green Logistics product
Page 18Read about our
revised long-term financial targets
3 DSV Annual Report 2021 Contents
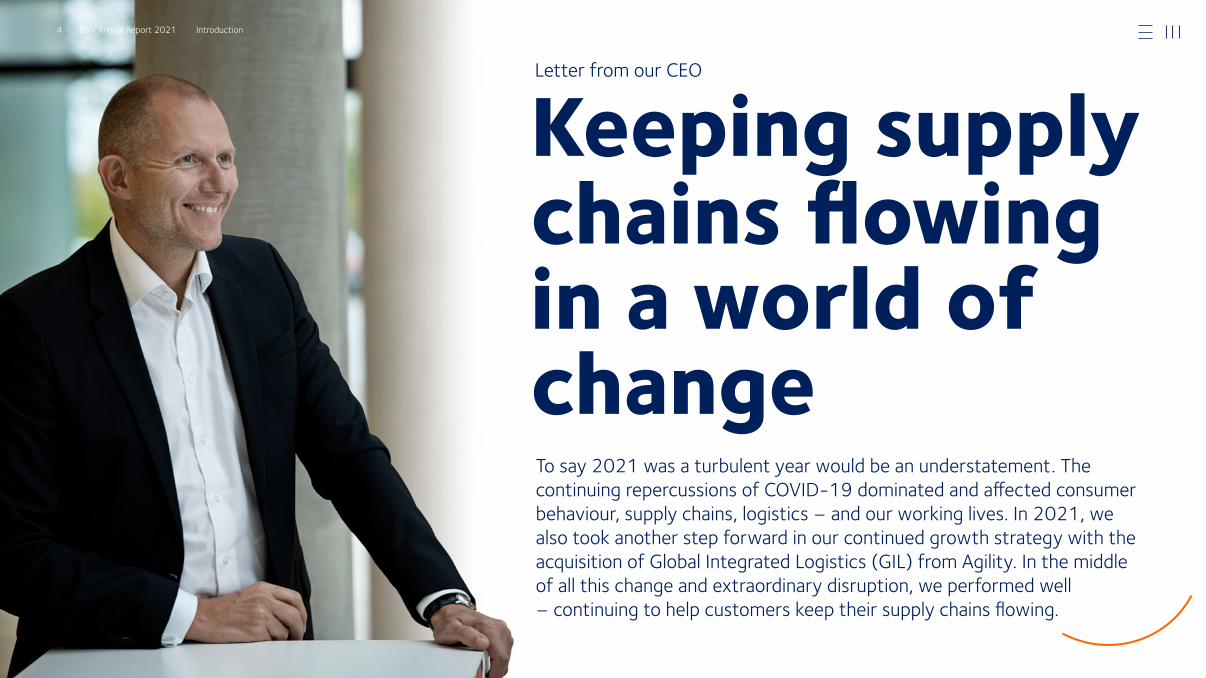
To say 2021 was a turbulent year would be an understatement. The continuing repercussions of COVID19 dominated and affected consumer behaviour, supply chains, logistics – and our working lives. In 2021, we also took another step forward in our continued growth strategy with the acquisition of Global Integrated Logistics (GIL) from Agility. In the middle of all this change and extraordinary disruption, we performed well – continuing to help customers keep their supply chains flowing.
Letter from our CEO
Keeping supply chains flowing in a world of change
4 DSV Annual Report 2021 Introduction
We understand what our
customers are going through,
and we will keep finding solutions.
Strong financial results2021 was a successful year for the DSV Group. Our revenue amounted to DKK 182.3 billion (+58.6%), gross profit was DKK 37.6 billion (+32.7%) and operating profit before special items was DKK 16.2 billion (+71.3%).
Our adjusted free cash flow was DKK 8,659 million. We dis-tributed DKK 18,761 million to shareholders in 2021 via share buybacks and dividends. And the DSV share price rose 49.8%.
A perfect stormIn the past year, we saw several unprecedented factors con-spiring across global supply chains.
Beyond the continuous pandemic lockdowns and restrictions, a surging demand for goods strained transport capacity, equipment, infrastructure and labour across the supply chain. Bottlenecks persist and have led to record-high freight rates in 2021. These disruptions continue to impact the global economy, raising difficult questions for the logistics industry and exposing global supply chain vulnerabilities.
There is no quick fix when it comes to solving these challen- ges. It will call for concerted collaboration between public and private sectors. We understand what our customers are going through, and we will keep finding solutions, optimising opera-tions and mitigating all the risks we can to keep supply chains running smoothly.
DSV is in a good position to ride out the storm. We have solid relationships with carriers. We have strong freight forwarding capabilities and skilled people who take immediate action when needed. We have worked to develop our digital pro-duction platforms and ensure more transparent supply chains.
We have modern, automated warehouses that can handle the larger inventories that come with increasing demand for e-fulfilment or increasing stock reserves.
Growing through acquisitionIn 2021, we completed the DKK 30 billion acquisition of GIL. This was a major milestone in our growth journey. Through this acquisition, we expanded our geographical reach – particularly in Asia and the Middle East – and improved our network and services. Today, we are in a stronger position than ever to support customers and grow our business with confidence.
Our teams are now bringing GIL into the DSV family, con soli-dating operations, IT, administration and logistics. While we integrate we make sure day-to-day business and service levels stay high for our customers, and we strive to keep momen-tum and progress in our other key strategic projects within IT and business development.
Our GIL integration plan is on track, and we expect to com-plete it in Q3 2022.
Trading on nature’s terms Today and tomorrow, sustainability should underpin every as-pect of our business. The supply chains we support have to significantly decarbonise if they are to keep flowing sustain-ably, and DSV must play an active role in helping our industry shape a genuinely sustainable future.
We have begun the long journey to achieve our science- based targets for cutting CO2 emissions. In 2021, we were proud to receive the Danish Climate Strategy Award in recog-nition of our ambitious goals and the actions we have already taken to reduce our scope 1, 2 and 3 emissions.
We use this recognition as motivation to handle the significant tasks ahead of us – tasks that we can only solve in close co-operation with our customers, suppliers, authorities and other important stakeholders. Cooperation, innovation and regulation are all needed to get us all the way to the target.
Last year, we launched a set of services under our new Green Logistics banner. The services range from CO2 reporting and supply chain optimisation to emission compensation and sus-tainable fuel solutions. We have designed each solution to cut our customers’ supply chain carbon footprints and at the same time reduce our own scope 3 emissions.
Always a people-centred businessFinally, I want to acknowledge the huge contribution of our employees and thank them for their resolute efforts in very difficult circumstances. 2021 taught us many valuable lessons; most importantly, it reminded us that freight forwarding will always be a people-centred business – supported by digital tools and a flexible approach to how we operate.
Whatever market challenges persist next year, we are optimistic about the future – and we are committed to keep supply chains flowing in this world of change.
Jens Bjørn AndersenGroup CEO, DSV A/S
5 DSV Annual Report 2021 Introduction
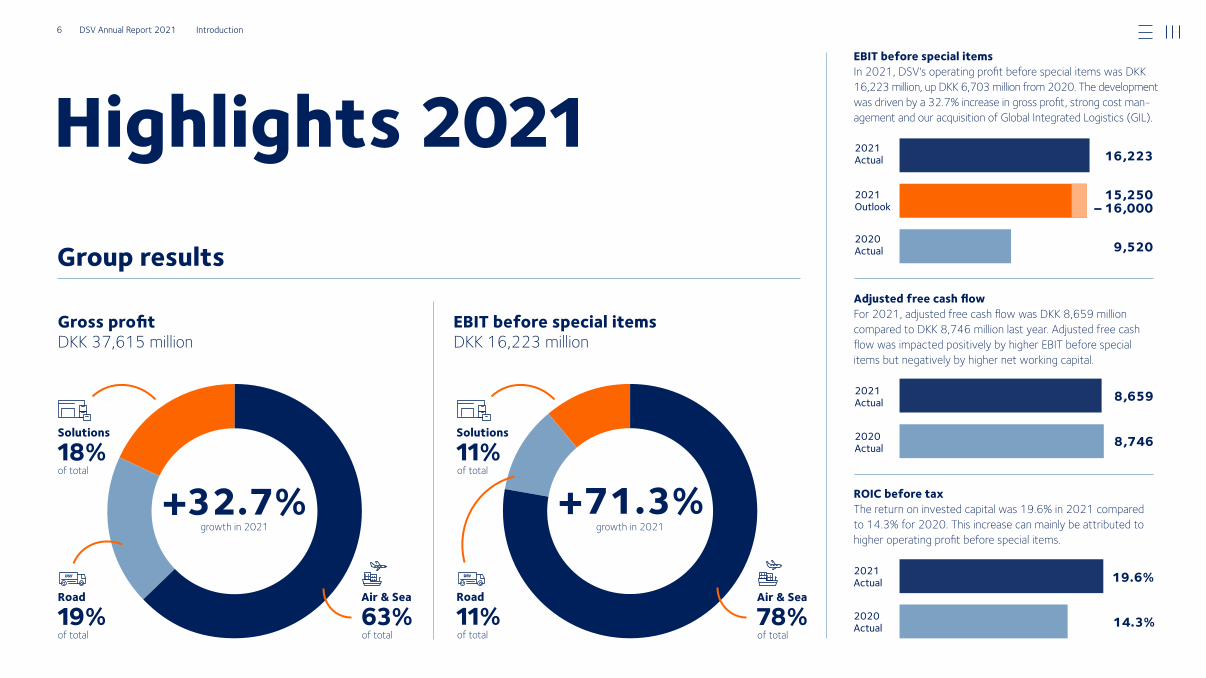
Highlights 2021Group results
EBIT before special items In 2021, DSV's operating profit before special items was DKK 16,223 million, up DKK 6,703 million from 2020. The development was driven by a 32.7% increase in gross profit, strong cost man-agement and our acquisition of Global Integrated Logistics (GIL).
Adjusted free cash flow For 2021, adjusted free cash flow was DKK 8,659 million compared to DKK 8,746 million last year. Adjusted free cash flow was impacted positively by higher EBIT before special items but negatively by higher net working capital.
ROIC before taxThe return on invested capital was 19.6% in 2021 compared to 14.3% for 2020. This increase can mainly be attributed to higher operating profit before special items.
2021 Actual 19.6%
Gross profitDKK 37,615 million
+32.7%
Air & Sea
63%Air & Sea
78%Road
19%Road
11%
Solutions
18%Solutions
11%
EBIT before special itemsDKK 16,223 million
+71.3%
2020 Actual 14.3%
2021 Actual 8,659
2020 Actual 8,746
2021 Actual
2021 Outlook
15,250 – 16,000
16,223
2020 Actual 9,520
of total
of total of total of totalof total
of total
growth in 2021 growth in 2021
6 DSV Annual Report 2021 Introduction
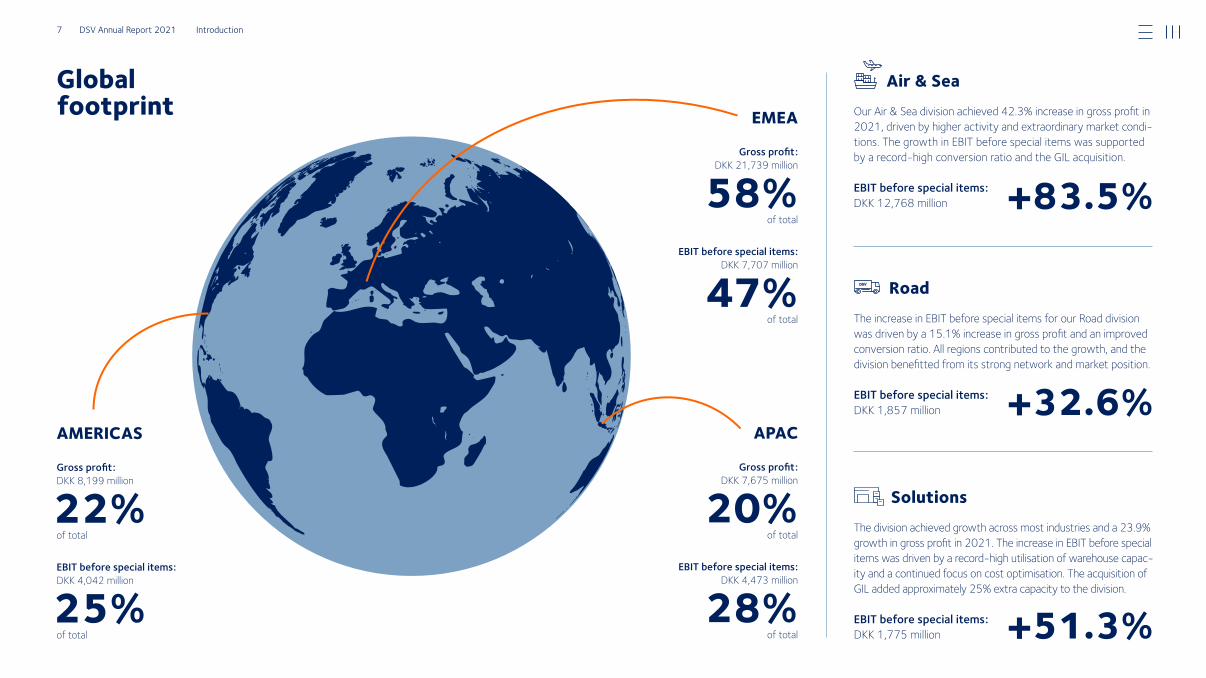
EMEA
Gross profit: DKK 21,739 million
58%of total
EBIT before special items: DKK 7,707 million
47%of total
APAC
Gross profit: DKK 7,675 million
20%of total
EBIT before special items: DKK 4,473 million
28%of total
AMERICAS
Gross profit: DKK 8,199 million
22%of total
EBIT before special items: DKK 4,042 million
25%of total
Air & SeaOur Air & Sea division achieved 42.3% increase in gross profit in 2021, driven by higher activity and extraordinary market condi-tions. The growth in EBIT before special items was supported by a record-high conversion ratio and the GIL acquisition.
EBIT before special items: DKK 12,768 million
RoadThe increase in EBIT before special items for our Road division was driven by a 15.1% increase in gross profit and an improved conversion ratio. All regions contributed to the growth, and the division benefitted from its strong network and market position.
EBIT before special items: DKK 1,857 million
SolutionsThe division achieved growth across most industries and a 23.9% growth in gross profit in 2021. The increase in EBIT before special items was driven by a record-high utilisation of warehouse capac-ity and a continued focus on cost optimisation. The acquisition of GIL added approximately 25% extra capacity to the division.
EBIT before special items: DKK 1,775 million
Global footprint
+51.3%
+32.6%
+83.5%
7 DSV Annual Report 2021 Introduction
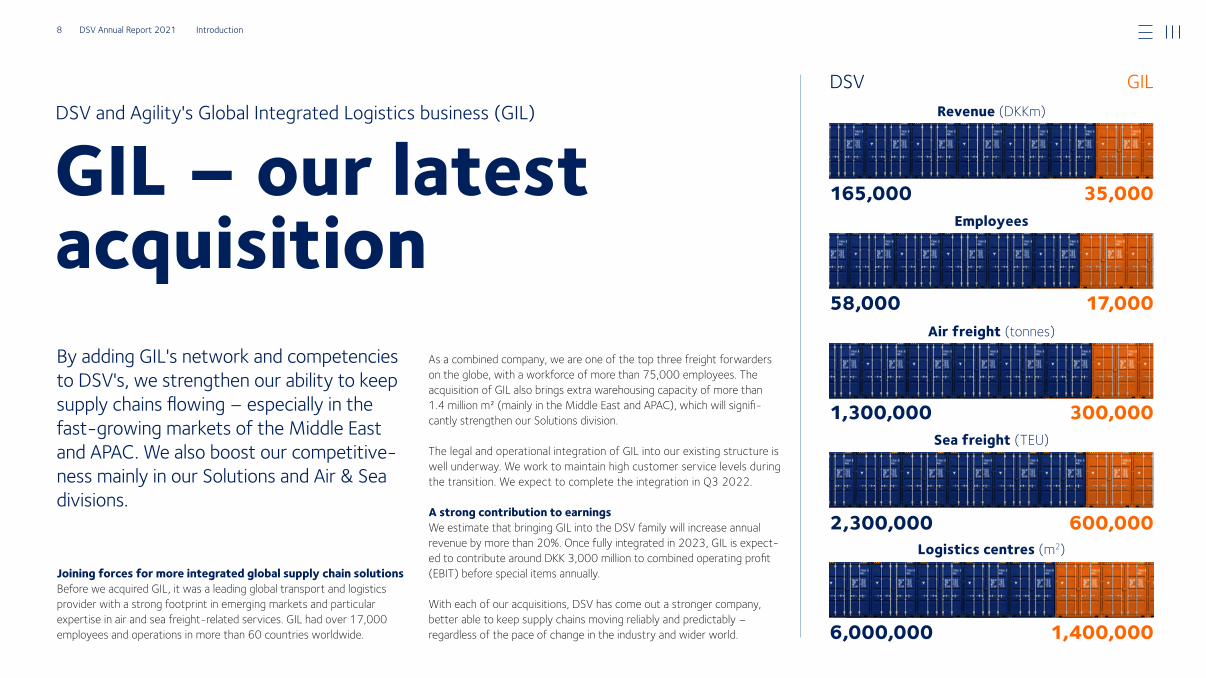
By adding GIL's network and competencies to DSV's, we strengthen our ability to keep supply chains flowing – especially in the fastgrowing markets of the Middle East and APAC. We also boost our competitiveness mainly in our Solutions and Air & Sea divisions.
As a combined company, we are one of the top three freight forwarders on the globe, with a workforce of more than 75,000 employees. The acquisition of GIL also brings extra warehousing capacity of more than 1.4 million m² (mainly in the Middle East and APAC), which will signifi-cantly strengthen our Solutions division.
The legal and operational integration of GIL into our existing structure is well underway. We work to maintain high customer service levels during the transition. We expect to complete the integration in Q3 2022.
A strong contribution to earningsWe estimate that bringing GIL into the DSV family will increase annual revenue by more than 20%. Once fully integrated in 2023, GIL is expect-ed to contribute around DKK 3,000 million to combined operating profit (EBIT) before special items annually.
With each of our acquisitions, DSV has come out a stronger company, better able to keep supply chains moving reliably and predictably – regardless of the pace of change in the industry and wider world.
DSV and Agility's Global Integrated Logistics business (GIL)
GIL – our latest acquisition
Joining forces for more integrated global supply chain solutionsBefore we acquired GIL, it was a leading global transport and logistics provider with a strong footprint in emerging markets and particular expertise in air and sea freight-related services. GIL had over 17,000 employees and operations in more than 60 countries worldwide.
DSV
Employees
Revenue (DKKm)
GIL
58,000
165,000
17,000
35,000
Air freight (tonnes)
1,300,000 300,000Sea freight (TEU)
2,300,000 600,000Logistics centres (m2)
6,000,000 1,400,000
8 DSV Annual Report 2021 Introduction
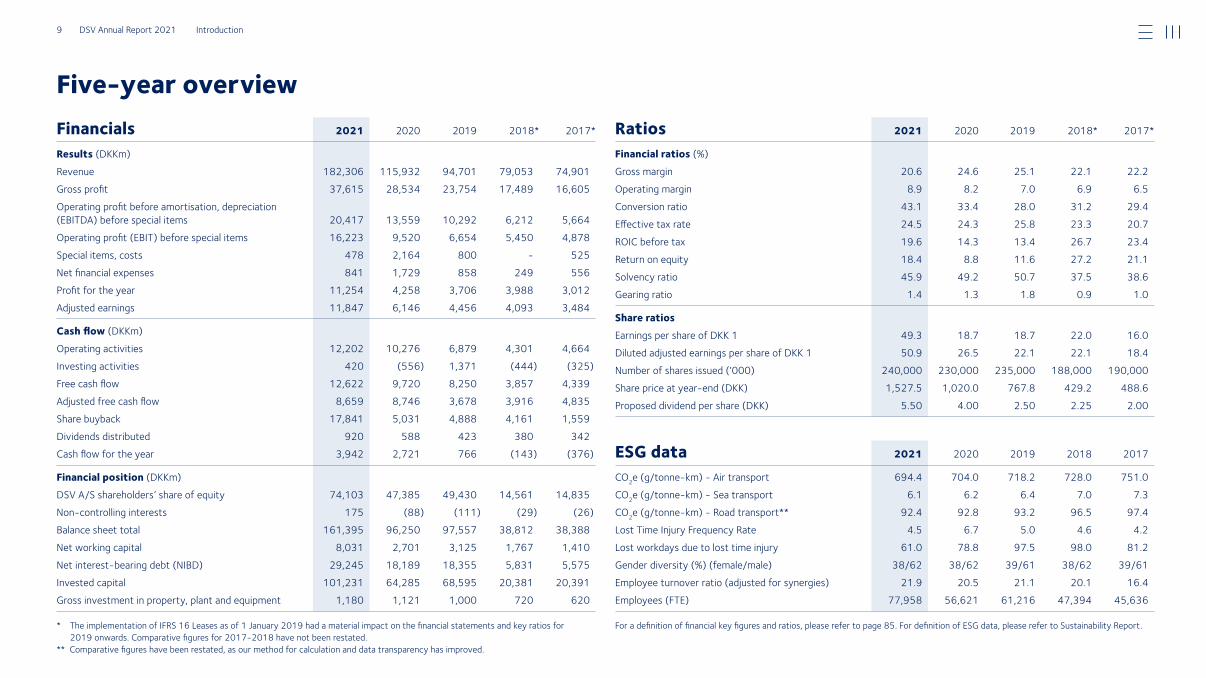
Five-year overviewRatios 2021 2020 2019 2018* 2017*
Financial ratios (%)Gross margin 20.6 24.6 25.1 22.1 22.2Operating margin 8.9 8.2 7.0 6.9 6.5Conversion ratio 43.1 33.4 28.0 31.2 29.4Effective tax rate 24.5 24.3 25.8 23.3 20.7
ROIC before tax 19.6 14.3 13.4 26.7 23.4Return on equity 18.4 8.8 11.6 27.2 21.1Solvency ratio 45.9 49.2 50.7 37.5 38.6Gearing ratio 1.4 1.3 1.8 0.9 1.0
Share ratiosEarnings per share of DKK 1 49.3 18.7 18.7 22.0 16.0Diluted adjusted earnings per share of DKK 1 50.9 26.5 22.1 22.1 18.4Number of shares issued (‘000) 240,000 230,000 235,000 188,000 190,000Share price at yearend (DKK) 1,527.5 1,020.0 767.8 429.2 488.6Proposed dividend per share (DKK) 5.50 4.00 2.50 2.25 2.00
Financials 2021 2020 2019 2018* 2017*
Results (DKKm)Revenue 182,306 115,932 94,701 79,053 74,901Gross profit 37,615 28,534 23,754 17,489 16,605Operating profit before amortisation, depreciation (EBITDA) before special items 20,417 13,559 10,292 6,212 5,664Operating profit (EBIT) before special items 16,223 9,520 6,654 5,450 4,878Special items, costs 478 2,164 800 525Net financial expenses 841 1,729 858 249 556Profit for the year 11,254 4,258 3,706 3,988 3,012Adjusted earnings 11,847 6,146 4,456 4,093 3,484
Cash flow (DKKm)Operating activities 12,202 10,276 6,879 4,301 4,664Investing activities 420 (556) 1,371 (444) (325)Free cash flow 12,622 9,720 8,250 3,857 4,339Adjusted free cash flow 8,659 8,746 3,678 3,916 4,835Share buyback 17,841 5,031 4,888 4,161 1,559Dividends distributed 920 588 423 380 342Cash flow for the year 3,942 2,721 766 (143) (376)
Financial position (DKKm)DSV A/S shareholders’ share of equity 74,103 47,385 49,430 14,561 14,835Noncontrolling interests 175 (88) (111) (29) (26)Balance sheet total 161,395 96,250 97,557 38,812 38,388Net working capital 8,031 2,701 3,125 1,767 1,410Net interestbearing debt (NIBD) 29,245 18,189 18,355 5,831 5,575Invested capital 101,231 64,285 68,595 20,381 20,391Gross investment in property, plant and equipment 1,180 1,121 1,000 720 620
ESG data 2021 2020 2019 2018 2017
CO2e (g/tonnekm) Air transport 694.4 704.0 718.2 728.0 751.0CO2e (g/tonnekm) Sea transport 6.1 6.2 6.4 7.0 7.3CO2e (g/tonnekm) Road transport** 92.4 92.8 93.2 96.5 97.4Lost Time Injury Frequency Rate 4.5 6.7 5.0 4.6 4.2Lost workdays due to lost time injury 61.0 78.8 97.5 98.0 81.2Gender diversity (%) (female/male) 38/62 38/62 39/61 38/62 39/61Employee turnover ratio (adjusted for synergies) 21.9 20.5 21.1 20.1 16.4Employees (FTE) 77,958 56,621 61,216 47,394 45,636
* The implementation of IFRS 16 Leases as of 1 January 2019 had a material impact on the financial statements and key ratios for 2019 onwards. Comparative figures for 20172018 have not been restated.
** Comparative figures have been restated, as our method for calculation and data transparency has improved.
For a definition of financial key figures and ratios, please refer to page 85. For definition of ESG data, please refer to Sustainability Report.
9 DSV Annual Report 2021 Introduction
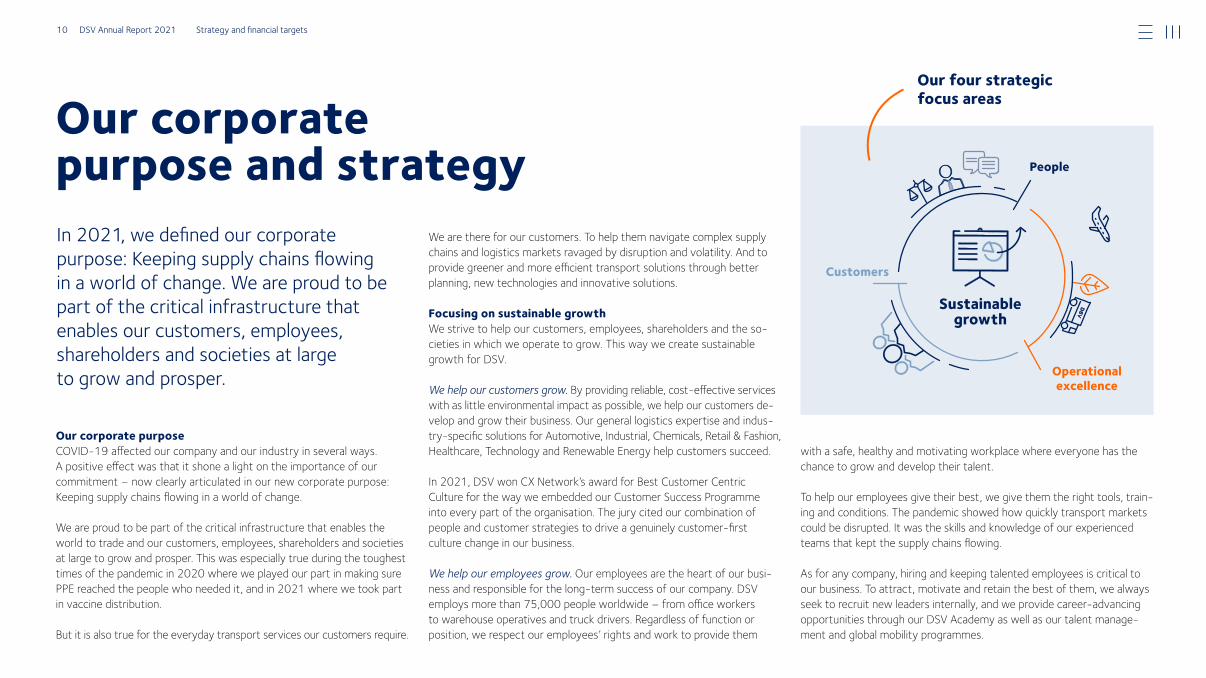
People
Customers
Operational excellence
Sustainable growth
Our corporate purpose and strategy
Our four strategic focus areas
Our corporate purpose COVID-19 affected our company and our industry in several ways. A positive effect was that it shone a light on the importance of our commitment – now clearly articulated in our new corporate purpose: Keeping supply chains flowing in a world of change.
We are proud to be part of the critical infrastructure that enables the world to trade and our customers, employees, shareholders and societies at large to grow and prosper. This was especially true during the toughest times of the pandemic in 2020 where we played our part in making sure PPE reached the people who needed it, and in 2021 where we took part in vaccine distribution.
But it is also true for the everyday transport services our customers require.
In 2021, we defined our corporate purpose: Keeping supply chains flowing in a world of change. We are proud to be part of the critical infrastructure that enables our customers, employees, shareholders and societies at large to grow and prosper.
We are there for our customers. To help them navigate complex supply chains and logistics markets ravaged by disruption and volatility. And to provide greener and more efficient transport solutions through better planning, new technologies and innovative solutions.
Focusing on sustainable growthWe strive to help our customers, employees, shareholders and the so-cieties in which we operate to grow. This way we create sustainable growth for DSV.
We help our customers grow. By providing reliable, cost-effective services with as little environmental impact as possible, we help our customers de-velop and grow their business. Our general logistics expertise and indus-try-specific solutions for Auto motive, Industrial, Chemicals, Retail & Fashion, Healthcare, Technology and Renew able Energy help customers succeed.
In 2021, DSV won CX Network’s award for Best Customer Centric Culture for the way we embedded our Customer Success Programme into every part of the organisation. The jury cited our combination of people and customer strategies to drive a genuinely customer-first culture change in our business.
We help our employees grow. Our employees are the heart of our busi-ness and responsible for the long-term success of our company. DSV employs more than 75,000 people worldwide – from office workers to warehouse operatives and truck drivers. Regardless of function or position, we respect our employees’ rights and work to provide them
with a safe, healthy and motivating workplace where everyone has the chance to grow and develop their talent.
To help our employees give their best, we give them the right tools, train-ing and conditions. The pandemic showed how quickly transport markets could be disrupted. It was the skills and knowledge of our experienced teams that kept the supply chains flowing.
As for any company, hiring and keeping talented employees is critical to our business. To attract, motivate and retain the best of them, we always seek to recruit new leaders internally, and we provide career-advancing opportunities through our DSV Academy as well as our talent manage-ment and global mobility programmes.
10 DSV Annual Report 2021 Strategy and financial targets
Having a diverse workforce, with people from different back-grounds all able to realise their potential, brings great advan-tages. It creates an inclusive and responsive culture, makes our workplaces more dynamic, and ultimately leads to better business decisions. In 2021, all managers across the Group completed a mandatory e-learning programme, ensuring that they are famil-iar with our policy and initiatives within inclusion and diversity.
We grow shareholder value. Creating profitable growth means balancing solid, above-market organic growth and an active acquisition strategy. Measured by revenue and profit margins, we are one of the industry’s largest and most profitable play-ers. This gives us a strong market position. It is also a founda-tion for continuously growing our business above market level everywhere we operate.
Strong footholds with large, global customers as well as in the SME segment give us diverse and resilient revenue streams. And the Group’s focus (and track record) on mergers, acquisitions and company integrations remains a key part of our strategy. In 2021, our acquisition of Global Integrated Logistics (GIL) from Agility added scale and capabilities to our network across more than 60 countries.
We help societies grow. We do business with integrity, respecting the dignity and rights of individuals in all cultures and countries. We believe in giving back to the communities we operate in, while finding new ways of reducing our opera-tional environmental footprint.
We are a United Nations Global Compact signatory, pledging to follow its 10 principles. Since 2015, we have also sup-ported the UN Sustainable Development Goals – identifying and working systematically with nine SDGs in the areas our business affects most.
Delivering operational excellence World trade drives world prosperity, but seamless trade is not a given. Through our persistent focus on transparency, pro-ductivity and scalability, we support more efficient global trade flows for all businesses.
Based on clear targets for each business area, we standardise our service catalogues and workflows. This boosts our produc-tivity and guarantees high quality services to customers – and it enables us to implement efficient operational systems and benefit from automation and new technology.
Working according to the principle of one main system per business area, we run a consolidated, standardised and scalable IT landscape. Where available, we use standard off-the-shelf IT systems. We take a systematic approach to prioritising data quality and security.
We maintain a flat, locally empowered organisation, firmly an-chor ed in local markets and working closely with local customers. By constantly measuring service quality, productivity and financial performance, we make sure our leaders have good, transparent insights for decision making. We believe in local ownership and de -cisions based on sound business acumen, supported by solid data.
As one global company, we aim to benefit from scale where we can. We work together as one global network, and we have centralised selected activities. This is reflected in our international shared service centres and group functions which among others include Property, Insurance and Procurement.
Purpose and strategy working together For each of our main business areas, we select strategic pro-jects and prepare separate business plans for each and priori-tise how we roll them out in a group-wide road map.
The DSV Group Executive Committee sets priorities, objec-tives and success measures for all our projects. This way, we ensure that the Group sticks to the long-term plans, adapts to market changes and takes advantage of new technologies and emerging opportunities.
Each of our key strategic projects must support one or more of our strategy focus areas: Sustainable growth, Operational excellence, Customers and People.
In 2021, some of the biggest projects were:• M&A – mainly acquiring and integrating GIL • the Road Way Forward project – a new digital
production system and standardised workflows to support our European Road network
• further developing our digital infrastructure and workflows – including our advanced integration and hybrid computing platforms
• our digital customer interaction capabilities • developing our physical infrastructure and workflows
– developing large and efficient warehouses, warehouse automation, terminals and offices
• developing and launching Green Logistics services
We will continue to focus on these areas in 2022.
We describe key projects for each of our divisions in the divisional reviews on pages 25-31. And you can read about our 2026 revised financial targets on page 18.
We believe in giving back to the communi
ties we operate in, while finding
new ways of cutting our operational
environmental footprint.
11 DSV Annual Report 2021 Strategy and financial targets
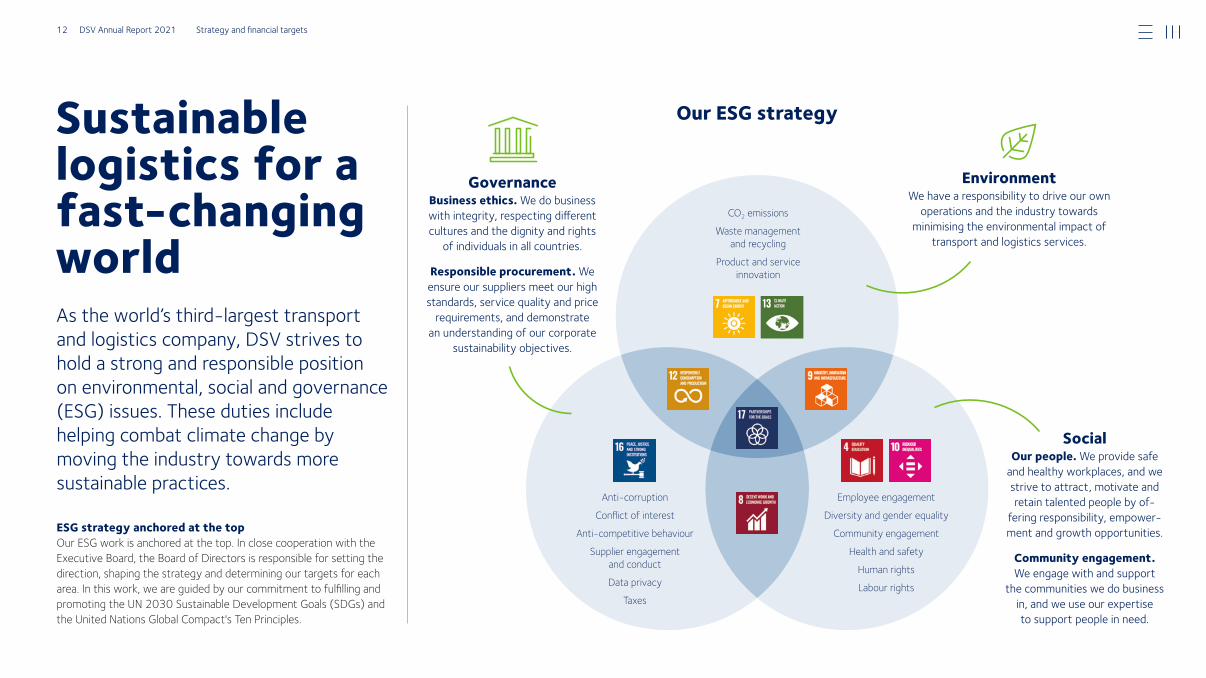
Sustainable logistics for a fast-changing world
ESG strategy anchored at the topOur ESG work is anchored at the top. In close cooperation with the Executive Board, the Board of Directors is responsible for setting the direction, shaping the strategy and determining our targets for each area. In this work, we are guided by our commitment to fulfilling and promoting the UN 2030 Sustainable Development Goals (SDGs) and the United Nations Global Compact's Ten Principles.
As the world’s thirdlargest transport and logistics company, DSV strives to hold a strong and responsible position on environmental, social and governance (ESG) issues. These duties include helping combat climate change by moving the industry towards more sustainable practices.
EnvironmentWe have a responsibility to drive our own
operations and the industry towards minimising the environ mental impact of
transport and logistics services.
GovernanceBusiness ethics. We do business with integrity, respecting different cultures and the dignity and rights
of individuals in all countries.
Responsible procurement. We ensure our suppliers meet our high standards, service quality and price
requirements, and demonstrate an unders tanding of our corporate
sustainability objectives.
SocialOur people. We provide safe
and healthy workplaces, and we strive to attract, motivate and retain talented people by of
fering responsibility, empowerment and growth opportunities.
Community engagement. We engage with and support
the communities we do business in, and we use our expertise to support people in need.
Our ESG strategy
Employee engagement
Diversity and gender equality
Community engagement
Health and safety
Human rights
Labour rights
CO2 emissions
Waste management and recycling
Product and service innovation
Anti-corruption
Conflict of interest
Anti-competitive behaviour
Supplier engagement and conduct
Data privacy
Taxes
12 DSV Annual Report 2021 Strategy and financial targets
On the other hand, climate changes may also provide business opportunities if we as a company are able to lead our industry and provide new low-emission transport services.
The uncertainty related to different future scenarios for trans-port is high, but, based on our current assessment, we do not expect a significant negative impact on our business opera-tions as a direct result of climate change.
Social and governance factorsWhile the environment is at the top of the global ESG agenda – for good reasons – we maintain our focus on social and governance factors as reflected in our ESG strategy. In short, we aim to do business with integrity and provide safe and healthy workplaces, where our colleagues all over the world are respected and given equal opportunities. We apply the same policies globally, and when we acquire companies, we ensure that the DSV standards are implemented across the organisation.
ESG value from acquisitionsOur M&A strategy does not only contribute to DSV’s fin-ancial results. We get new inspiration and capabilities on board across many areas; Panalpina took our approach to the environment and SBTi to a new level, and GIL adds a strong community engagement programme, which we will take inspiration from.
When we integrate, we always aim to take the best of both worlds in all parts of the business. Long term, this is the best way to achieve sustainable growth and value creation for all stakeholders.
We have defined strategies and specific targets for the three areas: environment, social and governance. As a global com-pany, we rely on strong alignment throughout the organisa-tion – from top management to divisions and countries – in order to realise the strategy for each of the areas.
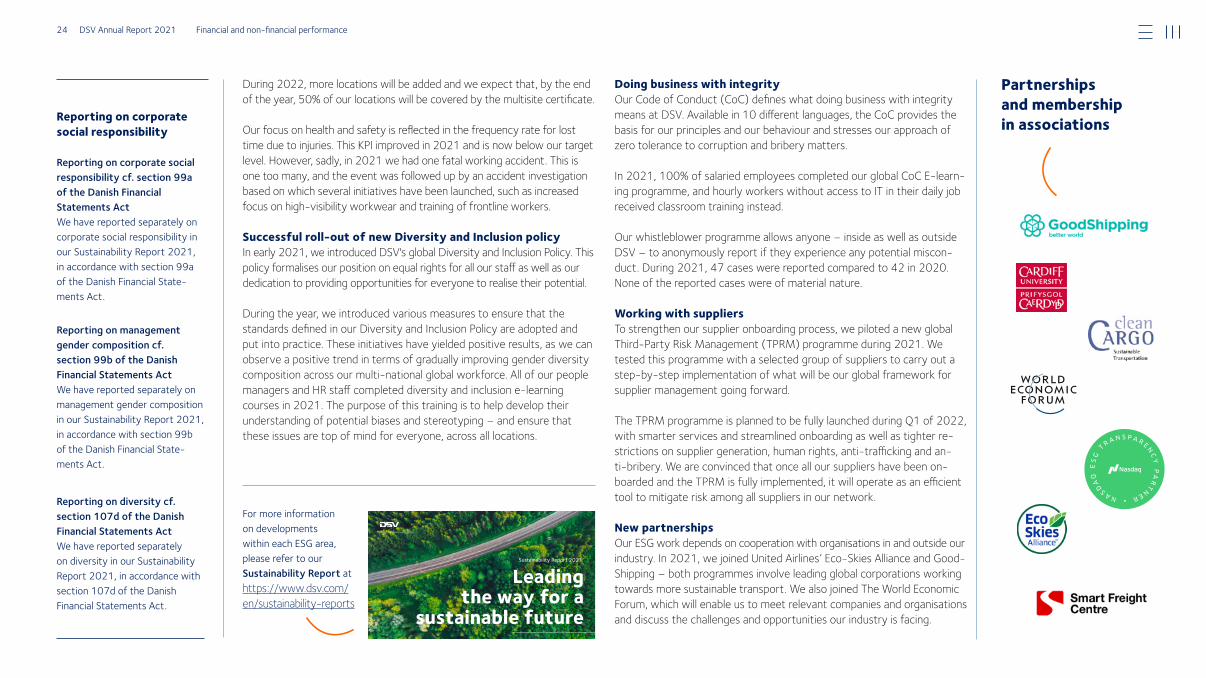
Developing partnerships We value open and honest communication with our em-ployees, customers, suppliers and investors on ESG issues. As part of our strategic management, we regularly engage in dialogue with our key stakeholders to ensure that we consider their primary concerns and listen to their input and good ideas.
We have entered into several partnerships, both with organi-sations in our industry and other areas, in order to cooperate and make progress within different areas. Especially within the environmental area, we acknowledge that we cannot achieve our targets alone – we have to engage in partner-ships with customers, suppliers and organisations, such as Clean Cargo Working Group (CCWG), GoodShipping and Eco-Skies Alliance.
The journey towards greener logisticsThe transport and logistics industry is the world’s third-largest source of greenhouse gas emissions. So the whole industry must work together and play an active role in reducing its CO2 footprint. We are working on a number of different initiatives to reduce both our internal (scope 1 and 2) emissions and, not least, our scope 3 emissions from transports carried out by our suppliers.
With our Green Logistics services we have taken the first steps, but the journey towards greener logistics is long. We depend on new technologies and alternative fuels becoming available, and we are involved in several partnerships to drive this agenda forward. At the same time, we will also help our customers to optimise their current supply chains; significant reductions can be achieved through better logistics planning.
We continue to work towards reducing our emissions, fol-lowing the Science Based Targets Initiative (SBTi). The tar-gets aim to reduce our CO2 emissions by 2030 from a 2019 baseline year. In 2021, we completed our acquisition of GIL, and because of the scale of this business transaction, we will in 2022 recalculate the emissions baseline to reflect our larger business. Throughout this process, we plan to evaluate how best to align with the 1.5⁰C warming scenarios and net zero greenhouse gas emissions target.
Managing the risk from climate changeThe long-term negative effects of climate change have the potential of significantly impacting our industry. Therefore, it is a risk that we monitor closely. We have implemented the Task Force on Climate-related Financial Disclosures (TCFD) frame-work to help us identify risks and opportunities from climate changes which can impact us.
The key risks identified are related to possible changes to global supply chains and the demand for specific transport services (e.g. air freight), implementation of new technology, implemen-tation of taxation on carbon emission, changes to transport lanes because of extreme weather and potential reputational damages if we as a company do not act against climate changes.
As part of our strategic
management, we regularly
engage in dialogue with
our key stakeholders.
13 DSV Annual Report 2021 Strategy and financial targets
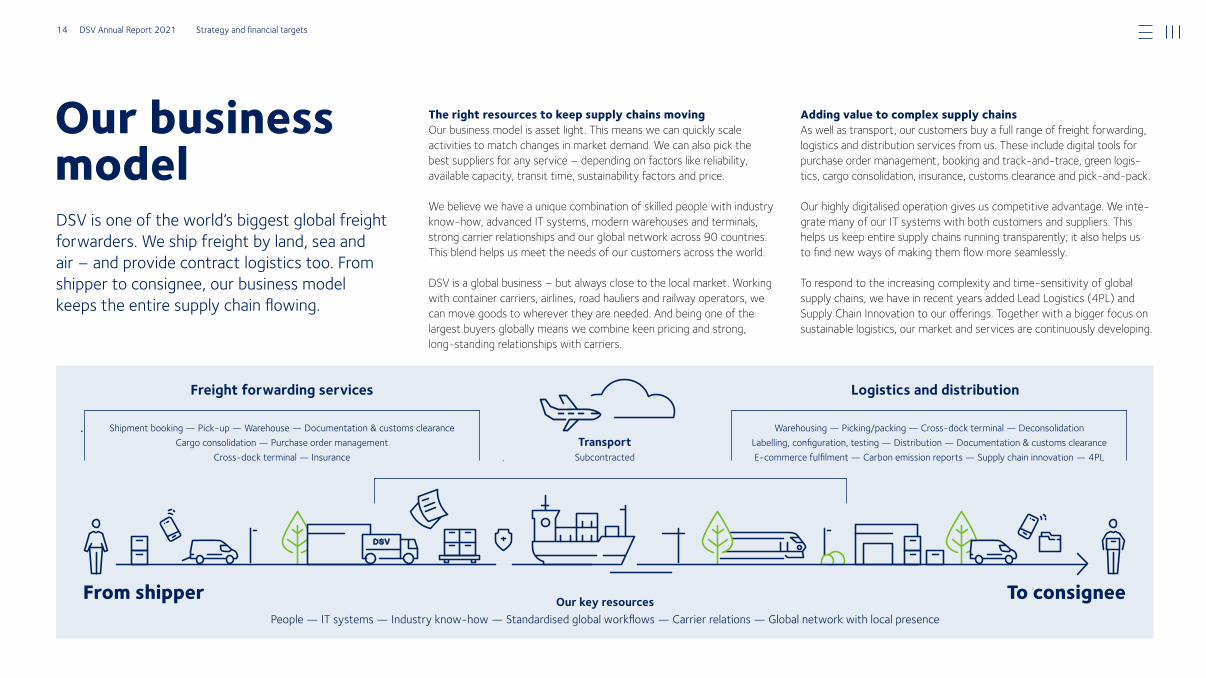
Our business model
TransportSubcontracted
From shipper Our key resourcesPeople — IT systems — Industry knowhow — Standardised global workflows — Carrier relations — Global network with local presence
Freight forwarding services Logistics and distribution
Shipment booking — Pickup — Warehouse — Documentation & customs clearance Cargo consolidation — Purchase order management
Crossdock terminal — Insurance
Warehousing — Picking/packing — Crossdock terminal — DeconsolidationLabelling, configuration, testing — Distribution — Documentation & customs clearanceEcommerce fulfilment — Carbon emission reports — Supply chain innovation — 4PL
To consignee
The right resources to keep supply chains movingOur business model is asset light. This means we can quickly scale activities to match changes in market demand. We can also pick the best suppliers for any service – depending on factors like reliability, available capacity, transit time, sustainability factors and price.
We believe we have a unique combination of skilled people with industry know-how, advanced IT systems, modern warehouses and terminals, strong carrier relationships and our global network across 90 countries. This blend helps us meet the needs of our customers across the world.
DSV is a global business – but always close to the local market. Working with container carriers, airlines, road hauliers and railway operators, we can move goods to wherever they are needed. And being one of the largest buyers globally means we combine keen pricing and strong, long-standing relationships with carriers.
Adding value to complex supply chainsAs well as transport, our customers buy a full range of freight forwarding, logistics and distribution services from us. These include digital tools for purchase order management, booking and track-and-trace, green logis-tics, cargo consolidation, insurance, customs clearance and pick-and-pack.
Our highly digitalised operation gives us competitive advantage. We inte-grate many of our IT systems with both customers and suppliers. This helps us keep entire supply chains running transparently; it also helps us to find new ways of making them flow more seamlessly.
To respond to the increasing complexity and time-sensitivity of global supply chains, we have in recent years added Lead Logistics (4PL) and Supply Chain Innovation to our offerings. Together with a bigger focus on sustainable logistics, our market and services are continuously developing.
DSV is one of the world’s biggest global freight forwarders. We ship freight by land, sea and air – and provide contract logistics too. From shipper to consignee, our business model keeps the entire supply chain flowing.
14 DSV Annual Report 2021 Strategy and financial targets
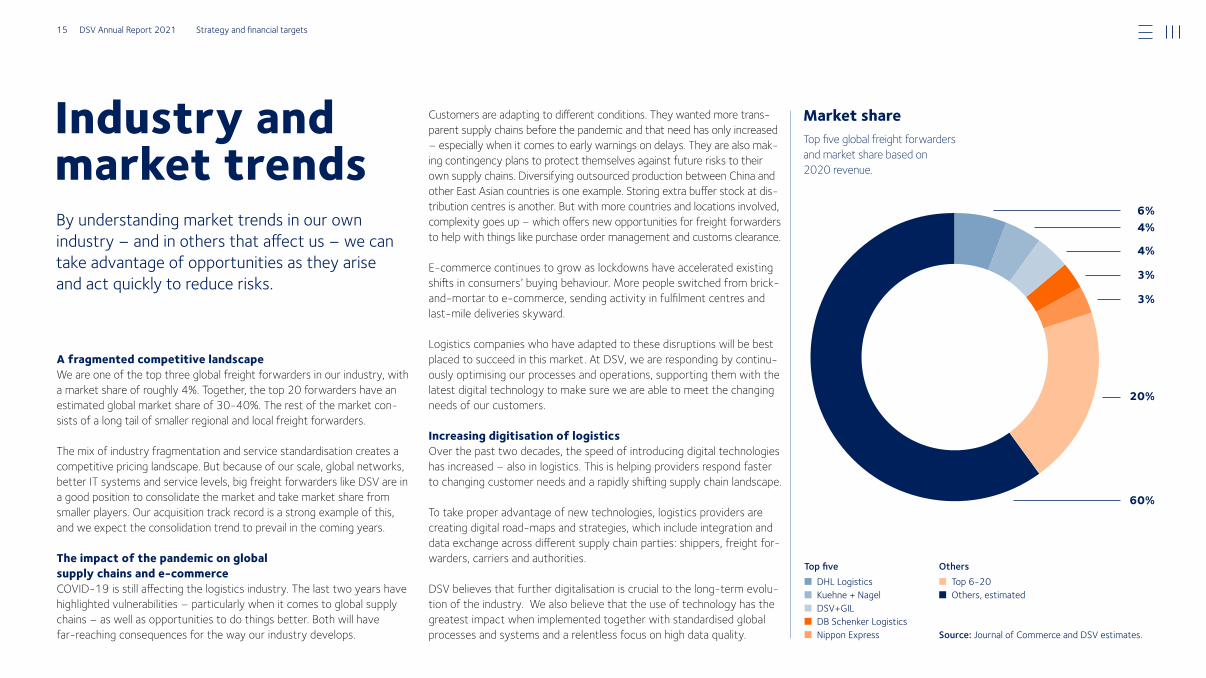
Source: Journal of Commerce and DSV estimates.
■ DHL Logistics■ Kuehne + Nagel ■ DSV+GIL■ DB Schenker Logistics■ Nippon Express
Top five
Market share Top five global freight forwarders and market share based on 2020 revenue.
Customers are adapting to different conditions. They wanted more trans-parent supply chains before the pandemic and that need has only increased – especially when it comes to early warnings on delays. They are also mak-ing contingency plans to protect themselves against future risks to their own supply chains. Diversifying outsourced production between China and other East Asian countries is one example. Storing extra buffer stock at dis-tribution centres is another. But with more countries and locations involved, complexity goes up – which offers new opportunities for freight forwarders to help with things like purchase order management and customs clearance.
E-commerce continues to grow as lockdowns have accelerated existing shifts in consumers’ buying behaviour. More people switched from brick-and-mortar to e-commerce, sending activity in fulfilment centres and last-mile deliveries skyward.
Logistics companies who have adapted to these disruptions will be best placed to succeed in this market. At DSV, we are responding by continu-ously optimising our processes and operations, supporting them with the latest digital technology to make sure we are able to meet the changing needs of our customers.
Increasing digitisation of logisticsOver the past two decades, the speed of introducing digital technologies has increased – also in logistics. This is helping providers respond faster to changing customer needs and a rapidly shifting supply chain landscape.
To take proper advantage of new technologies, logistics providers are creating digital road-maps and strategies, which include integration and data exchange across different supply chain parties: shippers, freight for-warders, carriers and authorities.
DSV believes that further digitalisation is crucial to the long-term evolu-tion of the industry. We also believe that the use of technology has the greatest impact when implemented together with standardised global processes and systems and a relentless focus on high data quality.
Industry and market trendsBy understanding market trends in our own industry – and in others that affect us – we can take advantage of opportunities as they arise and act quickly to reduce risks.
A fragmented competitive landscape We are one of the top three global freight forwarders in our industry, with a market share of roughly 4%. Together, the top 20 forwarders have an estimated global market share of 30-40%. The rest of the market con-sists of a long tail of smaller regional and local freight forwarders.
The mix of industry fragmentation and service standardisation creates a competitive pricing landscape. But because of our scale, global networks, better IT systems and service levels, big freight forwarders like DSV are in a good position to consolidate the market and take market share from smaller players. Our acquisition track record is a strong example of this, and we expect the consolidation trend to prevail in the coming years.
The impact of the pandemic on global supply chains and e-commerce COVID-19 is still affecting the logistics industry. The last two years have highlighted vulnerabilities – particularly when it comes to global supply chains – as well as opportunities to do things better. Both will have far-reaching consequences for the way our industry develops.
60%
20%
6%4%
4%
3%
3%
Others■ Top 620■ Others, estimated
15 DSV Annual Report 2021 Strategy and financial targets
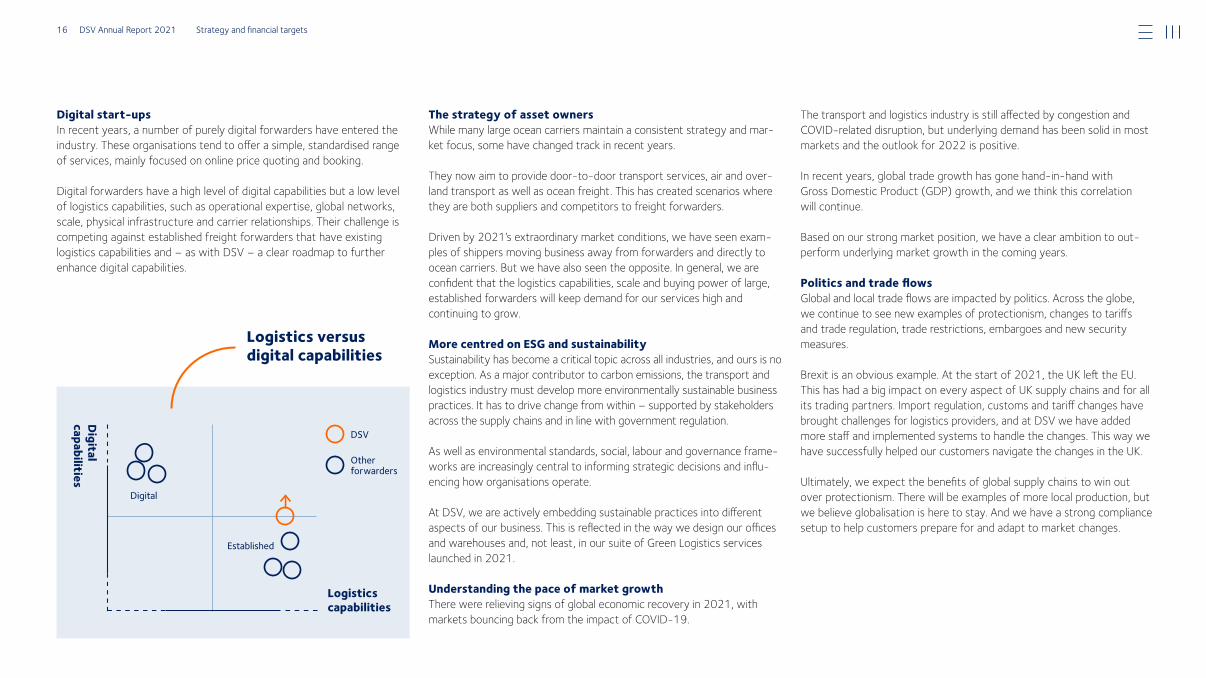
Digital start-upsIn recent years, a number of purely digital forwarders have entered the industry. These organisations tend to offer a simple, standardised range of services, mainly focused on online price quoting and booking.
Digital forwarders have a high level of digital capabilities but a low level of logistics capabilities, such as operational expertise, global networks, scale, physical infrastructure and carrier relationships. Their challenge is competing against established freight forwarders that have existing logistics capabilities and – as with DSV – a clear roadmap to further enhance digital capabilities.
The strategy of asset ownersWhile many large ocean carriers maintain a consistent strategy and mar-ket focus, some have changed track in recent years.
They now aim to provide door-to-door transport services, air and over-land transport as well as ocean freight. This has created scenarios where they are both suppliers and competitors to freight forwarders.
Driven by 2021’s extraordinary market conditions, we have seen exam-ples of shippers moving business away from forwarders and directly to ocean carriers. But we have also seen the opposite. In general, we are confident that the logistics capabilities, scale and buying power of large, established forwarders will keep demand for our services high and continuing to grow.
More centred on ESG and sustainability Sustainability has become a critical topic across all industries, and ours is no exception. As a major contributor to carbon emissions, the transport and logistics industry must develop more environmentally sustainable business practices. It has to drive change from within – supported by stakeholders across the supply chains and in line with government regulation.
As well as environmental standards, social, labour and governance frame-works are increasingly central to informing strategic decisions and influ-encing how organisations operate.
At DSV, we are actively embedding sustainable practices into different aspects of our business. This is reflected in the way we design our offices and warehouses and, not least, in our suite of Green Logistics services launched in 2021.
Understanding the pace of market growthThere were relieving signs of global economic recovery in 2021, with markets bouncing back from the impact of COVID-19.
The transport and logistics industry is still affected by congestion and COVID-related disruption, but underlying demand has been solid in most markets and the outlook for 2022 is positive.
In recent years, global trade growth has gone hand-in-hand with Gross Domestic Product (GDP) growth, and we think this correlation will continue.
Based on our strong market position, we have a clear ambition to out-perform underlying market growth in the coming years.
Politics and trade flowsGlobal and local trade flows are impacted by politics. Across the globe, we continue to see new examples of protectionism, changes to tariffs and trade regulation, trade restrictions, embargoes and new security measures.
Brexit is an obvious example. At the start of 2021, the UK left the EU. This has had a big impact on every aspect of UK supply chains and for all its trading partners. Import regulation, customs and tariff changes have brought challenges for logistics providers, and at DSV we have added more staff and implemented systems to handle the changes. This way we have successfully helped our customers navigate the changes in the UK.
Ultimately, we expect the benefits of global supply chains to win out over protectionism. There will be examples of more local production, but we believe globalisation is here to stay. And we have a strong compliance setup to help customers prepare for and adapt to market changes.
Logistics capabilities
Digital
capabilities
Logistics versus digital capabilities
Digital
Other forwarders
DSV
Established
16 DSV Annual Report 2021 Strategy and financial targets
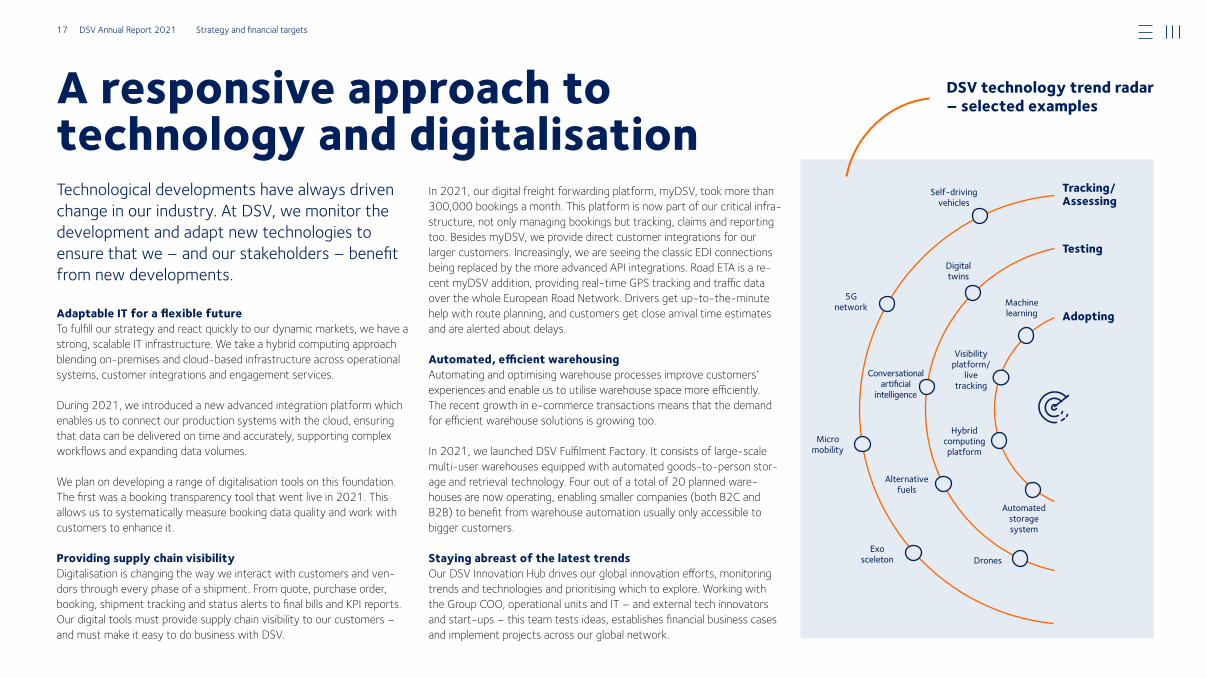
Conversational artificial
intelligence
Adaptable IT for a flexible future To fulfill our strategy and react quickly to our dynamic markets, we have a strong, scalable IT infrastructure. We take a hybrid computing approach blending on-premises and cloud-based infrastructure across operational systems, customer integrations and engagement services.
During 2021, we introduced a new advanced integration platform which enables us to connect our production systems with the cloud, ensuring that data can be delivered on time and accurately, supporting complex workflows and expanding data volumes.
We plan on developing a range of digitalisation tools on this foundation. The first was a booking transparency tool that went live in 2021. This allows us to systematically measure booking data quality and work with customers to enhance it.
Providing supply chain visibilityDigitalisation is changing the way we interact with customers and ven-dors through every phase of a shipment. From quote, purchase order, booking, shipment tracking and status alerts to final bills and KPI reports. Our digital tools must provide supply chain visibility to our customers – and must make it easy to do business with DSV.
A responsive approach to technology and digitalisation
In 2021, our digital freight forwarding platform, myDSV, took more than 300,000 bookings a month. This platform is now part of our critical infra-structure, not only managing bookings but tracking, claims and reporting too. Besides myDSV, we provide direct customer integrations for our larger customers. Increasingly, we are seeing the classic EDI connections being replaced by the more advanced API integrations. Road ETA is a re-cent myDSV addition, providing real-time GPS tracking and traffic data over the whole European Road Network. Drivers get up-to-the-minute help with route planning, and customers get close arrival time estimates and are alerted about delays.
Automated, efficient warehousingAutomating and optimising warehouse processes improve customers’ experiences and enable us to utilise warehouse space more efficiently. The recent growth in e-commerce transactions means that the demand for efficient warehouse solutions is growing too.
In 2021, we launched DSV Fulfilment Factory. It consists of large-scale multi-user warehouses equipped with automated goods-to-person stor-age and retrieval technology. Four out of a total of 20 planned ware-houses are now operating, enabling smaller companies (both B2C and B2B) to benefit from warehouse automation usually only accessible to bigger customers.
Staying abreast of the latest trendsOur DSV Innovation Hub drives our global innovation efforts, monitoring trends and technologies and prioritising which to explore. Working with the Group COO, operational units and IT – and external tech innovators and start-ups – this team tests ideas, establishes financial business cases and implement projects across our global network.
DSV technology trend radar – selected examples
Adopting
Testing
Tracking/ Assessing
Self-driving vehicles
Micro mobility
Exo sceleton
5G network
Alternative fuels
Digital twins
Drones
Machine learning
Visibility platform/
live tracking
Hybrid computing platform
Automated storage system
Technological developments have always driven change in our industry. At DSV, we monitor the development and adapt new technologies to ensure that we – and our stakeholders – benefit from new developments.
17 DSV Annual Report 2021 Strategy and financial targets
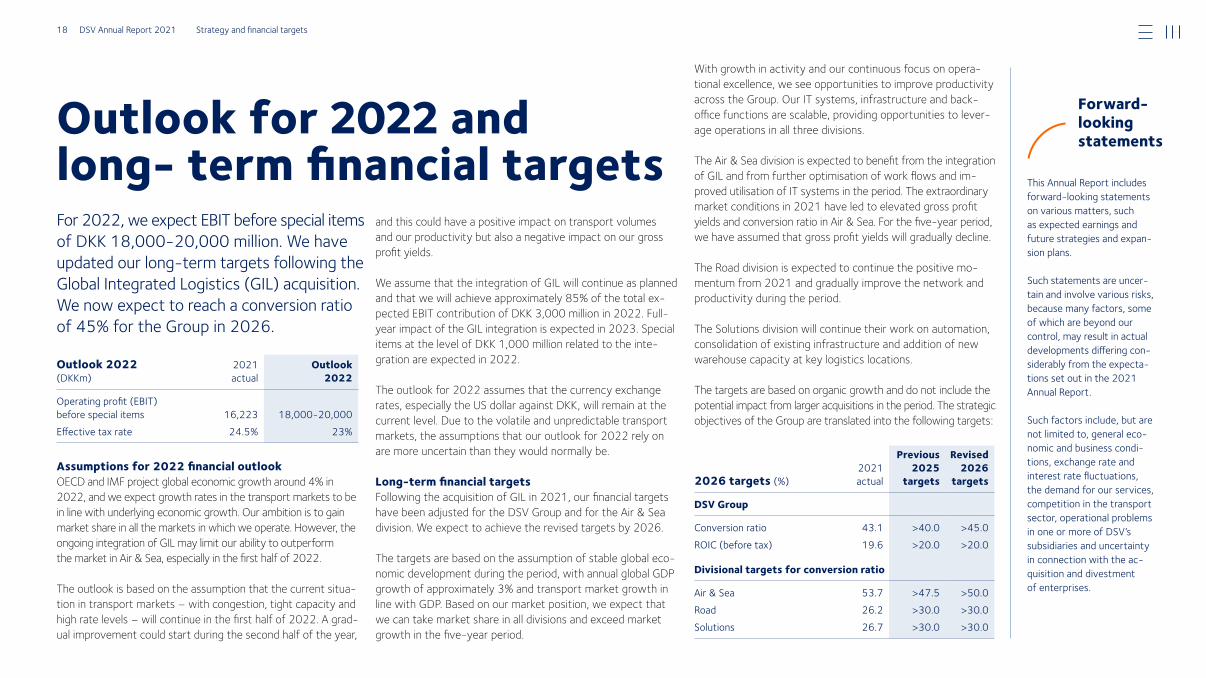
Outlook for 2022 and long- term financial targetsFor 2022, we expect EBIT before special items of DKK 18,00020,000 million. We have updated our longterm targets following the Global Integrated Logistics (GIL) acquisition. We now expect to reach a conversion ratio of 45% for the Group in 2026.
Outlook 2022 (DKKm)
2021actual
Outlook 2022
Operating profit (EBIT) before special items 16,223 18,00020,000Effective tax rate 24.5% 23%
2026 targets (%) 2021actual
Previous 2025
targets
Revised 2026
targets
DSV Group
Conversion ratio 43.1 >40.0 >45.0ROIC (before tax) 19.6 >20.0 >20.0
Divisional targets for conversion ratio
Air & Sea 53.7 >47.5 >50.0Road 26.2 >30.0 >30.0Solutions 26.7 >30.0 >30.0
Assumptions for 2022 financial outlookOECD and IMF project global economic growth around 4% in 2022, and we expect growth rates in the transport markets to be in line with underlying economic growth. Our ambition is to gain market share in all the markets in which we operate. However, the ongoing integration of GIL may limit our ability to outperform the market in Air & Sea, especially in the first half of 2022.
The outlook is based on the assumption that the current situa-tion in transport markets – with congestion, tight capacity and high rate levels – will continue in the first half of 2022. A grad-ual improvement could start during the second half of the year,
This Annual Report includes forwardlooking statements on various matters, such as expected earnings and future strategies and expansion plans.
Such statements are uncertain and involve various risks, because many factors, some of which are beyond our control, may result in actual developments differing considerably from the expectations set out in the 2021 Annual Report.
Such factors include, but are not limited to, general economic and business conditions, exchange rate and interest rate fluctuations, the demand for our services, competition in the transport sector, operational problems in one or more of DSV’s subsidiaries and uncertainty in connection with the acquisition and divestment of enterprises.
and this could have a positive impact on transport volumes and our productivity but also a negative impact on our gross profit yields.
We assume that the integration of GIL will continue as planned and that we will achieve approximately 85% of the total ex-pected EBIT contribution of DKK 3,000 million in 2022. Full-year impact of the GIL integration is expected in 2023. Special items at the level of DKK 1,000 million related to the inte-gration are expected in 2022.
The outlook for 2022 assumes that the currency exchange rates, especially the US dollar against DKK, will remain at the current level. Due to the volatile and unpredictable transport markets, the assumptions that our outlook for 2022 rely on are more uncertain than they would normally be.
Long-term financial targetsFollowing the acquisition of GIL in 2021, our financial targets have been adjusted for the DSV Group and for the Air & Sea division. We expect to achieve the revised targets by 2026.
The targets are based on the assumption of stable global eco-nomic development during the period, with annual global GDP growth of approximately 3% and transport market growth in line with GDP. Based on our market position, we expect that we can take market share in all divisions and exceed market growth in the five-year period.
With growth in activity and our continuous focus on opera-tional excellence, we see opportunities to improve productivity across the Group. Our IT systems, infrastructure and back- office functions are scalable, providing opportunities to lever-age operations in all three divisions.
The Air & Sea division is expected to benefit from the integration of GIL and from further optimisation of work flows and im-proved utilisation of IT systems in the period. The extraordinary market conditions in 2021 have led to elevated gross profit yields and conversion ratio in Air & Sea. For the five-year period, we have assumed that gross profit yields will gradually decline.
The Road division is expected to continue the positive mo-men tum from 2021 and gradually improve the network and productivity during the period.
The Solutions division will continue their work on automation, consolidation of existing infrastructure and addition of new warehouse capacity at key logistics locations.
The targets are based on organic growth and do not include the potential impact from larger acquisitions in the period. The strategic objectives of the Group are translated into the following targets:
Forward-looking statements
18 DSV Annual Report 2021 Strategy and financial targets
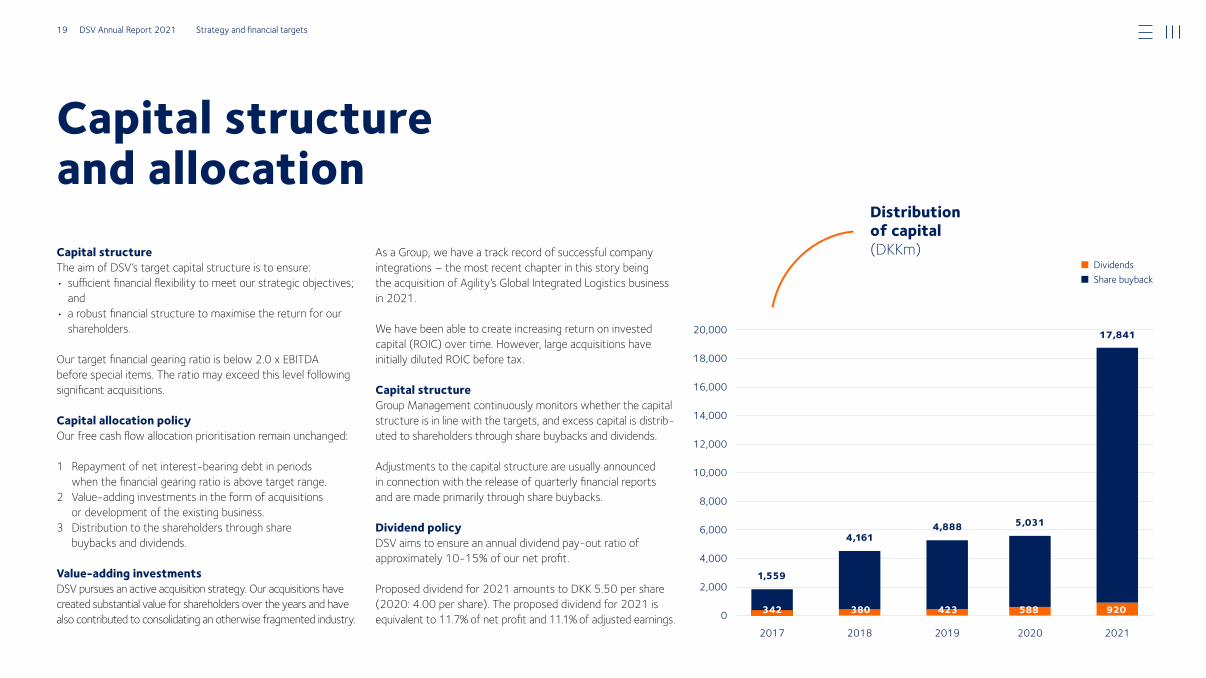
Capital structure The aim of DSV’s target capital structure is to ensure:• sufficient financial flexibility to meet our strategic objectives; and• a robust financial structure to maximise the return for our shareholders.
Our target financial gearing ratio is below 2.0 x EBITDA before special items. The ratio may exceed this level following significant acquisitions.
Capital allocation policyOur free cash flow allocation prioritisation remain unchanged:
1 Repayment of net interest-bearing debt in periods when the financial gearing ratio is above target range.
2 Value-adding investments in the form of acquisitions or development of the existing business.
3 Distribution to the shareholders through share buybacks and dividends.
Value-adding investmentsDSV pursues an active acquisition strategy. Our acquisitions have created substantial value for shareholders over the years and have also contributed to consolidating an otherwise fragmented industry.
As a Group, we have a track record of successful company integrations – the most recent chapter in this story being the acquisition of Agility’s Global Integrated Logistics business in 2021.
We have been able to create increasing return on invested capital (ROIC) over time. However, large acquisitions have initially diluted ROIC before tax.
Capital structureGroup Management continuously monitors whether the capital structure is in line with the targets, and excess capital is distrib-uted to shareholders through share buybacks and dividends.
Adjustments to the capital structure are usually announced in connection with the release of quarterly financial reports and are made primarily through share buybacks.
Dividend policyDSV aims to ensure an annual dividend pay-out ratio of approximately 10-15% of our net profit.
Proposed dividend for 2021 amounts to DKK 5.50 per share (2020: 4.00 per share). The proposed dividend for 2021 is equivalent to 11.7% of net profit and 11.1% of adjusted earnings.
Capital structure and allo cation
Distribution of capital (DKKm)
■ Dividends ■ Share buyback
2017 2018 2019 2021
20,000
18,000
16,000
14,000
12,000
10,000
8,000
6,000
4,000
2,000
02020
342
1,559
380
4,888 5,031
17,841
4,161
423 588 920
19 DSV Annual Report 2021 Strategy and financial targets
Income statement (DKKm) 2021 2020 Growth*
Revenue 182,306 115,932 58.6%Direct costs 144,691 87,398
Gross profit 37,615 28,534 32.7%
Gross margin 20.6% 24.6%Other external expenses 4,173 3,291Staff costs 13,025 11,684
Operating profit before amortisation and depreciation (EBITDA) before special items 20,417 13,559
Amortisation and depreciation 4,194 4,039
Operating profit (EBIT) before special items 16,223 9,520 71.3%
Conversion ratio 43.1% 33.4%Special items, costs 478 2,164Net financial expenses 841 1,729
Profit before tax 14,904 5,627
Tax on profit for the year 3,650 1,369
Profit for the year 11,254 4,258
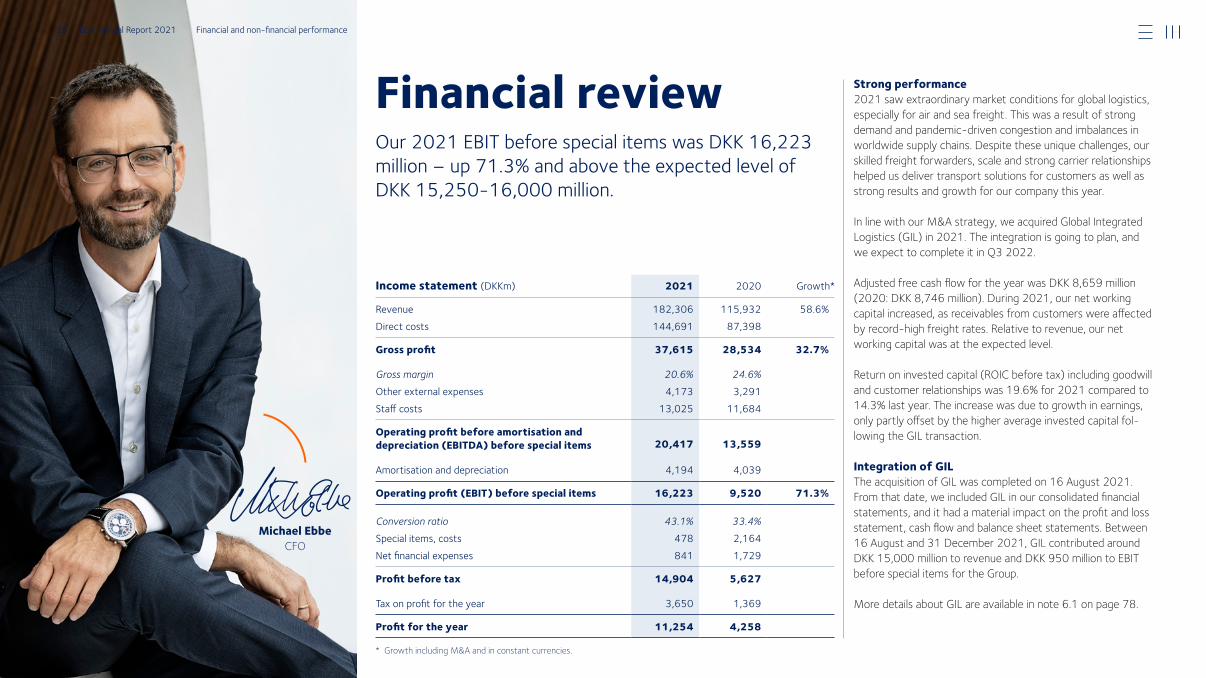
Our 2021 EBIT before special items was DKK 16,223 million – up 71.3% and above the expected level of DKK 15,25016,000 million.
Financial review Strong performance2021 saw extraordinary market conditions for global logistics, especially for air and sea freight. This was a result of strong demand and pandemic-driven congestion and imbalances in worldwide supply chains. Despite these unique challenges, our skilled freight forwarders, scale and strong carrier relationships helped us deliver transport solutions for customers as well as strong results and growth for our company this year.
In line with our M&A strategy, we acquired Global Integrated Logistics (GIL) in 2021. The integration is going to plan, and we expect to complete it in Q3 2022.
Adjusted free cash flow for the year was DKK 8,659 million (2020: DKK 8,746 million). During 2021, our net working capital increased, as receivables from customers were affected by record-high freight rates. Relative to revenue, our net working capital was at the expected level.
Return on invested capital (ROIC before tax) including goodwill and customer relationships was 19.6% for 2021 compared to 14.3% last year. The increase was due to growth in earnings, only partly offset by the higher average invested capital fol-lowing the GIL transaction.
Integration of GILThe acquisition of GIL was completed on 16 August 2021. From that date, we included GIL in our consolidated financial statements, and it had a material impact on the profit and loss statement, cash flow and balance sheet statements. Between 16 August and 31 December 2021, GIL contributed around DKK 15,000 million to revenue and DKK 950 million to EBIT before special items for the Group.
More details about GIL are available in note 6.1 on page 78.
* Growth including M&A and in constant currencies.
Michael Ebbe CFO
20 DSV Annual Report 2021 Financial and nonfinancial performance
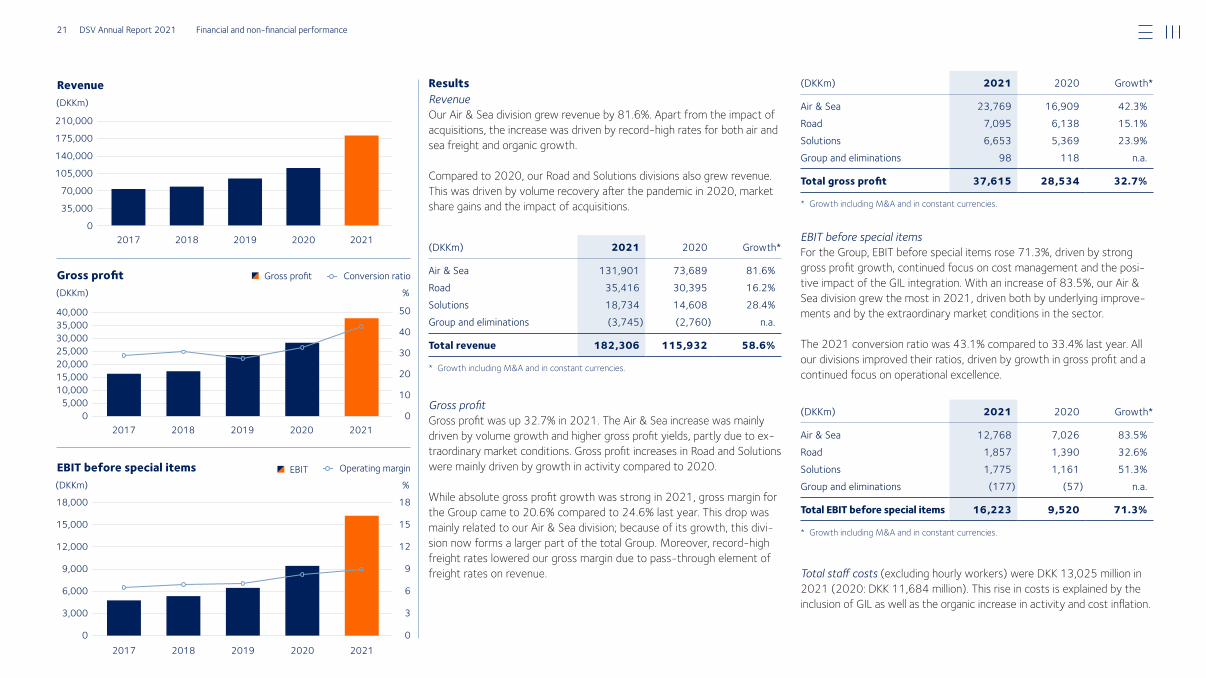
ResultsRevenue Our Air & Sea division grew revenue by 81.6%. Apart from the impact of acquisitions, the increase was driven by record-high rates for both air and sea freight and organic growth.
Compared to 2020, our Road and Solutions divisions also grew revenue. This was driven by volume recovery after the pandemic in 2020, market share gains and the impact of acquisitions.
(DKKm) 2021 2020 Growth*
Air & Sea 131,901 73,689 81.6%Road 35,416 30,395 16.2% Solutions 18,734 14,608 28.4%Group and eliminations (3,745) (2,760) n.a.
Total revenue 182,306 115,932 58.6%
* Growth including M&A and in constant currencies.
Gross profit Gross profit was up 32.7% in 2021. The Air & Sea increase was mainly driven by volume growth and higher gross profit yields, partly due to ex-traordinary market conditions. Gross profit increases in Road and Solutions were mainly driven by growth in activity compared to 2020.
While absolute gross profit growth was strong in 2021, gross margin for the Group came to 20.6% compared to 24.6% last year. This drop was mainly related to our Air & Sea division; because of its growth, this divi-sion now forms a larger part of the total Group. Moreover, record-high freight rates lowered our gross margin due to pass-through element of freight rates on revenue.
(DKKm) 2021 2020 Growth*
Air & Sea 23,769 16,909 42.3%Road 7,095 6,138 15.1%Solutions 6,653 5,369 23.9%Group and eliminations 98 118 n.a.
Total gross profit 37,615 28,534 32.7%
* Growth including M&A and in constant currencies.
EBIT before special itemsFor the Group, EBIT before special items rose 71.3%, driven by strong gross profit growth, continued focus on cost management and the posi-tive impact of the GIL integration. With an increase of 83.5%, our Air & Sea division grew the most in 2021, driven both by underlying improve-ments and by the extraordinary market conditions in the sector. The 2021 conversion ratio was 43.1% compared to 33.4% last year. All our divisions improved their ratios, driven by growth in gross profit and a continued focus on operational excellence.
(DKKm) 2021 2020 Growth*
Air & Sea 12,768 7,026 83.5%Road 1,857 1,390 32.6%Solutions 1,775 1,161 51.3%Group and eliminations (177) (57) n.a.
Total EBIT before special items 16,223 9,520 71.3%
* Growth including M&A and in constant currencies.
Total staff costs (excluding hourly workers) were DKK 13,025 million in 2021 (2020: DKK 11,684 million). This rise in costs is explained by the inclusion of GIL as well as the organic increase in activity and cost inflation.
Revenue (DKKm)
210,000
175,000
140,000
105,000
70,000
35,000
02021201920182017
Gross profit(DKKm)
40,00035,000 30,00025,00020,00015,00010,000
5,0000
%
20192018
50
40
30
20
10
0
EBIT before special items(DKKm)
18,000
15,000
12,000
9,000
6,000
3,000
0
%
2020201920182017
18
15
12
9
6
3
0
Gross profit
Operating margin
Conversion ratio
EBIT
2017 2020
2020
2021
2021
21 DSV Annual Report 2021 Financial and nonfinancial performance
Cash flow statement Cash flow from operating activities in 2021 rose by 18.7% to DKK 12,202 million. Cash flow was positively affected by higher EBITDA before special items but offset by an increase in net working capital.
On 31 December 2021, our net working capital was DKK 8,031 million compared to DKK 2,701 million in 2020. In the second half of 2021, receivables from our customers went up as a result of record-high freight rates and acquisition which led to a revenue increase and so an increase in trade receivables.
Relative to full-year revenue (pro forma incl. GIL and based on current rate levels), funds tied up in NWC at year-end increased to 3.5%, from 2.3% in 2020.
Cash flow from investing activities was a cash inflow of DKK 420 million in 2021 (2020: cash outflow of DKK 556 million). Purchase of intangible and tangible assets were on level with last year, and the difference can mainly be explained by the GIL acquisition, where a net cash position of DKK 1,819 million was included as positive cash flow from acquisition.
Adjusted free cash flow (adjusted for acquisitions, special items and IFRS 16) was DKK 8,659 million and on level with last year. Cash flow was im-pacted positively by higher EBIT before special items but reduced by higher working capital and higher tax payments.
Cash flow from financing activities was negative by DKK 8,680 million in 2021 (2020: negative DKK 6,999 million). This was mainly due to share-holder allocations and repayment of lease liabilities.
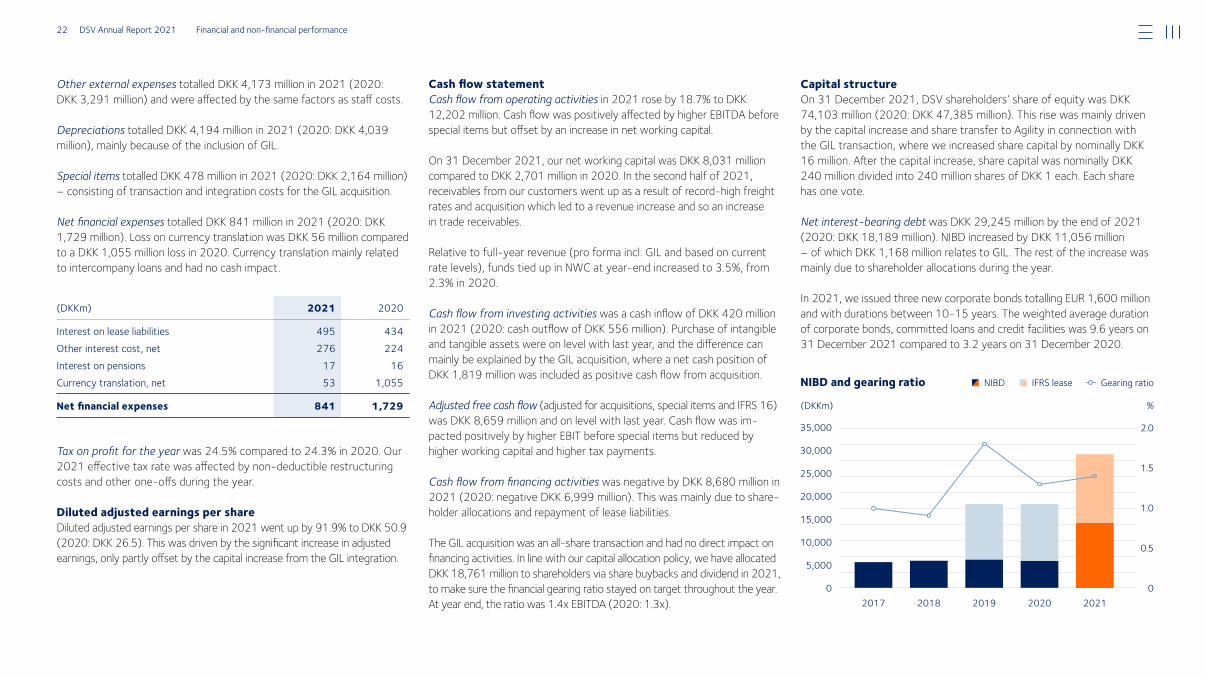
The GIL acquisition was an all-share transaction and had no direct impact on financing activities. In line with our capital allocation policy, we have allocated DKK 18,761 million to shareholders via share buybacks and dividend in 2021, to make sure the financial gearing ratio stayed on target throughout the year. At year end, the ratio was 1.4x EBITDA (2020: 1.3x).
Capital structureOn 31 December 2021, DSV shareholders’ share of equity was DKK 74,103 million (2020: DKK 47,385 million). This rise was mainly driven by the capital increase and share transfer to Agility in connection with the GIL transaction, where we increased share capital by nominally DKK 16 million. After the capital increase, share capital was nominally DKK 240 million divided into 240 million shares of DKK 1 each. Each share has one vote.
Net interest-bearing debt was DKK 29,245 million by the end of 2021 (2020: DKK 18,189 million). NIBD increased by DKK 11,056 million – of which DKK 1,168 million relates to GIL. The rest of the increase was mainly due to shareholder allocations during the year.
In 2021, we issued three new corporate bonds totalling EUR 1,600 million and with durations between 10-15 years. The weighted average duration of corporate bonds, committed loans and credit facilities was 9.6 years on 31 December 2021 compared to 3.2 years on 31 December 2020.
Other external expenses totalled DKK 4,173 million in 2021 (2020: DKK 3,291 million) and were affected by the same factors as staff costs.
Depreciations totalled DKK 4,194 million in 2021 (2020: DKK 4,039 million), mainly because of the inclusion of GIL.
Special items totalled DKK 478 million in 2021 (2020: DKK 2,164 million) – consisting of transaction and integration costs for the GIL acquisition.
Net financial expenses totalled DKK 841 million in 2021 (2020: DKK 1,729 million). Loss on currency translation was DKK 56 million compared to a DKK 1,055 million loss in 2020. Currency translation mainly related to intercompany loans and had no cash impact.
(DKKm) 2021 2020
Interest on lease liabilities 495 434Other interest cost, net 276 224Interest on pensions 17 16Currency translation, net 53 1,055
Net financial expenses 841 1,729
Tax on profit for the year was 24.5% compared to 24.3% in 2020. Our 2021 effective tax rate was affected by non-deductible restructuring costs and other one-offs during the year.
Diluted adjusted earnings per shareDiluted adjusted earnings per share in 2021 went up by 91.9% to DKK 50.9 (2020: DKK 26.5). This was driven by the significant increase in adjusted earnings, only partly offset by the capital increase from the GIL integration.
NIBD and gearing ratio Gearing ratioNIBD
(DKKm)
35,000
30,000
25,000
20,000
15,000
10,000
5,000
0
%
2020201920182017
2.0
1.5
1.0
0.5
0
IFRS lease
2021
22 DSV Annual Report 2021 Financial and nonfinancial performance
Non-financial review
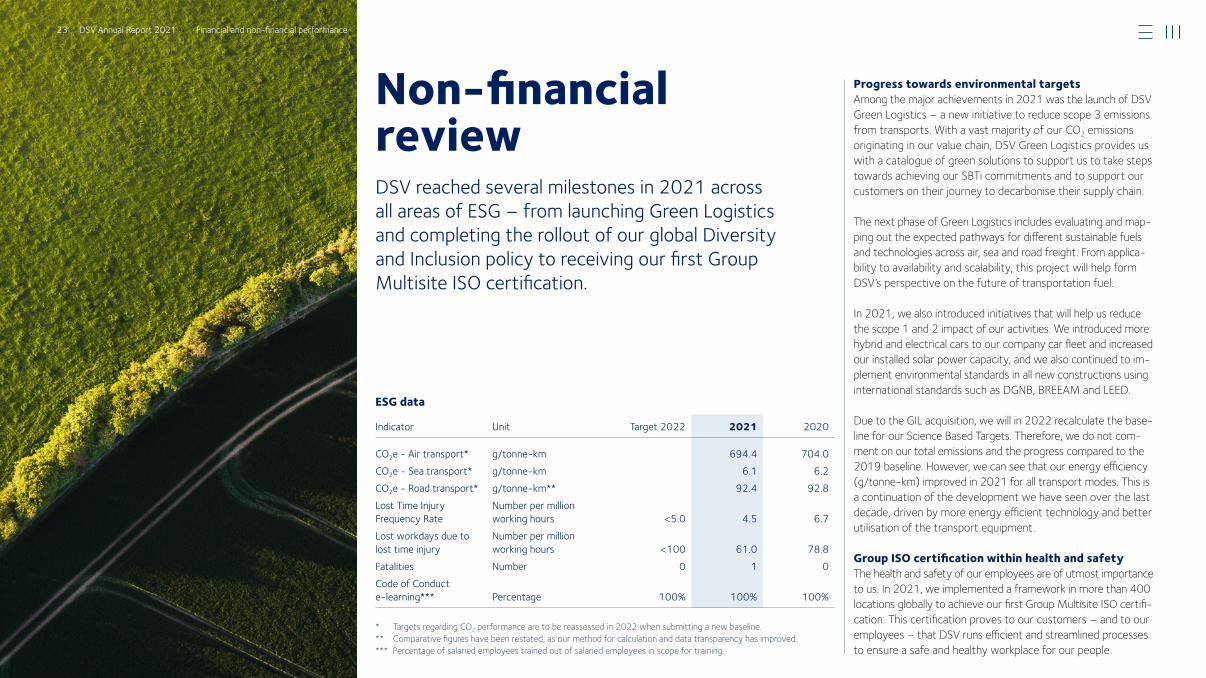
Indicator Unit Target 2022 2021 2020
CO2e Air transport* g/tonnekm 694.4 704.0CO2e Sea transport* g/tonnekm 6.1 6.2CO2e Road transport* g/tonnekm** 92.4 92.8Lost Time Injury Frequency Rate
Number per million working hours <5.0 4.5 6.7
Lost workdays due to lost time injury
Number per million working hours <100 61.0 78.8
Fatalities Number 0 1 0Code of Conduct elearning*** Percentage 100% 100% 100%
Progress towards environmental targets Among the major achievements in 2021 was the launch of DSV Green Logistics – a new initiative to reduce scope 3 emissions from transports. With a vast majority of our CO2 emissions originating in our value chain, DSV Green Logistics provides us with a catalogue of green solutions to support us to take steps towards achieving our SBTi commitments and to support our customers on their journey to decarbonise their supply chain.
The next phase of Green Logistics includes evaluating and map-ping out the expected pathways for different sustainable fuels and technologies across air, sea and road freight. From applica-bility to availability and scalability, this project will help form DSV’s perspective on the future of transportation fuel.
In 2021, we also introduced initiatives that will help us reduce the scope 1 and 2 impact of our activities. We introduced more hybrid and electrical cars to our company car fleet and increased our installed solar power capacity, and we also continued to im-plement environmental standards in all new constructions using international standards such as DGNB, BREEAM and LEED.
Due to the GIL acquisition, we will in 2022 recalculate the base-line for our Science Based Targets. Therefore, we do not com-ment on our total emissions and the progress compared to the 2019 baseline. However, we can see that our energy efficiency (g/tonne-km) improved in 2021 for all transport modes. This is a continuation of the development we have seen over the last decade, driven by more energy efficient technology and better utilisation of the transport equipment.
Group ISO certification within health and safety The health and safety of our employees are of utmost importance to us. In 2021, we implemented a framework in more than 400 locations globally to achieve our first Group Multisite ISO certifi-cation. This certification proves to our customers – and to our employees – that DSV runs efficient and streamlined processes to ensure a safe and healthy workplace for our people.
DSV reached several milestones in 2021 across all areas of ESG – from launching Green Logistics and completing the rollout of our global Diversity and Inclusion policy to receiving our first Group Multisite ISO certification.
ESG data
* Targets regarding CO2 performance are to be reassessed in 2022 when submitting a new baseline. ** Comparative figures have been restated, as our method for calculation and data transparency has improved.*** Percentage of salaried employees trained out of salaried employees in scope for training.
23 DSV Annual Report 2021 Financial and nonfinancial performance
Leading the way for a
sustainable future
Sustainability Report 2021
Reporting on corporate social responsibility Reporting on corporate social responsibility cf. section 99a of the Danish Financial Statements Act We have reported separately on corporate social responsibility in our Sustainability Report 2021, in accordance with section 99a of the Danish Financial Statements Act.
Reporting on management gender composition cf. section 99b of the Danish Financial Statements Act We have reported separately on management gender composition in our Sustainability Report 2021, in accordance with section 99b of the Danish Financial Statements Act.
Reporting on diversity cf. section 107d of the Danish Financial Statements Act We have reported separately on diversity in our Sustainability Report 2021, in accordance with section 107d of the Danish Financial Statements Act.
During 2022, more locations will be added and we expect that, by the end of the year, 50% of our locations will be covered by the multisite certificate.
Our focus on health and safety is reflected in the frequency rate for lost time due to injuries. This KPI improved in 2021 and is now below our target level. However, sadly, in 2021 we had one fatal working accident. This is one too many, and the event was followed up by an accident investigation based on which several initiatives have been launched, such as increased focus on high-visibility workwear and training of frontline workers.
Successful roll-out of new Diversity and Inclusion policy In early 2021, we introduced DSV's global Diversity and Inclusion Policy. This policy formalises our position on equal rights for all our staff as well as our dedication to providing opportunities for everyone to realise their potential.
During the year, we introduced various measures to ensure that the standards defined in our Diversity and Inclusion Policy are adopted and put into practice. These initiatives have yielded positive results, as we can observe a positive trend in terms of gradually improving gender diversity composition across our multi-national global workforce. All of our people managers and HR staff completed diversity and inclusion e-learning courses in 2021. The purpose of this training is to help develop their understanding of potential biases and stereotyping – and ensure that these issues are top of mind for everyone, across all locations.
Doing business with integrity Our Code of Conduct (CoC) defines what doing business with integrity means at DSV. Available in 10 different languages, the CoC provides the basis for our principles and our behaviour and stresses our approach of zero tolerance to corruption and bribery matters.
In 2021, 100% of salaried employees completed our global CoC E-learn-ing programme, and hourly workers without access to IT in their daily job received classroom training instead.
Our whistleblower programme allows anyone – inside as well as outside DSV – to anonymously report if they experience any potential miscon-duct. During 2021, 47 cases were reported compared to 42 in 2020. None of the reported cases were of material nature.
Working with suppliersTo strengthen our supplier onboarding process, we piloted a new global Third-Party Risk Management (TPRM) programme during 2021. We tested this programme with a selected group of suppliers to carry out a step-by-step implementation of what will be our global framework for supplier management going forward.
The TPRM programme is planned to be fully launched during Q1 of 2022, with smarter services and streamlined onboarding as well as tighter re-strictions on supplier generation, human rights, anti-trafficking and an-ti-bribery. We are convinced that once all our suppliers have been on-boarded and the TPRM is fully implemented, it will operate as an efficient tool to mitigate risk among all suppliers in our network.
New partnershipsOur ESG work depends on cooperation with organisations in and outside our industry. In 2021, we joined United Airlines’ Eco-Skies Alliance and Good-Shipping – both programmes involve leading global corporations working towards more sustainable transport. We also joined The World Economic Forum, which will enable us to meet relevant companies and organisations and discuss the challenges and opportunities our industry is facing.
Partnerships and membership in associations
For more information on developments within each ESG area, please refer to our Sustainability Report at https://www.dsv.com/en/sustainability-reports
24 DSV Annual Report 2021 Financial and nonfinancial performance
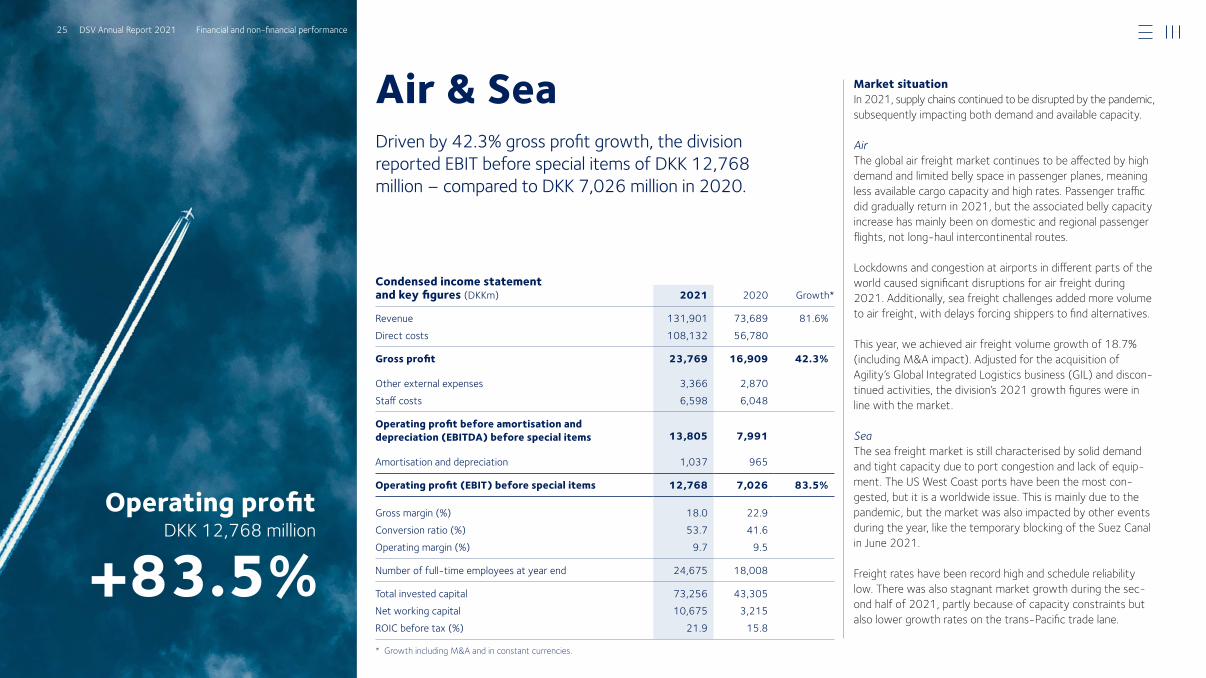
Driven by 42.3% gross profit growth, the division reported EBIT before special items of DKK 12,768 million – compared to DKK 7,026 million in 2020.
Air & Sea Market situationIn 2021, supply chains continued to be disrupted by the pandemic, subsequently impacting both demand and available capacity.
AirThe global air freight market continues to be affected by high demand and limited belly space in passenger planes, meaning less available cargo capacity and high rates. Passenger traffic did gradually return in 2021, but the associated belly capacity increase has mainly been on domestic and regional passenger flights, not long-haul intercontinental routes.
Lockdowns and congestion at airports in different parts of the world caused significant disruptions for air freight during 2021. Additionally, sea freight challenges added more volume to air freight, with delays forcing shippers to find alternatives.
This year, we achieved air freight volume growth of 18.7% (including M&A impact). Adjusted for the acquisition of Agility’s Global Integrated Logistics business (GIL) and discon-tinued activities, the division’s 2021 growth figures were in line with the market.
SeaThe sea freight market is still characterised by solid demand and tight capacity due to port congestion and lack of equip-ment. The US West Coast ports have been the most con-gested, but it is a worldwide issue. This is mainly due to the pandemic, but the market was also impacted by other events during the year, like the temporary blocking of the Suez Canal in June 2021.
Freight rates have been record high and schedule reliability low. There was also stagnant market growth during the sec-ond half of 2021, partly because of capacity constraints but also lower growth rates on the trans-Pacific trade lane.
Condensed income statement and key figures (DKKm) 2020 Growth*2021
Revenue 131,901 73,689 81.6%Direct costs 108,132 56,780
Gross profit 23,769 16,909 42.3%
Other external expenses 3,366 2,870Staff costs 6,598 6,048
Operating profit before amortisation and depreciation (EBITDA) before special items 13,805 7,991
Amortisation and depreciation 1,037 965
Operating profit (EBIT) before special items 12,768 7,026 83.5%
Gross margin (%) 18.0 22.9Conversion ratio (%) 53.7 41.6Operating margin (%) 9.7 9.5
Number of fulltime employees at year end 24,675 18,008
Total invested capital 73,256 43,305Net working capital 10,675 3,215ROIC before tax (%) 21.9 15.8
* Growth including M&A and in constant currencies.
Operating profitDKK 12,768 million
+83.5%
25 DSV Annual Report 2021 Financial and nonfinancial performance
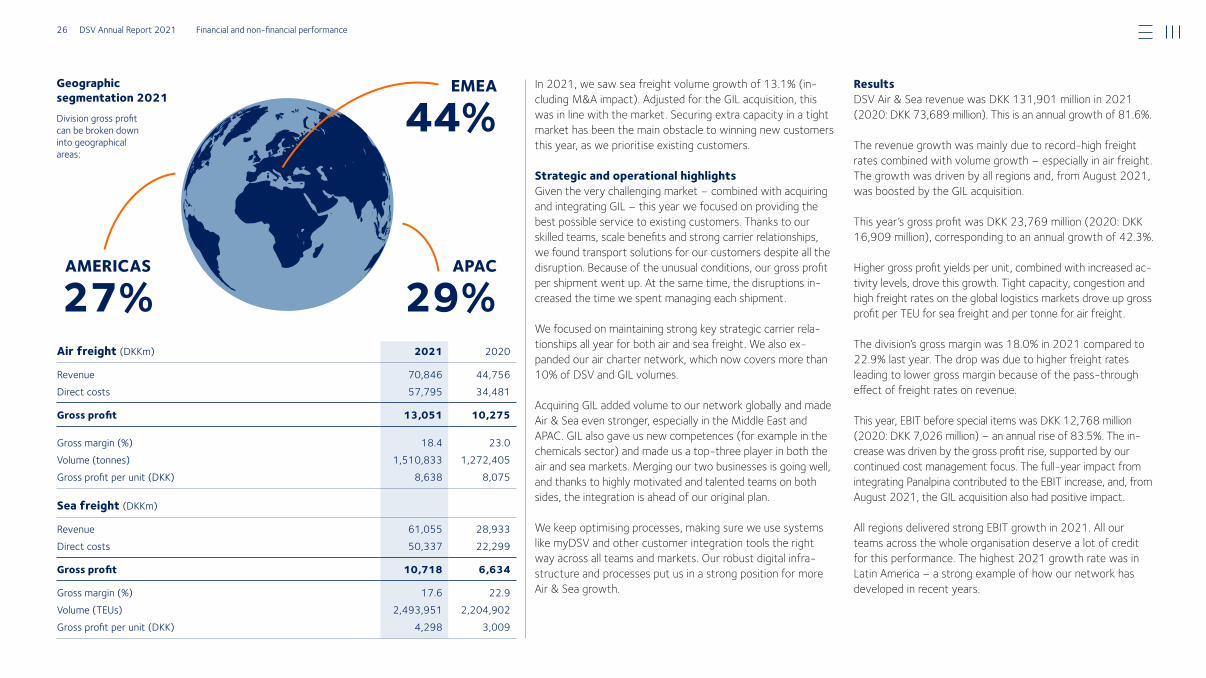
In 2021, we saw sea freight volume growth of 13.1% (in-cluding M&A impact). Adjusted for the GIL acquisition, this was in line with the market. Securing extra capacity in a tight market has been the main obstacle to winning new customers this year, as we prioritise existing customers.
Strategic and operational highlightsGiven the very challenging market – combined with acquiring and integrating GIL – this year we focused on providing the best possible service to existing customers. Thanks to our skilled teams, scale benefits and strong carrier relationships, we found transport solutions for our customers despite all the disruption. Because of the unusual conditions, our gross profit per shipment went up. At the same time, the disruptions in-creased the time we spent managing each shipment.
We focused on maintaining strong key strategic carrier rela-tionships all year for both air and sea freight. We also ex-panded our air charter network, which now covers more than 10% of DSV and GIL volumes.
Acquiring GIL added volume to our network globally and made Air & Sea even stronger, especially in the Middle East and APAC. GIL also gave us new competences (for example in the chemicals sector) and made us a top-three player in both the air and sea markets. Merging our two businesses is going well, and thanks to highly motivated and talented teams on both sides, the integration is ahead of our original plan.
We keep optimising processes, making sure we use systems like myDSV and other customer integration tools the right way across all teams and markets. Our robust digital infra-structure and processes put us in a strong position for more Air & Sea growth.
Geographic segmentation 2021Division gross profit can be broken down into geographi cal areas:
AMERICAS
27%
EMEA
44%
APAC
29%
Results DSV Air & Sea revenue was DKK 131,901 million in 2021 (2020: DKK 73,689 million). This is an annual growth of 81.6%.
The revenue growth was mainly due to record-high freight rates combined with volume growth – especially in air freight. The growth was driven by all regions and, from August 2021, was boosted by the GIL acquisition.
This year’s gross profit was DKK 23,769 million (2020: DKK 16,909 million), corresponding to an annual growth of 42.3%.
Higher gross profit yields per unit, combined with increased ac-tivity levels, drove this growth. Tight capacity, congestion and high freight rates on the global logistics markets drove up gross profit per TEU for sea freight and per tonne for air freight.
The division’s gross margin was 18.0% in 2021 compared to 22.9% last year. The drop was due to higher freight rates leading to lower gross margin because of the pass-through effect of freight rates on revenue.
This year, EBIT before special items was DKK 12,768 million (2020: DKK 7,026 million) – an annual rise of 83.5%. The in-crease was driven by the gross profit rise, supported by our continued cost management focus. The full-year impact from integrating Panalpina contributed to the EBIT increase, and, from August 2021, the GIL acquisition also had positive impact.
All regions delivered strong EBIT growth in 2021. All our teams across the whole organisation deserve a lot of credit for this performance. The highest 2021 growth rate was in Latin America – a strong example of how our network has developed in recent years.
Air freight (DKKm) 2021 2020
Revenue 70,846 44,756Direct costs 57,795 34,481
Gross profit 13,051 10,275
Gross margin (%) 18.4 23.0Volume (tonnes) 1,510,833 1,272,405Gross profit per unit (DKK) 8,638 8,075
Sea freight (DKKm)
Revenue 61,055 28,933Direct costs 50,337 22,299
Gross profit 10,718 6,634
Gross margin (%) 17.6 22.9Volume (TEUs) 2,493,951 2,204,902Gross profit per unit (DKK) 4,298 3,009
26 DSV Annual Report 2021 Financial and nonfinancial performance
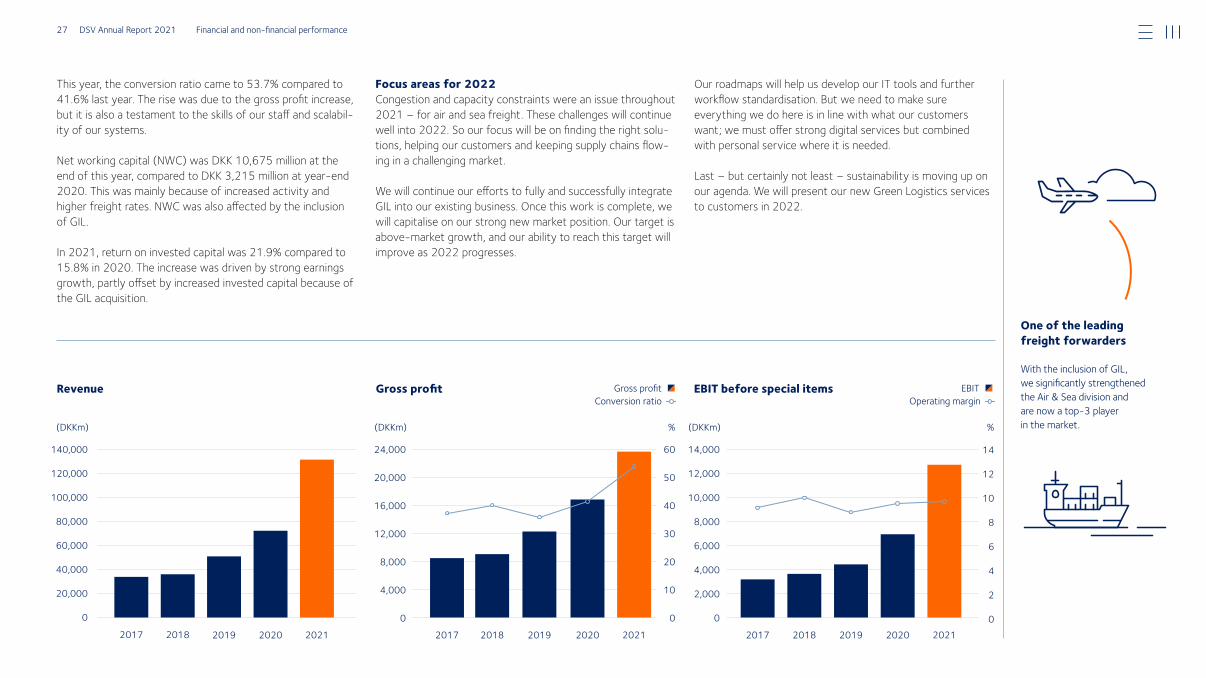
14
12
10
8
6
4
2
0
This year, the conversion ratio came to 53.7% compared to 41.6% last year. The rise was due to the gross profit increase, but it is also a testament to the skills of our staff and scalabil-ity of our systems.
Net working capital (NWC) was DKK 10,675 million at the end of this year, compared to DKK 3,215 million at year-end 2020. This was mainly because of increased activity and higher freight rates. NWC was also affected by the inclusion of GIL.
In 2021, return on invested capital was 21.9% compared to 15.8% in 2020. The increase was driven by strong earnings growth, partly offset by increased invested capital because of the GIL acquisition.
Focus areas for 2022Congestion and capacity constraints were an issue throughout 2021 – for air and sea freight. These challenges will continue well into 2022. So our focus will be on finding the right solu-tions, helping our customers and keeping supply chains flow-ing in a challenging market.
We will continue our efforts to fully and successfully integrate GIL into our existing business. Once this work is complete, we will capitalise on our strong new market position. Our target is above-market growth, and our ability to reach this target will improve as 2022 progresses.
Our roadmaps will help us develop our IT tools and further workflow standardisation. But we need to make sure everything we do here is in line with what our customers want; we must offer strong digital services but combined with personal service where it is needed.
Last – but certainly not least – sustainability is moving up on our agenda. We will present our new Green Logistics services to customers in 2022.
One of the leading freight forwarders
With the inclusion of GIL, we significantly strengthened the Air & Sea division and are now a top3 player in the market.
Revenue Gross profit EBIT before special itemsGross profit Conversion ratio Operating margin
EBIT
(DKKm) (DKKm) (DKKm)
140,000
120,000
100,000
80,000
60,000
40,000
20,000
0
24,000
20,000
16,000
12,000
8,000
4,000
0
14,000
12,000
10,000
8,000
6,000
4,000
2,000
0
%%
2020 2020 20202019 2019 20192018 2018 20182017 2017 2017
60
50
40
30
20
10
0
2021 2021 2021
27 DSV Annual Report 2021 Financial and nonfinancial performance
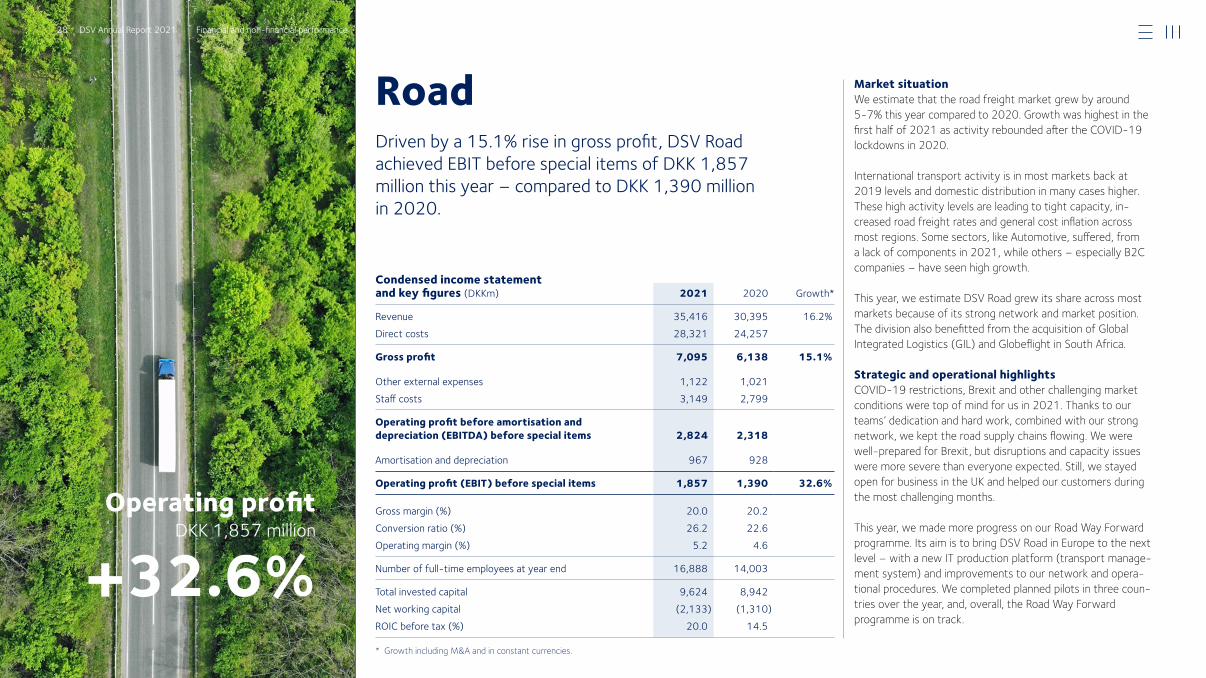
Driven by a 15.1% rise in gross profit, DSV Road achieved EBIT before special items of DKK 1,857 million this year – compared to DKK 1,390 million in 2020.
Road Market situationWe estimate that the road freight market grew by around 5-7% this year compared to 2020. Growth was highest in the first half of 2021 as activity rebounded after the COVID-19 lockdowns in 2020.
International transport activity is in most markets back at 2019 levels and domestic distribution in many cases higher. These high activity levels are leading to tight capacity, in-creased road freight rates and general cost inflation across most regions. Some sectors, like Automotive, suffered, from a lack of components in 2021, while others – especially B2C companies – have seen high growth.
This year, we estimate DSV Road grew its share across most markets because of its strong network and market position. The division also benefitted from the acquisition of Global Integrated Logistics (GIL) and Globeflight in South Africa.
Strategic and operational highlights COVID-19 restrictions, Brexit and other challenging market conditions were top of mind for us in 2021. Thanks to our teams’ dedication and hard work, combined with our strong network, we kept the road supply chains flowing. We were well-prepared for Brexit, but disruptions and capacity issues were more severe than everyone expected. Still, we stayed open for business in the UK and helped our customers during the most challenging months.
This year, we made more progress on our Road Way Forward programme. Its aim is to bring DSV Road in Europe to the next level – with a new IT production platform (transport manage-ment system) and improvements to our network and opera-tional procedures. We completed planned pilots in three coun-tries over the year, and, overall, the Road Way Forward programme is on track.
Condensed income statement and key figures (DKKm) 2020 Growth*2021
Revenue 35,416 30,395 16.2%Direct costs 28,321 24,257
Gross profit 7,095 6,138 15.1%
Other external expenses 1,122 1,021Staff costs 3,149 2,799
Operating profit before amortisation and depreciation (EBITDA) before special items 2,824 2,318
Amortisation and depreciation 967 928
Operating profit (EBIT) before special items 1,857 1,390 32.6%
Gross margin (%) 20.0 20.2Conversion ratio (%) 26.2 22.6Operating margin (%) 5.2 4.6
Number of fulltime employees at year end 16,888 14,003
Total invested capital 9,624 8,942Net working capital (2,133) (1,310)ROIC before tax (%) 20.0 14.5
* Growth including M&A and in constant currencies.
Operating profitDKK 1,857 million
+32.6%
28 DSV Annual Report 2021 Financial and nonfinancial performance
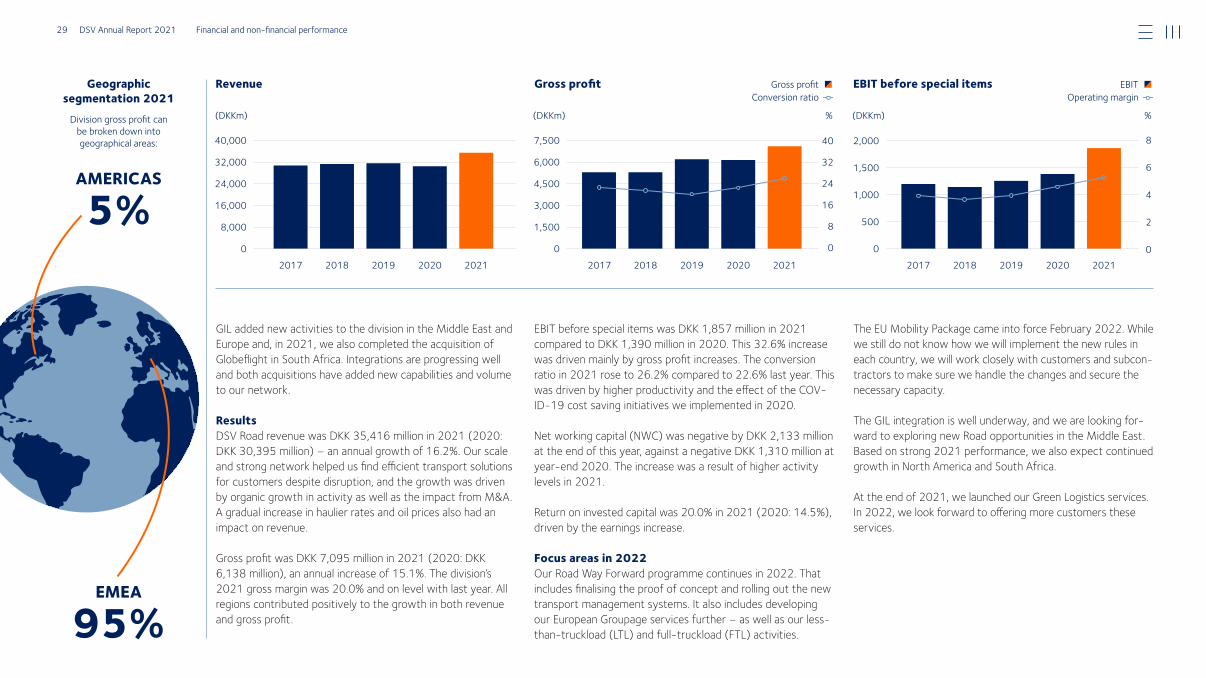
GIL added new activities to the division in the Middle East and Europe and, in 2021, we also completed the acquisition of Globeflight in South Africa. Integrations are progressing well and both acquisitions have added new capabilities and volume to our network.
Results DSV Road revenue was DKK 35,416 million in 2021 (2020: DKK 30,395 million) – an annual growth of 16.2%. Our scale and strong network helped us find efficient transport solutions for customers despite disruption, and the growth was driven by organic growth in activity as well as the impact from M&A. A gradual increase in haulier rates and oil prices also had an impact on revenue.
Gross profit was DKK 7,095 million in 2021 (2020: DKK 6,138 million), an annual increase of 15.1%. The division’s 2021 gross margin was 20.0% and on level with last year. All regions contributed positively to the growth in both revenue and gross profit.
EBIT before special items was DKK 1,857 million in 2021 compared to DKK 1,390 million in 2020. This 32.6% increase was driven mainly by gross profit increases. The conversion ratio in 2021 rose to 26.2% compared to 22.6% last year. This was driven by higher productivity and the effect of the COV-ID-19 cost saving initiatives we implemented in 2020.
Net working capital (NWC) was negative by DKK 2,133 million at the end of this year, against a negative DKK 1,310 million at year-end 2020. The increase was a result of higher activity levels in 2021.
Return on invested capital was 20.0% in 2021 (2020: 14.5%), driven by the earnings increase.
Focus areas in 2022Our Road Way Forward programme continues in 2022. That includes finalising the proof of concept and rolling out the new transport management systems. It also includes developing our European Groupage services further – as well as our less-than-truckload (LTL) and full-truckload (FTL) activities.
The EU Mobility Package came into force February 2022. While we still do not know how we will implement the new rules in each country, we will work closely with customers and subcon-tractors to make sure we handle the changes and secure the necessary capacity.
The GIL integration is well underway, and we are looking for-ward to exploring new Road opportunities in the Middle East. Based on strong 2021 performance, we also expect continued growth in North America and South Africa.
At the end of 2021, we launched our Green Logistics services. In 2022, we look forward to offering more customers these services.
Geographic segmentation 2021
Division gross profit can be broken down into geographi cal areas:
AMERICAS
5%
EMEA
95%
Revenue Gross profit EBIT before special itemsGross profit Conversion ratio Operating margin
EBIT
(DKKm) (DKKm) (DKKm)
40,000
32,000
24,000
16,000
8,000
0
7,500
6,000
4,500
3,000
1,500
0
2,000
1,500
1,000
500
0
%%
2020 2020 20202019 2019 20192018 2018 20182017 2017 2017
40
32
24
16
8
0
8
6
4
2
02021 2021 2021
29 DSV Annual Report 2021 Financial and nonfinancial performance
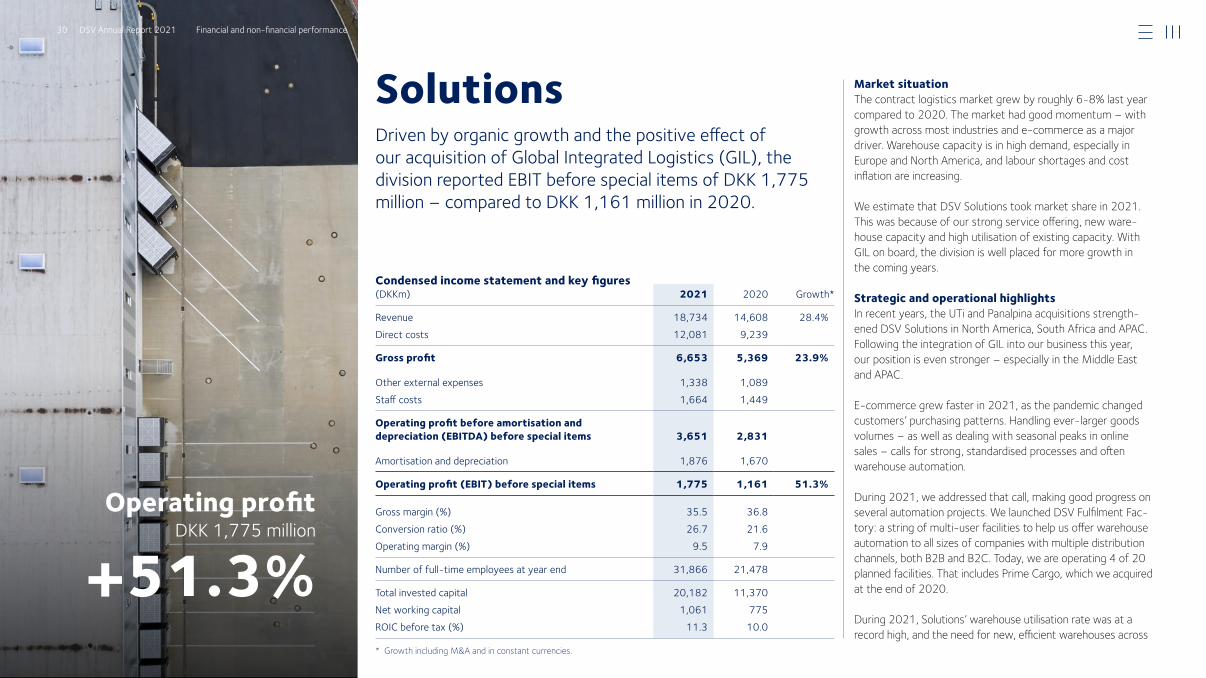
Driven by organic growth and the positive effect of our acquisition of Global Integrated Logistics (GIL), the division reported EBIT before special items of DKK 1,775 million – compared to DKK 1,161 million in 2020.
Solutions Market situation The contract logistics market grew by roughly 6-8% last year compared to 2020. The market had good momentum – with growth across most industries and e-commerce as a major driver. Warehouse capacity is in high demand, especially in Europe and North America, and labour shortages and cost inflation are increasing.
We estimate that DSV Solutions took market share in 2021. This was because of our strong service offering, new ware-house capacity and high utilisation of existing capacity. With GIL on board, the division is well placed for more growth in the coming years.
Strategic and operational highlights In recent years, the UTi and Panalpina acquisitions strength-ened DSV Solutions in North America, South Africa and APAC. Following the integration of GIL into our business this year, our position is even stronger – especially in the Middle East and APAC.
E-commerce grew faster in 2021, as the pandemic changed customers’ purchasing patterns. Handling ever-larger goods volumes – as well as dealing with seasonal peaks in online sales – calls for strong, standardised processes and often warehouse automation. During 2021, we addressed that call, making good progress on several automation projects. We launched DSV Fulfilment Fac-tory: a string of multi-user facilities to help us offer warehouse automation to all sizes of companies with multiple distribution channels, both B2B and B2C. Today, we are operating 4 of 20 planned facilities. That includes Prime Cargo, which we acquired at the end of 2020.
During 2021, Solutions’ warehouse utilisation rate was at a record high, and the need for new, efficient warehouses across
Condensed income statement and key figures (DKKm) 2020 Growth*2021
Revenue 18,734 14,608 28.4%Direct costs 12,081 9,239
Gross profit 6,653 5,369 23.9%
Other external expenses 1,338 1,089Staff costs 1,664 1,449
Operating profit before amortisation and depreciation (EBITDA) before special items 3,651 2,831
Amortisation and depreciation 1,876 1,670
Operating profit (EBIT) before special items 1,775 1,161 51.3%
Gross margin (%) 35.5 36.8Conversion ratio (%) 26.7 21.6Operating margin (%) 9.5 7.9
Number of fulltime employees at year end 31,866 21,478
Total invested capital 20,182 11,370Net working capital 1,061 775ROIC before tax (%) 11.3 10.0
* Growth including M&A and in constant currencies.
Operating profitDKK 1,775 million
+51.3%
30 DSV Annual Report 2021 Financial and nonfinancial performance
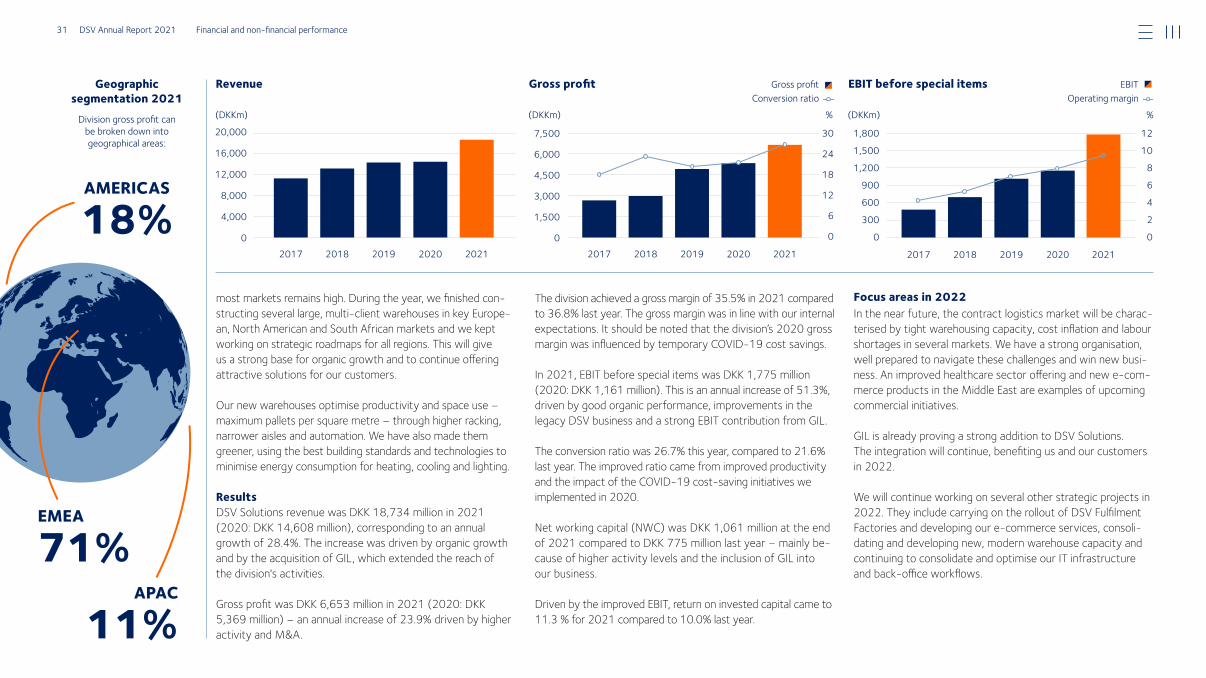
most markets remains high. During the year, we finished con-structing several large, multi-client warehouses in key Europe-an, North American and South African markets and we kept working on strategic roadmaps for all regions. This will give us a strong base for organic growth and to continue offering attractive solutions for our customers.
Our new warehouses optimise productivity and space use – maximum pallets per square metre – through higher racking, narrower aisles and automation. We have also made them greener, using the best building standards and technologies to minimise energy consumption for heating, cooling and lighting.
Results DSV Solutions revenue was DKK 18,734 million in 2021 (2020: DKK 14,608 million), corresponding to an annual growth of 28.4%. The increase was driven by organic growth and by the acquisition of GIL, which extended the reach of the division's activities.
Gross profit was DKK 6,653 million in 2021 (2020: DKK 5,369 million) – an annual increase of 23.9% driven by higher activity and M&A.
The division achieved a gross margin of 35.5% in 2021 compared to 36.8% last year. The gross margin was in line with our internal expectations. It should be noted that the division’s 2020 gross margin was influenced by temporary COVID-19 cost savings.
In 2021, EBIT before special items was DKK 1,775 million (2020: DKK 1,161 million). This is an annual increase of 51.3%, driven by good organic performance, improvements in the legacy DSV business and a strong EBIT contribution from GIL.
The conversion ratio was 26.7% this year, compared to 21.6% last year. The improved ratio came from improved productivity and the impact of the COVID-19 cost-saving initiatives we implemented in 2020.
Net working capital (NWC) was DKK 1,061 million at the end of 2021 compared to DKK 775 million last year – mainly be-cause of higher activity levels and the inclusion of GIL into our business.
Driven by the improved EBIT, return on invested capital came to 11.3 % for 2021 compared to 10.0% last year.
Focus areas in 2022In the near future, the contract logistics market will be charac-terised by tight warehousing capacity, cost inflation and labour shortages in several markets. We have a strong organisation, well prepared to navigate these challenges and win new busi-ness. An improved healthcare sector offering and new e-com-merce products in the Middle East are examples of upcoming commercial initiatives.
GIL is already proving a strong addition to DSV Solutions. The integration will continue, benefiting us and our customers in 2022.
We will continue working on several other strategic projects in 2022. They include carrying on the rollout of DSV Fulfilment Factories and developing our e-commerce services, consoli-dating and developing new, modern warehouse capacity and continuing to consolidate and optimise our IT infrastructure and back-office workflows.
Geographic segmentation 2021
Division gross profit can be broken down into geographi cal areas:
AMERICAS
18%
APAC
11%
EMEA
71%
Revenue Gross profit EBIT before special itemsGross profit Conversion ratio Operating margin
EBIT
(DKKm) (DKKm) (DKKm)
20,000
16,000
12,000
8,000
4,000
0
7,500
6,000
4,500
3,000
1,500
0
1,800
1,500
1,200
900
600
300
0
%%
2020 2020 2020 20212019 2019 20192018 2018 20182017 2017 2017
30
24
18
12
6
0
12
10
8
6
4
2
0
2021 2021
31 DSV Annual Report 2021 Financial and nonfinancial performance
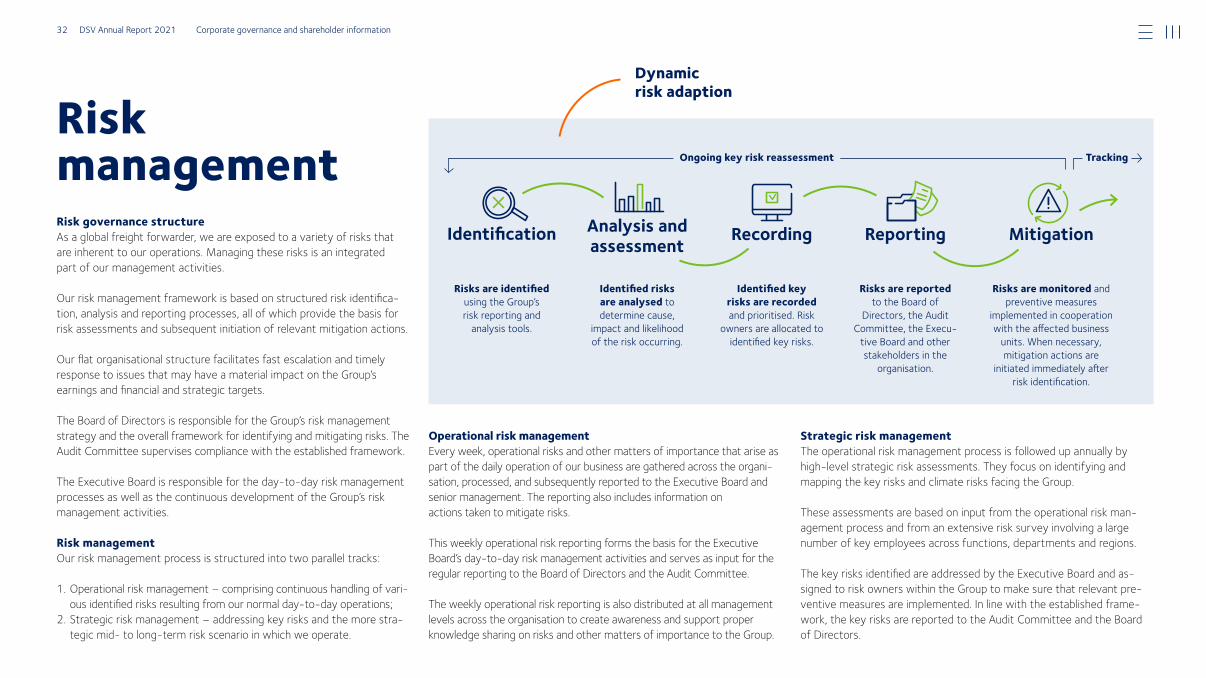
Risk managementRisk governance structureAs a global freight forwarder, we are exposed to a variety of risks that are inherent to our operations. Managing these risks is an integrated part of our management activities.
Our risk management framework is based on structured risk identifica-tion, analysis and reporting processes, all of which provide the basis for risk assessments and subsequent initiation of relevant mitigation actions.
Our flat organisational structure facilitates fast escalation and timely response to issues that may have a material impact on the Group’s earnings and financial and strategic targets.
The Board of Directors is responsible for the Group’s risk management strategy and the overall framework for identifying and mitigating risks. The Audit Committee supervises compliance with the established framework.
The Executive Board is responsible for the day-to-day risk management processes as well as the continuous development of the Group’s risk management activities.
Risk management Our risk management process is structured into two parallel tracks: 1. Operational risk management – comprising continuous handling of vari-
ous identified risks resulting from our normal day-to-day operations;2. Strategic risk management – addressing key risks and the more stra-
tegic mid- to long-term risk scenario in which we operate.
Operational risk managementEvery week, operational risks and other matters of importance that arise as part of the daily operation of our business are gathered across the organi-sation, processed, and subsequently reported to the Executive Board and senior management. The reporting also includes information on actions taken to mitigate risks.
This weekly operational risk reporting forms the basis for the Executive Board’s day-to-day risk management activities and serves as input for the regular reporting to the Board of Directors and the Audit Committee.
The weekly operational risk reporting is also distributed at all management levels across the organisation to create awareness and support proper knowledge sharing on risks and other matters of importance to the Group.
Strategic risk managementThe operational risk management process is followed up annually by high-level strategic risk assessments. They focus on identifying and mapping the key risks and climate risks facing the Group.
These assessments are based on input from the operational risk man-agement process and from an extensive risk survey involving a large number of key employees across functions, departments and regions.
The key risks identified are addressed by the Executive Board and as-signed to risk owners within the Group to make sure that relevant pre-ventive measures are implemented. In line with the established frame-work, the key risks are reported to the Audit Committee and the Board of Directors.
MitigationReportingRecordingAnalysis and assessment
Identification
Dynamic risk adaption
Identified risks are analysed to determine cause,
impact and likelihood of the risk occurring.
Risks are identified using the Group’s risk reporting and
analysis tools.
Identified key risks are recorded and prioritised. Risk
owners are allo cated to identified key risks.
Ongoing key risk reassessment Tracking
Risks are reported to the Board of
Directors, the Audit Committee, the Execu
tive Board and other stakeholders in the
organisation.
Risks are monitored and preventive measures
implemented in cooperation with the affected business
units. When necessary, mitigation actions are
initiated immediately after risk identification.
32 DSV Annual Report 2021 Corporate governance and shareholder information
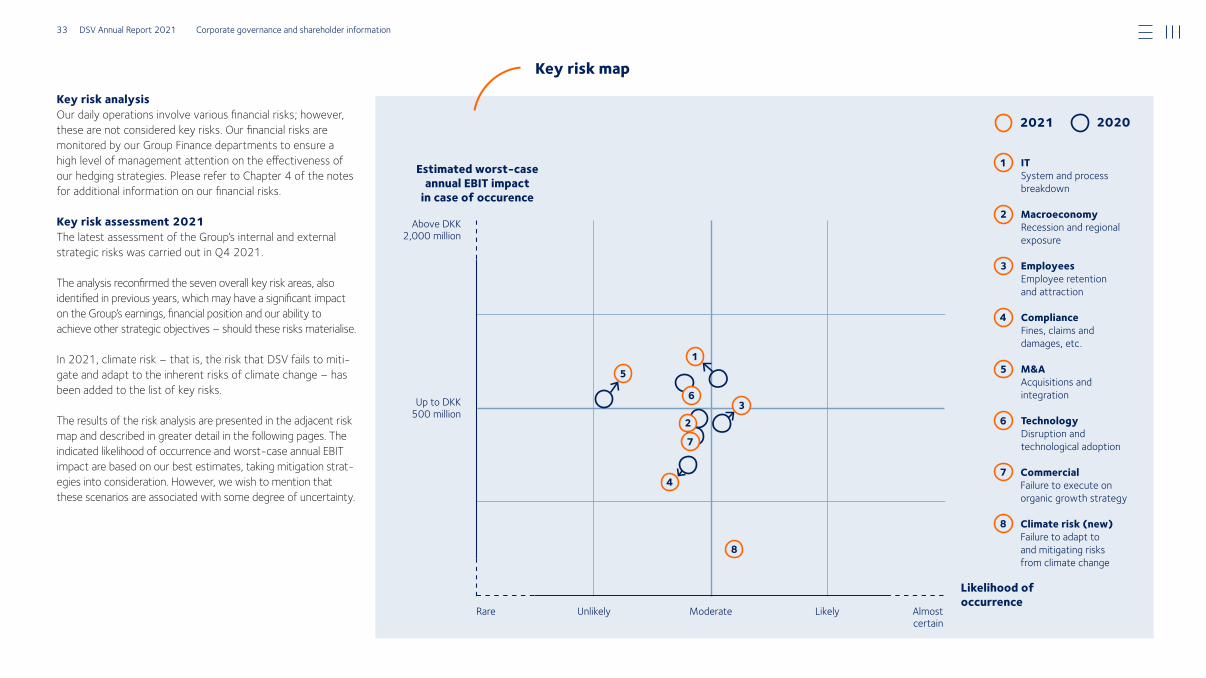
1
23
4
5
8
6
7
Key risk analysisOur daily operations involve various financial risks; however, these are not considered key risks. Our financial risks are monitored by our Group Finance departments to ensure a high level of management attention on the effectiveness of our hedging strategies. Please refer to Chapter 4 of the notes for additional information on our financial risks.
Key risk assessment 2021The latest assessment of the Group’s internal and external strategic risks was carried out in Q4 2021.
The analysis reconfirmed the seven overall key risk areas, also identified in previous years, which may have a significant impact on the Group’s earnings, financial position and our ability to achieve other strategic objectives – should these risks materialise.
In 2021, climate risk – that is, the risk that DSV fails to miti-gate and adapt to the inherent risks of climate change – has been added to the list of key risks.
The results of the risk analysis are presented in the adjacent risk map and described in greater detail in the following pages. The indicated likelihood of occurrence and worst-case annual EBIT impact are based on our best estimates, taking mitigation strat-egies into consideration. However, we wish to mention that these scenarios are associated with some degree of uncertainty.
1 IT System and process breakdown
2 Macroeconomy Recession and regional exposure
3 Employees Employee retention and attraction
4 Compliance Fines, claims and damages, etc.
5 M&A Acquisitions and integration
6 Technology Disruption and technological adoption
7 Com mercial Failure to execute on organic growth strategy
8 Climate risk (new) Failure to adapt to and mitigating risks from climate change
Likelihood of occurrence
Above DKK 2,000 million
2021 2020
Up to DKK 500 million
Estimated worst-case annual EBIT impact
in case of occurence
Almost certain
Moderate LikelyUnlikelyRare
Key risk map
33 DSV Annual Report 2021 Corporate governance and shareholder information
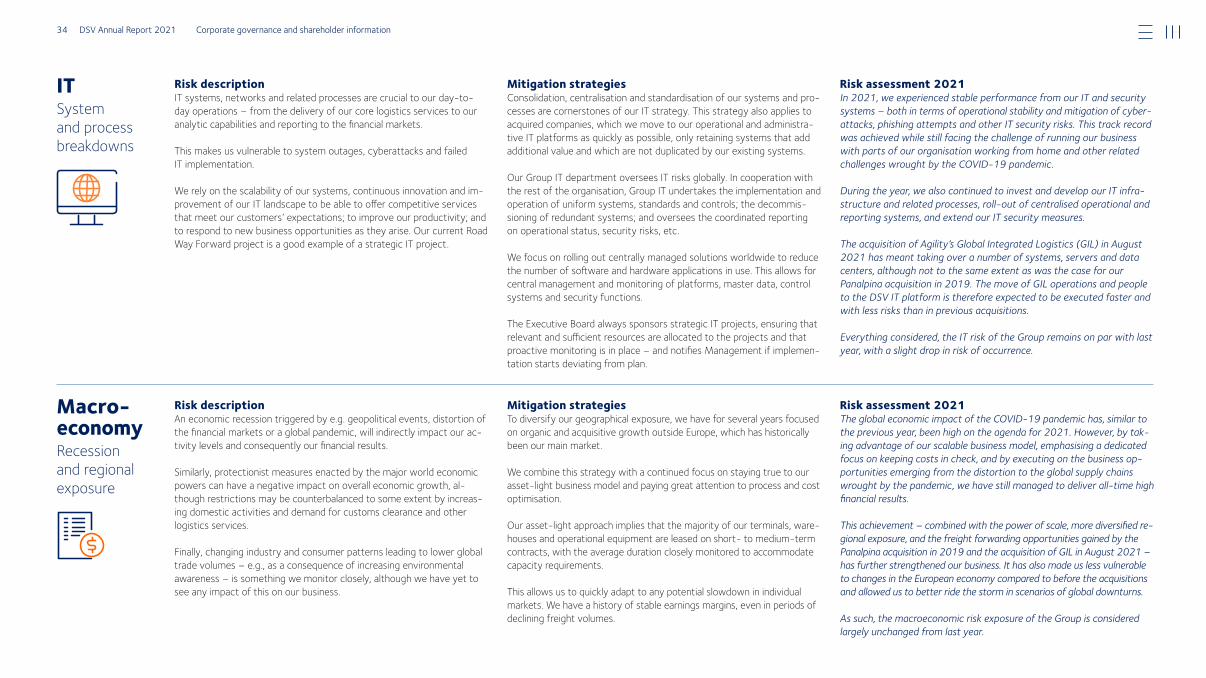
Risk descriptionIT systems, networks and related processes are crucial to our day-to-day operations – from the delivery of our core logistics services to our analytic capabilities and reporting to the financial markets.
This makes us vulnerable to system outages, cyberattacks and failed IT implementation.
We rely on the scalability of our systems, continuous innovation and im-provement of our IT landscape to be able to offer competitive services that meet our customers’ expectations; to improve our productivity; and to respond to new business opportunities as they arise. Our current Road Way Forward project is a good example of a strategic IT project.
Mitigation strategiesConsolidation, centralisation and standardisation of our systems and pro-cesses are cornerstones of our IT strategy. This strategy also applies to acquired companies, which we move to our operational and administra-tive IT platforms as quickly as possible, only retaining systems that add additional value and which are not duplicated by our existing systems.
Our Group IT department oversees IT risks globally. In cooperation with the rest of the organisation, Group IT undertakes the implementation and operation of uniform systems, standards and controls; the decommis-sioning of redundant systems; and oversees the coordinated reporting on operational status, security risks, etc.
We focus on rolling out centrally managed solutions worldwide to reduce the number of software and hardware applications in use. This allows for central management and monitoring of platforms, master data, control systems and security functions.
The Executive Board always sponsors strategic IT projects, ensuring that relevant and sufficient resources are allocated to the projects and that proactive monitoring is in place – and notifies Management if implemen-tation starts deviating from plan.
Risk assessment 2021In 2021, we experienced stable performance from our IT and security systems – both in terms of operational stability and mitigation of cyber-attacks, phishing attempts and other IT security risks. This track record was achieved while still facing the challenge of running our business with parts of our organisation working from home and other related challenges wrought by the COVID-19 pandemic.
During the year, we also continued to invest and develop our IT infra-structure and related processes, roll-out of centralised operational and reporting systems, and extend our IT security measures.
The acquisition of Agility’s Global Integrated Logistics (GIL) in August 2021 has meant taking over a number of systems, servers and data centers, although not to the same extent as was the case for our Panalpina acquisition in 2019. The move of GIL operations and people to the DSV IT platform is therefore expected to be executed faster and with less risks than in previous acquisitions.
Everything considered, the IT risk of the Group remains on par with last year, with a slight drop in risk of occurrence.
Risk descriptionAn economic recession triggered by e.g. geopolitical events, distortion of the financial markets or a global pandemic, will indirectly impact our ac-tivity levels and consequently our financial results.
Similarly, protectionist measures enacted by the major world economic powers can have a negative impact on overall economic growth, al-though restrictions may be counterbalanced to some extent by increas-ing domestic activities and demand for customs clearance and other logistics services.
Finally, changing industry and consumer patterns leading to lower global trade volumes – e.g., as a consequence of increasing environmental awareness – is something we monitor closely, although we have yet to see any impact of this on our business.
Mitigation strategiesTo diversify our geographical exposure, we have for several years focused on organic and acquisitive growth outside Europe, which has historically been our main market.
We combine this strategy with a continued focus on staying true to our asset-light business model and paying great attention to process and cost optimisation.
Our asset-light approach implies that the majority of our terminals, ware-houses and operational equipment are leased on short- to medium-term contracts, with the average duration closely monitored to accommodate capacity requirements.
This allows us to quickly adapt to any potential slowdown in individual markets. We have a history of stable earnings margins, even in periods of declining freight volumes.
Risk assessment 2021The global economic impact of the COVID-19 pandemic has, similar to the previous year, been high on the agenda for 2021. However, by tak-ing advantage of our scalable business model, emphasising a dedicated focus on keeping costs in check, and by executing on the business op-portunities emerging from the distortion to the global supply chains wrought by the pandemic, we have still managed to deliver all-time high financial results.
This achievement – combined with the power of scale, more diversified re-gional exposure, and the freight forwarding opportunities gained by the Panalpina acquisition in 2019 and the acquisition of GIL in August 2021 – has further strengthened our business. It has also made us less vulnerable to changes in the European economy compared to before the acquisitions and allowed us to better ride the storm in scenarios of global downturns.
As such, the macroeconomic risk exposure of the Group is considered largely unchanged from last year.
ITSystem and process breakdowns
Macro-economy Recession and regional exposure
34 DSV Annual Report 2021 Corporate governance and shareholder information
Risk descriptionEmployees are a vital resource to DSV.
Our business depends on highly-qualified management teams and em-ployees with technical and operational qualifications at all organisational levels – who are capable of handling situations that are out of the ordi-nary and collectively contributing to the Group’s financial results.
Failure to attract new talent or to retain existing, experienced key em-ployees can potentially have long-term consequences for the opera-tional, strategic and financial development of the Group.
Mitigation strategiesTo retain and attract the right colleagues, we strive to ensure that our company is an attractive place to work.
Across the organisation, we aim to offer a supportive and inspiring work-ing environment for all employees. This includes a good and safe physical environment in offices and warehouses, user-friendly IT systems and a healthy psychological environment – all of which are to be ensured through good leadership, transparency and mutual respect.
We have established a performance culture based on employee em-powerment, enabling our employees to influence their everyday work life. Additionally, we offer clear career-advancing opportunities to tal-ented employees.
We implement this strategy through several initiatives driven by both lo-cal management teams and our Group HR department. Examples include our updated Inclusion and Diversity Policy, employer branding activities and talent development programmes.
Risk assessment 2021Although the world has been through a global pandemic in the pastyears – which has had a derived effect on the global economy – thishas not affected the job market for skilled and experienced specialistsor managers. In fact, many of the countries in which we operate areexperiencing heated job markets, making it challenging to recruit newcandidates for open positions and retain existing colleagues.
During integrations we strive to maintain a high level of information towards the staff and to carry out the changes as quickly as possible, to avoid a prolonged period of uncertainty.
Still, the acquisition and integration of GIL will inherently carry uncer-tainties when it comes to key employee retention in both the DSV and former GIL organisations, as a consequence of the restructuring and reorganisations taking place during the integration phase.
We are seeing these challenges reflected in our employee turnover rate,although still at a manageable level. Still, as a consequence, the employeekey risk has slightly increased in 2021.
Risk descriptionAt all levels of our organisation and in all the countries we do business, we are committed to honest and ethical business practices and comply-ing with all relevant local regulations.
As a result of our global operations, we are subject to extensive national and international regulatory requirements. In particular, regulations relat-ing to tax, customs, VAT, data privacy and competition law continue to increase in scope and complexity. Trade embargoes impacting interna-tional transports is another area undergoing continuous changes.
Cases of non-compliance may carry a long-term impact on our public reputation, which may negatively impact relationships with our custom-ers and other stakeholders. Additionally, cases of non-compliance may lead to fines, claims, etc., for the Group, our Management and employees.
Mitigation strategies'We do not deal in compliance' is a mantra which is well-known through-out the DSV organisation. The high standards are set not only to safe-guard the company and its employees, but simply because we believe it is the right thing to do.
Our internal procedures, systems and employee training programmes are designed to ensure compliance with relevant legislation and our Code of Conduct.
Our compliance framework is integrated into our business processes, con-taining clear guidelines on how to identify compliance-related issues and how to act accordingly. In addition, communicating and creating aware-ness of relevant issues is high on our agenda, enacted through regular news updates, global newsletters, webcasts and internal conferences.
Significant compliance-related risks are monitored and managed at Group level in close cooperation with the local business units.
Risk assessment 2021Following the trend from previous years, regulatory requirements con-tinue to expand in scope and complexity within areas such as interna-tional taxation and transfer pricing, GDPR (data privacy) and goods/country restrictions.
This year’s acquisition of GIL has added further to this complexity, as the acquisition implied taking over new business activities, which, until fully integrated, implied an increased risk of non-conformance with ex-isting DSV compliance processes.
However, our previous history of successful integration of acquired businesses into our compliance framework reassures us that we will manage similarly on the GIL acquisition.
With regulatory complexity remaining high and the GIL acquisition add-ing additional complexity, the overall compliance risk exposure is con-sidered to be largely on par with last year.
Employees Retention and attraction failure
Com-pliance Fines, claims and damages, etc.
35 DSV Annual Report 2021 Corporate governance and shareholder information
Risk descriptionGrowth through acquisitions is fundamental to our corporate strategy, and the current DSV network is, to a large extent, a result of past strate-gic acquisitions.
Acquisitions always entail a risk of unsuccessful integration of the ac-quired company, which could result in cost synergies, strategic advan-tages and economies of scale being delayed or not fully realised.
Deciding on, and carrying out, the wrong acquisition may be costly and take up valuable resources that could have been spent on other potential acquisition candidates.
Mitigation strategiesWe have a history of successful integration of acquired companies and realisation of expected synergies. This rests on several factors. First of all, we stress the importance that any potential acquiree matches our business model. During the due diligence process, we make sure to in-volve the right people from our organisation, considering all vital aspects of the business.
Our IT, reporting and operational systems are designed to be scalable and to accommodate effective integration. This means that we are able to integrate acquired companies quickly.
Large integrations are headed by an integration board, and the activities are organised into work streams (operational, commercial, financial, IT, legal, tax, etc.). Each work stream reports systematically on the progress and risks during the entire process. The integration of operational activi-ties is anchored with and led by local management teams, based on guidance from Group Management. Local ownership ensures that ac-quired activities are well integrated.
Risk assessment 2021In August 2021, DSV acquired GIL in a DKK 30 billion business combi-nation – making this the second-largest acquisition in the history of our company.
An acquisition of this magnitude inherently implies an increased risk of a negative financial impact occurring, should the integration fail and the expected synergies not be fully realised.
As GIL is a well-run business, the experienced integration management teams from previous DSV acquisitions intact, and the processes and lessons learned from the UTi and Panalpina acquisitions fresh in mind, the added risk of the GIL acquisition is considered manageable.
The integration is progressing according to plan. As there is still some way to go before the GIL integration is complete, the M&A risk expo-sure is still considered slightly higher in 2021 compared to last year. However, the increase in risk is not at the same level as during previous acquisitions for the reasons previously mentioned.
Risk descriptionAs with most industries, the freight forwarding business is undergoing gradual changes in terms of technological developments as well as the competitive landscape, driven by both existing players and new entrants to the market.
Currently, digitalisation and automation of processes (quoting, booking, tracking, reporting and billing) are the most significant developments in the freight forwarding industry. These developments imply an oppor-tunity to optimise workflows and increase productivity, while also pro-viding higher levels of service and product offerings to our customers.
Failure to keep up with, adapt to and utilise these new technological opportunities will lead to gradual long-term loss of market share and earnings.
Mitigation strategiesOur overall mitigation approach focuses on monitoring of the logistics market, technologies, customer offerings and other processes that could potentially impact the way we do business. As highlighted in ‘A respon-sive approach to technology and digitalisation’ (page 17), we see new technologies as opportunities, not threats – and we are open to new ideas and ways of working.
We focus on developing our services, systems and operational proce-dures to ensure that we have a strong and competitive product offering that meets customer needs and enables us to remain price competitive. The aim of our IT strategy is to ensure that we can continue to benefit from our scale and global network in the future as a classic freight forwarder, while increasing our digital competences and utilising the ben-efits of technology.
An indirect impact of new technologies and changes in the competitive landscape is that some of the basic freight forwarding services are be-coming increasingly commoditised, leading to increasing price pressure. To compensate for this, we continuously seek to increase the scope of value-added services towards our customers.
Risk assessment 2021Failure to adapt the existing DSV business model to new technologies, services or other related business opportunities is a risk that we take seriously.
However, even though new technologies and related new ways of doing business continue to emerge, we are still to see new innovations that will have the potential to impact our core business in any signi-ficant way in the near future.
Likewise, we feel confident that our current technological initiatives will help us to stay competitive and on a par with developments in our industry.
Consequently, the potential financial impact and likelihood of tech-nology risks occurring remain largely unchanged from last year.
M&A Acquisitions and integration failure
Tech-nology Disruption and tech-nological adoption
36 DSV Annual Report 2021 Corporate governance and shareholder information
Risk descriptionWith the acquisitions of UTi Worldwide in 2016, Panalpina in 2019 and GIL in 2021, DSV has grown significantly in a few years, more than tri-pling our revenue and the number of employees of the Group.
Our network and market position have been strengthened, but the growth also carries challenges. While we integrate acquired companies and as we grow, we must maintain a strong commercial focus and col-laboration across the organisation.
Most of all, we must retain the focus on our customer’s needs, adapt to market changes and develop our services to ensure that we have a clear value proposition in the market. If we fail to adapt to these changes, our ability to execute on our organic growth strategy will be impaired and the long-term financial results of the Group will be impacted.
Mitigation strategiesManaging our commercial risk is anchored with the Executive Board and the Group Executive Committee. In this forum, strategic initiatives are aligned and our commercial threats and opportunities are explored. For each of our business areas we define the overall strategy and purpose, our value proposition and which customer segments we target.
In 2021 the executive board was expanded, and it is a part of the new COO role to support the strategic planning and drive strategic execution across the organisation.
Through regular business reviews with divisions and our operational com-panies in each country, Executive Management ensures that each division and country is aligned with the Group’s strategy and policies. The business reviews include financial performance, market situation, organisation, local strategic initiatives, etc.
Risk assessment 2021During 2021, the organisation has made good progress on several stra-tegic projects to support future organic growth.
In both Road and Solutions, it is our estimate that we have taken market shares in 2021, thanks to our strong market position, services and our dedicated teams. In Air & Sea, the disruption of the global markets meant that we focused more on servicing existing customers than on winning new business. The acquisition of GIL further impaired our ability to gain market shares short term, as parts of our organisation have been work-ing on the integration of GIL and retaining its customers.
We go into 2022 with a stronger market position than ever, and as wegradually put the GIL integration behind us, we are in a good position to get back on the organic growth path in Air & Sea the coming years. The risk assessment is unchanged from last year and management will continue to ensure that our organisation has the right commercial focus and works closely together in order to gain market share.
Risk descriptionThe long-term negative effects of climate change suggested by the UN and other organisations have the potential of significantly impacting our industry. As such, it is a risk that we monitor closely.
Associated risks may manifest themselves as physical disruptions of our logistic sites and operations or other forms of disruption in the global transport lanes, triggered by an increasing number of extreme weather events such as floods, storms and heatwaves.
Higher cost and complexity in running our business as a result of increas-ing climate regulations, taxations and customer requirements may also impact the financial results of our company – to the extent that we are not able to transfer the associated costs to our customers.
Finally, increasing consumer climate awareness may also carry changes in global supply and demand patterns, resulting in supply chains moving closer to home markets. This could have a dampening effect on the long-term growth potential on the intercontinental transport lanes.
Mitigation strategiesLike other areas, risk management for this area is anchored with the Board of Directors. Furthermore, our Sustainability Board, headed up by the Group CEO, is the executive management lead when it comes to identifying, assessing and reporting on the development in climate- related risk.
Our asset-light model enables us to adapt to changes in the market, as we have not invested in specific transport equipment.
As part of our mitigation strategy, we include the potential impact from climate changes when we plan our physical infrastructure. For example, our new warehouses are designed to resist more extreme weather and we choose locations where the risk of flooding is reduced.
To address the longer-term risk from climate change, we remain dedi-cated to contributing to reducing global CO2 emissions through our com-mitment to the Science Based Targets initiative. We aim to achieve this through a number of initiatives, such as continuing to invest in a modern and energy-efficient infrastructure and supporting green innovations.
Risk assessment 2021As reflected in our risk map, we are currently not seeing any significant finan-cial impact on our business operations as a direct result of climate change.
2021 was the first year we applied a climate risk assessment based on the principles from Task Force on Climate-related Financial Disclosures (TCFD). The assessment helps guide us and improves our internal un-derstanding of the impact of climate change on our business.
Taking into consideration the potential extreme long-term climate change scenarios projected by the UN and others, this may very well change in the future. However, at the current stage, making any pro-jections on the long-term effects on our business involves a significant degree of uncertainty and guesswork.
For additional details and results on our 2021 Task Force on Climate- related Financial Disclosures (TCFD) climate risk assessment, please see the DSV Sustainability Report 2021: https://www.dsv.com/en/ sustainability-reports
Com-mercial Failure to execute on organic growth strategy
Climate Failure to adapt to and mitigate risks from climate change
37 DSV Annual Report 2021 Corporate governance and shareholder information
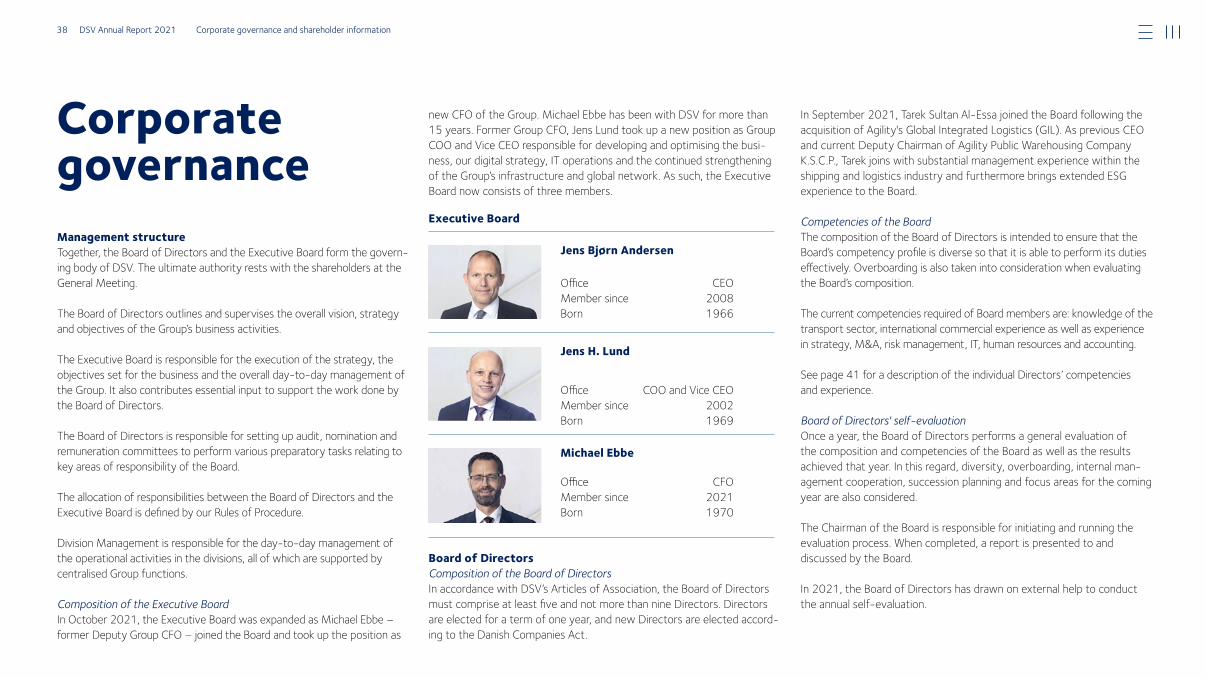
Corporate governance
new CFO of the Group. Michael Ebbe has been with DSV for more than 15 years. Former Group CFO, Jens Lund took up a new position as Group COO and Vice CEO responsible for developing and optimising the busi-ness, our digital strategy, IT operations and the continued strengthening of the Group’s infrastructure and global network. As such, the Executive Board now consists of three members.
Board of DirectorsComposition of the Board of DirectorsIn accordance with DSV’s Articles of Association, the Board of Directors must comprise at least five and not more than nine Directors. Directors are elected for a term of one year, and new Directors are elected accord-ing to the Danish Companies Act.
In September 2021, Tarek Sultan Al-Essa joined the Board following the acquisition of Agility's Global Integrated Logistics (GIL). As previous CEO and current Deputy Chairman of Agility Public Warehousing Company K.S.C.P., Tarek joins with substantial management experience within the shipping and logistics industry and furthermore brings extended ESG experience to the Board.
Competencies of the BoardThe composition of the Board of Directors is intended to ensure that the Board’s competency profile is diverse so that it is able to perform its duties effectively. Overboarding is also taken into consideration when evaluating the Board’s composition.
The current competencies required of Board members are: knowledge of the transport sector, international commercial experience as well as experience in strategy, M&A, risk management, IT, human resources and accounting.
See page 41 for a description of the individual Directors’ competencies and experience.
Board of Directors' self-evaluationOnce a year, the Board of Directors performs a general evaluation of the composition and competencies of the Board as well as the results achieved that year. In this regard, diversity, overboarding, internal man-agement cooperation, succession planning and focus areas for the coming year are also considered.
The Chairman of the Board is responsible for initiating and running the evaluation process. When completed, a report is presented to and discussed by the Board.
In 2021, the Board of Directors has drawn on external help to conduct the annual self-evaluation.
Management structureTogether, the Board of Directors and the Executive Board form the govern-ing body of DSV. The ultimate authority rests with the shareholders at the General Meeting.
The Board of Directors outlines and supervises the overall vision, strategy and objectives of the Group’s business activities.
The Executive Board is responsible for the execution of the strategy, the objectives set for the business and the overall day-to-day management of the Group. It also contributes essential input to support the work done by the Board of Directors.
The Board of Directors is responsible for setting up audit, nomination and remuneration committees to perform various preparatory tasks relating to key areas of responsibility of the Board.
The allocation of responsibilities between the Board of Directors and the Executive Board is defined by our Rules of Procedure.
Division Management is responsible for the day-to-day management of the operational activities in the divisions, all of which are supported by centralised Group functions.
Composition of the Executive BoardIn October 2021, the Executive Board was expanded as Michael Ebbe – former Deputy Group CFO – joined the Board and took up the position as
Jens Bjørn Andersen
Office CEOMember since 2008Born 1966
Jens H. Lund
Office COO and Vice CEOMember since 2002Born 1969
Michael Ebbe
Office CFOMember since 2021Born 1970
Executive Board
38 DSV Annual Report 2021 Corporate governance and shareholder information
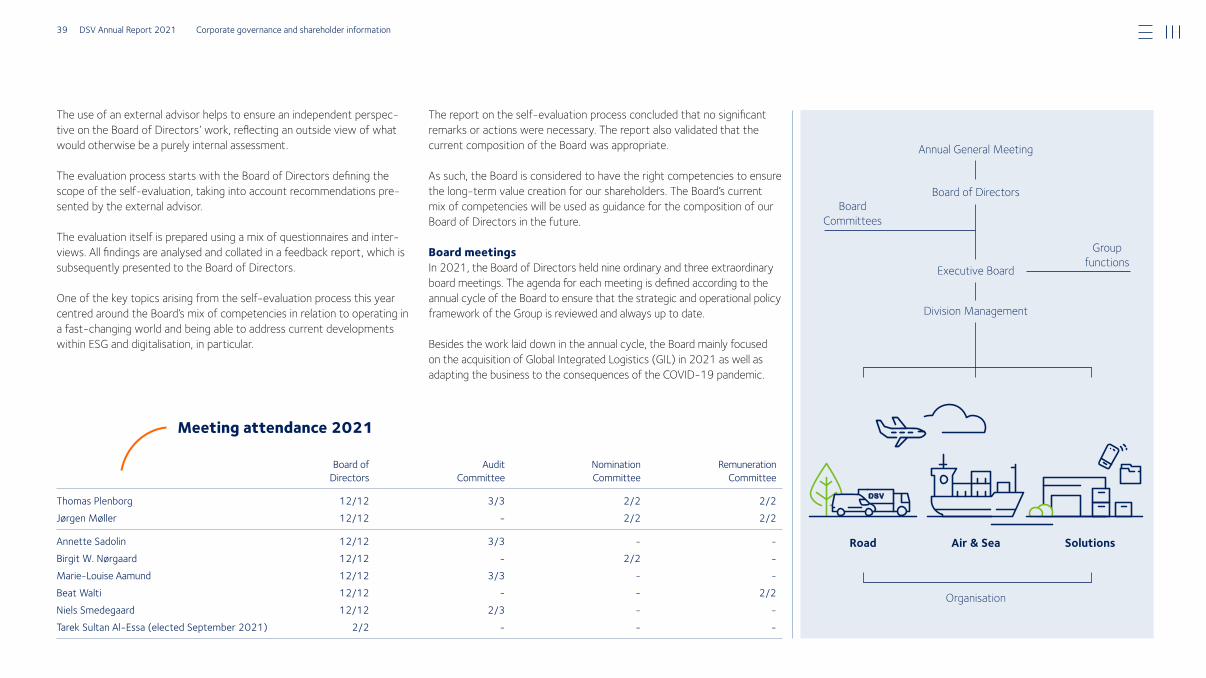
The use of an external advisor helps to ensure an independent perspec-tive on the Board of Directors’ work, reflecting an outside view of what would otherwise be a purely internal assessment.
The evaluation process starts with the Board of Directors defining the scope of the self-evaluation, taking into account recommendations pre-sented by the external advisor.
The evaluation itself is prepared using a mix of questionnaires and inter-views. All findings are analysed and collated in a feedback report, which is subsequently presented to the Board of Directors.
One of the key topics arising from the self-evaluation process this year centred around the Board’s mix of competencies in relation to operating in a fast-changing world and being able to address current developments within ESG and digitalisation, in particular.
Board of Directors
Audit Committee
Nomination Committee
Remune ration Committee
Thomas Plenborg 12/12 3/3 2/2 2/2Jørgen Møller 12/12 2/2 2/2
Annette Sadolin 12/12 3/3 Birgit W. Nørgaard 12/12 2/2 MarieLouise Aamund 12/12 3/3 Beat Walti 12/12 2/2Niels Smedegaard 12/12 2/3 Tarek Sultan AlEssa (elected September 2021) 2/2
Meeting attendance 2021
The report on the self-evaluation process concluded that no significant remarks or actions were necessary. The report also validated that the current composition of the Board was appropriate.
As such, the Board is considered to have the right competencies to ensure the long-term value creation for our shareholders. The Board’s current mix of competencies will be used as guidance for the composition of our Board of Directors in the future.
Board meetings In 2021, the Board of Directors held nine ordinary and three extraordinary board meetings. The agenda for each meeting is defined according to the annual cycle of the Board to ensure that the strategic and operational policy framework of the Group is reviewed and always up to date.
Besides the work laid down in the annual cycle, the Board mainly focused on the acquisition of Global Integrated Logistics (GIL) in 2021 as well as adapting the business to the consequences of the COVID-19 pandemic.
Organisation
Air & SeaRoad Solutions
Board Committees
Group functions
Annual General Meeting
Board of Directors
Executive Board
Division Management
39 DSV Annual Report 2021 Corporate governance and shareholder information
Board committeesThree committees assist the Board of Directors within each of their areas of responsibility. They evaluate and assess all material presented to the Board of Directors to make sure that the Board of Directors has a solid and informed basis for making its decisions.
The rules of procedure for the three committees are available at: https://www.dsv.com/en/board-committees
Remuneration of the Board of Directors and the Executive Board
Remuneration policyRemuneration of the Board of Directors and the Executive Board is carried out in accordance with the DSV Remuneration Policy as adopted by the Annual General Meeting.
The purpose of the Remuneration Policy is to ensure that DSV is able to attract and retain a qualified management team, to align management and shareholder interest, and to create sufficient incentive for the long-term value creation of the Company.
At the Extraordinary General Meeting held in September 2021, an updated Remuneration Policy was approved. Changes included the introduction of ESG variables as basis for the granting of variable remuneration as well as the removal of the option to grant discretionary bonuses to the Executive Board. The new DSV Remuneration Policy is available at: https://www.dsv.com/en/remuneration-policy
Remuneration reportThe remuneration of the members of the Board of Directors and the Executive Board is reported separately in the DSV Remuneration Report.
The report is prepared in accordance with section 139b of the Danish Companies Act and the Danish Recommendations on Corporate Govern-ance and is available at: https://www.dsv.com/en/remuneration-reports
Report on Corporate Governance cf. section 107b of the Danish Financial Statements ActIn managing DSV, the Board of Directors apply the latest Recommenda-tions on Corporate Governance issued by the Danish Committee on Corporate Governance.
The Board uses the Recommendations for guidance when setting up management structures, tasks and procedures and checks against them to make sure that we are acting in accordance with the principal inten-tions of the Recommendations. The Board regularly assesses its proce-dures based on the Recommendations.
DSV fully abided by the Recommendations in 2021.
Adherence to the Recommendations – including reporting on internal controls and risk management systems applied as basis for the financial reporting process – is reported in the Statutory Report on Corporate Governance available at https://www.dsv.com/en/governance-reports
Reporting on Data Ethics policies cf. section 99d of the Danish Financial Statements ActWe report separately on our policies and approach to Data Ethics in accordance with section 99d of the Danish Financial Statements Act. This report is found in our Statutory Report on Data Ethics, available at: https://www.dsv.com/en/data-ethics
40 DSV Annual Report 2021 Corporate governance and shareholder information
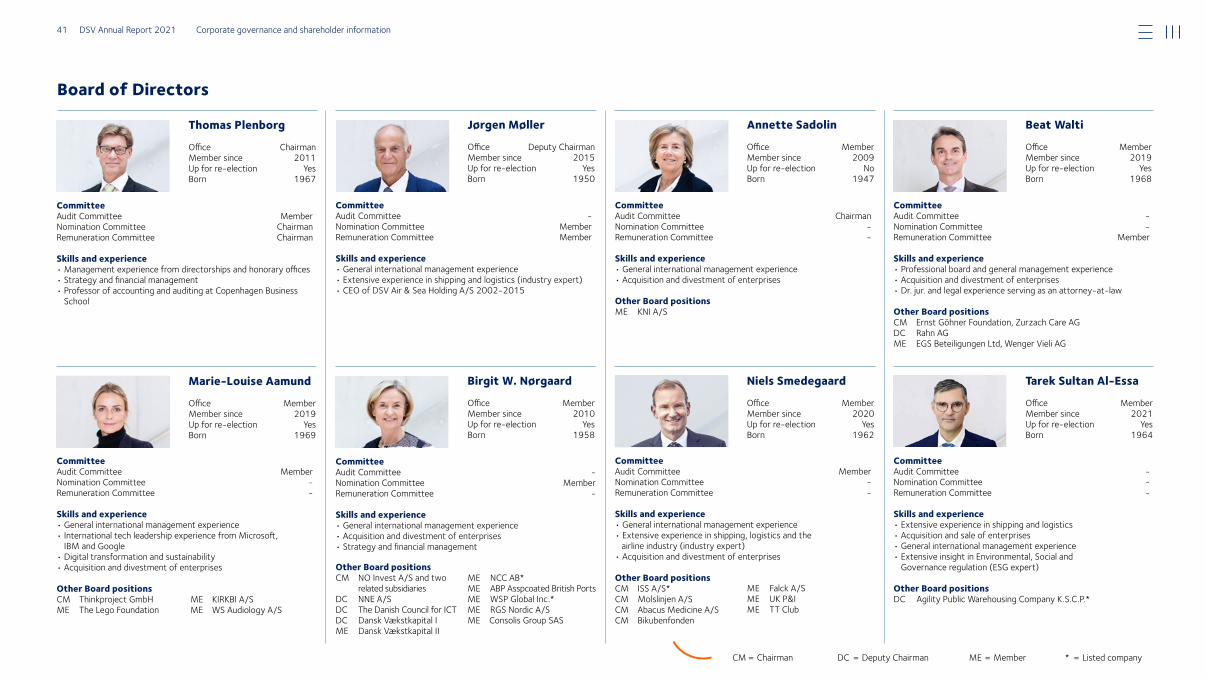
Jørgen Møller
Office Deputy ChairmanMember since 2015Up for reelection YesBorn 1950
Committee Audit Committee Nomination Committee MemberRemuneration Committee Member
Skills and experience• General international management experience• Extensive experience in shipping and logistics (industry expert)• CEO of DSV Air & Sea Holding A/S 20022015
Beat Walti
Office MemberMember since 2019 Up for reelection Yes Born 1968
Committee Audit Committee Nomination Committee Remuneration Committee Member
Skills and experience• Professional board and general management experience• Acquisition and divestment of enterprises• Dr. jur. and legal experience serving as an attorneyatlaw
Other Board positionsCM Ernst Göhner Foundation, Zurzach Care AG DC Rahn AGME EGS Beteiligungen Ltd, Wenger Vieli AG
Annette Sadolin
Office MemberMember since 2009Up for reelection NoBorn 1947
Committee Audit Committee ChairmanNomination Committee Remuneration Committee
Skills and experience• General international management experience• Acquisition and divestment of enterprises
Other Board positionsME KNI A/S
Birgit W. Nørgaard
Office MemberMember since 2010Up for reelection YesBorn 1958
Committee Audit Committee Nomination Committee MemberRemuneration Committee
Skills and experience• General international management experience • Acquisition and divestment of enterprises• Strategy and financial management
Other Board positionsCM NO Invest A/S and two related subsidiaries DC NNE A/SDC The Danish Council for ICT DC Dansk Vækstkapital IME Dansk Vækstkapital II
ME NCC AB*ME ABP Asspcoated British PortsME WSP Global Inc.* ME RGS Nordic A/SME Consolis Group SAS
Niels Smedegaard
Office MemberMember since 2020Up for reelection Yes Born 1962
Tarek Sultan Al-Essa
Office MemberMember since 2021Up for reelection Yes Born 1964
Committee Audit Committee MemberNomination Committee Remuneration Committee
Skills and experience• General international management experience• Extensive experience in shipping, logistics and the airline industry (industry expert)• Acquisition and divestment of enterprises
Other Board positions CM ISS A/S* CM Molslinjen A/SCM Abacus Medicine A/SCM Bikubenfonden
Committee Audit Committee Nomination Committee Remuneration Committee
Skills and experience• Extensive experience in shipping and logistics• Acquisition and sale of enterprises• General international management experience• Extensive insight in Environmental, Social and
Governance regulation (ESG expert)
Other Board positionsDC Agility Public Warehousing Company K.S.C.P.*
Thomas Plenborg
Office ChairmanMember since 2011Up for reelection YesBorn 1967
Board of Directors
Committee Audit Committee MemberNomination Committee ChairmanRemuneration Committee Chairman
Skills and experience• Management experience from directorships and honorary offices• Strategy and financial management• Professor of accounting and auditing at Copenhagen Business
School
Marie-Louise Aamund
Office MemberMember since 2019Up for reelection Yes Born 1969
Committee Audit Committee MemberNomination Committee Remuneration Committee
Skills and experience• General international management experience• International tech leadership experience from Microsoft,
IBM and Google• Digital transformation and sustainability• Acquisition and divestment of enterprises
Other Board positionsCM Thinkproject GmbH ME KIRKBI A/SME The Lego Foundation ME WS Audiology A/S
CM = Chairman DC = Deputy Chairman ME = Member * = Listed company
ME Falck A/SME UK P&IME TT Club
41 DSV Annual Report 2021 Corporate governance and shareholder information
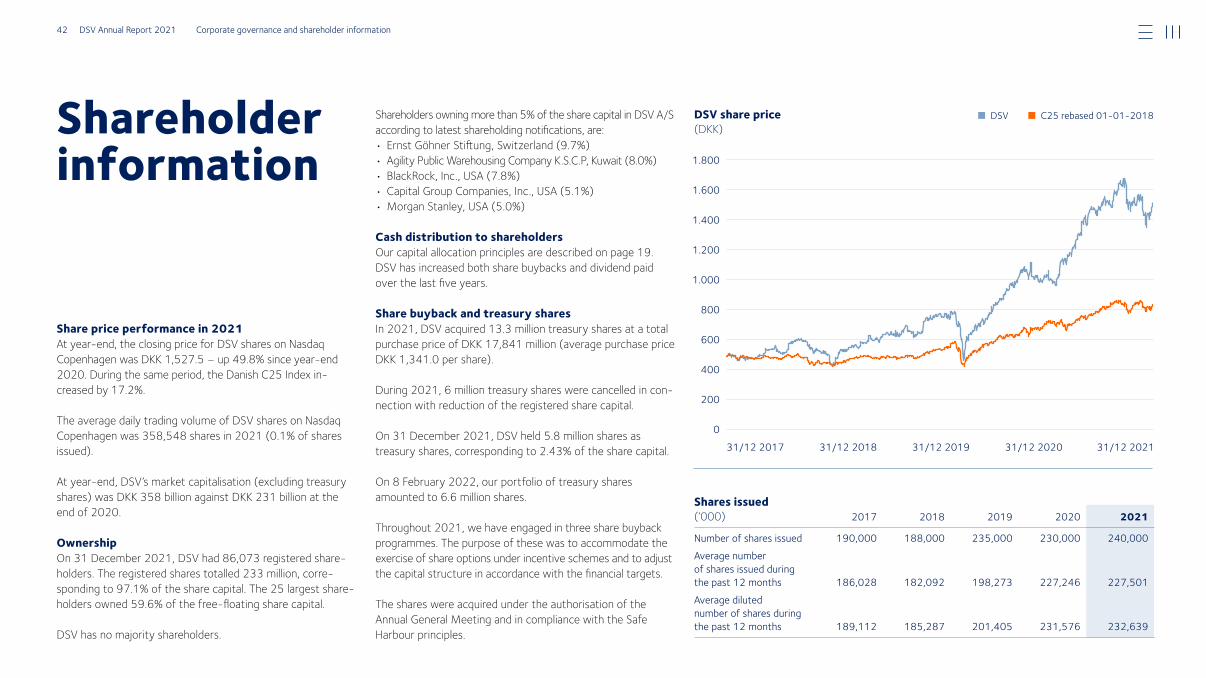
Shareholder information
Share price performance in 2021 At year-end, the closing price for DSV shares on Nasdaq Copenhagen was DKK 1,527.5 – up 49.8% since year-end 2020. During the same period, the Danish C25 Index in-creased by 17.2%.
The average daily trading volume of DSV shares on Nasdaq Copenhagen was 358,548 shares in 2021 (0.1% of shares issued).
At year-end, DSV’s market capitalisation (excluding treasury shares) was DKK 358 billion against DKK 231 billion at the end of 2020.
OwnershipOn 31 December 2021, DSV had 86,073 registered share-holders. The registered shares totalled 233 million, corre-sponding to 97.1% of the share capital. The 25 largest share-holders owned 59.6% of the free-floating share capital.
DSV has no majority shareholders.
Shareholders owning more than 5% of the share capital in DSV A/S according to latest shareholding notifications, are:• Ernst Göhner Stiftung, Switzerland (9.7%)• Agility Public Warehousing Company K.S.C.P, Kuwait (8.0%)• BlackRock, Inc., USA (7.8%)• Capital Group Companies, Inc., USA (5.1%)• Morgan Stanley, USA (5.0%)
Cash distribution to shareholdersOur capital allocation principles are described on page 19. DSV has increased both share buybacks and dividend paid over the last five years.
Share buyback and treasury sharesIn 2021, DSV acquired 13.3 million treasury shares at a total purchase price of DKK 17,841 million (average purchase price DKK 1,341.0 per share).
During 2021, 6 million treasury shares were cancelled in con-nection with reduction of the registered share capital.
On 31 December 2021, DSV held 5.8 million shares as treasury shares, corresponding to 2.43% of the share capital.
On 8 February 2022, our portfolio of treasury shares amounted to 6.6 million shares.
Throughout 2021, we have engaged in three share buyback programmes. The purpose of these was to accommodate the exercise of share options under incentive schemes and to adjust the capital structure in accordance with the financial targets.
The shares were acquired under the authorisation of the Annual General Meeting and in compliance with the Safe Harbour principles.
DSV share price (DKK)
■ DSV ■ C25 rebased 01012018
Shares issued (‘000) 2017 2018 2019 2020 2021
Number of shares issued 190,000 188,000 235,000 230,000 240,000Average number of shares issued during the past 12 months 186,028 182,092 198,273 227,246 227,501Average diluted number of shares during the past 12 months 189,112 185,287 201,405 231,576 232,639
31/12 201831/12 2017 31/12 2019 31/12 2020 31/12 2021
1.800
1.600
1.400
1.200
1.000
800
600
400
200
0
42 DSV Annual Report 2021 Corporate governance and shareholder information
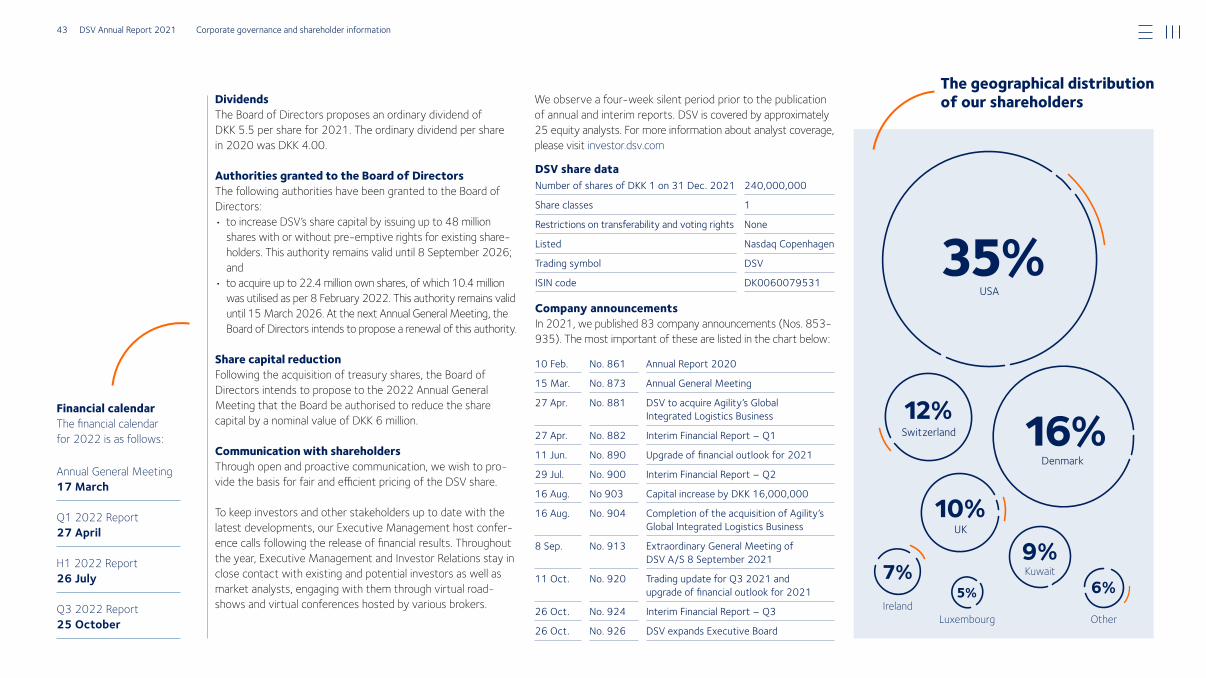
Company announcements In 2021, we published 83 company announcements (Nos. 853-935). The most important of these are listed in the chart below:
10 Feb. No. 861 Annual Report 2020
15 Mar. No. 873 Annual General Meeting
27 Apr. No. 881 DSV to acquire Agility’s Global Integrated Logistics Business
27 Apr. No. 882 Interim Financial Report – Q1
11 Jun. No. 890 Upgrade of financial outlook for 2021
29 Jul. No. 900 Interim Financial Report – Q2
16 Aug. No 903 Capital increase by DKK 16,000,000
16 Aug. No. 904 Completion of the acquisition of Agility’s Global Integrated Logistics Business
8 Sep. No. 913 Extraordinary General Meeting of DSV A/S 8 September 2021
11 Oct. No. 920 Trading update for Q3 2021 and upgrade of financial outlook for 2021
26 Oct. No. 924 Interim Financial Report – Q3
26 Oct. No. 926 DSV expands Executive Board
Number of shares of DKK 1 on 31 Dec. 2021 240,000,000
Share classes 1
Restrictions on transferability and voting rights None
Listed Nasdaq Copenhagen
Trading symbol DSV
ISIN code DK0060079531
DSV share data
Dividends The Board of Directors proposes an ordinary dividend of DKK 5.5 per share for 2021. The ordinary dividend per share in 2020 was DKK 4.00.
Authorities granted to the Board of DirectorsThe following authorities have been granted to the Board of Directors:• to increase DSV’s share capital by issuing up to 48 million
shares with or without pre-emptive rights for existing share-holders. This authority remains valid until 8 September 2026; and
• to acquire up to 22.4 million own shares, of which 10.4 million was utilised as per 8 February 2022. This authority remains valid until 15 March 2026. At the next Annual General Meeting, the Board of Directors intends to propose a renewal of this authority.
Share capital reductionFollowing the acquisition of treasury shares, the Board of Directors intends to propose to the 2022 Annual General Meeting that the Board be authorised to reduce the share capital by a nominal value of DKK 6 million.
Communication with shareholdersThrough open and proactive communication, we wish to pro-vide the basis for fair and efficient pricing of the DSV share.
To keep investors and other stakeholders up to date with the latest developments, our Executive Management host confer-ence calls following the release of financial results. Throughout the year, Executive Management and Investor Relations stay in close contact with existing and potential investors as well as market analysts, engaging with them through virtual road-shows and virtual conferences hosted by various brokers.
We observe a four-week silent period prior to the publication of annual and interim reports. DSV is covered by approximately 25 equity analysts. For more information about analyst coverage, please visit investor.dsv.com
Financial calendarThe financial calendar for 2022 is as follows:
Annual General Meeting17 March
Q1 2022 Report27 April
H1 2022 Report26 July
Q3 2022 Report25 October
Denmark
16%
Ireland
7% Kuwait9%
Luxembourg
5%
UK10%
Switzerland12%
USA
35%
Other
6%
The geographical distribution of our shareholders
43 DSV Annual Report 2021 Corporate governance and shareholder information
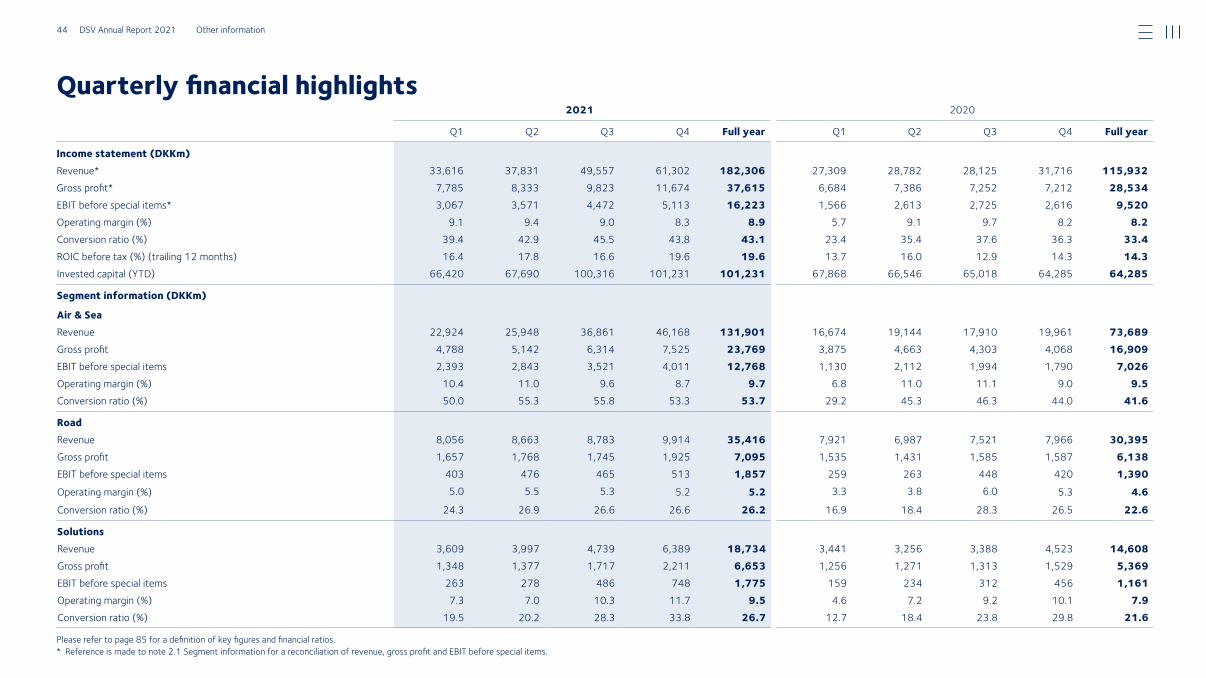
2021 2020
Q1 Q2 Q3 Q4 Full year Q1 Q2 Q3 Q4 Full year
Income statement (DKKm)Revenue* 33,616 37,831 49,557 61,302 182,306 27,309 28,782 28,125 31,716 115,932Gross profit* 7,785 8,333 9,823 11,674 37,615 6,684 7,386 7,252 7,212 28,534EBIT before special items* 3,067 3,571 4,472 5,113 16,223 1,566 2,613 2,725 2,616 9,520Operating margin (%) 9.1 9.4 9.0 8.3 8.9 5.7 9.1 9.7 8.2 8.2Conversion ratio (%) 39.4 42.9 45.5 43.8 43.1 23.4 35.4 37.6 36.3 33.4ROIC before tax (%) (trailing 12 months) 16.4 17.8 16.6 19.6 19.6 13.7 16.0 12.9 14.3 14.3Invested capital (YTD) 66,420 67,690 100,316 101,231 101,231 67,868 66,546 65,018 64,285 64,285
Segment information (DKKm)
Air & SeaRevenue 22,924 25,948 36,861 46,168 131,901 16,674 19,144 17,910 19,961 73,689Gross profit 4,788 5,142 6,314 7,525 23,769 3,875 4,663 4,303 4,068 16,909EBIT before special items 2,393 2,843 3,521 4,011 12,768 1,130 2,112 1,994 1,790 7,026Operating margin (%) 10.4 11.0 9.6 8.7 9.7 6.8 11.0 11.1 9.0 9.5Conversion ratio (%) 50.0 55.3 55.8 53.3 53.7 29.2 45.3 46.3 44.0 41.6
RoadRevenue 8,056 8,663 8,783 9,914 35,416 7,921 6,987 7,521 7,966 30,395Gross profit 1,657 1,768 1,745 1,925 7,095 1,535 1,431 1,585 1,587 6,138EBIT before special items 403 476 465 513 1,857 259 263 448 420 1,390
Operating margin (%) 5.0 5.5 5.3 5.2 5.2 3.3 3.8 6.0 5.3 4.6
Conversion ratio (%) 24.3 26.9 26.6 26.6 26.2 16.9 18.4 28.3 26.5 22.6
SolutionsRevenue 3,609 3,997 4,739 6,389 18,734 3,441 3,256 3,388 4,523 14,608Gross profit 1,348 1,377 1,717 2,211 6,653 1,256 1,271 1,313 1,529 5,369EBIT before special items 263 278 486 748 1,775 159 234 312 456 1,161Operating margin (%) 7.3 7.0 10.3 11.7 9.5 4.6 7.2 9.2 10.1 7.9Conversion ratio (%) 19.5 20.2 28.3 33.8 26.7 12.7 18.4 23.8 29.8 21.6
Please refer to page 85 for a definition of key figures and financial ratios.* Reference is made to note 2.1 Segment information for a reconciliation of revenue, gross profit and EBIT before special items.
Quarterly financial highlights
44 DSV Annual Report 2021 Other information
Consolidated financial statements 2021Income statement . . . . . . . . . . . . . . . . . . . . . . . . . . . . . . . . . . . . . . . . . . . . . 46Statement of comprehensive income. . . . . . . . . . . . . . . . . . . . . . . . . . . . 46Cash flow statement . . . . . . . . . . . . . . . . . . . . . . . . . . . . . . . . . . . . . . . . . . 47Balance sheet . . . . . . . . . . . . . . . . . . . . . . . . . . . . . . . . . . . . . . . . . . . . . . . . . 48Statement of changes in equity . . . . . . . . . . . . . . . . . . . . . . . . . . . . . . . . . 49Notes. . . . . . . . . . . . . . . . . . . . . . . . . . . . . . . . . . . . . . . . . . . . . . . . . . . . . . . . . 50
45 DSV Annual Report 2021 Consolidated financial statements 2021
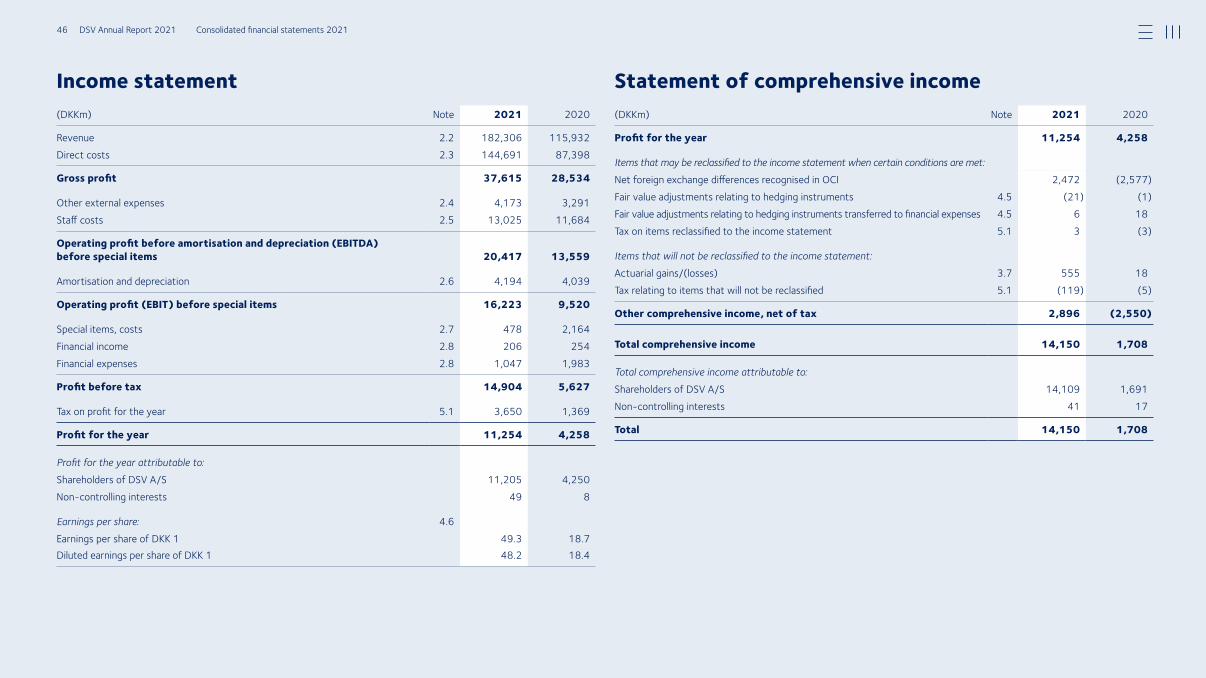
Income statement Statement of comprehensive income(DKKm) Note 2021 2020
Revenue 2.2 182,306 115,932Direct costs 2.3 144,691 87,398
Gross profit 37,615 28,534
Other external expenses 2.4 4,173 3,291Staff costs 2.5 13,025 11,684
Operating profit before amortisation and depreciation (EBITDA) before special items 20,417 13,559
Amortisation and depreciation 2.6 4,194 4,039
Operating profit (EBIT) before special items 16,223 9,520
Special items, costs 2.7 478 2,164Financial income 2.8 206 254Financial expenses 2.8 1,047 1,983
Profit before tax 14,904 5,627
Tax on profit for the year 5.1 3,650 1,369
Profit for the year 11,254 4,258
Profit for the year attributable to:Shareholders of DSV A/S 11,205 4,250Noncontrolling interests 49 8
Earnings per share: 4.6 Earnings per share of DKK 1 49.3 18.7Diluted earnings per share of DKK 1 48.2 18.4
(DKKm) Note 2021 2020
Profit for the year 11,254 4,258
Items that may be reclassified to the income statement when certain conditions are met:Net foreign exchange differences recognised in OCI 2,472 (2,577)Fair value adjustments relating to hedging instruments 4.5 (21) (1)Fair value adjustments relating to hedging instruments transferred to financial expenses 4.5 6 18Tax on items reclassified to the income statement 5.1 3 (3)
Items that will not be reclassified to the income statement: Actuarial gains/(losses) 3.7 555 18Tax relating to items that will not be reclassified 5.1 (119) (5)
Other comprehensive income, net of tax 2,896 (2,550)
Total comprehensive income 14,150 1,708
Total comprehensive income attributable to:Shareholders of DSV A/S 14,109 1,691Noncontrolling interests 41 17
Total 14,150 1,708
46 DSV Annual Report 2021 Consolidated financial statements 2021
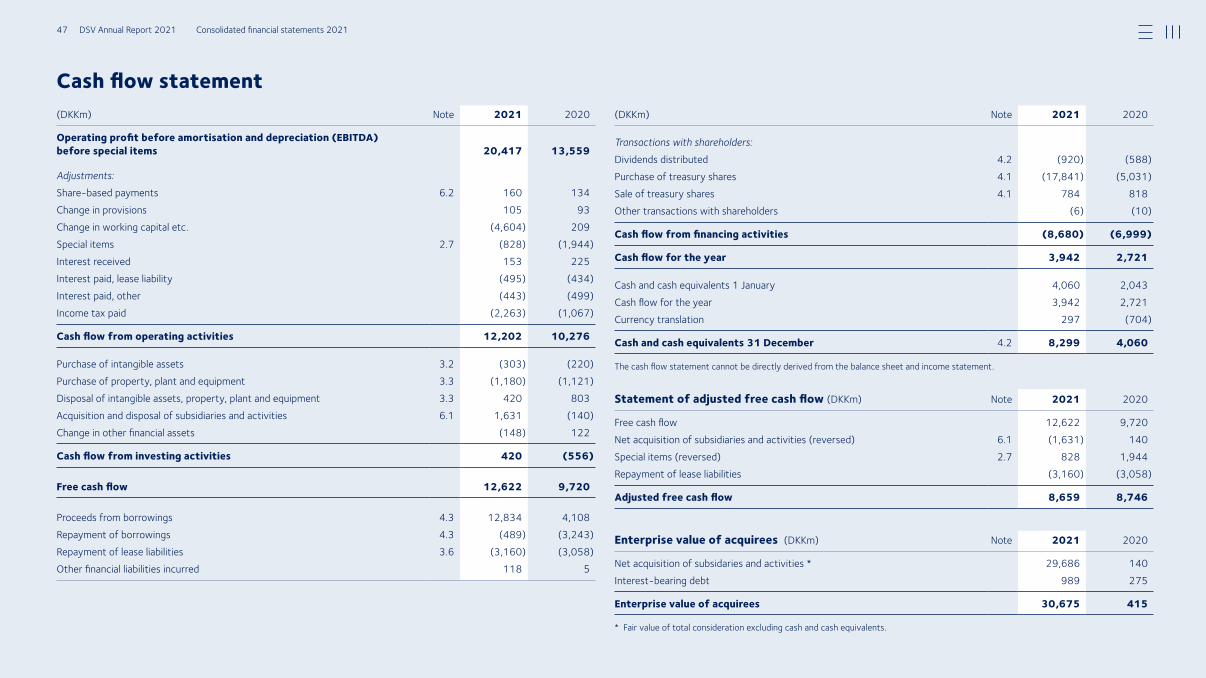
Cash flow statement(DKKm) Note 2021 2020
Operating profit before amortisation and depreciation (EBITDA) before special items 20,417 13,559
Adjustments:Sharebased payments 6.2 160 134Change in provisions 105 93Change in working capital etc. (4,604) 209Special items 2.7 (828) (1,944)Interest received 153 225Interest paid, lease liability (495) (434)Interest paid, other (443) (499)Income tax paid (2,263) (1,067)
Cash flow from operating activities 12,202 10,276
Purchase of intangible assets 3.2 (303) (220)Purchase of property, plant and equipment 3.3 (1,180) (1,121)Disposal of intangible assets, property, plant and equipment 3.3 420 803Acquisition and disposal of subsidiaries and activities 6.1 1,631 (140)Change in other financial assets (148) 122
Cash flow from investing activities 420 (556)
Free cash flow 12,622 9,720
Proceeds from borrowings 4.3 12,834 4,108Repayment of borrowings 4.3 (489) (3,243)Repayment of lease liabilities 3.6 (3,160) (3,058)Other financial liabilities incurred 118 5
(DKKm) Note 2021 2020
Transactions with shareholders:Dividends distributed 4.2 (920) (588)Purchase of treasury shares 4.1 (17,841) (5,031)Sale of treasury shares 4.1 784 818Other transactions with shareholders (6) (10)
Cash flow from financing activities (8,680) (6,999)
Cash flow for the year 3,942 2,721
Cash and cash equivalents 1 January 4,060 2,043Cash flow for the year 3,942 2,721Currency translation 297 (704)
Cash and cash equivalents 31 December 4.2 8,299 4,060
The cash flow statement cannot be directly derived from the balance sheet and income statement.
Statement of adjusted free cash flow (DKKm) Note 2021 2020
Free cash flow 12,622 9,720Net acquisition of subsidiaries and activities (reversed) 6.1 (1,631) 140Special items (reversed) 2.7 828 1,944Repayment of lease liabilities (3,160) (3,058)
Adjusted free cash flow 8,659 8,746
Enterprise value of acquirees (DKKm) Note 2021 2020
Net acquisition of subsidaries and activities * 29,686 140Interestbearing debt 989 275
Enterprise value of acquirees 30,675 415
* Fair value of total consideration excluding cash and cash equivalents.
47 DSV Annual Report 2021 Consolidated financial statements 2021
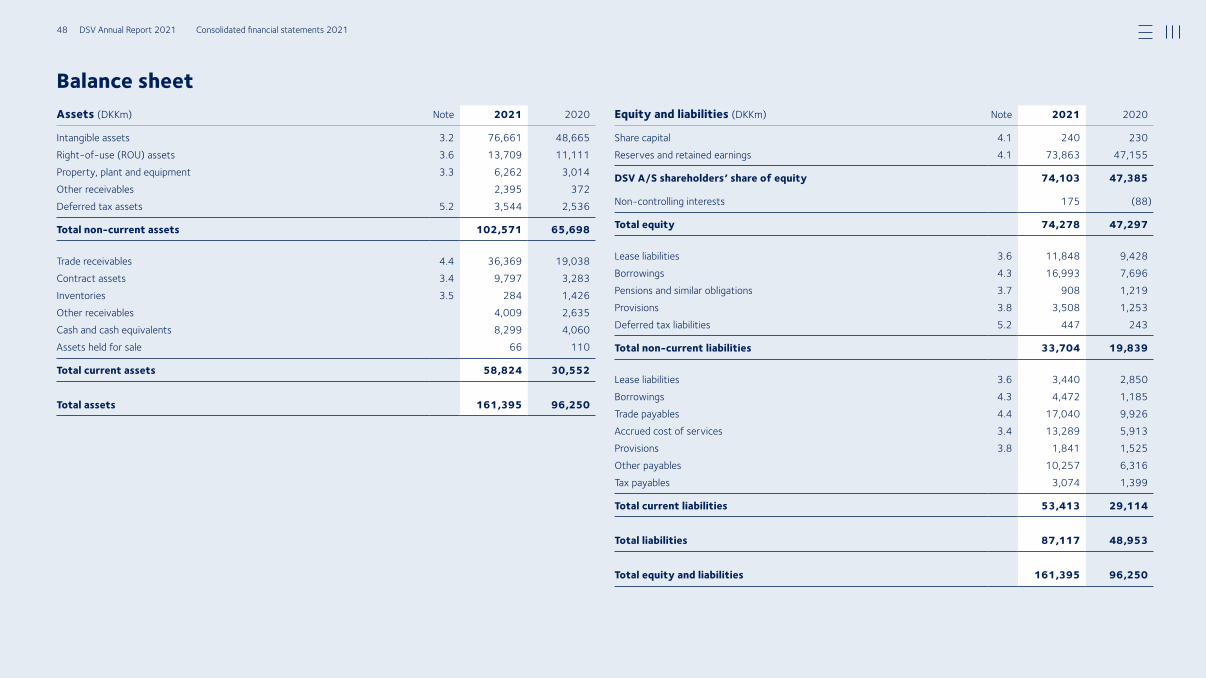
Balance sheetAssets (DKKm) Note 2021 2020
Intangible assets 3.2 76,661 48,665Rightofuse (ROU) assets 3.6 13,709 11,111Property, plant and equipment 3.3 6,262 3,014Other receivables 2,395 372Deferred tax assets 5.2 3,544 2,536
Total non-current assets 102,571 65,698
Trade receivables 4.4 36,369 19,038Contract assets 3.4 9,797 3,283Inventories 3.5 284 1,426Other receivables 4,009 2,635Cash and cash equivalents 8,299 4,060Assets held for sale 66 110
Total current assets 58,824 30,552
Total assets 161,395 96,250
Equity and liabilities (DKKm) Note 2021 2020
Share capital 4.1 240 230Reserves and retained earnings 4.1 73,863 47,155
DSV A/S shareholders’ share of equity 74,103 47,385
Noncontrolling interests 175 (88)
Total equity 74,278 47,297
Lease liabilities 3.6 11,848 9,428Borrowings 4.3 16,993 7,696Pensions and similar obligations 3.7 908 1,219Provisions 3.8 3,508 1,253Deferred tax liabilities 5.2 447 243
Total non-current liabilities 33,704 19,839
Lease liabilities 3.6 3,440 2,850Borrowings 4.3 4,472 1,185Trade payables 4.4 17,040 9,926Accrued cost of services 3.4 13,289 5,913Provisions 3.8 1,841 1,525Other payables 10,257 6,316Tax payables 3,074 1,399
Total current liabilities 53,413 29,114
Total liabilities 87,117 48,953
Total equity and liabilities 161,395 96,250
48 DSV Annual Report 2021 Consolidated financial statements 2021
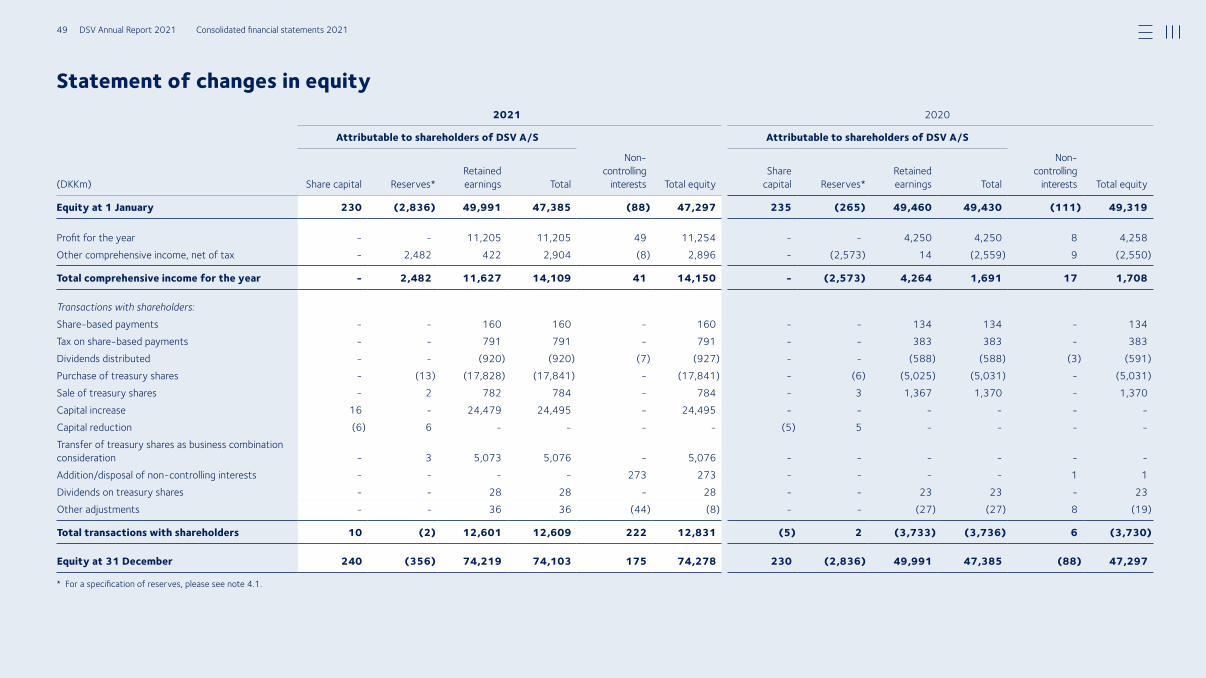
Statement of changes in equity2021 2020
Attributable to shareholders of DSV A/S Attributable to shareholders of DSV A/S
(DKKm) Share capital Reserves*Retained earnings Total
Noncon trolling
interests Total equityShare
capital Reserves*Retained earnings Total
Noncon trolling
interests Total equity
Equity at 1 January 230 (2,836) 49,991 47,385 (88) 47,297 235 (265) 49,460 49,430 (111) 49,319
Profit for the year 11,205 11,205 49 11,254 4,250 4,250 8 4,258Other comprehensive income, net of tax 2,482 422 2,904 (8) 2,896 (2,573) 14 (2,559) 9 (2,550)
Total comprehensive income for the year - 2,482 11,627 14,109 41 14,150 - (2,573) 4,264 1,691 17 1,708
Transactions with shareholders:Sharebased payments 160 160 160 134 134 134Tax on sharebased payments 791 791 791 383 383 383Dividends distributed (920) (920) (7) (927) (588) (588) (3) (591)Purchase of treasury shares (13) (17,828) (17,841) (17,841) (6) (5,025) (5,031) (5,031)Sale of treasury shares 2 782 784 784 3 1,367 1,370 1,370Capital increase 16 24,479 24,495 24,495 Capital reduction (6) 6 (5) 5 Transfer of treasury shares as business combination consideration 3 5,073 5,076 5,076 Addition/disposal of noncontrolling interests 273 273 1 1Dividends on treasury shares 28 28 28 23 23 23Other adjustments 36 36 (44) (8) (27) (27) 8 (19)
Total transactions with shareholders 10 (2) 12,601 12,609 222 12,831 (5) 2 (3,733) (3,736) 6 (3,730)
Equity at 31 December 240 (356) 74,219 74,103 175 74,278 230 (2,836) 49,991 47,385 (88) 47,297
* For a specification of reserves, please see note 4.1.
49 DSV Annual Report 2021 Consolidated financial statements 2021
Chapter 1
Basis of preparationIntroduction . . . . . . . . . . . . . . . . . . . . . . . . . . . . . . . . . 51Basis of measurement . . . . . . . . . . . . . . . . . . . . . . . . . . . 51Changes in accounting policies . . . . . . . . . . . . . . . . . . . . . . 51Management judgements and estimates . . . . . . . . . . . . . . . . 51Basis of consolidation . . . . . . . . . . . . . . . . . . . . . . . . . . . 51Foreign currency . . . . . . . . . . . . . . . . . . . . . . . . . . . . . . 52Presentation. . . . . . . . . . . . . . . . . . . . . . . . . . . . . . . . . 52New accounting regulations . . . . . . . . . . . . . . . . . . . . . . . . 52
Chapter 2
Profit for the year2.1 Segment information. . . . . . . . . . . . . . . . . . . . . . . . . 532.2 Revenue . . . . . . . . . . . . . . . . . . . . . . . . . . . . . . . . 552.3 Direct costs . . . . . . . . . . . . . . . . . . . . . . . . . . . . . . 562.4 Other external expenses. . . . . . . . . . . . . . . . . . . . . . . 562.5 Staff costs. . . . . . . . . . . . . . . . . . . . . . . . . . . . . . . 562.6 Amortisation and depreciation . . . . . . . . . . . . . . . . . . . 562.7 Special items . . . . . . . . . . . . . . . . . . . . . . . . . . . . . 572.8 Financial income and expenses . . . . . . . . . . . . . . . . . . . 57
Chapter 3
Operating assets and liabilities3.1 Impairment testing . . . . . . . . . . . . . . . . . . . . . . . . . . 583.2 Intangible assets . . . . . . . . . . . . . . . . . . . . . . . . . . . 603.3 Property, plant and equipment . . . . . . . . . . . . . . . . . . . 613.4 Contract assets and accrued costs of services . . . . . . . . . . 623.5 Inventories . . . . . . . . . . . . . . . . . . . . . . . . . . . . . . 623.6 Leases . . . . . . . . . . . . . . . . . . . . . . . . . . . . . . . . . 62
3.7 Pension obligations . . . . . . . . . . . . . . . . . . . . . . . . . . 643.8 Provisions . . . . . . . . . . . . . . . . . . . . . . . . . . . . . . . 66
Chapter 4
Capital structure and finances4.1 Equity . . . . . . . . . . . . . . . . . . . . . . . . . . . . . . . . . 674.2 Capital structure and capital allocation . . . . . . . . . . . . . . . 684.3 Financial liabilities . . . . . . . . . . . . . . . . . . . . . . . . . . . 694.4 Financial risks . . . . . . . . . . . . . . . . . . . . . . . . . . . . . 704.5 Derivative financial instruments. . . . . . . . . . . . . . . . . . . 734.6 Earnings per share . . . . . . . . . . . . . . . . . . . . . . . . . . 744.7 Financial instruments – fair value hierarchy . . . . . . . . . . . . 74
Chapter 5 Tax 5.1 Income tax . . . . . . . . . . . . . . . . . . . . . . . . . . . . . . 755.2 Deferred tax . . . . . . . . . . . . . . . . . . . . . . . . . . . . . 76
Chapter 6 Other notes6.1 Acquisition and disposal of entities . . . . . . . . . . . . . . . . . 786.2 Share option schemes . . . . . . . . . . . . . . . . . . . . . . . . 816.3 Remuneration of the Executive Board and
the Board of Directors . . . . . . . . . . . . . . . . . . . . . . . . 836.4 Fees to auditors appointed at the
Annual General Meeting . . . . . . . . . . . . . . . . . . . . . . . 836.5 Related-party transactions . . . . . . . . . . . . . . . . . . . . . 846.6 Contingent liabilities and security for debt. . . . . . . . . . . . . 84
Table of contentsNotes to the consolidated financial statements
50 DSV Annual Report 2021 Consolidated financial statements 2021
Chapter 1
IntroductionThe Annual Report of DSV A/S comprises the consolidated financial statements of DSV A/S and its subsidiaries.
The Board of Directors and Executive Board considered and approved the 2021 Annual Report of DSV A/S on 9 February 2022. The Annual Report will be submitted to the shareholders of DSV A/S for approval at the Annual General Meeting on 17 March 2022.
Basis of measurementAll amounts in the Annual Report are stated in Danish kroner (DKK) and rounded to the nearest million. The Annual Report has been prepared under the historical cost convention with the exception of derivative financial instruments and acquisition opening balances, which are meas-ured at fair value. Non-current assets held for sale are measured at the lower of their carrying amount and fair value less costs to sell. The accounting policies described in the notes have been applied consistently for the financial year and for the comparative figures.
Changes in accounting policiesAll amendments to the International Financial Reporting Standards (IFRS) effective for the financial year 2021 have been implemented as basis for preparing the consolidated financial statements and notes to the statements.
None of the implementations has had any material impact on the state-ments or notes presented.
Management judgements and estimatesIn preparing the consolidated financial statements, Management makes various accounting judgements and estimates that affect the reported amounts and disclosures in the financial statements and notes to the statements. These are based on professional experience, historical data and other factors available to Management.
By nature, a degree of uncertainty is involved when carrying out these judgements and estimates, hence actual results may deviate from the assessments made at the reporting date. Judgements and estimates are continuously evaluated, and the effects of any changes are recognised in the relevant period.
The primary financial statements items for which more significant accounting estimates are applied are listed below:
• Contract assets and accrued cost of services (note 3.4)• Provisions (note 3.8) • Acquisition and disposal of entities (note 6.1)• Tax (note 5.1 and note 5.2)
Additional description of management judgements and estimates made are provided in the relevant notes.
Basis of consolidationThe consolidated financial statements include the Parent Company (DSV A/S) and all subsidiaries over which DSV A/S exercises control. Entities in which the Group directly or indirectly controls at least 20%, but not more than 50%, of the voting power are accounted for as associates and measured using the equity method. Investments with negative net asset values are recognised at DKK 0.
The consolidated financial statements are prepared based on uniform accounting policies in all Group entities. Consolidation of Group entities is performed after elimination of all intra-group transactions, balances, income and expenses.
Basis of preparation
The 2021 Annual Report of DSV A/S has been prepared in accordance with the International Financial Reporting Standards (IFRS) as issued by the International Accounting Standards Board (IASB) and additional disclosure requirements in the Danish Financial Statements Act.
IFRS standards have been applied to the extent these have been endorsed by the European Union.
51 DSV Annual Report 2021 Consolidated financial statements 2021
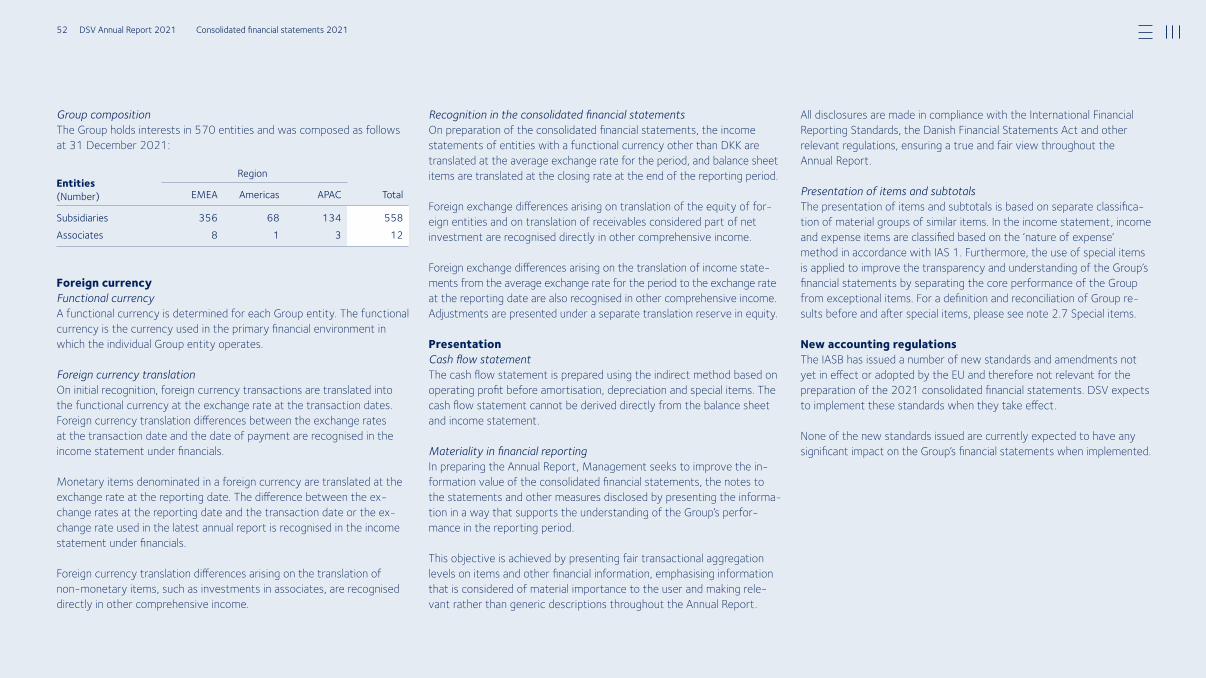
Group compositionThe Group holds interests in 570 entities and was composed as follows at 31 December 2021:
Entities (Number)
Region
EMEA Americas APAC Total
Subsidiaries 356 68 134 558Associates 8 1 3 12
Foreign currencyFunctional currencyA functional currency is determined for each Group entity. The functional currency is the currency used in the primary financial environment in which the individual Group entity operates.
Foreign currency translationOn initial recognition, foreign currency transactions are translated into the functional currency at the exchange rate at the transaction dates. Foreign currency translation differences between the exchange rates at the transaction date and the date of payment are recognised in the income statement under financials.
Monetary items denominated in a foreign currency are translated at the exchange rate at the reporting date. The difference between the ex-change rates at the reporting date and the transaction date or the ex-change rate used in the latest annual report is recognised in the income statement under financials.
Foreign currency translation differences arising on the translation of non-monetary items, such as investments in associates, are recognised directly in other comprehensive income.
Recognition in the consolidated financial statements On preparation of the consolidated financial statements, the income statements of entities with a functional currency other than DKK are translated at the average exchange rate for the period, and balance sheet items are translated at the closing rate at the end of the reporting period.
Foreign exchange differences arising on translation of the equity of for-eign entities and on translation of receivables considered part of net investment are recognised directly in other comprehensive income.
Foreign exchange differences arising on the translation of income state-ments from the average exchange rate for the period to the exchange rate at the reporting date are also recognised in other comprehensive income. Adjustments are presented under a separate translation reserve in equity.
PresentationCash flow statementThe cash flow statement is prepared using the indirect method based on operating profit before amortisation, depreciation and special items. The cash flow statement cannot be derived directly from the balance sheet and income statement.
Materiality in financial reportingIn preparing the Annual Report, Management seeks to improve the in-formation value of the consolidated financial statements, the notes to the statements and other measures disclosed by presenting the informa-tion in a way that supports the understanding of the Group’s perfor-mance in the reporting period.
This objective is achieved by presenting fair transactional aggregation levels on items and other financial information, emphasising information that is considered of material importance to the user and making rele-vant rather than generic descriptions throughout the Annual Report.
All disclosures are made in compliance with the International Financial Reporting Standards, the Danish Financial Statements Act and other relevant regulations, ensuring a true and fair view throughout the Annual Report.
Presentation of items and subtotalsThe presentation of items and subtotals is based on separate classifica-tion of material groups of similar items. In the income statement, income and expense items are classified based on the ‘nature of expense’ method in accordance with IAS 1. Furthermore, the use of special items is applied to improve the transparency and understanding of the Group’s financial statements by separating the core performance of the Group from exceptional items. For a definition and reconciliation of Group re-sults before and after special items, please see note 2.7 Special items.
New accounting regulationsThe IASB has issued a number of new standards and amendments not yet in effect or adopted by the EU and therefore not relevant for the preparation of the 2021 consolidated financial statements. DSV expects to implement these standards when they take effect.
None of the new standards issued are currently expected to have any significant impact on the Group’s financial statements when implemented.
52 DSV Annual Report 2021 Consolidated financial statements 2021
Chapter 2
Profit for the year
This chapter includes disclosures on components of consolidated profit for the year. The consolidated profit is based on the combined results of our three operating segments – Air & Sea, Road and Solutions – as described in the following.
Reference is also made to the comments on the financial performance of the Group and the divisions in Management’s commentary.
Accounting policiesOperating segments are defined by the operational and management structure of DSV, which is derived from the types of services we deliver and our geographical presence on the world market. As such, our oper-ating segments reflect our divisional and Group reporting used for management decision-making.
Operating segmentsOur business operations are carried out by three divisions, forming the basis of our segment reporting.
Air & Sea The Air & Sea division provides air and sea freight services across the globe. This includes a special Projects department, handling out of gauge cargo and special transportation projects.
Road The Road division provides road freight services across Europe, Middle East, North America and South Africa. Solutions The Solutions division offers contract logistics services, incl. warehousing and inventory management, across the globe.
Measurement of earnings by segmentOur business segments are measured and reported down to operating profit before special items. Segment results are accounted for in the same way as in the consolidated financial statements.
Segment income/expenses and assets/liabilities comprise the items directly attributable to the individual segment as well as the items that may be allocated to the individual segment on a reliable basis.
Income and expenses relating to Group functions, investing activities, etc., are managed at Group level. These items are not included in the
2.1 Segment information
statement of segment information, but are presented under ‘Non- allocated items and eliminations’.
Financial position of business segmentsAssets and liabilities are included in the segmental reporting to the extent they are used for the operation of the segment.
Assets and liabilities that cannot be attributed to any of the three segments on a reliable basis are presented under ‘Non-allocated items and eliminations’.
Geographical information DSV operates in most parts of the world and has activities in more than 90 countries, which are divided into the following geographical regions:
• EMEA: Europe, Middle East and Africa• Americas: North and South America• APAC: Asia, Australia and the Pacific
Revenue and non-current assets are allocated to the geographical areas according to the country in which the individual consolidated entity is based. The corporate headquarter of DSV is located in Denmark, which is included in the EMEA segment. DSV business is based on transactions in our global network rather than in individual countries or regions. Therefore, goodwill is not allocated to regions.
Intersegment transactions are made on an arm’s length basis.
Major customersDSV is not reliant on any major customers. No single customer exceeds 5% of combined Group revenue.
53 DSV Annual Report 2021 Consolidated financial statements 2021
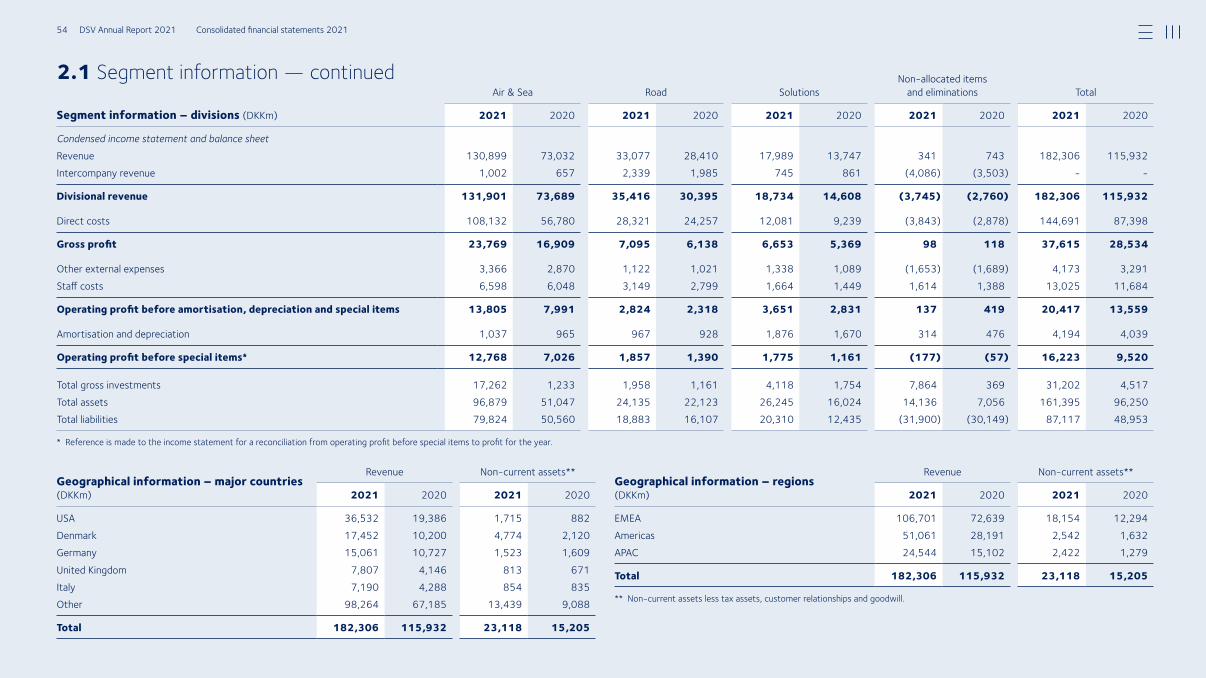
2.1 Segment information — continued Segment information – divisions (DKKm)
Air & Sea Road SolutionsNonallocated items
and eliminations Total
2021 2020 2021 2020 2021 2020 2021 2020 2021 2020
Condensed income statement and balance sheetRevenue 130,899 73,032 33,077 28,410 17,989 13,747 341 743 182,306 115,932Intercompany revenue 1,002 657 2,339 1,985 745 861 (4,086) (3,503)
Divisional revenue 131,901 73,689 35,416 30,395 18,734 14,608 (3,745) (2,760) 182,306 115,932
Direct costs 108,132 56,780 28,321 24,257 12,081 9,239 (3,843) (2,878) 144,691 87,398
Gross profit 23,769 16,909 7,095 6,138 6,653 5,369 98 118 37,615 28,534
Other external expenses 3,366 2,870 1,122 1,021 1,338 1,089 (1,653) (1,689) 4,173 3,291Staff costs 6,598 6,048 3,149 2,799 1,664 1,449 1,614 1,388 13,025 11,684
Operating profit before amortisation, depreciation and special items 13,805 7,991 2,824 2,318 3,651 2,831 137 419 20,417 13,559
Amortisation and depreciation 1,037 965 967 928 1,876 1,670 314 476 4,194 4,039
Operating profit before special items* 12,768 7,026 1,857 1,390 1,775 1,161 (177) (57) 16,223 9,520
Total gross investments 17,262 1,233 1,958 1,161 4,118 1,754 7,864 369 31,202 4,517Total assets 96,879 51,047 24,135 22,123 26,245 16,024 14,136 7,056 161,395 96,250Total liabilities 79,824 50,560 18,883 16,107 20,310 12,435 (31,900) (30,149) 87,117 48,953
Geographical information – major countries (DKKm)
Revenue Noncurrent assets**
2021 2020 2021 2020
USA 36,532 19,386 1,715 882Denmark 17,452 10,200 4,774 2,120Germany 15,061 10,727 1,523 1,609United Kingdom 7,807 4,146 813 671Italy 7,190 4,288 854 835Other 98,264 67,185 13,439 9,088
Total 182,306 115,932 23,118 15,205
Geographical information – regions (DKKm)
Revenue Noncurrent assets**
2021 2020 2021 2020
EMEA 106,701 72,639 18,154 12,294Americas 51,061 28,191 2,542 1,632APAC 24,544 15,102 2,422 1,279
Total 182,306 115,932 23,118 15,205
** Noncurrent assets less tax assets, customer relationships and goodwill.
* Reference is made to the income statement for a reconciliation from operating profit before special items to profit for the year.
54 DSV Annual Report 2021 Consolidated financial statements 2021
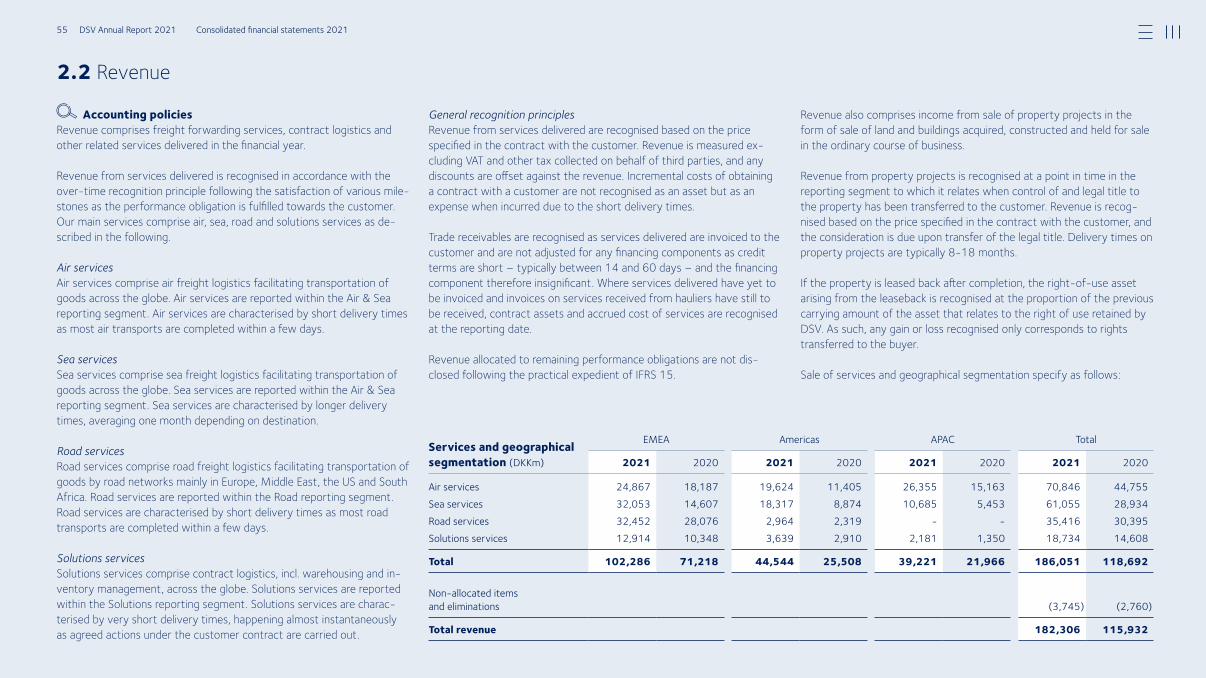
2.2 Revenue
Accounting policiesRevenue comprises freight forwarding services, contract logistics and other related services delivered in the finan cial year.
Revenue from services delivered is recognised in accordance with the over-time recognition principle following the satisfaction of various mile-stones as the performance obligation is fulfilled towards the customer. Our main services comprise air, sea, road and solutions services as de-scribed in the following.
Air services Air services comprise air freight logistics facilitating transportation of goods across the globe. Air services are reported within the Air & Sea reporting segment. Air services are characterised by short delivery times as most air transports are completed within a few days.
Sea servicesSea services comprise sea freight logistics facilitating transportation of goods across the globe. Sea services are reported within the Air & Sea reporting segment. Sea services are characterised by longer delivery times, averaging one month depending on destination.
Road servicesRoad services comprise road freight logistics facilitating transportation of goods by road networks mainly in Europe, Middle East, the US and South Africa. Road services are reported within the Road reporting segment. Road services are characterised by short delivery times as most road transports are completed within a few days.
Solutions servicesSolutions services comprise contract logistics, incl. warehousing and in-ventory management, across the globe. Solutions services are reported within the Solutions re porting segment. Solutions services are charac-terised by very short delivery times, happening almost instanta neously as agreed actions under the customer contract are carried out.
General recognition principlesRevenue from services delivered are recognised based on the price specified in the contract with the customer. Revenue is measured ex-cluding VAT and other tax collected on behalf of third parties, and any discounts are offset against the revenue. Incremental costs of obtaining a contract with a customer are not recognised as an asset but as an expense when incurred due to the short delivery times.
Trade receivables are recognised as services delivered are invoiced to the customer and are not adjusted for any financing components as credit terms are short – typically between 14 and 60 days – and the financing component therefore insignificant. Where services delivered have yet to be invoiced and invoices on services received from hauliers have still to be received, contract assets and accrued cost of services are recognised at the reporting date.
Revenue allocated to remaining performance obligations are not dis-closed following the practical expedient of IFRS 15.
Revenue also comprises income from sale of property projects in the form of sale of land and buildings acquired, constructed and held for sale in the ordinary course of business.
Revenue from property projects is recognised at a point in time in the reporting segment to which it relates when control of and legal title to the property has been transferred to the customer. Revenue is recog-nised based on the price specified in the contract with the customer, and the consideration is due upon transfer of the legal title. Delivery times on property projects are typically 8-18 months.
If the property is leased back after completion, the right-of-use asset arising from the leaseback is recognised at the proportion of the previous carrying amount of the asset that relates to the right of use retained by DSV. As such, any gain or loss recognised only corresponds to rights transferred to the buyer.
Sale of services and geographical segmentation specify as follows:
Services and geogra phical segmentation (DKKm)
EMEA Americas APAC Total
2021 2020 2021 2020 2021 2020 2021 2020
Air services 24,867 18,187 19,624 11,405 26,355 15,163 70,846 44,755Sea services 32,053 14,607 18,317 8,874 10,685 5,453 61,055 28,934Road services 32,452 28,076 2,964 2,319 35,416 30,395Solutions services 12,914 10,348 3,639 2,910 2,181 1,350 18,734 14,608
Total 102,286 71,218 44,544 25,508 39,221 21,966 186,051 118,692
Nonallocated items and eliminations (3,745) (2,760)
Total revenue 182,306 115,932
55 DSV Annual Report 2021 Consolidated financial statements 2021
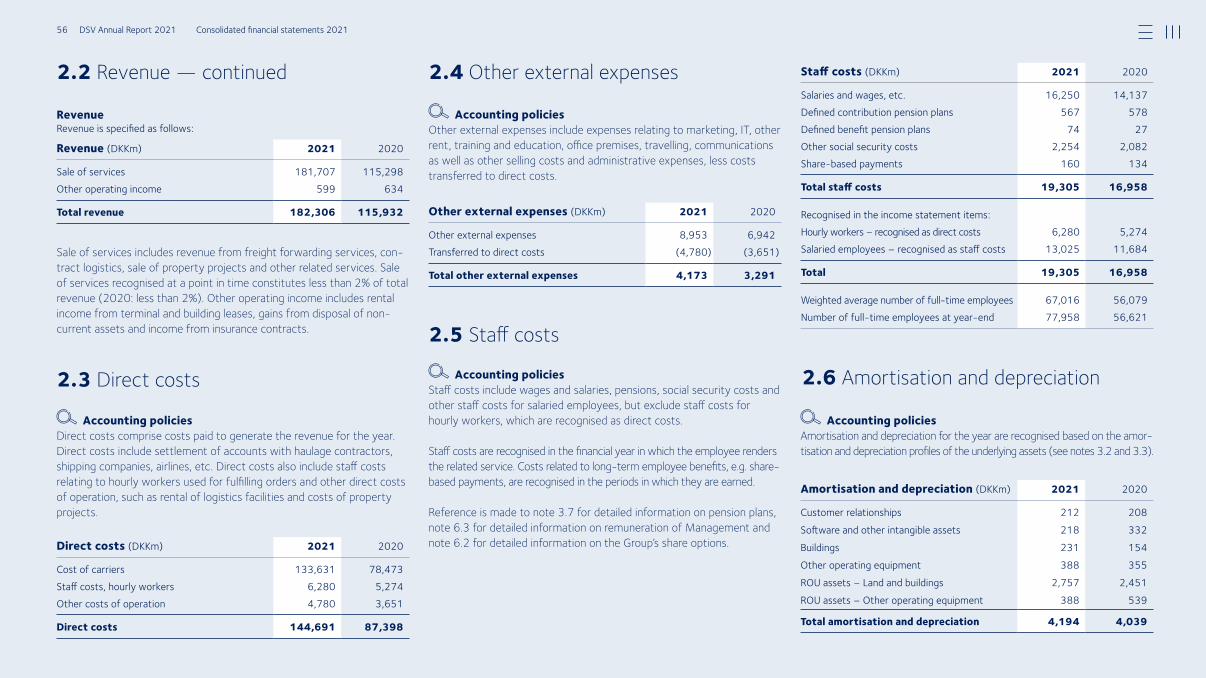
2.2 Revenue — continued 2.4 Other external expenses
2.6 Amortisation and depreciation
2.5 Staff costs
2.3 Direct costs
Accounting policiesOther external expenses include expenses relating to marketing, IT, other rent, training and education, office premises, travelling, communications as well as other selling costs and administrative expenses, less costs transferred to direct costs.
Sale of services includes revenue from freight forwarding services, con-tract logistics, sale of property projects and other related services. Sale of services recognised at a point in time constitutes less than 2% of total revenue (2020: less than 2%). Other operating income includes rental income from terminal and building leases, gains from disposal of non- current assets and income from insurance contracts.
RevenueRevenue is specified as follows:
Revenue (DKKm) 2021 2020
Sale of services 181,707 115,298Other operating income 599 634
Total revenue 182,306 115,932
Accounting policiesDirect costs comprise costs paid to generate the revenue for the year. Direct costs include settlement of accounts with haulage contractors, shipping companies, airlines, etc. Direct costs also include staff costs relating to hourly workers used for fulfilling orders and other direct costs of operation, such as rental of logistics facilities and costs of property projects.
Accounting policiesStaff costs include wages and salaries, pensions, social security costs and other staff costs for salaried employees, but exclude staff costs for hourly workers, which are recognised as direct costs.
Staff costs are recognised in the financial year in which the employee renders the related service. Costs related to long-term employee benefits, e.g. share-based payments, are recognised in the periods in which they are earned.
Reference is made to note 3.7 for detailed information on pension plans, note 6.3 for detailed information on remuneration of Management and note 6.2 for detailed information on the Group’s share options.
Accounting policiesAmortisation and depreciation for the year are recognised based on the amor-tisation and depreciation profiles of the underlying assets (see notes 3.2 and 3.3).
Direct costs (DKKm) 20202021
Cost of carriers 133,631 78,473Staff costs, hourly workers 6,280 5,274Other costs of operation 4,780 3,651
Direct costs 144,691 87,398
Other external expenses (DKKm) 2021 2020
Other external expenses 8,953 6,942Transferred to direct costs (4,780) (3,651)
Total other external expenses 4,173 3,291
Staff costs (DKKm) 2021 2020
Salaries and wages, etc. 16,250 14,137Defined contribution pension plans 567 578Defined benefit pension plans 74 27Other social security costs 2,254 2,082Sharebased payments 160 134
Total staff costs 19,305 16,958
Recognised in the income statement items:Hourly workers – recognised as direct costs 6,280 5,274Salaried employees – recognised as staff costs 13,025 11,684
Total 19,305 16,958
Weighted average number of fulltime employees 67,016 56,079Number of fulltime employees at yearend 77,958 56,621
Amortisation and depre ci ation (DKKm) 20202021
Customer relationships 212 208Software and other intangible assets 218 332Buildings 231 154Other operating equipment 388 355ROU assets – Land and buildings 2,757 2,451ROU assets – Other operating equipment 388 539
Total amortisation and depreciation 4,194 4,039
56 DSV Annual Report 2021 Consolidated financial statements 2021
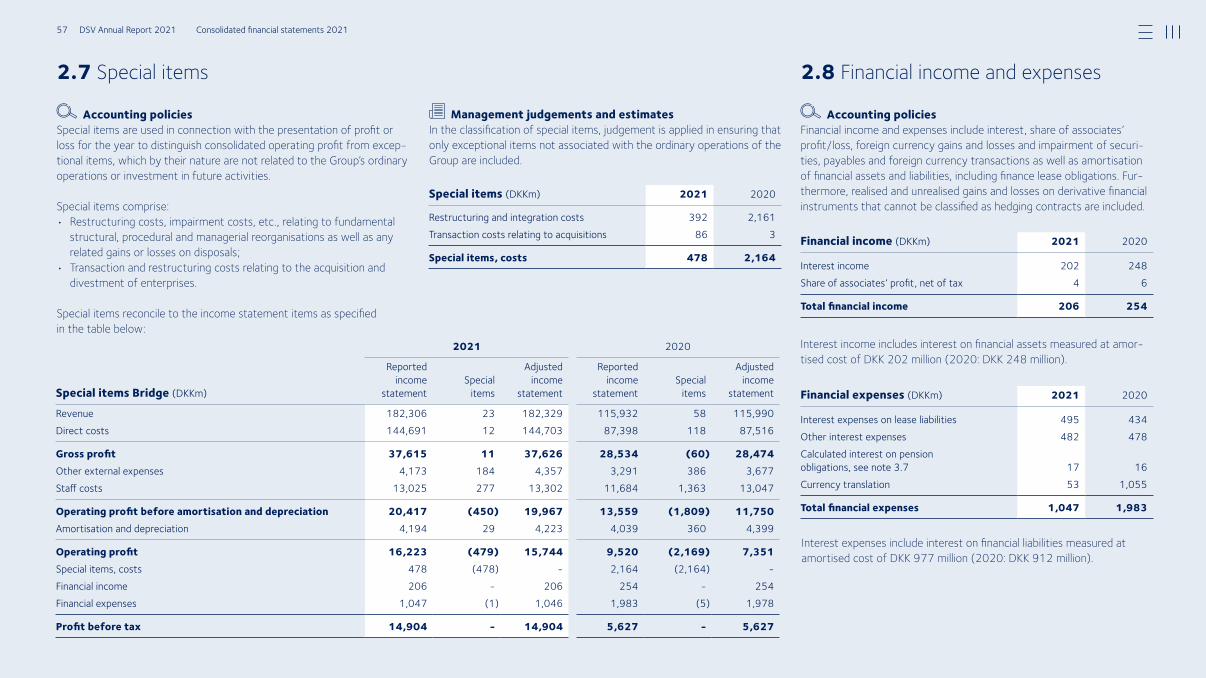
2.7 Special items 2.8 Financial income and expenses
Accounting policiesSpecial items are used in connection with the presentation of profit or loss for the year to distinguish consolidated operating profit from excep-tional items, which by their nature are not related to the Group’s ordinary operations or investment in future activities.
Special items comprise: • Restructuring costs, impairment costs, etc., relating to fundamental
structural, procedural and managerial reorganisations as well as any related gains or losses on disposals;
• Transaction and restructuring costs relating to the acqui sition and divestment of enterprises.
Special items reconcile to the income statement items as specified in the table below:
Accounting policiesFinancial income and expenses include interest, share of associates’ profit/loss, foreign currency gains and losses and impairment of securi-ties, payables and foreign currency transactions as well as amortisation of financial assets and liabilities, including finance lease obligations. Fur-thermore, realised and unrealised gains and losses on derivative financial instruments that cannot be classified as hedging contracts are included.
Interest income includes interest on financial assets measured at amor-tised cost of DKK 202 million (2020: DKK 248 million).
Interest expenses include interest on financial liabilities measured at amortised cost of DKK 977 million (2020: DKK 912 million).
2021 2020
Special items Bridge (DKKm)
Reported income
statementSpecial
items
Adjusted income
statement
Reported income
statementSpecial
items
Adjusted income
statement
Revenue 182,306 23 182,329 115,932 58 115,990Direct costs 144,691 12 144,703 87,398 118 87,516
Gross profit 37,615 11 37,626 28,534 (60) 28,474Other external expenses 4,173 184 4,357 3,291 386 3,677Staff costs 13,025 277 13,302 11,684 1,363 13,047
Operating profit before amortisation and depreciation 20,417 (450) 19,967 13,559 (1,809) 11,750Amortisation and depreciation 4,194 29 4,223 4,039 360 4,399
Operating profit 16,223 (479) 15,744 9,520 (2,169) 7,351Special items, costs 478 (478) 2,164 (2,164) Financial income 206 206 254 254Financial expenses 1,047 (1) 1,046 1,983 (5) 1,978
Profit before tax 14,904 - 14,904 5,627 - 5,627
Management judgements and estimatesIn the classification of special items, judgement is applied in ensuring that only exceptional items not associated with the ordinary operations of the Group are included.
Special items (DKKm) 2021 2020
Restructuring and integration costs 392 2,161Transaction costs relating to acquisitions 86 3
Special items, costs 478 2,164Financial income (DKKm) 2021 2020
Interest income 202 248Share of associates’ profit, net of tax 4 6
Total financial income 206 254
Financial expenses (DKKm) 2021 2020
Interest expenses on lease liabilities 495 434Other interest expenses 482 478Calculated interest on pension obligations, see note 3.7 17 16Currency translation 53 1,055
Total financial expenses 1,047 1,983
57 DSV Annual Report 2021 Consolidated financial statements 2021
Chapter 3
Operating assets and liabilitiesThis chapter includes notes disclosures on the Group’s invested capital that forms the basis of our business activities. Invested capital represents the Group’s property, plant and equipment, intangible assets and net working capital in the form of operating assets and liabilities.
Invested capital is structured based on our assetlight business model, including our focus on minimising funds tied up in working capital to optimise the generation of available free cash flow. Invested capital also comprises significant intangible assets mainly relating to acquired goodwill from business combinations carried out over the years.
Accounting policiesGoodwillThe carrying amount of goodwill is tested for impairment at least annu-ally together with other non-current assets of the Group.
Impairment testing is performed for each cash-generating unit to which consolidated goodwill is allocated, as defined by our divisional manage-ment and operational structure. The cash-generating units thereby fol-low our divisional structure: Air & Sea, Road and Solutions.
Goodwill is written down to its recoverable amount through the income statement if lower than the carrying amount.
The recoverable amount is determined as the present value of the dis-counted future net cash flow from the cash-generating unit to which the goodwill relates. In calculating the present value, discount rates are ap-plied reflecting the risk-free interest rate with the addition of risks relat-ing to the individual cash-generating units, such as geographical and fi-nancial exposure.
Other non-current intangible assets, property, plant and equipmentThe carrying amount of other non-current assets is tested for impair-ment at least once a year in connection with the impairment test of goodwill. If the tests show evidence of impairment, the asset is written down to the recoverable amount through the income statement if lower than the carrying amount. The recoverable amount is the higher of the fair value of the asset less the expected costs to sell and its value in use.
The value in use is calculated as the present value of expected future cash flows from the asset or the division of which the asset forms part.
3.1 Impairment testing
Management judgements and estimatesFor goodwill impairment testing, a number of estimates are made on the development in revenues, gross profits, operating margins, future capital expenditures, discount rates and growth expectations in the terminal pe-riod. These are based on an assessment of current and future develop-ments in the three cash-generating units and on historical data and as-sumptions of future expected market developments, including expected long-term average market growth rates.
Material value drivers affecting the future net cash flows of the three cash-generating units are:
Air & SeaThe Air & Sea division operates globally, so developments in the global economy and world trade therefore have a material impact on the divi-sion’s future net cash flow. Developments in gross profit per shipment, cost management initiatives and development in internal productivity (number of shipments per employee) also affect the division’s cash flow.
RoadThe Road division mainly operates on the EMEA and US markets, which means that the division’s future net cash flow is affected by the growth rate in these regions. Developments in gross profit per shipment, includ-ing truck and terminal utilisation rates, cost management initiatives and devel opment in internal productivity (number of shipments per em-ployee) also affect the division’s cash flow.
SolutionsThe Solutions division operates globally, so developments in the global economy and world trade therefore have a material impact on the divi-sion’s future net cash flow. Developments in warehouse lease costs and costs of related services, utilisation of warehouse facilities, cost manage-ment initiatives and development in internal productivity (number of or-der lines per employee) also affect the division’s cash flows.
58 DSV Annual Report 2021 Consolidated financial statements 2021
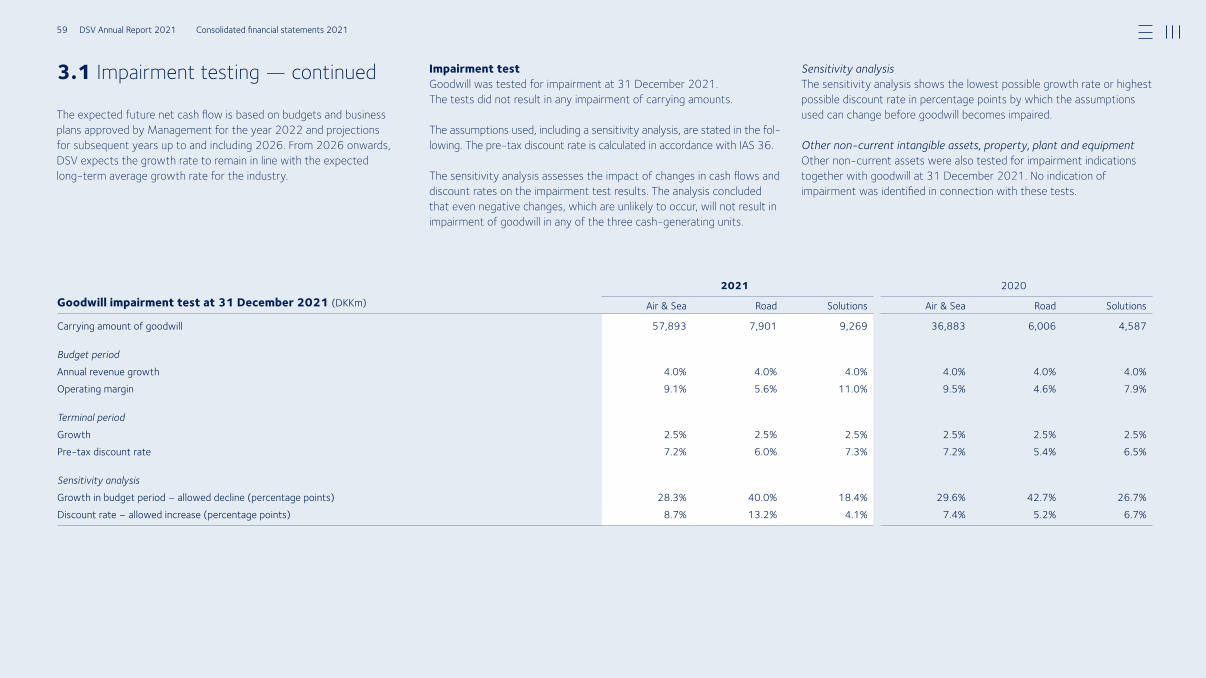
3.1 Impairment testing — continued
The expected future net cash flow is based on budgets and business plans approved by Management for the year 2022 and projections for subsequent years up to and including 2026. From 2026 onwards, DSV expects the growth rate to remain in line with the expected long-term average growth rate for the industry.
Goodwill impairment test at 31 December 2021 (DKKm)2021 2020
Air & Sea Road Solutions Air & Sea Road Solutions
Carrying amount of goodwill 57,893 7,901 9,269 36,883 6,006 4,587
Budget periodAnnual revenue growth 4.0% 4.0% 4.0% 4.0% 4.0% 4.0%Operating margin 9.1% 5.6% 11.0% 9.5% 4.6% 7.9%
Terminal periodGrowth 2.5% 2.5% 2.5% 2.5% 2.5% 2.5%Pretax discount rate 7.2% 6.0% 7.3% 7.2% 5.4% 6.5%
Sensitivity analysisGrowth in budget period – allowed decline (percentage points) 28.3% 40.0% 18.4% 29.6% 42.7% 26.7%Discount rate – allowed increase (percentage points) 8.7% 13.2% 4.1% 7.4% 5.2% 6.7%
Impairment test Goodwill was tested for impairment at 31 December 2021. The tests did not result in any impairment of carrying amounts.
The assumptions used, including a sensitivity analysis, are stated in the fol-lowing. The pre-tax discount rate is calculated in accordance with IAS 36.
The sensitivity analysis assesses the impact of changes in cash flows and discount rates on the impairment test results. The analysis concluded that even negative changes, which are unlikely to occur, will not result in impairment of goodwill in any of the three cash-generating units.
Sensitivity analysisThe sensitivity analysis shows the lowest possible growth rate or highest possible discount rate in percentage points by which the assumptions used can change before goodwill becomes impaired.
Other non-current intangible assets, property, plant and equipmentOther non-current assets were also tested for impairment indications together with goodwill at 31 December 2021. No indication of impairment was identified in connection with these tests.
59 DSV Annual Report 2021 Consolidated financial statements 2021
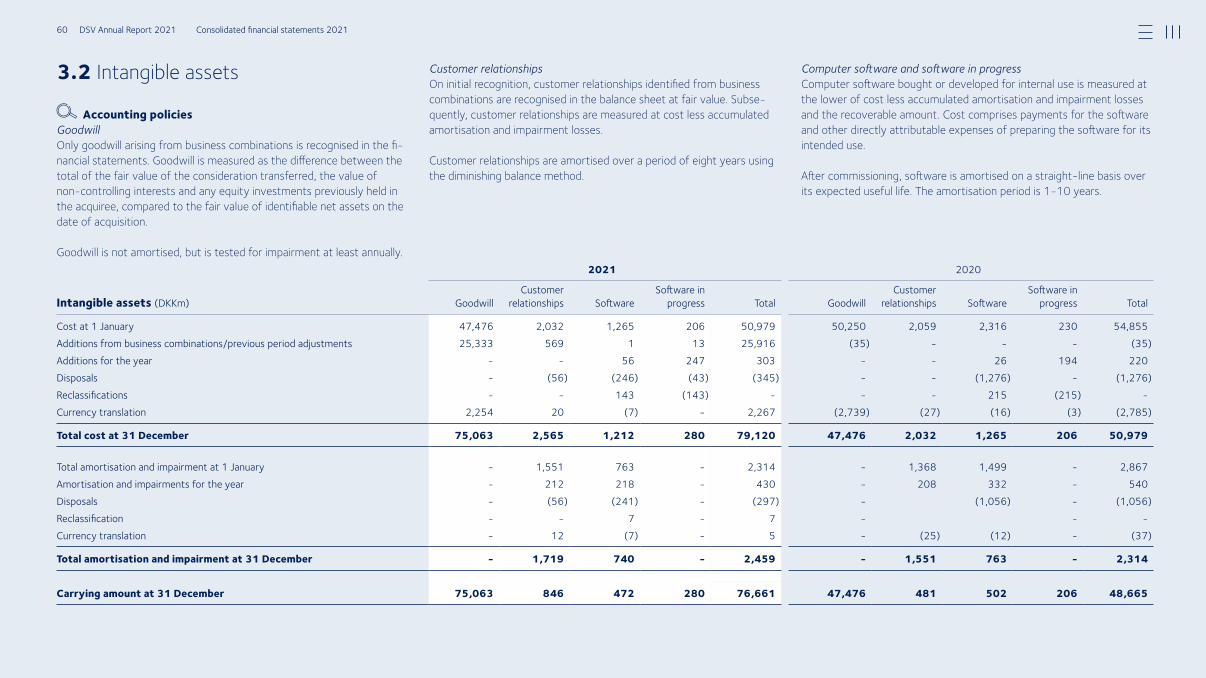
3.2 Intangible assets
Accounting policiesGoodwillOnly goodwill arising from business combinations is recognised in the fi-nancial statements. Goodwill is measured as the difference between the total of the fair value of the consideration transferred, the value of non-controlling interests and any equity investments previously held in the acquiree, compared to the fair value of identifiable net assets on the date of acquisition.
Goodwill is not amortised, but is tested for impairment at least annually.
Customer relationshipsOn initial recognition, customer relationships identified from business combinations are recognised in the balance sheet at fair value. Subse-quently, customer relationships are measured at cost less accumulated amortisation and impairment losses.
Customer relationships are amortised over a period of eight years using the diminishing balance method.
2021 2020
Intangible assets (DKKm) GoodwillCustomer
relationships SoftwareSoftware in
progress Total GoodwillCustomer
relationships SoftwareSoftware in
progress Total
Cost at 1 January 47,476 2,032 1,265 206 50,979 50,250 2,059 2,316 230 54,855Additions from business combinations/previous period adjustments 25,333 569 1 13 25,916 (35) (35)Additions for the year 56 247 303 26 194 220Disposals (56) (246) (43) (345) (1,276) (1,276)Reclassifications 143 (143) 215 (215) Currency translation 2,254 20 (7) 2,267 (2,739) (27) (16) (3) (2,785)
Total cost at 31 December 75,063 2,565 1,212 280 79,120 47,476 2,032 1,265 206 50,979
Total amortisation and impairment at 1 January 1,551 763 2,314 1,368 1,499 2,867Amortisation and impairments for the year 212 218 430 208 332 540Disposals (56) (241) (297) (1,056) (1,056)Reclassification 7 7 Currency translation 12 (7) 5 (25) (12) (37)
Total amortisation and impairment at 31 December - 1,719 740 - 2,459 - 1,551 763 - 2,314
Carrying amount at 31 December 75,063 846 472 280 76,661 47,476 481 502 206 48,665
Computer software and software in progressComputer software bought or developed for internal use is measured at the lower of cost less accumulated amortisation and impairment losses and the recoverable amount. Cost comprises payments for the software and other directly attributable expenses of preparing the software for its intended use.
After commissioning, software is amortised on a straight-line basis over its expected useful life. The amortisation period is 1-10 years.
60 DSV Annual Report 2021 Consolidated financial statements 2021
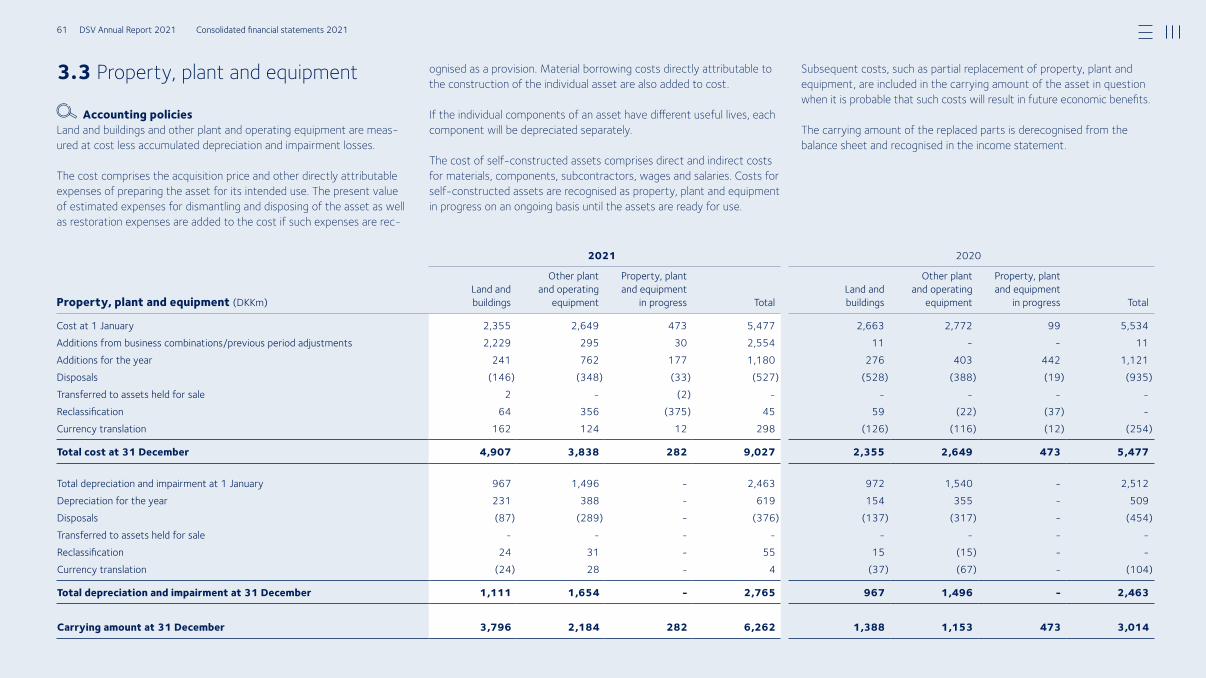
3.3 Property, plant and equipment
Accounting policiesLand and buildings and other plant and operating equipment are meas-ured at cost less accumulated depreciation and impairment losses.
The cost comprises the acquisition price and other directly attributable expenses of preparing the asset for its intended use. The present value of estimated expenses for dismantling and disposing of the asset as well as restoration expenses are added to the cost if such expenses are rec-
ognised as a provision. Material borrowing costs directly attributable to the construction of the individual asset are also added to cost.
If the individual components of an asset have different useful lives, each component will be depreciated separately.
The cost of self-constructed assets comprises direct and indirect costs for materials, components, subcontractors, wages and salaries. Costs for self-constructed assets are recognised as property, plant and equipment in progress on an ongoing basis until the assets are ready for use.
Subsequent costs, such as partial replacement of property, plant and equipment, are included in the carrying amount of the asset in question when it is probable that such costs will result in future economic benefits.
The carrying amount of the replaced parts is derecognised from the balance sheet and recognised in the income statement.
2021 2020
Property, plant and equipment (DKKm)Land and buildings
Other plant and operating
equipment
Property, plant and equipment
in progress TotalLand and buildings
Other plant and operating
equipment
Property, plant and equipment
in progress Total
Cost at 1 January 2,355 2,649 473 5,477 2,663 2,772 99 5,534Additions from business combinations/previous period adjustments 2,229 295 30 2,554 11 11Additions for the year 241 762 177 1,180 276 403 442 1,121Disposals (146) (348) (33) (527) (528) (388) (19) (935)Transferred to assets held for sale 2 (2) Reclassification 64 356 (375) 45 59 (22) (37) Currency translation 162 124 12 298 (126) (116) (12) (254)
Total cost at 31 December 4,907 3,838 282 9,027 2,355 2,649 473 5,477
Total depreciation and impairment at 1 January 967 1,496 2,463 972 1,540 2,512Depreciation for the year 231 388 619 154 355 509Disposals (87) (289) (376) (137) (317) (454)Transferred to assets held for sale Reclassification 24 31 55 15 (15) Currency translation (24) 28 4 (37) (67) (104)
Total depreciation and impairment at 31 December 1,111 1,654 - 2,765 967 1,496 - 2,463
Carrying amount at 31 December 3,796 2,184 282 6,262 1,388 1,153 473 3,014
61 DSV Annual Report 2021 Consolidated financial statements 2021
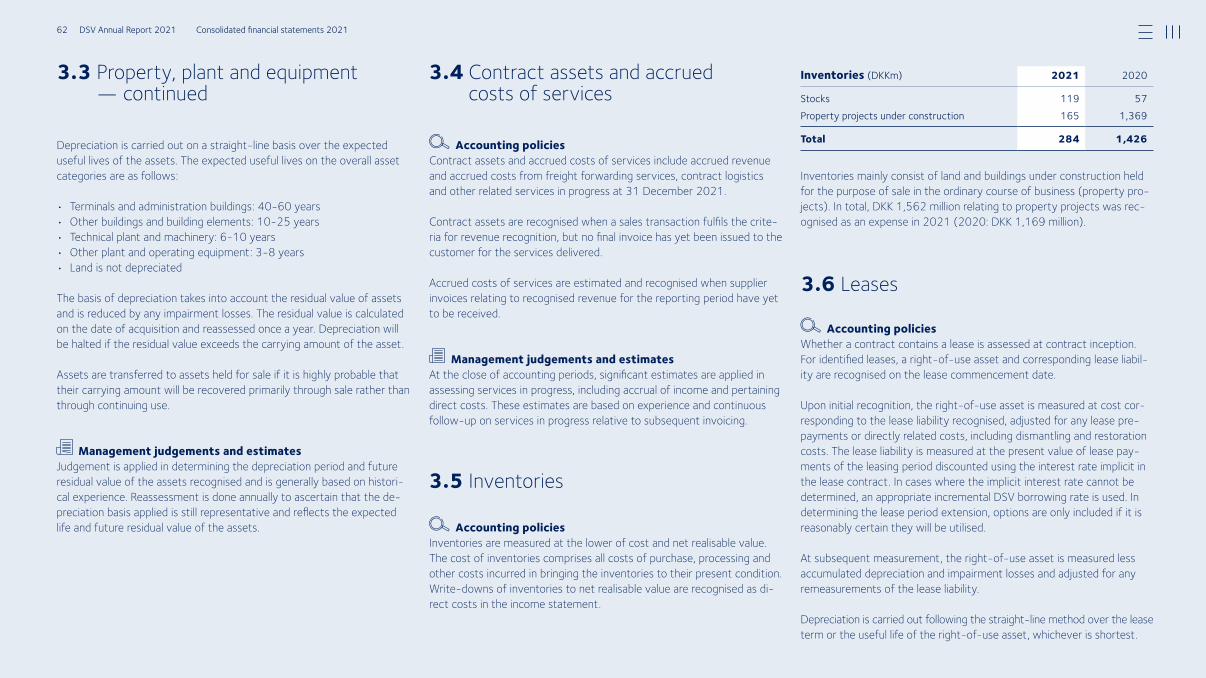
3.3 Property, plant and equipment — continued
3.4 Contract assets and accrued costs of services
3.6 Leases
3.5 Inventories
Depreciation is carried out on a straight-line basis over the expected useful lives of the assets. The expected useful lives on the overall asset categories are as follows:
• Terminals and administration buildings: 40-60 years• Other buildings and building elements: 10-25 years• Technical plant and machinery: 6-10 years• Other plant and operating equipment: 3-8 years• Land is not depreciated
The basis of depreciation takes into account the residual value of assets and is reduced by any impairment losses. The residual value is calculated on the date of acquisition and reassessed once a year. Depreciation will be halted if the residual value exceeds the carrying amount of the asset.
Assets are transferred to assets held for sale if it is highly probable that their carrying amount will be recovered primarily through sale rather than through continuing use.
Management judgements and estimatesJudgement is applied in determining the depreciation period and future residual value of the assets recognised and is generally based on histori-cal experience. Reassessment is done annually to ascertain that the de-preciation basis applied is still representative and reflects the expected life and future residual value of the assets.
Accounting policiesContract assets and accrued costs of services include accrued revenue and accrued costs from freight forwarding services, contract logistics and other related services in progress at 31 December 2021.
Contract assets are recognised when a sales transaction fulfils the crite-ria for revenue recognition, but no final invoice has yet been issued to the customer for the services delivered.
Accrued costs of services are estimated and recognised when supplier invoices relating to recognised revenue for the reporting period have yet to be received.
Management judgements and estimatesAt the close of accounting periods, significant estimates are applied in assessing services in progress, including accrual of income and pertaining direct costs. These estimates are based on experience and continuous follow-up on services in progress relative to subsequent invoicing.
Accounting policiesInventories are measured at the lower of cost and net realisable value. The cost of inventories comprises all costs of purchase, processing and other costs incurred in bringing the inventories to their present condition. Write-downs of inventories to net realisable value are recognised as di-rect costs in the income statement.
Accounting policiesWhether a contract contains a lease is assessed at contract inception. For identified leases, a right-of-use asset and corresponding lease liabil-ity are recognised on the lease commencement date.
Upon initial recognition, the right-of-use asset is measured at cost cor-responding to the lease liability recognised, adjusted for any lease pre-payments or directly related costs, including dismantling and restoration costs. The lease liability is measured at the present value of lease pay-ments of the leasing period discounted using the interest rate implicit in the lease contract. In cases where the implicit interest rate cannot be determined, an appropriate incremental DSV borrowing rate is used. In determining the lease period extension, options are only included if it is reasonably certain they will be utilised.
At subsequent measurement, the right-of-use asset is measured less accumulated depreciation and impairment losses and adjusted for any remeasurements of the lease liability.
Depreciation is carried out following the straight-line method over the lease term or the useful life of the right-of-use asset, whichever is shortest.
Inventories mainly consist of land and buildings under construction held for the purpose of sale in the ordinary course of business (property pro-jects). In total, DKK 1,562 million relating to property projects was rec-ognised as an expense in 2021 (2020: DKK 1,169 million).
Inventories (DKKm) 20202021
Stocks 119 57Property projects under construction 165 1,369
Total 284 1,426
62 DSV Annual Report 2021 Consolidated financial statements 2021
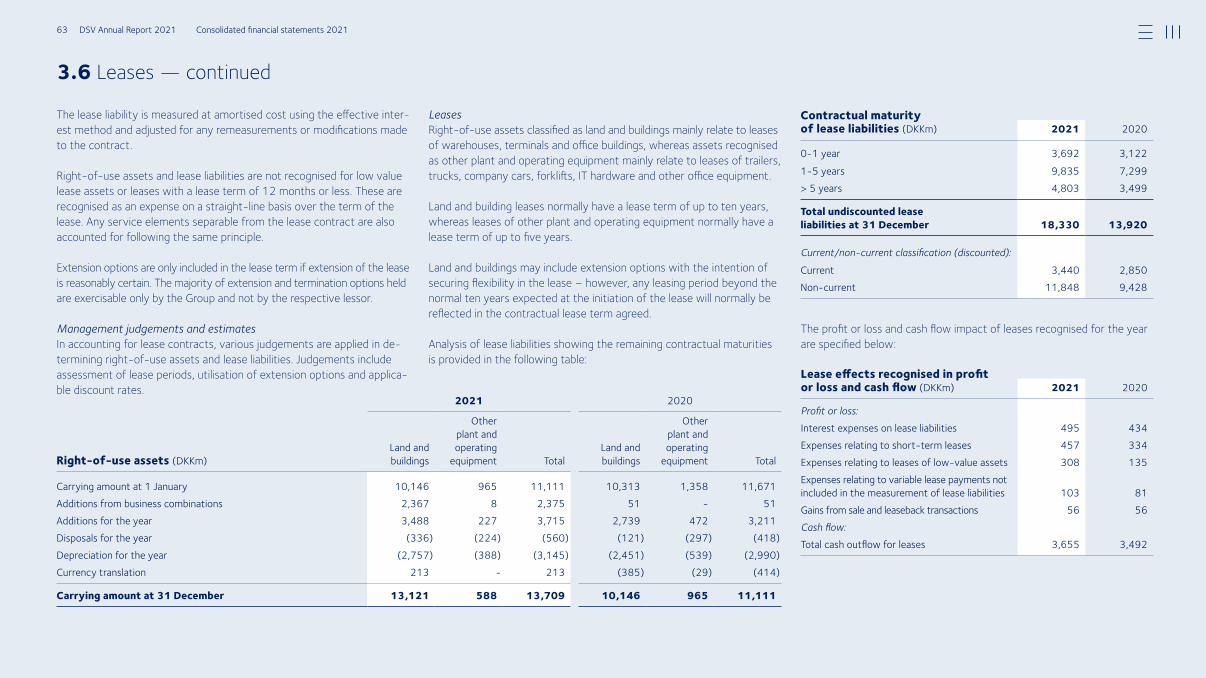
The lease liability is measured at amortised cost using the effective inter-est method and adjusted for any remeasurements or modifications made to the contract.
Right-of-use assets and lease liabilities are not recognised for low value lease assets or leases with a lease term of 12 months or less. These are recognised as an expense on a straight-line basis over the term of the lease. Any service elements separable from the lease contract are also accounted for following the same principle.
Extension options are only included in the lease term if extension of the lease is reasonably certain. The majority of extension and termination options held are exercisable only by the Group and not by the respective lessor.
Management judgements and estimatesIn accounting for lease contracts, various judgements are applied in de-termining right-of-use assets and lease liabilities. Judgements include assessment of lease periods, utilisation of extension options and applica-ble discount rates.
The profit or loss and cash flow impact of leases recognised for the year are specified below:
3.6 Leases — continued
2021 2020
Right-of-use assets (DKKm)Land and buildings
Other plant and operating
equipment TotalLand and buildings
Other plant and operating
equipment Total
Carrying amount at 1 January 10,146 965 11,111 10,313 1,358 11,671Additions from business combinations 2,367 8 2,375 51 51Additions for the year 3,488 227 3,715 2,739 472 3,211Disposals for the year (336) (224) (560) (121) (297) (418)Depreciation for the year (2,757) (388) (3,145) (2,451) (539) (2,990)Currency translation 213 213 (385) (29) (414)
Carrying amount at 31 December 13,121 588 13,709 10,146 965 11,111
Contractual maturity of lease liabilities (DKKm) 20202021
01 year 3,692 3,122
15 years 9,835 7,299> 5 years 4,803 3,499
Total undiscounted lease liabilities at 31 December 18,330 13,920
Current/non-current classification (discounted):
Current 3,440 2,850Noncurrent 11,848 9,428
Lease effects recognised in profit or loss and cash flow (DKKm) 20202021
Profit or loss:Interest expenses on lease liabilities 495 434Expenses relating to shortterm leases 457 334Expenses relating to leases of lowvalue assets 308 135Expenses relating to variable lease payments not included in the measurement of lease liabilities 103 81Gains from sale and leaseback transactions 56 56Cash flow:Total cash outflow for leases 3,655 3,492
LeasesRight-of-use assets classified as land and buildings mainly relate to leases of warehouses, terminals and office buildings, whereas assets recognised as other plant and operating equipment mainly relate to leases of trailers, trucks, company cars, forklifts, IT hardware and other office equipment.
Land and building leases normally have a lease term of up to ten years, whereas leases of other plant and operating equipment normally have a lease term of up to five years.
Land and buildings may include extension options with the intention of securing flexibility in the lease – however, any leasing period beyond the normal ten years expected at the initiation of the lease will normally be reflected in the contractual lease term agreed.
Analysis of lease liabilities showing the remaining contractual maturities is provided in the following table:
63 DSV Annual Report 2021 Consolidated financial statements 2021
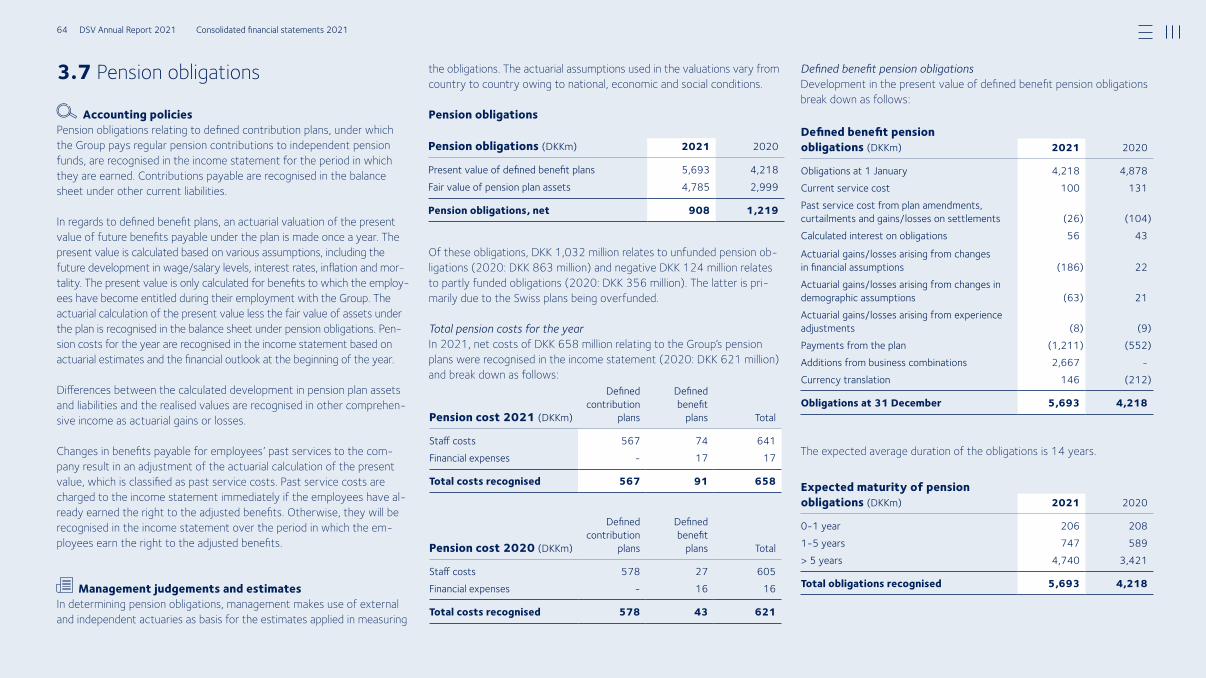
3.7 Pension obligations
Accounting policiesPension obligations relating to defined contribution plans, under which the Group pays regular pension contributions to independent pension funds, are recognised in the income statement for the period in which they are earned. Contributions payable are recognised in the balance sheet under other current liabilities.
In regards to defined benefit plans, an actuarial valuation of the present value of future benefits payable under the plan is made once a year. The present value is calculated based on various assumptions, including the future development in wage/salary levels, interest rates, inflation and mor-tality. The present value is only calculated for benefits to which the employ-ees have become entitled during their employment with the Group. The actuarial calculation of the present value less the fair value of assets under the plan is recognised in the balance sheet under pension obligations. Pen-sion costs for the year are recognised in the income statement based on actuarial estimates and the financial outlook at the beginning of the year.
Differences between the calculated development in pension plan assets and liabilities and the realised values are recognised in other comprehen-sive income as actuarial gains or losses.
Changes in benefits payable for employees’ past services to the com-pany result in an adjustment of the actuarial calculation of the present value, which is classified as past service costs. Past service costs are charged to the income statement immediately if the employees have al-ready earned the right to the adjusted benefits. Otherwise, they will be recognised in the income statement over the period in which the em-ployees earn the right to the adjusted benefits.
Management judgements and estimatesIn determining pension obligations, management makes use of external and independent actuaries as basis for the estimates applied in measuring
the obligations. The actuarial assumptions used in the valuations vary from country to country owing to national, economic and social conditions.
Pension obligations
Of these obligations, DKK 1,032 million relates to unfunded pension ob-ligations (2020: DKK 863 million) and negative DKK 124 million relates to partly funded obligations (2020: DKK 356 million). The latter is pri-marily due to the Swiss plans being overfunded.
Total pension costs for the yearIn 2021, net costs of DKK 658 million relating to the Group’s pension plans were recognised in the income statement (2020: DKK 621 million) and break down as follows:
Defined benefit pension obligationsDevelopment in the present value of defined benefit pension obligations break down as follows:
The expected average duration of the obligations is 14 years.
Pension obligations (DKKm) 2021 2020
Present value of defined benefit plans 5,693 4,218Fair value of pension plan assets 4,785 2,999
Pension obligations, net 908 1,219
Pension cost 2021 (DKKm)
Defined contribution
plans
Defined benefit
plans Total
Staff costs 567 74 641Financial expenses 17 17
Total costs recognised 567 91 658
Pension cost 2020 (DKKm)
Defined contribution
plans
Defined benefit
plans Total
Staff costs 578 27 605Financial expenses 16 16
Total costs recognised 578 43 621
Defined benefit pension obligations (DKKm) 20202021
Obligations at 1 January 4,218 4,878Current service cost 100 131Past service cost from plan amendments, curtailments and gains/losses on settlements (26) (104)Calculated interest on obligations 56 43
Actuarial gains/losses arising from changes in financial assumptions (186) 22Actuarial gains/losses arising from changes in demographic assumptions (63) 21Actuarial gains/losses arising from experience adjustments (8) (9)Payments from the plan (1,211) (552)Additions from business combinations 2,667 Currency translation 146 (212)
Obligations at 31 December 5,693 4,218
Expected maturity of pension obligations (DKKm) 20202021
01 year 206 20815 years 747 589> 5 years 4,740 3,421
Total obligations recognised 5,693 4,218
64 DSV Annual Report 2021 Consolidated financial statements 2021
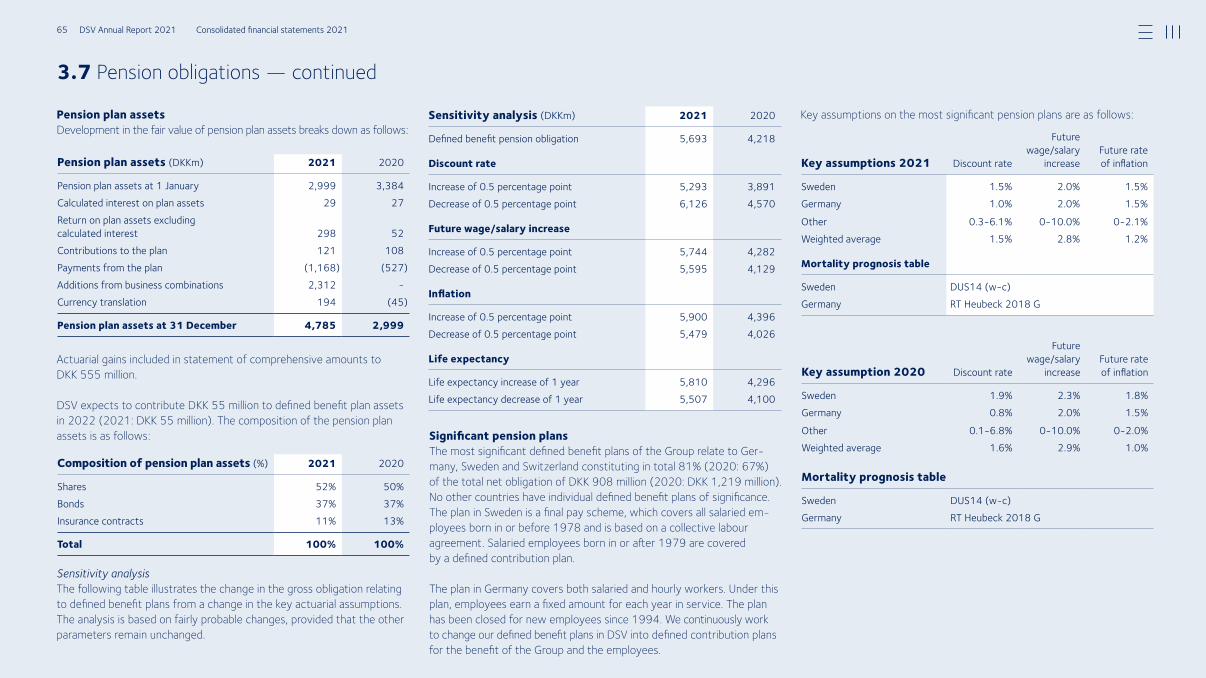
3.7 Pension obligations — continued
Pension plan assetsDevelopment in the fair value of pension plan assets breaks down as follows:
Actuarial gains included in statement of comprehensive amounts to DKK 555 million.
DSV expects to contribute DKK 55 million to defined benefit plan assets in 2022 (2021: DKK 55 million). The composition of the pension plan assets is as follows:
Sensitivity analysisThe following table illustrates the change in the gross obligation relating to defined benefit plans from a change in the key actuarial assumptions. The analysis is based on fairly probable changes, provided that the other parameters remain unchanged.
Significant pension plansThe most significant defined benefit plans of the Group relate to Ger-many, Sweden and Switzerland constituting in total 81% (2020: 67%) of the total net obligation of DKK 908 million (2020: DKK 1,219 million). No other countries have individual defined benefit plans of significance. The plan in Sweden is a final pay scheme, which covers all salaried em-ployees born in or before 1978 and is based on a collective labour agreement. Salaried employees born in or after 1979 are covered by a defined contribution plan.
The plan in Germany covers both salaried and hourly workers. Under this plan, employees earn a fixed amount for each year in service. The plan has been closed for new employees since 1994. We continuously work to change our defined benefit plans in DSV into defined contribution plans for the benefit of the Group and the employees.
Composition of pension plan assets (%) 20202021
Shares 52% 50%Bonds 37% 37%Insurance contracts 11% 13%
Total 100% 100%
Sensitivity analysis (DKKm) 20202021
Defined benefit pension obligation 5,693 4,218
Discount rate
Increase of 0.5 percentage point 5,293 3,891Decrease of 0.5 percentage point 6,126 4,570
Future wage/salary increase
Increase of 0.5 percentage point 5,744 4,282Decrease of 0.5 percentage point 5,595 4,129
Inflation
Increase of 0.5 percentage point 5,900 4,396Decrease of 0.5 percentage point 5,479 4,026
Life expectancy
Life expectancy increase of 1 year 5,810 4,296Life expectancy decrease of 1 year 5,507 4,100
Key assumptions on the most significant pension plans are as follows:
Key assumptions 2021 Discount rate
Future wage/salary
increaseFuture rate of inflation
Sweden 1.5% 2.0% 1.5%Germany 1.0% 2.0% 1.5%
Other 0.36.1% 010.0% 02.1%Weighted average 1.5% 2.8% 1.2%
Mortality prognosis table
Sweden DUS14 (wc)Germany RT Heubeck 2018 G
Key assumption 2020 Discount rate
Future wage/salary
increaseFuture rate of inflation
Sweden 1.9% 2.3% 1.8%Germany 0.8% 2.0% 1.5%
Other 0.16.8% 010.0% 02.0%Weighted average 1.6% 2.9% 1.0%
Mortality prognosis table
Sweden DUS14 (wc)Germany RT Heubeck 2018 G
Pension plan assets (DKKm) 2021 2020
Pension plan assets at 1 January 2,999 3,384Calculated interest on plan assets 29 27Return on plan assets excluding calculated interest 298 52Contributions to the plan 121 108Payments from the plan (1,168) (527)Additions from business combinations 2,312 Currency translation 194 (45)
Pension plan assets at 31 December 4,785 2,999
65 DSV Annual Report 2021 Consolidated financial statements 2021
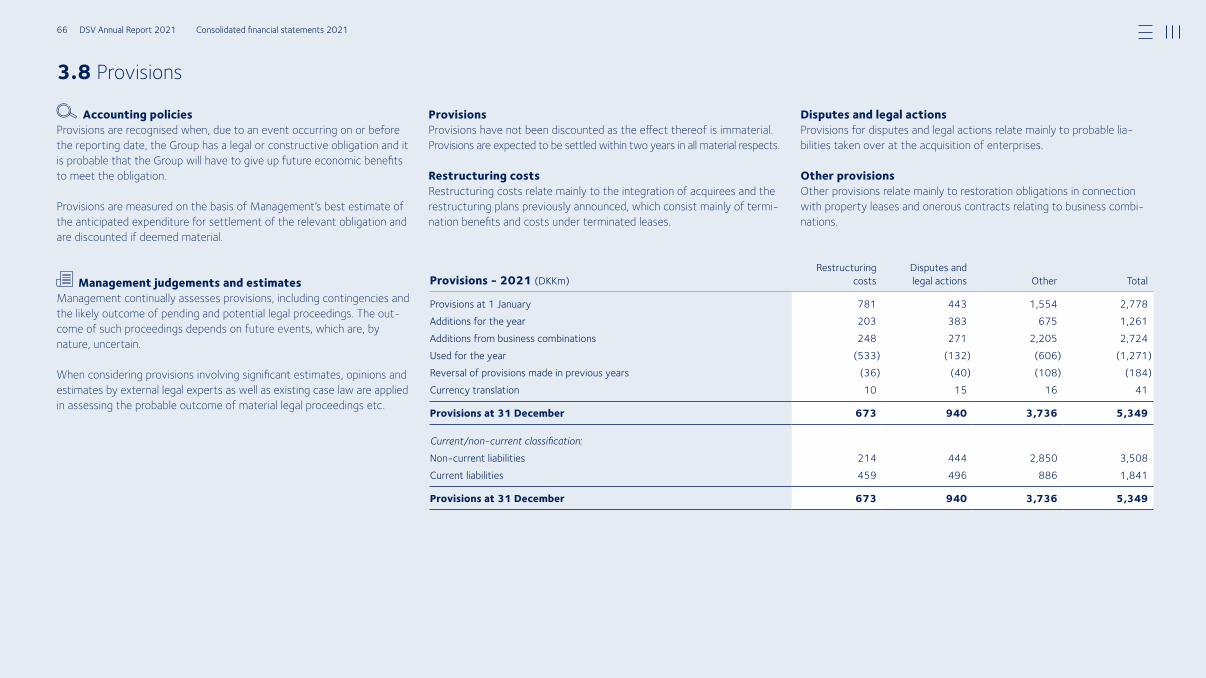
3.8 Provisions
Accounting policiesProvisions are recognised when, due to an event occurring on or before the reporting date, the Group has a legal or constructive obligation and it is probable that the Group will have to give up future economic benefits to meet the obligation.
Provisions are measured on the basis of Management’s best estimate of the anticipated expenditure for settle ment of the relevant obligation and are discounted if deemed material.
Management judgements and estimatesManagement continually assesses provisions, including contingencies and the likely outcome of pending and potential legal proceedings. The out-come of such proceedings depends on future events, which are, by nature, uncertain.
When considering provisions involving significant estimates, opinions and estimates by external legal experts as well as existing case law are applied in assessing the probable outcome of material legal proceedings etc.
Provisions Provisions have not been discounted as the effect thereof is immaterial. Provisions are expected to be settled within two years in all material respects.
Restructuring costsRestructuring costs relate mainly to the integration of acquirees and the restructuring plans previously announced, which consist mainly of termi-nation benefits and costs under terminated leases.
Provisions - 2021 (DKKm)Restruc turing
costsDisputes and legal actions Other Total
Provisions at 1 January 781 443 1,554 2,778Additions for the year 203 383 675 1,261Additions from business combinations 248 271 2,205 2,724Used for the year (533) (132) (606) (1,271)Reversal of provisions made in previous years (36) (40) (108) (184)Currency translation 10 15 16 41
Provisions at 31 December 673 940 3,736 5,349
Current/non-current classification:Noncurrent liabilities 214 444 2,850 3,508Current liabilities 459 496 886 1,841
Provisions at 31 December 673 940 3,736 5,349
Disputes and legal actionsProvisions for disputes and legal actions relate mainly to probable lia-bilities taken over at the acquisition of enterprises.
Other provisionsOther provisions relate mainly to restoration obligations in connection with property leases and onerous contracts relating to business combi-nations.
66 DSV Annual Report 2021 Consolidated financial statements 2021
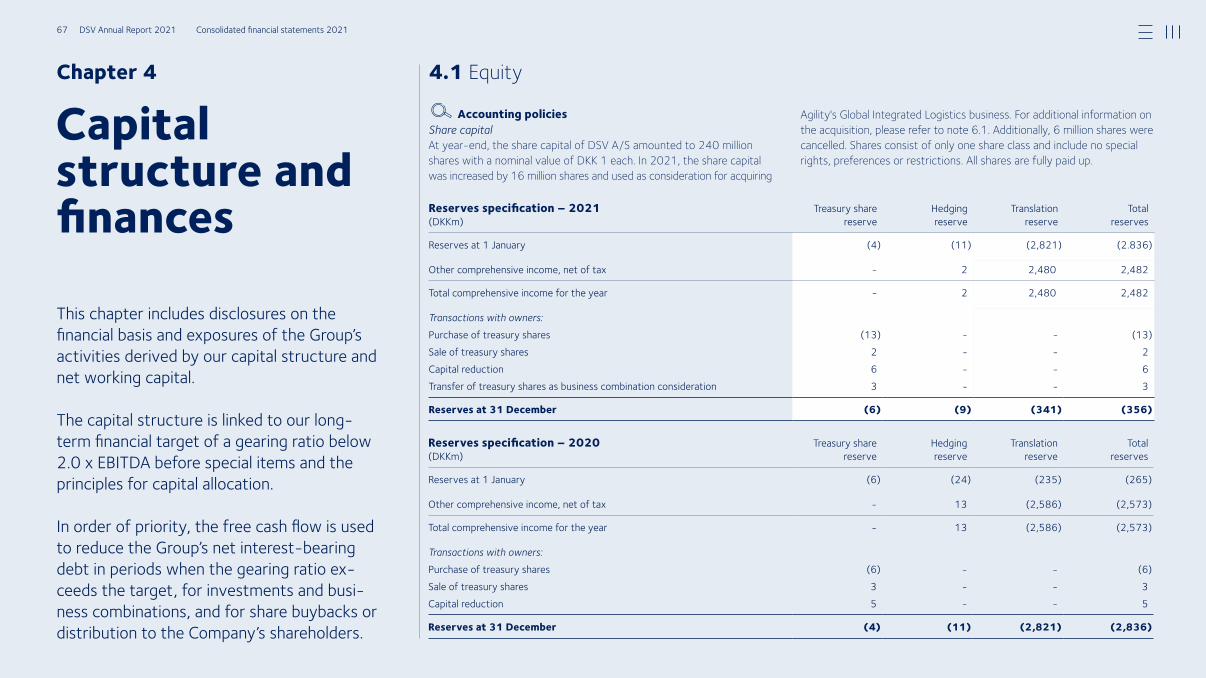
Chapter 4
Capital structure and finances
This chapter includes disclosures on the financial basis and exposures of the Group’s activities derived by our capital structure and net working capital.
The capital structure is linked to our longterm financial target of a gearing ratio below 2.0 x EBITDA before special items and the principles for capital allocation.
In order of priority, the free cash flow is used to reduce the Group’s net interest bearing debt in periods when the gearing ratio exceeds the target, for investments and business combinations, and for share buybacks or distribution to the Company’s shareholders.
Accounting policiesShare capitalAt year-end, the share capital of DSV A/S amounted to 240 million shares with a nominal value of DKK 1 each. In 2021, the share capital was increased by 16 million shares and used as consideration for acquiring
Agility's Global Integrated Logistics business. For additional information on the acquisition, please refer to note 6.1. Additionally, 6 million shares were cancelled. Shares consist of only one share class and include no special rights, preferences or restrictions. All shares are fully paid up.
Reserves specification – 2021 (DKKm)
Treasury share reserve
Hedging reserve
Translation reserve
Total reserves
Reserves at 1 January (4) (11) (2,821) (2.836)
Other comprehensive income, net of tax 2 2,480 2,482
Total comprehensive income for the year 2 2,480 2,482
Transactions with owners:Purchase of treasury shares (13) (13)Sale of treasury shares 2 2Capital reduction 6 6Transfer of treasury shares as business combination consideration 3 3
Reserves at 31 December (6) (9) (341) (356)
Reserves specification – 2020 (DKKm)
Treasury share reserve
Hedging reserve
Translation reserve
Total reserves
Reserves at 1 January (6) (24) (235) (265)
Other comprehensive income, net of tax 13 (2,586) (2,573)
Total comprehensive income for the year 13 (2,586) (2,573)
Transactions with owners:Purchase of treasury shares (6) (6)Sale of treasury shares 3 3Capital reduction 5 5
Reserves at 31 December (4) (11) (2,821) (2,836)
4.1 Equity
67 DSV Annual Report 2021 Consolidated financial statements 2021
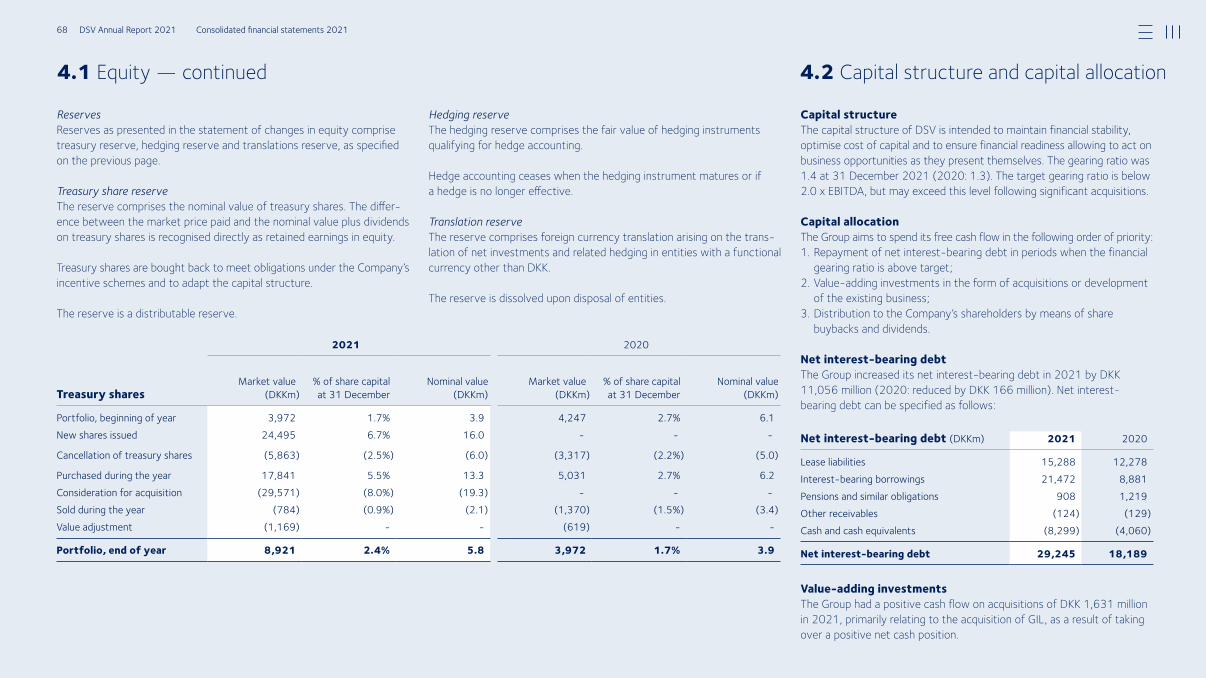
ReservesReserves as presented in the statement of changes in equity comprise treasury reserve, hedging reserve and translations reserve, as specified on the previous page. Treasury share reserveThe reserve comprises the nominal value of treasury shares. The differ-ence between the market price paid and the nominal value plus dividends on treasury shares is recognised directly as retained earnings in equity. Treasury shares are bought back to meet obligations under the Company’s incentive schemes and to adapt the capital structure. The reserve is a distributable reserve.
Hedging reserveThe hedging reserve comprises the fair value of hedging instruments qualifying for hedge accounting. Hedge accounting ceases when the hedging instrument matures or if a hedge is no longer effective. Translation reserveThe reserve comprises foreign currency translation arising on the trans-lation of net investments and related hedging in entities with a functional currency other than DKK. The reserve is dissolved upon disposal of entities.
4.1 Equity — continued 4.2 Capital structure and capital allocation
2021 2020
Treasury sharesMarket value
(DKKm)% of share capital at 31 December
Nominal value (DKKm)
Market value(DKKm)
% of share capital at 31 December
Nominal value (DKKm)
Portfolio, beginning of year 3,972 1.7% 3.9 4,247 2.7% 6.1 New shares issued 24,495 6.7% 16.0
Cancellation of treasury shares (5,863) (2.5%) (6.0) (3,317) (2.2%) (5.0)
Purchased during the year 17,841 5.5% 13.3 5,031 2.7% 6.2Consideration for acquisition (29,571) (8.0%) (19.3) Sold during the year (784) (0.9%) (2.1) (1,370) (1.5%) (3.4)Value adjustment (1,169) (619)
Portfolio, end of year 8,921 2.4% 5.8 3,972 1.7% 3.9
Capital structureThe capital structure of DSV is intended to maintain financial stability, optimise cost of capital and to ensure financial readiness allowing to act on business opportunities as they present themselves. The gearing ratio was 1.4 at 31 December 2021 (2020: 1.3). The target gearing ratio is below 2.0 x EBITDA, but may exceed this level following significant acquisitions.
Capital allocationThe Group aims to spend its free cash flow in the following order of priority:1. Repayment of net interest-bearing debt in periods when the financial
gearing ratio is above target;2. Value-adding investments in the form of acquisitions or development
of the existing business;3. Distribution to the Company’s shareholders by means of share
buybacks and dividends.
Net interest-bearing debt The Group increased its net interest-bearing debt in 2021 by DKK 11,056 million (2020: reduced by DKK 166 million). Net interest-bearing debt can be specified as follows:
Net interest-bearing debt (DKKm) 2021 2020
Lease liabilities 15,288 12,278Interestbearing borrowings 21,472 8,881Pensions and similar obligations 908 1,219Other receivables (124) (129)Cash and cash equivalents (8,299) (4,060)
Net interest-bearing debt 29,245 18,189
Value-adding investmentsThe Group had a positive cash flow on acquisitions of DKK 1,631 million in 2021, primarily relating to the acquisition of GIL, as a result of taking over a positive net cash position.
68 DSV Annual Report 2021 Consolidated financial statements 2021
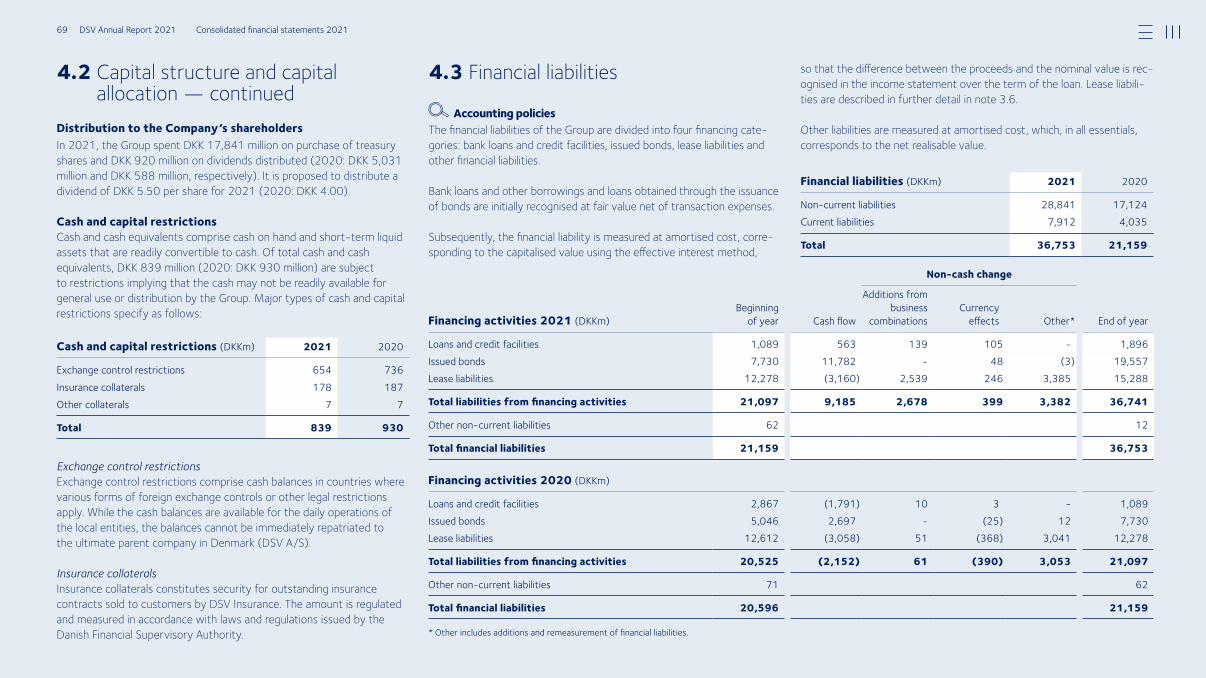
Accounting policiesThe financial liabilities of the Group are divided into four financing cate-gories: bank loans and credit facilities, issued bonds, lease liabilities and other financial liabilities.
Bank loans and other borrowings and loans obtained through the issuance of bonds are initially recognised at fair value net of transaction expenses.
Subsequently, the financial liability is measured at amortised cost, corre-sponding to the capitalised value using the effective interest method,
4.2 Capital structure and capital allocation — continued
4.3 Financial liabilities so that the difference between the proceeds and the nominal value is rec-ognised in the income statement over the term of the loan. Lease liabili-ties are described in further detail in note 3.6.
Other liabilities are measured at amortised cost, which, in all essentials, corresponds to the net realisable value.
Financial liabilities (DKKm) 20202021
Noncurrent liabilities 28,841 17,124Current liabilities 7,912 4,035
Total 36,753 21,159
Financing activities 2020 (DKKm)
Loans and credit facilities 2,867 (1,791) 10 3 1,089Issued bonds 5,046 2,697 (25) 12 7,730Lease liabilities 12,612 (3,058) 51 (368) 3,041 12,278
Total liabilities from financing activities 20,525 (2,152) 61 (390) 3,053 21,097
Other noncurrent liabilities 71 62
Total financial liabilities 20,596 21,159
* Other includes additions and remeasurement of financial liabilities.
Non-cash change
Financing activities 2021 (DKKm)Beginning
of year Cash flow
Additions from business
combinations Currency
effects Other* End of year
Loans and credit facilities 1,089 563 139 105 1,896Issued bonds 7,730 11,782 48 (3) 19,557Lease liabilities 12,278 (3,160) 2,539 246 3,385 15,288
Total liabilities from financing activities 21,097 9,185 2,678 399 3,382 36,741
Other noncurrent liabilities 62 12
Total financial liabilities 21,159 36,753
Distribution to the Company’s shareholdersIn 2021, the Group spent DKK 17,841 million on purchase of treasury shares and DKK 920 million on dividends distributed (2020: DKK 5,031 million and DKK 588 million, respectively). It is proposed to distribute a dividend of DKK 5.50 per share for 2021 (2020: DKK 4.00).
Cash and capital restrictionsCash and cash equivalents comprise cash on hand and short-term liquid assets that are readily convertible to cash. Of total cash and cash equivalents, DKK 839 million (2020: DKK 930 million) are subject to restrictions implying that the cash may not be readily available for general use or distribution by the Group. Major types of cash and capital restrictions specify as follows:
Cash and capital restrictions (DKKm) 20202021
Exchange control restrictions 654 736Insurance collaterals 178 187Other collaterals 7 7
Total 839 930
Exchange control restrictions Exchange control restrictions comprise cash balances in countries where various forms of foreign exchange controls or other legal restrictions apply. While the cash balances are available for the daily operations of the local entities, the balances cannot be immediately repatriated to the ultimate parent company in Denmark (DSV A/S).
Insurance collaterals Insurance collaterals constitutes security for outstanding insurance contracts sold to customers by DSV Insurance. The amount is regulated and measured in accordance with laws and regulations issued by the Danish Financial Supervisory Authority.
69 DSV Annual Report 2021 Consolidated financial statements 2021
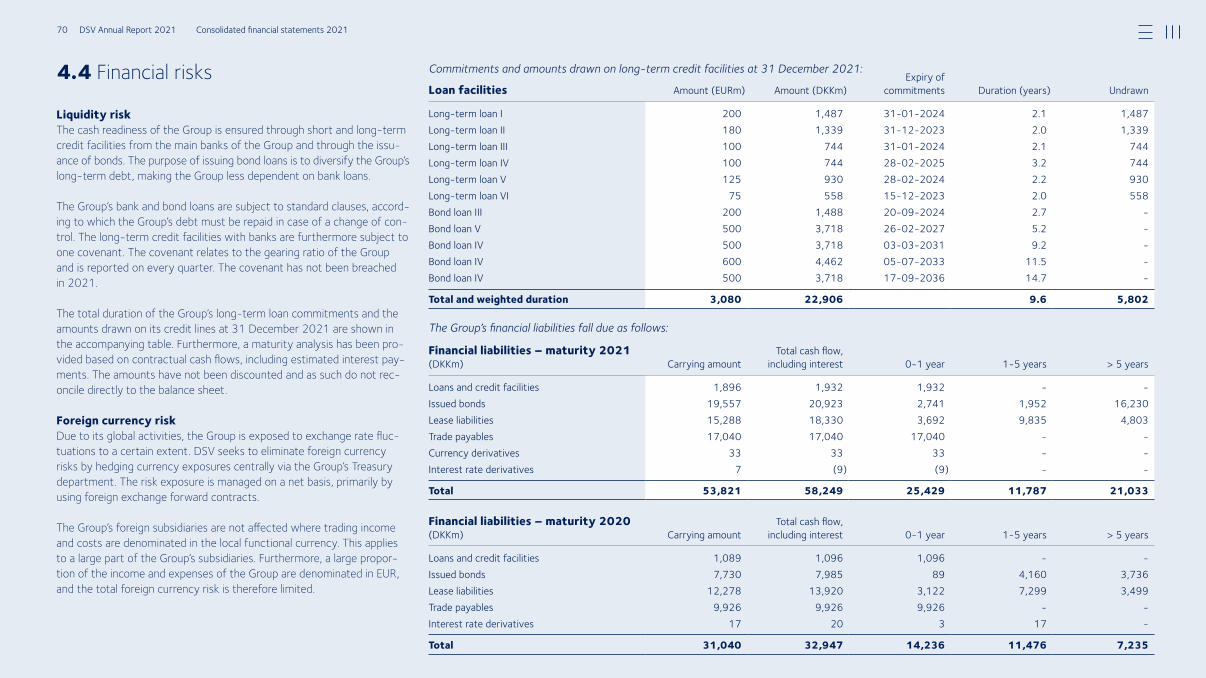
Commitments and amounts drawn on long-term credit facilities at 31 December 2021:
The Group’s financial liabilities fall due as follows:
4.4 Financial risks
Liquidity risk The cash readiness of the Group is ensured through short and long-term credit facilities from the main banks of the Group and through the issu-ance of bonds. The purpose of issuing bond loans is to diversify the Group’s long-term debt, making the Group less dependent on bank loans.
The Group’s bank and bond loans are subject to standard clauses, accord-ing to which the Group’s debt must be repaid in case of a change of con-trol. The long-term credit facilities with banks are furthermore subject to one covenant. The covenant relates to the gearing ratio of the Group and is reported on every quarter. The covenant has not been breached in 2021.
The total duration of the Group’s long-term loan commitments and the amounts drawn on its credit lines at 31 December 2021 are shown in the accompanying table. Furthermore, a maturity analysis has been pro-vided based on contractual cash flows, including estimated interest pay-ments. The amounts have not been discounted and as such do not rec-oncile directly to the balance sheet.
Foreign currency riskDue to its global activities, the Group is exposed to exchange rate fluc-tuations to a certain extent. DSV seeks to eliminate foreign currency risks by hedging currency exposures centrally via the Group’s Treasury department. The risk exposure is managed on a net basis, primarily by using foreign exchange forward contracts.
The Group’s foreign subsidiaries are not affected where trading income and costs are denominated in the local functional currency. This applies to a large part of the Group’s subsidiaries. Furthermore, a large propor-tion of the income and expenses of the Group are denominated in EUR, and the total foreign currency risk is therefore limited.
Loan facilities Amount (EURm) Amount (DKKm)Expiry of
commitments Duration (years) Undrawn
Longterm loan I 200 1,487 31012024 2.1 1,487Longterm loan II 180 1,339 31122023 2.0 1,339Longterm loan III 100 744 31012024 2.1 744Longterm loan IV 100 744 28022025 3.2 744Longterm loan V 125 930 28022024 2.2 930Longterm loan VI 75 558 15122023 2.0 558Bond loan III 200 1,488 20092024 2.7 Bond loan V 500 3,718 26022027 5.2 Bond loan IV 500 3,718 03032031 9.2 Bond loan IV 600 4,462 05072033 11.5 Bond loan IV 500 3,718 17092036 14.7
Total and weighted duration 3,080 22,906 9.6 5,802
Financial liabilities – maturity 2021 (DKKm) Carrying amount
Total cash flow, inclu ding interest 01 year 15 years > 5 years
Loans and credit facilities 1,896 1,932 1,932 Issued bonds 19,557 20,923 2,741 1,952 16,230Lease liabilities 15,288 18,330 3,692 9,835 4,803Trade payables 17,040 17,040 17,040 Currency derivatives 33 33 33 Interest rate derivatives 7 (9) (9)
Total 53,821 58,249 25,429 11,787 21,033
Financial liabilities – maturity 2020 (DKKm) Carrying amount
Total cash flow, inclu ding interest 01 year 15 years > 5 years
Loans and credit facilities 1,089 1,096 1,096 Issued bonds 7,730 7,985 89 4,160 3,736Lease liabilities 12,278 13,920 3,122 7,299 3,499Trade payables 9,926 9,926 9,926 Interest rate derivatives 17 20 3 17
Total 31,040 32,947 14,236 11,476 7,235
70 DSV Annual Report 2021 Consolidated financial statements 2021
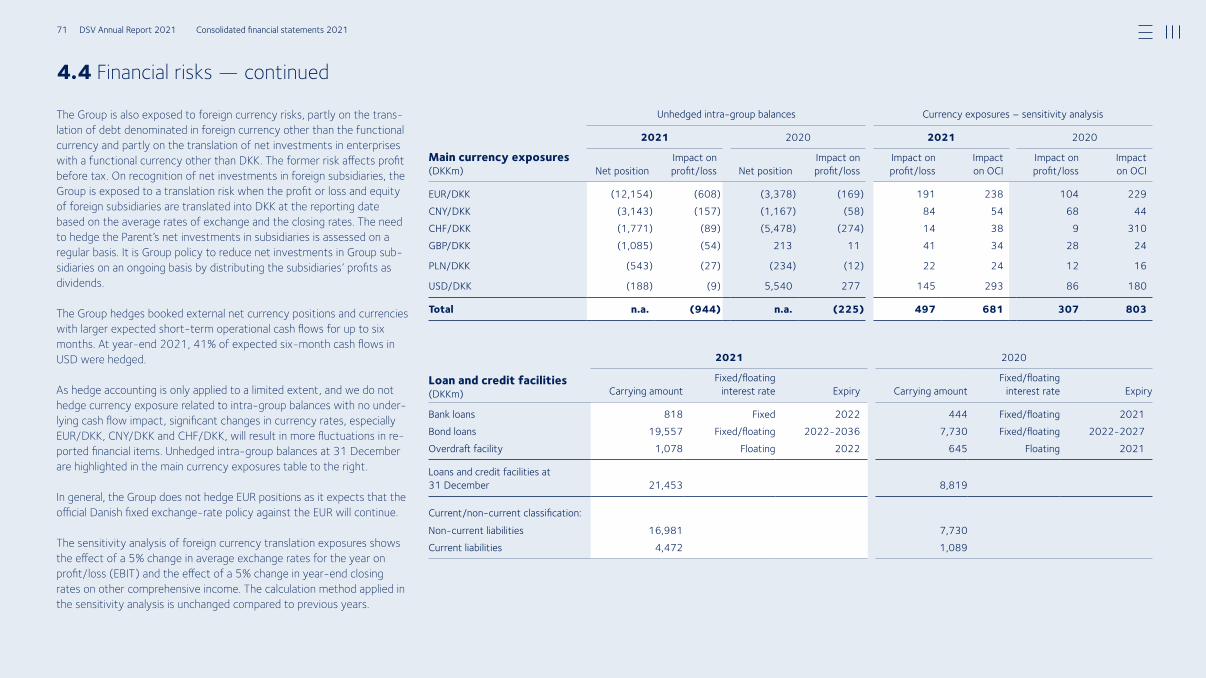
4.4 Financial risks — continued
The Group is also exposed to foreign currency risks, partly on the trans-lation of debt denominated in foreign currency other than the functional currency and partly on the translation of net investments in enterprises with a functional currency other than DKK. The former risk affects profit before tax. On recognition of net investments in foreign subsidiaries, the Group is exposed to a translation risk when the profit or loss and equity of foreign subsidiaries are translated into DKK at the reporting date based on the average rates of exchange and the closing rates. The need to hedge the Parent’s net investments in subsidiaries is assessed on a regular basis. It is Group policy to reduce net investments in Group sub-sidiaries on an ongoing basis by distributing the subsidiaries’ profits as dividends.
The Group hedges booked external net currency positions and currencies with larger expected short-term operational cash flows for up to six months. At year-end 2021, 41% of expected six-month cash flows in USD were hedged.
As hedge accounting is only applied to a limited extent, and we do not hedge currency exposure related to intra-group balances with no under-lying cash flow impact, significant changes in currency rates, especially EUR/DKK, CNY/DKK and CHF/DKK, will result in more fluctuations in re-ported financial items. Unhedged intra-group balances at 31 December are highlighted in the main currency exposures table to the right.
In general, the Group does not hedge EUR positions as it expects that the official Danish fixed exchange-rate policy against the EUR will continue.
The sensitivity analysis of foreign currency translation exposures shows the effect of a 5% change in average exchange rates for the year on profit/loss (EBIT) and the effect of a 5% change in year-end closing rates on other comprehensive income. The calculation method applied in the sensitivity analysis is unchanged compared to previous years.
Loan and credit facilities (DKKm)
2021 2020
Carrying amountFixed/floating
interest rate Expiry Carrying amountFixed/floating
interest rate Expiry
Bank loans 818 Fixed 2022 444 Fixed/floating 2021Bond loans 19,557 Fixed/floating 20222036 7,730 Fixed/floating 20222027Overdraft facility 1,078 Floating 2022 645 Floating 2021
Loans and credit facilities at 31 December 21,453 8,819
Current/noncurrent classification:Noncurrent liabilities 16,981 7,730Current liabilities 4,472 1,089
Unhedged intragroup balances Currency exposures – sensitivity analysis
Main currency exposures (DKKm)
2021 2020 2021 2020
Net positionImpact on profit/loss Net position
Impact on profit/loss
Impact on profit/loss
Impact on OCI
Impact on profit/loss
Impact on OCI
EUR/DKK (12,154) (608) (3,378) (169) 191 238 104 229CNY/DKK (3,143) (157) (1,167) (58) 84 54 68 44CHF/DKK (1,771) (89) (5,478) (274) 14 38 9 310GBP/DKK (1,085) (54) 213 11 41 34 28 24
PLN/DKK (543) (27) (234) (12) 22 24 12 16
USD/DKK (188) (9) 5,540 277 145 293 86 180
Total n.a. (944) n.a. (225) 497 681 307 803
71 DSV Annual Report 2021 Consolidated financial statements 2021
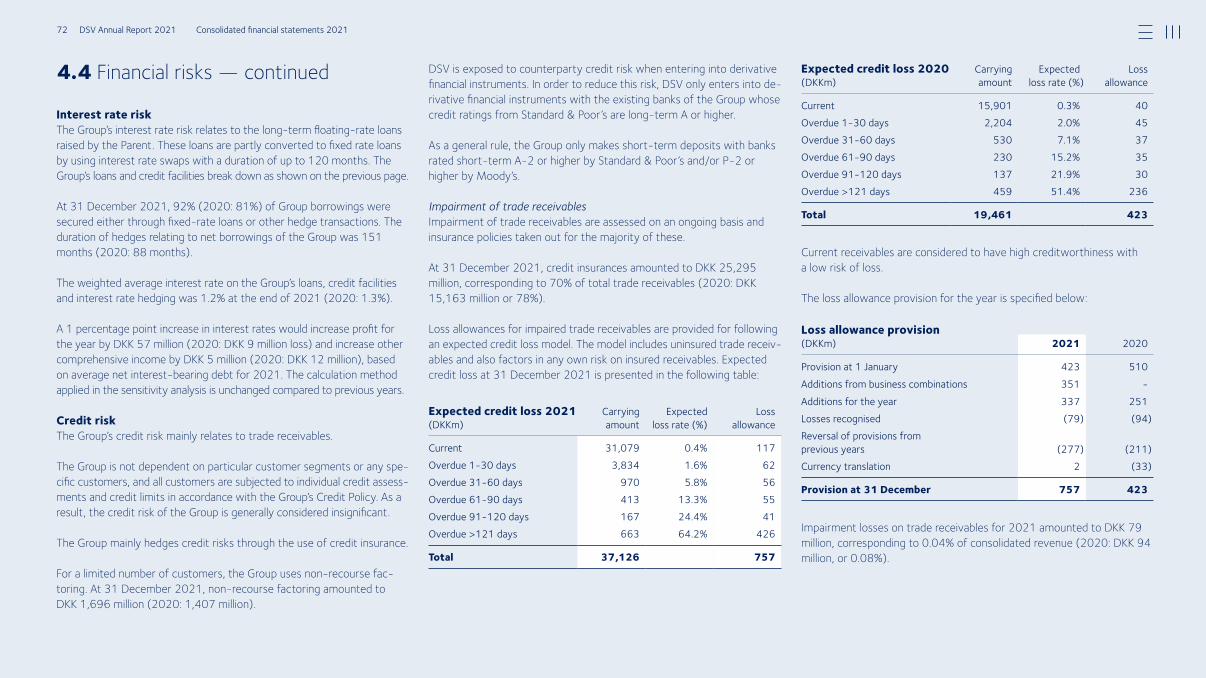
4.4 Financial risks — continued
Interest rate riskThe Group’s interest rate risk relates to the long-term floating-rate loans raised by the Parent. These loans are partly converted to fixed rate loans by using interest rate swaps with a duration of up to 120 months. The Group’s loans and credit facilities break down as shown on the pre vious page.
At 31 December 2021, 92% (2020: 81%) of Group borrowings were secured either through fixed-rate loans or other hedge transactions. The duration of hedges relating to net borrowings of the Group was 151 months (2020: 88 months).
The weighted average interest rate on the Group’s loans, credit facilitiesand interest rate hedging was 1.2% at the end of 2021 (2020: 1.3%).
A 1 percentage point increase in interest rates would increase profit for the year by DKK 57 million (2020: DKK 9 million loss) and increase other comprehensive income by DKK 5 million (2020: DKK 12 million), based on average net interest-bearing debt for 2021. The calculation method applied in the sensitivity analysis is unchanged compared to pre vious years.
Credit riskThe Group’s credit risk mainly relates to trade receivables.
The Group is not dependent on particular customer segments or any spe-cific customers, and all customers are subjected to individual credit assess-ments and credit limits in accordance with the Group’s Credit Policy. As a result, the credit risk of the Group is generally considered insignificant.
The Group mainly hedges credit risks through the use of credit insurance.
For a limited number of customers, the Group uses non-recourse fac-toring. At 31 December 2021, non-recourse factoring amounted to DKK 1,696 million (2020: 1,407 million).
DSV is exposed to counterparty credit risk when entering into derivative financial instruments. In order to reduce this risk, DSV only enters into de-rivative financial instruments with the existing banks of the Group whose credit ratings from Standard & Poor’s are long-term A or higher.
As a general rule, the Group only makes short-term deposits with banks rated short-term A-2 or higher by Standard & Poor’s and/or P-2 or higher by Moody’s.
Impairment of trade receivablesImpairment of trade receivables are assessed on an ongoing basis and insurance policies taken out for the majority of these.
At 31 December 2021, credit insurances amounted to DKK 25,295 million, corresponding to 70% of total trade receivables (2020: DKK 15,163 million or 78%).
Loss allowances for impaired trade receivables are provided for following an expected credit loss model. The model includes uninsured trade receiv-ables and also factors in any own risk on insured receivables. Expected credit loss at 31 December 2021 is presented in the following table:
Expected credit loss 2021(DKKm)
Carrying amount
Expected loss rate (%)
Loss allowance
Current 31,079 0.4% 117Overdue 130 days 3,834 1.6% 62Overdue 3160 days 970 5.8% 56Overdue 6190 days 413 13.3% 55Overdue 91120 days 167 24.4% 41Overdue >121 days 663 64.2% 426
Total 37,126 757
Expected credit loss 2020(DKKm)
Carrying amount
Expected loss rate (%)
Loss allowance
Current 15,901 0.3% 40Overdue 130 days 2,204 2.0% 45Overdue 3160 days 530 7.1% 37Overdue 6190 days 230 15.2% 35Overdue 91120 days 137 21.9% 30Overdue >121 days 459 51.4% 236
Total 19,461 423
Current receivables are considered to have high credit worthiness with a low risk of loss.
The loss allowance provision for the year is specified below:
Loss allowance provision (DKKm) 20202021
Provision at 1 January 423 510Additions from business combinations 351 Additions for the year 337 251Losses recognised (79) (94)Reversal of provisions from previous years (277) (211)Currency translation 2 (33)
Provision at 31 December 757 423
Impairment losses on trade receivables for 2021 amounted to DKK 79 million, corresponding to 0.04% of consolidated revenue (2020: DKK 94 million, or 0.08%).
72 DSV Annual Report 2021 Consolidated financial statements 2021
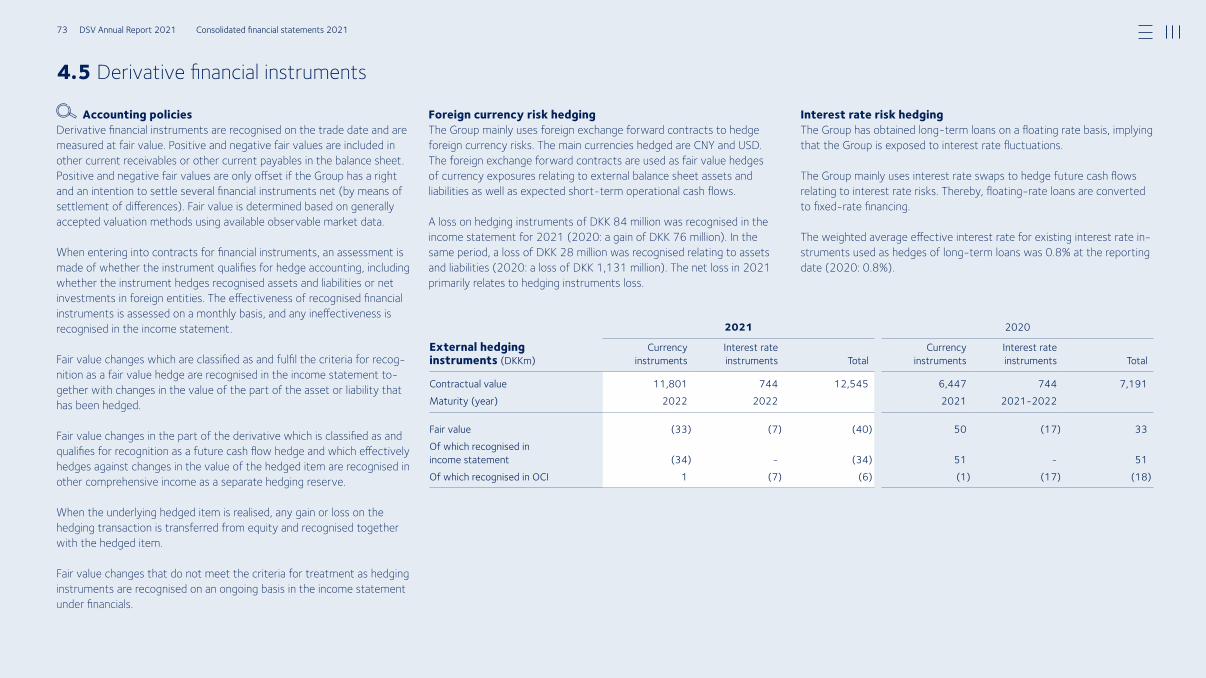
4.5 Derivative financial instruments
Accounting policiesDerivative financial instruments are recognised on the trade date and are measured at fair value. Positive and negative fair values are included in other current re ceivables or other current payables in the balance sheet. Positive and negative fair values are only offset if the Group has a right and an intention to settle several financial instruments net (by means of settlement of differences). Fair value is determined based on generally accepted valuation methods using available observable market data.
When entering into contracts for financial instruments, an assessment is made of whether the instrument qualifies for hedge accounting, including whether the instrument hedges recognised assets and liabilities or net investments in foreign entities. The effectiveness of recognised financial instruments is assessed on a monthly basis, and any in effectiveness is recognised in the income statement.
Fair value changes which are classified as and fulfil the criteria for recog-nition as a fair value hedge are recognised in the income statement to-gether with changes in the value of the part of the asset or liability that has been hedged.
Fair value changes in the part of the derivative which is classified as and qualifies for recognition as a future cash flow hedge and which effectively hedges against changes in the value of the hedged item are recognised in other comprehensive income as a separate hedging reserve.
When the underlying hedged item is realised, any gain or loss on the hedging transaction is transferred from equity and recognised together with the hedged item.
Fair value changes that do not meet the criteria for treatment as hedging instruments are recognised on an ongoing basis in the income statement under financials.
External hedging instruments (DKKm)
2021 2020
Currency instruments
Interest rate instruments Total
Currency instruments
Interest rate instruments Total
Contractual value 11,801 744 12,545 6,447 744 7,191Maturity (year) 2022 2022 2021 20212022
Fair value (33) (7) (40) 50 (17) 33Of which recognised in income statement (34) (34) 51 51Of which recognised in OCI 1 (7) (6) (1) (17) (18)
Foreign currency risk hedgingThe Group mainly uses foreign exchange forward contracts to hedge foreign currency risks. The main currencies hedged are CNY and USD. The foreign exchange forward contracts are used as fair value hedges of currency exposures relating to external balance sheet assets and liabilities as well as expected short-term operational cash flows.
A loss on hedging instruments of DKK 84 million was recognised in the income statement for 2021 (2020: a gain of DKK 76 million). In the same period, a loss of DKK 28 million was recognised relating to assets and liabilities (2020: a loss of DKK 1,131 million). The net loss in 2021 primarily relates to hedging instruments loss.
Interest rate risk hedgingThe Group has obtained long-term loans on a floating rate basis, implying that the Group is exposed to interest rate fluctuations.
The Group mainly uses interest rate swaps to hedge future cash flows relating to interest rate risks. Thereby, floating-rate loans are converted to fixed-rate financing.
The weighted average effective interest rate for existing interest rate in-struments used as hedges of long-term loans was 0.8% at the reporting date (2020: 0.8%).
73 DSV Annual Report 2021 Consolidated financial statements 2021
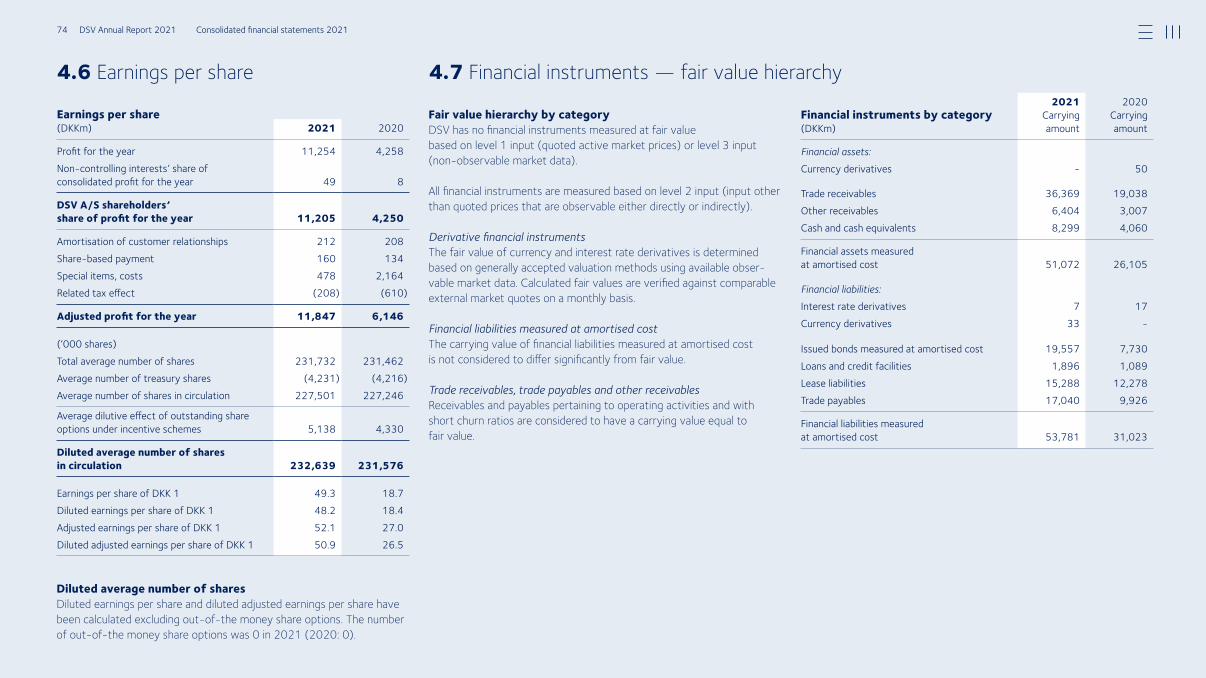
4.6 Earnings per share
Fair value hierarchy by categoryDSV has no financial instruments measured at fair value based on level 1 input (quoted active market prices) or level 3 input (non-observable market data).
All financial instruments are measured based on level 2 input (input other than quoted prices that are observable either directly or indirectly).
Derivative financial instruments The fair value of currency and interest rate derivatives is determined based on generally accepted valuation methods using available obser-vable market data. Calculated fair values are verified against comparable external market quotes on a monthly basis.
Financial liabilities measured at amortised costThe carrying value of financial liabilities measured at amortised cost is not considered to differ significantly from fair value. Trade receivables, trade payables and other receivablesReceivables and payables pertaining to operating activities and with short churn ratios are considered to have a carrying value equal to fair value.
Earnings per share (DKKm) 2021 2020
Profit for the year 11,254 4,258Noncontrolling interests’ share of consolidated profit for the year 49 8
DSV A/S shareholders’ share of profit for the year 11,205 4,250
Amortisation of customer relationships 212 208Sharebased payment 160 134Special items, costs 478 2,164Related tax effect (208) (610)
Adjusted profit for the year 11,847 6,146
(‘000 shares)Total average number of shares 231,732 231,462Average number of treasury shares (4,231) (4,216)Average number of shares in circulation 227,501 227,246
Average dilutive effect of outstanding share options under incentive schemes 5,138 4,330
Diluted average number of shares in circulation 232,639 231,576
Earnings per share of DKK 1 49.3 18.7Diluted earnings per share of DKK 1 48.2 18.4Adjusted earnings per share of DKK 1 52.1 27.0Diluted adjusted earnings per share of DKK 1 50.9 26.5
Financial instruments by category (DKKm)
2021 Carrying amount
2020 Carrying amount
Financial assets:Currency derivatives 50
Trade receivables 36,369 19,038Other receivables 6,404 3,007Cash and cash equivalents 8,299 4,060
Financial assets measured at amortised cost 51,072 26,105
Financial liabilities:Interest rate derivatives 7 17Currency derivatives 33
Issued bonds measured at amortised cost 19,557 7,730Loans and credit facilities 1,896 1,089Lease liabilities 15,288 12,278Trade payables 17,040 9,926
Financial liabilities measured at amortised cost 53,781 31,023
Diluted average number of shares Diluted earnings per share and diluted adjusted earnings per share have been calculated excluding out-of-the money share options. The number of out-of-the money share options was 0 in 2021 (2020: 0).
4.7 Financial instruments — fair value hierarchy
74 DSV Annual Report 2021 Consolidated financial statements 2021
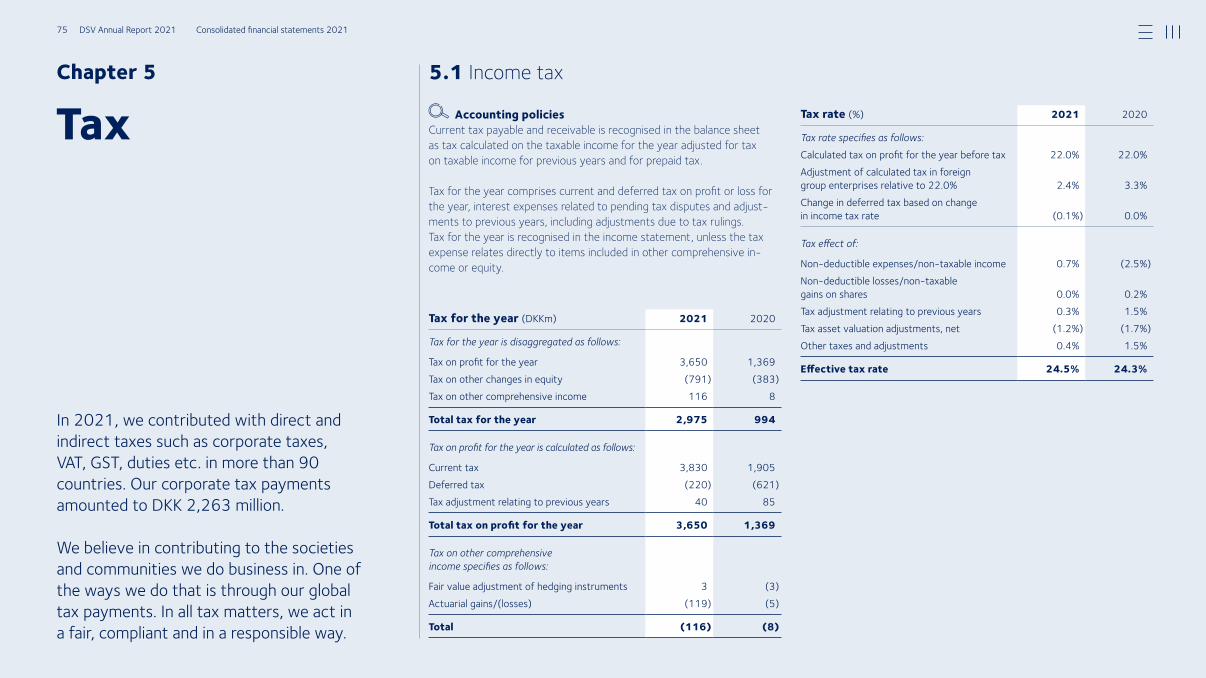
Chapter 5
Tax
In 2021, we contributed with direct and indirect taxes such as corporate taxes, VAT, GST, duties etc. in more than 90 countries. Our corporate tax payments amounted to DKK 2,263 million.
We believe in contributing to the societies and communities we do business in. One of the ways we do that is through our global tax payments. In all tax matters, we act in a fair, compliant and in a responsible way.
Accounting policiesCurrent tax payable and receivable is recognised in the balance sheet as tax calculated on the taxable income for the year adjusted for tax on taxable income for previous years and for prepaid tax.
Tax for the year comprises current and deferred tax on profit or loss for the year, interest expenses related to pending tax disputes and adjust-ments to previous years, including adjustments due to tax rulings. Tax for the year is recognised in the income statement, unless the tax expense relates directly to items included in other comprehensive in-come or equity.
Tax for the year (DKKm) 20202021
Tax for the year is disaggregated as follows:
Tax on profit for the year 3,650 1,369Tax on other changes in equity (791) (383)Tax on other comprehensive income 116 8
Total tax for the year 2,975 994
Tax on profit for the year is calculated as follows:
Current tax 3,830 1,905Deferred tax (220) (621)Tax adjustment relating to previous years 40 85
Total tax on profit for the year 3,650 1,369
Tax on other comprehensive income specifies as follows:
Fair value adjustment of hedging instruments 3 (3)Actuarial gains/(losses) (119) (5)
Total (116) (8)
5.1 Income tax
Tax rate (%) 20202021
Tax rate specifies as follows:Calculated tax on profit for the year before tax 22.0% 22.0%Adjustment of calculated tax in foreign group enterprises relative to 22.0% 2.4% 3.3%Change in deferred tax based on change in income tax rate (0.1%) 0.0%
Tax effect of:
Nondeductible expenses/nontaxable income 0.7% (2.5%)Nondeductible losses/nontaxable gains on shares 0.0% 0.2%Tax adjustment relating to previous years 0.3% 1.5%Tax asset valuation adjustments, net (1.2%) (1.7%)Other taxes and adjustments 0.4% 1.5%
Effective tax rate 24.5% 24.3%
75 DSV Annual Report 2021 Consolidated financial statements 2021
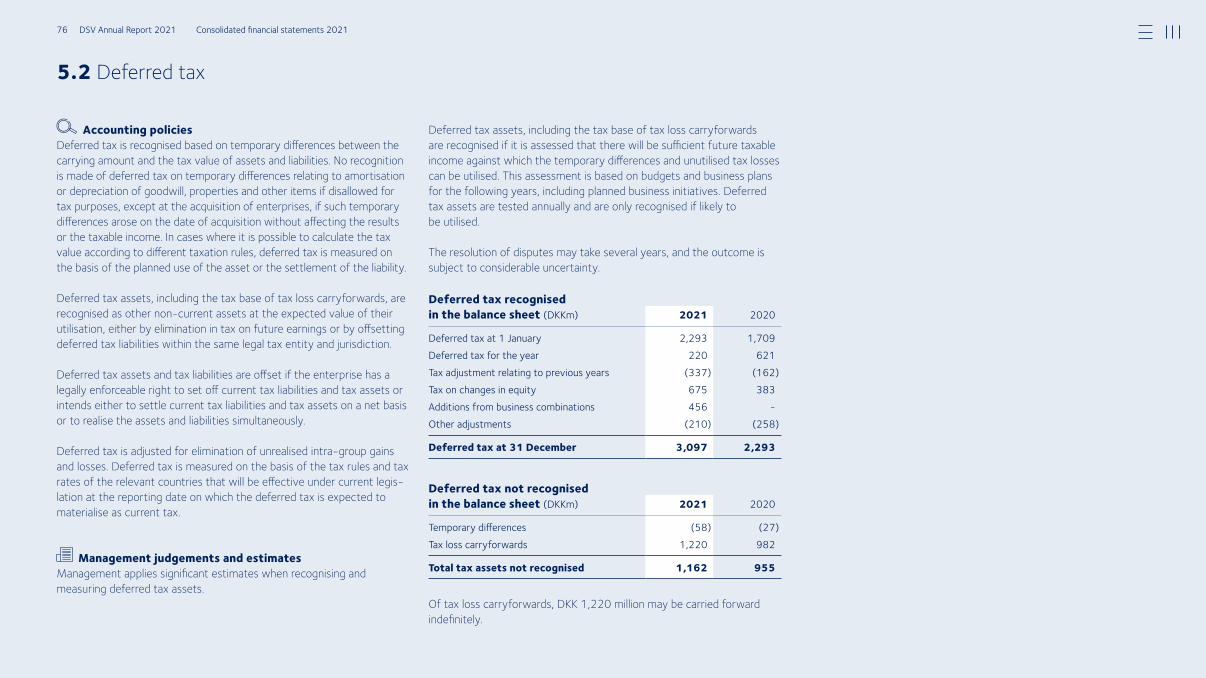
Accounting policiesDeferred tax is recognised based on temporary differences between the carrying amount and the tax value of assets and liabilities. No recognition is made of deferred tax on temporary differences relating to amortisation or depreciation of goodwill, properties and other items if disallowed for tax purposes, except at the acquisition of enterprises, if such temporary differences arose on the date of acquisition without affecting the results or the taxable income. In cases where it is possible to calculate the tax value according to different taxation rules, deferred tax is measured on the basis of the planned use of the asset or the settlement of the liability.
Deferred tax assets, including the tax base of tax loss carryforwards, are recognised as other non-current assets at the expected value of their utilisation, either by elimination in tax on future earnings or by offsetting deferred tax liabilities within the same legal tax entity and jurisdiction.
Deferred tax assets and tax liabilities are offset if the enterprise has a legally enforceable right to set off current tax liabilities and tax assets or intends either to settle current tax liabilities and tax assets on a net basis or to realise the assets and liabilities simultaneously.
Deferred tax is adjusted for elimination of unrealised intra-group gains and losses. Deferred tax is measured on the basis of the tax rules and tax rates of the relevant countries that will be effective under current legis-lation at the reporting date on which the deferred tax is expected to materialise as current tax.
Management judgements and estimatesManagement applies significant estimates when recognising and measuring deferred tax assets.
Deferred tax recognised in the balance sheet (DKKm) 20202021
Deferred tax at 1 January 2,293 1,709Deferred tax for the year 220 621Tax adjustment relating to previous years (337) (162)Tax on changes in equity 675 383Additions from business combinations 456 Other adjustments (210) (258)
Deferred tax at 31 December 3,097 2,293
Deferred tax not recog nised in the balance sheet (DKKm) 20202021
Temporary differences (58) (27)Tax loss carryforwards 1,220 982
Total tax assets not recognised 1,162 955
Of tax loss carryforwards, DKK 1,220 million may be carried forward indefinitely.
Deferred tax assets, including the tax base of tax loss carryforwards are recognised if it is assessed that there will be sufficient future taxable income against which the temporary differences and unutilised tax losses can be utilised. This assessment is based on budgets and business plans for the following years, including planned business initiatives. Deferred tax assets are tested annually and are only recognised if likely to be utilised.
The resolution of disputes may take several years, and the outcome is subject to considerable uncertainty.
5.2 Deferred tax
76 DSV Annual Report 2021 Consolidated financial statements 2021
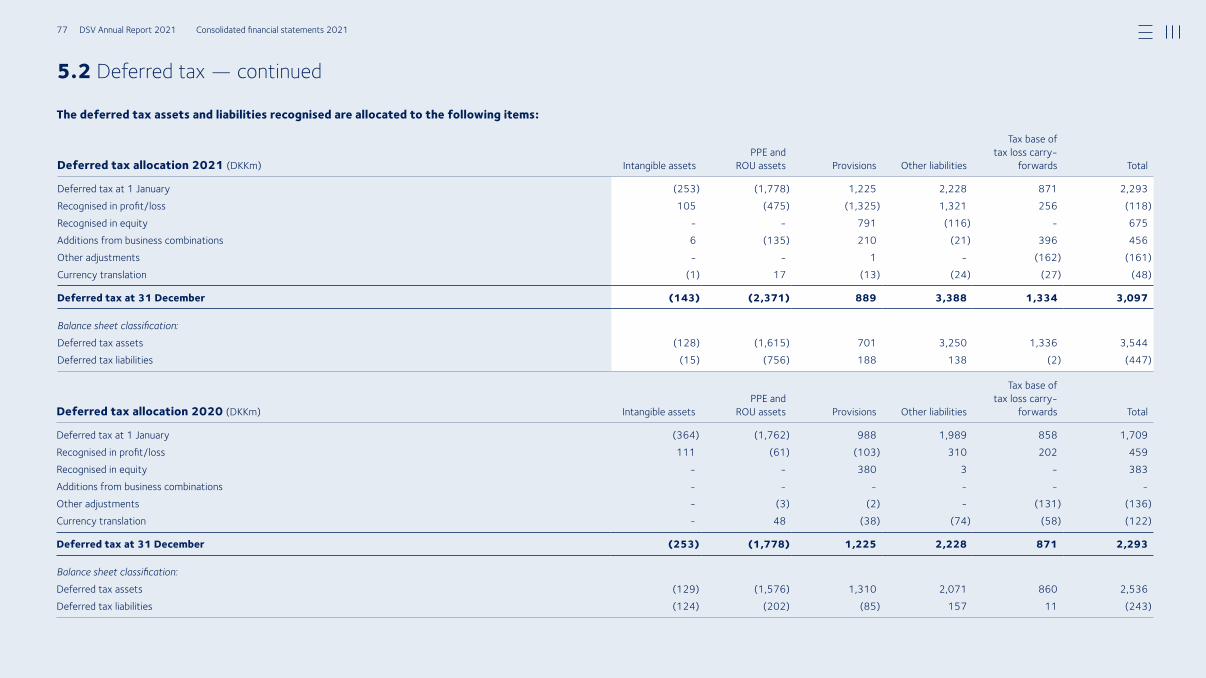
5.2 Deferred tax — continued
The deferred tax assets and liabilities recognised are allocated to the following items:
Deferred tax allocation 2021 (DKKm) Intangible assetsPPE and
ROU assets Provisions Other liabilities
Tax base oftax loss carry
forwards Total
Deferred tax at 1 January (253) (1,778) 1,225 2,228 871 2,293Recognised in profit/loss 105 (475) (1,325) 1,321 256 (118)Recognised in equity 791 (116) 675Additions from business combinations 6 (135) 210 (21) 396 456Other adjustments 1 (162) (161)Currency translation (1) 17 (13) (24) (27) (48)
Deferred tax at 31 December (143) (2,371) 889 3,388 1,334 3,097
Balance sheet classification:Deferred tax assets (128) (1,615) 701 3,250 1,336 3,544Deferred tax liabilities (15) (756) 188 138 (2) (447)
Deferred tax allocation 2020 (DKKm) Intangible assetsPPE and
ROU assets Provisions Other liabilities
Tax base of tax loss carry
forwards Total
Deferred tax at 1 January (364) (1,762) 988 1,989 858 1,709Recognised in profit/loss 111 (61) (103) 310 202 459Recognised in equity 380 3 383Additions from business combinations Other adjustments (3) (2) (131) (136)Currency translation 48 (38) (74) (58) (122)
Deferred tax at 31 December (253) (1,778) 1,225 2,228 871 2,293
Balance sheet classification:Deferred tax assets (129) (1,576) 1,310 2,071 860 2,536Deferred tax liabilities (124) (202) (85) 157 11 (243)
77 DSV Annual Report 2021 Consolidated financial statements 2021
Accounting policiesWhen accounting for business combinations, the acquisition method is applied in accordance with IFRS 3.
Acquirees are recognised in the consolidated financial statements from the date of acquisition. The date of acquisition is the date on which DSV obtains control of the company. Entities disposed of are recognised in the consolidated financial statements until the date of disposal. The date of disposal is the date on which DSV surrenders control of the company.
The consideration transferred as payment for the acquiree consists of the fair value of assets transferred, liabilities incurred to former owners of the acquiree and equity instruments issued. Contingent considerations dependent on future events or the performance of contractual obliga-tions are also recognised at fair value and form part of the total consid-eration transferred. Fair value changes in contingent considerations are recognised in the income statement until final settlement.
Identifiable assets, liabilities and contingent liabilities of the acquiree are measured at fair value at the date of acquisition by applying relevant val-uation methods. Identifiable intangibles are recognised if they are sepa-rable or arise from a contractual right. Deferred tax is recognised for identifiable tax benefits existing at the date of acquisition and from the perspective of the new combined Group in compliance with local tax legislation.
The excess of the total consideration transferred, value of non-con-trolling interests and the fair value of any equity investments previously held in the acquiree over the total identifiable net assets measured at fair value are recog nised as goodwill. If measurement of the identifiable net assets is uncertain at the date of acquisition, initial recognition is done based on provisional amounts. Measurement period adjustments to the provisional amounts may be done for up to 12 months following the date of acquisition.
The effects of cross-period measurement period adjustments are recog-nised in equity at the beginning of the financial year, and comparative figures are restated.
After the end of the measurement period, goodwill is no longer adjusted. Transaction costs inherent from the acquisition are recognised in the in-come statement when incurred.
Goodwill and fair value adjustments arising from the acquisition of an ac-quiree whose functional currency differs from the presentation currency of the Group are translated into the functional currency of the foreign entity using the exchange rate ruling at the date of acquisition.
Other than cross-period measurement period adjustments, comparative figures are not adjusted when acquiring or disposing of entities.
Management judgements and estimatesIn applying the acquisition method of accounting, estimates are an integral part of assessing fair values of several identifiable assets acquired and li-abilities assumed, as observable market prices are typically not available.
Valuation techniques where estimates are applied typically relate to de-termining the present value of future uncertain cash flows or assessing other events in which the outcome is uncertain at the date of acquisition.
More significant estimates are typically applied in accounting for prop-erty, plant and equipment, customer relationships, trade receivables, debt and contingent liabilities. As a result of the uncertainties inherent in fair value estimation, measurement period adjustments may be applied.
Acquisitions and disposalsOn 16 August 2021, DSV acquired the Global Integrated Logistics busi-ness (GIL) (from Agility Public Warehousing Company K.S.C.P.). No other material enterprises, non-controlling interests or activities were acquired
6.1 Acquisition and disposal of entities Chapter 6
Other notes
This chapter includes disclosures on other statutory information not directly related to the operating activities of the Group.
The chapter describes the acquisition and disposal of entities during the year, contingent liabilities and security for debt as well as transactions with Group Management, auditors and other related parties.
78 DSV Annual Report 2021 Consolidated financial statements 2021
6.1 Acquisition and disposal of entities — continued
the Solutions division. Finally, GIL adds road freight activities to DSV’s network in Europe and the Middle East.
DSV and GIL are a strong match with many potential synergies as a result of similarities in business models, services and strategies:• Commercial synergies and cross-selling opportunities from stronger
network and service offerings, new competencies and skills• Consolidation of operations, administration and logistics facilities• Consolidation of IT infrastructure• Strong focus on corporate responsibility and sustainability
The transaction is expected to be EPS accretive (diluted and adjusted) in year 2 after completion, and it is DSV’s aspiration to lift the operating margin of the combined entity to DSV's existing levels within the respec-tive business areas.
Consideration transferredThe consideration transferred for Global Integrated Logistics has been made in DSV equity instruments by offering in total 19,304,348 DSV shares at a fair value of DKK 29,493 million based on the acquisition date closing price of DKK 1,531 on Nasdaq Copenhagen offset by a cash consideration transferred from Agility to DSV of approximately DKK 61 million. Adjusted for the fair value of cash and cash equivalents acquired of DKK 1,759 million, the total net consideration amounted to DKK 27,734 million.
Transaction costsTotal transaction costs recognised until 31 December 2021 amount to DKK 86 million (recognised as special items).
Earnings impactAs a consequence of the integration of Global Integrated Logistics into DSV, the disclosed earnings impact is based on estimates as no financial reporting capabilities are maintained that provide detailed consolidated financial data on the separate pre-acquisition consolidation groups.
or divested in 2021. In 2020, no material enterprises, non-controlling interests or activities were acquired or divested.
About GILThe GIL business was a leading global transport and logistics provider with a strong footprint in emerging markets. The business offered a mix of integrated logistics services, including air, ocean and road freight for-warding services, contract logistics and specialised logistics capabilities. GIL operated a flexible, customer-centric and sustainability-driven busi-ness with a global workforce of approximately 17,000 employees and service provision across 100+ countries around the world (incl. agents). GIL empowered businesses of all sizes, from small businesses to large multinationals, through sector- specific expertise and digital tools and technology to enhance supply chain efficiency.
Strategic rationale and synergiesAcquisitions are an integral part of DSV's strategy, and DSV has a track record of successful integrations. The combination with GIL is expected to increase DSV's annual revenue by approximately 23%, thereby ranking the combined company in the freight forwarding industry top three with a combined workforce of more than 75,000 employees. The combined company has own operations in more than 90 countries.
Scale remains one of the key competitive advantages in freight forward-ing with significant operational and commercial benefits.
The Air & Sea division has been strengthened and will further cement its position as one of the largest providers. GIL’s presence in the fast-grow-ing emerging markets in APAC as well as Europe and Americas is a strong addition to DSV’s existing network.
Contract logistics capabilities are increasingly important due to complex supply chains and changing distribution channels. GIL brings additional warehousing capacity of more than 1.4 million square metres, mainly in APAC and the Middle East, and has thereby significantly strengthened
The acquisition is estimated to have contributed revenues of around DKK 15,000 million and operating profit before special items of DKK 950 mil-lion to the DSV Group results for the period 16 August 2021 to 31 De-cember 2021.
If the acquisition had occurred on 1 January 2021, consolidated pro-forma revenue and operating profit before special items for the period ended 31 December 2021 of the combined Group would have been approximately DKK 200,000 million and DKK 17,000 million, respectively.
Fair value of acquired net assets and recognised goodwillFair value of acquired net assets have been identified and goodwill rec-ognised. Net assets, goodwill and contingent assets and liabilities recog-nised at the reporting date are to some extent still provisional. Adjust-ments may be applied to these amounts for a period of up to twelve months from the acquisition date in accordance with IFRS 3.
The major categories of net assets for which acquisitional accounting is still ongoing mainly relate to other provisions and deferred tax assets. In addition, other minor adjustments may be applied to the various net asset categories as full alignment to DSV accounting policies is being finalised.
The fair value of acquired trade receivables, contract assets and other receivables amounts to DKK 9,265 million. Collectability of receivables has been assessed based on credit assessment policies; in this regard, expected credit losses of DKK 340 million have been provided for.
The fair value of other receivables recognised includes indemnification as-sets totalling DKK 1,818 million relating to various company- and value added taxes. Indemnification assest have not been excluded from the con-sideration transferred or opening balance recognition. Had the indemnifica-tion assets been excluded, consideration transferred and net assets recog-nised would have amounted to DKK 27,675 million and DKK 2,475 million instead, whereas acquisitional goodwill would have remained unchanged.
79 DSV Annual Report 2021 Consolidated financial statements 2021
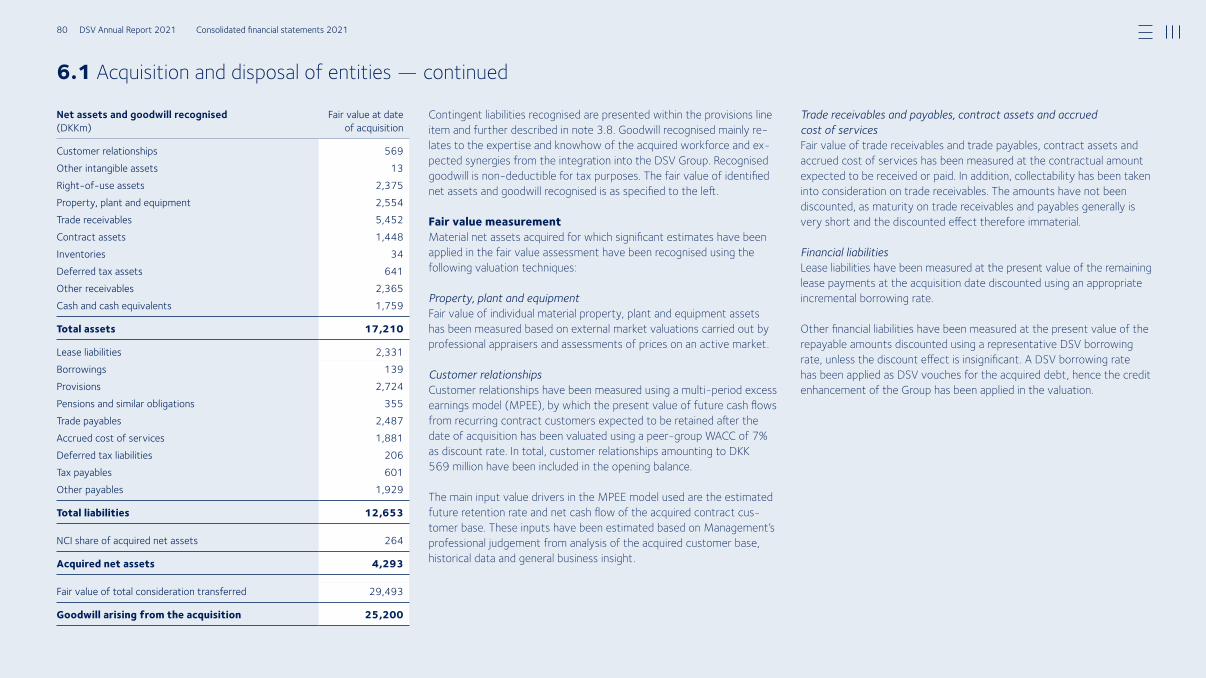
Contingent liabilities recognised are presented within the provisions line item and further described in note 3.8. Goodwill recognised mainly re-lates to the expertise and knowhow of the acquired workforce and ex-pected synergies from the integration into the DSV Group. Recognised goodwill is non-deductible for tax purposes. The fair value of identified net assets and goodwill recognised is as specified to the left.
Fair value measurementMaterial net assets acquired for which significant estimates have been applied in the fair value assessment have been recognised using the following valuation techniques:
Property, plant and equipmentFair value of individual material property, plant and equipment assets has been measured based on external market valuations carried out by professional appraisers and assessments of prices on an active market.
Customer relationships Customer relationships have been measured using a multi-period excess earnings model (MPEE), by which the present value of future cash flows from recurring contract customers expected to be retained after the date of acquisition has been valuated using a peer-group WACC of 7% as discount rate. In total, customer relationships amounting to DKK 569 million have been included in the opening balance.
The main input value drivers in the MPEE model used are the estimated future retention rate and net cash flow of the acquired contract cus-tomer base. These inputs have been estimated based on Management’s professional judgement from analysis of the acquired customer base, historical data and general business insight.
Trade receivables and payables, contract assets and accrued cost of servicesFair value of trade receivables and trade payables, contract assets and accrued cost of services has been measured at the contractual amount expected to be received or paid. In addition, collectability has been taken into consideration on trade receivables. The amounts have not been discounted, as maturity on trade receivables and payables generally is very short and the discounted effect therefore immaterial.
Financial liabilitiesLease liabilities have been measured at the present value of the remaining lease payments at the acquisition date discounted using an appropriate incremental borrowing rate.
Other financial liabilities have been measured at the present value of the repayable amounts discounted using a representative DSV borrowing rate, unless the discount effect is insignificant. A DSV borrowing rate has been applied as DSV vouches for the acquired debt, hence the credit enhancement of the Group has been applied in the valuation.
Net assets and goodwill recognised (DKKm)
Fair value at date of acquisition
Customer relationships 569Other intangible assets 13Rightofuse assets 2,375Property, plant and equipment 2,554Trade receivables 5,452Contract assets 1,448Inventories 34Deferred tax assets 641Other receivables 2,365Cash and cash equivalents 1,759
Total assets 17,210
Lease liabilities 2,331Borrowings 139Provisions 2,724Pensions and similar obligations 355Trade payables 2,487Accrued cost of services 1,881Deferred tax liabilities 206Tax payables 601Other payables 1,929
Total liabilities 12,653
NCI share of acquired net assets 264
Acquired net assets 4,293
Fair value of total consideration transferred 29,493
Goodwill arising from the acquisition 25,200
6.1 Acquisition and disposal of entities — continued
80 DSV Annual Report 2021 Consolidated financial statements 2021
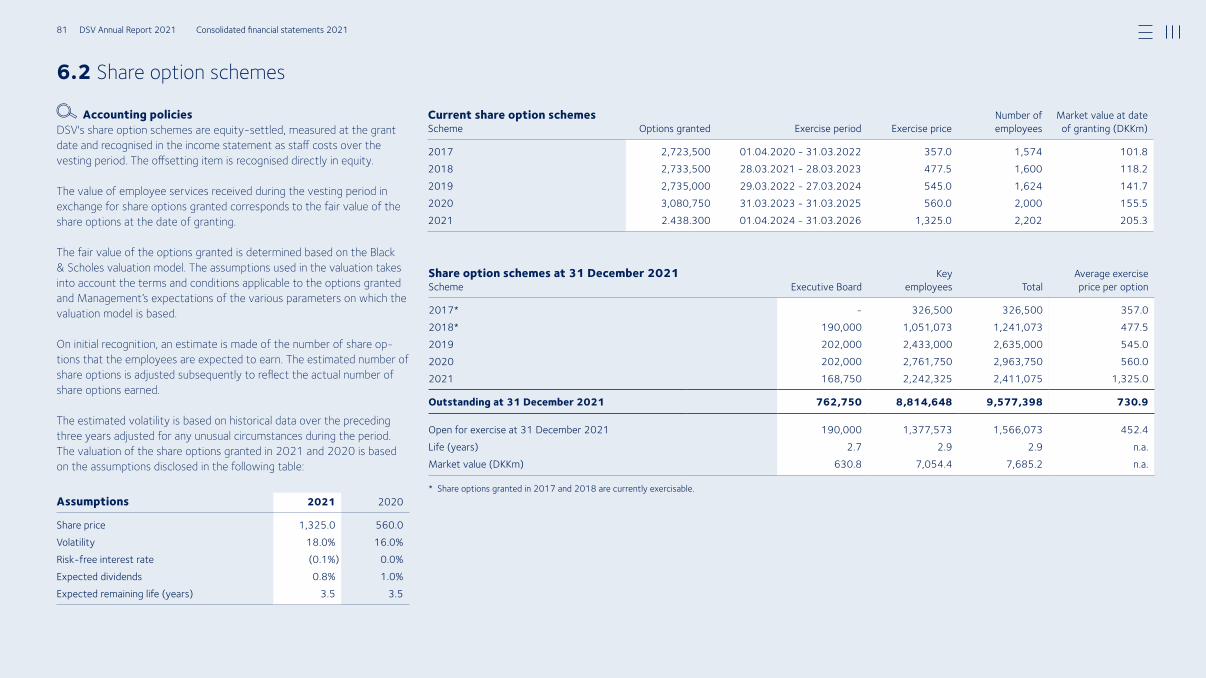
6.2 Share option schemes
Accounting policiesDSV's share option schemes are equity-settled, measured at the grant date and recognised in the income statement as staff costs over the vesting period. The offsetting item is recognised directly in equity.
The value of employee services received during the vesting period in exchange for share options granted corresponds to the fair value of the share options at the date of granting.
The fair value of the options granted is determined based on the Black & Scholes valuation model. The assumptions used in the valuation takes into account the terms and conditions applicable to the options granted and Management’s expectations of the various parameters on which the valuation model is based.
On initial recognition, an estimate is made of the number of share op-tions that the employees are expected to earn. The estimated number of share options is adjusted subsequently to reflect the actual number of share options earned.
The estimated volatility is based on historical data over the preceding three years adjusted for any unusual circumstances during the period. The valuation of the share options granted in 2021 and 2020 is based on the assumptions disclosed in the following table:
Assumptions 2021 2020
Share price 1,325.0 560.0Volatility 18.0% 16.0%Riskfree interest rate (0.1%) 0.0%Expected dividends 0.8% 1.0%Expected remaining life (years) 3.5 3.5
Current share option schemesScheme Options granted Exercise period Exercise price
Number of employees
Market value at date of granting (DKKm)
2017 2,723,500 01.04.2020 31.03.2022 357.0 1,574 101.82018 2,733,500 28.03.2021 28.03.2023 477.5 1,600 118.22019 2,735,000 29.03.2022 27.03.2024 545.0 1,624 141.72020 3,080,750 31.03.2023 31.03.2025 560.0 2,000 155.52021 2.438.300 01.04.2024 31.03.2026 1,325.0 2,202 205.3
Share option schemes at 31 December 2021Scheme Executive Board
Key employees Total
Average exercise price per option
2017* 326,500 326,500 357.0 2018* 190,000 1,051,073 1,241,073 477.52019 202,000 2,433,000 2,635,000 545.02020 202,000 2,761,750 2,963,750 560.02021 168,750 2,242,325 2,411,075 1,325.0
Outstanding at 31 December 2021 762,750 8,814,648 9,577,398 730.9
Open for exercise at 31 December 2021 190,000 1,377,573 1,566,073 452.4Life (years) 2.7 2.9 2.9 n.a.Market value (DKKm) 630.8 7,054.4 7,685.2 n.a.
* Share options granted in 2017 and 2018 are currently exercisable.
81 DSV Annual Report 2021 Consolidated financial statements 2021
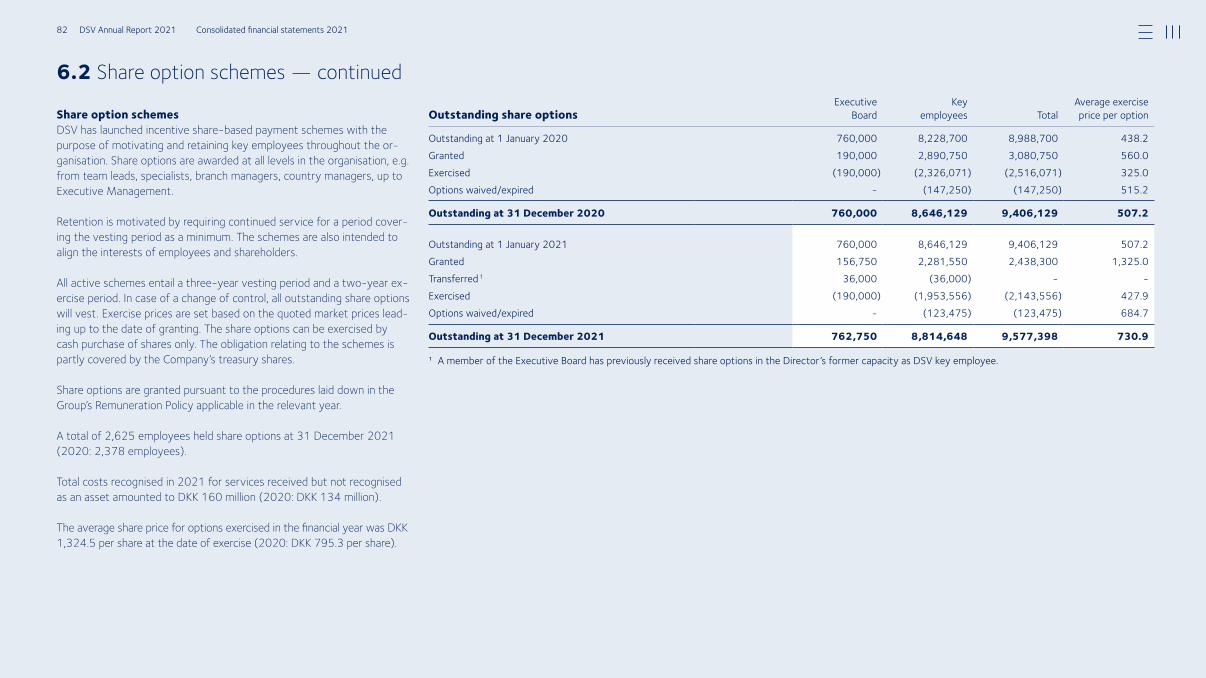
6.2 Share option schemes — continued
Share option schemesDSV has launched incentive share-based payment schemes with the purpose of motivating and retaining key employees throughout the or-ganisation. Share options are awarded at all levels in the organisation, e.g. from team leads, specialists, branch managers, country managers, up to Executive Management.
Retention is motivated by requiring continued service for a period cover-ing the vesting period as a minimum. The schemes are also intended to align the interests of employees and shareholders.
All active schemes entail a three-year vesting period and a two-year ex-ercise period. In case of a change of control, all outstanding share options will vest. Exercise prices are set based on the quoted market prices lead-ing up to the date of granting. The share options can be exercised by cash purchase of shares only. The obligation relating to the schemes is partly covered by the Company’s treasury shares.
Share options are granted pursuant to the procedures laid down in the Group’s Remuneration Policy applicable in the relevant year.
A total of 2,625 employees held share options at 31 December 2021 (2020: 2,378 employees).
Total costs recognised in 2021 for services received but not recognised as an asset amounted to DKK 160 million (2020: DKK 134 million).
The average share price for options exercised in the financial year was DKK 1,324.5 per share at the date of exercise (2020: DKK 795.3 per share).
Outstanding share optionsExecutive
BoardKey
employees TotalAverage exercise price per option
Outstanding at 1 January 2020 760,000 8,228,700 8,988,700 438.2Granted 190,000 2,890,750 3,080,750 560.0Exercised (190,000) (2,326,071) (2,516,071) 325.0Options waived/expired (147,250) (147,250) 515.2
Outstanding at 31 December 2020 760,000 8,646,129 9,406,129 507.2
Outstanding at 1 January 2021 760,000 8,646,129 9,406,129 507.2Granted 156,750 2,281,550 2,438,300 1,325.0Transferred 1 36,000 (36,000) Exercised (190,000) (1,953,556) (2,143,556) 427.9Options waived/expired (123,475) (123,475) 684.7
Outstanding at 31 December 2021 762,750 8,814,648 9,577,398 730.9
¹ A member of the Executive Board has previously received share options in the Director’s former capacity as DSV key employee.
82 DSV Annual Report 2021 Consolidated financial statements 2021
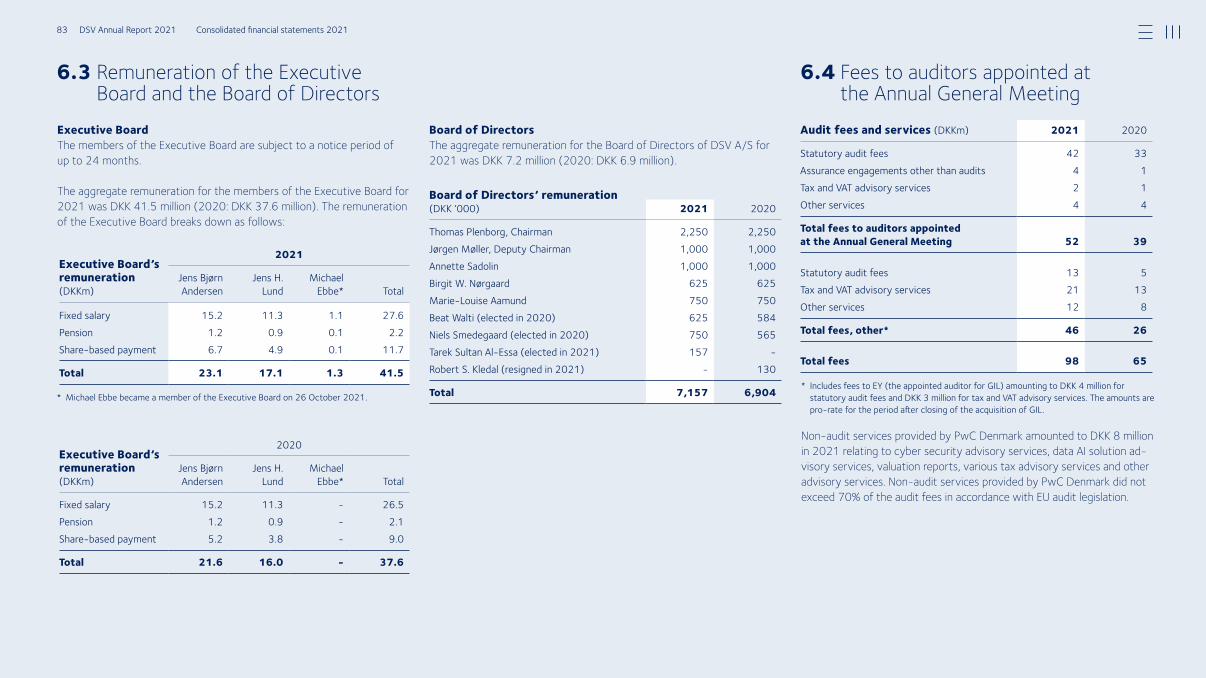
6.3 Remuneration of the Executive Board and the Board of Directors
6.4 Fees to auditors appointed at the Annual General Meeting
Board of DirectorsThe aggregate remuneration for the Board of Directors of DSV A/S for 2021 was DKK 7.2 million (2020: DKK 6.9 million).
Non-audit services provided by PwC Denmark amounted to DKK 8 million in 2021 relating to cyber security advisory services, data AI solution ad-visory services, valuation reports, various tax advisory services and other advisory services. Non-audit services provided by PwC Denmark did not exceed 70% of the audit fees in accordance with EU audit legislation.
* Includes fees to EY (the appointed auditor for GIL) amounting to DKK 4 million for statutory audit fees and DKK 3 million for tax and VAT advisory services. The amounts are prorate for the period after closing of the acquisition of GIL.
* Michael Ebbe became a member of the Executive Board on 26 October 2021.
Board of Directors’ remuneration (DKK ‘000) 20202021
Thomas Plenborg, Chairman 2,250 2,250Jørgen Møller, Deputy Chairman 1,000 1,000Annette Sadolin 1,000 1,000Birgit W. Nørgaard 625 625MarieLouise Aamund 750 750Beat Walti (elected in 2020) 625 584Niels Smedegaard (elected in 2020) 750 565Tarek Sultan AlEssa (elected in 2021) 157 Robert S. Kledal (resigned in 2021) 130
Total 7,157 6,904
Audit fees and services (DKKm) 2021 2020
Statutory audit fees 42 33 Assurance engagements other than audits 4 1Tax and VAT advisory services 2 1Other services 4 4
Total fees to auditors appointed at the Annual General Meeting 52 39
Statutory audit fees 13 5Tax and VAT advisory services 21 13Other services 12 8
Total fees, other* 46 26
Total fees 98 65
Executive Board’s remuneration (DKKm)
2021
Jens Bjørn Andersen
Jens H. Lund
Michael Ebbe* Total
Fixed salary 15.2 11.3 1.1 27.6Pension 1.2 0.9 0.1 2.2Sharebased payment 6.7 4.9 0.1 11.7
Total 23.1 17.1 1.3 41.5
Executive Board’s remuneration (DKKm)
2020
Jens Bjørn Andersen
Jens H. Lund
Michael Ebbe* Total
Fixed salary 15.2 11.3 26.5Pension 1.2 0.9 2.1Sharebased payment 5.2 3.8 9.0
Total 21.6 16.0 - 37.6
Executive BoardThe members of the Executive Board are subject to a notice period of up to 24 months.
The aggregate remuneration for the members of the Executive Board for 2021 was DKK 41.5 million (2020: DKK 37.6 million). The remuneration of the Executive Board breaks down as follows:
83 DSV Annual Report 2021 Consolidated financial statements 2021
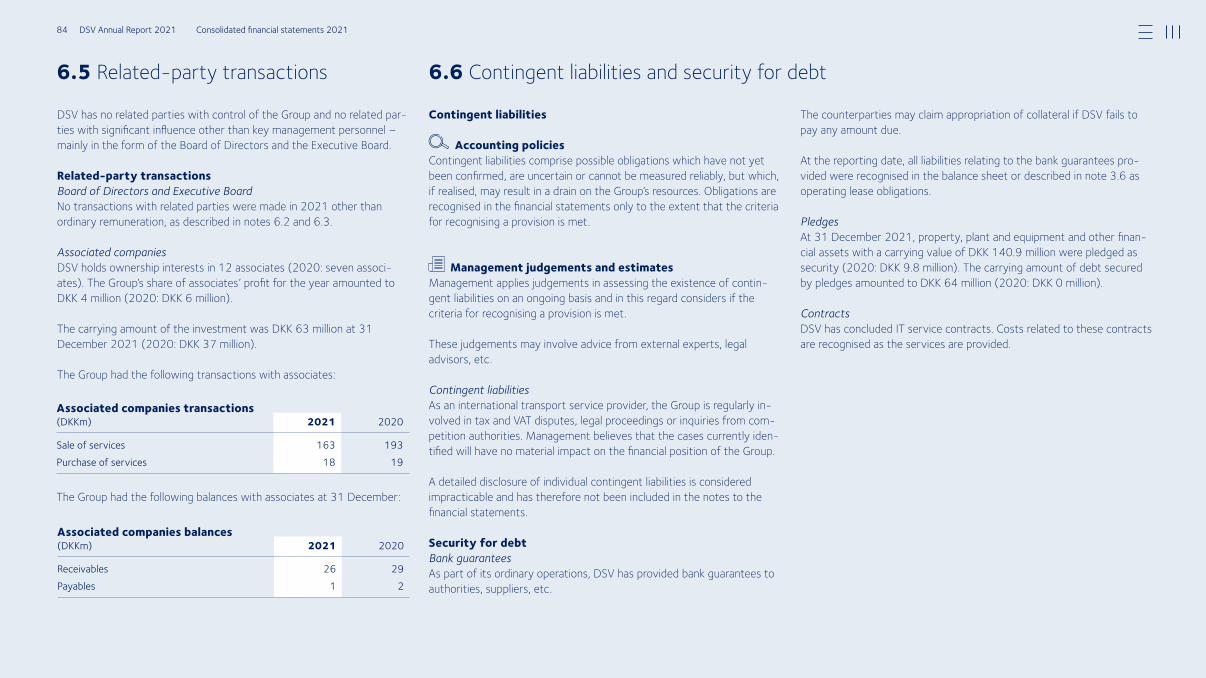
The Group had the following balances with associates at 31 December:
Contingent liabilities
Accounting policiesContingent liabilities comprise possible obligations which have not yet been confirmed, are uncertain or cannot be measured reliably, but which, if realised, may result in a drain on the Group’s resources. Obligations are recognised in the financial statements only to the extent that the criteria for recognising a provision is met.
Management judgements and estimatesManagement applies judgements in assessing the existence of contin-gent liabilities on an ongoing basis and in this regard considers if the criteria for recognising a provision is met.
These judgements may involve advice from external experts, legal advisors, etc.
Contingent liabilitiesAs an international transport service provider, the Group is regularly in-volved in tax and VAT disputes, legal proceedings or inquiries from com-petition authorities. Management believes that the cases currently iden-tified will have no material impact on the financial position of the Group.
A detailed disclosure of individual contingent liabilities is considered impracticable and has therefore not been included in the notes to the financial statements.
Security for debtBank guaranteesAs part of its ordinary operations, DSV has provided bank guarantees to authorities, suppliers, etc.
Associated companies balances (DKKm) 20202021
Receivables 26 29Payables 1 2
The counterparties may claim appropriation of collateral if DSV fails to pay any amount due.
At the reporting date, all liabilities relating to the bank guarantees pro-vided were recognised in the balance sheet or described in note 3.6 as operating lease obligations.
PledgesAt 31 December 2021, property, plant and equipment and other finan-cial assets with a carrying value of DKK 140.9 million were pledged as security (2020: DKK 9.8 million). The carrying amount of debt secured by pledges amounted to DKK 64 million (2020: DKK 0 million).
ContractsDSV has concluded IT service contracts. Costs related to these contracts are recognised as the services are provided.
Associated companies transactions (DKKm) 20202021
Sale of services 163 193Purchase of services 18 19
DSV has no related parties with control of the Group and no related par-ties with significant influence other than key management personnel – mainly in the form of the Board of Directors and the Executive Board.
Related-party transactionsBoard of Directors and Executive BoardNo transactions with related parties were made in 2021 other than ordinary remuneration, as described in notes 6.2 and 6.3.
Associated companiesDSV holds ownership interests in 12 associates (2020: seven associ-ates). The Group’s share of associates’ profit for the year amounted to DKK 4 million (2020: DKK 6 million).
The carrying amount of the investment was DKK 63 million at 31 December 2021 (2020: DKK 37 million).
The Group had the following transactions with associates:
6.6 Contingent liabilities and security for debt6.5 Related-party transactions
84 DSV Annual Report 2021 Consolidated financial statements 2021
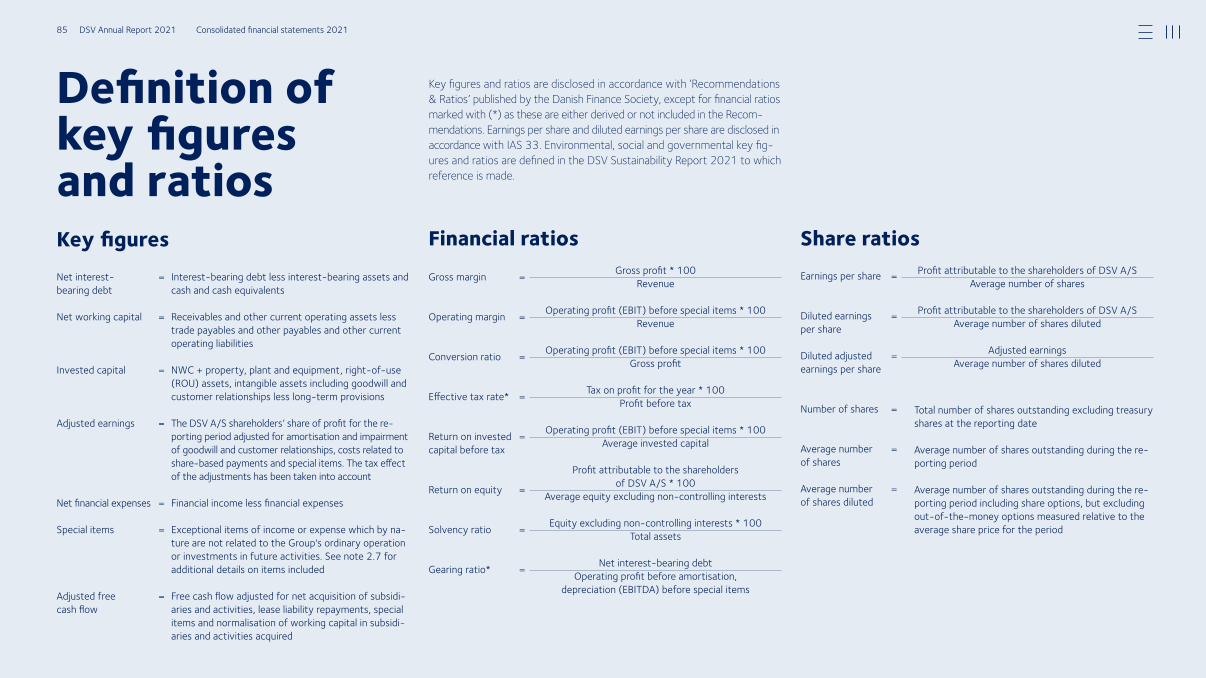
Definition of key figures and ratios
Key figures and ratios are disclosed in accordance with ‘Recommendations & Ratios’ published by the Danish Finance Society, except for financial ratios marked with (*) as these are either derived or not included in the Recom-mendations. Earnings per share and diluted earnings per share are disclosed in accordance with IAS 33. Environmental, social and governmental key fig-ures and ratios are defined in the DSV Sustainability Report 2021 to which reference is made.
Net interest = bearing debt
Net working capital =
Invested capital =
Adjusted earnings =
Net financial expenses =
Special items =
Adjusted free = cash flow
Gross margin =
Operating margin =
Conversion ratio =
Effective tax rate* =
Return on invested =capital before tax
Return on equity =
Solvency ratio =
Gearing ratio* =
Earnings per share =
Diluted earnings = per share
Diluted adjusted = earnings per share
Number of shares =
Average number = of shares
Average number =of shares diluted
Interestbearing debt less interestbearing assets and cash and cash equivalents
Receivables and other current operating assets less trade payables and other payables and other current operating liabilities
NWC + property, plant and equipment, rightofuse (ROU) assets, intangible assets including goodwill and customer relationships less longterm provisions
The DSV A/S shareholders’ share of profit for the reporting period adjusted for amortisation and impairment of goodwill and customer relationships, costs related to sharebased payments and special items. The tax effect of the adjustments has been taken into account
Financial income less financial expenses
Exceptional items of income or expense which by nature are not related to the Group's ordinary operation or investments in future activities. See note 2.7 for additional details on items included Free cash flow adjusted for net acquisition of subsidiaries and activities, lease liability repayments, special items and normalisation of working capital in subsidiaries and activities acquired
Gross profit * 100Revenue
Operating profit (EBIT) before special items * 100
Revenue
Operating profit (EBIT) before special items * 100Gross profit
Tax on profit for the year * 100Profit before tax
Operating profit (EBIT) before special items * 100Average invested capital
Profit attributable to the shareholders of DSV A/S * 100
Average equity excluding noncontrolling interests
Equity excluding noncontrolling interests * 100Total assets
Net interestbearing debtOperating profit before amortisation,
depreciation (EBITDA) before special items
Profit attributable to the shareholders of DSV A/SAverage number of shares
Profit attributable to the shareholders of DSV A/SAverage number of shares diluted
Adjusted earningsAverage number of shares diluted
Total number of shares outstanding excluding treasury shares at the reporting date
Average number of shares outstanding during the reporting period
Average number of shares outstanding during the reporting period including share options, but excluding outofthemoney options measured relative to the average share price for the period
Key figures Financial ratios Share ratios
85 DSV Annual Report 2021 Consolidated financial statements 2021
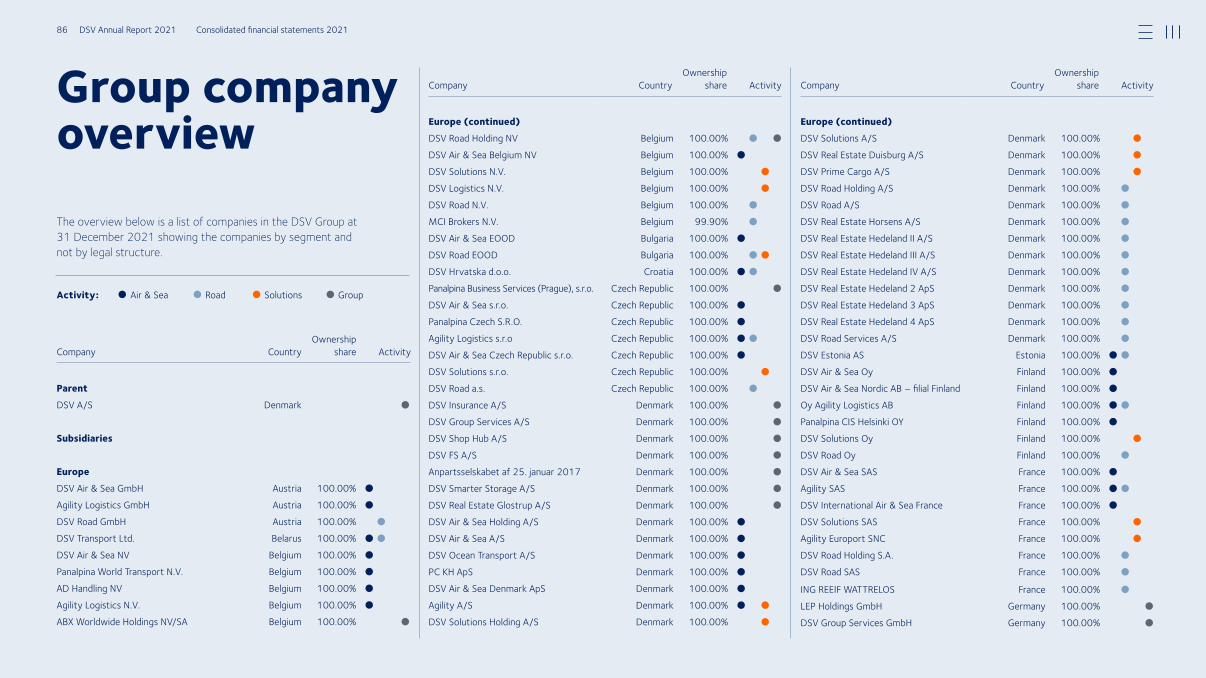
Group company overviewThe overview below is a list of companies in the DSV Group at 31 December 2021 showing the companies by segment and not by legal structure.
Company CountryOwnership
share Activity
Parent
DSV A/S Denmark
Subsidiaries
Europe
DSV Air & Sea GmbH Austria 100.00%
Agility Logistics GmbH Austria 100.00%
DSV Road GmbH Austria 100.00%
DSV Transport Ltd. Belarus 100.00%
DSV Air & Sea NV Belgium 100.00%
Panalpina World Transport N.V. Belgium 100.00%
AD Handling NV Belgium 100.00%
Agility Logistics N.V. Belgium 100.00%
ABX Worldwide Holdings NV/SA Belgium 100.00%
Air & Sea Road Solutions GroupActivity:
DSV Road Holding NV Belgium 100.00%
DSV Air & Sea Belgium NV Belgium 100.00%
DSV Solutions N.V. Belgium 100.00%
DSV Logistics N.V. Belgium 100.00%
DSV Road N.V. Belgium 100.00%
MCI Brokers N.V. Belgium 99.90%
DSV Air & Sea EOOD Bulgaria 100.00%
DSV Road EOOD Bulgaria 100.00%
DSV Hrvatska d.o.o. Croatia 100.00%
Panalpina Business Services (Prague), s.r.o. Czech Republic 100.00%
DSV Air & Sea s.r.o. Czech Republic 100.00%
Panalpina Czech S.R.O. Czech Republic 100.00%
Agility Logistics s.r.o Czech Republic 100.00%
DSV Air & Sea Czech Republic s.r.o. Czech Republic 100.00%
DSV Solutions s.r.o. Czech Republic 100.00%
DSV Road a.s. Czech Republic 100.00%
DSV Insurance A/S Denmark 100.00%
DSV Group Services A/S Denmark 100.00%
DSV Shop Hub A/S Denmark 100.00%
DSV FS A/S Denmark 100.00%
Anpartsselskabet af 25. januar 2017 Denmark 100.00%
DSV Smarter Storage A/S Denmark 100.00%
DSV Real Estate Glostrup A/S Denmark 100.00%
DSV Air & Sea Holding A/S Denmark 100.00%
DSV Air & Sea A/S Denmark 100.00%
DSV Ocean Transport A/S Denmark 100.00%
PC KH ApS Denmark 100.00%
DSV Air & Sea Denmark ApS Denmark 100.00%
Agility A/S Denmark 100.00%
DSV Solutions Holding A/S Denmark 100.00%
DSV Solutions A/S Denmark 100.00%
DSV Real Estate Duisburg A/S Denmark 100.00%
DSV Prime Cargo A/S Denmark 100.00%
DSV Road Holding A/S Denmark 100.00%
DSV Road A/S Denmark 100.00%
DSV Real Estate Horsens A/S Denmark 100.00%
DSV Real Estate Hedeland II A/S Denmark 100.00%
DSV Real Estate Hedeland III A/S Denmark 100.00%
DSV Real Estate Hedeland IV A/S Denmark 100.00%
DSV Real Estate Hedeland 2 ApS Denmark 100.00%
DSV Real Estate Hedeland 3 ApS Denmark 100.00%
DSV Real Estate Hedeland 4 ApS Denmark 100.00%
DSV Road Services A/S Denmark 100.00%
DSV Estonia AS Estonia 100.00%
DSV Air & Sea Oy Finland 100.00%
DSV Air & Sea Nordic AB – filial Finland Finland 100.00%
Oy Agility Logistics AB Finland 100.00%
Panalpina CIS Helsinki OY Finland 100.00%
DSV Solutions Oy Finland 100.00%
DSV Road Oy Finland 100.00%
DSV Air & Sea SAS France 100.00%
Agility SAS France 100.00%
DSV International Air & Sea France France 100.00%
DSV Solutions SAS France 100.00%
Agility Europort SNC France 100.00%
DSV Road Holding S.A. France 100.00%
DSV Road SAS France 100.00%
ING REEIF WATTRELOS France 100.00%
LEP Holdings GmbH Germany 100.00%
DSV Group Services GmbH Germany 100.00%
Company CountryOwnership
share Activity
Europe (continued)
Company CountryOwnership
share Activity
Europe (continued)
86 DSV Annual Report 2021 Consolidated financial statements 2021
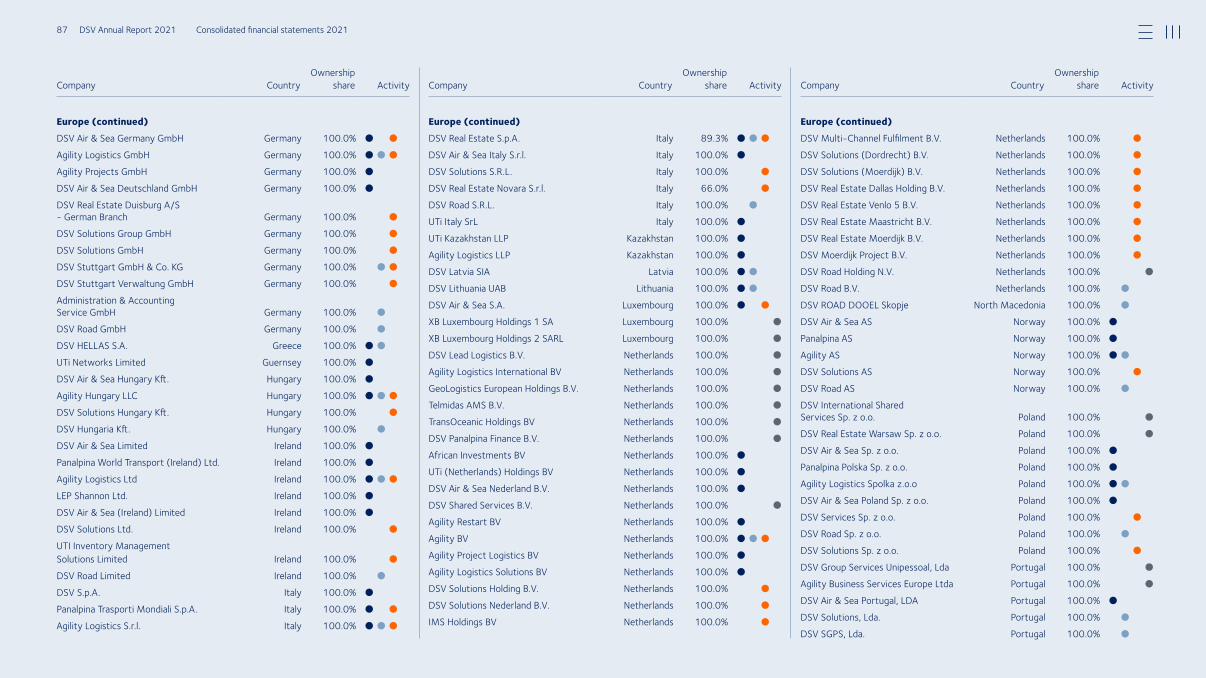
DSV Air & Sea Germany GmbH Germany 100.0%
Agility Logistics GmbH Germany 100.0%
Agility Projects GmbH Germany 100.0%
DSV Air & Sea Deutschland GmbH Germany 100.0%
DSV Real Estate Duisburg A/S German Branch Germany 100.0%
DSV Solutions Group GmbH Germany 100.0%
DSV Solutions GmbH Germany 100.0%
DSV Stuttgart GmbH & Co. KG Germany 100.0%
DSV Stuttgart Verwaltung GmbH Germany 100.0%
Administration & Accounting Service GmbH Germany 100.0%
DSV Road GmbH Germany 100.0%
DSV HELLAS S.A. Greece 100.0%
UTi Networks Limited Guernsey 100.0%
DSV Air & Sea Hungary Kft. Hungary 100.0%
Agility Hungary LLC Hungary 100.0%
DSV Solutions Hungary Kft. Hungary 100.0%
DSV Hungaria Kft. Hungary 100.0%
DSV Air & Sea Limited Ireland 100.0%
Panalpina World Transport (Ireland) Ltd. Ireland 100.0%
Agility Logistics Ltd Ireland 100.0%
LEP Shannon Ltd. Ireland 100.0%
DSV Air & Sea (Ireland) Limited Ireland 100.0%
DSV Solutions Ltd. Ireland 100.0%
UTI Inventory Management Solutions Limited Ireland 100.0%
DSV Road Limited Ireland 100.0%
DSV S.p.A. Italy 100.0%
Panalpina Trasporti Mondiali S.p.A. Italy 100.0%
Agility Logistics S.r.l. Italy 100.0%
DSV Real Estate S.p.A. Italy 89.3%
DSV Air & Sea Italy S.r.l. Italy 100.0%
DSV Solutions S.R.L. Italy 100.0%
DSV Real Estate Novara S.r.l. Italy 66.0%
DSV Road S.R.L. Italy 100.0%
UTi Italy SrL Italy 100.0%
UTi Kazakhstan LLP Kazakhstan 100.0%
Agility Logistics LLP Kazakhstan 100.0%
DSV Latvia SIA Latvia 100.0%
DSV Lithuania UAB Lithuania 100.0%
DSV Air & Sea S.A. Luxembourg 100.0%
XB Luxembourg Holdings 1 SA Luxembourg 100.0%
XB Luxembourg Holdings 2 SARL Luxembourg 100.0%
DSV Lead Logistics B.V. Netherlands 100.0%
Agility Logistics International BV Netherlands 100.0%
GeoLogistics European Holdings B.V. Netherlands 100.0%
Telmidas AMS B.V. Netherlands 100.0%
TransOceanic Holdings BV Netherlands 100.0%
DSV Panalpina Finance B.V. Netherlands 100.0%
African Investments BV Netherlands 100.0%
UTi (Netherlands) Holdings BV Netherlands 100.0%
DSV Air & Sea Nederland B.V. Netherlands 100.0%
DSV Shared Services B.V. Netherlands 100.0%
Agility Restart BV Netherlands 100.0%
Agility BV Netherlands 100.0%
Agility Project Logistics BV Netherlands 100.0%
Agility Logistics Solutions BV Netherlands 100.0%
DSV Solutions Holding B.V. Netherlands 100.0%
DSV Solutions Nederland B.V. Netherlands 100.0%
IMS Holdings BV Netherlands 100.0%
DSV MultiChannel Fulfilment B.V. Netherlands 100.0%
DSV Solutions (Dordrecht) B.V. Netherlands 100.0%
DSV Solutions (Moerdijk) B.V. Netherlands 100.0%
DSV Real Estate Dallas Holding B.V. Netherlands 100.0%
DSV Real Estate Venlo 5 B.V. Netherlands 100.0%
DSV Real Estate Maastricht B.V. Netherlands 100.0%
DSV Real Estate Moerdijk B.V. Netherlands 100.0%
DSV Moerdijk Project B.V. Netherlands 100.0%
DSV Road Holding N.V. Netherlands 100.0%
DSV Road B.V. Netherlands 100.0%
DSV ROAD DOOEL Skopje North Macedonia 100.0%
DSV Air & Sea AS Norway 100.0%
Panalpina AS Norway 100.0%
Agility AS Norway 100.0%
DSV Solutions AS Norway 100.0%
DSV Road AS Norway 100.0%
DSV International Shared Services Sp. z o.o. Poland 100.0%
DSV Real Estate Warsaw Sp. z o.o. Poland 100.0%
DSV Air & Sea Sp. z o.o. Poland 100.0%
Panalpina Polska Sp. z o.o. Poland 100.0%
Agility Logistics Spolka z.o.o Poland 100.0%
DSV Air & Sea Poland Sp. z o.o. Poland 100.0%
DSV Services Sp. z o.o. Poland 100.0%
DSV Road Sp. z o.o. Poland 100.0%
DSV Solutions Sp. z o.o. Poland 100.0%
DSV Group Services Unipessoal, Lda Portugal 100.0%
Agility Business Services Europe Ltda Portugal 100.0%
DSV Air & Sea Portugal, LDA Portugal 100.0%
DSV Solutions, Lda. Portugal 100.0%
DSV SGPS, Lda. Portugal 100.0%
Company CountryOwnership
share Activity
Europe (continued)
Company CountryOwnership
share Activity
Europe (continued)
Company CountryOwnership
share Activity
Europe (continued)
87 DSV Annual Report 2021 Consolidated financial statements 2021
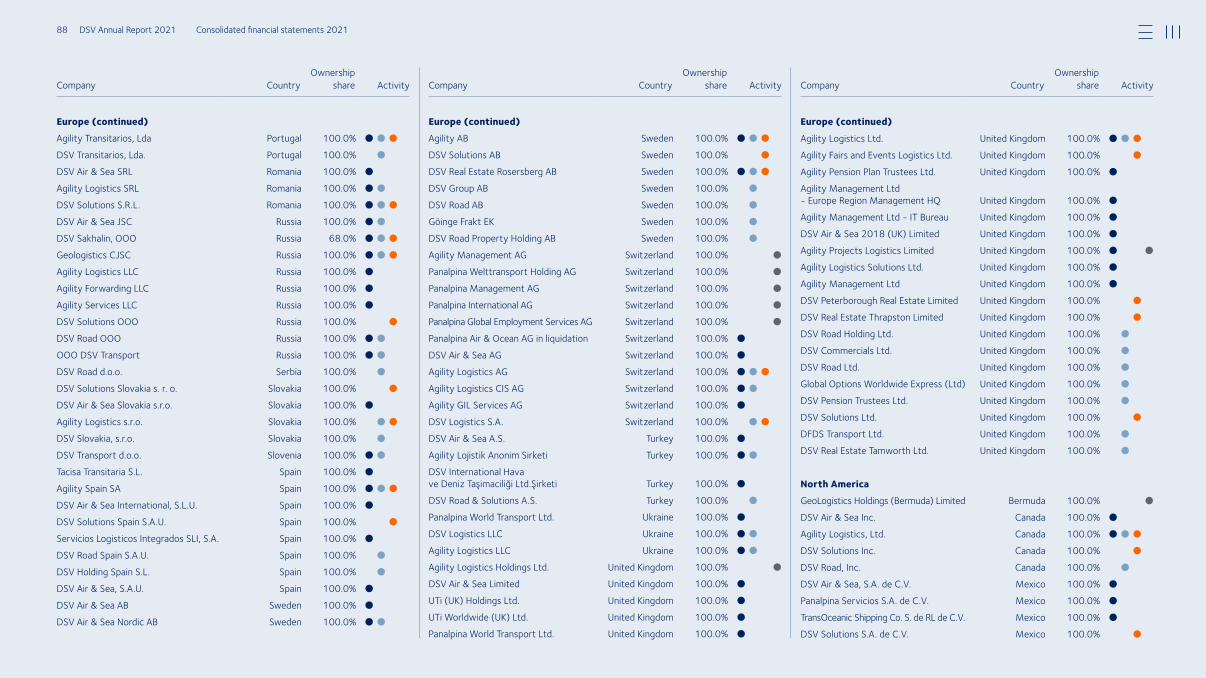
Agility Transitarios, Lda Portugal 100.0%
DSV Transitarios, Lda. Portugal 100.0%
DSV Air & Sea SRL Romania 100.0%
Agility Logistics SRL Romania 100.0%
DSV Solutions S.R.L. Romania 100.0%
DSV Air & Sea JSC Russia 100.0%
DSV Sakhalin, OOO Russia 68.0%
Geologistics CJSC Russia 100.0%
Agility Logistics LLC Russia 100.0%
Agility Forwarding LLC Russia 100.0%
Agility Services LLC Russia 100.0%
DSV Solutions OOO Russia 100.0%
DSV Road OOO Russia 100.0%
OOO DSV Transport Russia 100.0%
DSV Road d.o.o. Serbia 100.0%
DSV Solutions Slovakia s. r. o. Slovakia 100.0%
DSV Air & Sea Slovakia s.r.o. Slovakia 100.0%
Agility Logistics s.r.o. Slovakia 100.0%
DSV Slovakia, s.r.o. Slovakia 100.0%
DSV Transport d.o.o. Slovenia 100.0%
Tacisa Transitaria S.L. Spain 100.0%
Agility Spain SA Spain 100.0%
DSV Air & Sea International, S.L.U. Spain 100.0%
DSV Solutions Spain S.A.U. Spain 100.0%
Servicios Logisticos Integrados SLI, S.A. Spain 100.0%
DSV Road Spain S.A.U. Spain 100.0%
DSV Holding Spain S.L. Spain 100.0%
DSV Air & Sea, S.A.U. Spain 100.0%
DSV Air & Sea AB Sweden 100.0%
DSV Air & Sea Nordic AB Sweden 100.0%
Agility AB Sweden 100.0%
DSV Solutions AB Sweden 100.0%
DSV Real Estate Rosersberg AB Sweden 100.0%
DSV Group AB Sweden 100.0%
DSV Road AB Sweden 100.0%
Göinge Frakt EK Sweden 100.0%
DSV Road Property Holding AB Sweden 100.0%
Agility Management AG Switzerland 100.0%
Panalpina Welttransport Holding AG Switzerland 100.0%
Panalpina Management AG Switzerland 100.0%
Panalpina International AG Switzerland 100.0%
Panalpina Global Employment Services AG Switzerland 100.0%
Panalpina Air & Ocean AG in liquidation Switzerland 100.0%
DSV Air & Sea AG Switzerland 100.0%
Agility Logistics AG Switzerland 100.0%
Agility Logistics CIS AG Switzerland 100.0%
Agility GIL Services AG Switzerland 100.0%
DSV Logistics S.A. Switzerland 100.0%
DSV Air & Sea A.S. Turkey 100.0%
Agility Lojistik Anonim Sirketi Turkey 100.0%
DSV International Hava ve Deniz Taşimaciliği Ltd.Şirketi Turkey 100.0%
DSV Road & Solutions A.S. Turkey 100.0%
Panalpina World Transport Ltd. Ukraine 100.0%
DSV Logistics LLC Ukraine 100.0%
Agility Logistics LLC Ukraine 100.0%
Agility Logistics Holdings Ltd. United Kingdom 100.0%
DSV Air & Sea Limited United Kingdom 100.0%
UTi (UK) Holdings Ltd. United Kingdom 100.0%
UTi Worldwide (UK) Ltd. United Kingdom 100.0%
Panalpina World Transport Ltd. United Kingdom 100.0%
Agility Logistics Ltd. United Kingdom 100.0%
Agility Fairs and Events Logistics Ltd. United Kingdom 100.0%
Agility Pension Plan Trustees Ltd. United Kingdom 100.0%
Agility Management Ltd Europe Region Management HQ United Kingdom 100.0%
Agility Management Ltd IT Bureau United Kingdom 100.0%
DSV Air & Sea 2018 (UK) Limited United Kingdom 100.0%
Agility Projects Logistics Limited United Kingdom 100.0%
Agility Logistics Solutions Ltd. United Kingdom 100.0%
Agility Management Ltd United Kingdom 100.0%
DSV Peterborough Real Estate Limited United Kingdom 100.0%
DSV Real Estate Thrapston Limited United Kingdom 100.0%
DSV Road Holding Ltd. United Kingdom 100.0%
DSV Commercials Ltd. United Kingdom 100.0%
DSV Road Ltd. United Kingdom 100.0%
Global Options Worldwide Express (Ltd) United Kingdom 100.0%
DSV Pension Trustees Ltd. United Kingdom 100.0%
DSV Solutions Ltd. United Kingdom 100.0%
DFDS Transport Ltd. United Kingdom 100.0%
DSV Real Estate Tamworth Ltd. United Kingdom 100.0%
North America
GeoLogistics Holdings (Bermuda) Limited Bermuda 100.0%
DSV Air & Sea Inc. Canada 100.0%
Agility Logistics, Ltd. Canada 100.0%
DSV Solutions Inc. Canada 100.0%
DSV Road, Inc. Canada 100.0%
DSV Air & Sea, S.A. de C.V. Mexico 100.0%
Panalpina Servicios S.A. de C.V. Mexico 100.0%
TransOceanic Shipping Co. S. de RL de C.V. Mexico 100.0%
DSV Solutions S.A. de C.V. Mexico 100.0%
Company CountryOwnership
share Activity
Europe (continued)
Company CountryOwnership
share Activity
Europe (continued)
Company CountryOwnership
share Activity
Europe (continued)
88 DSV Annual Report 2021 Consolidated financial statements 2021
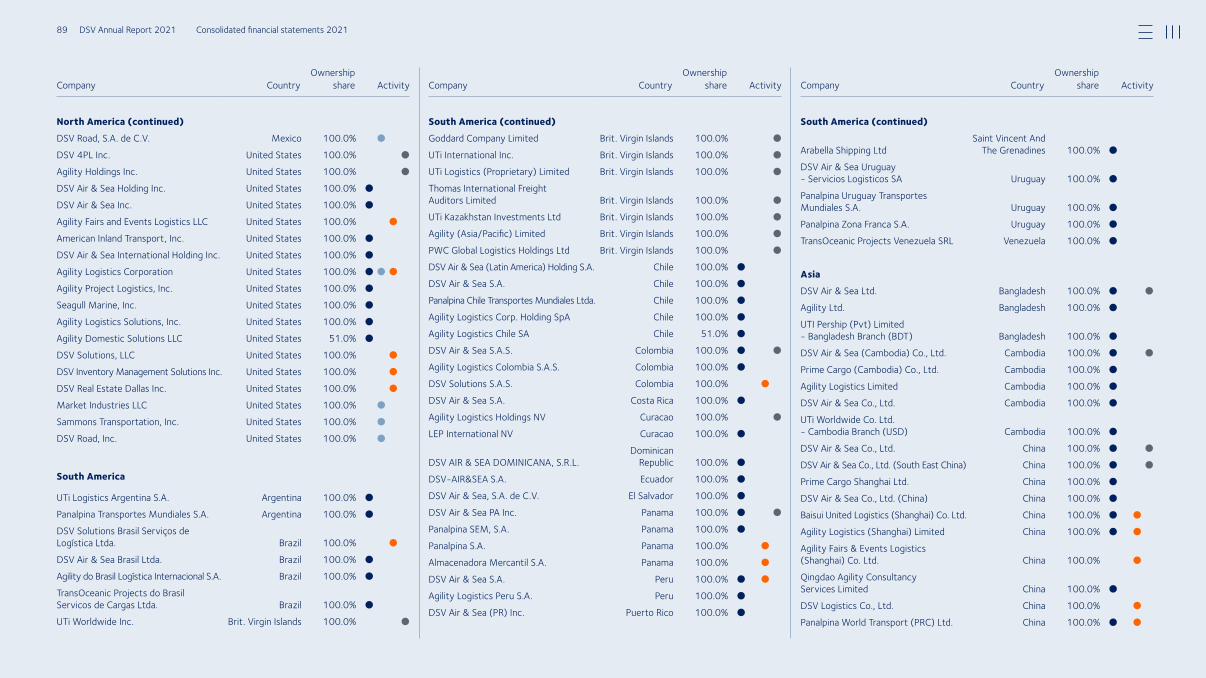
DSV Road, S.A. de C.V. Mexico 100.0%
DSV 4PL Inc. United States 100.0%
Agility Holdings Inc. United States 100.0%
DSV Air & Sea Holding Inc. United States 100.0%
DSV Air & Sea Inc. United States 100.0%
Agility Fairs and Events Logistics LLC United States 100.0%
American Inland Transport, Inc. United States 100.0%
DSV Air & Sea International Holding Inc. United States 100.0%
Agility Logistics Corporation United States 100.0%
Agility Project Logistics, Inc. United States 100.0%
Seagull Marine, Inc. United States 100.0%
Agility Logistics Solutions, Inc. United States 100.0%
Agility Domestic Solutions LLC United States 51.0%
DSV Solutions, LLC United States 100.0%
DSV Inventory Management Solutions Inc. United States 100.0%
DSV Real Estate Dallas Inc. United States 100.0%
Market Industries LLC United States 100.0%
Sammons Transportation, Inc. United States 100.0%
DSV Road, Inc. United States 100.0%
South America
UTi Logistics Argentina S.A. Argentina 100.0%
Panalpina Transportes Mundiales S.A. Argentina 100.0%
DSV Solutions Brasil Serviços de Logística Ltda. Brazil 100.0%
DSV Air & Sea Brasil Ltda. Brazil 100.0%
Agility do Brasil Logística Internacional S.A. Brazil 100.0%
TransOceanic Projects do Brasil Servicos de Cargas Ltda. Brazil 100.0%
UTi Worldwide Inc. Brit. Virgin Islands 100.0%
Goddard Company Limited Brit. Virgin Islands 100.0%
UTi International Inc. Brit. Virgin Islands 100.0%
UTi Logistics (Proprietary) Limited Brit. Virgin Islands 100.0%
Thomas International Freight Auditors Limited Brit. Virgin Islands 100.0%
UTi Kazakhstan Investments Ltd Brit. Virgin Islands 100.0%
Agility (Asia/Pacific) Limited Brit. Virgin Islands 100.0%
PWC Global Logistics Holdings Ltd Brit. Virgin Islands 100.0%
DSV Air & Sea (Latin America) Holding S.A. Chile 100.0%
DSV Air & Sea S.A. Chile 100.0%
Panalpina Chile Transportes Mundiales Ltda. Chile 100.0%
Agility Logistics Corp. Holding SpA Chile 100.0%
Agility Logistics Chile SA Chile 51.0%
DSV Air & Sea S.A.S. Colombia 100.0%
Agility Logistics Colombia S.A.S. Colombia 100.0%
DSV Solutions S.A.S. Colombia 100.0%
DSV Air & Sea S.A. Costa Rica 100.0%
Agility Logistics Holdings NV Curacao 100.0%
LEP International NV Curacao 100.0%
DSV AIR & SEA DOMINICANA, S.R.L.Dominican
Republic 100.0%
DSVAIR&SEA S.A. Ecuador 100.0%
DSV Air & Sea, S.A. de C.V. El Salvador 100.0%
DSV Air & Sea PA Inc. Panama 100.0%
Panalpina SEM, S.A. Panama 100.0%
Panalpina S.A. Panama 100.0%
Almacenadora Mercantil S.A. Panama 100.0%
DSV Air & Sea S.A. Peru 100.0%
Agility Logistics Peru S.A. Peru 100.0%
DSV Air & Sea (PR) Inc. Puerto Rico 100.0%
Arabella Shipping LtdSaint Vincent And
The Grenadines 100.0%
DSV Air & Sea Uruguay Servicios Logisticos SA Uruguay 100.0%
Panalpina Uruguay Transportes Mundiales S.A. Uruguay 100.0%
Panalpina Zona Franca S.A. Uruguay 100.0%
TransOceanic Projects Venezuela SRL Venezuela 100.0%
Asia
DSV Air & Sea Ltd. Bangladesh 100.0%
Agility Ltd. Bangladesh 100.0%
UTI Pership (Pvt) Limited Bangladesh Branch (BDT) Bangladesh 100.0%
DSV Air & Sea (Cambodia) Co., Ltd. Cambodia 100.0%
Prime Cargo (Cambodia) Co., Ltd. Cambodia 100.0%
Agility Logistics Limited Cambodia 100.0%
DSV Air & Sea Co., Ltd. Cambodia 100.0%
UTi Worldwide Co. Ltd. Cambodia Branch (USD) Cambodia 100.0%
DSV Air & Sea Co., Ltd. China 100.0%
DSV Air & Sea Co., Ltd. (South East China) China 100.0%
Prime Cargo Shanghai Ltd. China 100.0%
DSV Air & Sea Co., Ltd. (China) China 100.0%
Baisui United Logistics (Shanghai) Co. Ltd. China 100.0%
Agility Logistics (Shanghai) Limited China 100.0%
Agility Fairs & Events Logistics (Shanghai) Co. Ltd. China 100.0%
Qingdao Agility Consultancy Services Limited China 100.0%
DSV Logistics Co., Ltd. China 100.0%
Panalpina World Transport (PRC) Ltd. China 100.0%
Company CountryOwnership
share Activity
South America (continued)
Company CountryOwnership
share Activity
North America (continued)
Company CountryOwnership
share Activity
South America (continued)
89 DSV Annual Report 2021 Consolidated financial statements 2021
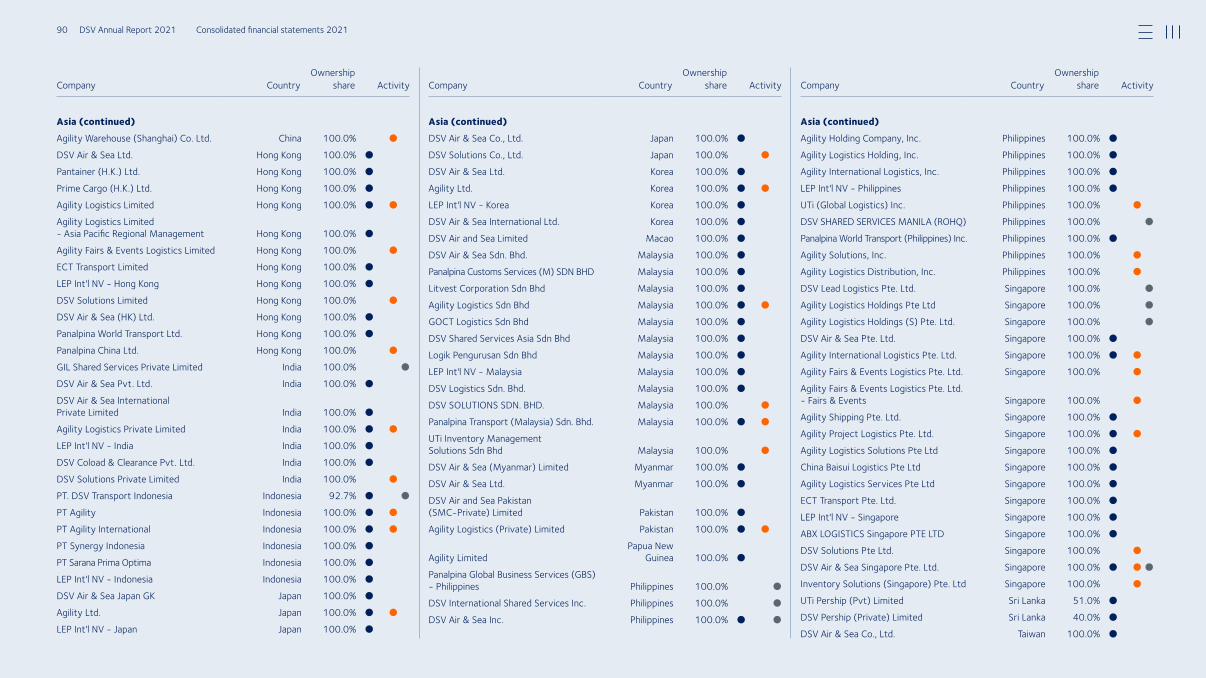
Agility Warehouse (Shanghai) Co. Ltd. China 100.0%
DSV Air & Sea Ltd. Hong Kong 100.0%
Pantainer (H.K.) Ltd. Hong Kong 100.0%
Prime Cargo (H.K.) Ltd. Hong Kong 100.0%
Agility Logistics Limited Hong Kong 100.0%
Agility Logistics Limited Asia Pacific Regional Management Hong Kong 100.0%
Agility Fairs & Events Logistics Limited Hong Kong 100.0%
ECT Transport Limited Hong Kong 100.0%
LEP Int'l NV Hong Kong Hong Kong 100.0%
DSV Solutions Limited Hong Kong 100.0%
DSV Air & Sea (HK) Ltd. Hong Kong 100.0%
Panalpina World Transport Ltd. Hong Kong 100.0%
Panalpina China Ltd. Hong Kong 100.0%
GIL Shared Services Private Limited India 100.0%
DSV Air & Sea Pvt. Ltd. India 100.0%
DSV Air & Sea International Private Limited India 100.0%
Agility Logistics Private Limited India 100.0%
LEP Int'l NV India India 100.0%
DSV Coload & Clearance Pvt. Ltd. India 100.0%
DSV Solutions Private Limited India 100.0%
PT. DSV Transport Indonesia Indonesia 92.7%
PT Agility Indonesia 100.0%
PT Agility International Indonesia 100.0%
PT Synergy Indonesia Indonesia 100.0%
PT Sarana Prima Optima Indonesia 100.0%
LEP Int'l NV Indonesia Indonesia 100.0%
DSV Air & Sea Japan GK Japan 100.0%
Agility Ltd. Japan 100.0%
LEP Int'l NV Japan Japan 100.0%
DSV Air & Sea Co., Ltd. Japan 100.0%
DSV Solutions Co., Ltd. Japan 100.0%
DSV Air & Sea Ltd. Korea 100.0%
Agility Ltd. Korea 100.0%
LEP Int'l NV Korea Korea 100.0%
DSV Air & Sea International Ltd. Korea 100.0%
DSV Air and Sea Limited Macao 100.0%
DSV Air & Sea Sdn. Bhd. Malaysia 100.0%
Panalpina Customs Services (M) SDN BHD Malaysia 100.0%
Litvest Corporation Sdn Bhd Malaysia 100.0%
Agility Logistics Sdn Bhd Malaysia 100.0%
GOCT Logistics Sdn Bhd Malaysia 100.0%
DSV Shared Services Asia Sdn Bhd Malaysia 100.0%
Logik Pengurusan Sdn Bhd Malaysia 100.0%
LEP Int'l NV Malaysia Malaysia 100.0%
DSV Logistics Sdn. Bhd. Malaysia 100.0%
DSV SOLUTIONS SDN. BHD. Malaysia 100.0%
Panalpina Transport (Malaysia) Sdn. Bhd. Malaysia 100.0%
UTi Inventory Management Solutions Sdn Bhd Malaysia 100.0%
DSV Air & Sea (Myanmar) Limited Myanmar 100.0%
DSV Air & Sea Ltd. Myanmar 100.0%
DSV Air and Sea Pakistan (SMCPrivate) Limited Pakistan 100.0%
Agility Logistics (Private) Limited Pakistan 100.0%
Agility LimitedPapua New
Guinea 100.0%
Panalpina Global Business Services (GBS) Philippines Philippines 100.0%
DSV International Shared Services Inc. Philippines 100.0%
DSV Air & Sea Inc. Philippines 100.0%
Agility Holding Company, Inc. Philippines 100.0%
Agility Logistics Holding, Inc. Philippines 100.0%
Agility International Logistics, Inc. Philippines 100.0%
LEP Int'l NV Philippines Philippines 100.0%
UTi (Global Logistics) Inc. Philippines 100.0%
DSV SHARED SERVICES MANILA (ROHQ) Philippines 100.0%
Panalpina World Transport (Philippines) Inc. Philippines 100.0%
Agility Solutions, Inc. Philippines 100.0%
Agility Logistics Distribution, Inc. Philippines 100.0%
DSV Lead Logistics Pte. Ltd. Singapore 100.0%
Agility Logistics Holdings Pte Ltd Singapore 100.0%
Agility Logistics Holdings (S) Pte. Ltd. Singapore 100.0%
DSV Air & Sea Pte. Ltd. Singapore 100.0%
Agility International Logistics Pte. Ltd. Singapore 100.0%
Agility Fairs & Events Logistics Pte. Ltd. Singapore 100.0%
Agility Fairs & Events Logistics Pte. Ltd. Fairs & Events Singapore 100.0%
Agility Shipping Pte. Ltd. Singapore 100.0%
Agility Project Logistics Pte. Ltd. Singapore 100.0%
Agility Logistics Solutions Pte Ltd Singapore 100.0%
China Baisui Logistics Pte Ltd Singapore 100.0%
Agility Logistics Services Pte Ltd Singapore 100.0%
ECT Transport Pte. Ltd. Singapore 100.0%
LEP Int'l NV Singapore Singapore 100.0%
ABX LOGISTICS Singapore PTE LTD Singapore 100.0%
DSV Solutions Pte Ltd. Singapore 100.0%
DSV Air & Sea Singapore Pte. Ltd. Singapore 100.0%
Inventory Solutions (Singapore) Pte. Ltd Singapore 100.0%
UTi Pership (Pvt) Limited Sri Lanka 51.0%
DSV Pership (Private) Limited Sri Lanka 40.0%
DSV Air & Sea Co., Ltd. Taiwan 100.0%
Company CountryOwnership
share Activity
Asia (continued)
Company CountryOwnership
share Activity
Asia (continued)
Company CountryOwnership
share Activity
Asia (continued)
90 DSV Annual Report 2021 Consolidated financial statements 2021
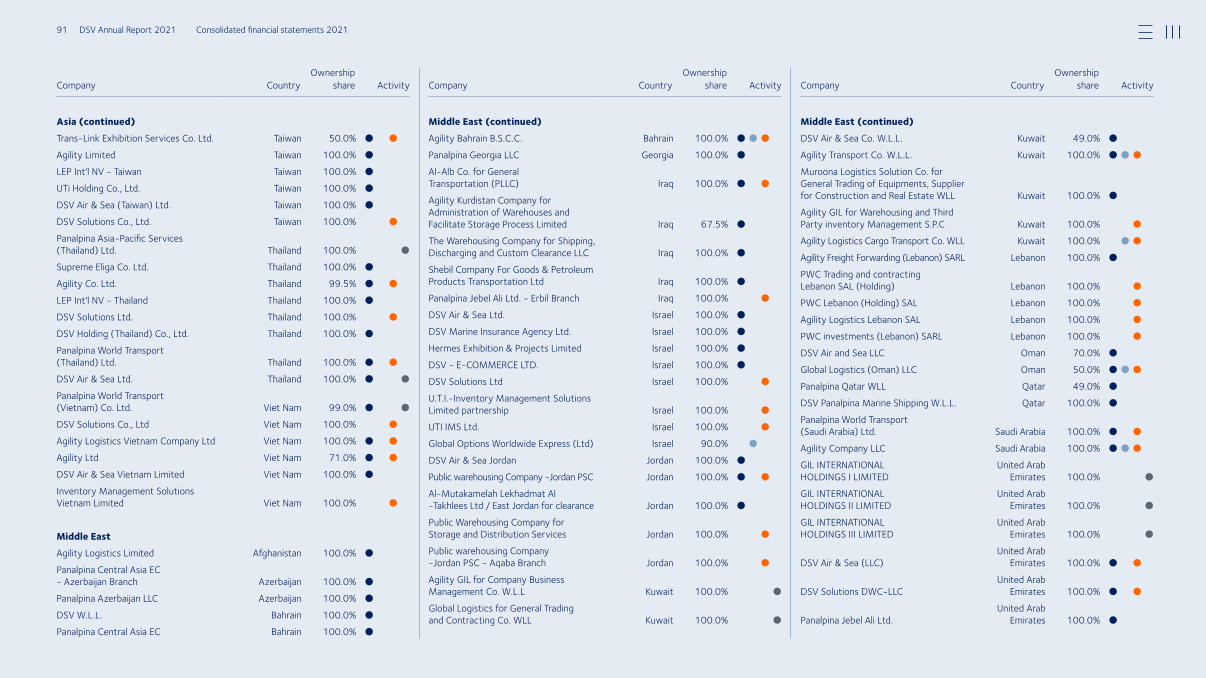
TransLink Exhibition Services Co. Ltd. Taiwan 50.0%
Agility Limited Taiwan 100.0%
LEP Int'l NV Taiwan Taiwan 100.0%
UTi Holding Co., Ltd. Taiwan 100.0%
DSV Air & Sea (Taiwan) Ltd. Taiwan 100.0%
DSV Solutions Co., Ltd. Taiwan 100.0%
Panalpina AsiaPacific Services (Thailand) Ltd. Thailand 100.0%
Supreme Eliga Co. Ltd. Thailand 100.0%
Agility Co. Ltd. Thailand 99.5%
LEP Int'l NV Thailand Thailand 100.0%
DSV Solutions Ltd. Thailand 100.0%
DSV Holding (Thailand) Co., Ltd. Thailand 100.0%
Panalpina World Transport (Thailand) Ltd. Thailand 100.0%
DSV Air & Sea Ltd. Thailand 100.0%
Panalpina World Transport (Vietnam) Co. Ltd. Viet Nam 99.0%
DSV Solutions Co., Ltd Viet Nam 100.0%
Agility Logistics Vietnam Company Ltd Viet Nam 100.0%
Agility Ltd Viet Nam 71.0%
DSV Air & Sea Vietnam Limited Viet Nam 100.0%
Inventory Management Solutions Vietnam Limited Viet Nam 100.0%
Middle East
Agility Logistics Limited Afghanistan 100.0%
Panalpina Central Asia EC Azerbaijan Branch Azerbaijan 100.0%
Panalpina Azerbaijan LLC Azerbaijan 100.0%
DSV W.L.L. Bahrain 100.0%
Panalpina Central Asia EC Bahrain 100.0%
Agility Bahrain B.S.C.C. Bahrain 100.0%
Panalpina Georgia LLC Georgia 100.0%
AlAlb Co. for General Transportation (PLLC) Iraq 100.0%
Agility Kurdistan Company for Admin istration of Warehouses and Facilitate Storage Process Limited Iraq 67.5%
The Warehousing Company for Shipping, Discharging and Custom Clearance LLC Iraq 100.0%
Shebil Company For Goods & Petroleum Products Transportation Ltd Iraq 100.0%
Panalpina Jebel Ali Ltd. Erbil Branch Iraq 100.0%
DSV Air & Sea Ltd. Israel 100.0%
DSV Marine Insurance Agency Ltd. Israel 100.0%
Hermes Exhibition & Projects Limited Israel 100.0%
DSV ECOMMERCE LTD. Israel 100.0%
DSV Solutions Ltd Israel 100.0%
U.T.I.Inventory Management Solutions Limited partnership Israel 100.0%
UTI IMS Ltd. Israel 100.0%
Global Options Worldwide Express (Ltd) Israel 90.0%
DSV Air & Sea Jordan Jordan 100.0%
Public warehousing Company Jordan PSC Jordan 100.0%
AlMutakamelah Lekhadmat Al Takhlees Ltd / East Jordan for clearance Jordan 100.0%
Public Warehousing Company for Storage and Distribution Services Jordan 100.0%
Public warehousing Company Jordan PSC Aqaba Branch Jordan 100.0%
Agility GIL for Company Business Management Co. W.L.L Kuwait 100.0%
Global Logistics for General Trading and Contracting Co. WLL Kuwait 100.0%
DSV Air & Sea Co. W.L.L. Kuwait 49.0%
Agility Transport Co. W.L.L. Kuwait 100.0%
Muroona Logistics Solution Co. for General Trading of Equipments, Supplier for Construction and Real Estate WLL Kuwait 100.0%
Agility GIL for Warehousing and Third Party inventory Management S.P.C Kuwait 100.0%
Agility Logistics Cargo Transport Co. WLL Kuwait 100.0%
Agility Freight Forwarding (Lebanon) SARL Lebanon 100.0%
PWC Trading and contracting Lebanon SAL (Holding) Lebanon 100.0%
PWC Lebanon (Holding) SAL Lebanon 100.0%
Agility Logistics Lebanon SAL Lebanon 100.0%
PWC investments (Lebanon) SARL Lebanon 100.0%
DSV Air and Sea LLC Oman 70.0%
Global Logistics (Oman) LLC Oman 50.0%
Panalpina Qatar WLL Qatar 49.0%
DSV Panalpina Marine Shipping W.L.L. Qatar 100.0%
Panalpina World Transport (Saudi Arabia) Ltd. Saudi Arabia 100.0%
Agility Company LLC Saudi Arabia 100.0%
GIL INTERNATIONAL HOLDINGS I LIMITED
United Arab Emirates 100.0%
GIL INTERNATIONAL HOLDINGS II LIMITED
United Arab Emirates 100.0%
GIL INTERNATIONAL HOLDINGS III LIMITED
United Arab Emirates 100.0%
DSV Air & Sea (LLC)United Arab
Emirates 100.0%
DSV Solutions DWCLLCUnited Arab
Emirates 100.0%
Panalpina Jebel Ali Ltd.United Arab
Emirates 100.0%
Company CountryOwnership
share Activity
Middle East (continued)
Company CountryOwnership
share Activity
Asia (continued)
Company CountryOwnership
share Activity
Middle East (continued)
91 DSV Annual Report 2021 Consolidated financial statements 2021
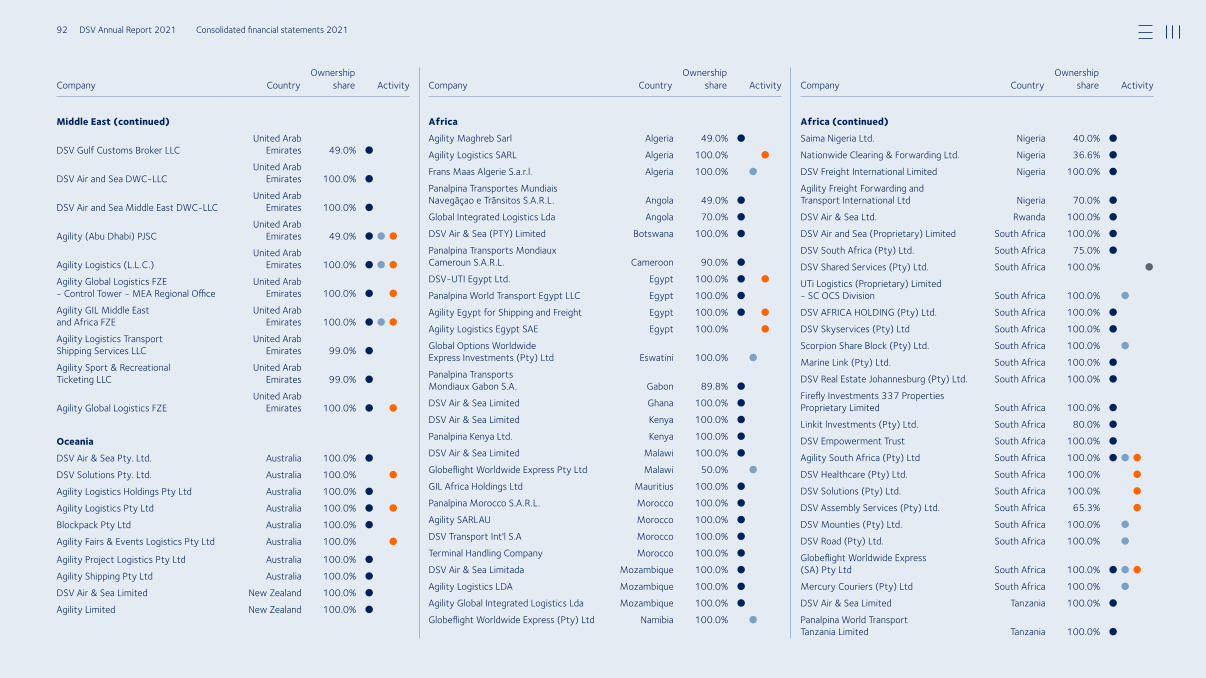
DSV Gulf Customs Broker LLCUnited Arab
Emirates 49.0%
DSV Air and Sea DWCLLCUnited Arab
Emirates 100.0%
DSV Air and Sea Middle East DWCLLCUnited Arab
Emirates 100.0%
Agility (Abu Dhabi) PJSCUnited Arab
Emirates 49.0%
Agility Logistics (L.L.C.)United Arab
Emirates 100.0%
Agility Global Logistics FZE Control Tower MEA Regional Office
United Arab Emirates 100.0%
Agility GIL Middle East and Africa FZE
United Arab Emirates 100.0%
Agility Logistics Transport Shipping Services LLC
United Arab Emirates 99.0%
Agility Sport & Recreational Ticketing LLC
United Arab Emirates 99.0%
Agility Global Logistics FZEUnited Arab
Emirates 100.0%
Oceania
DSV Air & Sea Pty. Ltd. Australia 100.0%
DSV Solutions Pty. Ltd. Australia 100.0%
Agility Logistics Holdings Pty Ltd Australia 100.0%
Agility Logistics Pty Ltd Australia 100.0%
Blockpack Pty Ltd Australia 100.0%
Agility Fairs & Events Logistics Pty Ltd Australia 100.0%
Agility Project Logistics Pty Ltd Australia 100.0%
Agility Shipping Pty Ltd Australia 100.0%
DSV Air & Sea Limited New Zealand 100.0%
Agility Limited New Zealand 100.0%
Agility Maghreb Sarl Algeria 49.0%
Agility Logistics SARL Algeria 100.0%
Frans Maas Algerie S.a.r.l. Algeria 100.0%
Panalpina Transportes Mundiais Navegãçao e Trânsitos S.A.R.L. Angola 49.0%
Global Integrated Logistics Lda Angola 70.0%
DSV Air & Sea (PTY) Limited Botswana 100.0%
Panalpina Transports Mondiaux Cameroun S.A.R.L. Cameroon 90.0%
DSVUTI Egypt Ltd. Egypt 100.0%
Panalpina World Transport Egypt LLC Egypt 100.0%
Agility Egypt for Shipping and Freight Egypt 100.0%
Agility Logistics Egypt SAE Egypt 100.0%
Global Options Worldwide Express Investments (Pty) Ltd Eswatini 100.0%
Panalpina Transports Mondiaux Gabon S.A. Gabon 89.8%
DSV Air & Sea Limited Ghana 100.0%
DSV Air & Sea Limited Kenya 100.0%
Panalpina Kenya Ltd. Kenya 100.0%
DSV Air & Sea Limited Malawi 100.0%
Globeflight Worldwide Express Pty Ltd Malawi 50.0%
GIL Africa Holdings Ltd Mauritius 100.0%
Panalpina Morocco S.A.R.L. Morocco 100.0%
Agility SARLAU Morocco 100.0%
DSV Transport Int'l S.A Morocco 100.0%
Terminal Handling Company Morocco 100.0%
DSV Air & Sea Limitada Mozambique 100.0%
Agility Logistics LDA Mozambique 100.0%
Agility Global Integrated Logistics Lda Mozambique 100.0%
Globeflight Worldwide Express (Pty) Ltd Namibia 100.0%
Saima Nigeria Ltd. Nigeria 40.0%
Nationwide Clearing & Forwarding Ltd. Nigeria 36.6%
DSV Freight International Limited Nigeria 100.0%
Agility Freight Forwarding and Transport International Ltd Nigeria 70.0%
DSV Air & Sea Ltd. Rwanda 100.0%
DSV Air and Sea (Proprietary) Limited South Africa 100.0%
DSV South Africa (Pty) Ltd. South Africa 75.0%
DSV Shared Services (Pty) Ltd. South Africa 100.0%
UTi Logistics (Proprietary) Limited SC OCS Division South Africa 100.0%
DSV AFRICA HOLDING (Pty) Ltd. South Africa 100.0%
DSV Skyservices (Pty) Ltd South Africa 100.0%
Scorpion Share Block (Pty) Ltd. South Africa 100.0%
Marine Link (Pty) Ltd. South Africa 100.0%
DSV Real Estate Johannesburg (Pty) Ltd. South Africa 100.0%
Firefly Investments 337 Properties Proprietary Limited South Africa 100.0%
Linkit lnvestments (Pty) Ltd. South Africa 80.0%
DSV Empowerment Trust South Africa 100.0%
Agility South Africa (Pty) Ltd South Africa 100.0%
DSV Healthcare (Pty) Ltd. South Africa 100.0%
DSV Solutions (Pty) Ltd. South Africa 100.0%
DSV Assembly Services (Pty) Ltd. South Africa 65.3%
DSV Mounties (Pty) Ltd. South Africa 100.0%
DSV Road (Pty) Ltd. South Africa 100.0%
Globeflight Worldwide Express (SA) Pty Ltd South Africa 100.0%
Mercury Couriers (Pty) Ltd South Africa 100.0%
DSV Air & Sea Limited Tanzania 100.0%
Panalpina World Transport Tanzania Limited Tanzania 100.0%
Company CountryOwnership
share Activity
Africa
Company CountryOwnership
share Activity
Middle East (continued)
Company CountryOwnership
share Activity
Africa (continued)
92 DSV Annual Report 2021 Consolidated financial statements 2021
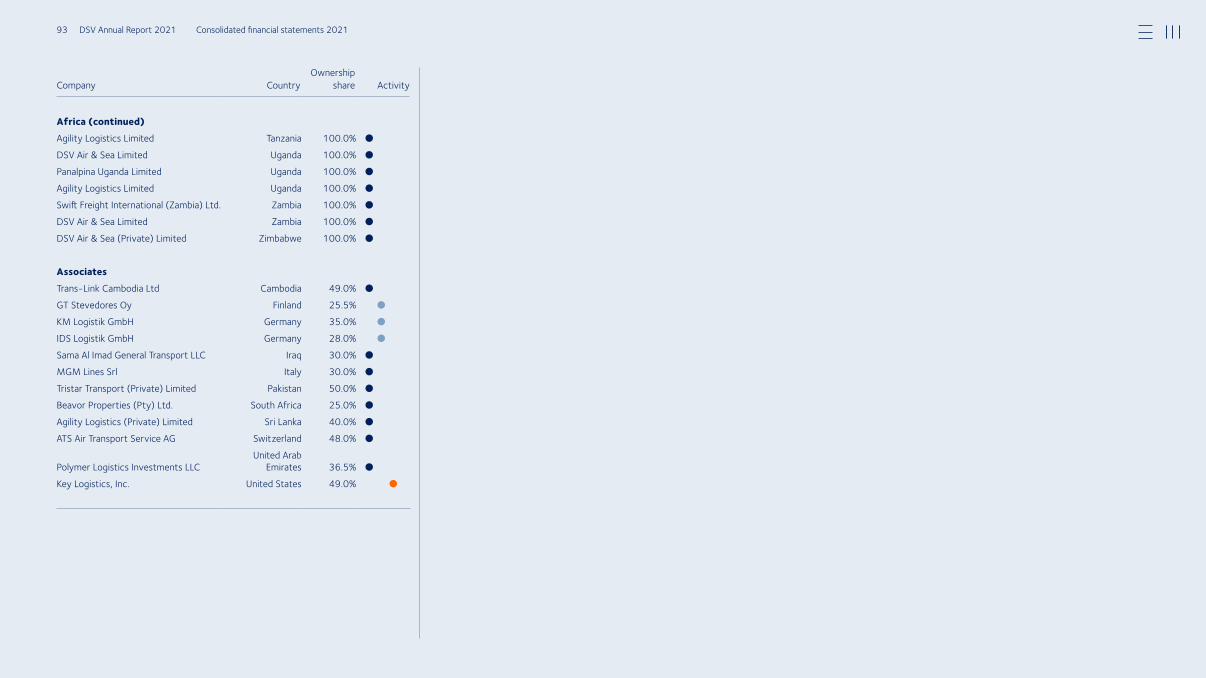
Agility Logistics Limited Tanzania 100.0%
DSV Air & Sea Limited Uganda 100.0%
Panalpina Uganda Limited Uganda 100.0%
Agility Logistics Limited Uganda 100.0%
Swift Freight International (Zambia) Ltd. Zambia 100.0%
DSV Air & Sea Limited Zambia 100.0%
DSV Air & Sea (Private) Limited Zimbabwe 100.0%
Associates
TransLink Cambodia Ltd Cambodia 49.0%
GT Stevedores Oy Finland 25.5%
KM Logistik GmbH Germany 35.0%
IDS Logistik GmbH Germany 28.0%
Sama Al Imad General Transport LLC Iraq 30.0%
MGM Lines Srl Italy 30.0%
Tristar Transport (Private) Limited Pakistan 50.0%
Beavor Properties (Pty) Ltd. South Africa 25.0%
Agility Logistics (Private) Limited Sri Lanka 40.0%
ATS Air Transport Service AG Switzerland 48.0%
Polymer Logistics Investments LLCUnited Arab
Emirates 36.5%
Key Logistics, Inc. United States 49.0%
Company CountryOwnership
share Activity
Africa (continued)
93 DSV Annual Report 2021 Consolidated financial statements 2021
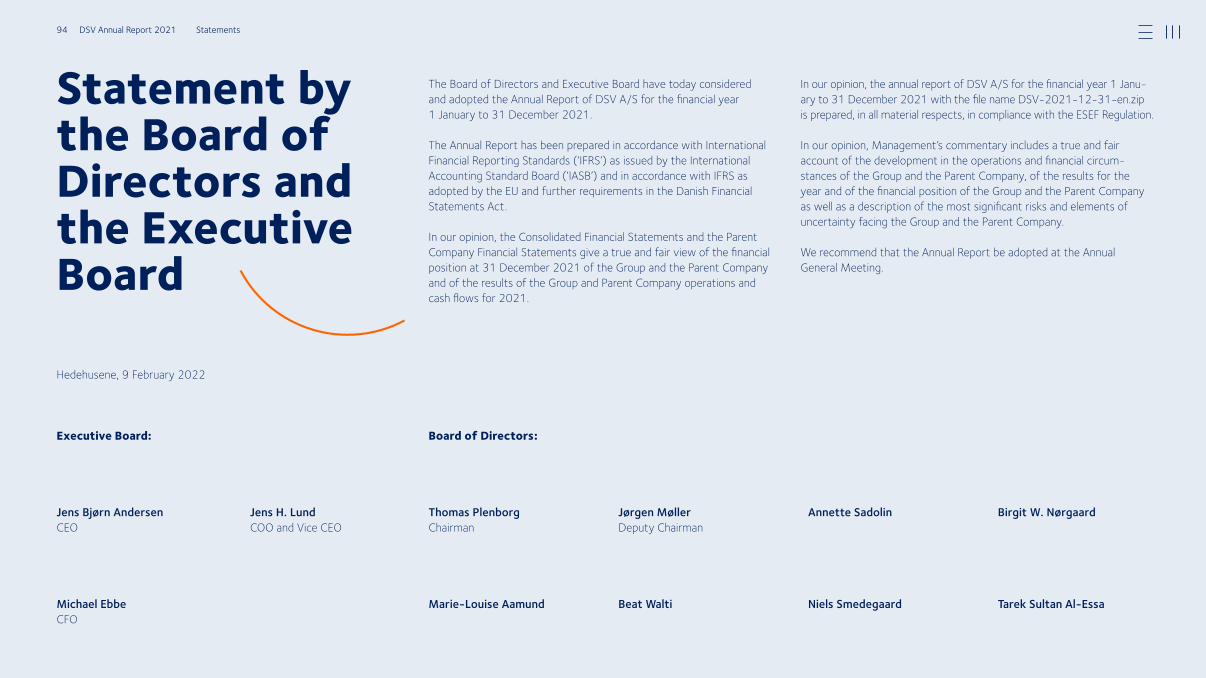
Statement by the Board of Directors and the Executive Board
The Board of Directors and Executive Board have today considered and adopted the Annual Report of DSV A/S for the financial year 1 January to 31 December 2021. The Annual Report has been prepared in accordance with International Financial Reporting Standards (‘IFRS’) as issued by the International Accounting Standard Board (‘IASB’) and in accordance with IFRS as adopted by the EU and further requirements in the Danish Financial Statements Act. In our opinion, the Consolidated Financial Statements and the Parent Company Financial Statements give a true and fair view of the financial position at 31 December 2021 of the Group and the Parent Company and of the results of the Group and Parent Company operations and cash flows for 2021.
Hedehusene, 9 February 2022
Executive Board:
Jens Bjørn Andersen CEO
Michael EbbeCFO
Jens H. LundCOO and Vice CEO
Board of Directors:
Thomas PlenborgChairman
Marie-Louise Aamund
Jørgen MøllerDeputy Chairman
Beat Walti
Annette Sadolin
Niels Smedegaard
Birgit W. Nørgaard
Tarek Sultan Al-Essa
In our opinion, the annual report of DSV A/S for the financial year 1 Janu-ary to 31 December 2021 with the file name DSV-2021-12-31-en.zip is prepared, in all material respects, in compliance with the ESEF Regulation. In our opinion, Management’s commentary includes a true and fair account of the development in the operations and financial circum-stances of the Group and the Parent Company, of the results for the year and of the financial position of the Group and the Parent Company as well as a description of the most significant risks and elements of uncertainty facing the Group and the Parent Company. We recommend that the Annual Report be adopted at the Annual General Meeting.
94 DSV Annual Report 2021 Statements
Independent Auditor’s reports
To the shareholders of DSV A/S Report on the audit of the Financial Statements
Our opinionIn our opinion, the Consolidated Financial Statements and the Parent Company Financial Statements give a true and fair view of the Group’s and the Parent Company’s financial position at 31 December 2021 and of the results of the Group’s and the Parent Company’s operations and cash flows for the financial year 1 January to 31 December 2021 in accord-ance with International Financial Reporting Standards (‘IFRS’) as issued by the International Accounting Standards Board (‘IASB’) and in accordance with IFRS as adopted by the EU and further requirements in the Danish Financial Statements Act.
Our opinion is consistent with our Auditor’s Long-form Report to the Audit Committee and the Board of Directors.
What we have auditedThe Consolidated Financial Statements and Parent Company Financial Statements of DSV A/S for the financial year 1 January to 31 December 2021 comprise income statement and statement of comprehensive in-come, cash flow statement, balance sheet, statement of changes in eq-uity and notes, including summary of significant accounting policies for the Group as well as for the Parent Company. Collectively referred to as the “Financial Statements”.
Basis for opinionWe conducted our audit in accordance with International Standards on Auditing (ISAs) and the additional requirements applicable in Denmark. Our responsibilities under those standards and requirements are further described in the Auditor’s responsibilities for the audit of the Financial Statements section of our report.
We believe that the audit evidence we have obtained is sufficient and appropriate to provide a basis for our opinion.
IndependenceWe are independent of the Group in accordance with the International Ethics Standards Board for Accountants’ International Code of Ethics for Professional Accountants (IESBA Code) and the additional ethical require-ments applicable in Denmark. We have also fulfilled our other ethical re-sponsibilities in accordance with these requirements and the IESBA Code.
To the best of our knowledge and belief, prohibited non-audit services re-ferred to in Article 5(1) of Regulation (EU) No 537/2014 were not provided.
AppointmentWe were first appointed auditors of DSV A/S on 9 March 2017 for the financial year 2017. We have been reappointed annually by shareholder resolution for a total period of uninterrupted engagement of five years including the financial year 2021.
Key audit mattersKey audit matters are those matters that, in our professional judgement, were of most significance in our audit of the Financial Statements for 2021. These matters were addressed in the context of our audit of the Financial Statements as a whole, and in forming our opinion thereon, and we do not provide a separate opinion on these matters.
Agility Global Integrated Logistics - Purchase price allocation
Agility Global Integrated Logistics (“GIL”) was acquired with accounting effect as at 16 August 2021. When acquiring GIL, DSV prepared a pur-
chase price allocation (’PPA’) for the acquisition, resulting in assets and liabilities being separately recognised and valued in the opening balance.When preparing the PPA, Management used the Group's valuation meth-odologies. In order to determine the fair value of the separately identified assets and liabilities in a business combination, the valuation methodolo-gies require input based on assumptions about the future and applied dis-counted cash flow forecasts, including regarding customer churn rates and WACC. The significant judgements and estimates, including methods and data applied and assumptions made by Management, involved in the PPA and opening balance mainly relate to assessing the fair value of the acquired customer relations and provisions.
We focused on this area because of the significance of the amounts in the PPA and because the PPA requires significant judgements and estimates by Management.
Reference is made to note 6.1 in the Consolidated Financial Statements.
How our audit addressed the key audit matterOur audit procedures included assessing the appropriateness of the ac-counting policies for business combinations applied by Management and assessing compliance with applicable financial reporting standards.
We involved our internal specialists in assessing the valuation methodo-logies and WACC used by management and the fair valuation of the ac-quired assets and liabilities. We challenged the significant assumptions used to determine the fair value of the acquired assets and liabilities in the business combination, including the fair value of the acquired customer relations and provisions.
Finally, we assessed the adequacy of disclosures relating to the business combination.
Revenue recognition, contract assets and accrued cost of services
The Group’s revenue consists primarily of services, i.e. shipments of goods between destinations, which by nature is rendered over a period of time.
95 DSV Annual Report 2021 Statements
We focused on this area, because at year-end, material contract assets and accrued cost of services exist which involve significant accounting estimates and which are complex by nature, i.e. accrual of income (con-tract assets) and related costs (accrued cost of services), including meth-ods and data applied and assumptions made by Management. The pro-cess of accruing for services rendered around the balance sheet date is, therefore, complex and dependent on relevant IT controls in certain oper-ational IT systems. Moreover in the Air & Sea division, an inherent risk ex-ists regarding estimates for recognising revenue in the right period at year-end due to the services being rendered over a lengthier period of time.
In addition, we focused on this area because of the significance of reve-nue and as revenue comprises a substantial number of transactions, in-cluding with different characteristics depending on which business seg-ment the revenue relates to.
Reference is made to notes 2.2 and 3.4 in the Consolidated Financial Statements.
How our audit addressed the key audit matterOur audit procedures included considering the appropriateness of the accounting policies for revenue recognition applied by Management and assessing compliance with applicable financial reporting standards. We tested relevant internal controls, including IT controls, concerning the timing of revenue recognition and evaluated whether these were designed in line with the Group’s accounting policies and were operating effectively.
For revenue, contract assets and accrued cost of services, we examined re-ports concerning services in progress and challenged the assumptions made by Management in this regard.
Moreover, we selected a sample of revenue transactions during the year and traced these to underlying evidence to ensure accuracy and existence.
In addition, we applied data analysis in our testing of revenue transactions in order to identify and assess transactions outside the ordinary transac-tion flow.
Deferred tax assets and income tax positions
The Group operates in many territories and is, consequently, subject to local laws and cross-border transfer pricing legislation, which complicates the Group’s tax matters, and which gives rise to provisions for income tax positions.
The Group also carries significant deferred tax assets on the balance sheet. The utilisation of tax assets are, inherently, uncertain, as they are dependent on the financial development of business activities in certain countries and regions.
We focused on this area because the valuation of deferred tax assets and provisions for income tax positions, including from business combinations, is complex and dependent on Management estimates, including Manage-ment’s applied model, data and assumptions.
Reference is made to note 5.2 to the Consolidated Financial Statement.
How our audit addressed the key audit matterOur audit procedures included considering the appropriateness of the Group’s accounting policies and valuation models within the tax account-ing area and assessing compliance with applicable financial reporting standards.
We also assessed Management’s process for identifying and assessing complex income tax transactions as well as deferred tax assets that might not be recoverable.
We tested provisions made for income tax positions. As part of this, we reviewed correspondence with tax authorities and discussed methods and data applied as well as assumptions made by Management. In doing so, we used our internal corporate tax specialists.
Moreover, we tested Management’s assessment of the recoverability of the carrying value of deferred tax assets arising from temporary differ-ences and tax loss carryforwards on the basis of internal forecasts of
future taxable income, and evaluated the assumptions made by Management in this connection.
Statement on Management’s CommentaryManagement is responsible for Management’s Commentary.
Our opinion on the Financial Statements does not cover Management’s Commentary, and we do not express any form of assurance conclusion thereon.In connection with our audit of the Financial Statements, our responsibility is to read Management’s Commentary and, in doing so, consider whether Management’s Commentary is materially inconsistent with the Financial Statements or our knowledge obtained in the audit, or otherwise appears to be materially misstated.
Moreover, we considered whether Management’s Commentary includes the disclosures required by the Danish Financial Statements Act. Based on the work we have performed, in our view, Management’s Commentary is in accordance with the Consolidated Financial Statements and the Parent Company Financial Statements and has been prepared in accordance with the requirements of the Danish Financial Statements Act. We did not identify any material misstatement in Management’s Commentary.
Management’s responsibilities for the Financial StatementsManagement is responsible for the preparation of consolidated financial statements and parent company financial statements that give a true and fair view in accordance with International Financial Reporting Stand-ards (‘IFRS’) as issued by the International Accounting Standards Board (‘IASB’) and in accordance with IFRS as adopted by the EU and further requirements in the Danish Financial Statements Act, and for such inter-nal control as Management determines is necessary to enable the prepa-ration of financial statements that are free from material misstatement, whether due to fraud or error.
In preparing the Financial Statements, Management is responsible for assessing the Group’s and the Parent Company’s ability to continue as a going concern, disclosing, as applicable, matters related to going concern and using the going concern basis of accounting unless Management
96 DSV Annual Report 2021 Statements
either intends to liquidate the Group or the Parent Company or to cease operations, or has no realistic alternative but to do so.
Auditor’s responsibilities for the audit of the Financial StatementsOur objectives are to obtain reasonable assurance about whether the Financial Statements as a whole are free from material misstatement, whether due to fraud or error, and to issue an auditor’s report that in-cludes our opinion. Reasonable assurance is a high level of assurance, but is not a guarantee that an audit conducted in accordance with ISAs and the additional requirements applicable in Denmark will always detect a material misstatement when it exists. Misstatements can arise from fraud or error and are considered material if, individually or in the aggregate, they could reasonably be expected to influence the economic decisions of users taken on the basis of these Financial Statements.
As part of an audit in accordance with ISAs and the additional require-ments applicable in Denmark, we exercise professional judgement and maintain professional scepticism throughout the audit.
We also: • Identify and assess the risks of material misstatement of the Financial
Statements, whether due to fraud or error, design and perform audit procedures responsive to those risks, and obtain audit evidence that is sufficient and appropriate to provide a basis for our opinion. The risk of not detecting a material misstatement resulting from fraud is higher than for one resulting from error, as fraud may involve collusion, for-gery, intentional omissions, misrepresentations, or the override of internal control.
• Obtain an understanding of internal control relevant to the audit in order to design audit procedures that are appropriate in the circum-stances, but not for the purpose of expressing an opinion on the effec-tiveness of the Group’s and the Parent Company’s internal control.
• Evaluate the appropriateness of accounting policies used and the reasonable-ness of accounting estimates and related disclosures made by Management.
• Conclude on the appropriateness of Management’s use of the going concern basis of accounting and based on the audit evidence obtained whether a material uncertainty exists related to events or conditions that may cast significant doubt on the Group’s and the Parent Compa-ny’s ability to continue as a going concern. If we conclude that a mate-rial uncertainty exists, we are required to draw attention in our audi-tor’s report to the related disclosures in the Financial Statements or, if such disclosures are inadequate, to modify our opinion. Our conclu-sions are based on the audit evidence obtained up to the date of our auditor’s report. However, future events or conditions may cause the Group or the Parent Company to cease to continue as a going concern.
• Evaluate the overall presentation, structure and content of the Finan-cial Statements, including the disclosures, and whether the Financial Statements represent the underlying transactions and events in a manner that gives a true and fair view.
• Obtain sufficient appropriate audit evidence regarding the financial in-formation of the entities or business activities within the Group to ex-press an opinion on the Consolidated Financial Statements. We are re-sponsible for the direction, supervision and performance of the group audit. We remain solely responsible for our audit opinion.
We communicate with those charged with governance regarding, among other matters, the planned scope and timing of the audit and significant audit findings, including any significant deficiencies in internal control that we identify during our audit.
We also provide those charged with governance with a statement that we have complied with relevant ethical requirements regarding independ-ence, and to communicate with them all relationships and other matters that may reasonably be thought to bear on our independence and, where applicable, actions taken to eliminate threats or safeguards applied.From the matters communicated with those charged with governance, we determine those matters that were of most significance in the audit of the Financial Statements of the current period and are therefore the key audit matters. We describe these matters in our auditor’s report unless law or regulation precludes public disclosure about the matter or when,
in extremely rare circumstances, we determine that a matter should not be communicated in our report because the adverse consequences of doing so would reasonably be expected to outweigh the public interest benefits of such communication.
Report on compliance with the ESEF RegulationAs part of our audit of the Financial Statements, we performed procedures to express an opinion on whether the annual report of DSV A/S for the fi-nancial year 1 January to 31 December 2021 with the filename DSV-2021-12-31-en.zip is prepared, in all material respects, in compliance with the Commission Delegated Regulation (EU) 2019/815 on the European Single Electronic Format (ESEF Regulation) which includes requirements re-lated to the preparation of the annual report in XHTML format and iXBRL tagging of the Consolidated Financial Statements.
Management is responsible for preparing an annual report that complies with the ESEF Regulation. This responsibility includes:• The preparing of the annual report in XHTML format;• The selection and application of appropriate iXBRL tags, including ex-
tensions to the ESEF taxonomy and the anchoring thereof to elements in the taxonomy, for all financial information required to be tagged using judgement where necessary;
• Ensuring consistency between iXBRL tagged data and the Consolidated Financial Statements presented in human-readable format; and
• For such internal control as Management determines necessary to enable the preparation of an annual report that is compliant with the ESEF Regulation.
Our responsibility is to obtain reasonable assurance on whether the annual report is prepared, in all material respects, in compliance with the ESEF Regulation based on the evidence we have obtained, and to issue a report that includes our opinion. The nature, timing and extent of procedures se-lected depend on the auditor’s judgement, including the assessment of the risks of material departures from the requirements set out in the ESEF Regulation, whether due to fraud or error.
97 DSV Annual Report 2021 Statements
The procedures include:• Testing whether the annual report is prepared in XHTML format;• Obtaining an understanding of the company’s iXBRL tagging process
and of internal control over the tagging process;• Evaluating the completeness of the iXBRL tagging of the Consolidated
Financial Statements;• Evaluating the appropriateness of the company’s use of iXBRL elements
selected from the ESEF taxonomy and the creation of extension elements where no suitable element in the ESEF taxonomy has been identified;
• Evaluating the use of anchoring of extension elements to elements in the ESEF taxonomy; and
• Reconciling the iXBRL tagged data with the audited Consolidated Financial Statements.
In our opinion, the annual report of DSV A/S for the financial year 1 January to 31 December 2021 with the file name DSV-2021-12-31-en.zip is prepared, in all material respects, in compliance with the ESEF Regulation.
Copenhagen, 9 February 2022
Lars BaungaardState Authorised Public AccountantMne23331
Kim TromholtState Authorised Public AccountantMne33251
PricewaterhouseCoopersStatsautoriseret RevisionspartnerselskabCVR no 3377 1231
98 DSV Annual Report 2021 Statements
Parent Company financialstatements 2021
Financial statements
Income statement . . . . . . . . . . . . . . . . . . . . . . . . . . . . 100Statement of comprehensive income . . . . . . . . . . . . . . . . . 100Cash flow statement . . . . . . . . . . . . . . . . . . . . . . . . . . . 101Balance sheet . . . . . . . . . . . . . . . . . . . . . . . . . . . . . . . 102Statement of changes in equity . . . . . . . . . . . . . . . . . . . . 103
Notes
Basis of preparation1. Accounting policies . . . . . . . . . . . . . . . . . . . . . . . . 1042. Changes in accounting policies . . . . . . . . . . . . . . . . . . 1043. Management judgements and estimates . . . . . . . . . . . . 1044. New accounting regulations . . . . . . . . . . . . . . . . . . . 104
Income statement 5. Revenue . . . . . . . . . . . . . . . . . . . . . . . . . . . . . . 1046. Fees to auditors appointed at the Annual General Meeting . . 1047. Staff costs . . . . . . . . . . . . . . . . . . . . . . . . . . . . . 1048. Special items . . . . . . . . . . . . . . . . . . . . . . . . . . . . 1049. Financial income . . . . . . . . . . . . . . . . . . . . . . . . . . 10510. Financial expenses . . . . . . . . . . . . . . . . . . . . . . . . . 10511. Income tax . . . . . . . . . . . . . . . . . . . . . . . . . . . . . 105
Table of contents
Balance sheet12. Intangible assets . . . . . . . . . . . . . . . . . . . . . . . . . . 10513. Other plant and operating equipment . . . . . . . . . . . . . . 10614. Current receivables from group entities and other receivables . 10615. Equity reserves . . . . . . . . . . . . . . . . . . . . . . . . . . 10616. Financial liabilities . . . . . . . . . . . . . . . . . . . . . . . . . 10717. Payables to Group entities and other payables . . . . . . . . . 10718. Deferred tax asset . . . . . . . . . . . . . . . . . . . . . . . . . 107
Supplementary information19. Share option schemes . . . . . . . . . . . . . . . . . . . . . . . 10820. Investments in Group entities . . . . . . . . . . . . . . . . . . 10821. Derivative financial instruments . . . . . . . . . . . . . . . . . 10922. Financial risks . . . . . . . . . . . . . . . . . . . . . . . . . . . . 10923. Contingent liabilities and security for debt . . . . . . . . . . . 11024. Related-party transactions . . . . . . . . . . . . . . . . . . . . 110
99 DSV Annual Report 2021 Parent Company financial statements 2021
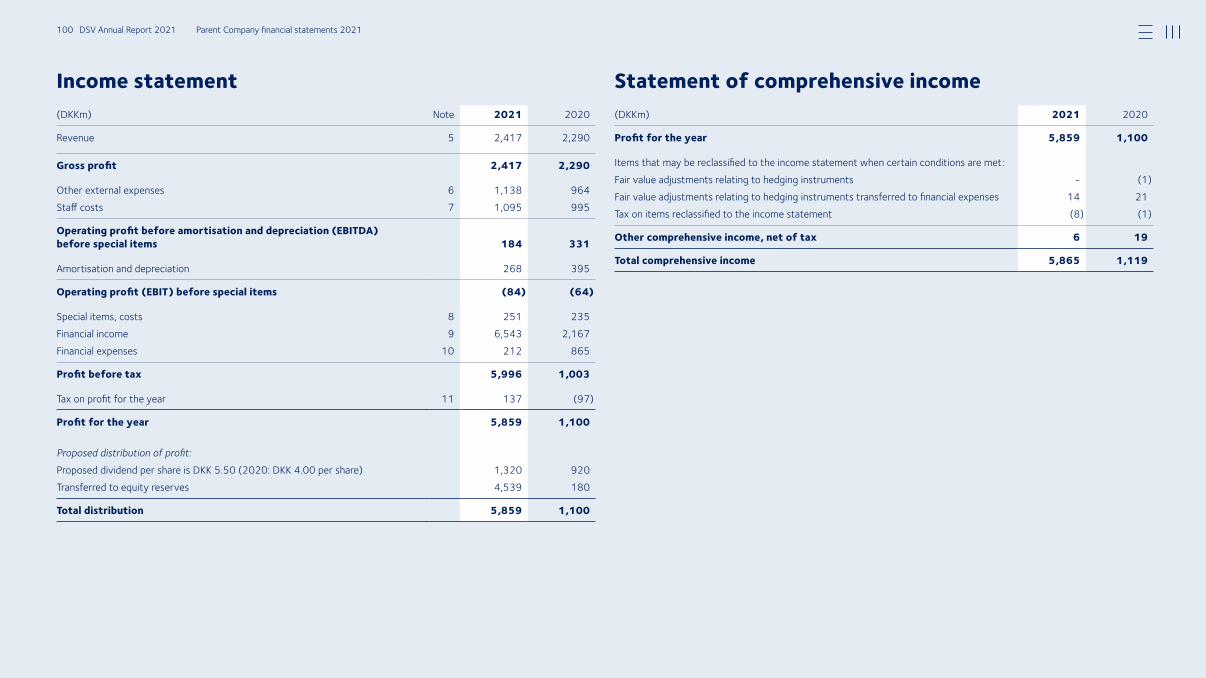
Income statement Statement of comprehensive income(DKKm) Note 2021 2020
Revenue 5 2,417 2,290
Gross profit 2,417 2,290
Other external expenses 6 1,138 964Staff costs 7 1,095 995
Operating profit before amortisation and depreciation (EBITDA) before special items 184 331
Amortisation and depreciation 268 395
Operating profit (EBIT) before special items (84) (64)
Special items, costs 8 251 235Financial income 9 6,543 2,167Financial expenses 10 212 865
Profit before tax 5,996 1,003
Tax on profit for the year 11 137 (97)
Profit for the year 5,859 1,100
Proposed distribution of profit:Proposed dividend per share is DKK 5.50 (2020: DKK 4.00 per share) 1,320 920Transferred to equity reserves 4,539 180
Total distribution 5,859 1,100
(DKKm) 2021 2020
Profit for the year 5,859 1,100
Items that may be reclassified to the income statement when certain conditions are met:Fair value adjustments relating to hedging instruments (1)Fair value adjustments relating to hedging instruments transferred to financial expenses 14 21Tax on items reclassified to the income statement (8) (1)
Other comprehensive income, net of tax 6 19
Total comprehensive income 5,865 1,119
100 DSV Annual Report 2021 Parent Company financial statements 2021
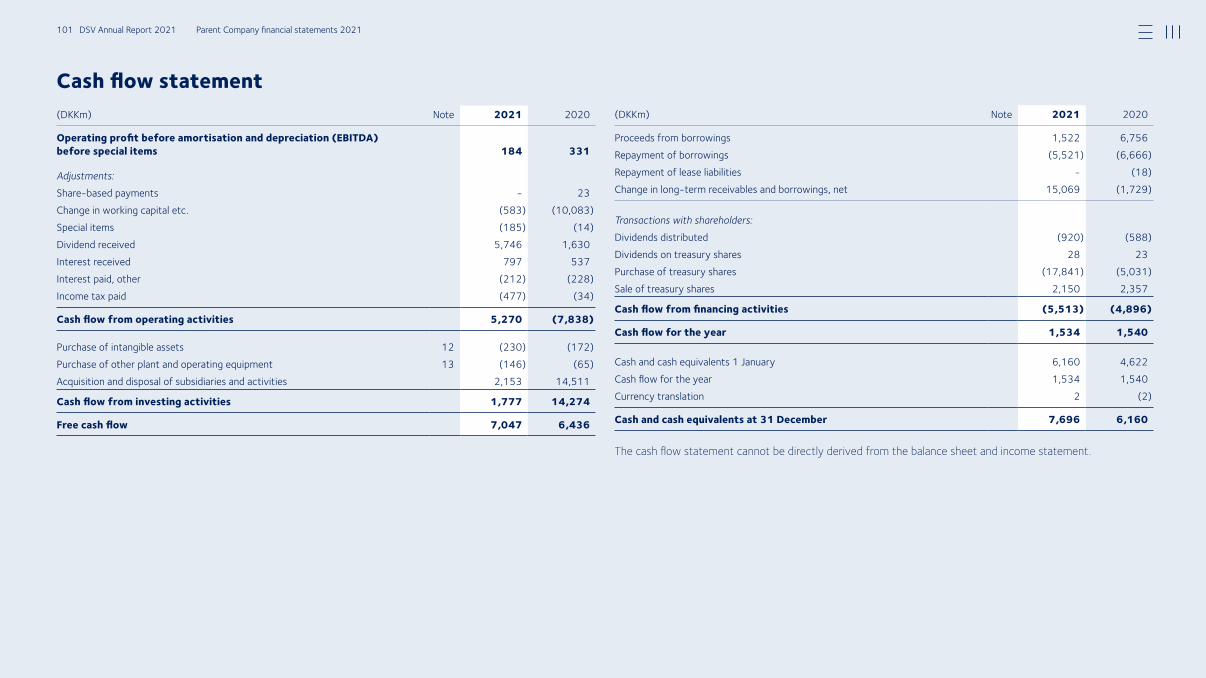
Cash flow statement(DKKm) Note 2021 2020
Operating profit before amortisation and depreciation (EBITDA) before special items 184 331
Adjustments:Sharebased payments 23Change in working capital etc. (583) (10,083)Special items (185) (14)Dividend received 5,746 1,630Interest received 797 537Interest paid, other (212) (228)Income tax paid (477) (34)
Cash flow from operating activities 5,270 (7,838)
Purchase of intangible assets 12 (230) (172)Purchase of other plant and operating equipment 13 (146) (65)Acquisition and disposal of subsidiaries and activities 2,153 14,511
Cash flow from investing activities 1,777 14,274
Free cash flow 7,047 6,436
(DKKm) Note 2021 2020
Proceeds from borrowings 1,522 6,756Repayment of borrowings (5,521) (6,666)Repayment of lease liabilities (18)Change in longterm receivables and borrowings, net 15,069 (1,729)
Transactions with shareholders:Dividends distributed (920) (588)Dividends on treasury shares 28 23Purchase of treasury shares (17,841) (5,031)Sale of treasury shares 2,150 2,357
Cash flow from financing activities (5,513) (4,896)
Cash flow for the year 1,534 1,540
Cash and cash equivalents 1 January 6,160 4,622Cash flow for the year 1,534 1,540Currency translation 2 (2)
Cash and cash equivalents at 31 December 7,696 6,160
The cash flow statement cannot be directly derived from the balance sheet and income statement.
101 DSV Annual Report 2021 Parent Company financial statements 2021
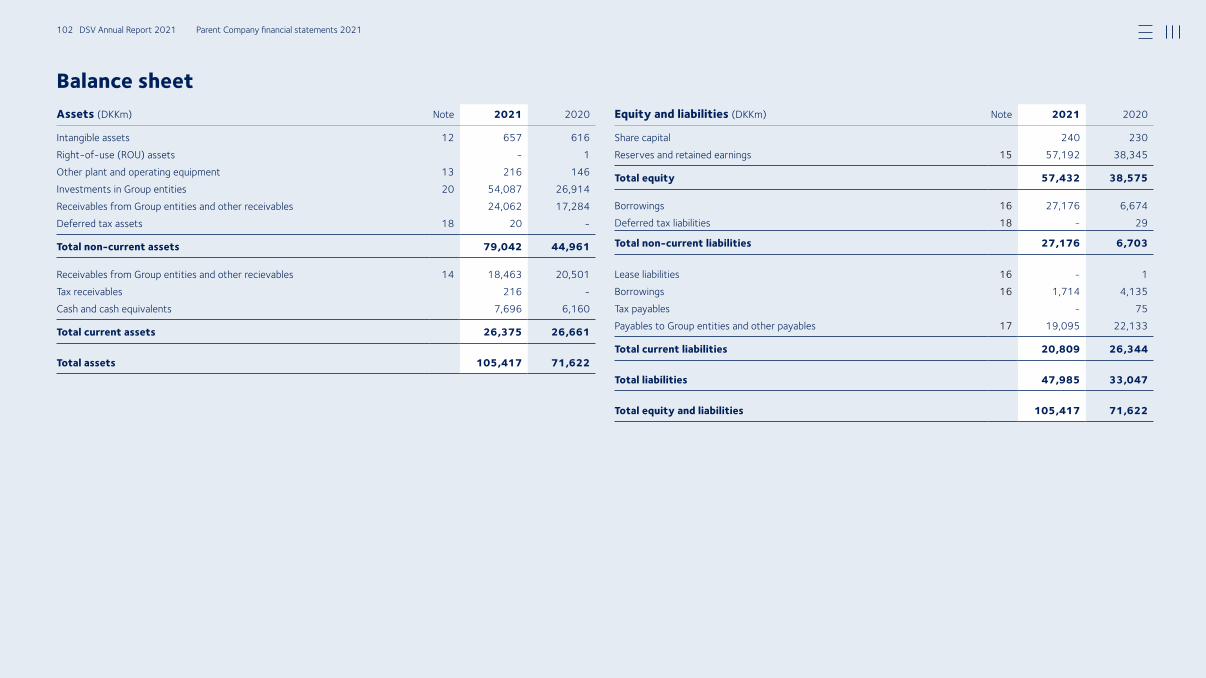
Assets (DKKm) Note 2021 2020
Intangible assets 12 657 616Rightofuse (ROU) assets 1Other plant and operating equipment 13 216 146Investments in Group entities 20 54,087 26,914Receivables from Group entities and other receivables 24,062 17,284Deferred tax assets 18 20
Total non-current assets 79,042 44,961
Receivables from Group entities and other recievables 14 18,463 20,501Tax receivables 216 Cash and cash equivalents 7,696 6,160
Total current assets 26,375 26,661
Total assets 105,417 71,622
Equity and liabilities (DKKm) Note 2021 2020
Share capital 240 230Reserves and retained earnings 15 57,192 38,345
Total equity 57,432 38,575
Borrowings 16 27,176 6,674Deferred tax liabilities 18 29
Total non-current liabilities 27,176 6,703
Lease liabilities 16 1Borrowings 16 1,714 4,135Tax payables 75Payables to Group entities and other payables 17 19,095 22,133
Total current liabilities 20,809 26,344
Total liabilities 47,985 33,047
Total equity and liabilities 105,417 71,622
Balance sheet
102 DSV Annual Report 2021 Parent Company financial statements 2021
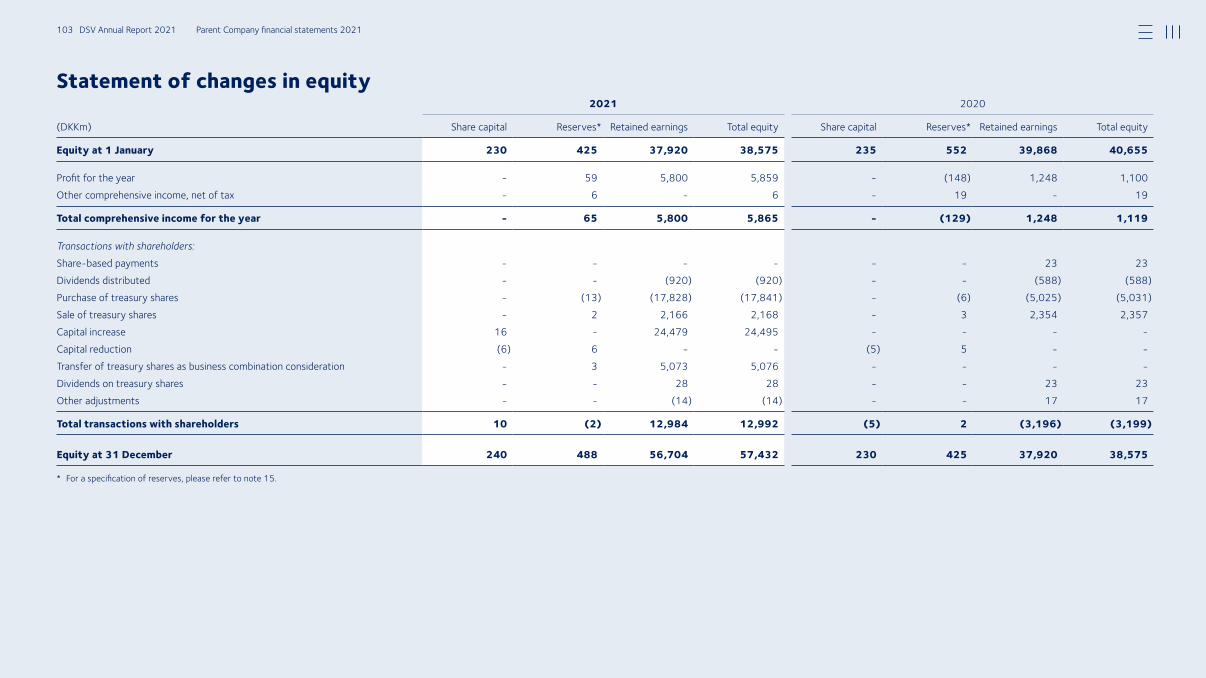
Statement of changes in equity2021 2020
(DKKm) Share capital Reserves* Retained earnings Total equity Share capital Reserves* Retained earnings Total equity
Equity at 1 January 230 425 37,920 38,575 235 552 39,868 40,655
Profit for the year 59 5,800 5,859 (148) 1,248 1,100Other comprehensive income, net of tax 6 6 19 19
Total comprehensive income for the year - 65 5,800 5,865 - (129) 1,248 1,119
Transactions with shareholders:Sharebased payments 23 23Dividends distributed (920) (920) (588) (588)Purchase of treasury shares (13) (17,828) (17,841) (6) (5,025) (5,031)Sale of treasury shares 2 2,166 2,168 3 2,354 2,357Capital increase 16 24,479 24,495 Capital reduction (6) 6 (5) 5 Transfer of treasury shares as business combination consideration 3 5,073 5,076 Dividends on treasury shares 28 28 23 23Other adjustments (14) (14) 17 17
Total transactions with shareholders 10 (2) 12,984 12,992 (5) 2 (3,196) (3,199)
Equity at 31 December 240 488 56,704 57,432 230 425 37,920 38,575
* For a specification of reserves, please refer to note 15.
103 DSV Annual Report 2021 Parent Company financial statements 2021
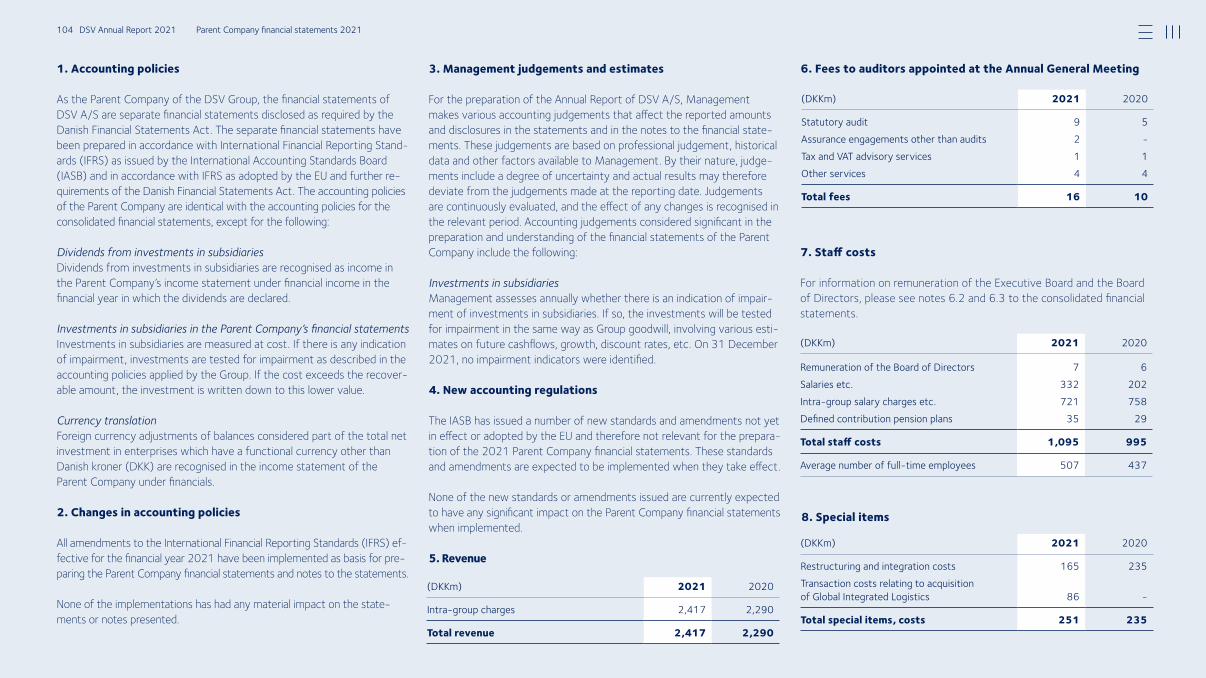
1. Accounting policies
As the Parent Company of the DSV Group, the financial statements of DSV A/S are separate financial statements disclosed as required by the Danish Financial Statements Act. The separate financial statements have been prepared in accordance with International Financial Reporting Stand-ards (IFRS) as issued by the International Accounting Standards Board (IASB) and in accordance with IFRS as adopted by the EU and further re-quirements of the Danish Financial Statements Act. The accounting policies of the Parent Company are identical with the accounting policies for the consolidated financial statements, except for the following:
Dividends from investments in subsidiariesDividends from investments in subsidiaries are recognised as income in the Parent Company’s income statement under financial income in the financial year in which the dividends are declared.
Investments in subsidiaries in the Parent Company’s financial statementsInvestments in subsidiaries are measured at cost. If there is any indication of impairment, investments are tested for impairment as described in the accounting policies applied by the Group. If the cost exceeds the recover-able amount, the investment is written down to this lower value.
Currency translationForeign currency adjustments of balances considered part of the total net investment in enterprises which have a functional currency other than Danish kroner (DKK) are recognised in the income statement of the Parent Company under financials. 2. Changes in accounting policies
All amendments to the International Financial Reporting Standards (IFRS) ef-fective for the financial year 2021 have been implemented as basis for pre-paring the Parent Company financial statements and notes to the statements.
None of the implementations has had any material impact on the state-ments or notes presented.
3. Management judgements and estimates
For the preparation of the Annual Report of DSV A/S, Management makes various accounting judgements that affect the reported amounts and disclosures in the statements and in the notes to the financial state-ments. These judgements are based on professional judgement, historical data and other factors available to Management. By their nature, judge-ments include a degree of uncertainty and actual results may therefore deviate from the judgements made at the reporting date. Judgements are continuously evaluated, and the effect of any changes is recognised in the relevant period. Accounting judgements considered significant in the preparation and understanding of the financial statements of the Parent Company include the following:
Investments in subsidiariesManagement assesses annually whether there is an indication of impair-ment of investments in subsidiaries. If so, the investments will be tested for impairment in the same way as Group goodwill, involving various esti-mates on future cashflows, growth, discount rates, etc. On 31 December 2021, no impairment indicators were identified.
4. New accounting regulations
The IASB has issued a number of new standards and amendments not yet in effect or adopted by the EU and therefore not relevant for the prepara-tion of the 2021 Parent Company financial statements. These standards and amendments are expected to be implemented when they take effect.
None of the new standards or amendments issued are currently expected to have any significant impact on the Parent Company financial statements when implemented.
5. Revenue
(DKKm) 2021 2020
Intragroup charges 2,417 2,290
Total revenue 2,417 2,290
(DKKm) 2021 2020
Statutory audit 9 5Assurance engagements other than audits 2 Tax and VAT advisory services 1 1Other services 4 4
Total fees 16 10
7. Staff costs
For information on remuneration of the Executive Board and the Board of Directors, please see notes 6.2 and 6.3 to the consolidated financial statements.
(DKKm) 2021 2020
Remuneration of the Board of Directors 7 6Salaries etc. 332 202Intragroup salary charges etc. 721 758Defined contribution pension plans 35 29
Total staff costs 1,095 995
Average number of fulltime employees 507 437
8. Special items
(DKKm) 2021 2020
Restructuring and integration costs 165 235Transaction costs relating to acquisition of Global Integrated Logistics 86
Total special items, costs 251 235
6. Fees to auditors appointed at the Annual General Meeting
104 DSV Annual Report 2021 Parent Company financial statements 2021
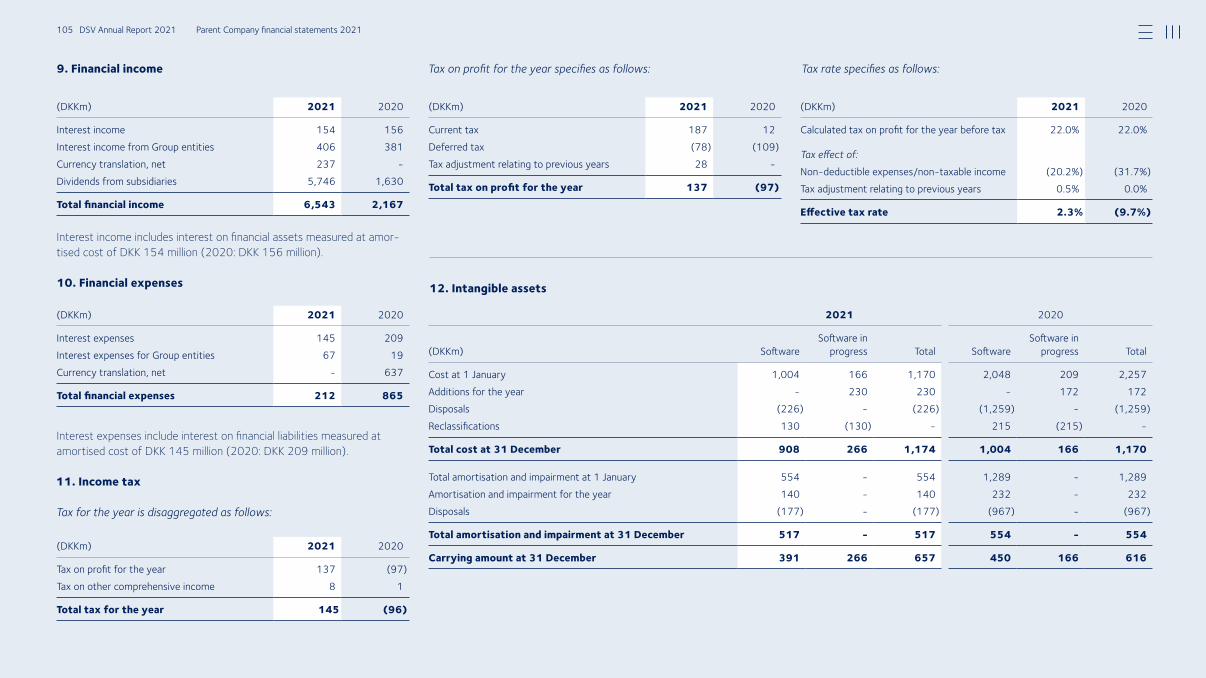
11. Income tax
Tax for the year is disaggregated as follows:
12. Intangible assets
Tax on profit for the year specifies as follows: Tax rate specifies as follows:
Interest income includes interest on financial assets measured at amor-tised cost of DKK 154 million (2020: DKK 156 million). 10. Financial expenses
Interest expenses include interest on financial liabilities measured at amortised cost of DKK 145 million (2020: DKK 209 million).
(DKKm) 2021 2020
Interest income 154 156Interest income from Group entities 406 381Currency translation, net 237 Dividends from subsidiaries 5,746 1,630
Total financial income 6,543 2,167
(DKKm) 2021 2020
Interest expenses 145 209Interest expenses for Group entities 67 19Currency translation, net 637
Total financial expenses 212 865
(DKKm) 2021 2020
Tax on profit for the year 137 (97)Tax on other comprehensive income 8 1
Total tax for the year 145 (96)
(DKKm) 2021 2020
Current tax 187 12Deferred tax (78) (109)Tax adjustment relating to previous years 28
Total tax on profit for the year 137 (97)
(DKKm) 2021 2020
Calculated tax on profit for the year before tax 22.0% 22.0%
Tax effect of:Nondeductible expenses/nontaxable income (20.2%) (31.7%)Tax adjustment relating to previous years 0.5% 0.0%
Effective tax rate 2.3% (9.7%)
2021 2020
(DKKm) SoftwareSoftware in
progress Total SoftwareSoftware in
progress Total
Cost at 1 January 1,004 166 1,170 2,048 209 2,257Additions for the year 230 230 172 172Disposals (226) (226) (1,259) (1,259)Reclassifications 130 (130) 215 (215)
Total cost at 31 December 908 266 1,174 1,004 166 1,170
Total amortisation and im pairment at 1 January 554 554 1,289 1,289Amortisation and impairment for the year 140 140 232 232Disposals (177) (177) (967) (967)
Total amortisation and im pairment at 31 December 517 - 517 554 - 554
Carrying amount at 31 December 391 266 657 450 166 616
9. Financial income
105 DSV Annual Report 2021 Parent Company financial statements 2021
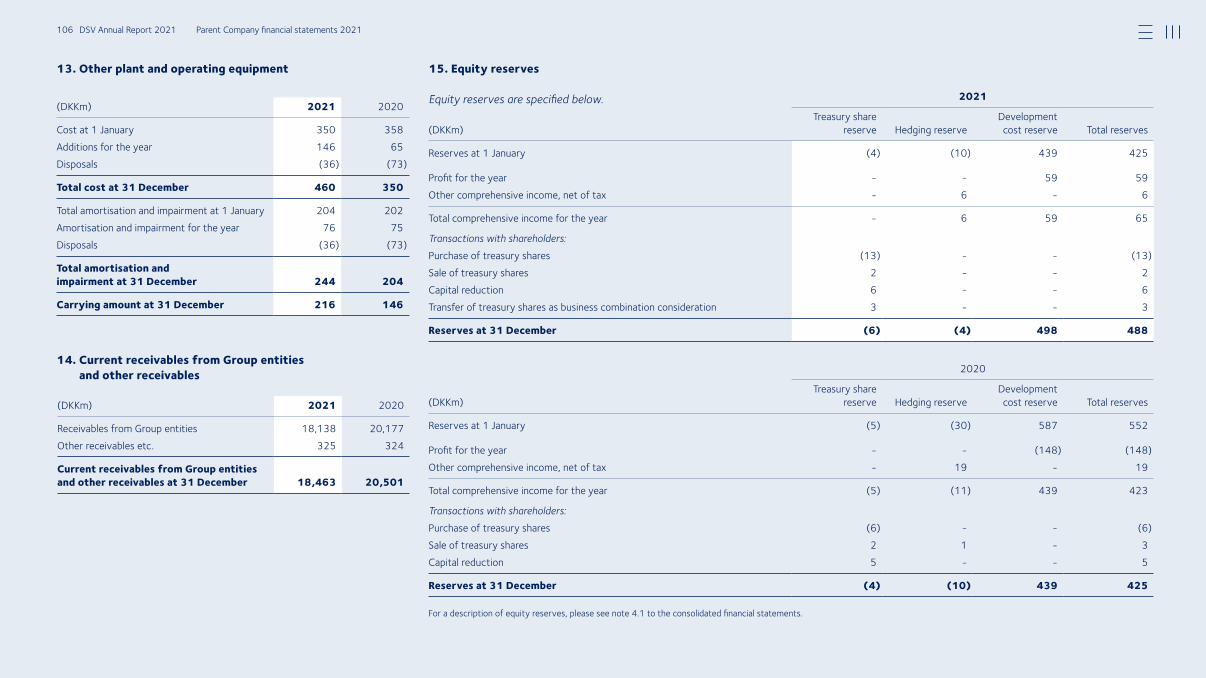
13. Other plant and operating equipment 15. Equity reserves
Equity reserves are specified below.
For a description of equity reserves, please see note 4.1 to the consolidated financial statements.
14. Current receivables from Group entities and other receivables
(DKKm) 2021 2020
Cost at 1 January 350 358Additions for the year 146 65Disposals (36) (73)
Total cost at 31 December 460 350
Total amortisation and impairment at 1 January 204 202Amortisation and impairment for the year 76 75Disposals (36) (73)
Total amortisation and impairment at 31 December 244 204
Carrying amount at 31 December 216 146
(DKKm) 2021 2020
Receivables from Group entities 18,138 20,177Other receivables etc. 325 324
Current receivables from Group entities and other receivables at 31 December 18,463 20,501
2021
(DKKm)Treasury share
reserve Hedging reserveDevelopment cost reserve Total reserves
Reserves at 1 January (4) (10) 439 425
Profit for the year 59 59Other comprehensive income, net of tax 6 6
Total comprehensive income for the year 6 59 65
Transactions with shareholders:Purchase of treasury shares (13) (13)Sale of treasury shares 2 2Capital reduction 6 6Transfer of treasury shares as business combination consideration 3 3
Reserves at 31 December (6) (4) 498 488
2020
(DKKm)Treasury share
reserve Hedging reserveDevelopment cost reserve Total reserves
Reserves at 1 January (5) (30) 587 552
Profit for the year (148) (148)Other comprehensive income, net of tax 19 19
Total comprehensive income for the year (5) (11) 439 423
Transactions with shareholders:Purchase of treasury shares (6) (6)Sale of treasury shares 2 1 3Capital reduction 5 5
Reserves at 31 December (4) (10) 439 425
106 DSV Annual Report 2021 Parent Company financial statements 2021
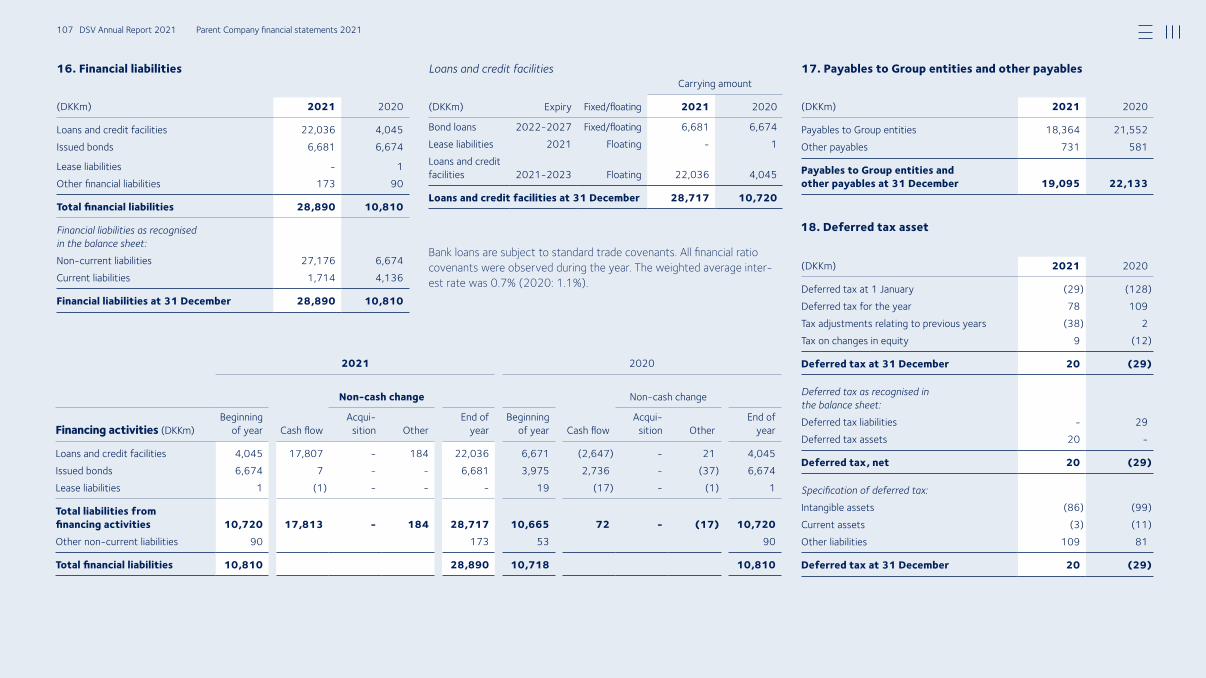
16. Financial liabilities 17. Payables to Group entities and other payables
18. Deferred tax asset
Loans and credit facilities
Bank loans are subject to standard trade covenants. All financial ratio covenants were observed during the year. The weighted average inter-est rate was 0.7% (2020: 1.1%).
(DKKm) 2021 2020
Loans and credit facilities 22,036 4,045Issued bonds 6,681 6,674
Lease liabilities 1Other financial liabilities 173 90
Total financial liabilities 28,890 10,810
Financial liabilities as recognised in the balance sheet:Noncurrent liabilities 27,176 6,674Current liabilities 1,714 4,136
Financial liabilities at 31 December 28,890 10,810
Carrying amount
(DKKm) Expiry Fixed/floating 2021 2020
Bond loans 20222027 Fixed/floating 6,681 6,674Lease liabilities 2021 Floating 1Loans and credit facilities 20212023 Floating 22,036 4,045
Loans and credit facilities at 31 December 28,717 10,720
2021 2020
Non-cash change Noncash change
Financing activities (DKKm)Beginning
of year Cash flowAcqui
sition OtherEnd of
yearBeginning
of year Cash flowAcqui
sition OtherEnd of
year
Loans and credit facilities 4,045 17,807 184 22,036 6,671 (2,647) 21 4,045Issued bonds 6,674 7 6,681 3,975 2,736 (37) 6,674Lease liabilities 1 (1) 19 (17) (1) 1
Total liabilities from financing activities 10,720 17,813 - 184 28,717 10,665 72 - (17) 10,720Other noncurrent liabilities 90 173 53 90
Total financial liabilities 10,810 28,890 10,718 10,810
(DKKm) 2021 2020
Payables to Group entities 18,364 21,552Other payables 731 581
Payables to Group entities and other payables at 31 December 19,095 22,133
(DKKm) 2021 2020
Deferred tax at 1 January (29) (128)Deferred tax for the year 78 109Tax adjustments relating to previous years (38) 2Tax on changes in equity 9 (12)
Deferred tax at 31 December 20 (29)
Deferred tax as recognised in the balance sheet:Deferred tax liabilities - 29Deferred tax assets 20
Deferred tax, net 20 (29)
Specification of deferred tax:Intangible assets (86) (99)Current assets (3) (11)Other liabilities 109 81
Deferred tax at 31 December 20 (29)
107 DSV Annual Report 2021 Parent Company financial statements 2021
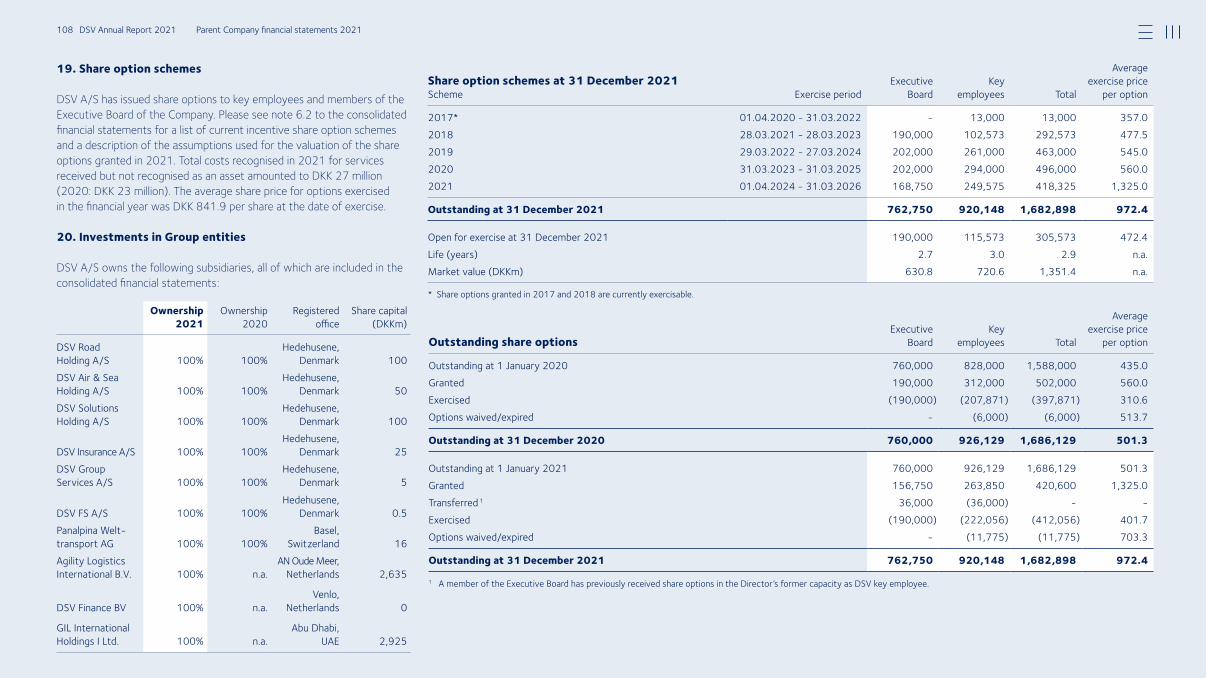
19. Share option schemes
DSV A/S has issued share options to key employees and members of the Executive Board of the Company. Please see note 6.2 to the consolidated financial statements for a list of current incentive share option schemes and a description of the assumptions used for the valuation of the share options granted in 2021. Total costs recognised in 2021 for services received but not recognised as an asset amounted to DKK 27 million (2020: DKK 23 million). The average share price for options exercised in the financial year was DKK 841.9 per share at the date of exercise.
20. Investments in Group entities
DSV A/S owns the following subsidiaries, all of which are included in the consolidated financial statements:
Owner ship 2021
Owner ship 2020
Registered office
Share capital (DKKm)
DSV Road Holding A/S 100% 100%
Hedehusene, Denmark 100
DSV Air & Sea Holding A/S 100% 100%
Hedehusene, Denmark 50
DSV Solutions Holding A/S 100% 100%
Hedehusene, Denmark 100
DSV Insurance A/S 100% 100%Hedehusene,
Denmark 25DSV Group Services A/S 100% 100%
Hedehusene, Denmark 5
DSV FS A/S 100% 100%Hedehusene,
Denmark 0.5Panalpina Welttransport AG 100% 100%
Basel, Switzerland 16
Agility Logistics International B.V. 100% n.a.
AN Oude Meer, Netherlands 2,635
DSV Finance BV 100% n.a.Venlo,
Netherlands 0
GIL International Holdings I Ltd. 100% n.a.
Abu Dhabi, UAE 2,925
Share option schemes at 31 December 2021Scheme Exercise period
ExecutiveBoard
Key employees Total
Average exercise price
per option
2017* 01.04.2020 31.03.2022 13,000 13,000 357.02018 28.03.2021 28.03.2023 190,000 102,573 292,573 477.52019 29.03.2022 27.03.2024 202,000 261,000 463,000 545.02020 31.03.2023 31.03.2025 202,000 294,000 496,000 560.02021 01.04.2024 31.03.2026 168,750 249,575 418,325 1,325.0
Outstanding at 31 December 2021 762,750 920,148 1,682,898 972.4
Open for exercise at 31 December 2021 190,000 115,573 305,573 472.4Life (years) 2.7 3.0 2.9 n.a.Market value (DKKm) 630.8 720.6 1,351.4 n.a.
* Share options granted in 2017 and 2018 are currently exercisable.
Outstanding share optionsExecutive
BoardKey
employees Total
Average exercise price
per option
Outstanding at 1 January 2020 760,000 828,000 1,588,000 435.0Granted 190,000 312,000 502,000 560.0Exercised (190,000) (207,871) (397,871) 310.6Options waived/expired (6,000) (6,000) 513.7
Outstanding at 31 December 2020 760,000 926,129 1,686,129 501.3
Outstanding at 1 January 2021 760,000 926,129 1,686,129 501.3Granted 156,750 263,850 420,600 1,325.0Transferred 1 36,000 (36,000) Exercised (190,000) (222,056) (412,056) 401.7Options waived/expired (11,775) (11,775) 703.3
Outstanding at 31 December 2021 762,750 920,148 1,682,898 972.4
1 A member of the Executive Board has previously received share options in the Director’s former capacity as DSV key employee.
108 DSV Annual Report 2021 Parent Company financial statements 2021
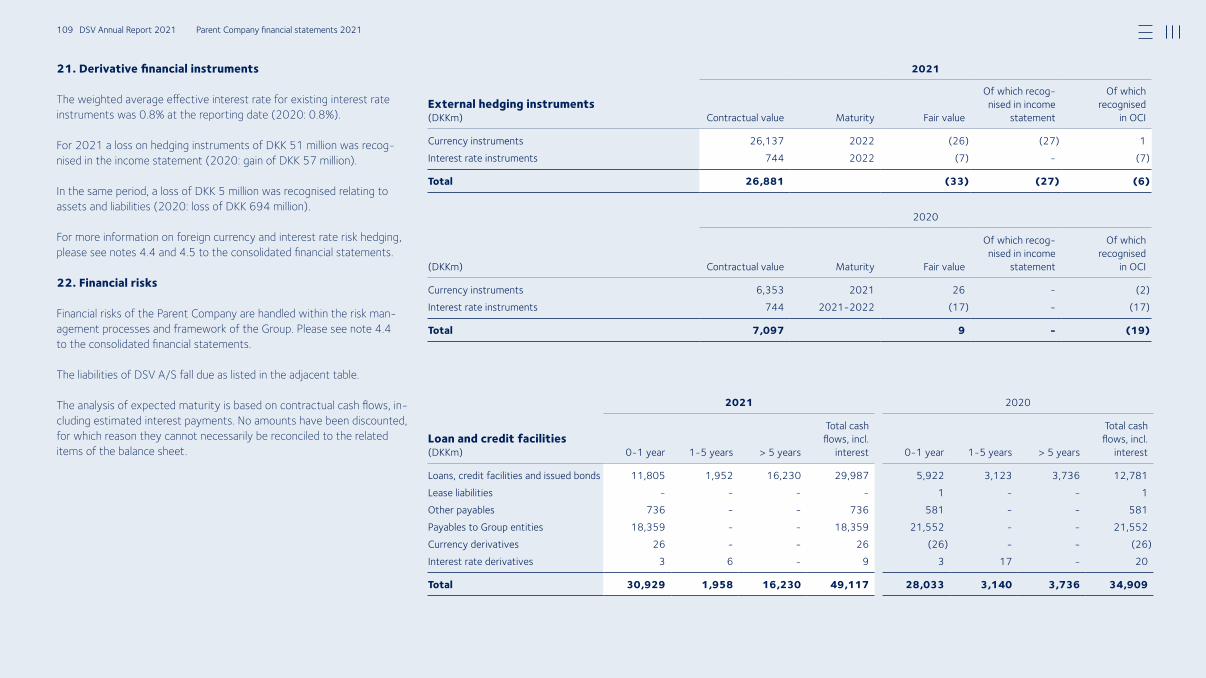
21. Derivative financial instruments
The weighted average effective interest rate for existing interest rate instruments was 0.8% at the reporting date (2020: 0.8%).
For 2021 a loss on hedging instruments of DKK 51 million was recog-nised in the income statement (2020: gain of DKK 57 million).
In the same period, a loss of DKK 5 million was recognised relating to assets and liabilities (2020: loss of DKK 694 million).
For more information on foreign currency and interest rate risk hedging, please see notes 4.4 and 4.5 to the consolidated financial statements.
22. Financial risks
Financial risks of the Parent Company are handled within the risk man-agement processes and framework of the Group. Please see note 4.4 to the consolidated financial statements.
The liabilities of DSV A/S fall due as listed in the adjacent table.
The analysis of expected maturity is based on contractual cash flows, in-cluding estimated interest payments. No amounts have been discounted, for which reason they cannot necessarily be reconciled to the related items of the balance sheet.
2021
External hedging instruments(DKKm) Contractual value Maturity Fair value
Of which recognised in income
statement
Of which recognised
in OCI
Currency instruments 26,137 2022 (26) (27) 1Interest rate instruments 744 2022 (7) (7)
Total 26,881 (33) (27) (6)
2020
(DKKm) Contractual value Maturity Fair value
Of which recognised in income
statement
Of whichrecognised
in OCI
Currency instruments 6,353 2021 26 (2)Interest rate instruments 744 20212022 (17) (17)
Total 7,097 9 - (19)
2021 2020
Loan and credit facilities(DKKm) 01 year 15 years > 5 years
Total cash flows, incl.
interest 01 year 15 years > 5 years
Total cash flows, incl.
interest
Loans, credit facilities and issued bonds 11,805 1,952 16,230 29,987 5,922 3,123 3,736 12,781Lease liabilities 1 1Other payables 736 736 581 581Payables to Group entities 18,359 18,359 21,552 21,552Currency derivatives 26 26 (26) (26)Interest rate derivatives 3 6 9 3 17 20
Total 30,929 1,958 16,230 49,117 28,033 3,140 3,736 34,909
109 DSV Annual Report 2021 Parent Company financial statements 2021
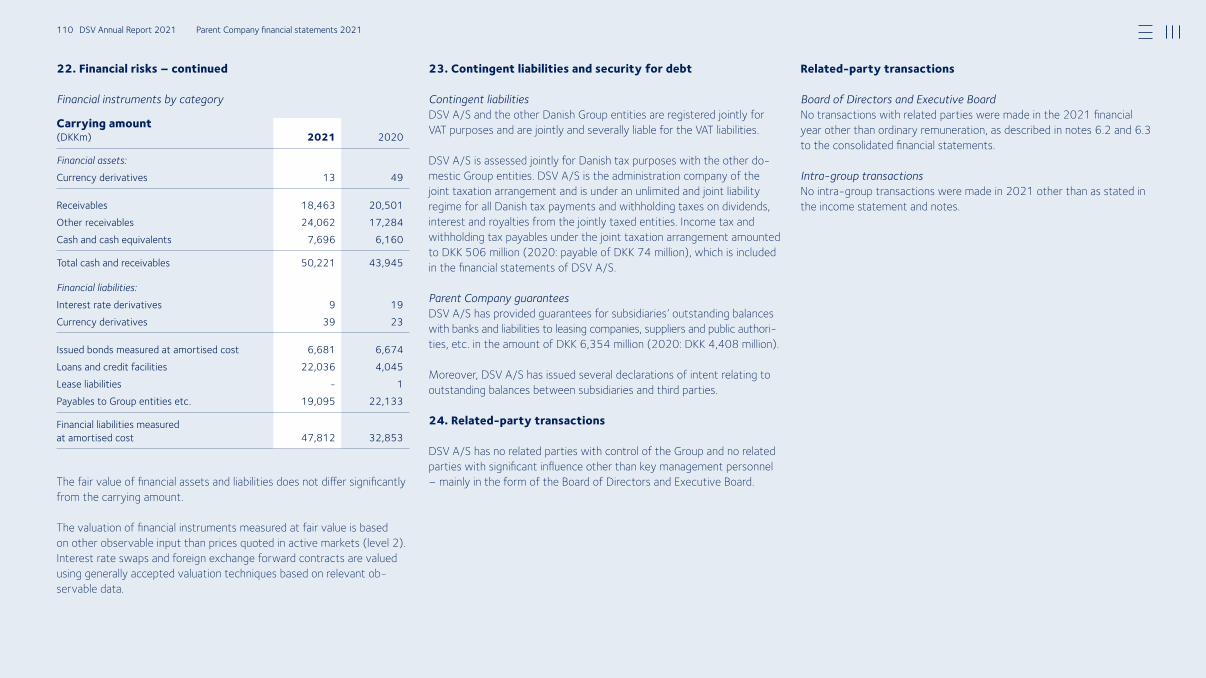
22. Financial risks – continued
Financial instruments by category
The fair value of financial assets and liabilities does not differ significantly from the carrying amount.
The valuation of financial instruments measured at fair value is based on other observable input than prices quoted in active markets (level 2). Interest rate swaps and foreign exchange forward contracts are valued using generally accepted valuation techniques based on relevant ob-servable data.
Carrying amount(DKKm) 2021 2020
Financial assets:Currency derivatives 13 49
Receivables 18,463 20,501Other receivables 24,062 17,284Cash and cash equivalents 7,696 6,160
Total cash and receivables 50,221 43,945
Financial liabilities:Interest rate derivatives 9 19Currency derivatives 39 23
Issued bonds measured at amortised cost 6,681 6,674Loans and credit facilities 22,036 4,045Lease liabilities 1Payables to Group entities etc. 19,095 22,133
Financial liabilities measured at amortised cost 47,812 32,853
23. Contingent liabilities and security for debt
Contingent liabilitiesDSV A/S and the other Danish Group entities are registered jointly for VAT purposes and are jointly and severally liable for the VAT liabilities.
DSV A/S is assessed jointly for Danish tax purposes with the other do-mestic Group entities. DSV A/S is the administration company of the joint taxation arrangement and is under an unlimited and joint liability regime for all Danish tax payments and withholding taxes on dividends, interest and royalties from the jointly taxed entities. Income tax and withholding tax payables under the joint taxation arrangement amounted to DKK 506 million (2020: payable of DKK 74 million), which is included in the financial statements of DSV A/S.
Parent Company guarantees DSV A/S has provided guarantees for subsidiaries’ outstanding balances with banks and liabilities to leasing companies, suppliers and public authori-ties, etc. in the amount of DKK 6,354 million (2020: DKK 4,408 million).
Moreover, DSV A/S has issued several declarations of intent relating to outstanding balances between subsidiaries and third parties.
24. Related-party transactions
DSV A/S has no related parties with control of the Group and no related parties with significant influence other than key management personnel – mainly in the form of the Board of Directors and Executive Board.
Related-party transactions
Board of Directors and Executive BoardNo transactions with related parties were made in the 2021 financial year other than ordinary remuneration, as described in notes 6.2 and 6.3 to the consolidated financial statements.
Intra-group transactionsNo intra-group transactions were made in 2021 other than as stated in the income statement and notes.
110 DSV Annual Report 2021 Parent Company financial statements 2021

DSV A/S
Hovedgaden 630 2640 Hedehusene Denmark
Tel. +45 4320 3040 Email: [email protected] www.dsv.com
CVRNo 58 23 35 28
Annual Report for the year ended 31 December 2021 – 45th financial year Published 9 February 2022
Related Documents


![Investor Relations - hanatourcompany.comhanatour]ir_presentation_june... · Investor Relations 1 Investor Relations Jun. 2009.(Korean) 2 ... (cf. 국내소비0.3% 증가, 자료:한국은행,2006)](https://static.cupdf.com/doc/110x72/5a881d307f8b9a87368ecd91/investor-relations-hanatourirpresentationjuneinvestor-relations-1-investor.jpg)