08/12/2020 2020 Godrej Properties: Benchmark Report https://portal.gresb.com/2020/reports/17642-godrej-properties/sections.html 1/41 Godrej Properties GRESB GRESB Real Estate Assessment 2020 SUBMITTED: 1 Aug 2020 10:37:34am Sat UTC

Welcome message from author
This document is posted to help you gain knowledge. Please leave a comment to let me know what you think about it! Share it to your friends and learn new things together.
Transcript
08/12/2020 2020 Godrej Properties: Benchmark Report
https://portal.gresb.com/2020/reports/17642-godrej-properties/sections.html 1/41
Godrej Properties
GRESB GRESB Real Estate Assessment 2020SUBMITTED: 1 Aug 2020 10:37:34am Sat UTC

08/12/2020 2020 Godrej Properties: Benchmark Report
https://portal.gresb.com/2020/reports/17642-godrej-properties/sections.html 2/41
Scorecard
GRESB Development Benchmark Report
2020
Rankings
GRESB Model
ESG Breakdown
GR
ES
B R
eal
Est
ate
Ass
essm
ent Godrej Properties
Godrej Properties
Status: Listed Location: India Property type: Residential: Multi-Family:High-Rise Multi-Family
78
2017
82
2018
77
201995
1stout of 6
Asia | Residential |Listed
1stout of 12
GRESB Score within Residential / Asia 1stout of 17
GRESB Score within Residential / Listed 2ndout of 29
GRESB Score within Asia / Listed
91stout of 183
Management Score within Asia 55thout of 86
Management Score within Asia / Listed 55thout of 86
Management Score within Asia / Listed
1stout of 12
Development Score within Residential /Asia
1stout of 17
Development Score within Residential /Listed
2ndout of 29
Development Score within Asia / Listed
The 2020 GRESB Assessment structure fundamentally changed, establishing a new baseline for measuring Performance. This affects thecomparability of benchmark scores with previous years. Please refer to the Results Communication to Stakeholders for guidance on interpreting the2020 results.
Development (%)
Man
agem
ent (
%)
0 50 100
0
50
100
This Entity Peer Group Avg. Peer Group GRESB Average GRESB Universe Asia
Europe Americas Oceania Globally Diversified
Entities with only one component submitted
Peer Average 79GRESB Average 74
GRESB Score Green Star
Benchmark Average 52GRESB Average 49
Development Score
Benchmark Average 27GRESB Average 26
Management Score
Benchmark Average 35GRESB Average 34
EnvironmentalBenchmark Average 23GRESB Average 20
SocialBenchmark Average 21GRESB Average 20
Governance
95100
6770
2830
4951
2426
2224

08/12/2020 2020 Godrej Properties: Benchmark Report
https://portal.gresb.com/2020/reports/17642-godrej-properties/sections.html 3/41
TrendO
vera
ll S
core
This Entity
Peer Group Range
GRESB Range
Peer Group Average
GRESB Average
2017 2018 2019 2020
0
50
100

08/12/2020 2020 Godrej Properties: Benchmark Report
https://portal.gresb.com/2020/reports/17642-godrej-properties/sections.html 4/41
Aspects, Strengths & Opportunities
MANAGEMENT COMPONENT
Benchmark group: Asia | Listed (86 entities)
Aspect Number of points
Weight inComponent
Weight in GRESBScore
PointsObtained
BenchmarkAverage Benchmark Distribution
Leadership 7 points
23.33% 7% 7 6.19
100%
42
0 25 50 75
Policies 4.5 points
15% 4.5% 4.5 4.36
100%
71
0 25 50 75
Reporting 3.5 points
11.67% 3.5% 3.5 3.28
100%
69
0 25 50 75
Risk Management 5 points
16.67% 5% 3 4.03
100%
40
0 25 50 75
StakeholderEngagement10 points
33.33% 10% 9.5 8.95
100%
43
0 25 50 75
DEVELOPMENT COMPONENT
Benchmark group: Asia | Residential | Listed (6 entities)
Aspect Number of points
Weight inComponent
Weight in GRESBScore
PointsObtained
BenchmarkAverage Benchmark Distribution
ESG Requirements 12 points
17.14% 12% 12 11
100%
4
0 25 50 75
Materials 6 points
8.57% 6% 6 3
100%
2
0 25 50 75
Building Certifications 13 points
18.57% 13% 13 8.35
100%
3
0 25 50 75
Leadership
Policies
Reporting
Risk Management
Stakeholder Engagement
ESG Requirements
MaterialsBuilding Certifications
Energy Consumption
Water Use
Waste Management
Stakeholder Engagement (Development)
25
50
75
100100
100
60
95
100
100100
85.7
100
100
93.3
This Entity Peer Group Average

08/12/2020 2020 Godrej Properties: Benchmark Report
https://portal.gresb.com/2020/reports/17642-godrej-properties/sections.html 5/41
Aspect Number of points
Weight inComponent
Weight in GRESBScore
PointsObtained
BenchmarkAverage Benchmark Distribution
Energy Consumption 14 points
20% 14% 12 6.49
100%
4
0 25 50 75
Water Use 5 points
7.14% 5% 5 4.17
100%
3
0 25 50 75
Waste Management 5 points
7.14% 5% 5 4.79
100%
5
0 25 50 75
StakeholderEngagement15 points
21.43% 15% 14 13.4
100%
3
0 25 50 75
Entity & Peer Group Characteristics
Peer Group Constituents
China Overseas Land & Investment Ltd. China Vanke Co., Ltd ES-CON JAPAN Ltd.
Godrej Properties Mahindra Lifespace Developers Limited Sino-Ocean Group Holding Ltd
This Entity
Geography: India
Sector: Residential
Legal Status: Listed
Total GAV: $7.87 Billion
Reporting Period: Fiscal Year, first month: AprilPeer Group (6 entities)
Peer Group Geography: Asia
Peer Group Sector: Residential
Legal Status: Listed
Average GAV: $51.1 Billion
Regional allocation of assets 100% India 50% China 33% India 17% Japan
Sector allocation of assets 99% Residential: Multi-Family < 1% Office: Corporate < 1% Hotel
92% Residential: Multi-Family 2% Hotel 1% Industrial: Distribution Warehouse 1% Residential: Other 1% Mixed use: Other < 1% Residential: Student Housing < 1% Office: Corporate < 1% Mixed use: Office/Residential < 1% Residential: Family Homes < 1% Lodging, Leisure & Recreation: Other < 1% Retail: Retail Centers < 1% Other

08/12/2020 2020 Godrej Properties: Benchmark Report
https://portal.gresb.com/2020/reports/17642-godrej-properties/sections.html 6/41
Validation
GRESB Validation
Automatic Automatic validation is integrated into the portal as participants fill out their Assessments, and consists of errors and warningsdisplayed in the portal to ensure that Assessment submissions are complete and accurate.
Manual Manual validation takes place after submission, and consists of document and text review to check that the answers provided inAssessment are supported by sufficient evidence. The manual validation process reviews the content of all Assessmentsubmissions for accuracy and consistency.
Asset-level Data Validation
Logic Checks There is a comprehensive set of validation rules implemented for asset-level reporting. These rules consist of logical checks onthe relationships between different data fields in the Asset Portal. These errors appear in red around the relevant fields in theAsset Portal Data Editor, along with a message explaining the error. Participants cannot aggregate their asset data to the portfoliolevel, and therefore cannot submit their Performance Component, until all validation errors are resolved.
Outlier Detection Based on statistical modelling, GRESB identifies outliers in reported performance data for selected indicators in the Real EstatePerformance Component. This analysis is performed to ensure that all participating entities included in the benchmarking andscoring process are compared based on a fair, quality-controlled dataset.
Evidence Manual Validation
LE6 PO1 PO2 PO3 RM1 SE2.1
RP1
Annual Report Sustainability Report Integrated Report Corporate Website Reporting to Investors Other Disclosure
SE5 DRE1 DMA1 DEN1 DWT1 DSE5.2
Manual Validation Decisions - Excluding Accepted Answers
Evidence
Indicator Decision Reason(s):
RM1 Notaccepted
Cannot confirm the existence of a framework for environmental managementNo high-level outline or diagram of the implemented EMS
SE5 Notaccepted
Not applicable to the reporting yearDoes not support most of the selected diversity metrics for governance bodiesDoes not support some of the selected diversity metrics for employees
DSE5.2 Partiallyaccepted
Does not support some of the selected issues
Other Answers
Indicator Decision Other answer provided:
= Accepted = Partially Accepted
= Not Accepted/Duplicate = No Response
08/12/2020 2020 Godrej Properties: Benchmark Report
https://portal.gresb.com/2020/reports/17642-godrej-properties/sections.html 7/41
Manual Validation Decisions - Excluding Accepted Answers
SE2.2 Duplicate We do conduct an employee engagement survey by a third party to gauge the engagements levels within the organisation and seekfeedback on various parameters which guide us in improving the experience for our employees. We also do dipsticks throughout the year.The data from the survey is analysed in depth using statistical tools to arrive at key focus areas for the organization. Focus groupdiscussions are also conducted to validate and deep dive into some of the findings. The action plans are made at an organization levelwhich then get further drilled down to regional level and then to site level. Dipsticks are conducted all through the year to assess theeffectiveness, efficiency and experience of the action plans and programs that have got implemented The Management committee of theyear spent 4 man days on the data emerging from these surveys and then identify the focus areas in line with the business priorities.Separate sessions are conducted with Regional heads and site heads to sensitize them on the various concerns emerging from the surveyfindings and then action plans are co-created with them. For areas where we would like to understand further nuances, such groups areidentified and focus groups are conducted.
RM1 Notaccepted
Thinkstep (ex. PE International - SoFi) - Aligned with GRI Standards 2016
DRE1 Duplicate Environmental attributes of building materials - environmental characteristics of the building materials such as paints, wood, coatings,etc.
DRE2 Duplicate Proximity to Public transport
Management
Management

08/12/2020 2020 Godrej Properties: Benchmark Report
https://portal.gresb.com/2020/reports/17642-godrej-properties/sections.html 8/41
ESG leadership commitments Percentage of Benchmark
ESG leadership standards and principles
Aspect Indicators
Score Max
Score Entity
(p)
Score Benchmark
(p)
Strengths & Opportunities
Leadership 7p | 23.33% 7 6.19 N/A
LE1 ESG leadership commitments Not scoredLE2 ESG Objectives 1 1 1 1% of peers scored lowerLE3 Individual responsible for ESG 2 2 1.91 5% of peers scored lowerLE4 ESG taskforce/committee 1 1 0.96 9% of peers scored lowerLE5 ESG senior decision-maker 1 1 0.99 1% of peers scored lowerLE6 Personnel ESG performance targets 2 2 1.34 53% of peers scored lower
Policies 4.5p | 15% 4.5 4.36 N/A
PO1 Policy on environmental issues 1.5 1.5 1.4 12% of peers scored lowerPO2 Policy on social issues 1.5 1.5 1.5 0% of peers scored lowerPO3 Policy on governance issues 1.5 1.5 1.46 6% of peers scored lower
Reporting 3.5p | 11.67% 3.5 3.28 N/A
RP1 ESG reporting 3.5 3.5 3.28 22% of peers scored lowerRP2.1 ESG incident monitoring Not scoredRP2.2 ESG incident ocurrences Not scored
Risk Management 5p | 16.67% 3 4.03 N/A
RM1 Environmental Management System (EMS) 2 0 1.1 82% of peers scored higherRM2 Process to implement governance policies 0.5 0.5 0.5 1% of peers scored lowerRM3.1 Social risk assessments 0.5 0.5 0.49 4% of peers scored lowerRM3.2 Governance risk assessments 0.5 0.5 0.49 6% of peers scored lowerRM4 ESG due diligence for new acquisitions 1.5 1.5 1.45 4% of peers scored lower
Stakeholder Engagement 10p | 33.33% 9.5 8.95 N/A
SE1 Employee training 1 1 0.93 31% of peers scored lowerSE2.1 Employee satisfaction survey 1 1 0.7 69% of peers scored lowerSE2.2 Employee engagement program 1 1 0.88 12% of peers scored lowerSE3.1 Employee health & well-being program 0.75 0.75 0.71 15% of peers scored lowerSE3.2 Employee health & well-being measures 1.25 1.25 1.21 12% of peers scored lowerSE4 Employee safety indicators 0.5 0.5 0.48 6% of peers scored lowerSE5 Inclusion and diversity 0.5 0 0.37 97% of peers scored higherSE6 Supply chain engagement program 1.5 1.5 1.37 24% of peers scored lowerSE7.1 Monitoring property/asset managers 1 1 0.91 10% of peers scored lowerSE7.2 Monitoring external suppliers/service providers 1 1 0.9 10% of peers scored lowerSE8 Stakeholder grievance process 0.5 0.5 0.49 5% of peers scored lower
ESG Commitments and Objectives
This aspect evaluates how the entity integrates ESG into its overall business strategy. The purpose of this section is to (1) identify public ESGcommitments made by the entity, (2) identify who is responsible for managing ESG issues and has decision-making authority, (3) communicate toinvestors how the entity structures management of ESG issues, and (4) determine how ESG is embedded into the entity.
LE1 Not scored
Yes 85%
Climate Action 100+ 3%
Global Investor Coalition on Climate Change (including AIGCC, Ceres, IGCC, IIGCC) 3%
International Labour Organization (ILO) Standards 22%

08/12/2020 2020 Godrej Properties: Benchmark Report
https://portal.gresb.com/2020/reports/17642-godrej-properties/sections.html 9/41
Provide applicable hyperlink
ESG Objectives Percentage of Benchmark
The objectives relate to
Business strategy integration
The objectives are
Provide applicable hyperlink
Communicate the objectives and explain how they are integrated into the overall business strategy (maximum 250 words)
LE2 POINTS: 1/1
Percentage of Benchmark
[99%] Fully integrated into the overall business strategy
[1%] Partially integrated into the overall business strategy
Montreal Pledge 5%
OECD - Guidelines for multinational enterprises 8%
PRI signatory 23%
RE 100 14%
Science Based Targets initiative 13%
Task Force on Climate-related Financial Disclosures (TCFD) 48%
UN Environment Programme Finance Initiative 15%
UN Global Compact 48%
UN Sustainable Development Goals 73%
WorldGBC’s Net Zero Carbon Buildings Commitment 1%
Other 40%
Evidence provided
🔗 https://www.godrej.com/good-and-green.html
No 15%
Yes 100%
General sustainability 87%
Environment 100%
Social 99%
Governance 99%
Health and well-being 94%
Publicly available 100%
Evidence provided
🔗 https://www.godrej.com/good-and-green.html
Not publicly available 0%

08/12/2020 2020 Godrej Properties: Benchmark Report
https://portal.gresb.com/2020/reports/17642-godrej-properties/sections.html 10/41
Individual responsible for ESG Percentage of Benchmark
The individual(s) is/are
ESG taskforce/committee Percentage of Benchmark
Members of the taskforce or committee
ESG senior decision-maker Percentage of Benchmark
The individual’s most senior role is as part of
ESG Decision Making
LE3 POINTS: 2/2
LE4 POINTS: 1/1
LE5 POINTS: 1/1
At Godrej, our sustainability strategy, Good & Green, is driven by the desire to help create a more inclusive and greener India. Launched in 2011 as one of our four key imperatives for 2020, Good & Green is based on shared value, a principle that aligns business competitiveness and growth with social and environmental impact. At its root lies the idea that companies can help solve critical social issues while strengthening their competitive advantage. By 2020, we aspire to create a more employable Indian workforce, build a greener India, and innovate for ‘good’ and ‘green’ products. ‘Good’ products are designed to address a critical social issue (e.g. healthcare and sanitation) for consumers at the base of the income pyramid. ‘Green’ products are those that are environmentally sustainable.
“
No 0%
Yes 97%
Dedicated employee(s) for whom ESG is the core responsibility 51%
Employee(s) for whom ESG is among their responsibilities 92%
External consultants/manager 78%
Investment partners (co-investors/JV partners) 3%
No 3%
Yes 99%
Board of Directors 83%
C-suite level staff 84%
Investment Committee 36%
Fund/portfolio managers 62%
Asset managers 80%
ESG portfolio manager 23%
Investment analysts 6%
Dedicated staff on ESG issues 50%
External managers or service providers 22%
Investor relations 72%
Other 53%
No 1%
Yes 99%

08/12/2020 2020 Godrej Properties: Benchmark Report
https://portal.gresb.com/2020/reports/17642-godrej-properties/sections.html 11/41
Process of informing the most senior decision-maker
Personnel ESG performance targets Percentage of Benchmark
Predetermined consequences
Personnel to whom these factors apply
Personnel to whom these factors apply
Percentage of Benchmark
[86%] Board of Directors
[11%] C-suite level staff
[2%] Other
[1%] No answer provided
LE6 POINTS: 2/2
Sustainable thinking forms the core of GPL ’s development proposition. Real estate is amongst the highest in resource consumption over its life cycle. As an ethical and responsible business GPL ’s policy decision is to design and build sustainable buildings and green homes that minimize impact on the environment. We at GPL have a C-suite level leader as the senior decision-maker accountable for ESG issues to ensure an effective integration of ESG into the business strategy and management from a top down approach. Some of our internal measurable targets towards ESG issues include: 1. 100% green certification for buildings with IGBC silver as minimum and performance incentives to increase ratings. 2. Usage of both passive and active techniques in Design to build sustainable buildings with measurable impact on resource consumption 3. Reporting during construction with the aim to reduce energy, waste, water and emission footprints in addition to measurable targets for initiatives to offset these as part of CSR initiatives. 4. Sustainability mapping for all projects for regulatory compliance 5. Setting up contractual mechanisms for procurement /construction with measurable targets 6. Industry initiatives for consumer awareness with measurable targets
“
No 1%
Yes 91%
Yes 90%
Financial consequences 87%
Board of Directors 30%
C-suite level staff 43%
Investment Committee 29%
Fund/portfolio managers 22%
Asset managers 43%
ESG portfolio manager 13%
Investment analysts 7%
Dedicated staff on ESG issues 37%
External managers or service providers 9%
Investor relations 42%
All employees 47%
Other 20%
Non-financial consequences 72%
Board of Directors 23%

08/12/2020 2020 Godrej Properties: Benchmark Report
https://portal.gresb.com/2020/reports/17642-godrej-properties/sections.html 12/41
Provide applicable evidence
Policy on environmental issues Percentage of Benchmark
Environmental issues included
ESG Policies
This aspect confirms the existence and scope of the entity’s policies that address environmental, social, and governance issues.
PO1 POINTS: 1.5/1.5
C-suite level staff 31%
Investment Committee 19%
Fund/portfolio managers 28%
Asset managers 33%
ESG portfolio manager 9%
Investment analysts 6%
Dedicated staff on ESG issues 30%
External managers or service providers 8%
Investor relations 35%
All employees 47%
Other 13%
No 1%
[ACCEPTED]Evidence provided (but not shared with investors)
No 9%
Yes 100%
Biodiversity and habitat 63%
Climate/climate change adaptation 64%
Energy consumption 98%
Greenhouse gas emissions 93%
Indoor environmental quality 33%
Material sourcing 60%
Pollution prevention 56%
Renewable energy 55%
Resilience to catastrophe/disaster 71%
Sustainable procurement 78%
Waste management 93%
Water consumption 93%
Other 17%

08/12/2020 2020 Godrej Properties: Benchmark Report
https://portal.gresb.com/2020/reports/17642-godrej-properties/sections.html 13/41
Provide applicable evidence
Policy on social issues Percentage of Benchmark
Social issues included
Provide applicable evidence
Policy on governance issues Percentage of Benchmark
Governance issues included
PO2 POINTS: 1.5/1.5
PO3 POINTS: 1.5/1.5
[ACCEPTED]Evidence provided
🔗 http://www.godrejgoodandgreen.com/
No 0%
Yes 100%
Child labor 66%
Community development 50%
Customer satisfaction 56%
Employee engagement 70%
Employee health & well-being 98%
Employee remuneration 81%
Forced or compulsory labor 66%
Freedom of association 35%
Health and safety: community 42%
Health and safety: contractors 47%
Health and safety: employees 99%
Health and safety: tenants/customers 85%
Human rights 77%
Inclusion and diversity 88%
Labor standards and working conditions 92%
Social enterprise partnering 17%
Stakeholder relations 91%
Other 16%
[ACCEPTED]Evidence provided (but not shared with investors)
No 0%
Yes 100%
Bribery and corruption 99%
Cybersecurity 88%
Data protection and privacy 100%

08/12/2020 2020 Godrej Properties: Benchmark Report
https://portal.gresb.com/2020/reports/17642-godrej-properties/sections.html 14/41
Provide applicable evidence
ESG reporting Percentage of Benchmark
Types of disclosure
Reporting level
Third-party review
Provide applicable evidence
Reporting level
ESG Disclosure
Institutional investors and other shareholders are primary drivers for greater sustainability reporting and disclosure among investable entities. Realestate companies and managers share how ESG management practices performance impacts the business through formal disclosure mechanisms.This aspect evaluates how the entity communicates its ESG actions and/or performance.
RP1 POINTS: 3.5/3.5
Aligned with
[69%] No answer provided
[18%] GRI Standards, 2016:
[12%] Other
[1%] INREV Sustainability Reporting Recommendations, 2016
Executive compensation 86%
Fiduciary duty 80%
Fraud 100%
Political contributions 51%
Shareholder rights 98%
Other 29%
[ACCEPTED]Evidence provided (but not shared with investors)
No 0%
Yes 100%
Section in Annual Report 88%
Entity 81%
Investment manager 0%
Group 7%
Yes 57%
Externally checked 47%
Externally verified 1%
Externally assured 9%
No 31%
[ACCEPTED]Evidence provided (but not shared with investors)
Stand-alone sustainability report(s) 78%
08/12/2020 2020 Godrej Properties: Benchmark Report
https://portal.gresb.com/2020/reports/17642-godrej-properties/sections.html 15/41
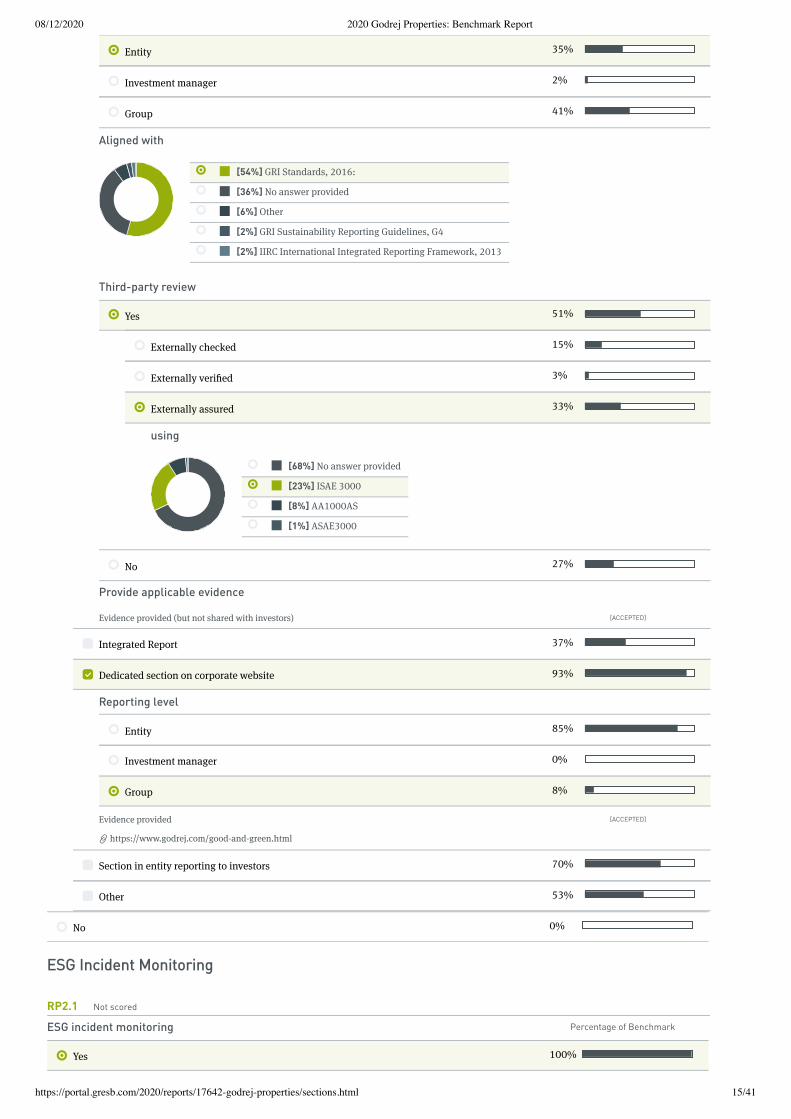
Third-party review
Provide applicable evidence
Reporting level
ESG incident monitoring Percentage of Benchmark
Aligned with
[54%] GRI Standards, 2016:
[36%] No answer provided
[6%] Other
[2%] GRI Sustainability Reporting Guidelines, G4
[2%] IIRC International Integrated Reporting Framework, 2013
using
[68%] No answer provided
[23%] ISAE 3000
[8%] AA1000AS
[1%] ASAE3000
ESG Incident Monitoring
RP2.1 Not scored
Entity 35%
Investment manager 2%
Group 41%
Yes 51%
Externally checked 15%
Externally verified 3%
Externally assured 33%
No 27%
[ACCEPTED]Evidence provided (but not shared with investors)
Integrated Report 37%
Dedicated section on corporate website 93%
Entity 85%
Investment manager 0%
Group 8%
[ACCEPTED]Evidence provided
🔗 https://www.godrej.com/good-and-green.html
Section in entity reporting to investors 70%
Other 53%
No 0%
Yes 100%

08/12/2020 2020 Godrej Properties: Benchmark Report
https://portal.gresb.com/2020/reports/17642-godrej-properties/sections.html 16/41
Stakeholders covered
Process for communicating ESG-related incidents
ESG incident ocurrences Percentage of Benchmark
Additional context
Environmental Management System (EMS) Percentage of Benchmark
RP2.2 Not scored
Risk Management
This aspect evaluates the processes used by the entity to support ESG implementation and investigates the steps undertaken to recognize and preventmaterial ESG related risks.
RM1 POINTS: 0/2
Clients/Customers 64%
Community/Public 83%
Contractors 65%
Employees 72%
Investors/Shareholders 95%
Regulators/Government 77%
Special interest groups (NGOs, Trade Unions, etc) 41%
Suppliers 55%
Other stakeholders 22%
This is a requirement under the Companies Act, 2013 & SEBI listing Regulations. This forms a part of the Annual Report and the section containing Chairman's message which is also publicly available on our website.“
No 0%
Yes
0
0
0
7%
"To reinforce the risk of corruption and its potential impact, we ensure that all operations at GPL are assessed for risks due to corruption as part of our Code of Conduct. In furtherance, we also provide anti-corruption trainings to all our employees during orientation sessions and are proud to declare that for FY19, there were no incidents of corruption reported. Additionally, for FY19, there were no incidents of non-compliance with laws and regulations in the social and economic area." - Chairman's Message, Annual Report
“
No 93%
Yes 84%
Aligned with 9%
Third-party certified using 27%

08/12/2020 2020 Godrej Properties: Benchmark Report
https://portal.gresb.com/2020/reports/17642-godrej-properties/sections.html 17/41
Provide applicable evidence
Process to implement governance policies Percentage of Benchmark
Systems and procedures used
Social risk assessments Percentage of Benchmark
Issues included
Percentage of Benchmark
[73%] No answer provided
[20%] ISO 14001
[7%] Other
RM2 POINTS: 0.5/0.5
Risk Assessments
RM3.1 POINTS: 0.5/0.5
[NOT ACCEPTED]Thinkstep (ex. PE International - SoFi) - Aligned with GRIStandards 2016
The EMS is not aligned with a standard nor certified externally 48%
[NOT ACCEPTED]Evidence provided (but not shared with investors)
No 16%
Yes 100%
Compliance linked to employee remuneration 50%
Dedicated help desks, focal points, ombudsman, hotlines 84%
Disciplinary actions in case of breach, i.e. warning, dismissal, zero tolerance policy 87%
Employee performance appraisal systems integrate compliance with codes of conduct 65%
Investment due diligence process 94%
Responsibilities, accountabilities and reporting lines are systematically defined in all divisions andgroup companies
63%
Training related to governance risks for employees 100%
Regular follow-ups 97%
When an employee joins the organization 99%
Whistle-blower mechanism 100%
Other 16%
No 0%
Not applicable 0%
Yes 99%
Child labor 47%
Community development 35%
Controversies linked to social enterprise partnering 29%
Customer satisfaction 72%
08/12/2020 2020 Godrej Properties: Benchmark Report
https://portal.gresb.com/2020/reports/17642-godrej-properties/sections.html 18/41
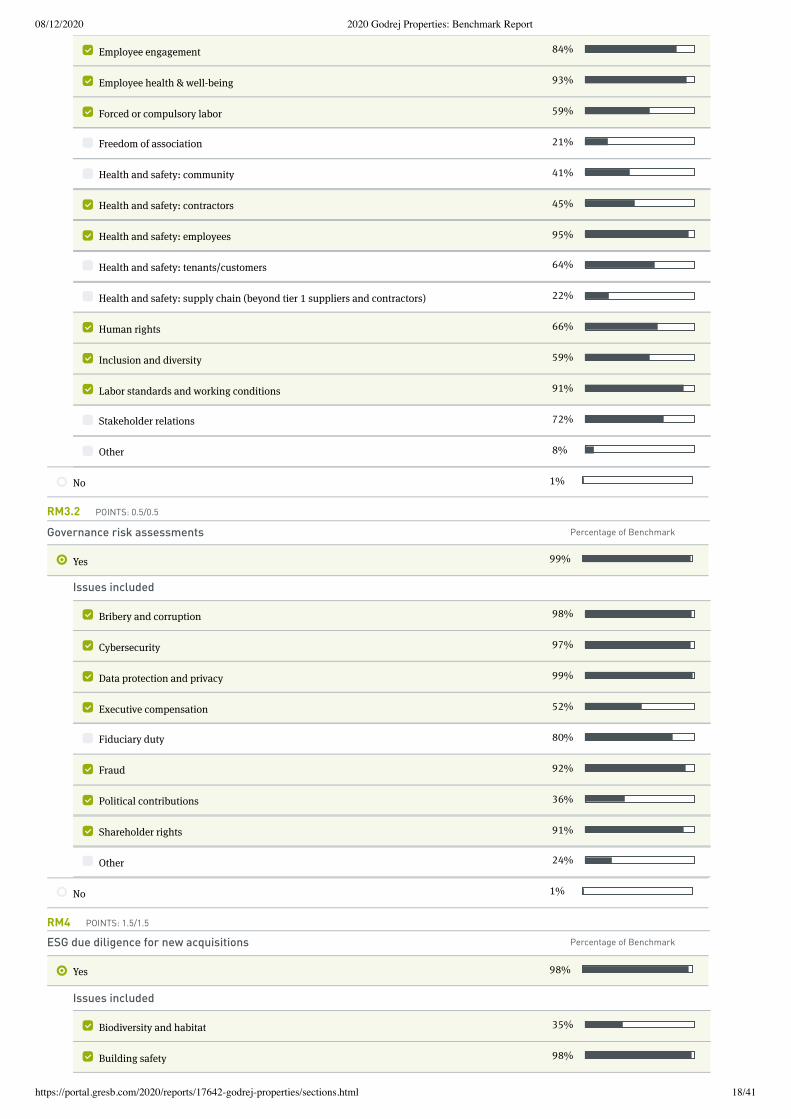
Governance risk assessments Percentage of Benchmark
Issues included
ESG due diligence for new acquisitions Percentage of Benchmark
Issues included
RM3.2 POINTS: 0.5/0.5
RM4 POINTS: 1.5/1.5
Employee engagement 84%
Employee health & well-being 93%
Forced or compulsory labor 59%
Freedom of association 21%
Health and safety: community 41%
Health and safety: contractors 45%
Health and safety: employees 95%
Health and safety: tenants/customers 64%
Health and safety: supply chain (beyond tier 1 suppliers and contractors) 22%
Human rights 66%
Inclusion and diversity 59%
Labor standards and working conditions 91%
Stakeholder relations 72%
Other 8%
No 1%
Yes 99%
Bribery and corruption 98%
Cybersecurity 97%
Data protection and privacy 99%
Executive compensation 52%
Fiduciary duty 80%
Fraud 92%
Political contributions 36%
Shareholder rights 91%
Other 24%
No 1%
Yes 98%
Biodiversity and habitat 35%
Building safety 98%

08/12/2020 2020 Godrej Properties: Benchmark Report
https://portal.gresb.com/2020/reports/17642-godrej-properties/sections.html 19/41
Employee training Percentage of Benchmark
ESG-specific training focuses on (multiple answers possible):
Employee satisfaction survey Percentage of Benchmark
The survey is undertaken
Employees
Improving the sustainability performance of a real estate portfolio requires dedicated resources, a commitment from senior management and tools formeasurement/management of resource consumption. It also requires the cooperation of other stakeholders, including employees and suppliers. Thisaspect identifies actions taken to engage with those stakeholders, as well as the nature of the engagement.
SE1 POINTS: 1/1
SE2.1 POINTS: 1/1
Climate/Climate change adaptation 49%
Compliance with regulatory requirements 93%
Contaminated land 95%
Energy efficiency 59%
Energy supply 72%
Flooding 77%
GHG emissions 55%
Health and well-being 84%
Indoor environmental quality 83%
Natural hazards 88%
Socio-economic 85%
Transportation 93%
Waste management 64%
Water efficiency 56%
Water supply 73%
Other 38%
No 1%
Not applicable 1%
Yes
Percentage of employees who received professional training: 100%
Percentage of employees who received ESG-specific training: 100%
100%Benchmark Average: 97 %
Benchmark Average: 90 %
Environmental issues 92%
Social issues 95%
Governance issues 85%
No 0%
Yes 94%

08/12/2020 2020 Godrej Properties: Benchmark Report
https://portal.gresb.com/2020/reports/17642-godrej-properties/sections.html 20/41
Provide applicable evidence
Quantitative metrics included
Metrics include
Employee engagement program Percentage of Benchmark
Program elements
SE2.2 POINTS: 1/1
Internally
Percentage of employees covered: 100%
Survey response rate: 87%
50%Benchmark Average: 48 %
Benchmark Average: 47 %
By an independent third party
Percentage of employees covered: 100%
Survey response rate: 77%
64%Benchmark Average: 60 %
Benchmark Average: 58 %
[ACCEPTED]Evidence provided
🔗 https://www.greatplacetowork.in/great/rated/India/Godrej-Properties
🔗 https://www.greatplacetowork.in/gptw-model/#gptw-model-forall
Yes 90%
Net Promoter Score 13%
Overall satisfaction score 69%
Other
[ACCEPTED]Motivation Indicator, Retention Indicator, Discretionary effort indicator, SustainableEngagement Index, Manager effectiveness index, Organizational Health Index
60%
No 5%
No 6%
Yes 94%
Planning and preparation for engagement 44%
Development of action plan 80%
Implementation 50%
Training 51%
Program review and evaluation 48%
Feedback sessions with c-suite level staff 86%
Feedback sessions with separate teams/departments 72%
Focus groups 49%
Other
[DUPLICATE]We do conduct an employee engagement survey by a third party to gauge theengagements levels within the organisation and seek feedback on various parameters which guideus in improving the experience for our employees. We also do dipsticks throughout the year. Thedata from the survey is analysed in depth using statistical tools to arrive at key focus areas for theorganization. Focus group discussions are also conducted to validate and deep dive into some of thefindings. The action plans are made at an organization level which then get further drilled down toregional level and then to site level. Dipsticks are conducted all through the year to assess theeffectiveness, efficiency and experience of the action plans and programs that have gotimplemented The Management committee of the year spent 4 man days on the data emerging fromthese surveys and then identify the focus areas in line with the business priorities. Separate sessionsare conducted with Regional heads and site heads to sensitize them on the various concernsemerging from the survey findings and then action plans are co-created with them. For areas where
20%

08/12/2020 2020 Godrej Properties: Benchmark Report
https://portal.gresb.com/2020/reports/17642-godrej-properties/sections.html 21/41
Employee health & well-being program Percentage of Benchmark
The program includes
Employee health & well-being measures Percentage of Benchmark
Measures covered
Monitoring employee health and well-being needs through
SE3.1 POINTS: 0.75/0.75
SE3.2 POINTS: 1.25/1.25
we would like to understand further nuances, such groups are identified and focus groups areconducted.
No 1%
Not applicable 5%
Yes 100%
Needs assessment 94%
Goal setting 88%
Action 100%
Monitoring 94%
No 0%
Yes 100%
Needs assessment 95%
Employee surveys on health and well-being
Percentage of employees: 100%
78%Benchmark Average: 77 %
Physical and/or mental health checks
Percentage of employees: 100%
94%Benchmark Average: 91 %
Other 6%
Goals address 90%
Mental health and well-being 77%
Physical health and well-being 88%
Social health and well-being 63%
Other 6%
Health is promoted through 100%
Acoustic comfort 43%
Biophilic design 57%
Childcare facilities contributions 29%
Flexible working hours 88%
Healthy eating 73%
Humidity 41%
Illumination

08/12/2020 2020 Godrej Properties: Benchmark Report
https://portal.gresb.com/2020/reports/17642-godrej-properties/sections.html 22/41
Employee safety indicators Percentage of Benchmark
Indicators monitored
Safety indicators calculation method
SE4 POINTS: 0.5/0.5
47%Inclusive design 53%
Indoor air quality 78%
Lighting controls and/or daylight 72%
Noise control 38%
Paid maternity leave in excess of legally required minimum 38%
Paid paternity leave in excess of legally required minimum 35%
Physical activity 78%
Physical and/or mental healthcare access 98%
Social interaction and connection 86%
Thermal comfort 72%
Water quality 63%
Working from home arrangements 83%
Other 23%
Outcomes are monitored by tracking 91%
Environmental quality 57%
Population experience and opinions 56%
Program performance 58%
Other 12%
No 0%
Not applicable 0%
Yes 99%
Work station and/or workplace checks
Percentage of employees: 100%
67%Benchmark Average: 64 %
Absentee rate 76%
Injury rate
0
76%
Lost day rate
0
78%
Other metrics 30%
At Godrej we have a truly trust based work environment and so our Sick Leaves are designed to enable employees to avail leave on a ‘need to’ basis when they are unwell. All employees are eligible to avail Sick Leaves on need basis. Given our trust based approach, we allow our employees to take up to 90 days of sick leave with pay. These are not tracked and hence we will not be able to provide an absentee rate.
“

08/12/2020 2020 Godrej Properties: Benchmark Report
https://portal.gresb.com/2020/reports/17642-godrej-properties/sections.html 23/41
Inclusion and diversity Percentage of Benchmark
Diversity metrics
Diversity metrics
Additional context
Provide applicable evidence
SE5 POINTS: 0/0.5
Suppliers
No 1%
Yes 99%
Diversity of governance bodies 98%
Age group distribution 87%
Board tenure 90%
Gender pay gap 21%
Gender ratio
Women: 10%
Men: 90%
98%Benchmark Average: 12 %
Benchmark Average: 86 %
International background 40%
Racial diversity 24%
Socioeconomic background 27%
Diversity of employees 97%
Age group distribution
Under 30 years old: 31.6%
Between 30 and 50 years old: 66.07%
Over 50 years old: 2.33%
88%Benchmark Average: 13 %
Benchmark Average: 57 %
Benchmark Average: 18 %
Gender pay gap 19%
Gender ratio
Women: 29.43%
Men: 70.57%
97%Benchmark Average: 36 %
Benchmark Average: 60 %
International background 42%
Racial diversity 27%
Socioeconomic background 19%
We view our diverse workforce and rich pool of talent, as a source of competitive advantage and a key to success; and are intent on creating aninclusive workplace that capitalizes on these differences. We value gender diversity and have focused diversity KRAs within HR for Resourcing and Retention. Our proactive hiring practice has led to anoverall gender diversity ratio of 30% for consecutive second year, making us one of the organizations having the highest D & I ratio in real estate sector. (confirm applicability to reporting period)
“
[NOT ACCEPTED]Evidence provided (but not shared with investors)
No 1%

08/12/2020 2020 Godrej Properties: Benchmark Report
https://portal.gresb.com/2020/reports/17642-godrej-properties/sections.html 24/41
Supply chain engagement program Percentage of Benchmark
Program elements
Topics included
External parties to whom the requirements apply
Monitoring property/asset managers Percentage of Benchmark
Monitoring compliance of
SE6 POINTS: 1.5/1.5
SE7.1 POINTS: 1/1
Yes 95%
Developing or applying ESG policies 90%
Planning and preparation for engagement 70%
Development of action plan 55%
Implementation of engagement plan 66%
Training 62%
Program review and evaluation 63%
Feedback sessions with stakeholders 67%
Other 6%
Business ethics 92%
Child labor 52%
Environmental process standards 83%
Environmental product standards 83%
Health and safety: employees 70%
Health and well-being 65%
Human health-based product standards 60%
Human rights 76%
Labor standards and working conditions 87%
Other 24%
Contractors 90%
Suppliers 90%
Supply chain (beyond 1 tier suppliers and contractors) 36%
Other 7%
No 5%
Yes 93%

08/12/2020 2020 Godrej Properties: Benchmark Report
https://portal.gresb.com/2020/reports/17642-godrej-properties/sections.html 25/41
Methods used
Monitoring external suppliers/service providers Percentage of Benchmark
Methods used
Stakeholder grievance process Percentage of Benchmark
Process characteristics
Percentage of Benchmark
[41%] Both internal and external property/asset managers
[35%] External property/asset managers
[17%] Internal property/asset managers
[7%] No answer provided
SE7.2 POINTS: 1/1
SE8 POINTS: 0.5/0.5
Checks performed by independent third party 26%
Property/asset manager ESG training 76%
Property/asset manager self-assessments 77%
Regular meetings and/or checks performed by the entity‘s employees 88%
Require external property/asset managers‘ alignment with a professional standard 21%
Other 6%
No 5%
Not applicable 2%
Yes 90%
Checks performed by an independent third party 16%
Regular meetings and/or checks performed by external property/asset managers 52%
Regular meetings and/or checks performed by the entity‘s employees 80%
Require supplier/service providers‘ alignment with a professional standard 29%
Supplier/service provider ESG training 42%
Supplier/service provider self-assessments 58%
Other 12%
No 10%
Not applicable 0%
Yes 99%
Accessible and easy to understand 98%
Anonymous 71%
Dialogue based 91%
Equitable & rights compatible 86%
Improvement based 77%

08/12/2020 2020 Godrej Properties: Benchmark Report
https://portal.gresb.com/2020/reports/17642-godrej-properties/sections.html 26/41
The process applies to
Legitimate & safe 90%
Predictable 35%
Prohibitive against retaliation 57%
Transparent 78%
Other 9%
Contractors 85%
Suppliers 84%
Supply chain (beyond tier 1 suppliers and contractors) 59%
Clients/Customers 95%
Community/Public 90%
Employees 94%
Investors/Shareholders 88%
Regulators/Government 44%
Special interest groups (NGO’s, Trade Unions, etc) 35%
Other 8%
No 1%

08/12/2020 2020 Godrej Properties: Benchmark Report
https://portal.gresb.com/2020/reports/17642-godrej-properties/sections.html 27/41
ESG strategy during development Percentage of Benchmark
Strategy elements
Development
Aspect Indicators
Score Max
Score Entity
(p)
Score Benchmark
(p)
Strengths & Opportunities
ESG Requirements 12p | 17.14% 12 11 N/A
DRE1 ESG strategy during development 4 4 3.67 33% of peers scored lowerDRE2 Site selection requirements 4 4 4 0% of peers scored lowerDRE3 Site design and development requirements 4 4 4 0% of peers scored lower
Materials 6p | 8.57% 6 3 N/A
DMA1 Materials selection requirements 6 6 3.33 66% of peers scored lowerDMA2.1 Life cycle assessments Not scoredDMA2.2 Embodied carbon disclosure Not scored
Building Certifications 13p | 18.57% 13 8.35 N/A
DBC1.1 Green building standard requirements 4 4 3.04 66% of peers scored lowerDBC1.2 Green building certifications 9 9 5.31 50% of peers scored lower
Energy Consumption 14p | 20% 12 6.49 N/A
DEN1 Energy efficiency requirements 6 6 5.17 83% of peers scored lowerDEN2.1 On-site renewable energy 6 6 1.27 83% of peers scored lowerDEN2.2 Net-zero carbon design and standards 2 0 0.05 33% of peers scored higher
Water Use 5p | 7.14% 5 4.17 N/A
DWT1 Water conservation strategy 5 5 4.17 50% of peers scored lower
Waste Management 5p | 7.14% 5 4.79 N/A
DWS1 Waste management strategy 5 5 4.79 16% of peers scored lower
Stakeholder Engagement 15p | 21.43% 14 13.4 N/A
DSE1 Health & well-being 2 2 1.88 50% of peers scored lowerDSE2.1 On-site safety 1.5 1.5 1.5 0% of peers scored lowerDSE2.2 Safety metrics 1.5 1.5 1.19 66% of peers scored lowerDSE3.1 Contractor ESG requirements 2 2 2 0% of peers scored lowerDSE3.2 Contractor monitoring methods 2 2 1.67 16% of peers scored lowerDSE4 Community engagement program 2 2 2 0% of peers scored lowerDSE5.1 Community impact assessment 2 2 1.83 16% of peers scored lowerDSE5.2 Community impact monitoring 2 1 1.33 50% of peers scored higher
Development
ESG Requirements
Integrating ESG requirements into construction activities can help mitigate the negative impact on ecological systems, and at the same time improvethe environmental efficiency of buildings in the operational phase. This aspect assesses the entity’s efforts to address ESG-issues during the design,construction, and site development of new buildings.
DRE1 POINTS: 4/4
Yes 100%

08/12/2020 2020 Godrej Properties: Benchmark Report
https://portal.gresb.com/2020/reports/17642-godrej-properties/sections.html 28/41
The strategy is
Provide applicable evidence
Business strategy integration
Percentage of Benchmark
[67%] Publicly available
[33%] Not publicly available
Biodiversity and habitat 83%
Building safety 100%
Climate/climate change adaptation 83%
Energy consumption 100%
Green building certifications 100%
Greenhouse gas emissions 83%
Health and well-being 100%
Indoor environmental quality 83%
Life-cycle assessments/embodied carbon 33%
Location and transportation 83%
Material sourcing 83%
Net-zero/carbon neutral design 50%
Pollution prevention 83%
Renewable energy 83%
Resilience to catastrophe/disaster 67%
Site selection and land use 83%
Sustainable procurement 83%
Waste management 100%
Water consumption 83%
Other
[DUPLICATE]Environmental attributes of building materials - environmental characteristics of thebuilding materials such as paints, wood, coatings, etc.
17%
[ACCEPTED]Evidence provided
🔗 https://www.godrej.com/good-and-green.html
The 2020 Sustainability Goals are to: 1. Ensuring employability- to skill 1 million youth 2. Greener India Reduce specific energy by 30%, Water Positivity, Carbon Neutrality, Zero waste to landfill & increase Renewable Energy by 30% 3. Green Product - 30% of a company's revenue must come from a Good or Green product.
“
No 0%

08/12/2020 2020 Godrej Properties: Benchmark Report
https://portal.gresb.com/2020/reports/17642-godrej-properties/sections.html 29/41
Site selection requirements Percentage of Benchmark
Criteria included
Site design and development requirements Percentage of Benchmark
Criteria included
DRE2 POINTS: 4/4
DRE3 POINTS: 4/4
Development
Materials
Consideration of the environmental attributes of materials during the design of development projects can reduce the overall life cycle emissions. Inaddition, consideration of health attributes for materials affects the on-site health and safety of personnel and health and well-being of occupants oncethe development is completed. This aspect assesses criteria on material selection related to (1) environmental and health attributes and (2) life cycleemissions, as well as disclosure on embodied carbon emissions.
Yes 100%
Connect to multi-modal transit networks 83%
Locate projects within existing developed areas 100%
Protect, restore, and conserve aquatic ecosystems 83%
Protect, restore, and conserve farmland 67%
Protect, restore, and conserve floodplain functions 67%
Protect, restore, and conserve habitats for native, threatened and endangered species 83%
Protect, restore, and conserve historical and heritage sites 83%
Redevelop brownfield sites 67%
Other
[DUPLICATE]Proximity to Public transport
50%
No 0%
Yes 100%
Manage waste by diverting construction and demolition materials from disposal 100%
Manage waste by diverting reusable vegetation, rocks, and soil from disposal 100%
Minimize light pollution to the surrounding community 83%
Minimize noise pollution to the surrounding community 83%
Perform environmental site assessment 83%
Protect air quality during construction 100%
Protect and restore habitat and soils disturbed during construction and/or during previousdevelopment
83%
Protect surface water and aquatic ecosystems by controlling and retaining construction pollutants 100%
Other
[ACCEPTED]Manage Heat island effect by encouring use of high SRI value materials and ensuringcovered parking area
17%
No 0%
08/12/2020 2020 Godrej Properties: Benchmark Report
https://portal.gresb.com/2020/reports/17642-godrej-properties/sections.html 30/41
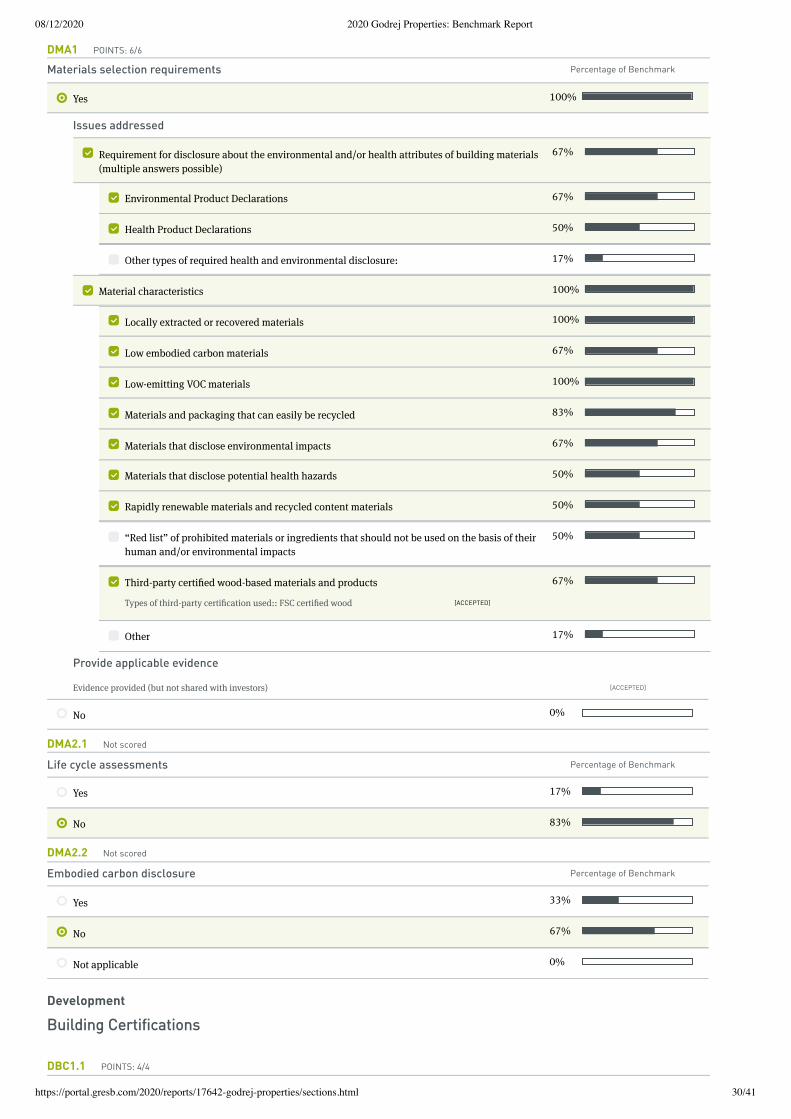
Materials selection requirements Percentage of Benchmark
Issues addressed
Provide applicable evidence
Life cycle assessments Percentage of Benchmark
Embodied carbon disclosure Percentage of Benchmark
DMA1 POINTS: 6/6
DMA2.1 Not scored
DMA2.2 Not scored
Development
Building Certifications
DBC1.1 POINTS: 4/4
Yes 100%
Requirement for disclosure about the environmental and/or health attributes of building materials(multiple answers possible)
67%
Environmental Product Declarations 67%
Health Product Declarations 50%
Other types of required health and environmental disclosure: 17%
Material characteristics 100%
Locally extracted or recovered materials 100%
Low embodied carbon materials 67%
Low-emitting VOC materials 100%
Materials and packaging that can easily be recycled 83%
Materials that disclose environmental impacts 67%
Materials that disclose potential health hazards 50%
Rapidly renewable materials and recycled content materials 50%
“Red list” of prohibited materials or ingredients that should not be used on the basis of theirhuman and/or environmental impacts
50%
Third-party certified wood-based materials and products
[ACCEPTED]Types of third-party certification used:: FSC certified wood
67%
Other 17%
[ACCEPTED]Evidence provided (but not shared with investors)
No 0%
Yes 17%
No 83%
Yes 33%
No 67%
Not applicable 0%

08/12/2020 2020 Godrej Properties: Benchmark Report
https://portal.gresb.com/2020/reports/17642-godrej-properties/sections.html 31/41
Green building standard requirements Percentage of Benchmark
Requirements
Green building certifications Percentage of Benchmark
Certification schemes used
Energy efficiency requirements Percentage of Benchmark
[50%] ≥75, ≤100%
[17%] 0%, <25%
[17%] ≥50%, <75%
[16%] No answer provided
DBC1.2 POINTS: 9/9
Scheme name / sub-scheme name/ level
Area Certified (sq.ft.)
% portfolio certified by floorarea 2019
Number ofassets
% of GAV certified - optional2019
IGBC Green/Homes 46590428 95 53
Development
Energy
This aspect describes the entity’s strategy to integrate energy efficiency measures, incorporate on-site renewable energy generation and approach todefine and achieve net-zero energy performance throughout design and construction activities.
DEN1 POINTS: 6/6
Yes 100%
Projects required to align with requirements of a third-party green building rating system 33%
Projects required to achieve certification with a green building rating system 50%
Projects required to achieve a specific level of certification
[FULL POINTS]Green building rating systems: Indian Green Building Council (IGBC) Green Homes,LEED India Core & Shell, Green Rating for Integrated Habitat Assessment (GRIHA)
[FULL POINTS]Level of certification: "Silver Rating" is a base level certification for projects mandatedinternally by the company.
83%
No 0%
Yes 100%
Projects registered to obtain a green building certificate 33%
Projects that obtained a green building certificate or official pre-certification 100%
No 0%
Not applicable 0%
Yes 100%
Requirements for planning and design 100%
Development and implementation of a commissioning plan 67%
Integrative design process 83%
To exceed relevant energy codes or standards 83%
Requirements for minimum energy use intensity post-occupancy 33%
08/12/2020 2020 Godrej Properties: Benchmark Report
https://portal.gresb.com/2020/reports/17642-godrej-properties/sections.html 32/41
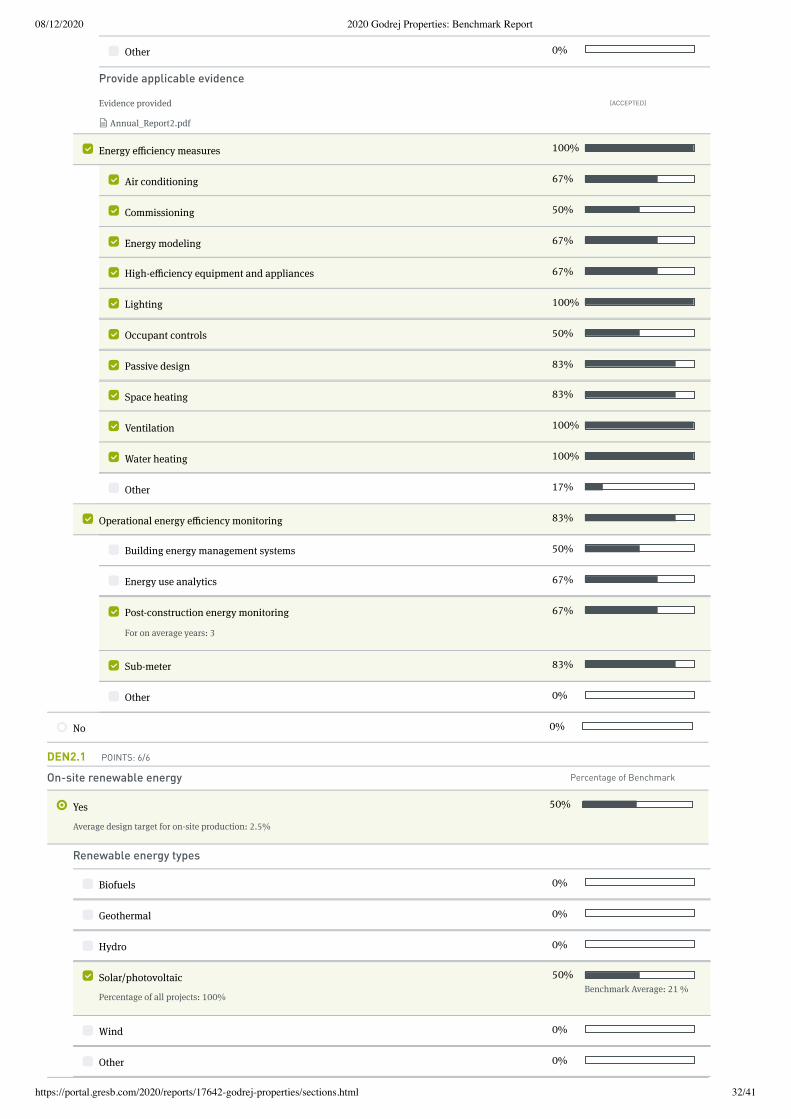
Provide applicable evidence
On-site renewable energy Percentage of Benchmark
Renewable energy types
DEN2.1 POINTS: 6/6
Other 0%
[ACCEPTED]Evidence provided
📄 Annual_Report2.pdf
Energy efficiency measures 100%
Air conditioning 67%
Commissioning 50%
Energy modeling 67%
High-efficiency equipment and appliances 67%
Lighting 100%
Occupant controls 50%
Passive design 83%
Space heating 83%
Ventilation 100%
Water heating 100%
Other 17%
Operational energy efficiency monitoring 83%
Building energy management systems 50%
Energy use analytics 67%
Post-construction energy monitoring
For on average years: 3
67%
Sub-meter 83%
Other 0%
No 0%
Yes
Average design target for on-site production: 2.5%
50%
Biofuels 0%
Geothermal 0%
Hydro 0%
Solar/photovoltaic
Percentage of all projects: 100%
50%Benchmark Average: 21 %
Wind 0%
Other 0%

08/12/2020 2020 Godrej Properties: Benchmark Report
https://portal.gresb.com/2020/reports/17642-godrej-properties/sections.html 33/41
Net-zero carbon design and standards Percentage of Benchmark
Water conservation strategy Percentage of Benchmark
Strategy elements
Provide applicable evidence
DEN2.2 POINTS: 0/2
Development
Water Conservation
This aspect describes the entity’s strategy to integrate water conservation measures in development projects.
DWT1 POINTS: 5/5
No 50%
Not applicable 0%
Yes 33%
No 67%
Yes 100%
Requirements for planning and design include 100%
Development and implementation of a commissioning plan 83%
Integrative design for water conservation 83%
Requirements for indoor water efficiency 100%
Requirements for outdoor water efficiency 83%
Requirements for process water efficiency 67%
Requirements for water supply 67%
Requirements for minimum water use intensity post-occupancy 33%
Other 0%
[ACCEPTED]Evidence provided (but not shared with investors)
Common water efficiency measures include 100%
Commissioning of water systems 67%
Drip/smart irrigation 100%
Drought tolerant/low-water landscaping 67%
High-efficiency/dry fixtures 83%
Leak detection system 50%
Occupant sensors 50%
On-site wastewater treatment 83%
Reuse of stormwater and greywater for non-potable applications 83%
Other 0%
Operational water efficiency monitoring 83%

08/12/2020 2020 Godrej Properties: Benchmark Report
https://portal.gresb.com/2020/reports/17642-godrej-properties/sections.html 34/41
Waste management strategy Percentage of Benchmark
Efficient solid waste management promotion strategies
Health & well-being Percentage of Benchmark
Design promotion activities
Development
Waste Management
This aspect describes the entity’s strategy to integrate efficient on-site waste management during the construction phase of its development projects.
DWS1 POINTS: 5/5
Development
Health, Safety & Well-being
This aspect identifies actions to engage with contractors and community, as well as the nature of the engagement during the project developmentphase.
DSE1 POINTS: 2/2
Post-construction water monitoring
For on average years: 3
67%
Sub-meter 83%
Water use analytics 33%
Other 17%
No 0%
Yes 100%
Management and construction practices (multiple answers possible) 100%
Construction waste signage 100%
Diversion rate requirements 67%
Education of employees/contractors on waste management 83%
Incentives for contractors for recovering, reusing and recycling building materials 17%
Targets for waste stream recovery, reuse and recycling 67%
Waste management plans 83%
Waste separation facilities 100%
Other 17%
On-site waste monitoring 83%
Hazardous waste monitoring/audit 83%
Non-hazardous waste monitoring/audit 83%
Other 0%
No 0%
Yes 100%

08/12/2020 2020 Godrej Properties: Benchmark Report
https://portal.gresb.com/2020/reports/17642-godrej-properties/sections.html 35/41
On-site safety Percentage of Benchmark
On-site safety promotion activities
DSE2.1 POINTS: 1.5/1.5
Requirements for planning and design 100%
Health Impact Assessment 67%
Integrated planning process 100%
Other planning process 17%
Health & well-being measures 100%
Acoustic comfort 67%
Active design features 83%
Biophilic design 50%
Commissioning 50%
Daylight 100%
Ergonomic workplace 50%
Humidity 50%
Illumination 67%
Inclusive design 67%
Indoor air quality 100%
Natural ventilation 100%
Occupant controls 83%
Physical activity 83%
Thermal comfort 67%
Water quality 83%
Other 0%
Monitoring health and well-being performance through 100%
Occupant education 83%
Post-construction health and well-being monitoring
For on average years: 3
67%
Other 17%
No 0%
Yes 100%
Availability of medical personnel 67%
Communicating safety information 100%
Continuously improving safety performance 83%
Demonstrating safety leadership 100%

08/12/2020 2020 Godrej Properties: Benchmark Report
https://portal.gresb.com/2020/reports/17642-godrej-properties/sections.html 36/41
Safety metrics Percentage of Benchmark
Indicators monitored
Explain the injury rate calculation method (maximum 250 words)
DSE2.2 POINTS: 1.5/1.5
Entrenching safety practices 100%
Managing safety risks 100%
On-site health and safety professional (coordinator) 67%
Personal Protective and Life Saving Equipment 83%
Promoting design for safety 67%
Training curriculum 83%
Other 0%
No 0%
Yes 100%
Injury rate
15.85
100%
In GPL, We have defined and developed safety performance indicators (Safety matrices) in line with Indian standard (IS 3786) & GILAC guideline and same is being monitored and maintained for review of GPL Safety Performance. 1. Total incident rate (Injury Rate): Ratio of the number of incidents including LTI, first aid and dangerous occurrence to the average number of persons employed during the period. It is expressed as the number of injuries per 1000 persons employed. 2. Near misses: Any unplanned incidents that occur at the workplace which, although not resulting in any injury or disease, had the potential to do so. 3. Severity rate: Ratio of total man-days lost per million man-hours to the total man-hours worked in year. 4. Dangerous Occurrences: Large scale - Collapse of structure, Fire, Explosion, Chemical spill, Gas Leak, Vehicle hitting against structure / facility, toppling of vehicle, Breakdown / Collapse of heavy equipment, but does not involve personal injury.
“
Fatalities
2
83%
Near misses
240
33%
Lost day rate 67%
Severity rate
288
33%
Other metrics
[ACCEPTED]Dangerous Occurrences -(a) collapse or failure of lifting appliances or hoist or conveyors orother similar equipment for handling building or construction material or breakage or failure ofrope, chain or loose gears; overturning of cranes used in building or other construction work;falling of objects from height; (b) collapse or subsidence of soil, any wall, floor, gallery, roof or anyother part of any structure, platform, staging, scaffolding or any means of access includingformwork; (c) contract work, excavation, collapse of transmission; (d) explosion of receiver or vesselused for storage, at a pressure greater than atmospheric pressure, of any gas or gases or any liquidor solid used as building material; (e) fire and explosion causing damage to any place onconstruction site where building material; (f) spillage or leakage of hazardous substances anddamage to their container; (g) collapse, capsizing, toppling or collision of transport equipment; (h)leakage or release of harmful toxic gases at the construction site. As per The Building and otherConstruction Workers‘ (Regulation of Employment and Conditions of Service) Act of India, 1996
Rate of other metric(s): 0
33%
No 0%

08/12/2020 2020 Godrej Properties: Benchmark Report
https://portal.gresb.com/2020/reports/17642-godrej-properties/sections.html 37/41
Contractor ESG requirements Percentage of Benchmark
Topics included
Contractor monitoring methods Percentage of Benchmark
Methods used
Community engagement program Percentage of Benchmark
Supply Chain
DSE3.1 POINTS: 2/2
DSE3.2 POINTS: 2/2
Community Impact and Engagement
DSE4 POINTS: 2/2
Yes
Percentage of projects covered: 100%
100%Benchmark Average: 100 %
Business ethics 83%
Child labor 83%
Community engagement 33%
Environmental process standards 83%
Environmental product standards 100%
Health and well-being 67%
Human rights 83%
Human health-based product standards 100%
Occupational safety 100%
Labor standards and working conditions 83%
Other 0%
No 0%
Yes 83%
Contractor ESG training 83%
Contractors provide update reports on environmental and social aspects during construction 83%
External audits by third party
Projects externally audited: 100%
67%Benchmark Average: 58 %
Internal audits
Projects internally audited: 100%
50%Benchmark Average: 43 %
Weekly/monthly (on-site) meetings and/or ad hoc site visits
Projects' meetings and/or site visits: 100%
67%Benchmark Average: 58 %
Other 0%
No 17%
Not applicable 0%
08/12/2020 2020 Godrej Properties: Benchmark Report
https://portal.gresb.com/2020/reports/17642-godrej-properties/sections.html 38/41
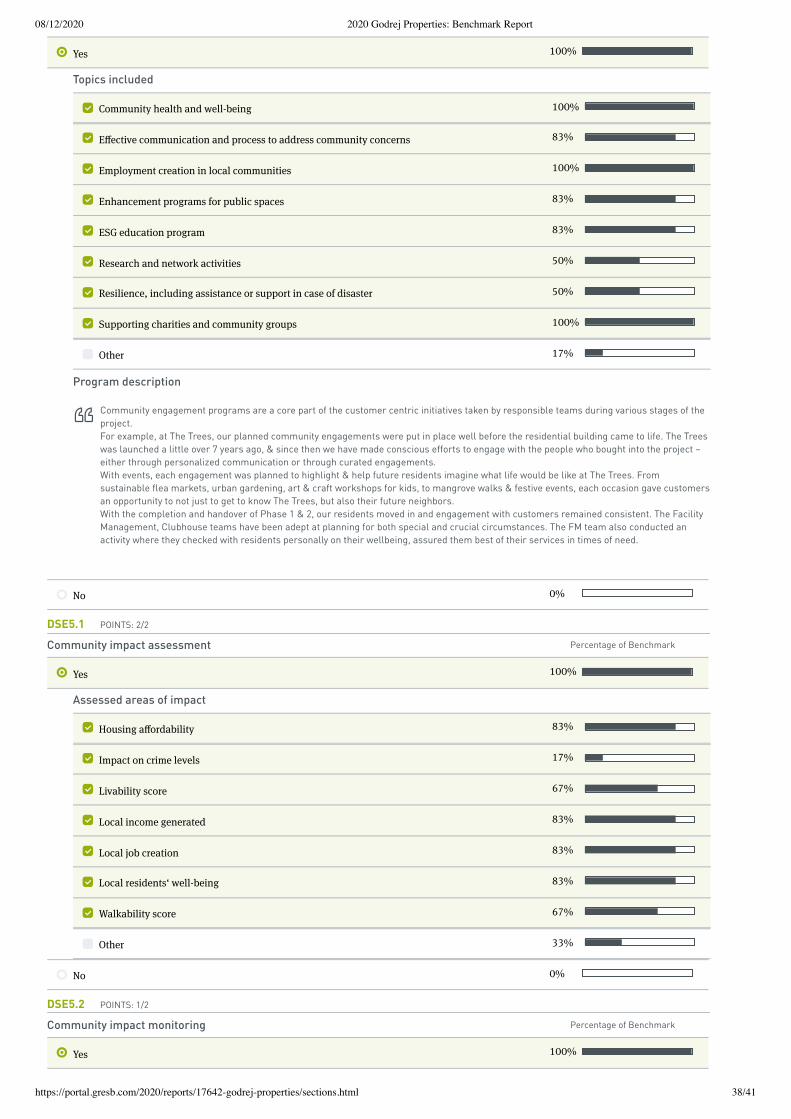
Topics included
Program description
Community impact assessment Percentage of Benchmark
Assessed areas of impact
Community impact monitoring Percentage of Benchmark
DSE5.1 POINTS: 2/2
DSE5.2 POINTS: 1/2
Yes 100%
Community health and well-being 100%
Effective communication and process to address community concerns 83%
Employment creation in local communities 100%
Enhancement programs for public spaces 83%
ESG education program 83%
Research and network activities 50%
Resilience, including assistance or support in case of disaster 50%
Supporting charities and community groups 100%
Other 17%
Community engagement programs are a core part of the customer centric initiatives taken by responsible teams during various stages of the project. For example, at The Trees, our planned community engagements were put in place well before the residential building came to life. The Trees was launched a little over 7 years ago, & since then we have made conscious efforts to engage with the people who bought into the project – either through personalized communication or through curated engagements. With events, each engagement was planned to highlight & help future residents imagine what life would be like at The Trees. From sustainable flea markets, urban gardening, art & craft workshops for kids, to mangrove walks & festive events, each occasion gave customers an opportunity to not just to get to know The Trees, but also their future neighbors. With the completion and handover of Phase 1 & 2, our residents moved in and engagement with customers remained consistent. The Facility Management, Clubhouse teams have been adept at planning for both special and crucial circumstances. The FM team also conducted an activity where they checked with residents personally on their wellbeing, assured them best of their services in times of need.
“
No 0%
Yes 100%
Housing affordability 83%
Impact on crime levels 17%
Livability score 67%
Local income generated 83%
Local job creation 83%
Local residents‘ well-being 83%
Walkability score 67%
Other 33%
No 0%
Yes 100%

08/12/2020 2020 Godrej Properties: Benchmark Report
https://portal.gresb.com/2020/reports/17642-godrej-properties/sections.html 39/41
Monitoring process includes
Process description
Provide applicable evidence
Disclaimer: 2020 Benchmark Report
The 2020 Benchmark Report (the “Report”) and the associated GRESB Scorecard (“Scorecard”) is based on information provided by GRESB participants byway of the GRESB annual assessment.
The Report is intended to be read only by personnel authorized by the particular respondent (“Respondent”) to which the Report pertains. The Report mayalso be viewed by Investors in the Respondent entity, who have the requisite rights to do so. The Score and Scorecard associated with the Report are notpublically available and are shared only with the Respondent and its investors.
Any Scorecard that is provided to the Respondent is merely for reference and discussion purposes, and is not provided as the basis for any professional adviceor for transactional use. GRESB, its parent company or affiliates, its advisors, consultants and sub-contractors shall not be responsible or liable for any advicegiven to third parties, any investment decisions or trading or any other actions taken by you or by third parties based on information contained in theScorecard. Except where stated otherwise, GRESB is the exclusive owner of all intellectual property rights in all the information contained in the Scorecardand Benchmark Report.
© 2020 GRESB BV
Analysis and interpretation of monitoring data 67%
Development and implementation of a communication plan 83%
Development and implementation of a community monitoring plan 83%
Development and implementation of a risk mitigation plan 100%
Identification of nuisance and/or disruption risks 100%
Identification of stakeholders and impacted groups 100%
Management practices to ensure accountability for performance goals and issues identified duringcommunity monitoring
50%
Other 17%
During the stages of all projects, GPL teams monitor and implement following strategies that help ensure least impact on surrounding community: • Controlled/restricted working hours looking at adjoining community - 8 am to 8 pm • Regular sprinkling of water on construction access roads and areas prone for dust. • Regular monitoring of noise level with the help of DB meters to ensure there is no disturbance to the people leaving around. • Full height 6 m barricading all along the plot to restrict trespassing and to help us minimize spread of dust outside our plot. • Use of mist machines during excavation to control emission of dust. • Minimize time required for excavation. • Covering of material / debris taking dumpers with cloth to avoid spillage of material on road and to control emission of dust. • Restricting dumping of debris material on government approved dumping yards / ensuring its reconciliation to ensure contractors are not dumping in landfills. • Installation of boom barriers and deployment of security personnel to ensure safe movement of residents and workers. • Well maintained medical screening facility at the site to avoid entry of medically unfit labors. • Incentive scheme for main contractor to maintain necessary housekeeping and basic hygiene and creating toilet facilities. • Regular monitoring and review by senior management to understand impact we are creating in the project as well outside community. Post-handover until the society is formed, GPL Facility team monitors the project through various operational services
“
[PARTIALLY ACCEPTED]Evidence provided (but not shared with investors)
No 0%

08/12/2020 2020 Godrej Properties: Benchmark Report
https://portal.gresb.com/2020/reports/17642-godrej-properties/sections.html 40/41
GRESB Partners
Global Partners
GRESB Partners
Premier Partners
GRESB Partners
Partners
Arc Skoru CBRE Advisors EVORA Measurabl
PwC WSP Yardi Systems

08/12/2020 2020 Godrej Properties: Benchmark Report
https://portal.gresb.com/2020/reports/17642-godrej-properties/sections.html 41/41
Related Documents