2017/2018 Winter Reliability Assessment

Welcome message from author
This document is posted to help you gain knowledge. Please leave a comment to let me know what you think about it! Share it to your friends and learn new things together.
Transcript

2017/2018 Winter Reliability Assessment
2017/2018 Winter Reliability Assessment Errata
Version Date
1.0 11/20/2017 Initial Version 1 Released
Changes Received After Initial Release
1.1 12/08/2017 Added new findings regarding Aliso Canyon and gas line outages from the report Aliso Canyon Winter Risk Assessment Technical Report 2017–18 Supplement, dated November 28
1.1 12/08/2017 NYISO Reserve margin changed from 18.1 to 18.0

Table of Contents Preface ............................................................................ 3 About this Report ............................................................ 5 Key Findings .................................................................... 6 Total Internal Demand .................................................. 11 Fuel Supply and Transportation .................................... 12 FRCC .............................................................................. 14 MISO .............................................................................. 15 MRO-Manitoba Hydro................................................... 16 MRO-SaskPower ............................................................ 17 NPCC-Maritimes ............................................................ 18
NPCC-New England ...................................................... 19 NPCC-New York ............................................................ 20 NPCC-Ontario ............................................................... 21 NPCC-Québec ............................................................... 22 PJM ............................................................................... 23 SERC .............................................................................. 24 SPP ................................................................................ 25 Texas RE-ERCOT ............................................................ 26 WECC ............................................................................ 27 Data Concepts and Assumptions .................................. 28
3 2017/2018 Winter Reliability Assessment
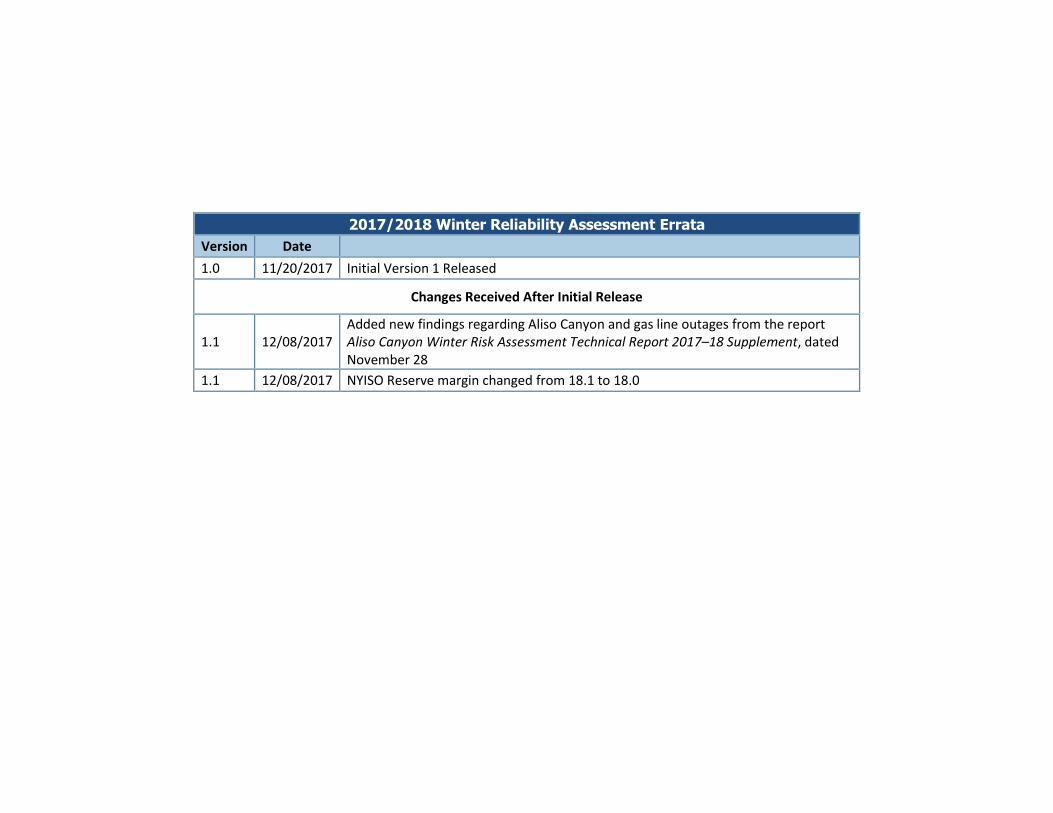
Preface The North American Electric Reliability Corporation (NERC) is a not-for-profit international regulatory authority whose mission is to assure the reliability of the bulk power system (BPS) in North America. NERC develops and enforces Reliability Standards; annually assesses seasonal and long‐term reliability; monitors the BPS through system awareness; and educates, trains, and certifies industry personnel. NERC’s area of responsibility spans the continental United States, Canada, and the northern portion of Baja California in Mexico. NERC is the electric reliability organization (ERO) for North America, subject to oversight by the Federal Energy Regulatory Commission (FERC) and governmental authorities in Canada. NERC’s jurisdiction includes users, owners, and operators of the BPS, which serve more than 334 million people. The North American BPS is divided into eight Regional Entity (RE) boundaries as shown in the map below. The assessment areas are shown on page 4. Refer to the Data Concepts and Assumptions section for more information.

4 2017/2018 Winter Reliability Assessment
FRCC—Florida Reliability Coordinating Council FRCC MRO—Midwest Reliability Organization MRO-SaskPower
MRO-Manitoba Hydro MISO SPP RE—Southwest Power Pool Regional Entity SPP
Texas-RE - Texas Reliability Entity ERCOT NPCC—Northeast Power Coordinating Council NPCC-Maritimes NPCC-New England NPCC-New York NPCC-Ontario NPCC-Québec RF—ReliabilityFirst PJM
WECC—Western Electricity Coordinating Council WECC-CA/MX WECC-NWPP-AB WECC-NWPP-BC WECC-NWPP-US
WECC-RMRG WECC-SRSG SERC—SERC Reliability Corporation SERC-East SERC-North SERC-Southeast
5 2017/2018 Winter Reliability Assessment
About this Report The objectives for NERC's Winter Reliability Assessment (WRA) are to identify, assess, and report details about the reliability of the North American Bulk Power System (BPS) and to make recommendations as necessary. The WRA identifies potential resource deficiencies and operating reliability concerns, determines peak electricity demand and supply changes, and highlights unique regional challenges. The WRA represents the results of collaborative efforts that involve the Reliability Assessment Subcommittee (RAS), the Regions, and NERC staff to develop sound technical bases for understanding these potential concerns, changes, and challenges. The WRA is intended to enable entities to discuss their plans for the upcoming winter period respond to ensure BPS reliability.
6 2017/2018 Winter Reliability Assessment
Key Findings NERC’s annual Winter Reliability Assessment covers the three-month (December–February) 2017/2018 winter period. The assessment provides an evaluation of the generation resource and the transmission system adequacy necessary to meet projected winter peak demands. The assessment monitors and identifies potential reliability issues of interest and regional areas of concern that pertain to meeting projected customer demands. The following key findings represent NERC’s independent evaluation of electric generation capacity and potential operational concerns that may need to be addressed:
Anticipated Resources in all assessment areas meet or exceed their respective Planning Reference Margin Levels for the upcoming winter period.
Like in years past and as seen in the discussions of the various seasonal readiness programs, winter preparedness continues to be a high priority for the assessment areas. Examples include the winter preparedness workshops conducted by ERCOT, MISO, and other Regions, the Winter Reliability Program in ISO New England (ISO-NE), and the Winter Transmission Assessment and Operational Seasonal Study conducted by FRCC.
Market-based initiatives reinforce the need to sustain generator performance during the extreme weather conditions. Programs such as the PJM Capacity Performance initiative which began in 2015, is now fully applicable to this winter. This initiative adds stricter resource performance requirements in the PJM energy market with limited allowances for non-performance. Higher nonperformance charges during peak-load hours were also initiated and could amount to significant financial penalties. Opportunities for increased capacity market revenues, such as payments for dual-fuel capability and firm fuel service, were also added. In ISO-NE, the winter fuel-reliability program and improved coordination of electric power and natural gas system operations resulted in more reliable resource performance during Winter 2016/2017. One of the improvements to ISO-NE’s Forward Capacity Market rules is pay-for-performance (PFP), which will go into effect in June 2018, creates stronger financial incentives for generators to perform when called upon during periods of system stress. PFP will also create incentives to make investments to increase unit availability, such as implementing dual-fuel capability and entering into firm gas-supply and firm transportation contracts.
The impacts on the BPS from Hurricane Harvey in Texas and Louisiana and Hurricane Irma in Florida are not expected to threaten reliability for the upcoming winter period.
Despite substantial progress made in addressing and coordinating the interdependencies between natural gas and electric infrastructure, the growing reliance on natural gas continues to raise BPS reliability concerns. Planning approaches, operational procedures, and regulatory partnerships are needed to assure fuel deliverability, availability, security (physical and cyber), and resilience from potential disruptions.
It is likely that withdrawals from the Aliso Canyon natural gas storage facility will be needed in Southern California. Under extreme cold weather events, there may be insufficient gas supplies to meet minimum electric generation demand that may pose a threat to electric reliability. The details for this key finding are discussed on the next page.

7 2017/2018 Winter Reliability Assessment
Challenges Impacting Southern California Following the initial release of NERC’s Winter Reliability Assessment, a report was issued by the Aliso Canyon Technical Assessment Group that was composed of technical experts from the California Public Utilities Commission (CPUC), the California Energy Commission (CEC), the California Independent System Operator CAISO, and the Los Angeles Department of Water and Power (LADWP). The report1 found the primary challenge in this upcoming winter is that three natural gas transmission pipelines that the Southern California Gas Company (SoCalGas) relies on to serve its customers are out of operation (Line 235-2, Line 4000, and Line 3000). Moreover, necessary maintenance on electric transmission lines to reduce reliability risks for Summer 2018 is scheduled to begin February 1, 2018. Combining these factors with unexpected but possible events (e.g., additional electric transmission or natural gas facility outages), the report finds that it is likely that the natural gas reserves at Aliso Canyon storage facility will be needed and, during extreme cold weather events, there may be insufficient gas supplies to meet gas demand even when relying on withdrawals from other operational storage fields. Should the natural gas system be unable to provide the fuel required to support minimum generation levels (i.e., either because gas demand is higher than assumed, other gas facility outages occur, or gas supply is not delivered to the receipt points), electric reliability may be threatened. The largest risk to the system is not from a single day with high gas demand; rather, it is from multiple days of higher demand that would draw down storage inventories to a point where storage could not be used to meet gas demand later in the winter. Demand for gas to supply electric generation can increase as actual electric demand may be higher than forecasted, unexpected outages of electric system elements may occur, or electric power imports may not be delivered as scheduled. Mitigation Steps SoCalGas has implemented two new physical mitigation measures to increase capacity on the gas system. These measures include temporarily increasing interruptible capacity at Kramer Junction by 150 MMcfd and by securing firm pipeline capacity of 200 MMcfd at Otay Mesa in San Diego County. In addition, Aliso Canyon Technical Assessment Group recommends that all mitigation measures that were in place for last winter (2016/2017) be continued for the upcoming winter season, which included demand response and other operational procedures. These measures will help mitigate but will not eliminate the risk to electric reliability for southern California. In addition, the California Independent System Operator (CAISO) has implemented the following mitigation steps:
With at least 24-hour notice of possible natural gas curtailments, CAISO can move generation away from the LA basin area and increase imports to that area.
With less than 24-hour notice, CAISO will attempt to redispatch generation away from the Basin, but that can only be done if there are resources available outside the area and transmission is available for imports.
CAISO is holding more reserves or unloaded capacity to respond to natural gas outages.
1 http://docketpublic.energy.ca.gov/PublicDocuments/17-IEPR-11/TN221863_20171128T103411_Aliso_Canyon_Winter_Risk_Assesment_Technical_Report_201718_Supp.pdf

8 2017/2018 Winter Reliability Assessment
CAISO and SoCalGas are communicating many times a day (as needed), checking on availability of gas (SoCalGas), and identifying changes in generation (CAISO) as peaking units or new generation is needed. This communication is allowing both parties to coordinate expected future natural gas demand.
The weather in southern California has been trending warmer than average and is expected to remain above average for the winter season. The slightly above normal temperature is helping to keep natural gas demand down in Southern California, which increased gas in storage for use later in the winter season. CAISO and SoCalGas were successful in requesting the CEC and the CPUC ease criteria needed before natural gas can be removed from Aliso Canyon, which gives the SoCalGas more flexibility to supply natural gas demand for both the CAISO and LADWP. Finally, as the Aliso Canyon Supplemental Assessment indicated, Line 4000 is expected to be back in service by December 30, and Line 3000 is expected to be back in service by May 1, 2018. There is still no estimated time of return to service for Line 235-2.

9 2017/2018 Winter Reliability Assessment
Resource Adequacy The Anticipated Reserve Margin is the primary metric used to evaluate resource adequacy by comparing the projected capability of anticipated resources to serve forecasted peak load.2 Large year-to-year changes in anticipated resources or forecasted peak load (total internal demand) can greatly impact Planning Reserve Margin calculations. All assessment areas have sufficient Anticipated Reserve Margins to meet or exceed their planning Reference Margin Level for the 2017/2018 winter as shown in the figure below.
Winter 2017/2018 Anticipated/Prospective Reserve Margins Compared to Reference Margin Level
Note: Areas with reserve margins greater than 50 percent are shown as 50 percent.
2 Refer to Data Concepts and Assumptions section for additional information on Anticipated Reserve Margins, Anticipated Resources, and Reference Margin Levels.
10 2017/2018 Winter Reliability Assessment
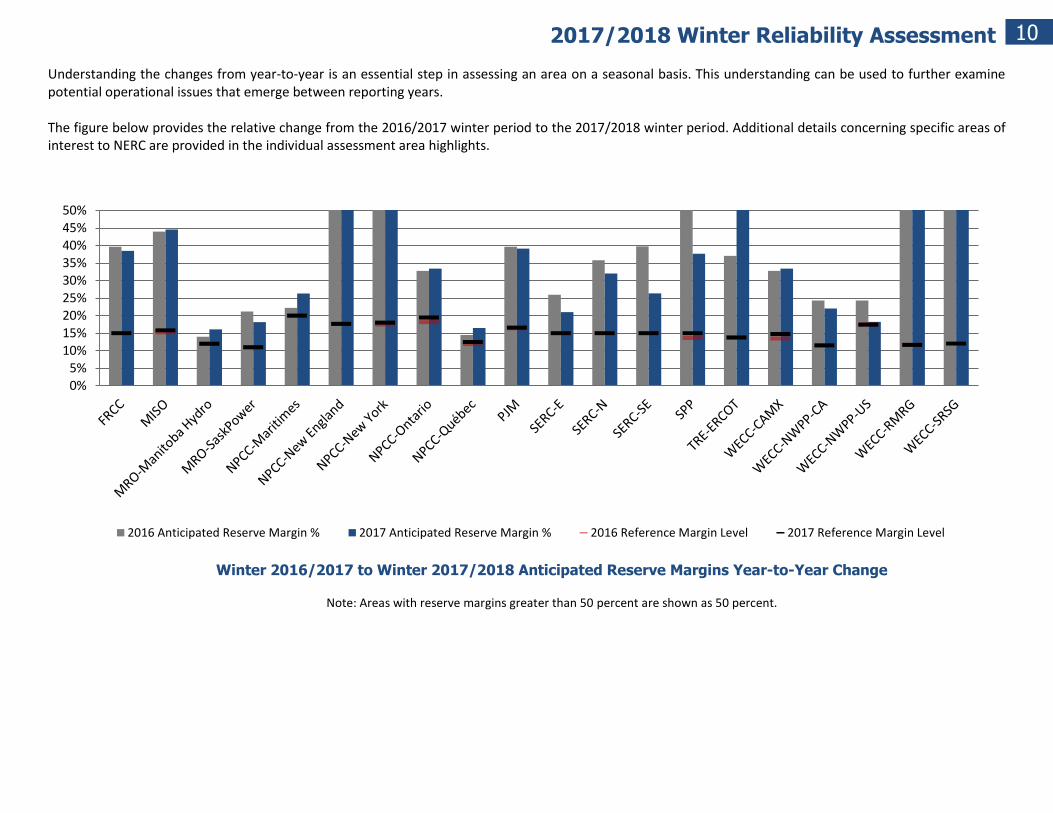
Understanding the changes from year-to-year is an essential step in assessing an area on a seasonal basis. This understanding can be used to further examine potential operational issues that emerge between reporting years. The figure below provides the relative change from the 2016/2017 winter period to the 2017/2018 winter period. Additional details concerning specific areas of interest to NERC are provided in the individual assessment area highlights.
0%5%
10%15%20%25%30%35%40%45%50%
2016 Anticipated Reserve Margin % 2017 Anticipated Reserve Margin % 2016 Reference Margin Level 2017 Reference Margin Level
Winter 2016/2017 to Winter 2017/2018 Anticipated Reserve Margins Year-to-Year Change
Note: Areas with reserve margins greater than 50 percent are shown as 50 percent.

11 2017/2018 Winter Reliability Assessment
Total Internal Demand Peak demand forecast for most assessment areas has decreased or remained flat compared to prior assessments. Some assessment areas are forecasting growth in Total Internal Demand. The increases in forecasted net internal demand for each assessment area are shown in the figure below:
Net Change in Net Internal Demand 2017/2018 winter compared to 2016/2017
-6.41%
-2.06% -1.82%-1.51%-1.34%
-1.32%-0.98%-0.72%-0.50%-0.26%-0.18%-0.04%-0.01%
0.01%0.45% 0.58%
1.27%1.33% 1.58%
2.55% 2.65%3.47%
4.27%
-8.00%
-6.00%
-4.00%
-2.00%
0.00%
2.00%
4.00%
6.00%

12 2017/2018 Winter Reliability Assessment
Fuel Supply and Transportation NERC anticipates adequate levels of fuel supply for all Assessment Areas for the upcoming winter period. Winter preparedness programs can ensure that on-site fuel storage is sufficient and equipment is ready to withstand extreme winter weather. The issues addressed by these programs are identified and discussed in the 2014 WRA in reference to the Polar Vortex.3 Power plants with on-site fuel have a decreased risk of generator unavailability to serve load. Many coal plants have at least two months of on-site coal (see below figure)4 while nuclear generation plants can operate continuously for more than two years. In areas that are highly dependent on natural gas (e.g., Florida), oil tanks are on-site to serve as a back-up fuel source. As generation with on-site fuel retires, the BPS becomes more vulnerable to fuel supply and delivery disruptions and thus attention to fuel assurance is needed.
U.S. Coal Plants Average Storage On-Site in Burn Days
3 http://www.nerc.com/pa/RAPA/ra/Reliability%20Assessments%20DL/2014WRA_final.pdf 4 https://www.eia.gov/electricity/monthly/update/fossil_fuel_stocks.php

13 2017/2018 Winter Reliability Assessment
Historical performance data from the NERC Generator Availability Data Systems (GADS) for natural-gas-fired units (simple cycle and combined cycle) were analyzed to determine the level of outages resulting from fuel unavailability. The range of plant outages, measured in MWs, was summarized for the eight Regions and NERC in aggregate for the time period year 2012 through year 2016. As can be seen in the figure below (note that the y-axis scales are different for each region), the fuel related outages for these units concentrated during the winter period. These historical outages that resulted from fuel unavailability during the winter months underscore the need for fuel assuredness and operational readiness during periods when reliance on natural gas can be critical.
Unavailable Gas Fired Units Resulting From Fuel Shortages and Conservation Interruptions

14 2017/2018 Winter Reliability Assessment
Highlights
The FRCC Region does not anticipate reliability issues for the upcoming winter season from resource adequacy.
A third major natural gas pipeline was put in-service (Summer 2017) increasing the availability of natural gas within the Region.
The FRCC continues to promote winter preparedness and has initiated a Winter Transmission Assessment and Operational Seasonal Study to assess the reliability of the BES during winter peak load.
FRCC
Existing On-Peak Generation
Generation Type MW Percent
Biomass 520 0.9%
Coal 7,229 12.7%
Hydro 44 0.1%
Natural Gas 42,633 74.9%
Nuclear 3,700 6.5%
Petroleum 2,778 4.9%
FRCC Resource Adequacy Data Demand, Resource, and Reserve Margins
2016/2017 WRA 2017/2018 WRA 2016/2017 vs. 2017/2018 WRA
Demand Projections Megawatts (MW) Megawatts (MW) Net Change (%)
Total Internal Demand (50/50) 45,521 44,836 -1.5%
Demand Response: Available 2,885 2,842 -1.5%
Net Internal Demand 42,636 41,994 -1.5%
Resource Projections Megawatts (MW) Megawatts (MW) Net Change (%)
Existing-Certain Capacity 54,839 56,190 2.5%
Tier 1 Planned Capacity 3,453 715 -79.3%
Net Firm Capacity Transfers 1,254 1,253 -0.1%
Anticipated Resources 59,546 58,158 -2.3%
Existing-Other Capacity 452 535 18.3%
Prospective Resources 59,998 58,693 -2.2%
Reserve Margins Percent (%) Percent (%) Annual Difference
Anticipated Reserve Margin 39.7% 38.5% -1.2
Prospective Reserve Margin 40.7% 39.8% -0.9
Reference Margin Level 15.0% 15.0% 0.0
FRCC The Florida Reliability Coordinating Council’s (FRCC) membership includes 32 Regional Entity Division members and 23 Member Services Division members composed of investor-owned utilities (IOUs), cooperatives, municipal utilities, power marketers, and independent power producers. FRCC is divided into 10 Balancing Authorities with 45 registered entities (including both members and non-members) performing the functions identified in the NERC Reliability Functional Model and defined in the NERC Reliability Standards. The Region contains a population of over 16 million people and has a geographic coverage of about 50,000 square miles over Florida.

15 2017/2018 Winter Reliability Assessment
MISO
Existing On-Peak Generation
Generation Type MW Percent
Biomass 535 0.4%
Coal 61,452 42.7%
Hydro 1,237 0.9%
Natural Gas 60,328 41.8%
Nuclear 12,866 8.9%
Petroleum 3,168 2.2%
Pumped Storage 2,562 1.8%
Solar 159 0.1%
Wind 1,675 1.2%
MISO Resource Adequacy Data Demand, Resource, and Reserve Margins
2016/2017 WRA 2017/2018 WRA 2016/2017 vs. 2017/2018 WRA
Demand Projections Megawatts (MW) Megawatts (MW) Net Change (%)
Total Internal Demand (50/50) 103,878 103,731 -0.1%
Demand Response: Available 4,506 4,347 -3.5%
Net Internal Demand 99,372 99,384 0.0%
Resource Projections Megawatts (MW) Megawatts (MW) Net Change (%)
Existing-Certain Capacity 145,095 144,108 -0.7%
Tier 1 Planned Capacity 0 1,559 0.0%
Net Firm Capacity Transfers -1,994 -1,994 0.0%
Anticipated Resources 143,101 143,673 0.4%
Existing-Other Capacity 2,267 2,194 -3.2%
Prospective Resources 146,495 147,642 0.8%
Reserve Margins Percent (%) Percent (%) Annual Difference
Anticipated Reserve Margin 44.0% 45.0% 1.0
Prospective Reserve Margin 47.4% 48.6% 1.2
Reference Margin Level 15.2% 15.8% 0.6
Highlights
MISO anticipates that reliability will be maintained during the upcoming season.
Every year, MISO hosts a Winter Readiness Workshop in October to prepare operators for the upcoming season. Topics presented at the workshop include forecasted reserve margin under various scenarios, transmission assessment, and a review of emergency operating procedures. MISO also urges generator owners to prepare for the winter season by weatherizing their units. MISO provides information on weatherization on its website.
MISO
The Midcontinent Independent System Operator, Inc. (MISO) is a not-for-profit, member-based organization administering wholesale electricity markets that provide customers with valued service; reliable, cost-effective systems and operations; dependable and transparent prices; open access to markets; and planning for long-term efficiency. MISO manages energy, reliability, and operating reserve markets that consist of 36 local Balancing Authorities and 394 market participants, serving approximately 42 million customers. Although parts of MISO fall in three NERC Regions, MRO is responsible for coordinating data and information submitted for NERC’s reliability assessments.
16 2017/2018 Winter Reliability Assessment
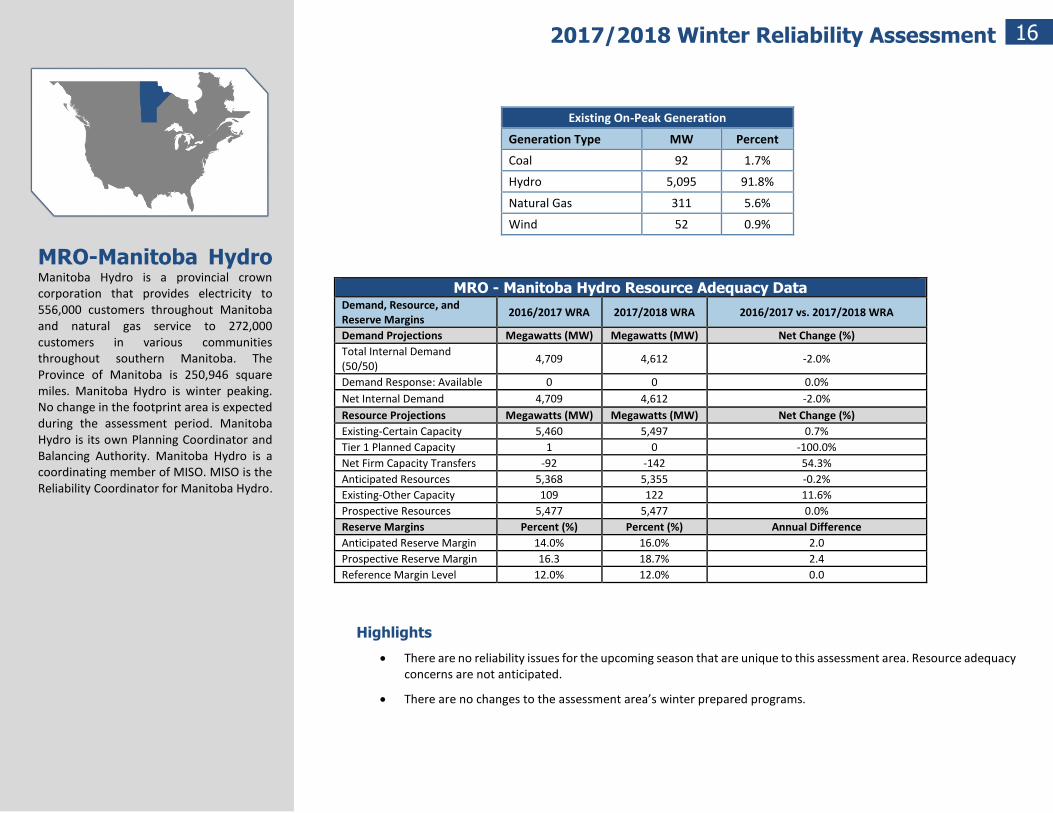
Existing On-Peak Generation
Generation Type MW Percent
Coal 92 1.7%
Hydro 5,095 91.8%
Natural Gas 311 5.6%
Wind 52 0.9%
MRO - Manitoba Hydro Resource Adequacy Data Demand, Resource, and Reserve Margins
2016/2017 WRA 2017/2018 WRA 2016/2017 vs. 2017/2018 WRA
Demand Projections Megawatts (MW) Megawatts (MW) Net Change (%)
Total Internal Demand (50/50)
4,709 4,612 -2.0%
Demand Response: Available 0 0 0.0%
Net Internal Demand 4,709 4,612 -2.0%
Resource Projections Megawatts (MW) Megawatts (MW) Net Change (%)
Existing-Certain Capacity 5,460 5,497 0.7%
Tier 1 Planned Capacity 1 0 -100.0%
Net Firm Capacity Transfers -92 -142 54.3%
Anticipated Resources 5,368 5,355 -0.2%
Existing-Other Capacity 109 122 11.6%
Prospective Resources 5,477 5,477 0.0%
Reserve Margins Percent (%) Percent (%) Annual Difference
Anticipated Reserve Margin 14.0% 16.0% 2.0
Prospective Reserve Margin 16.3 18.7% 2.4
Reference Margin Level 12.0% 12.0% 0.0
Highlights
There are no reliability issues for the upcoming season that are unique to this assessment area. Resource adequacy concerns are not anticipated.
There are no changes to the assessment area’s winter prepared programs.
MRO-Manitoba Hydro
Manitoba Hydro is a provincial crown corporation that provides electricity to 556,000 customers throughout Manitoba and natural gas service to 272,000 customers in various communities throughout southern Manitoba. The Province of Manitoba is 250,946 square miles. Manitoba Hydro is winter peaking. No change in the footprint area is expected during the assessment period. Manitoba Hydro is its own Planning Coordinator and Balancing Authority. Manitoba Hydro is a coordinating member of MISO. MISO is the Reliability Coordinator for Manitoba Hydro.
17 2017/2018 Winter Reliability Assessment
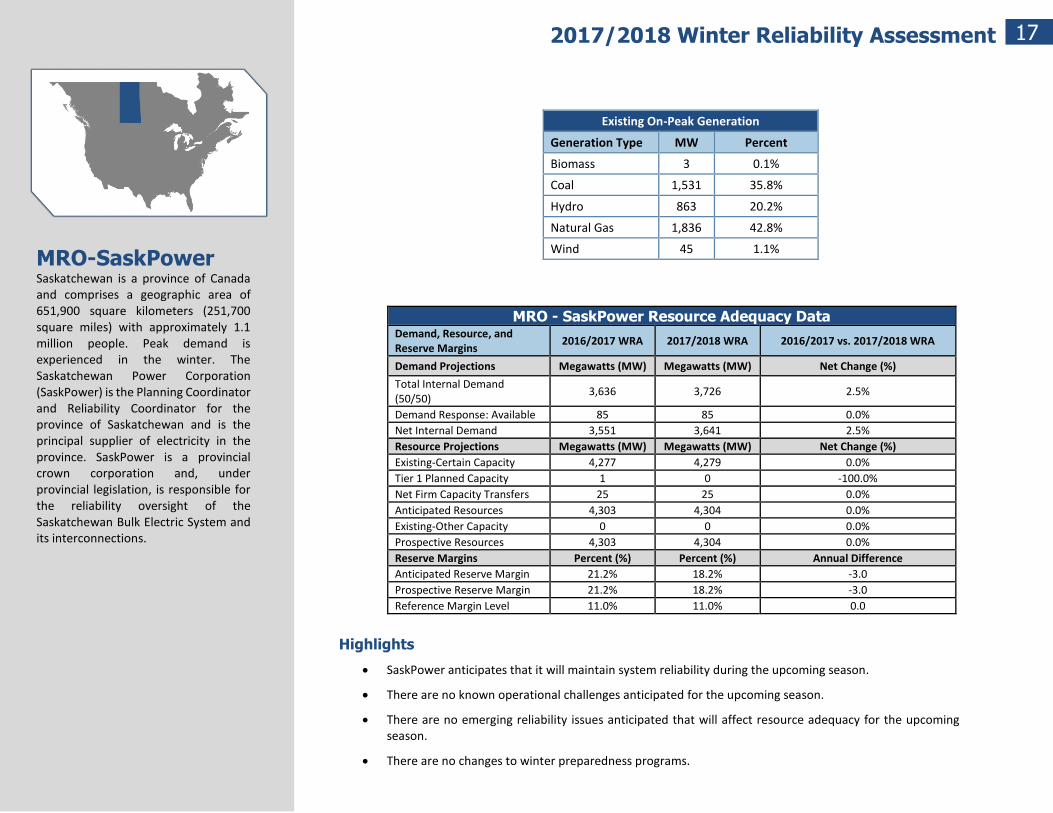
Existing On-Peak Generation
Generation Type MW Percent
Biomass 3 0.1%
Coal 1,531 35.8%
Hydro 863 20.2%
Natural Gas 1,836 42.8%
Wind 45 1.1%
MRO - SaskPower Resource Adequacy Data Demand, Resource, and Reserve Margins
2016/2017 WRA 2017/2018 WRA 2016/2017 vs. 2017/2018 WRA
Demand Projections Megawatts (MW) Megawatts (MW) Net Change (%)
Total Internal Demand (50/50)
3,636 3,726 2.5%
Demand Response: Available 85 85 0.0%
Net Internal Demand 3,551 3,641 2.5%
Resource Projections Megawatts (MW) Megawatts (MW) Net Change (%)
Existing-Certain Capacity 4,277 4,279 0.0%
Tier 1 Planned Capacity 1 0 -100.0%
Net Firm Capacity Transfers 25 25 0.0%
Anticipated Resources 4,303 4,304 0.0%
Existing-Other Capacity 0 0 0.0%
Prospective Resources 4,303 4,304 0.0%
Reserve Margins Percent (%) Percent (%) Annual Difference
Anticipated Reserve Margin 21.2% 18.2% -3.0
Prospective Reserve Margin 21.2% 18.2% -3.0
Reference Margin Level 11.0% 11.0% 0.0
Highlights
SaskPower anticipates that it will maintain system reliability during the upcoming season.
There are no known operational challenges anticipated for the upcoming season.
There are no emerging reliability issues anticipated that will affect resource adequacy for the upcoming season.
There are no changes to winter preparedness programs.
MRO-SaskPower
Saskatchewan is a province of Canada and comprises a geographic area of 651,900 square kilometers (251,700 square miles) with approximately 1.1 million people. Peak demand is experienced in the winter. The Saskatchewan Power Corporation (SaskPower) is the Planning Coordinator and Reliability Coordinator for the province of Saskatchewan and is the principal supplier of electricity in the province. SaskPower is a provincial crown corporation and, under provincial legislation, is responsible for the reliability oversight of the Saskatchewan Bulk Electric System and its interconnections.
18 2017/2018 Winter Reliability Assessment
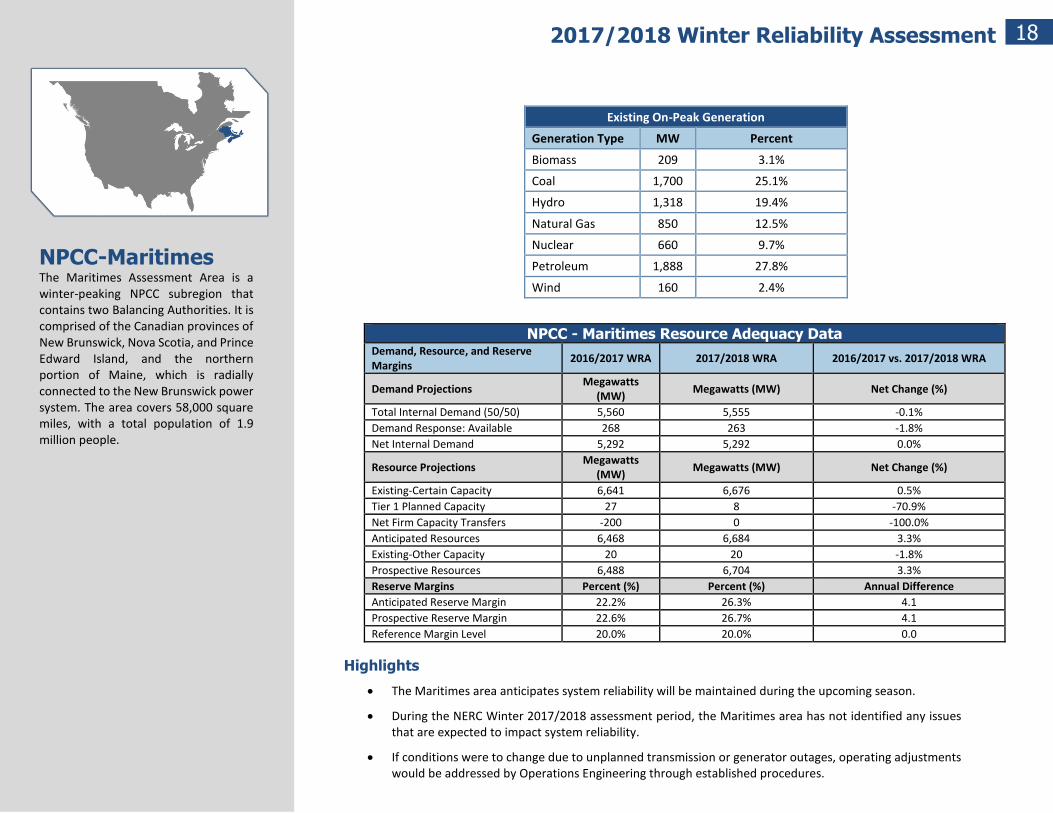
Existing On-Peak Generation
Generation Type MW Percent
Biomass 209 3.1%
Coal 1,700 25.1%
Hydro 1,318 19.4%
Natural Gas 850 12.5%
Nuclear 660 9.7%
Petroleum 1,888 27.8%
Wind 160 2.4%
NPCC - Maritimes Resource Adequacy Data Demand, Resource, and Reserve Margins
2016/2017 WRA 2017/2018 WRA 2016/2017 vs. 2017/2018 WRA
Demand Projections Megawatts
(MW) Megawatts (MW) Net Change (%)
Total Internal Demand (50/50) 5,560 5,555 -0.1%
Demand Response: Available 268 263 -1.8%
Net Internal Demand 5,292 5,292 0.0%
Resource Projections Megawatts
(MW) Megawatts (MW) Net Change (%)
Existing-Certain Capacity 6,641 6,676 0.5%
Tier 1 Planned Capacity 27 8 -70.9%
Net Firm Capacity Transfers -200 0 -100.0%
Anticipated Resources 6,468 6,684 3.3%
Existing-Other Capacity 20 20 -1.8%
Prospective Resources 6,488 6,704 3.3%
Reserve Margins Percent (%) Percent (%) Annual Difference
Anticipated Reserve Margin 22.2% 26.3% 4.1
Prospective Reserve Margin 22.6% 26.7% 4.1
Reference Margin Level 20.0% 20.0% 0.0
Highlights
The Maritimes area anticipates system reliability will be maintained during the upcoming season.
During the NERC Winter 2017/2018 assessment period, the Maritimes area has not identified any issues that are expected to impact system reliability.
If conditions were to change due to unplanned transmission or generator outages, operating adjustments would be addressed by Operations Engineering through established procedures.
NPCC-Maritimes
The Maritimes Assessment Area is a winter-peaking NPCC subregion that contains two Balancing Authorities. It is comprised of the Canadian provinces of New Brunswick, Nova Scotia, and Prince Edward Island, and the northern portion of Maine, which is radially connected to the New Brunswick power system. The area covers 58,000 square miles, with a total population of 1.9 million people.

19 2017/2018 Winter Reliability Assessment
Existing On-Peak Generation
Generation Type MW Percent
Biomass 986 3.0%
Coal 919 2.8%
Hydro 1,487 4.6%
Natural Gas 16,132 49.9%
Nuclear 4,025 12.5%
Petroleum 6,635 20.5%
Pumped Storage 1,785 5.5%
Solar 1 0.0%
Wind 383 1.2%
NPCC - New England Resource Adequacy Data Demand, Resource, and Reserve Margins
2016/2017 WRA 2017/2018 WRA 2016/2017 vs. 2017/2018 WRA
Demand Projections Megawatts (MW) Megawatts (MW) Net Change (%)
Total Internal Demand (50/50) 21,028 21,197 0.8%
Demand Response: Available 543 388 -28.5%
Net Internal Demand 20,485 20,809 1.6%
Resource Projections Megawatts (MW) Megawatts (MW) Net Change (%)
Existing-Certain Capacity 32,038 31,540 -1.6%
Tier 1 Planned Capacity 11 780 6990.9%
Net Firm Capacity Transfers 1,037 1,232 18.8%
Anticipated Resources 33,086 33,551 1.4%
Existing-Other Capacity 102 210 105.9%
Prospective Resources 33,214 33,790 1.7%
Reserve Margins Percent (%) Percent (%) Annual Difference
Anticipated Reserve Margin 61.5% 61.2% -0.3
Prospective Reserve Margin 62.2% 62.4% 0.2
Reference Margin Level 17.6% 16.6% -1.0
Highlights
ISO-NE does not anticipate any reliability issues for the 2017/2018 winter season.
ISO-NE expects that the FERC-approved Winter Reliability Program (ER15-2208-000 Winter Reliability Program – ISO New England) will continue to help address several challenges that could have an adverse impact on generation during the 2017/2018 winter period.
Similar to last year, the 2017/2018 Winter Reliability Program and other supportive activities provide a winter demand-response program that may be called on 30 times and incentives for reliability that encourage the following: creation of more dual-fuel facilities, increased on site storage of fuel oil before the start of winter, and contracts in place for liquefied natural gas for generation before the winter season.
NPCC-New England ISO New England (ISO‐NE) Inc. is a regional transmission organization that serves Connecticut, Maine, Massachusetts, New Hampshire, Rhode Island, and Vermont. It is responsible for the reliable day‐to‐day operation of New England’s bulk power generation and transmission system, and it also administers the area’s wholesale electricity markets and manages the comprehensive planning of the regional BPS. The New England regional electric power system serves approximately 14.5 million people over 68,000 square miles.
20 2017/2018 Winter Reliability Assessment
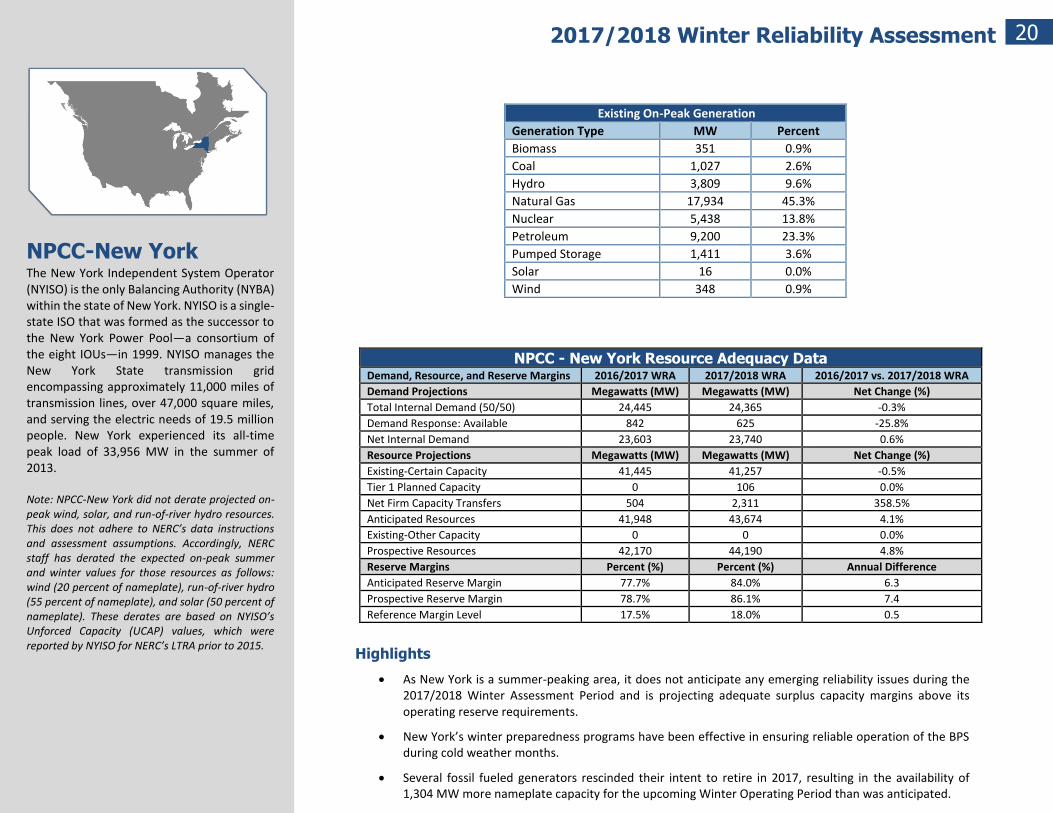
Existing On-Peak Generation
Generation Type MW Percent
Biomass 351 0.9%
Coal 1,027 2.6%
Hydro 3,809 9.6%
Natural Gas 17,934 45.3%
Nuclear 5,438 13.8%
Petroleum 9,200 23.3%
Pumped Storage 1,411 3.6%
Solar 16 0.0%
Wind 348 0.9%
NPCC - New York Resource Adequacy Data Demand, Resource, and Reserve Margins 2016/2017 WRA 2017/2018 WRA 2016/2017 vs. 2017/2018 WRA
Demand Projections Megawatts (MW) Megawatts (MW) Net Change (%)
Total Internal Demand (50/50) 24,445 24,365 -0.3%
Demand Response: Available 842 625 -25.8%
Net Internal Demand 23,603 23,740 0.6%
Resource Projections Megawatts (MW) Megawatts (MW) Net Change (%)
Existing-Certain Capacity 41,445 41,257 -0.5%
Tier 1 Planned Capacity 0 106 0.0%
Net Firm Capacity Transfers 504 2,311 358.5%
Anticipated Resources 41,948 43,674 4.1%
Existing-Other Capacity 0 0 0.0%
Prospective Resources 42,170 44,190 4.8%
Reserve Margins Percent (%) Percent (%) Annual Difference
Anticipated Reserve Margin 77.7% 84.0% 6.3
Prospective Reserve Margin 78.7% 86.1% 7.4
Reference Margin Level 17.5% 18.0% 0.5
Highlights
As New York is a summer-peaking area, it does not anticipate any emerging reliability issues during the 2017/2018 Winter Assessment Period and is projecting adequate surplus capacity margins above its operating reserve requirements.
New York’s winter preparedness programs have been effective in ensuring reliable operation of the BPS during cold weather months.
Several fossil fueled generators rescinded their intent to retire in 2017, resulting in the availability of 1,304 MW more nameplate capacity for the upcoming Winter Operating Period than was anticipated.
NPCC-New York
The New York Independent System Operator (NYISO) is the only Balancing Authority (NYBA) within the state of New York. NYISO is a single-state ISO that was formed as the successor to the New York Power Pool—a consortium of the eight IOUs—in 1999. NYISO manages the New York State transmission grid encompassing approximately 11,000 miles of transmission lines, over 47,000 square miles, and serving the electric needs of 19.5 million people. New York experienced its all-time peak load of 33,956 MW in the summer of 2013. Note: NPCC-New York did not derate projected on-peak wind, solar, and run-of-river hydro resources. This does not adhere to NERC’s data instructions and assessment assumptions. Accordingly, NERC staff has derated the expected on-peak summer and winter values for those resources as follows: wind (20 percent of nameplate), run-of-river hydro (55 percent of nameplate), and solar (50 percent of nameplate). These derates are based on NYISO’s Unforced Capacity (UCAP) values, which were reported by NYISO for NERC’s LTRA prior to 2015.
21 2017/2018 Winter Reliability Assessment
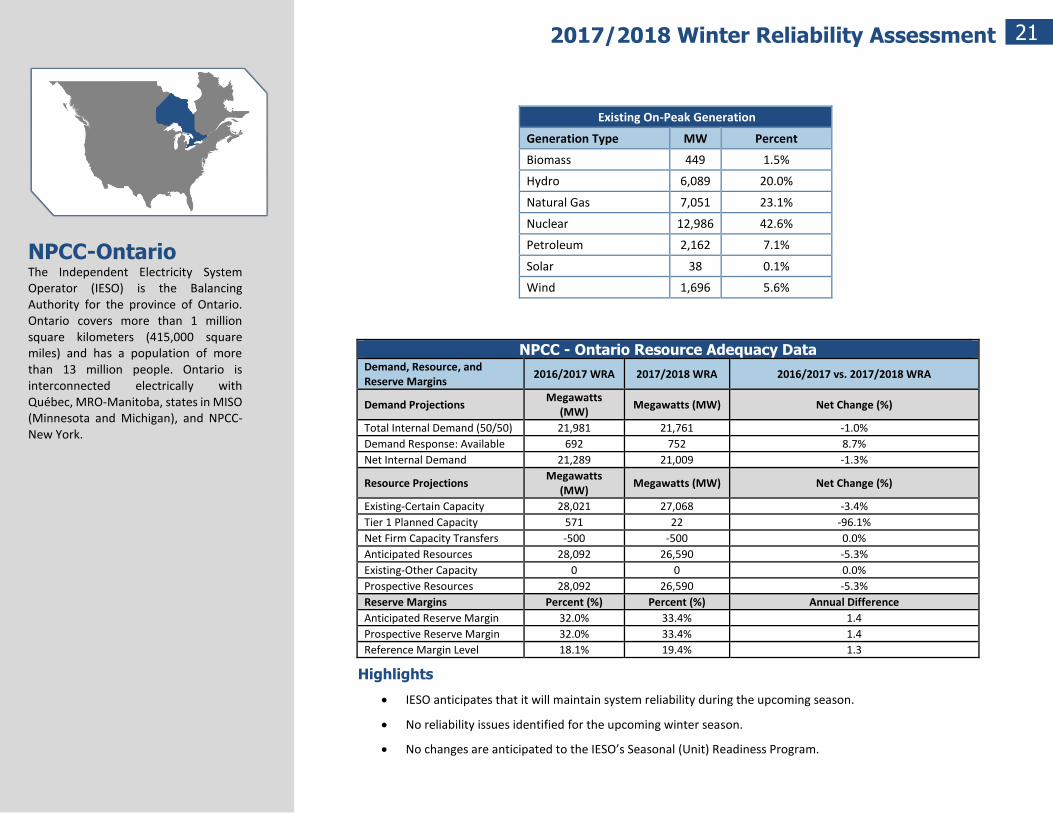
Existing On-Peak Generation
Generation Type MW Percent
Biomass 449 1.5%
Hydro 6,089 20.0%
Natural Gas 7,051 23.1%
Nuclear 12,986 42.6%
Petroleum 2,162 7.1%
Solar 38 0.1%
Wind 1,696 5.6%
NPCC - Ontario Resource Adequacy Data Demand, Resource, and Reserve Margins
2016/2017 WRA 2017/2018 WRA 2016/2017 vs. 2017/2018 WRA
Demand Projections Megawatts
(MW) Megawatts (MW) Net Change (%)
Total Internal Demand (50/50) 21,981 21,761 -1.0%
Demand Response: Available 692 752 8.7%
Net Internal Demand 21,289 21,009 -1.3%
Resource Projections Megawatts
(MW) Megawatts (MW) Net Change (%)
Existing-Certain Capacity 28,021 27,068 -3.4%
Tier 1 Planned Capacity 571 22 -96.1%
Net Firm Capacity Transfers -500 -500 0.0%
Anticipated Resources 28,092 26,590 -5.3%
Existing-Other Capacity 0 0 0.0%
Prospective Resources 28,092 26,590 -5.3%
Reserve Margins Percent (%) Percent (%) Annual Difference
Anticipated Reserve Margin 32.0% 33.4% 1.4
Prospective Reserve Margin 32.0% 33.4% 1.4
Reference Margin Level 18.1% 19.4% 1.3
Highlights
IESO anticipates that it will maintain system reliability during the upcoming season.
No reliability issues identified for the upcoming winter season.
No changes are anticipated to the IESO’s Seasonal (Unit) Readiness Program.
NPCC-Ontario
The Independent Electricity System Operator (IESO) is the Balancing Authority for the province of Ontario. Ontario covers more than 1 million square kilometers (415,000 square miles) and has a population of more than 13 million people. Ontario is interconnected electrically with Québec, MRO-Manitoba, states in MISO (Minnesota and Michigan), and NPCC-New York.

22 2017/2018 Winter Reliability Assessment
Existing On-Peak Generation
Generation Type MW Percent
Biomass 343 0.8%
Hydro 39,957 95.5%
Petroleum 436 1.0%
Wind 1,146 2.7%
NPCC - Québec Resource Adequacy Data Demand, Resource, and Reserve Margins 2016/2017 WRA 2017/2018 WRA 2016/2017 vs. 2017/2018 WRA
Demand Projections Megawatts (MW) Megawatts (MW) Net Change (%)
Total Internal Demand (50/50) 37,870 37,921 0.1%
Demand Response: Available 2,018 2,248 11.4%
Net Internal Demand 35,852 35,673 -0.5%
Resource Projections Megawatts (MW) Megawatts (MW) Net Change (%)
Existing-Certain Capacity 41,277 41,340 0.2%
Tier 1 Planned Capacity 98 541 452.2%
Net Firm Capacity Transfers -326 -330 1.2%
Anticipated Resources 41,049 41,551 1.2%
Existing-Other Capacity 0 0 0.0%
Prospective Resources 42,149 42,651 1.2%
Reserve Margins Percent (%) Percent (%) Annual Difference
Anticipated Reserve Margin 14.5% 16.5% 2.0
Prospective Reserve Margin 17.6% 19.6% 2.0
Reference Margin Level 11.9% 12.5% 0.6
Highlights
Québec predicts that it will maintain system resource adequacy this winter.
The Québec Area is a winter-peaking system with predominately hydroelectric generation resources. Adequate capacity margins above its reference reserve requirements are projected for the 2017/2018 winter assessment period.
No changes have been made to the Assessment Area’s winter preparedness programs.
NPCC-Québec
The Québec Assessment Area (Province of Québec) is a winter-peaking NPCC subregion that covers 595,391 square miles with a population of eight million. Québec is one of the four NERC interconnections in North America, with ties to Ontario, New York, New England, and the Maritimes, consisting of either HVDC ties, radial generation, or load to and from neighboring systems.

23 2017/2018 Winter Reliability Assessment
Existing On-Peak Generation
Generation Type MW Percent
Biomass 1,240 0.7%
Coal 59,311 32.9%
Hydro 3,141 1.7%
Natural Gas 63,187 35.1%
Nuclear 33,998 18.9%
Petroleum 12,428 6.9%
Pumped Storage 5,233 2.9%
Solar 366 0.2%
Wind 1,230 0.7%
PJM Resource Adequacy Data Demand, Resource, and Reserve Margins 2016/2017 WRA 2017/2018 WRA 2016/2017 vs. 2017/2018 WRA
Demand Projections Megawatts (MW) Megawatts (MW) Net Change (%)
Total Internal Demand (50/50) 132,482 132,652 0.1%
Demand Response: Available 138 355 157.2%
Net Internal Demand 132,344 132,297 0.0%
Resource Projections Megawatts (MW) Megawatts (MW) Net Change (%)
Existing-Certain Capacity 179,502 179,768 0.1%
Tier 1 Planned Capacity 0 0 0.0%
Net Firm Capacity Transfers 5,353 4,304 -19.6%
Anticipated Resources 184,855 184,072 -0.4%
Existing-Other Capacity 0 350 0.0%
Prospective Resources 184,877 184,422 -0.2%
Reserve Margins Percent (%) Percent (%) Annual Difference
Anticipated Reserve Margin 39.7% 39.1% -0.6
Prospective Reserve Margin 39.7% 39.4% -0.3
Reference Margin Level 16.4% 16.6% 0.2
Highlights
PJM anticipates that it will maintain system reliability during the upcoming season.
PJM has no emerging reliability issues.
The PJM Capacity Performance initiative, beginning in 2015 but now fully applicable to this winter, adds stricter resource performance requirements in the PJM energy market with very limited excuses for non-performance or not producing when called upon. Higher nonperformance charges during peak-load hours were also initiated and could amount to significant financial penalties. Opportunity for increased capacity market revenues, such as payments for dual-fuel capability and firm fuel service were also added.
PJM
PJM Interconnection is a regional transmission organization (RTO) that coordinates the movement of wholesale electricity in all or parts of Delaware, Illinois, Indiana, Kentucky, Maryland, Michigan, New Jersey, North Carolina, Ohio, Pennsylvania, Tennessee, Virginia, West Virginia, and the District of Columbia. PJM serves 61 million people and covers 243,417 square miles. PJM is a Balancing Authority, Planning Coordinator, Transmission Planner, Resource Planner, Interchange Authority, Transmission Operator, Transmission Service Provider, and Reliability Coordinator.

24 2017/2018 Winter Reliability Assessment
Existing On-Peak Generation
Generation Type MW Percent
Biomass 288 0.2%
Coal 53,422 31.2%
Hydro 9,747 5.7%
Natural Gas 71,364 41.7%
Nuclear 26,079 15.2%
Other 153 0.1%
Petroleum 2,889 1.7%
Pumped Storage 6,292 3.7%
Solar 755 0.4%
Wind 67 0.1%
SERC Resource Adequacy Data
Demand, Resource, and Reserve Margins
SERC-E SERC-N SERC-SE
2016/2017 WRA
2017/2018 WRA
2016/2017 vs. 2017/2018
WRA SERC Total SERC Total
Demand Projections Megawatts
(MW) Megawatts
(MW) Megawatts
(MW) Megawatts
(MW) Megawatts
(MW) Net Change
(%)
Total Internal Demand (50/50) 45,189 41,051 44,805 130,364 131,045 0.5%
Demand Response: Available 1,004 1,558 2,165 4,527 4,727 4.4%
Net Internal Demand 44,185 39,493 42,640 125,837 126,318 0.4%
Resource Projections Megawatts
(MW) Megawatts
(MW) Megawatts
(MW) Megawatts
(MW) Megawatts
(MW) Net Change
(%)
Existing-Certain Capacity 52,445 52,134 58,379 165,210 162,958 -1.4%
Tier 1 Planned Capacity 783 1,136 223 2,094 2,142 2.3%
Net Firm Capacity Transfers 226 -1,121 -2,003 1,118 -2,898 -359.2%
Anticipated Resources 53,454 52,150 56,599 168,422 162,203 -3.7%
Existing-Other Capacity 42 1,205 706 2,678 1,953 -27.1%
Prospective Resources 53,496 53,354 57,305 175,352 164,155 -6.4%
Planning Reserve Margins Percent (%) Percent (%) Percent (%) Percent (%) Percent (%) Annual
Difference
Anticipated Reserve Margin 21.0% 32.0% 32.7% 25.3% 28.4% 3.1
Prospective Reserve Margin 21.0% 35.1% 34.4% 28.2% 30.0% 1.8
Reference Margin Level 15.0% 15.0% 15.0% 15.0% 15.00% 0.0
Highlights
SERC anticipates that current resources are adequate to meet the peak winter demand for the region.
Entities within the region continue winterization efforts to maintain unit availability throughout the winter season.
The region does not expect adverse transmission impacts from normal winter weather.
SERC
The SERC assessment area covers approximately 308,900 square miles, serves a population estimated at 39.4 million, and is divided into three reporting areas: SERC-E, SERC-N, and SERC-SE. The SERC assessment area consists of 11 Balancing Authorities including: Alcoa Power Generating, Inc.–Yadkin Division, Associated Electric Cooperative, Inc., Duke Energy Carolinas and Duke Energy Progress, Electric Energy, Inc., LG&E and KU Services Company, PowerSouth Energy Cooperative, South Carolina Electric & Gas Company, South Carolina Public Service Authority, Southern Company Services, Inc., and Tennessee Valley Authority.

25 2017/2018 Winter Reliability Assessment
SPP
Existing On-Peak Generation
Generation Type MW Percent
Biomass 39 0.1%
Coal 23,995 34.6%
Hydro 4,771 6.9%
Natural Gas 33,873 48.8%
Nuclear 1,943 2.8%
Other 62 0.1%
Petroleum 1,713 2.5%
Pumped Storage 482 0.7%
Solar 197 0.3%
Wind 2,247 3.2%
SPP Resource Adequacy Data
Demand, Resource, and Reserve Margins 2016/2017 WRA 2017/2018 WRA 2016/2017 vs. 2017/2018
WRA
Demand Projections Megawatts (MW) Megawatts (MW) Net Change (%)
Total Internal Demand (50/50) 40,618 41,215 1.5%
Demand Response: Available 369 432 17.0%
Net Internal Demand 40,249 40,783 1.3%
Resource Projections Megawatts (MW) Megawatts (MW) Net Change (%)
Existing-Certain Capacity 65,847 67,263 2.2%
Tier 1 Planned Capacity 754 863 14.5%
Net Firm Capacity Transfers -1,537 -330 -78.5%
Anticipated Resources 65,064 67,796 4.2%
Existing-Other Capacity 100 100 0.0%
Prospective Resources 64,512 68,163 5.7%
Reserve Margins Percent (%) Percent (%) Annual Difference
Anticipated Reserve Margin 62% 66.2% 4.2
Prospective Reserve Margin 60.3% 67.1% 6.8
Reference Margin Level 13.6% 12.0% -1.6
Highlights
SPP does not foresee any impacts to resource adequacy for the upcoming winter season.
SPP
Southwest Power Pool (SPP) Planning Coordinator footprint covers 575,000 square miles and encompasses all or parts of Arkansas, Iowa, Kansas, Louisiana, Minnesota, Missouri, Montana, Nebraska, New Mexico, North Dakota, Oklahoma, South Dakota, Texas and Wyoming. The SPP Long‐Term Assessment is reported based on the Planning Coordinator footprint, which touches parts of the Southwest Power Pool Regional Entity, Midwest Reliability Organization Regional Entity, and Western Electricity Coordinating Council. The SPP Assessment Area footprint has approximately 61,000 miles of transmission lines, 756 generating plants, and 4,811 transmission‐class substations, and it serves a population of 18 million people.

26 2017/2018 Winter Reliability Assessment
Existing On-Peak Generation
Generation Type MW Percent
Biomass 199 0.2%
Coal 18,895 23.7%
Hydro 433 0.5%
Natural Gas 50,187 62.8%
Nuclear 5,164 6.5%
Solar 135 0.2%
Wind 4,869 6.1%
Texas RE-ERCOT Resource Adequacy Data Demand, Resource, and Reserve Margins 2016/2017 WRA 2017/2018 WRA 2016/2017 vs. 2017/2018 SRA
Demand Projections Megawatts (MW) Megawatts (MW) Net Change (%)
Total Internal Demand (50/50) 58,591 55,003 -6.1%
Demand Response: Available 2,484 2,494 0.4%
Net Internal Demand 56,107 52,509 -6.4%
Resource Projections Megawatts (MW) Megawatts (MW) Net Change (%)
Existing-Certain Capacity 73,836 82,139 11.2%
Tier 1 Planned Capacity 2,238 1,214 -45.8%
Net Firm Capacity Transfers 835 804 -3.7%
Anticipated Resources 76,909 84,157 9.4%
Existing-Other Capacity 0 0 0
Prospective Resources 78,160 84,269 7.8%
Reserve Margins Percent (%) Percent (%) Annual Difference
Anticipated Reserve Margin 37.1% 60.2% 23.1
Prospective Reserve Margin 39.3% 60.5% 21.2
Reference Margin Level 13.8% 13.8% 0.0
Highlights
ERCOT currently does not expect any emerging reliability issues for the upcoming winter season. Based on its own preliminary seasonal assessment, ERCOT expects to have sufficient operating reserves to cover a range of extreme unit outage/gas curtailment scenarios.
There are no changes to the ERCOT winter preparedness program. The Winter Weatherization Workshop kicking off the 2017/2018 winter season was held September 7, 2017.
Significant new generation resources added since the last WRA, including two gas-fired combined-cycle facilities totaling 2,378 MW (winter rating).
One coal unit of 470 MW is planned to be placed in mothball status starting in October 2017. It is expected to return to service between mid-May and mid-June 2018.
Texas RE-ERCOT The Electric Reliability Council of Texas (ERCOT) is the ISO for the ERCOT Interconnection and is located entirely in the state of Texas and operates as a single Balancing Authority. ERCOT is a summer peaking Region that covers approximately 200,000 square miles, connects 40,530 miles of transmission lines, and 566 generation units, it and serves 23 million customers. The Texas Reliability Entity (Texas RE) is responsible for the RE functions described in the Energy Policy Act of 2005 for the ERCOT Region. Note: In early October 2017, ERCOT received formal notice from Luminant that seven of its coal units are planned for retirement in January and February 2018. These include Monticello Units 1-3, Big Brown 1-2, and Sandow 4-5. The total summer-rated capacity is nearly 4,300 MW. In addition, ERCOT received a formal notice in late September 2017 that Barney M. Davis Unit 1 is planned for retirement as of December 31, 2017. This unit is a gas-steam turbine with a current summer-rated capacity of 300 MW. ERCOT’s final determination as to whether any of these units are needed for grid reliability is not expected until late November through December 2017. Due to the late timing of the announcements, these proposed plant retirements, as well as other recent resource updates, are not reflected in the Reserve Margins reported in this WRA. If ERCOT determines these units are not needed for transmission system reliability, the unit retirements would reduce the winter Anticipated Reserve Margin by 8.9 percent, decreasing it from 60.27 percent to 51.35 percent.
27 2017/2018 Winter Reliability Assessment
To WECC
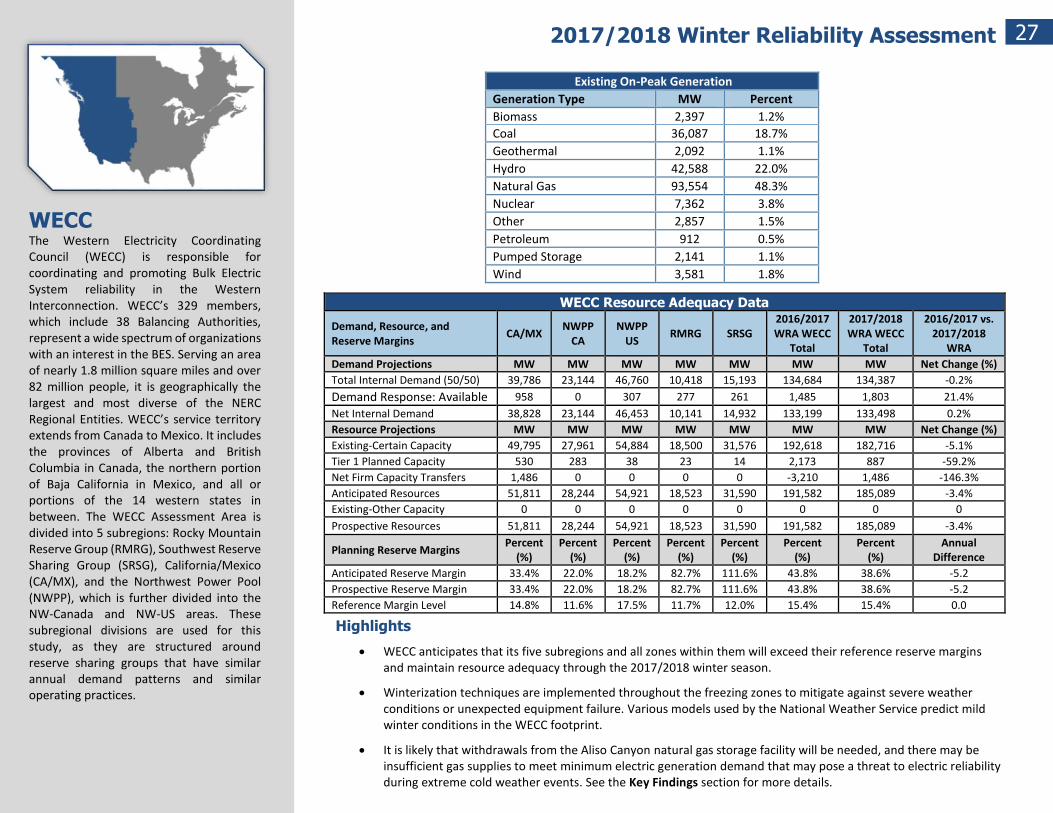
Existing On-Peak Generation
Generation Type MW Percent
Biomass 2,397 1.2%
Coal 36,087 18.7%
Geothermal 2,092 1.1%
Hydro 42,588 22.0%
Natural Gas 93,554 48.3%
Nuclear 7,362 3.8%
Other 2,857 1.5%
Petroleum 912 0.5%
Pumped Storage 2,141 1.1%
Wind 3,581 1.8%
WECC Resource Adequacy Data
Demand, Resource, and Reserve Margins
CA/MX NWPP
CA NWPP
US RMRG SRSG
2016/2017 WRA WECC
Total
2017/2018 WRA WECC
Total
2016/2017 vs. 2017/2018
WRA
Demand Projections MW MW MW MW MW MW MW Net Change (%)
Total Internal Demand (50/50) 39,786 23,144 46,760 10,418 15,193 134,684 134,387 -0.2%
Demand Response: Available 958 0 307 277 261 1,485 1,803 21.4%
Net Internal Demand 38,828 23,144 46,453 10,141 14,932 133,199 133,498 0.2%
Resource Projections MW MW MW MW MW MW MW Net Change (%)
Existing-Certain Capacity 49,795 27,961 54,884 18,500 31,576 192,618 182,716 -5.1%
Tier 1 Planned Capacity 530 283 38 23 14 2,173 887 -59.2%
Net Firm Capacity Transfers 1,486 0 0 0 0 -3,210 1,486 -146.3%
Anticipated Resources 51,811 28,244 54,921 18,523 31,590 191,582 185,089 -3.4%
Existing-Other Capacity 0 0 0 0 0 0 0 0
Prospective Resources 51,811 28,244 54,921 18,523 31,590 191,582 185,089 -3.4%
Planning Reserve Margins Percent
(%) Percent
(%) Percent
(%) Percent
(%) Percent
(%) Percent
(%) Percent
(%) Annual
Difference
Anticipated Reserve Margin 33.4% 22.0% 18.2% 82.7% 111.6% 43.8% 38.6% -5.2
Prospective Reserve Margin 33.4% 22.0% 18.2% 82.7% 111.6% 43.8% 38.6% -5.2
Reference Margin Level 14.8% 11.6% 17.5% 11.7% 12.0% 15.4% 15.4% 0.0
WECC The Western Electricity Coordinating Council (WECC) is responsible for coordinating and promoting Bulk Electric System reliability in the Western Interconnection. WECC’s 329 members, which include 38 Balancing Authorities, represent a wide spectrum of organizations with an interest in the BES. Serving an area of nearly 1.8 million square miles and over 82 million people, it is geographically the largest and most diverse of the NERC Regional Entities. WECC’s service territory extends from Canada to Mexico. It includes the provinces of Alberta and British Columbia in Canada, the northern portion of Baja California in Mexico, and all or portions of the 14 western states in between. The WECC Assessment Area is divided into 5 subregions: Rocky Mountain Reserve Group (RMRG), Southwest Reserve Sharing Group (SRSG), California/Mexico (CA/MX), and the Northwest Power Pool (NWPP), which is further divided into the NW-Canada and NW-US areas. These subregional divisions are used for this study, as they are structured around reserve sharing groups that have similar annual demand patterns and similar operating practices.
Highlights
WECC anticipates that its five subregions and all zones within them will exceed their reference reserve margins and maintain resource adequacy through the 2017/2018 winter season.
Winterization techniques are implemented throughout the freezing zones to mitigate against severe weather conditions or unexpected equipment failure. Various models used by the National Weather Service predict mild winter conditions in the WECC footprint.
It is likely that withdrawals from the Aliso Canyon natural gas storage facility will be needed, and there may be insufficient gas supplies to meet minimum electric generation demand that may pose a threat to electric reliability during extreme cold weather events. See the Key Findings section for more details.
28 2017/2018 Winter Reliability Assessment
Data Concepts and Assumptions The table below explains data concepts and important assumptions used throughout this assessment.
General Assumptions
Reliability of the interconnected bulk power system is comprised of both Adequacy and Operating Reliability.
Adequacy is the ability of the electric system to supply the aggregate electric power and energy requirements of the electricity consumers at all times taking into account scheduled and reasonably expected unscheduled outages of system components.
Operating Reliability is the ability of the electric system to withstand sudden disturbances such as electric short-circuits or unanticipated loss of system components.
The reserve margin calculation is an important industry planning metric used to examine future resource adequacy.
All data in this assessment is based on existing federal, state, and provincial laws and regulations.
Differences in data collection periods for each assessment area should be considered when comparing demand and capacity data between year-to-year seasonal assessments.
LTRA data has been used for this 2017/2018 winter assessment period.
A positive net transfer capability would indicate a net importing assessment area; a negative value would indicate a net exporter.
Demand Assumptions
Electricity demand projections, or load forecasts, are provided by each assessment area.
Load forecasts include peak hourly load,5 or total internal demand, for the summer and winter of each year.6
Total internal demand projections are based on normal weather (50/50 distribution)7 and are provided on a coincident8 basis for most assessment areas.
Net internal demand, used in all reserve margin calculations, and is equal to total internal demand, reduced by the amount of controllable and dispatchable demand response projected to be available during the peak hour.
Resource Assumptions
Resource planning methods vary throughout the North American BPS. NERC uses the following categories to provide a consistent approach for collecting and presenting resource adequacy:
Anticipated Resources:
Existing-Certain Capacity: Included in this category are commercially operable generating units, or portions of generating units, that meet at least one of the following requirements when examining the period of peak demand for the winter season: unit must have a firm capability and have a power purchase agreement (PPA) with
5 Glossary of Terms Used in NERC Reliability Standards 6 The summer season represents June–September and the winter season represents December–February. 7 Essentially, this means that there is a 50 percent probability that actual demand will be higher and a 50 percent probability that actual demand will be lower than the value provided for a given
season/year. 8 Coincident: The sum of two or more peak loads that occur in the same hour. Noncoincident: The sum of two or more peak loads on individual systems that do not occur in the same time interval.
Meaningful only when considering loads within a limited period of time, such as a day, a week, a month, a heating or cooling season, and usually for not more than one year. SERC and FRCC calculate total internal demand on a noncoincidental basis.
29 2017/2018 Winter Reliability Assessment
firm transmission must be in effect for the unit; unit must be classified as a designated network resource; and/or where energy-only markets exist, unit must be a designated market resource eligible to bid into the market.
Tier 1 Capacity Additions: includes capacity that either is under construction or has received approved planning requirements.
Net Firm Capacity Transfers (Imports minus Exports): transfers with firm contracts.
Prospective Resources: Includes all anticipated resources, plus:
Existing-Other Capacity: included in this category are commercially operable generating units, or portions of generating units, that are expected to be available to serve load for the period of peak demand for the summer or winter season but do not meet the requirements of existing-certain.
Reserve Margin Definitions
Reserve Margins: the primary metric used to measure resource adequacy; it is defined as the difference in resources (anticipated or prospective) and net internal demand, divided by net internal demand, shown as a percentile.
Anticipated Reserve Margin = (Anticipated Resources – Net Internal Demand)
Net Internal Demand
Prospective Reserve Margin = (Prospective Resources – Net Internal Demand)
Net Internal Demand
Reference Margin Level: the assumptions of this metric vary by assessment area. The reference margin level is typically based on load, generation, and transmission characteristics for each assessment area and, in some cases, the reference margin level is a requirement implemented by the respective state(s), provincial authorities, ISO/RTO, or other regulatory bodies. If such a requirement exists, the respective assessment area generally adopts this requirement as the reference margin level. In some cases, the reference margin level will fluctuate over the duration of the assessment period, or may be different for the summer and winter seasons. If one is not provided by a given assessment area, NERC applies a 15 percent reference margin level for predominately thermal systems and 10 percent for predominately hydro systems.
On-Peak Expected Capacity Generation Mix: generation mix is aggregated from 2016 LTRA data. Fuel types with nominal quantities were aggregated together as fuel types, renewables, other renewables, or other fuels.
Renewable Nameplate Capacities: these charts include renewable on peak and nameplate (de-rated and expected on peak added together) capacities.
Related Documents