2011 Reliability Performance Analysis Report July 2011

Welcome message from author
This document is posted to help you gain knowledge. Please leave a comment to let me know what you think about it! Share it to your friends and learn new things together.
Transcript
2011 Reliability Performance Analysis Report
July 2011
NERCrsquos Mission
i
NERCrsquos Mission The North American Electric Reliability Corporation (NERC) is an international regulatory authority established to evaluate reliability of the bulk power system in North America NERC develops and enforces Reliability Standards assesses adequacy annually via a ten-year forecast and winter and summer forecasts monitors the bulk power system and educates trains and certifies industry personnel NERC is the electric reliability organization for North America subject to oversight by the US Federal Energy Regulatory Commission (FERC) and governmental authorities in Canada1
NERC assesses and reports on the reliability and adequacy of the North American bulk power system which is divided into eight Regional areas as shown on the map and table below The users owners and operators of the bulk power system within these areas account for virtually all the electricity supplied in the US Canada and a portion of Baja California Norte Meacutexico
1 As of June 18 2007 the US Federal Energy Regulatory Commission (FERC) granted NERC the legal authority to enforce Reliability Standards with all US users owners and operators of the bulk power system and made compliance with those standards mandatory and enforceable In Canada NERC presently has memorandums of understanding in place with provincial authorities in Ontario New Brunswick Nova Scotia Queacutebec and Saskatchewan and with the Canadian National Energy Board NERC standards are mandatory and enforceable in Ontario and New Brunswick as a matter of provincial law NERC has an agreement with Manitoba Hydro making reliability standards mandatory for that entity and Manitoba has recently adopted legislation setting out a framework for standards to become mandatory for users owners and operators in the province In addition NERC has been designated as the ldquoelectric reliability organizationrdquo under Albertarsquos Transportation Regulation and certain reliability standards have been approved in that jurisdiction others are pending NERC and NPCC have been recognized as standards-setting bodies by the Reacutegie de lrsquoeacutenergie of Queacutebec and Queacutebec has the framework in place for reliability standards to become mandatory Nova Scotia and British Columbia also have frameworks in place for reliability standards to become mandatory and enforceable NERC is working with the other governmental authorities in Canada to achieve equivalent recognition
NERC Regional Entities
FRCC Florida Reliability Coordinating Council
SERC SERC Reliability Corporation
MRO Midwest Reliability Organization
SPP RE Southwest Power Pool Regional Entity
NPCC Northeast Power Coordinating Council
TRE Texas Reliability Entity
RFC ReliabilityFirst Corporation
WECC Western Electricity Coordinating Council
Note The highlighted area between SPP RE and SERC denotes overlapping Regional area boundaries For example some load serving entities participate in one Region and their associated transmission owneroperators in another
Table of Contents
ii
Table of Contents NERCrsquoS MISSION I TABLE OF CONTENTS II EXECUTIVE SUMMARY 3 INTRODUCTION 6 RELIABILITY METRICS PERFORMANCE 10
INTRODUCTION 10 2010 PERFORMANCE METRICS RESULTS AND TRENDS 12
ALR1-3 Planning Reserve Margin 12 ALR1-4 BPS Transmission Related Events Resulting in Loss of Load 14 ALR1-12 Interconnection Frequency Response 16 ALR2-3 Activation of Under Frequency Load Shedding 16 ALR2-4 Average Percent Non-Recovery Disturbance Control Standards (DCS) 17 ALR2-5 Disturbance Control Events Greater Than Most Severe Single Contingency 18 ALR 1-5 System Voltage Performance 20 ALR3-5 Interconnection Reliability Operating Limit System Operating Limit (IROLSOL) Exceedances 21 ALR4-1 Automatic Transmission Outages Caused by Protection System Misoperations 22 ALR6-11 ndash ALR6-14 23 ALR6-15 Element Availability Percentage (APC) 28 ALR6-16 Transmission System Unavailability 30 ALR6-2 Energy Emergency Alert 3 (EEA3) 31 ALR 6-3 Energy Emergency Alert 2 (EEA2) 33 ALR 6-1 Transmission Constraint Mitigation 35
INTEGRATED BULK POWER SYSTEM RISK ASSESSMENT 37 INTEGRATED RELIABILITY INDEX CONCEPTS 41 RELIABILITY METRICS CONCLUSIONS AND RECOMMENDATIONS 44
TRANSMISSION EQUIPMENT PERFORMANCE 45 INTRODUCTION 45 PERFORMANCE TRENDS 45 CONCLUSIONS 52
GENERATION EQUIPMENT PERFORMANCE 53 INTRODUCTION 53 GENERATION KEY PERFORMANCE INDICATORS 53 CONCLUSIONS AND RECOMMENDATIONS 60
DISTURBANCE EVENT TRENDS 62 INTRODUCTION 62 PERFORMANCE TRENDS 62 CONCLUSIONS 65
ABBREVIATIONS USED IN THIS REPORT 66 CONTRIBUTIONS 69
Executive Summary
3
Executive Summary 2011 Transition Report The 2011 Reliability Performance Analysis Report provides a view of North American bulk power system
historic reliability performance It integrates many efforts under way to offer technical analysis and
feedback on reliability trends to stakeholders regulators policymakers and industry The joint report
development was led by NERC staff in collaboration with several groups independently analyzing various
aspects of bulk power system reliability including the Reliability Metrics Working Group (RMWG) the
Transmission Availability Data System Working Group (TADSWG) Generating Availability Data System
Task Force (GADSTF) and Event Analysis Working Group (EAWG)
Since its inaugural report2
State of Reliability Report
the RMWG has advanced the development of reliability metrics that
demonstrate performance of the bulk power system As this work proceeds industry continues to
investigate areas which enhance the understanding of system reliability Other committees working
groups and task forces in addition to NERC staff are undertaking additional reliability analysis of the
system These efforts have resulted in an evolving body of work which far transcends that originally
produced in the first annual RMWG report
The 2011 Reliability Performance Analysis Report begins a transition from the 2009 metric performance
assessment to a ldquoState of Reliabilityrdquo report This transition is expected to evolve as more data becomes
available and understanding of the data and trends matures The annual State of Reliability report will
ultimately communicate the effectiveness of ERO (Electric Reliability Organization) reliability programs
and present an overall view of reliability performance
By addressing the key measurable components of bulk power system reliability the State of Reliability
report will help quantify the achievement of reliability goals Also the report will act as a foundation to
bring collaborative work together within the ERO to streamline reporting needs of multiple technical
groups and efficiently accelerate data and information transparency The key findings and
recommendations are envision to be used as input to NERCrsquos Reliability Standards and project
prioritization compliance process improvement event analysis reliability assessment and critical
infrastructure protection areas
2 httpwwwnerccomdocspcrmwgRMWG_Metric_Report-09-08-09pdf
Executive Summary
4
Key Findings and Recommendations
Reliability Metric Performance Among the Operating Committeersquos and Planning Committeersquos approved eighteen metrics that address
the characteristics of an adequate level of reliability (ALR) based on metric trends in the following seven
areas indicate the bulk power system is performing better during the time frame investigated
bull ALR1-3 Planning Reserve Margin
bull ALR1-4 BPS Transmission Related Events Resulting in Loss of Load
bull ALR2-5 Disturbance Control Events Greater than Most Severe Single Contingency
bull ALR6-2 Energy Emergency Alert 3 (EEA3)
bull ALR6-3 Energy Emergency Alert 2 (EEA2)
bull ALR6-11 Automatic Transmission Outages Caused by Protection System Misoperations
bull ALR6-13 Automatic Transmission Outages Caused by Failed AC Substation Equipment
Performance analysis has also included other performance categories though a number of the metrics
did not currently have sufficient data to derive useful conclusions The RMWG recommends their
continued data collection and review If a metric does not yield any useful trends in a five-year
reporting period the metric will be modified or withdrawn
Transmission Availability Performance On a NERC-wide average basis the automatic transmission outage rate has improved during the study
timeframe (2008 to 2010) Considering both automatic and non-automatic outages 2010 records
indicate transmission element availability percentage exceeds 95
A deeper review of the root causes of dependent and common mode events which include three or
more automatic outages should be a high priority for NERC and the industry The TADSWG
recommends a joint team be formed to analyze those outages as the effort requires significant
stakeholder subject matter experts with the support of reporting transmission owners
Generating Availability Performance The generating fleet in North America is continuing to age The average age of all unit types was slightly
over 32 years in 2010 while at the same time the coal-fired fleet averages over 44 years old Based on
the data all units appear to require maintenance with increasing regularity to meet unit availability
goals
In the last three years the Equivalent Forced Outage Rate ndash Demand (EFORd) increased indicating a
higher risk that a unit may not be available to meet generating requirements due to forced outages or
de-ratings The average forced outage hours for each unit have jumped from 270 hours to 314 hours
Executive Summary
5
between 2009 and 2010 During the same period the average maintenance hours also increased by 12
hours per unit translating to longer planned outage time More focus on preventive maintenance
during planned or maintenance outages may be needed
The three leading root causes for multiple unit forced trips are transmission outages lack of fuel and
storms Among reported lack of fuel outage events 78 percent of the units are oil-fired and 15 percent
are gas fired To reduce the number of fuel-related outages the GADSTF recommends performing more
detailed analysis and higher visibility to this risk type
Disturbance Events One of most important bulk power system performance measures is the number of significant
disturbance events and their impact on system reliability Since the event analysis field test commenced
in October 2010 a total of 42 events within five categories were reported through the end of 2010
Equipment failure is the number one cause out of the event analyses completed from 2010 This
suggests that a task force be formed to identify the type of equipment and reasons for failure The
information provided in event analysis reports in conjunction with other databases (TADS GADS
metrics database etc) should be used to track and evaluate trends in disturbance events
Report Organization This transitional report is intended to function as an anthology of bulk power system performance
assessments Following the introductory chapter the second chapter details results for 2010 RMWG
approved performance metrics and lays out methods for integrating the variety of risks into an
integrated risk index This chapter also addresses concepts for measuring bulk power system events
The third chapter outlines transmission system performance results that the TADSWG have endorsed
using the three-year history of TADS data Reviewed by the GADSTF the forth chapter provides an
overview of generating availability trends for 72 percent of generators in North America The fifth
chapter provides a brief summary of reported disturbances based on event categories described in the
EAWGrsquos enhanced event analysis field test process document3
3 httpwwwnerccomdocseawgEvent_Analysis_Process_Field_test_DRAFT_102510-Cleanpdf
Introduction
6
Figure 1 State of Reliability Concepts
Introduction Metric Report Evolution The NERC Reliability Metrics Working Group (RMWG) has come a long way from its formation following
the release of the initial reliability metric whitepaper in December 2007 Since that time the RMWG has
built the foundation of a metrics development process with the use of SMART ratings (Specific
Measurable Attainable Relevant and Tangible) in its 2009 report4
The first annual report published in June 2010
provided an overview and review of the first
seven metrics which were approved in the
2009 foundational report In August 2010 the
RMWG released its
expanding the approved metrics to
18 metrics and identifying the need for additional data by issuing a data request for ALR3-5 This
annual report is a testament to the evolution of the metrics from the first release to what it is today
Integrated Bulk Power
System Risk Assessment Concepts paper5
Based on the work done by the RMWG in 2010 NERCrsquos OCPC amended the grouprsquos scope directing the
RMWG to ldquodevelop a method that will provide an integrated reliability assessment of the bulk power
system performance using metric information and trendsrdquo This yearrsquos report builds on the work
undertaken by the RMWG over the past three years and moving further towards establishing a single
Integrated Reliability Index (IRI) covering three components event driven index (EDI) condition driven
introducing the ldquouniverse of riskrdquo to the bulk
power system In the concepts paper the
RMWG introduced a method to assess ldquoevent-
drivenrdquo risks and established a measure of
Severity Risk Index (SRI) to better quantify the
impact of various events of the bulk power
system The concepts paper was subsequently
endorsed by NERCrsquos Operating (OC) and
Planning Committees (PC) The SRI calculation
was further refined and then approved by NERCrsquos OCPC at their March 8-9 2011 meeting
4 2009 Bulk Power System Reliability Performance Metric Recommendations can be found at
httpwwwnerccomdocspcrmwgRMWG_Metric_Report-09-08-09pdf 5 httpwwwnerccomdocspcrmwgIntegrated_Bulk_Power_System_Risk_Assessment_Concepts_Finalpdf
Event Driven Index (EDI)
Indicates Risk from Major System Events
Standards Statute Driven
Index (SDI)
Indicates Risks from Severe
Impact Standard Violations
Condition Driven Index (CDI)
Indicates Risk from Key Reliability
Indicators
Introduction
7
Figure 2 Data Source Integration and Analysis
index (CDI) and standardsstatute driven index (SDI) as shown in Figure 1 These individual
components will be used to develop a reliability index that will assist industry in assessing its current
state of reliability This is an ambitious undertaking and it will continue to evolve as an understanding
of what factors contribute to or indicate the level of reliability develops As such this report will evolve
in the coming years as expanding the work with SRI will provide further analysis of the approved
reliability metrics and establish the cornerstones for developing an IRI The cornerstones are described
in section three with recommendations for next steps to better refine and weigh the components of the
IRI and how its use to establish a ldquoState of Reliabilityrdquo for the bulk power system in North America
For this work to be effective and useful to industry and other stakeholders it must use existing data
sources align with other industry analyses and integrate with other initiatives as shown in Figure 2
NERCrsquos various data resources are introduced in this report Transmission Availability Data System
(TADS) Generation Availability Data System (GADS) the event analysis database and future Demand
Availability Data System (DADS)6
The RMWG embraces an open
development process while
incorporating continuous improve-
ment through leveraging industry
expertise and technical judgment
As new data becomes available
more concrete conclusions from the
reliability metrics will be drawn and
recommendations for reliability
standards and compliance practices
will be developed for industryrsquos
consideration
When developing the IRI the experience gained will be leveraged in developing the Severity Risk Index
(SRI) This evolution will take time and the first assessment of ongoing reliability with an integrated
reliability index is expected in the 2012 Annual Report The goal is not only to measure performance
but to highlight areas for improvement as well as reinforcing and measuring industry success As this
integrated view of reliability is developed the individual quarterly performance metrics will be updated
as illustrated in Figure 3 on a new Reliability Indicators dashboard at NERCrsquos website7
6 DADS will begin mandatory data collection from April 2011 through October 2011 with data due on December 15 2011
The RMWG will
7 Reliability Indicatorsrsquo dashboard is available at httpwwwnerccompagephpcid=4|331
Introduction
8
keep the industry informed by conducting yearly webinars providing quarterly data updates and
publishing its annual report
Figure 3 NERC Reliability Indicators Dashboard
Roadmap for the Future As shown in Figure 4 the 2011 Reliability Performance Analysis report begins a transition from a 2009
metric performance assessment to a ldquoState of Reliabilityrdquo report by collaborating with other groups to
form a unified approach to historical reliability performance analysis This process will require
engagement with a number of NERC industry experts to paint a broad picture of the bulk power
systemrsquos historic reliability
Alignment to other industry reports is also important Analysis from the frequency response performed
by the Resources Subcommittee (RS) physical and cyber security assessment provided by the Critical
Infrastructure Protection Committee (CIPC) the wide area reliability coordination conducted by the
Reliability Coordinator Working Group (RCWG) the spare equipment availability system enhanced by
the Spare Equipment Database Task Force (SEDTF) the post seasonal assessment developed by the
Reliability Assessment Subcommittee (RAS) and demand response deployment summarized by the
Demand Response Data Task Force (DRDTF) will provide a significant foundation from which this report
draws Collaboration derived from these stakeholder groups further refines the metrics and use of
additional datasets will broaden the industryrsquos tool-chest for improving reliability of the bulk power
system
The annual State of Reliability report is aimed to communicate the effectiveness of ERO (Electric
Reliability Organization) by presenting an integrated view of historic reliability performance The report
will provide a platform for sound technical analysis and a way to provide feedback on reliability trends
to stakeholders regulators policymakers and industry The key findings and recommendations will
Introduction
9
ultimately be used as input to standards changes and project prioritization compliance process
improvement event analysis and critical infrastructure protection areas
Figure 4 Overview of the Transition to the 2012 State of Reliability Report
Reliability Metrics Performance
10
Reliability Metrics Performance Introduction Building upon last yearrsquos metric review the RMWG continues to assess the results of eighteen currently
approved performance metrics Due to data availability each of the performance metrics do not
address the same time periods (some metrics have just been established while others have data over
many years) though this will be an important improvement in the future Merit has been found in all
eighteen approved metrics At this time though the number of metrics is expected to will remain
constant however other metrics may supplant existing metrics In spite of the potentially changing mix
of approved metrics to goals is to ensure the historical and current assessments can still be performed
These metrics exist within an overall reliability framework and in total the performance metrics being
considered address the fundamental characteristics of an acceptable level of reliability (ALR) Each of
the elements being measured by the metrics should be considered in aggregate when making an
assessment of the reliability of the bulk power system with no single metric indicating exceptional or
poor performance of the power system
Due to regional differences (size of the region operating practices etc) comparing the performance of
one Region to another would be erroneous and inappropriate Furthermore depending on the region
being evaluated one metric may be more relevant to a specific regionrsquos performance than others and
assessment may not be strictly mathematical rather more subjective Finally choosing one regionrsquos
best metric performance to define targets for other regions is inappropriate
Another key principle followed in developing these metrics is to retain anonymity of any reporting
organization Thus granularity will be attempted up to the point that such actions might compromise
anonymity of any given company Certain reporting entities may appear inconsistent but they have
been preserved to maintain maximum granularity with individual anonymity
Although assessments have been made in a number of the performance categories others do not have
sufficient data to derive any conclusions from the metric results The RMWG recommends continued
assessment of these metrics until sufficient data is available Each of the eighteen performance metrics
are presented in summary with their SMART8 Table 1 ratings in The table provides a summary view of
the metrics with an assessment of the current metric trends observed by the RMWG Table 1 also
shows the order in which the metrics are aligned according to the standards objectives
8 SMART rating definitions are located at httpwwwnerccomdocspcrmwgSMART_20RATING_826pdf
Reliability Metrics Performance
11
Table 1 Metric SMART Ratings Relative to Standard Objectives
Metrics SMART Objectives Relative to Standards Prioritization
ALR Improvements
Trend
Rating
SMART
Rating
1-3 Planning Reserve Margin 13
1-4 BPS Transmission Related Events Resulting in Loss of Load 15
2-5 Disturbance Control Events Greater than Most Severe Single Contingency 12
6-2 Energy Emergency Alert 3 (EEA3) 15
6-3 Energy Emergency Alert 2 (EEA2) 15
Inconclusive
2-3 Activation of Under Frequency Load Shedding 10
2-4 Average Percent Non-Recovery DCS 15
4-1 Automatic Transmission Outages Caused by Protection System Misoperation 15
6-11 Automatic Transmission Outages Caused by Protection System Misoperation 14
6-12 Automatic Transmission Outages Caused by Human Error 14
6-13 Automatic Transmission Outages Caused by Failed AC Substation Equipment 14
6-14 Automatic Transmission Outages Caused by Failed AC Circuit Equipment 14
New Data
1-5 Systems Voltage Performance 14
3-5
Interconnected Reliability Operating Limit System Operating Limit (IROLSOL)
Exceedance 14
6-1 Transmission constraint Mitigation 14
6-15 Element Availability Percentage (APC) 13
6-16
Transmission System Unavailability on Operational Planned and Auto
Sustained Outages 13
No Data
1-12 Frequency Response 11
Trend Rating Symbols
Significant Improvement
Slight Improvement
Inconclusive
Slight Deterioration
Significant Deterioration
New Data
No Data
Reliability Metrics Performance
12
2010 Performance Metrics Results and Trends
ALR1-3 Planning Reserve Margin
Background
The Planning Reserve Margin9 is a measure of the relationship between the amount of resource capacity
forecast and the expected demand in the planning horizon10 Coupled with probabilistic analysis
calculated Planning Reserve Margins is an industry standard which has been used by system planners for
decades as an indication of system resource adequacy Generally the projected demand is based on a
5050 forecast11
Assessment
Planning Reserve Margin is the difference between forecast capacity and projected
peak demand normalized by projected peak demand and shown as a percentage Based on experience
for portions of the bulk power system that are not energy-constrained Planning Reserve Margin
indicates the amount of capacity available to maintain reliable operation while meeting unforeseen
increases in demand (eg extreme weather) and unexpected unavailability of existing capacity (eg
long-term generation outages) Further from a planning perspective Planning Reserve Margin trends
identify whether capacity additions are projected to keep pace with demand growth
Planning Reserve Margins considering anticipated capacity resources and adjusted potential capacity
resources decrease in the latter years of the 2009 and 2010 10-year forecast in each of the four
interconnections Typically the early years provide more certainty since new generation is either in
service or under construction with firm commitments In the later years there is less certainty about
the resources that will be needed to meet peak demand Declining Planning Reserve Margins are
inherent in a conventional forecast (assuming load growth) and do not necessarily indicate a trend of a
degrading resource adequacy Rather they are an indication of the potential need for additional
resources In addition key observations can be made to the Planning Reserve Margin forecast such as
short-term assessment rate of change through the assessment period identification of margins that are
approaching or below a target requirement and comparisons from year-to-year forecasts
While resource planners are able to forecast the need for resources the type of resource that will
actually be built or acquired to fill the need is usually unknown For example in the northeast US
markets with three to five year forward capacity markets no firm commitments can be made in the
9 Detailed calculations of Planning Reserve Margin are available at httpwwwnerccompagephpcid=4|331|333 10The Planning Reserve Margin indicated here is not the same as an operating reserve margin that system operators use for near-term
operations decisions 11These demand forecasts are based on ldquo5050rdquo or median weather (a 50 percent chance of the weather being warmer and a 50 percent
chance of the weather being cooler)
Reliability Metrics Performance
13
long-term However resource planners do recognize the need for resources in their long-term planning
and account for these resources through generator queues These queues are then adjusted to reflect
an adjusted forecast of resourcesmdashpro-rated by approximately 20 percent
When comparing the assessment of planning reserve margins between 2009 and 2010 the
interconnection Planning Reserve Margins are slightly higher on an annual basis in the 2010 forecast
compared to those of 2009 as shown in Figure 5
Figure 5 Planning Reserve Margin by Interconnection and Year
In general this is due to slightly higher capacity forecasts and slightly lower demand forecasts The pace
of any economic recovery will affect future comparisons This metric can be used by NERC to assess the
individual interconnections in the ten-year long-term reliability assessments If a noticeable change
Reliability Metrics Performance
14
occurs within the trend further investigation is necessary to determine the causes and likely effects on
reliability
Special Considerations
The Planning Reserve Margin is a capacity based metric Therefore it does not provide an accurate
assessment of performance in energy-limited systems (eg hydro capacity with limited water resources
or systems with significant variable generation penetration) In addition the Planning Reserve Margin
does not reflect potential transmission constraint internal to the respective interconnection Planning
Reserve Margin data shown in Figure 6 is used for NERCrsquos seasonal and long-term reliability
assessments and is the primary metric for determining the resource adequacy of a given assessment
area
The North American Bulk Power System is divided into four distinct interconnections These
interconnections are loosely connected with limited ability to share capacity or energy across the
interconnection To reflect this limitation the Planning Reserve Margins are calculated in this report
based on interconnection values rather than by national boundaries as is the practice of the Reliability
Assessment Subcommittee (RAS)
ALR1-4 BPS Transmission Related Events Resulting in Loss of Load
Background
This metric measures bulk power system transmission-related events resulting in the loss of load
Planners and operators can use this metric to validate their design and operating criteria by identifying
the number of instances when loss of load occurs
For the purposes of this metric an ldquoeventrdquo is an unplanned transmission disturbance that produces an
abnormal system condition due to equipment failures or system operational actions and results in the
loss of firm system demand for more than 15 minutes The reporting criteria for such events are
outlined below12
bull Entities with a previous year recorded peak demand of more than 3000 MW are required to
report all such losses of firm demands totaling more than 300 MW
bull All other entities are required to report all such losses of firm demands totaling more than 200
MW or 50 percent of the total customers being supplied immediately prior to the incident
whichever is less
bull Firm load shedding of 100 MW or more used to maintain the continuity of the bulk power
system reliability
12 Details of event definitions are available at httpwwwnerccomfilesEOP-004-1pdf
Reliability Metrics Performance
15
Assessment
Figure 6 illustrates that the number of bulk power system transmission-related events resulting in loss of
firm load13
Table 2
from 2002 to 2009 is relatively constant and suggests that 7 - 10 events per year is a norm for
the bulk power system However the magnitude of load loss shown in associated with these
events reflects a downward trend since 2007 Since the data includes weather-related events it will
provide the RMWG with an opportunity for further analysis and continued assessment of the trends
over time is recommended
Figure 6 BPS Transmission Related Events Resulting in Loss of Load Counts (2002-2009)
Table 2 BPS Transmission Related Events Resulting in Loss of Load MW Loss (2002-2009)
Year Load Loss (MW)
2002 3762
2003 65263
2004 2578
2005 6720
2006 4871
2007 11282
2008 5200
2009 2965
13The metric source data may require adjustments to accommodate all of the different groups for measurement and consistency as OE-417 is only used in the US
02468
101214
2002 2003 2004 2005 2006 2007 2008 2009
Count
Reliability Metrics Performance
16
ALR1-12 Interconnection Frequency Response
Background
This metric is used to track and monitor Interconnection Frequency Response Frequency Response is a
measure of an Interconnectionrsquos ability to stabilize frequency immediately following the sudden loss of
generation or load It is a critical component to the reliable operation of the bulk power system
particularly during disturbances and restoration The metric measures the average frequency responses
for all events where frequency drops more than 35 mHz within a year
Assessment
At this time there has been no data collected for ALR1-12 Therefore no assessment was made
ALR2-3 Activation of Under Frequency Load Shedding
Background
The purpose of Under Frequency Load Shedding (UFLS) is to balance generation and load in an island
following an extreme event The UFLS activation metric measures the number of times UFLS is activated
and the total MW of load interrupted in each Region and NERC wide
Assessment
Figure 7 and Table 3 illustrate a history of Under Frequency Load Shedding events from 2006 through
2010 Through this period itrsquos important to note that single events had a range load shedding from 15
MW to 7654 MW The activation of UFLS relays is the last automated reliability measure associated
with a decline in frequency in order to rebalance the system Further assessment of the MW loss for
these activations is recommended
Figure 7 ALR2-3 Count of Activations by Year and Regional Entity (2001-2010)
Reliability Metrics Performance
17
Table 3 ALR2-3 Under Frequency Load Shedding MW Loss
ALR2-3 Under Frequency Load Shedding MW Loss
2006 2007 2008 2009 2010
FRCC
2273
MRO
486
NPCC 94
63 20 25
RFC
SPP
672 15
SERC
ERCOT
WECC
Special Considerations
The use of a single metric cannot capture all of the relevant information associated with UFLS events as
the events relate to each respective UFLS plan The ability to measure the reliability of the bulk power
system is directly associated with how it performs compared to what is planned
ALR2-4 Average Percent Non-Recovery Disturbance Control Standards (DCS)
Background
This metric measures the Balancing Authorityrsquos (BA) or Reserve Sharing Grouprsquos (RSG) ability to balance
resources and demand with the timely deployment of contingency reserve thereby returning the
interconnection frequency to within defined limits following a Reportable Disturbance14
Assessment
The relative
percentage provides an indication of performance measured at a BA or RSG
Figure 8 illustrates the average percent non-recovery of DCS events from 2006 to 2010 The graph
provides a high-level indication of the performance of each respective RE However a single event may
not reflect all the reliability issues within a given RE In order to understand the reliability aspects it
may be necessary to request individual REs to further investigate and provide a more comprehensive
reliability report Further investigation may indicate the entity had sufficient contingency reserve but
through their implementation process failed to meet DCS recovery
14 Details of the Disturbance Control Performance Standard and Reportable Disturbance definitions are available at
httpwwwnerccomfilesBAL-002-0pdf
Reliability Metrics Performance
18
Continued trend assessment is recommended Where trends indicated potential issues the regional
entity will be requested to investigate and report their findings
Figure 8 Average Percent Non-Recovery of DCS Events (2006-2010)
Special Consideration
This metric aggregates the number of events based on reporting from individual Balancing Authorities or
Reserve Sharing Groups It does not capture the severity of the DCS events It should be noted that
most REs use 80 percent of the Most Severe Single Contingency to establish the minimum threshold for
reportable disturbance while others use 35 percent15
ALR2-5 Disturbance Control Events Greater Than Most Severe Single Contingency
Background
This metric represents the number of disturbance events that exceed the Most Severe Single
Contingency (MSSC) and is specific to each BA Each RE reports disturbances greater than the MSSC on
behalf of the BA or Reserve Sharing Group (RSG) The result helps validate current contingency reserve
requirements The MSSC is determined based on the specific configuration of each BA or RSG and can
vary in significance and impact on the BPS
15httpwwwweccbizStandardsDevelopmentListsRequest20FormDispFormaspxID=69ampSource=StandardsDevelopmentPagesWEC
CStandardsArchiveaspx
375
079
0
54
008
005
0
15 0
77
025
0
33
000510152025303540
2006
2007
2008
2009
2010
2006
2007
2008
2009
2010
2006
2007
2008
2009
2010
2006
2007
2008
2009
2010
2006
2007
2008
2009
2010
2006
2007
2008
2009
2010
2006
2007
2008
2009
2010
2006
2007
2008
2009
2010
FRCC MRO NPCC RFC SERC SPP ERCOT WECC
Region and Year
Reliability Metrics Performance
19
Assessment
Figure 9 represents the number of DCS events within each RE that are greater than the MSSC from 2006
to 2010 This metric and resulting trend can provide insight regarding the risk of events greater than
MSSC and the potential for loss of load
In 2010 SERC had 16 BAL-002 reporting entities eight Balancing Areas elected to maintain Contingency
Reserve levels independent of any reserve sharing group These 16 entities experienced 79 reportable
DCS eventsmdash32 (or 405 percent) of which were categorized as greater than their most severe single
contingency Every DCS event categorized as greater than the most severe single contingency occurred
within a Balancing Area maintaining independent Contingency Reserve levels Significantly all 79
regional entities reported compliance with the Disturbance Recovery Criterion including for those
Disturbances that were considered greater than their most severe single Contingency This supports a
conclusion that regardless of the size of the BA or participation in a Reserve Sharing Group SERCrsquos BAL-
002 reporting entities have demonstrated the ability in 2010 to use Contingency Reserve to balance
resources and demand and return Interconnection frequency within defined limits following Reportable
Disturbances
If the SERC Balancing Areas without large generating units and who do not participate in a Reserve
Sharing Group change the determination of their most severe single contingencies to effect an increase
in the DCS reporting threshold (and concurrently the threshold for determining those disturbances
which are greater than the most severe single contingency) there will certainly be a reduction in both
the gross count of DCS events in SERC and in the subset considered under ALR2-5 Masking the discrete
events which cause Balancing Area response may not reduce ldquoriskrdquo to the system However it is
desirable to maintain a reporting threshold which encourages the Balancing Authority to respond to any
unexplained change in ACE in a manner which supports Interconnection frequency based on
demonstrated performance SERC will continue to monitor DCS performance and will continue to
evaluate contingency reserve requirements but does not consider 2010 ALR2-5 performance to be an
adverse trend in ldquoextreme or unusualrdquo contingencies but rather within the normal range of expected
occurrences
Reliability Metrics Performance
20
Special Consideration
The metric reports the number of DCS events greater than MSSC without regards to the size of a BA or
RSG and without respect to the number of reporting entities within a given RE Because of the potential
for differences in the magnitude of MSSC and the resultant frequency of events trending should be
within each RE to provide any potential reliability indicators Each RE should investigate to determine
the cause and relative effect on reliability of the events within their footprints Small BA or RSG may
have a relatively small value of MSSC As such a high number of DCS greater than MCCS may not
indicate a reliability problem for the reporting RE but may indicate an issue for the respective BA or RSG
In addition events greater than MSSC may not cause a reliability issue for some BA RSG or RE if they
have more stringent standards which require contingency reserves greater than MSSC
ALR 1-5 System Voltage Performance
Background
The purpose of this metric is to measure the transmission system voltage performance (either absolute
or per unit of a nominal value) over time This should provide an indication of the reactive capability
available to the transmission system The metric is intended to record the amount of time that system
voltage is outside a predetermined band around nominal
0
5
10
15
20
25
30
2006
2007
2008
2009
2010
2006
2007
2008
2009
2010
2006
2007
2008
2009
2010
2006
2007
2008
2009
2010
2006
2007
2008
2009
2010
2006
2007
2008
2009
2010
2006
2007
2008
2009
2010
2006
2007
2008
2009
2010
FRCC MRO NPCC RFC SERC SPP ERCOT WECC
Cou
nt
Region and Year
Figure 9 Disturbance Control Events Greater Than Most Severe Single Contingency (2006-2010)
Reliability Metrics Performance
21
Special Considerations
Each Reliability Coordinator (RC) will work with the Transmission Owners (TOs) and Transmission
Operators (TOPs) within its footprint to identify specific buses and voltage ranges to monitor for this
metric The number of buses the monitored voltage levels and the acceptable voltage ranges may vary
by reporting entity
Status
With a pilot program requested in early 2011 a voluntary request to Reliability Coordinators (RC) was
made to develop a list of key buses This work continues with all of the RCs and their respective
Transmission Owners (TOs) to gather the list of key buses and their voltage ranges After this step has
been completed the TO will be requested to provide relevant data on key buses only Based upon the
usefulness of the data collected in the pilot program additional data collection will be reviewed in the
future
ALR3-5 Interconnection Reliability Operating Limit System Operating Limit (IROLSOL) Exceedances
Background
This metric illustrates the number of times that defined Interconnection Reliability Operating Limit
(IROL) or System Operating Limit (SOL) were exceeded and the duration of these events Exceeding
IROLSOLs could lead to outages if prompt operator control actions are not taken in a timely manner to
return the system to within normal operating limits This metric was approved by NERCrsquos Operating and
Planning Committees in June 2010 and a data request was subsequently issued in August 2010 to collect
the data for this metric Based on the results of the pilot conducted in the third and fourth quarter of
2010 there is merit in continuing measurement of this metric Note the reporting of IROLSOL
exceedances became mandatory in 2011 and data collected in Table 4 for 2010 has been provided
voluntarily
Reliability Metrics Performance
22
Table 4 ALR3-5 IROLSOL Exceedances
3Q2010 4Q2010 1Q2011
le 10 mins 123 226 124
le 20 mins 10 36 12
le 30 mins 3 7 3
gt 30 mins 0 1 0
Number of Reporting RCs 9 10 15
ALR4-1 Automatic Transmission Outages Caused by Protection System Misoperations
Background
Originally titled Correct Protection System Operations this metric has undergone a number of changes
since its initial development To ensure that it best portrays how misoperations affect transmission
outages it was necessary to establish a common understanding of misoperations and the data needed
to support the metric NERCrsquos Reliability Assessment Performance Analysis (RAPA) group evaluated
several options of transitioning from existing procedures for the collection of misoperations data and
recommended a consistent approach which was introduced at the beginning of 2011 With the NERC
System Protection and Control Subcommitteersquos (SPCS) technical guidance NERC and the regional
entities have agreed upon a set of specifications for misoperations reporting including format
categories event type codes and reporting period to have a final consistent reporting template16
Special Considerations
Only
automatic transmission outages 200 kV and above including AC circuits and transformers will be used
in the calculation of this metric
Data collection will not begin until the second quarter of 2011 for data beginning with January 2011 As
revised this metric cannot be calculated for this report at the current time The revised title and metric
form can be viewed at the NERC website17
16 The current Protection System Misoperation template is available at
httpwwwnerccomfilezrmwghtml 17The current metric ALR4-1 form is available at httpwwwnerccomdocspcrmwgALR_4-1Percentpdf
Reliability Metrics Performance
23
ALR6-11 ndash ALR6-14
ALR6-11 Automatic AC Transmission Outages Initiated by Failed Protection System Equipment
ALR6-12 Automatic AC Transmission Outages Initiated by Human Error
ALR6-13 Automatic AC Transmission Outages Initiated by Failed AC Substation Equipment
ALR6-14 Automatic AC Circuit Outages Initiated by Failed AC Circuit Equipment
Background
These metrics evolved from the original ALR4-1 metric for correct protection system operations and
now illustrate a normalized count (on a per circuit basis) of AC transmission element outages (ie TADS
momentary and sustained automatic outages) that were initiated by Failed Protection System
Equipment (ALR6-11) Human Error (ALR6-12) Failed AC Substation Equipment (ALR6-13) and Failed AC
Circuit Equipment (ALR6-14) These metrics are all related to the non-weather related initiating cause
codes for automatic outages of AC circuits and transformers operated 200 kV and above
Assessment
Figure 10 through Figure 13 show the normalized outages per circuit and outages per transformer for
facilities operated at 200 kV and above As shown in all eight of the charts there are some regional
trends in the three years worth of data However some Regionrsquos values have increased from one year
to the next stayed the same or decreased with no discernable regional trends For example ALR6-11
computes the automatic AC Circuit outages initiated by failed protection system equipment
There are some trends to the ALR6-11 to ALR6-14 data but many regions do not have enough data for a
valid trend analysis to be performed NERCrsquos outage rate seems to be improving every year On a
regional basis metric ALR6-11 along with ALR6-12 through ALR6-14 cannot be statistically understood
until confidence intervals18
18The detailed Confidence Interval computation is available at
are calculated ALR metric outage frequency rates and Regional equipment
inventories that are smaller than others are likely to require more than 36 months of outage data Some
numerically larger frequency rates and larger regional equipment inventories (such as NERC) do not
require more than 36 months of data to obtain a reasonably narrow confidence interval
httpwwwnerccomdocspctadstfTADS_Nov_2_2007APPENDIX_C_Confidence_Intervalpdf
Reliability Metrics Performance
24
While more data is still needed on a regional basis to determine if each regionrsquos bulk power system is
becoming more reliable year to year there are areas of potential improvement which include power
system condition protection performance and human factors These potential improvements are
presented due to the relatively large number of outages caused by these items The industry can
benefit from detailed analysis by identifying lessons learned and rolling average trends of NERC-wide
performance With a confidence interval of relatively narrow bandwidth one can determine whether
changes in statistical data are primarily due to random sampling error or if the statistics are significantly
different due to performance
Reliability Metrics Performance
25
ALR 6-11 ndash Automatic Outages Initiated by Failed Protection System Equipment
Automatic outages with an initiating cause code of failed protection system equipment are in Figure 10
Figure 10 ALR6-11 by Region (Includes NERC-Wide)
This code covers automatic outages caused by the failure of protection system equipment This
includes any relay andor control misoperations except those that are caused by incorrect relay or
control settings that do not coordinate with other protective devices
ALR6-12 ndash Automatic Outages Initiated by Human Error
Figure 11 shows the automatic outages with an initiating cause code of human error This code covers
automatic outages caused by any incorrect action traceable to employees andor contractors for
companies operating maintaining andor providing assistance to the Transmission Owner will be
identified and reported in this category
Reliability Metrics Performance
26
Also any human failure or interpretation of standard industry practices and guidelines that cause an
outage will be reported in this category
Figure 11 ALR6-12 by Region (Includes NERC-Wide)
Reliability Metrics Performance
27
ALR6-13 ndash Automatic Outages Initiated by Failed AC Substation Equipment
Figure 12 shows the automatic outages with an initiating cause code of failed AC substation equipment
This code covers automatic outages caused by the failure of AC Substation ie equipment ldquoinside the
substation fencerdquo including transformers and circuit breakers but excluding protection system
equipment19
19TADS Initiating Cause Code definitions are located at httpwwwnerccomdocspctadswgTADS_Definitions_Appendix_7_092909pdf
Figure 12 ALR6-13 by Region (Includes NERC-Wide)
Reliability Metrics Performance
28
ALR6-14 Automatic AC Transmission Outages Initiated by Failed AC Circuit Equipment
Figure 13 shows the automatic outages with an initiating cause code of failed AC circuit equipment
Automatic Outages related to the failure of AC Circuit equipment ie overhead or underground
equipment ldquooutside the substation fencerdquo 20
ALR6-15 Element Availability Percentage (APC)
Background
This metric uses data and calculations directly from the NERC TADS effort and illustrates the overall
percent of time the aggregate of transmission facilities are available and in service This is an aggregate
20TADS Initiating Cause Code definitions are located at httpwwwnerccomdocspctadswgTADS_Definitions_Appendix_7_092909pdf
Figure 13 ALR6-14 by Region (Includes NERC-Wide)
Reliability Metrics Performance
29
value using sustained outages (automatic and non-automatic) for both lines and transformers operated
at 200 kV and above for each Regional Entity Interconnection and for NERC This metric was approved
by the NERC Operating and Planning Committees in September 2010
Assessment
Figure 14 shows the aggregate element availability percentage (APC) for transmission and transformers
facilities operated at 200 kV and above The values are all over 90 percent which shows excellent
system availability The RMWG recommends continued metric assessment for at least a few more years
in order to determine the value of this metric
Figure 14 2010 ALR6-15 Element Availability Percentage
Notably the Eastern Interconnection does not include Quebec or ERCOT ERCOT does not have any
transformers with low-side voltage levels 200 kV and above
Special Consideration
It should be noted that the non-automatic outage data needed to calculate this metric was only first
collected for the calendar year 2010 as part of the TADS process Therefore only one year of data for
this metric is available at this time
Reliability Metrics Performance
30
ALR6-16 Transmission System Unavailability
Background
This metric uses data and calculations directly from the NERC TADS effort and shows the overall percent
of time the aggregate of transmission facilities are unavailable due to automatic and non-automatic
outages This is an aggregate value using sustained automatic outages for both lines and transformers
operated at 200 kV and above for each Regional Entity and for NERC This metric was approved by the
NERC Operating and Planning Committees in December 2010
Assessment
Figure 15 and Figure 16 illustrate the 2010 aggregate unavailability percentage for AC circuits and
transformer facilities operated at 200 kV and above The values for AC circuits are all under 3 percent
which shows excellent system availability
The RMWG recommends continued metric assessment for at least a few more years in order to
determine the value of this metric
Special Consideration
It should be noted that the non-automatic outage data needed to calculate this metric was only first
collected for the calendar year 2010 as part of the TADS process Therefore only one year of data for
this metric is available at this time
Figure 15 2010 ALR6-16 Transmission System Unavailability
Reliability Metrics Performance
31
Figure 16 2010 ALR6-16 Transmission System Unavailability by Outage Type
Notably the Eastern Interconnection does not include Quebec or ERCOT Also ERCOT does not have
any transformers with low-side voltage levels 200 kV and above
ALR6-2 Energy Emergency Alert 3 (EEA3)
Background
This metric identifies the number of times Energy Emergency Alerts Level 3 (EEA3) are issued EEA3
events are firm-load interruptions due to capacity and energy deficiency EEA3 is currently reported
collected and maintained in NERCrsquos Reliability Coordination Information System (RCIS) and is defined in
Attachment 1 of the NERC Standard EOP-00221
21 The latest version of Attachment 1 for EOP-002 is available at
This metric identifies the number of times EEA3s are
issued The number of EEA3s per year provides a relative indication of performance measured at a
Balancing Authority or interconnection level As historical data is gathered trends in future reports will
provide an indication of either decreasing or increasing use of EEA3s signaling adequacy of the electric
supply system This metric can also be considered in the context of Planning Reserve Margin Significant
increases or decreases in EEA3 events with relatively constant Planning Reserve Margins could indicate
httpwwwnerccompagephpcid=2|20
Reliability Metrics Performance
32
volatility in the actual loads compared to forecast levels or changes in the adequacy of the bulk power
system required to meet load demands
Assessment
Figure 17 shows the number of EEA3 events during 2006 and 2010 from an RE level An interactive
presentation was released and available at the Reliability Indicatorrsquos page22
The Acadiana Load Pocket (ALP) is an area in south central Louisiana that has experienced regular
transmission constraints and numerous Energy Emergency Alert filings by the SPP Reliability Controller
(SPP RC) Transmission within ALP is owned by Entergy Lafayette Utilities System (LUS) and Cleco
Power LLC (Cleco) The transmission constraints within the ALP are primarily caused by the local area
load and the lack of generation located in close proximity to the load area
The number of EEA3rsquos
declared in 2010 returned to more traditional numbers The 2009 spike in EEA3 events in the SPP
Region that was driven by issues in the Acadiana Load Pocket (ALP) were not present in 2010
Special Considerations
Ideally the measure should capture only EEAs that are declared for reliability reasons and not for
economic factors The RMWG has not been able to differentiate these reasons for future reporting and
it has made a recommendation to the Reliability Coordinator Working Group (RCWG) to consider a
revised EEA declaration to exclude economic factors
The reason the EEA volume decreased from 2009 to 2010 in SPP was because the SPP ICT RC23
coordinated an operating agreement between the five operating companies in the ALP The operating
agreement included a cost sharing re-dispatch that alleviated the need of a Transmission Loading Relief
(TLR-5) declaration24
22The EEA3 interactive presentation is available on the NERC website at
During 2009 there was no operating agreement therefore an entity had to
provide Network and Native Load (NNL) relief when a TLR-5 was called by the ICT RC When the TLR-5
was the primary tool to control the post contingent loading in the ALP some of the BAs would have their
firm transmission curtailed to the point where they could no longer serve their load therefore the EEA
3 was needed to communicate a capacityreserve deficiency
httpwwwnerccompagephpcid=4|331|335 23Southwest Power Pool (SPP) Independent Coordinator of Transmission (ICT) Reliability Coordinator (RC) 24More information on Transmission Load Relief is contained in the IRO-006 standard which is located at httpwwwnerccomfilesIRO-006-4pdf In particular TLR-5 definitions are referenced on page 16 and 17
Reliability Metrics Performance
33
Figure 17 ALR6-2 Energy Emergency Alert 3 (EEA3) Counts by Region (2006-2010)
Cleco Power Entergy and LUS are currently constructing an estimated $200 million transmission
infrastructure improvement project to mitigate transmission constraints into ALP Construction of the
project is scheduled to be complete in 2012 Completion of the project should help alleviate some of
the transmission congestion in this area Energy Emergency Alerts filed by the SPP Regional Entity
continue to decline
SPP RTO continues to coordinate operating plans with the operating entities in this area Mitigation
plans and local operating guides in place are expected to provide sufficient flexibility should issues arise
NERC will continue to monitor this area for Reliability Impacts and coordinate any actions with the SPP
Reliability Coordinator and SPP Regional Entity
ALR 6-3 Energy Emergency Alert 2 (EEA2)
Background
Energy Emergency Alert 2 (EEA2) is to measure the number of events BAs declare for deficient capacity
and energy during peak load periods which may serve as a leading indicator of energy and capacity
shortfall in the adequacy of the electric supply system EEA2 provides a sense of the frequency of
precursor events to the more severe EEA3 declarations This metric measures the number of events
1 3 1 2 214
3 4 4 1 5 334
4 2 1 52
1
0
5
10
15
20
25
30
3520
0620
0720
0820
0920
1020
0620
0720
0820
0920
1020
0620
0720
0820
0920
1020
0620
0720
0820
0920
1020
0620
0720
0820
0920
1020
0620
0720
0820
0920
1020
0620
0720
0820
0920
1020
0620
0720
0820
0920
10
FRCC MRO NPCC RFC SERC SPP TRE WECC
2006-2009
2010
Region and Year
Reliability Metrics Performance
34
Balancing Authorities declare for deficient capacity and energy during peak load periods At this time
however this data reflects inclusion of Demand Side Resources that would not be indicative of
inadequacy of the electric supply system
The number of EEA2 events and any trends in their reporting indicates how robust the system is in
being able to supply the aggregate load requirements The historical records may include demand
response activations and non-firm load interruptions per applicable contracts within the EEA alerts per
its definition25
Assessment
Demand response is a legitimate resource to be called upon by balancing authorities and
do not indicate a reliability concern As data is gathered in the future reports will provide an indication
of either decreasing or increasing adequacy in the electric supply system EEA2 events called solely for
activation of demand response (controllable or contractually prearranged demand-side dispatch
programs) or interruption of non-firm load per applicable contracts should be excluded This metric can
also be considered in the context of the Planning Reserve Margin Significant increases or decreases in
EEA2 events with relatively constant Planning Reserve Margins could indicate volatility in the actual
loads compared to forecast levels or changes in the adequacy of the bulk power system required to
meet load demands
Figure 18 shows the number of EEA2 events by Regional Entity from 2006 to 2010 EEA2 interactive
version available on line by quarter and region26
25 The EEA2 is defined at
The general trend continues to show improved
performance which may have been influenced by the overall reduction in demand throughout NERC
caused by the economic downturn Specific performance by any one region should be investigated
further for issues or events that may affect the results Determining whether performance reported
includes those events resulting from the economic operation of DSM and non-firm load interruption
should also be investigated The RMWG recommends continued metric assessment
httpwwwnerccomfilesEOP-002-2pdf 26 EEA2 interactive version located at httpwwwnerccompagephpcid=4|331|341
Reliability Metrics Performance
35
Special Considerations
The intent of this metric is to measure only EEAs that are called for reliability reasons and not for
economic factors such as demand side management (DSM) and non-firm load interruption The
historical data for this metric may include events that were called for economic factors According to
the RCWG recent data should only include EEAs called for reliability reasons
ALR 6-1 Transmission Constraint Mitigation
Background
The RMWG completed a pilot with four regional entities Based on the results the RMWG expanded the
pilot data collection to all regions and the initial results of the data collection are shown in Figure 19
and Table 5 Based on the results of the pilot there is merit in continuing to assess this metric The
intent of this metric is to identify trends in the number of mitigation measures (Special Protection
Schemes (SPS) Remedial Action Schemes (RAS) and Operating Procedures) required to meet reliability
requirements By their nature SPS do not indicate an inherent weakness in the bulk power system
rather they are an indication of methods that are taken to operate the system through the range of
conditions it must perform This metric is only intended to evaluate the trend use of these plans and
whether the metric indicates robustness of the transmission system is increasing remaining static or
decreasing
1 27
2 1 4 3 2 1 2 4 5 2 5 832
4724
211
5 38 5 1 1 8 7 4 1 1
05
101520253035404550
2006
2007
2008
2009
2010
2006
2007
2008
2009
2010
2006
2007
2008
2009
2010
2006
2007
2008
2009
2010
2006
2007
2008
2009
2010
2006
2007
2008
2009
2010
2006
2007
2008
2009
2010
2006
2007
2008
2009
2010
FRCC MRO NPCC RFC SERC SPP TRE WECC
2006-2009
2010
Region and Year
Figure 18 ALR6-3 Energy Emergency Alert 2 (EEA2)
Reliability Metrics Performance
36
Assessment
The pilot data indicates a relatively constant number of mitigation measures over the time period of
data collected
Figure 19 ALR6-1 Transmission Constraint Mitigation by SPSRAS (2009-2014)
0102030405060708090
100110120
2009
2010
2011
2014
2009
2010
2011
2014
2009
2010
2011
2014
2009
2010
2011
2014
2009
2010
2011
2014
2009
2010
2011
2014
2009
2010
2011
2014
2009
2010
2011
2014
FRCC MRO NPCC RFC SERC SPP ERCOT WECC
Coun
t
Region and Year
SPSRAS
Reliability Metrics Performance
37
Table 5 ALR6-1 Transmission Constraint Mitigation by Operating ProcedureGuides (2009-2011)
ALR6-1 Transmission Constraint Mitigation by Operating ProcedureGuides (2009-2014)
2009 2010 2011 2014
FRCC 107 75 66
MRO 79 79 81 81
NPCC 0 0 0
RFC 2 1 3 4
SPP 39 40 40 40
SERC 6 7 15
ERCOT 29 25 25
WECC 110 111
Special Considerations
A certain number of SPS mitigation plans may be necessary to support reliable operation of the system
If the number of SPS increase over time this may indicate that additional transmission capacity is
required A reduction in the number of SPS may be an indicator of increased generation or transmission
facilities being put into service which may indicate greater robustness of the bulk power system In
general mitigation plans are a viable and valuable tool for effective operation of the bulk power system
In power system planning reliability operability capacity and cost-efficiency are simultaneously
considered through a variety of scenarios to which the system may be subjected Mitigation measures
are a method for optimizing a power system across these scenarios Changes in quantities of mitigation
plans may indicate year-on-year differences in the system being evaluated
Integrated Bulk Power System Risk Assessment
Introduction In developing eighteen metrics to measure acceptable levels of reliability it has become clear that any
such measurement of reliability must include consideration of the risks present within the bulk power
system in order for us to appropriately prioritize and manage these system risks The scope for the
Reliability Metrics Working Group (RMWG)27
27 The RMWG scope can be viewed at
includes a task to develop a risk-based approach that
provides consistency in quantifying the severity of events The approach not only can be used to
httpwwwnerccomfilezrmwghtml
Reliability Metrics Performance
38
measure risk reduction over time but also can be applied uniformly in event analysis process to identify
the events that need to be analyzed in detail and sort out non-significant events
The Operating Committee (OC) and Planning Committee (PC) endorsed the concepts and framework28 of
the risk-based approach in their September 2010 joint meeting and further supported the event severity
risk index (SRI) calculation29
Recommendations
in March 2011
bull NERC should embrace the use of risk assessment to identify trends in addition to lessons learned
in order to improve bulk power system reliability
bull The RMWG should continue to coordinate and communicate with the Event Analysis Working
Group (EAWG) to apply the SRI into the event analysis process and root cause analysis
bull As trend evaluations increase the knowledge of risks to the bulk power system data required to
support additional assessment should be gathered
Event Severity Risk Index (SRI)
Risk assessment is an essential tool for achieving the alignment between organizations people and
technology This will assist in quantifying inherent risks identifying where potential high risks exist and
evaluating where the most significant lowering of risks can be achieved Being learning organizations
the Electric Reliability Organization (ERO) Regional Entities and Registered Entities can use these tools
to focus on the areas of highest risk to reliability to provide a sound basis for developing results-based
standards and compliance programs Risk assessment also serves to engage all stakeholders in a
dialogue about specific risk factors and helps direct a strategic plan for risk reduction and early
detection
The SRI is a daily blended metric for which transmission loss generation loss and load loss events are
calculated Each element (transmission generation and load loss) is factored by the systemrsquos inventory
for that element to rate significant events appropriately On a yearly basis these daily performances
can be sorted in descending order to evaluate the year-on-year performance of the system
In order to test drive the concepts the RMWG applied these calculations against historically memorable
days to derive SRIs Once these calculations were complete they were reviewed and evaluated by
various stakeholders for reasonableness Based upon feedback modifications to the calculation were
made and assessed against the historic days performed This iterative process locked down the details
28 httpwwwnerccomdocspcrmwgIntegrated_Bulk_Power_System_Risk_Assessment_Concepts_Finalpdf 29 httpwwwnerccomdocspcrmwgSRI_Equation_Refinement_May6_2011pdf
Reliability Metrics Performance
39
for the calculation of SRI whose calculation from zero (no transmission line outages generation outages
or load lost in a day) to 1000 (a theoretical condition in which every transmission line all generation
units and all load lost across the system in a single day)
Figure 20 captures the calculated severity risk value for each of the days for each year benchmarked
with the historic significant events which were used to concept test the calculation Since there is
significant disparity between days the bulk power system is stressed compared to those that are
ldquoroutinerdquo and ldquoherordquo days of the year where the system performed extremely well the curve is depicted
using a logarithmic scale Each yearrsquos data is sorted in descending order striking a characteristic shape
At the left-side of the curve the days in which the system is severely stressed are plotted The central
more linear portion of the curve identifies the routine day performance while the far right-side of the
curve shows the values plotted for days in which almost all lines and generation units are in service and
essentially no load is lost
The trends on the chart below show that 2009 and 2010 had fewer extreme days than 2008 Routine
daily performance appears generally consistent across all three years Figure 20 captures the days for
each year benchmarked with historically significant events
In Figure 20 NERCrsquos event categories and SRI ratings are directly related As the SRI increases the
category or severity of the event increases Historical events are also shown to relate modern
reliability measurements to give a perspective of how a well-known event would register on the SRI
scale
The event analysis process30
30
benefits from the SRI as it enables a numerical analysis of an event in
comparison to other events By this measure an event can be prioritized by its severity In a severe
event this is unnecessary However for events that do not result in severe stressing of the bulk power
system this prioritization can be a challenge By using the SRI the event analysis process can decide
which events to learn from and reduce which events to avoid and when resilience needs to be
increased under high impact low frequency events as shown in the blue boxes in the figure
httpwwwnerccompagephpcid=5|365
Reliability Metrics Performance
40
Figure 20 NERC Annual Daily Severity Risk Index (SRI) Sorted Descending with Historic Benchmark Days
Other factors that impact severity of a particular event to be considered in the future include whether
equipment operated as designed and resulted in loss of load from a reliability perspective (intentional
and controlled load-shedding) Mechanisms for enabling ongoing refinement to include the historic and
simulated events for future severity risk calculations are being explored
Reliability Metrics Performance
41
Integrated Reliability Index Concepts In December 2010 the RMWG was challenged by the OC and PC to develop a single index concept to
measure the universe of risks associated with the bulk power system As a result the integrated
reliability index (IRI) concepts were proposed31
Figure 21
the three components of which were defined to
quantify each specific risk aspect They are titled the Event Driven Index (EDI) StandardsStatute Driven
Index (SDI) and Condition Driven Index (CDI) illustrated in with measures associated with
system events standards compliance and eighteen performance metrics The development of an
integrated reliability index aims to inform increase transparency and quantify the effectiveness of risk
reduction or mitigation actions The goal is to provide the industry meaningful trends of the BPSrsquos
performance and guidance on how the industry can improve reliability and support risk-informed
decision making Once completed the IRI will facilitate holistic assessment of performance Finally the
IRI should help overcome concern and confusion about how many metrics are being analyzed for system
reliability assessments
Figure 21 Risk Model for Bulk Power System
The integrated model of event-driven condition-driven and standardsstatute-driven risk information
can be constructed to illustrate all possible logical relations between the three risk sets Due to the
nature of the system there may be some overlap among the components
31 httpwwwnerccomdocspcrmwgIntegrated_Reliability_Index_WhitePaper_DRAFTpdf
Event Driven Index (EDI)
Indicates Risk from
Major System Events
Standards Statute Driven
Index (SDI)
Indicates Risks from Severe Impact Standard Violations
Condition Driven Index (CDI)
Indicates Risk from Key Reliability
Indicators
Reliability Metrics Performance
42
The Three Components of the IRI The three components of the IRI work together as shown in Figure 22 to comprise a full picture of the
state of reliability
Figure 22 An overview of the components that comprise the Integrated Reliability Index (IRI)
Event-Driven Indicators (EDI)
The Event-Driven Indicator provides a basis for prioritization of events based on bulk power system
integrity equipment performance and engineering judgment This indicator can serve as a high value
risk assessment tool to be used by stakeholders to investigate and evaluate disturbance history and
measure the severity of these events The relative ranking of events requires industry expertise agreed-
upon goals and engineering judgment The EDI is a derivative of SRI results for a specific time period
but it transforms that performance into a form of an availability index These calculations will be further
refined as feedback is received
Condition-Driven Indicators (CDI)
The Condition-Driven Indicators focus on a set of measurable system conditions (performance
measures) to assess bulk power system reliability These reliability indicators identify factors that
positively or negatively impact reliability and are early predictors of the risk to reliability from events or
unmitigated violations A collection of these indicators measures how close reliability performance is to
the desired outcome and if the performance against these metrics is constant or improving
Reliability Metrics Performance
43
StandardsStatute-Driven Indicators (SDI)
The StandardsStatute-Driven Indicator is a calculation of success of compliance based upon the subset
of high-value standards and is divided by the number of participations who could have received the
violation within the time period considered Also based on these factors known unmitigated violations
of elevated risk factor requirements are weighted higher than lower risk factors The index decreases if
the compliance improvement is achieved over a trending period
IRI Index Calculation As with the SRI the IRI is based on an importance weighting factor which the RMWG can modify over
time after gaining experience with the new metric as well as consideration of feedback from industry
At this time the RMWG believes some form of blended weighting may serve to start to populate IRI
characteristic curves at a high and generic level Based upon feedback from stakeholders this approach
may change or as discussed below weighting factors may vary based on periodic review and risk model
update The RMWG will continue the refinement of the IRI calculation and consider other significant
factors that impact reliability (eg intentional and controlled load-shedding) further it will explore
developing mechanisms for enabling ongoing refinement which should be influenced by a wide set of
stakeholders
RMWG recommends the Event Driven Index (EDI) be weighted the highest (50 percent) since events
actually occurred indicating how the system was performing The Condition Driven Index (CDI) and
StandardsStatute Driven Index (SDI) are weighted 25 each since they are indicators of potential risks
to BPS reliability IRI can be calculated as follows
IRI is intended to be a composite metric which integrates several forms of individual risks to the bulk
power system Since the three components range across many stakeholder organizations these
concepts are developed as starting points for continued study and evaluation Additional supporting
materials can be found in the IRI whitepaper32
IRI Recommendations
including individual indices calculations and preliminary
trend information
For the IRI more investigation should be performed to determine the best way to integrate EDI CDI
and SDI into an Integrated Reliability Index (IRI) that quantitatively represents the reliability of the bulk
32 The IRI whitepaper can be found at httpwwwnerccomdocspcrmwgIntegrated_Reliability_Index_WhitePaper_DRAFTpdf
Reliability Metrics Performance
44
power system To this end study into determining the amount of overlap between the components is
necessary RMWG is currently working to determine the proper amount of overlap between the IRI
components
Also the CDI component of the IRI needs to be solidified This is especially true with the CDI More
accurate metric data is needed to paint a fuller picture of the CDI Many of the metrics used to calculate
the CDI are new or they have limited data Compared to the SDI which counts well-known violation
counts and the EDI which uses the well-defined CDI the CDI lacks the depth of rigor that the other two
components have acquired through their years of data RMWG is currently working to improve the CDI
Reliability Metrics Conclusions and Recommendations Among the eighteen metrics that address the characteristics of an adequate level of reliability (ALR)
metric trends indicate the system is performing better in the following seven areas
bull ALR1-3 Planning Reserve Margin
bull ALR1-4 BPS Transmission Related Events Resulting in Loss of Load
bull ALR2-5 Disturbance Control Events Greater than Most Severe Single Contingency
bull ALR6-2 Energy Emergency Alert 3 (EEA3)
bull ALR6-3 Energy Emergency Alert 2 (EEA2)
bull ALR6-11 Automatic Transmission Outages Caused by Protection System Misoperations
bull ALR6-13 Automatic Transmission Outages Caused by Failed AC Substation Equipment
Assessments have been made in other performance categories A number of them do not have
sufficient data to derive any conclusions from the results The RMWG recommends continued data
collection and assessment of these metrics If a metric does not yield any trend in a five-year reporting
period the metric will be modified or withdrawn
For the IRI more investigation should be performed to determine the overlap of the components (CDI
EDI and SDI) The CDI should be more thoroughly solidified as an index by collecting more data over
time
Transmission Equipment Performance
45
Transmission Equipment Performance Introduction The Transmission Availability Data System (TADS) effort began with the establishment of a TADS task force
by the NERC Planning Committee in October 2006 On October 27 2007 the NERC Board of Trustees
approved the collection of transmission automatic outage data beginning in calendar year 2008 (Phase I)
Subsequently on October 29 2008 the NERC Board approved the collection of Non-Automatic Outage data
that began for Calendar year 2010 (Phase II)
This chapter provides reliability performance analysis of the transmission system by focusing on the trends
of Automatic Outage data from calendar year 2008 thru 2010 Since only one year of Non-Automatic
Outage data has been collected that data will not be assessed in this report
When calculating bulk power system performance indices care must be exercised when interpreting results
as misinterpretation can lead to erroneous conclusions regarding system performance With only three
years of data in the smaller regions it is not clear whether a regionrsquos yearly outage variation compared to
the average is due to random statistical variation or that particular year is significantly different in
performance However on a NERC-wide basis after three years of data collection there is enough
information to accurately determine whether the yearly outage variation compared to the average is due to
random statistical variation or the particular year in question is significantly different in performance33
Performance Trends
Transmission performance information has been provided by Transmission Owners (TOs) within NERC
through the NERC TADS (Transmission Availability Data System) process The data presented reflects
Momentary and Sustained AC Automatic outages of transmission elements that operate at voltages ge 200 kV
(including the low side of transformers) with the criteria specified in the TADS process The following
elements listed below are included
bull AC Circuits ge 200 kV (Overhead and Underground Circuits) Radial circuits are included
bull DC Circuits with ge +-200 kV DC voltage
bull Transformers with ge 200 kV low-side voltage and
bull ACDC Back-to-Back (BTB) Converters with ge 200 kV AC voltage on both sides
33The detailed Confidence Interval computation is available at httpwwwnerccomdocspctadstfTADS_Nov_2_2007APPENDIX_C_Confidence_Intervalpdf
Transmission Equipment Performance
46
AC Element Outage Summary and Leading Causes Table 6 shows the 2008 2009 and 2010 NERC total AC transmission element inventory and a summary of
the associated outages As expected in general the number of circuits increased from year to year due to
new construction or re-construction to higher voltages For every outage experienced on the transmission
system cause codes are identified and recorded according to the TADS process Causes of both momentary
and sustained outages have been indicated These causes are analyzed to identify trends and similarities
and to provide insight into what could be done to possibly prevent future occurrences
Figure 23 and Figure 24 describe the top ten initiating cause codes for sustained and momentary automatic
outages combined from 2008-2010 Based on the two figures the relationship between the total number of
outages and total outage hours can be seen Failed AC Substation Equipment and Failed AC Circuit
Equipment only account for 15 percent of the total number of outages but account for 65 percent of the
total outage hours The two largest causes of outages within NERC (ldquoLightingrdquo and ldquoWeather excluding
Lightningrdquo) account for 34 percent of the total number of outages
The next three Human Error Failed Protection System Equipment and Failed AC Circuit Equipment have
very similar totals and should all be considered significant focus points in reducing the number of Sustained
Automatic Outages for all elements
Transmission Equipment Performance
47
Table 6 NERC - All AC Elements Sustained and Momentary Outage Performance Summary
2008 Number of Outages
AC Voltage
Class
No of
Circuits
Circuit
Miles Sustained Momentary
Total
Outages Total Outage Hours
200-299kV 4369 102131 1560 1062 2622 56595
300-399kV 1585 53631 793 753 1546 14681
400-599kV 586 31495 389 196 585 11766
600-799kV 110 9451 43 40 83 369
All Voltages 6650 196708 2785 2051 4836 83626
2009 Number of Outages
AC Voltage
Class
No of
Circuits
Circuit
Miles Sustained Momentary
Total
Outages Total Outage Hours
200-299kV 4468 102935 1387 898 2285 28828
300-399kV 1619 56447 641 610 1251 24714
400-599kV 592 32045 265 166 431 9110
600-799kV 110 9451 53 38 91 442
All Voltages 6789 200879 2346 1712 4038 63094
2010 Number of Outages
AC Voltage
Class
No of
Circuits
Circuit
Miles Sustained Momentary
Total
Outages Total Outage Hours
200-299kV 4567 104722 1506 918 2424 54941
300-399kV 1676 62415 721 601 1322 16043
400-599kV 605 31590 292 174 466 10442
600-799kV 111 9477 63 50 113 2303
All Voltages 6957 208204 2582 1743 4325 83729
Note The NERC table does not show redacted outages DC Circuit outages Transformer outages or ACDC
converter outages
Transmission Equipment Performance
48
Figure 23 NERC - Top Ten Sustained and Momentary Outages by Initiating Cause Code for All Elements
Figure 24 NERC - Top Ten Sustained Outage Hours by Cause Code
198
151
80
7271
6943
33
27
188
68
Lightning
Weather excluding lightningHuman Error
Failed AC Substation EquipmentFailed Protection System EquipmentFailed AC Circuit Equipment Foreign Interference
Power System Condition
Fire
Unknown
Remaining Cause Codes
299
246
188
58
52
42
3619
16 12 31 Failed AC Substation EquipmentFailed AC Circuit Equipment Weather excluding lightningUnavailable
Other
Fire
Unknown
Human Error
Failed Protection System EquipmentForeign Interference
Remaining Cause Codes
Transmission Equipment Performance
49
Transmission Monthly Outages Figure 25 displays the total number of Automatic Outages on a per-month basis The three months with the
highest total of outages were June July and August From a seasonal perspective winter had a monthly
average of 281 outages These include the months of November-March Summer had an average of 429
outages Summer included the months of April-October
Figure 25 Number of Outages by Month for AC Circuits (2008-2010)
This figure does not show redacted outages DC Circuit outages Transformer outages or ACDC Converter
outages
Outage Initiation Location For every outage experienced on the transmission system the outage initiation code is identified and
recorded according to the TADS process The outage initiation code can be analyzed to identify trends and
similarities and to provide insight into what could be done to possibly prevent future occurrences
The ldquoOutage Initiation Coderdquo describes where an automatic outage was initiated on the power system The
five codes are as follows
bull Element-Initiated
bull Other Element-Initiated
bull AC Substation-Initiated
bull ACDC Terminal-Initiated (for DC circuits)
bull Other Facility Initiated any facility not included in any other outage initiation code
JanuaryFebruar
yMarch April May June July August
September
October
November
December
2008 238 229 257 258 292 437 467 380 208 176 255 236
2009 315 201 339 334 398 553 546 515 351 235 226 294
2010 444 224 269 446 449 486 639 498 351 271 305 281
3 Year AVG 332 218 288 346 380 492 551 464 303 227 262 270
0
100
200
300
400
500
600
700
Out
ages
Transmission Equipment Performance
50
Notably the protection system is not part of an ldquoAC Substationrdquo or an ldquoACDC Terminalrdquo If a protection
system misoperates and initiates an outage it will be classified as ldquoOther-Facility Initiatedrdquo The following
Figures show the initiating location of the Automatic outages from 2008 to 2010
With both Momentary and Sustained Automatic Outages taken into account the outage was initiated on the
Element more than 67 percent of the time as shown in Figure 26 and Figure 27
When only the Sustained Automatic Outages are analyzed the outage initiation on both AC Substation and
Other Facility increased by 34 percent and 32 percent respectively Outages initiated on the Element itself
decreases by 78 percent as shown in Figure 26 and 27 For only the Momentary Automatic Outages the
outage initiation on the Element increases by 19 percent compared to Sustained Outages Element initiated
outages make up over 78 percent of the total outages when analyzing only Momentary Outages
Figure 26
Figure 27
Transmission Outage Events Figure 28 illustrates the relationship between the numbers of Automatic Outages associated per TADS
event 2008 2009 and 2010 tend to follow the same trend The largest number of Automatic Outages per
TADS event is fourteen in 2010 thirteen in 2009 and eight in 2008 There are around 70 to 100 TADS
events that contain between fourteen and three Automatic Outages (see below) There are around 330 to
400 TADS events that contain two or more Automatic Outages The rest of the events only contain one
Automatic Outage As noted in the lower right hand corner below the total number of Events in 2008 to
2010 ranged from 3920 to 4569 events per year Nearly 90 percent or more of the events contained one
Automatic Outage
Figure 26 Sustained Automatic Outage Initiation
Code
Figure 27 Momentary Automatic Outage Initiation
Code
Transmission Equipment Performance
51
Transmission Outage Mode Figure 29 and Figure 30 show the percentage of Outage Modes The ldquoOutage Mode Coderdquo describes
whether one Automatic Outage is related to other Automatic Outages A Single Mode outage is an
Automatic Outage of a single Element which occurs independently of any other Automatic Outages (if any)
A ldquoDependent Mode Initiating Outagerdquo is an Automatic Outage of a single Element that initiates one or more
subsequent Element Automatic Outages A ldquoDependent Mode Outagerdquo is an Automatic Outage of an
Element which occurred as a result of an initiating outage whether the initiating outage was an Element
outage or a non-Element outage A ldquoCommon Mode Outagerdquo is one of two or more Automatic Outages with
the same Initiating Cause Code and where the outages are not consequences of each other and occur nearly
simultaneously A ldquoCommon Mode Initiating Outagerdquo is a Common Mode Outage that initiates one or more
subsequent Automatic Outages
Over 72 percent of the total outages occurred on the bulk power system are Single Mode Outages The next
largest mode is Dependent with over 11 percent of the total outages being in this category For only
Sustained Automatic Outages outages related to each other increase with Dependent mode accounting for
13 percent of the outages and Common mode accounting for close to 11 percent of the outages
Independent Sustained outages still account for the largest portion with nearly 70 percent being Single
mode When just analyzing Momentary Automatic Outages Associated outages decrease with Dependent
Figure 28 Event Histogram (2008-2010)
Transmission Equipment Performance
52
mode accounting for only 9 percent of the outages The Common Mode percentage decreases while
Dependent Mode Initiating percentage increases compared to Sustained Outages Independent Momentary
outages account for the largest portion with over 76 percent being Single Mode
An investigation into the root causes of Dependent and Common mode events which include three or more
Automatic Outages (indentified in the TADS 2008 to 2010 data) should be a high priority Some protection
systems are designed to trip three or more circuits but some events go beyond what is designed Some also
have misoperations associated with multiple outage events
Conclusions On a NERC wide average basis automatic transmission outage rate is improving from 2008 to 2010 based on
reported data Considering both automatic and non-automatic outages 2010 records indicate transmission
element availability percentage is very high and exceeds 95 The unavailability rate for AC circuits and
transformers are only 15 and 29 respectively
The cause codes of Human Error Failed Protection System Equipment and Failed AC Circuit Equipment
should be considered significant focus points in reducing the number of Sustained Automatic Outages for all
elements A deeper look into the root causes of Dependent and Common mode events which include three
or more Automatic Outages (indentified in the TADS 2008 to 2010 data) should be a high priority Some
protection systems are designed to trip three or more circuits but some events go beyond what is designed
Some also have misoperations associated with multiple outage events
Figure 29 Sustained Automatic Outage Mode code Figure 30 Momentary Automatic Outage Mode code
Generation Equipment Performance
53
Generation Equipment Performance Introduction The development of the Generating Availability Data System (GADS) began in 1982 This series of databases
is used to voluntarily collect record and retrieve operating information By pooling individual unit
information with likewise units generating unit availability performance can be calculated providing
opportunities to identify trends and generating equipment reliability improvement opportunities The
information is used to support equipment reliability availability analyses and risk-informed decision-making
by system planners generation owners assessment modelers manufacturers and contractors etc Reports
and information resulting from the data collected through GADS are now used for benchmarking and
analyzing electric power plants
Currently the data collected through GADS contains 72 percent of the North American generating units
with generating capacity of 20 MW or higher34 Additionally many of the newer combined-cycle plants are
not reporting information and therefore a full view of each unit type is not presented Rather a sample of
all the units in North America that fit a given more general category is provided35 for the 2008-201036
Generation Key Performance Indicators
assessment period
Three key performance indicators37
In
the industry have used widely to measure the availability of generating
units (see Terms Used in This Report section for their calculation parameters) are Equivalent Availability
Factor (EAF) Net Capacity Factor (NCF) and Equivalent Forced Outage Rate ndash Demand (EFORd)
Table 7 the North American fleet average EAF NCF and EFORd compared to unit age for all generating
units with a capacity of 20 MW and higher is provided for the years 2008-2010 The EAF shows a decline
during the last three years NCF is up and down while the EFORd appears to be increasing As expected the
fleet of units reported to GADS is aging overall with the fossil units being about 12 years older than the
average age
34 httpwwwnerccomdocspcgadstfGADSTF_Recommendation_Report_02-18-2011_FINALpdf 35GADS contains some 1500+ units under 20 MW that is not included in this report These units are excluded because most units are not base-loaded and are in peaking operation
3684 percent of the 2010 dataset is available at this time while the 2008 and 2009 dataset is complete 37 httpwwwnerccompagephpcid=4|43
Generation Equipment Performance
54
Table 7 General Availability Review of GADS Fleet Units by Year
2008 2009 2010 Average
Equivalent Availability Factor (EAF) 8776 8774 8678 8743
Net Capacity Factor (NCF) 5083 4709 4880 4890
Equivalent Forced Outage Rate -
Demand (EFORd) 579 575 639 597
Number of Units ge20 MW 3713 3713 3713 3713
Average Age of the Fleet in Years (all
unit types) 303 311 321 312
Average Age of the Fleet in Years
(fossil units only) 422 432 440 433
Figure 31 provides the average forced outage hours (FOH) maintenance outage hours (MOH) and planned
outage hours (POH) for all units reporting 20 MW or larger During this three-year period the average FOH
291 hours average MOH is 163 hours average POH is 470 hours
Figure 31 shows a large increase in forced and maintenance events The average age of the units with a
capacity of 20MW and higher in 2009 is 316 years old However the average age of fossil units in 2010 is
442 years old These fossil units are the backbone of all operating units providing the base-load power
continuously and nearly 50 percent of all energy annually There appears to be no increase allocated for
annualsemi-annual maintenance (ie planned outages) for the older generating units The increase of
000100002000030000400005000060000700008000090000
100000
2008 2009 2010
463 479 468
154 161 173
288 270 314
Hou
rs
Planned Maintenance Forced
Figure 31 Average Outage Hours for Units gt 20 MW
Generation Equipment Performance
55
maintenance outage hours reflects an increased need to fix problems that cannot be deferred until the next
annualsemi-annual repairs As a result it shows one of two things are happening
bull More or longer planned outage time is needed to repair the aging generating fleet
bull More focus on preventive repairs during planned and maintenance events are needed
Multiple Unit Forced Outages and Causes Table 8 provides the annual multiple-unit forced outage trips resulting from the same cause for each of the
assessments years 2008-2010 respectively The ldquosingle unitrdquo trips are large units with a Net Dependable
Capacity of 750 MW or more The trips of ldquotwo unitsrdquo or more is any combination of unit capacity with the
total amount of lost capacity more than 750 MW
Table 8 also presents more information on the forced outages During 2008-2010 there were a large
number of double-unit outages resulting from the same event Investigations show that some of these trips
were at a single plant caused by common control and instrumentation for the units The incidents occurred
several times for several months and are a common mode issue internal to the plant
Table 8 Number of Multiple Unit Forced Outages and FrequencyYear
2008 2009 2010
Type of
Trip
of
Trips
Avg Outage
Hr Trip
Avg Outage
Hr Unit
of
Trips
Avg Outage
Hr Trip
Avg Outage
Hr Unit
of
Trips
Avg Outage
Hr Trip
Avg Outage
Hr Unit
Single-unit
Trip 591 58 58 284 64 64 339 66 66
Two-unit
Trip 281 43 22 508 96 48 206 41 20
Three-unit
Trip 74 48 16 223 146 48 47 109 36
Four-unit
Trip 12 77 19 111 112 28 40 121 30
Five-unit
Trip 11 1303 260 60 443 88 19 199 10
gt 5 units 20 166 16 93 206 50 37 246 6
Loss of ge 750 MW per Trip
The high number of five-unit trips in 2008 was due to Hurricane Ike hitting the Gulf Coast The highest total
number of multiple unit trips occurred in 2009 though as mentioned before the data collection for 2010 is
incomplete at this time The majority of 2009 multiple unit trips have three main causes (in order by
Generation Equipment Performance
56
number of events) transmission lack of fuel and storms A summary of the three categories for single as
well as multiple unit outages (all unit capacities) are reflected in Table 9
Table 9 Common Causes of Multiple Unit Forced Outages (2009)
Cause Number of Events Average MW Size of Unit
Transmission 1583 16
Lack of Fuel (Coal Mines Gas Lines etc) Not
in Operator Control
812 448
Storms Lightning and Other Acts of Nature 591 112
Some of the transmission outages based on storms in 2009 have been caused by the same reasons because
the storms may have caused transmission interference However the plants reported the problems
inconsistently with either the transmission interference or storms cause code Therefore they are depicted
as two different causes of forced outage
Marked transmission outages in 2009 were quite high Thirty-five percent came from one utility with a large
number of hydroelectric units The company related the trips to various problems including weather
(lightning storms) wildlife ldquoline bumpsrdquo and problems on the receiving end of the transmission line Nine
hundred and eighty-five transmission trips (62 percent) were from hydroelectric units38
In 2009 only ten transmission trips resulted in a loss of 750 MW or more per trip Twenty two generating
plants were affected by the ten trips Causes for the trips include feeder line trips (1 trip) breakers in the
switchyard (8 trips) personnel errors (2 trips) and unknown (10 trips)
The ldquoLack of Fuelrdquo outages are of interest as these events occur during the times when a unit is available to
operate but there is an interruption in fuels to operate the facilities These events do not include
interruptions of fuel due to contracts Rather the cause code is designed to account for units that are
expecting fuel and it is unavailable when requested Table 10 presents the distribution of ldquoLack of Fuelrdquo
events by NERC Region and Table 11 presents the unit types affected
38 The average size of the hydroelectric units were small ndash 335 MW
Generation Equipment Performance
57
Of the units that report ldquoLack of Fuelrdquo 78 percent of the units are oil-fired 15 percent of the units are gas-
fired and the remaining units are various other fuels Table 12 provides the top causes of forced outage for
several unit types For fossil units ldquoLack of Fuelrdquo as the number three cause behind waterwall tube leaks
and superheater tube leaks
Table 10 Forced Outages Due to Lack of Fuel by Region
Region Number of Lack of Fuel
Problems Reported
FRCC 0
MRO 3
NPCC 24
RFC 695
SERC 17
SPP 3
TRE 7
WECC 29
One company contributed to the majority of oil-fired lack of fuel events The units at the company are
actually dual-fuels (oil and gas) but market nominated gas monitoring causes the units to be on forced
outage nightly The units need gas to start up so they can run on oil When they shut down the units must
switch to gas to clean themselves With the gas restriction the unit canrsquot start and the unit goes on a
forced outage Until the band is lifted the two units will continue to be on a forced outage cycle
Event records also provide descriptions of why the unit was without fuel with the majority of descriptions
bull Temperatures affecting gas supply valves
bull Unexpected maintenance of gas pipe-lines
bull Compressor problemsmaintenance
Generation Equipment Performance
58
Table 11 Unit Type Profile of Forced Outages Due to Lack of Fuel
Unit Types Number of Lack of Fuel Problems Reported
Fossil 642
Nuclear 0
Gas Turbines 88
Diesel Engines 1
HydroPumped Storage 0
Combined Cycle 47
Generation Equipment Performance
59
Table 12 Causes of Forced Outage for Different Unit Types (2008-2010)
Fossil - all MW sizes all fuels
Rank Description Occurrence per Unit-year
MWH per Unit-year
Average Hours To Repair
Average Hours Between Failures
Unit-years
1 Waterwall (furnace wall) 0590 134106 59 3250 3868 2 Second Superheater
Leaks 0180 5182 60 3228 3868
3 Lack of Fuel (coal mines gas lines etc) where the operator is not in control
0480 4701 18 26 3868
Combined-Cycle blocks Rank Description Occurrence
per Unit-year
MWH per Unit-year
Average Hours To Repair
Average Hours Between Failures
Unit-years
1 HP Turbine Buckets Or Blades
0020 4663 1830 26280 466
2 Turbine Control Valves 0040 2777 100 7200 466 3 Gas Turbine Compressor -
High Pressure Shaft 0010 2266 663 4269 466
Nuclear units - all Reactor types Rank Description Occurrence
per Unit-year
MWH per Unit-year
Average Hours To Repair
Average Hours Between Failures
Unit-years
1 LP Turbine Buckets or Blades
0010 26415 8760 26280 288
2 Containment Structure 0010 9233 1226 26262 288 3 Feedwater Pump Local
Controls 0020 7620 692 12642 288
Simple-cycle gas turbine jet engines Rank Description Occurrence
per Unit-year
MWH per Unit-year
Average Hours To Repair
Average Hours Between Failures
Unit-years
1 Main Transformer 0030 1611 1016 20709 4181 2 Other Gas Turbine
Controls And Instrument Problems
0120 428 70 2614 4181
3 Other Gas Turbine Problems
0090 400 119 1701 4181
Generation Equipment Performance
60
2008-2010 Review of Summer versus Winter Availability To address seasonality of unit availability unit information for the months of June to September (summer)
and December through February (winter) were pooled to calculate force events during these timeframes for
2008-201039 Figure 32 shows the Equivalent Availability Factor (EAF) is three percentage points higher and
the Equivalent Forced Outage Rate - Demand (EFORd) is more than a half of a percentage point lower in the
summer period than in winter period This means the units were more reliable with less forced events
during high-demand times during the summer than during the winter seasons The generating unitrsquos
capability has a resulting higher Net Capacity Factor (NCF) of 45 percentage points in the summer season
for 2008-2010
During the spring season (March-May) 77 percent of the units took a planned outage (PO) for an average
231 hours (or 96 days) In fall (October-November) only 42 percent of the units experienced a PO and the
average duration was shorter ndash 134 hours (or 56 days) A few units took both spring and fall planned
outages although this is rare Based on this assessment the generating units are prepared for the summer
peak demand The resulting availability indicates that this maintenance was successful which is measured
by an increased EAF and lower EFORd
Figure 32 Summer-Winter Average EAF NCF and EFORd (2008-2010)
Conclusions and Recommendations During 2008-2010 the average Equivalent Availability Factor (EAF) which measures the overall availability
of generating units decreased At the same time the Net Capacity Factor (NCF) an indicator of energy
production increased The average number of forced outages in 2010 is greater than in 2008 while at the
same time the average planned outage times have decreased As a result the Equivalent Forced Outage
Rate ndash Demand (EFORd) also increased illustrating that more units have experienced forced events during
39 A study of peak periods was conducted by the NERC Generating Availability Trend Evaluation (GATE) Working Group several years ago see httpwwwnerccomfilesSeasonal-Performance-Trendspdf
9116
5343
396
8818
4896
441
0 10 20 30 40 50 60 70 80 90 100
EAF
NCF
EFORd
Percent ()
Winter
Summer
Generation Equipment Performance
61
peak-demand times in 2010 than in the previous two years Potentially with shorter planned outage
periods in 2010 there may be less time to repair equipment and prevent forced unit outages
There are warnings that units are not being maintained as well as they should be In the last three years
there has been an increase in Equivalent Forced Outage Rate ndash Demand (EFORd) This indicator measures
the rate of forced outage events on generating units during periods of load demand To confirm this
problem forced outage hours jumped from 270 to 314 hours per unit between 2009 and 2010 At the same
time maintenance events also increased by 12 hours per unit Planned outage events remain constant The
resulting conclusions from this trend are
bull More or longer planned outage time is needed to repair the generating fleet Whether age is the
cause of the increase need for planned outage time remains unknown and further investigation into
the cause for longer planned outage time is necessary
bull More focus on preventive repairs during planned and maintenance events are needed
There are many multiple unit forced outages due to lack of fuel The majority of multiple unit trips have
three main causes transmission lack of fuel and storms With special interest in the forced outages due to
ldquoLack of Fuelrdquo additional analysis revealed that 77 percent of the units experiencing unexpected fuel
stoppage are oil-fired fossil units while gas-fired units experienced 15 percent
Generating units continue to be more reliable during the peak summer periods
Disturbance Event Trends
62
Category 1 An event resulting in one or more of the following a Unintended loss of three or more BPS elements caused by
common mode failure b Failure or misoperation of an SPSRAS c System-wide voltage reduction of 3 or more d Unintended BPS system separation resulting in an island of
100 MW to 999 MW e Unplanned evacuation from a control center facility with BPS
SCADA functionality for 30 minutes or more Category 2 An event resulting in one or more of the following
a Complete loss of all BPS control center voice communication system(s) for 30 minutes or more
b Complete loss of SCADA control or monitoring functionality for 30 minutes or more
c Voltage excursions equal to or greater than 10 lasting more than five minutes
d Loss of off-site power (LOOP) to a nuclear generating station e Unintended system separation resulting in an island of 1000
MW to 4999 MW f Unintended loss of 300MW or more of firm load for more
than 15 minutes g Violation of an Interconnection Reliability Operating Limit
(IROL) for more than 30 minutes Category 3 An event resulting in one or more of the following
a The loss of load or generation of 2000 MW or more in the Eastern Interconnection or
b Western Interconnection or 1000 MW or more in the ERCOT or Queacutebec Interconnections
c Unintended system separation resulting in an island of 5000 MW to 10000 MW
d Unintended system separation resulting in an island of Florida from the Eastern Interconnection
Category 4 An event resulting in one or more of the following a The loss of load or generation from 5001 MW to 9999 MW b Unintended system separation resulting in an island of more
than 10000 MW (with the exception of Florida as described in Category 3c)
Category 5 An event resulting in one or more of the following a The loss of load of 10000 MW or more b The loss of generation of 10000 MW or more
Figure 33 BPS Event Category
Disturbance Event Trends Introduction The purpose of this section is to report event
analysis trends from the beginning of event
analysis field test40
One of the companion goals of the event
analysis program is the identification of trends
in the number magnitude and frequency of
events and their associated causes such as
human error equipment failure protection
system misoperations etc The information
provided in the event analysis database (EADB)
and various event analysis reports have been
used to track and identify trends in BPS events
in conjunction with other databases (TADS
GADS metric and benchmarking database)
to the end of 2010
The Event Analysis Working Group (EAWG)
continuously gathers event data and is moving
toward an integrated approach to analyzing
data assessing trends and communicating the
results to the industry
Performance Trends The event category is classified41
Figure 33
as shown in
with Category 5 being the most
severe Figure 34 depicts disturbance trends in
Category 1 to 5 system events from the
40 httpwwwnerccomdocseawgGalloway-Industry-EA-Field-Test-102210pdf 41httpwwwnerccomfiles2011-05-0220Event_Analysis_Process_Phase20220Field20Test20Draft20-20Final20-20For20postingpdf
Disturbance Event Trends
63
beginning of event analysis field test to the end of 201042
Figure 34 Event Category vs Date for All 2010 Categorized Events
From the figure in November and December
there were many more category 1 and 2 events than in October This is due to the field trial starting on
October 25 2010
In addition to the category of the events the status of the events plays a critical role in the accuracy of the
data By examining Figure 35 over 80 of the events reported in 2010 have been closed This means that
the category root cause and other important information have been sufficiently finalized in order for
analysis to be accurate for each event At this time there is not enough data to draw any long-term
conclusions about event investigation performance
42 Documents for the EA Field Test are located at httpwwwnerccompagephpcid=5|365
2
12 12
26
3
6 5
14
1 1
2
0
5
10
15
20
25
30
35
40
45
October November December 2010
Even
t Cou
nt
Category 3 Category 2 Category 1
Disturbance Event Trends
64
Figure 35 Event Count vs Status (All 2010 Events with Status)
By drilling down into the cause code for each closed 2010 event Figure 36 shows the top 3 event causes
From the figure equipment failure and protection system misoperation are the most significant causes for
events Because of how new and limited the data is however there may not be statistical significance for
this result Further trending of cause codes for closed events and developing a richer dataset to find any
trends between event cause codes and event counts should be performed
Figure 36 Top 3 Event Counts vs DAWG Cause Code for all Closed 2010 Events
10
32
42
0
5
10
15
20
25
30
35
40
45
Open Closed Open and Closed
Even
t Cou
nt
Status
1211
8
0
2
4
6
8
10
12
14
Equipment Failure Protection System Misoperation Human Error
Even
t Cou
nt
Cause Code
Disturbance Event Trends
65
Conclusions Due to the relatively new process for events analysis and categorization more time will be required before a
conclusive recommendation may be obtained Further analysis and new data should provide valuable
statistics in the future Over 80 of all event reports from 2010 are current listed as closed but no
conclusion about investigation performance may be obtained because of the limited amount of data It is
recommended to study ways to prevent equipment failure and protection system misoperations but there
is not enough data to draw a firm conclusion about the top causes of events at this time
Abbreviations Used in This Report
66
Abbreviations Used in This Report
Acronym Definition ALP Acadiana Load Pocket
ALR Adequate Level of Reliability
ARR Automatic Reliability Report
BA Balancing Authority
BPS Bulk Power System
CDI Condition Driven Index
CEII Critical Energy Infrastructure Information
CIPC Critical Infrastructure Protection Committee
CLECO Cleco Power LLC
DADS Future Demand Availability Data System
DCS Disturbance Control Standard
DOE Department Of Energy
DSM Demand Side Management
EA Event Analysis
EAF Equivalent Availability Factor
ECAR East Central Area Reliability
EDI Event Drive Index
EEA Energy Emergency Alert
EFORd Equivalent Forced Outage Rate Demand
EMS Energy Management System
ERCOT Electric Reliability Council of Texas
ERO Electric Reliability Organization
ESAI Energy Security Analysis Inc
FERC Federal Energy Regulatory Commission
FOH Forced Outage Hours
FRCC Florida Reliability Coordinating Council
GADS Generation Availability Data System
GOP Generation Operator
IEEE Institute of Electrical and Electronics Engineers
IESO Independent Electricity System Operator
IROL Interconnection Reliability Operating Limit
Abbreviations Used in This Report
67
Acronym Definition IRI Integrated Reliability Index
LOLE Loss of Load Expectation
LUS Lafayette Utilities System
MAIN Mid-America Interconnected Network Inc
MAPP Mid-continent Area Power Pool
MOH Maintenance Outage Hours
MRO Midwest Reliability Organization
MSSC Most Severe Single Contingency
NCF Net Capacity Factor
NEAT NERC Event Analysis Tool
NERC North American Electric Reliability Corporation
NPCC Northeast Power Coordinating Council
OC Operating Committee
OL Operating Limit
OP Operating Procedures
ORS Operating Reliability Subcommittee
PC Planning Committee
PO Planned Outage
POH Planned Outage Hours
RAPA Reliability Assessment Performance Analysis
RAS Remedial Action Schemes
RC Reliability Coordinator
RCIS Reliability Coordination Information System
RCWG Reliability Coordinator Working Group
RE Regional Entities
RFC Reliability First Corporation
RMWG Reliability Metrics Working Group
RSG Reserve Sharing Group
SAIDI System Average Interruption Duration Index
SAIFI System Average Interruption Frequency Index
SCADA Supervisory Control and Data Acquisition
SDI Standardstatute Driven Index
SERC SERC Reliability Corporation
Abbreviations Used in This Report
68
Acronym Definition SRI Severity Risk Index
SMART Specific Measurable Attainable Relevant and Tangible
SOL System Operating Limit
SPS Special Protection Schemes
SPCS System Protection and Control Subcommittee
SPP Southwest Power Pool
SRI System Risk Index
TADS Transmission Availability Data System
TADSWG Transmission Availability Data System Working Group
TO Transmission Owner
TOP Transmission Operator
WECC Western Electricity Coordinating Council
Contributions
69
Contributions This report was made feasible by the collaboration and hard work of both NERC staff and NERCrsquos
Industry Groups
NERC Industry Groups
Table 14 lists the NERC industry group contributors Without their contribution and collaboration this
report would not have been possible
Table 13 NERC Industry Group Contributions43
NERC Group
Relationship Contribution
Reliability Metrics Working Group
(RMWG)
Reports to the OCPC bull Lead Development of Report bull Provide Reliability Metrics Data bull Responsible for Reliability Metrics
Performance Chapter
Transmission Availability Working Group
(TADSWG)
Reports to the OCPC bull Provide Transmission Availability Data
bull Responsible for Transmission Equip-ment Performance Chapter
bull Content Review
Generation Availability Data System Task
Force
(GADSTF)
Reports to the OCPC bull Provide Generation Availability Data bull Responsible for Generation Equip-
ment Performance Chapter bull Content Review
Event Analysis Working Group
(EAWG)
Reports to the OCPC bull Provide Events Data bull Responsible for Disturbance Events
Trends Chapter bull Content Review
43 Rosters for RMWG TADSWG GADSTF and EAWG are available at httpwwwnerccomfilesrosterpdf
Contributions
70
NERC Staff Table 13 below lists the NERC staff who contributed to the 2011 Reliability Performance Analysis
Report
Table 14 Contributing NERC Staff
Name Title E-mail Address
Mark Lauby Vice President and Director of
Reliability Assessment and
Performance Analysis
marklaubynercnet
Jessica Bian Manager of Performance Analysis jessicabiannercnet
John Moura Manager of Reliability Assessments johnmouranercnet
Andrew Slone Engineer Reliability Performance
Analysis
andrewslonenercnet
Jim Robinson TADS Project Manager jimrobinsonnercnet
Clyde Melton Engineer Reliability Performance
Analysis
clydemeltonnercnet
Mike Curley Manager of GADS Services mikecurleynercnet
James Powell Engineer Reliability Performance
Analysis
jamespowellnercnet
Michelle Marx Administrative Assistant michellemarxnercnet
William Mo Intern Performance Analysis wmonercnet
- NERCrsquos Mission
- Table of Contents
- Executive Summary
-
- 2011 Transition Report
- State of Reliability Report
- Key Findings and Recommendations
-
- Reliability Metric Performance
- Transmission Availability Performance
- Generating Availability Performance
- Disturbance Events
- Report Organization
-
- Introduction
-
- Metric Report Evolution
- Roadmap for the Future
-
- Reliability Metrics Performance
-
- Introduction
- 2010 Performance Metrics Results and Trends
-
- ALR1-3 Planning Reserve Margin
-
- Background
- Assessment
- Special Considerations
-
- ALR1-4 BPS Transmission Related Events Resulting in Loss of Load
-
- Background
- Assessment
-
- ALR1-12 Interconnection Frequency Response
-
- Background
- Assessment
-
- ALR2-3 Activation of Under Frequency Load Shedding
-
- Background
- Assessment
- Special Considerations
-
- ALR2-4 Average Percent Non-Recovery Disturbance Control Standards (DCS)
-
- Background
- Assessment
- Special Consideration
-
- ALR2-5 Disturbance Control Events Greater Than Most Severe Single Contingency
-
- Background
- Assessment
- Special Consideration
-
- ALR 1-5 System Voltage Performance
-
- Background
- Special Considerations
- Status
-
- ALR3-5 Interconnection Reliability Operating Limit System Operating Limit (IROLSOL) Exceedances
-
- Background
-
- ALR4-1 Automatic Transmission Outages Caused by Protection System Misoperations
-
- Background
- Special Considerations
-
- ALR6-11 ndash ALR6-14
-
- Background
- Assessment
- ALR 6-11 ndash Automatic Outages Initiated by Failed Protection System Equipment
- ALR6-12 ndash Automatic Outages Initiated by Human Error
- ALR6-13 ndash Automatic Outages Initiated by Failed AC Substation Equipment
- ALR6-14 Automatic AC Transmission Outages Initiated by Failed AC Circuit Equipment
-
- ALR6-15 Element Availability Percentage (APC)
-
- Background
- Assessment
- Special Consideration
-
- ALR6-16 Transmission System Unavailability
-
- Background
- Assessment
- Special Consideration
-
- ALR6-2 Energy Emergency Alert 3 (EEA3)
-
- Background
- Assessment
- Special Considerations
-
- ALR 6-3 Energy Emergency Alert 2 (EEA2)
-
- Background
- Assessment
- Special Considerations
-
- ALR 6-1 Transmission Constraint Mitigation
-
- Background
- Assessment
- Special Considerations
-
- Integrated Bulk Power System Risk Assessment
-
- Introduction
- Recommendations
-
- Integrated Reliability Index Concepts
-
- The Three Components of the IRI
-
- Event-Driven Indicators (EDI)
- Condition-Driven Indicators (CDI)
- StandardsStatute-Driven Indicators (SDI)
-
- IRI Index Calculation
- IRI Recommendations
-
- Reliability Metrics Conclusions and Recommendations
-
- Transmission Equipment Performance
-
- Introduction
- Performance Trends
-
- AC Element Outage Summary and Leading Causes
- Transmission Monthly Outages
- Outage Initiation Location
- Transmission Outage Events
- Transmission Outage Mode
-
- Conclusions
-
- Generation Equipment Performance
-
- Introduction
- Generation Key Performance Indicators
-
- Multiple Unit Forced Outages and Causes
- 2008-2010 Review of Summer versus Winter Availability
-
- Conclusions and Recommendations
-
- Disturbance Event Trends
-
- Introduction
- Performance Trends
- Conclusions
-
- Abbreviations Used in This Report
- Contributions
-
- NERC Industry Groups
- NERC Staff
-
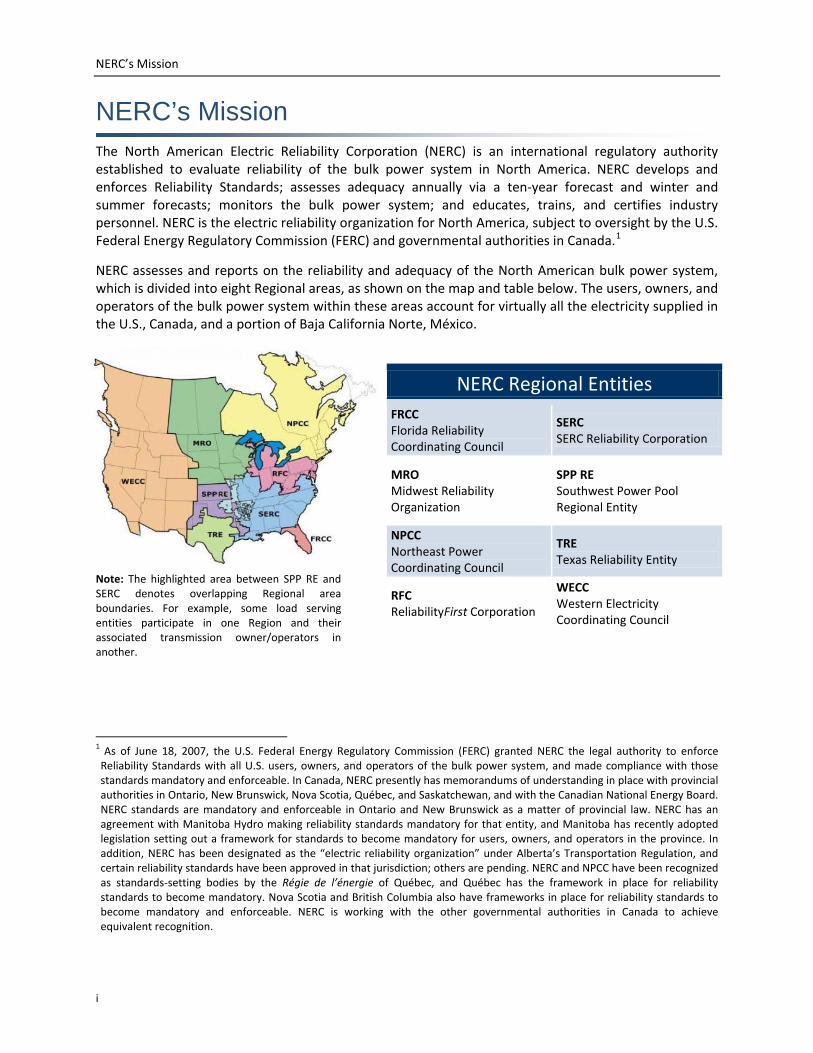
Executive Summary
3
Executive Summary 2011 Transition Report The 2011 Reliability Performance Analysis Report provides a view of North American bulk power system
historic reliability performance It integrates many efforts under way to offer technical analysis and
feedback on reliability trends to stakeholders regulators policymakers and industry The joint report
development was led by NERC staff in collaboration with several groups independently analyzing various
aspects of bulk power system reliability including the Reliability Metrics Working Group (RMWG) the
Transmission Availability Data System Working Group (TADSWG) Generating Availability Data System
Task Force (GADSTF) and Event Analysis Working Group (EAWG)
Since its inaugural report2
State of Reliability Report
the RMWG has advanced the development of reliability metrics that
demonstrate performance of the bulk power system As this work proceeds industry continues to
investigate areas which enhance the understanding of system reliability Other committees working
groups and task forces in addition to NERC staff are undertaking additional reliability analysis of the
system These efforts have resulted in an evolving body of work which far transcends that originally
produced in the first annual RMWG report
The 2011 Reliability Performance Analysis Report begins a transition from the 2009 metric performance
assessment to a ldquoState of Reliabilityrdquo report This transition is expected to evolve as more data becomes
available and understanding of the data and trends matures The annual State of Reliability report will
ultimately communicate the effectiveness of ERO (Electric Reliability Organization) reliability programs
and present an overall view of reliability performance
By addressing the key measurable components of bulk power system reliability the State of Reliability
report will help quantify the achievement of reliability goals Also the report will act as a foundation to
bring collaborative work together within the ERO to streamline reporting needs of multiple technical
groups and efficiently accelerate data and information transparency The key findings and
recommendations are envision to be used as input to NERCrsquos Reliability Standards and project
prioritization compliance process improvement event analysis reliability assessment and critical
infrastructure protection areas
2 httpwwwnerccomdocspcrmwgRMWG_Metric_Report-09-08-09pdf
Executive Summary
4
Key Findings and Recommendations
Reliability Metric Performance Among the Operating Committeersquos and Planning Committeersquos approved eighteen metrics that address
the characteristics of an adequate level of reliability (ALR) based on metric trends in the following seven
areas indicate the bulk power system is performing better during the time frame investigated
bull ALR1-3 Planning Reserve Margin
bull ALR1-4 BPS Transmission Related Events Resulting in Loss of Load
bull ALR2-5 Disturbance Control Events Greater than Most Severe Single Contingency
bull ALR6-2 Energy Emergency Alert 3 (EEA3)
bull ALR6-3 Energy Emergency Alert 2 (EEA2)
bull ALR6-11 Automatic Transmission Outages Caused by Protection System Misoperations
bull ALR6-13 Automatic Transmission Outages Caused by Failed AC Substation Equipment
Performance analysis has also included other performance categories though a number of the metrics
did not currently have sufficient data to derive useful conclusions The RMWG recommends their
continued data collection and review If a metric does not yield any useful trends in a five-year
reporting period the metric will be modified or withdrawn
Transmission Availability Performance On a NERC-wide average basis the automatic transmission outage rate has improved during the study
timeframe (2008 to 2010) Considering both automatic and non-automatic outages 2010 records
indicate transmission element availability percentage exceeds 95
A deeper review of the root causes of dependent and common mode events which include three or
more automatic outages should be a high priority for NERC and the industry The TADSWG
recommends a joint team be formed to analyze those outages as the effort requires significant
stakeholder subject matter experts with the support of reporting transmission owners
Generating Availability Performance The generating fleet in North America is continuing to age The average age of all unit types was slightly
over 32 years in 2010 while at the same time the coal-fired fleet averages over 44 years old Based on
the data all units appear to require maintenance with increasing regularity to meet unit availability
goals
In the last three years the Equivalent Forced Outage Rate ndash Demand (EFORd) increased indicating a
higher risk that a unit may not be available to meet generating requirements due to forced outages or
de-ratings The average forced outage hours for each unit have jumped from 270 hours to 314 hours
Executive Summary
5
between 2009 and 2010 During the same period the average maintenance hours also increased by 12
hours per unit translating to longer planned outage time More focus on preventive maintenance
during planned or maintenance outages may be needed
The three leading root causes for multiple unit forced trips are transmission outages lack of fuel and
storms Among reported lack of fuel outage events 78 percent of the units are oil-fired and 15 percent
are gas fired To reduce the number of fuel-related outages the GADSTF recommends performing more
detailed analysis and higher visibility to this risk type
Disturbance Events One of most important bulk power system performance measures is the number of significant
disturbance events and their impact on system reliability Since the event analysis field test commenced
in October 2010 a total of 42 events within five categories were reported through the end of 2010
Equipment failure is the number one cause out of the event analyses completed from 2010 This
suggests that a task force be formed to identify the type of equipment and reasons for failure The
information provided in event analysis reports in conjunction with other databases (TADS GADS
metrics database etc) should be used to track and evaluate trends in disturbance events
Report Organization This transitional report is intended to function as an anthology of bulk power system performance
assessments Following the introductory chapter the second chapter details results for 2010 RMWG
approved performance metrics and lays out methods for integrating the variety of risks into an
integrated risk index This chapter also addresses concepts for measuring bulk power system events
The third chapter outlines transmission system performance results that the TADSWG have endorsed
using the three-year history of TADS data Reviewed by the GADSTF the forth chapter provides an
overview of generating availability trends for 72 percent of generators in North America The fifth
chapter provides a brief summary of reported disturbances based on event categories described in the
EAWGrsquos enhanced event analysis field test process document3
3 httpwwwnerccomdocseawgEvent_Analysis_Process_Field_test_DRAFT_102510-Cleanpdf
Introduction
6
Figure 1 State of Reliability Concepts
Introduction Metric Report Evolution The NERC Reliability Metrics Working Group (RMWG) has come a long way from its formation following
the release of the initial reliability metric whitepaper in December 2007 Since that time the RMWG has
built the foundation of a metrics development process with the use of SMART ratings (Specific
Measurable Attainable Relevant and Tangible) in its 2009 report4
The first annual report published in June 2010
provided an overview and review of the first
seven metrics which were approved in the
2009 foundational report In August 2010 the
RMWG released its
expanding the approved metrics to
18 metrics and identifying the need for additional data by issuing a data request for ALR3-5 This
annual report is a testament to the evolution of the metrics from the first release to what it is today
Integrated Bulk Power
System Risk Assessment Concepts paper5
Based on the work done by the RMWG in 2010 NERCrsquos OCPC amended the grouprsquos scope directing the
RMWG to ldquodevelop a method that will provide an integrated reliability assessment of the bulk power
system performance using metric information and trendsrdquo This yearrsquos report builds on the work
undertaken by the RMWG over the past three years and moving further towards establishing a single
Integrated Reliability Index (IRI) covering three components event driven index (EDI) condition driven
introducing the ldquouniverse of riskrdquo to the bulk
power system In the concepts paper the
RMWG introduced a method to assess ldquoevent-
drivenrdquo risks and established a measure of
Severity Risk Index (SRI) to better quantify the
impact of various events of the bulk power
system The concepts paper was subsequently
endorsed by NERCrsquos Operating (OC) and
Planning Committees (PC) The SRI calculation
was further refined and then approved by NERCrsquos OCPC at their March 8-9 2011 meeting
4 2009 Bulk Power System Reliability Performance Metric Recommendations can be found at
httpwwwnerccomdocspcrmwgRMWG_Metric_Report-09-08-09pdf 5 httpwwwnerccomdocspcrmwgIntegrated_Bulk_Power_System_Risk_Assessment_Concepts_Finalpdf
Event Driven Index (EDI)
Indicates Risk from Major System Events
Standards Statute Driven
Index (SDI)
Indicates Risks from Severe
Impact Standard Violations
Condition Driven Index (CDI)
Indicates Risk from Key Reliability
Indicators
Introduction
7
Figure 2 Data Source Integration and Analysis
index (CDI) and standardsstatute driven index (SDI) as shown in Figure 1 These individual
components will be used to develop a reliability index that will assist industry in assessing its current
state of reliability This is an ambitious undertaking and it will continue to evolve as an understanding
of what factors contribute to or indicate the level of reliability develops As such this report will evolve
in the coming years as expanding the work with SRI will provide further analysis of the approved
reliability metrics and establish the cornerstones for developing an IRI The cornerstones are described
in section three with recommendations for next steps to better refine and weigh the components of the
IRI and how its use to establish a ldquoState of Reliabilityrdquo for the bulk power system in North America
For this work to be effective and useful to industry and other stakeholders it must use existing data
sources align with other industry analyses and integrate with other initiatives as shown in Figure 2
NERCrsquos various data resources are introduced in this report Transmission Availability Data System
(TADS) Generation Availability Data System (GADS) the event analysis database and future Demand
Availability Data System (DADS)6
The RMWG embraces an open
development process while
incorporating continuous improve-
ment through leveraging industry
expertise and technical judgment
As new data becomes available
more concrete conclusions from the
reliability metrics will be drawn and
recommendations for reliability
standards and compliance practices
will be developed for industryrsquos
consideration
When developing the IRI the experience gained will be leveraged in developing the Severity Risk Index
(SRI) This evolution will take time and the first assessment of ongoing reliability with an integrated
reliability index is expected in the 2012 Annual Report The goal is not only to measure performance
but to highlight areas for improvement as well as reinforcing and measuring industry success As this
integrated view of reliability is developed the individual quarterly performance metrics will be updated
as illustrated in Figure 3 on a new Reliability Indicators dashboard at NERCrsquos website7
6 DADS will begin mandatory data collection from April 2011 through October 2011 with data due on December 15 2011
The RMWG will
7 Reliability Indicatorsrsquo dashboard is available at httpwwwnerccompagephpcid=4|331
Introduction
8
keep the industry informed by conducting yearly webinars providing quarterly data updates and
publishing its annual report
Figure 3 NERC Reliability Indicators Dashboard
Roadmap for the Future As shown in Figure 4 the 2011 Reliability Performance Analysis report begins a transition from a 2009
metric performance assessment to a ldquoState of Reliabilityrdquo report by collaborating with other groups to
form a unified approach to historical reliability performance analysis This process will require
engagement with a number of NERC industry experts to paint a broad picture of the bulk power
systemrsquos historic reliability
Alignment to other industry reports is also important Analysis from the frequency response performed
by the Resources Subcommittee (RS) physical and cyber security assessment provided by the Critical
Infrastructure Protection Committee (CIPC) the wide area reliability coordination conducted by the
Reliability Coordinator Working Group (RCWG) the spare equipment availability system enhanced by
the Spare Equipment Database Task Force (SEDTF) the post seasonal assessment developed by the
Reliability Assessment Subcommittee (RAS) and demand response deployment summarized by the
Demand Response Data Task Force (DRDTF) will provide a significant foundation from which this report
draws Collaboration derived from these stakeholder groups further refines the metrics and use of
additional datasets will broaden the industryrsquos tool-chest for improving reliability of the bulk power
system
The annual State of Reliability report is aimed to communicate the effectiveness of ERO (Electric
Reliability Organization) by presenting an integrated view of historic reliability performance The report
will provide a platform for sound technical analysis and a way to provide feedback on reliability trends
to stakeholders regulators policymakers and industry The key findings and recommendations will
Introduction
9
ultimately be used as input to standards changes and project prioritization compliance process
improvement event analysis and critical infrastructure protection areas
Figure 4 Overview of the Transition to the 2012 State of Reliability Report
Reliability Metrics Performance
10
Reliability Metrics Performance Introduction Building upon last yearrsquos metric review the RMWG continues to assess the results of eighteen currently
approved performance metrics Due to data availability each of the performance metrics do not
address the same time periods (some metrics have just been established while others have data over
many years) though this will be an important improvement in the future Merit has been found in all
eighteen approved metrics At this time though the number of metrics is expected to will remain
constant however other metrics may supplant existing metrics In spite of the potentially changing mix
of approved metrics to goals is to ensure the historical and current assessments can still be performed
These metrics exist within an overall reliability framework and in total the performance metrics being
considered address the fundamental characteristics of an acceptable level of reliability (ALR) Each of
the elements being measured by the metrics should be considered in aggregate when making an
assessment of the reliability of the bulk power system with no single metric indicating exceptional or
poor performance of the power system
Due to regional differences (size of the region operating practices etc) comparing the performance of
one Region to another would be erroneous and inappropriate Furthermore depending on the region
being evaluated one metric may be more relevant to a specific regionrsquos performance than others and
assessment may not be strictly mathematical rather more subjective Finally choosing one regionrsquos
best metric performance to define targets for other regions is inappropriate
Another key principle followed in developing these metrics is to retain anonymity of any reporting
organization Thus granularity will be attempted up to the point that such actions might compromise
anonymity of any given company Certain reporting entities may appear inconsistent but they have
been preserved to maintain maximum granularity with individual anonymity
Although assessments have been made in a number of the performance categories others do not have
sufficient data to derive any conclusions from the metric results The RMWG recommends continued
assessment of these metrics until sufficient data is available Each of the eighteen performance metrics
are presented in summary with their SMART8 Table 1 ratings in The table provides a summary view of
the metrics with an assessment of the current metric trends observed by the RMWG Table 1 also
shows the order in which the metrics are aligned according to the standards objectives
8 SMART rating definitions are located at httpwwwnerccomdocspcrmwgSMART_20RATING_826pdf
Reliability Metrics Performance
11
Table 1 Metric SMART Ratings Relative to Standard Objectives
Metrics SMART Objectives Relative to Standards Prioritization
ALR Improvements
Trend
Rating
SMART
Rating
1-3 Planning Reserve Margin 13
1-4 BPS Transmission Related Events Resulting in Loss of Load 15
2-5 Disturbance Control Events Greater than Most Severe Single Contingency 12
6-2 Energy Emergency Alert 3 (EEA3) 15
6-3 Energy Emergency Alert 2 (EEA2) 15
Inconclusive
2-3 Activation of Under Frequency Load Shedding 10
2-4 Average Percent Non-Recovery DCS 15
4-1 Automatic Transmission Outages Caused by Protection System Misoperation 15
6-11 Automatic Transmission Outages Caused by Protection System Misoperation 14
6-12 Automatic Transmission Outages Caused by Human Error 14
6-13 Automatic Transmission Outages Caused by Failed AC Substation Equipment 14
6-14 Automatic Transmission Outages Caused by Failed AC Circuit Equipment 14
New Data
1-5 Systems Voltage Performance 14
3-5
Interconnected Reliability Operating Limit System Operating Limit (IROLSOL)
Exceedance 14
6-1 Transmission constraint Mitigation 14
6-15 Element Availability Percentage (APC) 13
6-16
Transmission System Unavailability on Operational Planned and Auto
Sustained Outages 13
No Data
1-12 Frequency Response 11
Trend Rating Symbols
Significant Improvement
Slight Improvement
Inconclusive
Slight Deterioration
Significant Deterioration
New Data
No Data
Reliability Metrics Performance
12
2010 Performance Metrics Results and Trends
ALR1-3 Planning Reserve Margin
Background
The Planning Reserve Margin9 is a measure of the relationship between the amount of resource capacity
forecast and the expected demand in the planning horizon10 Coupled with probabilistic analysis
calculated Planning Reserve Margins is an industry standard which has been used by system planners for
decades as an indication of system resource adequacy Generally the projected demand is based on a
5050 forecast11
Assessment
Planning Reserve Margin is the difference between forecast capacity and projected
peak demand normalized by projected peak demand and shown as a percentage Based on experience
for portions of the bulk power system that are not energy-constrained Planning Reserve Margin
indicates the amount of capacity available to maintain reliable operation while meeting unforeseen
increases in demand (eg extreme weather) and unexpected unavailability of existing capacity (eg
long-term generation outages) Further from a planning perspective Planning Reserve Margin trends
identify whether capacity additions are projected to keep pace with demand growth
Planning Reserve Margins considering anticipated capacity resources and adjusted potential capacity
resources decrease in the latter years of the 2009 and 2010 10-year forecast in each of the four
interconnections Typically the early years provide more certainty since new generation is either in
service or under construction with firm commitments In the later years there is less certainty about
the resources that will be needed to meet peak demand Declining Planning Reserve Margins are
inherent in a conventional forecast (assuming load growth) and do not necessarily indicate a trend of a
degrading resource adequacy Rather they are an indication of the potential need for additional
resources In addition key observations can be made to the Planning Reserve Margin forecast such as
short-term assessment rate of change through the assessment period identification of margins that are
approaching or below a target requirement and comparisons from year-to-year forecasts
While resource planners are able to forecast the need for resources the type of resource that will
actually be built or acquired to fill the need is usually unknown For example in the northeast US
markets with three to five year forward capacity markets no firm commitments can be made in the
9 Detailed calculations of Planning Reserve Margin are available at httpwwwnerccompagephpcid=4|331|333 10The Planning Reserve Margin indicated here is not the same as an operating reserve margin that system operators use for near-term
operations decisions 11These demand forecasts are based on ldquo5050rdquo or median weather (a 50 percent chance of the weather being warmer and a 50 percent
chance of the weather being cooler)
Reliability Metrics Performance
13
long-term However resource planners do recognize the need for resources in their long-term planning
and account for these resources through generator queues These queues are then adjusted to reflect
an adjusted forecast of resourcesmdashpro-rated by approximately 20 percent
When comparing the assessment of planning reserve margins between 2009 and 2010 the
interconnection Planning Reserve Margins are slightly higher on an annual basis in the 2010 forecast
compared to those of 2009 as shown in Figure 5
Figure 5 Planning Reserve Margin by Interconnection and Year
In general this is due to slightly higher capacity forecasts and slightly lower demand forecasts The pace
of any economic recovery will affect future comparisons This metric can be used by NERC to assess the
individual interconnections in the ten-year long-term reliability assessments If a noticeable change
Reliability Metrics Performance
14
occurs within the trend further investigation is necessary to determine the causes and likely effects on
reliability
Special Considerations
The Planning Reserve Margin is a capacity based metric Therefore it does not provide an accurate
assessment of performance in energy-limited systems (eg hydro capacity with limited water resources
or systems with significant variable generation penetration) In addition the Planning Reserve Margin
does not reflect potential transmission constraint internal to the respective interconnection Planning
Reserve Margin data shown in Figure 6 is used for NERCrsquos seasonal and long-term reliability
assessments and is the primary metric for determining the resource adequacy of a given assessment
area
The North American Bulk Power System is divided into four distinct interconnections These
interconnections are loosely connected with limited ability to share capacity or energy across the
interconnection To reflect this limitation the Planning Reserve Margins are calculated in this report
based on interconnection values rather than by national boundaries as is the practice of the Reliability
Assessment Subcommittee (RAS)
ALR1-4 BPS Transmission Related Events Resulting in Loss of Load
Background
This metric measures bulk power system transmission-related events resulting in the loss of load
Planners and operators can use this metric to validate their design and operating criteria by identifying
the number of instances when loss of load occurs
For the purposes of this metric an ldquoeventrdquo is an unplanned transmission disturbance that produces an
abnormal system condition due to equipment failures or system operational actions and results in the
loss of firm system demand for more than 15 minutes The reporting criteria for such events are
outlined below12
bull Entities with a previous year recorded peak demand of more than 3000 MW are required to
report all such losses of firm demands totaling more than 300 MW
bull All other entities are required to report all such losses of firm demands totaling more than 200
MW or 50 percent of the total customers being supplied immediately prior to the incident
whichever is less
bull Firm load shedding of 100 MW or more used to maintain the continuity of the bulk power
system reliability
12 Details of event definitions are available at httpwwwnerccomfilesEOP-004-1pdf
Reliability Metrics Performance
15
Assessment
Figure 6 illustrates that the number of bulk power system transmission-related events resulting in loss of
firm load13
Table 2
from 2002 to 2009 is relatively constant and suggests that 7 - 10 events per year is a norm for
the bulk power system However the magnitude of load loss shown in associated with these
events reflects a downward trend since 2007 Since the data includes weather-related events it will
provide the RMWG with an opportunity for further analysis and continued assessment of the trends
over time is recommended
Figure 6 BPS Transmission Related Events Resulting in Loss of Load Counts (2002-2009)
Table 2 BPS Transmission Related Events Resulting in Loss of Load MW Loss (2002-2009)
Year Load Loss (MW)
2002 3762
2003 65263
2004 2578
2005 6720
2006 4871
2007 11282
2008 5200
2009 2965
13The metric source data may require adjustments to accommodate all of the different groups for measurement and consistency as OE-417 is only used in the US
02468
101214
2002 2003 2004 2005 2006 2007 2008 2009
Count
Reliability Metrics Performance
16
ALR1-12 Interconnection Frequency Response
Background
This metric is used to track and monitor Interconnection Frequency Response Frequency Response is a
measure of an Interconnectionrsquos ability to stabilize frequency immediately following the sudden loss of
generation or load It is a critical component to the reliable operation of the bulk power system
particularly during disturbances and restoration The metric measures the average frequency responses
for all events where frequency drops more than 35 mHz within a year
Assessment
At this time there has been no data collected for ALR1-12 Therefore no assessment was made
ALR2-3 Activation of Under Frequency Load Shedding
Background
The purpose of Under Frequency Load Shedding (UFLS) is to balance generation and load in an island
following an extreme event The UFLS activation metric measures the number of times UFLS is activated
and the total MW of load interrupted in each Region and NERC wide
Assessment
Figure 7 and Table 3 illustrate a history of Under Frequency Load Shedding events from 2006 through
2010 Through this period itrsquos important to note that single events had a range load shedding from 15
MW to 7654 MW The activation of UFLS relays is the last automated reliability measure associated
with a decline in frequency in order to rebalance the system Further assessment of the MW loss for
these activations is recommended
Figure 7 ALR2-3 Count of Activations by Year and Regional Entity (2001-2010)
Reliability Metrics Performance
17
Table 3 ALR2-3 Under Frequency Load Shedding MW Loss
ALR2-3 Under Frequency Load Shedding MW Loss
2006 2007 2008 2009 2010
FRCC
2273
MRO
486
NPCC 94
63 20 25
RFC
SPP
672 15
SERC
ERCOT
WECC
Special Considerations
The use of a single metric cannot capture all of the relevant information associated with UFLS events as
the events relate to each respective UFLS plan The ability to measure the reliability of the bulk power
system is directly associated with how it performs compared to what is planned
ALR2-4 Average Percent Non-Recovery Disturbance Control Standards (DCS)
Background
This metric measures the Balancing Authorityrsquos (BA) or Reserve Sharing Grouprsquos (RSG) ability to balance
resources and demand with the timely deployment of contingency reserve thereby returning the
interconnection frequency to within defined limits following a Reportable Disturbance14
Assessment
The relative
percentage provides an indication of performance measured at a BA or RSG
Figure 8 illustrates the average percent non-recovery of DCS events from 2006 to 2010 The graph
provides a high-level indication of the performance of each respective RE However a single event may
not reflect all the reliability issues within a given RE In order to understand the reliability aspects it
may be necessary to request individual REs to further investigate and provide a more comprehensive
reliability report Further investigation may indicate the entity had sufficient contingency reserve but
through their implementation process failed to meet DCS recovery
14 Details of the Disturbance Control Performance Standard and Reportable Disturbance definitions are available at
httpwwwnerccomfilesBAL-002-0pdf
Reliability Metrics Performance
18
Continued trend assessment is recommended Where trends indicated potential issues the regional
entity will be requested to investigate and report their findings
Figure 8 Average Percent Non-Recovery of DCS Events (2006-2010)
Special Consideration
This metric aggregates the number of events based on reporting from individual Balancing Authorities or
Reserve Sharing Groups It does not capture the severity of the DCS events It should be noted that
most REs use 80 percent of the Most Severe Single Contingency to establish the minimum threshold for
reportable disturbance while others use 35 percent15
ALR2-5 Disturbance Control Events Greater Than Most Severe Single Contingency
Background
This metric represents the number of disturbance events that exceed the Most Severe Single
Contingency (MSSC) and is specific to each BA Each RE reports disturbances greater than the MSSC on
behalf of the BA or Reserve Sharing Group (RSG) The result helps validate current contingency reserve
requirements The MSSC is determined based on the specific configuration of each BA or RSG and can
vary in significance and impact on the BPS
15httpwwwweccbizStandardsDevelopmentListsRequest20FormDispFormaspxID=69ampSource=StandardsDevelopmentPagesWEC
CStandardsArchiveaspx
375
079
0
54
008
005
0
15 0
77
025
0
33
000510152025303540
2006
2007
2008
2009
2010
2006
2007
2008
2009
2010
2006
2007
2008
2009
2010
2006
2007
2008
2009
2010
2006
2007
2008
2009
2010
2006
2007
2008
2009
2010
2006
2007
2008
2009
2010
2006
2007
2008
2009
2010
FRCC MRO NPCC RFC SERC SPP ERCOT WECC
Region and Year
Reliability Metrics Performance
19
Assessment
Figure 9 represents the number of DCS events within each RE that are greater than the MSSC from 2006
to 2010 This metric and resulting trend can provide insight regarding the risk of events greater than
MSSC and the potential for loss of load
In 2010 SERC had 16 BAL-002 reporting entities eight Balancing Areas elected to maintain Contingency
Reserve levels independent of any reserve sharing group These 16 entities experienced 79 reportable
DCS eventsmdash32 (or 405 percent) of which were categorized as greater than their most severe single
contingency Every DCS event categorized as greater than the most severe single contingency occurred
within a Balancing Area maintaining independent Contingency Reserve levels Significantly all 79
regional entities reported compliance with the Disturbance Recovery Criterion including for those
Disturbances that were considered greater than their most severe single Contingency This supports a
conclusion that regardless of the size of the BA or participation in a Reserve Sharing Group SERCrsquos BAL-
002 reporting entities have demonstrated the ability in 2010 to use Contingency Reserve to balance
resources and demand and return Interconnection frequency within defined limits following Reportable
Disturbances
If the SERC Balancing Areas without large generating units and who do not participate in a Reserve
Sharing Group change the determination of their most severe single contingencies to effect an increase
in the DCS reporting threshold (and concurrently the threshold for determining those disturbances
which are greater than the most severe single contingency) there will certainly be a reduction in both
the gross count of DCS events in SERC and in the subset considered under ALR2-5 Masking the discrete
events which cause Balancing Area response may not reduce ldquoriskrdquo to the system However it is
desirable to maintain a reporting threshold which encourages the Balancing Authority to respond to any
unexplained change in ACE in a manner which supports Interconnection frequency based on
demonstrated performance SERC will continue to monitor DCS performance and will continue to
evaluate contingency reserve requirements but does not consider 2010 ALR2-5 performance to be an
adverse trend in ldquoextreme or unusualrdquo contingencies but rather within the normal range of expected
occurrences
Reliability Metrics Performance
20
Special Consideration
The metric reports the number of DCS events greater than MSSC without regards to the size of a BA or
RSG and without respect to the number of reporting entities within a given RE Because of the potential
for differences in the magnitude of MSSC and the resultant frequency of events trending should be
within each RE to provide any potential reliability indicators Each RE should investigate to determine
the cause and relative effect on reliability of the events within their footprints Small BA or RSG may
have a relatively small value of MSSC As such a high number of DCS greater than MCCS may not
indicate a reliability problem for the reporting RE but may indicate an issue for the respective BA or RSG
In addition events greater than MSSC may not cause a reliability issue for some BA RSG or RE if they
have more stringent standards which require contingency reserves greater than MSSC
ALR 1-5 System Voltage Performance
Background
The purpose of this metric is to measure the transmission system voltage performance (either absolute
or per unit of a nominal value) over time This should provide an indication of the reactive capability
available to the transmission system The metric is intended to record the amount of time that system
voltage is outside a predetermined band around nominal
0
5
10
15
20
25
30
2006
2007
2008
2009
2010
2006
2007
2008
2009
2010
2006
2007
2008
2009
2010
2006
2007
2008
2009
2010
2006
2007
2008
2009
2010
2006
2007
2008
2009
2010
2006
2007
2008
2009
2010
2006
2007
2008
2009
2010
FRCC MRO NPCC RFC SERC SPP ERCOT WECC
Cou
nt
Region and Year
Figure 9 Disturbance Control Events Greater Than Most Severe Single Contingency (2006-2010)
Reliability Metrics Performance
21
Special Considerations
Each Reliability Coordinator (RC) will work with the Transmission Owners (TOs) and Transmission
Operators (TOPs) within its footprint to identify specific buses and voltage ranges to monitor for this
metric The number of buses the monitored voltage levels and the acceptable voltage ranges may vary
by reporting entity
Status
With a pilot program requested in early 2011 a voluntary request to Reliability Coordinators (RC) was
made to develop a list of key buses This work continues with all of the RCs and their respective
Transmission Owners (TOs) to gather the list of key buses and their voltage ranges After this step has
been completed the TO will be requested to provide relevant data on key buses only Based upon the
usefulness of the data collected in the pilot program additional data collection will be reviewed in the
future
ALR3-5 Interconnection Reliability Operating Limit System Operating Limit (IROLSOL) Exceedances
Background
This metric illustrates the number of times that defined Interconnection Reliability Operating Limit
(IROL) or System Operating Limit (SOL) were exceeded and the duration of these events Exceeding
IROLSOLs could lead to outages if prompt operator control actions are not taken in a timely manner to
return the system to within normal operating limits This metric was approved by NERCrsquos Operating and
Planning Committees in June 2010 and a data request was subsequently issued in August 2010 to collect
the data for this metric Based on the results of the pilot conducted in the third and fourth quarter of
2010 there is merit in continuing measurement of this metric Note the reporting of IROLSOL
exceedances became mandatory in 2011 and data collected in Table 4 for 2010 has been provided
voluntarily
Reliability Metrics Performance
22
Table 4 ALR3-5 IROLSOL Exceedances
3Q2010 4Q2010 1Q2011
le 10 mins 123 226 124
le 20 mins 10 36 12
le 30 mins 3 7 3
gt 30 mins 0 1 0
Number of Reporting RCs 9 10 15
ALR4-1 Automatic Transmission Outages Caused by Protection System Misoperations
Background
Originally titled Correct Protection System Operations this metric has undergone a number of changes
since its initial development To ensure that it best portrays how misoperations affect transmission
outages it was necessary to establish a common understanding of misoperations and the data needed
to support the metric NERCrsquos Reliability Assessment Performance Analysis (RAPA) group evaluated
several options of transitioning from existing procedures for the collection of misoperations data and
recommended a consistent approach which was introduced at the beginning of 2011 With the NERC
System Protection and Control Subcommitteersquos (SPCS) technical guidance NERC and the regional
entities have agreed upon a set of specifications for misoperations reporting including format
categories event type codes and reporting period to have a final consistent reporting template16
Special Considerations
Only
automatic transmission outages 200 kV and above including AC circuits and transformers will be used
in the calculation of this metric
Data collection will not begin until the second quarter of 2011 for data beginning with January 2011 As
revised this metric cannot be calculated for this report at the current time The revised title and metric
form can be viewed at the NERC website17
16 The current Protection System Misoperation template is available at
httpwwwnerccomfilezrmwghtml 17The current metric ALR4-1 form is available at httpwwwnerccomdocspcrmwgALR_4-1Percentpdf
Reliability Metrics Performance
23
ALR6-11 ndash ALR6-14
ALR6-11 Automatic AC Transmission Outages Initiated by Failed Protection System Equipment
ALR6-12 Automatic AC Transmission Outages Initiated by Human Error
ALR6-13 Automatic AC Transmission Outages Initiated by Failed AC Substation Equipment
ALR6-14 Automatic AC Circuit Outages Initiated by Failed AC Circuit Equipment
Background
These metrics evolved from the original ALR4-1 metric for correct protection system operations and
now illustrate a normalized count (on a per circuit basis) of AC transmission element outages (ie TADS
momentary and sustained automatic outages) that were initiated by Failed Protection System
Equipment (ALR6-11) Human Error (ALR6-12) Failed AC Substation Equipment (ALR6-13) and Failed AC
Circuit Equipment (ALR6-14) These metrics are all related to the non-weather related initiating cause
codes for automatic outages of AC circuits and transformers operated 200 kV and above
Assessment
Figure 10 through Figure 13 show the normalized outages per circuit and outages per transformer for
facilities operated at 200 kV and above As shown in all eight of the charts there are some regional
trends in the three years worth of data However some Regionrsquos values have increased from one year
to the next stayed the same or decreased with no discernable regional trends For example ALR6-11
computes the automatic AC Circuit outages initiated by failed protection system equipment
There are some trends to the ALR6-11 to ALR6-14 data but many regions do not have enough data for a
valid trend analysis to be performed NERCrsquos outage rate seems to be improving every year On a
regional basis metric ALR6-11 along with ALR6-12 through ALR6-14 cannot be statistically understood
until confidence intervals18
18The detailed Confidence Interval computation is available at
are calculated ALR metric outage frequency rates and Regional equipment
inventories that are smaller than others are likely to require more than 36 months of outage data Some
numerically larger frequency rates and larger regional equipment inventories (such as NERC) do not
require more than 36 months of data to obtain a reasonably narrow confidence interval
httpwwwnerccomdocspctadstfTADS_Nov_2_2007APPENDIX_C_Confidence_Intervalpdf
Reliability Metrics Performance
24
While more data is still needed on a regional basis to determine if each regionrsquos bulk power system is
becoming more reliable year to year there are areas of potential improvement which include power
system condition protection performance and human factors These potential improvements are
presented due to the relatively large number of outages caused by these items The industry can
benefit from detailed analysis by identifying lessons learned and rolling average trends of NERC-wide
performance With a confidence interval of relatively narrow bandwidth one can determine whether
changes in statistical data are primarily due to random sampling error or if the statistics are significantly
different due to performance
Reliability Metrics Performance
25
ALR 6-11 ndash Automatic Outages Initiated by Failed Protection System Equipment
Automatic outages with an initiating cause code of failed protection system equipment are in Figure 10
Figure 10 ALR6-11 by Region (Includes NERC-Wide)
This code covers automatic outages caused by the failure of protection system equipment This
includes any relay andor control misoperations except those that are caused by incorrect relay or
control settings that do not coordinate with other protective devices
ALR6-12 ndash Automatic Outages Initiated by Human Error
Figure 11 shows the automatic outages with an initiating cause code of human error This code covers
automatic outages caused by any incorrect action traceable to employees andor contractors for
companies operating maintaining andor providing assistance to the Transmission Owner will be
identified and reported in this category
Reliability Metrics Performance
26
Also any human failure or interpretation of standard industry practices and guidelines that cause an
outage will be reported in this category
Figure 11 ALR6-12 by Region (Includes NERC-Wide)
Reliability Metrics Performance
27
ALR6-13 ndash Automatic Outages Initiated by Failed AC Substation Equipment
Figure 12 shows the automatic outages with an initiating cause code of failed AC substation equipment
This code covers automatic outages caused by the failure of AC Substation ie equipment ldquoinside the
substation fencerdquo including transformers and circuit breakers but excluding protection system
equipment19
19TADS Initiating Cause Code definitions are located at httpwwwnerccomdocspctadswgTADS_Definitions_Appendix_7_092909pdf
Figure 12 ALR6-13 by Region (Includes NERC-Wide)
Reliability Metrics Performance
28
ALR6-14 Automatic AC Transmission Outages Initiated by Failed AC Circuit Equipment
Figure 13 shows the automatic outages with an initiating cause code of failed AC circuit equipment
Automatic Outages related to the failure of AC Circuit equipment ie overhead or underground
equipment ldquooutside the substation fencerdquo 20
ALR6-15 Element Availability Percentage (APC)
Background
This metric uses data and calculations directly from the NERC TADS effort and illustrates the overall
percent of time the aggregate of transmission facilities are available and in service This is an aggregate
20TADS Initiating Cause Code definitions are located at httpwwwnerccomdocspctadswgTADS_Definitions_Appendix_7_092909pdf
Figure 13 ALR6-14 by Region (Includes NERC-Wide)
Reliability Metrics Performance
29
value using sustained outages (automatic and non-automatic) for both lines and transformers operated
at 200 kV and above for each Regional Entity Interconnection and for NERC This metric was approved
by the NERC Operating and Planning Committees in September 2010
Assessment
Figure 14 shows the aggregate element availability percentage (APC) for transmission and transformers
facilities operated at 200 kV and above The values are all over 90 percent which shows excellent
system availability The RMWG recommends continued metric assessment for at least a few more years
in order to determine the value of this metric
Figure 14 2010 ALR6-15 Element Availability Percentage
Notably the Eastern Interconnection does not include Quebec or ERCOT ERCOT does not have any
transformers with low-side voltage levels 200 kV and above
Special Consideration
It should be noted that the non-automatic outage data needed to calculate this metric was only first
collected for the calendar year 2010 as part of the TADS process Therefore only one year of data for
this metric is available at this time
Reliability Metrics Performance
30
ALR6-16 Transmission System Unavailability
Background
This metric uses data and calculations directly from the NERC TADS effort and shows the overall percent
of time the aggregate of transmission facilities are unavailable due to automatic and non-automatic
outages This is an aggregate value using sustained automatic outages for both lines and transformers
operated at 200 kV and above for each Regional Entity and for NERC This metric was approved by the
NERC Operating and Planning Committees in December 2010
Assessment
Figure 15 and Figure 16 illustrate the 2010 aggregate unavailability percentage for AC circuits and
transformer facilities operated at 200 kV and above The values for AC circuits are all under 3 percent
which shows excellent system availability
The RMWG recommends continued metric assessment for at least a few more years in order to
determine the value of this metric
Special Consideration
It should be noted that the non-automatic outage data needed to calculate this metric was only first
collected for the calendar year 2010 as part of the TADS process Therefore only one year of data for
this metric is available at this time
Figure 15 2010 ALR6-16 Transmission System Unavailability
Reliability Metrics Performance
31
Figure 16 2010 ALR6-16 Transmission System Unavailability by Outage Type
Notably the Eastern Interconnection does not include Quebec or ERCOT Also ERCOT does not have
any transformers with low-side voltage levels 200 kV and above
ALR6-2 Energy Emergency Alert 3 (EEA3)
Background
This metric identifies the number of times Energy Emergency Alerts Level 3 (EEA3) are issued EEA3
events are firm-load interruptions due to capacity and energy deficiency EEA3 is currently reported
collected and maintained in NERCrsquos Reliability Coordination Information System (RCIS) and is defined in
Attachment 1 of the NERC Standard EOP-00221
21 The latest version of Attachment 1 for EOP-002 is available at
This metric identifies the number of times EEA3s are
issued The number of EEA3s per year provides a relative indication of performance measured at a
Balancing Authority or interconnection level As historical data is gathered trends in future reports will
provide an indication of either decreasing or increasing use of EEA3s signaling adequacy of the electric
supply system This metric can also be considered in the context of Planning Reserve Margin Significant
increases or decreases in EEA3 events with relatively constant Planning Reserve Margins could indicate
httpwwwnerccompagephpcid=2|20
Reliability Metrics Performance
32
volatility in the actual loads compared to forecast levels or changes in the adequacy of the bulk power
system required to meet load demands
Assessment
Figure 17 shows the number of EEA3 events during 2006 and 2010 from an RE level An interactive
presentation was released and available at the Reliability Indicatorrsquos page22
The Acadiana Load Pocket (ALP) is an area in south central Louisiana that has experienced regular
transmission constraints and numerous Energy Emergency Alert filings by the SPP Reliability Controller
(SPP RC) Transmission within ALP is owned by Entergy Lafayette Utilities System (LUS) and Cleco
Power LLC (Cleco) The transmission constraints within the ALP are primarily caused by the local area
load and the lack of generation located in close proximity to the load area
The number of EEA3rsquos
declared in 2010 returned to more traditional numbers The 2009 spike in EEA3 events in the SPP
Region that was driven by issues in the Acadiana Load Pocket (ALP) were not present in 2010
Special Considerations
Ideally the measure should capture only EEAs that are declared for reliability reasons and not for
economic factors The RMWG has not been able to differentiate these reasons for future reporting and
it has made a recommendation to the Reliability Coordinator Working Group (RCWG) to consider a
revised EEA declaration to exclude economic factors
The reason the EEA volume decreased from 2009 to 2010 in SPP was because the SPP ICT RC23
coordinated an operating agreement between the five operating companies in the ALP The operating
agreement included a cost sharing re-dispatch that alleviated the need of a Transmission Loading Relief
(TLR-5) declaration24
22The EEA3 interactive presentation is available on the NERC website at
During 2009 there was no operating agreement therefore an entity had to
provide Network and Native Load (NNL) relief when a TLR-5 was called by the ICT RC When the TLR-5
was the primary tool to control the post contingent loading in the ALP some of the BAs would have their
firm transmission curtailed to the point where they could no longer serve their load therefore the EEA
3 was needed to communicate a capacityreserve deficiency
httpwwwnerccompagephpcid=4|331|335 23Southwest Power Pool (SPP) Independent Coordinator of Transmission (ICT) Reliability Coordinator (RC) 24More information on Transmission Load Relief is contained in the IRO-006 standard which is located at httpwwwnerccomfilesIRO-006-4pdf In particular TLR-5 definitions are referenced on page 16 and 17
Reliability Metrics Performance
33
Figure 17 ALR6-2 Energy Emergency Alert 3 (EEA3) Counts by Region (2006-2010)
Cleco Power Entergy and LUS are currently constructing an estimated $200 million transmission
infrastructure improvement project to mitigate transmission constraints into ALP Construction of the
project is scheduled to be complete in 2012 Completion of the project should help alleviate some of
the transmission congestion in this area Energy Emergency Alerts filed by the SPP Regional Entity
continue to decline
SPP RTO continues to coordinate operating plans with the operating entities in this area Mitigation
plans and local operating guides in place are expected to provide sufficient flexibility should issues arise
NERC will continue to monitor this area for Reliability Impacts and coordinate any actions with the SPP
Reliability Coordinator and SPP Regional Entity
ALR 6-3 Energy Emergency Alert 2 (EEA2)
Background
Energy Emergency Alert 2 (EEA2) is to measure the number of events BAs declare for deficient capacity
and energy during peak load periods which may serve as a leading indicator of energy and capacity
shortfall in the adequacy of the electric supply system EEA2 provides a sense of the frequency of
precursor events to the more severe EEA3 declarations This metric measures the number of events
1 3 1 2 214
3 4 4 1 5 334
4 2 1 52
1
0
5
10
15
20
25
30
3520
0620
0720
0820
0920
1020
0620
0720
0820
0920
1020
0620
0720
0820
0920
1020
0620
0720
0820
0920
1020
0620
0720
0820
0920
1020
0620
0720
0820
0920
1020
0620
0720
0820
0920
1020
0620
0720
0820
0920
10
FRCC MRO NPCC RFC SERC SPP TRE WECC
2006-2009
2010
Region and Year
Reliability Metrics Performance
34
Balancing Authorities declare for deficient capacity and energy during peak load periods At this time
however this data reflects inclusion of Demand Side Resources that would not be indicative of
inadequacy of the electric supply system
The number of EEA2 events and any trends in their reporting indicates how robust the system is in
being able to supply the aggregate load requirements The historical records may include demand
response activations and non-firm load interruptions per applicable contracts within the EEA alerts per
its definition25
Assessment
Demand response is a legitimate resource to be called upon by balancing authorities and
do not indicate a reliability concern As data is gathered in the future reports will provide an indication
of either decreasing or increasing adequacy in the electric supply system EEA2 events called solely for
activation of demand response (controllable or contractually prearranged demand-side dispatch
programs) or interruption of non-firm load per applicable contracts should be excluded This metric can
also be considered in the context of the Planning Reserve Margin Significant increases or decreases in
EEA2 events with relatively constant Planning Reserve Margins could indicate volatility in the actual
loads compared to forecast levels or changes in the adequacy of the bulk power system required to
meet load demands
Figure 18 shows the number of EEA2 events by Regional Entity from 2006 to 2010 EEA2 interactive
version available on line by quarter and region26
25 The EEA2 is defined at
The general trend continues to show improved
performance which may have been influenced by the overall reduction in demand throughout NERC
caused by the economic downturn Specific performance by any one region should be investigated
further for issues or events that may affect the results Determining whether performance reported
includes those events resulting from the economic operation of DSM and non-firm load interruption
should also be investigated The RMWG recommends continued metric assessment
httpwwwnerccomfilesEOP-002-2pdf 26 EEA2 interactive version located at httpwwwnerccompagephpcid=4|331|341
Reliability Metrics Performance
35
Special Considerations
The intent of this metric is to measure only EEAs that are called for reliability reasons and not for
economic factors such as demand side management (DSM) and non-firm load interruption The
historical data for this metric may include events that were called for economic factors According to
the RCWG recent data should only include EEAs called for reliability reasons
ALR 6-1 Transmission Constraint Mitigation
Background
The RMWG completed a pilot with four regional entities Based on the results the RMWG expanded the
pilot data collection to all regions and the initial results of the data collection are shown in Figure 19
and Table 5 Based on the results of the pilot there is merit in continuing to assess this metric The
intent of this metric is to identify trends in the number of mitigation measures (Special Protection
Schemes (SPS) Remedial Action Schemes (RAS) and Operating Procedures) required to meet reliability
requirements By their nature SPS do not indicate an inherent weakness in the bulk power system
rather they are an indication of methods that are taken to operate the system through the range of
conditions it must perform This metric is only intended to evaluate the trend use of these plans and
whether the metric indicates robustness of the transmission system is increasing remaining static or
decreasing
1 27
2 1 4 3 2 1 2 4 5 2 5 832
4724
211
5 38 5 1 1 8 7 4 1 1
05
101520253035404550
2006
2007
2008
2009
2010
2006
2007
2008
2009
2010
2006
2007
2008
2009
2010
2006
2007
2008
2009
2010
2006
2007
2008
2009
2010
2006
2007
2008
2009
2010
2006
2007
2008
2009
2010
2006
2007
2008
2009
2010
FRCC MRO NPCC RFC SERC SPP TRE WECC
2006-2009
2010
Region and Year
Figure 18 ALR6-3 Energy Emergency Alert 2 (EEA2)
Reliability Metrics Performance
36
Assessment
The pilot data indicates a relatively constant number of mitigation measures over the time period of
data collected
Figure 19 ALR6-1 Transmission Constraint Mitigation by SPSRAS (2009-2014)
0102030405060708090
100110120
2009
2010
2011
2014
2009
2010
2011
2014
2009
2010
2011
2014
2009
2010
2011
2014
2009
2010
2011
2014
2009
2010
2011
2014
2009
2010
2011
2014
2009
2010
2011
2014
FRCC MRO NPCC RFC SERC SPP ERCOT WECC
Coun
t
Region and Year
SPSRAS
Reliability Metrics Performance
37
Table 5 ALR6-1 Transmission Constraint Mitigation by Operating ProcedureGuides (2009-2011)
ALR6-1 Transmission Constraint Mitigation by Operating ProcedureGuides (2009-2014)
2009 2010 2011 2014
FRCC 107 75 66
MRO 79 79 81 81
NPCC 0 0 0
RFC 2 1 3 4
SPP 39 40 40 40
SERC 6 7 15
ERCOT 29 25 25
WECC 110 111
Special Considerations
A certain number of SPS mitigation plans may be necessary to support reliable operation of the system
If the number of SPS increase over time this may indicate that additional transmission capacity is
required A reduction in the number of SPS may be an indicator of increased generation or transmission
facilities being put into service which may indicate greater robustness of the bulk power system In
general mitigation plans are a viable and valuable tool for effective operation of the bulk power system
In power system planning reliability operability capacity and cost-efficiency are simultaneously
considered through a variety of scenarios to which the system may be subjected Mitigation measures
are a method for optimizing a power system across these scenarios Changes in quantities of mitigation
plans may indicate year-on-year differences in the system being evaluated
Integrated Bulk Power System Risk Assessment
Introduction In developing eighteen metrics to measure acceptable levels of reliability it has become clear that any
such measurement of reliability must include consideration of the risks present within the bulk power
system in order for us to appropriately prioritize and manage these system risks The scope for the
Reliability Metrics Working Group (RMWG)27
27 The RMWG scope can be viewed at
includes a task to develop a risk-based approach that
provides consistency in quantifying the severity of events The approach not only can be used to
httpwwwnerccomfilezrmwghtml
Reliability Metrics Performance
38
measure risk reduction over time but also can be applied uniformly in event analysis process to identify
the events that need to be analyzed in detail and sort out non-significant events
The Operating Committee (OC) and Planning Committee (PC) endorsed the concepts and framework28 of
the risk-based approach in their September 2010 joint meeting and further supported the event severity
risk index (SRI) calculation29
Recommendations
in March 2011
bull NERC should embrace the use of risk assessment to identify trends in addition to lessons learned
in order to improve bulk power system reliability
bull The RMWG should continue to coordinate and communicate with the Event Analysis Working
Group (EAWG) to apply the SRI into the event analysis process and root cause analysis
bull As trend evaluations increase the knowledge of risks to the bulk power system data required to
support additional assessment should be gathered
Event Severity Risk Index (SRI)
Risk assessment is an essential tool for achieving the alignment between organizations people and
technology This will assist in quantifying inherent risks identifying where potential high risks exist and
evaluating where the most significant lowering of risks can be achieved Being learning organizations
the Electric Reliability Organization (ERO) Regional Entities and Registered Entities can use these tools
to focus on the areas of highest risk to reliability to provide a sound basis for developing results-based
standards and compliance programs Risk assessment also serves to engage all stakeholders in a
dialogue about specific risk factors and helps direct a strategic plan for risk reduction and early
detection
The SRI is a daily blended metric for which transmission loss generation loss and load loss events are
calculated Each element (transmission generation and load loss) is factored by the systemrsquos inventory
for that element to rate significant events appropriately On a yearly basis these daily performances
can be sorted in descending order to evaluate the year-on-year performance of the system
In order to test drive the concepts the RMWG applied these calculations against historically memorable
days to derive SRIs Once these calculations were complete they were reviewed and evaluated by
various stakeholders for reasonableness Based upon feedback modifications to the calculation were
made and assessed against the historic days performed This iterative process locked down the details
28 httpwwwnerccomdocspcrmwgIntegrated_Bulk_Power_System_Risk_Assessment_Concepts_Finalpdf 29 httpwwwnerccomdocspcrmwgSRI_Equation_Refinement_May6_2011pdf
Reliability Metrics Performance
39
for the calculation of SRI whose calculation from zero (no transmission line outages generation outages
or load lost in a day) to 1000 (a theoretical condition in which every transmission line all generation
units and all load lost across the system in a single day)
Figure 20 captures the calculated severity risk value for each of the days for each year benchmarked
with the historic significant events which were used to concept test the calculation Since there is
significant disparity between days the bulk power system is stressed compared to those that are
ldquoroutinerdquo and ldquoherordquo days of the year where the system performed extremely well the curve is depicted
using a logarithmic scale Each yearrsquos data is sorted in descending order striking a characteristic shape
At the left-side of the curve the days in which the system is severely stressed are plotted The central
more linear portion of the curve identifies the routine day performance while the far right-side of the
curve shows the values plotted for days in which almost all lines and generation units are in service and
essentially no load is lost
The trends on the chart below show that 2009 and 2010 had fewer extreme days than 2008 Routine
daily performance appears generally consistent across all three years Figure 20 captures the days for
each year benchmarked with historically significant events
In Figure 20 NERCrsquos event categories and SRI ratings are directly related As the SRI increases the
category or severity of the event increases Historical events are also shown to relate modern
reliability measurements to give a perspective of how a well-known event would register on the SRI
scale
The event analysis process30
30
benefits from the SRI as it enables a numerical analysis of an event in
comparison to other events By this measure an event can be prioritized by its severity In a severe
event this is unnecessary However for events that do not result in severe stressing of the bulk power
system this prioritization can be a challenge By using the SRI the event analysis process can decide
which events to learn from and reduce which events to avoid and when resilience needs to be
increased under high impact low frequency events as shown in the blue boxes in the figure
httpwwwnerccompagephpcid=5|365
Reliability Metrics Performance
40
Figure 20 NERC Annual Daily Severity Risk Index (SRI) Sorted Descending with Historic Benchmark Days
Other factors that impact severity of a particular event to be considered in the future include whether
equipment operated as designed and resulted in loss of load from a reliability perspective (intentional
and controlled load-shedding) Mechanisms for enabling ongoing refinement to include the historic and
simulated events for future severity risk calculations are being explored
Reliability Metrics Performance
41
Integrated Reliability Index Concepts In December 2010 the RMWG was challenged by the OC and PC to develop a single index concept to
measure the universe of risks associated with the bulk power system As a result the integrated
reliability index (IRI) concepts were proposed31
Figure 21
the three components of which were defined to
quantify each specific risk aspect They are titled the Event Driven Index (EDI) StandardsStatute Driven
Index (SDI) and Condition Driven Index (CDI) illustrated in with measures associated with
system events standards compliance and eighteen performance metrics The development of an
integrated reliability index aims to inform increase transparency and quantify the effectiveness of risk
reduction or mitigation actions The goal is to provide the industry meaningful trends of the BPSrsquos
performance and guidance on how the industry can improve reliability and support risk-informed
decision making Once completed the IRI will facilitate holistic assessment of performance Finally the
IRI should help overcome concern and confusion about how many metrics are being analyzed for system
reliability assessments
Figure 21 Risk Model for Bulk Power System
The integrated model of event-driven condition-driven and standardsstatute-driven risk information
can be constructed to illustrate all possible logical relations between the three risk sets Due to the
nature of the system there may be some overlap among the components
31 httpwwwnerccomdocspcrmwgIntegrated_Reliability_Index_WhitePaper_DRAFTpdf
Event Driven Index (EDI)
Indicates Risk from
Major System Events
Standards Statute Driven
Index (SDI)
Indicates Risks from Severe Impact Standard Violations
Condition Driven Index (CDI)
Indicates Risk from Key Reliability
Indicators
Reliability Metrics Performance
42
The Three Components of the IRI The three components of the IRI work together as shown in Figure 22 to comprise a full picture of the
state of reliability
Figure 22 An overview of the components that comprise the Integrated Reliability Index (IRI)
Event-Driven Indicators (EDI)
The Event-Driven Indicator provides a basis for prioritization of events based on bulk power system
integrity equipment performance and engineering judgment This indicator can serve as a high value
risk assessment tool to be used by stakeholders to investigate and evaluate disturbance history and
measure the severity of these events The relative ranking of events requires industry expertise agreed-
upon goals and engineering judgment The EDI is a derivative of SRI results for a specific time period
but it transforms that performance into a form of an availability index These calculations will be further
refined as feedback is received
Condition-Driven Indicators (CDI)
The Condition-Driven Indicators focus on a set of measurable system conditions (performance
measures) to assess bulk power system reliability These reliability indicators identify factors that
positively or negatively impact reliability and are early predictors of the risk to reliability from events or
unmitigated violations A collection of these indicators measures how close reliability performance is to
the desired outcome and if the performance against these metrics is constant or improving
Reliability Metrics Performance
43
StandardsStatute-Driven Indicators (SDI)
The StandardsStatute-Driven Indicator is a calculation of success of compliance based upon the subset
of high-value standards and is divided by the number of participations who could have received the
violation within the time period considered Also based on these factors known unmitigated violations
of elevated risk factor requirements are weighted higher than lower risk factors The index decreases if
the compliance improvement is achieved over a trending period
IRI Index Calculation As with the SRI the IRI is based on an importance weighting factor which the RMWG can modify over
time after gaining experience with the new metric as well as consideration of feedback from industry
At this time the RMWG believes some form of blended weighting may serve to start to populate IRI
characteristic curves at a high and generic level Based upon feedback from stakeholders this approach
may change or as discussed below weighting factors may vary based on periodic review and risk model
update The RMWG will continue the refinement of the IRI calculation and consider other significant
factors that impact reliability (eg intentional and controlled load-shedding) further it will explore
developing mechanisms for enabling ongoing refinement which should be influenced by a wide set of
stakeholders
RMWG recommends the Event Driven Index (EDI) be weighted the highest (50 percent) since events
actually occurred indicating how the system was performing The Condition Driven Index (CDI) and
StandardsStatute Driven Index (SDI) are weighted 25 each since they are indicators of potential risks
to BPS reliability IRI can be calculated as follows
IRI is intended to be a composite metric which integrates several forms of individual risks to the bulk
power system Since the three components range across many stakeholder organizations these
concepts are developed as starting points for continued study and evaluation Additional supporting
materials can be found in the IRI whitepaper32
IRI Recommendations
including individual indices calculations and preliminary
trend information
For the IRI more investigation should be performed to determine the best way to integrate EDI CDI
and SDI into an Integrated Reliability Index (IRI) that quantitatively represents the reliability of the bulk
32 The IRI whitepaper can be found at httpwwwnerccomdocspcrmwgIntegrated_Reliability_Index_WhitePaper_DRAFTpdf
Reliability Metrics Performance
44
power system To this end study into determining the amount of overlap between the components is
necessary RMWG is currently working to determine the proper amount of overlap between the IRI
components
Also the CDI component of the IRI needs to be solidified This is especially true with the CDI More
accurate metric data is needed to paint a fuller picture of the CDI Many of the metrics used to calculate
the CDI are new or they have limited data Compared to the SDI which counts well-known violation
counts and the EDI which uses the well-defined CDI the CDI lacks the depth of rigor that the other two
components have acquired through their years of data RMWG is currently working to improve the CDI
Reliability Metrics Conclusions and Recommendations Among the eighteen metrics that address the characteristics of an adequate level of reliability (ALR)
metric trends indicate the system is performing better in the following seven areas
bull ALR1-3 Planning Reserve Margin
bull ALR1-4 BPS Transmission Related Events Resulting in Loss of Load
bull ALR2-5 Disturbance Control Events Greater than Most Severe Single Contingency
bull ALR6-2 Energy Emergency Alert 3 (EEA3)
bull ALR6-3 Energy Emergency Alert 2 (EEA2)
bull ALR6-11 Automatic Transmission Outages Caused by Protection System Misoperations
bull ALR6-13 Automatic Transmission Outages Caused by Failed AC Substation Equipment
Assessments have been made in other performance categories A number of them do not have
sufficient data to derive any conclusions from the results The RMWG recommends continued data
collection and assessment of these metrics If a metric does not yield any trend in a five-year reporting
period the metric will be modified or withdrawn
For the IRI more investigation should be performed to determine the overlap of the components (CDI
EDI and SDI) The CDI should be more thoroughly solidified as an index by collecting more data over
time
Transmission Equipment Performance
45
Transmission Equipment Performance Introduction The Transmission Availability Data System (TADS) effort began with the establishment of a TADS task force
by the NERC Planning Committee in October 2006 On October 27 2007 the NERC Board of Trustees
approved the collection of transmission automatic outage data beginning in calendar year 2008 (Phase I)
Subsequently on October 29 2008 the NERC Board approved the collection of Non-Automatic Outage data
that began for Calendar year 2010 (Phase II)
This chapter provides reliability performance analysis of the transmission system by focusing on the trends
of Automatic Outage data from calendar year 2008 thru 2010 Since only one year of Non-Automatic
Outage data has been collected that data will not be assessed in this report
When calculating bulk power system performance indices care must be exercised when interpreting results
as misinterpretation can lead to erroneous conclusions regarding system performance With only three
years of data in the smaller regions it is not clear whether a regionrsquos yearly outage variation compared to
the average is due to random statistical variation or that particular year is significantly different in
performance However on a NERC-wide basis after three years of data collection there is enough
information to accurately determine whether the yearly outage variation compared to the average is due to
random statistical variation or the particular year in question is significantly different in performance33
Performance Trends
Transmission performance information has been provided by Transmission Owners (TOs) within NERC
through the NERC TADS (Transmission Availability Data System) process The data presented reflects
Momentary and Sustained AC Automatic outages of transmission elements that operate at voltages ge 200 kV
(including the low side of transformers) with the criteria specified in the TADS process The following
elements listed below are included
bull AC Circuits ge 200 kV (Overhead and Underground Circuits) Radial circuits are included
bull DC Circuits with ge +-200 kV DC voltage
bull Transformers with ge 200 kV low-side voltage and
bull ACDC Back-to-Back (BTB) Converters with ge 200 kV AC voltage on both sides
33The detailed Confidence Interval computation is available at httpwwwnerccomdocspctadstfTADS_Nov_2_2007APPENDIX_C_Confidence_Intervalpdf
Transmission Equipment Performance
46
AC Element Outage Summary and Leading Causes Table 6 shows the 2008 2009 and 2010 NERC total AC transmission element inventory and a summary of
the associated outages As expected in general the number of circuits increased from year to year due to
new construction or re-construction to higher voltages For every outage experienced on the transmission
system cause codes are identified and recorded according to the TADS process Causes of both momentary
and sustained outages have been indicated These causes are analyzed to identify trends and similarities
and to provide insight into what could be done to possibly prevent future occurrences
Figure 23 and Figure 24 describe the top ten initiating cause codes for sustained and momentary automatic
outages combined from 2008-2010 Based on the two figures the relationship between the total number of
outages and total outage hours can be seen Failed AC Substation Equipment and Failed AC Circuit
Equipment only account for 15 percent of the total number of outages but account for 65 percent of the
total outage hours The two largest causes of outages within NERC (ldquoLightingrdquo and ldquoWeather excluding
Lightningrdquo) account for 34 percent of the total number of outages
The next three Human Error Failed Protection System Equipment and Failed AC Circuit Equipment have
very similar totals and should all be considered significant focus points in reducing the number of Sustained
Automatic Outages for all elements
Transmission Equipment Performance
47
Table 6 NERC - All AC Elements Sustained and Momentary Outage Performance Summary
2008 Number of Outages
AC Voltage
Class
No of
Circuits
Circuit
Miles Sustained Momentary
Total
Outages Total Outage Hours
200-299kV 4369 102131 1560 1062 2622 56595
300-399kV 1585 53631 793 753 1546 14681
400-599kV 586 31495 389 196 585 11766
600-799kV 110 9451 43 40 83 369
All Voltages 6650 196708 2785 2051 4836 83626
2009 Number of Outages
AC Voltage
Class
No of
Circuits
Circuit
Miles Sustained Momentary
Total
Outages Total Outage Hours
200-299kV 4468 102935 1387 898 2285 28828
300-399kV 1619 56447 641 610 1251 24714
400-599kV 592 32045 265 166 431 9110
600-799kV 110 9451 53 38 91 442
All Voltages 6789 200879 2346 1712 4038 63094
2010 Number of Outages
AC Voltage
Class
No of
Circuits
Circuit
Miles Sustained Momentary
Total
Outages Total Outage Hours
200-299kV 4567 104722 1506 918 2424 54941
300-399kV 1676 62415 721 601 1322 16043
400-599kV 605 31590 292 174 466 10442
600-799kV 111 9477 63 50 113 2303
All Voltages 6957 208204 2582 1743 4325 83729
Note The NERC table does not show redacted outages DC Circuit outages Transformer outages or ACDC
converter outages
Transmission Equipment Performance
48
Figure 23 NERC - Top Ten Sustained and Momentary Outages by Initiating Cause Code for All Elements
Figure 24 NERC - Top Ten Sustained Outage Hours by Cause Code
198
151
80
7271
6943
33
27
188
68
Lightning
Weather excluding lightningHuman Error
Failed AC Substation EquipmentFailed Protection System EquipmentFailed AC Circuit Equipment Foreign Interference
Power System Condition
Fire
Unknown
Remaining Cause Codes
299
246
188
58
52
42
3619
16 12 31 Failed AC Substation EquipmentFailed AC Circuit Equipment Weather excluding lightningUnavailable
Other
Fire
Unknown
Human Error
Failed Protection System EquipmentForeign Interference
Remaining Cause Codes
Transmission Equipment Performance
49
Transmission Monthly Outages Figure 25 displays the total number of Automatic Outages on a per-month basis The three months with the
highest total of outages were June July and August From a seasonal perspective winter had a monthly
average of 281 outages These include the months of November-March Summer had an average of 429
outages Summer included the months of April-October
Figure 25 Number of Outages by Month for AC Circuits (2008-2010)
This figure does not show redacted outages DC Circuit outages Transformer outages or ACDC Converter
outages
Outage Initiation Location For every outage experienced on the transmission system the outage initiation code is identified and
recorded according to the TADS process The outage initiation code can be analyzed to identify trends and
similarities and to provide insight into what could be done to possibly prevent future occurrences
The ldquoOutage Initiation Coderdquo describes where an automatic outage was initiated on the power system The
five codes are as follows
bull Element-Initiated
bull Other Element-Initiated
bull AC Substation-Initiated
bull ACDC Terminal-Initiated (for DC circuits)
bull Other Facility Initiated any facility not included in any other outage initiation code
JanuaryFebruar
yMarch April May June July August
September
October
November
December
2008 238 229 257 258 292 437 467 380 208 176 255 236
2009 315 201 339 334 398 553 546 515 351 235 226 294
2010 444 224 269 446 449 486 639 498 351 271 305 281
3 Year AVG 332 218 288 346 380 492 551 464 303 227 262 270
0
100
200
300
400
500
600
700
Out
ages
Transmission Equipment Performance
50
Notably the protection system is not part of an ldquoAC Substationrdquo or an ldquoACDC Terminalrdquo If a protection
system misoperates and initiates an outage it will be classified as ldquoOther-Facility Initiatedrdquo The following
Figures show the initiating location of the Automatic outages from 2008 to 2010
With both Momentary and Sustained Automatic Outages taken into account the outage was initiated on the
Element more than 67 percent of the time as shown in Figure 26 and Figure 27
When only the Sustained Automatic Outages are analyzed the outage initiation on both AC Substation and
Other Facility increased by 34 percent and 32 percent respectively Outages initiated on the Element itself
decreases by 78 percent as shown in Figure 26 and 27 For only the Momentary Automatic Outages the
outage initiation on the Element increases by 19 percent compared to Sustained Outages Element initiated
outages make up over 78 percent of the total outages when analyzing only Momentary Outages
Figure 26
Figure 27
Transmission Outage Events Figure 28 illustrates the relationship between the numbers of Automatic Outages associated per TADS
event 2008 2009 and 2010 tend to follow the same trend The largest number of Automatic Outages per
TADS event is fourteen in 2010 thirteen in 2009 and eight in 2008 There are around 70 to 100 TADS
events that contain between fourteen and three Automatic Outages (see below) There are around 330 to
400 TADS events that contain two or more Automatic Outages The rest of the events only contain one
Automatic Outage As noted in the lower right hand corner below the total number of Events in 2008 to
2010 ranged from 3920 to 4569 events per year Nearly 90 percent or more of the events contained one
Automatic Outage
Figure 26 Sustained Automatic Outage Initiation
Code
Figure 27 Momentary Automatic Outage Initiation
Code
Transmission Equipment Performance
51
Transmission Outage Mode Figure 29 and Figure 30 show the percentage of Outage Modes The ldquoOutage Mode Coderdquo describes
whether one Automatic Outage is related to other Automatic Outages A Single Mode outage is an
Automatic Outage of a single Element which occurs independently of any other Automatic Outages (if any)
A ldquoDependent Mode Initiating Outagerdquo is an Automatic Outage of a single Element that initiates one or more
subsequent Element Automatic Outages A ldquoDependent Mode Outagerdquo is an Automatic Outage of an
Element which occurred as a result of an initiating outage whether the initiating outage was an Element
outage or a non-Element outage A ldquoCommon Mode Outagerdquo is one of two or more Automatic Outages with
the same Initiating Cause Code and where the outages are not consequences of each other and occur nearly
simultaneously A ldquoCommon Mode Initiating Outagerdquo is a Common Mode Outage that initiates one or more
subsequent Automatic Outages
Over 72 percent of the total outages occurred on the bulk power system are Single Mode Outages The next
largest mode is Dependent with over 11 percent of the total outages being in this category For only
Sustained Automatic Outages outages related to each other increase with Dependent mode accounting for
13 percent of the outages and Common mode accounting for close to 11 percent of the outages
Independent Sustained outages still account for the largest portion with nearly 70 percent being Single
mode When just analyzing Momentary Automatic Outages Associated outages decrease with Dependent
Figure 28 Event Histogram (2008-2010)
Transmission Equipment Performance
52
mode accounting for only 9 percent of the outages The Common Mode percentage decreases while
Dependent Mode Initiating percentage increases compared to Sustained Outages Independent Momentary
outages account for the largest portion with over 76 percent being Single Mode
An investigation into the root causes of Dependent and Common mode events which include three or more
Automatic Outages (indentified in the TADS 2008 to 2010 data) should be a high priority Some protection
systems are designed to trip three or more circuits but some events go beyond what is designed Some also
have misoperations associated with multiple outage events
Conclusions On a NERC wide average basis automatic transmission outage rate is improving from 2008 to 2010 based on
reported data Considering both automatic and non-automatic outages 2010 records indicate transmission
element availability percentage is very high and exceeds 95 The unavailability rate for AC circuits and
transformers are only 15 and 29 respectively
The cause codes of Human Error Failed Protection System Equipment and Failed AC Circuit Equipment
should be considered significant focus points in reducing the number of Sustained Automatic Outages for all
elements A deeper look into the root causes of Dependent and Common mode events which include three
or more Automatic Outages (indentified in the TADS 2008 to 2010 data) should be a high priority Some
protection systems are designed to trip three or more circuits but some events go beyond what is designed
Some also have misoperations associated with multiple outage events
Figure 29 Sustained Automatic Outage Mode code Figure 30 Momentary Automatic Outage Mode code
Generation Equipment Performance
53
Generation Equipment Performance Introduction The development of the Generating Availability Data System (GADS) began in 1982 This series of databases
is used to voluntarily collect record and retrieve operating information By pooling individual unit
information with likewise units generating unit availability performance can be calculated providing
opportunities to identify trends and generating equipment reliability improvement opportunities The
information is used to support equipment reliability availability analyses and risk-informed decision-making
by system planners generation owners assessment modelers manufacturers and contractors etc Reports
and information resulting from the data collected through GADS are now used for benchmarking and
analyzing electric power plants
Currently the data collected through GADS contains 72 percent of the North American generating units
with generating capacity of 20 MW or higher34 Additionally many of the newer combined-cycle plants are
not reporting information and therefore a full view of each unit type is not presented Rather a sample of
all the units in North America that fit a given more general category is provided35 for the 2008-201036
Generation Key Performance Indicators
assessment period
Three key performance indicators37
In
the industry have used widely to measure the availability of generating
units (see Terms Used in This Report section for their calculation parameters) are Equivalent Availability
Factor (EAF) Net Capacity Factor (NCF) and Equivalent Forced Outage Rate ndash Demand (EFORd)
Table 7 the North American fleet average EAF NCF and EFORd compared to unit age for all generating
units with a capacity of 20 MW and higher is provided for the years 2008-2010 The EAF shows a decline
during the last three years NCF is up and down while the EFORd appears to be increasing As expected the
fleet of units reported to GADS is aging overall with the fossil units being about 12 years older than the
average age
34 httpwwwnerccomdocspcgadstfGADSTF_Recommendation_Report_02-18-2011_FINALpdf 35GADS contains some 1500+ units under 20 MW that is not included in this report These units are excluded because most units are not base-loaded and are in peaking operation
3684 percent of the 2010 dataset is available at this time while the 2008 and 2009 dataset is complete 37 httpwwwnerccompagephpcid=4|43
Generation Equipment Performance
54
Table 7 General Availability Review of GADS Fleet Units by Year
2008 2009 2010 Average
Equivalent Availability Factor (EAF) 8776 8774 8678 8743
Net Capacity Factor (NCF) 5083 4709 4880 4890
Equivalent Forced Outage Rate -
Demand (EFORd) 579 575 639 597
Number of Units ge20 MW 3713 3713 3713 3713
Average Age of the Fleet in Years (all
unit types) 303 311 321 312
Average Age of the Fleet in Years
(fossil units only) 422 432 440 433
Figure 31 provides the average forced outage hours (FOH) maintenance outage hours (MOH) and planned
outage hours (POH) for all units reporting 20 MW or larger During this three-year period the average FOH
291 hours average MOH is 163 hours average POH is 470 hours
Figure 31 shows a large increase in forced and maintenance events The average age of the units with a
capacity of 20MW and higher in 2009 is 316 years old However the average age of fossil units in 2010 is
442 years old These fossil units are the backbone of all operating units providing the base-load power
continuously and nearly 50 percent of all energy annually There appears to be no increase allocated for
annualsemi-annual maintenance (ie planned outages) for the older generating units The increase of
000100002000030000400005000060000700008000090000
100000
2008 2009 2010
463 479 468
154 161 173
288 270 314
Hou
rs
Planned Maintenance Forced
Figure 31 Average Outage Hours for Units gt 20 MW
Generation Equipment Performance
55
maintenance outage hours reflects an increased need to fix problems that cannot be deferred until the next
annualsemi-annual repairs As a result it shows one of two things are happening
bull More or longer planned outage time is needed to repair the aging generating fleet
bull More focus on preventive repairs during planned and maintenance events are needed
Multiple Unit Forced Outages and Causes Table 8 provides the annual multiple-unit forced outage trips resulting from the same cause for each of the
assessments years 2008-2010 respectively The ldquosingle unitrdquo trips are large units with a Net Dependable
Capacity of 750 MW or more The trips of ldquotwo unitsrdquo or more is any combination of unit capacity with the
total amount of lost capacity more than 750 MW
Table 8 also presents more information on the forced outages During 2008-2010 there were a large
number of double-unit outages resulting from the same event Investigations show that some of these trips
were at a single plant caused by common control and instrumentation for the units The incidents occurred
several times for several months and are a common mode issue internal to the plant
Table 8 Number of Multiple Unit Forced Outages and FrequencyYear
2008 2009 2010
Type of
Trip
of
Trips
Avg Outage
Hr Trip
Avg Outage
Hr Unit
of
Trips
Avg Outage
Hr Trip
Avg Outage
Hr Unit
of
Trips
Avg Outage
Hr Trip
Avg Outage
Hr Unit
Single-unit
Trip 591 58 58 284 64 64 339 66 66
Two-unit
Trip 281 43 22 508 96 48 206 41 20
Three-unit
Trip 74 48 16 223 146 48 47 109 36
Four-unit
Trip 12 77 19 111 112 28 40 121 30
Five-unit
Trip 11 1303 260 60 443 88 19 199 10
gt 5 units 20 166 16 93 206 50 37 246 6
Loss of ge 750 MW per Trip
The high number of five-unit trips in 2008 was due to Hurricane Ike hitting the Gulf Coast The highest total
number of multiple unit trips occurred in 2009 though as mentioned before the data collection for 2010 is
incomplete at this time The majority of 2009 multiple unit trips have three main causes (in order by
Generation Equipment Performance
56
number of events) transmission lack of fuel and storms A summary of the three categories for single as
well as multiple unit outages (all unit capacities) are reflected in Table 9
Table 9 Common Causes of Multiple Unit Forced Outages (2009)
Cause Number of Events Average MW Size of Unit
Transmission 1583 16
Lack of Fuel (Coal Mines Gas Lines etc) Not
in Operator Control
812 448
Storms Lightning and Other Acts of Nature 591 112
Some of the transmission outages based on storms in 2009 have been caused by the same reasons because
the storms may have caused transmission interference However the plants reported the problems
inconsistently with either the transmission interference or storms cause code Therefore they are depicted
as two different causes of forced outage
Marked transmission outages in 2009 were quite high Thirty-five percent came from one utility with a large
number of hydroelectric units The company related the trips to various problems including weather
(lightning storms) wildlife ldquoline bumpsrdquo and problems on the receiving end of the transmission line Nine
hundred and eighty-five transmission trips (62 percent) were from hydroelectric units38
In 2009 only ten transmission trips resulted in a loss of 750 MW or more per trip Twenty two generating
plants were affected by the ten trips Causes for the trips include feeder line trips (1 trip) breakers in the
switchyard (8 trips) personnel errors (2 trips) and unknown (10 trips)
The ldquoLack of Fuelrdquo outages are of interest as these events occur during the times when a unit is available to
operate but there is an interruption in fuels to operate the facilities These events do not include
interruptions of fuel due to contracts Rather the cause code is designed to account for units that are
expecting fuel and it is unavailable when requested Table 10 presents the distribution of ldquoLack of Fuelrdquo
events by NERC Region and Table 11 presents the unit types affected
38 The average size of the hydroelectric units were small ndash 335 MW
Generation Equipment Performance
57
Of the units that report ldquoLack of Fuelrdquo 78 percent of the units are oil-fired 15 percent of the units are gas-
fired and the remaining units are various other fuels Table 12 provides the top causes of forced outage for
several unit types For fossil units ldquoLack of Fuelrdquo as the number three cause behind waterwall tube leaks
and superheater tube leaks
Table 10 Forced Outages Due to Lack of Fuel by Region
Region Number of Lack of Fuel
Problems Reported
FRCC 0
MRO 3
NPCC 24
RFC 695
SERC 17
SPP 3
TRE 7
WECC 29
One company contributed to the majority of oil-fired lack of fuel events The units at the company are
actually dual-fuels (oil and gas) but market nominated gas monitoring causes the units to be on forced
outage nightly The units need gas to start up so they can run on oil When they shut down the units must
switch to gas to clean themselves With the gas restriction the unit canrsquot start and the unit goes on a
forced outage Until the band is lifted the two units will continue to be on a forced outage cycle
Event records also provide descriptions of why the unit was without fuel with the majority of descriptions
bull Temperatures affecting gas supply valves
bull Unexpected maintenance of gas pipe-lines
bull Compressor problemsmaintenance
Generation Equipment Performance
58
Table 11 Unit Type Profile of Forced Outages Due to Lack of Fuel
Unit Types Number of Lack of Fuel Problems Reported
Fossil 642
Nuclear 0
Gas Turbines 88
Diesel Engines 1
HydroPumped Storage 0
Combined Cycle 47
Generation Equipment Performance
59
Table 12 Causes of Forced Outage for Different Unit Types (2008-2010)
Fossil - all MW sizes all fuels
Rank Description Occurrence per Unit-year
MWH per Unit-year
Average Hours To Repair
Average Hours Between Failures
Unit-years
1 Waterwall (furnace wall) 0590 134106 59 3250 3868 2 Second Superheater
Leaks 0180 5182 60 3228 3868
3 Lack of Fuel (coal mines gas lines etc) where the operator is not in control
0480 4701 18 26 3868
Combined-Cycle blocks Rank Description Occurrence
per Unit-year
MWH per Unit-year
Average Hours To Repair
Average Hours Between Failures
Unit-years
1 HP Turbine Buckets Or Blades
0020 4663 1830 26280 466
2 Turbine Control Valves 0040 2777 100 7200 466 3 Gas Turbine Compressor -
High Pressure Shaft 0010 2266 663 4269 466
Nuclear units - all Reactor types Rank Description Occurrence
per Unit-year
MWH per Unit-year
Average Hours To Repair
Average Hours Between Failures
Unit-years
1 LP Turbine Buckets or Blades
0010 26415 8760 26280 288
2 Containment Structure 0010 9233 1226 26262 288 3 Feedwater Pump Local
Controls 0020 7620 692 12642 288
Simple-cycle gas turbine jet engines Rank Description Occurrence
per Unit-year
MWH per Unit-year
Average Hours To Repair
Average Hours Between Failures
Unit-years
1 Main Transformer 0030 1611 1016 20709 4181 2 Other Gas Turbine
Controls And Instrument Problems
0120 428 70 2614 4181
3 Other Gas Turbine Problems
0090 400 119 1701 4181
Generation Equipment Performance
60
2008-2010 Review of Summer versus Winter Availability To address seasonality of unit availability unit information for the months of June to September (summer)
and December through February (winter) were pooled to calculate force events during these timeframes for
2008-201039 Figure 32 shows the Equivalent Availability Factor (EAF) is three percentage points higher and
the Equivalent Forced Outage Rate - Demand (EFORd) is more than a half of a percentage point lower in the
summer period than in winter period This means the units were more reliable with less forced events
during high-demand times during the summer than during the winter seasons The generating unitrsquos
capability has a resulting higher Net Capacity Factor (NCF) of 45 percentage points in the summer season
for 2008-2010
During the spring season (March-May) 77 percent of the units took a planned outage (PO) for an average
231 hours (or 96 days) In fall (October-November) only 42 percent of the units experienced a PO and the
average duration was shorter ndash 134 hours (or 56 days) A few units took both spring and fall planned
outages although this is rare Based on this assessment the generating units are prepared for the summer
peak demand The resulting availability indicates that this maintenance was successful which is measured
by an increased EAF and lower EFORd
Figure 32 Summer-Winter Average EAF NCF and EFORd (2008-2010)
Conclusions and Recommendations During 2008-2010 the average Equivalent Availability Factor (EAF) which measures the overall availability
of generating units decreased At the same time the Net Capacity Factor (NCF) an indicator of energy
production increased The average number of forced outages in 2010 is greater than in 2008 while at the
same time the average planned outage times have decreased As a result the Equivalent Forced Outage
Rate ndash Demand (EFORd) also increased illustrating that more units have experienced forced events during
39 A study of peak periods was conducted by the NERC Generating Availability Trend Evaluation (GATE) Working Group several years ago see httpwwwnerccomfilesSeasonal-Performance-Trendspdf
9116
5343
396
8818
4896
441
0 10 20 30 40 50 60 70 80 90 100
EAF
NCF
EFORd
Percent ()
Winter
Summer
Generation Equipment Performance
61
peak-demand times in 2010 than in the previous two years Potentially with shorter planned outage
periods in 2010 there may be less time to repair equipment and prevent forced unit outages
There are warnings that units are not being maintained as well as they should be In the last three years
there has been an increase in Equivalent Forced Outage Rate ndash Demand (EFORd) This indicator measures
the rate of forced outage events on generating units during periods of load demand To confirm this
problem forced outage hours jumped from 270 to 314 hours per unit between 2009 and 2010 At the same
time maintenance events also increased by 12 hours per unit Planned outage events remain constant The
resulting conclusions from this trend are
bull More or longer planned outage time is needed to repair the generating fleet Whether age is the
cause of the increase need for planned outage time remains unknown and further investigation into
the cause for longer planned outage time is necessary
bull More focus on preventive repairs during planned and maintenance events are needed
There are many multiple unit forced outages due to lack of fuel The majority of multiple unit trips have
three main causes transmission lack of fuel and storms With special interest in the forced outages due to
ldquoLack of Fuelrdquo additional analysis revealed that 77 percent of the units experiencing unexpected fuel
stoppage are oil-fired fossil units while gas-fired units experienced 15 percent
Generating units continue to be more reliable during the peak summer periods
Disturbance Event Trends
62
Category 1 An event resulting in one or more of the following a Unintended loss of three or more BPS elements caused by
common mode failure b Failure or misoperation of an SPSRAS c System-wide voltage reduction of 3 or more d Unintended BPS system separation resulting in an island of
100 MW to 999 MW e Unplanned evacuation from a control center facility with BPS
SCADA functionality for 30 minutes or more Category 2 An event resulting in one or more of the following
a Complete loss of all BPS control center voice communication system(s) for 30 minutes or more
b Complete loss of SCADA control or monitoring functionality for 30 minutes or more
c Voltage excursions equal to or greater than 10 lasting more than five minutes
d Loss of off-site power (LOOP) to a nuclear generating station e Unintended system separation resulting in an island of 1000
MW to 4999 MW f Unintended loss of 300MW or more of firm load for more
than 15 minutes g Violation of an Interconnection Reliability Operating Limit
(IROL) for more than 30 minutes Category 3 An event resulting in one or more of the following
a The loss of load or generation of 2000 MW or more in the Eastern Interconnection or
b Western Interconnection or 1000 MW or more in the ERCOT or Queacutebec Interconnections
c Unintended system separation resulting in an island of 5000 MW to 10000 MW
d Unintended system separation resulting in an island of Florida from the Eastern Interconnection
Category 4 An event resulting in one or more of the following a The loss of load or generation from 5001 MW to 9999 MW b Unintended system separation resulting in an island of more
than 10000 MW (with the exception of Florida as described in Category 3c)
Category 5 An event resulting in one or more of the following a The loss of load of 10000 MW or more b The loss of generation of 10000 MW or more
Figure 33 BPS Event Category
Disturbance Event Trends Introduction The purpose of this section is to report event
analysis trends from the beginning of event
analysis field test40
One of the companion goals of the event
analysis program is the identification of trends
in the number magnitude and frequency of
events and their associated causes such as
human error equipment failure protection
system misoperations etc The information
provided in the event analysis database (EADB)
and various event analysis reports have been
used to track and identify trends in BPS events
in conjunction with other databases (TADS
GADS metric and benchmarking database)
to the end of 2010
The Event Analysis Working Group (EAWG)
continuously gathers event data and is moving
toward an integrated approach to analyzing
data assessing trends and communicating the
results to the industry
Performance Trends The event category is classified41
Figure 33
as shown in
with Category 5 being the most
severe Figure 34 depicts disturbance trends in
Category 1 to 5 system events from the
40 httpwwwnerccomdocseawgGalloway-Industry-EA-Field-Test-102210pdf 41httpwwwnerccomfiles2011-05-0220Event_Analysis_Process_Phase20220Field20Test20Draft20-20Final20-20For20postingpdf
Disturbance Event Trends
63
beginning of event analysis field test to the end of 201042
Figure 34 Event Category vs Date for All 2010 Categorized Events
From the figure in November and December
there were many more category 1 and 2 events than in October This is due to the field trial starting on
October 25 2010
In addition to the category of the events the status of the events plays a critical role in the accuracy of the
data By examining Figure 35 over 80 of the events reported in 2010 have been closed This means that
the category root cause and other important information have been sufficiently finalized in order for
analysis to be accurate for each event At this time there is not enough data to draw any long-term
conclusions about event investigation performance
42 Documents for the EA Field Test are located at httpwwwnerccompagephpcid=5|365
2
12 12
26
3
6 5
14
1 1
2
0
5
10
15
20
25
30
35
40
45
October November December 2010
Even
t Cou
nt
Category 3 Category 2 Category 1
Disturbance Event Trends
64
Figure 35 Event Count vs Status (All 2010 Events with Status)
By drilling down into the cause code for each closed 2010 event Figure 36 shows the top 3 event causes
From the figure equipment failure and protection system misoperation are the most significant causes for
events Because of how new and limited the data is however there may not be statistical significance for
this result Further trending of cause codes for closed events and developing a richer dataset to find any
trends between event cause codes and event counts should be performed
Figure 36 Top 3 Event Counts vs DAWG Cause Code for all Closed 2010 Events
10
32
42
0
5
10
15
20
25
30
35
40
45
Open Closed Open and Closed
Even
t Cou
nt
Status
1211
8
0
2
4
6
8
10
12
14
Equipment Failure Protection System Misoperation Human Error
Even
t Cou
nt
Cause Code
Disturbance Event Trends
65
Conclusions Due to the relatively new process for events analysis and categorization more time will be required before a
conclusive recommendation may be obtained Further analysis and new data should provide valuable
statistics in the future Over 80 of all event reports from 2010 are current listed as closed but no
conclusion about investigation performance may be obtained because of the limited amount of data It is
recommended to study ways to prevent equipment failure and protection system misoperations but there
is not enough data to draw a firm conclusion about the top causes of events at this time
Abbreviations Used in This Report
66
Abbreviations Used in This Report
Acronym Definition ALP Acadiana Load Pocket
ALR Adequate Level of Reliability
ARR Automatic Reliability Report
BA Balancing Authority
BPS Bulk Power System
CDI Condition Driven Index
CEII Critical Energy Infrastructure Information
CIPC Critical Infrastructure Protection Committee
CLECO Cleco Power LLC
DADS Future Demand Availability Data System
DCS Disturbance Control Standard
DOE Department Of Energy
DSM Demand Side Management
EA Event Analysis
EAF Equivalent Availability Factor
ECAR East Central Area Reliability
EDI Event Drive Index
EEA Energy Emergency Alert
EFORd Equivalent Forced Outage Rate Demand
EMS Energy Management System
ERCOT Electric Reliability Council of Texas
ERO Electric Reliability Organization
ESAI Energy Security Analysis Inc
FERC Federal Energy Regulatory Commission
FOH Forced Outage Hours
FRCC Florida Reliability Coordinating Council
GADS Generation Availability Data System
GOP Generation Operator
IEEE Institute of Electrical and Electronics Engineers
IESO Independent Electricity System Operator
IROL Interconnection Reliability Operating Limit
Abbreviations Used in This Report
67
Acronym Definition IRI Integrated Reliability Index
LOLE Loss of Load Expectation
LUS Lafayette Utilities System
MAIN Mid-America Interconnected Network Inc
MAPP Mid-continent Area Power Pool
MOH Maintenance Outage Hours
MRO Midwest Reliability Organization
MSSC Most Severe Single Contingency
NCF Net Capacity Factor
NEAT NERC Event Analysis Tool
NERC North American Electric Reliability Corporation
NPCC Northeast Power Coordinating Council
OC Operating Committee
OL Operating Limit
OP Operating Procedures
ORS Operating Reliability Subcommittee
PC Planning Committee
PO Planned Outage
POH Planned Outage Hours
RAPA Reliability Assessment Performance Analysis
RAS Remedial Action Schemes
RC Reliability Coordinator
RCIS Reliability Coordination Information System
RCWG Reliability Coordinator Working Group
RE Regional Entities
RFC Reliability First Corporation
RMWG Reliability Metrics Working Group
RSG Reserve Sharing Group
SAIDI System Average Interruption Duration Index
SAIFI System Average Interruption Frequency Index
SCADA Supervisory Control and Data Acquisition
SDI Standardstatute Driven Index
SERC SERC Reliability Corporation
Abbreviations Used in This Report
68
Acronym Definition SRI Severity Risk Index
SMART Specific Measurable Attainable Relevant and Tangible
SOL System Operating Limit
SPS Special Protection Schemes
SPCS System Protection and Control Subcommittee
SPP Southwest Power Pool
SRI System Risk Index
TADS Transmission Availability Data System
TADSWG Transmission Availability Data System Working Group
TO Transmission Owner
TOP Transmission Operator
WECC Western Electricity Coordinating Council
Contributions
69
Contributions This report was made feasible by the collaboration and hard work of both NERC staff and NERCrsquos
Industry Groups
NERC Industry Groups
Table 14 lists the NERC industry group contributors Without their contribution and collaboration this
report would not have been possible
Table 13 NERC Industry Group Contributions43
NERC Group
Relationship Contribution
Reliability Metrics Working Group
(RMWG)
Reports to the OCPC bull Lead Development of Report bull Provide Reliability Metrics Data bull Responsible for Reliability Metrics
Performance Chapter
Transmission Availability Working Group
(TADSWG)
Reports to the OCPC bull Provide Transmission Availability Data
bull Responsible for Transmission Equip-ment Performance Chapter
bull Content Review
Generation Availability Data System Task
Force
(GADSTF)
Reports to the OCPC bull Provide Generation Availability Data bull Responsible for Generation Equip-
ment Performance Chapter bull Content Review
Event Analysis Working Group
(EAWG)
Reports to the OCPC bull Provide Events Data bull Responsible for Disturbance Events
Trends Chapter bull Content Review
43 Rosters for RMWG TADSWG GADSTF and EAWG are available at httpwwwnerccomfilesrosterpdf
Contributions
70
NERC Staff Table 13 below lists the NERC staff who contributed to the 2011 Reliability Performance Analysis
Report
Table 14 Contributing NERC Staff
Name Title E-mail Address
Mark Lauby Vice President and Director of
Reliability Assessment and
Performance Analysis
marklaubynercnet
Jessica Bian Manager of Performance Analysis jessicabiannercnet
John Moura Manager of Reliability Assessments johnmouranercnet
Andrew Slone Engineer Reliability Performance
Analysis
andrewslonenercnet
Jim Robinson TADS Project Manager jimrobinsonnercnet
Clyde Melton Engineer Reliability Performance
Analysis
clydemeltonnercnet
Mike Curley Manager of GADS Services mikecurleynercnet
James Powell Engineer Reliability Performance
Analysis
jamespowellnercnet
Michelle Marx Administrative Assistant michellemarxnercnet
William Mo Intern Performance Analysis wmonercnet
- NERCrsquos Mission
- Table of Contents
- Executive Summary
-
- 2011 Transition Report
- State of Reliability Report
- Key Findings and Recommendations
-
- Reliability Metric Performance
- Transmission Availability Performance
- Generating Availability Performance
- Disturbance Events
- Report Organization
-
- Introduction
-
- Metric Report Evolution
- Roadmap for the Future
-
- Reliability Metrics Performance
-
- Introduction
- 2010 Performance Metrics Results and Trends
-
- ALR1-3 Planning Reserve Margin
-
- Background
- Assessment
- Special Considerations
-
- ALR1-4 BPS Transmission Related Events Resulting in Loss of Load
-
- Background
- Assessment
-
- ALR1-12 Interconnection Frequency Response
-
- Background
- Assessment
-
- ALR2-3 Activation of Under Frequency Load Shedding
-
- Background
- Assessment
- Special Considerations
-
- ALR2-4 Average Percent Non-Recovery Disturbance Control Standards (DCS)
-
- Background
- Assessment
- Special Consideration
-
- ALR2-5 Disturbance Control Events Greater Than Most Severe Single Contingency
-
- Background
- Assessment
- Special Consideration
-
- ALR 1-5 System Voltage Performance
-
- Background
- Special Considerations
- Status
-
- ALR3-5 Interconnection Reliability Operating Limit System Operating Limit (IROLSOL) Exceedances
-
- Background
-
- ALR4-1 Automatic Transmission Outages Caused by Protection System Misoperations
-
- Background
- Special Considerations
-
- ALR6-11 ndash ALR6-14
-
- Background
- Assessment
- ALR 6-11 ndash Automatic Outages Initiated by Failed Protection System Equipment
- ALR6-12 ndash Automatic Outages Initiated by Human Error
- ALR6-13 ndash Automatic Outages Initiated by Failed AC Substation Equipment
- ALR6-14 Automatic AC Transmission Outages Initiated by Failed AC Circuit Equipment
-
- ALR6-15 Element Availability Percentage (APC)
-
- Background
- Assessment
- Special Consideration
-
- ALR6-16 Transmission System Unavailability
-
- Background
- Assessment
- Special Consideration
-
- ALR6-2 Energy Emergency Alert 3 (EEA3)
-
- Background
- Assessment
- Special Considerations
-
- ALR 6-3 Energy Emergency Alert 2 (EEA2)
-
- Background
- Assessment
- Special Considerations
-
- ALR 6-1 Transmission Constraint Mitigation
-
- Background
- Assessment
- Special Considerations
-
- Integrated Bulk Power System Risk Assessment
-
- Introduction
- Recommendations
-
- Integrated Reliability Index Concepts
-
- The Three Components of the IRI
-
- Event-Driven Indicators (EDI)
- Condition-Driven Indicators (CDI)
- StandardsStatute-Driven Indicators (SDI)
-
- IRI Index Calculation
- IRI Recommendations
-
- Reliability Metrics Conclusions and Recommendations
-
- Transmission Equipment Performance
-
- Introduction
- Performance Trends
-
- AC Element Outage Summary and Leading Causes
- Transmission Monthly Outages
- Outage Initiation Location
- Transmission Outage Events
- Transmission Outage Mode
-
- Conclusions
-
- Generation Equipment Performance
-
- Introduction
- Generation Key Performance Indicators
-
- Multiple Unit Forced Outages and Causes
- 2008-2010 Review of Summer versus Winter Availability
-
- Conclusions and Recommendations
-
- Disturbance Event Trends
-
- Introduction
- Performance Trends
- Conclusions
-
- Abbreviations Used in This Report
- Contributions
-
- NERC Industry Groups
- NERC Staff
-

Executive Summary
4
Key Findings and Recommendations
Reliability Metric Performance Among the Operating Committeersquos and Planning Committeersquos approved eighteen metrics that address
the characteristics of an adequate level of reliability (ALR) based on metric trends in the following seven
areas indicate the bulk power system is performing better during the time frame investigated
bull ALR1-3 Planning Reserve Margin
bull ALR1-4 BPS Transmission Related Events Resulting in Loss of Load
bull ALR2-5 Disturbance Control Events Greater than Most Severe Single Contingency
bull ALR6-2 Energy Emergency Alert 3 (EEA3)
bull ALR6-3 Energy Emergency Alert 2 (EEA2)
bull ALR6-11 Automatic Transmission Outages Caused by Protection System Misoperations
bull ALR6-13 Automatic Transmission Outages Caused by Failed AC Substation Equipment
Performance analysis has also included other performance categories though a number of the metrics
did not currently have sufficient data to derive useful conclusions The RMWG recommends their
continued data collection and review If a metric does not yield any useful trends in a five-year
reporting period the metric will be modified or withdrawn
Transmission Availability Performance On a NERC-wide average basis the automatic transmission outage rate has improved during the study
timeframe (2008 to 2010) Considering both automatic and non-automatic outages 2010 records
indicate transmission element availability percentage exceeds 95
A deeper review of the root causes of dependent and common mode events which include three or
more automatic outages should be a high priority for NERC and the industry The TADSWG
recommends a joint team be formed to analyze those outages as the effort requires significant
stakeholder subject matter experts with the support of reporting transmission owners
Generating Availability Performance The generating fleet in North America is continuing to age The average age of all unit types was slightly
over 32 years in 2010 while at the same time the coal-fired fleet averages over 44 years old Based on
the data all units appear to require maintenance with increasing regularity to meet unit availability
goals
In the last three years the Equivalent Forced Outage Rate ndash Demand (EFORd) increased indicating a
higher risk that a unit may not be available to meet generating requirements due to forced outages or
de-ratings The average forced outage hours for each unit have jumped from 270 hours to 314 hours
Executive Summary
5
between 2009 and 2010 During the same period the average maintenance hours also increased by 12
hours per unit translating to longer planned outage time More focus on preventive maintenance
during planned or maintenance outages may be needed
The three leading root causes for multiple unit forced trips are transmission outages lack of fuel and
storms Among reported lack of fuel outage events 78 percent of the units are oil-fired and 15 percent
are gas fired To reduce the number of fuel-related outages the GADSTF recommends performing more
detailed analysis and higher visibility to this risk type
Disturbance Events One of most important bulk power system performance measures is the number of significant
disturbance events and their impact on system reliability Since the event analysis field test commenced
in October 2010 a total of 42 events within five categories were reported through the end of 2010
Equipment failure is the number one cause out of the event analyses completed from 2010 This
suggests that a task force be formed to identify the type of equipment and reasons for failure The
information provided in event analysis reports in conjunction with other databases (TADS GADS
metrics database etc) should be used to track and evaluate trends in disturbance events
Report Organization This transitional report is intended to function as an anthology of bulk power system performance
assessments Following the introductory chapter the second chapter details results for 2010 RMWG
approved performance metrics and lays out methods for integrating the variety of risks into an
integrated risk index This chapter also addresses concepts for measuring bulk power system events
The third chapter outlines transmission system performance results that the TADSWG have endorsed
using the three-year history of TADS data Reviewed by the GADSTF the forth chapter provides an
overview of generating availability trends for 72 percent of generators in North America The fifth
chapter provides a brief summary of reported disturbances based on event categories described in the
EAWGrsquos enhanced event analysis field test process document3
3 httpwwwnerccomdocseawgEvent_Analysis_Process_Field_test_DRAFT_102510-Cleanpdf
Introduction
6
Figure 1 State of Reliability Concepts
Introduction Metric Report Evolution The NERC Reliability Metrics Working Group (RMWG) has come a long way from its formation following
the release of the initial reliability metric whitepaper in December 2007 Since that time the RMWG has
built the foundation of a metrics development process with the use of SMART ratings (Specific
Measurable Attainable Relevant and Tangible) in its 2009 report4
The first annual report published in June 2010
provided an overview and review of the first
seven metrics which were approved in the
2009 foundational report In August 2010 the
RMWG released its
expanding the approved metrics to
18 metrics and identifying the need for additional data by issuing a data request for ALR3-5 This
annual report is a testament to the evolution of the metrics from the first release to what it is today
Integrated Bulk Power
System Risk Assessment Concepts paper5
Based on the work done by the RMWG in 2010 NERCrsquos OCPC amended the grouprsquos scope directing the
RMWG to ldquodevelop a method that will provide an integrated reliability assessment of the bulk power
system performance using metric information and trendsrdquo This yearrsquos report builds on the work
undertaken by the RMWG over the past three years and moving further towards establishing a single
Integrated Reliability Index (IRI) covering three components event driven index (EDI) condition driven
introducing the ldquouniverse of riskrdquo to the bulk
power system In the concepts paper the
RMWG introduced a method to assess ldquoevent-
drivenrdquo risks and established a measure of
Severity Risk Index (SRI) to better quantify the
impact of various events of the bulk power
system The concepts paper was subsequently
endorsed by NERCrsquos Operating (OC) and
Planning Committees (PC) The SRI calculation
was further refined and then approved by NERCrsquos OCPC at their March 8-9 2011 meeting
4 2009 Bulk Power System Reliability Performance Metric Recommendations can be found at
httpwwwnerccomdocspcrmwgRMWG_Metric_Report-09-08-09pdf 5 httpwwwnerccomdocspcrmwgIntegrated_Bulk_Power_System_Risk_Assessment_Concepts_Finalpdf
Event Driven Index (EDI)
Indicates Risk from Major System Events
Standards Statute Driven
Index (SDI)
Indicates Risks from Severe
Impact Standard Violations
Condition Driven Index (CDI)
Indicates Risk from Key Reliability
Indicators
Introduction
7
Figure 2 Data Source Integration and Analysis
index (CDI) and standardsstatute driven index (SDI) as shown in Figure 1 These individual
components will be used to develop a reliability index that will assist industry in assessing its current
state of reliability This is an ambitious undertaking and it will continue to evolve as an understanding
of what factors contribute to or indicate the level of reliability develops As such this report will evolve
in the coming years as expanding the work with SRI will provide further analysis of the approved
reliability metrics and establish the cornerstones for developing an IRI The cornerstones are described
in section three with recommendations for next steps to better refine and weigh the components of the
IRI and how its use to establish a ldquoState of Reliabilityrdquo for the bulk power system in North America
For this work to be effective and useful to industry and other stakeholders it must use existing data
sources align with other industry analyses and integrate with other initiatives as shown in Figure 2
NERCrsquos various data resources are introduced in this report Transmission Availability Data System
(TADS) Generation Availability Data System (GADS) the event analysis database and future Demand
Availability Data System (DADS)6
The RMWG embraces an open
development process while
incorporating continuous improve-
ment through leveraging industry
expertise and technical judgment
As new data becomes available
more concrete conclusions from the
reliability metrics will be drawn and
recommendations for reliability
standards and compliance practices
will be developed for industryrsquos
consideration
When developing the IRI the experience gained will be leveraged in developing the Severity Risk Index
(SRI) This evolution will take time and the first assessment of ongoing reliability with an integrated
reliability index is expected in the 2012 Annual Report The goal is not only to measure performance
but to highlight areas for improvement as well as reinforcing and measuring industry success As this
integrated view of reliability is developed the individual quarterly performance metrics will be updated
as illustrated in Figure 3 on a new Reliability Indicators dashboard at NERCrsquos website7
6 DADS will begin mandatory data collection from April 2011 through October 2011 with data due on December 15 2011
The RMWG will
7 Reliability Indicatorsrsquo dashboard is available at httpwwwnerccompagephpcid=4|331
Introduction
8
keep the industry informed by conducting yearly webinars providing quarterly data updates and
publishing its annual report
Figure 3 NERC Reliability Indicators Dashboard
Roadmap for the Future As shown in Figure 4 the 2011 Reliability Performance Analysis report begins a transition from a 2009
metric performance assessment to a ldquoState of Reliabilityrdquo report by collaborating with other groups to
form a unified approach to historical reliability performance analysis This process will require
engagement with a number of NERC industry experts to paint a broad picture of the bulk power
systemrsquos historic reliability
Alignment to other industry reports is also important Analysis from the frequency response performed
by the Resources Subcommittee (RS) physical and cyber security assessment provided by the Critical
Infrastructure Protection Committee (CIPC) the wide area reliability coordination conducted by the
Reliability Coordinator Working Group (RCWG) the spare equipment availability system enhanced by
the Spare Equipment Database Task Force (SEDTF) the post seasonal assessment developed by the
Reliability Assessment Subcommittee (RAS) and demand response deployment summarized by the
Demand Response Data Task Force (DRDTF) will provide a significant foundation from which this report
draws Collaboration derived from these stakeholder groups further refines the metrics and use of
additional datasets will broaden the industryrsquos tool-chest for improving reliability of the bulk power
system
The annual State of Reliability report is aimed to communicate the effectiveness of ERO (Electric
Reliability Organization) by presenting an integrated view of historic reliability performance The report
will provide a platform for sound technical analysis and a way to provide feedback on reliability trends
to stakeholders regulators policymakers and industry The key findings and recommendations will
Introduction
9
ultimately be used as input to standards changes and project prioritization compliance process
improvement event analysis and critical infrastructure protection areas
Figure 4 Overview of the Transition to the 2012 State of Reliability Report
Reliability Metrics Performance
10
Reliability Metrics Performance Introduction Building upon last yearrsquos metric review the RMWG continues to assess the results of eighteen currently
approved performance metrics Due to data availability each of the performance metrics do not
address the same time periods (some metrics have just been established while others have data over
many years) though this will be an important improvement in the future Merit has been found in all
eighteen approved metrics At this time though the number of metrics is expected to will remain
constant however other metrics may supplant existing metrics In spite of the potentially changing mix
of approved metrics to goals is to ensure the historical and current assessments can still be performed
These metrics exist within an overall reliability framework and in total the performance metrics being
considered address the fundamental characteristics of an acceptable level of reliability (ALR) Each of
the elements being measured by the metrics should be considered in aggregate when making an
assessment of the reliability of the bulk power system with no single metric indicating exceptional or
poor performance of the power system
Due to regional differences (size of the region operating practices etc) comparing the performance of
one Region to another would be erroneous and inappropriate Furthermore depending on the region
being evaluated one metric may be more relevant to a specific regionrsquos performance than others and
assessment may not be strictly mathematical rather more subjective Finally choosing one regionrsquos
best metric performance to define targets for other regions is inappropriate
Another key principle followed in developing these metrics is to retain anonymity of any reporting
organization Thus granularity will be attempted up to the point that such actions might compromise
anonymity of any given company Certain reporting entities may appear inconsistent but they have
been preserved to maintain maximum granularity with individual anonymity
Although assessments have been made in a number of the performance categories others do not have
sufficient data to derive any conclusions from the metric results The RMWG recommends continued
assessment of these metrics until sufficient data is available Each of the eighteen performance metrics
are presented in summary with their SMART8 Table 1 ratings in The table provides a summary view of
the metrics with an assessment of the current metric trends observed by the RMWG Table 1 also
shows the order in which the metrics are aligned according to the standards objectives
8 SMART rating definitions are located at httpwwwnerccomdocspcrmwgSMART_20RATING_826pdf
Reliability Metrics Performance
11
Table 1 Metric SMART Ratings Relative to Standard Objectives
Metrics SMART Objectives Relative to Standards Prioritization
ALR Improvements
Trend
Rating
SMART
Rating
1-3 Planning Reserve Margin 13
1-4 BPS Transmission Related Events Resulting in Loss of Load 15
2-5 Disturbance Control Events Greater than Most Severe Single Contingency 12
6-2 Energy Emergency Alert 3 (EEA3) 15
6-3 Energy Emergency Alert 2 (EEA2) 15
Inconclusive
2-3 Activation of Under Frequency Load Shedding 10
2-4 Average Percent Non-Recovery DCS 15
4-1 Automatic Transmission Outages Caused by Protection System Misoperation 15
6-11 Automatic Transmission Outages Caused by Protection System Misoperation 14
6-12 Automatic Transmission Outages Caused by Human Error 14
6-13 Automatic Transmission Outages Caused by Failed AC Substation Equipment 14
6-14 Automatic Transmission Outages Caused by Failed AC Circuit Equipment 14
New Data
1-5 Systems Voltage Performance 14
3-5
Interconnected Reliability Operating Limit System Operating Limit (IROLSOL)
Exceedance 14
6-1 Transmission constraint Mitigation 14
6-15 Element Availability Percentage (APC) 13
6-16
Transmission System Unavailability on Operational Planned and Auto
Sustained Outages 13
No Data
1-12 Frequency Response 11
Trend Rating Symbols
Significant Improvement
Slight Improvement
Inconclusive
Slight Deterioration
Significant Deterioration
New Data
No Data
Reliability Metrics Performance
12
2010 Performance Metrics Results and Trends
ALR1-3 Planning Reserve Margin
Background
The Planning Reserve Margin9 is a measure of the relationship between the amount of resource capacity
forecast and the expected demand in the planning horizon10 Coupled with probabilistic analysis
calculated Planning Reserve Margins is an industry standard which has been used by system planners for
decades as an indication of system resource adequacy Generally the projected demand is based on a
5050 forecast11
Assessment
Planning Reserve Margin is the difference between forecast capacity and projected
peak demand normalized by projected peak demand and shown as a percentage Based on experience
for portions of the bulk power system that are not energy-constrained Planning Reserve Margin
indicates the amount of capacity available to maintain reliable operation while meeting unforeseen
increases in demand (eg extreme weather) and unexpected unavailability of existing capacity (eg
long-term generation outages) Further from a planning perspective Planning Reserve Margin trends
identify whether capacity additions are projected to keep pace with demand growth
Planning Reserve Margins considering anticipated capacity resources and adjusted potential capacity
resources decrease in the latter years of the 2009 and 2010 10-year forecast in each of the four
interconnections Typically the early years provide more certainty since new generation is either in
service or under construction with firm commitments In the later years there is less certainty about
the resources that will be needed to meet peak demand Declining Planning Reserve Margins are
inherent in a conventional forecast (assuming load growth) and do not necessarily indicate a trend of a
degrading resource adequacy Rather they are an indication of the potential need for additional
resources In addition key observations can be made to the Planning Reserve Margin forecast such as
short-term assessment rate of change through the assessment period identification of margins that are
approaching or below a target requirement and comparisons from year-to-year forecasts
While resource planners are able to forecast the need for resources the type of resource that will
actually be built or acquired to fill the need is usually unknown For example in the northeast US
markets with three to five year forward capacity markets no firm commitments can be made in the
9 Detailed calculations of Planning Reserve Margin are available at httpwwwnerccompagephpcid=4|331|333 10The Planning Reserve Margin indicated here is not the same as an operating reserve margin that system operators use for near-term
operations decisions 11These demand forecasts are based on ldquo5050rdquo or median weather (a 50 percent chance of the weather being warmer and a 50 percent
chance of the weather being cooler)
Reliability Metrics Performance
13
long-term However resource planners do recognize the need for resources in their long-term planning
and account for these resources through generator queues These queues are then adjusted to reflect
an adjusted forecast of resourcesmdashpro-rated by approximately 20 percent
When comparing the assessment of planning reserve margins between 2009 and 2010 the
interconnection Planning Reserve Margins are slightly higher on an annual basis in the 2010 forecast
compared to those of 2009 as shown in Figure 5
Figure 5 Planning Reserve Margin by Interconnection and Year
In general this is due to slightly higher capacity forecasts and slightly lower demand forecasts The pace
of any economic recovery will affect future comparisons This metric can be used by NERC to assess the
individual interconnections in the ten-year long-term reliability assessments If a noticeable change
Reliability Metrics Performance
14
occurs within the trend further investigation is necessary to determine the causes and likely effects on
reliability
Special Considerations
The Planning Reserve Margin is a capacity based metric Therefore it does not provide an accurate
assessment of performance in energy-limited systems (eg hydro capacity with limited water resources
or systems with significant variable generation penetration) In addition the Planning Reserve Margin
does not reflect potential transmission constraint internal to the respective interconnection Planning
Reserve Margin data shown in Figure 6 is used for NERCrsquos seasonal and long-term reliability
assessments and is the primary metric for determining the resource adequacy of a given assessment
area
The North American Bulk Power System is divided into four distinct interconnections These
interconnections are loosely connected with limited ability to share capacity or energy across the
interconnection To reflect this limitation the Planning Reserve Margins are calculated in this report
based on interconnection values rather than by national boundaries as is the practice of the Reliability
Assessment Subcommittee (RAS)
ALR1-4 BPS Transmission Related Events Resulting in Loss of Load
Background
This metric measures bulk power system transmission-related events resulting in the loss of load
Planners and operators can use this metric to validate their design and operating criteria by identifying
the number of instances when loss of load occurs
For the purposes of this metric an ldquoeventrdquo is an unplanned transmission disturbance that produces an
abnormal system condition due to equipment failures or system operational actions and results in the
loss of firm system demand for more than 15 minutes The reporting criteria for such events are
outlined below12
bull Entities with a previous year recorded peak demand of more than 3000 MW are required to
report all such losses of firm demands totaling more than 300 MW
bull All other entities are required to report all such losses of firm demands totaling more than 200
MW or 50 percent of the total customers being supplied immediately prior to the incident
whichever is less
bull Firm load shedding of 100 MW or more used to maintain the continuity of the bulk power
system reliability
12 Details of event definitions are available at httpwwwnerccomfilesEOP-004-1pdf
Reliability Metrics Performance
15
Assessment
Figure 6 illustrates that the number of bulk power system transmission-related events resulting in loss of
firm load13
Table 2
from 2002 to 2009 is relatively constant and suggests that 7 - 10 events per year is a norm for
the bulk power system However the magnitude of load loss shown in associated with these
events reflects a downward trend since 2007 Since the data includes weather-related events it will
provide the RMWG with an opportunity for further analysis and continued assessment of the trends
over time is recommended
Figure 6 BPS Transmission Related Events Resulting in Loss of Load Counts (2002-2009)
Table 2 BPS Transmission Related Events Resulting in Loss of Load MW Loss (2002-2009)
Year Load Loss (MW)
2002 3762
2003 65263
2004 2578
2005 6720
2006 4871
2007 11282
2008 5200
2009 2965
13The metric source data may require adjustments to accommodate all of the different groups for measurement and consistency as OE-417 is only used in the US
02468
101214
2002 2003 2004 2005 2006 2007 2008 2009
Count
Reliability Metrics Performance
16
ALR1-12 Interconnection Frequency Response
Background
This metric is used to track and monitor Interconnection Frequency Response Frequency Response is a
measure of an Interconnectionrsquos ability to stabilize frequency immediately following the sudden loss of
generation or load It is a critical component to the reliable operation of the bulk power system
particularly during disturbances and restoration The metric measures the average frequency responses
for all events where frequency drops more than 35 mHz within a year
Assessment
At this time there has been no data collected for ALR1-12 Therefore no assessment was made
ALR2-3 Activation of Under Frequency Load Shedding
Background
The purpose of Under Frequency Load Shedding (UFLS) is to balance generation and load in an island
following an extreme event The UFLS activation metric measures the number of times UFLS is activated
and the total MW of load interrupted in each Region and NERC wide
Assessment
Figure 7 and Table 3 illustrate a history of Under Frequency Load Shedding events from 2006 through
2010 Through this period itrsquos important to note that single events had a range load shedding from 15
MW to 7654 MW The activation of UFLS relays is the last automated reliability measure associated
with a decline in frequency in order to rebalance the system Further assessment of the MW loss for
these activations is recommended
Figure 7 ALR2-3 Count of Activations by Year and Regional Entity (2001-2010)
Reliability Metrics Performance
17
Table 3 ALR2-3 Under Frequency Load Shedding MW Loss
ALR2-3 Under Frequency Load Shedding MW Loss
2006 2007 2008 2009 2010
FRCC
2273
MRO
486
NPCC 94
63 20 25
RFC
SPP
672 15
SERC
ERCOT
WECC
Special Considerations
The use of a single metric cannot capture all of the relevant information associated with UFLS events as
the events relate to each respective UFLS plan The ability to measure the reliability of the bulk power
system is directly associated with how it performs compared to what is planned
ALR2-4 Average Percent Non-Recovery Disturbance Control Standards (DCS)
Background
This metric measures the Balancing Authorityrsquos (BA) or Reserve Sharing Grouprsquos (RSG) ability to balance
resources and demand with the timely deployment of contingency reserve thereby returning the
interconnection frequency to within defined limits following a Reportable Disturbance14
Assessment
The relative
percentage provides an indication of performance measured at a BA or RSG
Figure 8 illustrates the average percent non-recovery of DCS events from 2006 to 2010 The graph
provides a high-level indication of the performance of each respective RE However a single event may
not reflect all the reliability issues within a given RE In order to understand the reliability aspects it
may be necessary to request individual REs to further investigate and provide a more comprehensive
reliability report Further investigation may indicate the entity had sufficient contingency reserve but
through their implementation process failed to meet DCS recovery
14 Details of the Disturbance Control Performance Standard and Reportable Disturbance definitions are available at
httpwwwnerccomfilesBAL-002-0pdf
Reliability Metrics Performance
18
Continued trend assessment is recommended Where trends indicated potential issues the regional
entity will be requested to investigate and report their findings
Figure 8 Average Percent Non-Recovery of DCS Events (2006-2010)
Special Consideration
This metric aggregates the number of events based on reporting from individual Balancing Authorities or
Reserve Sharing Groups It does not capture the severity of the DCS events It should be noted that
most REs use 80 percent of the Most Severe Single Contingency to establish the minimum threshold for
reportable disturbance while others use 35 percent15
ALR2-5 Disturbance Control Events Greater Than Most Severe Single Contingency
Background
This metric represents the number of disturbance events that exceed the Most Severe Single
Contingency (MSSC) and is specific to each BA Each RE reports disturbances greater than the MSSC on
behalf of the BA or Reserve Sharing Group (RSG) The result helps validate current contingency reserve
requirements The MSSC is determined based on the specific configuration of each BA or RSG and can
vary in significance and impact on the BPS
15httpwwwweccbizStandardsDevelopmentListsRequest20FormDispFormaspxID=69ampSource=StandardsDevelopmentPagesWEC
CStandardsArchiveaspx
375
079
0
54
008
005
0
15 0
77
025
0
33
000510152025303540
2006
2007
2008
2009
2010
2006
2007
2008
2009
2010
2006
2007
2008
2009
2010
2006
2007
2008
2009
2010
2006
2007
2008
2009
2010
2006
2007
2008
2009
2010
2006
2007
2008
2009
2010
2006
2007
2008
2009
2010
FRCC MRO NPCC RFC SERC SPP ERCOT WECC
Region and Year
Reliability Metrics Performance
19
Assessment
Figure 9 represents the number of DCS events within each RE that are greater than the MSSC from 2006
to 2010 This metric and resulting trend can provide insight regarding the risk of events greater than
MSSC and the potential for loss of load
In 2010 SERC had 16 BAL-002 reporting entities eight Balancing Areas elected to maintain Contingency
Reserve levels independent of any reserve sharing group These 16 entities experienced 79 reportable
DCS eventsmdash32 (or 405 percent) of which were categorized as greater than their most severe single
contingency Every DCS event categorized as greater than the most severe single contingency occurred
within a Balancing Area maintaining independent Contingency Reserve levels Significantly all 79
regional entities reported compliance with the Disturbance Recovery Criterion including for those
Disturbances that were considered greater than their most severe single Contingency This supports a
conclusion that regardless of the size of the BA or participation in a Reserve Sharing Group SERCrsquos BAL-
002 reporting entities have demonstrated the ability in 2010 to use Contingency Reserve to balance
resources and demand and return Interconnection frequency within defined limits following Reportable
Disturbances
If the SERC Balancing Areas without large generating units and who do not participate in a Reserve
Sharing Group change the determination of their most severe single contingencies to effect an increase
in the DCS reporting threshold (and concurrently the threshold for determining those disturbances
which are greater than the most severe single contingency) there will certainly be a reduction in both
the gross count of DCS events in SERC and in the subset considered under ALR2-5 Masking the discrete
events which cause Balancing Area response may not reduce ldquoriskrdquo to the system However it is
desirable to maintain a reporting threshold which encourages the Balancing Authority to respond to any
unexplained change in ACE in a manner which supports Interconnection frequency based on
demonstrated performance SERC will continue to monitor DCS performance and will continue to
evaluate contingency reserve requirements but does not consider 2010 ALR2-5 performance to be an
adverse trend in ldquoextreme or unusualrdquo contingencies but rather within the normal range of expected
occurrences
Reliability Metrics Performance
20
Special Consideration
The metric reports the number of DCS events greater than MSSC without regards to the size of a BA or
RSG and without respect to the number of reporting entities within a given RE Because of the potential
for differences in the magnitude of MSSC and the resultant frequency of events trending should be
within each RE to provide any potential reliability indicators Each RE should investigate to determine
the cause and relative effect on reliability of the events within their footprints Small BA or RSG may
have a relatively small value of MSSC As such a high number of DCS greater than MCCS may not
indicate a reliability problem for the reporting RE but may indicate an issue for the respective BA or RSG
In addition events greater than MSSC may not cause a reliability issue for some BA RSG or RE if they
have more stringent standards which require contingency reserves greater than MSSC
ALR 1-5 System Voltage Performance
Background
The purpose of this metric is to measure the transmission system voltage performance (either absolute
or per unit of a nominal value) over time This should provide an indication of the reactive capability
available to the transmission system The metric is intended to record the amount of time that system
voltage is outside a predetermined band around nominal
0
5
10
15
20
25
30
2006
2007
2008
2009
2010
2006
2007
2008
2009
2010
2006
2007
2008
2009
2010
2006
2007
2008
2009
2010
2006
2007
2008
2009
2010
2006
2007
2008
2009
2010
2006
2007
2008
2009
2010
2006
2007
2008
2009
2010
FRCC MRO NPCC RFC SERC SPP ERCOT WECC
Cou
nt
Region and Year
Figure 9 Disturbance Control Events Greater Than Most Severe Single Contingency (2006-2010)
Reliability Metrics Performance
21
Special Considerations
Each Reliability Coordinator (RC) will work with the Transmission Owners (TOs) and Transmission
Operators (TOPs) within its footprint to identify specific buses and voltage ranges to monitor for this
metric The number of buses the monitored voltage levels and the acceptable voltage ranges may vary
by reporting entity
Status
With a pilot program requested in early 2011 a voluntary request to Reliability Coordinators (RC) was
made to develop a list of key buses This work continues with all of the RCs and their respective
Transmission Owners (TOs) to gather the list of key buses and their voltage ranges After this step has
been completed the TO will be requested to provide relevant data on key buses only Based upon the
usefulness of the data collected in the pilot program additional data collection will be reviewed in the
future
ALR3-5 Interconnection Reliability Operating Limit System Operating Limit (IROLSOL) Exceedances
Background
This metric illustrates the number of times that defined Interconnection Reliability Operating Limit
(IROL) or System Operating Limit (SOL) were exceeded and the duration of these events Exceeding
IROLSOLs could lead to outages if prompt operator control actions are not taken in a timely manner to
return the system to within normal operating limits This metric was approved by NERCrsquos Operating and
Planning Committees in June 2010 and a data request was subsequently issued in August 2010 to collect
the data for this metric Based on the results of the pilot conducted in the third and fourth quarter of
2010 there is merit in continuing measurement of this metric Note the reporting of IROLSOL
exceedances became mandatory in 2011 and data collected in Table 4 for 2010 has been provided
voluntarily
Reliability Metrics Performance
22
Table 4 ALR3-5 IROLSOL Exceedances
3Q2010 4Q2010 1Q2011
le 10 mins 123 226 124
le 20 mins 10 36 12
le 30 mins 3 7 3
gt 30 mins 0 1 0
Number of Reporting RCs 9 10 15
ALR4-1 Automatic Transmission Outages Caused by Protection System Misoperations
Background
Originally titled Correct Protection System Operations this metric has undergone a number of changes
since its initial development To ensure that it best portrays how misoperations affect transmission
outages it was necessary to establish a common understanding of misoperations and the data needed
to support the metric NERCrsquos Reliability Assessment Performance Analysis (RAPA) group evaluated
several options of transitioning from existing procedures for the collection of misoperations data and
recommended a consistent approach which was introduced at the beginning of 2011 With the NERC
System Protection and Control Subcommitteersquos (SPCS) technical guidance NERC and the regional
entities have agreed upon a set of specifications for misoperations reporting including format
categories event type codes and reporting period to have a final consistent reporting template16
Special Considerations
Only
automatic transmission outages 200 kV and above including AC circuits and transformers will be used
in the calculation of this metric
Data collection will not begin until the second quarter of 2011 for data beginning with January 2011 As
revised this metric cannot be calculated for this report at the current time The revised title and metric
form can be viewed at the NERC website17
16 The current Protection System Misoperation template is available at
httpwwwnerccomfilezrmwghtml 17The current metric ALR4-1 form is available at httpwwwnerccomdocspcrmwgALR_4-1Percentpdf
Reliability Metrics Performance
23
ALR6-11 ndash ALR6-14
ALR6-11 Automatic AC Transmission Outages Initiated by Failed Protection System Equipment
ALR6-12 Automatic AC Transmission Outages Initiated by Human Error
ALR6-13 Automatic AC Transmission Outages Initiated by Failed AC Substation Equipment
ALR6-14 Automatic AC Circuit Outages Initiated by Failed AC Circuit Equipment
Background
These metrics evolved from the original ALR4-1 metric for correct protection system operations and
now illustrate a normalized count (on a per circuit basis) of AC transmission element outages (ie TADS
momentary and sustained automatic outages) that were initiated by Failed Protection System
Equipment (ALR6-11) Human Error (ALR6-12) Failed AC Substation Equipment (ALR6-13) and Failed AC
Circuit Equipment (ALR6-14) These metrics are all related to the non-weather related initiating cause
codes for automatic outages of AC circuits and transformers operated 200 kV and above
Assessment
Figure 10 through Figure 13 show the normalized outages per circuit and outages per transformer for
facilities operated at 200 kV and above As shown in all eight of the charts there are some regional
trends in the three years worth of data However some Regionrsquos values have increased from one year
to the next stayed the same or decreased with no discernable regional trends For example ALR6-11
computes the automatic AC Circuit outages initiated by failed protection system equipment
There are some trends to the ALR6-11 to ALR6-14 data but many regions do not have enough data for a
valid trend analysis to be performed NERCrsquos outage rate seems to be improving every year On a
regional basis metric ALR6-11 along with ALR6-12 through ALR6-14 cannot be statistically understood
until confidence intervals18
18The detailed Confidence Interval computation is available at
are calculated ALR metric outage frequency rates and Regional equipment
inventories that are smaller than others are likely to require more than 36 months of outage data Some
numerically larger frequency rates and larger regional equipment inventories (such as NERC) do not
require more than 36 months of data to obtain a reasonably narrow confidence interval
httpwwwnerccomdocspctadstfTADS_Nov_2_2007APPENDIX_C_Confidence_Intervalpdf
Reliability Metrics Performance
24
While more data is still needed on a regional basis to determine if each regionrsquos bulk power system is
becoming more reliable year to year there are areas of potential improvement which include power
system condition protection performance and human factors These potential improvements are
presented due to the relatively large number of outages caused by these items The industry can
benefit from detailed analysis by identifying lessons learned and rolling average trends of NERC-wide
performance With a confidence interval of relatively narrow bandwidth one can determine whether
changes in statistical data are primarily due to random sampling error or if the statistics are significantly
different due to performance
Reliability Metrics Performance
25
ALR 6-11 ndash Automatic Outages Initiated by Failed Protection System Equipment
Automatic outages with an initiating cause code of failed protection system equipment are in Figure 10
Figure 10 ALR6-11 by Region (Includes NERC-Wide)
This code covers automatic outages caused by the failure of protection system equipment This
includes any relay andor control misoperations except those that are caused by incorrect relay or
control settings that do not coordinate with other protective devices
ALR6-12 ndash Automatic Outages Initiated by Human Error
Figure 11 shows the automatic outages with an initiating cause code of human error This code covers
automatic outages caused by any incorrect action traceable to employees andor contractors for
companies operating maintaining andor providing assistance to the Transmission Owner will be
identified and reported in this category
Reliability Metrics Performance
26
Also any human failure or interpretation of standard industry practices and guidelines that cause an
outage will be reported in this category
Figure 11 ALR6-12 by Region (Includes NERC-Wide)
Reliability Metrics Performance
27
ALR6-13 ndash Automatic Outages Initiated by Failed AC Substation Equipment
Figure 12 shows the automatic outages with an initiating cause code of failed AC substation equipment
This code covers automatic outages caused by the failure of AC Substation ie equipment ldquoinside the
substation fencerdquo including transformers and circuit breakers but excluding protection system
equipment19
19TADS Initiating Cause Code definitions are located at httpwwwnerccomdocspctadswgTADS_Definitions_Appendix_7_092909pdf
Figure 12 ALR6-13 by Region (Includes NERC-Wide)
Reliability Metrics Performance
28
ALR6-14 Automatic AC Transmission Outages Initiated by Failed AC Circuit Equipment
Figure 13 shows the automatic outages with an initiating cause code of failed AC circuit equipment
Automatic Outages related to the failure of AC Circuit equipment ie overhead or underground
equipment ldquooutside the substation fencerdquo 20
ALR6-15 Element Availability Percentage (APC)
Background
This metric uses data and calculations directly from the NERC TADS effort and illustrates the overall
percent of time the aggregate of transmission facilities are available and in service This is an aggregate
20TADS Initiating Cause Code definitions are located at httpwwwnerccomdocspctadswgTADS_Definitions_Appendix_7_092909pdf
Figure 13 ALR6-14 by Region (Includes NERC-Wide)
Reliability Metrics Performance
29
value using sustained outages (automatic and non-automatic) for both lines and transformers operated
at 200 kV and above for each Regional Entity Interconnection and for NERC This metric was approved
by the NERC Operating and Planning Committees in September 2010
Assessment
Figure 14 shows the aggregate element availability percentage (APC) for transmission and transformers
facilities operated at 200 kV and above The values are all over 90 percent which shows excellent
system availability The RMWG recommends continued metric assessment for at least a few more years
in order to determine the value of this metric
Figure 14 2010 ALR6-15 Element Availability Percentage
Notably the Eastern Interconnection does not include Quebec or ERCOT ERCOT does not have any
transformers with low-side voltage levels 200 kV and above
Special Consideration
It should be noted that the non-automatic outage data needed to calculate this metric was only first
collected for the calendar year 2010 as part of the TADS process Therefore only one year of data for
this metric is available at this time
Reliability Metrics Performance
30
ALR6-16 Transmission System Unavailability
Background
This metric uses data and calculations directly from the NERC TADS effort and shows the overall percent
of time the aggregate of transmission facilities are unavailable due to automatic and non-automatic
outages This is an aggregate value using sustained automatic outages for both lines and transformers
operated at 200 kV and above for each Regional Entity and for NERC This metric was approved by the
NERC Operating and Planning Committees in December 2010
Assessment
Figure 15 and Figure 16 illustrate the 2010 aggregate unavailability percentage for AC circuits and
transformer facilities operated at 200 kV and above The values for AC circuits are all under 3 percent
which shows excellent system availability
The RMWG recommends continued metric assessment for at least a few more years in order to
determine the value of this metric
Special Consideration
It should be noted that the non-automatic outage data needed to calculate this metric was only first
collected for the calendar year 2010 as part of the TADS process Therefore only one year of data for
this metric is available at this time
Figure 15 2010 ALR6-16 Transmission System Unavailability
Reliability Metrics Performance
31
Figure 16 2010 ALR6-16 Transmission System Unavailability by Outage Type
Notably the Eastern Interconnection does not include Quebec or ERCOT Also ERCOT does not have
any transformers with low-side voltage levels 200 kV and above
ALR6-2 Energy Emergency Alert 3 (EEA3)
Background
This metric identifies the number of times Energy Emergency Alerts Level 3 (EEA3) are issued EEA3
events are firm-load interruptions due to capacity and energy deficiency EEA3 is currently reported
collected and maintained in NERCrsquos Reliability Coordination Information System (RCIS) and is defined in
Attachment 1 of the NERC Standard EOP-00221
21 The latest version of Attachment 1 for EOP-002 is available at
This metric identifies the number of times EEA3s are
issued The number of EEA3s per year provides a relative indication of performance measured at a
Balancing Authority or interconnection level As historical data is gathered trends in future reports will
provide an indication of either decreasing or increasing use of EEA3s signaling adequacy of the electric
supply system This metric can also be considered in the context of Planning Reserve Margin Significant
increases or decreases in EEA3 events with relatively constant Planning Reserve Margins could indicate
httpwwwnerccompagephpcid=2|20
Reliability Metrics Performance
32
volatility in the actual loads compared to forecast levels or changes in the adequacy of the bulk power
system required to meet load demands
Assessment
Figure 17 shows the number of EEA3 events during 2006 and 2010 from an RE level An interactive
presentation was released and available at the Reliability Indicatorrsquos page22
The Acadiana Load Pocket (ALP) is an area in south central Louisiana that has experienced regular
transmission constraints and numerous Energy Emergency Alert filings by the SPP Reliability Controller
(SPP RC) Transmission within ALP is owned by Entergy Lafayette Utilities System (LUS) and Cleco
Power LLC (Cleco) The transmission constraints within the ALP are primarily caused by the local area
load and the lack of generation located in close proximity to the load area
The number of EEA3rsquos
declared in 2010 returned to more traditional numbers The 2009 spike in EEA3 events in the SPP
Region that was driven by issues in the Acadiana Load Pocket (ALP) were not present in 2010
Special Considerations
Ideally the measure should capture only EEAs that are declared for reliability reasons and not for
economic factors The RMWG has not been able to differentiate these reasons for future reporting and
it has made a recommendation to the Reliability Coordinator Working Group (RCWG) to consider a
revised EEA declaration to exclude economic factors
The reason the EEA volume decreased from 2009 to 2010 in SPP was because the SPP ICT RC23
coordinated an operating agreement between the five operating companies in the ALP The operating
agreement included a cost sharing re-dispatch that alleviated the need of a Transmission Loading Relief
(TLR-5) declaration24
22The EEA3 interactive presentation is available on the NERC website at
During 2009 there was no operating agreement therefore an entity had to
provide Network and Native Load (NNL) relief when a TLR-5 was called by the ICT RC When the TLR-5
was the primary tool to control the post contingent loading in the ALP some of the BAs would have their
firm transmission curtailed to the point where they could no longer serve their load therefore the EEA
3 was needed to communicate a capacityreserve deficiency
httpwwwnerccompagephpcid=4|331|335 23Southwest Power Pool (SPP) Independent Coordinator of Transmission (ICT) Reliability Coordinator (RC) 24More information on Transmission Load Relief is contained in the IRO-006 standard which is located at httpwwwnerccomfilesIRO-006-4pdf In particular TLR-5 definitions are referenced on page 16 and 17
Reliability Metrics Performance
33
Figure 17 ALR6-2 Energy Emergency Alert 3 (EEA3) Counts by Region (2006-2010)
Cleco Power Entergy and LUS are currently constructing an estimated $200 million transmission
infrastructure improvement project to mitigate transmission constraints into ALP Construction of the
project is scheduled to be complete in 2012 Completion of the project should help alleviate some of
the transmission congestion in this area Energy Emergency Alerts filed by the SPP Regional Entity
continue to decline
SPP RTO continues to coordinate operating plans with the operating entities in this area Mitigation
plans and local operating guides in place are expected to provide sufficient flexibility should issues arise
NERC will continue to monitor this area for Reliability Impacts and coordinate any actions with the SPP
Reliability Coordinator and SPP Regional Entity
ALR 6-3 Energy Emergency Alert 2 (EEA2)
Background
Energy Emergency Alert 2 (EEA2) is to measure the number of events BAs declare for deficient capacity
and energy during peak load periods which may serve as a leading indicator of energy and capacity
shortfall in the adequacy of the electric supply system EEA2 provides a sense of the frequency of
precursor events to the more severe EEA3 declarations This metric measures the number of events
1 3 1 2 214
3 4 4 1 5 334
4 2 1 52
1
0
5
10
15
20
25
30
3520
0620
0720
0820
0920
1020
0620
0720
0820
0920
1020
0620
0720
0820
0920
1020
0620
0720
0820
0920
1020
0620
0720
0820
0920
1020
0620
0720
0820
0920
1020
0620
0720
0820
0920
1020
0620
0720
0820
0920
10
FRCC MRO NPCC RFC SERC SPP TRE WECC
2006-2009
2010
Region and Year
Reliability Metrics Performance
34
Balancing Authorities declare for deficient capacity and energy during peak load periods At this time
however this data reflects inclusion of Demand Side Resources that would not be indicative of
inadequacy of the electric supply system
The number of EEA2 events and any trends in their reporting indicates how robust the system is in
being able to supply the aggregate load requirements The historical records may include demand
response activations and non-firm load interruptions per applicable contracts within the EEA alerts per
its definition25
Assessment
Demand response is a legitimate resource to be called upon by balancing authorities and
do not indicate a reliability concern As data is gathered in the future reports will provide an indication
of either decreasing or increasing adequacy in the electric supply system EEA2 events called solely for
activation of demand response (controllable or contractually prearranged demand-side dispatch
programs) or interruption of non-firm load per applicable contracts should be excluded This metric can
also be considered in the context of the Planning Reserve Margin Significant increases or decreases in
EEA2 events with relatively constant Planning Reserve Margins could indicate volatility in the actual
loads compared to forecast levels or changes in the adequacy of the bulk power system required to
meet load demands
Figure 18 shows the number of EEA2 events by Regional Entity from 2006 to 2010 EEA2 interactive
version available on line by quarter and region26
25 The EEA2 is defined at
The general trend continues to show improved
performance which may have been influenced by the overall reduction in demand throughout NERC
caused by the economic downturn Specific performance by any one region should be investigated
further for issues or events that may affect the results Determining whether performance reported
includes those events resulting from the economic operation of DSM and non-firm load interruption
should also be investigated The RMWG recommends continued metric assessment
httpwwwnerccomfilesEOP-002-2pdf 26 EEA2 interactive version located at httpwwwnerccompagephpcid=4|331|341
Reliability Metrics Performance
35
Special Considerations
The intent of this metric is to measure only EEAs that are called for reliability reasons and not for
economic factors such as demand side management (DSM) and non-firm load interruption The
historical data for this metric may include events that were called for economic factors According to
the RCWG recent data should only include EEAs called for reliability reasons
ALR 6-1 Transmission Constraint Mitigation
Background
The RMWG completed a pilot with four regional entities Based on the results the RMWG expanded the
pilot data collection to all regions and the initial results of the data collection are shown in Figure 19
and Table 5 Based on the results of the pilot there is merit in continuing to assess this metric The
intent of this metric is to identify trends in the number of mitigation measures (Special Protection
Schemes (SPS) Remedial Action Schemes (RAS) and Operating Procedures) required to meet reliability
requirements By their nature SPS do not indicate an inherent weakness in the bulk power system
rather they are an indication of methods that are taken to operate the system through the range of
conditions it must perform This metric is only intended to evaluate the trend use of these plans and
whether the metric indicates robustness of the transmission system is increasing remaining static or
decreasing
1 27
2 1 4 3 2 1 2 4 5 2 5 832
4724
211
5 38 5 1 1 8 7 4 1 1
05
101520253035404550
2006
2007
2008
2009
2010
2006
2007
2008
2009
2010
2006
2007
2008
2009
2010
2006
2007
2008
2009
2010
2006
2007
2008
2009
2010
2006
2007
2008
2009
2010
2006
2007
2008
2009
2010
2006
2007
2008
2009
2010
FRCC MRO NPCC RFC SERC SPP TRE WECC
2006-2009
2010
Region and Year
Figure 18 ALR6-3 Energy Emergency Alert 2 (EEA2)
Reliability Metrics Performance
36
Assessment
The pilot data indicates a relatively constant number of mitigation measures over the time period of
data collected
Figure 19 ALR6-1 Transmission Constraint Mitigation by SPSRAS (2009-2014)
0102030405060708090
100110120
2009
2010
2011
2014
2009
2010
2011
2014
2009
2010
2011
2014
2009
2010
2011
2014
2009
2010
2011
2014
2009
2010
2011
2014
2009
2010
2011
2014
2009
2010
2011
2014
FRCC MRO NPCC RFC SERC SPP ERCOT WECC
Coun
t
Region and Year
SPSRAS
Reliability Metrics Performance
37
Table 5 ALR6-1 Transmission Constraint Mitigation by Operating ProcedureGuides (2009-2011)
ALR6-1 Transmission Constraint Mitigation by Operating ProcedureGuides (2009-2014)
2009 2010 2011 2014
FRCC 107 75 66
MRO 79 79 81 81
NPCC 0 0 0
RFC 2 1 3 4
SPP 39 40 40 40
SERC 6 7 15
ERCOT 29 25 25
WECC 110 111
Special Considerations
A certain number of SPS mitigation plans may be necessary to support reliable operation of the system
If the number of SPS increase over time this may indicate that additional transmission capacity is
required A reduction in the number of SPS may be an indicator of increased generation or transmission
facilities being put into service which may indicate greater robustness of the bulk power system In
general mitigation plans are a viable and valuable tool for effective operation of the bulk power system
In power system planning reliability operability capacity and cost-efficiency are simultaneously
considered through a variety of scenarios to which the system may be subjected Mitigation measures
are a method for optimizing a power system across these scenarios Changes in quantities of mitigation
plans may indicate year-on-year differences in the system being evaluated
Integrated Bulk Power System Risk Assessment
Introduction In developing eighteen metrics to measure acceptable levels of reliability it has become clear that any
such measurement of reliability must include consideration of the risks present within the bulk power
system in order for us to appropriately prioritize and manage these system risks The scope for the
Reliability Metrics Working Group (RMWG)27
27 The RMWG scope can be viewed at
includes a task to develop a risk-based approach that
provides consistency in quantifying the severity of events The approach not only can be used to
httpwwwnerccomfilezrmwghtml
Reliability Metrics Performance
38
measure risk reduction over time but also can be applied uniformly in event analysis process to identify
the events that need to be analyzed in detail and sort out non-significant events
The Operating Committee (OC) and Planning Committee (PC) endorsed the concepts and framework28 of
the risk-based approach in their September 2010 joint meeting and further supported the event severity
risk index (SRI) calculation29
Recommendations
in March 2011
bull NERC should embrace the use of risk assessment to identify trends in addition to lessons learned
in order to improve bulk power system reliability
bull The RMWG should continue to coordinate and communicate with the Event Analysis Working
Group (EAWG) to apply the SRI into the event analysis process and root cause analysis
bull As trend evaluations increase the knowledge of risks to the bulk power system data required to
support additional assessment should be gathered
Event Severity Risk Index (SRI)
Risk assessment is an essential tool for achieving the alignment between organizations people and
technology This will assist in quantifying inherent risks identifying where potential high risks exist and
evaluating where the most significant lowering of risks can be achieved Being learning organizations
the Electric Reliability Organization (ERO) Regional Entities and Registered Entities can use these tools
to focus on the areas of highest risk to reliability to provide a sound basis for developing results-based
standards and compliance programs Risk assessment also serves to engage all stakeholders in a
dialogue about specific risk factors and helps direct a strategic plan for risk reduction and early
detection
The SRI is a daily blended metric for which transmission loss generation loss and load loss events are
calculated Each element (transmission generation and load loss) is factored by the systemrsquos inventory
for that element to rate significant events appropriately On a yearly basis these daily performances
can be sorted in descending order to evaluate the year-on-year performance of the system
In order to test drive the concepts the RMWG applied these calculations against historically memorable
days to derive SRIs Once these calculations were complete they were reviewed and evaluated by
various stakeholders for reasonableness Based upon feedback modifications to the calculation were
made and assessed against the historic days performed This iterative process locked down the details
28 httpwwwnerccomdocspcrmwgIntegrated_Bulk_Power_System_Risk_Assessment_Concepts_Finalpdf 29 httpwwwnerccomdocspcrmwgSRI_Equation_Refinement_May6_2011pdf
Reliability Metrics Performance
39
for the calculation of SRI whose calculation from zero (no transmission line outages generation outages
or load lost in a day) to 1000 (a theoretical condition in which every transmission line all generation
units and all load lost across the system in a single day)
Figure 20 captures the calculated severity risk value for each of the days for each year benchmarked
with the historic significant events which were used to concept test the calculation Since there is
significant disparity between days the bulk power system is stressed compared to those that are
ldquoroutinerdquo and ldquoherordquo days of the year where the system performed extremely well the curve is depicted
using a logarithmic scale Each yearrsquos data is sorted in descending order striking a characteristic shape
At the left-side of the curve the days in which the system is severely stressed are plotted The central
more linear portion of the curve identifies the routine day performance while the far right-side of the
curve shows the values plotted for days in which almost all lines and generation units are in service and
essentially no load is lost
The trends on the chart below show that 2009 and 2010 had fewer extreme days than 2008 Routine
daily performance appears generally consistent across all three years Figure 20 captures the days for
each year benchmarked with historically significant events
In Figure 20 NERCrsquos event categories and SRI ratings are directly related As the SRI increases the
category or severity of the event increases Historical events are also shown to relate modern
reliability measurements to give a perspective of how a well-known event would register on the SRI
scale
The event analysis process30
30
benefits from the SRI as it enables a numerical analysis of an event in
comparison to other events By this measure an event can be prioritized by its severity In a severe
event this is unnecessary However for events that do not result in severe stressing of the bulk power
system this prioritization can be a challenge By using the SRI the event analysis process can decide
which events to learn from and reduce which events to avoid and when resilience needs to be
increased under high impact low frequency events as shown in the blue boxes in the figure
httpwwwnerccompagephpcid=5|365
Reliability Metrics Performance
40
Figure 20 NERC Annual Daily Severity Risk Index (SRI) Sorted Descending with Historic Benchmark Days
Other factors that impact severity of a particular event to be considered in the future include whether
equipment operated as designed and resulted in loss of load from a reliability perspective (intentional
and controlled load-shedding) Mechanisms for enabling ongoing refinement to include the historic and
simulated events for future severity risk calculations are being explored
Reliability Metrics Performance
41
Integrated Reliability Index Concepts In December 2010 the RMWG was challenged by the OC and PC to develop a single index concept to
measure the universe of risks associated with the bulk power system As a result the integrated
reliability index (IRI) concepts were proposed31
Figure 21
the three components of which were defined to
quantify each specific risk aspect They are titled the Event Driven Index (EDI) StandardsStatute Driven
Index (SDI) and Condition Driven Index (CDI) illustrated in with measures associated with
system events standards compliance and eighteen performance metrics The development of an
integrated reliability index aims to inform increase transparency and quantify the effectiveness of risk
reduction or mitigation actions The goal is to provide the industry meaningful trends of the BPSrsquos
performance and guidance on how the industry can improve reliability and support risk-informed
decision making Once completed the IRI will facilitate holistic assessment of performance Finally the
IRI should help overcome concern and confusion about how many metrics are being analyzed for system
reliability assessments
Figure 21 Risk Model for Bulk Power System
The integrated model of event-driven condition-driven and standardsstatute-driven risk information
can be constructed to illustrate all possible logical relations between the three risk sets Due to the
nature of the system there may be some overlap among the components
31 httpwwwnerccomdocspcrmwgIntegrated_Reliability_Index_WhitePaper_DRAFTpdf
Event Driven Index (EDI)
Indicates Risk from
Major System Events
Standards Statute Driven
Index (SDI)
Indicates Risks from Severe Impact Standard Violations
Condition Driven Index (CDI)
Indicates Risk from Key Reliability
Indicators
Reliability Metrics Performance
42
The Three Components of the IRI The three components of the IRI work together as shown in Figure 22 to comprise a full picture of the
state of reliability
Figure 22 An overview of the components that comprise the Integrated Reliability Index (IRI)
Event-Driven Indicators (EDI)
The Event-Driven Indicator provides a basis for prioritization of events based on bulk power system
integrity equipment performance and engineering judgment This indicator can serve as a high value
risk assessment tool to be used by stakeholders to investigate and evaluate disturbance history and
measure the severity of these events The relative ranking of events requires industry expertise agreed-
upon goals and engineering judgment The EDI is a derivative of SRI results for a specific time period
but it transforms that performance into a form of an availability index These calculations will be further
refined as feedback is received
Condition-Driven Indicators (CDI)
The Condition-Driven Indicators focus on a set of measurable system conditions (performance
measures) to assess bulk power system reliability These reliability indicators identify factors that
positively or negatively impact reliability and are early predictors of the risk to reliability from events or
unmitigated violations A collection of these indicators measures how close reliability performance is to
the desired outcome and if the performance against these metrics is constant or improving
Reliability Metrics Performance
43
StandardsStatute-Driven Indicators (SDI)
The StandardsStatute-Driven Indicator is a calculation of success of compliance based upon the subset
of high-value standards and is divided by the number of participations who could have received the
violation within the time period considered Also based on these factors known unmitigated violations
of elevated risk factor requirements are weighted higher than lower risk factors The index decreases if
the compliance improvement is achieved over a trending period
IRI Index Calculation As with the SRI the IRI is based on an importance weighting factor which the RMWG can modify over
time after gaining experience with the new metric as well as consideration of feedback from industry
At this time the RMWG believes some form of blended weighting may serve to start to populate IRI
characteristic curves at a high and generic level Based upon feedback from stakeholders this approach
may change or as discussed below weighting factors may vary based on periodic review and risk model
update The RMWG will continue the refinement of the IRI calculation and consider other significant
factors that impact reliability (eg intentional and controlled load-shedding) further it will explore
developing mechanisms for enabling ongoing refinement which should be influenced by a wide set of
stakeholders
RMWG recommends the Event Driven Index (EDI) be weighted the highest (50 percent) since events
actually occurred indicating how the system was performing The Condition Driven Index (CDI) and
StandardsStatute Driven Index (SDI) are weighted 25 each since they are indicators of potential risks
to BPS reliability IRI can be calculated as follows
IRI is intended to be a composite metric which integrates several forms of individual risks to the bulk
power system Since the three components range across many stakeholder organizations these
concepts are developed as starting points for continued study and evaluation Additional supporting
materials can be found in the IRI whitepaper32
IRI Recommendations
including individual indices calculations and preliminary
trend information
For the IRI more investigation should be performed to determine the best way to integrate EDI CDI
and SDI into an Integrated Reliability Index (IRI) that quantitatively represents the reliability of the bulk
32 The IRI whitepaper can be found at httpwwwnerccomdocspcrmwgIntegrated_Reliability_Index_WhitePaper_DRAFTpdf
Reliability Metrics Performance
44
power system To this end study into determining the amount of overlap between the components is
necessary RMWG is currently working to determine the proper amount of overlap between the IRI
components
Also the CDI component of the IRI needs to be solidified This is especially true with the CDI More
accurate metric data is needed to paint a fuller picture of the CDI Many of the metrics used to calculate
the CDI are new or they have limited data Compared to the SDI which counts well-known violation
counts and the EDI which uses the well-defined CDI the CDI lacks the depth of rigor that the other two
components have acquired through their years of data RMWG is currently working to improve the CDI
Reliability Metrics Conclusions and Recommendations Among the eighteen metrics that address the characteristics of an adequate level of reliability (ALR)
metric trends indicate the system is performing better in the following seven areas
bull ALR1-3 Planning Reserve Margin
bull ALR1-4 BPS Transmission Related Events Resulting in Loss of Load
bull ALR2-5 Disturbance Control Events Greater than Most Severe Single Contingency
bull ALR6-2 Energy Emergency Alert 3 (EEA3)
bull ALR6-3 Energy Emergency Alert 2 (EEA2)
bull ALR6-11 Automatic Transmission Outages Caused by Protection System Misoperations
bull ALR6-13 Automatic Transmission Outages Caused by Failed AC Substation Equipment
Assessments have been made in other performance categories A number of them do not have
sufficient data to derive any conclusions from the results The RMWG recommends continued data
collection and assessment of these metrics If a metric does not yield any trend in a five-year reporting
period the metric will be modified or withdrawn
For the IRI more investigation should be performed to determine the overlap of the components (CDI
EDI and SDI) The CDI should be more thoroughly solidified as an index by collecting more data over
time
Transmission Equipment Performance
45
Transmission Equipment Performance Introduction The Transmission Availability Data System (TADS) effort began with the establishment of a TADS task force
by the NERC Planning Committee in October 2006 On October 27 2007 the NERC Board of Trustees
approved the collection of transmission automatic outage data beginning in calendar year 2008 (Phase I)
Subsequently on October 29 2008 the NERC Board approved the collection of Non-Automatic Outage data
that began for Calendar year 2010 (Phase II)
This chapter provides reliability performance analysis of the transmission system by focusing on the trends
of Automatic Outage data from calendar year 2008 thru 2010 Since only one year of Non-Automatic
Outage data has been collected that data will not be assessed in this report
When calculating bulk power system performance indices care must be exercised when interpreting results
as misinterpretation can lead to erroneous conclusions regarding system performance With only three
years of data in the smaller regions it is not clear whether a regionrsquos yearly outage variation compared to
the average is due to random statistical variation or that particular year is significantly different in
performance However on a NERC-wide basis after three years of data collection there is enough
information to accurately determine whether the yearly outage variation compared to the average is due to
random statistical variation or the particular year in question is significantly different in performance33
Performance Trends
Transmission performance information has been provided by Transmission Owners (TOs) within NERC
through the NERC TADS (Transmission Availability Data System) process The data presented reflects
Momentary and Sustained AC Automatic outages of transmission elements that operate at voltages ge 200 kV
(including the low side of transformers) with the criteria specified in the TADS process The following
elements listed below are included
bull AC Circuits ge 200 kV (Overhead and Underground Circuits) Radial circuits are included
bull DC Circuits with ge +-200 kV DC voltage
bull Transformers with ge 200 kV low-side voltage and
bull ACDC Back-to-Back (BTB) Converters with ge 200 kV AC voltage on both sides
33The detailed Confidence Interval computation is available at httpwwwnerccomdocspctadstfTADS_Nov_2_2007APPENDIX_C_Confidence_Intervalpdf
Transmission Equipment Performance
46
AC Element Outage Summary and Leading Causes Table 6 shows the 2008 2009 and 2010 NERC total AC transmission element inventory and a summary of
the associated outages As expected in general the number of circuits increased from year to year due to
new construction or re-construction to higher voltages For every outage experienced on the transmission
system cause codes are identified and recorded according to the TADS process Causes of both momentary
and sustained outages have been indicated These causes are analyzed to identify trends and similarities
and to provide insight into what could be done to possibly prevent future occurrences
Figure 23 and Figure 24 describe the top ten initiating cause codes for sustained and momentary automatic
outages combined from 2008-2010 Based on the two figures the relationship between the total number of
outages and total outage hours can be seen Failed AC Substation Equipment and Failed AC Circuit
Equipment only account for 15 percent of the total number of outages but account for 65 percent of the
total outage hours The two largest causes of outages within NERC (ldquoLightingrdquo and ldquoWeather excluding
Lightningrdquo) account for 34 percent of the total number of outages
The next three Human Error Failed Protection System Equipment and Failed AC Circuit Equipment have
very similar totals and should all be considered significant focus points in reducing the number of Sustained
Automatic Outages for all elements
Transmission Equipment Performance
47
Table 6 NERC - All AC Elements Sustained and Momentary Outage Performance Summary
2008 Number of Outages
AC Voltage
Class
No of
Circuits
Circuit
Miles Sustained Momentary
Total
Outages Total Outage Hours
200-299kV 4369 102131 1560 1062 2622 56595
300-399kV 1585 53631 793 753 1546 14681
400-599kV 586 31495 389 196 585 11766
600-799kV 110 9451 43 40 83 369
All Voltages 6650 196708 2785 2051 4836 83626
2009 Number of Outages
AC Voltage
Class
No of
Circuits
Circuit
Miles Sustained Momentary
Total
Outages Total Outage Hours
200-299kV 4468 102935 1387 898 2285 28828
300-399kV 1619 56447 641 610 1251 24714
400-599kV 592 32045 265 166 431 9110
600-799kV 110 9451 53 38 91 442
All Voltages 6789 200879 2346 1712 4038 63094
2010 Number of Outages
AC Voltage
Class
No of
Circuits
Circuit
Miles Sustained Momentary
Total
Outages Total Outage Hours
200-299kV 4567 104722 1506 918 2424 54941
300-399kV 1676 62415 721 601 1322 16043
400-599kV 605 31590 292 174 466 10442
600-799kV 111 9477 63 50 113 2303
All Voltages 6957 208204 2582 1743 4325 83729
Note The NERC table does not show redacted outages DC Circuit outages Transformer outages or ACDC
converter outages
Transmission Equipment Performance
48
Figure 23 NERC - Top Ten Sustained and Momentary Outages by Initiating Cause Code for All Elements
Figure 24 NERC - Top Ten Sustained Outage Hours by Cause Code
198
151
80
7271
6943
33
27
188
68
Lightning
Weather excluding lightningHuman Error
Failed AC Substation EquipmentFailed Protection System EquipmentFailed AC Circuit Equipment Foreign Interference
Power System Condition
Fire
Unknown
Remaining Cause Codes
299
246
188
58
52
42
3619
16 12 31 Failed AC Substation EquipmentFailed AC Circuit Equipment Weather excluding lightningUnavailable
Other
Fire
Unknown
Human Error
Failed Protection System EquipmentForeign Interference
Remaining Cause Codes
Transmission Equipment Performance
49
Transmission Monthly Outages Figure 25 displays the total number of Automatic Outages on a per-month basis The three months with the
highest total of outages were June July and August From a seasonal perspective winter had a monthly
average of 281 outages These include the months of November-March Summer had an average of 429
outages Summer included the months of April-October
Figure 25 Number of Outages by Month for AC Circuits (2008-2010)
This figure does not show redacted outages DC Circuit outages Transformer outages or ACDC Converter
outages
Outage Initiation Location For every outage experienced on the transmission system the outage initiation code is identified and
recorded according to the TADS process The outage initiation code can be analyzed to identify trends and
similarities and to provide insight into what could be done to possibly prevent future occurrences
The ldquoOutage Initiation Coderdquo describes where an automatic outage was initiated on the power system The
five codes are as follows
bull Element-Initiated
bull Other Element-Initiated
bull AC Substation-Initiated
bull ACDC Terminal-Initiated (for DC circuits)
bull Other Facility Initiated any facility not included in any other outage initiation code
JanuaryFebruar
yMarch April May June July August
September
October
November
December
2008 238 229 257 258 292 437 467 380 208 176 255 236
2009 315 201 339 334 398 553 546 515 351 235 226 294
2010 444 224 269 446 449 486 639 498 351 271 305 281
3 Year AVG 332 218 288 346 380 492 551 464 303 227 262 270
0
100
200
300
400
500
600
700
Out
ages
Transmission Equipment Performance
50
Notably the protection system is not part of an ldquoAC Substationrdquo or an ldquoACDC Terminalrdquo If a protection
system misoperates and initiates an outage it will be classified as ldquoOther-Facility Initiatedrdquo The following
Figures show the initiating location of the Automatic outages from 2008 to 2010
With both Momentary and Sustained Automatic Outages taken into account the outage was initiated on the
Element more than 67 percent of the time as shown in Figure 26 and Figure 27
When only the Sustained Automatic Outages are analyzed the outage initiation on both AC Substation and
Other Facility increased by 34 percent and 32 percent respectively Outages initiated on the Element itself
decreases by 78 percent as shown in Figure 26 and 27 For only the Momentary Automatic Outages the
outage initiation on the Element increases by 19 percent compared to Sustained Outages Element initiated
outages make up over 78 percent of the total outages when analyzing only Momentary Outages
Figure 26
Figure 27
Transmission Outage Events Figure 28 illustrates the relationship between the numbers of Automatic Outages associated per TADS
event 2008 2009 and 2010 tend to follow the same trend The largest number of Automatic Outages per
TADS event is fourteen in 2010 thirteen in 2009 and eight in 2008 There are around 70 to 100 TADS
events that contain between fourteen and three Automatic Outages (see below) There are around 330 to
400 TADS events that contain two or more Automatic Outages The rest of the events only contain one
Automatic Outage As noted in the lower right hand corner below the total number of Events in 2008 to
2010 ranged from 3920 to 4569 events per year Nearly 90 percent or more of the events contained one
Automatic Outage
Figure 26 Sustained Automatic Outage Initiation
Code
Figure 27 Momentary Automatic Outage Initiation
Code
Transmission Equipment Performance
51
Transmission Outage Mode Figure 29 and Figure 30 show the percentage of Outage Modes The ldquoOutage Mode Coderdquo describes
whether one Automatic Outage is related to other Automatic Outages A Single Mode outage is an
Automatic Outage of a single Element which occurs independently of any other Automatic Outages (if any)
A ldquoDependent Mode Initiating Outagerdquo is an Automatic Outage of a single Element that initiates one or more
subsequent Element Automatic Outages A ldquoDependent Mode Outagerdquo is an Automatic Outage of an
Element which occurred as a result of an initiating outage whether the initiating outage was an Element
outage or a non-Element outage A ldquoCommon Mode Outagerdquo is one of two or more Automatic Outages with
the same Initiating Cause Code and where the outages are not consequences of each other and occur nearly
simultaneously A ldquoCommon Mode Initiating Outagerdquo is a Common Mode Outage that initiates one or more
subsequent Automatic Outages
Over 72 percent of the total outages occurred on the bulk power system are Single Mode Outages The next
largest mode is Dependent with over 11 percent of the total outages being in this category For only
Sustained Automatic Outages outages related to each other increase with Dependent mode accounting for
13 percent of the outages and Common mode accounting for close to 11 percent of the outages
Independent Sustained outages still account for the largest portion with nearly 70 percent being Single
mode When just analyzing Momentary Automatic Outages Associated outages decrease with Dependent
Figure 28 Event Histogram (2008-2010)
Transmission Equipment Performance
52
mode accounting for only 9 percent of the outages The Common Mode percentage decreases while
Dependent Mode Initiating percentage increases compared to Sustained Outages Independent Momentary
outages account for the largest portion with over 76 percent being Single Mode
An investigation into the root causes of Dependent and Common mode events which include three or more
Automatic Outages (indentified in the TADS 2008 to 2010 data) should be a high priority Some protection
systems are designed to trip three or more circuits but some events go beyond what is designed Some also
have misoperations associated with multiple outage events
Conclusions On a NERC wide average basis automatic transmission outage rate is improving from 2008 to 2010 based on
reported data Considering both automatic and non-automatic outages 2010 records indicate transmission
element availability percentage is very high and exceeds 95 The unavailability rate for AC circuits and
transformers are only 15 and 29 respectively
The cause codes of Human Error Failed Protection System Equipment and Failed AC Circuit Equipment
should be considered significant focus points in reducing the number of Sustained Automatic Outages for all
elements A deeper look into the root causes of Dependent and Common mode events which include three
or more Automatic Outages (indentified in the TADS 2008 to 2010 data) should be a high priority Some
protection systems are designed to trip three or more circuits but some events go beyond what is designed
Some also have misoperations associated with multiple outage events
Figure 29 Sustained Automatic Outage Mode code Figure 30 Momentary Automatic Outage Mode code
Generation Equipment Performance
53
Generation Equipment Performance Introduction The development of the Generating Availability Data System (GADS) began in 1982 This series of databases
is used to voluntarily collect record and retrieve operating information By pooling individual unit
information with likewise units generating unit availability performance can be calculated providing
opportunities to identify trends and generating equipment reliability improvement opportunities The
information is used to support equipment reliability availability analyses and risk-informed decision-making
by system planners generation owners assessment modelers manufacturers and contractors etc Reports
and information resulting from the data collected through GADS are now used for benchmarking and
analyzing electric power plants
Currently the data collected through GADS contains 72 percent of the North American generating units
with generating capacity of 20 MW or higher34 Additionally many of the newer combined-cycle plants are
not reporting information and therefore a full view of each unit type is not presented Rather a sample of
all the units in North America that fit a given more general category is provided35 for the 2008-201036
Generation Key Performance Indicators
assessment period
Three key performance indicators37
In
the industry have used widely to measure the availability of generating
units (see Terms Used in This Report section for their calculation parameters) are Equivalent Availability
Factor (EAF) Net Capacity Factor (NCF) and Equivalent Forced Outage Rate ndash Demand (EFORd)
Table 7 the North American fleet average EAF NCF and EFORd compared to unit age for all generating
units with a capacity of 20 MW and higher is provided for the years 2008-2010 The EAF shows a decline
during the last three years NCF is up and down while the EFORd appears to be increasing As expected the
fleet of units reported to GADS is aging overall with the fossil units being about 12 years older than the
average age
34 httpwwwnerccomdocspcgadstfGADSTF_Recommendation_Report_02-18-2011_FINALpdf 35GADS contains some 1500+ units under 20 MW that is not included in this report These units are excluded because most units are not base-loaded and are in peaking operation
3684 percent of the 2010 dataset is available at this time while the 2008 and 2009 dataset is complete 37 httpwwwnerccompagephpcid=4|43
Generation Equipment Performance
54
Table 7 General Availability Review of GADS Fleet Units by Year
2008 2009 2010 Average
Equivalent Availability Factor (EAF) 8776 8774 8678 8743
Net Capacity Factor (NCF) 5083 4709 4880 4890
Equivalent Forced Outage Rate -
Demand (EFORd) 579 575 639 597
Number of Units ge20 MW 3713 3713 3713 3713
Average Age of the Fleet in Years (all
unit types) 303 311 321 312
Average Age of the Fleet in Years
(fossil units only) 422 432 440 433
Figure 31 provides the average forced outage hours (FOH) maintenance outage hours (MOH) and planned
outage hours (POH) for all units reporting 20 MW or larger During this three-year period the average FOH
291 hours average MOH is 163 hours average POH is 470 hours
Figure 31 shows a large increase in forced and maintenance events The average age of the units with a
capacity of 20MW and higher in 2009 is 316 years old However the average age of fossil units in 2010 is
442 years old These fossil units are the backbone of all operating units providing the base-load power
continuously and nearly 50 percent of all energy annually There appears to be no increase allocated for
annualsemi-annual maintenance (ie planned outages) for the older generating units The increase of
000100002000030000400005000060000700008000090000
100000
2008 2009 2010
463 479 468
154 161 173
288 270 314
Hou
rs
Planned Maintenance Forced
Figure 31 Average Outage Hours for Units gt 20 MW
Generation Equipment Performance
55
maintenance outage hours reflects an increased need to fix problems that cannot be deferred until the next
annualsemi-annual repairs As a result it shows one of two things are happening
bull More or longer planned outage time is needed to repair the aging generating fleet
bull More focus on preventive repairs during planned and maintenance events are needed
Multiple Unit Forced Outages and Causes Table 8 provides the annual multiple-unit forced outage trips resulting from the same cause for each of the
assessments years 2008-2010 respectively The ldquosingle unitrdquo trips are large units with a Net Dependable
Capacity of 750 MW or more The trips of ldquotwo unitsrdquo or more is any combination of unit capacity with the
total amount of lost capacity more than 750 MW
Table 8 also presents more information on the forced outages During 2008-2010 there were a large
number of double-unit outages resulting from the same event Investigations show that some of these trips
were at a single plant caused by common control and instrumentation for the units The incidents occurred
several times for several months and are a common mode issue internal to the plant
Table 8 Number of Multiple Unit Forced Outages and FrequencyYear
2008 2009 2010
Type of
Trip
of
Trips
Avg Outage
Hr Trip
Avg Outage
Hr Unit
of
Trips
Avg Outage
Hr Trip
Avg Outage
Hr Unit
of
Trips
Avg Outage
Hr Trip
Avg Outage
Hr Unit
Single-unit
Trip 591 58 58 284 64 64 339 66 66
Two-unit
Trip 281 43 22 508 96 48 206 41 20
Three-unit
Trip 74 48 16 223 146 48 47 109 36
Four-unit
Trip 12 77 19 111 112 28 40 121 30
Five-unit
Trip 11 1303 260 60 443 88 19 199 10
gt 5 units 20 166 16 93 206 50 37 246 6
Loss of ge 750 MW per Trip
The high number of five-unit trips in 2008 was due to Hurricane Ike hitting the Gulf Coast The highest total
number of multiple unit trips occurred in 2009 though as mentioned before the data collection for 2010 is
incomplete at this time The majority of 2009 multiple unit trips have three main causes (in order by
Generation Equipment Performance
56
number of events) transmission lack of fuel and storms A summary of the three categories for single as
well as multiple unit outages (all unit capacities) are reflected in Table 9
Table 9 Common Causes of Multiple Unit Forced Outages (2009)
Cause Number of Events Average MW Size of Unit
Transmission 1583 16
Lack of Fuel (Coal Mines Gas Lines etc) Not
in Operator Control
812 448
Storms Lightning and Other Acts of Nature 591 112
Some of the transmission outages based on storms in 2009 have been caused by the same reasons because
the storms may have caused transmission interference However the plants reported the problems
inconsistently with either the transmission interference or storms cause code Therefore they are depicted
as two different causes of forced outage
Marked transmission outages in 2009 were quite high Thirty-five percent came from one utility with a large
number of hydroelectric units The company related the trips to various problems including weather
(lightning storms) wildlife ldquoline bumpsrdquo and problems on the receiving end of the transmission line Nine
hundred and eighty-five transmission trips (62 percent) were from hydroelectric units38
In 2009 only ten transmission trips resulted in a loss of 750 MW or more per trip Twenty two generating
plants were affected by the ten trips Causes for the trips include feeder line trips (1 trip) breakers in the
switchyard (8 trips) personnel errors (2 trips) and unknown (10 trips)
The ldquoLack of Fuelrdquo outages are of interest as these events occur during the times when a unit is available to
operate but there is an interruption in fuels to operate the facilities These events do not include
interruptions of fuel due to contracts Rather the cause code is designed to account for units that are
expecting fuel and it is unavailable when requested Table 10 presents the distribution of ldquoLack of Fuelrdquo
events by NERC Region and Table 11 presents the unit types affected
38 The average size of the hydroelectric units were small ndash 335 MW
Generation Equipment Performance
57
Of the units that report ldquoLack of Fuelrdquo 78 percent of the units are oil-fired 15 percent of the units are gas-
fired and the remaining units are various other fuels Table 12 provides the top causes of forced outage for
several unit types For fossil units ldquoLack of Fuelrdquo as the number three cause behind waterwall tube leaks
and superheater tube leaks
Table 10 Forced Outages Due to Lack of Fuel by Region
Region Number of Lack of Fuel
Problems Reported
FRCC 0
MRO 3
NPCC 24
RFC 695
SERC 17
SPP 3
TRE 7
WECC 29
One company contributed to the majority of oil-fired lack of fuel events The units at the company are
actually dual-fuels (oil and gas) but market nominated gas monitoring causes the units to be on forced
outage nightly The units need gas to start up so they can run on oil When they shut down the units must
switch to gas to clean themselves With the gas restriction the unit canrsquot start and the unit goes on a
forced outage Until the band is lifted the two units will continue to be on a forced outage cycle
Event records also provide descriptions of why the unit was without fuel with the majority of descriptions
bull Temperatures affecting gas supply valves
bull Unexpected maintenance of gas pipe-lines
bull Compressor problemsmaintenance
Generation Equipment Performance
58
Table 11 Unit Type Profile of Forced Outages Due to Lack of Fuel
Unit Types Number of Lack of Fuel Problems Reported
Fossil 642
Nuclear 0
Gas Turbines 88
Diesel Engines 1
HydroPumped Storage 0
Combined Cycle 47
Generation Equipment Performance
59
Table 12 Causes of Forced Outage for Different Unit Types (2008-2010)
Fossil - all MW sizes all fuels
Rank Description Occurrence per Unit-year
MWH per Unit-year
Average Hours To Repair
Average Hours Between Failures
Unit-years
1 Waterwall (furnace wall) 0590 134106 59 3250 3868 2 Second Superheater
Leaks 0180 5182 60 3228 3868
3 Lack of Fuel (coal mines gas lines etc) where the operator is not in control
0480 4701 18 26 3868
Combined-Cycle blocks Rank Description Occurrence
per Unit-year
MWH per Unit-year
Average Hours To Repair
Average Hours Between Failures
Unit-years
1 HP Turbine Buckets Or Blades
0020 4663 1830 26280 466
2 Turbine Control Valves 0040 2777 100 7200 466 3 Gas Turbine Compressor -
High Pressure Shaft 0010 2266 663 4269 466
Nuclear units - all Reactor types Rank Description Occurrence
per Unit-year
MWH per Unit-year
Average Hours To Repair
Average Hours Between Failures
Unit-years
1 LP Turbine Buckets or Blades
0010 26415 8760 26280 288
2 Containment Structure 0010 9233 1226 26262 288 3 Feedwater Pump Local
Controls 0020 7620 692 12642 288
Simple-cycle gas turbine jet engines Rank Description Occurrence
per Unit-year
MWH per Unit-year
Average Hours To Repair
Average Hours Between Failures
Unit-years
1 Main Transformer 0030 1611 1016 20709 4181 2 Other Gas Turbine
Controls And Instrument Problems
0120 428 70 2614 4181
3 Other Gas Turbine Problems
0090 400 119 1701 4181
Generation Equipment Performance
60
2008-2010 Review of Summer versus Winter Availability To address seasonality of unit availability unit information for the months of June to September (summer)
and December through February (winter) were pooled to calculate force events during these timeframes for
2008-201039 Figure 32 shows the Equivalent Availability Factor (EAF) is three percentage points higher and
the Equivalent Forced Outage Rate - Demand (EFORd) is more than a half of a percentage point lower in the
summer period than in winter period This means the units were more reliable with less forced events
during high-demand times during the summer than during the winter seasons The generating unitrsquos
capability has a resulting higher Net Capacity Factor (NCF) of 45 percentage points in the summer season
for 2008-2010
During the spring season (March-May) 77 percent of the units took a planned outage (PO) for an average
231 hours (or 96 days) In fall (October-November) only 42 percent of the units experienced a PO and the
average duration was shorter ndash 134 hours (or 56 days) A few units took both spring and fall planned
outages although this is rare Based on this assessment the generating units are prepared for the summer
peak demand The resulting availability indicates that this maintenance was successful which is measured
by an increased EAF and lower EFORd
Figure 32 Summer-Winter Average EAF NCF and EFORd (2008-2010)
Conclusions and Recommendations During 2008-2010 the average Equivalent Availability Factor (EAF) which measures the overall availability
of generating units decreased At the same time the Net Capacity Factor (NCF) an indicator of energy
production increased The average number of forced outages in 2010 is greater than in 2008 while at the
same time the average planned outage times have decreased As a result the Equivalent Forced Outage
Rate ndash Demand (EFORd) also increased illustrating that more units have experienced forced events during
39 A study of peak periods was conducted by the NERC Generating Availability Trend Evaluation (GATE) Working Group several years ago see httpwwwnerccomfilesSeasonal-Performance-Trendspdf
9116
5343
396
8818
4896
441
0 10 20 30 40 50 60 70 80 90 100
EAF
NCF
EFORd
Percent ()
Winter
Summer
Generation Equipment Performance
61
peak-demand times in 2010 than in the previous two years Potentially with shorter planned outage
periods in 2010 there may be less time to repair equipment and prevent forced unit outages
There are warnings that units are not being maintained as well as they should be In the last three years
there has been an increase in Equivalent Forced Outage Rate ndash Demand (EFORd) This indicator measures
the rate of forced outage events on generating units during periods of load demand To confirm this
problem forced outage hours jumped from 270 to 314 hours per unit between 2009 and 2010 At the same
time maintenance events also increased by 12 hours per unit Planned outage events remain constant The
resulting conclusions from this trend are
bull More or longer planned outage time is needed to repair the generating fleet Whether age is the
cause of the increase need for planned outage time remains unknown and further investigation into
the cause for longer planned outage time is necessary
bull More focus on preventive repairs during planned and maintenance events are needed
There are many multiple unit forced outages due to lack of fuel The majority of multiple unit trips have
three main causes transmission lack of fuel and storms With special interest in the forced outages due to
ldquoLack of Fuelrdquo additional analysis revealed that 77 percent of the units experiencing unexpected fuel
stoppage are oil-fired fossil units while gas-fired units experienced 15 percent
Generating units continue to be more reliable during the peak summer periods
Disturbance Event Trends
62
Category 1 An event resulting in one or more of the following a Unintended loss of three or more BPS elements caused by
common mode failure b Failure or misoperation of an SPSRAS c System-wide voltage reduction of 3 or more d Unintended BPS system separation resulting in an island of
100 MW to 999 MW e Unplanned evacuation from a control center facility with BPS
SCADA functionality for 30 minutes or more Category 2 An event resulting in one or more of the following
a Complete loss of all BPS control center voice communication system(s) for 30 minutes or more
b Complete loss of SCADA control or monitoring functionality for 30 minutes or more
c Voltage excursions equal to or greater than 10 lasting more than five minutes
d Loss of off-site power (LOOP) to a nuclear generating station e Unintended system separation resulting in an island of 1000
MW to 4999 MW f Unintended loss of 300MW or more of firm load for more
than 15 minutes g Violation of an Interconnection Reliability Operating Limit
(IROL) for more than 30 minutes Category 3 An event resulting in one or more of the following
a The loss of load or generation of 2000 MW or more in the Eastern Interconnection or
b Western Interconnection or 1000 MW or more in the ERCOT or Queacutebec Interconnections
c Unintended system separation resulting in an island of 5000 MW to 10000 MW
d Unintended system separation resulting in an island of Florida from the Eastern Interconnection
Category 4 An event resulting in one or more of the following a The loss of load or generation from 5001 MW to 9999 MW b Unintended system separation resulting in an island of more
than 10000 MW (with the exception of Florida as described in Category 3c)
Category 5 An event resulting in one or more of the following a The loss of load of 10000 MW or more b The loss of generation of 10000 MW or more
Figure 33 BPS Event Category
Disturbance Event Trends Introduction The purpose of this section is to report event
analysis trends from the beginning of event
analysis field test40
One of the companion goals of the event
analysis program is the identification of trends
in the number magnitude and frequency of
events and their associated causes such as
human error equipment failure protection
system misoperations etc The information
provided in the event analysis database (EADB)
and various event analysis reports have been
used to track and identify trends in BPS events
in conjunction with other databases (TADS
GADS metric and benchmarking database)
to the end of 2010
The Event Analysis Working Group (EAWG)
continuously gathers event data and is moving
toward an integrated approach to analyzing
data assessing trends and communicating the
results to the industry
Performance Trends The event category is classified41
Figure 33
as shown in
with Category 5 being the most
severe Figure 34 depicts disturbance trends in
Category 1 to 5 system events from the
40 httpwwwnerccomdocseawgGalloway-Industry-EA-Field-Test-102210pdf 41httpwwwnerccomfiles2011-05-0220Event_Analysis_Process_Phase20220Field20Test20Draft20-20Final20-20For20postingpdf
Disturbance Event Trends
63
beginning of event analysis field test to the end of 201042
Figure 34 Event Category vs Date for All 2010 Categorized Events
From the figure in November and December
there were many more category 1 and 2 events than in October This is due to the field trial starting on
October 25 2010
In addition to the category of the events the status of the events plays a critical role in the accuracy of the
data By examining Figure 35 over 80 of the events reported in 2010 have been closed This means that
the category root cause and other important information have been sufficiently finalized in order for
analysis to be accurate for each event At this time there is not enough data to draw any long-term
conclusions about event investigation performance
42 Documents for the EA Field Test are located at httpwwwnerccompagephpcid=5|365
2
12 12
26
3
6 5
14
1 1
2
0
5
10
15
20
25
30
35
40
45
October November December 2010
Even
t Cou
nt
Category 3 Category 2 Category 1
Disturbance Event Trends
64
Figure 35 Event Count vs Status (All 2010 Events with Status)
By drilling down into the cause code for each closed 2010 event Figure 36 shows the top 3 event causes
From the figure equipment failure and protection system misoperation are the most significant causes for
events Because of how new and limited the data is however there may not be statistical significance for
this result Further trending of cause codes for closed events and developing a richer dataset to find any
trends between event cause codes and event counts should be performed
Figure 36 Top 3 Event Counts vs DAWG Cause Code for all Closed 2010 Events
10
32
42
0
5
10
15
20
25
30
35
40
45
Open Closed Open and Closed
Even
t Cou
nt
Status
1211
8
0
2
4
6
8
10
12
14
Equipment Failure Protection System Misoperation Human Error
Even
t Cou
nt
Cause Code
Disturbance Event Trends
65
Conclusions Due to the relatively new process for events analysis and categorization more time will be required before a
conclusive recommendation may be obtained Further analysis and new data should provide valuable
statistics in the future Over 80 of all event reports from 2010 are current listed as closed but no
conclusion about investigation performance may be obtained because of the limited amount of data It is
recommended to study ways to prevent equipment failure and protection system misoperations but there
is not enough data to draw a firm conclusion about the top causes of events at this time
Abbreviations Used in This Report
66
Abbreviations Used in This Report
Acronym Definition ALP Acadiana Load Pocket
ALR Adequate Level of Reliability
ARR Automatic Reliability Report
BA Balancing Authority
BPS Bulk Power System
CDI Condition Driven Index
CEII Critical Energy Infrastructure Information
CIPC Critical Infrastructure Protection Committee
CLECO Cleco Power LLC
DADS Future Demand Availability Data System
DCS Disturbance Control Standard
DOE Department Of Energy
DSM Demand Side Management
EA Event Analysis
EAF Equivalent Availability Factor
ECAR East Central Area Reliability
EDI Event Drive Index
EEA Energy Emergency Alert
EFORd Equivalent Forced Outage Rate Demand
EMS Energy Management System
ERCOT Electric Reliability Council of Texas
ERO Electric Reliability Organization
ESAI Energy Security Analysis Inc
FERC Federal Energy Regulatory Commission
FOH Forced Outage Hours
FRCC Florida Reliability Coordinating Council
GADS Generation Availability Data System
GOP Generation Operator
IEEE Institute of Electrical and Electronics Engineers
IESO Independent Electricity System Operator
IROL Interconnection Reliability Operating Limit
Abbreviations Used in This Report
67
Acronym Definition IRI Integrated Reliability Index
LOLE Loss of Load Expectation
LUS Lafayette Utilities System
MAIN Mid-America Interconnected Network Inc
MAPP Mid-continent Area Power Pool
MOH Maintenance Outage Hours
MRO Midwest Reliability Organization
MSSC Most Severe Single Contingency
NCF Net Capacity Factor
NEAT NERC Event Analysis Tool
NERC North American Electric Reliability Corporation
NPCC Northeast Power Coordinating Council
OC Operating Committee
OL Operating Limit
OP Operating Procedures
ORS Operating Reliability Subcommittee
PC Planning Committee
PO Planned Outage
POH Planned Outage Hours
RAPA Reliability Assessment Performance Analysis
RAS Remedial Action Schemes
RC Reliability Coordinator
RCIS Reliability Coordination Information System
RCWG Reliability Coordinator Working Group
RE Regional Entities
RFC Reliability First Corporation
RMWG Reliability Metrics Working Group
RSG Reserve Sharing Group
SAIDI System Average Interruption Duration Index
SAIFI System Average Interruption Frequency Index
SCADA Supervisory Control and Data Acquisition
SDI Standardstatute Driven Index
SERC SERC Reliability Corporation
Abbreviations Used in This Report
68
Acronym Definition SRI Severity Risk Index
SMART Specific Measurable Attainable Relevant and Tangible
SOL System Operating Limit
SPS Special Protection Schemes
SPCS System Protection and Control Subcommittee
SPP Southwest Power Pool
SRI System Risk Index
TADS Transmission Availability Data System
TADSWG Transmission Availability Data System Working Group
TO Transmission Owner
TOP Transmission Operator
WECC Western Electricity Coordinating Council
Contributions
69
Contributions This report was made feasible by the collaboration and hard work of both NERC staff and NERCrsquos
Industry Groups
NERC Industry Groups
Table 14 lists the NERC industry group contributors Without their contribution and collaboration this
report would not have been possible
Table 13 NERC Industry Group Contributions43
NERC Group
Relationship Contribution
Reliability Metrics Working Group
(RMWG)
Reports to the OCPC bull Lead Development of Report bull Provide Reliability Metrics Data bull Responsible for Reliability Metrics
Performance Chapter
Transmission Availability Working Group
(TADSWG)
Reports to the OCPC bull Provide Transmission Availability Data
bull Responsible for Transmission Equip-ment Performance Chapter
bull Content Review
Generation Availability Data System Task
Force
(GADSTF)
Reports to the OCPC bull Provide Generation Availability Data bull Responsible for Generation Equip-
ment Performance Chapter bull Content Review
Event Analysis Working Group
(EAWG)
Reports to the OCPC bull Provide Events Data bull Responsible for Disturbance Events
Trends Chapter bull Content Review
43 Rosters for RMWG TADSWG GADSTF and EAWG are available at httpwwwnerccomfilesrosterpdf
Contributions
70
NERC Staff Table 13 below lists the NERC staff who contributed to the 2011 Reliability Performance Analysis
Report
Table 14 Contributing NERC Staff
Name Title E-mail Address
Mark Lauby Vice President and Director of
Reliability Assessment and
Performance Analysis
marklaubynercnet
Jessica Bian Manager of Performance Analysis jessicabiannercnet
John Moura Manager of Reliability Assessments johnmouranercnet
Andrew Slone Engineer Reliability Performance
Analysis
andrewslonenercnet
Jim Robinson TADS Project Manager jimrobinsonnercnet
Clyde Melton Engineer Reliability Performance
Analysis
clydemeltonnercnet
Mike Curley Manager of GADS Services mikecurleynercnet
James Powell Engineer Reliability Performance
Analysis
jamespowellnercnet
Michelle Marx Administrative Assistant michellemarxnercnet
William Mo Intern Performance Analysis wmonercnet
- NERCrsquos Mission
- Table of Contents
- Executive Summary
-
- 2011 Transition Report
- State of Reliability Report
- Key Findings and Recommendations
-
- Reliability Metric Performance
- Transmission Availability Performance
- Generating Availability Performance
- Disturbance Events
- Report Organization
-
- Introduction
-
- Metric Report Evolution
- Roadmap for the Future
-
- Reliability Metrics Performance
-
- Introduction
- 2010 Performance Metrics Results and Trends
-
- ALR1-3 Planning Reserve Margin
-
- Background
- Assessment
- Special Considerations
-
- ALR1-4 BPS Transmission Related Events Resulting in Loss of Load
-
- Background
- Assessment
-
- ALR1-12 Interconnection Frequency Response
-
- Background
- Assessment
-
- ALR2-3 Activation of Under Frequency Load Shedding
-
- Background
- Assessment
- Special Considerations
-
- ALR2-4 Average Percent Non-Recovery Disturbance Control Standards (DCS)
-
- Background
- Assessment
- Special Consideration
-
- ALR2-5 Disturbance Control Events Greater Than Most Severe Single Contingency
-
- Background
- Assessment
- Special Consideration
-
- ALR 1-5 System Voltage Performance
-
- Background
- Special Considerations
- Status
-
- ALR3-5 Interconnection Reliability Operating Limit System Operating Limit (IROLSOL) Exceedances
-
- Background
-
- ALR4-1 Automatic Transmission Outages Caused by Protection System Misoperations
-
- Background
- Special Considerations
-
- ALR6-11 ndash ALR6-14
-
- Background
- Assessment
- ALR 6-11 ndash Automatic Outages Initiated by Failed Protection System Equipment
- ALR6-12 ndash Automatic Outages Initiated by Human Error
- ALR6-13 ndash Automatic Outages Initiated by Failed AC Substation Equipment
- ALR6-14 Automatic AC Transmission Outages Initiated by Failed AC Circuit Equipment
-
- ALR6-15 Element Availability Percentage (APC)
-
- Background
- Assessment
- Special Consideration
-
- ALR6-16 Transmission System Unavailability
-
- Background
- Assessment
- Special Consideration
-
- ALR6-2 Energy Emergency Alert 3 (EEA3)
-
- Background
- Assessment
- Special Considerations
-
- ALR 6-3 Energy Emergency Alert 2 (EEA2)
-
- Background
- Assessment
- Special Considerations
-
- ALR 6-1 Transmission Constraint Mitigation
-
- Background
- Assessment
- Special Considerations
-
- Integrated Bulk Power System Risk Assessment
-
- Introduction
- Recommendations
-
- Integrated Reliability Index Concepts
-
- The Three Components of the IRI
-
- Event-Driven Indicators (EDI)
- Condition-Driven Indicators (CDI)
- StandardsStatute-Driven Indicators (SDI)
-
- IRI Index Calculation
- IRI Recommendations
-
- Reliability Metrics Conclusions and Recommendations
-
- Transmission Equipment Performance
-
- Introduction
- Performance Trends
-
- AC Element Outage Summary and Leading Causes
- Transmission Monthly Outages
- Outage Initiation Location
- Transmission Outage Events
- Transmission Outage Mode
-
- Conclusions
-
- Generation Equipment Performance
-
- Introduction
- Generation Key Performance Indicators
-
- Multiple Unit Forced Outages and Causes
- 2008-2010 Review of Summer versus Winter Availability
-
- Conclusions and Recommendations
-
- Disturbance Event Trends
-
- Introduction
- Performance Trends
- Conclusions
-
- Abbreviations Used in This Report
- Contributions
-
- NERC Industry Groups
- NERC Staff
-

Executive Summary
5
between 2009 and 2010 During the same period the average maintenance hours also increased by 12
hours per unit translating to longer planned outage time More focus on preventive maintenance
during planned or maintenance outages may be needed
The three leading root causes for multiple unit forced trips are transmission outages lack of fuel and
storms Among reported lack of fuel outage events 78 percent of the units are oil-fired and 15 percent
are gas fired To reduce the number of fuel-related outages the GADSTF recommends performing more
detailed analysis and higher visibility to this risk type
Disturbance Events One of most important bulk power system performance measures is the number of significant
disturbance events and their impact on system reliability Since the event analysis field test commenced
in October 2010 a total of 42 events within five categories were reported through the end of 2010
Equipment failure is the number one cause out of the event analyses completed from 2010 This
suggests that a task force be formed to identify the type of equipment and reasons for failure The
information provided in event analysis reports in conjunction with other databases (TADS GADS
metrics database etc) should be used to track and evaluate trends in disturbance events
Report Organization This transitional report is intended to function as an anthology of bulk power system performance
assessments Following the introductory chapter the second chapter details results for 2010 RMWG
approved performance metrics and lays out methods for integrating the variety of risks into an
integrated risk index This chapter also addresses concepts for measuring bulk power system events
The third chapter outlines transmission system performance results that the TADSWG have endorsed
using the three-year history of TADS data Reviewed by the GADSTF the forth chapter provides an
overview of generating availability trends for 72 percent of generators in North America The fifth
chapter provides a brief summary of reported disturbances based on event categories described in the
EAWGrsquos enhanced event analysis field test process document3
3 httpwwwnerccomdocseawgEvent_Analysis_Process_Field_test_DRAFT_102510-Cleanpdf
Introduction
6
Figure 1 State of Reliability Concepts
Introduction Metric Report Evolution The NERC Reliability Metrics Working Group (RMWG) has come a long way from its formation following
the release of the initial reliability metric whitepaper in December 2007 Since that time the RMWG has
built the foundation of a metrics development process with the use of SMART ratings (Specific
Measurable Attainable Relevant and Tangible) in its 2009 report4
The first annual report published in June 2010
provided an overview and review of the first
seven metrics which were approved in the
2009 foundational report In August 2010 the
RMWG released its
expanding the approved metrics to
18 metrics and identifying the need for additional data by issuing a data request for ALR3-5 This
annual report is a testament to the evolution of the metrics from the first release to what it is today
Integrated Bulk Power
System Risk Assessment Concepts paper5
Based on the work done by the RMWG in 2010 NERCrsquos OCPC amended the grouprsquos scope directing the
RMWG to ldquodevelop a method that will provide an integrated reliability assessment of the bulk power
system performance using metric information and trendsrdquo This yearrsquos report builds on the work
undertaken by the RMWG over the past three years and moving further towards establishing a single
Integrated Reliability Index (IRI) covering three components event driven index (EDI) condition driven
introducing the ldquouniverse of riskrdquo to the bulk
power system In the concepts paper the
RMWG introduced a method to assess ldquoevent-
drivenrdquo risks and established a measure of
Severity Risk Index (SRI) to better quantify the
impact of various events of the bulk power
system The concepts paper was subsequently
endorsed by NERCrsquos Operating (OC) and
Planning Committees (PC) The SRI calculation
was further refined and then approved by NERCrsquos OCPC at their March 8-9 2011 meeting
4 2009 Bulk Power System Reliability Performance Metric Recommendations can be found at
httpwwwnerccomdocspcrmwgRMWG_Metric_Report-09-08-09pdf 5 httpwwwnerccomdocspcrmwgIntegrated_Bulk_Power_System_Risk_Assessment_Concepts_Finalpdf
Event Driven Index (EDI)
Indicates Risk from Major System Events
Standards Statute Driven
Index (SDI)
Indicates Risks from Severe
Impact Standard Violations
Condition Driven Index (CDI)
Indicates Risk from Key Reliability
Indicators
Introduction
7
Figure 2 Data Source Integration and Analysis
index (CDI) and standardsstatute driven index (SDI) as shown in Figure 1 These individual
components will be used to develop a reliability index that will assist industry in assessing its current
state of reliability This is an ambitious undertaking and it will continue to evolve as an understanding
of what factors contribute to or indicate the level of reliability develops As such this report will evolve
in the coming years as expanding the work with SRI will provide further analysis of the approved
reliability metrics and establish the cornerstones for developing an IRI The cornerstones are described
in section three with recommendations for next steps to better refine and weigh the components of the
IRI and how its use to establish a ldquoState of Reliabilityrdquo for the bulk power system in North America
For this work to be effective and useful to industry and other stakeholders it must use existing data
sources align with other industry analyses and integrate with other initiatives as shown in Figure 2
NERCrsquos various data resources are introduced in this report Transmission Availability Data System
(TADS) Generation Availability Data System (GADS) the event analysis database and future Demand
Availability Data System (DADS)6
The RMWG embraces an open
development process while
incorporating continuous improve-
ment through leveraging industry
expertise and technical judgment
As new data becomes available
more concrete conclusions from the
reliability metrics will be drawn and
recommendations for reliability
standards and compliance practices
will be developed for industryrsquos
consideration
When developing the IRI the experience gained will be leveraged in developing the Severity Risk Index
(SRI) This evolution will take time and the first assessment of ongoing reliability with an integrated
reliability index is expected in the 2012 Annual Report The goal is not only to measure performance
but to highlight areas for improvement as well as reinforcing and measuring industry success As this
integrated view of reliability is developed the individual quarterly performance metrics will be updated
as illustrated in Figure 3 on a new Reliability Indicators dashboard at NERCrsquos website7
6 DADS will begin mandatory data collection from April 2011 through October 2011 with data due on December 15 2011
The RMWG will
7 Reliability Indicatorsrsquo dashboard is available at httpwwwnerccompagephpcid=4|331
Introduction
8
keep the industry informed by conducting yearly webinars providing quarterly data updates and
publishing its annual report
Figure 3 NERC Reliability Indicators Dashboard
Roadmap for the Future As shown in Figure 4 the 2011 Reliability Performance Analysis report begins a transition from a 2009
metric performance assessment to a ldquoState of Reliabilityrdquo report by collaborating with other groups to
form a unified approach to historical reliability performance analysis This process will require
engagement with a number of NERC industry experts to paint a broad picture of the bulk power
systemrsquos historic reliability
Alignment to other industry reports is also important Analysis from the frequency response performed
by the Resources Subcommittee (RS) physical and cyber security assessment provided by the Critical
Infrastructure Protection Committee (CIPC) the wide area reliability coordination conducted by the
Reliability Coordinator Working Group (RCWG) the spare equipment availability system enhanced by
the Spare Equipment Database Task Force (SEDTF) the post seasonal assessment developed by the
Reliability Assessment Subcommittee (RAS) and demand response deployment summarized by the
Demand Response Data Task Force (DRDTF) will provide a significant foundation from which this report
draws Collaboration derived from these stakeholder groups further refines the metrics and use of
additional datasets will broaden the industryrsquos tool-chest for improving reliability of the bulk power
system
The annual State of Reliability report is aimed to communicate the effectiveness of ERO (Electric
Reliability Organization) by presenting an integrated view of historic reliability performance The report
will provide a platform for sound technical analysis and a way to provide feedback on reliability trends
to stakeholders regulators policymakers and industry The key findings and recommendations will
Introduction
9
ultimately be used as input to standards changes and project prioritization compliance process
improvement event analysis and critical infrastructure protection areas
Figure 4 Overview of the Transition to the 2012 State of Reliability Report
Reliability Metrics Performance
10
Reliability Metrics Performance Introduction Building upon last yearrsquos metric review the RMWG continues to assess the results of eighteen currently
approved performance metrics Due to data availability each of the performance metrics do not
address the same time periods (some metrics have just been established while others have data over
many years) though this will be an important improvement in the future Merit has been found in all
eighteen approved metrics At this time though the number of metrics is expected to will remain
constant however other metrics may supplant existing metrics In spite of the potentially changing mix
of approved metrics to goals is to ensure the historical and current assessments can still be performed
These metrics exist within an overall reliability framework and in total the performance metrics being
considered address the fundamental characteristics of an acceptable level of reliability (ALR) Each of
the elements being measured by the metrics should be considered in aggregate when making an
assessment of the reliability of the bulk power system with no single metric indicating exceptional or
poor performance of the power system
Due to regional differences (size of the region operating practices etc) comparing the performance of
one Region to another would be erroneous and inappropriate Furthermore depending on the region
being evaluated one metric may be more relevant to a specific regionrsquos performance than others and
assessment may not be strictly mathematical rather more subjective Finally choosing one regionrsquos
best metric performance to define targets for other regions is inappropriate
Another key principle followed in developing these metrics is to retain anonymity of any reporting
organization Thus granularity will be attempted up to the point that such actions might compromise
anonymity of any given company Certain reporting entities may appear inconsistent but they have
been preserved to maintain maximum granularity with individual anonymity
Although assessments have been made in a number of the performance categories others do not have
sufficient data to derive any conclusions from the metric results The RMWG recommends continued
assessment of these metrics until sufficient data is available Each of the eighteen performance metrics
are presented in summary with their SMART8 Table 1 ratings in The table provides a summary view of
the metrics with an assessment of the current metric trends observed by the RMWG Table 1 also
shows the order in which the metrics are aligned according to the standards objectives
8 SMART rating definitions are located at httpwwwnerccomdocspcrmwgSMART_20RATING_826pdf
Reliability Metrics Performance
11
Table 1 Metric SMART Ratings Relative to Standard Objectives
Metrics SMART Objectives Relative to Standards Prioritization
ALR Improvements
Trend
Rating
SMART
Rating
1-3 Planning Reserve Margin 13
1-4 BPS Transmission Related Events Resulting in Loss of Load 15
2-5 Disturbance Control Events Greater than Most Severe Single Contingency 12
6-2 Energy Emergency Alert 3 (EEA3) 15
6-3 Energy Emergency Alert 2 (EEA2) 15
Inconclusive
2-3 Activation of Under Frequency Load Shedding 10
2-4 Average Percent Non-Recovery DCS 15
4-1 Automatic Transmission Outages Caused by Protection System Misoperation 15
6-11 Automatic Transmission Outages Caused by Protection System Misoperation 14
6-12 Automatic Transmission Outages Caused by Human Error 14
6-13 Automatic Transmission Outages Caused by Failed AC Substation Equipment 14
6-14 Automatic Transmission Outages Caused by Failed AC Circuit Equipment 14
New Data
1-5 Systems Voltage Performance 14
3-5
Interconnected Reliability Operating Limit System Operating Limit (IROLSOL)
Exceedance 14
6-1 Transmission constraint Mitigation 14
6-15 Element Availability Percentage (APC) 13
6-16
Transmission System Unavailability on Operational Planned and Auto
Sustained Outages 13
No Data
1-12 Frequency Response 11
Trend Rating Symbols
Significant Improvement
Slight Improvement
Inconclusive
Slight Deterioration
Significant Deterioration
New Data
No Data
Reliability Metrics Performance
12
2010 Performance Metrics Results and Trends
ALR1-3 Planning Reserve Margin
Background
The Planning Reserve Margin9 is a measure of the relationship between the amount of resource capacity
forecast and the expected demand in the planning horizon10 Coupled with probabilistic analysis
calculated Planning Reserve Margins is an industry standard which has been used by system planners for
decades as an indication of system resource adequacy Generally the projected demand is based on a
5050 forecast11
Assessment
Planning Reserve Margin is the difference between forecast capacity and projected
peak demand normalized by projected peak demand and shown as a percentage Based on experience
for portions of the bulk power system that are not energy-constrained Planning Reserve Margin
indicates the amount of capacity available to maintain reliable operation while meeting unforeseen
increases in demand (eg extreme weather) and unexpected unavailability of existing capacity (eg
long-term generation outages) Further from a planning perspective Planning Reserve Margin trends
identify whether capacity additions are projected to keep pace with demand growth
Planning Reserve Margins considering anticipated capacity resources and adjusted potential capacity
resources decrease in the latter years of the 2009 and 2010 10-year forecast in each of the four
interconnections Typically the early years provide more certainty since new generation is either in
service or under construction with firm commitments In the later years there is less certainty about
the resources that will be needed to meet peak demand Declining Planning Reserve Margins are
inherent in a conventional forecast (assuming load growth) and do not necessarily indicate a trend of a
degrading resource adequacy Rather they are an indication of the potential need for additional
resources In addition key observations can be made to the Planning Reserve Margin forecast such as
short-term assessment rate of change through the assessment period identification of margins that are
approaching or below a target requirement and comparisons from year-to-year forecasts
While resource planners are able to forecast the need for resources the type of resource that will
actually be built or acquired to fill the need is usually unknown For example in the northeast US
markets with three to five year forward capacity markets no firm commitments can be made in the
9 Detailed calculations of Planning Reserve Margin are available at httpwwwnerccompagephpcid=4|331|333 10The Planning Reserve Margin indicated here is not the same as an operating reserve margin that system operators use for near-term
operations decisions 11These demand forecasts are based on ldquo5050rdquo or median weather (a 50 percent chance of the weather being warmer and a 50 percent
chance of the weather being cooler)
Reliability Metrics Performance
13
long-term However resource planners do recognize the need for resources in their long-term planning
and account for these resources through generator queues These queues are then adjusted to reflect
an adjusted forecast of resourcesmdashpro-rated by approximately 20 percent
When comparing the assessment of planning reserve margins between 2009 and 2010 the
interconnection Planning Reserve Margins are slightly higher on an annual basis in the 2010 forecast
compared to those of 2009 as shown in Figure 5
Figure 5 Planning Reserve Margin by Interconnection and Year
In general this is due to slightly higher capacity forecasts and slightly lower demand forecasts The pace
of any economic recovery will affect future comparisons This metric can be used by NERC to assess the
individual interconnections in the ten-year long-term reliability assessments If a noticeable change
Reliability Metrics Performance
14
occurs within the trend further investigation is necessary to determine the causes and likely effects on
reliability
Special Considerations
The Planning Reserve Margin is a capacity based metric Therefore it does not provide an accurate
assessment of performance in energy-limited systems (eg hydro capacity with limited water resources
or systems with significant variable generation penetration) In addition the Planning Reserve Margin
does not reflect potential transmission constraint internal to the respective interconnection Planning
Reserve Margin data shown in Figure 6 is used for NERCrsquos seasonal and long-term reliability
assessments and is the primary metric for determining the resource adequacy of a given assessment
area
The North American Bulk Power System is divided into four distinct interconnections These
interconnections are loosely connected with limited ability to share capacity or energy across the
interconnection To reflect this limitation the Planning Reserve Margins are calculated in this report
based on interconnection values rather than by national boundaries as is the practice of the Reliability
Assessment Subcommittee (RAS)
ALR1-4 BPS Transmission Related Events Resulting in Loss of Load
Background
This metric measures bulk power system transmission-related events resulting in the loss of load
Planners and operators can use this metric to validate their design and operating criteria by identifying
the number of instances when loss of load occurs
For the purposes of this metric an ldquoeventrdquo is an unplanned transmission disturbance that produces an
abnormal system condition due to equipment failures or system operational actions and results in the
loss of firm system demand for more than 15 minutes The reporting criteria for such events are
outlined below12
bull Entities with a previous year recorded peak demand of more than 3000 MW are required to
report all such losses of firm demands totaling more than 300 MW
bull All other entities are required to report all such losses of firm demands totaling more than 200
MW or 50 percent of the total customers being supplied immediately prior to the incident
whichever is less
bull Firm load shedding of 100 MW or more used to maintain the continuity of the bulk power
system reliability
12 Details of event definitions are available at httpwwwnerccomfilesEOP-004-1pdf
Reliability Metrics Performance
15
Assessment
Figure 6 illustrates that the number of bulk power system transmission-related events resulting in loss of
firm load13
Table 2
from 2002 to 2009 is relatively constant and suggests that 7 - 10 events per year is a norm for
the bulk power system However the magnitude of load loss shown in associated with these
events reflects a downward trend since 2007 Since the data includes weather-related events it will
provide the RMWG with an opportunity for further analysis and continued assessment of the trends
over time is recommended
Figure 6 BPS Transmission Related Events Resulting in Loss of Load Counts (2002-2009)
Table 2 BPS Transmission Related Events Resulting in Loss of Load MW Loss (2002-2009)
Year Load Loss (MW)
2002 3762
2003 65263
2004 2578
2005 6720
2006 4871
2007 11282
2008 5200
2009 2965
13The metric source data may require adjustments to accommodate all of the different groups for measurement and consistency as OE-417 is only used in the US
02468
101214
2002 2003 2004 2005 2006 2007 2008 2009
Count
Reliability Metrics Performance
16
ALR1-12 Interconnection Frequency Response
Background
This metric is used to track and monitor Interconnection Frequency Response Frequency Response is a
measure of an Interconnectionrsquos ability to stabilize frequency immediately following the sudden loss of
generation or load It is a critical component to the reliable operation of the bulk power system
particularly during disturbances and restoration The metric measures the average frequency responses
for all events where frequency drops more than 35 mHz within a year
Assessment
At this time there has been no data collected for ALR1-12 Therefore no assessment was made
ALR2-3 Activation of Under Frequency Load Shedding
Background
The purpose of Under Frequency Load Shedding (UFLS) is to balance generation and load in an island
following an extreme event The UFLS activation metric measures the number of times UFLS is activated
and the total MW of load interrupted in each Region and NERC wide
Assessment
Figure 7 and Table 3 illustrate a history of Under Frequency Load Shedding events from 2006 through
2010 Through this period itrsquos important to note that single events had a range load shedding from 15
MW to 7654 MW The activation of UFLS relays is the last automated reliability measure associated
with a decline in frequency in order to rebalance the system Further assessment of the MW loss for
these activations is recommended
Figure 7 ALR2-3 Count of Activations by Year and Regional Entity (2001-2010)
Reliability Metrics Performance
17
Table 3 ALR2-3 Under Frequency Load Shedding MW Loss
ALR2-3 Under Frequency Load Shedding MW Loss
2006 2007 2008 2009 2010
FRCC
2273
MRO
486
NPCC 94
63 20 25
RFC
SPP
672 15
SERC
ERCOT
WECC
Special Considerations
The use of a single metric cannot capture all of the relevant information associated with UFLS events as
the events relate to each respective UFLS plan The ability to measure the reliability of the bulk power
system is directly associated with how it performs compared to what is planned
ALR2-4 Average Percent Non-Recovery Disturbance Control Standards (DCS)
Background
This metric measures the Balancing Authorityrsquos (BA) or Reserve Sharing Grouprsquos (RSG) ability to balance
resources and demand with the timely deployment of contingency reserve thereby returning the
interconnection frequency to within defined limits following a Reportable Disturbance14
Assessment
The relative
percentage provides an indication of performance measured at a BA or RSG
Figure 8 illustrates the average percent non-recovery of DCS events from 2006 to 2010 The graph
provides a high-level indication of the performance of each respective RE However a single event may
not reflect all the reliability issues within a given RE In order to understand the reliability aspects it
may be necessary to request individual REs to further investigate and provide a more comprehensive
reliability report Further investigation may indicate the entity had sufficient contingency reserve but
through their implementation process failed to meet DCS recovery
14 Details of the Disturbance Control Performance Standard and Reportable Disturbance definitions are available at
httpwwwnerccomfilesBAL-002-0pdf
Reliability Metrics Performance
18
Continued trend assessment is recommended Where trends indicated potential issues the regional
entity will be requested to investigate and report their findings
Figure 8 Average Percent Non-Recovery of DCS Events (2006-2010)
Special Consideration
This metric aggregates the number of events based on reporting from individual Balancing Authorities or
Reserve Sharing Groups It does not capture the severity of the DCS events It should be noted that
most REs use 80 percent of the Most Severe Single Contingency to establish the minimum threshold for
reportable disturbance while others use 35 percent15
ALR2-5 Disturbance Control Events Greater Than Most Severe Single Contingency
Background
This metric represents the number of disturbance events that exceed the Most Severe Single
Contingency (MSSC) and is specific to each BA Each RE reports disturbances greater than the MSSC on
behalf of the BA or Reserve Sharing Group (RSG) The result helps validate current contingency reserve
requirements The MSSC is determined based on the specific configuration of each BA or RSG and can
vary in significance and impact on the BPS
15httpwwwweccbizStandardsDevelopmentListsRequest20FormDispFormaspxID=69ampSource=StandardsDevelopmentPagesWEC
CStandardsArchiveaspx
375
079
0
54
008
005
0
15 0
77
025
0
33
000510152025303540
2006
2007
2008
2009
2010
2006
2007
2008
2009
2010
2006
2007
2008
2009
2010
2006
2007
2008
2009
2010
2006
2007
2008
2009
2010
2006
2007
2008
2009
2010
2006
2007
2008
2009
2010
2006
2007
2008
2009
2010
FRCC MRO NPCC RFC SERC SPP ERCOT WECC
Region and Year
Reliability Metrics Performance
19
Assessment
Figure 9 represents the number of DCS events within each RE that are greater than the MSSC from 2006
to 2010 This metric and resulting trend can provide insight regarding the risk of events greater than
MSSC and the potential for loss of load
In 2010 SERC had 16 BAL-002 reporting entities eight Balancing Areas elected to maintain Contingency
Reserve levels independent of any reserve sharing group These 16 entities experienced 79 reportable
DCS eventsmdash32 (or 405 percent) of which were categorized as greater than their most severe single
contingency Every DCS event categorized as greater than the most severe single contingency occurred
within a Balancing Area maintaining independent Contingency Reserve levels Significantly all 79
regional entities reported compliance with the Disturbance Recovery Criterion including for those
Disturbances that were considered greater than their most severe single Contingency This supports a
conclusion that regardless of the size of the BA or participation in a Reserve Sharing Group SERCrsquos BAL-
002 reporting entities have demonstrated the ability in 2010 to use Contingency Reserve to balance
resources and demand and return Interconnection frequency within defined limits following Reportable
Disturbances
If the SERC Balancing Areas without large generating units and who do not participate in a Reserve
Sharing Group change the determination of their most severe single contingencies to effect an increase
in the DCS reporting threshold (and concurrently the threshold for determining those disturbances
which are greater than the most severe single contingency) there will certainly be a reduction in both
the gross count of DCS events in SERC and in the subset considered under ALR2-5 Masking the discrete
events which cause Balancing Area response may not reduce ldquoriskrdquo to the system However it is
desirable to maintain a reporting threshold which encourages the Balancing Authority to respond to any
unexplained change in ACE in a manner which supports Interconnection frequency based on
demonstrated performance SERC will continue to monitor DCS performance and will continue to
evaluate contingency reserve requirements but does not consider 2010 ALR2-5 performance to be an
adverse trend in ldquoextreme or unusualrdquo contingencies but rather within the normal range of expected
occurrences
Reliability Metrics Performance
20
Special Consideration
The metric reports the number of DCS events greater than MSSC without regards to the size of a BA or
RSG and without respect to the number of reporting entities within a given RE Because of the potential
for differences in the magnitude of MSSC and the resultant frequency of events trending should be
within each RE to provide any potential reliability indicators Each RE should investigate to determine
the cause and relative effect on reliability of the events within their footprints Small BA or RSG may
have a relatively small value of MSSC As such a high number of DCS greater than MCCS may not
indicate a reliability problem for the reporting RE but may indicate an issue for the respective BA or RSG
In addition events greater than MSSC may not cause a reliability issue for some BA RSG or RE if they
have more stringent standards which require contingency reserves greater than MSSC
ALR 1-5 System Voltage Performance
Background
The purpose of this metric is to measure the transmission system voltage performance (either absolute
or per unit of a nominal value) over time This should provide an indication of the reactive capability
available to the transmission system The metric is intended to record the amount of time that system
voltage is outside a predetermined band around nominal
0
5
10
15
20
25
30
2006
2007
2008
2009
2010
2006
2007
2008
2009
2010
2006
2007
2008
2009
2010
2006
2007
2008
2009
2010
2006
2007
2008
2009
2010
2006
2007
2008
2009
2010
2006
2007
2008
2009
2010
2006
2007
2008
2009
2010
FRCC MRO NPCC RFC SERC SPP ERCOT WECC
Cou
nt
Region and Year
Figure 9 Disturbance Control Events Greater Than Most Severe Single Contingency (2006-2010)
Reliability Metrics Performance
21
Special Considerations
Each Reliability Coordinator (RC) will work with the Transmission Owners (TOs) and Transmission
Operators (TOPs) within its footprint to identify specific buses and voltage ranges to monitor for this
metric The number of buses the monitored voltage levels and the acceptable voltage ranges may vary
by reporting entity
Status
With a pilot program requested in early 2011 a voluntary request to Reliability Coordinators (RC) was
made to develop a list of key buses This work continues with all of the RCs and their respective
Transmission Owners (TOs) to gather the list of key buses and their voltage ranges After this step has
been completed the TO will be requested to provide relevant data on key buses only Based upon the
usefulness of the data collected in the pilot program additional data collection will be reviewed in the
future
ALR3-5 Interconnection Reliability Operating Limit System Operating Limit (IROLSOL) Exceedances
Background
This metric illustrates the number of times that defined Interconnection Reliability Operating Limit
(IROL) or System Operating Limit (SOL) were exceeded and the duration of these events Exceeding
IROLSOLs could lead to outages if prompt operator control actions are not taken in a timely manner to
return the system to within normal operating limits This metric was approved by NERCrsquos Operating and
Planning Committees in June 2010 and a data request was subsequently issued in August 2010 to collect
the data for this metric Based on the results of the pilot conducted in the third and fourth quarter of
2010 there is merit in continuing measurement of this metric Note the reporting of IROLSOL
exceedances became mandatory in 2011 and data collected in Table 4 for 2010 has been provided
voluntarily
Reliability Metrics Performance
22
Table 4 ALR3-5 IROLSOL Exceedances
3Q2010 4Q2010 1Q2011
le 10 mins 123 226 124
le 20 mins 10 36 12
le 30 mins 3 7 3
gt 30 mins 0 1 0
Number of Reporting RCs 9 10 15
ALR4-1 Automatic Transmission Outages Caused by Protection System Misoperations
Background
Originally titled Correct Protection System Operations this metric has undergone a number of changes
since its initial development To ensure that it best portrays how misoperations affect transmission
outages it was necessary to establish a common understanding of misoperations and the data needed
to support the metric NERCrsquos Reliability Assessment Performance Analysis (RAPA) group evaluated
several options of transitioning from existing procedures for the collection of misoperations data and
recommended a consistent approach which was introduced at the beginning of 2011 With the NERC
System Protection and Control Subcommitteersquos (SPCS) technical guidance NERC and the regional
entities have agreed upon a set of specifications for misoperations reporting including format
categories event type codes and reporting period to have a final consistent reporting template16
Special Considerations
Only
automatic transmission outages 200 kV and above including AC circuits and transformers will be used
in the calculation of this metric
Data collection will not begin until the second quarter of 2011 for data beginning with January 2011 As
revised this metric cannot be calculated for this report at the current time The revised title and metric
form can be viewed at the NERC website17
16 The current Protection System Misoperation template is available at
httpwwwnerccomfilezrmwghtml 17The current metric ALR4-1 form is available at httpwwwnerccomdocspcrmwgALR_4-1Percentpdf
Reliability Metrics Performance
23
ALR6-11 ndash ALR6-14
ALR6-11 Automatic AC Transmission Outages Initiated by Failed Protection System Equipment
ALR6-12 Automatic AC Transmission Outages Initiated by Human Error
ALR6-13 Automatic AC Transmission Outages Initiated by Failed AC Substation Equipment
ALR6-14 Automatic AC Circuit Outages Initiated by Failed AC Circuit Equipment
Background
These metrics evolved from the original ALR4-1 metric for correct protection system operations and
now illustrate a normalized count (on a per circuit basis) of AC transmission element outages (ie TADS
momentary and sustained automatic outages) that were initiated by Failed Protection System
Equipment (ALR6-11) Human Error (ALR6-12) Failed AC Substation Equipment (ALR6-13) and Failed AC
Circuit Equipment (ALR6-14) These metrics are all related to the non-weather related initiating cause
codes for automatic outages of AC circuits and transformers operated 200 kV and above
Assessment
Figure 10 through Figure 13 show the normalized outages per circuit and outages per transformer for
facilities operated at 200 kV and above As shown in all eight of the charts there are some regional
trends in the three years worth of data However some Regionrsquos values have increased from one year
to the next stayed the same or decreased with no discernable regional trends For example ALR6-11
computes the automatic AC Circuit outages initiated by failed protection system equipment
There are some trends to the ALR6-11 to ALR6-14 data but many regions do not have enough data for a
valid trend analysis to be performed NERCrsquos outage rate seems to be improving every year On a
regional basis metric ALR6-11 along with ALR6-12 through ALR6-14 cannot be statistically understood
until confidence intervals18
18The detailed Confidence Interval computation is available at
are calculated ALR metric outage frequency rates and Regional equipment
inventories that are smaller than others are likely to require more than 36 months of outage data Some
numerically larger frequency rates and larger regional equipment inventories (such as NERC) do not
require more than 36 months of data to obtain a reasonably narrow confidence interval
httpwwwnerccomdocspctadstfTADS_Nov_2_2007APPENDIX_C_Confidence_Intervalpdf
Reliability Metrics Performance
24
While more data is still needed on a regional basis to determine if each regionrsquos bulk power system is
becoming more reliable year to year there are areas of potential improvement which include power
system condition protection performance and human factors These potential improvements are
presented due to the relatively large number of outages caused by these items The industry can
benefit from detailed analysis by identifying lessons learned and rolling average trends of NERC-wide
performance With a confidence interval of relatively narrow bandwidth one can determine whether
changes in statistical data are primarily due to random sampling error or if the statistics are significantly
different due to performance
Reliability Metrics Performance
25
ALR 6-11 ndash Automatic Outages Initiated by Failed Protection System Equipment
Automatic outages with an initiating cause code of failed protection system equipment are in Figure 10
Figure 10 ALR6-11 by Region (Includes NERC-Wide)
This code covers automatic outages caused by the failure of protection system equipment This
includes any relay andor control misoperations except those that are caused by incorrect relay or
control settings that do not coordinate with other protective devices
ALR6-12 ndash Automatic Outages Initiated by Human Error
Figure 11 shows the automatic outages with an initiating cause code of human error This code covers
automatic outages caused by any incorrect action traceable to employees andor contractors for
companies operating maintaining andor providing assistance to the Transmission Owner will be
identified and reported in this category
Reliability Metrics Performance
26
Also any human failure or interpretation of standard industry practices and guidelines that cause an
outage will be reported in this category
Figure 11 ALR6-12 by Region (Includes NERC-Wide)
Reliability Metrics Performance
27
ALR6-13 ndash Automatic Outages Initiated by Failed AC Substation Equipment
Figure 12 shows the automatic outages with an initiating cause code of failed AC substation equipment
This code covers automatic outages caused by the failure of AC Substation ie equipment ldquoinside the
substation fencerdquo including transformers and circuit breakers but excluding protection system
equipment19
19TADS Initiating Cause Code definitions are located at httpwwwnerccomdocspctadswgTADS_Definitions_Appendix_7_092909pdf
Figure 12 ALR6-13 by Region (Includes NERC-Wide)
Reliability Metrics Performance
28
ALR6-14 Automatic AC Transmission Outages Initiated by Failed AC Circuit Equipment
Figure 13 shows the automatic outages with an initiating cause code of failed AC circuit equipment
Automatic Outages related to the failure of AC Circuit equipment ie overhead or underground
equipment ldquooutside the substation fencerdquo 20
ALR6-15 Element Availability Percentage (APC)
Background
This metric uses data and calculations directly from the NERC TADS effort and illustrates the overall
percent of time the aggregate of transmission facilities are available and in service This is an aggregate
20TADS Initiating Cause Code definitions are located at httpwwwnerccomdocspctadswgTADS_Definitions_Appendix_7_092909pdf
Figure 13 ALR6-14 by Region (Includes NERC-Wide)
Reliability Metrics Performance
29
value using sustained outages (automatic and non-automatic) for both lines and transformers operated
at 200 kV and above for each Regional Entity Interconnection and for NERC This metric was approved
by the NERC Operating and Planning Committees in September 2010
Assessment
Figure 14 shows the aggregate element availability percentage (APC) for transmission and transformers
facilities operated at 200 kV and above The values are all over 90 percent which shows excellent
system availability The RMWG recommends continued metric assessment for at least a few more years
in order to determine the value of this metric
Figure 14 2010 ALR6-15 Element Availability Percentage
Notably the Eastern Interconnection does not include Quebec or ERCOT ERCOT does not have any
transformers with low-side voltage levels 200 kV and above
Special Consideration
It should be noted that the non-automatic outage data needed to calculate this metric was only first
collected for the calendar year 2010 as part of the TADS process Therefore only one year of data for
this metric is available at this time
Reliability Metrics Performance
30
ALR6-16 Transmission System Unavailability
Background
This metric uses data and calculations directly from the NERC TADS effort and shows the overall percent
of time the aggregate of transmission facilities are unavailable due to automatic and non-automatic
outages This is an aggregate value using sustained automatic outages for both lines and transformers
operated at 200 kV and above for each Regional Entity and for NERC This metric was approved by the
NERC Operating and Planning Committees in December 2010
Assessment
Figure 15 and Figure 16 illustrate the 2010 aggregate unavailability percentage for AC circuits and
transformer facilities operated at 200 kV and above The values for AC circuits are all under 3 percent
which shows excellent system availability
The RMWG recommends continued metric assessment for at least a few more years in order to
determine the value of this metric
Special Consideration
It should be noted that the non-automatic outage data needed to calculate this metric was only first
collected for the calendar year 2010 as part of the TADS process Therefore only one year of data for
this metric is available at this time
Figure 15 2010 ALR6-16 Transmission System Unavailability
Reliability Metrics Performance
31
Figure 16 2010 ALR6-16 Transmission System Unavailability by Outage Type
Notably the Eastern Interconnection does not include Quebec or ERCOT Also ERCOT does not have
any transformers with low-side voltage levels 200 kV and above
ALR6-2 Energy Emergency Alert 3 (EEA3)
Background
This metric identifies the number of times Energy Emergency Alerts Level 3 (EEA3) are issued EEA3
events are firm-load interruptions due to capacity and energy deficiency EEA3 is currently reported
collected and maintained in NERCrsquos Reliability Coordination Information System (RCIS) and is defined in
Attachment 1 of the NERC Standard EOP-00221
21 The latest version of Attachment 1 for EOP-002 is available at
This metric identifies the number of times EEA3s are
issued The number of EEA3s per year provides a relative indication of performance measured at a
Balancing Authority or interconnection level As historical data is gathered trends in future reports will
provide an indication of either decreasing or increasing use of EEA3s signaling adequacy of the electric
supply system This metric can also be considered in the context of Planning Reserve Margin Significant
increases or decreases in EEA3 events with relatively constant Planning Reserve Margins could indicate
httpwwwnerccompagephpcid=2|20
Reliability Metrics Performance
32
volatility in the actual loads compared to forecast levels or changes in the adequacy of the bulk power
system required to meet load demands
Assessment
Figure 17 shows the number of EEA3 events during 2006 and 2010 from an RE level An interactive
presentation was released and available at the Reliability Indicatorrsquos page22
The Acadiana Load Pocket (ALP) is an area in south central Louisiana that has experienced regular
transmission constraints and numerous Energy Emergency Alert filings by the SPP Reliability Controller
(SPP RC) Transmission within ALP is owned by Entergy Lafayette Utilities System (LUS) and Cleco
Power LLC (Cleco) The transmission constraints within the ALP are primarily caused by the local area
load and the lack of generation located in close proximity to the load area
The number of EEA3rsquos
declared in 2010 returned to more traditional numbers The 2009 spike in EEA3 events in the SPP
Region that was driven by issues in the Acadiana Load Pocket (ALP) were not present in 2010
Special Considerations
Ideally the measure should capture only EEAs that are declared for reliability reasons and not for
economic factors The RMWG has not been able to differentiate these reasons for future reporting and
it has made a recommendation to the Reliability Coordinator Working Group (RCWG) to consider a
revised EEA declaration to exclude economic factors
The reason the EEA volume decreased from 2009 to 2010 in SPP was because the SPP ICT RC23
coordinated an operating agreement between the five operating companies in the ALP The operating
agreement included a cost sharing re-dispatch that alleviated the need of a Transmission Loading Relief
(TLR-5) declaration24
22The EEA3 interactive presentation is available on the NERC website at
During 2009 there was no operating agreement therefore an entity had to
provide Network and Native Load (NNL) relief when a TLR-5 was called by the ICT RC When the TLR-5
was the primary tool to control the post contingent loading in the ALP some of the BAs would have their
firm transmission curtailed to the point where they could no longer serve their load therefore the EEA
3 was needed to communicate a capacityreserve deficiency
httpwwwnerccompagephpcid=4|331|335 23Southwest Power Pool (SPP) Independent Coordinator of Transmission (ICT) Reliability Coordinator (RC) 24More information on Transmission Load Relief is contained in the IRO-006 standard which is located at httpwwwnerccomfilesIRO-006-4pdf In particular TLR-5 definitions are referenced on page 16 and 17
Reliability Metrics Performance
33
Figure 17 ALR6-2 Energy Emergency Alert 3 (EEA3) Counts by Region (2006-2010)
Cleco Power Entergy and LUS are currently constructing an estimated $200 million transmission
infrastructure improvement project to mitigate transmission constraints into ALP Construction of the
project is scheduled to be complete in 2012 Completion of the project should help alleviate some of
the transmission congestion in this area Energy Emergency Alerts filed by the SPP Regional Entity
continue to decline
SPP RTO continues to coordinate operating plans with the operating entities in this area Mitigation
plans and local operating guides in place are expected to provide sufficient flexibility should issues arise
NERC will continue to monitor this area for Reliability Impacts and coordinate any actions with the SPP
Reliability Coordinator and SPP Regional Entity
ALR 6-3 Energy Emergency Alert 2 (EEA2)
Background
Energy Emergency Alert 2 (EEA2) is to measure the number of events BAs declare for deficient capacity
and energy during peak load periods which may serve as a leading indicator of energy and capacity
shortfall in the adequacy of the electric supply system EEA2 provides a sense of the frequency of
precursor events to the more severe EEA3 declarations This metric measures the number of events
1 3 1 2 214
3 4 4 1 5 334
4 2 1 52
1
0
5
10
15
20
25
30
3520
0620
0720
0820
0920
1020
0620
0720
0820
0920
1020
0620
0720
0820
0920
1020
0620
0720
0820
0920
1020
0620
0720
0820
0920
1020
0620
0720
0820
0920
1020
0620
0720
0820
0920
1020
0620
0720
0820
0920
10
FRCC MRO NPCC RFC SERC SPP TRE WECC
2006-2009
2010
Region and Year
Reliability Metrics Performance
34
Balancing Authorities declare for deficient capacity and energy during peak load periods At this time
however this data reflects inclusion of Demand Side Resources that would not be indicative of
inadequacy of the electric supply system
The number of EEA2 events and any trends in their reporting indicates how robust the system is in
being able to supply the aggregate load requirements The historical records may include demand
response activations and non-firm load interruptions per applicable contracts within the EEA alerts per
its definition25
Assessment
Demand response is a legitimate resource to be called upon by balancing authorities and
do not indicate a reliability concern As data is gathered in the future reports will provide an indication
of either decreasing or increasing adequacy in the electric supply system EEA2 events called solely for
activation of demand response (controllable or contractually prearranged demand-side dispatch
programs) or interruption of non-firm load per applicable contracts should be excluded This metric can
also be considered in the context of the Planning Reserve Margin Significant increases or decreases in
EEA2 events with relatively constant Planning Reserve Margins could indicate volatility in the actual
loads compared to forecast levels or changes in the adequacy of the bulk power system required to
meet load demands
Figure 18 shows the number of EEA2 events by Regional Entity from 2006 to 2010 EEA2 interactive
version available on line by quarter and region26
25 The EEA2 is defined at
The general trend continues to show improved
performance which may have been influenced by the overall reduction in demand throughout NERC
caused by the economic downturn Specific performance by any one region should be investigated
further for issues or events that may affect the results Determining whether performance reported
includes those events resulting from the economic operation of DSM and non-firm load interruption
should also be investigated The RMWG recommends continued metric assessment
httpwwwnerccomfilesEOP-002-2pdf 26 EEA2 interactive version located at httpwwwnerccompagephpcid=4|331|341
Reliability Metrics Performance
35
Special Considerations
The intent of this metric is to measure only EEAs that are called for reliability reasons and not for
economic factors such as demand side management (DSM) and non-firm load interruption The
historical data for this metric may include events that were called for economic factors According to
the RCWG recent data should only include EEAs called for reliability reasons
ALR 6-1 Transmission Constraint Mitigation
Background
The RMWG completed a pilot with four regional entities Based on the results the RMWG expanded the
pilot data collection to all regions and the initial results of the data collection are shown in Figure 19
and Table 5 Based on the results of the pilot there is merit in continuing to assess this metric The
intent of this metric is to identify trends in the number of mitigation measures (Special Protection
Schemes (SPS) Remedial Action Schemes (RAS) and Operating Procedures) required to meet reliability
requirements By their nature SPS do not indicate an inherent weakness in the bulk power system
rather they are an indication of methods that are taken to operate the system through the range of
conditions it must perform This metric is only intended to evaluate the trend use of these plans and
whether the metric indicates robustness of the transmission system is increasing remaining static or
decreasing
1 27
2 1 4 3 2 1 2 4 5 2 5 832
4724
211
5 38 5 1 1 8 7 4 1 1
05
101520253035404550
2006
2007
2008
2009
2010
2006
2007
2008
2009
2010
2006
2007
2008
2009
2010
2006
2007
2008
2009
2010
2006
2007
2008
2009
2010
2006
2007
2008
2009
2010
2006
2007
2008
2009
2010
2006
2007
2008
2009
2010
FRCC MRO NPCC RFC SERC SPP TRE WECC
2006-2009
2010
Region and Year
Figure 18 ALR6-3 Energy Emergency Alert 2 (EEA2)
Reliability Metrics Performance
36
Assessment
The pilot data indicates a relatively constant number of mitigation measures over the time period of
data collected
Figure 19 ALR6-1 Transmission Constraint Mitigation by SPSRAS (2009-2014)
0102030405060708090
100110120
2009
2010
2011
2014
2009
2010
2011
2014
2009
2010
2011
2014
2009
2010
2011
2014
2009
2010
2011
2014
2009
2010
2011
2014
2009
2010
2011
2014
2009
2010
2011
2014
FRCC MRO NPCC RFC SERC SPP ERCOT WECC
Coun
t
Region and Year
SPSRAS
Reliability Metrics Performance
37
Table 5 ALR6-1 Transmission Constraint Mitigation by Operating ProcedureGuides (2009-2011)
ALR6-1 Transmission Constraint Mitigation by Operating ProcedureGuides (2009-2014)
2009 2010 2011 2014
FRCC 107 75 66
MRO 79 79 81 81
NPCC 0 0 0
RFC 2 1 3 4
SPP 39 40 40 40
SERC 6 7 15
ERCOT 29 25 25
WECC 110 111
Special Considerations
A certain number of SPS mitigation plans may be necessary to support reliable operation of the system
If the number of SPS increase over time this may indicate that additional transmission capacity is
required A reduction in the number of SPS may be an indicator of increased generation or transmission
facilities being put into service which may indicate greater robustness of the bulk power system In
general mitigation plans are a viable and valuable tool for effective operation of the bulk power system
In power system planning reliability operability capacity and cost-efficiency are simultaneously
considered through a variety of scenarios to which the system may be subjected Mitigation measures
are a method for optimizing a power system across these scenarios Changes in quantities of mitigation
plans may indicate year-on-year differences in the system being evaluated
Integrated Bulk Power System Risk Assessment
Introduction In developing eighteen metrics to measure acceptable levels of reliability it has become clear that any
such measurement of reliability must include consideration of the risks present within the bulk power
system in order for us to appropriately prioritize and manage these system risks The scope for the
Reliability Metrics Working Group (RMWG)27
27 The RMWG scope can be viewed at
includes a task to develop a risk-based approach that
provides consistency in quantifying the severity of events The approach not only can be used to
httpwwwnerccomfilezrmwghtml
Reliability Metrics Performance
38
measure risk reduction over time but also can be applied uniformly in event analysis process to identify
the events that need to be analyzed in detail and sort out non-significant events
The Operating Committee (OC) and Planning Committee (PC) endorsed the concepts and framework28 of
the risk-based approach in their September 2010 joint meeting and further supported the event severity
risk index (SRI) calculation29
Recommendations
in March 2011
bull NERC should embrace the use of risk assessment to identify trends in addition to lessons learned
in order to improve bulk power system reliability
bull The RMWG should continue to coordinate and communicate with the Event Analysis Working
Group (EAWG) to apply the SRI into the event analysis process and root cause analysis
bull As trend evaluations increase the knowledge of risks to the bulk power system data required to
support additional assessment should be gathered
Event Severity Risk Index (SRI)
Risk assessment is an essential tool for achieving the alignment between organizations people and
technology This will assist in quantifying inherent risks identifying where potential high risks exist and
evaluating where the most significant lowering of risks can be achieved Being learning organizations
the Electric Reliability Organization (ERO) Regional Entities and Registered Entities can use these tools
to focus on the areas of highest risk to reliability to provide a sound basis for developing results-based
standards and compliance programs Risk assessment also serves to engage all stakeholders in a
dialogue about specific risk factors and helps direct a strategic plan for risk reduction and early
detection
The SRI is a daily blended metric for which transmission loss generation loss and load loss events are
calculated Each element (transmission generation and load loss) is factored by the systemrsquos inventory
for that element to rate significant events appropriately On a yearly basis these daily performances
can be sorted in descending order to evaluate the year-on-year performance of the system
In order to test drive the concepts the RMWG applied these calculations against historically memorable
days to derive SRIs Once these calculations were complete they were reviewed and evaluated by
various stakeholders for reasonableness Based upon feedback modifications to the calculation were
made and assessed against the historic days performed This iterative process locked down the details
28 httpwwwnerccomdocspcrmwgIntegrated_Bulk_Power_System_Risk_Assessment_Concepts_Finalpdf 29 httpwwwnerccomdocspcrmwgSRI_Equation_Refinement_May6_2011pdf
Reliability Metrics Performance
39
for the calculation of SRI whose calculation from zero (no transmission line outages generation outages
or load lost in a day) to 1000 (a theoretical condition in which every transmission line all generation
units and all load lost across the system in a single day)
Figure 20 captures the calculated severity risk value for each of the days for each year benchmarked
with the historic significant events which were used to concept test the calculation Since there is
significant disparity between days the bulk power system is stressed compared to those that are
ldquoroutinerdquo and ldquoherordquo days of the year where the system performed extremely well the curve is depicted
using a logarithmic scale Each yearrsquos data is sorted in descending order striking a characteristic shape
At the left-side of the curve the days in which the system is severely stressed are plotted The central
more linear portion of the curve identifies the routine day performance while the far right-side of the
curve shows the values plotted for days in which almost all lines and generation units are in service and
essentially no load is lost
The trends on the chart below show that 2009 and 2010 had fewer extreme days than 2008 Routine
daily performance appears generally consistent across all three years Figure 20 captures the days for
each year benchmarked with historically significant events
In Figure 20 NERCrsquos event categories and SRI ratings are directly related As the SRI increases the
category or severity of the event increases Historical events are also shown to relate modern
reliability measurements to give a perspective of how a well-known event would register on the SRI
scale
The event analysis process30
30
benefits from the SRI as it enables a numerical analysis of an event in
comparison to other events By this measure an event can be prioritized by its severity In a severe
event this is unnecessary However for events that do not result in severe stressing of the bulk power
system this prioritization can be a challenge By using the SRI the event analysis process can decide
which events to learn from and reduce which events to avoid and when resilience needs to be
increased under high impact low frequency events as shown in the blue boxes in the figure
httpwwwnerccompagephpcid=5|365
Reliability Metrics Performance
40
Figure 20 NERC Annual Daily Severity Risk Index (SRI) Sorted Descending with Historic Benchmark Days
Other factors that impact severity of a particular event to be considered in the future include whether
equipment operated as designed and resulted in loss of load from a reliability perspective (intentional
and controlled load-shedding) Mechanisms for enabling ongoing refinement to include the historic and
simulated events for future severity risk calculations are being explored
Reliability Metrics Performance
41
Integrated Reliability Index Concepts In December 2010 the RMWG was challenged by the OC and PC to develop a single index concept to
measure the universe of risks associated with the bulk power system As a result the integrated
reliability index (IRI) concepts were proposed31
Figure 21
the three components of which were defined to
quantify each specific risk aspect They are titled the Event Driven Index (EDI) StandardsStatute Driven
Index (SDI) and Condition Driven Index (CDI) illustrated in with measures associated with
system events standards compliance and eighteen performance metrics The development of an
integrated reliability index aims to inform increase transparency and quantify the effectiveness of risk
reduction or mitigation actions The goal is to provide the industry meaningful trends of the BPSrsquos
performance and guidance on how the industry can improve reliability and support risk-informed
decision making Once completed the IRI will facilitate holistic assessment of performance Finally the
IRI should help overcome concern and confusion about how many metrics are being analyzed for system
reliability assessments
Figure 21 Risk Model for Bulk Power System
The integrated model of event-driven condition-driven and standardsstatute-driven risk information
can be constructed to illustrate all possible logical relations between the three risk sets Due to the
nature of the system there may be some overlap among the components
31 httpwwwnerccomdocspcrmwgIntegrated_Reliability_Index_WhitePaper_DRAFTpdf
Event Driven Index (EDI)
Indicates Risk from
Major System Events
Standards Statute Driven
Index (SDI)
Indicates Risks from Severe Impact Standard Violations
Condition Driven Index (CDI)
Indicates Risk from Key Reliability
Indicators
Reliability Metrics Performance
42
The Three Components of the IRI The three components of the IRI work together as shown in Figure 22 to comprise a full picture of the
state of reliability
Figure 22 An overview of the components that comprise the Integrated Reliability Index (IRI)
Event-Driven Indicators (EDI)
The Event-Driven Indicator provides a basis for prioritization of events based on bulk power system
integrity equipment performance and engineering judgment This indicator can serve as a high value
risk assessment tool to be used by stakeholders to investigate and evaluate disturbance history and
measure the severity of these events The relative ranking of events requires industry expertise agreed-
upon goals and engineering judgment The EDI is a derivative of SRI results for a specific time period
but it transforms that performance into a form of an availability index These calculations will be further
refined as feedback is received
Condition-Driven Indicators (CDI)
The Condition-Driven Indicators focus on a set of measurable system conditions (performance
measures) to assess bulk power system reliability These reliability indicators identify factors that
positively or negatively impact reliability and are early predictors of the risk to reliability from events or
unmitigated violations A collection of these indicators measures how close reliability performance is to
the desired outcome and if the performance against these metrics is constant or improving
Reliability Metrics Performance
43
StandardsStatute-Driven Indicators (SDI)
The StandardsStatute-Driven Indicator is a calculation of success of compliance based upon the subset
of high-value standards and is divided by the number of participations who could have received the
violation within the time period considered Also based on these factors known unmitigated violations
of elevated risk factor requirements are weighted higher than lower risk factors The index decreases if
the compliance improvement is achieved over a trending period
IRI Index Calculation As with the SRI the IRI is based on an importance weighting factor which the RMWG can modify over
time after gaining experience with the new metric as well as consideration of feedback from industry
At this time the RMWG believes some form of blended weighting may serve to start to populate IRI
characteristic curves at a high and generic level Based upon feedback from stakeholders this approach
may change or as discussed below weighting factors may vary based on periodic review and risk model
update The RMWG will continue the refinement of the IRI calculation and consider other significant
factors that impact reliability (eg intentional and controlled load-shedding) further it will explore
developing mechanisms for enabling ongoing refinement which should be influenced by a wide set of
stakeholders
RMWG recommends the Event Driven Index (EDI) be weighted the highest (50 percent) since events
actually occurred indicating how the system was performing The Condition Driven Index (CDI) and
StandardsStatute Driven Index (SDI) are weighted 25 each since they are indicators of potential risks
to BPS reliability IRI can be calculated as follows
IRI is intended to be a composite metric which integrates several forms of individual risks to the bulk
power system Since the three components range across many stakeholder organizations these
concepts are developed as starting points for continued study and evaluation Additional supporting
materials can be found in the IRI whitepaper32
IRI Recommendations
including individual indices calculations and preliminary
trend information
For the IRI more investigation should be performed to determine the best way to integrate EDI CDI
and SDI into an Integrated Reliability Index (IRI) that quantitatively represents the reliability of the bulk
32 The IRI whitepaper can be found at httpwwwnerccomdocspcrmwgIntegrated_Reliability_Index_WhitePaper_DRAFTpdf
Reliability Metrics Performance
44
power system To this end study into determining the amount of overlap between the components is
necessary RMWG is currently working to determine the proper amount of overlap between the IRI
components
Also the CDI component of the IRI needs to be solidified This is especially true with the CDI More
accurate metric data is needed to paint a fuller picture of the CDI Many of the metrics used to calculate
the CDI are new or they have limited data Compared to the SDI which counts well-known violation
counts and the EDI which uses the well-defined CDI the CDI lacks the depth of rigor that the other two
components have acquired through their years of data RMWG is currently working to improve the CDI
Reliability Metrics Conclusions and Recommendations Among the eighteen metrics that address the characteristics of an adequate level of reliability (ALR)
metric trends indicate the system is performing better in the following seven areas
bull ALR1-3 Planning Reserve Margin
bull ALR1-4 BPS Transmission Related Events Resulting in Loss of Load
bull ALR2-5 Disturbance Control Events Greater than Most Severe Single Contingency
bull ALR6-2 Energy Emergency Alert 3 (EEA3)
bull ALR6-3 Energy Emergency Alert 2 (EEA2)
bull ALR6-11 Automatic Transmission Outages Caused by Protection System Misoperations
bull ALR6-13 Automatic Transmission Outages Caused by Failed AC Substation Equipment
Assessments have been made in other performance categories A number of them do not have
sufficient data to derive any conclusions from the results The RMWG recommends continued data
collection and assessment of these metrics If a metric does not yield any trend in a five-year reporting
period the metric will be modified or withdrawn
For the IRI more investigation should be performed to determine the overlap of the components (CDI
EDI and SDI) The CDI should be more thoroughly solidified as an index by collecting more data over
time
Transmission Equipment Performance
45
Transmission Equipment Performance Introduction The Transmission Availability Data System (TADS) effort began with the establishment of a TADS task force
by the NERC Planning Committee in October 2006 On October 27 2007 the NERC Board of Trustees
approved the collection of transmission automatic outage data beginning in calendar year 2008 (Phase I)
Subsequently on October 29 2008 the NERC Board approved the collection of Non-Automatic Outage data
that began for Calendar year 2010 (Phase II)
This chapter provides reliability performance analysis of the transmission system by focusing on the trends
of Automatic Outage data from calendar year 2008 thru 2010 Since only one year of Non-Automatic
Outage data has been collected that data will not be assessed in this report
When calculating bulk power system performance indices care must be exercised when interpreting results
as misinterpretation can lead to erroneous conclusions regarding system performance With only three
years of data in the smaller regions it is not clear whether a regionrsquos yearly outage variation compared to
the average is due to random statistical variation or that particular year is significantly different in
performance However on a NERC-wide basis after three years of data collection there is enough
information to accurately determine whether the yearly outage variation compared to the average is due to
random statistical variation or the particular year in question is significantly different in performance33
Performance Trends
Transmission performance information has been provided by Transmission Owners (TOs) within NERC
through the NERC TADS (Transmission Availability Data System) process The data presented reflects
Momentary and Sustained AC Automatic outages of transmission elements that operate at voltages ge 200 kV
(including the low side of transformers) with the criteria specified in the TADS process The following
elements listed below are included
bull AC Circuits ge 200 kV (Overhead and Underground Circuits) Radial circuits are included
bull DC Circuits with ge +-200 kV DC voltage
bull Transformers with ge 200 kV low-side voltage and
bull ACDC Back-to-Back (BTB) Converters with ge 200 kV AC voltage on both sides
33The detailed Confidence Interval computation is available at httpwwwnerccomdocspctadstfTADS_Nov_2_2007APPENDIX_C_Confidence_Intervalpdf
Transmission Equipment Performance
46
AC Element Outage Summary and Leading Causes Table 6 shows the 2008 2009 and 2010 NERC total AC transmission element inventory and a summary of
the associated outages As expected in general the number of circuits increased from year to year due to
new construction or re-construction to higher voltages For every outage experienced on the transmission
system cause codes are identified and recorded according to the TADS process Causes of both momentary
and sustained outages have been indicated These causes are analyzed to identify trends and similarities
and to provide insight into what could be done to possibly prevent future occurrences
Figure 23 and Figure 24 describe the top ten initiating cause codes for sustained and momentary automatic
outages combined from 2008-2010 Based on the two figures the relationship between the total number of
outages and total outage hours can be seen Failed AC Substation Equipment and Failed AC Circuit
Equipment only account for 15 percent of the total number of outages but account for 65 percent of the
total outage hours The two largest causes of outages within NERC (ldquoLightingrdquo and ldquoWeather excluding
Lightningrdquo) account for 34 percent of the total number of outages
The next three Human Error Failed Protection System Equipment and Failed AC Circuit Equipment have
very similar totals and should all be considered significant focus points in reducing the number of Sustained
Automatic Outages for all elements
Transmission Equipment Performance
47
Table 6 NERC - All AC Elements Sustained and Momentary Outage Performance Summary
2008 Number of Outages
AC Voltage
Class
No of
Circuits
Circuit
Miles Sustained Momentary
Total
Outages Total Outage Hours
200-299kV 4369 102131 1560 1062 2622 56595
300-399kV 1585 53631 793 753 1546 14681
400-599kV 586 31495 389 196 585 11766
600-799kV 110 9451 43 40 83 369
All Voltages 6650 196708 2785 2051 4836 83626
2009 Number of Outages
AC Voltage
Class
No of
Circuits
Circuit
Miles Sustained Momentary
Total
Outages Total Outage Hours
200-299kV 4468 102935 1387 898 2285 28828
300-399kV 1619 56447 641 610 1251 24714
400-599kV 592 32045 265 166 431 9110
600-799kV 110 9451 53 38 91 442
All Voltages 6789 200879 2346 1712 4038 63094
2010 Number of Outages
AC Voltage
Class
No of
Circuits
Circuit
Miles Sustained Momentary
Total
Outages Total Outage Hours
200-299kV 4567 104722 1506 918 2424 54941
300-399kV 1676 62415 721 601 1322 16043
400-599kV 605 31590 292 174 466 10442
600-799kV 111 9477 63 50 113 2303
All Voltages 6957 208204 2582 1743 4325 83729
Note The NERC table does not show redacted outages DC Circuit outages Transformer outages or ACDC
converter outages
Transmission Equipment Performance
48
Figure 23 NERC - Top Ten Sustained and Momentary Outages by Initiating Cause Code for All Elements
Figure 24 NERC - Top Ten Sustained Outage Hours by Cause Code
198
151
80
7271
6943
33
27
188
68
Lightning
Weather excluding lightningHuman Error
Failed AC Substation EquipmentFailed Protection System EquipmentFailed AC Circuit Equipment Foreign Interference
Power System Condition
Fire
Unknown
Remaining Cause Codes
299
246
188
58
52
42
3619
16 12 31 Failed AC Substation EquipmentFailed AC Circuit Equipment Weather excluding lightningUnavailable
Other
Fire
Unknown
Human Error
Failed Protection System EquipmentForeign Interference
Remaining Cause Codes
Transmission Equipment Performance
49
Transmission Monthly Outages Figure 25 displays the total number of Automatic Outages on a per-month basis The three months with the
highest total of outages were June July and August From a seasonal perspective winter had a monthly
average of 281 outages These include the months of November-March Summer had an average of 429
outages Summer included the months of April-October
Figure 25 Number of Outages by Month for AC Circuits (2008-2010)
This figure does not show redacted outages DC Circuit outages Transformer outages or ACDC Converter
outages
Outage Initiation Location For every outage experienced on the transmission system the outage initiation code is identified and
recorded according to the TADS process The outage initiation code can be analyzed to identify trends and
similarities and to provide insight into what could be done to possibly prevent future occurrences
The ldquoOutage Initiation Coderdquo describes where an automatic outage was initiated on the power system The
five codes are as follows
bull Element-Initiated
bull Other Element-Initiated
bull AC Substation-Initiated
bull ACDC Terminal-Initiated (for DC circuits)
bull Other Facility Initiated any facility not included in any other outage initiation code
JanuaryFebruar
yMarch April May June July August
September
October
November
December
2008 238 229 257 258 292 437 467 380 208 176 255 236
2009 315 201 339 334 398 553 546 515 351 235 226 294
2010 444 224 269 446 449 486 639 498 351 271 305 281
3 Year AVG 332 218 288 346 380 492 551 464 303 227 262 270
0
100
200
300
400
500
600
700
Out
ages
Transmission Equipment Performance
50
Notably the protection system is not part of an ldquoAC Substationrdquo or an ldquoACDC Terminalrdquo If a protection
system misoperates and initiates an outage it will be classified as ldquoOther-Facility Initiatedrdquo The following
Figures show the initiating location of the Automatic outages from 2008 to 2010
With both Momentary and Sustained Automatic Outages taken into account the outage was initiated on the
Element more than 67 percent of the time as shown in Figure 26 and Figure 27
When only the Sustained Automatic Outages are analyzed the outage initiation on both AC Substation and
Other Facility increased by 34 percent and 32 percent respectively Outages initiated on the Element itself
decreases by 78 percent as shown in Figure 26 and 27 For only the Momentary Automatic Outages the
outage initiation on the Element increases by 19 percent compared to Sustained Outages Element initiated
outages make up over 78 percent of the total outages when analyzing only Momentary Outages
Figure 26
Figure 27
Transmission Outage Events Figure 28 illustrates the relationship between the numbers of Automatic Outages associated per TADS
event 2008 2009 and 2010 tend to follow the same trend The largest number of Automatic Outages per
TADS event is fourteen in 2010 thirteen in 2009 and eight in 2008 There are around 70 to 100 TADS
events that contain between fourteen and three Automatic Outages (see below) There are around 330 to
400 TADS events that contain two or more Automatic Outages The rest of the events only contain one
Automatic Outage As noted in the lower right hand corner below the total number of Events in 2008 to
2010 ranged from 3920 to 4569 events per year Nearly 90 percent or more of the events contained one
Automatic Outage
Figure 26 Sustained Automatic Outage Initiation
Code
Figure 27 Momentary Automatic Outage Initiation
Code
Transmission Equipment Performance
51
Transmission Outage Mode Figure 29 and Figure 30 show the percentage of Outage Modes The ldquoOutage Mode Coderdquo describes
whether one Automatic Outage is related to other Automatic Outages A Single Mode outage is an
Automatic Outage of a single Element which occurs independently of any other Automatic Outages (if any)
A ldquoDependent Mode Initiating Outagerdquo is an Automatic Outage of a single Element that initiates one or more
subsequent Element Automatic Outages A ldquoDependent Mode Outagerdquo is an Automatic Outage of an
Element which occurred as a result of an initiating outage whether the initiating outage was an Element
outage or a non-Element outage A ldquoCommon Mode Outagerdquo is one of two or more Automatic Outages with
the same Initiating Cause Code and where the outages are not consequences of each other and occur nearly
simultaneously A ldquoCommon Mode Initiating Outagerdquo is a Common Mode Outage that initiates one or more
subsequent Automatic Outages
Over 72 percent of the total outages occurred on the bulk power system are Single Mode Outages The next
largest mode is Dependent with over 11 percent of the total outages being in this category For only
Sustained Automatic Outages outages related to each other increase with Dependent mode accounting for
13 percent of the outages and Common mode accounting for close to 11 percent of the outages
Independent Sustained outages still account for the largest portion with nearly 70 percent being Single
mode When just analyzing Momentary Automatic Outages Associated outages decrease with Dependent
Figure 28 Event Histogram (2008-2010)
Transmission Equipment Performance
52
mode accounting for only 9 percent of the outages The Common Mode percentage decreases while
Dependent Mode Initiating percentage increases compared to Sustained Outages Independent Momentary
outages account for the largest portion with over 76 percent being Single Mode
An investigation into the root causes of Dependent and Common mode events which include three or more
Automatic Outages (indentified in the TADS 2008 to 2010 data) should be a high priority Some protection
systems are designed to trip three or more circuits but some events go beyond what is designed Some also
have misoperations associated with multiple outage events
Conclusions On a NERC wide average basis automatic transmission outage rate is improving from 2008 to 2010 based on
reported data Considering both automatic and non-automatic outages 2010 records indicate transmission
element availability percentage is very high and exceeds 95 The unavailability rate for AC circuits and
transformers are only 15 and 29 respectively
The cause codes of Human Error Failed Protection System Equipment and Failed AC Circuit Equipment
should be considered significant focus points in reducing the number of Sustained Automatic Outages for all
elements A deeper look into the root causes of Dependent and Common mode events which include three
or more Automatic Outages (indentified in the TADS 2008 to 2010 data) should be a high priority Some
protection systems are designed to trip three or more circuits but some events go beyond what is designed
Some also have misoperations associated with multiple outage events
Figure 29 Sustained Automatic Outage Mode code Figure 30 Momentary Automatic Outage Mode code
Generation Equipment Performance
53
Generation Equipment Performance Introduction The development of the Generating Availability Data System (GADS) began in 1982 This series of databases
is used to voluntarily collect record and retrieve operating information By pooling individual unit
information with likewise units generating unit availability performance can be calculated providing
opportunities to identify trends and generating equipment reliability improvement opportunities The
information is used to support equipment reliability availability analyses and risk-informed decision-making
by system planners generation owners assessment modelers manufacturers and contractors etc Reports
and information resulting from the data collected through GADS are now used for benchmarking and
analyzing electric power plants
Currently the data collected through GADS contains 72 percent of the North American generating units
with generating capacity of 20 MW or higher34 Additionally many of the newer combined-cycle plants are
not reporting information and therefore a full view of each unit type is not presented Rather a sample of
all the units in North America that fit a given more general category is provided35 for the 2008-201036
Generation Key Performance Indicators
assessment period
Three key performance indicators37
In
the industry have used widely to measure the availability of generating
units (see Terms Used in This Report section for their calculation parameters) are Equivalent Availability
Factor (EAF) Net Capacity Factor (NCF) and Equivalent Forced Outage Rate ndash Demand (EFORd)
Table 7 the North American fleet average EAF NCF and EFORd compared to unit age for all generating
units with a capacity of 20 MW and higher is provided for the years 2008-2010 The EAF shows a decline
during the last three years NCF is up and down while the EFORd appears to be increasing As expected the
fleet of units reported to GADS is aging overall with the fossil units being about 12 years older than the
average age
34 httpwwwnerccomdocspcgadstfGADSTF_Recommendation_Report_02-18-2011_FINALpdf 35GADS contains some 1500+ units under 20 MW that is not included in this report These units are excluded because most units are not base-loaded and are in peaking operation
3684 percent of the 2010 dataset is available at this time while the 2008 and 2009 dataset is complete 37 httpwwwnerccompagephpcid=4|43
Generation Equipment Performance
54
Table 7 General Availability Review of GADS Fleet Units by Year
2008 2009 2010 Average
Equivalent Availability Factor (EAF) 8776 8774 8678 8743
Net Capacity Factor (NCF) 5083 4709 4880 4890
Equivalent Forced Outage Rate -
Demand (EFORd) 579 575 639 597
Number of Units ge20 MW 3713 3713 3713 3713
Average Age of the Fleet in Years (all
unit types) 303 311 321 312
Average Age of the Fleet in Years
(fossil units only) 422 432 440 433
Figure 31 provides the average forced outage hours (FOH) maintenance outage hours (MOH) and planned
outage hours (POH) for all units reporting 20 MW or larger During this three-year period the average FOH
291 hours average MOH is 163 hours average POH is 470 hours
Figure 31 shows a large increase in forced and maintenance events The average age of the units with a
capacity of 20MW and higher in 2009 is 316 years old However the average age of fossil units in 2010 is
442 years old These fossil units are the backbone of all operating units providing the base-load power
continuously and nearly 50 percent of all energy annually There appears to be no increase allocated for
annualsemi-annual maintenance (ie planned outages) for the older generating units The increase of
000100002000030000400005000060000700008000090000
100000
2008 2009 2010
463 479 468
154 161 173
288 270 314
Hou
rs
Planned Maintenance Forced
Figure 31 Average Outage Hours for Units gt 20 MW
Generation Equipment Performance
55
maintenance outage hours reflects an increased need to fix problems that cannot be deferred until the next
annualsemi-annual repairs As a result it shows one of two things are happening
bull More or longer planned outage time is needed to repair the aging generating fleet
bull More focus on preventive repairs during planned and maintenance events are needed
Multiple Unit Forced Outages and Causes Table 8 provides the annual multiple-unit forced outage trips resulting from the same cause for each of the
assessments years 2008-2010 respectively The ldquosingle unitrdquo trips are large units with a Net Dependable
Capacity of 750 MW or more The trips of ldquotwo unitsrdquo or more is any combination of unit capacity with the
total amount of lost capacity more than 750 MW
Table 8 also presents more information on the forced outages During 2008-2010 there were a large
number of double-unit outages resulting from the same event Investigations show that some of these trips
were at a single plant caused by common control and instrumentation for the units The incidents occurred
several times for several months and are a common mode issue internal to the plant
Table 8 Number of Multiple Unit Forced Outages and FrequencyYear
2008 2009 2010
Type of
Trip
of
Trips
Avg Outage
Hr Trip
Avg Outage
Hr Unit
of
Trips
Avg Outage
Hr Trip
Avg Outage
Hr Unit
of
Trips
Avg Outage
Hr Trip
Avg Outage
Hr Unit
Single-unit
Trip 591 58 58 284 64 64 339 66 66
Two-unit
Trip 281 43 22 508 96 48 206 41 20
Three-unit
Trip 74 48 16 223 146 48 47 109 36
Four-unit
Trip 12 77 19 111 112 28 40 121 30
Five-unit
Trip 11 1303 260 60 443 88 19 199 10
gt 5 units 20 166 16 93 206 50 37 246 6
Loss of ge 750 MW per Trip
The high number of five-unit trips in 2008 was due to Hurricane Ike hitting the Gulf Coast The highest total
number of multiple unit trips occurred in 2009 though as mentioned before the data collection for 2010 is
incomplete at this time The majority of 2009 multiple unit trips have three main causes (in order by
Generation Equipment Performance
56
number of events) transmission lack of fuel and storms A summary of the three categories for single as
well as multiple unit outages (all unit capacities) are reflected in Table 9
Table 9 Common Causes of Multiple Unit Forced Outages (2009)
Cause Number of Events Average MW Size of Unit
Transmission 1583 16
Lack of Fuel (Coal Mines Gas Lines etc) Not
in Operator Control
812 448
Storms Lightning and Other Acts of Nature 591 112
Some of the transmission outages based on storms in 2009 have been caused by the same reasons because
the storms may have caused transmission interference However the plants reported the problems
inconsistently with either the transmission interference or storms cause code Therefore they are depicted
as two different causes of forced outage
Marked transmission outages in 2009 were quite high Thirty-five percent came from one utility with a large
number of hydroelectric units The company related the trips to various problems including weather
(lightning storms) wildlife ldquoline bumpsrdquo and problems on the receiving end of the transmission line Nine
hundred and eighty-five transmission trips (62 percent) were from hydroelectric units38
In 2009 only ten transmission trips resulted in a loss of 750 MW or more per trip Twenty two generating
plants were affected by the ten trips Causes for the trips include feeder line trips (1 trip) breakers in the
switchyard (8 trips) personnel errors (2 trips) and unknown (10 trips)
The ldquoLack of Fuelrdquo outages are of interest as these events occur during the times when a unit is available to
operate but there is an interruption in fuels to operate the facilities These events do not include
interruptions of fuel due to contracts Rather the cause code is designed to account for units that are
expecting fuel and it is unavailable when requested Table 10 presents the distribution of ldquoLack of Fuelrdquo
events by NERC Region and Table 11 presents the unit types affected
38 The average size of the hydroelectric units were small ndash 335 MW
Generation Equipment Performance
57
Of the units that report ldquoLack of Fuelrdquo 78 percent of the units are oil-fired 15 percent of the units are gas-
fired and the remaining units are various other fuels Table 12 provides the top causes of forced outage for
several unit types For fossil units ldquoLack of Fuelrdquo as the number three cause behind waterwall tube leaks
and superheater tube leaks
Table 10 Forced Outages Due to Lack of Fuel by Region
Region Number of Lack of Fuel
Problems Reported
FRCC 0
MRO 3
NPCC 24
RFC 695
SERC 17
SPP 3
TRE 7
WECC 29
One company contributed to the majority of oil-fired lack of fuel events The units at the company are
actually dual-fuels (oil and gas) but market nominated gas monitoring causes the units to be on forced
outage nightly The units need gas to start up so they can run on oil When they shut down the units must
switch to gas to clean themselves With the gas restriction the unit canrsquot start and the unit goes on a
forced outage Until the band is lifted the two units will continue to be on a forced outage cycle
Event records also provide descriptions of why the unit was without fuel with the majority of descriptions
bull Temperatures affecting gas supply valves
bull Unexpected maintenance of gas pipe-lines
bull Compressor problemsmaintenance
Generation Equipment Performance
58
Table 11 Unit Type Profile of Forced Outages Due to Lack of Fuel
Unit Types Number of Lack of Fuel Problems Reported
Fossil 642
Nuclear 0
Gas Turbines 88
Diesel Engines 1
HydroPumped Storage 0
Combined Cycle 47
Generation Equipment Performance
59
Table 12 Causes of Forced Outage for Different Unit Types (2008-2010)
Fossil - all MW sizes all fuels
Rank Description Occurrence per Unit-year
MWH per Unit-year
Average Hours To Repair
Average Hours Between Failures
Unit-years
1 Waterwall (furnace wall) 0590 134106 59 3250 3868 2 Second Superheater
Leaks 0180 5182 60 3228 3868
3 Lack of Fuel (coal mines gas lines etc) where the operator is not in control
0480 4701 18 26 3868
Combined-Cycle blocks Rank Description Occurrence
per Unit-year
MWH per Unit-year
Average Hours To Repair
Average Hours Between Failures
Unit-years
1 HP Turbine Buckets Or Blades
0020 4663 1830 26280 466
2 Turbine Control Valves 0040 2777 100 7200 466 3 Gas Turbine Compressor -
High Pressure Shaft 0010 2266 663 4269 466
Nuclear units - all Reactor types Rank Description Occurrence
per Unit-year
MWH per Unit-year
Average Hours To Repair
Average Hours Between Failures
Unit-years
1 LP Turbine Buckets or Blades
0010 26415 8760 26280 288
2 Containment Structure 0010 9233 1226 26262 288 3 Feedwater Pump Local
Controls 0020 7620 692 12642 288
Simple-cycle gas turbine jet engines Rank Description Occurrence
per Unit-year
MWH per Unit-year
Average Hours To Repair
Average Hours Between Failures
Unit-years
1 Main Transformer 0030 1611 1016 20709 4181 2 Other Gas Turbine
Controls And Instrument Problems
0120 428 70 2614 4181
3 Other Gas Turbine Problems
0090 400 119 1701 4181
Generation Equipment Performance
60
2008-2010 Review of Summer versus Winter Availability To address seasonality of unit availability unit information for the months of June to September (summer)
and December through February (winter) were pooled to calculate force events during these timeframes for
2008-201039 Figure 32 shows the Equivalent Availability Factor (EAF) is three percentage points higher and
the Equivalent Forced Outage Rate - Demand (EFORd) is more than a half of a percentage point lower in the
summer period than in winter period This means the units were more reliable with less forced events
during high-demand times during the summer than during the winter seasons The generating unitrsquos
capability has a resulting higher Net Capacity Factor (NCF) of 45 percentage points in the summer season
for 2008-2010
During the spring season (March-May) 77 percent of the units took a planned outage (PO) for an average
231 hours (or 96 days) In fall (October-November) only 42 percent of the units experienced a PO and the
average duration was shorter ndash 134 hours (or 56 days) A few units took both spring and fall planned
outages although this is rare Based on this assessment the generating units are prepared for the summer
peak demand The resulting availability indicates that this maintenance was successful which is measured
by an increased EAF and lower EFORd
Figure 32 Summer-Winter Average EAF NCF and EFORd (2008-2010)
Conclusions and Recommendations During 2008-2010 the average Equivalent Availability Factor (EAF) which measures the overall availability
of generating units decreased At the same time the Net Capacity Factor (NCF) an indicator of energy
production increased The average number of forced outages in 2010 is greater than in 2008 while at the
same time the average planned outage times have decreased As a result the Equivalent Forced Outage
Rate ndash Demand (EFORd) also increased illustrating that more units have experienced forced events during
39 A study of peak periods was conducted by the NERC Generating Availability Trend Evaluation (GATE) Working Group several years ago see httpwwwnerccomfilesSeasonal-Performance-Trendspdf
9116
5343
396
8818
4896
441
0 10 20 30 40 50 60 70 80 90 100
EAF
NCF
EFORd
Percent ()
Winter
Summer
Generation Equipment Performance
61
peak-demand times in 2010 than in the previous two years Potentially with shorter planned outage
periods in 2010 there may be less time to repair equipment and prevent forced unit outages
There are warnings that units are not being maintained as well as they should be In the last three years
there has been an increase in Equivalent Forced Outage Rate ndash Demand (EFORd) This indicator measures
the rate of forced outage events on generating units during periods of load demand To confirm this
problem forced outage hours jumped from 270 to 314 hours per unit between 2009 and 2010 At the same
time maintenance events also increased by 12 hours per unit Planned outage events remain constant The
resulting conclusions from this trend are
bull More or longer planned outage time is needed to repair the generating fleet Whether age is the
cause of the increase need for planned outage time remains unknown and further investigation into
the cause for longer planned outage time is necessary
bull More focus on preventive repairs during planned and maintenance events are needed
There are many multiple unit forced outages due to lack of fuel The majority of multiple unit trips have
three main causes transmission lack of fuel and storms With special interest in the forced outages due to
ldquoLack of Fuelrdquo additional analysis revealed that 77 percent of the units experiencing unexpected fuel
stoppage are oil-fired fossil units while gas-fired units experienced 15 percent
Generating units continue to be more reliable during the peak summer periods
Disturbance Event Trends
62
Category 1 An event resulting in one or more of the following a Unintended loss of three or more BPS elements caused by
common mode failure b Failure or misoperation of an SPSRAS c System-wide voltage reduction of 3 or more d Unintended BPS system separation resulting in an island of
100 MW to 999 MW e Unplanned evacuation from a control center facility with BPS
SCADA functionality for 30 minutes or more Category 2 An event resulting in one or more of the following
a Complete loss of all BPS control center voice communication system(s) for 30 minutes or more
b Complete loss of SCADA control or monitoring functionality for 30 minutes or more
c Voltage excursions equal to or greater than 10 lasting more than five minutes
d Loss of off-site power (LOOP) to a nuclear generating station e Unintended system separation resulting in an island of 1000
MW to 4999 MW f Unintended loss of 300MW or more of firm load for more
than 15 minutes g Violation of an Interconnection Reliability Operating Limit
(IROL) for more than 30 minutes Category 3 An event resulting in one or more of the following
a The loss of load or generation of 2000 MW or more in the Eastern Interconnection or
b Western Interconnection or 1000 MW or more in the ERCOT or Queacutebec Interconnections
c Unintended system separation resulting in an island of 5000 MW to 10000 MW
d Unintended system separation resulting in an island of Florida from the Eastern Interconnection
Category 4 An event resulting in one or more of the following a The loss of load or generation from 5001 MW to 9999 MW b Unintended system separation resulting in an island of more
than 10000 MW (with the exception of Florida as described in Category 3c)
Category 5 An event resulting in one or more of the following a The loss of load of 10000 MW or more b The loss of generation of 10000 MW or more
Figure 33 BPS Event Category
Disturbance Event Trends Introduction The purpose of this section is to report event
analysis trends from the beginning of event
analysis field test40
One of the companion goals of the event
analysis program is the identification of trends
in the number magnitude and frequency of
events and their associated causes such as
human error equipment failure protection
system misoperations etc The information
provided in the event analysis database (EADB)
and various event analysis reports have been
used to track and identify trends in BPS events
in conjunction with other databases (TADS
GADS metric and benchmarking database)
to the end of 2010
The Event Analysis Working Group (EAWG)
continuously gathers event data and is moving
toward an integrated approach to analyzing
data assessing trends and communicating the
results to the industry
Performance Trends The event category is classified41
Figure 33
as shown in
with Category 5 being the most
severe Figure 34 depicts disturbance trends in
Category 1 to 5 system events from the
40 httpwwwnerccomdocseawgGalloway-Industry-EA-Field-Test-102210pdf 41httpwwwnerccomfiles2011-05-0220Event_Analysis_Process_Phase20220Field20Test20Draft20-20Final20-20For20postingpdf
Disturbance Event Trends
63
beginning of event analysis field test to the end of 201042
Figure 34 Event Category vs Date for All 2010 Categorized Events
From the figure in November and December
there were many more category 1 and 2 events than in October This is due to the field trial starting on
October 25 2010
In addition to the category of the events the status of the events plays a critical role in the accuracy of the
data By examining Figure 35 over 80 of the events reported in 2010 have been closed This means that
the category root cause and other important information have been sufficiently finalized in order for
analysis to be accurate for each event At this time there is not enough data to draw any long-term
conclusions about event investigation performance
42 Documents for the EA Field Test are located at httpwwwnerccompagephpcid=5|365
2
12 12
26
3
6 5
14
1 1
2
0
5
10
15
20
25
30
35
40
45
October November December 2010
Even
t Cou
nt
Category 3 Category 2 Category 1
Disturbance Event Trends
64
Figure 35 Event Count vs Status (All 2010 Events with Status)
By drilling down into the cause code for each closed 2010 event Figure 36 shows the top 3 event causes
From the figure equipment failure and protection system misoperation are the most significant causes for
events Because of how new and limited the data is however there may not be statistical significance for
this result Further trending of cause codes for closed events and developing a richer dataset to find any
trends between event cause codes and event counts should be performed
Figure 36 Top 3 Event Counts vs DAWG Cause Code for all Closed 2010 Events
10
32
42
0
5
10
15
20
25
30
35
40
45
Open Closed Open and Closed
Even
t Cou
nt
Status
1211
8
0
2
4
6
8
10
12
14
Equipment Failure Protection System Misoperation Human Error
Even
t Cou
nt
Cause Code
Disturbance Event Trends
65
Conclusions Due to the relatively new process for events analysis and categorization more time will be required before a
conclusive recommendation may be obtained Further analysis and new data should provide valuable
statistics in the future Over 80 of all event reports from 2010 are current listed as closed but no
conclusion about investigation performance may be obtained because of the limited amount of data It is
recommended to study ways to prevent equipment failure and protection system misoperations but there
is not enough data to draw a firm conclusion about the top causes of events at this time
Abbreviations Used in This Report
66
Abbreviations Used in This Report
Acronym Definition ALP Acadiana Load Pocket
ALR Adequate Level of Reliability
ARR Automatic Reliability Report
BA Balancing Authority
BPS Bulk Power System
CDI Condition Driven Index
CEII Critical Energy Infrastructure Information
CIPC Critical Infrastructure Protection Committee
CLECO Cleco Power LLC
DADS Future Demand Availability Data System
DCS Disturbance Control Standard
DOE Department Of Energy
DSM Demand Side Management
EA Event Analysis
EAF Equivalent Availability Factor
ECAR East Central Area Reliability
EDI Event Drive Index
EEA Energy Emergency Alert
EFORd Equivalent Forced Outage Rate Demand
EMS Energy Management System
ERCOT Electric Reliability Council of Texas
ERO Electric Reliability Organization
ESAI Energy Security Analysis Inc
FERC Federal Energy Regulatory Commission
FOH Forced Outage Hours
FRCC Florida Reliability Coordinating Council
GADS Generation Availability Data System
GOP Generation Operator
IEEE Institute of Electrical and Electronics Engineers
IESO Independent Electricity System Operator
IROL Interconnection Reliability Operating Limit
Abbreviations Used in This Report
67
Acronym Definition IRI Integrated Reliability Index
LOLE Loss of Load Expectation
LUS Lafayette Utilities System
MAIN Mid-America Interconnected Network Inc
MAPP Mid-continent Area Power Pool
MOH Maintenance Outage Hours
MRO Midwest Reliability Organization
MSSC Most Severe Single Contingency
NCF Net Capacity Factor
NEAT NERC Event Analysis Tool
NERC North American Electric Reliability Corporation
NPCC Northeast Power Coordinating Council
OC Operating Committee
OL Operating Limit
OP Operating Procedures
ORS Operating Reliability Subcommittee
PC Planning Committee
PO Planned Outage
POH Planned Outage Hours
RAPA Reliability Assessment Performance Analysis
RAS Remedial Action Schemes
RC Reliability Coordinator
RCIS Reliability Coordination Information System
RCWG Reliability Coordinator Working Group
RE Regional Entities
RFC Reliability First Corporation
RMWG Reliability Metrics Working Group
RSG Reserve Sharing Group
SAIDI System Average Interruption Duration Index
SAIFI System Average Interruption Frequency Index
SCADA Supervisory Control and Data Acquisition
SDI Standardstatute Driven Index
SERC SERC Reliability Corporation
Abbreviations Used in This Report
68
Acronym Definition SRI Severity Risk Index
SMART Specific Measurable Attainable Relevant and Tangible
SOL System Operating Limit
SPS Special Protection Schemes
SPCS System Protection and Control Subcommittee
SPP Southwest Power Pool
SRI System Risk Index
TADS Transmission Availability Data System
TADSWG Transmission Availability Data System Working Group
TO Transmission Owner
TOP Transmission Operator
WECC Western Electricity Coordinating Council
Contributions
69
Contributions This report was made feasible by the collaboration and hard work of both NERC staff and NERCrsquos
Industry Groups
NERC Industry Groups
Table 14 lists the NERC industry group contributors Without their contribution and collaboration this
report would not have been possible
Table 13 NERC Industry Group Contributions43
NERC Group
Relationship Contribution
Reliability Metrics Working Group
(RMWG)
Reports to the OCPC bull Lead Development of Report bull Provide Reliability Metrics Data bull Responsible for Reliability Metrics
Performance Chapter
Transmission Availability Working Group
(TADSWG)
Reports to the OCPC bull Provide Transmission Availability Data
bull Responsible for Transmission Equip-ment Performance Chapter
bull Content Review
Generation Availability Data System Task
Force
(GADSTF)
Reports to the OCPC bull Provide Generation Availability Data bull Responsible for Generation Equip-
ment Performance Chapter bull Content Review
Event Analysis Working Group
(EAWG)
Reports to the OCPC bull Provide Events Data bull Responsible for Disturbance Events
Trends Chapter bull Content Review
43 Rosters for RMWG TADSWG GADSTF and EAWG are available at httpwwwnerccomfilesrosterpdf
Contributions
70
NERC Staff Table 13 below lists the NERC staff who contributed to the 2011 Reliability Performance Analysis
Report
Table 14 Contributing NERC Staff
Name Title E-mail Address
Mark Lauby Vice President and Director of
Reliability Assessment and
Performance Analysis
marklaubynercnet
Jessica Bian Manager of Performance Analysis jessicabiannercnet
John Moura Manager of Reliability Assessments johnmouranercnet
Andrew Slone Engineer Reliability Performance
Analysis
andrewslonenercnet
Jim Robinson TADS Project Manager jimrobinsonnercnet
Clyde Melton Engineer Reliability Performance
Analysis
clydemeltonnercnet
Mike Curley Manager of GADS Services mikecurleynercnet
James Powell Engineer Reliability Performance
Analysis
jamespowellnercnet
Michelle Marx Administrative Assistant michellemarxnercnet
William Mo Intern Performance Analysis wmonercnet
- NERCrsquos Mission
- Table of Contents
- Executive Summary
-
- 2011 Transition Report
- State of Reliability Report
- Key Findings and Recommendations
-
- Reliability Metric Performance
- Transmission Availability Performance
- Generating Availability Performance
- Disturbance Events
- Report Organization
-
- Introduction
-
- Metric Report Evolution
- Roadmap for the Future
-
- Reliability Metrics Performance
-
- Introduction
- 2010 Performance Metrics Results and Trends
-
- ALR1-3 Planning Reserve Margin
-
- Background
- Assessment
- Special Considerations
-
- ALR1-4 BPS Transmission Related Events Resulting in Loss of Load
-
- Background
- Assessment
-
- ALR1-12 Interconnection Frequency Response
-
- Background
- Assessment
-
- ALR2-3 Activation of Under Frequency Load Shedding
-
- Background
- Assessment
- Special Considerations
-
- ALR2-4 Average Percent Non-Recovery Disturbance Control Standards (DCS)
-
- Background
- Assessment
- Special Consideration
-
- ALR2-5 Disturbance Control Events Greater Than Most Severe Single Contingency
-
- Background
- Assessment
- Special Consideration
-
- ALR 1-5 System Voltage Performance
-
- Background
- Special Considerations
- Status
-
- ALR3-5 Interconnection Reliability Operating Limit System Operating Limit (IROLSOL) Exceedances
-
- Background
-
- ALR4-1 Automatic Transmission Outages Caused by Protection System Misoperations
-
- Background
- Special Considerations
-
- ALR6-11 ndash ALR6-14
-
- Background
- Assessment
- ALR 6-11 ndash Automatic Outages Initiated by Failed Protection System Equipment
- ALR6-12 ndash Automatic Outages Initiated by Human Error
- ALR6-13 ndash Automatic Outages Initiated by Failed AC Substation Equipment
- ALR6-14 Automatic AC Transmission Outages Initiated by Failed AC Circuit Equipment
-
- ALR6-15 Element Availability Percentage (APC)
-
- Background
- Assessment
- Special Consideration
-
- ALR6-16 Transmission System Unavailability
-
- Background
- Assessment
- Special Consideration
-
- ALR6-2 Energy Emergency Alert 3 (EEA3)
-
- Background
- Assessment
- Special Considerations
-
- ALR 6-3 Energy Emergency Alert 2 (EEA2)
-
- Background
- Assessment
- Special Considerations
-
- ALR 6-1 Transmission Constraint Mitigation
-
- Background
- Assessment
- Special Considerations
-
- Integrated Bulk Power System Risk Assessment
-
- Introduction
- Recommendations
-
- Integrated Reliability Index Concepts
-
- The Three Components of the IRI
-
- Event-Driven Indicators (EDI)
- Condition-Driven Indicators (CDI)
- StandardsStatute-Driven Indicators (SDI)
-
- IRI Index Calculation
- IRI Recommendations
-
- Reliability Metrics Conclusions and Recommendations
-
- Transmission Equipment Performance
-
- Introduction
- Performance Trends
-
- AC Element Outage Summary and Leading Causes
- Transmission Monthly Outages
- Outage Initiation Location
- Transmission Outage Events
- Transmission Outage Mode
-
- Conclusions
-
- Generation Equipment Performance
-
- Introduction
- Generation Key Performance Indicators
-
- Multiple Unit Forced Outages and Causes
- 2008-2010 Review of Summer versus Winter Availability
-
- Conclusions and Recommendations
-
- Disturbance Event Trends
-
- Introduction
- Performance Trends
- Conclusions
-
- Abbreviations Used in This Report
- Contributions
-
- NERC Industry Groups
- NERC Staff
-
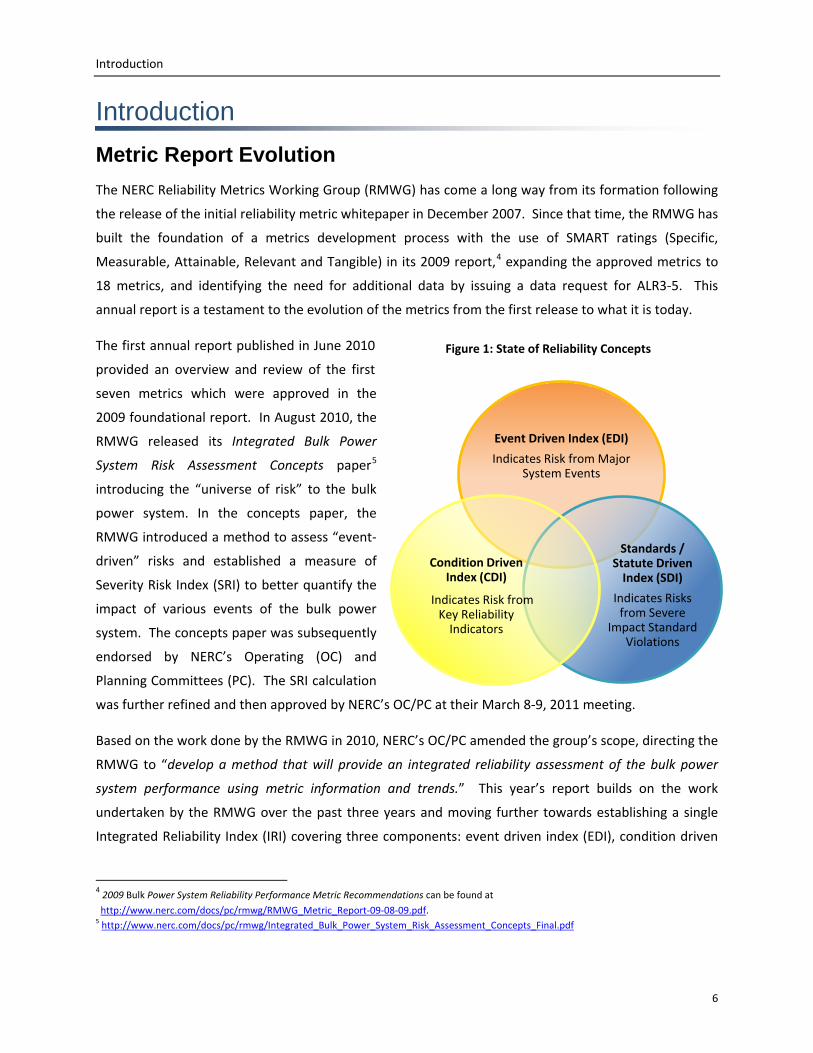
Introduction
6
Figure 1 State of Reliability Concepts
Introduction Metric Report Evolution The NERC Reliability Metrics Working Group (RMWG) has come a long way from its formation following
the release of the initial reliability metric whitepaper in December 2007 Since that time the RMWG has
built the foundation of a metrics development process with the use of SMART ratings (Specific
Measurable Attainable Relevant and Tangible) in its 2009 report4
The first annual report published in June 2010
provided an overview and review of the first
seven metrics which were approved in the
2009 foundational report In August 2010 the
RMWG released its
expanding the approved metrics to
18 metrics and identifying the need for additional data by issuing a data request for ALR3-5 This
annual report is a testament to the evolution of the metrics from the first release to what it is today
Integrated Bulk Power
System Risk Assessment Concepts paper5
Based on the work done by the RMWG in 2010 NERCrsquos OCPC amended the grouprsquos scope directing the
RMWG to ldquodevelop a method that will provide an integrated reliability assessment of the bulk power
system performance using metric information and trendsrdquo This yearrsquos report builds on the work
undertaken by the RMWG over the past three years and moving further towards establishing a single
Integrated Reliability Index (IRI) covering three components event driven index (EDI) condition driven
introducing the ldquouniverse of riskrdquo to the bulk
power system In the concepts paper the
RMWG introduced a method to assess ldquoevent-
drivenrdquo risks and established a measure of
Severity Risk Index (SRI) to better quantify the
impact of various events of the bulk power
system The concepts paper was subsequently
endorsed by NERCrsquos Operating (OC) and
Planning Committees (PC) The SRI calculation
was further refined and then approved by NERCrsquos OCPC at their March 8-9 2011 meeting
4 2009 Bulk Power System Reliability Performance Metric Recommendations can be found at
httpwwwnerccomdocspcrmwgRMWG_Metric_Report-09-08-09pdf 5 httpwwwnerccomdocspcrmwgIntegrated_Bulk_Power_System_Risk_Assessment_Concepts_Finalpdf
Event Driven Index (EDI)
Indicates Risk from Major System Events
Standards Statute Driven
Index (SDI)
Indicates Risks from Severe
Impact Standard Violations
Condition Driven Index (CDI)
Indicates Risk from Key Reliability
Indicators
Introduction
7
Figure 2 Data Source Integration and Analysis
index (CDI) and standardsstatute driven index (SDI) as shown in Figure 1 These individual
components will be used to develop a reliability index that will assist industry in assessing its current
state of reliability This is an ambitious undertaking and it will continue to evolve as an understanding
of what factors contribute to or indicate the level of reliability develops As such this report will evolve
in the coming years as expanding the work with SRI will provide further analysis of the approved
reliability metrics and establish the cornerstones for developing an IRI The cornerstones are described
in section three with recommendations for next steps to better refine and weigh the components of the
IRI and how its use to establish a ldquoState of Reliabilityrdquo for the bulk power system in North America
For this work to be effective and useful to industry and other stakeholders it must use existing data
sources align with other industry analyses and integrate with other initiatives as shown in Figure 2
NERCrsquos various data resources are introduced in this report Transmission Availability Data System
(TADS) Generation Availability Data System (GADS) the event analysis database and future Demand
Availability Data System (DADS)6
The RMWG embraces an open
development process while
incorporating continuous improve-
ment through leveraging industry
expertise and technical judgment
As new data becomes available
more concrete conclusions from the
reliability metrics will be drawn and
recommendations for reliability
standards and compliance practices
will be developed for industryrsquos
consideration
When developing the IRI the experience gained will be leveraged in developing the Severity Risk Index
(SRI) This evolution will take time and the first assessment of ongoing reliability with an integrated
reliability index is expected in the 2012 Annual Report The goal is not only to measure performance
but to highlight areas for improvement as well as reinforcing and measuring industry success As this
integrated view of reliability is developed the individual quarterly performance metrics will be updated
as illustrated in Figure 3 on a new Reliability Indicators dashboard at NERCrsquos website7
6 DADS will begin mandatory data collection from April 2011 through October 2011 with data due on December 15 2011
The RMWG will
7 Reliability Indicatorsrsquo dashboard is available at httpwwwnerccompagephpcid=4|331
Introduction
8
keep the industry informed by conducting yearly webinars providing quarterly data updates and
publishing its annual report
Figure 3 NERC Reliability Indicators Dashboard
Roadmap for the Future As shown in Figure 4 the 2011 Reliability Performance Analysis report begins a transition from a 2009
metric performance assessment to a ldquoState of Reliabilityrdquo report by collaborating with other groups to
form a unified approach to historical reliability performance analysis This process will require
engagement with a number of NERC industry experts to paint a broad picture of the bulk power
systemrsquos historic reliability
Alignment to other industry reports is also important Analysis from the frequency response performed
by the Resources Subcommittee (RS) physical and cyber security assessment provided by the Critical
Infrastructure Protection Committee (CIPC) the wide area reliability coordination conducted by the
Reliability Coordinator Working Group (RCWG) the spare equipment availability system enhanced by
the Spare Equipment Database Task Force (SEDTF) the post seasonal assessment developed by the
Reliability Assessment Subcommittee (RAS) and demand response deployment summarized by the
Demand Response Data Task Force (DRDTF) will provide a significant foundation from which this report
draws Collaboration derived from these stakeholder groups further refines the metrics and use of
additional datasets will broaden the industryrsquos tool-chest for improving reliability of the bulk power
system
The annual State of Reliability report is aimed to communicate the effectiveness of ERO (Electric
Reliability Organization) by presenting an integrated view of historic reliability performance The report
will provide a platform for sound technical analysis and a way to provide feedback on reliability trends
to stakeholders regulators policymakers and industry The key findings and recommendations will
Introduction
9
ultimately be used as input to standards changes and project prioritization compliance process
improvement event analysis and critical infrastructure protection areas
Figure 4 Overview of the Transition to the 2012 State of Reliability Report
Reliability Metrics Performance
10
Reliability Metrics Performance Introduction Building upon last yearrsquos metric review the RMWG continues to assess the results of eighteen currently
approved performance metrics Due to data availability each of the performance metrics do not
address the same time periods (some metrics have just been established while others have data over
many years) though this will be an important improvement in the future Merit has been found in all
eighteen approved metrics At this time though the number of metrics is expected to will remain
constant however other metrics may supplant existing metrics In spite of the potentially changing mix
of approved metrics to goals is to ensure the historical and current assessments can still be performed
These metrics exist within an overall reliability framework and in total the performance metrics being
considered address the fundamental characteristics of an acceptable level of reliability (ALR) Each of
the elements being measured by the metrics should be considered in aggregate when making an
assessment of the reliability of the bulk power system with no single metric indicating exceptional or
poor performance of the power system
Due to regional differences (size of the region operating practices etc) comparing the performance of
one Region to another would be erroneous and inappropriate Furthermore depending on the region
being evaluated one metric may be more relevant to a specific regionrsquos performance than others and
assessment may not be strictly mathematical rather more subjective Finally choosing one regionrsquos
best metric performance to define targets for other regions is inappropriate
Another key principle followed in developing these metrics is to retain anonymity of any reporting
organization Thus granularity will be attempted up to the point that such actions might compromise
anonymity of any given company Certain reporting entities may appear inconsistent but they have
been preserved to maintain maximum granularity with individual anonymity
Although assessments have been made in a number of the performance categories others do not have
sufficient data to derive any conclusions from the metric results The RMWG recommends continued
assessment of these metrics until sufficient data is available Each of the eighteen performance metrics
are presented in summary with their SMART8 Table 1 ratings in The table provides a summary view of
the metrics with an assessment of the current metric trends observed by the RMWG Table 1 also
shows the order in which the metrics are aligned according to the standards objectives
8 SMART rating definitions are located at httpwwwnerccomdocspcrmwgSMART_20RATING_826pdf
Reliability Metrics Performance
11
Table 1 Metric SMART Ratings Relative to Standard Objectives
Metrics SMART Objectives Relative to Standards Prioritization
ALR Improvements
Trend
Rating
SMART
Rating
1-3 Planning Reserve Margin 13
1-4 BPS Transmission Related Events Resulting in Loss of Load 15
2-5 Disturbance Control Events Greater than Most Severe Single Contingency 12
6-2 Energy Emergency Alert 3 (EEA3) 15
6-3 Energy Emergency Alert 2 (EEA2) 15
Inconclusive
2-3 Activation of Under Frequency Load Shedding 10
2-4 Average Percent Non-Recovery DCS 15
4-1 Automatic Transmission Outages Caused by Protection System Misoperation 15
6-11 Automatic Transmission Outages Caused by Protection System Misoperation 14
6-12 Automatic Transmission Outages Caused by Human Error 14
6-13 Automatic Transmission Outages Caused by Failed AC Substation Equipment 14
6-14 Automatic Transmission Outages Caused by Failed AC Circuit Equipment 14
New Data
1-5 Systems Voltage Performance 14
3-5
Interconnected Reliability Operating Limit System Operating Limit (IROLSOL)
Exceedance 14
6-1 Transmission constraint Mitigation 14
6-15 Element Availability Percentage (APC) 13
6-16
Transmission System Unavailability on Operational Planned and Auto
Sustained Outages 13
No Data
1-12 Frequency Response 11
Trend Rating Symbols
Significant Improvement
Slight Improvement
Inconclusive
Slight Deterioration
Significant Deterioration
New Data
No Data
Reliability Metrics Performance
12
2010 Performance Metrics Results and Trends
ALR1-3 Planning Reserve Margin
Background
The Planning Reserve Margin9 is a measure of the relationship between the amount of resource capacity
forecast and the expected demand in the planning horizon10 Coupled with probabilistic analysis
calculated Planning Reserve Margins is an industry standard which has been used by system planners for
decades as an indication of system resource adequacy Generally the projected demand is based on a
5050 forecast11
Assessment
Planning Reserve Margin is the difference between forecast capacity and projected
peak demand normalized by projected peak demand and shown as a percentage Based on experience
for portions of the bulk power system that are not energy-constrained Planning Reserve Margin
indicates the amount of capacity available to maintain reliable operation while meeting unforeseen
increases in demand (eg extreme weather) and unexpected unavailability of existing capacity (eg
long-term generation outages) Further from a planning perspective Planning Reserve Margin trends
identify whether capacity additions are projected to keep pace with demand growth
Planning Reserve Margins considering anticipated capacity resources and adjusted potential capacity
resources decrease in the latter years of the 2009 and 2010 10-year forecast in each of the four
interconnections Typically the early years provide more certainty since new generation is either in
service or under construction with firm commitments In the later years there is less certainty about
the resources that will be needed to meet peak demand Declining Planning Reserve Margins are
inherent in a conventional forecast (assuming load growth) and do not necessarily indicate a trend of a
degrading resource adequacy Rather they are an indication of the potential need for additional
resources In addition key observations can be made to the Planning Reserve Margin forecast such as
short-term assessment rate of change through the assessment period identification of margins that are
approaching or below a target requirement and comparisons from year-to-year forecasts
While resource planners are able to forecast the need for resources the type of resource that will
actually be built or acquired to fill the need is usually unknown For example in the northeast US
markets with three to five year forward capacity markets no firm commitments can be made in the
9 Detailed calculations of Planning Reserve Margin are available at httpwwwnerccompagephpcid=4|331|333 10The Planning Reserve Margin indicated here is not the same as an operating reserve margin that system operators use for near-term
operations decisions 11These demand forecasts are based on ldquo5050rdquo or median weather (a 50 percent chance of the weather being warmer and a 50 percent
chance of the weather being cooler)
Reliability Metrics Performance
13
long-term However resource planners do recognize the need for resources in their long-term planning
and account for these resources through generator queues These queues are then adjusted to reflect
an adjusted forecast of resourcesmdashpro-rated by approximately 20 percent
When comparing the assessment of planning reserve margins between 2009 and 2010 the
interconnection Planning Reserve Margins are slightly higher on an annual basis in the 2010 forecast
compared to those of 2009 as shown in Figure 5
Figure 5 Planning Reserve Margin by Interconnection and Year
In general this is due to slightly higher capacity forecasts and slightly lower demand forecasts The pace
of any economic recovery will affect future comparisons This metric can be used by NERC to assess the
individual interconnections in the ten-year long-term reliability assessments If a noticeable change
Reliability Metrics Performance
14
occurs within the trend further investigation is necessary to determine the causes and likely effects on
reliability
Special Considerations
The Planning Reserve Margin is a capacity based metric Therefore it does not provide an accurate
assessment of performance in energy-limited systems (eg hydro capacity with limited water resources
or systems with significant variable generation penetration) In addition the Planning Reserve Margin
does not reflect potential transmission constraint internal to the respective interconnection Planning
Reserve Margin data shown in Figure 6 is used for NERCrsquos seasonal and long-term reliability
assessments and is the primary metric for determining the resource adequacy of a given assessment
area
The North American Bulk Power System is divided into four distinct interconnections These
interconnections are loosely connected with limited ability to share capacity or energy across the
interconnection To reflect this limitation the Planning Reserve Margins are calculated in this report
based on interconnection values rather than by national boundaries as is the practice of the Reliability
Assessment Subcommittee (RAS)
ALR1-4 BPS Transmission Related Events Resulting in Loss of Load
Background
This metric measures bulk power system transmission-related events resulting in the loss of load
Planners and operators can use this metric to validate their design and operating criteria by identifying
the number of instances when loss of load occurs
For the purposes of this metric an ldquoeventrdquo is an unplanned transmission disturbance that produces an
abnormal system condition due to equipment failures or system operational actions and results in the
loss of firm system demand for more than 15 minutes The reporting criteria for such events are
outlined below12
bull Entities with a previous year recorded peak demand of more than 3000 MW are required to
report all such losses of firm demands totaling more than 300 MW
bull All other entities are required to report all such losses of firm demands totaling more than 200
MW or 50 percent of the total customers being supplied immediately prior to the incident
whichever is less
bull Firm load shedding of 100 MW or more used to maintain the continuity of the bulk power
system reliability
12 Details of event definitions are available at httpwwwnerccomfilesEOP-004-1pdf
Reliability Metrics Performance
15
Assessment
Figure 6 illustrates that the number of bulk power system transmission-related events resulting in loss of
firm load13
Table 2
from 2002 to 2009 is relatively constant and suggests that 7 - 10 events per year is a norm for
the bulk power system However the magnitude of load loss shown in associated with these
events reflects a downward trend since 2007 Since the data includes weather-related events it will
provide the RMWG with an opportunity for further analysis and continued assessment of the trends
over time is recommended
Figure 6 BPS Transmission Related Events Resulting in Loss of Load Counts (2002-2009)
Table 2 BPS Transmission Related Events Resulting in Loss of Load MW Loss (2002-2009)
Year Load Loss (MW)
2002 3762
2003 65263
2004 2578
2005 6720
2006 4871
2007 11282
2008 5200
2009 2965
13The metric source data may require adjustments to accommodate all of the different groups for measurement and consistency as OE-417 is only used in the US
02468
101214
2002 2003 2004 2005 2006 2007 2008 2009
Count
Reliability Metrics Performance
16
ALR1-12 Interconnection Frequency Response
Background
This metric is used to track and monitor Interconnection Frequency Response Frequency Response is a
measure of an Interconnectionrsquos ability to stabilize frequency immediately following the sudden loss of
generation or load It is a critical component to the reliable operation of the bulk power system
particularly during disturbances and restoration The metric measures the average frequency responses
for all events where frequency drops more than 35 mHz within a year
Assessment
At this time there has been no data collected for ALR1-12 Therefore no assessment was made
ALR2-3 Activation of Under Frequency Load Shedding
Background
The purpose of Under Frequency Load Shedding (UFLS) is to balance generation and load in an island
following an extreme event The UFLS activation metric measures the number of times UFLS is activated
and the total MW of load interrupted in each Region and NERC wide
Assessment
Figure 7 and Table 3 illustrate a history of Under Frequency Load Shedding events from 2006 through
2010 Through this period itrsquos important to note that single events had a range load shedding from 15
MW to 7654 MW The activation of UFLS relays is the last automated reliability measure associated
with a decline in frequency in order to rebalance the system Further assessment of the MW loss for
these activations is recommended
Figure 7 ALR2-3 Count of Activations by Year and Regional Entity (2001-2010)
Reliability Metrics Performance
17
Table 3 ALR2-3 Under Frequency Load Shedding MW Loss
ALR2-3 Under Frequency Load Shedding MW Loss
2006 2007 2008 2009 2010
FRCC
2273
MRO
486
NPCC 94
63 20 25
RFC
SPP
672 15
SERC
ERCOT
WECC
Special Considerations
The use of a single metric cannot capture all of the relevant information associated with UFLS events as
the events relate to each respective UFLS plan The ability to measure the reliability of the bulk power
system is directly associated with how it performs compared to what is planned
ALR2-4 Average Percent Non-Recovery Disturbance Control Standards (DCS)
Background
This metric measures the Balancing Authorityrsquos (BA) or Reserve Sharing Grouprsquos (RSG) ability to balance
resources and demand with the timely deployment of contingency reserve thereby returning the
interconnection frequency to within defined limits following a Reportable Disturbance14
Assessment
The relative
percentage provides an indication of performance measured at a BA or RSG
Figure 8 illustrates the average percent non-recovery of DCS events from 2006 to 2010 The graph
provides a high-level indication of the performance of each respective RE However a single event may
not reflect all the reliability issues within a given RE In order to understand the reliability aspects it
may be necessary to request individual REs to further investigate and provide a more comprehensive
reliability report Further investigation may indicate the entity had sufficient contingency reserve but
through their implementation process failed to meet DCS recovery
14 Details of the Disturbance Control Performance Standard and Reportable Disturbance definitions are available at
httpwwwnerccomfilesBAL-002-0pdf
Reliability Metrics Performance
18
Continued trend assessment is recommended Where trends indicated potential issues the regional
entity will be requested to investigate and report their findings
Figure 8 Average Percent Non-Recovery of DCS Events (2006-2010)
Special Consideration
This metric aggregates the number of events based on reporting from individual Balancing Authorities or
Reserve Sharing Groups It does not capture the severity of the DCS events It should be noted that
most REs use 80 percent of the Most Severe Single Contingency to establish the minimum threshold for
reportable disturbance while others use 35 percent15
ALR2-5 Disturbance Control Events Greater Than Most Severe Single Contingency
Background
This metric represents the number of disturbance events that exceed the Most Severe Single
Contingency (MSSC) and is specific to each BA Each RE reports disturbances greater than the MSSC on
behalf of the BA or Reserve Sharing Group (RSG) The result helps validate current contingency reserve
requirements The MSSC is determined based on the specific configuration of each BA or RSG and can
vary in significance and impact on the BPS
15httpwwwweccbizStandardsDevelopmentListsRequest20FormDispFormaspxID=69ampSource=StandardsDevelopmentPagesWEC
CStandardsArchiveaspx
375
079
0
54
008
005
0
15 0
77
025
0
33
000510152025303540
2006
2007
2008
2009
2010
2006
2007
2008
2009
2010
2006
2007
2008
2009
2010
2006
2007
2008
2009
2010
2006
2007
2008
2009
2010
2006
2007
2008
2009
2010
2006
2007
2008
2009
2010
2006
2007
2008
2009
2010
FRCC MRO NPCC RFC SERC SPP ERCOT WECC
Region and Year
Reliability Metrics Performance
19
Assessment
Figure 9 represents the number of DCS events within each RE that are greater than the MSSC from 2006
to 2010 This metric and resulting trend can provide insight regarding the risk of events greater than
MSSC and the potential for loss of load
In 2010 SERC had 16 BAL-002 reporting entities eight Balancing Areas elected to maintain Contingency
Reserve levels independent of any reserve sharing group These 16 entities experienced 79 reportable
DCS eventsmdash32 (or 405 percent) of which were categorized as greater than their most severe single
contingency Every DCS event categorized as greater than the most severe single contingency occurred
within a Balancing Area maintaining independent Contingency Reserve levels Significantly all 79
regional entities reported compliance with the Disturbance Recovery Criterion including for those
Disturbances that were considered greater than their most severe single Contingency This supports a
conclusion that regardless of the size of the BA or participation in a Reserve Sharing Group SERCrsquos BAL-
002 reporting entities have demonstrated the ability in 2010 to use Contingency Reserve to balance
resources and demand and return Interconnection frequency within defined limits following Reportable
Disturbances
If the SERC Balancing Areas without large generating units and who do not participate in a Reserve
Sharing Group change the determination of their most severe single contingencies to effect an increase
in the DCS reporting threshold (and concurrently the threshold for determining those disturbances
which are greater than the most severe single contingency) there will certainly be a reduction in both
the gross count of DCS events in SERC and in the subset considered under ALR2-5 Masking the discrete
events which cause Balancing Area response may not reduce ldquoriskrdquo to the system However it is
desirable to maintain a reporting threshold which encourages the Balancing Authority to respond to any
unexplained change in ACE in a manner which supports Interconnection frequency based on
demonstrated performance SERC will continue to monitor DCS performance and will continue to
evaluate contingency reserve requirements but does not consider 2010 ALR2-5 performance to be an
adverse trend in ldquoextreme or unusualrdquo contingencies but rather within the normal range of expected
occurrences
Reliability Metrics Performance
20
Special Consideration
The metric reports the number of DCS events greater than MSSC without regards to the size of a BA or
RSG and without respect to the number of reporting entities within a given RE Because of the potential
for differences in the magnitude of MSSC and the resultant frequency of events trending should be
within each RE to provide any potential reliability indicators Each RE should investigate to determine
the cause and relative effect on reliability of the events within their footprints Small BA or RSG may
have a relatively small value of MSSC As such a high number of DCS greater than MCCS may not
indicate a reliability problem for the reporting RE but may indicate an issue for the respective BA or RSG
In addition events greater than MSSC may not cause a reliability issue for some BA RSG or RE if they
have more stringent standards which require contingency reserves greater than MSSC
ALR 1-5 System Voltage Performance
Background
The purpose of this metric is to measure the transmission system voltage performance (either absolute
or per unit of a nominal value) over time This should provide an indication of the reactive capability
available to the transmission system The metric is intended to record the amount of time that system
voltage is outside a predetermined band around nominal
0
5
10
15
20
25
30
2006
2007
2008
2009
2010
2006
2007
2008
2009
2010
2006
2007
2008
2009
2010
2006
2007
2008
2009
2010
2006
2007
2008
2009
2010
2006
2007
2008
2009
2010
2006
2007
2008
2009
2010
2006
2007
2008
2009
2010
FRCC MRO NPCC RFC SERC SPP ERCOT WECC
Cou
nt
Region and Year
Figure 9 Disturbance Control Events Greater Than Most Severe Single Contingency (2006-2010)
Reliability Metrics Performance
21
Special Considerations
Each Reliability Coordinator (RC) will work with the Transmission Owners (TOs) and Transmission
Operators (TOPs) within its footprint to identify specific buses and voltage ranges to monitor for this
metric The number of buses the monitored voltage levels and the acceptable voltage ranges may vary
by reporting entity
Status
With a pilot program requested in early 2011 a voluntary request to Reliability Coordinators (RC) was
made to develop a list of key buses This work continues with all of the RCs and their respective
Transmission Owners (TOs) to gather the list of key buses and their voltage ranges After this step has
been completed the TO will be requested to provide relevant data on key buses only Based upon the
usefulness of the data collected in the pilot program additional data collection will be reviewed in the
future
ALR3-5 Interconnection Reliability Operating Limit System Operating Limit (IROLSOL) Exceedances
Background
This metric illustrates the number of times that defined Interconnection Reliability Operating Limit
(IROL) or System Operating Limit (SOL) were exceeded and the duration of these events Exceeding
IROLSOLs could lead to outages if prompt operator control actions are not taken in a timely manner to
return the system to within normal operating limits This metric was approved by NERCrsquos Operating and
Planning Committees in June 2010 and a data request was subsequently issued in August 2010 to collect
the data for this metric Based on the results of the pilot conducted in the third and fourth quarter of
2010 there is merit in continuing measurement of this metric Note the reporting of IROLSOL
exceedances became mandatory in 2011 and data collected in Table 4 for 2010 has been provided
voluntarily
Reliability Metrics Performance
22
Table 4 ALR3-5 IROLSOL Exceedances
3Q2010 4Q2010 1Q2011
le 10 mins 123 226 124
le 20 mins 10 36 12
le 30 mins 3 7 3
gt 30 mins 0 1 0
Number of Reporting RCs 9 10 15
ALR4-1 Automatic Transmission Outages Caused by Protection System Misoperations
Background
Originally titled Correct Protection System Operations this metric has undergone a number of changes
since its initial development To ensure that it best portrays how misoperations affect transmission
outages it was necessary to establish a common understanding of misoperations and the data needed
to support the metric NERCrsquos Reliability Assessment Performance Analysis (RAPA) group evaluated
several options of transitioning from existing procedures for the collection of misoperations data and
recommended a consistent approach which was introduced at the beginning of 2011 With the NERC
System Protection and Control Subcommitteersquos (SPCS) technical guidance NERC and the regional
entities have agreed upon a set of specifications for misoperations reporting including format
categories event type codes and reporting period to have a final consistent reporting template16
Special Considerations
Only
automatic transmission outages 200 kV and above including AC circuits and transformers will be used
in the calculation of this metric
Data collection will not begin until the second quarter of 2011 for data beginning with January 2011 As
revised this metric cannot be calculated for this report at the current time The revised title and metric
form can be viewed at the NERC website17
16 The current Protection System Misoperation template is available at
httpwwwnerccomfilezrmwghtml 17The current metric ALR4-1 form is available at httpwwwnerccomdocspcrmwgALR_4-1Percentpdf
Reliability Metrics Performance
23
ALR6-11 ndash ALR6-14
ALR6-11 Automatic AC Transmission Outages Initiated by Failed Protection System Equipment
ALR6-12 Automatic AC Transmission Outages Initiated by Human Error
ALR6-13 Automatic AC Transmission Outages Initiated by Failed AC Substation Equipment
ALR6-14 Automatic AC Circuit Outages Initiated by Failed AC Circuit Equipment
Background
These metrics evolved from the original ALR4-1 metric for correct protection system operations and
now illustrate a normalized count (on a per circuit basis) of AC transmission element outages (ie TADS
momentary and sustained automatic outages) that were initiated by Failed Protection System
Equipment (ALR6-11) Human Error (ALR6-12) Failed AC Substation Equipment (ALR6-13) and Failed AC
Circuit Equipment (ALR6-14) These metrics are all related to the non-weather related initiating cause
codes for automatic outages of AC circuits and transformers operated 200 kV and above
Assessment
Figure 10 through Figure 13 show the normalized outages per circuit and outages per transformer for
facilities operated at 200 kV and above As shown in all eight of the charts there are some regional
trends in the three years worth of data However some Regionrsquos values have increased from one year
to the next stayed the same or decreased with no discernable regional trends For example ALR6-11
computes the automatic AC Circuit outages initiated by failed protection system equipment
There are some trends to the ALR6-11 to ALR6-14 data but many regions do not have enough data for a
valid trend analysis to be performed NERCrsquos outage rate seems to be improving every year On a
regional basis metric ALR6-11 along with ALR6-12 through ALR6-14 cannot be statistically understood
until confidence intervals18
18The detailed Confidence Interval computation is available at
are calculated ALR metric outage frequency rates and Regional equipment
inventories that are smaller than others are likely to require more than 36 months of outage data Some
numerically larger frequency rates and larger regional equipment inventories (such as NERC) do not
require more than 36 months of data to obtain a reasonably narrow confidence interval
httpwwwnerccomdocspctadstfTADS_Nov_2_2007APPENDIX_C_Confidence_Intervalpdf
Reliability Metrics Performance
24
While more data is still needed on a regional basis to determine if each regionrsquos bulk power system is
becoming more reliable year to year there are areas of potential improvement which include power
system condition protection performance and human factors These potential improvements are
presented due to the relatively large number of outages caused by these items The industry can
benefit from detailed analysis by identifying lessons learned and rolling average trends of NERC-wide
performance With a confidence interval of relatively narrow bandwidth one can determine whether
changes in statistical data are primarily due to random sampling error or if the statistics are significantly
different due to performance
Reliability Metrics Performance
25
ALR 6-11 ndash Automatic Outages Initiated by Failed Protection System Equipment
Automatic outages with an initiating cause code of failed protection system equipment are in Figure 10
Figure 10 ALR6-11 by Region (Includes NERC-Wide)
This code covers automatic outages caused by the failure of protection system equipment This
includes any relay andor control misoperations except those that are caused by incorrect relay or
control settings that do not coordinate with other protective devices
ALR6-12 ndash Automatic Outages Initiated by Human Error
Figure 11 shows the automatic outages with an initiating cause code of human error This code covers
automatic outages caused by any incorrect action traceable to employees andor contractors for
companies operating maintaining andor providing assistance to the Transmission Owner will be
identified and reported in this category
Reliability Metrics Performance
26
Also any human failure or interpretation of standard industry practices and guidelines that cause an
outage will be reported in this category
Figure 11 ALR6-12 by Region (Includes NERC-Wide)
Reliability Metrics Performance
27
ALR6-13 ndash Automatic Outages Initiated by Failed AC Substation Equipment
Figure 12 shows the automatic outages with an initiating cause code of failed AC substation equipment
This code covers automatic outages caused by the failure of AC Substation ie equipment ldquoinside the
substation fencerdquo including transformers and circuit breakers but excluding protection system
equipment19
19TADS Initiating Cause Code definitions are located at httpwwwnerccomdocspctadswgTADS_Definitions_Appendix_7_092909pdf
Figure 12 ALR6-13 by Region (Includes NERC-Wide)
Reliability Metrics Performance
28
ALR6-14 Automatic AC Transmission Outages Initiated by Failed AC Circuit Equipment
Figure 13 shows the automatic outages with an initiating cause code of failed AC circuit equipment
Automatic Outages related to the failure of AC Circuit equipment ie overhead or underground
equipment ldquooutside the substation fencerdquo 20
ALR6-15 Element Availability Percentage (APC)
Background
This metric uses data and calculations directly from the NERC TADS effort and illustrates the overall
percent of time the aggregate of transmission facilities are available and in service This is an aggregate
20TADS Initiating Cause Code definitions are located at httpwwwnerccomdocspctadswgTADS_Definitions_Appendix_7_092909pdf
Figure 13 ALR6-14 by Region (Includes NERC-Wide)
Reliability Metrics Performance
29
value using sustained outages (automatic and non-automatic) for both lines and transformers operated
at 200 kV and above for each Regional Entity Interconnection and for NERC This metric was approved
by the NERC Operating and Planning Committees in September 2010
Assessment
Figure 14 shows the aggregate element availability percentage (APC) for transmission and transformers
facilities operated at 200 kV and above The values are all over 90 percent which shows excellent
system availability The RMWG recommends continued metric assessment for at least a few more years
in order to determine the value of this metric
Figure 14 2010 ALR6-15 Element Availability Percentage
Notably the Eastern Interconnection does not include Quebec or ERCOT ERCOT does not have any
transformers with low-side voltage levels 200 kV and above
Special Consideration
It should be noted that the non-automatic outage data needed to calculate this metric was only first
collected for the calendar year 2010 as part of the TADS process Therefore only one year of data for
this metric is available at this time
Reliability Metrics Performance
30
ALR6-16 Transmission System Unavailability
Background
This metric uses data and calculations directly from the NERC TADS effort and shows the overall percent
of time the aggregate of transmission facilities are unavailable due to automatic and non-automatic
outages This is an aggregate value using sustained automatic outages for both lines and transformers
operated at 200 kV and above for each Regional Entity and for NERC This metric was approved by the
NERC Operating and Planning Committees in December 2010
Assessment
Figure 15 and Figure 16 illustrate the 2010 aggregate unavailability percentage for AC circuits and
transformer facilities operated at 200 kV and above The values for AC circuits are all under 3 percent
which shows excellent system availability
The RMWG recommends continued metric assessment for at least a few more years in order to
determine the value of this metric
Special Consideration
It should be noted that the non-automatic outage data needed to calculate this metric was only first
collected for the calendar year 2010 as part of the TADS process Therefore only one year of data for
this metric is available at this time
Figure 15 2010 ALR6-16 Transmission System Unavailability
Reliability Metrics Performance
31
Figure 16 2010 ALR6-16 Transmission System Unavailability by Outage Type
Notably the Eastern Interconnection does not include Quebec or ERCOT Also ERCOT does not have
any transformers with low-side voltage levels 200 kV and above
ALR6-2 Energy Emergency Alert 3 (EEA3)
Background
This metric identifies the number of times Energy Emergency Alerts Level 3 (EEA3) are issued EEA3
events are firm-load interruptions due to capacity and energy deficiency EEA3 is currently reported
collected and maintained in NERCrsquos Reliability Coordination Information System (RCIS) and is defined in
Attachment 1 of the NERC Standard EOP-00221
21 The latest version of Attachment 1 for EOP-002 is available at
This metric identifies the number of times EEA3s are
issued The number of EEA3s per year provides a relative indication of performance measured at a
Balancing Authority or interconnection level As historical data is gathered trends in future reports will
provide an indication of either decreasing or increasing use of EEA3s signaling adequacy of the electric
supply system This metric can also be considered in the context of Planning Reserve Margin Significant
increases or decreases in EEA3 events with relatively constant Planning Reserve Margins could indicate
httpwwwnerccompagephpcid=2|20
Reliability Metrics Performance
32
volatility in the actual loads compared to forecast levels or changes in the adequacy of the bulk power
system required to meet load demands
Assessment
Figure 17 shows the number of EEA3 events during 2006 and 2010 from an RE level An interactive
presentation was released and available at the Reliability Indicatorrsquos page22
The Acadiana Load Pocket (ALP) is an area in south central Louisiana that has experienced regular
transmission constraints and numerous Energy Emergency Alert filings by the SPP Reliability Controller
(SPP RC) Transmission within ALP is owned by Entergy Lafayette Utilities System (LUS) and Cleco
Power LLC (Cleco) The transmission constraints within the ALP are primarily caused by the local area
load and the lack of generation located in close proximity to the load area
The number of EEA3rsquos
declared in 2010 returned to more traditional numbers The 2009 spike in EEA3 events in the SPP
Region that was driven by issues in the Acadiana Load Pocket (ALP) were not present in 2010
Special Considerations
Ideally the measure should capture only EEAs that are declared for reliability reasons and not for
economic factors The RMWG has not been able to differentiate these reasons for future reporting and
it has made a recommendation to the Reliability Coordinator Working Group (RCWG) to consider a
revised EEA declaration to exclude economic factors
The reason the EEA volume decreased from 2009 to 2010 in SPP was because the SPP ICT RC23
coordinated an operating agreement between the five operating companies in the ALP The operating
agreement included a cost sharing re-dispatch that alleviated the need of a Transmission Loading Relief
(TLR-5) declaration24
22The EEA3 interactive presentation is available on the NERC website at
During 2009 there was no operating agreement therefore an entity had to
provide Network and Native Load (NNL) relief when a TLR-5 was called by the ICT RC When the TLR-5
was the primary tool to control the post contingent loading in the ALP some of the BAs would have their
firm transmission curtailed to the point where they could no longer serve their load therefore the EEA
3 was needed to communicate a capacityreserve deficiency
httpwwwnerccompagephpcid=4|331|335 23Southwest Power Pool (SPP) Independent Coordinator of Transmission (ICT) Reliability Coordinator (RC) 24More information on Transmission Load Relief is contained in the IRO-006 standard which is located at httpwwwnerccomfilesIRO-006-4pdf In particular TLR-5 definitions are referenced on page 16 and 17
Reliability Metrics Performance
33
Figure 17 ALR6-2 Energy Emergency Alert 3 (EEA3) Counts by Region (2006-2010)
Cleco Power Entergy and LUS are currently constructing an estimated $200 million transmission
infrastructure improvement project to mitigate transmission constraints into ALP Construction of the
project is scheduled to be complete in 2012 Completion of the project should help alleviate some of
the transmission congestion in this area Energy Emergency Alerts filed by the SPP Regional Entity
continue to decline
SPP RTO continues to coordinate operating plans with the operating entities in this area Mitigation
plans and local operating guides in place are expected to provide sufficient flexibility should issues arise
NERC will continue to monitor this area for Reliability Impacts and coordinate any actions with the SPP
Reliability Coordinator and SPP Regional Entity
ALR 6-3 Energy Emergency Alert 2 (EEA2)
Background
Energy Emergency Alert 2 (EEA2) is to measure the number of events BAs declare for deficient capacity
and energy during peak load periods which may serve as a leading indicator of energy and capacity
shortfall in the adequacy of the electric supply system EEA2 provides a sense of the frequency of
precursor events to the more severe EEA3 declarations This metric measures the number of events
1 3 1 2 214
3 4 4 1 5 334
4 2 1 52
1
0
5
10
15
20
25
30
3520
0620
0720
0820
0920
1020
0620
0720
0820
0920
1020
0620
0720
0820
0920
1020
0620
0720
0820
0920
1020
0620
0720
0820
0920
1020
0620
0720
0820
0920
1020
0620
0720
0820
0920
1020
0620
0720
0820
0920
10
FRCC MRO NPCC RFC SERC SPP TRE WECC
2006-2009
2010
Region and Year
Reliability Metrics Performance
34
Balancing Authorities declare for deficient capacity and energy during peak load periods At this time
however this data reflects inclusion of Demand Side Resources that would not be indicative of
inadequacy of the electric supply system
The number of EEA2 events and any trends in their reporting indicates how robust the system is in
being able to supply the aggregate load requirements The historical records may include demand
response activations and non-firm load interruptions per applicable contracts within the EEA alerts per
its definition25
Assessment
Demand response is a legitimate resource to be called upon by balancing authorities and
do not indicate a reliability concern As data is gathered in the future reports will provide an indication
of either decreasing or increasing adequacy in the electric supply system EEA2 events called solely for
activation of demand response (controllable or contractually prearranged demand-side dispatch
programs) or interruption of non-firm load per applicable contracts should be excluded This metric can
also be considered in the context of the Planning Reserve Margin Significant increases or decreases in
EEA2 events with relatively constant Planning Reserve Margins could indicate volatility in the actual
loads compared to forecast levels or changes in the adequacy of the bulk power system required to
meet load demands
Figure 18 shows the number of EEA2 events by Regional Entity from 2006 to 2010 EEA2 interactive
version available on line by quarter and region26
25 The EEA2 is defined at
The general trend continues to show improved
performance which may have been influenced by the overall reduction in demand throughout NERC
caused by the economic downturn Specific performance by any one region should be investigated
further for issues or events that may affect the results Determining whether performance reported
includes those events resulting from the economic operation of DSM and non-firm load interruption
should also be investigated The RMWG recommends continued metric assessment
httpwwwnerccomfilesEOP-002-2pdf 26 EEA2 interactive version located at httpwwwnerccompagephpcid=4|331|341
Reliability Metrics Performance
35
Special Considerations
The intent of this metric is to measure only EEAs that are called for reliability reasons and not for
economic factors such as demand side management (DSM) and non-firm load interruption The
historical data for this metric may include events that were called for economic factors According to
the RCWG recent data should only include EEAs called for reliability reasons
ALR 6-1 Transmission Constraint Mitigation
Background
The RMWG completed a pilot with four regional entities Based on the results the RMWG expanded the
pilot data collection to all regions and the initial results of the data collection are shown in Figure 19
and Table 5 Based on the results of the pilot there is merit in continuing to assess this metric The
intent of this metric is to identify trends in the number of mitigation measures (Special Protection
Schemes (SPS) Remedial Action Schemes (RAS) and Operating Procedures) required to meet reliability
requirements By their nature SPS do not indicate an inherent weakness in the bulk power system
rather they are an indication of methods that are taken to operate the system through the range of
conditions it must perform This metric is only intended to evaluate the trend use of these plans and
whether the metric indicates robustness of the transmission system is increasing remaining static or
decreasing
1 27
2 1 4 3 2 1 2 4 5 2 5 832
4724
211
5 38 5 1 1 8 7 4 1 1
05
101520253035404550
2006
2007
2008
2009
2010
2006
2007
2008
2009
2010
2006
2007
2008
2009
2010
2006
2007
2008
2009
2010
2006
2007
2008
2009
2010
2006
2007
2008
2009
2010
2006
2007
2008
2009
2010
2006
2007
2008
2009
2010
FRCC MRO NPCC RFC SERC SPP TRE WECC
2006-2009
2010
Region and Year
Figure 18 ALR6-3 Energy Emergency Alert 2 (EEA2)
Reliability Metrics Performance
36
Assessment
The pilot data indicates a relatively constant number of mitigation measures over the time period of
data collected
Figure 19 ALR6-1 Transmission Constraint Mitigation by SPSRAS (2009-2014)
0102030405060708090
100110120
2009
2010
2011
2014
2009
2010
2011
2014
2009
2010
2011
2014
2009
2010
2011
2014
2009
2010
2011
2014
2009
2010
2011
2014
2009
2010
2011
2014
2009
2010
2011
2014
FRCC MRO NPCC RFC SERC SPP ERCOT WECC
Coun
t
Region and Year
SPSRAS
Reliability Metrics Performance
37
Table 5 ALR6-1 Transmission Constraint Mitigation by Operating ProcedureGuides (2009-2011)
ALR6-1 Transmission Constraint Mitigation by Operating ProcedureGuides (2009-2014)
2009 2010 2011 2014
FRCC 107 75 66
MRO 79 79 81 81
NPCC 0 0 0
RFC 2 1 3 4
SPP 39 40 40 40
SERC 6 7 15
ERCOT 29 25 25
WECC 110 111
Special Considerations
A certain number of SPS mitigation plans may be necessary to support reliable operation of the system
If the number of SPS increase over time this may indicate that additional transmission capacity is
required A reduction in the number of SPS may be an indicator of increased generation or transmission
facilities being put into service which may indicate greater robustness of the bulk power system In
general mitigation plans are a viable and valuable tool for effective operation of the bulk power system
In power system planning reliability operability capacity and cost-efficiency are simultaneously
considered through a variety of scenarios to which the system may be subjected Mitigation measures
are a method for optimizing a power system across these scenarios Changes in quantities of mitigation
plans may indicate year-on-year differences in the system being evaluated
Integrated Bulk Power System Risk Assessment
Introduction In developing eighteen metrics to measure acceptable levels of reliability it has become clear that any
such measurement of reliability must include consideration of the risks present within the bulk power
system in order for us to appropriately prioritize and manage these system risks The scope for the
Reliability Metrics Working Group (RMWG)27
27 The RMWG scope can be viewed at
includes a task to develop a risk-based approach that
provides consistency in quantifying the severity of events The approach not only can be used to
httpwwwnerccomfilezrmwghtml
Reliability Metrics Performance
38
measure risk reduction over time but also can be applied uniformly in event analysis process to identify
the events that need to be analyzed in detail and sort out non-significant events
The Operating Committee (OC) and Planning Committee (PC) endorsed the concepts and framework28 of
the risk-based approach in their September 2010 joint meeting and further supported the event severity
risk index (SRI) calculation29
Recommendations
in March 2011
bull NERC should embrace the use of risk assessment to identify trends in addition to lessons learned
in order to improve bulk power system reliability
bull The RMWG should continue to coordinate and communicate with the Event Analysis Working
Group (EAWG) to apply the SRI into the event analysis process and root cause analysis
bull As trend evaluations increase the knowledge of risks to the bulk power system data required to
support additional assessment should be gathered
Event Severity Risk Index (SRI)
Risk assessment is an essential tool for achieving the alignment between organizations people and
technology This will assist in quantifying inherent risks identifying where potential high risks exist and
evaluating where the most significant lowering of risks can be achieved Being learning organizations
the Electric Reliability Organization (ERO) Regional Entities and Registered Entities can use these tools
to focus on the areas of highest risk to reliability to provide a sound basis for developing results-based
standards and compliance programs Risk assessment also serves to engage all stakeholders in a
dialogue about specific risk factors and helps direct a strategic plan for risk reduction and early
detection
The SRI is a daily blended metric for which transmission loss generation loss and load loss events are
calculated Each element (transmission generation and load loss) is factored by the systemrsquos inventory
for that element to rate significant events appropriately On a yearly basis these daily performances
can be sorted in descending order to evaluate the year-on-year performance of the system
In order to test drive the concepts the RMWG applied these calculations against historically memorable
days to derive SRIs Once these calculations were complete they were reviewed and evaluated by
various stakeholders for reasonableness Based upon feedback modifications to the calculation were
made and assessed against the historic days performed This iterative process locked down the details
28 httpwwwnerccomdocspcrmwgIntegrated_Bulk_Power_System_Risk_Assessment_Concepts_Finalpdf 29 httpwwwnerccomdocspcrmwgSRI_Equation_Refinement_May6_2011pdf
Reliability Metrics Performance
39
for the calculation of SRI whose calculation from zero (no transmission line outages generation outages
or load lost in a day) to 1000 (a theoretical condition in which every transmission line all generation
units and all load lost across the system in a single day)
Figure 20 captures the calculated severity risk value for each of the days for each year benchmarked
with the historic significant events which were used to concept test the calculation Since there is
significant disparity between days the bulk power system is stressed compared to those that are
ldquoroutinerdquo and ldquoherordquo days of the year where the system performed extremely well the curve is depicted
using a logarithmic scale Each yearrsquos data is sorted in descending order striking a characteristic shape
At the left-side of the curve the days in which the system is severely stressed are plotted The central
more linear portion of the curve identifies the routine day performance while the far right-side of the
curve shows the values plotted for days in which almost all lines and generation units are in service and
essentially no load is lost
The trends on the chart below show that 2009 and 2010 had fewer extreme days than 2008 Routine
daily performance appears generally consistent across all three years Figure 20 captures the days for
each year benchmarked with historically significant events
In Figure 20 NERCrsquos event categories and SRI ratings are directly related As the SRI increases the
category or severity of the event increases Historical events are also shown to relate modern
reliability measurements to give a perspective of how a well-known event would register on the SRI
scale
The event analysis process30
30
benefits from the SRI as it enables a numerical analysis of an event in
comparison to other events By this measure an event can be prioritized by its severity In a severe
event this is unnecessary However for events that do not result in severe stressing of the bulk power
system this prioritization can be a challenge By using the SRI the event analysis process can decide
which events to learn from and reduce which events to avoid and when resilience needs to be
increased under high impact low frequency events as shown in the blue boxes in the figure
httpwwwnerccompagephpcid=5|365
Reliability Metrics Performance
40
Figure 20 NERC Annual Daily Severity Risk Index (SRI) Sorted Descending with Historic Benchmark Days
Other factors that impact severity of a particular event to be considered in the future include whether
equipment operated as designed and resulted in loss of load from a reliability perspective (intentional
and controlled load-shedding) Mechanisms for enabling ongoing refinement to include the historic and
simulated events for future severity risk calculations are being explored
Reliability Metrics Performance
41
Integrated Reliability Index Concepts In December 2010 the RMWG was challenged by the OC and PC to develop a single index concept to
measure the universe of risks associated with the bulk power system As a result the integrated
reliability index (IRI) concepts were proposed31
Figure 21
the three components of which were defined to
quantify each specific risk aspect They are titled the Event Driven Index (EDI) StandardsStatute Driven
Index (SDI) and Condition Driven Index (CDI) illustrated in with measures associated with
system events standards compliance and eighteen performance metrics The development of an
integrated reliability index aims to inform increase transparency and quantify the effectiveness of risk
reduction or mitigation actions The goal is to provide the industry meaningful trends of the BPSrsquos
performance and guidance on how the industry can improve reliability and support risk-informed
decision making Once completed the IRI will facilitate holistic assessment of performance Finally the
IRI should help overcome concern and confusion about how many metrics are being analyzed for system
reliability assessments
Figure 21 Risk Model for Bulk Power System
The integrated model of event-driven condition-driven and standardsstatute-driven risk information
can be constructed to illustrate all possible logical relations between the three risk sets Due to the
nature of the system there may be some overlap among the components
31 httpwwwnerccomdocspcrmwgIntegrated_Reliability_Index_WhitePaper_DRAFTpdf
Event Driven Index (EDI)
Indicates Risk from
Major System Events
Standards Statute Driven
Index (SDI)
Indicates Risks from Severe Impact Standard Violations
Condition Driven Index (CDI)
Indicates Risk from Key Reliability
Indicators
Reliability Metrics Performance
42
The Three Components of the IRI The three components of the IRI work together as shown in Figure 22 to comprise a full picture of the
state of reliability
Figure 22 An overview of the components that comprise the Integrated Reliability Index (IRI)
Event-Driven Indicators (EDI)
The Event-Driven Indicator provides a basis for prioritization of events based on bulk power system
integrity equipment performance and engineering judgment This indicator can serve as a high value
risk assessment tool to be used by stakeholders to investigate and evaluate disturbance history and
measure the severity of these events The relative ranking of events requires industry expertise agreed-
upon goals and engineering judgment The EDI is a derivative of SRI results for a specific time period
but it transforms that performance into a form of an availability index These calculations will be further
refined as feedback is received
Condition-Driven Indicators (CDI)
The Condition-Driven Indicators focus on a set of measurable system conditions (performance
measures) to assess bulk power system reliability These reliability indicators identify factors that
positively or negatively impact reliability and are early predictors of the risk to reliability from events or
unmitigated violations A collection of these indicators measures how close reliability performance is to
the desired outcome and if the performance against these metrics is constant or improving
Reliability Metrics Performance
43
StandardsStatute-Driven Indicators (SDI)
The StandardsStatute-Driven Indicator is a calculation of success of compliance based upon the subset
of high-value standards and is divided by the number of participations who could have received the
violation within the time period considered Also based on these factors known unmitigated violations
of elevated risk factor requirements are weighted higher than lower risk factors The index decreases if
the compliance improvement is achieved over a trending period
IRI Index Calculation As with the SRI the IRI is based on an importance weighting factor which the RMWG can modify over
time after gaining experience with the new metric as well as consideration of feedback from industry
At this time the RMWG believes some form of blended weighting may serve to start to populate IRI
characteristic curves at a high and generic level Based upon feedback from stakeholders this approach
may change or as discussed below weighting factors may vary based on periodic review and risk model
update The RMWG will continue the refinement of the IRI calculation and consider other significant
factors that impact reliability (eg intentional and controlled load-shedding) further it will explore
developing mechanisms for enabling ongoing refinement which should be influenced by a wide set of
stakeholders
RMWG recommends the Event Driven Index (EDI) be weighted the highest (50 percent) since events
actually occurred indicating how the system was performing The Condition Driven Index (CDI) and
StandardsStatute Driven Index (SDI) are weighted 25 each since they are indicators of potential risks
to BPS reliability IRI can be calculated as follows
IRI is intended to be a composite metric which integrates several forms of individual risks to the bulk
power system Since the three components range across many stakeholder organizations these
concepts are developed as starting points for continued study and evaluation Additional supporting
materials can be found in the IRI whitepaper32
IRI Recommendations
including individual indices calculations and preliminary
trend information
For the IRI more investigation should be performed to determine the best way to integrate EDI CDI
and SDI into an Integrated Reliability Index (IRI) that quantitatively represents the reliability of the bulk
32 The IRI whitepaper can be found at httpwwwnerccomdocspcrmwgIntegrated_Reliability_Index_WhitePaper_DRAFTpdf
Reliability Metrics Performance
44
power system To this end study into determining the amount of overlap between the components is
necessary RMWG is currently working to determine the proper amount of overlap between the IRI
components
Also the CDI component of the IRI needs to be solidified This is especially true with the CDI More
accurate metric data is needed to paint a fuller picture of the CDI Many of the metrics used to calculate
the CDI are new or they have limited data Compared to the SDI which counts well-known violation
counts and the EDI which uses the well-defined CDI the CDI lacks the depth of rigor that the other two
components have acquired through their years of data RMWG is currently working to improve the CDI
Reliability Metrics Conclusions and Recommendations Among the eighteen metrics that address the characteristics of an adequate level of reliability (ALR)
metric trends indicate the system is performing better in the following seven areas
bull ALR1-3 Planning Reserve Margin
bull ALR1-4 BPS Transmission Related Events Resulting in Loss of Load
bull ALR2-5 Disturbance Control Events Greater than Most Severe Single Contingency
bull ALR6-2 Energy Emergency Alert 3 (EEA3)
bull ALR6-3 Energy Emergency Alert 2 (EEA2)
bull ALR6-11 Automatic Transmission Outages Caused by Protection System Misoperations
bull ALR6-13 Automatic Transmission Outages Caused by Failed AC Substation Equipment
Assessments have been made in other performance categories A number of them do not have
sufficient data to derive any conclusions from the results The RMWG recommends continued data
collection and assessment of these metrics If a metric does not yield any trend in a five-year reporting
period the metric will be modified or withdrawn
For the IRI more investigation should be performed to determine the overlap of the components (CDI
EDI and SDI) The CDI should be more thoroughly solidified as an index by collecting more data over
time
Transmission Equipment Performance
45
Transmission Equipment Performance Introduction The Transmission Availability Data System (TADS) effort began with the establishment of a TADS task force
by the NERC Planning Committee in October 2006 On October 27 2007 the NERC Board of Trustees
approved the collection of transmission automatic outage data beginning in calendar year 2008 (Phase I)
Subsequently on October 29 2008 the NERC Board approved the collection of Non-Automatic Outage data
that began for Calendar year 2010 (Phase II)
This chapter provides reliability performance analysis of the transmission system by focusing on the trends
of Automatic Outage data from calendar year 2008 thru 2010 Since only one year of Non-Automatic
Outage data has been collected that data will not be assessed in this report
When calculating bulk power system performance indices care must be exercised when interpreting results
as misinterpretation can lead to erroneous conclusions regarding system performance With only three
years of data in the smaller regions it is not clear whether a regionrsquos yearly outage variation compared to
the average is due to random statistical variation or that particular year is significantly different in
performance However on a NERC-wide basis after three years of data collection there is enough
information to accurately determine whether the yearly outage variation compared to the average is due to
random statistical variation or the particular year in question is significantly different in performance33
Performance Trends
Transmission performance information has been provided by Transmission Owners (TOs) within NERC
through the NERC TADS (Transmission Availability Data System) process The data presented reflects
Momentary and Sustained AC Automatic outages of transmission elements that operate at voltages ge 200 kV
(including the low side of transformers) with the criteria specified in the TADS process The following
elements listed below are included
bull AC Circuits ge 200 kV (Overhead and Underground Circuits) Radial circuits are included
bull DC Circuits with ge +-200 kV DC voltage
bull Transformers with ge 200 kV low-side voltage and
bull ACDC Back-to-Back (BTB) Converters with ge 200 kV AC voltage on both sides
33The detailed Confidence Interval computation is available at httpwwwnerccomdocspctadstfTADS_Nov_2_2007APPENDIX_C_Confidence_Intervalpdf
Transmission Equipment Performance
46
AC Element Outage Summary and Leading Causes Table 6 shows the 2008 2009 and 2010 NERC total AC transmission element inventory and a summary of
the associated outages As expected in general the number of circuits increased from year to year due to
new construction or re-construction to higher voltages For every outage experienced on the transmission
system cause codes are identified and recorded according to the TADS process Causes of both momentary
and sustained outages have been indicated These causes are analyzed to identify trends and similarities
and to provide insight into what could be done to possibly prevent future occurrences
Figure 23 and Figure 24 describe the top ten initiating cause codes for sustained and momentary automatic
outages combined from 2008-2010 Based on the two figures the relationship between the total number of
outages and total outage hours can be seen Failed AC Substation Equipment and Failed AC Circuit
Equipment only account for 15 percent of the total number of outages but account for 65 percent of the
total outage hours The two largest causes of outages within NERC (ldquoLightingrdquo and ldquoWeather excluding
Lightningrdquo) account for 34 percent of the total number of outages
The next three Human Error Failed Protection System Equipment and Failed AC Circuit Equipment have
very similar totals and should all be considered significant focus points in reducing the number of Sustained
Automatic Outages for all elements
Transmission Equipment Performance
47
Table 6 NERC - All AC Elements Sustained and Momentary Outage Performance Summary
2008 Number of Outages
AC Voltage
Class
No of
Circuits
Circuit
Miles Sustained Momentary
Total
Outages Total Outage Hours
200-299kV 4369 102131 1560 1062 2622 56595
300-399kV 1585 53631 793 753 1546 14681
400-599kV 586 31495 389 196 585 11766
600-799kV 110 9451 43 40 83 369
All Voltages 6650 196708 2785 2051 4836 83626
2009 Number of Outages
AC Voltage
Class
No of
Circuits
Circuit
Miles Sustained Momentary
Total
Outages Total Outage Hours
200-299kV 4468 102935 1387 898 2285 28828
300-399kV 1619 56447 641 610 1251 24714
400-599kV 592 32045 265 166 431 9110
600-799kV 110 9451 53 38 91 442
All Voltages 6789 200879 2346 1712 4038 63094
2010 Number of Outages
AC Voltage
Class
No of
Circuits
Circuit
Miles Sustained Momentary
Total
Outages Total Outage Hours
200-299kV 4567 104722 1506 918 2424 54941
300-399kV 1676 62415 721 601 1322 16043
400-599kV 605 31590 292 174 466 10442
600-799kV 111 9477 63 50 113 2303
All Voltages 6957 208204 2582 1743 4325 83729
Note The NERC table does not show redacted outages DC Circuit outages Transformer outages or ACDC
converter outages
Transmission Equipment Performance
48
Figure 23 NERC - Top Ten Sustained and Momentary Outages by Initiating Cause Code for All Elements
Figure 24 NERC - Top Ten Sustained Outage Hours by Cause Code
198
151
80
7271
6943
33
27
188
68
Lightning
Weather excluding lightningHuman Error
Failed AC Substation EquipmentFailed Protection System EquipmentFailed AC Circuit Equipment Foreign Interference
Power System Condition
Fire
Unknown
Remaining Cause Codes
299
246
188
58
52
42
3619
16 12 31 Failed AC Substation EquipmentFailed AC Circuit Equipment Weather excluding lightningUnavailable
Other
Fire
Unknown
Human Error
Failed Protection System EquipmentForeign Interference
Remaining Cause Codes
Transmission Equipment Performance
49
Transmission Monthly Outages Figure 25 displays the total number of Automatic Outages on a per-month basis The three months with the
highest total of outages were June July and August From a seasonal perspective winter had a monthly
average of 281 outages These include the months of November-March Summer had an average of 429
outages Summer included the months of April-October
Figure 25 Number of Outages by Month for AC Circuits (2008-2010)
This figure does not show redacted outages DC Circuit outages Transformer outages or ACDC Converter
outages
Outage Initiation Location For every outage experienced on the transmission system the outage initiation code is identified and
recorded according to the TADS process The outage initiation code can be analyzed to identify trends and
similarities and to provide insight into what could be done to possibly prevent future occurrences
The ldquoOutage Initiation Coderdquo describes where an automatic outage was initiated on the power system The
five codes are as follows
bull Element-Initiated
bull Other Element-Initiated
bull AC Substation-Initiated
bull ACDC Terminal-Initiated (for DC circuits)
bull Other Facility Initiated any facility not included in any other outage initiation code
JanuaryFebruar
yMarch April May June July August
September
October
November
December
2008 238 229 257 258 292 437 467 380 208 176 255 236
2009 315 201 339 334 398 553 546 515 351 235 226 294
2010 444 224 269 446 449 486 639 498 351 271 305 281
3 Year AVG 332 218 288 346 380 492 551 464 303 227 262 270
0
100
200
300
400
500
600
700
Out
ages
Transmission Equipment Performance
50
Notably the protection system is not part of an ldquoAC Substationrdquo or an ldquoACDC Terminalrdquo If a protection
system misoperates and initiates an outage it will be classified as ldquoOther-Facility Initiatedrdquo The following
Figures show the initiating location of the Automatic outages from 2008 to 2010
With both Momentary and Sustained Automatic Outages taken into account the outage was initiated on the
Element more than 67 percent of the time as shown in Figure 26 and Figure 27
When only the Sustained Automatic Outages are analyzed the outage initiation on both AC Substation and
Other Facility increased by 34 percent and 32 percent respectively Outages initiated on the Element itself
decreases by 78 percent as shown in Figure 26 and 27 For only the Momentary Automatic Outages the
outage initiation on the Element increases by 19 percent compared to Sustained Outages Element initiated
outages make up over 78 percent of the total outages when analyzing only Momentary Outages
Figure 26
Figure 27
Transmission Outage Events Figure 28 illustrates the relationship between the numbers of Automatic Outages associated per TADS
event 2008 2009 and 2010 tend to follow the same trend The largest number of Automatic Outages per
TADS event is fourteen in 2010 thirteen in 2009 and eight in 2008 There are around 70 to 100 TADS
events that contain between fourteen and three Automatic Outages (see below) There are around 330 to
400 TADS events that contain two or more Automatic Outages The rest of the events only contain one
Automatic Outage As noted in the lower right hand corner below the total number of Events in 2008 to
2010 ranged from 3920 to 4569 events per year Nearly 90 percent or more of the events contained one
Automatic Outage
Figure 26 Sustained Automatic Outage Initiation
Code
Figure 27 Momentary Automatic Outage Initiation
Code
Transmission Equipment Performance
51
Transmission Outage Mode Figure 29 and Figure 30 show the percentage of Outage Modes The ldquoOutage Mode Coderdquo describes
whether one Automatic Outage is related to other Automatic Outages A Single Mode outage is an
Automatic Outage of a single Element which occurs independently of any other Automatic Outages (if any)
A ldquoDependent Mode Initiating Outagerdquo is an Automatic Outage of a single Element that initiates one or more
subsequent Element Automatic Outages A ldquoDependent Mode Outagerdquo is an Automatic Outage of an
Element which occurred as a result of an initiating outage whether the initiating outage was an Element
outage or a non-Element outage A ldquoCommon Mode Outagerdquo is one of two or more Automatic Outages with
the same Initiating Cause Code and where the outages are not consequences of each other and occur nearly
simultaneously A ldquoCommon Mode Initiating Outagerdquo is a Common Mode Outage that initiates one or more
subsequent Automatic Outages
Over 72 percent of the total outages occurred on the bulk power system are Single Mode Outages The next
largest mode is Dependent with over 11 percent of the total outages being in this category For only
Sustained Automatic Outages outages related to each other increase with Dependent mode accounting for
13 percent of the outages and Common mode accounting for close to 11 percent of the outages
Independent Sustained outages still account for the largest portion with nearly 70 percent being Single
mode When just analyzing Momentary Automatic Outages Associated outages decrease with Dependent
Figure 28 Event Histogram (2008-2010)
Transmission Equipment Performance
52
mode accounting for only 9 percent of the outages The Common Mode percentage decreases while
Dependent Mode Initiating percentage increases compared to Sustained Outages Independent Momentary
outages account for the largest portion with over 76 percent being Single Mode
An investigation into the root causes of Dependent and Common mode events which include three or more
Automatic Outages (indentified in the TADS 2008 to 2010 data) should be a high priority Some protection
systems are designed to trip three or more circuits but some events go beyond what is designed Some also
have misoperations associated with multiple outage events
Conclusions On a NERC wide average basis automatic transmission outage rate is improving from 2008 to 2010 based on
reported data Considering both automatic and non-automatic outages 2010 records indicate transmission
element availability percentage is very high and exceeds 95 The unavailability rate for AC circuits and
transformers are only 15 and 29 respectively
The cause codes of Human Error Failed Protection System Equipment and Failed AC Circuit Equipment
should be considered significant focus points in reducing the number of Sustained Automatic Outages for all
elements A deeper look into the root causes of Dependent and Common mode events which include three
or more Automatic Outages (indentified in the TADS 2008 to 2010 data) should be a high priority Some
protection systems are designed to trip three or more circuits but some events go beyond what is designed
Some also have misoperations associated with multiple outage events
Figure 29 Sustained Automatic Outage Mode code Figure 30 Momentary Automatic Outage Mode code
Generation Equipment Performance
53
Generation Equipment Performance Introduction The development of the Generating Availability Data System (GADS) began in 1982 This series of databases
is used to voluntarily collect record and retrieve operating information By pooling individual unit
information with likewise units generating unit availability performance can be calculated providing
opportunities to identify trends and generating equipment reliability improvement opportunities The
information is used to support equipment reliability availability analyses and risk-informed decision-making
by system planners generation owners assessment modelers manufacturers and contractors etc Reports
and information resulting from the data collected through GADS are now used for benchmarking and
analyzing electric power plants
Currently the data collected through GADS contains 72 percent of the North American generating units
with generating capacity of 20 MW or higher34 Additionally many of the newer combined-cycle plants are
not reporting information and therefore a full view of each unit type is not presented Rather a sample of
all the units in North America that fit a given more general category is provided35 for the 2008-201036
Generation Key Performance Indicators
assessment period
Three key performance indicators37
In
the industry have used widely to measure the availability of generating
units (see Terms Used in This Report section for their calculation parameters) are Equivalent Availability
Factor (EAF) Net Capacity Factor (NCF) and Equivalent Forced Outage Rate ndash Demand (EFORd)
Table 7 the North American fleet average EAF NCF and EFORd compared to unit age for all generating
units with a capacity of 20 MW and higher is provided for the years 2008-2010 The EAF shows a decline
during the last three years NCF is up and down while the EFORd appears to be increasing As expected the
fleet of units reported to GADS is aging overall with the fossil units being about 12 years older than the
average age
34 httpwwwnerccomdocspcgadstfGADSTF_Recommendation_Report_02-18-2011_FINALpdf 35GADS contains some 1500+ units under 20 MW that is not included in this report These units are excluded because most units are not base-loaded and are in peaking operation
3684 percent of the 2010 dataset is available at this time while the 2008 and 2009 dataset is complete 37 httpwwwnerccompagephpcid=4|43
Generation Equipment Performance
54
Table 7 General Availability Review of GADS Fleet Units by Year
2008 2009 2010 Average
Equivalent Availability Factor (EAF) 8776 8774 8678 8743
Net Capacity Factor (NCF) 5083 4709 4880 4890
Equivalent Forced Outage Rate -
Demand (EFORd) 579 575 639 597
Number of Units ge20 MW 3713 3713 3713 3713
Average Age of the Fleet in Years (all
unit types) 303 311 321 312
Average Age of the Fleet in Years
(fossil units only) 422 432 440 433
Figure 31 provides the average forced outage hours (FOH) maintenance outage hours (MOH) and planned
outage hours (POH) for all units reporting 20 MW or larger During this three-year period the average FOH
291 hours average MOH is 163 hours average POH is 470 hours
Figure 31 shows a large increase in forced and maintenance events The average age of the units with a
capacity of 20MW and higher in 2009 is 316 years old However the average age of fossil units in 2010 is
442 years old These fossil units are the backbone of all operating units providing the base-load power
continuously and nearly 50 percent of all energy annually There appears to be no increase allocated for
annualsemi-annual maintenance (ie planned outages) for the older generating units The increase of
000100002000030000400005000060000700008000090000
100000
2008 2009 2010
463 479 468
154 161 173
288 270 314
Hou
rs
Planned Maintenance Forced
Figure 31 Average Outage Hours for Units gt 20 MW
Generation Equipment Performance
55
maintenance outage hours reflects an increased need to fix problems that cannot be deferred until the next
annualsemi-annual repairs As a result it shows one of two things are happening
bull More or longer planned outage time is needed to repair the aging generating fleet
bull More focus on preventive repairs during planned and maintenance events are needed
Multiple Unit Forced Outages and Causes Table 8 provides the annual multiple-unit forced outage trips resulting from the same cause for each of the
assessments years 2008-2010 respectively The ldquosingle unitrdquo trips are large units with a Net Dependable
Capacity of 750 MW or more The trips of ldquotwo unitsrdquo or more is any combination of unit capacity with the
total amount of lost capacity more than 750 MW
Table 8 also presents more information on the forced outages During 2008-2010 there were a large
number of double-unit outages resulting from the same event Investigations show that some of these trips
were at a single plant caused by common control and instrumentation for the units The incidents occurred
several times for several months and are a common mode issue internal to the plant
Table 8 Number of Multiple Unit Forced Outages and FrequencyYear
2008 2009 2010
Type of
Trip
of
Trips
Avg Outage
Hr Trip
Avg Outage
Hr Unit
of
Trips
Avg Outage
Hr Trip
Avg Outage
Hr Unit
of
Trips
Avg Outage
Hr Trip
Avg Outage
Hr Unit
Single-unit
Trip 591 58 58 284 64 64 339 66 66
Two-unit
Trip 281 43 22 508 96 48 206 41 20
Three-unit
Trip 74 48 16 223 146 48 47 109 36
Four-unit
Trip 12 77 19 111 112 28 40 121 30
Five-unit
Trip 11 1303 260 60 443 88 19 199 10
gt 5 units 20 166 16 93 206 50 37 246 6
Loss of ge 750 MW per Trip
The high number of five-unit trips in 2008 was due to Hurricane Ike hitting the Gulf Coast The highest total
number of multiple unit trips occurred in 2009 though as mentioned before the data collection for 2010 is
incomplete at this time The majority of 2009 multiple unit trips have three main causes (in order by
Generation Equipment Performance
56
number of events) transmission lack of fuel and storms A summary of the three categories for single as
well as multiple unit outages (all unit capacities) are reflected in Table 9
Table 9 Common Causes of Multiple Unit Forced Outages (2009)
Cause Number of Events Average MW Size of Unit
Transmission 1583 16
Lack of Fuel (Coal Mines Gas Lines etc) Not
in Operator Control
812 448
Storms Lightning and Other Acts of Nature 591 112
Some of the transmission outages based on storms in 2009 have been caused by the same reasons because
the storms may have caused transmission interference However the plants reported the problems
inconsistently with either the transmission interference or storms cause code Therefore they are depicted
as two different causes of forced outage
Marked transmission outages in 2009 were quite high Thirty-five percent came from one utility with a large
number of hydroelectric units The company related the trips to various problems including weather
(lightning storms) wildlife ldquoline bumpsrdquo and problems on the receiving end of the transmission line Nine
hundred and eighty-five transmission trips (62 percent) were from hydroelectric units38
In 2009 only ten transmission trips resulted in a loss of 750 MW or more per trip Twenty two generating
plants were affected by the ten trips Causes for the trips include feeder line trips (1 trip) breakers in the
switchyard (8 trips) personnel errors (2 trips) and unknown (10 trips)
The ldquoLack of Fuelrdquo outages are of interest as these events occur during the times when a unit is available to
operate but there is an interruption in fuels to operate the facilities These events do not include
interruptions of fuel due to contracts Rather the cause code is designed to account for units that are
expecting fuel and it is unavailable when requested Table 10 presents the distribution of ldquoLack of Fuelrdquo
events by NERC Region and Table 11 presents the unit types affected
38 The average size of the hydroelectric units were small ndash 335 MW
Generation Equipment Performance
57
Of the units that report ldquoLack of Fuelrdquo 78 percent of the units are oil-fired 15 percent of the units are gas-
fired and the remaining units are various other fuels Table 12 provides the top causes of forced outage for
several unit types For fossil units ldquoLack of Fuelrdquo as the number three cause behind waterwall tube leaks
and superheater tube leaks
Table 10 Forced Outages Due to Lack of Fuel by Region
Region Number of Lack of Fuel
Problems Reported
FRCC 0
MRO 3
NPCC 24
RFC 695
SERC 17
SPP 3
TRE 7
WECC 29
One company contributed to the majority of oil-fired lack of fuel events The units at the company are
actually dual-fuels (oil and gas) but market nominated gas monitoring causes the units to be on forced
outage nightly The units need gas to start up so they can run on oil When they shut down the units must
switch to gas to clean themselves With the gas restriction the unit canrsquot start and the unit goes on a
forced outage Until the band is lifted the two units will continue to be on a forced outage cycle
Event records also provide descriptions of why the unit was without fuel with the majority of descriptions
bull Temperatures affecting gas supply valves
bull Unexpected maintenance of gas pipe-lines
bull Compressor problemsmaintenance
Generation Equipment Performance
58
Table 11 Unit Type Profile of Forced Outages Due to Lack of Fuel
Unit Types Number of Lack of Fuel Problems Reported
Fossil 642
Nuclear 0
Gas Turbines 88
Diesel Engines 1
HydroPumped Storage 0
Combined Cycle 47
Generation Equipment Performance
59
Table 12 Causes of Forced Outage for Different Unit Types (2008-2010)
Fossil - all MW sizes all fuels
Rank Description Occurrence per Unit-year
MWH per Unit-year
Average Hours To Repair
Average Hours Between Failures
Unit-years
1 Waterwall (furnace wall) 0590 134106 59 3250 3868 2 Second Superheater
Leaks 0180 5182 60 3228 3868
3 Lack of Fuel (coal mines gas lines etc) where the operator is not in control
0480 4701 18 26 3868
Combined-Cycle blocks Rank Description Occurrence
per Unit-year
MWH per Unit-year
Average Hours To Repair
Average Hours Between Failures
Unit-years
1 HP Turbine Buckets Or Blades
0020 4663 1830 26280 466
2 Turbine Control Valves 0040 2777 100 7200 466 3 Gas Turbine Compressor -
High Pressure Shaft 0010 2266 663 4269 466
Nuclear units - all Reactor types Rank Description Occurrence
per Unit-year
MWH per Unit-year
Average Hours To Repair
Average Hours Between Failures
Unit-years
1 LP Turbine Buckets or Blades
0010 26415 8760 26280 288
2 Containment Structure 0010 9233 1226 26262 288 3 Feedwater Pump Local
Controls 0020 7620 692 12642 288
Simple-cycle gas turbine jet engines Rank Description Occurrence
per Unit-year
MWH per Unit-year
Average Hours To Repair
Average Hours Between Failures
Unit-years
1 Main Transformer 0030 1611 1016 20709 4181 2 Other Gas Turbine
Controls And Instrument Problems
0120 428 70 2614 4181
3 Other Gas Turbine Problems
0090 400 119 1701 4181
Generation Equipment Performance
60
2008-2010 Review of Summer versus Winter Availability To address seasonality of unit availability unit information for the months of June to September (summer)
and December through February (winter) were pooled to calculate force events during these timeframes for
2008-201039 Figure 32 shows the Equivalent Availability Factor (EAF) is three percentage points higher and
the Equivalent Forced Outage Rate - Demand (EFORd) is more than a half of a percentage point lower in the
summer period than in winter period This means the units were more reliable with less forced events
during high-demand times during the summer than during the winter seasons The generating unitrsquos
capability has a resulting higher Net Capacity Factor (NCF) of 45 percentage points in the summer season
for 2008-2010
During the spring season (March-May) 77 percent of the units took a planned outage (PO) for an average
231 hours (or 96 days) In fall (October-November) only 42 percent of the units experienced a PO and the
average duration was shorter ndash 134 hours (or 56 days) A few units took both spring and fall planned
outages although this is rare Based on this assessment the generating units are prepared for the summer
peak demand The resulting availability indicates that this maintenance was successful which is measured
by an increased EAF and lower EFORd
Figure 32 Summer-Winter Average EAF NCF and EFORd (2008-2010)
Conclusions and Recommendations During 2008-2010 the average Equivalent Availability Factor (EAF) which measures the overall availability
of generating units decreased At the same time the Net Capacity Factor (NCF) an indicator of energy
production increased The average number of forced outages in 2010 is greater than in 2008 while at the
same time the average planned outage times have decreased As a result the Equivalent Forced Outage
Rate ndash Demand (EFORd) also increased illustrating that more units have experienced forced events during
39 A study of peak periods was conducted by the NERC Generating Availability Trend Evaluation (GATE) Working Group several years ago see httpwwwnerccomfilesSeasonal-Performance-Trendspdf
9116
5343
396
8818
4896
441
0 10 20 30 40 50 60 70 80 90 100
EAF
NCF
EFORd
Percent ()
Winter
Summer
Generation Equipment Performance
61
peak-demand times in 2010 than in the previous two years Potentially with shorter planned outage
periods in 2010 there may be less time to repair equipment and prevent forced unit outages
There are warnings that units are not being maintained as well as they should be In the last three years
there has been an increase in Equivalent Forced Outage Rate ndash Demand (EFORd) This indicator measures
the rate of forced outage events on generating units during periods of load demand To confirm this
problem forced outage hours jumped from 270 to 314 hours per unit between 2009 and 2010 At the same
time maintenance events also increased by 12 hours per unit Planned outage events remain constant The
resulting conclusions from this trend are
bull More or longer planned outage time is needed to repair the generating fleet Whether age is the
cause of the increase need for planned outage time remains unknown and further investigation into
the cause for longer planned outage time is necessary
bull More focus on preventive repairs during planned and maintenance events are needed
There are many multiple unit forced outages due to lack of fuel The majority of multiple unit trips have
three main causes transmission lack of fuel and storms With special interest in the forced outages due to
ldquoLack of Fuelrdquo additional analysis revealed that 77 percent of the units experiencing unexpected fuel
stoppage are oil-fired fossil units while gas-fired units experienced 15 percent
Generating units continue to be more reliable during the peak summer periods
Disturbance Event Trends
62
Category 1 An event resulting in one or more of the following a Unintended loss of three or more BPS elements caused by
common mode failure b Failure or misoperation of an SPSRAS c System-wide voltage reduction of 3 or more d Unintended BPS system separation resulting in an island of
100 MW to 999 MW e Unplanned evacuation from a control center facility with BPS
SCADA functionality for 30 minutes or more Category 2 An event resulting in one or more of the following
a Complete loss of all BPS control center voice communication system(s) for 30 minutes or more
b Complete loss of SCADA control or monitoring functionality for 30 minutes or more
c Voltage excursions equal to or greater than 10 lasting more than five minutes
d Loss of off-site power (LOOP) to a nuclear generating station e Unintended system separation resulting in an island of 1000
MW to 4999 MW f Unintended loss of 300MW or more of firm load for more
than 15 minutes g Violation of an Interconnection Reliability Operating Limit
(IROL) for more than 30 minutes Category 3 An event resulting in one or more of the following
a The loss of load or generation of 2000 MW or more in the Eastern Interconnection or
b Western Interconnection or 1000 MW or more in the ERCOT or Queacutebec Interconnections
c Unintended system separation resulting in an island of 5000 MW to 10000 MW
d Unintended system separation resulting in an island of Florida from the Eastern Interconnection
Category 4 An event resulting in one or more of the following a The loss of load or generation from 5001 MW to 9999 MW b Unintended system separation resulting in an island of more
than 10000 MW (with the exception of Florida as described in Category 3c)
Category 5 An event resulting in one or more of the following a The loss of load of 10000 MW or more b The loss of generation of 10000 MW or more
Figure 33 BPS Event Category
Disturbance Event Trends Introduction The purpose of this section is to report event
analysis trends from the beginning of event
analysis field test40
One of the companion goals of the event
analysis program is the identification of trends
in the number magnitude and frequency of
events and their associated causes such as
human error equipment failure protection
system misoperations etc The information
provided in the event analysis database (EADB)
and various event analysis reports have been
used to track and identify trends in BPS events
in conjunction with other databases (TADS
GADS metric and benchmarking database)
to the end of 2010
The Event Analysis Working Group (EAWG)
continuously gathers event data and is moving
toward an integrated approach to analyzing
data assessing trends and communicating the
results to the industry
Performance Trends The event category is classified41
Figure 33
as shown in
with Category 5 being the most
severe Figure 34 depicts disturbance trends in
Category 1 to 5 system events from the
40 httpwwwnerccomdocseawgGalloway-Industry-EA-Field-Test-102210pdf 41httpwwwnerccomfiles2011-05-0220Event_Analysis_Process_Phase20220Field20Test20Draft20-20Final20-20For20postingpdf
Disturbance Event Trends
63
beginning of event analysis field test to the end of 201042
Figure 34 Event Category vs Date for All 2010 Categorized Events
From the figure in November and December
there were many more category 1 and 2 events than in October This is due to the field trial starting on
October 25 2010
In addition to the category of the events the status of the events plays a critical role in the accuracy of the
data By examining Figure 35 over 80 of the events reported in 2010 have been closed This means that
the category root cause and other important information have been sufficiently finalized in order for
analysis to be accurate for each event At this time there is not enough data to draw any long-term
conclusions about event investigation performance
42 Documents for the EA Field Test are located at httpwwwnerccompagephpcid=5|365
2
12 12
26
3
6 5
14
1 1
2
0
5
10
15
20
25
30
35
40
45
October November December 2010
Even
t Cou
nt
Category 3 Category 2 Category 1
Disturbance Event Trends
64
Figure 35 Event Count vs Status (All 2010 Events with Status)
By drilling down into the cause code for each closed 2010 event Figure 36 shows the top 3 event causes
From the figure equipment failure and protection system misoperation are the most significant causes for
events Because of how new and limited the data is however there may not be statistical significance for
this result Further trending of cause codes for closed events and developing a richer dataset to find any
trends between event cause codes and event counts should be performed
Figure 36 Top 3 Event Counts vs DAWG Cause Code for all Closed 2010 Events
10
32
42
0
5
10
15
20
25
30
35
40
45
Open Closed Open and Closed
Even
t Cou
nt
Status
1211
8
0
2
4
6
8
10
12
14
Equipment Failure Protection System Misoperation Human Error
Even
t Cou
nt
Cause Code
Disturbance Event Trends
65
Conclusions Due to the relatively new process for events analysis and categorization more time will be required before a
conclusive recommendation may be obtained Further analysis and new data should provide valuable
statistics in the future Over 80 of all event reports from 2010 are current listed as closed but no
conclusion about investigation performance may be obtained because of the limited amount of data It is
recommended to study ways to prevent equipment failure and protection system misoperations but there
is not enough data to draw a firm conclusion about the top causes of events at this time
Abbreviations Used in This Report
66
Abbreviations Used in This Report
Acronym Definition ALP Acadiana Load Pocket
ALR Adequate Level of Reliability
ARR Automatic Reliability Report
BA Balancing Authority
BPS Bulk Power System
CDI Condition Driven Index
CEII Critical Energy Infrastructure Information
CIPC Critical Infrastructure Protection Committee
CLECO Cleco Power LLC
DADS Future Demand Availability Data System
DCS Disturbance Control Standard
DOE Department Of Energy
DSM Demand Side Management
EA Event Analysis
EAF Equivalent Availability Factor
ECAR East Central Area Reliability
EDI Event Drive Index
EEA Energy Emergency Alert
EFORd Equivalent Forced Outage Rate Demand
EMS Energy Management System
ERCOT Electric Reliability Council of Texas
ERO Electric Reliability Organization
ESAI Energy Security Analysis Inc
FERC Federal Energy Regulatory Commission
FOH Forced Outage Hours
FRCC Florida Reliability Coordinating Council
GADS Generation Availability Data System
GOP Generation Operator
IEEE Institute of Electrical and Electronics Engineers
IESO Independent Electricity System Operator
IROL Interconnection Reliability Operating Limit
Abbreviations Used in This Report
67
Acronym Definition IRI Integrated Reliability Index
LOLE Loss of Load Expectation
LUS Lafayette Utilities System
MAIN Mid-America Interconnected Network Inc
MAPP Mid-continent Area Power Pool
MOH Maintenance Outage Hours
MRO Midwest Reliability Organization
MSSC Most Severe Single Contingency
NCF Net Capacity Factor
NEAT NERC Event Analysis Tool
NERC North American Electric Reliability Corporation
NPCC Northeast Power Coordinating Council
OC Operating Committee
OL Operating Limit
OP Operating Procedures
ORS Operating Reliability Subcommittee
PC Planning Committee
PO Planned Outage
POH Planned Outage Hours
RAPA Reliability Assessment Performance Analysis
RAS Remedial Action Schemes
RC Reliability Coordinator
RCIS Reliability Coordination Information System
RCWG Reliability Coordinator Working Group
RE Regional Entities
RFC Reliability First Corporation
RMWG Reliability Metrics Working Group
RSG Reserve Sharing Group
SAIDI System Average Interruption Duration Index
SAIFI System Average Interruption Frequency Index
SCADA Supervisory Control and Data Acquisition
SDI Standardstatute Driven Index
SERC SERC Reliability Corporation
Abbreviations Used in This Report
68
Acronym Definition SRI Severity Risk Index
SMART Specific Measurable Attainable Relevant and Tangible
SOL System Operating Limit
SPS Special Protection Schemes
SPCS System Protection and Control Subcommittee
SPP Southwest Power Pool
SRI System Risk Index
TADS Transmission Availability Data System
TADSWG Transmission Availability Data System Working Group
TO Transmission Owner
TOP Transmission Operator
WECC Western Electricity Coordinating Council
Contributions
69
Contributions This report was made feasible by the collaboration and hard work of both NERC staff and NERCrsquos
Industry Groups
NERC Industry Groups
Table 14 lists the NERC industry group contributors Without their contribution and collaboration this
report would not have been possible
Table 13 NERC Industry Group Contributions43
NERC Group
Relationship Contribution
Reliability Metrics Working Group
(RMWG)
Reports to the OCPC bull Lead Development of Report bull Provide Reliability Metrics Data bull Responsible for Reliability Metrics
Performance Chapter
Transmission Availability Working Group
(TADSWG)
Reports to the OCPC bull Provide Transmission Availability Data
bull Responsible for Transmission Equip-ment Performance Chapter
bull Content Review
Generation Availability Data System Task
Force
(GADSTF)
Reports to the OCPC bull Provide Generation Availability Data bull Responsible for Generation Equip-
ment Performance Chapter bull Content Review
Event Analysis Working Group
(EAWG)
Reports to the OCPC bull Provide Events Data bull Responsible for Disturbance Events
Trends Chapter bull Content Review
43 Rosters for RMWG TADSWG GADSTF and EAWG are available at httpwwwnerccomfilesrosterpdf
Contributions
70
NERC Staff Table 13 below lists the NERC staff who contributed to the 2011 Reliability Performance Analysis
Report
Table 14 Contributing NERC Staff
Name Title E-mail Address
Mark Lauby Vice President and Director of
Reliability Assessment and
Performance Analysis
marklaubynercnet
Jessica Bian Manager of Performance Analysis jessicabiannercnet
John Moura Manager of Reliability Assessments johnmouranercnet
Andrew Slone Engineer Reliability Performance
Analysis
andrewslonenercnet
Jim Robinson TADS Project Manager jimrobinsonnercnet
Clyde Melton Engineer Reliability Performance
Analysis
clydemeltonnercnet
Mike Curley Manager of GADS Services mikecurleynercnet
James Powell Engineer Reliability Performance
Analysis
jamespowellnercnet
Michelle Marx Administrative Assistant michellemarxnercnet
William Mo Intern Performance Analysis wmonercnet
- NERCrsquos Mission
- Table of Contents
- Executive Summary
-
- 2011 Transition Report
- State of Reliability Report
- Key Findings and Recommendations
-
- Reliability Metric Performance
- Transmission Availability Performance
- Generating Availability Performance
- Disturbance Events
- Report Organization
-
- Introduction
-
- Metric Report Evolution
- Roadmap for the Future
-
- Reliability Metrics Performance
-
- Introduction
- 2010 Performance Metrics Results and Trends
-
- ALR1-3 Planning Reserve Margin
-
- Background
- Assessment
- Special Considerations
-
- ALR1-4 BPS Transmission Related Events Resulting in Loss of Load
-
- Background
- Assessment
-
- ALR1-12 Interconnection Frequency Response
-
- Background
- Assessment
-
- ALR2-3 Activation of Under Frequency Load Shedding
-
- Background
- Assessment
- Special Considerations
-
- ALR2-4 Average Percent Non-Recovery Disturbance Control Standards (DCS)
-
- Background
- Assessment
- Special Consideration
-
- ALR2-5 Disturbance Control Events Greater Than Most Severe Single Contingency
-
- Background
- Assessment
- Special Consideration
-
- ALR 1-5 System Voltage Performance
-
- Background
- Special Considerations
- Status
-
- ALR3-5 Interconnection Reliability Operating Limit System Operating Limit (IROLSOL) Exceedances
-
- Background
-
- ALR4-1 Automatic Transmission Outages Caused by Protection System Misoperations
-
- Background
- Special Considerations
-
- ALR6-11 ndash ALR6-14
-
- Background
- Assessment
- ALR 6-11 ndash Automatic Outages Initiated by Failed Protection System Equipment
- ALR6-12 ndash Automatic Outages Initiated by Human Error
- ALR6-13 ndash Automatic Outages Initiated by Failed AC Substation Equipment
- ALR6-14 Automatic AC Transmission Outages Initiated by Failed AC Circuit Equipment
-
- ALR6-15 Element Availability Percentage (APC)
-
- Background
- Assessment
- Special Consideration
-
- ALR6-16 Transmission System Unavailability
-
- Background
- Assessment
- Special Consideration
-
- ALR6-2 Energy Emergency Alert 3 (EEA3)
-
- Background
- Assessment
- Special Considerations
-
- ALR 6-3 Energy Emergency Alert 2 (EEA2)
-
- Background
- Assessment
- Special Considerations
-
- ALR 6-1 Transmission Constraint Mitigation
-
- Background
- Assessment
- Special Considerations
-
- Integrated Bulk Power System Risk Assessment
-
- Introduction
- Recommendations
-
- Integrated Reliability Index Concepts
-
- The Three Components of the IRI
-
- Event-Driven Indicators (EDI)
- Condition-Driven Indicators (CDI)
- StandardsStatute-Driven Indicators (SDI)
-
- IRI Index Calculation
- IRI Recommendations
-
- Reliability Metrics Conclusions and Recommendations
-
- Transmission Equipment Performance
-
- Introduction
- Performance Trends
-
- AC Element Outage Summary and Leading Causes
- Transmission Monthly Outages
- Outage Initiation Location
- Transmission Outage Events
- Transmission Outage Mode
-
- Conclusions
-
- Generation Equipment Performance
-
- Introduction
- Generation Key Performance Indicators
-
- Multiple Unit Forced Outages and Causes
- 2008-2010 Review of Summer versus Winter Availability
-
- Conclusions and Recommendations
-
- Disturbance Event Trends
-
- Introduction
- Performance Trends
- Conclusions
-
- Abbreviations Used in This Report
- Contributions
-
- NERC Industry Groups
- NERC Staff
-

Introduction
8
keep the industry informed by conducting yearly webinars providing quarterly data updates and
publishing its annual report
Figure 3 NERC Reliability Indicators Dashboard
Roadmap for the Future As shown in Figure 4 the 2011 Reliability Performance Analysis report begins a transition from a 2009
metric performance assessment to a ldquoState of Reliabilityrdquo report by collaborating with other groups to
form a unified approach to historical reliability performance analysis This process will require
engagement with a number of NERC industry experts to paint a broad picture of the bulk power
systemrsquos historic reliability
Alignment to other industry reports is also important Analysis from the frequency response performed
by the Resources Subcommittee (RS) physical and cyber security assessment provided by the Critical
Infrastructure Protection Committee (CIPC) the wide area reliability coordination conducted by the
Reliability Coordinator Working Group (RCWG) the spare equipment availability system enhanced by
the Spare Equipment Database Task Force (SEDTF) the post seasonal assessment developed by the
Reliability Assessment Subcommittee (RAS) and demand response deployment summarized by the
Demand Response Data Task Force (DRDTF) will provide a significant foundation from which this report
draws Collaboration derived from these stakeholder groups further refines the metrics and use of
additional datasets will broaden the industryrsquos tool-chest for improving reliability of the bulk power
system
The annual State of Reliability report is aimed to communicate the effectiveness of ERO (Electric
Reliability Organization) by presenting an integrated view of historic reliability performance The report
will provide a platform for sound technical analysis and a way to provide feedback on reliability trends
to stakeholders regulators policymakers and industry The key findings and recommendations will
Introduction
9
ultimately be used as input to standards changes and project prioritization compliance process
improvement event analysis and critical infrastructure protection areas
Figure 4 Overview of the Transition to the 2012 State of Reliability Report
Reliability Metrics Performance
10
Reliability Metrics Performance Introduction Building upon last yearrsquos metric review the RMWG continues to assess the results of eighteen currently
approved performance metrics Due to data availability each of the performance metrics do not
address the same time periods (some metrics have just been established while others have data over
many years) though this will be an important improvement in the future Merit has been found in all
eighteen approved metrics At this time though the number of metrics is expected to will remain
constant however other metrics may supplant existing metrics In spite of the potentially changing mix
of approved metrics to goals is to ensure the historical and current assessments can still be performed
These metrics exist within an overall reliability framework and in total the performance metrics being
considered address the fundamental characteristics of an acceptable level of reliability (ALR) Each of
the elements being measured by the metrics should be considered in aggregate when making an
assessment of the reliability of the bulk power system with no single metric indicating exceptional or
poor performance of the power system
Due to regional differences (size of the region operating practices etc) comparing the performance of
one Region to another would be erroneous and inappropriate Furthermore depending on the region
being evaluated one metric may be more relevant to a specific regionrsquos performance than others and
assessment may not be strictly mathematical rather more subjective Finally choosing one regionrsquos
best metric performance to define targets for other regions is inappropriate
Another key principle followed in developing these metrics is to retain anonymity of any reporting
organization Thus granularity will be attempted up to the point that such actions might compromise
anonymity of any given company Certain reporting entities may appear inconsistent but they have
been preserved to maintain maximum granularity with individual anonymity
Although assessments have been made in a number of the performance categories others do not have
sufficient data to derive any conclusions from the metric results The RMWG recommends continued
assessment of these metrics until sufficient data is available Each of the eighteen performance metrics
are presented in summary with their SMART8 Table 1 ratings in The table provides a summary view of
the metrics with an assessment of the current metric trends observed by the RMWG Table 1 also
shows the order in which the metrics are aligned according to the standards objectives
8 SMART rating definitions are located at httpwwwnerccomdocspcrmwgSMART_20RATING_826pdf
Reliability Metrics Performance
11
Table 1 Metric SMART Ratings Relative to Standard Objectives
Metrics SMART Objectives Relative to Standards Prioritization
ALR Improvements
Trend
Rating
SMART
Rating
1-3 Planning Reserve Margin 13
1-4 BPS Transmission Related Events Resulting in Loss of Load 15
2-5 Disturbance Control Events Greater than Most Severe Single Contingency 12
6-2 Energy Emergency Alert 3 (EEA3) 15
6-3 Energy Emergency Alert 2 (EEA2) 15
Inconclusive
2-3 Activation of Under Frequency Load Shedding 10
2-4 Average Percent Non-Recovery DCS 15
4-1 Automatic Transmission Outages Caused by Protection System Misoperation 15
6-11 Automatic Transmission Outages Caused by Protection System Misoperation 14
6-12 Automatic Transmission Outages Caused by Human Error 14
6-13 Automatic Transmission Outages Caused by Failed AC Substation Equipment 14
6-14 Automatic Transmission Outages Caused by Failed AC Circuit Equipment 14
New Data
1-5 Systems Voltage Performance 14
3-5
Interconnected Reliability Operating Limit System Operating Limit (IROLSOL)
Exceedance 14
6-1 Transmission constraint Mitigation 14
6-15 Element Availability Percentage (APC) 13
6-16
Transmission System Unavailability on Operational Planned and Auto
Sustained Outages 13
No Data
1-12 Frequency Response 11
Trend Rating Symbols
Significant Improvement
Slight Improvement
Inconclusive
Slight Deterioration
Significant Deterioration
New Data
No Data
Reliability Metrics Performance
12
2010 Performance Metrics Results and Trends
ALR1-3 Planning Reserve Margin
Background
The Planning Reserve Margin9 is a measure of the relationship between the amount of resource capacity
forecast and the expected demand in the planning horizon10 Coupled with probabilistic analysis
calculated Planning Reserve Margins is an industry standard which has been used by system planners for
decades as an indication of system resource adequacy Generally the projected demand is based on a
5050 forecast11
Assessment
Planning Reserve Margin is the difference between forecast capacity and projected
peak demand normalized by projected peak demand and shown as a percentage Based on experience
for portions of the bulk power system that are not energy-constrained Planning Reserve Margin
indicates the amount of capacity available to maintain reliable operation while meeting unforeseen
increases in demand (eg extreme weather) and unexpected unavailability of existing capacity (eg
long-term generation outages) Further from a planning perspective Planning Reserve Margin trends
identify whether capacity additions are projected to keep pace with demand growth
Planning Reserve Margins considering anticipated capacity resources and adjusted potential capacity
resources decrease in the latter years of the 2009 and 2010 10-year forecast in each of the four
interconnections Typically the early years provide more certainty since new generation is either in
service or under construction with firm commitments In the later years there is less certainty about
the resources that will be needed to meet peak demand Declining Planning Reserve Margins are
inherent in a conventional forecast (assuming load growth) and do not necessarily indicate a trend of a
degrading resource adequacy Rather they are an indication of the potential need for additional
resources In addition key observations can be made to the Planning Reserve Margin forecast such as
short-term assessment rate of change through the assessment period identification of margins that are
approaching or below a target requirement and comparisons from year-to-year forecasts
While resource planners are able to forecast the need for resources the type of resource that will
actually be built or acquired to fill the need is usually unknown For example in the northeast US
markets with three to five year forward capacity markets no firm commitments can be made in the
9 Detailed calculations of Planning Reserve Margin are available at httpwwwnerccompagephpcid=4|331|333 10The Planning Reserve Margin indicated here is not the same as an operating reserve margin that system operators use for near-term
operations decisions 11These demand forecasts are based on ldquo5050rdquo or median weather (a 50 percent chance of the weather being warmer and a 50 percent
chance of the weather being cooler)
Reliability Metrics Performance
13
long-term However resource planners do recognize the need for resources in their long-term planning
and account for these resources through generator queues These queues are then adjusted to reflect
an adjusted forecast of resourcesmdashpro-rated by approximately 20 percent
When comparing the assessment of planning reserve margins between 2009 and 2010 the
interconnection Planning Reserve Margins are slightly higher on an annual basis in the 2010 forecast
compared to those of 2009 as shown in Figure 5
Figure 5 Planning Reserve Margin by Interconnection and Year
In general this is due to slightly higher capacity forecasts and slightly lower demand forecasts The pace
of any economic recovery will affect future comparisons This metric can be used by NERC to assess the
individual interconnections in the ten-year long-term reliability assessments If a noticeable change
Reliability Metrics Performance
14
occurs within the trend further investigation is necessary to determine the causes and likely effects on
reliability
Special Considerations
The Planning Reserve Margin is a capacity based metric Therefore it does not provide an accurate
assessment of performance in energy-limited systems (eg hydro capacity with limited water resources
or systems with significant variable generation penetration) In addition the Planning Reserve Margin
does not reflect potential transmission constraint internal to the respective interconnection Planning
Reserve Margin data shown in Figure 6 is used for NERCrsquos seasonal and long-term reliability
assessments and is the primary metric for determining the resource adequacy of a given assessment
area
The North American Bulk Power System is divided into four distinct interconnections These
interconnections are loosely connected with limited ability to share capacity or energy across the
interconnection To reflect this limitation the Planning Reserve Margins are calculated in this report
based on interconnection values rather than by national boundaries as is the practice of the Reliability
Assessment Subcommittee (RAS)
ALR1-4 BPS Transmission Related Events Resulting in Loss of Load
Background
This metric measures bulk power system transmission-related events resulting in the loss of load
Planners and operators can use this metric to validate their design and operating criteria by identifying
the number of instances when loss of load occurs
For the purposes of this metric an ldquoeventrdquo is an unplanned transmission disturbance that produces an
abnormal system condition due to equipment failures or system operational actions and results in the
loss of firm system demand for more than 15 minutes The reporting criteria for such events are
outlined below12
bull Entities with a previous year recorded peak demand of more than 3000 MW are required to
report all such losses of firm demands totaling more than 300 MW
bull All other entities are required to report all such losses of firm demands totaling more than 200
MW or 50 percent of the total customers being supplied immediately prior to the incident
whichever is less
bull Firm load shedding of 100 MW or more used to maintain the continuity of the bulk power
system reliability
12 Details of event definitions are available at httpwwwnerccomfilesEOP-004-1pdf
Reliability Metrics Performance
15
Assessment
Figure 6 illustrates that the number of bulk power system transmission-related events resulting in loss of
firm load13
Table 2
from 2002 to 2009 is relatively constant and suggests that 7 - 10 events per year is a norm for
the bulk power system However the magnitude of load loss shown in associated with these
events reflects a downward trend since 2007 Since the data includes weather-related events it will
provide the RMWG with an opportunity for further analysis and continued assessment of the trends
over time is recommended
Figure 6 BPS Transmission Related Events Resulting in Loss of Load Counts (2002-2009)
Table 2 BPS Transmission Related Events Resulting in Loss of Load MW Loss (2002-2009)
Year Load Loss (MW)
2002 3762
2003 65263
2004 2578
2005 6720
2006 4871
2007 11282
2008 5200
2009 2965
13The metric source data may require adjustments to accommodate all of the different groups for measurement and consistency as OE-417 is only used in the US
02468
101214
2002 2003 2004 2005 2006 2007 2008 2009
Count
Reliability Metrics Performance
16
ALR1-12 Interconnection Frequency Response
Background
This metric is used to track and monitor Interconnection Frequency Response Frequency Response is a
measure of an Interconnectionrsquos ability to stabilize frequency immediately following the sudden loss of
generation or load It is a critical component to the reliable operation of the bulk power system
particularly during disturbances and restoration The metric measures the average frequency responses
for all events where frequency drops more than 35 mHz within a year
Assessment
At this time there has been no data collected for ALR1-12 Therefore no assessment was made
ALR2-3 Activation of Under Frequency Load Shedding
Background
The purpose of Under Frequency Load Shedding (UFLS) is to balance generation and load in an island
following an extreme event The UFLS activation metric measures the number of times UFLS is activated
and the total MW of load interrupted in each Region and NERC wide
Assessment
Figure 7 and Table 3 illustrate a history of Under Frequency Load Shedding events from 2006 through
2010 Through this period itrsquos important to note that single events had a range load shedding from 15
MW to 7654 MW The activation of UFLS relays is the last automated reliability measure associated
with a decline in frequency in order to rebalance the system Further assessment of the MW loss for
these activations is recommended
Figure 7 ALR2-3 Count of Activations by Year and Regional Entity (2001-2010)
Reliability Metrics Performance
17
Table 3 ALR2-3 Under Frequency Load Shedding MW Loss
ALR2-3 Under Frequency Load Shedding MW Loss
2006 2007 2008 2009 2010
FRCC
2273
MRO
486
NPCC 94
63 20 25
RFC
SPP
672 15
SERC
ERCOT
WECC
Special Considerations
The use of a single metric cannot capture all of the relevant information associated with UFLS events as
the events relate to each respective UFLS plan The ability to measure the reliability of the bulk power
system is directly associated with how it performs compared to what is planned
ALR2-4 Average Percent Non-Recovery Disturbance Control Standards (DCS)
Background
This metric measures the Balancing Authorityrsquos (BA) or Reserve Sharing Grouprsquos (RSG) ability to balance
resources and demand with the timely deployment of contingency reserve thereby returning the
interconnection frequency to within defined limits following a Reportable Disturbance14
Assessment
The relative
percentage provides an indication of performance measured at a BA or RSG
Figure 8 illustrates the average percent non-recovery of DCS events from 2006 to 2010 The graph
provides a high-level indication of the performance of each respective RE However a single event may
not reflect all the reliability issues within a given RE In order to understand the reliability aspects it
may be necessary to request individual REs to further investigate and provide a more comprehensive
reliability report Further investigation may indicate the entity had sufficient contingency reserve but
through their implementation process failed to meet DCS recovery
14 Details of the Disturbance Control Performance Standard and Reportable Disturbance definitions are available at
httpwwwnerccomfilesBAL-002-0pdf
Reliability Metrics Performance
18
Continued trend assessment is recommended Where trends indicated potential issues the regional
entity will be requested to investigate and report their findings
Figure 8 Average Percent Non-Recovery of DCS Events (2006-2010)
Special Consideration
This metric aggregates the number of events based on reporting from individual Balancing Authorities or
Reserve Sharing Groups It does not capture the severity of the DCS events It should be noted that
most REs use 80 percent of the Most Severe Single Contingency to establish the minimum threshold for
reportable disturbance while others use 35 percent15
ALR2-5 Disturbance Control Events Greater Than Most Severe Single Contingency
Background
This metric represents the number of disturbance events that exceed the Most Severe Single
Contingency (MSSC) and is specific to each BA Each RE reports disturbances greater than the MSSC on
behalf of the BA or Reserve Sharing Group (RSG) The result helps validate current contingency reserve
requirements The MSSC is determined based on the specific configuration of each BA or RSG and can
vary in significance and impact on the BPS
15httpwwwweccbizStandardsDevelopmentListsRequest20FormDispFormaspxID=69ampSource=StandardsDevelopmentPagesWEC
CStandardsArchiveaspx
375
079
0
54
008
005
0
15 0
77
025
0
33
000510152025303540
2006
2007
2008
2009
2010
2006
2007
2008
2009
2010
2006
2007
2008
2009
2010
2006
2007
2008
2009
2010
2006
2007
2008
2009
2010
2006
2007
2008
2009
2010
2006
2007
2008
2009
2010
2006
2007
2008
2009
2010
FRCC MRO NPCC RFC SERC SPP ERCOT WECC
Region and Year
Reliability Metrics Performance
19
Assessment
Figure 9 represents the number of DCS events within each RE that are greater than the MSSC from 2006
to 2010 This metric and resulting trend can provide insight regarding the risk of events greater than
MSSC and the potential for loss of load
In 2010 SERC had 16 BAL-002 reporting entities eight Balancing Areas elected to maintain Contingency
Reserve levels independent of any reserve sharing group These 16 entities experienced 79 reportable
DCS eventsmdash32 (or 405 percent) of which were categorized as greater than their most severe single
contingency Every DCS event categorized as greater than the most severe single contingency occurred
within a Balancing Area maintaining independent Contingency Reserve levels Significantly all 79
regional entities reported compliance with the Disturbance Recovery Criterion including for those
Disturbances that were considered greater than their most severe single Contingency This supports a
conclusion that regardless of the size of the BA or participation in a Reserve Sharing Group SERCrsquos BAL-
002 reporting entities have demonstrated the ability in 2010 to use Contingency Reserve to balance
resources and demand and return Interconnection frequency within defined limits following Reportable
Disturbances
If the SERC Balancing Areas without large generating units and who do not participate in a Reserve
Sharing Group change the determination of their most severe single contingencies to effect an increase
in the DCS reporting threshold (and concurrently the threshold for determining those disturbances
which are greater than the most severe single contingency) there will certainly be a reduction in both
the gross count of DCS events in SERC and in the subset considered under ALR2-5 Masking the discrete
events which cause Balancing Area response may not reduce ldquoriskrdquo to the system However it is
desirable to maintain a reporting threshold which encourages the Balancing Authority to respond to any
unexplained change in ACE in a manner which supports Interconnection frequency based on
demonstrated performance SERC will continue to monitor DCS performance and will continue to
evaluate contingency reserve requirements but does not consider 2010 ALR2-5 performance to be an
adverse trend in ldquoextreme or unusualrdquo contingencies but rather within the normal range of expected
occurrences
Reliability Metrics Performance
20
Special Consideration
The metric reports the number of DCS events greater than MSSC without regards to the size of a BA or
RSG and without respect to the number of reporting entities within a given RE Because of the potential
for differences in the magnitude of MSSC and the resultant frequency of events trending should be
within each RE to provide any potential reliability indicators Each RE should investigate to determine
the cause and relative effect on reliability of the events within their footprints Small BA or RSG may
have a relatively small value of MSSC As such a high number of DCS greater than MCCS may not
indicate a reliability problem for the reporting RE but may indicate an issue for the respective BA or RSG
In addition events greater than MSSC may not cause a reliability issue for some BA RSG or RE if they
have more stringent standards which require contingency reserves greater than MSSC
ALR 1-5 System Voltage Performance
Background
The purpose of this metric is to measure the transmission system voltage performance (either absolute
or per unit of a nominal value) over time This should provide an indication of the reactive capability
available to the transmission system The metric is intended to record the amount of time that system
voltage is outside a predetermined band around nominal
0
5
10
15
20
25
30
2006
2007
2008
2009
2010
2006
2007
2008
2009
2010
2006
2007
2008
2009
2010
2006
2007
2008
2009
2010
2006
2007
2008
2009
2010
2006
2007
2008
2009
2010
2006
2007
2008
2009
2010
2006
2007
2008
2009
2010
FRCC MRO NPCC RFC SERC SPP ERCOT WECC
Cou
nt
Region and Year
Figure 9 Disturbance Control Events Greater Than Most Severe Single Contingency (2006-2010)
Reliability Metrics Performance
21
Special Considerations
Each Reliability Coordinator (RC) will work with the Transmission Owners (TOs) and Transmission
Operators (TOPs) within its footprint to identify specific buses and voltage ranges to monitor for this
metric The number of buses the monitored voltage levels and the acceptable voltage ranges may vary
by reporting entity
Status
With a pilot program requested in early 2011 a voluntary request to Reliability Coordinators (RC) was
made to develop a list of key buses This work continues with all of the RCs and their respective
Transmission Owners (TOs) to gather the list of key buses and their voltage ranges After this step has
been completed the TO will be requested to provide relevant data on key buses only Based upon the
usefulness of the data collected in the pilot program additional data collection will be reviewed in the
future
ALR3-5 Interconnection Reliability Operating Limit System Operating Limit (IROLSOL) Exceedances
Background
This metric illustrates the number of times that defined Interconnection Reliability Operating Limit
(IROL) or System Operating Limit (SOL) were exceeded and the duration of these events Exceeding
IROLSOLs could lead to outages if prompt operator control actions are not taken in a timely manner to
return the system to within normal operating limits This metric was approved by NERCrsquos Operating and
Planning Committees in June 2010 and a data request was subsequently issued in August 2010 to collect
the data for this metric Based on the results of the pilot conducted in the third and fourth quarter of
2010 there is merit in continuing measurement of this metric Note the reporting of IROLSOL
exceedances became mandatory in 2011 and data collected in Table 4 for 2010 has been provided
voluntarily
Reliability Metrics Performance
22
Table 4 ALR3-5 IROLSOL Exceedances
3Q2010 4Q2010 1Q2011
le 10 mins 123 226 124
le 20 mins 10 36 12
le 30 mins 3 7 3
gt 30 mins 0 1 0
Number of Reporting RCs 9 10 15
ALR4-1 Automatic Transmission Outages Caused by Protection System Misoperations
Background
Originally titled Correct Protection System Operations this metric has undergone a number of changes
since its initial development To ensure that it best portrays how misoperations affect transmission
outages it was necessary to establish a common understanding of misoperations and the data needed
to support the metric NERCrsquos Reliability Assessment Performance Analysis (RAPA) group evaluated
several options of transitioning from existing procedures for the collection of misoperations data and
recommended a consistent approach which was introduced at the beginning of 2011 With the NERC
System Protection and Control Subcommitteersquos (SPCS) technical guidance NERC and the regional
entities have agreed upon a set of specifications for misoperations reporting including format
categories event type codes and reporting period to have a final consistent reporting template16
Special Considerations
Only
automatic transmission outages 200 kV and above including AC circuits and transformers will be used
in the calculation of this metric
Data collection will not begin until the second quarter of 2011 for data beginning with January 2011 As
revised this metric cannot be calculated for this report at the current time The revised title and metric
form can be viewed at the NERC website17
16 The current Protection System Misoperation template is available at
httpwwwnerccomfilezrmwghtml 17The current metric ALR4-1 form is available at httpwwwnerccomdocspcrmwgALR_4-1Percentpdf
Reliability Metrics Performance
23
ALR6-11 ndash ALR6-14
ALR6-11 Automatic AC Transmission Outages Initiated by Failed Protection System Equipment
ALR6-12 Automatic AC Transmission Outages Initiated by Human Error
ALR6-13 Automatic AC Transmission Outages Initiated by Failed AC Substation Equipment
ALR6-14 Automatic AC Circuit Outages Initiated by Failed AC Circuit Equipment
Background
These metrics evolved from the original ALR4-1 metric for correct protection system operations and
now illustrate a normalized count (on a per circuit basis) of AC transmission element outages (ie TADS
momentary and sustained automatic outages) that were initiated by Failed Protection System
Equipment (ALR6-11) Human Error (ALR6-12) Failed AC Substation Equipment (ALR6-13) and Failed AC
Circuit Equipment (ALR6-14) These metrics are all related to the non-weather related initiating cause
codes for automatic outages of AC circuits and transformers operated 200 kV and above
Assessment
Figure 10 through Figure 13 show the normalized outages per circuit and outages per transformer for
facilities operated at 200 kV and above As shown in all eight of the charts there are some regional
trends in the three years worth of data However some Regionrsquos values have increased from one year
to the next stayed the same or decreased with no discernable regional trends For example ALR6-11
computes the automatic AC Circuit outages initiated by failed protection system equipment
There are some trends to the ALR6-11 to ALR6-14 data but many regions do not have enough data for a
valid trend analysis to be performed NERCrsquos outage rate seems to be improving every year On a
regional basis metric ALR6-11 along with ALR6-12 through ALR6-14 cannot be statistically understood
until confidence intervals18
18The detailed Confidence Interval computation is available at
are calculated ALR metric outage frequency rates and Regional equipment
inventories that are smaller than others are likely to require more than 36 months of outage data Some
numerically larger frequency rates and larger regional equipment inventories (such as NERC) do not
require more than 36 months of data to obtain a reasonably narrow confidence interval
httpwwwnerccomdocspctadstfTADS_Nov_2_2007APPENDIX_C_Confidence_Intervalpdf
Reliability Metrics Performance
24
While more data is still needed on a regional basis to determine if each regionrsquos bulk power system is
becoming more reliable year to year there are areas of potential improvement which include power
system condition protection performance and human factors These potential improvements are
presented due to the relatively large number of outages caused by these items The industry can
benefit from detailed analysis by identifying lessons learned and rolling average trends of NERC-wide
performance With a confidence interval of relatively narrow bandwidth one can determine whether
changes in statistical data are primarily due to random sampling error or if the statistics are significantly
different due to performance
Reliability Metrics Performance
25
ALR 6-11 ndash Automatic Outages Initiated by Failed Protection System Equipment
Automatic outages with an initiating cause code of failed protection system equipment are in Figure 10
Figure 10 ALR6-11 by Region (Includes NERC-Wide)
This code covers automatic outages caused by the failure of protection system equipment This
includes any relay andor control misoperations except those that are caused by incorrect relay or
control settings that do not coordinate with other protective devices
ALR6-12 ndash Automatic Outages Initiated by Human Error
Figure 11 shows the automatic outages with an initiating cause code of human error This code covers
automatic outages caused by any incorrect action traceable to employees andor contractors for
companies operating maintaining andor providing assistance to the Transmission Owner will be
identified and reported in this category
Reliability Metrics Performance
26
Also any human failure or interpretation of standard industry practices and guidelines that cause an
outage will be reported in this category
Figure 11 ALR6-12 by Region (Includes NERC-Wide)
Reliability Metrics Performance
27
ALR6-13 ndash Automatic Outages Initiated by Failed AC Substation Equipment
Figure 12 shows the automatic outages with an initiating cause code of failed AC substation equipment
This code covers automatic outages caused by the failure of AC Substation ie equipment ldquoinside the
substation fencerdquo including transformers and circuit breakers but excluding protection system
equipment19
19TADS Initiating Cause Code definitions are located at httpwwwnerccomdocspctadswgTADS_Definitions_Appendix_7_092909pdf
Figure 12 ALR6-13 by Region (Includes NERC-Wide)
Reliability Metrics Performance
28
ALR6-14 Automatic AC Transmission Outages Initiated by Failed AC Circuit Equipment
Figure 13 shows the automatic outages with an initiating cause code of failed AC circuit equipment
Automatic Outages related to the failure of AC Circuit equipment ie overhead or underground
equipment ldquooutside the substation fencerdquo 20
ALR6-15 Element Availability Percentage (APC)
Background
This metric uses data and calculations directly from the NERC TADS effort and illustrates the overall
percent of time the aggregate of transmission facilities are available and in service This is an aggregate
20TADS Initiating Cause Code definitions are located at httpwwwnerccomdocspctadswgTADS_Definitions_Appendix_7_092909pdf
Figure 13 ALR6-14 by Region (Includes NERC-Wide)
Reliability Metrics Performance
29
value using sustained outages (automatic and non-automatic) for both lines and transformers operated
at 200 kV and above for each Regional Entity Interconnection and for NERC This metric was approved
by the NERC Operating and Planning Committees in September 2010
Assessment
Figure 14 shows the aggregate element availability percentage (APC) for transmission and transformers
facilities operated at 200 kV and above The values are all over 90 percent which shows excellent
system availability The RMWG recommends continued metric assessment for at least a few more years
in order to determine the value of this metric
Figure 14 2010 ALR6-15 Element Availability Percentage
Notably the Eastern Interconnection does not include Quebec or ERCOT ERCOT does not have any
transformers with low-side voltage levels 200 kV and above
Special Consideration
It should be noted that the non-automatic outage data needed to calculate this metric was only first
collected for the calendar year 2010 as part of the TADS process Therefore only one year of data for
this metric is available at this time
Reliability Metrics Performance
30
ALR6-16 Transmission System Unavailability
Background
This metric uses data and calculations directly from the NERC TADS effort and shows the overall percent
of time the aggregate of transmission facilities are unavailable due to automatic and non-automatic
outages This is an aggregate value using sustained automatic outages for both lines and transformers
operated at 200 kV and above for each Regional Entity and for NERC This metric was approved by the
NERC Operating and Planning Committees in December 2010
Assessment
Figure 15 and Figure 16 illustrate the 2010 aggregate unavailability percentage for AC circuits and
transformer facilities operated at 200 kV and above The values for AC circuits are all under 3 percent
which shows excellent system availability
The RMWG recommends continued metric assessment for at least a few more years in order to
determine the value of this metric
Special Consideration
It should be noted that the non-automatic outage data needed to calculate this metric was only first
collected for the calendar year 2010 as part of the TADS process Therefore only one year of data for
this metric is available at this time
Figure 15 2010 ALR6-16 Transmission System Unavailability
Reliability Metrics Performance
31
Figure 16 2010 ALR6-16 Transmission System Unavailability by Outage Type
Notably the Eastern Interconnection does not include Quebec or ERCOT Also ERCOT does not have
any transformers with low-side voltage levels 200 kV and above
ALR6-2 Energy Emergency Alert 3 (EEA3)
Background
This metric identifies the number of times Energy Emergency Alerts Level 3 (EEA3) are issued EEA3
events are firm-load interruptions due to capacity and energy deficiency EEA3 is currently reported
collected and maintained in NERCrsquos Reliability Coordination Information System (RCIS) and is defined in
Attachment 1 of the NERC Standard EOP-00221
21 The latest version of Attachment 1 for EOP-002 is available at
This metric identifies the number of times EEA3s are
issued The number of EEA3s per year provides a relative indication of performance measured at a
Balancing Authority or interconnection level As historical data is gathered trends in future reports will
provide an indication of either decreasing or increasing use of EEA3s signaling adequacy of the electric
supply system This metric can also be considered in the context of Planning Reserve Margin Significant
increases or decreases in EEA3 events with relatively constant Planning Reserve Margins could indicate
httpwwwnerccompagephpcid=2|20
Reliability Metrics Performance
32
volatility in the actual loads compared to forecast levels or changes in the adequacy of the bulk power
system required to meet load demands
Assessment
Figure 17 shows the number of EEA3 events during 2006 and 2010 from an RE level An interactive
presentation was released and available at the Reliability Indicatorrsquos page22
The Acadiana Load Pocket (ALP) is an area in south central Louisiana that has experienced regular
transmission constraints and numerous Energy Emergency Alert filings by the SPP Reliability Controller
(SPP RC) Transmission within ALP is owned by Entergy Lafayette Utilities System (LUS) and Cleco
Power LLC (Cleco) The transmission constraints within the ALP are primarily caused by the local area
load and the lack of generation located in close proximity to the load area
The number of EEA3rsquos
declared in 2010 returned to more traditional numbers The 2009 spike in EEA3 events in the SPP
Region that was driven by issues in the Acadiana Load Pocket (ALP) were not present in 2010
Special Considerations
Ideally the measure should capture only EEAs that are declared for reliability reasons and not for
economic factors The RMWG has not been able to differentiate these reasons for future reporting and
it has made a recommendation to the Reliability Coordinator Working Group (RCWG) to consider a
revised EEA declaration to exclude economic factors
The reason the EEA volume decreased from 2009 to 2010 in SPP was because the SPP ICT RC23
coordinated an operating agreement between the five operating companies in the ALP The operating
agreement included a cost sharing re-dispatch that alleviated the need of a Transmission Loading Relief
(TLR-5) declaration24
22The EEA3 interactive presentation is available on the NERC website at
During 2009 there was no operating agreement therefore an entity had to
provide Network and Native Load (NNL) relief when a TLR-5 was called by the ICT RC When the TLR-5
was the primary tool to control the post contingent loading in the ALP some of the BAs would have their
firm transmission curtailed to the point where they could no longer serve their load therefore the EEA
3 was needed to communicate a capacityreserve deficiency
httpwwwnerccompagephpcid=4|331|335 23Southwest Power Pool (SPP) Independent Coordinator of Transmission (ICT) Reliability Coordinator (RC) 24More information on Transmission Load Relief is contained in the IRO-006 standard which is located at httpwwwnerccomfilesIRO-006-4pdf In particular TLR-5 definitions are referenced on page 16 and 17
Reliability Metrics Performance
33
Figure 17 ALR6-2 Energy Emergency Alert 3 (EEA3) Counts by Region (2006-2010)
Cleco Power Entergy and LUS are currently constructing an estimated $200 million transmission
infrastructure improvement project to mitigate transmission constraints into ALP Construction of the
project is scheduled to be complete in 2012 Completion of the project should help alleviate some of
the transmission congestion in this area Energy Emergency Alerts filed by the SPP Regional Entity
continue to decline
SPP RTO continues to coordinate operating plans with the operating entities in this area Mitigation
plans and local operating guides in place are expected to provide sufficient flexibility should issues arise
NERC will continue to monitor this area for Reliability Impacts and coordinate any actions with the SPP
Reliability Coordinator and SPP Regional Entity
ALR 6-3 Energy Emergency Alert 2 (EEA2)
Background
Energy Emergency Alert 2 (EEA2) is to measure the number of events BAs declare for deficient capacity
and energy during peak load periods which may serve as a leading indicator of energy and capacity
shortfall in the adequacy of the electric supply system EEA2 provides a sense of the frequency of
precursor events to the more severe EEA3 declarations This metric measures the number of events
1 3 1 2 214
3 4 4 1 5 334
4 2 1 52
1
0
5
10
15
20
25
30
3520
0620
0720
0820
0920
1020
0620
0720
0820
0920
1020
0620
0720
0820
0920
1020
0620
0720
0820
0920
1020
0620
0720
0820
0920
1020
0620
0720
0820
0920
1020
0620
0720
0820
0920
1020
0620
0720
0820
0920
10
FRCC MRO NPCC RFC SERC SPP TRE WECC
2006-2009
2010
Region and Year
Reliability Metrics Performance
34
Balancing Authorities declare for deficient capacity and energy during peak load periods At this time
however this data reflects inclusion of Demand Side Resources that would not be indicative of
inadequacy of the electric supply system
The number of EEA2 events and any trends in their reporting indicates how robust the system is in
being able to supply the aggregate load requirements The historical records may include demand
response activations and non-firm load interruptions per applicable contracts within the EEA alerts per
its definition25
Assessment
Demand response is a legitimate resource to be called upon by balancing authorities and
do not indicate a reliability concern As data is gathered in the future reports will provide an indication
of either decreasing or increasing adequacy in the electric supply system EEA2 events called solely for
activation of demand response (controllable or contractually prearranged demand-side dispatch
programs) or interruption of non-firm load per applicable contracts should be excluded This metric can
also be considered in the context of the Planning Reserve Margin Significant increases or decreases in
EEA2 events with relatively constant Planning Reserve Margins could indicate volatility in the actual
loads compared to forecast levels or changes in the adequacy of the bulk power system required to
meet load demands
Figure 18 shows the number of EEA2 events by Regional Entity from 2006 to 2010 EEA2 interactive
version available on line by quarter and region26
25 The EEA2 is defined at
The general trend continues to show improved
performance which may have been influenced by the overall reduction in demand throughout NERC
caused by the economic downturn Specific performance by any one region should be investigated
further for issues or events that may affect the results Determining whether performance reported
includes those events resulting from the economic operation of DSM and non-firm load interruption
should also be investigated The RMWG recommends continued metric assessment
httpwwwnerccomfilesEOP-002-2pdf 26 EEA2 interactive version located at httpwwwnerccompagephpcid=4|331|341
Reliability Metrics Performance
35
Special Considerations
The intent of this metric is to measure only EEAs that are called for reliability reasons and not for
economic factors such as demand side management (DSM) and non-firm load interruption The
historical data for this metric may include events that were called for economic factors According to
the RCWG recent data should only include EEAs called for reliability reasons
ALR 6-1 Transmission Constraint Mitigation
Background
The RMWG completed a pilot with four regional entities Based on the results the RMWG expanded the
pilot data collection to all regions and the initial results of the data collection are shown in Figure 19
and Table 5 Based on the results of the pilot there is merit in continuing to assess this metric The
intent of this metric is to identify trends in the number of mitigation measures (Special Protection
Schemes (SPS) Remedial Action Schemes (RAS) and Operating Procedures) required to meet reliability
requirements By their nature SPS do not indicate an inherent weakness in the bulk power system
rather they are an indication of methods that are taken to operate the system through the range of
conditions it must perform This metric is only intended to evaluate the trend use of these plans and
whether the metric indicates robustness of the transmission system is increasing remaining static or
decreasing
1 27
2 1 4 3 2 1 2 4 5 2 5 832
4724
211
5 38 5 1 1 8 7 4 1 1
05
101520253035404550
2006
2007
2008
2009
2010
2006
2007
2008
2009
2010
2006
2007
2008
2009
2010
2006
2007
2008
2009
2010
2006
2007
2008
2009
2010
2006
2007
2008
2009
2010
2006
2007
2008
2009
2010
2006
2007
2008
2009
2010
FRCC MRO NPCC RFC SERC SPP TRE WECC
2006-2009
2010
Region and Year
Figure 18 ALR6-3 Energy Emergency Alert 2 (EEA2)
Reliability Metrics Performance
36
Assessment
The pilot data indicates a relatively constant number of mitigation measures over the time period of
data collected
Figure 19 ALR6-1 Transmission Constraint Mitigation by SPSRAS (2009-2014)
0102030405060708090
100110120
2009
2010
2011
2014
2009
2010
2011
2014
2009
2010
2011
2014
2009
2010
2011
2014
2009
2010
2011
2014
2009
2010
2011
2014
2009
2010
2011
2014
2009
2010
2011
2014
FRCC MRO NPCC RFC SERC SPP ERCOT WECC
Coun
t
Region and Year
SPSRAS
Reliability Metrics Performance
37
Table 5 ALR6-1 Transmission Constraint Mitigation by Operating ProcedureGuides (2009-2011)
ALR6-1 Transmission Constraint Mitigation by Operating ProcedureGuides (2009-2014)
2009 2010 2011 2014
FRCC 107 75 66
MRO 79 79 81 81
NPCC 0 0 0
RFC 2 1 3 4
SPP 39 40 40 40
SERC 6 7 15
ERCOT 29 25 25
WECC 110 111
Special Considerations
A certain number of SPS mitigation plans may be necessary to support reliable operation of the system
If the number of SPS increase over time this may indicate that additional transmission capacity is
required A reduction in the number of SPS may be an indicator of increased generation or transmission
facilities being put into service which may indicate greater robustness of the bulk power system In
general mitigation plans are a viable and valuable tool for effective operation of the bulk power system
In power system planning reliability operability capacity and cost-efficiency are simultaneously
considered through a variety of scenarios to which the system may be subjected Mitigation measures
are a method for optimizing a power system across these scenarios Changes in quantities of mitigation
plans may indicate year-on-year differences in the system being evaluated
Integrated Bulk Power System Risk Assessment
Introduction In developing eighteen metrics to measure acceptable levels of reliability it has become clear that any
such measurement of reliability must include consideration of the risks present within the bulk power
system in order for us to appropriately prioritize and manage these system risks The scope for the
Reliability Metrics Working Group (RMWG)27
27 The RMWG scope can be viewed at
includes a task to develop a risk-based approach that
provides consistency in quantifying the severity of events The approach not only can be used to
httpwwwnerccomfilezrmwghtml
Reliability Metrics Performance
38
measure risk reduction over time but also can be applied uniformly in event analysis process to identify
the events that need to be analyzed in detail and sort out non-significant events
The Operating Committee (OC) and Planning Committee (PC) endorsed the concepts and framework28 of
the risk-based approach in their September 2010 joint meeting and further supported the event severity
risk index (SRI) calculation29
Recommendations
in March 2011
bull NERC should embrace the use of risk assessment to identify trends in addition to lessons learned
in order to improve bulk power system reliability
bull The RMWG should continue to coordinate and communicate with the Event Analysis Working
Group (EAWG) to apply the SRI into the event analysis process and root cause analysis
bull As trend evaluations increase the knowledge of risks to the bulk power system data required to
support additional assessment should be gathered
Event Severity Risk Index (SRI)
Risk assessment is an essential tool for achieving the alignment between organizations people and
technology This will assist in quantifying inherent risks identifying where potential high risks exist and
evaluating where the most significant lowering of risks can be achieved Being learning organizations
the Electric Reliability Organization (ERO) Regional Entities and Registered Entities can use these tools
to focus on the areas of highest risk to reliability to provide a sound basis for developing results-based
standards and compliance programs Risk assessment also serves to engage all stakeholders in a
dialogue about specific risk factors and helps direct a strategic plan for risk reduction and early
detection
The SRI is a daily blended metric for which transmission loss generation loss and load loss events are
calculated Each element (transmission generation and load loss) is factored by the systemrsquos inventory
for that element to rate significant events appropriately On a yearly basis these daily performances
can be sorted in descending order to evaluate the year-on-year performance of the system
In order to test drive the concepts the RMWG applied these calculations against historically memorable
days to derive SRIs Once these calculations were complete they were reviewed and evaluated by
various stakeholders for reasonableness Based upon feedback modifications to the calculation were
made and assessed against the historic days performed This iterative process locked down the details
28 httpwwwnerccomdocspcrmwgIntegrated_Bulk_Power_System_Risk_Assessment_Concepts_Finalpdf 29 httpwwwnerccomdocspcrmwgSRI_Equation_Refinement_May6_2011pdf
Reliability Metrics Performance
39
for the calculation of SRI whose calculation from zero (no transmission line outages generation outages
or load lost in a day) to 1000 (a theoretical condition in which every transmission line all generation
units and all load lost across the system in a single day)
Figure 20 captures the calculated severity risk value for each of the days for each year benchmarked
with the historic significant events which were used to concept test the calculation Since there is
significant disparity between days the bulk power system is stressed compared to those that are
ldquoroutinerdquo and ldquoherordquo days of the year where the system performed extremely well the curve is depicted
using a logarithmic scale Each yearrsquos data is sorted in descending order striking a characteristic shape
At the left-side of the curve the days in which the system is severely stressed are plotted The central
more linear portion of the curve identifies the routine day performance while the far right-side of the
curve shows the values plotted for days in which almost all lines and generation units are in service and
essentially no load is lost
The trends on the chart below show that 2009 and 2010 had fewer extreme days than 2008 Routine
daily performance appears generally consistent across all three years Figure 20 captures the days for
each year benchmarked with historically significant events
In Figure 20 NERCrsquos event categories and SRI ratings are directly related As the SRI increases the
category or severity of the event increases Historical events are also shown to relate modern
reliability measurements to give a perspective of how a well-known event would register on the SRI
scale
The event analysis process30
30
benefits from the SRI as it enables a numerical analysis of an event in
comparison to other events By this measure an event can be prioritized by its severity In a severe
event this is unnecessary However for events that do not result in severe stressing of the bulk power
system this prioritization can be a challenge By using the SRI the event analysis process can decide
which events to learn from and reduce which events to avoid and when resilience needs to be
increased under high impact low frequency events as shown in the blue boxes in the figure
httpwwwnerccompagephpcid=5|365
Reliability Metrics Performance
40
Figure 20 NERC Annual Daily Severity Risk Index (SRI) Sorted Descending with Historic Benchmark Days
Other factors that impact severity of a particular event to be considered in the future include whether
equipment operated as designed and resulted in loss of load from a reliability perspective (intentional
and controlled load-shedding) Mechanisms for enabling ongoing refinement to include the historic and
simulated events for future severity risk calculations are being explored
Reliability Metrics Performance
41
Integrated Reliability Index Concepts In December 2010 the RMWG was challenged by the OC and PC to develop a single index concept to
measure the universe of risks associated with the bulk power system As a result the integrated
reliability index (IRI) concepts were proposed31
Figure 21
the three components of which were defined to
quantify each specific risk aspect They are titled the Event Driven Index (EDI) StandardsStatute Driven
Index (SDI) and Condition Driven Index (CDI) illustrated in with measures associated with
system events standards compliance and eighteen performance metrics The development of an
integrated reliability index aims to inform increase transparency and quantify the effectiveness of risk
reduction or mitigation actions The goal is to provide the industry meaningful trends of the BPSrsquos
performance and guidance on how the industry can improve reliability and support risk-informed
decision making Once completed the IRI will facilitate holistic assessment of performance Finally the
IRI should help overcome concern and confusion about how many metrics are being analyzed for system
reliability assessments
Figure 21 Risk Model for Bulk Power System
The integrated model of event-driven condition-driven and standardsstatute-driven risk information
can be constructed to illustrate all possible logical relations between the three risk sets Due to the
nature of the system there may be some overlap among the components
31 httpwwwnerccomdocspcrmwgIntegrated_Reliability_Index_WhitePaper_DRAFTpdf
Event Driven Index (EDI)
Indicates Risk from
Major System Events
Standards Statute Driven
Index (SDI)
Indicates Risks from Severe Impact Standard Violations
Condition Driven Index (CDI)
Indicates Risk from Key Reliability
Indicators
Reliability Metrics Performance
42
The Three Components of the IRI The three components of the IRI work together as shown in Figure 22 to comprise a full picture of the
state of reliability
Figure 22 An overview of the components that comprise the Integrated Reliability Index (IRI)
Event-Driven Indicators (EDI)
The Event-Driven Indicator provides a basis for prioritization of events based on bulk power system
integrity equipment performance and engineering judgment This indicator can serve as a high value
risk assessment tool to be used by stakeholders to investigate and evaluate disturbance history and
measure the severity of these events The relative ranking of events requires industry expertise agreed-
upon goals and engineering judgment The EDI is a derivative of SRI results for a specific time period
but it transforms that performance into a form of an availability index These calculations will be further
refined as feedback is received
Condition-Driven Indicators (CDI)
The Condition-Driven Indicators focus on a set of measurable system conditions (performance
measures) to assess bulk power system reliability These reliability indicators identify factors that
positively or negatively impact reliability and are early predictors of the risk to reliability from events or
unmitigated violations A collection of these indicators measures how close reliability performance is to
the desired outcome and if the performance against these metrics is constant or improving
Reliability Metrics Performance
43
StandardsStatute-Driven Indicators (SDI)
The StandardsStatute-Driven Indicator is a calculation of success of compliance based upon the subset
of high-value standards and is divided by the number of participations who could have received the
violation within the time period considered Also based on these factors known unmitigated violations
of elevated risk factor requirements are weighted higher than lower risk factors The index decreases if
the compliance improvement is achieved over a trending period
IRI Index Calculation As with the SRI the IRI is based on an importance weighting factor which the RMWG can modify over
time after gaining experience with the new metric as well as consideration of feedback from industry
At this time the RMWG believes some form of blended weighting may serve to start to populate IRI
characteristic curves at a high and generic level Based upon feedback from stakeholders this approach
may change or as discussed below weighting factors may vary based on periodic review and risk model
update The RMWG will continue the refinement of the IRI calculation and consider other significant
factors that impact reliability (eg intentional and controlled load-shedding) further it will explore
developing mechanisms for enabling ongoing refinement which should be influenced by a wide set of
stakeholders
RMWG recommends the Event Driven Index (EDI) be weighted the highest (50 percent) since events
actually occurred indicating how the system was performing The Condition Driven Index (CDI) and
StandardsStatute Driven Index (SDI) are weighted 25 each since they are indicators of potential risks
to BPS reliability IRI can be calculated as follows
IRI is intended to be a composite metric which integrates several forms of individual risks to the bulk
power system Since the three components range across many stakeholder organizations these
concepts are developed as starting points for continued study and evaluation Additional supporting
materials can be found in the IRI whitepaper32
IRI Recommendations
including individual indices calculations and preliminary
trend information
For the IRI more investigation should be performed to determine the best way to integrate EDI CDI
and SDI into an Integrated Reliability Index (IRI) that quantitatively represents the reliability of the bulk
32 The IRI whitepaper can be found at httpwwwnerccomdocspcrmwgIntegrated_Reliability_Index_WhitePaper_DRAFTpdf
Reliability Metrics Performance
44
power system To this end study into determining the amount of overlap between the components is
necessary RMWG is currently working to determine the proper amount of overlap between the IRI
components
Also the CDI component of the IRI needs to be solidified This is especially true with the CDI More
accurate metric data is needed to paint a fuller picture of the CDI Many of the metrics used to calculate
the CDI are new or they have limited data Compared to the SDI which counts well-known violation
counts and the EDI which uses the well-defined CDI the CDI lacks the depth of rigor that the other two
components have acquired through their years of data RMWG is currently working to improve the CDI
Reliability Metrics Conclusions and Recommendations Among the eighteen metrics that address the characteristics of an adequate level of reliability (ALR)
metric trends indicate the system is performing better in the following seven areas
bull ALR1-3 Planning Reserve Margin
bull ALR1-4 BPS Transmission Related Events Resulting in Loss of Load
bull ALR2-5 Disturbance Control Events Greater than Most Severe Single Contingency
bull ALR6-2 Energy Emergency Alert 3 (EEA3)
bull ALR6-3 Energy Emergency Alert 2 (EEA2)
bull ALR6-11 Automatic Transmission Outages Caused by Protection System Misoperations
bull ALR6-13 Automatic Transmission Outages Caused by Failed AC Substation Equipment
Assessments have been made in other performance categories A number of them do not have
sufficient data to derive any conclusions from the results The RMWG recommends continued data
collection and assessment of these metrics If a metric does not yield any trend in a five-year reporting
period the metric will be modified or withdrawn
For the IRI more investigation should be performed to determine the overlap of the components (CDI
EDI and SDI) The CDI should be more thoroughly solidified as an index by collecting more data over
time
Transmission Equipment Performance
45
Transmission Equipment Performance Introduction The Transmission Availability Data System (TADS) effort began with the establishment of a TADS task force
by the NERC Planning Committee in October 2006 On October 27 2007 the NERC Board of Trustees
approved the collection of transmission automatic outage data beginning in calendar year 2008 (Phase I)
Subsequently on October 29 2008 the NERC Board approved the collection of Non-Automatic Outage data
that began for Calendar year 2010 (Phase II)
This chapter provides reliability performance analysis of the transmission system by focusing on the trends
of Automatic Outage data from calendar year 2008 thru 2010 Since only one year of Non-Automatic
Outage data has been collected that data will not be assessed in this report
When calculating bulk power system performance indices care must be exercised when interpreting results
as misinterpretation can lead to erroneous conclusions regarding system performance With only three
years of data in the smaller regions it is not clear whether a regionrsquos yearly outage variation compared to
the average is due to random statistical variation or that particular year is significantly different in
performance However on a NERC-wide basis after three years of data collection there is enough
information to accurately determine whether the yearly outage variation compared to the average is due to
random statistical variation or the particular year in question is significantly different in performance33
Performance Trends
Transmission performance information has been provided by Transmission Owners (TOs) within NERC
through the NERC TADS (Transmission Availability Data System) process The data presented reflects
Momentary and Sustained AC Automatic outages of transmission elements that operate at voltages ge 200 kV
(including the low side of transformers) with the criteria specified in the TADS process The following
elements listed below are included
bull AC Circuits ge 200 kV (Overhead and Underground Circuits) Radial circuits are included
bull DC Circuits with ge +-200 kV DC voltage
bull Transformers with ge 200 kV low-side voltage and
bull ACDC Back-to-Back (BTB) Converters with ge 200 kV AC voltage on both sides
33The detailed Confidence Interval computation is available at httpwwwnerccomdocspctadstfTADS_Nov_2_2007APPENDIX_C_Confidence_Intervalpdf
Transmission Equipment Performance
46
AC Element Outage Summary and Leading Causes Table 6 shows the 2008 2009 and 2010 NERC total AC transmission element inventory and a summary of
the associated outages As expected in general the number of circuits increased from year to year due to
new construction or re-construction to higher voltages For every outage experienced on the transmission
system cause codes are identified and recorded according to the TADS process Causes of both momentary
and sustained outages have been indicated These causes are analyzed to identify trends and similarities
and to provide insight into what could be done to possibly prevent future occurrences
Figure 23 and Figure 24 describe the top ten initiating cause codes for sustained and momentary automatic
outages combined from 2008-2010 Based on the two figures the relationship between the total number of
outages and total outage hours can be seen Failed AC Substation Equipment and Failed AC Circuit
Equipment only account for 15 percent of the total number of outages but account for 65 percent of the
total outage hours The two largest causes of outages within NERC (ldquoLightingrdquo and ldquoWeather excluding
Lightningrdquo) account for 34 percent of the total number of outages
The next three Human Error Failed Protection System Equipment and Failed AC Circuit Equipment have
very similar totals and should all be considered significant focus points in reducing the number of Sustained
Automatic Outages for all elements
Transmission Equipment Performance
47
Table 6 NERC - All AC Elements Sustained and Momentary Outage Performance Summary
2008 Number of Outages
AC Voltage
Class
No of
Circuits
Circuit
Miles Sustained Momentary
Total
Outages Total Outage Hours
200-299kV 4369 102131 1560 1062 2622 56595
300-399kV 1585 53631 793 753 1546 14681
400-599kV 586 31495 389 196 585 11766
600-799kV 110 9451 43 40 83 369
All Voltages 6650 196708 2785 2051 4836 83626
2009 Number of Outages
AC Voltage
Class
No of
Circuits
Circuit
Miles Sustained Momentary
Total
Outages Total Outage Hours
200-299kV 4468 102935 1387 898 2285 28828
300-399kV 1619 56447 641 610 1251 24714
400-599kV 592 32045 265 166 431 9110
600-799kV 110 9451 53 38 91 442
All Voltages 6789 200879 2346 1712 4038 63094
2010 Number of Outages
AC Voltage
Class
No of
Circuits
Circuit
Miles Sustained Momentary
Total
Outages Total Outage Hours
200-299kV 4567 104722 1506 918 2424 54941
300-399kV 1676 62415 721 601 1322 16043
400-599kV 605 31590 292 174 466 10442
600-799kV 111 9477 63 50 113 2303
All Voltages 6957 208204 2582 1743 4325 83729
Note The NERC table does not show redacted outages DC Circuit outages Transformer outages or ACDC
converter outages
Transmission Equipment Performance
48
Figure 23 NERC - Top Ten Sustained and Momentary Outages by Initiating Cause Code for All Elements
Figure 24 NERC - Top Ten Sustained Outage Hours by Cause Code
198
151
80
7271
6943
33
27
188
68
Lightning
Weather excluding lightningHuman Error
Failed AC Substation EquipmentFailed Protection System EquipmentFailed AC Circuit Equipment Foreign Interference
Power System Condition
Fire
Unknown
Remaining Cause Codes
299
246
188
58
52
42
3619
16 12 31 Failed AC Substation EquipmentFailed AC Circuit Equipment Weather excluding lightningUnavailable
Other
Fire
Unknown
Human Error
Failed Protection System EquipmentForeign Interference
Remaining Cause Codes
Transmission Equipment Performance
49
Transmission Monthly Outages Figure 25 displays the total number of Automatic Outages on a per-month basis The three months with the
highest total of outages were June July and August From a seasonal perspective winter had a monthly
average of 281 outages These include the months of November-March Summer had an average of 429
outages Summer included the months of April-October
Figure 25 Number of Outages by Month for AC Circuits (2008-2010)
This figure does not show redacted outages DC Circuit outages Transformer outages or ACDC Converter
outages
Outage Initiation Location For every outage experienced on the transmission system the outage initiation code is identified and
recorded according to the TADS process The outage initiation code can be analyzed to identify trends and
similarities and to provide insight into what could be done to possibly prevent future occurrences
The ldquoOutage Initiation Coderdquo describes where an automatic outage was initiated on the power system The
five codes are as follows
bull Element-Initiated
bull Other Element-Initiated
bull AC Substation-Initiated
bull ACDC Terminal-Initiated (for DC circuits)
bull Other Facility Initiated any facility not included in any other outage initiation code
JanuaryFebruar
yMarch April May June July August
September
October
November
December
2008 238 229 257 258 292 437 467 380 208 176 255 236
2009 315 201 339 334 398 553 546 515 351 235 226 294
2010 444 224 269 446 449 486 639 498 351 271 305 281
3 Year AVG 332 218 288 346 380 492 551 464 303 227 262 270
0
100
200
300
400
500
600
700
Out
ages
Transmission Equipment Performance
50
Notably the protection system is not part of an ldquoAC Substationrdquo or an ldquoACDC Terminalrdquo If a protection
system misoperates and initiates an outage it will be classified as ldquoOther-Facility Initiatedrdquo The following
Figures show the initiating location of the Automatic outages from 2008 to 2010
With both Momentary and Sustained Automatic Outages taken into account the outage was initiated on the
Element more than 67 percent of the time as shown in Figure 26 and Figure 27
When only the Sustained Automatic Outages are analyzed the outage initiation on both AC Substation and
Other Facility increased by 34 percent and 32 percent respectively Outages initiated on the Element itself
decreases by 78 percent as shown in Figure 26 and 27 For only the Momentary Automatic Outages the
outage initiation on the Element increases by 19 percent compared to Sustained Outages Element initiated
outages make up over 78 percent of the total outages when analyzing only Momentary Outages
Figure 26
Figure 27
Transmission Outage Events Figure 28 illustrates the relationship between the numbers of Automatic Outages associated per TADS
event 2008 2009 and 2010 tend to follow the same trend The largest number of Automatic Outages per
TADS event is fourteen in 2010 thirteen in 2009 and eight in 2008 There are around 70 to 100 TADS
events that contain between fourteen and three Automatic Outages (see below) There are around 330 to
400 TADS events that contain two or more Automatic Outages The rest of the events only contain one
Automatic Outage As noted in the lower right hand corner below the total number of Events in 2008 to
2010 ranged from 3920 to 4569 events per year Nearly 90 percent or more of the events contained one
Automatic Outage
Figure 26 Sustained Automatic Outage Initiation
Code
Figure 27 Momentary Automatic Outage Initiation
Code
Transmission Equipment Performance
51
Transmission Outage Mode Figure 29 and Figure 30 show the percentage of Outage Modes The ldquoOutage Mode Coderdquo describes
whether one Automatic Outage is related to other Automatic Outages A Single Mode outage is an
Automatic Outage of a single Element which occurs independently of any other Automatic Outages (if any)
A ldquoDependent Mode Initiating Outagerdquo is an Automatic Outage of a single Element that initiates one or more
subsequent Element Automatic Outages A ldquoDependent Mode Outagerdquo is an Automatic Outage of an
Element which occurred as a result of an initiating outage whether the initiating outage was an Element
outage or a non-Element outage A ldquoCommon Mode Outagerdquo is one of two or more Automatic Outages with
the same Initiating Cause Code and where the outages are not consequences of each other and occur nearly
simultaneously A ldquoCommon Mode Initiating Outagerdquo is a Common Mode Outage that initiates one or more
subsequent Automatic Outages
Over 72 percent of the total outages occurred on the bulk power system are Single Mode Outages The next
largest mode is Dependent with over 11 percent of the total outages being in this category For only
Sustained Automatic Outages outages related to each other increase with Dependent mode accounting for
13 percent of the outages and Common mode accounting for close to 11 percent of the outages
Independent Sustained outages still account for the largest portion with nearly 70 percent being Single
mode When just analyzing Momentary Automatic Outages Associated outages decrease with Dependent
Figure 28 Event Histogram (2008-2010)
Transmission Equipment Performance
52
mode accounting for only 9 percent of the outages The Common Mode percentage decreases while
Dependent Mode Initiating percentage increases compared to Sustained Outages Independent Momentary
outages account for the largest portion with over 76 percent being Single Mode
An investigation into the root causes of Dependent and Common mode events which include three or more
Automatic Outages (indentified in the TADS 2008 to 2010 data) should be a high priority Some protection
systems are designed to trip three or more circuits but some events go beyond what is designed Some also
have misoperations associated with multiple outage events
Conclusions On a NERC wide average basis automatic transmission outage rate is improving from 2008 to 2010 based on
reported data Considering both automatic and non-automatic outages 2010 records indicate transmission
element availability percentage is very high and exceeds 95 The unavailability rate for AC circuits and
transformers are only 15 and 29 respectively
The cause codes of Human Error Failed Protection System Equipment and Failed AC Circuit Equipment
should be considered significant focus points in reducing the number of Sustained Automatic Outages for all
elements A deeper look into the root causes of Dependent and Common mode events which include three
or more Automatic Outages (indentified in the TADS 2008 to 2010 data) should be a high priority Some
protection systems are designed to trip three or more circuits but some events go beyond what is designed
Some also have misoperations associated with multiple outage events
Figure 29 Sustained Automatic Outage Mode code Figure 30 Momentary Automatic Outage Mode code
Generation Equipment Performance
53
Generation Equipment Performance Introduction The development of the Generating Availability Data System (GADS) began in 1982 This series of databases
is used to voluntarily collect record and retrieve operating information By pooling individual unit
information with likewise units generating unit availability performance can be calculated providing
opportunities to identify trends and generating equipment reliability improvement opportunities The
information is used to support equipment reliability availability analyses and risk-informed decision-making
by system planners generation owners assessment modelers manufacturers and contractors etc Reports
and information resulting from the data collected through GADS are now used for benchmarking and
analyzing electric power plants
Currently the data collected through GADS contains 72 percent of the North American generating units
with generating capacity of 20 MW or higher34 Additionally many of the newer combined-cycle plants are
not reporting information and therefore a full view of each unit type is not presented Rather a sample of
all the units in North America that fit a given more general category is provided35 for the 2008-201036
Generation Key Performance Indicators
assessment period
Three key performance indicators37
In
the industry have used widely to measure the availability of generating
units (see Terms Used in This Report section for their calculation parameters) are Equivalent Availability
Factor (EAF) Net Capacity Factor (NCF) and Equivalent Forced Outage Rate ndash Demand (EFORd)
Table 7 the North American fleet average EAF NCF and EFORd compared to unit age for all generating
units with a capacity of 20 MW and higher is provided for the years 2008-2010 The EAF shows a decline
during the last three years NCF is up and down while the EFORd appears to be increasing As expected the
fleet of units reported to GADS is aging overall with the fossil units being about 12 years older than the
average age
34 httpwwwnerccomdocspcgadstfGADSTF_Recommendation_Report_02-18-2011_FINALpdf 35GADS contains some 1500+ units under 20 MW that is not included in this report These units are excluded because most units are not base-loaded and are in peaking operation
3684 percent of the 2010 dataset is available at this time while the 2008 and 2009 dataset is complete 37 httpwwwnerccompagephpcid=4|43
Generation Equipment Performance
54
Table 7 General Availability Review of GADS Fleet Units by Year
2008 2009 2010 Average
Equivalent Availability Factor (EAF) 8776 8774 8678 8743
Net Capacity Factor (NCF) 5083 4709 4880 4890
Equivalent Forced Outage Rate -
Demand (EFORd) 579 575 639 597
Number of Units ge20 MW 3713 3713 3713 3713
Average Age of the Fleet in Years (all
unit types) 303 311 321 312
Average Age of the Fleet in Years
(fossil units only) 422 432 440 433
Figure 31 provides the average forced outage hours (FOH) maintenance outage hours (MOH) and planned
outage hours (POH) for all units reporting 20 MW or larger During this three-year period the average FOH
291 hours average MOH is 163 hours average POH is 470 hours
Figure 31 shows a large increase in forced and maintenance events The average age of the units with a
capacity of 20MW and higher in 2009 is 316 years old However the average age of fossil units in 2010 is
442 years old These fossil units are the backbone of all operating units providing the base-load power
continuously and nearly 50 percent of all energy annually There appears to be no increase allocated for
annualsemi-annual maintenance (ie planned outages) for the older generating units The increase of
000100002000030000400005000060000700008000090000
100000
2008 2009 2010
463 479 468
154 161 173
288 270 314
Hou
rs
Planned Maintenance Forced
Figure 31 Average Outage Hours for Units gt 20 MW
Generation Equipment Performance
55
maintenance outage hours reflects an increased need to fix problems that cannot be deferred until the next
annualsemi-annual repairs As a result it shows one of two things are happening
bull More or longer planned outage time is needed to repair the aging generating fleet
bull More focus on preventive repairs during planned and maintenance events are needed
Multiple Unit Forced Outages and Causes Table 8 provides the annual multiple-unit forced outage trips resulting from the same cause for each of the
assessments years 2008-2010 respectively The ldquosingle unitrdquo trips are large units with a Net Dependable
Capacity of 750 MW or more The trips of ldquotwo unitsrdquo or more is any combination of unit capacity with the
total amount of lost capacity more than 750 MW
Table 8 also presents more information on the forced outages During 2008-2010 there were a large
number of double-unit outages resulting from the same event Investigations show that some of these trips
were at a single plant caused by common control and instrumentation for the units The incidents occurred
several times for several months and are a common mode issue internal to the plant
Table 8 Number of Multiple Unit Forced Outages and FrequencyYear
2008 2009 2010
Type of
Trip
of
Trips
Avg Outage
Hr Trip
Avg Outage
Hr Unit
of
Trips
Avg Outage
Hr Trip
Avg Outage
Hr Unit
of
Trips
Avg Outage
Hr Trip
Avg Outage
Hr Unit
Single-unit
Trip 591 58 58 284 64 64 339 66 66
Two-unit
Trip 281 43 22 508 96 48 206 41 20
Three-unit
Trip 74 48 16 223 146 48 47 109 36
Four-unit
Trip 12 77 19 111 112 28 40 121 30
Five-unit
Trip 11 1303 260 60 443 88 19 199 10
gt 5 units 20 166 16 93 206 50 37 246 6
Loss of ge 750 MW per Trip
The high number of five-unit trips in 2008 was due to Hurricane Ike hitting the Gulf Coast The highest total
number of multiple unit trips occurred in 2009 though as mentioned before the data collection for 2010 is
incomplete at this time The majority of 2009 multiple unit trips have three main causes (in order by
Generation Equipment Performance
56
number of events) transmission lack of fuel and storms A summary of the three categories for single as
well as multiple unit outages (all unit capacities) are reflected in Table 9
Table 9 Common Causes of Multiple Unit Forced Outages (2009)
Cause Number of Events Average MW Size of Unit
Transmission 1583 16
Lack of Fuel (Coal Mines Gas Lines etc) Not
in Operator Control
812 448
Storms Lightning and Other Acts of Nature 591 112
Some of the transmission outages based on storms in 2009 have been caused by the same reasons because
the storms may have caused transmission interference However the plants reported the problems
inconsistently with either the transmission interference or storms cause code Therefore they are depicted
as two different causes of forced outage
Marked transmission outages in 2009 were quite high Thirty-five percent came from one utility with a large
number of hydroelectric units The company related the trips to various problems including weather
(lightning storms) wildlife ldquoline bumpsrdquo and problems on the receiving end of the transmission line Nine
hundred and eighty-five transmission trips (62 percent) were from hydroelectric units38
In 2009 only ten transmission trips resulted in a loss of 750 MW or more per trip Twenty two generating
plants were affected by the ten trips Causes for the trips include feeder line trips (1 trip) breakers in the
switchyard (8 trips) personnel errors (2 trips) and unknown (10 trips)
The ldquoLack of Fuelrdquo outages are of interest as these events occur during the times when a unit is available to
operate but there is an interruption in fuels to operate the facilities These events do not include
interruptions of fuel due to contracts Rather the cause code is designed to account for units that are
expecting fuel and it is unavailable when requested Table 10 presents the distribution of ldquoLack of Fuelrdquo
events by NERC Region and Table 11 presents the unit types affected
38 The average size of the hydroelectric units were small ndash 335 MW
Generation Equipment Performance
57
Of the units that report ldquoLack of Fuelrdquo 78 percent of the units are oil-fired 15 percent of the units are gas-
fired and the remaining units are various other fuels Table 12 provides the top causes of forced outage for
several unit types For fossil units ldquoLack of Fuelrdquo as the number three cause behind waterwall tube leaks
and superheater tube leaks
Table 10 Forced Outages Due to Lack of Fuel by Region
Region Number of Lack of Fuel
Problems Reported
FRCC 0
MRO 3
NPCC 24
RFC 695
SERC 17
SPP 3
TRE 7
WECC 29
One company contributed to the majority of oil-fired lack of fuel events The units at the company are
actually dual-fuels (oil and gas) but market nominated gas monitoring causes the units to be on forced
outage nightly The units need gas to start up so they can run on oil When they shut down the units must
switch to gas to clean themselves With the gas restriction the unit canrsquot start and the unit goes on a
forced outage Until the band is lifted the two units will continue to be on a forced outage cycle
Event records also provide descriptions of why the unit was without fuel with the majority of descriptions
bull Temperatures affecting gas supply valves
bull Unexpected maintenance of gas pipe-lines
bull Compressor problemsmaintenance
Generation Equipment Performance
58
Table 11 Unit Type Profile of Forced Outages Due to Lack of Fuel
Unit Types Number of Lack of Fuel Problems Reported
Fossil 642
Nuclear 0
Gas Turbines 88
Diesel Engines 1
HydroPumped Storage 0
Combined Cycle 47
Generation Equipment Performance
59
Table 12 Causes of Forced Outage for Different Unit Types (2008-2010)
Fossil - all MW sizes all fuels
Rank Description Occurrence per Unit-year
MWH per Unit-year
Average Hours To Repair
Average Hours Between Failures
Unit-years
1 Waterwall (furnace wall) 0590 134106 59 3250 3868 2 Second Superheater
Leaks 0180 5182 60 3228 3868
3 Lack of Fuel (coal mines gas lines etc) where the operator is not in control
0480 4701 18 26 3868
Combined-Cycle blocks Rank Description Occurrence
per Unit-year
MWH per Unit-year
Average Hours To Repair
Average Hours Between Failures
Unit-years
1 HP Turbine Buckets Or Blades
0020 4663 1830 26280 466
2 Turbine Control Valves 0040 2777 100 7200 466 3 Gas Turbine Compressor -
High Pressure Shaft 0010 2266 663 4269 466
Nuclear units - all Reactor types Rank Description Occurrence
per Unit-year
MWH per Unit-year
Average Hours To Repair
Average Hours Between Failures
Unit-years
1 LP Turbine Buckets or Blades
0010 26415 8760 26280 288
2 Containment Structure 0010 9233 1226 26262 288 3 Feedwater Pump Local
Controls 0020 7620 692 12642 288
Simple-cycle gas turbine jet engines Rank Description Occurrence
per Unit-year
MWH per Unit-year
Average Hours To Repair
Average Hours Between Failures
Unit-years
1 Main Transformer 0030 1611 1016 20709 4181 2 Other Gas Turbine
Controls And Instrument Problems
0120 428 70 2614 4181
3 Other Gas Turbine Problems
0090 400 119 1701 4181
Generation Equipment Performance
60
2008-2010 Review of Summer versus Winter Availability To address seasonality of unit availability unit information for the months of June to September (summer)
and December through February (winter) were pooled to calculate force events during these timeframes for
2008-201039 Figure 32 shows the Equivalent Availability Factor (EAF) is three percentage points higher and
the Equivalent Forced Outage Rate - Demand (EFORd) is more than a half of a percentage point lower in the
summer period than in winter period This means the units were more reliable with less forced events
during high-demand times during the summer than during the winter seasons The generating unitrsquos
capability has a resulting higher Net Capacity Factor (NCF) of 45 percentage points in the summer season
for 2008-2010
During the spring season (March-May) 77 percent of the units took a planned outage (PO) for an average
231 hours (or 96 days) In fall (October-November) only 42 percent of the units experienced a PO and the
average duration was shorter ndash 134 hours (or 56 days) A few units took both spring and fall planned
outages although this is rare Based on this assessment the generating units are prepared for the summer
peak demand The resulting availability indicates that this maintenance was successful which is measured
by an increased EAF and lower EFORd
Figure 32 Summer-Winter Average EAF NCF and EFORd (2008-2010)
Conclusions and Recommendations During 2008-2010 the average Equivalent Availability Factor (EAF) which measures the overall availability
of generating units decreased At the same time the Net Capacity Factor (NCF) an indicator of energy
production increased The average number of forced outages in 2010 is greater than in 2008 while at the
same time the average planned outage times have decreased As a result the Equivalent Forced Outage
Rate ndash Demand (EFORd) also increased illustrating that more units have experienced forced events during
39 A study of peak periods was conducted by the NERC Generating Availability Trend Evaluation (GATE) Working Group several years ago see httpwwwnerccomfilesSeasonal-Performance-Trendspdf
9116
5343
396
8818
4896
441
0 10 20 30 40 50 60 70 80 90 100
EAF
NCF
EFORd
Percent ()
Winter
Summer
Generation Equipment Performance
61
peak-demand times in 2010 than in the previous two years Potentially with shorter planned outage
periods in 2010 there may be less time to repair equipment and prevent forced unit outages
There are warnings that units are not being maintained as well as they should be In the last three years
there has been an increase in Equivalent Forced Outage Rate ndash Demand (EFORd) This indicator measures
the rate of forced outage events on generating units during periods of load demand To confirm this
problem forced outage hours jumped from 270 to 314 hours per unit between 2009 and 2010 At the same
time maintenance events also increased by 12 hours per unit Planned outage events remain constant The
resulting conclusions from this trend are
bull More or longer planned outage time is needed to repair the generating fleet Whether age is the
cause of the increase need for planned outage time remains unknown and further investigation into
the cause for longer planned outage time is necessary
bull More focus on preventive repairs during planned and maintenance events are needed
There are many multiple unit forced outages due to lack of fuel The majority of multiple unit trips have
three main causes transmission lack of fuel and storms With special interest in the forced outages due to
ldquoLack of Fuelrdquo additional analysis revealed that 77 percent of the units experiencing unexpected fuel
stoppage are oil-fired fossil units while gas-fired units experienced 15 percent
Generating units continue to be more reliable during the peak summer periods
Disturbance Event Trends
62
Category 1 An event resulting in one or more of the following a Unintended loss of three or more BPS elements caused by
common mode failure b Failure or misoperation of an SPSRAS c System-wide voltage reduction of 3 or more d Unintended BPS system separation resulting in an island of
100 MW to 999 MW e Unplanned evacuation from a control center facility with BPS
SCADA functionality for 30 minutes or more Category 2 An event resulting in one or more of the following
a Complete loss of all BPS control center voice communication system(s) for 30 minutes or more
b Complete loss of SCADA control or monitoring functionality for 30 minutes or more
c Voltage excursions equal to or greater than 10 lasting more than five minutes
d Loss of off-site power (LOOP) to a nuclear generating station e Unintended system separation resulting in an island of 1000
MW to 4999 MW f Unintended loss of 300MW or more of firm load for more
than 15 minutes g Violation of an Interconnection Reliability Operating Limit
(IROL) for more than 30 minutes Category 3 An event resulting in one or more of the following
a The loss of load or generation of 2000 MW or more in the Eastern Interconnection or
b Western Interconnection or 1000 MW or more in the ERCOT or Queacutebec Interconnections
c Unintended system separation resulting in an island of 5000 MW to 10000 MW
d Unintended system separation resulting in an island of Florida from the Eastern Interconnection
Category 4 An event resulting in one or more of the following a The loss of load or generation from 5001 MW to 9999 MW b Unintended system separation resulting in an island of more
than 10000 MW (with the exception of Florida as described in Category 3c)
Category 5 An event resulting in one or more of the following a The loss of load of 10000 MW or more b The loss of generation of 10000 MW or more
Figure 33 BPS Event Category
Disturbance Event Trends Introduction The purpose of this section is to report event
analysis trends from the beginning of event
analysis field test40
One of the companion goals of the event
analysis program is the identification of trends
in the number magnitude and frequency of
events and their associated causes such as
human error equipment failure protection
system misoperations etc The information
provided in the event analysis database (EADB)
and various event analysis reports have been
used to track and identify trends in BPS events
in conjunction with other databases (TADS
GADS metric and benchmarking database)
to the end of 2010
The Event Analysis Working Group (EAWG)
continuously gathers event data and is moving
toward an integrated approach to analyzing
data assessing trends and communicating the
results to the industry
Performance Trends The event category is classified41
Figure 33
as shown in
with Category 5 being the most
severe Figure 34 depicts disturbance trends in
Category 1 to 5 system events from the
40 httpwwwnerccomdocseawgGalloway-Industry-EA-Field-Test-102210pdf 41httpwwwnerccomfiles2011-05-0220Event_Analysis_Process_Phase20220Field20Test20Draft20-20Final20-20For20postingpdf
Disturbance Event Trends
63
beginning of event analysis field test to the end of 201042
Figure 34 Event Category vs Date for All 2010 Categorized Events
From the figure in November and December
there were many more category 1 and 2 events than in October This is due to the field trial starting on
October 25 2010
In addition to the category of the events the status of the events plays a critical role in the accuracy of the
data By examining Figure 35 over 80 of the events reported in 2010 have been closed This means that
the category root cause and other important information have been sufficiently finalized in order for
analysis to be accurate for each event At this time there is not enough data to draw any long-term
conclusions about event investigation performance
42 Documents for the EA Field Test are located at httpwwwnerccompagephpcid=5|365
2
12 12
26
3
6 5
14
1 1
2
0
5
10
15
20
25
30
35
40
45
October November December 2010
Even
t Cou
nt
Category 3 Category 2 Category 1
Disturbance Event Trends
64
Figure 35 Event Count vs Status (All 2010 Events with Status)
By drilling down into the cause code for each closed 2010 event Figure 36 shows the top 3 event causes
From the figure equipment failure and protection system misoperation are the most significant causes for
events Because of how new and limited the data is however there may not be statistical significance for
this result Further trending of cause codes for closed events and developing a richer dataset to find any
trends between event cause codes and event counts should be performed
Figure 36 Top 3 Event Counts vs DAWG Cause Code for all Closed 2010 Events
10
32
42
0
5
10
15
20
25
30
35
40
45
Open Closed Open and Closed
Even
t Cou
nt
Status
1211
8
0
2
4
6
8
10
12
14
Equipment Failure Protection System Misoperation Human Error
Even
t Cou
nt
Cause Code
Disturbance Event Trends
65
Conclusions Due to the relatively new process for events analysis and categorization more time will be required before a
conclusive recommendation may be obtained Further analysis and new data should provide valuable
statistics in the future Over 80 of all event reports from 2010 are current listed as closed but no
conclusion about investigation performance may be obtained because of the limited amount of data It is
recommended to study ways to prevent equipment failure and protection system misoperations but there
is not enough data to draw a firm conclusion about the top causes of events at this time
Abbreviations Used in This Report
66
Abbreviations Used in This Report
Acronym Definition ALP Acadiana Load Pocket
ALR Adequate Level of Reliability
ARR Automatic Reliability Report
BA Balancing Authority
BPS Bulk Power System
CDI Condition Driven Index
CEII Critical Energy Infrastructure Information
CIPC Critical Infrastructure Protection Committee
CLECO Cleco Power LLC
DADS Future Demand Availability Data System
DCS Disturbance Control Standard
DOE Department Of Energy
DSM Demand Side Management
EA Event Analysis
EAF Equivalent Availability Factor
ECAR East Central Area Reliability
EDI Event Drive Index
EEA Energy Emergency Alert
EFORd Equivalent Forced Outage Rate Demand
EMS Energy Management System
ERCOT Electric Reliability Council of Texas
ERO Electric Reliability Organization
ESAI Energy Security Analysis Inc
FERC Federal Energy Regulatory Commission
FOH Forced Outage Hours
FRCC Florida Reliability Coordinating Council
GADS Generation Availability Data System
GOP Generation Operator
IEEE Institute of Electrical and Electronics Engineers
IESO Independent Electricity System Operator
IROL Interconnection Reliability Operating Limit
Abbreviations Used in This Report
67
Acronym Definition IRI Integrated Reliability Index
LOLE Loss of Load Expectation
LUS Lafayette Utilities System
MAIN Mid-America Interconnected Network Inc
MAPP Mid-continent Area Power Pool
MOH Maintenance Outage Hours
MRO Midwest Reliability Organization
MSSC Most Severe Single Contingency
NCF Net Capacity Factor
NEAT NERC Event Analysis Tool
NERC North American Electric Reliability Corporation
NPCC Northeast Power Coordinating Council
OC Operating Committee
OL Operating Limit
OP Operating Procedures
ORS Operating Reliability Subcommittee
PC Planning Committee
PO Planned Outage
POH Planned Outage Hours
RAPA Reliability Assessment Performance Analysis
RAS Remedial Action Schemes
RC Reliability Coordinator
RCIS Reliability Coordination Information System
RCWG Reliability Coordinator Working Group
RE Regional Entities
RFC Reliability First Corporation
RMWG Reliability Metrics Working Group
RSG Reserve Sharing Group
SAIDI System Average Interruption Duration Index
SAIFI System Average Interruption Frequency Index
SCADA Supervisory Control and Data Acquisition
SDI Standardstatute Driven Index
SERC SERC Reliability Corporation
Abbreviations Used in This Report
68
Acronym Definition SRI Severity Risk Index
SMART Specific Measurable Attainable Relevant and Tangible
SOL System Operating Limit
SPS Special Protection Schemes
SPCS System Protection and Control Subcommittee
SPP Southwest Power Pool
SRI System Risk Index
TADS Transmission Availability Data System
TADSWG Transmission Availability Data System Working Group
TO Transmission Owner
TOP Transmission Operator
WECC Western Electricity Coordinating Council
Contributions
69
Contributions This report was made feasible by the collaboration and hard work of both NERC staff and NERCrsquos
Industry Groups
NERC Industry Groups
Table 14 lists the NERC industry group contributors Without their contribution and collaboration this
report would not have been possible
Table 13 NERC Industry Group Contributions43
NERC Group
Relationship Contribution
Reliability Metrics Working Group
(RMWG)
Reports to the OCPC bull Lead Development of Report bull Provide Reliability Metrics Data bull Responsible for Reliability Metrics
Performance Chapter
Transmission Availability Working Group
(TADSWG)
Reports to the OCPC bull Provide Transmission Availability Data
bull Responsible for Transmission Equip-ment Performance Chapter
bull Content Review
Generation Availability Data System Task
Force
(GADSTF)
Reports to the OCPC bull Provide Generation Availability Data bull Responsible for Generation Equip-
ment Performance Chapter bull Content Review
Event Analysis Working Group
(EAWG)
Reports to the OCPC bull Provide Events Data bull Responsible for Disturbance Events
Trends Chapter bull Content Review
43 Rosters for RMWG TADSWG GADSTF and EAWG are available at httpwwwnerccomfilesrosterpdf
Contributions
70
NERC Staff Table 13 below lists the NERC staff who contributed to the 2011 Reliability Performance Analysis
Report
Table 14 Contributing NERC Staff
Name Title E-mail Address
Mark Lauby Vice President and Director of
Reliability Assessment and
Performance Analysis
marklaubynercnet
Jessica Bian Manager of Performance Analysis jessicabiannercnet
John Moura Manager of Reliability Assessments johnmouranercnet
Andrew Slone Engineer Reliability Performance
Analysis
andrewslonenercnet
Jim Robinson TADS Project Manager jimrobinsonnercnet
Clyde Melton Engineer Reliability Performance
Analysis
clydemeltonnercnet
Mike Curley Manager of GADS Services mikecurleynercnet
James Powell Engineer Reliability Performance
Analysis
jamespowellnercnet
Michelle Marx Administrative Assistant michellemarxnercnet
William Mo Intern Performance Analysis wmonercnet
- NERCrsquos Mission
- Table of Contents
- Executive Summary
-
- 2011 Transition Report
- State of Reliability Report
- Key Findings and Recommendations
-
- Reliability Metric Performance
- Transmission Availability Performance
- Generating Availability Performance
- Disturbance Events
- Report Organization
-
- Introduction
-
- Metric Report Evolution
- Roadmap for the Future
-
- Reliability Metrics Performance
-
- Introduction
- 2010 Performance Metrics Results and Trends
-
- ALR1-3 Planning Reserve Margin
-
- Background
- Assessment
- Special Considerations
-
- ALR1-4 BPS Transmission Related Events Resulting in Loss of Load
-
- Background
- Assessment
-
- ALR1-12 Interconnection Frequency Response
-
- Background
- Assessment
-
- ALR2-3 Activation of Under Frequency Load Shedding
-
- Background
- Assessment
- Special Considerations
-
- ALR2-4 Average Percent Non-Recovery Disturbance Control Standards (DCS)
-
- Background
- Assessment
- Special Consideration
-
- ALR2-5 Disturbance Control Events Greater Than Most Severe Single Contingency
-
- Background
- Assessment
- Special Consideration
-
- ALR 1-5 System Voltage Performance
-
- Background
- Special Considerations
- Status
-
- ALR3-5 Interconnection Reliability Operating Limit System Operating Limit (IROLSOL) Exceedances
-
- Background
-
- ALR4-1 Automatic Transmission Outages Caused by Protection System Misoperations
-
- Background
- Special Considerations
-
- ALR6-11 ndash ALR6-14
-
- Background
- Assessment
- ALR 6-11 ndash Automatic Outages Initiated by Failed Protection System Equipment
- ALR6-12 ndash Automatic Outages Initiated by Human Error
- ALR6-13 ndash Automatic Outages Initiated by Failed AC Substation Equipment
- ALR6-14 Automatic AC Transmission Outages Initiated by Failed AC Circuit Equipment
-
- ALR6-15 Element Availability Percentage (APC)
-
- Background
- Assessment
- Special Consideration
-
- ALR6-16 Transmission System Unavailability
-
- Background
- Assessment
- Special Consideration
-
- ALR6-2 Energy Emergency Alert 3 (EEA3)
-
- Background
- Assessment
- Special Considerations
-
- ALR 6-3 Energy Emergency Alert 2 (EEA2)
-
- Background
- Assessment
- Special Considerations
-
- ALR 6-1 Transmission Constraint Mitigation
-
- Background
- Assessment
- Special Considerations
-
- Integrated Bulk Power System Risk Assessment
-
- Introduction
- Recommendations
-
- Integrated Reliability Index Concepts
-
- The Three Components of the IRI
-
- Event-Driven Indicators (EDI)
- Condition-Driven Indicators (CDI)
- StandardsStatute-Driven Indicators (SDI)
-
- IRI Index Calculation
- IRI Recommendations
-
- Reliability Metrics Conclusions and Recommendations
-
- Transmission Equipment Performance
-
- Introduction
- Performance Trends
-
- AC Element Outage Summary and Leading Causes
- Transmission Monthly Outages
- Outage Initiation Location
- Transmission Outage Events
- Transmission Outage Mode
-
- Conclusions
-
- Generation Equipment Performance
-
- Introduction
- Generation Key Performance Indicators
-
- Multiple Unit Forced Outages and Causes
- 2008-2010 Review of Summer versus Winter Availability
-
- Conclusions and Recommendations
-
- Disturbance Event Trends
-
- Introduction
- Performance Trends
- Conclusions
-
- Abbreviations Used in This Report
- Contributions
-
- NERC Industry Groups
- NERC Staff
-

Introduction
9
ultimately be used as input to standards changes and project prioritization compliance process
improvement event analysis and critical infrastructure protection areas
Figure 4 Overview of the Transition to the 2012 State of Reliability Report
Reliability Metrics Performance
10
Reliability Metrics Performance Introduction Building upon last yearrsquos metric review the RMWG continues to assess the results of eighteen currently
approved performance metrics Due to data availability each of the performance metrics do not
address the same time periods (some metrics have just been established while others have data over
many years) though this will be an important improvement in the future Merit has been found in all
eighteen approved metrics At this time though the number of metrics is expected to will remain
constant however other metrics may supplant existing metrics In spite of the potentially changing mix
of approved metrics to goals is to ensure the historical and current assessments can still be performed
These metrics exist within an overall reliability framework and in total the performance metrics being
considered address the fundamental characteristics of an acceptable level of reliability (ALR) Each of
the elements being measured by the metrics should be considered in aggregate when making an
assessment of the reliability of the bulk power system with no single metric indicating exceptional or
poor performance of the power system
Due to regional differences (size of the region operating practices etc) comparing the performance of
one Region to another would be erroneous and inappropriate Furthermore depending on the region
being evaluated one metric may be more relevant to a specific regionrsquos performance than others and
assessment may not be strictly mathematical rather more subjective Finally choosing one regionrsquos
best metric performance to define targets for other regions is inappropriate
Another key principle followed in developing these metrics is to retain anonymity of any reporting
organization Thus granularity will be attempted up to the point that such actions might compromise
anonymity of any given company Certain reporting entities may appear inconsistent but they have
been preserved to maintain maximum granularity with individual anonymity
Although assessments have been made in a number of the performance categories others do not have
sufficient data to derive any conclusions from the metric results The RMWG recommends continued
assessment of these metrics until sufficient data is available Each of the eighteen performance metrics
are presented in summary with their SMART8 Table 1 ratings in The table provides a summary view of
the metrics with an assessment of the current metric trends observed by the RMWG Table 1 also
shows the order in which the metrics are aligned according to the standards objectives
8 SMART rating definitions are located at httpwwwnerccomdocspcrmwgSMART_20RATING_826pdf
Reliability Metrics Performance
11
Table 1 Metric SMART Ratings Relative to Standard Objectives
Metrics SMART Objectives Relative to Standards Prioritization
ALR Improvements
Trend
Rating
SMART
Rating
1-3 Planning Reserve Margin 13
1-4 BPS Transmission Related Events Resulting in Loss of Load 15
2-5 Disturbance Control Events Greater than Most Severe Single Contingency 12
6-2 Energy Emergency Alert 3 (EEA3) 15
6-3 Energy Emergency Alert 2 (EEA2) 15
Inconclusive
2-3 Activation of Under Frequency Load Shedding 10
2-4 Average Percent Non-Recovery DCS 15
4-1 Automatic Transmission Outages Caused by Protection System Misoperation 15
6-11 Automatic Transmission Outages Caused by Protection System Misoperation 14
6-12 Automatic Transmission Outages Caused by Human Error 14
6-13 Automatic Transmission Outages Caused by Failed AC Substation Equipment 14
6-14 Automatic Transmission Outages Caused by Failed AC Circuit Equipment 14
New Data
1-5 Systems Voltage Performance 14
3-5
Interconnected Reliability Operating Limit System Operating Limit (IROLSOL)
Exceedance 14
6-1 Transmission constraint Mitigation 14
6-15 Element Availability Percentage (APC) 13
6-16
Transmission System Unavailability on Operational Planned and Auto
Sustained Outages 13
No Data
1-12 Frequency Response 11
Trend Rating Symbols
Significant Improvement
Slight Improvement
Inconclusive
Slight Deterioration
Significant Deterioration
New Data
No Data
Reliability Metrics Performance
12
2010 Performance Metrics Results and Trends
ALR1-3 Planning Reserve Margin
Background
The Planning Reserve Margin9 is a measure of the relationship between the amount of resource capacity
forecast and the expected demand in the planning horizon10 Coupled with probabilistic analysis
calculated Planning Reserve Margins is an industry standard which has been used by system planners for
decades as an indication of system resource adequacy Generally the projected demand is based on a
5050 forecast11
Assessment
Planning Reserve Margin is the difference between forecast capacity and projected
peak demand normalized by projected peak demand and shown as a percentage Based on experience
for portions of the bulk power system that are not energy-constrained Planning Reserve Margin
indicates the amount of capacity available to maintain reliable operation while meeting unforeseen
increases in demand (eg extreme weather) and unexpected unavailability of existing capacity (eg
long-term generation outages) Further from a planning perspective Planning Reserve Margin trends
identify whether capacity additions are projected to keep pace with demand growth
Planning Reserve Margins considering anticipated capacity resources and adjusted potential capacity
resources decrease in the latter years of the 2009 and 2010 10-year forecast in each of the four
interconnections Typically the early years provide more certainty since new generation is either in
service or under construction with firm commitments In the later years there is less certainty about
the resources that will be needed to meet peak demand Declining Planning Reserve Margins are
inherent in a conventional forecast (assuming load growth) and do not necessarily indicate a trend of a
degrading resource adequacy Rather they are an indication of the potential need for additional
resources In addition key observations can be made to the Planning Reserve Margin forecast such as
short-term assessment rate of change through the assessment period identification of margins that are
approaching or below a target requirement and comparisons from year-to-year forecasts
While resource planners are able to forecast the need for resources the type of resource that will
actually be built or acquired to fill the need is usually unknown For example in the northeast US
markets with three to five year forward capacity markets no firm commitments can be made in the
9 Detailed calculations of Planning Reserve Margin are available at httpwwwnerccompagephpcid=4|331|333 10The Planning Reserve Margin indicated here is not the same as an operating reserve margin that system operators use for near-term
operations decisions 11These demand forecasts are based on ldquo5050rdquo or median weather (a 50 percent chance of the weather being warmer and a 50 percent
chance of the weather being cooler)
Reliability Metrics Performance
13
long-term However resource planners do recognize the need for resources in their long-term planning
and account for these resources through generator queues These queues are then adjusted to reflect
an adjusted forecast of resourcesmdashpro-rated by approximately 20 percent
When comparing the assessment of planning reserve margins between 2009 and 2010 the
interconnection Planning Reserve Margins are slightly higher on an annual basis in the 2010 forecast
compared to those of 2009 as shown in Figure 5
Figure 5 Planning Reserve Margin by Interconnection and Year
In general this is due to slightly higher capacity forecasts and slightly lower demand forecasts The pace
of any economic recovery will affect future comparisons This metric can be used by NERC to assess the
individual interconnections in the ten-year long-term reliability assessments If a noticeable change
Reliability Metrics Performance
14
occurs within the trend further investigation is necessary to determine the causes and likely effects on
reliability
Special Considerations
The Planning Reserve Margin is a capacity based metric Therefore it does not provide an accurate
assessment of performance in energy-limited systems (eg hydro capacity with limited water resources
or systems with significant variable generation penetration) In addition the Planning Reserve Margin
does not reflect potential transmission constraint internal to the respective interconnection Planning
Reserve Margin data shown in Figure 6 is used for NERCrsquos seasonal and long-term reliability
assessments and is the primary metric for determining the resource adequacy of a given assessment
area
The North American Bulk Power System is divided into four distinct interconnections These
interconnections are loosely connected with limited ability to share capacity or energy across the
interconnection To reflect this limitation the Planning Reserve Margins are calculated in this report
based on interconnection values rather than by national boundaries as is the practice of the Reliability
Assessment Subcommittee (RAS)
ALR1-4 BPS Transmission Related Events Resulting in Loss of Load
Background
This metric measures bulk power system transmission-related events resulting in the loss of load
Planners and operators can use this metric to validate their design and operating criteria by identifying
the number of instances when loss of load occurs
For the purposes of this metric an ldquoeventrdquo is an unplanned transmission disturbance that produces an
abnormal system condition due to equipment failures or system operational actions and results in the
loss of firm system demand for more than 15 minutes The reporting criteria for such events are
outlined below12
bull Entities with a previous year recorded peak demand of more than 3000 MW are required to
report all such losses of firm demands totaling more than 300 MW
bull All other entities are required to report all such losses of firm demands totaling more than 200
MW or 50 percent of the total customers being supplied immediately prior to the incident
whichever is less
bull Firm load shedding of 100 MW or more used to maintain the continuity of the bulk power
system reliability
12 Details of event definitions are available at httpwwwnerccomfilesEOP-004-1pdf
Reliability Metrics Performance
15
Assessment
Figure 6 illustrates that the number of bulk power system transmission-related events resulting in loss of
firm load13
Table 2
from 2002 to 2009 is relatively constant and suggests that 7 - 10 events per year is a norm for
the bulk power system However the magnitude of load loss shown in associated with these
events reflects a downward trend since 2007 Since the data includes weather-related events it will
provide the RMWG with an opportunity for further analysis and continued assessment of the trends
over time is recommended
Figure 6 BPS Transmission Related Events Resulting in Loss of Load Counts (2002-2009)
Table 2 BPS Transmission Related Events Resulting in Loss of Load MW Loss (2002-2009)
Year Load Loss (MW)
2002 3762
2003 65263
2004 2578
2005 6720
2006 4871
2007 11282
2008 5200
2009 2965
13The metric source data may require adjustments to accommodate all of the different groups for measurement and consistency as OE-417 is only used in the US
02468
101214
2002 2003 2004 2005 2006 2007 2008 2009
Count
Reliability Metrics Performance
16
ALR1-12 Interconnection Frequency Response
Background
This metric is used to track and monitor Interconnection Frequency Response Frequency Response is a
measure of an Interconnectionrsquos ability to stabilize frequency immediately following the sudden loss of
generation or load It is a critical component to the reliable operation of the bulk power system
particularly during disturbances and restoration The metric measures the average frequency responses
for all events where frequency drops more than 35 mHz within a year
Assessment
At this time there has been no data collected for ALR1-12 Therefore no assessment was made
ALR2-3 Activation of Under Frequency Load Shedding
Background
The purpose of Under Frequency Load Shedding (UFLS) is to balance generation and load in an island
following an extreme event The UFLS activation metric measures the number of times UFLS is activated
and the total MW of load interrupted in each Region and NERC wide
Assessment
Figure 7 and Table 3 illustrate a history of Under Frequency Load Shedding events from 2006 through
2010 Through this period itrsquos important to note that single events had a range load shedding from 15
MW to 7654 MW The activation of UFLS relays is the last automated reliability measure associated
with a decline in frequency in order to rebalance the system Further assessment of the MW loss for
these activations is recommended
Figure 7 ALR2-3 Count of Activations by Year and Regional Entity (2001-2010)
Reliability Metrics Performance
17
Table 3 ALR2-3 Under Frequency Load Shedding MW Loss
ALR2-3 Under Frequency Load Shedding MW Loss
2006 2007 2008 2009 2010
FRCC
2273
MRO
486
NPCC 94
63 20 25
RFC
SPP
672 15
SERC
ERCOT
WECC
Special Considerations
The use of a single metric cannot capture all of the relevant information associated with UFLS events as
the events relate to each respective UFLS plan The ability to measure the reliability of the bulk power
system is directly associated with how it performs compared to what is planned
ALR2-4 Average Percent Non-Recovery Disturbance Control Standards (DCS)
Background
This metric measures the Balancing Authorityrsquos (BA) or Reserve Sharing Grouprsquos (RSG) ability to balance
resources and demand with the timely deployment of contingency reserve thereby returning the
interconnection frequency to within defined limits following a Reportable Disturbance14
Assessment
The relative
percentage provides an indication of performance measured at a BA or RSG
Figure 8 illustrates the average percent non-recovery of DCS events from 2006 to 2010 The graph
provides a high-level indication of the performance of each respective RE However a single event may
not reflect all the reliability issues within a given RE In order to understand the reliability aspects it
may be necessary to request individual REs to further investigate and provide a more comprehensive
reliability report Further investigation may indicate the entity had sufficient contingency reserve but
through their implementation process failed to meet DCS recovery
14 Details of the Disturbance Control Performance Standard and Reportable Disturbance definitions are available at
httpwwwnerccomfilesBAL-002-0pdf
Reliability Metrics Performance
18
Continued trend assessment is recommended Where trends indicated potential issues the regional
entity will be requested to investigate and report their findings
Figure 8 Average Percent Non-Recovery of DCS Events (2006-2010)
Special Consideration
This metric aggregates the number of events based on reporting from individual Balancing Authorities or
Reserve Sharing Groups It does not capture the severity of the DCS events It should be noted that
most REs use 80 percent of the Most Severe Single Contingency to establish the minimum threshold for
reportable disturbance while others use 35 percent15
ALR2-5 Disturbance Control Events Greater Than Most Severe Single Contingency
Background
This metric represents the number of disturbance events that exceed the Most Severe Single
Contingency (MSSC) and is specific to each BA Each RE reports disturbances greater than the MSSC on
behalf of the BA or Reserve Sharing Group (RSG) The result helps validate current contingency reserve
requirements The MSSC is determined based on the specific configuration of each BA or RSG and can
vary in significance and impact on the BPS
15httpwwwweccbizStandardsDevelopmentListsRequest20FormDispFormaspxID=69ampSource=StandardsDevelopmentPagesWEC
CStandardsArchiveaspx
375
079
0
54
008
005
0
15 0
77
025
0
33
000510152025303540
2006
2007
2008
2009
2010
2006
2007
2008
2009
2010
2006
2007
2008
2009
2010
2006
2007
2008
2009
2010
2006
2007
2008
2009
2010
2006
2007
2008
2009
2010
2006
2007
2008
2009
2010
2006
2007
2008
2009
2010
FRCC MRO NPCC RFC SERC SPP ERCOT WECC
Region and Year
Reliability Metrics Performance
19
Assessment
Figure 9 represents the number of DCS events within each RE that are greater than the MSSC from 2006
to 2010 This metric and resulting trend can provide insight regarding the risk of events greater than
MSSC and the potential for loss of load
In 2010 SERC had 16 BAL-002 reporting entities eight Balancing Areas elected to maintain Contingency
Reserve levels independent of any reserve sharing group These 16 entities experienced 79 reportable
DCS eventsmdash32 (or 405 percent) of which were categorized as greater than their most severe single
contingency Every DCS event categorized as greater than the most severe single contingency occurred
within a Balancing Area maintaining independent Contingency Reserve levels Significantly all 79
regional entities reported compliance with the Disturbance Recovery Criterion including for those
Disturbances that were considered greater than their most severe single Contingency This supports a
conclusion that regardless of the size of the BA or participation in a Reserve Sharing Group SERCrsquos BAL-
002 reporting entities have demonstrated the ability in 2010 to use Contingency Reserve to balance
resources and demand and return Interconnection frequency within defined limits following Reportable
Disturbances
If the SERC Balancing Areas without large generating units and who do not participate in a Reserve
Sharing Group change the determination of their most severe single contingencies to effect an increase
in the DCS reporting threshold (and concurrently the threshold for determining those disturbances
which are greater than the most severe single contingency) there will certainly be a reduction in both
the gross count of DCS events in SERC and in the subset considered under ALR2-5 Masking the discrete
events which cause Balancing Area response may not reduce ldquoriskrdquo to the system However it is
desirable to maintain a reporting threshold which encourages the Balancing Authority to respond to any
unexplained change in ACE in a manner which supports Interconnection frequency based on
demonstrated performance SERC will continue to monitor DCS performance and will continue to
evaluate contingency reserve requirements but does not consider 2010 ALR2-5 performance to be an
adverse trend in ldquoextreme or unusualrdquo contingencies but rather within the normal range of expected
occurrences
Reliability Metrics Performance
20
Special Consideration
The metric reports the number of DCS events greater than MSSC without regards to the size of a BA or
RSG and without respect to the number of reporting entities within a given RE Because of the potential
for differences in the magnitude of MSSC and the resultant frequency of events trending should be
within each RE to provide any potential reliability indicators Each RE should investigate to determine
the cause and relative effect on reliability of the events within their footprints Small BA or RSG may
have a relatively small value of MSSC As such a high number of DCS greater than MCCS may not
indicate a reliability problem for the reporting RE but may indicate an issue for the respective BA or RSG
In addition events greater than MSSC may not cause a reliability issue for some BA RSG or RE if they
have more stringent standards which require contingency reserves greater than MSSC
ALR 1-5 System Voltage Performance
Background
The purpose of this metric is to measure the transmission system voltage performance (either absolute
or per unit of a nominal value) over time This should provide an indication of the reactive capability
available to the transmission system The metric is intended to record the amount of time that system
voltage is outside a predetermined band around nominal
0
5
10
15
20
25
30
2006
2007
2008
2009
2010
2006
2007
2008
2009
2010
2006
2007
2008
2009
2010
2006
2007
2008
2009
2010
2006
2007
2008
2009
2010
2006
2007
2008
2009
2010
2006
2007
2008
2009
2010
2006
2007
2008
2009
2010
FRCC MRO NPCC RFC SERC SPP ERCOT WECC
Cou
nt
Region and Year
Figure 9 Disturbance Control Events Greater Than Most Severe Single Contingency (2006-2010)
Reliability Metrics Performance
21
Special Considerations
Each Reliability Coordinator (RC) will work with the Transmission Owners (TOs) and Transmission
Operators (TOPs) within its footprint to identify specific buses and voltage ranges to monitor for this
metric The number of buses the monitored voltage levels and the acceptable voltage ranges may vary
by reporting entity
Status
With a pilot program requested in early 2011 a voluntary request to Reliability Coordinators (RC) was
made to develop a list of key buses This work continues with all of the RCs and their respective
Transmission Owners (TOs) to gather the list of key buses and their voltage ranges After this step has
been completed the TO will be requested to provide relevant data on key buses only Based upon the
usefulness of the data collected in the pilot program additional data collection will be reviewed in the
future
ALR3-5 Interconnection Reliability Operating Limit System Operating Limit (IROLSOL) Exceedances
Background
This metric illustrates the number of times that defined Interconnection Reliability Operating Limit
(IROL) or System Operating Limit (SOL) were exceeded and the duration of these events Exceeding
IROLSOLs could lead to outages if prompt operator control actions are not taken in a timely manner to
return the system to within normal operating limits This metric was approved by NERCrsquos Operating and
Planning Committees in June 2010 and a data request was subsequently issued in August 2010 to collect
the data for this metric Based on the results of the pilot conducted in the third and fourth quarter of
2010 there is merit in continuing measurement of this metric Note the reporting of IROLSOL
exceedances became mandatory in 2011 and data collected in Table 4 for 2010 has been provided
voluntarily
Reliability Metrics Performance
22
Table 4 ALR3-5 IROLSOL Exceedances
3Q2010 4Q2010 1Q2011
le 10 mins 123 226 124
le 20 mins 10 36 12
le 30 mins 3 7 3
gt 30 mins 0 1 0
Number of Reporting RCs 9 10 15
ALR4-1 Automatic Transmission Outages Caused by Protection System Misoperations
Background
Originally titled Correct Protection System Operations this metric has undergone a number of changes
since its initial development To ensure that it best portrays how misoperations affect transmission
outages it was necessary to establish a common understanding of misoperations and the data needed
to support the metric NERCrsquos Reliability Assessment Performance Analysis (RAPA) group evaluated
several options of transitioning from existing procedures for the collection of misoperations data and
recommended a consistent approach which was introduced at the beginning of 2011 With the NERC
System Protection and Control Subcommitteersquos (SPCS) technical guidance NERC and the regional
entities have agreed upon a set of specifications for misoperations reporting including format
categories event type codes and reporting period to have a final consistent reporting template16
Special Considerations
Only
automatic transmission outages 200 kV and above including AC circuits and transformers will be used
in the calculation of this metric
Data collection will not begin until the second quarter of 2011 for data beginning with January 2011 As
revised this metric cannot be calculated for this report at the current time The revised title and metric
form can be viewed at the NERC website17
16 The current Protection System Misoperation template is available at
httpwwwnerccomfilezrmwghtml 17The current metric ALR4-1 form is available at httpwwwnerccomdocspcrmwgALR_4-1Percentpdf
Reliability Metrics Performance
23
ALR6-11 ndash ALR6-14
ALR6-11 Automatic AC Transmission Outages Initiated by Failed Protection System Equipment
ALR6-12 Automatic AC Transmission Outages Initiated by Human Error
ALR6-13 Automatic AC Transmission Outages Initiated by Failed AC Substation Equipment
ALR6-14 Automatic AC Circuit Outages Initiated by Failed AC Circuit Equipment
Background
These metrics evolved from the original ALR4-1 metric for correct protection system operations and
now illustrate a normalized count (on a per circuit basis) of AC transmission element outages (ie TADS
momentary and sustained automatic outages) that were initiated by Failed Protection System
Equipment (ALR6-11) Human Error (ALR6-12) Failed AC Substation Equipment (ALR6-13) and Failed AC
Circuit Equipment (ALR6-14) These metrics are all related to the non-weather related initiating cause
codes for automatic outages of AC circuits and transformers operated 200 kV and above
Assessment
Figure 10 through Figure 13 show the normalized outages per circuit and outages per transformer for
facilities operated at 200 kV and above As shown in all eight of the charts there are some regional
trends in the three years worth of data However some Regionrsquos values have increased from one year
to the next stayed the same or decreased with no discernable regional trends For example ALR6-11
computes the automatic AC Circuit outages initiated by failed protection system equipment
There are some trends to the ALR6-11 to ALR6-14 data but many regions do not have enough data for a
valid trend analysis to be performed NERCrsquos outage rate seems to be improving every year On a
regional basis metric ALR6-11 along with ALR6-12 through ALR6-14 cannot be statistically understood
until confidence intervals18
18The detailed Confidence Interval computation is available at
are calculated ALR metric outage frequency rates and Regional equipment
inventories that are smaller than others are likely to require more than 36 months of outage data Some
numerically larger frequency rates and larger regional equipment inventories (such as NERC) do not
require more than 36 months of data to obtain a reasonably narrow confidence interval
httpwwwnerccomdocspctadstfTADS_Nov_2_2007APPENDIX_C_Confidence_Intervalpdf
Reliability Metrics Performance
24
While more data is still needed on a regional basis to determine if each regionrsquos bulk power system is
becoming more reliable year to year there are areas of potential improvement which include power
system condition protection performance and human factors These potential improvements are
presented due to the relatively large number of outages caused by these items The industry can
benefit from detailed analysis by identifying lessons learned and rolling average trends of NERC-wide
performance With a confidence interval of relatively narrow bandwidth one can determine whether
changes in statistical data are primarily due to random sampling error or if the statistics are significantly
different due to performance
Reliability Metrics Performance
25
ALR 6-11 ndash Automatic Outages Initiated by Failed Protection System Equipment
Automatic outages with an initiating cause code of failed protection system equipment are in Figure 10
Figure 10 ALR6-11 by Region (Includes NERC-Wide)
This code covers automatic outages caused by the failure of protection system equipment This
includes any relay andor control misoperations except those that are caused by incorrect relay or
control settings that do not coordinate with other protective devices
ALR6-12 ndash Automatic Outages Initiated by Human Error
Figure 11 shows the automatic outages with an initiating cause code of human error This code covers
automatic outages caused by any incorrect action traceable to employees andor contractors for
companies operating maintaining andor providing assistance to the Transmission Owner will be
identified and reported in this category
Reliability Metrics Performance
26
Also any human failure or interpretation of standard industry practices and guidelines that cause an
outage will be reported in this category
Figure 11 ALR6-12 by Region (Includes NERC-Wide)
Reliability Metrics Performance
27
ALR6-13 ndash Automatic Outages Initiated by Failed AC Substation Equipment
Figure 12 shows the automatic outages with an initiating cause code of failed AC substation equipment
This code covers automatic outages caused by the failure of AC Substation ie equipment ldquoinside the
substation fencerdquo including transformers and circuit breakers but excluding protection system
equipment19
19TADS Initiating Cause Code definitions are located at httpwwwnerccomdocspctadswgTADS_Definitions_Appendix_7_092909pdf
Figure 12 ALR6-13 by Region (Includes NERC-Wide)
Reliability Metrics Performance
28
ALR6-14 Automatic AC Transmission Outages Initiated by Failed AC Circuit Equipment
Figure 13 shows the automatic outages with an initiating cause code of failed AC circuit equipment
Automatic Outages related to the failure of AC Circuit equipment ie overhead or underground
equipment ldquooutside the substation fencerdquo 20
ALR6-15 Element Availability Percentage (APC)
Background
This metric uses data and calculations directly from the NERC TADS effort and illustrates the overall
percent of time the aggregate of transmission facilities are available and in service This is an aggregate
20TADS Initiating Cause Code definitions are located at httpwwwnerccomdocspctadswgTADS_Definitions_Appendix_7_092909pdf
Figure 13 ALR6-14 by Region (Includes NERC-Wide)
Reliability Metrics Performance
29
value using sustained outages (automatic and non-automatic) for both lines and transformers operated
at 200 kV and above for each Regional Entity Interconnection and for NERC This metric was approved
by the NERC Operating and Planning Committees in September 2010
Assessment
Figure 14 shows the aggregate element availability percentage (APC) for transmission and transformers
facilities operated at 200 kV and above The values are all over 90 percent which shows excellent
system availability The RMWG recommends continued metric assessment for at least a few more years
in order to determine the value of this metric
Figure 14 2010 ALR6-15 Element Availability Percentage
Notably the Eastern Interconnection does not include Quebec or ERCOT ERCOT does not have any
transformers with low-side voltage levels 200 kV and above
Special Consideration
It should be noted that the non-automatic outage data needed to calculate this metric was only first
collected for the calendar year 2010 as part of the TADS process Therefore only one year of data for
this metric is available at this time
Reliability Metrics Performance
30
ALR6-16 Transmission System Unavailability
Background
This metric uses data and calculations directly from the NERC TADS effort and shows the overall percent
of time the aggregate of transmission facilities are unavailable due to automatic and non-automatic
outages This is an aggregate value using sustained automatic outages for both lines and transformers
operated at 200 kV and above for each Regional Entity and for NERC This metric was approved by the
NERC Operating and Planning Committees in December 2010
Assessment
Figure 15 and Figure 16 illustrate the 2010 aggregate unavailability percentage for AC circuits and
transformer facilities operated at 200 kV and above The values for AC circuits are all under 3 percent
which shows excellent system availability
The RMWG recommends continued metric assessment for at least a few more years in order to
determine the value of this metric
Special Consideration
It should be noted that the non-automatic outage data needed to calculate this metric was only first
collected for the calendar year 2010 as part of the TADS process Therefore only one year of data for
this metric is available at this time
Figure 15 2010 ALR6-16 Transmission System Unavailability
Reliability Metrics Performance
31
Figure 16 2010 ALR6-16 Transmission System Unavailability by Outage Type
Notably the Eastern Interconnection does not include Quebec or ERCOT Also ERCOT does not have
any transformers with low-side voltage levels 200 kV and above
ALR6-2 Energy Emergency Alert 3 (EEA3)
Background
This metric identifies the number of times Energy Emergency Alerts Level 3 (EEA3) are issued EEA3
events are firm-load interruptions due to capacity and energy deficiency EEA3 is currently reported
collected and maintained in NERCrsquos Reliability Coordination Information System (RCIS) and is defined in
Attachment 1 of the NERC Standard EOP-00221
21 The latest version of Attachment 1 for EOP-002 is available at
This metric identifies the number of times EEA3s are
issued The number of EEA3s per year provides a relative indication of performance measured at a
Balancing Authority or interconnection level As historical data is gathered trends in future reports will
provide an indication of either decreasing or increasing use of EEA3s signaling adequacy of the electric
supply system This metric can also be considered in the context of Planning Reserve Margin Significant
increases or decreases in EEA3 events with relatively constant Planning Reserve Margins could indicate
httpwwwnerccompagephpcid=2|20
Reliability Metrics Performance
32
volatility in the actual loads compared to forecast levels or changes in the adequacy of the bulk power
system required to meet load demands
Assessment
Figure 17 shows the number of EEA3 events during 2006 and 2010 from an RE level An interactive
presentation was released and available at the Reliability Indicatorrsquos page22
The Acadiana Load Pocket (ALP) is an area in south central Louisiana that has experienced regular
transmission constraints and numerous Energy Emergency Alert filings by the SPP Reliability Controller
(SPP RC) Transmission within ALP is owned by Entergy Lafayette Utilities System (LUS) and Cleco
Power LLC (Cleco) The transmission constraints within the ALP are primarily caused by the local area
load and the lack of generation located in close proximity to the load area
The number of EEA3rsquos
declared in 2010 returned to more traditional numbers The 2009 spike in EEA3 events in the SPP
Region that was driven by issues in the Acadiana Load Pocket (ALP) were not present in 2010
Special Considerations
Ideally the measure should capture only EEAs that are declared for reliability reasons and not for
economic factors The RMWG has not been able to differentiate these reasons for future reporting and
it has made a recommendation to the Reliability Coordinator Working Group (RCWG) to consider a
revised EEA declaration to exclude economic factors
The reason the EEA volume decreased from 2009 to 2010 in SPP was because the SPP ICT RC23
coordinated an operating agreement between the five operating companies in the ALP The operating
agreement included a cost sharing re-dispatch that alleviated the need of a Transmission Loading Relief
(TLR-5) declaration24
22The EEA3 interactive presentation is available on the NERC website at
During 2009 there was no operating agreement therefore an entity had to
provide Network and Native Load (NNL) relief when a TLR-5 was called by the ICT RC When the TLR-5
was the primary tool to control the post contingent loading in the ALP some of the BAs would have their
firm transmission curtailed to the point where they could no longer serve their load therefore the EEA
3 was needed to communicate a capacityreserve deficiency
httpwwwnerccompagephpcid=4|331|335 23Southwest Power Pool (SPP) Independent Coordinator of Transmission (ICT) Reliability Coordinator (RC) 24More information on Transmission Load Relief is contained in the IRO-006 standard which is located at httpwwwnerccomfilesIRO-006-4pdf In particular TLR-5 definitions are referenced on page 16 and 17
Reliability Metrics Performance
33
Figure 17 ALR6-2 Energy Emergency Alert 3 (EEA3) Counts by Region (2006-2010)
Cleco Power Entergy and LUS are currently constructing an estimated $200 million transmission
infrastructure improvement project to mitigate transmission constraints into ALP Construction of the
project is scheduled to be complete in 2012 Completion of the project should help alleviate some of
the transmission congestion in this area Energy Emergency Alerts filed by the SPP Regional Entity
continue to decline
SPP RTO continues to coordinate operating plans with the operating entities in this area Mitigation
plans and local operating guides in place are expected to provide sufficient flexibility should issues arise
NERC will continue to monitor this area for Reliability Impacts and coordinate any actions with the SPP
Reliability Coordinator and SPP Regional Entity
ALR 6-3 Energy Emergency Alert 2 (EEA2)
Background
Energy Emergency Alert 2 (EEA2) is to measure the number of events BAs declare for deficient capacity
and energy during peak load periods which may serve as a leading indicator of energy and capacity
shortfall in the adequacy of the electric supply system EEA2 provides a sense of the frequency of
precursor events to the more severe EEA3 declarations This metric measures the number of events
1 3 1 2 214
3 4 4 1 5 334
4 2 1 52
1
0
5
10
15
20
25
30
3520
0620
0720
0820
0920
1020
0620
0720
0820
0920
1020
0620
0720
0820
0920
1020
0620
0720
0820
0920
1020
0620
0720
0820
0920
1020
0620
0720
0820
0920
1020
0620
0720
0820
0920
1020
0620
0720
0820
0920
10
FRCC MRO NPCC RFC SERC SPP TRE WECC
2006-2009
2010
Region and Year
Reliability Metrics Performance
34
Balancing Authorities declare for deficient capacity and energy during peak load periods At this time
however this data reflects inclusion of Demand Side Resources that would not be indicative of
inadequacy of the electric supply system
The number of EEA2 events and any trends in their reporting indicates how robust the system is in
being able to supply the aggregate load requirements The historical records may include demand
response activations and non-firm load interruptions per applicable contracts within the EEA alerts per
its definition25
Assessment
Demand response is a legitimate resource to be called upon by balancing authorities and
do not indicate a reliability concern As data is gathered in the future reports will provide an indication
of either decreasing or increasing adequacy in the electric supply system EEA2 events called solely for
activation of demand response (controllable or contractually prearranged demand-side dispatch
programs) or interruption of non-firm load per applicable contracts should be excluded This metric can
also be considered in the context of the Planning Reserve Margin Significant increases or decreases in
EEA2 events with relatively constant Planning Reserve Margins could indicate volatility in the actual
loads compared to forecast levels or changes in the adequacy of the bulk power system required to
meet load demands
Figure 18 shows the number of EEA2 events by Regional Entity from 2006 to 2010 EEA2 interactive
version available on line by quarter and region26
25 The EEA2 is defined at
The general trend continues to show improved
performance which may have been influenced by the overall reduction in demand throughout NERC
caused by the economic downturn Specific performance by any one region should be investigated
further for issues or events that may affect the results Determining whether performance reported
includes those events resulting from the economic operation of DSM and non-firm load interruption
should also be investigated The RMWG recommends continued metric assessment
httpwwwnerccomfilesEOP-002-2pdf 26 EEA2 interactive version located at httpwwwnerccompagephpcid=4|331|341
Reliability Metrics Performance
35
Special Considerations
The intent of this metric is to measure only EEAs that are called for reliability reasons and not for
economic factors such as demand side management (DSM) and non-firm load interruption The
historical data for this metric may include events that were called for economic factors According to
the RCWG recent data should only include EEAs called for reliability reasons
ALR 6-1 Transmission Constraint Mitigation
Background
The RMWG completed a pilot with four regional entities Based on the results the RMWG expanded the
pilot data collection to all regions and the initial results of the data collection are shown in Figure 19
and Table 5 Based on the results of the pilot there is merit in continuing to assess this metric The
intent of this metric is to identify trends in the number of mitigation measures (Special Protection
Schemes (SPS) Remedial Action Schemes (RAS) and Operating Procedures) required to meet reliability
requirements By their nature SPS do not indicate an inherent weakness in the bulk power system
rather they are an indication of methods that are taken to operate the system through the range of
conditions it must perform This metric is only intended to evaluate the trend use of these plans and
whether the metric indicates robustness of the transmission system is increasing remaining static or
decreasing
1 27
2 1 4 3 2 1 2 4 5 2 5 832
4724
211
5 38 5 1 1 8 7 4 1 1
05
101520253035404550
2006
2007
2008
2009
2010
2006
2007
2008
2009
2010
2006
2007
2008
2009
2010
2006
2007
2008
2009
2010
2006
2007
2008
2009
2010
2006
2007
2008
2009
2010
2006
2007
2008
2009
2010
2006
2007
2008
2009
2010
FRCC MRO NPCC RFC SERC SPP TRE WECC
2006-2009
2010
Region and Year
Figure 18 ALR6-3 Energy Emergency Alert 2 (EEA2)
Reliability Metrics Performance
36
Assessment
The pilot data indicates a relatively constant number of mitigation measures over the time period of
data collected
Figure 19 ALR6-1 Transmission Constraint Mitigation by SPSRAS (2009-2014)
0102030405060708090
100110120
2009
2010
2011
2014
2009
2010
2011
2014
2009
2010
2011
2014
2009
2010
2011
2014
2009
2010
2011
2014
2009
2010
2011
2014
2009
2010
2011
2014
2009
2010
2011
2014
FRCC MRO NPCC RFC SERC SPP ERCOT WECC
Coun
t
Region and Year
SPSRAS
Reliability Metrics Performance
37
Table 5 ALR6-1 Transmission Constraint Mitigation by Operating ProcedureGuides (2009-2011)
ALR6-1 Transmission Constraint Mitigation by Operating ProcedureGuides (2009-2014)
2009 2010 2011 2014
FRCC 107 75 66
MRO 79 79 81 81
NPCC 0 0 0
RFC 2 1 3 4
SPP 39 40 40 40
SERC 6 7 15
ERCOT 29 25 25
WECC 110 111
Special Considerations
A certain number of SPS mitigation plans may be necessary to support reliable operation of the system
If the number of SPS increase over time this may indicate that additional transmission capacity is
required A reduction in the number of SPS may be an indicator of increased generation or transmission
facilities being put into service which may indicate greater robustness of the bulk power system In
general mitigation plans are a viable and valuable tool for effective operation of the bulk power system
In power system planning reliability operability capacity and cost-efficiency are simultaneously
considered through a variety of scenarios to which the system may be subjected Mitigation measures
are a method for optimizing a power system across these scenarios Changes in quantities of mitigation
plans may indicate year-on-year differences in the system being evaluated
Integrated Bulk Power System Risk Assessment
Introduction In developing eighteen metrics to measure acceptable levels of reliability it has become clear that any
such measurement of reliability must include consideration of the risks present within the bulk power
system in order for us to appropriately prioritize and manage these system risks The scope for the
Reliability Metrics Working Group (RMWG)27
27 The RMWG scope can be viewed at
includes a task to develop a risk-based approach that
provides consistency in quantifying the severity of events The approach not only can be used to
httpwwwnerccomfilezrmwghtml
Reliability Metrics Performance
38
measure risk reduction over time but also can be applied uniformly in event analysis process to identify
the events that need to be analyzed in detail and sort out non-significant events
The Operating Committee (OC) and Planning Committee (PC) endorsed the concepts and framework28 of
the risk-based approach in their September 2010 joint meeting and further supported the event severity
risk index (SRI) calculation29
Recommendations
in March 2011
bull NERC should embrace the use of risk assessment to identify trends in addition to lessons learned
in order to improve bulk power system reliability
bull The RMWG should continue to coordinate and communicate with the Event Analysis Working
Group (EAWG) to apply the SRI into the event analysis process and root cause analysis
bull As trend evaluations increase the knowledge of risks to the bulk power system data required to
support additional assessment should be gathered
Event Severity Risk Index (SRI)
Risk assessment is an essential tool for achieving the alignment between organizations people and
technology This will assist in quantifying inherent risks identifying where potential high risks exist and
evaluating where the most significant lowering of risks can be achieved Being learning organizations
the Electric Reliability Organization (ERO) Regional Entities and Registered Entities can use these tools
to focus on the areas of highest risk to reliability to provide a sound basis for developing results-based
standards and compliance programs Risk assessment also serves to engage all stakeholders in a
dialogue about specific risk factors and helps direct a strategic plan for risk reduction and early
detection
The SRI is a daily blended metric for which transmission loss generation loss and load loss events are
calculated Each element (transmission generation and load loss) is factored by the systemrsquos inventory
for that element to rate significant events appropriately On a yearly basis these daily performances
can be sorted in descending order to evaluate the year-on-year performance of the system
In order to test drive the concepts the RMWG applied these calculations against historically memorable
days to derive SRIs Once these calculations were complete they were reviewed and evaluated by
various stakeholders for reasonableness Based upon feedback modifications to the calculation were
made and assessed against the historic days performed This iterative process locked down the details
28 httpwwwnerccomdocspcrmwgIntegrated_Bulk_Power_System_Risk_Assessment_Concepts_Finalpdf 29 httpwwwnerccomdocspcrmwgSRI_Equation_Refinement_May6_2011pdf
Reliability Metrics Performance
39
for the calculation of SRI whose calculation from zero (no transmission line outages generation outages
or load lost in a day) to 1000 (a theoretical condition in which every transmission line all generation
units and all load lost across the system in a single day)
Figure 20 captures the calculated severity risk value for each of the days for each year benchmarked
with the historic significant events which were used to concept test the calculation Since there is
significant disparity between days the bulk power system is stressed compared to those that are
ldquoroutinerdquo and ldquoherordquo days of the year where the system performed extremely well the curve is depicted
using a logarithmic scale Each yearrsquos data is sorted in descending order striking a characteristic shape
At the left-side of the curve the days in which the system is severely stressed are plotted The central
more linear portion of the curve identifies the routine day performance while the far right-side of the
curve shows the values plotted for days in which almost all lines and generation units are in service and
essentially no load is lost
The trends on the chart below show that 2009 and 2010 had fewer extreme days than 2008 Routine
daily performance appears generally consistent across all three years Figure 20 captures the days for
each year benchmarked with historically significant events
In Figure 20 NERCrsquos event categories and SRI ratings are directly related As the SRI increases the
category or severity of the event increases Historical events are also shown to relate modern
reliability measurements to give a perspective of how a well-known event would register on the SRI
scale
The event analysis process30
30
benefits from the SRI as it enables a numerical analysis of an event in
comparison to other events By this measure an event can be prioritized by its severity In a severe
event this is unnecessary However for events that do not result in severe stressing of the bulk power
system this prioritization can be a challenge By using the SRI the event analysis process can decide
which events to learn from and reduce which events to avoid and when resilience needs to be
increased under high impact low frequency events as shown in the blue boxes in the figure
httpwwwnerccompagephpcid=5|365
Reliability Metrics Performance
40
Figure 20 NERC Annual Daily Severity Risk Index (SRI) Sorted Descending with Historic Benchmark Days
Other factors that impact severity of a particular event to be considered in the future include whether
equipment operated as designed and resulted in loss of load from a reliability perspective (intentional
and controlled load-shedding) Mechanisms for enabling ongoing refinement to include the historic and
simulated events for future severity risk calculations are being explored
Reliability Metrics Performance
41
Integrated Reliability Index Concepts In December 2010 the RMWG was challenged by the OC and PC to develop a single index concept to
measure the universe of risks associated with the bulk power system As a result the integrated
reliability index (IRI) concepts were proposed31
Figure 21
the three components of which were defined to
quantify each specific risk aspect They are titled the Event Driven Index (EDI) StandardsStatute Driven
Index (SDI) and Condition Driven Index (CDI) illustrated in with measures associated with
system events standards compliance and eighteen performance metrics The development of an
integrated reliability index aims to inform increase transparency and quantify the effectiveness of risk
reduction or mitigation actions The goal is to provide the industry meaningful trends of the BPSrsquos
performance and guidance on how the industry can improve reliability and support risk-informed
decision making Once completed the IRI will facilitate holistic assessment of performance Finally the
IRI should help overcome concern and confusion about how many metrics are being analyzed for system
reliability assessments
Figure 21 Risk Model for Bulk Power System
The integrated model of event-driven condition-driven and standardsstatute-driven risk information
can be constructed to illustrate all possible logical relations between the three risk sets Due to the
nature of the system there may be some overlap among the components
31 httpwwwnerccomdocspcrmwgIntegrated_Reliability_Index_WhitePaper_DRAFTpdf
Event Driven Index (EDI)
Indicates Risk from
Major System Events
Standards Statute Driven
Index (SDI)
Indicates Risks from Severe Impact Standard Violations
Condition Driven Index (CDI)
Indicates Risk from Key Reliability
Indicators
Reliability Metrics Performance
42
The Three Components of the IRI The three components of the IRI work together as shown in Figure 22 to comprise a full picture of the
state of reliability
Figure 22 An overview of the components that comprise the Integrated Reliability Index (IRI)
Event-Driven Indicators (EDI)
The Event-Driven Indicator provides a basis for prioritization of events based on bulk power system
integrity equipment performance and engineering judgment This indicator can serve as a high value
risk assessment tool to be used by stakeholders to investigate and evaluate disturbance history and
measure the severity of these events The relative ranking of events requires industry expertise agreed-
upon goals and engineering judgment The EDI is a derivative of SRI results for a specific time period
but it transforms that performance into a form of an availability index These calculations will be further
refined as feedback is received
Condition-Driven Indicators (CDI)
The Condition-Driven Indicators focus on a set of measurable system conditions (performance
measures) to assess bulk power system reliability These reliability indicators identify factors that
positively or negatively impact reliability and are early predictors of the risk to reliability from events or
unmitigated violations A collection of these indicators measures how close reliability performance is to
the desired outcome and if the performance against these metrics is constant or improving
Reliability Metrics Performance
43
StandardsStatute-Driven Indicators (SDI)
The StandardsStatute-Driven Indicator is a calculation of success of compliance based upon the subset
of high-value standards and is divided by the number of participations who could have received the
violation within the time period considered Also based on these factors known unmitigated violations
of elevated risk factor requirements are weighted higher than lower risk factors The index decreases if
the compliance improvement is achieved over a trending period
IRI Index Calculation As with the SRI the IRI is based on an importance weighting factor which the RMWG can modify over
time after gaining experience with the new metric as well as consideration of feedback from industry
At this time the RMWG believes some form of blended weighting may serve to start to populate IRI
characteristic curves at a high and generic level Based upon feedback from stakeholders this approach
may change or as discussed below weighting factors may vary based on periodic review and risk model
update The RMWG will continue the refinement of the IRI calculation and consider other significant
factors that impact reliability (eg intentional and controlled load-shedding) further it will explore
developing mechanisms for enabling ongoing refinement which should be influenced by a wide set of
stakeholders
RMWG recommends the Event Driven Index (EDI) be weighted the highest (50 percent) since events
actually occurred indicating how the system was performing The Condition Driven Index (CDI) and
StandardsStatute Driven Index (SDI) are weighted 25 each since they are indicators of potential risks
to BPS reliability IRI can be calculated as follows
IRI is intended to be a composite metric which integrates several forms of individual risks to the bulk
power system Since the three components range across many stakeholder organizations these
concepts are developed as starting points for continued study and evaluation Additional supporting
materials can be found in the IRI whitepaper32
IRI Recommendations
including individual indices calculations and preliminary
trend information
For the IRI more investigation should be performed to determine the best way to integrate EDI CDI
and SDI into an Integrated Reliability Index (IRI) that quantitatively represents the reliability of the bulk
32 The IRI whitepaper can be found at httpwwwnerccomdocspcrmwgIntegrated_Reliability_Index_WhitePaper_DRAFTpdf
Reliability Metrics Performance
44
power system To this end study into determining the amount of overlap between the components is
necessary RMWG is currently working to determine the proper amount of overlap between the IRI
components
Also the CDI component of the IRI needs to be solidified This is especially true with the CDI More
accurate metric data is needed to paint a fuller picture of the CDI Many of the metrics used to calculate
the CDI are new or they have limited data Compared to the SDI which counts well-known violation
counts and the EDI which uses the well-defined CDI the CDI lacks the depth of rigor that the other two
components have acquired through their years of data RMWG is currently working to improve the CDI
Reliability Metrics Conclusions and Recommendations Among the eighteen metrics that address the characteristics of an adequate level of reliability (ALR)
metric trends indicate the system is performing better in the following seven areas
bull ALR1-3 Planning Reserve Margin
bull ALR1-4 BPS Transmission Related Events Resulting in Loss of Load
bull ALR2-5 Disturbance Control Events Greater than Most Severe Single Contingency
bull ALR6-2 Energy Emergency Alert 3 (EEA3)
bull ALR6-3 Energy Emergency Alert 2 (EEA2)
bull ALR6-11 Automatic Transmission Outages Caused by Protection System Misoperations
bull ALR6-13 Automatic Transmission Outages Caused by Failed AC Substation Equipment
Assessments have been made in other performance categories A number of them do not have
sufficient data to derive any conclusions from the results The RMWG recommends continued data
collection and assessment of these metrics If a metric does not yield any trend in a five-year reporting
period the metric will be modified or withdrawn
For the IRI more investigation should be performed to determine the overlap of the components (CDI
EDI and SDI) The CDI should be more thoroughly solidified as an index by collecting more data over
time
Transmission Equipment Performance
45
Transmission Equipment Performance Introduction The Transmission Availability Data System (TADS) effort began with the establishment of a TADS task force
by the NERC Planning Committee in October 2006 On October 27 2007 the NERC Board of Trustees
approved the collection of transmission automatic outage data beginning in calendar year 2008 (Phase I)
Subsequently on October 29 2008 the NERC Board approved the collection of Non-Automatic Outage data
that began for Calendar year 2010 (Phase II)
This chapter provides reliability performance analysis of the transmission system by focusing on the trends
of Automatic Outage data from calendar year 2008 thru 2010 Since only one year of Non-Automatic
Outage data has been collected that data will not be assessed in this report
When calculating bulk power system performance indices care must be exercised when interpreting results
as misinterpretation can lead to erroneous conclusions regarding system performance With only three
years of data in the smaller regions it is not clear whether a regionrsquos yearly outage variation compared to
the average is due to random statistical variation or that particular year is significantly different in
performance However on a NERC-wide basis after three years of data collection there is enough
information to accurately determine whether the yearly outage variation compared to the average is due to
random statistical variation or the particular year in question is significantly different in performance33
Performance Trends
Transmission performance information has been provided by Transmission Owners (TOs) within NERC
through the NERC TADS (Transmission Availability Data System) process The data presented reflects
Momentary and Sustained AC Automatic outages of transmission elements that operate at voltages ge 200 kV
(including the low side of transformers) with the criteria specified in the TADS process The following
elements listed below are included
bull AC Circuits ge 200 kV (Overhead and Underground Circuits) Radial circuits are included
bull DC Circuits with ge +-200 kV DC voltage
bull Transformers with ge 200 kV low-side voltage and
bull ACDC Back-to-Back (BTB) Converters with ge 200 kV AC voltage on both sides
33The detailed Confidence Interval computation is available at httpwwwnerccomdocspctadstfTADS_Nov_2_2007APPENDIX_C_Confidence_Intervalpdf
Transmission Equipment Performance
46
AC Element Outage Summary and Leading Causes Table 6 shows the 2008 2009 and 2010 NERC total AC transmission element inventory and a summary of
the associated outages As expected in general the number of circuits increased from year to year due to
new construction or re-construction to higher voltages For every outage experienced on the transmission
system cause codes are identified and recorded according to the TADS process Causes of both momentary
and sustained outages have been indicated These causes are analyzed to identify trends and similarities
and to provide insight into what could be done to possibly prevent future occurrences
Figure 23 and Figure 24 describe the top ten initiating cause codes for sustained and momentary automatic
outages combined from 2008-2010 Based on the two figures the relationship between the total number of
outages and total outage hours can be seen Failed AC Substation Equipment and Failed AC Circuit
Equipment only account for 15 percent of the total number of outages but account for 65 percent of the
total outage hours The two largest causes of outages within NERC (ldquoLightingrdquo and ldquoWeather excluding
Lightningrdquo) account for 34 percent of the total number of outages
The next three Human Error Failed Protection System Equipment and Failed AC Circuit Equipment have
very similar totals and should all be considered significant focus points in reducing the number of Sustained
Automatic Outages for all elements
Transmission Equipment Performance
47
Table 6 NERC - All AC Elements Sustained and Momentary Outage Performance Summary
2008 Number of Outages
AC Voltage
Class
No of
Circuits
Circuit
Miles Sustained Momentary
Total
Outages Total Outage Hours
200-299kV 4369 102131 1560 1062 2622 56595
300-399kV 1585 53631 793 753 1546 14681
400-599kV 586 31495 389 196 585 11766
600-799kV 110 9451 43 40 83 369
All Voltages 6650 196708 2785 2051 4836 83626
2009 Number of Outages
AC Voltage
Class
No of
Circuits
Circuit
Miles Sustained Momentary
Total
Outages Total Outage Hours
200-299kV 4468 102935 1387 898 2285 28828
300-399kV 1619 56447 641 610 1251 24714
400-599kV 592 32045 265 166 431 9110
600-799kV 110 9451 53 38 91 442
All Voltages 6789 200879 2346 1712 4038 63094
2010 Number of Outages
AC Voltage
Class
No of
Circuits
Circuit
Miles Sustained Momentary
Total
Outages Total Outage Hours
200-299kV 4567 104722 1506 918 2424 54941
300-399kV 1676 62415 721 601 1322 16043
400-599kV 605 31590 292 174 466 10442
600-799kV 111 9477 63 50 113 2303
All Voltages 6957 208204 2582 1743 4325 83729
Note The NERC table does not show redacted outages DC Circuit outages Transformer outages or ACDC
converter outages
Transmission Equipment Performance
48
Figure 23 NERC - Top Ten Sustained and Momentary Outages by Initiating Cause Code for All Elements
Figure 24 NERC - Top Ten Sustained Outage Hours by Cause Code
198
151
80
7271
6943
33
27
188
68
Lightning
Weather excluding lightningHuman Error
Failed AC Substation EquipmentFailed Protection System EquipmentFailed AC Circuit Equipment Foreign Interference
Power System Condition
Fire
Unknown
Remaining Cause Codes
299
246
188
58
52
42
3619
16 12 31 Failed AC Substation EquipmentFailed AC Circuit Equipment Weather excluding lightningUnavailable
Other
Fire
Unknown
Human Error
Failed Protection System EquipmentForeign Interference
Remaining Cause Codes
Transmission Equipment Performance
49
Transmission Monthly Outages Figure 25 displays the total number of Automatic Outages on a per-month basis The three months with the
highest total of outages were June July and August From a seasonal perspective winter had a monthly
average of 281 outages These include the months of November-March Summer had an average of 429
outages Summer included the months of April-October
Figure 25 Number of Outages by Month for AC Circuits (2008-2010)
This figure does not show redacted outages DC Circuit outages Transformer outages or ACDC Converter
outages
Outage Initiation Location For every outage experienced on the transmission system the outage initiation code is identified and
recorded according to the TADS process The outage initiation code can be analyzed to identify trends and
similarities and to provide insight into what could be done to possibly prevent future occurrences
The ldquoOutage Initiation Coderdquo describes where an automatic outage was initiated on the power system The
five codes are as follows
bull Element-Initiated
bull Other Element-Initiated
bull AC Substation-Initiated
bull ACDC Terminal-Initiated (for DC circuits)
bull Other Facility Initiated any facility not included in any other outage initiation code
JanuaryFebruar
yMarch April May June July August
September
October
November
December
2008 238 229 257 258 292 437 467 380 208 176 255 236
2009 315 201 339 334 398 553 546 515 351 235 226 294
2010 444 224 269 446 449 486 639 498 351 271 305 281
3 Year AVG 332 218 288 346 380 492 551 464 303 227 262 270
0
100
200
300
400
500
600
700
Out
ages
Transmission Equipment Performance
50
Notably the protection system is not part of an ldquoAC Substationrdquo or an ldquoACDC Terminalrdquo If a protection
system misoperates and initiates an outage it will be classified as ldquoOther-Facility Initiatedrdquo The following
Figures show the initiating location of the Automatic outages from 2008 to 2010
With both Momentary and Sustained Automatic Outages taken into account the outage was initiated on the
Element more than 67 percent of the time as shown in Figure 26 and Figure 27
When only the Sustained Automatic Outages are analyzed the outage initiation on both AC Substation and
Other Facility increased by 34 percent and 32 percent respectively Outages initiated on the Element itself
decreases by 78 percent as shown in Figure 26 and 27 For only the Momentary Automatic Outages the
outage initiation on the Element increases by 19 percent compared to Sustained Outages Element initiated
outages make up over 78 percent of the total outages when analyzing only Momentary Outages
Figure 26
Figure 27
Transmission Outage Events Figure 28 illustrates the relationship between the numbers of Automatic Outages associated per TADS
event 2008 2009 and 2010 tend to follow the same trend The largest number of Automatic Outages per
TADS event is fourteen in 2010 thirteen in 2009 and eight in 2008 There are around 70 to 100 TADS
events that contain between fourteen and three Automatic Outages (see below) There are around 330 to
400 TADS events that contain two or more Automatic Outages The rest of the events only contain one
Automatic Outage As noted in the lower right hand corner below the total number of Events in 2008 to
2010 ranged from 3920 to 4569 events per year Nearly 90 percent or more of the events contained one
Automatic Outage
Figure 26 Sustained Automatic Outage Initiation
Code
Figure 27 Momentary Automatic Outage Initiation
Code
Transmission Equipment Performance
51
Transmission Outage Mode Figure 29 and Figure 30 show the percentage of Outage Modes The ldquoOutage Mode Coderdquo describes
whether one Automatic Outage is related to other Automatic Outages A Single Mode outage is an
Automatic Outage of a single Element which occurs independently of any other Automatic Outages (if any)
A ldquoDependent Mode Initiating Outagerdquo is an Automatic Outage of a single Element that initiates one or more
subsequent Element Automatic Outages A ldquoDependent Mode Outagerdquo is an Automatic Outage of an
Element which occurred as a result of an initiating outage whether the initiating outage was an Element
outage or a non-Element outage A ldquoCommon Mode Outagerdquo is one of two or more Automatic Outages with
the same Initiating Cause Code and where the outages are not consequences of each other and occur nearly
simultaneously A ldquoCommon Mode Initiating Outagerdquo is a Common Mode Outage that initiates one or more
subsequent Automatic Outages
Over 72 percent of the total outages occurred on the bulk power system are Single Mode Outages The next
largest mode is Dependent with over 11 percent of the total outages being in this category For only
Sustained Automatic Outages outages related to each other increase with Dependent mode accounting for
13 percent of the outages and Common mode accounting for close to 11 percent of the outages
Independent Sustained outages still account for the largest portion with nearly 70 percent being Single
mode When just analyzing Momentary Automatic Outages Associated outages decrease with Dependent
Figure 28 Event Histogram (2008-2010)
Transmission Equipment Performance
52
mode accounting for only 9 percent of the outages The Common Mode percentage decreases while
Dependent Mode Initiating percentage increases compared to Sustained Outages Independent Momentary
outages account for the largest portion with over 76 percent being Single Mode
An investigation into the root causes of Dependent and Common mode events which include three or more
Automatic Outages (indentified in the TADS 2008 to 2010 data) should be a high priority Some protection
systems are designed to trip three or more circuits but some events go beyond what is designed Some also
have misoperations associated with multiple outage events
Conclusions On a NERC wide average basis automatic transmission outage rate is improving from 2008 to 2010 based on
reported data Considering both automatic and non-automatic outages 2010 records indicate transmission
element availability percentage is very high and exceeds 95 The unavailability rate for AC circuits and
transformers are only 15 and 29 respectively
The cause codes of Human Error Failed Protection System Equipment and Failed AC Circuit Equipment
should be considered significant focus points in reducing the number of Sustained Automatic Outages for all
elements A deeper look into the root causes of Dependent and Common mode events which include three
or more Automatic Outages (indentified in the TADS 2008 to 2010 data) should be a high priority Some
protection systems are designed to trip three or more circuits but some events go beyond what is designed
Some also have misoperations associated with multiple outage events
Figure 29 Sustained Automatic Outage Mode code Figure 30 Momentary Automatic Outage Mode code
Generation Equipment Performance
53
Generation Equipment Performance Introduction The development of the Generating Availability Data System (GADS) began in 1982 This series of databases
is used to voluntarily collect record and retrieve operating information By pooling individual unit
information with likewise units generating unit availability performance can be calculated providing
opportunities to identify trends and generating equipment reliability improvement opportunities The
information is used to support equipment reliability availability analyses and risk-informed decision-making
by system planners generation owners assessment modelers manufacturers and contractors etc Reports
and information resulting from the data collected through GADS are now used for benchmarking and
analyzing electric power plants
Currently the data collected through GADS contains 72 percent of the North American generating units
with generating capacity of 20 MW or higher34 Additionally many of the newer combined-cycle plants are
not reporting information and therefore a full view of each unit type is not presented Rather a sample of
all the units in North America that fit a given more general category is provided35 for the 2008-201036
Generation Key Performance Indicators
assessment period
Three key performance indicators37
In
the industry have used widely to measure the availability of generating
units (see Terms Used in This Report section for their calculation parameters) are Equivalent Availability
Factor (EAF) Net Capacity Factor (NCF) and Equivalent Forced Outage Rate ndash Demand (EFORd)
Table 7 the North American fleet average EAF NCF and EFORd compared to unit age for all generating
units with a capacity of 20 MW and higher is provided for the years 2008-2010 The EAF shows a decline
during the last three years NCF is up and down while the EFORd appears to be increasing As expected the
fleet of units reported to GADS is aging overall with the fossil units being about 12 years older than the
average age
34 httpwwwnerccomdocspcgadstfGADSTF_Recommendation_Report_02-18-2011_FINALpdf 35GADS contains some 1500+ units under 20 MW that is not included in this report These units are excluded because most units are not base-loaded and are in peaking operation
3684 percent of the 2010 dataset is available at this time while the 2008 and 2009 dataset is complete 37 httpwwwnerccompagephpcid=4|43
Generation Equipment Performance
54
Table 7 General Availability Review of GADS Fleet Units by Year
2008 2009 2010 Average
Equivalent Availability Factor (EAF) 8776 8774 8678 8743
Net Capacity Factor (NCF) 5083 4709 4880 4890
Equivalent Forced Outage Rate -
Demand (EFORd) 579 575 639 597
Number of Units ge20 MW 3713 3713 3713 3713
Average Age of the Fleet in Years (all
unit types) 303 311 321 312
Average Age of the Fleet in Years
(fossil units only) 422 432 440 433
Figure 31 provides the average forced outage hours (FOH) maintenance outage hours (MOH) and planned
outage hours (POH) for all units reporting 20 MW or larger During this three-year period the average FOH
291 hours average MOH is 163 hours average POH is 470 hours
Figure 31 shows a large increase in forced and maintenance events The average age of the units with a
capacity of 20MW and higher in 2009 is 316 years old However the average age of fossil units in 2010 is
442 years old These fossil units are the backbone of all operating units providing the base-load power
continuously and nearly 50 percent of all energy annually There appears to be no increase allocated for
annualsemi-annual maintenance (ie planned outages) for the older generating units The increase of
000100002000030000400005000060000700008000090000
100000
2008 2009 2010
463 479 468
154 161 173
288 270 314
Hou
rs
Planned Maintenance Forced
Figure 31 Average Outage Hours for Units gt 20 MW
Generation Equipment Performance
55
maintenance outage hours reflects an increased need to fix problems that cannot be deferred until the next
annualsemi-annual repairs As a result it shows one of two things are happening
bull More or longer planned outage time is needed to repair the aging generating fleet
bull More focus on preventive repairs during planned and maintenance events are needed
Multiple Unit Forced Outages and Causes Table 8 provides the annual multiple-unit forced outage trips resulting from the same cause for each of the
assessments years 2008-2010 respectively The ldquosingle unitrdquo trips are large units with a Net Dependable
Capacity of 750 MW or more The trips of ldquotwo unitsrdquo or more is any combination of unit capacity with the
total amount of lost capacity more than 750 MW
Table 8 also presents more information on the forced outages During 2008-2010 there were a large
number of double-unit outages resulting from the same event Investigations show that some of these trips
were at a single plant caused by common control and instrumentation for the units The incidents occurred
several times for several months and are a common mode issue internal to the plant
Table 8 Number of Multiple Unit Forced Outages and FrequencyYear
2008 2009 2010
Type of
Trip
of
Trips
Avg Outage
Hr Trip
Avg Outage
Hr Unit
of
Trips
Avg Outage
Hr Trip
Avg Outage
Hr Unit
of
Trips
Avg Outage
Hr Trip
Avg Outage
Hr Unit
Single-unit
Trip 591 58 58 284 64 64 339 66 66
Two-unit
Trip 281 43 22 508 96 48 206 41 20
Three-unit
Trip 74 48 16 223 146 48 47 109 36
Four-unit
Trip 12 77 19 111 112 28 40 121 30
Five-unit
Trip 11 1303 260 60 443 88 19 199 10
gt 5 units 20 166 16 93 206 50 37 246 6
Loss of ge 750 MW per Trip
The high number of five-unit trips in 2008 was due to Hurricane Ike hitting the Gulf Coast The highest total
number of multiple unit trips occurred in 2009 though as mentioned before the data collection for 2010 is
incomplete at this time The majority of 2009 multiple unit trips have three main causes (in order by
Generation Equipment Performance
56
number of events) transmission lack of fuel and storms A summary of the three categories for single as
well as multiple unit outages (all unit capacities) are reflected in Table 9
Table 9 Common Causes of Multiple Unit Forced Outages (2009)
Cause Number of Events Average MW Size of Unit
Transmission 1583 16
Lack of Fuel (Coal Mines Gas Lines etc) Not
in Operator Control
812 448
Storms Lightning and Other Acts of Nature 591 112
Some of the transmission outages based on storms in 2009 have been caused by the same reasons because
the storms may have caused transmission interference However the plants reported the problems
inconsistently with either the transmission interference or storms cause code Therefore they are depicted
as two different causes of forced outage
Marked transmission outages in 2009 were quite high Thirty-five percent came from one utility with a large
number of hydroelectric units The company related the trips to various problems including weather
(lightning storms) wildlife ldquoline bumpsrdquo and problems on the receiving end of the transmission line Nine
hundred and eighty-five transmission trips (62 percent) were from hydroelectric units38
In 2009 only ten transmission trips resulted in a loss of 750 MW or more per trip Twenty two generating
plants were affected by the ten trips Causes for the trips include feeder line trips (1 trip) breakers in the
switchyard (8 trips) personnel errors (2 trips) and unknown (10 trips)
The ldquoLack of Fuelrdquo outages are of interest as these events occur during the times when a unit is available to
operate but there is an interruption in fuels to operate the facilities These events do not include
interruptions of fuel due to contracts Rather the cause code is designed to account for units that are
expecting fuel and it is unavailable when requested Table 10 presents the distribution of ldquoLack of Fuelrdquo
events by NERC Region and Table 11 presents the unit types affected
38 The average size of the hydroelectric units were small ndash 335 MW
Generation Equipment Performance
57
Of the units that report ldquoLack of Fuelrdquo 78 percent of the units are oil-fired 15 percent of the units are gas-
fired and the remaining units are various other fuels Table 12 provides the top causes of forced outage for
several unit types For fossil units ldquoLack of Fuelrdquo as the number three cause behind waterwall tube leaks
and superheater tube leaks
Table 10 Forced Outages Due to Lack of Fuel by Region
Region Number of Lack of Fuel
Problems Reported
FRCC 0
MRO 3
NPCC 24
RFC 695
SERC 17
SPP 3
TRE 7
WECC 29
One company contributed to the majority of oil-fired lack of fuel events The units at the company are
actually dual-fuels (oil and gas) but market nominated gas monitoring causes the units to be on forced
outage nightly The units need gas to start up so they can run on oil When they shut down the units must
switch to gas to clean themselves With the gas restriction the unit canrsquot start and the unit goes on a
forced outage Until the band is lifted the two units will continue to be on a forced outage cycle
Event records also provide descriptions of why the unit was without fuel with the majority of descriptions
bull Temperatures affecting gas supply valves
bull Unexpected maintenance of gas pipe-lines
bull Compressor problemsmaintenance
Generation Equipment Performance
58
Table 11 Unit Type Profile of Forced Outages Due to Lack of Fuel
Unit Types Number of Lack of Fuel Problems Reported
Fossil 642
Nuclear 0
Gas Turbines 88
Diesel Engines 1
HydroPumped Storage 0
Combined Cycle 47
Generation Equipment Performance
59
Table 12 Causes of Forced Outage for Different Unit Types (2008-2010)
Fossil - all MW sizes all fuels
Rank Description Occurrence per Unit-year
MWH per Unit-year
Average Hours To Repair
Average Hours Between Failures
Unit-years
1 Waterwall (furnace wall) 0590 134106 59 3250 3868 2 Second Superheater
Leaks 0180 5182 60 3228 3868
3 Lack of Fuel (coal mines gas lines etc) where the operator is not in control
0480 4701 18 26 3868
Combined-Cycle blocks Rank Description Occurrence
per Unit-year
MWH per Unit-year
Average Hours To Repair
Average Hours Between Failures
Unit-years
1 HP Turbine Buckets Or Blades
0020 4663 1830 26280 466
2 Turbine Control Valves 0040 2777 100 7200 466 3 Gas Turbine Compressor -
High Pressure Shaft 0010 2266 663 4269 466
Nuclear units - all Reactor types Rank Description Occurrence
per Unit-year
MWH per Unit-year
Average Hours To Repair
Average Hours Between Failures
Unit-years
1 LP Turbine Buckets or Blades
0010 26415 8760 26280 288
2 Containment Structure 0010 9233 1226 26262 288 3 Feedwater Pump Local
Controls 0020 7620 692 12642 288
Simple-cycle gas turbine jet engines Rank Description Occurrence
per Unit-year
MWH per Unit-year
Average Hours To Repair
Average Hours Between Failures
Unit-years
1 Main Transformer 0030 1611 1016 20709 4181 2 Other Gas Turbine
Controls And Instrument Problems
0120 428 70 2614 4181
3 Other Gas Turbine Problems
0090 400 119 1701 4181
Generation Equipment Performance
60
2008-2010 Review of Summer versus Winter Availability To address seasonality of unit availability unit information for the months of June to September (summer)
and December through February (winter) were pooled to calculate force events during these timeframes for
2008-201039 Figure 32 shows the Equivalent Availability Factor (EAF) is three percentage points higher and
the Equivalent Forced Outage Rate - Demand (EFORd) is more than a half of a percentage point lower in the
summer period than in winter period This means the units were more reliable with less forced events
during high-demand times during the summer than during the winter seasons The generating unitrsquos
capability has a resulting higher Net Capacity Factor (NCF) of 45 percentage points in the summer season
for 2008-2010
During the spring season (March-May) 77 percent of the units took a planned outage (PO) for an average
231 hours (or 96 days) In fall (October-November) only 42 percent of the units experienced a PO and the
average duration was shorter ndash 134 hours (or 56 days) A few units took both spring and fall planned
outages although this is rare Based on this assessment the generating units are prepared for the summer
peak demand The resulting availability indicates that this maintenance was successful which is measured
by an increased EAF and lower EFORd
Figure 32 Summer-Winter Average EAF NCF and EFORd (2008-2010)
Conclusions and Recommendations During 2008-2010 the average Equivalent Availability Factor (EAF) which measures the overall availability
of generating units decreased At the same time the Net Capacity Factor (NCF) an indicator of energy
production increased The average number of forced outages in 2010 is greater than in 2008 while at the
same time the average planned outage times have decreased As a result the Equivalent Forced Outage
Rate ndash Demand (EFORd) also increased illustrating that more units have experienced forced events during
39 A study of peak periods was conducted by the NERC Generating Availability Trend Evaluation (GATE) Working Group several years ago see httpwwwnerccomfilesSeasonal-Performance-Trendspdf
9116
5343
396
8818
4896
441
0 10 20 30 40 50 60 70 80 90 100
EAF
NCF
EFORd
Percent ()
Winter
Summer
Generation Equipment Performance
61
peak-demand times in 2010 than in the previous two years Potentially with shorter planned outage
periods in 2010 there may be less time to repair equipment and prevent forced unit outages
There are warnings that units are not being maintained as well as they should be In the last three years
there has been an increase in Equivalent Forced Outage Rate ndash Demand (EFORd) This indicator measures
the rate of forced outage events on generating units during periods of load demand To confirm this
problem forced outage hours jumped from 270 to 314 hours per unit between 2009 and 2010 At the same
time maintenance events also increased by 12 hours per unit Planned outage events remain constant The
resulting conclusions from this trend are
bull More or longer planned outage time is needed to repair the generating fleet Whether age is the
cause of the increase need for planned outage time remains unknown and further investigation into
the cause for longer planned outage time is necessary
bull More focus on preventive repairs during planned and maintenance events are needed
There are many multiple unit forced outages due to lack of fuel The majority of multiple unit trips have
three main causes transmission lack of fuel and storms With special interest in the forced outages due to
ldquoLack of Fuelrdquo additional analysis revealed that 77 percent of the units experiencing unexpected fuel
stoppage are oil-fired fossil units while gas-fired units experienced 15 percent
Generating units continue to be more reliable during the peak summer periods
Disturbance Event Trends
62
Category 1 An event resulting in one or more of the following a Unintended loss of three or more BPS elements caused by
common mode failure b Failure or misoperation of an SPSRAS c System-wide voltage reduction of 3 or more d Unintended BPS system separation resulting in an island of
100 MW to 999 MW e Unplanned evacuation from a control center facility with BPS
SCADA functionality for 30 minutes or more Category 2 An event resulting in one or more of the following
a Complete loss of all BPS control center voice communication system(s) for 30 minutes or more
b Complete loss of SCADA control or monitoring functionality for 30 minutes or more
c Voltage excursions equal to or greater than 10 lasting more than five minutes
d Loss of off-site power (LOOP) to a nuclear generating station e Unintended system separation resulting in an island of 1000
MW to 4999 MW f Unintended loss of 300MW or more of firm load for more
than 15 minutes g Violation of an Interconnection Reliability Operating Limit
(IROL) for more than 30 minutes Category 3 An event resulting in one or more of the following
a The loss of load or generation of 2000 MW or more in the Eastern Interconnection or
b Western Interconnection or 1000 MW or more in the ERCOT or Queacutebec Interconnections
c Unintended system separation resulting in an island of 5000 MW to 10000 MW
d Unintended system separation resulting in an island of Florida from the Eastern Interconnection
Category 4 An event resulting in one or more of the following a The loss of load or generation from 5001 MW to 9999 MW b Unintended system separation resulting in an island of more
than 10000 MW (with the exception of Florida as described in Category 3c)
Category 5 An event resulting in one or more of the following a The loss of load of 10000 MW or more b The loss of generation of 10000 MW or more
Figure 33 BPS Event Category
Disturbance Event Trends Introduction The purpose of this section is to report event
analysis trends from the beginning of event
analysis field test40
One of the companion goals of the event
analysis program is the identification of trends
in the number magnitude and frequency of
events and their associated causes such as
human error equipment failure protection
system misoperations etc The information
provided in the event analysis database (EADB)
and various event analysis reports have been
used to track and identify trends in BPS events
in conjunction with other databases (TADS
GADS metric and benchmarking database)
to the end of 2010
The Event Analysis Working Group (EAWG)
continuously gathers event data and is moving
toward an integrated approach to analyzing
data assessing trends and communicating the
results to the industry
Performance Trends The event category is classified41
Figure 33
as shown in
with Category 5 being the most
severe Figure 34 depicts disturbance trends in
Category 1 to 5 system events from the
40 httpwwwnerccomdocseawgGalloway-Industry-EA-Field-Test-102210pdf 41httpwwwnerccomfiles2011-05-0220Event_Analysis_Process_Phase20220Field20Test20Draft20-20Final20-20For20postingpdf
Disturbance Event Trends
63
beginning of event analysis field test to the end of 201042
Figure 34 Event Category vs Date for All 2010 Categorized Events
From the figure in November and December
there were many more category 1 and 2 events than in October This is due to the field trial starting on
October 25 2010
In addition to the category of the events the status of the events plays a critical role in the accuracy of the
data By examining Figure 35 over 80 of the events reported in 2010 have been closed This means that
the category root cause and other important information have been sufficiently finalized in order for
analysis to be accurate for each event At this time there is not enough data to draw any long-term
conclusions about event investigation performance
42 Documents for the EA Field Test are located at httpwwwnerccompagephpcid=5|365
2
12 12
26
3
6 5
14
1 1
2
0
5
10
15
20
25
30
35
40
45
October November December 2010
Even
t Cou
nt
Category 3 Category 2 Category 1
Disturbance Event Trends
64
Figure 35 Event Count vs Status (All 2010 Events with Status)
By drilling down into the cause code for each closed 2010 event Figure 36 shows the top 3 event causes
From the figure equipment failure and protection system misoperation are the most significant causes for
events Because of how new and limited the data is however there may not be statistical significance for
this result Further trending of cause codes for closed events and developing a richer dataset to find any
trends between event cause codes and event counts should be performed
Figure 36 Top 3 Event Counts vs DAWG Cause Code for all Closed 2010 Events
10
32
42
0
5
10
15
20
25
30
35
40
45
Open Closed Open and Closed
Even
t Cou
nt
Status
1211
8
0
2
4
6
8
10
12
14
Equipment Failure Protection System Misoperation Human Error
Even
t Cou
nt
Cause Code
Disturbance Event Trends
65
Conclusions Due to the relatively new process for events analysis and categorization more time will be required before a
conclusive recommendation may be obtained Further analysis and new data should provide valuable
statistics in the future Over 80 of all event reports from 2010 are current listed as closed but no
conclusion about investigation performance may be obtained because of the limited amount of data It is
recommended to study ways to prevent equipment failure and protection system misoperations but there
is not enough data to draw a firm conclusion about the top causes of events at this time
Abbreviations Used in This Report
66
Abbreviations Used in This Report
Acronym Definition ALP Acadiana Load Pocket
ALR Adequate Level of Reliability
ARR Automatic Reliability Report
BA Balancing Authority
BPS Bulk Power System
CDI Condition Driven Index
CEII Critical Energy Infrastructure Information
CIPC Critical Infrastructure Protection Committee
CLECO Cleco Power LLC
DADS Future Demand Availability Data System
DCS Disturbance Control Standard
DOE Department Of Energy
DSM Demand Side Management
EA Event Analysis
EAF Equivalent Availability Factor
ECAR East Central Area Reliability
EDI Event Drive Index
EEA Energy Emergency Alert
EFORd Equivalent Forced Outage Rate Demand
EMS Energy Management System
ERCOT Electric Reliability Council of Texas
ERO Electric Reliability Organization
ESAI Energy Security Analysis Inc
FERC Federal Energy Regulatory Commission
FOH Forced Outage Hours
FRCC Florida Reliability Coordinating Council
GADS Generation Availability Data System
GOP Generation Operator
IEEE Institute of Electrical and Electronics Engineers
IESO Independent Electricity System Operator
IROL Interconnection Reliability Operating Limit
Abbreviations Used in This Report
67
Acronym Definition IRI Integrated Reliability Index
LOLE Loss of Load Expectation
LUS Lafayette Utilities System
MAIN Mid-America Interconnected Network Inc
MAPP Mid-continent Area Power Pool
MOH Maintenance Outage Hours
MRO Midwest Reliability Organization
MSSC Most Severe Single Contingency
NCF Net Capacity Factor
NEAT NERC Event Analysis Tool
NERC North American Electric Reliability Corporation
NPCC Northeast Power Coordinating Council
OC Operating Committee
OL Operating Limit
OP Operating Procedures
ORS Operating Reliability Subcommittee
PC Planning Committee
PO Planned Outage
POH Planned Outage Hours
RAPA Reliability Assessment Performance Analysis
RAS Remedial Action Schemes
RC Reliability Coordinator
RCIS Reliability Coordination Information System
RCWG Reliability Coordinator Working Group
RE Regional Entities
RFC Reliability First Corporation
RMWG Reliability Metrics Working Group
RSG Reserve Sharing Group
SAIDI System Average Interruption Duration Index
SAIFI System Average Interruption Frequency Index
SCADA Supervisory Control and Data Acquisition
SDI Standardstatute Driven Index
SERC SERC Reliability Corporation
Abbreviations Used in This Report
68
Acronym Definition SRI Severity Risk Index
SMART Specific Measurable Attainable Relevant and Tangible
SOL System Operating Limit
SPS Special Protection Schemes
SPCS System Protection and Control Subcommittee
SPP Southwest Power Pool
SRI System Risk Index
TADS Transmission Availability Data System
TADSWG Transmission Availability Data System Working Group
TO Transmission Owner
TOP Transmission Operator
WECC Western Electricity Coordinating Council
Contributions
69
Contributions This report was made feasible by the collaboration and hard work of both NERC staff and NERCrsquos
Industry Groups
NERC Industry Groups
Table 14 lists the NERC industry group contributors Without their contribution and collaboration this
report would not have been possible
Table 13 NERC Industry Group Contributions43
NERC Group
Relationship Contribution
Reliability Metrics Working Group
(RMWG)
Reports to the OCPC bull Lead Development of Report bull Provide Reliability Metrics Data bull Responsible for Reliability Metrics
Performance Chapter
Transmission Availability Working Group
(TADSWG)
Reports to the OCPC bull Provide Transmission Availability Data
bull Responsible for Transmission Equip-ment Performance Chapter
bull Content Review
Generation Availability Data System Task
Force
(GADSTF)
Reports to the OCPC bull Provide Generation Availability Data bull Responsible for Generation Equip-
ment Performance Chapter bull Content Review
Event Analysis Working Group
(EAWG)
Reports to the OCPC bull Provide Events Data bull Responsible for Disturbance Events
Trends Chapter bull Content Review
43 Rosters for RMWG TADSWG GADSTF and EAWG are available at httpwwwnerccomfilesrosterpdf
Contributions
70
NERC Staff Table 13 below lists the NERC staff who contributed to the 2011 Reliability Performance Analysis
Report
Table 14 Contributing NERC Staff
Name Title E-mail Address
Mark Lauby Vice President and Director of
Reliability Assessment and
Performance Analysis
marklaubynercnet
Jessica Bian Manager of Performance Analysis jessicabiannercnet
John Moura Manager of Reliability Assessments johnmouranercnet
Andrew Slone Engineer Reliability Performance
Analysis
andrewslonenercnet
Jim Robinson TADS Project Manager jimrobinsonnercnet
Clyde Melton Engineer Reliability Performance
Analysis
clydemeltonnercnet
Mike Curley Manager of GADS Services mikecurleynercnet
James Powell Engineer Reliability Performance
Analysis
jamespowellnercnet
Michelle Marx Administrative Assistant michellemarxnercnet
William Mo Intern Performance Analysis wmonercnet
- NERCrsquos Mission
- Table of Contents
- Executive Summary
-
- 2011 Transition Report
- State of Reliability Report
- Key Findings and Recommendations
-
- Reliability Metric Performance
- Transmission Availability Performance
- Generating Availability Performance
- Disturbance Events
- Report Organization
-
- Introduction
-
- Metric Report Evolution
- Roadmap for the Future
-
- Reliability Metrics Performance
-
- Introduction
- 2010 Performance Metrics Results and Trends
-
- ALR1-3 Planning Reserve Margin
-
- Background
- Assessment
- Special Considerations
-
- ALR1-4 BPS Transmission Related Events Resulting in Loss of Load
-
- Background
- Assessment
-
- ALR1-12 Interconnection Frequency Response
-
- Background
- Assessment
-
- ALR2-3 Activation of Under Frequency Load Shedding
-
- Background
- Assessment
- Special Considerations
-
- ALR2-4 Average Percent Non-Recovery Disturbance Control Standards (DCS)
-
- Background
- Assessment
- Special Consideration
-
- ALR2-5 Disturbance Control Events Greater Than Most Severe Single Contingency
-
- Background
- Assessment
- Special Consideration
-
- ALR 1-5 System Voltage Performance
-
- Background
- Special Considerations
- Status
-
- ALR3-5 Interconnection Reliability Operating Limit System Operating Limit (IROLSOL) Exceedances
-
- Background
-
- ALR4-1 Automatic Transmission Outages Caused by Protection System Misoperations
-
- Background
- Special Considerations
-
- ALR6-11 ndash ALR6-14
-
- Background
- Assessment
- ALR 6-11 ndash Automatic Outages Initiated by Failed Protection System Equipment
- ALR6-12 ndash Automatic Outages Initiated by Human Error
- ALR6-13 ndash Automatic Outages Initiated by Failed AC Substation Equipment
- ALR6-14 Automatic AC Transmission Outages Initiated by Failed AC Circuit Equipment
-
- ALR6-15 Element Availability Percentage (APC)
-
- Background
- Assessment
- Special Consideration
-
- ALR6-16 Transmission System Unavailability
-
- Background
- Assessment
- Special Consideration
-
- ALR6-2 Energy Emergency Alert 3 (EEA3)
-
- Background
- Assessment
- Special Considerations
-
- ALR 6-3 Energy Emergency Alert 2 (EEA2)
-
- Background
- Assessment
- Special Considerations
-
- ALR 6-1 Transmission Constraint Mitigation
-
- Background
- Assessment
- Special Considerations
-
- Integrated Bulk Power System Risk Assessment
-
- Introduction
- Recommendations
-
- Integrated Reliability Index Concepts
-
- The Three Components of the IRI
-
- Event-Driven Indicators (EDI)
- Condition-Driven Indicators (CDI)
- StandardsStatute-Driven Indicators (SDI)
-
- IRI Index Calculation
- IRI Recommendations
-
- Reliability Metrics Conclusions and Recommendations
-
- Transmission Equipment Performance
-
- Introduction
- Performance Trends
-
- AC Element Outage Summary and Leading Causes
- Transmission Monthly Outages
- Outage Initiation Location
- Transmission Outage Events
- Transmission Outage Mode
-
- Conclusions
-
- Generation Equipment Performance
-
- Introduction
- Generation Key Performance Indicators
-
- Multiple Unit Forced Outages and Causes
- 2008-2010 Review of Summer versus Winter Availability
-
- Conclusions and Recommendations
-
- Disturbance Event Trends
-
- Introduction
- Performance Trends
- Conclusions
-
- Abbreviations Used in This Report
- Contributions
-
- NERC Industry Groups
- NERC Staff
-

Reliability Metrics Performance
10
Reliability Metrics Performance Introduction Building upon last yearrsquos metric review the RMWG continues to assess the results of eighteen currently
approved performance metrics Due to data availability each of the performance metrics do not
address the same time periods (some metrics have just been established while others have data over
many years) though this will be an important improvement in the future Merit has been found in all
eighteen approved metrics At this time though the number of metrics is expected to will remain
constant however other metrics may supplant existing metrics In spite of the potentially changing mix
of approved metrics to goals is to ensure the historical and current assessments can still be performed
These metrics exist within an overall reliability framework and in total the performance metrics being
considered address the fundamental characteristics of an acceptable level of reliability (ALR) Each of
the elements being measured by the metrics should be considered in aggregate when making an
assessment of the reliability of the bulk power system with no single metric indicating exceptional or
poor performance of the power system
Due to regional differences (size of the region operating practices etc) comparing the performance of
one Region to another would be erroneous and inappropriate Furthermore depending on the region
being evaluated one metric may be more relevant to a specific regionrsquos performance than others and
assessment may not be strictly mathematical rather more subjective Finally choosing one regionrsquos
best metric performance to define targets for other regions is inappropriate
Another key principle followed in developing these metrics is to retain anonymity of any reporting
organization Thus granularity will be attempted up to the point that such actions might compromise
anonymity of any given company Certain reporting entities may appear inconsistent but they have
been preserved to maintain maximum granularity with individual anonymity
Although assessments have been made in a number of the performance categories others do not have
sufficient data to derive any conclusions from the metric results The RMWG recommends continued
assessment of these metrics until sufficient data is available Each of the eighteen performance metrics
are presented in summary with their SMART8 Table 1 ratings in The table provides a summary view of
the metrics with an assessment of the current metric trends observed by the RMWG Table 1 also
shows the order in which the metrics are aligned according to the standards objectives
8 SMART rating definitions are located at httpwwwnerccomdocspcrmwgSMART_20RATING_826pdf
Reliability Metrics Performance
11
Table 1 Metric SMART Ratings Relative to Standard Objectives
Metrics SMART Objectives Relative to Standards Prioritization
ALR Improvements
Trend
Rating
SMART
Rating
1-3 Planning Reserve Margin 13
1-4 BPS Transmission Related Events Resulting in Loss of Load 15
2-5 Disturbance Control Events Greater than Most Severe Single Contingency 12
6-2 Energy Emergency Alert 3 (EEA3) 15
6-3 Energy Emergency Alert 2 (EEA2) 15
Inconclusive
2-3 Activation of Under Frequency Load Shedding 10
2-4 Average Percent Non-Recovery DCS 15
4-1 Automatic Transmission Outages Caused by Protection System Misoperation 15
6-11 Automatic Transmission Outages Caused by Protection System Misoperation 14
6-12 Automatic Transmission Outages Caused by Human Error 14
6-13 Automatic Transmission Outages Caused by Failed AC Substation Equipment 14
6-14 Automatic Transmission Outages Caused by Failed AC Circuit Equipment 14
New Data
1-5 Systems Voltage Performance 14
3-5
Interconnected Reliability Operating Limit System Operating Limit (IROLSOL)
Exceedance 14
6-1 Transmission constraint Mitigation 14
6-15 Element Availability Percentage (APC) 13
6-16
Transmission System Unavailability on Operational Planned and Auto
Sustained Outages 13
No Data
1-12 Frequency Response 11
Trend Rating Symbols
Significant Improvement
Slight Improvement
Inconclusive
Slight Deterioration
Significant Deterioration
New Data
No Data
Reliability Metrics Performance
12
2010 Performance Metrics Results and Trends
ALR1-3 Planning Reserve Margin
Background
The Planning Reserve Margin9 is a measure of the relationship between the amount of resource capacity
forecast and the expected demand in the planning horizon10 Coupled with probabilistic analysis
calculated Planning Reserve Margins is an industry standard which has been used by system planners for
decades as an indication of system resource adequacy Generally the projected demand is based on a
5050 forecast11
Assessment
Planning Reserve Margin is the difference between forecast capacity and projected
peak demand normalized by projected peak demand and shown as a percentage Based on experience
for portions of the bulk power system that are not energy-constrained Planning Reserve Margin
indicates the amount of capacity available to maintain reliable operation while meeting unforeseen
increases in demand (eg extreme weather) and unexpected unavailability of existing capacity (eg
long-term generation outages) Further from a planning perspective Planning Reserve Margin trends
identify whether capacity additions are projected to keep pace with demand growth
Planning Reserve Margins considering anticipated capacity resources and adjusted potential capacity
resources decrease in the latter years of the 2009 and 2010 10-year forecast in each of the four
interconnections Typically the early years provide more certainty since new generation is either in
service or under construction with firm commitments In the later years there is less certainty about
the resources that will be needed to meet peak demand Declining Planning Reserve Margins are
inherent in a conventional forecast (assuming load growth) and do not necessarily indicate a trend of a
degrading resource adequacy Rather they are an indication of the potential need for additional
resources In addition key observations can be made to the Planning Reserve Margin forecast such as
short-term assessment rate of change through the assessment period identification of margins that are
approaching or below a target requirement and comparisons from year-to-year forecasts
While resource planners are able to forecast the need for resources the type of resource that will
actually be built or acquired to fill the need is usually unknown For example in the northeast US
markets with three to five year forward capacity markets no firm commitments can be made in the
9 Detailed calculations of Planning Reserve Margin are available at httpwwwnerccompagephpcid=4|331|333 10The Planning Reserve Margin indicated here is not the same as an operating reserve margin that system operators use for near-term
operations decisions 11These demand forecasts are based on ldquo5050rdquo or median weather (a 50 percent chance of the weather being warmer and a 50 percent
chance of the weather being cooler)
Reliability Metrics Performance
13
long-term However resource planners do recognize the need for resources in their long-term planning
and account for these resources through generator queues These queues are then adjusted to reflect
an adjusted forecast of resourcesmdashpro-rated by approximately 20 percent
When comparing the assessment of planning reserve margins between 2009 and 2010 the
interconnection Planning Reserve Margins are slightly higher on an annual basis in the 2010 forecast
compared to those of 2009 as shown in Figure 5
Figure 5 Planning Reserve Margin by Interconnection and Year
In general this is due to slightly higher capacity forecasts and slightly lower demand forecasts The pace
of any economic recovery will affect future comparisons This metric can be used by NERC to assess the
individual interconnections in the ten-year long-term reliability assessments If a noticeable change
Reliability Metrics Performance
14
occurs within the trend further investigation is necessary to determine the causes and likely effects on
reliability
Special Considerations
The Planning Reserve Margin is a capacity based metric Therefore it does not provide an accurate
assessment of performance in energy-limited systems (eg hydro capacity with limited water resources
or systems with significant variable generation penetration) In addition the Planning Reserve Margin
does not reflect potential transmission constraint internal to the respective interconnection Planning
Reserve Margin data shown in Figure 6 is used for NERCrsquos seasonal and long-term reliability
assessments and is the primary metric for determining the resource adequacy of a given assessment
area
The North American Bulk Power System is divided into four distinct interconnections These
interconnections are loosely connected with limited ability to share capacity or energy across the
interconnection To reflect this limitation the Planning Reserve Margins are calculated in this report
based on interconnection values rather than by national boundaries as is the practice of the Reliability
Assessment Subcommittee (RAS)
ALR1-4 BPS Transmission Related Events Resulting in Loss of Load
Background
This metric measures bulk power system transmission-related events resulting in the loss of load
Planners and operators can use this metric to validate their design and operating criteria by identifying
the number of instances when loss of load occurs
For the purposes of this metric an ldquoeventrdquo is an unplanned transmission disturbance that produces an
abnormal system condition due to equipment failures or system operational actions and results in the
loss of firm system demand for more than 15 minutes The reporting criteria for such events are
outlined below12
bull Entities with a previous year recorded peak demand of more than 3000 MW are required to
report all such losses of firm demands totaling more than 300 MW
bull All other entities are required to report all such losses of firm demands totaling more than 200
MW or 50 percent of the total customers being supplied immediately prior to the incident
whichever is less
bull Firm load shedding of 100 MW or more used to maintain the continuity of the bulk power
system reliability
12 Details of event definitions are available at httpwwwnerccomfilesEOP-004-1pdf
Reliability Metrics Performance
15
Assessment
Figure 6 illustrates that the number of bulk power system transmission-related events resulting in loss of
firm load13
Table 2
from 2002 to 2009 is relatively constant and suggests that 7 - 10 events per year is a norm for
the bulk power system However the magnitude of load loss shown in associated with these
events reflects a downward trend since 2007 Since the data includes weather-related events it will
provide the RMWG with an opportunity for further analysis and continued assessment of the trends
over time is recommended
Figure 6 BPS Transmission Related Events Resulting in Loss of Load Counts (2002-2009)
Table 2 BPS Transmission Related Events Resulting in Loss of Load MW Loss (2002-2009)
Year Load Loss (MW)
2002 3762
2003 65263
2004 2578
2005 6720
2006 4871
2007 11282
2008 5200
2009 2965
13The metric source data may require adjustments to accommodate all of the different groups for measurement and consistency as OE-417 is only used in the US
02468
101214
2002 2003 2004 2005 2006 2007 2008 2009
Count
Reliability Metrics Performance
16
ALR1-12 Interconnection Frequency Response
Background
This metric is used to track and monitor Interconnection Frequency Response Frequency Response is a
measure of an Interconnectionrsquos ability to stabilize frequency immediately following the sudden loss of
generation or load It is a critical component to the reliable operation of the bulk power system
particularly during disturbances and restoration The metric measures the average frequency responses
for all events where frequency drops more than 35 mHz within a year
Assessment
At this time there has been no data collected for ALR1-12 Therefore no assessment was made
ALR2-3 Activation of Under Frequency Load Shedding
Background
The purpose of Under Frequency Load Shedding (UFLS) is to balance generation and load in an island
following an extreme event The UFLS activation metric measures the number of times UFLS is activated
and the total MW of load interrupted in each Region and NERC wide
Assessment
Figure 7 and Table 3 illustrate a history of Under Frequency Load Shedding events from 2006 through
2010 Through this period itrsquos important to note that single events had a range load shedding from 15
MW to 7654 MW The activation of UFLS relays is the last automated reliability measure associated
with a decline in frequency in order to rebalance the system Further assessment of the MW loss for
these activations is recommended
Figure 7 ALR2-3 Count of Activations by Year and Regional Entity (2001-2010)
Reliability Metrics Performance
17
Table 3 ALR2-3 Under Frequency Load Shedding MW Loss
ALR2-3 Under Frequency Load Shedding MW Loss
2006 2007 2008 2009 2010
FRCC
2273
MRO
486
NPCC 94
63 20 25
RFC
SPP
672 15
SERC
ERCOT
WECC
Special Considerations
The use of a single metric cannot capture all of the relevant information associated with UFLS events as
the events relate to each respective UFLS plan The ability to measure the reliability of the bulk power
system is directly associated with how it performs compared to what is planned
ALR2-4 Average Percent Non-Recovery Disturbance Control Standards (DCS)
Background
This metric measures the Balancing Authorityrsquos (BA) or Reserve Sharing Grouprsquos (RSG) ability to balance
resources and demand with the timely deployment of contingency reserve thereby returning the
interconnection frequency to within defined limits following a Reportable Disturbance14
Assessment
The relative
percentage provides an indication of performance measured at a BA or RSG
Figure 8 illustrates the average percent non-recovery of DCS events from 2006 to 2010 The graph
provides a high-level indication of the performance of each respective RE However a single event may
not reflect all the reliability issues within a given RE In order to understand the reliability aspects it
may be necessary to request individual REs to further investigate and provide a more comprehensive
reliability report Further investigation may indicate the entity had sufficient contingency reserve but
through their implementation process failed to meet DCS recovery
14 Details of the Disturbance Control Performance Standard and Reportable Disturbance definitions are available at
httpwwwnerccomfilesBAL-002-0pdf
Reliability Metrics Performance
18
Continued trend assessment is recommended Where trends indicated potential issues the regional
entity will be requested to investigate and report their findings
Figure 8 Average Percent Non-Recovery of DCS Events (2006-2010)
Special Consideration
This metric aggregates the number of events based on reporting from individual Balancing Authorities or
Reserve Sharing Groups It does not capture the severity of the DCS events It should be noted that
most REs use 80 percent of the Most Severe Single Contingency to establish the minimum threshold for
reportable disturbance while others use 35 percent15
ALR2-5 Disturbance Control Events Greater Than Most Severe Single Contingency
Background
This metric represents the number of disturbance events that exceed the Most Severe Single
Contingency (MSSC) and is specific to each BA Each RE reports disturbances greater than the MSSC on
behalf of the BA or Reserve Sharing Group (RSG) The result helps validate current contingency reserve
requirements The MSSC is determined based on the specific configuration of each BA or RSG and can
vary in significance and impact on the BPS
15httpwwwweccbizStandardsDevelopmentListsRequest20FormDispFormaspxID=69ampSource=StandardsDevelopmentPagesWEC
CStandardsArchiveaspx
375
079
0
54
008
005
0
15 0
77
025
0
33
000510152025303540
2006
2007
2008
2009
2010
2006
2007
2008
2009
2010
2006
2007
2008
2009
2010
2006
2007
2008
2009
2010
2006
2007
2008
2009
2010
2006
2007
2008
2009
2010
2006
2007
2008
2009
2010
2006
2007
2008
2009
2010
FRCC MRO NPCC RFC SERC SPP ERCOT WECC
Region and Year
Reliability Metrics Performance
19
Assessment
Figure 9 represents the number of DCS events within each RE that are greater than the MSSC from 2006
to 2010 This metric and resulting trend can provide insight regarding the risk of events greater than
MSSC and the potential for loss of load
In 2010 SERC had 16 BAL-002 reporting entities eight Balancing Areas elected to maintain Contingency
Reserve levels independent of any reserve sharing group These 16 entities experienced 79 reportable
DCS eventsmdash32 (or 405 percent) of which were categorized as greater than their most severe single
contingency Every DCS event categorized as greater than the most severe single contingency occurred
within a Balancing Area maintaining independent Contingency Reserve levels Significantly all 79
regional entities reported compliance with the Disturbance Recovery Criterion including for those
Disturbances that were considered greater than their most severe single Contingency This supports a
conclusion that regardless of the size of the BA or participation in a Reserve Sharing Group SERCrsquos BAL-
002 reporting entities have demonstrated the ability in 2010 to use Contingency Reserve to balance
resources and demand and return Interconnection frequency within defined limits following Reportable
Disturbances
If the SERC Balancing Areas without large generating units and who do not participate in a Reserve
Sharing Group change the determination of their most severe single contingencies to effect an increase
in the DCS reporting threshold (and concurrently the threshold for determining those disturbances
which are greater than the most severe single contingency) there will certainly be a reduction in both
the gross count of DCS events in SERC and in the subset considered under ALR2-5 Masking the discrete
events which cause Balancing Area response may not reduce ldquoriskrdquo to the system However it is
desirable to maintain a reporting threshold which encourages the Balancing Authority to respond to any
unexplained change in ACE in a manner which supports Interconnection frequency based on
demonstrated performance SERC will continue to monitor DCS performance and will continue to
evaluate contingency reserve requirements but does not consider 2010 ALR2-5 performance to be an
adverse trend in ldquoextreme or unusualrdquo contingencies but rather within the normal range of expected
occurrences
Reliability Metrics Performance
20
Special Consideration
The metric reports the number of DCS events greater than MSSC without regards to the size of a BA or
RSG and without respect to the number of reporting entities within a given RE Because of the potential
for differences in the magnitude of MSSC and the resultant frequency of events trending should be
within each RE to provide any potential reliability indicators Each RE should investigate to determine
the cause and relative effect on reliability of the events within their footprints Small BA or RSG may
have a relatively small value of MSSC As such a high number of DCS greater than MCCS may not
indicate a reliability problem for the reporting RE but may indicate an issue for the respective BA or RSG
In addition events greater than MSSC may not cause a reliability issue for some BA RSG or RE if they
have more stringent standards which require contingency reserves greater than MSSC
ALR 1-5 System Voltage Performance
Background
The purpose of this metric is to measure the transmission system voltage performance (either absolute
or per unit of a nominal value) over time This should provide an indication of the reactive capability
available to the transmission system The metric is intended to record the amount of time that system
voltage is outside a predetermined band around nominal
0
5
10
15
20
25
30
2006
2007
2008
2009
2010
2006
2007
2008
2009
2010
2006
2007
2008
2009
2010
2006
2007
2008
2009
2010
2006
2007
2008
2009
2010
2006
2007
2008
2009
2010
2006
2007
2008
2009
2010
2006
2007
2008
2009
2010
FRCC MRO NPCC RFC SERC SPP ERCOT WECC
Cou
nt
Region and Year
Figure 9 Disturbance Control Events Greater Than Most Severe Single Contingency (2006-2010)
Reliability Metrics Performance
21
Special Considerations
Each Reliability Coordinator (RC) will work with the Transmission Owners (TOs) and Transmission
Operators (TOPs) within its footprint to identify specific buses and voltage ranges to monitor for this
metric The number of buses the monitored voltage levels and the acceptable voltage ranges may vary
by reporting entity
Status
With a pilot program requested in early 2011 a voluntary request to Reliability Coordinators (RC) was
made to develop a list of key buses This work continues with all of the RCs and their respective
Transmission Owners (TOs) to gather the list of key buses and their voltage ranges After this step has
been completed the TO will be requested to provide relevant data on key buses only Based upon the
usefulness of the data collected in the pilot program additional data collection will be reviewed in the
future
ALR3-5 Interconnection Reliability Operating Limit System Operating Limit (IROLSOL) Exceedances
Background
This metric illustrates the number of times that defined Interconnection Reliability Operating Limit
(IROL) or System Operating Limit (SOL) were exceeded and the duration of these events Exceeding
IROLSOLs could lead to outages if prompt operator control actions are not taken in a timely manner to
return the system to within normal operating limits This metric was approved by NERCrsquos Operating and
Planning Committees in June 2010 and a data request was subsequently issued in August 2010 to collect
the data for this metric Based on the results of the pilot conducted in the third and fourth quarter of
2010 there is merit in continuing measurement of this metric Note the reporting of IROLSOL
exceedances became mandatory in 2011 and data collected in Table 4 for 2010 has been provided
voluntarily
Reliability Metrics Performance
22
Table 4 ALR3-5 IROLSOL Exceedances
3Q2010 4Q2010 1Q2011
le 10 mins 123 226 124
le 20 mins 10 36 12
le 30 mins 3 7 3
gt 30 mins 0 1 0
Number of Reporting RCs 9 10 15
ALR4-1 Automatic Transmission Outages Caused by Protection System Misoperations
Background
Originally titled Correct Protection System Operations this metric has undergone a number of changes
since its initial development To ensure that it best portrays how misoperations affect transmission
outages it was necessary to establish a common understanding of misoperations and the data needed
to support the metric NERCrsquos Reliability Assessment Performance Analysis (RAPA) group evaluated
several options of transitioning from existing procedures for the collection of misoperations data and
recommended a consistent approach which was introduced at the beginning of 2011 With the NERC
System Protection and Control Subcommitteersquos (SPCS) technical guidance NERC and the regional
entities have agreed upon a set of specifications for misoperations reporting including format
categories event type codes and reporting period to have a final consistent reporting template16
Special Considerations
Only
automatic transmission outages 200 kV and above including AC circuits and transformers will be used
in the calculation of this metric
Data collection will not begin until the second quarter of 2011 for data beginning with January 2011 As
revised this metric cannot be calculated for this report at the current time The revised title and metric
form can be viewed at the NERC website17
16 The current Protection System Misoperation template is available at
httpwwwnerccomfilezrmwghtml 17The current metric ALR4-1 form is available at httpwwwnerccomdocspcrmwgALR_4-1Percentpdf
Reliability Metrics Performance
23
ALR6-11 ndash ALR6-14
ALR6-11 Automatic AC Transmission Outages Initiated by Failed Protection System Equipment
ALR6-12 Automatic AC Transmission Outages Initiated by Human Error
ALR6-13 Automatic AC Transmission Outages Initiated by Failed AC Substation Equipment
ALR6-14 Automatic AC Circuit Outages Initiated by Failed AC Circuit Equipment
Background
These metrics evolved from the original ALR4-1 metric for correct protection system operations and
now illustrate a normalized count (on a per circuit basis) of AC transmission element outages (ie TADS
momentary and sustained automatic outages) that were initiated by Failed Protection System
Equipment (ALR6-11) Human Error (ALR6-12) Failed AC Substation Equipment (ALR6-13) and Failed AC
Circuit Equipment (ALR6-14) These metrics are all related to the non-weather related initiating cause
codes for automatic outages of AC circuits and transformers operated 200 kV and above
Assessment
Figure 10 through Figure 13 show the normalized outages per circuit and outages per transformer for
facilities operated at 200 kV and above As shown in all eight of the charts there are some regional
trends in the three years worth of data However some Regionrsquos values have increased from one year
to the next stayed the same or decreased with no discernable regional trends For example ALR6-11
computes the automatic AC Circuit outages initiated by failed protection system equipment
There are some trends to the ALR6-11 to ALR6-14 data but many regions do not have enough data for a
valid trend analysis to be performed NERCrsquos outage rate seems to be improving every year On a
regional basis metric ALR6-11 along with ALR6-12 through ALR6-14 cannot be statistically understood
until confidence intervals18
18The detailed Confidence Interval computation is available at
are calculated ALR metric outage frequency rates and Regional equipment
inventories that are smaller than others are likely to require more than 36 months of outage data Some
numerically larger frequency rates and larger regional equipment inventories (such as NERC) do not
require more than 36 months of data to obtain a reasonably narrow confidence interval
httpwwwnerccomdocspctadstfTADS_Nov_2_2007APPENDIX_C_Confidence_Intervalpdf
Reliability Metrics Performance
24
While more data is still needed on a regional basis to determine if each regionrsquos bulk power system is
becoming more reliable year to year there are areas of potential improvement which include power
system condition protection performance and human factors These potential improvements are
presented due to the relatively large number of outages caused by these items The industry can
benefit from detailed analysis by identifying lessons learned and rolling average trends of NERC-wide
performance With a confidence interval of relatively narrow bandwidth one can determine whether
changes in statistical data are primarily due to random sampling error or if the statistics are significantly
different due to performance
Reliability Metrics Performance
25
ALR 6-11 ndash Automatic Outages Initiated by Failed Protection System Equipment
Automatic outages with an initiating cause code of failed protection system equipment are in Figure 10
Figure 10 ALR6-11 by Region (Includes NERC-Wide)
This code covers automatic outages caused by the failure of protection system equipment This
includes any relay andor control misoperations except those that are caused by incorrect relay or
control settings that do not coordinate with other protective devices
ALR6-12 ndash Automatic Outages Initiated by Human Error
Figure 11 shows the automatic outages with an initiating cause code of human error This code covers
automatic outages caused by any incorrect action traceable to employees andor contractors for
companies operating maintaining andor providing assistance to the Transmission Owner will be
identified and reported in this category
Reliability Metrics Performance
26
Also any human failure or interpretation of standard industry practices and guidelines that cause an
outage will be reported in this category
Figure 11 ALR6-12 by Region (Includes NERC-Wide)
Reliability Metrics Performance
27
ALR6-13 ndash Automatic Outages Initiated by Failed AC Substation Equipment
Figure 12 shows the automatic outages with an initiating cause code of failed AC substation equipment
This code covers automatic outages caused by the failure of AC Substation ie equipment ldquoinside the
substation fencerdquo including transformers and circuit breakers but excluding protection system
equipment19
19TADS Initiating Cause Code definitions are located at httpwwwnerccomdocspctadswgTADS_Definitions_Appendix_7_092909pdf
Figure 12 ALR6-13 by Region (Includes NERC-Wide)
Reliability Metrics Performance
28
ALR6-14 Automatic AC Transmission Outages Initiated by Failed AC Circuit Equipment
Figure 13 shows the automatic outages with an initiating cause code of failed AC circuit equipment
Automatic Outages related to the failure of AC Circuit equipment ie overhead or underground
equipment ldquooutside the substation fencerdquo 20
ALR6-15 Element Availability Percentage (APC)
Background
This metric uses data and calculations directly from the NERC TADS effort and illustrates the overall
percent of time the aggregate of transmission facilities are available and in service This is an aggregate
20TADS Initiating Cause Code definitions are located at httpwwwnerccomdocspctadswgTADS_Definitions_Appendix_7_092909pdf
Figure 13 ALR6-14 by Region (Includes NERC-Wide)
Reliability Metrics Performance
29
value using sustained outages (automatic and non-automatic) for both lines and transformers operated
at 200 kV and above for each Regional Entity Interconnection and for NERC This metric was approved
by the NERC Operating and Planning Committees in September 2010
Assessment
Figure 14 shows the aggregate element availability percentage (APC) for transmission and transformers
facilities operated at 200 kV and above The values are all over 90 percent which shows excellent
system availability The RMWG recommends continued metric assessment for at least a few more years
in order to determine the value of this metric
Figure 14 2010 ALR6-15 Element Availability Percentage
Notably the Eastern Interconnection does not include Quebec or ERCOT ERCOT does not have any
transformers with low-side voltage levels 200 kV and above
Special Consideration
It should be noted that the non-automatic outage data needed to calculate this metric was only first
collected for the calendar year 2010 as part of the TADS process Therefore only one year of data for
this metric is available at this time
Reliability Metrics Performance
30
ALR6-16 Transmission System Unavailability
Background
This metric uses data and calculations directly from the NERC TADS effort and shows the overall percent
of time the aggregate of transmission facilities are unavailable due to automatic and non-automatic
outages This is an aggregate value using sustained automatic outages for both lines and transformers
operated at 200 kV and above for each Regional Entity and for NERC This metric was approved by the
NERC Operating and Planning Committees in December 2010
Assessment
Figure 15 and Figure 16 illustrate the 2010 aggregate unavailability percentage for AC circuits and
transformer facilities operated at 200 kV and above The values for AC circuits are all under 3 percent
which shows excellent system availability
The RMWG recommends continued metric assessment for at least a few more years in order to
determine the value of this metric
Special Consideration
It should be noted that the non-automatic outage data needed to calculate this metric was only first
collected for the calendar year 2010 as part of the TADS process Therefore only one year of data for
this metric is available at this time
Figure 15 2010 ALR6-16 Transmission System Unavailability
Reliability Metrics Performance
31
Figure 16 2010 ALR6-16 Transmission System Unavailability by Outage Type
Notably the Eastern Interconnection does not include Quebec or ERCOT Also ERCOT does not have
any transformers with low-side voltage levels 200 kV and above
ALR6-2 Energy Emergency Alert 3 (EEA3)
Background
This metric identifies the number of times Energy Emergency Alerts Level 3 (EEA3) are issued EEA3
events are firm-load interruptions due to capacity and energy deficiency EEA3 is currently reported
collected and maintained in NERCrsquos Reliability Coordination Information System (RCIS) and is defined in
Attachment 1 of the NERC Standard EOP-00221
21 The latest version of Attachment 1 for EOP-002 is available at
This metric identifies the number of times EEA3s are
issued The number of EEA3s per year provides a relative indication of performance measured at a
Balancing Authority or interconnection level As historical data is gathered trends in future reports will
provide an indication of either decreasing or increasing use of EEA3s signaling adequacy of the electric
supply system This metric can also be considered in the context of Planning Reserve Margin Significant
increases or decreases in EEA3 events with relatively constant Planning Reserve Margins could indicate
httpwwwnerccompagephpcid=2|20
Reliability Metrics Performance
32
volatility in the actual loads compared to forecast levels or changes in the adequacy of the bulk power
system required to meet load demands
Assessment
Figure 17 shows the number of EEA3 events during 2006 and 2010 from an RE level An interactive
presentation was released and available at the Reliability Indicatorrsquos page22
The Acadiana Load Pocket (ALP) is an area in south central Louisiana that has experienced regular
transmission constraints and numerous Energy Emergency Alert filings by the SPP Reliability Controller
(SPP RC) Transmission within ALP is owned by Entergy Lafayette Utilities System (LUS) and Cleco
Power LLC (Cleco) The transmission constraints within the ALP are primarily caused by the local area
load and the lack of generation located in close proximity to the load area
The number of EEA3rsquos
declared in 2010 returned to more traditional numbers The 2009 spike in EEA3 events in the SPP
Region that was driven by issues in the Acadiana Load Pocket (ALP) were not present in 2010
Special Considerations
Ideally the measure should capture only EEAs that are declared for reliability reasons and not for
economic factors The RMWG has not been able to differentiate these reasons for future reporting and
it has made a recommendation to the Reliability Coordinator Working Group (RCWG) to consider a
revised EEA declaration to exclude economic factors
The reason the EEA volume decreased from 2009 to 2010 in SPP was because the SPP ICT RC23
coordinated an operating agreement between the five operating companies in the ALP The operating
agreement included a cost sharing re-dispatch that alleviated the need of a Transmission Loading Relief
(TLR-5) declaration24
22The EEA3 interactive presentation is available on the NERC website at
During 2009 there was no operating agreement therefore an entity had to
provide Network and Native Load (NNL) relief when a TLR-5 was called by the ICT RC When the TLR-5
was the primary tool to control the post contingent loading in the ALP some of the BAs would have their
firm transmission curtailed to the point where they could no longer serve their load therefore the EEA
3 was needed to communicate a capacityreserve deficiency
httpwwwnerccompagephpcid=4|331|335 23Southwest Power Pool (SPP) Independent Coordinator of Transmission (ICT) Reliability Coordinator (RC) 24More information on Transmission Load Relief is contained in the IRO-006 standard which is located at httpwwwnerccomfilesIRO-006-4pdf In particular TLR-5 definitions are referenced on page 16 and 17
Reliability Metrics Performance
33
Figure 17 ALR6-2 Energy Emergency Alert 3 (EEA3) Counts by Region (2006-2010)
Cleco Power Entergy and LUS are currently constructing an estimated $200 million transmission
infrastructure improvement project to mitigate transmission constraints into ALP Construction of the
project is scheduled to be complete in 2012 Completion of the project should help alleviate some of
the transmission congestion in this area Energy Emergency Alerts filed by the SPP Regional Entity
continue to decline
SPP RTO continues to coordinate operating plans with the operating entities in this area Mitigation
plans and local operating guides in place are expected to provide sufficient flexibility should issues arise
NERC will continue to monitor this area for Reliability Impacts and coordinate any actions with the SPP
Reliability Coordinator and SPP Regional Entity
ALR 6-3 Energy Emergency Alert 2 (EEA2)
Background
Energy Emergency Alert 2 (EEA2) is to measure the number of events BAs declare for deficient capacity
and energy during peak load periods which may serve as a leading indicator of energy and capacity
shortfall in the adequacy of the electric supply system EEA2 provides a sense of the frequency of
precursor events to the more severe EEA3 declarations This metric measures the number of events
1 3 1 2 214
3 4 4 1 5 334
4 2 1 52
1
0
5
10
15
20
25
30
3520
0620
0720
0820
0920
1020
0620
0720
0820
0920
1020
0620
0720
0820
0920
1020
0620
0720
0820
0920
1020
0620
0720
0820
0920
1020
0620
0720
0820
0920
1020
0620
0720
0820
0920
1020
0620
0720
0820
0920
10
FRCC MRO NPCC RFC SERC SPP TRE WECC
2006-2009
2010
Region and Year
Reliability Metrics Performance
34
Balancing Authorities declare for deficient capacity and energy during peak load periods At this time
however this data reflects inclusion of Demand Side Resources that would not be indicative of
inadequacy of the electric supply system
The number of EEA2 events and any trends in their reporting indicates how robust the system is in
being able to supply the aggregate load requirements The historical records may include demand
response activations and non-firm load interruptions per applicable contracts within the EEA alerts per
its definition25
Assessment
Demand response is a legitimate resource to be called upon by balancing authorities and
do not indicate a reliability concern As data is gathered in the future reports will provide an indication
of either decreasing or increasing adequacy in the electric supply system EEA2 events called solely for
activation of demand response (controllable or contractually prearranged demand-side dispatch
programs) or interruption of non-firm load per applicable contracts should be excluded This metric can
also be considered in the context of the Planning Reserve Margin Significant increases or decreases in
EEA2 events with relatively constant Planning Reserve Margins could indicate volatility in the actual
loads compared to forecast levels or changes in the adequacy of the bulk power system required to
meet load demands
Figure 18 shows the number of EEA2 events by Regional Entity from 2006 to 2010 EEA2 interactive
version available on line by quarter and region26
25 The EEA2 is defined at
The general trend continues to show improved
performance which may have been influenced by the overall reduction in demand throughout NERC
caused by the economic downturn Specific performance by any one region should be investigated
further for issues or events that may affect the results Determining whether performance reported
includes those events resulting from the economic operation of DSM and non-firm load interruption
should also be investigated The RMWG recommends continued metric assessment
httpwwwnerccomfilesEOP-002-2pdf 26 EEA2 interactive version located at httpwwwnerccompagephpcid=4|331|341
Reliability Metrics Performance
35
Special Considerations
The intent of this metric is to measure only EEAs that are called for reliability reasons and not for
economic factors such as demand side management (DSM) and non-firm load interruption The
historical data for this metric may include events that were called for economic factors According to
the RCWG recent data should only include EEAs called for reliability reasons
ALR 6-1 Transmission Constraint Mitigation
Background
The RMWG completed a pilot with four regional entities Based on the results the RMWG expanded the
pilot data collection to all regions and the initial results of the data collection are shown in Figure 19
and Table 5 Based on the results of the pilot there is merit in continuing to assess this metric The
intent of this metric is to identify trends in the number of mitigation measures (Special Protection
Schemes (SPS) Remedial Action Schemes (RAS) and Operating Procedures) required to meet reliability
requirements By their nature SPS do not indicate an inherent weakness in the bulk power system
rather they are an indication of methods that are taken to operate the system through the range of
conditions it must perform This metric is only intended to evaluate the trend use of these plans and
whether the metric indicates robustness of the transmission system is increasing remaining static or
decreasing
1 27
2 1 4 3 2 1 2 4 5 2 5 832
4724
211
5 38 5 1 1 8 7 4 1 1
05
101520253035404550
2006
2007
2008
2009
2010
2006
2007
2008
2009
2010
2006
2007
2008
2009
2010
2006
2007
2008
2009
2010
2006
2007
2008
2009
2010
2006
2007
2008
2009
2010
2006
2007
2008
2009
2010
2006
2007
2008
2009
2010
FRCC MRO NPCC RFC SERC SPP TRE WECC
2006-2009
2010
Region and Year
Figure 18 ALR6-3 Energy Emergency Alert 2 (EEA2)
Reliability Metrics Performance
36
Assessment
The pilot data indicates a relatively constant number of mitigation measures over the time period of
data collected
Figure 19 ALR6-1 Transmission Constraint Mitigation by SPSRAS (2009-2014)
0102030405060708090
100110120
2009
2010
2011
2014
2009
2010
2011
2014
2009
2010
2011
2014
2009
2010
2011
2014
2009
2010
2011
2014
2009
2010
2011
2014
2009
2010
2011
2014
2009
2010
2011
2014
FRCC MRO NPCC RFC SERC SPP ERCOT WECC
Coun
t
Region and Year
SPSRAS
Reliability Metrics Performance
37
Table 5 ALR6-1 Transmission Constraint Mitigation by Operating ProcedureGuides (2009-2011)
ALR6-1 Transmission Constraint Mitigation by Operating ProcedureGuides (2009-2014)
2009 2010 2011 2014
FRCC 107 75 66
MRO 79 79 81 81
NPCC 0 0 0
RFC 2 1 3 4
SPP 39 40 40 40
SERC 6 7 15
ERCOT 29 25 25
WECC 110 111
Special Considerations
A certain number of SPS mitigation plans may be necessary to support reliable operation of the system
If the number of SPS increase over time this may indicate that additional transmission capacity is
required A reduction in the number of SPS may be an indicator of increased generation or transmission
facilities being put into service which may indicate greater robustness of the bulk power system In
general mitigation plans are a viable and valuable tool for effective operation of the bulk power system
In power system planning reliability operability capacity and cost-efficiency are simultaneously
considered through a variety of scenarios to which the system may be subjected Mitigation measures
are a method for optimizing a power system across these scenarios Changes in quantities of mitigation
plans may indicate year-on-year differences in the system being evaluated
Integrated Bulk Power System Risk Assessment
Introduction In developing eighteen metrics to measure acceptable levels of reliability it has become clear that any
such measurement of reliability must include consideration of the risks present within the bulk power
system in order for us to appropriately prioritize and manage these system risks The scope for the
Reliability Metrics Working Group (RMWG)27
27 The RMWG scope can be viewed at
includes a task to develop a risk-based approach that
provides consistency in quantifying the severity of events The approach not only can be used to
httpwwwnerccomfilezrmwghtml
Reliability Metrics Performance
38
measure risk reduction over time but also can be applied uniformly in event analysis process to identify
the events that need to be analyzed in detail and sort out non-significant events
The Operating Committee (OC) and Planning Committee (PC) endorsed the concepts and framework28 of
the risk-based approach in their September 2010 joint meeting and further supported the event severity
risk index (SRI) calculation29
Recommendations
in March 2011
bull NERC should embrace the use of risk assessment to identify trends in addition to lessons learned
in order to improve bulk power system reliability
bull The RMWG should continue to coordinate and communicate with the Event Analysis Working
Group (EAWG) to apply the SRI into the event analysis process and root cause analysis
bull As trend evaluations increase the knowledge of risks to the bulk power system data required to
support additional assessment should be gathered
Event Severity Risk Index (SRI)
Risk assessment is an essential tool for achieving the alignment between organizations people and
technology This will assist in quantifying inherent risks identifying where potential high risks exist and
evaluating where the most significant lowering of risks can be achieved Being learning organizations
the Electric Reliability Organization (ERO) Regional Entities and Registered Entities can use these tools
to focus on the areas of highest risk to reliability to provide a sound basis for developing results-based
standards and compliance programs Risk assessment also serves to engage all stakeholders in a
dialogue about specific risk factors and helps direct a strategic plan for risk reduction and early
detection
The SRI is a daily blended metric for which transmission loss generation loss and load loss events are
calculated Each element (transmission generation and load loss) is factored by the systemrsquos inventory
for that element to rate significant events appropriately On a yearly basis these daily performances
can be sorted in descending order to evaluate the year-on-year performance of the system
In order to test drive the concepts the RMWG applied these calculations against historically memorable
days to derive SRIs Once these calculations were complete they were reviewed and evaluated by
various stakeholders for reasonableness Based upon feedback modifications to the calculation were
made and assessed against the historic days performed This iterative process locked down the details
28 httpwwwnerccomdocspcrmwgIntegrated_Bulk_Power_System_Risk_Assessment_Concepts_Finalpdf 29 httpwwwnerccomdocspcrmwgSRI_Equation_Refinement_May6_2011pdf
Reliability Metrics Performance
39
for the calculation of SRI whose calculation from zero (no transmission line outages generation outages
or load lost in a day) to 1000 (a theoretical condition in which every transmission line all generation
units and all load lost across the system in a single day)
Figure 20 captures the calculated severity risk value for each of the days for each year benchmarked
with the historic significant events which were used to concept test the calculation Since there is
significant disparity between days the bulk power system is stressed compared to those that are
ldquoroutinerdquo and ldquoherordquo days of the year where the system performed extremely well the curve is depicted
using a logarithmic scale Each yearrsquos data is sorted in descending order striking a characteristic shape
At the left-side of the curve the days in which the system is severely stressed are plotted The central
more linear portion of the curve identifies the routine day performance while the far right-side of the
curve shows the values plotted for days in which almost all lines and generation units are in service and
essentially no load is lost
The trends on the chart below show that 2009 and 2010 had fewer extreme days than 2008 Routine
daily performance appears generally consistent across all three years Figure 20 captures the days for
each year benchmarked with historically significant events
In Figure 20 NERCrsquos event categories and SRI ratings are directly related As the SRI increases the
category or severity of the event increases Historical events are also shown to relate modern
reliability measurements to give a perspective of how a well-known event would register on the SRI
scale
The event analysis process30
30
benefits from the SRI as it enables a numerical analysis of an event in
comparison to other events By this measure an event can be prioritized by its severity In a severe
event this is unnecessary However for events that do not result in severe stressing of the bulk power
system this prioritization can be a challenge By using the SRI the event analysis process can decide
which events to learn from and reduce which events to avoid and when resilience needs to be
increased under high impact low frequency events as shown in the blue boxes in the figure
httpwwwnerccompagephpcid=5|365
Reliability Metrics Performance
40
Figure 20 NERC Annual Daily Severity Risk Index (SRI) Sorted Descending with Historic Benchmark Days
Other factors that impact severity of a particular event to be considered in the future include whether
equipment operated as designed and resulted in loss of load from a reliability perspective (intentional
and controlled load-shedding) Mechanisms for enabling ongoing refinement to include the historic and
simulated events for future severity risk calculations are being explored
Reliability Metrics Performance
41
Integrated Reliability Index Concepts In December 2010 the RMWG was challenged by the OC and PC to develop a single index concept to
measure the universe of risks associated with the bulk power system As a result the integrated
reliability index (IRI) concepts were proposed31
Figure 21
the three components of which were defined to
quantify each specific risk aspect They are titled the Event Driven Index (EDI) StandardsStatute Driven
Index (SDI) and Condition Driven Index (CDI) illustrated in with measures associated with
system events standards compliance and eighteen performance metrics The development of an
integrated reliability index aims to inform increase transparency and quantify the effectiveness of risk
reduction or mitigation actions The goal is to provide the industry meaningful trends of the BPSrsquos
performance and guidance on how the industry can improve reliability and support risk-informed
decision making Once completed the IRI will facilitate holistic assessment of performance Finally the
IRI should help overcome concern and confusion about how many metrics are being analyzed for system
reliability assessments
Figure 21 Risk Model for Bulk Power System
The integrated model of event-driven condition-driven and standardsstatute-driven risk information
can be constructed to illustrate all possible logical relations between the three risk sets Due to the
nature of the system there may be some overlap among the components
31 httpwwwnerccomdocspcrmwgIntegrated_Reliability_Index_WhitePaper_DRAFTpdf
Event Driven Index (EDI)
Indicates Risk from
Major System Events
Standards Statute Driven
Index (SDI)
Indicates Risks from Severe Impact Standard Violations
Condition Driven Index (CDI)
Indicates Risk from Key Reliability
Indicators
Reliability Metrics Performance
42
The Three Components of the IRI The three components of the IRI work together as shown in Figure 22 to comprise a full picture of the
state of reliability
Figure 22 An overview of the components that comprise the Integrated Reliability Index (IRI)
Event-Driven Indicators (EDI)
The Event-Driven Indicator provides a basis for prioritization of events based on bulk power system
integrity equipment performance and engineering judgment This indicator can serve as a high value
risk assessment tool to be used by stakeholders to investigate and evaluate disturbance history and
measure the severity of these events The relative ranking of events requires industry expertise agreed-
upon goals and engineering judgment The EDI is a derivative of SRI results for a specific time period
but it transforms that performance into a form of an availability index These calculations will be further
refined as feedback is received
Condition-Driven Indicators (CDI)
The Condition-Driven Indicators focus on a set of measurable system conditions (performance
measures) to assess bulk power system reliability These reliability indicators identify factors that
positively or negatively impact reliability and are early predictors of the risk to reliability from events or
unmitigated violations A collection of these indicators measures how close reliability performance is to
the desired outcome and if the performance against these metrics is constant or improving
Reliability Metrics Performance
43
StandardsStatute-Driven Indicators (SDI)
The StandardsStatute-Driven Indicator is a calculation of success of compliance based upon the subset
of high-value standards and is divided by the number of participations who could have received the
violation within the time period considered Also based on these factors known unmitigated violations
of elevated risk factor requirements are weighted higher than lower risk factors The index decreases if
the compliance improvement is achieved over a trending period
IRI Index Calculation As with the SRI the IRI is based on an importance weighting factor which the RMWG can modify over
time after gaining experience with the new metric as well as consideration of feedback from industry
At this time the RMWG believes some form of blended weighting may serve to start to populate IRI
characteristic curves at a high and generic level Based upon feedback from stakeholders this approach
may change or as discussed below weighting factors may vary based on periodic review and risk model
update The RMWG will continue the refinement of the IRI calculation and consider other significant
factors that impact reliability (eg intentional and controlled load-shedding) further it will explore
developing mechanisms for enabling ongoing refinement which should be influenced by a wide set of
stakeholders
RMWG recommends the Event Driven Index (EDI) be weighted the highest (50 percent) since events
actually occurred indicating how the system was performing The Condition Driven Index (CDI) and
StandardsStatute Driven Index (SDI) are weighted 25 each since they are indicators of potential risks
to BPS reliability IRI can be calculated as follows
IRI is intended to be a composite metric which integrates several forms of individual risks to the bulk
power system Since the three components range across many stakeholder organizations these
concepts are developed as starting points for continued study and evaluation Additional supporting
materials can be found in the IRI whitepaper32
IRI Recommendations
including individual indices calculations and preliminary
trend information
For the IRI more investigation should be performed to determine the best way to integrate EDI CDI
and SDI into an Integrated Reliability Index (IRI) that quantitatively represents the reliability of the bulk
32 The IRI whitepaper can be found at httpwwwnerccomdocspcrmwgIntegrated_Reliability_Index_WhitePaper_DRAFTpdf
Reliability Metrics Performance
44
power system To this end study into determining the amount of overlap between the components is
necessary RMWG is currently working to determine the proper amount of overlap between the IRI
components
Also the CDI component of the IRI needs to be solidified This is especially true with the CDI More
accurate metric data is needed to paint a fuller picture of the CDI Many of the metrics used to calculate
the CDI are new or they have limited data Compared to the SDI which counts well-known violation
counts and the EDI which uses the well-defined CDI the CDI lacks the depth of rigor that the other two
components have acquired through their years of data RMWG is currently working to improve the CDI
Reliability Metrics Conclusions and Recommendations Among the eighteen metrics that address the characteristics of an adequate level of reliability (ALR)
metric trends indicate the system is performing better in the following seven areas
bull ALR1-3 Planning Reserve Margin
bull ALR1-4 BPS Transmission Related Events Resulting in Loss of Load
bull ALR2-5 Disturbance Control Events Greater than Most Severe Single Contingency
bull ALR6-2 Energy Emergency Alert 3 (EEA3)
bull ALR6-3 Energy Emergency Alert 2 (EEA2)
bull ALR6-11 Automatic Transmission Outages Caused by Protection System Misoperations
bull ALR6-13 Automatic Transmission Outages Caused by Failed AC Substation Equipment
Assessments have been made in other performance categories A number of them do not have
sufficient data to derive any conclusions from the results The RMWG recommends continued data
collection and assessment of these metrics If a metric does not yield any trend in a five-year reporting
period the metric will be modified or withdrawn
For the IRI more investigation should be performed to determine the overlap of the components (CDI
EDI and SDI) The CDI should be more thoroughly solidified as an index by collecting more data over
time
Transmission Equipment Performance
45
Transmission Equipment Performance Introduction The Transmission Availability Data System (TADS) effort began with the establishment of a TADS task force
by the NERC Planning Committee in October 2006 On October 27 2007 the NERC Board of Trustees
approved the collection of transmission automatic outage data beginning in calendar year 2008 (Phase I)
Subsequently on October 29 2008 the NERC Board approved the collection of Non-Automatic Outage data
that began for Calendar year 2010 (Phase II)
This chapter provides reliability performance analysis of the transmission system by focusing on the trends
of Automatic Outage data from calendar year 2008 thru 2010 Since only one year of Non-Automatic
Outage data has been collected that data will not be assessed in this report
When calculating bulk power system performance indices care must be exercised when interpreting results
as misinterpretation can lead to erroneous conclusions regarding system performance With only three
years of data in the smaller regions it is not clear whether a regionrsquos yearly outage variation compared to
the average is due to random statistical variation or that particular year is significantly different in
performance However on a NERC-wide basis after three years of data collection there is enough
information to accurately determine whether the yearly outage variation compared to the average is due to
random statistical variation or the particular year in question is significantly different in performance33
Performance Trends
Transmission performance information has been provided by Transmission Owners (TOs) within NERC
through the NERC TADS (Transmission Availability Data System) process The data presented reflects
Momentary and Sustained AC Automatic outages of transmission elements that operate at voltages ge 200 kV
(including the low side of transformers) with the criteria specified in the TADS process The following
elements listed below are included
bull AC Circuits ge 200 kV (Overhead and Underground Circuits) Radial circuits are included
bull DC Circuits with ge +-200 kV DC voltage
bull Transformers with ge 200 kV low-side voltage and
bull ACDC Back-to-Back (BTB) Converters with ge 200 kV AC voltage on both sides
33The detailed Confidence Interval computation is available at httpwwwnerccomdocspctadstfTADS_Nov_2_2007APPENDIX_C_Confidence_Intervalpdf
Transmission Equipment Performance
46
AC Element Outage Summary and Leading Causes Table 6 shows the 2008 2009 and 2010 NERC total AC transmission element inventory and a summary of
the associated outages As expected in general the number of circuits increased from year to year due to
new construction or re-construction to higher voltages For every outage experienced on the transmission
system cause codes are identified and recorded according to the TADS process Causes of both momentary
and sustained outages have been indicated These causes are analyzed to identify trends and similarities
and to provide insight into what could be done to possibly prevent future occurrences
Figure 23 and Figure 24 describe the top ten initiating cause codes for sustained and momentary automatic
outages combined from 2008-2010 Based on the two figures the relationship between the total number of
outages and total outage hours can be seen Failed AC Substation Equipment and Failed AC Circuit
Equipment only account for 15 percent of the total number of outages but account for 65 percent of the
total outage hours The two largest causes of outages within NERC (ldquoLightingrdquo and ldquoWeather excluding
Lightningrdquo) account for 34 percent of the total number of outages
The next three Human Error Failed Protection System Equipment and Failed AC Circuit Equipment have
very similar totals and should all be considered significant focus points in reducing the number of Sustained
Automatic Outages for all elements
Transmission Equipment Performance
47
Table 6 NERC - All AC Elements Sustained and Momentary Outage Performance Summary
2008 Number of Outages
AC Voltage
Class
No of
Circuits
Circuit
Miles Sustained Momentary
Total
Outages Total Outage Hours
200-299kV 4369 102131 1560 1062 2622 56595
300-399kV 1585 53631 793 753 1546 14681
400-599kV 586 31495 389 196 585 11766
600-799kV 110 9451 43 40 83 369
All Voltages 6650 196708 2785 2051 4836 83626
2009 Number of Outages
AC Voltage
Class
No of
Circuits
Circuit
Miles Sustained Momentary
Total
Outages Total Outage Hours
200-299kV 4468 102935 1387 898 2285 28828
300-399kV 1619 56447 641 610 1251 24714
400-599kV 592 32045 265 166 431 9110
600-799kV 110 9451 53 38 91 442
All Voltages 6789 200879 2346 1712 4038 63094
2010 Number of Outages
AC Voltage
Class
No of
Circuits
Circuit
Miles Sustained Momentary
Total
Outages Total Outage Hours
200-299kV 4567 104722 1506 918 2424 54941
300-399kV 1676 62415 721 601 1322 16043
400-599kV 605 31590 292 174 466 10442
600-799kV 111 9477 63 50 113 2303
All Voltages 6957 208204 2582 1743 4325 83729
Note The NERC table does not show redacted outages DC Circuit outages Transformer outages or ACDC
converter outages
Transmission Equipment Performance
48
Figure 23 NERC - Top Ten Sustained and Momentary Outages by Initiating Cause Code for All Elements
Figure 24 NERC - Top Ten Sustained Outage Hours by Cause Code
198
151
80
7271
6943
33
27
188
68
Lightning
Weather excluding lightningHuman Error
Failed AC Substation EquipmentFailed Protection System EquipmentFailed AC Circuit Equipment Foreign Interference
Power System Condition
Fire
Unknown
Remaining Cause Codes
299
246
188
58
52
42
3619
16 12 31 Failed AC Substation EquipmentFailed AC Circuit Equipment Weather excluding lightningUnavailable
Other
Fire
Unknown
Human Error
Failed Protection System EquipmentForeign Interference
Remaining Cause Codes
Transmission Equipment Performance
49
Transmission Monthly Outages Figure 25 displays the total number of Automatic Outages on a per-month basis The three months with the
highest total of outages were June July and August From a seasonal perspective winter had a monthly
average of 281 outages These include the months of November-March Summer had an average of 429
outages Summer included the months of April-October
Figure 25 Number of Outages by Month for AC Circuits (2008-2010)
This figure does not show redacted outages DC Circuit outages Transformer outages or ACDC Converter
outages
Outage Initiation Location For every outage experienced on the transmission system the outage initiation code is identified and
recorded according to the TADS process The outage initiation code can be analyzed to identify trends and
similarities and to provide insight into what could be done to possibly prevent future occurrences
The ldquoOutage Initiation Coderdquo describes where an automatic outage was initiated on the power system The
five codes are as follows
bull Element-Initiated
bull Other Element-Initiated
bull AC Substation-Initiated
bull ACDC Terminal-Initiated (for DC circuits)
bull Other Facility Initiated any facility not included in any other outage initiation code
JanuaryFebruar
yMarch April May June July August
September
October
November
December
2008 238 229 257 258 292 437 467 380 208 176 255 236
2009 315 201 339 334 398 553 546 515 351 235 226 294
2010 444 224 269 446 449 486 639 498 351 271 305 281
3 Year AVG 332 218 288 346 380 492 551 464 303 227 262 270
0
100
200
300
400
500
600
700
Out
ages
Transmission Equipment Performance
50
Notably the protection system is not part of an ldquoAC Substationrdquo or an ldquoACDC Terminalrdquo If a protection
system misoperates and initiates an outage it will be classified as ldquoOther-Facility Initiatedrdquo The following
Figures show the initiating location of the Automatic outages from 2008 to 2010
With both Momentary and Sustained Automatic Outages taken into account the outage was initiated on the
Element more than 67 percent of the time as shown in Figure 26 and Figure 27
When only the Sustained Automatic Outages are analyzed the outage initiation on both AC Substation and
Other Facility increased by 34 percent and 32 percent respectively Outages initiated on the Element itself
decreases by 78 percent as shown in Figure 26 and 27 For only the Momentary Automatic Outages the
outage initiation on the Element increases by 19 percent compared to Sustained Outages Element initiated
outages make up over 78 percent of the total outages when analyzing only Momentary Outages
Figure 26
Figure 27
Transmission Outage Events Figure 28 illustrates the relationship between the numbers of Automatic Outages associated per TADS
event 2008 2009 and 2010 tend to follow the same trend The largest number of Automatic Outages per
TADS event is fourteen in 2010 thirteen in 2009 and eight in 2008 There are around 70 to 100 TADS
events that contain between fourteen and three Automatic Outages (see below) There are around 330 to
400 TADS events that contain two or more Automatic Outages The rest of the events only contain one
Automatic Outage As noted in the lower right hand corner below the total number of Events in 2008 to
2010 ranged from 3920 to 4569 events per year Nearly 90 percent or more of the events contained one
Automatic Outage
Figure 26 Sustained Automatic Outage Initiation
Code
Figure 27 Momentary Automatic Outage Initiation
Code
Transmission Equipment Performance
51
Transmission Outage Mode Figure 29 and Figure 30 show the percentage of Outage Modes The ldquoOutage Mode Coderdquo describes
whether one Automatic Outage is related to other Automatic Outages A Single Mode outage is an
Automatic Outage of a single Element which occurs independently of any other Automatic Outages (if any)
A ldquoDependent Mode Initiating Outagerdquo is an Automatic Outage of a single Element that initiates one or more
subsequent Element Automatic Outages A ldquoDependent Mode Outagerdquo is an Automatic Outage of an
Element which occurred as a result of an initiating outage whether the initiating outage was an Element
outage or a non-Element outage A ldquoCommon Mode Outagerdquo is one of two or more Automatic Outages with
the same Initiating Cause Code and where the outages are not consequences of each other and occur nearly
simultaneously A ldquoCommon Mode Initiating Outagerdquo is a Common Mode Outage that initiates one or more
subsequent Automatic Outages
Over 72 percent of the total outages occurred on the bulk power system are Single Mode Outages The next
largest mode is Dependent with over 11 percent of the total outages being in this category For only
Sustained Automatic Outages outages related to each other increase with Dependent mode accounting for
13 percent of the outages and Common mode accounting for close to 11 percent of the outages
Independent Sustained outages still account for the largest portion with nearly 70 percent being Single
mode When just analyzing Momentary Automatic Outages Associated outages decrease with Dependent
Figure 28 Event Histogram (2008-2010)
Transmission Equipment Performance
52
mode accounting for only 9 percent of the outages The Common Mode percentage decreases while
Dependent Mode Initiating percentage increases compared to Sustained Outages Independent Momentary
outages account for the largest portion with over 76 percent being Single Mode
An investigation into the root causes of Dependent and Common mode events which include three or more
Automatic Outages (indentified in the TADS 2008 to 2010 data) should be a high priority Some protection
systems are designed to trip three or more circuits but some events go beyond what is designed Some also
have misoperations associated with multiple outage events
Conclusions On a NERC wide average basis automatic transmission outage rate is improving from 2008 to 2010 based on
reported data Considering both automatic and non-automatic outages 2010 records indicate transmission
element availability percentage is very high and exceeds 95 The unavailability rate for AC circuits and
transformers are only 15 and 29 respectively
The cause codes of Human Error Failed Protection System Equipment and Failed AC Circuit Equipment
should be considered significant focus points in reducing the number of Sustained Automatic Outages for all
elements A deeper look into the root causes of Dependent and Common mode events which include three
or more Automatic Outages (indentified in the TADS 2008 to 2010 data) should be a high priority Some
protection systems are designed to trip three or more circuits but some events go beyond what is designed
Some also have misoperations associated with multiple outage events
Figure 29 Sustained Automatic Outage Mode code Figure 30 Momentary Automatic Outage Mode code
Generation Equipment Performance
53
Generation Equipment Performance Introduction The development of the Generating Availability Data System (GADS) began in 1982 This series of databases
is used to voluntarily collect record and retrieve operating information By pooling individual unit
information with likewise units generating unit availability performance can be calculated providing
opportunities to identify trends and generating equipment reliability improvement opportunities The
information is used to support equipment reliability availability analyses and risk-informed decision-making
by system planners generation owners assessment modelers manufacturers and contractors etc Reports
and information resulting from the data collected through GADS are now used for benchmarking and
analyzing electric power plants
Currently the data collected through GADS contains 72 percent of the North American generating units
with generating capacity of 20 MW or higher34 Additionally many of the newer combined-cycle plants are
not reporting information and therefore a full view of each unit type is not presented Rather a sample of
all the units in North America that fit a given more general category is provided35 for the 2008-201036
Generation Key Performance Indicators
assessment period
Three key performance indicators37
In
the industry have used widely to measure the availability of generating
units (see Terms Used in This Report section for their calculation parameters) are Equivalent Availability
Factor (EAF) Net Capacity Factor (NCF) and Equivalent Forced Outage Rate ndash Demand (EFORd)
Table 7 the North American fleet average EAF NCF and EFORd compared to unit age for all generating
units with a capacity of 20 MW and higher is provided for the years 2008-2010 The EAF shows a decline
during the last three years NCF is up and down while the EFORd appears to be increasing As expected the
fleet of units reported to GADS is aging overall with the fossil units being about 12 years older than the
average age
34 httpwwwnerccomdocspcgadstfGADSTF_Recommendation_Report_02-18-2011_FINALpdf 35GADS contains some 1500+ units under 20 MW that is not included in this report These units are excluded because most units are not base-loaded and are in peaking operation
3684 percent of the 2010 dataset is available at this time while the 2008 and 2009 dataset is complete 37 httpwwwnerccompagephpcid=4|43
Generation Equipment Performance
54
Table 7 General Availability Review of GADS Fleet Units by Year
2008 2009 2010 Average
Equivalent Availability Factor (EAF) 8776 8774 8678 8743
Net Capacity Factor (NCF) 5083 4709 4880 4890
Equivalent Forced Outage Rate -
Demand (EFORd) 579 575 639 597
Number of Units ge20 MW 3713 3713 3713 3713
Average Age of the Fleet in Years (all
unit types) 303 311 321 312
Average Age of the Fleet in Years
(fossil units only) 422 432 440 433
Figure 31 provides the average forced outage hours (FOH) maintenance outage hours (MOH) and planned
outage hours (POH) for all units reporting 20 MW or larger During this three-year period the average FOH
291 hours average MOH is 163 hours average POH is 470 hours
Figure 31 shows a large increase in forced and maintenance events The average age of the units with a
capacity of 20MW and higher in 2009 is 316 years old However the average age of fossil units in 2010 is
442 years old These fossil units are the backbone of all operating units providing the base-load power
continuously and nearly 50 percent of all energy annually There appears to be no increase allocated for
annualsemi-annual maintenance (ie planned outages) for the older generating units The increase of
000100002000030000400005000060000700008000090000
100000
2008 2009 2010
463 479 468
154 161 173
288 270 314
Hou
rs
Planned Maintenance Forced
Figure 31 Average Outage Hours for Units gt 20 MW
Generation Equipment Performance
55
maintenance outage hours reflects an increased need to fix problems that cannot be deferred until the next
annualsemi-annual repairs As a result it shows one of two things are happening
bull More or longer planned outage time is needed to repair the aging generating fleet
bull More focus on preventive repairs during planned and maintenance events are needed
Multiple Unit Forced Outages and Causes Table 8 provides the annual multiple-unit forced outage trips resulting from the same cause for each of the
assessments years 2008-2010 respectively The ldquosingle unitrdquo trips are large units with a Net Dependable
Capacity of 750 MW or more The trips of ldquotwo unitsrdquo or more is any combination of unit capacity with the
total amount of lost capacity more than 750 MW
Table 8 also presents more information on the forced outages During 2008-2010 there were a large
number of double-unit outages resulting from the same event Investigations show that some of these trips
were at a single plant caused by common control and instrumentation for the units The incidents occurred
several times for several months and are a common mode issue internal to the plant
Table 8 Number of Multiple Unit Forced Outages and FrequencyYear
2008 2009 2010
Type of
Trip
of
Trips
Avg Outage
Hr Trip
Avg Outage
Hr Unit
of
Trips
Avg Outage
Hr Trip
Avg Outage
Hr Unit
of
Trips
Avg Outage
Hr Trip
Avg Outage
Hr Unit
Single-unit
Trip 591 58 58 284 64 64 339 66 66
Two-unit
Trip 281 43 22 508 96 48 206 41 20
Three-unit
Trip 74 48 16 223 146 48 47 109 36
Four-unit
Trip 12 77 19 111 112 28 40 121 30
Five-unit
Trip 11 1303 260 60 443 88 19 199 10
gt 5 units 20 166 16 93 206 50 37 246 6
Loss of ge 750 MW per Trip
The high number of five-unit trips in 2008 was due to Hurricane Ike hitting the Gulf Coast The highest total
number of multiple unit trips occurred in 2009 though as mentioned before the data collection for 2010 is
incomplete at this time The majority of 2009 multiple unit trips have three main causes (in order by
Generation Equipment Performance
56
number of events) transmission lack of fuel and storms A summary of the three categories for single as
well as multiple unit outages (all unit capacities) are reflected in Table 9
Table 9 Common Causes of Multiple Unit Forced Outages (2009)
Cause Number of Events Average MW Size of Unit
Transmission 1583 16
Lack of Fuel (Coal Mines Gas Lines etc) Not
in Operator Control
812 448
Storms Lightning and Other Acts of Nature 591 112
Some of the transmission outages based on storms in 2009 have been caused by the same reasons because
the storms may have caused transmission interference However the plants reported the problems
inconsistently with either the transmission interference or storms cause code Therefore they are depicted
as two different causes of forced outage
Marked transmission outages in 2009 were quite high Thirty-five percent came from one utility with a large
number of hydroelectric units The company related the trips to various problems including weather
(lightning storms) wildlife ldquoline bumpsrdquo and problems on the receiving end of the transmission line Nine
hundred and eighty-five transmission trips (62 percent) were from hydroelectric units38
In 2009 only ten transmission trips resulted in a loss of 750 MW or more per trip Twenty two generating
plants were affected by the ten trips Causes for the trips include feeder line trips (1 trip) breakers in the
switchyard (8 trips) personnel errors (2 trips) and unknown (10 trips)
The ldquoLack of Fuelrdquo outages are of interest as these events occur during the times when a unit is available to
operate but there is an interruption in fuels to operate the facilities These events do not include
interruptions of fuel due to contracts Rather the cause code is designed to account for units that are
expecting fuel and it is unavailable when requested Table 10 presents the distribution of ldquoLack of Fuelrdquo
events by NERC Region and Table 11 presents the unit types affected
38 The average size of the hydroelectric units were small ndash 335 MW
Generation Equipment Performance
57
Of the units that report ldquoLack of Fuelrdquo 78 percent of the units are oil-fired 15 percent of the units are gas-
fired and the remaining units are various other fuels Table 12 provides the top causes of forced outage for
several unit types For fossil units ldquoLack of Fuelrdquo as the number three cause behind waterwall tube leaks
and superheater tube leaks
Table 10 Forced Outages Due to Lack of Fuel by Region
Region Number of Lack of Fuel
Problems Reported
FRCC 0
MRO 3
NPCC 24
RFC 695
SERC 17
SPP 3
TRE 7
WECC 29
One company contributed to the majority of oil-fired lack of fuel events The units at the company are
actually dual-fuels (oil and gas) but market nominated gas monitoring causes the units to be on forced
outage nightly The units need gas to start up so they can run on oil When they shut down the units must
switch to gas to clean themselves With the gas restriction the unit canrsquot start and the unit goes on a
forced outage Until the band is lifted the two units will continue to be on a forced outage cycle
Event records also provide descriptions of why the unit was without fuel with the majority of descriptions
bull Temperatures affecting gas supply valves
bull Unexpected maintenance of gas pipe-lines
bull Compressor problemsmaintenance
Generation Equipment Performance
58
Table 11 Unit Type Profile of Forced Outages Due to Lack of Fuel
Unit Types Number of Lack of Fuel Problems Reported
Fossil 642
Nuclear 0
Gas Turbines 88
Diesel Engines 1
HydroPumped Storage 0
Combined Cycle 47
Generation Equipment Performance
59
Table 12 Causes of Forced Outage for Different Unit Types (2008-2010)
Fossil - all MW sizes all fuels
Rank Description Occurrence per Unit-year
MWH per Unit-year
Average Hours To Repair
Average Hours Between Failures
Unit-years
1 Waterwall (furnace wall) 0590 134106 59 3250 3868 2 Second Superheater
Leaks 0180 5182 60 3228 3868
3 Lack of Fuel (coal mines gas lines etc) where the operator is not in control
0480 4701 18 26 3868
Combined-Cycle blocks Rank Description Occurrence
per Unit-year
MWH per Unit-year
Average Hours To Repair
Average Hours Between Failures
Unit-years
1 HP Turbine Buckets Or Blades
0020 4663 1830 26280 466
2 Turbine Control Valves 0040 2777 100 7200 466 3 Gas Turbine Compressor -
High Pressure Shaft 0010 2266 663 4269 466
Nuclear units - all Reactor types Rank Description Occurrence
per Unit-year
MWH per Unit-year
Average Hours To Repair
Average Hours Between Failures
Unit-years
1 LP Turbine Buckets or Blades
0010 26415 8760 26280 288
2 Containment Structure 0010 9233 1226 26262 288 3 Feedwater Pump Local
Controls 0020 7620 692 12642 288
Simple-cycle gas turbine jet engines Rank Description Occurrence
per Unit-year
MWH per Unit-year
Average Hours To Repair
Average Hours Between Failures
Unit-years
1 Main Transformer 0030 1611 1016 20709 4181 2 Other Gas Turbine
Controls And Instrument Problems
0120 428 70 2614 4181
3 Other Gas Turbine Problems
0090 400 119 1701 4181
Generation Equipment Performance
60
2008-2010 Review of Summer versus Winter Availability To address seasonality of unit availability unit information for the months of June to September (summer)
and December through February (winter) were pooled to calculate force events during these timeframes for
2008-201039 Figure 32 shows the Equivalent Availability Factor (EAF) is three percentage points higher and
the Equivalent Forced Outage Rate - Demand (EFORd) is more than a half of a percentage point lower in the
summer period than in winter period This means the units were more reliable with less forced events
during high-demand times during the summer than during the winter seasons The generating unitrsquos
capability has a resulting higher Net Capacity Factor (NCF) of 45 percentage points in the summer season
for 2008-2010
During the spring season (March-May) 77 percent of the units took a planned outage (PO) for an average
231 hours (or 96 days) In fall (October-November) only 42 percent of the units experienced a PO and the
average duration was shorter ndash 134 hours (or 56 days) A few units took both spring and fall planned
outages although this is rare Based on this assessment the generating units are prepared for the summer
peak demand The resulting availability indicates that this maintenance was successful which is measured
by an increased EAF and lower EFORd
Figure 32 Summer-Winter Average EAF NCF and EFORd (2008-2010)
Conclusions and Recommendations During 2008-2010 the average Equivalent Availability Factor (EAF) which measures the overall availability
of generating units decreased At the same time the Net Capacity Factor (NCF) an indicator of energy
production increased The average number of forced outages in 2010 is greater than in 2008 while at the
same time the average planned outage times have decreased As a result the Equivalent Forced Outage
Rate ndash Demand (EFORd) also increased illustrating that more units have experienced forced events during
39 A study of peak periods was conducted by the NERC Generating Availability Trend Evaluation (GATE) Working Group several years ago see httpwwwnerccomfilesSeasonal-Performance-Trendspdf
9116
5343
396
8818
4896
441
0 10 20 30 40 50 60 70 80 90 100
EAF
NCF
EFORd
Percent ()
Winter
Summer
Generation Equipment Performance
61
peak-demand times in 2010 than in the previous two years Potentially with shorter planned outage
periods in 2010 there may be less time to repair equipment and prevent forced unit outages
There are warnings that units are not being maintained as well as they should be In the last three years
there has been an increase in Equivalent Forced Outage Rate ndash Demand (EFORd) This indicator measures
the rate of forced outage events on generating units during periods of load demand To confirm this
problem forced outage hours jumped from 270 to 314 hours per unit between 2009 and 2010 At the same
time maintenance events also increased by 12 hours per unit Planned outage events remain constant The
resulting conclusions from this trend are
bull More or longer planned outage time is needed to repair the generating fleet Whether age is the
cause of the increase need for planned outage time remains unknown and further investigation into
the cause for longer planned outage time is necessary
bull More focus on preventive repairs during planned and maintenance events are needed
There are many multiple unit forced outages due to lack of fuel The majority of multiple unit trips have
three main causes transmission lack of fuel and storms With special interest in the forced outages due to
ldquoLack of Fuelrdquo additional analysis revealed that 77 percent of the units experiencing unexpected fuel
stoppage are oil-fired fossil units while gas-fired units experienced 15 percent
Generating units continue to be more reliable during the peak summer periods
Disturbance Event Trends
62
Category 1 An event resulting in one or more of the following a Unintended loss of three or more BPS elements caused by
common mode failure b Failure or misoperation of an SPSRAS c System-wide voltage reduction of 3 or more d Unintended BPS system separation resulting in an island of
100 MW to 999 MW e Unplanned evacuation from a control center facility with BPS
SCADA functionality for 30 minutes or more Category 2 An event resulting in one or more of the following
a Complete loss of all BPS control center voice communication system(s) for 30 minutes or more
b Complete loss of SCADA control or monitoring functionality for 30 minutes or more
c Voltage excursions equal to or greater than 10 lasting more than five minutes
d Loss of off-site power (LOOP) to a nuclear generating station e Unintended system separation resulting in an island of 1000
MW to 4999 MW f Unintended loss of 300MW or more of firm load for more
than 15 minutes g Violation of an Interconnection Reliability Operating Limit
(IROL) for more than 30 minutes Category 3 An event resulting in one or more of the following
a The loss of load or generation of 2000 MW or more in the Eastern Interconnection or
b Western Interconnection or 1000 MW or more in the ERCOT or Queacutebec Interconnections
c Unintended system separation resulting in an island of 5000 MW to 10000 MW
d Unintended system separation resulting in an island of Florida from the Eastern Interconnection
Category 4 An event resulting in one or more of the following a The loss of load or generation from 5001 MW to 9999 MW b Unintended system separation resulting in an island of more
than 10000 MW (with the exception of Florida as described in Category 3c)
Category 5 An event resulting in one or more of the following a The loss of load of 10000 MW or more b The loss of generation of 10000 MW or more
Figure 33 BPS Event Category
Disturbance Event Trends Introduction The purpose of this section is to report event
analysis trends from the beginning of event
analysis field test40
One of the companion goals of the event
analysis program is the identification of trends
in the number magnitude and frequency of
events and their associated causes such as
human error equipment failure protection
system misoperations etc The information
provided in the event analysis database (EADB)
and various event analysis reports have been
used to track and identify trends in BPS events
in conjunction with other databases (TADS
GADS metric and benchmarking database)
to the end of 2010
The Event Analysis Working Group (EAWG)
continuously gathers event data and is moving
toward an integrated approach to analyzing
data assessing trends and communicating the
results to the industry
Performance Trends The event category is classified41
Figure 33
as shown in
with Category 5 being the most
severe Figure 34 depicts disturbance trends in
Category 1 to 5 system events from the
40 httpwwwnerccomdocseawgGalloway-Industry-EA-Field-Test-102210pdf 41httpwwwnerccomfiles2011-05-0220Event_Analysis_Process_Phase20220Field20Test20Draft20-20Final20-20For20postingpdf
Disturbance Event Trends
63
beginning of event analysis field test to the end of 201042
Figure 34 Event Category vs Date for All 2010 Categorized Events
From the figure in November and December
there were many more category 1 and 2 events than in October This is due to the field trial starting on
October 25 2010
In addition to the category of the events the status of the events plays a critical role in the accuracy of the
data By examining Figure 35 over 80 of the events reported in 2010 have been closed This means that
the category root cause and other important information have been sufficiently finalized in order for
analysis to be accurate for each event At this time there is not enough data to draw any long-term
conclusions about event investigation performance
42 Documents for the EA Field Test are located at httpwwwnerccompagephpcid=5|365
2
12 12
26
3
6 5
14
1 1
2
0
5
10
15
20
25
30
35
40
45
October November December 2010
Even
t Cou
nt
Category 3 Category 2 Category 1
Disturbance Event Trends
64
Figure 35 Event Count vs Status (All 2010 Events with Status)
By drilling down into the cause code for each closed 2010 event Figure 36 shows the top 3 event causes
From the figure equipment failure and protection system misoperation are the most significant causes for
events Because of how new and limited the data is however there may not be statistical significance for
this result Further trending of cause codes for closed events and developing a richer dataset to find any
trends between event cause codes and event counts should be performed
Figure 36 Top 3 Event Counts vs DAWG Cause Code for all Closed 2010 Events
10
32
42
0
5
10
15
20
25
30
35
40
45
Open Closed Open and Closed
Even
t Cou
nt
Status
1211
8
0
2
4
6
8
10
12
14
Equipment Failure Protection System Misoperation Human Error
Even
t Cou
nt
Cause Code
Disturbance Event Trends
65
Conclusions Due to the relatively new process for events analysis and categorization more time will be required before a
conclusive recommendation may be obtained Further analysis and new data should provide valuable
statistics in the future Over 80 of all event reports from 2010 are current listed as closed but no
conclusion about investigation performance may be obtained because of the limited amount of data It is
recommended to study ways to prevent equipment failure and protection system misoperations but there
is not enough data to draw a firm conclusion about the top causes of events at this time
Abbreviations Used in This Report
66
Abbreviations Used in This Report
Acronym Definition ALP Acadiana Load Pocket
ALR Adequate Level of Reliability
ARR Automatic Reliability Report
BA Balancing Authority
BPS Bulk Power System
CDI Condition Driven Index
CEII Critical Energy Infrastructure Information
CIPC Critical Infrastructure Protection Committee
CLECO Cleco Power LLC
DADS Future Demand Availability Data System
DCS Disturbance Control Standard
DOE Department Of Energy
DSM Demand Side Management
EA Event Analysis
EAF Equivalent Availability Factor
ECAR East Central Area Reliability
EDI Event Drive Index
EEA Energy Emergency Alert
EFORd Equivalent Forced Outage Rate Demand
EMS Energy Management System
ERCOT Electric Reliability Council of Texas
ERO Electric Reliability Organization
ESAI Energy Security Analysis Inc
FERC Federal Energy Regulatory Commission
FOH Forced Outage Hours
FRCC Florida Reliability Coordinating Council
GADS Generation Availability Data System
GOP Generation Operator
IEEE Institute of Electrical and Electronics Engineers
IESO Independent Electricity System Operator
IROL Interconnection Reliability Operating Limit
Abbreviations Used in This Report
67
Acronym Definition IRI Integrated Reliability Index
LOLE Loss of Load Expectation
LUS Lafayette Utilities System
MAIN Mid-America Interconnected Network Inc
MAPP Mid-continent Area Power Pool
MOH Maintenance Outage Hours
MRO Midwest Reliability Organization
MSSC Most Severe Single Contingency
NCF Net Capacity Factor
NEAT NERC Event Analysis Tool
NERC North American Electric Reliability Corporation
NPCC Northeast Power Coordinating Council
OC Operating Committee
OL Operating Limit
OP Operating Procedures
ORS Operating Reliability Subcommittee
PC Planning Committee
PO Planned Outage
POH Planned Outage Hours
RAPA Reliability Assessment Performance Analysis
RAS Remedial Action Schemes
RC Reliability Coordinator
RCIS Reliability Coordination Information System
RCWG Reliability Coordinator Working Group
RE Regional Entities
RFC Reliability First Corporation
RMWG Reliability Metrics Working Group
RSG Reserve Sharing Group
SAIDI System Average Interruption Duration Index
SAIFI System Average Interruption Frequency Index
SCADA Supervisory Control and Data Acquisition
SDI Standardstatute Driven Index
SERC SERC Reliability Corporation
Abbreviations Used in This Report
68
Acronym Definition SRI Severity Risk Index
SMART Specific Measurable Attainable Relevant and Tangible
SOL System Operating Limit
SPS Special Protection Schemes
SPCS System Protection and Control Subcommittee
SPP Southwest Power Pool
SRI System Risk Index
TADS Transmission Availability Data System
TADSWG Transmission Availability Data System Working Group
TO Transmission Owner
TOP Transmission Operator
WECC Western Electricity Coordinating Council
Contributions
69
Contributions This report was made feasible by the collaboration and hard work of both NERC staff and NERCrsquos
Industry Groups
NERC Industry Groups
Table 14 lists the NERC industry group contributors Without their contribution and collaboration this
report would not have been possible
Table 13 NERC Industry Group Contributions43
NERC Group
Relationship Contribution
Reliability Metrics Working Group
(RMWG)
Reports to the OCPC bull Lead Development of Report bull Provide Reliability Metrics Data bull Responsible for Reliability Metrics
Performance Chapter
Transmission Availability Working Group
(TADSWG)
Reports to the OCPC bull Provide Transmission Availability Data
bull Responsible for Transmission Equip-ment Performance Chapter
bull Content Review
Generation Availability Data System Task
Force
(GADSTF)
Reports to the OCPC bull Provide Generation Availability Data bull Responsible for Generation Equip-
ment Performance Chapter bull Content Review
Event Analysis Working Group
(EAWG)
Reports to the OCPC bull Provide Events Data bull Responsible for Disturbance Events
Trends Chapter bull Content Review
43 Rosters for RMWG TADSWG GADSTF and EAWG are available at httpwwwnerccomfilesrosterpdf
Contributions
70
NERC Staff Table 13 below lists the NERC staff who contributed to the 2011 Reliability Performance Analysis
Report
Table 14 Contributing NERC Staff
Name Title E-mail Address
Mark Lauby Vice President and Director of
Reliability Assessment and
Performance Analysis
marklaubynercnet
Jessica Bian Manager of Performance Analysis jessicabiannercnet
John Moura Manager of Reliability Assessments johnmouranercnet
Andrew Slone Engineer Reliability Performance
Analysis
andrewslonenercnet
Jim Robinson TADS Project Manager jimrobinsonnercnet
Clyde Melton Engineer Reliability Performance
Analysis
clydemeltonnercnet
Mike Curley Manager of GADS Services mikecurleynercnet
James Powell Engineer Reliability Performance
Analysis
jamespowellnercnet
Michelle Marx Administrative Assistant michellemarxnercnet
William Mo Intern Performance Analysis wmonercnet
- NERCrsquos Mission
- Table of Contents
- Executive Summary
-
- 2011 Transition Report
- State of Reliability Report
- Key Findings and Recommendations
-
- Reliability Metric Performance
- Transmission Availability Performance
- Generating Availability Performance
- Disturbance Events
- Report Organization
-
- Introduction
-
- Metric Report Evolution
- Roadmap for the Future
-
- Reliability Metrics Performance
-
- Introduction
- 2010 Performance Metrics Results and Trends
-
- ALR1-3 Planning Reserve Margin
-
- Background
- Assessment
- Special Considerations
-
- ALR1-4 BPS Transmission Related Events Resulting in Loss of Load
-
- Background
- Assessment
-
- ALR1-12 Interconnection Frequency Response
-
- Background
- Assessment
-
- ALR2-3 Activation of Under Frequency Load Shedding
-
- Background
- Assessment
- Special Considerations
-
- ALR2-4 Average Percent Non-Recovery Disturbance Control Standards (DCS)
-
- Background
- Assessment
- Special Consideration
-
- ALR2-5 Disturbance Control Events Greater Than Most Severe Single Contingency
-
- Background
- Assessment
- Special Consideration
-
- ALR 1-5 System Voltage Performance
-
- Background
- Special Considerations
- Status
-
- ALR3-5 Interconnection Reliability Operating Limit System Operating Limit (IROLSOL) Exceedances
-
- Background
-
- ALR4-1 Automatic Transmission Outages Caused by Protection System Misoperations
-
- Background
- Special Considerations
-
- ALR6-11 ndash ALR6-14
-
- Background
- Assessment
- ALR 6-11 ndash Automatic Outages Initiated by Failed Protection System Equipment
- ALR6-12 ndash Automatic Outages Initiated by Human Error
- ALR6-13 ndash Automatic Outages Initiated by Failed AC Substation Equipment
- ALR6-14 Automatic AC Transmission Outages Initiated by Failed AC Circuit Equipment
-
- ALR6-15 Element Availability Percentage (APC)
-
- Background
- Assessment
- Special Consideration
-
- ALR6-16 Transmission System Unavailability
-
- Background
- Assessment
- Special Consideration
-
- ALR6-2 Energy Emergency Alert 3 (EEA3)
-
- Background
- Assessment
- Special Considerations
-
- ALR 6-3 Energy Emergency Alert 2 (EEA2)
-
- Background
- Assessment
- Special Considerations
-
- ALR 6-1 Transmission Constraint Mitigation
-
- Background
- Assessment
- Special Considerations
-
- Integrated Bulk Power System Risk Assessment
-
- Introduction
- Recommendations
-
- Integrated Reliability Index Concepts
-
- The Three Components of the IRI
-
- Event-Driven Indicators (EDI)
- Condition-Driven Indicators (CDI)
- StandardsStatute-Driven Indicators (SDI)
-
- IRI Index Calculation
- IRI Recommendations
-
- Reliability Metrics Conclusions and Recommendations
-
- Transmission Equipment Performance
-
- Introduction
- Performance Trends
-
- AC Element Outage Summary and Leading Causes
- Transmission Monthly Outages
- Outage Initiation Location
- Transmission Outage Events
- Transmission Outage Mode
-
- Conclusions
-
- Generation Equipment Performance
-
- Introduction
- Generation Key Performance Indicators
-
- Multiple Unit Forced Outages and Causes
- 2008-2010 Review of Summer versus Winter Availability
-
- Conclusions and Recommendations
-
- Disturbance Event Trends
-
- Introduction
- Performance Trends
- Conclusions
-
- Abbreviations Used in This Report
- Contributions
-
- NERC Industry Groups
- NERC Staff
-

Reliability Metrics Performance
12
2010 Performance Metrics Results and Trends
ALR1-3 Planning Reserve Margin
Background
The Planning Reserve Margin9 is a measure of the relationship between the amount of resource capacity
forecast and the expected demand in the planning horizon10 Coupled with probabilistic analysis
calculated Planning Reserve Margins is an industry standard which has been used by system planners for
decades as an indication of system resource adequacy Generally the projected demand is based on a
5050 forecast11
Assessment
Planning Reserve Margin is the difference between forecast capacity and projected
peak demand normalized by projected peak demand and shown as a percentage Based on experience
for portions of the bulk power system that are not energy-constrained Planning Reserve Margin
indicates the amount of capacity available to maintain reliable operation while meeting unforeseen
increases in demand (eg extreme weather) and unexpected unavailability of existing capacity (eg
long-term generation outages) Further from a planning perspective Planning Reserve Margin trends
identify whether capacity additions are projected to keep pace with demand growth
Planning Reserve Margins considering anticipated capacity resources and adjusted potential capacity
resources decrease in the latter years of the 2009 and 2010 10-year forecast in each of the four
interconnections Typically the early years provide more certainty since new generation is either in
service or under construction with firm commitments In the later years there is less certainty about
the resources that will be needed to meet peak demand Declining Planning Reserve Margins are
inherent in a conventional forecast (assuming load growth) and do not necessarily indicate a trend of a
degrading resource adequacy Rather they are an indication of the potential need for additional
resources In addition key observations can be made to the Planning Reserve Margin forecast such as
short-term assessment rate of change through the assessment period identification of margins that are
approaching or below a target requirement and comparisons from year-to-year forecasts
While resource planners are able to forecast the need for resources the type of resource that will
actually be built or acquired to fill the need is usually unknown For example in the northeast US
markets with three to five year forward capacity markets no firm commitments can be made in the
9 Detailed calculations of Planning Reserve Margin are available at httpwwwnerccompagephpcid=4|331|333 10The Planning Reserve Margin indicated here is not the same as an operating reserve margin that system operators use for near-term
operations decisions 11These demand forecasts are based on ldquo5050rdquo or median weather (a 50 percent chance of the weather being warmer and a 50 percent
chance of the weather being cooler)
Reliability Metrics Performance
13
long-term However resource planners do recognize the need for resources in their long-term planning
and account for these resources through generator queues These queues are then adjusted to reflect
an adjusted forecast of resourcesmdashpro-rated by approximately 20 percent
When comparing the assessment of planning reserve margins between 2009 and 2010 the
interconnection Planning Reserve Margins are slightly higher on an annual basis in the 2010 forecast
compared to those of 2009 as shown in Figure 5
Figure 5 Planning Reserve Margin by Interconnection and Year
In general this is due to slightly higher capacity forecasts and slightly lower demand forecasts The pace
of any economic recovery will affect future comparisons This metric can be used by NERC to assess the
individual interconnections in the ten-year long-term reliability assessments If a noticeable change
Reliability Metrics Performance
14
occurs within the trend further investigation is necessary to determine the causes and likely effects on
reliability
Special Considerations
The Planning Reserve Margin is a capacity based metric Therefore it does not provide an accurate
assessment of performance in energy-limited systems (eg hydro capacity with limited water resources
or systems with significant variable generation penetration) In addition the Planning Reserve Margin
does not reflect potential transmission constraint internal to the respective interconnection Planning
Reserve Margin data shown in Figure 6 is used for NERCrsquos seasonal and long-term reliability
assessments and is the primary metric for determining the resource adequacy of a given assessment
area
The North American Bulk Power System is divided into four distinct interconnections These
interconnections are loosely connected with limited ability to share capacity or energy across the
interconnection To reflect this limitation the Planning Reserve Margins are calculated in this report
based on interconnection values rather than by national boundaries as is the practice of the Reliability
Assessment Subcommittee (RAS)
ALR1-4 BPS Transmission Related Events Resulting in Loss of Load
Background
This metric measures bulk power system transmission-related events resulting in the loss of load
Planners and operators can use this metric to validate their design and operating criteria by identifying
the number of instances when loss of load occurs
For the purposes of this metric an ldquoeventrdquo is an unplanned transmission disturbance that produces an
abnormal system condition due to equipment failures or system operational actions and results in the
loss of firm system demand for more than 15 minutes The reporting criteria for such events are
outlined below12
bull Entities with a previous year recorded peak demand of more than 3000 MW are required to
report all such losses of firm demands totaling more than 300 MW
bull All other entities are required to report all such losses of firm demands totaling more than 200
MW or 50 percent of the total customers being supplied immediately prior to the incident
whichever is less
bull Firm load shedding of 100 MW or more used to maintain the continuity of the bulk power
system reliability
12 Details of event definitions are available at httpwwwnerccomfilesEOP-004-1pdf
Reliability Metrics Performance
15
Assessment
Figure 6 illustrates that the number of bulk power system transmission-related events resulting in loss of
firm load13
Table 2
from 2002 to 2009 is relatively constant and suggests that 7 - 10 events per year is a norm for
the bulk power system However the magnitude of load loss shown in associated with these
events reflects a downward trend since 2007 Since the data includes weather-related events it will
provide the RMWG with an opportunity for further analysis and continued assessment of the trends
over time is recommended
Figure 6 BPS Transmission Related Events Resulting in Loss of Load Counts (2002-2009)
Table 2 BPS Transmission Related Events Resulting in Loss of Load MW Loss (2002-2009)
Year Load Loss (MW)
2002 3762
2003 65263
2004 2578
2005 6720
2006 4871
2007 11282
2008 5200
2009 2965
13The metric source data may require adjustments to accommodate all of the different groups for measurement and consistency as OE-417 is only used in the US
02468
101214
2002 2003 2004 2005 2006 2007 2008 2009
Count
Reliability Metrics Performance
16
ALR1-12 Interconnection Frequency Response
Background
This metric is used to track and monitor Interconnection Frequency Response Frequency Response is a
measure of an Interconnectionrsquos ability to stabilize frequency immediately following the sudden loss of
generation or load It is a critical component to the reliable operation of the bulk power system
particularly during disturbances and restoration The metric measures the average frequency responses
for all events where frequency drops more than 35 mHz within a year
Assessment
At this time there has been no data collected for ALR1-12 Therefore no assessment was made
ALR2-3 Activation of Under Frequency Load Shedding
Background
The purpose of Under Frequency Load Shedding (UFLS) is to balance generation and load in an island
following an extreme event The UFLS activation metric measures the number of times UFLS is activated
and the total MW of load interrupted in each Region and NERC wide
Assessment
Figure 7 and Table 3 illustrate a history of Under Frequency Load Shedding events from 2006 through
2010 Through this period itrsquos important to note that single events had a range load shedding from 15
MW to 7654 MW The activation of UFLS relays is the last automated reliability measure associated
with a decline in frequency in order to rebalance the system Further assessment of the MW loss for
these activations is recommended
Figure 7 ALR2-3 Count of Activations by Year and Regional Entity (2001-2010)
Reliability Metrics Performance
17
Table 3 ALR2-3 Under Frequency Load Shedding MW Loss
ALR2-3 Under Frequency Load Shedding MW Loss
2006 2007 2008 2009 2010
FRCC
2273
MRO
486
NPCC 94
63 20 25
RFC
SPP
672 15
SERC
ERCOT
WECC
Special Considerations
The use of a single metric cannot capture all of the relevant information associated with UFLS events as
the events relate to each respective UFLS plan The ability to measure the reliability of the bulk power
system is directly associated with how it performs compared to what is planned
ALR2-4 Average Percent Non-Recovery Disturbance Control Standards (DCS)
Background
This metric measures the Balancing Authorityrsquos (BA) or Reserve Sharing Grouprsquos (RSG) ability to balance
resources and demand with the timely deployment of contingency reserve thereby returning the
interconnection frequency to within defined limits following a Reportable Disturbance14
Assessment
The relative
percentage provides an indication of performance measured at a BA or RSG
Figure 8 illustrates the average percent non-recovery of DCS events from 2006 to 2010 The graph
provides a high-level indication of the performance of each respective RE However a single event may
not reflect all the reliability issues within a given RE In order to understand the reliability aspects it
may be necessary to request individual REs to further investigate and provide a more comprehensive
reliability report Further investigation may indicate the entity had sufficient contingency reserve but
through their implementation process failed to meet DCS recovery
14 Details of the Disturbance Control Performance Standard and Reportable Disturbance definitions are available at
httpwwwnerccomfilesBAL-002-0pdf
Reliability Metrics Performance
18
Continued trend assessment is recommended Where trends indicated potential issues the regional
entity will be requested to investigate and report their findings
Figure 8 Average Percent Non-Recovery of DCS Events (2006-2010)
Special Consideration
This metric aggregates the number of events based on reporting from individual Balancing Authorities or
Reserve Sharing Groups It does not capture the severity of the DCS events It should be noted that
most REs use 80 percent of the Most Severe Single Contingency to establish the minimum threshold for
reportable disturbance while others use 35 percent15
ALR2-5 Disturbance Control Events Greater Than Most Severe Single Contingency
Background
This metric represents the number of disturbance events that exceed the Most Severe Single
Contingency (MSSC) and is specific to each BA Each RE reports disturbances greater than the MSSC on
behalf of the BA or Reserve Sharing Group (RSG) The result helps validate current contingency reserve
requirements The MSSC is determined based on the specific configuration of each BA or RSG and can
vary in significance and impact on the BPS
15httpwwwweccbizStandardsDevelopmentListsRequest20FormDispFormaspxID=69ampSource=StandardsDevelopmentPagesWEC
CStandardsArchiveaspx
375
079
0
54
008
005
0
15 0
77
025
0
33
000510152025303540
2006
2007
2008
2009
2010
2006
2007
2008
2009
2010
2006
2007
2008
2009
2010
2006
2007
2008
2009
2010
2006
2007
2008
2009
2010
2006
2007
2008
2009
2010
2006
2007
2008
2009
2010
2006
2007
2008
2009
2010
FRCC MRO NPCC RFC SERC SPP ERCOT WECC
Region and Year
Reliability Metrics Performance
19
Assessment
Figure 9 represents the number of DCS events within each RE that are greater than the MSSC from 2006
to 2010 This metric and resulting trend can provide insight regarding the risk of events greater than
MSSC and the potential for loss of load
In 2010 SERC had 16 BAL-002 reporting entities eight Balancing Areas elected to maintain Contingency
Reserve levels independent of any reserve sharing group These 16 entities experienced 79 reportable
DCS eventsmdash32 (or 405 percent) of which were categorized as greater than their most severe single
contingency Every DCS event categorized as greater than the most severe single contingency occurred
within a Balancing Area maintaining independent Contingency Reserve levels Significantly all 79
regional entities reported compliance with the Disturbance Recovery Criterion including for those
Disturbances that were considered greater than their most severe single Contingency This supports a
conclusion that regardless of the size of the BA or participation in a Reserve Sharing Group SERCrsquos BAL-
002 reporting entities have demonstrated the ability in 2010 to use Contingency Reserve to balance
resources and demand and return Interconnection frequency within defined limits following Reportable
Disturbances
If the SERC Balancing Areas without large generating units and who do not participate in a Reserve
Sharing Group change the determination of their most severe single contingencies to effect an increase
in the DCS reporting threshold (and concurrently the threshold for determining those disturbances
which are greater than the most severe single contingency) there will certainly be a reduction in both
the gross count of DCS events in SERC and in the subset considered under ALR2-5 Masking the discrete
events which cause Balancing Area response may not reduce ldquoriskrdquo to the system However it is
desirable to maintain a reporting threshold which encourages the Balancing Authority to respond to any
unexplained change in ACE in a manner which supports Interconnection frequency based on
demonstrated performance SERC will continue to monitor DCS performance and will continue to
evaluate contingency reserve requirements but does not consider 2010 ALR2-5 performance to be an
adverse trend in ldquoextreme or unusualrdquo contingencies but rather within the normal range of expected
occurrences
Reliability Metrics Performance
20
Special Consideration
The metric reports the number of DCS events greater than MSSC without regards to the size of a BA or
RSG and without respect to the number of reporting entities within a given RE Because of the potential
for differences in the magnitude of MSSC and the resultant frequency of events trending should be
within each RE to provide any potential reliability indicators Each RE should investigate to determine
the cause and relative effect on reliability of the events within their footprints Small BA or RSG may
have a relatively small value of MSSC As such a high number of DCS greater than MCCS may not
indicate a reliability problem for the reporting RE but may indicate an issue for the respective BA or RSG
In addition events greater than MSSC may not cause a reliability issue for some BA RSG or RE if they
have more stringent standards which require contingency reserves greater than MSSC
ALR 1-5 System Voltage Performance
Background
The purpose of this metric is to measure the transmission system voltage performance (either absolute
or per unit of a nominal value) over time This should provide an indication of the reactive capability
available to the transmission system The metric is intended to record the amount of time that system
voltage is outside a predetermined band around nominal
0
5
10
15
20
25
30
2006
2007
2008
2009
2010
2006
2007
2008
2009
2010
2006
2007
2008
2009
2010
2006
2007
2008
2009
2010
2006
2007
2008
2009
2010
2006
2007
2008
2009
2010
2006
2007
2008
2009
2010
2006
2007
2008
2009
2010
FRCC MRO NPCC RFC SERC SPP ERCOT WECC
Cou
nt
Region and Year
Figure 9 Disturbance Control Events Greater Than Most Severe Single Contingency (2006-2010)
Reliability Metrics Performance
21
Special Considerations
Each Reliability Coordinator (RC) will work with the Transmission Owners (TOs) and Transmission
Operators (TOPs) within its footprint to identify specific buses and voltage ranges to monitor for this
metric The number of buses the monitored voltage levels and the acceptable voltage ranges may vary
by reporting entity
Status
With a pilot program requested in early 2011 a voluntary request to Reliability Coordinators (RC) was
made to develop a list of key buses This work continues with all of the RCs and their respective
Transmission Owners (TOs) to gather the list of key buses and their voltage ranges After this step has
been completed the TO will be requested to provide relevant data on key buses only Based upon the
usefulness of the data collected in the pilot program additional data collection will be reviewed in the
future
ALR3-5 Interconnection Reliability Operating Limit System Operating Limit (IROLSOL) Exceedances
Background
This metric illustrates the number of times that defined Interconnection Reliability Operating Limit
(IROL) or System Operating Limit (SOL) were exceeded and the duration of these events Exceeding
IROLSOLs could lead to outages if prompt operator control actions are not taken in a timely manner to
return the system to within normal operating limits This metric was approved by NERCrsquos Operating and
Planning Committees in June 2010 and a data request was subsequently issued in August 2010 to collect
the data for this metric Based on the results of the pilot conducted in the third and fourth quarter of
2010 there is merit in continuing measurement of this metric Note the reporting of IROLSOL
exceedances became mandatory in 2011 and data collected in Table 4 for 2010 has been provided
voluntarily
Reliability Metrics Performance
22
Table 4 ALR3-5 IROLSOL Exceedances
3Q2010 4Q2010 1Q2011
le 10 mins 123 226 124
le 20 mins 10 36 12
le 30 mins 3 7 3
gt 30 mins 0 1 0
Number of Reporting RCs 9 10 15
ALR4-1 Automatic Transmission Outages Caused by Protection System Misoperations
Background
Originally titled Correct Protection System Operations this metric has undergone a number of changes
since its initial development To ensure that it best portrays how misoperations affect transmission
outages it was necessary to establish a common understanding of misoperations and the data needed
to support the metric NERCrsquos Reliability Assessment Performance Analysis (RAPA) group evaluated
several options of transitioning from existing procedures for the collection of misoperations data and
recommended a consistent approach which was introduced at the beginning of 2011 With the NERC
System Protection and Control Subcommitteersquos (SPCS) technical guidance NERC and the regional
entities have agreed upon a set of specifications for misoperations reporting including format
categories event type codes and reporting period to have a final consistent reporting template16
Special Considerations
Only
automatic transmission outages 200 kV and above including AC circuits and transformers will be used
in the calculation of this metric
Data collection will not begin until the second quarter of 2011 for data beginning with January 2011 As
revised this metric cannot be calculated for this report at the current time The revised title and metric
form can be viewed at the NERC website17
16 The current Protection System Misoperation template is available at
httpwwwnerccomfilezrmwghtml 17The current metric ALR4-1 form is available at httpwwwnerccomdocspcrmwgALR_4-1Percentpdf
Reliability Metrics Performance
23
ALR6-11 ndash ALR6-14
ALR6-11 Automatic AC Transmission Outages Initiated by Failed Protection System Equipment
ALR6-12 Automatic AC Transmission Outages Initiated by Human Error
ALR6-13 Automatic AC Transmission Outages Initiated by Failed AC Substation Equipment
ALR6-14 Automatic AC Circuit Outages Initiated by Failed AC Circuit Equipment
Background
These metrics evolved from the original ALR4-1 metric for correct protection system operations and
now illustrate a normalized count (on a per circuit basis) of AC transmission element outages (ie TADS
momentary and sustained automatic outages) that were initiated by Failed Protection System
Equipment (ALR6-11) Human Error (ALR6-12) Failed AC Substation Equipment (ALR6-13) and Failed AC
Circuit Equipment (ALR6-14) These metrics are all related to the non-weather related initiating cause
codes for automatic outages of AC circuits and transformers operated 200 kV and above
Assessment
Figure 10 through Figure 13 show the normalized outages per circuit and outages per transformer for
facilities operated at 200 kV and above As shown in all eight of the charts there are some regional
trends in the three years worth of data However some Regionrsquos values have increased from one year
to the next stayed the same or decreased with no discernable regional trends For example ALR6-11
computes the automatic AC Circuit outages initiated by failed protection system equipment
There are some trends to the ALR6-11 to ALR6-14 data but many regions do not have enough data for a
valid trend analysis to be performed NERCrsquos outage rate seems to be improving every year On a
regional basis metric ALR6-11 along with ALR6-12 through ALR6-14 cannot be statistically understood
until confidence intervals18
18The detailed Confidence Interval computation is available at
are calculated ALR metric outage frequency rates and Regional equipment
inventories that are smaller than others are likely to require more than 36 months of outage data Some
numerically larger frequency rates and larger regional equipment inventories (such as NERC) do not
require more than 36 months of data to obtain a reasonably narrow confidence interval
httpwwwnerccomdocspctadstfTADS_Nov_2_2007APPENDIX_C_Confidence_Intervalpdf
Reliability Metrics Performance
24
While more data is still needed on a regional basis to determine if each regionrsquos bulk power system is
becoming more reliable year to year there are areas of potential improvement which include power
system condition protection performance and human factors These potential improvements are
presented due to the relatively large number of outages caused by these items The industry can
benefit from detailed analysis by identifying lessons learned and rolling average trends of NERC-wide
performance With a confidence interval of relatively narrow bandwidth one can determine whether
changes in statistical data are primarily due to random sampling error or if the statistics are significantly
different due to performance
Reliability Metrics Performance
25
ALR 6-11 ndash Automatic Outages Initiated by Failed Protection System Equipment
Automatic outages with an initiating cause code of failed protection system equipment are in Figure 10
Figure 10 ALR6-11 by Region (Includes NERC-Wide)
This code covers automatic outages caused by the failure of protection system equipment This
includes any relay andor control misoperations except those that are caused by incorrect relay or
control settings that do not coordinate with other protective devices
ALR6-12 ndash Automatic Outages Initiated by Human Error
Figure 11 shows the automatic outages with an initiating cause code of human error This code covers
automatic outages caused by any incorrect action traceable to employees andor contractors for
companies operating maintaining andor providing assistance to the Transmission Owner will be
identified and reported in this category
Reliability Metrics Performance
26
Also any human failure or interpretation of standard industry practices and guidelines that cause an
outage will be reported in this category
Figure 11 ALR6-12 by Region (Includes NERC-Wide)
Reliability Metrics Performance
27
ALR6-13 ndash Automatic Outages Initiated by Failed AC Substation Equipment
Figure 12 shows the automatic outages with an initiating cause code of failed AC substation equipment
This code covers automatic outages caused by the failure of AC Substation ie equipment ldquoinside the
substation fencerdquo including transformers and circuit breakers but excluding protection system
equipment19
19TADS Initiating Cause Code definitions are located at httpwwwnerccomdocspctadswgTADS_Definitions_Appendix_7_092909pdf
Figure 12 ALR6-13 by Region (Includes NERC-Wide)
Reliability Metrics Performance
28
ALR6-14 Automatic AC Transmission Outages Initiated by Failed AC Circuit Equipment
Figure 13 shows the automatic outages with an initiating cause code of failed AC circuit equipment
Automatic Outages related to the failure of AC Circuit equipment ie overhead or underground
equipment ldquooutside the substation fencerdquo 20
ALR6-15 Element Availability Percentage (APC)
Background
This metric uses data and calculations directly from the NERC TADS effort and illustrates the overall
percent of time the aggregate of transmission facilities are available and in service This is an aggregate
20TADS Initiating Cause Code definitions are located at httpwwwnerccomdocspctadswgTADS_Definitions_Appendix_7_092909pdf
Figure 13 ALR6-14 by Region (Includes NERC-Wide)
Reliability Metrics Performance
29
value using sustained outages (automatic and non-automatic) for both lines and transformers operated
at 200 kV and above for each Regional Entity Interconnection and for NERC This metric was approved
by the NERC Operating and Planning Committees in September 2010
Assessment
Figure 14 shows the aggregate element availability percentage (APC) for transmission and transformers
facilities operated at 200 kV and above The values are all over 90 percent which shows excellent
system availability The RMWG recommends continued metric assessment for at least a few more years
in order to determine the value of this metric
Figure 14 2010 ALR6-15 Element Availability Percentage
Notably the Eastern Interconnection does not include Quebec or ERCOT ERCOT does not have any
transformers with low-side voltage levels 200 kV and above
Special Consideration
It should be noted that the non-automatic outage data needed to calculate this metric was only first
collected for the calendar year 2010 as part of the TADS process Therefore only one year of data for
this metric is available at this time
Reliability Metrics Performance
30
ALR6-16 Transmission System Unavailability
Background
This metric uses data and calculations directly from the NERC TADS effort and shows the overall percent
of time the aggregate of transmission facilities are unavailable due to automatic and non-automatic
outages This is an aggregate value using sustained automatic outages for both lines and transformers
operated at 200 kV and above for each Regional Entity and for NERC This metric was approved by the
NERC Operating and Planning Committees in December 2010
Assessment
Figure 15 and Figure 16 illustrate the 2010 aggregate unavailability percentage for AC circuits and
transformer facilities operated at 200 kV and above The values for AC circuits are all under 3 percent
which shows excellent system availability
The RMWG recommends continued metric assessment for at least a few more years in order to
determine the value of this metric
Special Consideration
It should be noted that the non-automatic outage data needed to calculate this metric was only first
collected for the calendar year 2010 as part of the TADS process Therefore only one year of data for
this metric is available at this time
Figure 15 2010 ALR6-16 Transmission System Unavailability
Reliability Metrics Performance
31
Figure 16 2010 ALR6-16 Transmission System Unavailability by Outage Type
Notably the Eastern Interconnection does not include Quebec or ERCOT Also ERCOT does not have
any transformers with low-side voltage levels 200 kV and above
ALR6-2 Energy Emergency Alert 3 (EEA3)
Background
This metric identifies the number of times Energy Emergency Alerts Level 3 (EEA3) are issued EEA3
events are firm-load interruptions due to capacity and energy deficiency EEA3 is currently reported
collected and maintained in NERCrsquos Reliability Coordination Information System (RCIS) and is defined in
Attachment 1 of the NERC Standard EOP-00221
21 The latest version of Attachment 1 for EOP-002 is available at
This metric identifies the number of times EEA3s are
issued The number of EEA3s per year provides a relative indication of performance measured at a
Balancing Authority or interconnection level As historical data is gathered trends in future reports will
provide an indication of either decreasing or increasing use of EEA3s signaling adequacy of the electric
supply system This metric can also be considered in the context of Planning Reserve Margin Significant
increases or decreases in EEA3 events with relatively constant Planning Reserve Margins could indicate
httpwwwnerccompagephpcid=2|20
Reliability Metrics Performance
32
volatility in the actual loads compared to forecast levels or changes in the adequacy of the bulk power
system required to meet load demands
Assessment
Figure 17 shows the number of EEA3 events during 2006 and 2010 from an RE level An interactive
presentation was released and available at the Reliability Indicatorrsquos page22
The Acadiana Load Pocket (ALP) is an area in south central Louisiana that has experienced regular
transmission constraints and numerous Energy Emergency Alert filings by the SPP Reliability Controller
(SPP RC) Transmission within ALP is owned by Entergy Lafayette Utilities System (LUS) and Cleco
Power LLC (Cleco) The transmission constraints within the ALP are primarily caused by the local area
load and the lack of generation located in close proximity to the load area
The number of EEA3rsquos
declared in 2010 returned to more traditional numbers The 2009 spike in EEA3 events in the SPP
Region that was driven by issues in the Acadiana Load Pocket (ALP) were not present in 2010
Special Considerations
Ideally the measure should capture only EEAs that are declared for reliability reasons and not for
economic factors The RMWG has not been able to differentiate these reasons for future reporting and
it has made a recommendation to the Reliability Coordinator Working Group (RCWG) to consider a
revised EEA declaration to exclude economic factors
The reason the EEA volume decreased from 2009 to 2010 in SPP was because the SPP ICT RC23
coordinated an operating agreement between the five operating companies in the ALP The operating
agreement included a cost sharing re-dispatch that alleviated the need of a Transmission Loading Relief
(TLR-5) declaration24
22The EEA3 interactive presentation is available on the NERC website at
During 2009 there was no operating agreement therefore an entity had to
provide Network and Native Load (NNL) relief when a TLR-5 was called by the ICT RC When the TLR-5
was the primary tool to control the post contingent loading in the ALP some of the BAs would have their
firm transmission curtailed to the point where they could no longer serve their load therefore the EEA
3 was needed to communicate a capacityreserve deficiency
httpwwwnerccompagephpcid=4|331|335 23Southwest Power Pool (SPP) Independent Coordinator of Transmission (ICT) Reliability Coordinator (RC) 24More information on Transmission Load Relief is contained in the IRO-006 standard which is located at httpwwwnerccomfilesIRO-006-4pdf In particular TLR-5 definitions are referenced on page 16 and 17
Reliability Metrics Performance
33
Figure 17 ALR6-2 Energy Emergency Alert 3 (EEA3) Counts by Region (2006-2010)
Cleco Power Entergy and LUS are currently constructing an estimated $200 million transmission
infrastructure improvement project to mitigate transmission constraints into ALP Construction of the
project is scheduled to be complete in 2012 Completion of the project should help alleviate some of
the transmission congestion in this area Energy Emergency Alerts filed by the SPP Regional Entity
continue to decline
SPP RTO continues to coordinate operating plans with the operating entities in this area Mitigation
plans and local operating guides in place are expected to provide sufficient flexibility should issues arise
NERC will continue to monitor this area for Reliability Impacts and coordinate any actions with the SPP
Reliability Coordinator and SPP Regional Entity
ALR 6-3 Energy Emergency Alert 2 (EEA2)
Background
Energy Emergency Alert 2 (EEA2) is to measure the number of events BAs declare for deficient capacity
and energy during peak load periods which may serve as a leading indicator of energy and capacity
shortfall in the adequacy of the electric supply system EEA2 provides a sense of the frequency of
precursor events to the more severe EEA3 declarations This metric measures the number of events
1 3 1 2 214
3 4 4 1 5 334
4 2 1 52
1
0
5
10
15
20
25
30
3520
0620
0720
0820
0920
1020
0620
0720
0820
0920
1020
0620
0720
0820
0920
1020
0620
0720
0820
0920
1020
0620
0720
0820
0920
1020
0620
0720
0820
0920
1020
0620
0720
0820
0920
1020
0620
0720
0820
0920
10
FRCC MRO NPCC RFC SERC SPP TRE WECC
2006-2009
2010
Region and Year
Reliability Metrics Performance
34
Balancing Authorities declare for deficient capacity and energy during peak load periods At this time
however this data reflects inclusion of Demand Side Resources that would not be indicative of
inadequacy of the electric supply system
The number of EEA2 events and any trends in their reporting indicates how robust the system is in
being able to supply the aggregate load requirements The historical records may include demand
response activations and non-firm load interruptions per applicable contracts within the EEA alerts per
its definition25
Assessment
Demand response is a legitimate resource to be called upon by balancing authorities and
do not indicate a reliability concern As data is gathered in the future reports will provide an indication
of either decreasing or increasing adequacy in the electric supply system EEA2 events called solely for
activation of demand response (controllable or contractually prearranged demand-side dispatch
programs) or interruption of non-firm load per applicable contracts should be excluded This metric can
also be considered in the context of the Planning Reserve Margin Significant increases or decreases in
EEA2 events with relatively constant Planning Reserve Margins could indicate volatility in the actual
loads compared to forecast levels or changes in the adequacy of the bulk power system required to
meet load demands
Figure 18 shows the number of EEA2 events by Regional Entity from 2006 to 2010 EEA2 interactive
version available on line by quarter and region26
25 The EEA2 is defined at
The general trend continues to show improved
performance which may have been influenced by the overall reduction in demand throughout NERC
caused by the economic downturn Specific performance by any one region should be investigated
further for issues or events that may affect the results Determining whether performance reported
includes those events resulting from the economic operation of DSM and non-firm load interruption
should also be investigated The RMWG recommends continued metric assessment
httpwwwnerccomfilesEOP-002-2pdf 26 EEA2 interactive version located at httpwwwnerccompagephpcid=4|331|341
Reliability Metrics Performance
35
Special Considerations
The intent of this metric is to measure only EEAs that are called for reliability reasons and not for
economic factors such as demand side management (DSM) and non-firm load interruption The
historical data for this metric may include events that were called for economic factors According to
the RCWG recent data should only include EEAs called for reliability reasons
ALR 6-1 Transmission Constraint Mitigation
Background
The RMWG completed a pilot with four regional entities Based on the results the RMWG expanded the
pilot data collection to all regions and the initial results of the data collection are shown in Figure 19
and Table 5 Based on the results of the pilot there is merit in continuing to assess this metric The
intent of this metric is to identify trends in the number of mitigation measures (Special Protection
Schemes (SPS) Remedial Action Schemes (RAS) and Operating Procedures) required to meet reliability
requirements By their nature SPS do not indicate an inherent weakness in the bulk power system
rather they are an indication of methods that are taken to operate the system through the range of
conditions it must perform This metric is only intended to evaluate the trend use of these plans and
whether the metric indicates robustness of the transmission system is increasing remaining static or
decreasing
1 27
2 1 4 3 2 1 2 4 5 2 5 832
4724
211
5 38 5 1 1 8 7 4 1 1
05
101520253035404550
2006
2007
2008
2009
2010
2006
2007
2008
2009
2010
2006
2007
2008
2009
2010
2006
2007
2008
2009
2010
2006
2007
2008
2009
2010
2006
2007
2008
2009
2010
2006
2007
2008
2009
2010
2006
2007
2008
2009
2010
FRCC MRO NPCC RFC SERC SPP TRE WECC
2006-2009
2010
Region and Year
Figure 18 ALR6-3 Energy Emergency Alert 2 (EEA2)
Reliability Metrics Performance
36
Assessment
The pilot data indicates a relatively constant number of mitigation measures over the time period of
data collected
Figure 19 ALR6-1 Transmission Constraint Mitigation by SPSRAS (2009-2014)
0102030405060708090
100110120
2009
2010
2011
2014
2009
2010
2011
2014
2009
2010
2011
2014
2009
2010
2011
2014
2009
2010
2011
2014
2009
2010
2011
2014
2009
2010
2011
2014
2009
2010
2011
2014
FRCC MRO NPCC RFC SERC SPP ERCOT WECC
Coun
t
Region and Year
SPSRAS
Reliability Metrics Performance
37
Table 5 ALR6-1 Transmission Constraint Mitigation by Operating ProcedureGuides (2009-2011)
ALR6-1 Transmission Constraint Mitigation by Operating ProcedureGuides (2009-2014)
2009 2010 2011 2014
FRCC 107 75 66
MRO 79 79 81 81
NPCC 0 0 0
RFC 2 1 3 4
SPP 39 40 40 40
SERC 6 7 15
ERCOT 29 25 25
WECC 110 111
Special Considerations
A certain number of SPS mitigation plans may be necessary to support reliable operation of the system
If the number of SPS increase over time this may indicate that additional transmission capacity is
required A reduction in the number of SPS may be an indicator of increased generation or transmission
facilities being put into service which may indicate greater robustness of the bulk power system In
general mitigation plans are a viable and valuable tool for effective operation of the bulk power system
In power system planning reliability operability capacity and cost-efficiency are simultaneously
considered through a variety of scenarios to which the system may be subjected Mitigation measures
are a method for optimizing a power system across these scenarios Changes in quantities of mitigation
plans may indicate year-on-year differences in the system being evaluated
Integrated Bulk Power System Risk Assessment
Introduction In developing eighteen metrics to measure acceptable levels of reliability it has become clear that any
such measurement of reliability must include consideration of the risks present within the bulk power
system in order for us to appropriately prioritize and manage these system risks The scope for the
Reliability Metrics Working Group (RMWG)27
27 The RMWG scope can be viewed at
includes a task to develop a risk-based approach that
provides consistency in quantifying the severity of events The approach not only can be used to
httpwwwnerccomfilezrmwghtml
Reliability Metrics Performance
38
measure risk reduction over time but also can be applied uniformly in event analysis process to identify
the events that need to be analyzed in detail and sort out non-significant events
The Operating Committee (OC) and Planning Committee (PC) endorsed the concepts and framework28 of
the risk-based approach in their September 2010 joint meeting and further supported the event severity
risk index (SRI) calculation29
Recommendations
in March 2011
bull NERC should embrace the use of risk assessment to identify trends in addition to lessons learned
in order to improve bulk power system reliability
bull The RMWG should continue to coordinate and communicate with the Event Analysis Working
Group (EAWG) to apply the SRI into the event analysis process and root cause analysis
bull As trend evaluations increase the knowledge of risks to the bulk power system data required to
support additional assessment should be gathered
Event Severity Risk Index (SRI)
Risk assessment is an essential tool for achieving the alignment between organizations people and
technology This will assist in quantifying inherent risks identifying where potential high risks exist and
evaluating where the most significant lowering of risks can be achieved Being learning organizations
the Electric Reliability Organization (ERO) Regional Entities and Registered Entities can use these tools
to focus on the areas of highest risk to reliability to provide a sound basis for developing results-based
standards and compliance programs Risk assessment also serves to engage all stakeholders in a
dialogue about specific risk factors and helps direct a strategic plan for risk reduction and early
detection
The SRI is a daily blended metric for which transmission loss generation loss and load loss events are
calculated Each element (transmission generation and load loss) is factored by the systemrsquos inventory
for that element to rate significant events appropriately On a yearly basis these daily performances
can be sorted in descending order to evaluate the year-on-year performance of the system
In order to test drive the concepts the RMWG applied these calculations against historically memorable
days to derive SRIs Once these calculations were complete they were reviewed and evaluated by
various stakeholders for reasonableness Based upon feedback modifications to the calculation were
made and assessed against the historic days performed This iterative process locked down the details
28 httpwwwnerccomdocspcrmwgIntegrated_Bulk_Power_System_Risk_Assessment_Concepts_Finalpdf 29 httpwwwnerccomdocspcrmwgSRI_Equation_Refinement_May6_2011pdf
Reliability Metrics Performance
39
for the calculation of SRI whose calculation from zero (no transmission line outages generation outages
or load lost in a day) to 1000 (a theoretical condition in which every transmission line all generation
units and all load lost across the system in a single day)
Figure 20 captures the calculated severity risk value for each of the days for each year benchmarked
with the historic significant events which were used to concept test the calculation Since there is
significant disparity between days the bulk power system is stressed compared to those that are
ldquoroutinerdquo and ldquoherordquo days of the year where the system performed extremely well the curve is depicted
using a logarithmic scale Each yearrsquos data is sorted in descending order striking a characteristic shape
At the left-side of the curve the days in which the system is severely stressed are plotted The central
more linear portion of the curve identifies the routine day performance while the far right-side of the
curve shows the values plotted for days in which almost all lines and generation units are in service and
essentially no load is lost
The trends on the chart below show that 2009 and 2010 had fewer extreme days than 2008 Routine
daily performance appears generally consistent across all three years Figure 20 captures the days for
each year benchmarked with historically significant events
In Figure 20 NERCrsquos event categories and SRI ratings are directly related As the SRI increases the
category or severity of the event increases Historical events are also shown to relate modern
reliability measurements to give a perspective of how a well-known event would register on the SRI
scale
The event analysis process30
30
benefits from the SRI as it enables a numerical analysis of an event in
comparison to other events By this measure an event can be prioritized by its severity In a severe
event this is unnecessary However for events that do not result in severe stressing of the bulk power
system this prioritization can be a challenge By using the SRI the event analysis process can decide
which events to learn from and reduce which events to avoid and when resilience needs to be
increased under high impact low frequency events as shown in the blue boxes in the figure
httpwwwnerccompagephpcid=5|365
Reliability Metrics Performance
40
Figure 20 NERC Annual Daily Severity Risk Index (SRI) Sorted Descending with Historic Benchmark Days
Other factors that impact severity of a particular event to be considered in the future include whether
equipment operated as designed and resulted in loss of load from a reliability perspective (intentional
and controlled load-shedding) Mechanisms for enabling ongoing refinement to include the historic and
simulated events for future severity risk calculations are being explored
Reliability Metrics Performance
41
Integrated Reliability Index Concepts In December 2010 the RMWG was challenged by the OC and PC to develop a single index concept to
measure the universe of risks associated with the bulk power system As a result the integrated
reliability index (IRI) concepts were proposed31
Figure 21
the three components of which were defined to
quantify each specific risk aspect They are titled the Event Driven Index (EDI) StandardsStatute Driven
Index (SDI) and Condition Driven Index (CDI) illustrated in with measures associated with
system events standards compliance and eighteen performance metrics The development of an
integrated reliability index aims to inform increase transparency and quantify the effectiveness of risk
reduction or mitigation actions The goal is to provide the industry meaningful trends of the BPSrsquos
performance and guidance on how the industry can improve reliability and support risk-informed
decision making Once completed the IRI will facilitate holistic assessment of performance Finally the
IRI should help overcome concern and confusion about how many metrics are being analyzed for system
reliability assessments
Figure 21 Risk Model for Bulk Power System
The integrated model of event-driven condition-driven and standardsstatute-driven risk information
can be constructed to illustrate all possible logical relations between the three risk sets Due to the
nature of the system there may be some overlap among the components
31 httpwwwnerccomdocspcrmwgIntegrated_Reliability_Index_WhitePaper_DRAFTpdf
Event Driven Index (EDI)
Indicates Risk from
Major System Events
Standards Statute Driven
Index (SDI)
Indicates Risks from Severe Impact Standard Violations
Condition Driven Index (CDI)
Indicates Risk from Key Reliability
Indicators
Reliability Metrics Performance
42
The Three Components of the IRI The three components of the IRI work together as shown in Figure 22 to comprise a full picture of the
state of reliability
Figure 22 An overview of the components that comprise the Integrated Reliability Index (IRI)
Event-Driven Indicators (EDI)
The Event-Driven Indicator provides a basis for prioritization of events based on bulk power system
integrity equipment performance and engineering judgment This indicator can serve as a high value
risk assessment tool to be used by stakeholders to investigate and evaluate disturbance history and
measure the severity of these events The relative ranking of events requires industry expertise agreed-
upon goals and engineering judgment The EDI is a derivative of SRI results for a specific time period
but it transforms that performance into a form of an availability index These calculations will be further
refined as feedback is received
Condition-Driven Indicators (CDI)
The Condition-Driven Indicators focus on a set of measurable system conditions (performance
measures) to assess bulk power system reliability These reliability indicators identify factors that
positively or negatively impact reliability and are early predictors of the risk to reliability from events or
unmitigated violations A collection of these indicators measures how close reliability performance is to
the desired outcome and if the performance against these metrics is constant or improving
Reliability Metrics Performance
43
StandardsStatute-Driven Indicators (SDI)
The StandardsStatute-Driven Indicator is a calculation of success of compliance based upon the subset
of high-value standards and is divided by the number of participations who could have received the
violation within the time period considered Also based on these factors known unmitigated violations
of elevated risk factor requirements are weighted higher than lower risk factors The index decreases if
the compliance improvement is achieved over a trending period
IRI Index Calculation As with the SRI the IRI is based on an importance weighting factor which the RMWG can modify over
time after gaining experience with the new metric as well as consideration of feedback from industry
At this time the RMWG believes some form of blended weighting may serve to start to populate IRI
characteristic curves at a high and generic level Based upon feedback from stakeholders this approach
may change or as discussed below weighting factors may vary based on periodic review and risk model
update The RMWG will continue the refinement of the IRI calculation and consider other significant
factors that impact reliability (eg intentional and controlled load-shedding) further it will explore
developing mechanisms for enabling ongoing refinement which should be influenced by a wide set of
stakeholders
RMWG recommends the Event Driven Index (EDI) be weighted the highest (50 percent) since events
actually occurred indicating how the system was performing The Condition Driven Index (CDI) and
StandardsStatute Driven Index (SDI) are weighted 25 each since they are indicators of potential risks
to BPS reliability IRI can be calculated as follows
IRI is intended to be a composite metric which integrates several forms of individual risks to the bulk
power system Since the three components range across many stakeholder organizations these
concepts are developed as starting points for continued study and evaluation Additional supporting
materials can be found in the IRI whitepaper32
IRI Recommendations
including individual indices calculations and preliminary
trend information
For the IRI more investigation should be performed to determine the best way to integrate EDI CDI
and SDI into an Integrated Reliability Index (IRI) that quantitatively represents the reliability of the bulk
32 The IRI whitepaper can be found at httpwwwnerccomdocspcrmwgIntegrated_Reliability_Index_WhitePaper_DRAFTpdf
Reliability Metrics Performance
44
power system To this end study into determining the amount of overlap between the components is
necessary RMWG is currently working to determine the proper amount of overlap between the IRI
components
Also the CDI component of the IRI needs to be solidified This is especially true with the CDI More
accurate metric data is needed to paint a fuller picture of the CDI Many of the metrics used to calculate
the CDI are new or they have limited data Compared to the SDI which counts well-known violation
counts and the EDI which uses the well-defined CDI the CDI lacks the depth of rigor that the other two
components have acquired through their years of data RMWG is currently working to improve the CDI
Reliability Metrics Conclusions and Recommendations Among the eighteen metrics that address the characteristics of an adequate level of reliability (ALR)
metric trends indicate the system is performing better in the following seven areas
bull ALR1-3 Planning Reserve Margin
bull ALR1-4 BPS Transmission Related Events Resulting in Loss of Load
bull ALR2-5 Disturbance Control Events Greater than Most Severe Single Contingency
bull ALR6-2 Energy Emergency Alert 3 (EEA3)
bull ALR6-3 Energy Emergency Alert 2 (EEA2)
bull ALR6-11 Automatic Transmission Outages Caused by Protection System Misoperations
bull ALR6-13 Automatic Transmission Outages Caused by Failed AC Substation Equipment
Assessments have been made in other performance categories A number of them do not have
sufficient data to derive any conclusions from the results The RMWG recommends continued data
collection and assessment of these metrics If a metric does not yield any trend in a five-year reporting
period the metric will be modified or withdrawn
For the IRI more investigation should be performed to determine the overlap of the components (CDI
EDI and SDI) The CDI should be more thoroughly solidified as an index by collecting more data over
time
Transmission Equipment Performance
45
Transmission Equipment Performance Introduction The Transmission Availability Data System (TADS) effort began with the establishment of a TADS task force
by the NERC Planning Committee in October 2006 On October 27 2007 the NERC Board of Trustees
approved the collection of transmission automatic outage data beginning in calendar year 2008 (Phase I)
Subsequently on October 29 2008 the NERC Board approved the collection of Non-Automatic Outage data
that began for Calendar year 2010 (Phase II)
This chapter provides reliability performance analysis of the transmission system by focusing on the trends
of Automatic Outage data from calendar year 2008 thru 2010 Since only one year of Non-Automatic
Outage data has been collected that data will not be assessed in this report
When calculating bulk power system performance indices care must be exercised when interpreting results
as misinterpretation can lead to erroneous conclusions regarding system performance With only three
years of data in the smaller regions it is not clear whether a regionrsquos yearly outage variation compared to
the average is due to random statistical variation or that particular year is significantly different in
performance However on a NERC-wide basis after three years of data collection there is enough
information to accurately determine whether the yearly outage variation compared to the average is due to
random statistical variation or the particular year in question is significantly different in performance33
Performance Trends
Transmission performance information has been provided by Transmission Owners (TOs) within NERC
through the NERC TADS (Transmission Availability Data System) process The data presented reflects
Momentary and Sustained AC Automatic outages of transmission elements that operate at voltages ge 200 kV
(including the low side of transformers) with the criteria specified in the TADS process The following
elements listed below are included
bull AC Circuits ge 200 kV (Overhead and Underground Circuits) Radial circuits are included
bull DC Circuits with ge +-200 kV DC voltage
bull Transformers with ge 200 kV low-side voltage and
bull ACDC Back-to-Back (BTB) Converters with ge 200 kV AC voltage on both sides
33The detailed Confidence Interval computation is available at httpwwwnerccomdocspctadstfTADS_Nov_2_2007APPENDIX_C_Confidence_Intervalpdf
Transmission Equipment Performance
46
AC Element Outage Summary and Leading Causes Table 6 shows the 2008 2009 and 2010 NERC total AC transmission element inventory and a summary of
the associated outages As expected in general the number of circuits increased from year to year due to
new construction or re-construction to higher voltages For every outage experienced on the transmission
system cause codes are identified and recorded according to the TADS process Causes of both momentary
and sustained outages have been indicated These causes are analyzed to identify trends and similarities
and to provide insight into what could be done to possibly prevent future occurrences
Figure 23 and Figure 24 describe the top ten initiating cause codes for sustained and momentary automatic
outages combined from 2008-2010 Based on the two figures the relationship between the total number of
outages and total outage hours can be seen Failed AC Substation Equipment and Failed AC Circuit
Equipment only account for 15 percent of the total number of outages but account for 65 percent of the
total outage hours The two largest causes of outages within NERC (ldquoLightingrdquo and ldquoWeather excluding
Lightningrdquo) account for 34 percent of the total number of outages
The next three Human Error Failed Protection System Equipment and Failed AC Circuit Equipment have
very similar totals and should all be considered significant focus points in reducing the number of Sustained
Automatic Outages for all elements
Transmission Equipment Performance
47
Table 6 NERC - All AC Elements Sustained and Momentary Outage Performance Summary
2008 Number of Outages
AC Voltage
Class
No of
Circuits
Circuit
Miles Sustained Momentary
Total
Outages Total Outage Hours
200-299kV 4369 102131 1560 1062 2622 56595
300-399kV 1585 53631 793 753 1546 14681
400-599kV 586 31495 389 196 585 11766
600-799kV 110 9451 43 40 83 369
All Voltages 6650 196708 2785 2051 4836 83626
2009 Number of Outages
AC Voltage
Class
No of
Circuits
Circuit
Miles Sustained Momentary
Total
Outages Total Outage Hours
200-299kV 4468 102935 1387 898 2285 28828
300-399kV 1619 56447 641 610 1251 24714
400-599kV 592 32045 265 166 431 9110
600-799kV 110 9451 53 38 91 442
All Voltages 6789 200879 2346 1712 4038 63094
2010 Number of Outages
AC Voltage
Class
No of
Circuits
Circuit
Miles Sustained Momentary
Total
Outages Total Outage Hours
200-299kV 4567 104722 1506 918 2424 54941
300-399kV 1676 62415 721 601 1322 16043
400-599kV 605 31590 292 174 466 10442
600-799kV 111 9477 63 50 113 2303
All Voltages 6957 208204 2582 1743 4325 83729
Note The NERC table does not show redacted outages DC Circuit outages Transformer outages or ACDC
converter outages
Transmission Equipment Performance
48
Figure 23 NERC - Top Ten Sustained and Momentary Outages by Initiating Cause Code for All Elements
Figure 24 NERC - Top Ten Sustained Outage Hours by Cause Code
198
151
80
7271
6943
33
27
188
68
Lightning
Weather excluding lightningHuman Error
Failed AC Substation EquipmentFailed Protection System EquipmentFailed AC Circuit Equipment Foreign Interference
Power System Condition
Fire
Unknown
Remaining Cause Codes
299
246
188
58
52
42
3619
16 12 31 Failed AC Substation EquipmentFailed AC Circuit Equipment Weather excluding lightningUnavailable
Other
Fire
Unknown
Human Error
Failed Protection System EquipmentForeign Interference
Remaining Cause Codes
Transmission Equipment Performance
49
Transmission Monthly Outages Figure 25 displays the total number of Automatic Outages on a per-month basis The three months with the
highest total of outages were June July and August From a seasonal perspective winter had a monthly
average of 281 outages These include the months of November-March Summer had an average of 429
outages Summer included the months of April-October
Figure 25 Number of Outages by Month for AC Circuits (2008-2010)
This figure does not show redacted outages DC Circuit outages Transformer outages or ACDC Converter
outages
Outage Initiation Location For every outage experienced on the transmission system the outage initiation code is identified and
recorded according to the TADS process The outage initiation code can be analyzed to identify trends and
similarities and to provide insight into what could be done to possibly prevent future occurrences
The ldquoOutage Initiation Coderdquo describes where an automatic outage was initiated on the power system The
five codes are as follows
bull Element-Initiated
bull Other Element-Initiated
bull AC Substation-Initiated
bull ACDC Terminal-Initiated (for DC circuits)
bull Other Facility Initiated any facility not included in any other outage initiation code
JanuaryFebruar
yMarch April May June July August
September
October
November
December
2008 238 229 257 258 292 437 467 380 208 176 255 236
2009 315 201 339 334 398 553 546 515 351 235 226 294
2010 444 224 269 446 449 486 639 498 351 271 305 281
3 Year AVG 332 218 288 346 380 492 551 464 303 227 262 270
0
100
200
300
400
500
600
700
Out
ages
Transmission Equipment Performance
50
Notably the protection system is not part of an ldquoAC Substationrdquo or an ldquoACDC Terminalrdquo If a protection
system misoperates and initiates an outage it will be classified as ldquoOther-Facility Initiatedrdquo The following
Figures show the initiating location of the Automatic outages from 2008 to 2010
With both Momentary and Sustained Automatic Outages taken into account the outage was initiated on the
Element more than 67 percent of the time as shown in Figure 26 and Figure 27
When only the Sustained Automatic Outages are analyzed the outage initiation on both AC Substation and
Other Facility increased by 34 percent and 32 percent respectively Outages initiated on the Element itself
decreases by 78 percent as shown in Figure 26 and 27 For only the Momentary Automatic Outages the
outage initiation on the Element increases by 19 percent compared to Sustained Outages Element initiated
outages make up over 78 percent of the total outages when analyzing only Momentary Outages
Figure 26
Figure 27
Transmission Outage Events Figure 28 illustrates the relationship between the numbers of Automatic Outages associated per TADS
event 2008 2009 and 2010 tend to follow the same trend The largest number of Automatic Outages per
TADS event is fourteen in 2010 thirteen in 2009 and eight in 2008 There are around 70 to 100 TADS
events that contain between fourteen and three Automatic Outages (see below) There are around 330 to
400 TADS events that contain two or more Automatic Outages The rest of the events only contain one
Automatic Outage As noted in the lower right hand corner below the total number of Events in 2008 to
2010 ranged from 3920 to 4569 events per year Nearly 90 percent or more of the events contained one
Automatic Outage
Figure 26 Sustained Automatic Outage Initiation
Code
Figure 27 Momentary Automatic Outage Initiation
Code
Transmission Equipment Performance
51
Transmission Outage Mode Figure 29 and Figure 30 show the percentage of Outage Modes The ldquoOutage Mode Coderdquo describes
whether one Automatic Outage is related to other Automatic Outages A Single Mode outage is an
Automatic Outage of a single Element which occurs independently of any other Automatic Outages (if any)
A ldquoDependent Mode Initiating Outagerdquo is an Automatic Outage of a single Element that initiates one or more
subsequent Element Automatic Outages A ldquoDependent Mode Outagerdquo is an Automatic Outage of an
Element which occurred as a result of an initiating outage whether the initiating outage was an Element
outage or a non-Element outage A ldquoCommon Mode Outagerdquo is one of two or more Automatic Outages with
the same Initiating Cause Code and where the outages are not consequences of each other and occur nearly
simultaneously A ldquoCommon Mode Initiating Outagerdquo is a Common Mode Outage that initiates one or more
subsequent Automatic Outages
Over 72 percent of the total outages occurred on the bulk power system are Single Mode Outages The next
largest mode is Dependent with over 11 percent of the total outages being in this category For only
Sustained Automatic Outages outages related to each other increase with Dependent mode accounting for
13 percent of the outages and Common mode accounting for close to 11 percent of the outages
Independent Sustained outages still account for the largest portion with nearly 70 percent being Single
mode When just analyzing Momentary Automatic Outages Associated outages decrease with Dependent
Figure 28 Event Histogram (2008-2010)
Transmission Equipment Performance
52
mode accounting for only 9 percent of the outages The Common Mode percentage decreases while
Dependent Mode Initiating percentage increases compared to Sustained Outages Independent Momentary
outages account for the largest portion with over 76 percent being Single Mode
An investigation into the root causes of Dependent and Common mode events which include three or more
Automatic Outages (indentified in the TADS 2008 to 2010 data) should be a high priority Some protection
systems are designed to trip three or more circuits but some events go beyond what is designed Some also
have misoperations associated with multiple outage events
Conclusions On a NERC wide average basis automatic transmission outage rate is improving from 2008 to 2010 based on
reported data Considering both automatic and non-automatic outages 2010 records indicate transmission
element availability percentage is very high and exceeds 95 The unavailability rate for AC circuits and
transformers are only 15 and 29 respectively
The cause codes of Human Error Failed Protection System Equipment and Failed AC Circuit Equipment
should be considered significant focus points in reducing the number of Sustained Automatic Outages for all
elements A deeper look into the root causes of Dependent and Common mode events which include three
or more Automatic Outages (indentified in the TADS 2008 to 2010 data) should be a high priority Some
protection systems are designed to trip three or more circuits but some events go beyond what is designed
Some also have misoperations associated with multiple outage events
Figure 29 Sustained Automatic Outage Mode code Figure 30 Momentary Automatic Outage Mode code
Generation Equipment Performance
53
Generation Equipment Performance Introduction The development of the Generating Availability Data System (GADS) began in 1982 This series of databases
is used to voluntarily collect record and retrieve operating information By pooling individual unit
information with likewise units generating unit availability performance can be calculated providing
opportunities to identify trends and generating equipment reliability improvement opportunities The
information is used to support equipment reliability availability analyses and risk-informed decision-making
by system planners generation owners assessment modelers manufacturers and contractors etc Reports
and information resulting from the data collected through GADS are now used for benchmarking and
analyzing electric power plants
Currently the data collected through GADS contains 72 percent of the North American generating units
with generating capacity of 20 MW or higher34 Additionally many of the newer combined-cycle plants are
not reporting information and therefore a full view of each unit type is not presented Rather a sample of
all the units in North America that fit a given more general category is provided35 for the 2008-201036
Generation Key Performance Indicators
assessment period
Three key performance indicators37
In
the industry have used widely to measure the availability of generating
units (see Terms Used in This Report section for their calculation parameters) are Equivalent Availability
Factor (EAF) Net Capacity Factor (NCF) and Equivalent Forced Outage Rate ndash Demand (EFORd)
Table 7 the North American fleet average EAF NCF and EFORd compared to unit age for all generating
units with a capacity of 20 MW and higher is provided for the years 2008-2010 The EAF shows a decline
during the last three years NCF is up and down while the EFORd appears to be increasing As expected the
fleet of units reported to GADS is aging overall with the fossil units being about 12 years older than the
average age
34 httpwwwnerccomdocspcgadstfGADSTF_Recommendation_Report_02-18-2011_FINALpdf 35GADS contains some 1500+ units under 20 MW that is not included in this report These units are excluded because most units are not base-loaded and are in peaking operation
3684 percent of the 2010 dataset is available at this time while the 2008 and 2009 dataset is complete 37 httpwwwnerccompagephpcid=4|43
Generation Equipment Performance
54
Table 7 General Availability Review of GADS Fleet Units by Year
2008 2009 2010 Average
Equivalent Availability Factor (EAF) 8776 8774 8678 8743
Net Capacity Factor (NCF) 5083 4709 4880 4890
Equivalent Forced Outage Rate -
Demand (EFORd) 579 575 639 597
Number of Units ge20 MW 3713 3713 3713 3713
Average Age of the Fleet in Years (all
unit types) 303 311 321 312
Average Age of the Fleet in Years
(fossil units only) 422 432 440 433
Figure 31 provides the average forced outage hours (FOH) maintenance outage hours (MOH) and planned
outage hours (POH) for all units reporting 20 MW or larger During this three-year period the average FOH
291 hours average MOH is 163 hours average POH is 470 hours
Figure 31 shows a large increase in forced and maintenance events The average age of the units with a
capacity of 20MW and higher in 2009 is 316 years old However the average age of fossil units in 2010 is
442 years old These fossil units are the backbone of all operating units providing the base-load power
continuously and nearly 50 percent of all energy annually There appears to be no increase allocated for
annualsemi-annual maintenance (ie planned outages) for the older generating units The increase of
000100002000030000400005000060000700008000090000
100000
2008 2009 2010
463 479 468
154 161 173
288 270 314
Hou
rs
Planned Maintenance Forced
Figure 31 Average Outage Hours for Units gt 20 MW
Generation Equipment Performance
55
maintenance outage hours reflects an increased need to fix problems that cannot be deferred until the next
annualsemi-annual repairs As a result it shows one of two things are happening
bull More or longer planned outage time is needed to repair the aging generating fleet
bull More focus on preventive repairs during planned and maintenance events are needed
Multiple Unit Forced Outages and Causes Table 8 provides the annual multiple-unit forced outage trips resulting from the same cause for each of the
assessments years 2008-2010 respectively The ldquosingle unitrdquo trips are large units with a Net Dependable
Capacity of 750 MW or more The trips of ldquotwo unitsrdquo or more is any combination of unit capacity with the
total amount of lost capacity more than 750 MW
Table 8 also presents more information on the forced outages During 2008-2010 there were a large
number of double-unit outages resulting from the same event Investigations show that some of these trips
were at a single plant caused by common control and instrumentation for the units The incidents occurred
several times for several months and are a common mode issue internal to the plant
Table 8 Number of Multiple Unit Forced Outages and FrequencyYear
2008 2009 2010
Type of
Trip
of
Trips
Avg Outage
Hr Trip
Avg Outage
Hr Unit
of
Trips
Avg Outage
Hr Trip
Avg Outage
Hr Unit
of
Trips
Avg Outage
Hr Trip
Avg Outage
Hr Unit
Single-unit
Trip 591 58 58 284 64 64 339 66 66
Two-unit
Trip 281 43 22 508 96 48 206 41 20
Three-unit
Trip 74 48 16 223 146 48 47 109 36
Four-unit
Trip 12 77 19 111 112 28 40 121 30
Five-unit
Trip 11 1303 260 60 443 88 19 199 10
gt 5 units 20 166 16 93 206 50 37 246 6
Loss of ge 750 MW per Trip
The high number of five-unit trips in 2008 was due to Hurricane Ike hitting the Gulf Coast The highest total
number of multiple unit trips occurred in 2009 though as mentioned before the data collection for 2010 is
incomplete at this time The majority of 2009 multiple unit trips have three main causes (in order by
Generation Equipment Performance
56
number of events) transmission lack of fuel and storms A summary of the three categories for single as
well as multiple unit outages (all unit capacities) are reflected in Table 9
Table 9 Common Causes of Multiple Unit Forced Outages (2009)
Cause Number of Events Average MW Size of Unit
Transmission 1583 16
Lack of Fuel (Coal Mines Gas Lines etc) Not
in Operator Control
812 448
Storms Lightning and Other Acts of Nature 591 112
Some of the transmission outages based on storms in 2009 have been caused by the same reasons because
the storms may have caused transmission interference However the plants reported the problems
inconsistently with either the transmission interference or storms cause code Therefore they are depicted
as two different causes of forced outage
Marked transmission outages in 2009 were quite high Thirty-five percent came from one utility with a large
number of hydroelectric units The company related the trips to various problems including weather
(lightning storms) wildlife ldquoline bumpsrdquo and problems on the receiving end of the transmission line Nine
hundred and eighty-five transmission trips (62 percent) were from hydroelectric units38
In 2009 only ten transmission trips resulted in a loss of 750 MW or more per trip Twenty two generating
plants were affected by the ten trips Causes for the trips include feeder line trips (1 trip) breakers in the
switchyard (8 trips) personnel errors (2 trips) and unknown (10 trips)
The ldquoLack of Fuelrdquo outages are of interest as these events occur during the times when a unit is available to
operate but there is an interruption in fuels to operate the facilities These events do not include
interruptions of fuel due to contracts Rather the cause code is designed to account for units that are
expecting fuel and it is unavailable when requested Table 10 presents the distribution of ldquoLack of Fuelrdquo
events by NERC Region and Table 11 presents the unit types affected
38 The average size of the hydroelectric units were small ndash 335 MW
Generation Equipment Performance
57
Of the units that report ldquoLack of Fuelrdquo 78 percent of the units are oil-fired 15 percent of the units are gas-
fired and the remaining units are various other fuels Table 12 provides the top causes of forced outage for
several unit types For fossil units ldquoLack of Fuelrdquo as the number three cause behind waterwall tube leaks
and superheater tube leaks
Table 10 Forced Outages Due to Lack of Fuel by Region
Region Number of Lack of Fuel
Problems Reported
FRCC 0
MRO 3
NPCC 24
RFC 695
SERC 17
SPP 3
TRE 7
WECC 29
One company contributed to the majority of oil-fired lack of fuel events The units at the company are
actually dual-fuels (oil and gas) but market nominated gas monitoring causes the units to be on forced
outage nightly The units need gas to start up so they can run on oil When they shut down the units must
switch to gas to clean themselves With the gas restriction the unit canrsquot start and the unit goes on a
forced outage Until the band is lifted the two units will continue to be on a forced outage cycle
Event records also provide descriptions of why the unit was without fuel with the majority of descriptions
bull Temperatures affecting gas supply valves
bull Unexpected maintenance of gas pipe-lines
bull Compressor problemsmaintenance
Generation Equipment Performance
58
Table 11 Unit Type Profile of Forced Outages Due to Lack of Fuel
Unit Types Number of Lack of Fuel Problems Reported
Fossil 642
Nuclear 0
Gas Turbines 88
Diesel Engines 1
HydroPumped Storage 0
Combined Cycle 47
Generation Equipment Performance
59
Table 12 Causes of Forced Outage for Different Unit Types (2008-2010)
Fossil - all MW sizes all fuels
Rank Description Occurrence per Unit-year
MWH per Unit-year
Average Hours To Repair
Average Hours Between Failures
Unit-years
1 Waterwall (furnace wall) 0590 134106 59 3250 3868 2 Second Superheater
Leaks 0180 5182 60 3228 3868
3 Lack of Fuel (coal mines gas lines etc) where the operator is not in control
0480 4701 18 26 3868
Combined-Cycle blocks Rank Description Occurrence
per Unit-year
MWH per Unit-year
Average Hours To Repair
Average Hours Between Failures
Unit-years
1 HP Turbine Buckets Or Blades
0020 4663 1830 26280 466
2 Turbine Control Valves 0040 2777 100 7200 466 3 Gas Turbine Compressor -
High Pressure Shaft 0010 2266 663 4269 466
Nuclear units - all Reactor types Rank Description Occurrence
per Unit-year
MWH per Unit-year
Average Hours To Repair
Average Hours Between Failures
Unit-years
1 LP Turbine Buckets or Blades
0010 26415 8760 26280 288
2 Containment Structure 0010 9233 1226 26262 288 3 Feedwater Pump Local
Controls 0020 7620 692 12642 288
Simple-cycle gas turbine jet engines Rank Description Occurrence
per Unit-year
MWH per Unit-year
Average Hours To Repair
Average Hours Between Failures
Unit-years
1 Main Transformer 0030 1611 1016 20709 4181 2 Other Gas Turbine
Controls And Instrument Problems
0120 428 70 2614 4181
3 Other Gas Turbine Problems
0090 400 119 1701 4181
Generation Equipment Performance
60
2008-2010 Review of Summer versus Winter Availability To address seasonality of unit availability unit information for the months of June to September (summer)
and December through February (winter) were pooled to calculate force events during these timeframes for
2008-201039 Figure 32 shows the Equivalent Availability Factor (EAF) is three percentage points higher and
the Equivalent Forced Outage Rate - Demand (EFORd) is more than a half of a percentage point lower in the
summer period than in winter period This means the units were more reliable with less forced events
during high-demand times during the summer than during the winter seasons The generating unitrsquos
capability has a resulting higher Net Capacity Factor (NCF) of 45 percentage points in the summer season
for 2008-2010
During the spring season (March-May) 77 percent of the units took a planned outage (PO) for an average
231 hours (or 96 days) In fall (October-November) only 42 percent of the units experienced a PO and the
average duration was shorter ndash 134 hours (or 56 days) A few units took both spring and fall planned
outages although this is rare Based on this assessment the generating units are prepared for the summer
peak demand The resulting availability indicates that this maintenance was successful which is measured
by an increased EAF and lower EFORd
Figure 32 Summer-Winter Average EAF NCF and EFORd (2008-2010)
Conclusions and Recommendations During 2008-2010 the average Equivalent Availability Factor (EAF) which measures the overall availability
of generating units decreased At the same time the Net Capacity Factor (NCF) an indicator of energy
production increased The average number of forced outages in 2010 is greater than in 2008 while at the
same time the average planned outage times have decreased As a result the Equivalent Forced Outage
Rate ndash Demand (EFORd) also increased illustrating that more units have experienced forced events during
39 A study of peak periods was conducted by the NERC Generating Availability Trend Evaluation (GATE) Working Group several years ago see httpwwwnerccomfilesSeasonal-Performance-Trendspdf
9116
5343
396
8818
4896
441
0 10 20 30 40 50 60 70 80 90 100
EAF
NCF
EFORd
Percent ()
Winter
Summer
Generation Equipment Performance
61
peak-demand times in 2010 than in the previous two years Potentially with shorter planned outage
periods in 2010 there may be less time to repair equipment and prevent forced unit outages
There are warnings that units are not being maintained as well as they should be In the last three years
there has been an increase in Equivalent Forced Outage Rate ndash Demand (EFORd) This indicator measures
the rate of forced outage events on generating units during periods of load demand To confirm this
problem forced outage hours jumped from 270 to 314 hours per unit between 2009 and 2010 At the same
time maintenance events also increased by 12 hours per unit Planned outage events remain constant The
resulting conclusions from this trend are
bull More or longer planned outage time is needed to repair the generating fleet Whether age is the
cause of the increase need for planned outage time remains unknown and further investigation into
the cause for longer planned outage time is necessary
bull More focus on preventive repairs during planned and maintenance events are needed
There are many multiple unit forced outages due to lack of fuel The majority of multiple unit trips have
three main causes transmission lack of fuel and storms With special interest in the forced outages due to
ldquoLack of Fuelrdquo additional analysis revealed that 77 percent of the units experiencing unexpected fuel
stoppage are oil-fired fossil units while gas-fired units experienced 15 percent
Generating units continue to be more reliable during the peak summer periods
Disturbance Event Trends
62
Category 1 An event resulting in one or more of the following a Unintended loss of three or more BPS elements caused by
common mode failure b Failure or misoperation of an SPSRAS c System-wide voltage reduction of 3 or more d Unintended BPS system separation resulting in an island of
100 MW to 999 MW e Unplanned evacuation from a control center facility with BPS
SCADA functionality for 30 minutes or more Category 2 An event resulting in one or more of the following
a Complete loss of all BPS control center voice communication system(s) for 30 minutes or more
b Complete loss of SCADA control or monitoring functionality for 30 minutes or more
c Voltage excursions equal to or greater than 10 lasting more than five minutes
d Loss of off-site power (LOOP) to a nuclear generating station e Unintended system separation resulting in an island of 1000
MW to 4999 MW f Unintended loss of 300MW or more of firm load for more
than 15 minutes g Violation of an Interconnection Reliability Operating Limit
(IROL) for more than 30 minutes Category 3 An event resulting in one or more of the following
a The loss of load or generation of 2000 MW or more in the Eastern Interconnection or
b Western Interconnection or 1000 MW or more in the ERCOT or Queacutebec Interconnections
c Unintended system separation resulting in an island of 5000 MW to 10000 MW
d Unintended system separation resulting in an island of Florida from the Eastern Interconnection
Category 4 An event resulting in one or more of the following a The loss of load or generation from 5001 MW to 9999 MW b Unintended system separation resulting in an island of more
than 10000 MW (with the exception of Florida as described in Category 3c)
Category 5 An event resulting in one or more of the following a The loss of load of 10000 MW or more b The loss of generation of 10000 MW or more
Figure 33 BPS Event Category
Disturbance Event Trends Introduction The purpose of this section is to report event
analysis trends from the beginning of event
analysis field test40
One of the companion goals of the event
analysis program is the identification of trends
in the number magnitude and frequency of
events and their associated causes such as
human error equipment failure protection
system misoperations etc The information
provided in the event analysis database (EADB)
and various event analysis reports have been
used to track and identify trends in BPS events
in conjunction with other databases (TADS
GADS metric and benchmarking database)
to the end of 2010
The Event Analysis Working Group (EAWG)
continuously gathers event data and is moving
toward an integrated approach to analyzing
data assessing trends and communicating the
results to the industry
Performance Trends The event category is classified41
Figure 33
as shown in
with Category 5 being the most
severe Figure 34 depicts disturbance trends in
Category 1 to 5 system events from the
40 httpwwwnerccomdocseawgGalloway-Industry-EA-Field-Test-102210pdf 41httpwwwnerccomfiles2011-05-0220Event_Analysis_Process_Phase20220Field20Test20Draft20-20Final20-20For20postingpdf
Disturbance Event Trends
63
beginning of event analysis field test to the end of 201042
Figure 34 Event Category vs Date for All 2010 Categorized Events
From the figure in November and December
there were many more category 1 and 2 events than in October This is due to the field trial starting on
October 25 2010
In addition to the category of the events the status of the events plays a critical role in the accuracy of the
data By examining Figure 35 over 80 of the events reported in 2010 have been closed This means that
the category root cause and other important information have been sufficiently finalized in order for
analysis to be accurate for each event At this time there is not enough data to draw any long-term
conclusions about event investigation performance
42 Documents for the EA Field Test are located at httpwwwnerccompagephpcid=5|365
2
12 12
26
3
6 5
14
1 1
2
0
5
10
15
20
25
30
35
40
45
October November December 2010
Even
t Cou
nt
Category 3 Category 2 Category 1
Disturbance Event Trends
64
Figure 35 Event Count vs Status (All 2010 Events with Status)
By drilling down into the cause code for each closed 2010 event Figure 36 shows the top 3 event causes
From the figure equipment failure and protection system misoperation are the most significant causes for
events Because of how new and limited the data is however there may not be statistical significance for
this result Further trending of cause codes for closed events and developing a richer dataset to find any
trends between event cause codes and event counts should be performed
Figure 36 Top 3 Event Counts vs DAWG Cause Code for all Closed 2010 Events
10
32
42
0
5
10
15
20
25
30
35
40
45
Open Closed Open and Closed
Even
t Cou
nt
Status
1211
8
0
2
4
6
8
10
12
14
Equipment Failure Protection System Misoperation Human Error
Even
t Cou
nt
Cause Code
Disturbance Event Trends
65
Conclusions Due to the relatively new process for events analysis and categorization more time will be required before a
conclusive recommendation may be obtained Further analysis and new data should provide valuable
statistics in the future Over 80 of all event reports from 2010 are current listed as closed but no
conclusion about investigation performance may be obtained because of the limited amount of data It is
recommended to study ways to prevent equipment failure and protection system misoperations but there
is not enough data to draw a firm conclusion about the top causes of events at this time
Abbreviations Used in This Report
66
Abbreviations Used in This Report
Acronym Definition ALP Acadiana Load Pocket
ALR Adequate Level of Reliability
ARR Automatic Reliability Report
BA Balancing Authority
BPS Bulk Power System
CDI Condition Driven Index
CEII Critical Energy Infrastructure Information
CIPC Critical Infrastructure Protection Committee
CLECO Cleco Power LLC
DADS Future Demand Availability Data System
DCS Disturbance Control Standard
DOE Department Of Energy
DSM Demand Side Management
EA Event Analysis
EAF Equivalent Availability Factor
ECAR East Central Area Reliability
EDI Event Drive Index
EEA Energy Emergency Alert
EFORd Equivalent Forced Outage Rate Demand
EMS Energy Management System
ERCOT Electric Reliability Council of Texas
ERO Electric Reliability Organization
ESAI Energy Security Analysis Inc
FERC Federal Energy Regulatory Commission
FOH Forced Outage Hours
FRCC Florida Reliability Coordinating Council
GADS Generation Availability Data System
GOP Generation Operator
IEEE Institute of Electrical and Electronics Engineers
IESO Independent Electricity System Operator
IROL Interconnection Reliability Operating Limit
Abbreviations Used in This Report
67
Acronym Definition IRI Integrated Reliability Index
LOLE Loss of Load Expectation
LUS Lafayette Utilities System
MAIN Mid-America Interconnected Network Inc
MAPP Mid-continent Area Power Pool
MOH Maintenance Outage Hours
MRO Midwest Reliability Organization
MSSC Most Severe Single Contingency
NCF Net Capacity Factor
NEAT NERC Event Analysis Tool
NERC North American Electric Reliability Corporation
NPCC Northeast Power Coordinating Council
OC Operating Committee
OL Operating Limit
OP Operating Procedures
ORS Operating Reliability Subcommittee
PC Planning Committee
PO Planned Outage
POH Planned Outage Hours
RAPA Reliability Assessment Performance Analysis
RAS Remedial Action Schemes
RC Reliability Coordinator
RCIS Reliability Coordination Information System
RCWG Reliability Coordinator Working Group
RE Regional Entities
RFC Reliability First Corporation
RMWG Reliability Metrics Working Group
RSG Reserve Sharing Group
SAIDI System Average Interruption Duration Index
SAIFI System Average Interruption Frequency Index
SCADA Supervisory Control and Data Acquisition
SDI Standardstatute Driven Index
SERC SERC Reliability Corporation
Abbreviations Used in This Report
68
Acronym Definition SRI Severity Risk Index
SMART Specific Measurable Attainable Relevant and Tangible
SOL System Operating Limit
SPS Special Protection Schemes
SPCS System Protection and Control Subcommittee
SPP Southwest Power Pool
SRI System Risk Index
TADS Transmission Availability Data System
TADSWG Transmission Availability Data System Working Group
TO Transmission Owner
TOP Transmission Operator
WECC Western Electricity Coordinating Council
Contributions
69
Contributions This report was made feasible by the collaboration and hard work of both NERC staff and NERCrsquos
Industry Groups
NERC Industry Groups
Table 14 lists the NERC industry group contributors Without their contribution and collaboration this
report would not have been possible
Table 13 NERC Industry Group Contributions43
NERC Group
Relationship Contribution
Reliability Metrics Working Group
(RMWG)
Reports to the OCPC bull Lead Development of Report bull Provide Reliability Metrics Data bull Responsible for Reliability Metrics
Performance Chapter
Transmission Availability Working Group
(TADSWG)
Reports to the OCPC bull Provide Transmission Availability Data
bull Responsible for Transmission Equip-ment Performance Chapter
bull Content Review
Generation Availability Data System Task
Force
(GADSTF)
Reports to the OCPC bull Provide Generation Availability Data bull Responsible for Generation Equip-
ment Performance Chapter bull Content Review
Event Analysis Working Group
(EAWG)
Reports to the OCPC bull Provide Events Data bull Responsible for Disturbance Events
Trends Chapter bull Content Review
43 Rosters for RMWG TADSWG GADSTF and EAWG are available at httpwwwnerccomfilesrosterpdf
Contributions
70
NERC Staff Table 13 below lists the NERC staff who contributed to the 2011 Reliability Performance Analysis
Report
Table 14 Contributing NERC Staff
Name Title E-mail Address
Mark Lauby Vice President and Director of
Reliability Assessment and
Performance Analysis
marklaubynercnet
Jessica Bian Manager of Performance Analysis jessicabiannercnet
John Moura Manager of Reliability Assessments johnmouranercnet
Andrew Slone Engineer Reliability Performance
Analysis
andrewslonenercnet
Jim Robinson TADS Project Manager jimrobinsonnercnet
Clyde Melton Engineer Reliability Performance
Analysis
clydemeltonnercnet
Mike Curley Manager of GADS Services mikecurleynercnet
James Powell Engineer Reliability Performance
Analysis
jamespowellnercnet
Michelle Marx Administrative Assistant michellemarxnercnet
William Mo Intern Performance Analysis wmonercnet
- NERCrsquos Mission
- Table of Contents
- Executive Summary
-
- 2011 Transition Report
- State of Reliability Report
- Key Findings and Recommendations
-
- Reliability Metric Performance
- Transmission Availability Performance
- Generating Availability Performance
- Disturbance Events
- Report Organization
-
- Introduction
-
- Metric Report Evolution
- Roadmap for the Future
-
- Reliability Metrics Performance
-
- Introduction
- 2010 Performance Metrics Results and Trends
-
- ALR1-3 Planning Reserve Margin
-
- Background
- Assessment
- Special Considerations
-
- ALR1-4 BPS Transmission Related Events Resulting in Loss of Load
-
- Background
- Assessment
-
- ALR1-12 Interconnection Frequency Response
-
- Background
- Assessment
-
- ALR2-3 Activation of Under Frequency Load Shedding
-
- Background
- Assessment
- Special Considerations
-
- ALR2-4 Average Percent Non-Recovery Disturbance Control Standards (DCS)
-
- Background
- Assessment
- Special Consideration
-
- ALR2-5 Disturbance Control Events Greater Than Most Severe Single Contingency
-
- Background
- Assessment
- Special Consideration
-
- ALR 1-5 System Voltage Performance
-
- Background
- Special Considerations
- Status
-
- ALR3-5 Interconnection Reliability Operating Limit System Operating Limit (IROLSOL) Exceedances
-
- Background
-
- ALR4-1 Automatic Transmission Outages Caused by Protection System Misoperations
-
- Background
- Special Considerations
-
- ALR6-11 ndash ALR6-14
-
- Background
- Assessment
- ALR 6-11 ndash Automatic Outages Initiated by Failed Protection System Equipment
- ALR6-12 ndash Automatic Outages Initiated by Human Error
- ALR6-13 ndash Automatic Outages Initiated by Failed AC Substation Equipment
- ALR6-14 Automatic AC Transmission Outages Initiated by Failed AC Circuit Equipment
-
- ALR6-15 Element Availability Percentage (APC)
-
- Background
- Assessment
- Special Consideration
-
- ALR6-16 Transmission System Unavailability
-
- Background
- Assessment
- Special Consideration
-
- ALR6-2 Energy Emergency Alert 3 (EEA3)
-
- Background
- Assessment
- Special Considerations
-
- ALR 6-3 Energy Emergency Alert 2 (EEA2)
-
- Background
- Assessment
- Special Considerations
-
- ALR 6-1 Transmission Constraint Mitigation
-
- Background
- Assessment
- Special Considerations
-
- Integrated Bulk Power System Risk Assessment
-
- Introduction
- Recommendations
-
- Integrated Reliability Index Concepts
-
- The Three Components of the IRI
-
- Event-Driven Indicators (EDI)
- Condition-Driven Indicators (CDI)
- StandardsStatute-Driven Indicators (SDI)
-
- IRI Index Calculation
- IRI Recommendations
-
- Reliability Metrics Conclusions and Recommendations
-
- Transmission Equipment Performance
-
- Introduction
- Performance Trends
-
- AC Element Outage Summary and Leading Causes
- Transmission Monthly Outages
- Outage Initiation Location
- Transmission Outage Events
- Transmission Outage Mode
-
- Conclusions
-
- Generation Equipment Performance
-
- Introduction
- Generation Key Performance Indicators
-
- Multiple Unit Forced Outages and Causes
- 2008-2010 Review of Summer versus Winter Availability
-
- Conclusions and Recommendations
-
- Disturbance Event Trends
-
- Introduction
- Performance Trends
- Conclusions
-
- Abbreviations Used in This Report
- Contributions
-
- NERC Industry Groups
- NERC Staff
-

Reliability Metrics Performance
13
long-term However resource planners do recognize the need for resources in their long-term planning
and account for these resources through generator queues These queues are then adjusted to reflect
an adjusted forecast of resourcesmdashpro-rated by approximately 20 percent
When comparing the assessment of planning reserve margins between 2009 and 2010 the
interconnection Planning Reserve Margins are slightly higher on an annual basis in the 2010 forecast
compared to those of 2009 as shown in Figure 5
Figure 5 Planning Reserve Margin by Interconnection and Year
In general this is due to slightly higher capacity forecasts and slightly lower demand forecasts The pace
of any economic recovery will affect future comparisons This metric can be used by NERC to assess the
individual interconnections in the ten-year long-term reliability assessments If a noticeable change
Reliability Metrics Performance
14
occurs within the trend further investigation is necessary to determine the causes and likely effects on
reliability
Special Considerations
The Planning Reserve Margin is a capacity based metric Therefore it does not provide an accurate
assessment of performance in energy-limited systems (eg hydro capacity with limited water resources
or systems with significant variable generation penetration) In addition the Planning Reserve Margin
does not reflect potential transmission constraint internal to the respective interconnection Planning
Reserve Margin data shown in Figure 6 is used for NERCrsquos seasonal and long-term reliability
assessments and is the primary metric for determining the resource adequacy of a given assessment
area
The North American Bulk Power System is divided into four distinct interconnections These
interconnections are loosely connected with limited ability to share capacity or energy across the
interconnection To reflect this limitation the Planning Reserve Margins are calculated in this report
based on interconnection values rather than by national boundaries as is the practice of the Reliability
Assessment Subcommittee (RAS)
ALR1-4 BPS Transmission Related Events Resulting in Loss of Load
Background
This metric measures bulk power system transmission-related events resulting in the loss of load
Planners and operators can use this metric to validate their design and operating criteria by identifying
the number of instances when loss of load occurs
For the purposes of this metric an ldquoeventrdquo is an unplanned transmission disturbance that produces an
abnormal system condition due to equipment failures or system operational actions and results in the
loss of firm system demand for more than 15 minutes The reporting criteria for such events are
outlined below12
bull Entities with a previous year recorded peak demand of more than 3000 MW are required to
report all such losses of firm demands totaling more than 300 MW
bull All other entities are required to report all such losses of firm demands totaling more than 200
MW or 50 percent of the total customers being supplied immediately prior to the incident
whichever is less
bull Firm load shedding of 100 MW or more used to maintain the continuity of the bulk power
system reliability
12 Details of event definitions are available at httpwwwnerccomfilesEOP-004-1pdf
Reliability Metrics Performance
15
Assessment
Figure 6 illustrates that the number of bulk power system transmission-related events resulting in loss of
firm load13
Table 2
from 2002 to 2009 is relatively constant and suggests that 7 - 10 events per year is a norm for
the bulk power system However the magnitude of load loss shown in associated with these
events reflects a downward trend since 2007 Since the data includes weather-related events it will
provide the RMWG with an opportunity for further analysis and continued assessment of the trends
over time is recommended
Figure 6 BPS Transmission Related Events Resulting in Loss of Load Counts (2002-2009)
Table 2 BPS Transmission Related Events Resulting in Loss of Load MW Loss (2002-2009)
Year Load Loss (MW)
2002 3762
2003 65263
2004 2578
2005 6720
2006 4871
2007 11282
2008 5200
2009 2965
13The metric source data may require adjustments to accommodate all of the different groups for measurement and consistency as OE-417 is only used in the US
02468
101214
2002 2003 2004 2005 2006 2007 2008 2009
Count
Reliability Metrics Performance
16
ALR1-12 Interconnection Frequency Response
Background
This metric is used to track and monitor Interconnection Frequency Response Frequency Response is a
measure of an Interconnectionrsquos ability to stabilize frequency immediately following the sudden loss of
generation or load It is a critical component to the reliable operation of the bulk power system
particularly during disturbances and restoration The metric measures the average frequency responses
for all events where frequency drops more than 35 mHz within a year
Assessment
At this time there has been no data collected for ALR1-12 Therefore no assessment was made
ALR2-3 Activation of Under Frequency Load Shedding
Background
The purpose of Under Frequency Load Shedding (UFLS) is to balance generation and load in an island
following an extreme event The UFLS activation metric measures the number of times UFLS is activated
and the total MW of load interrupted in each Region and NERC wide
Assessment
Figure 7 and Table 3 illustrate a history of Under Frequency Load Shedding events from 2006 through
2010 Through this period itrsquos important to note that single events had a range load shedding from 15
MW to 7654 MW The activation of UFLS relays is the last automated reliability measure associated
with a decline in frequency in order to rebalance the system Further assessment of the MW loss for
these activations is recommended
Figure 7 ALR2-3 Count of Activations by Year and Regional Entity (2001-2010)
Reliability Metrics Performance
17
Table 3 ALR2-3 Under Frequency Load Shedding MW Loss
ALR2-3 Under Frequency Load Shedding MW Loss
2006 2007 2008 2009 2010
FRCC
2273
MRO
486
NPCC 94
63 20 25
RFC
SPP
672 15
SERC
ERCOT
WECC
Special Considerations
The use of a single metric cannot capture all of the relevant information associated with UFLS events as
the events relate to each respective UFLS plan The ability to measure the reliability of the bulk power
system is directly associated with how it performs compared to what is planned
ALR2-4 Average Percent Non-Recovery Disturbance Control Standards (DCS)
Background
This metric measures the Balancing Authorityrsquos (BA) or Reserve Sharing Grouprsquos (RSG) ability to balance
resources and demand with the timely deployment of contingency reserve thereby returning the
interconnection frequency to within defined limits following a Reportable Disturbance14
Assessment
The relative
percentage provides an indication of performance measured at a BA or RSG
Figure 8 illustrates the average percent non-recovery of DCS events from 2006 to 2010 The graph
provides a high-level indication of the performance of each respective RE However a single event may
not reflect all the reliability issues within a given RE In order to understand the reliability aspects it
may be necessary to request individual REs to further investigate and provide a more comprehensive
reliability report Further investigation may indicate the entity had sufficient contingency reserve but
through their implementation process failed to meet DCS recovery
14 Details of the Disturbance Control Performance Standard and Reportable Disturbance definitions are available at
httpwwwnerccomfilesBAL-002-0pdf
Reliability Metrics Performance
18
Continued trend assessment is recommended Where trends indicated potential issues the regional
entity will be requested to investigate and report their findings
Figure 8 Average Percent Non-Recovery of DCS Events (2006-2010)
Special Consideration
This metric aggregates the number of events based on reporting from individual Balancing Authorities or
Reserve Sharing Groups It does not capture the severity of the DCS events It should be noted that
most REs use 80 percent of the Most Severe Single Contingency to establish the minimum threshold for
reportable disturbance while others use 35 percent15
ALR2-5 Disturbance Control Events Greater Than Most Severe Single Contingency
Background
This metric represents the number of disturbance events that exceed the Most Severe Single
Contingency (MSSC) and is specific to each BA Each RE reports disturbances greater than the MSSC on
behalf of the BA or Reserve Sharing Group (RSG) The result helps validate current contingency reserve
requirements The MSSC is determined based on the specific configuration of each BA or RSG and can
vary in significance and impact on the BPS
15httpwwwweccbizStandardsDevelopmentListsRequest20FormDispFormaspxID=69ampSource=StandardsDevelopmentPagesWEC
CStandardsArchiveaspx
375
079
0
54
008
005
0
15 0
77
025
0
33
000510152025303540
2006
2007
2008
2009
2010
2006
2007
2008
2009
2010
2006
2007
2008
2009
2010
2006
2007
2008
2009
2010
2006
2007
2008
2009
2010
2006
2007
2008
2009
2010
2006
2007
2008
2009
2010
2006
2007
2008
2009
2010
FRCC MRO NPCC RFC SERC SPP ERCOT WECC
Region and Year
Reliability Metrics Performance
19
Assessment
Figure 9 represents the number of DCS events within each RE that are greater than the MSSC from 2006
to 2010 This metric and resulting trend can provide insight regarding the risk of events greater than
MSSC and the potential for loss of load
In 2010 SERC had 16 BAL-002 reporting entities eight Balancing Areas elected to maintain Contingency
Reserve levels independent of any reserve sharing group These 16 entities experienced 79 reportable
DCS eventsmdash32 (or 405 percent) of which were categorized as greater than their most severe single
contingency Every DCS event categorized as greater than the most severe single contingency occurred
within a Balancing Area maintaining independent Contingency Reserve levels Significantly all 79
regional entities reported compliance with the Disturbance Recovery Criterion including for those
Disturbances that were considered greater than their most severe single Contingency This supports a
conclusion that regardless of the size of the BA or participation in a Reserve Sharing Group SERCrsquos BAL-
002 reporting entities have demonstrated the ability in 2010 to use Contingency Reserve to balance
resources and demand and return Interconnection frequency within defined limits following Reportable
Disturbances
If the SERC Balancing Areas without large generating units and who do not participate in a Reserve
Sharing Group change the determination of their most severe single contingencies to effect an increase
in the DCS reporting threshold (and concurrently the threshold for determining those disturbances
which are greater than the most severe single contingency) there will certainly be a reduction in both
the gross count of DCS events in SERC and in the subset considered under ALR2-5 Masking the discrete
events which cause Balancing Area response may not reduce ldquoriskrdquo to the system However it is
desirable to maintain a reporting threshold which encourages the Balancing Authority to respond to any
unexplained change in ACE in a manner which supports Interconnection frequency based on
demonstrated performance SERC will continue to monitor DCS performance and will continue to
evaluate contingency reserve requirements but does not consider 2010 ALR2-5 performance to be an
adverse trend in ldquoextreme or unusualrdquo contingencies but rather within the normal range of expected
occurrences
Reliability Metrics Performance
20
Special Consideration
The metric reports the number of DCS events greater than MSSC without regards to the size of a BA or
RSG and without respect to the number of reporting entities within a given RE Because of the potential
for differences in the magnitude of MSSC and the resultant frequency of events trending should be
within each RE to provide any potential reliability indicators Each RE should investigate to determine
the cause and relative effect on reliability of the events within their footprints Small BA or RSG may
have a relatively small value of MSSC As such a high number of DCS greater than MCCS may not
indicate a reliability problem for the reporting RE but may indicate an issue for the respective BA or RSG
In addition events greater than MSSC may not cause a reliability issue for some BA RSG or RE if they
have more stringent standards which require contingency reserves greater than MSSC
ALR 1-5 System Voltage Performance
Background
The purpose of this metric is to measure the transmission system voltage performance (either absolute
or per unit of a nominal value) over time This should provide an indication of the reactive capability
available to the transmission system The metric is intended to record the amount of time that system
voltage is outside a predetermined band around nominal
0
5
10
15
20
25
30
2006
2007
2008
2009
2010
2006
2007
2008
2009
2010
2006
2007
2008
2009
2010
2006
2007
2008
2009
2010
2006
2007
2008
2009
2010
2006
2007
2008
2009
2010
2006
2007
2008
2009
2010
2006
2007
2008
2009
2010
FRCC MRO NPCC RFC SERC SPP ERCOT WECC
Cou
nt
Region and Year
Figure 9 Disturbance Control Events Greater Than Most Severe Single Contingency (2006-2010)
Reliability Metrics Performance
21
Special Considerations
Each Reliability Coordinator (RC) will work with the Transmission Owners (TOs) and Transmission
Operators (TOPs) within its footprint to identify specific buses and voltage ranges to monitor for this
metric The number of buses the monitored voltage levels and the acceptable voltage ranges may vary
by reporting entity
Status
With a pilot program requested in early 2011 a voluntary request to Reliability Coordinators (RC) was
made to develop a list of key buses This work continues with all of the RCs and their respective
Transmission Owners (TOs) to gather the list of key buses and their voltage ranges After this step has
been completed the TO will be requested to provide relevant data on key buses only Based upon the
usefulness of the data collected in the pilot program additional data collection will be reviewed in the
future
ALR3-5 Interconnection Reliability Operating Limit System Operating Limit (IROLSOL) Exceedances
Background
This metric illustrates the number of times that defined Interconnection Reliability Operating Limit
(IROL) or System Operating Limit (SOL) were exceeded and the duration of these events Exceeding
IROLSOLs could lead to outages if prompt operator control actions are not taken in a timely manner to
return the system to within normal operating limits This metric was approved by NERCrsquos Operating and
Planning Committees in June 2010 and a data request was subsequently issued in August 2010 to collect
the data for this metric Based on the results of the pilot conducted in the third and fourth quarter of
2010 there is merit in continuing measurement of this metric Note the reporting of IROLSOL
exceedances became mandatory in 2011 and data collected in Table 4 for 2010 has been provided
voluntarily
Reliability Metrics Performance
22
Table 4 ALR3-5 IROLSOL Exceedances
3Q2010 4Q2010 1Q2011
le 10 mins 123 226 124
le 20 mins 10 36 12
le 30 mins 3 7 3
gt 30 mins 0 1 0
Number of Reporting RCs 9 10 15
ALR4-1 Automatic Transmission Outages Caused by Protection System Misoperations
Background
Originally titled Correct Protection System Operations this metric has undergone a number of changes
since its initial development To ensure that it best portrays how misoperations affect transmission
outages it was necessary to establish a common understanding of misoperations and the data needed
to support the metric NERCrsquos Reliability Assessment Performance Analysis (RAPA) group evaluated
several options of transitioning from existing procedures for the collection of misoperations data and
recommended a consistent approach which was introduced at the beginning of 2011 With the NERC
System Protection and Control Subcommitteersquos (SPCS) technical guidance NERC and the regional
entities have agreed upon a set of specifications for misoperations reporting including format
categories event type codes and reporting period to have a final consistent reporting template16
Special Considerations
Only
automatic transmission outages 200 kV and above including AC circuits and transformers will be used
in the calculation of this metric
Data collection will not begin until the second quarter of 2011 for data beginning with January 2011 As
revised this metric cannot be calculated for this report at the current time The revised title and metric
form can be viewed at the NERC website17
16 The current Protection System Misoperation template is available at
httpwwwnerccomfilezrmwghtml 17The current metric ALR4-1 form is available at httpwwwnerccomdocspcrmwgALR_4-1Percentpdf
Reliability Metrics Performance
23
ALR6-11 ndash ALR6-14
ALR6-11 Automatic AC Transmission Outages Initiated by Failed Protection System Equipment
ALR6-12 Automatic AC Transmission Outages Initiated by Human Error
ALR6-13 Automatic AC Transmission Outages Initiated by Failed AC Substation Equipment
ALR6-14 Automatic AC Circuit Outages Initiated by Failed AC Circuit Equipment
Background
These metrics evolved from the original ALR4-1 metric for correct protection system operations and
now illustrate a normalized count (on a per circuit basis) of AC transmission element outages (ie TADS
momentary and sustained automatic outages) that were initiated by Failed Protection System
Equipment (ALR6-11) Human Error (ALR6-12) Failed AC Substation Equipment (ALR6-13) and Failed AC
Circuit Equipment (ALR6-14) These metrics are all related to the non-weather related initiating cause
codes for automatic outages of AC circuits and transformers operated 200 kV and above
Assessment
Figure 10 through Figure 13 show the normalized outages per circuit and outages per transformer for
facilities operated at 200 kV and above As shown in all eight of the charts there are some regional
trends in the three years worth of data However some Regionrsquos values have increased from one year
to the next stayed the same or decreased with no discernable regional trends For example ALR6-11
computes the automatic AC Circuit outages initiated by failed protection system equipment
There are some trends to the ALR6-11 to ALR6-14 data but many regions do not have enough data for a
valid trend analysis to be performed NERCrsquos outage rate seems to be improving every year On a
regional basis metric ALR6-11 along with ALR6-12 through ALR6-14 cannot be statistically understood
until confidence intervals18
18The detailed Confidence Interval computation is available at
are calculated ALR metric outage frequency rates and Regional equipment
inventories that are smaller than others are likely to require more than 36 months of outage data Some
numerically larger frequency rates and larger regional equipment inventories (such as NERC) do not
require more than 36 months of data to obtain a reasonably narrow confidence interval
httpwwwnerccomdocspctadstfTADS_Nov_2_2007APPENDIX_C_Confidence_Intervalpdf
Reliability Metrics Performance
24
While more data is still needed on a regional basis to determine if each regionrsquos bulk power system is
becoming more reliable year to year there are areas of potential improvement which include power
system condition protection performance and human factors These potential improvements are
presented due to the relatively large number of outages caused by these items The industry can
benefit from detailed analysis by identifying lessons learned and rolling average trends of NERC-wide
performance With a confidence interval of relatively narrow bandwidth one can determine whether
changes in statistical data are primarily due to random sampling error or if the statistics are significantly
different due to performance
Reliability Metrics Performance
25
ALR 6-11 ndash Automatic Outages Initiated by Failed Protection System Equipment
Automatic outages with an initiating cause code of failed protection system equipment are in Figure 10
Figure 10 ALR6-11 by Region (Includes NERC-Wide)
This code covers automatic outages caused by the failure of protection system equipment This
includes any relay andor control misoperations except those that are caused by incorrect relay or
control settings that do not coordinate with other protective devices
ALR6-12 ndash Automatic Outages Initiated by Human Error
Figure 11 shows the automatic outages with an initiating cause code of human error This code covers
automatic outages caused by any incorrect action traceable to employees andor contractors for
companies operating maintaining andor providing assistance to the Transmission Owner will be
identified and reported in this category
Reliability Metrics Performance
26
Also any human failure or interpretation of standard industry practices and guidelines that cause an
outage will be reported in this category
Figure 11 ALR6-12 by Region (Includes NERC-Wide)
Reliability Metrics Performance
27
ALR6-13 ndash Automatic Outages Initiated by Failed AC Substation Equipment
Figure 12 shows the automatic outages with an initiating cause code of failed AC substation equipment
This code covers automatic outages caused by the failure of AC Substation ie equipment ldquoinside the
substation fencerdquo including transformers and circuit breakers but excluding protection system
equipment19
19TADS Initiating Cause Code definitions are located at httpwwwnerccomdocspctadswgTADS_Definitions_Appendix_7_092909pdf
Figure 12 ALR6-13 by Region (Includes NERC-Wide)
Reliability Metrics Performance
28
ALR6-14 Automatic AC Transmission Outages Initiated by Failed AC Circuit Equipment
Figure 13 shows the automatic outages with an initiating cause code of failed AC circuit equipment
Automatic Outages related to the failure of AC Circuit equipment ie overhead or underground
equipment ldquooutside the substation fencerdquo 20
ALR6-15 Element Availability Percentage (APC)
Background
This metric uses data and calculations directly from the NERC TADS effort and illustrates the overall
percent of time the aggregate of transmission facilities are available and in service This is an aggregate
20TADS Initiating Cause Code definitions are located at httpwwwnerccomdocspctadswgTADS_Definitions_Appendix_7_092909pdf
Figure 13 ALR6-14 by Region (Includes NERC-Wide)
Reliability Metrics Performance
29
value using sustained outages (automatic and non-automatic) for both lines and transformers operated
at 200 kV and above for each Regional Entity Interconnection and for NERC This metric was approved
by the NERC Operating and Planning Committees in September 2010
Assessment
Figure 14 shows the aggregate element availability percentage (APC) for transmission and transformers
facilities operated at 200 kV and above The values are all over 90 percent which shows excellent
system availability The RMWG recommends continued metric assessment for at least a few more years
in order to determine the value of this metric
Figure 14 2010 ALR6-15 Element Availability Percentage
Notably the Eastern Interconnection does not include Quebec or ERCOT ERCOT does not have any
transformers with low-side voltage levels 200 kV and above
Special Consideration
It should be noted that the non-automatic outage data needed to calculate this metric was only first
collected for the calendar year 2010 as part of the TADS process Therefore only one year of data for
this metric is available at this time
Reliability Metrics Performance
30
ALR6-16 Transmission System Unavailability
Background
This metric uses data and calculations directly from the NERC TADS effort and shows the overall percent
of time the aggregate of transmission facilities are unavailable due to automatic and non-automatic
outages This is an aggregate value using sustained automatic outages for both lines and transformers
operated at 200 kV and above for each Regional Entity and for NERC This metric was approved by the
NERC Operating and Planning Committees in December 2010
Assessment
Figure 15 and Figure 16 illustrate the 2010 aggregate unavailability percentage for AC circuits and
transformer facilities operated at 200 kV and above The values for AC circuits are all under 3 percent
which shows excellent system availability
The RMWG recommends continued metric assessment for at least a few more years in order to
determine the value of this metric
Special Consideration
It should be noted that the non-automatic outage data needed to calculate this metric was only first
collected for the calendar year 2010 as part of the TADS process Therefore only one year of data for
this metric is available at this time
Figure 15 2010 ALR6-16 Transmission System Unavailability
Reliability Metrics Performance
31
Figure 16 2010 ALR6-16 Transmission System Unavailability by Outage Type
Notably the Eastern Interconnection does not include Quebec or ERCOT Also ERCOT does not have
any transformers with low-side voltage levels 200 kV and above
ALR6-2 Energy Emergency Alert 3 (EEA3)
Background
This metric identifies the number of times Energy Emergency Alerts Level 3 (EEA3) are issued EEA3
events are firm-load interruptions due to capacity and energy deficiency EEA3 is currently reported
collected and maintained in NERCrsquos Reliability Coordination Information System (RCIS) and is defined in
Attachment 1 of the NERC Standard EOP-00221
21 The latest version of Attachment 1 for EOP-002 is available at
This metric identifies the number of times EEA3s are
issued The number of EEA3s per year provides a relative indication of performance measured at a
Balancing Authority or interconnection level As historical data is gathered trends in future reports will
provide an indication of either decreasing or increasing use of EEA3s signaling adequacy of the electric
supply system This metric can also be considered in the context of Planning Reserve Margin Significant
increases or decreases in EEA3 events with relatively constant Planning Reserve Margins could indicate
httpwwwnerccompagephpcid=2|20
Reliability Metrics Performance
32
volatility in the actual loads compared to forecast levels or changes in the adequacy of the bulk power
system required to meet load demands
Assessment
Figure 17 shows the number of EEA3 events during 2006 and 2010 from an RE level An interactive
presentation was released and available at the Reliability Indicatorrsquos page22
The Acadiana Load Pocket (ALP) is an area in south central Louisiana that has experienced regular
transmission constraints and numerous Energy Emergency Alert filings by the SPP Reliability Controller
(SPP RC) Transmission within ALP is owned by Entergy Lafayette Utilities System (LUS) and Cleco
Power LLC (Cleco) The transmission constraints within the ALP are primarily caused by the local area
load and the lack of generation located in close proximity to the load area
The number of EEA3rsquos
declared in 2010 returned to more traditional numbers The 2009 spike in EEA3 events in the SPP
Region that was driven by issues in the Acadiana Load Pocket (ALP) were not present in 2010
Special Considerations
Ideally the measure should capture only EEAs that are declared for reliability reasons and not for
economic factors The RMWG has not been able to differentiate these reasons for future reporting and
it has made a recommendation to the Reliability Coordinator Working Group (RCWG) to consider a
revised EEA declaration to exclude economic factors
The reason the EEA volume decreased from 2009 to 2010 in SPP was because the SPP ICT RC23
coordinated an operating agreement between the five operating companies in the ALP The operating
agreement included a cost sharing re-dispatch that alleviated the need of a Transmission Loading Relief
(TLR-5) declaration24
22The EEA3 interactive presentation is available on the NERC website at
During 2009 there was no operating agreement therefore an entity had to
provide Network and Native Load (NNL) relief when a TLR-5 was called by the ICT RC When the TLR-5
was the primary tool to control the post contingent loading in the ALP some of the BAs would have their
firm transmission curtailed to the point where they could no longer serve their load therefore the EEA
3 was needed to communicate a capacityreserve deficiency
httpwwwnerccompagephpcid=4|331|335 23Southwest Power Pool (SPP) Independent Coordinator of Transmission (ICT) Reliability Coordinator (RC) 24More information on Transmission Load Relief is contained in the IRO-006 standard which is located at httpwwwnerccomfilesIRO-006-4pdf In particular TLR-5 definitions are referenced on page 16 and 17
Reliability Metrics Performance
33
Figure 17 ALR6-2 Energy Emergency Alert 3 (EEA3) Counts by Region (2006-2010)
Cleco Power Entergy and LUS are currently constructing an estimated $200 million transmission
infrastructure improvement project to mitigate transmission constraints into ALP Construction of the
project is scheduled to be complete in 2012 Completion of the project should help alleviate some of
the transmission congestion in this area Energy Emergency Alerts filed by the SPP Regional Entity
continue to decline
SPP RTO continues to coordinate operating plans with the operating entities in this area Mitigation
plans and local operating guides in place are expected to provide sufficient flexibility should issues arise
NERC will continue to monitor this area for Reliability Impacts and coordinate any actions with the SPP
Reliability Coordinator and SPP Regional Entity
ALR 6-3 Energy Emergency Alert 2 (EEA2)
Background
Energy Emergency Alert 2 (EEA2) is to measure the number of events BAs declare for deficient capacity
and energy during peak load periods which may serve as a leading indicator of energy and capacity
shortfall in the adequacy of the electric supply system EEA2 provides a sense of the frequency of
precursor events to the more severe EEA3 declarations This metric measures the number of events
1 3 1 2 214
3 4 4 1 5 334
4 2 1 52
1
0
5
10
15
20
25
30
3520
0620
0720
0820
0920
1020
0620
0720
0820
0920
1020
0620
0720
0820
0920
1020
0620
0720
0820
0920
1020
0620
0720
0820
0920
1020
0620
0720
0820
0920
1020
0620
0720
0820
0920
1020
0620
0720
0820
0920
10
FRCC MRO NPCC RFC SERC SPP TRE WECC
2006-2009
2010
Region and Year
Reliability Metrics Performance
34
Balancing Authorities declare for deficient capacity and energy during peak load periods At this time
however this data reflects inclusion of Demand Side Resources that would not be indicative of
inadequacy of the electric supply system
The number of EEA2 events and any trends in their reporting indicates how robust the system is in
being able to supply the aggregate load requirements The historical records may include demand
response activations and non-firm load interruptions per applicable contracts within the EEA alerts per
its definition25
Assessment
Demand response is a legitimate resource to be called upon by balancing authorities and
do not indicate a reliability concern As data is gathered in the future reports will provide an indication
of either decreasing or increasing adequacy in the electric supply system EEA2 events called solely for
activation of demand response (controllable or contractually prearranged demand-side dispatch
programs) or interruption of non-firm load per applicable contracts should be excluded This metric can
also be considered in the context of the Planning Reserve Margin Significant increases or decreases in
EEA2 events with relatively constant Planning Reserve Margins could indicate volatility in the actual
loads compared to forecast levels or changes in the adequacy of the bulk power system required to
meet load demands
Figure 18 shows the number of EEA2 events by Regional Entity from 2006 to 2010 EEA2 interactive
version available on line by quarter and region26
25 The EEA2 is defined at
The general trend continues to show improved
performance which may have been influenced by the overall reduction in demand throughout NERC
caused by the economic downturn Specific performance by any one region should be investigated
further for issues or events that may affect the results Determining whether performance reported
includes those events resulting from the economic operation of DSM and non-firm load interruption
should also be investigated The RMWG recommends continued metric assessment
httpwwwnerccomfilesEOP-002-2pdf 26 EEA2 interactive version located at httpwwwnerccompagephpcid=4|331|341
Reliability Metrics Performance
35
Special Considerations
The intent of this metric is to measure only EEAs that are called for reliability reasons and not for
economic factors such as demand side management (DSM) and non-firm load interruption The
historical data for this metric may include events that were called for economic factors According to
the RCWG recent data should only include EEAs called for reliability reasons
ALR 6-1 Transmission Constraint Mitigation
Background
The RMWG completed a pilot with four regional entities Based on the results the RMWG expanded the
pilot data collection to all regions and the initial results of the data collection are shown in Figure 19
and Table 5 Based on the results of the pilot there is merit in continuing to assess this metric The
intent of this metric is to identify trends in the number of mitigation measures (Special Protection
Schemes (SPS) Remedial Action Schemes (RAS) and Operating Procedures) required to meet reliability
requirements By their nature SPS do not indicate an inherent weakness in the bulk power system
rather they are an indication of methods that are taken to operate the system through the range of
conditions it must perform This metric is only intended to evaluate the trend use of these plans and
whether the metric indicates robustness of the transmission system is increasing remaining static or
decreasing
1 27
2 1 4 3 2 1 2 4 5 2 5 832
4724
211
5 38 5 1 1 8 7 4 1 1
05
101520253035404550
2006
2007
2008
2009
2010
2006
2007
2008
2009
2010
2006
2007
2008
2009
2010
2006
2007
2008
2009
2010
2006
2007
2008
2009
2010
2006
2007
2008
2009
2010
2006
2007
2008
2009
2010
2006
2007
2008
2009
2010
FRCC MRO NPCC RFC SERC SPP TRE WECC
2006-2009
2010
Region and Year
Figure 18 ALR6-3 Energy Emergency Alert 2 (EEA2)
Reliability Metrics Performance
36
Assessment
The pilot data indicates a relatively constant number of mitigation measures over the time period of
data collected
Figure 19 ALR6-1 Transmission Constraint Mitigation by SPSRAS (2009-2014)
0102030405060708090
100110120
2009
2010
2011
2014
2009
2010
2011
2014
2009
2010
2011
2014
2009
2010
2011
2014
2009
2010
2011
2014
2009
2010
2011
2014
2009
2010
2011
2014
2009
2010
2011
2014
FRCC MRO NPCC RFC SERC SPP ERCOT WECC
Coun
t
Region and Year
SPSRAS
Reliability Metrics Performance
37
Table 5 ALR6-1 Transmission Constraint Mitigation by Operating ProcedureGuides (2009-2011)
ALR6-1 Transmission Constraint Mitigation by Operating ProcedureGuides (2009-2014)
2009 2010 2011 2014
FRCC 107 75 66
MRO 79 79 81 81
NPCC 0 0 0
RFC 2 1 3 4
SPP 39 40 40 40
SERC 6 7 15
ERCOT 29 25 25
WECC 110 111
Special Considerations
A certain number of SPS mitigation plans may be necessary to support reliable operation of the system
If the number of SPS increase over time this may indicate that additional transmission capacity is
required A reduction in the number of SPS may be an indicator of increased generation or transmission
facilities being put into service which may indicate greater robustness of the bulk power system In
general mitigation plans are a viable and valuable tool for effective operation of the bulk power system
In power system planning reliability operability capacity and cost-efficiency are simultaneously
considered through a variety of scenarios to which the system may be subjected Mitigation measures
are a method for optimizing a power system across these scenarios Changes in quantities of mitigation
plans may indicate year-on-year differences in the system being evaluated
Integrated Bulk Power System Risk Assessment
Introduction In developing eighteen metrics to measure acceptable levels of reliability it has become clear that any
such measurement of reliability must include consideration of the risks present within the bulk power
system in order for us to appropriately prioritize and manage these system risks The scope for the
Reliability Metrics Working Group (RMWG)27
27 The RMWG scope can be viewed at
includes a task to develop a risk-based approach that
provides consistency in quantifying the severity of events The approach not only can be used to
httpwwwnerccomfilezrmwghtml
Reliability Metrics Performance
38
measure risk reduction over time but also can be applied uniformly in event analysis process to identify
the events that need to be analyzed in detail and sort out non-significant events
The Operating Committee (OC) and Planning Committee (PC) endorsed the concepts and framework28 of
the risk-based approach in their September 2010 joint meeting and further supported the event severity
risk index (SRI) calculation29
Recommendations
in March 2011
bull NERC should embrace the use of risk assessment to identify trends in addition to lessons learned
in order to improve bulk power system reliability
bull The RMWG should continue to coordinate and communicate with the Event Analysis Working
Group (EAWG) to apply the SRI into the event analysis process and root cause analysis
bull As trend evaluations increase the knowledge of risks to the bulk power system data required to
support additional assessment should be gathered
Event Severity Risk Index (SRI)
Risk assessment is an essential tool for achieving the alignment between organizations people and
technology This will assist in quantifying inherent risks identifying where potential high risks exist and
evaluating where the most significant lowering of risks can be achieved Being learning organizations
the Electric Reliability Organization (ERO) Regional Entities and Registered Entities can use these tools
to focus on the areas of highest risk to reliability to provide a sound basis for developing results-based
standards and compliance programs Risk assessment also serves to engage all stakeholders in a
dialogue about specific risk factors and helps direct a strategic plan for risk reduction and early
detection
The SRI is a daily blended metric for which transmission loss generation loss and load loss events are
calculated Each element (transmission generation and load loss) is factored by the systemrsquos inventory
for that element to rate significant events appropriately On a yearly basis these daily performances
can be sorted in descending order to evaluate the year-on-year performance of the system
In order to test drive the concepts the RMWG applied these calculations against historically memorable
days to derive SRIs Once these calculations were complete they were reviewed and evaluated by
various stakeholders for reasonableness Based upon feedback modifications to the calculation were
made and assessed against the historic days performed This iterative process locked down the details
28 httpwwwnerccomdocspcrmwgIntegrated_Bulk_Power_System_Risk_Assessment_Concepts_Finalpdf 29 httpwwwnerccomdocspcrmwgSRI_Equation_Refinement_May6_2011pdf
Reliability Metrics Performance
39
for the calculation of SRI whose calculation from zero (no transmission line outages generation outages
or load lost in a day) to 1000 (a theoretical condition in which every transmission line all generation
units and all load lost across the system in a single day)
Figure 20 captures the calculated severity risk value for each of the days for each year benchmarked
with the historic significant events which were used to concept test the calculation Since there is
significant disparity between days the bulk power system is stressed compared to those that are
ldquoroutinerdquo and ldquoherordquo days of the year where the system performed extremely well the curve is depicted
using a logarithmic scale Each yearrsquos data is sorted in descending order striking a characteristic shape
At the left-side of the curve the days in which the system is severely stressed are plotted The central
more linear portion of the curve identifies the routine day performance while the far right-side of the
curve shows the values plotted for days in which almost all lines and generation units are in service and
essentially no load is lost
The trends on the chart below show that 2009 and 2010 had fewer extreme days than 2008 Routine
daily performance appears generally consistent across all three years Figure 20 captures the days for
each year benchmarked with historically significant events
In Figure 20 NERCrsquos event categories and SRI ratings are directly related As the SRI increases the
category or severity of the event increases Historical events are also shown to relate modern
reliability measurements to give a perspective of how a well-known event would register on the SRI
scale
The event analysis process30
30
benefits from the SRI as it enables a numerical analysis of an event in
comparison to other events By this measure an event can be prioritized by its severity In a severe
event this is unnecessary However for events that do not result in severe stressing of the bulk power
system this prioritization can be a challenge By using the SRI the event analysis process can decide
which events to learn from and reduce which events to avoid and when resilience needs to be
increased under high impact low frequency events as shown in the blue boxes in the figure
httpwwwnerccompagephpcid=5|365
Reliability Metrics Performance
40
Figure 20 NERC Annual Daily Severity Risk Index (SRI) Sorted Descending with Historic Benchmark Days
Other factors that impact severity of a particular event to be considered in the future include whether
equipment operated as designed and resulted in loss of load from a reliability perspective (intentional
and controlled load-shedding) Mechanisms for enabling ongoing refinement to include the historic and
simulated events for future severity risk calculations are being explored
Reliability Metrics Performance
41
Integrated Reliability Index Concepts In December 2010 the RMWG was challenged by the OC and PC to develop a single index concept to
measure the universe of risks associated with the bulk power system As a result the integrated
reliability index (IRI) concepts were proposed31
Figure 21
the three components of which were defined to
quantify each specific risk aspect They are titled the Event Driven Index (EDI) StandardsStatute Driven
Index (SDI) and Condition Driven Index (CDI) illustrated in with measures associated with
system events standards compliance and eighteen performance metrics The development of an
integrated reliability index aims to inform increase transparency and quantify the effectiveness of risk
reduction or mitigation actions The goal is to provide the industry meaningful trends of the BPSrsquos
performance and guidance on how the industry can improve reliability and support risk-informed
decision making Once completed the IRI will facilitate holistic assessment of performance Finally the
IRI should help overcome concern and confusion about how many metrics are being analyzed for system
reliability assessments
Figure 21 Risk Model for Bulk Power System
The integrated model of event-driven condition-driven and standardsstatute-driven risk information
can be constructed to illustrate all possible logical relations between the three risk sets Due to the
nature of the system there may be some overlap among the components
31 httpwwwnerccomdocspcrmwgIntegrated_Reliability_Index_WhitePaper_DRAFTpdf
Event Driven Index (EDI)
Indicates Risk from
Major System Events
Standards Statute Driven
Index (SDI)
Indicates Risks from Severe Impact Standard Violations
Condition Driven Index (CDI)
Indicates Risk from Key Reliability
Indicators
Reliability Metrics Performance
42
The Three Components of the IRI The three components of the IRI work together as shown in Figure 22 to comprise a full picture of the
state of reliability
Figure 22 An overview of the components that comprise the Integrated Reliability Index (IRI)
Event-Driven Indicators (EDI)
The Event-Driven Indicator provides a basis for prioritization of events based on bulk power system
integrity equipment performance and engineering judgment This indicator can serve as a high value
risk assessment tool to be used by stakeholders to investigate and evaluate disturbance history and
measure the severity of these events The relative ranking of events requires industry expertise agreed-
upon goals and engineering judgment The EDI is a derivative of SRI results for a specific time period
but it transforms that performance into a form of an availability index These calculations will be further
refined as feedback is received
Condition-Driven Indicators (CDI)
The Condition-Driven Indicators focus on a set of measurable system conditions (performance
measures) to assess bulk power system reliability These reliability indicators identify factors that
positively or negatively impact reliability and are early predictors of the risk to reliability from events or
unmitigated violations A collection of these indicators measures how close reliability performance is to
the desired outcome and if the performance against these metrics is constant or improving
Reliability Metrics Performance
43
StandardsStatute-Driven Indicators (SDI)
The StandardsStatute-Driven Indicator is a calculation of success of compliance based upon the subset
of high-value standards and is divided by the number of participations who could have received the
violation within the time period considered Also based on these factors known unmitigated violations
of elevated risk factor requirements are weighted higher than lower risk factors The index decreases if
the compliance improvement is achieved over a trending period
IRI Index Calculation As with the SRI the IRI is based on an importance weighting factor which the RMWG can modify over
time after gaining experience with the new metric as well as consideration of feedback from industry
At this time the RMWG believes some form of blended weighting may serve to start to populate IRI
characteristic curves at a high and generic level Based upon feedback from stakeholders this approach
may change or as discussed below weighting factors may vary based on periodic review and risk model
update The RMWG will continue the refinement of the IRI calculation and consider other significant
factors that impact reliability (eg intentional and controlled load-shedding) further it will explore
developing mechanisms for enabling ongoing refinement which should be influenced by a wide set of
stakeholders
RMWG recommends the Event Driven Index (EDI) be weighted the highest (50 percent) since events
actually occurred indicating how the system was performing The Condition Driven Index (CDI) and
StandardsStatute Driven Index (SDI) are weighted 25 each since they are indicators of potential risks
to BPS reliability IRI can be calculated as follows
IRI is intended to be a composite metric which integrates several forms of individual risks to the bulk
power system Since the three components range across many stakeholder organizations these
concepts are developed as starting points for continued study and evaluation Additional supporting
materials can be found in the IRI whitepaper32
IRI Recommendations
including individual indices calculations and preliminary
trend information
For the IRI more investigation should be performed to determine the best way to integrate EDI CDI
and SDI into an Integrated Reliability Index (IRI) that quantitatively represents the reliability of the bulk
32 The IRI whitepaper can be found at httpwwwnerccomdocspcrmwgIntegrated_Reliability_Index_WhitePaper_DRAFTpdf
Reliability Metrics Performance
44
power system To this end study into determining the amount of overlap between the components is
necessary RMWG is currently working to determine the proper amount of overlap between the IRI
components
Also the CDI component of the IRI needs to be solidified This is especially true with the CDI More
accurate metric data is needed to paint a fuller picture of the CDI Many of the metrics used to calculate
the CDI are new or they have limited data Compared to the SDI which counts well-known violation
counts and the EDI which uses the well-defined CDI the CDI lacks the depth of rigor that the other two
components have acquired through their years of data RMWG is currently working to improve the CDI
Reliability Metrics Conclusions and Recommendations Among the eighteen metrics that address the characteristics of an adequate level of reliability (ALR)
metric trends indicate the system is performing better in the following seven areas
bull ALR1-3 Planning Reserve Margin
bull ALR1-4 BPS Transmission Related Events Resulting in Loss of Load
bull ALR2-5 Disturbance Control Events Greater than Most Severe Single Contingency
bull ALR6-2 Energy Emergency Alert 3 (EEA3)
bull ALR6-3 Energy Emergency Alert 2 (EEA2)
bull ALR6-11 Automatic Transmission Outages Caused by Protection System Misoperations
bull ALR6-13 Automatic Transmission Outages Caused by Failed AC Substation Equipment
Assessments have been made in other performance categories A number of them do not have
sufficient data to derive any conclusions from the results The RMWG recommends continued data
collection and assessment of these metrics If a metric does not yield any trend in a five-year reporting
period the metric will be modified or withdrawn
For the IRI more investigation should be performed to determine the overlap of the components (CDI
EDI and SDI) The CDI should be more thoroughly solidified as an index by collecting more data over
time
Transmission Equipment Performance
45
Transmission Equipment Performance Introduction The Transmission Availability Data System (TADS) effort began with the establishment of a TADS task force
by the NERC Planning Committee in October 2006 On October 27 2007 the NERC Board of Trustees
approved the collection of transmission automatic outage data beginning in calendar year 2008 (Phase I)
Subsequently on October 29 2008 the NERC Board approved the collection of Non-Automatic Outage data
that began for Calendar year 2010 (Phase II)
This chapter provides reliability performance analysis of the transmission system by focusing on the trends
of Automatic Outage data from calendar year 2008 thru 2010 Since only one year of Non-Automatic
Outage data has been collected that data will not be assessed in this report
When calculating bulk power system performance indices care must be exercised when interpreting results
as misinterpretation can lead to erroneous conclusions regarding system performance With only three
years of data in the smaller regions it is not clear whether a regionrsquos yearly outage variation compared to
the average is due to random statistical variation or that particular year is significantly different in
performance However on a NERC-wide basis after three years of data collection there is enough
information to accurately determine whether the yearly outage variation compared to the average is due to
random statistical variation or the particular year in question is significantly different in performance33
Performance Trends
Transmission performance information has been provided by Transmission Owners (TOs) within NERC
through the NERC TADS (Transmission Availability Data System) process The data presented reflects
Momentary and Sustained AC Automatic outages of transmission elements that operate at voltages ge 200 kV
(including the low side of transformers) with the criteria specified in the TADS process The following
elements listed below are included
bull AC Circuits ge 200 kV (Overhead and Underground Circuits) Radial circuits are included
bull DC Circuits with ge +-200 kV DC voltage
bull Transformers with ge 200 kV low-side voltage and
bull ACDC Back-to-Back (BTB) Converters with ge 200 kV AC voltage on both sides
33The detailed Confidence Interval computation is available at httpwwwnerccomdocspctadstfTADS_Nov_2_2007APPENDIX_C_Confidence_Intervalpdf
Transmission Equipment Performance
46
AC Element Outage Summary and Leading Causes Table 6 shows the 2008 2009 and 2010 NERC total AC transmission element inventory and a summary of
the associated outages As expected in general the number of circuits increased from year to year due to
new construction or re-construction to higher voltages For every outage experienced on the transmission
system cause codes are identified and recorded according to the TADS process Causes of both momentary
and sustained outages have been indicated These causes are analyzed to identify trends and similarities
and to provide insight into what could be done to possibly prevent future occurrences
Figure 23 and Figure 24 describe the top ten initiating cause codes for sustained and momentary automatic
outages combined from 2008-2010 Based on the two figures the relationship between the total number of
outages and total outage hours can be seen Failed AC Substation Equipment and Failed AC Circuit
Equipment only account for 15 percent of the total number of outages but account for 65 percent of the
total outage hours The two largest causes of outages within NERC (ldquoLightingrdquo and ldquoWeather excluding
Lightningrdquo) account for 34 percent of the total number of outages
The next three Human Error Failed Protection System Equipment and Failed AC Circuit Equipment have
very similar totals and should all be considered significant focus points in reducing the number of Sustained
Automatic Outages for all elements
Transmission Equipment Performance
47
Table 6 NERC - All AC Elements Sustained and Momentary Outage Performance Summary
2008 Number of Outages
AC Voltage
Class
No of
Circuits
Circuit
Miles Sustained Momentary
Total
Outages Total Outage Hours
200-299kV 4369 102131 1560 1062 2622 56595
300-399kV 1585 53631 793 753 1546 14681
400-599kV 586 31495 389 196 585 11766
600-799kV 110 9451 43 40 83 369
All Voltages 6650 196708 2785 2051 4836 83626
2009 Number of Outages
AC Voltage
Class
No of
Circuits
Circuit
Miles Sustained Momentary
Total
Outages Total Outage Hours
200-299kV 4468 102935 1387 898 2285 28828
300-399kV 1619 56447 641 610 1251 24714
400-599kV 592 32045 265 166 431 9110
600-799kV 110 9451 53 38 91 442
All Voltages 6789 200879 2346 1712 4038 63094
2010 Number of Outages
AC Voltage
Class
No of
Circuits
Circuit
Miles Sustained Momentary
Total
Outages Total Outage Hours
200-299kV 4567 104722 1506 918 2424 54941
300-399kV 1676 62415 721 601 1322 16043
400-599kV 605 31590 292 174 466 10442
600-799kV 111 9477 63 50 113 2303
All Voltages 6957 208204 2582 1743 4325 83729
Note The NERC table does not show redacted outages DC Circuit outages Transformer outages or ACDC
converter outages
Transmission Equipment Performance
48
Figure 23 NERC - Top Ten Sustained and Momentary Outages by Initiating Cause Code for All Elements
Figure 24 NERC - Top Ten Sustained Outage Hours by Cause Code
198
151
80
7271
6943
33
27
188
68
Lightning
Weather excluding lightningHuman Error
Failed AC Substation EquipmentFailed Protection System EquipmentFailed AC Circuit Equipment Foreign Interference
Power System Condition
Fire
Unknown
Remaining Cause Codes
299
246
188
58
52
42
3619
16 12 31 Failed AC Substation EquipmentFailed AC Circuit Equipment Weather excluding lightningUnavailable
Other
Fire
Unknown
Human Error
Failed Protection System EquipmentForeign Interference
Remaining Cause Codes
Transmission Equipment Performance
49
Transmission Monthly Outages Figure 25 displays the total number of Automatic Outages on a per-month basis The three months with the
highest total of outages were June July and August From a seasonal perspective winter had a monthly
average of 281 outages These include the months of November-March Summer had an average of 429
outages Summer included the months of April-October
Figure 25 Number of Outages by Month for AC Circuits (2008-2010)
This figure does not show redacted outages DC Circuit outages Transformer outages or ACDC Converter
outages
Outage Initiation Location For every outage experienced on the transmission system the outage initiation code is identified and
recorded according to the TADS process The outage initiation code can be analyzed to identify trends and
similarities and to provide insight into what could be done to possibly prevent future occurrences
The ldquoOutage Initiation Coderdquo describes where an automatic outage was initiated on the power system The
five codes are as follows
bull Element-Initiated
bull Other Element-Initiated
bull AC Substation-Initiated
bull ACDC Terminal-Initiated (for DC circuits)
bull Other Facility Initiated any facility not included in any other outage initiation code
JanuaryFebruar
yMarch April May June July August
September
October
November
December
2008 238 229 257 258 292 437 467 380 208 176 255 236
2009 315 201 339 334 398 553 546 515 351 235 226 294
2010 444 224 269 446 449 486 639 498 351 271 305 281
3 Year AVG 332 218 288 346 380 492 551 464 303 227 262 270
0
100
200
300
400
500
600
700
Out
ages
Transmission Equipment Performance
50
Notably the protection system is not part of an ldquoAC Substationrdquo or an ldquoACDC Terminalrdquo If a protection
system misoperates and initiates an outage it will be classified as ldquoOther-Facility Initiatedrdquo The following
Figures show the initiating location of the Automatic outages from 2008 to 2010
With both Momentary and Sustained Automatic Outages taken into account the outage was initiated on the
Element more than 67 percent of the time as shown in Figure 26 and Figure 27
When only the Sustained Automatic Outages are analyzed the outage initiation on both AC Substation and
Other Facility increased by 34 percent and 32 percent respectively Outages initiated on the Element itself
decreases by 78 percent as shown in Figure 26 and 27 For only the Momentary Automatic Outages the
outage initiation on the Element increases by 19 percent compared to Sustained Outages Element initiated
outages make up over 78 percent of the total outages when analyzing only Momentary Outages
Figure 26
Figure 27
Transmission Outage Events Figure 28 illustrates the relationship between the numbers of Automatic Outages associated per TADS
event 2008 2009 and 2010 tend to follow the same trend The largest number of Automatic Outages per
TADS event is fourteen in 2010 thirteen in 2009 and eight in 2008 There are around 70 to 100 TADS
events that contain between fourteen and three Automatic Outages (see below) There are around 330 to
400 TADS events that contain two or more Automatic Outages The rest of the events only contain one
Automatic Outage As noted in the lower right hand corner below the total number of Events in 2008 to
2010 ranged from 3920 to 4569 events per year Nearly 90 percent or more of the events contained one
Automatic Outage
Figure 26 Sustained Automatic Outage Initiation
Code
Figure 27 Momentary Automatic Outage Initiation
Code
Transmission Equipment Performance
51
Transmission Outage Mode Figure 29 and Figure 30 show the percentage of Outage Modes The ldquoOutage Mode Coderdquo describes
whether one Automatic Outage is related to other Automatic Outages A Single Mode outage is an
Automatic Outage of a single Element which occurs independently of any other Automatic Outages (if any)
A ldquoDependent Mode Initiating Outagerdquo is an Automatic Outage of a single Element that initiates one or more
subsequent Element Automatic Outages A ldquoDependent Mode Outagerdquo is an Automatic Outage of an
Element which occurred as a result of an initiating outage whether the initiating outage was an Element
outage or a non-Element outage A ldquoCommon Mode Outagerdquo is one of two or more Automatic Outages with
the same Initiating Cause Code and where the outages are not consequences of each other and occur nearly
simultaneously A ldquoCommon Mode Initiating Outagerdquo is a Common Mode Outage that initiates one or more
subsequent Automatic Outages
Over 72 percent of the total outages occurred on the bulk power system are Single Mode Outages The next
largest mode is Dependent with over 11 percent of the total outages being in this category For only
Sustained Automatic Outages outages related to each other increase with Dependent mode accounting for
13 percent of the outages and Common mode accounting for close to 11 percent of the outages
Independent Sustained outages still account for the largest portion with nearly 70 percent being Single
mode When just analyzing Momentary Automatic Outages Associated outages decrease with Dependent
Figure 28 Event Histogram (2008-2010)
Transmission Equipment Performance
52
mode accounting for only 9 percent of the outages The Common Mode percentage decreases while
Dependent Mode Initiating percentage increases compared to Sustained Outages Independent Momentary
outages account for the largest portion with over 76 percent being Single Mode
An investigation into the root causes of Dependent and Common mode events which include three or more
Automatic Outages (indentified in the TADS 2008 to 2010 data) should be a high priority Some protection
systems are designed to trip three or more circuits but some events go beyond what is designed Some also
have misoperations associated with multiple outage events
Conclusions On a NERC wide average basis automatic transmission outage rate is improving from 2008 to 2010 based on
reported data Considering both automatic and non-automatic outages 2010 records indicate transmission
element availability percentage is very high and exceeds 95 The unavailability rate for AC circuits and
transformers are only 15 and 29 respectively
The cause codes of Human Error Failed Protection System Equipment and Failed AC Circuit Equipment
should be considered significant focus points in reducing the number of Sustained Automatic Outages for all
elements A deeper look into the root causes of Dependent and Common mode events which include three
or more Automatic Outages (indentified in the TADS 2008 to 2010 data) should be a high priority Some
protection systems are designed to trip three or more circuits but some events go beyond what is designed
Some also have misoperations associated with multiple outage events
Figure 29 Sustained Automatic Outage Mode code Figure 30 Momentary Automatic Outage Mode code
Generation Equipment Performance
53
Generation Equipment Performance Introduction The development of the Generating Availability Data System (GADS) began in 1982 This series of databases
is used to voluntarily collect record and retrieve operating information By pooling individual unit
information with likewise units generating unit availability performance can be calculated providing
opportunities to identify trends and generating equipment reliability improvement opportunities The
information is used to support equipment reliability availability analyses and risk-informed decision-making
by system planners generation owners assessment modelers manufacturers and contractors etc Reports
and information resulting from the data collected through GADS are now used for benchmarking and
analyzing electric power plants
Currently the data collected through GADS contains 72 percent of the North American generating units
with generating capacity of 20 MW or higher34 Additionally many of the newer combined-cycle plants are
not reporting information and therefore a full view of each unit type is not presented Rather a sample of
all the units in North America that fit a given more general category is provided35 for the 2008-201036
Generation Key Performance Indicators
assessment period
Three key performance indicators37
In
the industry have used widely to measure the availability of generating
units (see Terms Used in This Report section for their calculation parameters) are Equivalent Availability
Factor (EAF) Net Capacity Factor (NCF) and Equivalent Forced Outage Rate ndash Demand (EFORd)
Table 7 the North American fleet average EAF NCF and EFORd compared to unit age for all generating
units with a capacity of 20 MW and higher is provided for the years 2008-2010 The EAF shows a decline
during the last three years NCF is up and down while the EFORd appears to be increasing As expected the
fleet of units reported to GADS is aging overall with the fossil units being about 12 years older than the
average age
34 httpwwwnerccomdocspcgadstfGADSTF_Recommendation_Report_02-18-2011_FINALpdf 35GADS contains some 1500+ units under 20 MW that is not included in this report These units are excluded because most units are not base-loaded and are in peaking operation
3684 percent of the 2010 dataset is available at this time while the 2008 and 2009 dataset is complete 37 httpwwwnerccompagephpcid=4|43
Generation Equipment Performance
54
Table 7 General Availability Review of GADS Fleet Units by Year
2008 2009 2010 Average
Equivalent Availability Factor (EAF) 8776 8774 8678 8743
Net Capacity Factor (NCF) 5083 4709 4880 4890
Equivalent Forced Outage Rate -
Demand (EFORd) 579 575 639 597
Number of Units ge20 MW 3713 3713 3713 3713
Average Age of the Fleet in Years (all
unit types) 303 311 321 312
Average Age of the Fleet in Years
(fossil units only) 422 432 440 433
Figure 31 provides the average forced outage hours (FOH) maintenance outage hours (MOH) and planned
outage hours (POH) for all units reporting 20 MW or larger During this three-year period the average FOH
291 hours average MOH is 163 hours average POH is 470 hours
Figure 31 shows a large increase in forced and maintenance events The average age of the units with a
capacity of 20MW and higher in 2009 is 316 years old However the average age of fossil units in 2010 is
442 years old These fossil units are the backbone of all operating units providing the base-load power
continuously and nearly 50 percent of all energy annually There appears to be no increase allocated for
annualsemi-annual maintenance (ie planned outages) for the older generating units The increase of
000100002000030000400005000060000700008000090000
100000
2008 2009 2010
463 479 468
154 161 173
288 270 314
Hou
rs
Planned Maintenance Forced
Figure 31 Average Outage Hours for Units gt 20 MW
Generation Equipment Performance
55
maintenance outage hours reflects an increased need to fix problems that cannot be deferred until the next
annualsemi-annual repairs As a result it shows one of two things are happening
bull More or longer planned outage time is needed to repair the aging generating fleet
bull More focus on preventive repairs during planned and maintenance events are needed
Multiple Unit Forced Outages and Causes Table 8 provides the annual multiple-unit forced outage trips resulting from the same cause for each of the
assessments years 2008-2010 respectively The ldquosingle unitrdquo trips are large units with a Net Dependable
Capacity of 750 MW or more The trips of ldquotwo unitsrdquo or more is any combination of unit capacity with the
total amount of lost capacity more than 750 MW
Table 8 also presents more information on the forced outages During 2008-2010 there were a large
number of double-unit outages resulting from the same event Investigations show that some of these trips
were at a single plant caused by common control and instrumentation for the units The incidents occurred
several times for several months and are a common mode issue internal to the plant
Table 8 Number of Multiple Unit Forced Outages and FrequencyYear
2008 2009 2010
Type of
Trip
of
Trips
Avg Outage
Hr Trip
Avg Outage
Hr Unit
of
Trips
Avg Outage
Hr Trip
Avg Outage
Hr Unit
of
Trips
Avg Outage
Hr Trip
Avg Outage
Hr Unit
Single-unit
Trip 591 58 58 284 64 64 339 66 66
Two-unit
Trip 281 43 22 508 96 48 206 41 20
Three-unit
Trip 74 48 16 223 146 48 47 109 36
Four-unit
Trip 12 77 19 111 112 28 40 121 30
Five-unit
Trip 11 1303 260 60 443 88 19 199 10
gt 5 units 20 166 16 93 206 50 37 246 6
Loss of ge 750 MW per Trip
The high number of five-unit trips in 2008 was due to Hurricane Ike hitting the Gulf Coast The highest total
number of multiple unit trips occurred in 2009 though as mentioned before the data collection for 2010 is
incomplete at this time The majority of 2009 multiple unit trips have three main causes (in order by
Generation Equipment Performance
56
number of events) transmission lack of fuel and storms A summary of the three categories for single as
well as multiple unit outages (all unit capacities) are reflected in Table 9
Table 9 Common Causes of Multiple Unit Forced Outages (2009)
Cause Number of Events Average MW Size of Unit
Transmission 1583 16
Lack of Fuel (Coal Mines Gas Lines etc) Not
in Operator Control
812 448
Storms Lightning and Other Acts of Nature 591 112
Some of the transmission outages based on storms in 2009 have been caused by the same reasons because
the storms may have caused transmission interference However the plants reported the problems
inconsistently with either the transmission interference or storms cause code Therefore they are depicted
as two different causes of forced outage
Marked transmission outages in 2009 were quite high Thirty-five percent came from one utility with a large
number of hydroelectric units The company related the trips to various problems including weather
(lightning storms) wildlife ldquoline bumpsrdquo and problems on the receiving end of the transmission line Nine
hundred and eighty-five transmission trips (62 percent) were from hydroelectric units38
In 2009 only ten transmission trips resulted in a loss of 750 MW or more per trip Twenty two generating
plants were affected by the ten trips Causes for the trips include feeder line trips (1 trip) breakers in the
switchyard (8 trips) personnel errors (2 trips) and unknown (10 trips)
The ldquoLack of Fuelrdquo outages are of interest as these events occur during the times when a unit is available to
operate but there is an interruption in fuels to operate the facilities These events do not include
interruptions of fuel due to contracts Rather the cause code is designed to account for units that are
expecting fuel and it is unavailable when requested Table 10 presents the distribution of ldquoLack of Fuelrdquo
events by NERC Region and Table 11 presents the unit types affected
38 The average size of the hydroelectric units were small ndash 335 MW
Generation Equipment Performance
57
Of the units that report ldquoLack of Fuelrdquo 78 percent of the units are oil-fired 15 percent of the units are gas-
fired and the remaining units are various other fuels Table 12 provides the top causes of forced outage for
several unit types For fossil units ldquoLack of Fuelrdquo as the number three cause behind waterwall tube leaks
and superheater tube leaks
Table 10 Forced Outages Due to Lack of Fuel by Region
Region Number of Lack of Fuel
Problems Reported
FRCC 0
MRO 3
NPCC 24
RFC 695
SERC 17
SPP 3
TRE 7
WECC 29
One company contributed to the majority of oil-fired lack of fuel events The units at the company are
actually dual-fuels (oil and gas) but market nominated gas monitoring causes the units to be on forced
outage nightly The units need gas to start up so they can run on oil When they shut down the units must
switch to gas to clean themselves With the gas restriction the unit canrsquot start and the unit goes on a
forced outage Until the band is lifted the two units will continue to be on a forced outage cycle
Event records also provide descriptions of why the unit was without fuel with the majority of descriptions
bull Temperatures affecting gas supply valves
bull Unexpected maintenance of gas pipe-lines
bull Compressor problemsmaintenance
Generation Equipment Performance
58
Table 11 Unit Type Profile of Forced Outages Due to Lack of Fuel
Unit Types Number of Lack of Fuel Problems Reported
Fossil 642
Nuclear 0
Gas Turbines 88
Diesel Engines 1
HydroPumped Storage 0
Combined Cycle 47
Generation Equipment Performance
59
Table 12 Causes of Forced Outage for Different Unit Types (2008-2010)
Fossil - all MW sizes all fuels
Rank Description Occurrence per Unit-year
MWH per Unit-year
Average Hours To Repair
Average Hours Between Failures
Unit-years
1 Waterwall (furnace wall) 0590 134106 59 3250 3868 2 Second Superheater
Leaks 0180 5182 60 3228 3868
3 Lack of Fuel (coal mines gas lines etc) where the operator is not in control
0480 4701 18 26 3868
Combined-Cycle blocks Rank Description Occurrence
per Unit-year
MWH per Unit-year
Average Hours To Repair
Average Hours Between Failures
Unit-years
1 HP Turbine Buckets Or Blades
0020 4663 1830 26280 466
2 Turbine Control Valves 0040 2777 100 7200 466 3 Gas Turbine Compressor -
High Pressure Shaft 0010 2266 663 4269 466
Nuclear units - all Reactor types Rank Description Occurrence
per Unit-year
MWH per Unit-year
Average Hours To Repair
Average Hours Between Failures
Unit-years
1 LP Turbine Buckets or Blades
0010 26415 8760 26280 288
2 Containment Structure 0010 9233 1226 26262 288 3 Feedwater Pump Local
Controls 0020 7620 692 12642 288
Simple-cycle gas turbine jet engines Rank Description Occurrence
per Unit-year
MWH per Unit-year
Average Hours To Repair
Average Hours Between Failures
Unit-years
1 Main Transformer 0030 1611 1016 20709 4181 2 Other Gas Turbine
Controls And Instrument Problems
0120 428 70 2614 4181
3 Other Gas Turbine Problems
0090 400 119 1701 4181
Generation Equipment Performance
60
2008-2010 Review of Summer versus Winter Availability To address seasonality of unit availability unit information for the months of June to September (summer)
and December through February (winter) were pooled to calculate force events during these timeframes for
2008-201039 Figure 32 shows the Equivalent Availability Factor (EAF) is three percentage points higher and
the Equivalent Forced Outage Rate - Demand (EFORd) is more than a half of a percentage point lower in the
summer period than in winter period This means the units were more reliable with less forced events
during high-demand times during the summer than during the winter seasons The generating unitrsquos
capability has a resulting higher Net Capacity Factor (NCF) of 45 percentage points in the summer season
for 2008-2010
During the spring season (March-May) 77 percent of the units took a planned outage (PO) for an average
231 hours (or 96 days) In fall (October-November) only 42 percent of the units experienced a PO and the
average duration was shorter ndash 134 hours (or 56 days) A few units took both spring and fall planned
outages although this is rare Based on this assessment the generating units are prepared for the summer
peak demand The resulting availability indicates that this maintenance was successful which is measured
by an increased EAF and lower EFORd
Figure 32 Summer-Winter Average EAF NCF and EFORd (2008-2010)
Conclusions and Recommendations During 2008-2010 the average Equivalent Availability Factor (EAF) which measures the overall availability
of generating units decreased At the same time the Net Capacity Factor (NCF) an indicator of energy
production increased The average number of forced outages in 2010 is greater than in 2008 while at the
same time the average planned outage times have decreased As a result the Equivalent Forced Outage
Rate ndash Demand (EFORd) also increased illustrating that more units have experienced forced events during
39 A study of peak periods was conducted by the NERC Generating Availability Trend Evaluation (GATE) Working Group several years ago see httpwwwnerccomfilesSeasonal-Performance-Trendspdf
9116
5343
396
8818
4896
441
0 10 20 30 40 50 60 70 80 90 100
EAF
NCF
EFORd
Percent ()
Winter
Summer
Generation Equipment Performance
61
peak-demand times in 2010 than in the previous two years Potentially with shorter planned outage
periods in 2010 there may be less time to repair equipment and prevent forced unit outages
There are warnings that units are not being maintained as well as they should be In the last three years
there has been an increase in Equivalent Forced Outage Rate ndash Demand (EFORd) This indicator measures
the rate of forced outage events on generating units during periods of load demand To confirm this
problem forced outage hours jumped from 270 to 314 hours per unit between 2009 and 2010 At the same
time maintenance events also increased by 12 hours per unit Planned outage events remain constant The
resulting conclusions from this trend are
bull More or longer planned outage time is needed to repair the generating fleet Whether age is the
cause of the increase need for planned outage time remains unknown and further investigation into
the cause for longer planned outage time is necessary
bull More focus on preventive repairs during planned and maintenance events are needed
There are many multiple unit forced outages due to lack of fuel The majority of multiple unit trips have
three main causes transmission lack of fuel and storms With special interest in the forced outages due to
ldquoLack of Fuelrdquo additional analysis revealed that 77 percent of the units experiencing unexpected fuel
stoppage are oil-fired fossil units while gas-fired units experienced 15 percent
Generating units continue to be more reliable during the peak summer periods
Disturbance Event Trends
62
Category 1 An event resulting in one or more of the following a Unintended loss of three or more BPS elements caused by
common mode failure b Failure or misoperation of an SPSRAS c System-wide voltage reduction of 3 or more d Unintended BPS system separation resulting in an island of
100 MW to 999 MW e Unplanned evacuation from a control center facility with BPS
SCADA functionality for 30 minutes or more Category 2 An event resulting in one or more of the following
a Complete loss of all BPS control center voice communication system(s) for 30 minutes or more
b Complete loss of SCADA control or monitoring functionality for 30 minutes or more
c Voltage excursions equal to or greater than 10 lasting more than five minutes
d Loss of off-site power (LOOP) to a nuclear generating station e Unintended system separation resulting in an island of 1000
MW to 4999 MW f Unintended loss of 300MW or more of firm load for more
than 15 minutes g Violation of an Interconnection Reliability Operating Limit
(IROL) for more than 30 minutes Category 3 An event resulting in one or more of the following
a The loss of load or generation of 2000 MW or more in the Eastern Interconnection or
b Western Interconnection or 1000 MW or more in the ERCOT or Queacutebec Interconnections
c Unintended system separation resulting in an island of 5000 MW to 10000 MW
d Unintended system separation resulting in an island of Florida from the Eastern Interconnection
Category 4 An event resulting in one or more of the following a The loss of load or generation from 5001 MW to 9999 MW b Unintended system separation resulting in an island of more
than 10000 MW (with the exception of Florida as described in Category 3c)
Category 5 An event resulting in one or more of the following a The loss of load of 10000 MW or more b The loss of generation of 10000 MW or more
Figure 33 BPS Event Category
Disturbance Event Trends Introduction The purpose of this section is to report event
analysis trends from the beginning of event
analysis field test40
One of the companion goals of the event
analysis program is the identification of trends
in the number magnitude and frequency of
events and their associated causes such as
human error equipment failure protection
system misoperations etc The information
provided in the event analysis database (EADB)
and various event analysis reports have been
used to track and identify trends in BPS events
in conjunction with other databases (TADS
GADS metric and benchmarking database)
to the end of 2010
The Event Analysis Working Group (EAWG)
continuously gathers event data and is moving
toward an integrated approach to analyzing
data assessing trends and communicating the
results to the industry
Performance Trends The event category is classified41
Figure 33
as shown in
with Category 5 being the most
severe Figure 34 depicts disturbance trends in
Category 1 to 5 system events from the
40 httpwwwnerccomdocseawgGalloway-Industry-EA-Field-Test-102210pdf 41httpwwwnerccomfiles2011-05-0220Event_Analysis_Process_Phase20220Field20Test20Draft20-20Final20-20For20postingpdf
Disturbance Event Trends
63
beginning of event analysis field test to the end of 201042
Figure 34 Event Category vs Date for All 2010 Categorized Events
From the figure in November and December
there were many more category 1 and 2 events than in October This is due to the field trial starting on
October 25 2010
In addition to the category of the events the status of the events plays a critical role in the accuracy of the
data By examining Figure 35 over 80 of the events reported in 2010 have been closed This means that
the category root cause and other important information have been sufficiently finalized in order for
analysis to be accurate for each event At this time there is not enough data to draw any long-term
conclusions about event investigation performance
42 Documents for the EA Field Test are located at httpwwwnerccompagephpcid=5|365
2
12 12
26
3
6 5
14
1 1
2
0
5
10
15
20
25
30
35
40
45
October November December 2010
Even
t Cou
nt
Category 3 Category 2 Category 1
Disturbance Event Trends
64
Figure 35 Event Count vs Status (All 2010 Events with Status)
By drilling down into the cause code for each closed 2010 event Figure 36 shows the top 3 event causes
From the figure equipment failure and protection system misoperation are the most significant causes for
events Because of how new and limited the data is however there may not be statistical significance for
this result Further trending of cause codes for closed events and developing a richer dataset to find any
trends between event cause codes and event counts should be performed
Figure 36 Top 3 Event Counts vs DAWG Cause Code for all Closed 2010 Events
10
32
42
0
5
10
15
20
25
30
35
40
45
Open Closed Open and Closed
Even
t Cou
nt
Status
1211
8
0
2
4
6
8
10
12
14
Equipment Failure Protection System Misoperation Human Error
Even
t Cou
nt
Cause Code
Disturbance Event Trends
65
Conclusions Due to the relatively new process for events analysis and categorization more time will be required before a
conclusive recommendation may be obtained Further analysis and new data should provide valuable
statistics in the future Over 80 of all event reports from 2010 are current listed as closed but no
conclusion about investigation performance may be obtained because of the limited amount of data It is
recommended to study ways to prevent equipment failure and protection system misoperations but there
is not enough data to draw a firm conclusion about the top causes of events at this time
Abbreviations Used in This Report
66
Abbreviations Used in This Report
Acronym Definition ALP Acadiana Load Pocket
ALR Adequate Level of Reliability
ARR Automatic Reliability Report
BA Balancing Authority
BPS Bulk Power System
CDI Condition Driven Index
CEII Critical Energy Infrastructure Information
CIPC Critical Infrastructure Protection Committee
CLECO Cleco Power LLC
DADS Future Demand Availability Data System
DCS Disturbance Control Standard
DOE Department Of Energy
DSM Demand Side Management
EA Event Analysis
EAF Equivalent Availability Factor
ECAR East Central Area Reliability
EDI Event Drive Index
EEA Energy Emergency Alert
EFORd Equivalent Forced Outage Rate Demand
EMS Energy Management System
ERCOT Electric Reliability Council of Texas
ERO Electric Reliability Organization
ESAI Energy Security Analysis Inc
FERC Federal Energy Regulatory Commission
FOH Forced Outage Hours
FRCC Florida Reliability Coordinating Council
GADS Generation Availability Data System
GOP Generation Operator
IEEE Institute of Electrical and Electronics Engineers
IESO Independent Electricity System Operator
IROL Interconnection Reliability Operating Limit
Abbreviations Used in This Report
67
Acronym Definition IRI Integrated Reliability Index
LOLE Loss of Load Expectation
LUS Lafayette Utilities System
MAIN Mid-America Interconnected Network Inc
MAPP Mid-continent Area Power Pool
MOH Maintenance Outage Hours
MRO Midwest Reliability Organization
MSSC Most Severe Single Contingency
NCF Net Capacity Factor
NEAT NERC Event Analysis Tool
NERC North American Electric Reliability Corporation
NPCC Northeast Power Coordinating Council
OC Operating Committee
OL Operating Limit
OP Operating Procedures
ORS Operating Reliability Subcommittee
PC Planning Committee
PO Planned Outage
POH Planned Outage Hours
RAPA Reliability Assessment Performance Analysis
RAS Remedial Action Schemes
RC Reliability Coordinator
RCIS Reliability Coordination Information System
RCWG Reliability Coordinator Working Group
RE Regional Entities
RFC Reliability First Corporation
RMWG Reliability Metrics Working Group
RSG Reserve Sharing Group
SAIDI System Average Interruption Duration Index
SAIFI System Average Interruption Frequency Index
SCADA Supervisory Control and Data Acquisition
SDI Standardstatute Driven Index
SERC SERC Reliability Corporation
Abbreviations Used in This Report
68
Acronym Definition SRI Severity Risk Index
SMART Specific Measurable Attainable Relevant and Tangible
SOL System Operating Limit
SPS Special Protection Schemes
SPCS System Protection and Control Subcommittee
SPP Southwest Power Pool
SRI System Risk Index
TADS Transmission Availability Data System
TADSWG Transmission Availability Data System Working Group
TO Transmission Owner
TOP Transmission Operator
WECC Western Electricity Coordinating Council
Contributions
69
Contributions This report was made feasible by the collaboration and hard work of both NERC staff and NERCrsquos
Industry Groups
NERC Industry Groups
Table 14 lists the NERC industry group contributors Without their contribution and collaboration this
report would not have been possible
Table 13 NERC Industry Group Contributions43
NERC Group
Relationship Contribution
Reliability Metrics Working Group
(RMWG)
Reports to the OCPC bull Lead Development of Report bull Provide Reliability Metrics Data bull Responsible for Reliability Metrics
Performance Chapter
Transmission Availability Working Group
(TADSWG)
Reports to the OCPC bull Provide Transmission Availability Data
bull Responsible for Transmission Equip-ment Performance Chapter
bull Content Review
Generation Availability Data System Task
Force
(GADSTF)
Reports to the OCPC bull Provide Generation Availability Data bull Responsible for Generation Equip-
ment Performance Chapter bull Content Review
Event Analysis Working Group
(EAWG)
Reports to the OCPC bull Provide Events Data bull Responsible for Disturbance Events
Trends Chapter bull Content Review
43 Rosters for RMWG TADSWG GADSTF and EAWG are available at httpwwwnerccomfilesrosterpdf
Contributions
70
NERC Staff Table 13 below lists the NERC staff who contributed to the 2011 Reliability Performance Analysis
Report
Table 14 Contributing NERC Staff
Name Title E-mail Address
Mark Lauby Vice President and Director of
Reliability Assessment and
Performance Analysis
marklaubynercnet
Jessica Bian Manager of Performance Analysis jessicabiannercnet
John Moura Manager of Reliability Assessments johnmouranercnet
Andrew Slone Engineer Reliability Performance
Analysis
andrewslonenercnet
Jim Robinson TADS Project Manager jimrobinsonnercnet
Clyde Melton Engineer Reliability Performance
Analysis
clydemeltonnercnet
Mike Curley Manager of GADS Services mikecurleynercnet
James Powell Engineer Reliability Performance
Analysis
jamespowellnercnet
Michelle Marx Administrative Assistant michellemarxnercnet
William Mo Intern Performance Analysis wmonercnet
- NERCrsquos Mission
- Table of Contents
- Executive Summary
-
- 2011 Transition Report
- State of Reliability Report
- Key Findings and Recommendations
-
- Reliability Metric Performance
- Transmission Availability Performance
- Generating Availability Performance
- Disturbance Events
- Report Organization
-
- Introduction
-
- Metric Report Evolution
- Roadmap for the Future
-
- Reliability Metrics Performance
-
- Introduction
- 2010 Performance Metrics Results and Trends
-
- ALR1-3 Planning Reserve Margin
-
- Background
- Assessment
- Special Considerations
-
- ALR1-4 BPS Transmission Related Events Resulting in Loss of Load
-
- Background
- Assessment
-
- ALR1-12 Interconnection Frequency Response
-
- Background
- Assessment
-
- ALR2-3 Activation of Under Frequency Load Shedding
-
- Background
- Assessment
- Special Considerations
-
- ALR2-4 Average Percent Non-Recovery Disturbance Control Standards (DCS)
-
- Background
- Assessment
- Special Consideration
-
- ALR2-5 Disturbance Control Events Greater Than Most Severe Single Contingency
-
- Background
- Assessment
- Special Consideration
-
- ALR 1-5 System Voltage Performance
-
- Background
- Special Considerations
- Status
-
- ALR3-5 Interconnection Reliability Operating Limit System Operating Limit (IROLSOL) Exceedances
-
- Background
-
- ALR4-1 Automatic Transmission Outages Caused by Protection System Misoperations
-
- Background
- Special Considerations
-
- ALR6-11 ndash ALR6-14
-
- Background
- Assessment
- ALR 6-11 ndash Automatic Outages Initiated by Failed Protection System Equipment
- ALR6-12 ndash Automatic Outages Initiated by Human Error
- ALR6-13 ndash Automatic Outages Initiated by Failed AC Substation Equipment
- ALR6-14 Automatic AC Transmission Outages Initiated by Failed AC Circuit Equipment
-
- ALR6-15 Element Availability Percentage (APC)
-
- Background
- Assessment
- Special Consideration
-
- ALR6-16 Transmission System Unavailability
-
- Background
- Assessment
- Special Consideration
-
- ALR6-2 Energy Emergency Alert 3 (EEA3)
-
- Background
- Assessment
- Special Considerations
-
- ALR 6-3 Energy Emergency Alert 2 (EEA2)
-
- Background
- Assessment
- Special Considerations
-
- ALR 6-1 Transmission Constraint Mitigation
-
- Background
- Assessment
- Special Considerations
-
- Integrated Bulk Power System Risk Assessment
-
- Introduction
- Recommendations
-
- Integrated Reliability Index Concepts
-
- The Three Components of the IRI
-
- Event-Driven Indicators (EDI)
- Condition-Driven Indicators (CDI)
- StandardsStatute-Driven Indicators (SDI)
-
- IRI Index Calculation
- IRI Recommendations
-
- Reliability Metrics Conclusions and Recommendations
-
- Transmission Equipment Performance
-
- Introduction
- Performance Trends
-
- AC Element Outage Summary and Leading Causes
- Transmission Monthly Outages
- Outage Initiation Location
- Transmission Outage Events
- Transmission Outage Mode
-
- Conclusions
-
- Generation Equipment Performance
-
- Introduction
- Generation Key Performance Indicators
-
- Multiple Unit Forced Outages and Causes
- 2008-2010 Review of Summer versus Winter Availability
-
- Conclusions and Recommendations
-
- Disturbance Event Trends
-
- Introduction
- Performance Trends
- Conclusions
-
- Abbreviations Used in This Report
- Contributions
-
- NERC Industry Groups
- NERC Staff
-
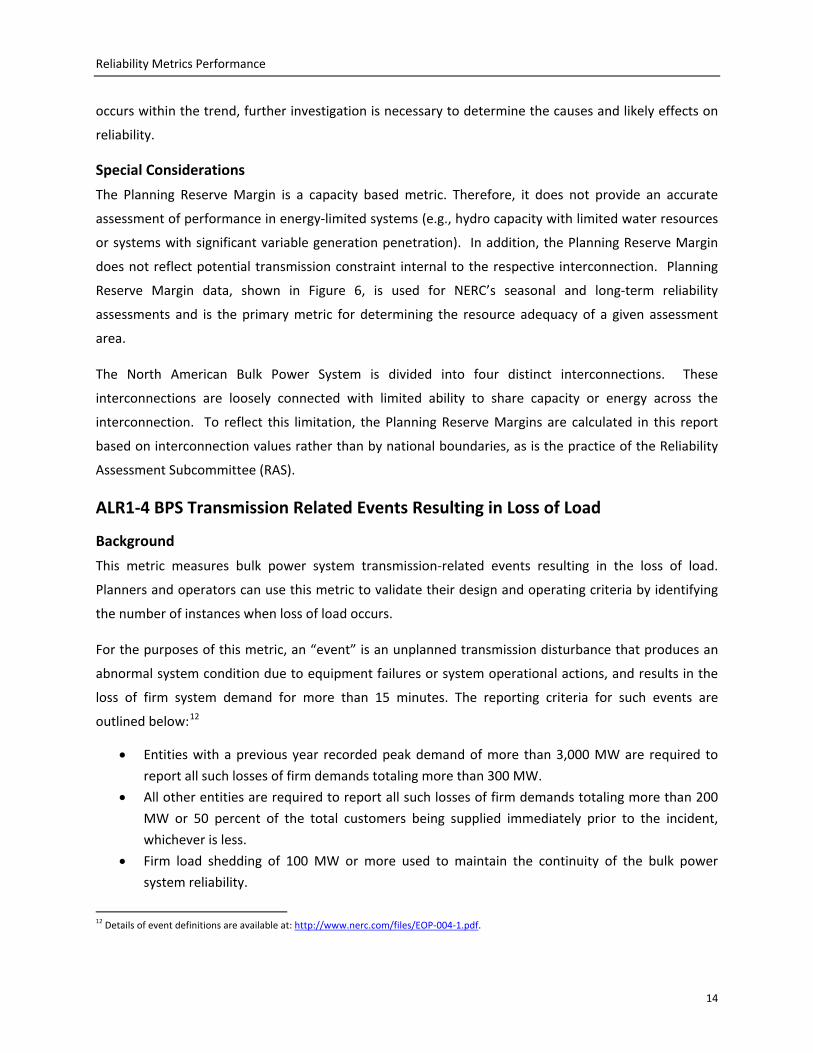
Reliability Metrics Performance
14
occurs within the trend further investigation is necessary to determine the causes and likely effects on
reliability
Special Considerations
The Planning Reserve Margin is a capacity based metric Therefore it does not provide an accurate
assessment of performance in energy-limited systems (eg hydro capacity with limited water resources
or systems with significant variable generation penetration) In addition the Planning Reserve Margin
does not reflect potential transmission constraint internal to the respective interconnection Planning
Reserve Margin data shown in Figure 6 is used for NERCrsquos seasonal and long-term reliability
assessments and is the primary metric for determining the resource adequacy of a given assessment
area
The North American Bulk Power System is divided into four distinct interconnections These
interconnections are loosely connected with limited ability to share capacity or energy across the
interconnection To reflect this limitation the Planning Reserve Margins are calculated in this report
based on interconnection values rather than by national boundaries as is the practice of the Reliability
Assessment Subcommittee (RAS)
ALR1-4 BPS Transmission Related Events Resulting in Loss of Load
Background
This metric measures bulk power system transmission-related events resulting in the loss of load
Planners and operators can use this metric to validate their design and operating criteria by identifying
the number of instances when loss of load occurs
For the purposes of this metric an ldquoeventrdquo is an unplanned transmission disturbance that produces an
abnormal system condition due to equipment failures or system operational actions and results in the
loss of firm system demand for more than 15 minutes The reporting criteria for such events are
outlined below12
bull Entities with a previous year recorded peak demand of more than 3000 MW are required to
report all such losses of firm demands totaling more than 300 MW
bull All other entities are required to report all such losses of firm demands totaling more than 200
MW or 50 percent of the total customers being supplied immediately prior to the incident
whichever is less
bull Firm load shedding of 100 MW or more used to maintain the continuity of the bulk power
system reliability
12 Details of event definitions are available at httpwwwnerccomfilesEOP-004-1pdf
Reliability Metrics Performance
15
Assessment
Figure 6 illustrates that the number of bulk power system transmission-related events resulting in loss of
firm load13
Table 2
from 2002 to 2009 is relatively constant and suggests that 7 - 10 events per year is a norm for
the bulk power system However the magnitude of load loss shown in associated with these
events reflects a downward trend since 2007 Since the data includes weather-related events it will
provide the RMWG with an opportunity for further analysis and continued assessment of the trends
over time is recommended
Figure 6 BPS Transmission Related Events Resulting in Loss of Load Counts (2002-2009)
Table 2 BPS Transmission Related Events Resulting in Loss of Load MW Loss (2002-2009)
Year Load Loss (MW)
2002 3762
2003 65263
2004 2578
2005 6720
2006 4871
2007 11282
2008 5200
2009 2965
13The metric source data may require adjustments to accommodate all of the different groups for measurement and consistency as OE-417 is only used in the US
02468
101214
2002 2003 2004 2005 2006 2007 2008 2009
Count
Reliability Metrics Performance
16
ALR1-12 Interconnection Frequency Response
Background
This metric is used to track and monitor Interconnection Frequency Response Frequency Response is a
measure of an Interconnectionrsquos ability to stabilize frequency immediately following the sudden loss of
generation or load It is a critical component to the reliable operation of the bulk power system
particularly during disturbances and restoration The metric measures the average frequency responses
for all events where frequency drops more than 35 mHz within a year
Assessment
At this time there has been no data collected for ALR1-12 Therefore no assessment was made
ALR2-3 Activation of Under Frequency Load Shedding
Background
The purpose of Under Frequency Load Shedding (UFLS) is to balance generation and load in an island
following an extreme event The UFLS activation metric measures the number of times UFLS is activated
and the total MW of load interrupted in each Region and NERC wide
Assessment
Figure 7 and Table 3 illustrate a history of Under Frequency Load Shedding events from 2006 through
2010 Through this period itrsquos important to note that single events had a range load shedding from 15
MW to 7654 MW The activation of UFLS relays is the last automated reliability measure associated
with a decline in frequency in order to rebalance the system Further assessment of the MW loss for
these activations is recommended
Figure 7 ALR2-3 Count of Activations by Year and Regional Entity (2001-2010)
Reliability Metrics Performance
17
Table 3 ALR2-3 Under Frequency Load Shedding MW Loss
ALR2-3 Under Frequency Load Shedding MW Loss
2006 2007 2008 2009 2010
FRCC
2273
MRO
486
NPCC 94
63 20 25
RFC
SPP
672 15
SERC
ERCOT
WECC
Special Considerations
The use of a single metric cannot capture all of the relevant information associated with UFLS events as
the events relate to each respective UFLS plan The ability to measure the reliability of the bulk power
system is directly associated with how it performs compared to what is planned
ALR2-4 Average Percent Non-Recovery Disturbance Control Standards (DCS)
Background
This metric measures the Balancing Authorityrsquos (BA) or Reserve Sharing Grouprsquos (RSG) ability to balance
resources and demand with the timely deployment of contingency reserve thereby returning the
interconnection frequency to within defined limits following a Reportable Disturbance14
Assessment
The relative
percentage provides an indication of performance measured at a BA or RSG
Figure 8 illustrates the average percent non-recovery of DCS events from 2006 to 2010 The graph
provides a high-level indication of the performance of each respective RE However a single event may
not reflect all the reliability issues within a given RE In order to understand the reliability aspects it
may be necessary to request individual REs to further investigate and provide a more comprehensive
reliability report Further investigation may indicate the entity had sufficient contingency reserve but
through their implementation process failed to meet DCS recovery
14 Details of the Disturbance Control Performance Standard and Reportable Disturbance definitions are available at
httpwwwnerccomfilesBAL-002-0pdf
Reliability Metrics Performance
18
Continued trend assessment is recommended Where trends indicated potential issues the regional
entity will be requested to investigate and report their findings
Figure 8 Average Percent Non-Recovery of DCS Events (2006-2010)
Special Consideration
This metric aggregates the number of events based on reporting from individual Balancing Authorities or
Reserve Sharing Groups It does not capture the severity of the DCS events It should be noted that
most REs use 80 percent of the Most Severe Single Contingency to establish the minimum threshold for
reportable disturbance while others use 35 percent15
ALR2-5 Disturbance Control Events Greater Than Most Severe Single Contingency
Background
This metric represents the number of disturbance events that exceed the Most Severe Single
Contingency (MSSC) and is specific to each BA Each RE reports disturbances greater than the MSSC on
behalf of the BA or Reserve Sharing Group (RSG) The result helps validate current contingency reserve
requirements The MSSC is determined based on the specific configuration of each BA or RSG and can
vary in significance and impact on the BPS
15httpwwwweccbizStandardsDevelopmentListsRequest20FormDispFormaspxID=69ampSource=StandardsDevelopmentPagesWEC
CStandardsArchiveaspx
375
079
0
54
008
005
0
15 0
77
025
0
33
000510152025303540
2006
2007
2008
2009
2010
2006
2007
2008
2009
2010
2006
2007
2008
2009
2010
2006
2007
2008
2009
2010
2006
2007
2008
2009
2010
2006
2007
2008
2009
2010
2006
2007
2008
2009
2010
2006
2007
2008
2009
2010
FRCC MRO NPCC RFC SERC SPP ERCOT WECC
Region and Year
Reliability Metrics Performance
19
Assessment
Figure 9 represents the number of DCS events within each RE that are greater than the MSSC from 2006
to 2010 This metric and resulting trend can provide insight regarding the risk of events greater than
MSSC and the potential for loss of load
In 2010 SERC had 16 BAL-002 reporting entities eight Balancing Areas elected to maintain Contingency
Reserve levels independent of any reserve sharing group These 16 entities experienced 79 reportable
DCS eventsmdash32 (or 405 percent) of which were categorized as greater than their most severe single
contingency Every DCS event categorized as greater than the most severe single contingency occurred
within a Balancing Area maintaining independent Contingency Reserve levels Significantly all 79
regional entities reported compliance with the Disturbance Recovery Criterion including for those
Disturbances that were considered greater than their most severe single Contingency This supports a
conclusion that regardless of the size of the BA or participation in a Reserve Sharing Group SERCrsquos BAL-
002 reporting entities have demonstrated the ability in 2010 to use Contingency Reserve to balance
resources and demand and return Interconnection frequency within defined limits following Reportable
Disturbances
If the SERC Balancing Areas without large generating units and who do not participate in a Reserve
Sharing Group change the determination of their most severe single contingencies to effect an increase
in the DCS reporting threshold (and concurrently the threshold for determining those disturbances
which are greater than the most severe single contingency) there will certainly be a reduction in both
the gross count of DCS events in SERC and in the subset considered under ALR2-5 Masking the discrete
events which cause Balancing Area response may not reduce ldquoriskrdquo to the system However it is
desirable to maintain a reporting threshold which encourages the Balancing Authority to respond to any
unexplained change in ACE in a manner which supports Interconnection frequency based on
demonstrated performance SERC will continue to monitor DCS performance and will continue to
evaluate contingency reserve requirements but does not consider 2010 ALR2-5 performance to be an
adverse trend in ldquoextreme or unusualrdquo contingencies but rather within the normal range of expected
occurrences
Reliability Metrics Performance
20
Special Consideration
The metric reports the number of DCS events greater than MSSC without regards to the size of a BA or
RSG and without respect to the number of reporting entities within a given RE Because of the potential
for differences in the magnitude of MSSC and the resultant frequency of events trending should be
within each RE to provide any potential reliability indicators Each RE should investigate to determine
the cause and relative effect on reliability of the events within their footprints Small BA or RSG may
have a relatively small value of MSSC As such a high number of DCS greater than MCCS may not
indicate a reliability problem for the reporting RE but may indicate an issue for the respective BA or RSG
In addition events greater than MSSC may not cause a reliability issue for some BA RSG or RE if they
have more stringent standards which require contingency reserves greater than MSSC
ALR 1-5 System Voltage Performance
Background
The purpose of this metric is to measure the transmission system voltage performance (either absolute
or per unit of a nominal value) over time This should provide an indication of the reactive capability
available to the transmission system The metric is intended to record the amount of time that system
voltage is outside a predetermined band around nominal
0
5
10
15
20
25
30
2006
2007
2008
2009
2010
2006
2007
2008
2009
2010
2006
2007
2008
2009
2010
2006
2007
2008
2009
2010
2006
2007
2008
2009
2010
2006
2007
2008
2009
2010
2006
2007
2008
2009
2010
2006
2007
2008
2009
2010
FRCC MRO NPCC RFC SERC SPP ERCOT WECC
Cou
nt
Region and Year
Figure 9 Disturbance Control Events Greater Than Most Severe Single Contingency (2006-2010)
Reliability Metrics Performance
21
Special Considerations
Each Reliability Coordinator (RC) will work with the Transmission Owners (TOs) and Transmission
Operators (TOPs) within its footprint to identify specific buses and voltage ranges to monitor for this
metric The number of buses the monitored voltage levels and the acceptable voltage ranges may vary
by reporting entity
Status
With a pilot program requested in early 2011 a voluntary request to Reliability Coordinators (RC) was
made to develop a list of key buses This work continues with all of the RCs and their respective
Transmission Owners (TOs) to gather the list of key buses and their voltage ranges After this step has
been completed the TO will be requested to provide relevant data on key buses only Based upon the
usefulness of the data collected in the pilot program additional data collection will be reviewed in the
future
ALR3-5 Interconnection Reliability Operating Limit System Operating Limit (IROLSOL) Exceedances
Background
This metric illustrates the number of times that defined Interconnection Reliability Operating Limit
(IROL) or System Operating Limit (SOL) were exceeded and the duration of these events Exceeding
IROLSOLs could lead to outages if prompt operator control actions are not taken in a timely manner to
return the system to within normal operating limits This metric was approved by NERCrsquos Operating and
Planning Committees in June 2010 and a data request was subsequently issued in August 2010 to collect
the data for this metric Based on the results of the pilot conducted in the third and fourth quarter of
2010 there is merit in continuing measurement of this metric Note the reporting of IROLSOL
exceedances became mandatory in 2011 and data collected in Table 4 for 2010 has been provided
voluntarily
Reliability Metrics Performance
22
Table 4 ALR3-5 IROLSOL Exceedances
3Q2010 4Q2010 1Q2011
le 10 mins 123 226 124
le 20 mins 10 36 12
le 30 mins 3 7 3
gt 30 mins 0 1 0
Number of Reporting RCs 9 10 15
ALR4-1 Automatic Transmission Outages Caused by Protection System Misoperations
Background
Originally titled Correct Protection System Operations this metric has undergone a number of changes
since its initial development To ensure that it best portrays how misoperations affect transmission
outages it was necessary to establish a common understanding of misoperations and the data needed
to support the metric NERCrsquos Reliability Assessment Performance Analysis (RAPA) group evaluated
several options of transitioning from existing procedures for the collection of misoperations data and
recommended a consistent approach which was introduced at the beginning of 2011 With the NERC
System Protection and Control Subcommitteersquos (SPCS) technical guidance NERC and the regional
entities have agreed upon a set of specifications for misoperations reporting including format
categories event type codes and reporting period to have a final consistent reporting template16
Special Considerations
Only
automatic transmission outages 200 kV and above including AC circuits and transformers will be used
in the calculation of this metric
Data collection will not begin until the second quarter of 2011 for data beginning with January 2011 As
revised this metric cannot be calculated for this report at the current time The revised title and metric
form can be viewed at the NERC website17
16 The current Protection System Misoperation template is available at
httpwwwnerccomfilezrmwghtml 17The current metric ALR4-1 form is available at httpwwwnerccomdocspcrmwgALR_4-1Percentpdf
Reliability Metrics Performance
23
ALR6-11 ndash ALR6-14
ALR6-11 Automatic AC Transmission Outages Initiated by Failed Protection System Equipment
ALR6-12 Automatic AC Transmission Outages Initiated by Human Error
ALR6-13 Automatic AC Transmission Outages Initiated by Failed AC Substation Equipment
ALR6-14 Automatic AC Circuit Outages Initiated by Failed AC Circuit Equipment
Background
These metrics evolved from the original ALR4-1 metric for correct protection system operations and
now illustrate a normalized count (on a per circuit basis) of AC transmission element outages (ie TADS
momentary and sustained automatic outages) that were initiated by Failed Protection System
Equipment (ALR6-11) Human Error (ALR6-12) Failed AC Substation Equipment (ALR6-13) and Failed AC
Circuit Equipment (ALR6-14) These metrics are all related to the non-weather related initiating cause
codes for automatic outages of AC circuits and transformers operated 200 kV and above
Assessment
Figure 10 through Figure 13 show the normalized outages per circuit and outages per transformer for
facilities operated at 200 kV and above As shown in all eight of the charts there are some regional
trends in the three years worth of data However some Regionrsquos values have increased from one year
to the next stayed the same or decreased with no discernable regional trends For example ALR6-11
computes the automatic AC Circuit outages initiated by failed protection system equipment
There are some trends to the ALR6-11 to ALR6-14 data but many regions do not have enough data for a
valid trend analysis to be performed NERCrsquos outage rate seems to be improving every year On a
regional basis metric ALR6-11 along with ALR6-12 through ALR6-14 cannot be statistically understood
until confidence intervals18
18The detailed Confidence Interval computation is available at
are calculated ALR metric outage frequency rates and Regional equipment
inventories that are smaller than others are likely to require more than 36 months of outage data Some
numerically larger frequency rates and larger regional equipment inventories (such as NERC) do not
require more than 36 months of data to obtain a reasonably narrow confidence interval
httpwwwnerccomdocspctadstfTADS_Nov_2_2007APPENDIX_C_Confidence_Intervalpdf
Reliability Metrics Performance
24
While more data is still needed on a regional basis to determine if each regionrsquos bulk power system is
becoming more reliable year to year there are areas of potential improvement which include power
system condition protection performance and human factors These potential improvements are
presented due to the relatively large number of outages caused by these items The industry can
benefit from detailed analysis by identifying lessons learned and rolling average trends of NERC-wide
performance With a confidence interval of relatively narrow bandwidth one can determine whether
changes in statistical data are primarily due to random sampling error or if the statistics are significantly
different due to performance
Reliability Metrics Performance
25
ALR 6-11 ndash Automatic Outages Initiated by Failed Protection System Equipment
Automatic outages with an initiating cause code of failed protection system equipment are in Figure 10
Figure 10 ALR6-11 by Region (Includes NERC-Wide)
This code covers automatic outages caused by the failure of protection system equipment This
includes any relay andor control misoperations except those that are caused by incorrect relay or
control settings that do not coordinate with other protective devices
ALR6-12 ndash Automatic Outages Initiated by Human Error
Figure 11 shows the automatic outages with an initiating cause code of human error This code covers
automatic outages caused by any incorrect action traceable to employees andor contractors for
companies operating maintaining andor providing assistance to the Transmission Owner will be
identified and reported in this category
Reliability Metrics Performance
26
Also any human failure or interpretation of standard industry practices and guidelines that cause an
outage will be reported in this category
Figure 11 ALR6-12 by Region (Includes NERC-Wide)
Reliability Metrics Performance
27
ALR6-13 ndash Automatic Outages Initiated by Failed AC Substation Equipment
Figure 12 shows the automatic outages with an initiating cause code of failed AC substation equipment
This code covers automatic outages caused by the failure of AC Substation ie equipment ldquoinside the
substation fencerdquo including transformers and circuit breakers but excluding protection system
equipment19
19TADS Initiating Cause Code definitions are located at httpwwwnerccomdocspctadswgTADS_Definitions_Appendix_7_092909pdf
Figure 12 ALR6-13 by Region (Includes NERC-Wide)
Reliability Metrics Performance
28
ALR6-14 Automatic AC Transmission Outages Initiated by Failed AC Circuit Equipment
Figure 13 shows the automatic outages with an initiating cause code of failed AC circuit equipment
Automatic Outages related to the failure of AC Circuit equipment ie overhead or underground
equipment ldquooutside the substation fencerdquo 20
ALR6-15 Element Availability Percentage (APC)
Background
This metric uses data and calculations directly from the NERC TADS effort and illustrates the overall
percent of time the aggregate of transmission facilities are available and in service This is an aggregate
20TADS Initiating Cause Code definitions are located at httpwwwnerccomdocspctadswgTADS_Definitions_Appendix_7_092909pdf
Figure 13 ALR6-14 by Region (Includes NERC-Wide)
Reliability Metrics Performance
29
value using sustained outages (automatic and non-automatic) for both lines and transformers operated
at 200 kV and above for each Regional Entity Interconnection and for NERC This metric was approved
by the NERC Operating and Planning Committees in September 2010
Assessment
Figure 14 shows the aggregate element availability percentage (APC) for transmission and transformers
facilities operated at 200 kV and above The values are all over 90 percent which shows excellent
system availability The RMWG recommends continued metric assessment for at least a few more years
in order to determine the value of this metric
Figure 14 2010 ALR6-15 Element Availability Percentage
Notably the Eastern Interconnection does not include Quebec or ERCOT ERCOT does not have any
transformers with low-side voltage levels 200 kV and above
Special Consideration
It should be noted that the non-automatic outage data needed to calculate this metric was only first
collected for the calendar year 2010 as part of the TADS process Therefore only one year of data for
this metric is available at this time
Reliability Metrics Performance
30
ALR6-16 Transmission System Unavailability
Background
This metric uses data and calculations directly from the NERC TADS effort and shows the overall percent
of time the aggregate of transmission facilities are unavailable due to automatic and non-automatic
outages This is an aggregate value using sustained automatic outages for both lines and transformers
operated at 200 kV and above for each Regional Entity and for NERC This metric was approved by the
NERC Operating and Planning Committees in December 2010
Assessment
Figure 15 and Figure 16 illustrate the 2010 aggregate unavailability percentage for AC circuits and
transformer facilities operated at 200 kV and above The values for AC circuits are all under 3 percent
which shows excellent system availability
The RMWG recommends continued metric assessment for at least a few more years in order to
determine the value of this metric
Special Consideration
It should be noted that the non-automatic outage data needed to calculate this metric was only first
collected for the calendar year 2010 as part of the TADS process Therefore only one year of data for
this metric is available at this time
Figure 15 2010 ALR6-16 Transmission System Unavailability
Reliability Metrics Performance
31
Figure 16 2010 ALR6-16 Transmission System Unavailability by Outage Type
Notably the Eastern Interconnection does not include Quebec or ERCOT Also ERCOT does not have
any transformers with low-side voltage levels 200 kV and above
ALR6-2 Energy Emergency Alert 3 (EEA3)
Background
This metric identifies the number of times Energy Emergency Alerts Level 3 (EEA3) are issued EEA3
events are firm-load interruptions due to capacity and energy deficiency EEA3 is currently reported
collected and maintained in NERCrsquos Reliability Coordination Information System (RCIS) and is defined in
Attachment 1 of the NERC Standard EOP-00221
21 The latest version of Attachment 1 for EOP-002 is available at
This metric identifies the number of times EEA3s are
issued The number of EEA3s per year provides a relative indication of performance measured at a
Balancing Authority or interconnection level As historical data is gathered trends in future reports will
provide an indication of either decreasing or increasing use of EEA3s signaling adequacy of the electric
supply system This metric can also be considered in the context of Planning Reserve Margin Significant
increases or decreases in EEA3 events with relatively constant Planning Reserve Margins could indicate
httpwwwnerccompagephpcid=2|20
Reliability Metrics Performance
32
volatility in the actual loads compared to forecast levels or changes in the adequacy of the bulk power
system required to meet load demands
Assessment
Figure 17 shows the number of EEA3 events during 2006 and 2010 from an RE level An interactive
presentation was released and available at the Reliability Indicatorrsquos page22
The Acadiana Load Pocket (ALP) is an area in south central Louisiana that has experienced regular
transmission constraints and numerous Energy Emergency Alert filings by the SPP Reliability Controller
(SPP RC) Transmission within ALP is owned by Entergy Lafayette Utilities System (LUS) and Cleco
Power LLC (Cleco) The transmission constraints within the ALP are primarily caused by the local area
load and the lack of generation located in close proximity to the load area
The number of EEA3rsquos
declared in 2010 returned to more traditional numbers The 2009 spike in EEA3 events in the SPP
Region that was driven by issues in the Acadiana Load Pocket (ALP) were not present in 2010
Special Considerations
Ideally the measure should capture only EEAs that are declared for reliability reasons and not for
economic factors The RMWG has not been able to differentiate these reasons for future reporting and
it has made a recommendation to the Reliability Coordinator Working Group (RCWG) to consider a
revised EEA declaration to exclude economic factors
The reason the EEA volume decreased from 2009 to 2010 in SPP was because the SPP ICT RC23
coordinated an operating agreement between the five operating companies in the ALP The operating
agreement included a cost sharing re-dispatch that alleviated the need of a Transmission Loading Relief
(TLR-5) declaration24
22The EEA3 interactive presentation is available on the NERC website at
During 2009 there was no operating agreement therefore an entity had to
provide Network and Native Load (NNL) relief when a TLR-5 was called by the ICT RC When the TLR-5
was the primary tool to control the post contingent loading in the ALP some of the BAs would have their
firm transmission curtailed to the point where they could no longer serve their load therefore the EEA
3 was needed to communicate a capacityreserve deficiency
httpwwwnerccompagephpcid=4|331|335 23Southwest Power Pool (SPP) Independent Coordinator of Transmission (ICT) Reliability Coordinator (RC) 24More information on Transmission Load Relief is contained in the IRO-006 standard which is located at httpwwwnerccomfilesIRO-006-4pdf In particular TLR-5 definitions are referenced on page 16 and 17
Reliability Metrics Performance
33
Figure 17 ALR6-2 Energy Emergency Alert 3 (EEA3) Counts by Region (2006-2010)
Cleco Power Entergy and LUS are currently constructing an estimated $200 million transmission
infrastructure improvement project to mitigate transmission constraints into ALP Construction of the
project is scheduled to be complete in 2012 Completion of the project should help alleviate some of
the transmission congestion in this area Energy Emergency Alerts filed by the SPP Regional Entity
continue to decline
SPP RTO continues to coordinate operating plans with the operating entities in this area Mitigation
plans and local operating guides in place are expected to provide sufficient flexibility should issues arise
NERC will continue to monitor this area for Reliability Impacts and coordinate any actions with the SPP
Reliability Coordinator and SPP Regional Entity
ALR 6-3 Energy Emergency Alert 2 (EEA2)
Background
Energy Emergency Alert 2 (EEA2) is to measure the number of events BAs declare for deficient capacity
and energy during peak load periods which may serve as a leading indicator of energy and capacity
shortfall in the adequacy of the electric supply system EEA2 provides a sense of the frequency of
precursor events to the more severe EEA3 declarations This metric measures the number of events
1 3 1 2 214
3 4 4 1 5 334
4 2 1 52
1
0
5
10
15
20
25
30
3520
0620
0720
0820
0920
1020
0620
0720
0820
0920
1020
0620
0720
0820
0920
1020
0620
0720
0820
0920
1020
0620
0720
0820
0920
1020
0620
0720
0820
0920
1020
0620
0720
0820
0920
1020
0620
0720
0820
0920
10
FRCC MRO NPCC RFC SERC SPP TRE WECC
2006-2009
2010
Region and Year
Reliability Metrics Performance
34
Balancing Authorities declare for deficient capacity and energy during peak load periods At this time
however this data reflects inclusion of Demand Side Resources that would not be indicative of
inadequacy of the electric supply system
The number of EEA2 events and any trends in their reporting indicates how robust the system is in
being able to supply the aggregate load requirements The historical records may include demand
response activations and non-firm load interruptions per applicable contracts within the EEA alerts per
its definition25
Assessment
Demand response is a legitimate resource to be called upon by balancing authorities and
do not indicate a reliability concern As data is gathered in the future reports will provide an indication
of either decreasing or increasing adequacy in the electric supply system EEA2 events called solely for
activation of demand response (controllable or contractually prearranged demand-side dispatch
programs) or interruption of non-firm load per applicable contracts should be excluded This metric can
also be considered in the context of the Planning Reserve Margin Significant increases or decreases in
EEA2 events with relatively constant Planning Reserve Margins could indicate volatility in the actual
loads compared to forecast levels or changes in the adequacy of the bulk power system required to
meet load demands
Figure 18 shows the number of EEA2 events by Regional Entity from 2006 to 2010 EEA2 interactive
version available on line by quarter and region26
25 The EEA2 is defined at
The general trend continues to show improved
performance which may have been influenced by the overall reduction in demand throughout NERC
caused by the economic downturn Specific performance by any one region should be investigated
further for issues or events that may affect the results Determining whether performance reported
includes those events resulting from the economic operation of DSM and non-firm load interruption
should also be investigated The RMWG recommends continued metric assessment
httpwwwnerccomfilesEOP-002-2pdf 26 EEA2 interactive version located at httpwwwnerccompagephpcid=4|331|341
Reliability Metrics Performance
35
Special Considerations
The intent of this metric is to measure only EEAs that are called for reliability reasons and not for
economic factors such as demand side management (DSM) and non-firm load interruption The
historical data for this metric may include events that were called for economic factors According to
the RCWG recent data should only include EEAs called for reliability reasons
ALR 6-1 Transmission Constraint Mitigation
Background
The RMWG completed a pilot with four regional entities Based on the results the RMWG expanded the
pilot data collection to all regions and the initial results of the data collection are shown in Figure 19
and Table 5 Based on the results of the pilot there is merit in continuing to assess this metric The
intent of this metric is to identify trends in the number of mitigation measures (Special Protection
Schemes (SPS) Remedial Action Schemes (RAS) and Operating Procedures) required to meet reliability
requirements By their nature SPS do not indicate an inherent weakness in the bulk power system
rather they are an indication of methods that are taken to operate the system through the range of
conditions it must perform This metric is only intended to evaluate the trend use of these plans and
whether the metric indicates robustness of the transmission system is increasing remaining static or
decreasing
1 27
2 1 4 3 2 1 2 4 5 2 5 832
4724
211
5 38 5 1 1 8 7 4 1 1
05
101520253035404550
2006
2007
2008
2009
2010
2006
2007
2008
2009
2010
2006
2007
2008
2009
2010
2006
2007
2008
2009
2010
2006
2007
2008
2009
2010
2006
2007
2008
2009
2010
2006
2007
2008
2009
2010
2006
2007
2008
2009
2010
FRCC MRO NPCC RFC SERC SPP TRE WECC
2006-2009
2010
Region and Year
Figure 18 ALR6-3 Energy Emergency Alert 2 (EEA2)
Reliability Metrics Performance
36
Assessment
The pilot data indicates a relatively constant number of mitigation measures over the time period of
data collected
Figure 19 ALR6-1 Transmission Constraint Mitigation by SPSRAS (2009-2014)
0102030405060708090
100110120
2009
2010
2011
2014
2009
2010
2011
2014
2009
2010
2011
2014
2009
2010
2011
2014
2009
2010
2011
2014
2009
2010
2011
2014
2009
2010
2011
2014
2009
2010
2011
2014
FRCC MRO NPCC RFC SERC SPP ERCOT WECC
Coun
t
Region and Year
SPSRAS
Reliability Metrics Performance
37
Table 5 ALR6-1 Transmission Constraint Mitigation by Operating ProcedureGuides (2009-2011)
ALR6-1 Transmission Constraint Mitigation by Operating ProcedureGuides (2009-2014)
2009 2010 2011 2014
FRCC 107 75 66
MRO 79 79 81 81
NPCC 0 0 0
RFC 2 1 3 4
SPP 39 40 40 40
SERC 6 7 15
ERCOT 29 25 25
WECC 110 111
Special Considerations
A certain number of SPS mitigation plans may be necessary to support reliable operation of the system
If the number of SPS increase over time this may indicate that additional transmission capacity is
required A reduction in the number of SPS may be an indicator of increased generation or transmission
facilities being put into service which may indicate greater robustness of the bulk power system In
general mitigation plans are a viable and valuable tool for effective operation of the bulk power system
In power system planning reliability operability capacity and cost-efficiency are simultaneously
considered through a variety of scenarios to which the system may be subjected Mitigation measures
are a method for optimizing a power system across these scenarios Changes in quantities of mitigation
plans may indicate year-on-year differences in the system being evaluated
Integrated Bulk Power System Risk Assessment
Introduction In developing eighteen metrics to measure acceptable levels of reliability it has become clear that any
such measurement of reliability must include consideration of the risks present within the bulk power
system in order for us to appropriately prioritize and manage these system risks The scope for the
Reliability Metrics Working Group (RMWG)27
27 The RMWG scope can be viewed at
includes a task to develop a risk-based approach that
provides consistency in quantifying the severity of events The approach not only can be used to
httpwwwnerccomfilezrmwghtml
Reliability Metrics Performance
38
measure risk reduction over time but also can be applied uniformly in event analysis process to identify
the events that need to be analyzed in detail and sort out non-significant events
The Operating Committee (OC) and Planning Committee (PC) endorsed the concepts and framework28 of
the risk-based approach in their September 2010 joint meeting and further supported the event severity
risk index (SRI) calculation29
Recommendations
in March 2011
bull NERC should embrace the use of risk assessment to identify trends in addition to lessons learned
in order to improve bulk power system reliability
bull The RMWG should continue to coordinate and communicate with the Event Analysis Working
Group (EAWG) to apply the SRI into the event analysis process and root cause analysis
bull As trend evaluations increase the knowledge of risks to the bulk power system data required to
support additional assessment should be gathered
Event Severity Risk Index (SRI)
Risk assessment is an essential tool for achieving the alignment between organizations people and
technology This will assist in quantifying inherent risks identifying where potential high risks exist and
evaluating where the most significant lowering of risks can be achieved Being learning organizations
the Electric Reliability Organization (ERO) Regional Entities and Registered Entities can use these tools
to focus on the areas of highest risk to reliability to provide a sound basis for developing results-based
standards and compliance programs Risk assessment also serves to engage all stakeholders in a
dialogue about specific risk factors and helps direct a strategic plan for risk reduction and early
detection
The SRI is a daily blended metric for which transmission loss generation loss and load loss events are
calculated Each element (transmission generation and load loss) is factored by the systemrsquos inventory
for that element to rate significant events appropriately On a yearly basis these daily performances
can be sorted in descending order to evaluate the year-on-year performance of the system
In order to test drive the concepts the RMWG applied these calculations against historically memorable
days to derive SRIs Once these calculations were complete they were reviewed and evaluated by
various stakeholders for reasonableness Based upon feedback modifications to the calculation were
made and assessed against the historic days performed This iterative process locked down the details
28 httpwwwnerccomdocspcrmwgIntegrated_Bulk_Power_System_Risk_Assessment_Concepts_Finalpdf 29 httpwwwnerccomdocspcrmwgSRI_Equation_Refinement_May6_2011pdf
Reliability Metrics Performance
39
for the calculation of SRI whose calculation from zero (no transmission line outages generation outages
or load lost in a day) to 1000 (a theoretical condition in which every transmission line all generation
units and all load lost across the system in a single day)
Figure 20 captures the calculated severity risk value for each of the days for each year benchmarked
with the historic significant events which were used to concept test the calculation Since there is
significant disparity between days the bulk power system is stressed compared to those that are
ldquoroutinerdquo and ldquoherordquo days of the year where the system performed extremely well the curve is depicted
using a logarithmic scale Each yearrsquos data is sorted in descending order striking a characteristic shape
At the left-side of the curve the days in which the system is severely stressed are plotted The central
more linear portion of the curve identifies the routine day performance while the far right-side of the
curve shows the values plotted for days in which almost all lines and generation units are in service and
essentially no load is lost
The trends on the chart below show that 2009 and 2010 had fewer extreme days than 2008 Routine
daily performance appears generally consistent across all three years Figure 20 captures the days for
each year benchmarked with historically significant events
In Figure 20 NERCrsquos event categories and SRI ratings are directly related As the SRI increases the
category or severity of the event increases Historical events are also shown to relate modern
reliability measurements to give a perspective of how a well-known event would register on the SRI
scale
The event analysis process30
30
benefits from the SRI as it enables a numerical analysis of an event in
comparison to other events By this measure an event can be prioritized by its severity In a severe
event this is unnecessary However for events that do not result in severe stressing of the bulk power
system this prioritization can be a challenge By using the SRI the event analysis process can decide
which events to learn from and reduce which events to avoid and when resilience needs to be
increased under high impact low frequency events as shown in the blue boxes in the figure
httpwwwnerccompagephpcid=5|365
Reliability Metrics Performance
40
Figure 20 NERC Annual Daily Severity Risk Index (SRI) Sorted Descending with Historic Benchmark Days
Other factors that impact severity of a particular event to be considered in the future include whether
equipment operated as designed and resulted in loss of load from a reliability perspective (intentional
and controlled load-shedding) Mechanisms for enabling ongoing refinement to include the historic and
simulated events for future severity risk calculations are being explored
Reliability Metrics Performance
41
Integrated Reliability Index Concepts In December 2010 the RMWG was challenged by the OC and PC to develop a single index concept to
measure the universe of risks associated with the bulk power system As a result the integrated
reliability index (IRI) concepts were proposed31
Figure 21
the three components of which were defined to
quantify each specific risk aspect They are titled the Event Driven Index (EDI) StandardsStatute Driven
Index (SDI) and Condition Driven Index (CDI) illustrated in with measures associated with
system events standards compliance and eighteen performance metrics The development of an
integrated reliability index aims to inform increase transparency and quantify the effectiveness of risk
reduction or mitigation actions The goal is to provide the industry meaningful trends of the BPSrsquos
performance and guidance on how the industry can improve reliability and support risk-informed
decision making Once completed the IRI will facilitate holistic assessment of performance Finally the
IRI should help overcome concern and confusion about how many metrics are being analyzed for system
reliability assessments
Figure 21 Risk Model for Bulk Power System
The integrated model of event-driven condition-driven and standardsstatute-driven risk information
can be constructed to illustrate all possible logical relations between the three risk sets Due to the
nature of the system there may be some overlap among the components
31 httpwwwnerccomdocspcrmwgIntegrated_Reliability_Index_WhitePaper_DRAFTpdf
Event Driven Index (EDI)
Indicates Risk from
Major System Events
Standards Statute Driven
Index (SDI)
Indicates Risks from Severe Impact Standard Violations
Condition Driven Index (CDI)
Indicates Risk from Key Reliability
Indicators
Reliability Metrics Performance
42
The Three Components of the IRI The three components of the IRI work together as shown in Figure 22 to comprise a full picture of the
state of reliability
Figure 22 An overview of the components that comprise the Integrated Reliability Index (IRI)
Event-Driven Indicators (EDI)
The Event-Driven Indicator provides a basis for prioritization of events based on bulk power system
integrity equipment performance and engineering judgment This indicator can serve as a high value
risk assessment tool to be used by stakeholders to investigate and evaluate disturbance history and
measure the severity of these events The relative ranking of events requires industry expertise agreed-
upon goals and engineering judgment The EDI is a derivative of SRI results for a specific time period
but it transforms that performance into a form of an availability index These calculations will be further
refined as feedback is received
Condition-Driven Indicators (CDI)
The Condition-Driven Indicators focus on a set of measurable system conditions (performance
measures) to assess bulk power system reliability These reliability indicators identify factors that
positively or negatively impact reliability and are early predictors of the risk to reliability from events or
unmitigated violations A collection of these indicators measures how close reliability performance is to
the desired outcome and if the performance against these metrics is constant or improving
Reliability Metrics Performance
43
StandardsStatute-Driven Indicators (SDI)
The StandardsStatute-Driven Indicator is a calculation of success of compliance based upon the subset
of high-value standards and is divided by the number of participations who could have received the
violation within the time period considered Also based on these factors known unmitigated violations
of elevated risk factor requirements are weighted higher than lower risk factors The index decreases if
the compliance improvement is achieved over a trending period
IRI Index Calculation As with the SRI the IRI is based on an importance weighting factor which the RMWG can modify over
time after gaining experience with the new metric as well as consideration of feedback from industry
At this time the RMWG believes some form of blended weighting may serve to start to populate IRI
characteristic curves at a high and generic level Based upon feedback from stakeholders this approach
may change or as discussed below weighting factors may vary based on periodic review and risk model
update The RMWG will continue the refinement of the IRI calculation and consider other significant
factors that impact reliability (eg intentional and controlled load-shedding) further it will explore
developing mechanisms for enabling ongoing refinement which should be influenced by a wide set of
stakeholders
RMWG recommends the Event Driven Index (EDI) be weighted the highest (50 percent) since events
actually occurred indicating how the system was performing The Condition Driven Index (CDI) and
StandardsStatute Driven Index (SDI) are weighted 25 each since they are indicators of potential risks
to BPS reliability IRI can be calculated as follows
IRI is intended to be a composite metric which integrates several forms of individual risks to the bulk
power system Since the three components range across many stakeholder organizations these
concepts are developed as starting points for continued study and evaluation Additional supporting
materials can be found in the IRI whitepaper32
IRI Recommendations
including individual indices calculations and preliminary
trend information
For the IRI more investigation should be performed to determine the best way to integrate EDI CDI
and SDI into an Integrated Reliability Index (IRI) that quantitatively represents the reliability of the bulk
32 The IRI whitepaper can be found at httpwwwnerccomdocspcrmwgIntegrated_Reliability_Index_WhitePaper_DRAFTpdf
Reliability Metrics Performance
44
power system To this end study into determining the amount of overlap between the components is
necessary RMWG is currently working to determine the proper amount of overlap between the IRI
components
Also the CDI component of the IRI needs to be solidified This is especially true with the CDI More
accurate metric data is needed to paint a fuller picture of the CDI Many of the metrics used to calculate
the CDI are new or they have limited data Compared to the SDI which counts well-known violation
counts and the EDI which uses the well-defined CDI the CDI lacks the depth of rigor that the other two
components have acquired through their years of data RMWG is currently working to improve the CDI
Reliability Metrics Conclusions and Recommendations Among the eighteen metrics that address the characteristics of an adequate level of reliability (ALR)
metric trends indicate the system is performing better in the following seven areas
bull ALR1-3 Planning Reserve Margin
bull ALR1-4 BPS Transmission Related Events Resulting in Loss of Load
bull ALR2-5 Disturbance Control Events Greater than Most Severe Single Contingency
bull ALR6-2 Energy Emergency Alert 3 (EEA3)
bull ALR6-3 Energy Emergency Alert 2 (EEA2)
bull ALR6-11 Automatic Transmission Outages Caused by Protection System Misoperations
bull ALR6-13 Automatic Transmission Outages Caused by Failed AC Substation Equipment
Assessments have been made in other performance categories A number of them do not have
sufficient data to derive any conclusions from the results The RMWG recommends continued data
collection and assessment of these metrics If a metric does not yield any trend in a five-year reporting
period the metric will be modified or withdrawn
For the IRI more investigation should be performed to determine the overlap of the components (CDI
EDI and SDI) The CDI should be more thoroughly solidified as an index by collecting more data over
time
Transmission Equipment Performance
45
Transmission Equipment Performance Introduction The Transmission Availability Data System (TADS) effort began with the establishment of a TADS task force
by the NERC Planning Committee in October 2006 On October 27 2007 the NERC Board of Trustees
approved the collection of transmission automatic outage data beginning in calendar year 2008 (Phase I)
Subsequently on October 29 2008 the NERC Board approved the collection of Non-Automatic Outage data
that began for Calendar year 2010 (Phase II)
This chapter provides reliability performance analysis of the transmission system by focusing on the trends
of Automatic Outage data from calendar year 2008 thru 2010 Since only one year of Non-Automatic
Outage data has been collected that data will not be assessed in this report
When calculating bulk power system performance indices care must be exercised when interpreting results
as misinterpretation can lead to erroneous conclusions regarding system performance With only three
years of data in the smaller regions it is not clear whether a regionrsquos yearly outage variation compared to
the average is due to random statistical variation or that particular year is significantly different in
performance However on a NERC-wide basis after three years of data collection there is enough
information to accurately determine whether the yearly outage variation compared to the average is due to
random statistical variation or the particular year in question is significantly different in performance33
Performance Trends
Transmission performance information has been provided by Transmission Owners (TOs) within NERC
through the NERC TADS (Transmission Availability Data System) process The data presented reflects
Momentary and Sustained AC Automatic outages of transmission elements that operate at voltages ge 200 kV
(including the low side of transformers) with the criteria specified in the TADS process The following
elements listed below are included
bull AC Circuits ge 200 kV (Overhead and Underground Circuits) Radial circuits are included
bull DC Circuits with ge +-200 kV DC voltage
bull Transformers with ge 200 kV low-side voltage and
bull ACDC Back-to-Back (BTB) Converters with ge 200 kV AC voltage on both sides
33The detailed Confidence Interval computation is available at httpwwwnerccomdocspctadstfTADS_Nov_2_2007APPENDIX_C_Confidence_Intervalpdf
Transmission Equipment Performance
46
AC Element Outage Summary and Leading Causes Table 6 shows the 2008 2009 and 2010 NERC total AC transmission element inventory and a summary of
the associated outages As expected in general the number of circuits increased from year to year due to
new construction or re-construction to higher voltages For every outage experienced on the transmission
system cause codes are identified and recorded according to the TADS process Causes of both momentary
and sustained outages have been indicated These causes are analyzed to identify trends and similarities
and to provide insight into what could be done to possibly prevent future occurrences
Figure 23 and Figure 24 describe the top ten initiating cause codes for sustained and momentary automatic
outages combined from 2008-2010 Based on the two figures the relationship between the total number of
outages and total outage hours can be seen Failed AC Substation Equipment and Failed AC Circuit
Equipment only account for 15 percent of the total number of outages but account for 65 percent of the
total outage hours The two largest causes of outages within NERC (ldquoLightingrdquo and ldquoWeather excluding
Lightningrdquo) account for 34 percent of the total number of outages
The next three Human Error Failed Protection System Equipment and Failed AC Circuit Equipment have
very similar totals and should all be considered significant focus points in reducing the number of Sustained
Automatic Outages for all elements
Transmission Equipment Performance
47
Table 6 NERC - All AC Elements Sustained and Momentary Outage Performance Summary
2008 Number of Outages
AC Voltage
Class
No of
Circuits
Circuit
Miles Sustained Momentary
Total
Outages Total Outage Hours
200-299kV 4369 102131 1560 1062 2622 56595
300-399kV 1585 53631 793 753 1546 14681
400-599kV 586 31495 389 196 585 11766
600-799kV 110 9451 43 40 83 369
All Voltages 6650 196708 2785 2051 4836 83626
2009 Number of Outages
AC Voltage
Class
No of
Circuits
Circuit
Miles Sustained Momentary
Total
Outages Total Outage Hours
200-299kV 4468 102935 1387 898 2285 28828
300-399kV 1619 56447 641 610 1251 24714
400-599kV 592 32045 265 166 431 9110
600-799kV 110 9451 53 38 91 442
All Voltages 6789 200879 2346 1712 4038 63094
2010 Number of Outages
AC Voltage
Class
No of
Circuits
Circuit
Miles Sustained Momentary
Total
Outages Total Outage Hours
200-299kV 4567 104722 1506 918 2424 54941
300-399kV 1676 62415 721 601 1322 16043
400-599kV 605 31590 292 174 466 10442
600-799kV 111 9477 63 50 113 2303
All Voltages 6957 208204 2582 1743 4325 83729
Note The NERC table does not show redacted outages DC Circuit outages Transformer outages or ACDC
converter outages
Transmission Equipment Performance
48
Figure 23 NERC - Top Ten Sustained and Momentary Outages by Initiating Cause Code for All Elements
Figure 24 NERC - Top Ten Sustained Outage Hours by Cause Code
198
151
80
7271
6943
33
27
188
68
Lightning
Weather excluding lightningHuman Error
Failed AC Substation EquipmentFailed Protection System EquipmentFailed AC Circuit Equipment Foreign Interference
Power System Condition
Fire
Unknown
Remaining Cause Codes
299
246
188
58
52
42
3619
16 12 31 Failed AC Substation EquipmentFailed AC Circuit Equipment Weather excluding lightningUnavailable
Other
Fire
Unknown
Human Error
Failed Protection System EquipmentForeign Interference
Remaining Cause Codes
Transmission Equipment Performance
49
Transmission Monthly Outages Figure 25 displays the total number of Automatic Outages on a per-month basis The three months with the
highest total of outages were June July and August From a seasonal perspective winter had a monthly
average of 281 outages These include the months of November-March Summer had an average of 429
outages Summer included the months of April-October
Figure 25 Number of Outages by Month for AC Circuits (2008-2010)
This figure does not show redacted outages DC Circuit outages Transformer outages or ACDC Converter
outages
Outage Initiation Location For every outage experienced on the transmission system the outage initiation code is identified and
recorded according to the TADS process The outage initiation code can be analyzed to identify trends and
similarities and to provide insight into what could be done to possibly prevent future occurrences
The ldquoOutage Initiation Coderdquo describes where an automatic outage was initiated on the power system The
five codes are as follows
bull Element-Initiated
bull Other Element-Initiated
bull AC Substation-Initiated
bull ACDC Terminal-Initiated (for DC circuits)
bull Other Facility Initiated any facility not included in any other outage initiation code
JanuaryFebruar
yMarch April May June July August
September
October
November
December
2008 238 229 257 258 292 437 467 380 208 176 255 236
2009 315 201 339 334 398 553 546 515 351 235 226 294
2010 444 224 269 446 449 486 639 498 351 271 305 281
3 Year AVG 332 218 288 346 380 492 551 464 303 227 262 270
0
100
200
300
400
500
600
700
Out
ages
Transmission Equipment Performance
50
Notably the protection system is not part of an ldquoAC Substationrdquo or an ldquoACDC Terminalrdquo If a protection
system misoperates and initiates an outage it will be classified as ldquoOther-Facility Initiatedrdquo The following
Figures show the initiating location of the Automatic outages from 2008 to 2010
With both Momentary and Sustained Automatic Outages taken into account the outage was initiated on the
Element more than 67 percent of the time as shown in Figure 26 and Figure 27
When only the Sustained Automatic Outages are analyzed the outage initiation on both AC Substation and
Other Facility increased by 34 percent and 32 percent respectively Outages initiated on the Element itself
decreases by 78 percent as shown in Figure 26 and 27 For only the Momentary Automatic Outages the
outage initiation on the Element increases by 19 percent compared to Sustained Outages Element initiated
outages make up over 78 percent of the total outages when analyzing only Momentary Outages
Figure 26
Figure 27
Transmission Outage Events Figure 28 illustrates the relationship between the numbers of Automatic Outages associated per TADS
event 2008 2009 and 2010 tend to follow the same trend The largest number of Automatic Outages per
TADS event is fourteen in 2010 thirteen in 2009 and eight in 2008 There are around 70 to 100 TADS
events that contain between fourteen and three Automatic Outages (see below) There are around 330 to
400 TADS events that contain two or more Automatic Outages The rest of the events only contain one
Automatic Outage As noted in the lower right hand corner below the total number of Events in 2008 to
2010 ranged from 3920 to 4569 events per year Nearly 90 percent or more of the events contained one
Automatic Outage
Figure 26 Sustained Automatic Outage Initiation
Code
Figure 27 Momentary Automatic Outage Initiation
Code
Transmission Equipment Performance
51
Transmission Outage Mode Figure 29 and Figure 30 show the percentage of Outage Modes The ldquoOutage Mode Coderdquo describes
whether one Automatic Outage is related to other Automatic Outages A Single Mode outage is an
Automatic Outage of a single Element which occurs independently of any other Automatic Outages (if any)
A ldquoDependent Mode Initiating Outagerdquo is an Automatic Outage of a single Element that initiates one or more
subsequent Element Automatic Outages A ldquoDependent Mode Outagerdquo is an Automatic Outage of an
Element which occurred as a result of an initiating outage whether the initiating outage was an Element
outage or a non-Element outage A ldquoCommon Mode Outagerdquo is one of two or more Automatic Outages with
the same Initiating Cause Code and where the outages are not consequences of each other and occur nearly
simultaneously A ldquoCommon Mode Initiating Outagerdquo is a Common Mode Outage that initiates one or more
subsequent Automatic Outages
Over 72 percent of the total outages occurred on the bulk power system are Single Mode Outages The next
largest mode is Dependent with over 11 percent of the total outages being in this category For only
Sustained Automatic Outages outages related to each other increase with Dependent mode accounting for
13 percent of the outages and Common mode accounting for close to 11 percent of the outages
Independent Sustained outages still account for the largest portion with nearly 70 percent being Single
mode When just analyzing Momentary Automatic Outages Associated outages decrease with Dependent
Figure 28 Event Histogram (2008-2010)
Transmission Equipment Performance
52
mode accounting for only 9 percent of the outages The Common Mode percentage decreases while
Dependent Mode Initiating percentage increases compared to Sustained Outages Independent Momentary
outages account for the largest portion with over 76 percent being Single Mode
An investigation into the root causes of Dependent and Common mode events which include three or more
Automatic Outages (indentified in the TADS 2008 to 2010 data) should be a high priority Some protection
systems are designed to trip three or more circuits but some events go beyond what is designed Some also
have misoperations associated with multiple outage events
Conclusions On a NERC wide average basis automatic transmission outage rate is improving from 2008 to 2010 based on
reported data Considering both automatic and non-automatic outages 2010 records indicate transmission
element availability percentage is very high and exceeds 95 The unavailability rate for AC circuits and
transformers are only 15 and 29 respectively
The cause codes of Human Error Failed Protection System Equipment and Failed AC Circuit Equipment
should be considered significant focus points in reducing the number of Sustained Automatic Outages for all
elements A deeper look into the root causes of Dependent and Common mode events which include three
or more Automatic Outages (indentified in the TADS 2008 to 2010 data) should be a high priority Some
protection systems are designed to trip three or more circuits but some events go beyond what is designed
Some also have misoperations associated with multiple outage events
Figure 29 Sustained Automatic Outage Mode code Figure 30 Momentary Automatic Outage Mode code
Generation Equipment Performance
53
Generation Equipment Performance Introduction The development of the Generating Availability Data System (GADS) began in 1982 This series of databases
is used to voluntarily collect record and retrieve operating information By pooling individual unit
information with likewise units generating unit availability performance can be calculated providing
opportunities to identify trends and generating equipment reliability improvement opportunities The
information is used to support equipment reliability availability analyses and risk-informed decision-making
by system planners generation owners assessment modelers manufacturers and contractors etc Reports
and information resulting from the data collected through GADS are now used for benchmarking and
analyzing electric power plants
Currently the data collected through GADS contains 72 percent of the North American generating units
with generating capacity of 20 MW or higher34 Additionally many of the newer combined-cycle plants are
not reporting information and therefore a full view of each unit type is not presented Rather a sample of
all the units in North America that fit a given more general category is provided35 for the 2008-201036
Generation Key Performance Indicators
assessment period
Three key performance indicators37
In
the industry have used widely to measure the availability of generating
units (see Terms Used in This Report section for their calculation parameters) are Equivalent Availability
Factor (EAF) Net Capacity Factor (NCF) and Equivalent Forced Outage Rate ndash Demand (EFORd)
Table 7 the North American fleet average EAF NCF and EFORd compared to unit age for all generating
units with a capacity of 20 MW and higher is provided for the years 2008-2010 The EAF shows a decline
during the last three years NCF is up and down while the EFORd appears to be increasing As expected the
fleet of units reported to GADS is aging overall with the fossil units being about 12 years older than the
average age
34 httpwwwnerccomdocspcgadstfGADSTF_Recommendation_Report_02-18-2011_FINALpdf 35GADS contains some 1500+ units under 20 MW that is not included in this report These units are excluded because most units are not base-loaded and are in peaking operation
3684 percent of the 2010 dataset is available at this time while the 2008 and 2009 dataset is complete 37 httpwwwnerccompagephpcid=4|43
Generation Equipment Performance
54
Table 7 General Availability Review of GADS Fleet Units by Year
2008 2009 2010 Average
Equivalent Availability Factor (EAF) 8776 8774 8678 8743
Net Capacity Factor (NCF) 5083 4709 4880 4890
Equivalent Forced Outage Rate -
Demand (EFORd) 579 575 639 597
Number of Units ge20 MW 3713 3713 3713 3713
Average Age of the Fleet in Years (all
unit types) 303 311 321 312
Average Age of the Fleet in Years
(fossil units only) 422 432 440 433
Figure 31 provides the average forced outage hours (FOH) maintenance outage hours (MOH) and planned
outage hours (POH) for all units reporting 20 MW or larger During this three-year period the average FOH
291 hours average MOH is 163 hours average POH is 470 hours
Figure 31 shows a large increase in forced and maintenance events The average age of the units with a
capacity of 20MW and higher in 2009 is 316 years old However the average age of fossil units in 2010 is
442 years old These fossil units are the backbone of all operating units providing the base-load power
continuously and nearly 50 percent of all energy annually There appears to be no increase allocated for
annualsemi-annual maintenance (ie planned outages) for the older generating units The increase of
000100002000030000400005000060000700008000090000
100000
2008 2009 2010
463 479 468
154 161 173
288 270 314
Hou
rs
Planned Maintenance Forced
Figure 31 Average Outage Hours for Units gt 20 MW
Generation Equipment Performance
55
maintenance outage hours reflects an increased need to fix problems that cannot be deferred until the next
annualsemi-annual repairs As a result it shows one of two things are happening
bull More or longer planned outage time is needed to repair the aging generating fleet
bull More focus on preventive repairs during planned and maintenance events are needed
Multiple Unit Forced Outages and Causes Table 8 provides the annual multiple-unit forced outage trips resulting from the same cause for each of the
assessments years 2008-2010 respectively The ldquosingle unitrdquo trips are large units with a Net Dependable
Capacity of 750 MW or more The trips of ldquotwo unitsrdquo or more is any combination of unit capacity with the
total amount of lost capacity more than 750 MW
Table 8 also presents more information on the forced outages During 2008-2010 there were a large
number of double-unit outages resulting from the same event Investigations show that some of these trips
were at a single plant caused by common control and instrumentation for the units The incidents occurred
several times for several months and are a common mode issue internal to the plant
Table 8 Number of Multiple Unit Forced Outages and FrequencyYear
2008 2009 2010
Type of
Trip
of
Trips
Avg Outage
Hr Trip
Avg Outage
Hr Unit
of
Trips
Avg Outage
Hr Trip
Avg Outage
Hr Unit
of
Trips
Avg Outage
Hr Trip
Avg Outage
Hr Unit
Single-unit
Trip 591 58 58 284 64 64 339 66 66
Two-unit
Trip 281 43 22 508 96 48 206 41 20
Three-unit
Trip 74 48 16 223 146 48 47 109 36
Four-unit
Trip 12 77 19 111 112 28 40 121 30
Five-unit
Trip 11 1303 260 60 443 88 19 199 10
gt 5 units 20 166 16 93 206 50 37 246 6
Loss of ge 750 MW per Trip
The high number of five-unit trips in 2008 was due to Hurricane Ike hitting the Gulf Coast The highest total
number of multiple unit trips occurred in 2009 though as mentioned before the data collection for 2010 is
incomplete at this time The majority of 2009 multiple unit trips have three main causes (in order by
Generation Equipment Performance
56
number of events) transmission lack of fuel and storms A summary of the three categories for single as
well as multiple unit outages (all unit capacities) are reflected in Table 9
Table 9 Common Causes of Multiple Unit Forced Outages (2009)
Cause Number of Events Average MW Size of Unit
Transmission 1583 16
Lack of Fuel (Coal Mines Gas Lines etc) Not
in Operator Control
812 448
Storms Lightning and Other Acts of Nature 591 112
Some of the transmission outages based on storms in 2009 have been caused by the same reasons because
the storms may have caused transmission interference However the plants reported the problems
inconsistently with either the transmission interference or storms cause code Therefore they are depicted
as two different causes of forced outage
Marked transmission outages in 2009 were quite high Thirty-five percent came from one utility with a large
number of hydroelectric units The company related the trips to various problems including weather
(lightning storms) wildlife ldquoline bumpsrdquo and problems on the receiving end of the transmission line Nine
hundred and eighty-five transmission trips (62 percent) were from hydroelectric units38
In 2009 only ten transmission trips resulted in a loss of 750 MW or more per trip Twenty two generating
plants were affected by the ten trips Causes for the trips include feeder line trips (1 trip) breakers in the
switchyard (8 trips) personnel errors (2 trips) and unknown (10 trips)
The ldquoLack of Fuelrdquo outages are of interest as these events occur during the times when a unit is available to
operate but there is an interruption in fuels to operate the facilities These events do not include
interruptions of fuel due to contracts Rather the cause code is designed to account for units that are
expecting fuel and it is unavailable when requested Table 10 presents the distribution of ldquoLack of Fuelrdquo
events by NERC Region and Table 11 presents the unit types affected
38 The average size of the hydroelectric units were small ndash 335 MW
Generation Equipment Performance
57
Of the units that report ldquoLack of Fuelrdquo 78 percent of the units are oil-fired 15 percent of the units are gas-
fired and the remaining units are various other fuels Table 12 provides the top causes of forced outage for
several unit types For fossil units ldquoLack of Fuelrdquo as the number three cause behind waterwall tube leaks
and superheater tube leaks
Table 10 Forced Outages Due to Lack of Fuel by Region
Region Number of Lack of Fuel
Problems Reported
FRCC 0
MRO 3
NPCC 24
RFC 695
SERC 17
SPP 3
TRE 7
WECC 29
One company contributed to the majority of oil-fired lack of fuel events The units at the company are
actually dual-fuels (oil and gas) but market nominated gas monitoring causes the units to be on forced
outage nightly The units need gas to start up so they can run on oil When they shut down the units must
switch to gas to clean themselves With the gas restriction the unit canrsquot start and the unit goes on a
forced outage Until the band is lifted the two units will continue to be on a forced outage cycle
Event records also provide descriptions of why the unit was without fuel with the majority of descriptions
bull Temperatures affecting gas supply valves
bull Unexpected maintenance of gas pipe-lines
bull Compressor problemsmaintenance
Generation Equipment Performance
58
Table 11 Unit Type Profile of Forced Outages Due to Lack of Fuel
Unit Types Number of Lack of Fuel Problems Reported
Fossil 642
Nuclear 0
Gas Turbines 88
Diesel Engines 1
HydroPumped Storage 0
Combined Cycle 47
Generation Equipment Performance
59
Table 12 Causes of Forced Outage for Different Unit Types (2008-2010)
Fossil - all MW sizes all fuels
Rank Description Occurrence per Unit-year
MWH per Unit-year
Average Hours To Repair
Average Hours Between Failures
Unit-years
1 Waterwall (furnace wall) 0590 134106 59 3250 3868 2 Second Superheater
Leaks 0180 5182 60 3228 3868
3 Lack of Fuel (coal mines gas lines etc) where the operator is not in control
0480 4701 18 26 3868
Combined-Cycle blocks Rank Description Occurrence
per Unit-year
MWH per Unit-year
Average Hours To Repair
Average Hours Between Failures
Unit-years
1 HP Turbine Buckets Or Blades
0020 4663 1830 26280 466
2 Turbine Control Valves 0040 2777 100 7200 466 3 Gas Turbine Compressor -
High Pressure Shaft 0010 2266 663 4269 466
Nuclear units - all Reactor types Rank Description Occurrence
per Unit-year
MWH per Unit-year
Average Hours To Repair
Average Hours Between Failures
Unit-years
1 LP Turbine Buckets or Blades
0010 26415 8760 26280 288
2 Containment Structure 0010 9233 1226 26262 288 3 Feedwater Pump Local
Controls 0020 7620 692 12642 288
Simple-cycle gas turbine jet engines Rank Description Occurrence
per Unit-year
MWH per Unit-year
Average Hours To Repair
Average Hours Between Failures
Unit-years
1 Main Transformer 0030 1611 1016 20709 4181 2 Other Gas Turbine
Controls And Instrument Problems
0120 428 70 2614 4181
3 Other Gas Turbine Problems
0090 400 119 1701 4181
Generation Equipment Performance
60
2008-2010 Review of Summer versus Winter Availability To address seasonality of unit availability unit information for the months of June to September (summer)
and December through February (winter) were pooled to calculate force events during these timeframes for
2008-201039 Figure 32 shows the Equivalent Availability Factor (EAF) is three percentage points higher and
the Equivalent Forced Outage Rate - Demand (EFORd) is more than a half of a percentage point lower in the
summer period than in winter period This means the units were more reliable with less forced events
during high-demand times during the summer than during the winter seasons The generating unitrsquos
capability has a resulting higher Net Capacity Factor (NCF) of 45 percentage points in the summer season
for 2008-2010
During the spring season (March-May) 77 percent of the units took a planned outage (PO) for an average
231 hours (or 96 days) In fall (October-November) only 42 percent of the units experienced a PO and the
average duration was shorter ndash 134 hours (or 56 days) A few units took both spring and fall planned
outages although this is rare Based on this assessment the generating units are prepared for the summer
peak demand The resulting availability indicates that this maintenance was successful which is measured
by an increased EAF and lower EFORd
Figure 32 Summer-Winter Average EAF NCF and EFORd (2008-2010)
Conclusions and Recommendations During 2008-2010 the average Equivalent Availability Factor (EAF) which measures the overall availability
of generating units decreased At the same time the Net Capacity Factor (NCF) an indicator of energy
production increased The average number of forced outages in 2010 is greater than in 2008 while at the
same time the average planned outage times have decreased As a result the Equivalent Forced Outage
Rate ndash Demand (EFORd) also increased illustrating that more units have experienced forced events during
39 A study of peak periods was conducted by the NERC Generating Availability Trend Evaluation (GATE) Working Group several years ago see httpwwwnerccomfilesSeasonal-Performance-Trendspdf
9116
5343
396
8818
4896
441
0 10 20 30 40 50 60 70 80 90 100
EAF
NCF
EFORd
Percent ()
Winter
Summer
Generation Equipment Performance
61
peak-demand times in 2010 than in the previous two years Potentially with shorter planned outage
periods in 2010 there may be less time to repair equipment and prevent forced unit outages
There are warnings that units are not being maintained as well as they should be In the last three years
there has been an increase in Equivalent Forced Outage Rate ndash Demand (EFORd) This indicator measures
the rate of forced outage events on generating units during periods of load demand To confirm this
problem forced outage hours jumped from 270 to 314 hours per unit between 2009 and 2010 At the same
time maintenance events also increased by 12 hours per unit Planned outage events remain constant The
resulting conclusions from this trend are
bull More or longer planned outage time is needed to repair the generating fleet Whether age is the
cause of the increase need for planned outage time remains unknown and further investigation into
the cause for longer planned outage time is necessary
bull More focus on preventive repairs during planned and maintenance events are needed
There are many multiple unit forced outages due to lack of fuel The majority of multiple unit trips have
three main causes transmission lack of fuel and storms With special interest in the forced outages due to
ldquoLack of Fuelrdquo additional analysis revealed that 77 percent of the units experiencing unexpected fuel
stoppage are oil-fired fossil units while gas-fired units experienced 15 percent
Generating units continue to be more reliable during the peak summer periods
Disturbance Event Trends
62
Category 1 An event resulting in one or more of the following a Unintended loss of three or more BPS elements caused by
common mode failure b Failure or misoperation of an SPSRAS c System-wide voltage reduction of 3 or more d Unintended BPS system separation resulting in an island of
100 MW to 999 MW e Unplanned evacuation from a control center facility with BPS
SCADA functionality for 30 minutes or more Category 2 An event resulting in one or more of the following
a Complete loss of all BPS control center voice communication system(s) for 30 minutes or more
b Complete loss of SCADA control or monitoring functionality for 30 minutes or more
c Voltage excursions equal to or greater than 10 lasting more than five minutes
d Loss of off-site power (LOOP) to a nuclear generating station e Unintended system separation resulting in an island of 1000
MW to 4999 MW f Unintended loss of 300MW or more of firm load for more
than 15 minutes g Violation of an Interconnection Reliability Operating Limit
(IROL) for more than 30 minutes Category 3 An event resulting in one or more of the following
a The loss of load or generation of 2000 MW or more in the Eastern Interconnection or
b Western Interconnection or 1000 MW or more in the ERCOT or Queacutebec Interconnections
c Unintended system separation resulting in an island of 5000 MW to 10000 MW
d Unintended system separation resulting in an island of Florida from the Eastern Interconnection
Category 4 An event resulting in one or more of the following a The loss of load or generation from 5001 MW to 9999 MW b Unintended system separation resulting in an island of more
than 10000 MW (with the exception of Florida as described in Category 3c)
Category 5 An event resulting in one or more of the following a The loss of load of 10000 MW or more b The loss of generation of 10000 MW or more
Figure 33 BPS Event Category
Disturbance Event Trends Introduction The purpose of this section is to report event
analysis trends from the beginning of event
analysis field test40
One of the companion goals of the event
analysis program is the identification of trends
in the number magnitude and frequency of
events and their associated causes such as
human error equipment failure protection
system misoperations etc The information
provided in the event analysis database (EADB)
and various event analysis reports have been
used to track and identify trends in BPS events
in conjunction with other databases (TADS
GADS metric and benchmarking database)
to the end of 2010
The Event Analysis Working Group (EAWG)
continuously gathers event data and is moving
toward an integrated approach to analyzing
data assessing trends and communicating the
results to the industry
Performance Trends The event category is classified41
Figure 33
as shown in
with Category 5 being the most
severe Figure 34 depicts disturbance trends in
Category 1 to 5 system events from the
40 httpwwwnerccomdocseawgGalloway-Industry-EA-Field-Test-102210pdf 41httpwwwnerccomfiles2011-05-0220Event_Analysis_Process_Phase20220Field20Test20Draft20-20Final20-20For20postingpdf
Disturbance Event Trends
63
beginning of event analysis field test to the end of 201042
Figure 34 Event Category vs Date for All 2010 Categorized Events
From the figure in November and December
there were many more category 1 and 2 events than in October This is due to the field trial starting on
October 25 2010
In addition to the category of the events the status of the events plays a critical role in the accuracy of the
data By examining Figure 35 over 80 of the events reported in 2010 have been closed This means that
the category root cause and other important information have been sufficiently finalized in order for
analysis to be accurate for each event At this time there is not enough data to draw any long-term
conclusions about event investigation performance
42 Documents for the EA Field Test are located at httpwwwnerccompagephpcid=5|365
2
12 12
26
3
6 5
14
1 1
2
0
5
10
15
20
25
30
35
40
45
October November December 2010
Even
t Cou
nt
Category 3 Category 2 Category 1
Disturbance Event Trends
64
Figure 35 Event Count vs Status (All 2010 Events with Status)
By drilling down into the cause code for each closed 2010 event Figure 36 shows the top 3 event causes
From the figure equipment failure and protection system misoperation are the most significant causes for
events Because of how new and limited the data is however there may not be statistical significance for
this result Further trending of cause codes for closed events and developing a richer dataset to find any
trends between event cause codes and event counts should be performed
Figure 36 Top 3 Event Counts vs DAWG Cause Code for all Closed 2010 Events
10
32
42
0
5
10
15
20
25
30
35
40
45
Open Closed Open and Closed
Even
t Cou
nt
Status
1211
8
0
2
4
6
8
10
12
14
Equipment Failure Protection System Misoperation Human Error
Even
t Cou
nt
Cause Code
Disturbance Event Trends
65
Conclusions Due to the relatively new process for events analysis and categorization more time will be required before a
conclusive recommendation may be obtained Further analysis and new data should provide valuable
statistics in the future Over 80 of all event reports from 2010 are current listed as closed but no
conclusion about investigation performance may be obtained because of the limited amount of data It is
recommended to study ways to prevent equipment failure and protection system misoperations but there
is not enough data to draw a firm conclusion about the top causes of events at this time
Abbreviations Used in This Report
66
Abbreviations Used in This Report
Acronym Definition ALP Acadiana Load Pocket
ALR Adequate Level of Reliability
ARR Automatic Reliability Report
BA Balancing Authority
BPS Bulk Power System
CDI Condition Driven Index
CEII Critical Energy Infrastructure Information
CIPC Critical Infrastructure Protection Committee
CLECO Cleco Power LLC
DADS Future Demand Availability Data System
DCS Disturbance Control Standard
DOE Department Of Energy
DSM Demand Side Management
EA Event Analysis
EAF Equivalent Availability Factor
ECAR East Central Area Reliability
EDI Event Drive Index
EEA Energy Emergency Alert
EFORd Equivalent Forced Outage Rate Demand
EMS Energy Management System
ERCOT Electric Reliability Council of Texas
ERO Electric Reliability Organization
ESAI Energy Security Analysis Inc
FERC Federal Energy Regulatory Commission
FOH Forced Outage Hours
FRCC Florida Reliability Coordinating Council
GADS Generation Availability Data System
GOP Generation Operator
IEEE Institute of Electrical and Electronics Engineers
IESO Independent Electricity System Operator
IROL Interconnection Reliability Operating Limit
Abbreviations Used in This Report
67
Acronym Definition IRI Integrated Reliability Index
LOLE Loss of Load Expectation
LUS Lafayette Utilities System
MAIN Mid-America Interconnected Network Inc
MAPP Mid-continent Area Power Pool
MOH Maintenance Outage Hours
MRO Midwest Reliability Organization
MSSC Most Severe Single Contingency
NCF Net Capacity Factor
NEAT NERC Event Analysis Tool
NERC North American Electric Reliability Corporation
NPCC Northeast Power Coordinating Council
OC Operating Committee
OL Operating Limit
OP Operating Procedures
ORS Operating Reliability Subcommittee
PC Planning Committee
PO Planned Outage
POH Planned Outage Hours
RAPA Reliability Assessment Performance Analysis
RAS Remedial Action Schemes
RC Reliability Coordinator
RCIS Reliability Coordination Information System
RCWG Reliability Coordinator Working Group
RE Regional Entities
RFC Reliability First Corporation
RMWG Reliability Metrics Working Group
RSG Reserve Sharing Group
SAIDI System Average Interruption Duration Index
SAIFI System Average Interruption Frequency Index
SCADA Supervisory Control and Data Acquisition
SDI Standardstatute Driven Index
SERC SERC Reliability Corporation
Abbreviations Used in This Report
68
Acronym Definition SRI Severity Risk Index
SMART Specific Measurable Attainable Relevant and Tangible
SOL System Operating Limit
SPS Special Protection Schemes
SPCS System Protection and Control Subcommittee
SPP Southwest Power Pool
SRI System Risk Index
TADS Transmission Availability Data System
TADSWG Transmission Availability Data System Working Group
TO Transmission Owner
TOP Transmission Operator
WECC Western Electricity Coordinating Council
Contributions
69
Contributions This report was made feasible by the collaboration and hard work of both NERC staff and NERCrsquos
Industry Groups
NERC Industry Groups
Table 14 lists the NERC industry group contributors Without their contribution and collaboration this
report would not have been possible
Table 13 NERC Industry Group Contributions43
NERC Group
Relationship Contribution
Reliability Metrics Working Group
(RMWG)
Reports to the OCPC bull Lead Development of Report bull Provide Reliability Metrics Data bull Responsible for Reliability Metrics
Performance Chapter
Transmission Availability Working Group
(TADSWG)
Reports to the OCPC bull Provide Transmission Availability Data
bull Responsible for Transmission Equip-ment Performance Chapter
bull Content Review
Generation Availability Data System Task
Force
(GADSTF)
Reports to the OCPC bull Provide Generation Availability Data bull Responsible for Generation Equip-
ment Performance Chapter bull Content Review
Event Analysis Working Group
(EAWG)
Reports to the OCPC bull Provide Events Data bull Responsible for Disturbance Events
Trends Chapter bull Content Review
43 Rosters for RMWG TADSWG GADSTF and EAWG are available at httpwwwnerccomfilesrosterpdf
Contributions
70
NERC Staff Table 13 below lists the NERC staff who contributed to the 2011 Reliability Performance Analysis
Report
Table 14 Contributing NERC Staff
Name Title E-mail Address
Mark Lauby Vice President and Director of
Reliability Assessment and
Performance Analysis
marklaubynercnet
Jessica Bian Manager of Performance Analysis jessicabiannercnet
John Moura Manager of Reliability Assessments johnmouranercnet
Andrew Slone Engineer Reliability Performance
Analysis
andrewslonenercnet
Jim Robinson TADS Project Manager jimrobinsonnercnet
Clyde Melton Engineer Reliability Performance
Analysis
clydemeltonnercnet
Mike Curley Manager of GADS Services mikecurleynercnet
James Powell Engineer Reliability Performance
Analysis
jamespowellnercnet
Michelle Marx Administrative Assistant michellemarxnercnet
William Mo Intern Performance Analysis wmonercnet
- NERCrsquos Mission
- Table of Contents
- Executive Summary
-
- 2011 Transition Report
- State of Reliability Report
- Key Findings and Recommendations
-
- Reliability Metric Performance
- Transmission Availability Performance
- Generating Availability Performance
- Disturbance Events
- Report Organization
-
- Introduction
-
- Metric Report Evolution
- Roadmap for the Future
-
- Reliability Metrics Performance
-
- Introduction
- 2010 Performance Metrics Results and Trends
-
- ALR1-3 Planning Reserve Margin
-
- Background
- Assessment
- Special Considerations
-
- ALR1-4 BPS Transmission Related Events Resulting in Loss of Load
-
- Background
- Assessment
-
- ALR1-12 Interconnection Frequency Response
-
- Background
- Assessment
-
- ALR2-3 Activation of Under Frequency Load Shedding
-
- Background
- Assessment
- Special Considerations
-
- ALR2-4 Average Percent Non-Recovery Disturbance Control Standards (DCS)
-
- Background
- Assessment
- Special Consideration
-
- ALR2-5 Disturbance Control Events Greater Than Most Severe Single Contingency
-
- Background
- Assessment
- Special Consideration
-
- ALR 1-5 System Voltage Performance
-
- Background
- Special Considerations
- Status
-
- ALR3-5 Interconnection Reliability Operating Limit System Operating Limit (IROLSOL) Exceedances
-
- Background
-
- ALR4-1 Automatic Transmission Outages Caused by Protection System Misoperations
-
- Background
- Special Considerations
-
- ALR6-11 ndash ALR6-14
-
- Background
- Assessment
- ALR 6-11 ndash Automatic Outages Initiated by Failed Protection System Equipment
- ALR6-12 ndash Automatic Outages Initiated by Human Error
- ALR6-13 ndash Automatic Outages Initiated by Failed AC Substation Equipment
- ALR6-14 Automatic AC Transmission Outages Initiated by Failed AC Circuit Equipment
-
- ALR6-15 Element Availability Percentage (APC)
-
- Background
- Assessment
- Special Consideration
-
- ALR6-16 Transmission System Unavailability
-
- Background
- Assessment
- Special Consideration
-
- ALR6-2 Energy Emergency Alert 3 (EEA3)
-
- Background
- Assessment
- Special Considerations
-
- ALR 6-3 Energy Emergency Alert 2 (EEA2)
-
- Background
- Assessment
- Special Considerations
-
- ALR 6-1 Transmission Constraint Mitigation
-
- Background
- Assessment
- Special Considerations
-
- Integrated Bulk Power System Risk Assessment
-
- Introduction
- Recommendations
-
- Integrated Reliability Index Concepts
-
- The Three Components of the IRI
-
- Event-Driven Indicators (EDI)
- Condition-Driven Indicators (CDI)
- StandardsStatute-Driven Indicators (SDI)
-
- IRI Index Calculation
- IRI Recommendations
-
- Reliability Metrics Conclusions and Recommendations
-
- Transmission Equipment Performance
-
- Introduction
- Performance Trends
-
- AC Element Outage Summary and Leading Causes
- Transmission Monthly Outages
- Outage Initiation Location
- Transmission Outage Events
- Transmission Outage Mode
-
- Conclusions
-
- Generation Equipment Performance
-
- Introduction
- Generation Key Performance Indicators
-
- Multiple Unit Forced Outages and Causes
- 2008-2010 Review of Summer versus Winter Availability
-
- Conclusions and Recommendations
-
- Disturbance Event Trends
-
- Introduction
- Performance Trends
- Conclusions
-
- Abbreviations Used in This Report
- Contributions
-
- NERC Industry Groups
- NERC Staff
-

Reliability Metrics Performance
15
Assessment
Figure 6 illustrates that the number of bulk power system transmission-related events resulting in loss of
firm load13
Table 2
from 2002 to 2009 is relatively constant and suggests that 7 - 10 events per year is a norm for
the bulk power system However the magnitude of load loss shown in associated with these
events reflects a downward trend since 2007 Since the data includes weather-related events it will
provide the RMWG with an opportunity for further analysis and continued assessment of the trends
over time is recommended
Figure 6 BPS Transmission Related Events Resulting in Loss of Load Counts (2002-2009)
Table 2 BPS Transmission Related Events Resulting in Loss of Load MW Loss (2002-2009)
Year Load Loss (MW)
2002 3762
2003 65263
2004 2578
2005 6720
2006 4871
2007 11282
2008 5200
2009 2965
13The metric source data may require adjustments to accommodate all of the different groups for measurement and consistency as OE-417 is only used in the US
02468
101214
2002 2003 2004 2005 2006 2007 2008 2009
Count
Reliability Metrics Performance
16
ALR1-12 Interconnection Frequency Response
Background
This metric is used to track and monitor Interconnection Frequency Response Frequency Response is a
measure of an Interconnectionrsquos ability to stabilize frequency immediately following the sudden loss of
generation or load It is a critical component to the reliable operation of the bulk power system
particularly during disturbances and restoration The metric measures the average frequency responses
for all events where frequency drops more than 35 mHz within a year
Assessment
At this time there has been no data collected for ALR1-12 Therefore no assessment was made
ALR2-3 Activation of Under Frequency Load Shedding
Background
The purpose of Under Frequency Load Shedding (UFLS) is to balance generation and load in an island
following an extreme event The UFLS activation metric measures the number of times UFLS is activated
and the total MW of load interrupted in each Region and NERC wide
Assessment
Figure 7 and Table 3 illustrate a history of Under Frequency Load Shedding events from 2006 through
2010 Through this period itrsquos important to note that single events had a range load shedding from 15
MW to 7654 MW The activation of UFLS relays is the last automated reliability measure associated
with a decline in frequency in order to rebalance the system Further assessment of the MW loss for
these activations is recommended
Figure 7 ALR2-3 Count of Activations by Year and Regional Entity (2001-2010)
Reliability Metrics Performance
17
Table 3 ALR2-3 Under Frequency Load Shedding MW Loss
ALR2-3 Under Frequency Load Shedding MW Loss
2006 2007 2008 2009 2010
FRCC
2273
MRO
486
NPCC 94
63 20 25
RFC
SPP
672 15
SERC
ERCOT
WECC
Special Considerations
The use of a single metric cannot capture all of the relevant information associated with UFLS events as
the events relate to each respective UFLS plan The ability to measure the reliability of the bulk power
system is directly associated with how it performs compared to what is planned
ALR2-4 Average Percent Non-Recovery Disturbance Control Standards (DCS)
Background
This metric measures the Balancing Authorityrsquos (BA) or Reserve Sharing Grouprsquos (RSG) ability to balance
resources and demand with the timely deployment of contingency reserve thereby returning the
interconnection frequency to within defined limits following a Reportable Disturbance14
Assessment
The relative
percentage provides an indication of performance measured at a BA or RSG
Figure 8 illustrates the average percent non-recovery of DCS events from 2006 to 2010 The graph
provides a high-level indication of the performance of each respective RE However a single event may
not reflect all the reliability issues within a given RE In order to understand the reliability aspects it
may be necessary to request individual REs to further investigate and provide a more comprehensive
reliability report Further investigation may indicate the entity had sufficient contingency reserve but
through their implementation process failed to meet DCS recovery
14 Details of the Disturbance Control Performance Standard and Reportable Disturbance definitions are available at
httpwwwnerccomfilesBAL-002-0pdf
Reliability Metrics Performance
18
Continued trend assessment is recommended Where trends indicated potential issues the regional
entity will be requested to investigate and report their findings
Figure 8 Average Percent Non-Recovery of DCS Events (2006-2010)
Special Consideration
This metric aggregates the number of events based on reporting from individual Balancing Authorities or
Reserve Sharing Groups It does not capture the severity of the DCS events It should be noted that
most REs use 80 percent of the Most Severe Single Contingency to establish the minimum threshold for
reportable disturbance while others use 35 percent15
ALR2-5 Disturbance Control Events Greater Than Most Severe Single Contingency
Background
This metric represents the number of disturbance events that exceed the Most Severe Single
Contingency (MSSC) and is specific to each BA Each RE reports disturbances greater than the MSSC on
behalf of the BA or Reserve Sharing Group (RSG) The result helps validate current contingency reserve
requirements The MSSC is determined based on the specific configuration of each BA or RSG and can
vary in significance and impact on the BPS
15httpwwwweccbizStandardsDevelopmentListsRequest20FormDispFormaspxID=69ampSource=StandardsDevelopmentPagesWEC
CStandardsArchiveaspx
375
079
0
54
008
005
0
15 0
77
025
0
33
000510152025303540
2006
2007
2008
2009
2010
2006
2007
2008
2009
2010
2006
2007
2008
2009
2010
2006
2007
2008
2009
2010
2006
2007
2008
2009
2010
2006
2007
2008
2009
2010
2006
2007
2008
2009
2010
2006
2007
2008
2009
2010
FRCC MRO NPCC RFC SERC SPP ERCOT WECC
Region and Year
Reliability Metrics Performance
19
Assessment
Figure 9 represents the number of DCS events within each RE that are greater than the MSSC from 2006
to 2010 This metric and resulting trend can provide insight regarding the risk of events greater than
MSSC and the potential for loss of load
In 2010 SERC had 16 BAL-002 reporting entities eight Balancing Areas elected to maintain Contingency
Reserve levels independent of any reserve sharing group These 16 entities experienced 79 reportable
DCS eventsmdash32 (or 405 percent) of which were categorized as greater than their most severe single
contingency Every DCS event categorized as greater than the most severe single contingency occurred
within a Balancing Area maintaining independent Contingency Reserve levels Significantly all 79
regional entities reported compliance with the Disturbance Recovery Criterion including for those
Disturbances that were considered greater than their most severe single Contingency This supports a
conclusion that regardless of the size of the BA or participation in a Reserve Sharing Group SERCrsquos BAL-
002 reporting entities have demonstrated the ability in 2010 to use Contingency Reserve to balance
resources and demand and return Interconnection frequency within defined limits following Reportable
Disturbances
If the SERC Balancing Areas without large generating units and who do not participate in a Reserve
Sharing Group change the determination of their most severe single contingencies to effect an increase
in the DCS reporting threshold (and concurrently the threshold for determining those disturbances
which are greater than the most severe single contingency) there will certainly be a reduction in both
the gross count of DCS events in SERC and in the subset considered under ALR2-5 Masking the discrete
events which cause Balancing Area response may not reduce ldquoriskrdquo to the system However it is
desirable to maintain a reporting threshold which encourages the Balancing Authority to respond to any
unexplained change in ACE in a manner which supports Interconnection frequency based on
demonstrated performance SERC will continue to monitor DCS performance and will continue to
evaluate contingency reserve requirements but does not consider 2010 ALR2-5 performance to be an
adverse trend in ldquoextreme or unusualrdquo contingencies but rather within the normal range of expected
occurrences
Reliability Metrics Performance
20
Special Consideration
The metric reports the number of DCS events greater than MSSC without regards to the size of a BA or
RSG and without respect to the number of reporting entities within a given RE Because of the potential
for differences in the magnitude of MSSC and the resultant frequency of events trending should be
within each RE to provide any potential reliability indicators Each RE should investigate to determine
the cause and relative effect on reliability of the events within their footprints Small BA or RSG may
have a relatively small value of MSSC As such a high number of DCS greater than MCCS may not
indicate a reliability problem for the reporting RE but may indicate an issue for the respective BA or RSG
In addition events greater than MSSC may not cause a reliability issue for some BA RSG or RE if they
have more stringent standards which require contingency reserves greater than MSSC
ALR 1-5 System Voltage Performance
Background
The purpose of this metric is to measure the transmission system voltage performance (either absolute
or per unit of a nominal value) over time This should provide an indication of the reactive capability
available to the transmission system The metric is intended to record the amount of time that system
voltage is outside a predetermined band around nominal
0
5
10
15
20
25
30
2006
2007
2008
2009
2010
2006
2007
2008
2009
2010
2006
2007
2008
2009
2010
2006
2007
2008
2009
2010
2006
2007
2008
2009
2010
2006
2007
2008
2009
2010
2006
2007
2008
2009
2010
2006
2007
2008
2009
2010
FRCC MRO NPCC RFC SERC SPP ERCOT WECC
Cou
nt
Region and Year
Figure 9 Disturbance Control Events Greater Than Most Severe Single Contingency (2006-2010)
Reliability Metrics Performance
21
Special Considerations
Each Reliability Coordinator (RC) will work with the Transmission Owners (TOs) and Transmission
Operators (TOPs) within its footprint to identify specific buses and voltage ranges to monitor for this
metric The number of buses the monitored voltage levels and the acceptable voltage ranges may vary
by reporting entity
Status
With a pilot program requested in early 2011 a voluntary request to Reliability Coordinators (RC) was
made to develop a list of key buses This work continues with all of the RCs and their respective
Transmission Owners (TOs) to gather the list of key buses and their voltage ranges After this step has
been completed the TO will be requested to provide relevant data on key buses only Based upon the
usefulness of the data collected in the pilot program additional data collection will be reviewed in the
future
ALR3-5 Interconnection Reliability Operating Limit System Operating Limit (IROLSOL) Exceedances
Background
This metric illustrates the number of times that defined Interconnection Reliability Operating Limit
(IROL) or System Operating Limit (SOL) were exceeded and the duration of these events Exceeding
IROLSOLs could lead to outages if prompt operator control actions are not taken in a timely manner to
return the system to within normal operating limits This metric was approved by NERCrsquos Operating and
Planning Committees in June 2010 and a data request was subsequently issued in August 2010 to collect
the data for this metric Based on the results of the pilot conducted in the third and fourth quarter of
2010 there is merit in continuing measurement of this metric Note the reporting of IROLSOL
exceedances became mandatory in 2011 and data collected in Table 4 for 2010 has been provided
voluntarily
Reliability Metrics Performance
22
Table 4 ALR3-5 IROLSOL Exceedances
3Q2010 4Q2010 1Q2011
le 10 mins 123 226 124
le 20 mins 10 36 12
le 30 mins 3 7 3
gt 30 mins 0 1 0
Number of Reporting RCs 9 10 15
ALR4-1 Automatic Transmission Outages Caused by Protection System Misoperations
Background
Originally titled Correct Protection System Operations this metric has undergone a number of changes
since its initial development To ensure that it best portrays how misoperations affect transmission
outages it was necessary to establish a common understanding of misoperations and the data needed
to support the metric NERCrsquos Reliability Assessment Performance Analysis (RAPA) group evaluated
several options of transitioning from existing procedures for the collection of misoperations data and
recommended a consistent approach which was introduced at the beginning of 2011 With the NERC
System Protection and Control Subcommitteersquos (SPCS) technical guidance NERC and the regional
entities have agreed upon a set of specifications for misoperations reporting including format
categories event type codes and reporting period to have a final consistent reporting template16
Special Considerations
Only
automatic transmission outages 200 kV and above including AC circuits and transformers will be used
in the calculation of this metric
Data collection will not begin until the second quarter of 2011 for data beginning with January 2011 As
revised this metric cannot be calculated for this report at the current time The revised title and metric
form can be viewed at the NERC website17
16 The current Protection System Misoperation template is available at
httpwwwnerccomfilezrmwghtml 17The current metric ALR4-1 form is available at httpwwwnerccomdocspcrmwgALR_4-1Percentpdf
Reliability Metrics Performance
23
ALR6-11 ndash ALR6-14
ALR6-11 Automatic AC Transmission Outages Initiated by Failed Protection System Equipment
ALR6-12 Automatic AC Transmission Outages Initiated by Human Error
ALR6-13 Automatic AC Transmission Outages Initiated by Failed AC Substation Equipment
ALR6-14 Automatic AC Circuit Outages Initiated by Failed AC Circuit Equipment
Background
These metrics evolved from the original ALR4-1 metric for correct protection system operations and
now illustrate a normalized count (on a per circuit basis) of AC transmission element outages (ie TADS
momentary and sustained automatic outages) that were initiated by Failed Protection System
Equipment (ALR6-11) Human Error (ALR6-12) Failed AC Substation Equipment (ALR6-13) and Failed AC
Circuit Equipment (ALR6-14) These metrics are all related to the non-weather related initiating cause
codes for automatic outages of AC circuits and transformers operated 200 kV and above
Assessment
Figure 10 through Figure 13 show the normalized outages per circuit and outages per transformer for
facilities operated at 200 kV and above As shown in all eight of the charts there are some regional
trends in the three years worth of data However some Regionrsquos values have increased from one year
to the next stayed the same or decreased with no discernable regional trends For example ALR6-11
computes the automatic AC Circuit outages initiated by failed protection system equipment
There are some trends to the ALR6-11 to ALR6-14 data but many regions do not have enough data for a
valid trend analysis to be performed NERCrsquos outage rate seems to be improving every year On a
regional basis metric ALR6-11 along with ALR6-12 through ALR6-14 cannot be statistically understood
until confidence intervals18
18The detailed Confidence Interval computation is available at
are calculated ALR metric outage frequency rates and Regional equipment
inventories that are smaller than others are likely to require more than 36 months of outage data Some
numerically larger frequency rates and larger regional equipment inventories (such as NERC) do not
require more than 36 months of data to obtain a reasonably narrow confidence interval
httpwwwnerccomdocspctadstfTADS_Nov_2_2007APPENDIX_C_Confidence_Intervalpdf
Reliability Metrics Performance
24
While more data is still needed on a regional basis to determine if each regionrsquos bulk power system is
becoming more reliable year to year there are areas of potential improvement which include power
system condition protection performance and human factors These potential improvements are
presented due to the relatively large number of outages caused by these items The industry can
benefit from detailed analysis by identifying lessons learned and rolling average trends of NERC-wide
performance With a confidence interval of relatively narrow bandwidth one can determine whether
changes in statistical data are primarily due to random sampling error or if the statistics are significantly
different due to performance
Reliability Metrics Performance
25
ALR 6-11 ndash Automatic Outages Initiated by Failed Protection System Equipment
Automatic outages with an initiating cause code of failed protection system equipment are in Figure 10
Figure 10 ALR6-11 by Region (Includes NERC-Wide)
This code covers automatic outages caused by the failure of protection system equipment This
includes any relay andor control misoperations except those that are caused by incorrect relay or
control settings that do not coordinate with other protective devices
ALR6-12 ndash Automatic Outages Initiated by Human Error
Figure 11 shows the automatic outages with an initiating cause code of human error This code covers
automatic outages caused by any incorrect action traceable to employees andor contractors for
companies operating maintaining andor providing assistance to the Transmission Owner will be
identified and reported in this category
Reliability Metrics Performance
26
Also any human failure or interpretation of standard industry practices and guidelines that cause an
outage will be reported in this category
Figure 11 ALR6-12 by Region (Includes NERC-Wide)
Reliability Metrics Performance
27
ALR6-13 ndash Automatic Outages Initiated by Failed AC Substation Equipment
Figure 12 shows the automatic outages with an initiating cause code of failed AC substation equipment
This code covers automatic outages caused by the failure of AC Substation ie equipment ldquoinside the
substation fencerdquo including transformers and circuit breakers but excluding protection system
equipment19
19TADS Initiating Cause Code definitions are located at httpwwwnerccomdocspctadswgTADS_Definitions_Appendix_7_092909pdf
Figure 12 ALR6-13 by Region (Includes NERC-Wide)
Reliability Metrics Performance
28
ALR6-14 Automatic AC Transmission Outages Initiated by Failed AC Circuit Equipment
Figure 13 shows the automatic outages with an initiating cause code of failed AC circuit equipment
Automatic Outages related to the failure of AC Circuit equipment ie overhead or underground
equipment ldquooutside the substation fencerdquo 20
ALR6-15 Element Availability Percentage (APC)
Background
This metric uses data and calculations directly from the NERC TADS effort and illustrates the overall
percent of time the aggregate of transmission facilities are available and in service This is an aggregate
20TADS Initiating Cause Code definitions are located at httpwwwnerccomdocspctadswgTADS_Definitions_Appendix_7_092909pdf
Figure 13 ALR6-14 by Region (Includes NERC-Wide)
Reliability Metrics Performance
29
value using sustained outages (automatic and non-automatic) for both lines and transformers operated
at 200 kV and above for each Regional Entity Interconnection and for NERC This metric was approved
by the NERC Operating and Planning Committees in September 2010
Assessment
Figure 14 shows the aggregate element availability percentage (APC) for transmission and transformers
facilities operated at 200 kV and above The values are all over 90 percent which shows excellent
system availability The RMWG recommends continued metric assessment for at least a few more years
in order to determine the value of this metric
Figure 14 2010 ALR6-15 Element Availability Percentage
Notably the Eastern Interconnection does not include Quebec or ERCOT ERCOT does not have any
transformers with low-side voltage levels 200 kV and above
Special Consideration
It should be noted that the non-automatic outage data needed to calculate this metric was only first
collected for the calendar year 2010 as part of the TADS process Therefore only one year of data for
this metric is available at this time
Reliability Metrics Performance
30
ALR6-16 Transmission System Unavailability
Background
This metric uses data and calculations directly from the NERC TADS effort and shows the overall percent
of time the aggregate of transmission facilities are unavailable due to automatic and non-automatic
outages This is an aggregate value using sustained automatic outages for both lines and transformers
operated at 200 kV and above for each Regional Entity and for NERC This metric was approved by the
NERC Operating and Planning Committees in December 2010
Assessment
Figure 15 and Figure 16 illustrate the 2010 aggregate unavailability percentage for AC circuits and
transformer facilities operated at 200 kV and above The values for AC circuits are all under 3 percent
which shows excellent system availability
The RMWG recommends continued metric assessment for at least a few more years in order to
determine the value of this metric
Special Consideration
It should be noted that the non-automatic outage data needed to calculate this metric was only first
collected for the calendar year 2010 as part of the TADS process Therefore only one year of data for
this metric is available at this time
Figure 15 2010 ALR6-16 Transmission System Unavailability
Reliability Metrics Performance
31
Figure 16 2010 ALR6-16 Transmission System Unavailability by Outage Type
Notably the Eastern Interconnection does not include Quebec or ERCOT Also ERCOT does not have
any transformers with low-side voltage levels 200 kV and above
ALR6-2 Energy Emergency Alert 3 (EEA3)
Background
This metric identifies the number of times Energy Emergency Alerts Level 3 (EEA3) are issued EEA3
events are firm-load interruptions due to capacity and energy deficiency EEA3 is currently reported
collected and maintained in NERCrsquos Reliability Coordination Information System (RCIS) and is defined in
Attachment 1 of the NERC Standard EOP-00221
21 The latest version of Attachment 1 for EOP-002 is available at
This metric identifies the number of times EEA3s are
issued The number of EEA3s per year provides a relative indication of performance measured at a
Balancing Authority or interconnection level As historical data is gathered trends in future reports will
provide an indication of either decreasing or increasing use of EEA3s signaling adequacy of the electric
supply system This metric can also be considered in the context of Planning Reserve Margin Significant
increases or decreases in EEA3 events with relatively constant Planning Reserve Margins could indicate
httpwwwnerccompagephpcid=2|20
Reliability Metrics Performance
32
volatility in the actual loads compared to forecast levels or changes in the adequacy of the bulk power
system required to meet load demands
Assessment
Figure 17 shows the number of EEA3 events during 2006 and 2010 from an RE level An interactive
presentation was released and available at the Reliability Indicatorrsquos page22
The Acadiana Load Pocket (ALP) is an area in south central Louisiana that has experienced regular
transmission constraints and numerous Energy Emergency Alert filings by the SPP Reliability Controller
(SPP RC) Transmission within ALP is owned by Entergy Lafayette Utilities System (LUS) and Cleco
Power LLC (Cleco) The transmission constraints within the ALP are primarily caused by the local area
load and the lack of generation located in close proximity to the load area
The number of EEA3rsquos
declared in 2010 returned to more traditional numbers The 2009 spike in EEA3 events in the SPP
Region that was driven by issues in the Acadiana Load Pocket (ALP) were not present in 2010
Special Considerations
Ideally the measure should capture only EEAs that are declared for reliability reasons and not for
economic factors The RMWG has not been able to differentiate these reasons for future reporting and
it has made a recommendation to the Reliability Coordinator Working Group (RCWG) to consider a
revised EEA declaration to exclude economic factors
The reason the EEA volume decreased from 2009 to 2010 in SPP was because the SPP ICT RC23
coordinated an operating agreement between the five operating companies in the ALP The operating
agreement included a cost sharing re-dispatch that alleviated the need of a Transmission Loading Relief
(TLR-5) declaration24
22The EEA3 interactive presentation is available on the NERC website at
During 2009 there was no operating agreement therefore an entity had to
provide Network and Native Load (NNL) relief when a TLR-5 was called by the ICT RC When the TLR-5
was the primary tool to control the post contingent loading in the ALP some of the BAs would have their
firm transmission curtailed to the point where they could no longer serve their load therefore the EEA
3 was needed to communicate a capacityreserve deficiency
httpwwwnerccompagephpcid=4|331|335 23Southwest Power Pool (SPP) Independent Coordinator of Transmission (ICT) Reliability Coordinator (RC) 24More information on Transmission Load Relief is contained in the IRO-006 standard which is located at httpwwwnerccomfilesIRO-006-4pdf In particular TLR-5 definitions are referenced on page 16 and 17
Reliability Metrics Performance
33
Figure 17 ALR6-2 Energy Emergency Alert 3 (EEA3) Counts by Region (2006-2010)
Cleco Power Entergy and LUS are currently constructing an estimated $200 million transmission
infrastructure improvement project to mitigate transmission constraints into ALP Construction of the
project is scheduled to be complete in 2012 Completion of the project should help alleviate some of
the transmission congestion in this area Energy Emergency Alerts filed by the SPP Regional Entity
continue to decline
SPP RTO continues to coordinate operating plans with the operating entities in this area Mitigation
plans and local operating guides in place are expected to provide sufficient flexibility should issues arise
NERC will continue to monitor this area for Reliability Impacts and coordinate any actions with the SPP
Reliability Coordinator and SPP Regional Entity
ALR 6-3 Energy Emergency Alert 2 (EEA2)
Background
Energy Emergency Alert 2 (EEA2) is to measure the number of events BAs declare for deficient capacity
and energy during peak load periods which may serve as a leading indicator of energy and capacity
shortfall in the adequacy of the electric supply system EEA2 provides a sense of the frequency of
precursor events to the more severe EEA3 declarations This metric measures the number of events
1 3 1 2 214
3 4 4 1 5 334
4 2 1 52
1
0
5
10
15
20
25
30
3520
0620
0720
0820
0920
1020
0620
0720
0820
0920
1020
0620
0720
0820
0920
1020
0620
0720
0820
0920
1020
0620
0720
0820
0920
1020
0620
0720
0820
0920
1020
0620
0720
0820
0920
1020
0620
0720
0820
0920
10
FRCC MRO NPCC RFC SERC SPP TRE WECC
2006-2009
2010
Region and Year
Reliability Metrics Performance
34
Balancing Authorities declare for deficient capacity and energy during peak load periods At this time
however this data reflects inclusion of Demand Side Resources that would not be indicative of
inadequacy of the electric supply system
The number of EEA2 events and any trends in their reporting indicates how robust the system is in
being able to supply the aggregate load requirements The historical records may include demand
response activations and non-firm load interruptions per applicable contracts within the EEA alerts per
its definition25
Assessment
Demand response is a legitimate resource to be called upon by balancing authorities and
do not indicate a reliability concern As data is gathered in the future reports will provide an indication
of either decreasing or increasing adequacy in the electric supply system EEA2 events called solely for
activation of demand response (controllable or contractually prearranged demand-side dispatch
programs) or interruption of non-firm load per applicable contracts should be excluded This metric can
also be considered in the context of the Planning Reserve Margin Significant increases or decreases in
EEA2 events with relatively constant Planning Reserve Margins could indicate volatility in the actual
loads compared to forecast levels or changes in the adequacy of the bulk power system required to
meet load demands
Figure 18 shows the number of EEA2 events by Regional Entity from 2006 to 2010 EEA2 interactive
version available on line by quarter and region26
25 The EEA2 is defined at
The general trend continues to show improved
performance which may have been influenced by the overall reduction in demand throughout NERC
caused by the economic downturn Specific performance by any one region should be investigated
further for issues or events that may affect the results Determining whether performance reported
includes those events resulting from the economic operation of DSM and non-firm load interruption
should also be investigated The RMWG recommends continued metric assessment
httpwwwnerccomfilesEOP-002-2pdf 26 EEA2 interactive version located at httpwwwnerccompagephpcid=4|331|341
Reliability Metrics Performance
35
Special Considerations
The intent of this metric is to measure only EEAs that are called for reliability reasons and not for
economic factors such as demand side management (DSM) and non-firm load interruption The
historical data for this metric may include events that were called for economic factors According to
the RCWG recent data should only include EEAs called for reliability reasons
ALR 6-1 Transmission Constraint Mitigation
Background
The RMWG completed a pilot with four regional entities Based on the results the RMWG expanded the
pilot data collection to all regions and the initial results of the data collection are shown in Figure 19
and Table 5 Based on the results of the pilot there is merit in continuing to assess this metric The
intent of this metric is to identify trends in the number of mitigation measures (Special Protection
Schemes (SPS) Remedial Action Schemes (RAS) and Operating Procedures) required to meet reliability
requirements By their nature SPS do not indicate an inherent weakness in the bulk power system
rather they are an indication of methods that are taken to operate the system through the range of
conditions it must perform This metric is only intended to evaluate the trend use of these plans and
whether the metric indicates robustness of the transmission system is increasing remaining static or
decreasing
1 27
2 1 4 3 2 1 2 4 5 2 5 832
4724
211
5 38 5 1 1 8 7 4 1 1
05
101520253035404550
2006
2007
2008
2009
2010
2006
2007
2008
2009
2010
2006
2007
2008
2009
2010
2006
2007
2008
2009
2010
2006
2007
2008
2009
2010
2006
2007
2008
2009
2010
2006
2007
2008
2009
2010
2006
2007
2008
2009
2010
FRCC MRO NPCC RFC SERC SPP TRE WECC
2006-2009
2010
Region and Year
Figure 18 ALR6-3 Energy Emergency Alert 2 (EEA2)
Reliability Metrics Performance
36
Assessment
The pilot data indicates a relatively constant number of mitigation measures over the time period of
data collected
Figure 19 ALR6-1 Transmission Constraint Mitigation by SPSRAS (2009-2014)
0102030405060708090
100110120
2009
2010
2011
2014
2009
2010
2011
2014
2009
2010
2011
2014
2009
2010
2011
2014
2009
2010
2011
2014
2009
2010
2011
2014
2009
2010
2011
2014
2009
2010
2011
2014
FRCC MRO NPCC RFC SERC SPP ERCOT WECC
Coun
t
Region and Year
SPSRAS
Reliability Metrics Performance
37
Table 5 ALR6-1 Transmission Constraint Mitigation by Operating ProcedureGuides (2009-2011)
ALR6-1 Transmission Constraint Mitigation by Operating ProcedureGuides (2009-2014)
2009 2010 2011 2014
FRCC 107 75 66
MRO 79 79 81 81
NPCC 0 0 0
RFC 2 1 3 4
SPP 39 40 40 40
SERC 6 7 15
ERCOT 29 25 25
WECC 110 111
Special Considerations
A certain number of SPS mitigation plans may be necessary to support reliable operation of the system
If the number of SPS increase over time this may indicate that additional transmission capacity is
required A reduction in the number of SPS may be an indicator of increased generation or transmission
facilities being put into service which may indicate greater robustness of the bulk power system In
general mitigation plans are a viable and valuable tool for effective operation of the bulk power system
In power system planning reliability operability capacity and cost-efficiency are simultaneously
considered through a variety of scenarios to which the system may be subjected Mitigation measures
are a method for optimizing a power system across these scenarios Changes in quantities of mitigation
plans may indicate year-on-year differences in the system being evaluated
Integrated Bulk Power System Risk Assessment
Introduction In developing eighteen metrics to measure acceptable levels of reliability it has become clear that any
such measurement of reliability must include consideration of the risks present within the bulk power
system in order for us to appropriately prioritize and manage these system risks The scope for the
Reliability Metrics Working Group (RMWG)27
27 The RMWG scope can be viewed at
includes a task to develop a risk-based approach that
provides consistency in quantifying the severity of events The approach not only can be used to
httpwwwnerccomfilezrmwghtml
Reliability Metrics Performance
38
measure risk reduction over time but also can be applied uniformly in event analysis process to identify
the events that need to be analyzed in detail and sort out non-significant events
The Operating Committee (OC) and Planning Committee (PC) endorsed the concepts and framework28 of
the risk-based approach in their September 2010 joint meeting and further supported the event severity
risk index (SRI) calculation29
Recommendations
in March 2011
bull NERC should embrace the use of risk assessment to identify trends in addition to lessons learned
in order to improve bulk power system reliability
bull The RMWG should continue to coordinate and communicate with the Event Analysis Working
Group (EAWG) to apply the SRI into the event analysis process and root cause analysis
bull As trend evaluations increase the knowledge of risks to the bulk power system data required to
support additional assessment should be gathered
Event Severity Risk Index (SRI)
Risk assessment is an essential tool for achieving the alignment between organizations people and
technology This will assist in quantifying inherent risks identifying where potential high risks exist and
evaluating where the most significant lowering of risks can be achieved Being learning organizations
the Electric Reliability Organization (ERO) Regional Entities and Registered Entities can use these tools
to focus on the areas of highest risk to reliability to provide a sound basis for developing results-based
standards and compliance programs Risk assessment also serves to engage all stakeholders in a
dialogue about specific risk factors and helps direct a strategic plan for risk reduction and early
detection
The SRI is a daily blended metric for which transmission loss generation loss and load loss events are
calculated Each element (transmission generation and load loss) is factored by the systemrsquos inventory
for that element to rate significant events appropriately On a yearly basis these daily performances
can be sorted in descending order to evaluate the year-on-year performance of the system
In order to test drive the concepts the RMWG applied these calculations against historically memorable
days to derive SRIs Once these calculations were complete they were reviewed and evaluated by
various stakeholders for reasonableness Based upon feedback modifications to the calculation were
made and assessed against the historic days performed This iterative process locked down the details
28 httpwwwnerccomdocspcrmwgIntegrated_Bulk_Power_System_Risk_Assessment_Concepts_Finalpdf 29 httpwwwnerccomdocspcrmwgSRI_Equation_Refinement_May6_2011pdf
Reliability Metrics Performance
39
for the calculation of SRI whose calculation from zero (no transmission line outages generation outages
or load lost in a day) to 1000 (a theoretical condition in which every transmission line all generation
units and all load lost across the system in a single day)
Figure 20 captures the calculated severity risk value for each of the days for each year benchmarked
with the historic significant events which were used to concept test the calculation Since there is
significant disparity between days the bulk power system is stressed compared to those that are
ldquoroutinerdquo and ldquoherordquo days of the year where the system performed extremely well the curve is depicted
using a logarithmic scale Each yearrsquos data is sorted in descending order striking a characteristic shape
At the left-side of the curve the days in which the system is severely stressed are plotted The central
more linear portion of the curve identifies the routine day performance while the far right-side of the
curve shows the values plotted for days in which almost all lines and generation units are in service and
essentially no load is lost
The trends on the chart below show that 2009 and 2010 had fewer extreme days than 2008 Routine
daily performance appears generally consistent across all three years Figure 20 captures the days for
each year benchmarked with historically significant events
In Figure 20 NERCrsquos event categories and SRI ratings are directly related As the SRI increases the
category or severity of the event increases Historical events are also shown to relate modern
reliability measurements to give a perspective of how a well-known event would register on the SRI
scale
The event analysis process30
30
benefits from the SRI as it enables a numerical analysis of an event in
comparison to other events By this measure an event can be prioritized by its severity In a severe
event this is unnecessary However for events that do not result in severe stressing of the bulk power
system this prioritization can be a challenge By using the SRI the event analysis process can decide
which events to learn from and reduce which events to avoid and when resilience needs to be
increased under high impact low frequency events as shown in the blue boxes in the figure
httpwwwnerccompagephpcid=5|365
Reliability Metrics Performance
40
Figure 20 NERC Annual Daily Severity Risk Index (SRI) Sorted Descending with Historic Benchmark Days
Other factors that impact severity of a particular event to be considered in the future include whether
equipment operated as designed and resulted in loss of load from a reliability perspective (intentional
and controlled load-shedding) Mechanisms for enabling ongoing refinement to include the historic and
simulated events for future severity risk calculations are being explored
Reliability Metrics Performance
41
Integrated Reliability Index Concepts In December 2010 the RMWG was challenged by the OC and PC to develop a single index concept to
measure the universe of risks associated with the bulk power system As a result the integrated
reliability index (IRI) concepts were proposed31
Figure 21
the three components of which were defined to
quantify each specific risk aspect They are titled the Event Driven Index (EDI) StandardsStatute Driven
Index (SDI) and Condition Driven Index (CDI) illustrated in with measures associated with
system events standards compliance and eighteen performance metrics The development of an
integrated reliability index aims to inform increase transparency and quantify the effectiveness of risk
reduction or mitigation actions The goal is to provide the industry meaningful trends of the BPSrsquos
performance and guidance on how the industry can improve reliability and support risk-informed
decision making Once completed the IRI will facilitate holistic assessment of performance Finally the
IRI should help overcome concern and confusion about how many metrics are being analyzed for system
reliability assessments
Figure 21 Risk Model for Bulk Power System
The integrated model of event-driven condition-driven and standardsstatute-driven risk information
can be constructed to illustrate all possible logical relations between the three risk sets Due to the
nature of the system there may be some overlap among the components
31 httpwwwnerccomdocspcrmwgIntegrated_Reliability_Index_WhitePaper_DRAFTpdf
Event Driven Index (EDI)
Indicates Risk from
Major System Events
Standards Statute Driven
Index (SDI)
Indicates Risks from Severe Impact Standard Violations
Condition Driven Index (CDI)
Indicates Risk from Key Reliability
Indicators
Reliability Metrics Performance
42
The Three Components of the IRI The three components of the IRI work together as shown in Figure 22 to comprise a full picture of the
state of reliability
Figure 22 An overview of the components that comprise the Integrated Reliability Index (IRI)
Event-Driven Indicators (EDI)
The Event-Driven Indicator provides a basis for prioritization of events based on bulk power system
integrity equipment performance and engineering judgment This indicator can serve as a high value
risk assessment tool to be used by stakeholders to investigate and evaluate disturbance history and
measure the severity of these events The relative ranking of events requires industry expertise agreed-
upon goals and engineering judgment The EDI is a derivative of SRI results for a specific time period
but it transforms that performance into a form of an availability index These calculations will be further
refined as feedback is received
Condition-Driven Indicators (CDI)
The Condition-Driven Indicators focus on a set of measurable system conditions (performance
measures) to assess bulk power system reliability These reliability indicators identify factors that
positively or negatively impact reliability and are early predictors of the risk to reliability from events or
unmitigated violations A collection of these indicators measures how close reliability performance is to
the desired outcome and if the performance against these metrics is constant or improving
Reliability Metrics Performance
43
StandardsStatute-Driven Indicators (SDI)
The StandardsStatute-Driven Indicator is a calculation of success of compliance based upon the subset
of high-value standards and is divided by the number of participations who could have received the
violation within the time period considered Also based on these factors known unmitigated violations
of elevated risk factor requirements are weighted higher than lower risk factors The index decreases if
the compliance improvement is achieved over a trending period
IRI Index Calculation As with the SRI the IRI is based on an importance weighting factor which the RMWG can modify over
time after gaining experience with the new metric as well as consideration of feedback from industry
At this time the RMWG believes some form of blended weighting may serve to start to populate IRI
characteristic curves at a high and generic level Based upon feedback from stakeholders this approach
may change or as discussed below weighting factors may vary based on periodic review and risk model
update The RMWG will continue the refinement of the IRI calculation and consider other significant
factors that impact reliability (eg intentional and controlled load-shedding) further it will explore
developing mechanisms for enabling ongoing refinement which should be influenced by a wide set of
stakeholders
RMWG recommends the Event Driven Index (EDI) be weighted the highest (50 percent) since events
actually occurred indicating how the system was performing The Condition Driven Index (CDI) and
StandardsStatute Driven Index (SDI) are weighted 25 each since they are indicators of potential risks
to BPS reliability IRI can be calculated as follows
IRI is intended to be a composite metric which integrates several forms of individual risks to the bulk
power system Since the three components range across many stakeholder organizations these
concepts are developed as starting points for continued study and evaluation Additional supporting
materials can be found in the IRI whitepaper32
IRI Recommendations
including individual indices calculations and preliminary
trend information
For the IRI more investigation should be performed to determine the best way to integrate EDI CDI
and SDI into an Integrated Reliability Index (IRI) that quantitatively represents the reliability of the bulk
32 The IRI whitepaper can be found at httpwwwnerccomdocspcrmwgIntegrated_Reliability_Index_WhitePaper_DRAFTpdf
Reliability Metrics Performance
44
power system To this end study into determining the amount of overlap between the components is
necessary RMWG is currently working to determine the proper amount of overlap between the IRI
components
Also the CDI component of the IRI needs to be solidified This is especially true with the CDI More
accurate metric data is needed to paint a fuller picture of the CDI Many of the metrics used to calculate
the CDI are new or they have limited data Compared to the SDI which counts well-known violation
counts and the EDI which uses the well-defined CDI the CDI lacks the depth of rigor that the other two
components have acquired through their years of data RMWG is currently working to improve the CDI
Reliability Metrics Conclusions and Recommendations Among the eighteen metrics that address the characteristics of an adequate level of reliability (ALR)
metric trends indicate the system is performing better in the following seven areas
bull ALR1-3 Planning Reserve Margin
bull ALR1-4 BPS Transmission Related Events Resulting in Loss of Load
bull ALR2-5 Disturbance Control Events Greater than Most Severe Single Contingency
bull ALR6-2 Energy Emergency Alert 3 (EEA3)
bull ALR6-3 Energy Emergency Alert 2 (EEA2)
bull ALR6-11 Automatic Transmission Outages Caused by Protection System Misoperations
bull ALR6-13 Automatic Transmission Outages Caused by Failed AC Substation Equipment
Assessments have been made in other performance categories A number of them do not have
sufficient data to derive any conclusions from the results The RMWG recommends continued data
collection and assessment of these metrics If a metric does not yield any trend in a five-year reporting
period the metric will be modified or withdrawn
For the IRI more investigation should be performed to determine the overlap of the components (CDI
EDI and SDI) The CDI should be more thoroughly solidified as an index by collecting more data over
time
Transmission Equipment Performance
45
Transmission Equipment Performance Introduction The Transmission Availability Data System (TADS) effort began with the establishment of a TADS task force
by the NERC Planning Committee in October 2006 On October 27 2007 the NERC Board of Trustees
approved the collection of transmission automatic outage data beginning in calendar year 2008 (Phase I)
Subsequently on October 29 2008 the NERC Board approved the collection of Non-Automatic Outage data
that began for Calendar year 2010 (Phase II)
This chapter provides reliability performance analysis of the transmission system by focusing on the trends
of Automatic Outage data from calendar year 2008 thru 2010 Since only one year of Non-Automatic
Outage data has been collected that data will not be assessed in this report
When calculating bulk power system performance indices care must be exercised when interpreting results
as misinterpretation can lead to erroneous conclusions regarding system performance With only three
years of data in the smaller regions it is not clear whether a regionrsquos yearly outage variation compared to
the average is due to random statistical variation or that particular year is significantly different in
performance However on a NERC-wide basis after three years of data collection there is enough
information to accurately determine whether the yearly outage variation compared to the average is due to
random statistical variation or the particular year in question is significantly different in performance33
Performance Trends
Transmission performance information has been provided by Transmission Owners (TOs) within NERC
through the NERC TADS (Transmission Availability Data System) process The data presented reflects
Momentary and Sustained AC Automatic outages of transmission elements that operate at voltages ge 200 kV
(including the low side of transformers) with the criteria specified in the TADS process The following
elements listed below are included
bull AC Circuits ge 200 kV (Overhead and Underground Circuits) Radial circuits are included
bull DC Circuits with ge +-200 kV DC voltage
bull Transformers with ge 200 kV low-side voltage and
bull ACDC Back-to-Back (BTB) Converters with ge 200 kV AC voltage on both sides
33The detailed Confidence Interval computation is available at httpwwwnerccomdocspctadstfTADS_Nov_2_2007APPENDIX_C_Confidence_Intervalpdf
Transmission Equipment Performance
46
AC Element Outage Summary and Leading Causes Table 6 shows the 2008 2009 and 2010 NERC total AC transmission element inventory and a summary of
the associated outages As expected in general the number of circuits increased from year to year due to
new construction or re-construction to higher voltages For every outage experienced on the transmission
system cause codes are identified and recorded according to the TADS process Causes of both momentary
and sustained outages have been indicated These causes are analyzed to identify trends and similarities
and to provide insight into what could be done to possibly prevent future occurrences
Figure 23 and Figure 24 describe the top ten initiating cause codes for sustained and momentary automatic
outages combined from 2008-2010 Based on the two figures the relationship between the total number of
outages and total outage hours can be seen Failed AC Substation Equipment and Failed AC Circuit
Equipment only account for 15 percent of the total number of outages but account for 65 percent of the
total outage hours The two largest causes of outages within NERC (ldquoLightingrdquo and ldquoWeather excluding
Lightningrdquo) account for 34 percent of the total number of outages
The next three Human Error Failed Protection System Equipment and Failed AC Circuit Equipment have
very similar totals and should all be considered significant focus points in reducing the number of Sustained
Automatic Outages for all elements
Transmission Equipment Performance
47
Table 6 NERC - All AC Elements Sustained and Momentary Outage Performance Summary
2008 Number of Outages
AC Voltage
Class
No of
Circuits
Circuit
Miles Sustained Momentary
Total
Outages Total Outage Hours
200-299kV 4369 102131 1560 1062 2622 56595
300-399kV 1585 53631 793 753 1546 14681
400-599kV 586 31495 389 196 585 11766
600-799kV 110 9451 43 40 83 369
All Voltages 6650 196708 2785 2051 4836 83626
2009 Number of Outages
AC Voltage
Class
No of
Circuits
Circuit
Miles Sustained Momentary
Total
Outages Total Outage Hours
200-299kV 4468 102935 1387 898 2285 28828
300-399kV 1619 56447 641 610 1251 24714
400-599kV 592 32045 265 166 431 9110
600-799kV 110 9451 53 38 91 442
All Voltages 6789 200879 2346 1712 4038 63094
2010 Number of Outages
AC Voltage
Class
No of
Circuits
Circuit
Miles Sustained Momentary
Total
Outages Total Outage Hours
200-299kV 4567 104722 1506 918 2424 54941
300-399kV 1676 62415 721 601 1322 16043
400-599kV 605 31590 292 174 466 10442
600-799kV 111 9477 63 50 113 2303
All Voltages 6957 208204 2582 1743 4325 83729
Note The NERC table does not show redacted outages DC Circuit outages Transformer outages or ACDC
converter outages
Transmission Equipment Performance
48
Figure 23 NERC - Top Ten Sustained and Momentary Outages by Initiating Cause Code for All Elements
Figure 24 NERC - Top Ten Sustained Outage Hours by Cause Code
198
151
80
7271
6943
33
27
188
68
Lightning
Weather excluding lightningHuman Error
Failed AC Substation EquipmentFailed Protection System EquipmentFailed AC Circuit Equipment Foreign Interference
Power System Condition
Fire
Unknown
Remaining Cause Codes
299
246
188
58
52
42
3619
16 12 31 Failed AC Substation EquipmentFailed AC Circuit Equipment Weather excluding lightningUnavailable
Other
Fire
Unknown
Human Error
Failed Protection System EquipmentForeign Interference
Remaining Cause Codes
Transmission Equipment Performance
49
Transmission Monthly Outages Figure 25 displays the total number of Automatic Outages on a per-month basis The three months with the
highest total of outages were June July and August From a seasonal perspective winter had a monthly
average of 281 outages These include the months of November-March Summer had an average of 429
outages Summer included the months of April-October
Figure 25 Number of Outages by Month for AC Circuits (2008-2010)
This figure does not show redacted outages DC Circuit outages Transformer outages or ACDC Converter
outages
Outage Initiation Location For every outage experienced on the transmission system the outage initiation code is identified and
recorded according to the TADS process The outage initiation code can be analyzed to identify trends and
similarities and to provide insight into what could be done to possibly prevent future occurrences
The ldquoOutage Initiation Coderdquo describes where an automatic outage was initiated on the power system The
five codes are as follows
bull Element-Initiated
bull Other Element-Initiated
bull AC Substation-Initiated
bull ACDC Terminal-Initiated (for DC circuits)
bull Other Facility Initiated any facility not included in any other outage initiation code
JanuaryFebruar
yMarch April May June July August
September
October
November
December
2008 238 229 257 258 292 437 467 380 208 176 255 236
2009 315 201 339 334 398 553 546 515 351 235 226 294
2010 444 224 269 446 449 486 639 498 351 271 305 281
3 Year AVG 332 218 288 346 380 492 551 464 303 227 262 270
0
100
200
300
400
500
600
700
Out
ages
Transmission Equipment Performance
50
Notably the protection system is not part of an ldquoAC Substationrdquo or an ldquoACDC Terminalrdquo If a protection
system misoperates and initiates an outage it will be classified as ldquoOther-Facility Initiatedrdquo The following
Figures show the initiating location of the Automatic outages from 2008 to 2010
With both Momentary and Sustained Automatic Outages taken into account the outage was initiated on the
Element more than 67 percent of the time as shown in Figure 26 and Figure 27
When only the Sustained Automatic Outages are analyzed the outage initiation on both AC Substation and
Other Facility increased by 34 percent and 32 percent respectively Outages initiated on the Element itself
decreases by 78 percent as shown in Figure 26 and 27 For only the Momentary Automatic Outages the
outage initiation on the Element increases by 19 percent compared to Sustained Outages Element initiated
outages make up over 78 percent of the total outages when analyzing only Momentary Outages
Figure 26
Figure 27
Transmission Outage Events Figure 28 illustrates the relationship between the numbers of Automatic Outages associated per TADS
event 2008 2009 and 2010 tend to follow the same trend The largest number of Automatic Outages per
TADS event is fourteen in 2010 thirteen in 2009 and eight in 2008 There are around 70 to 100 TADS
events that contain between fourteen and three Automatic Outages (see below) There are around 330 to
400 TADS events that contain two or more Automatic Outages The rest of the events only contain one
Automatic Outage As noted in the lower right hand corner below the total number of Events in 2008 to
2010 ranged from 3920 to 4569 events per year Nearly 90 percent or more of the events contained one
Automatic Outage
Figure 26 Sustained Automatic Outage Initiation
Code
Figure 27 Momentary Automatic Outage Initiation
Code
Transmission Equipment Performance
51
Transmission Outage Mode Figure 29 and Figure 30 show the percentage of Outage Modes The ldquoOutage Mode Coderdquo describes
whether one Automatic Outage is related to other Automatic Outages A Single Mode outage is an
Automatic Outage of a single Element which occurs independently of any other Automatic Outages (if any)
A ldquoDependent Mode Initiating Outagerdquo is an Automatic Outage of a single Element that initiates one or more
subsequent Element Automatic Outages A ldquoDependent Mode Outagerdquo is an Automatic Outage of an
Element which occurred as a result of an initiating outage whether the initiating outage was an Element
outage or a non-Element outage A ldquoCommon Mode Outagerdquo is one of two or more Automatic Outages with
the same Initiating Cause Code and where the outages are not consequences of each other and occur nearly
simultaneously A ldquoCommon Mode Initiating Outagerdquo is a Common Mode Outage that initiates one or more
subsequent Automatic Outages
Over 72 percent of the total outages occurred on the bulk power system are Single Mode Outages The next
largest mode is Dependent with over 11 percent of the total outages being in this category For only
Sustained Automatic Outages outages related to each other increase with Dependent mode accounting for
13 percent of the outages and Common mode accounting for close to 11 percent of the outages
Independent Sustained outages still account for the largest portion with nearly 70 percent being Single
mode When just analyzing Momentary Automatic Outages Associated outages decrease with Dependent
Figure 28 Event Histogram (2008-2010)
Transmission Equipment Performance
52
mode accounting for only 9 percent of the outages The Common Mode percentage decreases while
Dependent Mode Initiating percentage increases compared to Sustained Outages Independent Momentary
outages account for the largest portion with over 76 percent being Single Mode
An investigation into the root causes of Dependent and Common mode events which include three or more
Automatic Outages (indentified in the TADS 2008 to 2010 data) should be a high priority Some protection
systems are designed to trip three or more circuits but some events go beyond what is designed Some also
have misoperations associated with multiple outage events
Conclusions On a NERC wide average basis automatic transmission outage rate is improving from 2008 to 2010 based on
reported data Considering both automatic and non-automatic outages 2010 records indicate transmission
element availability percentage is very high and exceeds 95 The unavailability rate for AC circuits and
transformers are only 15 and 29 respectively
The cause codes of Human Error Failed Protection System Equipment and Failed AC Circuit Equipment
should be considered significant focus points in reducing the number of Sustained Automatic Outages for all
elements A deeper look into the root causes of Dependent and Common mode events which include three
or more Automatic Outages (indentified in the TADS 2008 to 2010 data) should be a high priority Some
protection systems are designed to trip three or more circuits but some events go beyond what is designed
Some also have misoperations associated with multiple outage events
Figure 29 Sustained Automatic Outage Mode code Figure 30 Momentary Automatic Outage Mode code
Generation Equipment Performance
53
Generation Equipment Performance Introduction The development of the Generating Availability Data System (GADS) began in 1982 This series of databases
is used to voluntarily collect record and retrieve operating information By pooling individual unit
information with likewise units generating unit availability performance can be calculated providing
opportunities to identify trends and generating equipment reliability improvement opportunities The
information is used to support equipment reliability availability analyses and risk-informed decision-making
by system planners generation owners assessment modelers manufacturers and contractors etc Reports
and information resulting from the data collected through GADS are now used for benchmarking and
analyzing electric power plants
Currently the data collected through GADS contains 72 percent of the North American generating units
with generating capacity of 20 MW or higher34 Additionally many of the newer combined-cycle plants are
not reporting information and therefore a full view of each unit type is not presented Rather a sample of
all the units in North America that fit a given more general category is provided35 for the 2008-201036
Generation Key Performance Indicators
assessment period
Three key performance indicators37
In
the industry have used widely to measure the availability of generating
units (see Terms Used in This Report section for their calculation parameters) are Equivalent Availability
Factor (EAF) Net Capacity Factor (NCF) and Equivalent Forced Outage Rate ndash Demand (EFORd)
Table 7 the North American fleet average EAF NCF and EFORd compared to unit age for all generating
units with a capacity of 20 MW and higher is provided for the years 2008-2010 The EAF shows a decline
during the last three years NCF is up and down while the EFORd appears to be increasing As expected the
fleet of units reported to GADS is aging overall with the fossil units being about 12 years older than the
average age
34 httpwwwnerccomdocspcgadstfGADSTF_Recommendation_Report_02-18-2011_FINALpdf 35GADS contains some 1500+ units under 20 MW that is not included in this report These units are excluded because most units are not base-loaded and are in peaking operation
3684 percent of the 2010 dataset is available at this time while the 2008 and 2009 dataset is complete 37 httpwwwnerccompagephpcid=4|43
Generation Equipment Performance
54
Table 7 General Availability Review of GADS Fleet Units by Year
2008 2009 2010 Average
Equivalent Availability Factor (EAF) 8776 8774 8678 8743
Net Capacity Factor (NCF) 5083 4709 4880 4890
Equivalent Forced Outage Rate -
Demand (EFORd) 579 575 639 597
Number of Units ge20 MW 3713 3713 3713 3713
Average Age of the Fleet in Years (all
unit types) 303 311 321 312
Average Age of the Fleet in Years
(fossil units only) 422 432 440 433
Figure 31 provides the average forced outage hours (FOH) maintenance outage hours (MOH) and planned
outage hours (POH) for all units reporting 20 MW or larger During this three-year period the average FOH
291 hours average MOH is 163 hours average POH is 470 hours
Figure 31 shows a large increase in forced and maintenance events The average age of the units with a
capacity of 20MW and higher in 2009 is 316 years old However the average age of fossil units in 2010 is
442 years old These fossil units are the backbone of all operating units providing the base-load power
continuously and nearly 50 percent of all energy annually There appears to be no increase allocated for
annualsemi-annual maintenance (ie planned outages) for the older generating units The increase of
000100002000030000400005000060000700008000090000
100000
2008 2009 2010
463 479 468
154 161 173
288 270 314
Hou
rs
Planned Maintenance Forced
Figure 31 Average Outage Hours for Units gt 20 MW
Generation Equipment Performance
55
maintenance outage hours reflects an increased need to fix problems that cannot be deferred until the next
annualsemi-annual repairs As a result it shows one of two things are happening
bull More or longer planned outage time is needed to repair the aging generating fleet
bull More focus on preventive repairs during planned and maintenance events are needed
Multiple Unit Forced Outages and Causes Table 8 provides the annual multiple-unit forced outage trips resulting from the same cause for each of the
assessments years 2008-2010 respectively The ldquosingle unitrdquo trips are large units with a Net Dependable
Capacity of 750 MW or more The trips of ldquotwo unitsrdquo or more is any combination of unit capacity with the
total amount of lost capacity more than 750 MW
Table 8 also presents more information on the forced outages During 2008-2010 there were a large
number of double-unit outages resulting from the same event Investigations show that some of these trips
were at a single plant caused by common control and instrumentation for the units The incidents occurred
several times for several months and are a common mode issue internal to the plant
Table 8 Number of Multiple Unit Forced Outages and FrequencyYear
2008 2009 2010
Type of
Trip
of
Trips
Avg Outage
Hr Trip
Avg Outage
Hr Unit
of
Trips
Avg Outage
Hr Trip
Avg Outage
Hr Unit
of
Trips
Avg Outage
Hr Trip
Avg Outage
Hr Unit
Single-unit
Trip 591 58 58 284 64 64 339 66 66
Two-unit
Trip 281 43 22 508 96 48 206 41 20
Three-unit
Trip 74 48 16 223 146 48 47 109 36
Four-unit
Trip 12 77 19 111 112 28 40 121 30
Five-unit
Trip 11 1303 260 60 443 88 19 199 10
gt 5 units 20 166 16 93 206 50 37 246 6
Loss of ge 750 MW per Trip
The high number of five-unit trips in 2008 was due to Hurricane Ike hitting the Gulf Coast The highest total
number of multiple unit trips occurred in 2009 though as mentioned before the data collection for 2010 is
incomplete at this time The majority of 2009 multiple unit trips have three main causes (in order by
Generation Equipment Performance
56
number of events) transmission lack of fuel and storms A summary of the three categories for single as
well as multiple unit outages (all unit capacities) are reflected in Table 9
Table 9 Common Causes of Multiple Unit Forced Outages (2009)
Cause Number of Events Average MW Size of Unit
Transmission 1583 16
Lack of Fuel (Coal Mines Gas Lines etc) Not
in Operator Control
812 448
Storms Lightning and Other Acts of Nature 591 112
Some of the transmission outages based on storms in 2009 have been caused by the same reasons because
the storms may have caused transmission interference However the plants reported the problems
inconsistently with either the transmission interference or storms cause code Therefore they are depicted
as two different causes of forced outage
Marked transmission outages in 2009 were quite high Thirty-five percent came from one utility with a large
number of hydroelectric units The company related the trips to various problems including weather
(lightning storms) wildlife ldquoline bumpsrdquo and problems on the receiving end of the transmission line Nine
hundred and eighty-five transmission trips (62 percent) were from hydroelectric units38
In 2009 only ten transmission trips resulted in a loss of 750 MW or more per trip Twenty two generating
plants were affected by the ten trips Causes for the trips include feeder line trips (1 trip) breakers in the
switchyard (8 trips) personnel errors (2 trips) and unknown (10 trips)
The ldquoLack of Fuelrdquo outages are of interest as these events occur during the times when a unit is available to
operate but there is an interruption in fuels to operate the facilities These events do not include
interruptions of fuel due to contracts Rather the cause code is designed to account for units that are
expecting fuel and it is unavailable when requested Table 10 presents the distribution of ldquoLack of Fuelrdquo
events by NERC Region and Table 11 presents the unit types affected
38 The average size of the hydroelectric units were small ndash 335 MW
Generation Equipment Performance
57
Of the units that report ldquoLack of Fuelrdquo 78 percent of the units are oil-fired 15 percent of the units are gas-
fired and the remaining units are various other fuels Table 12 provides the top causes of forced outage for
several unit types For fossil units ldquoLack of Fuelrdquo as the number three cause behind waterwall tube leaks
and superheater tube leaks
Table 10 Forced Outages Due to Lack of Fuel by Region
Region Number of Lack of Fuel
Problems Reported
FRCC 0
MRO 3
NPCC 24
RFC 695
SERC 17
SPP 3
TRE 7
WECC 29
One company contributed to the majority of oil-fired lack of fuel events The units at the company are
actually dual-fuels (oil and gas) but market nominated gas monitoring causes the units to be on forced
outage nightly The units need gas to start up so they can run on oil When they shut down the units must
switch to gas to clean themselves With the gas restriction the unit canrsquot start and the unit goes on a
forced outage Until the band is lifted the two units will continue to be on a forced outage cycle
Event records also provide descriptions of why the unit was without fuel with the majority of descriptions
bull Temperatures affecting gas supply valves
bull Unexpected maintenance of gas pipe-lines
bull Compressor problemsmaintenance
Generation Equipment Performance
58
Table 11 Unit Type Profile of Forced Outages Due to Lack of Fuel
Unit Types Number of Lack of Fuel Problems Reported
Fossil 642
Nuclear 0
Gas Turbines 88
Diesel Engines 1
HydroPumped Storage 0
Combined Cycle 47
Generation Equipment Performance
59
Table 12 Causes of Forced Outage for Different Unit Types (2008-2010)
Fossil - all MW sizes all fuels
Rank Description Occurrence per Unit-year
MWH per Unit-year
Average Hours To Repair
Average Hours Between Failures
Unit-years
1 Waterwall (furnace wall) 0590 134106 59 3250 3868 2 Second Superheater
Leaks 0180 5182 60 3228 3868
3 Lack of Fuel (coal mines gas lines etc) where the operator is not in control
0480 4701 18 26 3868
Combined-Cycle blocks Rank Description Occurrence
per Unit-year
MWH per Unit-year
Average Hours To Repair
Average Hours Between Failures
Unit-years
1 HP Turbine Buckets Or Blades
0020 4663 1830 26280 466
2 Turbine Control Valves 0040 2777 100 7200 466 3 Gas Turbine Compressor -
High Pressure Shaft 0010 2266 663 4269 466
Nuclear units - all Reactor types Rank Description Occurrence
per Unit-year
MWH per Unit-year
Average Hours To Repair
Average Hours Between Failures
Unit-years
1 LP Turbine Buckets or Blades
0010 26415 8760 26280 288
2 Containment Structure 0010 9233 1226 26262 288 3 Feedwater Pump Local
Controls 0020 7620 692 12642 288
Simple-cycle gas turbine jet engines Rank Description Occurrence
per Unit-year
MWH per Unit-year
Average Hours To Repair
Average Hours Between Failures
Unit-years
1 Main Transformer 0030 1611 1016 20709 4181 2 Other Gas Turbine
Controls And Instrument Problems
0120 428 70 2614 4181
3 Other Gas Turbine Problems
0090 400 119 1701 4181
Generation Equipment Performance
60
2008-2010 Review of Summer versus Winter Availability To address seasonality of unit availability unit information for the months of June to September (summer)
and December through February (winter) were pooled to calculate force events during these timeframes for
2008-201039 Figure 32 shows the Equivalent Availability Factor (EAF) is three percentage points higher and
the Equivalent Forced Outage Rate - Demand (EFORd) is more than a half of a percentage point lower in the
summer period than in winter period This means the units were more reliable with less forced events
during high-demand times during the summer than during the winter seasons The generating unitrsquos
capability has a resulting higher Net Capacity Factor (NCF) of 45 percentage points in the summer season
for 2008-2010
During the spring season (March-May) 77 percent of the units took a planned outage (PO) for an average
231 hours (or 96 days) In fall (October-November) only 42 percent of the units experienced a PO and the
average duration was shorter ndash 134 hours (or 56 days) A few units took both spring and fall planned
outages although this is rare Based on this assessment the generating units are prepared for the summer
peak demand The resulting availability indicates that this maintenance was successful which is measured
by an increased EAF and lower EFORd
Figure 32 Summer-Winter Average EAF NCF and EFORd (2008-2010)
Conclusions and Recommendations During 2008-2010 the average Equivalent Availability Factor (EAF) which measures the overall availability
of generating units decreased At the same time the Net Capacity Factor (NCF) an indicator of energy
production increased The average number of forced outages in 2010 is greater than in 2008 while at the
same time the average planned outage times have decreased As a result the Equivalent Forced Outage
Rate ndash Demand (EFORd) also increased illustrating that more units have experienced forced events during
39 A study of peak periods was conducted by the NERC Generating Availability Trend Evaluation (GATE) Working Group several years ago see httpwwwnerccomfilesSeasonal-Performance-Trendspdf
9116
5343
396
8818
4896
441
0 10 20 30 40 50 60 70 80 90 100
EAF
NCF
EFORd
Percent ()
Winter
Summer
Generation Equipment Performance
61
peak-demand times in 2010 than in the previous two years Potentially with shorter planned outage
periods in 2010 there may be less time to repair equipment and prevent forced unit outages
There are warnings that units are not being maintained as well as they should be In the last three years
there has been an increase in Equivalent Forced Outage Rate ndash Demand (EFORd) This indicator measures
the rate of forced outage events on generating units during periods of load demand To confirm this
problem forced outage hours jumped from 270 to 314 hours per unit between 2009 and 2010 At the same
time maintenance events also increased by 12 hours per unit Planned outage events remain constant The
resulting conclusions from this trend are
bull More or longer planned outage time is needed to repair the generating fleet Whether age is the
cause of the increase need for planned outage time remains unknown and further investigation into
the cause for longer planned outage time is necessary
bull More focus on preventive repairs during planned and maintenance events are needed
There are many multiple unit forced outages due to lack of fuel The majority of multiple unit trips have
three main causes transmission lack of fuel and storms With special interest in the forced outages due to
ldquoLack of Fuelrdquo additional analysis revealed that 77 percent of the units experiencing unexpected fuel
stoppage are oil-fired fossil units while gas-fired units experienced 15 percent
Generating units continue to be more reliable during the peak summer periods
Disturbance Event Trends
62
Category 1 An event resulting in one or more of the following a Unintended loss of three or more BPS elements caused by
common mode failure b Failure or misoperation of an SPSRAS c System-wide voltage reduction of 3 or more d Unintended BPS system separation resulting in an island of
100 MW to 999 MW e Unplanned evacuation from a control center facility with BPS
SCADA functionality for 30 minutes or more Category 2 An event resulting in one or more of the following
a Complete loss of all BPS control center voice communication system(s) for 30 minutes or more
b Complete loss of SCADA control or monitoring functionality for 30 minutes or more
c Voltage excursions equal to or greater than 10 lasting more than five minutes
d Loss of off-site power (LOOP) to a nuclear generating station e Unintended system separation resulting in an island of 1000
MW to 4999 MW f Unintended loss of 300MW or more of firm load for more
than 15 minutes g Violation of an Interconnection Reliability Operating Limit
(IROL) for more than 30 minutes Category 3 An event resulting in one or more of the following
a The loss of load or generation of 2000 MW or more in the Eastern Interconnection or
b Western Interconnection or 1000 MW or more in the ERCOT or Queacutebec Interconnections
c Unintended system separation resulting in an island of 5000 MW to 10000 MW
d Unintended system separation resulting in an island of Florida from the Eastern Interconnection
Category 4 An event resulting in one or more of the following a The loss of load or generation from 5001 MW to 9999 MW b Unintended system separation resulting in an island of more
than 10000 MW (with the exception of Florida as described in Category 3c)
Category 5 An event resulting in one or more of the following a The loss of load of 10000 MW or more b The loss of generation of 10000 MW or more
Figure 33 BPS Event Category
Disturbance Event Trends Introduction The purpose of this section is to report event
analysis trends from the beginning of event
analysis field test40
One of the companion goals of the event
analysis program is the identification of trends
in the number magnitude and frequency of
events and their associated causes such as
human error equipment failure protection
system misoperations etc The information
provided in the event analysis database (EADB)
and various event analysis reports have been
used to track and identify trends in BPS events
in conjunction with other databases (TADS
GADS metric and benchmarking database)
to the end of 2010
The Event Analysis Working Group (EAWG)
continuously gathers event data and is moving
toward an integrated approach to analyzing
data assessing trends and communicating the
results to the industry
Performance Trends The event category is classified41
Figure 33
as shown in
with Category 5 being the most
severe Figure 34 depicts disturbance trends in
Category 1 to 5 system events from the
40 httpwwwnerccomdocseawgGalloway-Industry-EA-Field-Test-102210pdf 41httpwwwnerccomfiles2011-05-0220Event_Analysis_Process_Phase20220Field20Test20Draft20-20Final20-20For20postingpdf
Disturbance Event Trends
63
beginning of event analysis field test to the end of 201042
Figure 34 Event Category vs Date for All 2010 Categorized Events
From the figure in November and December
there were many more category 1 and 2 events than in October This is due to the field trial starting on
October 25 2010
In addition to the category of the events the status of the events plays a critical role in the accuracy of the
data By examining Figure 35 over 80 of the events reported in 2010 have been closed This means that
the category root cause and other important information have been sufficiently finalized in order for
analysis to be accurate for each event At this time there is not enough data to draw any long-term
conclusions about event investigation performance
42 Documents for the EA Field Test are located at httpwwwnerccompagephpcid=5|365
2
12 12
26
3
6 5
14
1 1
2
0
5
10
15
20
25
30
35
40
45
October November December 2010
Even
t Cou
nt
Category 3 Category 2 Category 1
Disturbance Event Trends
64
Figure 35 Event Count vs Status (All 2010 Events with Status)
By drilling down into the cause code for each closed 2010 event Figure 36 shows the top 3 event causes
From the figure equipment failure and protection system misoperation are the most significant causes for
events Because of how new and limited the data is however there may not be statistical significance for
this result Further trending of cause codes for closed events and developing a richer dataset to find any
trends between event cause codes and event counts should be performed
Figure 36 Top 3 Event Counts vs DAWG Cause Code for all Closed 2010 Events
10
32
42
0
5
10
15
20
25
30
35
40
45
Open Closed Open and Closed
Even
t Cou
nt
Status
1211
8
0
2
4
6
8
10
12
14
Equipment Failure Protection System Misoperation Human Error
Even
t Cou
nt
Cause Code
Disturbance Event Trends
65
Conclusions Due to the relatively new process for events analysis and categorization more time will be required before a
conclusive recommendation may be obtained Further analysis and new data should provide valuable
statistics in the future Over 80 of all event reports from 2010 are current listed as closed but no
conclusion about investigation performance may be obtained because of the limited amount of data It is
recommended to study ways to prevent equipment failure and protection system misoperations but there
is not enough data to draw a firm conclusion about the top causes of events at this time
Abbreviations Used in This Report
66
Abbreviations Used in This Report
Acronym Definition ALP Acadiana Load Pocket
ALR Adequate Level of Reliability
ARR Automatic Reliability Report
BA Balancing Authority
BPS Bulk Power System
CDI Condition Driven Index
CEII Critical Energy Infrastructure Information
CIPC Critical Infrastructure Protection Committee
CLECO Cleco Power LLC
DADS Future Demand Availability Data System
DCS Disturbance Control Standard
DOE Department Of Energy
DSM Demand Side Management
EA Event Analysis
EAF Equivalent Availability Factor
ECAR East Central Area Reliability
EDI Event Drive Index
EEA Energy Emergency Alert
EFORd Equivalent Forced Outage Rate Demand
EMS Energy Management System
ERCOT Electric Reliability Council of Texas
ERO Electric Reliability Organization
ESAI Energy Security Analysis Inc
FERC Federal Energy Regulatory Commission
FOH Forced Outage Hours
FRCC Florida Reliability Coordinating Council
GADS Generation Availability Data System
GOP Generation Operator
IEEE Institute of Electrical and Electronics Engineers
IESO Independent Electricity System Operator
IROL Interconnection Reliability Operating Limit
Abbreviations Used in This Report
67
Acronym Definition IRI Integrated Reliability Index
LOLE Loss of Load Expectation
LUS Lafayette Utilities System
MAIN Mid-America Interconnected Network Inc
MAPP Mid-continent Area Power Pool
MOH Maintenance Outage Hours
MRO Midwest Reliability Organization
MSSC Most Severe Single Contingency
NCF Net Capacity Factor
NEAT NERC Event Analysis Tool
NERC North American Electric Reliability Corporation
NPCC Northeast Power Coordinating Council
OC Operating Committee
OL Operating Limit
OP Operating Procedures
ORS Operating Reliability Subcommittee
PC Planning Committee
PO Planned Outage
POH Planned Outage Hours
RAPA Reliability Assessment Performance Analysis
RAS Remedial Action Schemes
RC Reliability Coordinator
RCIS Reliability Coordination Information System
RCWG Reliability Coordinator Working Group
RE Regional Entities
RFC Reliability First Corporation
RMWG Reliability Metrics Working Group
RSG Reserve Sharing Group
SAIDI System Average Interruption Duration Index
SAIFI System Average Interruption Frequency Index
SCADA Supervisory Control and Data Acquisition
SDI Standardstatute Driven Index
SERC SERC Reliability Corporation
Abbreviations Used in This Report
68
Acronym Definition SRI Severity Risk Index
SMART Specific Measurable Attainable Relevant and Tangible
SOL System Operating Limit
SPS Special Protection Schemes
SPCS System Protection and Control Subcommittee
SPP Southwest Power Pool
SRI System Risk Index
TADS Transmission Availability Data System
TADSWG Transmission Availability Data System Working Group
TO Transmission Owner
TOP Transmission Operator
WECC Western Electricity Coordinating Council
Contributions
69
Contributions This report was made feasible by the collaboration and hard work of both NERC staff and NERCrsquos
Industry Groups
NERC Industry Groups
Table 14 lists the NERC industry group contributors Without their contribution and collaboration this
report would not have been possible
Table 13 NERC Industry Group Contributions43
NERC Group
Relationship Contribution
Reliability Metrics Working Group
(RMWG)
Reports to the OCPC bull Lead Development of Report bull Provide Reliability Metrics Data bull Responsible for Reliability Metrics
Performance Chapter
Transmission Availability Working Group
(TADSWG)
Reports to the OCPC bull Provide Transmission Availability Data
bull Responsible for Transmission Equip-ment Performance Chapter
bull Content Review
Generation Availability Data System Task
Force
(GADSTF)
Reports to the OCPC bull Provide Generation Availability Data bull Responsible for Generation Equip-
ment Performance Chapter bull Content Review
Event Analysis Working Group
(EAWG)
Reports to the OCPC bull Provide Events Data bull Responsible for Disturbance Events
Trends Chapter bull Content Review
43 Rosters for RMWG TADSWG GADSTF and EAWG are available at httpwwwnerccomfilesrosterpdf
Contributions
70
NERC Staff Table 13 below lists the NERC staff who contributed to the 2011 Reliability Performance Analysis
Report
Table 14 Contributing NERC Staff
Name Title E-mail Address
Mark Lauby Vice President and Director of
Reliability Assessment and
Performance Analysis
marklaubynercnet
Jessica Bian Manager of Performance Analysis jessicabiannercnet
John Moura Manager of Reliability Assessments johnmouranercnet
Andrew Slone Engineer Reliability Performance
Analysis
andrewslonenercnet
Jim Robinson TADS Project Manager jimrobinsonnercnet
Clyde Melton Engineer Reliability Performance
Analysis
clydemeltonnercnet
Mike Curley Manager of GADS Services mikecurleynercnet
James Powell Engineer Reliability Performance
Analysis
jamespowellnercnet
Michelle Marx Administrative Assistant michellemarxnercnet
William Mo Intern Performance Analysis wmonercnet
- NERCrsquos Mission
- Table of Contents
- Executive Summary
-
- 2011 Transition Report
- State of Reliability Report
- Key Findings and Recommendations
-
- Reliability Metric Performance
- Transmission Availability Performance
- Generating Availability Performance
- Disturbance Events
- Report Organization
-
- Introduction
-
- Metric Report Evolution
- Roadmap for the Future
-
- Reliability Metrics Performance
-
- Introduction
- 2010 Performance Metrics Results and Trends
-
- ALR1-3 Planning Reserve Margin
-
- Background
- Assessment
- Special Considerations
-
- ALR1-4 BPS Transmission Related Events Resulting in Loss of Load
-
- Background
- Assessment
-
- ALR1-12 Interconnection Frequency Response
-
- Background
- Assessment
-
- ALR2-3 Activation of Under Frequency Load Shedding
-
- Background
- Assessment
- Special Considerations
-
- ALR2-4 Average Percent Non-Recovery Disturbance Control Standards (DCS)
-
- Background
- Assessment
- Special Consideration
-
- ALR2-5 Disturbance Control Events Greater Than Most Severe Single Contingency
-
- Background
- Assessment
- Special Consideration
-
- ALR 1-5 System Voltage Performance
-
- Background
- Special Considerations
- Status
-
- ALR3-5 Interconnection Reliability Operating Limit System Operating Limit (IROLSOL) Exceedances
-
- Background
-
- ALR4-1 Automatic Transmission Outages Caused by Protection System Misoperations
-
- Background
- Special Considerations
-
- ALR6-11 ndash ALR6-14
-
- Background
- Assessment
- ALR 6-11 ndash Automatic Outages Initiated by Failed Protection System Equipment
- ALR6-12 ndash Automatic Outages Initiated by Human Error
- ALR6-13 ndash Automatic Outages Initiated by Failed AC Substation Equipment
- ALR6-14 Automatic AC Transmission Outages Initiated by Failed AC Circuit Equipment
-
- ALR6-15 Element Availability Percentage (APC)
-
- Background
- Assessment
- Special Consideration
-
- ALR6-16 Transmission System Unavailability
-
- Background
- Assessment
- Special Consideration
-
- ALR6-2 Energy Emergency Alert 3 (EEA3)
-
- Background
- Assessment
- Special Considerations
-
- ALR 6-3 Energy Emergency Alert 2 (EEA2)
-
- Background
- Assessment
- Special Considerations
-
- ALR 6-1 Transmission Constraint Mitigation
-
- Background
- Assessment
- Special Considerations
-
- Integrated Bulk Power System Risk Assessment
-
- Introduction
- Recommendations
-
- Integrated Reliability Index Concepts
-
- The Three Components of the IRI
-
- Event-Driven Indicators (EDI)
- Condition-Driven Indicators (CDI)
- StandardsStatute-Driven Indicators (SDI)
-
- IRI Index Calculation
- IRI Recommendations
-
- Reliability Metrics Conclusions and Recommendations
-
- Transmission Equipment Performance
-
- Introduction
- Performance Trends
-
- AC Element Outage Summary and Leading Causes
- Transmission Monthly Outages
- Outage Initiation Location
- Transmission Outage Events
- Transmission Outage Mode
-
- Conclusions
-
- Generation Equipment Performance
-
- Introduction
- Generation Key Performance Indicators
-
- Multiple Unit Forced Outages and Causes
- 2008-2010 Review of Summer versus Winter Availability
-
- Conclusions and Recommendations
-
- Disturbance Event Trends
-
- Introduction
- Performance Trends
- Conclusions
-
- Abbreviations Used in This Report
- Contributions
-
- NERC Industry Groups
- NERC Staff
-
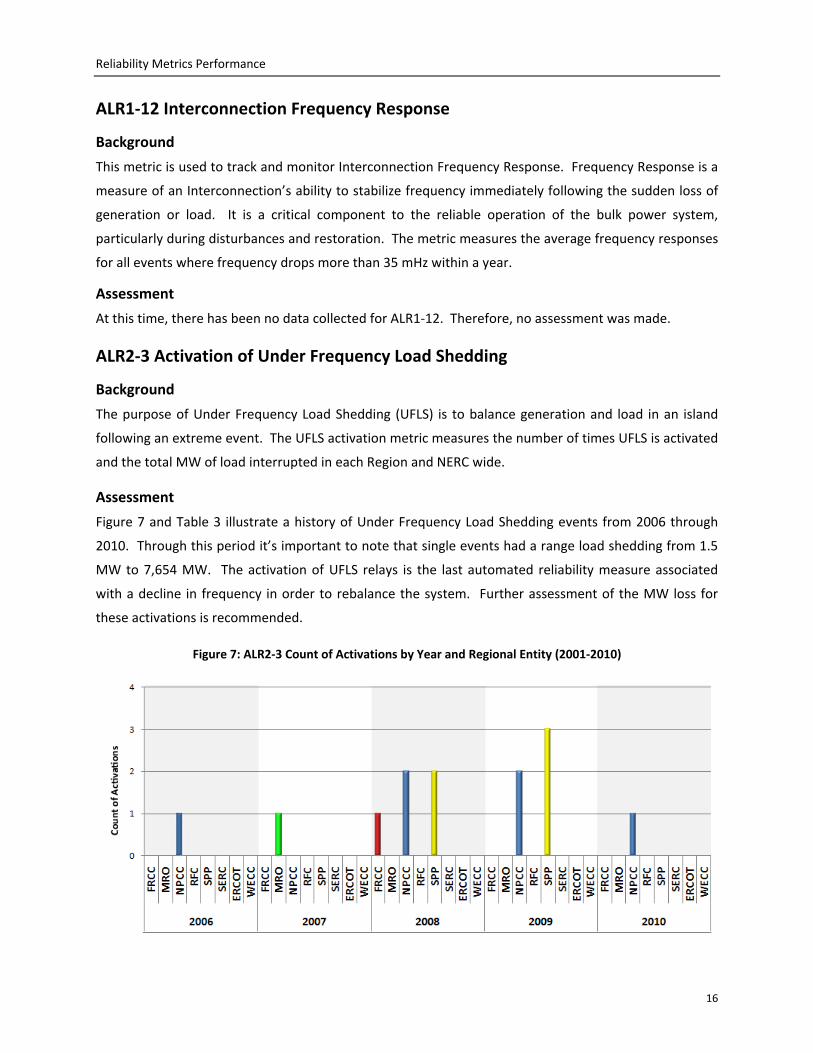
Reliability Metrics Performance
16
ALR1-12 Interconnection Frequency Response
Background
This metric is used to track and monitor Interconnection Frequency Response Frequency Response is a
measure of an Interconnectionrsquos ability to stabilize frequency immediately following the sudden loss of
generation or load It is a critical component to the reliable operation of the bulk power system
particularly during disturbances and restoration The metric measures the average frequency responses
for all events where frequency drops more than 35 mHz within a year
Assessment
At this time there has been no data collected for ALR1-12 Therefore no assessment was made
ALR2-3 Activation of Under Frequency Load Shedding
Background
The purpose of Under Frequency Load Shedding (UFLS) is to balance generation and load in an island
following an extreme event The UFLS activation metric measures the number of times UFLS is activated
and the total MW of load interrupted in each Region and NERC wide
Assessment
Figure 7 and Table 3 illustrate a history of Under Frequency Load Shedding events from 2006 through
2010 Through this period itrsquos important to note that single events had a range load shedding from 15
MW to 7654 MW The activation of UFLS relays is the last automated reliability measure associated
with a decline in frequency in order to rebalance the system Further assessment of the MW loss for
these activations is recommended
Figure 7 ALR2-3 Count of Activations by Year and Regional Entity (2001-2010)
Reliability Metrics Performance
17
Table 3 ALR2-3 Under Frequency Load Shedding MW Loss
ALR2-3 Under Frequency Load Shedding MW Loss
2006 2007 2008 2009 2010
FRCC
2273
MRO
486
NPCC 94
63 20 25
RFC
SPP
672 15
SERC
ERCOT
WECC
Special Considerations
The use of a single metric cannot capture all of the relevant information associated with UFLS events as
the events relate to each respective UFLS plan The ability to measure the reliability of the bulk power
system is directly associated with how it performs compared to what is planned
ALR2-4 Average Percent Non-Recovery Disturbance Control Standards (DCS)
Background
This metric measures the Balancing Authorityrsquos (BA) or Reserve Sharing Grouprsquos (RSG) ability to balance
resources and demand with the timely deployment of contingency reserve thereby returning the
interconnection frequency to within defined limits following a Reportable Disturbance14
Assessment
The relative
percentage provides an indication of performance measured at a BA or RSG
Figure 8 illustrates the average percent non-recovery of DCS events from 2006 to 2010 The graph
provides a high-level indication of the performance of each respective RE However a single event may
not reflect all the reliability issues within a given RE In order to understand the reliability aspects it
may be necessary to request individual REs to further investigate and provide a more comprehensive
reliability report Further investigation may indicate the entity had sufficient contingency reserve but
through their implementation process failed to meet DCS recovery
14 Details of the Disturbance Control Performance Standard and Reportable Disturbance definitions are available at
httpwwwnerccomfilesBAL-002-0pdf
Reliability Metrics Performance
18
Continued trend assessment is recommended Where trends indicated potential issues the regional
entity will be requested to investigate and report their findings
Figure 8 Average Percent Non-Recovery of DCS Events (2006-2010)
Special Consideration
This metric aggregates the number of events based on reporting from individual Balancing Authorities or
Reserve Sharing Groups It does not capture the severity of the DCS events It should be noted that
most REs use 80 percent of the Most Severe Single Contingency to establish the minimum threshold for
reportable disturbance while others use 35 percent15
ALR2-5 Disturbance Control Events Greater Than Most Severe Single Contingency
Background
This metric represents the number of disturbance events that exceed the Most Severe Single
Contingency (MSSC) and is specific to each BA Each RE reports disturbances greater than the MSSC on
behalf of the BA or Reserve Sharing Group (RSG) The result helps validate current contingency reserve
requirements The MSSC is determined based on the specific configuration of each BA or RSG and can
vary in significance and impact on the BPS
15httpwwwweccbizStandardsDevelopmentListsRequest20FormDispFormaspxID=69ampSource=StandardsDevelopmentPagesWEC
CStandardsArchiveaspx
375
079
0
54
008
005
0
15 0
77
025
0
33
000510152025303540
2006
2007
2008
2009
2010
2006
2007
2008
2009
2010
2006
2007
2008
2009
2010
2006
2007
2008
2009
2010
2006
2007
2008
2009
2010
2006
2007
2008
2009
2010
2006
2007
2008
2009
2010
2006
2007
2008
2009
2010
FRCC MRO NPCC RFC SERC SPP ERCOT WECC
Region and Year
Reliability Metrics Performance
19
Assessment
Figure 9 represents the number of DCS events within each RE that are greater than the MSSC from 2006
to 2010 This metric and resulting trend can provide insight regarding the risk of events greater than
MSSC and the potential for loss of load
In 2010 SERC had 16 BAL-002 reporting entities eight Balancing Areas elected to maintain Contingency
Reserve levels independent of any reserve sharing group These 16 entities experienced 79 reportable
DCS eventsmdash32 (or 405 percent) of which were categorized as greater than their most severe single
contingency Every DCS event categorized as greater than the most severe single contingency occurred
within a Balancing Area maintaining independent Contingency Reserve levels Significantly all 79
regional entities reported compliance with the Disturbance Recovery Criterion including for those
Disturbances that were considered greater than their most severe single Contingency This supports a
conclusion that regardless of the size of the BA or participation in a Reserve Sharing Group SERCrsquos BAL-
002 reporting entities have demonstrated the ability in 2010 to use Contingency Reserve to balance
resources and demand and return Interconnection frequency within defined limits following Reportable
Disturbances
If the SERC Balancing Areas without large generating units and who do not participate in a Reserve
Sharing Group change the determination of their most severe single contingencies to effect an increase
in the DCS reporting threshold (and concurrently the threshold for determining those disturbances
which are greater than the most severe single contingency) there will certainly be a reduction in both
the gross count of DCS events in SERC and in the subset considered under ALR2-5 Masking the discrete
events which cause Balancing Area response may not reduce ldquoriskrdquo to the system However it is
desirable to maintain a reporting threshold which encourages the Balancing Authority to respond to any
unexplained change in ACE in a manner which supports Interconnection frequency based on
demonstrated performance SERC will continue to monitor DCS performance and will continue to
evaluate contingency reserve requirements but does not consider 2010 ALR2-5 performance to be an
adverse trend in ldquoextreme or unusualrdquo contingencies but rather within the normal range of expected
occurrences
Reliability Metrics Performance
20
Special Consideration
The metric reports the number of DCS events greater than MSSC without regards to the size of a BA or
RSG and without respect to the number of reporting entities within a given RE Because of the potential
for differences in the magnitude of MSSC and the resultant frequency of events trending should be
within each RE to provide any potential reliability indicators Each RE should investigate to determine
the cause and relative effect on reliability of the events within their footprints Small BA or RSG may
have a relatively small value of MSSC As such a high number of DCS greater than MCCS may not
indicate a reliability problem for the reporting RE but may indicate an issue for the respective BA or RSG
In addition events greater than MSSC may not cause a reliability issue for some BA RSG or RE if they
have more stringent standards which require contingency reserves greater than MSSC
ALR 1-5 System Voltage Performance
Background
The purpose of this metric is to measure the transmission system voltage performance (either absolute
or per unit of a nominal value) over time This should provide an indication of the reactive capability
available to the transmission system The metric is intended to record the amount of time that system
voltage is outside a predetermined band around nominal
0
5
10
15
20
25
30
2006
2007
2008
2009
2010
2006
2007
2008
2009
2010
2006
2007
2008
2009
2010
2006
2007
2008
2009
2010
2006
2007
2008
2009
2010
2006
2007
2008
2009
2010
2006
2007
2008
2009
2010
2006
2007
2008
2009
2010
FRCC MRO NPCC RFC SERC SPP ERCOT WECC
Cou
nt
Region and Year
Figure 9 Disturbance Control Events Greater Than Most Severe Single Contingency (2006-2010)
Reliability Metrics Performance
21
Special Considerations
Each Reliability Coordinator (RC) will work with the Transmission Owners (TOs) and Transmission
Operators (TOPs) within its footprint to identify specific buses and voltage ranges to monitor for this
metric The number of buses the monitored voltage levels and the acceptable voltage ranges may vary
by reporting entity
Status
With a pilot program requested in early 2011 a voluntary request to Reliability Coordinators (RC) was
made to develop a list of key buses This work continues with all of the RCs and their respective
Transmission Owners (TOs) to gather the list of key buses and their voltage ranges After this step has
been completed the TO will be requested to provide relevant data on key buses only Based upon the
usefulness of the data collected in the pilot program additional data collection will be reviewed in the
future
ALR3-5 Interconnection Reliability Operating Limit System Operating Limit (IROLSOL) Exceedances
Background
This metric illustrates the number of times that defined Interconnection Reliability Operating Limit
(IROL) or System Operating Limit (SOL) were exceeded and the duration of these events Exceeding
IROLSOLs could lead to outages if prompt operator control actions are not taken in a timely manner to
return the system to within normal operating limits This metric was approved by NERCrsquos Operating and
Planning Committees in June 2010 and a data request was subsequently issued in August 2010 to collect
the data for this metric Based on the results of the pilot conducted in the third and fourth quarter of
2010 there is merit in continuing measurement of this metric Note the reporting of IROLSOL
exceedances became mandatory in 2011 and data collected in Table 4 for 2010 has been provided
voluntarily
Reliability Metrics Performance
22
Table 4 ALR3-5 IROLSOL Exceedances
3Q2010 4Q2010 1Q2011
le 10 mins 123 226 124
le 20 mins 10 36 12
le 30 mins 3 7 3
gt 30 mins 0 1 0
Number of Reporting RCs 9 10 15
ALR4-1 Automatic Transmission Outages Caused by Protection System Misoperations
Background
Originally titled Correct Protection System Operations this metric has undergone a number of changes
since its initial development To ensure that it best portrays how misoperations affect transmission
outages it was necessary to establish a common understanding of misoperations and the data needed
to support the metric NERCrsquos Reliability Assessment Performance Analysis (RAPA) group evaluated
several options of transitioning from existing procedures for the collection of misoperations data and
recommended a consistent approach which was introduced at the beginning of 2011 With the NERC
System Protection and Control Subcommitteersquos (SPCS) technical guidance NERC and the regional
entities have agreed upon a set of specifications for misoperations reporting including format
categories event type codes and reporting period to have a final consistent reporting template16
Special Considerations
Only
automatic transmission outages 200 kV and above including AC circuits and transformers will be used
in the calculation of this metric
Data collection will not begin until the second quarter of 2011 for data beginning with January 2011 As
revised this metric cannot be calculated for this report at the current time The revised title and metric
form can be viewed at the NERC website17
16 The current Protection System Misoperation template is available at
httpwwwnerccomfilezrmwghtml 17The current metric ALR4-1 form is available at httpwwwnerccomdocspcrmwgALR_4-1Percentpdf
Reliability Metrics Performance
23
ALR6-11 ndash ALR6-14
ALR6-11 Automatic AC Transmission Outages Initiated by Failed Protection System Equipment
ALR6-12 Automatic AC Transmission Outages Initiated by Human Error
ALR6-13 Automatic AC Transmission Outages Initiated by Failed AC Substation Equipment
ALR6-14 Automatic AC Circuit Outages Initiated by Failed AC Circuit Equipment
Background
These metrics evolved from the original ALR4-1 metric for correct protection system operations and
now illustrate a normalized count (on a per circuit basis) of AC transmission element outages (ie TADS
momentary and sustained automatic outages) that were initiated by Failed Protection System
Equipment (ALR6-11) Human Error (ALR6-12) Failed AC Substation Equipment (ALR6-13) and Failed AC
Circuit Equipment (ALR6-14) These metrics are all related to the non-weather related initiating cause
codes for automatic outages of AC circuits and transformers operated 200 kV and above
Assessment
Figure 10 through Figure 13 show the normalized outages per circuit and outages per transformer for
facilities operated at 200 kV and above As shown in all eight of the charts there are some regional
trends in the three years worth of data However some Regionrsquos values have increased from one year
to the next stayed the same or decreased with no discernable regional trends For example ALR6-11
computes the automatic AC Circuit outages initiated by failed protection system equipment
There are some trends to the ALR6-11 to ALR6-14 data but many regions do not have enough data for a
valid trend analysis to be performed NERCrsquos outage rate seems to be improving every year On a
regional basis metric ALR6-11 along with ALR6-12 through ALR6-14 cannot be statistically understood
until confidence intervals18
18The detailed Confidence Interval computation is available at
are calculated ALR metric outage frequency rates and Regional equipment
inventories that are smaller than others are likely to require more than 36 months of outage data Some
numerically larger frequency rates and larger regional equipment inventories (such as NERC) do not
require more than 36 months of data to obtain a reasonably narrow confidence interval
httpwwwnerccomdocspctadstfTADS_Nov_2_2007APPENDIX_C_Confidence_Intervalpdf
Reliability Metrics Performance
24
While more data is still needed on a regional basis to determine if each regionrsquos bulk power system is
becoming more reliable year to year there are areas of potential improvement which include power
system condition protection performance and human factors These potential improvements are
presented due to the relatively large number of outages caused by these items The industry can
benefit from detailed analysis by identifying lessons learned and rolling average trends of NERC-wide
performance With a confidence interval of relatively narrow bandwidth one can determine whether
changes in statistical data are primarily due to random sampling error or if the statistics are significantly
different due to performance
Reliability Metrics Performance
25
ALR 6-11 ndash Automatic Outages Initiated by Failed Protection System Equipment
Automatic outages with an initiating cause code of failed protection system equipment are in Figure 10
Figure 10 ALR6-11 by Region (Includes NERC-Wide)
This code covers automatic outages caused by the failure of protection system equipment This
includes any relay andor control misoperations except those that are caused by incorrect relay or
control settings that do not coordinate with other protective devices
ALR6-12 ndash Automatic Outages Initiated by Human Error
Figure 11 shows the automatic outages with an initiating cause code of human error This code covers
automatic outages caused by any incorrect action traceable to employees andor contractors for
companies operating maintaining andor providing assistance to the Transmission Owner will be
identified and reported in this category
Reliability Metrics Performance
26
Also any human failure or interpretation of standard industry practices and guidelines that cause an
outage will be reported in this category
Figure 11 ALR6-12 by Region (Includes NERC-Wide)
Reliability Metrics Performance
27
ALR6-13 ndash Automatic Outages Initiated by Failed AC Substation Equipment
Figure 12 shows the automatic outages with an initiating cause code of failed AC substation equipment
This code covers automatic outages caused by the failure of AC Substation ie equipment ldquoinside the
substation fencerdquo including transformers and circuit breakers but excluding protection system
equipment19
19TADS Initiating Cause Code definitions are located at httpwwwnerccomdocspctadswgTADS_Definitions_Appendix_7_092909pdf
Figure 12 ALR6-13 by Region (Includes NERC-Wide)
Reliability Metrics Performance
28
ALR6-14 Automatic AC Transmission Outages Initiated by Failed AC Circuit Equipment
Figure 13 shows the automatic outages with an initiating cause code of failed AC circuit equipment
Automatic Outages related to the failure of AC Circuit equipment ie overhead or underground
equipment ldquooutside the substation fencerdquo 20
ALR6-15 Element Availability Percentage (APC)
Background
This metric uses data and calculations directly from the NERC TADS effort and illustrates the overall
percent of time the aggregate of transmission facilities are available and in service This is an aggregate
20TADS Initiating Cause Code definitions are located at httpwwwnerccomdocspctadswgTADS_Definitions_Appendix_7_092909pdf
Figure 13 ALR6-14 by Region (Includes NERC-Wide)
Reliability Metrics Performance
29
value using sustained outages (automatic and non-automatic) for both lines and transformers operated
at 200 kV and above for each Regional Entity Interconnection and for NERC This metric was approved
by the NERC Operating and Planning Committees in September 2010
Assessment
Figure 14 shows the aggregate element availability percentage (APC) for transmission and transformers
facilities operated at 200 kV and above The values are all over 90 percent which shows excellent
system availability The RMWG recommends continued metric assessment for at least a few more years
in order to determine the value of this metric
Figure 14 2010 ALR6-15 Element Availability Percentage
Notably the Eastern Interconnection does not include Quebec or ERCOT ERCOT does not have any
transformers with low-side voltage levels 200 kV and above
Special Consideration
It should be noted that the non-automatic outage data needed to calculate this metric was only first
collected for the calendar year 2010 as part of the TADS process Therefore only one year of data for
this metric is available at this time
Reliability Metrics Performance
30
ALR6-16 Transmission System Unavailability
Background
This metric uses data and calculations directly from the NERC TADS effort and shows the overall percent
of time the aggregate of transmission facilities are unavailable due to automatic and non-automatic
outages This is an aggregate value using sustained automatic outages for both lines and transformers
operated at 200 kV and above for each Regional Entity and for NERC This metric was approved by the
NERC Operating and Planning Committees in December 2010
Assessment
Figure 15 and Figure 16 illustrate the 2010 aggregate unavailability percentage for AC circuits and
transformer facilities operated at 200 kV and above The values for AC circuits are all under 3 percent
which shows excellent system availability
The RMWG recommends continued metric assessment for at least a few more years in order to
determine the value of this metric
Special Consideration
It should be noted that the non-automatic outage data needed to calculate this metric was only first
collected for the calendar year 2010 as part of the TADS process Therefore only one year of data for
this metric is available at this time
Figure 15 2010 ALR6-16 Transmission System Unavailability
Reliability Metrics Performance
31
Figure 16 2010 ALR6-16 Transmission System Unavailability by Outage Type
Notably the Eastern Interconnection does not include Quebec or ERCOT Also ERCOT does not have
any transformers with low-side voltage levels 200 kV and above
ALR6-2 Energy Emergency Alert 3 (EEA3)
Background
This metric identifies the number of times Energy Emergency Alerts Level 3 (EEA3) are issued EEA3
events are firm-load interruptions due to capacity and energy deficiency EEA3 is currently reported
collected and maintained in NERCrsquos Reliability Coordination Information System (RCIS) and is defined in
Attachment 1 of the NERC Standard EOP-00221
21 The latest version of Attachment 1 for EOP-002 is available at
This metric identifies the number of times EEA3s are
issued The number of EEA3s per year provides a relative indication of performance measured at a
Balancing Authority or interconnection level As historical data is gathered trends in future reports will
provide an indication of either decreasing or increasing use of EEA3s signaling adequacy of the electric
supply system This metric can also be considered in the context of Planning Reserve Margin Significant
increases or decreases in EEA3 events with relatively constant Planning Reserve Margins could indicate
httpwwwnerccompagephpcid=2|20
Reliability Metrics Performance
32
volatility in the actual loads compared to forecast levels or changes in the adequacy of the bulk power
system required to meet load demands
Assessment
Figure 17 shows the number of EEA3 events during 2006 and 2010 from an RE level An interactive
presentation was released and available at the Reliability Indicatorrsquos page22
The Acadiana Load Pocket (ALP) is an area in south central Louisiana that has experienced regular
transmission constraints and numerous Energy Emergency Alert filings by the SPP Reliability Controller
(SPP RC) Transmission within ALP is owned by Entergy Lafayette Utilities System (LUS) and Cleco
Power LLC (Cleco) The transmission constraints within the ALP are primarily caused by the local area
load and the lack of generation located in close proximity to the load area
The number of EEA3rsquos
declared in 2010 returned to more traditional numbers The 2009 spike in EEA3 events in the SPP
Region that was driven by issues in the Acadiana Load Pocket (ALP) were not present in 2010
Special Considerations
Ideally the measure should capture only EEAs that are declared for reliability reasons and not for
economic factors The RMWG has not been able to differentiate these reasons for future reporting and
it has made a recommendation to the Reliability Coordinator Working Group (RCWG) to consider a
revised EEA declaration to exclude economic factors
The reason the EEA volume decreased from 2009 to 2010 in SPP was because the SPP ICT RC23
coordinated an operating agreement between the five operating companies in the ALP The operating
agreement included a cost sharing re-dispatch that alleviated the need of a Transmission Loading Relief
(TLR-5) declaration24
22The EEA3 interactive presentation is available on the NERC website at
During 2009 there was no operating agreement therefore an entity had to
provide Network and Native Load (NNL) relief when a TLR-5 was called by the ICT RC When the TLR-5
was the primary tool to control the post contingent loading in the ALP some of the BAs would have their
firm transmission curtailed to the point where they could no longer serve their load therefore the EEA
3 was needed to communicate a capacityreserve deficiency
httpwwwnerccompagephpcid=4|331|335 23Southwest Power Pool (SPP) Independent Coordinator of Transmission (ICT) Reliability Coordinator (RC) 24More information on Transmission Load Relief is contained in the IRO-006 standard which is located at httpwwwnerccomfilesIRO-006-4pdf In particular TLR-5 definitions are referenced on page 16 and 17
Reliability Metrics Performance
33
Figure 17 ALR6-2 Energy Emergency Alert 3 (EEA3) Counts by Region (2006-2010)
Cleco Power Entergy and LUS are currently constructing an estimated $200 million transmission
infrastructure improvement project to mitigate transmission constraints into ALP Construction of the
project is scheduled to be complete in 2012 Completion of the project should help alleviate some of
the transmission congestion in this area Energy Emergency Alerts filed by the SPP Regional Entity
continue to decline
SPP RTO continues to coordinate operating plans with the operating entities in this area Mitigation
plans and local operating guides in place are expected to provide sufficient flexibility should issues arise
NERC will continue to monitor this area for Reliability Impacts and coordinate any actions with the SPP
Reliability Coordinator and SPP Regional Entity
ALR 6-3 Energy Emergency Alert 2 (EEA2)
Background
Energy Emergency Alert 2 (EEA2) is to measure the number of events BAs declare for deficient capacity
and energy during peak load periods which may serve as a leading indicator of energy and capacity
shortfall in the adequacy of the electric supply system EEA2 provides a sense of the frequency of
precursor events to the more severe EEA3 declarations This metric measures the number of events
1 3 1 2 214
3 4 4 1 5 334
4 2 1 52
1
0
5
10
15
20
25
30
3520
0620
0720
0820
0920
1020
0620
0720
0820
0920
1020
0620
0720
0820
0920
1020
0620
0720
0820
0920
1020
0620
0720
0820
0920
1020
0620
0720
0820
0920
1020
0620
0720
0820
0920
1020
0620
0720
0820
0920
10
FRCC MRO NPCC RFC SERC SPP TRE WECC
2006-2009
2010
Region and Year
Reliability Metrics Performance
34
Balancing Authorities declare for deficient capacity and energy during peak load periods At this time
however this data reflects inclusion of Demand Side Resources that would not be indicative of
inadequacy of the electric supply system
The number of EEA2 events and any trends in their reporting indicates how robust the system is in
being able to supply the aggregate load requirements The historical records may include demand
response activations and non-firm load interruptions per applicable contracts within the EEA alerts per
its definition25
Assessment
Demand response is a legitimate resource to be called upon by balancing authorities and
do not indicate a reliability concern As data is gathered in the future reports will provide an indication
of either decreasing or increasing adequacy in the electric supply system EEA2 events called solely for
activation of demand response (controllable or contractually prearranged demand-side dispatch
programs) or interruption of non-firm load per applicable contracts should be excluded This metric can
also be considered in the context of the Planning Reserve Margin Significant increases or decreases in
EEA2 events with relatively constant Planning Reserve Margins could indicate volatility in the actual
loads compared to forecast levels or changes in the adequacy of the bulk power system required to
meet load demands
Figure 18 shows the number of EEA2 events by Regional Entity from 2006 to 2010 EEA2 interactive
version available on line by quarter and region26
25 The EEA2 is defined at
The general trend continues to show improved
performance which may have been influenced by the overall reduction in demand throughout NERC
caused by the economic downturn Specific performance by any one region should be investigated
further for issues or events that may affect the results Determining whether performance reported
includes those events resulting from the economic operation of DSM and non-firm load interruption
should also be investigated The RMWG recommends continued metric assessment
httpwwwnerccomfilesEOP-002-2pdf 26 EEA2 interactive version located at httpwwwnerccompagephpcid=4|331|341
Reliability Metrics Performance
35
Special Considerations
The intent of this metric is to measure only EEAs that are called for reliability reasons and not for
economic factors such as demand side management (DSM) and non-firm load interruption The
historical data for this metric may include events that were called for economic factors According to
the RCWG recent data should only include EEAs called for reliability reasons
ALR 6-1 Transmission Constraint Mitigation
Background
The RMWG completed a pilot with four regional entities Based on the results the RMWG expanded the
pilot data collection to all regions and the initial results of the data collection are shown in Figure 19
and Table 5 Based on the results of the pilot there is merit in continuing to assess this metric The
intent of this metric is to identify trends in the number of mitigation measures (Special Protection
Schemes (SPS) Remedial Action Schemes (RAS) and Operating Procedures) required to meet reliability
requirements By their nature SPS do not indicate an inherent weakness in the bulk power system
rather they are an indication of methods that are taken to operate the system through the range of
conditions it must perform This metric is only intended to evaluate the trend use of these plans and
whether the metric indicates robustness of the transmission system is increasing remaining static or
decreasing
1 27
2 1 4 3 2 1 2 4 5 2 5 832
4724
211
5 38 5 1 1 8 7 4 1 1
05
101520253035404550
2006
2007
2008
2009
2010
2006
2007
2008
2009
2010
2006
2007
2008
2009
2010
2006
2007
2008
2009
2010
2006
2007
2008
2009
2010
2006
2007
2008
2009
2010
2006
2007
2008
2009
2010
2006
2007
2008
2009
2010
FRCC MRO NPCC RFC SERC SPP TRE WECC
2006-2009
2010
Region and Year
Figure 18 ALR6-3 Energy Emergency Alert 2 (EEA2)
Reliability Metrics Performance
36
Assessment
The pilot data indicates a relatively constant number of mitigation measures over the time period of
data collected
Figure 19 ALR6-1 Transmission Constraint Mitigation by SPSRAS (2009-2014)
0102030405060708090
100110120
2009
2010
2011
2014
2009
2010
2011
2014
2009
2010
2011
2014
2009
2010
2011
2014
2009
2010
2011
2014
2009
2010
2011
2014
2009
2010
2011
2014
2009
2010
2011
2014
FRCC MRO NPCC RFC SERC SPP ERCOT WECC
Coun
t
Region and Year
SPSRAS
Reliability Metrics Performance
37
Table 5 ALR6-1 Transmission Constraint Mitigation by Operating ProcedureGuides (2009-2011)
ALR6-1 Transmission Constraint Mitigation by Operating ProcedureGuides (2009-2014)
2009 2010 2011 2014
FRCC 107 75 66
MRO 79 79 81 81
NPCC 0 0 0
RFC 2 1 3 4
SPP 39 40 40 40
SERC 6 7 15
ERCOT 29 25 25
WECC 110 111
Special Considerations
A certain number of SPS mitigation plans may be necessary to support reliable operation of the system
If the number of SPS increase over time this may indicate that additional transmission capacity is
required A reduction in the number of SPS may be an indicator of increased generation or transmission
facilities being put into service which may indicate greater robustness of the bulk power system In
general mitigation plans are a viable and valuable tool for effective operation of the bulk power system
In power system planning reliability operability capacity and cost-efficiency are simultaneously
considered through a variety of scenarios to which the system may be subjected Mitigation measures
are a method for optimizing a power system across these scenarios Changes in quantities of mitigation
plans may indicate year-on-year differences in the system being evaluated
Integrated Bulk Power System Risk Assessment
Introduction In developing eighteen metrics to measure acceptable levels of reliability it has become clear that any
such measurement of reliability must include consideration of the risks present within the bulk power
system in order for us to appropriately prioritize and manage these system risks The scope for the
Reliability Metrics Working Group (RMWG)27
27 The RMWG scope can be viewed at
includes a task to develop a risk-based approach that
provides consistency in quantifying the severity of events The approach not only can be used to
httpwwwnerccomfilezrmwghtml
Reliability Metrics Performance
38
measure risk reduction over time but also can be applied uniformly in event analysis process to identify
the events that need to be analyzed in detail and sort out non-significant events
The Operating Committee (OC) and Planning Committee (PC) endorsed the concepts and framework28 of
the risk-based approach in their September 2010 joint meeting and further supported the event severity
risk index (SRI) calculation29
Recommendations
in March 2011
bull NERC should embrace the use of risk assessment to identify trends in addition to lessons learned
in order to improve bulk power system reliability
bull The RMWG should continue to coordinate and communicate with the Event Analysis Working
Group (EAWG) to apply the SRI into the event analysis process and root cause analysis
bull As trend evaluations increase the knowledge of risks to the bulk power system data required to
support additional assessment should be gathered
Event Severity Risk Index (SRI)
Risk assessment is an essential tool for achieving the alignment between organizations people and
technology This will assist in quantifying inherent risks identifying where potential high risks exist and
evaluating where the most significant lowering of risks can be achieved Being learning organizations
the Electric Reliability Organization (ERO) Regional Entities and Registered Entities can use these tools
to focus on the areas of highest risk to reliability to provide a sound basis for developing results-based
standards and compliance programs Risk assessment also serves to engage all stakeholders in a
dialogue about specific risk factors and helps direct a strategic plan for risk reduction and early
detection
The SRI is a daily blended metric for which transmission loss generation loss and load loss events are
calculated Each element (transmission generation and load loss) is factored by the systemrsquos inventory
for that element to rate significant events appropriately On a yearly basis these daily performances
can be sorted in descending order to evaluate the year-on-year performance of the system
In order to test drive the concepts the RMWG applied these calculations against historically memorable
days to derive SRIs Once these calculations were complete they were reviewed and evaluated by
various stakeholders for reasonableness Based upon feedback modifications to the calculation were
made and assessed against the historic days performed This iterative process locked down the details
28 httpwwwnerccomdocspcrmwgIntegrated_Bulk_Power_System_Risk_Assessment_Concepts_Finalpdf 29 httpwwwnerccomdocspcrmwgSRI_Equation_Refinement_May6_2011pdf
Reliability Metrics Performance
39
for the calculation of SRI whose calculation from zero (no transmission line outages generation outages
or load lost in a day) to 1000 (a theoretical condition in which every transmission line all generation
units and all load lost across the system in a single day)
Figure 20 captures the calculated severity risk value for each of the days for each year benchmarked
with the historic significant events which were used to concept test the calculation Since there is
significant disparity between days the bulk power system is stressed compared to those that are
ldquoroutinerdquo and ldquoherordquo days of the year where the system performed extremely well the curve is depicted
using a logarithmic scale Each yearrsquos data is sorted in descending order striking a characteristic shape
At the left-side of the curve the days in which the system is severely stressed are plotted The central
more linear portion of the curve identifies the routine day performance while the far right-side of the
curve shows the values plotted for days in which almost all lines and generation units are in service and
essentially no load is lost
The trends on the chart below show that 2009 and 2010 had fewer extreme days than 2008 Routine
daily performance appears generally consistent across all three years Figure 20 captures the days for
each year benchmarked with historically significant events
In Figure 20 NERCrsquos event categories and SRI ratings are directly related As the SRI increases the
category or severity of the event increases Historical events are also shown to relate modern
reliability measurements to give a perspective of how a well-known event would register on the SRI
scale
The event analysis process30
30
benefits from the SRI as it enables a numerical analysis of an event in
comparison to other events By this measure an event can be prioritized by its severity In a severe
event this is unnecessary However for events that do not result in severe stressing of the bulk power
system this prioritization can be a challenge By using the SRI the event analysis process can decide
which events to learn from and reduce which events to avoid and when resilience needs to be
increased under high impact low frequency events as shown in the blue boxes in the figure
httpwwwnerccompagephpcid=5|365
Reliability Metrics Performance
40
Figure 20 NERC Annual Daily Severity Risk Index (SRI) Sorted Descending with Historic Benchmark Days
Other factors that impact severity of a particular event to be considered in the future include whether
equipment operated as designed and resulted in loss of load from a reliability perspective (intentional
and controlled load-shedding) Mechanisms for enabling ongoing refinement to include the historic and
simulated events for future severity risk calculations are being explored
Reliability Metrics Performance
41
Integrated Reliability Index Concepts In December 2010 the RMWG was challenged by the OC and PC to develop a single index concept to
measure the universe of risks associated with the bulk power system As a result the integrated
reliability index (IRI) concepts were proposed31
Figure 21
the three components of which were defined to
quantify each specific risk aspect They are titled the Event Driven Index (EDI) StandardsStatute Driven
Index (SDI) and Condition Driven Index (CDI) illustrated in with measures associated with
system events standards compliance and eighteen performance metrics The development of an
integrated reliability index aims to inform increase transparency and quantify the effectiveness of risk
reduction or mitigation actions The goal is to provide the industry meaningful trends of the BPSrsquos
performance and guidance on how the industry can improve reliability and support risk-informed
decision making Once completed the IRI will facilitate holistic assessment of performance Finally the
IRI should help overcome concern and confusion about how many metrics are being analyzed for system
reliability assessments
Figure 21 Risk Model for Bulk Power System
The integrated model of event-driven condition-driven and standardsstatute-driven risk information
can be constructed to illustrate all possible logical relations between the three risk sets Due to the
nature of the system there may be some overlap among the components
31 httpwwwnerccomdocspcrmwgIntegrated_Reliability_Index_WhitePaper_DRAFTpdf
Event Driven Index (EDI)
Indicates Risk from
Major System Events
Standards Statute Driven
Index (SDI)
Indicates Risks from Severe Impact Standard Violations
Condition Driven Index (CDI)
Indicates Risk from Key Reliability
Indicators
Reliability Metrics Performance
42
The Three Components of the IRI The three components of the IRI work together as shown in Figure 22 to comprise a full picture of the
state of reliability
Figure 22 An overview of the components that comprise the Integrated Reliability Index (IRI)
Event-Driven Indicators (EDI)
The Event-Driven Indicator provides a basis for prioritization of events based on bulk power system
integrity equipment performance and engineering judgment This indicator can serve as a high value
risk assessment tool to be used by stakeholders to investigate and evaluate disturbance history and
measure the severity of these events The relative ranking of events requires industry expertise agreed-
upon goals and engineering judgment The EDI is a derivative of SRI results for a specific time period
but it transforms that performance into a form of an availability index These calculations will be further
refined as feedback is received
Condition-Driven Indicators (CDI)
The Condition-Driven Indicators focus on a set of measurable system conditions (performance
measures) to assess bulk power system reliability These reliability indicators identify factors that
positively or negatively impact reliability and are early predictors of the risk to reliability from events or
unmitigated violations A collection of these indicators measures how close reliability performance is to
the desired outcome and if the performance against these metrics is constant or improving
Reliability Metrics Performance
43
StandardsStatute-Driven Indicators (SDI)
The StandardsStatute-Driven Indicator is a calculation of success of compliance based upon the subset
of high-value standards and is divided by the number of participations who could have received the
violation within the time period considered Also based on these factors known unmitigated violations
of elevated risk factor requirements are weighted higher than lower risk factors The index decreases if
the compliance improvement is achieved over a trending period
IRI Index Calculation As with the SRI the IRI is based on an importance weighting factor which the RMWG can modify over
time after gaining experience with the new metric as well as consideration of feedback from industry
At this time the RMWG believes some form of blended weighting may serve to start to populate IRI
characteristic curves at a high and generic level Based upon feedback from stakeholders this approach
may change or as discussed below weighting factors may vary based on periodic review and risk model
update The RMWG will continue the refinement of the IRI calculation and consider other significant
factors that impact reliability (eg intentional and controlled load-shedding) further it will explore
developing mechanisms for enabling ongoing refinement which should be influenced by a wide set of
stakeholders
RMWG recommends the Event Driven Index (EDI) be weighted the highest (50 percent) since events
actually occurred indicating how the system was performing The Condition Driven Index (CDI) and
StandardsStatute Driven Index (SDI) are weighted 25 each since they are indicators of potential risks
to BPS reliability IRI can be calculated as follows
IRI is intended to be a composite metric which integrates several forms of individual risks to the bulk
power system Since the three components range across many stakeholder organizations these
concepts are developed as starting points for continued study and evaluation Additional supporting
materials can be found in the IRI whitepaper32
IRI Recommendations
including individual indices calculations and preliminary
trend information
For the IRI more investigation should be performed to determine the best way to integrate EDI CDI
and SDI into an Integrated Reliability Index (IRI) that quantitatively represents the reliability of the bulk
32 The IRI whitepaper can be found at httpwwwnerccomdocspcrmwgIntegrated_Reliability_Index_WhitePaper_DRAFTpdf
Reliability Metrics Performance
44
power system To this end study into determining the amount of overlap between the components is
necessary RMWG is currently working to determine the proper amount of overlap between the IRI
components
Also the CDI component of the IRI needs to be solidified This is especially true with the CDI More
accurate metric data is needed to paint a fuller picture of the CDI Many of the metrics used to calculate
the CDI are new or they have limited data Compared to the SDI which counts well-known violation
counts and the EDI which uses the well-defined CDI the CDI lacks the depth of rigor that the other two
components have acquired through their years of data RMWG is currently working to improve the CDI
Reliability Metrics Conclusions and Recommendations Among the eighteen metrics that address the characteristics of an adequate level of reliability (ALR)
metric trends indicate the system is performing better in the following seven areas
bull ALR1-3 Planning Reserve Margin
bull ALR1-4 BPS Transmission Related Events Resulting in Loss of Load
bull ALR2-5 Disturbance Control Events Greater than Most Severe Single Contingency
bull ALR6-2 Energy Emergency Alert 3 (EEA3)
bull ALR6-3 Energy Emergency Alert 2 (EEA2)
bull ALR6-11 Automatic Transmission Outages Caused by Protection System Misoperations
bull ALR6-13 Automatic Transmission Outages Caused by Failed AC Substation Equipment
Assessments have been made in other performance categories A number of them do not have
sufficient data to derive any conclusions from the results The RMWG recommends continued data
collection and assessment of these metrics If a metric does not yield any trend in a five-year reporting
period the metric will be modified or withdrawn
For the IRI more investigation should be performed to determine the overlap of the components (CDI
EDI and SDI) The CDI should be more thoroughly solidified as an index by collecting more data over
time
Transmission Equipment Performance
45
Transmission Equipment Performance Introduction The Transmission Availability Data System (TADS) effort began with the establishment of a TADS task force
by the NERC Planning Committee in October 2006 On October 27 2007 the NERC Board of Trustees
approved the collection of transmission automatic outage data beginning in calendar year 2008 (Phase I)
Subsequently on October 29 2008 the NERC Board approved the collection of Non-Automatic Outage data
that began for Calendar year 2010 (Phase II)
This chapter provides reliability performance analysis of the transmission system by focusing on the trends
of Automatic Outage data from calendar year 2008 thru 2010 Since only one year of Non-Automatic
Outage data has been collected that data will not be assessed in this report
When calculating bulk power system performance indices care must be exercised when interpreting results
as misinterpretation can lead to erroneous conclusions regarding system performance With only three
years of data in the smaller regions it is not clear whether a regionrsquos yearly outage variation compared to
the average is due to random statistical variation or that particular year is significantly different in
performance However on a NERC-wide basis after three years of data collection there is enough
information to accurately determine whether the yearly outage variation compared to the average is due to
random statistical variation or the particular year in question is significantly different in performance33
Performance Trends
Transmission performance information has been provided by Transmission Owners (TOs) within NERC
through the NERC TADS (Transmission Availability Data System) process The data presented reflects
Momentary and Sustained AC Automatic outages of transmission elements that operate at voltages ge 200 kV
(including the low side of transformers) with the criteria specified in the TADS process The following
elements listed below are included
bull AC Circuits ge 200 kV (Overhead and Underground Circuits) Radial circuits are included
bull DC Circuits with ge +-200 kV DC voltage
bull Transformers with ge 200 kV low-side voltage and
bull ACDC Back-to-Back (BTB) Converters with ge 200 kV AC voltage on both sides
33The detailed Confidence Interval computation is available at httpwwwnerccomdocspctadstfTADS_Nov_2_2007APPENDIX_C_Confidence_Intervalpdf
Transmission Equipment Performance
46
AC Element Outage Summary and Leading Causes Table 6 shows the 2008 2009 and 2010 NERC total AC transmission element inventory and a summary of
the associated outages As expected in general the number of circuits increased from year to year due to
new construction or re-construction to higher voltages For every outage experienced on the transmission
system cause codes are identified and recorded according to the TADS process Causes of both momentary
and sustained outages have been indicated These causes are analyzed to identify trends and similarities
and to provide insight into what could be done to possibly prevent future occurrences
Figure 23 and Figure 24 describe the top ten initiating cause codes for sustained and momentary automatic
outages combined from 2008-2010 Based on the two figures the relationship between the total number of
outages and total outage hours can be seen Failed AC Substation Equipment and Failed AC Circuit
Equipment only account for 15 percent of the total number of outages but account for 65 percent of the
total outage hours The two largest causes of outages within NERC (ldquoLightingrdquo and ldquoWeather excluding
Lightningrdquo) account for 34 percent of the total number of outages
The next three Human Error Failed Protection System Equipment and Failed AC Circuit Equipment have
very similar totals and should all be considered significant focus points in reducing the number of Sustained
Automatic Outages for all elements
Transmission Equipment Performance
47
Table 6 NERC - All AC Elements Sustained and Momentary Outage Performance Summary
2008 Number of Outages
AC Voltage
Class
No of
Circuits
Circuit
Miles Sustained Momentary
Total
Outages Total Outage Hours
200-299kV 4369 102131 1560 1062 2622 56595
300-399kV 1585 53631 793 753 1546 14681
400-599kV 586 31495 389 196 585 11766
600-799kV 110 9451 43 40 83 369
All Voltages 6650 196708 2785 2051 4836 83626
2009 Number of Outages
AC Voltage
Class
No of
Circuits
Circuit
Miles Sustained Momentary
Total
Outages Total Outage Hours
200-299kV 4468 102935 1387 898 2285 28828
300-399kV 1619 56447 641 610 1251 24714
400-599kV 592 32045 265 166 431 9110
600-799kV 110 9451 53 38 91 442
All Voltages 6789 200879 2346 1712 4038 63094
2010 Number of Outages
AC Voltage
Class
No of
Circuits
Circuit
Miles Sustained Momentary
Total
Outages Total Outage Hours
200-299kV 4567 104722 1506 918 2424 54941
300-399kV 1676 62415 721 601 1322 16043
400-599kV 605 31590 292 174 466 10442
600-799kV 111 9477 63 50 113 2303
All Voltages 6957 208204 2582 1743 4325 83729
Note The NERC table does not show redacted outages DC Circuit outages Transformer outages or ACDC
converter outages
Transmission Equipment Performance
48
Figure 23 NERC - Top Ten Sustained and Momentary Outages by Initiating Cause Code for All Elements
Figure 24 NERC - Top Ten Sustained Outage Hours by Cause Code
198
151
80
7271
6943
33
27
188
68
Lightning
Weather excluding lightningHuman Error
Failed AC Substation EquipmentFailed Protection System EquipmentFailed AC Circuit Equipment Foreign Interference
Power System Condition
Fire
Unknown
Remaining Cause Codes
299
246
188
58
52
42
3619
16 12 31 Failed AC Substation EquipmentFailed AC Circuit Equipment Weather excluding lightningUnavailable
Other
Fire
Unknown
Human Error
Failed Protection System EquipmentForeign Interference
Remaining Cause Codes
Transmission Equipment Performance
49
Transmission Monthly Outages Figure 25 displays the total number of Automatic Outages on a per-month basis The three months with the
highest total of outages were June July and August From a seasonal perspective winter had a monthly
average of 281 outages These include the months of November-March Summer had an average of 429
outages Summer included the months of April-October
Figure 25 Number of Outages by Month for AC Circuits (2008-2010)
This figure does not show redacted outages DC Circuit outages Transformer outages or ACDC Converter
outages
Outage Initiation Location For every outage experienced on the transmission system the outage initiation code is identified and
recorded according to the TADS process The outage initiation code can be analyzed to identify trends and
similarities and to provide insight into what could be done to possibly prevent future occurrences
The ldquoOutage Initiation Coderdquo describes where an automatic outage was initiated on the power system The
five codes are as follows
bull Element-Initiated
bull Other Element-Initiated
bull AC Substation-Initiated
bull ACDC Terminal-Initiated (for DC circuits)
bull Other Facility Initiated any facility not included in any other outage initiation code
JanuaryFebruar
yMarch April May June July August
September
October
November
December
2008 238 229 257 258 292 437 467 380 208 176 255 236
2009 315 201 339 334 398 553 546 515 351 235 226 294
2010 444 224 269 446 449 486 639 498 351 271 305 281
3 Year AVG 332 218 288 346 380 492 551 464 303 227 262 270
0
100
200
300
400
500
600
700
Out
ages
Transmission Equipment Performance
50
Notably the protection system is not part of an ldquoAC Substationrdquo or an ldquoACDC Terminalrdquo If a protection
system misoperates and initiates an outage it will be classified as ldquoOther-Facility Initiatedrdquo The following
Figures show the initiating location of the Automatic outages from 2008 to 2010
With both Momentary and Sustained Automatic Outages taken into account the outage was initiated on the
Element more than 67 percent of the time as shown in Figure 26 and Figure 27
When only the Sustained Automatic Outages are analyzed the outage initiation on both AC Substation and
Other Facility increased by 34 percent and 32 percent respectively Outages initiated on the Element itself
decreases by 78 percent as shown in Figure 26 and 27 For only the Momentary Automatic Outages the
outage initiation on the Element increases by 19 percent compared to Sustained Outages Element initiated
outages make up over 78 percent of the total outages when analyzing only Momentary Outages
Figure 26
Figure 27
Transmission Outage Events Figure 28 illustrates the relationship between the numbers of Automatic Outages associated per TADS
event 2008 2009 and 2010 tend to follow the same trend The largest number of Automatic Outages per
TADS event is fourteen in 2010 thirteen in 2009 and eight in 2008 There are around 70 to 100 TADS
events that contain between fourteen and three Automatic Outages (see below) There are around 330 to
400 TADS events that contain two or more Automatic Outages The rest of the events only contain one
Automatic Outage As noted in the lower right hand corner below the total number of Events in 2008 to
2010 ranged from 3920 to 4569 events per year Nearly 90 percent or more of the events contained one
Automatic Outage
Figure 26 Sustained Automatic Outage Initiation
Code
Figure 27 Momentary Automatic Outage Initiation
Code
Transmission Equipment Performance
51
Transmission Outage Mode Figure 29 and Figure 30 show the percentage of Outage Modes The ldquoOutage Mode Coderdquo describes
whether one Automatic Outage is related to other Automatic Outages A Single Mode outage is an
Automatic Outage of a single Element which occurs independently of any other Automatic Outages (if any)
A ldquoDependent Mode Initiating Outagerdquo is an Automatic Outage of a single Element that initiates one or more
subsequent Element Automatic Outages A ldquoDependent Mode Outagerdquo is an Automatic Outage of an
Element which occurred as a result of an initiating outage whether the initiating outage was an Element
outage or a non-Element outage A ldquoCommon Mode Outagerdquo is one of two or more Automatic Outages with
the same Initiating Cause Code and where the outages are not consequences of each other and occur nearly
simultaneously A ldquoCommon Mode Initiating Outagerdquo is a Common Mode Outage that initiates one or more
subsequent Automatic Outages
Over 72 percent of the total outages occurred on the bulk power system are Single Mode Outages The next
largest mode is Dependent with over 11 percent of the total outages being in this category For only
Sustained Automatic Outages outages related to each other increase with Dependent mode accounting for
13 percent of the outages and Common mode accounting for close to 11 percent of the outages
Independent Sustained outages still account for the largest portion with nearly 70 percent being Single
mode When just analyzing Momentary Automatic Outages Associated outages decrease with Dependent
Figure 28 Event Histogram (2008-2010)
Transmission Equipment Performance
52
mode accounting for only 9 percent of the outages The Common Mode percentage decreases while
Dependent Mode Initiating percentage increases compared to Sustained Outages Independent Momentary
outages account for the largest portion with over 76 percent being Single Mode
An investigation into the root causes of Dependent and Common mode events which include three or more
Automatic Outages (indentified in the TADS 2008 to 2010 data) should be a high priority Some protection
systems are designed to trip three or more circuits but some events go beyond what is designed Some also
have misoperations associated with multiple outage events
Conclusions On a NERC wide average basis automatic transmission outage rate is improving from 2008 to 2010 based on
reported data Considering both automatic and non-automatic outages 2010 records indicate transmission
element availability percentage is very high and exceeds 95 The unavailability rate for AC circuits and
transformers are only 15 and 29 respectively
The cause codes of Human Error Failed Protection System Equipment and Failed AC Circuit Equipment
should be considered significant focus points in reducing the number of Sustained Automatic Outages for all
elements A deeper look into the root causes of Dependent and Common mode events which include three
or more Automatic Outages (indentified in the TADS 2008 to 2010 data) should be a high priority Some
protection systems are designed to trip three or more circuits but some events go beyond what is designed
Some also have misoperations associated with multiple outage events
Figure 29 Sustained Automatic Outage Mode code Figure 30 Momentary Automatic Outage Mode code
Generation Equipment Performance
53
Generation Equipment Performance Introduction The development of the Generating Availability Data System (GADS) began in 1982 This series of databases
is used to voluntarily collect record and retrieve operating information By pooling individual unit
information with likewise units generating unit availability performance can be calculated providing
opportunities to identify trends and generating equipment reliability improvement opportunities The
information is used to support equipment reliability availability analyses and risk-informed decision-making
by system planners generation owners assessment modelers manufacturers and contractors etc Reports
and information resulting from the data collected through GADS are now used for benchmarking and
analyzing electric power plants
Currently the data collected through GADS contains 72 percent of the North American generating units
with generating capacity of 20 MW or higher34 Additionally many of the newer combined-cycle plants are
not reporting information and therefore a full view of each unit type is not presented Rather a sample of
all the units in North America that fit a given more general category is provided35 for the 2008-201036
Generation Key Performance Indicators
assessment period
Three key performance indicators37
In
the industry have used widely to measure the availability of generating
units (see Terms Used in This Report section for their calculation parameters) are Equivalent Availability
Factor (EAF) Net Capacity Factor (NCF) and Equivalent Forced Outage Rate ndash Demand (EFORd)
Table 7 the North American fleet average EAF NCF and EFORd compared to unit age for all generating
units with a capacity of 20 MW and higher is provided for the years 2008-2010 The EAF shows a decline
during the last three years NCF is up and down while the EFORd appears to be increasing As expected the
fleet of units reported to GADS is aging overall with the fossil units being about 12 years older than the
average age
34 httpwwwnerccomdocspcgadstfGADSTF_Recommendation_Report_02-18-2011_FINALpdf 35GADS contains some 1500+ units under 20 MW that is not included in this report These units are excluded because most units are not base-loaded and are in peaking operation
3684 percent of the 2010 dataset is available at this time while the 2008 and 2009 dataset is complete 37 httpwwwnerccompagephpcid=4|43
Generation Equipment Performance
54
Table 7 General Availability Review of GADS Fleet Units by Year
2008 2009 2010 Average
Equivalent Availability Factor (EAF) 8776 8774 8678 8743
Net Capacity Factor (NCF) 5083 4709 4880 4890
Equivalent Forced Outage Rate -
Demand (EFORd) 579 575 639 597
Number of Units ge20 MW 3713 3713 3713 3713
Average Age of the Fleet in Years (all
unit types) 303 311 321 312
Average Age of the Fleet in Years
(fossil units only) 422 432 440 433
Figure 31 provides the average forced outage hours (FOH) maintenance outage hours (MOH) and planned
outage hours (POH) for all units reporting 20 MW or larger During this three-year period the average FOH
291 hours average MOH is 163 hours average POH is 470 hours
Figure 31 shows a large increase in forced and maintenance events The average age of the units with a
capacity of 20MW and higher in 2009 is 316 years old However the average age of fossil units in 2010 is
442 years old These fossil units are the backbone of all operating units providing the base-load power
continuously and nearly 50 percent of all energy annually There appears to be no increase allocated for
annualsemi-annual maintenance (ie planned outages) for the older generating units The increase of
000100002000030000400005000060000700008000090000
100000
2008 2009 2010
463 479 468
154 161 173
288 270 314
Hou
rs
Planned Maintenance Forced
Figure 31 Average Outage Hours for Units gt 20 MW
Generation Equipment Performance
55
maintenance outage hours reflects an increased need to fix problems that cannot be deferred until the next
annualsemi-annual repairs As a result it shows one of two things are happening
bull More or longer planned outage time is needed to repair the aging generating fleet
bull More focus on preventive repairs during planned and maintenance events are needed
Multiple Unit Forced Outages and Causes Table 8 provides the annual multiple-unit forced outage trips resulting from the same cause for each of the
assessments years 2008-2010 respectively The ldquosingle unitrdquo trips are large units with a Net Dependable
Capacity of 750 MW or more The trips of ldquotwo unitsrdquo or more is any combination of unit capacity with the
total amount of lost capacity more than 750 MW
Table 8 also presents more information on the forced outages During 2008-2010 there were a large
number of double-unit outages resulting from the same event Investigations show that some of these trips
were at a single plant caused by common control and instrumentation for the units The incidents occurred
several times for several months and are a common mode issue internal to the plant
Table 8 Number of Multiple Unit Forced Outages and FrequencyYear
2008 2009 2010
Type of
Trip
of
Trips
Avg Outage
Hr Trip
Avg Outage
Hr Unit
of
Trips
Avg Outage
Hr Trip
Avg Outage
Hr Unit
of
Trips
Avg Outage
Hr Trip
Avg Outage
Hr Unit
Single-unit
Trip 591 58 58 284 64 64 339 66 66
Two-unit
Trip 281 43 22 508 96 48 206 41 20
Three-unit
Trip 74 48 16 223 146 48 47 109 36
Four-unit
Trip 12 77 19 111 112 28 40 121 30
Five-unit
Trip 11 1303 260 60 443 88 19 199 10
gt 5 units 20 166 16 93 206 50 37 246 6
Loss of ge 750 MW per Trip
The high number of five-unit trips in 2008 was due to Hurricane Ike hitting the Gulf Coast The highest total
number of multiple unit trips occurred in 2009 though as mentioned before the data collection for 2010 is
incomplete at this time The majority of 2009 multiple unit trips have three main causes (in order by
Generation Equipment Performance
56
number of events) transmission lack of fuel and storms A summary of the three categories for single as
well as multiple unit outages (all unit capacities) are reflected in Table 9
Table 9 Common Causes of Multiple Unit Forced Outages (2009)
Cause Number of Events Average MW Size of Unit
Transmission 1583 16
Lack of Fuel (Coal Mines Gas Lines etc) Not
in Operator Control
812 448
Storms Lightning and Other Acts of Nature 591 112
Some of the transmission outages based on storms in 2009 have been caused by the same reasons because
the storms may have caused transmission interference However the plants reported the problems
inconsistently with either the transmission interference or storms cause code Therefore they are depicted
as two different causes of forced outage
Marked transmission outages in 2009 were quite high Thirty-five percent came from one utility with a large
number of hydroelectric units The company related the trips to various problems including weather
(lightning storms) wildlife ldquoline bumpsrdquo and problems on the receiving end of the transmission line Nine
hundred and eighty-five transmission trips (62 percent) were from hydroelectric units38
In 2009 only ten transmission trips resulted in a loss of 750 MW or more per trip Twenty two generating
plants were affected by the ten trips Causes for the trips include feeder line trips (1 trip) breakers in the
switchyard (8 trips) personnel errors (2 trips) and unknown (10 trips)
The ldquoLack of Fuelrdquo outages are of interest as these events occur during the times when a unit is available to
operate but there is an interruption in fuels to operate the facilities These events do not include
interruptions of fuel due to contracts Rather the cause code is designed to account for units that are
expecting fuel and it is unavailable when requested Table 10 presents the distribution of ldquoLack of Fuelrdquo
events by NERC Region and Table 11 presents the unit types affected
38 The average size of the hydroelectric units were small ndash 335 MW
Generation Equipment Performance
57
Of the units that report ldquoLack of Fuelrdquo 78 percent of the units are oil-fired 15 percent of the units are gas-
fired and the remaining units are various other fuels Table 12 provides the top causes of forced outage for
several unit types For fossil units ldquoLack of Fuelrdquo as the number three cause behind waterwall tube leaks
and superheater tube leaks
Table 10 Forced Outages Due to Lack of Fuel by Region
Region Number of Lack of Fuel
Problems Reported
FRCC 0
MRO 3
NPCC 24
RFC 695
SERC 17
SPP 3
TRE 7
WECC 29
One company contributed to the majority of oil-fired lack of fuel events The units at the company are
actually dual-fuels (oil and gas) but market nominated gas monitoring causes the units to be on forced
outage nightly The units need gas to start up so they can run on oil When they shut down the units must
switch to gas to clean themselves With the gas restriction the unit canrsquot start and the unit goes on a
forced outage Until the band is lifted the two units will continue to be on a forced outage cycle
Event records also provide descriptions of why the unit was without fuel with the majority of descriptions
bull Temperatures affecting gas supply valves
bull Unexpected maintenance of gas pipe-lines
bull Compressor problemsmaintenance
Generation Equipment Performance
58
Table 11 Unit Type Profile of Forced Outages Due to Lack of Fuel
Unit Types Number of Lack of Fuel Problems Reported
Fossil 642
Nuclear 0
Gas Turbines 88
Diesel Engines 1
HydroPumped Storage 0
Combined Cycle 47
Generation Equipment Performance
59
Table 12 Causes of Forced Outage for Different Unit Types (2008-2010)
Fossil - all MW sizes all fuels
Rank Description Occurrence per Unit-year
MWH per Unit-year
Average Hours To Repair
Average Hours Between Failures
Unit-years
1 Waterwall (furnace wall) 0590 134106 59 3250 3868 2 Second Superheater
Leaks 0180 5182 60 3228 3868
3 Lack of Fuel (coal mines gas lines etc) where the operator is not in control
0480 4701 18 26 3868
Combined-Cycle blocks Rank Description Occurrence
per Unit-year
MWH per Unit-year
Average Hours To Repair
Average Hours Between Failures
Unit-years
1 HP Turbine Buckets Or Blades
0020 4663 1830 26280 466
2 Turbine Control Valves 0040 2777 100 7200 466 3 Gas Turbine Compressor -
High Pressure Shaft 0010 2266 663 4269 466
Nuclear units - all Reactor types Rank Description Occurrence
per Unit-year
MWH per Unit-year
Average Hours To Repair
Average Hours Between Failures
Unit-years
1 LP Turbine Buckets or Blades
0010 26415 8760 26280 288
2 Containment Structure 0010 9233 1226 26262 288 3 Feedwater Pump Local
Controls 0020 7620 692 12642 288
Simple-cycle gas turbine jet engines Rank Description Occurrence
per Unit-year
MWH per Unit-year
Average Hours To Repair
Average Hours Between Failures
Unit-years
1 Main Transformer 0030 1611 1016 20709 4181 2 Other Gas Turbine
Controls And Instrument Problems
0120 428 70 2614 4181
3 Other Gas Turbine Problems
0090 400 119 1701 4181
Generation Equipment Performance
60
2008-2010 Review of Summer versus Winter Availability To address seasonality of unit availability unit information for the months of June to September (summer)
and December through February (winter) were pooled to calculate force events during these timeframes for
2008-201039 Figure 32 shows the Equivalent Availability Factor (EAF) is three percentage points higher and
the Equivalent Forced Outage Rate - Demand (EFORd) is more than a half of a percentage point lower in the
summer period than in winter period This means the units were more reliable with less forced events
during high-demand times during the summer than during the winter seasons The generating unitrsquos
capability has a resulting higher Net Capacity Factor (NCF) of 45 percentage points in the summer season
for 2008-2010
During the spring season (March-May) 77 percent of the units took a planned outage (PO) for an average
231 hours (or 96 days) In fall (October-November) only 42 percent of the units experienced a PO and the
average duration was shorter ndash 134 hours (or 56 days) A few units took both spring and fall planned
outages although this is rare Based on this assessment the generating units are prepared for the summer
peak demand The resulting availability indicates that this maintenance was successful which is measured
by an increased EAF and lower EFORd
Figure 32 Summer-Winter Average EAF NCF and EFORd (2008-2010)
Conclusions and Recommendations During 2008-2010 the average Equivalent Availability Factor (EAF) which measures the overall availability
of generating units decreased At the same time the Net Capacity Factor (NCF) an indicator of energy
production increased The average number of forced outages in 2010 is greater than in 2008 while at the
same time the average planned outage times have decreased As a result the Equivalent Forced Outage
Rate ndash Demand (EFORd) also increased illustrating that more units have experienced forced events during
39 A study of peak periods was conducted by the NERC Generating Availability Trend Evaluation (GATE) Working Group several years ago see httpwwwnerccomfilesSeasonal-Performance-Trendspdf
9116
5343
396
8818
4896
441
0 10 20 30 40 50 60 70 80 90 100
EAF
NCF
EFORd
Percent ()
Winter
Summer
Generation Equipment Performance
61
peak-demand times in 2010 than in the previous two years Potentially with shorter planned outage
periods in 2010 there may be less time to repair equipment and prevent forced unit outages
There are warnings that units are not being maintained as well as they should be In the last three years
there has been an increase in Equivalent Forced Outage Rate ndash Demand (EFORd) This indicator measures
the rate of forced outage events on generating units during periods of load demand To confirm this
problem forced outage hours jumped from 270 to 314 hours per unit between 2009 and 2010 At the same
time maintenance events also increased by 12 hours per unit Planned outage events remain constant The
resulting conclusions from this trend are
bull More or longer planned outage time is needed to repair the generating fleet Whether age is the
cause of the increase need for planned outage time remains unknown and further investigation into
the cause for longer planned outage time is necessary
bull More focus on preventive repairs during planned and maintenance events are needed
There are many multiple unit forced outages due to lack of fuel The majority of multiple unit trips have
three main causes transmission lack of fuel and storms With special interest in the forced outages due to
ldquoLack of Fuelrdquo additional analysis revealed that 77 percent of the units experiencing unexpected fuel
stoppage are oil-fired fossil units while gas-fired units experienced 15 percent
Generating units continue to be more reliable during the peak summer periods
Disturbance Event Trends
62
Category 1 An event resulting in one or more of the following a Unintended loss of three or more BPS elements caused by
common mode failure b Failure or misoperation of an SPSRAS c System-wide voltage reduction of 3 or more d Unintended BPS system separation resulting in an island of
100 MW to 999 MW e Unplanned evacuation from a control center facility with BPS
SCADA functionality for 30 minutes or more Category 2 An event resulting in one or more of the following
a Complete loss of all BPS control center voice communication system(s) for 30 minutes or more
b Complete loss of SCADA control or monitoring functionality for 30 minutes or more
c Voltage excursions equal to or greater than 10 lasting more than five minutes
d Loss of off-site power (LOOP) to a nuclear generating station e Unintended system separation resulting in an island of 1000
MW to 4999 MW f Unintended loss of 300MW or more of firm load for more
than 15 minutes g Violation of an Interconnection Reliability Operating Limit
(IROL) for more than 30 minutes Category 3 An event resulting in one or more of the following
a The loss of load or generation of 2000 MW or more in the Eastern Interconnection or
b Western Interconnection or 1000 MW or more in the ERCOT or Queacutebec Interconnections
c Unintended system separation resulting in an island of 5000 MW to 10000 MW
d Unintended system separation resulting in an island of Florida from the Eastern Interconnection
Category 4 An event resulting in one or more of the following a The loss of load or generation from 5001 MW to 9999 MW b Unintended system separation resulting in an island of more
than 10000 MW (with the exception of Florida as described in Category 3c)
Category 5 An event resulting in one or more of the following a The loss of load of 10000 MW or more b The loss of generation of 10000 MW or more
Figure 33 BPS Event Category
Disturbance Event Trends Introduction The purpose of this section is to report event
analysis trends from the beginning of event
analysis field test40
One of the companion goals of the event
analysis program is the identification of trends
in the number magnitude and frequency of
events and their associated causes such as
human error equipment failure protection
system misoperations etc The information
provided in the event analysis database (EADB)
and various event analysis reports have been
used to track and identify trends in BPS events
in conjunction with other databases (TADS
GADS metric and benchmarking database)
to the end of 2010
The Event Analysis Working Group (EAWG)
continuously gathers event data and is moving
toward an integrated approach to analyzing
data assessing trends and communicating the
results to the industry
Performance Trends The event category is classified41
Figure 33
as shown in
with Category 5 being the most
severe Figure 34 depicts disturbance trends in
Category 1 to 5 system events from the
40 httpwwwnerccomdocseawgGalloway-Industry-EA-Field-Test-102210pdf 41httpwwwnerccomfiles2011-05-0220Event_Analysis_Process_Phase20220Field20Test20Draft20-20Final20-20For20postingpdf
Disturbance Event Trends
63
beginning of event analysis field test to the end of 201042
Figure 34 Event Category vs Date for All 2010 Categorized Events
From the figure in November and December
there were many more category 1 and 2 events than in October This is due to the field trial starting on
October 25 2010
In addition to the category of the events the status of the events plays a critical role in the accuracy of the
data By examining Figure 35 over 80 of the events reported in 2010 have been closed This means that
the category root cause and other important information have been sufficiently finalized in order for
analysis to be accurate for each event At this time there is not enough data to draw any long-term
conclusions about event investigation performance
42 Documents for the EA Field Test are located at httpwwwnerccompagephpcid=5|365
2
12 12
26
3
6 5
14
1 1
2
0
5
10
15
20
25
30
35
40
45
October November December 2010
Even
t Cou
nt
Category 3 Category 2 Category 1
Disturbance Event Trends
64
Figure 35 Event Count vs Status (All 2010 Events with Status)
By drilling down into the cause code for each closed 2010 event Figure 36 shows the top 3 event causes
From the figure equipment failure and protection system misoperation are the most significant causes for
events Because of how new and limited the data is however there may not be statistical significance for
this result Further trending of cause codes for closed events and developing a richer dataset to find any
trends between event cause codes and event counts should be performed
Figure 36 Top 3 Event Counts vs DAWG Cause Code for all Closed 2010 Events
10
32
42
0
5
10
15
20
25
30
35
40
45
Open Closed Open and Closed
Even
t Cou
nt
Status
1211
8
0
2
4
6
8
10
12
14
Equipment Failure Protection System Misoperation Human Error
Even
t Cou
nt
Cause Code
Disturbance Event Trends
65
Conclusions Due to the relatively new process for events analysis and categorization more time will be required before a
conclusive recommendation may be obtained Further analysis and new data should provide valuable
statistics in the future Over 80 of all event reports from 2010 are current listed as closed but no
conclusion about investigation performance may be obtained because of the limited amount of data It is
recommended to study ways to prevent equipment failure and protection system misoperations but there
is not enough data to draw a firm conclusion about the top causes of events at this time
Abbreviations Used in This Report
66
Abbreviations Used in This Report
Acronym Definition ALP Acadiana Load Pocket
ALR Adequate Level of Reliability
ARR Automatic Reliability Report
BA Balancing Authority
BPS Bulk Power System
CDI Condition Driven Index
CEII Critical Energy Infrastructure Information
CIPC Critical Infrastructure Protection Committee
CLECO Cleco Power LLC
DADS Future Demand Availability Data System
DCS Disturbance Control Standard
DOE Department Of Energy
DSM Demand Side Management
EA Event Analysis
EAF Equivalent Availability Factor
ECAR East Central Area Reliability
EDI Event Drive Index
EEA Energy Emergency Alert
EFORd Equivalent Forced Outage Rate Demand
EMS Energy Management System
ERCOT Electric Reliability Council of Texas
ERO Electric Reliability Organization
ESAI Energy Security Analysis Inc
FERC Federal Energy Regulatory Commission
FOH Forced Outage Hours
FRCC Florida Reliability Coordinating Council
GADS Generation Availability Data System
GOP Generation Operator
IEEE Institute of Electrical and Electronics Engineers
IESO Independent Electricity System Operator
IROL Interconnection Reliability Operating Limit
Abbreviations Used in This Report
67
Acronym Definition IRI Integrated Reliability Index
LOLE Loss of Load Expectation
LUS Lafayette Utilities System
MAIN Mid-America Interconnected Network Inc
MAPP Mid-continent Area Power Pool
MOH Maintenance Outage Hours
MRO Midwest Reliability Organization
MSSC Most Severe Single Contingency
NCF Net Capacity Factor
NEAT NERC Event Analysis Tool
NERC North American Electric Reliability Corporation
NPCC Northeast Power Coordinating Council
OC Operating Committee
OL Operating Limit
OP Operating Procedures
ORS Operating Reliability Subcommittee
PC Planning Committee
PO Planned Outage
POH Planned Outage Hours
RAPA Reliability Assessment Performance Analysis
RAS Remedial Action Schemes
RC Reliability Coordinator
RCIS Reliability Coordination Information System
RCWG Reliability Coordinator Working Group
RE Regional Entities
RFC Reliability First Corporation
RMWG Reliability Metrics Working Group
RSG Reserve Sharing Group
SAIDI System Average Interruption Duration Index
SAIFI System Average Interruption Frequency Index
SCADA Supervisory Control and Data Acquisition
SDI Standardstatute Driven Index
SERC SERC Reliability Corporation
Abbreviations Used in This Report
68
Acronym Definition SRI Severity Risk Index
SMART Specific Measurable Attainable Relevant and Tangible
SOL System Operating Limit
SPS Special Protection Schemes
SPCS System Protection and Control Subcommittee
SPP Southwest Power Pool
SRI System Risk Index
TADS Transmission Availability Data System
TADSWG Transmission Availability Data System Working Group
TO Transmission Owner
TOP Transmission Operator
WECC Western Electricity Coordinating Council
Contributions
69
Contributions This report was made feasible by the collaboration and hard work of both NERC staff and NERCrsquos
Industry Groups
NERC Industry Groups
Table 14 lists the NERC industry group contributors Without their contribution and collaboration this
report would not have been possible
Table 13 NERC Industry Group Contributions43
NERC Group
Relationship Contribution
Reliability Metrics Working Group
(RMWG)
Reports to the OCPC bull Lead Development of Report bull Provide Reliability Metrics Data bull Responsible for Reliability Metrics
Performance Chapter
Transmission Availability Working Group
(TADSWG)
Reports to the OCPC bull Provide Transmission Availability Data
bull Responsible for Transmission Equip-ment Performance Chapter
bull Content Review
Generation Availability Data System Task
Force
(GADSTF)
Reports to the OCPC bull Provide Generation Availability Data bull Responsible for Generation Equip-
ment Performance Chapter bull Content Review
Event Analysis Working Group
(EAWG)
Reports to the OCPC bull Provide Events Data bull Responsible for Disturbance Events
Trends Chapter bull Content Review
43 Rosters for RMWG TADSWG GADSTF and EAWG are available at httpwwwnerccomfilesrosterpdf
Contributions
70
NERC Staff Table 13 below lists the NERC staff who contributed to the 2011 Reliability Performance Analysis
Report
Table 14 Contributing NERC Staff
Name Title E-mail Address
Mark Lauby Vice President and Director of
Reliability Assessment and
Performance Analysis
marklaubynercnet
Jessica Bian Manager of Performance Analysis jessicabiannercnet
John Moura Manager of Reliability Assessments johnmouranercnet
Andrew Slone Engineer Reliability Performance
Analysis
andrewslonenercnet
Jim Robinson TADS Project Manager jimrobinsonnercnet
Clyde Melton Engineer Reliability Performance
Analysis
clydemeltonnercnet
Mike Curley Manager of GADS Services mikecurleynercnet
James Powell Engineer Reliability Performance
Analysis
jamespowellnercnet
Michelle Marx Administrative Assistant michellemarxnercnet
William Mo Intern Performance Analysis wmonercnet
- NERCrsquos Mission
- Table of Contents
- Executive Summary
-
- 2011 Transition Report
- State of Reliability Report
- Key Findings and Recommendations
-
- Reliability Metric Performance
- Transmission Availability Performance
- Generating Availability Performance
- Disturbance Events
- Report Organization
-
- Introduction
-
- Metric Report Evolution
- Roadmap for the Future
-
- Reliability Metrics Performance
-
- Introduction
- 2010 Performance Metrics Results and Trends
-
- ALR1-3 Planning Reserve Margin
-
- Background
- Assessment
- Special Considerations
-
- ALR1-4 BPS Transmission Related Events Resulting in Loss of Load
-
- Background
- Assessment
-
- ALR1-12 Interconnection Frequency Response
-
- Background
- Assessment
-
- ALR2-3 Activation of Under Frequency Load Shedding
-
- Background
- Assessment
- Special Considerations
-
- ALR2-4 Average Percent Non-Recovery Disturbance Control Standards (DCS)
-
- Background
- Assessment
- Special Consideration
-
- ALR2-5 Disturbance Control Events Greater Than Most Severe Single Contingency
-
- Background
- Assessment
- Special Consideration
-
- ALR 1-5 System Voltage Performance
-
- Background
- Special Considerations
- Status
-
- ALR3-5 Interconnection Reliability Operating Limit System Operating Limit (IROLSOL) Exceedances
-
- Background
-
- ALR4-1 Automatic Transmission Outages Caused by Protection System Misoperations
-
- Background
- Special Considerations
-
- ALR6-11 ndash ALR6-14
-
- Background
- Assessment
- ALR 6-11 ndash Automatic Outages Initiated by Failed Protection System Equipment
- ALR6-12 ndash Automatic Outages Initiated by Human Error
- ALR6-13 ndash Automatic Outages Initiated by Failed AC Substation Equipment
- ALR6-14 Automatic AC Transmission Outages Initiated by Failed AC Circuit Equipment
-
- ALR6-15 Element Availability Percentage (APC)
-
- Background
- Assessment
- Special Consideration
-
- ALR6-16 Transmission System Unavailability
-
- Background
- Assessment
- Special Consideration
-
- ALR6-2 Energy Emergency Alert 3 (EEA3)
-
- Background
- Assessment
- Special Considerations
-
- ALR 6-3 Energy Emergency Alert 2 (EEA2)
-
- Background
- Assessment
- Special Considerations
-
- ALR 6-1 Transmission Constraint Mitigation
-
- Background
- Assessment
- Special Considerations
-
- Integrated Bulk Power System Risk Assessment
-
- Introduction
- Recommendations
-
- Integrated Reliability Index Concepts
-
- The Three Components of the IRI
-
- Event-Driven Indicators (EDI)
- Condition-Driven Indicators (CDI)
- StandardsStatute-Driven Indicators (SDI)
-
- IRI Index Calculation
- IRI Recommendations
-
- Reliability Metrics Conclusions and Recommendations
-
- Transmission Equipment Performance
-
- Introduction
- Performance Trends
-
- AC Element Outage Summary and Leading Causes
- Transmission Monthly Outages
- Outage Initiation Location
- Transmission Outage Events
- Transmission Outage Mode
-
- Conclusions
-
- Generation Equipment Performance
-
- Introduction
- Generation Key Performance Indicators
-
- Multiple Unit Forced Outages and Causes
- 2008-2010 Review of Summer versus Winter Availability
-
- Conclusions and Recommendations
-
- Disturbance Event Trends
-
- Introduction
- Performance Trends
- Conclusions
-
- Abbreviations Used in This Report
- Contributions
-
- NERC Industry Groups
- NERC Staff
-
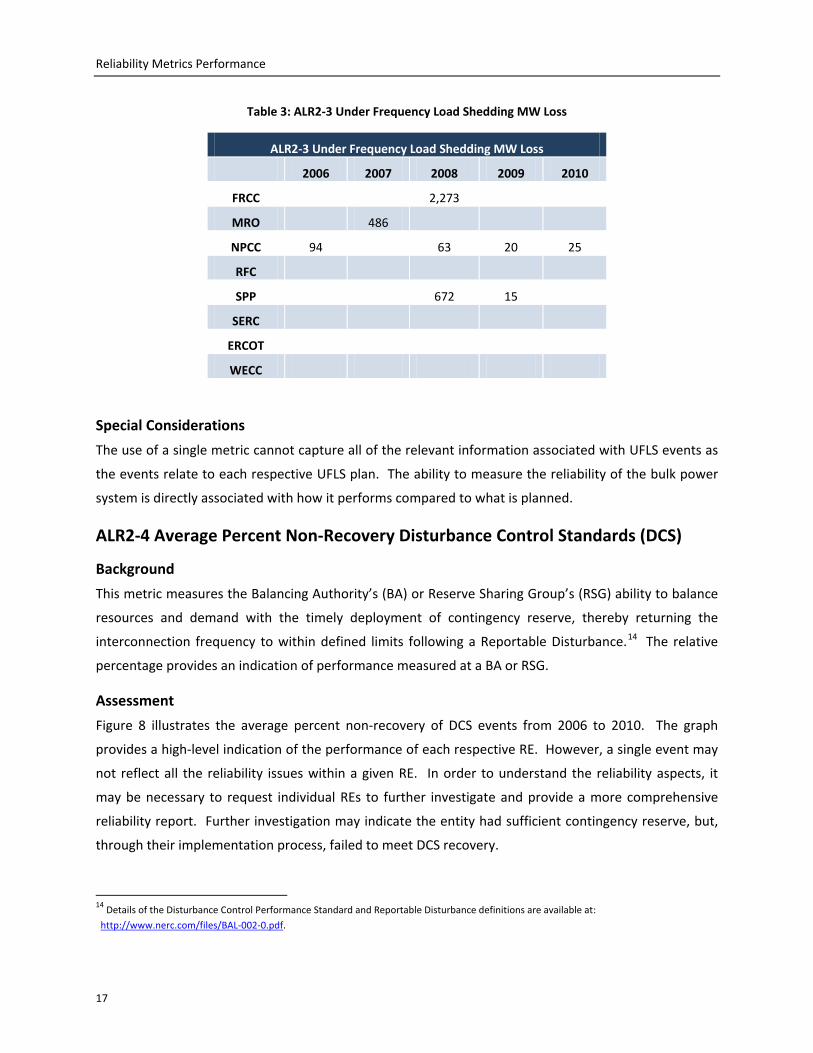
Reliability Metrics Performance
20
Special Consideration
The metric reports the number of DCS events greater than MSSC without regards to the size of a BA or
RSG and without respect to the number of reporting entities within a given RE Because of the potential
for differences in the magnitude of MSSC and the resultant frequency of events trending should be
within each RE to provide any potential reliability indicators Each RE should investigate to determine
the cause and relative effect on reliability of the events within their footprints Small BA or RSG may
have a relatively small value of MSSC As such a high number of DCS greater than MCCS may not
indicate a reliability problem for the reporting RE but may indicate an issue for the respective BA or RSG
In addition events greater than MSSC may not cause a reliability issue for some BA RSG or RE if they
have more stringent standards which require contingency reserves greater than MSSC
ALR 1-5 System Voltage Performance
Background
The purpose of this metric is to measure the transmission system voltage performance (either absolute
or per unit of a nominal value) over time This should provide an indication of the reactive capability
available to the transmission system The metric is intended to record the amount of time that system
voltage is outside a predetermined band around nominal
0
5
10
15
20
25
30
2006
2007
2008
2009
2010
2006
2007
2008
2009
2010
2006
2007
2008
2009
2010
2006
2007
2008
2009
2010
2006
2007
2008
2009
2010
2006
2007
2008
2009
2010
2006
2007
2008
2009
2010
2006
2007
2008
2009
2010
FRCC MRO NPCC RFC SERC SPP ERCOT WECC
Cou
nt
Region and Year
Figure 9 Disturbance Control Events Greater Than Most Severe Single Contingency (2006-2010)
Reliability Metrics Performance
21
Special Considerations
Each Reliability Coordinator (RC) will work with the Transmission Owners (TOs) and Transmission
Operators (TOPs) within its footprint to identify specific buses and voltage ranges to monitor for this
metric The number of buses the monitored voltage levels and the acceptable voltage ranges may vary
by reporting entity
Status
With a pilot program requested in early 2011 a voluntary request to Reliability Coordinators (RC) was
made to develop a list of key buses This work continues with all of the RCs and their respective
Transmission Owners (TOs) to gather the list of key buses and their voltage ranges After this step has
been completed the TO will be requested to provide relevant data on key buses only Based upon the
usefulness of the data collected in the pilot program additional data collection will be reviewed in the
future
ALR3-5 Interconnection Reliability Operating Limit System Operating Limit (IROLSOL) Exceedances
Background
This metric illustrates the number of times that defined Interconnection Reliability Operating Limit
(IROL) or System Operating Limit (SOL) were exceeded and the duration of these events Exceeding
IROLSOLs could lead to outages if prompt operator control actions are not taken in a timely manner to
return the system to within normal operating limits This metric was approved by NERCrsquos Operating and
Planning Committees in June 2010 and a data request was subsequently issued in August 2010 to collect
the data for this metric Based on the results of the pilot conducted in the third and fourth quarter of
2010 there is merit in continuing measurement of this metric Note the reporting of IROLSOL
exceedances became mandatory in 2011 and data collected in Table 4 for 2010 has been provided
voluntarily
Reliability Metrics Performance
22
Table 4 ALR3-5 IROLSOL Exceedances
3Q2010 4Q2010 1Q2011
le 10 mins 123 226 124
le 20 mins 10 36 12
le 30 mins 3 7 3
gt 30 mins 0 1 0
Number of Reporting RCs 9 10 15
ALR4-1 Automatic Transmission Outages Caused by Protection System Misoperations
Background
Originally titled Correct Protection System Operations this metric has undergone a number of changes
since its initial development To ensure that it best portrays how misoperations affect transmission
outages it was necessary to establish a common understanding of misoperations and the data needed
to support the metric NERCrsquos Reliability Assessment Performance Analysis (RAPA) group evaluated
several options of transitioning from existing procedures for the collection of misoperations data and
recommended a consistent approach which was introduced at the beginning of 2011 With the NERC
System Protection and Control Subcommitteersquos (SPCS) technical guidance NERC and the regional
entities have agreed upon a set of specifications for misoperations reporting including format
categories event type codes and reporting period to have a final consistent reporting template16
Special Considerations
Only
automatic transmission outages 200 kV and above including AC circuits and transformers will be used
in the calculation of this metric
Data collection will not begin until the second quarter of 2011 for data beginning with January 2011 As
revised this metric cannot be calculated for this report at the current time The revised title and metric
form can be viewed at the NERC website17
16 The current Protection System Misoperation template is available at
httpwwwnerccomfilezrmwghtml 17The current metric ALR4-1 form is available at httpwwwnerccomdocspcrmwgALR_4-1Percentpdf
Reliability Metrics Performance
23
ALR6-11 ndash ALR6-14
ALR6-11 Automatic AC Transmission Outages Initiated by Failed Protection System Equipment
ALR6-12 Automatic AC Transmission Outages Initiated by Human Error
ALR6-13 Automatic AC Transmission Outages Initiated by Failed AC Substation Equipment
ALR6-14 Automatic AC Circuit Outages Initiated by Failed AC Circuit Equipment
Background
These metrics evolved from the original ALR4-1 metric for correct protection system operations and
now illustrate a normalized count (on a per circuit basis) of AC transmission element outages (ie TADS
momentary and sustained automatic outages) that were initiated by Failed Protection System
Equipment (ALR6-11) Human Error (ALR6-12) Failed AC Substation Equipment (ALR6-13) and Failed AC
Circuit Equipment (ALR6-14) These metrics are all related to the non-weather related initiating cause
codes for automatic outages of AC circuits and transformers operated 200 kV and above
Assessment
Figure 10 through Figure 13 show the normalized outages per circuit and outages per transformer for
facilities operated at 200 kV and above As shown in all eight of the charts there are some regional
trends in the three years worth of data However some Regionrsquos values have increased from one year
to the next stayed the same or decreased with no discernable regional trends For example ALR6-11
computes the automatic AC Circuit outages initiated by failed protection system equipment
There are some trends to the ALR6-11 to ALR6-14 data but many regions do not have enough data for a
valid trend analysis to be performed NERCrsquos outage rate seems to be improving every year On a
regional basis metric ALR6-11 along with ALR6-12 through ALR6-14 cannot be statistically understood
until confidence intervals18
18The detailed Confidence Interval computation is available at
are calculated ALR metric outage frequency rates and Regional equipment
inventories that are smaller than others are likely to require more than 36 months of outage data Some
numerically larger frequency rates and larger regional equipment inventories (such as NERC) do not
require more than 36 months of data to obtain a reasonably narrow confidence interval
httpwwwnerccomdocspctadstfTADS_Nov_2_2007APPENDIX_C_Confidence_Intervalpdf
Reliability Metrics Performance
24
While more data is still needed on a regional basis to determine if each regionrsquos bulk power system is
becoming more reliable year to year there are areas of potential improvement which include power
system condition protection performance and human factors These potential improvements are
presented due to the relatively large number of outages caused by these items The industry can
benefit from detailed analysis by identifying lessons learned and rolling average trends of NERC-wide
performance With a confidence interval of relatively narrow bandwidth one can determine whether
changes in statistical data are primarily due to random sampling error or if the statistics are significantly
different due to performance
Reliability Metrics Performance
25
ALR 6-11 ndash Automatic Outages Initiated by Failed Protection System Equipment
Automatic outages with an initiating cause code of failed protection system equipment are in Figure 10
Figure 10 ALR6-11 by Region (Includes NERC-Wide)
This code covers automatic outages caused by the failure of protection system equipment This
includes any relay andor control misoperations except those that are caused by incorrect relay or
control settings that do not coordinate with other protective devices
ALR6-12 ndash Automatic Outages Initiated by Human Error
Figure 11 shows the automatic outages with an initiating cause code of human error This code covers
automatic outages caused by any incorrect action traceable to employees andor contractors for
companies operating maintaining andor providing assistance to the Transmission Owner will be
identified and reported in this category
Reliability Metrics Performance
26
Also any human failure or interpretation of standard industry practices and guidelines that cause an
outage will be reported in this category
Figure 11 ALR6-12 by Region (Includes NERC-Wide)
Reliability Metrics Performance
27
ALR6-13 ndash Automatic Outages Initiated by Failed AC Substation Equipment
Figure 12 shows the automatic outages with an initiating cause code of failed AC substation equipment
This code covers automatic outages caused by the failure of AC Substation ie equipment ldquoinside the
substation fencerdquo including transformers and circuit breakers but excluding protection system
equipment19
19TADS Initiating Cause Code definitions are located at httpwwwnerccomdocspctadswgTADS_Definitions_Appendix_7_092909pdf
Figure 12 ALR6-13 by Region (Includes NERC-Wide)
Reliability Metrics Performance
28
ALR6-14 Automatic AC Transmission Outages Initiated by Failed AC Circuit Equipment
Figure 13 shows the automatic outages with an initiating cause code of failed AC circuit equipment
Automatic Outages related to the failure of AC Circuit equipment ie overhead or underground
equipment ldquooutside the substation fencerdquo 20
ALR6-15 Element Availability Percentage (APC)
Background
This metric uses data and calculations directly from the NERC TADS effort and illustrates the overall
percent of time the aggregate of transmission facilities are available and in service This is an aggregate
20TADS Initiating Cause Code definitions are located at httpwwwnerccomdocspctadswgTADS_Definitions_Appendix_7_092909pdf
Figure 13 ALR6-14 by Region (Includes NERC-Wide)
Reliability Metrics Performance
29
value using sustained outages (automatic and non-automatic) for both lines and transformers operated
at 200 kV and above for each Regional Entity Interconnection and for NERC This metric was approved
by the NERC Operating and Planning Committees in September 2010
Assessment
Figure 14 shows the aggregate element availability percentage (APC) for transmission and transformers
facilities operated at 200 kV and above The values are all over 90 percent which shows excellent
system availability The RMWG recommends continued metric assessment for at least a few more years
in order to determine the value of this metric
Figure 14 2010 ALR6-15 Element Availability Percentage
Notably the Eastern Interconnection does not include Quebec or ERCOT ERCOT does not have any
transformers with low-side voltage levels 200 kV and above
Special Consideration
It should be noted that the non-automatic outage data needed to calculate this metric was only first
collected for the calendar year 2010 as part of the TADS process Therefore only one year of data for
this metric is available at this time
Reliability Metrics Performance
30
ALR6-16 Transmission System Unavailability
Background
This metric uses data and calculations directly from the NERC TADS effort and shows the overall percent
of time the aggregate of transmission facilities are unavailable due to automatic and non-automatic
outages This is an aggregate value using sustained automatic outages for both lines and transformers
operated at 200 kV and above for each Regional Entity and for NERC This metric was approved by the
NERC Operating and Planning Committees in December 2010
Assessment
Figure 15 and Figure 16 illustrate the 2010 aggregate unavailability percentage for AC circuits and
transformer facilities operated at 200 kV and above The values for AC circuits are all under 3 percent
which shows excellent system availability
The RMWG recommends continued metric assessment for at least a few more years in order to
determine the value of this metric
Special Consideration
It should be noted that the non-automatic outage data needed to calculate this metric was only first
collected for the calendar year 2010 as part of the TADS process Therefore only one year of data for
this metric is available at this time
Figure 15 2010 ALR6-16 Transmission System Unavailability
Reliability Metrics Performance
31
Figure 16 2010 ALR6-16 Transmission System Unavailability by Outage Type
Notably the Eastern Interconnection does not include Quebec or ERCOT Also ERCOT does not have
any transformers with low-side voltage levels 200 kV and above
ALR6-2 Energy Emergency Alert 3 (EEA3)
Background
This metric identifies the number of times Energy Emergency Alerts Level 3 (EEA3) are issued EEA3
events are firm-load interruptions due to capacity and energy deficiency EEA3 is currently reported
collected and maintained in NERCrsquos Reliability Coordination Information System (RCIS) and is defined in
Attachment 1 of the NERC Standard EOP-00221
21 The latest version of Attachment 1 for EOP-002 is available at
This metric identifies the number of times EEA3s are
issued The number of EEA3s per year provides a relative indication of performance measured at a
Balancing Authority or interconnection level As historical data is gathered trends in future reports will
provide an indication of either decreasing or increasing use of EEA3s signaling adequacy of the electric
supply system This metric can also be considered in the context of Planning Reserve Margin Significant
increases or decreases in EEA3 events with relatively constant Planning Reserve Margins could indicate
httpwwwnerccompagephpcid=2|20
Reliability Metrics Performance
32
volatility in the actual loads compared to forecast levels or changes in the adequacy of the bulk power
system required to meet load demands
Assessment
Figure 17 shows the number of EEA3 events during 2006 and 2010 from an RE level An interactive
presentation was released and available at the Reliability Indicatorrsquos page22
The Acadiana Load Pocket (ALP) is an area in south central Louisiana that has experienced regular
transmission constraints and numerous Energy Emergency Alert filings by the SPP Reliability Controller
(SPP RC) Transmission within ALP is owned by Entergy Lafayette Utilities System (LUS) and Cleco
Power LLC (Cleco) The transmission constraints within the ALP are primarily caused by the local area
load and the lack of generation located in close proximity to the load area
The number of EEA3rsquos
declared in 2010 returned to more traditional numbers The 2009 spike in EEA3 events in the SPP
Region that was driven by issues in the Acadiana Load Pocket (ALP) were not present in 2010
Special Considerations
Ideally the measure should capture only EEAs that are declared for reliability reasons and not for
economic factors The RMWG has not been able to differentiate these reasons for future reporting and
it has made a recommendation to the Reliability Coordinator Working Group (RCWG) to consider a
revised EEA declaration to exclude economic factors
The reason the EEA volume decreased from 2009 to 2010 in SPP was because the SPP ICT RC23
coordinated an operating agreement between the five operating companies in the ALP The operating
agreement included a cost sharing re-dispatch that alleviated the need of a Transmission Loading Relief
(TLR-5) declaration24
22The EEA3 interactive presentation is available on the NERC website at
During 2009 there was no operating agreement therefore an entity had to
provide Network and Native Load (NNL) relief when a TLR-5 was called by the ICT RC When the TLR-5
was the primary tool to control the post contingent loading in the ALP some of the BAs would have their
firm transmission curtailed to the point where they could no longer serve their load therefore the EEA
3 was needed to communicate a capacityreserve deficiency
httpwwwnerccompagephpcid=4|331|335 23Southwest Power Pool (SPP) Independent Coordinator of Transmission (ICT) Reliability Coordinator (RC) 24More information on Transmission Load Relief is contained in the IRO-006 standard which is located at httpwwwnerccomfilesIRO-006-4pdf In particular TLR-5 definitions are referenced on page 16 and 17
Reliability Metrics Performance
33
Figure 17 ALR6-2 Energy Emergency Alert 3 (EEA3) Counts by Region (2006-2010)
Cleco Power Entergy and LUS are currently constructing an estimated $200 million transmission
infrastructure improvement project to mitigate transmission constraints into ALP Construction of the
project is scheduled to be complete in 2012 Completion of the project should help alleviate some of
the transmission congestion in this area Energy Emergency Alerts filed by the SPP Regional Entity
continue to decline
SPP RTO continues to coordinate operating plans with the operating entities in this area Mitigation
plans and local operating guides in place are expected to provide sufficient flexibility should issues arise
NERC will continue to monitor this area for Reliability Impacts and coordinate any actions with the SPP
Reliability Coordinator and SPP Regional Entity
ALR 6-3 Energy Emergency Alert 2 (EEA2)
Background
Energy Emergency Alert 2 (EEA2) is to measure the number of events BAs declare for deficient capacity
and energy during peak load periods which may serve as a leading indicator of energy and capacity
shortfall in the adequacy of the electric supply system EEA2 provides a sense of the frequency of
precursor events to the more severe EEA3 declarations This metric measures the number of events
1 3 1 2 214
3 4 4 1 5 334
4 2 1 52
1
0
5
10
15
20
25
30
3520
0620
0720
0820
0920
1020
0620
0720
0820
0920
1020
0620
0720
0820
0920
1020
0620
0720
0820
0920
1020
0620
0720
0820
0920
1020
0620
0720
0820
0920
1020
0620
0720
0820
0920
1020
0620
0720
0820
0920
10
FRCC MRO NPCC RFC SERC SPP TRE WECC
2006-2009
2010
Region and Year
Reliability Metrics Performance
34
Balancing Authorities declare for deficient capacity and energy during peak load periods At this time
however this data reflects inclusion of Demand Side Resources that would not be indicative of
inadequacy of the electric supply system
The number of EEA2 events and any trends in their reporting indicates how robust the system is in
being able to supply the aggregate load requirements The historical records may include demand
response activations and non-firm load interruptions per applicable contracts within the EEA alerts per
its definition25
Assessment
Demand response is a legitimate resource to be called upon by balancing authorities and
do not indicate a reliability concern As data is gathered in the future reports will provide an indication
of either decreasing or increasing adequacy in the electric supply system EEA2 events called solely for
activation of demand response (controllable or contractually prearranged demand-side dispatch
programs) or interruption of non-firm load per applicable contracts should be excluded This metric can
also be considered in the context of the Planning Reserve Margin Significant increases or decreases in
EEA2 events with relatively constant Planning Reserve Margins could indicate volatility in the actual
loads compared to forecast levels or changes in the adequacy of the bulk power system required to
meet load demands
Figure 18 shows the number of EEA2 events by Regional Entity from 2006 to 2010 EEA2 interactive
version available on line by quarter and region26
25 The EEA2 is defined at
The general trend continues to show improved
performance which may have been influenced by the overall reduction in demand throughout NERC
caused by the economic downturn Specific performance by any one region should be investigated
further for issues or events that may affect the results Determining whether performance reported
includes those events resulting from the economic operation of DSM and non-firm load interruption
should also be investigated The RMWG recommends continued metric assessment
httpwwwnerccomfilesEOP-002-2pdf 26 EEA2 interactive version located at httpwwwnerccompagephpcid=4|331|341
Reliability Metrics Performance
35
Special Considerations
The intent of this metric is to measure only EEAs that are called for reliability reasons and not for
economic factors such as demand side management (DSM) and non-firm load interruption The
historical data for this metric may include events that were called for economic factors According to
the RCWG recent data should only include EEAs called for reliability reasons
ALR 6-1 Transmission Constraint Mitigation
Background
The RMWG completed a pilot with four regional entities Based on the results the RMWG expanded the
pilot data collection to all regions and the initial results of the data collection are shown in Figure 19
and Table 5 Based on the results of the pilot there is merit in continuing to assess this metric The
intent of this metric is to identify trends in the number of mitigation measures (Special Protection
Schemes (SPS) Remedial Action Schemes (RAS) and Operating Procedures) required to meet reliability
requirements By their nature SPS do not indicate an inherent weakness in the bulk power system
rather they are an indication of methods that are taken to operate the system through the range of
conditions it must perform This metric is only intended to evaluate the trend use of these plans and
whether the metric indicates robustness of the transmission system is increasing remaining static or
decreasing
1 27
2 1 4 3 2 1 2 4 5 2 5 832
4724
211
5 38 5 1 1 8 7 4 1 1
05
101520253035404550
2006
2007
2008
2009
2010
2006
2007
2008
2009
2010
2006
2007
2008
2009
2010
2006
2007
2008
2009
2010
2006
2007
2008
2009
2010
2006
2007
2008
2009
2010
2006
2007
2008
2009
2010
2006
2007
2008
2009
2010
FRCC MRO NPCC RFC SERC SPP TRE WECC
2006-2009
2010
Region and Year
Figure 18 ALR6-3 Energy Emergency Alert 2 (EEA2)
Reliability Metrics Performance
36
Assessment
The pilot data indicates a relatively constant number of mitigation measures over the time period of
data collected
Figure 19 ALR6-1 Transmission Constraint Mitigation by SPSRAS (2009-2014)
0102030405060708090
100110120
2009
2010
2011
2014
2009
2010
2011
2014
2009
2010
2011
2014
2009
2010
2011
2014
2009
2010
2011
2014
2009
2010
2011
2014
2009
2010
2011
2014
2009
2010
2011
2014
FRCC MRO NPCC RFC SERC SPP ERCOT WECC
Coun
t
Region and Year
SPSRAS
Reliability Metrics Performance
37
Table 5 ALR6-1 Transmission Constraint Mitigation by Operating ProcedureGuides (2009-2011)
ALR6-1 Transmission Constraint Mitigation by Operating ProcedureGuides (2009-2014)
2009 2010 2011 2014
FRCC 107 75 66
MRO 79 79 81 81
NPCC 0 0 0
RFC 2 1 3 4
SPP 39 40 40 40
SERC 6 7 15
ERCOT 29 25 25
WECC 110 111
Special Considerations
A certain number of SPS mitigation plans may be necessary to support reliable operation of the system
If the number of SPS increase over time this may indicate that additional transmission capacity is
required A reduction in the number of SPS may be an indicator of increased generation or transmission
facilities being put into service which may indicate greater robustness of the bulk power system In
general mitigation plans are a viable and valuable tool for effective operation of the bulk power system
In power system planning reliability operability capacity and cost-efficiency are simultaneously
considered through a variety of scenarios to which the system may be subjected Mitigation measures
are a method for optimizing a power system across these scenarios Changes in quantities of mitigation
plans may indicate year-on-year differences in the system being evaluated
Integrated Bulk Power System Risk Assessment
Introduction In developing eighteen metrics to measure acceptable levels of reliability it has become clear that any
such measurement of reliability must include consideration of the risks present within the bulk power
system in order for us to appropriately prioritize and manage these system risks The scope for the
Reliability Metrics Working Group (RMWG)27
27 The RMWG scope can be viewed at
includes a task to develop a risk-based approach that
provides consistency in quantifying the severity of events The approach not only can be used to
httpwwwnerccomfilezrmwghtml
Reliability Metrics Performance
38
measure risk reduction over time but also can be applied uniformly in event analysis process to identify
the events that need to be analyzed in detail and sort out non-significant events
The Operating Committee (OC) and Planning Committee (PC) endorsed the concepts and framework28 of
the risk-based approach in their September 2010 joint meeting and further supported the event severity
risk index (SRI) calculation29
Recommendations
in March 2011
bull NERC should embrace the use of risk assessment to identify trends in addition to lessons learned
in order to improve bulk power system reliability
bull The RMWG should continue to coordinate and communicate with the Event Analysis Working
Group (EAWG) to apply the SRI into the event analysis process and root cause analysis
bull As trend evaluations increase the knowledge of risks to the bulk power system data required to
support additional assessment should be gathered
Event Severity Risk Index (SRI)
Risk assessment is an essential tool for achieving the alignment between organizations people and
technology This will assist in quantifying inherent risks identifying where potential high risks exist and
evaluating where the most significant lowering of risks can be achieved Being learning organizations
the Electric Reliability Organization (ERO) Regional Entities and Registered Entities can use these tools
to focus on the areas of highest risk to reliability to provide a sound basis for developing results-based
standards and compliance programs Risk assessment also serves to engage all stakeholders in a
dialogue about specific risk factors and helps direct a strategic plan for risk reduction and early
detection
The SRI is a daily blended metric for which transmission loss generation loss and load loss events are
calculated Each element (transmission generation and load loss) is factored by the systemrsquos inventory
for that element to rate significant events appropriately On a yearly basis these daily performances
can be sorted in descending order to evaluate the year-on-year performance of the system
In order to test drive the concepts the RMWG applied these calculations against historically memorable
days to derive SRIs Once these calculations were complete they were reviewed and evaluated by
various stakeholders for reasonableness Based upon feedback modifications to the calculation were
made and assessed against the historic days performed This iterative process locked down the details
28 httpwwwnerccomdocspcrmwgIntegrated_Bulk_Power_System_Risk_Assessment_Concepts_Finalpdf 29 httpwwwnerccomdocspcrmwgSRI_Equation_Refinement_May6_2011pdf
Reliability Metrics Performance
39
for the calculation of SRI whose calculation from zero (no transmission line outages generation outages
or load lost in a day) to 1000 (a theoretical condition in which every transmission line all generation
units and all load lost across the system in a single day)
Figure 20 captures the calculated severity risk value for each of the days for each year benchmarked
with the historic significant events which were used to concept test the calculation Since there is
significant disparity between days the bulk power system is stressed compared to those that are
ldquoroutinerdquo and ldquoherordquo days of the year where the system performed extremely well the curve is depicted
using a logarithmic scale Each yearrsquos data is sorted in descending order striking a characteristic shape
At the left-side of the curve the days in which the system is severely stressed are plotted The central
more linear portion of the curve identifies the routine day performance while the far right-side of the
curve shows the values plotted for days in which almost all lines and generation units are in service and
essentially no load is lost
The trends on the chart below show that 2009 and 2010 had fewer extreme days than 2008 Routine
daily performance appears generally consistent across all three years Figure 20 captures the days for
each year benchmarked with historically significant events
In Figure 20 NERCrsquos event categories and SRI ratings are directly related As the SRI increases the
category or severity of the event increases Historical events are also shown to relate modern
reliability measurements to give a perspective of how a well-known event would register on the SRI
scale
The event analysis process30
30
benefits from the SRI as it enables a numerical analysis of an event in
comparison to other events By this measure an event can be prioritized by its severity In a severe
event this is unnecessary However for events that do not result in severe stressing of the bulk power
system this prioritization can be a challenge By using the SRI the event analysis process can decide
which events to learn from and reduce which events to avoid and when resilience needs to be
increased under high impact low frequency events as shown in the blue boxes in the figure
httpwwwnerccompagephpcid=5|365
Reliability Metrics Performance
40
Figure 20 NERC Annual Daily Severity Risk Index (SRI) Sorted Descending with Historic Benchmark Days
Other factors that impact severity of a particular event to be considered in the future include whether
equipment operated as designed and resulted in loss of load from a reliability perspective (intentional
and controlled load-shedding) Mechanisms for enabling ongoing refinement to include the historic and
simulated events for future severity risk calculations are being explored
Reliability Metrics Performance
41
Integrated Reliability Index Concepts In December 2010 the RMWG was challenged by the OC and PC to develop a single index concept to
measure the universe of risks associated with the bulk power system As a result the integrated
reliability index (IRI) concepts were proposed31
Figure 21
the three components of which were defined to
quantify each specific risk aspect They are titled the Event Driven Index (EDI) StandardsStatute Driven
Index (SDI) and Condition Driven Index (CDI) illustrated in with measures associated with
system events standards compliance and eighteen performance metrics The development of an
integrated reliability index aims to inform increase transparency and quantify the effectiveness of risk
reduction or mitigation actions The goal is to provide the industry meaningful trends of the BPSrsquos
performance and guidance on how the industry can improve reliability and support risk-informed
decision making Once completed the IRI will facilitate holistic assessment of performance Finally the
IRI should help overcome concern and confusion about how many metrics are being analyzed for system
reliability assessments
Figure 21 Risk Model for Bulk Power System
The integrated model of event-driven condition-driven and standardsstatute-driven risk information
can be constructed to illustrate all possible logical relations between the three risk sets Due to the
nature of the system there may be some overlap among the components
31 httpwwwnerccomdocspcrmwgIntegrated_Reliability_Index_WhitePaper_DRAFTpdf
Event Driven Index (EDI)
Indicates Risk from
Major System Events
Standards Statute Driven
Index (SDI)
Indicates Risks from Severe Impact Standard Violations
Condition Driven Index (CDI)
Indicates Risk from Key Reliability
Indicators
Reliability Metrics Performance
42
The Three Components of the IRI The three components of the IRI work together as shown in Figure 22 to comprise a full picture of the
state of reliability
Figure 22 An overview of the components that comprise the Integrated Reliability Index (IRI)
Event-Driven Indicators (EDI)
The Event-Driven Indicator provides a basis for prioritization of events based on bulk power system
integrity equipment performance and engineering judgment This indicator can serve as a high value
risk assessment tool to be used by stakeholders to investigate and evaluate disturbance history and
measure the severity of these events The relative ranking of events requires industry expertise agreed-
upon goals and engineering judgment The EDI is a derivative of SRI results for a specific time period
but it transforms that performance into a form of an availability index These calculations will be further
refined as feedback is received
Condition-Driven Indicators (CDI)
The Condition-Driven Indicators focus on a set of measurable system conditions (performance
measures) to assess bulk power system reliability These reliability indicators identify factors that
positively or negatively impact reliability and are early predictors of the risk to reliability from events or
unmitigated violations A collection of these indicators measures how close reliability performance is to
the desired outcome and if the performance against these metrics is constant or improving
Reliability Metrics Performance
43
StandardsStatute-Driven Indicators (SDI)
The StandardsStatute-Driven Indicator is a calculation of success of compliance based upon the subset
of high-value standards and is divided by the number of participations who could have received the
violation within the time period considered Also based on these factors known unmitigated violations
of elevated risk factor requirements are weighted higher than lower risk factors The index decreases if
the compliance improvement is achieved over a trending period
IRI Index Calculation As with the SRI the IRI is based on an importance weighting factor which the RMWG can modify over
time after gaining experience with the new metric as well as consideration of feedback from industry
At this time the RMWG believes some form of blended weighting may serve to start to populate IRI
characteristic curves at a high and generic level Based upon feedback from stakeholders this approach
may change or as discussed below weighting factors may vary based on periodic review and risk model
update The RMWG will continue the refinement of the IRI calculation and consider other significant
factors that impact reliability (eg intentional and controlled load-shedding) further it will explore
developing mechanisms for enabling ongoing refinement which should be influenced by a wide set of
stakeholders
RMWG recommends the Event Driven Index (EDI) be weighted the highest (50 percent) since events
actually occurred indicating how the system was performing The Condition Driven Index (CDI) and
StandardsStatute Driven Index (SDI) are weighted 25 each since they are indicators of potential risks
to BPS reliability IRI can be calculated as follows
IRI is intended to be a composite metric which integrates several forms of individual risks to the bulk
power system Since the three components range across many stakeholder organizations these
concepts are developed as starting points for continued study and evaluation Additional supporting
materials can be found in the IRI whitepaper32
IRI Recommendations
including individual indices calculations and preliminary
trend information
For the IRI more investigation should be performed to determine the best way to integrate EDI CDI
and SDI into an Integrated Reliability Index (IRI) that quantitatively represents the reliability of the bulk
32 The IRI whitepaper can be found at httpwwwnerccomdocspcrmwgIntegrated_Reliability_Index_WhitePaper_DRAFTpdf
Reliability Metrics Performance
44
power system To this end study into determining the amount of overlap between the components is
necessary RMWG is currently working to determine the proper amount of overlap between the IRI
components
Also the CDI component of the IRI needs to be solidified This is especially true with the CDI More
accurate metric data is needed to paint a fuller picture of the CDI Many of the metrics used to calculate
the CDI are new or they have limited data Compared to the SDI which counts well-known violation
counts and the EDI which uses the well-defined CDI the CDI lacks the depth of rigor that the other two
components have acquired through their years of data RMWG is currently working to improve the CDI
Reliability Metrics Conclusions and Recommendations Among the eighteen metrics that address the characteristics of an adequate level of reliability (ALR)
metric trends indicate the system is performing better in the following seven areas
bull ALR1-3 Planning Reserve Margin
bull ALR1-4 BPS Transmission Related Events Resulting in Loss of Load
bull ALR2-5 Disturbance Control Events Greater than Most Severe Single Contingency
bull ALR6-2 Energy Emergency Alert 3 (EEA3)
bull ALR6-3 Energy Emergency Alert 2 (EEA2)
bull ALR6-11 Automatic Transmission Outages Caused by Protection System Misoperations
bull ALR6-13 Automatic Transmission Outages Caused by Failed AC Substation Equipment
Assessments have been made in other performance categories A number of them do not have
sufficient data to derive any conclusions from the results The RMWG recommends continued data
collection and assessment of these metrics If a metric does not yield any trend in a five-year reporting
period the metric will be modified or withdrawn
For the IRI more investigation should be performed to determine the overlap of the components (CDI
EDI and SDI) The CDI should be more thoroughly solidified as an index by collecting more data over
time
Transmission Equipment Performance
45
Transmission Equipment Performance Introduction The Transmission Availability Data System (TADS) effort began with the establishment of a TADS task force
by the NERC Planning Committee in October 2006 On October 27 2007 the NERC Board of Trustees
approved the collection of transmission automatic outage data beginning in calendar year 2008 (Phase I)
Subsequently on October 29 2008 the NERC Board approved the collection of Non-Automatic Outage data
that began for Calendar year 2010 (Phase II)
This chapter provides reliability performance analysis of the transmission system by focusing on the trends
of Automatic Outage data from calendar year 2008 thru 2010 Since only one year of Non-Automatic
Outage data has been collected that data will not be assessed in this report
When calculating bulk power system performance indices care must be exercised when interpreting results
as misinterpretation can lead to erroneous conclusions regarding system performance With only three
years of data in the smaller regions it is not clear whether a regionrsquos yearly outage variation compared to
the average is due to random statistical variation or that particular year is significantly different in
performance However on a NERC-wide basis after three years of data collection there is enough
information to accurately determine whether the yearly outage variation compared to the average is due to
random statistical variation or the particular year in question is significantly different in performance33
Performance Trends
Transmission performance information has been provided by Transmission Owners (TOs) within NERC
through the NERC TADS (Transmission Availability Data System) process The data presented reflects
Momentary and Sustained AC Automatic outages of transmission elements that operate at voltages ge 200 kV
(including the low side of transformers) with the criteria specified in the TADS process The following
elements listed below are included
bull AC Circuits ge 200 kV (Overhead and Underground Circuits) Radial circuits are included
bull DC Circuits with ge +-200 kV DC voltage
bull Transformers with ge 200 kV low-side voltage and
bull ACDC Back-to-Back (BTB) Converters with ge 200 kV AC voltage on both sides
33The detailed Confidence Interval computation is available at httpwwwnerccomdocspctadstfTADS_Nov_2_2007APPENDIX_C_Confidence_Intervalpdf
Transmission Equipment Performance
46
AC Element Outage Summary and Leading Causes Table 6 shows the 2008 2009 and 2010 NERC total AC transmission element inventory and a summary of
the associated outages As expected in general the number of circuits increased from year to year due to
new construction or re-construction to higher voltages For every outage experienced on the transmission
system cause codes are identified and recorded according to the TADS process Causes of both momentary
and sustained outages have been indicated These causes are analyzed to identify trends and similarities
and to provide insight into what could be done to possibly prevent future occurrences
Figure 23 and Figure 24 describe the top ten initiating cause codes for sustained and momentary automatic
outages combined from 2008-2010 Based on the two figures the relationship between the total number of
outages and total outage hours can be seen Failed AC Substation Equipment and Failed AC Circuit
Equipment only account for 15 percent of the total number of outages but account for 65 percent of the
total outage hours The two largest causes of outages within NERC (ldquoLightingrdquo and ldquoWeather excluding
Lightningrdquo) account for 34 percent of the total number of outages
The next three Human Error Failed Protection System Equipment and Failed AC Circuit Equipment have
very similar totals and should all be considered significant focus points in reducing the number of Sustained
Automatic Outages for all elements
Transmission Equipment Performance
47
Table 6 NERC - All AC Elements Sustained and Momentary Outage Performance Summary
2008 Number of Outages
AC Voltage
Class
No of
Circuits
Circuit
Miles Sustained Momentary
Total
Outages Total Outage Hours
200-299kV 4369 102131 1560 1062 2622 56595
300-399kV 1585 53631 793 753 1546 14681
400-599kV 586 31495 389 196 585 11766
600-799kV 110 9451 43 40 83 369
All Voltages 6650 196708 2785 2051 4836 83626
2009 Number of Outages
AC Voltage
Class
No of
Circuits
Circuit
Miles Sustained Momentary
Total
Outages Total Outage Hours
200-299kV 4468 102935 1387 898 2285 28828
300-399kV 1619 56447 641 610 1251 24714
400-599kV 592 32045 265 166 431 9110
600-799kV 110 9451 53 38 91 442
All Voltages 6789 200879 2346 1712 4038 63094
2010 Number of Outages
AC Voltage
Class
No of
Circuits
Circuit
Miles Sustained Momentary
Total
Outages Total Outage Hours
200-299kV 4567 104722 1506 918 2424 54941
300-399kV 1676 62415 721 601 1322 16043
400-599kV 605 31590 292 174 466 10442
600-799kV 111 9477 63 50 113 2303
All Voltages 6957 208204 2582 1743 4325 83729
Note The NERC table does not show redacted outages DC Circuit outages Transformer outages or ACDC
converter outages
Transmission Equipment Performance
48
Figure 23 NERC - Top Ten Sustained and Momentary Outages by Initiating Cause Code for All Elements
Figure 24 NERC - Top Ten Sustained Outage Hours by Cause Code
198
151
80
7271
6943
33
27
188
68
Lightning
Weather excluding lightningHuman Error
Failed AC Substation EquipmentFailed Protection System EquipmentFailed AC Circuit Equipment Foreign Interference
Power System Condition
Fire
Unknown
Remaining Cause Codes
299
246
188
58
52
42
3619
16 12 31 Failed AC Substation EquipmentFailed AC Circuit Equipment Weather excluding lightningUnavailable
Other
Fire
Unknown
Human Error
Failed Protection System EquipmentForeign Interference
Remaining Cause Codes
Transmission Equipment Performance
49
Transmission Monthly Outages Figure 25 displays the total number of Automatic Outages on a per-month basis The three months with the
highest total of outages were June July and August From a seasonal perspective winter had a monthly
average of 281 outages These include the months of November-March Summer had an average of 429
outages Summer included the months of April-October
Figure 25 Number of Outages by Month for AC Circuits (2008-2010)
This figure does not show redacted outages DC Circuit outages Transformer outages or ACDC Converter
outages
Outage Initiation Location For every outage experienced on the transmission system the outage initiation code is identified and
recorded according to the TADS process The outage initiation code can be analyzed to identify trends and
similarities and to provide insight into what could be done to possibly prevent future occurrences
The ldquoOutage Initiation Coderdquo describes where an automatic outage was initiated on the power system The
five codes are as follows
bull Element-Initiated
bull Other Element-Initiated
bull AC Substation-Initiated
bull ACDC Terminal-Initiated (for DC circuits)
bull Other Facility Initiated any facility not included in any other outage initiation code
JanuaryFebruar
yMarch April May June July August
September
October
November
December
2008 238 229 257 258 292 437 467 380 208 176 255 236
2009 315 201 339 334 398 553 546 515 351 235 226 294
2010 444 224 269 446 449 486 639 498 351 271 305 281
3 Year AVG 332 218 288 346 380 492 551 464 303 227 262 270
0
100
200
300
400
500
600
700
Out
ages
Transmission Equipment Performance
50
Notably the protection system is not part of an ldquoAC Substationrdquo or an ldquoACDC Terminalrdquo If a protection
system misoperates and initiates an outage it will be classified as ldquoOther-Facility Initiatedrdquo The following
Figures show the initiating location of the Automatic outages from 2008 to 2010
With both Momentary and Sustained Automatic Outages taken into account the outage was initiated on the
Element more than 67 percent of the time as shown in Figure 26 and Figure 27
When only the Sustained Automatic Outages are analyzed the outage initiation on both AC Substation and
Other Facility increased by 34 percent and 32 percent respectively Outages initiated on the Element itself
decreases by 78 percent as shown in Figure 26 and 27 For only the Momentary Automatic Outages the
outage initiation on the Element increases by 19 percent compared to Sustained Outages Element initiated
outages make up over 78 percent of the total outages when analyzing only Momentary Outages
Figure 26
Figure 27
Transmission Outage Events Figure 28 illustrates the relationship between the numbers of Automatic Outages associated per TADS
event 2008 2009 and 2010 tend to follow the same trend The largest number of Automatic Outages per
TADS event is fourteen in 2010 thirteen in 2009 and eight in 2008 There are around 70 to 100 TADS
events that contain between fourteen and three Automatic Outages (see below) There are around 330 to
400 TADS events that contain two or more Automatic Outages The rest of the events only contain one
Automatic Outage As noted in the lower right hand corner below the total number of Events in 2008 to
2010 ranged from 3920 to 4569 events per year Nearly 90 percent or more of the events contained one
Automatic Outage
Figure 26 Sustained Automatic Outage Initiation
Code
Figure 27 Momentary Automatic Outage Initiation
Code
Transmission Equipment Performance
51
Transmission Outage Mode Figure 29 and Figure 30 show the percentage of Outage Modes The ldquoOutage Mode Coderdquo describes
whether one Automatic Outage is related to other Automatic Outages A Single Mode outage is an
Automatic Outage of a single Element which occurs independently of any other Automatic Outages (if any)
A ldquoDependent Mode Initiating Outagerdquo is an Automatic Outage of a single Element that initiates one or more
subsequent Element Automatic Outages A ldquoDependent Mode Outagerdquo is an Automatic Outage of an
Element which occurred as a result of an initiating outage whether the initiating outage was an Element
outage or a non-Element outage A ldquoCommon Mode Outagerdquo is one of two or more Automatic Outages with
the same Initiating Cause Code and where the outages are not consequences of each other and occur nearly
simultaneously A ldquoCommon Mode Initiating Outagerdquo is a Common Mode Outage that initiates one or more
subsequent Automatic Outages
Over 72 percent of the total outages occurred on the bulk power system are Single Mode Outages The next
largest mode is Dependent with over 11 percent of the total outages being in this category For only
Sustained Automatic Outages outages related to each other increase with Dependent mode accounting for
13 percent of the outages and Common mode accounting for close to 11 percent of the outages
Independent Sustained outages still account for the largest portion with nearly 70 percent being Single
mode When just analyzing Momentary Automatic Outages Associated outages decrease with Dependent
Figure 28 Event Histogram (2008-2010)
Transmission Equipment Performance
52
mode accounting for only 9 percent of the outages The Common Mode percentage decreases while
Dependent Mode Initiating percentage increases compared to Sustained Outages Independent Momentary
outages account for the largest portion with over 76 percent being Single Mode
An investigation into the root causes of Dependent and Common mode events which include three or more
Automatic Outages (indentified in the TADS 2008 to 2010 data) should be a high priority Some protection
systems are designed to trip three or more circuits but some events go beyond what is designed Some also
have misoperations associated with multiple outage events
Conclusions On a NERC wide average basis automatic transmission outage rate is improving from 2008 to 2010 based on
reported data Considering both automatic and non-automatic outages 2010 records indicate transmission
element availability percentage is very high and exceeds 95 The unavailability rate for AC circuits and
transformers are only 15 and 29 respectively
The cause codes of Human Error Failed Protection System Equipment and Failed AC Circuit Equipment
should be considered significant focus points in reducing the number of Sustained Automatic Outages for all
elements A deeper look into the root causes of Dependent and Common mode events which include three
or more Automatic Outages (indentified in the TADS 2008 to 2010 data) should be a high priority Some
protection systems are designed to trip three or more circuits but some events go beyond what is designed
Some also have misoperations associated with multiple outage events
Figure 29 Sustained Automatic Outage Mode code Figure 30 Momentary Automatic Outage Mode code
Generation Equipment Performance
53
Generation Equipment Performance Introduction The development of the Generating Availability Data System (GADS) began in 1982 This series of databases
is used to voluntarily collect record and retrieve operating information By pooling individual unit
information with likewise units generating unit availability performance can be calculated providing
opportunities to identify trends and generating equipment reliability improvement opportunities The
information is used to support equipment reliability availability analyses and risk-informed decision-making
by system planners generation owners assessment modelers manufacturers and contractors etc Reports
and information resulting from the data collected through GADS are now used for benchmarking and
analyzing electric power plants
Currently the data collected through GADS contains 72 percent of the North American generating units
with generating capacity of 20 MW or higher34 Additionally many of the newer combined-cycle plants are
not reporting information and therefore a full view of each unit type is not presented Rather a sample of
all the units in North America that fit a given more general category is provided35 for the 2008-201036
Generation Key Performance Indicators
assessment period
Three key performance indicators37
In
the industry have used widely to measure the availability of generating
units (see Terms Used in This Report section for their calculation parameters) are Equivalent Availability
Factor (EAF) Net Capacity Factor (NCF) and Equivalent Forced Outage Rate ndash Demand (EFORd)
Table 7 the North American fleet average EAF NCF and EFORd compared to unit age for all generating
units with a capacity of 20 MW and higher is provided for the years 2008-2010 The EAF shows a decline
during the last three years NCF is up and down while the EFORd appears to be increasing As expected the
fleet of units reported to GADS is aging overall with the fossil units being about 12 years older than the
average age
34 httpwwwnerccomdocspcgadstfGADSTF_Recommendation_Report_02-18-2011_FINALpdf 35GADS contains some 1500+ units under 20 MW that is not included in this report These units are excluded because most units are not base-loaded and are in peaking operation
3684 percent of the 2010 dataset is available at this time while the 2008 and 2009 dataset is complete 37 httpwwwnerccompagephpcid=4|43
Generation Equipment Performance
54
Table 7 General Availability Review of GADS Fleet Units by Year
2008 2009 2010 Average
Equivalent Availability Factor (EAF) 8776 8774 8678 8743
Net Capacity Factor (NCF) 5083 4709 4880 4890
Equivalent Forced Outage Rate -
Demand (EFORd) 579 575 639 597
Number of Units ge20 MW 3713 3713 3713 3713
Average Age of the Fleet in Years (all
unit types) 303 311 321 312
Average Age of the Fleet in Years
(fossil units only) 422 432 440 433
Figure 31 provides the average forced outage hours (FOH) maintenance outage hours (MOH) and planned
outage hours (POH) for all units reporting 20 MW or larger During this three-year period the average FOH
291 hours average MOH is 163 hours average POH is 470 hours
Figure 31 shows a large increase in forced and maintenance events The average age of the units with a
capacity of 20MW and higher in 2009 is 316 years old However the average age of fossil units in 2010 is
442 years old These fossil units are the backbone of all operating units providing the base-load power
continuously and nearly 50 percent of all energy annually There appears to be no increase allocated for
annualsemi-annual maintenance (ie planned outages) for the older generating units The increase of
000100002000030000400005000060000700008000090000
100000
2008 2009 2010
463 479 468
154 161 173
288 270 314
Hou
rs
Planned Maintenance Forced
Figure 31 Average Outage Hours for Units gt 20 MW
Generation Equipment Performance
55
maintenance outage hours reflects an increased need to fix problems that cannot be deferred until the next
annualsemi-annual repairs As a result it shows one of two things are happening
bull More or longer planned outage time is needed to repair the aging generating fleet
bull More focus on preventive repairs during planned and maintenance events are needed
Multiple Unit Forced Outages and Causes Table 8 provides the annual multiple-unit forced outage trips resulting from the same cause for each of the
assessments years 2008-2010 respectively The ldquosingle unitrdquo trips are large units with a Net Dependable
Capacity of 750 MW or more The trips of ldquotwo unitsrdquo or more is any combination of unit capacity with the
total amount of lost capacity more than 750 MW
Table 8 also presents more information on the forced outages During 2008-2010 there were a large
number of double-unit outages resulting from the same event Investigations show that some of these trips
were at a single plant caused by common control and instrumentation for the units The incidents occurred
several times for several months and are a common mode issue internal to the plant
Table 8 Number of Multiple Unit Forced Outages and FrequencyYear
2008 2009 2010
Type of
Trip
of
Trips
Avg Outage
Hr Trip
Avg Outage
Hr Unit
of
Trips
Avg Outage
Hr Trip
Avg Outage
Hr Unit
of
Trips
Avg Outage
Hr Trip
Avg Outage
Hr Unit
Single-unit
Trip 591 58 58 284 64 64 339 66 66
Two-unit
Trip 281 43 22 508 96 48 206 41 20
Three-unit
Trip 74 48 16 223 146 48 47 109 36
Four-unit
Trip 12 77 19 111 112 28 40 121 30
Five-unit
Trip 11 1303 260 60 443 88 19 199 10
gt 5 units 20 166 16 93 206 50 37 246 6
Loss of ge 750 MW per Trip
The high number of five-unit trips in 2008 was due to Hurricane Ike hitting the Gulf Coast The highest total
number of multiple unit trips occurred in 2009 though as mentioned before the data collection for 2010 is
incomplete at this time The majority of 2009 multiple unit trips have three main causes (in order by
Generation Equipment Performance
56
number of events) transmission lack of fuel and storms A summary of the three categories for single as
well as multiple unit outages (all unit capacities) are reflected in Table 9
Table 9 Common Causes of Multiple Unit Forced Outages (2009)
Cause Number of Events Average MW Size of Unit
Transmission 1583 16
Lack of Fuel (Coal Mines Gas Lines etc) Not
in Operator Control
812 448
Storms Lightning and Other Acts of Nature 591 112
Some of the transmission outages based on storms in 2009 have been caused by the same reasons because
the storms may have caused transmission interference However the plants reported the problems
inconsistently with either the transmission interference or storms cause code Therefore they are depicted
as two different causes of forced outage
Marked transmission outages in 2009 were quite high Thirty-five percent came from one utility with a large
number of hydroelectric units The company related the trips to various problems including weather
(lightning storms) wildlife ldquoline bumpsrdquo and problems on the receiving end of the transmission line Nine
hundred and eighty-five transmission trips (62 percent) were from hydroelectric units38
In 2009 only ten transmission trips resulted in a loss of 750 MW or more per trip Twenty two generating
plants were affected by the ten trips Causes for the trips include feeder line trips (1 trip) breakers in the
switchyard (8 trips) personnel errors (2 trips) and unknown (10 trips)
The ldquoLack of Fuelrdquo outages are of interest as these events occur during the times when a unit is available to
operate but there is an interruption in fuels to operate the facilities These events do not include
interruptions of fuel due to contracts Rather the cause code is designed to account for units that are
expecting fuel and it is unavailable when requested Table 10 presents the distribution of ldquoLack of Fuelrdquo
events by NERC Region and Table 11 presents the unit types affected
38 The average size of the hydroelectric units were small ndash 335 MW
Generation Equipment Performance
57
Of the units that report ldquoLack of Fuelrdquo 78 percent of the units are oil-fired 15 percent of the units are gas-
fired and the remaining units are various other fuels Table 12 provides the top causes of forced outage for
several unit types For fossil units ldquoLack of Fuelrdquo as the number three cause behind waterwall tube leaks
and superheater tube leaks
Table 10 Forced Outages Due to Lack of Fuel by Region
Region Number of Lack of Fuel
Problems Reported
FRCC 0
MRO 3
NPCC 24
RFC 695
SERC 17
SPP 3
TRE 7
WECC 29
One company contributed to the majority of oil-fired lack of fuel events The units at the company are
actually dual-fuels (oil and gas) but market nominated gas monitoring causes the units to be on forced
outage nightly The units need gas to start up so they can run on oil When they shut down the units must
switch to gas to clean themselves With the gas restriction the unit canrsquot start and the unit goes on a
forced outage Until the band is lifted the two units will continue to be on a forced outage cycle
Event records also provide descriptions of why the unit was without fuel with the majority of descriptions
bull Temperatures affecting gas supply valves
bull Unexpected maintenance of gas pipe-lines
bull Compressor problemsmaintenance
Generation Equipment Performance
58
Table 11 Unit Type Profile of Forced Outages Due to Lack of Fuel
Unit Types Number of Lack of Fuel Problems Reported
Fossil 642
Nuclear 0
Gas Turbines 88
Diesel Engines 1
HydroPumped Storage 0
Combined Cycle 47
Generation Equipment Performance
59
Table 12 Causes of Forced Outage for Different Unit Types (2008-2010)
Fossil - all MW sizes all fuels
Rank Description Occurrence per Unit-year
MWH per Unit-year
Average Hours To Repair
Average Hours Between Failures
Unit-years
1 Waterwall (furnace wall) 0590 134106 59 3250 3868 2 Second Superheater
Leaks 0180 5182 60 3228 3868
3 Lack of Fuel (coal mines gas lines etc) where the operator is not in control
0480 4701 18 26 3868
Combined-Cycle blocks Rank Description Occurrence
per Unit-year
MWH per Unit-year
Average Hours To Repair
Average Hours Between Failures
Unit-years
1 HP Turbine Buckets Or Blades
0020 4663 1830 26280 466
2 Turbine Control Valves 0040 2777 100 7200 466 3 Gas Turbine Compressor -
High Pressure Shaft 0010 2266 663 4269 466
Nuclear units - all Reactor types Rank Description Occurrence
per Unit-year
MWH per Unit-year
Average Hours To Repair
Average Hours Between Failures
Unit-years
1 LP Turbine Buckets or Blades
0010 26415 8760 26280 288
2 Containment Structure 0010 9233 1226 26262 288 3 Feedwater Pump Local
Controls 0020 7620 692 12642 288
Simple-cycle gas turbine jet engines Rank Description Occurrence
per Unit-year
MWH per Unit-year
Average Hours To Repair
Average Hours Between Failures
Unit-years
1 Main Transformer 0030 1611 1016 20709 4181 2 Other Gas Turbine
Controls And Instrument Problems
0120 428 70 2614 4181
3 Other Gas Turbine Problems
0090 400 119 1701 4181
Generation Equipment Performance
60
2008-2010 Review of Summer versus Winter Availability To address seasonality of unit availability unit information for the months of June to September (summer)
and December through February (winter) were pooled to calculate force events during these timeframes for
2008-201039 Figure 32 shows the Equivalent Availability Factor (EAF) is three percentage points higher and
the Equivalent Forced Outage Rate - Demand (EFORd) is more than a half of a percentage point lower in the
summer period than in winter period This means the units were more reliable with less forced events
during high-demand times during the summer than during the winter seasons The generating unitrsquos
capability has a resulting higher Net Capacity Factor (NCF) of 45 percentage points in the summer season
for 2008-2010
During the spring season (March-May) 77 percent of the units took a planned outage (PO) for an average
231 hours (or 96 days) In fall (October-November) only 42 percent of the units experienced a PO and the
average duration was shorter ndash 134 hours (or 56 days) A few units took both spring and fall planned
outages although this is rare Based on this assessment the generating units are prepared for the summer
peak demand The resulting availability indicates that this maintenance was successful which is measured
by an increased EAF and lower EFORd
Figure 32 Summer-Winter Average EAF NCF and EFORd (2008-2010)
Conclusions and Recommendations During 2008-2010 the average Equivalent Availability Factor (EAF) which measures the overall availability
of generating units decreased At the same time the Net Capacity Factor (NCF) an indicator of energy
production increased The average number of forced outages in 2010 is greater than in 2008 while at the
same time the average planned outage times have decreased As a result the Equivalent Forced Outage
Rate ndash Demand (EFORd) also increased illustrating that more units have experienced forced events during
39 A study of peak periods was conducted by the NERC Generating Availability Trend Evaluation (GATE) Working Group several years ago see httpwwwnerccomfilesSeasonal-Performance-Trendspdf
9116
5343
396
8818
4896
441
0 10 20 30 40 50 60 70 80 90 100
EAF
NCF
EFORd
Percent ()
Winter
Summer
Generation Equipment Performance
61
peak-demand times in 2010 than in the previous two years Potentially with shorter planned outage
periods in 2010 there may be less time to repair equipment and prevent forced unit outages
There are warnings that units are not being maintained as well as they should be In the last three years
there has been an increase in Equivalent Forced Outage Rate ndash Demand (EFORd) This indicator measures
the rate of forced outage events on generating units during periods of load demand To confirm this
problem forced outage hours jumped from 270 to 314 hours per unit between 2009 and 2010 At the same
time maintenance events also increased by 12 hours per unit Planned outage events remain constant The
resulting conclusions from this trend are
bull More or longer planned outage time is needed to repair the generating fleet Whether age is the
cause of the increase need for planned outage time remains unknown and further investigation into
the cause for longer planned outage time is necessary
bull More focus on preventive repairs during planned and maintenance events are needed
There are many multiple unit forced outages due to lack of fuel The majority of multiple unit trips have
three main causes transmission lack of fuel and storms With special interest in the forced outages due to
ldquoLack of Fuelrdquo additional analysis revealed that 77 percent of the units experiencing unexpected fuel
stoppage are oil-fired fossil units while gas-fired units experienced 15 percent
Generating units continue to be more reliable during the peak summer periods
Disturbance Event Trends
62
Category 1 An event resulting in one or more of the following a Unintended loss of three or more BPS elements caused by
common mode failure b Failure or misoperation of an SPSRAS c System-wide voltage reduction of 3 or more d Unintended BPS system separation resulting in an island of
100 MW to 999 MW e Unplanned evacuation from a control center facility with BPS
SCADA functionality for 30 minutes or more Category 2 An event resulting in one or more of the following
a Complete loss of all BPS control center voice communication system(s) for 30 minutes or more
b Complete loss of SCADA control or monitoring functionality for 30 minutes or more
c Voltage excursions equal to or greater than 10 lasting more than five minutes
d Loss of off-site power (LOOP) to a nuclear generating station e Unintended system separation resulting in an island of 1000
MW to 4999 MW f Unintended loss of 300MW or more of firm load for more
than 15 minutes g Violation of an Interconnection Reliability Operating Limit
(IROL) for more than 30 minutes Category 3 An event resulting in one or more of the following
a The loss of load or generation of 2000 MW or more in the Eastern Interconnection or
b Western Interconnection or 1000 MW or more in the ERCOT or Queacutebec Interconnections
c Unintended system separation resulting in an island of 5000 MW to 10000 MW
d Unintended system separation resulting in an island of Florida from the Eastern Interconnection
Category 4 An event resulting in one or more of the following a The loss of load or generation from 5001 MW to 9999 MW b Unintended system separation resulting in an island of more
than 10000 MW (with the exception of Florida as described in Category 3c)
Category 5 An event resulting in one or more of the following a The loss of load of 10000 MW or more b The loss of generation of 10000 MW or more
Figure 33 BPS Event Category
Disturbance Event Trends Introduction The purpose of this section is to report event
analysis trends from the beginning of event
analysis field test40
One of the companion goals of the event
analysis program is the identification of trends
in the number magnitude and frequency of
events and their associated causes such as
human error equipment failure protection
system misoperations etc The information
provided in the event analysis database (EADB)
and various event analysis reports have been
used to track and identify trends in BPS events
in conjunction with other databases (TADS
GADS metric and benchmarking database)
to the end of 2010
The Event Analysis Working Group (EAWG)
continuously gathers event data and is moving
toward an integrated approach to analyzing
data assessing trends and communicating the
results to the industry
Performance Trends The event category is classified41
Figure 33
as shown in
with Category 5 being the most
severe Figure 34 depicts disturbance trends in
Category 1 to 5 system events from the
40 httpwwwnerccomdocseawgGalloway-Industry-EA-Field-Test-102210pdf 41httpwwwnerccomfiles2011-05-0220Event_Analysis_Process_Phase20220Field20Test20Draft20-20Final20-20For20postingpdf
Disturbance Event Trends
63
beginning of event analysis field test to the end of 201042
Figure 34 Event Category vs Date for All 2010 Categorized Events
From the figure in November and December
there were many more category 1 and 2 events than in October This is due to the field trial starting on
October 25 2010
In addition to the category of the events the status of the events plays a critical role in the accuracy of the
data By examining Figure 35 over 80 of the events reported in 2010 have been closed This means that
the category root cause and other important information have been sufficiently finalized in order for
analysis to be accurate for each event At this time there is not enough data to draw any long-term
conclusions about event investigation performance
42 Documents for the EA Field Test are located at httpwwwnerccompagephpcid=5|365
2
12 12
26
3
6 5
14
1 1
2
0
5
10
15
20
25
30
35
40
45
October November December 2010
Even
t Cou
nt
Category 3 Category 2 Category 1
Disturbance Event Trends
64
Figure 35 Event Count vs Status (All 2010 Events with Status)
By drilling down into the cause code for each closed 2010 event Figure 36 shows the top 3 event causes
From the figure equipment failure and protection system misoperation are the most significant causes for
events Because of how new and limited the data is however there may not be statistical significance for
this result Further trending of cause codes for closed events and developing a richer dataset to find any
trends between event cause codes and event counts should be performed
Figure 36 Top 3 Event Counts vs DAWG Cause Code for all Closed 2010 Events
10
32
42
0
5
10
15
20
25
30
35
40
45
Open Closed Open and Closed
Even
t Cou
nt
Status
1211
8
0
2
4
6
8
10
12
14
Equipment Failure Protection System Misoperation Human Error
Even
t Cou
nt
Cause Code
Disturbance Event Trends
65
Conclusions Due to the relatively new process for events analysis and categorization more time will be required before a
conclusive recommendation may be obtained Further analysis and new data should provide valuable
statistics in the future Over 80 of all event reports from 2010 are current listed as closed but no
conclusion about investigation performance may be obtained because of the limited amount of data It is
recommended to study ways to prevent equipment failure and protection system misoperations but there
is not enough data to draw a firm conclusion about the top causes of events at this time
Abbreviations Used in This Report
66
Abbreviations Used in This Report
Acronym Definition ALP Acadiana Load Pocket
ALR Adequate Level of Reliability
ARR Automatic Reliability Report
BA Balancing Authority
BPS Bulk Power System
CDI Condition Driven Index
CEII Critical Energy Infrastructure Information
CIPC Critical Infrastructure Protection Committee
CLECO Cleco Power LLC
DADS Future Demand Availability Data System
DCS Disturbance Control Standard
DOE Department Of Energy
DSM Demand Side Management
EA Event Analysis
EAF Equivalent Availability Factor
ECAR East Central Area Reliability
EDI Event Drive Index
EEA Energy Emergency Alert
EFORd Equivalent Forced Outage Rate Demand
EMS Energy Management System
ERCOT Electric Reliability Council of Texas
ERO Electric Reliability Organization
ESAI Energy Security Analysis Inc
FERC Federal Energy Regulatory Commission
FOH Forced Outage Hours
FRCC Florida Reliability Coordinating Council
GADS Generation Availability Data System
GOP Generation Operator
IEEE Institute of Electrical and Electronics Engineers
IESO Independent Electricity System Operator
IROL Interconnection Reliability Operating Limit
Abbreviations Used in This Report
67
Acronym Definition IRI Integrated Reliability Index
LOLE Loss of Load Expectation
LUS Lafayette Utilities System
MAIN Mid-America Interconnected Network Inc
MAPP Mid-continent Area Power Pool
MOH Maintenance Outage Hours
MRO Midwest Reliability Organization
MSSC Most Severe Single Contingency
NCF Net Capacity Factor
NEAT NERC Event Analysis Tool
NERC North American Electric Reliability Corporation
NPCC Northeast Power Coordinating Council
OC Operating Committee
OL Operating Limit
OP Operating Procedures
ORS Operating Reliability Subcommittee
PC Planning Committee
PO Planned Outage
POH Planned Outage Hours
RAPA Reliability Assessment Performance Analysis
RAS Remedial Action Schemes
RC Reliability Coordinator
RCIS Reliability Coordination Information System
RCWG Reliability Coordinator Working Group
RE Regional Entities
RFC Reliability First Corporation
RMWG Reliability Metrics Working Group
RSG Reserve Sharing Group
SAIDI System Average Interruption Duration Index
SAIFI System Average Interruption Frequency Index
SCADA Supervisory Control and Data Acquisition
SDI Standardstatute Driven Index
SERC SERC Reliability Corporation
Abbreviations Used in This Report
68
Acronym Definition SRI Severity Risk Index
SMART Specific Measurable Attainable Relevant and Tangible
SOL System Operating Limit
SPS Special Protection Schemes
SPCS System Protection and Control Subcommittee
SPP Southwest Power Pool
SRI System Risk Index
TADS Transmission Availability Data System
TADSWG Transmission Availability Data System Working Group
TO Transmission Owner
TOP Transmission Operator
WECC Western Electricity Coordinating Council
Contributions
69
Contributions This report was made feasible by the collaboration and hard work of both NERC staff and NERCrsquos
Industry Groups
NERC Industry Groups
Table 14 lists the NERC industry group contributors Without their contribution and collaboration this
report would not have been possible
Table 13 NERC Industry Group Contributions43
NERC Group
Relationship Contribution
Reliability Metrics Working Group
(RMWG)
Reports to the OCPC bull Lead Development of Report bull Provide Reliability Metrics Data bull Responsible for Reliability Metrics
Performance Chapter
Transmission Availability Working Group
(TADSWG)
Reports to the OCPC bull Provide Transmission Availability Data
bull Responsible for Transmission Equip-ment Performance Chapter
bull Content Review
Generation Availability Data System Task
Force
(GADSTF)
Reports to the OCPC bull Provide Generation Availability Data bull Responsible for Generation Equip-
ment Performance Chapter bull Content Review
Event Analysis Working Group
(EAWG)
Reports to the OCPC bull Provide Events Data bull Responsible for Disturbance Events
Trends Chapter bull Content Review
43 Rosters for RMWG TADSWG GADSTF and EAWG are available at httpwwwnerccomfilesrosterpdf
Contributions
70
NERC Staff Table 13 below lists the NERC staff who contributed to the 2011 Reliability Performance Analysis
Report
Table 14 Contributing NERC Staff
Name Title E-mail Address
Mark Lauby Vice President and Director of
Reliability Assessment and
Performance Analysis
marklaubynercnet
Jessica Bian Manager of Performance Analysis jessicabiannercnet
John Moura Manager of Reliability Assessments johnmouranercnet
Andrew Slone Engineer Reliability Performance
Analysis
andrewslonenercnet
Jim Robinson TADS Project Manager jimrobinsonnercnet
Clyde Melton Engineer Reliability Performance
Analysis
clydemeltonnercnet
Mike Curley Manager of GADS Services mikecurleynercnet
James Powell Engineer Reliability Performance
Analysis
jamespowellnercnet
Michelle Marx Administrative Assistant michellemarxnercnet
William Mo Intern Performance Analysis wmonercnet
- NERCrsquos Mission
- Table of Contents
- Executive Summary
-
- 2011 Transition Report
- State of Reliability Report
- Key Findings and Recommendations
-
- Reliability Metric Performance
- Transmission Availability Performance
- Generating Availability Performance
- Disturbance Events
- Report Organization
-
- Introduction
-
- Metric Report Evolution
- Roadmap for the Future
-
- Reliability Metrics Performance
-
- Introduction
- 2010 Performance Metrics Results and Trends
-
- ALR1-3 Planning Reserve Margin
-
- Background
- Assessment
- Special Considerations
-
- ALR1-4 BPS Transmission Related Events Resulting in Loss of Load
-
- Background
- Assessment
-
- ALR1-12 Interconnection Frequency Response
-
- Background
- Assessment
-
- ALR2-3 Activation of Under Frequency Load Shedding
-
- Background
- Assessment
- Special Considerations
-
- ALR2-4 Average Percent Non-Recovery Disturbance Control Standards (DCS)
-
- Background
- Assessment
- Special Consideration
-
- ALR2-5 Disturbance Control Events Greater Than Most Severe Single Contingency
-
- Background
- Assessment
- Special Consideration
-
- ALR 1-5 System Voltage Performance
-
- Background
- Special Considerations
- Status
-
- ALR3-5 Interconnection Reliability Operating Limit System Operating Limit (IROLSOL) Exceedances
-
- Background
-
- ALR4-1 Automatic Transmission Outages Caused by Protection System Misoperations
-
- Background
- Special Considerations
-
- ALR6-11 ndash ALR6-14
-
- Background
- Assessment
- ALR 6-11 ndash Automatic Outages Initiated by Failed Protection System Equipment
- ALR6-12 ndash Automatic Outages Initiated by Human Error
- ALR6-13 ndash Automatic Outages Initiated by Failed AC Substation Equipment
- ALR6-14 Automatic AC Transmission Outages Initiated by Failed AC Circuit Equipment
-
- ALR6-15 Element Availability Percentage (APC)
-
- Background
- Assessment
- Special Consideration
-
- ALR6-16 Transmission System Unavailability
-
- Background
- Assessment
- Special Consideration
-
- ALR6-2 Energy Emergency Alert 3 (EEA3)
-
- Background
- Assessment
- Special Considerations
-
- ALR 6-3 Energy Emergency Alert 2 (EEA2)
-
- Background
- Assessment
- Special Considerations
-
- ALR 6-1 Transmission Constraint Mitigation
-
- Background
- Assessment
- Special Considerations
-
- Integrated Bulk Power System Risk Assessment
-
- Introduction
- Recommendations
-
- Integrated Reliability Index Concepts
-
- The Three Components of the IRI
-
- Event-Driven Indicators (EDI)
- Condition-Driven Indicators (CDI)
- StandardsStatute-Driven Indicators (SDI)
-
- IRI Index Calculation
- IRI Recommendations
-
- Reliability Metrics Conclusions and Recommendations
-
- Transmission Equipment Performance
-
- Introduction
- Performance Trends
-
- AC Element Outage Summary and Leading Causes
- Transmission Monthly Outages
- Outage Initiation Location
- Transmission Outage Events
- Transmission Outage Mode
-
- Conclusions
-
- Generation Equipment Performance
-
- Introduction
- Generation Key Performance Indicators
-
- Multiple Unit Forced Outages and Causes
- 2008-2010 Review of Summer versus Winter Availability
-
- Conclusions and Recommendations
-
- Disturbance Event Trends
-
- Introduction
- Performance Trends
- Conclusions
-
- Abbreviations Used in This Report
- Contributions
-
- NERC Industry Groups
- NERC Staff
-

Reliability Metrics Performance
25
ALR 6-11 ndash Automatic Outages Initiated by Failed Protection System Equipment
Automatic outages with an initiating cause code of failed protection system equipment are in Figure 10
Figure 10 ALR6-11 by Region (Includes NERC-Wide)
This code covers automatic outages caused by the failure of protection system equipment This
includes any relay andor control misoperations except those that are caused by incorrect relay or
control settings that do not coordinate with other protective devices
ALR6-12 ndash Automatic Outages Initiated by Human Error
Figure 11 shows the automatic outages with an initiating cause code of human error This code covers
automatic outages caused by any incorrect action traceable to employees andor contractors for
companies operating maintaining andor providing assistance to the Transmission Owner will be
identified and reported in this category
Reliability Metrics Performance
26
Also any human failure or interpretation of standard industry practices and guidelines that cause an
outage will be reported in this category
Figure 11 ALR6-12 by Region (Includes NERC-Wide)
Reliability Metrics Performance
27
ALR6-13 ndash Automatic Outages Initiated by Failed AC Substation Equipment
Figure 12 shows the automatic outages with an initiating cause code of failed AC substation equipment
This code covers automatic outages caused by the failure of AC Substation ie equipment ldquoinside the
substation fencerdquo including transformers and circuit breakers but excluding protection system
equipment19
19TADS Initiating Cause Code definitions are located at httpwwwnerccomdocspctadswgTADS_Definitions_Appendix_7_092909pdf
Figure 12 ALR6-13 by Region (Includes NERC-Wide)
Reliability Metrics Performance
28
ALR6-14 Automatic AC Transmission Outages Initiated by Failed AC Circuit Equipment
Figure 13 shows the automatic outages with an initiating cause code of failed AC circuit equipment
Automatic Outages related to the failure of AC Circuit equipment ie overhead or underground
equipment ldquooutside the substation fencerdquo 20
ALR6-15 Element Availability Percentage (APC)
Background
This metric uses data and calculations directly from the NERC TADS effort and illustrates the overall
percent of time the aggregate of transmission facilities are available and in service This is an aggregate
20TADS Initiating Cause Code definitions are located at httpwwwnerccomdocspctadswgTADS_Definitions_Appendix_7_092909pdf
Figure 13 ALR6-14 by Region (Includes NERC-Wide)
Reliability Metrics Performance
29
value using sustained outages (automatic and non-automatic) for both lines and transformers operated
at 200 kV and above for each Regional Entity Interconnection and for NERC This metric was approved
by the NERC Operating and Planning Committees in September 2010
Assessment
Figure 14 shows the aggregate element availability percentage (APC) for transmission and transformers
facilities operated at 200 kV and above The values are all over 90 percent which shows excellent
system availability The RMWG recommends continued metric assessment for at least a few more years
in order to determine the value of this metric
Figure 14 2010 ALR6-15 Element Availability Percentage
Notably the Eastern Interconnection does not include Quebec or ERCOT ERCOT does not have any
transformers with low-side voltage levels 200 kV and above
Special Consideration
It should be noted that the non-automatic outage data needed to calculate this metric was only first
collected for the calendar year 2010 as part of the TADS process Therefore only one year of data for
this metric is available at this time
Reliability Metrics Performance
30
ALR6-16 Transmission System Unavailability
Background
This metric uses data and calculations directly from the NERC TADS effort and shows the overall percent
of time the aggregate of transmission facilities are unavailable due to automatic and non-automatic
outages This is an aggregate value using sustained automatic outages for both lines and transformers
operated at 200 kV and above for each Regional Entity and for NERC This metric was approved by the
NERC Operating and Planning Committees in December 2010
Assessment
Figure 15 and Figure 16 illustrate the 2010 aggregate unavailability percentage for AC circuits and
transformer facilities operated at 200 kV and above The values for AC circuits are all under 3 percent
which shows excellent system availability
The RMWG recommends continued metric assessment for at least a few more years in order to
determine the value of this metric
Special Consideration
It should be noted that the non-automatic outage data needed to calculate this metric was only first
collected for the calendar year 2010 as part of the TADS process Therefore only one year of data for
this metric is available at this time
Figure 15 2010 ALR6-16 Transmission System Unavailability
Reliability Metrics Performance
31
Figure 16 2010 ALR6-16 Transmission System Unavailability by Outage Type
Notably the Eastern Interconnection does not include Quebec or ERCOT Also ERCOT does not have
any transformers with low-side voltage levels 200 kV and above
ALR6-2 Energy Emergency Alert 3 (EEA3)
Background
This metric identifies the number of times Energy Emergency Alerts Level 3 (EEA3) are issued EEA3
events are firm-load interruptions due to capacity and energy deficiency EEA3 is currently reported
collected and maintained in NERCrsquos Reliability Coordination Information System (RCIS) and is defined in
Attachment 1 of the NERC Standard EOP-00221
21 The latest version of Attachment 1 for EOP-002 is available at
This metric identifies the number of times EEA3s are
issued The number of EEA3s per year provides a relative indication of performance measured at a
Balancing Authority or interconnection level As historical data is gathered trends in future reports will
provide an indication of either decreasing or increasing use of EEA3s signaling adequacy of the electric
supply system This metric can also be considered in the context of Planning Reserve Margin Significant
increases or decreases in EEA3 events with relatively constant Planning Reserve Margins could indicate
httpwwwnerccompagephpcid=2|20
Reliability Metrics Performance
32
volatility in the actual loads compared to forecast levels or changes in the adequacy of the bulk power
system required to meet load demands
Assessment
Figure 17 shows the number of EEA3 events during 2006 and 2010 from an RE level An interactive
presentation was released and available at the Reliability Indicatorrsquos page22
The Acadiana Load Pocket (ALP) is an area in south central Louisiana that has experienced regular
transmission constraints and numerous Energy Emergency Alert filings by the SPP Reliability Controller
(SPP RC) Transmission within ALP is owned by Entergy Lafayette Utilities System (LUS) and Cleco
Power LLC (Cleco) The transmission constraints within the ALP are primarily caused by the local area
load and the lack of generation located in close proximity to the load area
The number of EEA3rsquos
declared in 2010 returned to more traditional numbers The 2009 spike in EEA3 events in the SPP
Region that was driven by issues in the Acadiana Load Pocket (ALP) were not present in 2010
Special Considerations
Ideally the measure should capture only EEAs that are declared for reliability reasons and not for
economic factors The RMWG has not been able to differentiate these reasons for future reporting and
it has made a recommendation to the Reliability Coordinator Working Group (RCWG) to consider a
revised EEA declaration to exclude economic factors
The reason the EEA volume decreased from 2009 to 2010 in SPP was because the SPP ICT RC23
coordinated an operating agreement between the five operating companies in the ALP The operating
agreement included a cost sharing re-dispatch that alleviated the need of a Transmission Loading Relief
(TLR-5) declaration24
22The EEA3 interactive presentation is available on the NERC website at
During 2009 there was no operating agreement therefore an entity had to
provide Network and Native Load (NNL) relief when a TLR-5 was called by the ICT RC When the TLR-5
was the primary tool to control the post contingent loading in the ALP some of the BAs would have their
firm transmission curtailed to the point where they could no longer serve their load therefore the EEA
3 was needed to communicate a capacityreserve deficiency
httpwwwnerccompagephpcid=4|331|335 23Southwest Power Pool (SPP) Independent Coordinator of Transmission (ICT) Reliability Coordinator (RC) 24More information on Transmission Load Relief is contained in the IRO-006 standard which is located at httpwwwnerccomfilesIRO-006-4pdf In particular TLR-5 definitions are referenced on page 16 and 17
Reliability Metrics Performance
33
Figure 17 ALR6-2 Energy Emergency Alert 3 (EEA3) Counts by Region (2006-2010)
Cleco Power Entergy and LUS are currently constructing an estimated $200 million transmission
infrastructure improvement project to mitigate transmission constraints into ALP Construction of the
project is scheduled to be complete in 2012 Completion of the project should help alleviate some of
the transmission congestion in this area Energy Emergency Alerts filed by the SPP Regional Entity
continue to decline
SPP RTO continues to coordinate operating plans with the operating entities in this area Mitigation
plans and local operating guides in place are expected to provide sufficient flexibility should issues arise
NERC will continue to monitor this area for Reliability Impacts and coordinate any actions with the SPP
Reliability Coordinator and SPP Regional Entity
ALR 6-3 Energy Emergency Alert 2 (EEA2)
Background
Energy Emergency Alert 2 (EEA2) is to measure the number of events BAs declare for deficient capacity
and energy during peak load periods which may serve as a leading indicator of energy and capacity
shortfall in the adequacy of the electric supply system EEA2 provides a sense of the frequency of
precursor events to the more severe EEA3 declarations This metric measures the number of events
1 3 1 2 214
3 4 4 1 5 334
4 2 1 52
1
0
5
10
15
20
25
30
3520
0620
0720
0820
0920
1020
0620
0720
0820
0920
1020
0620
0720
0820
0920
1020
0620
0720
0820
0920
1020
0620
0720
0820
0920
1020
0620
0720
0820
0920
1020
0620
0720
0820
0920
1020
0620
0720
0820
0920
10
FRCC MRO NPCC RFC SERC SPP TRE WECC
2006-2009
2010
Region and Year
Reliability Metrics Performance
34
Balancing Authorities declare for deficient capacity and energy during peak load periods At this time
however this data reflects inclusion of Demand Side Resources that would not be indicative of
inadequacy of the electric supply system
The number of EEA2 events and any trends in their reporting indicates how robust the system is in
being able to supply the aggregate load requirements The historical records may include demand
response activations and non-firm load interruptions per applicable contracts within the EEA alerts per
its definition25
Assessment
Demand response is a legitimate resource to be called upon by balancing authorities and
do not indicate a reliability concern As data is gathered in the future reports will provide an indication
of either decreasing or increasing adequacy in the electric supply system EEA2 events called solely for
activation of demand response (controllable or contractually prearranged demand-side dispatch
programs) or interruption of non-firm load per applicable contracts should be excluded This metric can
also be considered in the context of the Planning Reserve Margin Significant increases or decreases in
EEA2 events with relatively constant Planning Reserve Margins could indicate volatility in the actual
loads compared to forecast levels or changes in the adequacy of the bulk power system required to
meet load demands
Figure 18 shows the number of EEA2 events by Regional Entity from 2006 to 2010 EEA2 interactive
version available on line by quarter and region26
25 The EEA2 is defined at
The general trend continues to show improved
performance which may have been influenced by the overall reduction in demand throughout NERC
caused by the economic downturn Specific performance by any one region should be investigated
further for issues or events that may affect the results Determining whether performance reported
includes those events resulting from the economic operation of DSM and non-firm load interruption
should also be investigated The RMWG recommends continued metric assessment
httpwwwnerccomfilesEOP-002-2pdf 26 EEA2 interactive version located at httpwwwnerccompagephpcid=4|331|341
Reliability Metrics Performance
35
Special Considerations
The intent of this metric is to measure only EEAs that are called for reliability reasons and not for
economic factors such as demand side management (DSM) and non-firm load interruption The
historical data for this metric may include events that were called for economic factors According to
the RCWG recent data should only include EEAs called for reliability reasons
ALR 6-1 Transmission Constraint Mitigation
Background
The RMWG completed a pilot with four regional entities Based on the results the RMWG expanded the
pilot data collection to all regions and the initial results of the data collection are shown in Figure 19
and Table 5 Based on the results of the pilot there is merit in continuing to assess this metric The
intent of this metric is to identify trends in the number of mitigation measures (Special Protection
Schemes (SPS) Remedial Action Schemes (RAS) and Operating Procedures) required to meet reliability
requirements By their nature SPS do not indicate an inherent weakness in the bulk power system
rather they are an indication of methods that are taken to operate the system through the range of
conditions it must perform This metric is only intended to evaluate the trend use of these plans and
whether the metric indicates robustness of the transmission system is increasing remaining static or
decreasing
1 27
2 1 4 3 2 1 2 4 5 2 5 832
4724
211
5 38 5 1 1 8 7 4 1 1
05
101520253035404550
2006
2007
2008
2009
2010
2006
2007
2008
2009
2010
2006
2007
2008
2009
2010
2006
2007
2008
2009
2010
2006
2007
2008
2009
2010
2006
2007
2008
2009
2010
2006
2007
2008
2009
2010
2006
2007
2008
2009
2010
FRCC MRO NPCC RFC SERC SPP TRE WECC
2006-2009
2010
Region and Year
Figure 18 ALR6-3 Energy Emergency Alert 2 (EEA2)
Reliability Metrics Performance
36
Assessment
The pilot data indicates a relatively constant number of mitigation measures over the time period of
data collected
Figure 19 ALR6-1 Transmission Constraint Mitigation by SPSRAS (2009-2014)
0102030405060708090
100110120
2009
2010
2011
2014
2009
2010
2011
2014
2009
2010
2011
2014
2009
2010
2011
2014
2009
2010
2011
2014
2009
2010
2011
2014
2009
2010
2011
2014
2009
2010
2011
2014
FRCC MRO NPCC RFC SERC SPP ERCOT WECC
Coun
t
Region and Year
SPSRAS
Reliability Metrics Performance
37
Table 5 ALR6-1 Transmission Constraint Mitigation by Operating ProcedureGuides (2009-2011)
ALR6-1 Transmission Constraint Mitigation by Operating ProcedureGuides (2009-2014)
2009 2010 2011 2014
FRCC 107 75 66
MRO 79 79 81 81
NPCC 0 0 0
RFC 2 1 3 4
SPP 39 40 40 40
SERC 6 7 15
ERCOT 29 25 25
WECC 110 111
Special Considerations
A certain number of SPS mitigation plans may be necessary to support reliable operation of the system
If the number of SPS increase over time this may indicate that additional transmission capacity is
required A reduction in the number of SPS may be an indicator of increased generation or transmission
facilities being put into service which may indicate greater robustness of the bulk power system In
general mitigation plans are a viable and valuable tool for effective operation of the bulk power system
In power system planning reliability operability capacity and cost-efficiency are simultaneously
considered through a variety of scenarios to which the system may be subjected Mitigation measures
are a method for optimizing a power system across these scenarios Changes in quantities of mitigation
plans may indicate year-on-year differences in the system being evaluated
Integrated Bulk Power System Risk Assessment
Introduction In developing eighteen metrics to measure acceptable levels of reliability it has become clear that any
such measurement of reliability must include consideration of the risks present within the bulk power
system in order for us to appropriately prioritize and manage these system risks The scope for the
Reliability Metrics Working Group (RMWG)27
27 The RMWG scope can be viewed at
includes a task to develop a risk-based approach that
provides consistency in quantifying the severity of events The approach not only can be used to
httpwwwnerccomfilezrmwghtml
Reliability Metrics Performance
38
measure risk reduction over time but also can be applied uniformly in event analysis process to identify
the events that need to be analyzed in detail and sort out non-significant events
The Operating Committee (OC) and Planning Committee (PC) endorsed the concepts and framework28 of
the risk-based approach in their September 2010 joint meeting and further supported the event severity
risk index (SRI) calculation29
Recommendations
in March 2011
bull NERC should embrace the use of risk assessment to identify trends in addition to lessons learned
in order to improve bulk power system reliability
bull The RMWG should continue to coordinate and communicate with the Event Analysis Working
Group (EAWG) to apply the SRI into the event analysis process and root cause analysis
bull As trend evaluations increase the knowledge of risks to the bulk power system data required to
support additional assessment should be gathered
Event Severity Risk Index (SRI)
Risk assessment is an essential tool for achieving the alignment between organizations people and
technology This will assist in quantifying inherent risks identifying where potential high risks exist and
evaluating where the most significant lowering of risks can be achieved Being learning organizations
the Electric Reliability Organization (ERO) Regional Entities and Registered Entities can use these tools
to focus on the areas of highest risk to reliability to provide a sound basis for developing results-based
standards and compliance programs Risk assessment also serves to engage all stakeholders in a
dialogue about specific risk factors and helps direct a strategic plan for risk reduction and early
detection
The SRI is a daily blended metric for which transmission loss generation loss and load loss events are
calculated Each element (transmission generation and load loss) is factored by the systemrsquos inventory
for that element to rate significant events appropriately On a yearly basis these daily performances
can be sorted in descending order to evaluate the year-on-year performance of the system
In order to test drive the concepts the RMWG applied these calculations against historically memorable
days to derive SRIs Once these calculations were complete they were reviewed and evaluated by
various stakeholders for reasonableness Based upon feedback modifications to the calculation were
made and assessed against the historic days performed This iterative process locked down the details
28 httpwwwnerccomdocspcrmwgIntegrated_Bulk_Power_System_Risk_Assessment_Concepts_Finalpdf 29 httpwwwnerccomdocspcrmwgSRI_Equation_Refinement_May6_2011pdf
Reliability Metrics Performance
39
for the calculation of SRI whose calculation from zero (no transmission line outages generation outages
or load lost in a day) to 1000 (a theoretical condition in which every transmission line all generation
units and all load lost across the system in a single day)
Figure 20 captures the calculated severity risk value for each of the days for each year benchmarked
with the historic significant events which were used to concept test the calculation Since there is
significant disparity between days the bulk power system is stressed compared to those that are
ldquoroutinerdquo and ldquoherordquo days of the year where the system performed extremely well the curve is depicted
using a logarithmic scale Each yearrsquos data is sorted in descending order striking a characteristic shape
At the left-side of the curve the days in which the system is severely stressed are plotted The central
more linear portion of the curve identifies the routine day performance while the far right-side of the
curve shows the values plotted for days in which almost all lines and generation units are in service and
essentially no load is lost
The trends on the chart below show that 2009 and 2010 had fewer extreme days than 2008 Routine
daily performance appears generally consistent across all three years Figure 20 captures the days for
each year benchmarked with historically significant events
In Figure 20 NERCrsquos event categories and SRI ratings are directly related As the SRI increases the
category or severity of the event increases Historical events are also shown to relate modern
reliability measurements to give a perspective of how a well-known event would register on the SRI
scale
The event analysis process30
30
benefits from the SRI as it enables a numerical analysis of an event in
comparison to other events By this measure an event can be prioritized by its severity In a severe
event this is unnecessary However for events that do not result in severe stressing of the bulk power
system this prioritization can be a challenge By using the SRI the event analysis process can decide
which events to learn from and reduce which events to avoid and when resilience needs to be
increased under high impact low frequency events as shown in the blue boxes in the figure
httpwwwnerccompagephpcid=5|365
Reliability Metrics Performance
40
Figure 20 NERC Annual Daily Severity Risk Index (SRI) Sorted Descending with Historic Benchmark Days
Other factors that impact severity of a particular event to be considered in the future include whether
equipment operated as designed and resulted in loss of load from a reliability perspective (intentional
and controlled load-shedding) Mechanisms for enabling ongoing refinement to include the historic and
simulated events for future severity risk calculations are being explored
Reliability Metrics Performance
41
Integrated Reliability Index Concepts In December 2010 the RMWG was challenged by the OC and PC to develop a single index concept to
measure the universe of risks associated with the bulk power system As a result the integrated
reliability index (IRI) concepts were proposed31
Figure 21
the three components of which were defined to
quantify each specific risk aspect They are titled the Event Driven Index (EDI) StandardsStatute Driven
Index (SDI) and Condition Driven Index (CDI) illustrated in with measures associated with
system events standards compliance and eighteen performance metrics The development of an
integrated reliability index aims to inform increase transparency and quantify the effectiveness of risk
reduction or mitigation actions The goal is to provide the industry meaningful trends of the BPSrsquos
performance and guidance on how the industry can improve reliability and support risk-informed
decision making Once completed the IRI will facilitate holistic assessment of performance Finally the
IRI should help overcome concern and confusion about how many metrics are being analyzed for system
reliability assessments
Figure 21 Risk Model for Bulk Power System
The integrated model of event-driven condition-driven and standardsstatute-driven risk information
can be constructed to illustrate all possible logical relations between the three risk sets Due to the
nature of the system there may be some overlap among the components
31 httpwwwnerccomdocspcrmwgIntegrated_Reliability_Index_WhitePaper_DRAFTpdf
Event Driven Index (EDI)
Indicates Risk from
Major System Events
Standards Statute Driven
Index (SDI)
Indicates Risks from Severe Impact Standard Violations
Condition Driven Index (CDI)
Indicates Risk from Key Reliability
Indicators
Reliability Metrics Performance
42
The Three Components of the IRI The three components of the IRI work together as shown in Figure 22 to comprise a full picture of the
state of reliability
Figure 22 An overview of the components that comprise the Integrated Reliability Index (IRI)
Event-Driven Indicators (EDI)
The Event-Driven Indicator provides a basis for prioritization of events based on bulk power system
integrity equipment performance and engineering judgment This indicator can serve as a high value
risk assessment tool to be used by stakeholders to investigate and evaluate disturbance history and
measure the severity of these events The relative ranking of events requires industry expertise agreed-
upon goals and engineering judgment The EDI is a derivative of SRI results for a specific time period
but it transforms that performance into a form of an availability index These calculations will be further
refined as feedback is received
Condition-Driven Indicators (CDI)
The Condition-Driven Indicators focus on a set of measurable system conditions (performance
measures) to assess bulk power system reliability These reliability indicators identify factors that
positively or negatively impact reliability and are early predictors of the risk to reliability from events or
unmitigated violations A collection of these indicators measures how close reliability performance is to
the desired outcome and if the performance against these metrics is constant or improving
Reliability Metrics Performance
43
StandardsStatute-Driven Indicators (SDI)
The StandardsStatute-Driven Indicator is a calculation of success of compliance based upon the subset
of high-value standards and is divided by the number of participations who could have received the
violation within the time period considered Also based on these factors known unmitigated violations
of elevated risk factor requirements are weighted higher than lower risk factors The index decreases if
the compliance improvement is achieved over a trending period
IRI Index Calculation As with the SRI the IRI is based on an importance weighting factor which the RMWG can modify over
time after gaining experience with the new metric as well as consideration of feedback from industry
At this time the RMWG believes some form of blended weighting may serve to start to populate IRI
characteristic curves at a high and generic level Based upon feedback from stakeholders this approach
may change or as discussed below weighting factors may vary based on periodic review and risk model
update The RMWG will continue the refinement of the IRI calculation and consider other significant
factors that impact reliability (eg intentional and controlled load-shedding) further it will explore
developing mechanisms for enabling ongoing refinement which should be influenced by a wide set of
stakeholders
RMWG recommends the Event Driven Index (EDI) be weighted the highest (50 percent) since events
actually occurred indicating how the system was performing The Condition Driven Index (CDI) and
StandardsStatute Driven Index (SDI) are weighted 25 each since they are indicators of potential risks
to BPS reliability IRI can be calculated as follows
IRI is intended to be a composite metric which integrates several forms of individual risks to the bulk
power system Since the three components range across many stakeholder organizations these
concepts are developed as starting points for continued study and evaluation Additional supporting
materials can be found in the IRI whitepaper32
IRI Recommendations
including individual indices calculations and preliminary
trend information
For the IRI more investigation should be performed to determine the best way to integrate EDI CDI
and SDI into an Integrated Reliability Index (IRI) that quantitatively represents the reliability of the bulk
32 The IRI whitepaper can be found at httpwwwnerccomdocspcrmwgIntegrated_Reliability_Index_WhitePaper_DRAFTpdf
Reliability Metrics Performance
44
power system To this end study into determining the amount of overlap between the components is
necessary RMWG is currently working to determine the proper amount of overlap between the IRI
components
Also the CDI component of the IRI needs to be solidified This is especially true with the CDI More
accurate metric data is needed to paint a fuller picture of the CDI Many of the metrics used to calculate
the CDI are new or they have limited data Compared to the SDI which counts well-known violation
counts and the EDI which uses the well-defined CDI the CDI lacks the depth of rigor that the other two
components have acquired through their years of data RMWG is currently working to improve the CDI
Reliability Metrics Conclusions and Recommendations Among the eighteen metrics that address the characteristics of an adequate level of reliability (ALR)
metric trends indicate the system is performing better in the following seven areas
bull ALR1-3 Planning Reserve Margin
bull ALR1-4 BPS Transmission Related Events Resulting in Loss of Load
bull ALR2-5 Disturbance Control Events Greater than Most Severe Single Contingency
bull ALR6-2 Energy Emergency Alert 3 (EEA3)
bull ALR6-3 Energy Emergency Alert 2 (EEA2)
bull ALR6-11 Automatic Transmission Outages Caused by Protection System Misoperations
bull ALR6-13 Automatic Transmission Outages Caused by Failed AC Substation Equipment
Assessments have been made in other performance categories A number of them do not have
sufficient data to derive any conclusions from the results The RMWG recommends continued data
collection and assessment of these metrics If a metric does not yield any trend in a five-year reporting
period the metric will be modified or withdrawn
For the IRI more investigation should be performed to determine the overlap of the components (CDI
EDI and SDI) The CDI should be more thoroughly solidified as an index by collecting more data over
time
Transmission Equipment Performance
45
Transmission Equipment Performance Introduction The Transmission Availability Data System (TADS) effort began with the establishment of a TADS task force
by the NERC Planning Committee in October 2006 On October 27 2007 the NERC Board of Trustees
approved the collection of transmission automatic outage data beginning in calendar year 2008 (Phase I)
Subsequently on October 29 2008 the NERC Board approved the collection of Non-Automatic Outage data
that began for Calendar year 2010 (Phase II)
This chapter provides reliability performance analysis of the transmission system by focusing on the trends
of Automatic Outage data from calendar year 2008 thru 2010 Since only one year of Non-Automatic
Outage data has been collected that data will not be assessed in this report
When calculating bulk power system performance indices care must be exercised when interpreting results
as misinterpretation can lead to erroneous conclusions regarding system performance With only three
years of data in the smaller regions it is not clear whether a regionrsquos yearly outage variation compared to
the average is due to random statistical variation or that particular year is significantly different in
performance However on a NERC-wide basis after three years of data collection there is enough
information to accurately determine whether the yearly outage variation compared to the average is due to
random statistical variation or the particular year in question is significantly different in performance33
Performance Trends
Transmission performance information has been provided by Transmission Owners (TOs) within NERC
through the NERC TADS (Transmission Availability Data System) process The data presented reflects
Momentary and Sustained AC Automatic outages of transmission elements that operate at voltages ge 200 kV
(including the low side of transformers) with the criteria specified in the TADS process The following
elements listed below are included
bull AC Circuits ge 200 kV (Overhead and Underground Circuits) Radial circuits are included
bull DC Circuits with ge +-200 kV DC voltage
bull Transformers with ge 200 kV low-side voltage and
bull ACDC Back-to-Back (BTB) Converters with ge 200 kV AC voltage on both sides
33The detailed Confidence Interval computation is available at httpwwwnerccomdocspctadstfTADS_Nov_2_2007APPENDIX_C_Confidence_Intervalpdf
Transmission Equipment Performance
46
AC Element Outage Summary and Leading Causes Table 6 shows the 2008 2009 and 2010 NERC total AC transmission element inventory and a summary of
the associated outages As expected in general the number of circuits increased from year to year due to
new construction or re-construction to higher voltages For every outage experienced on the transmission
system cause codes are identified and recorded according to the TADS process Causes of both momentary
and sustained outages have been indicated These causes are analyzed to identify trends and similarities
and to provide insight into what could be done to possibly prevent future occurrences
Figure 23 and Figure 24 describe the top ten initiating cause codes for sustained and momentary automatic
outages combined from 2008-2010 Based on the two figures the relationship between the total number of
outages and total outage hours can be seen Failed AC Substation Equipment and Failed AC Circuit
Equipment only account for 15 percent of the total number of outages but account for 65 percent of the
total outage hours The two largest causes of outages within NERC (ldquoLightingrdquo and ldquoWeather excluding
Lightningrdquo) account for 34 percent of the total number of outages
The next three Human Error Failed Protection System Equipment and Failed AC Circuit Equipment have
very similar totals and should all be considered significant focus points in reducing the number of Sustained
Automatic Outages for all elements
Transmission Equipment Performance
47
Table 6 NERC - All AC Elements Sustained and Momentary Outage Performance Summary
2008 Number of Outages
AC Voltage
Class
No of
Circuits
Circuit
Miles Sustained Momentary
Total
Outages Total Outage Hours
200-299kV 4369 102131 1560 1062 2622 56595
300-399kV 1585 53631 793 753 1546 14681
400-599kV 586 31495 389 196 585 11766
600-799kV 110 9451 43 40 83 369
All Voltages 6650 196708 2785 2051 4836 83626
2009 Number of Outages
AC Voltage
Class
No of
Circuits
Circuit
Miles Sustained Momentary
Total
Outages Total Outage Hours
200-299kV 4468 102935 1387 898 2285 28828
300-399kV 1619 56447 641 610 1251 24714
400-599kV 592 32045 265 166 431 9110
600-799kV 110 9451 53 38 91 442
All Voltages 6789 200879 2346 1712 4038 63094
2010 Number of Outages
AC Voltage
Class
No of
Circuits
Circuit
Miles Sustained Momentary
Total
Outages Total Outage Hours
200-299kV 4567 104722 1506 918 2424 54941
300-399kV 1676 62415 721 601 1322 16043
400-599kV 605 31590 292 174 466 10442
600-799kV 111 9477 63 50 113 2303
All Voltages 6957 208204 2582 1743 4325 83729
Note The NERC table does not show redacted outages DC Circuit outages Transformer outages or ACDC
converter outages
Transmission Equipment Performance
48
Figure 23 NERC - Top Ten Sustained and Momentary Outages by Initiating Cause Code for All Elements
Figure 24 NERC - Top Ten Sustained Outage Hours by Cause Code
198
151
80
7271
6943
33
27
188
68
Lightning
Weather excluding lightningHuman Error
Failed AC Substation EquipmentFailed Protection System EquipmentFailed AC Circuit Equipment Foreign Interference
Power System Condition
Fire
Unknown
Remaining Cause Codes
299
246
188
58
52
42
3619
16 12 31 Failed AC Substation EquipmentFailed AC Circuit Equipment Weather excluding lightningUnavailable
Other
Fire
Unknown
Human Error
Failed Protection System EquipmentForeign Interference
Remaining Cause Codes
Transmission Equipment Performance
49
Transmission Monthly Outages Figure 25 displays the total number of Automatic Outages on a per-month basis The three months with the
highest total of outages were June July and August From a seasonal perspective winter had a monthly
average of 281 outages These include the months of November-March Summer had an average of 429
outages Summer included the months of April-October
Figure 25 Number of Outages by Month for AC Circuits (2008-2010)
This figure does not show redacted outages DC Circuit outages Transformer outages or ACDC Converter
outages
Outage Initiation Location For every outage experienced on the transmission system the outage initiation code is identified and
recorded according to the TADS process The outage initiation code can be analyzed to identify trends and
similarities and to provide insight into what could be done to possibly prevent future occurrences
The ldquoOutage Initiation Coderdquo describes where an automatic outage was initiated on the power system The
five codes are as follows
bull Element-Initiated
bull Other Element-Initiated
bull AC Substation-Initiated
bull ACDC Terminal-Initiated (for DC circuits)
bull Other Facility Initiated any facility not included in any other outage initiation code
JanuaryFebruar
yMarch April May June July August
September
October
November
December
2008 238 229 257 258 292 437 467 380 208 176 255 236
2009 315 201 339 334 398 553 546 515 351 235 226 294
2010 444 224 269 446 449 486 639 498 351 271 305 281
3 Year AVG 332 218 288 346 380 492 551 464 303 227 262 270
0
100
200
300
400
500
600
700
Out
ages
Transmission Equipment Performance
50
Notably the protection system is not part of an ldquoAC Substationrdquo or an ldquoACDC Terminalrdquo If a protection
system misoperates and initiates an outage it will be classified as ldquoOther-Facility Initiatedrdquo The following
Figures show the initiating location of the Automatic outages from 2008 to 2010
With both Momentary and Sustained Automatic Outages taken into account the outage was initiated on the
Element more than 67 percent of the time as shown in Figure 26 and Figure 27
When only the Sustained Automatic Outages are analyzed the outage initiation on both AC Substation and
Other Facility increased by 34 percent and 32 percent respectively Outages initiated on the Element itself
decreases by 78 percent as shown in Figure 26 and 27 For only the Momentary Automatic Outages the
outage initiation on the Element increases by 19 percent compared to Sustained Outages Element initiated
outages make up over 78 percent of the total outages when analyzing only Momentary Outages
Figure 26
Figure 27
Transmission Outage Events Figure 28 illustrates the relationship between the numbers of Automatic Outages associated per TADS
event 2008 2009 and 2010 tend to follow the same trend The largest number of Automatic Outages per
TADS event is fourteen in 2010 thirteen in 2009 and eight in 2008 There are around 70 to 100 TADS
events that contain between fourteen and three Automatic Outages (see below) There are around 330 to
400 TADS events that contain two or more Automatic Outages The rest of the events only contain one
Automatic Outage As noted in the lower right hand corner below the total number of Events in 2008 to
2010 ranged from 3920 to 4569 events per year Nearly 90 percent or more of the events contained one
Automatic Outage
Figure 26 Sustained Automatic Outage Initiation
Code
Figure 27 Momentary Automatic Outage Initiation
Code
Transmission Equipment Performance
51
Transmission Outage Mode Figure 29 and Figure 30 show the percentage of Outage Modes The ldquoOutage Mode Coderdquo describes
whether one Automatic Outage is related to other Automatic Outages A Single Mode outage is an
Automatic Outage of a single Element which occurs independently of any other Automatic Outages (if any)
A ldquoDependent Mode Initiating Outagerdquo is an Automatic Outage of a single Element that initiates one or more
subsequent Element Automatic Outages A ldquoDependent Mode Outagerdquo is an Automatic Outage of an
Element which occurred as a result of an initiating outage whether the initiating outage was an Element
outage or a non-Element outage A ldquoCommon Mode Outagerdquo is one of two or more Automatic Outages with
the same Initiating Cause Code and where the outages are not consequences of each other and occur nearly
simultaneously A ldquoCommon Mode Initiating Outagerdquo is a Common Mode Outage that initiates one or more
subsequent Automatic Outages
Over 72 percent of the total outages occurred on the bulk power system are Single Mode Outages The next
largest mode is Dependent with over 11 percent of the total outages being in this category For only
Sustained Automatic Outages outages related to each other increase with Dependent mode accounting for
13 percent of the outages and Common mode accounting for close to 11 percent of the outages
Independent Sustained outages still account for the largest portion with nearly 70 percent being Single
mode When just analyzing Momentary Automatic Outages Associated outages decrease with Dependent
Figure 28 Event Histogram (2008-2010)
Transmission Equipment Performance
52
mode accounting for only 9 percent of the outages The Common Mode percentage decreases while
Dependent Mode Initiating percentage increases compared to Sustained Outages Independent Momentary
outages account for the largest portion with over 76 percent being Single Mode
An investigation into the root causes of Dependent and Common mode events which include three or more
Automatic Outages (indentified in the TADS 2008 to 2010 data) should be a high priority Some protection
systems are designed to trip three or more circuits but some events go beyond what is designed Some also
have misoperations associated with multiple outage events
Conclusions On a NERC wide average basis automatic transmission outage rate is improving from 2008 to 2010 based on
reported data Considering both automatic and non-automatic outages 2010 records indicate transmission
element availability percentage is very high and exceeds 95 The unavailability rate for AC circuits and
transformers are only 15 and 29 respectively
The cause codes of Human Error Failed Protection System Equipment and Failed AC Circuit Equipment
should be considered significant focus points in reducing the number of Sustained Automatic Outages for all
elements A deeper look into the root causes of Dependent and Common mode events which include three
or more Automatic Outages (indentified in the TADS 2008 to 2010 data) should be a high priority Some
protection systems are designed to trip three or more circuits but some events go beyond what is designed
Some also have misoperations associated with multiple outage events
Figure 29 Sustained Automatic Outage Mode code Figure 30 Momentary Automatic Outage Mode code
Generation Equipment Performance
53
Generation Equipment Performance Introduction The development of the Generating Availability Data System (GADS) began in 1982 This series of databases
is used to voluntarily collect record and retrieve operating information By pooling individual unit
information with likewise units generating unit availability performance can be calculated providing
opportunities to identify trends and generating equipment reliability improvement opportunities The
information is used to support equipment reliability availability analyses and risk-informed decision-making
by system planners generation owners assessment modelers manufacturers and contractors etc Reports
and information resulting from the data collected through GADS are now used for benchmarking and
analyzing electric power plants
Currently the data collected through GADS contains 72 percent of the North American generating units
with generating capacity of 20 MW or higher34 Additionally many of the newer combined-cycle plants are
not reporting information and therefore a full view of each unit type is not presented Rather a sample of
all the units in North America that fit a given more general category is provided35 for the 2008-201036
Generation Key Performance Indicators
assessment period
Three key performance indicators37
In
the industry have used widely to measure the availability of generating
units (see Terms Used in This Report section for their calculation parameters) are Equivalent Availability
Factor (EAF) Net Capacity Factor (NCF) and Equivalent Forced Outage Rate ndash Demand (EFORd)
Table 7 the North American fleet average EAF NCF and EFORd compared to unit age for all generating
units with a capacity of 20 MW and higher is provided for the years 2008-2010 The EAF shows a decline
during the last three years NCF is up and down while the EFORd appears to be increasing As expected the
fleet of units reported to GADS is aging overall with the fossil units being about 12 years older than the
average age
34 httpwwwnerccomdocspcgadstfGADSTF_Recommendation_Report_02-18-2011_FINALpdf 35GADS contains some 1500+ units under 20 MW that is not included in this report These units are excluded because most units are not base-loaded and are in peaking operation
3684 percent of the 2010 dataset is available at this time while the 2008 and 2009 dataset is complete 37 httpwwwnerccompagephpcid=4|43
Generation Equipment Performance
54
Table 7 General Availability Review of GADS Fleet Units by Year
2008 2009 2010 Average
Equivalent Availability Factor (EAF) 8776 8774 8678 8743
Net Capacity Factor (NCF) 5083 4709 4880 4890
Equivalent Forced Outage Rate -
Demand (EFORd) 579 575 639 597
Number of Units ge20 MW 3713 3713 3713 3713
Average Age of the Fleet in Years (all
unit types) 303 311 321 312
Average Age of the Fleet in Years
(fossil units only) 422 432 440 433
Figure 31 provides the average forced outage hours (FOH) maintenance outage hours (MOH) and planned
outage hours (POH) for all units reporting 20 MW or larger During this three-year period the average FOH
291 hours average MOH is 163 hours average POH is 470 hours
Figure 31 shows a large increase in forced and maintenance events The average age of the units with a
capacity of 20MW and higher in 2009 is 316 years old However the average age of fossil units in 2010 is
442 years old These fossil units are the backbone of all operating units providing the base-load power
continuously and nearly 50 percent of all energy annually There appears to be no increase allocated for
annualsemi-annual maintenance (ie planned outages) for the older generating units The increase of
000100002000030000400005000060000700008000090000
100000
2008 2009 2010
463 479 468
154 161 173
288 270 314
Hou
rs
Planned Maintenance Forced
Figure 31 Average Outage Hours for Units gt 20 MW
Generation Equipment Performance
55
maintenance outage hours reflects an increased need to fix problems that cannot be deferred until the next
annualsemi-annual repairs As a result it shows one of two things are happening
bull More or longer planned outage time is needed to repair the aging generating fleet
bull More focus on preventive repairs during planned and maintenance events are needed
Multiple Unit Forced Outages and Causes Table 8 provides the annual multiple-unit forced outage trips resulting from the same cause for each of the
assessments years 2008-2010 respectively The ldquosingle unitrdquo trips are large units with a Net Dependable
Capacity of 750 MW or more The trips of ldquotwo unitsrdquo or more is any combination of unit capacity with the
total amount of lost capacity more than 750 MW
Table 8 also presents more information on the forced outages During 2008-2010 there were a large
number of double-unit outages resulting from the same event Investigations show that some of these trips
were at a single plant caused by common control and instrumentation for the units The incidents occurred
several times for several months and are a common mode issue internal to the plant
Table 8 Number of Multiple Unit Forced Outages and FrequencyYear
2008 2009 2010
Type of
Trip
of
Trips
Avg Outage
Hr Trip
Avg Outage
Hr Unit
of
Trips
Avg Outage
Hr Trip
Avg Outage
Hr Unit
of
Trips
Avg Outage
Hr Trip
Avg Outage
Hr Unit
Single-unit
Trip 591 58 58 284 64 64 339 66 66
Two-unit
Trip 281 43 22 508 96 48 206 41 20
Three-unit
Trip 74 48 16 223 146 48 47 109 36
Four-unit
Trip 12 77 19 111 112 28 40 121 30
Five-unit
Trip 11 1303 260 60 443 88 19 199 10
gt 5 units 20 166 16 93 206 50 37 246 6
Loss of ge 750 MW per Trip
The high number of five-unit trips in 2008 was due to Hurricane Ike hitting the Gulf Coast The highest total
number of multiple unit trips occurred in 2009 though as mentioned before the data collection for 2010 is
incomplete at this time The majority of 2009 multiple unit trips have three main causes (in order by
Generation Equipment Performance
56
number of events) transmission lack of fuel and storms A summary of the three categories for single as
well as multiple unit outages (all unit capacities) are reflected in Table 9
Table 9 Common Causes of Multiple Unit Forced Outages (2009)
Cause Number of Events Average MW Size of Unit
Transmission 1583 16
Lack of Fuel (Coal Mines Gas Lines etc) Not
in Operator Control
812 448
Storms Lightning and Other Acts of Nature 591 112
Some of the transmission outages based on storms in 2009 have been caused by the same reasons because
the storms may have caused transmission interference However the plants reported the problems
inconsistently with either the transmission interference or storms cause code Therefore they are depicted
as two different causes of forced outage
Marked transmission outages in 2009 were quite high Thirty-five percent came from one utility with a large
number of hydroelectric units The company related the trips to various problems including weather
(lightning storms) wildlife ldquoline bumpsrdquo and problems on the receiving end of the transmission line Nine
hundred and eighty-five transmission trips (62 percent) were from hydroelectric units38
In 2009 only ten transmission trips resulted in a loss of 750 MW or more per trip Twenty two generating
plants were affected by the ten trips Causes for the trips include feeder line trips (1 trip) breakers in the
switchyard (8 trips) personnel errors (2 trips) and unknown (10 trips)
The ldquoLack of Fuelrdquo outages are of interest as these events occur during the times when a unit is available to
operate but there is an interruption in fuels to operate the facilities These events do not include
interruptions of fuel due to contracts Rather the cause code is designed to account for units that are
expecting fuel and it is unavailable when requested Table 10 presents the distribution of ldquoLack of Fuelrdquo
events by NERC Region and Table 11 presents the unit types affected
38 The average size of the hydroelectric units were small ndash 335 MW
Generation Equipment Performance
57
Of the units that report ldquoLack of Fuelrdquo 78 percent of the units are oil-fired 15 percent of the units are gas-
fired and the remaining units are various other fuels Table 12 provides the top causes of forced outage for
several unit types For fossil units ldquoLack of Fuelrdquo as the number three cause behind waterwall tube leaks
and superheater tube leaks
Table 10 Forced Outages Due to Lack of Fuel by Region
Region Number of Lack of Fuel
Problems Reported
FRCC 0
MRO 3
NPCC 24
RFC 695
SERC 17
SPP 3
TRE 7
WECC 29
One company contributed to the majority of oil-fired lack of fuel events The units at the company are
actually dual-fuels (oil and gas) but market nominated gas monitoring causes the units to be on forced
outage nightly The units need gas to start up so they can run on oil When they shut down the units must
switch to gas to clean themselves With the gas restriction the unit canrsquot start and the unit goes on a
forced outage Until the band is lifted the two units will continue to be on a forced outage cycle
Event records also provide descriptions of why the unit was without fuel with the majority of descriptions
bull Temperatures affecting gas supply valves
bull Unexpected maintenance of gas pipe-lines
bull Compressor problemsmaintenance
Generation Equipment Performance
58
Table 11 Unit Type Profile of Forced Outages Due to Lack of Fuel
Unit Types Number of Lack of Fuel Problems Reported
Fossil 642
Nuclear 0
Gas Turbines 88
Diesel Engines 1
HydroPumped Storage 0
Combined Cycle 47
Generation Equipment Performance
59
Table 12 Causes of Forced Outage for Different Unit Types (2008-2010)
Fossil - all MW sizes all fuels
Rank Description Occurrence per Unit-year
MWH per Unit-year
Average Hours To Repair
Average Hours Between Failures
Unit-years
1 Waterwall (furnace wall) 0590 134106 59 3250 3868 2 Second Superheater
Leaks 0180 5182 60 3228 3868
3 Lack of Fuel (coal mines gas lines etc) where the operator is not in control
0480 4701 18 26 3868
Combined-Cycle blocks Rank Description Occurrence
per Unit-year
MWH per Unit-year
Average Hours To Repair
Average Hours Between Failures
Unit-years
1 HP Turbine Buckets Or Blades
0020 4663 1830 26280 466
2 Turbine Control Valves 0040 2777 100 7200 466 3 Gas Turbine Compressor -
High Pressure Shaft 0010 2266 663 4269 466
Nuclear units - all Reactor types Rank Description Occurrence
per Unit-year
MWH per Unit-year
Average Hours To Repair
Average Hours Between Failures
Unit-years
1 LP Turbine Buckets or Blades
0010 26415 8760 26280 288
2 Containment Structure 0010 9233 1226 26262 288 3 Feedwater Pump Local
Controls 0020 7620 692 12642 288
Simple-cycle gas turbine jet engines Rank Description Occurrence
per Unit-year
MWH per Unit-year
Average Hours To Repair
Average Hours Between Failures
Unit-years
1 Main Transformer 0030 1611 1016 20709 4181 2 Other Gas Turbine
Controls And Instrument Problems
0120 428 70 2614 4181
3 Other Gas Turbine Problems
0090 400 119 1701 4181
Generation Equipment Performance
60
2008-2010 Review of Summer versus Winter Availability To address seasonality of unit availability unit information for the months of June to September (summer)
and December through February (winter) were pooled to calculate force events during these timeframes for
2008-201039 Figure 32 shows the Equivalent Availability Factor (EAF) is three percentage points higher and
the Equivalent Forced Outage Rate - Demand (EFORd) is more than a half of a percentage point lower in the
summer period than in winter period This means the units were more reliable with less forced events
during high-demand times during the summer than during the winter seasons The generating unitrsquos
capability has a resulting higher Net Capacity Factor (NCF) of 45 percentage points in the summer season
for 2008-2010
During the spring season (March-May) 77 percent of the units took a planned outage (PO) for an average
231 hours (or 96 days) In fall (October-November) only 42 percent of the units experienced a PO and the
average duration was shorter ndash 134 hours (or 56 days) A few units took both spring and fall planned
outages although this is rare Based on this assessment the generating units are prepared for the summer
peak demand The resulting availability indicates that this maintenance was successful which is measured
by an increased EAF and lower EFORd
Figure 32 Summer-Winter Average EAF NCF and EFORd (2008-2010)
Conclusions and Recommendations During 2008-2010 the average Equivalent Availability Factor (EAF) which measures the overall availability
of generating units decreased At the same time the Net Capacity Factor (NCF) an indicator of energy
production increased The average number of forced outages in 2010 is greater than in 2008 while at the
same time the average planned outage times have decreased As a result the Equivalent Forced Outage
Rate ndash Demand (EFORd) also increased illustrating that more units have experienced forced events during
39 A study of peak periods was conducted by the NERC Generating Availability Trend Evaluation (GATE) Working Group several years ago see httpwwwnerccomfilesSeasonal-Performance-Trendspdf
9116
5343
396
8818
4896
441
0 10 20 30 40 50 60 70 80 90 100
EAF
NCF
EFORd
Percent ()
Winter
Summer
Generation Equipment Performance
61
peak-demand times in 2010 than in the previous two years Potentially with shorter planned outage
periods in 2010 there may be less time to repair equipment and prevent forced unit outages
There are warnings that units are not being maintained as well as they should be In the last three years
there has been an increase in Equivalent Forced Outage Rate ndash Demand (EFORd) This indicator measures
the rate of forced outage events on generating units during periods of load demand To confirm this
problem forced outage hours jumped from 270 to 314 hours per unit between 2009 and 2010 At the same
time maintenance events also increased by 12 hours per unit Planned outage events remain constant The
resulting conclusions from this trend are
bull More or longer planned outage time is needed to repair the generating fleet Whether age is the
cause of the increase need for planned outage time remains unknown and further investigation into
the cause for longer planned outage time is necessary
bull More focus on preventive repairs during planned and maintenance events are needed
There are many multiple unit forced outages due to lack of fuel The majority of multiple unit trips have
three main causes transmission lack of fuel and storms With special interest in the forced outages due to
ldquoLack of Fuelrdquo additional analysis revealed that 77 percent of the units experiencing unexpected fuel
stoppage are oil-fired fossil units while gas-fired units experienced 15 percent
Generating units continue to be more reliable during the peak summer periods
Disturbance Event Trends
62
Category 1 An event resulting in one or more of the following a Unintended loss of three or more BPS elements caused by
common mode failure b Failure or misoperation of an SPSRAS c System-wide voltage reduction of 3 or more d Unintended BPS system separation resulting in an island of
100 MW to 999 MW e Unplanned evacuation from a control center facility with BPS
SCADA functionality for 30 minutes or more Category 2 An event resulting in one or more of the following
a Complete loss of all BPS control center voice communication system(s) for 30 minutes or more
b Complete loss of SCADA control or monitoring functionality for 30 minutes or more
c Voltage excursions equal to or greater than 10 lasting more than five minutes
d Loss of off-site power (LOOP) to a nuclear generating station e Unintended system separation resulting in an island of 1000
MW to 4999 MW f Unintended loss of 300MW or more of firm load for more
than 15 minutes g Violation of an Interconnection Reliability Operating Limit
(IROL) for more than 30 minutes Category 3 An event resulting in one or more of the following
a The loss of load or generation of 2000 MW or more in the Eastern Interconnection or
b Western Interconnection or 1000 MW or more in the ERCOT or Queacutebec Interconnections
c Unintended system separation resulting in an island of 5000 MW to 10000 MW
d Unintended system separation resulting in an island of Florida from the Eastern Interconnection
Category 4 An event resulting in one or more of the following a The loss of load or generation from 5001 MW to 9999 MW b Unintended system separation resulting in an island of more
than 10000 MW (with the exception of Florida as described in Category 3c)
Category 5 An event resulting in one or more of the following a The loss of load of 10000 MW or more b The loss of generation of 10000 MW or more
Figure 33 BPS Event Category
Disturbance Event Trends Introduction The purpose of this section is to report event
analysis trends from the beginning of event
analysis field test40
One of the companion goals of the event
analysis program is the identification of trends
in the number magnitude and frequency of
events and their associated causes such as
human error equipment failure protection
system misoperations etc The information
provided in the event analysis database (EADB)
and various event analysis reports have been
used to track and identify trends in BPS events
in conjunction with other databases (TADS
GADS metric and benchmarking database)
to the end of 2010
The Event Analysis Working Group (EAWG)
continuously gathers event data and is moving
toward an integrated approach to analyzing
data assessing trends and communicating the
results to the industry
Performance Trends The event category is classified41
Figure 33
as shown in
with Category 5 being the most
severe Figure 34 depicts disturbance trends in
Category 1 to 5 system events from the
40 httpwwwnerccomdocseawgGalloway-Industry-EA-Field-Test-102210pdf 41httpwwwnerccomfiles2011-05-0220Event_Analysis_Process_Phase20220Field20Test20Draft20-20Final20-20For20postingpdf
Disturbance Event Trends
63
beginning of event analysis field test to the end of 201042
Figure 34 Event Category vs Date for All 2010 Categorized Events
From the figure in November and December
there were many more category 1 and 2 events than in October This is due to the field trial starting on
October 25 2010
In addition to the category of the events the status of the events plays a critical role in the accuracy of the
data By examining Figure 35 over 80 of the events reported in 2010 have been closed This means that
the category root cause and other important information have been sufficiently finalized in order for
analysis to be accurate for each event At this time there is not enough data to draw any long-term
conclusions about event investigation performance
42 Documents for the EA Field Test are located at httpwwwnerccompagephpcid=5|365
2
12 12
26
3
6 5
14
1 1
2
0
5
10
15
20
25
30
35
40
45
October November December 2010
Even
t Cou
nt
Category 3 Category 2 Category 1
Disturbance Event Trends
64
Figure 35 Event Count vs Status (All 2010 Events with Status)
By drilling down into the cause code for each closed 2010 event Figure 36 shows the top 3 event causes
From the figure equipment failure and protection system misoperation are the most significant causes for
events Because of how new and limited the data is however there may not be statistical significance for
this result Further trending of cause codes for closed events and developing a richer dataset to find any
trends between event cause codes and event counts should be performed
Figure 36 Top 3 Event Counts vs DAWG Cause Code for all Closed 2010 Events
10
32
42
0
5
10
15
20
25
30
35
40
45
Open Closed Open and Closed
Even
t Cou
nt
Status
1211
8
0
2
4
6
8
10
12
14
Equipment Failure Protection System Misoperation Human Error
Even
t Cou
nt
Cause Code
Disturbance Event Trends
65
Conclusions Due to the relatively new process for events analysis and categorization more time will be required before a
conclusive recommendation may be obtained Further analysis and new data should provide valuable
statistics in the future Over 80 of all event reports from 2010 are current listed as closed but no
conclusion about investigation performance may be obtained because of the limited amount of data It is
recommended to study ways to prevent equipment failure and protection system misoperations but there
is not enough data to draw a firm conclusion about the top causes of events at this time
Abbreviations Used in This Report
66
Abbreviations Used in This Report
Acronym Definition ALP Acadiana Load Pocket
ALR Adequate Level of Reliability
ARR Automatic Reliability Report
BA Balancing Authority
BPS Bulk Power System
CDI Condition Driven Index
CEII Critical Energy Infrastructure Information
CIPC Critical Infrastructure Protection Committee
CLECO Cleco Power LLC
DADS Future Demand Availability Data System
DCS Disturbance Control Standard
DOE Department Of Energy
DSM Demand Side Management
EA Event Analysis
EAF Equivalent Availability Factor
ECAR East Central Area Reliability
EDI Event Drive Index
EEA Energy Emergency Alert
EFORd Equivalent Forced Outage Rate Demand
EMS Energy Management System
ERCOT Electric Reliability Council of Texas
ERO Electric Reliability Organization
ESAI Energy Security Analysis Inc
FERC Federal Energy Regulatory Commission
FOH Forced Outage Hours
FRCC Florida Reliability Coordinating Council
GADS Generation Availability Data System
GOP Generation Operator
IEEE Institute of Electrical and Electronics Engineers
IESO Independent Electricity System Operator
IROL Interconnection Reliability Operating Limit
Abbreviations Used in This Report
67
Acronym Definition IRI Integrated Reliability Index
LOLE Loss of Load Expectation
LUS Lafayette Utilities System
MAIN Mid-America Interconnected Network Inc
MAPP Mid-continent Area Power Pool
MOH Maintenance Outage Hours
MRO Midwest Reliability Organization
MSSC Most Severe Single Contingency
NCF Net Capacity Factor
NEAT NERC Event Analysis Tool
NERC North American Electric Reliability Corporation
NPCC Northeast Power Coordinating Council
OC Operating Committee
OL Operating Limit
OP Operating Procedures
ORS Operating Reliability Subcommittee
PC Planning Committee
PO Planned Outage
POH Planned Outage Hours
RAPA Reliability Assessment Performance Analysis
RAS Remedial Action Schemes
RC Reliability Coordinator
RCIS Reliability Coordination Information System
RCWG Reliability Coordinator Working Group
RE Regional Entities
RFC Reliability First Corporation
RMWG Reliability Metrics Working Group
RSG Reserve Sharing Group
SAIDI System Average Interruption Duration Index
SAIFI System Average Interruption Frequency Index
SCADA Supervisory Control and Data Acquisition
SDI Standardstatute Driven Index
SERC SERC Reliability Corporation
Abbreviations Used in This Report
68
Acronym Definition SRI Severity Risk Index
SMART Specific Measurable Attainable Relevant and Tangible
SOL System Operating Limit
SPS Special Protection Schemes
SPCS System Protection and Control Subcommittee
SPP Southwest Power Pool
SRI System Risk Index
TADS Transmission Availability Data System
TADSWG Transmission Availability Data System Working Group
TO Transmission Owner
TOP Transmission Operator
WECC Western Electricity Coordinating Council
Contributions
69
Contributions This report was made feasible by the collaboration and hard work of both NERC staff and NERCrsquos
Industry Groups
NERC Industry Groups
Table 14 lists the NERC industry group contributors Without their contribution and collaboration this
report would not have been possible
Table 13 NERC Industry Group Contributions43
NERC Group
Relationship Contribution
Reliability Metrics Working Group
(RMWG)
Reports to the OCPC bull Lead Development of Report bull Provide Reliability Metrics Data bull Responsible for Reliability Metrics
Performance Chapter
Transmission Availability Working Group
(TADSWG)
Reports to the OCPC bull Provide Transmission Availability Data
bull Responsible for Transmission Equip-ment Performance Chapter
bull Content Review
Generation Availability Data System Task
Force
(GADSTF)
Reports to the OCPC bull Provide Generation Availability Data bull Responsible for Generation Equip-
ment Performance Chapter bull Content Review
Event Analysis Working Group
(EAWG)
Reports to the OCPC bull Provide Events Data bull Responsible for Disturbance Events
Trends Chapter bull Content Review
43 Rosters for RMWG TADSWG GADSTF and EAWG are available at httpwwwnerccomfilesrosterpdf
Contributions
70
NERC Staff Table 13 below lists the NERC staff who contributed to the 2011 Reliability Performance Analysis
Report
Table 14 Contributing NERC Staff
Name Title E-mail Address
Mark Lauby Vice President and Director of
Reliability Assessment and
Performance Analysis
marklaubynercnet
Jessica Bian Manager of Performance Analysis jessicabiannercnet
John Moura Manager of Reliability Assessments johnmouranercnet
Andrew Slone Engineer Reliability Performance
Analysis
andrewslonenercnet
Jim Robinson TADS Project Manager jimrobinsonnercnet
Clyde Melton Engineer Reliability Performance
Analysis
clydemeltonnercnet
Mike Curley Manager of GADS Services mikecurleynercnet
James Powell Engineer Reliability Performance
Analysis
jamespowellnercnet
Michelle Marx Administrative Assistant michellemarxnercnet
William Mo Intern Performance Analysis wmonercnet
- NERCrsquos Mission
- Table of Contents
- Executive Summary
-
- 2011 Transition Report
- State of Reliability Report
- Key Findings and Recommendations
-
- Reliability Metric Performance
- Transmission Availability Performance
- Generating Availability Performance
- Disturbance Events
- Report Organization
-
- Introduction
-
- Metric Report Evolution
- Roadmap for the Future
-
- Reliability Metrics Performance
-
- Introduction
- 2010 Performance Metrics Results and Trends
-
- ALR1-3 Planning Reserve Margin
-
- Background
- Assessment
- Special Considerations
-
- ALR1-4 BPS Transmission Related Events Resulting in Loss of Load
-
- Background
- Assessment
-
- ALR1-12 Interconnection Frequency Response
-
- Background
- Assessment
-
- ALR2-3 Activation of Under Frequency Load Shedding
-
- Background
- Assessment
- Special Considerations
-
- ALR2-4 Average Percent Non-Recovery Disturbance Control Standards (DCS)
-
- Background
- Assessment
- Special Consideration
-
- ALR2-5 Disturbance Control Events Greater Than Most Severe Single Contingency
-
- Background
- Assessment
- Special Consideration
-
- ALR 1-5 System Voltage Performance
-
- Background
- Special Considerations
- Status
-
- ALR3-5 Interconnection Reliability Operating Limit System Operating Limit (IROLSOL) Exceedances
-
- Background
-
- ALR4-1 Automatic Transmission Outages Caused by Protection System Misoperations
-
- Background
- Special Considerations
-
- ALR6-11 ndash ALR6-14
-
- Background
- Assessment
- ALR 6-11 ndash Automatic Outages Initiated by Failed Protection System Equipment
- ALR6-12 ndash Automatic Outages Initiated by Human Error
- ALR6-13 ndash Automatic Outages Initiated by Failed AC Substation Equipment
- ALR6-14 Automatic AC Transmission Outages Initiated by Failed AC Circuit Equipment
-
- ALR6-15 Element Availability Percentage (APC)
-
- Background
- Assessment
- Special Consideration
-
- ALR6-16 Transmission System Unavailability
-
- Background
- Assessment
- Special Consideration
-
- ALR6-2 Energy Emergency Alert 3 (EEA3)
-
- Background
- Assessment
- Special Considerations
-
- ALR 6-3 Energy Emergency Alert 2 (EEA2)
-
- Background
- Assessment
- Special Considerations
-
- ALR 6-1 Transmission Constraint Mitigation
-
- Background
- Assessment
- Special Considerations
-
- Integrated Bulk Power System Risk Assessment
-
- Introduction
- Recommendations
-
- Integrated Reliability Index Concepts
-
- The Three Components of the IRI
-
- Event-Driven Indicators (EDI)
- Condition-Driven Indicators (CDI)
- StandardsStatute-Driven Indicators (SDI)
-
- IRI Index Calculation
- IRI Recommendations
-
- Reliability Metrics Conclusions and Recommendations
-
- Transmission Equipment Performance
-
- Introduction
- Performance Trends
-
- AC Element Outage Summary and Leading Causes
- Transmission Monthly Outages
- Outage Initiation Location
- Transmission Outage Events
- Transmission Outage Mode
-
- Conclusions
-
- Generation Equipment Performance
-
- Introduction
- Generation Key Performance Indicators
-
- Multiple Unit Forced Outages and Causes
- 2008-2010 Review of Summer versus Winter Availability
-
- Conclusions and Recommendations
-
- Disturbance Event Trends
-
- Introduction
- Performance Trends
- Conclusions
-
- Abbreviations Used in This Report
- Contributions
-
- NERC Industry Groups
- NERC Staff
-

Reliability Metrics Performance
26
Also any human failure or interpretation of standard industry practices and guidelines that cause an
outage will be reported in this category
Figure 11 ALR6-12 by Region (Includes NERC-Wide)
Reliability Metrics Performance
27
ALR6-13 ndash Automatic Outages Initiated by Failed AC Substation Equipment
Figure 12 shows the automatic outages with an initiating cause code of failed AC substation equipment
This code covers automatic outages caused by the failure of AC Substation ie equipment ldquoinside the
substation fencerdquo including transformers and circuit breakers but excluding protection system
equipment19
19TADS Initiating Cause Code definitions are located at httpwwwnerccomdocspctadswgTADS_Definitions_Appendix_7_092909pdf
Figure 12 ALR6-13 by Region (Includes NERC-Wide)
Reliability Metrics Performance
28
ALR6-14 Automatic AC Transmission Outages Initiated by Failed AC Circuit Equipment
Figure 13 shows the automatic outages with an initiating cause code of failed AC circuit equipment
Automatic Outages related to the failure of AC Circuit equipment ie overhead or underground
equipment ldquooutside the substation fencerdquo 20
ALR6-15 Element Availability Percentage (APC)
Background
This metric uses data and calculations directly from the NERC TADS effort and illustrates the overall
percent of time the aggregate of transmission facilities are available and in service This is an aggregate
20TADS Initiating Cause Code definitions are located at httpwwwnerccomdocspctadswgTADS_Definitions_Appendix_7_092909pdf
Figure 13 ALR6-14 by Region (Includes NERC-Wide)
Reliability Metrics Performance
29
value using sustained outages (automatic and non-automatic) for both lines and transformers operated
at 200 kV and above for each Regional Entity Interconnection and for NERC This metric was approved
by the NERC Operating and Planning Committees in September 2010
Assessment
Figure 14 shows the aggregate element availability percentage (APC) for transmission and transformers
facilities operated at 200 kV and above The values are all over 90 percent which shows excellent
system availability The RMWG recommends continued metric assessment for at least a few more years
in order to determine the value of this metric
Figure 14 2010 ALR6-15 Element Availability Percentage
Notably the Eastern Interconnection does not include Quebec or ERCOT ERCOT does not have any
transformers with low-side voltage levels 200 kV and above
Special Consideration
It should be noted that the non-automatic outage data needed to calculate this metric was only first
collected for the calendar year 2010 as part of the TADS process Therefore only one year of data for
this metric is available at this time
Reliability Metrics Performance
30
ALR6-16 Transmission System Unavailability
Background
This metric uses data and calculations directly from the NERC TADS effort and shows the overall percent
of time the aggregate of transmission facilities are unavailable due to automatic and non-automatic
outages This is an aggregate value using sustained automatic outages for both lines and transformers
operated at 200 kV and above for each Regional Entity and for NERC This metric was approved by the
NERC Operating and Planning Committees in December 2010
Assessment
Figure 15 and Figure 16 illustrate the 2010 aggregate unavailability percentage for AC circuits and
transformer facilities operated at 200 kV and above The values for AC circuits are all under 3 percent
which shows excellent system availability
The RMWG recommends continued metric assessment for at least a few more years in order to
determine the value of this metric
Special Consideration
It should be noted that the non-automatic outage data needed to calculate this metric was only first
collected for the calendar year 2010 as part of the TADS process Therefore only one year of data for
this metric is available at this time
Figure 15 2010 ALR6-16 Transmission System Unavailability
Reliability Metrics Performance
31
Figure 16 2010 ALR6-16 Transmission System Unavailability by Outage Type
Notably the Eastern Interconnection does not include Quebec or ERCOT Also ERCOT does not have
any transformers with low-side voltage levels 200 kV and above
ALR6-2 Energy Emergency Alert 3 (EEA3)
Background
This metric identifies the number of times Energy Emergency Alerts Level 3 (EEA3) are issued EEA3
events are firm-load interruptions due to capacity and energy deficiency EEA3 is currently reported
collected and maintained in NERCrsquos Reliability Coordination Information System (RCIS) and is defined in
Attachment 1 of the NERC Standard EOP-00221
21 The latest version of Attachment 1 for EOP-002 is available at
This metric identifies the number of times EEA3s are
issued The number of EEA3s per year provides a relative indication of performance measured at a
Balancing Authority or interconnection level As historical data is gathered trends in future reports will
provide an indication of either decreasing or increasing use of EEA3s signaling adequacy of the electric
supply system This metric can also be considered in the context of Planning Reserve Margin Significant
increases or decreases in EEA3 events with relatively constant Planning Reserve Margins could indicate
httpwwwnerccompagephpcid=2|20
Reliability Metrics Performance
32
volatility in the actual loads compared to forecast levels or changes in the adequacy of the bulk power
system required to meet load demands
Assessment
Figure 17 shows the number of EEA3 events during 2006 and 2010 from an RE level An interactive
presentation was released and available at the Reliability Indicatorrsquos page22
The Acadiana Load Pocket (ALP) is an area in south central Louisiana that has experienced regular
transmission constraints and numerous Energy Emergency Alert filings by the SPP Reliability Controller
(SPP RC) Transmission within ALP is owned by Entergy Lafayette Utilities System (LUS) and Cleco
Power LLC (Cleco) The transmission constraints within the ALP are primarily caused by the local area
load and the lack of generation located in close proximity to the load area
The number of EEA3rsquos
declared in 2010 returned to more traditional numbers The 2009 spike in EEA3 events in the SPP
Region that was driven by issues in the Acadiana Load Pocket (ALP) were not present in 2010
Special Considerations
Ideally the measure should capture only EEAs that are declared for reliability reasons and not for
economic factors The RMWG has not been able to differentiate these reasons for future reporting and
it has made a recommendation to the Reliability Coordinator Working Group (RCWG) to consider a
revised EEA declaration to exclude economic factors
The reason the EEA volume decreased from 2009 to 2010 in SPP was because the SPP ICT RC23
coordinated an operating agreement between the five operating companies in the ALP The operating
agreement included a cost sharing re-dispatch that alleviated the need of a Transmission Loading Relief
(TLR-5) declaration24
22The EEA3 interactive presentation is available on the NERC website at
During 2009 there was no operating agreement therefore an entity had to
provide Network and Native Load (NNL) relief when a TLR-5 was called by the ICT RC When the TLR-5
was the primary tool to control the post contingent loading in the ALP some of the BAs would have their
firm transmission curtailed to the point where they could no longer serve their load therefore the EEA
3 was needed to communicate a capacityreserve deficiency
httpwwwnerccompagephpcid=4|331|335 23Southwest Power Pool (SPP) Independent Coordinator of Transmission (ICT) Reliability Coordinator (RC) 24More information on Transmission Load Relief is contained in the IRO-006 standard which is located at httpwwwnerccomfilesIRO-006-4pdf In particular TLR-5 definitions are referenced on page 16 and 17
Reliability Metrics Performance
33
Figure 17 ALR6-2 Energy Emergency Alert 3 (EEA3) Counts by Region (2006-2010)
Cleco Power Entergy and LUS are currently constructing an estimated $200 million transmission
infrastructure improvement project to mitigate transmission constraints into ALP Construction of the
project is scheduled to be complete in 2012 Completion of the project should help alleviate some of
the transmission congestion in this area Energy Emergency Alerts filed by the SPP Regional Entity
continue to decline
SPP RTO continues to coordinate operating plans with the operating entities in this area Mitigation
plans and local operating guides in place are expected to provide sufficient flexibility should issues arise
NERC will continue to monitor this area for Reliability Impacts and coordinate any actions with the SPP
Reliability Coordinator and SPP Regional Entity
ALR 6-3 Energy Emergency Alert 2 (EEA2)
Background
Energy Emergency Alert 2 (EEA2) is to measure the number of events BAs declare for deficient capacity
and energy during peak load periods which may serve as a leading indicator of energy and capacity
shortfall in the adequacy of the electric supply system EEA2 provides a sense of the frequency of
precursor events to the more severe EEA3 declarations This metric measures the number of events
1 3 1 2 214
3 4 4 1 5 334
4 2 1 52
1
0
5
10
15
20
25
30
3520
0620
0720
0820
0920
1020
0620
0720
0820
0920
1020
0620
0720
0820
0920
1020
0620
0720
0820
0920
1020
0620
0720
0820
0920
1020
0620
0720
0820
0920
1020
0620
0720
0820
0920
1020
0620
0720
0820
0920
10
FRCC MRO NPCC RFC SERC SPP TRE WECC
2006-2009
2010
Region and Year
Reliability Metrics Performance
34
Balancing Authorities declare for deficient capacity and energy during peak load periods At this time
however this data reflects inclusion of Demand Side Resources that would not be indicative of
inadequacy of the electric supply system
The number of EEA2 events and any trends in their reporting indicates how robust the system is in
being able to supply the aggregate load requirements The historical records may include demand
response activations and non-firm load interruptions per applicable contracts within the EEA alerts per
its definition25
Assessment
Demand response is a legitimate resource to be called upon by balancing authorities and
do not indicate a reliability concern As data is gathered in the future reports will provide an indication
of either decreasing or increasing adequacy in the electric supply system EEA2 events called solely for
activation of demand response (controllable or contractually prearranged demand-side dispatch
programs) or interruption of non-firm load per applicable contracts should be excluded This metric can
also be considered in the context of the Planning Reserve Margin Significant increases or decreases in
EEA2 events with relatively constant Planning Reserve Margins could indicate volatility in the actual
loads compared to forecast levels or changes in the adequacy of the bulk power system required to
meet load demands
Figure 18 shows the number of EEA2 events by Regional Entity from 2006 to 2010 EEA2 interactive
version available on line by quarter and region26
25 The EEA2 is defined at
The general trend continues to show improved
performance which may have been influenced by the overall reduction in demand throughout NERC
caused by the economic downturn Specific performance by any one region should be investigated
further for issues or events that may affect the results Determining whether performance reported
includes those events resulting from the economic operation of DSM and non-firm load interruption
should also be investigated The RMWG recommends continued metric assessment
httpwwwnerccomfilesEOP-002-2pdf 26 EEA2 interactive version located at httpwwwnerccompagephpcid=4|331|341
Reliability Metrics Performance
35
Special Considerations
The intent of this metric is to measure only EEAs that are called for reliability reasons and not for
economic factors such as demand side management (DSM) and non-firm load interruption The
historical data for this metric may include events that were called for economic factors According to
the RCWG recent data should only include EEAs called for reliability reasons
ALR 6-1 Transmission Constraint Mitigation
Background
The RMWG completed a pilot with four regional entities Based on the results the RMWG expanded the
pilot data collection to all regions and the initial results of the data collection are shown in Figure 19
and Table 5 Based on the results of the pilot there is merit in continuing to assess this metric The
intent of this metric is to identify trends in the number of mitigation measures (Special Protection
Schemes (SPS) Remedial Action Schemes (RAS) and Operating Procedures) required to meet reliability
requirements By their nature SPS do not indicate an inherent weakness in the bulk power system
rather they are an indication of methods that are taken to operate the system through the range of
conditions it must perform This metric is only intended to evaluate the trend use of these plans and
whether the metric indicates robustness of the transmission system is increasing remaining static or
decreasing
1 27
2 1 4 3 2 1 2 4 5 2 5 832
4724
211
5 38 5 1 1 8 7 4 1 1
05
101520253035404550
2006
2007
2008
2009
2010
2006
2007
2008
2009
2010
2006
2007
2008
2009
2010
2006
2007
2008
2009
2010
2006
2007
2008
2009
2010
2006
2007
2008
2009
2010
2006
2007
2008
2009
2010
2006
2007
2008
2009
2010
FRCC MRO NPCC RFC SERC SPP TRE WECC
2006-2009
2010
Region and Year
Figure 18 ALR6-3 Energy Emergency Alert 2 (EEA2)
Reliability Metrics Performance
36
Assessment
The pilot data indicates a relatively constant number of mitigation measures over the time period of
data collected
Figure 19 ALR6-1 Transmission Constraint Mitigation by SPSRAS (2009-2014)
0102030405060708090
100110120
2009
2010
2011
2014
2009
2010
2011
2014
2009
2010
2011
2014
2009
2010
2011
2014
2009
2010
2011
2014
2009
2010
2011
2014
2009
2010
2011
2014
2009
2010
2011
2014
FRCC MRO NPCC RFC SERC SPP ERCOT WECC
Coun
t
Region and Year
SPSRAS
Reliability Metrics Performance
37
Table 5 ALR6-1 Transmission Constraint Mitigation by Operating ProcedureGuides (2009-2011)
ALR6-1 Transmission Constraint Mitigation by Operating ProcedureGuides (2009-2014)
2009 2010 2011 2014
FRCC 107 75 66
MRO 79 79 81 81
NPCC 0 0 0
RFC 2 1 3 4
SPP 39 40 40 40
SERC 6 7 15
ERCOT 29 25 25
WECC 110 111
Special Considerations
A certain number of SPS mitigation plans may be necessary to support reliable operation of the system
If the number of SPS increase over time this may indicate that additional transmission capacity is
required A reduction in the number of SPS may be an indicator of increased generation or transmission
facilities being put into service which may indicate greater robustness of the bulk power system In
general mitigation plans are a viable and valuable tool for effective operation of the bulk power system
In power system planning reliability operability capacity and cost-efficiency are simultaneously
considered through a variety of scenarios to which the system may be subjected Mitigation measures
are a method for optimizing a power system across these scenarios Changes in quantities of mitigation
plans may indicate year-on-year differences in the system being evaluated
Integrated Bulk Power System Risk Assessment
Introduction In developing eighteen metrics to measure acceptable levels of reliability it has become clear that any
such measurement of reliability must include consideration of the risks present within the bulk power
system in order for us to appropriately prioritize and manage these system risks The scope for the
Reliability Metrics Working Group (RMWG)27
27 The RMWG scope can be viewed at
includes a task to develop a risk-based approach that
provides consistency in quantifying the severity of events The approach not only can be used to
httpwwwnerccomfilezrmwghtml
Reliability Metrics Performance
38
measure risk reduction over time but also can be applied uniformly in event analysis process to identify
the events that need to be analyzed in detail and sort out non-significant events
The Operating Committee (OC) and Planning Committee (PC) endorsed the concepts and framework28 of
the risk-based approach in their September 2010 joint meeting and further supported the event severity
risk index (SRI) calculation29
Recommendations
in March 2011
bull NERC should embrace the use of risk assessment to identify trends in addition to lessons learned
in order to improve bulk power system reliability
bull The RMWG should continue to coordinate and communicate with the Event Analysis Working
Group (EAWG) to apply the SRI into the event analysis process and root cause analysis
bull As trend evaluations increase the knowledge of risks to the bulk power system data required to
support additional assessment should be gathered
Event Severity Risk Index (SRI)
Risk assessment is an essential tool for achieving the alignment between organizations people and
technology This will assist in quantifying inherent risks identifying where potential high risks exist and
evaluating where the most significant lowering of risks can be achieved Being learning organizations
the Electric Reliability Organization (ERO) Regional Entities and Registered Entities can use these tools
to focus on the areas of highest risk to reliability to provide a sound basis for developing results-based
standards and compliance programs Risk assessment also serves to engage all stakeholders in a
dialogue about specific risk factors and helps direct a strategic plan for risk reduction and early
detection
The SRI is a daily blended metric for which transmission loss generation loss and load loss events are
calculated Each element (transmission generation and load loss) is factored by the systemrsquos inventory
for that element to rate significant events appropriately On a yearly basis these daily performances
can be sorted in descending order to evaluate the year-on-year performance of the system
In order to test drive the concepts the RMWG applied these calculations against historically memorable
days to derive SRIs Once these calculations were complete they were reviewed and evaluated by
various stakeholders for reasonableness Based upon feedback modifications to the calculation were
made and assessed against the historic days performed This iterative process locked down the details
28 httpwwwnerccomdocspcrmwgIntegrated_Bulk_Power_System_Risk_Assessment_Concepts_Finalpdf 29 httpwwwnerccomdocspcrmwgSRI_Equation_Refinement_May6_2011pdf
Reliability Metrics Performance
39
for the calculation of SRI whose calculation from zero (no transmission line outages generation outages
or load lost in a day) to 1000 (a theoretical condition in which every transmission line all generation
units and all load lost across the system in a single day)
Figure 20 captures the calculated severity risk value for each of the days for each year benchmarked
with the historic significant events which were used to concept test the calculation Since there is
significant disparity between days the bulk power system is stressed compared to those that are
ldquoroutinerdquo and ldquoherordquo days of the year where the system performed extremely well the curve is depicted
using a logarithmic scale Each yearrsquos data is sorted in descending order striking a characteristic shape
At the left-side of the curve the days in which the system is severely stressed are plotted The central
more linear portion of the curve identifies the routine day performance while the far right-side of the
curve shows the values plotted for days in which almost all lines and generation units are in service and
essentially no load is lost
The trends on the chart below show that 2009 and 2010 had fewer extreme days than 2008 Routine
daily performance appears generally consistent across all three years Figure 20 captures the days for
each year benchmarked with historically significant events
In Figure 20 NERCrsquos event categories and SRI ratings are directly related As the SRI increases the
category or severity of the event increases Historical events are also shown to relate modern
reliability measurements to give a perspective of how a well-known event would register on the SRI
scale
The event analysis process30
30
benefits from the SRI as it enables a numerical analysis of an event in
comparison to other events By this measure an event can be prioritized by its severity In a severe
event this is unnecessary However for events that do not result in severe stressing of the bulk power
system this prioritization can be a challenge By using the SRI the event analysis process can decide
which events to learn from and reduce which events to avoid and when resilience needs to be
increased under high impact low frequency events as shown in the blue boxes in the figure
httpwwwnerccompagephpcid=5|365
Reliability Metrics Performance
40
Figure 20 NERC Annual Daily Severity Risk Index (SRI) Sorted Descending with Historic Benchmark Days
Other factors that impact severity of a particular event to be considered in the future include whether
equipment operated as designed and resulted in loss of load from a reliability perspective (intentional
and controlled load-shedding) Mechanisms for enabling ongoing refinement to include the historic and
simulated events for future severity risk calculations are being explored
Reliability Metrics Performance
41
Integrated Reliability Index Concepts In December 2010 the RMWG was challenged by the OC and PC to develop a single index concept to
measure the universe of risks associated with the bulk power system As a result the integrated
reliability index (IRI) concepts were proposed31
Figure 21
the three components of which were defined to
quantify each specific risk aspect They are titled the Event Driven Index (EDI) StandardsStatute Driven
Index (SDI) and Condition Driven Index (CDI) illustrated in with measures associated with
system events standards compliance and eighteen performance metrics The development of an
integrated reliability index aims to inform increase transparency and quantify the effectiveness of risk
reduction or mitigation actions The goal is to provide the industry meaningful trends of the BPSrsquos
performance and guidance on how the industry can improve reliability and support risk-informed
decision making Once completed the IRI will facilitate holistic assessment of performance Finally the
IRI should help overcome concern and confusion about how many metrics are being analyzed for system
reliability assessments
Figure 21 Risk Model for Bulk Power System
The integrated model of event-driven condition-driven and standardsstatute-driven risk information
can be constructed to illustrate all possible logical relations between the three risk sets Due to the
nature of the system there may be some overlap among the components
31 httpwwwnerccomdocspcrmwgIntegrated_Reliability_Index_WhitePaper_DRAFTpdf
Event Driven Index (EDI)
Indicates Risk from
Major System Events
Standards Statute Driven
Index (SDI)
Indicates Risks from Severe Impact Standard Violations
Condition Driven Index (CDI)
Indicates Risk from Key Reliability
Indicators
Reliability Metrics Performance
42
The Three Components of the IRI The three components of the IRI work together as shown in Figure 22 to comprise a full picture of the
state of reliability
Figure 22 An overview of the components that comprise the Integrated Reliability Index (IRI)
Event-Driven Indicators (EDI)
The Event-Driven Indicator provides a basis for prioritization of events based on bulk power system
integrity equipment performance and engineering judgment This indicator can serve as a high value
risk assessment tool to be used by stakeholders to investigate and evaluate disturbance history and
measure the severity of these events The relative ranking of events requires industry expertise agreed-
upon goals and engineering judgment The EDI is a derivative of SRI results for a specific time period
but it transforms that performance into a form of an availability index These calculations will be further
refined as feedback is received
Condition-Driven Indicators (CDI)
The Condition-Driven Indicators focus on a set of measurable system conditions (performance
measures) to assess bulk power system reliability These reliability indicators identify factors that
positively or negatively impact reliability and are early predictors of the risk to reliability from events or
unmitigated violations A collection of these indicators measures how close reliability performance is to
the desired outcome and if the performance against these metrics is constant or improving
Reliability Metrics Performance
43
StandardsStatute-Driven Indicators (SDI)
The StandardsStatute-Driven Indicator is a calculation of success of compliance based upon the subset
of high-value standards and is divided by the number of participations who could have received the
violation within the time period considered Also based on these factors known unmitigated violations
of elevated risk factor requirements are weighted higher than lower risk factors The index decreases if
the compliance improvement is achieved over a trending period
IRI Index Calculation As with the SRI the IRI is based on an importance weighting factor which the RMWG can modify over
time after gaining experience with the new metric as well as consideration of feedback from industry
At this time the RMWG believes some form of blended weighting may serve to start to populate IRI
characteristic curves at a high and generic level Based upon feedback from stakeholders this approach
may change or as discussed below weighting factors may vary based on periodic review and risk model
update The RMWG will continue the refinement of the IRI calculation and consider other significant
factors that impact reliability (eg intentional and controlled load-shedding) further it will explore
developing mechanisms for enabling ongoing refinement which should be influenced by a wide set of
stakeholders
RMWG recommends the Event Driven Index (EDI) be weighted the highest (50 percent) since events
actually occurred indicating how the system was performing The Condition Driven Index (CDI) and
StandardsStatute Driven Index (SDI) are weighted 25 each since they are indicators of potential risks
to BPS reliability IRI can be calculated as follows
IRI is intended to be a composite metric which integrates several forms of individual risks to the bulk
power system Since the three components range across many stakeholder organizations these
concepts are developed as starting points for continued study and evaluation Additional supporting
materials can be found in the IRI whitepaper32
IRI Recommendations
including individual indices calculations and preliminary
trend information
For the IRI more investigation should be performed to determine the best way to integrate EDI CDI
and SDI into an Integrated Reliability Index (IRI) that quantitatively represents the reliability of the bulk
32 The IRI whitepaper can be found at httpwwwnerccomdocspcrmwgIntegrated_Reliability_Index_WhitePaper_DRAFTpdf
Reliability Metrics Performance
44
power system To this end study into determining the amount of overlap between the components is
necessary RMWG is currently working to determine the proper amount of overlap between the IRI
components
Also the CDI component of the IRI needs to be solidified This is especially true with the CDI More
accurate metric data is needed to paint a fuller picture of the CDI Many of the metrics used to calculate
the CDI are new or they have limited data Compared to the SDI which counts well-known violation
counts and the EDI which uses the well-defined CDI the CDI lacks the depth of rigor that the other two
components have acquired through their years of data RMWG is currently working to improve the CDI
Reliability Metrics Conclusions and Recommendations Among the eighteen metrics that address the characteristics of an adequate level of reliability (ALR)
metric trends indicate the system is performing better in the following seven areas
bull ALR1-3 Planning Reserve Margin
bull ALR1-4 BPS Transmission Related Events Resulting in Loss of Load
bull ALR2-5 Disturbance Control Events Greater than Most Severe Single Contingency
bull ALR6-2 Energy Emergency Alert 3 (EEA3)
bull ALR6-3 Energy Emergency Alert 2 (EEA2)
bull ALR6-11 Automatic Transmission Outages Caused by Protection System Misoperations
bull ALR6-13 Automatic Transmission Outages Caused by Failed AC Substation Equipment
Assessments have been made in other performance categories A number of them do not have
sufficient data to derive any conclusions from the results The RMWG recommends continued data
collection and assessment of these metrics If a metric does not yield any trend in a five-year reporting
period the metric will be modified or withdrawn
For the IRI more investigation should be performed to determine the overlap of the components (CDI
EDI and SDI) The CDI should be more thoroughly solidified as an index by collecting more data over
time
Transmission Equipment Performance
45
Transmission Equipment Performance Introduction The Transmission Availability Data System (TADS) effort began with the establishment of a TADS task force
by the NERC Planning Committee in October 2006 On October 27 2007 the NERC Board of Trustees
approved the collection of transmission automatic outage data beginning in calendar year 2008 (Phase I)
Subsequently on October 29 2008 the NERC Board approved the collection of Non-Automatic Outage data
that began for Calendar year 2010 (Phase II)
This chapter provides reliability performance analysis of the transmission system by focusing on the trends
of Automatic Outage data from calendar year 2008 thru 2010 Since only one year of Non-Automatic
Outage data has been collected that data will not be assessed in this report
When calculating bulk power system performance indices care must be exercised when interpreting results
as misinterpretation can lead to erroneous conclusions regarding system performance With only three
years of data in the smaller regions it is not clear whether a regionrsquos yearly outage variation compared to
the average is due to random statistical variation or that particular year is significantly different in
performance However on a NERC-wide basis after three years of data collection there is enough
information to accurately determine whether the yearly outage variation compared to the average is due to
random statistical variation or the particular year in question is significantly different in performance33
Performance Trends
Transmission performance information has been provided by Transmission Owners (TOs) within NERC
through the NERC TADS (Transmission Availability Data System) process The data presented reflects
Momentary and Sustained AC Automatic outages of transmission elements that operate at voltages ge 200 kV
(including the low side of transformers) with the criteria specified in the TADS process The following
elements listed below are included
bull AC Circuits ge 200 kV (Overhead and Underground Circuits) Radial circuits are included
bull DC Circuits with ge +-200 kV DC voltage
bull Transformers with ge 200 kV low-side voltage and
bull ACDC Back-to-Back (BTB) Converters with ge 200 kV AC voltage on both sides
33The detailed Confidence Interval computation is available at httpwwwnerccomdocspctadstfTADS_Nov_2_2007APPENDIX_C_Confidence_Intervalpdf
Transmission Equipment Performance
46
AC Element Outage Summary and Leading Causes Table 6 shows the 2008 2009 and 2010 NERC total AC transmission element inventory and a summary of
the associated outages As expected in general the number of circuits increased from year to year due to
new construction or re-construction to higher voltages For every outage experienced on the transmission
system cause codes are identified and recorded according to the TADS process Causes of both momentary
and sustained outages have been indicated These causes are analyzed to identify trends and similarities
and to provide insight into what could be done to possibly prevent future occurrences
Figure 23 and Figure 24 describe the top ten initiating cause codes for sustained and momentary automatic
outages combined from 2008-2010 Based on the two figures the relationship between the total number of
outages and total outage hours can be seen Failed AC Substation Equipment and Failed AC Circuit
Equipment only account for 15 percent of the total number of outages but account for 65 percent of the
total outage hours The two largest causes of outages within NERC (ldquoLightingrdquo and ldquoWeather excluding
Lightningrdquo) account for 34 percent of the total number of outages
The next three Human Error Failed Protection System Equipment and Failed AC Circuit Equipment have
very similar totals and should all be considered significant focus points in reducing the number of Sustained
Automatic Outages for all elements
Transmission Equipment Performance
47
Table 6 NERC - All AC Elements Sustained and Momentary Outage Performance Summary
2008 Number of Outages
AC Voltage
Class
No of
Circuits
Circuit
Miles Sustained Momentary
Total
Outages Total Outage Hours
200-299kV 4369 102131 1560 1062 2622 56595
300-399kV 1585 53631 793 753 1546 14681
400-599kV 586 31495 389 196 585 11766
600-799kV 110 9451 43 40 83 369
All Voltages 6650 196708 2785 2051 4836 83626
2009 Number of Outages
AC Voltage
Class
No of
Circuits
Circuit
Miles Sustained Momentary
Total
Outages Total Outage Hours
200-299kV 4468 102935 1387 898 2285 28828
300-399kV 1619 56447 641 610 1251 24714
400-599kV 592 32045 265 166 431 9110
600-799kV 110 9451 53 38 91 442
All Voltages 6789 200879 2346 1712 4038 63094
2010 Number of Outages
AC Voltage
Class
No of
Circuits
Circuit
Miles Sustained Momentary
Total
Outages Total Outage Hours
200-299kV 4567 104722 1506 918 2424 54941
300-399kV 1676 62415 721 601 1322 16043
400-599kV 605 31590 292 174 466 10442
600-799kV 111 9477 63 50 113 2303
All Voltages 6957 208204 2582 1743 4325 83729
Note The NERC table does not show redacted outages DC Circuit outages Transformer outages or ACDC
converter outages
Transmission Equipment Performance
48
Figure 23 NERC - Top Ten Sustained and Momentary Outages by Initiating Cause Code for All Elements
Figure 24 NERC - Top Ten Sustained Outage Hours by Cause Code
198
151
80
7271
6943
33
27
188
68
Lightning
Weather excluding lightningHuman Error
Failed AC Substation EquipmentFailed Protection System EquipmentFailed AC Circuit Equipment Foreign Interference
Power System Condition
Fire
Unknown
Remaining Cause Codes
299
246
188
58
52
42
3619
16 12 31 Failed AC Substation EquipmentFailed AC Circuit Equipment Weather excluding lightningUnavailable
Other
Fire
Unknown
Human Error
Failed Protection System EquipmentForeign Interference
Remaining Cause Codes
Transmission Equipment Performance
49
Transmission Monthly Outages Figure 25 displays the total number of Automatic Outages on a per-month basis The three months with the
highest total of outages were June July and August From a seasonal perspective winter had a monthly
average of 281 outages These include the months of November-March Summer had an average of 429
outages Summer included the months of April-October
Figure 25 Number of Outages by Month for AC Circuits (2008-2010)
This figure does not show redacted outages DC Circuit outages Transformer outages or ACDC Converter
outages
Outage Initiation Location For every outage experienced on the transmission system the outage initiation code is identified and
recorded according to the TADS process The outage initiation code can be analyzed to identify trends and
similarities and to provide insight into what could be done to possibly prevent future occurrences
The ldquoOutage Initiation Coderdquo describes where an automatic outage was initiated on the power system The
five codes are as follows
bull Element-Initiated
bull Other Element-Initiated
bull AC Substation-Initiated
bull ACDC Terminal-Initiated (for DC circuits)
bull Other Facility Initiated any facility not included in any other outage initiation code
JanuaryFebruar
yMarch April May June July August
September
October
November
December
2008 238 229 257 258 292 437 467 380 208 176 255 236
2009 315 201 339 334 398 553 546 515 351 235 226 294
2010 444 224 269 446 449 486 639 498 351 271 305 281
3 Year AVG 332 218 288 346 380 492 551 464 303 227 262 270
0
100
200
300
400
500
600
700
Out
ages
Transmission Equipment Performance
50
Notably the protection system is not part of an ldquoAC Substationrdquo or an ldquoACDC Terminalrdquo If a protection
system misoperates and initiates an outage it will be classified as ldquoOther-Facility Initiatedrdquo The following
Figures show the initiating location of the Automatic outages from 2008 to 2010
With both Momentary and Sustained Automatic Outages taken into account the outage was initiated on the
Element more than 67 percent of the time as shown in Figure 26 and Figure 27
When only the Sustained Automatic Outages are analyzed the outage initiation on both AC Substation and
Other Facility increased by 34 percent and 32 percent respectively Outages initiated on the Element itself
decreases by 78 percent as shown in Figure 26 and 27 For only the Momentary Automatic Outages the
outage initiation on the Element increases by 19 percent compared to Sustained Outages Element initiated
outages make up over 78 percent of the total outages when analyzing only Momentary Outages
Figure 26
Figure 27
Transmission Outage Events Figure 28 illustrates the relationship between the numbers of Automatic Outages associated per TADS
event 2008 2009 and 2010 tend to follow the same trend The largest number of Automatic Outages per
TADS event is fourteen in 2010 thirteen in 2009 and eight in 2008 There are around 70 to 100 TADS
events that contain between fourteen and three Automatic Outages (see below) There are around 330 to
400 TADS events that contain two or more Automatic Outages The rest of the events only contain one
Automatic Outage As noted in the lower right hand corner below the total number of Events in 2008 to
2010 ranged from 3920 to 4569 events per year Nearly 90 percent or more of the events contained one
Automatic Outage
Figure 26 Sustained Automatic Outage Initiation
Code
Figure 27 Momentary Automatic Outage Initiation
Code
Transmission Equipment Performance
51
Transmission Outage Mode Figure 29 and Figure 30 show the percentage of Outage Modes The ldquoOutage Mode Coderdquo describes
whether one Automatic Outage is related to other Automatic Outages A Single Mode outage is an
Automatic Outage of a single Element which occurs independently of any other Automatic Outages (if any)
A ldquoDependent Mode Initiating Outagerdquo is an Automatic Outage of a single Element that initiates one or more
subsequent Element Automatic Outages A ldquoDependent Mode Outagerdquo is an Automatic Outage of an
Element which occurred as a result of an initiating outage whether the initiating outage was an Element
outage or a non-Element outage A ldquoCommon Mode Outagerdquo is one of two or more Automatic Outages with
the same Initiating Cause Code and where the outages are not consequences of each other and occur nearly
simultaneously A ldquoCommon Mode Initiating Outagerdquo is a Common Mode Outage that initiates one or more
subsequent Automatic Outages
Over 72 percent of the total outages occurred on the bulk power system are Single Mode Outages The next
largest mode is Dependent with over 11 percent of the total outages being in this category For only
Sustained Automatic Outages outages related to each other increase with Dependent mode accounting for
13 percent of the outages and Common mode accounting for close to 11 percent of the outages
Independent Sustained outages still account for the largest portion with nearly 70 percent being Single
mode When just analyzing Momentary Automatic Outages Associated outages decrease with Dependent
Figure 28 Event Histogram (2008-2010)
Transmission Equipment Performance
52
mode accounting for only 9 percent of the outages The Common Mode percentage decreases while
Dependent Mode Initiating percentage increases compared to Sustained Outages Independent Momentary
outages account for the largest portion with over 76 percent being Single Mode
An investigation into the root causes of Dependent and Common mode events which include three or more
Automatic Outages (indentified in the TADS 2008 to 2010 data) should be a high priority Some protection
systems are designed to trip three or more circuits but some events go beyond what is designed Some also
have misoperations associated with multiple outage events
Conclusions On a NERC wide average basis automatic transmission outage rate is improving from 2008 to 2010 based on
reported data Considering both automatic and non-automatic outages 2010 records indicate transmission
element availability percentage is very high and exceeds 95 The unavailability rate for AC circuits and
transformers are only 15 and 29 respectively
The cause codes of Human Error Failed Protection System Equipment and Failed AC Circuit Equipment
should be considered significant focus points in reducing the number of Sustained Automatic Outages for all
elements A deeper look into the root causes of Dependent and Common mode events which include three
or more Automatic Outages (indentified in the TADS 2008 to 2010 data) should be a high priority Some
protection systems are designed to trip three or more circuits but some events go beyond what is designed
Some also have misoperations associated with multiple outage events
Figure 29 Sustained Automatic Outage Mode code Figure 30 Momentary Automatic Outage Mode code
Generation Equipment Performance
53
Generation Equipment Performance Introduction The development of the Generating Availability Data System (GADS) began in 1982 This series of databases
is used to voluntarily collect record and retrieve operating information By pooling individual unit
information with likewise units generating unit availability performance can be calculated providing
opportunities to identify trends and generating equipment reliability improvement opportunities The
information is used to support equipment reliability availability analyses and risk-informed decision-making
by system planners generation owners assessment modelers manufacturers and contractors etc Reports
and information resulting from the data collected through GADS are now used for benchmarking and
analyzing electric power plants
Currently the data collected through GADS contains 72 percent of the North American generating units
with generating capacity of 20 MW or higher34 Additionally many of the newer combined-cycle plants are
not reporting information and therefore a full view of each unit type is not presented Rather a sample of
all the units in North America that fit a given more general category is provided35 for the 2008-201036
Generation Key Performance Indicators
assessment period
Three key performance indicators37
In
the industry have used widely to measure the availability of generating
units (see Terms Used in This Report section for their calculation parameters) are Equivalent Availability
Factor (EAF) Net Capacity Factor (NCF) and Equivalent Forced Outage Rate ndash Demand (EFORd)
Table 7 the North American fleet average EAF NCF and EFORd compared to unit age for all generating
units with a capacity of 20 MW and higher is provided for the years 2008-2010 The EAF shows a decline
during the last three years NCF is up and down while the EFORd appears to be increasing As expected the
fleet of units reported to GADS is aging overall with the fossil units being about 12 years older than the
average age
34 httpwwwnerccomdocspcgadstfGADSTF_Recommendation_Report_02-18-2011_FINALpdf 35GADS contains some 1500+ units under 20 MW that is not included in this report These units are excluded because most units are not base-loaded and are in peaking operation
3684 percent of the 2010 dataset is available at this time while the 2008 and 2009 dataset is complete 37 httpwwwnerccompagephpcid=4|43
Generation Equipment Performance
54
Table 7 General Availability Review of GADS Fleet Units by Year
2008 2009 2010 Average
Equivalent Availability Factor (EAF) 8776 8774 8678 8743
Net Capacity Factor (NCF) 5083 4709 4880 4890
Equivalent Forced Outage Rate -
Demand (EFORd) 579 575 639 597
Number of Units ge20 MW 3713 3713 3713 3713
Average Age of the Fleet in Years (all
unit types) 303 311 321 312
Average Age of the Fleet in Years
(fossil units only) 422 432 440 433
Figure 31 provides the average forced outage hours (FOH) maintenance outage hours (MOH) and planned
outage hours (POH) for all units reporting 20 MW or larger During this three-year period the average FOH
291 hours average MOH is 163 hours average POH is 470 hours
Figure 31 shows a large increase in forced and maintenance events The average age of the units with a
capacity of 20MW and higher in 2009 is 316 years old However the average age of fossil units in 2010 is
442 years old These fossil units are the backbone of all operating units providing the base-load power
continuously and nearly 50 percent of all energy annually There appears to be no increase allocated for
annualsemi-annual maintenance (ie planned outages) for the older generating units The increase of
000100002000030000400005000060000700008000090000
100000
2008 2009 2010
463 479 468
154 161 173
288 270 314
Hou
rs
Planned Maintenance Forced
Figure 31 Average Outage Hours for Units gt 20 MW
Generation Equipment Performance
55
maintenance outage hours reflects an increased need to fix problems that cannot be deferred until the next
annualsemi-annual repairs As a result it shows one of two things are happening
bull More or longer planned outage time is needed to repair the aging generating fleet
bull More focus on preventive repairs during planned and maintenance events are needed
Multiple Unit Forced Outages and Causes Table 8 provides the annual multiple-unit forced outage trips resulting from the same cause for each of the
assessments years 2008-2010 respectively The ldquosingle unitrdquo trips are large units with a Net Dependable
Capacity of 750 MW or more The trips of ldquotwo unitsrdquo or more is any combination of unit capacity with the
total amount of lost capacity more than 750 MW
Table 8 also presents more information on the forced outages During 2008-2010 there were a large
number of double-unit outages resulting from the same event Investigations show that some of these trips
were at a single plant caused by common control and instrumentation for the units The incidents occurred
several times for several months and are a common mode issue internal to the plant
Table 8 Number of Multiple Unit Forced Outages and FrequencyYear
2008 2009 2010
Type of
Trip
of
Trips
Avg Outage
Hr Trip
Avg Outage
Hr Unit
of
Trips
Avg Outage
Hr Trip
Avg Outage
Hr Unit
of
Trips
Avg Outage
Hr Trip
Avg Outage
Hr Unit
Single-unit
Trip 591 58 58 284 64 64 339 66 66
Two-unit
Trip 281 43 22 508 96 48 206 41 20
Three-unit
Trip 74 48 16 223 146 48 47 109 36
Four-unit
Trip 12 77 19 111 112 28 40 121 30
Five-unit
Trip 11 1303 260 60 443 88 19 199 10
gt 5 units 20 166 16 93 206 50 37 246 6
Loss of ge 750 MW per Trip
The high number of five-unit trips in 2008 was due to Hurricane Ike hitting the Gulf Coast The highest total
number of multiple unit trips occurred in 2009 though as mentioned before the data collection for 2010 is
incomplete at this time The majority of 2009 multiple unit trips have three main causes (in order by
Generation Equipment Performance
56
number of events) transmission lack of fuel and storms A summary of the three categories for single as
well as multiple unit outages (all unit capacities) are reflected in Table 9
Table 9 Common Causes of Multiple Unit Forced Outages (2009)
Cause Number of Events Average MW Size of Unit
Transmission 1583 16
Lack of Fuel (Coal Mines Gas Lines etc) Not
in Operator Control
812 448
Storms Lightning and Other Acts of Nature 591 112
Some of the transmission outages based on storms in 2009 have been caused by the same reasons because
the storms may have caused transmission interference However the plants reported the problems
inconsistently with either the transmission interference or storms cause code Therefore they are depicted
as two different causes of forced outage
Marked transmission outages in 2009 were quite high Thirty-five percent came from one utility with a large
number of hydroelectric units The company related the trips to various problems including weather
(lightning storms) wildlife ldquoline bumpsrdquo and problems on the receiving end of the transmission line Nine
hundred and eighty-five transmission trips (62 percent) were from hydroelectric units38
In 2009 only ten transmission trips resulted in a loss of 750 MW or more per trip Twenty two generating
plants were affected by the ten trips Causes for the trips include feeder line trips (1 trip) breakers in the
switchyard (8 trips) personnel errors (2 trips) and unknown (10 trips)
The ldquoLack of Fuelrdquo outages are of interest as these events occur during the times when a unit is available to
operate but there is an interruption in fuels to operate the facilities These events do not include
interruptions of fuel due to contracts Rather the cause code is designed to account for units that are
expecting fuel and it is unavailable when requested Table 10 presents the distribution of ldquoLack of Fuelrdquo
events by NERC Region and Table 11 presents the unit types affected
38 The average size of the hydroelectric units were small ndash 335 MW
Generation Equipment Performance
57
Of the units that report ldquoLack of Fuelrdquo 78 percent of the units are oil-fired 15 percent of the units are gas-
fired and the remaining units are various other fuels Table 12 provides the top causes of forced outage for
several unit types For fossil units ldquoLack of Fuelrdquo as the number three cause behind waterwall tube leaks
and superheater tube leaks
Table 10 Forced Outages Due to Lack of Fuel by Region
Region Number of Lack of Fuel
Problems Reported
FRCC 0
MRO 3
NPCC 24
RFC 695
SERC 17
SPP 3
TRE 7
WECC 29
One company contributed to the majority of oil-fired lack of fuel events The units at the company are
actually dual-fuels (oil and gas) but market nominated gas monitoring causes the units to be on forced
outage nightly The units need gas to start up so they can run on oil When they shut down the units must
switch to gas to clean themselves With the gas restriction the unit canrsquot start and the unit goes on a
forced outage Until the band is lifted the two units will continue to be on a forced outage cycle
Event records also provide descriptions of why the unit was without fuel with the majority of descriptions
bull Temperatures affecting gas supply valves
bull Unexpected maintenance of gas pipe-lines
bull Compressor problemsmaintenance
Generation Equipment Performance
58
Table 11 Unit Type Profile of Forced Outages Due to Lack of Fuel
Unit Types Number of Lack of Fuel Problems Reported
Fossil 642
Nuclear 0
Gas Turbines 88
Diesel Engines 1
HydroPumped Storage 0
Combined Cycle 47
Generation Equipment Performance
59
Table 12 Causes of Forced Outage for Different Unit Types (2008-2010)
Fossil - all MW sizes all fuels
Rank Description Occurrence per Unit-year
MWH per Unit-year
Average Hours To Repair
Average Hours Between Failures
Unit-years
1 Waterwall (furnace wall) 0590 134106 59 3250 3868 2 Second Superheater
Leaks 0180 5182 60 3228 3868
3 Lack of Fuel (coal mines gas lines etc) where the operator is not in control
0480 4701 18 26 3868
Combined-Cycle blocks Rank Description Occurrence
per Unit-year
MWH per Unit-year
Average Hours To Repair
Average Hours Between Failures
Unit-years
1 HP Turbine Buckets Or Blades
0020 4663 1830 26280 466
2 Turbine Control Valves 0040 2777 100 7200 466 3 Gas Turbine Compressor -
High Pressure Shaft 0010 2266 663 4269 466
Nuclear units - all Reactor types Rank Description Occurrence
per Unit-year
MWH per Unit-year
Average Hours To Repair
Average Hours Between Failures
Unit-years
1 LP Turbine Buckets or Blades
0010 26415 8760 26280 288
2 Containment Structure 0010 9233 1226 26262 288 3 Feedwater Pump Local
Controls 0020 7620 692 12642 288
Simple-cycle gas turbine jet engines Rank Description Occurrence
per Unit-year
MWH per Unit-year
Average Hours To Repair
Average Hours Between Failures
Unit-years
1 Main Transformer 0030 1611 1016 20709 4181 2 Other Gas Turbine
Controls And Instrument Problems
0120 428 70 2614 4181
3 Other Gas Turbine Problems
0090 400 119 1701 4181
Generation Equipment Performance
60
2008-2010 Review of Summer versus Winter Availability To address seasonality of unit availability unit information for the months of June to September (summer)
and December through February (winter) were pooled to calculate force events during these timeframes for
2008-201039 Figure 32 shows the Equivalent Availability Factor (EAF) is three percentage points higher and
the Equivalent Forced Outage Rate - Demand (EFORd) is more than a half of a percentage point lower in the
summer period than in winter period This means the units were more reliable with less forced events
during high-demand times during the summer than during the winter seasons The generating unitrsquos
capability has a resulting higher Net Capacity Factor (NCF) of 45 percentage points in the summer season
for 2008-2010
During the spring season (March-May) 77 percent of the units took a planned outage (PO) for an average
231 hours (or 96 days) In fall (October-November) only 42 percent of the units experienced a PO and the
average duration was shorter ndash 134 hours (or 56 days) A few units took both spring and fall planned
outages although this is rare Based on this assessment the generating units are prepared for the summer
peak demand The resulting availability indicates that this maintenance was successful which is measured
by an increased EAF and lower EFORd
Figure 32 Summer-Winter Average EAF NCF and EFORd (2008-2010)
Conclusions and Recommendations During 2008-2010 the average Equivalent Availability Factor (EAF) which measures the overall availability
of generating units decreased At the same time the Net Capacity Factor (NCF) an indicator of energy
production increased The average number of forced outages in 2010 is greater than in 2008 while at the
same time the average planned outage times have decreased As a result the Equivalent Forced Outage
Rate ndash Demand (EFORd) also increased illustrating that more units have experienced forced events during
39 A study of peak periods was conducted by the NERC Generating Availability Trend Evaluation (GATE) Working Group several years ago see httpwwwnerccomfilesSeasonal-Performance-Trendspdf
9116
5343
396
8818
4896
441
0 10 20 30 40 50 60 70 80 90 100
EAF
NCF
EFORd
Percent ()
Winter
Summer
Generation Equipment Performance
61
peak-demand times in 2010 than in the previous two years Potentially with shorter planned outage
periods in 2010 there may be less time to repair equipment and prevent forced unit outages
There are warnings that units are not being maintained as well as they should be In the last three years
there has been an increase in Equivalent Forced Outage Rate ndash Demand (EFORd) This indicator measures
the rate of forced outage events on generating units during periods of load demand To confirm this
problem forced outage hours jumped from 270 to 314 hours per unit between 2009 and 2010 At the same
time maintenance events also increased by 12 hours per unit Planned outage events remain constant The
resulting conclusions from this trend are
bull More or longer planned outage time is needed to repair the generating fleet Whether age is the
cause of the increase need for planned outage time remains unknown and further investigation into
the cause for longer planned outage time is necessary
bull More focus on preventive repairs during planned and maintenance events are needed
There are many multiple unit forced outages due to lack of fuel The majority of multiple unit trips have
three main causes transmission lack of fuel and storms With special interest in the forced outages due to
ldquoLack of Fuelrdquo additional analysis revealed that 77 percent of the units experiencing unexpected fuel
stoppage are oil-fired fossil units while gas-fired units experienced 15 percent
Generating units continue to be more reliable during the peak summer periods
Disturbance Event Trends
62
Category 1 An event resulting in one or more of the following a Unintended loss of three or more BPS elements caused by
common mode failure b Failure or misoperation of an SPSRAS c System-wide voltage reduction of 3 or more d Unintended BPS system separation resulting in an island of
100 MW to 999 MW e Unplanned evacuation from a control center facility with BPS
SCADA functionality for 30 minutes or more Category 2 An event resulting in one or more of the following
a Complete loss of all BPS control center voice communication system(s) for 30 minutes or more
b Complete loss of SCADA control or monitoring functionality for 30 minutes or more
c Voltage excursions equal to or greater than 10 lasting more than five minutes
d Loss of off-site power (LOOP) to a nuclear generating station e Unintended system separation resulting in an island of 1000
MW to 4999 MW f Unintended loss of 300MW or more of firm load for more
than 15 minutes g Violation of an Interconnection Reliability Operating Limit
(IROL) for more than 30 minutes Category 3 An event resulting in one or more of the following
a The loss of load or generation of 2000 MW or more in the Eastern Interconnection or
b Western Interconnection or 1000 MW or more in the ERCOT or Queacutebec Interconnections
c Unintended system separation resulting in an island of 5000 MW to 10000 MW
d Unintended system separation resulting in an island of Florida from the Eastern Interconnection
Category 4 An event resulting in one or more of the following a The loss of load or generation from 5001 MW to 9999 MW b Unintended system separation resulting in an island of more
than 10000 MW (with the exception of Florida as described in Category 3c)
Category 5 An event resulting in one or more of the following a The loss of load of 10000 MW or more b The loss of generation of 10000 MW or more
Figure 33 BPS Event Category
Disturbance Event Trends Introduction The purpose of this section is to report event
analysis trends from the beginning of event
analysis field test40
One of the companion goals of the event
analysis program is the identification of trends
in the number magnitude and frequency of
events and their associated causes such as
human error equipment failure protection
system misoperations etc The information
provided in the event analysis database (EADB)
and various event analysis reports have been
used to track and identify trends in BPS events
in conjunction with other databases (TADS
GADS metric and benchmarking database)
to the end of 2010
The Event Analysis Working Group (EAWG)
continuously gathers event data and is moving
toward an integrated approach to analyzing
data assessing trends and communicating the
results to the industry
Performance Trends The event category is classified41
Figure 33
as shown in
with Category 5 being the most
severe Figure 34 depicts disturbance trends in
Category 1 to 5 system events from the
40 httpwwwnerccomdocseawgGalloway-Industry-EA-Field-Test-102210pdf 41httpwwwnerccomfiles2011-05-0220Event_Analysis_Process_Phase20220Field20Test20Draft20-20Final20-20For20postingpdf
Disturbance Event Trends
63
beginning of event analysis field test to the end of 201042
Figure 34 Event Category vs Date for All 2010 Categorized Events
From the figure in November and December
there were many more category 1 and 2 events than in October This is due to the field trial starting on
October 25 2010
In addition to the category of the events the status of the events plays a critical role in the accuracy of the
data By examining Figure 35 over 80 of the events reported in 2010 have been closed This means that
the category root cause and other important information have been sufficiently finalized in order for
analysis to be accurate for each event At this time there is not enough data to draw any long-term
conclusions about event investigation performance
42 Documents for the EA Field Test are located at httpwwwnerccompagephpcid=5|365
2
12 12
26
3
6 5
14
1 1
2
0
5
10
15
20
25
30
35
40
45
October November December 2010
Even
t Cou
nt
Category 3 Category 2 Category 1
Disturbance Event Trends
64
Figure 35 Event Count vs Status (All 2010 Events with Status)
By drilling down into the cause code for each closed 2010 event Figure 36 shows the top 3 event causes
From the figure equipment failure and protection system misoperation are the most significant causes for
events Because of how new and limited the data is however there may not be statistical significance for
this result Further trending of cause codes for closed events and developing a richer dataset to find any
trends between event cause codes and event counts should be performed
Figure 36 Top 3 Event Counts vs DAWG Cause Code for all Closed 2010 Events
10
32
42
0
5
10
15
20
25
30
35
40
45
Open Closed Open and Closed
Even
t Cou
nt
Status
1211
8
0
2
4
6
8
10
12
14
Equipment Failure Protection System Misoperation Human Error
Even
t Cou
nt
Cause Code
Disturbance Event Trends
65
Conclusions Due to the relatively new process for events analysis and categorization more time will be required before a
conclusive recommendation may be obtained Further analysis and new data should provide valuable
statistics in the future Over 80 of all event reports from 2010 are current listed as closed but no
conclusion about investigation performance may be obtained because of the limited amount of data It is
recommended to study ways to prevent equipment failure and protection system misoperations but there
is not enough data to draw a firm conclusion about the top causes of events at this time
Abbreviations Used in This Report
66
Abbreviations Used in This Report
Acronym Definition ALP Acadiana Load Pocket
ALR Adequate Level of Reliability
ARR Automatic Reliability Report
BA Balancing Authority
BPS Bulk Power System
CDI Condition Driven Index
CEII Critical Energy Infrastructure Information
CIPC Critical Infrastructure Protection Committee
CLECO Cleco Power LLC
DADS Future Demand Availability Data System
DCS Disturbance Control Standard
DOE Department Of Energy
DSM Demand Side Management
EA Event Analysis
EAF Equivalent Availability Factor
ECAR East Central Area Reliability
EDI Event Drive Index
EEA Energy Emergency Alert
EFORd Equivalent Forced Outage Rate Demand
EMS Energy Management System
ERCOT Electric Reliability Council of Texas
ERO Electric Reliability Organization
ESAI Energy Security Analysis Inc
FERC Federal Energy Regulatory Commission
FOH Forced Outage Hours
FRCC Florida Reliability Coordinating Council
GADS Generation Availability Data System
GOP Generation Operator
IEEE Institute of Electrical and Electronics Engineers
IESO Independent Electricity System Operator
IROL Interconnection Reliability Operating Limit
Abbreviations Used in This Report
67
Acronym Definition IRI Integrated Reliability Index
LOLE Loss of Load Expectation
LUS Lafayette Utilities System
MAIN Mid-America Interconnected Network Inc
MAPP Mid-continent Area Power Pool
MOH Maintenance Outage Hours
MRO Midwest Reliability Organization
MSSC Most Severe Single Contingency
NCF Net Capacity Factor
NEAT NERC Event Analysis Tool
NERC North American Electric Reliability Corporation
NPCC Northeast Power Coordinating Council
OC Operating Committee
OL Operating Limit
OP Operating Procedures
ORS Operating Reliability Subcommittee
PC Planning Committee
PO Planned Outage
POH Planned Outage Hours
RAPA Reliability Assessment Performance Analysis
RAS Remedial Action Schemes
RC Reliability Coordinator
RCIS Reliability Coordination Information System
RCWG Reliability Coordinator Working Group
RE Regional Entities
RFC Reliability First Corporation
RMWG Reliability Metrics Working Group
RSG Reserve Sharing Group
SAIDI System Average Interruption Duration Index
SAIFI System Average Interruption Frequency Index
SCADA Supervisory Control and Data Acquisition
SDI Standardstatute Driven Index
SERC SERC Reliability Corporation
Abbreviations Used in This Report
68
Acronym Definition SRI Severity Risk Index
SMART Specific Measurable Attainable Relevant and Tangible
SOL System Operating Limit
SPS Special Protection Schemes
SPCS System Protection and Control Subcommittee
SPP Southwest Power Pool
SRI System Risk Index
TADS Transmission Availability Data System
TADSWG Transmission Availability Data System Working Group
TO Transmission Owner
TOP Transmission Operator
WECC Western Electricity Coordinating Council
Contributions
69
Contributions This report was made feasible by the collaboration and hard work of both NERC staff and NERCrsquos
Industry Groups
NERC Industry Groups
Table 14 lists the NERC industry group contributors Without their contribution and collaboration this
report would not have been possible
Table 13 NERC Industry Group Contributions43
NERC Group
Relationship Contribution
Reliability Metrics Working Group
(RMWG)
Reports to the OCPC bull Lead Development of Report bull Provide Reliability Metrics Data bull Responsible for Reliability Metrics
Performance Chapter
Transmission Availability Working Group
(TADSWG)
Reports to the OCPC bull Provide Transmission Availability Data
bull Responsible for Transmission Equip-ment Performance Chapter
bull Content Review
Generation Availability Data System Task
Force
(GADSTF)
Reports to the OCPC bull Provide Generation Availability Data bull Responsible for Generation Equip-
ment Performance Chapter bull Content Review
Event Analysis Working Group
(EAWG)
Reports to the OCPC bull Provide Events Data bull Responsible for Disturbance Events
Trends Chapter bull Content Review
43 Rosters for RMWG TADSWG GADSTF and EAWG are available at httpwwwnerccomfilesrosterpdf
Contributions
70
NERC Staff Table 13 below lists the NERC staff who contributed to the 2011 Reliability Performance Analysis
Report
Table 14 Contributing NERC Staff
Name Title E-mail Address
Mark Lauby Vice President and Director of
Reliability Assessment and
Performance Analysis
marklaubynercnet
Jessica Bian Manager of Performance Analysis jessicabiannercnet
John Moura Manager of Reliability Assessments johnmouranercnet
Andrew Slone Engineer Reliability Performance
Analysis
andrewslonenercnet
Jim Robinson TADS Project Manager jimrobinsonnercnet
Clyde Melton Engineer Reliability Performance
Analysis
clydemeltonnercnet
Mike Curley Manager of GADS Services mikecurleynercnet
James Powell Engineer Reliability Performance
Analysis
jamespowellnercnet
Michelle Marx Administrative Assistant michellemarxnercnet
William Mo Intern Performance Analysis wmonercnet
- NERCrsquos Mission
- Table of Contents
- Executive Summary
-
- 2011 Transition Report
- State of Reliability Report
- Key Findings and Recommendations
-
- Reliability Metric Performance
- Transmission Availability Performance
- Generating Availability Performance
- Disturbance Events
- Report Organization
-
- Introduction
-
- Metric Report Evolution
- Roadmap for the Future
-
- Reliability Metrics Performance
-
- Introduction
- 2010 Performance Metrics Results and Trends
-
- ALR1-3 Planning Reserve Margin
-
- Background
- Assessment
- Special Considerations
-
- ALR1-4 BPS Transmission Related Events Resulting in Loss of Load
-
- Background
- Assessment
-
- ALR1-12 Interconnection Frequency Response
-
- Background
- Assessment
-
- ALR2-3 Activation of Under Frequency Load Shedding
-
- Background
- Assessment
- Special Considerations
-
- ALR2-4 Average Percent Non-Recovery Disturbance Control Standards (DCS)
-
- Background
- Assessment
- Special Consideration
-
- ALR2-5 Disturbance Control Events Greater Than Most Severe Single Contingency
-
- Background
- Assessment
- Special Consideration
-
- ALR 1-5 System Voltage Performance
-
- Background
- Special Considerations
- Status
-
- ALR3-5 Interconnection Reliability Operating Limit System Operating Limit (IROLSOL) Exceedances
-
- Background
-
- ALR4-1 Automatic Transmission Outages Caused by Protection System Misoperations
-
- Background
- Special Considerations
-
- ALR6-11 ndash ALR6-14
-
- Background
- Assessment
- ALR 6-11 ndash Automatic Outages Initiated by Failed Protection System Equipment
- ALR6-12 ndash Automatic Outages Initiated by Human Error
- ALR6-13 ndash Automatic Outages Initiated by Failed AC Substation Equipment
- ALR6-14 Automatic AC Transmission Outages Initiated by Failed AC Circuit Equipment
-
- ALR6-15 Element Availability Percentage (APC)
-
- Background
- Assessment
- Special Consideration
-
- ALR6-16 Transmission System Unavailability
-
- Background
- Assessment
- Special Consideration
-
- ALR6-2 Energy Emergency Alert 3 (EEA3)
-
- Background
- Assessment
- Special Considerations
-
- ALR 6-3 Energy Emergency Alert 2 (EEA2)
-
- Background
- Assessment
- Special Considerations
-
- ALR 6-1 Transmission Constraint Mitigation
-
- Background
- Assessment
- Special Considerations
-
- Integrated Bulk Power System Risk Assessment
-
- Introduction
- Recommendations
-
- Integrated Reliability Index Concepts
-
- The Three Components of the IRI
-
- Event-Driven Indicators (EDI)
- Condition-Driven Indicators (CDI)
- StandardsStatute-Driven Indicators (SDI)
-
- IRI Index Calculation
- IRI Recommendations
-
- Reliability Metrics Conclusions and Recommendations
-
- Transmission Equipment Performance
-
- Introduction
- Performance Trends
-
- AC Element Outage Summary and Leading Causes
- Transmission Monthly Outages
- Outage Initiation Location
- Transmission Outage Events
- Transmission Outage Mode
-
- Conclusions
-
- Generation Equipment Performance
-
- Introduction
- Generation Key Performance Indicators
-
- Multiple Unit Forced Outages and Causes
- 2008-2010 Review of Summer versus Winter Availability
-
- Conclusions and Recommendations
-
- Disturbance Event Trends
-
- Introduction
- Performance Trends
- Conclusions
-
- Abbreviations Used in This Report
- Contributions
-
- NERC Industry Groups
- NERC Staff
-

Reliability Metrics Performance
27
ALR6-13 ndash Automatic Outages Initiated by Failed AC Substation Equipment
Figure 12 shows the automatic outages with an initiating cause code of failed AC substation equipment
This code covers automatic outages caused by the failure of AC Substation ie equipment ldquoinside the
substation fencerdquo including transformers and circuit breakers but excluding protection system
equipment19
19TADS Initiating Cause Code definitions are located at httpwwwnerccomdocspctadswgTADS_Definitions_Appendix_7_092909pdf
Figure 12 ALR6-13 by Region (Includes NERC-Wide)
Reliability Metrics Performance
28
ALR6-14 Automatic AC Transmission Outages Initiated by Failed AC Circuit Equipment
Figure 13 shows the automatic outages with an initiating cause code of failed AC circuit equipment
Automatic Outages related to the failure of AC Circuit equipment ie overhead or underground
equipment ldquooutside the substation fencerdquo 20
ALR6-15 Element Availability Percentage (APC)
Background
This metric uses data and calculations directly from the NERC TADS effort and illustrates the overall
percent of time the aggregate of transmission facilities are available and in service This is an aggregate
20TADS Initiating Cause Code definitions are located at httpwwwnerccomdocspctadswgTADS_Definitions_Appendix_7_092909pdf
Figure 13 ALR6-14 by Region (Includes NERC-Wide)
Reliability Metrics Performance
29
value using sustained outages (automatic and non-automatic) for both lines and transformers operated
at 200 kV and above for each Regional Entity Interconnection and for NERC This metric was approved
by the NERC Operating and Planning Committees in September 2010
Assessment
Figure 14 shows the aggregate element availability percentage (APC) for transmission and transformers
facilities operated at 200 kV and above The values are all over 90 percent which shows excellent
system availability The RMWG recommends continued metric assessment for at least a few more years
in order to determine the value of this metric
Figure 14 2010 ALR6-15 Element Availability Percentage
Notably the Eastern Interconnection does not include Quebec or ERCOT ERCOT does not have any
transformers with low-side voltage levels 200 kV and above
Special Consideration
It should be noted that the non-automatic outage data needed to calculate this metric was only first
collected for the calendar year 2010 as part of the TADS process Therefore only one year of data for
this metric is available at this time
Reliability Metrics Performance
30
ALR6-16 Transmission System Unavailability
Background
This metric uses data and calculations directly from the NERC TADS effort and shows the overall percent
of time the aggregate of transmission facilities are unavailable due to automatic and non-automatic
outages This is an aggregate value using sustained automatic outages for both lines and transformers
operated at 200 kV and above for each Regional Entity and for NERC This metric was approved by the
NERC Operating and Planning Committees in December 2010
Assessment
Figure 15 and Figure 16 illustrate the 2010 aggregate unavailability percentage for AC circuits and
transformer facilities operated at 200 kV and above The values for AC circuits are all under 3 percent
which shows excellent system availability
The RMWG recommends continued metric assessment for at least a few more years in order to
determine the value of this metric
Special Consideration
It should be noted that the non-automatic outage data needed to calculate this metric was only first
collected for the calendar year 2010 as part of the TADS process Therefore only one year of data for
this metric is available at this time
Figure 15 2010 ALR6-16 Transmission System Unavailability
Reliability Metrics Performance
31
Figure 16 2010 ALR6-16 Transmission System Unavailability by Outage Type
Notably the Eastern Interconnection does not include Quebec or ERCOT Also ERCOT does not have
any transformers with low-side voltage levels 200 kV and above
ALR6-2 Energy Emergency Alert 3 (EEA3)
Background
This metric identifies the number of times Energy Emergency Alerts Level 3 (EEA3) are issued EEA3
events are firm-load interruptions due to capacity and energy deficiency EEA3 is currently reported
collected and maintained in NERCrsquos Reliability Coordination Information System (RCIS) and is defined in
Attachment 1 of the NERC Standard EOP-00221
21 The latest version of Attachment 1 for EOP-002 is available at
This metric identifies the number of times EEA3s are
issued The number of EEA3s per year provides a relative indication of performance measured at a
Balancing Authority or interconnection level As historical data is gathered trends in future reports will
provide an indication of either decreasing or increasing use of EEA3s signaling adequacy of the electric
supply system This metric can also be considered in the context of Planning Reserve Margin Significant
increases or decreases in EEA3 events with relatively constant Planning Reserve Margins could indicate
httpwwwnerccompagephpcid=2|20
Reliability Metrics Performance
32
volatility in the actual loads compared to forecast levels or changes in the adequacy of the bulk power
system required to meet load demands
Assessment
Figure 17 shows the number of EEA3 events during 2006 and 2010 from an RE level An interactive
presentation was released and available at the Reliability Indicatorrsquos page22
The Acadiana Load Pocket (ALP) is an area in south central Louisiana that has experienced regular
transmission constraints and numerous Energy Emergency Alert filings by the SPP Reliability Controller
(SPP RC) Transmission within ALP is owned by Entergy Lafayette Utilities System (LUS) and Cleco
Power LLC (Cleco) The transmission constraints within the ALP are primarily caused by the local area
load and the lack of generation located in close proximity to the load area
The number of EEA3rsquos
declared in 2010 returned to more traditional numbers The 2009 spike in EEA3 events in the SPP
Region that was driven by issues in the Acadiana Load Pocket (ALP) were not present in 2010
Special Considerations
Ideally the measure should capture only EEAs that are declared for reliability reasons and not for
economic factors The RMWG has not been able to differentiate these reasons for future reporting and
it has made a recommendation to the Reliability Coordinator Working Group (RCWG) to consider a
revised EEA declaration to exclude economic factors
The reason the EEA volume decreased from 2009 to 2010 in SPP was because the SPP ICT RC23
coordinated an operating agreement between the five operating companies in the ALP The operating
agreement included a cost sharing re-dispatch that alleviated the need of a Transmission Loading Relief
(TLR-5) declaration24
22The EEA3 interactive presentation is available on the NERC website at
During 2009 there was no operating agreement therefore an entity had to
provide Network and Native Load (NNL) relief when a TLR-5 was called by the ICT RC When the TLR-5
was the primary tool to control the post contingent loading in the ALP some of the BAs would have their
firm transmission curtailed to the point where they could no longer serve their load therefore the EEA
3 was needed to communicate a capacityreserve deficiency
httpwwwnerccompagephpcid=4|331|335 23Southwest Power Pool (SPP) Independent Coordinator of Transmission (ICT) Reliability Coordinator (RC) 24More information on Transmission Load Relief is contained in the IRO-006 standard which is located at httpwwwnerccomfilesIRO-006-4pdf In particular TLR-5 definitions are referenced on page 16 and 17
Reliability Metrics Performance
33
Figure 17 ALR6-2 Energy Emergency Alert 3 (EEA3) Counts by Region (2006-2010)
Cleco Power Entergy and LUS are currently constructing an estimated $200 million transmission
infrastructure improvement project to mitigate transmission constraints into ALP Construction of the
project is scheduled to be complete in 2012 Completion of the project should help alleviate some of
the transmission congestion in this area Energy Emergency Alerts filed by the SPP Regional Entity
continue to decline
SPP RTO continues to coordinate operating plans with the operating entities in this area Mitigation
plans and local operating guides in place are expected to provide sufficient flexibility should issues arise
NERC will continue to monitor this area for Reliability Impacts and coordinate any actions with the SPP
Reliability Coordinator and SPP Regional Entity
ALR 6-3 Energy Emergency Alert 2 (EEA2)
Background
Energy Emergency Alert 2 (EEA2) is to measure the number of events BAs declare for deficient capacity
and energy during peak load periods which may serve as a leading indicator of energy and capacity
shortfall in the adequacy of the electric supply system EEA2 provides a sense of the frequency of
precursor events to the more severe EEA3 declarations This metric measures the number of events
1 3 1 2 214
3 4 4 1 5 334
4 2 1 52
1
0
5
10
15
20
25
30
3520
0620
0720
0820
0920
1020
0620
0720
0820
0920
1020
0620
0720
0820
0920
1020
0620
0720
0820
0920
1020
0620
0720
0820
0920
1020
0620
0720
0820
0920
1020
0620
0720
0820
0920
1020
0620
0720
0820
0920
10
FRCC MRO NPCC RFC SERC SPP TRE WECC
2006-2009
2010
Region and Year
Reliability Metrics Performance
34
Balancing Authorities declare for deficient capacity and energy during peak load periods At this time
however this data reflects inclusion of Demand Side Resources that would not be indicative of
inadequacy of the electric supply system
The number of EEA2 events and any trends in their reporting indicates how robust the system is in
being able to supply the aggregate load requirements The historical records may include demand
response activations and non-firm load interruptions per applicable contracts within the EEA alerts per
its definition25
Assessment
Demand response is a legitimate resource to be called upon by balancing authorities and
do not indicate a reliability concern As data is gathered in the future reports will provide an indication
of either decreasing or increasing adequacy in the electric supply system EEA2 events called solely for
activation of demand response (controllable or contractually prearranged demand-side dispatch
programs) or interruption of non-firm load per applicable contracts should be excluded This metric can
also be considered in the context of the Planning Reserve Margin Significant increases or decreases in
EEA2 events with relatively constant Planning Reserve Margins could indicate volatility in the actual
loads compared to forecast levels or changes in the adequacy of the bulk power system required to
meet load demands
Figure 18 shows the number of EEA2 events by Regional Entity from 2006 to 2010 EEA2 interactive
version available on line by quarter and region26
25 The EEA2 is defined at
The general trend continues to show improved
performance which may have been influenced by the overall reduction in demand throughout NERC
caused by the economic downturn Specific performance by any one region should be investigated
further for issues or events that may affect the results Determining whether performance reported
includes those events resulting from the economic operation of DSM and non-firm load interruption
should also be investigated The RMWG recommends continued metric assessment
httpwwwnerccomfilesEOP-002-2pdf 26 EEA2 interactive version located at httpwwwnerccompagephpcid=4|331|341
Reliability Metrics Performance
35
Special Considerations
The intent of this metric is to measure only EEAs that are called for reliability reasons and not for
economic factors such as demand side management (DSM) and non-firm load interruption The
historical data for this metric may include events that were called for economic factors According to
the RCWG recent data should only include EEAs called for reliability reasons
ALR 6-1 Transmission Constraint Mitigation
Background
The RMWG completed a pilot with four regional entities Based on the results the RMWG expanded the
pilot data collection to all regions and the initial results of the data collection are shown in Figure 19
and Table 5 Based on the results of the pilot there is merit in continuing to assess this metric The
intent of this metric is to identify trends in the number of mitigation measures (Special Protection
Schemes (SPS) Remedial Action Schemes (RAS) and Operating Procedures) required to meet reliability
requirements By their nature SPS do not indicate an inherent weakness in the bulk power system
rather they are an indication of methods that are taken to operate the system through the range of
conditions it must perform This metric is only intended to evaluate the trend use of these plans and
whether the metric indicates robustness of the transmission system is increasing remaining static or
decreasing
1 27
2 1 4 3 2 1 2 4 5 2 5 832
4724
211
5 38 5 1 1 8 7 4 1 1
05
101520253035404550
2006
2007
2008
2009
2010
2006
2007
2008
2009
2010
2006
2007
2008
2009
2010
2006
2007
2008
2009
2010
2006
2007
2008
2009
2010
2006
2007
2008
2009
2010
2006
2007
2008
2009
2010
2006
2007
2008
2009
2010
FRCC MRO NPCC RFC SERC SPP TRE WECC
2006-2009
2010
Region and Year
Figure 18 ALR6-3 Energy Emergency Alert 2 (EEA2)
Reliability Metrics Performance
36
Assessment
The pilot data indicates a relatively constant number of mitigation measures over the time period of
data collected
Figure 19 ALR6-1 Transmission Constraint Mitigation by SPSRAS (2009-2014)
0102030405060708090
100110120
2009
2010
2011
2014
2009
2010
2011
2014
2009
2010
2011
2014
2009
2010
2011
2014
2009
2010
2011
2014
2009
2010
2011
2014
2009
2010
2011
2014
2009
2010
2011
2014
FRCC MRO NPCC RFC SERC SPP ERCOT WECC
Coun
t
Region and Year
SPSRAS
Reliability Metrics Performance
37
Table 5 ALR6-1 Transmission Constraint Mitigation by Operating ProcedureGuides (2009-2011)
ALR6-1 Transmission Constraint Mitigation by Operating ProcedureGuides (2009-2014)
2009 2010 2011 2014
FRCC 107 75 66
MRO 79 79 81 81
NPCC 0 0 0
RFC 2 1 3 4
SPP 39 40 40 40
SERC 6 7 15
ERCOT 29 25 25
WECC 110 111
Special Considerations
A certain number of SPS mitigation plans may be necessary to support reliable operation of the system
If the number of SPS increase over time this may indicate that additional transmission capacity is
required A reduction in the number of SPS may be an indicator of increased generation or transmission
facilities being put into service which may indicate greater robustness of the bulk power system In
general mitigation plans are a viable and valuable tool for effective operation of the bulk power system
In power system planning reliability operability capacity and cost-efficiency are simultaneously
considered through a variety of scenarios to which the system may be subjected Mitigation measures
are a method for optimizing a power system across these scenarios Changes in quantities of mitigation
plans may indicate year-on-year differences in the system being evaluated
Integrated Bulk Power System Risk Assessment
Introduction In developing eighteen metrics to measure acceptable levels of reliability it has become clear that any
such measurement of reliability must include consideration of the risks present within the bulk power
system in order for us to appropriately prioritize and manage these system risks The scope for the
Reliability Metrics Working Group (RMWG)27
27 The RMWG scope can be viewed at
includes a task to develop a risk-based approach that
provides consistency in quantifying the severity of events The approach not only can be used to
httpwwwnerccomfilezrmwghtml
Reliability Metrics Performance
38
measure risk reduction over time but also can be applied uniformly in event analysis process to identify
the events that need to be analyzed in detail and sort out non-significant events
The Operating Committee (OC) and Planning Committee (PC) endorsed the concepts and framework28 of
the risk-based approach in their September 2010 joint meeting and further supported the event severity
risk index (SRI) calculation29
Recommendations
in March 2011
bull NERC should embrace the use of risk assessment to identify trends in addition to lessons learned
in order to improve bulk power system reliability
bull The RMWG should continue to coordinate and communicate with the Event Analysis Working
Group (EAWG) to apply the SRI into the event analysis process and root cause analysis
bull As trend evaluations increase the knowledge of risks to the bulk power system data required to
support additional assessment should be gathered
Event Severity Risk Index (SRI)
Risk assessment is an essential tool for achieving the alignment between organizations people and
technology This will assist in quantifying inherent risks identifying where potential high risks exist and
evaluating where the most significant lowering of risks can be achieved Being learning organizations
the Electric Reliability Organization (ERO) Regional Entities and Registered Entities can use these tools
to focus on the areas of highest risk to reliability to provide a sound basis for developing results-based
standards and compliance programs Risk assessment also serves to engage all stakeholders in a
dialogue about specific risk factors and helps direct a strategic plan for risk reduction and early
detection
The SRI is a daily blended metric for which transmission loss generation loss and load loss events are
calculated Each element (transmission generation and load loss) is factored by the systemrsquos inventory
for that element to rate significant events appropriately On a yearly basis these daily performances
can be sorted in descending order to evaluate the year-on-year performance of the system
In order to test drive the concepts the RMWG applied these calculations against historically memorable
days to derive SRIs Once these calculations were complete they were reviewed and evaluated by
various stakeholders for reasonableness Based upon feedback modifications to the calculation were
made and assessed against the historic days performed This iterative process locked down the details
28 httpwwwnerccomdocspcrmwgIntegrated_Bulk_Power_System_Risk_Assessment_Concepts_Finalpdf 29 httpwwwnerccomdocspcrmwgSRI_Equation_Refinement_May6_2011pdf
Reliability Metrics Performance
39
for the calculation of SRI whose calculation from zero (no transmission line outages generation outages
or load lost in a day) to 1000 (a theoretical condition in which every transmission line all generation
units and all load lost across the system in a single day)
Figure 20 captures the calculated severity risk value for each of the days for each year benchmarked
with the historic significant events which were used to concept test the calculation Since there is
significant disparity between days the bulk power system is stressed compared to those that are
ldquoroutinerdquo and ldquoherordquo days of the year where the system performed extremely well the curve is depicted
using a logarithmic scale Each yearrsquos data is sorted in descending order striking a characteristic shape
At the left-side of the curve the days in which the system is severely stressed are plotted The central
more linear portion of the curve identifies the routine day performance while the far right-side of the
curve shows the values plotted for days in which almost all lines and generation units are in service and
essentially no load is lost
The trends on the chart below show that 2009 and 2010 had fewer extreme days than 2008 Routine
daily performance appears generally consistent across all three years Figure 20 captures the days for
each year benchmarked with historically significant events
In Figure 20 NERCrsquos event categories and SRI ratings are directly related As the SRI increases the
category or severity of the event increases Historical events are also shown to relate modern
reliability measurements to give a perspective of how a well-known event would register on the SRI
scale
The event analysis process30
30
benefits from the SRI as it enables a numerical analysis of an event in
comparison to other events By this measure an event can be prioritized by its severity In a severe
event this is unnecessary However for events that do not result in severe stressing of the bulk power
system this prioritization can be a challenge By using the SRI the event analysis process can decide
which events to learn from and reduce which events to avoid and when resilience needs to be
increased under high impact low frequency events as shown in the blue boxes in the figure
httpwwwnerccompagephpcid=5|365
Reliability Metrics Performance
40
Figure 20 NERC Annual Daily Severity Risk Index (SRI) Sorted Descending with Historic Benchmark Days
Other factors that impact severity of a particular event to be considered in the future include whether
equipment operated as designed and resulted in loss of load from a reliability perspective (intentional
and controlled load-shedding) Mechanisms for enabling ongoing refinement to include the historic and
simulated events for future severity risk calculations are being explored
Reliability Metrics Performance
41
Integrated Reliability Index Concepts In December 2010 the RMWG was challenged by the OC and PC to develop a single index concept to
measure the universe of risks associated with the bulk power system As a result the integrated
reliability index (IRI) concepts were proposed31
Figure 21
the three components of which were defined to
quantify each specific risk aspect They are titled the Event Driven Index (EDI) StandardsStatute Driven
Index (SDI) and Condition Driven Index (CDI) illustrated in with measures associated with
system events standards compliance and eighteen performance metrics The development of an
integrated reliability index aims to inform increase transparency and quantify the effectiveness of risk
reduction or mitigation actions The goal is to provide the industry meaningful trends of the BPSrsquos
performance and guidance on how the industry can improve reliability and support risk-informed
decision making Once completed the IRI will facilitate holistic assessment of performance Finally the
IRI should help overcome concern and confusion about how many metrics are being analyzed for system
reliability assessments
Figure 21 Risk Model for Bulk Power System
The integrated model of event-driven condition-driven and standardsstatute-driven risk information
can be constructed to illustrate all possible logical relations between the three risk sets Due to the
nature of the system there may be some overlap among the components
31 httpwwwnerccomdocspcrmwgIntegrated_Reliability_Index_WhitePaper_DRAFTpdf
Event Driven Index (EDI)
Indicates Risk from
Major System Events
Standards Statute Driven
Index (SDI)
Indicates Risks from Severe Impact Standard Violations
Condition Driven Index (CDI)
Indicates Risk from Key Reliability
Indicators
Reliability Metrics Performance
42
The Three Components of the IRI The three components of the IRI work together as shown in Figure 22 to comprise a full picture of the
state of reliability
Figure 22 An overview of the components that comprise the Integrated Reliability Index (IRI)
Event-Driven Indicators (EDI)
The Event-Driven Indicator provides a basis for prioritization of events based on bulk power system
integrity equipment performance and engineering judgment This indicator can serve as a high value
risk assessment tool to be used by stakeholders to investigate and evaluate disturbance history and
measure the severity of these events The relative ranking of events requires industry expertise agreed-
upon goals and engineering judgment The EDI is a derivative of SRI results for a specific time period
but it transforms that performance into a form of an availability index These calculations will be further
refined as feedback is received
Condition-Driven Indicators (CDI)
The Condition-Driven Indicators focus on a set of measurable system conditions (performance
measures) to assess bulk power system reliability These reliability indicators identify factors that
positively or negatively impact reliability and are early predictors of the risk to reliability from events or
unmitigated violations A collection of these indicators measures how close reliability performance is to
the desired outcome and if the performance against these metrics is constant or improving
Reliability Metrics Performance
43
StandardsStatute-Driven Indicators (SDI)
The StandardsStatute-Driven Indicator is a calculation of success of compliance based upon the subset
of high-value standards and is divided by the number of participations who could have received the
violation within the time period considered Also based on these factors known unmitigated violations
of elevated risk factor requirements are weighted higher than lower risk factors The index decreases if
the compliance improvement is achieved over a trending period
IRI Index Calculation As with the SRI the IRI is based on an importance weighting factor which the RMWG can modify over
time after gaining experience with the new metric as well as consideration of feedback from industry
At this time the RMWG believes some form of blended weighting may serve to start to populate IRI
characteristic curves at a high and generic level Based upon feedback from stakeholders this approach
may change or as discussed below weighting factors may vary based on periodic review and risk model
update The RMWG will continue the refinement of the IRI calculation and consider other significant
factors that impact reliability (eg intentional and controlled load-shedding) further it will explore
developing mechanisms for enabling ongoing refinement which should be influenced by a wide set of
stakeholders
RMWG recommends the Event Driven Index (EDI) be weighted the highest (50 percent) since events
actually occurred indicating how the system was performing The Condition Driven Index (CDI) and
StandardsStatute Driven Index (SDI) are weighted 25 each since they are indicators of potential risks
to BPS reliability IRI can be calculated as follows
IRI is intended to be a composite metric which integrates several forms of individual risks to the bulk
power system Since the three components range across many stakeholder organizations these
concepts are developed as starting points for continued study and evaluation Additional supporting
materials can be found in the IRI whitepaper32
IRI Recommendations
including individual indices calculations and preliminary
trend information
For the IRI more investigation should be performed to determine the best way to integrate EDI CDI
and SDI into an Integrated Reliability Index (IRI) that quantitatively represents the reliability of the bulk
32 The IRI whitepaper can be found at httpwwwnerccomdocspcrmwgIntegrated_Reliability_Index_WhitePaper_DRAFTpdf
Reliability Metrics Performance
44
power system To this end study into determining the amount of overlap between the components is
necessary RMWG is currently working to determine the proper amount of overlap between the IRI
components
Also the CDI component of the IRI needs to be solidified This is especially true with the CDI More
accurate metric data is needed to paint a fuller picture of the CDI Many of the metrics used to calculate
the CDI are new or they have limited data Compared to the SDI which counts well-known violation
counts and the EDI which uses the well-defined CDI the CDI lacks the depth of rigor that the other two
components have acquired through their years of data RMWG is currently working to improve the CDI
Reliability Metrics Conclusions and Recommendations Among the eighteen metrics that address the characteristics of an adequate level of reliability (ALR)
metric trends indicate the system is performing better in the following seven areas
bull ALR1-3 Planning Reserve Margin
bull ALR1-4 BPS Transmission Related Events Resulting in Loss of Load
bull ALR2-5 Disturbance Control Events Greater than Most Severe Single Contingency
bull ALR6-2 Energy Emergency Alert 3 (EEA3)
bull ALR6-3 Energy Emergency Alert 2 (EEA2)
bull ALR6-11 Automatic Transmission Outages Caused by Protection System Misoperations
bull ALR6-13 Automatic Transmission Outages Caused by Failed AC Substation Equipment
Assessments have been made in other performance categories A number of them do not have
sufficient data to derive any conclusions from the results The RMWG recommends continued data
collection and assessment of these metrics If a metric does not yield any trend in a five-year reporting
period the metric will be modified or withdrawn
For the IRI more investigation should be performed to determine the overlap of the components (CDI
EDI and SDI) The CDI should be more thoroughly solidified as an index by collecting more data over
time
Transmission Equipment Performance
45
Transmission Equipment Performance Introduction The Transmission Availability Data System (TADS) effort began with the establishment of a TADS task force
by the NERC Planning Committee in October 2006 On October 27 2007 the NERC Board of Trustees
approved the collection of transmission automatic outage data beginning in calendar year 2008 (Phase I)
Subsequently on October 29 2008 the NERC Board approved the collection of Non-Automatic Outage data
that began for Calendar year 2010 (Phase II)
This chapter provides reliability performance analysis of the transmission system by focusing on the trends
of Automatic Outage data from calendar year 2008 thru 2010 Since only one year of Non-Automatic
Outage data has been collected that data will not be assessed in this report
When calculating bulk power system performance indices care must be exercised when interpreting results
as misinterpretation can lead to erroneous conclusions regarding system performance With only three
years of data in the smaller regions it is not clear whether a regionrsquos yearly outage variation compared to
the average is due to random statistical variation or that particular year is significantly different in
performance However on a NERC-wide basis after three years of data collection there is enough
information to accurately determine whether the yearly outage variation compared to the average is due to
random statistical variation or the particular year in question is significantly different in performance33
Performance Trends
Transmission performance information has been provided by Transmission Owners (TOs) within NERC
through the NERC TADS (Transmission Availability Data System) process The data presented reflects
Momentary and Sustained AC Automatic outages of transmission elements that operate at voltages ge 200 kV
(including the low side of transformers) with the criteria specified in the TADS process The following
elements listed below are included
bull AC Circuits ge 200 kV (Overhead and Underground Circuits) Radial circuits are included
bull DC Circuits with ge +-200 kV DC voltage
bull Transformers with ge 200 kV low-side voltage and
bull ACDC Back-to-Back (BTB) Converters with ge 200 kV AC voltage on both sides
33The detailed Confidence Interval computation is available at httpwwwnerccomdocspctadstfTADS_Nov_2_2007APPENDIX_C_Confidence_Intervalpdf
Transmission Equipment Performance
46
AC Element Outage Summary and Leading Causes Table 6 shows the 2008 2009 and 2010 NERC total AC transmission element inventory and a summary of
the associated outages As expected in general the number of circuits increased from year to year due to
new construction or re-construction to higher voltages For every outage experienced on the transmission
system cause codes are identified and recorded according to the TADS process Causes of both momentary
and sustained outages have been indicated These causes are analyzed to identify trends and similarities
and to provide insight into what could be done to possibly prevent future occurrences
Figure 23 and Figure 24 describe the top ten initiating cause codes for sustained and momentary automatic
outages combined from 2008-2010 Based on the two figures the relationship between the total number of
outages and total outage hours can be seen Failed AC Substation Equipment and Failed AC Circuit
Equipment only account for 15 percent of the total number of outages but account for 65 percent of the
total outage hours The two largest causes of outages within NERC (ldquoLightingrdquo and ldquoWeather excluding
Lightningrdquo) account for 34 percent of the total number of outages
The next three Human Error Failed Protection System Equipment and Failed AC Circuit Equipment have
very similar totals and should all be considered significant focus points in reducing the number of Sustained
Automatic Outages for all elements
Transmission Equipment Performance
47
Table 6 NERC - All AC Elements Sustained and Momentary Outage Performance Summary
2008 Number of Outages
AC Voltage
Class
No of
Circuits
Circuit
Miles Sustained Momentary
Total
Outages Total Outage Hours
200-299kV 4369 102131 1560 1062 2622 56595
300-399kV 1585 53631 793 753 1546 14681
400-599kV 586 31495 389 196 585 11766
600-799kV 110 9451 43 40 83 369
All Voltages 6650 196708 2785 2051 4836 83626
2009 Number of Outages
AC Voltage
Class
No of
Circuits
Circuit
Miles Sustained Momentary
Total
Outages Total Outage Hours
200-299kV 4468 102935 1387 898 2285 28828
300-399kV 1619 56447 641 610 1251 24714
400-599kV 592 32045 265 166 431 9110
600-799kV 110 9451 53 38 91 442
All Voltages 6789 200879 2346 1712 4038 63094
2010 Number of Outages
AC Voltage
Class
No of
Circuits
Circuit
Miles Sustained Momentary
Total
Outages Total Outage Hours
200-299kV 4567 104722 1506 918 2424 54941
300-399kV 1676 62415 721 601 1322 16043
400-599kV 605 31590 292 174 466 10442
600-799kV 111 9477 63 50 113 2303
All Voltages 6957 208204 2582 1743 4325 83729
Note The NERC table does not show redacted outages DC Circuit outages Transformer outages or ACDC
converter outages
Transmission Equipment Performance
48
Figure 23 NERC - Top Ten Sustained and Momentary Outages by Initiating Cause Code for All Elements
Figure 24 NERC - Top Ten Sustained Outage Hours by Cause Code
198
151
80
7271
6943
33
27
188
68
Lightning
Weather excluding lightningHuman Error
Failed AC Substation EquipmentFailed Protection System EquipmentFailed AC Circuit Equipment Foreign Interference
Power System Condition
Fire
Unknown
Remaining Cause Codes
299
246
188
58
52
42
3619
16 12 31 Failed AC Substation EquipmentFailed AC Circuit Equipment Weather excluding lightningUnavailable
Other
Fire
Unknown
Human Error
Failed Protection System EquipmentForeign Interference
Remaining Cause Codes
Transmission Equipment Performance
49
Transmission Monthly Outages Figure 25 displays the total number of Automatic Outages on a per-month basis The three months with the
highest total of outages were June July and August From a seasonal perspective winter had a monthly
average of 281 outages These include the months of November-March Summer had an average of 429
outages Summer included the months of April-October
Figure 25 Number of Outages by Month for AC Circuits (2008-2010)
This figure does not show redacted outages DC Circuit outages Transformer outages or ACDC Converter
outages
Outage Initiation Location For every outage experienced on the transmission system the outage initiation code is identified and
recorded according to the TADS process The outage initiation code can be analyzed to identify trends and
similarities and to provide insight into what could be done to possibly prevent future occurrences
The ldquoOutage Initiation Coderdquo describes where an automatic outage was initiated on the power system The
five codes are as follows
bull Element-Initiated
bull Other Element-Initiated
bull AC Substation-Initiated
bull ACDC Terminal-Initiated (for DC circuits)
bull Other Facility Initiated any facility not included in any other outage initiation code
JanuaryFebruar
yMarch April May June July August
September
October
November
December
2008 238 229 257 258 292 437 467 380 208 176 255 236
2009 315 201 339 334 398 553 546 515 351 235 226 294
2010 444 224 269 446 449 486 639 498 351 271 305 281
3 Year AVG 332 218 288 346 380 492 551 464 303 227 262 270
0
100
200
300
400
500
600
700
Out
ages
Transmission Equipment Performance
50
Notably the protection system is not part of an ldquoAC Substationrdquo or an ldquoACDC Terminalrdquo If a protection
system misoperates and initiates an outage it will be classified as ldquoOther-Facility Initiatedrdquo The following
Figures show the initiating location of the Automatic outages from 2008 to 2010
With both Momentary and Sustained Automatic Outages taken into account the outage was initiated on the
Element more than 67 percent of the time as shown in Figure 26 and Figure 27
When only the Sustained Automatic Outages are analyzed the outage initiation on both AC Substation and
Other Facility increased by 34 percent and 32 percent respectively Outages initiated on the Element itself
decreases by 78 percent as shown in Figure 26 and 27 For only the Momentary Automatic Outages the
outage initiation on the Element increases by 19 percent compared to Sustained Outages Element initiated
outages make up over 78 percent of the total outages when analyzing only Momentary Outages
Figure 26
Figure 27
Transmission Outage Events Figure 28 illustrates the relationship between the numbers of Automatic Outages associated per TADS
event 2008 2009 and 2010 tend to follow the same trend The largest number of Automatic Outages per
TADS event is fourteen in 2010 thirteen in 2009 and eight in 2008 There are around 70 to 100 TADS
events that contain between fourteen and three Automatic Outages (see below) There are around 330 to
400 TADS events that contain two or more Automatic Outages The rest of the events only contain one
Automatic Outage As noted in the lower right hand corner below the total number of Events in 2008 to
2010 ranged from 3920 to 4569 events per year Nearly 90 percent or more of the events contained one
Automatic Outage
Figure 26 Sustained Automatic Outage Initiation
Code
Figure 27 Momentary Automatic Outage Initiation
Code
Transmission Equipment Performance
51
Transmission Outage Mode Figure 29 and Figure 30 show the percentage of Outage Modes The ldquoOutage Mode Coderdquo describes
whether one Automatic Outage is related to other Automatic Outages A Single Mode outage is an
Automatic Outage of a single Element which occurs independently of any other Automatic Outages (if any)
A ldquoDependent Mode Initiating Outagerdquo is an Automatic Outage of a single Element that initiates one or more
subsequent Element Automatic Outages A ldquoDependent Mode Outagerdquo is an Automatic Outage of an
Element which occurred as a result of an initiating outage whether the initiating outage was an Element
outage or a non-Element outage A ldquoCommon Mode Outagerdquo is one of two or more Automatic Outages with
the same Initiating Cause Code and where the outages are not consequences of each other and occur nearly
simultaneously A ldquoCommon Mode Initiating Outagerdquo is a Common Mode Outage that initiates one or more
subsequent Automatic Outages
Over 72 percent of the total outages occurred on the bulk power system are Single Mode Outages The next
largest mode is Dependent with over 11 percent of the total outages being in this category For only
Sustained Automatic Outages outages related to each other increase with Dependent mode accounting for
13 percent of the outages and Common mode accounting for close to 11 percent of the outages
Independent Sustained outages still account for the largest portion with nearly 70 percent being Single
mode When just analyzing Momentary Automatic Outages Associated outages decrease with Dependent
Figure 28 Event Histogram (2008-2010)
Transmission Equipment Performance
52
mode accounting for only 9 percent of the outages The Common Mode percentage decreases while
Dependent Mode Initiating percentage increases compared to Sustained Outages Independent Momentary
outages account for the largest portion with over 76 percent being Single Mode
An investigation into the root causes of Dependent and Common mode events which include three or more
Automatic Outages (indentified in the TADS 2008 to 2010 data) should be a high priority Some protection
systems are designed to trip three or more circuits but some events go beyond what is designed Some also
have misoperations associated with multiple outage events
Conclusions On a NERC wide average basis automatic transmission outage rate is improving from 2008 to 2010 based on
reported data Considering both automatic and non-automatic outages 2010 records indicate transmission
element availability percentage is very high and exceeds 95 The unavailability rate for AC circuits and
transformers are only 15 and 29 respectively
The cause codes of Human Error Failed Protection System Equipment and Failed AC Circuit Equipment
should be considered significant focus points in reducing the number of Sustained Automatic Outages for all
elements A deeper look into the root causes of Dependent and Common mode events which include three
or more Automatic Outages (indentified in the TADS 2008 to 2010 data) should be a high priority Some
protection systems are designed to trip three or more circuits but some events go beyond what is designed
Some also have misoperations associated with multiple outage events
Figure 29 Sustained Automatic Outage Mode code Figure 30 Momentary Automatic Outage Mode code
Generation Equipment Performance
53
Generation Equipment Performance Introduction The development of the Generating Availability Data System (GADS) began in 1982 This series of databases
is used to voluntarily collect record and retrieve operating information By pooling individual unit
information with likewise units generating unit availability performance can be calculated providing
opportunities to identify trends and generating equipment reliability improvement opportunities The
information is used to support equipment reliability availability analyses and risk-informed decision-making
by system planners generation owners assessment modelers manufacturers and contractors etc Reports
and information resulting from the data collected through GADS are now used for benchmarking and
analyzing electric power plants
Currently the data collected through GADS contains 72 percent of the North American generating units
with generating capacity of 20 MW or higher34 Additionally many of the newer combined-cycle plants are
not reporting information and therefore a full view of each unit type is not presented Rather a sample of
all the units in North America that fit a given more general category is provided35 for the 2008-201036
Generation Key Performance Indicators
assessment period
Three key performance indicators37
In
the industry have used widely to measure the availability of generating
units (see Terms Used in This Report section for their calculation parameters) are Equivalent Availability
Factor (EAF) Net Capacity Factor (NCF) and Equivalent Forced Outage Rate ndash Demand (EFORd)
Table 7 the North American fleet average EAF NCF and EFORd compared to unit age for all generating
units with a capacity of 20 MW and higher is provided for the years 2008-2010 The EAF shows a decline
during the last three years NCF is up and down while the EFORd appears to be increasing As expected the
fleet of units reported to GADS is aging overall with the fossil units being about 12 years older than the
average age
34 httpwwwnerccomdocspcgadstfGADSTF_Recommendation_Report_02-18-2011_FINALpdf 35GADS contains some 1500+ units under 20 MW that is not included in this report These units are excluded because most units are not base-loaded and are in peaking operation
3684 percent of the 2010 dataset is available at this time while the 2008 and 2009 dataset is complete 37 httpwwwnerccompagephpcid=4|43
Generation Equipment Performance
54
Table 7 General Availability Review of GADS Fleet Units by Year
2008 2009 2010 Average
Equivalent Availability Factor (EAF) 8776 8774 8678 8743
Net Capacity Factor (NCF) 5083 4709 4880 4890
Equivalent Forced Outage Rate -
Demand (EFORd) 579 575 639 597
Number of Units ge20 MW 3713 3713 3713 3713
Average Age of the Fleet in Years (all
unit types) 303 311 321 312
Average Age of the Fleet in Years
(fossil units only) 422 432 440 433
Figure 31 provides the average forced outage hours (FOH) maintenance outage hours (MOH) and planned
outage hours (POH) for all units reporting 20 MW or larger During this three-year period the average FOH
291 hours average MOH is 163 hours average POH is 470 hours
Figure 31 shows a large increase in forced and maintenance events The average age of the units with a
capacity of 20MW and higher in 2009 is 316 years old However the average age of fossil units in 2010 is
442 years old These fossil units are the backbone of all operating units providing the base-load power
continuously and nearly 50 percent of all energy annually There appears to be no increase allocated for
annualsemi-annual maintenance (ie planned outages) for the older generating units The increase of
000100002000030000400005000060000700008000090000
100000
2008 2009 2010
463 479 468
154 161 173
288 270 314
Hou
rs
Planned Maintenance Forced
Figure 31 Average Outage Hours for Units gt 20 MW
Generation Equipment Performance
55
maintenance outage hours reflects an increased need to fix problems that cannot be deferred until the next
annualsemi-annual repairs As a result it shows one of two things are happening
bull More or longer planned outage time is needed to repair the aging generating fleet
bull More focus on preventive repairs during planned and maintenance events are needed
Multiple Unit Forced Outages and Causes Table 8 provides the annual multiple-unit forced outage trips resulting from the same cause for each of the
assessments years 2008-2010 respectively The ldquosingle unitrdquo trips are large units with a Net Dependable
Capacity of 750 MW or more The trips of ldquotwo unitsrdquo or more is any combination of unit capacity with the
total amount of lost capacity more than 750 MW
Table 8 also presents more information on the forced outages During 2008-2010 there were a large
number of double-unit outages resulting from the same event Investigations show that some of these trips
were at a single plant caused by common control and instrumentation for the units The incidents occurred
several times for several months and are a common mode issue internal to the plant
Table 8 Number of Multiple Unit Forced Outages and FrequencyYear
2008 2009 2010
Type of
Trip
of
Trips
Avg Outage
Hr Trip
Avg Outage
Hr Unit
of
Trips
Avg Outage
Hr Trip
Avg Outage
Hr Unit
of
Trips
Avg Outage
Hr Trip
Avg Outage
Hr Unit
Single-unit
Trip 591 58 58 284 64 64 339 66 66
Two-unit
Trip 281 43 22 508 96 48 206 41 20
Three-unit
Trip 74 48 16 223 146 48 47 109 36
Four-unit
Trip 12 77 19 111 112 28 40 121 30
Five-unit
Trip 11 1303 260 60 443 88 19 199 10
gt 5 units 20 166 16 93 206 50 37 246 6
Loss of ge 750 MW per Trip
The high number of five-unit trips in 2008 was due to Hurricane Ike hitting the Gulf Coast The highest total
number of multiple unit trips occurred in 2009 though as mentioned before the data collection for 2010 is
incomplete at this time The majority of 2009 multiple unit trips have three main causes (in order by
Generation Equipment Performance
56
number of events) transmission lack of fuel and storms A summary of the three categories for single as
well as multiple unit outages (all unit capacities) are reflected in Table 9
Table 9 Common Causes of Multiple Unit Forced Outages (2009)
Cause Number of Events Average MW Size of Unit
Transmission 1583 16
Lack of Fuel (Coal Mines Gas Lines etc) Not
in Operator Control
812 448
Storms Lightning and Other Acts of Nature 591 112
Some of the transmission outages based on storms in 2009 have been caused by the same reasons because
the storms may have caused transmission interference However the plants reported the problems
inconsistently with either the transmission interference or storms cause code Therefore they are depicted
as two different causes of forced outage
Marked transmission outages in 2009 were quite high Thirty-five percent came from one utility with a large
number of hydroelectric units The company related the trips to various problems including weather
(lightning storms) wildlife ldquoline bumpsrdquo and problems on the receiving end of the transmission line Nine
hundred and eighty-five transmission trips (62 percent) were from hydroelectric units38
In 2009 only ten transmission trips resulted in a loss of 750 MW or more per trip Twenty two generating
plants were affected by the ten trips Causes for the trips include feeder line trips (1 trip) breakers in the
switchyard (8 trips) personnel errors (2 trips) and unknown (10 trips)
The ldquoLack of Fuelrdquo outages are of interest as these events occur during the times when a unit is available to
operate but there is an interruption in fuels to operate the facilities These events do not include
interruptions of fuel due to contracts Rather the cause code is designed to account for units that are
expecting fuel and it is unavailable when requested Table 10 presents the distribution of ldquoLack of Fuelrdquo
events by NERC Region and Table 11 presents the unit types affected
38 The average size of the hydroelectric units were small ndash 335 MW
Generation Equipment Performance
57
Of the units that report ldquoLack of Fuelrdquo 78 percent of the units are oil-fired 15 percent of the units are gas-
fired and the remaining units are various other fuels Table 12 provides the top causes of forced outage for
several unit types For fossil units ldquoLack of Fuelrdquo as the number three cause behind waterwall tube leaks
and superheater tube leaks
Table 10 Forced Outages Due to Lack of Fuel by Region
Region Number of Lack of Fuel
Problems Reported
FRCC 0
MRO 3
NPCC 24
RFC 695
SERC 17
SPP 3
TRE 7
WECC 29
One company contributed to the majority of oil-fired lack of fuel events The units at the company are
actually dual-fuels (oil and gas) but market nominated gas monitoring causes the units to be on forced
outage nightly The units need gas to start up so they can run on oil When they shut down the units must
switch to gas to clean themselves With the gas restriction the unit canrsquot start and the unit goes on a
forced outage Until the band is lifted the two units will continue to be on a forced outage cycle
Event records also provide descriptions of why the unit was without fuel with the majority of descriptions
bull Temperatures affecting gas supply valves
bull Unexpected maintenance of gas pipe-lines
bull Compressor problemsmaintenance
Generation Equipment Performance
58
Table 11 Unit Type Profile of Forced Outages Due to Lack of Fuel
Unit Types Number of Lack of Fuel Problems Reported
Fossil 642
Nuclear 0
Gas Turbines 88
Diesel Engines 1
HydroPumped Storage 0
Combined Cycle 47
Generation Equipment Performance
59
Table 12 Causes of Forced Outage for Different Unit Types (2008-2010)
Fossil - all MW sizes all fuels
Rank Description Occurrence per Unit-year
MWH per Unit-year
Average Hours To Repair
Average Hours Between Failures
Unit-years
1 Waterwall (furnace wall) 0590 134106 59 3250 3868 2 Second Superheater
Leaks 0180 5182 60 3228 3868
3 Lack of Fuel (coal mines gas lines etc) where the operator is not in control
0480 4701 18 26 3868
Combined-Cycle blocks Rank Description Occurrence
per Unit-year
MWH per Unit-year
Average Hours To Repair
Average Hours Between Failures
Unit-years
1 HP Turbine Buckets Or Blades
0020 4663 1830 26280 466
2 Turbine Control Valves 0040 2777 100 7200 466 3 Gas Turbine Compressor -
High Pressure Shaft 0010 2266 663 4269 466
Nuclear units - all Reactor types Rank Description Occurrence
per Unit-year
MWH per Unit-year
Average Hours To Repair
Average Hours Between Failures
Unit-years
1 LP Turbine Buckets or Blades
0010 26415 8760 26280 288
2 Containment Structure 0010 9233 1226 26262 288 3 Feedwater Pump Local
Controls 0020 7620 692 12642 288
Simple-cycle gas turbine jet engines Rank Description Occurrence
per Unit-year
MWH per Unit-year
Average Hours To Repair
Average Hours Between Failures
Unit-years
1 Main Transformer 0030 1611 1016 20709 4181 2 Other Gas Turbine
Controls And Instrument Problems
0120 428 70 2614 4181
3 Other Gas Turbine Problems
0090 400 119 1701 4181
Generation Equipment Performance
60
2008-2010 Review of Summer versus Winter Availability To address seasonality of unit availability unit information for the months of June to September (summer)
and December through February (winter) were pooled to calculate force events during these timeframes for
2008-201039 Figure 32 shows the Equivalent Availability Factor (EAF) is three percentage points higher and
the Equivalent Forced Outage Rate - Demand (EFORd) is more than a half of a percentage point lower in the
summer period than in winter period This means the units were more reliable with less forced events
during high-demand times during the summer than during the winter seasons The generating unitrsquos
capability has a resulting higher Net Capacity Factor (NCF) of 45 percentage points in the summer season
for 2008-2010
During the spring season (March-May) 77 percent of the units took a planned outage (PO) for an average
231 hours (or 96 days) In fall (October-November) only 42 percent of the units experienced a PO and the
average duration was shorter ndash 134 hours (or 56 days) A few units took both spring and fall planned
outages although this is rare Based on this assessment the generating units are prepared for the summer
peak demand The resulting availability indicates that this maintenance was successful which is measured
by an increased EAF and lower EFORd
Figure 32 Summer-Winter Average EAF NCF and EFORd (2008-2010)
Conclusions and Recommendations During 2008-2010 the average Equivalent Availability Factor (EAF) which measures the overall availability
of generating units decreased At the same time the Net Capacity Factor (NCF) an indicator of energy
production increased The average number of forced outages in 2010 is greater than in 2008 while at the
same time the average planned outage times have decreased As a result the Equivalent Forced Outage
Rate ndash Demand (EFORd) also increased illustrating that more units have experienced forced events during
39 A study of peak periods was conducted by the NERC Generating Availability Trend Evaluation (GATE) Working Group several years ago see httpwwwnerccomfilesSeasonal-Performance-Trendspdf
9116
5343
396
8818
4896
441
0 10 20 30 40 50 60 70 80 90 100
EAF
NCF
EFORd
Percent ()
Winter
Summer
Generation Equipment Performance
61
peak-demand times in 2010 than in the previous two years Potentially with shorter planned outage
periods in 2010 there may be less time to repair equipment and prevent forced unit outages
There are warnings that units are not being maintained as well as they should be In the last three years
there has been an increase in Equivalent Forced Outage Rate ndash Demand (EFORd) This indicator measures
the rate of forced outage events on generating units during periods of load demand To confirm this
problem forced outage hours jumped from 270 to 314 hours per unit between 2009 and 2010 At the same
time maintenance events also increased by 12 hours per unit Planned outage events remain constant The
resulting conclusions from this trend are
bull More or longer planned outage time is needed to repair the generating fleet Whether age is the
cause of the increase need for planned outage time remains unknown and further investigation into
the cause for longer planned outage time is necessary
bull More focus on preventive repairs during planned and maintenance events are needed
There are many multiple unit forced outages due to lack of fuel The majority of multiple unit trips have
three main causes transmission lack of fuel and storms With special interest in the forced outages due to
ldquoLack of Fuelrdquo additional analysis revealed that 77 percent of the units experiencing unexpected fuel
stoppage are oil-fired fossil units while gas-fired units experienced 15 percent
Generating units continue to be more reliable during the peak summer periods
Disturbance Event Trends
62
Category 1 An event resulting in one or more of the following a Unintended loss of three or more BPS elements caused by
common mode failure b Failure or misoperation of an SPSRAS c System-wide voltage reduction of 3 or more d Unintended BPS system separation resulting in an island of
100 MW to 999 MW e Unplanned evacuation from a control center facility with BPS
SCADA functionality for 30 minutes or more Category 2 An event resulting in one or more of the following
a Complete loss of all BPS control center voice communication system(s) for 30 minutes or more
b Complete loss of SCADA control or monitoring functionality for 30 minutes or more
c Voltage excursions equal to or greater than 10 lasting more than five minutes
d Loss of off-site power (LOOP) to a nuclear generating station e Unintended system separation resulting in an island of 1000
MW to 4999 MW f Unintended loss of 300MW or more of firm load for more
than 15 minutes g Violation of an Interconnection Reliability Operating Limit
(IROL) for more than 30 minutes Category 3 An event resulting in one or more of the following
a The loss of load or generation of 2000 MW or more in the Eastern Interconnection or
b Western Interconnection or 1000 MW or more in the ERCOT or Queacutebec Interconnections
c Unintended system separation resulting in an island of 5000 MW to 10000 MW
d Unintended system separation resulting in an island of Florida from the Eastern Interconnection
Category 4 An event resulting in one or more of the following a The loss of load or generation from 5001 MW to 9999 MW b Unintended system separation resulting in an island of more
than 10000 MW (with the exception of Florida as described in Category 3c)
Category 5 An event resulting in one or more of the following a The loss of load of 10000 MW or more b The loss of generation of 10000 MW or more
Figure 33 BPS Event Category
Disturbance Event Trends Introduction The purpose of this section is to report event
analysis trends from the beginning of event
analysis field test40
One of the companion goals of the event
analysis program is the identification of trends
in the number magnitude and frequency of
events and their associated causes such as
human error equipment failure protection
system misoperations etc The information
provided in the event analysis database (EADB)
and various event analysis reports have been
used to track and identify trends in BPS events
in conjunction with other databases (TADS
GADS metric and benchmarking database)
to the end of 2010
The Event Analysis Working Group (EAWG)
continuously gathers event data and is moving
toward an integrated approach to analyzing
data assessing trends and communicating the
results to the industry
Performance Trends The event category is classified41
Figure 33
as shown in
with Category 5 being the most
severe Figure 34 depicts disturbance trends in
Category 1 to 5 system events from the
40 httpwwwnerccomdocseawgGalloway-Industry-EA-Field-Test-102210pdf 41httpwwwnerccomfiles2011-05-0220Event_Analysis_Process_Phase20220Field20Test20Draft20-20Final20-20For20postingpdf
Disturbance Event Trends
63
beginning of event analysis field test to the end of 201042
Figure 34 Event Category vs Date for All 2010 Categorized Events
From the figure in November and December
there were many more category 1 and 2 events than in October This is due to the field trial starting on
October 25 2010
In addition to the category of the events the status of the events plays a critical role in the accuracy of the
data By examining Figure 35 over 80 of the events reported in 2010 have been closed This means that
the category root cause and other important information have been sufficiently finalized in order for
analysis to be accurate for each event At this time there is not enough data to draw any long-term
conclusions about event investigation performance
42 Documents for the EA Field Test are located at httpwwwnerccompagephpcid=5|365
2
12 12
26
3
6 5
14
1 1
2
0
5
10
15
20
25
30
35
40
45
October November December 2010
Even
t Cou
nt
Category 3 Category 2 Category 1
Disturbance Event Trends
64
Figure 35 Event Count vs Status (All 2010 Events with Status)
By drilling down into the cause code for each closed 2010 event Figure 36 shows the top 3 event causes
From the figure equipment failure and protection system misoperation are the most significant causes for
events Because of how new and limited the data is however there may not be statistical significance for
this result Further trending of cause codes for closed events and developing a richer dataset to find any
trends between event cause codes and event counts should be performed
Figure 36 Top 3 Event Counts vs DAWG Cause Code for all Closed 2010 Events
10
32
42
0
5
10
15
20
25
30
35
40
45
Open Closed Open and Closed
Even
t Cou
nt
Status
1211
8
0
2
4
6
8
10
12
14
Equipment Failure Protection System Misoperation Human Error
Even
t Cou
nt
Cause Code
Disturbance Event Trends
65
Conclusions Due to the relatively new process for events analysis and categorization more time will be required before a
conclusive recommendation may be obtained Further analysis and new data should provide valuable
statistics in the future Over 80 of all event reports from 2010 are current listed as closed but no
conclusion about investigation performance may be obtained because of the limited amount of data It is
recommended to study ways to prevent equipment failure and protection system misoperations but there
is not enough data to draw a firm conclusion about the top causes of events at this time
Abbreviations Used in This Report
66
Abbreviations Used in This Report
Acronym Definition ALP Acadiana Load Pocket
ALR Adequate Level of Reliability
ARR Automatic Reliability Report
BA Balancing Authority
BPS Bulk Power System
CDI Condition Driven Index
CEII Critical Energy Infrastructure Information
CIPC Critical Infrastructure Protection Committee
CLECO Cleco Power LLC
DADS Future Demand Availability Data System
DCS Disturbance Control Standard
DOE Department Of Energy
DSM Demand Side Management
EA Event Analysis
EAF Equivalent Availability Factor
ECAR East Central Area Reliability
EDI Event Drive Index
EEA Energy Emergency Alert
EFORd Equivalent Forced Outage Rate Demand
EMS Energy Management System
ERCOT Electric Reliability Council of Texas
ERO Electric Reliability Organization
ESAI Energy Security Analysis Inc
FERC Federal Energy Regulatory Commission
FOH Forced Outage Hours
FRCC Florida Reliability Coordinating Council
GADS Generation Availability Data System
GOP Generation Operator
IEEE Institute of Electrical and Electronics Engineers
IESO Independent Electricity System Operator
IROL Interconnection Reliability Operating Limit
Abbreviations Used in This Report
67
Acronym Definition IRI Integrated Reliability Index
LOLE Loss of Load Expectation
LUS Lafayette Utilities System
MAIN Mid-America Interconnected Network Inc
MAPP Mid-continent Area Power Pool
MOH Maintenance Outage Hours
MRO Midwest Reliability Organization
MSSC Most Severe Single Contingency
NCF Net Capacity Factor
NEAT NERC Event Analysis Tool
NERC North American Electric Reliability Corporation
NPCC Northeast Power Coordinating Council
OC Operating Committee
OL Operating Limit
OP Operating Procedures
ORS Operating Reliability Subcommittee
PC Planning Committee
PO Planned Outage
POH Planned Outage Hours
RAPA Reliability Assessment Performance Analysis
RAS Remedial Action Schemes
RC Reliability Coordinator
RCIS Reliability Coordination Information System
RCWG Reliability Coordinator Working Group
RE Regional Entities
RFC Reliability First Corporation
RMWG Reliability Metrics Working Group
RSG Reserve Sharing Group
SAIDI System Average Interruption Duration Index
SAIFI System Average Interruption Frequency Index
SCADA Supervisory Control and Data Acquisition
SDI Standardstatute Driven Index
SERC SERC Reliability Corporation
Abbreviations Used in This Report
68
Acronym Definition SRI Severity Risk Index
SMART Specific Measurable Attainable Relevant and Tangible
SOL System Operating Limit
SPS Special Protection Schemes
SPCS System Protection and Control Subcommittee
SPP Southwest Power Pool
SRI System Risk Index
TADS Transmission Availability Data System
TADSWG Transmission Availability Data System Working Group
TO Transmission Owner
TOP Transmission Operator
WECC Western Electricity Coordinating Council
Contributions
69
Contributions This report was made feasible by the collaboration and hard work of both NERC staff and NERCrsquos
Industry Groups
NERC Industry Groups
Table 14 lists the NERC industry group contributors Without their contribution and collaboration this
report would not have been possible
Table 13 NERC Industry Group Contributions43
NERC Group
Relationship Contribution
Reliability Metrics Working Group
(RMWG)
Reports to the OCPC bull Lead Development of Report bull Provide Reliability Metrics Data bull Responsible for Reliability Metrics
Performance Chapter
Transmission Availability Working Group
(TADSWG)
Reports to the OCPC bull Provide Transmission Availability Data
bull Responsible for Transmission Equip-ment Performance Chapter
bull Content Review
Generation Availability Data System Task
Force
(GADSTF)
Reports to the OCPC bull Provide Generation Availability Data bull Responsible for Generation Equip-
ment Performance Chapter bull Content Review
Event Analysis Working Group
(EAWG)
Reports to the OCPC bull Provide Events Data bull Responsible for Disturbance Events
Trends Chapter bull Content Review
43 Rosters for RMWG TADSWG GADSTF and EAWG are available at httpwwwnerccomfilesrosterpdf
Contributions
70
NERC Staff Table 13 below lists the NERC staff who contributed to the 2011 Reliability Performance Analysis
Report
Table 14 Contributing NERC Staff
Name Title E-mail Address
Mark Lauby Vice President and Director of
Reliability Assessment and
Performance Analysis
marklaubynercnet
Jessica Bian Manager of Performance Analysis jessicabiannercnet
John Moura Manager of Reliability Assessments johnmouranercnet
Andrew Slone Engineer Reliability Performance
Analysis
andrewslonenercnet
Jim Robinson TADS Project Manager jimrobinsonnercnet
Clyde Melton Engineer Reliability Performance
Analysis
clydemeltonnercnet
Mike Curley Manager of GADS Services mikecurleynercnet
James Powell Engineer Reliability Performance
Analysis
jamespowellnercnet
Michelle Marx Administrative Assistant michellemarxnercnet
William Mo Intern Performance Analysis wmonercnet
- NERCrsquos Mission
- Table of Contents
- Executive Summary
-
- 2011 Transition Report
- State of Reliability Report
- Key Findings and Recommendations
-
- Reliability Metric Performance
- Transmission Availability Performance
- Generating Availability Performance
- Disturbance Events
- Report Organization
-
- Introduction
-
- Metric Report Evolution
- Roadmap for the Future
-
- Reliability Metrics Performance
-
- Introduction
- 2010 Performance Metrics Results and Trends
-
- ALR1-3 Planning Reserve Margin
-
- Background
- Assessment
- Special Considerations
-
- ALR1-4 BPS Transmission Related Events Resulting in Loss of Load
-
- Background
- Assessment
-
- ALR1-12 Interconnection Frequency Response
-
- Background
- Assessment
-
- ALR2-3 Activation of Under Frequency Load Shedding
-
- Background
- Assessment
- Special Considerations
-
- ALR2-4 Average Percent Non-Recovery Disturbance Control Standards (DCS)
-
- Background
- Assessment
- Special Consideration
-
- ALR2-5 Disturbance Control Events Greater Than Most Severe Single Contingency
-
- Background
- Assessment
- Special Consideration
-
- ALR 1-5 System Voltage Performance
-
- Background
- Special Considerations
- Status
-
- ALR3-5 Interconnection Reliability Operating Limit System Operating Limit (IROLSOL) Exceedances
-
- Background
-
- ALR4-1 Automatic Transmission Outages Caused by Protection System Misoperations
-
- Background
- Special Considerations
-
- ALR6-11 ndash ALR6-14
-
- Background
- Assessment
- ALR 6-11 ndash Automatic Outages Initiated by Failed Protection System Equipment
- ALR6-12 ndash Automatic Outages Initiated by Human Error
- ALR6-13 ndash Automatic Outages Initiated by Failed AC Substation Equipment
- ALR6-14 Automatic AC Transmission Outages Initiated by Failed AC Circuit Equipment
-
- ALR6-15 Element Availability Percentage (APC)
-
- Background
- Assessment
- Special Consideration
-
- ALR6-16 Transmission System Unavailability
-
- Background
- Assessment
- Special Consideration
-
- ALR6-2 Energy Emergency Alert 3 (EEA3)
-
- Background
- Assessment
- Special Considerations
-
- ALR 6-3 Energy Emergency Alert 2 (EEA2)
-
- Background
- Assessment
- Special Considerations
-
- ALR 6-1 Transmission Constraint Mitigation
-
- Background
- Assessment
- Special Considerations
-
- Integrated Bulk Power System Risk Assessment
-
- Introduction
- Recommendations
-
- Integrated Reliability Index Concepts
-
- The Three Components of the IRI
-
- Event-Driven Indicators (EDI)
- Condition-Driven Indicators (CDI)
- StandardsStatute-Driven Indicators (SDI)
-
- IRI Index Calculation
- IRI Recommendations
-
- Reliability Metrics Conclusions and Recommendations
-
- Transmission Equipment Performance
-
- Introduction
- Performance Trends
-
- AC Element Outage Summary and Leading Causes
- Transmission Monthly Outages
- Outage Initiation Location
- Transmission Outage Events
- Transmission Outage Mode
-
- Conclusions
-
- Generation Equipment Performance
-
- Introduction
- Generation Key Performance Indicators
-
- Multiple Unit Forced Outages and Causes
- 2008-2010 Review of Summer versus Winter Availability
-
- Conclusions and Recommendations
-
- Disturbance Event Trends
-
- Introduction
- Performance Trends
- Conclusions
-
- Abbreviations Used in This Report
- Contributions
-
- NERC Industry Groups
- NERC Staff
-

Reliability Metrics Performance
30
ALR6-16 Transmission System Unavailability
Background
This metric uses data and calculations directly from the NERC TADS effort and shows the overall percent
of time the aggregate of transmission facilities are unavailable due to automatic and non-automatic
outages This is an aggregate value using sustained automatic outages for both lines and transformers
operated at 200 kV and above for each Regional Entity and for NERC This metric was approved by the
NERC Operating and Planning Committees in December 2010
Assessment
Figure 15 and Figure 16 illustrate the 2010 aggregate unavailability percentage for AC circuits and
transformer facilities operated at 200 kV and above The values for AC circuits are all under 3 percent
which shows excellent system availability
The RMWG recommends continued metric assessment for at least a few more years in order to
determine the value of this metric
Special Consideration
It should be noted that the non-automatic outage data needed to calculate this metric was only first
collected for the calendar year 2010 as part of the TADS process Therefore only one year of data for
this metric is available at this time
Figure 15 2010 ALR6-16 Transmission System Unavailability
Reliability Metrics Performance
31
Figure 16 2010 ALR6-16 Transmission System Unavailability by Outage Type
Notably the Eastern Interconnection does not include Quebec or ERCOT Also ERCOT does not have
any transformers with low-side voltage levels 200 kV and above
ALR6-2 Energy Emergency Alert 3 (EEA3)
Background
This metric identifies the number of times Energy Emergency Alerts Level 3 (EEA3) are issued EEA3
events are firm-load interruptions due to capacity and energy deficiency EEA3 is currently reported
collected and maintained in NERCrsquos Reliability Coordination Information System (RCIS) and is defined in
Attachment 1 of the NERC Standard EOP-00221
21 The latest version of Attachment 1 for EOP-002 is available at
This metric identifies the number of times EEA3s are
issued The number of EEA3s per year provides a relative indication of performance measured at a
Balancing Authority or interconnection level As historical data is gathered trends in future reports will
provide an indication of either decreasing or increasing use of EEA3s signaling adequacy of the electric
supply system This metric can also be considered in the context of Planning Reserve Margin Significant
increases or decreases in EEA3 events with relatively constant Planning Reserve Margins could indicate
httpwwwnerccompagephpcid=2|20
Reliability Metrics Performance
32
volatility in the actual loads compared to forecast levels or changes in the adequacy of the bulk power
system required to meet load demands
Assessment
Figure 17 shows the number of EEA3 events during 2006 and 2010 from an RE level An interactive
presentation was released and available at the Reliability Indicatorrsquos page22
The Acadiana Load Pocket (ALP) is an area in south central Louisiana that has experienced regular
transmission constraints and numerous Energy Emergency Alert filings by the SPP Reliability Controller
(SPP RC) Transmission within ALP is owned by Entergy Lafayette Utilities System (LUS) and Cleco
Power LLC (Cleco) The transmission constraints within the ALP are primarily caused by the local area
load and the lack of generation located in close proximity to the load area
The number of EEA3rsquos
declared in 2010 returned to more traditional numbers The 2009 spike in EEA3 events in the SPP
Region that was driven by issues in the Acadiana Load Pocket (ALP) were not present in 2010
Special Considerations
Ideally the measure should capture only EEAs that are declared for reliability reasons and not for
economic factors The RMWG has not been able to differentiate these reasons for future reporting and
it has made a recommendation to the Reliability Coordinator Working Group (RCWG) to consider a
revised EEA declaration to exclude economic factors
The reason the EEA volume decreased from 2009 to 2010 in SPP was because the SPP ICT RC23
coordinated an operating agreement between the five operating companies in the ALP The operating
agreement included a cost sharing re-dispatch that alleviated the need of a Transmission Loading Relief
(TLR-5) declaration24
22The EEA3 interactive presentation is available on the NERC website at
During 2009 there was no operating agreement therefore an entity had to
provide Network and Native Load (NNL) relief when a TLR-5 was called by the ICT RC When the TLR-5
was the primary tool to control the post contingent loading in the ALP some of the BAs would have their
firm transmission curtailed to the point where they could no longer serve their load therefore the EEA
3 was needed to communicate a capacityreserve deficiency
httpwwwnerccompagephpcid=4|331|335 23Southwest Power Pool (SPP) Independent Coordinator of Transmission (ICT) Reliability Coordinator (RC) 24More information on Transmission Load Relief is contained in the IRO-006 standard which is located at httpwwwnerccomfilesIRO-006-4pdf In particular TLR-5 definitions are referenced on page 16 and 17
Reliability Metrics Performance
33
Figure 17 ALR6-2 Energy Emergency Alert 3 (EEA3) Counts by Region (2006-2010)
Cleco Power Entergy and LUS are currently constructing an estimated $200 million transmission
infrastructure improvement project to mitigate transmission constraints into ALP Construction of the
project is scheduled to be complete in 2012 Completion of the project should help alleviate some of
the transmission congestion in this area Energy Emergency Alerts filed by the SPP Regional Entity
continue to decline
SPP RTO continues to coordinate operating plans with the operating entities in this area Mitigation
plans and local operating guides in place are expected to provide sufficient flexibility should issues arise
NERC will continue to monitor this area for Reliability Impacts and coordinate any actions with the SPP
Reliability Coordinator and SPP Regional Entity
ALR 6-3 Energy Emergency Alert 2 (EEA2)
Background
Energy Emergency Alert 2 (EEA2) is to measure the number of events BAs declare for deficient capacity
and energy during peak load periods which may serve as a leading indicator of energy and capacity
shortfall in the adequacy of the electric supply system EEA2 provides a sense of the frequency of
precursor events to the more severe EEA3 declarations This metric measures the number of events
1 3 1 2 214
3 4 4 1 5 334
4 2 1 52
1
0
5
10
15
20
25
30
3520
0620
0720
0820
0920
1020
0620
0720
0820
0920
1020
0620
0720
0820
0920
1020
0620
0720
0820
0920
1020
0620
0720
0820
0920
1020
0620
0720
0820
0920
1020
0620
0720
0820
0920
1020
0620
0720
0820
0920
10
FRCC MRO NPCC RFC SERC SPP TRE WECC
2006-2009
2010
Region and Year
Reliability Metrics Performance
34
Balancing Authorities declare for deficient capacity and energy during peak load periods At this time
however this data reflects inclusion of Demand Side Resources that would not be indicative of
inadequacy of the electric supply system
The number of EEA2 events and any trends in their reporting indicates how robust the system is in
being able to supply the aggregate load requirements The historical records may include demand
response activations and non-firm load interruptions per applicable contracts within the EEA alerts per
its definition25
Assessment
Demand response is a legitimate resource to be called upon by balancing authorities and
do not indicate a reliability concern As data is gathered in the future reports will provide an indication
of either decreasing or increasing adequacy in the electric supply system EEA2 events called solely for
activation of demand response (controllable or contractually prearranged demand-side dispatch
programs) or interruption of non-firm load per applicable contracts should be excluded This metric can
also be considered in the context of the Planning Reserve Margin Significant increases or decreases in
EEA2 events with relatively constant Planning Reserve Margins could indicate volatility in the actual
loads compared to forecast levels or changes in the adequacy of the bulk power system required to
meet load demands
Figure 18 shows the number of EEA2 events by Regional Entity from 2006 to 2010 EEA2 interactive
version available on line by quarter and region26
25 The EEA2 is defined at
The general trend continues to show improved
performance which may have been influenced by the overall reduction in demand throughout NERC
caused by the economic downturn Specific performance by any one region should be investigated
further for issues or events that may affect the results Determining whether performance reported
includes those events resulting from the economic operation of DSM and non-firm load interruption
should also be investigated The RMWG recommends continued metric assessment
httpwwwnerccomfilesEOP-002-2pdf 26 EEA2 interactive version located at httpwwwnerccompagephpcid=4|331|341
Reliability Metrics Performance
35
Special Considerations
The intent of this metric is to measure only EEAs that are called for reliability reasons and not for
economic factors such as demand side management (DSM) and non-firm load interruption The
historical data for this metric may include events that were called for economic factors According to
the RCWG recent data should only include EEAs called for reliability reasons
ALR 6-1 Transmission Constraint Mitigation
Background
The RMWG completed a pilot with four regional entities Based on the results the RMWG expanded the
pilot data collection to all regions and the initial results of the data collection are shown in Figure 19
and Table 5 Based on the results of the pilot there is merit in continuing to assess this metric The
intent of this metric is to identify trends in the number of mitigation measures (Special Protection
Schemes (SPS) Remedial Action Schemes (RAS) and Operating Procedures) required to meet reliability
requirements By their nature SPS do not indicate an inherent weakness in the bulk power system
rather they are an indication of methods that are taken to operate the system through the range of
conditions it must perform This metric is only intended to evaluate the trend use of these plans and
whether the metric indicates robustness of the transmission system is increasing remaining static or
decreasing
1 27
2 1 4 3 2 1 2 4 5 2 5 832
4724
211
5 38 5 1 1 8 7 4 1 1
05
101520253035404550
2006
2007
2008
2009
2010
2006
2007
2008
2009
2010
2006
2007
2008
2009
2010
2006
2007
2008
2009
2010
2006
2007
2008
2009
2010
2006
2007
2008
2009
2010
2006
2007
2008
2009
2010
2006
2007
2008
2009
2010
FRCC MRO NPCC RFC SERC SPP TRE WECC
2006-2009
2010
Region and Year
Figure 18 ALR6-3 Energy Emergency Alert 2 (EEA2)
Reliability Metrics Performance
36
Assessment
The pilot data indicates a relatively constant number of mitigation measures over the time period of
data collected
Figure 19 ALR6-1 Transmission Constraint Mitigation by SPSRAS (2009-2014)
0102030405060708090
100110120
2009
2010
2011
2014
2009
2010
2011
2014
2009
2010
2011
2014
2009
2010
2011
2014
2009
2010
2011
2014
2009
2010
2011
2014
2009
2010
2011
2014
2009
2010
2011
2014
FRCC MRO NPCC RFC SERC SPP ERCOT WECC
Coun
t
Region and Year
SPSRAS
Reliability Metrics Performance
37
Table 5 ALR6-1 Transmission Constraint Mitigation by Operating ProcedureGuides (2009-2011)
ALR6-1 Transmission Constraint Mitigation by Operating ProcedureGuides (2009-2014)
2009 2010 2011 2014
FRCC 107 75 66
MRO 79 79 81 81
NPCC 0 0 0
RFC 2 1 3 4
SPP 39 40 40 40
SERC 6 7 15
ERCOT 29 25 25
WECC 110 111
Special Considerations
A certain number of SPS mitigation plans may be necessary to support reliable operation of the system
If the number of SPS increase over time this may indicate that additional transmission capacity is
required A reduction in the number of SPS may be an indicator of increased generation or transmission
facilities being put into service which may indicate greater robustness of the bulk power system In
general mitigation plans are a viable and valuable tool for effective operation of the bulk power system
In power system planning reliability operability capacity and cost-efficiency are simultaneously
considered through a variety of scenarios to which the system may be subjected Mitigation measures
are a method for optimizing a power system across these scenarios Changes in quantities of mitigation
plans may indicate year-on-year differences in the system being evaluated
Integrated Bulk Power System Risk Assessment
Introduction In developing eighteen metrics to measure acceptable levels of reliability it has become clear that any
such measurement of reliability must include consideration of the risks present within the bulk power
system in order for us to appropriately prioritize and manage these system risks The scope for the
Reliability Metrics Working Group (RMWG)27
27 The RMWG scope can be viewed at
includes a task to develop a risk-based approach that
provides consistency in quantifying the severity of events The approach not only can be used to
httpwwwnerccomfilezrmwghtml
Reliability Metrics Performance
38
measure risk reduction over time but also can be applied uniformly in event analysis process to identify
the events that need to be analyzed in detail and sort out non-significant events
The Operating Committee (OC) and Planning Committee (PC) endorsed the concepts and framework28 of
the risk-based approach in their September 2010 joint meeting and further supported the event severity
risk index (SRI) calculation29
Recommendations
in March 2011
bull NERC should embrace the use of risk assessment to identify trends in addition to lessons learned
in order to improve bulk power system reliability
bull The RMWG should continue to coordinate and communicate with the Event Analysis Working
Group (EAWG) to apply the SRI into the event analysis process and root cause analysis
bull As trend evaluations increase the knowledge of risks to the bulk power system data required to
support additional assessment should be gathered
Event Severity Risk Index (SRI)
Risk assessment is an essential tool for achieving the alignment between organizations people and
technology This will assist in quantifying inherent risks identifying where potential high risks exist and
evaluating where the most significant lowering of risks can be achieved Being learning organizations
the Electric Reliability Organization (ERO) Regional Entities and Registered Entities can use these tools
to focus on the areas of highest risk to reliability to provide a sound basis for developing results-based
standards and compliance programs Risk assessment also serves to engage all stakeholders in a
dialogue about specific risk factors and helps direct a strategic plan for risk reduction and early
detection
The SRI is a daily blended metric for which transmission loss generation loss and load loss events are
calculated Each element (transmission generation and load loss) is factored by the systemrsquos inventory
for that element to rate significant events appropriately On a yearly basis these daily performances
can be sorted in descending order to evaluate the year-on-year performance of the system
In order to test drive the concepts the RMWG applied these calculations against historically memorable
days to derive SRIs Once these calculations were complete they were reviewed and evaluated by
various stakeholders for reasonableness Based upon feedback modifications to the calculation were
made and assessed against the historic days performed This iterative process locked down the details
28 httpwwwnerccomdocspcrmwgIntegrated_Bulk_Power_System_Risk_Assessment_Concepts_Finalpdf 29 httpwwwnerccomdocspcrmwgSRI_Equation_Refinement_May6_2011pdf
Reliability Metrics Performance
39
for the calculation of SRI whose calculation from zero (no transmission line outages generation outages
or load lost in a day) to 1000 (a theoretical condition in which every transmission line all generation
units and all load lost across the system in a single day)
Figure 20 captures the calculated severity risk value for each of the days for each year benchmarked
with the historic significant events which were used to concept test the calculation Since there is
significant disparity between days the bulk power system is stressed compared to those that are
ldquoroutinerdquo and ldquoherordquo days of the year where the system performed extremely well the curve is depicted
using a logarithmic scale Each yearrsquos data is sorted in descending order striking a characteristic shape
At the left-side of the curve the days in which the system is severely stressed are plotted The central
more linear portion of the curve identifies the routine day performance while the far right-side of the
curve shows the values plotted for days in which almost all lines and generation units are in service and
essentially no load is lost
The trends on the chart below show that 2009 and 2010 had fewer extreme days than 2008 Routine
daily performance appears generally consistent across all three years Figure 20 captures the days for
each year benchmarked with historically significant events
In Figure 20 NERCrsquos event categories and SRI ratings are directly related As the SRI increases the
category or severity of the event increases Historical events are also shown to relate modern
reliability measurements to give a perspective of how a well-known event would register on the SRI
scale
The event analysis process30
30
benefits from the SRI as it enables a numerical analysis of an event in
comparison to other events By this measure an event can be prioritized by its severity In a severe
event this is unnecessary However for events that do not result in severe stressing of the bulk power
system this prioritization can be a challenge By using the SRI the event analysis process can decide
which events to learn from and reduce which events to avoid and when resilience needs to be
increased under high impact low frequency events as shown in the blue boxes in the figure
httpwwwnerccompagephpcid=5|365
Reliability Metrics Performance
40
Figure 20 NERC Annual Daily Severity Risk Index (SRI) Sorted Descending with Historic Benchmark Days
Other factors that impact severity of a particular event to be considered in the future include whether
equipment operated as designed and resulted in loss of load from a reliability perspective (intentional
and controlled load-shedding) Mechanisms for enabling ongoing refinement to include the historic and
simulated events for future severity risk calculations are being explored
Reliability Metrics Performance
41
Integrated Reliability Index Concepts In December 2010 the RMWG was challenged by the OC and PC to develop a single index concept to
measure the universe of risks associated with the bulk power system As a result the integrated
reliability index (IRI) concepts were proposed31
Figure 21
the three components of which were defined to
quantify each specific risk aspect They are titled the Event Driven Index (EDI) StandardsStatute Driven
Index (SDI) and Condition Driven Index (CDI) illustrated in with measures associated with
system events standards compliance and eighteen performance metrics The development of an
integrated reliability index aims to inform increase transparency and quantify the effectiveness of risk
reduction or mitigation actions The goal is to provide the industry meaningful trends of the BPSrsquos
performance and guidance on how the industry can improve reliability and support risk-informed
decision making Once completed the IRI will facilitate holistic assessment of performance Finally the
IRI should help overcome concern and confusion about how many metrics are being analyzed for system
reliability assessments
Figure 21 Risk Model for Bulk Power System
The integrated model of event-driven condition-driven and standardsstatute-driven risk information
can be constructed to illustrate all possible logical relations between the three risk sets Due to the
nature of the system there may be some overlap among the components
31 httpwwwnerccomdocspcrmwgIntegrated_Reliability_Index_WhitePaper_DRAFTpdf
Event Driven Index (EDI)
Indicates Risk from
Major System Events
Standards Statute Driven
Index (SDI)
Indicates Risks from Severe Impact Standard Violations
Condition Driven Index (CDI)
Indicates Risk from Key Reliability
Indicators
Reliability Metrics Performance
42
The Three Components of the IRI The three components of the IRI work together as shown in Figure 22 to comprise a full picture of the
state of reliability
Figure 22 An overview of the components that comprise the Integrated Reliability Index (IRI)
Event-Driven Indicators (EDI)
The Event-Driven Indicator provides a basis for prioritization of events based on bulk power system
integrity equipment performance and engineering judgment This indicator can serve as a high value
risk assessment tool to be used by stakeholders to investigate and evaluate disturbance history and
measure the severity of these events The relative ranking of events requires industry expertise agreed-
upon goals and engineering judgment The EDI is a derivative of SRI results for a specific time period
but it transforms that performance into a form of an availability index These calculations will be further
refined as feedback is received
Condition-Driven Indicators (CDI)
The Condition-Driven Indicators focus on a set of measurable system conditions (performance
measures) to assess bulk power system reliability These reliability indicators identify factors that
positively or negatively impact reliability and are early predictors of the risk to reliability from events or
unmitigated violations A collection of these indicators measures how close reliability performance is to
the desired outcome and if the performance against these metrics is constant or improving
Reliability Metrics Performance
43
StandardsStatute-Driven Indicators (SDI)
The StandardsStatute-Driven Indicator is a calculation of success of compliance based upon the subset
of high-value standards and is divided by the number of participations who could have received the
violation within the time period considered Also based on these factors known unmitigated violations
of elevated risk factor requirements are weighted higher than lower risk factors The index decreases if
the compliance improvement is achieved over a trending period
IRI Index Calculation As with the SRI the IRI is based on an importance weighting factor which the RMWG can modify over
time after gaining experience with the new metric as well as consideration of feedback from industry
At this time the RMWG believes some form of blended weighting may serve to start to populate IRI
characteristic curves at a high and generic level Based upon feedback from stakeholders this approach
may change or as discussed below weighting factors may vary based on periodic review and risk model
update The RMWG will continue the refinement of the IRI calculation and consider other significant
factors that impact reliability (eg intentional and controlled load-shedding) further it will explore
developing mechanisms for enabling ongoing refinement which should be influenced by a wide set of
stakeholders
RMWG recommends the Event Driven Index (EDI) be weighted the highest (50 percent) since events
actually occurred indicating how the system was performing The Condition Driven Index (CDI) and
StandardsStatute Driven Index (SDI) are weighted 25 each since they are indicators of potential risks
to BPS reliability IRI can be calculated as follows
IRI is intended to be a composite metric which integrates several forms of individual risks to the bulk
power system Since the three components range across many stakeholder organizations these
concepts are developed as starting points for continued study and evaluation Additional supporting
materials can be found in the IRI whitepaper32
IRI Recommendations
including individual indices calculations and preliminary
trend information
For the IRI more investigation should be performed to determine the best way to integrate EDI CDI
and SDI into an Integrated Reliability Index (IRI) that quantitatively represents the reliability of the bulk
32 The IRI whitepaper can be found at httpwwwnerccomdocspcrmwgIntegrated_Reliability_Index_WhitePaper_DRAFTpdf
Reliability Metrics Performance
44
power system To this end study into determining the amount of overlap between the components is
necessary RMWG is currently working to determine the proper amount of overlap between the IRI
components
Also the CDI component of the IRI needs to be solidified This is especially true with the CDI More
accurate metric data is needed to paint a fuller picture of the CDI Many of the metrics used to calculate
the CDI are new or they have limited data Compared to the SDI which counts well-known violation
counts and the EDI which uses the well-defined CDI the CDI lacks the depth of rigor that the other two
components have acquired through their years of data RMWG is currently working to improve the CDI
Reliability Metrics Conclusions and Recommendations Among the eighteen metrics that address the characteristics of an adequate level of reliability (ALR)
metric trends indicate the system is performing better in the following seven areas
bull ALR1-3 Planning Reserve Margin
bull ALR1-4 BPS Transmission Related Events Resulting in Loss of Load
bull ALR2-5 Disturbance Control Events Greater than Most Severe Single Contingency
bull ALR6-2 Energy Emergency Alert 3 (EEA3)
bull ALR6-3 Energy Emergency Alert 2 (EEA2)
bull ALR6-11 Automatic Transmission Outages Caused by Protection System Misoperations
bull ALR6-13 Automatic Transmission Outages Caused by Failed AC Substation Equipment
Assessments have been made in other performance categories A number of them do not have
sufficient data to derive any conclusions from the results The RMWG recommends continued data
collection and assessment of these metrics If a metric does not yield any trend in a five-year reporting
period the metric will be modified or withdrawn
For the IRI more investigation should be performed to determine the overlap of the components (CDI
EDI and SDI) The CDI should be more thoroughly solidified as an index by collecting more data over
time
Transmission Equipment Performance
45
Transmission Equipment Performance Introduction The Transmission Availability Data System (TADS) effort began with the establishment of a TADS task force
by the NERC Planning Committee in October 2006 On October 27 2007 the NERC Board of Trustees
approved the collection of transmission automatic outage data beginning in calendar year 2008 (Phase I)
Subsequently on October 29 2008 the NERC Board approved the collection of Non-Automatic Outage data
that began for Calendar year 2010 (Phase II)
This chapter provides reliability performance analysis of the transmission system by focusing on the trends
of Automatic Outage data from calendar year 2008 thru 2010 Since only one year of Non-Automatic
Outage data has been collected that data will not be assessed in this report
When calculating bulk power system performance indices care must be exercised when interpreting results
as misinterpretation can lead to erroneous conclusions regarding system performance With only three
years of data in the smaller regions it is not clear whether a regionrsquos yearly outage variation compared to
the average is due to random statistical variation or that particular year is significantly different in
performance However on a NERC-wide basis after three years of data collection there is enough
information to accurately determine whether the yearly outage variation compared to the average is due to
random statistical variation or the particular year in question is significantly different in performance33
Performance Trends
Transmission performance information has been provided by Transmission Owners (TOs) within NERC
through the NERC TADS (Transmission Availability Data System) process The data presented reflects
Momentary and Sustained AC Automatic outages of transmission elements that operate at voltages ge 200 kV
(including the low side of transformers) with the criteria specified in the TADS process The following
elements listed below are included
bull AC Circuits ge 200 kV (Overhead and Underground Circuits) Radial circuits are included
bull DC Circuits with ge +-200 kV DC voltage
bull Transformers with ge 200 kV low-side voltage and
bull ACDC Back-to-Back (BTB) Converters with ge 200 kV AC voltage on both sides
33The detailed Confidence Interval computation is available at httpwwwnerccomdocspctadstfTADS_Nov_2_2007APPENDIX_C_Confidence_Intervalpdf
Transmission Equipment Performance
46
AC Element Outage Summary and Leading Causes Table 6 shows the 2008 2009 and 2010 NERC total AC transmission element inventory and a summary of
the associated outages As expected in general the number of circuits increased from year to year due to
new construction or re-construction to higher voltages For every outage experienced on the transmission
system cause codes are identified and recorded according to the TADS process Causes of both momentary
and sustained outages have been indicated These causes are analyzed to identify trends and similarities
and to provide insight into what could be done to possibly prevent future occurrences
Figure 23 and Figure 24 describe the top ten initiating cause codes for sustained and momentary automatic
outages combined from 2008-2010 Based on the two figures the relationship between the total number of
outages and total outage hours can be seen Failed AC Substation Equipment and Failed AC Circuit
Equipment only account for 15 percent of the total number of outages but account for 65 percent of the
total outage hours The two largest causes of outages within NERC (ldquoLightingrdquo and ldquoWeather excluding
Lightningrdquo) account for 34 percent of the total number of outages
The next three Human Error Failed Protection System Equipment and Failed AC Circuit Equipment have
very similar totals and should all be considered significant focus points in reducing the number of Sustained
Automatic Outages for all elements
Transmission Equipment Performance
47
Table 6 NERC - All AC Elements Sustained and Momentary Outage Performance Summary
2008 Number of Outages
AC Voltage
Class
No of
Circuits
Circuit
Miles Sustained Momentary
Total
Outages Total Outage Hours
200-299kV 4369 102131 1560 1062 2622 56595
300-399kV 1585 53631 793 753 1546 14681
400-599kV 586 31495 389 196 585 11766
600-799kV 110 9451 43 40 83 369
All Voltages 6650 196708 2785 2051 4836 83626
2009 Number of Outages
AC Voltage
Class
No of
Circuits
Circuit
Miles Sustained Momentary
Total
Outages Total Outage Hours
200-299kV 4468 102935 1387 898 2285 28828
300-399kV 1619 56447 641 610 1251 24714
400-599kV 592 32045 265 166 431 9110
600-799kV 110 9451 53 38 91 442
All Voltages 6789 200879 2346 1712 4038 63094
2010 Number of Outages
AC Voltage
Class
No of
Circuits
Circuit
Miles Sustained Momentary
Total
Outages Total Outage Hours
200-299kV 4567 104722 1506 918 2424 54941
300-399kV 1676 62415 721 601 1322 16043
400-599kV 605 31590 292 174 466 10442
600-799kV 111 9477 63 50 113 2303
All Voltages 6957 208204 2582 1743 4325 83729
Note The NERC table does not show redacted outages DC Circuit outages Transformer outages or ACDC
converter outages
Transmission Equipment Performance
48
Figure 23 NERC - Top Ten Sustained and Momentary Outages by Initiating Cause Code for All Elements
Figure 24 NERC - Top Ten Sustained Outage Hours by Cause Code
198
151
80
7271
6943
33
27
188
68
Lightning
Weather excluding lightningHuman Error
Failed AC Substation EquipmentFailed Protection System EquipmentFailed AC Circuit Equipment Foreign Interference
Power System Condition
Fire
Unknown
Remaining Cause Codes
299
246
188
58
52
42
3619
16 12 31 Failed AC Substation EquipmentFailed AC Circuit Equipment Weather excluding lightningUnavailable
Other
Fire
Unknown
Human Error
Failed Protection System EquipmentForeign Interference
Remaining Cause Codes
Transmission Equipment Performance
49
Transmission Monthly Outages Figure 25 displays the total number of Automatic Outages on a per-month basis The three months with the
highest total of outages were June July and August From a seasonal perspective winter had a monthly
average of 281 outages These include the months of November-March Summer had an average of 429
outages Summer included the months of April-October
Figure 25 Number of Outages by Month for AC Circuits (2008-2010)
This figure does not show redacted outages DC Circuit outages Transformer outages or ACDC Converter
outages
Outage Initiation Location For every outage experienced on the transmission system the outage initiation code is identified and
recorded according to the TADS process The outage initiation code can be analyzed to identify trends and
similarities and to provide insight into what could be done to possibly prevent future occurrences
The ldquoOutage Initiation Coderdquo describes where an automatic outage was initiated on the power system The
five codes are as follows
bull Element-Initiated
bull Other Element-Initiated
bull AC Substation-Initiated
bull ACDC Terminal-Initiated (for DC circuits)
bull Other Facility Initiated any facility not included in any other outage initiation code
JanuaryFebruar
yMarch April May June July August
September
October
November
December
2008 238 229 257 258 292 437 467 380 208 176 255 236
2009 315 201 339 334 398 553 546 515 351 235 226 294
2010 444 224 269 446 449 486 639 498 351 271 305 281
3 Year AVG 332 218 288 346 380 492 551 464 303 227 262 270
0
100
200
300
400
500
600
700
Out
ages
Transmission Equipment Performance
50
Notably the protection system is not part of an ldquoAC Substationrdquo or an ldquoACDC Terminalrdquo If a protection
system misoperates and initiates an outage it will be classified as ldquoOther-Facility Initiatedrdquo The following
Figures show the initiating location of the Automatic outages from 2008 to 2010
With both Momentary and Sustained Automatic Outages taken into account the outage was initiated on the
Element more than 67 percent of the time as shown in Figure 26 and Figure 27
When only the Sustained Automatic Outages are analyzed the outage initiation on both AC Substation and
Other Facility increased by 34 percent and 32 percent respectively Outages initiated on the Element itself
decreases by 78 percent as shown in Figure 26 and 27 For only the Momentary Automatic Outages the
outage initiation on the Element increases by 19 percent compared to Sustained Outages Element initiated
outages make up over 78 percent of the total outages when analyzing only Momentary Outages
Figure 26
Figure 27
Transmission Outage Events Figure 28 illustrates the relationship between the numbers of Automatic Outages associated per TADS
event 2008 2009 and 2010 tend to follow the same trend The largest number of Automatic Outages per
TADS event is fourteen in 2010 thirteen in 2009 and eight in 2008 There are around 70 to 100 TADS
events that contain between fourteen and three Automatic Outages (see below) There are around 330 to
400 TADS events that contain two or more Automatic Outages The rest of the events only contain one
Automatic Outage As noted in the lower right hand corner below the total number of Events in 2008 to
2010 ranged from 3920 to 4569 events per year Nearly 90 percent or more of the events contained one
Automatic Outage
Figure 26 Sustained Automatic Outage Initiation
Code
Figure 27 Momentary Automatic Outage Initiation
Code
Transmission Equipment Performance
51
Transmission Outage Mode Figure 29 and Figure 30 show the percentage of Outage Modes The ldquoOutage Mode Coderdquo describes
whether one Automatic Outage is related to other Automatic Outages A Single Mode outage is an
Automatic Outage of a single Element which occurs independently of any other Automatic Outages (if any)
A ldquoDependent Mode Initiating Outagerdquo is an Automatic Outage of a single Element that initiates one or more
subsequent Element Automatic Outages A ldquoDependent Mode Outagerdquo is an Automatic Outage of an
Element which occurred as a result of an initiating outage whether the initiating outage was an Element
outage or a non-Element outage A ldquoCommon Mode Outagerdquo is one of two or more Automatic Outages with
the same Initiating Cause Code and where the outages are not consequences of each other and occur nearly
simultaneously A ldquoCommon Mode Initiating Outagerdquo is a Common Mode Outage that initiates one or more
subsequent Automatic Outages
Over 72 percent of the total outages occurred on the bulk power system are Single Mode Outages The next
largest mode is Dependent with over 11 percent of the total outages being in this category For only
Sustained Automatic Outages outages related to each other increase with Dependent mode accounting for
13 percent of the outages and Common mode accounting for close to 11 percent of the outages
Independent Sustained outages still account for the largest portion with nearly 70 percent being Single
mode When just analyzing Momentary Automatic Outages Associated outages decrease with Dependent
Figure 28 Event Histogram (2008-2010)
Transmission Equipment Performance
52
mode accounting for only 9 percent of the outages The Common Mode percentage decreases while
Dependent Mode Initiating percentage increases compared to Sustained Outages Independent Momentary
outages account for the largest portion with over 76 percent being Single Mode
An investigation into the root causes of Dependent and Common mode events which include three or more
Automatic Outages (indentified in the TADS 2008 to 2010 data) should be a high priority Some protection
systems are designed to trip three or more circuits but some events go beyond what is designed Some also
have misoperations associated with multiple outage events
Conclusions On a NERC wide average basis automatic transmission outage rate is improving from 2008 to 2010 based on
reported data Considering both automatic and non-automatic outages 2010 records indicate transmission
element availability percentage is very high and exceeds 95 The unavailability rate for AC circuits and
transformers are only 15 and 29 respectively
The cause codes of Human Error Failed Protection System Equipment and Failed AC Circuit Equipment
should be considered significant focus points in reducing the number of Sustained Automatic Outages for all
elements A deeper look into the root causes of Dependent and Common mode events which include three
or more Automatic Outages (indentified in the TADS 2008 to 2010 data) should be a high priority Some
protection systems are designed to trip three or more circuits but some events go beyond what is designed
Some also have misoperations associated with multiple outage events
Figure 29 Sustained Automatic Outage Mode code Figure 30 Momentary Automatic Outage Mode code
Generation Equipment Performance
53
Generation Equipment Performance Introduction The development of the Generating Availability Data System (GADS) began in 1982 This series of databases
is used to voluntarily collect record and retrieve operating information By pooling individual unit
information with likewise units generating unit availability performance can be calculated providing
opportunities to identify trends and generating equipment reliability improvement opportunities The
information is used to support equipment reliability availability analyses and risk-informed decision-making
by system planners generation owners assessment modelers manufacturers and contractors etc Reports
and information resulting from the data collected through GADS are now used for benchmarking and
analyzing electric power plants
Currently the data collected through GADS contains 72 percent of the North American generating units
with generating capacity of 20 MW or higher34 Additionally many of the newer combined-cycle plants are
not reporting information and therefore a full view of each unit type is not presented Rather a sample of
all the units in North America that fit a given more general category is provided35 for the 2008-201036
Generation Key Performance Indicators
assessment period
Three key performance indicators37
In
the industry have used widely to measure the availability of generating
units (see Terms Used in This Report section for their calculation parameters) are Equivalent Availability
Factor (EAF) Net Capacity Factor (NCF) and Equivalent Forced Outage Rate ndash Demand (EFORd)
Table 7 the North American fleet average EAF NCF and EFORd compared to unit age for all generating
units with a capacity of 20 MW and higher is provided for the years 2008-2010 The EAF shows a decline
during the last three years NCF is up and down while the EFORd appears to be increasing As expected the
fleet of units reported to GADS is aging overall with the fossil units being about 12 years older than the
average age
34 httpwwwnerccomdocspcgadstfGADSTF_Recommendation_Report_02-18-2011_FINALpdf 35GADS contains some 1500+ units under 20 MW that is not included in this report These units are excluded because most units are not base-loaded and are in peaking operation
3684 percent of the 2010 dataset is available at this time while the 2008 and 2009 dataset is complete 37 httpwwwnerccompagephpcid=4|43
Generation Equipment Performance
54
Table 7 General Availability Review of GADS Fleet Units by Year
2008 2009 2010 Average
Equivalent Availability Factor (EAF) 8776 8774 8678 8743
Net Capacity Factor (NCF) 5083 4709 4880 4890
Equivalent Forced Outage Rate -
Demand (EFORd) 579 575 639 597
Number of Units ge20 MW 3713 3713 3713 3713
Average Age of the Fleet in Years (all
unit types) 303 311 321 312
Average Age of the Fleet in Years
(fossil units only) 422 432 440 433
Figure 31 provides the average forced outage hours (FOH) maintenance outage hours (MOH) and planned
outage hours (POH) for all units reporting 20 MW or larger During this three-year period the average FOH
291 hours average MOH is 163 hours average POH is 470 hours
Figure 31 shows a large increase in forced and maintenance events The average age of the units with a
capacity of 20MW and higher in 2009 is 316 years old However the average age of fossil units in 2010 is
442 years old These fossil units are the backbone of all operating units providing the base-load power
continuously and nearly 50 percent of all energy annually There appears to be no increase allocated for
annualsemi-annual maintenance (ie planned outages) for the older generating units The increase of
000100002000030000400005000060000700008000090000
100000
2008 2009 2010
463 479 468
154 161 173
288 270 314
Hou
rs
Planned Maintenance Forced
Figure 31 Average Outage Hours for Units gt 20 MW
Generation Equipment Performance
55
maintenance outage hours reflects an increased need to fix problems that cannot be deferred until the next
annualsemi-annual repairs As a result it shows one of two things are happening
bull More or longer planned outage time is needed to repair the aging generating fleet
bull More focus on preventive repairs during planned and maintenance events are needed
Multiple Unit Forced Outages and Causes Table 8 provides the annual multiple-unit forced outage trips resulting from the same cause for each of the
assessments years 2008-2010 respectively The ldquosingle unitrdquo trips are large units with a Net Dependable
Capacity of 750 MW or more The trips of ldquotwo unitsrdquo or more is any combination of unit capacity with the
total amount of lost capacity more than 750 MW
Table 8 also presents more information on the forced outages During 2008-2010 there were a large
number of double-unit outages resulting from the same event Investigations show that some of these trips
were at a single plant caused by common control and instrumentation for the units The incidents occurred
several times for several months and are a common mode issue internal to the plant
Table 8 Number of Multiple Unit Forced Outages and FrequencyYear
2008 2009 2010
Type of
Trip
of
Trips
Avg Outage
Hr Trip
Avg Outage
Hr Unit
of
Trips
Avg Outage
Hr Trip
Avg Outage
Hr Unit
of
Trips
Avg Outage
Hr Trip
Avg Outage
Hr Unit
Single-unit
Trip 591 58 58 284 64 64 339 66 66
Two-unit
Trip 281 43 22 508 96 48 206 41 20
Three-unit
Trip 74 48 16 223 146 48 47 109 36
Four-unit
Trip 12 77 19 111 112 28 40 121 30
Five-unit
Trip 11 1303 260 60 443 88 19 199 10
gt 5 units 20 166 16 93 206 50 37 246 6
Loss of ge 750 MW per Trip
The high number of five-unit trips in 2008 was due to Hurricane Ike hitting the Gulf Coast The highest total
number of multiple unit trips occurred in 2009 though as mentioned before the data collection for 2010 is
incomplete at this time The majority of 2009 multiple unit trips have three main causes (in order by
Generation Equipment Performance
56
number of events) transmission lack of fuel and storms A summary of the three categories for single as
well as multiple unit outages (all unit capacities) are reflected in Table 9
Table 9 Common Causes of Multiple Unit Forced Outages (2009)
Cause Number of Events Average MW Size of Unit
Transmission 1583 16
Lack of Fuel (Coal Mines Gas Lines etc) Not
in Operator Control
812 448
Storms Lightning and Other Acts of Nature 591 112
Some of the transmission outages based on storms in 2009 have been caused by the same reasons because
the storms may have caused transmission interference However the plants reported the problems
inconsistently with either the transmission interference or storms cause code Therefore they are depicted
as two different causes of forced outage
Marked transmission outages in 2009 were quite high Thirty-five percent came from one utility with a large
number of hydroelectric units The company related the trips to various problems including weather
(lightning storms) wildlife ldquoline bumpsrdquo and problems on the receiving end of the transmission line Nine
hundred and eighty-five transmission trips (62 percent) were from hydroelectric units38
In 2009 only ten transmission trips resulted in a loss of 750 MW or more per trip Twenty two generating
plants were affected by the ten trips Causes for the trips include feeder line trips (1 trip) breakers in the
switchyard (8 trips) personnel errors (2 trips) and unknown (10 trips)
The ldquoLack of Fuelrdquo outages are of interest as these events occur during the times when a unit is available to
operate but there is an interruption in fuels to operate the facilities These events do not include
interruptions of fuel due to contracts Rather the cause code is designed to account for units that are
expecting fuel and it is unavailable when requested Table 10 presents the distribution of ldquoLack of Fuelrdquo
events by NERC Region and Table 11 presents the unit types affected
38 The average size of the hydroelectric units were small ndash 335 MW
Generation Equipment Performance
57
Of the units that report ldquoLack of Fuelrdquo 78 percent of the units are oil-fired 15 percent of the units are gas-
fired and the remaining units are various other fuels Table 12 provides the top causes of forced outage for
several unit types For fossil units ldquoLack of Fuelrdquo as the number three cause behind waterwall tube leaks
and superheater tube leaks
Table 10 Forced Outages Due to Lack of Fuel by Region
Region Number of Lack of Fuel
Problems Reported
FRCC 0
MRO 3
NPCC 24
RFC 695
SERC 17
SPP 3
TRE 7
WECC 29
One company contributed to the majority of oil-fired lack of fuel events The units at the company are
actually dual-fuels (oil and gas) but market nominated gas monitoring causes the units to be on forced
outage nightly The units need gas to start up so they can run on oil When they shut down the units must
switch to gas to clean themselves With the gas restriction the unit canrsquot start and the unit goes on a
forced outage Until the band is lifted the two units will continue to be on a forced outage cycle
Event records also provide descriptions of why the unit was without fuel with the majority of descriptions
bull Temperatures affecting gas supply valves
bull Unexpected maintenance of gas pipe-lines
bull Compressor problemsmaintenance
Generation Equipment Performance
58
Table 11 Unit Type Profile of Forced Outages Due to Lack of Fuel
Unit Types Number of Lack of Fuel Problems Reported
Fossil 642
Nuclear 0
Gas Turbines 88
Diesel Engines 1
HydroPumped Storage 0
Combined Cycle 47
Generation Equipment Performance
59
Table 12 Causes of Forced Outage for Different Unit Types (2008-2010)
Fossil - all MW sizes all fuels
Rank Description Occurrence per Unit-year
MWH per Unit-year
Average Hours To Repair
Average Hours Between Failures
Unit-years
1 Waterwall (furnace wall) 0590 134106 59 3250 3868 2 Second Superheater
Leaks 0180 5182 60 3228 3868
3 Lack of Fuel (coal mines gas lines etc) where the operator is not in control
0480 4701 18 26 3868
Combined-Cycle blocks Rank Description Occurrence
per Unit-year
MWH per Unit-year
Average Hours To Repair
Average Hours Between Failures
Unit-years
1 HP Turbine Buckets Or Blades
0020 4663 1830 26280 466
2 Turbine Control Valves 0040 2777 100 7200 466 3 Gas Turbine Compressor -
High Pressure Shaft 0010 2266 663 4269 466
Nuclear units - all Reactor types Rank Description Occurrence
per Unit-year
MWH per Unit-year
Average Hours To Repair
Average Hours Between Failures
Unit-years
1 LP Turbine Buckets or Blades
0010 26415 8760 26280 288
2 Containment Structure 0010 9233 1226 26262 288 3 Feedwater Pump Local
Controls 0020 7620 692 12642 288
Simple-cycle gas turbine jet engines Rank Description Occurrence
per Unit-year
MWH per Unit-year
Average Hours To Repair
Average Hours Between Failures
Unit-years
1 Main Transformer 0030 1611 1016 20709 4181 2 Other Gas Turbine
Controls And Instrument Problems
0120 428 70 2614 4181
3 Other Gas Turbine Problems
0090 400 119 1701 4181
Generation Equipment Performance
60
2008-2010 Review of Summer versus Winter Availability To address seasonality of unit availability unit information for the months of June to September (summer)
and December through February (winter) were pooled to calculate force events during these timeframes for
2008-201039 Figure 32 shows the Equivalent Availability Factor (EAF) is three percentage points higher and
the Equivalent Forced Outage Rate - Demand (EFORd) is more than a half of a percentage point lower in the
summer period than in winter period This means the units were more reliable with less forced events
during high-demand times during the summer than during the winter seasons The generating unitrsquos
capability has a resulting higher Net Capacity Factor (NCF) of 45 percentage points in the summer season
for 2008-2010
During the spring season (March-May) 77 percent of the units took a planned outage (PO) for an average
231 hours (or 96 days) In fall (October-November) only 42 percent of the units experienced a PO and the
average duration was shorter ndash 134 hours (or 56 days) A few units took both spring and fall planned
outages although this is rare Based on this assessment the generating units are prepared for the summer
peak demand The resulting availability indicates that this maintenance was successful which is measured
by an increased EAF and lower EFORd
Figure 32 Summer-Winter Average EAF NCF and EFORd (2008-2010)
Conclusions and Recommendations During 2008-2010 the average Equivalent Availability Factor (EAF) which measures the overall availability
of generating units decreased At the same time the Net Capacity Factor (NCF) an indicator of energy
production increased The average number of forced outages in 2010 is greater than in 2008 while at the
same time the average planned outage times have decreased As a result the Equivalent Forced Outage
Rate ndash Demand (EFORd) also increased illustrating that more units have experienced forced events during
39 A study of peak periods was conducted by the NERC Generating Availability Trend Evaluation (GATE) Working Group several years ago see httpwwwnerccomfilesSeasonal-Performance-Trendspdf
9116
5343
396
8818
4896
441
0 10 20 30 40 50 60 70 80 90 100
EAF
NCF
EFORd
Percent ()
Winter
Summer
Generation Equipment Performance
61
peak-demand times in 2010 than in the previous two years Potentially with shorter planned outage
periods in 2010 there may be less time to repair equipment and prevent forced unit outages
There are warnings that units are not being maintained as well as they should be In the last three years
there has been an increase in Equivalent Forced Outage Rate ndash Demand (EFORd) This indicator measures
the rate of forced outage events on generating units during periods of load demand To confirm this
problem forced outage hours jumped from 270 to 314 hours per unit between 2009 and 2010 At the same
time maintenance events also increased by 12 hours per unit Planned outage events remain constant The
resulting conclusions from this trend are
bull More or longer planned outage time is needed to repair the generating fleet Whether age is the
cause of the increase need for planned outage time remains unknown and further investigation into
the cause for longer planned outage time is necessary
bull More focus on preventive repairs during planned and maintenance events are needed
There are many multiple unit forced outages due to lack of fuel The majority of multiple unit trips have
three main causes transmission lack of fuel and storms With special interest in the forced outages due to
ldquoLack of Fuelrdquo additional analysis revealed that 77 percent of the units experiencing unexpected fuel
stoppage are oil-fired fossil units while gas-fired units experienced 15 percent
Generating units continue to be more reliable during the peak summer periods
Disturbance Event Trends
62
Category 1 An event resulting in one or more of the following a Unintended loss of three or more BPS elements caused by
common mode failure b Failure or misoperation of an SPSRAS c System-wide voltage reduction of 3 or more d Unintended BPS system separation resulting in an island of
100 MW to 999 MW e Unplanned evacuation from a control center facility with BPS
SCADA functionality for 30 minutes or more Category 2 An event resulting in one or more of the following
a Complete loss of all BPS control center voice communication system(s) for 30 minutes or more
b Complete loss of SCADA control or monitoring functionality for 30 minutes or more
c Voltage excursions equal to or greater than 10 lasting more than five minutes
d Loss of off-site power (LOOP) to a nuclear generating station e Unintended system separation resulting in an island of 1000
MW to 4999 MW f Unintended loss of 300MW or more of firm load for more
than 15 minutes g Violation of an Interconnection Reliability Operating Limit
(IROL) for more than 30 minutes Category 3 An event resulting in one or more of the following
a The loss of load or generation of 2000 MW or more in the Eastern Interconnection or
b Western Interconnection or 1000 MW or more in the ERCOT or Queacutebec Interconnections
c Unintended system separation resulting in an island of 5000 MW to 10000 MW
d Unintended system separation resulting in an island of Florida from the Eastern Interconnection
Category 4 An event resulting in one or more of the following a The loss of load or generation from 5001 MW to 9999 MW b Unintended system separation resulting in an island of more
than 10000 MW (with the exception of Florida as described in Category 3c)
Category 5 An event resulting in one or more of the following a The loss of load of 10000 MW or more b The loss of generation of 10000 MW or more
Figure 33 BPS Event Category
Disturbance Event Trends Introduction The purpose of this section is to report event
analysis trends from the beginning of event
analysis field test40
One of the companion goals of the event
analysis program is the identification of trends
in the number magnitude and frequency of
events and their associated causes such as
human error equipment failure protection
system misoperations etc The information
provided in the event analysis database (EADB)
and various event analysis reports have been
used to track and identify trends in BPS events
in conjunction with other databases (TADS
GADS metric and benchmarking database)
to the end of 2010
The Event Analysis Working Group (EAWG)
continuously gathers event data and is moving
toward an integrated approach to analyzing
data assessing trends and communicating the
results to the industry
Performance Trends The event category is classified41
Figure 33
as shown in
with Category 5 being the most
severe Figure 34 depicts disturbance trends in
Category 1 to 5 system events from the
40 httpwwwnerccomdocseawgGalloway-Industry-EA-Field-Test-102210pdf 41httpwwwnerccomfiles2011-05-0220Event_Analysis_Process_Phase20220Field20Test20Draft20-20Final20-20For20postingpdf
Disturbance Event Trends
63
beginning of event analysis field test to the end of 201042
Figure 34 Event Category vs Date for All 2010 Categorized Events
From the figure in November and December
there were many more category 1 and 2 events than in October This is due to the field trial starting on
October 25 2010
In addition to the category of the events the status of the events plays a critical role in the accuracy of the
data By examining Figure 35 over 80 of the events reported in 2010 have been closed This means that
the category root cause and other important information have been sufficiently finalized in order for
analysis to be accurate for each event At this time there is not enough data to draw any long-term
conclusions about event investigation performance
42 Documents for the EA Field Test are located at httpwwwnerccompagephpcid=5|365
2
12 12
26
3
6 5
14
1 1
2
0
5
10
15
20
25
30
35
40
45
October November December 2010
Even
t Cou
nt
Category 3 Category 2 Category 1
Disturbance Event Trends
64
Figure 35 Event Count vs Status (All 2010 Events with Status)
By drilling down into the cause code for each closed 2010 event Figure 36 shows the top 3 event causes
From the figure equipment failure and protection system misoperation are the most significant causes for
events Because of how new and limited the data is however there may not be statistical significance for
this result Further trending of cause codes for closed events and developing a richer dataset to find any
trends between event cause codes and event counts should be performed
Figure 36 Top 3 Event Counts vs DAWG Cause Code for all Closed 2010 Events
10
32
42
0
5
10
15
20
25
30
35
40
45
Open Closed Open and Closed
Even
t Cou
nt
Status
1211
8
0
2
4
6
8
10
12
14
Equipment Failure Protection System Misoperation Human Error
Even
t Cou
nt
Cause Code
Disturbance Event Trends
65
Conclusions Due to the relatively new process for events analysis and categorization more time will be required before a
conclusive recommendation may be obtained Further analysis and new data should provide valuable
statistics in the future Over 80 of all event reports from 2010 are current listed as closed but no
conclusion about investigation performance may be obtained because of the limited amount of data It is
recommended to study ways to prevent equipment failure and protection system misoperations but there
is not enough data to draw a firm conclusion about the top causes of events at this time
Abbreviations Used in This Report
66
Abbreviations Used in This Report
Acronym Definition ALP Acadiana Load Pocket
ALR Adequate Level of Reliability
ARR Automatic Reliability Report
BA Balancing Authority
BPS Bulk Power System
CDI Condition Driven Index
CEII Critical Energy Infrastructure Information
CIPC Critical Infrastructure Protection Committee
CLECO Cleco Power LLC
DADS Future Demand Availability Data System
DCS Disturbance Control Standard
DOE Department Of Energy
DSM Demand Side Management
EA Event Analysis
EAF Equivalent Availability Factor
ECAR East Central Area Reliability
EDI Event Drive Index
EEA Energy Emergency Alert
EFORd Equivalent Forced Outage Rate Demand
EMS Energy Management System
ERCOT Electric Reliability Council of Texas
ERO Electric Reliability Organization
ESAI Energy Security Analysis Inc
FERC Federal Energy Regulatory Commission
FOH Forced Outage Hours
FRCC Florida Reliability Coordinating Council
GADS Generation Availability Data System
GOP Generation Operator
IEEE Institute of Electrical and Electronics Engineers
IESO Independent Electricity System Operator
IROL Interconnection Reliability Operating Limit
Abbreviations Used in This Report
67
Acronym Definition IRI Integrated Reliability Index
LOLE Loss of Load Expectation
LUS Lafayette Utilities System
MAIN Mid-America Interconnected Network Inc
MAPP Mid-continent Area Power Pool
MOH Maintenance Outage Hours
MRO Midwest Reliability Organization
MSSC Most Severe Single Contingency
NCF Net Capacity Factor
NEAT NERC Event Analysis Tool
NERC North American Electric Reliability Corporation
NPCC Northeast Power Coordinating Council
OC Operating Committee
OL Operating Limit
OP Operating Procedures
ORS Operating Reliability Subcommittee
PC Planning Committee
PO Planned Outage
POH Planned Outage Hours
RAPA Reliability Assessment Performance Analysis
RAS Remedial Action Schemes
RC Reliability Coordinator
RCIS Reliability Coordination Information System
RCWG Reliability Coordinator Working Group
RE Regional Entities
RFC Reliability First Corporation
RMWG Reliability Metrics Working Group
RSG Reserve Sharing Group
SAIDI System Average Interruption Duration Index
SAIFI System Average Interruption Frequency Index
SCADA Supervisory Control and Data Acquisition
SDI Standardstatute Driven Index
SERC SERC Reliability Corporation
Abbreviations Used in This Report
68
Acronym Definition SRI Severity Risk Index
SMART Specific Measurable Attainable Relevant and Tangible
SOL System Operating Limit
SPS Special Protection Schemes
SPCS System Protection and Control Subcommittee
SPP Southwest Power Pool
SRI System Risk Index
TADS Transmission Availability Data System
TADSWG Transmission Availability Data System Working Group
TO Transmission Owner
TOP Transmission Operator
WECC Western Electricity Coordinating Council
Contributions
69
Contributions This report was made feasible by the collaboration and hard work of both NERC staff and NERCrsquos
Industry Groups
NERC Industry Groups
Table 14 lists the NERC industry group contributors Without their contribution and collaboration this
report would not have been possible
Table 13 NERC Industry Group Contributions43
NERC Group
Relationship Contribution
Reliability Metrics Working Group
(RMWG)
Reports to the OCPC bull Lead Development of Report bull Provide Reliability Metrics Data bull Responsible for Reliability Metrics
Performance Chapter
Transmission Availability Working Group
(TADSWG)
Reports to the OCPC bull Provide Transmission Availability Data
bull Responsible for Transmission Equip-ment Performance Chapter
bull Content Review
Generation Availability Data System Task
Force
(GADSTF)
Reports to the OCPC bull Provide Generation Availability Data bull Responsible for Generation Equip-
ment Performance Chapter bull Content Review
Event Analysis Working Group
(EAWG)
Reports to the OCPC bull Provide Events Data bull Responsible for Disturbance Events
Trends Chapter bull Content Review
43 Rosters for RMWG TADSWG GADSTF and EAWG are available at httpwwwnerccomfilesrosterpdf
Contributions
70
NERC Staff Table 13 below lists the NERC staff who contributed to the 2011 Reliability Performance Analysis
Report
Table 14 Contributing NERC Staff
Name Title E-mail Address
Mark Lauby Vice President and Director of
Reliability Assessment and
Performance Analysis
marklaubynercnet
Jessica Bian Manager of Performance Analysis jessicabiannercnet
John Moura Manager of Reliability Assessments johnmouranercnet
Andrew Slone Engineer Reliability Performance
Analysis
andrewslonenercnet
Jim Robinson TADS Project Manager jimrobinsonnercnet
Clyde Melton Engineer Reliability Performance
Analysis
clydemeltonnercnet
Mike Curley Manager of GADS Services mikecurleynercnet
James Powell Engineer Reliability Performance
Analysis
jamespowellnercnet
Michelle Marx Administrative Assistant michellemarxnercnet
William Mo Intern Performance Analysis wmonercnet
- NERCrsquos Mission
- Table of Contents
- Executive Summary
-
- 2011 Transition Report
- State of Reliability Report
- Key Findings and Recommendations
-
- Reliability Metric Performance
- Transmission Availability Performance
- Generating Availability Performance
- Disturbance Events
- Report Organization
-
- Introduction
-
- Metric Report Evolution
- Roadmap for the Future
-
- Reliability Metrics Performance
-
- Introduction
- 2010 Performance Metrics Results and Trends
-
- ALR1-3 Planning Reserve Margin
-
- Background
- Assessment
- Special Considerations
-
- ALR1-4 BPS Transmission Related Events Resulting in Loss of Load
-
- Background
- Assessment
-
- ALR1-12 Interconnection Frequency Response
-
- Background
- Assessment
-
- ALR2-3 Activation of Under Frequency Load Shedding
-
- Background
- Assessment
- Special Considerations
-
- ALR2-4 Average Percent Non-Recovery Disturbance Control Standards (DCS)
-
- Background
- Assessment
- Special Consideration
-
- ALR2-5 Disturbance Control Events Greater Than Most Severe Single Contingency
-
- Background
- Assessment
- Special Consideration
-
- ALR 1-5 System Voltage Performance
-
- Background
- Special Considerations
- Status
-
- ALR3-5 Interconnection Reliability Operating Limit System Operating Limit (IROLSOL) Exceedances
-
- Background
-
- ALR4-1 Automatic Transmission Outages Caused by Protection System Misoperations
-
- Background
- Special Considerations
-
- ALR6-11 ndash ALR6-14
-
- Background
- Assessment
- ALR 6-11 ndash Automatic Outages Initiated by Failed Protection System Equipment
- ALR6-12 ndash Automatic Outages Initiated by Human Error
- ALR6-13 ndash Automatic Outages Initiated by Failed AC Substation Equipment
- ALR6-14 Automatic AC Transmission Outages Initiated by Failed AC Circuit Equipment
-
- ALR6-15 Element Availability Percentage (APC)
-
- Background
- Assessment
- Special Consideration
-
- ALR6-16 Transmission System Unavailability
-
- Background
- Assessment
- Special Consideration
-
- ALR6-2 Energy Emergency Alert 3 (EEA3)
-
- Background
- Assessment
- Special Considerations
-
- ALR 6-3 Energy Emergency Alert 2 (EEA2)
-
- Background
- Assessment
- Special Considerations
-
- ALR 6-1 Transmission Constraint Mitigation
-
- Background
- Assessment
- Special Considerations
-
- Integrated Bulk Power System Risk Assessment
-
- Introduction
- Recommendations
-
- Integrated Reliability Index Concepts
-
- The Three Components of the IRI
-
- Event-Driven Indicators (EDI)
- Condition-Driven Indicators (CDI)
- StandardsStatute-Driven Indicators (SDI)
-
- IRI Index Calculation
- IRI Recommendations
-
- Reliability Metrics Conclusions and Recommendations
-
- Transmission Equipment Performance
-
- Introduction
- Performance Trends
-
- AC Element Outage Summary and Leading Causes
- Transmission Monthly Outages
- Outage Initiation Location
- Transmission Outage Events
- Transmission Outage Mode
-
- Conclusions
-
- Generation Equipment Performance
-
- Introduction
- Generation Key Performance Indicators
-
- Multiple Unit Forced Outages and Causes
- 2008-2010 Review of Summer versus Winter Availability
-
- Conclusions and Recommendations
-
- Disturbance Event Trends
-
- Introduction
- Performance Trends
- Conclusions
-
- Abbreviations Used in This Report
- Contributions
-
- NERC Industry Groups
- NERC Staff
-
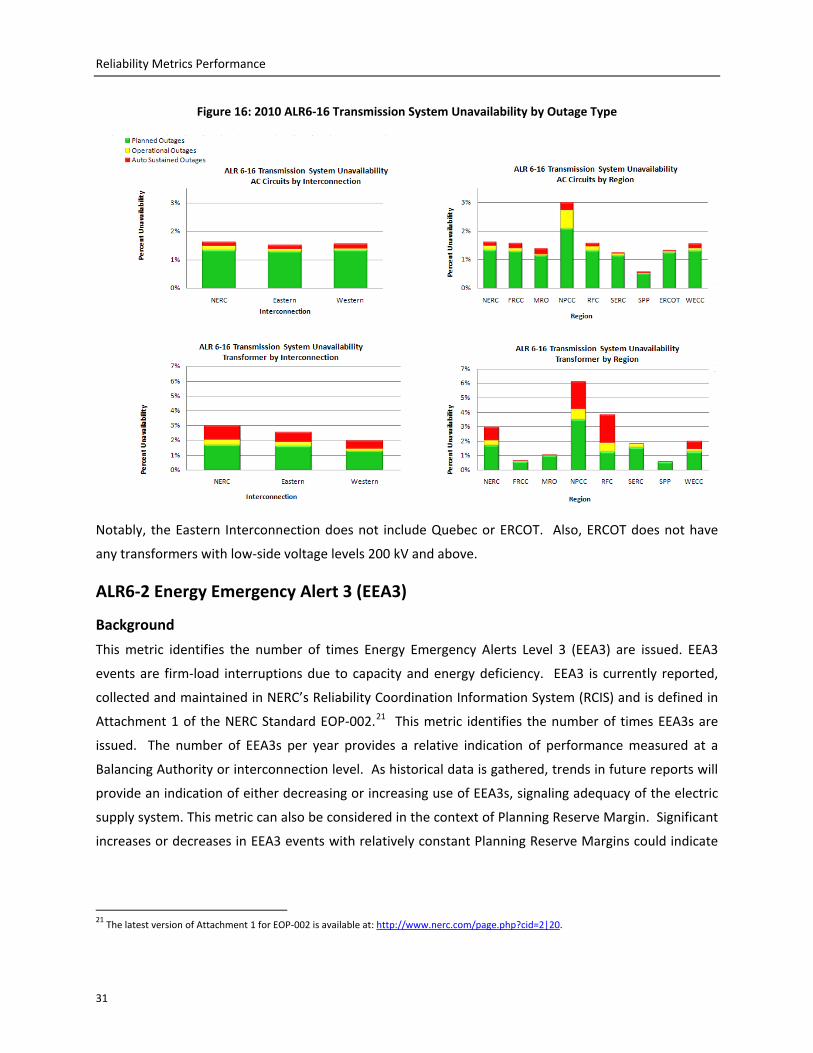
Reliability Metrics Performance
32
volatility in the actual loads compared to forecast levels or changes in the adequacy of the bulk power
system required to meet load demands
Assessment
Figure 17 shows the number of EEA3 events during 2006 and 2010 from an RE level An interactive
presentation was released and available at the Reliability Indicatorrsquos page22
The Acadiana Load Pocket (ALP) is an area in south central Louisiana that has experienced regular
transmission constraints and numerous Energy Emergency Alert filings by the SPP Reliability Controller
(SPP RC) Transmission within ALP is owned by Entergy Lafayette Utilities System (LUS) and Cleco
Power LLC (Cleco) The transmission constraints within the ALP are primarily caused by the local area
load and the lack of generation located in close proximity to the load area
The number of EEA3rsquos
declared in 2010 returned to more traditional numbers The 2009 spike in EEA3 events in the SPP
Region that was driven by issues in the Acadiana Load Pocket (ALP) were not present in 2010
Special Considerations
Ideally the measure should capture only EEAs that are declared for reliability reasons and not for
economic factors The RMWG has not been able to differentiate these reasons for future reporting and
it has made a recommendation to the Reliability Coordinator Working Group (RCWG) to consider a
revised EEA declaration to exclude economic factors
The reason the EEA volume decreased from 2009 to 2010 in SPP was because the SPP ICT RC23
coordinated an operating agreement between the five operating companies in the ALP The operating
agreement included a cost sharing re-dispatch that alleviated the need of a Transmission Loading Relief
(TLR-5) declaration24
22The EEA3 interactive presentation is available on the NERC website at
During 2009 there was no operating agreement therefore an entity had to
provide Network and Native Load (NNL) relief when a TLR-5 was called by the ICT RC When the TLR-5
was the primary tool to control the post contingent loading in the ALP some of the BAs would have their
firm transmission curtailed to the point where they could no longer serve their load therefore the EEA
3 was needed to communicate a capacityreserve deficiency
httpwwwnerccompagephpcid=4|331|335 23Southwest Power Pool (SPP) Independent Coordinator of Transmission (ICT) Reliability Coordinator (RC) 24More information on Transmission Load Relief is contained in the IRO-006 standard which is located at httpwwwnerccomfilesIRO-006-4pdf In particular TLR-5 definitions are referenced on page 16 and 17
Reliability Metrics Performance
33
Figure 17 ALR6-2 Energy Emergency Alert 3 (EEA3) Counts by Region (2006-2010)
Cleco Power Entergy and LUS are currently constructing an estimated $200 million transmission
infrastructure improvement project to mitigate transmission constraints into ALP Construction of the
project is scheduled to be complete in 2012 Completion of the project should help alleviate some of
the transmission congestion in this area Energy Emergency Alerts filed by the SPP Regional Entity
continue to decline
SPP RTO continues to coordinate operating plans with the operating entities in this area Mitigation
plans and local operating guides in place are expected to provide sufficient flexibility should issues arise
NERC will continue to monitor this area for Reliability Impacts and coordinate any actions with the SPP
Reliability Coordinator and SPP Regional Entity
ALR 6-3 Energy Emergency Alert 2 (EEA2)
Background
Energy Emergency Alert 2 (EEA2) is to measure the number of events BAs declare for deficient capacity
and energy during peak load periods which may serve as a leading indicator of energy and capacity
shortfall in the adequacy of the electric supply system EEA2 provides a sense of the frequency of
precursor events to the more severe EEA3 declarations This metric measures the number of events
1 3 1 2 214
3 4 4 1 5 334
4 2 1 52
1
0
5
10
15
20
25
30
3520
0620
0720
0820
0920
1020
0620
0720
0820
0920
1020
0620
0720
0820
0920
1020
0620
0720
0820
0920
1020
0620
0720
0820
0920
1020
0620
0720
0820
0920
1020
0620
0720
0820
0920
1020
0620
0720
0820
0920
10
FRCC MRO NPCC RFC SERC SPP TRE WECC
2006-2009
2010
Region and Year
Reliability Metrics Performance
34
Balancing Authorities declare for deficient capacity and energy during peak load periods At this time
however this data reflects inclusion of Demand Side Resources that would not be indicative of
inadequacy of the electric supply system
The number of EEA2 events and any trends in their reporting indicates how robust the system is in
being able to supply the aggregate load requirements The historical records may include demand
response activations and non-firm load interruptions per applicable contracts within the EEA alerts per
its definition25
Assessment
Demand response is a legitimate resource to be called upon by balancing authorities and
do not indicate a reliability concern As data is gathered in the future reports will provide an indication
of either decreasing or increasing adequacy in the electric supply system EEA2 events called solely for
activation of demand response (controllable or contractually prearranged demand-side dispatch
programs) or interruption of non-firm load per applicable contracts should be excluded This metric can
also be considered in the context of the Planning Reserve Margin Significant increases or decreases in
EEA2 events with relatively constant Planning Reserve Margins could indicate volatility in the actual
loads compared to forecast levels or changes in the adequacy of the bulk power system required to
meet load demands
Figure 18 shows the number of EEA2 events by Regional Entity from 2006 to 2010 EEA2 interactive
version available on line by quarter and region26
25 The EEA2 is defined at
The general trend continues to show improved
performance which may have been influenced by the overall reduction in demand throughout NERC
caused by the economic downturn Specific performance by any one region should be investigated
further for issues or events that may affect the results Determining whether performance reported
includes those events resulting from the economic operation of DSM and non-firm load interruption
should also be investigated The RMWG recommends continued metric assessment
httpwwwnerccomfilesEOP-002-2pdf 26 EEA2 interactive version located at httpwwwnerccompagephpcid=4|331|341
Reliability Metrics Performance
35
Special Considerations
The intent of this metric is to measure only EEAs that are called for reliability reasons and not for
economic factors such as demand side management (DSM) and non-firm load interruption The
historical data for this metric may include events that were called for economic factors According to
the RCWG recent data should only include EEAs called for reliability reasons
ALR 6-1 Transmission Constraint Mitigation
Background
The RMWG completed a pilot with four regional entities Based on the results the RMWG expanded the
pilot data collection to all regions and the initial results of the data collection are shown in Figure 19
and Table 5 Based on the results of the pilot there is merit in continuing to assess this metric The
intent of this metric is to identify trends in the number of mitigation measures (Special Protection
Schemes (SPS) Remedial Action Schemes (RAS) and Operating Procedures) required to meet reliability
requirements By their nature SPS do not indicate an inherent weakness in the bulk power system
rather they are an indication of methods that are taken to operate the system through the range of
conditions it must perform This metric is only intended to evaluate the trend use of these plans and
whether the metric indicates robustness of the transmission system is increasing remaining static or
decreasing
1 27
2 1 4 3 2 1 2 4 5 2 5 832
4724
211
5 38 5 1 1 8 7 4 1 1
05
101520253035404550
2006
2007
2008
2009
2010
2006
2007
2008
2009
2010
2006
2007
2008
2009
2010
2006
2007
2008
2009
2010
2006
2007
2008
2009
2010
2006
2007
2008
2009
2010
2006
2007
2008
2009
2010
2006
2007
2008
2009
2010
FRCC MRO NPCC RFC SERC SPP TRE WECC
2006-2009
2010
Region and Year
Figure 18 ALR6-3 Energy Emergency Alert 2 (EEA2)
Reliability Metrics Performance
36
Assessment
The pilot data indicates a relatively constant number of mitigation measures over the time period of
data collected
Figure 19 ALR6-1 Transmission Constraint Mitigation by SPSRAS (2009-2014)
0102030405060708090
100110120
2009
2010
2011
2014
2009
2010
2011
2014
2009
2010
2011
2014
2009
2010
2011
2014
2009
2010
2011
2014
2009
2010
2011
2014
2009
2010
2011
2014
2009
2010
2011
2014
FRCC MRO NPCC RFC SERC SPP ERCOT WECC
Coun
t
Region and Year
SPSRAS
Reliability Metrics Performance
37
Table 5 ALR6-1 Transmission Constraint Mitigation by Operating ProcedureGuides (2009-2011)
ALR6-1 Transmission Constraint Mitigation by Operating ProcedureGuides (2009-2014)
2009 2010 2011 2014
FRCC 107 75 66
MRO 79 79 81 81
NPCC 0 0 0
RFC 2 1 3 4
SPP 39 40 40 40
SERC 6 7 15
ERCOT 29 25 25
WECC 110 111
Special Considerations
A certain number of SPS mitigation plans may be necessary to support reliable operation of the system
If the number of SPS increase over time this may indicate that additional transmission capacity is
required A reduction in the number of SPS may be an indicator of increased generation or transmission
facilities being put into service which may indicate greater robustness of the bulk power system In
general mitigation plans are a viable and valuable tool for effective operation of the bulk power system
In power system planning reliability operability capacity and cost-efficiency are simultaneously
considered through a variety of scenarios to which the system may be subjected Mitigation measures
are a method for optimizing a power system across these scenarios Changes in quantities of mitigation
plans may indicate year-on-year differences in the system being evaluated
Integrated Bulk Power System Risk Assessment
Introduction In developing eighteen metrics to measure acceptable levels of reliability it has become clear that any
such measurement of reliability must include consideration of the risks present within the bulk power
system in order for us to appropriately prioritize and manage these system risks The scope for the
Reliability Metrics Working Group (RMWG)27
27 The RMWG scope can be viewed at
includes a task to develop a risk-based approach that
provides consistency in quantifying the severity of events The approach not only can be used to
httpwwwnerccomfilezrmwghtml
Reliability Metrics Performance
38
measure risk reduction over time but also can be applied uniformly in event analysis process to identify
the events that need to be analyzed in detail and sort out non-significant events
The Operating Committee (OC) and Planning Committee (PC) endorsed the concepts and framework28 of
the risk-based approach in their September 2010 joint meeting and further supported the event severity
risk index (SRI) calculation29
Recommendations
in March 2011
bull NERC should embrace the use of risk assessment to identify trends in addition to lessons learned
in order to improve bulk power system reliability
bull The RMWG should continue to coordinate and communicate with the Event Analysis Working
Group (EAWG) to apply the SRI into the event analysis process and root cause analysis
bull As trend evaluations increase the knowledge of risks to the bulk power system data required to
support additional assessment should be gathered
Event Severity Risk Index (SRI)
Risk assessment is an essential tool for achieving the alignment between organizations people and
technology This will assist in quantifying inherent risks identifying where potential high risks exist and
evaluating where the most significant lowering of risks can be achieved Being learning organizations
the Electric Reliability Organization (ERO) Regional Entities and Registered Entities can use these tools
to focus on the areas of highest risk to reliability to provide a sound basis for developing results-based
standards and compliance programs Risk assessment also serves to engage all stakeholders in a
dialogue about specific risk factors and helps direct a strategic plan for risk reduction and early
detection
The SRI is a daily blended metric for which transmission loss generation loss and load loss events are
calculated Each element (transmission generation and load loss) is factored by the systemrsquos inventory
for that element to rate significant events appropriately On a yearly basis these daily performances
can be sorted in descending order to evaluate the year-on-year performance of the system
In order to test drive the concepts the RMWG applied these calculations against historically memorable
days to derive SRIs Once these calculations were complete they were reviewed and evaluated by
various stakeholders for reasonableness Based upon feedback modifications to the calculation were
made and assessed against the historic days performed This iterative process locked down the details
28 httpwwwnerccomdocspcrmwgIntegrated_Bulk_Power_System_Risk_Assessment_Concepts_Finalpdf 29 httpwwwnerccomdocspcrmwgSRI_Equation_Refinement_May6_2011pdf
Reliability Metrics Performance
39
for the calculation of SRI whose calculation from zero (no transmission line outages generation outages
or load lost in a day) to 1000 (a theoretical condition in which every transmission line all generation
units and all load lost across the system in a single day)
Figure 20 captures the calculated severity risk value for each of the days for each year benchmarked
with the historic significant events which were used to concept test the calculation Since there is
significant disparity between days the bulk power system is stressed compared to those that are
ldquoroutinerdquo and ldquoherordquo days of the year where the system performed extremely well the curve is depicted
using a logarithmic scale Each yearrsquos data is sorted in descending order striking a characteristic shape
At the left-side of the curve the days in which the system is severely stressed are plotted The central
more linear portion of the curve identifies the routine day performance while the far right-side of the
curve shows the values plotted for days in which almost all lines and generation units are in service and
essentially no load is lost
The trends on the chart below show that 2009 and 2010 had fewer extreme days than 2008 Routine
daily performance appears generally consistent across all three years Figure 20 captures the days for
each year benchmarked with historically significant events
In Figure 20 NERCrsquos event categories and SRI ratings are directly related As the SRI increases the
category or severity of the event increases Historical events are also shown to relate modern
reliability measurements to give a perspective of how a well-known event would register on the SRI
scale
The event analysis process30
30
benefits from the SRI as it enables a numerical analysis of an event in
comparison to other events By this measure an event can be prioritized by its severity In a severe
event this is unnecessary However for events that do not result in severe stressing of the bulk power
system this prioritization can be a challenge By using the SRI the event analysis process can decide
which events to learn from and reduce which events to avoid and when resilience needs to be
increased under high impact low frequency events as shown in the blue boxes in the figure
httpwwwnerccompagephpcid=5|365
Reliability Metrics Performance
40
Figure 20 NERC Annual Daily Severity Risk Index (SRI) Sorted Descending with Historic Benchmark Days
Other factors that impact severity of a particular event to be considered in the future include whether
equipment operated as designed and resulted in loss of load from a reliability perspective (intentional
and controlled load-shedding) Mechanisms for enabling ongoing refinement to include the historic and
simulated events for future severity risk calculations are being explored
Reliability Metrics Performance
41
Integrated Reliability Index Concepts In December 2010 the RMWG was challenged by the OC and PC to develop a single index concept to
measure the universe of risks associated with the bulk power system As a result the integrated
reliability index (IRI) concepts were proposed31
Figure 21
the three components of which were defined to
quantify each specific risk aspect They are titled the Event Driven Index (EDI) StandardsStatute Driven
Index (SDI) and Condition Driven Index (CDI) illustrated in with measures associated with
system events standards compliance and eighteen performance metrics The development of an
integrated reliability index aims to inform increase transparency and quantify the effectiveness of risk
reduction or mitigation actions The goal is to provide the industry meaningful trends of the BPSrsquos
performance and guidance on how the industry can improve reliability and support risk-informed
decision making Once completed the IRI will facilitate holistic assessment of performance Finally the
IRI should help overcome concern and confusion about how many metrics are being analyzed for system
reliability assessments
Figure 21 Risk Model for Bulk Power System
The integrated model of event-driven condition-driven and standardsstatute-driven risk information
can be constructed to illustrate all possible logical relations between the three risk sets Due to the
nature of the system there may be some overlap among the components
31 httpwwwnerccomdocspcrmwgIntegrated_Reliability_Index_WhitePaper_DRAFTpdf
Event Driven Index (EDI)
Indicates Risk from
Major System Events
Standards Statute Driven
Index (SDI)
Indicates Risks from Severe Impact Standard Violations
Condition Driven Index (CDI)
Indicates Risk from Key Reliability
Indicators
Reliability Metrics Performance
42
The Three Components of the IRI The three components of the IRI work together as shown in Figure 22 to comprise a full picture of the
state of reliability
Figure 22 An overview of the components that comprise the Integrated Reliability Index (IRI)
Event-Driven Indicators (EDI)
The Event-Driven Indicator provides a basis for prioritization of events based on bulk power system
integrity equipment performance and engineering judgment This indicator can serve as a high value
risk assessment tool to be used by stakeholders to investigate and evaluate disturbance history and
measure the severity of these events The relative ranking of events requires industry expertise agreed-
upon goals and engineering judgment The EDI is a derivative of SRI results for a specific time period
but it transforms that performance into a form of an availability index These calculations will be further
refined as feedback is received
Condition-Driven Indicators (CDI)
The Condition-Driven Indicators focus on a set of measurable system conditions (performance
measures) to assess bulk power system reliability These reliability indicators identify factors that
positively or negatively impact reliability and are early predictors of the risk to reliability from events or
unmitigated violations A collection of these indicators measures how close reliability performance is to
the desired outcome and if the performance against these metrics is constant or improving
Reliability Metrics Performance
43
StandardsStatute-Driven Indicators (SDI)
The StandardsStatute-Driven Indicator is a calculation of success of compliance based upon the subset
of high-value standards and is divided by the number of participations who could have received the
violation within the time period considered Also based on these factors known unmitigated violations
of elevated risk factor requirements are weighted higher than lower risk factors The index decreases if
the compliance improvement is achieved over a trending period
IRI Index Calculation As with the SRI the IRI is based on an importance weighting factor which the RMWG can modify over
time after gaining experience with the new metric as well as consideration of feedback from industry
At this time the RMWG believes some form of blended weighting may serve to start to populate IRI
characteristic curves at a high and generic level Based upon feedback from stakeholders this approach
may change or as discussed below weighting factors may vary based on periodic review and risk model
update The RMWG will continue the refinement of the IRI calculation and consider other significant
factors that impact reliability (eg intentional and controlled load-shedding) further it will explore
developing mechanisms for enabling ongoing refinement which should be influenced by a wide set of
stakeholders
RMWG recommends the Event Driven Index (EDI) be weighted the highest (50 percent) since events
actually occurred indicating how the system was performing The Condition Driven Index (CDI) and
StandardsStatute Driven Index (SDI) are weighted 25 each since they are indicators of potential risks
to BPS reliability IRI can be calculated as follows
IRI is intended to be a composite metric which integrates several forms of individual risks to the bulk
power system Since the three components range across many stakeholder organizations these
concepts are developed as starting points for continued study and evaluation Additional supporting
materials can be found in the IRI whitepaper32
IRI Recommendations
including individual indices calculations and preliminary
trend information
For the IRI more investigation should be performed to determine the best way to integrate EDI CDI
and SDI into an Integrated Reliability Index (IRI) that quantitatively represents the reliability of the bulk
32 The IRI whitepaper can be found at httpwwwnerccomdocspcrmwgIntegrated_Reliability_Index_WhitePaper_DRAFTpdf
Reliability Metrics Performance
44
power system To this end study into determining the amount of overlap between the components is
necessary RMWG is currently working to determine the proper amount of overlap between the IRI
components
Also the CDI component of the IRI needs to be solidified This is especially true with the CDI More
accurate metric data is needed to paint a fuller picture of the CDI Many of the metrics used to calculate
the CDI are new or they have limited data Compared to the SDI which counts well-known violation
counts and the EDI which uses the well-defined CDI the CDI lacks the depth of rigor that the other two
components have acquired through their years of data RMWG is currently working to improve the CDI
Reliability Metrics Conclusions and Recommendations Among the eighteen metrics that address the characteristics of an adequate level of reliability (ALR)
metric trends indicate the system is performing better in the following seven areas
bull ALR1-3 Planning Reserve Margin
bull ALR1-4 BPS Transmission Related Events Resulting in Loss of Load
bull ALR2-5 Disturbance Control Events Greater than Most Severe Single Contingency
bull ALR6-2 Energy Emergency Alert 3 (EEA3)
bull ALR6-3 Energy Emergency Alert 2 (EEA2)
bull ALR6-11 Automatic Transmission Outages Caused by Protection System Misoperations
bull ALR6-13 Automatic Transmission Outages Caused by Failed AC Substation Equipment
Assessments have been made in other performance categories A number of them do not have
sufficient data to derive any conclusions from the results The RMWG recommends continued data
collection and assessment of these metrics If a metric does not yield any trend in a five-year reporting
period the metric will be modified or withdrawn
For the IRI more investigation should be performed to determine the overlap of the components (CDI
EDI and SDI) The CDI should be more thoroughly solidified as an index by collecting more data over
time
Transmission Equipment Performance
45
Transmission Equipment Performance Introduction The Transmission Availability Data System (TADS) effort began with the establishment of a TADS task force
by the NERC Planning Committee in October 2006 On October 27 2007 the NERC Board of Trustees
approved the collection of transmission automatic outage data beginning in calendar year 2008 (Phase I)
Subsequently on October 29 2008 the NERC Board approved the collection of Non-Automatic Outage data
that began for Calendar year 2010 (Phase II)
This chapter provides reliability performance analysis of the transmission system by focusing on the trends
of Automatic Outage data from calendar year 2008 thru 2010 Since only one year of Non-Automatic
Outage data has been collected that data will not be assessed in this report
When calculating bulk power system performance indices care must be exercised when interpreting results
as misinterpretation can lead to erroneous conclusions regarding system performance With only three
years of data in the smaller regions it is not clear whether a regionrsquos yearly outage variation compared to
the average is due to random statistical variation or that particular year is significantly different in
performance However on a NERC-wide basis after three years of data collection there is enough
information to accurately determine whether the yearly outage variation compared to the average is due to
random statistical variation or the particular year in question is significantly different in performance33
Performance Trends
Transmission performance information has been provided by Transmission Owners (TOs) within NERC
through the NERC TADS (Transmission Availability Data System) process The data presented reflects
Momentary and Sustained AC Automatic outages of transmission elements that operate at voltages ge 200 kV
(including the low side of transformers) with the criteria specified in the TADS process The following
elements listed below are included
bull AC Circuits ge 200 kV (Overhead and Underground Circuits) Radial circuits are included
bull DC Circuits with ge +-200 kV DC voltage
bull Transformers with ge 200 kV low-side voltage and
bull ACDC Back-to-Back (BTB) Converters with ge 200 kV AC voltage on both sides
33The detailed Confidence Interval computation is available at httpwwwnerccomdocspctadstfTADS_Nov_2_2007APPENDIX_C_Confidence_Intervalpdf
Transmission Equipment Performance
46
AC Element Outage Summary and Leading Causes Table 6 shows the 2008 2009 and 2010 NERC total AC transmission element inventory and a summary of
the associated outages As expected in general the number of circuits increased from year to year due to
new construction or re-construction to higher voltages For every outage experienced on the transmission
system cause codes are identified and recorded according to the TADS process Causes of both momentary
and sustained outages have been indicated These causes are analyzed to identify trends and similarities
and to provide insight into what could be done to possibly prevent future occurrences
Figure 23 and Figure 24 describe the top ten initiating cause codes for sustained and momentary automatic
outages combined from 2008-2010 Based on the two figures the relationship between the total number of
outages and total outage hours can be seen Failed AC Substation Equipment and Failed AC Circuit
Equipment only account for 15 percent of the total number of outages but account for 65 percent of the
total outage hours The two largest causes of outages within NERC (ldquoLightingrdquo and ldquoWeather excluding
Lightningrdquo) account for 34 percent of the total number of outages
The next three Human Error Failed Protection System Equipment and Failed AC Circuit Equipment have
very similar totals and should all be considered significant focus points in reducing the number of Sustained
Automatic Outages for all elements
Transmission Equipment Performance
47
Table 6 NERC - All AC Elements Sustained and Momentary Outage Performance Summary
2008 Number of Outages
AC Voltage
Class
No of
Circuits
Circuit
Miles Sustained Momentary
Total
Outages Total Outage Hours
200-299kV 4369 102131 1560 1062 2622 56595
300-399kV 1585 53631 793 753 1546 14681
400-599kV 586 31495 389 196 585 11766
600-799kV 110 9451 43 40 83 369
All Voltages 6650 196708 2785 2051 4836 83626
2009 Number of Outages
AC Voltage
Class
No of
Circuits
Circuit
Miles Sustained Momentary
Total
Outages Total Outage Hours
200-299kV 4468 102935 1387 898 2285 28828
300-399kV 1619 56447 641 610 1251 24714
400-599kV 592 32045 265 166 431 9110
600-799kV 110 9451 53 38 91 442
All Voltages 6789 200879 2346 1712 4038 63094
2010 Number of Outages
AC Voltage
Class
No of
Circuits
Circuit
Miles Sustained Momentary
Total
Outages Total Outage Hours
200-299kV 4567 104722 1506 918 2424 54941
300-399kV 1676 62415 721 601 1322 16043
400-599kV 605 31590 292 174 466 10442
600-799kV 111 9477 63 50 113 2303
All Voltages 6957 208204 2582 1743 4325 83729
Note The NERC table does not show redacted outages DC Circuit outages Transformer outages or ACDC
converter outages
Transmission Equipment Performance
48
Figure 23 NERC - Top Ten Sustained and Momentary Outages by Initiating Cause Code for All Elements
Figure 24 NERC - Top Ten Sustained Outage Hours by Cause Code
198
151
80
7271
6943
33
27
188
68
Lightning
Weather excluding lightningHuman Error
Failed AC Substation EquipmentFailed Protection System EquipmentFailed AC Circuit Equipment Foreign Interference
Power System Condition
Fire
Unknown
Remaining Cause Codes
299
246
188
58
52
42
3619
16 12 31 Failed AC Substation EquipmentFailed AC Circuit Equipment Weather excluding lightningUnavailable
Other
Fire
Unknown
Human Error
Failed Protection System EquipmentForeign Interference
Remaining Cause Codes
Transmission Equipment Performance
49
Transmission Monthly Outages Figure 25 displays the total number of Automatic Outages on a per-month basis The three months with the
highest total of outages were June July and August From a seasonal perspective winter had a monthly
average of 281 outages These include the months of November-March Summer had an average of 429
outages Summer included the months of April-October
Figure 25 Number of Outages by Month for AC Circuits (2008-2010)
This figure does not show redacted outages DC Circuit outages Transformer outages or ACDC Converter
outages
Outage Initiation Location For every outage experienced on the transmission system the outage initiation code is identified and
recorded according to the TADS process The outage initiation code can be analyzed to identify trends and
similarities and to provide insight into what could be done to possibly prevent future occurrences
The ldquoOutage Initiation Coderdquo describes where an automatic outage was initiated on the power system The
five codes are as follows
bull Element-Initiated
bull Other Element-Initiated
bull AC Substation-Initiated
bull ACDC Terminal-Initiated (for DC circuits)
bull Other Facility Initiated any facility not included in any other outage initiation code
JanuaryFebruar
yMarch April May June July August
September
October
November
December
2008 238 229 257 258 292 437 467 380 208 176 255 236
2009 315 201 339 334 398 553 546 515 351 235 226 294
2010 444 224 269 446 449 486 639 498 351 271 305 281
3 Year AVG 332 218 288 346 380 492 551 464 303 227 262 270
0
100
200
300
400
500
600
700
Out
ages
Transmission Equipment Performance
50
Notably the protection system is not part of an ldquoAC Substationrdquo or an ldquoACDC Terminalrdquo If a protection
system misoperates and initiates an outage it will be classified as ldquoOther-Facility Initiatedrdquo The following
Figures show the initiating location of the Automatic outages from 2008 to 2010
With both Momentary and Sustained Automatic Outages taken into account the outage was initiated on the
Element more than 67 percent of the time as shown in Figure 26 and Figure 27
When only the Sustained Automatic Outages are analyzed the outage initiation on both AC Substation and
Other Facility increased by 34 percent and 32 percent respectively Outages initiated on the Element itself
decreases by 78 percent as shown in Figure 26 and 27 For only the Momentary Automatic Outages the
outage initiation on the Element increases by 19 percent compared to Sustained Outages Element initiated
outages make up over 78 percent of the total outages when analyzing only Momentary Outages
Figure 26
Figure 27
Transmission Outage Events Figure 28 illustrates the relationship between the numbers of Automatic Outages associated per TADS
event 2008 2009 and 2010 tend to follow the same trend The largest number of Automatic Outages per
TADS event is fourteen in 2010 thirteen in 2009 and eight in 2008 There are around 70 to 100 TADS
events that contain between fourteen and three Automatic Outages (see below) There are around 330 to
400 TADS events that contain two or more Automatic Outages The rest of the events only contain one
Automatic Outage As noted in the lower right hand corner below the total number of Events in 2008 to
2010 ranged from 3920 to 4569 events per year Nearly 90 percent or more of the events contained one
Automatic Outage
Figure 26 Sustained Automatic Outage Initiation
Code
Figure 27 Momentary Automatic Outage Initiation
Code
Transmission Equipment Performance
51
Transmission Outage Mode Figure 29 and Figure 30 show the percentage of Outage Modes The ldquoOutage Mode Coderdquo describes
whether one Automatic Outage is related to other Automatic Outages A Single Mode outage is an
Automatic Outage of a single Element which occurs independently of any other Automatic Outages (if any)
A ldquoDependent Mode Initiating Outagerdquo is an Automatic Outage of a single Element that initiates one or more
subsequent Element Automatic Outages A ldquoDependent Mode Outagerdquo is an Automatic Outage of an
Element which occurred as a result of an initiating outage whether the initiating outage was an Element
outage or a non-Element outage A ldquoCommon Mode Outagerdquo is one of two or more Automatic Outages with
the same Initiating Cause Code and where the outages are not consequences of each other and occur nearly
simultaneously A ldquoCommon Mode Initiating Outagerdquo is a Common Mode Outage that initiates one or more
subsequent Automatic Outages
Over 72 percent of the total outages occurred on the bulk power system are Single Mode Outages The next
largest mode is Dependent with over 11 percent of the total outages being in this category For only
Sustained Automatic Outages outages related to each other increase with Dependent mode accounting for
13 percent of the outages and Common mode accounting for close to 11 percent of the outages
Independent Sustained outages still account for the largest portion with nearly 70 percent being Single
mode When just analyzing Momentary Automatic Outages Associated outages decrease with Dependent
Figure 28 Event Histogram (2008-2010)
Transmission Equipment Performance
52
mode accounting for only 9 percent of the outages The Common Mode percentage decreases while
Dependent Mode Initiating percentage increases compared to Sustained Outages Independent Momentary
outages account for the largest portion with over 76 percent being Single Mode
An investigation into the root causes of Dependent and Common mode events which include three or more
Automatic Outages (indentified in the TADS 2008 to 2010 data) should be a high priority Some protection
systems are designed to trip three or more circuits but some events go beyond what is designed Some also
have misoperations associated with multiple outage events
Conclusions On a NERC wide average basis automatic transmission outage rate is improving from 2008 to 2010 based on
reported data Considering both automatic and non-automatic outages 2010 records indicate transmission
element availability percentage is very high and exceeds 95 The unavailability rate for AC circuits and
transformers are only 15 and 29 respectively
The cause codes of Human Error Failed Protection System Equipment and Failed AC Circuit Equipment
should be considered significant focus points in reducing the number of Sustained Automatic Outages for all
elements A deeper look into the root causes of Dependent and Common mode events which include three
or more Automatic Outages (indentified in the TADS 2008 to 2010 data) should be a high priority Some
protection systems are designed to trip three or more circuits but some events go beyond what is designed
Some also have misoperations associated with multiple outage events
Figure 29 Sustained Automatic Outage Mode code Figure 30 Momentary Automatic Outage Mode code
Generation Equipment Performance
53
Generation Equipment Performance Introduction The development of the Generating Availability Data System (GADS) began in 1982 This series of databases
is used to voluntarily collect record and retrieve operating information By pooling individual unit
information with likewise units generating unit availability performance can be calculated providing
opportunities to identify trends and generating equipment reliability improvement opportunities The
information is used to support equipment reliability availability analyses and risk-informed decision-making
by system planners generation owners assessment modelers manufacturers and contractors etc Reports
and information resulting from the data collected through GADS are now used for benchmarking and
analyzing electric power plants
Currently the data collected through GADS contains 72 percent of the North American generating units
with generating capacity of 20 MW or higher34 Additionally many of the newer combined-cycle plants are
not reporting information and therefore a full view of each unit type is not presented Rather a sample of
all the units in North America that fit a given more general category is provided35 for the 2008-201036
Generation Key Performance Indicators
assessment period
Three key performance indicators37
In
the industry have used widely to measure the availability of generating
units (see Terms Used in This Report section for their calculation parameters) are Equivalent Availability
Factor (EAF) Net Capacity Factor (NCF) and Equivalent Forced Outage Rate ndash Demand (EFORd)
Table 7 the North American fleet average EAF NCF and EFORd compared to unit age for all generating
units with a capacity of 20 MW and higher is provided for the years 2008-2010 The EAF shows a decline
during the last three years NCF is up and down while the EFORd appears to be increasing As expected the
fleet of units reported to GADS is aging overall with the fossil units being about 12 years older than the
average age
34 httpwwwnerccomdocspcgadstfGADSTF_Recommendation_Report_02-18-2011_FINALpdf 35GADS contains some 1500+ units under 20 MW that is not included in this report These units are excluded because most units are not base-loaded and are in peaking operation
3684 percent of the 2010 dataset is available at this time while the 2008 and 2009 dataset is complete 37 httpwwwnerccompagephpcid=4|43
Generation Equipment Performance
54
Table 7 General Availability Review of GADS Fleet Units by Year
2008 2009 2010 Average
Equivalent Availability Factor (EAF) 8776 8774 8678 8743
Net Capacity Factor (NCF) 5083 4709 4880 4890
Equivalent Forced Outage Rate -
Demand (EFORd) 579 575 639 597
Number of Units ge20 MW 3713 3713 3713 3713
Average Age of the Fleet in Years (all
unit types) 303 311 321 312
Average Age of the Fleet in Years
(fossil units only) 422 432 440 433
Figure 31 provides the average forced outage hours (FOH) maintenance outage hours (MOH) and planned
outage hours (POH) for all units reporting 20 MW or larger During this three-year period the average FOH
291 hours average MOH is 163 hours average POH is 470 hours
Figure 31 shows a large increase in forced and maintenance events The average age of the units with a
capacity of 20MW and higher in 2009 is 316 years old However the average age of fossil units in 2010 is
442 years old These fossil units are the backbone of all operating units providing the base-load power
continuously and nearly 50 percent of all energy annually There appears to be no increase allocated for
annualsemi-annual maintenance (ie planned outages) for the older generating units The increase of
000100002000030000400005000060000700008000090000
100000
2008 2009 2010
463 479 468
154 161 173
288 270 314
Hou
rs
Planned Maintenance Forced
Figure 31 Average Outage Hours for Units gt 20 MW
Generation Equipment Performance
55
maintenance outage hours reflects an increased need to fix problems that cannot be deferred until the next
annualsemi-annual repairs As a result it shows one of two things are happening
bull More or longer planned outage time is needed to repair the aging generating fleet
bull More focus on preventive repairs during planned and maintenance events are needed
Multiple Unit Forced Outages and Causes Table 8 provides the annual multiple-unit forced outage trips resulting from the same cause for each of the
assessments years 2008-2010 respectively The ldquosingle unitrdquo trips are large units with a Net Dependable
Capacity of 750 MW or more The trips of ldquotwo unitsrdquo or more is any combination of unit capacity with the
total amount of lost capacity more than 750 MW
Table 8 also presents more information on the forced outages During 2008-2010 there were a large
number of double-unit outages resulting from the same event Investigations show that some of these trips
were at a single plant caused by common control and instrumentation for the units The incidents occurred
several times for several months and are a common mode issue internal to the plant
Table 8 Number of Multiple Unit Forced Outages and FrequencyYear
2008 2009 2010
Type of
Trip
of
Trips
Avg Outage
Hr Trip
Avg Outage
Hr Unit
of
Trips
Avg Outage
Hr Trip
Avg Outage
Hr Unit
of
Trips
Avg Outage
Hr Trip
Avg Outage
Hr Unit
Single-unit
Trip 591 58 58 284 64 64 339 66 66
Two-unit
Trip 281 43 22 508 96 48 206 41 20
Three-unit
Trip 74 48 16 223 146 48 47 109 36
Four-unit
Trip 12 77 19 111 112 28 40 121 30
Five-unit
Trip 11 1303 260 60 443 88 19 199 10
gt 5 units 20 166 16 93 206 50 37 246 6
Loss of ge 750 MW per Trip
The high number of five-unit trips in 2008 was due to Hurricane Ike hitting the Gulf Coast The highest total
number of multiple unit trips occurred in 2009 though as mentioned before the data collection for 2010 is
incomplete at this time The majority of 2009 multiple unit trips have three main causes (in order by
Generation Equipment Performance
56
number of events) transmission lack of fuel and storms A summary of the three categories for single as
well as multiple unit outages (all unit capacities) are reflected in Table 9
Table 9 Common Causes of Multiple Unit Forced Outages (2009)
Cause Number of Events Average MW Size of Unit
Transmission 1583 16
Lack of Fuel (Coal Mines Gas Lines etc) Not
in Operator Control
812 448
Storms Lightning and Other Acts of Nature 591 112
Some of the transmission outages based on storms in 2009 have been caused by the same reasons because
the storms may have caused transmission interference However the plants reported the problems
inconsistently with either the transmission interference or storms cause code Therefore they are depicted
as two different causes of forced outage
Marked transmission outages in 2009 were quite high Thirty-five percent came from one utility with a large
number of hydroelectric units The company related the trips to various problems including weather
(lightning storms) wildlife ldquoline bumpsrdquo and problems on the receiving end of the transmission line Nine
hundred and eighty-five transmission trips (62 percent) were from hydroelectric units38
In 2009 only ten transmission trips resulted in a loss of 750 MW or more per trip Twenty two generating
plants were affected by the ten trips Causes for the trips include feeder line trips (1 trip) breakers in the
switchyard (8 trips) personnel errors (2 trips) and unknown (10 trips)
The ldquoLack of Fuelrdquo outages are of interest as these events occur during the times when a unit is available to
operate but there is an interruption in fuels to operate the facilities These events do not include
interruptions of fuel due to contracts Rather the cause code is designed to account for units that are
expecting fuel and it is unavailable when requested Table 10 presents the distribution of ldquoLack of Fuelrdquo
events by NERC Region and Table 11 presents the unit types affected
38 The average size of the hydroelectric units were small ndash 335 MW
Generation Equipment Performance
57
Of the units that report ldquoLack of Fuelrdquo 78 percent of the units are oil-fired 15 percent of the units are gas-
fired and the remaining units are various other fuels Table 12 provides the top causes of forced outage for
several unit types For fossil units ldquoLack of Fuelrdquo as the number three cause behind waterwall tube leaks
and superheater tube leaks
Table 10 Forced Outages Due to Lack of Fuel by Region
Region Number of Lack of Fuel
Problems Reported
FRCC 0
MRO 3
NPCC 24
RFC 695
SERC 17
SPP 3
TRE 7
WECC 29
One company contributed to the majority of oil-fired lack of fuel events The units at the company are
actually dual-fuels (oil and gas) but market nominated gas monitoring causes the units to be on forced
outage nightly The units need gas to start up so they can run on oil When they shut down the units must
switch to gas to clean themselves With the gas restriction the unit canrsquot start and the unit goes on a
forced outage Until the band is lifted the two units will continue to be on a forced outage cycle
Event records also provide descriptions of why the unit was without fuel with the majority of descriptions
bull Temperatures affecting gas supply valves
bull Unexpected maintenance of gas pipe-lines
bull Compressor problemsmaintenance
Generation Equipment Performance
58
Table 11 Unit Type Profile of Forced Outages Due to Lack of Fuel
Unit Types Number of Lack of Fuel Problems Reported
Fossil 642
Nuclear 0
Gas Turbines 88
Diesel Engines 1
HydroPumped Storage 0
Combined Cycle 47
Generation Equipment Performance
59
Table 12 Causes of Forced Outage for Different Unit Types (2008-2010)
Fossil - all MW sizes all fuels
Rank Description Occurrence per Unit-year
MWH per Unit-year
Average Hours To Repair
Average Hours Between Failures
Unit-years
1 Waterwall (furnace wall) 0590 134106 59 3250 3868 2 Second Superheater
Leaks 0180 5182 60 3228 3868
3 Lack of Fuel (coal mines gas lines etc) where the operator is not in control
0480 4701 18 26 3868
Combined-Cycle blocks Rank Description Occurrence
per Unit-year
MWH per Unit-year
Average Hours To Repair
Average Hours Between Failures
Unit-years
1 HP Turbine Buckets Or Blades
0020 4663 1830 26280 466
2 Turbine Control Valves 0040 2777 100 7200 466 3 Gas Turbine Compressor -
High Pressure Shaft 0010 2266 663 4269 466
Nuclear units - all Reactor types Rank Description Occurrence
per Unit-year
MWH per Unit-year
Average Hours To Repair
Average Hours Between Failures
Unit-years
1 LP Turbine Buckets or Blades
0010 26415 8760 26280 288
2 Containment Structure 0010 9233 1226 26262 288 3 Feedwater Pump Local
Controls 0020 7620 692 12642 288
Simple-cycle gas turbine jet engines Rank Description Occurrence
per Unit-year
MWH per Unit-year
Average Hours To Repair
Average Hours Between Failures
Unit-years
1 Main Transformer 0030 1611 1016 20709 4181 2 Other Gas Turbine
Controls And Instrument Problems
0120 428 70 2614 4181
3 Other Gas Turbine Problems
0090 400 119 1701 4181
Generation Equipment Performance
60
2008-2010 Review of Summer versus Winter Availability To address seasonality of unit availability unit information for the months of June to September (summer)
and December through February (winter) were pooled to calculate force events during these timeframes for
2008-201039 Figure 32 shows the Equivalent Availability Factor (EAF) is three percentage points higher and
the Equivalent Forced Outage Rate - Demand (EFORd) is more than a half of a percentage point lower in the
summer period than in winter period This means the units were more reliable with less forced events
during high-demand times during the summer than during the winter seasons The generating unitrsquos
capability has a resulting higher Net Capacity Factor (NCF) of 45 percentage points in the summer season
for 2008-2010
During the spring season (March-May) 77 percent of the units took a planned outage (PO) for an average
231 hours (or 96 days) In fall (October-November) only 42 percent of the units experienced a PO and the
average duration was shorter ndash 134 hours (or 56 days) A few units took both spring and fall planned
outages although this is rare Based on this assessment the generating units are prepared for the summer
peak demand The resulting availability indicates that this maintenance was successful which is measured
by an increased EAF and lower EFORd
Figure 32 Summer-Winter Average EAF NCF and EFORd (2008-2010)
Conclusions and Recommendations During 2008-2010 the average Equivalent Availability Factor (EAF) which measures the overall availability
of generating units decreased At the same time the Net Capacity Factor (NCF) an indicator of energy
production increased The average number of forced outages in 2010 is greater than in 2008 while at the
same time the average planned outage times have decreased As a result the Equivalent Forced Outage
Rate ndash Demand (EFORd) also increased illustrating that more units have experienced forced events during
39 A study of peak periods was conducted by the NERC Generating Availability Trend Evaluation (GATE) Working Group several years ago see httpwwwnerccomfilesSeasonal-Performance-Trendspdf
9116
5343
396
8818
4896
441
0 10 20 30 40 50 60 70 80 90 100
EAF
NCF
EFORd
Percent ()
Winter
Summer
Generation Equipment Performance
61
peak-demand times in 2010 than in the previous two years Potentially with shorter planned outage
periods in 2010 there may be less time to repair equipment and prevent forced unit outages
There are warnings that units are not being maintained as well as they should be In the last three years
there has been an increase in Equivalent Forced Outage Rate ndash Demand (EFORd) This indicator measures
the rate of forced outage events on generating units during periods of load demand To confirm this
problem forced outage hours jumped from 270 to 314 hours per unit between 2009 and 2010 At the same
time maintenance events also increased by 12 hours per unit Planned outage events remain constant The
resulting conclusions from this trend are
bull More or longer planned outage time is needed to repair the generating fleet Whether age is the
cause of the increase need for planned outage time remains unknown and further investigation into
the cause for longer planned outage time is necessary
bull More focus on preventive repairs during planned and maintenance events are needed
There are many multiple unit forced outages due to lack of fuel The majority of multiple unit trips have
three main causes transmission lack of fuel and storms With special interest in the forced outages due to
ldquoLack of Fuelrdquo additional analysis revealed that 77 percent of the units experiencing unexpected fuel
stoppage are oil-fired fossil units while gas-fired units experienced 15 percent
Generating units continue to be more reliable during the peak summer periods
Disturbance Event Trends
62
Category 1 An event resulting in one or more of the following a Unintended loss of three or more BPS elements caused by
common mode failure b Failure or misoperation of an SPSRAS c System-wide voltage reduction of 3 or more d Unintended BPS system separation resulting in an island of
100 MW to 999 MW e Unplanned evacuation from a control center facility with BPS
SCADA functionality for 30 minutes or more Category 2 An event resulting in one or more of the following
a Complete loss of all BPS control center voice communication system(s) for 30 minutes or more
b Complete loss of SCADA control or monitoring functionality for 30 minutes or more
c Voltage excursions equal to or greater than 10 lasting more than five minutes
d Loss of off-site power (LOOP) to a nuclear generating station e Unintended system separation resulting in an island of 1000
MW to 4999 MW f Unintended loss of 300MW or more of firm load for more
than 15 minutes g Violation of an Interconnection Reliability Operating Limit
(IROL) for more than 30 minutes Category 3 An event resulting in one or more of the following
a The loss of load or generation of 2000 MW or more in the Eastern Interconnection or
b Western Interconnection or 1000 MW or more in the ERCOT or Queacutebec Interconnections
c Unintended system separation resulting in an island of 5000 MW to 10000 MW
d Unintended system separation resulting in an island of Florida from the Eastern Interconnection
Category 4 An event resulting in one or more of the following a The loss of load or generation from 5001 MW to 9999 MW b Unintended system separation resulting in an island of more
than 10000 MW (with the exception of Florida as described in Category 3c)
Category 5 An event resulting in one or more of the following a The loss of load of 10000 MW or more b The loss of generation of 10000 MW or more
Figure 33 BPS Event Category
Disturbance Event Trends Introduction The purpose of this section is to report event
analysis trends from the beginning of event
analysis field test40
One of the companion goals of the event
analysis program is the identification of trends
in the number magnitude and frequency of
events and their associated causes such as
human error equipment failure protection
system misoperations etc The information
provided in the event analysis database (EADB)
and various event analysis reports have been
used to track and identify trends in BPS events
in conjunction with other databases (TADS
GADS metric and benchmarking database)
to the end of 2010
The Event Analysis Working Group (EAWG)
continuously gathers event data and is moving
toward an integrated approach to analyzing
data assessing trends and communicating the
results to the industry
Performance Trends The event category is classified41
Figure 33
as shown in
with Category 5 being the most
severe Figure 34 depicts disturbance trends in
Category 1 to 5 system events from the
40 httpwwwnerccomdocseawgGalloway-Industry-EA-Field-Test-102210pdf 41httpwwwnerccomfiles2011-05-0220Event_Analysis_Process_Phase20220Field20Test20Draft20-20Final20-20For20postingpdf
Disturbance Event Trends
63
beginning of event analysis field test to the end of 201042
Figure 34 Event Category vs Date for All 2010 Categorized Events
From the figure in November and December
there were many more category 1 and 2 events than in October This is due to the field trial starting on
October 25 2010
In addition to the category of the events the status of the events plays a critical role in the accuracy of the
data By examining Figure 35 over 80 of the events reported in 2010 have been closed This means that
the category root cause and other important information have been sufficiently finalized in order for
analysis to be accurate for each event At this time there is not enough data to draw any long-term
conclusions about event investigation performance
42 Documents for the EA Field Test are located at httpwwwnerccompagephpcid=5|365
2
12 12
26
3
6 5
14
1 1
2
0
5
10
15
20
25
30
35
40
45
October November December 2010
Even
t Cou
nt
Category 3 Category 2 Category 1
Disturbance Event Trends
64
Figure 35 Event Count vs Status (All 2010 Events with Status)
By drilling down into the cause code for each closed 2010 event Figure 36 shows the top 3 event causes
From the figure equipment failure and protection system misoperation are the most significant causes for
events Because of how new and limited the data is however there may not be statistical significance for
this result Further trending of cause codes for closed events and developing a richer dataset to find any
trends between event cause codes and event counts should be performed
Figure 36 Top 3 Event Counts vs DAWG Cause Code for all Closed 2010 Events
10
32
42
0
5
10
15
20
25
30
35
40
45
Open Closed Open and Closed
Even
t Cou
nt
Status
1211
8
0
2
4
6
8
10
12
14
Equipment Failure Protection System Misoperation Human Error
Even
t Cou
nt
Cause Code
Disturbance Event Trends
65
Conclusions Due to the relatively new process for events analysis and categorization more time will be required before a
conclusive recommendation may be obtained Further analysis and new data should provide valuable
statistics in the future Over 80 of all event reports from 2010 are current listed as closed but no
conclusion about investigation performance may be obtained because of the limited amount of data It is
recommended to study ways to prevent equipment failure and protection system misoperations but there
is not enough data to draw a firm conclusion about the top causes of events at this time
Abbreviations Used in This Report
66
Abbreviations Used in This Report
Acronym Definition ALP Acadiana Load Pocket
ALR Adequate Level of Reliability
ARR Automatic Reliability Report
BA Balancing Authority
BPS Bulk Power System
CDI Condition Driven Index
CEII Critical Energy Infrastructure Information
CIPC Critical Infrastructure Protection Committee
CLECO Cleco Power LLC
DADS Future Demand Availability Data System
DCS Disturbance Control Standard
DOE Department Of Energy
DSM Demand Side Management
EA Event Analysis
EAF Equivalent Availability Factor
ECAR East Central Area Reliability
EDI Event Drive Index
EEA Energy Emergency Alert
EFORd Equivalent Forced Outage Rate Demand
EMS Energy Management System
ERCOT Electric Reliability Council of Texas
ERO Electric Reliability Organization
ESAI Energy Security Analysis Inc
FERC Federal Energy Regulatory Commission
FOH Forced Outage Hours
FRCC Florida Reliability Coordinating Council
GADS Generation Availability Data System
GOP Generation Operator
IEEE Institute of Electrical and Electronics Engineers
IESO Independent Electricity System Operator
IROL Interconnection Reliability Operating Limit
Abbreviations Used in This Report
67
Acronym Definition IRI Integrated Reliability Index
LOLE Loss of Load Expectation
LUS Lafayette Utilities System
MAIN Mid-America Interconnected Network Inc
MAPP Mid-continent Area Power Pool
MOH Maintenance Outage Hours
MRO Midwest Reliability Organization
MSSC Most Severe Single Contingency
NCF Net Capacity Factor
NEAT NERC Event Analysis Tool
NERC North American Electric Reliability Corporation
NPCC Northeast Power Coordinating Council
OC Operating Committee
OL Operating Limit
OP Operating Procedures
ORS Operating Reliability Subcommittee
PC Planning Committee
PO Planned Outage
POH Planned Outage Hours
RAPA Reliability Assessment Performance Analysis
RAS Remedial Action Schemes
RC Reliability Coordinator
RCIS Reliability Coordination Information System
RCWG Reliability Coordinator Working Group
RE Regional Entities
RFC Reliability First Corporation
RMWG Reliability Metrics Working Group
RSG Reserve Sharing Group
SAIDI System Average Interruption Duration Index
SAIFI System Average Interruption Frequency Index
SCADA Supervisory Control and Data Acquisition
SDI Standardstatute Driven Index
SERC SERC Reliability Corporation
Abbreviations Used in This Report
68
Acronym Definition SRI Severity Risk Index
SMART Specific Measurable Attainable Relevant and Tangible
SOL System Operating Limit
SPS Special Protection Schemes
SPCS System Protection and Control Subcommittee
SPP Southwest Power Pool
SRI System Risk Index
TADS Transmission Availability Data System
TADSWG Transmission Availability Data System Working Group
TO Transmission Owner
TOP Transmission Operator
WECC Western Electricity Coordinating Council
Contributions
69
Contributions This report was made feasible by the collaboration and hard work of both NERC staff and NERCrsquos
Industry Groups
NERC Industry Groups
Table 14 lists the NERC industry group contributors Without their contribution and collaboration this
report would not have been possible
Table 13 NERC Industry Group Contributions43
NERC Group
Relationship Contribution
Reliability Metrics Working Group
(RMWG)
Reports to the OCPC bull Lead Development of Report bull Provide Reliability Metrics Data bull Responsible for Reliability Metrics
Performance Chapter
Transmission Availability Working Group
(TADSWG)
Reports to the OCPC bull Provide Transmission Availability Data
bull Responsible for Transmission Equip-ment Performance Chapter
bull Content Review
Generation Availability Data System Task
Force
(GADSTF)
Reports to the OCPC bull Provide Generation Availability Data bull Responsible for Generation Equip-
ment Performance Chapter bull Content Review
Event Analysis Working Group
(EAWG)
Reports to the OCPC bull Provide Events Data bull Responsible for Disturbance Events
Trends Chapter bull Content Review
43 Rosters for RMWG TADSWG GADSTF and EAWG are available at httpwwwnerccomfilesrosterpdf
Contributions
70
NERC Staff Table 13 below lists the NERC staff who contributed to the 2011 Reliability Performance Analysis
Report
Table 14 Contributing NERC Staff
Name Title E-mail Address
Mark Lauby Vice President and Director of
Reliability Assessment and
Performance Analysis
marklaubynercnet
Jessica Bian Manager of Performance Analysis jessicabiannercnet
John Moura Manager of Reliability Assessments johnmouranercnet
Andrew Slone Engineer Reliability Performance
Analysis
andrewslonenercnet
Jim Robinson TADS Project Manager jimrobinsonnercnet
Clyde Melton Engineer Reliability Performance
Analysis
clydemeltonnercnet
Mike Curley Manager of GADS Services mikecurleynercnet
James Powell Engineer Reliability Performance
Analysis
jamespowellnercnet
Michelle Marx Administrative Assistant michellemarxnercnet
William Mo Intern Performance Analysis wmonercnet
- NERCrsquos Mission
- Table of Contents
- Executive Summary
-
- 2011 Transition Report
- State of Reliability Report
- Key Findings and Recommendations
-
- Reliability Metric Performance
- Transmission Availability Performance
- Generating Availability Performance
- Disturbance Events
- Report Organization
-
- Introduction
-
- Metric Report Evolution
- Roadmap for the Future
-
- Reliability Metrics Performance
-
- Introduction
- 2010 Performance Metrics Results and Trends
-
- ALR1-3 Planning Reserve Margin
-
- Background
- Assessment
- Special Considerations
-
- ALR1-4 BPS Transmission Related Events Resulting in Loss of Load
-
- Background
- Assessment
-
- ALR1-12 Interconnection Frequency Response
-
- Background
- Assessment
-
- ALR2-3 Activation of Under Frequency Load Shedding
-
- Background
- Assessment
- Special Considerations
-
- ALR2-4 Average Percent Non-Recovery Disturbance Control Standards (DCS)
-
- Background
- Assessment
- Special Consideration
-
- ALR2-5 Disturbance Control Events Greater Than Most Severe Single Contingency
-
- Background
- Assessment
- Special Consideration
-
- ALR 1-5 System Voltage Performance
-
- Background
- Special Considerations
- Status
-
- ALR3-5 Interconnection Reliability Operating Limit System Operating Limit (IROLSOL) Exceedances
-
- Background
-
- ALR4-1 Automatic Transmission Outages Caused by Protection System Misoperations
-
- Background
- Special Considerations
-
- ALR6-11 ndash ALR6-14
-
- Background
- Assessment
- ALR 6-11 ndash Automatic Outages Initiated by Failed Protection System Equipment
- ALR6-12 ndash Automatic Outages Initiated by Human Error
- ALR6-13 ndash Automatic Outages Initiated by Failed AC Substation Equipment
- ALR6-14 Automatic AC Transmission Outages Initiated by Failed AC Circuit Equipment
-
- ALR6-15 Element Availability Percentage (APC)
-
- Background
- Assessment
- Special Consideration
-
- ALR6-16 Transmission System Unavailability
-
- Background
- Assessment
- Special Consideration
-
- ALR6-2 Energy Emergency Alert 3 (EEA3)
-
- Background
- Assessment
- Special Considerations
-
- ALR 6-3 Energy Emergency Alert 2 (EEA2)
-
- Background
- Assessment
- Special Considerations
-
- ALR 6-1 Transmission Constraint Mitigation
-
- Background
- Assessment
- Special Considerations
-
- Integrated Bulk Power System Risk Assessment
-
- Introduction
- Recommendations
-
- Integrated Reliability Index Concepts
-
- The Three Components of the IRI
-
- Event-Driven Indicators (EDI)
- Condition-Driven Indicators (CDI)
- StandardsStatute-Driven Indicators (SDI)
-
- IRI Index Calculation
- IRI Recommendations
-
- Reliability Metrics Conclusions and Recommendations
-
- Transmission Equipment Performance
-
- Introduction
- Performance Trends
-
- AC Element Outage Summary and Leading Causes
- Transmission Monthly Outages
- Outage Initiation Location
- Transmission Outage Events
- Transmission Outage Mode
-
- Conclusions
-
- Generation Equipment Performance
-
- Introduction
- Generation Key Performance Indicators
-
- Multiple Unit Forced Outages and Causes
- 2008-2010 Review of Summer versus Winter Availability
-
- Conclusions and Recommendations
-
- Disturbance Event Trends
-
- Introduction
- Performance Trends
- Conclusions
-
- Abbreviations Used in This Report
- Contributions
-
- NERC Industry Groups
- NERC Staff
-

Reliability Metrics Performance
33
Figure 17 ALR6-2 Energy Emergency Alert 3 (EEA3) Counts by Region (2006-2010)
Cleco Power Entergy and LUS are currently constructing an estimated $200 million transmission
infrastructure improvement project to mitigate transmission constraints into ALP Construction of the
project is scheduled to be complete in 2012 Completion of the project should help alleviate some of
the transmission congestion in this area Energy Emergency Alerts filed by the SPP Regional Entity
continue to decline
SPP RTO continues to coordinate operating plans with the operating entities in this area Mitigation
plans and local operating guides in place are expected to provide sufficient flexibility should issues arise
NERC will continue to monitor this area for Reliability Impacts and coordinate any actions with the SPP
Reliability Coordinator and SPP Regional Entity
ALR 6-3 Energy Emergency Alert 2 (EEA2)
Background
Energy Emergency Alert 2 (EEA2) is to measure the number of events BAs declare for deficient capacity
and energy during peak load periods which may serve as a leading indicator of energy and capacity
shortfall in the adequacy of the electric supply system EEA2 provides a sense of the frequency of
precursor events to the more severe EEA3 declarations This metric measures the number of events
1 3 1 2 214
3 4 4 1 5 334
4 2 1 52
1
0
5
10
15
20
25
30
3520
0620
0720
0820
0920
1020
0620
0720
0820
0920
1020
0620
0720
0820
0920
1020
0620
0720
0820
0920
1020
0620
0720
0820
0920
1020
0620
0720
0820
0920
1020
0620
0720
0820
0920
1020
0620
0720
0820
0920
10
FRCC MRO NPCC RFC SERC SPP TRE WECC
2006-2009
2010
Region and Year
Reliability Metrics Performance
34
Balancing Authorities declare for deficient capacity and energy during peak load periods At this time
however this data reflects inclusion of Demand Side Resources that would not be indicative of
inadequacy of the electric supply system
The number of EEA2 events and any trends in their reporting indicates how robust the system is in
being able to supply the aggregate load requirements The historical records may include demand
response activations and non-firm load interruptions per applicable contracts within the EEA alerts per
its definition25
Assessment
Demand response is a legitimate resource to be called upon by balancing authorities and
do not indicate a reliability concern As data is gathered in the future reports will provide an indication
of either decreasing or increasing adequacy in the electric supply system EEA2 events called solely for
activation of demand response (controllable or contractually prearranged demand-side dispatch
programs) or interruption of non-firm load per applicable contracts should be excluded This metric can
also be considered in the context of the Planning Reserve Margin Significant increases or decreases in
EEA2 events with relatively constant Planning Reserve Margins could indicate volatility in the actual
loads compared to forecast levels or changes in the adequacy of the bulk power system required to
meet load demands
Figure 18 shows the number of EEA2 events by Regional Entity from 2006 to 2010 EEA2 interactive
version available on line by quarter and region26
25 The EEA2 is defined at
The general trend continues to show improved
performance which may have been influenced by the overall reduction in demand throughout NERC
caused by the economic downturn Specific performance by any one region should be investigated
further for issues or events that may affect the results Determining whether performance reported
includes those events resulting from the economic operation of DSM and non-firm load interruption
should also be investigated The RMWG recommends continued metric assessment
httpwwwnerccomfilesEOP-002-2pdf 26 EEA2 interactive version located at httpwwwnerccompagephpcid=4|331|341
Reliability Metrics Performance
35
Special Considerations
The intent of this metric is to measure only EEAs that are called for reliability reasons and not for
economic factors such as demand side management (DSM) and non-firm load interruption The
historical data for this metric may include events that were called for economic factors According to
the RCWG recent data should only include EEAs called for reliability reasons
ALR 6-1 Transmission Constraint Mitigation
Background
The RMWG completed a pilot with four regional entities Based on the results the RMWG expanded the
pilot data collection to all regions and the initial results of the data collection are shown in Figure 19
and Table 5 Based on the results of the pilot there is merit in continuing to assess this metric The
intent of this metric is to identify trends in the number of mitigation measures (Special Protection
Schemes (SPS) Remedial Action Schemes (RAS) and Operating Procedures) required to meet reliability
requirements By their nature SPS do not indicate an inherent weakness in the bulk power system
rather they are an indication of methods that are taken to operate the system through the range of
conditions it must perform This metric is only intended to evaluate the trend use of these plans and
whether the metric indicates robustness of the transmission system is increasing remaining static or
decreasing
1 27
2 1 4 3 2 1 2 4 5 2 5 832
4724
211
5 38 5 1 1 8 7 4 1 1
05
101520253035404550
2006
2007
2008
2009
2010
2006
2007
2008
2009
2010
2006
2007
2008
2009
2010
2006
2007
2008
2009
2010
2006
2007
2008
2009
2010
2006
2007
2008
2009
2010
2006
2007
2008
2009
2010
2006
2007
2008
2009
2010
FRCC MRO NPCC RFC SERC SPP TRE WECC
2006-2009
2010
Region and Year
Figure 18 ALR6-3 Energy Emergency Alert 2 (EEA2)
Reliability Metrics Performance
36
Assessment
The pilot data indicates a relatively constant number of mitigation measures over the time period of
data collected
Figure 19 ALR6-1 Transmission Constraint Mitigation by SPSRAS (2009-2014)
0102030405060708090
100110120
2009
2010
2011
2014
2009
2010
2011
2014
2009
2010
2011
2014
2009
2010
2011
2014
2009
2010
2011
2014
2009
2010
2011
2014
2009
2010
2011
2014
2009
2010
2011
2014
FRCC MRO NPCC RFC SERC SPP ERCOT WECC
Coun
t
Region and Year
SPSRAS
Reliability Metrics Performance
37
Table 5 ALR6-1 Transmission Constraint Mitigation by Operating ProcedureGuides (2009-2011)
ALR6-1 Transmission Constraint Mitigation by Operating ProcedureGuides (2009-2014)
2009 2010 2011 2014
FRCC 107 75 66
MRO 79 79 81 81
NPCC 0 0 0
RFC 2 1 3 4
SPP 39 40 40 40
SERC 6 7 15
ERCOT 29 25 25
WECC 110 111
Special Considerations
A certain number of SPS mitigation plans may be necessary to support reliable operation of the system
If the number of SPS increase over time this may indicate that additional transmission capacity is
required A reduction in the number of SPS may be an indicator of increased generation or transmission
facilities being put into service which may indicate greater robustness of the bulk power system In
general mitigation plans are a viable and valuable tool for effective operation of the bulk power system
In power system planning reliability operability capacity and cost-efficiency are simultaneously
considered through a variety of scenarios to which the system may be subjected Mitigation measures
are a method for optimizing a power system across these scenarios Changes in quantities of mitigation
plans may indicate year-on-year differences in the system being evaluated
Integrated Bulk Power System Risk Assessment
Introduction In developing eighteen metrics to measure acceptable levels of reliability it has become clear that any
such measurement of reliability must include consideration of the risks present within the bulk power
system in order for us to appropriately prioritize and manage these system risks The scope for the
Reliability Metrics Working Group (RMWG)27
27 The RMWG scope can be viewed at
includes a task to develop a risk-based approach that
provides consistency in quantifying the severity of events The approach not only can be used to
httpwwwnerccomfilezrmwghtml
Reliability Metrics Performance
38
measure risk reduction over time but also can be applied uniformly in event analysis process to identify
the events that need to be analyzed in detail and sort out non-significant events
The Operating Committee (OC) and Planning Committee (PC) endorsed the concepts and framework28 of
the risk-based approach in their September 2010 joint meeting and further supported the event severity
risk index (SRI) calculation29
Recommendations
in March 2011
bull NERC should embrace the use of risk assessment to identify trends in addition to lessons learned
in order to improve bulk power system reliability
bull The RMWG should continue to coordinate and communicate with the Event Analysis Working
Group (EAWG) to apply the SRI into the event analysis process and root cause analysis
bull As trend evaluations increase the knowledge of risks to the bulk power system data required to
support additional assessment should be gathered
Event Severity Risk Index (SRI)
Risk assessment is an essential tool for achieving the alignment between organizations people and
technology This will assist in quantifying inherent risks identifying where potential high risks exist and
evaluating where the most significant lowering of risks can be achieved Being learning organizations
the Electric Reliability Organization (ERO) Regional Entities and Registered Entities can use these tools
to focus on the areas of highest risk to reliability to provide a sound basis for developing results-based
standards and compliance programs Risk assessment also serves to engage all stakeholders in a
dialogue about specific risk factors and helps direct a strategic plan for risk reduction and early
detection
The SRI is a daily blended metric for which transmission loss generation loss and load loss events are
calculated Each element (transmission generation and load loss) is factored by the systemrsquos inventory
for that element to rate significant events appropriately On a yearly basis these daily performances
can be sorted in descending order to evaluate the year-on-year performance of the system
In order to test drive the concepts the RMWG applied these calculations against historically memorable
days to derive SRIs Once these calculations were complete they were reviewed and evaluated by
various stakeholders for reasonableness Based upon feedback modifications to the calculation were
made and assessed against the historic days performed This iterative process locked down the details
28 httpwwwnerccomdocspcrmwgIntegrated_Bulk_Power_System_Risk_Assessment_Concepts_Finalpdf 29 httpwwwnerccomdocspcrmwgSRI_Equation_Refinement_May6_2011pdf
Reliability Metrics Performance
39
for the calculation of SRI whose calculation from zero (no transmission line outages generation outages
or load lost in a day) to 1000 (a theoretical condition in which every transmission line all generation
units and all load lost across the system in a single day)
Figure 20 captures the calculated severity risk value for each of the days for each year benchmarked
with the historic significant events which were used to concept test the calculation Since there is
significant disparity between days the bulk power system is stressed compared to those that are
ldquoroutinerdquo and ldquoherordquo days of the year where the system performed extremely well the curve is depicted
using a logarithmic scale Each yearrsquos data is sorted in descending order striking a characteristic shape
At the left-side of the curve the days in which the system is severely stressed are plotted The central
more linear portion of the curve identifies the routine day performance while the far right-side of the
curve shows the values plotted for days in which almost all lines and generation units are in service and
essentially no load is lost
The trends on the chart below show that 2009 and 2010 had fewer extreme days than 2008 Routine
daily performance appears generally consistent across all three years Figure 20 captures the days for
each year benchmarked with historically significant events
In Figure 20 NERCrsquos event categories and SRI ratings are directly related As the SRI increases the
category or severity of the event increases Historical events are also shown to relate modern
reliability measurements to give a perspective of how a well-known event would register on the SRI
scale
The event analysis process30
30
benefits from the SRI as it enables a numerical analysis of an event in
comparison to other events By this measure an event can be prioritized by its severity In a severe
event this is unnecessary However for events that do not result in severe stressing of the bulk power
system this prioritization can be a challenge By using the SRI the event analysis process can decide
which events to learn from and reduce which events to avoid and when resilience needs to be
increased under high impact low frequency events as shown in the blue boxes in the figure
httpwwwnerccompagephpcid=5|365
Reliability Metrics Performance
40
Figure 20 NERC Annual Daily Severity Risk Index (SRI) Sorted Descending with Historic Benchmark Days
Other factors that impact severity of a particular event to be considered in the future include whether
equipment operated as designed and resulted in loss of load from a reliability perspective (intentional
and controlled load-shedding) Mechanisms for enabling ongoing refinement to include the historic and
simulated events for future severity risk calculations are being explored
Reliability Metrics Performance
41
Integrated Reliability Index Concepts In December 2010 the RMWG was challenged by the OC and PC to develop a single index concept to
measure the universe of risks associated with the bulk power system As a result the integrated
reliability index (IRI) concepts were proposed31
Figure 21
the three components of which were defined to
quantify each specific risk aspect They are titled the Event Driven Index (EDI) StandardsStatute Driven
Index (SDI) and Condition Driven Index (CDI) illustrated in with measures associated with
system events standards compliance and eighteen performance metrics The development of an
integrated reliability index aims to inform increase transparency and quantify the effectiveness of risk
reduction or mitigation actions The goal is to provide the industry meaningful trends of the BPSrsquos
performance and guidance on how the industry can improve reliability and support risk-informed
decision making Once completed the IRI will facilitate holistic assessment of performance Finally the
IRI should help overcome concern and confusion about how many metrics are being analyzed for system
reliability assessments
Figure 21 Risk Model for Bulk Power System
The integrated model of event-driven condition-driven and standardsstatute-driven risk information
can be constructed to illustrate all possible logical relations between the three risk sets Due to the
nature of the system there may be some overlap among the components
31 httpwwwnerccomdocspcrmwgIntegrated_Reliability_Index_WhitePaper_DRAFTpdf
Event Driven Index (EDI)
Indicates Risk from
Major System Events
Standards Statute Driven
Index (SDI)
Indicates Risks from Severe Impact Standard Violations
Condition Driven Index (CDI)
Indicates Risk from Key Reliability
Indicators
Reliability Metrics Performance
42
The Three Components of the IRI The three components of the IRI work together as shown in Figure 22 to comprise a full picture of the
state of reliability
Figure 22 An overview of the components that comprise the Integrated Reliability Index (IRI)
Event-Driven Indicators (EDI)
The Event-Driven Indicator provides a basis for prioritization of events based on bulk power system
integrity equipment performance and engineering judgment This indicator can serve as a high value
risk assessment tool to be used by stakeholders to investigate and evaluate disturbance history and
measure the severity of these events The relative ranking of events requires industry expertise agreed-
upon goals and engineering judgment The EDI is a derivative of SRI results for a specific time period
but it transforms that performance into a form of an availability index These calculations will be further
refined as feedback is received
Condition-Driven Indicators (CDI)
The Condition-Driven Indicators focus on a set of measurable system conditions (performance
measures) to assess bulk power system reliability These reliability indicators identify factors that
positively or negatively impact reliability and are early predictors of the risk to reliability from events or
unmitigated violations A collection of these indicators measures how close reliability performance is to
the desired outcome and if the performance against these metrics is constant or improving
Reliability Metrics Performance
43
StandardsStatute-Driven Indicators (SDI)
The StandardsStatute-Driven Indicator is a calculation of success of compliance based upon the subset
of high-value standards and is divided by the number of participations who could have received the
violation within the time period considered Also based on these factors known unmitigated violations
of elevated risk factor requirements are weighted higher than lower risk factors The index decreases if
the compliance improvement is achieved over a trending period
IRI Index Calculation As with the SRI the IRI is based on an importance weighting factor which the RMWG can modify over
time after gaining experience with the new metric as well as consideration of feedback from industry
At this time the RMWG believes some form of blended weighting may serve to start to populate IRI
characteristic curves at a high and generic level Based upon feedback from stakeholders this approach
may change or as discussed below weighting factors may vary based on periodic review and risk model
update The RMWG will continue the refinement of the IRI calculation and consider other significant
factors that impact reliability (eg intentional and controlled load-shedding) further it will explore
developing mechanisms for enabling ongoing refinement which should be influenced by a wide set of
stakeholders
RMWG recommends the Event Driven Index (EDI) be weighted the highest (50 percent) since events
actually occurred indicating how the system was performing The Condition Driven Index (CDI) and
StandardsStatute Driven Index (SDI) are weighted 25 each since they are indicators of potential risks
to BPS reliability IRI can be calculated as follows
IRI is intended to be a composite metric which integrates several forms of individual risks to the bulk
power system Since the three components range across many stakeholder organizations these
concepts are developed as starting points for continued study and evaluation Additional supporting
materials can be found in the IRI whitepaper32
IRI Recommendations
including individual indices calculations and preliminary
trend information
For the IRI more investigation should be performed to determine the best way to integrate EDI CDI
and SDI into an Integrated Reliability Index (IRI) that quantitatively represents the reliability of the bulk
32 The IRI whitepaper can be found at httpwwwnerccomdocspcrmwgIntegrated_Reliability_Index_WhitePaper_DRAFTpdf
Reliability Metrics Performance
44
power system To this end study into determining the amount of overlap between the components is
necessary RMWG is currently working to determine the proper amount of overlap between the IRI
components
Also the CDI component of the IRI needs to be solidified This is especially true with the CDI More
accurate metric data is needed to paint a fuller picture of the CDI Many of the metrics used to calculate
the CDI are new or they have limited data Compared to the SDI which counts well-known violation
counts and the EDI which uses the well-defined CDI the CDI lacks the depth of rigor that the other two
components have acquired through their years of data RMWG is currently working to improve the CDI
Reliability Metrics Conclusions and Recommendations Among the eighteen metrics that address the characteristics of an adequate level of reliability (ALR)
metric trends indicate the system is performing better in the following seven areas
bull ALR1-3 Planning Reserve Margin
bull ALR1-4 BPS Transmission Related Events Resulting in Loss of Load
bull ALR2-5 Disturbance Control Events Greater than Most Severe Single Contingency
bull ALR6-2 Energy Emergency Alert 3 (EEA3)
bull ALR6-3 Energy Emergency Alert 2 (EEA2)
bull ALR6-11 Automatic Transmission Outages Caused by Protection System Misoperations
bull ALR6-13 Automatic Transmission Outages Caused by Failed AC Substation Equipment
Assessments have been made in other performance categories A number of them do not have
sufficient data to derive any conclusions from the results The RMWG recommends continued data
collection and assessment of these metrics If a metric does not yield any trend in a five-year reporting
period the metric will be modified or withdrawn
For the IRI more investigation should be performed to determine the overlap of the components (CDI
EDI and SDI) The CDI should be more thoroughly solidified as an index by collecting more data over
time
Transmission Equipment Performance
45
Transmission Equipment Performance Introduction The Transmission Availability Data System (TADS) effort began with the establishment of a TADS task force
by the NERC Planning Committee in October 2006 On October 27 2007 the NERC Board of Trustees
approved the collection of transmission automatic outage data beginning in calendar year 2008 (Phase I)
Subsequently on October 29 2008 the NERC Board approved the collection of Non-Automatic Outage data
that began for Calendar year 2010 (Phase II)
This chapter provides reliability performance analysis of the transmission system by focusing on the trends
of Automatic Outage data from calendar year 2008 thru 2010 Since only one year of Non-Automatic
Outage data has been collected that data will not be assessed in this report
When calculating bulk power system performance indices care must be exercised when interpreting results
as misinterpretation can lead to erroneous conclusions regarding system performance With only three
years of data in the smaller regions it is not clear whether a regionrsquos yearly outage variation compared to
the average is due to random statistical variation or that particular year is significantly different in
performance However on a NERC-wide basis after three years of data collection there is enough
information to accurately determine whether the yearly outage variation compared to the average is due to
random statistical variation or the particular year in question is significantly different in performance33
Performance Trends
Transmission performance information has been provided by Transmission Owners (TOs) within NERC
through the NERC TADS (Transmission Availability Data System) process The data presented reflects
Momentary and Sustained AC Automatic outages of transmission elements that operate at voltages ge 200 kV
(including the low side of transformers) with the criteria specified in the TADS process The following
elements listed below are included
bull AC Circuits ge 200 kV (Overhead and Underground Circuits) Radial circuits are included
bull DC Circuits with ge +-200 kV DC voltage
bull Transformers with ge 200 kV low-side voltage and
bull ACDC Back-to-Back (BTB) Converters with ge 200 kV AC voltage on both sides
33The detailed Confidence Interval computation is available at httpwwwnerccomdocspctadstfTADS_Nov_2_2007APPENDIX_C_Confidence_Intervalpdf
Transmission Equipment Performance
46
AC Element Outage Summary and Leading Causes Table 6 shows the 2008 2009 and 2010 NERC total AC transmission element inventory and a summary of
the associated outages As expected in general the number of circuits increased from year to year due to
new construction or re-construction to higher voltages For every outage experienced on the transmission
system cause codes are identified and recorded according to the TADS process Causes of both momentary
and sustained outages have been indicated These causes are analyzed to identify trends and similarities
and to provide insight into what could be done to possibly prevent future occurrences
Figure 23 and Figure 24 describe the top ten initiating cause codes for sustained and momentary automatic
outages combined from 2008-2010 Based on the two figures the relationship between the total number of
outages and total outage hours can be seen Failed AC Substation Equipment and Failed AC Circuit
Equipment only account for 15 percent of the total number of outages but account for 65 percent of the
total outage hours The two largest causes of outages within NERC (ldquoLightingrdquo and ldquoWeather excluding
Lightningrdquo) account for 34 percent of the total number of outages
The next three Human Error Failed Protection System Equipment and Failed AC Circuit Equipment have
very similar totals and should all be considered significant focus points in reducing the number of Sustained
Automatic Outages for all elements
Transmission Equipment Performance
47
Table 6 NERC - All AC Elements Sustained and Momentary Outage Performance Summary
2008 Number of Outages
AC Voltage
Class
No of
Circuits
Circuit
Miles Sustained Momentary
Total
Outages Total Outage Hours
200-299kV 4369 102131 1560 1062 2622 56595
300-399kV 1585 53631 793 753 1546 14681
400-599kV 586 31495 389 196 585 11766
600-799kV 110 9451 43 40 83 369
All Voltages 6650 196708 2785 2051 4836 83626
2009 Number of Outages
AC Voltage
Class
No of
Circuits
Circuit
Miles Sustained Momentary
Total
Outages Total Outage Hours
200-299kV 4468 102935 1387 898 2285 28828
300-399kV 1619 56447 641 610 1251 24714
400-599kV 592 32045 265 166 431 9110
600-799kV 110 9451 53 38 91 442
All Voltages 6789 200879 2346 1712 4038 63094
2010 Number of Outages
AC Voltage
Class
No of
Circuits
Circuit
Miles Sustained Momentary
Total
Outages Total Outage Hours
200-299kV 4567 104722 1506 918 2424 54941
300-399kV 1676 62415 721 601 1322 16043
400-599kV 605 31590 292 174 466 10442
600-799kV 111 9477 63 50 113 2303
All Voltages 6957 208204 2582 1743 4325 83729
Note The NERC table does not show redacted outages DC Circuit outages Transformer outages or ACDC
converter outages
Transmission Equipment Performance
48
Figure 23 NERC - Top Ten Sustained and Momentary Outages by Initiating Cause Code for All Elements
Figure 24 NERC - Top Ten Sustained Outage Hours by Cause Code
198
151
80
7271
6943
33
27
188
68
Lightning
Weather excluding lightningHuman Error
Failed AC Substation EquipmentFailed Protection System EquipmentFailed AC Circuit Equipment Foreign Interference
Power System Condition
Fire
Unknown
Remaining Cause Codes
299
246
188
58
52
42
3619
16 12 31 Failed AC Substation EquipmentFailed AC Circuit Equipment Weather excluding lightningUnavailable
Other
Fire
Unknown
Human Error
Failed Protection System EquipmentForeign Interference
Remaining Cause Codes
Transmission Equipment Performance
49
Transmission Monthly Outages Figure 25 displays the total number of Automatic Outages on a per-month basis The three months with the
highest total of outages were June July and August From a seasonal perspective winter had a monthly
average of 281 outages These include the months of November-March Summer had an average of 429
outages Summer included the months of April-October
Figure 25 Number of Outages by Month for AC Circuits (2008-2010)
This figure does not show redacted outages DC Circuit outages Transformer outages or ACDC Converter
outages
Outage Initiation Location For every outage experienced on the transmission system the outage initiation code is identified and
recorded according to the TADS process The outage initiation code can be analyzed to identify trends and
similarities and to provide insight into what could be done to possibly prevent future occurrences
The ldquoOutage Initiation Coderdquo describes where an automatic outage was initiated on the power system The
five codes are as follows
bull Element-Initiated
bull Other Element-Initiated
bull AC Substation-Initiated
bull ACDC Terminal-Initiated (for DC circuits)
bull Other Facility Initiated any facility not included in any other outage initiation code
JanuaryFebruar
yMarch April May June July August
September
October
November
December
2008 238 229 257 258 292 437 467 380 208 176 255 236
2009 315 201 339 334 398 553 546 515 351 235 226 294
2010 444 224 269 446 449 486 639 498 351 271 305 281
3 Year AVG 332 218 288 346 380 492 551 464 303 227 262 270
0
100
200
300
400
500
600
700
Out
ages
Transmission Equipment Performance
50
Notably the protection system is not part of an ldquoAC Substationrdquo or an ldquoACDC Terminalrdquo If a protection
system misoperates and initiates an outage it will be classified as ldquoOther-Facility Initiatedrdquo The following
Figures show the initiating location of the Automatic outages from 2008 to 2010
With both Momentary and Sustained Automatic Outages taken into account the outage was initiated on the
Element more than 67 percent of the time as shown in Figure 26 and Figure 27
When only the Sustained Automatic Outages are analyzed the outage initiation on both AC Substation and
Other Facility increased by 34 percent and 32 percent respectively Outages initiated on the Element itself
decreases by 78 percent as shown in Figure 26 and 27 For only the Momentary Automatic Outages the
outage initiation on the Element increases by 19 percent compared to Sustained Outages Element initiated
outages make up over 78 percent of the total outages when analyzing only Momentary Outages
Figure 26
Figure 27
Transmission Outage Events Figure 28 illustrates the relationship between the numbers of Automatic Outages associated per TADS
event 2008 2009 and 2010 tend to follow the same trend The largest number of Automatic Outages per
TADS event is fourteen in 2010 thirteen in 2009 and eight in 2008 There are around 70 to 100 TADS
events that contain between fourteen and three Automatic Outages (see below) There are around 330 to
400 TADS events that contain two or more Automatic Outages The rest of the events only contain one
Automatic Outage As noted in the lower right hand corner below the total number of Events in 2008 to
2010 ranged from 3920 to 4569 events per year Nearly 90 percent or more of the events contained one
Automatic Outage
Figure 26 Sustained Automatic Outage Initiation
Code
Figure 27 Momentary Automatic Outage Initiation
Code
Transmission Equipment Performance
51
Transmission Outage Mode Figure 29 and Figure 30 show the percentage of Outage Modes The ldquoOutage Mode Coderdquo describes
whether one Automatic Outage is related to other Automatic Outages A Single Mode outage is an
Automatic Outage of a single Element which occurs independently of any other Automatic Outages (if any)
A ldquoDependent Mode Initiating Outagerdquo is an Automatic Outage of a single Element that initiates one or more
subsequent Element Automatic Outages A ldquoDependent Mode Outagerdquo is an Automatic Outage of an
Element which occurred as a result of an initiating outage whether the initiating outage was an Element
outage or a non-Element outage A ldquoCommon Mode Outagerdquo is one of two or more Automatic Outages with
the same Initiating Cause Code and where the outages are not consequences of each other and occur nearly
simultaneously A ldquoCommon Mode Initiating Outagerdquo is a Common Mode Outage that initiates one or more
subsequent Automatic Outages
Over 72 percent of the total outages occurred on the bulk power system are Single Mode Outages The next
largest mode is Dependent with over 11 percent of the total outages being in this category For only
Sustained Automatic Outages outages related to each other increase with Dependent mode accounting for
13 percent of the outages and Common mode accounting for close to 11 percent of the outages
Independent Sustained outages still account for the largest portion with nearly 70 percent being Single
mode When just analyzing Momentary Automatic Outages Associated outages decrease with Dependent
Figure 28 Event Histogram (2008-2010)
Transmission Equipment Performance
52
mode accounting for only 9 percent of the outages The Common Mode percentage decreases while
Dependent Mode Initiating percentage increases compared to Sustained Outages Independent Momentary
outages account for the largest portion with over 76 percent being Single Mode
An investigation into the root causes of Dependent and Common mode events which include three or more
Automatic Outages (indentified in the TADS 2008 to 2010 data) should be a high priority Some protection
systems are designed to trip three or more circuits but some events go beyond what is designed Some also
have misoperations associated with multiple outage events
Conclusions On a NERC wide average basis automatic transmission outage rate is improving from 2008 to 2010 based on
reported data Considering both automatic and non-automatic outages 2010 records indicate transmission
element availability percentage is very high and exceeds 95 The unavailability rate for AC circuits and
transformers are only 15 and 29 respectively
The cause codes of Human Error Failed Protection System Equipment and Failed AC Circuit Equipment
should be considered significant focus points in reducing the number of Sustained Automatic Outages for all
elements A deeper look into the root causes of Dependent and Common mode events which include three
or more Automatic Outages (indentified in the TADS 2008 to 2010 data) should be a high priority Some
protection systems are designed to trip three or more circuits but some events go beyond what is designed
Some also have misoperations associated with multiple outage events
Figure 29 Sustained Automatic Outage Mode code Figure 30 Momentary Automatic Outage Mode code
Generation Equipment Performance
53
Generation Equipment Performance Introduction The development of the Generating Availability Data System (GADS) began in 1982 This series of databases
is used to voluntarily collect record and retrieve operating information By pooling individual unit
information with likewise units generating unit availability performance can be calculated providing
opportunities to identify trends and generating equipment reliability improvement opportunities The
information is used to support equipment reliability availability analyses and risk-informed decision-making
by system planners generation owners assessment modelers manufacturers and contractors etc Reports
and information resulting from the data collected through GADS are now used for benchmarking and
analyzing electric power plants
Currently the data collected through GADS contains 72 percent of the North American generating units
with generating capacity of 20 MW or higher34 Additionally many of the newer combined-cycle plants are
not reporting information and therefore a full view of each unit type is not presented Rather a sample of
all the units in North America that fit a given more general category is provided35 for the 2008-201036
Generation Key Performance Indicators
assessment period
Three key performance indicators37
In
the industry have used widely to measure the availability of generating
units (see Terms Used in This Report section for their calculation parameters) are Equivalent Availability
Factor (EAF) Net Capacity Factor (NCF) and Equivalent Forced Outage Rate ndash Demand (EFORd)
Table 7 the North American fleet average EAF NCF and EFORd compared to unit age for all generating
units with a capacity of 20 MW and higher is provided for the years 2008-2010 The EAF shows a decline
during the last three years NCF is up and down while the EFORd appears to be increasing As expected the
fleet of units reported to GADS is aging overall with the fossil units being about 12 years older than the
average age
34 httpwwwnerccomdocspcgadstfGADSTF_Recommendation_Report_02-18-2011_FINALpdf 35GADS contains some 1500+ units under 20 MW that is not included in this report These units are excluded because most units are not base-loaded and are in peaking operation
3684 percent of the 2010 dataset is available at this time while the 2008 and 2009 dataset is complete 37 httpwwwnerccompagephpcid=4|43
Generation Equipment Performance
54
Table 7 General Availability Review of GADS Fleet Units by Year
2008 2009 2010 Average
Equivalent Availability Factor (EAF) 8776 8774 8678 8743
Net Capacity Factor (NCF) 5083 4709 4880 4890
Equivalent Forced Outage Rate -
Demand (EFORd) 579 575 639 597
Number of Units ge20 MW 3713 3713 3713 3713
Average Age of the Fleet in Years (all
unit types) 303 311 321 312
Average Age of the Fleet in Years
(fossil units only) 422 432 440 433
Figure 31 provides the average forced outage hours (FOH) maintenance outage hours (MOH) and planned
outage hours (POH) for all units reporting 20 MW or larger During this three-year period the average FOH
291 hours average MOH is 163 hours average POH is 470 hours
Figure 31 shows a large increase in forced and maintenance events The average age of the units with a
capacity of 20MW and higher in 2009 is 316 years old However the average age of fossil units in 2010 is
442 years old These fossil units are the backbone of all operating units providing the base-load power
continuously and nearly 50 percent of all energy annually There appears to be no increase allocated for
annualsemi-annual maintenance (ie planned outages) for the older generating units The increase of
000100002000030000400005000060000700008000090000
100000
2008 2009 2010
463 479 468
154 161 173
288 270 314
Hou
rs
Planned Maintenance Forced
Figure 31 Average Outage Hours for Units gt 20 MW
Generation Equipment Performance
55
maintenance outage hours reflects an increased need to fix problems that cannot be deferred until the next
annualsemi-annual repairs As a result it shows one of two things are happening
bull More or longer planned outage time is needed to repair the aging generating fleet
bull More focus on preventive repairs during planned and maintenance events are needed
Multiple Unit Forced Outages and Causes Table 8 provides the annual multiple-unit forced outage trips resulting from the same cause for each of the
assessments years 2008-2010 respectively The ldquosingle unitrdquo trips are large units with a Net Dependable
Capacity of 750 MW or more The trips of ldquotwo unitsrdquo or more is any combination of unit capacity with the
total amount of lost capacity more than 750 MW
Table 8 also presents more information on the forced outages During 2008-2010 there were a large
number of double-unit outages resulting from the same event Investigations show that some of these trips
were at a single plant caused by common control and instrumentation for the units The incidents occurred
several times for several months and are a common mode issue internal to the plant
Table 8 Number of Multiple Unit Forced Outages and FrequencyYear
2008 2009 2010
Type of
Trip
of
Trips
Avg Outage
Hr Trip
Avg Outage
Hr Unit
of
Trips
Avg Outage
Hr Trip
Avg Outage
Hr Unit
of
Trips
Avg Outage
Hr Trip
Avg Outage
Hr Unit
Single-unit
Trip 591 58 58 284 64 64 339 66 66
Two-unit
Trip 281 43 22 508 96 48 206 41 20
Three-unit
Trip 74 48 16 223 146 48 47 109 36
Four-unit
Trip 12 77 19 111 112 28 40 121 30
Five-unit
Trip 11 1303 260 60 443 88 19 199 10
gt 5 units 20 166 16 93 206 50 37 246 6
Loss of ge 750 MW per Trip
The high number of five-unit trips in 2008 was due to Hurricane Ike hitting the Gulf Coast The highest total
number of multiple unit trips occurred in 2009 though as mentioned before the data collection for 2010 is
incomplete at this time The majority of 2009 multiple unit trips have three main causes (in order by
Generation Equipment Performance
56
number of events) transmission lack of fuel and storms A summary of the three categories for single as
well as multiple unit outages (all unit capacities) are reflected in Table 9
Table 9 Common Causes of Multiple Unit Forced Outages (2009)
Cause Number of Events Average MW Size of Unit
Transmission 1583 16
Lack of Fuel (Coal Mines Gas Lines etc) Not
in Operator Control
812 448
Storms Lightning and Other Acts of Nature 591 112
Some of the transmission outages based on storms in 2009 have been caused by the same reasons because
the storms may have caused transmission interference However the plants reported the problems
inconsistently with either the transmission interference or storms cause code Therefore they are depicted
as two different causes of forced outage
Marked transmission outages in 2009 were quite high Thirty-five percent came from one utility with a large
number of hydroelectric units The company related the trips to various problems including weather
(lightning storms) wildlife ldquoline bumpsrdquo and problems on the receiving end of the transmission line Nine
hundred and eighty-five transmission trips (62 percent) were from hydroelectric units38
In 2009 only ten transmission trips resulted in a loss of 750 MW or more per trip Twenty two generating
plants were affected by the ten trips Causes for the trips include feeder line trips (1 trip) breakers in the
switchyard (8 trips) personnel errors (2 trips) and unknown (10 trips)
The ldquoLack of Fuelrdquo outages are of interest as these events occur during the times when a unit is available to
operate but there is an interruption in fuels to operate the facilities These events do not include
interruptions of fuel due to contracts Rather the cause code is designed to account for units that are
expecting fuel and it is unavailable when requested Table 10 presents the distribution of ldquoLack of Fuelrdquo
events by NERC Region and Table 11 presents the unit types affected
38 The average size of the hydroelectric units were small ndash 335 MW
Generation Equipment Performance
57
Of the units that report ldquoLack of Fuelrdquo 78 percent of the units are oil-fired 15 percent of the units are gas-
fired and the remaining units are various other fuels Table 12 provides the top causes of forced outage for
several unit types For fossil units ldquoLack of Fuelrdquo as the number three cause behind waterwall tube leaks
and superheater tube leaks
Table 10 Forced Outages Due to Lack of Fuel by Region
Region Number of Lack of Fuel
Problems Reported
FRCC 0
MRO 3
NPCC 24
RFC 695
SERC 17
SPP 3
TRE 7
WECC 29
One company contributed to the majority of oil-fired lack of fuel events The units at the company are
actually dual-fuels (oil and gas) but market nominated gas monitoring causes the units to be on forced
outage nightly The units need gas to start up so they can run on oil When they shut down the units must
switch to gas to clean themselves With the gas restriction the unit canrsquot start and the unit goes on a
forced outage Until the band is lifted the two units will continue to be on a forced outage cycle
Event records also provide descriptions of why the unit was without fuel with the majority of descriptions
bull Temperatures affecting gas supply valves
bull Unexpected maintenance of gas pipe-lines
bull Compressor problemsmaintenance
Generation Equipment Performance
58
Table 11 Unit Type Profile of Forced Outages Due to Lack of Fuel
Unit Types Number of Lack of Fuel Problems Reported
Fossil 642
Nuclear 0
Gas Turbines 88
Diesel Engines 1
HydroPumped Storage 0
Combined Cycle 47
Generation Equipment Performance
59
Table 12 Causes of Forced Outage for Different Unit Types (2008-2010)
Fossil - all MW sizes all fuels
Rank Description Occurrence per Unit-year
MWH per Unit-year
Average Hours To Repair
Average Hours Between Failures
Unit-years
1 Waterwall (furnace wall) 0590 134106 59 3250 3868 2 Second Superheater
Leaks 0180 5182 60 3228 3868
3 Lack of Fuel (coal mines gas lines etc) where the operator is not in control
0480 4701 18 26 3868
Combined-Cycle blocks Rank Description Occurrence
per Unit-year
MWH per Unit-year
Average Hours To Repair
Average Hours Between Failures
Unit-years
1 HP Turbine Buckets Or Blades
0020 4663 1830 26280 466
2 Turbine Control Valves 0040 2777 100 7200 466 3 Gas Turbine Compressor -
High Pressure Shaft 0010 2266 663 4269 466
Nuclear units - all Reactor types Rank Description Occurrence
per Unit-year
MWH per Unit-year
Average Hours To Repair
Average Hours Between Failures
Unit-years
1 LP Turbine Buckets or Blades
0010 26415 8760 26280 288
2 Containment Structure 0010 9233 1226 26262 288 3 Feedwater Pump Local
Controls 0020 7620 692 12642 288
Simple-cycle gas turbine jet engines Rank Description Occurrence
per Unit-year
MWH per Unit-year
Average Hours To Repair
Average Hours Between Failures
Unit-years
1 Main Transformer 0030 1611 1016 20709 4181 2 Other Gas Turbine
Controls And Instrument Problems
0120 428 70 2614 4181
3 Other Gas Turbine Problems
0090 400 119 1701 4181
Generation Equipment Performance
60
2008-2010 Review of Summer versus Winter Availability To address seasonality of unit availability unit information for the months of June to September (summer)
and December through February (winter) were pooled to calculate force events during these timeframes for
2008-201039 Figure 32 shows the Equivalent Availability Factor (EAF) is three percentage points higher and
the Equivalent Forced Outage Rate - Demand (EFORd) is more than a half of a percentage point lower in the
summer period than in winter period This means the units were more reliable with less forced events
during high-demand times during the summer than during the winter seasons The generating unitrsquos
capability has a resulting higher Net Capacity Factor (NCF) of 45 percentage points in the summer season
for 2008-2010
During the spring season (March-May) 77 percent of the units took a planned outage (PO) for an average
231 hours (or 96 days) In fall (October-November) only 42 percent of the units experienced a PO and the
average duration was shorter ndash 134 hours (or 56 days) A few units took both spring and fall planned
outages although this is rare Based on this assessment the generating units are prepared for the summer
peak demand The resulting availability indicates that this maintenance was successful which is measured
by an increased EAF and lower EFORd
Figure 32 Summer-Winter Average EAF NCF and EFORd (2008-2010)
Conclusions and Recommendations During 2008-2010 the average Equivalent Availability Factor (EAF) which measures the overall availability
of generating units decreased At the same time the Net Capacity Factor (NCF) an indicator of energy
production increased The average number of forced outages in 2010 is greater than in 2008 while at the
same time the average planned outage times have decreased As a result the Equivalent Forced Outage
Rate ndash Demand (EFORd) also increased illustrating that more units have experienced forced events during
39 A study of peak periods was conducted by the NERC Generating Availability Trend Evaluation (GATE) Working Group several years ago see httpwwwnerccomfilesSeasonal-Performance-Trendspdf
9116
5343
396
8818
4896
441
0 10 20 30 40 50 60 70 80 90 100
EAF
NCF
EFORd
Percent ()
Winter
Summer
Generation Equipment Performance
61
peak-demand times in 2010 than in the previous two years Potentially with shorter planned outage
periods in 2010 there may be less time to repair equipment and prevent forced unit outages
There are warnings that units are not being maintained as well as they should be In the last three years
there has been an increase in Equivalent Forced Outage Rate ndash Demand (EFORd) This indicator measures
the rate of forced outage events on generating units during periods of load demand To confirm this
problem forced outage hours jumped from 270 to 314 hours per unit between 2009 and 2010 At the same
time maintenance events also increased by 12 hours per unit Planned outage events remain constant The
resulting conclusions from this trend are
bull More or longer planned outage time is needed to repair the generating fleet Whether age is the
cause of the increase need for planned outage time remains unknown and further investigation into
the cause for longer planned outage time is necessary
bull More focus on preventive repairs during planned and maintenance events are needed
There are many multiple unit forced outages due to lack of fuel The majority of multiple unit trips have
three main causes transmission lack of fuel and storms With special interest in the forced outages due to
ldquoLack of Fuelrdquo additional analysis revealed that 77 percent of the units experiencing unexpected fuel
stoppage are oil-fired fossil units while gas-fired units experienced 15 percent
Generating units continue to be more reliable during the peak summer periods
Disturbance Event Trends
62
Category 1 An event resulting in one or more of the following a Unintended loss of three or more BPS elements caused by
common mode failure b Failure or misoperation of an SPSRAS c System-wide voltage reduction of 3 or more d Unintended BPS system separation resulting in an island of
100 MW to 999 MW e Unplanned evacuation from a control center facility with BPS
SCADA functionality for 30 minutes or more Category 2 An event resulting in one or more of the following
a Complete loss of all BPS control center voice communication system(s) for 30 minutes or more
b Complete loss of SCADA control or monitoring functionality for 30 minutes or more
c Voltage excursions equal to or greater than 10 lasting more than five minutes
d Loss of off-site power (LOOP) to a nuclear generating station e Unintended system separation resulting in an island of 1000
MW to 4999 MW f Unintended loss of 300MW or more of firm load for more
than 15 minutes g Violation of an Interconnection Reliability Operating Limit
(IROL) for more than 30 minutes Category 3 An event resulting in one or more of the following
a The loss of load or generation of 2000 MW or more in the Eastern Interconnection or
b Western Interconnection or 1000 MW or more in the ERCOT or Queacutebec Interconnections
c Unintended system separation resulting in an island of 5000 MW to 10000 MW
d Unintended system separation resulting in an island of Florida from the Eastern Interconnection
Category 4 An event resulting in one or more of the following a The loss of load or generation from 5001 MW to 9999 MW b Unintended system separation resulting in an island of more
than 10000 MW (with the exception of Florida as described in Category 3c)
Category 5 An event resulting in one or more of the following a The loss of load of 10000 MW or more b The loss of generation of 10000 MW or more
Figure 33 BPS Event Category
Disturbance Event Trends Introduction The purpose of this section is to report event
analysis trends from the beginning of event
analysis field test40
One of the companion goals of the event
analysis program is the identification of trends
in the number magnitude and frequency of
events and their associated causes such as
human error equipment failure protection
system misoperations etc The information
provided in the event analysis database (EADB)
and various event analysis reports have been
used to track and identify trends in BPS events
in conjunction with other databases (TADS
GADS metric and benchmarking database)
to the end of 2010
The Event Analysis Working Group (EAWG)
continuously gathers event data and is moving
toward an integrated approach to analyzing
data assessing trends and communicating the
results to the industry
Performance Trends The event category is classified41
Figure 33
as shown in
with Category 5 being the most
severe Figure 34 depicts disturbance trends in
Category 1 to 5 system events from the
40 httpwwwnerccomdocseawgGalloway-Industry-EA-Field-Test-102210pdf 41httpwwwnerccomfiles2011-05-0220Event_Analysis_Process_Phase20220Field20Test20Draft20-20Final20-20For20postingpdf
Disturbance Event Trends
63
beginning of event analysis field test to the end of 201042
Figure 34 Event Category vs Date for All 2010 Categorized Events
From the figure in November and December
there were many more category 1 and 2 events than in October This is due to the field trial starting on
October 25 2010
In addition to the category of the events the status of the events plays a critical role in the accuracy of the
data By examining Figure 35 over 80 of the events reported in 2010 have been closed This means that
the category root cause and other important information have been sufficiently finalized in order for
analysis to be accurate for each event At this time there is not enough data to draw any long-term
conclusions about event investigation performance
42 Documents for the EA Field Test are located at httpwwwnerccompagephpcid=5|365
2
12 12
26
3
6 5
14
1 1
2
0
5
10
15
20
25
30
35
40
45
October November December 2010
Even
t Cou
nt
Category 3 Category 2 Category 1
Disturbance Event Trends
64
Figure 35 Event Count vs Status (All 2010 Events with Status)
By drilling down into the cause code for each closed 2010 event Figure 36 shows the top 3 event causes
From the figure equipment failure and protection system misoperation are the most significant causes for
events Because of how new and limited the data is however there may not be statistical significance for
this result Further trending of cause codes for closed events and developing a richer dataset to find any
trends between event cause codes and event counts should be performed
Figure 36 Top 3 Event Counts vs DAWG Cause Code for all Closed 2010 Events
10
32
42
0
5
10
15
20
25
30
35
40
45
Open Closed Open and Closed
Even
t Cou
nt
Status
1211
8
0
2
4
6
8
10
12
14
Equipment Failure Protection System Misoperation Human Error
Even
t Cou
nt
Cause Code
Disturbance Event Trends
65
Conclusions Due to the relatively new process for events analysis and categorization more time will be required before a
conclusive recommendation may be obtained Further analysis and new data should provide valuable
statistics in the future Over 80 of all event reports from 2010 are current listed as closed but no
conclusion about investigation performance may be obtained because of the limited amount of data It is
recommended to study ways to prevent equipment failure and protection system misoperations but there
is not enough data to draw a firm conclusion about the top causes of events at this time
Abbreviations Used in This Report
66
Abbreviations Used in This Report
Acronym Definition ALP Acadiana Load Pocket
ALR Adequate Level of Reliability
ARR Automatic Reliability Report
BA Balancing Authority
BPS Bulk Power System
CDI Condition Driven Index
CEII Critical Energy Infrastructure Information
CIPC Critical Infrastructure Protection Committee
CLECO Cleco Power LLC
DADS Future Demand Availability Data System
DCS Disturbance Control Standard
DOE Department Of Energy
DSM Demand Side Management
EA Event Analysis
EAF Equivalent Availability Factor
ECAR East Central Area Reliability
EDI Event Drive Index
EEA Energy Emergency Alert
EFORd Equivalent Forced Outage Rate Demand
EMS Energy Management System
ERCOT Electric Reliability Council of Texas
ERO Electric Reliability Organization
ESAI Energy Security Analysis Inc
FERC Federal Energy Regulatory Commission
FOH Forced Outage Hours
FRCC Florida Reliability Coordinating Council
GADS Generation Availability Data System
GOP Generation Operator
IEEE Institute of Electrical and Electronics Engineers
IESO Independent Electricity System Operator
IROL Interconnection Reliability Operating Limit
Abbreviations Used in This Report
67
Acronym Definition IRI Integrated Reliability Index
LOLE Loss of Load Expectation
LUS Lafayette Utilities System
MAIN Mid-America Interconnected Network Inc
MAPP Mid-continent Area Power Pool
MOH Maintenance Outage Hours
MRO Midwest Reliability Organization
MSSC Most Severe Single Contingency
NCF Net Capacity Factor
NEAT NERC Event Analysis Tool
NERC North American Electric Reliability Corporation
NPCC Northeast Power Coordinating Council
OC Operating Committee
OL Operating Limit
OP Operating Procedures
ORS Operating Reliability Subcommittee
PC Planning Committee
PO Planned Outage
POH Planned Outage Hours
RAPA Reliability Assessment Performance Analysis
RAS Remedial Action Schemes
RC Reliability Coordinator
RCIS Reliability Coordination Information System
RCWG Reliability Coordinator Working Group
RE Regional Entities
RFC Reliability First Corporation
RMWG Reliability Metrics Working Group
RSG Reserve Sharing Group
SAIDI System Average Interruption Duration Index
SAIFI System Average Interruption Frequency Index
SCADA Supervisory Control and Data Acquisition
SDI Standardstatute Driven Index
SERC SERC Reliability Corporation
Abbreviations Used in This Report
68
Acronym Definition SRI Severity Risk Index
SMART Specific Measurable Attainable Relevant and Tangible
SOL System Operating Limit
SPS Special Protection Schemes
SPCS System Protection and Control Subcommittee
SPP Southwest Power Pool
SRI System Risk Index
TADS Transmission Availability Data System
TADSWG Transmission Availability Data System Working Group
TO Transmission Owner
TOP Transmission Operator
WECC Western Electricity Coordinating Council
Contributions
69
Contributions This report was made feasible by the collaboration and hard work of both NERC staff and NERCrsquos
Industry Groups
NERC Industry Groups
Table 14 lists the NERC industry group contributors Without their contribution and collaboration this
report would not have been possible
Table 13 NERC Industry Group Contributions43
NERC Group
Relationship Contribution
Reliability Metrics Working Group
(RMWG)
Reports to the OCPC bull Lead Development of Report bull Provide Reliability Metrics Data bull Responsible for Reliability Metrics
Performance Chapter
Transmission Availability Working Group
(TADSWG)
Reports to the OCPC bull Provide Transmission Availability Data
bull Responsible for Transmission Equip-ment Performance Chapter
bull Content Review
Generation Availability Data System Task
Force
(GADSTF)
Reports to the OCPC bull Provide Generation Availability Data bull Responsible for Generation Equip-
ment Performance Chapter bull Content Review
Event Analysis Working Group
(EAWG)
Reports to the OCPC bull Provide Events Data bull Responsible for Disturbance Events
Trends Chapter bull Content Review
43 Rosters for RMWG TADSWG GADSTF and EAWG are available at httpwwwnerccomfilesrosterpdf
Contributions
70
NERC Staff Table 13 below lists the NERC staff who contributed to the 2011 Reliability Performance Analysis
Report
Table 14 Contributing NERC Staff
Name Title E-mail Address
Mark Lauby Vice President and Director of
Reliability Assessment and
Performance Analysis
marklaubynercnet
Jessica Bian Manager of Performance Analysis jessicabiannercnet
John Moura Manager of Reliability Assessments johnmouranercnet
Andrew Slone Engineer Reliability Performance
Analysis
andrewslonenercnet
Jim Robinson TADS Project Manager jimrobinsonnercnet
Clyde Melton Engineer Reliability Performance
Analysis
clydemeltonnercnet
Mike Curley Manager of GADS Services mikecurleynercnet
James Powell Engineer Reliability Performance
Analysis
jamespowellnercnet
Michelle Marx Administrative Assistant michellemarxnercnet
William Mo Intern Performance Analysis wmonercnet
- NERCrsquos Mission
- Table of Contents
- Executive Summary
-
- 2011 Transition Report
- State of Reliability Report
- Key Findings and Recommendations
-
- Reliability Metric Performance
- Transmission Availability Performance
- Generating Availability Performance
- Disturbance Events
- Report Organization
-
- Introduction
-
- Metric Report Evolution
- Roadmap for the Future
-
- Reliability Metrics Performance
-
- Introduction
- 2010 Performance Metrics Results and Trends
-
- ALR1-3 Planning Reserve Margin
-
- Background
- Assessment
- Special Considerations
-
- ALR1-4 BPS Transmission Related Events Resulting in Loss of Load
-
- Background
- Assessment
-
- ALR1-12 Interconnection Frequency Response
-
- Background
- Assessment
-
- ALR2-3 Activation of Under Frequency Load Shedding
-
- Background
- Assessment
- Special Considerations
-
- ALR2-4 Average Percent Non-Recovery Disturbance Control Standards (DCS)
-
- Background
- Assessment
- Special Consideration
-
- ALR2-5 Disturbance Control Events Greater Than Most Severe Single Contingency
-
- Background
- Assessment
- Special Consideration
-
- ALR 1-5 System Voltage Performance
-
- Background
- Special Considerations
- Status
-
- ALR3-5 Interconnection Reliability Operating Limit System Operating Limit (IROLSOL) Exceedances
-
- Background
-
- ALR4-1 Automatic Transmission Outages Caused by Protection System Misoperations
-
- Background
- Special Considerations
-
- ALR6-11 ndash ALR6-14
-
- Background
- Assessment
- ALR 6-11 ndash Automatic Outages Initiated by Failed Protection System Equipment
- ALR6-12 ndash Automatic Outages Initiated by Human Error
- ALR6-13 ndash Automatic Outages Initiated by Failed AC Substation Equipment
- ALR6-14 Automatic AC Transmission Outages Initiated by Failed AC Circuit Equipment
-
- ALR6-15 Element Availability Percentage (APC)
-
- Background
- Assessment
- Special Consideration
-
- ALR6-16 Transmission System Unavailability
-
- Background
- Assessment
- Special Consideration
-
- ALR6-2 Energy Emergency Alert 3 (EEA3)
-
- Background
- Assessment
- Special Considerations
-
- ALR 6-3 Energy Emergency Alert 2 (EEA2)
-
- Background
- Assessment
- Special Considerations
-
- ALR 6-1 Transmission Constraint Mitigation
-
- Background
- Assessment
- Special Considerations
-
- Integrated Bulk Power System Risk Assessment
-
- Introduction
- Recommendations
-
- Integrated Reliability Index Concepts
-
- The Three Components of the IRI
-
- Event-Driven Indicators (EDI)
- Condition-Driven Indicators (CDI)
- StandardsStatute-Driven Indicators (SDI)
-
- IRI Index Calculation
- IRI Recommendations
-
- Reliability Metrics Conclusions and Recommendations
-
- Transmission Equipment Performance
-
- Introduction
- Performance Trends
-
- AC Element Outage Summary and Leading Causes
- Transmission Monthly Outages
- Outage Initiation Location
- Transmission Outage Events
- Transmission Outage Mode
-
- Conclusions
-
- Generation Equipment Performance
-
- Introduction
- Generation Key Performance Indicators
-
- Multiple Unit Forced Outages and Causes
- 2008-2010 Review of Summer versus Winter Availability
-
- Conclusions and Recommendations
-
- Disturbance Event Trends
-
- Introduction
- Performance Trends
- Conclusions
-
- Abbreviations Used in This Report
- Contributions
-
- NERC Industry Groups
- NERC Staff
-
Reliability Metrics Performance
34
Balancing Authorities declare for deficient capacity and energy during peak load periods At this time
however this data reflects inclusion of Demand Side Resources that would not be indicative of
inadequacy of the electric supply system
The number of EEA2 events and any trends in their reporting indicates how robust the system is in
being able to supply the aggregate load requirements The historical records may include demand
response activations and non-firm load interruptions per applicable contracts within the EEA alerts per
its definition25
Assessment
Demand response is a legitimate resource to be called upon by balancing authorities and
do not indicate a reliability concern As data is gathered in the future reports will provide an indication
of either decreasing or increasing adequacy in the electric supply system EEA2 events called solely for
activation of demand response (controllable or contractually prearranged demand-side dispatch
programs) or interruption of non-firm load per applicable contracts should be excluded This metric can
also be considered in the context of the Planning Reserve Margin Significant increases or decreases in
EEA2 events with relatively constant Planning Reserve Margins could indicate volatility in the actual
loads compared to forecast levels or changes in the adequacy of the bulk power system required to
meet load demands
Figure 18 shows the number of EEA2 events by Regional Entity from 2006 to 2010 EEA2 interactive
version available on line by quarter and region26
25 The EEA2 is defined at
The general trend continues to show improved
performance which may have been influenced by the overall reduction in demand throughout NERC
caused by the economic downturn Specific performance by any one region should be investigated
further for issues or events that may affect the results Determining whether performance reported
includes those events resulting from the economic operation of DSM and non-firm load interruption
should also be investigated The RMWG recommends continued metric assessment
httpwwwnerccomfilesEOP-002-2pdf 26 EEA2 interactive version located at httpwwwnerccompagephpcid=4|331|341
Reliability Metrics Performance
35
Special Considerations
The intent of this metric is to measure only EEAs that are called for reliability reasons and not for
economic factors such as demand side management (DSM) and non-firm load interruption The
historical data for this metric may include events that were called for economic factors According to
the RCWG recent data should only include EEAs called for reliability reasons
ALR 6-1 Transmission Constraint Mitigation
Background
The RMWG completed a pilot with four regional entities Based on the results the RMWG expanded the
pilot data collection to all regions and the initial results of the data collection are shown in Figure 19
and Table 5 Based on the results of the pilot there is merit in continuing to assess this metric The
intent of this metric is to identify trends in the number of mitigation measures (Special Protection
Schemes (SPS) Remedial Action Schemes (RAS) and Operating Procedures) required to meet reliability
requirements By their nature SPS do not indicate an inherent weakness in the bulk power system
rather they are an indication of methods that are taken to operate the system through the range of
conditions it must perform This metric is only intended to evaluate the trend use of these plans and
whether the metric indicates robustness of the transmission system is increasing remaining static or
decreasing
1 27
2 1 4 3 2 1 2 4 5 2 5 832
4724
211
5 38 5 1 1 8 7 4 1 1
05
101520253035404550
2006
2007
2008
2009
2010
2006
2007
2008
2009
2010
2006
2007
2008
2009
2010
2006
2007
2008
2009
2010
2006
2007
2008
2009
2010
2006
2007
2008
2009
2010
2006
2007
2008
2009
2010
2006
2007
2008
2009
2010
FRCC MRO NPCC RFC SERC SPP TRE WECC
2006-2009
2010
Region and Year
Figure 18 ALR6-3 Energy Emergency Alert 2 (EEA2)
Reliability Metrics Performance
36
Assessment
The pilot data indicates a relatively constant number of mitigation measures over the time period of
data collected
Figure 19 ALR6-1 Transmission Constraint Mitigation by SPSRAS (2009-2014)
0102030405060708090
100110120
2009
2010
2011
2014
2009
2010
2011
2014
2009
2010
2011
2014
2009
2010
2011
2014
2009
2010
2011
2014
2009
2010
2011
2014
2009
2010
2011
2014
2009
2010
2011
2014
FRCC MRO NPCC RFC SERC SPP ERCOT WECC
Coun
t
Region and Year
SPSRAS
Reliability Metrics Performance
37
Table 5 ALR6-1 Transmission Constraint Mitigation by Operating ProcedureGuides (2009-2011)
ALR6-1 Transmission Constraint Mitigation by Operating ProcedureGuides (2009-2014)
2009 2010 2011 2014
FRCC 107 75 66
MRO 79 79 81 81
NPCC 0 0 0
RFC 2 1 3 4
SPP 39 40 40 40
SERC 6 7 15
ERCOT 29 25 25
WECC 110 111
Special Considerations
A certain number of SPS mitigation plans may be necessary to support reliable operation of the system
If the number of SPS increase over time this may indicate that additional transmission capacity is
required A reduction in the number of SPS may be an indicator of increased generation or transmission
facilities being put into service which may indicate greater robustness of the bulk power system In
general mitigation plans are a viable and valuable tool for effective operation of the bulk power system
In power system planning reliability operability capacity and cost-efficiency are simultaneously
considered through a variety of scenarios to which the system may be subjected Mitigation measures
are a method for optimizing a power system across these scenarios Changes in quantities of mitigation
plans may indicate year-on-year differences in the system being evaluated
Integrated Bulk Power System Risk Assessment
Introduction In developing eighteen metrics to measure acceptable levels of reliability it has become clear that any
such measurement of reliability must include consideration of the risks present within the bulk power
system in order for us to appropriately prioritize and manage these system risks The scope for the
Reliability Metrics Working Group (RMWG)27
27 The RMWG scope can be viewed at
includes a task to develop a risk-based approach that
provides consistency in quantifying the severity of events The approach not only can be used to
httpwwwnerccomfilezrmwghtml
Reliability Metrics Performance
38
measure risk reduction over time but also can be applied uniformly in event analysis process to identify
the events that need to be analyzed in detail and sort out non-significant events
The Operating Committee (OC) and Planning Committee (PC) endorsed the concepts and framework28 of
the risk-based approach in their September 2010 joint meeting and further supported the event severity
risk index (SRI) calculation29
Recommendations
in March 2011
bull NERC should embrace the use of risk assessment to identify trends in addition to lessons learned
in order to improve bulk power system reliability
bull The RMWG should continue to coordinate and communicate with the Event Analysis Working
Group (EAWG) to apply the SRI into the event analysis process and root cause analysis
bull As trend evaluations increase the knowledge of risks to the bulk power system data required to
support additional assessment should be gathered
Event Severity Risk Index (SRI)
Risk assessment is an essential tool for achieving the alignment between organizations people and
technology This will assist in quantifying inherent risks identifying where potential high risks exist and
evaluating where the most significant lowering of risks can be achieved Being learning organizations
the Electric Reliability Organization (ERO) Regional Entities and Registered Entities can use these tools
to focus on the areas of highest risk to reliability to provide a sound basis for developing results-based
standards and compliance programs Risk assessment also serves to engage all stakeholders in a
dialogue about specific risk factors and helps direct a strategic plan for risk reduction and early
detection
The SRI is a daily blended metric for which transmission loss generation loss and load loss events are
calculated Each element (transmission generation and load loss) is factored by the systemrsquos inventory
for that element to rate significant events appropriately On a yearly basis these daily performances
can be sorted in descending order to evaluate the year-on-year performance of the system
In order to test drive the concepts the RMWG applied these calculations against historically memorable
days to derive SRIs Once these calculations were complete they were reviewed and evaluated by
various stakeholders for reasonableness Based upon feedback modifications to the calculation were
made and assessed against the historic days performed This iterative process locked down the details
28 httpwwwnerccomdocspcrmwgIntegrated_Bulk_Power_System_Risk_Assessment_Concepts_Finalpdf 29 httpwwwnerccomdocspcrmwgSRI_Equation_Refinement_May6_2011pdf
Reliability Metrics Performance
39
for the calculation of SRI whose calculation from zero (no transmission line outages generation outages
or load lost in a day) to 1000 (a theoretical condition in which every transmission line all generation
units and all load lost across the system in a single day)
Figure 20 captures the calculated severity risk value for each of the days for each year benchmarked
with the historic significant events which were used to concept test the calculation Since there is
significant disparity between days the bulk power system is stressed compared to those that are
ldquoroutinerdquo and ldquoherordquo days of the year where the system performed extremely well the curve is depicted
using a logarithmic scale Each yearrsquos data is sorted in descending order striking a characteristic shape
At the left-side of the curve the days in which the system is severely stressed are plotted The central
more linear portion of the curve identifies the routine day performance while the far right-side of the
curve shows the values plotted for days in which almost all lines and generation units are in service and
essentially no load is lost
The trends on the chart below show that 2009 and 2010 had fewer extreme days than 2008 Routine
daily performance appears generally consistent across all three years Figure 20 captures the days for
each year benchmarked with historically significant events
In Figure 20 NERCrsquos event categories and SRI ratings are directly related As the SRI increases the
category or severity of the event increases Historical events are also shown to relate modern
reliability measurements to give a perspective of how a well-known event would register on the SRI
scale
The event analysis process30
30
benefits from the SRI as it enables a numerical analysis of an event in
comparison to other events By this measure an event can be prioritized by its severity In a severe
event this is unnecessary However for events that do not result in severe stressing of the bulk power
system this prioritization can be a challenge By using the SRI the event analysis process can decide
which events to learn from and reduce which events to avoid and when resilience needs to be
increased under high impact low frequency events as shown in the blue boxes in the figure
httpwwwnerccompagephpcid=5|365
Reliability Metrics Performance
40
Figure 20 NERC Annual Daily Severity Risk Index (SRI) Sorted Descending with Historic Benchmark Days
Other factors that impact severity of a particular event to be considered in the future include whether
equipment operated as designed and resulted in loss of load from a reliability perspective (intentional
and controlled load-shedding) Mechanisms for enabling ongoing refinement to include the historic and
simulated events for future severity risk calculations are being explored
Reliability Metrics Performance
41
Integrated Reliability Index Concepts In December 2010 the RMWG was challenged by the OC and PC to develop a single index concept to
measure the universe of risks associated with the bulk power system As a result the integrated
reliability index (IRI) concepts were proposed31
Figure 21
the three components of which were defined to
quantify each specific risk aspect They are titled the Event Driven Index (EDI) StandardsStatute Driven
Index (SDI) and Condition Driven Index (CDI) illustrated in with measures associated with
system events standards compliance and eighteen performance metrics The development of an
integrated reliability index aims to inform increase transparency and quantify the effectiveness of risk
reduction or mitigation actions The goal is to provide the industry meaningful trends of the BPSrsquos
performance and guidance on how the industry can improve reliability and support risk-informed
decision making Once completed the IRI will facilitate holistic assessment of performance Finally the
IRI should help overcome concern and confusion about how many metrics are being analyzed for system
reliability assessments
Figure 21 Risk Model for Bulk Power System
The integrated model of event-driven condition-driven and standardsstatute-driven risk information
can be constructed to illustrate all possible logical relations between the three risk sets Due to the
nature of the system there may be some overlap among the components
31 httpwwwnerccomdocspcrmwgIntegrated_Reliability_Index_WhitePaper_DRAFTpdf
Event Driven Index (EDI)
Indicates Risk from
Major System Events
Standards Statute Driven
Index (SDI)
Indicates Risks from Severe Impact Standard Violations
Condition Driven Index (CDI)
Indicates Risk from Key Reliability
Indicators
Reliability Metrics Performance
42
The Three Components of the IRI The three components of the IRI work together as shown in Figure 22 to comprise a full picture of the
state of reliability
Figure 22 An overview of the components that comprise the Integrated Reliability Index (IRI)
Event-Driven Indicators (EDI)
The Event-Driven Indicator provides a basis for prioritization of events based on bulk power system
integrity equipment performance and engineering judgment This indicator can serve as a high value
risk assessment tool to be used by stakeholders to investigate and evaluate disturbance history and
measure the severity of these events The relative ranking of events requires industry expertise agreed-
upon goals and engineering judgment The EDI is a derivative of SRI results for a specific time period
but it transforms that performance into a form of an availability index These calculations will be further
refined as feedback is received
Condition-Driven Indicators (CDI)
The Condition-Driven Indicators focus on a set of measurable system conditions (performance
measures) to assess bulk power system reliability These reliability indicators identify factors that
positively or negatively impact reliability and are early predictors of the risk to reliability from events or
unmitigated violations A collection of these indicators measures how close reliability performance is to
the desired outcome and if the performance against these metrics is constant or improving
Reliability Metrics Performance
43
StandardsStatute-Driven Indicators (SDI)
The StandardsStatute-Driven Indicator is a calculation of success of compliance based upon the subset
of high-value standards and is divided by the number of participations who could have received the
violation within the time period considered Also based on these factors known unmitigated violations
of elevated risk factor requirements are weighted higher than lower risk factors The index decreases if
the compliance improvement is achieved over a trending period
IRI Index Calculation As with the SRI the IRI is based on an importance weighting factor which the RMWG can modify over
time after gaining experience with the new metric as well as consideration of feedback from industry
At this time the RMWG believes some form of blended weighting may serve to start to populate IRI
characteristic curves at a high and generic level Based upon feedback from stakeholders this approach
may change or as discussed below weighting factors may vary based on periodic review and risk model
update The RMWG will continue the refinement of the IRI calculation and consider other significant
factors that impact reliability (eg intentional and controlled load-shedding) further it will explore
developing mechanisms for enabling ongoing refinement which should be influenced by a wide set of
stakeholders
RMWG recommends the Event Driven Index (EDI) be weighted the highest (50 percent) since events
actually occurred indicating how the system was performing The Condition Driven Index (CDI) and
StandardsStatute Driven Index (SDI) are weighted 25 each since they are indicators of potential risks
to BPS reliability IRI can be calculated as follows
IRI is intended to be a composite metric which integrates several forms of individual risks to the bulk
power system Since the three components range across many stakeholder organizations these
concepts are developed as starting points for continued study and evaluation Additional supporting
materials can be found in the IRI whitepaper32
IRI Recommendations
including individual indices calculations and preliminary
trend information
For the IRI more investigation should be performed to determine the best way to integrate EDI CDI
and SDI into an Integrated Reliability Index (IRI) that quantitatively represents the reliability of the bulk
32 The IRI whitepaper can be found at httpwwwnerccomdocspcrmwgIntegrated_Reliability_Index_WhitePaper_DRAFTpdf
Reliability Metrics Performance
44
power system To this end study into determining the amount of overlap between the components is
necessary RMWG is currently working to determine the proper amount of overlap between the IRI
components
Also the CDI component of the IRI needs to be solidified This is especially true with the CDI More
accurate metric data is needed to paint a fuller picture of the CDI Many of the metrics used to calculate
the CDI are new or they have limited data Compared to the SDI which counts well-known violation
counts and the EDI which uses the well-defined CDI the CDI lacks the depth of rigor that the other two
components have acquired through their years of data RMWG is currently working to improve the CDI
Reliability Metrics Conclusions and Recommendations Among the eighteen metrics that address the characteristics of an adequate level of reliability (ALR)
metric trends indicate the system is performing better in the following seven areas
bull ALR1-3 Planning Reserve Margin
bull ALR1-4 BPS Transmission Related Events Resulting in Loss of Load
bull ALR2-5 Disturbance Control Events Greater than Most Severe Single Contingency
bull ALR6-2 Energy Emergency Alert 3 (EEA3)
bull ALR6-3 Energy Emergency Alert 2 (EEA2)
bull ALR6-11 Automatic Transmission Outages Caused by Protection System Misoperations
bull ALR6-13 Automatic Transmission Outages Caused by Failed AC Substation Equipment
Assessments have been made in other performance categories A number of them do not have
sufficient data to derive any conclusions from the results The RMWG recommends continued data
collection and assessment of these metrics If a metric does not yield any trend in a five-year reporting
period the metric will be modified or withdrawn
For the IRI more investigation should be performed to determine the overlap of the components (CDI
EDI and SDI) The CDI should be more thoroughly solidified as an index by collecting more data over
time
Transmission Equipment Performance
45
Transmission Equipment Performance Introduction The Transmission Availability Data System (TADS) effort began with the establishment of a TADS task force
by the NERC Planning Committee in October 2006 On October 27 2007 the NERC Board of Trustees
approved the collection of transmission automatic outage data beginning in calendar year 2008 (Phase I)
Subsequently on October 29 2008 the NERC Board approved the collection of Non-Automatic Outage data
that began for Calendar year 2010 (Phase II)
This chapter provides reliability performance analysis of the transmission system by focusing on the trends
of Automatic Outage data from calendar year 2008 thru 2010 Since only one year of Non-Automatic
Outage data has been collected that data will not be assessed in this report
When calculating bulk power system performance indices care must be exercised when interpreting results
as misinterpretation can lead to erroneous conclusions regarding system performance With only three
years of data in the smaller regions it is not clear whether a regionrsquos yearly outage variation compared to
the average is due to random statistical variation or that particular year is significantly different in
performance However on a NERC-wide basis after three years of data collection there is enough
information to accurately determine whether the yearly outage variation compared to the average is due to
random statistical variation or the particular year in question is significantly different in performance33
Performance Trends
Transmission performance information has been provided by Transmission Owners (TOs) within NERC
through the NERC TADS (Transmission Availability Data System) process The data presented reflects
Momentary and Sustained AC Automatic outages of transmission elements that operate at voltages ge 200 kV
(including the low side of transformers) with the criteria specified in the TADS process The following
elements listed below are included
bull AC Circuits ge 200 kV (Overhead and Underground Circuits) Radial circuits are included
bull DC Circuits with ge +-200 kV DC voltage
bull Transformers with ge 200 kV low-side voltage and
bull ACDC Back-to-Back (BTB) Converters with ge 200 kV AC voltage on both sides
33The detailed Confidence Interval computation is available at httpwwwnerccomdocspctadstfTADS_Nov_2_2007APPENDIX_C_Confidence_Intervalpdf
Transmission Equipment Performance
46
AC Element Outage Summary and Leading Causes Table 6 shows the 2008 2009 and 2010 NERC total AC transmission element inventory and a summary of
the associated outages As expected in general the number of circuits increased from year to year due to
new construction or re-construction to higher voltages For every outage experienced on the transmission
system cause codes are identified and recorded according to the TADS process Causes of both momentary
and sustained outages have been indicated These causes are analyzed to identify trends and similarities
and to provide insight into what could be done to possibly prevent future occurrences
Figure 23 and Figure 24 describe the top ten initiating cause codes for sustained and momentary automatic
outages combined from 2008-2010 Based on the two figures the relationship between the total number of
outages and total outage hours can be seen Failed AC Substation Equipment and Failed AC Circuit
Equipment only account for 15 percent of the total number of outages but account for 65 percent of the
total outage hours The two largest causes of outages within NERC (ldquoLightingrdquo and ldquoWeather excluding
Lightningrdquo) account for 34 percent of the total number of outages
The next three Human Error Failed Protection System Equipment and Failed AC Circuit Equipment have
very similar totals and should all be considered significant focus points in reducing the number of Sustained
Automatic Outages for all elements
Transmission Equipment Performance
47
Table 6 NERC - All AC Elements Sustained and Momentary Outage Performance Summary
2008 Number of Outages
AC Voltage
Class
No of
Circuits
Circuit
Miles Sustained Momentary
Total
Outages Total Outage Hours
200-299kV 4369 102131 1560 1062 2622 56595
300-399kV 1585 53631 793 753 1546 14681
400-599kV 586 31495 389 196 585 11766
600-799kV 110 9451 43 40 83 369
All Voltages 6650 196708 2785 2051 4836 83626
2009 Number of Outages
AC Voltage
Class
No of
Circuits
Circuit
Miles Sustained Momentary
Total
Outages Total Outage Hours
200-299kV 4468 102935 1387 898 2285 28828
300-399kV 1619 56447 641 610 1251 24714
400-599kV 592 32045 265 166 431 9110
600-799kV 110 9451 53 38 91 442
All Voltages 6789 200879 2346 1712 4038 63094
2010 Number of Outages
AC Voltage
Class
No of
Circuits
Circuit
Miles Sustained Momentary
Total
Outages Total Outage Hours
200-299kV 4567 104722 1506 918 2424 54941
300-399kV 1676 62415 721 601 1322 16043
400-599kV 605 31590 292 174 466 10442
600-799kV 111 9477 63 50 113 2303
All Voltages 6957 208204 2582 1743 4325 83729
Note The NERC table does not show redacted outages DC Circuit outages Transformer outages or ACDC
converter outages
Transmission Equipment Performance
48
Figure 23 NERC - Top Ten Sustained and Momentary Outages by Initiating Cause Code for All Elements
Figure 24 NERC - Top Ten Sustained Outage Hours by Cause Code
198
151
80
7271
6943
33
27
188
68
Lightning
Weather excluding lightningHuman Error
Failed AC Substation EquipmentFailed Protection System EquipmentFailed AC Circuit Equipment Foreign Interference
Power System Condition
Fire
Unknown
Remaining Cause Codes
299
246
188
58
52
42
3619
16 12 31 Failed AC Substation EquipmentFailed AC Circuit Equipment Weather excluding lightningUnavailable
Other
Fire
Unknown
Human Error
Failed Protection System EquipmentForeign Interference
Remaining Cause Codes
Transmission Equipment Performance
49
Transmission Monthly Outages Figure 25 displays the total number of Automatic Outages on a per-month basis The three months with the
highest total of outages were June July and August From a seasonal perspective winter had a monthly
average of 281 outages These include the months of November-March Summer had an average of 429
outages Summer included the months of April-October
Figure 25 Number of Outages by Month for AC Circuits (2008-2010)
This figure does not show redacted outages DC Circuit outages Transformer outages or ACDC Converter
outages
Outage Initiation Location For every outage experienced on the transmission system the outage initiation code is identified and
recorded according to the TADS process The outage initiation code can be analyzed to identify trends and
similarities and to provide insight into what could be done to possibly prevent future occurrences
The ldquoOutage Initiation Coderdquo describes where an automatic outage was initiated on the power system The
five codes are as follows
bull Element-Initiated
bull Other Element-Initiated
bull AC Substation-Initiated
bull ACDC Terminal-Initiated (for DC circuits)
bull Other Facility Initiated any facility not included in any other outage initiation code
JanuaryFebruar
yMarch April May June July August
September
October
November
December
2008 238 229 257 258 292 437 467 380 208 176 255 236
2009 315 201 339 334 398 553 546 515 351 235 226 294
2010 444 224 269 446 449 486 639 498 351 271 305 281
3 Year AVG 332 218 288 346 380 492 551 464 303 227 262 270
0
100
200
300
400
500
600
700
Out
ages
Transmission Equipment Performance
50
Notably the protection system is not part of an ldquoAC Substationrdquo or an ldquoACDC Terminalrdquo If a protection
system misoperates and initiates an outage it will be classified as ldquoOther-Facility Initiatedrdquo The following
Figures show the initiating location of the Automatic outages from 2008 to 2010
With both Momentary and Sustained Automatic Outages taken into account the outage was initiated on the
Element more than 67 percent of the time as shown in Figure 26 and Figure 27
When only the Sustained Automatic Outages are analyzed the outage initiation on both AC Substation and
Other Facility increased by 34 percent and 32 percent respectively Outages initiated on the Element itself
decreases by 78 percent as shown in Figure 26 and 27 For only the Momentary Automatic Outages the
outage initiation on the Element increases by 19 percent compared to Sustained Outages Element initiated
outages make up over 78 percent of the total outages when analyzing only Momentary Outages
Figure 26
Figure 27
Transmission Outage Events Figure 28 illustrates the relationship between the numbers of Automatic Outages associated per TADS
event 2008 2009 and 2010 tend to follow the same trend The largest number of Automatic Outages per
TADS event is fourteen in 2010 thirteen in 2009 and eight in 2008 There are around 70 to 100 TADS
events that contain between fourteen and three Automatic Outages (see below) There are around 330 to
400 TADS events that contain two or more Automatic Outages The rest of the events only contain one
Automatic Outage As noted in the lower right hand corner below the total number of Events in 2008 to
2010 ranged from 3920 to 4569 events per year Nearly 90 percent or more of the events contained one
Automatic Outage
Figure 26 Sustained Automatic Outage Initiation
Code
Figure 27 Momentary Automatic Outage Initiation
Code
Transmission Equipment Performance
51
Transmission Outage Mode Figure 29 and Figure 30 show the percentage of Outage Modes The ldquoOutage Mode Coderdquo describes
whether one Automatic Outage is related to other Automatic Outages A Single Mode outage is an
Automatic Outage of a single Element which occurs independently of any other Automatic Outages (if any)
A ldquoDependent Mode Initiating Outagerdquo is an Automatic Outage of a single Element that initiates one or more
subsequent Element Automatic Outages A ldquoDependent Mode Outagerdquo is an Automatic Outage of an
Element which occurred as a result of an initiating outage whether the initiating outage was an Element
outage or a non-Element outage A ldquoCommon Mode Outagerdquo is one of two or more Automatic Outages with
the same Initiating Cause Code and where the outages are not consequences of each other and occur nearly
simultaneously A ldquoCommon Mode Initiating Outagerdquo is a Common Mode Outage that initiates one or more
subsequent Automatic Outages
Over 72 percent of the total outages occurred on the bulk power system are Single Mode Outages The next
largest mode is Dependent with over 11 percent of the total outages being in this category For only
Sustained Automatic Outages outages related to each other increase with Dependent mode accounting for
13 percent of the outages and Common mode accounting for close to 11 percent of the outages
Independent Sustained outages still account for the largest portion with nearly 70 percent being Single
mode When just analyzing Momentary Automatic Outages Associated outages decrease with Dependent
Figure 28 Event Histogram (2008-2010)
Transmission Equipment Performance
52
mode accounting for only 9 percent of the outages The Common Mode percentage decreases while
Dependent Mode Initiating percentage increases compared to Sustained Outages Independent Momentary
outages account for the largest portion with over 76 percent being Single Mode
An investigation into the root causes of Dependent and Common mode events which include three or more
Automatic Outages (indentified in the TADS 2008 to 2010 data) should be a high priority Some protection
systems are designed to trip three or more circuits but some events go beyond what is designed Some also
have misoperations associated with multiple outage events
Conclusions On a NERC wide average basis automatic transmission outage rate is improving from 2008 to 2010 based on
reported data Considering both automatic and non-automatic outages 2010 records indicate transmission
element availability percentage is very high and exceeds 95 The unavailability rate for AC circuits and
transformers are only 15 and 29 respectively
The cause codes of Human Error Failed Protection System Equipment and Failed AC Circuit Equipment
should be considered significant focus points in reducing the number of Sustained Automatic Outages for all
elements A deeper look into the root causes of Dependent and Common mode events which include three
or more Automatic Outages (indentified in the TADS 2008 to 2010 data) should be a high priority Some
protection systems are designed to trip three or more circuits but some events go beyond what is designed
Some also have misoperations associated with multiple outage events
Figure 29 Sustained Automatic Outage Mode code Figure 30 Momentary Automatic Outage Mode code
Generation Equipment Performance
53
Generation Equipment Performance Introduction The development of the Generating Availability Data System (GADS) began in 1982 This series of databases
is used to voluntarily collect record and retrieve operating information By pooling individual unit
information with likewise units generating unit availability performance can be calculated providing
opportunities to identify trends and generating equipment reliability improvement opportunities The
information is used to support equipment reliability availability analyses and risk-informed decision-making
by system planners generation owners assessment modelers manufacturers and contractors etc Reports
and information resulting from the data collected through GADS are now used for benchmarking and
analyzing electric power plants
Currently the data collected through GADS contains 72 percent of the North American generating units
with generating capacity of 20 MW or higher34 Additionally many of the newer combined-cycle plants are
not reporting information and therefore a full view of each unit type is not presented Rather a sample of
all the units in North America that fit a given more general category is provided35 for the 2008-201036
Generation Key Performance Indicators
assessment period
Three key performance indicators37
In
the industry have used widely to measure the availability of generating
units (see Terms Used in This Report section for their calculation parameters) are Equivalent Availability
Factor (EAF) Net Capacity Factor (NCF) and Equivalent Forced Outage Rate ndash Demand (EFORd)
Table 7 the North American fleet average EAF NCF and EFORd compared to unit age for all generating
units with a capacity of 20 MW and higher is provided for the years 2008-2010 The EAF shows a decline
during the last three years NCF is up and down while the EFORd appears to be increasing As expected the
fleet of units reported to GADS is aging overall with the fossil units being about 12 years older than the
average age
34 httpwwwnerccomdocspcgadstfGADSTF_Recommendation_Report_02-18-2011_FINALpdf 35GADS contains some 1500+ units under 20 MW that is not included in this report These units are excluded because most units are not base-loaded and are in peaking operation
3684 percent of the 2010 dataset is available at this time while the 2008 and 2009 dataset is complete 37 httpwwwnerccompagephpcid=4|43
Generation Equipment Performance
54
Table 7 General Availability Review of GADS Fleet Units by Year
2008 2009 2010 Average
Equivalent Availability Factor (EAF) 8776 8774 8678 8743
Net Capacity Factor (NCF) 5083 4709 4880 4890
Equivalent Forced Outage Rate -
Demand (EFORd) 579 575 639 597
Number of Units ge20 MW 3713 3713 3713 3713
Average Age of the Fleet in Years (all
unit types) 303 311 321 312
Average Age of the Fleet in Years
(fossil units only) 422 432 440 433
Figure 31 provides the average forced outage hours (FOH) maintenance outage hours (MOH) and planned
outage hours (POH) for all units reporting 20 MW or larger During this three-year period the average FOH
291 hours average MOH is 163 hours average POH is 470 hours
Figure 31 shows a large increase in forced and maintenance events The average age of the units with a
capacity of 20MW and higher in 2009 is 316 years old However the average age of fossil units in 2010 is
442 years old These fossil units are the backbone of all operating units providing the base-load power
continuously and nearly 50 percent of all energy annually There appears to be no increase allocated for
annualsemi-annual maintenance (ie planned outages) for the older generating units The increase of
000100002000030000400005000060000700008000090000
100000
2008 2009 2010
463 479 468
154 161 173
288 270 314
Hou
rs
Planned Maintenance Forced
Figure 31 Average Outage Hours for Units gt 20 MW
Generation Equipment Performance
55
maintenance outage hours reflects an increased need to fix problems that cannot be deferred until the next
annualsemi-annual repairs As a result it shows one of two things are happening
bull More or longer planned outage time is needed to repair the aging generating fleet
bull More focus on preventive repairs during planned and maintenance events are needed
Multiple Unit Forced Outages and Causes Table 8 provides the annual multiple-unit forced outage trips resulting from the same cause for each of the
assessments years 2008-2010 respectively The ldquosingle unitrdquo trips are large units with a Net Dependable
Capacity of 750 MW or more The trips of ldquotwo unitsrdquo or more is any combination of unit capacity with the
total amount of lost capacity more than 750 MW
Table 8 also presents more information on the forced outages During 2008-2010 there were a large
number of double-unit outages resulting from the same event Investigations show that some of these trips
were at a single plant caused by common control and instrumentation for the units The incidents occurred
several times for several months and are a common mode issue internal to the plant
Table 8 Number of Multiple Unit Forced Outages and FrequencyYear
2008 2009 2010
Type of
Trip
of
Trips
Avg Outage
Hr Trip
Avg Outage
Hr Unit
of
Trips
Avg Outage
Hr Trip
Avg Outage
Hr Unit
of
Trips
Avg Outage
Hr Trip
Avg Outage
Hr Unit
Single-unit
Trip 591 58 58 284 64 64 339 66 66
Two-unit
Trip 281 43 22 508 96 48 206 41 20
Three-unit
Trip 74 48 16 223 146 48 47 109 36
Four-unit
Trip 12 77 19 111 112 28 40 121 30
Five-unit
Trip 11 1303 260 60 443 88 19 199 10
gt 5 units 20 166 16 93 206 50 37 246 6
Loss of ge 750 MW per Trip
The high number of five-unit trips in 2008 was due to Hurricane Ike hitting the Gulf Coast The highest total
number of multiple unit trips occurred in 2009 though as mentioned before the data collection for 2010 is
incomplete at this time The majority of 2009 multiple unit trips have three main causes (in order by
Generation Equipment Performance
56
number of events) transmission lack of fuel and storms A summary of the three categories for single as
well as multiple unit outages (all unit capacities) are reflected in Table 9
Table 9 Common Causes of Multiple Unit Forced Outages (2009)
Cause Number of Events Average MW Size of Unit
Transmission 1583 16
Lack of Fuel (Coal Mines Gas Lines etc) Not
in Operator Control
812 448
Storms Lightning and Other Acts of Nature 591 112
Some of the transmission outages based on storms in 2009 have been caused by the same reasons because
the storms may have caused transmission interference However the plants reported the problems
inconsistently with either the transmission interference or storms cause code Therefore they are depicted
as two different causes of forced outage
Marked transmission outages in 2009 were quite high Thirty-five percent came from one utility with a large
number of hydroelectric units The company related the trips to various problems including weather
(lightning storms) wildlife ldquoline bumpsrdquo and problems on the receiving end of the transmission line Nine
hundred and eighty-five transmission trips (62 percent) were from hydroelectric units38
In 2009 only ten transmission trips resulted in a loss of 750 MW or more per trip Twenty two generating
plants were affected by the ten trips Causes for the trips include feeder line trips (1 trip) breakers in the
switchyard (8 trips) personnel errors (2 trips) and unknown (10 trips)
The ldquoLack of Fuelrdquo outages are of interest as these events occur during the times when a unit is available to
operate but there is an interruption in fuels to operate the facilities These events do not include
interruptions of fuel due to contracts Rather the cause code is designed to account for units that are
expecting fuel and it is unavailable when requested Table 10 presents the distribution of ldquoLack of Fuelrdquo
events by NERC Region and Table 11 presents the unit types affected
38 The average size of the hydroelectric units were small ndash 335 MW
Generation Equipment Performance
57
Of the units that report ldquoLack of Fuelrdquo 78 percent of the units are oil-fired 15 percent of the units are gas-
fired and the remaining units are various other fuels Table 12 provides the top causes of forced outage for
several unit types For fossil units ldquoLack of Fuelrdquo as the number three cause behind waterwall tube leaks
and superheater tube leaks
Table 10 Forced Outages Due to Lack of Fuel by Region
Region Number of Lack of Fuel
Problems Reported
FRCC 0
MRO 3
NPCC 24
RFC 695
SERC 17
SPP 3
TRE 7
WECC 29
One company contributed to the majority of oil-fired lack of fuel events The units at the company are
actually dual-fuels (oil and gas) but market nominated gas monitoring causes the units to be on forced
outage nightly The units need gas to start up so they can run on oil When they shut down the units must
switch to gas to clean themselves With the gas restriction the unit canrsquot start and the unit goes on a
forced outage Until the band is lifted the two units will continue to be on a forced outage cycle
Event records also provide descriptions of why the unit was without fuel with the majority of descriptions
bull Temperatures affecting gas supply valves
bull Unexpected maintenance of gas pipe-lines
bull Compressor problemsmaintenance
Generation Equipment Performance
58
Table 11 Unit Type Profile of Forced Outages Due to Lack of Fuel
Unit Types Number of Lack of Fuel Problems Reported
Fossil 642
Nuclear 0
Gas Turbines 88
Diesel Engines 1
HydroPumped Storage 0
Combined Cycle 47
Generation Equipment Performance
59
Table 12 Causes of Forced Outage for Different Unit Types (2008-2010)
Fossil - all MW sizes all fuels
Rank Description Occurrence per Unit-year
MWH per Unit-year
Average Hours To Repair
Average Hours Between Failures
Unit-years
1 Waterwall (furnace wall) 0590 134106 59 3250 3868 2 Second Superheater
Leaks 0180 5182 60 3228 3868
3 Lack of Fuel (coal mines gas lines etc) where the operator is not in control
0480 4701 18 26 3868
Combined-Cycle blocks Rank Description Occurrence
per Unit-year
MWH per Unit-year
Average Hours To Repair
Average Hours Between Failures
Unit-years
1 HP Turbine Buckets Or Blades
0020 4663 1830 26280 466
2 Turbine Control Valves 0040 2777 100 7200 466 3 Gas Turbine Compressor -
High Pressure Shaft 0010 2266 663 4269 466
Nuclear units - all Reactor types Rank Description Occurrence
per Unit-year
MWH per Unit-year
Average Hours To Repair
Average Hours Between Failures
Unit-years
1 LP Turbine Buckets or Blades
0010 26415 8760 26280 288
2 Containment Structure 0010 9233 1226 26262 288 3 Feedwater Pump Local
Controls 0020 7620 692 12642 288
Simple-cycle gas turbine jet engines Rank Description Occurrence
per Unit-year
MWH per Unit-year
Average Hours To Repair
Average Hours Between Failures
Unit-years
1 Main Transformer 0030 1611 1016 20709 4181 2 Other Gas Turbine
Controls And Instrument Problems
0120 428 70 2614 4181
3 Other Gas Turbine Problems
0090 400 119 1701 4181
Generation Equipment Performance
60
2008-2010 Review of Summer versus Winter Availability To address seasonality of unit availability unit information for the months of June to September (summer)
and December through February (winter) were pooled to calculate force events during these timeframes for
2008-201039 Figure 32 shows the Equivalent Availability Factor (EAF) is three percentage points higher and
the Equivalent Forced Outage Rate - Demand (EFORd) is more than a half of a percentage point lower in the
summer period than in winter period This means the units were more reliable with less forced events
during high-demand times during the summer than during the winter seasons The generating unitrsquos
capability has a resulting higher Net Capacity Factor (NCF) of 45 percentage points in the summer season
for 2008-2010
During the spring season (March-May) 77 percent of the units took a planned outage (PO) for an average
231 hours (or 96 days) In fall (October-November) only 42 percent of the units experienced a PO and the
average duration was shorter ndash 134 hours (or 56 days) A few units took both spring and fall planned
outages although this is rare Based on this assessment the generating units are prepared for the summer
peak demand The resulting availability indicates that this maintenance was successful which is measured
by an increased EAF and lower EFORd
Figure 32 Summer-Winter Average EAF NCF and EFORd (2008-2010)
Conclusions and Recommendations During 2008-2010 the average Equivalent Availability Factor (EAF) which measures the overall availability
of generating units decreased At the same time the Net Capacity Factor (NCF) an indicator of energy
production increased The average number of forced outages in 2010 is greater than in 2008 while at the
same time the average planned outage times have decreased As a result the Equivalent Forced Outage
Rate ndash Demand (EFORd) also increased illustrating that more units have experienced forced events during
39 A study of peak periods was conducted by the NERC Generating Availability Trend Evaluation (GATE) Working Group several years ago see httpwwwnerccomfilesSeasonal-Performance-Trendspdf
9116
5343
396
8818
4896
441
0 10 20 30 40 50 60 70 80 90 100
EAF
NCF
EFORd
Percent ()
Winter
Summer
Generation Equipment Performance
61
peak-demand times in 2010 than in the previous two years Potentially with shorter planned outage
periods in 2010 there may be less time to repair equipment and prevent forced unit outages
There are warnings that units are not being maintained as well as they should be In the last three years
there has been an increase in Equivalent Forced Outage Rate ndash Demand (EFORd) This indicator measures
the rate of forced outage events on generating units during periods of load demand To confirm this
problem forced outage hours jumped from 270 to 314 hours per unit between 2009 and 2010 At the same
time maintenance events also increased by 12 hours per unit Planned outage events remain constant The
resulting conclusions from this trend are
bull More or longer planned outage time is needed to repair the generating fleet Whether age is the
cause of the increase need for planned outage time remains unknown and further investigation into
the cause for longer planned outage time is necessary
bull More focus on preventive repairs during planned and maintenance events are needed
There are many multiple unit forced outages due to lack of fuel The majority of multiple unit trips have
three main causes transmission lack of fuel and storms With special interest in the forced outages due to
ldquoLack of Fuelrdquo additional analysis revealed that 77 percent of the units experiencing unexpected fuel
stoppage are oil-fired fossil units while gas-fired units experienced 15 percent
Generating units continue to be more reliable during the peak summer periods
Disturbance Event Trends
62
Category 1 An event resulting in one or more of the following a Unintended loss of three or more BPS elements caused by
common mode failure b Failure or misoperation of an SPSRAS c System-wide voltage reduction of 3 or more d Unintended BPS system separation resulting in an island of
100 MW to 999 MW e Unplanned evacuation from a control center facility with BPS
SCADA functionality for 30 minutes or more Category 2 An event resulting in one or more of the following
a Complete loss of all BPS control center voice communication system(s) for 30 minutes or more
b Complete loss of SCADA control or monitoring functionality for 30 minutes or more
c Voltage excursions equal to or greater than 10 lasting more than five minutes
d Loss of off-site power (LOOP) to a nuclear generating station e Unintended system separation resulting in an island of 1000
MW to 4999 MW f Unintended loss of 300MW or more of firm load for more
than 15 minutes g Violation of an Interconnection Reliability Operating Limit
(IROL) for more than 30 minutes Category 3 An event resulting in one or more of the following
a The loss of load or generation of 2000 MW or more in the Eastern Interconnection or
b Western Interconnection or 1000 MW or more in the ERCOT or Queacutebec Interconnections
c Unintended system separation resulting in an island of 5000 MW to 10000 MW
d Unintended system separation resulting in an island of Florida from the Eastern Interconnection
Category 4 An event resulting in one or more of the following a The loss of load or generation from 5001 MW to 9999 MW b Unintended system separation resulting in an island of more
than 10000 MW (with the exception of Florida as described in Category 3c)
Category 5 An event resulting in one or more of the following a The loss of load of 10000 MW or more b The loss of generation of 10000 MW or more
Figure 33 BPS Event Category
Disturbance Event Trends Introduction The purpose of this section is to report event
analysis trends from the beginning of event
analysis field test40
One of the companion goals of the event
analysis program is the identification of trends
in the number magnitude and frequency of
events and their associated causes such as
human error equipment failure protection
system misoperations etc The information
provided in the event analysis database (EADB)
and various event analysis reports have been
used to track and identify trends in BPS events
in conjunction with other databases (TADS
GADS metric and benchmarking database)
to the end of 2010
The Event Analysis Working Group (EAWG)
continuously gathers event data and is moving
toward an integrated approach to analyzing
data assessing trends and communicating the
results to the industry
Performance Trends The event category is classified41
Figure 33
as shown in
with Category 5 being the most
severe Figure 34 depicts disturbance trends in
Category 1 to 5 system events from the
40 httpwwwnerccomdocseawgGalloway-Industry-EA-Field-Test-102210pdf 41httpwwwnerccomfiles2011-05-0220Event_Analysis_Process_Phase20220Field20Test20Draft20-20Final20-20For20postingpdf
Disturbance Event Trends
63
beginning of event analysis field test to the end of 201042
Figure 34 Event Category vs Date for All 2010 Categorized Events
From the figure in November and December
there were many more category 1 and 2 events than in October This is due to the field trial starting on
October 25 2010
In addition to the category of the events the status of the events plays a critical role in the accuracy of the
data By examining Figure 35 over 80 of the events reported in 2010 have been closed This means that
the category root cause and other important information have been sufficiently finalized in order for
analysis to be accurate for each event At this time there is not enough data to draw any long-term
conclusions about event investigation performance
42 Documents for the EA Field Test are located at httpwwwnerccompagephpcid=5|365
2
12 12
26
3
6 5
14
1 1
2
0
5
10
15
20
25
30
35
40
45
October November December 2010
Even
t Cou
nt
Category 3 Category 2 Category 1
Disturbance Event Trends
64
Figure 35 Event Count vs Status (All 2010 Events with Status)
By drilling down into the cause code for each closed 2010 event Figure 36 shows the top 3 event causes
From the figure equipment failure and protection system misoperation are the most significant causes for
events Because of how new and limited the data is however there may not be statistical significance for
this result Further trending of cause codes for closed events and developing a richer dataset to find any
trends between event cause codes and event counts should be performed
Figure 36 Top 3 Event Counts vs DAWG Cause Code for all Closed 2010 Events
10
32
42
0
5
10
15
20
25
30
35
40
45
Open Closed Open and Closed
Even
t Cou
nt
Status
1211
8
0
2
4
6
8
10
12
14
Equipment Failure Protection System Misoperation Human Error
Even
t Cou
nt
Cause Code
Disturbance Event Trends
65
Conclusions Due to the relatively new process for events analysis and categorization more time will be required before a
conclusive recommendation may be obtained Further analysis and new data should provide valuable
statistics in the future Over 80 of all event reports from 2010 are current listed as closed but no
conclusion about investigation performance may be obtained because of the limited amount of data It is
recommended to study ways to prevent equipment failure and protection system misoperations but there
is not enough data to draw a firm conclusion about the top causes of events at this time
Abbreviations Used in This Report
66
Abbreviations Used in This Report
Acronym Definition ALP Acadiana Load Pocket
ALR Adequate Level of Reliability
ARR Automatic Reliability Report
BA Balancing Authority
BPS Bulk Power System
CDI Condition Driven Index
CEII Critical Energy Infrastructure Information
CIPC Critical Infrastructure Protection Committee
CLECO Cleco Power LLC
DADS Future Demand Availability Data System
DCS Disturbance Control Standard
DOE Department Of Energy
DSM Demand Side Management
EA Event Analysis
EAF Equivalent Availability Factor
ECAR East Central Area Reliability
EDI Event Drive Index
EEA Energy Emergency Alert
EFORd Equivalent Forced Outage Rate Demand
EMS Energy Management System
ERCOT Electric Reliability Council of Texas
ERO Electric Reliability Organization
ESAI Energy Security Analysis Inc
FERC Federal Energy Regulatory Commission
FOH Forced Outage Hours
FRCC Florida Reliability Coordinating Council
GADS Generation Availability Data System
GOP Generation Operator
IEEE Institute of Electrical and Electronics Engineers
IESO Independent Electricity System Operator
IROL Interconnection Reliability Operating Limit
Abbreviations Used in This Report
67
Acronym Definition IRI Integrated Reliability Index
LOLE Loss of Load Expectation
LUS Lafayette Utilities System
MAIN Mid-America Interconnected Network Inc
MAPP Mid-continent Area Power Pool
MOH Maintenance Outage Hours
MRO Midwest Reliability Organization
MSSC Most Severe Single Contingency
NCF Net Capacity Factor
NEAT NERC Event Analysis Tool
NERC North American Electric Reliability Corporation
NPCC Northeast Power Coordinating Council
OC Operating Committee
OL Operating Limit
OP Operating Procedures
ORS Operating Reliability Subcommittee
PC Planning Committee
PO Planned Outage
POH Planned Outage Hours
RAPA Reliability Assessment Performance Analysis
RAS Remedial Action Schemes
RC Reliability Coordinator
RCIS Reliability Coordination Information System
RCWG Reliability Coordinator Working Group
RE Regional Entities
RFC Reliability First Corporation
RMWG Reliability Metrics Working Group
RSG Reserve Sharing Group
SAIDI System Average Interruption Duration Index
SAIFI System Average Interruption Frequency Index
SCADA Supervisory Control and Data Acquisition
SDI Standardstatute Driven Index
SERC SERC Reliability Corporation
Abbreviations Used in This Report
68
Acronym Definition SRI Severity Risk Index
SMART Specific Measurable Attainable Relevant and Tangible
SOL System Operating Limit
SPS Special Protection Schemes
SPCS System Protection and Control Subcommittee
SPP Southwest Power Pool
SRI System Risk Index
TADS Transmission Availability Data System
TADSWG Transmission Availability Data System Working Group
TO Transmission Owner
TOP Transmission Operator
WECC Western Electricity Coordinating Council
Contributions
69
Contributions This report was made feasible by the collaboration and hard work of both NERC staff and NERCrsquos
Industry Groups
NERC Industry Groups
Table 14 lists the NERC industry group contributors Without their contribution and collaboration this
report would not have been possible
Table 13 NERC Industry Group Contributions43
NERC Group
Relationship Contribution
Reliability Metrics Working Group
(RMWG)
Reports to the OCPC bull Lead Development of Report bull Provide Reliability Metrics Data bull Responsible for Reliability Metrics
Performance Chapter
Transmission Availability Working Group
(TADSWG)
Reports to the OCPC bull Provide Transmission Availability Data
bull Responsible for Transmission Equip-ment Performance Chapter
bull Content Review
Generation Availability Data System Task
Force
(GADSTF)
Reports to the OCPC bull Provide Generation Availability Data bull Responsible for Generation Equip-
ment Performance Chapter bull Content Review
Event Analysis Working Group
(EAWG)
Reports to the OCPC bull Provide Events Data bull Responsible for Disturbance Events
Trends Chapter bull Content Review
43 Rosters for RMWG TADSWG GADSTF and EAWG are available at httpwwwnerccomfilesrosterpdf
Contributions
70
NERC Staff Table 13 below lists the NERC staff who contributed to the 2011 Reliability Performance Analysis
Report
Table 14 Contributing NERC Staff
Name Title E-mail Address
Mark Lauby Vice President and Director of
Reliability Assessment and
Performance Analysis
marklaubynercnet
Jessica Bian Manager of Performance Analysis jessicabiannercnet
John Moura Manager of Reliability Assessments johnmouranercnet
Andrew Slone Engineer Reliability Performance
Analysis
andrewslonenercnet
Jim Robinson TADS Project Manager jimrobinsonnercnet
Clyde Melton Engineer Reliability Performance
Analysis
clydemeltonnercnet
Mike Curley Manager of GADS Services mikecurleynercnet
James Powell Engineer Reliability Performance
Analysis
jamespowellnercnet
Michelle Marx Administrative Assistant michellemarxnercnet
William Mo Intern Performance Analysis wmonercnet
- NERCrsquos Mission
- Table of Contents
- Executive Summary
-
- 2011 Transition Report
- State of Reliability Report
- Key Findings and Recommendations
-
- Reliability Metric Performance
- Transmission Availability Performance
- Generating Availability Performance
- Disturbance Events
- Report Organization
-
- Introduction
-
- Metric Report Evolution
- Roadmap for the Future
-
- Reliability Metrics Performance
-
- Introduction
- 2010 Performance Metrics Results and Trends
-
- ALR1-3 Planning Reserve Margin
-
- Background
- Assessment
- Special Considerations
-
- ALR1-4 BPS Transmission Related Events Resulting in Loss of Load
-
- Background
- Assessment
-
- ALR1-12 Interconnection Frequency Response
-
- Background
- Assessment
-
- ALR2-3 Activation of Under Frequency Load Shedding
-
- Background
- Assessment
- Special Considerations
-
- ALR2-4 Average Percent Non-Recovery Disturbance Control Standards (DCS)
-
- Background
- Assessment
- Special Consideration
-
- ALR2-5 Disturbance Control Events Greater Than Most Severe Single Contingency
-
- Background
- Assessment
- Special Consideration
-
- ALR 1-5 System Voltage Performance
-
- Background
- Special Considerations
- Status
-
- ALR3-5 Interconnection Reliability Operating Limit System Operating Limit (IROLSOL) Exceedances
-
- Background
-
- ALR4-1 Automatic Transmission Outages Caused by Protection System Misoperations
-
- Background
- Special Considerations
-
- ALR6-11 ndash ALR6-14
-
- Background
- Assessment
- ALR 6-11 ndash Automatic Outages Initiated by Failed Protection System Equipment
- ALR6-12 ndash Automatic Outages Initiated by Human Error
- ALR6-13 ndash Automatic Outages Initiated by Failed AC Substation Equipment
- ALR6-14 Automatic AC Transmission Outages Initiated by Failed AC Circuit Equipment
-
- ALR6-15 Element Availability Percentage (APC)
-
- Background
- Assessment
- Special Consideration
-
- ALR6-16 Transmission System Unavailability
-
- Background
- Assessment
- Special Consideration
-
- ALR6-2 Energy Emergency Alert 3 (EEA3)
-
- Background
- Assessment
- Special Considerations
-
- ALR 6-3 Energy Emergency Alert 2 (EEA2)
-
- Background
- Assessment
- Special Considerations
-
- ALR 6-1 Transmission Constraint Mitigation
-
- Background
- Assessment
- Special Considerations
-
- Integrated Bulk Power System Risk Assessment
-
- Introduction
- Recommendations
-
- Integrated Reliability Index Concepts
-
- The Three Components of the IRI
-
- Event-Driven Indicators (EDI)
- Condition-Driven Indicators (CDI)
- StandardsStatute-Driven Indicators (SDI)
-
- IRI Index Calculation
- IRI Recommendations
-
- Reliability Metrics Conclusions and Recommendations
-
- Transmission Equipment Performance
-
- Introduction
- Performance Trends
-
- AC Element Outage Summary and Leading Causes
- Transmission Monthly Outages
- Outage Initiation Location
- Transmission Outage Events
- Transmission Outage Mode
-
- Conclusions
-
- Generation Equipment Performance
-
- Introduction
- Generation Key Performance Indicators
-
- Multiple Unit Forced Outages and Causes
- 2008-2010 Review of Summer versus Winter Availability
-
- Conclusions and Recommendations
-
- Disturbance Event Trends
-
- Introduction
- Performance Trends
- Conclusions
-
- Abbreviations Used in This Report
- Contributions
-
- NERC Industry Groups
- NERC Staff
-

Reliability Metrics Performance
35
Special Considerations
The intent of this metric is to measure only EEAs that are called for reliability reasons and not for
economic factors such as demand side management (DSM) and non-firm load interruption The
historical data for this metric may include events that were called for economic factors According to
the RCWG recent data should only include EEAs called for reliability reasons
ALR 6-1 Transmission Constraint Mitigation
Background
The RMWG completed a pilot with four regional entities Based on the results the RMWG expanded the
pilot data collection to all regions and the initial results of the data collection are shown in Figure 19
and Table 5 Based on the results of the pilot there is merit in continuing to assess this metric The
intent of this metric is to identify trends in the number of mitigation measures (Special Protection
Schemes (SPS) Remedial Action Schemes (RAS) and Operating Procedures) required to meet reliability
requirements By their nature SPS do not indicate an inherent weakness in the bulk power system
rather they are an indication of methods that are taken to operate the system through the range of
conditions it must perform This metric is only intended to evaluate the trend use of these plans and
whether the metric indicates robustness of the transmission system is increasing remaining static or
decreasing
1 27
2 1 4 3 2 1 2 4 5 2 5 832
4724
211
5 38 5 1 1 8 7 4 1 1
05
101520253035404550
2006
2007
2008
2009
2010
2006
2007
2008
2009
2010
2006
2007
2008
2009
2010
2006
2007
2008
2009
2010
2006
2007
2008
2009
2010
2006
2007
2008
2009
2010
2006
2007
2008
2009
2010
2006
2007
2008
2009
2010
FRCC MRO NPCC RFC SERC SPP TRE WECC
2006-2009
2010
Region and Year
Figure 18 ALR6-3 Energy Emergency Alert 2 (EEA2)
Reliability Metrics Performance
36
Assessment
The pilot data indicates a relatively constant number of mitigation measures over the time period of
data collected
Figure 19 ALR6-1 Transmission Constraint Mitigation by SPSRAS (2009-2014)
0102030405060708090
100110120
2009
2010
2011
2014
2009
2010
2011
2014
2009
2010
2011
2014
2009
2010
2011
2014
2009
2010
2011
2014
2009
2010
2011
2014
2009
2010
2011
2014
2009
2010
2011
2014
FRCC MRO NPCC RFC SERC SPP ERCOT WECC
Coun
t
Region and Year
SPSRAS
Reliability Metrics Performance
37
Table 5 ALR6-1 Transmission Constraint Mitigation by Operating ProcedureGuides (2009-2011)
ALR6-1 Transmission Constraint Mitigation by Operating ProcedureGuides (2009-2014)
2009 2010 2011 2014
FRCC 107 75 66
MRO 79 79 81 81
NPCC 0 0 0
RFC 2 1 3 4
SPP 39 40 40 40
SERC 6 7 15
ERCOT 29 25 25
WECC 110 111
Special Considerations
A certain number of SPS mitigation plans may be necessary to support reliable operation of the system
If the number of SPS increase over time this may indicate that additional transmission capacity is
required A reduction in the number of SPS may be an indicator of increased generation or transmission
facilities being put into service which may indicate greater robustness of the bulk power system In
general mitigation plans are a viable and valuable tool for effective operation of the bulk power system
In power system planning reliability operability capacity and cost-efficiency are simultaneously
considered through a variety of scenarios to which the system may be subjected Mitigation measures
are a method for optimizing a power system across these scenarios Changes in quantities of mitigation
plans may indicate year-on-year differences in the system being evaluated
Integrated Bulk Power System Risk Assessment
Introduction In developing eighteen metrics to measure acceptable levels of reliability it has become clear that any
such measurement of reliability must include consideration of the risks present within the bulk power
system in order for us to appropriately prioritize and manage these system risks The scope for the
Reliability Metrics Working Group (RMWG)27
27 The RMWG scope can be viewed at
includes a task to develop a risk-based approach that
provides consistency in quantifying the severity of events The approach not only can be used to
httpwwwnerccomfilezrmwghtml
Reliability Metrics Performance
38
measure risk reduction over time but also can be applied uniformly in event analysis process to identify
the events that need to be analyzed in detail and sort out non-significant events
The Operating Committee (OC) and Planning Committee (PC) endorsed the concepts and framework28 of
the risk-based approach in their September 2010 joint meeting and further supported the event severity
risk index (SRI) calculation29
Recommendations
in March 2011
bull NERC should embrace the use of risk assessment to identify trends in addition to lessons learned
in order to improve bulk power system reliability
bull The RMWG should continue to coordinate and communicate with the Event Analysis Working
Group (EAWG) to apply the SRI into the event analysis process and root cause analysis
bull As trend evaluations increase the knowledge of risks to the bulk power system data required to
support additional assessment should be gathered
Event Severity Risk Index (SRI)
Risk assessment is an essential tool for achieving the alignment between organizations people and
technology This will assist in quantifying inherent risks identifying where potential high risks exist and
evaluating where the most significant lowering of risks can be achieved Being learning organizations
the Electric Reliability Organization (ERO) Regional Entities and Registered Entities can use these tools
to focus on the areas of highest risk to reliability to provide a sound basis for developing results-based
standards and compliance programs Risk assessment also serves to engage all stakeholders in a
dialogue about specific risk factors and helps direct a strategic plan for risk reduction and early
detection
The SRI is a daily blended metric for which transmission loss generation loss and load loss events are
calculated Each element (transmission generation and load loss) is factored by the systemrsquos inventory
for that element to rate significant events appropriately On a yearly basis these daily performances
can be sorted in descending order to evaluate the year-on-year performance of the system
In order to test drive the concepts the RMWG applied these calculations against historically memorable
days to derive SRIs Once these calculations were complete they were reviewed and evaluated by
various stakeholders for reasonableness Based upon feedback modifications to the calculation were
made and assessed against the historic days performed This iterative process locked down the details
28 httpwwwnerccomdocspcrmwgIntegrated_Bulk_Power_System_Risk_Assessment_Concepts_Finalpdf 29 httpwwwnerccomdocspcrmwgSRI_Equation_Refinement_May6_2011pdf
Reliability Metrics Performance
39
for the calculation of SRI whose calculation from zero (no transmission line outages generation outages
or load lost in a day) to 1000 (a theoretical condition in which every transmission line all generation
units and all load lost across the system in a single day)
Figure 20 captures the calculated severity risk value for each of the days for each year benchmarked
with the historic significant events which were used to concept test the calculation Since there is
significant disparity between days the bulk power system is stressed compared to those that are
ldquoroutinerdquo and ldquoherordquo days of the year where the system performed extremely well the curve is depicted
using a logarithmic scale Each yearrsquos data is sorted in descending order striking a characteristic shape
At the left-side of the curve the days in which the system is severely stressed are plotted The central
more linear portion of the curve identifies the routine day performance while the far right-side of the
curve shows the values plotted for days in which almost all lines and generation units are in service and
essentially no load is lost
The trends on the chart below show that 2009 and 2010 had fewer extreme days than 2008 Routine
daily performance appears generally consistent across all three years Figure 20 captures the days for
each year benchmarked with historically significant events
In Figure 20 NERCrsquos event categories and SRI ratings are directly related As the SRI increases the
category or severity of the event increases Historical events are also shown to relate modern
reliability measurements to give a perspective of how a well-known event would register on the SRI
scale
The event analysis process30
30
benefits from the SRI as it enables a numerical analysis of an event in
comparison to other events By this measure an event can be prioritized by its severity In a severe
event this is unnecessary However for events that do not result in severe stressing of the bulk power
system this prioritization can be a challenge By using the SRI the event analysis process can decide
which events to learn from and reduce which events to avoid and when resilience needs to be
increased under high impact low frequency events as shown in the blue boxes in the figure
httpwwwnerccompagephpcid=5|365
Reliability Metrics Performance
40
Figure 20 NERC Annual Daily Severity Risk Index (SRI) Sorted Descending with Historic Benchmark Days
Other factors that impact severity of a particular event to be considered in the future include whether
equipment operated as designed and resulted in loss of load from a reliability perspective (intentional
and controlled load-shedding) Mechanisms for enabling ongoing refinement to include the historic and
simulated events for future severity risk calculations are being explored
Reliability Metrics Performance
41
Integrated Reliability Index Concepts In December 2010 the RMWG was challenged by the OC and PC to develop a single index concept to
measure the universe of risks associated with the bulk power system As a result the integrated
reliability index (IRI) concepts were proposed31
Figure 21
the three components of which were defined to
quantify each specific risk aspect They are titled the Event Driven Index (EDI) StandardsStatute Driven
Index (SDI) and Condition Driven Index (CDI) illustrated in with measures associated with
system events standards compliance and eighteen performance metrics The development of an
integrated reliability index aims to inform increase transparency and quantify the effectiveness of risk
reduction or mitigation actions The goal is to provide the industry meaningful trends of the BPSrsquos
performance and guidance on how the industry can improve reliability and support risk-informed
decision making Once completed the IRI will facilitate holistic assessment of performance Finally the
IRI should help overcome concern and confusion about how many metrics are being analyzed for system
reliability assessments
Figure 21 Risk Model for Bulk Power System
The integrated model of event-driven condition-driven and standardsstatute-driven risk information
can be constructed to illustrate all possible logical relations between the three risk sets Due to the
nature of the system there may be some overlap among the components
31 httpwwwnerccomdocspcrmwgIntegrated_Reliability_Index_WhitePaper_DRAFTpdf
Event Driven Index (EDI)
Indicates Risk from
Major System Events
Standards Statute Driven
Index (SDI)
Indicates Risks from Severe Impact Standard Violations
Condition Driven Index (CDI)
Indicates Risk from Key Reliability
Indicators
Reliability Metrics Performance
42
The Three Components of the IRI The three components of the IRI work together as shown in Figure 22 to comprise a full picture of the
state of reliability
Figure 22 An overview of the components that comprise the Integrated Reliability Index (IRI)
Event-Driven Indicators (EDI)
The Event-Driven Indicator provides a basis for prioritization of events based on bulk power system
integrity equipment performance and engineering judgment This indicator can serve as a high value
risk assessment tool to be used by stakeholders to investigate and evaluate disturbance history and
measure the severity of these events The relative ranking of events requires industry expertise agreed-
upon goals and engineering judgment The EDI is a derivative of SRI results for a specific time period
but it transforms that performance into a form of an availability index These calculations will be further
refined as feedback is received
Condition-Driven Indicators (CDI)
The Condition-Driven Indicators focus on a set of measurable system conditions (performance
measures) to assess bulk power system reliability These reliability indicators identify factors that
positively or negatively impact reliability and are early predictors of the risk to reliability from events or
unmitigated violations A collection of these indicators measures how close reliability performance is to
the desired outcome and if the performance against these metrics is constant or improving
Reliability Metrics Performance
43
StandardsStatute-Driven Indicators (SDI)
The StandardsStatute-Driven Indicator is a calculation of success of compliance based upon the subset
of high-value standards and is divided by the number of participations who could have received the
violation within the time period considered Also based on these factors known unmitigated violations
of elevated risk factor requirements are weighted higher than lower risk factors The index decreases if
the compliance improvement is achieved over a trending period
IRI Index Calculation As with the SRI the IRI is based on an importance weighting factor which the RMWG can modify over
time after gaining experience with the new metric as well as consideration of feedback from industry
At this time the RMWG believes some form of blended weighting may serve to start to populate IRI
characteristic curves at a high and generic level Based upon feedback from stakeholders this approach
may change or as discussed below weighting factors may vary based on periodic review and risk model
update The RMWG will continue the refinement of the IRI calculation and consider other significant
factors that impact reliability (eg intentional and controlled load-shedding) further it will explore
developing mechanisms for enabling ongoing refinement which should be influenced by a wide set of
stakeholders
RMWG recommends the Event Driven Index (EDI) be weighted the highest (50 percent) since events
actually occurred indicating how the system was performing The Condition Driven Index (CDI) and
StandardsStatute Driven Index (SDI) are weighted 25 each since they are indicators of potential risks
to BPS reliability IRI can be calculated as follows
IRI is intended to be a composite metric which integrates several forms of individual risks to the bulk
power system Since the three components range across many stakeholder organizations these
concepts are developed as starting points for continued study and evaluation Additional supporting
materials can be found in the IRI whitepaper32
IRI Recommendations
including individual indices calculations and preliminary
trend information
For the IRI more investigation should be performed to determine the best way to integrate EDI CDI
and SDI into an Integrated Reliability Index (IRI) that quantitatively represents the reliability of the bulk
32 The IRI whitepaper can be found at httpwwwnerccomdocspcrmwgIntegrated_Reliability_Index_WhitePaper_DRAFTpdf
Reliability Metrics Performance
44
power system To this end study into determining the amount of overlap between the components is
necessary RMWG is currently working to determine the proper amount of overlap between the IRI
components
Also the CDI component of the IRI needs to be solidified This is especially true with the CDI More
accurate metric data is needed to paint a fuller picture of the CDI Many of the metrics used to calculate
the CDI are new or they have limited data Compared to the SDI which counts well-known violation
counts and the EDI which uses the well-defined CDI the CDI lacks the depth of rigor that the other two
components have acquired through their years of data RMWG is currently working to improve the CDI
Reliability Metrics Conclusions and Recommendations Among the eighteen metrics that address the characteristics of an adequate level of reliability (ALR)
metric trends indicate the system is performing better in the following seven areas
bull ALR1-3 Planning Reserve Margin
bull ALR1-4 BPS Transmission Related Events Resulting in Loss of Load
bull ALR2-5 Disturbance Control Events Greater than Most Severe Single Contingency
bull ALR6-2 Energy Emergency Alert 3 (EEA3)
bull ALR6-3 Energy Emergency Alert 2 (EEA2)
bull ALR6-11 Automatic Transmission Outages Caused by Protection System Misoperations
bull ALR6-13 Automatic Transmission Outages Caused by Failed AC Substation Equipment
Assessments have been made in other performance categories A number of them do not have
sufficient data to derive any conclusions from the results The RMWG recommends continued data
collection and assessment of these metrics If a metric does not yield any trend in a five-year reporting
period the metric will be modified or withdrawn
For the IRI more investigation should be performed to determine the overlap of the components (CDI
EDI and SDI) The CDI should be more thoroughly solidified as an index by collecting more data over
time
Transmission Equipment Performance
45
Transmission Equipment Performance Introduction The Transmission Availability Data System (TADS) effort began with the establishment of a TADS task force
by the NERC Planning Committee in October 2006 On October 27 2007 the NERC Board of Trustees
approved the collection of transmission automatic outage data beginning in calendar year 2008 (Phase I)
Subsequently on October 29 2008 the NERC Board approved the collection of Non-Automatic Outage data
that began for Calendar year 2010 (Phase II)
This chapter provides reliability performance analysis of the transmission system by focusing on the trends
of Automatic Outage data from calendar year 2008 thru 2010 Since only one year of Non-Automatic
Outage data has been collected that data will not be assessed in this report
When calculating bulk power system performance indices care must be exercised when interpreting results
as misinterpretation can lead to erroneous conclusions regarding system performance With only three
years of data in the smaller regions it is not clear whether a regionrsquos yearly outage variation compared to
the average is due to random statistical variation or that particular year is significantly different in
performance However on a NERC-wide basis after three years of data collection there is enough
information to accurately determine whether the yearly outage variation compared to the average is due to
random statistical variation or the particular year in question is significantly different in performance33
Performance Trends
Transmission performance information has been provided by Transmission Owners (TOs) within NERC
through the NERC TADS (Transmission Availability Data System) process The data presented reflects
Momentary and Sustained AC Automatic outages of transmission elements that operate at voltages ge 200 kV
(including the low side of transformers) with the criteria specified in the TADS process The following
elements listed below are included
bull AC Circuits ge 200 kV (Overhead and Underground Circuits) Radial circuits are included
bull DC Circuits with ge +-200 kV DC voltage
bull Transformers with ge 200 kV low-side voltage and
bull ACDC Back-to-Back (BTB) Converters with ge 200 kV AC voltage on both sides
33The detailed Confidence Interval computation is available at httpwwwnerccomdocspctadstfTADS_Nov_2_2007APPENDIX_C_Confidence_Intervalpdf
Transmission Equipment Performance
46
AC Element Outage Summary and Leading Causes Table 6 shows the 2008 2009 and 2010 NERC total AC transmission element inventory and a summary of
the associated outages As expected in general the number of circuits increased from year to year due to
new construction or re-construction to higher voltages For every outage experienced on the transmission
system cause codes are identified and recorded according to the TADS process Causes of both momentary
and sustained outages have been indicated These causes are analyzed to identify trends and similarities
and to provide insight into what could be done to possibly prevent future occurrences
Figure 23 and Figure 24 describe the top ten initiating cause codes for sustained and momentary automatic
outages combined from 2008-2010 Based on the two figures the relationship between the total number of
outages and total outage hours can be seen Failed AC Substation Equipment and Failed AC Circuit
Equipment only account for 15 percent of the total number of outages but account for 65 percent of the
total outage hours The two largest causes of outages within NERC (ldquoLightingrdquo and ldquoWeather excluding
Lightningrdquo) account for 34 percent of the total number of outages
The next three Human Error Failed Protection System Equipment and Failed AC Circuit Equipment have
very similar totals and should all be considered significant focus points in reducing the number of Sustained
Automatic Outages for all elements
Transmission Equipment Performance
47
Table 6 NERC - All AC Elements Sustained and Momentary Outage Performance Summary
2008 Number of Outages
AC Voltage
Class
No of
Circuits
Circuit
Miles Sustained Momentary
Total
Outages Total Outage Hours
200-299kV 4369 102131 1560 1062 2622 56595
300-399kV 1585 53631 793 753 1546 14681
400-599kV 586 31495 389 196 585 11766
600-799kV 110 9451 43 40 83 369
All Voltages 6650 196708 2785 2051 4836 83626
2009 Number of Outages
AC Voltage
Class
No of
Circuits
Circuit
Miles Sustained Momentary
Total
Outages Total Outage Hours
200-299kV 4468 102935 1387 898 2285 28828
300-399kV 1619 56447 641 610 1251 24714
400-599kV 592 32045 265 166 431 9110
600-799kV 110 9451 53 38 91 442
All Voltages 6789 200879 2346 1712 4038 63094
2010 Number of Outages
AC Voltage
Class
No of
Circuits
Circuit
Miles Sustained Momentary
Total
Outages Total Outage Hours
200-299kV 4567 104722 1506 918 2424 54941
300-399kV 1676 62415 721 601 1322 16043
400-599kV 605 31590 292 174 466 10442
600-799kV 111 9477 63 50 113 2303
All Voltages 6957 208204 2582 1743 4325 83729
Note The NERC table does not show redacted outages DC Circuit outages Transformer outages or ACDC
converter outages
Transmission Equipment Performance
48
Figure 23 NERC - Top Ten Sustained and Momentary Outages by Initiating Cause Code for All Elements
Figure 24 NERC - Top Ten Sustained Outage Hours by Cause Code
198
151
80
7271
6943
33
27
188
68
Lightning
Weather excluding lightningHuman Error
Failed AC Substation EquipmentFailed Protection System EquipmentFailed AC Circuit Equipment Foreign Interference
Power System Condition
Fire
Unknown
Remaining Cause Codes
299
246
188
58
52
42
3619
16 12 31 Failed AC Substation EquipmentFailed AC Circuit Equipment Weather excluding lightningUnavailable
Other
Fire
Unknown
Human Error
Failed Protection System EquipmentForeign Interference
Remaining Cause Codes
Transmission Equipment Performance
49
Transmission Monthly Outages Figure 25 displays the total number of Automatic Outages on a per-month basis The three months with the
highest total of outages were June July and August From a seasonal perspective winter had a monthly
average of 281 outages These include the months of November-March Summer had an average of 429
outages Summer included the months of April-October
Figure 25 Number of Outages by Month for AC Circuits (2008-2010)
This figure does not show redacted outages DC Circuit outages Transformer outages or ACDC Converter
outages
Outage Initiation Location For every outage experienced on the transmission system the outage initiation code is identified and
recorded according to the TADS process The outage initiation code can be analyzed to identify trends and
similarities and to provide insight into what could be done to possibly prevent future occurrences
The ldquoOutage Initiation Coderdquo describes where an automatic outage was initiated on the power system The
five codes are as follows
bull Element-Initiated
bull Other Element-Initiated
bull AC Substation-Initiated
bull ACDC Terminal-Initiated (for DC circuits)
bull Other Facility Initiated any facility not included in any other outage initiation code
JanuaryFebruar
yMarch April May June July August
September
October
November
December
2008 238 229 257 258 292 437 467 380 208 176 255 236
2009 315 201 339 334 398 553 546 515 351 235 226 294
2010 444 224 269 446 449 486 639 498 351 271 305 281
3 Year AVG 332 218 288 346 380 492 551 464 303 227 262 270
0
100
200
300
400
500
600
700
Out
ages
Transmission Equipment Performance
50
Notably the protection system is not part of an ldquoAC Substationrdquo or an ldquoACDC Terminalrdquo If a protection
system misoperates and initiates an outage it will be classified as ldquoOther-Facility Initiatedrdquo The following
Figures show the initiating location of the Automatic outages from 2008 to 2010
With both Momentary and Sustained Automatic Outages taken into account the outage was initiated on the
Element more than 67 percent of the time as shown in Figure 26 and Figure 27
When only the Sustained Automatic Outages are analyzed the outage initiation on both AC Substation and
Other Facility increased by 34 percent and 32 percent respectively Outages initiated on the Element itself
decreases by 78 percent as shown in Figure 26 and 27 For only the Momentary Automatic Outages the
outage initiation on the Element increases by 19 percent compared to Sustained Outages Element initiated
outages make up over 78 percent of the total outages when analyzing only Momentary Outages
Figure 26
Figure 27
Transmission Outage Events Figure 28 illustrates the relationship between the numbers of Automatic Outages associated per TADS
event 2008 2009 and 2010 tend to follow the same trend The largest number of Automatic Outages per
TADS event is fourteen in 2010 thirteen in 2009 and eight in 2008 There are around 70 to 100 TADS
events that contain between fourteen and three Automatic Outages (see below) There are around 330 to
400 TADS events that contain two or more Automatic Outages The rest of the events only contain one
Automatic Outage As noted in the lower right hand corner below the total number of Events in 2008 to
2010 ranged from 3920 to 4569 events per year Nearly 90 percent or more of the events contained one
Automatic Outage
Figure 26 Sustained Automatic Outage Initiation
Code
Figure 27 Momentary Automatic Outage Initiation
Code
Transmission Equipment Performance
51
Transmission Outage Mode Figure 29 and Figure 30 show the percentage of Outage Modes The ldquoOutage Mode Coderdquo describes
whether one Automatic Outage is related to other Automatic Outages A Single Mode outage is an
Automatic Outage of a single Element which occurs independently of any other Automatic Outages (if any)
A ldquoDependent Mode Initiating Outagerdquo is an Automatic Outage of a single Element that initiates one or more
subsequent Element Automatic Outages A ldquoDependent Mode Outagerdquo is an Automatic Outage of an
Element which occurred as a result of an initiating outage whether the initiating outage was an Element
outage or a non-Element outage A ldquoCommon Mode Outagerdquo is one of two or more Automatic Outages with
the same Initiating Cause Code and where the outages are not consequences of each other and occur nearly
simultaneously A ldquoCommon Mode Initiating Outagerdquo is a Common Mode Outage that initiates one or more
subsequent Automatic Outages
Over 72 percent of the total outages occurred on the bulk power system are Single Mode Outages The next
largest mode is Dependent with over 11 percent of the total outages being in this category For only
Sustained Automatic Outages outages related to each other increase with Dependent mode accounting for
13 percent of the outages and Common mode accounting for close to 11 percent of the outages
Independent Sustained outages still account for the largest portion with nearly 70 percent being Single
mode When just analyzing Momentary Automatic Outages Associated outages decrease with Dependent
Figure 28 Event Histogram (2008-2010)
Transmission Equipment Performance
52
mode accounting for only 9 percent of the outages The Common Mode percentage decreases while
Dependent Mode Initiating percentage increases compared to Sustained Outages Independent Momentary
outages account for the largest portion with over 76 percent being Single Mode
An investigation into the root causes of Dependent and Common mode events which include three or more
Automatic Outages (indentified in the TADS 2008 to 2010 data) should be a high priority Some protection
systems are designed to trip three or more circuits but some events go beyond what is designed Some also
have misoperations associated with multiple outage events
Conclusions On a NERC wide average basis automatic transmission outage rate is improving from 2008 to 2010 based on
reported data Considering both automatic and non-automatic outages 2010 records indicate transmission
element availability percentage is very high and exceeds 95 The unavailability rate for AC circuits and
transformers are only 15 and 29 respectively
The cause codes of Human Error Failed Protection System Equipment and Failed AC Circuit Equipment
should be considered significant focus points in reducing the number of Sustained Automatic Outages for all
elements A deeper look into the root causes of Dependent and Common mode events which include three
or more Automatic Outages (indentified in the TADS 2008 to 2010 data) should be a high priority Some
protection systems are designed to trip three or more circuits but some events go beyond what is designed
Some also have misoperations associated with multiple outage events
Figure 29 Sustained Automatic Outage Mode code Figure 30 Momentary Automatic Outage Mode code
Generation Equipment Performance
53
Generation Equipment Performance Introduction The development of the Generating Availability Data System (GADS) began in 1982 This series of databases
is used to voluntarily collect record and retrieve operating information By pooling individual unit
information with likewise units generating unit availability performance can be calculated providing
opportunities to identify trends and generating equipment reliability improvement opportunities The
information is used to support equipment reliability availability analyses and risk-informed decision-making
by system planners generation owners assessment modelers manufacturers and contractors etc Reports
and information resulting from the data collected through GADS are now used for benchmarking and
analyzing electric power plants
Currently the data collected through GADS contains 72 percent of the North American generating units
with generating capacity of 20 MW or higher34 Additionally many of the newer combined-cycle plants are
not reporting information and therefore a full view of each unit type is not presented Rather a sample of
all the units in North America that fit a given more general category is provided35 for the 2008-201036
Generation Key Performance Indicators
assessment period
Three key performance indicators37
In
the industry have used widely to measure the availability of generating
units (see Terms Used in This Report section for their calculation parameters) are Equivalent Availability
Factor (EAF) Net Capacity Factor (NCF) and Equivalent Forced Outage Rate ndash Demand (EFORd)
Table 7 the North American fleet average EAF NCF and EFORd compared to unit age for all generating
units with a capacity of 20 MW and higher is provided for the years 2008-2010 The EAF shows a decline
during the last three years NCF is up and down while the EFORd appears to be increasing As expected the
fleet of units reported to GADS is aging overall with the fossil units being about 12 years older than the
average age
34 httpwwwnerccomdocspcgadstfGADSTF_Recommendation_Report_02-18-2011_FINALpdf 35GADS contains some 1500+ units under 20 MW that is not included in this report These units are excluded because most units are not base-loaded and are in peaking operation
3684 percent of the 2010 dataset is available at this time while the 2008 and 2009 dataset is complete 37 httpwwwnerccompagephpcid=4|43
Generation Equipment Performance
54
Table 7 General Availability Review of GADS Fleet Units by Year
2008 2009 2010 Average
Equivalent Availability Factor (EAF) 8776 8774 8678 8743
Net Capacity Factor (NCF) 5083 4709 4880 4890
Equivalent Forced Outage Rate -
Demand (EFORd) 579 575 639 597
Number of Units ge20 MW 3713 3713 3713 3713
Average Age of the Fleet in Years (all
unit types) 303 311 321 312
Average Age of the Fleet in Years
(fossil units only) 422 432 440 433
Figure 31 provides the average forced outage hours (FOH) maintenance outage hours (MOH) and planned
outage hours (POH) for all units reporting 20 MW or larger During this three-year period the average FOH
291 hours average MOH is 163 hours average POH is 470 hours
Figure 31 shows a large increase in forced and maintenance events The average age of the units with a
capacity of 20MW and higher in 2009 is 316 years old However the average age of fossil units in 2010 is
442 years old These fossil units are the backbone of all operating units providing the base-load power
continuously and nearly 50 percent of all energy annually There appears to be no increase allocated for
annualsemi-annual maintenance (ie planned outages) for the older generating units The increase of
000100002000030000400005000060000700008000090000
100000
2008 2009 2010
463 479 468
154 161 173
288 270 314
Hou
rs
Planned Maintenance Forced
Figure 31 Average Outage Hours for Units gt 20 MW
Generation Equipment Performance
55
maintenance outage hours reflects an increased need to fix problems that cannot be deferred until the next
annualsemi-annual repairs As a result it shows one of two things are happening
bull More or longer planned outage time is needed to repair the aging generating fleet
bull More focus on preventive repairs during planned and maintenance events are needed
Multiple Unit Forced Outages and Causes Table 8 provides the annual multiple-unit forced outage trips resulting from the same cause for each of the
assessments years 2008-2010 respectively The ldquosingle unitrdquo trips are large units with a Net Dependable
Capacity of 750 MW or more The trips of ldquotwo unitsrdquo or more is any combination of unit capacity with the
total amount of lost capacity more than 750 MW
Table 8 also presents more information on the forced outages During 2008-2010 there were a large
number of double-unit outages resulting from the same event Investigations show that some of these trips
were at a single plant caused by common control and instrumentation for the units The incidents occurred
several times for several months and are a common mode issue internal to the plant
Table 8 Number of Multiple Unit Forced Outages and FrequencyYear
2008 2009 2010
Type of
Trip
of
Trips
Avg Outage
Hr Trip
Avg Outage
Hr Unit
of
Trips
Avg Outage
Hr Trip
Avg Outage
Hr Unit
of
Trips
Avg Outage
Hr Trip
Avg Outage
Hr Unit
Single-unit
Trip 591 58 58 284 64 64 339 66 66
Two-unit
Trip 281 43 22 508 96 48 206 41 20
Three-unit
Trip 74 48 16 223 146 48 47 109 36
Four-unit
Trip 12 77 19 111 112 28 40 121 30
Five-unit
Trip 11 1303 260 60 443 88 19 199 10
gt 5 units 20 166 16 93 206 50 37 246 6
Loss of ge 750 MW per Trip
The high number of five-unit trips in 2008 was due to Hurricane Ike hitting the Gulf Coast The highest total
number of multiple unit trips occurred in 2009 though as mentioned before the data collection for 2010 is
incomplete at this time The majority of 2009 multiple unit trips have three main causes (in order by
Generation Equipment Performance
56
number of events) transmission lack of fuel and storms A summary of the three categories for single as
well as multiple unit outages (all unit capacities) are reflected in Table 9
Table 9 Common Causes of Multiple Unit Forced Outages (2009)
Cause Number of Events Average MW Size of Unit
Transmission 1583 16
Lack of Fuel (Coal Mines Gas Lines etc) Not
in Operator Control
812 448
Storms Lightning and Other Acts of Nature 591 112
Some of the transmission outages based on storms in 2009 have been caused by the same reasons because
the storms may have caused transmission interference However the plants reported the problems
inconsistently with either the transmission interference or storms cause code Therefore they are depicted
as two different causes of forced outage
Marked transmission outages in 2009 were quite high Thirty-five percent came from one utility with a large
number of hydroelectric units The company related the trips to various problems including weather
(lightning storms) wildlife ldquoline bumpsrdquo and problems on the receiving end of the transmission line Nine
hundred and eighty-five transmission trips (62 percent) were from hydroelectric units38
In 2009 only ten transmission trips resulted in a loss of 750 MW or more per trip Twenty two generating
plants were affected by the ten trips Causes for the trips include feeder line trips (1 trip) breakers in the
switchyard (8 trips) personnel errors (2 trips) and unknown (10 trips)
The ldquoLack of Fuelrdquo outages are of interest as these events occur during the times when a unit is available to
operate but there is an interruption in fuels to operate the facilities These events do not include
interruptions of fuel due to contracts Rather the cause code is designed to account for units that are
expecting fuel and it is unavailable when requested Table 10 presents the distribution of ldquoLack of Fuelrdquo
events by NERC Region and Table 11 presents the unit types affected
38 The average size of the hydroelectric units were small ndash 335 MW
Generation Equipment Performance
57
Of the units that report ldquoLack of Fuelrdquo 78 percent of the units are oil-fired 15 percent of the units are gas-
fired and the remaining units are various other fuels Table 12 provides the top causes of forced outage for
several unit types For fossil units ldquoLack of Fuelrdquo as the number three cause behind waterwall tube leaks
and superheater tube leaks
Table 10 Forced Outages Due to Lack of Fuel by Region
Region Number of Lack of Fuel
Problems Reported
FRCC 0
MRO 3
NPCC 24
RFC 695
SERC 17
SPP 3
TRE 7
WECC 29
One company contributed to the majority of oil-fired lack of fuel events The units at the company are
actually dual-fuels (oil and gas) but market nominated gas monitoring causes the units to be on forced
outage nightly The units need gas to start up so they can run on oil When they shut down the units must
switch to gas to clean themselves With the gas restriction the unit canrsquot start and the unit goes on a
forced outage Until the band is lifted the two units will continue to be on a forced outage cycle
Event records also provide descriptions of why the unit was without fuel with the majority of descriptions
bull Temperatures affecting gas supply valves
bull Unexpected maintenance of gas pipe-lines
bull Compressor problemsmaintenance
Generation Equipment Performance
58
Table 11 Unit Type Profile of Forced Outages Due to Lack of Fuel
Unit Types Number of Lack of Fuel Problems Reported
Fossil 642
Nuclear 0
Gas Turbines 88
Diesel Engines 1
HydroPumped Storage 0
Combined Cycle 47
Generation Equipment Performance
59
Table 12 Causes of Forced Outage for Different Unit Types (2008-2010)
Fossil - all MW sizes all fuels
Rank Description Occurrence per Unit-year
MWH per Unit-year
Average Hours To Repair
Average Hours Between Failures
Unit-years
1 Waterwall (furnace wall) 0590 134106 59 3250 3868 2 Second Superheater
Leaks 0180 5182 60 3228 3868
3 Lack of Fuel (coal mines gas lines etc) where the operator is not in control
0480 4701 18 26 3868
Combined-Cycle blocks Rank Description Occurrence
per Unit-year
MWH per Unit-year
Average Hours To Repair
Average Hours Between Failures
Unit-years
1 HP Turbine Buckets Or Blades
0020 4663 1830 26280 466
2 Turbine Control Valves 0040 2777 100 7200 466 3 Gas Turbine Compressor -
High Pressure Shaft 0010 2266 663 4269 466
Nuclear units - all Reactor types Rank Description Occurrence
per Unit-year
MWH per Unit-year
Average Hours To Repair
Average Hours Between Failures
Unit-years
1 LP Turbine Buckets or Blades
0010 26415 8760 26280 288
2 Containment Structure 0010 9233 1226 26262 288 3 Feedwater Pump Local
Controls 0020 7620 692 12642 288
Simple-cycle gas turbine jet engines Rank Description Occurrence
per Unit-year
MWH per Unit-year
Average Hours To Repair
Average Hours Between Failures
Unit-years
1 Main Transformer 0030 1611 1016 20709 4181 2 Other Gas Turbine
Controls And Instrument Problems
0120 428 70 2614 4181
3 Other Gas Turbine Problems
0090 400 119 1701 4181
Generation Equipment Performance
60
2008-2010 Review of Summer versus Winter Availability To address seasonality of unit availability unit information for the months of June to September (summer)
and December through February (winter) were pooled to calculate force events during these timeframes for
2008-201039 Figure 32 shows the Equivalent Availability Factor (EAF) is three percentage points higher and
the Equivalent Forced Outage Rate - Demand (EFORd) is more than a half of a percentage point lower in the
summer period than in winter period This means the units were more reliable with less forced events
during high-demand times during the summer than during the winter seasons The generating unitrsquos
capability has a resulting higher Net Capacity Factor (NCF) of 45 percentage points in the summer season
for 2008-2010
During the spring season (March-May) 77 percent of the units took a planned outage (PO) for an average
231 hours (or 96 days) In fall (October-November) only 42 percent of the units experienced a PO and the
average duration was shorter ndash 134 hours (or 56 days) A few units took both spring and fall planned
outages although this is rare Based on this assessment the generating units are prepared for the summer
peak demand The resulting availability indicates that this maintenance was successful which is measured
by an increased EAF and lower EFORd
Figure 32 Summer-Winter Average EAF NCF and EFORd (2008-2010)
Conclusions and Recommendations During 2008-2010 the average Equivalent Availability Factor (EAF) which measures the overall availability
of generating units decreased At the same time the Net Capacity Factor (NCF) an indicator of energy
production increased The average number of forced outages in 2010 is greater than in 2008 while at the
same time the average planned outage times have decreased As a result the Equivalent Forced Outage
Rate ndash Demand (EFORd) also increased illustrating that more units have experienced forced events during
39 A study of peak periods was conducted by the NERC Generating Availability Trend Evaluation (GATE) Working Group several years ago see httpwwwnerccomfilesSeasonal-Performance-Trendspdf
9116
5343
396
8818
4896
441
0 10 20 30 40 50 60 70 80 90 100
EAF
NCF
EFORd
Percent ()
Winter
Summer
Generation Equipment Performance
61
peak-demand times in 2010 than in the previous two years Potentially with shorter planned outage
periods in 2010 there may be less time to repair equipment and prevent forced unit outages
There are warnings that units are not being maintained as well as they should be In the last three years
there has been an increase in Equivalent Forced Outage Rate ndash Demand (EFORd) This indicator measures
the rate of forced outage events on generating units during periods of load demand To confirm this
problem forced outage hours jumped from 270 to 314 hours per unit between 2009 and 2010 At the same
time maintenance events also increased by 12 hours per unit Planned outage events remain constant The
resulting conclusions from this trend are
bull More or longer planned outage time is needed to repair the generating fleet Whether age is the
cause of the increase need for planned outage time remains unknown and further investigation into
the cause for longer planned outage time is necessary
bull More focus on preventive repairs during planned and maintenance events are needed
There are many multiple unit forced outages due to lack of fuel The majority of multiple unit trips have
three main causes transmission lack of fuel and storms With special interest in the forced outages due to
ldquoLack of Fuelrdquo additional analysis revealed that 77 percent of the units experiencing unexpected fuel
stoppage are oil-fired fossil units while gas-fired units experienced 15 percent
Generating units continue to be more reliable during the peak summer periods
Disturbance Event Trends
62
Category 1 An event resulting in one or more of the following a Unintended loss of three or more BPS elements caused by
common mode failure b Failure or misoperation of an SPSRAS c System-wide voltage reduction of 3 or more d Unintended BPS system separation resulting in an island of
100 MW to 999 MW e Unplanned evacuation from a control center facility with BPS
SCADA functionality for 30 minutes or more Category 2 An event resulting in one or more of the following
a Complete loss of all BPS control center voice communication system(s) for 30 minutes or more
b Complete loss of SCADA control or monitoring functionality for 30 minutes or more
c Voltage excursions equal to or greater than 10 lasting more than five minutes
d Loss of off-site power (LOOP) to a nuclear generating station e Unintended system separation resulting in an island of 1000
MW to 4999 MW f Unintended loss of 300MW or more of firm load for more
than 15 minutes g Violation of an Interconnection Reliability Operating Limit
(IROL) for more than 30 minutes Category 3 An event resulting in one or more of the following
a The loss of load or generation of 2000 MW or more in the Eastern Interconnection or
b Western Interconnection or 1000 MW or more in the ERCOT or Queacutebec Interconnections
c Unintended system separation resulting in an island of 5000 MW to 10000 MW
d Unintended system separation resulting in an island of Florida from the Eastern Interconnection
Category 4 An event resulting in one or more of the following a The loss of load or generation from 5001 MW to 9999 MW b Unintended system separation resulting in an island of more
than 10000 MW (with the exception of Florida as described in Category 3c)
Category 5 An event resulting in one or more of the following a The loss of load of 10000 MW or more b The loss of generation of 10000 MW or more
Figure 33 BPS Event Category
Disturbance Event Trends Introduction The purpose of this section is to report event
analysis trends from the beginning of event
analysis field test40
One of the companion goals of the event
analysis program is the identification of trends
in the number magnitude and frequency of
events and their associated causes such as
human error equipment failure protection
system misoperations etc The information
provided in the event analysis database (EADB)
and various event analysis reports have been
used to track and identify trends in BPS events
in conjunction with other databases (TADS
GADS metric and benchmarking database)
to the end of 2010
The Event Analysis Working Group (EAWG)
continuously gathers event data and is moving
toward an integrated approach to analyzing
data assessing trends and communicating the
results to the industry
Performance Trends The event category is classified41
Figure 33
as shown in
with Category 5 being the most
severe Figure 34 depicts disturbance trends in
Category 1 to 5 system events from the
40 httpwwwnerccomdocseawgGalloway-Industry-EA-Field-Test-102210pdf 41httpwwwnerccomfiles2011-05-0220Event_Analysis_Process_Phase20220Field20Test20Draft20-20Final20-20For20postingpdf
Disturbance Event Trends
63
beginning of event analysis field test to the end of 201042
Figure 34 Event Category vs Date for All 2010 Categorized Events
From the figure in November and December
there were many more category 1 and 2 events than in October This is due to the field trial starting on
October 25 2010
In addition to the category of the events the status of the events plays a critical role in the accuracy of the
data By examining Figure 35 over 80 of the events reported in 2010 have been closed This means that
the category root cause and other important information have been sufficiently finalized in order for
analysis to be accurate for each event At this time there is not enough data to draw any long-term
conclusions about event investigation performance
42 Documents for the EA Field Test are located at httpwwwnerccompagephpcid=5|365
2
12 12
26
3
6 5
14
1 1
2
0
5
10
15
20
25
30
35
40
45
October November December 2010
Even
t Cou
nt
Category 3 Category 2 Category 1
Disturbance Event Trends
64
Figure 35 Event Count vs Status (All 2010 Events with Status)
By drilling down into the cause code for each closed 2010 event Figure 36 shows the top 3 event causes
From the figure equipment failure and protection system misoperation are the most significant causes for
events Because of how new and limited the data is however there may not be statistical significance for
this result Further trending of cause codes for closed events and developing a richer dataset to find any
trends between event cause codes and event counts should be performed
Figure 36 Top 3 Event Counts vs DAWG Cause Code for all Closed 2010 Events
10
32
42
0
5
10
15
20
25
30
35
40
45
Open Closed Open and Closed
Even
t Cou
nt
Status
1211
8
0
2
4
6
8
10
12
14
Equipment Failure Protection System Misoperation Human Error
Even
t Cou
nt
Cause Code
Disturbance Event Trends
65
Conclusions Due to the relatively new process for events analysis and categorization more time will be required before a
conclusive recommendation may be obtained Further analysis and new data should provide valuable
statistics in the future Over 80 of all event reports from 2010 are current listed as closed but no
conclusion about investigation performance may be obtained because of the limited amount of data It is
recommended to study ways to prevent equipment failure and protection system misoperations but there
is not enough data to draw a firm conclusion about the top causes of events at this time
Abbreviations Used in This Report
66
Abbreviations Used in This Report
Acronym Definition ALP Acadiana Load Pocket
ALR Adequate Level of Reliability
ARR Automatic Reliability Report
BA Balancing Authority
BPS Bulk Power System
CDI Condition Driven Index
CEII Critical Energy Infrastructure Information
CIPC Critical Infrastructure Protection Committee
CLECO Cleco Power LLC
DADS Future Demand Availability Data System
DCS Disturbance Control Standard
DOE Department Of Energy
DSM Demand Side Management
EA Event Analysis
EAF Equivalent Availability Factor
ECAR East Central Area Reliability
EDI Event Drive Index
EEA Energy Emergency Alert
EFORd Equivalent Forced Outage Rate Demand
EMS Energy Management System
ERCOT Electric Reliability Council of Texas
ERO Electric Reliability Organization
ESAI Energy Security Analysis Inc
FERC Federal Energy Regulatory Commission
FOH Forced Outage Hours
FRCC Florida Reliability Coordinating Council
GADS Generation Availability Data System
GOP Generation Operator
IEEE Institute of Electrical and Electronics Engineers
IESO Independent Electricity System Operator
IROL Interconnection Reliability Operating Limit
Abbreviations Used in This Report
67
Acronym Definition IRI Integrated Reliability Index
LOLE Loss of Load Expectation
LUS Lafayette Utilities System
MAIN Mid-America Interconnected Network Inc
MAPP Mid-continent Area Power Pool
MOH Maintenance Outage Hours
MRO Midwest Reliability Organization
MSSC Most Severe Single Contingency
NCF Net Capacity Factor
NEAT NERC Event Analysis Tool
NERC North American Electric Reliability Corporation
NPCC Northeast Power Coordinating Council
OC Operating Committee
OL Operating Limit
OP Operating Procedures
ORS Operating Reliability Subcommittee
PC Planning Committee
PO Planned Outage
POH Planned Outage Hours
RAPA Reliability Assessment Performance Analysis
RAS Remedial Action Schemes
RC Reliability Coordinator
RCIS Reliability Coordination Information System
RCWG Reliability Coordinator Working Group
RE Regional Entities
RFC Reliability First Corporation
RMWG Reliability Metrics Working Group
RSG Reserve Sharing Group
SAIDI System Average Interruption Duration Index
SAIFI System Average Interruption Frequency Index
SCADA Supervisory Control and Data Acquisition
SDI Standardstatute Driven Index
SERC SERC Reliability Corporation
Abbreviations Used in This Report
68
Acronym Definition SRI Severity Risk Index
SMART Specific Measurable Attainable Relevant and Tangible
SOL System Operating Limit
SPS Special Protection Schemes
SPCS System Protection and Control Subcommittee
SPP Southwest Power Pool
SRI System Risk Index
TADS Transmission Availability Data System
TADSWG Transmission Availability Data System Working Group
TO Transmission Owner
TOP Transmission Operator
WECC Western Electricity Coordinating Council
Contributions
69
Contributions This report was made feasible by the collaboration and hard work of both NERC staff and NERCrsquos
Industry Groups
NERC Industry Groups
Table 14 lists the NERC industry group contributors Without their contribution and collaboration this
report would not have been possible
Table 13 NERC Industry Group Contributions43
NERC Group
Relationship Contribution
Reliability Metrics Working Group
(RMWG)
Reports to the OCPC bull Lead Development of Report bull Provide Reliability Metrics Data bull Responsible for Reliability Metrics
Performance Chapter
Transmission Availability Working Group
(TADSWG)
Reports to the OCPC bull Provide Transmission Availability Data
bull Responsible for Transmission Equip-ment Performance Chapter
bull Content Review
Generation Availability Data System Task
Force
(GADSTF)
Reports to the OCPC bull Provide Generation Availability Data bull Responsible for Generation Equip-
ment Performance Chapter bull Content Review
Event Analysis Working Group
(EAWG)
Reports to the OCPC bull Provide Events Data bull Responsible for Disturbance Events
Trends Chapter bull Content Review
43 Rosters for RMWG TADSWG GADSTF and EAWG are available at httpwwwnerccomfilesrosterpdf
Contributions
70
NERC Staff Table 13 below lists the NERC staff who contributed to the 2011 Reliability Performance Analysis
Report
Table 14 Contributing NERC Staff
Name Title E-mail Address
Mark Lauby Vice President and Director of
Reliability Assessment and
Performance Analysis
marklaubynercnet
Jessica Bian Manager of Performance Analysis jessicabiannercnet
John Moura Manager of Reliability Assessments johnmouranercnet
Andrew Slone Engineer Reliability Performance
Analysis
andrewslonenercnet
Jim Robinson TADS Project Manager jimrobinsonnercnet
Clyde Melton Engineer Reliability Performance
Analysis
clydemeltonnercnet
Mike Curley Manager of GADS Services mikecurleynercnet
James Powell Engineer Reliability Performance
Analysis
jamespowellnercnet
Michelle Marx Administrative Assistant michellemarxnercnet
William Mo Intern Performance Analysis wmonercnet
- NERCrsquos Mission
- Table of Contents
- Executive Summary
-
- 2011 Transition Report
- State of Reliability Report
- Key Findings and Recommendations
-
- Reliability Metric Performance
- Transmission Availability Performance
- Generating Availability Performance
- Disturbance Events
- Report Organization
-
- Introduction
-
- Metric Report Evolution
- Roadmap for the Future
-
- Reliability Metrics Performance
-
- Introduction
- 2010 Performance Metrics Results and Trends
-
- ALR1-3 Planning Reserve Margin
-
- Background
- Assessment
- Special Considerations
-
- ALR1-4 BPS Transmission Related Events Resulting in Loss of Load
-
- Background
- Assessment
-
- ALR1-12 Interconnection Frequency Response
-
- Background
- Assessment
-
- ALR2-3 Activation of Under Frequency Load Shedding
-
- Background
- Assessment
- Special Considerations
-
- ALR2-4 Average Percent Non-Recovery Disturbance Control Standards (DCS)
-
- Background
- Assessment
- Special Consideration
-
- ALR2-5 Disturbance Control Events Greater Than Most Severe Single Contingency
-
- Background
- Assessment
- Special Consideration
-
- ALR 1-5 System Voltage Performance
-
- Background
- Special Considerations
- Status
-
- ALR3-5 Interconnection Reliability Operating Limit System Operating Limit (IROLSOL) Exceedances
-
- Background
-
- ALR4-1 Automatic Transmission Outages Caused by Protection System Misoperations
-
- Background
- Special Considerations
-
- ALR6-11 ndash ALR6-14
-
- Background
- Assessment
- ALR 6-11 ndash Automatic Outages Initiated by Failed Protection System Equipment
- ALR6-12 ndash Automatic Outages Initiated by Human Error
- ALR6-13 ndash Automatic Outages Initiated by Failed AC Substation Equipment
- ALR6-14 Automatic AC Transmission Outages Initiated by Failed AC Circuit Equipment
-
- ALR6-15 Element Availability Percentage (APC)
-
- Background
- Assessment
- Special Consideration
-
- ALR6-16 Transmission System Unavailability
-
- Background
- Assessment
- Special Consideration
-
- ALR6-2 Energy Emergency Alert 3 (EEA3)
-
- Background
- Assessment
- Special Considerations
-
- ALR 6-3 Energy Emergency Alert 2 (EEA2)
-
- Background
- Assessment
- Special Considerations
-
- ALR 6-1 Transmission Constraint Mitigation
-
- Background
- Assessment
- Special Considerations
-
- Integrated Bulk Power System Risk Assessment
-
- Introduction
- Recommendations
-
- Integrated Reliability Index Concepts
-
- The Three Components of the IRI
-
- Event-Driven Indicators (EDI)
- Condition-Driven Indicators (CDI)
- StandardsStatute-Driven Indicators (SDI)
-
- IRI Index Calculation
- IRI Recommendations
-
- Reliability Metrics Conclusions and Recommendations
-
- Transmission Equipment Performance
-
- Introduction
- Performance Trends
-
- AC Element Outage Summary and Leading Causes
- Transmission Monthly Outages
- Outage Initiation Location
- Transmission Outage Events
- Transmission Outage Mode
-
- Conclusions
-
- Generation Equipment Performance
-
- Introduction
- Generation Key Performance Indicators
-
- Multiple Unit Forced Outages and Causes
- 2008-2010 Review of Summer versus Winter Availability
-
- Conclusions and Recommendations
-
- Disturbance Event Trends
-
- Introduction
- Performance Trends
- Conclusions
-
- Abbreviations Used in This Report
- Contributions
-
- NERC Industry Groups
- NERC Staff
-

Reliability Metrics Performance
37
Table 5 ALR6-1 Transmission Constraint Mitigation by Operating ProcedureGuides (2009-2011)
ALR6-1 Transmission Constraint Mitigation by Operating ProcedureGuides (2009-2014)
2009 2010 2011 2014
FRCC 107 75 66
MRO 79 79 81 81
NPCC 0 0 0
RFC 2 1 3 4
SPP 39 40 40 40
SERC 6 7 15
ERCOT 29 25 25
WECC 110 111
Special Considerations
A certain number of SPS mitigation plans may be necessary to support reliable operation of the system
If the number of SPS increase over time this may indicate that additional transmission capacity is
required A reduction in the number of SPS may be an indicator of increased generation or transmission
facilities being put into service which may indicate greater robustness of the bulk power system In
general mitigation plans are a viable and valuable tool for effective operation of the bulk power system
In power system planning reliability operability capacity and cost-efficiency are simultaneously
considered through a variety of scenarios to which the system may be subjected Mitigation measures
are a method for optimizing a power system across these scenarios Changes in quantities of mitigation
plans may indicate year-on-year differences in the system being evaluated
Integrated Bulk Power System Risk Assessment
Introduction In developing eighteen metrics to measure acceptable levels of reliability it has become clear that any
such measurement of reliability must include consideration of the risks present within the bulk power
system in order for us to appropriately prioritize and manage these system risks The scope for the
Reliability Metrics Working Group (RMWG)27
27 The RMWG scope can be viewed at
includes a task to develop a risk-based approach that
provides consistency in quantifying the severity of events The approach not only can be used to
httpwwwnerccomfilezrmwghtml
Reliability Metrics Performance
38
measure risk reduction over time but also can be applied uniformly in event analysis process to identify
the events that need to be analyzed in detail and sort out non-significant events
The Operating Committee (OC) and Planning Committee (PC) endorsed the concepts and framework28 of
the risk-based approach in their September 2010 joint meeting and further supported the event severity
risk index (SRI) calculation29
Recommendations
in March 2011
bull NERC should embrace the use of risk assessment to identify trends in addition to lessons learned
in order to improve bulk power system reliability
bull The RMWG should continue to coordinate and communicate with the Event Analysis Working
Group (EAWG) to apply the SRI into the event analysis process and root cause analysis
bull As trend evaluations increase the knowledge of risks to the bulk power system data required to
support additional assessment should be gathered
Event Severity Risk Index (SRI)
Risk assessment is an essential tool for achieving the alignment between organizations people and
technology This will assist in quantifying inherent risks identifying where potential high risks exist and
evaluating where the most significant lowering of risks can be achieved Being learning organizations
the Electric Reliability Organization (ERO) Regional Entities and Registered Entities can use these tools
to focus on the areas of highest risk to reliability to provide a sound basis for developing results-based
standards and compliance programs Risk assessment also serves to engage all stakeholders in a
dialogue about specific risk factors and helps direct a strategic plan for risk reduction and early
detection
The SRI is a daily blended metric for which transmission loss generation loss and load loss events are
calculated Each element (transmission generation and load loss) is factored by the systemrsquos inventory
for that element to rate significant events appropriately On a yearly basis these daily performances
can be sorted in descending order to evaluate the year-on-year performance of the system
In order to test drive the concepts the RMWG applied these calculations against historically memorable
days to derive SRIs Once these calculations were complete they were reviewed and evaluated by
various stakeholders for reasonableness Based upon feedback modifications to the calculation were
made and assessed against the historic days performed This iterative process locked down the details
28 httpwwwnerccomdocspcrmwgIntegrated_Bulk_Power_System_Risk_Assessment_Concepts_Finalpdf 29 httpwwwnerccomdocspcrmwgSRI_Equation_Refinement_May6_2011pdf
Reliability Metrics Performance
39
for the calculation of SRI whose calculation from zero (no transmission line outages generation outages
or load lost in a day) to 1000 (a theoretical condition in which every transmission line all generation
units and all load lost across the system in a single day)
Figure 20 captures the calculated severity risk value for each of the days for each year benchmarked
with the historic significant events which were used to concept test the calculation Since there is
significant disparity between days the bulk power system is stressed compared to those that are
ldquoroutinerdquo and ldquoherordquo days of the year where the system performed extremely well the curve is depicted
using a logarithmic scale Each yearrsquos data is sorted in descending order striking a characteristic shape
At the left-side of the curve the days in which the system is severely stressed are plotted The central
more linear portion of the curve identifies the routine day performance while the far right-side of the
curve shows the values plotted for days in which almost all lines and generation units are in service and
essentially no load is lost
The trends on the chart below show that 2009 and 2010 had fewer extreme days than 2008 Routine
daily performance appears generally consistent across all three years Figure 20 captures the days for
each year benchmarked with historically significant events
In Figure 20 NERCrsquos event categories and SRI ratings are directly related As the SRI increases the
category or severity of the event increases Historical events are also shown to relate modern
reliability measurements to give a perspective of how a well-known event would register on the SRI
scale
The event analysis process30
30
benefits from the SRI as it enables a numerical analysis of an event in
comparison to other events By this measure an event can be prioritized by its severity In a severe
event this is unnecessary However for events that do not result in severe stressing of the bulk power
system this prioritization can be a challenge By using the SRI the event analysis process can decide
which events to learn from and reduce which events to avoid and when resilience needs to be
increased under high impact low frequency events as shown in the blue boxes in the figure
httpwwwnerccompagephpcid=5|365
Reliability Metrics Performance
40
Figure 20 NERC Annual Daily Severity Risk Index (SRI) Sorted Descending with Historic Benchmark Days
Other factors that impact severity of a particular event to be considered in the future include whether
equipment operated as designed and resulted in loss of load from a reliability perspective (intentional
and controlled load-shedding) Mechanisms for enabling ongoing refinement to include the historic and
simulated events for future severity risk calculations are being explored
Reliability Metrics Performance
41
Integrated Reliability Index Concepts In December 2010 the RMWG was challenged by the OC and PC to develop a single index concept to
measure the universe of risks associated with the bulk power system As a result the integrated
reliability index (IRI) concepts were proposed31
Figure 21
the three components of which were defined to
quantify each specific risk aspect They are titled the Event Driven Index (EDI) StandardsStatute Driven
Index (SDI) and Condition Driven Index (CDI) illustrated in with measures associated with
system events standards compliance and eighteen performance metrics The development of an
integrated reliability index aims to inform increase transparency and quantify the effectiveness of risk
reduction or mitigation actions The goal is to provide the industry meaningful trends of the BPSrsquos
performance and guidance on how the industry can improve reliability and support risk-informed
decision making Once completed the IRI will facilitate holistic assessment of performance Finally the
IRI should help overcome concern and confusion about how many metrics are being analyzed for system
reliability assessments
Figure 21 Risk Model for Bulk Power System
The integrated model of event-driven condition-driven and standardsstatute-driven risk information
can be constructed to illustrate all possible logical relations between the three risk sets Due to the
nature of the system there may be some overlap among the components
31 httpwwwnerccomdocspcrmwgIntegrated_Reliability_Index_WhitePaper_DRAFTpdf
Event Driven Index (EDI)
Indicates Risk from
Major System Events
Standards Statute Driven
Index (SDI)
Indicates Risks from Severe Impact Standard Violations
Condition Driven Index (CDI)
Indicates Risk from Key Reliability
Indicators
Reliability Metrics Performance
42
The Three Components of the IRI The three components of the IRI work together as shown in Figure 22 to comprise a full picture of the
state of reliability
Figure 22 An overview of the components that comprise the Integrated Reliability Index (IRI)
Event-Driven Indicators (EDI)
The Event-Driven Indicator provides a basis for prioritization of events based on bulk power system
integrity equipment performance and engineering judgment This indicator can serve as a high value
risk assessment tool to be used by stakeholders to investigate and evaluate disturbance history and
measure the severity of these events The relative ranking of events requires industry expertise agreed-
upon goals and engineering judgment The EDI is a derivative of SRI results for a specific time period
but it transforms that performance into a form of an availability index These calculations will be further
refined as feedback is received
Condition-Driven Indicators (CDI)
The Condition-Driven Indicators focus on a set of measurable system conditions (performance
measures) to assess bulk power system reliability These reliability indicators identify factors that
positively or negatively impact reliability and are early predictors of the risk to reliability from events or
unmitigated violations A collection of these indicators measures how close reliability performance is to
the desired outcome and if the performance against these metrics is constant or improving
Reliability Metrics Performance
43
StandardsStatute-Driven Indicators (SDI)
The StandardsStatute-Driven Indicator is a calculation of success of compliance based upon the subset
of high-value standards and is divided by the number of participations who could have received the
violation within the time period considered Also based on these factors known unmitigated violations
of elevated risk factor requirements are weighted higher than lower risk factors The index decreases if
the compliance improvement is achieved over a trending period
IRI Index Calculation As with the SRI the IRI is based on an importance weighting factor which the RMWG can modify over
time after gaining experience with the new metric as well as consideration of feedback from industry
At this time the RMWG believes some form of blended weighting may serve to start to populate IRI
characteristic curves at a high and generic level Based upon feedback from stakeholders this approach
may change or as discussed below weighting factors may vary based on periodic review and risk model
update The RMWG will continue the refinement of the IRI calculation and consider other significant
factors that impact reliability (eg intentional and controlled load-shedding) further it will explore
developing mechanisms for enabling ongoing refinement which should be influenced by a wide set of
stakeholders
RMWG recommends the Event Driven Index (EDI) be weighted the highest (50 percent) since events
actually occurred indicating how the system was performing The Condition Driven Index (CDI) and
StandardsStatute Driven Index (SDI) are weighted 25 each since they are indicators of potential risks
to BPS reliability IRI can be calculated as follows
IRI is intended to be a composite metric which integrates several forms of individual risks to the bulk
power system Since the three components range across many stakeholder organizations these
concepts are developed as starting points for continued study and evaluation Additional supporting
materials can be found in the IRI whitepaper32
IRI Recommendations
including individual indices calculations and preliminary
trend information
For the IRI more investigation should be performed to determine the best way to integrate EDI CDI
and SDI into an Integrated Reliability Index (IRI) that quantitatively represents the reliability of the bulk
32 The IRI whitepaper can be found at httpwwwnerccomdocspcrmwgIntegrated_Reliability_Index_WhitePaper_DRAFTpdf
Reliability Metrics Performance
44
power system To this end study into determining the amount of overlap between the components is
necessary RMWG is currently working to determine the proper amount of overlap between the IRI
components
Also the CDI component of the IRI needs to be solidified This is especially true with the CDI More
accurate metric data is needed to paint a fuller picture of the CDI Many of the metrics used to calculate
the CDI are new or they have limited data Compared to the SDI which counts well-known violation
counts and the EDI which uses the well-defined CDI the CDI lacks the depth of rigor that the other two
components have acquired through their years of data RMWG is currently working to improve the CDI
Reliability Metrics Conclusions and Recommendations Among the eighteen metrics that address the characteristics of an adequate level of reliability (ALR)
metric trends indicate the system is performing better in the following seven areas
bull ALR1-3 Planning Reserve Margin
bull ALR1-4 BPS Transmission Related Events Resulting in Loss of Load
bull ALR2-5 Disturbance Control Events Greater than Most Severe Single Contingency
bull ALR6-2 Energy Emergency Alert 3 (EEA3)
bull ALR6-3 Energy Emergency Alert 2 (EEA2)
bull ALR6-11 Automatic Transmission Outages Caused by Protection System Misoperations
bull ALR6-13 Automatic Transmission Outages Caused by Failed AC Substation Equipment
Assessments have been made in other performance categories A number of them do not have
sufficient data to derive any conclusions from the results The RMWG recommends continued data
collection and assessment of these metrics If a metric does not yield any trend in a five-year reporting
period the metric will be modified or withdrawn
For the IRI more investigation should be performed to determine the overlap of the components (CDI
EDI and SDI) The CDI should be more thoroughly solidified as an index by collecting more data over
time
Transmission Equipment Performance
45
Transmission Equipment Performance Introduction The Transmission Availability Data System (TADS) effort began with the establishment of a TADS task force
by the NERC Planning Committee in October 2006 On October 27 2007 the NERC Board of Trustees
approved the collection of transmission automatic outage data beginning in calendar year 2008 (Phase I)
Subsequently on October 29 2008 the NERC Board approved the collection of Non-Automatic Outage data
that began for Calendar year 2010 (Phase II)
This chapter provides reliability performance analysis of the transmission system by focusing on the trends
of Automatic Outage data from calendar year 2008 thru 2010 Since only one year of Non-Automatic
Outage data has been collected that data will not be assessed in this report
When calculating bulk power system performance indices care must be exercised when interpreting results
as misinterpretation can lead to erroneous conclusions regarding system performance With only three
years of data in the smaller regions it is not clear whether a regionrsquos yearly outage variation compared to
the average is due to random statistical variation or that particular year is significantly different in
performance However on a NERC-wide basis after three years of data collection there is enough
information to accurately determine whether the yearly outage variation compared to the average is due to
random statistical variation or the particular year in question is significantly different in performance33
Performance Trends
Transmission performance information has been provided by Transmission Owners (TOs) within NERC
through the NERC TADS (Transmission Availability Data System) process The data presented reflects
Momentary and Sustained AC Automatic outages of transmission elements that operate at voltages ge 200 kV
(including the low side of transformers) with the criteria specified in the TADS process The following
elements listed below are included
bull AC Circuits ge 200 kV (Overhead and Underground Circuits) Radial circuits are included
bull DC Circuits with ge +-200 kV DC voltage
bull Transformers with ge 200 kV low-side voltage and
bull ACDC Back-to-Back (BTB) Converters with ge 200 kV AC voltage on both sides
33The detailed Confidence Interval computation is available at httpwwwnerccomdocspctadstfTADS_Nov_2_2007APPENDIX_C_Confidence_Intervalpdf
Transmission Equipment Performance
46
AC Element Outage Summary and Leading Causes Table 6 shows the 2008 2009 and 2010 NERC total AC transmission element inventory and a summary of
the associated outages As expected in general the number of circuits increased from year to year due to
new construction or re-construction to higher voltages For every outage experienced on the transmission
system cause codes are identified and recorded according to the TADS process Causes of both momentary
and sustained outages have been indicated These causes are analyzed to identify trends and similarities
and to provide insight into what could be done to possibly prevent future occurrences
Figure 23 and Figure 24 describe the top ten initiating cause codes for sustained and momentary automatic
outages combined from 2008-2010 Based on the two figures the relationship between the total number of
outages and total outage hours can be seen Failed AC Substation Equipment and Failed AC Circuit
Equipment only account for 15 percent of the total number of outages but account for 65 percent of the
total outage hours The two largest causes of outages within NERC (ldquoLightingrdquo and ldquoWeather excluding
Lightningrdquo) account for 34 percent of the total number of outages
The next three Human Error Failed Protection System Equipment and Failed AC Circuit Equipment have
very similar totals and should all be considered significant focus points in reducing the number of Sustained
Automatic Outages for all elements
Transmission Equipment Performance
47
Table 6 NERC - All AC Elements Sustained and Momentary Outage Performance Summary
2008 Number of Outages
AC Voltage
Class
No of
Circuits
Circuit
Miles Sustained Momentary
Total
Outages Total Outage Hours
200-299kV 4369 102131 1560 1062 2622 56595
300-399kV 1585 53631 793 753 1546 14681
400-599kV 586 31495 389 196 585 11766
600-799kV 110 9451 43 40 83 369
All Voltages 6650 196708 2785 2051 4836 83626
2009 Number of Outages
AC Voltage
Class
No of
Circuits
Circuit
Miles Sustained Momentary
Total
Outages Total Outage Hours
200-299kV 4468 102935 1387 898 2285 28828
300-399kV 1619 56447 641 610 1251 24714
400-599kV 592 32045 265 166 431 9110
600-799kV 110 9451 53 38 91 442
All Voltages 6789 200879 2346 1712 4038 63094
2010 Number of Outages
AC Voltage
Class
No of
Circuits
Circuit
Miles Sustained Momentary
Total
Outages Total Outage Hours
200-299kV 4567 104722 1506 918 2424 54941
300-399kV 1676 62415 721 601 1322 16043
400-599kV 605 31590 292 174 466 10442
600-799kV 111 9477 63 50 113 2303
All Voltages 6957 208204 2582 1743 4325 83729
Note The NERC table does not show redacted outages DC Circuit outages Transformer outages or ACDC
converter outages
Transmission Equipment Performance
48
Figure 23 NERC - Top Ten Sustained and Momentary Outages by Initiating Cause Code for All Elements
Figure 24 NERC - Top Ten Sustained Outage Hours by Cause Code
198
151
80
7271
6943
33
27
188
68
Lightning
Weather excluding lightningHuman Error
Failed AC Substation EquipmentFailed Protection System EquipmentFailed AC Circuit Equipment Foreign Interference
Power System Condition
Fire
Unknown
Remaining Cause Codes
299
246
188
58
52
42
3619
16 12 31 Failed AC Substation EquipmentFailed AC Circuit Equipment Weather excluding lightningUnavailable
Other
Fire
Unknown
Human Error
Failed Protection System EquipmentForeign Interference
Remaining Cause Codes
Transmission Equipment Performance
49
Transmission Monthly Outages Figure 25 displays the total number of Automatic Outages on a per-month basis The three months with the
highest total of outages were June July and August From a seasonal perspective winter had a monthly
average of 281 outages These include the months of November-March Summer had an average of 429
outages Summer included the months of April-October
Figure 25 Number of Outages by Month for AC Circuits (2008-2010)
This figure does not show redacted outages DC Circuit outages Transformer outages or ACDC Converter
outages
Outage Initiation Location For every outage experienced on the transmission system the outage initiation code is identified and
recorded according to the TADS process The outage initiation code can be analyzed to identify trends and
similarities and to provide insight into what could be done to possibly prevent future occurrences
The ldquoOutage Initiation Coderdquo describes where an automatic outage was initiated on the power system The
five codes are as follows
bull Element-Initiated
bull Other Element-Initiated
bull AC Substation-Initiated
bull ACDC Terminal-Initiated (for DC circuits)
bull Other Facility Initiated any facility not included in any other outage initiation code
JanuaryFebruar
yMarch April May June July August
September
October
November
December
2008 238 229 257 258 292 437 467 380 208 176 255 236
2009 315 201 339 334 398 553 546 515 351 235 226 294
2010 444 224 269 446 449 486 639 498 351 271 305 281
3 Year AVG 332 218 288 346 380 492 551 464 303 227 262 270
0
100
200
300
400
500
600
700
Out
ages
Transmission Equipment Performance
50
Notably the protection system is not part of an ldquoAC Substationrdquo or an ldquoACDC Terminalrdquo If a protection
system misoperates and initiates an outage it will be classified as ldquoOther-Facility Initiatedrdquo The following
Figures show the initiating location of the Automatic outages from 2008 to 2010
With both Momentary and Sustained Automatic Outages taken into account the outage was initiated on the
Element more than 67 percent of the time as shown in Figure 26 and Figure 27
When only the Sustained Automatic Outages are analyzed the outage initiation on both AC Substation and
Other Facility increased by 34 percent and 32 percent respectively Outages initiated on the Element itself
decreases by 78 percent as shown in Figure 26 and 27 For only the Momentary Automatic Outages the
outage initiation on the Element increases by 19 percent compared to Sustained Outages Element initiated
outages make up over 78 percent of the total outages when analyzing only Momentary Outages
Figure 26
Figure 27
Transmission Outage Events Figure 28 illustrates the relationship between the numbers of Automatic Outages associated per TADS
event 2008 2009 and 2010 tend to follow the same trend The largest number of Automatic Outages per
TADS event is fourteen in 2010 thirteen in 2009 and eight in 2008 There are around 70 to 100 TADS
events that contain between fourteen and three Automatic Outages (see below) There are around 330 to
400 TADS events that contain two or more Automatic Outages The rest of the events only contain one
Automatic Outage As noted in the lower right hand corner below the total number of Events in 2008 to
2010 ranged from 3920 to 4569 events per year Nearly 90 percent or more of the events contained one
Automatic Outage
Figure 26 Sustained Automatic Outage Initiation
Code
Figure 27 Momentary Automatic Outage Initiation
Code
Transmission Equipment Performance
51
Transmission Outage Mode Figure 29 and Figure 30 show the percentage of Outage Modes The ldquoOutage Mode Coderdquo describes
whether one Automatic Outage is related to other Automatic Outages A Single Mode outage is an
Automatic Outage of a single Element which occurs independently of any other Automatic Outages (if any)
A ldquoDependent Mode Initiating Outagerdquo is an Automatic Outage of a single Element that initiates one or more
subsequent Element Automatic Outages A ldquoDependent Mode Outagerdquo is an Automatic Outage of an
Element which occurred as a result of an initiating outage whether the initiating outage was an Element
outage or a non-Element outage A ldquoCommon Mode Outagerdquo is one of two or more Automatic Outages with
the same Initiating Cause Code and where the outages are not consequences of each other and occur nearly
simultaneously A ldquoCommon Mode Initiating Outagerdquo is a Common Mode Outage that initiates one or more
subsequent Automatic Outages
Over 72 percent of the total outages occurred on the bulk power system are Single Mode Outages The next
largest mode is Dependent with over 11 percent of the total outages being in this category For only
Sustained Automatic Outages outages related to each other increase with Dependent mode accounting for
13 percent of the outages and Common mode accounting for close to 11 percent of the outages
Independent Sustained outages still account for the largest portion with nearly 70 percent being Single
mode When just analyzing Momentary Automatic Outages Associated outages decrease with Dependent
Figure 28 Event Histogram (2008-2010)
Transmission Equipment Performance
52
mode accounting for only 9 percent of the outages The Common Mode percentage decreases while
Dependent Mode Initiating percentage increases compared to Sustained Outages Independent Momentary
outages account for the largest portion with over 76 percent being Single Mode
An investigation into the root causes of Dependent and Common mode events which include three or more
Automatic Outages (indentified in the TADS 2008 to 2010 data) should be a high priority Some protection
systems are designed to trip three or more circuits but some events go beyond what is designed Some also
have misoperations associated with multiple outage events
Conclusions On a NERC wide average basis automatic transmission outage rate is improving from 2008 to 2010 based on
reported data Considering both automatic and non-automatic outages 2010 records indicate transmission
element availability percentage is very high and exceeds 95 The unavailability rate for AC circuits and
transformers are only 15 and 29 respectively
The cause codes of Human Error Failed Protection System Equipment and Failed AC Circuit Equipment
should be considered significant focus points in reducing the number of Sustained Automatic Outages for all
elements A deeper look into the root causes of Dependent and Common mode events which include three
or more Automatic Outages (indentified in the TADS 2008 to 2010 data) should be a high priority Some
protection systems are designed to trip three or more circuits but some events go beyond what is designed
Some also have misoperations associated with multiple outage events
Figure 29 Sustained Automatic Outage Mode code Figure 30 Momentary Automatic Outage Mode code
Generation Equipment Performance
53
Generation Equipment Performance Introduction The development of the Generating Availability Data System (GADS) began in 1982 This series of databases
is used to voluntarily collect record and retrieve operating information By pooling individual unit
information with likewise units generating unit availability performance can be calculated providing
opportunities to identify trends and generating equipment reliability improvement opportunities The
information is used to support equipment reliability availability analyses and risk-informed decision-making
by system planners generation owners assessment modelers manufacturers and contractors etc Reports
and information resulting from the data collected through GADS are now used for benchmarking and
analyzing electric power plants
Currently the data collected through GADS contains 72 percent of the North American generating units
with generating capacity of 20 MW or higher34 Additionally many of the newer combined-cycle plants are
not reporting information and therefore a full view of each unit type is not presented Rather a sample of
all the units in North America that fit a given more general category is provided35 for the 2008-201036
Generation Key Performance Indicators
assessment period
Three key performance indicators37
In
the industry have used widely to measure the availability of generating
units (see Terms Used in This Report section for their calculation parameters) are Equivalent Availability
Factor (EAF) Net Capacity Factor (NCF) and Equivalent Forced Outage Rate ndash Demand (EFORd)
Table 7 the North American fleet average EAF NCF and EFORd compared to unit age for all generating
units with a capacity of 20 MW and higher is provided for the years 2008-2010 The EAF shows a decline
during the last three years NCF is up and down while the EFORd appears to be increasing As expected the
fleet of units reported to GADS is aging overall with the fossil units being about 12 years older than the
average age
34 httpwwwnerccomdocspcgadstfGADSTF_Recommendation_Report_02-18-2011_FINALpdf 35GADS contains some 1500+ units under 20 MW that is not included in this report These units are excluded because most units are not base-loaded and are in peaking operation
3684 percent of the 2010 dataset is available at this time while the 2008 and 2009 dataset is complete 37 httpwwwnerccompagephpcid=4|43
Generation Equipment Performance
54
Table 7 General Availability Review of GADS Fleet Units by Year
2008 2009 2010 Average
Equivalent Availability Factor (EAF) 8776 8774 8678 8743
Net Capacity Factor (NCF) 5083 4709 4880 4890
Equivalent Forced Outage Rate -
Demand (EFORd) 579 575 639 597
Number of Units ge20 MW 3713 3713 3713 3713
Average Age of the Fleet in Years (all
unit types) 303 311 321 312
Average Age of the Fleet in Years
(fossil units only) 422 432 440 433
Figure 31 provides the average forced outage hours (FOH) maintenance outage hours (MOH) and planned
outage hours (POH) for all units reporting 20 MW or larger During this three-year period the average FOH
291 hours average MOH is 163 hours average POH is 470 hours
Figure 31 shows a large increase in forced and maintenance events The average age of the units with a
capacity of 20MW and higher in 2009 is 316 years old However the average age of fossil units in 2010 is
442 years old These fossil units are the backbone of all operating units providing the base-load power
continuously and nearly 50 percent of all energy annually There appears to be no increase allocated for
annualsemi-annual maintenance (ie planned outages) for the older generating units The increase of
000100002000030000400005000060000700008000090000
100000
2008 2009 2010
463 479 468
154 161 173
288 270 314
Hou
rs
Planned Maintenance Forced
Figure 31 Average Outage Hours for Units gt 20 MW
Generation Equipment Performance
55
maintenance outage hours reflects an increased need to fix problems that cannot be deferred until the next
annualsemi-annual repairs As a result it shows one of two things are happening
bull More or longer planned outage time is needed to repair the aging generating fleet
bull More focus on preventive repairs during planned and maintenance events are needed
Multiple Unit Forced Outages and Causes Table 8 provides the annual multiple-unit forced outage trips resulting from the same cause for each of the
assessments years 2008-2010 respectively The ldquosingle unitrdquo trips are large units with a Net Dependable
Capacity of 750 MW or more The trips of ldquotwo unitsrdquo or more is any combination of unit capacity with the
total amount of lost capacity more than 750 MW
Table 8 also presents more information on the forced outages During 2008-2010 there were a large
number of double-unit outages resulting from the same event Investigations show that some of these trips
were at a single plant caused by common control and instrumentation for the units The incidents occurred
several times for several months and are a common mode issue internal to the plant
Table 8 Number of Multiple Unit Forced Outages and FrequencyYear
2008 2009 2010
Type of
Trip
of
Trips
Avg Outage
Hr Trip
Avg Outage
Hr Unit
of
Trips
Avg Outage
Hr Trip
Avg Outage
Hr Unit
of
Trips
Avg Outage
Hr Trip
Avg Outage
Hr Unit
Single-unit
Trip 591 58 58 284 64 64 339 66 66
Two-unit
Trip 281 43 22 508 96 48 206 41 20
Three-unit
Trip 74 48 16 223 146 48 47 109 36
Four-unit
Trip 12 77 19 111 112 28 40 121 30
Five-unit
Trip 11 1303 260 60 443 88 19 199 10
gt 5 units 20 166 16 93 206 50 37 246 6
Loss of ge 750 MW per Trip
The high number of five-unit trips in 2008 was due to Hurricane Ike hitting the Gulf Coast The highest total
number of multiple unit trips occurred in 2009 though as mentioned before the data collection for 2010 is
incomplete at this time The majority of 2009 multiple unit trips have three main causes (in order by
Generation Equipment Performance
56
number of events) transmission lack of fuel and storms A summary of the three categories for single as
well as multiple unit outages (all unit capacities) are reflected in Table 9
Table 9 Common Causes of Multiple Unit Forced Outages (2009)
Cause Number of Events Average MW Size of Unit
Transmission 1583 16
Lack of Fuel (Coal Mines Gas Lines etc) Not
in Operator Control
812 448
Storms Lightning and Other Acts of Nature 591 112
Some of the transmission outages based on storms in 2009 have been caused by the same reasons because
the storms may have caused transmission interference However the plants reported the problems
inconsistently with either the transmission interference or storms cause code Therefore they are depicted
as two different causes of forced outage
Marked transmission outages in 2009 were quite high Thirty-five percent came from one utility with a large
number of hydroelectric units The company related the trips to various problems including weather
(lightning storms) wildlife ldquoline bumpsrdquo and problems on the receiving end of the transmission line Nine
hundred and eighty-five transmission trips (62 percent) were from hydroelectric units38
In 2009 only ten transmission trips resulted in a loss of 750 MW or more per trip Twenty two generating
plants were affected by the ten trips Causes for the trips include feeder line trips (1 trip) breakers in the
switchyard (8 trips) personnel errors (2 trips) and unknown (10 trips)
The ldquoLack of Fuelrdquo outages are of interest as these events occur during the times when a unit is available to
operate but there is an interruption in fuels to operate the facilities These events do not include
interruptions of fuel due to contracts Rather the cause code is designed to account for units that are
expecting fuel and it is unavailable when requested Table 10 presents the distribution of ldquoLack of Fuelrdquo
events by NERC Region and Table 11 presents the unit types affected
38 The average size of the hydroelectric units were small ndash 335 MW
Generation Equipment Performance
57
Of the units that report ldquoLack of Fuelrdquo 78 percent of the units are oil-fired 15 percent of the units are gas-
fired and the remaining units are various other fuels Table 12 provides the top causes of forced outage for
several unit types For fossil units ldquoLack of Fuelrdquo as the number three cause behind waterwall tube leaks
and superheater tube leaks
Table 10 Forced Outages Due to Lack of Fuel by Region
Region Number of Lack of Fuel
Problems Reported
FRCC 0
MRO 3
NPCC 24
RFC 695
SERC 17
SPP 3
TRE 7
WECC 29
One company contributed to the majority of oil-fired lack of fuel events The units at the company are
actually dual-fuels (oil and gas) but market nominated gas monitoring causes the units to be on forced
outage nightly The units need gas to start up so they can run on oil When they shut down the units must
switch to gas to clean themselves With the gas restriction the unit canrsquot start and the unit goes on a
forced outage Until the band is lifted the two units will continue to be on a forced outage cycle
Event records also provide descriptions of why the unit was without fuel with the majority of descriptions
bull Temperatures affecting gas supply valves
bull Unexpected maintenance of gas pipe-lines
bull Compressor problemsmaintenance
Generation Equipment Performance
58
Table 11 Unit Type Profile of Forced Outages Due to Lack of Fuel
Unit Types Number of Lack of Fuel Problems Reported
Fossil 642
Nuclear 0
Gas Turbines 88
Diesel Engines 1
HydroPumped Storage 0
Combined Cycle 47
Generation Equipment Performance
59
Table 12 Causes of Forced Outage for Different Unit Types (2008-2010)
Fossil - all MW sizes all fuels
Rank Description Occurrence per Unit-year
MWH per Unit-year
Average Hours To Repair
Average Hours Between Failures
Unit-years
1 Waterwall (furnace wall) 0590 134106 59 3250 3868 2 Second Superheater
Leaks 0180 5182 60 3228 3868
3 Lack of Fuel (coal mines gas lines etc) where the operator is not in control
0480 4701 18 26 3868
Combined-Cycle blocks Rank Description Occurrence
per Unit-year
MWH per Unit-year
Average Hours To Repair
Average Hours Between Failures
Unit-years
1 HP Turbine Buckets Or Blades
0020 4663 1830 26280 466
2 Turbine Control Valves 0040 2777 100 7200 466 3 Gas Turbine Compressor -
High Pressure Shaft 0010 2266 663 4269 466
Nuclear units - all Reactor types Rank Description Occurrence
per Unit-year
MWH per Unit-year
Average Hours To Repair
Average Hours Between Failures
Unit-years
1 LP Turbine Buckets or Blades
0010 26415 8760 26280 288
2 Containment Structure 0010 9233 1226 26262 288 3 Feedwater Pump Local
Controls 0020 7620 692 12642 288
Simple-cycle gas turbine jet engines Rank Description Occurrence
per Unit-year
MWH per Unit-year
Average Hours To Repair
Average Hours Between Failures
Unit-years
1 Main Transformer 0030 1611 1016 20709 4181 2 Other Gas Turbine
Controls And Instrument Problems
0120 428 70 2614 4181
3 Other Gas Turbine Problems
0090 400 119 1701 4181
Generation Equipment Performance
60
2008-2010 Review of Summer versus Winter Availability To address seasonality of unit availability unit information for the months of June to September (summer)
and December through February (winter) were pooled to calculate force events during these timeframes for
2008-201039 Figure 32 shows the Equivalent Availability Factor (EAF) is three percentage points higher and
the Equivalent Forced Outage Rate - Demand (EFORd) is more than a half of a percentage point lower in the
summer period than in winter period This means the units were more reliable with less forced events
during high-demand times during the summer than during the winter seasons The generating unitrsquos
capability has a resulting higher Net Capacity Factor (NCF) of 45 percentage points in the summer season
for 2008-2010
During the spring season (March-May) 77 percent of the units took a planned outage (PO) for an average
231 hours (or 96 days) In fall (October-November) only 42 percent of the units experienced a PO and the
average duration was shorter ndash 134 hours (or 56 days) A few units took both spring and fall planned
outages although this is rare Based on this assessment the generating units are prepared for the summer
peak demand The resulting availability indicates that this maintenance was successful which is measured
by an increased EAF and lower EFORd
Figure 32 Summer-Winter Average EAF NCF and EFORd (2008-2010)
Conclusions and Recommendations During 2008-2010 the average Equivalent Availability Factor (EAF) which measures the overall availability
of generating units decreased At the same time the Net Capacity Factor (NCF) an indicator of energy
production increased The average number of forced outages in 2010 is greater than in 2008 while at the
same time the average planned outage times have decreased As a result the Equivalent Forced Outage
Rate ndash Demand (EFORd) also increased illustrating that more units have experienced forced events during
39 A study of peak periods was conducted by the NERC Generating Availability Trend Evaluation (GATE) Working Group several years ago see httpwwwnerccomfilesSeasonal-Performance-Trendspdf
9116
5343
396
8818
4896
441
0 10 20 30 40 50 60 70 80 90 100
EAF
NCF
EFORd
Percent ()
Winter
Summer
Generation Equipment Performance
61
peak-demand times in 2010 than in the previous two years Potentially with shorter planned outage
periods in 2010 there may be less time to repair equipment and prevent forced unit outages
There are warnings that units are not being maintained as well as they should be In the last three years
there has been an increase in Equivalent Forced Outage Rate ndash Demand (EFORd) This indicator measures
the rate of forced outage events on generating units during periods of load demand To confirm this
problem forced outage hours jumped from 270 to 314 hours per unit between 2009 and 2010 At the same
time maintenance events also increased by 12 hours per unit Planned outage events remain constant The
resulting conclusions from this trend are
bull More or longer planned outage time is needed to repair the generating fleet Whether age is the
cause of the increase need for planned outage time remains unknown and further investigation into
the cause for longer planned outage time is necessary
bull More focus on preventive repairs during planned and maintenance events are needed
There are many multiple unit forced outages due to lack of fuel The majority of multiple unit trips have
three main causes transmission lack of fuel and storms With special interest in the forced outages due to
ldquoLack of Fuelrdquo additional analysis revealed that 77 percent of the units experiencing unexpected fuel
stoppage are oil-fired fossil units while gas-fired units experienced 15 percent
Generating units continue to be more reliable during the peak summer periods
Disturbance Event Trends
62
Category 1 An event resulting in one or more of the following a Unintended loss of three or more BPS elements caused by
common mode failure b Failure or misoperation of an SPSRAS c System-wide voltage reduction of 3 or more d Unintended BPS system separation resulting in an island of
100 MW to 999 MW e Unplanned evacuation from a control center facility with BPS
SCADA functionality for 30 minutes or more Category 2 An event resulting in one or more of the following
a Complete loss of all BPS control center voice communication system(s) for 30 minutes or more
b Complete loss of SCADA control or monitoring functionality for 30 minutes or more
c Voltage excursions equal to or greater than 10 lasting more than five minutes
d Loss of off-site power (LOOP) to a nuclear generating station e Unintended system separation resulting in an island of 1000
MW to 4999 MW f Unintended loss of 300MW or more of firm load for more
than 15 minutes g Violation of an Interconnection Reliability Operating Limit
(IROL) for more than 30 minutes Category 3 An event resulting in one or more of the following
a The loss of load or generation of 2000 MW or more in the Eastern Interconnection or
b Western Interconnection or 1000 MW or more in the ERCOT or Queacutebec Interconnections
c Unintended system separation resulting in an island of 5000 MW to 10000 MW
d Unintended system separation resulting in an island of Florida from the Eastern Interconnection
Category 4 An event resulting in one or more of the following a The loss of load or generation from 5001 MW to 9999 MW b Unintended system separation resulting in an island of more
than 10000 MW (with the exception of Florida as described in Category 3c)
Category 5 An event resulting in one or more of the following a The loss of load of 10000 MW or more b The loss of generation of 10000 MW or more
Figure 33 BPS Event Category
Disturbance Event Trends Introduction The purpose of this section is to report event
analysis trends from the beginning of event
analysis field test40
One of the companion goals of the event
analysis program is the identification of trends
in the number magnitude and frequency of
events and their associated causes such as
human error equipment failure protection
system misoperations etc The information
provided in the event analysis database (EADB)
and various event analysis reports have been
used to track and identify trends in BPS events
in conjunction with other databases (TADS
GADS metric and benchmarking database)
to the end of 2010
The Event Analysis Working Group (EAWG)
continuously gathers event data and is moving
toward an integrated approach to analyzing
data assessing trends and communicating the
results to the industry
Performance Trends The event category is classified41
Figure 33
as shown in
with Category 5 being the most
severe Figure 34 depicts disturbance trends in
Category 1 to 5 system events from the
40 httpwwwnerccomdocseawgGalloway-Industry-EA-Field-Test-102210pdf 41httpwwwnerccomfiles2011-05-0220Event_Analysis_Process_Phase20220Field20Test20Draft20-20Final20-20For20postingpdf
Disturbance Event Trends
63
beginning of event analysis field test to the end of 201042
Figure 34 Event Category vs Date for All 2010 Categorized Events
From the figure in November and December
there were many more category 1 and 2 events than in October This is due to the field trial starting on
October 25 2010
In addition to the category of the events the status of the events plays a critical role in the accuracy of the
data By examining Figure 35 over 80 of the events reported in 2010 have been closed This means that
the category root cause and other important information have been sufficiently finalized in order for
analysis to be accurate for each event At this time there is not enough data to draw any long-term
conclusions about event investigation performance
42 Documents for the EA Field Test are located at httpwwwnerccompagephpcid=5|365
2
12 12
26
3
6 5
14
1 1
2
0
5
10
15
20
25
30
35
40
45
October November December 2010
Even
t Cou
nt
Category 3 Category 2 Category 1
Disturbance Event Trends
64
Figure 35 Event Count vs Status (All 2010 Events with Status)
By drilling down into the cause code for each closed 2010 event Figure 36 shows the top 3 event causes
From the figure equipment failure and protection system misoperation are the most significant causes for
events Because of how new and limited the data is however there may not be statistical significance for
this result Further trending of cause codes for closed events and developing a richer dataset to find any
trends between event cause codes and event counts should be performed
Figure 36 Top 3 Event Counts vs DAWG Cause Code for all Closed 2010 Events
10
32
42
0
5
10
15
20
25
30
35
40
45
Open Closed Open and Closed
Even
t Cou
nt
Status
1211
8
0
2
4
6
8
10
12
14
Equipment Failure Protection System Misoperation Human Error
Even
t Cou
nt
Cause Code
Disturbance Event Trends
65
Conclusions Due to the relatively new process for events analysis and categorization more time will be required before a
conclusive recommendation may be obtained Further analysis and new data should provide valuable
statistics in the future Over 80 of all event reports from 2010 are current listed as closed but no
conclusion about investigation performance may be obtained because of the limited amount of data It is
recommended to study ways to prevent equipment failure and protection system misoperations but there
is not enough data to draw a firm conclusion about the top causes of events at this time
Abbreviations Used in This Report
66
Abbreviations Used in This Report
Acronym Definition ALP Acadiana Load Pocket
ALR Adequate Level of Reliability
ARR Automatic Reliability Report
BA Balancing Authority
BPS Bulk Power System
CDI Condition Driven Index
CEII Critical Energy Infrastructure Information
CIPC Critical Infrastructure Protection Committee
CLECO Cleco Power LLC
DADS Future Demand Availability Data System
DCS Disturbance Control Standard
DOE Department Of Energy
DSM Demand Side Management
EA Event Analysis
EAF Equivalent Availability Factor
ECAR East Central Area Reliability
EDI Event Drive Index
EEA Energy Emergency Alert
EFORd Equivalent Forced Outage Rate Demand
EMS Energy Management System
ERCOT Electric Reliability Council of Texas
ERO Electric Reliability Organization
ESAI Energy Security Analysis Inc
FERC Federal Energy Regulatory Commission
FOH Forced Outage Hours
FRCC Florida Reliability Coordinating Council
GADS Generation Availability Data System
GOP Generation Operator
IEEE Institute of Electrical and Electronics Engineers
IESO Independent Electricity System Operator
IROL Interconnection Reliability Operating Limit
Abbreviations Used in This Report
67
Acronym Definition IRI Integrated Reliability Index
LOLE Loss of Load Expectation
LUS Lafayette Utilities System
MAIN Mid-America Interconnected Network Inc
MAPP Mid-continent Area Power Pool
MOH Maintenance Outage Hours
MRO Midwest Reliability Organization
MSSC Most Severe Single Contingency
NCF Net Capacity Factor
NEAT NERC Event Analysis Tool
NERC North American Electric Reliability Corporation
NPCC Northeast Power Coordinating Council
OC Operating Committee
OL Operating Limit
OP Operating Procedures
ORS Operating Reliability Subcommittee
PC Planning Committee
PO Planned Outage
POH Planned Outage Hours
RAPA Reliability Assessment Performance Analysis
RAS Remedial Action Schemes
RC Reliability Coordinator
RCIS Reliability Coordination Information System
RCWG Reliability Coordinator Working Group
RE Regional Entities
RFC Reliability First Corporation
RMWG Reliability Metrics Working Group
RSG Reserve Sharing Group
SAIDI System Average Interruption Duration Index
SAIFI System Average Interruption Frequency Index
SCADA Supervisory Control and Data Acquisition
SDI Standardstatute Driven Index
SERC SERC Reliability Corporation
Abbreviations Used in This Report
68
Acronym Definition SRI Severity Risk Index
SMART Specific Measurable Attainable Relevant and Tangible
SOL System Operating Limit
SPS Special Protection Schemes
SPCS System Protection and Control Subcommittee
SPP Southwest Power Pool
SRI System Risk Index
TADS Transmission Availability Data System
TADSWG Transmission Availability Data System Working Group
TO Transmission Owner
TOP Transmission Operator
WECC Western Electricity Coordinating Council
Contributions
69
Contributions This report was made feasible by the collaboration and hard work of both NERC staff and NERCrsquos
Industry Groups
NERC Industry Groups
Table 14 lists the NERC industry group contributors Without their contribution and collaboration this
report would not have been possible
Table 13 NERC Industry Group Contributions43
NERC Group
Relationship Contribution
Reliability Metrics Working Group
(RMWG)
Reports to the OCPC bull Lead Development of Report bull Provide Reliability Metrics Data bull Responsible for Reliability Metrics
Performance Chapter
Transmission Availability Working Group
(TADSWG)
Reports to the OCPC bull Provide Transmission Availability Data
bull Responsible for Transmission Equip-ment Performance Chapter
bull Content Review
Generation Availability Data System Task
Force
(GADSTF)
Reports to the OCPC bull Provide Generation Availability Data bull Responsible for Generation Equip-
ment Performance Chapter bull Content Review
Event Analysis Working Group
(EAWG)
Reports to the OCPC bull Provide Events Data bull Responsible for Disturbance Events
Trends Chapter bull Content Review
43 Rosters for RMWG TADSWG GADSTF and EAWG are available at httpwwwnerccomfilesrosterpdf
Contributions
70
NERC Staff Table 13 below lists the NERC staff who contributed to the 2011 Reliability Performance Analysis
Report
Table 14 Contributing NERC Staff
Name Title E-mail Address
Mark Lauby Vice President and Director of
Reliability Assessment and
Performance Analysis
marklaubynercnet
Jessica Bian Manager of Performance Analysis jessicabiannercnet
John Moura Manager of Reliability Assessments johnmouranercnet
Andrew Slone Engineer Reliability Performance
Analysis
andrewslonenercnet
Jim Robinson TADS Project Manager jimrobinsonnercnet
Clyde Melton Engineer Reliability Performance
Analysis
clydemeltonnercnet
Mike Curley Manager of GADS Services mikecurleynercnet
James Powell Engineer Reliability Performance
Analysis
jamespowellnercnet
Michelle Marx Administrative Assistant michellemarxnercnet
William Mo Intern Performance Analysis wmonercnet
- NERCrsquos Mission
- Table of Contents
- Executive Summary
-
- 2011 Transition Report
- State of Reliability Report
- Key Findings and Recommendations
-
- Reliability Metric Performance
- Transmission Availability Performance
- Generating Availability Performance
- Disturbance Events
- Report Organization
-
- Introduction
-
- Metric Report Evolution
- Roadmap for the Future
-
- Reliability Metrics Performance
-
- Introduction
- 2010 Performance Metrics Results and Trends
-
- ALR1-3 Planning Reserve Margin
-
- Background
- Assessment
- Special Considerations
-
- ALR1-4 BPS Transmission Related Events Resulting in Loss of Load
-
- Background
- Assessment
-
- ALR1-12 Interconnection Frequency Response
-
- Background
- Assessment
-
- ALR2-3 Activation of Under Frequency Load Shedding
-
- Background
- Assessment
- Special Considerations
-
- ALR2-4 Average Percent Non-Recovery Disturbance Control Standards (DCS)
-
- Background
- Assessment
- Special Consideration
-
- ALR2-5 Disturbance Control Events Greater Than Most Severe Single Contingency
-
- Background
- Assessment
- Special Consideration
-
- ALR 1-5 System Voltage Performance
-
- Background
- Special Considerations
- Status
-
- ALR3-5 Interconnection Reliability Operating Limit System Operating Limit (IROLSOL) Exceedances
-
- Background
-
- ALR4-1 Automatic Transmission Outages Caused by Protection System Misoperations
-
- Background
- Special Considerations
-
- ALR6-11 ndash ALR6-14
-
- Background
- Assessment
- ALR 6-11 ndash Automatic Outages Initiated by Failed Protection System Equipment
- ALR6-12 ndash Automatic Outages Initiated by Human Error
- ALR6-13 ndash Automatic Outages Initiated by Failed AC Substation Equipment
- ALR6-14 Automatic AC Transmission Outages Initiated by Failed AC Circuit Equipment
-
- ALR6-15 Element Availability Percentage (APC)
-
- Background
- Assessment
- Special Consideration
-
- ALR6-16 Transmission System Unavailability
-
- Background
- Assessment
- Special Consideration
-
- ALR6-2 Energy Emergency Alert 3 (EEA3)
-
- Background
- Assessment
- Special Considerations
-
- ALR 6-3 Energy Emergency Alert 2 (EEA2)
-
- Background
- Assessment
- Special Considerations
-
- ALR 6-1 Transmission Constraint Mitigation
-
- Background
- Assessment
- Special Considerations
-
- Integrated Bulk Power System Risk Assessment
-
- Introduction
- Recommendations
-
- Integrated Reliability Index Concepts
-
- The Three Components of the IRI
-
- Event-Driven Indicators (EDI)
- Condition-Driven Indicators (CDI)
- StandardsStatute-Driven Indicators (SDI)
-
- IRI Index Calculation
- IRI Recommendations
-
- Reliability Metrics Conclusions and Recommendations
-
- Transmission Equipment Performance
-
- Introduction
- Performance Trends
-
- AC Element Outage Summary and Leading Causes
- Transmission Monthly Outages
- Outage Initiation Location
- Transmission Outage Events
- Transmission Outage Mode
-
- Conclusions
-
- Generation Equipment Performance
-
- Introduction
- Generation Key Performance Indicators
-
- Multiple Unit Forced Outages and Causes
- 2008-2010 Review of Summer versus Winter Availability
-
- Conclusions and Recommendations
-
- Disturbance Event Trends
-
- Introduction
- Performance Trends
- Conclusions
-
- Abbreviations Used in This Report
- Contributions
-
- NERC Industry Groups
- NERC Staff
-
Reliability Metrics Performance
39
for the calculation of SRI whose calculation from zero (no transmission line outages generation outages
or load lost in a day) to 1000 (a theoretical condition in which every transmission line all generation
units and all load lost across the system in a single day)
Figure 20 captures the calculated severity risk value for each of the days for each year benchmarked
with the historic significant events which were used to concept test the calculation Since there is
significant disparity between days the bulk power system is stressed compared to those that are
ldquoroutinerdquo and ldquoherordquo days of the year where the system performed extremely well the curve is depicted
using a logarithmic scale Each yearrsquos data is sorted in descending order striking a characteristic shape
At the left-side of the curve the days in which the system is severely stressed are plotted The central
more linear portion of the curve identifies the routine day performance while the far right-side of the
curve shows the values plotted for days in which almost all lines and generation units are in service and
essentially no load is lost
The trends on the chart below show that 2009 and 2010 had fewer extreme days than 2008 Routine
daily performance appears generally consistent across all three years Figure 20 captures the days for
each year benchmarked with historically significant events
In Figure 20 NERCrsquos event categories and SRI ratings are directly related As the SRI increases the
category or severity of the event increases Historical events are also shown to relate modern
reliability measurements to give a perspective of how a well-known event would register on the SRI
scale
The event analysis process30
30
benefits from the SRI as it enables a numerical analysis of an event in
comparison to other events By this measure an event can be prioritized by its severity In a severe
event this is unnecessary However for events that do not result in severe stressing of the bulk power
system this prioritization can be a challenge By using the SRI the event analysis process can decide
which events to learn from and reduce which events to avoid and when resilience needs to be
increased under high impact low frequency events as shown in the blue boxes in the figure
httpwwwnerccompagephpcid=5|365
Reliability Metrics Performance
40
Figure 20 NERC Annual Daily Severity Risk Index (SRI) Sorted Descending with Historic Benchmark Days
Other factors that impact severity of a particular event to be considered in the future include whether
equipment operated as designed and resulted in loss of load from a reliability perspective (intentional
and controlled load-shedding) Mechanisms for enabling ongoing refinement to include the historic and
simulated events for future severity risk calculations are being explored
Reliability Metrics Performance
41
Integrated Reliability Index Concepts In December 2010 the RMWG was challenged by the OC and PC to develop a single index concept to
measure the universe of risks associated with the bulk power system As a result the integrated
reliability index (IRI) concepts were proposed31
Figure 21
the three components of which were defined to
quantify each specific risk aspect They are titled the Event Driven Index (EDI) StandardsStatute Driven
Index (SDI) and Condition Driven Index (CDI) illustrated in with measures associated with
system events standards compliance and eighteen performance metrics The development of an
integrated reliability index aims to inform increase transparency and quantify the effectiveness of risk
reduction or mitigation actions The goal is to provide the industry meaningful trends of the BPSrsquos
performance and guidance on how the industry can improve reliability and support risk-informed
decision making Once completed the IRI will facilitate holistic assessment of performance Finally the
IRI should help overcome concern and confusion about how many metrics are being analyzed for system
reliability assessments
Figure 21 Risk Model for Bulk Power System
The integrated model of event-driven condition-driven and standardsstatute-driven risk information
can be constructed to illustrate all possible logical relations between the three risk sets Due to the
nature of the system there may be some overlap among the components
31 httpwwwnerccomdocspcrmwgIntegrated_Reliability_Index_WhitePaper_DRAFTpdf
Event Driven Index (EDI)
Indicates Risk from
Major System Events
Standards Statute Driven
Index (SDI)
Indicates Risks from Severe Impact Standard Violations
Condition Driven Index (CDI)
Indicates Risk from Key Reliability
Indicators
Reliability Metrics Performance
42
The Three Components of the IRI The three components of the IRI work together as shown in Figure 22 to comprise a full picture of the
state of reliability
Figure 22 An overview of the components that comprise the Integrated Reliability Index (IRI)
Event-Driven Indicators (EDI)
The Event-Driven Indicator provides a basis for prioritization of events based on bulk power system
integrity equipment performance and engineering judgment This indicator can serve as a high value
risk assessment tool to be used by stakeholders to investigate and evaluate disturbance history and
measure the severity of these events The relative ranking of events requires industry expertise agreed-
upon goals and engineering judgment The EDI is a derivative of SRI results for a specific time period
but it transforms that performance into a form of an availability index These calculations will be further
refined as feedback is received
Condition-Driven Indicators (CDI)
The Condition-Driven Indicators focus on a set of measurable system conditions (performance
measures) to assess bulk power system reliability These reliability indicators identify factors that
positively or negatively impact reliability and are early predictors of the risk to reliability from events or
unmitigated violations A collection of these indicators measures how close reliability performance is to
the desired outcome and if the performance against these metrics is constant or improving
Reliability Metrics Performance
43
StandardsStatute-Driven Indicators (SDI)
The StandardsStatute-Driven Indicator is a calculation of success of compliance based upon the subset
of high-value standards and is divided by the number of participations who could have received the
violation within the time period considered Also based on these factors known unmitigated violations
of elevated risk factor requirements are weighted higher than lower risk factors The index decreases if
the compliance improvement is achieved over a trending period
IRI Index Calculation As with the SRI the IRI is based on an importance weighting factor which the RMWG can modify over
time after gaining experience with the new metric as well as consideration of feedback from industry
At this time the RMWG believes some form of blended weighting may serve to start to populate IRI
characteristic curves at a high and generic level Based upon feedback from stakeholders this approach
may change or as discussed below weighting factors may vary based on periodic review and risk model
update The RMWG will continue the refinement of the IRI calculation and consider other significant
factors that impact reliability (eg intentional and controlled load-shedding) further it will explore
developing mechanisms for enabling ongoing refinement which should be influenced by a wide set of
stakeholders
RMWG recommends the Event Driven Index (EDI) be weighted the highest (50 percent) since events
actually occurred indicating how the system was performing The Condition Driven Index (CDI) and
StandardsStatute Driven Index (SDI) are weighted 25 each since they are indicators of potential risks
to BPS reliability IRI can be calculated as follows
IRI is intended to be a composite metric which integrates several forms of individual risks to the bulk
power system Since the three components range across many stakeholder organizations these
concepts are developed as starting points for continued study and evaluation Additional supporting
materials can be found in the IRI whitepaper32
IRI Recommendations
including individual indices calculations and preliminary
trend information
For the IRI more investigation should be performed to determine the best way to integrate EDI CDI
and SDI into an Integrated Reliability Index (IRI) that quantitatively represents the reliability of the bulk
32 The IRI whitepaper can be found at httpwwwnerccomdocspcrmwgIntegrated_Reliability_Index_WhitePaper_DRAFTpdf
Reliability Metrics Performance
44
power system To this end study into determining the amount of overlap between the components is
necessary RMWG is currently working to determine the proper amount of overlap between the IRI
components
Also the CDI component of the IRI needs to be solidified This is especially true with the CDI More
accurate metric data is needed to paint a fuller picture of the CDI Many of the metrics used to calculate
the CDI are new or they have limited data Compared to the SDI which counts well-known violation
counts and the EDI which uses the well-defined CDI the CDI lacks the depth of rigor that the other two
components have acquired through their years of data RMWG is currently working to improve the CDI
Reliability Metrics Conclusions and Recommendations Among the eighteen metrics that address the characteristics of an adequate level of reliability (ALR)
metric trends indicate the system is performing better in the following seven areas
bull ALR1-3 Planning Reserve Margin
bull ALR1-4 BPS Transmission Related Events Resulting in Loss of Load
bull ALR2-5 Disturbance Control Events Greater than Most Severe Single Contingency
bull ALR6-2 Energy Emergency Alert 3 (EEA3)
bull ALR6-3 Energy Emergency Alert 2 (EEA2)
bull ALR6-11 Automatic Transmission Outages Caused by Protection System Misoperations
bull ALR6-13 Automatic Transmission Outages Caused by Failed AC Substation Equipment
Assessments have been made in other performance categories A number of them do not have
sufficient data to derive any conclusions from the results The RMWG recommends continued data
collection and assessment of these metrics If a metric does not yield any trend in a five-year reporting
period the metric will be modified or withdrawn
For the IRI more investigation should be performed to determine the overlap of the components (CDI
EDI and SDI) The CDI should be more thoroughly solidified as an index by collecting more data over
time
Transmission Equipment Performance
45
Transmission Equipment Performance Introduction The Transmission Availability Data System (TADS) effort began with the establishment of a TADS task force
by the NERC Planning Committee in October 2006 On October 27 2007 the NERC Board of Trustees
approved the collection of transmission automatic outage data beginning in calendar year 2008 (Phase I)
Subsequently on October 29 2008 the NERC Board approved the collection of Non-Automatic Outage data
that began for Calendar year 2010 (Phase II)
This chapter provides reliability performance analysis of the transmission system by focusing on the trends
of Automatic Outage data from calendar year 2008 thru 2010 Since only one year of Non-Automatic
Outage data has been collected that data will not be assessed in this report
When calculating bulk power system performance indices care must be exercised when interpreting results
as misinterpretation can lead to erroneous conclusions regarding system performance With only three
years of data in the smaller regions it is not clear whether a regionrsquos yearly outage variation compared to
the average is due to random statistical variation or that particular year is significantly different in
performance However on a NERC-wide basis after three years of data collection there is enough
information to accurately determine whether the yearly outage variation compared to the average is due to
random statistical variation or the particular year in question is significantly different in performance33
Performance Trends
Transmission performance information has been provided by Transmission Owners (TOs) within NERC
through the NERC TADS (Transmission Availability Data System) process The data presented reflects
Momentary and Sustained AC Automatic outages of transmission elements that operate at voltages ge 200 kV
(including the low side of transformers) with the criteria specified in the TADS process The following
elements listed below are included
bull AC Circuits ge 200 kV (Overhead and Underground Circuits) Radial circuits are included
bull DC Circuits with ge +-200 kV DC voltage
bull Transformers with ge 200 kV low-side voltage and
bull ACDC Back-to-Back (BTB) Converters with ge 200 kV AC voltage on both sides
33The detailed Confidence Interval computation is available at httpwwwnerccomdocspctadstfTADS_Nov_2_2007APPENDIX_C_Confidence_Intervalpdf
Transmission Equipment Performance
46
AC Element Outage Summary and Leading Causes Table 6 shows the 2008 2009 and 2010 NERC total AC transmission element inventory and a summary of
the associated outages As expected in general the number of circuits increased from year to year due to
new construction or re-construction to higher voltages For every outage experienced on the transmission
system cause codes are identified and recorded according to the TADS process Causes of both momentary
and sustained outages have been indicated These causes are analyzed to identify trends and similarities
and to provide insight into what could be done to possibly prevent future occurrences
Figure 23 and Figure 24 describe the top ten initiating cause codes for sustained and momentary automatic
outages combined from 2008-2010 Based on the two figures the relationship between the total number of
outages and total outage hours can be seen Failed AC Substation Equipment and Failed AC Circuit
Equipment only account for 15 percent of the total number of outages but account for 65 percent of the
total outage hours The two largest causes of outages within NERC (ldquoLightingrdquo and ldquoWeather excluding
Lightningrdquo) account for 34 percent of the total number of outages
The next three Human Error Failed Protection System Equipment and Failed AC Circuit Equipment have
very similar totals and should all be considered significant focus points in reducing the number of Sustained
Automatic Outages for all elements
Transmission Equipment Performance
47
Table 6 NERC - All AC Elements Sustained and Momentary Outage Performance Summary
2008 Number of Outages
AC Voltage
Class
No of
Circuits
Circuit
Miles Sustained Momentary
Total
Outages Total Outage Hours
200-299kV 4369 102131 1560 1062 2622 56595
300-399kV 1585 53631 793 753 1546 14681
400-599kV 586 31495 389 196 585 11766
600-799kV 110 9451 43 40 83 369
All Voltages 6650 196708 2785 2051 4836 83626
2009 Number of Outages
AC Voltage
Class
No of
Circuits
Circuit
Miles Sustained Momentary
Total
Outages Total Outage Hours
200-299kV 4468 102935 1387 898 2285 28828
300-399kV 1619 56447 641 610 1251 24714
400-599kV 592 32045 265 166 431 9110
600-799kV 110 9451 53 38 91 442
All Voltages 6789 200879 2346 1712 4038 63094
2010 Number of Outages
AC Voltage
Class
No of
Circuits
Circuit
Miles Sustained Momentary
Total
Outages Total Outage Hours
200-299kV 4567 104722 1506 918 2424 54941
300-399kV 1676 62415 721 601 1322 16043
400-599kV 605 31590 292 174 466 10442
600-799kV 111 9477 63 50 113 2303
All Voltages 6957 208204 2582 1743 4325 83729
Note The NERC table does not show redacted outages DC Circuit outages Transformer outages or ACDC
converter outages
Transmission Equipment Performance
48
Figure 23 NERC - Top Ten Sustained and Momentary Outages by Initiating Cause Code for All Elements
Figure 24 NERC - Top Ten Sustained Outage Hours by Cause Code
198
151
80
7271
6943
33
27
188
68
Lightning
Weather excluding lightningHuman Error
Failed AC Substation EquipmentFailed Protection System EquipmentFailed AC Circuit Equipment Foreign Interference
Power System Condition
Fire
Unknown
Remaining Cause Codes
299
246
188
58
52
42
3619
16 12 31 Failed AC Substation EquipmentFailed AC Circuit Equipment Weather excluding lightningUnavailable
Other
Fire
Unknown
Human Error
Failed Protection System EquipmentForeign Interference
Remaining Cause Codes
Transmission Equipment Performance
49
Transmission Monthly Outages Figure 25 displays the total number of Automatic Outages on a per-month basis The three months with the
highest total of outages were June July and August From a seasonal perspective winter had a monthly
average of 281 outages These include the months of November-March Summer had an average of 429
outages Summer included the months of April-October
Figure 25 Number of Outages by Month for AC Circuits (2008-2010)
This figure does not show redacted outages DC Circuit outages Transformer outages or ACDC Converter
outages
Outage Initiation Location For every outage experienced on the transmission system the outage initiation code is identified and
recorded according to the TADS process The outage initiation code can be analyzed to identify trends and
similarities and to provide insight into what could be done to possibly prevent future occurrences
The ldquoOutage Initiation Coderdquo describes where an automatic outage was initiated on the power system The
five codes are as follows
bull Element-Initiated
bull Other Element-Initiated
bull AC Substation-Initiated
bull ACDC Terminal-Initiated (for DC circuits)
bull Other Facility Initiated any facility not included in any other outage initiation code
JanuaryFebruar
yMarch April May June July August
September
October
November
December
2008 238 229 257 258 292 437 467 380 208 176 255 236
2009 315 201 339 334 398 553 546 515 351 235 226 294
2010 444 224 269 446 449 486 639 498 351 271 305 281
3 Year AVG 332 218 288 346 380 492 551 464 303 227 262 270
0
100
200
300
400
500
600
700
Out
ages
Transmission Equipment Performance
50
Notably the protection system is not part of an ldquoAC Substationrdquo or an ldquoACDC Terminalrdquo If a protection
system misoperates and initiates an outage it will be classified as ldquoOther-Facility Initiatedrdquo The following
Figures show the initiating location of the Automatic outages from 2008 to 2010
With both Momentary and Sustained Automatic Outages taken into account the outage was initiated on the
Element more than 67 percent of the time as shown in Figure 26 and Figure 27
When only the Sustained Automatic Outages are analyzed the outage initiation on both AC Substation and
Other Facility increased by 34 percent and 32 percent respectively Outages initiated on the Element itself
decreases by 78 percent as shown in Figure 26 and 27 For only the Momentary Automatic Outages the
outage initiation on the Element increases by 19 percent compared to Sustained Outages Element initiated
outages make up over 78 percent of the total outages when analyzing only Momentary Outages
Figure 26
Figure 27
Transmission Outage Events Figure 28 illustrates the relationship between the numbers of Automatic Outages associated per TADS
event 2008 2009 and 2010 tend to follow the same trend The largest number of Automatic Outages per
TADS event is fourteen in 2010 thirteen in 2009 and eight in 2008 There are around 70 to 100 TADS
events that contain between fourteen and three Automatic Outages (see below) There are around 330 to
400 TADS events that contain two or more Automatic Outages The rest of the events only contain one
Automatic Outage As noted in the lower right hand corner below the total number of Events in 2008 to
2010 ranged from 3920 to 4569 events per year Nearly 90 percent or more of the events contained one
Automatic Outage
Figure 26 Sustained Automatic Outage Initiation
Code
Figure 27 Momentary Automatic Outage Initiation
Code
Transmission Equipment Performance
51
Transmission Outage Mode Figure 29 and Figure 30 show the percentage of Outage Modes The ldquoOutage Mode Coderdquo describes
whether one Automatic Outage is related to other Automatic Outages A Single Mode outage is an
Automatic Outage of a single Element which occurs independently of any other Automatic Outages (if any)
A ldquoDependent Mode Initiating Outagerdquo is an Automatic Outage of a single Element that initiates one or more
subsequent Element Automatic Outages A ldquoDependent Mode Outagerdquo is an Automatic Outage of an
Element which occurred as a result of an initiating outage whether the initiating outage was an Element
outage or a non-Element outage A ldquoCommon Mode Outagerdquo is one of two or more Automatic Outages with
the same Initiating Cause Code and where the outages are not consequences of each other and occur nearly
simultaneously A ldquoCommon Mode Initiating Outagerdquo is a Common Mode Outage that initiates one or more
subsequent Automatic Outages
Over 72 percent of the total outages occurred on the bulk power system are Single Mode Outages The next
largest mode is Dependent with over 11 percent of the total outages being in this category For only
Sustained Automatic Outages outages related to each other increase with Dependent mode accounting for
13 percent of the outages and Common mode accounting for close to 11 percent of the outages
Independent Sustained outages still account for the largest portion with nearly 70 percent being Single
mode When just analyzing Momentary Automatic Outages Associated outages decrease with Dependent
Figure 28 Event Histogram (2008-2010)
Transmission Equipment Performance
52
mode accounting for only 9 percent of the outages The Common Mode percentage decreases while
Dependent Mode Initiating percentage increases compared to Sustained Outages Independent Momentary
outages account for the largest portion with over 76 percent being Single Mode
An investigation into the root causes of Dependent and Common mode events which include three or more
Automatic Outages (indentified in the TADS 2008 to 2010 data) should be a high priority Some protection
systems are designed to trip three or more circuits but some events go beyond what is designed Some also
have misoperations associated with multiple outage events
Conclusions On a NERC wide average basis automatic transmission outage rate is improving from 2008 to 2010 based on
reported data Considering both automatic and non-automatic outages 2010 records indicate transmission
element availability percentage is very high and exceeds 95 The unavailability rate for AC circuits and
transformers are only 15 and 29 respectively
The cause codes of Human Error Failed Protection System Equipment and Failed AC Circuit Equipment
should be considered significant focus points in reducing the number of Sustained Automatic Outages for all
elements A deeper look into the root causes of Dependent and Common mode events which include three
or more Automatic Outages (indentified in the TADS 2008 to 2010 data) should be a high priority Some
protection systems are designed to trip three or more circuits but some events go beyond what is designed
Some also have misoperations associated with multiple outage events
Figure 29 Sustained Automatic Outage Mode code Figure 30 Momentary Automatic Outage Mode code
Generation Equipment Performance
53
Generation Equipment Performance Introduction The development of the Generating Availability Data System (GADS) began in 1982 This series of databases
is used to voluntarily collect record and retrieve operating information By pooling individual unit
information with likewise units generating unit availability performance can be calculated providing
opportunities to identify trends and generating equipment reliability improvement opportunities The
information is used to support equipment reliability availability analyses and risk-informed decision-making
by system planners generation owners assessment modelers manufacturers and contractors etc Reports
and information resulting from the data collected through GADS are now used for benchmarking and
analyzing electric power plants
Currently the data collected through GADS contains 72 percent of the North American generating units
with generating capacity of 20 MW or higher34 Additionally many of the newer combined-cycle plants are
not reporting information and therefore a full view of each unit type is not presented Rather a sample of
all the units in North America that fit a given more general category is provided35 for the 2008-201036
Generation Key Performance Indicators
assessment period
Three key performance indicators37
In
the industry have used widely to measure the availability of generating
units (see Terms Used in This Report section for their calculation parameters) are Equivalent Availability
Factor (EAF) Net Capacity Factor (NCF) and Equivalent Forced Outage Rate ndash Demand (EFORd)
Table 7 the North American fleet average EAF NCF and EFORd compared to unit age for all generating
units with a capacity of 20 MW and higher is provided for the years 2008-2010 The EAF shows a decline
during the last three years NCF is up and down while the EFORd appears to be increasing As expected the
fleet of units reported to GADS is aging overall with the fossil units being about 12 years older than the
average age
34 httpwwwnerccomdocspcgadstfGADSTF_Recommendation_Report_02-18-2011_FINALpdf 35GADS contains some 1500+ units under 20 MW that is not included in this report These units are excluded because most units are not base-loaded and are in peaking operation
3684 percent of the 2010 dataset is available at this time while the 2008 and 2009 dataset is complete 37 httpwwwnerccompagephpcid=4|43
Generation Equipment Performance
54
Table 7 General Availability Review of GADS Fleet Units by Year
2008 2009 2010 Average
Equivalent Availability Factor (EAF) 8776 8774 8678 8743
Net Capacity Factor (NCF) 5083 4709 4880 4890
Equivalent Forced Outage Rate -
Demand (EFORd) 579 575 639 597
Number of Units ge20 MW 3713 3713 3713 3713
Average Age of the Fleet in Years (all
unit types) 303 311 321 312
Average Age of the Fleet in Years
(fossil units only) 422 432 440 433
Figure 31 provides the average forced outage hours (FOH) maintenance outage hours (MOH) and planned
outage hours (POH) for all units reporting 20 MW or larger During this three-year period the average FOH
291 hours average MOH is 163 hours average POH is 470 hours
Figure 31 shows a large increase in forced and maintenance events The average age of the units with a
capacity of 20MW and higher in 2009 is 316 years old However the average age of fossil units in 2010 is
442 years old These fossil units are the backbone of all operating units providing the base-load power
continuously and nearly 50 percent of all energy annually There appears to be no increase allocated for
annualsemi-annual maintenance (ie planned outages) for the older generating units The increase of
000100002000030000400005000060000700008000090000
100000
2008 2009 2010
463 479 468
154 161 173
288 270 314
Hou
rs
Planned Maintenance Forced
Figure 31 Average Outage Hours for Units gt 20 MW
Generation Equipment Performance
55
maintenance outage hours reflects an increased need to fix problems that cannot be deferred until the next
annualsemi-annual repairs As a result it shows one of two things are happening
bull More or longer planned outage time is needed to repair the aging generating fleet
bull More focus on preventive repairs during planned and maintenance events are needed
Multiple Unit Forced Outages and Causes Table 8 provides the annual multiple-unit forced outage trips resulting from the same cause for each of the
assessments years 2008-2010 respectively The ldquosingle unitrdquo trips are large units with a Net Dependable
Capacity of 750 MW or more The trips of ldquotwo unitsrdquo or more is any combination of unit capacity with the
total amount of lost capacity more than 750 MW
Table 8 also presents more information on the forced outages During 2008-2010 there were a large
number of double-unit outages resulting from the same event Investigations show that some of these trips
were at a single plant caused by common control and instrumentation for the units The incidents occurred
several times for several months and are a common mode issue internal to the plant
Table 8 Number of Multiple Unit Forced Outages and FrequencyYear
2008 2009 2010
Type of
Trip
of
Trips
Avg Outage
Hr Trip
Avg Outage
Hr Unit
of
Trips
Avg Outage
Hr Trip
Avg Outage
Hr Unit
of
Trips
Avg Outage
Hr Trip
Avg Outage
Hr Unit
Single-unit
Trip 591 58 58 284 64 64 339 66 66
Two-unit
Trip 281 43 22 508 96 48 206 41 20
Three-unit
Trip 74 48 16 223 146 48 47 109 36
Four-unit
Trip 12 77 19 111 112 28 40 121 30
Five-unit
Trip 11 1303 260 60 443 88 19 199 10
gt 5 units 20 166 16 93 206 50 37 246 6
Loss of ge 750 MW per Trip
The high number of five-unit trips in 2008 was due to Hurricane Ike hitting the Gulf Coast The highest total
number of multiple unit trips occurred in 2009 though as mentioned before the data collection for 2010 is
incomplete at this time The majority of 2009 multiple unit trips have three main causes (in order by
Generation Equipment Performance
56
number of events) transmission lack of fuel and storms A summary of the three categories for single as
well as multiple unit outages (all unit capacities) are reflected in Table 9
Table 9 Common Causes of Multiple Unit Forced Outages (2009)
Cause Number of Events Average MW Size of Unit
Transmission 1583 16
Lack of Fuel (Coal Mines Gas Lines etc) Not
in Operator Control
812 448
Storms Lightning and Other Acts of Nature 591 112
Some of the transmission outages based on storms in 2009 have been caused by the same reasons because
the storms may have caused transmission interference However the plants reported the problems
inconsistently with either the transmission interference or storms cause code Therefore they are depicted
as two different causes of forced outage
Marked transmission outages in 2009 were quite high Thirty-five percent came from one utility with a large
number of hydroelectric units The company related the trips to various problems including weather
(lightning storms) wildlife ldquoline bumpsrdquo and problems on the receiving end of the transmission line Nine
hundred and eighty-five transmission trips (62 percent) were from hydroelectric units38
In 2009 only ten transmission trips resulted in a loss of 750 MW or more per trip Twenty two generating
plants were affected by the ten trips Causes for the trips include feeder line trips (1 trip) breakers in the
switchyard (8 trips) personnel errors (2 trips) and unknown (10 trips)
The ldquoLack of Fuelrdquo outages are of interest as these events occur during the times when a unit is available to
operate but there is an interruption in fuels to operate the facilities These events do not include
interruptions of fuel due to contracts Rather the cause code is designed to account for units that are
expecting fuel and it is unavailable when requested Table 10 presents the distribution of ldquoLack of Fuelrdquo
events by NERC Region and Table 11 presents the unit types affected
38 The average size of the hydroelectric units were small ndash 335 MW
Generation Equipment Performance
57
Of the units that report ldquoLack of Fuelrdquo 78 percent of the units are oil-fired 15 percent of the units are gas-
fired and the remaining units are various other fuels Table 12 provides the top causes of forced outage for
several unit types For fossil units ldquoLack of Fuelrdquo as the number three cause behind waterwall tube leaks
and superheater tube leaks
Table 10 Forced Outages Due to Lack of Fuel by Region
Region Number of Lack of Fuel
Problems Reported
FRCC 0
MRO 3
NPCC 24
RFC 695
SERC 17
SPP 3
TRE 7
WECC 29
One company contributed to the majority of oil-fired lack of fuel events The units at the company are
actually dual-fuels (oil and gas) but market nominated gas monitoring causes the units to be on forced
outage nightly The units need gas to start up so they can run on oil When they shut down the units must
switch to gas to clean themselves With the gas restriction the unit canrsquot start and the unit goes on a
forced outage Until the band is lifted the two units will continue to be on a forced outage cycle
Event records also provide descriptions of why the unit was without fuel with the majority of descriptions
bull Temperatures affecting gas supply valves
bull Unexpected maintenance of gas pipe-lines
bull Compressor problemsmaintenance
Generation Equipment Performance
58
Table 11 Unit Type Profile of Forced Outages Due to Lack of Fuel
Unit Types Number of Lack of Fuel Problems Reported
Fossil 642
Nuclear 0
Gas Turbines 88
Diesel Engines 1
HydroPumped Storage 0
Combined Cycle 47
Generation Equipment Performance
59
Table 12 Causes of Forced Outage for Different Unit Types (2008-2010)
Fossil - all MW sizes all fuels
Rank Description Occurrence per Unit-year
MWH per Unit-year
Average Hours To Repair
Average Hours Between Failures
Unit-years
1 Waterwall (furnace wall) 0590 134106 59 3250 3868 2 Second Superheater
Leaks 0180 5182 60 3228 3868
3 Lack of Fuel (coal mines gas lines etc) where the operator is not in control
0480 4701 18 26 3868
Combined-Cycle blocks Rank Description Occurrence
per Unit-year
MWH per Unit-year
Average Hours To Repair
Average Hours Between Failures
Unit-years
1 HP Turbine Buckets Or Blades
0020 4663 1830 26280 466
2 Turbine Control Valves 0040 2777 100 7200 466 3 Gas Turbine Compressor -
High Pressure Shaft 0010 2266 663 4269 466
Nuclear units - all Reactor types Rank Description Occurrence
per Unit-year
MWH per Unit-year
Average Hours To Repair
Average Hours Between Failures
Unit-years
1 LP Turbine Buckets or Blades
0010 26415 8760 26280 288
2 Containment Structure 0010 9233 1226 26262 288 3 Feedwater Pump Local
Controls 0020 7620 692 12642 288
Simple-cycle gas turbine jet engines Rank Description Occurrence
per Unit-year
MWH per Unit-year
Average Hours To Repair
Average Hours Between Failures
Unit-years
1 Main Transformer 0030 1611 1016 20709 4181 2 Other Gas Turbine
Controls And Instrument Problems
0120 428 70 2614 4181
3 Other Gas Turbine Problems
0090 400 119 1701 4181
Generation Equipment Performance
60
2008-2010 Review of Summer versus Winter Availability To address seasonality of unit availability unit information for the months of June to September (summer)
and December through February (winter) were pooled to calculate force events during these timeframes for
2008-201039 Figure 32 shows the Equivalent Availability Factor (EAF) is three percentage points higher and
the Equivalent Forced Outage Rate - Demand (EFORd) is more than a half of a percentage point lower in the
summer period than in winter period This means the units were more reliable with less forced events
during high-demand times during the summer than during the winter seasons The generating unitrsquos
capability has a resulting higher Net Capacity Factor (NCF) of 45 percentage points in the summer season
for 2008-2010
During the spring season (March-May) 77 percent of the units took a planned outage (PO) for an average
231 hours (or 96 days) In fall (October-November) only 42 percent of the units experienced a PO and the
average duration was shorter ndash 134 hours (or 56 days) A few units took both spring and fall planned
outages although this is rare Based on this assessment the generating units are prepared for the summer
peak demand The resulting availability indicates that this maintenance was successful which is measured
by an increased EAF and lower EFORd
Figure 32 Summer-Winter Average EAF NCF and EFORd (2008-2010)
Conclusions and Recommendations During 2008-2010 the average Equivalent Availability Factor (EAF) which measures the overall availability
of generating units decreased At the same time the Net Capacity Factor (NCF) an indicator of energy
production increased The average number of forced outages in 2010 is greater than in 2008 while at the
same time the average planned outage times have decreased As a result the Equivalent Forced Outage
Rate ndash Demand (EFORd) also increased illustrating that more units have experienced forced events during
39 A study of peak periods was conducted by the NERC Generating Availability Trend Evaluation (GATE) Working Group several years ago see httpwwwnerccomfilesSeasonal-Performance-Trendspdf
9116
5343
396
8818
4896
441
0 10 20 30 40 50 60 70 80 90 100
EAF
NCF
EFORd
Percent ()
Winter
Summer
Generation Equipment Performance
61
peak-demand times in 2010 than in the previous two years Potentially with shorter planned outage
periods in 2010 there may be less time to repair equipment and prevent forced unit outages
There are warnings that units are not being maintained as well as they should be In the last three years
there has been an increase in Equivalent Forced Outage Rate ndash Demand (EFORd) This indicator measures
the rate of forced outage events on generating units during periods of load demand To confirm this
problem forced outage hours jumped from 270 to 314 hours per unit between 2009 and 2010 At the same
time maintenance events also increased by 12 hours per unit Planned outage events remain constant The
resulting conclusions from this trend are
bull More or longer planned outage time is needed to repair the generating fleet Whether age is the
cause of the increase need for planned outage time remains unknown and further investigation into
the cause for longer planned outage time is necessary
bull More focus on preventive repairs during planned and maintenance events are needed
There are many multiple unit forced outages due to lack of fuel The majority of multiple unit trips have
three main causes transmission lack of fuel and storms With special interest in the forced outages due to
ldquoLack of Fuelrdquo additional analysis revealed that 77 percent of the units experiencing unexpected fuel
stoppage are oil-fired fossil units while gas-fired units experienced 15 percent
Generating units continue to be more reliable during the peak summer periods
Disturbance Event Trends
62
Category 1 An event resulting in one or more of the following a Unintended loss of three or more BPS elements caused by
common mode failure b Failure or misoperation of an SPSRAS c System-wide voltage reduction of 3 or more d Unintended BPS system separation resulting in an island of
100 MW to 999 MW e Unplanned evacuation from a control center facility with BPS
SCADA functionality for 30 minutes or more Category 2 An event resulting in one or more of the following
a Complete loss of all BPS control center voice communication system(s) for 30 minutes or more
b Complete loss of SCADA control or monitoring functionality for 30 minutes or more
c Voltage excursions equal to or greater than 10 lasting more than five minutes
d Loss of off-site power (LOOP) to a nuclear generating station e Unintended system separation resulting in an island of 1000
MW to 4999 MW f Unintended loss of 300MW or more of firm load for more
than 15 minutes g Violation of an Interconnection Reliability Operating Limit
(IROL) for more than 30 minutes Category 3 An event resulting in one or more of the following
a The loss of load or generation of 2000 MW or more in the Eastern Interconnection or
b Western Interconnection or 1000 MW or more in the ERCOT or Queacutebec Interconnections
c Unintended system separation resulting in an island of 5000 MW to 10000 MW
d Unintended system separation resulting in an island of Florida from the Eastern Interconnection
Category 4 An event resulting in one or more of the following a The loss of load or generation from 5001 MW to 9999 MW b Unintended system separation resulting in an island of more
than 10000 MW (with the exception of Florida as described in Category 3c)
Category 5 An event resulting in one or more of the following a The loss of load of 10000 MW or more b The loss of generation of 10000 MW or more
Figure 33 BPS Event Category
Disturbance Event Trends Introduction The purpose of this section is to report event
analysis trends from the beginning of event
analysis field test40
One of the companion goals of the event
analysis program is the identification of trends
in the number magnitude and frequency of
events and their associated causes such as
human error equipment failure protection
system misoperations etc The information
provided in the event analysis database (EADB)
and various event analysis reports have been
used to track and identify trends in BPS events
in conjunction with other databases (TADS
GADS metric and benchmarking database)
to the end of 2010
The Event Analysis Working Group (EAWG)
continuously gathers event data and is moving
toward an integrated approach to analyzing
data assessing trends and communicating the
results to the industry
Performance Trends The event category is classified41
Figure 33
as shown in
with Category 5 being the most
severe Figure 34 depicts disturbance trends in
Category 1 to 5 system events from the
40 httpwwwnerccomdocseawgGalloway-Industry-EA-Field-Test-102210pdf 41httpwwwnerccomfiles2011-05-0220Event_Analysis_Process_Phase20220Field20Test20Draft20-20Final20-20For20postingpdf
Disturbance Event Trends
63
beginning of event analysis field test to the end of 201042
Figure 34 Event Category vs Date for All 2010 Categorized Events
From the figure in November and December
there were many more category 1 and 2 events than in October This is due to the field trial starting on
October 25 2010
In addition to the category of the events the status of the events plays a critical role in the accuracy of the
data By examining Figure 35 over 80 of the events reported in 2010 have been closed This means that
the category root cause and other important information have been sufficiently finalized in order for
analysis to be accurate for each event At this time there is not enough data to draw any long-term
conclusions about event investigation performance
42 Documents for the EA Field Test are located at httpwwwnerccompagephpcid=5|365
2
12 12
26
3
6 5
14
1 1
2
0
5
10
15
20
25
30
35
40
45
October November December 2010
Even
t Cou
nt
Category 3 Category 2 Category 1
Disturbance Event Trends
64
Figure 35 Event Count vs Status (All 2010 Events with Status)
By drilling down into the cause code for each closed 2010 event Figure 36 shows the top 3 event causes
From the figure equipment failure and protection system misoperation are the most significant causes for
events Because of how new and limited the data is however there may not be statistical significance for
this result Further trending of cause codes for closed events and developing a richer dataset to find any
trends between event cause codes and event counts should be performed
Figure 36 Top 3 Event Counts vs DAWG Cause Code for all Closed 2010 Events
10
32
42
0
5
10
15
20
25
30
35
40
45
Open Closed Open and Closed
Even
t Cou
nt
Status
1211
8
0
2
4
6
8
10
12
14
Equipment Failure Protection System Misoperation Human Error
Even
t Cou
nt
Cause Code
Disturbance Event Trends
65
Conclusions Due to the relatively new process for events analysis and categorization more time will be required before a
conclusive recommendation may be obtained Further analysis and new data should provide valuable
statistics in the future Over 80 of all event reports from 2010 are current listed as closed but no
conclusion about investigation performance may be obtained because of the limited amount of data It is
recommended to study ways to prevent equipment failure and protection system misoperations but there
is not enough data to draw a firm conclusion about the top causes of events at this time
Abbreviations Used in This Report
66
Abbreviations Used in This Report
Acronym Definition ALP Acadiana Load Pocket
ALR Adequate Level of Reliability
ARR Automatic Reliability Report
BA Balancing Authority
BPS Bulk Power System
CDI Condition Driven Index
CEII Critical Energy Infrastructure Information
CIPC Critical Infrastructure Protection Committee
CLECO Cleco Power LLC
DADS Future Demand Availability Data System
DCS Disturbance Control Standard
DOE Department Of Energy
DSM Demand Side Management
EA Event Analysis
EAF Equivalent Availability Factor
ECAR East Central Area Reliability
EDI Event Drive Index
EEA Energy Emergency Alert
EFORd Equivalent Forced Outage Rate Demand
EMS Energy Management System
ERCOT Electric Reliability Council of Texas
ERO Electric Reliability Organization
ESAI Energy Security Analysis Inc
FERC Federal Energy Regulatory Commission
FOH Forced Outage Hours
FRCC Florida Reliability Coordinating Council
GADS Generation Availability Data System
GOP Generation Operator
IEEE Institute of Electrical and Electronics Engineers
IESO Independent Electricity System Operator
IROL Interconnection Reliability Operating Limit
Abbreviations Used in This Report
67
Acronym Definition IRI Integrated Reliability Index
LOLE Loss of Load Expectation
LUS Lafayette Utilities System
MAIN Mid-America Interconnected Network Inc
MAPP Mid-continent Area Power Pool
MOH Maintenance Outage Hours
MRO Midwest Reliability Organization
MSSC Most Severe Single Contingency
NCF Net Capacity Factor
NEAT NERC Event Analysis Tool
NERC North American Electric Reliability Corporation
NPCC Northeast Power Coordinating Council
OC Operating Committee
OL Operating Limit
OP Operating Procedures
ORS Operating Reliability Subcommittee
PC Planning Committee
PO Planned Outage
POH Planned Outage Hours
RAPA Reliability Assessment Performance Analysis
RAS Remedial Action Schemes
RC Reliability Coordinator
RCIS Reliability Coordination Information System
RCWG Reliability Coordinator Working Group
RE Regional Entities
RFC Reliability First Corporation
RMWG Reliability Metrics Working Group
RSG Reserve Sharing Group
SAIDI System Average Interruption Duration Index
SAIFI System Average Interruption Frequency Index
SCADA Supervisory Control and Data Acquisition
SDI Standardstatute Driven Index
SERC SERC Reliability Corporation
Abbreviations Used in This Report
68
Acronym Definition SRI Severity Risk Index
SMART Specific Measurable Attainable Relevant and Tangible
SOL System Operating Limit
SPS Special Protection Schemes
SPCS System Protection and Control Subcommittee
SPP Southwest Power Pool
SRI System Risk Index
TADS Transmission Availability Data System
TADSWG Transmission Availability Data System Working Group
TO Transmission Owner
TOP Transmission Operator
WECC Western Electricity Coordinating Council
Contributions
69
Contributions This report was made feasible by the collaboration and hard work of both NERC staff and NERCrsquos
Industry Groups
NERC Industry Groups
Table 14 lists the NERC industry group contributors Without their contribution and collaboration this
report would not have been possible
Table 13 NERC Industry Group Contributions43
NERC Group
Relationship Contribution
Reliability Metrics Working Group
(RMWG)
Reports to the OCPC bull Lead Development of Report bull Provide Reliability Metrics Data bull Responsible for Reliability Metrics
Performance Chapter
Transmission Availability Working Group
(TADSWG)
Reports to the OCPC bull Provide Transmission Availability Data
bull Responsible for Transmission Equip-ment Performance Chapter
bull Content Review
Generation Availability Data System Task
Force
(GADSTF)
Reports to the OCPC bull Provide Generation Availability Data bull Responsible for Generation Equip-
ment Performance Chapter bull Content Review
Event Analysis Working Group
(EAWG)
Reports to the OCPC bull Provide Events Data bull Responsible for Disturbance Events
Trends Chapter bull Content Review
43 Rosters for RMWG TADSWG GADSTF and EAWG are available at httpwwwnerccomfilesrosterpdf
Contributions
70
NERC Staff Table 13 below lists the NERC staff who contributed to the 2011 Reliability Performance Analysis
Report
Table 14 Contributing NERC Staff
Name Title E-mail Address
Mark Lauby Vice President and Director of
Reliability Assessment and
Performance Analysis
marklaubynercnet
Jessica Bian Manager of Performance Analysis jessicabiannercnet
John Moura Manager of Reliability Assessments johnmouranercnet
Andrew Slone Engineer Reliability Performance
Analysis
andrewslonenercnet
Jim Robinson TADS Project Manager jimrobinsonnercnet
Clyde Melton Engineer Reliability Performance
Analysis
clydemeltonnercnet
Mike Curley Manager of GADS Services mikecurleynercnet
James Powell Engineer Reliability Performance
Analysis
jamespowellnercnet
Michelle Marx Administrative Assistant michellemarxnercnet
William Mo Intern Performance Analysis wmonercnet
- NERCrsquos Mission
- Table of Contents
- Executive Summary
-
- 2011 Transition Report
- State of Reliability Report
- Key Findings and Recommendations
-
- Reliability Metric Performance
- Transmission Availability Performance
- Generating Availability Performance
- Disturbance Events
- Report Organization
-
- Introduction
-
- Metric Report Evolution
- Roadmap for the Future
-
- Reliability Metrics Performance
-
- Introduction
- 2010 Performance Metrics Results and Trends
-
- ALR1-3 Planning Reserve Margin
-
- Background
- Assessment
- Special Considerations
-
- ALR1-4 BPS Transmission Related Events Resulting in Loss of Load
-
- Background
- Assessment
-
- ALR1-12 Interconnection Frequency Response
-
- Background
- Assessment
-
- ALR2-3 Activation of Under Frequency Load Shedding
-
- Background
- Assessment
- Special Considerations
-
- ALR2-4 Average Percent Non-Recovery Disturbance Control Standards (DCS)
-
- Background
- Assessment
- Special Consideration
-
- ALR2-5 Disturbance Control Events Greater Than Most Severe Single Contingency
-
- Background
- Assessment
- Special Consideration
-
- ALR 1-5 System Voltage Performance
-
- Background
- Special Considerations
- Status
-
- ALR3-5 Interconnection Reliability Operating Limit System Operating Limit (IROLSOL) Exceedances
-
- Background
-
- ALR4-1 Automatic Transmission Outages Caused by Protection System Misoperations
-
- Background
- Special Considerations
-
- ALR6-11 ndash ALR6-14
-
- Background
- Assessment
- ALR 6-11 ndash Automatic Outages Initiated by Failed Protection System Equipment
- ALR6-12 ndash Automatic Outages Initiated by Human Error
- ALR6-13 ndash Automatic Outages Initiated by Failed AC Substation Equipment
- ALR6-14 Automatic AC Transmission Outages Initiated by Failed AC Circuit Equipment
-
- ALR6-15 Element Availability Percentage (APC)
-
- Background
- Assessment
- Special Consideration
-
- ALR6-16 Transmission System Unavailability
-
- Background
- Assessment
- Special Consideration
-
- ALR6-2 Energy Emergency Alert 3 (EEA3)
-
- Background
- Assessment
- Special Considerations
-
- ALR 6-3 Energy Emergency Alert 2 (EEA2)
-
- Background
- Assessment
- Special Considerations
-
- ALR 6-1 Transmission Constraint Mitigation
-
- Background
- Assessment
- Special Considerations
-
- Integrated Bulk Power System Risk Assessment
-
- Introduction
- Recommendations
-
- Integrated Reliability Index Concepts
-
- The Three Components of the IRI
-
- Event-Driven Indicators (EDI)
- Condition-Driven Indicators (CDI)
- StandardsStatute-Driven Indicators (SDI)
-
- IRI Index Calculation
- IRI Recommendations
-
- Reliability Metrics Conclusions and Recommendations
-
- Transmission Equipment Performance
-
- Introduction
- Performance Trends
-
- AC Element Outage Summary and Leading Causes
- Transmission Monthly Outages
- Outage Initiation Location
- Transmission Outage Events
- Transmission Outage Mode
-
- Conclusions
-
- Generation Equipment Performance
-
- Introduction
- Generation Key Performance Indicators
-
- Multiple Unit Forced Outages and Causes
- 2008-2010 Review of Summer versus Winter Availability
-
- Conclusions and Recommendations
-
- Disturbance Event Trends
-
- Introduction
- Performance Trends
- Conclusions
-
- Abbreviations Used in This Report
- Contributions
-
- NERC Industry Groups
- NERC Staff
-

Reliability Metrics Performance
40
Figure 20 NERC Annual Daily Severity Risk Index (SRI) Sorted Descending with Historic Benchmark Days
Other factors that impact severity of a particular event to be considered in the future include whether
equipment operated as designed and resulted in loss of load from a reliability perspective (intentional
and controlled load-shedding) Mechanisms for enabling ongoing refinement to include the historic and
simulated events for future severity risk calculations are being explored
Reliability Metrics Performance
41
Integrated Reliability Index Concepts In December 2010 the RMWG was challenged by the OC and PC to develop a single index concept to
measure the universe of risks associated with the bulk power system As a result the integrated
reliability index (IRI) concepts were proposed31
Figure 21
the three components of which were defined to
quantify each specific risk aspect They are titled the Event Driven Index (EDI) StandardsStatute Driven
Index (SDI) and Condition Driven Index (CDI) illustrated in with measures associated with
system events standards compliance and eighteen performance metrics The development of an
integrated reliability index aims to inform increase transparency and quantify the effectiveness of risk
reduction or mitigation actions The goal is to provide the industry meaningful trends of the BPSrsquos
performance and guidance on how the industry can improve reliability and support risk-informed
decision making Once completed the IRI will facilitate holistic assessment of performance Finally the
IRI should help overcome concern and confusion about how many metrics are being analyzed for system
reliability assessments
Figure 21 Risk Model for Bulk Power System
The integrated model of event-driven condition-driven and standardsstatute-driven risk information
can be constructed to illustrate all possible logical relations between the three risk sets Due to the
nature of the system there may be some overlap among the components
31 httpwwwnerccomdocspcrmwgIntegrated_Reliability_Index_WhitePaper_DRAFTpdf
Event Driven Index (EDI)
Indicates Risk from
Major System Events
Standards Statute Driven
Index (SDI)
Indicates Risks from Severe Impact Standard Violations
Condition Driven Index (CDI)
Indicates Risk from Key Reliability
Indicators
Reliability Metrics Performance
42
The Three Components of the IRI The three components of the IRI work together as shown in Figure 22 to comprise a full picture of the
state of reliability
Figure 22 An overview of the components that comprise the Integrated Reliability Index (IRI)
Event-Driven Indicators (EDI)
The Event-Driven Indicator provides a basis for prioritization of events based on bulk power system
integrity equipment performance and engineering judgment This indicator can serve as a high value
risk assessment tool to be used by stakeholders to investigate and evaluate disturbance history and
measure the severity of these events The relative ranking of events requires industry expertise agreed-
upon goals and engineering judgment The EDI is a derivative of SRI results for a specific time period
but it transforms that performance into a form of an availability index These calculations will be further
refined as feedback is received
Condition-Driven Indicators (CDI)
The Condition-Driven Indicators focus on a set of measurable system conditions (performance
measures) to assess bulk power system reliability These reliability indicators identify factors that
positively or negatively impact reliability and are early predictors of the risk to reliability from events or
unmitigated violations A collection of these indicators measures how close reliability performance is to
the desired outcome and if the performance against these metrics is constant or improving
Reliability Metrics Performance
43
StandardsStatute-Driven Indicators (SDI)
The StandardsStatute-Driven Indicator is a calculation of success of compliance based upon the subset
of high-value standards and is divided by the number of participations who could have received the
violation within the time period considered Also based on these factors known unmitigated violations
of elevated risk factor requirements are weighted higher than lower risk factors The index decreases if
the compliance improvement is achieved over a trending period
IRI Index Calculation As with the SRI the IRI is based on an importance weighting factor which the RMWG can modify over
time after gaining experience with the new metric as well as consideration of feedback from industry
At this time the RMWG believes some form of blended weighting may serve to start to populate IRI
characteristic curves at a high and generic level Based upon feedback from stakeholders this approach
may change or as discussed below weighting factors may vary based on periodic review and risk model
update The RMWG will continue the refinement of the IRI calculation and consider other significant
factors that impact reliability (eg intentional and controlled load-shedding) further it will explore
developing mechanisms for enabling ongoing refinement which should be influenced by a wide set of
stakeholders
RMWG recommends the Event Driven Index (EDI) be weighted the highest (50 percent) since events
actually occurred indicating how the system was performing The Condition Driven Index (CDI) and
StandardsStatute Driven Index (SDI) are weighted 25 each since they are indicators of potential risks
to BPS reliability IRI can be calculated as follows
IRI is intended to be a composite metric which integrates several forms of individual risks to the bulk
power system Since the three components range across many stakeholder organizations these
concepts are developed as starting points for continued study and evaluation Additional supporting
materials can be found in the IRI whitepaper32
IRI Recommendations
including individual indices calculations and preliminary
trend information
For the IRI more investigation should be performed to determine the best way to integrate EDI CDI
and SDI into an Integrated Reliability Index (IRI) that quantitatively represents the reliability of the bulk
32 The IRI whitepaper can be found at httpwwwnerccomdocspcrmwgIntegrated_Reliability_Index_WhitePaper_DRAFTpdf
Reliability Metrics Performance
44
power system To this end study into determining the amount of overlap between the components is
necessary RMWG is currently working to determine the proper amount of overlap between the IRI
components
Also the CDI component of the IRI needs to be solidified This is especially true with the CDI More
accurate metric data is needed to paint a fuller picture of the CDI Many of the metrics used to calculate
the CDI are new or they have limited data Compared to the SDI which counts well-known violation
counts and the EDI which uses the well-defined CDI the CDI lacks the depth of rigor that the other two
components have acquired through their years of data RMWG is currently working to improve the CDI
Reliability Metrics Conclusions and Recommendations Among the eighteen metrics that address the characteristics of an adequate level of reliability (ALR)
metric trends indicate the system is performing better in the following seven areas
bull ALR1-3 Planning Reserve Margin
bull ALR1-4 BPS Transmission Related Events Resulting in Loss of Load
bull ALR2-5 Disturbance Control Events Greater than Most Severe Single Contingency
bull ALR6-2 Energy Emergency Alert 3 (EEA3)
bull ALR6-3 Energy Emergency Alert 2 (EEA2)
bull ALR6-11 Automatic Transmission Outages Caused by Protection System Misoperations
bull ALR6-13 Automatic Transmission Outages Caused by Failed AC Substation Equipment
Assessments have been made in other performance categories A number of them do not have
sufficient data to derive any conclusions from the results The RMWG recommends continued data
collection and assessment of these metrics If a metric does not yield any trend in a five-year reporting
period the metric will be modified or withdrawn
For the IRI more investigation should be performed to determine the overlap of the components (CDI
EDI and SDI) The CDI should be more thoroughly solidified as an index by collecting more data over
time
Transmission Equipment Performance
45
Transmission Equipment Performance Introduction The Transmission Availability Data System (TADS) effort began with the establishment of a TADS task force
by the NERC Planning Committee in October 2006 On October 27 2007 the NERC Board of Trustees
approved the collection of transmission automatic outage data beginning in calendar year 2008 (Phase I)
Subsequently on October 29 2008 the NERC Board approved the collection of Non-Automatic Outage data
that began for Calendar year 2010 (Phase II)
This chapter provides reliability performance analysis of the transmission system by focusing on the trends
of Automatic Outage data from calendar year 2008 thru 2010 Since only one year of Non-Automatic
Outage data has been collected that data will not be assessed in this report
When calculating bulk power system performance indices care must be exercised when interpreting results
as misinterpretation can lead to erroneous conclusions regarding system performance With only three
years of data in the smaller regions it is not clear whether a regionrsquos yearly outage variation compared to
the average is due to random statistical variation or that particular year is significantly different in
performance However on a NERC-wide basis after three years of data collection there is enough
information to accurately determine whether the yearly outage variation compared to the average is due to
random statistical variation or the particular year in question is significantly different in performance33
Performance Trends
Transmission performance information has been provided by Transmission Owners (TOs) within NERC
through the NERC TADS (Transmission Availability Data System) process The data presented reflects
Momentary and Sustained AC Automatic outages of transmission elements that operate at voltages ge 200 kV
(including the low side of transformers) with the criteria specified in the TADS process The following
elements listed below are included
bull AC Circuits ge 200 kV (Overhead and Underground Circuits) Radial circuits are included
bull DC Circuits with ge +-200 kV DC voltage
bull Transformers with ge 200 kV low-side voltage and
bull ACDC Back-to-Back (BTB) Converters with ge 200 kV AC voltage on both sides
33The detailed Confidence Interval computation is available at httpwwwnerccomdocspctadstfTADS_Nov_2_2007APPENDIX_C_Confidence_Intervalpdf
Transmission Equipment Performance
46
AC Element Outage Summary and Leading Causes Table 6 shows the 2008 2009 and 2010 NERC total AC transmission element inventory and a summary of
the associated outages As expected in general the number of circuits increased from year to year due to
new construction or re-construction to higher voltages For every outage experienced on the transmission
system cause codes are identified and recorded according to the TADS process Causes of both momentary
and sustained outages have been indicated These causes are analyzed to identify trends and similarities
and to provide insight into what could be done to possibly prevent future occurrences
Figure 23 and Figure 24 describe the top ten initiating cause codes for sustained and momentary automatic
outages combined from 2008-2010 Based on the two figures the relationship between the total number of
outages and total outage hours can be seen Failed AC Substation Equipment and Failed AC Circuit
Equipment only account for 15 percent of the total number of outages but account for 65 percent of the
total outage hours The two largest causes of outages within NERC (ldquoLightingrdquo and ldquoWeather excluding
Lightningrdquo) account for 34 percent of the total number of outages
The next three Human Error Failed Protection System Equipment and Failed AC Circuit Equipment have
very similar totals and should all be considered significant focus points in reducing the number of Sustained
Automatic Outages for all elements
Transmission Equipment Performance
47
Table 6 NERC - All AC Elements Sustained and Momentary Outage Performance Summary
2008 Number of Outages
AC Voltage
Class
No of
Circuits
Circuit
Miles Sustained Momentary
Total
Outages Total Outage Hours
200-299kV 4369 102131 1560 1062 2622 56595
300-399kV 1585 53631 793 753 1546 14681
400-599kV 586 31495 389 196 585 11766
600-799kV 110 9451 43 40 83 369
All Voltages 6650 196708 2785 2051 4836 83626
2009 Number of Outages
AC Voltage
Class
No of
Circuits
Circuit
Miles Sustained Momentary
Total
Outages Total Outage Hours
200-299kV 4468 102935 1387 898 2285 28828
300-399kV 1619 56447 641 610 1251 24714
400-599kV 592 32045 265 166 431 9110
600-799kV 110 9451 53 38 91 442
All Voltages 6789 200879 2346 1712 4038 63094
2010 Number of Outages
AC Voltage
Class
No of
Circuits
Circuit
Miles Sustained Momentary
Total
Outages Total Outage Hours
200-299kV 4567 104722 1506 918 2424 54941
300-399kV 1676 62415 721 601 1322 16043
400-599kV 605 31590 292 174 466 10442
600-799kV 111 9477 63 50 113 2303
All Voltages 6957 208204 2582 1743 4325 83729
Note The NERC table does not show redacted outages DC Circuit outages Transformer outages or ACDC
converter outages
Transmission Equipment Performance
48
Figure 23 NERC - Top Ten Sustained and Momentary Outages by Initiating Cause Code for All Elements
Figure 24 NERC - Top Ten Sustained Outage Hours by Cause Code
198
151
80
7271
6943
33
27
188
68
Lightning
Weather excluding lightningHuman Error
Failed AC Substation EquipmentFailed Protection System EquipmentFailed AC Circuit Equipment Foreign Interference
Power System Condition
Fire
Unknown
Remaining Cause Codes
299
246
188
58
52
42
3619
16 12 31 Failed AC Substation EquipmentFailed AC Circuit Equipment Weather excluding lightningUnavailable
Other
Fire
Unknown
Human Error
Failed Protection System EquipmentForeign Interference
Remaining Cause Codes
Transmission Equipment Performance
49
Transmission Monthly Outages Figure 25 displays the total number of Automatic Outages on a per-month basis The three months with the
highest total of outages were June July and August From a seasonal perspective winter had a monthly
average of 281 outages These include the months of November-March Summer had an average of 429
outages Summer included the months of April-October
Figure 25 Number of Outages by Month for AC Circuits (2008-2010)
This figure does not show redacted outages DC Circuit outages Transformer outages or ACDC Converter
outages
Outage Initiation Location For every outage experienced on the transmission system the outage initiation code is identified and
recorded according to the TADS process The outage initiation code can be analyzed to identify trends and
similarities and to provide insight into what could be done to possibly prevent future occurrences
The ldquoOutage Initiation Coderdquo describes where an automatic outage was initiated on the power system The
five codes are as follows
bull Element-Initiated
bull Other Element-Initiated
bull AC Substation-Initiated
bull ACDC Terminal-Initiated (for DC circuits)
bull Other Facility Initiated any facility not included in any other outage initiation code
JanuaryFebruar
yMarch April May June July August
September
October
November
December
2008 238 229 257 258 292 437 467 380 208 176 255 236
2009 315 201 339 334 398 553 546 515 351 235 226 294
2010 444 224 269 446 449 486 639 498 351 271 305 281
3 Year AVG 332 218 288 346 380 492 551 464 303 227 262 270
0
100
200
300
400
500
600
700
Out
ages
Transmission Equipment Performance
50
Notably the protection system is not part of an ldquoAC Substationrdquo or an ldquoACDC Terminalrdquo If a protection
system misoperates and initiates an outage it will be classified as ldquoOther-Facility Initiatedrdquo The following
Figures show the initiating location of the Automatic outages from 2008 to 2010
With both Momentary and Sustained Automatic Outages taken into account the outage was initiated on the
Element more than 67 percent of the time as shown in Figure 26 and Figure 27
When only the Sustained Automatic Outages are analyzed the outage initiation on both AC Substation and
Other Facility increased by 34 percent and 32 percent respectively Outages initiated on the Element itself
decreases by 78 percent as shown in Figure 26 and 27 For only the Momentary Automatic Outages the
outage initiation on the Element increases by 19 percent compared to Sustained Outages Element initiated
outages make up over 78 percent of the total outages when analyzing only Momentary Outages
Figure 26
Figure 27
Transmission Outage Events Figure 28 illustrates the relationship between the numbers of Automatic Outages associated per TADS
event 2008 2009 and 2010 tend to follow the same trend The largest number of Automatic Outages per
TADS event is fourteen in 2010 thirteen in 2009 and eight in 2008 There are around 70 to 100 TADS
events that contain between fourteen and three Automatic Outages (see below) There are around 330 to
400 TADS events that contain two or more Automatic Outages The rest of the events only contain one
Automatic Outage As noted in the lower right hand corner below the total number of Events in 2008 to
2010 ranged from 3920 to 4569 events per year Nearly 90 percent or more of the events contained one
Automatic Outage
Figure 26 Sustained Automatic Outage Initiation
Code
Figure 27 Momentary Automatic Outage Initiation
Code
Transmission Equipment Performance
51
Transmission Outage Mode Figure 29 and Figure 30 show the percentage of Outage Modes The ldquoOutage Mode Coderdquo describes
whether one Automatic Outage is related to other Automatic Outages A Single Mode outage is an
Automatic Outage of a single Element which occurs independently of any other Automatic Outages (if any)
A ldquoDependent Mode Initiating Outagerdquo is an Automatic Outage of a single Element that initiates one or more
subsequent Element Automatic Outages A ldquoDependent Mode Outagerdquo is an Automatic Outage of an
Element which occurred as a result of an initiating outage whether the initiating outage was an Element
outage or a non-Element outage A ldquoCommon Mode Outagerdquo is one of two or more Automatic Outages with
the same Initiating Cause Code and where the outages are not consequences of each other and occur nearly
simultaneously A ldquoCommon Mode Initiating Outagerdquo is a Common Mode Outage that initiates one or more
subsequent Automatic Outages
Over 72 percent of the total outages occurred on the bulk power system are Single Mode Outages The next
largest mode is Dependent with over 11 percent of the total outages being in this category For only
Sustained Automatic Outages outages related to each other increase with Dependent mode accounting for
13 percent of the outages and Common mode accounting for close to 11 percent of the outages
Independent Sustained outages still account for the largest portion with nearly 70 percent being Single
mode When just analyzing Momentary Automatic Outages Associated outages decrease with Dependent
Figure 28 Event Histogram (2008-2010)
Transmission Equipment Performance
52
mode accounting for only 9 percent of the outages The Common Mode percentage decreases while
Dependent Mode Initiating percentage increases compared to Sustained Outages Independent Momentary
outages account for the largest portion with over 76 percent being Single Mode
An investigation into the root causes of Dependent and Common mode events which include three or more
Automatic Outages (indentified in the TADS 2008 to 2010 data) should be a high priority Some protection
systems are designed to trip three or more circuits but some events go beyond what is designed Some also
have misoperations associated with multiple outage events
Conclusions On a NERC wide average basis automatic transmission outage rate is improving from 2008 to 2010 based on
reported data Considering both automatic and non-automatic outages 2010 records indicate transmission
element availability percentage is very high and exceeds 95 The unavailability rate for AC circuits and
transformers are only 15 and 29 respectively
The cause codes of Human Error Failed Protection System Equipment and Failed AC Circuit Equipment
should be considered significant focus points in reducing the number of Sustained Automatic Outages for all
elements A deeper look into the root causes of Dependent and Common mode events which include three
or more Automatic Outages (indentified in the TADS 2008 to 2010 data) should be a high priority Some
protection systems are designed to trip three or more circuits but some events go beyond what is designed
Some also have misoperations associated with multiple outage events
Figure 29 Sustained Automatic Outage Mode code Figure 30 Momentary Automatic Outage Mode code
Generation Equipment Performance
53
Generation Equipment Performance Introduction The development of the Generating Availability Data System (GADS) began in 1982 This series of databases
is used to voluntarily collect record and retrieve operating information By pooling individual unit
information with likewise units generating unit availability performance can be calculated providing
opportunities to identify trends and generating equipment reliability improvement opportunities The
information is used to support equipment reliability availability analyses and risk-informed decision-making
by system planners generation owners assessment modelers manufacturers and contractors etc Reports
and information resulting from the data collected through GADS are now used for benchmarking and
analyzing electric power plants
Currently the data collected through GADS contains 72 percent of the North American generating units
with generating capacity of 20 MW or higher34 Additionally many of the newer combined-cycle plants are
not reporting information and therefore a full view of each unit type is not presented Rather a sample of
all the units in North America that fit a given more general category is provided35 for the 2008-201036
Generation Key Performance Indicators
assessment period
Three key performance indicators37
In
the industry have used widely to measure the availability of generating
units (see Terms Used in This Report section for their calculation parameters) are Equivalent Availability
Factor (EAF) Net Capacity Factor (NCF) and Equivalent Forced Outage Rate ndash Demand (EFORd)
Table 7 the North American fleet average EAF NCF and EFORd compared to unit age for all generating
units with a capacity of 20 MW and higher is provided for the years 2008-2010 The EAF shows a decline
during the last three years NCF is up and down while the EFORd appears to be increasing As expected the
fleet of units reported to GADS is aging overall with the fossil units being about 12 years older than the
average age
34 httpwwwnerccomdocspcgadstfGADSTF_Recommendation_Report_02-18-2011_FINALpdf 35GADS contains some 1500+ units under 20 MW that is not included in this report These units are excluded because most units are not base-loaded and are in peaking operation
3684 percent of the 2010 dataset is available at this time while the 2008 and 2009 dataset is complete 37 httpwwwnerccompagephpcid=4|43
Generation Equipment Performance
54
Table 7 General Availability Review of GADS Fleet Units by Year
2008 2009 2010 Average
Equivalent Availability Factor (EAF) 8776 8774 8678 8743
Net Capacity Factor (NCF) 5083 4709 4880 4890
Equivalent Forced Outage Rate -
Demand (EFORd) 579 575 639 597
Number of Units ge20 MW 3713 3713 3713 3713
Average Age of the Fleet in Years (all
unit types) 303 311 321 312
Average Age of the Fleet in Years
(fossil units only) 422 432 440 433
Figure 31 provides the average forced outage hours (FOH) maintenance outage hours (MOH) and planned
outage hours (POH) for all units reporting 20 MW or larger During this three-year period the average FOH
291 hours average MOH is 163 hours average POH is 470 hours
Figure 31 shows a large increase in forced and maintenance events The average age of the units with a
capacity of 20MW and higher in 2009 is 316 years old However the average age of fossil units in 2010 is
442 years old These fossil units are the backbone of all operating units providing the base-load power
continuously and nearly 50 percent of all energy annually There appears to be no increase allocated for
annualsemi-annual maintenance (ie planned outages) for the older generating units The increase of
000100002000030000400005000060000700008000090000
100000
2008 2009 2010
463 479 468
154 161 173
288 270 314
Hou
rs
Planned Maintenance Forced
Figure 31 Average Outage Hours for Units gt 20 MW
Generation Equipment Performance
55
maintenance outage hours reflects an increased need to fix problems that cannot be deferred until the next
annualsemi-annual repairs As a result it shows one of two things are happening
bull More or longer planned outage time is needed to repair the aging generating fleet
bull More focus on preventive repairs during planned and maintenance events are needed
Multiple Unit Forced Outages and Causes Table 8 provides the annual multiple-unit forced outage trips resulting from the same cause for each of the
assessments years 2008-2010 respectively The ldquosingle unitrdquo trips are large units with a Net Dependable
Capacity of 750 MW or more The trips of ldquotwo unitsrdquo or more is any combination of unit capacity with the
total amount of lost capacity more than 750 MW
Table 8 also presents more information on the forced outages During 2008-2010 there were a large
number of double-unit outages resulting from the same event Investigations show that some of these trips
were at a single plant caused by common control and instrumentation for the units The incidents occurred
several times for several months and are a common mode issue internal to the plant
Table 8 Number of Multiple Unit Forced Outages and FrequencyYear
2008 2009 2010
Type of
Trip
of
Trips
Avg Outage
Hr Trip
Avg Outage
Hr Unit
of
Trips
Avg Outage
Hr Trip
Avg Outage
Hr Unit
of
Trips
Avg Outage
Hr Trip
Avg Outage
Hr Unit
Single-unit
Trip 591 58 58 284 64 64 339 66 66
Two-unit
Trip 281 43 22 508 96 48 206 41 20
Three-unit
Trip 74 48 16 223 146 48 47 109 36
Four-unit
Trip 12 77 19 111 112 28 40 121 30
Five-unit
Trip 11 1303 260 60 443 88 19 199 10
gt 5 units 20 166 16 93 206 50 37 246 6
Loss of ge 750 MW per Trip
The high number of five-unit trips in 2008 was due to Hurricane Ike hitting the Gulf Coast The highest total
number of multiple unit trips occurred in 2009 though as mentioned before the data collection for 2010 is
incomplete at this time The majority of 2009 multiple unit trips have three main causes (in order by
Generation Equipment Performance
56
number of events) transmission lack of fuel and storms A summary of the three categories for single as
well as multiple unit outages (all unit capacities) are reflected in Table 9
Table 9 Common Causes of Multiple Unit Forced Outages (2009)
Cause Number of Events Average MW Size of Unit
Transmission 1583 16
Lack of Fuel (Coal Mines Gas Lines etc) Not
in Operator Control
812 448
Storms Lightning and Other Acts of Nature 591 112
Some of the transmission outages based on storms in 2009 have been caused by the same reasons because
the storms may have caused transmission interference However the plants reported the problems
inconsistently with either the transmission interference or storms cause code Therefore they are depicted
as two different causes of forced outage
Marked transmission outages in 2009 were quite high Thirty-five percent came from one utility with a large
number of hydroelectric units The company related the trips to various problems including weather
(lightning storms) wildlife ldquoline bumpsrdquo and problems on the receiving end of the transmission line Nine
hundred and eighty-five transmission trips (62 percent) were from hydroelectric units38
In 2009 only ten transmission trips resulted in a loss of 750 MW or more per trip Twenty two generating
plants were affected by the ten trips Causes for the trips include feeder line trips (1 trip) breakers in the
switchyard (8 trips) personnel errors (2 trips) and unknown (10 trips)
The ldquoLack of Fuelrdquo outages are of interest as these events occur during the times when a unit is available to
operate but there is an interruption in fuels to operate the facilities These events do not include
interruptions of fuel due to contracts Rather the cause code is designed to account for units that are
expecting fuel and it is unavailable when requested Table 10 presents the distribution of ldquoLack of Fuelrdquo
events by NERC Region and Table 11 presents the unit types affected
38 The average size of the hydroelectric units were small ndash 335 MW
Generation Equipment Performance
57
Of the units that report ldquoLack of Fuelrdquo 78 percent of the units are oil-fired 15 percent of the units are gas-
fired and the remaining units are various other fuels Table 12 provides the top causes of forced outage for
several unit types For fossil units ldquoLack of Fuelrdquo as the number three cause behind waterwall tube leaks
and superheater tube leaks
Table 10 Forced Outages Due to Lack of Fuel by Region
Region Number of Lack of Fuel
Problems Reported
FRCC 0
MRO 3
NPCC 24
RFC 695
SERC 17
SPP 3
TRE 7
WECC 29
One company contributed to the majority of oil-fired lack of fuel events The units at the company are
actually dual-fuels (oil and gas) but market nominated gas monitoring causes the units to be on forced
outage nightly The units need gas to start up so they can run on oil When they shut down the units must
switch to gas to clean themselves With the gas restriction the unit canrsquot start and the unit goes on a
forced outage Until the band is lifted the two units will continue to be on a forced outage cycle
Event records also provide descriptions of why the unit was without fuel with the majority of descriptions
bull Temperatures affecting gas supply valves
bull Unexpected maintenance of gas pipe-lines
bull Compressor problemsmaintenance
Generation Equipment Performance
58
Table 11 Unit Type Profile of Forced Outages Due to Lack of Fuel
Unit Types Number of Lack of Fuel Problems Reported
Fossil 642
Nuclear 0
Gas Turbines 88
Diesel Engines 1
HydroPumped Storage 0
Combined Cycle 47
Generation Equipment Performance
59
Table 12 Causes of Forced Outage for Different Unit Types (2008-2010)
Fossil - all MW sizes all fuels
Rank Description Occurrence per Unit-year
MWH per Unit-year
Average Hours To Repair
Average Hours Between Failures
Unit-years
1 Waterwall (furnace wall) 0590 134106 59 3250 3868 2 Second Superheater
Leaks 0180 5182 60 3228 3868
3 Lack of Fuel (coal mines gas lines etc) where the operator is not in control
0480 4701 18 26 3868
Combined-Cycle blocks Rank Description Occurrence
per Unit-year
MWH per Unit-year
Average Hours To Repair
Average Hours Between Failures
Unit-years
1 HP Turbine Buckets Or Blades
0020 4663 1830 26280 466
2 Turbine Control Valves 0040 2777 100 7200 466 3 Gas Turbine Compressor -
High Pressure Shaft 0010 2266 663 4269 466
Nuclear units - all Reactor types Rank Description Occurrence
per Unit-year
MWH per Unit-year
Average Hours To Repair
Average Hours Between Failures
Unit-years
1 LP Turbine Buckets or Blades
0010 26415 8760 26280 288
2 Containment Structure 0010 9233 1226 26262 288 3 Feedwater Pump Local
Controls 0020 7620 692 12642 288
Simple-cycle gas turbine jet engines Rank Description Occurrence
per Unit-year
MWH per Unit-year
Average Hours To Repair
Average Hours Between Failures
Unit-years
1 Main Transformer 0030 1611 1016 20709 4181 2 Other Gas Turbine
Controls And Instrument Problems
0120 428 70 2614 4181
3 Other Gas Turbine Problems
0090 400 119 1701 4181
Generation Equipment Performance
60
2008-2010 Review of Summer versus Winter Availability To address seasonality of unit availability unit information for the months of June to September (summer)
and December through February (winter) were pooled to calculate force events during these timeframes for
2008-201039 Figure 32 shows the Equivalent Availability Factor (EAF) is three percentage points higher and
the Equivalent Forced Outage Rate - Demand (EFORd) is more than a half of a percentage point lower in the
summer period than in winter period This means the units were more reliable with less forced events
during high-demand times during the summer than during the winter seasons The generating unitrsquos
capability has a resulting higher Net Capacity Factor (NCF) of 45 percentage points in the summer season
for 2008-2010
During the spring season (March-May) 77 percent of the units took a planned outage (PO) for an average
231 hours (or 96 days) In fall (October-November) only 42 percent of the units experienced a PO and the
average duration was shorter ndash 134 hours (or 56 days) A few units took both spring and fall planned
outages although this is rare Based on this assessment the generating units are prepared for the summer
peak demand The resulting availability indicates that this maintenance was successful which is measured
by an increased EAF and lower EFORd
Figure 32 Summer-Winter Average EAF NCF and EFORd (2008-2010)
Conclusions and Recommendations During 2008-2010 the average Equivalent Availability Factor (EAF) which measures the overall availability
of generating units decreased At the same time the Net Capacity Factor (NCF) an indicator of energy
production increased The average number of forced outages in 2010 is greater than in 2008 while at the
same time the average planned outage times have decreased As a result the Equivalent Forced Outage
Rate ndash Demand (EFORd) also increased illustrating that more units have experienced forced events during
39 A study of peak periods was conducted by the NERC Generating Availability Trend Evaluation (GATE) Working Group several years ago see httpwwwnerccomfilesSeasonal-Performance-Trendspdf
9116
5343
396
8818
4896
441
0 10 20 30 40 50 60 70 80 90 100
EAF
NCF
EFORd
Percent ()
Winter
Summer
Generation Equipment Performance
61
peak-demand times in 2010 than in the previous two years Potentially with shorter planned outage
periods in 2010 there may be less time to repair equipment and prevent forced unit outages
There are warnings that units are not being maintained as well as they should be In the last three years
there has been an increase in Equivalent Forced Outage Rate ndash Demand (EFORd) This indicator measures
the rate of forced outage events on generating units during periods of load demand To confirm this
problem forced outage hours jumped from 270 to 314 hours per unit between 2009 and 2010 At the same
time maintenance events also increased by 12 hours per unit Planned outage events remain constant The
resulting conclusions from this trend are
bull More or longer planned outage time is needed to repair the generating fleet Whether age is the
cause of the increase need for planned outage time remains unknown and further investigation into
the cause for longer planned outage time is necessary
bull More focus on preventive repairs during planned and maintenance events are needed
There are many multiple unit forced outages due to lack of fuel The majority of multiple unit trips have
three main causes transmission lack of fuel and storms With special interest in the forced outages due to
ldquoLack of Fuelrdquo additional analysis revealed that 77 percent of the units experiencing unexpected fuel
stoppage are oil-fired fossil units while gas-fired units experienced 15 percent
Generating units continue to be more reliable during the peak summer periods
Disturbance Event Trends
62
Category 1 An event resulting in one or more of the following a Unintended loss of three or more BPS elements caused by
common mode failure b Failure or misoperation of an SPSRAS c System-wide voltage reduction of 3 or more d Unintended BPS system separation resulting in an island of
100 MW to 999 MW e Unplanned evacuation from a control center facility with BPS
SCADA functionality for 30 minutes or more Category 2 An event resulting in one or more of the following
a Complete loss of all BPS control center voice communication system(s) for 30 minutes or more
b Complete loss of SCADA control or monitoring functionality for 30 minutes or more
c Voltage excursions equal to or greater than 10 lasting more than five minutes
d Loss of off-site power (LOOP) to a nuclear generating station e Unintended system separation resulting in an island of 1000
MW to 4999 MW f Unintended loss of 300MW or more of firm load for more
than 15 minutes g Violation of an Interconnection Reliability Operating Limit
(IROL) for more than 30 minutes Category 3 An event resulting in one or more of the following
a The loss of load or generation of 2000 MW or more in the Eastern Interconnection or
b Western Interconnection or 1000 MW or more in the ERCOT or Queacutebec Interconnections
c Unintended system separation resulting in an island of 5000 MW to 10000 MW
d Unintended system separation resulting in an island of Florida from the Eastern Interconnection
Category 4 An event resulting in one or more of the following a The loss of load or generation from 5001 MW to 9999 MW b Unintended system separation resulting in an island of more
than 10000 MW (with the exception of Florida as described in Category 3c)
Category 5 An event resulting in one or more of the following a The loss of load of 10000 MW or more b The loss of generation of 10000 MW or more
Figure 33 BPS Event Category
Disturbance Event Trends Introduction The purpose of this section is to report event
analysis trends from the beginning of event
analysis field test40
One of the companion goals of the event
analysis program is the identification of trends
in the number magnitude and frequency of
events and their associated causes such as
human error equipment failure protection
system misoperations etc The information
provided in the event analysis database (EADB)
and various event analysis reports have been
used to track and identify trends in BPS events
in conjunction with other databases (TADS
GADS metric and benchmarking database)
to the end of 2010
The Event Analysis Working Group (EAWG)
continuously gathers event data and is moving
toward an integrated approach to analyzing
data assessing trends and communicating the
results to the industry
Performance Trends The event category is classified41
Figure 33
as shown in
with Category 5 being the most
severe Figure 34 depicts disturbance trends in
Category 1 to 5 system events from the
40 httpwwwnerccomdocseawgGalloway-Industry-EA-Field-Test-102210pdf 41httpwwwnerccomfiles2011-05-0220Event_Analysis_Process_Phase20220Field20Test20Draft20-20Final20-20For20postingpdf
Disturbance Event Trends
63
beginning of event analysis field test to the end of 201042
Figure 34 Event Category vs Date for All 2010 Categorized Events
From the figure in November and December
there were many more category 1 and 2 events than in October This is due to the field trial starting on
October 25 2010
In addition to the category of the events the status of the events plays a critical role in the accuracy of the
data By examining Figure 35 over 80 of the events reported in 2010 have been closed This means that
the category root cause and other important information have been sufficiently finalized in order for
analysis to be accurate for each event At this time there is not enough data to draw any long-term
conclusions about event investigation performance
42 Documents for the EA Field Test are located at httpwwwnerccompagephpcid=5|365
2
12 12
26
3
6 5
14
1 1
2
0
5
10
15
20
25
30
35
40
45
October November December 2010
Even
t Cou
nt
Category 3 Category 2 Category 1
Disturbance Event Trends
64
Figure 35 Event Count vs Status (All 2010 Events with Status)
By drilling down into the cause code for each closed 2010 event Figure 36 shows the top 3 event causes
From the figure equipment failure and protection system misoperation are the most significant causes for
events Because of how new and limited the data is however there may not be statistical significance for
this result Further trending of cause codes for closed events and developing a richer dataset to find any
trends between event cause codes and event counts should be performed
Figure 36 Top 3 Event Counts vs DAWG Cause Code for all Closed 2010 Events
10
32
42
0
5
10
15
20
25
30
35
40
45
Open Closed Open and Closed
Even
t Cou
nt
Status
1211
8
0
2
4
6
8
10
12
14
Equipment Failure Protection System Misoperation Human Error
Even
t Cou
nt
Cause Code
Disturbance Event Trends
65
Conclusions Due to the relatively new process for events analysis and categorization more time will be required before a
conclusive recommendation may be obtained Further analysis and new data should provide valuable
statistics in the future Over 80 of all event reports from 2010 are current listed as closed but no
conclusion about investigation performance may be obtained because of the limited amount of data It is
recommended to study ways to prevent equipment failure and protection system misoperations but there
is not enough data to draw a firm conclusion about the top causes of events at this time
Abbreviations Used in This Report
66
Abbreviations Used in This Report
Acronym Definition ALP Acadiana Load Pocket
ALR Adequate Level of Reliability
ARR Automatic Reliability Report
BA Balancing Authority
BPS Bulk Power System
CDI Condition Driven Index
CEII Critical Energy Infrastructure Information
CIPC Critical Infrastructure Protection Committee
CLECO Cleco Power LLC
DADS Future Demand Availability Data System
DCS Disturbance Control Standard
DOE Department Of Energy
DSM Demand Side Management
EA Event Analysis
EAF Equivalent Availability Factor
ECAR East Central Area Reliability
EDI Event Drive Index
EEA Energy Emergency Alert
EFORd Equivalent Forced Outage Rate Demand
EMS Energy Management System
ERCOT Electric Reliability Council of Texas
ERO Electric Reliability Organization
ESAI Energy Security Analysis Inc
FERC Federal Energy Regulatory Commission
FOH Forced Outage Hours
FRCC Florida Reliability Coordinating Council
GADS Generation Availability Data System
GOP Generation Operator
IEEE Institute of Electrical and Electronics Engineers
IESO Independent Electricity System Operator
IROL Interconnection Reliability Operating Limit
Abbreviations Used in This Report
67
Acronym Definition IRI Integrated Reliability Index
LOLE Loss of Load Expectation
LUS Lafayette Utilities System
MAIN Mid-America Interconnected Network Inc
MAPP Mid-continent Area Power Pool
MOH Maintenance Outage Hours
MRO Midwest Reliability Organization
MSSC Most Severe Single Contingency
NCF Net Capacity Factor
NEAT NERC Event Analysis Tool
NERC North American Electric Reliability Corporation
NPCC Northeast Power Coordinating Council
OC Operating Committee
OL Operating Limit
OP Operating Procedures
ORS Operating Reliability Subcommittee
PC Planning Committee
PO Planned Outage
POH Planned Outage Hours
RAPA Reliability Assessment Performance Analysis
RAS Remedial Action Schemes
RC Reliability Coordinator
RCIS Reliability Coordination Information System
RCWG Reliability Coordinator Working Group
RE Regional Entities
RFC Reliability First Corporation
RMWG Reliability Metrics Working Group
RSG Reserve Sharing Group
SAIDI System Average Interruption Duration Index
SAIFI System Average Interruption Frequency Index
SCADA Supervisory Control and Data Acquisition
SDI Standardstatute Driven Index
SERC SERC Reliability Corporation
Abbreviations Used in This Report
68
Acronym Definition SRI Severity Risk Index
SMART Specific Measurable Attainable Relevant and Tangible
SOL System Operating Limit
SPS Special Protection Schemes
SPCS System Protection and Control Subcommittee
SPP Southwest Power Pool
SRI System Risk Index
TADS Transmission Availability Data System
TADSWG Transmission Availability Data System Working Group
TO Transmission Owner
TOP Transmission Operator
WECC Western Electricity Coordinating Council
Contributions
69
Contributions This report was made feasible by the collaboration and hard work of both NERC staff and NERCrsquos
Industry Groups
NERC Industry Groups
Table 14 lists the NERC industry group contributors Without their contribution and collaboration this
report would not have been possible
Table 13 NERC Industry Group Contributions43
NERC Group
Relationship Contribution
Reliability Metrics Working Group
(RMWG)
Reports to the OCPC bull Lead Development of Report bull Provide Reliability Metrics Data bull Responsible for Reliability Metrics
Performance Chapter
Transmission Availability Working Group
(TADSWG)
Reports to the OCPC bull Provide Transmission Availability Data
bull Responsible for Transmission Equip-ment Performance Chapter
bull Content Review
Generation Availability Data System Task
Force
(GADSTF)
Reports to the OCPC bull Provide Generation Availability Data bull Responsible for Generation Equip-
ment Performance Chapter bull Content Review
Event Analysis Working Group
(EAWG)
Reports to the OCPC bull Provide Events Data bull Responsible for Disturbance Events
Trends Chapter bull Content Review
43 Rosters for RMWG TADSWG GADSTF and EAWG are available at httpwwwnerccomfilesrosterpdf
Contributions
70
NERC Staff Table 13 below lists the NERC staff who contributed to the 2011 Reliability Performance Analysis
Report
Table 14 Contributing NERC Staff
Name Title E-mail Address
Mark Lauby Vice President and Director of
Reliability Assessment and
Performance Analysis
marklaubynercnet
Jessica Bian Manager of Performance Analysis jessicabiannercnet
John Moura Manager of Reliability Assessments johnmouranercnet
Andrew Slone Engineer Reliability Performance
Analysis
andrewslonenercnet
Jim Robinson TADS Project Manager jimrobinsonnercnet
Clyde Melton Engineer Reliability Performance
Analysis
clydemeltonnercnet
Mike Curley Manager of GADS Services mikecurleynercnet
James Powell Engineer Reliability Performance
Analysis
jamespowellnercnet
Michelle Marx Administrative Assistant michellemarxnercnet
William Mo Intern Performance Analysis wmonercnet
- NERCrsquos Mission
- Table of Contents
- Executive Summary
-
- 2011 Transition Report
- State of Reliability Report
- Key Findings and Recommendations
-
- Reliability Metric Performance
- Transmission Availability Performance
- Generating Availability Performance
- Disturbance Events
- Report Organization
-
- Introduction
-
- Metric Report Evolution
- Roadmap for the Future
-
- Reliability Metrics Performance
-
- Introduction
- 2010 Performance Metrics Results and Trends
-
- ALR1-3 Planning Reserve Margin
-
- Background
- Assessment
- Special Considerations
-
- ALR1-4 BPS Transmission Related Events Resulting in Loss of Load
-
- Background
- Assessment
-
- ALR1-12 Interconnection Frequency Response
-
- Background
- Assessment
-
- ALR2-3 Activation of Under Frequency Load Shedding
-
- Background
- Assessment
- Special Considerations
-
- ALR2-4 Average Percent Non-Recovery Disturbance Control Standards (DCS)
-
- Background
- Assessment
- Special Consideration
-
- ALR2-5 Disturbance Control Events Greater Than Most Severe Single Contingency
-
- Background
- Assessment
- Special Consideration
-
- ALR 1-5 System Voltage Performance
-
- Background
- Special Considerations
- Status
-
- ALR3-5 Interconnection Reliability Operating Limit System Operating Limit (IROLSOL) Exceedances
-
- Background
-
- ALR4-1 Automatic Transmission Outages Caused by Protection System Misoperations
-
- Background
- Special Considerations
-
- ALR6-11 ndash ALR6-14
-
- Background
- Assessment
- ALR 6-11 ndash Automatic Outages Initiated by Failed Protection System Equipment
- ALR6-12 ndash Automatic Outages Initiated by Human Error
- ALR6-13 ndash Automatic Outages Initiated by Failed AC Substation Equipment
- ALR6-14 Automatic AC Transmission Outages Initiated by Failed AC Circuit Equipment
-
- ALR6-15 Element Availability Percentage (APC)
-
- Background
- Assessment
- Special Consideration
-
- ALR6-16 Transmission System Unavailability
-
- Background
- Assessment
- Special Consideration
-
- ALR6-2 Energy Emergency Alert 3 (EEA3)
-
- Background
- Assessment
- Special Considerations
-
- ALR 6-3 Energy Emergency Alert 2 (EEA2)
-
- Background
- Assessment
- Special Considerations
-
- ALR 6-1 Transmission Constraint Mitigation
-
- Background
- Assessment
- Special Considerations
-
- Integrated Bulk Power System Risk Assessment
-
- Introduction
- Recommendations
-
- Integrated Reliability Index Concepts
-
- The Three Components of the IRI
-
- Event-Driven Indicators (EDI)
- Condition-Driven Indicators (CDI)
- StandardsStatute-Driven Indicators (SDI)
-
- IRI Index Calculation
- IRI Recommendations
-
- Reliability Metrics Conclusions and Recommendations
-
- Transmission Equipment Performance
-
- Introduction
- Performance Trends
-
- AC Element Outage Summary and Leading Causes
- Transmission Monthly Outages
- Outage Initiation Location
- Transmission Outage Events
- Transmission Outage Mode
-
- Conclusions
-
- Generation Equipment Performance
-
- Introduction
- Generation Key Performance Indicators
-
- Multiple Unit Forced Outages and Causes
- 2008-2010 Review of Summer versus Winter Availability
-
- Conclusions and Recommendations
-
- Disturbance Event Trends
-
- Introduction
- Performance Trends
- Conclusions
-
- Abbreviations Used in This Report
- Contributions
-
- NERC Industry Groups
- NERC Staff
-

Reliability Metrics Performance
41
Integrated Reliability Index Concepts In December 2010 the RMWG was challenged by the OC and PC to develop a single index concept to
measure the universe of risks associated with the bulk power system As a result the integrated
reliability index (IRI) concepts were proposed31
Figure 21
the three components of which were defined to
quantify each specific risk aspect They are titled the Event Driven Index (EDI) StandardsStatute Driven
Index (SDI) and Condition Driven Index (CDI) illustrated in with measures associated with
system events standards compliance and eighteen performance metrics The development of an
integrated reliability index aims to inform increase transparency and quantify the effectiveness of risk
reduction or mitigation actions The goal is to provide the industry meaningful trends of the BPSrsquos
performance and guidance on how the industry can improve reliability and support risk-informed
decision making Once completed the IRI will facilitate holistic assessment of performance Finally the
IRI should help overcome concern and confusion about how many metrics are being analyzed for system
reliability assessments
Figure 21 Risk Model for Bulk Power System
The integrated model of event-driven condition-driven and standardsstatute-driven risk information
can be constructed to illustrate all possible logical relations between the three risk sets Due to the
nature of the system there may be some overlap among the components
31 httpwwwnerccomdocspcrmwgIntegrated_Reliability_Index_WhitePaper_DRAFTpdf
Event Driven Index (EDI)
Indicates Risk from
Major System Events
Standards Statute Driven
Index (SDI)
Indicates Risks from Severe Impact Standard Violations
Condition Driven Index (CDI)
Indicates Risk from Key Reliability
Indicators
Reliability Metrics Performance
42
The Three Components of the IRI The three components of the IRI work together as shown in Figure 22 to comprise a full picture of the
state of reliability
Figure 22 An overview of the components that comprise the Integrated Reliability Index (IRI)
Event-Driven Indicators (EDI)
The Event-Driven Indicator provides a basis for prioritization of events based on bulk power system
integrity equipment performance and engineering judgment This indicator can serve as a high value
risk assessment tool to be used by stakeholders to investigate and evaluate disturbance history and
measure the severity of these events The relative ranking of events requires industry expertise agreed-
upon goals and engineering judgment The EDI is a derivative of SRI results for a specific time period
but it transforms that performance into a form of an availability index These calculations will be further
refined as feedback is received
Condition-Driven Indicators (CDI)
The Condition-Driven Indicators focus on a set of measurable system conditions (performance
measures) to assess bulk power system reliability These reliability indicators identify factors that
positively or negatively impact reliability and are early predictors of the risk to reliability from events or
unmitigated violations A collection of these indicators measures how close reliability performance is to
the desired outcome and if the performance against these metrics is constant or improving
Reliability Metrics Performance
43
StandardsStatute-Driven Indicators (SDI)
The StandardsStatute-Driven Indicator is a calculation of success of compliance based upon the subset
of high-value standards and is divided by the number of participations who could have received the
violation within the time period considered Also based on these factors known unmitigated violations
of elevated risk factor requirements are weighted higher than lower risk factors The index decreases if
the compliance improvement is achieved over a trending period
IRI Index Calculation As with the SRI the IRI is based on an importance weighting factor which the RMWG can modify over
time after gaining experience with the new metric as well as consideration of feedback from industry
At this time the RMWG believes some form of blended weighting may serve to start to populate IRI
characteristic curves at a high and generic level Based upon feedback from stakeholders this approach
may change or as discussed below weighting factors may vary based on periodic review and risk model
update The RMWG will continue the refinement of the IRI calculation and consider other significant
factors that impact reliability (eg intentional and controlled load-shedding) further it will explore
developing mechanisms for enabling ongoing refinement which should be influenced by a wide set of
stakeholders
RMWG recommends the Event Driven Index (EDI) be weighted the highest (50 percent) since events
actually occurred indicating how the system was performing The Condition Driven Index (CDI) and
StandardsStatute Driven Index (SDI) are weighted 25 each since they are indicators of potential risks
to BPS reliability IRI can be calculated as follows
IRI is intended to be a composite metric which integrates several forms of individual risks to the bulk
power system Since the three components range across many stakeholder organizations these
concepts are developed as starting points for continued study and evaluation Additional supporting
materials can be found in the IRI whitepaper32
IRI Recommendations
including individual indices calculations and preliminary
trend information
For the IRI more investigation should be performed to determine the best way to integrate EDI CDI
and SDI into an Integrated Reliability Index (IRI) that quantitatively represents the reliability of the bulk
32 The IRI whitepaper can be found at httpwwwnerccomdocspcrmwgIntegrated_Reliability_Index_WhitePaper_DRAFTpdf
Reliability Metrics Performance
44
power system To this end study into determining the amount of overlap between the components is
necessary RMWG is currently working to determine the proper amount of overlap between the IRI
components
Also the CDI component of the IRI needs to be solidified This is especially true with the CDI More
accurate metric data is needed to paint a fuller picture of the CDI Many of the metrics used to calculate
the CDI are new or they have limited data Compared to the SDI which counts well-known violation
counts and the EDI which uses the well-defined CDI the CDI lacks the depth of rigor that the other two
components have acquired through their years of data RMWG is currently working to improve the CDI
Reliability Metrics Conclusions and Recommendations Among the eighteen metrics that address the characteristics of an adequate level of reliability (ALR)
metric trends indicate the system is performing better in the following seven areas
bull ALR1-3 Planning Reserve Margin
bull ALR1-4 BPS Transmission Related Events Resulting in Loss of Load
bull ALR2-5 Disturbance Control Events Greater than Most Severe Single Contingency
bull ALR6-2 Energy Emergency Alert 3 (EEA3)
bull ALR6-3 Energy Emergency Alert 2 (EEA2)
bull ALR6-11 Automatic Transmission Outages Caused by Protection System Misoperations
bull ALR6-13 Automatic Transmission Outages Caused by Failed AC Substation Equipment
Assessments have been made in other performance categories A number of them do not have
sufficient data to derive any conclusions from the results The RMWG recommends continued data
collection and assessment of these metrics If a metric does not yield any trend in a five-year reporting
period the metric will be modified or withdrawn
For the IRI more investigation should be performed to determine the overlap of the components (CDI
EDI and SDI) The CDI should be more thoroughly solidified as an index by collecting more data over
time
Transmission Equipment Performance
45
Transmission Equipment Performance Introduction The Transmission Availability Data System (TADS) effort began with the establishment of a TADS task force
by the NERC Planning Committee in October 2006 On October 27 2007 the NERC Board of Trustees
approved the collection of transmission automatic outage data beginning in calendar year 2008 (Phase I)
Subsequently on October 29 2008 the NERC Board approved the collection of Non-Automatic Outage data
that began for Calendar year 2010 (Phase II)
This chapter provides reliability performance analysis of the transmission system by focusing on the trends
of Automatic Outage data from calendar year 2008 thru 2010 Since only one year of Non-Automatic
Outage data has been collected that data will not be assessed in this report
When calculating bulk power system performance indices care must be exercised when interpreting results
as misinterpretation can lead to erroneous conclusions regarding system performance With only three
years of data in the smaller regions it is not clear whether a regionrsquos yearly outage variation compared to
the average is due to random statistical variation or that particular year is significantly different in
performance However on a NERC-wide basis after three years of data collection there is enough
information to accurately determine whether the yearly outage variation compared to the average is due to
random statistical variation or the particular year in question is significantly different in performance33
Performance Trends
Transmission performance information has been provided by Transmission Owners (TOs) within NERC
through the NERC TADS (Transmission Availability Data System) process The data presented reflects
Momentary and Sustained AC Automatic outages of transmission elements that operate at voltages ge 200 kV
(including the low side of transformers) with the criteria specified in the TADS process The following
elements listed below are included
bull AC Circuits ge 200 kV (Overhead and Underground Circuits) Radial circuits are included
bull DC Circuits with ge +-200 kV DC voltage
bull Transformers with ge 200 kV low-side voltage and
bull ACDC Back-to-Back (BTB) Converters with ge 200 kV AC voltage on both sides
33The detailed Confidence Interval computation is available at httpwwwnerccomdocspctadstfTADS_Nov_2_2007APPENDIX_C_Confidence_Intervalpdf
Transmission Equipment Performance
46
AC Element Outage Summary and Leading Causes Table 6 shows the 2008 2009 and 2010 NERC total AC transmission element inventory and a summary of
the associated outages As expected in general the number of circuits increased from year to year due to
new construction or re-construction to higher voltages For every outage experienced on the transmission
system cause codes are identified and recorded according to the TADS process Causes of both momentary
and sustained outages have been indicated These causes are analyzed to identify trends and similarities
and to provide insight into what could be done to possibly prevent future occurrences
Figure 23 and Figure 24 describe the top ten initiating cause codes for sustained and momentary automatic
outages combined from 2008-2010 Based on the two figures the relationship between the total number of
outages and total outage hours can be seen Failed AC Substation Equipment and Failed AC Circuit
Equipment only account for 15 percent of the total number of outages but account for 65 percent of the
total outage hours The two largest causes of outages within NERC (ldquoLightingrdquo and ldquoWeather excluding
Lightningrdquo) account for 34 percent of the total number of outages
The next three Human Error Failed Protection System Equipment and Failed AC Circuit Equipment have
very similar totals and should all be considered significant focus points in reducing the number of Sustained
Automatic Outages for all elements
Transmission Equipment Performance
47
Table 6 NERC - All AC Elements Sustained and Momentary Outage Performance Summary
2008 Number of Outages
AC Voltage
Class
No of
Circuits
Circuit
Miles Sustained Momentary
Total
Outages Total Outage Hours
200-299kV 4369 102131 1560 1062 2622 56595
300-399kV 1585 53631 793 753 1546 14681
400-599kV 586 31495 389 196 585 11766
600-799kV 110 9451 43 40 83 369
All Voltages 6650 196708 2785 2051 4836 83626
2009 Number of Outages
AC Voltage
Class
No of
Circuits
Circuit
Miles Sustained Momentary
Total
Outages Total Outage Hours
200-299kV 4468 102935 1387 898 2285 28828
300-399kV 1619 56447 641 610 1251 24714
400-599kV 592 32045 265 166 431 9110
600-799kV 110 9451 53 38 91 442
All Voltages 6789 200879 2346 1712 4038 63094
2010 Number of Outages
AC Voltage
Class
No of
Circuits
Circuit
Miles Sustained Momentary
Total
Outages Total Outage Hours
200-299kV 4567 104722 1506 918 2424 54941
300-399kV 1676 62415 721 601 1322 16043
400-599kV 605 31590 292 174 466 10442
600-799kV 111 9477 63 50 113 2303
All Voltages 6957 208204 2582 1743 4325 83729
Note The NERC table does not show redacted outages DC Circuit outages Transformer outages or ACDC
converter outages
Transmission Equipment Performance
48
Figure 23 NERC - Top Ten Sustained and Momentary Outages by Initiating Cause Code for All Elements
Figure 24 NERC - Top Ten Sustained Outage Hours by Cause Code
198
151
80
7271
6943
33
27
188
68
Lightning
Weather excluding lightningHuman Error
Failed AC Substation EquipmentFailed Protection System EquipmentFailed AC Circuit Equipment Foreign Interference
Power System Condition
Fire
Unknown
Remaining Cause Codes
299
246
188
58
52
42
3619
16 12 31 Failed AC Substation EquipmentFailed AC Circuit Equipment Weather excluding lightningUnavailable
Other
Fire
Unknown
Human Error
Failed Protection System EquipmentForeign Interference
Remaining Cause Codes
Transmission Equipment Performance
49
Transmission Monthly Outages Figure 25 displays the total number of Automatic Outages on a per-month basis The three months with the
highest total of outages were June July and August From a seasonal perspective winter had a monthly
average of 281 outages These include the months of November-March Summer had an average of 429
outages Summer included the months of April-October
Figure 25 Number of Outages by Month for AC Circuits (2008-2010)
This figure does not show redacted outages DC Circuit outages Transformer outages or ACDC Converter
outages
Outage Initiation Location For every outage experienced on the transmission system the outage initiation code is identified and
recorded according to the TADS process The outage initiation code can be analyzed to identify trends and
similarities and to provide insight into what could be done to possibly prevent future occurrences
The ldquoOutage Initiation Coderdquo describes where an automatic outage was initiated on the power system The
five codes are as follows
bull Element-Initiated
bull Other Element-Initiated
bull AC Substation-Initiated
bull ACDC Terminal-Initiated (for DC circuits)
bull Other Facility Initiated any facility not included in any other outage initiation code
JanuaryFebruar
yMarch April May June July August
September
October
November
December
2008 238 229 257 258 292 437 467 380 208 176 255 236
2009 315 201 339 334 398 553 546 515 351 235 226 294
2010 444 224 269 446 449 486 639 498 351 271 305 281
3 Year AVG 332 218 288 346 380 492 551 464 303 227 262 270
0
100
200
300
400
500
600
700
Out
ages
Transmission Equipment Performance
50
Notably the protection system is not part of an ldquoAC Substationrdquo or an ldquoACDC Terminalrdquo If a protection
system misoperates and initiates an outage it will be classified as ldquoOther-Facility Initiatedrdquo The following
Figures show the initiating location of the Automatic outages from 2008 to 2010
With both Momentary and Sustained Automatic Outages taken into account the outage was initiated on the
Element more than 67 percent of the time as shown in Figure 26 and Figure 27
When only the Sustained Automatic Outages are analyzed the outage initiation on both AC Substation and
Other Facility increased by 34 percent and 32 percent respectively Outages initiated on the Element itself
decreases by 78 percent as shown in Figure 26 and 27 For only the Momentary Automatic Outages the
outage initiation on the Element increases by 19 percent compared to Sustained Outages Element initiated
outages make up over 78 percent of the total outages when analyzing only Momentary Outages
Figure 26
Figure 27
Transmission Outage Events Figure 28 illustrates the relationship between the numbers of Automatic Outages associated per TADS
event 2008 2009 and 2010 tend to follow the same trend The largest number of Automatic Outages per
TADS event is fourteen in 2010 thirteen in 2009 and eight in 2008 There are around 70 to 100 TADS
events that contain between fourteen and three Automatic Outages (see below) There are around 330 to
400 TADS events that contain two or more Automatic Outages The rest of the events only contain one
Automatic Outage As noted in the lower right hand corner below the total number of Events in 2008 to
2010 ranged from 3920 to 4569 events per year Nearly 90 percent or more of the events contained one
Automatic Outage
Figure 26 Sustained Automatic Outage Initiation
Code
Figure 27 Momentary Automatic Outage Initiation
Code
Transmission Equipment Performance
51
Transmission Outage Mode Figure 29 and Figure 30 show the percentage of Outage Modes The ldquoOutage Mode Coderdquo describes
whether one Automatic Outage is related to other Automatic Outages A Single Mode outage is an
Automatic Outage of a single Element which occurs independently of any other Automatic Outages (if any)
A ldquoDependent Mode Initiating Outagerdquo is an Automatic Outage of a single Element that initiates one or more
subsequent Element Automatic Outages A ldquoDependent Mode Outagerdquo is an Automatic Outage of an
Element which occurred as a result of an initiating outage whether the initiating outage was an Element
outage or a non-Element outage A ldquoCommon Mode Outagerdquo is one of two or more Automatic Outages with
the same Initiating Cause Code and where the outages are not consequences of each other and occur nearly
simultaneously A ldquoCommon Mode Initiating Outagerdquo is a Common Mode Outage that initiates one or more
subsequent Automatic Outages
Over 72 percent of the total outages occurred on the bulk power system are Single Mode Outages The next
largest mode is Dependent with over 11 percent of the total outages being in this category For only
Sustained Automatic Outages outages related to each other increase with Dependent mode accounting for
13 percent of the outages and Common mode accounting for close to 11 percent of the outages
Independent Sustained outages still account for the largest portion with nearly 70 percent being Single
mode When just analyzing Momentary Automatic Outages Associated outages decrease with Dependent
Figure 28 Event Histogram (2008-2010)
Transmission Equipment Performance
52
mode accounting for only 9 percent of the outages The Common Mode percentage decreases while
Dependent Mode Initiating percentage increases compared to Sustained Outages Independent Momentary
outages account for the largest portion with over 76 percent being Single Mode
An investigation into the root causes of Dependent and Common mode events which include three or more
Automatic Outages (indentified in the TADS 2008 to 2010 data) should be a high priority Some protection
systems are designed to trip three or more circuits but some events go beyond what is designed Some also
have misoperations associated with multiple outage events
Conclusions On a NERC wide average basis automatic transmission outage rate is improving from 2008 to 2010 based on
reported data Considering both automatic and non-automatic outages 2010 records indicate transmission
element availability percentage is very high and exceeds 95 The unavailability rate for AC circuits and
transformers are only 15 and 29 respectively
The cause codes of Human Error Failed Protection System Equipment and Failed AC Circuit Equipment
should be considered significant focus points in reducing the number of Sustained Automatic Outages for all
elements A deeper look into the root causes of Dependent and Common mode events which include three
or more Automatic Outages (indentified in the TADS 2008 to 2010 data) should be a high priority Some
protection systems are designed to trip three or more circuits but some events go beyond what is designed
Some also have misoperations associated with multiple outage events
Figure 29 Sustained Automatic Outage Mode code Figure 30 Momentary Automatic Outage Mode code
Generation Equipment Performance
53
Generation Equipment Performance Introduction The development of the Generating Availability Data System (GADS) began in 1982 This series of databases
is used to voluntarily collect record and retrieve operating information By pooling individual unit
information with likewise units generating unit availability performance can be calculated providing
opportunities to identify trends and generating equipment reliability improvement opportunities The
information is used to support equipment reliability availability analyses and risk-informed decision-making
by system planners generation owners assessment modelers manufacturers and contractors etc Reports
and information resulting from the data collected through GADS are now used for benchmarking and
analyzing electric power plants
Currently the data collected through GADS contains 72 percent of the North American generating units
with generating capacity of 20 MW or higher34 Additionally many of the newer combined-cycle plants are
not reporting information and therefore a full view of each unit type is not presented Rather a sample of
all the units in North America that fit a given more general category is provided35 for the 2008-201036
Generation Key Performance Indicators
assessment period
Three key performance indicators37
In
the industry have used widely to measure the availability of generating
units (see Terms Used in This Report section for their calculation parameters) are Equivalent Availability
Factor (EAF) Net Capacity Factor (NCF) and Equivalent Forced Outage Rate ndash Demand (EFORd)
Table 7 the North American fleet average EAF NCF and EFORd compared to unit age for all generating
units with a capacity of 20 MW and higher is provided for the years 2008-2010 The EAF shows a decline
during the last three years NCF is up and down while the EFORd appears to be increasing As expected the
fleet of units reported to GADS is aging overall with the fossil units being about 12 years older than the
average age
34 httpwwwnerccomdocspcgadstfGADSTF_Recommendation_Report_02-18-2011_FINALpdf 35GADS contains some 1500+ units under 20 MW that is not included in this report These units are excluded because most units are not base-loaded and are in peaking operation
3684 percent of the 2010 dataset is available at this time while the 2008 and 2009 dataset is complete 37 httpwwwnerccompagephpcid=4|43
Generation Equipment Performance
54
Table 7 General Availability Review of GADS Fleet Units by Year
2008 2009 2010 Average
Equivalent Availability Factor (EAF) 8776 8774 8678 8743
Net Capacity Factor (NCF) 5083 4709 4880 4890
Equivalent Forced Outage Rate -
Demand (EFORd) 579 575 639 597
Number of Units ge20 MW 3713 3713 3713 3713
Average Age of the Fleet in Years (all
unit types) 303 311 321 312
Average Age of the Fleet in Years
(fossil units only) 422 432 440 433
Figure 31 provides the average forced outage hours (FOH) maintenance outage hours (MOH) and planned
outage hours (POH) for all units reporting 20 MW or larger During this three-year period the average FOH
291 hours average MOH is 163 hours average POH is 470 hours
Figure 31 shows a large increase in forced and maintenance events The average age of the units with a
capacity of 20MW and higher in 2009 is 316 years old However the average age of fossil units in 2010 is
442 years old These fossil units are the backbone of all operating units providing the base-load power
continuously and nearly 50 percent of all energy annually There appears to be no increase allocated for
annualsemi-annual maintenance (ie planned outages) for the older generating units The increase of
000100002000030000400005000060000700008000090000
100000
2008 2009 2010
463 479 468
154 161 173
288 270 314
Hou
rs
Planned Maintenance Forced
Figure 31 Average Outage Hours for Units gt 20 MW
Generation Equipment Performance
55
maintenance outage hours reflects an increased need to fix problems that cannot be deferred until the next
annualsemi-annual repairs As a result it shows one of two things are happening
bull More or longer planned outage time is needed to repair the aging generating fleet
bull More focus on preventive repairs during planned and maintenance events are needed
Multiple Unit Forced Outages and Causes Table 8 provides the annual multiple-unit forced outage trips resulting from the same cause for each of the
assessments years 2008-2010 respectively The ldquosingle unitrdquo trips are large units with a Net Dependable
Capacity of 750 MW or more The trips of ldquotwo unitsrdquo or more is any combination of unit capacity with the
total amount of lost capacity more than 750 MW
Table 8 also presents more information on the forced outages During 2008-2010 there were a large
number of double-unit outages resulting from the same event Investigations show that some of these trips
were at a single plant caused by common control and instrumentation for the units The incidents occurred
several times for several months and are a common mode issue internal to the plant
Table 8 Number of Multiple Unit Forced Outages and FrequencyYear
2008 2009 2010
Type of
Trip
of
Trips
Avg Outage
Hr Trip
Avg Outage
Hr Unit
of
Trips
Avg Outage
Hr Trip
Avg Outage
Hr Unit
of
Trips
Avg Outage
Hr Trip
Avg Outage
Hr Unit
Single-unit
Trip 591 58 58 284 64 64 339 66 66
Two-unit
Trip 281 43 22 508 96 48 206 41 20
Three-unit
Trip 74 48 16 223 146 48 47 109 36
Four-unit
Trip 12 77 19 111 112 28 40 121 30
Five-unit
Trip 11 1303 260 60 443 88 19 199 10
gt 5 units 20 166 16 93 206 50 37 246 6
Loss of ge 750 MW per Trip
The high number of five-unit trips in 2008 was due to Hurricane Ike hitting the Gulf Coast The highest total
number of multiple unit trips occurred in 2009 though as mentioned before the data collection for 2010 is
incomplete at this time The majority of 2009 multiple unit trips have three main causes (in order by
Generation Equipment Performance
56
number of events) transmission lack of fuel and storms A summary of the three categories for single as
well as multiple unit outages (all unit capacities) are reflected in Table 9
Table 9 Common Causes of Multiple Unit Forced Outages (2009)
Cause Number of Events Average MW Size of Unit
Transmission 1583 16
Lack of Fuel (Coal Mines Gas Lines etc) Not
in Operator Control
812 448
Storms Lightning and Other Acts of Nature 591 112
Some of the transmission outages based on storms in 2009 have been caused by the same reasons because
the storms may have caused transmission interference However the plants reported the problems
inconsistently with either the transmission interference or storms cause code Therefore they are depicted
as two different causes of forced outage
Marked transmission outages in 2009 were quite high Thirty-five percent came from one utility with a large
number of hydroelectric units The company related the trips to various problems including weather
(lightning storms) wildlife ldquoline bumpsrdquo and problems on the receiving end of the transmission line Nine
hundred and eighty-five transmission trips (62 percent) were from hydroelectric units38
In 2009 only ten transmission trips resulted in a loss of 750 MW or more per trip Twenty two generating
plants were affected by the ten trips Causes for the trips include feeder line trips (1 trip) breakers in the
switchyard (8 trips) personnel errors (2 trips) and unknown (10 trips)
The ldquoLack of Fuelrdquo outages are of interest as these events occur during the times when a unit is available to
operate but there is an interruption in fuels to operate the facilities These events do not include
interruptions of fuel due to contracts Rather the cause code is designed to account for units that are
expecting fuel and it is unavailable when requested Table 10 presents the distribution of ldquoLack of Fuelrdquo
events by NERC Region and Table 11 presents the unit types affected
38 The average size of the hydroelectric units were small ndash 335 MW
Generation Equipment Performance
57
Of the units that report ldquoLack of Fuelrdquo 78 percent of the units are oil-fired 15 percent of the units are gas-
fired and the remaining units are various other fuels Table 12 provides the top causes of forced outage for
several unit types For fossil units ldquoLack of Fuelrdquo as the number three cause behind waterwall tube leaks
and superheater tube leaks
Table 10 Forced Outages Due to Lack of Fuel by Region
Region Number of Lack of Fuel
Problems Reported
FRCC 0
MRO 3
NPCC 24
RFC 695
SERC 17
SPP 3
TRE 7
WECC 29
One company contributed to the majority of oil-fired lack of fuel events The units at the company are
actually dual-fuels (oil and gas) but market nominated gas monitoring causes the units to be on forced
outage nightly The units need gas to start up so they can run on oil When they shut down the units must
switch to gas to clean themselves With the gas restriction the unit canrsquot start and the unit goes on a
forced outage Until the band is lifted the two units will continue to be on a forced outage cycle
Event records also provide descriptions of why the unit was without fuel with the majority of descriptions
bull Temperatures affecting gas supply valves
bull Unexpected maintenance of gas pipe-lines
bull Compressor problemsmaintenance
Generation Equipment Performance
58
Table 11 Unit Type Profile of Forced Outages Due to Lack of Fuel
Unit Types Number of Lack of Fuel Problems Reported
Fossil 642
Nuclear 0
Gas Turbines 88
Diesel Engines 1
HydroPumped Storage 0
Combined Cycle 47
Generation Equipment Performance
59
Table 12 Causes of Forced Outage for Different Unit Types (2008-2010)
Fossil - all MW sizes all fuels
Rank Description Occurrence per Unit-year
MWH per Unit-year
Average Hours To Repair
Average Hours Between Failures
Unit-years
1 Waterwall (furnace wall) 0590 134106 59 3250 3868 2 Second Superheater
Leaks 0180 5182 60 3228 3868
3 Lack of Fuel (coal mines gas lines etc) where the operator is not in control
0480 4701 18 26 3868
Combined-Cycle blocks Rank Description Occurrence
per Unit-year
MWH per Unit-year
Average Hours To Repair
Average Hours Between Failures
Unit-years
1 HP Turbine Buckets Or Blades
0020 4663 1830 26280 466
2 Turbine Control Valves 0040 2777 100 7200 466 3 Gas Turbine Compressor -
High Pressure Shaft 0010 2266 663 4269 466
Nuclear units - all Reactor types Rank Description Occurrence
per Unit-year
MWH per Unit-year
Average Hours To Repair
Average Hours Between Failures
Unit-years
1 LP Turbine Buckets or Blades
0010 26415 8760 26280 288
2 Containment Structure 0010 9233 1226 26262 288 3 Feedwater Pump Local
Controls 0020 7620 692 12642 288
Simple-cycle gas turbine jet engines Rank Description Occurrence
per Unit-year
MWH per Unit-year
Average Hours To Repair
Average Hours Between Failures
Unit-years
1 Main Transformer 0030 1611 1016 20709 4181 2 Other Gas Turbine
Controls And Instrument Problems
0120 428 70 2614 4181
3 Other Gas Turbine Problems
0090 400 119 1701 4181
Generation Equipment Performance
60
2008-2010 Review of Summer versus Winter Availability To address seasonality of unit availability unit information for the months of June to September (summer)
and December through February (winter) were pooled to calculate force events during these timeframes for
2008-201039 Figure 32 shows the Equivalent Availability Factor (EAF) is three percentage points higher and
the Equivalent Forced Outage Rate - Demand (EFORd) is more than a half of a percentage point lower in the
summer period than in winter period This means the units were more reliable with less forced events
during high-demand times during the summer than during the winter seasons The generating unitrsquos
capability has a resulting higher Net Capacity Factor (NCF) of 45 percentage points in the summer season
for 2008-2010
During the spring season (March-May) 77 percent of the units took a planned outage (PO) for an average
231 hours (or 96 days) In fall (October-November) only 42 percent of the units experienced a PO and the
average duration was shorter ndash 134 hours (or 56 days) A few units took both spring and fall planned
outages although this is rare Based on this assessment the generating units are prepared for the summer
peak demand The resulting availability indicates that this maintenance was successful which is measured
by an increased EAF and lower EFORd
Figure 32 Summer-Winter Average EAF NCF and EFORd (2008-2010)
Conclusions and Recommendations During 2008-2010 the average Equivalent Availability Factor (EAF) which measures the overall availability
of generating units decreased At the same time the Net Capacity Factor (NCF) an indicator of energy
production increased The average number of forced outages in 2010 is greater than in 2008 while at the
same time the average planned outage times have decreased As a result the Equivalent Forced Outage
Rate ndash Demand (EFORd) also increased illustrating that more units have experienced forced events during
39 A study of peak periods was conducted by the NERC Generating Availability Trend Evaluation (GATE) Working Group several years ago see httpwwwnerccomfilesSeasonal-Performance-Trendspdf
9116
5343
396
8818
4896
441
0 10 20 30 40 50 60 70 80 90 100
EAF
NCF
EFORd
Percent ()
Winter
Summer
Generation Equipment Performance
61
peak-demand times in 2010 than in the previous two years Potentially with shorter planned outage
periods in 2010 there may be less time to repair equipment and prevent forced unit outages
There are warnings that units are not being maintained as well as they should be In the last three years
there has been an increase in Equivalent Forced Outage Rate ndash Demand (EFORd) This indicator measures
the rate of forced outage events on generating units during periods of load demand To confirm this
problem forced outage hours jumped from 270 to 314 hours per unit between 2009 and 2010 At the same
time maintenance events also increased by 12 hours per unit Planned outage events remain constant The
resulting conclusions from this trend are
bull More or longer planned outage time is needed to repair the generating fleet Whether age is the
cause of the increase need for planned outage time remains unknown and further investigation into
the cause for longer planned outage time is necessary
bull More focus on preventive repairs during planned and maintenance events are needed
There are many multiple unit forced outages due to lack of fuel The majority of multiple unit trips have
three main causes transmission lack of fuel and storms With special interest in the forced outages due to
ldquoLack of Fuelrdquo additional analysis revealed that 77 percent of the units experiencing unexpected fuel
stoppage are oil-fired fossil units while gas-fired units experienced 15 percent
Generating units continue to be more reliable during the peak summer periods
Disturbance Event Trends
62
Category 1 An event resulting in one or more of the following a Unintended loss of three or more BPS elements caused by
common mode failure b Failure or misoperation of an SPSRAS c System-wide voltage reduction of 3 or more d Unintended BPS system separation resulting in an island of
100 MW to 999 MW e Unplanned evacuation from a control center facility with BPS
SCADA functionality for 30 minutes or more Category 2 An event resulting in one or more of the following
a Complete loss of all BPS control center voice communication system(s) for 30 minutes or more
b Complete loss of SCADA control or monitoring functionality for 30 minutes or more
c Voltage excursions equal to or greater than 10 lasting more than five minutes
d Loss of off-site power (LOOP) to a nuclear generating station e Unintended system separation resulting in an island of 1000
MW to 4999 MW f Unintended loss of 300MW or more of firm load for more
than 15 minutes g Violation of an Interconnection Reliability Operating Limit
(IROL) for more than 30 minutes Category 3 An event resulting in one or more of the following
a The loss of load or generation of 2000 MW or more in the Eastern Interconnection or
b Western Interconnection or 1000 MW or more in the ERCOT or Queacutebec Interconnections
c Unintended system separation resulting in an island of 5000 MW to 10000 MW
d Unintended system separation resulting in an island of Florida from the Eastern Interconnection
Category 4 An event resulting in one or more of the following a The loss of load or generation from 5001 MW to 9999 MW b Unintended system separation resulting in an island of more
than 10000 MW (with the exception of Florida as described in Category 3c)
Category 5 An event resulting in one or more of the following a The loss of load of 10000 MW or more b The loss of generation of 10000 MW or more
Figure 33 BPS Event Category
Disturbance Event Trends Introduction The purpose of this section is to report event
analysis trends from the beginning of event
analysis field test40
One of the companion goals of the event
analysis program is the identification of trends
in the number magnitude and frequency of
events and their associated causes such as
human error equipment failure protection
system misoperations etc The information
provided in the event analysis database (EADB)
and various event analysis reports have been
used to track and identify trends in BPS events
in conjunction with other databases (TADS
GADS metric and benchmarking database)
to the end of 2010
The Event Analysis Working Group (EAWG)
continuously gathers event data and is moving
toward an integrated approach to analyzing
data assessing trends and communicating the
results to the industry
Performance Trends The event category is classified41
Figure 33
as shown in
with Category 5 being the most
severe Figure 34 depicts disturbance trends in
Category 1 to 5 system events from the
40 httpwwwnerccomdocseawgGalloway-Industry-EA-Field-Test-102210pdf 41httpwwwnerccomfiles2011-05-0220Event_Analysis_Process_Phase20220Field20Test20Draft20-20Final20-20For20postingpdf
Disturbance Event Trends
63
beginning of event analysis field test to the end of 201042
Figure 34 Event Category vs Date for All 2010 Categorized Events
From the figure in November and December
there were many more category 1 and 2 events than in October This is due to the field trial starting on
October 25 2010
In addition to the category of the events the status of the events plays a critical role in the accuracy of the
data By examining Figure 35 over 80 of the events reported in 2010 have been closed This means that
the category root cause and other important information have been sufficiently finalized in order for
analysis to be accurate for each event At this time there is not enough data to draw any long-term
conclusions about event investigation performance
42 Documents for the EA Field Test are located at httpwwwnerccompagephpcid=5|365
2
12 12
26
3
6 5
14
1 1
2
0
5
10
15
20
25
30
35
40
45
October November December 2010
Even
t Cou
nt
Category 3 Category 2 Category 1
Disturbance Event Trends
64
Figure 35 Event Count vs Status (All 2010 Events with Status)
By drilling down into the cause code for each closed 2010 event Figure 36 shows the top 3 event causes
From the figure equipment failure and protection system misoperation are the most significant causes for
events Because of how new and limited the data is however there may not be statistical significance for
this result Further trending of cause codes for closed events and developing a richer dataset to find any
trends between event cause codes and event counts should be performed
Figure 36 Top 3 Event Counts vs DAWG Cause Code for all Closed 2010 Events
10
32
42
0
5
10
15
20
25
30
35
40
45
Open Closed Open and Closed
Even
t Cou
nt
Status
1211
8
0
2
4
6
8
10
12
14
Equipment Failure Protection System Misoperation Human Error
Even
t Cou
nt
Cause Code
Disturbance Event Trends
65
Conclusions Due to the relatively new process for events analysis and categorization more time will be required before a
conclusive recommendation may be obtained Further analysis and new data should provide valuable
statistics in the future Over 80 of all event reports from 2010 are current listed as closed but no
conclusion about investigation performance may be obtained because of the limited amount of data It is
recommended to study ways to prevent equipment failure and protection system misoperations but there
is not enough data to draw a firm conclusion about the top causes of events at this time
Abbreviations Used in This Report
66
Abbreviations Used in This Report
Acronym Definition ALP Acadiana Load Pocket
ALR Adequate Level of Reliability
ARR Automatic Reliability Report
BA Balancing Authority
BPS Bulk Power System
CDI Condition Driven Index
CEII Critical Energy Infrastructure Information
CIPC Critical Infrastructure Protection Committee
CLECO Cleco Power LLC
DADS Future Demand Availability Data System
DCS Disturbance Control Standard
DOE Department Of Energy
DSM Demand Side Management
EA Event Analysis
EAF Equivalent Availability Factor
ECAR East Central Area Reliability
EDI Event Drive Index
EEA Energy Emergency Alert
EFORd Equivalent Forced Outage Rate Demand
EMS Energy Management System
ERCOT Electric Reliability Council of Texas
ERO Electric Reliability Organization
ESAI Energy Security Analysis Inc
FERC Federal Energy Regulatory Commission
FOH Forced Outage Hours
FRCC Florida Reliability Coordinating Council
GADS Generation Availability Data System
GOP Generation Operator
IEEE Institute of Electrical and Electronics Engineers
IESO Independent Electricity System Operator
IROL Interconnection Reliability Operating Limit
Abbreviations Used in This Report
67
Acronym Definition IRI Integrated Reliability Index
LOLE Loss of Load Expectation
LUS Lafayette Utilities System
MAIN Mid-America Interconnected Network Inc
MAPP Mid-continent Area Power Pool
MOH Maintenance Outage Hours
MRO Midwest Reliability Organization
MSSC Most Severe Single Contingency
NCF Net Capacity Factor
NEAT NERC Event Analysis Tool
NERC North American Electric Reliability Corporation
NPCC Northeast Power Coordinating Council
OC Operating Committee
OL Operating Limit
OP Operating Procedures
ORS Operating Reliability Subcommittee
PC Planning Committee
PO Planned Outage
POH Planned Outage Hours
RAPA Reliability Assessment Performance Analysis
RAS Remedial Action Schemes
RC Reliability Coordinator
RCIS Reliability Coordination Information System
RCWG Reliability Coordinator Working Group
RE Regional Entities
RFC Reliability First Corporation
RMWG Reliability Metrics Working Group
RSG Reserve Sharing Group
SAIDI System Average Interruption Duration Index
SAIFI System Average Interruption Frequency Index
SCADA Supervisory Control and Data Acquisition
SDI Standardstatute Driven Index
SERC SERC Reliability Corporation
Abbreviations Used in This Report
68
Acronym Definition SRI Severity Risk Index
SMART Specific Measurable Attainable Relevant and Tangible
SOL System Operating Limit
SPS Special Protection Schemes
SPCS System Protection and Control Subcommittee
SPP Southwest Power Pool
SRI System Risk Index
TADS Transmission Availability Data System
TADSWG Transmission Availability Data System Working Group
TO Transmission Owner
TOP Transmission Operator
WECC Western Electricity Coordinating Council
Contributions
69
Contributions This report was made feasible by the collaboration and hard work of both NERC staff and NERCrsquos
Industry Groups
NERC Industry Groups
Table 14 lists the NERC industry group contributors Without their contribution and collaboration this
report would not have been possible
Table 13 NERC Industry Group Contributions43
NERC Group
Relationship Contribution
Reliability Metrics Working Group
(RMWG)
Reports to the OCPC bull Lead Development of Report bull Provide Reliability Metrics Data bull Responsible for Reliability Metrics
Performance Chapter
Transmission Availability Working Group
(TADSWG)
Reports to the OCPC bull Provide Transmission Availability Data
bull Responsible for Transmission Equip-ment Performance Chapter
bull Content Review
Generation Availability Data System Task
Force
(GADSTF)
Reports to the OCPC bull Provide Generation Availability Data bull Responsible for Generation Equip-
ment Performance Chapter bull Content Review
Event Analysis Working Group
(EAWG)
Reports to the OCPC bull Provide Events Data bull Responsible for Disturbance Events
Trends Chapter bull Content Review
43 Rosters for RMWG TADSWG GADSTF and EAWG are available at httpwwwnerccomfilesrosterpdf
Contributions
70
NERC Staff Table 13 below lists the NERC staff who contributed to the 2011 Reliability Performance Analysis
Report
Table 14 Contributing NERC Staff
Name Title E-mail Address
Mark Lauby Vice President and Director of
Reliability Assessment and
Performance Analysis
marklaubynercnet
Jessica Bian Manager of Performance Analysis jessicabiannercnet
John Moura Manager of Reliability Assessments johnmouranercnet
Andrew Slone Engineer Reliability Performance
Analysis
andrewslonenercnet
Jim Robinson TADS Project Manager jimrobinsonnercnet
Clyde Melton Engineer Reliability Performance
Analysis
clydemeltonnercnet
Mike Curley Manager of GADS Services mikecurleynercnet
James Powell Engineer Reliability Performance
Analysis
jamespowellnercnet
Michelle Marx Administrative Assistant michellemarxnercnet
William Mo Intern Performance Analysis wmonercnet
- NERCrsquos Mission
- Table of Contents
- Executive Summary
-
- 2011 Transition Report
- State of Reliability Report
- Key Findings and Recommendations
-
- Reliability Metric Performance
- Transmission Availability Performance
- Generating Availability Performance
- Disturbance Events
- Report Organization
-
- Introduction
-
- Metric Report Evolution
- Roadmap for the Future
-
- Reliability Metrics Performance
-
- Introduction
- 2010 Performance Metrics Results and Trends
-
- ALR1-3 Planning Reserve Margin
-
- Background
- Assessment
- Special Considerations
-
- ALR1-4 BPS Transmission Related Events Resulting in Loss of Load
-
- Background
- Assessment
-
- ALR1-12 Interconnection Frequency Response
-
- Background
- Assessment
-
- ALR2-3 Activation of Under Frequency Load Shedding
-
- Background
- Assessment
- Special Considerations
-
- ALR2-4 Average Percent Non-Recovery Disturbance Control Standards (DCS)
-
- Background
- Assessment
- Special Consideration
-
- ALR2-5 Disturbance Control Events Greater Than Most Severe Single Contingency
-
- Background
- Assessment
- Special Consideration
-
- ALR 1-5 System Voltage Performance
-
- Background
- Special Considerations
- Status
-
- ALR3-5 Interconnection Reliability Operating Limit System Operating Limit (IROLSOL) Exceedances
-
- Background
-
- ALR4-1 Automatic Transmission Outages Caused by Protection System Misoperations
-
- Background
- Special Considerations
-
- ALR6-11 ndash ALR6-14
-
- Background
- Assessment
- ALR 6-11 ndash Automatic Outages Initiated by Failed Protection System Equipment
- ALR6-12 ndash Automatic Outages Initiated by Human Error
- ALR6-13 ndash Automatic Outages Initiated by Failed AC Substation Equipment
- ALR6-14 Automatic AC Transmission Outages Initiated by Failed AC Circuit Equipment
-
- ALR6-15 Element Availability Percentage (APC)
-
- Background
- Assessment
- Special Consideration
-
- ALR6-16 Transmission System Unavailability
-
- Background
- Assessment
- Special Consideration
-
- ALR6-2 Energy Emergency Alert 3 (EEA3)
-
- Background
- Assessment
- Special Considerations
-
- ALR 6-3 Energy Emergency Alert 2 (EEA2)
-
- Background
- Assessment
- Special Considerations
-
- ALR 6-1 Transmission Constraint Mitigation
-
- Background
- Assessment
- Special Considerations
-
- Integrated Bulk Power System Risk Assessment
-
- Introduction
- Recommendations
-
- Integrated Reliability Index Concepts
-
- The Three Components of the IRI
-
- Event-Driven Indicators (EDI)
- Condition-Driven Indicators (CDI)
- StandardsStatute-Driven Indicators (SDI)
-
- IRI Index Calculation
- IRI Recommendations
-
- Reliability Metrics Conclusions and Recommendations
-
- Transmission Equipment Performance
-
- Introduction
- Performance Trends
-
- AC Element Outage Summary and Leading Causes
- Transmission Monthly Outages
- Outage Initiation Location
- Transmission Outage Events
- Transmission Outage Mode
-
- Conclusions
-
- Generation Equipment Performance
-
- Introduction
- Generation Key Performance Indicators
-
- Multiple Unit Forced Outages and Causes
- 2008-2010 Review of Summer versus Winter Availability
-
- Conclusions and Recommendations
-
- Disturbance Event Trends
-
- Introduction
- Performance Trends
- Conclusions
-
- Abbreviations Used in This Report
- Contributions
-
- NERC Industry Groups
- NERC Staff
-
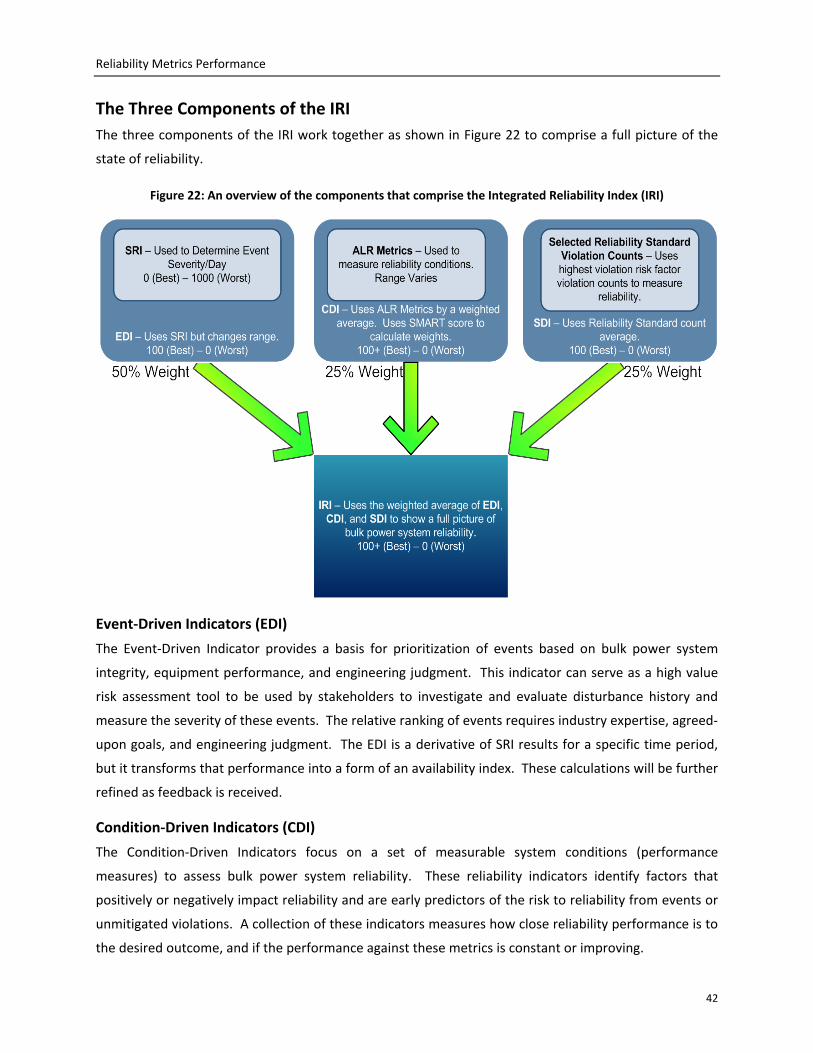
Reliability Metrics Performance
42
The Three Components of the IRI The three components of the IRI work together as shown in Figure 22 to comprise a full picture of the
state of reliability
Figure 22 An overview of the components that comprise the Integrated Reliability Index (IRI)
Event-Driven Indicators (EDI)
The Event-Driven Indicator provides a basis for prioritization of events based on bulk power system
integrity equipment performance and engineering judgment This indicator can serve as a high value
risk assessment tool to be used by stakeholders to investigate and evaluate disturbance history and
measure the severity of these events The relative ranking of events requires industry expertise agreed-
upon goals and engineering judgment The EDI is a derivative of SRI results for a specific time period
but it transforms that performance into a form of an availability index These calculations will be further
refined as feedback is received
Condition-Driven Indicators (CDI)
The Condition-Driven Indicators focus on a set of measurable system conditions (performance
measures) to assess bulk power system reliability These reliability indicators identify factors that
positively or negatively impact reliability and are early predictors of the risk to reliability from events or
unmitigated violations A collection of these indicators measures how close reliability performance is to
the desired outcome and if the performance against these metrics is constant or improving
Reliability Metrics Performance
43
StandardsStatute-Driven Indicators (SDI)
The StandardsStatute-Driven Indicator is a calculation of success of compliance based upon the subset
of high-value standards and is divided by the number of participations who could have received the
violation within the time period considered Also based on these factors known unmitigated violations
of elevated risk factor requirements are weighted higher than lower risk factors The index decreases if
the compliance improvement is achieved over a trending period
IRI Index Calculation As with the SRI the IRI is based on an importance weighting factor which the RMWG can modify over
time after gaining experience with the new metric as well as consideration of feedback from industry
At this time the RMWG believes some form of blended weighting may serve to start to populate IRI
characteristic curves at a high and generic level Based upon feedback from stakeholders this approach
may change or as discussed below weighting factors may vary based on periodic review and risk model
update The RMWG will continue the refinement of the IRI calculation and consider other significant
factors that impact reliability (eg intentional and controlled load-shedding) further it will explore
developing mechanisms for enabling ongoing refinement which should be influenced by a wide set of
stakeholders
RMWG recommends the Event Driven Index (EDI) be weighted the highest (50 percent) since events
actually occurred indicating how the system was performing The Condition Driven Index (CDI) and
StandardsStatute Driven Index (SDI) are weighted 25 each since they are indicators of potential risks
to BPS reliability IRI can be calculated as follows
IRI is intended to be a composite metric which integrates several forms of individual risks to the bulk
power system Since the three components range across many stakeholder organizations these
concepts are developed as starting points for continued study and evaluation Additional supporting
materials can be found in the IRI whitepaper32
IRI Recommendations
including individual indices calculations and preliminary
trend information
For the IRI more investigation should be performed to determine the best way to integrate EDI CDI
and SDI into an Integrated Reliability Index (IRI) that quantitatively represents the reliability of the bulk
32 The IRI whitepaper can be found at httpwwwnerccomdocspcrmwgIntegrated_Reliability_Index_WhitePaper_DRAFTpdf
Reliability Metrics Performance
44
power system To this end study into determining the amount of overlap between the components is
necessary RMWG is currently working to determine the proper amount of overlap between the IRI
components
Also the CDI component of the IRI needs to be solidified This is especially true with the CDI More
accurate metric data is needed to paint a fuller picture of the CDI Many of the metrics used to calculate
the CDI are new or they have limited data Compared to the SDI which counts well-known violation
counts and the EDI which uses the well-defined CDI the CDI lacks the depth of rigor that the other two
components have acquired through their years of data RMWG is currently working to improve the CDI
Reliability Metrics Conclusions and Recommendations Among the eighteen metrics that address the characteristics of an adequate level of reliability (ALR)
metric trends indicate the system is performing better in the following seven areas
bull ALR1-3 Planning Reserve Margin
bull ALR1-4 BPS Transmission Related Events Resulting in Loss of Load
bull ALR2-5 Disturbance Control Events Greater than Most Severe Single Contingency
bull ALR6-2 Energy Emergency Alert 3 (EEA3)
bull ALR6-3 Energy Emergency Alert 2 (EEA2)
bull ALR6-11 Automatic Transmission Outages Caused by Protection System Misoperations
bull ALR6-13 Automatic Transmission Outages Caused by Failed AC Substation Equipment
Assessments have been made in other performance categories A number of them do not have
sufficient data to derive any conclusions from the results The RMWG recommends continued data
collection and assessment of these metrics If a metric does not yield any trend in a five-year reporting
period the metric will be modified or withdrawn
For the IRI more investigation should be performed to determine the overlap of the components (CDI
EDI and SDI) The CDI should be more thoroughly solidified as an index by collecting more data over
time
Transmission Equipment Performance
45
Transmission Equipment Performance Introduction The Transmission Availability Data System (TADS) effort began with the establishment of a TADS task force
by the NERC Planning Committee in October 2006 On October 27 2007 the NERC Board of Trustees
approved the collection of transmission automatic outage data beginning in calendar year 2008 (Phase I)
Subsequently on October 29 2008 the NERC Board approved the collection of Non-Automatic Outage data
that began for Calendar year 2010 (Phase II)
This chapter provides reliability performance analysis of the transmission system by focusing on the trends
of Automatic Outage data from calendar year 2008 thru 2010 Since only one year of Non-Automatic
Outage data has been collected that data will not be assessed in this report
When calculating bulk power system performance indices care must be exercised when interpreting results
as misinterpretation can lead to erroneous conclusions regarding system performance With only three
years of data in the smaller regions it is not clear whether a regionrsquos yearly outage variation compared to
the average is due to random statistical variation or that particular year is significantly different in
performance However on a NERC-wide basis after three years of data collection there is enough
information to accurately determine whether the yearly outage variation compared to the average is due to
random statistical variation or the particular year in question is significantly different in performance33
Performance Trends
Transmission performance information has been provided by Transmission Owners (TOs) within NERC
through the NERC TADS (Transmission Availability Data System) process The data presented reflects
Momentary and Sustained AC Automatic outages of transmission elements that operate at voltages ge 200 kV
(including the low side of transformers) with the criteria specified in the TADS process The following
elements listed below are included
bull AC Circuits ge 200 kV (Overhead and Underground Circuits) Radial circuits are included
bull DC Circuits with ge +-200 kV DC voltage
bull Transformers with ge 200 kV low-side voltage and
bull ACDC Back-to-Back (BTB) Converters with ge 200 kV AC voltage on both sides
33The detailed Confidence Interval computation is available at httpwwwnerccomdocspctadstfTADS_Nov_2_2007APPENDIX_C_Confidence_Intervalpdf
Transmission Equipment Performance
46
AC Element Outage Summary and Leading Causes Table 6 shows the 2008 2009 and 2010 NERC total AC transmission element inventory and a summary of
the associated outages As expected in general the number of circuits increased from year to year due to
new construction or re-construction to higher voltages For every outage experienced on the transmission
system cause codes are identified and recorded according to the TADS process Causes of both momentary
and sustained outages have been indicated These causes are analyzed to identify trends and similarities
and to provide insight into what could be done to possibly prevent future occurrences
Figure 23 and Figure 24 describe the top ten initiating cause codes for sustained and momentary automatic
outages combined from 2008-2010 Based on the two figures the relationship between the total number of
outages and total outage hours can be seen Failed AC Substation Equipment and Failed AC Circuit
Equipment only account for 15 percent of the total number of outages but account for 65 percent of the
total outage hours The two largest causes of outages within NERC (ldquoLightingrdquo and ldquoWeather excluding
Lightningrdquo) account for 34 percent of the total number of outages
The next three Human Error Failed Protection System Equipment and Failed AC Circuit Equipment have
very similar totals and should all be considered significant focus points in reducing the number of Sustained
Automatic Outages for all elements
Transmission Equipment Performance
47
Table 6 NERC - All AC Elements Sustained and Momentary Outage Performance Summary
2008 Number of Outages
AC Voltage
Class
No of
Circuits
Circuit
Miles Sustained Momentary
Total
Outages Total Outage Hours
200-299kV 4369 102131 1560 1062 2622 56595
300-399kV 1585 53631 793 753 1546 14681
400-599kV 586 31495 389 196 585 11766
600-799kV 110 9451 43 40 83 369
All Voltages 6650 196708 2785 2051 4836 83626
2009 Number of Outages
AC Voltage
Class
No of
Circuits
Circuit
Miles Sustained Momentary
Total
Outages Total Outage Hours
200-299kV 4468 102935 1387 898 2285 28828
300-399kV 1619 56447 641 610 1251 24714
400-599kV 592 32045 265 166 431 9110
600-799kV 110 9451 53 38 91 442
All Voltages 6789 200879 2346 1712 4038 63094
2010 Number of Outages
AC Voltage
Class
No of
Circuits
Circuit
Miles Sustained Momentary
Total
Outages Total Outage Hours
200-299kV 4567 104722 1506 918 2424 54941
300-399kV 1676 62415 721 601 1322 16043
400-599kV 605 31590 292 174 466 10442
600-799kV 111 9477 63 50 113 2303
All Voltages 6957 208204 2582 1743 4325 83729
Note The NERC table does not show redacted outages DC Circuit outages Transformer outages or ACDC
converter outages
Transmission Equipment Performance
48
Figure 23 NERC - Top Ten Sustained and Momentary Outages by Initiating Cause Code for All Elements
Figure 24 NERC - Top Ten Sustained Outage Hours by Cause Code
198
151
80
7271
6943
33
27
188
68
Lightning
Weather excluding lightningHuman Error
Failed AC Substation EquipmentFailed Protection System EquipmentFailed AC Circuit Equipment Foreign Interference
Power System Condition
Fire
Unknown
Remaining Cause Codes
299
246
188
58
52
42
3619
16 12 31 Failed AC Substation EquipmentFailed AC Circuit Equipment Weather excluding lightningUnavailable
Other
Fire
Unknown
Human Error
Failed Protection System EquipmentForeign Interference
Remaining Cause Codes
Transmission Equipment Performance
49
Transmission Monthly Outages Figure 25 displays the total number of Automatic Outages on a per-month basis The three months with the
highest total of outages were June July and August From a seasonal perspective winter had a monthly
average of 281 outages These include the months of November-March Summer had an average of 429
outages Summer included the months of April-October
Figure 25 Number of Outages by Month for AC Circuits (2008-2010)
This figure does not show redacted outages DC Circuit outages Transformer outages or ACDC Converter
outages
Outage Initiation Location For every outage experienced on the transmission system the outage initiation code is identified and
recorded according to the TADS process The outage initiation code can be analyzed to identify trends and
similarities and to provide insight into what could be done to possibly prevent future occurrences
The ldquoOutage Initiation Coderdquo describes where an automatic outage was initiated on the power system The
five codes are as follows
bull Element-Initiated
bull Other Element-Initiated
bull AC Substation-Initiated
bull ACDC Terminal-Initiated (for DC circuits)
bull Other Facility Initiated any facility not included in any other outage initiation code
JanuaryFebruar
yMarch April May June July August
September
October
November
December
2008 238 229 257 258 292 437 467 380 208 176 255 236
2009 315 201 339 334 398 553 546 515 351 235 226 294
2010 444 224 269 446 449 486 639 498 351 271 305 281
3 Year AVG 332 218 288 346 380 492 551 464 303 227 262 270
0
100
200
300
400
500
600
700
Out
ages
Transmission Equipment Performance
50
Notably the protection system is not part of an ldquoAC Substationrdquo or an ldquoACDC Terminalrdquo If a protection
system misoperates and initiates an outage it will be classified as ldquoOther-Facility Initiatedrdquo The following
Figures show the initiating location of the Automatic outages from 2008 to 2010
With both Momentary and Sustained Automatic Outages taken into account the outage was initiated on the
Element more than 67 percent of the time as shown in Figure 26 and Figure 27
When only the Sustained Automatic Outages are analyzed the outage initiation on both AC Substation and
Other Facility increased by 34 percent and 32 percent respectively Outages initiated on the Element itself
decreases by 78 percent as shown in Figure 26 and 27 For only the Momentary Automatic Outages the
outage initiation on the Element increases by 19 percent compared to Sustained Outages Element initiated
outages make up over 78 percent of the total outages when analyzing only Momentary Outages
Figure 26
Figure 27
Transmission Outage Events Figure 28 illustrates the relationship between the numbers of Automatic Outages associated per TADS
event 2008 2009 and 2010 tend to follow the same trend The largest number of Automatic Outages per
TADS event is fourteen in 2010 thirteen in 2009 and eight in 2008 There are around 70 to 100 TADS
events that contain between fourteen and three Automatic Outages (see below) There are around 330 to
400 TADS events that contain two or more Automatic Outages The rest of the events only contain one
Automatic Outage As noted in the lower right hand corner below the total number of Events in 2008 to
2010 ranged from 3920 to 4569 events per year Nearly 90 percent or more of the events contained one
Automatic Outage
Figure 26 Sustained Automatic Outage Initiation
Code
Figure 27 Momentary Automatic Outage Initiation
Code
Transmission Equipment Performance
51
Transmission Outage Mode Figure 29 and Figure 30 show the percentage of Outage Modes The ldquoOutage Mode Coderdquo describes
whether one Automatic Outage is related to other Automatic Outages A Single Mode outage is an
Automatic Outage of a single Element which occurs independently of any other Automatic Outages (if any)
A ldquoDependent Mode Initiating Outagerdquo is an Automatic Outage of a single Element that initiates one or more
subsequent Element Automatic Outages A ldquoDependent Mode Outagerdquo is an Automatic Outage of an
Element which occurred as a result of an initiating outage whether the initiating outage was an Element
outage or a non-Element outage A ldquoCommon Mode Outagerdquo is one of two or more Automatic Outages with
the same Initiating Cause Code and where the outages are not consequences of each other and occur nearly
simultaneously A ldquoCommon Mode Initiating Outagerdquo is a Common Mode Outage that initiates one or more
subsequent Automatic Outages
Over 72 percent of the total outages occurred on the bulk power system are Single Mode Outages The next
largest mode is Dependent with over 11 percent of the total outages being in this category For only
Sustained Automatic Outages outages related to each other increase with Dependent mode accounting for
13 percent of the outages and Common mode accounting for close to 11 percent of the outages
Independent Sustained outages still account for the largest portion with nearly 70 percent being Single
mode When just analyzing Momentary Automatic Outages Associated outages decrease with Dependent
Figure 28 Event Histogram (2008-2010)
Transmission Equipment Performance
52
mode accounting for only 9 percent of the outages The Common Mode percentage decreases while
Dependent Mode Initiating percentage increases compared to Sustained Outages Independent Momentary
outages account for the largest portion with over 76 percent being Single Mode
An investigation into the root causes of Dependent and Common mode events which include three or more
Automatic Outages (indentified in the TADS 2008 to 2010 data) should be a high priority Some protection
systems are designed to trip three or more circuits but some events go beyond what is designed Some also
have misoperations associated with multiple outage events
Conclusions On a NERC wide average basis automatic transmission outage rate is improving from 2008 to 2010 based on
reported data Considering both automatic and non-automatic outages 2010 records indicate transmission
element availability percentage is very high and exceeds 95 The unavailability rate for AC circuits and
transformers are only 15 and 29 respectively
The cause codes of Human Error Failed Protection System Equipment and Failed AC Circuit Equipment
should be considered significant focus points in reducing the number of Sustained Automatic Outages for all
elements A deeper look into the root causes of Dependent and Common mode events which include three
or more Automatic Outages (indentified in the TADS 2008 to 2010 data) should be a high priority Some
protection systems are designed to trip three or more circuits but some events go beyond what is designed
Some also have misoperations associated with multiple outage events
Figure 29 Sustained Automatic Outage Mode code Figure 30 Momentary Automatic Outage Mode code
Generation Equipment Performance
53
Generation Equipment Performance Introduction The development of the Generating Availability Data System (GADS) began in 1982 This series of databases
is used to voluntarily collect record and retrieve operating information By pooling individual unit
information with likewise units generating unit availability performance can be calculated providing
opportunities to identify trends and generating equipment reliability improvement opportunities The
information is used to support equipment reliability availability analyses and risk-informed decision-making
by system planners generation owners assessment modelers manufacturers and contractors etc Reports
and information resulting from the data collected through GADS are now used for benchmarking and
analyzing electric power plants
Currently the data collected through GADS contains 72 percent of the North American generating units
with generating capacity of 20 MW or higher34 Additionally many of the newer combined-cycle plants are
not reporting information and therefore a full view of each unit type is not presented Rather a sample of
all the units in North America that fit a given more general category is provided35 for the 2008-201036
Generation Key Performance Indicators
assessment period
Three key performance indicators37
In
the industry have used widely to measure the availability of generating
units (see Terms Used in This Report section for their calculation parameters) are Equivalent Availability
Factor (EAF) Net Capacity Factor (NCF) and Equivalent Forced Outage Rate ndash Demand (EFORd)
Table 7 the North American fleet average EAF NCF and EFORd compared to unit age for all generating
units with a capacity of 20 MW and higher is provided for the years 2008-2010 The EAF shows a decline
during the last three years NCF is up and down while the EFORd appears to be increasing As expected the
fleet of units reported to GADS is aging overall with the fossil units being about 12 years older than the
average age
34 httpwwwnerccomdocspcgadstfGADSTF_Recommendation_Report_02-18-2011_FINALpdf 35GADS contains some 1500+ units under 20 MW that is not included in this report These units are excluded because most units are not base-loaded and are in peaking operation
3684 percent of the 2010 dataset is available at this time while the 2008 and 2009 dataset is complete 37 httpwwwnerccompagephpcid=4|43
Generation Equipment Performance
54
Table 7 General Availability Review of GADS Fleet Units by Year
2008 2009 2010 Average
Equivalent Availability Factor (EAF) 8776 8774 8678 8743
Net Capacity Factor (NCF) 5083 4709 4880 4890
Equivalent Forced Outage Rate -
Demand (EFORd) 579 575 639 597
Number of Units ge20 MW 3713 3713 3713 3713
Average Age of the Fleet in Years (all
unit types) 303 311 321 312
Average Age of the Fleet in Years
(fossil units only) 422 432 440 433
Figure 31 provides the average forced outage hours (FOH) maintenance outage hours (MOH) and planned
outage hours (POH) for all units reporting 20 MW or larger During this three-year period the average FOH
291 hours average MOH is 163 hours average POH is 470 hours
Figure 31 shows a large increase in forced and maintenance events The average age of the units with a
capacity of 20MW and higher in 2009 is 316 years old However the average age of fossil units in 2010 is
442 years old These fossil units are the backbone of all operating units providing the base-load power
continuously and nearly 50 percent of all energy annually There appears to be no increase allocated for
annualsemi-annual maintenance (ie planned outages) for the older generating units The increase of
000100002000030000400005000060000700008000090000
100000
2008 2009 2010
463 479 468
154 161 173
288 270 314
Hou
rs
Planned Maintenance Forced
Figure 31 Average Outage Hours for Units gt 20 MW
Generation Equipment Performance
55
maintenance outage hours reflects an increased need to fix problems that cannot be deferred until the next
annualsemi-annual repairs As a result it shows one of two things are happening
bull More or longer planned outage time is needed to repair the aging generating fleet
bull More focus on preventive repairs during planned and maintenance events are needed
Multiple Unit Forced Outages and Causes Table 8 provides the annual multiple-unit forced outage trips resulting from the same cause for each of the
assessments years 2008-2010 respectively The ldquosingle unitrdquo trips are large units with a Net Dependable
Capacity of 750 MW or more The trips of ldquotwo unitsrdquo or more is any combination of unit capacity with the
total amount of lost capacity more than 750 MW
Table 8 also presents more information on the forced outages During 2008-2010 there were a large
number of double-unit outages resulting from the same event Investigations show that some of these trips
were at a single plant caused by common control and instrumentation for the units The incidents occurred
several times for several months and are a common mode issue internal to the plant
Table 8 Number of Multiple Unit Forced Outages and FrequencyYear
2008 2009 2010
Type of
Trip
of
Trips
Avg Outage
Hr Trip
Avg Outage
Hr Unit
of
Trips
Avg Outage
Hr Trip
Avg Outage
Hr Unit
of
Trips
Avg Outage
Hr Trip
Avg Outage
Hr Unit
Single-unit
Trip 591 58 58 284 64 64 339 66 66
Two-unit
Trip 281 43 22 508 96 48 206 41 20
Three-unit
Trip 74 48 16 223 146 48 47 109 36
Four-unit
Trip 12 77 19 111 112 28 40 121 30
Five-unit
Trip 11 1303 260 60 443 88 19 199 10
gt 5 units 20 166 16 93 206 50 37 246 6
Loss of ge 750 MW per Trip
The high number of five-unit trips in 2008 was due to Hurricane Ike hitting the Gulf Coast The highest total
number of multiple unit trips occurred in 2009 though as mentioned before the data collection for 2010 is
incomplete at this time The majority of 2009 multiple unit trips have three main causes (in order by
Generation Equipment Performance
56
number of events) transmission lack of fuel and storms A summary of the three categories for single as
well as multiple unit outages (all unit capacities) are reflected in Table 9
Table 9 Common Causes of Multiple Unit Forced Outages (2009)
Cause Number of Events Average MW Size of Unit
Transmission 1583 16
Lack of Fuel (Coal Mines Gas Lines etc) Not
in Operator Control
812 448
Storms Lightning and Other Acts of Nature 591 112
Some of the transmission outages based on storms in 2009 have been caused by the same reasons because
the storms may have caused transmission interference However the plants reported the problems
inconsistently with either the transmission interference or storms cause code Therefore they are depicted
as two different causes of forced outage
Marked transmission outages in 2009 were quite high Thirty-five percent came from one utility with a large
number of hydroelectric units The company related the trips to various problems including weather
(lightning storms) wildlife ldquoline bumpsrdquo and problems on the receiving end of the transmission line Nine
hundred and eighty-five transmission trips (62 percent) were from hydroelectric units38
In 2009 only ten transmission trips resulted in a loss of 750 MW or more per trip Twenty two generating
plants were affected by the ten trips Causes for the trips include feeder line trips (1 trip) breakers in the
switchyard (8 trips) personnel errors (2 trips) and unknown (10 trips)
The ldquoLack of Fuelrdquo outages are of interest as these events occur during the times when a unit is available to
operate but there is an interruption in fuels to operate the facilities These events do not include
interruptions of fuel due to contracts Rather the cause code is designed to account for units that are
expecting fuel and it is unavailable when requested Table 10 presents the distribution of ldquoLack of Fuelrdquo
events by NERC Region and Table 11 presents the unit types affected
38 The average size of the hydroelectric units were small ndash 335 MW
Generation Equipment Performance
57
Of the units that report ldquoLack of Fuelrdquo 78 percent of the units are oil-fired 15 percent of the units are gas-
fired and the remaining units are various other fuels Table 12 provides the top causes of forced outage for
several unit types For fossil units ldquoLack of Fuelrdquo as the number three cause behind waterwall tube leaks
and superheater tube leaks
Table 10 Forced Outages Due to Lack of Fuel by Region
Region Number of Lack of Fuel
Problems Reported
FRCC 0
MRO 3
NPCC 24
RFC 695
SERC 17
SPP 3
TRE 7
WECC 29
One company contributed to the majority of oil-fired lack of fuel events The units at the company are
actually dual-fuels (oil and gas) but market nominated gas monitoring causes the units to be on forced
outage nightly The units need gas to start up so they can run on oil When they shut down the units must
switch to gas to clean themselves With the gas restriction the unit canrsquot start and the unit goes on a
forced outage Until the band is lifted the two units will continue to be on a forced outage cycle
Event records also provide descriptions of why the unit was without fuel with the majority of descriptions
bull Temperatures affecting gas supply valves
bull Unexpected maintenance of gas pipe-lines
bull Compressor problemsmaintenance
Generation Equipment Performance
58
Table 11 Unit Type Profile of Forced Outages Due to Lack of Fuel
Unit Types Number of Lack of Fuel Problems Reported
Fossil 642
Nuclear 0
Gas Turbines 88
Diesel Engines 1
HydroPumped Storage 0
Combined Cycle 47
Generation Equipment Performance
59
Table 12 Causes of Forced Outage for Different Unit Types (2008-2010)
Fossil - all MW sizes all fuels
Rank Description Occurrence per Unit-year
MWH per Unit-year
Average Hours To Repair
Average Hours Between Failures
Unit-years
1 Waterwall (furnace wall) 0590 134106 59 3250 3868 2 Second Superheater
Leaks 0180 5182 60 3228 3868
3 Lack of Fuel (coal mines gas lines etc) where the operator is not in control
0480 4701 18 26 3868
Combined-Cycle blocks Rank Description Occurrence
per Unit-year
MWH per Unit-year
Average Hours To Repair
Average Hours Between Failures
Unit-years
1 HP Turbine Buckets Or Blades
0020 4663 1830 26280 466
2 Turbine Control Valves 0040 2777 100 7200 466 3 Gas Turbine Compressor -
High Pressure Shaft 0010 2266 663 4269 466
Nuclear units - all Reactor types Rank Description Occurrence
per Unit-year
MWH per Unit-year
Average Hours To Repair
Average Hours Between Failures
Unit-years
1 LP Turbine Buckets or Blades
0010 26415 8760 26280 288
2 Containment Structure 0010 9233 1226 26262 288 3 Feedwater Pump Local
Controls 0020 7620 692 12642 288
Simple-cycle gas turbine jet engines Rank Description Occurrence
per Unit-year
MWH per Unit-year
Average Hours To Repair
Average Hours Between Failures
Unit-years
1 Main Transformer 0030 1611 1016 20709 4181 2 Other Gas Turbine
Controls And Instrument Problems
0120 428 70 2614 4181
3 Other Gas Turbine Problems
0090 400 119 1701 4181
Generation Equipment Performance
60
2008-2010 Review of Summer versus Winter Availability To address seasonality of unit availability unit information for the months of June to September (summer)
and December through February (winter) were pooled to calculate force events during these timeframes for
2008-201039 Figure 32 shows the Equivalent Availability Factor (EAF) is three percentage points higher and
the Equivalent Forced Outage Rate - Demand (EFORd) is more than a half of a percentage point lower in the
summer period than in winter period This means the units were more reliable with less forced events
during high-demand times during the summer than during the winter seasons The generating unitrsquos
capability has a resulting higher Net Capacity Factor (NCF) of 45 percentage points in the summer season
for 2008-2010
During the spring season (March-May) 77 percent of the units took a planned outage (PO) for an average
231 hours (or 96 days) In fall (October-November) only 42 percent of the units experienced a PO and the
average duration was shorter ndash 134 hours (or 56 days) A few units took both spring and fall planned
outages although this is rare Based on this assessment the generating units are prepared for the summer
peak demand The resulting availability indicates that this maintenance was successful which is measured
by an increased EAF and lower EFORd
Figure 32 Summer-Winter Average EAF NCF and EFORd (2008-2010)
Conclusions and Recommendations During 2008-2010 the average Equivalent Availability Factor (EAF) which measures the overall availability
of generating units decreased At the same time the Net Capacity Factor (NCF) an indicator of energy
production increased The average number of forced outages in 2010 is greater than in 2008 while at the
same time the average planned outage times have decreased As a result the Equivalent Forced Outage
Rate ndash Demand (EFORd) also increased illustrating that more units have experienced forced events during
39 A study of peak periods was conducted by the NERC Generating Availability Trend Evaluation (GATE) Working Group several years ago see httpwwwnerccomfilesSeasonal-Performance-Trendspdf
9116
5343
396
8818
4896
441
0 10 20 30 40 50 60 70 80 90 100
EAF
NCF
EFORd
Percent ()
Winter
Summer
Generation Equipment Performance
61
peak-demand times in 2010 than in the previous two years Potentially with shorter planned outage
periods in 2010 there may be less time to repair equipment and prevent forced unit outages
There are warnings that units are not being maintained as well as they should be In the last three years
there has been an increase in Equivalent Forced Outage Rate ndash Demand (EFORd) This indicator measures
the rate of forced outage events on generating units during periods of load demand To confirm this
problem forced outage hours jumped from 270 to 314 hours per unit between 2009 and 2010 At the same
time maintenance events also increased by 12 hours per unit Planned outage events remain constant The
resulting conclusions from this trend are
bull More or longer planned outage time is needed to repair the generating fleet Whether age is the
cause of the increase need for planned outage time remains unknown and further investigation into
the cause for longer planned outage time is necessary
bull More focus on preventive repairs during planned and maintenance events are needed
There are many multiple unit forced outages due to lack of fuel The majority of multiple unit trips have
three main causes transmission lack of fuel and storms With special interest in the forced outages due to
ldquoLack of Fuelrdquo additional analysis revealed that 77 percent of the units experiencing unexpected fuel
stoppage are oil-fired fossil units while gas-fired units experienced 15 percent
Generating units continue to be more reliable during the peak summer periods
Disturbance Event Trends
62
Category 1 An event resulting in one or more of the following a Unintended loss of three or more BPS elements caused by
common mode failure b Failure or misoperation of an SPSRAS c System-wide voltage reduction of 3 or more d Unintended BPS system separation resulting in an island of
100 MW to 999 MW e Unplanned evacuation from a control center facility with BPS
SCADA functionality for 30 minutes or more Category 2 An event resulting in one or more of the following
a Complete loss of all BPS control center voice communication system(s) for 30 minutes or more
b Complete loss of SCADA control or monitoring functionality for 30 minutes or more
c Voltage excursions equal to or greater than 10 lasting more than five minutes
d Loss of off-site power (LOOP) to a nuclear generating station e Unintended system separation resulting in an island of 1000
MW to 4999 MW f Unintended loss of 300MW or more of firm load for more
than 15 minutes g Violation of an Interconnection Reliability Operating Limit
(IROL) for more than 30 minutes Category 3 An event resulting in one or more of the following
a The loss of load or generation of 2000 MW or more in the Eastern Interconnection or
b Western Interconnection or 1000 MW or more in the ERCOT or Queacutebec Interconnections
c Unintended system separation resulting in an island of 5000 MW to 10000 MW
d Unintended system separation resulting in an island of Florida from the Eastern Interconnection
Category 4 An event resulting in one or more of the following a The loss of load or generation from 5001 MW to 9999 MW b Unintended system separation resulting in an island of more
than 10000 MW (with the exception of Florida as described in Category 3c)
Category 5 An event resulting in one or more of the following a The loss of load of 10000 MW or more b The loss of generation of 10000 MW or more
Figure 33 BPS Event Category
Disturbance Event Trends Introduction The purpose of this section is to report event
analysis trends from the beginning of event
analysis field test40
One of the companion goals of the event
analysis program is the identification of trends
in the number magnitude and frequency of
events and their associated causes such as
human error equipment failure protection
system misoperations etc The information
provided in the event analysis database (EADB)
and various event analysis reports have been
used to track and identify trends in BPS events
in conjunction with other databases (TADS
GADS metric and benchmarking database)
to the end of 2010
The Event Analysis Working Group (EAWG)
continuously gathers event data and is moving
toward an integrated approach to analyzing
data assessing trends and communicating the
results to the industry
Performance Trends The event category is classified41
Figure 33
as shown in
with Category 5 being the most
severe Figure 34 depicts disturbance trends in
Category 1 to 5 system events from the
40 httpwwwnerccomdocseawgGalloway-Industry-EA-Field-Test-102210pdf 41httpwwwnerccomfiles2011-05-0220Event_Analysis_Process_Phase20220Field20Test20Draft20-20Final20-20For20postingpdf
Disturbance Event Trends
63
beginning of event analysis field test to the end of 201042
Figure 34 Event Category vs Date for All 2010 Categorized Events
From the figure in November and December
there were many more category 1 and 2 events than in October This is due to the field trial starting on
October 25 2010
In addition to the category of the events the status of the events plays a critical role in the accuracy of the
data By examining Figure 35 over 80 of the events reported in 2010 have been closed This means that
the category root cause and other important information have been sufficiently finalized in order for
analysis to be accurate for each event At this time there is not enough data to draw any long-term
conclusions about event investigation performance
42 Documents for the EA Field Test are located at httpwwwnerccompagephpcid=5|365
2
12 12
26
3
6 5
14
1 1
2
0
5
10
15
20
25
30
35
40
45
October November December 2010
Even
t Cou
nt
Category 3 Category 2 Category 1
Disturbance Event Trends
64
Figure 35 Event Count vs Status (All 2010 Events with Status)
By drilling down into the cause code for each closed 2010 event Figure 36 shows the top 3 event causes
From the figure equipment failure and protection system misoperation are the most significant causes for
events Because of how new and limited the data is however there may not be statistical significance for
this result Further trending of cause codes for closed events and developing a richer dataset to find any
trends between event cause codes and event counts should be performed
Figure 36 Top 3 Event Counts vs DAWG Cause Code for all Closed 2010 Events
10
32
42
0
5
10
15
20
25
30
35
40
45
Open Closed Open and Closed
Even
t Cou
nt
Status
1211
8
0
2
4
6
8
10
12
14
Equipment Failure Protection System Misoperation Human Error
Even
t Cou
nt
Cause Code
Disturbance Event Trends
65
Conclusions Due to the relatively new process for events analysis and categorization more time will be required before a
conclusive recommendation may be obtained Further analysis and new data should provide valuable
statistics in the future Over 80 of all event reports from 2010 are current listed as closed but no
conclusion about investigation performance may be obtained because of the limited amount of data It is
recommended to study ways to prevent equipment failure and protection system misoperations but there
is not enough data to draw a firm conclusion about the top causes of events at this time
Abbreviations Used in This Report
66
Abbreviations Used in This Report
Acronym Definition ALP Acadiana Load Pocket
ALR Adequate Level of Reliability
ARR Automatic Reliability Report
BA Balancing Authority
BPS Bulk Power System
CDI Condition Driven Index
CEII Critical Energy Infrastructure Information
CIPC Critical Infrastructure Protection Committee
CLECO Cleco Power LLC
DADS Future Demand Availability Data System
DCS Disturbance Control Standard
DOE Department Of Energy
DSM Demand Side Management
EA Event Analysis
EAF Equivalent Availability Factor
ECAR East Central Area Reliability
EDI Event Drive Index
EEA Energy Emergency Alert
EFORd Equivalent Forced Outage Rate Demand
EMS Energy Management System
ERCOT Electric Reliability Council of Texas
ERO Electric Reliability Organization
ESAI Energy Security Analysis Inc
FERC Federal Energy Regulatory Commission
FOH Forced Outage Hours
FRCC Florida Reliability Coordinating Council
GADS Generation Availability Data System
GOP Generation Operator
IEEE Institute of Electrical and Electronics Engineers
IESO Independent Electricity System Operator
IROL Interconnection Reliability Operating Limit
Abbreviations Used in This Report
67
Acronym Definition IRI Integrated Reliability Index
LOLE Loss of Load Expectation
LUS Lafayette Utilities System
MAIN Mid-America Interconnected Network Inc
MAPP Mid-continent Area Power Pool
MOH Maintenance Outage Hours
MRO Midwest Reliability Organization
MSSC Most Severe Single Contingency
NCF Net Capacity Factor
NEAT NERC Event Analysis Tool
NERC North American Electric Reliability Corporation
NPCC Northeast Power Coordinating Council
OC Operating Committee
OL Operating Limit
OP Operating Procedures
ORS Operating Reliability Subcommittee
PC Planning Committee
PO Planned Outage
POH Planned Outage Hours
RAPA Reliability Assessment Performance Analysis
RAS Remedial Action Schemes
RC Reliability Coordinator
RCIS Reliability Coordination Information System
RCWG Reliability Coordinator Working Group
RE Regional Entities
RFC Reliability First Corporation
RMWG Reliability Metrics Working Group
RSG Reserve Sharing Group
SAIDI System Average Interruption Duration Index
SAIFI System Average Interruption Frequency Index
SCADA Supervisory Control and Data Acquisition
SDI Standardstatute Driven Index
SERC SERC Reliability Corporation
Abbreviations Used in This Report
68
Acronym Definition SRI Severity Risk Index
SMART Specific Measurable Attainable Relevant and Tangible
SOL System Operating Limit
SPS Special Protection Schemes
SPCS System Protection and Control Subcommittee
SPP Southwest Power Pool
SRI System Risk Index
TADS Transmission Availability Data System
TADSWG Transmission Availability Data System Working Group
TO Transmission Owner
TOP Transmission Operator
WECC Western Electricity Coordinating Council
Contributions
69
Contributions This report was made feasible by the collaboration and hard work of both NERC staff and NERCrsquos
Industry Groups
NERC Industry Groups
Table 14 lists the NERC industry group contributors Without their contribution and collaboration this
report would not have been possible
Table 13 NERC Industry Group Contributions43
NERC Group
Relationship Contribution
Reliability Metrics Working Group
(RMWG)
Reports to the OCPC bull Lead Development of Report bull Provide Reliability Metrics Data bull Responsible for Reliability Metrics
Performance Chapter
Transmission Availability Working Group
(TADSWG)
Reports to the OCPC bull Provide Transmission Availability Data
bull Responsible for Transmission Equip-ment Performance Chapter
bull Content Review
Generation Availability Data System Task
Force
(GADSTF)
Reports to the OCPC bull Provide Generation Availability Data bull Responsible for Generation Equip-
ment Performance Chapter bull Content Review
Event Analysis Working Group
(EAWG)
Reports to the OCPC bull Provide Events Data bull Responsible for Disturbance Events
Trends Chapter bull Content Review
43 Rosters for RMWG TADSWG GADSTF and EAWG are available at httpwwwnerccomfilesrosterpdf
Contributions
70
NERC Staff Table 13 below lists the NERC staff who contributed to the 2011 Reliability Performance Analysis
Report
Table 14 Contributing NERC Staff
Name Title E-mail Address
Mark Lauby Vice President and Director of
Reliability Assessment and
Performance Analysis
marklaubynercnet
Jessica Bian Manager of Performance Analysis jessicabiannercnet
John Moura Manager of Reliability Assessments johnmouranercnet
Andrew Slone Engineer Reliability Performance
Analysis
andrewslonenercnet
Jim Robinson TADS Project Manager jimrobinsonnercnet
Clyde Melton Engineer Reliability Performance
Analysis
clydemeltonnercnet
Mike Curley Manager of GADS Services mikecurleynercnet
James Powell Engineer Reliability Performance
Analysis
jamespowellnercnet
Michelle Marx Administrative Assistant michellemarxnercnet
William Mo Intern Performance Analysis wmonercnet
- NERCrsquos Mission
- Table of Contents
- Executive Summary
-
- 2011 Transition Report
- State of Reliability Report
- Key Findings and Recommendations
-
- Reliability Metric Performance
- Transmission Availability Performance
- Generating Availability Performance
- Disturbance Events
- Report Organization
-
- Introduction
-
- Metric Report Evolution
- Roadmap for the Future
-
- Reliability Metrics Performance
-
- Introduction
- 2010 Performance Metrics Results and Trends
-
- ALR1-3 Planning Reserve Margin
-
- Background
- Assessment
- Special Considerations
-
- ALR1-4 BPS Transmission Related Events Resulting in Loss of Load
-
- Background
- Assessment
-
- ALR1-12 Interconnection Frequency Response
-
- Background
- Assessment
-
- ALR2-3 Activation of Under Frequency Load Shedding
-
- Background
- Assessment
- Special Considerations
-
- ALR2-4 Average Percent Non-Recovery Disturbance Control Standards (DCS)
-
- Background
- Assessment
- Special Consideration
-
- ALR2-5 Disturbance Control Events Greater Than Most Severe Single Contingency
-
- Background
- Assessment
- Special Consideration
-
- ALR 1-5 System Voltage Performance
-
- Background
- Special Considerations
- Status
-
- ALR3-5 Interconnection Reliability Operating Limit System Operating Limit (IROLSOL) Exceedances
-
- Background
-
- ALR4-1 Automatic Transmission Outages Caused by Protection System Misoperations
-
- Background
- Special Considerations
-
- ALR6-11 ndash ALR6-14
-
- Background
- Assessment
- ALR 6-11 ndash Automatic Outages Initiated by Failed Protection System Equipment
- ALR6-12 ndash Automatic Outages Initiated by Human Error
- ALR6-13 ndash Automatic Outages Initiated by Failed AC Substation Equipment
- ALR6-14 Automatic AC Transmission Outages Initiated by Failed AC Circuit Equipment
-
- ALR6-15 Element Availability Percentage (APC)
-
- Background
- Assessment
- Special Consideration
-
- ALR6-16 Transmission System Unavailability
-
- Background
- Assessment
- Special Consideration
-
- ALR6-2 Energy Emergency Alert 3 (EEA3)
-
- Background
- Assessment
- Special Considerations
-
- ALR 6-3 Energy Emergency Alert 2 (EEA2)
-
- Background
- Assessment
- Special Considerations
-
- ALR 6-1 Transmission Constraint Mitigation
-
- Background
- Assessment
- Special Considerations
-
- Integrated Bulk Power System Risk Assessment
-
- Introduction
- Recommendations
-
- Integrated Reliability Index Concepts
-
- The Three Components of the IRI
-
- Event-Driven Indicators (EDI)
- Condition-Driven Indicators (CDI)
- StandardsStatute-Driven Indicators (SDI)
-
- IRI Index Calculation
- IRI Recommendations
-
- Reliability Metrics Conclusions and Recommendations
-
- Transmission Equipment Performance
-
- Introduction
- Performance Trends
-
- AC Element Outage Summary and Leading Causes
- Transmission Monthly Outages
- Outage Initiation Location
- Transmission Outage Events
- Transmission Outage Mode
-
- Conclusions
-
- Generation Equipment Performance
-
- Introduction
- Generation Key Performance Indicators
-
- Multiple Unit Forced Outages and Causes
- 2008-2010 Review of Summer versus Winter Availability
-
- Conclusions and Recommendations
-
- Disturbance Event Trends
-
- Introduction
- Performance Trends
- Conclusions
-
- Abbreviations Used in This Report
- Contributions
-
- NERC Industry Groups
- NERC Staff
-

Reliability Metrics Performance
44
power system To this end study into determining the amount of overlap between the components is
necessary RMWG is currently working to determine the proper amount of overlap between the IRI
components
Also the CDI component of the IRI needs to be solidified This is especially true with the CDI More
accurate metric data is needed to paint a fuller picture of the CDI Many of the metrics used to calculate
the CDI are new or they have limited data Compared to the SDI which counts well-known violation
counts and the EDI which uses the well-defined CDI the CDI lacks the depth of rigor that the other two
components have acquired through their years of data RMWG is currently working to improve the CDI
Reliability Metrics Conclusions and Recommendations Among the eighteen metrics that address the characteristics of an adequate level of reliability (ALR)
metric trends indicate the system is performing better in the following seven areas
bull ALR1-3 Planning Reserve Margin
bull ALR1-4 BPS Transmission Related Events Resulting in Loss of Load
bull ALR2-5 Disturbance Control Events Greater than Most Severe Single Contingency
bull ALR6-2 Energy Emergency Alert 3 (EEA3)
bull ALR6-3 Energy Emergency Alert 2 (EEA2)
bull ALR6-11 Automatic Transmission Outages Caused by Protection System Misoperations
bull ALR6-13 Automatic Transmission Outages Caused by Failed AC Substation Equipment
Assessments have been made in other performance categories A number of them do not have
sufficient data to derive any conclusions from the results The RMWG recommends continued data
collection and assessment of these metrics If a metric does not yield any trend in a five-year reporting
period the metric will be modified or withdrawn
For the IRI more investigation should be performed to determine the overlap of the components (CDI
EDI and SDI) The CDI should be more thoroughly solidified as an index by collecting more data over
time
Transmission Equipment Performance
45
Transmission Equipment Performance Introduction The Transmission Availability Data System (TADS) effort began with the establishment of a TADS task force
by the NERC Planning Committee in October 2006 On October 27 2007 the NERC Board of Trustees
approved the collection of transmission automatic outage data beginning in calendar year 2008 (Phase I)
Subsequently on October 29 2008 the NERC Board approved the collection of Non-Automatic Outage data
that began for Calendar year 2010 (Phase II)
This chapter provides reliability performance analysis of the transmission system by focusing on the trends
of Automatic Outage data from calendar year 2008 thru 2010 Since only one year of Non-Automatic
Outage data has been collected that data will not be assessed in this report
When calculating bulk power system performance indices care must be exercised when interpreting results
as misinterpretation can lead to erroneous conclusions regarding system performance With only three
years of data in the smaller regions it is not clear whether a regionrsquos yearly outage variation compared to
the average is due to random statistical variation or that particular year is significantly different in
performance However on a NERC-wide basis after three years of data collection there is enough
information to accurately determine whether the yearly outage variation compared to the average is due to
random statistical variation or the particular year in question is significantly different in performance33
Performance Trends
Transmission performance information has been provided by Transmission Owners (TOs) within NERC
through the NERC TADS (Transmission Availability Data System) process The data presented reflects
Momentary and Sustained AC Automatic outages of transmission elements that operate at voltages ge 200 kV
(including the low side of transformers) with the criteria specified in the TADS process The following
elements listed below are included
bull AC Circuits ge 200 kV (Overhead and Underground Circuits) Radial circuits are included
bull DC Circuits with ge +-200 kV DC voltage
bull Transformers with ge 200 kV low-side voltage and
bull ACDC Back-to-Back (BTB) Converters with ge 200 kV AC voltage on both sides
33The detailed Confidence Interval computation is available at httpwwwnerccomdocspctadstfTADS_Nov_2_2007APPENDIX_C_Confidence_Intervalpdf
Transmission Equipment Performance
46
AC Element Outage Summary and Leading Causes Table 6 shows the 2008 2009 and 2010 NERC total AC transmission element inventory and a summary of
the associated outages As expected in general the number of circuits increased from year to year due to
new construction or re-construction to higher voltages For every outage experienced on the transmission
system cause codes are identified and recorded according to the TADS process Causes of both momentary
and sustained outages have been indicated These causes are analyzed to identify trends and similarities
and to provide insight into what could be done to possibly prevent future occurrences
Figure 23 and Figure 24 describe the top ten initiating cause codes for sustained and momentary automatic
outages combined from 2008-2010 Based on the two figures the relationship between the total number of
outages and total outage hours can be seen Failed AC Substation Equipment and Failed AC Circuit
Equipment only account for 15 percent of the total number of outages but account for 65 percent of the
total outage hours The two largest causes of outages within NERC (ldquoLightingrdquo and ldquoWeather excluding
Lightningrdquo) account for 34 percent of the total number of outages
The next three Human Error Failed Protection System Equipment and Failed AC Circuit Equipment have
very similar totals and should all be considered significant focus points in reducing the number of Sustained
Automatic Outages for all elements
Transmission Equipment Performance
47
Table 6 NERC - All AC Elements Sustained and Momentary Outage Performance Summary
2008 Number of Outages
AC Voltage
Class
No of
Circuits
Circuit
Miles Sustained Momentary
Total
Outages Total Outage Hours
200-299kV 4369 102131 1560 1062 2622 56595
300-399kV 1585 53631 793 753 1546 14681
400-599kV 586 31495 389 196 585 11766
600-799kV 110 9451 43 40 83 369
All Voltages 6650 196708 2785 2051 4836 83626
2009 Number of Outages
AC Voltage
Class
No of
Circuits
Circuit
Miles Sustained Momentary
Total
Outages Total Outage Hours
200-299kV 4468 102935 1387 898 2285 28828
300-399kV 1619 56447 641 610 1251 24714
400-599kV 592 32045 265 166 431 9110
600-799kV 110 9451 53 38 91 442
All Voltages 6789 200879 2346 1712 4038 63094
2010 Number of Outages
AC Voltage
Class
No of
Circuits
Circuit
Miles Sustained Momentary
Total
Outages Total Outage Hours
200-299kV 4567 104722 1506 918 2424 54941
300-399kV 1676 62415 721 601 1322 16043
400-599kV 605 31590 292 174 466 10442
600-799kV 111 9477 63 50 113 2303
All Voltages 6957 208204 2582 1743 4325 83729
Note The NERC table does not show redacted outages DC Circuit outages Transformer outages or ACDC
converter outages
Transmission Equipment Performance
48
Figure 23 NERC - Top Ten Sustained and Momentary Outages by Initiating Cause Code for All Elements
Figure 24 NERC - Top Ten Sustained Outage Hours by Cause Code
198
151
80
7271
6943
33
27
188
68
Lightning
Weather excluding lightningHuman Error
Failed AC Substation EquipmentFailed Protection System EquipmentFailed AC Circuit Equipment Foreign Interference
Power System Condition
Fire
Unknown
Remaining Cause Codes
299
246
188
58
52
42
3619
16 12 31 Failed AC Substation EquipmentFailed AC Circuit Equipment Weather excluding lightningUnavailable
Other
Fire
Unknown
Human Error
Failed Protection System EquipmentForeign Interference
Remaining Cause Codes
Transmission Equipment Performance
49
Transmission Monthly Outages Figure 25 displays the total number of Automatic Outages on a per-month basis The three months with the
highest total of outages were June July and August From a seasonal perspective winter had a monthly
average of 281 outages These include the months of November-March Summer had an average of 429
outages Summer included the months of April-October
Figure 25 Number of Outages by Month for AC Circuits (2008-2010)
This figure does not show redacted outages DC Circuit outages Transformer outages or ACDC Converter
outages
Outage Initiation Location For every outage experienced on the transmission system the outage initiation code is identified and
recorded according to the TADS process The outage initiation code can be analyzed to identify trends and
similarities and to provide insight into what could be done to possibly prevent future occurrences
The ldquoOutage Initiation Coderdquo describes where an automatic outage was initiated on the power system The
five codes are as follows
bull Element-Initiated
bull Other Element-Initiated
bull AC Substation-Initiated
bull ACDC Terminal-Initiated (for DC circuits)
bull Other Facility Initiated any facility not included in any other outage initiation code
JanuaryFebruar
yMarch April May June July August
September
October
November
December
2008 238 229 257 258 292 437 467 380 208 176 255 236
2009 315 201 339 334 398 553 546 515 351 235 226 294
2010 444 224 269 446 449 486 639 498 351 271 305 281
3 Year AVG 332 218 288 346 380 492 551 464 303 227 262 270
0
100
200
300
400
500
600
700
Out
ages
Transmission Equipment Performance
50
Notably the protection system is not part of an ldquoAC Substationrdquo or an ldquoACDC Terminalrdquo If a protection
system misoperates and initiates an outage it will be classified as ldquoOther-Facility Initiatedrdquo The following
Figures show the initiating location of the Automatic outages from 2008 to 2010
With both Momentary and Sustained Automatic Outages taken into account the outage was initiated on the
Element more than 67 percent of the time as shown in Figure 26 and Figure 27
When only the Sustained Automatic Outages are analyzed the outage initiation on both AC Substation and
Other Facility increased by 34 percent and 32 percent respectively Outages initiated on the Element itself
decreases by 78 percent as shown in Figure 26 and 27 For only the Momentary Automatic Outages the
outage initiation on the Element increases by 19 percent compared to Sustained Outages Element initiated
outages make up over 78 percent of the total outages when analyzing only Momentary Outages
Figure 26
Figure 27
Transmission Outage Events Figure 28 illustrates the relationship between the numbers of Automatic Outages associated per TADS
event 2008 2009 and 2010 tend to follow the same trend The largest number of Automatic Outages per
TADS event is fourteen in 2010 thirteen in 2009 and eight in 2008 There are around 70 to 100 TADS
events that contain between fourteen and three Automatic Outages (see below) There are around 330 to
400 TADS events that contain two or more Automatic Outages The rest of the events only contain one
Automatic Outage As noted in the lower right hand corner below the total number of Events in 2008 to
2010 ranged from 3920 to 4569 events per year Nearly 90 percent or more of the events contained one
Automatic Outage
Figure 26 Sustained Automatic Outage Initiation
Code
Figure 27 Momentary Automatic Outage Initiation
Code
Transmission Equipment Performance
51
Transmission Outage Mode Figure 29 and Figure 30 show the percentage of Outage Modes The ldquoOutage Mode Coderdquo describes
whether one Automatic Outage is related to other Automatic Outages A Single Mode outage is an
Automatic Outage of a single Element which occurs independently of any other Automatic Outages (if any)
A ldquoDependent Mode Initiating Outagerdquo is an Automatic Outage of a single Element that initiates one or more
subsequent Element Automatic Outages A ldquoDependent Mode Outagerdquo is an Automatic Outage of an
Element which occurred as a result of an initiating outage whether the initiating outage was an Element
outage or a non-Element outage A ldquoCommon Mode Outagerdquo is one of two or more Automatic Outages with
the same Initiating Cause Code and where the outages are not consequences of each other and occur nearly
simultaneously A ldquoCommon Mode Initiating Outagerdquo is a Common Mode Outage that initiates one or more
subsequent Automatic Outages
Over 72 percent of the total outages occurred on the bulk power system are Single Mode Outages The next
largest mode is Dependent with over 11 percent of the total outages being in this category For only
Sustained Automatic Outages outages related to each other increase with Dependent mode accounting for
13 percent of the outages and Common mode accounting for close to 11 percent of the outages
Independent Sustained outages still account for the largest portion with nearly 70 percent being Single
mode When just analyzing Momentary Automatic Outages Associated outages decrease with Dependent
Figure 28 Event Histogram (2008-2010)
Transmission Equipment Performance
52
mode accounting for only 9 percent of the outages The Common Mode percentage decreases while
Dependent Mode Initiating percentage increases compared to Sustained Outages Independent Momentary
outages account for the largest portion with over 76 percent being Single Mode
An investigation into the root causes of Dependent and Common mode events which include three or more
Automatic Outages (indentified in the TADS 2008 to 2010 data) should be a high priority Some protection
systems are designed to trip three or more circuits but some events go beyond what is designed Some also
have misoperations associated with multiple outage events
Conclusions On a NERC wide average basis automatic transmission outage rate is improving from 2008 to 2010 based on
reported data Considering both automatic and non-automatic outages 2010 records indicate transmission
element availability percentage is very high and exceeds 95 The unavailability rate for AC circuits and
transformers are only 15 and 29 respectively
The cause codes of Human Error Failed Protection System Equipment and Failed AC Circuit Equipment
should be considered significant focus points in reducing the number of Sustained Automatic Outages for all
elements A deeper look into the root causes of Dependent and Common mode events which include three
or more Automatic Outages (indentified in the TADS 2008 to 2010 data) should be a high priority Some
protection systems are designed to trip three or more circuits but some events go beyond what is designed
Some also have misoperations associated with multiple outage events
Figure 29 Sustained Automatic Outage Mode code Figure 30 Momentary Automatic Outage Mode code
Generation Equipment Performance
53
Generation Equipment Performance Introduction The development of the Generating Availability Data System (GADS) began in 1982 This series of databases
is used to voluntarily collect record and retrieve operating information By pooling individual unit
information with likewise units generating unit availability performance can be calculated providing
opportunities to identify trends and generating equipment reliability improvement opportunities The
information is used to support equipment reliability availability analyses and risk-informed decision-making
by system planners generation owners assessment modelers manufacturers and contractors etc Reports
and information resulting from the data collected through GADS are now used for benchmarking and
analyzing electric power plants
Currently the data collected through GADS contains 72 percent of the North American generating units
with generating capacity of 20 MW or higher34 Additionally many of the newer combined-cycle plants are
not reporting information and therefore a full view of each unit type is not presented Rather a sample of
all the units in North America that fit a given more general category is provided35 for the 2008-201036
Generation Key Performance Indicators
assessment period
Three key performance indicators37
In
the industry have used widely to measure the availability of generating
units (see Terms Used in This Report section for their calculation parameters) are Equivalent Availability
Factor (EAF) Net Capacity Factor (NCF) and Equivalent Forced Outage Rate ndash Demand (EFORd)
Table 7 the North American fleet average EAF NCF and EFORd compared to unit age for all generating
units with a capacity of 20 MW and higher is provided for the years 2008-2010 The EAF shows a decline
during the last three years NCF is up and down while the EFORd appears to be increasing As expected the
fleet of units reported to GADS is aging overall with the fossil units being about 12 years older than the
average age
34 httpwwwnerccomdocspcgadstfGADSTF_Recommendation_Report_02-18-2011_FINALpdf 35GADS contains some 1500+ units under 20 MW that is not included in this report These units are excluded because most units are not base-loaded and are in peaking operation
3684 percent of the 2010 dataset is available at this time while the 2008 and 2009 dataset is complete 37 httpwwwnerccompagephpcid=4|43
Generation Equipment Performance
54
Table 7 General Availability Review of GADS Fleet Units by Year
2008 2009 2010 Average
Equivalent Availability Factor (EAF) 8776 8774 8678 8743
Net Capacity Factor (NCF) 5083 4709 4880 4890
Equivalent Forced Outage Rate -
Demand (EFORd) 579 575 639 597
Number of Units ge20 MW 3713 3713 3713 3713
Average Age of the Fleet in Years (all
unit types) 303 311 321 312
Average Age of the Fleet in Years
(fossil units only) 422 432 440 433
Figure 31 provides the average forced outage hours (FOH) maintenance outage hours (MOH) and planned
outage hours (POH) for all units reporting 20 MW or larger During this three-year period the average FOH
291 hours average MOH is 163 hours average POH is 470 hours
Figure 31 shows a large increase in forced and maintenance events The average age of the units with a
capacity of 20MW and higher in 2009 is 316 years old However the average age of fossil units in 2010 is
442 years old These fossil units are the backbone of all operating units providing the base-load power
continuously and nearly 50 percent of all energy annually There appears to be no increase allocated for
annualsemi-annual maintenance (ie planned outages) for the older generating units The increase of
000100002000030000400005000060000700008000090000
100000
2008 2009 2010
463 479 468
154 161 173
288 270 314
Hou
rs
Planned Maintenance Forced
Figure 31 Average Outage Hours for Units gt 20 MW
Generation Equipment Performance
55
maintenance outage hours reflects an increased need to fix problems that cannot be deferred until the next
annualsemi-annual repairs As a result it shows one of two things are happening
bull More or longer planned outage time is needed to repair the aging generating fleet
bull More focus on preventive repairs during planned and maintenance events are needed
Multiple Unit Forced Outages and Causes Table 8 provides the annual multiple-unit forced outage trips resulting from the same cause for each of the
assessments years 2008-2010 respectively The ldquosingle unitrdquo trips are large units with a Net Dependable
Capacity of 750 MW or more The trips of ldquotwo unitsrdquo or more is any combination of unit capacity with the
total amount of lost capacity more than 750 MW
Table 8 also presents more information on the forced outages During 2008-2010 there were a large
number of double-unit outages resulting from the same event Investigations show that some of these trips
were at a single plant caused by common control and instrumentation for the units The incidents occurred
several times for several months and are a common mode issue internal to the plant
Table 8 Number of Multiple Unit Forced Outages and FrequencyYear
2008 2009 2010
Type of
Trip
of
Trips
Avg Outage
Hr Trip
Avg Outage
Hr Unit
of
Trips
Avg Outage
Hr Trip
Avg Outage
Hr Unit
of
Trips
Avg Outage
Hr Trip
Avg Outage
Hr Unit
Single-unit
Trip 591 58 58 284 64 64 339 66 66
Two-unit
Trip 281 43 22 508 96 48 206 41 20
Three-unit
Trip 74 48 16 223 146 48 47 109 36
Four-unit
Trip 12 77 19 111 112 28 40 121 30
Five-unit
Trip 11 1303 260 60 443 88 19 199 10
gt 5 units 20 166 16 93 206 50 37 246 6
Loss of ge 750 MW per Trip
The high number of five-unit trips in 2008 was due to Hurricane Ike hitting the Gulf Coast The highest total
number of multiple unit trips occurred in 2009 though as mentioned before the data collection for 2010 is
incomplete at this time The majority of 2009 multiple unit trips have three main causes (in order by
Generation Equipment Performance
56
number of events) transmission lack of fuel and storms A summary of the three categories for single as
well as multiple unit outages (all unit capacities) are reflected in Table 9
Table 9 Common Causes of Multiple Unit Forced Outages (2009)
Cause Number of Events Average MW Size of Unit
Transmission 1583 16
Lack of Fuel (Coal Mines Gas Lines etc) Not
in Operator Control
812 448
Storms Lightning and Other Acts of Nature 591 112
Some of the transmission outages based on storms in 2009 have been caused by the same reasons because
the storms may have caused transmission interference However the plants reported the problems
inconsistently with either the transmission interference or storms cause code Therefore they are depicted
as two different causes of forced outage
Marked transmission outages in 2009 were quite high Thirty-five percent came from one utility with a large
number of hydroelectric units The company related the trips to various problems including weather
(lightning storms) wildlife ldquoline bumpsrdquo and problems on the receiving end of the transmission line Nine
hundred and eighty-five transmission trips (62 percent) were from hydroelectric units38
In 2009 only ten transmission trips resulted in a loss of 750 MW or more per trip Twenty two generating
plants were affected by the ten trips Causes for the trips include feeder line trips (1 trip) breakers in the
switchyard (8 trips) personnel errors (2 trips) and unknown (10 trips)
The ldquoLack of Fuelrdquo outages are of interest as these events occur during the times when a unit is available to
operate but there is an interruption in fuels to operate the facilities These events do not include
interruptions of fuel due to contracts Rather the cause code is designed to account for units that are
expecting fuel and it is unavailable when requested Table 10 presents the distribution of ldquoLack of Fuelrdquo
events by NERC Region and Table 11 presents the unit types affected
38 The average size of the hydroelectric units were small ndash 335 MW
Generation Equipment Performance
57
Of the units that report ldquoLack of Fuelrdquo 78 percent of the units are oil-fired 15 percent of the units are gas-
fired and the remaining units are various other fuels Table 12 provides the top causes of forced outage for
several unit types For fossil units ldquoLack of Fuelrdquo as the number three cause behind waterwall tube leaks
and superheater tube leaks
Table 10 Forced Outages Due to Lack of Fuel by Region
Region Number of Lack of Fuel
Problems Reported
FRCC 0
MRO 3
NPCC 24
RFC 695
SERC 17
SPP 3
TRE 7
WECC 29
One company contributed to the majority of oil-fired lack of fuel events The units at the company are
actually dual-fuels (oil and gas) but market nominated gas monitoring causes the units to be on forced
outage nightly The units need gas to start up so they can run on oil When they shut down the units must
switch to gas to clean themselves With the gas restriction the unit canrsquot start and the unit goes on a
forced outage Until the band is lifted the two units will continue to be on a forced outage cycle
Event records also provide descriptions of why the unit was without fuel with the majority of descriptions
bull Temperatures affecting gas supply valves
bull Unexpected maintenance of gas pipe-lines
bull Compressor problemsmaintenance
Generation Equipment Performance
58
Table 11 Unit Type Profile of Forced Outages Due to Lack of Fuel
Unit Types Number of Lack of Fuel Problems Reported
Fossil 642
Nuclear 0
Gas Turbines 88
Diesel Engines 1
HydroPumped Storage 0
Combined Cycle 47
Generation Equipment Performance
59
Table 12 Causes of Forced Outage for Different Unit Types (2008-2010)
Fossil - all MW sizes all fuels
Rank Description Occurrence per Unit-year
MWH per Unit-year
Average Hours To Repair
Average Hours Between Failures
Unit-years
1 Waterwall (furnace wall) 0590 134106 59 3250 3868 2 Second Superheater
Leaks 0180 5182 60 3228 3868
3 Lack of Fuel (coal mines gas lines etc) where the operator is not in control
0480 4701 18 26 3868
Combined-Cycle blocks Rank Description Occurrence
per Unit-year
MWH per Unit-year
Average Hours To Repair
Average Hours Between Failures
Unit-years
1 HP Turbine Buckets Or Blades
0020 4663 1830 26280 466
2 Turbine Control Valves 0040 2777 100 7200 466 3 Gas Turbine Compressor -
High Pressure Shaft 0010 2266 663 4269 466
Nuclear units - all Reactor types Rank Description Occurrence
per Unit-year
MWH per Unit-year
Average Hours To Repair
Average Hours Between Failures
Unit-years
1 LP Turbine Buckets or Blades
0010 26415 8760 26280 288
2 Containment Structure 0010 9233 1226 26262 288 3 Feedwater Pump Local
Controls 0020 7620 692 12642 288
Simple-cycle gas turbine jet engines Rank Description Occurrence
per Unit-year
MWH per Unit-year
Average Hours To Repair
Average Hours Between Failures
Unit-years
1 Main Transformer 0030 1611 1016 20709 4181 2 Other Gas Turbine
Controls And Instrument Problems
0120 428 70 2614 4181
3 Other Gas Turbine Problems
0090 400 119 1701 4181
Generation Equipment Performance
60
2008-2010 Review of Summer versus Winter Availability To address seasonality of unit availability unit information for the months of June to September (summer)
and December through February (winter) were pooled to calculate force events during these timeframes for
2008-201039 Figure 32 shows the Equivalent Availability Factor (EAF) is three percentage points higher and
the Equivalent Forced Outage Rate - Demand (EFORd) is more than a half of a percentage point lower in the
summer period than in winter period This means the units were more reliable with less forced events
during high-demand times during the summer than during the winter seasons The generating unitrsquos
capability has a resulting higher Net Capacity Factor (NCF) of 45 percentage points in the summer season
for 2008-2010
During the spring season (March-May) 77 percent of the units took a planned outage (PO) for an average
231 hours (or 96 days) In fall (October-November) only 42 percent of the units experienced a PO and the
average duration was shorter ndash 134 hours (or 56 days) A few units took both spring and fall planned
outages although this is rare Based on this assessment the generating units are prepared for the summer
peak demand The resulting availability indicates that this maintenance was successful which is measured
by an increased EAF and lower EFORd
Figure 32 Summer-Winter Average EAF NCF and EFORd (2008-2010)
Conclusions and Recommendations During 2008-2010 the average Equivalent Availability Factor (EAF) which measures the overall availability
of generating units decreased At the same time the Net Capacity Factor (NCF) an indicator of energy
production increased The average number of forced outages in 2010 is greater than in 2008 while at the
same time the average planned outage times have decreased As a result the Equivalent Forced Outage
Rate ndash Demand (EFORd) also increased illustrating that more units have experienced forced events during
39 A study of peak periods was conducted by the NERC Generating Availability Trend Evaluation (GATE) Working Group several years ago see httpwwwnerccomfilesSeasonal-Performance-Trendspdf
9116
5343
396
8818
4896
441
0 10 20 30 40 50 60 70 80 90 100
EAF
NCF
EFORd
Percent ()
Winter
Summer
Generation Equipment Performance
61
peak-demand times in 2010 than in the previous two years Potentially with shorter planned outage
periods in 2010 there may be less time to repair equipment and prevent forced unit outages
There are warnings that units are not being maintained as well as they should be In the last three years
there has been an increase in Equivalent Forced Outage Rate ndash Demand (EFORd) This indicator measures
the rate of forced outage events on generating units during periods of load demand To confirm this
problem forced outage hours jumped from 270 to 314 hours per unit between 2009 and 2010 At the same
time maintenance events also increased by 12 hours per unit Planned outage events remain constant The
resulting conclusions from this trend are
bull More or longer planned outage time is needed to repair the generating fleet Whether age is the
cause of the increase need for planned outage time remains unknown and further investigation into
the cause for longer planned outage time is necessary
bull More focus on preventive repairs during planned and maintenance events are needed
There are many multiple unit forced outages due to lack of fuel The majority of multiple unit trips have
three main causes transmission lack of fuel and storms With special interest in the forced outages due to
ldquoLack of Fuelrdquo additional analysis revealed that 77 percent of the units experiencing unexpected fuel
stoppage are oil-fired fossil units while gas-fired units experienced 15 percent
Generating units continue to be more reliable during the peak summer periods
Disturbance Event Trends
62
Category 1 An event resulting in one or more of the following a Unintended loss of three or more BPS elements caused by
common mode failure b Failure or misoperation of an SPSRAS c System-wide voltage reduction of 3 or more d Unintended BPS system separation resulting in an island of
100 MW to 999 MW e Unplanned evacuation from a control center facility with BPS
SCADA functionality for 30 minutes or more Category 2 An event resulting in one or more of the following
a Complete loss of all BPS control center voice communication system(s) for 30 minutes or more
b Complete loss of SCADA control or monitoring functionality for 30 minutes or more
c Voltage excursions equal to or greater than 10 lasting more than five minutes
d Loss of off-site power (LOOP) to a nuclear generating station e Unintended system separation resulting in an island of 1000
MW to 4999 MW f Unintended loss of 300MW or more of firm load for more
than 15 minutes g Violation of an Interconnection Reliability Operating Limit
(IROL) for more than 30 minutes Category 3 An event resulting in one or more of the following
a The loss of load or generation of 2000 MW or more in the Eastern Interconnection or
b Western Interconnection or 1000 MW or more in the ERCOT or Queacutebec Interconnections
c Unintended system separation resulting in an island of 5000 MW to 10000 MW
d Unintended system separation resulting in an island of Florida from the Eastern Interconnection
Category 4 An event resulting in one or more of the following a The loss of load or generation from 5001 MW to 9999 MW b Unintended system separation resulting in an island of more
than 10000 MW (with the exception of Florida as described in Category 3c)
Category 5 An event resulting in one or more of the following a The loss of load of 10000 MW or more b The loss of generation of 10000 MW or more
Figure 33 BPS Event Category
Disturbance Event Trends Introduction The purpose of this section is to report event
analysis trends from the beginning of event
analysis field test40
One of the companion goals of the event
analysis program is the identification of trends
in the number magnitude and frequency of
events and their associated causes such as
human error equipment failure protection
system misoperations etc The information
provided in the event analysis database (EADB)
and various event analysis reports have been
used to track and identify trends in BPS events
in conjunction with other databases (TADS
GADS metric and benchmarking database)
to the end of 2010
The Event Analysis Working Group (EAWG)
continuously gathers event data and is moving
toward an integrated approach to analyzing
data assessing trends and communicating the
results to the industry
Performance Trends The event category is classified41
Figure 33
as shown in
with Category 5 being the most
severe Figure 34 depicts disturbance trends in
Category 1 to 5 system events from the
40 httpwwwnerccomdocseawgGalloway-Industry-EA-Field-Test-102210pdf 41httpwwwnerccomfiles2011-05-0220Event_Analysis_Process_Phase20220Field20Test20Draft20-20Final20-20For20postingpdf
Disturbance Event Trends
63
beginning of event analysis field test to the end of 201042
Figure 34 Event Category vs Date for All 2010 Categorized Events
From the figure in November and December
there were many more category 1 and 2 events than in October This is due to the field trial starting on
October 25 2010
In addition to the category of the events the status of the events plays a critical role in the accuracy of the
data By examining Figure 35 over 80 of the events reported in 2010 have been closed This means that
the category root cause and other important information have been sufficiently finalized in order for
analysis to be accurate for each event At this time there is not enough data to draw any long-term
conclusions about event investigation performance
42 Documents for the EA Field Test are located at httpwwwnerccompagephpcid=5|365
2
12 12
26
3
6 5
14
1 1
2
0
5
10
15
20
25
30
35
40
45
October November December 2010
Even
t Cou
nt
Category 3 Category 2 Category 1
Disturbance Event Trends
64
Figure 35 Event Count vs Status (All 2010 Events with Status)
By drilling down into the cause code for each closed 2010 event Figure 36 shows the top 3 event causes
From the figure equipment failure and protection system misoperation are the most significant causes for
events Because of how new and limited the data is however there may not be statistical significance for
this result Further trending of cause codes for closed events and developing a richer dataset to find any
trends between event cause codes and event counts should be performed
Figure 36 Top 3 Event Counts vs DAWG Cause Code for all Closed 2010 Events
10
32
42
0
5
10
15
20
25
30
35
40
45
Open Closed Open and Closed
Even
t Cou
nt
Status
1211
8
0
2
4
6
8
10
12
14
Equipment Failure Protection System Misoperation Human Error
Even
t Cou
nt
Cause Code
Disturbance Event Trends
65
Conclusions Due to the relatively new process for events analysis and categorization more time will be required before a
conclusive recommendation may be obtained Further analysis and new data should provide valuable
statistics in the future Over 80 of all event reports from 2010 are current listed as closed but no
conclusion about investigation performance may be obtained because of the limited amount of data It is
recommended to study ways to prevent equipment failure and protection system misoperations but there
is not enough data to draw a firm conclusion about the top causes of events at this time
Abbreviations Used in This Report
66
Abbreviations Used in This Report
Acronym Definition ALP Acadiana Load Pocket
ALR Adequate Level of Reliability
ARR Automatic Reliability Report
BA Balancing Authority
BPS Bulk Power System
CDI Condition Driven Index
CEII Critical Energy Infrastructure Information
CIPC Critical Infrastructure Protection Committee
CLECO Cleco Power LLC
DADS Future Demand Availability Data System
DCS Disturbance Control Standard
DOE Department Of Energy
DSM Demand Side Management
EA Event Analysis
EAF Equivalent Availability Factor
ECAR East Central Area Reliability
EDI Event Drive Index
EEA Energy Emergency Alert
EFORd Equivalent Forced Outage Rate Demand
EMS Energy Management System
ERCOT Electric Reliability Council of Texas
ERO Electric Reliability Organization
ESAI Energy Security Analysis Inc
FERC Federal Energy Regulatory Commission
FOH Forced Outage Hours
FRCC Florida Reliability Coordinating Council
GADS Generation Availability Data System
GOP Generation Operator
IEEE Institute of Electrical and Electronics Engineers
IESO Independent Electricity System Operator
IROL Interconnection Reliability Operating Limit
Abbreviations Used in This Report
67
Acronym Definition IRI Integrated Reliability Index
LOLE Loss of Load Expectation
LUS Lafayette Utilities System
MAIN Mid-America Interconnected Network Inc
MAPP Mid-continent Area Power Pool
MOH Maintenance Outage Hours
MRO Midwest Reliability Organization
MSSC Most Severe Single Contingency
NCF Net Capacity Factor
NEAT NERC Event Analysis Tool
NERC North American Electric Reliability Corporation
NPCC Northeast Power Coordinating Council
OC Operating Committee
OL Operating Limit
OP Operating Procedures
ORS Operating Reliability Subcommittee
PC Planning Committee
PO Planned Outage
POH Planned Outage Hours
RAPA Reliability Assessment Performance Analysis
RAS Remedial Action Schemes
RC Reliability Coordinator
RCIS Reliability Coordination Information System
RCWG Reliability Coordinator Working Group
RE Regional Entities
RFC Reliability First Corporation
RMWG Reliability Metrics Working Group
RSG Reserve Sharing Group
SAIDI System Average Interruption Duration Index
SAIFI System Average Interruption Frequency Index
SCADA Supervisory Control and Data Acquisition
SDI Standardstatute Driven Index
SERC SERC Reliability Corporation
Abbreviations Used in This Report
68
Acronym Definition SRI Severity Risk Index
SMART Specific Measurable Attainable Relevant and Tangible
SOL System Operating Limit
SPS Special Protection Schemes
SPCS System Protection and Control Subcommittee
SPP Southwest Power Pool
SRI System Risk Index
TADS Transmission Availability Data System
TADSWG Transmission Availability Data System Working Group
TO Transmission Owner
TOP Transmission Operator
WECC Western Electricity Coordinating Council
Contributions
69
Contributions This report was made feasible by the collaboration and hard work of both NERC staff and NERCrsquos
Industry Groups
NERC Industry Groups
Table 14 lists the NERC industry group contributors Without their contribution and collaboration this
report would not have been possible
Table 13 NERC Industry Group Contributions43
NERC Group
Relationship Contribution
Reliability Metrics Working Group
(RMWG)
Reports to the OCPC bull Lead Development of Report bull Provide Reliability Metrics Data bull Responsible for Reliability Metrics
Performance Chapter
Transmission Availability Working Group
(TADSWG)
Reports to the OCPC bull Provide Transmission Availability Data
bull Responsible for Transmission Equip-ment Performance Chapter
bull Content Review
Generation Availability Data System Task
Force
(GADSTF)
Reports to the OCPC bull Provide Generation Availability Data bull Responsible for Generation Equip-
ment Performance Chapter bull Content Review
Event Analysis Working Group
(EAWG)
Reports to the OCPC bull Provide Events Data bull Responsible for Disturbance Events
Trends Chapter bull Content Review
43 Rosters for RMWG TADSWG GADSTF and EAWG are available at httpwwwnerccomfilesrosterpdf
Contributions
70
NERC Staff Table 13 below lists the NERC staff who contributed to the 2011 Reliability Performance Analysis
Report
Table 14 Contributing NERC Staff
Name Title E-mail Address
Mark Lauby Vice President and Director of
Reliability Assessment and
Performance Analysis
marklaubynercnet
Jessica Bian Manager of Performance Analysis jessicabiannercnet
John Moura Manager of Reliability Assessments johnmouranercnet
Andrew Slone Engineer Reliability Performance
Analysis
andrewslonenercnet
Jim Robinson TADS Project Manager jimrobinsonnercnet
Clyde Melton Engineer Reliability Performance
Analysis
clydemeltonnercnet
Mike Curley Manager of GADS Services mikecurleynercnet
James Powell Engineer Reliability Performance
Analysis
jamespowellnercnet
Michelle Marx Administrative Assistant michellemarxnercnet
William Mo Intern Performance Analysis wmonercnet
- NERCrsquos Mission
- Table of Contents
- Executive Summary
-
- 2011 Transition Report
- State of Reliability Report
- Key Findings and Recommendations
-
- Reliability Metric Performance
- Transmission Availability Performance
- Generating Availability Performance
- Disturbance Events
- Report Organization
-
- Introduction
-
- Metric Report Evolution
- Roadmap for the Future
-
- Reliability Metrics Performance
-
- Introduction
- 2010 Performance Metrics Results and Trends
-
- ALR1-3 Planning Reserve Margin
-
- Background
- Assessment
- Special Considerations
-
- ALR1-4 BPS Transmission Related Events Resulting in Loss of Load
-
- Background
- Assessment
-
- ALR1-12 Interconnection Frequency Response
-
- Background
- Assessment
-
- ALR2-3 Activation of Under Frequency Load Shedding
-
- Background
- Assessment
- Special Considerations
-
- ALR2-4 Average Percent Non-Recovery Disturbance Control Standards (DCS)
-
- Background
- Assessment
- Special Consideration
-
- ALR2-5 Disturbance Control Events Greater Than Most Severe Single Contingency
-
- Background
- Assessment
- Special Consideration
-
- ALR 1-5 System Voltage Performance
-
- Background
- Special Considerations
- Status
-
- ALR3-5 Interconnection Reliability Operating Limit System Operating Limit (IROLSOL) Exceedances
-
- Background
-
- ALR4-1 Automatic Transmission Outages Caused by Protection System Misoperations
-
- Background
- Special Considerations
-
- ALR6-11 ndash ALR6-14
-
- Background
- Assessment
- ALR 6-11 ndash Automatic Outages Initiated by Failed Protection System Equipment
- ALR6-12 ndash Automatic Outages Initiated by Human Error
- ALR6-13 ndash Automatic Outages Initiated by Failed AC Substation Equipment
- ALR6-14 Automatic AC Transmission Outages Initiated by Failed AC Circuit Equipment
-
- ALR6-15 Element Availability Percentage (APC)
-
- Background
- Assessment
- Special Consideration
-
- ALR6-16 Transmission System Unavailability
-
- Background
- Assessment
- Special Consideration
-
- ALR6-2 Energy Emergency Alert 3 (EEA3)
-
- Background
- Assessment
- Special Considerations
-
- ALR 6-3 Energy Emergency Alert 2 (EEA2)
-
- Background
- Assessment
- Special Considerations
-
- ALR 6-1 Transmission Constraint Mitigation
-
- Background
- Assessment
- Special Considerations
-
- Integrated Bulk Power System Risk Assessment
-
- Introduction
- Recommendations
-
- Integrated Reliability Index Concepts
-
- The Three Components of the IRI
-
- Event-Driven Indicators (EDI)
- Condition-Driven Indicators (CDI)
- StandardsStatute-Driven Indicators (SDI)
-
- IRI Index Calculation
- IRI Recommendations
-
- Reliability Metrics Conclusions and Recommendations
-
- Transmission Equipment Performance
-
- Introduction
- Performance Trends
-
- AC Element Outage Summary and Leading Causes
- Transmission Monthly Outages
- Outage Initiation Location
- Transmission Outage Events
- Transmission Outage Mode
-
- Conclusions
-
- Generation Equipment Performance
-
- Introduction
- Generation Key Performance Indicators
-
- Multiple Unit Forced Outages and Causes
- 2008-2010 Review of Summer versus Winter Availability
-
- Conclusions and Recommendations
-
- Disturbance Event Trends
-
- Introduction
- Performance Trends
- Conclusions
-
- Abbreviations Used in This Report
- Contributions
-
- NERC Industry Groups
- NERC Staff
-

Transmission Equipment Performance
45
Transmission Equipment Performance Introduction The Transmission Availability Data System (TADS) effort began with the establishment of a TADS task force
by the NERC Planning Committee in October 2006 On October 27 2007 the NERC Board of Trustees
approved the collection of transmission automatic outage data beginning in calendar year 2008 (Phase I)
Subsequently on October 29 2008 the NERC Board approved the collection of Non-Automatic Outage data
that began for Calendar year 2010 (Phase II)
This chapter provides reliability performance analysis of the transmission system by focusing on the trends
of Automatic Outage data from calendar year 2008 thru 2010 Since only one year of Non-Automatic
Outage data has been collected that data will not be assessed in this report
When calculating bulk power system performance indices care must be exercised when interpreting results
as misinterpretation can lead to erroneous conclusions regarding system performance With only three
years of data in the smaller regions it is not clear whether a regionrsquos yearly outage variation compared to
the average is due to random statistical variation or that particular year is significantly different in
performance However on a NERC-wide basis after three years of data collection there is enough
information to accurately determine whether the yearly outage variation compared to the average is due to
random statistical variation or the particular year in question is significantly different in performance33
Performance Trends
Transmission performance information has been provided by Transmission Owners (TOs) within NERC
through the NERC TADS (Transmission Availability Data System) process The data presented reflects
Momentary and Sustained AC Automatic outages of transmission elements that operate at voltages ge 200 kV
(including the low side of transformers) with the criteria specified in the TADS process The following
elements listed below are included
bull AC Circuits ge 200 kV (Overhead and Underground Circuits) Radial circuits are included
bull DC Circuits with ge +-200 kV DC voltage
bull Transformers with ge 200 kV low-side voltage and
bull ACDC Back-to-Back (BTB) Converters with ge 200 kV AC voltage on both sides
33The detailed Confidence Interval computation is available at httpwwwnerccomdocspctadstfTADS_Nov_2_2007APPENDIX_C_Confidence_Intervalpdf
Transmission Equipment Performance
46
AC Element Outage Summary and Leading Causes Table 6 shows the 2008 2009 and 2010 NERC total AC transmission element inventory and a summary of
the associated outages As expected in general the number of circuits increased from year to year due to
new construction or re-construction to higher voltages For every outage experienced on the transmission
system cause codes are identified and recorded according to the TADS process Causes of both momentary
and sustained outages have been indicated These causes are analyzed to identify trends and similarities
and to provide insight into what could be done to possibly prevent future occurrences
Figure 23 and Figure 24 describe the top ten initiating cause codes for sustained and momentary automatic
outages combined from 2008-2010 Based on the two figures the relationship between the total number of
outages and total outage hours can be seen Failed AC Substation Equipment and Failed AC Circuit
Equipment only account for 15 percent of the total number of outages but account for 65 percent of the
total outage hours The two largest causes of outages within NERC (ldquoLightingrdquo and ldquoWeather excluding
Lightningrdquo) account for 34 percent of the total number of outages
The next three Human Error Failed Protection System Equipment and Failed AC Circuit Equipment have
very similar totals and should all be considered significant focus points in reducing the number of Sustained
Automatic Outages for all elements
Transmission Equipment Performance
47
Table 6 NERC - All AC Elements Sustained and Momentary Outage Performance Summary
2008 Number of Outages
AC Voltage
Class
No of
Circuits
Circuit
Miles Sustained Momentary
Total
Outages Total Outage Hours
200-299kV 4369 102131 1560 1062 2622 56595
300-399kV 1585 53631 793 753 1546 14681
400-599kV 586 31495 389 196 585 11766
600-799kV 110 9451 43 40 83 369
All Voltages 6650 196708 2785 2051 4836 83626
2009 Number of Outages
AC Voltage
Class
No of
Circuits
Circuit
Miles Sustained Momentary
Total
Outages Total Outage Hours
200-299kV 4468 102935 1387 898 2285 28828
300-399kV 1619 56447 641 610 1251 24714
400-599kV 592 32045 265 166 431 9110
600-799kV 110 9451 53 38 91 442
All Voltages 6789 200879 2346 1712 4038 63094
2010 Number of Outages
AC Voltage
Class
No of
Circuits
Circuit
Miles Sustained Momentary
Total
Outages Total Outage Hours
200-299kV 4567 104722 1506 918 2424 54941
300-399kV 1676 62415 721 601 1322 16043
400-599kV 605 31590 292 174 466 10442
600-799kV 111 9477 63 50 113 2303
All Voltages 6957 208204 2582 1743 4325 83729
Note The NERC table does not show redacted outages DC Circuit outages Transformer outages or ACDC
converter outages
Transmission Equipment Performance
48
Figure 23 NERC - Top Ten Sustained and Momentary Outages by Initiating Cause Code for All Elements
Figure 24 NERC - Top Ten Sustained Outage Hours by Cause Code
198
151
80
7271
6943
33
27
188
68
Lightning
Weather excluding lightningHuman Error
Failed AC Substation EquipmentFailed Protection System EquipmentFailed AC Circuit Equipment Foreign Interference
Power System Condition
Fire
Unknown
Remaining Cause Codes
299
246
188
58
52
42
3619
16 12 31 Failed AC Substation EquipmentFailed AC Circuit Equipment Weather excluding lightningUnavailable
Other
Fire
Unknown
Human Error
Failed Protection System EquipmentForeign Interference
Remaining Cause Codes
Transmission Equipment Performance
49
Transmission Monthly Outages Figure 25 displays the total number of Automatic Outages on a per-month basis The three months with the
highest total of outages were June July and August From a seasonal perspective winter had a monthly
average of 281 outages These include the months of November-March Summer had an average of 429
outages Summer included the months of April-October
Figure 25 Number of Outages by Month for AC Circuits (2008-2010)
This figure does not show redacted outages DC Circuit outages Transformer outages or ACDC Converter
outages
Outage Initiation Location For every outage experienced on the transmission system the outage initiation code is identified and
recorded according to the TADS process The outage initiation code can be analyzed to identify trends and
similarities and to provide insight into what could be done to possibly prevent future occurrences
The ldquoOutage Initiation Coderdquo describes where an automatic outage was initiated on the power system The
five codes are as follows
bull Element-Initiated
bull Other Element-Initiated
bull AC Substation-Initiated
bull ACDC Terminal-Initiated (for DC circuits)
bull Other Facility Initiated any facility not included in any other outage initiation code
JanuaryFebruar
yMarch April May June July August
September
October
November
December
2008 238 229 257 258 292 437 467 380 208 176 255 236
2009 315 201 339 334 398 553 546 515 351 235 226 294
2010 444 224 269 446 449 486 639 498 351 271 305 281
3 Year AVG 332 218 288 346 380 492 551 464 303 227 262 270
0
100
200
300
400
500
600
700
Out
ages
Transmission Equipment Performance
50
Notably the protection system is not part of an ldquoAC Substationrdquo or an ldquoACDC Terminalrdquo If a protection
system misoperates and initiates an outage it will be classified as ldquoOther-Facility Initiatedrdquo The following
Figures show the initiating location of the Automatic outages from 2008 to 2010
With both Momentary and Sustained Automatic Outages taken into account the outage was initiated on the
Element more than 67 percent of the time as shown in Figure 26 and Figure 27
When only the Sustained Automatic Outages are analyzed the outage initiation on both AC Substation and
Other Facility increased by 34 percent and 32 percent respectively Outages initiated on the Element itself
decreases by 78 percent as shown in Figure 26 and 27 For only the Momentary Automatic Outages the
outage initiation on the Element increases by 19 percent compared to Sustained Outages Element initiated
outages make up over 78 percent of the total outages when analyzing only Momentary Outages
Figure 26
Figure 27
Transmission Outage Events Figure 28 illustrates the relationship between the numbers of Automatic Outages associated per TADS
event 2008 2009 and 2010 tend to follow the same trend The largest number of Automatic Outages per
TADS event is fourteen in 2010 thirteen in 2009 and eight in 2008 There are around 70 to 100 TADS
events that contain between fourteen and three Automatic Outages (see below) There are around 330 to
400 TADS events that contain two or more Automatic Outages The rest of the events only contain one
Automatic Outage As noted in the lower right hand corner below the total number of Events in 2008 to
2010 ranged from 3920 to 4569 events per year Nearly 90 percent or more of the events contained one
Automatic Outage
Figure 26 Sustained Automatic Outage Initiation
Code
Figure 27 Momentary Automatic Outage Initiation
Code
Transmission Equipment Performance
51
Transmission Outage Mode Figure 29 and Figure 30 show the percentage of Outage Modes The ldquoOutage Mode Coderdquo describes
whether one Automatic Outage is related to other Automatic Outages A Single Mode outage is an
Automatic Outage of a single Element which occurs independently of any other Automatic Outages (if any)
A ldquoDependent Mode Initiating Outagerdquo is an Automatic Outage of a single Element that initiates one or more
subsequent Element Automatic Outages A ldquoDependent Mode Outagerdquo is an Automatic Outage of an
Element which occurred as a result of an initiating outage whether the initiating outage was an Element
outage or a non-Element outage A ldquoCommon Mode Outagerdquo is one of two or more Automatic Outages with
the same Initiating Cause Code and where the outages are not consequences of each other and occur nearly
simultaneously A ldquoCommon Mode Initiating Outagerdquo is a Common Mode Outage that initiates one or more
subsequent Automatic Outages
Over 72 percent of the total outages occurred on the bulk power system are Single Mode Outages The next
largest mode is Dependent with over 11 percent of the total outages being in this category For only
Sustained Automatic Outages outages related to each other increase with Dependent mode accounting for
13 percent of the outages and Common mode accounting for close to 11 percent of the outages
Independent Sustained outages still account for the largest portion with nearly 70 percent being Single
mode When just analyzing Momentary Automatic Outages Associated outages decrease with Dependent
Figure 28 Event Histogram (2008-2010)
Transmission Equipment Performance
52
mode accounting for only 9 percent of the outages The Common Mode percentage decreases while
Dependent Mode Initiating percentage increases compared to Sustained Outages Independent Momentary
outages account for the largest portion with over 76 percent being Single Mode
An investigation into the root causes of Dependent and Common mode events which include three or more
Automatic Outages (indentified in the TADS 2008 to 2010 data) should be a high priority Some protection
systems are designed to trip three or more circuits but some events go beyond what is designed Some also
have misoperations associated with multiple outage events
Conclusions On a NERC wide average basis automatic transmission outage rate is improving from 2008 to 2010 based on
reported data Considering both automatic and non-automatic outages 2010 records indicate transmission
element availability percentage is very high and exceeds 95 The unavailability rate for AC circuits and
transformers are only 15 and 29 respectively
The cause codes of Human Error Failed Protection System Equipment and Failed AC Circuit Equipment
should be considered significant focus points in reducing the number of Sustained Automatic Outages for all
elements A deeper look into the root causes of Dependent and Common mode events which include three
or more Automatic Outages (indentified in the TADS 2008 to 2010 data) should be a high priority Some
protection systems are designed to trip three or more circuits but some events go beyond what is designed
Some also have misoperations associated with multiple outage events
Figure 29 Sustained Automatic Outage Mode code Figure 30 Momentary Automatic Outage Mode code
Generation Equipment Performance
53
Generation Equipment Performance Introduction The development of the Generating Availability Data System (GADS) began in 1982 This series of databases
is used to voluntarily collect record and retrieve operating information By pooling individual unit
information with likewise units generating unit availability performance can be calculated providing
opportunities to identify trends and generating equipment reliability improvement opportunities The
information is used to support equipment reliability availability analyses and risk-informed decision-making
by system planners generation owners assessment modelers manufacturers and contractors etc Reports
and information resulting from the data collected through GADS are now used for benchmarking and
analyzing electric power plants
Currently the data collected through GADS contains 72 percent of the North American generating units
with generating capacity of 20 MW or higher34 Additionally many of the newer combined-cycle plants are
not reporting information and therefore a full view of each unit type is not presented Rather a sample of
all the units in North America that fit a given more general category is provided35 for the 2008-201036
Generation Key Performance Indicators
assessment period
Three key performance indicators37
In
the industry have used widely to measure the availability of generating
units (see Terms Used in This Report section for their calculation parameters) are Equivalent Availability
Factor (EAF) Net Capacity Factor (NCF) and Equivalent Forced Outage Rate ndash Demand (EFORd)
Table 7 the North American fleet average EAF NCF and EFORd compared to unit age for all generating
units with a capacity of 20 MW and higher is provided for the years 2008-2010 The EAF shows a decline
during the last three years NCF is up and down while the EFORd appears to be increasing As expected the
fleet of units reported to GADS is aging overall with the fossil units being about 12 years older than the
average age
34 httpwwwnerccomdocspcgadstfGADSTF_Recommendation_Report_02-18-2011_FINALpdf 35GADS contains some 1500+ units under 20 MW that is not included in this report These units are excluded because most units are not base-loaded and are in peaking operation
3684 percent of the 2010 dataset is available at this time while the 2008 and 2009 dataset is complete 37 httpwwwnerccompagephpcid=4|43
Generation Equipment Performance
54
Table 7 General Availability Review of GADS Fleet Units by Year
2008 2009 2010 Average
Equivalent Availability Factor (EAF) 8776 8774 8678 8743
Net Capacity Factor (NCF) 5083 4709 4880 4890
Equivalent Forced Outage Rate -
Demand (EFORd) 579 575 639 597
Number of Units ge20 MW 3713 3713 3713 3713
Average Age of the Fleet in Years (all
unit types) 303 311 321 312
Average Age of the Fleet in Years
(fossil units only) 422 432 440 433
Figure 31 provides the average forced outage hours (FOH) maintenance outage hours (MOH) and planned
outage hours (POH) for all units reporting 20 MW or larger During this three-year period the average FOH
291 hours average MOH is 163 hours average POH is 470 hours
Figure 31 shows a large increase in forced and maintenance events The average age of the units with a
capacity of 20MW and higher in 2009 is 316 years old However the average age of fossil units in 2010 is
442 years old These fossil units are the backbone of all operating units providing the base-load power
continuously and nearly 50 percent of all energy annually There appears to be no increase allocated for
annualsemi-annual maintenance (ie planned outages) for the older generating units The increase of
000100002000030000400005000060000700008000090000
100000
2008 2009 2010
463 479 468
154 161 173
288 270 314
Hou
rs
Planned Maintenance Forced
Figure 31 Average Outage Hours for Units gt 20 MW
Generation Equipment Performance
55
maintenance outage hours reflects an increased need to fix problems that cannot be deferred until the next
annualsemi-annual repairs As a result it shows one of two things are happening
bull More or longer planned outage time is needed to repair the aging generating fleet
bull More focus on preventive repairs during planned and maintenance events are needed
Multiple Unit Forced Outages and Causes Table 8 provides the annual multiple-unit forced outage trips resulting from the same cause for each of the
assessments years 2008-2010 respectively The ldquosingle unitrdquo trips are large units with a Net Dependable
Capacity of 750 MW or more The trips of ldquotwo unitsrdquo or more is any combination of unit capacity with the
total amount of lost capacity more than 750 MW
Table 8 also presents more information on the forced outages During 2008-2010 there were a large
number of double-unit outages resulting from the same event Investigations show that some of these trips
were at a single plant caused by common control and instrumentation for the units The incidents occurred
several times for several months and are a common mode issue internal to the plant
Table 8 Number of Multiple Unit Forced Outages and FrequencyYear
2008 2009 2010
Type of
Trip
of
Trips
Avg Outage
Hr Trip
Avg Outage
Hr Unit
of
Trips
Avg Outage
Hr Trip
Avg Outage
Hr Unit
of
Trips
Avg Outage
Hr Trip
Avg Outage
Hr Unit
Single-unit
Trip 591 58 58 284 64 64 339 66 66
Two-unit
Trip 281 43 22 508 96 48 206 41 20
Three-unit
Trip 74 48 16 223 146 48 47 109 36
Four-unit
Trip 12 77 19 111 112 28 40 121 30
Five-unit
Trip 11 1303 260 60 443 88 19 199 10
gt 5 units 20 166 16 93 206 50 37 246 6
Loss of ge 750 MW per Trip
The high number of five-unit trips in 2008 was due to Hurricane Ike hitting the Gulf Coast The highest total
number of multiple unit trips occurred in 2009 though as mentioned before the data collection for 2010 is
incomplete at this time The majority of 2009 multiple unit trips have three main causes (in order by
Generation Equipment Performance
56
number of events) transmission lack of fuel and storms A summary of the three categories for single as
well as multiple unit outages (all unit capacities) are reflected in Table 9
Table 9 Common Causes of Multiple Unit Forced Outages (2009)
Cause Number of Events Average MW Size of Unit
Transmission 1583 16
Lack of Fuel (Coal Mines Gas Lines etc) Not
in Operator Control
812 448
Storms Lightning and Other Acts of Nature 591 112
Some of the transmission outages based on storms in 2009 have been caused by the same reasons because
the storms may have caused transmission interference However the plants reported the problems
inconsistently with either the transmission interference or storms cause code Therefore they are depicted
as two different causes of forced outage
Marked transmission outages in 2009 were quite high Thirty-five percent came from one utility with a large
number of hydroelectric units The company related the trips to various problems including weather
(lightning storms) wildlife ldquoline bumpsrdquo and problems on the receiving end of the transmission line Nine
hundred and eighty-five transmission trips (62 percent) were from hydroelectric units38
In 2009 only ten transmission trips resulted in a loss of 750 MW or more per trip Twenty two generating
plants were affected by the ten trips Causes for the trips include feeder line trips (1 trip) breakers in the
switchyard (8 trips) personnel errors (2 trips) and unknown (10 trips)
The ldquoLack of Fuelrdquo outages are of interest as these events occur during the times when a unit is available to
operate but there is an interruption in fuels to operate the facilities These events do not include
interruptions of fuel due to contracts Rather the cause code is designed to account for units that are
expecting fuel and it is unavailable when requested Table 10 presents the distribution of ldquoLack of Fuelrdquo
events by NERC Region and Table 11 presents the unit types affected
38 The average size of the hydroelectric units were small ndash 335 MW
Generation Equipment Performance
57
Of the units that report ldquoLack of Fuelrdquo 78 percent of the units are oil-fired 15 percent of the units are gas-
fired and the remaining units are various other fuels Table 12 provides the top causes of forced outage for
several unit types For fossil units ldquoLack of Fuelrdquo as the number three cause behind waterwall tube leaks
and superheater tube leaks
Table 10 Forced Outages Due to Lack of Fuel by Region
Region Number of Lack of Fuel
Problems Reported
FRCC 0
MRO 3
NPCC 24
RFC 695
SERC 17
SPP 3
TRE 7
WECC 29
One company contributed to the majority of oil-fired lack of fuel events The units at the company are
actually dual-fuels (oil and gas) but market nominated gas monitoring causes the units to be on forced
outage nightly The units need gas to start up so they can run on oil When they shut down the units must
switch to gas to clean themselves With the gas restriction the unit canrsquot start and the unit goes on a
forced outage Until the band is lifted the two units will continue to be on a forced outage cycle
Event records also provide descriptions of why the unit was without fuel with the majority of descriptions
bull Temperatures affecting gas supply valves
bull Unexpected maintenance of gas pipe-lines
bull Compressor problemsmaintenance
Generation Equipment Performance
58
Table 11 Unit Type Profile of Forced Outages Due to Lack of Fuel
Unit Types Number of Lack of Fuel Problems Reported
Fossil 642
Nuclear 0
Gas Turbines 88
Diesel Engines 1
HydroPumped Storage 0
Combined Cycle 47
Generation Equipment Performance
59
Table 12 Causes of Forced Outage for Different Unit Types (2008-2010)
Fossil - all MW sizes all fuels
Rank Description Occurrence per Unit-year
MWH per Unit-year
Average Hours To Repair
Average Hours Between Failures
Unit-years
1 Waterwall (furnace wall) 0590 134106 59 3250 3868 2 Second Superheater
Leaks 0180 5182 60 3228 3868
3 Lack of Fuel (coal mines gas lines etc) where the operator is not in control
0480 4701 18 26 3868
Combined-Cycle blocks Rank Description Occurrence
per Unit-year
MWH per Unit-year
Average Hours To Repair
Average Hours Between Failures
Unit-years
1 HP Turbine Buckets Or Blades
0020 4663 1830 26280 466
2 Turbine Control Valves 0040 2777 100 7200 466 3 Gas Turbine Compressor -
High Pressure Shaft 0010 2266 663 4269 466
Nuclear units - all Reactor types Rank Description Occurrence
per Unit-year
MWH per Unit-year
Average Hours To Repair
Average Hours Between Failures
Unit-years
1 LP Turbine Buckets or Blades
0010 26415 8760 26280 288
2 Containment Structure 0010 9233 1226 26262 288 3 Feedwater Pump Local
Controls 0020 7620 692 12642 288
Simple-cycle gas turbine jet engines Rank Description Occurrence
per Unit-year
MWH per Unit-year
Average Hours To Repair
Average Hours Between Failures
Unit-years
1 Main Transformer 0030 1611 1016 20709 4181 2 Other Gas Turbine
Controls And Instrument Problems
0120 428 70 2614 4181
3 Other Gas Turbine Problems
0090 400 119 1701 4181
Generation Equipment Performance
60
2008-2010 Review of Summer versus Winter Availability To address seasonality of unit availability unit information for the months of June to September (summer)
and December through February (winter) were pooled to calculate force events during these timeframes for
2008-201039 Figure 32 shows the Equivalent Availability Factor (EAF) is three percentage points higher and
the Equivalent Forced Outage Rate - Demand (EFORd) is more than a half of a percentage point lower in the
summer period than in winter period This means the units were more reliable with less forced events
during high-demand times during the summer than during the winter seasons The generating unitrsquos
capability has a resulting higher Net Capacity Factor (NCF) of 45 percentage points in the summer season
for 2008-2010
During the spring season (March-May) 77 percent of the units took a planned outage (PO) for an average
231 hours (or 96 days) In fall (October-November) only 42 percent of the units experienced a PO and the
average duration was shorter ndash 134 hours (or 56 days) A few units took both spring and fall planned
outages although this is rare Based on this assessment the generating units are prepared for the summer
peak demand The resulting availability indicates that this maintenance was successful which is measured
by an increased EAF and lower EFORd
Figure 32 Summer-Winter Average EAF NCF and EFORd (2008-2010)
Conclusions and Recommendations During 2008-2010 the average Equivalent Availability Factor (EAF) which measures the overall availability
of generating units decreased At the same time the Net Capacity Factor (NCF) an indicator of energy
production increased The average number of forced outages in 2010 is greater than in 2008 while at the
same time the average planned outage times have decreased As a result the Equivalent Forced Outage
Rate ndash Demand (EFORd) also increased illustrating that more units have experienced forced events during
39 A study of peak periods was conducted by the NERC Generating Availability Trend Evaluation (GATE) Working Group several years ago see httpwwwnerccomfilesSeasonal-Performance-Trendspdf
9116
5343
396
8818
4896
441
0 10 20 30 40 50 60 70 80 90 100
EAF
NCF
EFORd
Percent ()
Winter
Summer
Generation Equipment Performance
61
peak-demand times in 2010 than in the previous two years Potentially with shorter planned outage
periods in 2010 there may be less time to repair equipment and prevent forced unit outages
There are warnings that units are not being maintained as well as they should be In the last three years
there has been an increase in Equivalent Forced Outage Rate ndash Demand (EFORd) This indicator measures
the rate of forced outage events on generating units during periods of load demand To confirm this
problem forced outage hours jumped from 270 to 314 hours per unit between 2009 and 2010 At the same
time maintenance events also increased by 12 hours per unit Planned outage events remain constant The
resulting conclusions from this trend are
bull More or longer planned outage time is needed to repair the generating fleet Whether age is the
cause of the increase need for planned outage time remains unknown and further investigation into
the cause for longer planned outage time is necessary
bull More focus on preventive repairs during planned and maintenance events are needed
There are many multiple unit forced outages due to lack of fuel The majority of multiple unit trips have
three main causes transmission lack of fuel and storms With special interest in the forced outages due to
ldquoLack of Fuelrdquo additional analysis revealed that 77 percent of the units experiencing unexpected fuel
stoppage are oil-fired fossil units while gas-fired units experienced 15 percent
Generating units continue to be more reliable during the peak summer periods
Disturbance Event Trends
62
Category 1 An event resulting in one or more of the following a Unintended loss of three or more BPS elements caused by
common mode failure b Failure or misoperation of an SPSRAS c System-wide voltage reduction of 3 or more d Unintended BPS system separation resulting in an island of
100 MW to 999 MW e Unplanned evacuation from a control center facility with BPS
SCADA functionality for 30 minutes or more Category 2 An event resulting in one or more of the following
a Complete loss of all BPS control center voice communication system(s) for 30 minutes or more
b Complete loss of SCADA control or monitoring functionality for 30 minutes or more
c Voltage excursions equal to or greater than 10 lasting more than five minutes
d Loss of off-site power (LOOP) to a nuclear generating station e Unintended system separation resulting in an island of 1000
MW to 4999 MW f Unintended loss of 300MW or more of firm load for more
than 15 minutes g Violation of an Interconnection Reliability Operating Limit
(IROL) for more than 30 minutes Category 3 An event resulting in one or more of the following
a The loss of load or generation of 2000 MW or more in the Eastern Interconnection or
b Western Interconnection or 1000 MW or more in the ERCOT or Queacutebec Interconnections
c Unintended system separation resulting in an island of 5000 MW to 10000 MW
d Unintended system separation resulting in an island of Florida from the Eastern Interconnection
Category 4 An event resulting in one or more of the following a The loss of load or generation from 5001 MW to 9999 MW b Unintended system separation resulting in an island of more
than 10000 MW (with the exception of Florida as described in Category 3c)
Category 5 An event resulting in one or more of the following a The loss of load of 10000 MW or more b The loss of generation of 10000 MW or more
Figure 33 BPS Event Category
Disturbance Event Trends Introduction The purpose of this section is to report event
analysis trends from the beginning of event
analysis field test40
One of the companion goals of the event
analysis program is the identification of trends
in the number magnitude and frequency of
events and their associated causes such as
human error equipment failure protection
system misoperations etc The information
provided in the event analysis database (EADB)
and various event analysis reports have been
used to track and identify trends in BPS events
in conjunction with other databases (TADS
GADS metric and benchmarking database)
to the end of 2010
The Event Analysis Working Group (EAWG)
continuously gathers event data and is moving
toward an integrated approach to analyzing
data assessing trends and communicating the
results to the industry
Performance Trends The event category is classified41
Figure 33
as shown in
with Category 5 being the most
severe Figure 34 depicts disturbance trends in
Category 1 to 5 system events from the
40 httpwwwnerccomdocseawgGalloway-Industry-EA-Field-Test-102210pdf 41httpwwwnerccomfiles2011-05-0220Event_Analysis_Process_Phase20220Field20Test20Draft20-20Final20-20For20postingpdf
Disturbance Event Trends
63
beginning of event analysis field test to the end of 201042
Figure 34 Event Category vs Date for All 2010 Categorized Events
From the figure in November and December
there were many more category 1 and 2 events than in October This is due to the field trial starting on
October 25 2010
In addition to the category of the events the status of the events plays a critical role in the accuracy of the
data By examining Figure 35 over 80 of the events reported in 2010 have been closed This means that
the category root cause and other important information have been sufficiently finalized in order for
analysis to be accurate for each event At this time there is not enough data to draw any long-term
conclusions about event investigation performance
42 Documents for the EA Field Test are located at httpwwwnerccompagephpcid=5|365
2
12 12
26
3
6 5
14
1 1
2
0
5
10
15
20
25
30
35
40
45
October November December 2010
Even
t Cou
nt
Category 3 Category 2 Category 1
Disturbance Event Trends
64
Figure 35 Event Count vs Status (All 2010 Events with Status)
By drilling down into the cause code for each closed 2010 event Figure 36 shows the top 3 event causes
From the figure equipment failure and protection system misoperation are the most significant causes for
events Because of how new and limited the data is however there may not be statistical significance for
this result Further trending of cause codes for closed events and developing a richer dataset to find any
trends between event cause codes and event counts should be performed
Figure 36 Top 3 Event Counts vs DAWG Cause Code for all Closed 2010 Events
10
32
42
0
5
10
15
20
25
30
35
40
45
Open Closed Open and Closed
Even
t Cou
nt
Status
1211
8
0
2
4
6
8
10
12
14
Equipment Failure Protection System Misoperation Human Error
Even
t Cou
nt
Cause Code
Disturbance Event Trends
65
Conclusions Due to the relatively new process for events analysis and categorization more time will be required before a
conclusive recommendation may be obtained Further analysis and new data should provide valuable
statistics in the future Over 80 of all event reports from 2010 are current listed as closed but no
conclusion about investigation performance may be obtained because of the limited amount of data It is
recommended to study ways to prevent equipment failure and protection system misoperations but there
is not enough data to draw a firm conclusion about the top causes of events at this time
Abbreviations Used in This Report
66
Abbreviations Used in This Report
Acronym Definition ALP Acadiana Load Pocket
ALR Adequate Level of Reliability
ARR Automatic Reliability Report
BA Balancing Authority
BPS Bulk Power System
CDI Condition Driven Index
CEII Critical Energy Infrastructure Information
CIPC Critical Infrastructure Protection Committee
CLECO Cleco Power LLC
DADS Future Demand Availability Data System
DCS Disturbance Control Standard
DOE Department Of Energy
DSM Demand Side Management
EA Event Analysis
EAF Equivalent Availability Factor
ECAR East Central Area Reliability
EDI Event Drive Index
EEA Energy Emergency Alert
EFORd Equivalent Forced Outage Rate Demand
EMS Energy Management System
ERCOT Electric Reliability Council of Texas
ERO Electric Reliability Organization
ESAI Energy Security Analysis Inc
FERC Federal Energy Regulatory Commission
FOH Forced Outage Hours
FRCC Florida Reliability Coordinating Council
GADS Generation Availability Data System
GOP Generation Operator
IEEE Institute of Electrical and Electronics Engineers
IESO Independent Electricity System Operator
IROL Interconnection Reliability Operating Limit
Abbreviations Used in This Report
67
Acronym Definition IRI Integrated Reliability Index
LOLE Loss of Load Expectation
LUS Lafayette Utilities System
MAIN Mid-America Interconnected Network Inc
MAPP Mid-continent Area Power Pool
MOH Maintenance Outage Hours
MRO Midwest Reliability Organization
MSSC Most Severe Single Contingency
NCF Net Capacity Factor
NEAT NERC Event Analysis Tool
NERC North American Electric Reliability Corporation
NPCC Northeast Power Coordinating Council
OC Operating Committee
OL Operating Limit
OP Operating Procedures
ORS Operating Reliability Subcommittee
PC Planning Committee
PO Planned Outage
POH Planned Outage Hours
RAPA Reliability Assessment Performance Analysis
RAS Remedial Action Schemes
RC Reliability Coordinator
RCIS Reliability Coordination Information System
RCWG Reliability Coordinator Working Group
RE Regional Entities
RFC Reliability First Corporation
RMWG Reliability Metrics Working Group
RSG Reserve Sharing Group
SAIDI System Average Interruption Duration Index
SAIFI System Average Interruption Frequency Index
SCADA Supervisory Control and Data Acquisition
SDI Standardstatute Driven Index
SERC SERC Reliability Corporation
Abbreviations Used in This Report
68
Acronym Definition SRI Severity Risk Index
SMART Specific Measurable Attainable Relevant and Tangible
SOL System Operating Limit
SPS Special Protection Schemes
SPCS System Protection and Control Subcommittee
SPP Southwest Power Pool
SRI System Risk Index
TADS Transmission Availability Data System
TADSWG Transmission Availability Data System Working Group
TO Transmission Owner
TOP Transmission Operator
WECC Western Electricity Coordinating Council
Contributions
69
Contributions This report was made feasible by the collaboration and hard work of both NERC staff and NERCrsquos
Industry Groups
NERC Industry Groups
Table 14 lists the NERC industry group contributors Without their contribution and collaboration this
report would not have been possible
Table 13 NERC Industry Group Contributions43
NERC Group
Relationship Contribution
Reliability Metrics Working Group
(RMWG)
Reports to the OCPC bull Lead Development of Report bull Provide Reliability Metrics Data bull Responsible for Reliability Metrics
Performance Chapter
Transmission Availability Working Group
(TADSWG)
Reports to the OCPC bull Provide Transmission Availability Data
bull Responsible for Transmission Equip-ment Performance Chapter
bull Content Review
Generation Availability Data System Task
Force
(GADSTF)
Reports to the OCPC bull Provide Generation Availability Data bull Responsible for Generation Equip-
ment Performance Chapter bull Content Review
Event Analysis Working Group
(EAWG)
Reports to the OCPC bull Provide Events Data bull Responsible for Disturbance Events
Trends Chapter bull Content Review
43 Rosters for RMWG TADSWG GADSTF and EAWG are available at httpwwwnerccomfilesrosterpdf
Contributions
70
NERC Staff Table 13 below lists the NERC staff who contributed to the 2011 Reliability Performance Analysis
Report
Table 14 Contributing NERC Staff
Name Title E-mail Address
Mark Lauby Vice President and Director of
Reliability Assessment and
Performance Analysis
marklaubynercnet
Jessica Bian Manager of Performance Analysis jessicabiannercnet
John Moura Manager of Reliability Assessments johnmouranercnet
Andrew Slone Engineer Reliability Performance
Analysis
andrewslonenercnet
Jim Robinson TADS Project Manager jimrobinsonnercnet
Clyde Melton Engineer Reliability Performance
Analysis
clydemeltonnercnet
Mike Curley Manager of GADS Services mikecurleynercnet
James Powell Engineer Reliability Performance
Analysis
jamespowellnercnet
Michelle Marx Administrative Assistant michellemarxnercnet
William Mo Intern Performance Analysis wmonercnet
- NERCrsquos Mission
- Table of Contents
- Executive Summary
-
- 2011 Transition Report
- State of Reliability Report
- Key Findings and Recommendations
-
- Reliability Metric Performance
- Transmission Availability Performance
- Generating Availability Performance
- Disturbance Events
- Report Organization
-
- Introduction
-
- Metric Report Evolution
- Roadmap for the Future
-
- Reliability Metrics Performance
-
- Introduction
- 2010 Performance Metrics Results and Trends
-
- ALR1-3 Planning Reserve Margin
-
- Background
- Assessment
- Special Considerations
-
- ALR1-4 BPS Transmission Related Events Resulting in Loss of Load
-
- Background
- Assessment
-
- ALR1-12 Interconnection Frequency Response
-
- Background
- Assessment
-
- ALR2-3 Activation of Under Frequency Load Shedding
-
- Background
- Assessment
- Special Considerations
-
- ALR2-4 Average Percent Non-Recovery Disturbance Control Standards (DCS)
-
- Background
- Assessment
- Special Consideration
-
- ALR2-5 Disturbance Control Events Greater Than Most Severe Single Contingency
-
- Background
- Assessment
- Special Consideration
-
- ALR 1-5 System Voltage Performance
-
- Background
- Special Considerations
- Status
-
- ALR3-5 Interconnection Reliability Operating Limit System Operating Limit (IROLSOL) Exceedances
-
- Background
-
- ALR4-1 Automatic Transmission Outages Caused by Protection System Misoperations
-
- Background
- Special Considerations
-
- ALR6-11 ndash ALR6-14
-
- Background
- Assessment
- ALR 6-11 ndash Automatic Outages Initiated by Failed Protection System Equipment
- ALR6-12 ndash Automatic Outages Initiated by Human Error
- ALR6-13 ndash Automatic Outages Initiated by Failed AC Substation Equipment
- ALR6-14 Automatic AC Transmission Outages Initiated by Failed AC Circuit Equipment
-
- ALR6-15 Element Availability Percentage (APC)
-
- Background
- Assessment
- Special Consideration
-
- ALR6-16 Transmission System Unavailability
-
- Background
- Assessment
- Special Consideration
-
- ALR6-2 Energy Emergency Alert 3 (EEA3)
-
- Background
- Assessment
- Special Considerations
-
- ALR 6-3 Energy Emergency Alert 2 (EEA2)
-
- Background
- Assessment
- Special Considerations
-
- ALR 6-1 Transmission Constraint Mitigation
-
- Background
- Assessment
- Special Considerations
-
- Integrated Bulk Power System Risk Assessment
-
- Introduction
- Recommendations
-
- Integrated Reliability Index Concepts
-
- The Three Components of the IRI
-
- Event-Driven Indicators (EDI)
- Condition-Driven Indicators (CDI)
- StandardsStatute-Driven Indicators (SDI)
-
- IRI Index Calculation
- IRI Recommendations
-
- Reliability Metrics Conclusions and Recommendations
-
- Transmission Equipment Performance
-
- Introduction
- Performance Trends
-
- AC Element Outage Summary and Leading Causes
- Transmission Monthly Outages
- Outage Initiation Location
- Transmission Outage Events
- Transmission Outage Mode
-
- Conclusions
-
- Generation Equipment Performance
-
- Introduction
- Generation Key Performance Indicators
-
- Multiple Unit Forced Outages and Causes
- 2008-2010 Review of Summer versus Winter Availability
-
- Conclusions and Recommendations
-
- Disturbance Event Trends
-
- Introduction
- Performance Trends
- Conclusions
-
- Abbreviations Used in This Report
- Contributions
-
- NERC Industry Groups
- NERC Staff
-

Transmission Equipment Performance
50
Notably the protection system is not part of an ldquoAC Substationrdquo or an ldquoACDC Terminalrdquo If a protection
system misoperates and initiates an outage it will be classified as ldquoOther-Facility Initiatedrdquo The following
Figures show the initiating location of the Automatic outages from 2008 to 2010
With both Momentary and Sustained Automatic Outages taken into account the outage was initiated on the
Element more than 67 percent of the time as shown in Figure 26 and Figure 27
When only the Sustained Automatic Outages are analyzed the outage initiation on both AC Substation and
Other Facility increased by 34 percent and 32 percent respectively Outages initiated on the Element itself
decreases by 78 percent as shown in Figure 26 and 27 For only the Momentary Automatic Outages the
outage initiation on the Element increases by 19 percent compared to Sustained Outages Element initiated
outages make up over 78 percent of the total outages when analyzing only Momentary Outages
Figure 26
Figure 27
Transmission Outage Events Figure 28 illustrates the relationship between the numbers of Automatic Outages associated per TADS
event 2008 2009 and 2010 tend to follow the same trend The largest number of Automatic Outages per
TADS event is fourteen in 2010 thirteen in 2009 and eight in 2008 There are around 70 to 100 TADS
events that contain between fourteen and three Automatic Outages (see below) There are around 330 to
400 TADS events that contain two or more Automatic Outages The rest of the events only contain one
Automatic Outage As noted in the lower right hand corner below the total number of Events in 2008 to
2010 ranged from 3920 to 4569 events per year Nearly 90 percent or more of the events contained one
Automatic Outage
Figure 26 Sustained Automatic Outage Initiation
Code
Figure 27 Momentary Automatic Outage Initiation
Code
Transmission Equipment Performance
51
Transmission Outage Mode Figure 29 and Figure 30 show the percentage of Outage Modes The ldquoOutage Mode Coderdquo describes
whether one Automatic Outage is related to other Automatic Outages A Single Mode outage is an
Automatic Outage of a single Element which occurs independently of any other Automatic Outages (if any)
A ldquoDependent Mode Initiating Outagerdquo is an Automatic Outage of a single Element that initiates one or more
subsequent Element Automatic Outages A ldquoDependent Mode Outagerdquo is an Automatic Outage of an
Element which occurred as a result of an initiating outage whether the initiating outage was an Element
outage or a non-Element outage A ldquoCommon Mode Outagerdquo is one of two or more Automatic Outages with
the same Initiating Cause Code and where the outages are not consequences of each other and occur nearly
simultaneously A ldquoCommon Mode Initiating Outagerdquo is a Common Mode Outage that initiates one or more
subsequent Automatic Outages
Over 72 percent of the total outages occurred on the bulk power system are Single Mode Outages The next
largest mode is Dependent with over 11 percent of the total outages being in this category For only
Sustained Automatic Outages outages related to each other increase with Dependent mode accounting for
13 percent of the outages and Common mode accounting for close to 11 percent of the outages
Independent Sustained outages still account for the largest portion with nearly 70 percent being Single
mode When just analyzing Momentary Automatic Outages Associated outages decrease with Dependent
Figure 28 Event Histogram (2008-2010)
Transmission Equipment Performance
52
mode accounting for only 9 percent of the outages The Common Mode percentage decreases while
Dependent Mode Initiating percentage increases compared to Sustained Outages Independent Momentary
outages account for the largest portion with over 76 percent being Single Mode
An investigation into the root causes of Dependent and Common mode events which include three or more
Automatic Outages (indentified in the TADS 2008 to 2010 data) should be a high priority Some protection
systems are designed to trip three or more circuits but some events go beyond what is designed Some also
have misoperations associated with multiple outage events
Conclusions On a NERC wide average basis automatic transmission outage rate is improving from 2008 to 2010 based on
reported data Considering both automatic and non-automatic outages 2010 records indicate transmission
element availability percentage is very high and exceeds 95 The unavailability rate for AC circuits and
transformers are only 15 and 29 respectively
The cause codes of Human Error Failed Protection System Equipment and Failed AC Circuit Equipment
should be considered significant focus points in reducing the number of Sustained Automatic Outages for all
elements A deeper look into the root causes of Dependent and Common mode events which include three
or more Automatic Outages (indentified in the TADS 2008 to 2010 data) should be a high priority Some
protection systems are designed to trip three or more circuits but some events go beyond what is designed
Some also have misoperations associated with multiple outage events
Figure 29 Sustained Automatic Outage Mode code Figure 30 Momentary Automatic Outage Mode code
Generation Equipment Performance
53
Generation Equipment Performance Introduction The development of the Generating Availability Data System (GADS) began in 1982 This series of databases
is used to voluntarily collect record and retrieve operating information By pooling individual unit
information with likewise units generating unit availability performance can be calculated providing
opportunities to identify trends and generating equipment reliability improvement opportunities The
information is used to support equipment reliability availability analyses and risk-informed decision-making
by system planners generation owners assessment modelers manufacturers and contractors etc Reports
and information resulting from the data collected through GADS are now used for benchmarking and
analyzing electric power plants
Currently the data collected through GADS contains 72 percent of the North American generating units
with generating capacity of 20 MW or higher34 Additionally many of the newer combined-cycle plants are
not reporting information and therefore a full view of each unit type is not presented Rather a sample of
all the units in North America that fit a given more general category is provided35 for the 2008-201036
Generation Key Performance Indicators
assessment period
Three key performance indicators37
In
the industry have used widely to measure the availability of generating
units (see Terms Used in This Report section for their calculation parameters) are Equivalent Availability
Factor (EAF) Net Capacity Factor (NCF) and Equivalent Forced Outage Rate ndash Demand (EFORd)
Table 7 the North American fleet average EAF NCF and EFORd compared to unit age for all generating
units with a capacity of 20 MW and higher is provided for the years 2008-2010 The EAF shows a decline
during the last three years NCF is up and down while the EFORd appears to be increasing As expected the
fleet of units reported to GADS is aging overall with the fossil units being about 12 years older than the
average age
34 httpwwwnerccomdocspcgadstfGADSTF_Recommendation_Report_02-18-2011_FINALpdf 35GADS contains some 1500+ units under 20 MW that is not included in this report These units are excluded because most units are not base-loaded and are in peaking operation
3684 percent of the 2010 dataset is available at this time while the 2008 and 2009 dataset is complete 37 httpwwwnerccompagephpcid=4|43
Generation Equipment Performance
54
Table 7 General Availability Review of GADS Fleet Units by Year
2008 2009 2010 Average
Equivalent Availability Factor (EAF) 8776 8774 8678 8743
Net Capacity Factor (NCF) 5083 4709 4880 4890
Equivalent Forced Outage Rate -
Demand (EFORd) 579 575 639 597
Number of Units ge20 MW 3713 3713 3713 3713
Average Age of the Fleet in Years (all
unit types) 303 311 321 312
Average Age of the Fleet in Years
(fossil units only) 422 432 440 433
Figure 31 provides the average forced outage hours (FOH) maintenance outage hours (MOH) and planned
outage hours (POH) for all units reporting 20 MW or larger During this three-year period the average FOH
291 hours average MOH is 163 hours average POH is 470 hours
Figure 31 shows a large increase in forced and maintenance events The average age of the units with a
capacity of 20MW and higher in 2009 is 316 years old However the average age of fossil units in 2010 is
442 years old These fossil units are the backbone of all operating units providing the base-load power
continuously and nearly 50 percent of all energy annually There appears to be no increase allocated for
annualsemi-annual maintenance (ie planned outages) for the older generating units The increase of
000100002000030000400005000060000700008000090000
100000
2008 2009 2010
463 479 468
154 161 173
288 270 314
Hou
rs
Planned Maintenance Forced
Figure 31 Average Outage Hours for Units gt 20 MW
Generation Equipment Performance
55
maintenance outage hours reflects an increased need to fix problems that cannot be deferred until the next
annualsemi-annual repairs As a result it shows one of two things are happening
bull More or longer planned outage time is needed to repair the aging generating fleet
bull More focus on preventive repairs during planned and maintenance events are needed
Multiple Unit Forced Outages and Causes Table 8 provides the annual multiple-unit forced outage trips resulting from the same cause for each of the
assessments years 2008-2010 respectively The ldquosingle unitrdquo trips are large units with a Net Dependable
Capacity of 750 MW or more The trips of ldquotwo unitsrdquo or more is any combination of unit capacity with the
total amount of lost capacity more than 750 MW
Table 8 also presents more information on the forced outages During 2008-2010 there were a large
number of double-unit outages resulting from the same event Investigations show that some of these trips
were at a single plant caused by common control and instrumentation for the units The incidents occurred
several times for several months and are a common mode issue internal to the plant
Table 8 Number of Multiple Unit Forced Outages and FrequencyYear
2008 2009 2010
Type of
Trip
of
Trips
Avg Outage
Hr Trip
Avg Outage
Hr Unit
of
Trips
Avg Outage
Hr Trip
Avg Outage
Hr Unit
of
Trips
Avg Outage
Hr Trip
Avg Outage
Hr Unit
Single-unit
Trip 591 58 58 284 64 64 339 66 66
Two-unit
Trip 281 43 22 508 96 48 206 41 20
Three-unit
Trip 74 48 16 223 146 48 47 109 36
Four-unit
Trip 12 77 19 111 112 28 40 121 30
Five-unit
Trip 11 1303 260 60 443 88 19 199 10
gt 5 units 20 166 16 93 206 50 37 246 6
Loss of ge 750 MW per Trip
The high number of five-unit trips in 2008 was due to Hurricane Ike hitting the Gulf Coast The highest total
number of multiple unit trips occurred in 2009 though as mentioned before the data collection for 2010 is
incomplete at this time The majority of 2009 multiple unit trips have three main causes (in order by
Generation Equipment Performance
56
number of events) transmission lack of fuel and storms A summary of the three categories for single as
well as multiple unit outages (all unit capacities) are reflected in Table 9
Table 9 Common Causes of Multiple Unit Forced Outages (2009)
Cause Number of Events Average MW Size of Unit
Transmission 1583 16
Lack of Fuel (Coal Mines Gas Lines etc) Not
in Operator Control
812 448
Storms Lightning and Other Acts of Nature 591 112
Some of the transmission outages based on storms in 2009 have been caused by the same reasons because
the storms may have caused transmission interference However the plants reported the problems
inconsistently with either the transmission interference or storms cause code Therefore they are depicted
as two different causes of forced outage
Marked transmission outages in 2009 were quite high Thirty-five percent came from one utility with a large
number of hydroelectric units The company related the trips to various problems including weather
(lightning storms) wildlife ldquoline bumpsrdquo and problems on the receiving end of the transmission line Nine
hundred and eighty-five transmission trips (62 percent) were from hydroelectric units38
In 2009 only ten transmission trips resulted in a loss of 750 MW or more per trip Twenty two generating
plants were affected by the ten trips Causes for the trips include feeder line trips (1 trip) breakers in the
switchyard (8 trips) personnel errors (2 trips) and unknown (10 trips)
The ldquoLack of Fuelrdquo outages are of interest as these events occur during the times when a unit is available to
operate but there is an interruption in fuels to operate the facilities These events do not include
interruptions of fuel due to contracts Rather the cause code is designed to account for units that are
expecting fuel and it is unavailable when requested Table 10 presents the distribution of ldquoLack of Fuelrdquo
events by NERC Region and Table 11 presents the unit types affected
38 The average size of the hydroelectric units were small ndash 335 MW
Generation Equipment Performance
57
Of the units that report ldquoLack of Fuelrdquo 78 percent of the units are oil-fired 15 percent of the units are gas-
fired and the remaining units are various other fuels Table 12 provides the top causes of forced outage for
several unit types For fossil units ldquoLack of Fuelrdquo as the number three cause behind waterwall tube leaks
and superheater tube leaks
Table 10 Forced Outages Due to Lack of Fuel by Region
Region Number of Lack of Fuel
Problems Reported
FRCC 0
MRO 3
NPCC 24
RFC 695
SERC 17
SPP 3
TRE 7
WECC 29
One company contributed to the majority of oil-fired lack of fuel events The units at the company are
actually dual-fuels (oil and gas) but market nominated gas monitoring causes the units to be on forced
outage nightly The units need gas to start up so they can run on oil When they shut down the units must
switch to gas to clean themselves With the gas restriction the unit canrsquot start and the unit goes on a
forced outage Until the band is lifted the two units will continue to be on a forced outage cycle
Event records also provide descriptions of why the unit was without fuel with the majority of descriptions
bull Temperatures affecting gas supply valves
bull Unexpected maintenance of gas pipe-lines
bull Compressor problemsmaintenance
Generation Equipment Performance
58
Table 11 Unit Type Profile of Forced Outages Due to Lack of Fuel
Unit Types Number of Lack of Fuel Problems Reported
Fossil 642
Nuclear 0
Gas Turbines 88
Diesel Engines 1
HydroPumped Storage 0
Combined Cycle 47
Generation Equipment Performance
59
Table 12 Causes of Forced Outage for Different Unit Types (2008-2010)
Fossil - all MW sizes all fuels
Rank Description Occurrence per Unit-year
MWH per Unit-year
Average Hours To Repair
Average Hours Between Failures
Unit-years
1 Waterwall (furnace wall) 0590 134106 59 3250 3868 2 Second Superheater
Leaks 0180 5182 60 3228 3868
3 Lack of Fuel (coal mines gas lines etc) where the operator is not in control
0480 4701 18 26 3868
Combined-Cycle blocks Rank Description Occurrence
per Unit-year
MWH per Unit-year
Average Hours To Repair
Average Hours Between Failures
Unit-years
1 HP Turbine Buckets Or Blades
0020 4663 1830 26280 466
2 Turbine Control Valves 0040 2777 100 7200 466 3 Gas Turbine Compressor -
High Pressure Shaft 0010 2266 663 4269 466
Nuclear units - all Reactor types Rank Description Occurrence
per Unit-year
MWH per Unit-year
Average Hours To Repair
Average Hours Between Failures
Unit-years
1 LP Turbine Buckets or Blades
0010 26415 8760 26280 288
2 Containment Structure 0010 9233 1226 26262 288 3 Feedwater Pump Local
Controls 0020 7620 692 12642 288
Simple-cycle gas turbine jet engines Rank Description Occurrence
per Unit-year
MWH per Unit-year
Average Hours To Repair
Average Hours Between Failures
Unit-years
1 Main Transformer 0030 1611 1016 20709 4181 2 Other Gas Turbine
Controls And Instrument Problems
0120 428 70 2614 4181
3 Other Gas Turbine Problems
0090 400 119 1701 4181
Generation Equipment Performance
60
2008-2010 Review of Summer versus Winter Availability To address seasonality of unit availability unit information for the months of June to September (summer)
and December through February (winter) were pooled to calculate force events during these timeframes for
2008-201039 Figure 32 shows the Equivalent Availability Factor (EAF) is three percentage points higher and
the Equivalent Forced Outage Rate - Demand (EFORd) is more than a half of a percentage point lower in the
summer period than in winter period This means the units were more reliable with less forced events
during high-demand times during the summer than during the winter seasons The generating unitrsquos
capability has a resulting higher Net Capacity Factor (NCF) of 45 percentage points in the summer season
for 2008-2010
During the spring season (March-May) 77 percent of the units took a planned outage (PO) for an average
231 hours (or 96 days) In fall (October-November) only 42 percent of the units experienced a PO and the
average duration was shorter ndash 134 hours (or 56 days) A few units took both spring and fall planned
outages although this is rare Based on this assessment the generating units are prepared for the summer
peak demand The resulting availability indicates that this maintenance was successful which is measured
by an increased EAF and lower EFORd
Figure 32 Summer-Winter Average EAF NCF and EFORd (2008-2010)
Conclusions and Recommendations During 2008-2010 the average Equivalent Availability Factor (EAF) which measures the overall availability
of generating units decreased At the same time the Net Capacity Factor (NCF) an indicator of energy
production increased The average number of forced outages in 2010 is greater than in 2008 while at the
same time the average planned outage times have decreased As a result the Equivalent Forced Outage
Rate ndash Demand (EFORd) also increased illustrating that more units have experienced forced events during
39 A study of peak periods was conducted by the NERC Generating Availability Trend Evaluation (GATE) Working Group several years ago see httpwwwnerccomfilesSeasonal-Performance-Trendspdf
9116
5343
396
8818
4896
441
0 10 20 30 40 50 60 70 80 90 100
EAF
NCF
EFORd
Percent ()
Winter
Summer
Generation Equipment Performance
61
peak-demand times in 2010 than in the previous two years Potentially with shorter planned outage
periods in 2010 there may be less time to repair equipment and prevent forced unit outages
There are warnings that units are not being maintained as well as they should be In the last three years
there has been an increase in Equivalent Forced Outage Rate ndash Demand (EFORd) This indicator measures
the rate of forced outage events on generating units during periods of load demand To confirm this
problem forced outage hours jumped from 270 to 314 hours per unit between 2009 and 2010 At the same
time maintenance events also increased by 12 hours per unit Planned outage events remain constant The
resulting conclusions from this trend are
bull More or longer planned outage time is needed to repair the generating fleet Whether age is the
cause of the increase need for planned outage time remains unknown and further investigation into
the cause for longer planned outage time is necessary
bull More focus on preventive repairs during planned and maintenance events are needed
There are many multiple unit forced outages due to lack of fuel The majority of multiple unit trips have
three main causes transmission lack of fuel and storms With special interest in the forced outages due to
ldquoLack of Fuelrdquo additional analysis revealed that 77 percent of the units experiencing unexpected fuel
stoppage are oil-fired fossil units while gas-fired units experienced 15 percent
Generating units continue to be more reliable during the peak summer periods
Disturbance Event Trends
62
Category 1 An event resulting in one or more of the following a Unintended loss of three or more BPS elements caused by
common mode failure b Failure or misoperation of an SPSRAS c System-wide voltage reduction of 3 or more d Unintended BPS system separation resulting in an island of
100 MW to 999 MW e Unplanned evacuation from a control center facility with BPS
SCADA functionality for 30 minutes or more Category 2 An event resulting in one or more of the following
a Complete loss of all BPS control center voice communication system(s) for 30 minutes or more
b Complete loss of SCADA control or monitoring functionality for 30 minutes or more
c Voltage excursions equal to or greater than 10 lasting more than five minutes
d Loss of off-site power (LOOP) to a nuclear generating station e Unintended system separation resulting in an island of 1000
MW to 4999 MW f Unintended loss of 300MW or more of firm load for more
than 15 minutes g Violation of an Interconnection Reliability Operating Limit
(IROL) for more than 30 minutes Category 3 An event resulting in one or more of the following
a The loss of load or generation of 2000 MW or more in the Eastern Interconnection or
b Western Interconnection or 1000 MW or more in the ERCOT or Queacutebec Interconnections
c Unintended system separation resulting in an island of 5000 MW to 10000 MW
d Unintended system separation resulting in an island of Florida from the Eastern Interconnection
Category 4 An event resulting in one or more of the following a The loss of load or generation from 5001 MW to 9999 MW b Unintended system separation resulting in an island of more
than 10000 MW (with the exception of Florida as described in Category 3c)
Category 5 An event resulting in one or more of the following a The loss of load of 10000 MW or more b The loss of generation of 10000 MW or more
Figure 33 BPS Event Category
Disturbance Event Trends Introduction The purpose of this section is to report event
analysis trends from the beginning of event
analysis field test40
One of the companion goals of the event
analysis program is the identification of trends
in the number magnitude and frequency of
events and their associated causes such as
human error equipment failure protection
system misoperations etc The information
provided in the event analysis database (EADB)
and various event analysis reports have been
used to track and identify trends in BPS events
in conjunction with other databases (TADS
GADS metric and benchmarking database)
to the end of 2010
The Event Analysis Working Group (EAWG)
continuously gathers event data and is moving
toward an integrated approach to analyzing
data assessing trends and communicating the
results to the industry
Performance Trends The event category is classified41
Figure 33
as shown in
with Category 5 being the most
severe Figure 34 depicts disturbance trends in
Category 1 to 5 system events from the
40 httpwwwnerccomdocseawgGalloway-Industry-EA-Field-Test-102210pdf 41httpwwwnerccomfiles2011-05-0220Event_Analysis_Process_Phase20220Field20Test20Draft20-20Final20-20For20postingpdf
Disturbance Event Trends
63
beginning of event analysis field test to the end of 201042
Figure 34 Event Category vs Date for All 2010 Categorized Events
From the figure in November and December
there were many more category 1 and 2 events than in October This is due to the field trial starting on
October 25 2010
In addition to the category of the events the status of the events plays a critical role in the accuracy of the
data By examining Figure 35 over 80 of the events reported in 2010 have been closed This means that
the category root cause and other important information have been sufficiently finalized in order for
analysis to be accurate for each event At this time there is not enough data to draw any long-term
conclusions about event investigation performance
42 Documents for the EA Field Test are located at httpwwwnerccompagephpcid=5|365
2
12 12
26
3
6 5
14
1 1
2
0
5
10
15
20
25
30
35
40
45
October November December 2010
Even
t Cou
nt
Category 3 Category 2 Category 1
Disturbance Event Trends
64
Figure 35 Event Count vs Status (All 2010 Events with Status)
By drilling down into the cause code for each closed 2010 event Figure 36 shows the top 3 event causes
From the figure equipment failure and protection system misoperation are the most significant causes for
events Because of how new and limited the data is however there may not be statistical significance for
this result Further trending of cause codes for closed events and developing a richer dataset to find any
trends between event cause codes and event counts should be performed
Figure 36 Top 3 Event Counts vs DAWG Cause Code for all Closed 2010 Events
10
32
42
0
5
10
15
20
25
30
35
40
45
Open Closed Open and Closed
Even
t Cou
nt
Status
1211
8
0
2
4
6
8
10
12
14
Equipment Failure Protection System Misoperation Human Error
Even
t Cou
nt
Cause Code
Disturbance Event Trends
65
Conclusions Due to the relatively new process for events analysis and categorization more time will be required before a
conclusive recommendation may be obtained Further analysis and new data should provide valuable
statistics in the future Over 80 of all event reports from 2010 are current listed as closed but no
conclusion about investigation performance may be obtained because of the limited amount of data It is
recommended to study ways to prevent equipment failure and protection system misoperations but there
is not enough data to draw a firm conclusion about the top causes of events at this time
Abbreviations Used in This Report
66
Abbreviations Used in This Report
Acronym Definition ALP Acadiana Load Pocket
ALR Adequate Level of Reliability
ARR Automatic Reliability Report
BA Balancing Authority
BPS Bulk Power System
CDI Condition Driven Index
CEII Critical Energy Infrastructure Information
CIPC Critical Infrastructure Protection Committee
CLECO Cleco Power LLC
DADS Future Demand Availability Data System
DCS Disturbance Control Standard
DOE Department Of Energy
DSM Demand Side Management
EA Event Analysis
EAF Equivalent Availability Factor
ECAR East Central Area Reliability
EDI Event Drive Index
EEA Energy Emergency Alert
EFORd Equivalent Forced Outage Rate Demand
EMS Energy Management System
ERCOT Electric Reliability Council of Texas
ERO Electric Reliability Organization
ESAI Energy Security Analysis Inc
FERC Federal Energy Regulatory Commission
FOH Forced Outage Hours
FRCC Florida Reliability Coordinating Council
GADS Generation Availability Data System
GOP Generation Operator
IEEE Institute of Electrical and Electronics Engineers
IESO Independent Electricity System Operator
IROL Interconnection Reliability Operating Limit
Abbreviations Used in This Report
67
Acronym Definition IRI Integrated Reliability Index
LOLE Loss of Load Expectation
LUS Lafayette Utilities System
MAIN Mid-America Interconnected Network Inc
MAPP Mid-continent Area Power Pool
MOH Maintenance Outage Hours
MRO Midwest Reliability Organization
MSSC Most Severe Single Contingency
NCF Net Capacity Factor
NEAT NERC Event Analysis Tool
NERC North American Electric Reliability Corporation
NPCC Northeast Power Coordinating Council
OC Operating Committee
OL Operating Limit
OP Operating Procedures
ORS Operating Reliability Subcommittee
PC Planning Committee
PO Planned Outage
POH Planned Outage Hours
RAPA Reliability Assessment Performance Analysis
RAS Remedial Action Schemes
RC Reliability Coordinator
RCIS Reliability Coordination Information System
RCWG Reliability Coordinator Working Group
RE Regional Entities
RFC Reliability First Corporation
RMWG Reliability Metrics Working Group
RSG Reserve Sharing Group
SAIDI System Average Interruption Duration Index
SAIFI System Average Interruption Frequency Index
SCADA Supervisory Control and Data Acquisition
SDI Standardstatute Driven Index
SERC SERC Reliability Corporation
Abbreviations Used in This Report
68
Acronym Definition SRI Severity Risk Index
SMART Specific Measurable Attainable Relevant and Tangible
SOL System Operating Limit
SPS Special Protection Schemes
SPCS System Protection and Control Subcommittee
SPP Southwest Power Pool
SRI System Risk Index
TADS Transmission Availability Data System
TADSWG Transmission Availability Data System Working Group
TO Transmission Owner
TOP Transmission Operator
WECC Western Electricity Coordinating Council
Contributions
69
Contributions This report was made feasible by the collaboration and hard work of both NERC staff and NERCrsquos
Industry Groups
NERC Industry Groups
Table 14 lists the NERC industry group contributors Without their contribution and collaboration this
report would not have been possible
Table 13 NERC Industry Group Contributions43
NERC Group
Relationship Contribution
Reliability Metrics Working Group
(RMWG)
Reports to the OCPC bull Lead Development of Report bull Provide Reliability Metrics Data bull Responsible for Reliability Metrics
Performance Chapter
Transmission Availability Working Group
(TADSWG)
Reports to the OCPC bull Provide Transmission Availability Data
bull Responsible for Transmission Equip-ment Performance Chapter
bull Content Review
Generation Availability Data System Task
Force
(GADSTF)
Reports to the OCPC bull Provide Generation Availability Data bull Responsible for Generation Equip-
ment Performance Chapter bull Content Review
Event Analysis Working Group
(EAWG)
Reports to the OCPC bull Provide Events Data bull Responsible for Disturbance Events
Trends Chapter bull Content Review
43 Rosters for RMWG TADSWG GADSTF and EAWG are available at httpwwwnerccomfilesrosterpdf
Contributions
70
NERC Staff Table 13 below lists the NERC staff who contributed to the 2011 Reliability Performance Analysis
Report
Table 14 Contributing NERC Staff
Name Title E-mail Address
Mark Lauby Vice President and Director of
Reliability Assessment and
Performance Analysis
marklaubynercnet
Jessica Bian Manager of Performance Analysis jessicabiannercnet
John Moura Manager of Reliability Assessments johnmouranercnet
Andrew Slone Engineer Reliability Performance
Analysis
andrewslonenercnet
Jim Robinson TADS Project Manager jimrobinsonnercnet
Clyde Melton Engineer Reliability Performance
Analysis
clydemeltonnercnet
Mike Curley Manager of GADS Services mikecurleynercnet
James Powell Engineer Reliability Performance
Analysis
jamespowellnercnet
Michelle Marx Administrative Assistant michellemarxnercnet
William Mo Intern Performance Analysis wmonercnet
- NERCrsquos Mission
- Table of Contents
- Executive Summary
-
- 2011 Transition Report
- State of Reliability Report
- Key Findings and Recommendations
-
- Reliability Metric Performance
- Transmission Availability Performance
- Generating Availability Performance
- Disturbance Events
- Report Organization
-
- Introduction
-
- Metric Report Evolution
- Roadmap for the Future
-
- Reliability Metrics Performance
-
- Introduction
- 2010 Performance Metrics Results and Trends
-
- ALR1-3 Planning Reserve Margin
-
- Background
- Assessment
- Special Considerations
-
- ALR1-4 BPS Transmission Related Events Resulting in Loss of Load
-
- Background
- Assessment
-
- ALR1-12 Interconnection Frequency Response
-
- Background
- Assessment
-
- ALR2-3 Activation of Under Frequency Load Shedding
-
- Background
- Assessment
- Special Considerations
-
- ALR2-4 Average Percent Non-Recovery Disturbance Control Standards (DCS)
-
- Background
- Assessment
- Special Consideration
-
- ALR2-5 Disturbance Control Events Greater Than Most Severe Single Contingency
-
- Background
- Assessment
- Special Consideration
-
- ALR 1-5 System Voltage Performance
-
- Background
- Special Considerations
- Status
-
- ALR3-5 Interconnection Reliability Operating Limit System Operating Limit (IROLSOL) Exceedances
-
- Background
-
- ALR4-1 Automatic Transmission Outages Caused by Protection System Misoperations
-
- Background
- Special Considerations
-
- ALR6-11 ndash ALR6-14
-
- Background
- Assessment
- ALR 6-11 ndash Automatic Outages Initiated by Failed Protection System Equipment
- ALR6-12 ndash Automatic Outages Initiated by Human Error
- ALR6-13 ndash Automatic Outages Initiated by Failed AC Substation Equipment
- ALR6-14 Automatic AC Transmission Outages Initiated by Failed AC Circuit Equipment
-
- ALR6-15 Element Availability Percentage (APC)
-
- Background
- Assessment
- Special Consideration
-
- ALR6-16 Transmission System Unavailability
-
- Background
- Assessment
- Special Consideration
-
- ALR6-2 Energy Emergency Alert 3 (EEA3)
-
- Background
- Assessment
- Special Considerations
-
- ALR 6-3 Energy Emergency Alert 2 (EEA2)
-
- Background
- Assessment
- Special Considerations
-
- ALR 6-1 Transmission Constraint Mitigation
-
- Background
- Assessment
- Special Considerations
-
- Integrated Bulk Power System Risk Assessment
-
- Introduction
- Recommendations
-
- Integrated Reliability Index Concepts
-
- The Three Components of the IRI
-
- Event-Driven Indicators (EDI)
- Condition-Driven Indicators (CDI)
- StandardsStatute-Driven Indicators (SDI)
-
- IRI Index Calculation
- IRI Recommendations
-
- Reliability Metrics Conclusions and Recommendations
-
- Transmission Equipment Performance
-
- Introduction
- Performance Trends
-
- AC Element Outage Summary and Leading Causes
- Transmission Monthly Outages
- Outage Initiation Location
- Transmission Outage Events
- Transmission Outage Mode
-
- Conclusions
-
- Generation Equipment Performance
-
- Introduction
- Generation Key Performance Indicators
-
- Multiple Unit Forced Outages and Causes
- 2008-2010 Review of Summer versus Winter Availability
-
- Conclusions and Recommendations
-
- Disturbance Event Trends
-
- Introduction
- Performance Trends
- Conclusions
-
- Abbreviations Used in This Report
- Contributions
-
- NERC Industry Groups
- NERC Staff
-
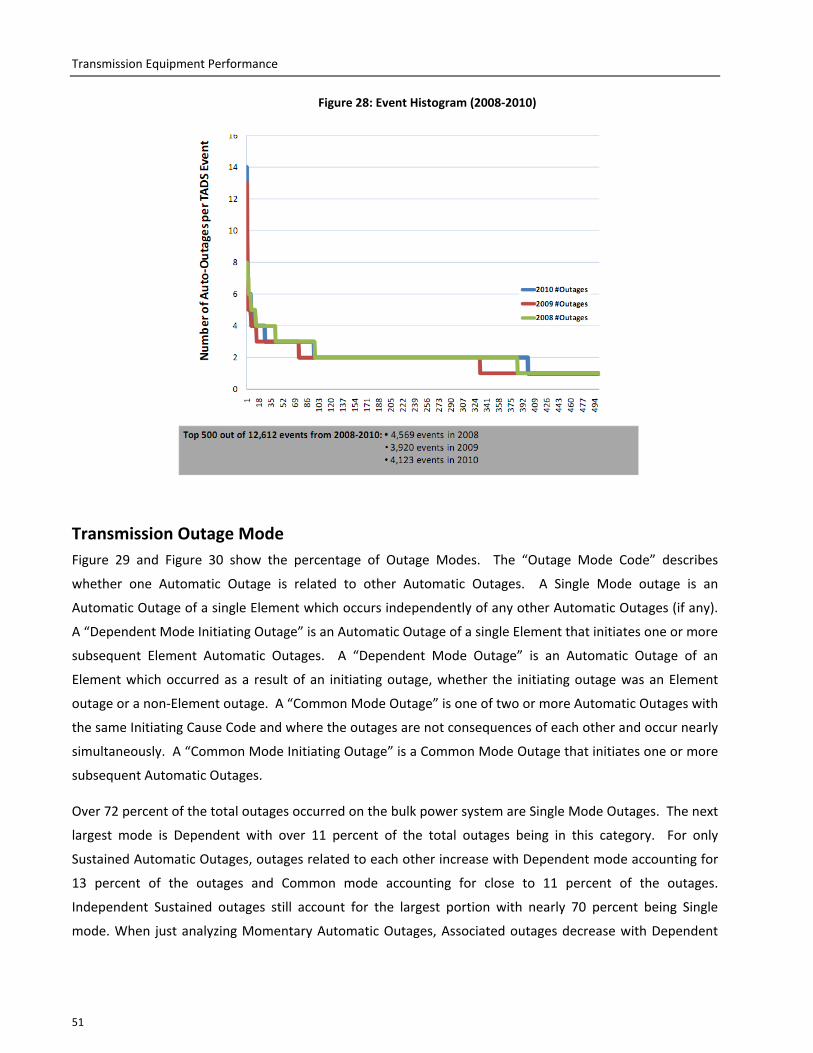
Transmission Equipment Performance
52
mode accounting for only 9 percent of the outages The Common Mode percentage decreases while
Dependent Mode Initiating percentage increases compared to Sustained Outages Independent Momentary
outages account for the largest portion with over 76 percent being Single Mode
An investigation into the root causes of Dependent and Common mode events which include three or more
Automatic Outages (indentified in the TADS 2008 to 2010 data) should be a high priority Some protection
systems are designed to trip three or more circuits but some events go beyond what is designed Some also
have misoperations associated with multiple outage events
Conclusions On a NERC wide average basis automatic transmission outage rate is improving from 2008 to 2010 based on
reported data Considering both automatic and non-automatic outages 2010 records indicate transmission
element availability percentage is very high and exceeds 95 The unavailability rate for AC circuits and
transformers are only 15 and 29 respectively
The cause codes of Human Error Failed Protection System Equipment and Failed AC Circuit Equipment
should be considered significant focus points in reducing the number of Sustained Automatic Outages for all
elements A deeper look into the root causes of Dependent and Common mode events which include three
or more Automatic Outages (indentified in the TADS 2008 to 2010 data) should be a high priority Some
protection systems are designed to trip three or more circuits but some events go beyond what is designed
Some also have misoperations associated with multiple outage events
Figure 29 Sustained Automatic Outage Mode code Figure 30 Momentary Automatic Outage Mode code
Generation Equipment Performance
53
Generation Equipment Performance Introduction The development of the Generating Availability Data System (GADS) began in 1982 This series of databases
is used to voluntarily collect record and retrieve operating information By pooling individual unit
information with likewise units generating unit availability performance can be calculated providing
opportunities to identify trends and generating equipment reliability improvement opportunities The
information is used to support equipment reliability availability analyses and risk-informed decision-making
by system planners generation owners assessment modelers manufacturers and contractors etc Reports
and information resulting from the data collected through GADS are now used for benchmarking and
analyzing electric power plants
Currently the data collected through GADS contains 72 percent of the North American generating units
with generating capacity of 20 MW or higher34 Additionally many of the newer combined-cycle plants are
not reporting information and therefore a full view of each unit type is not presented Rather a sample of
all the units in North America that fit a given more general category is provided35 for the 2008-201036
Generation Key Performance Indicators
assessment period
Three key performance indicators37
In
the industry have used widely to measure the availability of generating
units (see Terms Used in This Report section for their calculation parameters) are Equivalent Availability
Factor (EAF) Net Capacity Factor (NCF) and Equivalent Forced Outage Rate ndash Demand (EFORd)
Table 7 the North American fleet average EAF NCF and EFORd compared to unit age for all generating
units with a capacity of 20 MW and higher is provided for the years 2008-2010 The EAF shows a decline
during the last three years NCF is up and down while the EFORd appears to be increasing As expected the
fleet of units reported to GADS is aging overall with the fossil units being about 12 years older than the
average age
34 httpwwwnerccomdocspcgadstfGADSTF_Recommendation_Report_02-18-2011_FINALpdf 35GADS contains some 1500+ units under 20 MW that is not included in this report These units are excluded because most units are not base-loaded and are in peaking operation
3684 percent of the 2010 dataset is available at this time while the 2008 and 2009 dataset is complete 37 httpwwwnerccompagephpcid=4|43
Generation Equipment Performance
54
Table 7 General Availability Review of GADS Fleet Units by Year
2008 2009 2010 Average
Equivalent Availability Factor (EAF) 8776 8774 8678 8743
Net Capacity Factor (NCF) 5083 4709 4880 4890
Equivalent Forced Outage Rate -
Demand (EFORd) 579 575 639 597
Number of Units ge20 MW 3713 3713 3713 3713
Average Age of the Fleet in Years (all
unit types) 303 311 321 312
Average Age of the Fleet in Years
(fossil units only) 422 432 440 433
Figure 31 provides the average forced outage hours (FOH) maintenance outage hours (MOH) and planned
outage hours (POH) for all units reporting 20 MW or larger During this three-year period the average FOH
291 hours average MOH is 163 hours average POH is 470 hours
Figure 31 shows a large increase in forced and maintenance events The average age of the units with a
capacity of 20MW and higher in 2009 is 316 years old However the average age of fossil units in 2010 is
442 years old These fossil units are the backbone of all operating units providing the base-load power
continuously and nearly 50 percent of all energy annually There appears to be no increase allocated for
annualsemi-annual maintenance (ie planned outages) for the older generating units The increase of
000100002000030000400005000060000700008000090000
100000
2008 2009 2010
463 479 468
154 161 173
288 270 314
Hou
rs
Planned Maintenance Forced
Figure 31 Average Outage Hours for Units gt 20 MW
Generation Equipment Performance
55
maintenance outage hours reflects an increased need to fix problems that cannot be deferred until the next
annualsemi-annual repairs As a result it shows one of two things are happening
bull More or longer planned outage time is needed to repair the aging generating fleet
bull More focus on preventive repairs during planned and maintenance events are needed
Multiple Unit Forced Outages and Causes Table 8 provides the annual multiple-unit forced outage trips resulting from the same cause for each of the
assessments years 2008-2010 respectively The ldquosingle unitrdquo trips are large units with a Net Dependable
Capacity of 750 MW or more The trips of ldquotwo unitsrdquo or more is any combination of unit capacity with the
total amount of lost capacity more than 750 MW
Table 8 also presents more information on the forced outages During 2008-2010 there were a large
number of double-unit outages resulting from the same event Investigations show that some of these trips
were at a single plant caused by common control and instrumentation for the units The incidents occurred
several times for several months and are a common mode issue internal to the plant
Table 8 Number of Multiple Unit Forced Outages and FrequencyYear
2008 2009 2010
Type of
Trip
of
Trips
Avg Outage
Hr Trip
Avg Outage
Hr Unit
of
Trips
Avg Outage
Hr Trip
Avg Outage
Hr Unit
of
Trips
Avg Outage
Hr Trip
Avg Outage
Hr Unit
Single-unit
Trip 591 58 58 284 64 64 339 66 66
Two-unit
Trip 281 43 22 508 96 48 206 41 20
Three-unit
Trip 74 48 16 223 146 48 47 109 36
Four-unit
Trip 12 77 19 111 112 28 40 121 30
Five-unit
Trip 11 1303 260 60 443 88 19 199 10
gt 5 units 20 166 16 93 206 50 37 246 6
Loss of ge 750 MW per Trip
The high number of five-unit trips in 2008 was due to Hurricane Ike hitting the Gulf Coast The highest total
number of multiple unit trips occurred in 2009 though as mentioned before the data collection for 2010 is
incomplete at this time The majority of 2009 multiple unit trips have three main causes (in order by
Generation Equipment Performance
56
number of events) transmission lack of fuel and storms A summary of the three categories for single as
well as multiple unit outages (all unit capacities) are reflected in Table 9
Table 9 Common Causes of Multiple Unit Forced Outages (2009)
Cause Number of Events Average MW Size of Unit
Transmission 1583 16
Lack of Fuel (Coal Mines Gas Lines etc) Not
in Operator Control
812 448
Storms Lightning and Other Acts of Nature 591 112
Some of the transmission outages based on storms in 2009 have been caused by the same reasons because
the storms may have caused transmission interference However the plants reported the problems
inconsistently with either the transmission interference or storms cause code Therefore they are depicted
as two different causes of forced outage
Marked transmission outages in 2009 were quite high Thirty-five percent came from one utility with a large
number of hydroelectric units The company related the trips to various problems including weather
(lightning storms) wildlife ldquoline bumpsrdquo and problems on the receiving end of the transmission line Nine
hundred and eighty-five transmission trips (62 percent) were from hydroelectric units38
In 2009 only ten transmission trips resulted in a loss of 750 MW or more per trip Twenty two generating
plants were affected by the ten trips Causes for the trips include feeder line trips (1 trip) breakers in the
switchyard (8 trips) personnel errors (2 trips) and unknown (10 trips)
The ldquoLack of Fuelrdquo outages are of interest as these events occur during the times when a unit is available to
operate but there is an interruption in fuels to operate the facilities These events do not include
interruptions of fuel due to contracts Rather the cause code is designed to account for units that are
expecting fuel and it is unavailable when requested Table 10 presents the distribution of ldquoLack of Fuelrdquo
events by NERC Region and Table 11 presents the unit types affected
38 The average size of the hydroelectric units were small ndash 335 MW
Generation Equipment Performance
57
Of the units that report ldquoLack of Fuelrdquo 78 percent of the units are oil-fired 15 percent of the units are gas-
fired and the remaining units are various other fuels Table 12 provides the top causes of forced outage for
several unit types For fossil units ldquoLack of Fuelrdquo as the number three cause behind waterwall tube leaks
and superheater tube leaks
Table 10 Forced Outages Due to Lack of Fuel by Region
Region Number of Lack of Fuel
Problems Reported
FRCC 0
MRO 3
NPCC 24
RFC 695
SERC 17
SPP 3
TRE 7
WECC 29
One company contributed to the majority of oil-fired lack of fuel events The units at the company are
actually dual-fuels (oil and gas) but market nominated gas monitoring causes the units to be on forced
outage nightly The units need gas to start up so they can run on oil When they shut down the units must
switch to gas to clean themselves With the gas restriction the unit canrsquot start and the unit goes on a
forced outage Until the band is lifted the two units will continue to be on a forced outage cycle
Event records also provide descriptions of why the unit was without fuel with the majority of descriptions
bull Temperatures affecting gas supply valves
bull Unexpected maintenance of gas pipe-lines
bull Compressor problemsmaintenance
Generation Equipment Performance
58
Table 11 Unit Type Profile of Forced Outages Due to Lack of Fuel
Unit Types Number of Lack of Fuel Problems Reported
Fossil 642
Nuclear 0
Gas Turbines 88
Diesel Engines 1
HydroPumped Storage 0
Combined Cycle 47
Generation Equipment Performance
59
Table 12 Causes of Forced Outage for Different Unit Types (2008-2010)
Fossil - all MW sizes all fuels
Rank Description Occurrence per Unit-year
MWH per Unit-year
Average Hours To Repair
Average Hours Between Failures
Unit-years
1 Waterwall (furnace wall) 0590 134106 59 3250 3868 2 Second Superheater
Leaks 0180 5182 60 3228 3868
3 Lack of Fuel (coal mines gas lines etc) where the operator is not in control
0480 4701 18 26 3868
Combined-Cycle blocks Rank Description Occurrence
per Unit-year
MWH per Unit-year
Average Hours To Repair
Average Hours Between Failures
Unit-years
1 HP Turbine Buckets Or Blades
0020 4663 1830 26280 466
2 Turbine Control Valves 0040 2777 100 7200 466 3 Gas Turbine Compressor -
High Pressure Shaft 0010 2266 663 4269 466
Nuclear units - all Reactor types Rank Description Occurrence
per Unit-year
MWH per Unit-year
Average Hours To Repair
Average Hours Between Failures
Unit-years
1 LP Turbine Buckets or Blades
0010 26415 8760 26280 288
2 Containment Structure 0010 9233 1226 26262 288 3 Feedwater Pump Local
Controls 0020 7620 692 12642 288
Simple-cycle gas turbine jet engines Rank Description Occurrence
per Unit-year
MWH per Unit-year
Average Hours To Repair
Average Hours Between Failures
Unit-years
1 Main Transformer 0030 1611 1016 20709 4181 2 Other Gas Turbine
Controls And Instrument Problems
0120 428 70 2614 4181
3 Other Gas Turbine Problems
0090 400 119 1701 4181
Generation Equipment Performance
60
2008-2010 Review of Summer versus Winter Availability To address seasonality of unit availability unit information for the months of June to September (summer)
and December through February (winter) were pooled to calculate force events during these timeframes for
2008-201039 Figure 32 shows the Equivalent Availability Factor (EAF) is three percentage points higher and
the Equivalent Forced Outage Rate - Demand (EFORd) is more than a half of a percentage point lower in the
summer period than in winter period This means the units were more reliable with less forced events
during high-demand times during the summer than during the winter seasons The generating unitrsquos
capability has a resulting higher Net Capacity Factor (NCF) of 45 percentage points in the summer season
for 2008-2010
During the spring season (March-May) 77 percent of the units took a planned outage (PO) for an average
231 hours (or 96 days) In fall (October-November) only 42 percent of the units experienced a PO and the
average duration was shorter ndash 134 hours (or 56 days) A few units took both spring and fall planned
outages although this is rare Based on this assessment the generating units are prepared for the summer
peak demand The resulting availability indicates that this maintenance was successful which is measured
by an increased EAF and lower EFORd
Figure 32 Summer-Winter Average EAF NCF and EFORd (2008-2010)
Conclusions and Recommendations During 2008-2010 the average Equivalent Availability Factor (EAF) which measures the overall availability
of generating units decreased At the same time the Net Capacity Factor (NCF) an indicator of energy
production increased The average number of forced outages in 2010 is greater than in 2008 while at the
same time the average planned outage times have decreased As a result the Equivalent Forced Outage
Rate ndash Demand (EFORd) also increased illustrating that more units have experienced forced events during
39 A study of peak periods was conducted by the NERC Generating Availability Trend Evaluation (GATE) Working Group several years ago see httpwwwnerccomfilesSeasonal-Performance-Trendspdf
9116
5343
396
8818
4896
441
0 10 20 30 40 50 60 70 80 90 100
EAF
NCF
EFORd
Percent ()
Winter
Summer
Generation Equipment Performance
61
peak-demand times in 2010 than in the previous two years Potentially with shorter planned outage
periods in 2010 there may be less time to repair equipment and prevent forced unit outages
There are warnings that units are not being maintained as well as they should be In the last three years
there has been an increase in Equivalent Forced Outage Rate ndash Demand (EFORd) This indicator measures
the rate of forced outage events on generating units during periods of load demand To confirm this
problem forced outage hours jumped from 270 to 314 hours per unit between 2009 and 2010 At the same
time maintenance events also increased by 12 hours per unit Planned outage events remain constant The
resulting conclusions from this trend are
bull More or longer planned outage time is needed to repair the generating fleet Whether age is the
cause of the increase need for planned outage time remains unknown and further investigation into
the cause for longer planned outage time is necessary
bull More focus on preventive repairs during planned and maintenance events are needed
There are many multiple unit forced outages due to lack of fuel The majority of multiple unit trips have
three main causes transmission lack of fuel and storms With special interest in the forced outages due to
ldquoLack of Fuelrdquo additional analysis revealed that 77 percent of the units experiencing unexpected fuel
stoppage are oil-fired fossil units while gas-fired units experienced 15 percent
Generating units continue to be more reliable during the peak summer periods
Disturbance Event Trends
62
Category 1 An event resulting in one or more of the following a Unintended loss of three or more BPS elements caused by
common mode failure b Failure or misoperation of an SPSRAS c System-wide voltage reduction of 3 or more d Unintended BPS system separation resulting in an island of
100 MW to 999 MW e Unplanned evacuation from a control center facility with BPS
SCADA functionality for 30 minutes or more Category 2 An event resulting in one or more of the following
a Complete loss of all BPS control center voice communication system(s) for 30 minutes or more
b Complete loss of SCADA control or monitoring functionality for 30 minutes or more
c Voltage excursions equal to or greater than 10 lasting more than five minutes
d Loss of off-site power (LOOP) to a nuclear generating station e Unintended system separation resulting in an island of 1000
MW to 4999 MW f Unintended loss of 300MW or more of firm load for more
than 15 minutes g Violation of an Interconnection Reliability Operating Limit
(IROL) for more than 30 minutes Category 3 An event resulting in one or more of the following
a The loss of load or generation of 2000 MW or more in the Eastern Interconnection or
b Western Interconnection or 1000 MW or more in the ERCOT or Queacutebec Interconnections
c Unintended system separation resulting in an island of 5000 MW to 10000 MW
d Unintended system separation resulting in an island of Florida from the Eastern Interconnection
Category 4 An event resulting in one or more of the following a The loss of load or generation from 5001 MW to 9999 MW b Unintended system separation resulting in an island of more
than 10000 MW (with the exception of Florida as described in Category 3c)
Category 5 An event resulting in one or more of the following a The loss of load of 10000 MW or more b The loss of generation of 10000 MW or more
Figure 33 BPS Event Category
Disturbance Event Trends Introduction The purpose of this section is to report event
analysis trends from the beginning of event
analysis field test40
One of the companion goals of the event
analysis program is the identification of trends
in the number magnitude and frequency of
events and their associated causes such as
human error equipment failure protection
system misoperations etc The information
provided in the event analysis database (EADB)
and various event analysis reports have been
used to track and identify trends in BPS events
in conjunction with other databases (TADS
GADS metric and benchmarking database)
to the end of 2010
The Event Analysis Working Group (EAWG)
continuously gathers event data and is moving
toward an integrated approach to analyzing
data assessing trends and communicating the
results to the industry
Performance Trends The event category is classified41
Figure 33
as shown in
with Category 5 being the most
severe Figure 34 depicts disturbance trends in
Category 1 to 5 system events from the
40 httpwwwnerccomdocseawgGalloway-Industry-EA-Field-Test-102210pdf 41httpwwwnerccomfiles2011-05-0220Event_Analysis_Process_Phase20220Field20Test20Draft20-20Final20-20For20postingpdf
Disturbance Event Trends
63
beginning of event analysis field test to the end of 201042
Figure 34 Event Category vs Date for All 2010 Categorized Events
From the figure in November and December
there were many more category 1 and 2 events than in October This is due to the field trial starting on
October 25 2010
In addition to the category of the events the status of the events plays a critical role in the accuracy of the
data By examining Figure 35 over 80 of the events reported in 2010 have been closed This means that
the category root cause and other important information have been sufficiently finalized in order for
analysis to be accurate for each event At this time there is not enough data to draw any long-term
conclusions about event investigation performance
42 Documents for the EA Field Test are located at httpwwwnerccompagephpcid=5|365
2
12 12
26
3
6 5
14
1 1
2
0
5
10
15
20
25
30
35
40
45
October November December 2010
Even
t Cou
nt
Category 3 Category 2 Category 1
Disturbance Event Trends
64
Figure 35 Event Count vs Status (All 2010 Events with Status)
By drilling down into the cause code for each closed 2010 event Figure 36 shows the top 3 event causes
From the figure equipment failure and protection system misoperation are the most significant causes for
events Because of how new and limited the data is however there may not be statistical significance for
this result Further trending of cause codes for closed events and developing a richer dataset to find any
trends between event cause codes and event counts should be performed
Figure 36 Top 3 Event Counts vs DAWG Cause Code for all Closed 2010 Events
10
32
42
0
5
10
15
20
25
30
35
40
45
Open Closed Open and Closed
Even
t Cou
nt
Status
1211
8
0
2
4
6
8
10
12
14
Equipment Failure Protection System Misoperation Human Error
Even
t Cou
nt
Cause Code
Disturbance Event Trends
65
Conclusions Due to the relatively new process for events analysis and categorization more time will be required before a
conclusive recommendation may be obtained Further analysis and new data should provide valuable
statistics in the future Over 80 of all event reports from 2010 are current listed as closed but no
conclusion about investigation performance may be obtained because of the limited amount of data It is
recommended to study ways to prevent equipment failure and protection system misoperations but there
is not enough data to draw a firm conclusion about the top causes of events at this time
Abbreviations Used in This Report
66
Abbreviations Used in This Report
Acronym Definition ALP Acadiana Load Pocket
ALR Adequate Level of Reliability
ARR Automatic Reliability Report
BA Balancing Authority
BPS Bulk Power System
CDI Condition Driven Index
CEII Critical Energy Infrastructure Information
CIPC Critical Infrastructure Protection Committee
CLECO Cleco Power LLC
DADS Future Demand Availability Data System
DCS Disturbance Control Standard
DOE Department Of Energy
DSM Demand Side Management
EA Event Analysis
EAF Equivalent Availability Factor
ECAR East Central Area Reliability
EDI Event Drive Index
EEA Energy Emergency Alert
EFORd Equivalent Forced Outage Rate Demand
EMS Energy Management System
ERCOT Electric Reliability Council of Texas
ERO Electric Reliability Organization
ESAI Energy Security Analysis Inc
FERC Federal Energy Regulatory Commission
FOH Forced Outage Hours
FRCC Florida Reliability Coordinating Council
GADS Generation Availability Data System
GOP Generation Operator
IEEE Institute of Electrical and Electronics Engineers
IESO Independent Electricity System Operator
IROL Interconnection Reliability Operating Limit
Abbreviations Used in This Report
67
Acronym Definition IRI Integrated Reliability Index
LOLE Loss of Load Expectation
LUS Lafayette Utilities System
MAIN Mid-America Interconnected Network Inc
MAPP Mid-continent Area Power Pool
MOH Maintenance Outage Hours
MRO Midwest Reliability Organization
MSSC Most Severe Single Contingency
NCF Net Capacity Factor
NEAT NERC Event Analysis Tool
NERC North American Electric Reliability Corporation
NPCC Northeast Power Coordinating Council
OC Operating Committee
OL Operating Limit
OP Operating Procedures
ORS Operating Reliability Subcommittee
PC Planning Committee
PO Planned Outage
POH Planned Outage Hours
RAPA Reliability Assessment Performance Analysis
RAS Remedial Action Schemes
RC Reliability Coordinator
RCIS Reliability Coordination Information System
RCWG Reliability Coordinator Working Group
RE Regional Entities
RFC Reliability First Corporation
RMWG Reliability Metrics Working Group
RSG Reserve Sharing Group
SAIDI System Average Interruption Duration Index
SAIFI System Average Interruption Frequency Index
SCADA Supervisory Control and Data Acquisition
SDI Standardstatute Driven Index
SERC SERC Reliability Corporation
Abbreviations Used in This Report
68
Acronym Definition SRI Severity Risk Index
SMART Specific Measurable Attainable Relevant and Tangible
SOL System Operating Limit
SPS Special Protection Schemes
SPCS System Protection and Control Subcommittee
SPP Southwest Power Pool
SRI System Risk Index
TADS Transmission Availability Data System
TADSWG Transmission Availability Data System Working Group
TO Transmission Owner
TOP Transmission Operator
WECC Western Electricity Coordinating Council
Contributions
69
Contributions This report was made feasible by the collaboration and hard work of both NERC staff and NERCrsquos
Industry Groups
NERC Industry Groups
Table 14 lists the NERC industry group contributors Without their contribution and collaboration this
report would not have been possible
Table 13 NERC Industry Group Contributions43
NERC Group
Relationship Contribution
Reliability Metrics Working Group
(RMWG)
Reports to the OCPC bull Lead Development of Report bull Provide Reliability Metrics Data bull Responsible for Reliability Metrics
Performance Chapter
Transmission Availability Working Group
(TADSWG)
Reports to the OCPC bull Provide Transmission Availability Data
bull Responsible for Transmission Equip-ment Performance Chapter
bull Content Review
Generation Availability Data System Task
Force
(GADSTF)
Reports to the OCPC bull Provide Generation Availability Data bull Responsible for Generation Equip-
ment Performance Chapter bull Content Review
Event Analysis Working Group
(EAWG)
Reports to the OCPC bull Provide Events Data bull Responsible for Disturbance Events
Trends Chapter bull Content Review
43 Rosters for RMWG TADSWG GADSTF and EAWG are available at httpwwwnerccomfilesrosterpdf
Contributions
70
NERC Staff Table 13 below lists the NERC staff who contributed to the 2011 Reliability Performance Analysis
Report
Table 14 Contributing NERC Staff
Name Title E-mail Address
Mark Lauby Vice President and Director of
Reliability Assessment and
Performance Analysis
marklaubynercnet
Jessica Bian Manager of Performance Analysis jessicabiannercnet
John Moura Manager of Reliability Assessments johnmouranercnet
Andrew Slone Engineer Reliability Performance
Analysis
andrewslonenercnet
Jim Robinson TADS Project Manager jimrobinsonnercnet
Clyde Melton Engineer Reliability Performance
Analysis
clydemeltonnercnet
Mike Curley Manager of GADS Services mikecurleynercnet
James Powell Engineer Reliability Performance
Analysis
jamespowellnercnet
Michelle Marx Administrative Assistant michellemarxnercnet
William Mo Intern Performance Analysis wmonercnet
- NERCrsquos Mission
- Table of Contents
- Executive Summary
-
- 2011 Transition Report
- State of Reliability Report
- Key Findings and Recommendations
-
- Reliability Metric Performance
- Transmission Availability Performance
- Generating Availability Performance
- Disturbance Events
- Report Organization
-
- Introduction
-
- Metric Report Evolution
- Roadmap for the Future
-
- Reliability Metrics Performance
-
- Introduction
- 2010 Performance Metrics Results and Trends
-
- ALR1-3 Planning Reserve Margin
-
- Background
- Assessment
- Special Considerations
-
- ALR1-4 BPS Transmission Related Events Resulting in Loss of Load
-
- Background
- Assessment
-
- ALR1-12 Interconnection Frequency Response
-
- Background
- Assessment
-
- ALR2-3 Activation of Under Frequency Load Shedding
-
- Background
- Assessment
- Special Considerations
-
- ALR2-4 Average Percent Non-Recovery Disturbance Control Standards (DCS)
-
- Background
- Assessment
- Special Consideration
-
- ALR2-5 Disturbance Control Events Greater Than Most Severe Single Contingency
-
- Background
- Assessment
- Special Consideration
-
- ALR 1-5 System Voltage Performance
-
- Background
- Special Considerations
- Status
-
- ALR3-5 Interconnection Reliability Operating Limit System Operating Limit (IROLSOL) Exceedances
-
- Background
-
- ALR4-1 Automatic Transmission Outages Caused by Protection System Misoperations
-
- Background
- Special Considerations
-
- ALR6-11 ndash ALR6-14
-
- Background
- Assessment
- ALR 6-11 ndash Automatic Outages Initiated by Failed Protection System Equipment
- ALR6-12 ndash Automatic Outages Initiated by Human Error
- ALR6-13 ndash Automatic Outages Initiated by Failed AC Substation Equipment
- ALR6-14 Automatic AC Transmission Outages Initiated by Failed AC Circuit Equipment
-
- ALR6-15 Element Availability Percentage (APC)
-
- Background
- Assessment
- Special Consideration
-
- ALR6-16 Transmission System Unavailability
-
- Background
- Assessment
- Special Consideration
-
- ALR6-2 Energy Emergency Alert 3 (EEA3)
-
- Background
- Assessment
- Special Considerations
-
- ALR 6-3 Energy Emergency Alert 2 (EEA2)
-
- Background
- Assessment
- Special Considerations
-
- ALR 6-1 Transmission Constraint Mitigation
-
- Background
- Assessment
- Special Considerations
-
- Integrated Bulk Power System Risk Assessment
-
- Introduction
- Recommendations
-
- Integrated Reliability Index Concepts
-
- The Three Components of the IRI
-
- Event-Driven Indicators (EDI)
- Condition-Driven Indicators (CDI)
- StandardsStatute-Driven Indicators (SDI)
-
- IRI Index Calculation
- IRI Recommendations
-
- Reliability Metrics Conclusions and Recommendations
-
- Transmission Equipment Performance
-
- Introduction
- Performance Trends
-
- AC Element Outage Summary and Leading Causes
- Transmission Monthly Outages
- Outage Initiation Location
- Transmission Outage Events
- Transmission Outage Mode
-
- Conclusions
-
- Generation Equipment Performance
-
- Introduction
- Generation Key Performance Indicators
-
- Multiple Unit Forced Outages and Causes
- 2008-2010 Review of Summer versus Winter Availability
-
- Conclusions and Recommendations
-
- Disturbance Event Trends
-
- Introduction
- Performance Trends
- Conclusions
-
- Abbreviations Used in This Report
- Contributions
-
- NERC Industry Groups
- NERC Staff
-

Generation Equipment Performance
53
Generation Equipment Performance Introduction The development of the Generating Availability Data System (GADS) began in 1982 This series of databases
is used to voluntarily collect record and retrieve operating information By pooling individual unit
information with likewise units generating unit availability performance can be calculated providing
opportunities to identify trends and generating equipment reliability improvement opportunities The
information is used to support equipment reliability availability analyses and risk-informed decision-making
by system planners generation owners assessment modelers manufacturers and contractors etc Reports
and information resulting from the data collected through GADS are now used for benchmarking and
analyzing electric power plants
Currently the data collected through GADS contains 72 percent of the North American generating units
with generating capacity of 20 MW or higher34 Additionally many of the newer combined-cycle plants are
not reporting information and therefore a full view of each unit type is not presented Rather a sample of
all the units in North America that fit a given more general category is provided35 for the 2008-201036
Generation Key Performance Indicators
assessment period
Three key performance indicators37
In
the industry have used widely to measure the availability of generating
units (see Terms Used in This Report section for their calculation parameters) are Equivalent Availability
Factor (EAF) Net Capacity Factor (NCF) and Equivalent Forced Outage Rate ndash Demand (EFORd)
Table 7 the North American fleet average EAF NCF and EFORd compared to unit age for all generating
units with a capacity of 20 MW and higher is provided for the years 2008-2010 The EAF shows a decline
during the last three years NCF is up and down while the EFORd appears to be increasing As expected the
fleet of units reported to GADS is aging overall with the fossil units being about 12 years older than the
average age
34 httpwwwnerccomdocspcgadstfGADSTF_Recommendation_Report_02-18-2011_FINALpdf 35GADS contains some 1500+ units under 20 MW that is not included in this report These units are excluded because most units are not base-loaded and are in peaking operation
3684 percent of the 2010 dataset is available at this time while the 2008 and 2009 dataset is complete 37 httpwwwnerccompagephpcid=4|43
Generation Equipment Performance
54
Table 7 General Availability Review of GADS Fleet Units by Year
2008 2009 2010 Average
Equivalent Availability Factor (EAF) 8776 8774 8678 8743
Net Capacity Factor (NCF) 5083 4709 4880 4890
Equivalent Forced Outage Rate -
Demand (EFORd) 579 575 639 597
Number of Units ge20 MW 3713 3713 3713 3713
Average Age of the Fleet in Years (all
unit types) 303 311 321 312
Average Age of the Fleet in Years
(fossil units only) 422 432 440 433
Figure 31 provides the average forced outage hours (FOH) maintenance outage hours (MOH) and planned
outage hours (POH) for all units reporting 20 MW or larger During this three-year period the average FOH
291 hours average MOH is 163 hours average POH is 470 hours
Figure 31 shows a large increase in forced and maintenance events The average age of the units with a
capacity of 20MW and higher in 2009 is 316 years old However the average age of fossil units in 2010 is
442 years old These fossil units are the backbone of all operating units providing the base-load power
continuously and nearly 50 percent of all energy annually There appears to be no increase allocated for
annualsemi-annual maintenance (ie planned outages) for the older generating units The increase of
000100002000030000400005000060000700008000090000
100000
2008 2009 2010
463 479 468
154 161 173
288 270 314
Hou
rs
Planned Maintenance Forced
Figure 31 Average Outage Hours for Units gt 20 MW
Generation Equipment Performance
55
maintenance outage hours reflects an increased need to fix problems that cannot be deferred until the next
annualsemi-annual repairs As a result it shows one of two things are happening
bull More or longer planned outage time is needed to repair the aging generating fleet
bull More focus on preventive repairs during planned and maintenance events are needed
Multiple Unit Forced Outages and Causes Table 8 provides the annual multiple-unit forced outage trips resulting from the same cause for each of the
assessments years 2008-2010 respectively The ldquosingle unitrdquo trips are large units with a Net Dependable
Capacity of 750 MW or more The trips of ldquotwo unitsrdquo or more is any combination of unit capacity with the
total amount of lost capacity more than 750 MW
Table 8 also presents more information on the forced outages During 2008-2010 there were a large
number of double-unit outages resulting from the same event Investigations show that some of these trips
were at a single plant caused by common control and instrumentation for the units The incidents occurred
several times for several months and are a common mode issue internal to the plant
Table 8 Number of Multiple Unit Forced Outages and FrequencyYear
2008 2009 2010
Type of
Trip
of
Trips
Avg Outage
Hr Trip
Avg Outage
Hr Unit
of
Trips
Avg Outage
Hr Trip
Avg Outage
Hr Unit
of
Trips
Avg Outage
Hr Trip
Avg Outage
Hr Unit
Single-unit
Trip 591 58 58 284 64 64 339 66 66
Two-unit
Trip 281 43 22 508 96 48 206 41 20
Three-unit
Trip 74 48 16 223 146 48 47 109 36
Four-unit
Trip 12 77 19 111 112 28 40 121 30
Five-unit
Trip 11 1303 260 60 443 88 19 199 10
gt 5 units 20 166 16 93 206 50 37 246 6
Loss of ge 750 MW per Trip
The high number of five-unit trips in 2008 was due to Hurricane Ike hitting the Gulf Coast The highest total
number of multiple unit trips occurred in 2009 though as mentioned before the data collection for 2010 is
incomplete at this time The majority of 2009 multiple unit trips have three main causes (in order by
Generation Equipment Performance
56
number of events) transmission lack of fuel and storms A summary of the three categories for single as
well as multiple unit outages (all unit capacities) are reflected in Table 9
Table 9 Common Causes of Multiple Unit Forced Outages (2009)
Cause Number of Events Average MW Size of Unit
Transmission 1583 16
Lack of Fuel (Coal Mines Gas Lines etc) Not
in Operator Control
812 448
Storms Lightning and Other Acts of Nature 591 112
Some of the transmission outages based on storms in 2009 have been caused by the same reasons because
the storms may have caused transmission interference However the plants reported the problems
inconsistently with either the transmission interference or storms cause code Therefore they are depicted
as two different causes of forced outage
Marked transmission outages in 2009 were quite high Thirty-five percent came from one utility with a large
number of hydroelectric units The company related the trips to various problems including weather
(lightning storms) wildlife ldquoline bumpsrdquo and problems on the receiving end of the transmission line Nine
hundred and eighty-five transmission trips (62 percent) were from hydroelectric units38
In 2009 only ten transmission trips resulted in a loss of 750 MW or more per trip Twenty two generating
plants were affected by the ten trips Causes for the trips include feeder line trips (1 trip) breakers in the
switchyard (8 trips) personnel errors (2 trips) and unknown (10 trips)
The ldquoLack of Fuelrdquo outages are of interest as these events occur during the times when a unit is available to
operate but there is an interruption in fuels to operate the facilities These events do not include
interruptions of fuel due to contracts Rather the cause code is designed to account for units that are
expecting fuel and it is unavailable when requested Table 10 presents the distribution of ldquoLack of Fuelrdquo
events by NERC Region and Table 11 presents the unit types affected
38 The average size of the hydroelectric units were small ndash 335 MW
Generation Equipment Performance
57
Of the units that report ldquoLack of Fuelrdquo 78 percent of the units are oil-fired 15 percent of the units are gas-
fired and the remaining units are various other fuels Table 12 provides the top causes of forced outage for
several unit types For fossil units ldquoLack of Fuelrdquo as the number three cause behind waterwall tube leaks
and superheater tube leaks
Table 10 Forced Outages Due to Lack of Fuel by Region
Region Number of Lack of Fuel
Problems Reported
FRCC 0
MRO 3
NPCC 24
RFC 695
SERC 17
SPP 3
TRE 7
WECC 29
One company contributed to the majority of oil-fired lack of fuel events The units at the company are
actually dual-fuels (oil and gas) but market nominated gas monitoring causes the units to be on forced
outage nightly The units need gas to start up so they can run on oil When they shut down the units must
switch to gas to clean themselves With the gas restriction the unit canrsquot start and the unit goes on a
forced outage Until the band is lifted the two units will continue to be on a forced outage cycle
Event records also provide descriptions of why the unit was without fuel with the majority of descriptions
bull Temperatures affecting gas supply valves
bull Unexpected maintenance of gas pipe-lines
bull Compressor problemsmaintenance
Generation Equipment Performance
58
Table 11 Unit Type Profile of Forced Outages Due to Lack of Fuel
Unit Types Number of Lack of Fuel Problems Reported
Fossil 642
Nuclear 0
Gas Turbines 88
Diesel Engines 1
HydroPumped Storage 0
Combined Cycle 47
Generation Equipment Performance
59
Table 12 Causes of Forced Outage for Different Unit Types (2008-2010)
Fossil - all MW sizes all fuels
Rank Description Occurrence per Unit-year
MWH per Unit-year
Average Hours To Repair
Average Hours Between Failures
Unit-years
1 Waterwall (furnace wall) 0590 134106 59 3250 3868 2 Second Superheater
Leaks 0180 5182 60 3228 3868
3 Lack of Fuel (coal mines gas lines etc) where the operator is not in control
0480 4701 18 26 3868
Combined-Cycle blocks Rank Description Occurrence
per Unit-year
MWH per Unit-year
Average Hours To Repair
Average Hours Between Failures
Unit-years
1 HP Turbine Buckets Or Blades
0020 4663 1830 26280 466
2 Turbine Control Valves 0040 2777 100 7200 466 3 Gas Turbine Compressor -
High Pressure Shaft 0010 2266 663 4269 466
Nuclear units - all Reactor types Rank Description Occurrence
per Unit-year
MWH per Unit-year
Average Hours To Repair
Average Hours Between Failures
Unit-years
1 LP Turbine Buckets or Blades
0010 26415 8760 26280 288
2 Containment Structure 0010 9233 1226 26262 288 3 Feedwater Pump Local
Controls 0020 7620 692 12642 288
Simple-cycle gas turbine jet engines Rank Description Occurrence
per Unit-year
MWH per Unit-year
Average Hours To Repair
Average Hours Between Failures
Unit-years
1 Main Transformer 0030 1611 1016 20709 4181 2 Other Gas Turbine
Controls And Instrument Problems
0120 428 70 2614 4181
3 Other Gas Turbine Problems
0090 400 119 1701 4181
Generation Equipment Performance
60
2008-2010 Review of Summer versus Winter Availability To address seasonality of unit availability unit information for the months of June to September (summer)
and December through February (winter) were pooled to calculate force events during these timeframes for
2008-201039 Figure 32 shows the Equivalent Availability Factor (EAF) is three percentage points higher and
the Equivalent Forced Outage Rate - Demand (EFORd) is more than a half of a percentage point lower in the
summer period than in winter period This means the units were more reliable with less forced events
during high-demand times during the summer than during the winter seasons The generating unitrsquos
capability has a resulting higher Net Capacity Factor (NCF) of 45 percentage points in the summer season
for 2008-2010
During the spring season (March-May) 77 percent of the units took a planned outage (PO) for an average
231 hours (or 96 days) In fall (October-November) only 42 percent of the units experienced a PO and the
average duration was shorter ndash 134 hours (or 56 days) A few units took both spring and fall planned
outages although this is rare Based on this assessment the generating units are prepared for the summer
peak demand The resulting availability indicates that this maintenance was successful which is measured
by an increased EAF and lower EFORd
Figure 32 Summer-Winter Average EAF NCF and EFORd (2008-2010)
Conclusions and Recommendations During 2008-2010 the average Equivalent Availability Factor (EAF) which measures the overall availability
of generating units decreased At the same time the Net Capacity Factor (NCF) an indicator of energy
production increased The average number of forced outages in 2010 is greater than in 2008 while at the
same time the average planned outage times have decreased As a result the Equivalent Forced Outage
Rate ndash Demand (EFORd) also increased illustrating that more units have experienced forced events during
39 A study of peak periods was conducted by the NERC Generating Availability Trend Evaluation (GATE) Working Group several years ago see httpwwwnerccomfilesSeasonal-Performance-Trendspdf
9116
5343
396
8818
4896
441
0 10 20 30 40 50 60 70 80 90 100
EAF
NCF
EFORd
Percent ()
Winter
Summer
Generation Equipment Performance
61
peak-demand times in 2010 than in the previous two years Potentially with shorter planned outage
periods in 2010 there may be less time to repair equipment and prevent forced unit outages
There are warnings that units are not being maintained as well as they should be In the last three years
there has been an increase in Equivalent Forced Outage Rate ndash Demand (EFORd) This indicator measures
the rate of forced outage events on generating units during periods of load demand To confirm this
problem forced outage hours jumped from 270 to 314 hours per unit between 2009 and 2010 At the same
time maintenance events also increased by 12 hours per unit Planned outage events remain constant The
resulting conclusions from this trend are
bull More or longer planned outage time is needed to repair the generating fleet Whether age is the
cause of the increase need for planned outage time remains unknown and further investigation into
the cause for longer planned outage time is necessary
bull More focus on preventive repairs during planned and maintenance events are needed
There are many multiple unit forced outages due to lack of fuel The majority of multiple unit trips have
three main causes transmission lack of fuel and storms With special interest in the forced outages due to
ldquoLack of Fuelrdquo additional analysis revealed that 77 percent of the units experiencing unexpected fuel
stoppage are oil-fired fossil units while gas-fired units experienced 15 percent
Generating units continue to be more reliable during the peak summer periods
Disturbance Event Trends
62
Category 1 An event resulting in one or more of the following a Unintended loss of three or more BPS elements caused by
common mode failure b Failure or misoperation of an SPSRAS c System-wide voltage reduction of 3 or more d Unintended BPS system separation resulting in an island of
100 MW to 999 MW e Unplanned evacuation from a control center facility with BPS
SCADA functionality for 30 minutes or more Category 2 An event resulting in one or more of the following
a Complete loss of all BPS control center voice communication system(s) for 30 minutes or more
b Complete loss of SCADA control or monitoring functionality for 30 minutes or more
c Voltage excursions equal to or greater than 10 lasting more than five minutes
d Loss of off-site power (LOOP) to a nuclear generating station e Unintended system separation resulting in an island of 1000
MW to 4999 MW f Unintended loss of 300MW or more of firm load for more
than 15 minutes g Violation of an Interconnection Reliability Operating Limit
(IROL) for more than 30 minutes Category 3 An event resulting in one or more of the following
a The loss of load or generation of 2000 MW or more in the Eastern Interconnection or
b Western Interconnection or 1000 MW or more in the ERCOT or Queacutebec Interconnections
c Unintended system separation resulting in an island of 5000 MW to 10000 MW
d Unintended system separation resulting in an island of Florida from the Eastern Interconnection
Category 4 An event resulting in one or more of the following a The loss of load or generation from 5001 MW to 9999 MW b Unintended system separation resulting in an island of more
than 10000 MW (with the exception of Florida as described in Category 3c)
Category 5 An event resulting in one or more of the following a The loss of load of 10000 MW or more b The loss of generation of 10000 MW or more
Figure 33 BPS Event Category
Disturbance Event Trends Introduction The purpose of this section is to report event
analysis trends from the beginning of event
analysis field test40
One of the companion goals of the event
analysis program is the identification of trends
in the number magnitude and frequency of
events and their associated causes such as
human error equipment failure protection
system misoperations etc The information
provided in the event analysis database (EADB)
and various event analysis reports have been
used to track and identify trends in BPS events
in conjunction with other databases (TADS
GADS metric and benchmarking database)
to the end of 2010
The Event Analysis Working Group (EAWG)
continuously gathers event data and is moving
toward an integrated approach to analyzing
data assessing trends and communicating the
results to the industry
Performance Trends The event category is classified41
Figure 33
as shown in
with Category 5 being the most
severe Figure 34 depicts disturbance trends in
Category 1 to 5 system events from the
40 httpwwwnerccomdocseawgGalloway-Industry-EA-Field-Test-102210pdf 41httpwwwnerccomfiles2011-05-0220Event_Analysis_Process_Phase20220Field20Test20Draft20-20Final20-20For20postingpdf
Disturbance Event Trends
63
beginning of event analysis field test to the end of 201042
Figure 34 Event Category vs Date for All 2010 Categorized Events
From the figure in November and December
there were many more category 1 and 2 events than in October This is due to the field trial starting on
October 25 2010
In addition to the category of the events the status of the events plays a critical role in the accuracy of the
data By examining Figure 35 over 80 of the events reported in 2010 have been closed This means that
the category root cause and other important information have been sufficiently finalized in order for
analysis to be accurate for each event At this time there is not enough data to draw any long-term
conclusions about event investigation performance
42 Documents for the EA Field Test are located at httpwwwnerccompagephpcid=5|365
2
12 12
26
3
6 5
14
1 1
2
0
5
10
15
20
25
30
35
40
45
October November December 2010
Even
t Cou
nt
Category 3 Category 2 Category 1
Disturbance Event Trends
64
Figure 35 Event Count vs Status (All 2010 Events with Status)
By drilling down into the cause code for each closed 2010 event Figure 36 shows the top 3 event causes
From the figure equipment failure and protection system misoperation are the most significant causes for
events Because of how new and limited the data is however there may not be statistical significance for
this result Further trending of cause codes for closed events and developing a richer dataset to find any
trends between event cause codes and event counts should be performed
Figure 36 Top 3 Event Counts vs DAWG Cause Code for all Closed 2010 Events
10
32
42
0
5
10
15
20
25
30
35
40
45
Open Closed Open and Closed
Even
t Cou
nt
Status
1211
8
0
2
4
6
8
10
12
14
Equipment Failure Protection System Misoperation Human Error
Even
t Cou
nt
Cause Code
Disturbance Event Trends
65
Conclusions Due to the relatively new process for events analysis and categorization more time will be required before a
conclusive recommendation may be obtained Further analysis and new data should provide valuable
statistics in the future Over 80 of all event reports from 2010 are current listed as closed but no
conclusion about investigation performance may be obtained because of the limited amount of data It is
recommended to study ways to prevent equipment failure and protection system misoperations but there
is not enough data to draw a firm conclusion about the top causes of events at this time
Abbreviations Used in This Report
66
Abbreviations Used in This Report
Acronym Definition ALP Acadiana Load Pocket
ALR Adequate Level of Reliability
ARR Automatic Reliability Report
BA Balancing Authority
BPS Bulk Power System
CDI Condition Driven Index
CEII Critical Energy Infrastructure Information
CIPC Critical Infrastructure Protection Committee
CLECO Cleco Power LLC
DADS Future Demand Availability Data System
DCS Disturbance Control Standard
DOE Department Of Energy
DSM Demand Side Management
EA Event Analysis
EAF Equivalent Availability Factor
ECAR East Central Area Reliability
EDI Event Drive Index
EEA Energy Emergency Alert
EFORd Equivalent Forced Outage Rate Demand
EMS Energy Management System
ERCOT Electric Reliability Council of Texas
ERO Electric Reliability Organization
ESAI Energy Security Analysis Inc
FERC Federal Energy Regulatory Commission
FOH Forced Outage Hours
FRCC Florida Reliability Coordinating Council
GADS Generation Availability Data System
GOP Generation Operator
IEEE Institute of Electrical and Electronics Engineers
IESO Independent Electricity System Operator
IROL Interconnection Reliability Operating Limit
Abbreviations Used in This Report
67
Acronym Definition IRI Integrated Reliability Index
LOLE Loss of Load Expectation
LUS Lafayette Utilities System
MAIN Mid-America Interconnected Network Inc
MAPP Mid-continent Area Power Pool
MOH Maintenance Outage Hours
MRO Midwest Reliability Organization
MSSC Most Severe Single Contingency
NCF Net Capacity Factor
NEAT NERC Event Analysis Tool
NERC North American Electric Reliability Corporation
NPCC Northeast Power Coordinating Council
OC Operating Committee
OL Operating Limit
OP Operating Procedures
ORS Operating Reliability Subcommittee
PC Planning Committee
PO Planned Outage
POH Planned Outage Hours
RAPA Reliability Assessment Performance Analysis
RAS Remedial Action Schemes
RC Reliability Coordinator
RCIS Reliability Coordination Information System
RCWG Reliability Coordinator Working Group
RE Regional Entities
RFC Reliability First Corporation
RMWG Reliability Metrics Working Group
RSG Reserve Sharing Group
SAIDI System Average Interruption Duration Index
SAIFI System Average Interruption Frequency Index
SCADA Supervisory Control and Data Acquisition
SDI Standardstatute Driven Index
SERC SERC Reliability Corporation
Abbreviations Used in This Report
68
Acronym Definition SRI Severity Risk Index
SMART Specific Measurable Attainable Relevant and Tangible
SOL System Operating Limit
SPS Special Protection Schemes
SPCS System Protection and Control Subcommittee
SPP Southwest Power Pool
SRI System Risk Index
TADS Transmission Availability Data System
TADSWG Transmission Availability Data System Working Group
TO Transmission Owner
TOP Transmission Operator
WECC Western Electricity Coordinating Council
Contributions
69
Contributions This report was made feasible by the collaboration and hard work of both NERC staff and NERCrsquos
Industry Groups
NERC Industry Groups
Table 14 lists the NERC industry group contributors Without their contribution and collaboration this
report would not have been possible
Table 13 NERC Industry Group Contributions43
NERC Group
Relationship Contribution
Reliability Metrics Working Group
(RMWG)
Reports to the OCPC bull Lead Development of Report bull Provide Reliability Metrics Data bull Responsible for Reliability Metrics
Performance Chapter
Transmission Availability Working Group
(TADSWG)
Reports to the OCPC bull Provide Transmission Availability Data
bull Responsible for Transmission Equip-ment Performance Chapter
bull Content Review
Generation Availability Data System Task
Force
(GADSTF)
Reports to the OCPC bull Provide Generation Availability Data bull Responsible for Generation Equip-
ment Performance Chapter bull Content Review
Event Analysis Working Group
(EAWG)
Reports to the OCPC bull Provide Events Data bull Responsible for Disturbance Events
Trends Chapter bull Content Review
43 Rosters for RMWG TADSWG GADSTF and EAWG are available at httpwwwnerccomfilesrosterpdf
Contributions
70
NERC Staff Table 13 below lists the NERC staff who contributed to the 2011 Reliability Performance Analysis
Report
Table 14 Contributing NERC Staff
Name Title E-mail Address
Mark Lauby Vice President and Director of
Reliability Assessment and
Performance Analysis
marklaubynercnet
Jessica Bian Manager of Performance Analysis jessicabiannercnet
John Moura Manager of Reliability Assessments johnmouranercnet
Andrew Slone Engineer Reliability Performance
Analysis
andrewslonenercnet
Jim Robinson TADS Project Manager jimrobinsonnercnet
Clyde Melton Engineer Reliability Performance
Analysis
clydemeltonnercnet
Mike Curley Manager of GADS Services mikecurleynercnet
James Powell Engineer Reliability Performance
Analysis
jamespowellnercnet
Michelle Marx Administrative Assistant michellemarxnercnet
William Mo Intern Performance Analysis wmonercnet
- NERCrsquos Mission
- Table of Contents
- Executive Summary
-
- 2011 Transition Report
- State of Reliability Report
- Key Findings and Recommendations
-
- Reliability Metric Performance
- Transmission Availability Performance
- Generating Availability Performance
- Disturbance Events
- Report Organization
-
- Introduction
-
- Metric Report Evolution
- Roadmap for the Future
-
- Reliability Metrics Performance
-
- Introduction
- 2010 Performance Metrics Results and Trends
-
- ALR1-3 Planning Reserve Margin
-
- Background
- Assessment
- Special Considerations
-
- ALR1-4 BPS Transmission Related Events Resulting in Loss of Load
-
- Background
- Assessment
-
- ALR1-12 Interconnection Frequency Response
-
- Background
- Assessment
-
- ALR2-3 Activation of Under Frequency Load Shedding
-
- Background
- Assessment
- Special Considerations
-
- ALR2-4 Average Percent Non-Recovery Disturbance Control Standards (DCS)
-
- Background
- Assessment
- Special Consideration
-
- ALR2-5 Disturbance Control Events Greater Than Most Severe Single Contingency
-
- Background
- Assessment
- Special Consideration
-
- ALR 1-5 System Voltage Performance
-
- Background
- Special Considerations
- Status
-
- ALR3-5 Interconnection Reliability Operating Limit System Operating Limit (IROLSOL) Exceedances
-
- Background
-
- ALR4-1 Automatic Transmission Outages Caused by Protection System Misoperations
-
- Background
- Special Considerations
-
- ALR6-11 ndash ALR6-14
-
- Background
- Assessment
- ALR 6-11 ndash Automatic Outages Initiated by Failed Protection System Equipment
- ALR6-12 ndash Automatic Outages Initiated by Human Error
- ALR6-13 ndash Automatic Outages Initiated by Failed AC Substation Equipment
- ALR6-14 Automatic AC Transmission Outages Initiated by Failed AC Circuit Equipment
-
- ALR6-15 Element Availability Percentage (APC)
-
- Background
- Assessment
- Special Consideration
-
- ALR6-16 Transmission System Unavailability
-
- Background
- Assessment
- Special Consideration
-
- ALR6-2 Energy Emergency Alert 3 (EEA3)
-
- Background
- Assessment
- Special Considerations
-
- ALR 6-3 Energy Emergency Alert 2 (EEA2)
-
- Background
- Assessment
- Special Considerations
-
- ALR 6-1 Transmission Constraint Mitigation
-
- Background
- Assessment
- Special Considerations
-
- Integrated Bulk Power System Risk Assessment
-
- Introduction
- Recommendations
-
- Integrated Reliability Index Concepts
-
- The Three Components of the IRI
-
- Event-Driven Indicators (EDI)
- Condition-Driven Indicators (CDI)
- StandardsStatute-Driven Indicators (SDI)
-
- IRI Index Calculation
- IRI Recommendations
-
- Reliability Metrics Conclusions and Recommendations
-
- Transmission Equipment Performance
-
- Introduction
- Performance Trends
-
- AC Element Outage Summary and Leading Causes
- Transmission Monthly Outages
- Outage Initiation Location
- Transmission Outage Events
- Transmission Outage Mode
-
- Conclusions
-
- Generation Equipment Performance
-
- Introduction
- Generation Key Performance Indicators
-
- Multiple Unit Forced Outages and Causes
- 2008-2010 Review of Summer versus Winter Availability
-
- Conclusions and Recommendations
-
- Disturbance Event Trends
-
- Introduction
- Performance Trends
- Conclusions
-
- Abbreviations Used in This Report
- Contributions
-
- NERC Industry Groups
- NERC Staff
-
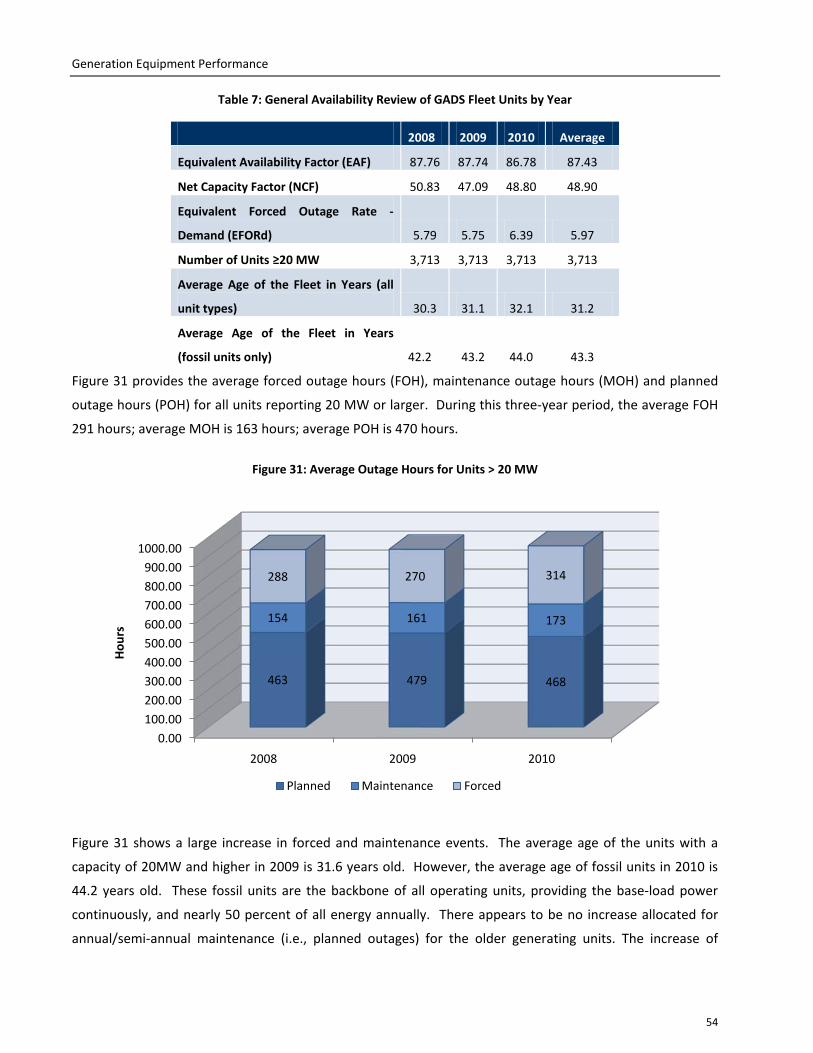
Generation Equipment Performance
59
Table 12 Causes of Forced Outage for Different Unit Types (2008-2010)
Fossil - all MW sizes all fuels
Rank Description Occurrence per Unit-year
MWH per Unit-year
Average Hours To Repair
Average Hours Between Failures
Unit-years
1 Waterwall (furnace wall) 0590 134106 59 3250 3868 2 Second Superheater
Leaks 0180 5182 60 3228 3868
3 Lack of Fuel (coal mines gas lines etc) where the operator is not in control
0480 4701 18 26 3868
Combined-Cycle blocks Rank Description Occurrence
per Unit-year
MWH per Unit-year
Average Hours To Repair
Average Hours Between Failures
Unit-years
1 HP Turbine Buckets Or Blades
0020 4663 1830 26280 466
2 Turbine Control Valves 0040 2777 100 7200 466 3 Gas Turbine Compressor -
High Pressure Shaft 0010 2266 663 4269 466
Nuclear units - all Reactor types Rank Description Occurrence
per Unit-year
MWH per Unit-year
Average Hours To Repair
Average Hours Between Failures
Unit-years
1 LP Turbine Buckets or Blades
0010 26415 8760 26280 288
2 Containment Structure 0010 9233 1226 26262 288 3 Feedwater Pump Local
Controls 0020 7620 692 12642 288
Simple-cycle gas turbine jet engines Rank Description Occurrence
per Unit-year
MWH per Unit-year
Average Hours To Repair
Average Hours Between Failures
Unit-years
1 Main Transformer 0030 1611 1016 20709 4181 2 Other Gas Turbine
Controls And Instrument Problems
0120 428 70 2614 4181
3 Other Gas Turbine Problems
0090 400 119 1701 4181
Generation Equipment Performance
60
2008-2010 Review of Summer versus Winter Availability To address seasonality of unit availability unit information for the months of June to September (summer)
and December through February (winter) were pooled to calculate force events during these timeframes for
2008-201039 Figure 32 shows the Equivalent Availability Factor (EAF) is three percentage points higher and
the Equivalent Forced Outage Rate - Demand (EFORd) is more than a half of a percentage point lower in the
summer period than in winter period This means the units were more reliable with less forced events
during high-demand times during the summer than during the winter seasons The generating unitrsquos
capability has a resulting higher Net Capacity Factor (NCF) of 45 percentage points in the summer season
for 2008-2010
During the spring season (March-May) 77 percent of the units took a planned outage (PO) for an average
231 hours (or 96 days) In fall (October-November) only 42 percent of the units experienced a PO and the
average duration was shorter ndash 134 hours (or 56 days) A few units took both spring and fall planned
outages although this is rare Based on this assessment the generating units are prepared for the summer
peak demand The resulting availability indicates that this maintenance was successful which is measured
by an increased EAF and lower EFORd
Figure 32 Summer-Winter Average EAF NCF and EFORd (2008-2010)
Conclusions and Recommendations During 2008-2010 the average Equivalent Availability Factor (EAF) which measures the overall availability
of generating units decreased At the same time the Net Capacity Factor (NCF) an indicator of energy
production increased The average number of forced outages in 2010 is greater than in 2008 while at the
same time the average planned outage times have decreased As a result the Equivalent Forced Outage
Rate ndash Demand (EFORd) also increased illustrating that more units have experienced forced events during
39 A study of peak periods was conducted by the NERC Generating Availability Trend Evaluation (GATE) Working Group several years ago see httpwwwnerccomfilesSeasonal-Performance-Trendspdf
9116
5343
396
8818
4896
441
0 10 20 30 40 50 60 70 80 90 100
EAF
NCF
EFORd
Percent ()
Winter
Summer
Generation Equipment Performance
61
peak-demand times in 2010 than in the previous two years Potentially with shorter planned outage
periods in 2010 there may be less time to repair equipment and prevent forced unit outages
There are warnings that units are not being maintained as well as they should be In the last three years
there has been an increase in Equivalent Forced Outage Rate ndash Demand (EFORd) This indicator measures
the rate of forced outage events on generating units during periods of load demand To confirm this
problem forced outage hours jumped from 270 to 314 hours per unit between 2009 and 2010 At the same
time maintenance events also increased by 12 hours per unit Planned outage events remain constant The
resulting conclusions from this trend are
bull More or longer planned outage time is needed to repair the generating fleet Whether age is the
cause of the increase need for planned outage time remains unknown and further investigation into
the cause for longer planned outage time is necessary
bull More focus on preventive repairs during planned and maintenance events are needed
There are many multiple unit forced outages due to lack of fuel The majority of multiple unit trips have
three main causes transmission lack of fuel and storms With special interest in the forced outages due to
ldquoLack of Fuelrdquo additional analysis revealed that 77 percent of the units experiencing unexpected fuel
stoppage are oil-fired fossil units while gas-fired units experienced 15 percent
Generating units continue to be more reliable during the peak summer periods
Disturbance Event Trends
62
Category 1 An event resulting in one or more of the following a Unintended loss of three or more BPS elements caused by
common mode failure b Failure or misoperation of an SPSRAS c System-wide voltage reduction of 3 or more d Unintended BPS system separation resulting in an island of
100 MW to 999 MW e Unplanned evacuation from a control center facility with BPS
SCADA functionality for 30 minutes or more Category 2 An event resulting in one or more of the following
a Complete loss of all BPS control center voice communication system(s) for 30 minutes or more
b Complete loss of SCADA control or monitoring functionality for 30 minutes or more
c Voltage excursions equal to or greater than 10 lasting more than five minutes
d Loss of off-site power (LOOP) to a nuclear generating station e Unintended system separation resulting in an island of 1000
MW to 4999 MW f Unintended loss of 300MW or more of firm load for more
than 15 minutes g Violation of an Interconnection Reliability Operating Limit
(IROL) for more than 30 minutes Category 3 An event resulting in one or more of the following
a The loss of load or generation of 2000 MW or more in the Eastern Interconnection or
b Western Interconnection or 1000 MW or more in the ERCOT or Queacutebec Interconnections
c Unintended system separation resulting in an island of 5000 MW to 10000 MW
d Unintended system separation resulting in an island of Florida from the Eastern Interconnection
Category 4 An event resulting in one or more of the following a The loss of load or generation from 5001 MW to 9999 MW b Unintended system separation resulting in an island of more
than 10000 MW (with the exception of Florida as described in Category 3c)
Category 5 An event resulting in one or more of the following a The loss of load of 10000 MW or more b The loss of generation of 10000 MW or more
Figure 33 BPS Event Category
Disturbance Event Trends Introduction The purpose of this section is to report event
analysis trends from the beginning of event
analysis field test40
One of the companion goals of the event
analysis program is the identification of trends
in the number magnitude and frequency of
events and their associated causes such as
human error equipment failure protection
system misoperations etc The information
provided in the event analysis database (EADB)
and various event analysis reports have been
used to track and identify trends in BPS events
in conjunction with other databases (TADS
GADS metric and benchmarking database)
to the end of 2010
The Event Analysis Working Group (EAWG)
continuously gathers event data and is moving
toward an integrated approach to analyzing
data assessing trends and communicating the
results to the industry
Performance Trends The event category is classified41
Figure 33
as shown in
with Category 5 being the most
severe Figure 34 depicts disturbance trends in
Category 1 to 5 system events from the
40 httpwwwnerccomdocseawgGalloway-Industry-EA-Field-Test-102210pdf 41httpwwwnerccomfiles2011-05-0220Event_Analysis_Process_Phase20220Field20Test20Draft20-20Final20-20For20postingpdf
Disturbance Event Trends
63
beginning of event analysis field test to the end of 201042
Figure 34 Event Category vs Date for All 2010 Categorized Events
From the figure in November and December
there were many more category 1 and 2 events than in October This is due to the field trial starting on
October 25 2010
In addition to the category of the events the status of the events plays a critical role in the accuracy of the
data By examining Figure 35 over 80 of the events reported in 2010 have been closed This means that
the category root cause and other important information have been sufficiently finalized in order for
analysis to be accurate for each event At this time there is not enough data to draw any long-term
conclusions about event investigation performance
42 Documents for the EA Field Test are located at httpwwwnerccompagephpcid=5|365
2
12 12
26
3
6 5
14
1 1
2
0
5
10
15
20
25
30
35
40
45
October November December 2010
Even
t Cou
nt
Category 3 Category 2 Category 1
Disturbance Event Trends
64
Figure 35 Event Count vs Status (All 2010 Events with Status)
By drilling down into the cause code for each closed 2010 event Figure 36 shows the top 3 event causes
From the figure equipment failure and protection system misoperation are the most significant causes for
events Because of how new and limited the data is however there may not be statistical significance for
this result Further trending of cause codes for closed events and developing a richer dataset to find any
trends between event cause codes and event counts should be performed
Figure 36 Top 3 Event Counts vs DAWG Cause Code for all Closed 2010 Events
10
32
42
0
5
10
15
20
25
30
35
40
45
Open Closed Open and Closed
Even
t Cou
nt
Status
1211
8
0
2
4
6
8
10
12
14
Equipment Failure Protection System Misoperation Human Error
Even
t Cou
nt
Cause Code
Disturbance Event Trends
65
Conclusions Due to the relatively new process for events analysis and categorization more time will be required before a
conclusive recommendation may be obtained Further analysis and new data should provide valuable
statistics in the future Over 80 of all event reports from 2010 are current listed as closed but no
conclusion about investigation performance may be obtained because of the limited amount of data It is
recommended to study ways to prevent equipment failure and protection system misoperations but there
is not enough data to draw a firm conclusion about the top causes of events at this time
Abbreviations Used in This Report
66
Abbreviations Used in This Report
Acronym Definition ALP Acadiana Load Pocket
ALR Adequate Level of Reliability
ARR Automatic Reliability Report
BA Balancing Authority
BPS Bulk Power System
CDI Condition Driven Index
CEII Critical Energy Infrastructure Information
CIPC Critical Infrastructure Protection Committee
CLECO Cleco Power LLC
DADS Future Demand Availability Data System
DCS Disturbance Control Standard
DOE Department Of Energy
DSM Demand Side Management
EA Event Analysis
EAF Equivalent Availability Factor
ECAR East Central Area Reliability
EDI Event Drive Index
EEA Energy Emergency Alert
EFORd Equivalent Forced Outage Rate Demand
EMS Energy Management System
ERCOT Electric Reliability Council of Texas
ERO Electric Reliability Organization
ESAI Energy Security Analysis Inc
FERC Federal Energy Regulatory Commission
FOH Forced Outage Hours
FRCC Florida Reliability Coordinating Council
GADS Generation Availability Data System
GOP Generation Operator
IEEE Institute of Electrical and Electronics Engineers
IESO Independent Electricity System Operator
IROL Interconnection Reliability Operating Limit
Abbreviations Used in This Report
67
Acronym Definition IRI Integrated Reliability Index
LOLE Loss of Load Expectation
LUS Lafayette Utilities System
MAIN Mid-America Interconnected Network Inc
MAPP Mid-continent Area Power Pool
MOH Maintenance Outage Hours
MRO Midwest Reliability Organization
MSSC Most Severe Single Contingency
NCF Net Capacity Factor
NEAT NERC Event Analysis Tool
NERC North American Electric Reliability Corporation
NPCC Northeast Power Coordinating Council
OC Operating Committee
OL Operating Limit
OP Operating Procedures
ORS Operating Reliability Subcommittee
PC Planning Committee
PO Planned Outage
POH Planned Outage Hours
RAPA Reliability Assessment Performance Analysis
RAS Remedial Action Schemes
RC Reliability Coordinator
RCIS Reliability Coordination Information System
RCWG Reliability Coordinator Working Group
RE Regional Entities
RFC Reliability First Corporation
RMWG Reliability Metrics Working Group
RSG Reserve Sharing Group
SAIDI System Average Interruption Duration Index
SAIFI System Average Interruption Frequency Index
SCADA Supervisory Control and Data Acquisition
SDI Standardstatute Driven Index
SERC SERC Reliability Corporation
Abbreviations Used in This Report
68
Acronym Definition SRI Severity Risk Index
SMART Specific Measurable Attainable Relevant and Tangible
SOL System Operating Limit
SPS Special Protection Schemes
SPCS System Protection and Control Subcommittee
SPP Southwest Power Pool
SRI System Risk Index
TADS Transmission Availability Data System
TADSWG Transmission Availability Data System Working Group
TO Transmission Owner
TOP Transmission Operator
WECC Western Electricity Coordinating Council
Contributions
69
Contributions This report was made feasible by the collaboration and hard work of both NERC staff and NERCrsquos
Industry Groups
NERC Industry Groups
Table 14 lists the NERC industry group contributors Without their contribution and collaboration this
report would not have been possible
Table 13 NERC Industry Group Contributions43
NERC Group
Relationship Contribution
Reliability Metrics Working Group
(RMWG)
Reports to the OCPC bull Lead Development of Report bull Provide Reliability Metrics Data bull Responsible for Reliability Metrics
Performance Chapter
Transmission Availability Working Group
(TADSWG)
Reports to the OCPC bull Provide Transmission Availability Data
bull Responsible for Transmission Equip-ment Performance Chapter
bull Content Review
Generation Availability Data System Task
Force
(GADSTF)
Reports to the OCPC bull Provide Generation Availability Data bull Responsible for Generation Equip-
ment Performance Chapter bull Content Review
Event Analysis Working Group
(EAWG)
Reports to the OCPC bull Provide Events Data bull Responsible for Disturbance Events
Trends Chapter bull Content Review
43 Rosters for RMWG TADSWG GADSTF and EAWG are available at httpwwwnerccomfilesrosterpdf
Contributions
70
NERC Staff Table 13 below lists the NERC staff who contributed to the 2011 Reliability Performance Analysis
Report
Table 14 Contributing NERC Staff
Name Title E-mail Address
Mark Lauby Vice President and Director of
Reliability Assessment and
Performance Analysis
marklaubynercnet
Jessica Bian Manager of Performance Analysis jessicabiannercnet
John Moura Manager of Reliability Assessments johnmouranercnet
Andrew Slone Engineer Reliability Performance
Analysis
andrewslonenercnet
Jim Robinson TADS Project Manager jimrobinsonnercnet
Clyde Melton Engineer Reliability Performance
Analysis
clydemeltonnercnet
Mike Curley Manager of GADS Services mikecurleynercnet
James Powell Engineer Reliability Performance
Analysis
jamespowellnercnet
Michelle Marx Administrative Assistant michellemarxnercnet
William Mo Intern Performance Analysis wmonercnet
- NERCrsquos Mission
- Table of Contents
- Executive Summary
-
- 2011 Transition Report
- State of Reliability Report
- Key Findings and Recommendations
-
- Reliability Metric Performance
- Transmission Availability Performance
- Generating Availability Performance
- Disturbance Events
- Report Organization
-
- Introduction
-
- Metric Report Evolution
- Roadmap for the Future
-
- Reliability Metrics Performance
-
- Introduction
- 2010 Performance Metrics Results and Trends
-
- ALR1-3 Planning Reserve Margin
-
- Background
- Assessment
- Special Considerations
-
- ALR1-4 BPS Transmission Related Events Resulting in Loss of Load
-
- Background
- Assessment
-
- ALR1-12 Interconnection Frequency Response
-
- Background
- Assessment
-
- ALR2-3 Activation of Under Frequency Load Shedding
-
- Background
- Assessment
- Special Considerations
-
- ALR2-4 Average Percent Non-Recovery Disturbance Control Standards (DCS)
-
- Background
- Assessment
- Special Consideration
-
- ALR2-5 Disturbance Control Events Greater Than Most Severe Single Contingency
-
- Background
- Assessment
- Special Consideration
-
- ALR 1-5 System Voltage Performance
-
- Background
- Special Considerations
- Status
-
- ALR3-5 Interconnection Reliability Operating Limit System Operating Limit (IROLSOL) Exceedances
-
- Background
-
- ALR4-1 Automatic Transmission Outages Caused by Protection System Misoperations
-
- Background
- Special Considerations
-
- ALR6-11 ndash ALR6-14
-
- Background
- Assessment
- ALR 6-11 ndash Automatic Outages Initiated by Failed Protection System Equipment
- ALR6-12 ndash Automatic Outages Initiated by Human Error
- ALR6-13 ndash Automatic Outages Initiated by Failed AC Substation Equipment
- ALR6-14 Automatic AC Transmission Outages Initiated by Failed AC Circuit Equipment
-
- ALR6-15 Element Availability Percentage (APC)
-
- Background
- Assessment
- Special Consideration
-
- ALR6-16 Transmission System Unavailability
-
- Background
- Assessment
- Special Consideration
-
- ALR6-2 Energy Emergency Alert 3 (EEA3)
-
- Background
- Assessment
- Special Considerations
-
- ALR 6-3 Energy Emergency Alert 2 (EEA2)
-
- Background
- Assessment
- Special Considerations
-
- ALR 6-1 Transmission Constraint Mitigation
-
- Background
- Assessment
- Special Considerations
-
- Integrated Bulk Power System Risk Assessment
-
- Introduction
- Recommendations
-
- Integrated Reliability Index Concepts
-
- The Three Components of the IRI
-
- Event-Driven Indicators (EDI)
- Condition-Driven Indicators (CDI)
- StandardsStatute-Driven Indicators (SDI)
-
- IRI Index Calculation
- IRI Recommendations
-
- Reliability Metrics Conclusions and Recommendations
-
- Transmission Equipment Performance
-
- Introduction
- Performance Trends
-
- AC Element Outage Summary and Leading Causes
- Transmission Monthly Outages
- Outage Initiation Location
- Transmission Outage Events
- Transmission Outage Mode
-
- Conclusions
-
- Generation Equipment Performance
-
- Introduction
- Generation Key Performance Indicators
-
- Multiple Unit Forced Outages and Causes
- 2008-2010 Review of Summer versus Winter Availability
-
- Conclusions and Recommendations
-
- Disturbance Event Trends
-
- Introduction
- Performance Trends
- Conclusions
-
- Abbreviations Used in This Report
- Contributions
-
- NERC Industry Groups
- NERC Staff
-
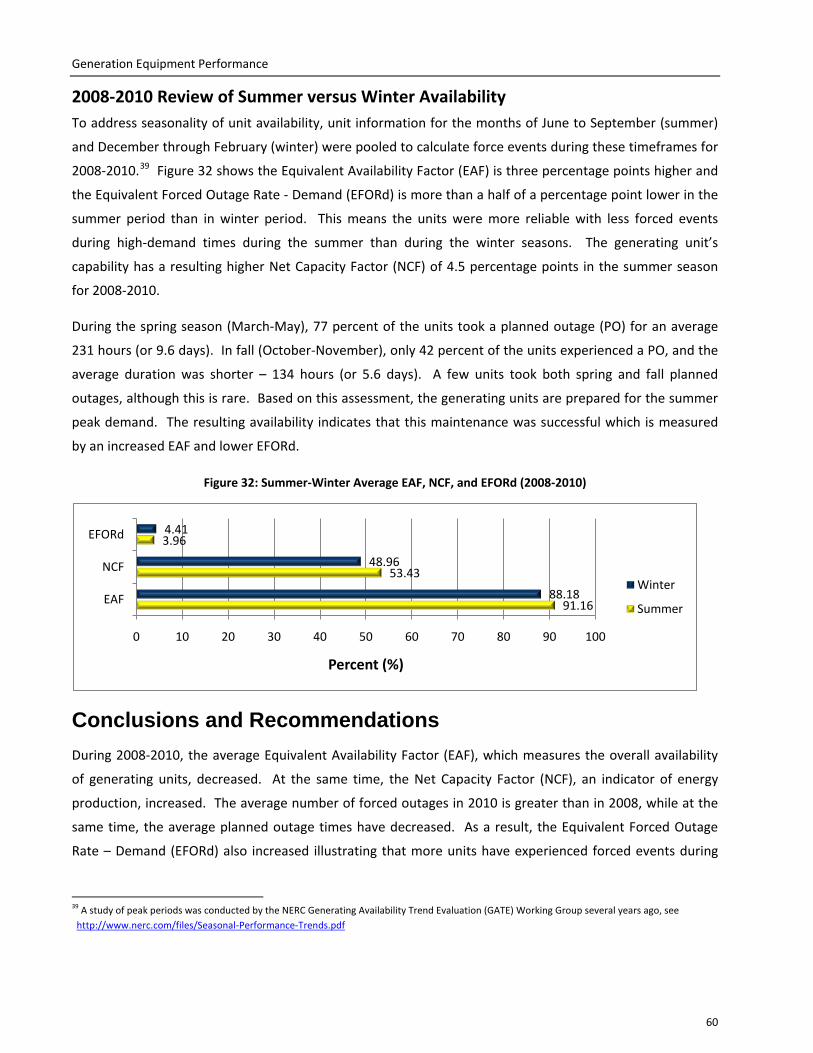
Generation Equipment Performance
61
peak-demand times in 2010 than in the previous two years Potentially with shorter planned outage
periods in 2010 there may be less time to repair equipment and prevent forced unit outages
There are warnings that units are not being maintained as well as they should be In the last three years
there has been an increase in Equivalent Forced Outage Rate ndash Demand (EFORd) This indicator measures
the rate of forced outage events on generating units during periods of load demand To confirm this
problem forced outage hours jumped from 270 to 314 hours per unit between 2009 and 2010 At the same
time maintenance events also increased by 12 hours per unit Planned outage events remain constant The
resulting conclusions from this trend are
bull More or longer planned outage time is needed to repair the generating fleet Whether age is the
cause of the increase need for planned outage time remains unknown and further investigation into
the cause for longer planned outage time is necessary
bull More focus on preventive repairs during planned and maintenance events are needed
There are many multiple unit forced outages due to lack of fuel The majority of multiple unit trips have
three main causes transmission lack of fuel and storms With special interest in the forced outages due to
ldquoLack of Fuelrdquo additional analysis revealed that 77 percent of the units experiencing unexpected fuel
stoppage are oil-fired fossil units while gas-fired units experienced 15 percent
Generating units continue to be more reliable during the peak summer periods
Disturbance Event Trends
62
Category 1 An event resulting in one or more of the following a Unintended loss of three or more BPS elements caused by
common mode failure b Failure or misoperation of an SPSRAS c System-wide voltage reduction of 3 or more d Unintended BPS system separation resulting in an island of
100 MW to 999 MW e Unplanned evacuation from a control center facility with BPS
SCADA functionality for 30 minutes or more Category 2 An event resulting in one or more of the following
a Complete loss of all BPS control center voice communication system(s) for 30 minutes or more
b Complete loss of SCADA control or monitoring functionality for 30 minutes or more
c Voltage excursions equal to or greater than 10 lasting more than five minutes
d Loss of off-site power (LOOP) to a nuclear generating station e Unintended system separation resulting in an island of 1000
MW to 4999 MW f Unintended loss of 300MW or more of firm load for more
than 15 minutes g Violation of an Interconnection Reliability Operating Limit
(IROL) for more than 30 minutes Category 3 An event resulting in one or more of the following
a The loss of load or generation of 2000 MW or more in the Eastern Interconnection or
b Western Interconnection or 1000 MW or more in the ERCOT or Queacutebec Interconnections
c Unintended system separation resulting in an island of 5000 MW to 10000 MW
d Unintended system separation resulting in an island of Florida from the Eastern Interconnection
Category 4 An event resulting in one or more of the following a The loss of load or generation from 5001 MW to 9999 MW b Unintended system separation resulting in an island of more
than 10000 MW (with the exception of Florida as described in Category 3c)
Category 5 An event resulting in one or more of the following a The loss of load of 10000 MW or more b The loss of generation of 10000 MW or more
Figure 33 BPS Event Category
Disturbance Event Trends Introduction The purpose of this section is to report event
analysis trends from the beginning of event
analysis field test40
One of the companion goals of the event
analysis program is the identification of trends
in the number magnitude and frequency of
events and their associated causes such as
human error equipment failure protection
system misoperations etc The information
provided in the event analysis database (EADB)
and various event analysis reports have been
used to track and identify trends in BPS events
in conjunction with other databases (TADS
GADS metric and benchmarking database)
to the end of 2010
The Event Analysis Working Group (EAWG)
continuously gathers event data and is moving
toward an integrated approach to analyzing
data assessing trends and communicating the
results to the industry
Performance Trends The event category is classified41
Figure 33
as shown in
with Category 5 being the most
severe Figure 34 depicts disturbance trends in
Category 1 to 5 system events from the
40 httpwwwnerccomdocseawgGalloway-Industry-EA-Field-Test-102210pdf 41httpwwwnerccomfiles2011-05-0220Event_Analysis_Process_Phase20220Field20Test20Draft20-20Final20-20For20postingpdf
Disturbance Event Trends
63
beginning of event analysis field test to the end of 201042
Figure 34 Event Category vs Date for All 2010 Categorized Events
From the figure in November and December
there were many more category 1 and 2 events than in October This is due to the field trial starting on
October 25 2010
In addition to the category of the events the status of the events plays a critical role in the accuracy of the
data By examining Figure 35 over 80 of the events reported in 2010 have been closed This means that
the category root cause and other important information have been sufficiently finalized in order for
analysis to be accurate for each event At this time there is not enough data to draw any long-term
conclusions about event investigation performance
42 Documents for the EA Field Test are located at httpwwwnerccompagephpcid=5|365
2
12 12
26
3
6 5
14
1 1
2
0
5
10
15
20
25
30
35
40
45
October November December 2010
Even
t Cou
nt
Category 3 Category 2 Category 1
Disturbance Event Trends
64
Figure 35 Event Count vs Status (All 2010 Events with Status)
By drilling down into the cause code for each closed 2010 event Figure 36 shows the top 3 event causes
From the figure equipment failure and protection system misoperation are the most significant causes for
events Because of how new and limited the data is however there may not be statistical significance for
this result Further trending of cause codes for closed events and developing a richer dataset to find any
trends between event cause codes and event counts should be performed
Figure 36 Top 3 Event Counts vs DAWG Cause Code for all Closed 2010 Events
10
32
42
0
5
10
15
20
25
30
35
40
45
Open Closed Open and Closed
Even
t Cou
nt
Status
1211
8
0
2
4
6
8
10
12
14
Equipment Failure Protection System Misoperation Human Error
Even
t Cou
nt
Cause Code
Disturbance Event Trends
65
Conclusions Due to the relatively new process for events analysis and categorization more time will be required before a
conclusive recommendation may be obtained Further analysis and new data should provide valuable
statistics in the future Over 80 of all event reports from 2010 are current listed as closed but no
conclusion about investigation performance may be obtained because of the limited amount of data It is
recommended to study ways to prevent equipment failure and protection system misoperations but there
is not enough data to draw a firm conclusion about the top causes of events at this time
Abbreviations Used in This Report
66
Abbreviations Used in This Report
Acronym Definition ALP Acadiana Load Pocket
ALR Adequate Level of Reliability
ARR Automatic Reliability Report
BA Balancing Authority
BPS Bulk Power System
CDI Condition Driven Index
CEII Critical Energy Infrastructure Information
CIPC Critical Infrastructure Protection Committee
CLECO Cleco Power LLC
DADS Future Demand Availability Data System
DCS Disturbance Control Standard
DOE Department Of Energy
DSM Demand Side Management
EA Event Analysis
EAF Equivalent Availability Factor
ECAR East Central Area Reliability
EDI Event Drive Index
EEA Energy Emergency Alert
EFORd Equivalent Forced Outage Rate Demand
EMS Energy Management System
ERCOT Electric Reliability Council of Texas
ERO Electric Reliability Organization
ESAI Energy Security Analysis Inc
FERC Federal Energy Regulatory Commission
FOH Forced Outage Hours
FRCC Florida Reliability Coordinating Council
GADS Generation Availability Data System
GOP Generation Operator
IEEE Institute of Electrical and Electronics Engineers
IESO Independent Electricity System Operator
IROL Interconnection Reliability Operating Limit
Abbreviations Used in This Report
67
Acronym Definition IRI Integrated Reliability Index
LOLE Loss of Load Expectation
LUS Lafayette Utilities System
MAIN Mid-America Interconnected Network Inc
MAPP Mid-continent Area Power Pool
MOH Maintenance Outage Hours
MRO Midwest Reliability Organization
MSSC Most Severe Single Contingency
NCF Net Capacity Factor
NEAT NERC Event Analysis Tool
NERC North American Electric Reliability Corporation
NPCC Northeast Power Coordinating Council
OC Operating Committee
OL Operating Limit
OP Operating Procedures
ORS Operating Reliability Subcommittee
PC Planning Committee
PO Planned Outage
POH Planned Outage Hours
RAPA Reliability Assessment Performance Analysis
RAS Remedial Action Schemes
RC Reliability Coordinator
RCIS Reliability Coordination Information System
RCWG Reliability Coordinator Working Group
RE Regional Entities
RFC Reliability First Corporation
RMWG Reliability Metrics Working Group
RSG Reserve Sharing Group
SAIDI System Average Interruption Duration Index
SAIFI System Average Interruption Frequency Index
SCADA Supervisory Control and Data Acquisition
SDI Standardstatute Driven Index
SERC SERC Reliability Corporation
Abbreviations Used in This Report
68
Acronym Definition SRI Severity Risk Index
SMART Specific Measurable Attainable Relevant and Tangible
SOL System Operating Limit
SPS Special Protection Schemes
SPCS System Protection and Control Subcommittee
SPP Southwest Power Pool
SRI System Risk Index
TADS Transmission Availability Data System
TADSWG Transmission Availability Data System Working Group
TO Transmission Owner
TOP Transmission Operator
WECC Western Electricity Coordinating Council
Contributions
69
Contributions This report was made feasible by the collaboration and hard work of both NERC staff and NERCrsquos
Industry Groups
NERC Industry Groups
Table 14 lists the NERC industry group contributors Without their contribution and collaboration this
report would not have been possible
Table 13 NERC Industry Group Contributions43
NERC Group
Relationship Contribution
Reliability Metrics Working Group
(RMWG)
Reports to the OCPC bull Lead Development of Report bull Provide Reliability Metrics Data bull Responsible for Reliability Metrics
Performance Chapter
Transmission Availability Working Group
(TADSWG)
Reports to the OCPC bull Provide Transmission Availability Data
bull Responsible for Transmission Equip-ment Performance Chapter
bull Content Review
Generation Availability Data System Task
Force
(GADSTF)
Reports to the OCPC bull Provide Generation Availability Data bull Responsible for Generation Equip-
ment Performance Chapter bull Content Review
Event Analysis Working Group
(EAWG)
Reports to the OCPC bull Provide Events Data bull Responsible for Disturbance Events
Trends Chapter bull Content Review
43 Rosters for RMWG TADSWG GADSTF and EAWG are available at httpwwwnerccomfilesrosterpdf
Contributions
70
NERC Staff Table 13 below lists the NERC staff who contributed to the 2011 Reliability Performance Analysis
Report
Table 14 Contributing NERC Staff
Name Title E-mail Address
Mark Lauby Vice President and Director of
Reliability Assessment and
Performance Analysis
marklaubynercnet
Jessica Bian Manager of Performance Analysis jessicabiannercnet
John Moura Manager of Reliability Assessments johnmouranercnet
Andrew Slone Engineer Reliability Performance
Analysis
andrewslonenercnet
Jim Robinson TADS Project Manager jimrobinsonnercnet
Clyde Melton Engineer Reliability Performance
Analysis
clydemeltonnercnet
Mike Curley Manager of GADS Services mikecurleynercnet
James Powell Engineer Reliability Performance
Analysis
jamespowellnercnet
Michelle Marx Administrative Assistant michellemarxnercnet
William Mo Intern Performance Analysis wmonercnet
- NERCrsquos Mission
- Table of Contents
- Executive Summary
-
- 2011 Transition Report
- State of Reliability Report
- Key Findings and Recommendations
-
- Reliability Metric Performance
- Transmission Availability Performance
- Generating Availability Performance
- Disturbance Events
- Report Organization
-
- Introduction
-
- Metric Report Evolution
- Roadmap for the Future
-
- Reliability Metrics Performance
-
- Introduction
- 2010 Performance Metrics Results and Trends
-
- ALR1-3 Planning Reserve Margin
-
- Background
- Assessment
- Special Considerations
-
- ALR1-4 BPS Transmission Related Events Resulting in Loss of Load
-
- Background
- Assessment
-
- ALR1-12 Interconnection Frequency Response
-
- Background
- Assessment
-
- ALR2-3 Activation of Under Frequency Load Shedding
-
- Background
- Assessment
- Special Considerations
-
- ALR2-4 Average Percent Non-Recovery Disturbance Control Standards (DCS)
-
- Background
- Assessment
- Special Consideration
-
- ALR2-5 Disturbance Control Events Greater Than Most Severe Single Contingency
-
- Background
- Assessment
- Special Consideration
-
- ALR 1-5 System Voltage Performance
-
- Background
- Special Considerations
- Status
-
- ALR3-5 Interconnection Reliability Operating Limit System Operating Limit (IROLSOL) Exceedances
-
- Background
-
- ALR4-1 Automatic Transmission Outages Caused by Protection System Misoperations
-
- Background
- Special Considerations
-
- ALR6-11 ndash ALR6-14
-
- Background
- Assessment
- ALR 6-11 ndash Automatic Outages Initiated by Failed Protection System Equipment
- ALR6-12 ndash Automatic Outages Initiated by Human Error
- ALR6-13 ndash Automatic Outages Initiated by Failed AC Substation Equipment
- ALR6-14 Automatic AC Transmission Outages Initiated by Failed AC Circuit Equipment
-
- ALR6-15 Element Availability Percentage (APC)
-
- Background
- Assessment
- Special Consideration
-
- ALR6-16 Transmission System Unavailability
-
- Background
- Assessment
- Special Consideration
-
- ALR6-2 Energy Emergency Alert 3 (EEA3)
-
- Background
- Assessment
- Special Considerations
-
- ALR 6-3 Energy Emergency Alert 2 (EEA2)
-
- Background
- Assessment
- Special Considerations
-
- ALR 6-1 Transmission Constraint Mitigation
-
- Background
- Assessment
- Special Considerations
-
- Integrated Bulk Power System Risk Assessment
-
- Introduction
- Recommendations
-
- Integrated Reliability Index Concepts
-
- The Three Components of the IRI
-
- Event-Driven Indicators (EDI)
- Condition-Driven Indicators (CDI)
- StandardsStatute-Driven Indicators (SDI)
-
- IRI Index Calculation
- IRI Recommendations
-
- Reliability Metrics Conclusions and Recommendations
-
- Transmission Equipment Performance
-
- Introduction
- Performance Trends
-
- AC Element Outage Summary and Leading Causes
- Transmission Monthly Outages
- Outage Initiation Location
- Transmission Outage Events
- Transmission Outage Mode
-
- Conclusions
-
- Generation Equipment Performance
-
- Introduction
- Generation Key Performance Indicators
-
- Multiple Unit Forced Outages and Causes
- 2008-2010 Review of Summer versus Winter Availability
-
- Conclusions and Recommendations
-
- Disturbance Event Trends
-
- Introduction
- Performance Trends
- Conclusions
-
- Abbreviations Used in This Report
- Contributions
-
- NERC Industry Groups
- NERC Staff
-
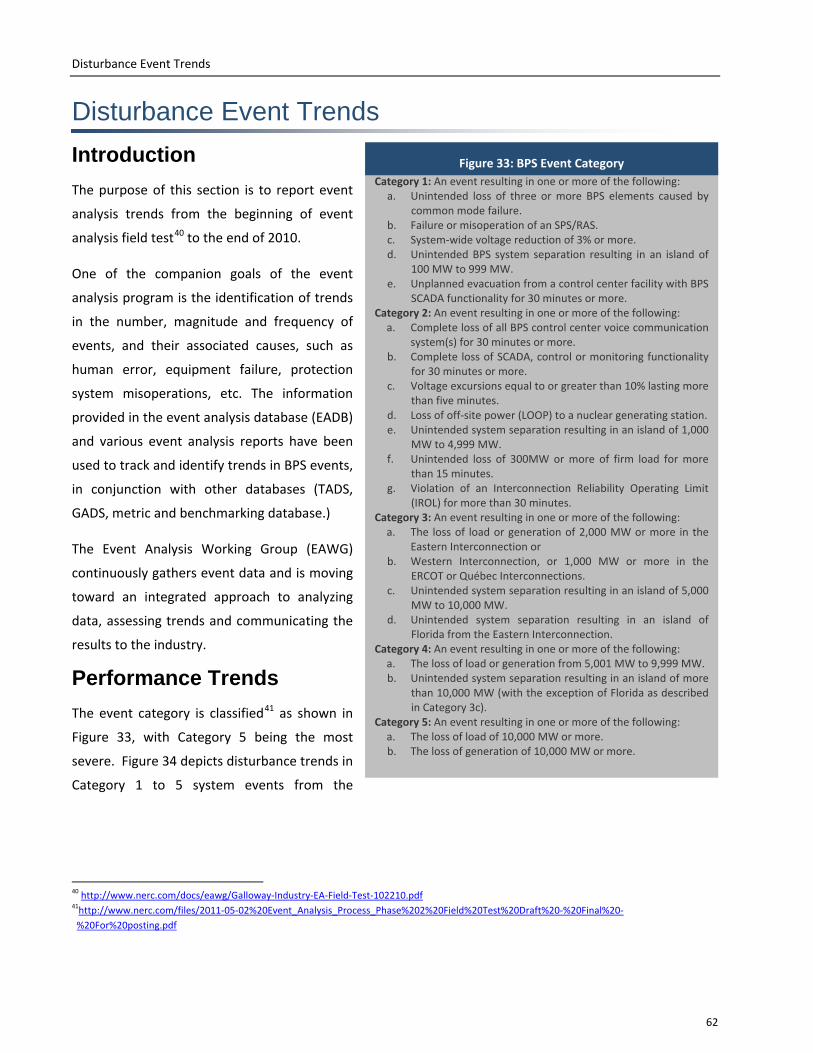
Disturbance Event Trends
65
Conclusions Due to the relatively new process for events analysis and categorization more time will be required before a
conclusive recommendation may be obtained Further analysis and new data should provide valuable
statistics in the future Over 80 of all event reports from 2010 are current listed as closed but no
conclusion about investigation performance may be obtained because of the limited amount of data It is
recommended to study ways to prevent equipment failure and protection system misoperations but there
is not enough data to draw a firm conclusion about the top causes of events at this time
Abbreviations Used in This Report
66
Abbreviations Used in This Report
Acronym Definition ALP Acadiana Load Pocket
ALR Adequate Level of Reliability
ARR Automatic Reliability Report
BA Balancing Authority
BPS Bulk Power System
CDI Condition Driven Index
CEII Critical Energy Infrastructure Information
CIPC Critical Infrastructure Protection Committee
CLECO Cleco Power LLC
DADS Future Demand Availability Data System
DCS Disturbance Control Standard
DOE Department Of Energy
DSM Demand Side Management
EA Event Analysis
EAF Equivalent Availability Factor
ECAR East Central Area Reliability
EDI Event Drive Index
EEA Energy Emergency Alert
EFORd Equivalent Forced Outage Rate Demand
EMS Energy Management System
ERCOT Electric Reliability Council of Texas
ERO Electric Reliability Organization
ESAI Energy Security Analysis Inc
FERC Federal Energy Regulatory Commission
FOH Forced Outage Hours
FRCC Florida Reliability Coordinating Council
GADS Generation Availability Data System
GOP Generation Operator
IEEE Institute of Electrical and Electronics Engineers
IESO Independent Electricity System Operator
IROL Interconnection Reliability Operating Limit
Abbreviations Used in This Report
67
Acronym Definition IRI Integrated Reliability Index
LOLE Loss of Load Expectation
LUS Lafayette Utilities System
MAIN Mid-America Interconnected Network Inc
MAPP Mid-continent Area Power Pool
MOH Maintenance Outage Hours
MRO Midwest Reliability Organization
MSSC Most Severe Single Contingency
NCF Net Capacity Factor
NEAT NERC Event Analysis Tool
NERC North American Electric Reliability Corporation
NPCC Northeast Power Coordinating Council
OC Operating Committee
OL Operating Limit
OP Operating Procedures
ORS Operating Reliability Subcommittee
PC Planning Committee
PO Planned Outage
POH Planned Outage Hours
RAPA Reliability Assessment Performance Analysis
RAS Remedial Action Schemes
RC Reliability Coordinator
RCIS Reliability Coordination Information System
RCWG Reliability Coordinator Working Group
RE Regional Entities
RFC Reliability First Corporation
RMWG Reliability Metrics Working Group
RSG Reserve Sharing Group
SAIDI System Average Interruption Duration Index
SAIFI System Average Interruption Frequency Index
SCADA Supervisory Control and Data Acquisition
SDI Standardstatute Driven Index
SERC SERC Reliability Corporation
Abbreviations Used in This Report
68
Acronym Definition SRI Severity Risk Index
SMART Specific Measurable Attainable Relevant and Tangible
SOL System Operating Limit
SPS Special Protection Schemes
SPCS System Protection and Control Subcommittee
SPP Southwest Power Pool
SRI System Risk Index
TADS Transmission Availability Data System
TADSWG Transmission Availability Data System Working Group
TO Transmission Owner
TOP Transmission Operator
WECC Western Electricity Coordinating Council
Contributions
69
Contributions This report was made feasible by the collaboration and hard work of both NERC staff and NERCrsquos
Industry Groups
NERC Industry Groups
Table 14 lists the NERC industry group contributors Without their contribution and collaboration this
report would not have been possible
Table 13 NERC Industry Group Contributions43
NERC Group
Relationship Contribution
Reliability Metrics Working Group
(RMWG)
Reports to the OCPC bull Lead Development of Report bull Provide Reliability Metrics Data bull Responsible for Reliability Metrics
Performance Chapter
Transmission Availability Working Group
(TADSWG)
Reports to the OCPC bull Provide Transmission Availability Data
bull Responsible for Transmission Equip-ment Performance Chapter
bull Content Review
Generation Availability Data System Task
Force
(GADSTF)
Reports to the OCPC bull Provide Generation Availability Data bull Responsible for Generation Equip-
ment Performance Chapter bull Content Review
Event Analysis Working Group
(EAWG)
Reports to the OCPC bull Provide Events Data bull Responsible for Disturbance Events
Trends Chapter bull Content Review
43 Rosters for RMWG TADSWG GADSTF and EAWG are available at httpwwwnerccomfilesrosterpdf
Contributions
70
NERC Staff Table 13 below lists the NERC staff who contributed to the 2011 Reliability Performance Analysis
Report
Table 14 Contributing NERC Staff
Name Title E-mail Address
Mark Lauby Vice President and Director of
Reliability Assessment and
Performance Analysis
marklaubynercnet
Jessica Bian Manager of Performance Analysis jessicabiannercnet
John Moura Manager of Reliability Assessments johnmouranercnet
Andrew Slone Engineer Reliability Performance
Analysis
andrewslonenercnet
Jim Robinson TADS Project Manager jimrobinsonnercnet
Clyde Melton Engineer Reliability Performance
Analysis
clydemeltonnercnet
Mike Curley Manager of GADS Services mikecurleynercnet
James Powell Engineer Reliability Performance
Analysis
jamespowellnercnet
Michelle Marx Administrative Assistant michellemarxnercnet
William Mo Intern Performance Analysis wmonercnet
- NERCrsquos Mission
- Table of Contents
- Executive Summary
-
- 2011 Transition Report
- State of Reliability Report
- Key Findings and Recommendations
-
- Reliability Metric Performance
- Transmission Availability Performance
- Generating Availability Performance
- Disturbance Events
- Report Organization
-
- Introduction
-
- Metric Report Evolution
- Roadmap for the Future
-
- Reliability Metrics Performance
-
- Introduction
- 2010 Performance Metrics Results and Trends
-
- ALR1-3 Planning Reserve Margin
-
- Background
- Assessment
- Special Considerations
-
- ALR1-4 BPS Transmission Related Events Resulting in Loss of Load
-
- Background
- Assessment
-
- ALR1-12 Interconnection Frequency Response
-
- Background
- Assessment
-
- ALR2-3 Activation of Under Frequency Load Shedding
-
- Background
- Assessment
- Special Considerations
-
- ALR2-4 Average Percent Non-Recovery Disturbance Control Standards (DCS)
-
- Background
- Assessment
- Special Consideration
-
- ALR2-5 Disturbance Control Events Greater Than Most Severe Single Contingency
-
- Background
- Assessment
- Special Consideration
-
- ALR 1-5 System Voltage Performance
-
- Background
- Special Considerations
- Status
-
- ALR3-5 Interconnection Reliability Operating Limit System Operating Limit (IROLSOL) Exceedances
-
- Background
-
- ALR4-1 Automatic Transmission Outages Caused by Protection System Misoperations
-
- Background
- Special Considerations
-
- ALR6-11 ndash ALR6-14
-
- Background
- Assessment
- ALR 6-11 ndash Automatic Outages Initiated by Failed Protection System Equipment
- ALR6-12 ndash Automatic Outages Initiated by Human Error
- ALR6-13 ndash Automatic Outages Initiated by Failed AC Substation Equipment
- ALR6-14 Automatic AC Transmission Outages Initiated by Failed AC Circuit Equipment
-
- ALR6-15 Element Availability Percentage (APC)
-
- Background
- Assessment
- Special Consideration
-
- ALR6-16 Transmission System Unavailability
-
- Background
- Assessment
- Special Consideration
-
- ALR6-2 Energy Emergency Alert 3 (EEA3)
-
- Background
- Assessment
- Special Considerations
-
- ALR 6-3 Energy Emergency Alert 2 (EEA2)
-
- Background
- Assessment
- Special Considerations
-
- ALR 6-1 Transmission Constraint Mitigation
-
- Background
- Assessment
- Special Considerations
-
- Integrated Bulk Power System Risk Assessment
-
- Introduction
- Recommendations
-
- Integrated Reliability Index Concepts
-
- The Three Components of the IRI
-
- Event-Driven Indicators (EDI)
- Condition-Driven Indicators (CDI)
- StandardsStatute-Driven Indicators (SDI)
-
- IRI Index Calculation
- IRI Recommendations
-
- Reliability Metrics Conclusions and Recommendations
-
- Transmission Equipment Performance
-
- Introduction
- Performance Trends
-
- AC Element Outage Summary and Leading Causes
- Transmission Monthly Outages
- Outage Initiation Location
- Transmission Outage Events
- Transmission Outage Mode
-
- Conclusions
-
- Generation Equipment Performance
-
- Introduction
- Generation Key Performance Indicators
-
- Multiple Unit Forced Outages and Causes
- 2008-2010 Review of Summer versus Winter Availability
-
- Conclusions and Recommendations
-
- Disturbance Event Trends
-
- Introduction
- Performance Trends
- Conclusions
-
- Abbreviations Used in This Report
- Contributions
-
- NERC Industry Groups
- NERC Staff
-

Abbreviations Used in This Report
68
Acronym Definition SRI Severity Risk Index
SMART Specific Measurable Attainable Relevant and Tangible
SOL System Operating Limit
SPS Special Protection Schemes
SPCS System Protection and Control Subcommittee
SPP Southwest Power Pool
SRI System Risk Index
TADS Transmission Availability Data System
TADSWG Transmission Availability Data System Working Group
TO Transmission Owner
TOP Transmission Operator
WECC Western Electricity Coordinating Council
Contributions
69
Contributions This report was made feasible by the collaboration and hard work of both NERC staff and NERCrsquos
Industry Groups
NERC Industry Groups
Table 14 lists the NERC industry group contributors Without their contribution and collaboration this
report would not have been possible
Table 13 NERC Industry Group Contributions43
NERC Group
Relationship Contribution
Reliability Metrics Working Group
(RMWG)
Reports to the OCPC bull Lead Development of Report bull Provide Reliability Metrics Data bull Responsible for Reliability Metrics
Performance Chapter
Transmission Availability Working Group
(TADSWG)
Reports to the OCPC bull Provide Transmission Availability Data
bull Responsible for Transmission Equip-ment Performance Chapter
bull Content Review
Generation Availability Data System Task
Force
(GADSTF)
Reports to the OCPC bull Provide Generation Availability Data bull Responsible for Generation Equip-
ment Performance Chapter bull Content Review
Event Analysis Working Group
(EAWG)
Reports to the OCPC bull Provide Events Data bull Responsible for Disturbance Events
Trends Chapter bull Content Review
43 Rosters for RMWG TADSWG GADSTF and EAWG are available at httpwwwnerccomfilesrosterpdf
Contributions
70
NERC Staff Table 13 below lists the NERC staff who contributed to the 2011 Reliability Performance Analysis
Report
Table 14 Contributing NERC Staff
Name Title E-mail Address
Mark Lauby Vice President and Director of
Reliability Assessment and
Performance Analysis
marklaubynercnet
Jessica Bian Manager of Performance Analysis jessicabiannercnet
John Moura Manager of Reliability Assessments johnmouranercnet
Andrew Slone Engineer Reliability Performance
Analysis
andrewslonenercnet
Jim Robinson TADS Project Manager jimrobinsonnercnet
Clyde Melton Engineer Reliability Performance
Analysis
clydemeltonnercnet
Mike Curley Manager of GADS Services mikecurleynercnet
James Powell Engineer Reliability Performance
Analysis
jamespowellnercnet
Michelle Marx Administrative Assistant michellemarxnercnet
William Mo Intern Performance Analysis wmonercnet
- NERCrsquos Mission
- Table of Contents
- Executive Summary
-
- 2011 Transition Report
- State of Reliability Report
- Key Findings and Recommendations
-
- Reliability Metric Performance
- Transmission Availability Performance
- Generating Availability Performance
- Disturbance Events
- Report Organization
-
- Introduction
-
- Metric Report Evolution
- Roadmap for the Future
-
- Reliability Metrics Performance
-
- Introduction
- 2010 Performance Metrics Results and Trends
-
- ALR1-3 Planning Reserve Margin
-
- Background
- Assessment
- Special Considerations
-
- ALR1-4 BPS Transmission Related Events Resulting in Loss of Load
-
- Background
- Assessment
-
- ALR1-12 Interconnection Frequency Response
-
- Background
- Assessment
-
- ALR2-3 Activation of Under Frequency Load Shedding
-
- Background
- Assessment
- Special Considerations
-
- ALR2-4 Average Percent Non-Recovery Disturbance Control Standards (DCS)
-
- Background
- Assessment
- Special Consideration
-
- ALR2-5 Disturbance Control Events Greater Than Most Severe Single Contingency
-
- Background
- Assessment
- Special Consideration
-
- ALR 1-5 System Voltage Performance
-
- Background
- Special Considerations
- Status
-
- ALR3-5 Interconnection Reliability Operating Limit System Operating Limit (IROLSOL) Exceedances
-
- Background
-
- ALR4-1 Automatic Transmission Outages Caused by Protection System Misoperations
-
- Background
- Special Considerations
-
- ALR6-11 ndash ALR6-14
-
- Background
- Assessment
- ALR 6-11 ndash Automatic Outages Initiated by Failed Protection System Equipment
- ALR6-12 ndash Automatic Outages Initiated by Human Error
- ALR6-13 ndash Automatic Outages Initiated by Failed AC Substation Equipment
- ALR6-14 Automatic AC Transmission Outages Initiated by Failed AC Circuit Equipment
-
- ALR6-15 Element Availability Percentage (APC)
-
- Background
- Assessment
- Special Consideration
-
- ALR6-16 Transmission System Unavailability
-
- Background
- Assessment
- Special Consideration
-
- ALR6-2 Energy Emergency Alert 3 (EEA3)
-
- Background
- Assessment
- Special Considerations
-
- ALR 6-3 Energy Emergency Alert 2 (EEA2)
-
- Background
- Assessment
- Special Considerations
-
- ALR 6-1 Transmission Constraint Mitigation
-
- Background
- Assessment
- Special Considerations
-
- Integrated Bulk Power System Risk Assessment
-
- Introduction
- Recommendations
-
- Integrated Reliability Index Concepts
-
- The Three Components of the IRI
-
- Event-Driven Indicators (EDI)
- Condition-Driven Indicators (CDI)
- StandardsStatute-Driven Indicators (SDI)
-
- IRI Index Calculation
- IRI Recommendations
-
- Reliability Metrics Conclusions and Recommendations
-
- Transmission Equipment Performance
-
- Introduction
- Performance Trends
-
- AC Element Outage Summary and Leading Causes
- Transmission Monthly Outages
- Outage Initiation Location
- Transmission Outage Events
- Transmission Outage Mode
-
- Conclusions
-
- Generation Equipment Performance
-
- Introduction
- Generation Key Performance Indicators
-
- Multiple Unit Forced Outages and Causes
- 2008-2010 Review of Summer versus Winter Availability
-
- Conclusions and Recommendations
-
- Disturbance Event Trends
-
- Introduction
- Performance Trends
- Conclusions
-
- Abbreviations Used in This Report
- Contributions
-
- NERC Industry Groups
- NERC Staff
-
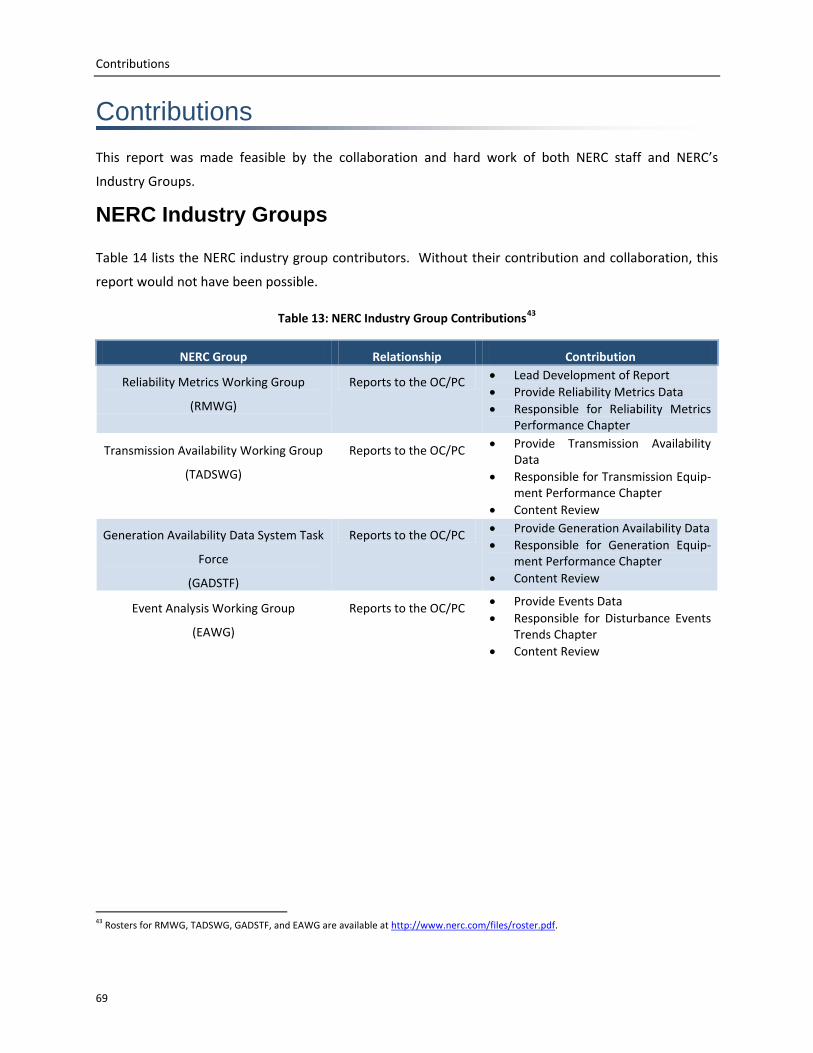
Contributions
70
NERC Staff Table 13 below lists the NERC staff who contributed to the 2011 Reliability Performance Analysis
Report
Table 14 Contributing NERC Staff
Name Title E-mail Address
Mark Lauby Vice President and Director of
Reliability Assessment and
Performance Analysis
marklaubynercnet
Jessica Bian Manager of Performance Analysis jessicabiannercnet
John Moura Manager of Reliability Assessments johnmouranercnet
Andrew Slone Engineer Reliability Performance
Analysis
andrewslonenercnet
Jim Robinson TADS Project Manager jimrobinsonnercnet
Clyde Melton Engineer Reliability Performance
Analysis
clydemeltonnercnet
Mike Curley Manager of GADS Services mikecurleynercnet
James Powell Engineer Reliability Performance
Analysis
jamespowellnercnet
Michelle Marx Administrative Assistant michellemarxnercnet
William Mo Intern Performance Analysis wmonercnet
- NERCrsquos Mission
- Table of Contents
- Executive Summary
-
- 2011 Transition Report
- State of Reliability Report
- Key Findings and Recommendations
-
- Reliability Metric Performance
- Transmission Availability Performance
- Generating Availability Performance
- Disturbance Events
- Report Organization
-
- Introduction
-
- Metric Report Evolution
- Roadmap for the Future
-
- Reliability Metrics Performance
-
- Introduction
- 2010 Performance Metrics Results and Trends
-
- ALR1-3 Planning Reserve Margin
-
- Background
- Assessment
- Special Considerations
-
- ALR1-4 BPS Transmission Related Events Resulting in Loss of Load
-
- Background
- Assessment
-
- ALR1-12 Interconnection Frequency Response
-
- Background
- Assessment
-
- ALR2-3 Activation of Under Frequency Load Shedding
-
- Background
- Assessment
- Special Considerations
-
- ALR2-4 Average Percent Non-Recovery Disturbance Control Standards (DCS)
-
- Background
- Assessment
- Special Consideration
-
- ALR2-5 Disturbance Control Events Greater Than Most Severe Single Contingency
-
- Background
- Assessment
- Special Consideration
-
- ALR 1-5 System Voltage Performance
-
- Background
- Special Considerations
- Status
-
- ALR3-5 Interconnection Reliability Operating Limit System Operating Limit (IROLSOL) Exceedances
-
- Background
-
- ALR4-1 Automatic Transmission Outages Caused by Protection System Misoperations
-
- Background
- Special Considerations
-
- ALR6-11 ndash ALR6-14
-
- Background
- Assessment
- ALR 6-11 ndash Automatic Outages Initiated by Failed Protection System Equipment
- ALR6-12 ndash Automatic Outages Initiated by Human Error
- ALR6-13 ndash Automatic Outages Initiated by Failed AC Substation Equipment
- ALR6-14 Automatic AC Transmission Outages Initiated by Failed AC Circuit Equipment
-
- ALR6-15 Element Availability Percentage (APC)
-
- Background
- Assessment
- Special Consideration
-
- ALR6-16 Transmission System Unavailability
-
- Background
- Assessment
- Special Consideration
-
- ALR6-2 Energy Emergency Alert 3 (EEA3)
-
- Background
- Assessment
- Special Considerations
-
- ALR 6-3 Energy Emergency Alert 2 (EEA2)
-
- Background
- Assessment
- Special Considerations
-
- ALR 6-1 Transmission Constraint Mitigation
-
- Background
- Assessment
- Special Considerations
-
- Integrated Bulk Power System Risk Assessment
-
- Introduction
- Recommendations
-
- Integrated Reliability Index Concepts
-
- The Three Components of the IRI
-
- Event-Driven Indicators (EDI)
- Condition-Driven Indicators (CDI)
- StandardsStatute-Driven Indicators (SDI)
-
- IRI Index Calculation
- IRI Recommendations
-
- Reliability Metrics Conclusions and Recommendations
-
- Transmission Equipment Performance
-
- Introduction
- Performance Trends
-
- AC Element Outage Summary and Leading Causes
- Transmission Monthly Outages
- Outage Initiation Location
- Transmission Outage Events
- Transmission Outage Mode
-
- Conclusions
-
- Generation Equipment Performance
-
- Introduction
- Generation Key Performance Indicators
-
- Multiple Unit Forced Outages and Causes
- 2008-2010 Review of Summer versus Winter Availability
-
- Conclusions and Recommendations
-
- Disturbance Event Trends
-
- Introduction
- Performance Trends
- Conclusions
-
- Abbreviations Used in This Report
- Contributions
-
- NERC Industry Groups
- NERC Staff
-
Related Documents