2017 FINRA Annual Financial Report

Welcome message from author
This document is posted to help you gain knowledge. Please leave a comment to let me know what you think about it! Share it to your friends and learn new things together.
Transcript

2017 FINRA Annual Financial Report

Contents
A Message From the President and CEO 1
Management Report on Operations 5
Investment Committee Report 17
Audit Committee Report 20
Management Compensation Committee Report 22
Management Report on Internal Control Over Financial Reporting 26
Report of Independent Registered Public Accounting Firm— Opinion on Internal Control Over Financial Reporting 27
Report of Independent Registered Public Accounting Firm— Opinion on the Financial Statements 29
FINRA 2017 Consolidated Financial Statements:
Consolidated Balance Sheets 30
Consolidated Statements of Operations 32
Consolidated Statements of Comprehensive Income 33
Consolidated Statements of Changes in Equity 34
Consolidated Statements of Cash Flows 35
Notes to Consolidated Financial Statements 37
FINRA Board of Governors 67
FINRA Officers 67
FINRA Corporate Offices 68
FINRA District Offices 68
FINRA Market Regulation Regional Offices 69
FINRA Dispute Resolution Regional Offices 69
Cover Photo: Office of Fraud Detection & Market Intelligence
Inside Cover: Market Regulation – Fixed Income

FINRA 2017 Annual Financial Report 1
As a not-for-profit, self-regulatory organization whose operations are funded by member firm fees—without the support of any taxpayer dollars—FINRA must prudently manage its finances to ensure it can appropriately fund its mission to protect investors and promote market integrity in a manner that facilitates vibrant capital markets.
To guide our longer-term financial planning and the development of our annual budget, in January we published a summary of our Financial Guiding Principles outlining how we seek to fund our mission, manage expenses responsibly, maintain reasonable member firm fees, use fine monies to promote compliance and improve markets, and sustain appropriate financial reserves. The Principles also underscore the importance of financial transparency for FINRA. To that end, we once again publish an Annual Financial Report that presents FINRA’s financial operations for the prior year in accordance with GAAP.
Financial Operations for 2017
As described in the 2017 Annual Financial Report, operating revenues for 2017 declined 2 percent to $828.1 million in 2017. In response to declining revenues, FINRA tightly managed expenses, which declined 4 percent to $992.3 million in 2017. The key drivers for the changes to our revenues and expenses are discussed more fully in the Annual Financial Report.
A MESSAGE FROM THE PRESIDENT AND CEO
Robert W. Cook | President and Chief Executive Officer

2 FINRA2017AnnualFinancialReport
Despite the gap between our operating revenues and expenses, FINRA did not increase member firm fee rates in 2017 (and has not done so since 2013). Instead, in line with the Financial Guiding Principles, FINRA leveraged financial reserves to support operations while deferring fee increases. FINRA maintains a strong balance sheet to support its operations, with approximately $1.6 billion in equity (net assets). This financial reserve originally derived from the sale of NASDAQ that culminated in 2006. Gains from our investment portfolio and other sources of non-operating revenues drove overall net income for 2017 to $41.6 million.
2018 Budget
To further promote financial transparency, FINRA also committed in the Financial Guiding Principles to publish at the start of each year a summary of our Board-approved budget for that year. Accordingly, last January we published—for the first time—our annual budget together with comparable financial data from prior years.
FINRA’s 2018 budget was designed to meet the evolving challenges posed by our ongoing regulatory responsibilities and flat revenues in a manner that reflects our Financial Guiding Principles. As described more fully in the annual budget summary, although we project our expenses will again exceed our operating revenues in 2018, FINRA is not increasing member fees for 2018. Instead, we are again leveraging our financial reserves to fund our regulatory operations. In addition, under the supervision of our Board, we will continue to review and manage our overall expenses to ensure they are appropriately calibrated to our mission of protecting investors and promoting the integrity of our markets.
Robert W. CookPresidentandChiefExecutiveOfficer
Technology Development Services and Market Regulation

FINRA plays an essential role in the oversight of U.S. broker-dealersWe promote market integrity in a manner that supports the important role
our capital markets play in the U.S. financial systems.
Our technology looks across markets to detect potential fraud.
We processed 36 billion market events on average every day in 2017.
X
855 FRAUD
AND INSIDER TRADING CASES
We protect investors from bad actors.
Coordinating closely with the SEC and other federal and state regulators is an important part of our regulatory work.
referred to the SEC and other federal or state law enforcement
agencies for prosecution
We work to keep investors informed.
FINRA Investor Education Foundation Committed $110 million+ for financial capability and fraud prevention initiatives since inception
Securities Helpline for SeniorsFacilitated the return of $5.4 million in voluntary reimbursements to senior investors from April 2015 through April 2018
7,800+ exams conducted in 2017 20 firms expelled
$64.9 million in fines
$66.8 million in restitution to harmed investors
733 brokers suspended
492 brokers barred

Enforcement and Member Supervision

FINRA 2017 Annual Financial Report 5
Management Report on Operations
Who We Are
The Financial Industry Regulatory Authority, Inc.® (FINRA®) is a not-for-profit self-regulatory organization (SRO) authorized by federal law to help protect investors and ensure the fair and honest operation of financial markets. Under the oversight of the Securities and Exchange Commission (SEC), we regulate the activities of U.S. broker-dealers and perform market regulation pursuant to our own statutory responsibility and under contract for certain exchanges.
Our Mission
Our core mission is to pursue investor protection and market integrity, and we carry it out by overseeing virtually every aspect of the broker-dealer industry.
Our Regulatory Model
To carry out its mission, FINRA uses a multi-pronged approach that includes regulation, rulemaking, transparency and education:
Member Regulation—monitors and examines for member compliance with applicable statutes and rules.
Market Regulation—conducts automated surveillance, examinations and investigations of trading market activity in U.S. equities, options and fixed income markets.
Enforcement—investigates possible misconduct and brings disciplinary actions for violations of industry rules and regulations.
Fraud Detection—centralizes FINRA’s review of allegations of serious fraud and significant investor harm, analyzes trading activity across U.S. markets for evidence of insider trading, and analyzes tips and complaints of possible fraud or other misconduct that are submitted to FINRA’s Whistleblower hotline or mailbox.
Office of Dispute Resolution Neutral Management

6 FINRA 2017 Annual Financial Report
Corporate Financing—oversees corporate offerings to identify fraudulent private placements and reviews the fairness of underwriting compensation.
Investor Education—provides investors with financial tools and resources, and through the FINRA Investor Education Foundation®, FINRA supports important research and financial education initiatives.
FINRA’s Regulatory Policy Committee; Regulatory Operations Oversight Committee; Finance, Operations and Technology Committee (Finance Committee); Management Compensation Committee; Executive Committee and Audit Committee of the Board of Governors (Board) all meet multiple times throughout the year to review both the accomplishments and the risks and challenges associated with each of these areas in the furtherance of FINRA’s mission.
Further description of FINRA’s statutory responsibilities as well as its responsibilities under contract for certain exchanges can be found in Note 1, “Organization and Nature of Operations,” to the consolidated financial statements.
Rulemaking and Guidance—prepares changes to FINRA rules, provides guidance applicable to securities firms and brokers, and evaluates the potential impacts of FINRA’s rulemaking on all market participants. FINRA solicits comment on its proposed rules from its members, investors and other interested parties, and, with limited exceptions, all FINRA rules must be approved by the SEC.
Registration and Disclosure—operates FINRA’s facilities to register and test securities industry personnel and provides those same services under contract for the benefit of investment advisers and mortgage brokers.
Market Transparency—operates facilities that disseminate real-time and historical market information for over-the-counter (OTC) trading in the equity and fixed income markets, and maintains the databases FINRA uses to oversee OTC securities.
Dispute Resolution—operates a dispute resolution forum for investors, brokerage firms and their registered employees, and administers arbitrations and mediations.
Advertising Regulation—oversees compliance with rules intended to ensure that member communications to the public are fair, balanced and not misleading.
Technology Operations and Enterprise Technology Services

FINRA 2017 Annual Financial Report 7
Risk Oversight and Operational Regulation (ROOR)
This Management Report should be read in connection with the consolidated financial statements and accompanying notes included elsewhere in this Annual Financial Report. The 2017 consolidated financial statements reflect the activities of FINRA and its consolidated subsidiaries, collectively referred to as “we,” “our,” “us,” “FINRA” or the “Company” throughout this Management Report. As of and for the years ended December 31, 2017 and 2016, FINRA’s primary consolidated subsidiaries are FINRA Regulation, Inc. and the FINRA Investor Education Foundation (the Foundation).
Our consolidated financial statements are prepared in conformity with U.S. generally accepted accounting principles (U.S. GAAP). Under U.S. GAAP, we are required to adopt accounting principles and make estimates and judgments to develop amounts reported in the consolidated financial statements and accompanying notes.
We describe our significant accounting policies in Note 2, “Summary of Significant Accounting Policies,” Note 5, “Fair Value Measurement,” and Note 7, “Employee Benefit Liabilities,” to the consolidated financial statements.
RESULTS OF OPERATIONS
Summary of Operations
The following table provides a summary of our financial results on a U.S. GAAP basis for the two years ended December 31,2017. Years Ended December 31,
2017 2016 (in millions)
Operating revenues $ 828.1 $ 844.6Fines 64.9 173.8Net revenues 893.0 1,018.4
Expenses (992.3) (1,037.4)Interest and dividend income 26.0 31.4Operating (loss) income (73.3) 12.4
Net realized and unrealized investment gains 32.6 17.1Equity earnings from other investments 83.9 29.7Other expense (1.6) (1.5)Net income $ 41.6 $ 57.7
We reported net income of $41.6 million in 2017 versus net income of $57.7 million in 2016, a decrease of $16.1 million year over year. The decrease in revenues was partially offset by lower expenses and improved investment returns. A more detailed look at our operating results follows.
ˆ200F$TiRP!z$GP$tÆŠ200F$TiRP!z$GP$t˘
592132 FIN 8FINRAANNUAL REPORT 2017
26-Jun-2018 10:56 ESTCLN PSWDC
Donnelley Financial ADG pf_rend 33*PMT 4C
ADGP64RS1512.6.31
g37u56-4.0g98t04-2.0
Management Report on Operations (continued)
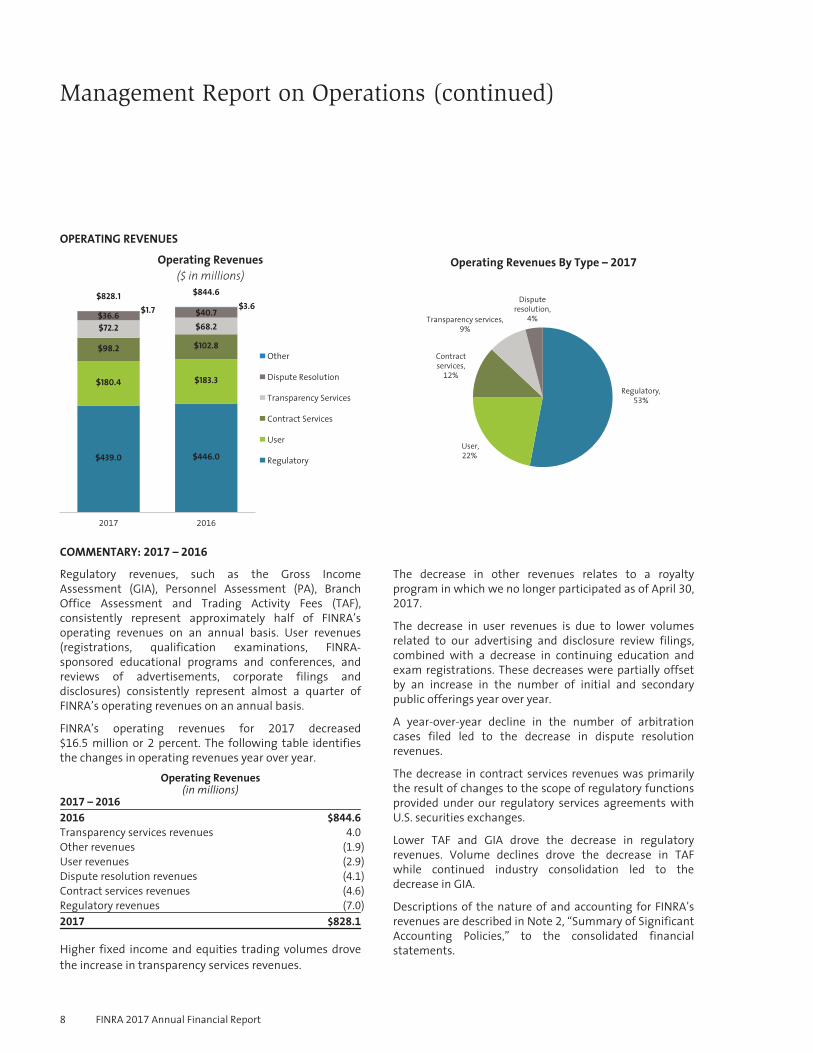
OPERATING REVENUES
Operating Revenues($ in millions)
2017 2016
Regulatory
User
Contract Services
Transparency Services
Dispute Resolution
Other
$828.1 $844.6
$439.0
$180.4
$98.2
$72.2$36.6 $1.7
$446.0
$183.3
$102.8
$68.2$40.7 $3.6
Operating Revenues By Type – 2017
Regulatory,53%
User,22%
Contractservices,
12%
Transparency services,9%
Disputeresolution,
4%
COMMENTARY: 2017 – 2016
Regulatory revenues, such as the Gross IncomeAssessment (GIA), Personnel Assessment (PA), BranchOffice Assessment and Trading Activity Fees (TAF),consistently represent approximately half of FINRA’soperating revenues on an annual basis. User revenues(registrations, qualification examinations, FINRA-sponsored educational programs and conferences, andreviews of advertisements, corporate filings anddisclosures) consistently represent almost a quarter ofFINRA’s operating revenues on an annual basis.
FINRA’s operating revenues for 2017 decreased$16.5 million or 2 percent. The following table identifiesthe changes in operating revenues year over year.
Operating Revenues(in millions)
2017 – 2016
2016 $844.6
Transparency services revenues 4.0
Other revenues (1.9)
User revenues (2.9)
Dispute resolution revenues (4.1)
Contract services revenues (4.6)
Regulatory revenues (7.0)
2017 $828.1
Higher fixed income and equities trading volumes drovethe increase in transparency services revenues.
The decrease in other revenues relates to a royaltyprogram in which we no longer participated as of April 30,2017.
The decrease in user revenues is due to lower volumesrelated to our advertising and disclosure review filings,combined with a decrease in continuing education andexam registrations. These decreases were partially offsetby an increase in the number of initial and secondarypublic offerings year over year.
A year-over-year decline in the number of arbitrationcases filed led to the decrease in dispute resolutionrevenues.
The decrease in contract services revenues was primarilythe result of changes to the scope of regulatory functionsprovided under our regulatory services agreements withU.S. securities exchanges.
Lower TAF and GIA drove the decrease in regulatoryrevenues. Volume declines drove the decrease in TAFwhile continued industry consolidation led to thedecrease in GIA.
Descriptions of the nature of and accounting for FINRA’srevenues are described in Note 2, “Summary of SignificantAccounting Policies,” to the consolidated financialstatements.
8 FINRA 2017 Annual Financial Report
ˆ200F$TiRP!z$KrmMcŠ 200F$TiRP!z$KrmMc
592132 FIN 9FINRAANNUAL REPORT 2017
26-Jun-2018 10:56 ESTCLN PSWDC
Donnelley Financial ADG pf_rend 29*PMT 4C
ADGP64RS1512.6.31
g71g06-1.0g78c71-1.0
Management Report on Operations (continued)
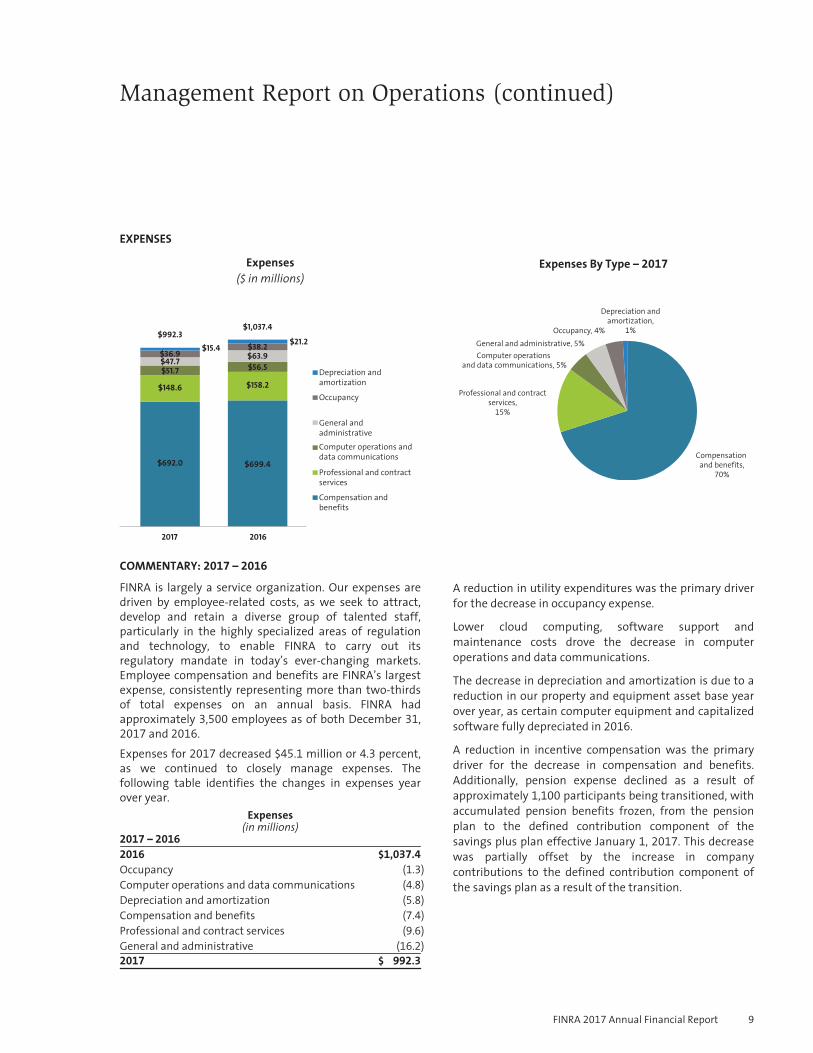
EXPENSES
Expenses($ in millions)
2017 2016
Depreciation andamortization
Compensation andbenefits
Professional and contractservices
General andadministrativeComputer operations anddata communications
Occupancy
$992.3$1,037.4
$699.4$692.0
$148.6$51.7$47.7$36.9
$158.2
$56.5$63.9
$21.2$15.4 $38.2
Expenses By Type – 2017
Compensation and benefits,
70%
Computer operations and data communications, 5%
Professional and contractservices,
15%
Occupancy, 4%
General and administrative, 5%
Depreciation andamortization,
1%
COMMENTARY: 2017 – 2016
FINRA is largely a service organization. Our expenses aredriven by employee-related costs, as we seek to attract,develop and retain a diverse group of talented staff,particularly in the highly specialized areas of regulationand technology, to enable FINRA to carry out itsregulatory mandate in today’s ever-changing markets.Employee compensation and benefits are FINRA’s largestexpense, consistently representing more than two-thirdsof total expenses on an annual basis. FINRA hadapproximately 3,500 employees as of both December 31,2017 and 2016.Expenses for 2017 decreased $45.1 million or 4.3 percent,as we continued to closely manage expenses. Thefollowing table identifies the changes in expenses yearover year.
Expenses(in millions)
2017 – 2016
2016 $1,037.4
Occupancy (1.3)
Computer operations and data communications (4.8)
Depreciation and amortization (5.8)
Compensation and benefits (7.4)
Professional and contract services (9.6)
General and administrative (16.2)
2017 $ 992.3
A reduction in utility expenditures was the primary driverfor the decrease in occupancy expense.
Lower cloud computing, software support andmaintenance costs drove the decrease in computeroperations and data communications.
The decrease in depreciation and amortization is due to areduction in our property and equipment asset base yearover year, as certain computer equipment and capitalizedsoftware fully depreciated in 2016.
A reduction in incentive compensation was the primarydriver for the decrease in compensation and benefits.Additionally, pension expense declined as a result ofapproximately 1,100 participants being transitioned, withaccumulated pension benefits frozen, from the pensionplan to the defined contribution component of thesavings plus plan effective January 1, 2017. This decreasewas partially offset by the increase in companycontributions to the defined contribution component ofthe savings plan as a result of the transition.
FINRA 2017 Annual Financial Report 9

ˆ200F$TiRP!z$Nv0MgŠ 200F$TiRP!z$Nv0Mg
592132 FIN 10FINRAANNUAL REPORT 2017
26-Jun-2018 10:56 ESTCLN PSWDC
Donnelley Financial ADG pf_rend 29*PMT 1C
ADGP64RS1512.6.31
Management Report on Operations (continued)
The decrease in professional and contract services was due to a planned reduction in consulting expenses combined with anet reduction in initiatives spending year over year. Related to initiatives, we wrapped up two major initiatives in 2016: 1)our market regulation cloud migration; and 2) our integration efforts related to our regulatory services agreement withCboe Global Markets, Inc. In 2017, we focused our efforts on migrating other FINRA applications to the cloud andimplementing the first phase of the Treasuries initiative, where firms were required to report transactions in Treasurysecurities through our Trade Reporting and Compliance Engine® (TRACE®) to provide increased understanding andenhanced surveillance of the Treasury market, while keeping initiative spending below 2016 levels.
The decrease in general and administrative expenses was driven by the managed reduction of expenses related tomarketing, as we wrapped up spending on our BrokerCheck® ad campaign in 2016, as well as travel-related costs.Additionally, favorable collection experience drove the reduction in our bad debt expense related to fines.
INVESTMENT RETURNS
COMMENTARY: 2017 – 2016
Traditionally, FINRA has relied on the investment returns from its balance sheet to fund operating expenditures in excessof its annual revenues in any given year. FINRA’s portfolio returns were 8.8 percent in 2017 compared to 3.8 percent in2016.
FINRA’s investment returns, including interest and dividend income, for 2017 increased $64.3 million. The following tableidentifies the changes in investment returns year over year.
Investment2017
returns2016
returnsIncrease
(decrease)(in millions)
Limited partnership $ 83.9 $29.7 $54.2
Fixed income 21.5 25.0 (3.5)
Equity 13.2 19.0 (5.8)
Private 12.1 — 12.1
Executive retirement 5.7 2.9 2.8
Foundation 5.0 1.4 3.6
Other 1.1 0.2 0.9
Total $142.5 $78.2 $64.3
Market performance drove the equity gains associated with our limited partnership, a broadly diversified multi-asset fund,in 2017 and 2016.
In 2017, fixed income and equity redemptions used to fund new investments were the primary drivers of the decrease inreturns for both of these investments.
As part of our new investment strategy, we moved funds into private investments that produced $12.1 million in returnsfor the year.
Market performance drove the increase in our executive retirement investments.
Realized gains from the sale of investments to fund the Foundation’s new investment strategy were the primary driver forthe increase in Foundation returns.
Additional information regarding FINRA’s investment portfolio (the Portfolio), strategy and returns can be found in theaccompanying Investment Committee Report of this 2017 Annual Financial Report.
10 FINRA 2017 Annual Financial Report

ˆ200F$TiRP!z$T1dthŠ 200F$TiRP!z$T1dth
592132 FIN 11FINRAANNUAL REPORT 2017
26-Jun-2018 10:56 ESTCLN PSWDC
Donnelley Financial ADG pf_rend 20*PMT 1C
ADGP64RS1512.6.31
Management Report on Operations (continued)
RESTITUTION AND FINES
FINRA is dedicated to investor protection and market integrity through effective and efficient regulation of broker-dealers.One of FINRA’s tools for achieving this objective is vigorous, fair and effective enforcement of our members’ compliancewith securities laws and regulations.
When a member firm or registered representative engages in misconduct, restitution for harmed customers is our highestpriority, although there are many cases in which it is not practical. Restitution may be ordered when an investor hassuffered a quantifiable loss due to misconduct. The calculation of restitution is based on the actual amount of the losssustained by the investor, as demonstrated by evidence. We ordered restitution to harmed investors of $66.8 million and$27.9 million during 2017 and 2016. Restitution is assessed separately from fines and has no impact on how or when weuse fine money.
When a member firm or registered representative engages in misconduct, we also assess whether a sanction should beimposed in order to discourage similar conduct by the firm, registered representative or others. When we impose fines, theamounts are based on the facts and circumstances of the misconduct and the principles set forth in the FINRA SanctionGuidelines. The National Adjudicatory Council (NAC), which is composed of industry and non-industry members, continuesto maintain the FINRA Sanction Guidelines for use by the various bodies adjudicating FINRA disciplinary decisions, includingHearing Panels and the NAC itself, in determining appropriate remedial sanctions. FINRA publishes the FINRA SanctionGuidelines so that members, associated persons and their counsel may become more familiar with the types of disciplinarysanctions that may be applicable to various violations.
FINRA recognizes fines revenue upon issuance of a written consent or disciplinary decision. Fines are not based on revenueconsiderations, and we do not establish any minimum amount of fines that must be collected for purposes of our annualbudget. These monies are not considered in determining employee compensation and benefits.
The total amount of fines decreased by $108.9 million in 2017 to $64.9 million.
In January 2018, FINRA published Financial Guiding Principles that updated our policy for the use of fine monies. Underthat policy, any use of fine monies, regardless of amount, must be separately approved by the Board or its FinanceCommittee. The Board or Finance Committee may authorize the use of these funds for: (1) capital/initiatives ornon-recurring strategic expenditures that promote more effective and efficient regulatory oversight by FINRA (includingleveraging technology and data in a secure manner) or that enable improved compliance by member firms; (2) activities toeducate investors, promote compliance by member firms through education, compliance resources or similar projects, orensure our employees are highly trained in the markets, products and businesses we regulate; (3) capital initiativesrequired by new legal, regulatory or audit requirements; or (4) replenishing reserves in years where such reserves dropbelow levels reasonably appropriate to preserve FINRA’s long-term ability to fund its regulatory obligations.
In accordance with the Financial Guiding Principles, FINRA will issue a separate detailed report beginning next year onexpenditures related to fines during the previous fiscal year. This report will cover all projects for which fine monies wereused in the 2018 fiscal year.
FINRA 2017 Annual Financial Report 11

ˆ200F$TiRP!z$WmYM[Š200F$TiRP!z$WmYM[
592132 FIN 12FINRAANNUAL REPORT 2017
26-Jun-2018 10:56 ESTCLN PSWDC
Donnelley Financial ADG pf_rend 24*PMT 4C
ADGP64RS1512.6.31
g97r74-2.0g72q98-2.0
Management Report on Operations (continued)
BALANCE SHEET
Our focus is to ensure a balance sheet that positions FINRA to respond to the regulatory needs of our members and theinvesting public in today’s continually evolving markets. To that end, our balance sheet remains strong, with net assets ofapproximately $1.6 billion as of both December 31, 2017 and 2016. FINRA’s working capital (excluding fines) was$721.7 million as of December 31, 2017, and $833.8 million as of December 31, 2016. Our working capital and cash ratios(excluding fines) were 2.28 and 1.89 as of December 31, 2017, compared to 2.46 and 2.19 as of December 31, 2016. Thedecreases in FINRA’s working capital and the working capital and cash ratios were driven by the use of cash and theredemption of trading securities during 2017 to purchase long-term investments as part of our change in investmentstrategy.
Assets
Assets By Type as of December 31
($ in millions)
Cash and investments
Receivables
Property and equipment
Other
2017 2016
$2,097.5
$2,402.8
$146.2$106.0
$53.1
$2,046.8
$2,332.2
$127.6$111.5
$46.3
Assets By Type as of December 31, 2017
Property andequipment,
5%Receivables,
6%
Other,2%
Cash andinvestments,
87%
COMMENTARY: 2017 – 2016
Cash and investments (cash, cash equivalents andtrading, available-for-sale and other investments,including investments receivable), are the largest portionof FINRA’s total assets, consistently representing close to
90 percent of total assets annually. Our primary marketrisk relates to the Portfolio. Our investments are impactedby fluctuations in the securities markets and interestrates, as well as other financial and nonfinancial risks.
12 FINRA 2017 Annual Financial Report

ˆ200F$TiRP!z$ZprMÀŠ200F$TiRP!z$ZprM
592132 FIN 13FINRAANNUAL REPORT 2017
26-Jun-2018 10:56 ESTCLN PSWDC
Donnelley Financial ADG pf_rend 23*PMT 4C
ADGP64RS1512.6.31
g10m84-3.0
Management Report on Operations (continued)
Assets (continued)
Cash and investments as of December 31, 2017, arepresented in the following chart.
Cash and Investments By Typeas of December 31, 2017
Limitedpartnership,
31%
Tradinginvestments,
20%
Available-for-saleinvestments,
15%
Cash and cashequivalents,
15%
Privateinvestment funds,
15%
Investmentsreceivable,
4%
Total assets increased $70.6 million or 3 percent. Thefollowing table identifies the individually materialchanges in assets year over year.
Assets(in millions)
2017 – 2016
2016 $2,332.2
Investment returns 142.5
Change in market value for available-for-salesecurities 31.3
Increase in SEC fees 22.2
Pension and postretirement plan contributions (13.3)
Depreciation and amortization (15.4)
Change in investments (net trade date) (25.1)
Cash used in operating activities (62.3)
Other (9.3)
2017 $2,402.8
Total assets increased year over year primarily due toinvestment returns and change in market value of8.8 percent in 2017 and an approximate six percent SECfee rate increase from December 31, 2016, toDecember 31, 2017.
These increases were offset by pension andpostretirement plan contributions, depreciation andamortization of our property, equipment and intangibleassets, the change in investments payable and areduction in operating cash during 2017.
The pension plan’s funding policy is to fund at least100 percent of the plan’s funding target liability as setforth by the Internal Revenue Service. We made a$10 million contribution to the pension plan during 2017.
Depreciation and amortization represent the normalreduction in our property, equipment and intangible assetbase year over year.
Investments payable relate to investments purchased butnot yet settled (paid) on or prior to the balance sheet dateand fluctuate based on the timing and amount ofpending investment activities. The decrease in theinvestments payable balance from one year to anotherresults in a decrease in total assets.
Finally, 2017 operating activities (cash-basis expenses inexcess of revenues) led to a cash decrease of $62.3 million.This amount represents cash used in operating activitiesin the consolidated statement of cash flows excluding the$23.6 million of cash redemptions of equity methodinvestments classified as returns on the investment underthe cumulative earnings approach.
FINRA 2017 Annual Financial Report 13

ˆ200F$TiRP!z$bVktUŠ 200F$TiRP!z$bVktU
592132 FIN 14FINRAANNUAL REPORT 2017
26-Jun-2018 10:56 ESTCLN PSWDC
Donnelley Financial ADG pf_rend 41*PMT 4C
ADGP64RS1512.6.31
g30v74-1.0g73c41-2.0
Management Report on Operations (continued)
Liabilities
Liabilities By Type as of December 31
($ in millions)$806.9$780.5
2017 2016
Other
Deferred revenues
Pension and other postretirement*
Investments payable
$195.9 $173.7
$192.9$154.4
$183.7
$79.9
$77.8
$54.4$30.2$26.4
$183.7
$78.9
$70.2$53.2$30.8 $1.3
SEC fee payable
Accrued personnel and benefit costs
Deposits and renewals
Accounts payable and accrued expenses
* includes current and long-term pension and other postretirement liabilities,respectively, of $9.2 million and $183.7 million as of December 31, 2017, and$6.9 million and $147.5 million as of December 31, 2016.
Liabilities By Type as of December 31, 2017
Other,6%
Deferred revenues,
10%
Accrued personneland benefit costs,
23%
Pension andother
postretirement,24%
SEC fee payable,24%Deposits and
renewals, 9%
Accounts payable andaccrued expenses,
4%
COMMENTARY: 2017 – 2016
Total liabilities increased $26.4 million or 3.4 percent. Thefollowing table identifies the individually materialchanges in liabilities year over year.
Liabilities(in millions)
2017 – 2016
2016 $780.5
Increase in pension plan liability 29.0
Increase in SEC fees payable 22.2
Decrease in deposits and renewals (7.6)
Decrease in investments payable (25.1)Other 7.9
2017 $806.9
Pension plan changes in actuarial assumptions andnormal costs, partially offset by asset performance andthe annual pension contribution, led to a $29 millionincrease in the pension liability year over year. Thisincrease was driven by $66.7 million of actuarial lossesand $38.2 million of service and interest costs, offset byfavorable asset performance of $65.9 million and ourpension contribution of $10 million. The actuarial losses
were due primarily to a decrease in the discount rate from4.25 percent at December 31, 2016, to 3.65 percent atDecember 31, 2017. Service and interest costs representbenefits attributed to the current year.
Pension and other postretirement benefit costs representa significant liability to FINRA in terms of both theassumptions used to estimate the liability and its portionof FINRA’s total liabilities. These costs have historicallyrepresented close to 25 percent of total liabilities on anannual basis. Further disclosures regarding theassumptions used in determining our pension and otherpostretirement liabilities can be found in Note 2,“Summary of Significant Accounting Policies.”
The rate increase from $21.80 to $23.10 per million dollarsin transactions drove the increase in our SEC fee payable.We remit these SEC fees to the U.S. Treasurysemiannually, in March and September.
Deposits and renewals decreased due to lower firm fundinginto our Central Registration Depository (CRD®) system.
Investments payable relate to security trades and otherinvestment redemptions or purchases executed on or prior
14 FINRA 2017 Annual Financial Report

ˆ200F$TiRP!z$hbLtHŠ 200F$TiRP!z$hbLtH
592132 FIN 15FINRAANNUAL REPORT 2017
26-Jun-2018 10:56 ESTCLN PSWDC
Donnelley Financial ADG pf_rend 27*PMT 4C
ADGP64RS1512.6.31
g66v17-2.0
Management Report on Operations (continued)
to the balance sheet date, but not yet settled, as we follow trade-date accounting. Year-end balances fluctuate based on thetiming and amount of pending investment activity.
LIQUIDITY AND CAPITAL RESOURCES
Liquidity is the ongoing ability to fund asset growth and business operations and meet contractual obligations throughunrestricted access to funding at reasonable market rates. Liquidity management involves forecasting fundingrequirements and maintaining sufficient working capital to meet business needs and accommodate fluctuations in assetand liability levels due to changes in business operations or unanticipated events. We primarily rely on operating cashflows to fund current and future operations.
We maintain an unsecured line of credit agreement with the option to borrow up to $200 million at the LIBOR DailyFloating Rate plus 0.55 percent (2.1 percent at December 31, 2017). This line of credit is available to us from January 1 toJune 30 of each year. The line of credit provides us with a mechanism to fund operations prior to the annual billing of theGIA and PA in April, and the subsequent receipt of those funds, without having to make redemptions from the Portfolio. Asof December 31, 2017, and December 31, 2016, no amounts were outstanding under this line of credit. Additionally, as ofthe date of this report, no amount was outstanding under this line of credit.
The Portfolio is governed by a policy based on the degree of risk deemed appropriate for FINRA assets by the Board as applied toits investment objectives. FINRA’s Investment Committee, whose members have extensive background and experience in theinvestment community, provides overall guidance and advice in determining the appropriate policy and allocation for thePortfolio. As of December 31, 2017, our investments remained highly liquid, with 63 percent available in 30 days or less.
ENTERPRISE RISK MANAGEMENT
FINRA’s Enterprise Risk Management (ERM) program is designed to provide a consolidated, organization-wide view of therisks that FINRA faces in the execution of its mission, strategic goals and key business objectives. The program covers abroad spectrum of risks in various risk categories, such as strategic, operational, legal and compliance, and financial, andprovides transparency for senior management and the Board regarding FINRA’s enterprise-level risks and how they arebeing managed. The chart below shows the governance structure FINRA has in place to oversee and manage enterprise risk.
ManagementCommittee
Board of Governors
Oversight of Enterprise Risks
RegulatoryPolicy
Committee
Finance, Operations& Technology
Committee
ManagementCompensation
Committee
ERM Team
Internal Audit
ExecutiveCommittee
CEO
CFAO
Executive Leadership
Senior Leadership
AuditCommittee
Oversight of ERM Process
ERM WorkingGroup
FINRA 2017 Annual Financial Report 15

ˆ200F$TiRP!z$kegt+Š200F$TiRP!z$kegt+
592132 FIN 16FINRAANNUAL REPORT 2017
26-Jun-2018 10:56 ESTCLN PSWDC
Donnelley Financial ADG pf_rend 28*PMT 1C
ADGP64RS1512.6.31
Management Report on Operations (continued)
The Board oversees the ERM program, with oversight of the ERM process delegated to the Audit Committee and theprimary oversight for each enterprise risk assigned to a specific Board committee, with support by other committees andworking groups as the need arises.
Where Board committees are assigned primary risk oversight responsibility, those committees meet to review and discussthe assigned enterprise risk with the designated risk owners, including factors impacting the risk, risk response, and risktolerances and metrics.
Executive support and oversight of ERM is effected through the Management Committee, comprised of the ChiefExecutive Officer (CEO), Chief Financial and Administrative Officer (CFAO) and other senior executives across theorganization. There is also an ERM Working Group that brings together senior managers across FINRA to provide freshperspectives and support. FINRA’s Internal Audit Department serves the ERM program in an advisory capacity.
FINRA’s ERM program addresses a number of areas important to the execution of the organization’s mission, and FINRAmanagement is actively engaged with the Board in the program’s operations.
CYBER AND INFORMATION SECURITY
FINRA operates a comprehensive security program designed to mitigate cyber and physical information security threatsand ensure compliance with applicable data privacy regulations and laws. We base our program upon industry bestpractices, and are guided by federal and international standards, and data privacy laws and regulations. Cybersecurity andinformation security breach risks are integrated into FINRA’s ERM program.
Specifically, FINRA’s information-security practices and operational controls include leading practices such as a formalsecurity assessment program used to evaluate vendor, partner, and third party security practices; and real-time logging,monitoring and alerting of security events.
FINRA’s adoption of cloud technology provides numerous benefits, such as access to best-of-breed security solutions madeavailable by the cloud provider’s scale of operations. Another benefit is our ability to use micro-segmentation, or puttingeach server into a security zone of one, which dramatically reduces attack surface area. Cloud technology also enables usto focus on the automation and tools necessary to raise the compliance bar and simplify controls, which allows us toconsistently build fully compliant quality-control and production environments.
FINRA information technology systems are subject to numerous mandatory and voluntary inspections including, but notlimited to, the following:
Ô regular vulnerability scans;Ô application code analysis and security testing using automated scans, dynamic testing and manual attack
techniques to identify application-level vulnerabilities;Ô periodic independent third-party penetration tests and application security assessments;Ô annual inspections conducted by the Securities and Exchange Commission;Ô an annual Service Organization Control (SOC) 2 Type II Assessment; andÔ annual assessments by our Internal Audit department.
16 FINRA 2017 Annual Financial Report

ˆ200F$TiRP!z$nHaM_Š200F$TiRP!z$nHaM_
592132 FIN 17FINRAANNUAL REPORT 2017
26-Jun-2018 10:56 ESTCLN PSWDC
Donnelley Financial ADG pf_rend 39*PMT 1C
ADGP64RS1512.6.31
Investment Committee ReportYear Ended December 31, 2017
FINRA’s investment portfolio,* which originally derived from the sale of NASDAQ that culminated in 2006, is overseen bythe Investment Committee, a standing committee of FINRA, and managed to preserve principal and support ourregulatory operations. FINRA has a set of Financial Guiding Principles that establish a goal of maintaining investmentbalances equal to at least one year of expenditures. Distributions from the portfolio are subject to prior approval by theBoard of Governors (Board), and may be used to defer member fee increases or make up cash flow losses, among otheruses.
FINRA’s portfolio earned 8.8 percent in 2017, including returns from its cash operating fund. Overall, 2017 was a yearcharacterized by rising markets within a stable risk environment. Globally, equities produced substantial returns bolsteredby strong economic data and optimism concerning the reduction in U.S. corporate tax rates. Bonds experienced moremodest returns as the Federal Reserve continued to raise interest rates amid strengthening U.S. economic data andincreasing inflation expectations. The chart below shows investment results for FINRA and for several common marketindices and standard portfolios of equities and bonds. As of December 31, 2017, FINRA’s investment portfolio, includingcash, totaled approximately $1.7 billion. Portfolio liquidity remains strong, with $1.1 billion, or 63 percent, available in 30
days or less as of December 31, 2017.
Annualized Returns2017 3-Year 5-Year Inception (1)
FINRA 8.8% 4.3% 4.9% 3.8%
U.S. Consumer Price Index 2.1% 1.6% 1.4% 2.1%
Bloomberg Barclays U.S. Aggregate Bond Index 3.5% 2.2% 2.1% 4.1%
40% MSCI ACWI (2)/60% BB U.S. Agg. Bond Index 11.6% 5.4% 5.9% 6.0%
60% MSCI ACWI (2)/40% BB U.S. Agg. Bond Index 15.8% 6.9% 7.7% 6.7%
Standard Deviation 2017 3-Year 5-YearFINRA 0.9% 3.2% 3.2%
40% MSCI ACWI (2)/60% BB U.S. Agg. Bond Index 1.5% 4.4% 4.4%
60% MSCI ACWI (2)/40% BB U.S. Agg. Bond Index 1.8% 6.3% 6.1%
Sharpe Ratio (3) 3-Year 5-YearFINRA 1.2 1.4
40% MSCI ACWI (2)/60% BB U.S. Agg. Bond Index 1.1 1.3
60% MSCI ACWI (2)/40% BB U.S. Agg. Bond Index 1.0 1.2
(1) Since inception as of 1/1/04.(2) The MSCI All Country World Index is a broad, investable index designed to measure the performance of global equity
markets.(3) The Sharpe ratio is the return earned in excess of the risk-free rate (3-Month US Treasury Bill) on a portfolio, relative to the
portfolio’s total risk, as measured by the standard deviation of its returns over the measurement period.
The FINRA Board is responsible for FINRA’s investments and approved the charter that guides the FINRA InvestmentCommittee. The Investment Committee, which is composed of members of the Board and other outside investmentprofessionals, advises the Board and provides guidance in determining the appropriate policy, guidelines and allocation forFINRA’s investments. The FINRA Investment Office is responsible for management of the investments within theframework of the investment policy. FINRA engages investment consultants to support the Investment Office as needed.The Investment Committee met six times during 2017.
* For the purposes of this Investment Committee report, FINRA’s investment portfolio includes the FINRA Investor EducationFoundation’s investments and investments net of their related receivables and payables on the consolidated balance sheet,and excludes Section 31 fees received but not yet remitted to the SEC.
FINRA 2017 Annual Financial Report 17

ˆ200F$TiRP!z$orBMÄŠ200F$TiRP!z$orBM˜
592132 FIN 18FINRAANNUAL REPORT 2017
26-Jun-2018 10:56 ESTCLN PSWDC
Donnelley Financial ADG pf_rend 23*PMT 4C
ADGP64RS1512.6.31
g25l69-2.0
Investment Committee Report (continued)
FINRA operates under a low volatility investment strategy, with the objective of creating a lower-risk portfolio than atraditional 60 percent stock/40 percent bond allocation as measured by standard deviation. In 2017, the InvestmentCommittee directed the gradual implementation of revisions to FINRA’s investment policy that were approved by theBoard in December 2016. The revised policy consists of a core portfolio of stocks and bonds and a satellite portfolio ofstrategies with lower correlations to the capital markets for risk-managed diversification. The policy will increase portfolioliquidity and reduce overall fees, while remaining consistent with FINRA’s risk tolerance. With this policy, FINRA continuesto maintain a broadly diversified investment portfolio, representing a wide range of assets and asset classes, in order toattain acceptable levels of risk as determined by the Board. The Investment Committee reviews the policy annually andmay recommend changes subject to approval by the Board.
The chart below shows portfolio exposures as of December 31, 2017. Primary exposures are 33 percent bonds/cash,37 percent equities and 26 percent non-correlated. Real assets, at 4 percent, comprise investments in real estate,commodities and Treasury Inflation-Protected Securities (TIPS).
Exposures as of December 31, 2017
Bonds / Cash,33%
Equities,37%
Real Assets,4%
Non-correlated,26%
FINRA has an Investments Conflicts of Interest policy that establishes the standards governing the separation ofinvestment activities and decisions from FINRA’s regulatory operations. FINRA’s investment strategy limits the directownership of investment assets to debt securities, mutual and commingled funds, treasury futures, limited partnershipinterests and shares in private investment funds. Within our fixed income portfolio, all securities in the banking andbrokerage sectors are held in a blind trust, in order to prohibit any knowledge of or participation in the making of suchinvestments by any FINRA regulatory personnel, and to avoid any appearance of a conflict of interest with FINRA’sresponsibilities. Our limited partnership interest and our investments in public and private funds are each maintained as apooled vehicle in which FINRA has neither management discretion nor direct ownership of the underlying investments.
18 FINRA 2017 Annual Financial Report

ˆ200F$TiRP!z$qlGt0Š 200F$TiRP!z$qlGt0
592132 FIN 19FINRAANNUAL REPORT 2017
26-Jun-2018 10:56 ESTCLN PSWDC
Donnelley Financial ADG pf_rendSTART PAGE
19*PMT 1C
ADGP64RS1512.6.31
Investment Committee Report (continued)
Third-party providers make all implementation decisions within the portfolio. With respect to internal activities, theoversight and management of the portfolio is performed by the Investment Committee and limited to essential staffonly—defined as the Chief Executive Officer, Chief Financial and Administrative Officer, Investment Office, CorporateGeneral Counsel, Corporate Secretary, Internal Audit and FINRA subject-matter experts assisting the internal auditors andthe independent auditor in the performance of audit responsibilities with respect to the FINRA investment portfolio. Withthose exceptions, no individual in the regulatory arm of the organization has any knowledge of the securities within ourinvestment portfolio.
Members of the Investment Committee:
Luis M. Viceira, ChairCarol Anthony (John) DavidsonRichard J. FlanneryWilliam H. HeymanCharles I. PlosserRichard C. RomanoGeorge (Gus) Sauter
June 27, 2018
FINRA 2017 Annual Financial Report 19

ˆ200F$TiRP!z$sDyt:Š200F$TiRP!z$sDyt:
592132 FIN 20FINRAANNUAL REPORT 2017
26-Jun-2018 10:56 ESTCLN PSWDC
Donnelley Financial ADG pf_rend 22*PMT 1C
ADGP64RS1512.6.31
Audit Committee ReportYear Ended December 31, 2017
The Audit Committee of the Board of Governors (Board) assists the Board in fulfilling its responsibility for Board oversightof the quality and integrity of the accounting, auditing and financial reporting practices of FINRA in accordance with theCharter adopted by the Board.
Each member of the Audit Committee is an independent director as defined by the Securities and Exchange Commission’s(SEC) Rule 10A-3 under The Securities Exchange Act of 1934, Listing Standards Relating to Audit Committees. In addition,the Audit Committee and Board have determined that Leslie F. Seidman, Carol Anthony (John) Davidson and Eileen Murrayare audit committee financial experts, as defined by the SEC.
During 2017, the Audit Committee met seven times.
The Charter and the By-Laws of FINRA make the Chief Audit Executive directly responsible to the Audit Committee. In allrespects, the Charter complies with standards applicable to publicly-owned companies. (The Charter for the FINRA AuditCommittee is available at: www.finra.org/about/audit-committee-charter.)
Additionally, the Charter gives the Audit Committee responsibility for monitoring the independence of the independentauditor, recommending the appointment of the independent auditor for approval by the Board, ensuring sufficient scopeof independent auditor activities to perform an adequate financial statement audit and ensuring the independent auditoris fairly and appropriately compensated for its effort. The Charter makes clear that the independent auditor is accountableto the Audit Committee and the Board, as representatives of the members and the public. In addition, the AuditCommittee discusses significant areas of the audit engagement with the independent auditor, with and withoutmanagement present, as needed.
In discharging its oversight responsibility, the Audit Committee reviewed the assessments of audit risk and the audit plansof both the independent and internal auditors. The Audit Committee also discussed with management, the internalauditors, and the independent auditor the quality and adequacy of FINRA’s internal controls and the internal auditorganization, responsibilities, budget and staffing.
In conducting its formal annual assessment of the independent auditor, Audit Committee considerations include, but arenot limited to, the following factors: (i) the most recent results from surveys conducted by management regarding theperformance of the independent auditor, incorporating audit quality, the experience of the engagement team,reasonableness of audit cost, Public Company Accounting Oversight Board (PCAOB) inspection results of the independentauditor and the ongoing strength of the independent audit firm’s reputation; (ii) the length of time the firm has served asFINRA’s independent auditor; and (iii) the timeliness of the independent auditor in escalating issues and reporting resultsto and answering questions proposed by the Audit Committee.
The lead audit partner, having primary responsibility for the audit, rotates off the engagement every five years, and theAudit Committee is involved in the selection of the lead audit partner. The current lead audit partner was appointed in July2016.
Ernst & Young LLP (EY) has served as FINRA’s auditor since 1986.
20 FINRA 2017 Annual Financial Report

ˆ200F$TiRP!z$uxsMbŠ 200F$TiRP!z$uxsMb
592132 FIN 21FINRAANNUAL REPORT 2017
26-Jun-2018 10:56 ESTCLN PSWDC
Donnelley Financial ADG pf_rend 20*PMT 1C
ADGP64RS1512.6.31
Audit Committee Report (continued)
The Audit Committee obtained a written statement from EY, describing all relationships with FINRA. The Audit Committeediscussed those relationships and was satisfied that none of the relationships were incompatible with the auditor’sindependence. The Audit Committee has reviewed and approved all services, including non-audit services, performed by EYfor FINRA and the associated fees before initiation of each engagement. We have summarized such services and fees inthe following table:
FINRA2017 2016
Audit services (1) $1,193,995 $1,109,995
Audit-related services (2) 282,300 274,000
Tax services (3) 114,057 99,490
All other services (4) — 499,227
Total $1,590,352 $1,982,712
(1) For 2017 and 2016, audit services represent the consolidated financial statement audit and the audit of internal control overfinancial reporting.
(2) Audit and attest services provided to FINRA and subsidiaries.
(3) Tax services represent fees related to tax return preparation and review services in connection with the 2017 and 2016 Form990s and related Form 990-Ts, as well as other tax compliance, advice and planning.
(4) All other services represent EY’s advisory services related to FINRA’s efforts to leverage technology innovations and thestandard reporting metrics initiative.
The Audit Committee discussed and reviewed with the independent auditor all communications required under the rulesadopted by the PCAOB. Further, the Audit Committee has reviewed and discussed with management and EY, with andwithout management present, the consolidated audited financial statements as of December 31, 2017; management’sassessment of the effectiveness of FINRA’s internal control over financial reporting; and EY’s report on the consolidatedfinancial statements and on FINRA’s internal control over financial reporting. Based on those discussions, the AuditCommittee recommended to the Board that FINRA’s audited consolidated financial statements and related reports oninternal control be included in the Annual Report for the year ended December 31, 2017.
Members of the Audit Committee:
Leslie F. Seidman, ChairCarol Anthony (John) DavidsonEileen Murray
June 27, 2018
FINRA 2017 Annual Financial Report 21

ˆ200F$TiRP!z$wTXMÁŠ200F$TiRP!z$wTXM`
592132 FIN 22FINRAANNUAL REPORT 2017
26-Jun-2018 10:56 ESTCLN PSWDC
Donnelley Financial ADG pf_rendSTART PAGE
18*PMT 1C
ADGP64RS1512.6.31
Management Compensation Committee ReportYear Ended December 31, 2017
FINRA Compensation Philosophy
FINRA’s compensation philosophy is a pay-for-performance model that seeks to achieve pay levels in line with thecompetitive market while meeting the objectives of attracting, developing and retaining high-performing individuals whoare capable of achieving our mission, and to provide rewards commensurate with individual contributions and FINRA’soverall performance. This philosophy applies to employees at all levels within the organization.
Benchmarking
FINRA strives to be competitive with the external market when establishing starting pay rates, annual incentives andsalary structures. A number of external sources are leveraged to compile market data to establish these structures. FINRAuses specific position survey data to evaluate skill sets and benchmarks the compensation paid to internal talent todetermine whether compensation is comparable to the price that those skills would command on the open market.Ultimately, in assessing how to price staff positions, FINRA places an emphasis foremost on the demands andcompetitiveness of each job to ensure that FINRA is paying equitably for skills, expertise and performance level within theoverall context of remaining comparable to the market.
Defining the relevant employment market for competitive compensation benchmarking purposes is a significantchallenge for FINRA due to the scarcity of natural comparisons, the uniqueness of functions performed, the need forspecialized expertise in financial services and securities law and a constantly changing environment under heightenedscrutiny.
As part of its compensation philosophy, FINRA has determined that its competitive compensation positioning for allemployees should be considered against a broad section of financial services and capital market companies, as this is themost likely sector from which FINRA will recruit talent, and that would recruit talent away from the Company. FINRA alsobenchmarks against general industry positions and law departments for jobs that are not unique to the financial servicesindustry. FINRA recognizes that it does not provide fully competitive opportunities, particularly in the equity/long-termincentive area, when compared to certain global investment and securities firms. As a result, benchmarking for keyexecutives will follow the same philosophy but with ranges geared to offset the lack of long-term incentives.
Executive Compensation
The Management Compensation Committee (the Committee), which is composed solely of public members of the Boardof Governors (Board), is responsible for approving salary levels and incentive compensation ranges for top-level executives.The Committee determines the incentive compensation awards based on actual performance. In determining salary andincentive compensation, management and the Committee consider operational, strategic and financial factors in additionto individual performance. The salary and incentive compensation recommendations for the CEO are reviewed andapproved by the Board annually. The Committee met five times during 2017.
22 FINRA 2017 Annual Financial Report

ˆ200F$TiRP!z$zvBtÊ200F$TiRP!z$zvBtˆ
592132 FIN 23FINRAANNUAL REPORT 2017
26-Jun-2018 10:57 ESTCLN PSWDC
Donnelley Financial ADG pf_rend 18*PMT 1C
ADGP64RS1512.6.31
Management Compensation Committee Report (continued)
The Committee has the sole right and responsibility to hire and terminate a compensation consultant. In 2017, as in pastyears, the Committee engaged Mercer, Inc. (Mercer), an independent third-party compensation consultant, to prepare acompensation study, which included objective analysis of current compensation levels and benchmarking usinginformation from a comparable segment of the market for key executives. To ensure the independence of Mercer:
Ô throughout the year, Mercer reported directly and exclusively to the Committee;Ô no Mercer employee is hired by FINRA;Ô Mercer provides no significant services, other than compensation consulting services, to FINRA;Ô any interaction between Mercer and FINRA executive management is limited to discussions on behalf of the
Committee and information that is presented to the Committee for approval; andÔ fees paid to Mercer for compensation consulting services are reasonable and in line with industry standards.
In determining a benchmarking strategy for key executives, financial services organizations (broker-dealers, investmentbanks, Federal Reserve banks, commercial banks, insurance companies, exchanges and regulators) were determined to bethe most relevant group for comparison purposes. The Committee and Mercer engaged in substantial research andconsideration of the functions and operations of several potential comparisons as well as general competitive conditions.Ultimately, the Committee approved a benchmarking process for key executives that focused on the following sources:
Ô Public comparison group comprised of a blend of financial services organizations engaged in brokerage orother related banking activities.
Ô Public exchanges and regulators.Ô Financial services industry survey data.
The Committee will routinely review the aforementioned sources in determining annual salary and incentivecompensation.
FINRA 2017 Annual Financial Report 23

ˆ200F$TiRP!z$#7jt5Š200F$TiRP!z$#7jt5
592132 FIN 24FINRAANNUAL REPORT 2017
26-Jun-2018 10:57 ESTCLN PSWDC
Donnelley Financial ADG pf_rend 25*PMT 1C
ADGP64RS1512.6.31
Management Compensation Committee Report (continued)
Summary Compensation Table
The following table presents actual 2017 and 2016 compensation data in the year paid (all amounts are in dollars). The2018 salary information represents the base annual salary at which the named executives, as of June 27, 2018, arecompensated. It does not represent 2018 year-to-date earnings. The 2018 incentive compensation amounts represent theactual payment in March 2018 based on 2017 performance. Other amounts, including deferred compensation and otherbenefits, are not presented for 2018, as these accumulate over the course of the year and final amounts are notdetermined until year-end. The top ten executives are determined based on total 2018 salary and incentive compensationas described above.
Name and principal position Salary (1)Incentive
compensation (2)
Othercompensation
anddeferrals (3)
Otherbenefits (4) Total
Robert W. Cook 2018 1,000,000 1,350,000 (5) * * 2,350,000 (5)
President and Chief Executive Officer 2017 1,000,000 0 (6) 440,984 10,539 1,451,523
2016 (7) 346,154 — 92,865 3,293 442,312
Todd T. Diganci 2018 600,000 625,500 * * 1,225,500
EVP – Chief Financial and 2017 600,000 695,000 145,105 37,250 1,477,355
Administrative Officer 2016 592,308 750,000 128,438 28,634 1,499,380
Steven J. Randich 2018 500,000 527,000 * * 1,027,000
EVP and Chief Information Officer 2017 500,000 580,000 239,633 33,415 1,353,048
2016 500,000 575,000 143,473 34,315 1,252,788
Robert L. D. Colby 2018 500,000 441,000 * * 941,000
EVP and Chief Legal Officer 2017 500,000 490,000 173,840 29,297 1,193,137
2016 500,000 525,000 142,006 24,455 1,191,461
Thomas R. Gira 2018 450,000 418,500 * * 868,500
EVP, Market Regulation and 2017 450,000 465,000 76,230 28,027 1,019,257
Transparency Services 2016 446,154 500,000 1,672,753 (8) 39,002 2,657,909
Susan Schroeder 2018 (9) 420,000 400,000 * * 820,000
EVP and Head of Enforcement 2017 (9) 353,390 240,000 214,731 30,176 838,297
2016 322,573 260,000 83,538 22,196 688,307
Cameron K. FunkhouserEVP, Office of Fraud Detectionand Market Intelligence
2018 375,000 384,500 * * 759,500
2017 375,000 418,000 90,799 30,664 914,463
2016 375,000 435,000 72,543 35,392 917,935
Michael G. Rufino 2018 365,000 380,000 * * 745,000
EVP, Head of Member Regulation – 2017 365,000 413,000 134,050 41,406 953,456
Sales Practice 2016 363,462 430,000 218,391 36,314 1,048,167
Marcia E. Asquith 2018 (9) 370,000 370,000 * * 740,000
EVP, Board and External Relations 2017 (9) 332,308 355,000 128,673 24,909 840,890
2016 287,692 300,000 106,802 36,365 730,859
William J. Wollman 2018 365,000 322,000 * * 687,000
EVP, Member Regulation – Risk 2017 365,000 350,000 204,787 28,859 948,646
Oversight and Operational Regulation 2016 361,154 365,000 273,327 25,079 1,024,560
* 2018 deferred compensation and other benefits cannot be fully determined until the end of the calendar year, and aretherefore not included in the above table.
24 FINRA 2017 Annual Financial Report

ˆ200F$TiRP!z$&@st,Š200F$TiRP!z$&@st,
592132 FIN 25FINRAANNUAL REPORT 2017
26-Jun-2018 10:57 ESTCLN PSWDC
Donnelley Financial ADG pf_rend 23*PMT 1C
ADGP64RS1512.6.31
Management Compensation Committee Report (continued)
1 Salary is paid bi-weekly, one week in arrears. 2018 salary information represents the executives’ current base annual rate ofpay as of June 27, 2018.
2 Incentive compensation is paid after the close of the calendar year based on the prior year’s performance. Payments arereflected in the table above in the year paid, consistent with FINRA’s reporting in its Form 990 tax returns. Thus, the amountpresented in 2018 was paid in March 2018, based on 2017 performance.
3 Other compensation and deferrals include earnings and accruals in supplemental executive retirement plans, which are notavailable to all employees. Mr. Diganci, Mr. Gira and Mr. Funkhouser participate in FINRA’s supplemental defined benefitretirement plan, which is now closed to new participants. The remaining listed executives are participants in thesupplemental defined contribution retirement plan. Other compensation and deferrals also include payments and accrualsfor multi-year retention arrangements as well as employer-funded 401(k) matching contributions and the accrual of benefitsin FINRA’s employee retirement plans. The 401(k) and retirement plans are generally available to all employees.
4 Other benefits include taxable and non-taxable benefits such as employer-paid health, life and disability insurance, whichare generally available to all employees. They also include parking, travel subsidies, tax gross-ups and other miscellaneousfringe benefits.
5 In 2018, Mr. Cook contributed $675,000 of his 2017 incentive compensation (less estimated taxes payable by him) to theFINRA Investor Education Foundation. After consideration of this contribution, Mr. Cook’s total compensation for 2018 waseffectively $1,675,000.
6 Mr. Cook was eligible for but declined to accept incentive compensation for 2016.7 The 2016 compensation for Mr. Cook represents a partial year of employment.8 This amount represents a one-time cliff vesting event within the supplemental defined benefit retirement plan, covering
more than 24 years of service to FINRA.9 The year-over-year increase in compensation for these individuals is driven by their promotion to Executive Vice President
during 2017.Components of CompensationDirect Compensation
Ô Base salaries consist of job-grade structures to provide for appropriate flexibility in hiring and retention. Actualsalaries are based on job content, performance and relevant experience levels, and may fall above or belowcompetitive levels.
Ô Incentive compensation is an additional “at-risk” compensation that is performance-based and determined inrelation to individual achievements and FINRA’s overall performance. The size of the actual award varies basedon goal achievement, performance, grade level and degree of responsibility within the organization. Ifawarded, it is paid as a lump sum in the following year.
Indirect CompensationÔ Supplemental retirement benefits are provided for top executives and are either defined benefit or defined
contribution based on employment start date. These plans are non-qualified and are based on salary, officerlevel, and, depending on officer level, a portion of incentive compensation.
Ô Employee and family health, life and other insurance, pension and 401(k) deferral and matching programs, healthclub subsidies and other benefits are generally available to all employees. Additionally, certain executives receivemiscellaneous taxable fringe benefits that may include parking, travel subsidies and similar minor items.
Members of the Management Compensation Committee:Rochelle B. Lazarus, ChairCarol Anthony (John) DavidsonWilliam H. HeymanHillary SaleLuis M. Viceira
June 27, 2018
FINRA 2017 Annual Financial Report 25

ˆ200F$TiRP!z#k6iMvŠ 200F$TiRP!z#k6iMv
592132 FIN 26FINRAANNUAL REPORT 2017
26-Jun-2018 10:56 ESTCLN PSWDC
Donnelley Financial ADG pf_rendSTART PAGE
25*PMT 1C
ADGP64RS3712.6.31
g38c77-1.0diganci_todd-2.0
Management Report on Internal Control Over FinancialReporting
FINRA management is responsible for the preparation and integrity of the consolidated financial statements appearing inour annual report. The consolidated financial statements were prepared in conformity with U.S. generally acceptedaccounting principles (U.S. GAAP) and include amounts based on management’s estimates and judgments. FINRAmanagement is also responsible for establishing and maintaining adequate internal control over financial reporting andfor the assessment of the effectiveness of internal control over financial reporting. Internal control over financial reportingis a process designed by management to provide reasonable assurance regarding the reliability of financial reporting andthe preparation of financial statements in accordance with U.S. GAAP.
FINRA maintains a system of internal control that is designed to provide reasonable assurance as to the fair and reliablepreparation and presentation of the consolidated financial statements, as well as to safeguard assets from unauthorizeduse or disposition that could have a material effect on the consolidated financial statements. FINRA’s internal control overfinancial reporting includes written policies and procedures that 1) pertain to the maintenance of records that, inreasonable detail, accurately and fairly reflect the transactions and dispositions of FINRA’s assets; 2) provide reasonableassurance that transactions are recorded as necessary to permit preparation of consolidated financial statements inaccordance with U.S. GAAP, and that receipts and expenditures of FINRA are being made only in accordance withauthorizations of FINRA’s management and governors; and 3) provide reasonable assurance regarding prevention ortimely detection of unauthorized acquisition, use or disposition of FINRA’s assets that could have a material effect on theconsolidated financial statements.
Because of its inherent limitations, internal control over financial reporting may not prevent or detect misstatements dueto error or fraud, including the possibility of the circumvention or overriding of controls. Projections of any evaluation ofeffectiveness to future periods are subject to the risk that controls may become inadequate because of changes inconditions, or that the degree of compliance with the policies or procedures may deteriorate.
Under the supervision of the President and Chief Executive Officer and the Chief Financial and Administrative Officer,FINRA’s management assessed the effectiveness of FINRA’s internal control over financial reporting as of December 31,2017. In making this assessment, management used the criteria set forth by the Committee of Sponsoring Organizationsof the Treadway Commission in Internal Control—Integrated Framework (2013 framework). This evaluation includedreviews of the documentation of controls, evaluations of the design effectiveness of controls, tests of the operatingeffectiveness of controls and a conclusion on management’s evaluation. Based on this assessment, we assert that FINRAmaintained effective internal control over financial reporting as of December 31, 2017.
FINRA’s consolidated financial statements included in this annual report have been audited by Ernst & Young LLP (EY), anindependent registered public accounting firm. EY has also issued an attestation report on FINRA’s internal control overfinancial reporting as of December 31, 2017.
June 27, 2018
Robert W. CookPresident and Chief Executive Officer
Todd T. DiganciExecutive Vice President – Chief Financial andAdministrative Officer
26 FINRA 2017 Annual Financial Report

ˆ200F$TiRP!z#oMCt†Š200F$TiRP!z#oMCt
592132 FIN 27FINRAANNUAL REPORT 2017
26-Jun-2018 10:56 ESTCLN PSWDC
Donnelley Financial ADG pf_rendSTART PAGE
21*PMT 1C
ADGP64RS3712.6.31
Report of Independent Registered Public Accounting Firm
To the Board of Governors ofFinancial Industry Regulatory Authority, Inc.
Opinion on Internal Control over Financial Reporting
We have audited the Financial Industry Regulatory Authority, Inc.’s internal control over financial reporting as ofDecember 31, 2017, based on criteria established in Internal Control—Integrated Framework issued by the Committee ofSponsoring Organizations of the Treadway Commission (2013 framework) (the COSO criteria). In our opinion, the FinancialIndustry Regulatory Authority, Inc. (FINRA) maintained, in all material respects, effective internal control over financialreporting as of December 31, 2017, based on the COSO criteria.
We also have audited, in accordance with the auditing standards of the Public Company Accounting Oversight Board(United States) (the PCAOB) and in accordance with auditing standards generally accepted in the United States of America,the consolidated balance sheets of FINRA as of December 31, 2017 and 2016, the related consolidated statements ofoperations, comprehensive income, changes in equity and cash flows for the years then ended, and the related notes andour report dated June 27, 2018 expressed an unqualified opinion thereon.
Basis for Opinion
FINRA’s management is responsible for maintaining effective internal control over financial reporting and for itsassessment of the effectiveness of internal control over financial reporting included in the accompanying ManagementReport on Internal Control Over Financial Reporting. Our responsibility is to express an opinion on FINRA’s internal controlover financial reporting based on our audit. We are required to be independent with respect to FINRA in accordance withthe relevant ethical requirements relating to our audit.
We conducted our audit in accordance with the auditing standards of the PCAOB and in accordance with auditingstandards generally accepted in the United States of America. Those standards require that we plan and perform the auditto obtain reasonable assurance about whether effective internal control over financial reporting was maintained in allmaterial respects.
Our audit included obtaining an understanding of internal control over financial reporting, assessing the risk that amaterial weakness exists, testing and evaluating the design and operating effectiveness of internal control based on theassessed risk, and performing such other procedures as we considered necessary in the circumstances. We believe that ouraudit provides a reasonable basis for our opinion.
Definition and Limitations of Internal Control Over Financial Reporting
A company’s internal control over financial reporting is a process designed to provide reasonable assurance regarding thereliability of financial reporting and the preparation of financial statements for external purposes in accordance withgenerally accepted accounting principles. A company’s internal control over financial reporting includes those policies andprocedures that (1) pertain to the maintenance of records that, in reasonable detail, accurately and fairly reflect thetransactions and dispositions of the assets of the company; (2) provide reasonable assurance that transactions arerecorded as necessary to permit preparation of financial statements in accordance with generally accepted accountingprinciples, and that receipts and expenditures of the company are being made only in accordance with authorizations ofmanagement and governors of the company; and (3) provide reasonable assurance regarding prevention or timelydetection of unauthorized acquisition, use, or disposition of the company’s assets that could have a material effect on thefinancial statements.
FINRA 2017 Annual Financial Report 27

ˆ200F$TiRP!z#sy9t"Š200F$TiRP!z#sy9t"
592132 FIN 28FINRAANNUAL REPORT 2017
26-Jun-2018 10:56 ESTCLN PSWDC
Donnelley Financial ADG pf_rend 21*PMT 1C
ADGP64RS3712.6.31
g09a84-1.0
Report of Independent Registered Public Accounting Firm(continued)
Because of its inherent limitations, internal control over financial reporting may not prevent or detect misstatements.Also, projections of any evaluation of effectiveness to future periods are subject to the risk that controls may becomeinadequate because of changes in conditions, or that the degree of compliance with the policies or procedures maydeteriorate.
Tysons, VirginiaJune 27, 2018
28 FINRA 2017 Annual Financial Report
ˆ200F$TiRP!z#wMyMsŠ 200F$TiRP!z#wMyMs
592132 FIN 29FINRAANNUAL REPORT 2017
26-Jun-2018 10:56 ESTCLN PSWDC
Donnelley Financial ADG pf_rend 25*PMT 1C
ADGP64RS3712.6.31
g09a84-1.0
Report of Independent Registered Public Accounting Firm
To the Board of Governors ofFinancial Industry Regulatory Authority, Inc.
Opinion on the Financial Statements
We have audited the accompanying consolidated balance sheets of the Financial Industry Regulatory Authority, Inc.(FINRA) as of December 31, 2017 and 2016, the related consolidated statements of operations, comprehensive income,changes in equity and cash flows for the years then ended, and the related notes (collectively referred to as the“consolidated financial statements”). In our opinion, the consolidated financial statements present fairly, in all materialrespects, the financial position of FINRA at December 31, 2017 and 2016, and the results of its operations and its cashflows for the years then ended in conformity with U.S. generally accepted accounting principles.
We also have audited, in accordance with the auditing standards of the Public Company Accounting Oversight Board(United States) (PCAOB) and in accordance with auditing standards generally accepted in the United States of America,FINRA’s internal control over financial reporting as of December 31, 2017, based on criteria established in Internal Control-Integrated Framework issued by the Committee of Sponsoring Organizations of the Treadway Commission (2013
framework) and our report dated June 27, 2018 expressed an unqualified opinion thereon.
Basis for Opinion
These financial statements are the responsibility of FINRA’s management. Our responsibility is to express an opinion onFINRA’s financial statements based on our audits. We are required to be independent with respect to FINRA in accordancewith the relevant ethical requirements relating to our audits.
We conducted our audits in accordance with the auditing standards of the PCAOB and in accordance with auditingstandards generally accepted in the United States of America. Those standards require that we plan and perform the auditto obtain reasonable assurance about whether the financial statements are free of material misstatement, whether dueto error or fraud. Our audits included performing procedures to assess the risks of material misstatement of the financialstatements, whether due to error or fraud, and performing procedures that respond to those risks. Such proceduresincluded examining, on a test basis, evidence regarding the amounts and disclosures in the financial statements. Ouraudits also included evaluating the accounting principles used and significant estimates made by management, as well asevaluating the overall presentation of the financial statements. We believe that our audits provide a reasonable basis forour opinion.
We have served as FINRA’s auditor since 1986.
Tysons, VirginiaJune 27, 2018
FINRA 2017 Annual Financial Report 29

ˆ200F$TiRP!z#ygRM~Š200F$TiRP!z#ygRM~
592132 FIN 30FINRAANNUAL REPORT 2017
26-Jun-2018 10:56 ESTCLN PSWDC
Donnelley Financial ADG pf_rendSTART PAGE
19*PMT 1C
ADGP64RS3712.6.31
FINRA Consolidated Balance Sheets(In millions)
December 31,2017 2016
AssetsCurrent assets:
Cash and cash equivalents $ 311.7 $ 332.4Investments:
Trading, at fair value 431.6 693.7
Available-for-sale, at fair value 323.1 278.8
Receivables, net 146.2 127.6
Investments receivable 78.1 25.7
Other current assets 22.7 19.0
Total current assets 1,313.4 1,477.2
Property and equipment:Land, buildings and improvements 127.6 129.1
Data-processing equipment and software 113.8 243.0
Furniture, equipment and leasehold improvements 70.5 72.2
311.9 444.3
Less accumulated depreciation and amortization (205.9) (332.8)
Total property and equipment, net 106.0 111.5
Other investments:Limited partnership 642.8 715.7
Private investment funds, at fair value 309.8 —
All other 0.4 0.5
Other assets 30.4 27.3
Total assets $2,402.8 $2,332.2
See accompanying notes.
30 FINRA 2017 Annual Financial Report
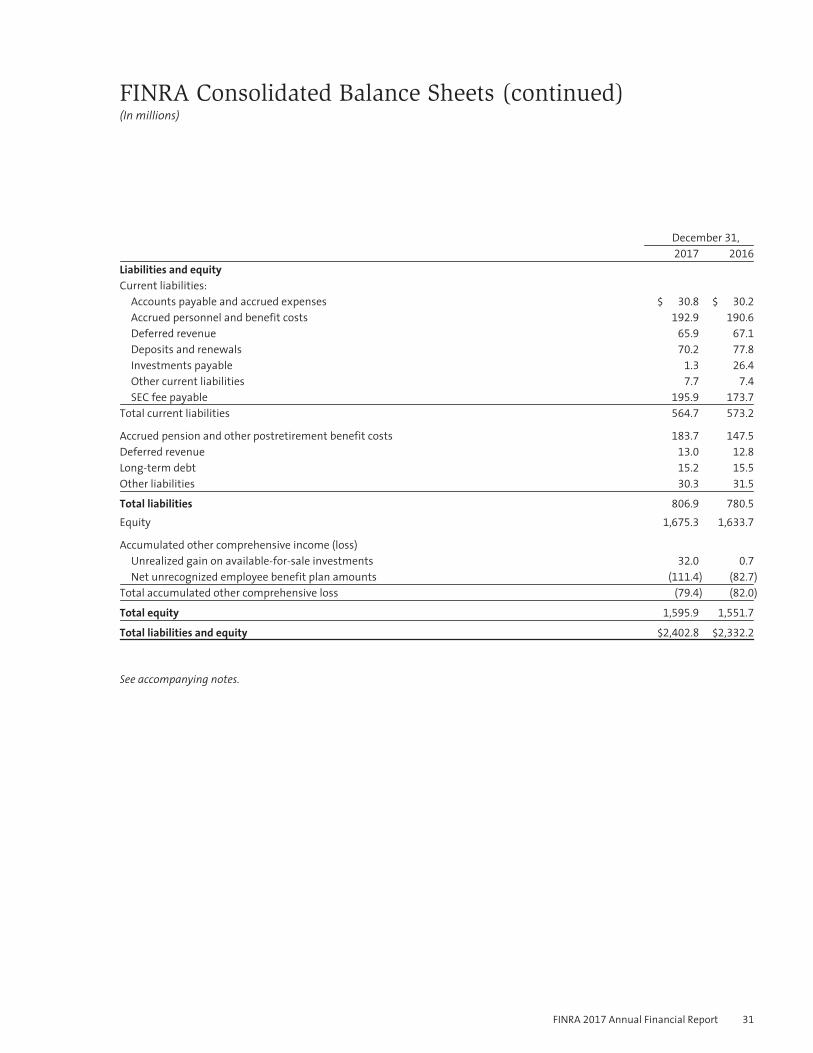
ˆ200F$TiRP!z#!ywMbŠ200F$TiRP!z#!ywMb
592132 FIN 31FINRAANNUAL REPORT 2017
26-Jun-2018 10:56 ESTCLN PSWDC
Donnelley Financial ADG pf_rend 22*PMT 1C
ADGP64RS3712.6.31
FINRA Consolidated Balance Sheets (continued)(In millions)
December 31,2017 2016
Liabilities and equityCurrent liabilities:
Accounts payable and accrued expenses $ 30.8 $ 30.2
Accrued personnel and benefit costs 192.9 190.6
Deferred revenue 65.9 67.1
Deposits and renewals 70.2 77.8
Investments payable 1.3 26.4
Other current liabilities 7.7 7.4
SEC fee payable 195.9 173.7
Total current liabilities 564.7 573.2
Accrued pension and other postretirement benefit costs 183.7 147.5
Deferred revenue 13.0 12.8
Long-term debt 15.2 15.5
Other liabilities 30.3 31.5
Total liabilities 806.9 780.5
Equity 1,675.3 1,633.7
Accumulated other comprehensive income (loss)Unrealized gain on available-for-sale investments 32.0 0.7
Net unrecognized employee benefit plan amounts (111.4) (82.7)
Total accumulated other comprehensive loss (79.4) (82.0)
Total equity 1,595.9 1,551.7
Total liabilities and equity $2,402.8 $2,332.2
See accompanying notes.
FINRA 2017 Annual Financial Report 31

ˆ200F$TiRP!z#&wGtÁŠ200F$TiRP!z#&wGt`
592132 FIN 32FINRAANNUAL REPORT 2017
26-Jun-2018 10:56 ESTCLN PSWDC
Donnelley Financial ADG pf_rend 23*PMT 1C
ADGP64RS3712.6.31
FINRA Consolidated Statements of Operations(In millions)
Years Ended December 31,2017 2016
RevenuesOperating revenues
Regulatory revenues $ 439.0 $ 446.0
User revenues 180.4 183.3
Contract services revenues 98.2 102.8
Transparency services revenues 72.2 68.2
Dispute resolution revenues 36.6 40.7
Other revenues 1.7 3.6
Total operating revenues 828.1 844.6
Fines 64.9 173.8
Activity assessment revenues 547.9 507.1
Total revenues 1,440.9 1,525.5
Activity assessment cost of revenues (547.9) (507.1)
Net revenues 893.0 1,018.4
ExpensesCompensation and benefits 692.0 699.4
Professional and contract services 148.6 158.2
Computer operations and data communications 51.7 56.5
Occupancy 36.9 38.2
Depreciation and amortization 15.4 21.2
General and administrative 47.7 63.9
Total expenses 992.3 1,037.4
Interest and dividend income 26.0 31.4
Operating (loss) income (73.3) 12.4
Other income (expense)Net realized and unrealized investment gains 32.6 17.1
Equity method earnings from other investments 83.9 29.7
Other expense (1.6) (1.5)
Net income $ 41.6 $ 57.7
See accompanying notes.
32 FINRA 2017 Annual Financial Report

ˆ200F$TiRP!z$2b8M^Š200F$TiRP!z$2b8M^
592132 FIN 33FINRAANNUAL REPORT 2017
26-Jun-2018 10:56 ESTCLN PSWDC
Donnelley Financial ADG pf_rendSTART PAGE
22*PMT 1C
ADGP64RS3712.6.31
FINRA Consolidated Statements of Comprehensive Income(In millions)
Years Ended December 31,2017 2016
Net income $ 41.6 $ 57.7
Change in unrealized gain or loss on available-for-sale investments 31.3 0.6
Employee benefit plan adjustments (28.7) 43.1
Comprehensive income $ 44.2 $101.4
See accompanying notes.
FINRA 2017 Annual Financial Report 33

ˆ200F$TiRP!z$6nltFŠ 200F$TiRP!z$6nltF
592132 FIN 34FINRAANNUAL REPORT 2017
26-Jun-2018 10:56 ESTCLN PSWDC
Donnelley Financial ADG pf_rendSTART PAGE
23*PMT 1C
ADGP64RS3712.6.31
FINRA Consolidated Statements of Changes in Equity(In millions)
Accumulated OtherComprehensive Income (Loss)
Equity
Unrealized Gain onAvailable-for-Sale
Investments
NetUnrecognized
EmployeeBenefit Plan
Amounts TotalBalance, January 1, 2016 $1,576.0 $ 0.1 $(125.8) $1,450.3Comprehensive income 57.7 0.6 43.1 101.4
Balance, December 31, 2016 1,633.7 0.7 (82.7) 1,551.7
Comprehensive income 41.6 31.3 (28.7) 44.2
Balance, December 31, 2017 $1,675.3 $32.0 $(111.4) $1,595.9
See accompanying notes.
34 FINRA 2017 Annual Financial Report

ˆ200F$TiRP!z$BbutZŠ 200F$TiRP!z$BbutZ
592132 FIN 35FINRAANNUAL REPORT 2017
26-Jun-2018 10:56 ESTCLN PSWDC
Donnelley Financial ADG pf_rendSTART PAGE
24*PMT 1C
ADGP64RS3712.6.31
FINRA Consolidated Statements of Cash Flows(In millions)
Years Ended December 31,2017 2016
Reconciliation of net income to cash (used in) provided by operating activitiesNet income $ 41.6 $ 57.7
Adjustments to reconcile net income to net cash (used in) provided by operating activities:Depreciation and amortization 15.4 21.2
Net realized and unrealized investment gains (32.6) (17.1)
Equity method investments (60.3) 6.6
Bad debt expense 2.7 6.4
Loss on disposal of property and equipment 2.1 2.3
Net change in operating assets and liabilities:Receivables, net (21.3) (10.5)
Other current assets (2.8) 8.2
Other assets (5.1) (2.3)
Accounts payable and accrued expenses (0.6) (17.7)
Accrued personnel and benefit costs 2.3 (2.0)
Deferred revenue (1.0) (1.5)
Deposits and renewals (7.6) 6.4
SEC fee payable 22.2 28.4
Accrued pension and other postretirement benefit costs 7.5 (1.5)
Other liabilities (1.2) (0.2)
Net cash (used in) provided by operating activities $(38.7) $ 84.4
See accompanying notes.
FINRA 2017 Annual Financial Report 35

ˆ200F$TiRP!z$Ff8tkŠ 200F$TiRP!z$Ff8tk
592132 FIN 36FINRAANNUAL REPORT 2017
26-Jun-2018 10:56 ESTCLN PSWDC
Donnelley Financial ADG pf_rend 19*PMT 1C
ADGP64RS3712.6.31
FINRA Consolidated Statements of Cash Flows (continued)(In millions)
Years Ended December 31,2017 2016
Cash flow from investing activitiesNet proceeds from sales (purchases) of trading securities $ 268.6 $ (53.1)Proceeds from redemptions of available-for-sale investments 105.6 2.5
Purchases of available-for-sale investments (104.7) (8.8)
Equity method investments 55.8 0.1
Purchases of other investments (297.8) —
Net purchases of property and equipment (7.3) (10.9)
Other (1.3) —
Net cash provided by (used in) investing activities 18.9 (70.2)
Cash flow from financing activitiesPrincipal payment on long-term debt (0.9) (0.9)
Net cash used in financing activities (0.9) (0.9)
(Decrease) increase in cash and cash equivalents (20.7) 13.3
Cash and cash equivalents at beginning of year 332.4 319.1
Cash and cash equivalents at end of year $ 311.7 $332.4
See accompanying notes.
36 FINRA 2017 Annual Financial Report

ˆ200F$TiRP!z$JiXt?Š200F$TiRP!z$JiXt?
592132 FIN 37FINRAANNUAL REPORT 2017
26-Jun-2018 10:56 ESTCLN PSWDC
Donnelley Financial ADG pf_rendSTART PAGE
19*PMT 1C
ADGP64RS3712.6.31
FINRA 2017 Notes to Consolidated Financial Statements
1. ORGANIZATION AND NATURE OF OPERATIONS
References to the terms “we,” “our,” “us,” “FINRA” or the “Company” used throughout these Notes to ConsolidatedFinancial Statements refer to the Financial Industry Regulatory Authority, Inc. (FINRA), a Delaware corporation, and itswholly owned subsidiaries. FINRA wholly owns the following significant subsidiaries: FINRA Regulation, Inc. (FINRA REG)and the FINRA Investor Education Foundation (the Foundation). The Foundation is a tax-exempt membership corporationincorporated in the State of Delaware, with FINRA as the sole member.
We are a self-regulatory organization (SRO) for brokerage firms doing business with the public in the United States. Weregulate the activities of U.S. broker-dealers and perform market regulation pursuant to our own statutory responsibilityand under contract for certain exchanges. Our statutory regulatory functions include examinations of securities firms,continuous surveillance of markets, reviews of fraud allegations and disciplinary actions against firms and registeredrepresentatives. FINRA’s examination process is risk-based, meaning our approach for identifying firms for examination isbased upon risk, scale and scope of firm operations. We conduct examinations to determine whether firms are incompliance with federal securities law and FINRA rules, as well as in response to investor complaints, terminations ofbrokerage employees for cause, arbitrations and referrals from other regulators. FINRA operates unique equity and optionscross-market surveillance programs. Employing advanced technology, these programs collect and integrate trading dataacross exchanges and alternative trading systems to detect potential market manipulation and other rule violations. Weprovide a heightened and expedited review of allegations of serious fraud and consolidate recognized expertise inexpedited fraud detection and investigation to prevent further harm to investors. We bring disciplinary actions againstfirms and their employees that may result in sanctions including censures, fines, suspensions and, in egregious cases,expulsions or bars from the industry. In appropriate cases, we require firms and individuals to provide restitution toharmed investors and often impose other conditions on a firm’s business to prevent repeated wrongdoing.
We perform market regulation services under contract for the New York Stock Exchange LLC (NYSE), NYSE Arca, Inc. (NYSEArca), NYSE American, LLC (NYSE American), The Nasdaq Stock Market LLC (Nasdaq), Nasdaq BX, Inc. (Boston), Nasdaq PHLXLLC (Philadelphia), Cboe Global Markets, Inc. (the Cboe, C2, BZX, BYX, EDGA and EDGX exchanges, collectively referred to asCboe), the International Securities Exchange, LLC (ISE, ISE Gemini and ISE Mercury), The Investors Exchange (IEX), theBoston Options Exchange, LLC (BOX), and the Miami International Securities Exchange, LLC (MIAX Options) and MIAXPEARL LLC (MIAX PEARL), collectively referred to as MIAX. We also regulate the over-the-counter (OTC) securities marketsfor listed and unlisted equities and the OTC markets for corporate bonds, asset-backed instruments, certain governmentagency instruments, municipal securities and other fixed income instruments.
We provide arbitration and mediation services to assist in the resolution of monetary and business disputes between andamong investors, broker-dealers and individual brokers. We also provide dispute resolution services for several exchangesthrough contractual agreements, thereby offering consistent procedures and the uniformity of a single forum for theresolution of securities-industry related disputes.
We provide technology-driven registration, testing and continuing education, and other regulatory services, as well asoperational and support services to firms, other SROs, the Securities and Exchange Commission (SEC), the North AmericanSecurities Administrators Association, state regulators, the investing public, the Conference of State Bank Supervisors andits wholly-owned subsidiary, the State Regulatory Registry LLC (SRR). We developed and continue to enhance BrokerCheck,a free tool that helps investors research the professional backgrounds of current and former FINRA-registered brokeragefirms and brokers, as well as investment adviser firms and representatives.
FINRA 2017 Annual Financial Report 37

ˆ200F$TiRP!z$MlqtkŠ 200F$TiRP!z$Mlqtk
592132 FIN 38FINRAANNUAL REPORT 2017
26-Jun-2018 10:56 ESTCLN PSWDC
Donnelley Financial ADG pf_rend 20*PMT 1C
ADGP64RS3712.6.31
FINRA 2017 Notes to Consolidated Financial Statements
1. ORGANIZATION AND NATURE OF OPERATIONS (CONTINUED)
We are committed to ensuring that investors and market participants have access to market information, so they canmore effectively assess securities prices and valuations, through the management and operation of FINRA’s OTC markettransparency facilities. These facilities include the Trade Reporting and Compliance Engine (TRACE) for fixed incomesecurities, the OTC Reporting FacilityTM (ORFTM) and OTC Bulletin Board® (OTCBB®) for equity securities not listed on anexchange and the Trade Reporting Facilities® (TRFs®), operated in partnership with NYSE and Nasdaq, for OTC trading inequity securities that are listed on an exchange. In this capacity, we provide the public and professionals with timelyquotes and trade information for equity and debt securities.
The Foundation empowers underserved Americans with the knowledge, skills and tools to make sound financial decisionsthroughout life. To accomplish its mission, the Foundation undertakes and funds innovative research and educationalprojects aimed at segments of the American public that could benefit from additional resources.
2. SUMMARY OF SIGNIFICANT ACCOUNTING POLICIES
BASIS OF PRESENTATION
The accompanying consolidated financial statements are prepared in accordance with U.S. generally accepted accountingprinciples (U.S. GAAP) and include the accounts of FINRA and its wholly owned subsidiaries. We have eliminated allintercompany balances and transactions in consolidation.
USE OF ESTIMATES
The preparation of these consolidated financial statements requires management to make estimates and assumptions,including estimates of fair value of investments, valuation of investments and assumptions related to our benefit plans,and the estimated service periods related to our recognition of certain revenue, that affect the amounts reported in theconsolidated financial statements and accompanying notes. Actual results could materially differ from those estimates.
CASH AND CASH EQUIVALENTS
Cash and cash equivalents include demand cash, cash held in banks and all non-restricted, highly liquid investments withoriginal maturities of 90 days or less when acquired.
38 FINRA 2017 Annual Financial Report

ˆ200F$TiRP!z$SJot[Š200F$TiRP!z$SJot[
592132 FIN 39FINRAANNUAL REPORT 2017
26-Jun-2018 10:56 ESTCLN PSWDC
Donnelley Financial ADG pf_rend 20*PMT 1C
ADGP64RS3712.6.31
FINRA 2017 Notes to Consolidated Financial Statements
2. SUMMARY OF SIGNIFICANT ACCOUNTING POLICIES (CONTINUED)
INVESTMENTS
Debt and Marketable Equity Securities
At the time of purchase, we classify individual debt and marketable equity securities as trading, available-for-sale orheld-to-maturity based on the type of security and our intent and ability to sell or to hold the securities. We havedesignated our investments in debt and marketable equity securities as either trading or available-for-sale. Tradingsecurities are carried at fair value, with changes in fair value recorded as a component of net realized and unrealizedinvestment gains in the consolidated statements of operations. We present cash flows from purchases and sales oftrading securities as investing activities based on the nature and purpose for which the securities were acquired. Werecord available-for-sale securities at fair value and recognize temporary changes in fair value as unrealized gains (losses)as a separate component of other comprehensive income (loss).
Fair value is determined based on quoted market prices, when available, or on estimates provided by external pricingsources or dealers who make markets in such securities. Realized gains and losses on sales of securities are included inearnings using the average cost method. Investment receivables or payables relate to security trades and otherinvestment redemptions or purchases executed on or prior to the balance sheet date, but not yet settled, as we followtrade-date accounting.
Other Investments
FINRA invests in a limited partnership, which we account for under the equity method. The application of the equitymethod to the limited partnership, including our related equity earnings (losses), retains the investment companyaccounting applied by such funds.
We use the cumulative earnings approach for determining the cash flow presentation of distributions from our equitymethod investments. Distributions received are included in our consolidated statements of cash flows as operatingactivities, unless the cumulative distributions exceed our portion of the cumulative equity in the net earnings of our equitymethod investments, in which case the excess distributions are deemed to be returns of the investment and are classifiedas investing activities in the consolidated statements of cash flows.
FINRA elected the fair value option on new investments in private investment funds made during 2017. Such election isirrevocable and applied on a financial instrument by financial instrument basis at initial recognition. These privateinvestment funds calculate net asset value per share (or its equivalent) as the investment account value. We made thiselection to better reflect such instruments that are measured on a fair value basis. Interest and dividends are recordedwhen reported to us.
Other-Than-Temporary Impairment
FINRA periodically monitors and evaluates the realizability of its available-for-sale and equity method investments. Whenassessing realizability, including other-than-temporary declines in value, we consider such factors as intent to hold, theextent of the decline in value, the duration of unrealized losses, the potential for recovery in the near term and theprobability that we will sell an equity method investment at an amount different from the net asset value of ourownership interest. We also review the financial statements of our equity method investments for potential indicators ofimpairment. If events and circumstances indicate that a decline in the value of these assets has occurred and is deemedother-than-temporary, the carrying value of the investment is reduced to its fair value and the impairment is charged toearnings.
FINRA 2017 Annual Financial Report 39
ˆ200F$TiRP!z$V@iMdŠ200F$TiRP!z$V@iMd
592132 FIN 40FINRAANNUAL REPORT 2017
26-Jun-2018 10:56 ESTCLN PSWDC
Donnelley Financial ADG pf_rend 19*PMT 1C
ADGP64RS3712.6.31
FINRA 2017 Notes to Consolidated Financial Statements
2. SUMMARY OF SIGNIFICANT ACCOUNTING POLICIES (CONTINUED)
RECEIVABLES, NET
The Company’s receivables are primarily concentrated with FINRA-registered firms, associated persons, NYSE, Nasdaq,Cboe and other exchanges. The consolidated financial statements present receivables net of an allowance for uncollectibleaccounts. As of December 31, 2017 and 2016, an allowance for uncollectible accounts of $11 million and $13.4 million,respectively, was presented within receivables, net in the accompanying consolidated balance sheets. We calculate theallowance based on the age, source of the underlying receivable and past collection experience. We maintain theallowance at a level that management believes to be sufficient to absorb estimated losses inherent in our accountsreceivable portfolio. The allowance as of December 31, 2017 and 2016, primarily related to fines and arbitration activities.The allowance is increased by the provision for bad debts, which is charged against operating results and decreased by theamount of charge-offs, net of recoveries. We base the amount charged against operating results on several factors,including a periodic assessment of the collectibility of each account. In circumstances where a specific firm’s inability tomeet its financial obligations is known (e.g., bankruptcy filings), we record a specific provision for bad debts to reduce thereceivable to the amount we reasonably believe will be collected.
PROPERTY AND EQUIPMENT
FINRA records property and equipment at cost less accumulated depreciation. We expense repairs and maintenance costsas incurred. We calculate depreciation and amortization as follows:Asset category Depreciation/amortization method Estimated useful livesBuildings and improvements Straight-line 10 to 40 yearsData-processing equipment and software Straight-line 2 to 5 yearsFurniture and equipment Straight-line 5 to 10 years
Leasehold improvements Straight-lineShorter of term of lease or usefullife of improvement
Depreciation and amortization expense for property and equipment totaled $11.8 million and $13.8 million for 2017 and2016, respectively.
40 FINRA 2017 Annual Financial Report

ˆ200F$TiRP!z$YgbtGŠ 200F$TiRP!z$YgbtG
592132 FIN 41FINRAANNUAL REPORT 2017
26-Jun-2018 10:56 ESTCLN PSWDC
Donnelley Financial ADG pf_rend 17*PMT 1C
ADGP64RS3712.6.31
FINRA 2017 Notes to Consolidated Financial Statements
2. SUMMARY OF SIGNIFICANT ACCOUNTING POLICIES (CONTINUED)
IMPAIRMENT OF LONG-LIVED ASSETS
We review our long-lived assets for impairment annually. In the event facts and circumstances indicate that long-livedassets or other assets may be impaired, we perform an evaluation of recoverability that compares the estimated future,undiscounted cash flows associated with the asset to the asset’s carrying amount. If the evaluation fails the recoverabilitytest, we would then prepare a discounted cash flow analysis to estimate fair value and the amount of any impairment. In2017 and 2016, there were no indicators of long-lived asset impairment, and no impairment charges were recognized.
DEFERRED REVENUE
Deferred revenue represents cash received for which we have not yet provided the related services. Included in deferredrevenue is the unearned portion of mediation fees, arbitration fees, registration fees and firm application fees. Werecognize revenue from the upfront initial components of these fees on a straight-line basis over estimated serviceperiods.
The following chart reflects our estimated service periods and the basis for those estimated service periods for eachdeferred fee:Fee type Service period Estimation basisMediation fees 4 months Average duration of a mediation caseArbitration fees 14 months Average duration of an arbitration caseRegistration fees 4 years Average time individuals spend at a single firmFirm application fees 12 years Average lifespan for all member firms
DEPOSIT AND RENEWAL LIABILITIES
FINRA’s deposit and renewal liabilities primarily represent deposits into our Central Registration Depository (CRD) system.FINRA-registered firms use these deposits to pay for services, including registration fees charged by states and other SROs.
REVENUE RECOGNITION AND COST OF REVENUE
Revenues are generally measured by an exchange of values and recognized when: (1) there is persuasive evidence of anarrangement; (2) services have been rendered and payment has been contractually earned; (3) the fee is fixed ordeterminable; and (4) collectability is reasonably assured. Our recognition policy by type of fee is described in theparagraphs below.
Regulatory Revenues
Regulatory revenues include assessments for the supervision and regulation of firms through examination, policy making,rulemaking and enforcement activities. Regulatory revenues are recorded net of any firm rebates. The primary regulatoryrevenues are the Trading Activity Fee (TAF), Gross Income Assessment (GIA), Personnel Assessment (PA) and Branch OfficeAssessment (BOA). The TAF is calculated on the sell side of all transactions by firms in all covered securities regardless ofwhere the trade is executed and is assessed directly on the firm responsible for clearing the transaction. Firms self-reportthe TAF to us, and we recognize the income in the month the transactions occur. As the TAF is a self-reported revenuestream for us, subsequent adjustments may occur. We recognize these adjustments as revenue adjustments in the periodthey become known to us. The GIA, PA and BOA represent annual fees charged to firms and representatives. We recognizethese fees ratably over the applicable annual period.
FINRA 2017 Annual Financial Report 41

ˆ200F$TiRP!z$=agMhŠ200F$TiRP!z$=agMh
592132 FIN 42FINRAANNUAL REPORT 2017
26-Jun-2018 10:56 ESTCLN PSWDC
Donnelley Financial ADG pf_rend 18*PMT 1C
ADGP64RS3712.6.31
FINRA 2017 Notes to Consolidated Financial Statements
2. SUMMARY OF SIGNIFICANT ACCOUNTING POLICIES (CONTINUED)
User Revenues
User revenues represent amounts charged for initial and annual registrations, qualification examinations, FINRA-sponsored educational programs and conferences, reviews of advertisements, corporate filings (corporate financing fees)and disclosures.
FINRA charges registration fees for all registered representatives and investment advisers. First-year registration andapplication fees consist of two deliverables that we account for as separate units of accounting: upfront registrationdelivered at inception and an ongoing service obligation for the remainder of that calendar year. We allocate arrangementconsideration to upfront registrations based on our estimates of selling price. We estimate the selling prices of upfrontregistrations based on our internal cost structure, pricing practices and objectives, and historical prices. We allocatearrangement consideration to the remaining service obligation based on vendor-specific objective evidence of the pricingfor these services. Upfront registration revenue is recognized over the estimated service period for individualrepresentatives (four years) and firms (12 years), while the remaining service obligation revenue is recognized ratably overthe related remaining annual period. While the pricing model currently in use captures all critical variables, unforeseenchanges due to external market forces may result in the revision to some of our inputs. These modifications may result inthe allocation of consideration in future periods that differs from the allocation presently in use. Absent a significantchange in the pricing inputs, future changes in the pricing model are not expected to materially impact our allocation ofarrangement consideration.
Qualification fees consist of examination and continuing education fees. We recognize qualification fees as we administerexaminations or continuing education programs. FINRA-sponsored meeting and conference fees include fees paid byfinancial services industry participants for participating in our educational programs. We recognize these fees when theprogram or conference takes place. Advertising fees are charged for our review of firms’ communications to ensure thatthey are fair, balanced and not misleading. We recognize advertising fees as revenue when our review is complete.Corporate financing fees are charged for our review of proposed public offerings. We recognize corporate financing feeswhen our review is completed. FINRA requires the timely disclosure of regulatory actions, liens and judgments, amongother things, and charges a fee to review the disclosures to determine whether an applicant is subject to a statutorydisqualification or whether the applicant may present a regulatory risk for the firm and customers. FINRA recognizes thesedisclosure review fees when our review is complete.
Contract Services Revenues
Contract services revenues represent amounts charged for regulatory services provided primarily to the NYSE markets, theNasdaq markets, the Cboe markets and other exchanges, as well as the TRFs, for services including surveillance reviews,investigations, examinations and the disciplinary process. Contract services revenues also include fees for the mortgagelicensing system FINRA developed and deployed to SRR. We recognize contract services revenues as the services areprovided according to the terms and timeframes associated with each individual contract.
Transparency Services Revenues
Transparency services revenues represent amounts charged for the use of TRACE. In addition, fees are charged for our ORFservice for the reporting of trades and comparison in certain OTC equity securities. TRACE fees include market data fees, aswell as fees charged on secondary market transactions in eligible fixed income securities reported to us. The OTCBB is aregulated quotation service in which fees are charged for a variety of services related to the display of real-time quotes inOTC equity securities that are eligible for quotation on the OTCBB. In addition, fees are earned for the sale of market datafrom the OTCBB and the ORF. We recognize transparency services revenues as the transactions occur or when the marketdata is sold.
42 FINRA 2017 Annual Financial Report

ˆ200F$TiRP@B0%sQMCŠ 200F$TiRP@B0%sQMC
592132 FIN 43FINRAANNUAL REPORT 2017
27-Jun-2018 13:02 ESTCLN PSWDC
Donnelley Financial ADG bashs0dc 18*PMT 1C
VDI-W7-PR3-030612.6.31
FINRA 2017 Notes to Consolidated Financial Statements
2. SUMMARY OF SIGNIFICANT ACCOUNTING POLICIES (CONTINUED)
Dispute Resolution Revenues
FINRA earns fees during the arbitration and mediation processes. Certain arbitration fees, such as initial, counterclaim,cross-claim and other filing fees, and surcharge fees, relate to the entire period covered by an arbitration case, and arerecognized as revenue over the average duration of an arbitration case (14 months). Mediation filing fees are recognizedover the average duration of a mediation case (four months). All other arbitration- and mediation-related fees, such aspre-hearing and hearing processing fees, adjournment fees, hearing session fees and mediation session fees, which areevent-driven, are recognized as the service is provided. Dispute resolution revenues also include arbitrator application feesthat are recognized as the service is provided.
Fines
Fines represent sanctions for rule violations. FINRA recognizes fine revenue upon issuance of a written consent ordisciplinary decision. We do not view fines as part of our operating revenues. FINRA limits the use of fine monies to capitalexpenditures and regulatory and other projects reported to and approved by our Finance, Operations and TechnologyCommittee or Board of Governors (Board).
Activity Assessment Revenues and Cost of Revenues
FINRA, as an SRO, pays certain fees and assessments to the SEC pursuant to Section 31 of the Securities Exchange Act of1934. These fees are designed to recover costs incurred by the government for the supervision and regulation of securitiesmarkets and securities professionals, and are calculated based on the aggregate dollar amount of sales of coveredsecurities transacted by or through any firm other than on a national securities exchange. Such covered transactions arereported to us through the TRFs and ORF. We remit these SEC fees to the U.S. Treasury semiannually, in March andSeptember.
We recover the cost of the Section 31 fees and assessments through an activity assessment, charged to thefirm responsible for clearing the transaction, based on the aggregate dollar amount of sales of coveredsecurities transacted by or through any firm other than on a national securities exchange. The assessments billed tosecurities firms are recognized when the transactions are reported. As of December 31, 2017 and 2016, we had$50.3 million and $43.9 million, respectively, of SEC fee receivables presented within receivables, net in the accompanyingconsolidated balance sheets. FINRA, as the primary obligor to the SEC, reports the activity assessment on a gross basiswithin revenues. Amounts due to the SEC are reported as a cost of revenue. We report amounts pending remittance to theSEC in SEC fee payable in the accompanying consolidated balance sheets.
Activity assessment revenues and cost of revenues are driven by third-party providers and securities firms reportingactivity in a complete, accurate and timely manner. As a result, subsequent adjustments may occur. We recognize anyresulting activity assessment adjustments in the period they become known to us.
Interest and Dividend Income
FINRA recognizes interest income from cash, trading investments and available-for-sale investments as it is earned.Dividend income is recognized on the ex-dividend date.
CLOUD COMPUTING COSTS
We account for our cloud computing arrangement as a service contract and expense applicable costs as incurred. As ourhosting arrangement does not give us the contractual right to the software at any time during the hosting period withoutpenalty, we are not deemed to have a software license. Cloud computing costs totaled $18.8 million and $20.9 million forthe years ended December 31, 2017 and 2016, respectively, and were included in computer operations and datacommunications in the consolidated statement of operations.
FINRA 2017 Annual Financial Report 43

ˆ200F$TiRP!z$j2#t/Š200F$TiRP!z$j2#t/
592132 FIN 44FINRAANNUAL REPORT 2017
26-Jun-2018 10:56 ESTCLN PSWDC
Donnelley Financial ADG pf_rend 22*PMT 1C
ADGP64RS3712.6.31
FINRA 2017 Notes to Consolidated Financial Statements
2. SUMMARY OF SIGNIFICANT ACCOUNTING POLICIES (CONTINUED)
PENSION AND OTHER POSTRETIREMENT LIABILITIES
FINRA provides two non-contributory defined benefit pension plans for the benefit of eligible employees. Thenon-contributory defined benefit plans consist of a qualified Employees Retirement Plan (ERP) and a non-qualifiedSupplemental Executive Retirement Plan (SERP). Both plans are now closed to new participants. We also offer access toretiree medical coverage for eligible retirees and their dependents. Eligible retirees pay the full premium cost to beenrolled in the Company’s retiree medical coverage. Additionally, we provide an employer-funded defined contributionRetiree Medical Account Plan (RMA Plan) to help our retirees offset health care premiums during retirement. Under theRMA Plan, Retiree Medical Accounts are created for eligible employees and fixed annual credits are applied to thoseaccounts for each year of FINRA service beginning at age 40.
In calculating the expense and liability related to all of the abovementioned plans, we use several statistical and otherfactors, which attempt to anticipate future events. Key factors include assumptions about the expected rates of return onplan assets and the discount rate as determined by FINRA, within certain guidelines, as well as assumptions regardingfuture salary increases, mortality, turnover, retirement ages and the medical expense trend rate. We consider marketconditions, including changes in investment returns and interest rates, in making these assumptions. The discount rateused in the calculations is developed using a composite yield curve analysis based on a portfolio of high-quality,non-callable, marketable bonds. We determine the long-term rate of return based on analysis of historical and projectedreturns as prepared by our actuary and external investment consultant. FINRA’s Pension/401(k) Plan Committee (thePension Committee) reviews and advises FINRA management on both the expected long-term rate of return and thediscount rate assumptions. Amortization of net gain or loss included in accumulated other comprehensive income (loss)reflects a corridor based on 10 percent of the greater of the projected benefit obligation or the market-related value ofplan assets as of the beginning of the plan year, and is included as a component of net periodic pension cost.
The actuarial assumptions that we use in determining pension and other postretirement liabilities and expenses maydiffer materially from actual results due to changing market and economic conditions, as well as early withdrawals byterminating plan participants. While we believe that the assumptions used are appropriate, differences in actualexperience or changes in assumptions related to the ERP may materially affect our financial position. A 25 basis-pointincrease (decrease) in the discount rate assumption as of December 31, 2017, would cause the ERP projected benefitobligation to decrease (increase) by approximately $21.5 million.
INCOME TAXES
FINRA and FINRA REG are tax-exempt organizations under Internal Revenue Code (IRC) Section 501(c)(6). The Foundation isa tax-exempt organization under IRC Section 501(c)(4). However, unrelated business income activities are taxed at normalcorporate rates to the extent that they result in taxable net income. We determine deferred tax assets and liabilities basedon differences between the financial statement carrying amounts and the tax basis of existing assets and liabilities (i.e.,temporary differences). We measure these assets and liabilities at the enacted rates that we expect will be in effect whenwe will realize these differences. We also determine deferred tax assets based on the amount of net operating losscarryforwards. If necessary, we establish a valuation allowance to reduce deferred tax assets to the amount that is morelikely than not to be realized.
CONCENTRATION OF CREDIT RISK
Financial instruments that potentially subject us to concentrations of credit risk, consist of cash and cash equivalents,trading investments, other investments and accounts receivable. We do not require collateral on these financialinstruments.
We maintain cash and cash equivalents in excess of federally insured limits, principally with financial institutions locatedin the U.S. Risk on accounts receivable is reduced by the number of entities comprising our member firm base and through
44 FINRA 2017 Annual Financial Report

ˆ200F$TiRP!z$m6JtmŠ 200F$TiRP!z$m6Jtm
592132 FIN 45FINRAANNUAL REPORT 2017
26-Jun-2018 10:56 ESTCLN PSWDC
Donnelley Financial ADG pf_rend 25*PMT 1C
ADGP64RS3712.6.31
FINRA 2017 Notes to Consolidated Financial Statements
2. SUMMARY OF SIGNIFICANT ACCOUNTING POLICIES (CONTINUED)
ongoing evaluation of collectibility of amounts owed to us. We use outside investment managers to manage ourinvestment portfolio and a custody agent, a publicly traded company headquartered in New York, to hold our tradingsecurities.
We maintain a broadly diversified investment portfolio, representing a wide range of assets and asset classes, in order toattain acceptable levels of risk and return. FINRA’s investment portfolio consists of investments in debt securities, amutual fund and commingled funds containing equity securities and other investments (including a limited partnershipand private investments). The Foundation’s investment portfolio consists of commingled funds and a private investment.Our limited partnership investment represents approximately 38 percent of our total invested assets, excluding cash, as ofDecember 31, 2017.
The Company attempts to minimize credit risk by monitoring the creditworthiness of the financial institutions with whichit transacts business.
RECENT ACCOUNTING PRONOUNCEMENTS
In May 2014, the Financial Accounting Standards Board (FASB) issued Accounting Standards Update (ASU) 2014-09,Revenue from Contracts with Customers (Topic 606). The ASU provides that a company recognize revenue when it transferspromised goods or services to customers in an amount that reflects the consideration to which the company expects to beentitled in exchange for those goods or services. Accordingly, companies will need to use more judgment and make moreestimates, which may include identifying performance obligations in the contract, estimating the amount of variableconsideration to include in the transaction price and allocating the transaction price to each separate performanceobligation. In August 2015, the FASB issued ASU 2015-14, Revenue from Contracts with Customers (Topic 606): Deferral ofthe Effective Date, which deferred the effective date of the new standard by one year. In 2016 and 2017, the FASBcontinued to issue various technical improvements through various ASUs, including principal versus agent considerations,identifying performance obligations and licensing. The new revenue standard is effective for FINRA on January 1, 2019;however, as a nonpublic entity, we may early adopt on January 1, 2018. FINRA does not intend to early adopt the ASU. Asof December 31, 2017, we have completed our diagnostic assessment of the ASU and are still considering the potentialimpact that the new guidance will have on our consolidated financial statements. We are currently in the process ofdesigning the data disclosure requirements associated with the ASU.
In January 2016, the FASB issued ASU 2016-01, Financial Instruments—Overall (Subtopic 825-10): Recognition andMeasurement of Financial Assets and Financial Liabilities. The ASU eliminates the available-for-sale classification of equityinvestments and requires entities to measure equity investments that do not result in consolidation and are notaccounted for under the equity method at fair value and recognize any changes in fair value in net income. The ASU iseffective for FINRA on January 1, 2019. We are currently assessing the potential impact that the ASU will have on ourconsolidated financial statements.
In February 2016, the FASB issued ASU 2016-02, Leases. The ASU requires lessees to put most leases on their balance sheetsbut recognize expenses on their statements of operations in a manner similar to today’s accounting. The ASU alsoeliminates today’s real estate-specific provisions for all entities. For lessors, the ASU modifies the classification criteria andthe accounting for sales-type and direct financing leases. The ASU is effective for FINRA on January 1, 2020. Early adoptionis permitted; however, we do not intend to early adopt the ASU. We are currently completing a diagnostic assessment ofthe ASU based on our current inventory of leases to determine the impact to our consolidated financial statements.
In July 2016, the FASB issued the final guidance on credit losses, ASU 2016-13, Financial Instruments—Credit Losses (Topic326): Measurement of Credit Losses on Financial Instruments, which will significantly change how entities will measurecredit losses for most financial assets and certain other instruments that are not measured at fair value through net
FINRA 2017 Annual Financial Report 45

ˆ200F$TiRP!z#bP6tyŠ 200F$TiRP!z#bP6ty
592132 FIN 46FINRAANNUAL REPORT 2017
26-Jun-2018 10:56 ESTCLN PSWDC
Donnelley Financial ADG pf_rend 24*PMT 1C
ADGP64RS1312.6.31
FINRA 2017 Notes to Consolidated Financial Statements
2. SUMMARY OF SIGNIFICANT ACCOUNTING POLICIES (CONTINUED)
income. Entities will be required to use a new forward-looking “expected loss” model and record an allowance that, whendeducted from the amortized cost basis of the financial asset, presents the net amount expected to be collected on thefinancial asset. This approach will apply to most financial assets measured at amortized cost and certain otherinstruments, including trade and other receivables, loans, held-to-maturity debt securities, net investments in leases andoff-balance-sheet credit exposures. The ASU will also require significantly more disclosures to be made in an entity’sfinancial statements. The ASU is effective for FINRA on January 1, 2021. Early adoption is permitted; however, we do notintend to early adopt the ASU. We are currently assessing the potential impact that the ASU will have on our consolidatedfinancial statements.
In August 2016, the FASB issued ASU 2016-15, Statement of Cash Flows (Topic 230): Classification of Certain Cash Receiptsand Cash Payments, which clarifies how entities should classify certain cash receipts, such as distributions received fromequity method investees, and cash payments on the statement of cash flows. The ASU is effective for FINRA on January 1,2019. Early adoption is permitted; however, we do not intend to early adopt the ASU. We are currently assessing thepotential impact that the ASU will have on our consolidated financial statements.
The following accounting pronouncements were also recently issued:
Ô ASU No. 2016-16, Income Taxes (Topic 710): Intra-Entity Transfers of Assets Other Than Inventory; effective forFINRA in 2019;
Ô ASU No. 2017-06, Plan Accounting: Defined Benefit Pension Plans (Topic 960), Defined Contribution Pension Plans(Topic 962), Health and Welfare Benefit Plans (Topic 965): Employee Benefit Plan Master Trust Reporting (aconsensus of the Emerging Issues Task Force), effective for FINRA in 2019; and
Ô ASU No. 2017-07, Compensation—Retirement Benefits (Topic 715): Improving the Presentation of Net PeriodicPension Cost and Net Periodic Postretirement Benefit Cost, effective for FINRA in 2019.
We have assessed these pronouncements and determined that they do not have any material impact on our consolidatedresults of operations or financial position, and they will be adopted as of their future effective date.
The following accounting pronouncements have been adopted by FINRA with no material effect on our consolidatedfinancial statements:
Ô ASU No. 2015-02, Consolidations (Topic 810): Amendments to the Consolidation Analysis, effective for FINRA in2017;
Ô ASU No. 2015-07, Fair Value Measurement (Topic 820): Disclosures for Investments in Certain Entities ThatCalculate Net Asset Value per Share (or Its Equivalent)—a consensus of the FASB Emerging Issues Task Force;effective in 2017, but early adopted in 2015; and
Ô ASU No. 2015-17, Income Taxes (Topic 740): Balance Sheet Classification of Deferred Taxes; effective in 2018, butearly adopted in 2015.
46 FINRA 2017 Annual Financial Report

ˆ200F$TiRP!z#eSVt@Š200F$TiRP!z#eSVt@
592132 FIN 47FINRAANNUAL REPORT 2017
26-Jun-2018 10:56 ESTCLN PSWDC
Donnelley Financial ADG pf_rend 22*PMT 1C
ADGP64RS1312.6.31
FINRA 2017 Notes to Consolidated Financial Statements
3. DEFERRED REVENUE
The following is a summary of amounts that we included in current and non-current deferred revenue as of December 31,2017, and the years over which we will recognize those amounts:
Registration Arbitration Annual Total(in millions)
Year ending December 31,2018 $ 7.1 $4.5 $54.3 $65.92019 5.1 — — 5.12020 3.3 — — 3.3
2021 1.5 — — 1.5
2022 and thereafter 3.1 — — 3.1
$20.1 $4.5 $54.3 $78.9
The following is a summary of activity in our current and non-current deferred revenue for the periods endedDecember 31, 2017 and 2016, for all revenue arrangements. Annual revenue below primarily includes the GIA, PA, BOA andregistered representative renewal fees. The additions reflect the fees charged during the period, while the amortizationreflects the revenues recognized during the period based on the significant accounting policies described in Note 2:
Registration Arbitration Annual Total(in millions)
Balance as of January 1, 2017 $19.9 $ 4.9 $ 55.1 $ 79.9Additions 8.9 8.2 306.8 323.9
Amortization (8.7) (8.6) (307.6) (324.9)
Balance as of December 31, 2017 $20.1 $ 4.5 $ 54.3 $ 78.9
Registration Arbitration Annual Total(in millions)
Balance as of January 1, 2016 $20.0 $ 5.1 $ 56.3 $ 81.4Additions 8.8 8.9 312.6 330.3
Amortization (8.9) (9.1) (313.8) (331.8)
Balance as of December 31, 2016 $19.9 $ 4.9 $ 55.1 $ 79.9
4. INVESTMENTS
FINRA owns a diverse investment portfolio consisting of 1) U.S. government (and state and local) securities; 2) agencymortgage-backed securities; 3) corporate and asset-backed securities; 4) mutual and commingled funds; 5) other investments(including a limited partnership and private investments); and 6) other financial instruments. We have classified ourmarketable investments as trading or available-for-sale based on their nature, and our intent and ability to sell or to hold thesecurities.
FINRA 2017 Annual Financial Report 47

ˆ200F$TiRP!z#liLMeŠ 200F$TiRP!z#liLMe
592132 FIN 48FINRAANNUAL REPORT 2017
26-Jun-2018 10:56 ESTCLN PSWDC
Donnelley Financial ADG pf_rend 22*PMT 1C
ADGP64RS1312.6.31
FINRA 2017 Notes to Consolidated Financial Statements
4. INVESTMENTS (CONTINUED)
Our investment policy strives to preserve principal, in real terms, while seeking to earn a long-term rate of returncommensurate with the degree of risk deemed appropriate by the Board. We execute our investment strategy through aseparately managed account and direct investments. During 2017, our active trading portfolio was managed by aninvestment manager, who has the authority to buy and sell investments within FINRA-determined, pre-establishedparameters. FINRA’s investment portfolio consisted of the following as of:
December 31,2017 2016
(in millions)Trading investments $ 431.6 $ 693.7Available-for-sale investments: FINRA 271.6 229.1
Available-for-sale investments: Foundation 51.5 49.7
Other investments:Limited partnership: FINRA 642.8 692.6
Limited partnership: Foundation — 23.1
Private investment funds: FINRA 282.1 —
Private investment fund: Foundation 27.7 —
Other 0.4 0.5
Total other investments 953.0 716.2
Total $1,707.7 $1,688.7
TRADING INVESTMENTS
Our unrealized gain for the period on trading securities held at December 31, 2017, was $4.2 million. Our unrealized lossfor the period on trading securities held at December 31, 2016, was $16.6 million.
During 2016, we made an investment in a mutual fund classified as an available-for-sale investment in the amount of$218.8 million, $213.5 million of which represented a transfer of holdings in trading investments, with the remaining$5.3 million in cash. Only the cash portion of this transaction is reflected in the accompanying consolidated statements ofcash flows. No similar types of investment transactions occurred during 2017.
48 FINRA 2017 Annual Financial Report

ˆ200F$TiRP!z#p40tÆŠ200F$TiRP!z#p40t˘
592132 FIN 49FINRAANNUAL REPORT 2017
26-Jun-2018 10:56 ESTCLN PSWDC
Donnelley Financial ADG pf_rend 24*PMT 1C
ADGP64RS1312.6.31
FINRA 2017 Notes to Consolidated Financial Statements
4. INVESTMENTS (CONTINUED)
AVAILABLE-FOR-SALE INVESTMENTSFINRA’s available-for-sale investments consisted of the following:
AmortizedCost
Gross Unrealized FairValueGain Loss
(in millions)As of December 31, 2017:FINRA:
Mutual funds $166.0 $20.2 $ — $186.2Commingled funds 75.1 10.3 — 85.4
Total FINRA $241.1 $30.5 $ — $271.6Foundation:
Commingled funds $ 50.0 $ 1.5 $ — $ 51.5
As of December 31, 2016:FINRA:
Mutual funds $229.8 $ 0.4 $(1.1) $229.1Foundation:
Mutual fund $ 24.0 $ 1.1 $ — $ 25.1
Commingled fund 24.3 0.3 — 24.6Total Foundation $ 48.3 $ 1.4 $ — $ 49.7
For 2017 and 2016, gross investment gains recognized from our investments in mutual and commingled funds, includingamounts reclassified from unrealized gains and losses in accumulated other comprehensive income (loss), were as follows:
2017 2016
(in millions)Gross investment gains recognized $9.1 $0.2
Amounts reclassified from accumulated other comprehensive income (loss) 1.2 0.1
For 2017 and 2016, there were no gross investment losses recognized from our investments in mutual and commingledfunds.
Other-Than-Temporary Declines in Fair Value
In 2017 and 2016, we did not record any impairment charges related to our mutual and commingled funds. As ofDecember 31, 2017 and 2016, we did not identify any events or circumstances that would indicate the value of our mutualand commingled funds should be impaired. Should there be any impairment charges related to other-than-temporarydeclines in the fair value of available-for-sale investments, they would be reflected in net realized and unrealizedinvestment gains in the consolidated statements of operations.
Temporary Declines in Fair Value
As of December 31, 2017, FINRA had no available-for-sale investments with aggregate unrealized losses. As ofDecember 31, 2016, FINRA had one mutual fund with a fair value of $221.5 million, reflecting unrealized losses of$1.1 million less than six months in duration. As of December 31, 2017 and 2016, the Foundation had no available-for-saleinvestments with aggregate unrealized losses.
OTHER INVESTMENTSOur other investments consist of an investment in one limited partnership accounted for under the equity method andprivate investment funds for which the fair value option has been elected.
FINRA 2017 Annual Financial Report 49

ˆ200F$TiRP@9@fCFMAŠ 200F$TiRP@9@fCFMA
592132 FIN 50FINRAANNUAL REPORT 2017
27-Jun-2018 12:52 ESTCLN PSWDC
Donnelley Financial ADG babus4dc 27*PMT 1C
VDI-W7-PR3-115812.6.31
FINRA 2017 Notes to Consolidated Financial Statements
4. INVESTMENTS (CONTINUED)
Limited Partnership
The limited partnership investment represents a variable interest in an investment limited partnership, whose generalpartner is fully independent of FINRA management and its Board. The purpose of the limited partnership is to maximizerisk-adjusted returns over the long term by investing in a highly diversified asset allocation strategy. The nature of thelimited partnership includes investments in equity, fixed income, real assets and alternative investments. FINRA, as alimited partner, does not have the power to direct the activities of the partnership that most significantly impact thepartnership’s business. Therefore, we are not the primary beneficiary and account for our interest under the equitymethod. Our equity in the earnings of the partnership is based on the partnership’s reported net asset value (whichapproximates fair value). The partnership’s net assets consist primarily of its investments accounted for at fair value; themajority of the partnership’s fair value measurements are based on the estimates of the general partner.
The limited partnership investment is included in other investments in the consolidated balance sheets. The gains areincluded in equity earnings from other investments in the consolidated statements of operations. The following tablesummarizes 2017 and 2016 activity related to the limited partnership for both FINRA and the Foundation.
Limitedpartnership:
FINRA
Limitedpartnership:Foundation Total
(in millions)Balance, January 1, 2016 $ 698.8 $ 24.0 $ 722.8
Equity earnings 28.8 0.9 29.7
Redemptions (35.0) (1.8) (36.8)
Balance, December 31, 2016 692.6 23.1 $ 715.7
Equity earnings 81.9 2.0 83.9
Redemptions (131.7) (25.1) (156.8)
Balance, December 31, 2017 $ 642.8 $ — $ 642.8
FINRA and the Foundation redeemed $156.8 million and $36.8 million in the aggregate during 2017 and 2016, respectively.During 2017, the Foundation redeemed all of its interest in the limited partnership. No contributions were made during2017 and 2016. The maximum exposure to loss related to this partnership is limited to $642.8 million, the carryingamount of the investment, due to the legal structure and design of this partnership. We have no outstanding capitalcommitments, guarantees or any other liquidity arrangements with this partnership. Our consolidated ownership interestin this partnership was 69.7 percent at December 31, 2017 and 63 percent at December 31, 2016.
The following table shows our ownership interest in all equity method investments (limited partnership and hedge funds)as of and for the periods ended December 31, 2017 and 2016.
2017 2016
Total net assets (in billions of dollars) $ 3.3 $ 8.0
Total gains from operations (in millions of dollars) $ 184.0 $776.7
Weighted ownership interest in all equity method investees (percentage) 19.6% 8.9%
We did not recognize any impairment charges on our equity method investments for the years ended December 31, 2017
and 2016.
Private Investment Funds
During 2017, both FINRA and the Foundation invested in a private investment fund for which the fair value option waselected, and FINRA invested in two additional private investment funds for which the fair value option was elected. Thefollowing table summarizes the 2017 activity related to the private investment funds for both FINRA and the Foundation.
50 FINRA 2017 Annual Financial Report

ˆ200F$TiRP!z#x4nMÄŠ200F$TiRP!z#x4nM˜
592132 FIN 51FINRAANNUAL REPORT 2017
26-Jun-2018 10:56 ESTCLN PSWDC
Donnelley Financial ADG pf_rend 24*PMT 1C
ADGP64RS1312.6.31
FINRA 2017 Notes to Consolidated Financial Statements
4. INVESTMENTS (CONTINUED)
Aggregate carryingamount as ofDecember 31,
2017
Net gains (losses)from changes in fair
value for the yearended
December 31, 2017
(in millions)Private investment funds: FINRA $282.1 12.1
Private investment fund: Foundation 27.7 (0.2)
Total $309.8 $11.9
The aggregate carrying amounts of these investments were included in other investments in the consolidated balancesheets. Net gains (losses) from changes in fair value on these investments were included in net realized and unrealizedgains in the consolidated statement of operations. No interest and dividends were recorded.
5. FAIR VALUE MEASUREMENT
The Company considers cash and cash equivalents, trading and available-for-sale investments, receivables, investmentsreceivable and investments payable to be its financial instruments. The carrying amounts reported in the consolidatedbalance sheets for these financial instruments equal or closely approximate fair value.
U.S. GAAP defines fair value as the price that would be received upon the sale of an asset or paid to transfer a liability in anorderly transaction between market participants as of the measurement date (i.e., an exit price).
U.S. GAAP prioritizes the level of market price observability used in measuring assets and liabilities at fair value. There are anumber of factors that impact market price observability, including the type of assets and liabilities, and the specificcharacteristics of the assets and liabilities. Assets and liabilities with prices that are readily available, actively quoted or forwhich fair value can be measured from actively quoted prices generally will have a higher degree of market priceobservability and less degree of judgment used in measuring fair value.
Assets and liabilities measured at fair value are classified into one of the following categories:
Level 1 Quoted prices (unadjusted) in active markets for identical assets or liabilities that the entity has the abilityto access as of the measurement date.
Level 2 Inputs other than quoted prices included within Level 1 that are observable for the asset or liability, eitherdirectly or indirectly, through corroboration with observable data.
Level 3 Unobservable inputs, such as internally developed pricing models for the asset or liability due to little or nomarket activity for the asset or liability.
In certain cases, the inputs used to measure fair value may fall into different levels of the fair value hierarchy. In suchcases, an asset or liability’s level within the fair value hierarchy is based on the lowest level input that is significant to thefair value measurement. The assessment of significance of a particular input to the fair value measurement in its entiretyrequires judgment and factors specific to the asset or liability.
FINRA 2017 Annual Financial Report 51

ˆ200F$TiRP!z#zpgtGŠ 200F$TiRP!z#zpgtG
592132 FIN 52FINRAANNUAL REPORT 2017
26-Jun-2018 10:56 ESTCLN PSWDC
Donnelley Financial ADG pf_rend 20*PMT 1C
ADGP64RS1312.6.31
FINRA 2017 Notes to Consolidated Financial Statements
5. FAIR VALUE MEASUREMENT (CONTINUED)
The following table presents information about our assets that are measured at fair value on a recurring basis as ofDecember 31, 2017, and indicates the fair value hierarchy of the valuation techniques used to determine fair value:
Fair Value Measurement at December 31, 2017
Measured Using
Description
Total carryingamount in
balancesheet
December 31,2017
Quoted pricesin active
markets foridentical assets
(Level 1)
Significantother
observableinputs
(Level 2)(in millions)
Assets:Trading securities
Fixed incomeAgency mortgage-backed securities
FNMA $ 24.9 $ — $ 24.9
GNMA 9.9 — 9.9
FHLMC 8.9 — 8.9
Corporate debt securitiesBanking 76.2 — 76.2
Consumer non-cyclical 37.7 — 37.7
Industrial 34.5 — 34.5
Other financial institutions 33.4 — 33.4
Utility 32.1 — 32.1
Consumer cyclical 19.1 — 19.1
Communication 18.9 — 18.9
Other 1.9 — 1.9
Asset-backed securities 55.8 — 55.8
Government securities 39.8 — 39.8
Mutual funds 38.5 38.5 —
Available-for-sale securitiesMutual funds
U.S. equity 180.1 180.1 —
Other 6.1 6.1 —
Commingled fundsInternational equity 79.4 — 79.4
U.S. fixed income 31.3 — 31.3
U.S. equity 26.2 — 26.2
Total assets in the fair value hierarchy 754.7 224.7 530.0
Private investment funds, measured at net asset value 309.8 — —
Total assets measured at fair value $1,064.5 $224.7 $530.0
52 FINRA 2017 Annual Financial Report

ˆ200F$TiRP!z#$CPMÀŠ200F$TiRP!z#$CPM
592132 FIN 53FINRAANNUAL REPORT 2017
26-Jun-2018 10:56 ESTCLN PSWDC
Donnelley Financial ADG pf_rend 21*PMT 1C
ADGP64RS1312.6.31
FINRA 2017 Notes to Consolidated Financial Statements
5. FAIR VALUE MEASUREMENT (CONTINUED)
The following table presents information about our assets that are measured at fair value on a recurring basis as ofDecember 31, 2016, and indicates the fair value hierarchy of the valuation techniques utilized to determine fair value:
Fair Value Measurement at December 31, 2016
Measured Using
Description
Total carryingamount in
balancesheet
December 31,
2016
Quoted pricesin active
markets foridentical assets
(Level 1)
Significantother
observableinputs
(Level 2)(in millions)
Assets:Trading securities
Fixed incomeAgency mortgage-backed securities
FHLMC $104.9 $ — $104.9
FNMA 47.1 — 47.1
GNMA 13.7 — 13.7
Corporate debt securitiesBanking 122.5 — 122.5
Consumer non-cyclical 64.7 — 64.7
Industrial 59.0 — 59.0
Utility 44.4 — 44.4
Consumer cyclical 41.7 — 41.7
Insurance 35.3 — 35.3
Communication 28.9 — 28.9
Other financial institutions 27.5 — 27.5
Asset-backed securities 51.4 — 51.4
Government securities 21.0 — 21.0
Mutual funds 31.6 31.6 —
Available-for-sale securitiesMutual funds
U.S. equity 246.6 246.6 —
Other 7.6 7.6 —
Commingled fund 24.6 — 24.6
Total assets in the fair value hierarchy $972.5 $285.8 $686.7
As of December 31, 2017 and 2016, we had no investments categorized in Level 3 of the fair value hierarchy.
Changes in the fair value of trading securities and other investments measured at net asset value are recorded as acomponent of net realized and unrealized investment gains in the consolidated statements of operations. Temporarychanges in the fair value of available-for-sale securities are recognized as unrealized gains as a separate component ofother comprehensive income (loss).
For the years ended December 31, 2017 and 2016, there were no transfers between Level 1, Level 2 or Level 3 of the fairvalue hierarchy.
FINRA 2017 Annual Financial Report 53

ˆ200F$TiRP!z$0h3tSŠ 200F$TiRP!z$0h3tS
592132 FIN 54FINRAANNUAL REPORT 2017
26-Jun-2018 10:56 ESTCLN PSWDC
Donnelley Financial ADG pf_rend 20*PMT 1C
ADGP64RS1312.6.31
FINRA 2017 Notes to Consolidated Financial Statements
5. FAIR VALUE MEASUREMENT (CONTINUED)
The following is a description of the valuation methodologies used for financial assets measured at fair value on arecurring basis and the general classification of these instruments pursuant to the fair value hierarchy.
Fixed Income
All of our fixed income securities classified as trading securities are priced using the services of third-party pricing vendors.These vendors utilize evaluated and industry-accepted pricing models that vary by asset class and incorporate marketinputs such as available trade, bid and other market information to determine the fair value of the securities. Accordingly,the valuation of these securities is categorized in Level 2 of the fair value hierarchy.
We independently validate the fair value measurement of our trading securities to determine that the assigned fair valuesare appropriate. To validate pricing information received, our policy is to employ a variety of procedures throughout theyear, including comparing information received to other pricing sources and performing independent price checks.
Mutual Funds
All of the mutual funds classified as trading securities, which consist of funds invested in domestic bonds, as well asdomestic and international equities, relate to our defined contribution SERP for senior officers and deferred compensationplan for officers under the provisions of Section 457(b) of the IRC.
The Company also invests in mutual funds that are classified as available-for-sale investments based on our intent andability to sell or to hold these investments. One mutual fund investment, related to our closed defined benefit SERPobligation, consists of a life-cycle fund focused on asset allocation through investments in other mutual funds, primarily inbonds with the remainder in equities. Additionally, we have a domestic mutual fund that invests in high-qualitycompanies that have both the ability and the commitment to grow their dividends over time.
These investments are valued at the publicly quoted net asset value per share which is computed as of the close of business onthe balance sheet date. Accordingly, the valuation of these securities is categorized in Level 1 of the fair value hierarchy.
Commingled Funds
As of December 31, 2017, all of our commingled funds are classified as available-for-sale investments based on our intentand ability to sell or to hold these investments. Our commingled funds employ a variety of strategies, including domesticand international equities and domestic fixed income securities. As of December 31, 2016, we held only one commingledfund that primarily focused in U.S. fixed income securities.
These investments are valued at the quoted net asset value per unit, computed as of the close of business on the balancesheet date. Units of these investments are valued daily and a unit-holder’s ability to transact in the funds’ units occursdaily; however, units are not traded on an active exchange. As the fair value per unit is readily determinable, the valuationof these securities is categorized in Level 2 of the fair value hierarchy.
Other Investments Measured at Net Asset Value
During 2017, the Company invested in certain other investments for which the fair value option has been elected. Theseinvestments are private investment funds that are offshore feeder funds in a “master-feeder” structure and substantially,all of their capital is invested in their respective master funds. The master funds’ investment objectives generally includeproducing risk-adjusted returns while maintaining low correlation to traditional markets by taking long and shortpositions in major equities, fixed income, currencies and commodities markets offering a high level of liquidity.
Our investments in these feeder funds are valued at the reported net asset value on the balance sheet date, as a practicalexpedient to fair value. These investments generally have a redemption notice period between three to 30 days, andshares may be redeemed on a semimonthly or a monthly basis. We do not have any outstanding capital commitmentsrelated to these investments.
54 FINRA 2017 Annual Financial Report

ˆ200F$TiRP!z$3kRtrŠ 200F$TiRP!z$3kRtr
592132 FIN 55FINRAANNUAL REPORT 2017
26-Jun-2018 10:56 ESTCLN PSWDC
Donnelley Financial ADG pf_rend 20*PMT 1C
ADGP64RS1312.6.31
FINRA 2017 Notes to Consolidated Financial Statements
5. FAIR VALUE MEASUREMENT (CONTINUED)
In accordance with ASC Subtopic 820-10, as these investments are measured at fair value using the net asset value pershare practical expedient, they have not been classified in the fair value hierarchy. The aggregate fair value amountpresented in the fair value hierarchy is intended to permit reconciliation of the fair value hierarchy to the fair value of theassets presented on the consolidated balance sheet.
6. INCOME TAXES
FINRA and FINRA REG are tax-exempt organizations under IRC Section 501(c)(6). The Foundation is a tax-exemptorganization under IRC Section 501(c)(4).
Unrelated Business Income
Unrelated business income activities are taxed at normal corporate rates to the extent that they have taxable net income.Our unrelated business activities consist primarily of mortgage licensing services provided under our contract with SRR,certain external client exams and other consulting services.
In 2013, management performed an evaluation of the net operating loss (NOL) previously reported under New NASDHolding, Inc. (NAHO), which at that time was a wholly-owned taxable subsidiary of FINRA. Management determined thatFINRA, as the parent organization, should succeed to the NAHO NOLs upon the liquidation of NAHO. At the time ofliquidation, the NOL was determined to have a remaining value, net of gains recognized as part of the transaction, of$60.2 million. As a result of this recognition, as of December 31, 2017 and 2016, FINRA had federal unrelated business losscarryforwards of $51.3 million and $54.2 million, respectively, primarily related to NAHO losses and internationalconsulting. The loss carryforwards are scheduled to expire beginning in 2022 through 2028.
In 2013, the deferred tax asset related to the transfer of the NAHO NOL to FINRA was measured at $20.5 million based onfederal tax rates then in effect. In order to record a deferred tax asset without a valuation allowance, it must be more likelythan not that the deferred tax asset will be realized. A component of realization is dependent on generating sufficienttaxable income prior to the expiration of the loss carryforwards, as well as evaluation of uncertain tax positions. In 2013,we recorded a valuation allowance equal to the amount of the deferred tax asset resulting from the NAHO liquidation.
The enactment of the Tax Cuts and Jobs Act (TCJA) on December 15, 2017, affected FINRA’s deferred tax assets, valuationallowance and unrecognized tax benefit. For the period ending December 31, 2017, the federal provision was measured atexisting rates for 2017. However, the December 31, 2017, asset and liability balances are measured at the rates expectedto be in effect when those assets and liabilities are likely to be realized. As a result, the deferred tax asset and valuationallowance were both reduced by $6.6 million. The deferred tax asset and valuation allowance were further reduced by anadditional $0.6 million due to the elimination of corporate alternative minimum tax (AMT). A corresponding increase inthe unrecognized tax benefit also was recorded. This elimination entitles FINRA to a refund of prior AMT paid, totaling$0.6 million.
FINRA 2017 Annual Financial Report 55

ˆ200F$TiRP!z$90Bt5Š 200F$TiRP!z$90Bt5
592132 FIN 56FINRAANNUAL REPORT 2017
26-Jun-2018 10:56 ESTCLN PSWDC
Donnelley Financial ADG pf_rend 22*PMT 1C
ADGP64RS1312.6.31
FINRA 2017 Notes to Consolidated Financial Statements
6. INCOME TAXES (CONTINUED)
The following table summarizes the 2017 and 2016 activity related to the federal deferred tax asset and valuationallowance:
Deferred taxasset—NOLs
Otherdeferred
taxasset
Valuationallowance
Netdeferred
taxassets
Deferred tax asset, January 1, 2016 $19.6 $ 0.5 $(20.1) $—
2016 federal provision (1.2) 0.1 1.1 —
Deferred tax asset, December 31, 2016 18.4 0.6 (19.0) —
2017 federal provision (1.0) — 1.0 —
2017 deferred tax asset before TCJA recognition 17.4 0.6 (18.0) —
Adjustment for future effective rate reduction from 34 percent to 21 percent (6.6) — 6.6 —
Adjustment for AMT elimination — (0.6) 0.6 —
Deferred tax asset, December 31, 2017 $10.8 $ — $(10.8) $—
As discussed above, we recorded provisional amounts related to the TCJA in our 2017 consolidated financial statements.We continue to assess the impacts of the TCJA to determine what impact, if any, the TCJA may have on FINRA’s taxpositions, unrelated business taxable income and potential excise taxes. We will monitor developments and finalize ourassessment of the TCJA in 2018.
There were no other significant deferred tax assets related to unrelated business income. The 2017 and 2016 income taxprovision of $1.6 million and $1.5 million, respectively, primarily represented the net change in deferred tax assets relatedto unrelated business loss carryforwards during the year in addition to state income tax and other minor adjustments. Theincome tax provision was included in other expense in the consolidated statements of operations.
We did not have any significant unrelated business income taxes payable in 2017 or 2016.
Uncertain Tax Positions
U.S. GAAP provides a two-step approach for evaluating tax positions. Recognition (step 1) occurs when an entity concludesthat a tax position, based solely on its technical merits, is more likely than not to be sustained upon examination.Measurement (step 2) occurs when the tax benefit is measured as the largest amount of benefit, determined on acumulative probability basis, that is more likely than not to be realized upon ultimate settlement. From 2014 through2017, the years management considers to be open for examination by taxing authorities, management did not identifythe existence of any uncertain tax positions related to current operations. However, FINRA has recognized an uncertain taxposition related to the succession to the NAHO NOLs. The unrecognized tax benefit of the NAHO NOL has been partiallyoffset by non-NAHO NOLs resulting in a net unrecognized tax benefit liability of $3.0 million as of December 31, 2017, and$1.5 million as of December 31, 2016.
56 FINRA 2017 Annual Financial Report

ˆ200F$TiRP!z$D3ZtSŠ 200F$TiRP!z$D3ZtS
592132 FIN 57FINRAANNUAL REPORT 2017
26-Jun-2018 10:56 ESTCLN PSWDC
Donnelley Financial ADG pf_rend 25*PMT 1C
ADGP64RS1312.6.31
FINRA 2017 Notes to Consolidated Financial Statements
7. EMPLOYEE BENEFIT LIABILITIES
BENEFIT PLANS
The following table summarizes the benefit plans offered by FINRA.
Plan Eligible employees
Defined benefit ERP As of January 1, 2018, fewer than 700 current employeesnot previously phased out of the plan in 2017 (closed tonew participants)
Defined benefit SERP Fewer than 10 current senior executives not previouslyphased out of the plan in 2011 (closed to newparticipants)
Retiree medical plan Eligible active employees, retirees and their dependents
Postretirement life insurance benefit plan Fewer than 150 retirees who opted into the plan (closedto new participants)
Voluntary contributory savings plans All active employees
Defined contribution component of the savings plan Active employees not participating in the defined benefitERP
Deferred compensation plan for officers Active officer-level employees (vice president and above)
Supplemental defined contribution plan for senior officers Active senior executives not participating in the definedbenefit SERP
A brief description of the plans follows.
Defined Benefit ERP and SERP
We provide two non-contributory defined benefit pension plans to eligible employees, including a qualified ERP and anon-qualified SERP. The benefits are based primarily on years of service and employees’ average compensation during thehighest 60 consecutive months of employment. Both plans are now closed to new participants.
Effective January 1, 2017, approximately 1,100 ERP participants who did not meet certain age and service criteria weretransferred to the defined contribution component of the savings plan. ERP benefits for the transitioned participantsaccrued through December 31, 2016. The total amount of benefits these participants accumulated in the ERP was frozenas of December 31, 2016, and will be made available to them upon retirement. Beginning January 1, 2017, theseparticipants started receiving contributions in the defined contribution component of the savings plan. Some transitionedparticipants will receive transition credits in the form of additional contributions for up to five years, if they meet certainage and service criteria. After this transition, approximately 700 participants remained in the ERP as of January 1, 2017.
Retiree Medical Benefit Plan
The Company offers access to retiree medical coverage for eligible active employees, retirees and their dependents. Eligibleretirees pay the full premium cost to be enrolled in the Company’s retiree medical coverage. Additionally, the Companyprovides an employer-funded defined contribution RMA Plan to help our retirees offset health care premiums duringretirement. Under the RMA Plan, Retiree Medical Accounts are created for eligible employees and retirees and fixed annualcredits are applied to those accounts for each year of FINRA service beginning at age 40. Active employees may also accruecredits for a portion of their unused vacation and personal leave. The credits can be accessed only in retirement and maybe used only toward paying a portion of monthly premiums under FINRA-sponsored retiree health plans.
FINRA 2017 Annual Financial Report 57

ˆ200F$TiRP!z$H=FMHŠ200F$TiRP!z$H=FMH
592132 FIN 58FINRAANNUAL REPORT 2017
26-Jun-2018 10:56 ESTCLN PSWDC
Donnelley Financial ADG pf_rend 25*PMT 1C
ADGP64RS1312.6.31
FINRA 2017 Notes to Consolidated Financial Statements
7. EMPLOYEE BENEFIT LIABILITIES (CONTINUED)
Postretirement Life Insurance Benefit Plan
The Company provides a non-contributory specified life insurance benefit to eligible retired employees. Thepostretirement life insurance benefit plan is closed with respect to new participants.
Voluntary Contributory Savings Plan
FINRA maintains a voluntary contributory savings plan for eligible employees. Employees are immediately eligible to makeelective contributions to the plan up to specified plan limits. Employees are also eligible to receive from FINRA acorresponding dollar-for-dollar matching contribution on any elective contribution made by the participant to the savingsplan up to a maximum of 6 percent of base compensation. Prior to 2017, employees were eligible to receive adollar-for-dollar matching contribution up to a maximum of 4 percent of base compensation, plus an additionaldiscretionary match of up to 2 percent of base compensation. The plan also had a retiree medical match equal to 25 centson the dollar for elective contributions in excess of 6 percent of compensation, up to an annual maximum match of$1,000. Effective January 1, 2017, the 4 percent basic match, the discretionary match and the retiree medical match werereplaced with a straightforward 6 percent match of eligible base compensation contributed by a participant.
The savings plan expense for 2017 and 2016 was $24 million and $25.2 million, respectively, which was included withincompensation and benefits expense in the consolidated statements of operations.
Defined Contribution Component of the Savings Plan
FINRA has also offered a defined contribution component of the savings plan to all new hires since January 1, 2011, as wellas to the ERP participants who elected in 2011 to participate in the defined contribution component instead of the ERPbeginning January 1, 2012. The accrued benefit of the former ERP participants was frozen, but future service with FINRAstill allows for growth into vesting and eligibility for early retirement and/or early payment subsidies. As previouslymentioned, effective January 1, 2017, approximately 1,100 ERP participants who did not meet certain age and servicecriteria as of December 31, 2016, were also transferred to the defined contribution component of the savings plan.
The Company’s contributions for this component are based on a participant’s age plus years of service, and vesting is on agraduated scale over six years. The investment options are the same as the current options in the savings plan. Expensesrelated to the defined contribution component of the savings plan for 2017 and 2016 were $22.9 million and $9.1 million,respectively, which were included within compensation and benefits expense in the consolidated statements ofoperations.
Deferred Compensation Plan for Officers
FINRA maintains a deferred compensation plan for officers under the provisions of Section 457(b) of the IRC. Eligibleemployees may contribute to the plan and, at its discretion, FINRA may make additional contributions to the plan. FINRAplaced the assets of this plan into an irrevocable rabbi trust that the Company consolidates. As of December 31, 2017,$20.5 million of investments and $20.5 million of amounts due to plan participants were included in trading investmentsand accrued personnel and benefit costs in the consolidated balance sheet, representing participant contributions to thisplan and accrued earnings. As of December 31, 2016, $17.4 million of investments and $17.4 million of amounts due toplan participants were included in trading investments and accrued personnel and benefit costs in the consolidatedbalance sheet, representing participant contributions to this plan and accrued earnings. As of December 31, 2017 and2016, FINRA made no additional contributions to this plan.
Supplemental Defined Contribution Plan for Senior Officers
FINRA maintains a supplemental defined contribution plan for the Company’s senior officers and makes annualcontributions based on salary and a portion of incentive compensation. Contributions and earnings vest upon the earlier
58 FINRA 2017 Annual Financial Report

ˆ200F$TiRP!z$LcbM.Š200F$TiRP!z$LcbM.
592132 FIN 59FINRAANNUAL REPORT 2017
26-Jun-2018 10:56 ESTCLN PSWDC
Donnelley Financial ADG pf_rend 29*PMT 1C
ADGP64RS1312.6.31
FINRA 2017 Notes to Consolidated Financial Statements
7. EMPLOYEE BENEFIT LIABILITIES (CONTINUED)
of 1) the end of each third year of participation following such contribution; 2) attainment of age 62; 3) death; or 4) adisabled participant’s termination of employment. FINRA placed the assets of this plan into an irrevocable rabbi trust thatthe Company consolidates. As of December 31, 2017, $18 million of investments and $18 million of amounts due to planparticipants were included in trading investments and accrued personnel and benefit costs in the consolidated balancesheet, representing FINRA’s contributions to this plan and accrued earnings. As of December 31, 2016, $14.2 million ofinvestments and $14.2 million of amounts due to plan participants were included in trading investments and accruedpersonnel and benefit costs in the consolidated balance sheet, representing FINRA’s contributions to this plan and accruedearnings.
PLAN DISCLOSURES
The following tables disclose information related to our “Pension Plans,” which include the ERP and SERP described above,and “Other Plans,” which include the retiree medical benefit and postretirement life insurance benefit plans describedabove. The reconciliation of the projected benefit obligation, the change in the fair value of plan assets for the periodsended December 31, 2017 and 2016, and the accumulated benefit obligation at December 31, 2017 and 2016, were asfollows:
Pension Plans Other Plans2017 2016 2017 2016
(in millions)Change in benefit obligationBenefit obligation at beginning of period $ 549.3 $538.7 $ 67.6 $ 70.4
Service cost 16.2 29.2 3.6 4.2
Interest cost 23.0 21.9 2.8 3.1
Actuarial losses (gains) 66.6 54.8 6.0 (8.3)
Benefits paid (18.7) (15.1) (1.9) (1.8)
Curtailment gain due to employee transition — (80.2) — —
Benefit obligation at end of period $ 636.4 $549.3 $ 78.1 $ 67.6
Change in plan assetsFair value of plan assets at beginning of period $ 462.5 $408.5 $ — $ —
Actual return on plan assets 65.8 26.8 — —
Company contributions 12.0 42.3 1.9 1.8
Benefits paid (18.7) (15.1) (1.9) (1.8)
Fair value of plan assets at end of period $ 521.6 $462.5 $ — $ —
Underfunded status of the plan $(114.8) $ (86.8) $(78.1) $(67.6)
Accumulated benefit obligation $ 576.9 $492.1
Our total accrued pension and other postretirement liability in the consolidated balance sheets comprised the following:Pension Plans Other Plans2017 2016 2017 2016
(in millions)Current $ 7.5 $ 5.3 $ 1.7 $ 1.6
Noncurrent 107.3 81.5 76.4 66.0
Net amount at December 31 $114.8 $86.8 $78.1 $67.6
FINRA 2017 Annual Financial Report 59

ˆ200F$TiRP!z$PfvMÇŠ200F$TiRP!z$PfvM˙
592132 FIN 60FINRAANNUAL REPORT 2017
26-Jun-2018 10:56 ESTCLN PSWDC
Donnelley Financial ADG pf_rend 28*PMT 1C
ADGP64RS1312.6.31
FINRA 2017 Notes to Consolidated Financial Statements
7. EMPLOYEE BENEFIT LIABILITIES (CONTINUED)
The current portion of pension and other liabilities represented the net present actuarial value of benefits to be paid overthe next 12 months in excess of plan assets, and was included in accrued personnel and benefit costs in the consolidatedbalance sheet. There are no plan assets for the SERP, retiree medical benefit and postretirement life insurance benefitplans.
The Company does not expect any plan assets to be returned to it during the year ending December 31, 2018.
The components of net periodic benefit cost included in the consolidated statements of operations were as follows:Pension Plans Other Plans2017 2016 2017 2016
(in millions)Service cost $ 16.2 $ 29.2 $3.6 $4.2Interest cost 23.0 21.9 2.8 3.1
Expected return on plan assets (25.8) (24.1) — —
Recognized net actuarial losses 2.2 4.5 — 0.3
Prior service cost recognized 0.1 0.1 1.4 1.4
Settlement expense 0.2 — — —
Curtailment expense as a result of the employee transition — 0.4 — —
Total $ 15.9 $ 32.0 $7.8 $9.0
The assumed health care cost trend rate to be used for the next year to measure the expected cost of other plan liabilitiesis 7.5 percent, with a gradual decline to 6.5 percent by the year 2022. This estimated trend rate is subject to change. Theassumed health care cost trend rate can have a significant effect on the amounts reported. However, a 1-percentage-point change in the assumed health care cost trend rate would not have a material impact on the benefit obligation orservice and interest components of net periodic benefit cost.
The net amounts included in accumulated other comprehensive income (loss) were as follows:Pension Plans Other Plans2017 2016 2017 2016
(in millions)Unrecognized net actuarial loss $(96.7) $(72.5) $ (9.8) $ (3.9)Unrecognized prior service cost (0.1) (0.2) (4.8) (6.1)
Net amount at December 31 $(96.8) $(72.7) $(14.6) $(10.0)
60 FINRA 2017 Annual Financial Report

ˆ200F$TiRP!z$VBtMWŠ 200F$TiRP!z$VBtMW
592132 FIN 61FINRAANNUAL REPORT 2017
26-Jun-2018 10:56 ESTCLN PSWDC
Donnelley Financial ADG pf_rend 29*PMT 1C
ADGP64RS1312.6.31
FINRA 2017 Notes to Consolidated Financial Statements
7. EMPLOYEE BENEFIT LIABILITIES (CONTINUED)
The following amounts were included in other comprehensive income (loss) during 2017:
Incurred but NotYet Recognized in Net
Periodic Benefit Cost
ReclassificationAdjustment for
Prior PeriodAmounts
Recognized(in millions)
Actuarial (loss) gainPension plans $(26.4) $2.2
Other plans (5.9) —(32.3) 2.2
Prior service costPension plans — 0.1
Other plans (0.1) 1.4
(0.1) 1.5
$(32.4) $3.7
The estimated amounts to be amortized from accumulated other comprehensive income (loss) into net periodic benefitcost during 2018 based on December 31, 2017, plan measurements were as follows:
Pension Plans Other Plans(in millions)
Unrecognized prior service costs $0.1 $1.4
Unrecognized actuarial losses 3.1 0.1
The weighted-average assumptions used to determine benefit obligations for the years ended December 31, 2017, and2016, were as follows:
Pension Plans Other Plans2017 2016 2017 2016
Discount rate 3.65% 4.25% 3.47% 4.05%
Rate of compensation increase 3.00% 3.89% — —
The weighted-average assumptions used to determine net periodic benefit cost for the years were as follows:Pension Plans Other Plans2017 2016 2017 2016
Discount rate 4.25% 4.50% 4.05% 4.10%
Rate of compensation increase 3.89% 3.89% — —
Expected return on plan assets 5.75% 6.00% — —
The assumptions above are used to develop the benefit obligations at year end and to develop the net periodic benefit costfor the subsequent year. Therefore, the assumptions used to determine benefit obligations are established at each yearend while the assumptions used to determine net periodic benefit cost for each year are established at the end of eachprevious year. The expected return on plan assets that will be used in the determination of 2018 net periodic benefit costis 5.75 percent.
FINRA 2017 Annual Financial Report 61

ˆ200F$TiRP!z$Xvmt‹Š200F$TiRP!z$Xvmt
592132 FIN 62FINRAANNUAL REPORT 2017
26-Jun-2018 10:56 ESTCLN PSWDC
Donnelley Financial ADG pf_rend 22*PMT 1C
ADGP64RS1312.6.31
FINRA 2017 Notes to Consolidated Financial Statements
7. EMPLOYEE BENEFIT LIABILITIES (CONTINUED)
The benefit obligations and the net periodic benefit cost are based on actuarial assumptions that are reviewed on anannual basis. We revise these assumptions based on an annual evaluation of long-term trends, as well as marketconditions, which may have an impact on the cost of providing retirement benefits.
PLAN ASSETS
We fund our ERP obligation, and we have established an irrevocable rabbi trust to fund our SERP obligation. The retireemedical benefit and postretirement life insurance benefit plans are unfunded plans.
The trust related to the SERP obligation is included in our consolidated financial statements. As of December 31, 2017, and2016, $6.1 million and $7.6 million of investments were included in available-for-sale securities in the consolidatedbalance sheets, representing the amounts contributed by FINRA, plus earned income and market value gains, lessdistributions to retirees and market value losses.
The investment policy and strategy of the ERP assets are established by the Pension Committee, which is comprised of across-representative body of FINRA officers assisted by outside counsel, investment advisors and actuaries. TheManagement Compensation and Investment Committees of the Board have oversight responsibilities with respect to theERP and its assets. The investment policy and strategy strive to achieve a rate of return on plan assets that will, over thelong term, in concert with Company contributions, fund the plan’s liabilities to provide for required benefits. As the fundedstatus of the plan improves, the plan will assume less risk through reductions in return-seeking exposure and/or improvedmatching of fixed income assets with liabilities.
The ERP assets are allocated among a diversified portfolio of equity investments, fixed income securities, alternativeinvestments and cash equivalents with both domestic and international strategies. Derivatives are permitted on a limitedscale for hedging or creation of market exposures. Direct debt and equity interests are prohibited in any broker-dealer,exchange, contract market, regulatory client, alternative or electronic trading system or entity that derives a certainthreshold of revenue from broker-dealer activities. Asset allocations are reviewed quarterly and adjusted, as appropriate,to remain within target allocations. The Pension Committee reviews the investment policy annually, under the guidance ofan investment consultant, to determine whether a change in the policy or asset allocation targets is necessary.
The ERP assets consisted of the following as of December 31, 2017 and 2016:2017
TargetAllocation 2017 2016
Equity securities:U.S. equity 18.0% 17.9% 17.7%
Non-U.S. equity 16.0% 16.3% 16.2%
Global equity 23.0% 23.3% 16.1%
U.S. fixed income securities 39.0% 38.2% 44.9%
Alternative investments 3.0% 2.8% 3.1%
Cash equivalents 1.0% 1.5% 2.0%
Total 100.0% 100.0% 100.0%
The expected long-term rate of return for the plan’s total assets is based on the expected returns of each of the abovecategories, weighted based on the current target allocation for each class. Based on historical experience, the PensionCommittee expects that the ERP’s active asset managers overall will provide a modest premium to their respective marketbenchmark indexes. At least annually, the Pension Committee evaluates whether adjustments are needed based onhistorical returns to more accurately reflect expectations of future returns.
62 FINRA 2017 Annual Financial Report

ˆ200F$TiRP!z$aKWMÊ200F$TiRP!z$aKWMˆ
592132 FIN 63FINRAANNUAL REPORT 2017
26-Jun-2018 10:56 ESTCLN PSWDC
Donnelley Financial ADG pf_rend 21*PMT 1C
ADGP64RS1312.6.31
FINRA 2017 Notes to Consolidated Financial Statements
7. EMPLOYEE BENEFIT LIABILITIES (CONTINUED)
The following tables present information about the fair value of the Company’s ERP assets at December 31, 2017 and2016, by asset category, and indicate the fair value hierarchy of the valuation techniques used to determine fair value:
Fair Value Measurement atDecember 31, 2017
Measured Using
Description
Quoted prices inactive markets for
identical assets(Level 1)
Significant otherobservable
inputs(Level 2) Total
(in millions)Short-term investments in money market fund $ 8.0 $ — $ 8.0Corporate stocks 15.3 — 15.3
Common/collective trusts (a):Equity — 233.2 233.2
Fixed income — 48.4 48.4
Mutual funds:Equity 50.8 — 50.8
Fixed income 164.0 — 164.0
Total assets in the fair value hierarchy 238.1 281.6 519.7
Partnership/joint venture interests measured at net asset value (b): — — 1.9
Total $238.1 $281.6 $521.6
Fair Value Measurement atDecember 31, 2016
Measured Using
Description
Quoted prices inactive markets for
identical assets(Level 1)
Significant otherobservable
inputs(Level 2) Total
(in millions)Short-term investments in money market fund $ 10.2 $ — $ 10.2Corporate stocks 18.2 — 18.2
Common/collective trusts (a):Equity — 169.4 169.4
Fixed income — 45.6 45.6
Mutual funds:Equity 42.6 — 42.6
Fixed income 174.2 — 174.2
Total assets in the fair value hierarchy 245.2 215.0 460.2
Partnership/joint venture interests measured at net asset value (b): — — 2.3
Total $245.2 $215.0 $462.5
(a) Includes both domestic and international equity and fixed income securities. Fair values are readily available and have beenestimated using the net asset value per unit of the funds. Investment managers are not constrained by any particularinvestment style and may invest in either “growth” or “value” securities. Units of this investment are valued daily and a unit-holder’s ability to transact in the trusts’ units occurs daily; however, units are not available on an active exchange. As the fairvalue per unit is readily determinable, the valuation of these securities is categorized in Level 2 of the fair value hierarchy.
FINRA 2017 Annual Financial Report 63

ˆ200F$TiRP!z$cd!MiŠ200F$TiRP!z$cd!Mi
592132 FIN 64FINRAANNUAL REPORT 2017
26-Jun-2018 10:56 ESTCLN PSWDC
Donnelley Financial ADG pf_rend 31*PMT 1C
ADGP64RS1312.6.31
FINRA 2017 Notes to Consolidated Financial Statements
7. EMPLOYEE BENEFIT LIABILITIES (CONTINUED)
(b) In accordance with ASC Subtopic 820-10, a certain investment that is measured at fair value using the net asset value pershare practical expedient has not been classified in the fair value hierarchy. The fair value amount presented in this table isintended to permit reconciliation of the fair value hierarchy to the fair value of plan assets presented in the plan disclosuressection of this footnote.
The investment included in this category is a private equity fund that invests in the natural resources and real estateindustries. The investment is nonredeemable. The fair value of the investment has been estimated using the net asset valueper share of the investment. The term of the investment is the later of August 11, 2018, or one year after the date on whichall of its underlying investments have been disposed, but may be terminated earlier as set forth in the partnershipagreement. The commitment to the fund is $5.3 million, of which $3.8 million had been funded as of both December 31,2017 and 2016.
For the years ended December 31, 2017 and 2016, there were no transfers between Level 1, Level 2 or Level 3 of the fairvalue hierarchy.
The valuation techniques and inputs used to measure fair value of the ERP assets are consistent with the Company’svaluation procedures as disclosed in Note 5, “Fair Value Measurement.” For alternative investments, net asset value is usedas a practical expedient to measure fair value unless it is probable that an investment will be sold for a different amount.In these cases, fair value is measured based on recent observable transaction information for similar investments, theconsideration of non-binding bids from potential buyers and third-party valuations.
EXPECTED FUTURE BENEFIT PAYMENTS
We measure our plans as of the end of each fiscal year. The ERP’s funding policy is to fund at least 100 percent of the ERP’sfunding target liability as set forth by the Internal Revenue Service. In 2018, we expect to contribute $43.6 million to theERP. We do not expect to contribute to the SERP in 2018. In addition, we expect to make the following benefit payments toparticipants over the next 10 years:
Pension Plans Other Plans(in millions)
Year ending December 31,2018 $ 31.3 $ 3.3
2019 27.3 5.6
2020 34.0 5.8
2021 33.3 6.3
2022 35.9 7.3
2023 through 2027 197.5 51.9
Total $359.3 $80.2
64 FINRA 2017 Annual Financial Report

ˆ200F$TiRP!z$iL7tPŠ 200F$TiRP!z$iL7tP
592132 FIN 65FINRAANNUAL REPORT 2017
26-Jun-2018 10:56 ESTCLN PSWDC
Donnelley Financial ADG pf_rend 32*PMT 1C
ADGP64RS1312.6.31
FINRA 2017 Notes to Consolidated Financial Statements
8. ACCUMULATED OTHER COMPREHENSIVE INCOME (LOSS)
The following is a summary of changes in accumulated other comprehensive income (loss) as of December 31, 2017, and2016.
Unrealizedgain on
available-for-sale
investments
Netunrecognized
employeebenefit plan
amounts Total(in millions)
Balance, January 1, 2016 $ 0.1 $(125.8) $(125.7)
Other comprehensive income before reclassifications 0.7 36.8 37.5
Amounts reclassified from accumulated other comprehensive (income) loss (a) (0.1) 6.3 6.2
Net current-period other comprehensive income 0.6 43.1 43.7
Balance, December 31, 2016 0.7 (82.7) $ (82.0)
Other comprehensive income (loss) before reclassifications 32.5 (32.4) 0.1
Amounts reclassified from accumulated other comprehensive (income) loss (a) (1.2) 3.7 2.5
Net current-period other comprehensive income (loss) 31.3 (28.7) 2.6
Balance, December 31, 2017 $32.0 $(111.4) $ (79.4)
(a) Reclassified amounts for gains on available-for-sale investments were recorded in net realized and unrealized investmentgains in the consolidated statements of operations — see Note 4, “Investments,” for additional information. Reclassified netunrecognized employee benefit plan amounts were included as a component of net periodic benefit cost and recorded incompensation and benefits expense in the consolidated statements of operations — see Note 7, “Employee BenefitLiabilities,” for additional information.
9. LEASES
FINRA leases certain office space and equipment in connection with its operations. The majority of these leases containescalation clauses based on increases in rent, property taxes and building operating costs. Certain of these leases alsocontain renewal options. Rent expense for operating leases was $24.5 million and $25.2 million for the years endedDecember 31, 2017, and 2016, which was included in occupancy expense in the consolidated statements of operations.
Future minimum lease payments under non-cancelable operating leases with initial or remaining terms of one year ormore consisted of the following at December 31, 2017:Year ending December 31, (in millions)2018 $ 29.0
2019 27.8
2020 22.9
2021 8.8
2022 6.7
Remaining years 17.6
Total minimum lease payments $ 112.8
Future minimum lease payments drop significantly in 2021 with the expiration of our lease at One Liberty Plaza in NewYork City, New York, for which we are currently assessing future leasing arrangements.
FINRA 2017 Annual Financial Report 65

ˆ200F$TiRP!z#9lWt?Š200F$TiRP!z#9lWt?
592132 FIN 66FINRAANNUAL REPORT 2017
26-Jun-2018 10:56 ESTCLN PSWDC
Donnelley Financial ADG pf_rend 23*PMT 1C
ADGP64RS3212.6.31
FINRA 2017 Notes to Consolidated Financial Statements
10. DEBT
FINRA maintains an unsecured line of credit agreement and has the option to borrow up to $200 million at the LIBOR DailyFloating Rate plus 0.55 percent (2.1 percent at December 31, 2017). This line of credit expires on June 30, 2018. As ofDecember 31, 2017, and December 31, 2016, no amounts were outstanding under this line of credit. Additionally, as ofJune 27, 2018, the date these financial statements became available to be issued, no amount was outstanding under thisline of credit.
As of December 31, 2017 and 2016, we had outstanding debt of $15.5 million and $16.4 million, respectively, on ourunsecured 2.99 percent fixed rate seven-year term loan related to our 2015 purchase of the Omega Building in Rockville,Maryland.
11. COMMITMENTS AND CONTINGENCIES
General Litigation
The Company may be subject to claims arising out of the conduct of its business. Currently, there are certain legalproceedings pending against us. Management is not aware of any unasserted claims or assessments that would have amaterial adverse effect on our financial position and the results of operations. While the outcome of any pending or futurelitigation cannot be predicted, management does not believe that any such matter will have a material adverse effect onour business or financial position. As of December 31, 2017, there were no material estimated losses requiring disclosurerelated to pending legal proceedings, because we believe the loss from these matters is not reasonably possible. Webelieve any litigation contingency involves a chance of loss that is either remote or reasonably possible. Such pending legalmatters involve unspecified claim amounts, in which the respective plaintiffs seek an indeterminate amount of damages.The outcome of such matters is always uncertain, and unforeseen results can occur. It is possible that such outcomescould require us to pay damages or make other expenditures or establish accruals in amounts that we could not estimateas of December 31, 2017.
12. SUBSEQUENT EVENTS
Subsequent events have been evaluated through June 27, 2018, the date these financial statements became available tobe issued. These financial statements have been approved by management, who has determined that no subsequentevent occurred that would require disclosure in the financial statements or accompanying notes.
66 FINRA 2017 Annual Financial Report

ˆ200F$TiRP!z#F7BMŠ200F$TiRP!z#F7BM´
592132 FIN 67FINRAANNUAL REPORT 2017
26-Jun-2018 10:56 ESTCLN PSWDC
Donnelley Financial ADG pf_rendSTART PAGE
9*PMT 1C
ADGP64RS3212.6.31
FINRA Board ofGovernors as ofJune 13, 2018William H. Heyman (Public)ChairmanThe Travelers Companies, Inc.New York, NY
Robert W. CookPresident and CEOFINRAWashington, DC
Carol Anthony (John) Davidson(Public)RetiredBonita Springs, FL
Andrew S. Duff (Industry)Piper Jaffray CompaniesMinneapolis, MN
Stephen A. Kohn (Industry)Stephen A. Kohn &Associates, Ltd.Lakewood, CO
Brian J. Kovack (Industry)Kovack Securities, Inc.Ft. Lauderdale, FL
Rochelle B. Lazarus (Public)Ogilvy & MatherNew York, NY
Joshua S. Levine (Public)Kita Capital ManagementNew York, NY
Brigitte C. Madrian (Public)Harvard Kennedy School ofGovernmentCambridge, MA
Joseph M. Mecane (Industry)Citadel SecuritiesNew York, NY
Robert A. Muh (Industry)Sutter Securities, Inc.San Francisco, CA
Kathleen A. Murphy (Industry)Fidelity InvestmentsBoston, MA
Eileen K. Murray (Public)Bridgewater AssociatesWestport, CT
Charles I. Plosser (Public)Former President and CEOFederal Reserve Bank ofPhiladelphiaAmelia Island, FL
Joseph R.V. Romano (Industry)Romano Brothers & Co.Evanston, IL
Hillary A. Sale (Public)Washington University School ofLawSt. Louis, MO
Timothy C. Scheve (Industry)Janney Montgomery Scott, LLCPhiladelphia, PA
Leslie F. Seidman (Public)Former Chairman, FinancialAccounting Standards BoardWestport, CT
Luis M. Viceira (Public)Harvard Business SchoolBoston, MA
Elisse B. Walter (Public)Former Commissioner andChairman, U.S. Securities andExchange CommissionBethesda, MD
Amy L. Webber (Industry)Cambridge InvestmentResearch, Inc.Fairfield, IA
Susan Wolburgh Jenah (Public)Former President and CEOInvestment Industry RegulatoryOrganization of CanadaToronto, ON
FINRA Officers asof June 7, 2018
Robert W. CookPresident and Chief ExecutiveOfficer
Marcia E. AsquithExecutive Vice President, Boardand External Relations
Richard W. BerryExecutive Vice President andDirector of Dispute Resolution
Robert L. D. ColbyExecutive Vice President andChief Legal Officer
Carlo V. di FlorioExecutive Vice President, Riskand Shared Services
Todd T. DiganciExecutive Vice President—ChiefFinancial Officer and ChiefAdministrative Officer
Cameron K. FunkhouserExecutive Vice President, Officeof Fraud Detection and MarketIntelligence
Thomas R. GiraExecutive Vice President, MarketRegulation and TransparencyServices
Bari HavlikExecutive Vice President,Member Supervision
Derek W. LindenExecutive Vice President,Registration and Disclosure
Steven J. RandichExecutive Vice President andChief Information Officer
FINRA 2017 Annual Financial Report 67

ˆ200F$TiRP!z#M%hM]Š200F$TiRP!z#M%hM]
592132 FIN 68FINRAANNUAL REPORT 2017
26-Jun-2018 10:56 ESTCLN PSWDC
Donnelley Financial ADG pf_rend 12*PMT 1C
ADGP64RS3212.6.31
Michael G. RufinoExecutive Vice President, Head ofMember Regulation—SalesPractice
Susan SchroederExecutive Vice President andHead of Enforcement
Thomas M. SelmanExecutive Vice President,Regulatory Policy and LegalCompliance Officer
William J. WollmanExecutive Vice President,Member Regulation—RiskOversight and OperationalRegulation
FINRA CorporateOffices1735 K Street, NWWashington, DC 20006
(202) 728-8000
9509 Key West AvenueRockville, MD 20850
(301) 590-6500
9513 Key West AvenueRockville, MD 20850
(301) 590-6500
15200 Omega DriveSuite 210
Rockville, MD 20850
(240) 386-4000
15200 Omega DriveSuite 300
Rockville, MD 20850
(301) 258-8500
One Liberty Plaza165 BroadwayNew York, NY 10006
(212) 858-4000
Brookfield Place200 Liberty StreetNew York, NY 10281
(212) 416-0600
FINRA DistrictOfficesAtlantaOne Securities Center3490 Piedmont Road, NESuite 500
Atlanta, GA 30305
(404) 239-6100
(404) 237-9290 (fax)
Boca RatonBoca Center Tower 1
5200 Town Center CircleSuite 200
Boca Raton, FL 33486
(561) 443-8000
(561) 443-7995 (fax)
Boston99 High StreetSuite 900
Boston, MA 02110
(617) 532-3400
(617) 451-3524 (fax)
Chicago55 West Monroe StreetSuite 2700
Chicago, IL 60603
(312) 899-4400
(312) 606-0742 (fax)
Dallas12801 North Central ExpresswaySuite 1050
Dallas, TX 75243
(972) 701-8554
(972) 716-7646 (fax)
Denver4600 South Syracuse StreetSuite 1400
Denver, CO 80237
(303) 446-3100
(303) 620-9450 (fax)
Kansas City120 West 12th StreetSuite 800
Kansas City, MO 64105
(816) 421-5700
(816) 421-5029 (fax)
Long IslandTwo Jericho Plaza2nd Floor, Wing AJericho, NY 11753
(516) 827-6100
(516) 827-6101 (fax)
Los Angeles300 South Grand AvenueSuite 1600
Los Angeles, CA 90071
(213) 229-2300
(213) 617-3299 (fax)
New Jersey581 Main StreetSuite 710
Woodbridge, NJ 07095
(732) 596-2000
(732) 596-2001 (fax)
New Orleans1100 Poydras StreetEnergy CentreSuite 850
New Orleans, LA 70163
(504) 522-6527
(504) 522-4077 (fax)
New York CityBrookfield Place200 Liberty StreetNew York, NY 10281
(212) 858-4000
(212) 858-4189 (fax)
Philadelphia1601 Market StreetSuite 2700
Philadelphia, PA 19103
(215) 665-1180
(215) 496-0434 (fax)
San Francisco100 Pine StreetSuite 1800
San Francisco, CA 94111
(415) 217-1100
(301) 527-4800 (fax)
68 FINRA 2017 Annual Financial Report

ˆ200F$TiRP!z#R1@M#Š200F$TiRP!z#R1@M#
592132 FIN 69FINRAANNUAL REPORT 2017
26-Jun-2018 10:56 ESTCLN PSWDC
Donnelley Financial ADG pf_rend 16*PMT 1C
ADGP64RS3212.6.31
FINRA MarketRegulationRegional Offices55 West Monroe StreetSuite 2700
Chicago, IL 60603
(312) 899-4504
(312) 236-9257 (fax)
440 South LaSalle StreetSuite 3500
Chicago, IL 60605
One Liberty Plaza165 BroadwayNew York, NY 10006
(212) 858-4000
1601 Market StreetSuite 2700
Philadelphia, PA 19103
(215) 665-1180
(215) 496-0434 (fax)
FINRA DisputeResolutionRegional OfficesMidwest Region55 West Monroe StreetSuite 2600
Chicago, IL 60603
(312) 899-4440
(301) 527-4851 (fax)
Northeast RegionOne Liberty Plaza165 Broadway27th FloorNew York, NY 10006
(212) 858-4200
(301) 527-4873 (fax)
Southeast RegionBoca Center Tower 1
5200 Town Center CircleSuite 200
Boca Raton, FL 33486
(561) 416-0277
(301) 527-4868 (fax)
West Region300 South Grand AvenueSuite 1700
Los Angeles, CA 90071
(213) 613-2680
(301) 527-4766 (fax)
FINRA 2017 Annual Financial Report 69

ˆ200F$TiRPxQaqV#t*Š 200F$TiRPxQaqV#t*
592132 DISCLAIMER 1FINRAANNUAL REPORT 2017
08-Jun-2018 12:51 ESTCLN PSWDC
Donnelley Financial ADG katht0dc 7*PMT 1C
VDI-W7-PFL-101012.6.31
This Annual Financial Report and the information contained herein is for general educational and informational purposesonly. The information contained herein is only timely as of the date of this report and the information, estimates andexpressions of judgment herein are subject to change without notice. To the extent this Annual Financial Report containsstatements that are not recitations of historical fact, such statements may constitute “forward-looking statements”. Inthis respect, the words “estimate,” “project,” “anticipate,” “expect,” “intend,” “believe,” and similar expressions areintended to identify forward-looking statements. Forward-looking statements are based on current expectations of futureevents and are subject to risks and uncertainties that could cause actual results to differ materially from those expressedor implied by such statements. All forward-looking statements included in this Section are made only as of the date of thestatement, and FINRA assumes no obligation to update any forward-looking statements made by them as a result of newinformation, future events, or other factors. Although FINRA takes reasonable care to ensure that the informationcontained in the Annual Financial Report is accurate, the information is provided “as is” and FINRA makes norepresentations or warranties, express or implied, regarding the information contained herein, including but not limited toany warranties regarding the accuracy, completeness or timeliness of the information provided herein. Neither FINRA norany of its respective affiliates, directors, officers, registered representatives or employees, nor any third party vendor, willbe liable or have any liability, whether in contract, tort, strict liability or otherwise, for any direct, indirect, incidental,consequential, punitive or special damages arising out of or in any way connected with your access or use or inability toaccess or use the Annual Financial Report or reliance on its content. Persons considering or making investment decisionsshould refer to the annual, quarterly and current reports, proxy statements and other information filed by the prospectiveinvestment vehicle with the Securities and Exchange Commission (SEC) under the Securities Exchange Act of 1934, asamended. Such reports and other information may be read and copied at the SEC’s Public Reference Room at 100 F Street,N.E., Washington, DC 20549 or obtained by mail from the Public Reference Room at prescribed rates. Such reports andother information are also available at the SEC’s Internet Web site, www.sec.gov. This Annual Financial Report does notincorporate by reference any other document or information.
©Copyright 2018. Financial Industry Regulatory Authority, Inc. All Rights Reserved. FINRA is a registered trademark ofFinancial Industry Regulatory Authority, Inc. No portion of this document may be duplicated, republished, modified,redistributed, or manipulated in any form without prior written permission from FINRA.
FINRA 2017 Annual Financial Report


Investor protection. Market integrity. 1735 K Street NWWashington, DC20006-1506
www.finra.org© 2018 FINRA. All rights reserved. FINRA and other trademarks of the Financial Industry Regulatory Authority, Inc. may not be used without permission.18_0124.1—06/18
Related Documents