LPL Financial Member FINRA/SIPC 1 Member FINRA/SIPC LPL Financial Holdings Inc. Q1 2018 Earnings May 3, 2018 Q1 2018 Earnings Key Metrics

Welcome message from author
This document is posted to help you gain knowledge. Please leave a comment to let me know what you think about it! Share it to your friends and learn new things together.
Transcript

LPL Financial Member FINRA/SIPC
1Member FINRA/SIPC
LPL Financial Holdings Inc.
Q1 2018 Earnings
May 3, 2018
Q1 2018 Earnings Key Metrics
LPL Financial Member FINRA/SIPC
2
Notice to Investors: Safe Harbor StatementStatements in this presentation regarding LPL Financial Holdings Inc.’s (together with its subsidiaries, the “Company”) future financial and
operating results, and outlook, including forecasts and statements relating to the Company’s future deposit betas (and related gross profit
benefit), Core G&A expenses (including outlook for 2018, outlook prior to the acquisition of the broker-dealer network of National Planning
Holdings, Inc. (“NPH”), and outlook for NPH), promotional expenses (including outlook prior to NPH and for NPH), NPH onboarding costs, and
the amount and timing of NPH annual run-rate EBITDA, as well as any other statements that are not related to present facts or current
conditions or that are not purely historical, constitute forward-looking statements. These forward-looking statements are based on the
Company's historical performance and its plans, estimates, and expectations as of May 3, 2018. Forward-looking statements are not
guarantees that the future results, plans, intentions, or expectations expressed or implied by the Company will be achieved. Matters subject to
forward-looking statements involve known and unknown risks and uncertainties, including economic, legislative, regulatory, competitive, and
other factors, which may cause actual financial or operating results, levels of activity, or the timing of events, to be materially different than
those expressed or implied by forward-looking statements. Important factors that could cause or contribute to such differences include:
changes in interest rates and fees payable by banks participating in the Company's cash sweep program; the Company's success and
strategy in managing cash sweep program fees; changes in general economic and financial market conditions, including retail investor
sentiment; fluctuations in the levels and value of advisory and brokerage assets, and the related impact on revenue; effects of competition in
the financial services industry and the success of the Company in attracting and retaining financial advisors and institutions; changes in the
number of the Company's financial advisors and institutions, and their ability to market effectively financial products and services; whether
retail investors served by newly-recruited advisors choose to open accounts and/or move their respective assets to a new account at the
Company; changes in the growth and profitability of the Company's fee-based business; the effect of current, pending and future legislation,
regulation and regulatory actions, including changes in the retail retirement savings area; changes made to the Company’s offerings, services,
and pricing, and the effect that such changes may have on the Company’s gross profit streams and costs; execution of the Company's plans
and its success in realizing the synergies, expense savings, service improvements and efficiencies expected to result from its initiatives
and/or programs, including as a result of the NPH acquisition; and the other factors set forth in Part I, “Item 1A. Risk Factors” in the
Company's 2017 Annual Report on Form 10-K, as may be amended or updated in the Company's Quarterly Reports on Form 10-Q or
subsequent filings with the SEC. Except as required by law, the Company specifically disclaims any obligation to update any forward-looking
statements as a result of developments occurring after May 3, 2018, even if its estimates change, and statements contained herein are not to
be relied upon as representing the Company's views as of any date subsequent to May 3, 2018.

LPL Financial Member FINRA/SIPC
3
*Notice to Investors: Non-GAAP Financial MeasuresManagement believes that presenting certain non-GAAP financial measures by excluding or including certain items can be helpful to investors and analysts who may wish to use some or all
of this information to analyze the Company’s current performance, prospects, and valuation. Management uses this non-GAAP information internally to evaluate operating performance and
in formulating the budget for future periods. Management believes that the non-GAAP measures and metrics discussed herein are appropriate for evaluating the performance of the
Company. Specific Non-GAAP financial measures have been marked with an * (asterisk) within this presentation. Management has also presented certain non-GAAP financial
measures further adjusted to reflect the impact of the Company’s acquisition of the broker/dealer network of National Planning Holdings, Inc. (“NPH”). Reconciliations and
calculations of all such measures can be found on pages 24-27.
Gross profit is calculated as net revenues, which were $1,242 million for the three months ended March 31, 2018, less commission and advisory expenses and brokerage, clearing, and
exchange fees, which were $762 million and $16 million, respectively, for the three months ended March 31, 2018. All other operating expense categories, including depreciation and
amortization of fixed assets and amortization of intangible assets, are considered general and administrative in nature. Because the Company’s gross profit amounts do not include any
depreciation and amortization expense, the Company considers its gross profit amounts to be non-GAAP measures that may not be comparable to those of others in its industry.
Management believes that gross profit amounts can provide investors with useful insight into the Company’s core operating performance before indirect costs that are general and
administrative in nature. For a calculation of gross profit, please see page 24 of this presentation.
EBITDA is defined as net income plus interest expense, income tax expense, depreciation, amortization, and loss on extinguishment of debt. The Company presents EBITDA because
management believes that it can be a useful financial metric in understanding the Company’s earnings from operations. EBITDA is not a measure of the Company's financial performance
under GAAP and should not be considered as an alternative to net income or any other performance measure derived in accordance with GAAP, or as an alternative to cash flows from
operating activities as a measure of profitability or liquidity. For a reconciliation of net income to EBITDA, please see page 25 of this presentation. In addition, the Company’s EBITDA can
differ significantly from EBITDA calculated by other companies, depending on long-term strategic decisions regarding capital structure, the tax jurisdictions in which companies operate, and
capital investments.
EPS Prior to Amortization of Intangible Assets is defined as GAAP EPS plus the per share impact of Amortization of Intangible Assets. The per share impact is calculated as Amortization of
Intangible Assets expense, net of applicable tax benefit, divided by the number of shares outstanding for the applicable period. The Company presents EPS Prior to Amortization of
Intangible Assets because management believes the metric can provide investors with useful insight into the Company’s core operating performance by excluding non-cash items that
management does not believe impact the Company’s ongoing operations. EPS Prior to Amortization of Intangible Assets is not a measure of the Company's financial performance under
GAAP and should not be considered as an alternative to GAAP EPS or any other performance measure derived in accordance with GAAP. For a reconciliation of EPS Prior to Amortization
of Intangible Assets to GAAP EPS, please see page 26 of this presentation.
Core G&A consists of total operating expenses, excluding the following expenses: commission and advisory, regulatory charges, promotional, employee share-based compensation,
depreciation and amortization, amortization of intangible assets, and brokerage, clearing, and exchange. Management presents Core G&A because it believes Core G&A reflects the
corporate operating expense categories over which management can generally exercise a measure of control, compared with expense items over which management either cannot exercise
control, such as commission and advisory expenses, or which management views as promotional expense necessary to support advisor growth and retention including conferences and
transition assistance. Core G&A is not a measure of the Company’s total operating expenses as calculated in accordance with GAAP. For a reconciliation of Core G&A to the Company’s
total operating expenses, please see page 27 of this presentation. The Company does not provide an outlook for its total operating expenses because it contains expense components, such
as commission and advisory expenses, that are market-driven and over which the Company cannot exercise control. Accordingly a reconciliation of the Company’s outlook for Core G&A to
an outlook for total operating expenses cannot be made available without unreasonable effort.

LPL Financial Member FINRA/SIPC
4
60% 60% 59% 58% 57% 56% 55% 56% 56% 54% 53% -1.2 pts 0.6 pts -4.1 pts -1.0 pts
25% 25% 25% 25% 25% 25% 26% 26% 26% 26% 27% 0.7 pts -0.1 pts 1.7 pts 0.6 pts
15% 15% 16% 17% 17% 18% 19% 18% 18% 20% 20% 0.5 pts -0.5 pts 2.4 pts 0.3 pts
$479 $488 $502 $509 $530 $542 $560 $615 $648 $581 $578
Q1 Q2 Q3 Q4 Q1 Q2 Q3 Q4 Q1
2016 2017 2018
$289 $292 $297 $298 $305 $305 $310 $342 $364
$315 $308 20% 6% 1% -2%
$120 $122 $125 $127 $134 $138 $145
$160 $168
$153 $156 26% 5% 17% 2%
$70 $74 $81 $85 $92 $99 $105
$113 $116
$113 $114 26% 2% 24% 1%$479 $488 $502 $509 $530 $542
$560
$615 $648
$581 $578 22% 5% 9% 0%
Q1 Q2 Q3 Q4 Q1 Q2 Q3 Q4 Q1
2016 2017 2018
Brokerage Assets(1) Hybrid Advisory Assets(2)
Corporate Advisory Assets(3)
Q1 Total Brokerage and Advisory Assets increased 22% year-over-year to $648 billion, up 5% sequentially
Total Brokerage and Advisory Assets ($ billions) Total Brokerage and Advisory Asset Mix
Total Advisory
Assets ($B): $190 $196 $206 $212 $226 $237 $250 $273 $283 $265 $270 26% 4% 20% 2%
Brokerage Assets Hybrid Advisory Corporate Advisory % of Total Assets(1) Assets % of Total Assets(2) Assets % of Total Assets(3)
Including NPH Prior to NPH
YOY Change
SEQChange
YOY Change
SEQChange
Including NPH Prior to NPH
YOY Change
SEQChange
YOY Change
SEQChange
Q4 ‘17 Prior to
NPH
Q4 ‘17 Prior to
NPH
Q1 '18 Prior to
NPH
Q1 ‘18 Prior to
NPHAdvisory Percent of
Total Assets: 40% 40% 41% 42% 43% 44% 45% 44% 44% 46 % 47% 1.2 pts -0.6 pts 4.1 pts 1.0 pts
LPL Financial Member FINRA/SIPC
5
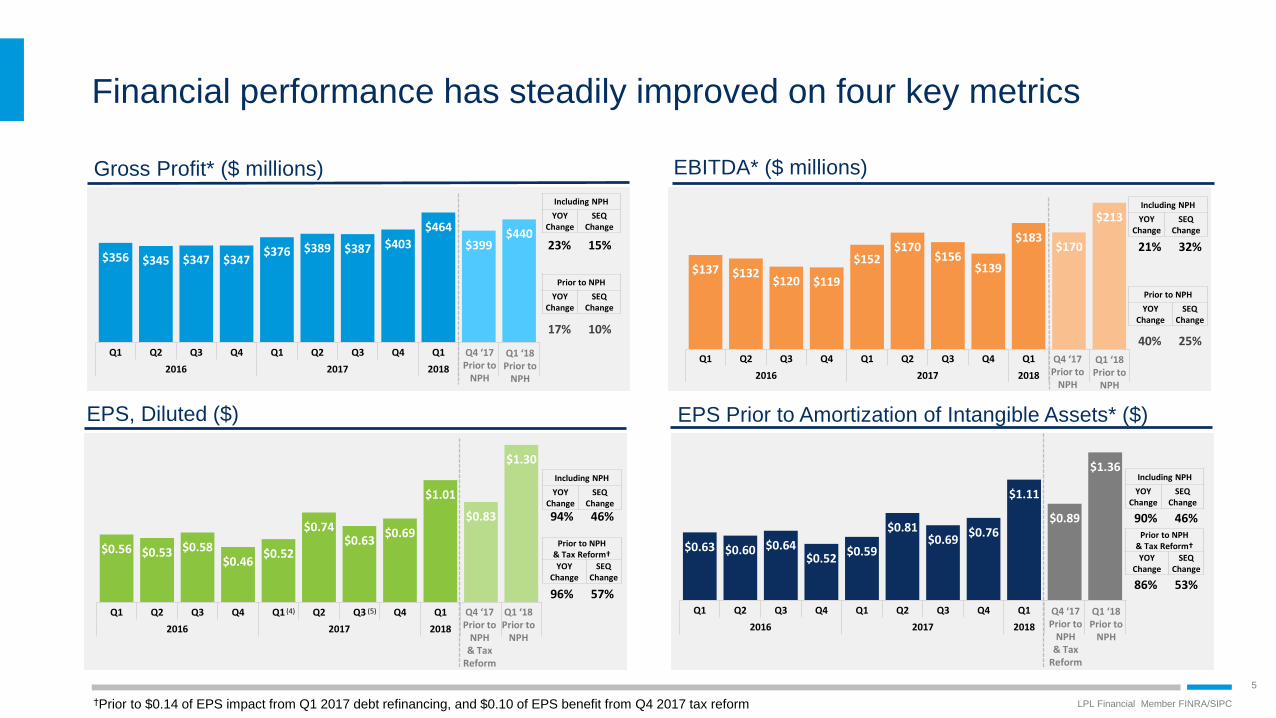
96% 57%
$0.56 $0.53 $0.58 $0.46
$0.52
$0.74 $0.63
$0.69
$1.01
$0.83
$1.30
94% 46%
Q1 Q2 Q3 Q4 Q1 Q2 Q3 Q4 Q1
2016 2017 2018
86% 53%
$0.63 $0.60 $0.64 $0.52
$0.59
$0.81 $0.69
$0.76
$1.11
$0.89
$1.36
90% 46%
Q1 Q2 Q3 Q4 Q1 Q2 Q3 Q4 Q1
2016 2017 2018
40% 25%
$137 $132 $120 $119
$152 $170
$156 $139
$183 $170
$213
21% 32%
Q1 Q2 Q3 Q4 Q1 Q2 Q3 Q4 Q1
2016 2017 2018
17% 10%
$356 $345 $347 $347 $376 $389 $387 $403
$464
$399 $440
23% 15%
Q1 Q2 Q3 Q4 Q1 Q2 Q3 Q4 Q1
2016 2017 2018
Financial performance has steadily improved on four key metrics
Gross Profit* ($ millions) EBITDA* ($ millions)
EPS, Diluted ($)
(4) (5)
EPS Prior to Amortization of Intangible Assets* ($)
Including NPH
YOY Change
SEQChange
Including NPH
YOY Change
SEQChange
Including NPH
YOY Change
SEQChange
Including NPH
YOY Change
SEQChange
Prior to NPH
YOY Change
SEQChange
Prior to NPH & Tax Reform†
YOY Change
SEQChange
Prior to NPH
YOY Change
SEQChange
Prior to NPH & Tax Reform†
YOY Change
SEQChange
Q4 ‘17 Prior to
NPH & Tax
Reform
Q4 ‘17 Prior to
NPH & Tax
Reform
Q4 ‘17 Prior to
NPH
Q4 ‘17 Prior to
NPH
Q1 ‘18 Prior to
NPH
Q1 ‘18 Prior to
NPH
Q1 ‘18 Prior to
NPH
Q1 ‘18 Prior to
NPH
†Prior to $0.14 of EPS impact from Q1 2017 debt refinancing, and $0.10 of EPS benefit from Q4 2017 tax reform
LPL Financial Member FINRA/SIPC
6
$0.59 $0.73
$1.36 $1.11
Q1 2017Results
DebtRefinancing
Cost
Q1 2017Results Prior
to DebtRefinancing
Q1 2018ResultsPrior to
NPH
NPH Impact Q1 2018Results
$0.76 $0.89
$1.36 $1.11
Q4 2017Results
TaxReform
NPHImpact
Q4 2017ResultsPrior to
NPH andTax Reform
Q1 2018ResultsPrior to
NPH
NPHImpact
Q1 2018Results
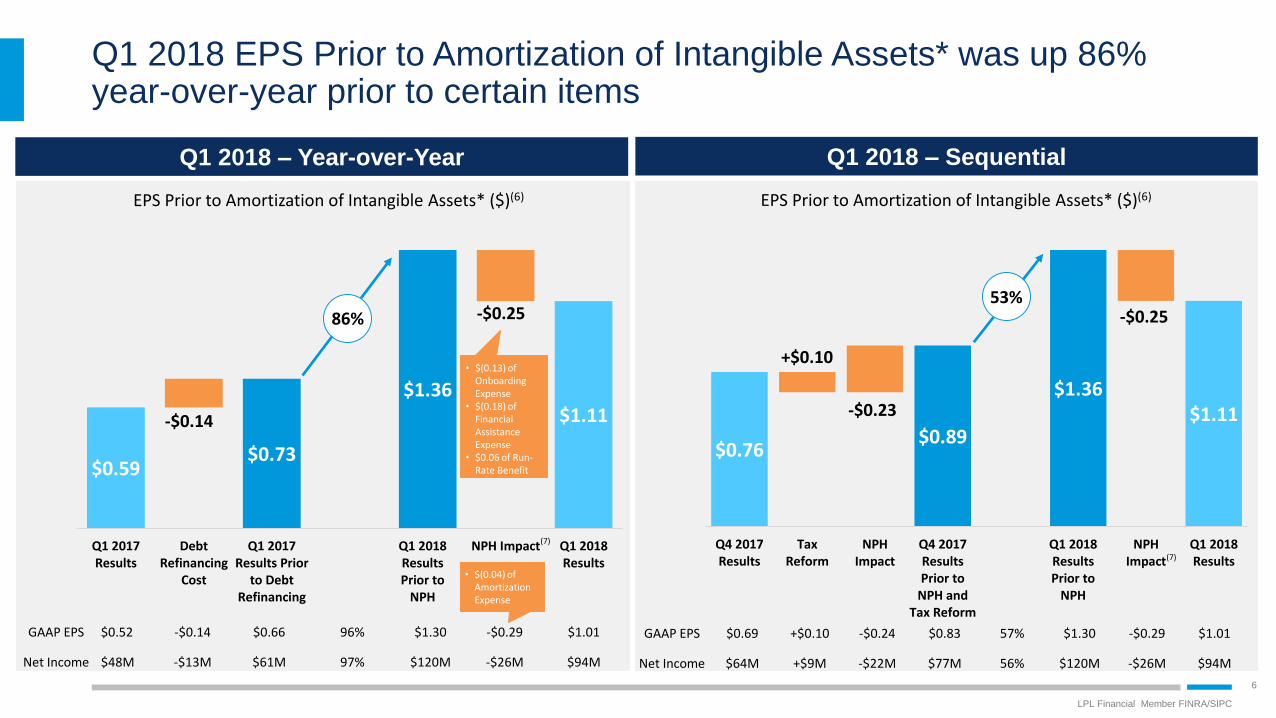
Q1 2018 – Year-over-Year
Q1 2018 EPS Prior to Amortization of Intangible Assets* was up 86% year-over-year prior to certain items
GAAP EPS $0.52 -$0.14 $0.66 96% $1.30 -$0.29 $1.01
Net Income $48M -$13M $61M 97% $120M -$26M $94M
86%
Q1 2018 – Sequential
53%
GAAP EPS $0.69 +$0.10 -$0.24 $0.83 57% $1.30 -$0.29 $1.01
Net Income $64M +$9M -$22M $77M 56% $120M -$26M $94M
EPS Prior to Amortization of Intangible Assets* ($)(6) EPS Prior to Amortization of Intangible Assets* ($)(6)
-$0.25
-$0.23
+$0.10• $(0.13) of
Onboarding Expense
• $(0.18) of Financial Assistance Expense
• $0.06 of Run-Rate Benefit
-$0.25
-$0.14
• $(0.04) of Amortization Expense
(7)
(7)

LPL Financial Member FINRA/SIPC
7
-$3.0-$4.1
-$1.0-$1.5
-$3.1-$2.3
-$3.4
-$5.5-$4.0
-1% -2% -4%-3% -5%
-7%-5% -4% -5%
Q1 Q2 Q3 Q4 Q1 Q2 Q3 Q4 Q1
2016 2017 2018
$6.3$6.9
$2.0$2.8
$4.1$4.8
$6.0 $5.9$6.9
4%6%
8% 9% 11% 10% 12% 10% 10%
Q1 Q2 Q3 Q4 Q1 Q2 Q3 Q4 Q1
2016 2017 2018
$3.3 $2.9
$1.0 $1.3 $1.0
$2.5 $2.6
$0.4
$2.9
1% 1% 1%
2% 2%
0%
2% 2% 2%
Q1 Q2 Q3 Q4 Q1 Q2 Q3 Q4 Q1
2016 2017 2018
Q1 Total Net New Assets were an inflow of $2.9 billion prior to NPH
Net New Advisory Assets(8) ($ billions)Total Net New Assets ($ billions) Net New Brokerage Assets(9) ($ billions)
Net Brokerage to Advisory Conversions(10) (billions): $1.0 $1.4 $1.3 $1.7 $2.3 $2.0 $1.9 $2.1(11) $2.5(12)
$37.5
$34.2
$14.0
$7.7
$23.5
$26.6
Total NNA Prior to NPH Total NNA from NPH
Total NNA Annualized Growth Rate Prior to NPH
Advisory NNA Prior to NPH Advisory NNA from NPH
Advisory NNA Annualized Growth Rate Prior to NPH
Brokerage NNA Prior to NPH Brokerage NNA from NPH
Brokerage NNA Annualized Growth Rate Prior to NPH
$38.9
$36.0$13.1
$6.2
$25.8
$29.9

LPL Financial Member FINRA/SIPC
8
$120 $122 $125 $127 $134 $138 $145 $160 $168
$153 $156 26% 5% 17% 2%
$70 $74 $81 $85 $92
$99 $105
$113 $116
$113 $114 26% 2% 24% 1%$190 $196
$206 $212 $226
$237 $250
$273 $283
$265 $270 26% 4% 20% 2%
Q1 Q2 Q3 Q4 Q1 Q2 Q3 Q4 Q1
2016 2017 2018
$0.2 $0.9 $1.1 $1.9
$3.5 $3.2 $4.0
$11.1 $10.4
$3.9 $4.3
$1.8 $1.9
$3.0 $2.9
$2.5 $2.7
$2.9
$2.9
$2.7
$2.4 $2.6
$2.0 $2.8
$4.1 $4.8
$6.0 $5.9
$6.9
$14.0
$13.1
$6.3 $6.9
Q1 Q2 Q3 Q4 Q1 Q2 Q3 Q4 Q1
2016 2017 2018
Q1 Corporate Advisory Assets increased 26% year-over-year to $168 billion, including $12 billion from NPH
Corporate and Hybrid Advisory Platform Mix ($ billions) Corporate and Hybrid Advisory NNA Mix ($ billions)
Hybrid Advisory NNA(13)
Corporate Advisory NNA(14)
Hybrid Advisory Assets(2)
Corporate Advisory Assets(3) Including NPH Prior to NPH
YOY Change
SEQChange
YOY Change
SEQChange
Hybrid Advisory 11% 11% 16% 14% 12% 12% 12% n/m n/m 11% 9%
Corporate Advisory 1% 3% 3% 6% 11% 10% 12% n/m n/m 9% 11%
Q4 ‘17 Prior to
NPH
Q4 ‘17 Prior to
NPH
Annualized NNA Growth
Q1 ‘18 Prior to
NPH
Q1 ‘18 Prior to
NPH

LPL Financial Member FINRA/SIPC
9
$22 $22 $23 $23 $25
$27 $29
$33 $36
$32 $33
11.8%11.4%
11.1% 11.0% 11.1%11.4%
11.7%12.1%
12.7%
12.0%12.3%
Q1 Q2 Q3 Q4 Q1 Q2 Q3 Q4 Q1
2016 2017 2018
-$0.3 -$0.2 -$0.4
$0.3
$0.9
$1.3 $1.5
$1.4 $1.8
$1.1
$1.5
-5% -3% -7%6%
16%21% 22% 19% 22%
Q1 Q2 Q3 Q4 Q1 Q2 Q3 Q4 Q1
2016 2017 2018
Q1 Centrally Managed Assets increased 44% year over year to $36 billion, including $3 billion from NPH
Centrally Managed Assets(15) ($ billions)
Centrally Managed NNA Prior to NPH NPH Centrally Managed NNA
Centrally Managed NNA Annualized Growth Rate Prior to NPH
Centrally Managed NNA(16) ($ billions)
Including NPH
YOY Change SEQ Change
33% 5%
Centrally Managed AssetsCentrally Managed Assets % of Total Advisory Assets
Q4 ‘17 Prior to
NPH
Q1 ‘18 Prior to
NPH
44% 9%
Prior to NPH
YOY Change SEQ Change
$2.5
$3.3

LPL Financial Member FINRA/SIPC
10
$466 $485 $502 $502 $525 $539 $554
$586
$645
$574 $587 23% 10% 12% 2%
30.6 bps28.4 bps 27.7 bps 27.6 bps
28.7 bps 28.8 bps 27.9 bps 27.5 bps28.8 bps
27.8 bps30.0 bps 0.1 bps 1.3 bps 1.3 bps 2.2 bps
21.2 bps19.9 bps 20.3 bps 20.5 bps
19.4 bps 18.5 bps 19.0 bps20.1 bps 19.5 bps
18.0 bps 17.5 bps 0.1 bps -0.6 bps -1.9 bps -0.5 bps
Q1 Q2 Q3 Q4 Q1 Q2 Q3 Q4 Q1
2016 2017 2018
Q1 EBIT ROA prior to NPH was 12.5 basis points, up 3.2 basis points year-over-year
EBIT ROA(20):
Average Total Brokerage & Advisory Assets ($ billions)
9.4 bps 8.5 bps 7.4 bps 7.1 bps 9.3 bps 10.3 bps 8.9 bps 7.4 bps 9.3bps 9.8bps 12.5bps 0.0bps 1.9bps 3.2bps 2.7bps
Average Total Brokerage & Advisory Assets(17) Gross Profit* ROA(18) OPEX ROA(19)
Q4 ‘17 Prior to
NPH
Q1 ‘18 Prior to
NPH
Including NPH Prior to NPH
YOY Change SEQ Change YOY Change SEQ Change

LPL Financial Member FINRA/SIPC
11
10.3 8.9 7.7 8.1 8.1 7.7 6.9 7.1 8.4 7.1 8.4 0.3 1.3 0.4 1.3
3.73.4
3.23.9 4.5 5.3 5.9 6.0
6.56.2
6.8 1.9 0.4 2.2 0.6
8.08.0
7.87.6 7.4 7.5 7.4 7.2
7.17.2
7.5 -0.3 -0.1 0.1 0.4
7.7
7.37.6 7.1 7.2 7.1 6.5 6.0
6.26.1
6.7 -0.9 0.3 -0.5 0.6
0.9
0.91.4 0.9 1.4 1.1
1.2 1.20.5
1.2
0.5 -0.9 -0.7 -0.9 -0.7
30.628.4 27.7 27.6
28.7 28.8 27.9 27.528.8 27.8
30.0 0.1 1.3 1.3 2.2
Q1 Q2 Q3 Q4 Q1 Q2 Q3 Q4 Q1
2016 2017 2018
Q1 Gross Profit* ROA prior to NPH increased 1.3 basis points year-over-year
Gross Profit* ROA(18) (bps)
Including NPH Prior to NPH
YOY Change SEQ Change YOY Change SEQ Change
Q4 ‘17 Prior to
NPH
Net Commission & Advisory Fees Cash Sweep Other Asset-Based(21)
Transaction & Fee, Net of BC&E Interest & Income and Other
Q1 ‘18 Prior to
NPH

LPL Financial Member FINRA/SIPC
12
$120 $108 $96 $102 $106 $104 $96 $104 $136
$102 $124 28% 30% 17% 21%
$43 $41
$41 $49 $60 $72 $82
$88
$104
$88
$99 74% 18% 66% 13%
$93 $97
$98 $95
$98 $102 $102
$105
$115
$103
$111 18% 9% 13% 7%$89
$88 $95 $89 $94
$95 $91 $88
$101
$88
$98 7% 15% 4% 12%
$10 $11 $17 $12
$19 $15 $16
$18
$8
$18
$8 -56% -53% -58% -56%
$356 $345 $347 $347 $376 $389 $387
$403
$464
$399
$440 23% 15% 17% 10%
Q1 Q2 Q3 Q4 Q1 Q2 Q3 Q4 Q1
2016 2017 2018
Q1 Gross Profit* prior to NPH increased 17% year-over-year
Gross Profit* ($ millions)
Including NPH Prior to NPH
YOY Change SEQ Change YOY Change SEQ Change
Q4 ‘17 Prior to
NPH
Q1 ‘18 Prior to
NPH
Net Commission & Advisory Fees Cash Sweep Other Asset-Based(21)
Transaction & Fee, Net of BC&E Interest & Income and Other
22%

LPL Financial Member FINRA/SIPC
13
15.113.9 14.0 14.4 13.5 13.1 12.9 13.3 12.5 12.7 12.4 -1.0 -0.8 -1.1 -0.3
3.12.9 3.4 2.8
2.82.4 3.1
4.14.2
2.6 2.3 1.4 0.1 -0.5 -0.3
0.10.5
0.4 0.50.4
0.4 0.3
0.40.4
0.40.4 n/m n/m n/m n/m
0.60.4
0.4 0.40.4
0.4 0.4
0.30.3
0.3 0.4 -0.1 0.1 0.0 0.1
1.61.5 1.5 1.6
1.61.6 1.6
1.41.3
1.4 1.4 -0.3 -0.1 -0.2 0.0
0.80.8 0.8 0.8
0.70.7 0.7
0.70.8
0.6 0.6 0.1 0.1 -0.1 0.0
21.219.9 20.3 20.5
19.418.5 19.0
20.1 19.518.0 17.5 0.1 -0.6 -1.9 -0.5
Q1 Q2 Q3 Q4 Q1 Q2 Q3 Q4 Q1
2016 2017 2018
Q1 Total OPEX ROA prior to NPH was down 1.9 basis points year-over-year and down 0.5 basis points sequentially
Total OPEX ROA(19) (bps)
(22)
Including NPH Prior to NPH
YOY Change SEQ Change YOY Change SEQ Change
Q4 ‘17 Prior to
NPH
Q1 ‘18 Prior to
NPH
Core G&A* Promotional Employee Share-based Compensation D&A Expense (ex Amortization of Intangible Assets) Amortization of Intangible Assets Regulatory
(23)

LPL Financial Member FINRA/SIPC
14
$175 $168 $175 $181 $177 $176 $179 $195 $201
$183 $182 14% 3% 3% -6%
$36 $35
$43 $36 $37 $32 $43
$60 $67
$37 $34 84% 12% -7% -8%$1 $6
$4 $6 $5 $5 $4
$5 $6
$5 $6 n/m n/m n/m n/m$6 $5 $4 $5 $5 $5
$5
$4 $6
$4 $6 7% 33% 6% 38%$19 $19 $18 $20 $21 $21
$22
$20 $21
$19 $20 0% 3% -3% 6%$10 $10 $10 $9 $9 $9
$9
$10
$13
$9 $9 39% 32% -8% -3%$247 $241
$255 $257 $254 $250 $262
$294 $314
$257 $256 24% 7% 1% 0%
Q1 Q2 Q3 Q4 Q1 Q2 Q3 Q4 Q1
2016 2017 2018
Q1 Total OPEX prior to NPH increased 1% year-over-year and was roughly flat sequentially
Total OPEX(19) ($ millions)
(22)
Including NPH Prior to NPH
YOY Change SEQ Change YOY Change SEQ Change
Q4 ‘17 Prior to
NPH
Q1 ‘18 Prior to
NPH
Core G&A* Promotional Employee Share-based Compensation D&A Expense (ex Amortization of Intangible Assets) Amortization of Intangible Assets Regulatory
(23)
LPL Financial Member FINRA/SIPC
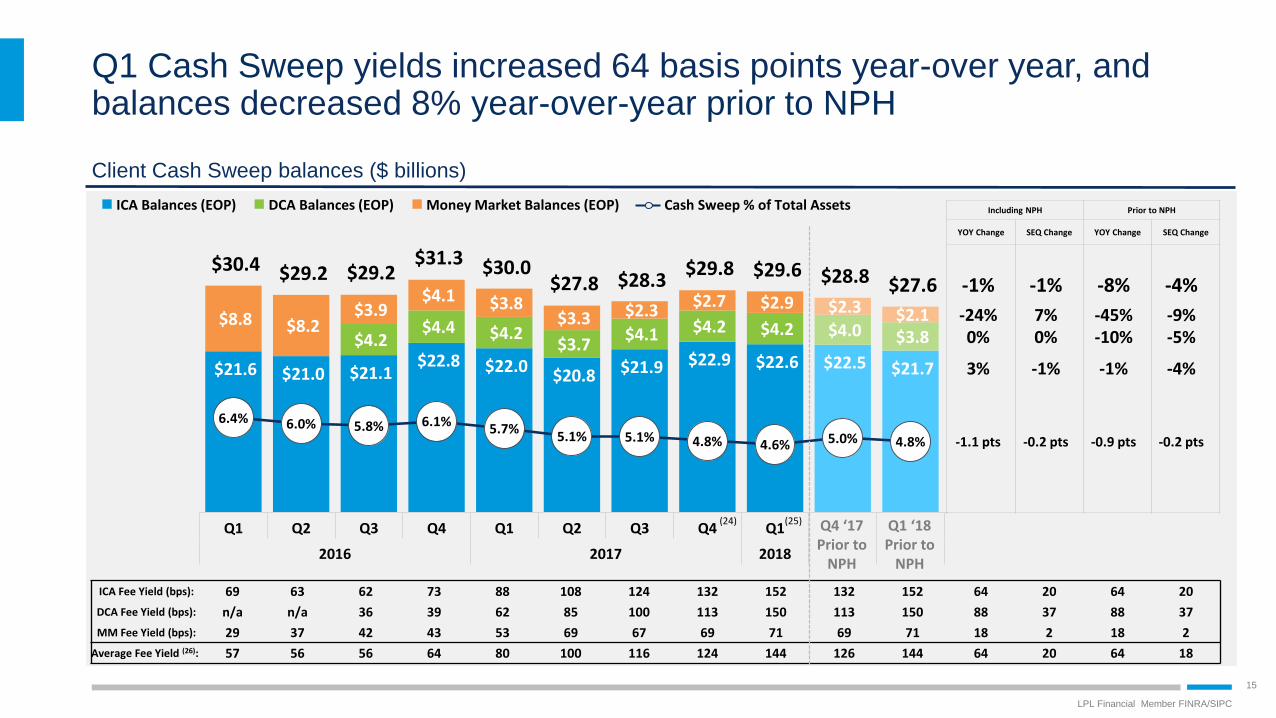
15
$21.6 $21.0 $21.1 $22.8 $22.0
$20.8 $21.9 $22.9 $22.6 $22.5 $21.7 3% -1% -1% -4%
$4.2 $4.4 $4.2
$3.7 $4.1 $4.2 $4.2 $4.0 $3.8 0% 0% -10% -5%
$8.8 $8.2 $3.9
$4.1 $3.8 $3.3 $2.3
$2.7 $2.9 $2.3 $2.1 -24% 7% -45% -9%
$30.4 $29.2 $29.2 $31.3 $30.0
$27.8 $28.3 $29.8 $29.6 $28.8 $27.6 -1% -1% -8% -4%
6.4% 6.0% 5.8% 6.1% 5.7% 5.1% 5.1% 4.8% 4.6% 5.0% 4.8% -1.1 pts -0.2 pts -0.9 pts -0.2 pts
Q1 Q2 Q3 Q4 Q1 Q2 Q3 Q4 Q1
2016 2017 2018
ICA Balances (EOP) DCA Balances (EOP) Money Market Balances (EOP) Cash Sweep % of Total Assets
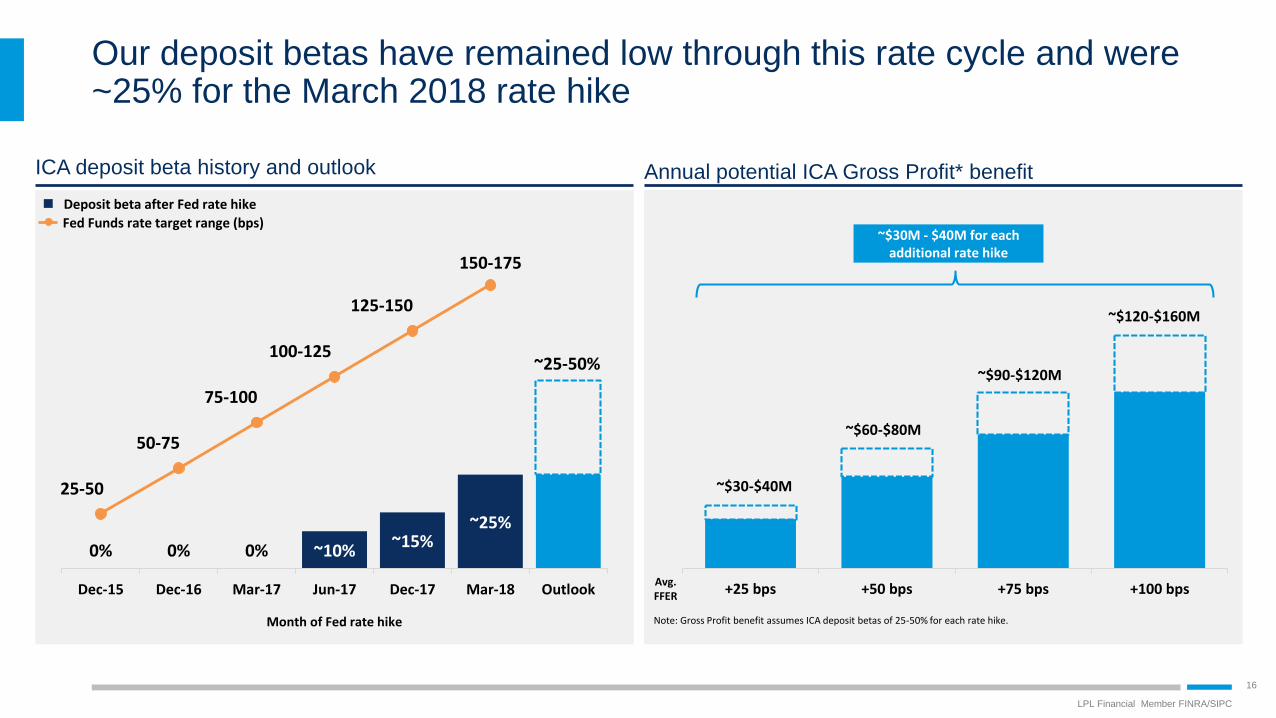
Q1 Cash Sweep yields increased 64 basis points year-over year, and balances decreased 8% year-over-year prior to NPH
Client Cash Sweep balances ($ billions)
ICA Fee Yield (bps): 69 63 62 73 88 108 124 132 152 132 152 64 20 64 20
DCA Fee Yield (bps): n/a n/a 36 39 62 85 100 113 150 113 150 88 37 88 37
MM Fee Yield (bps): 29 37 42 43 53 69 67 69 71 69 71 18 2 18 2
Average Fee Yield (26): 57 56 56 64 80 100 116 124 144 126 144 64 20 64 18
(24)
Including NPH Prior to NPH
YOY Change SEQ Change YOY Change SEQ Change
Q4 ‘17 Prior to
NPH
Q1 ‘18 Prior to
NPH
(25)
LPL Financial Member FINRA/SIPC
16
~$30-$40M
~$60-$80M
~$90-$120M
~$120-$160M
+25 bps +50 bps +75 bps +100 bps
ICA deposit beta history and outlook Annual potential ICA Gross Profit* benefit
Deposit beta after Fed rate hike
Fed Funds rate target range (bps)
Avg. FFER
~$30M - $40M for each additional rate hike
Month of Fed rate hike Note: Gross Profit benefit assumes ICA deposit betas of 25-50% for each rate hike.
Our deposit betas have remained low through this rate cycle and were ~25% for the March 2018 rate hike
0% 0% 0% ~10%~15%
~25%
25-50
50-75
75-100
100-125
125-150
150-175
Dec-15 Dec-16 Mar-17 Jun-17 Dec-17 Mar-18 Outlook
~25-50%

LPL Financial Member FINRA/SIPC
17
Annual Core G&A* Growth
Long-term cost strategy
Focus on delivering operating leverage
Prioritize investments that drive organic growth
Drive productivity and efficiency
Adapt cost trajectory as environment evolves
2018 Core G&A outlook
Core G&A outlook prior to NPH of $730-$750M
We believe we have a larger set of opportunities to invest in
organic growth
This creates a range slightly wider than we’ve had historically
Total Core G&A outlook including NPH of $800-$830M
NPH expense will be inherently more variable than the rest of
Core G&A given the timing of advisor and asset onboarding
This variability may impact the timing and amount of expense in
2018, but we do not expect it to impact our run-rate estimates
for the transaction
Our outlook for 2018 Core G&A* is $800 to $830 million, with most year-over-year growth driven by costs to support NPH
Lower Recent Expense Trajectory
Core G&A ($ millions): $695 $700 $712 $730-$750
Additional 2018 Core G&A Outlook for NPH: ~$70-$80 million
Total 2018 Core G&A Outlook: ~$800-$830 million
7%
<1%
2%
3-5%
2015 2016 2017Prior to NPH
2018 OutlookPrior to NPH
LPL Financial Member FINRA/SIPC
18
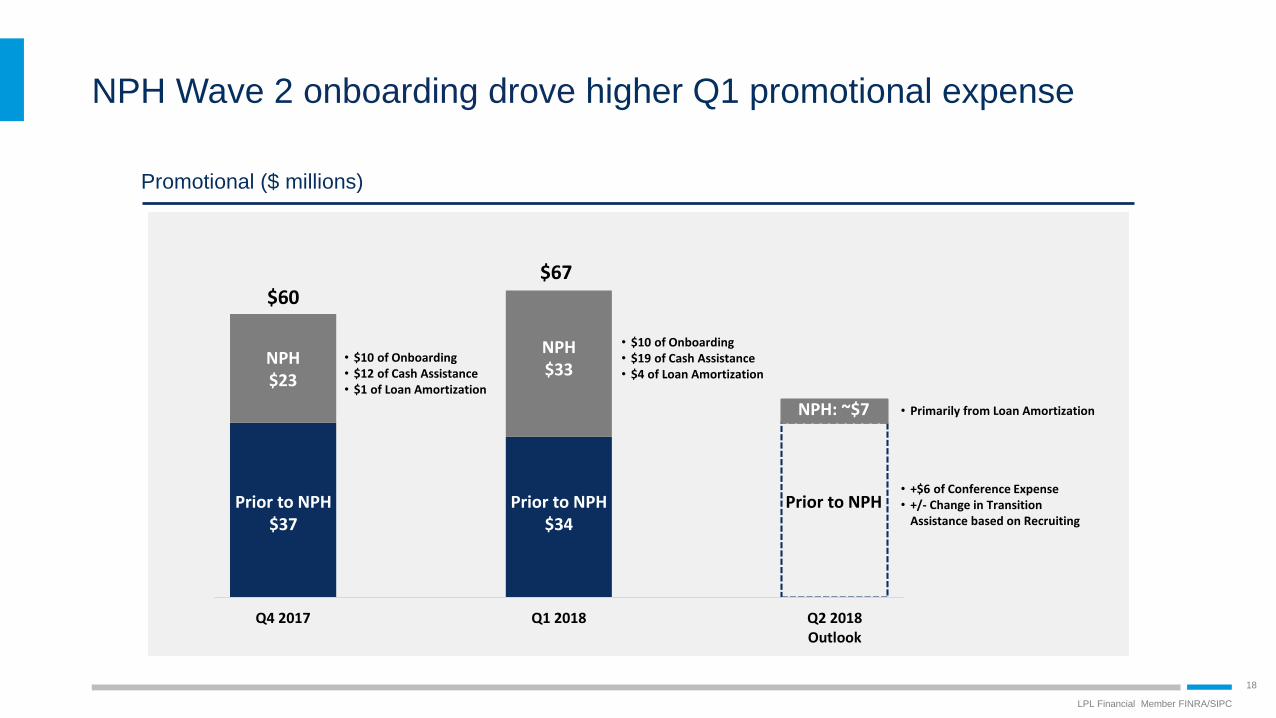
Q4 2017 Q1 2018 Q2 2018Outlook
NPH Wave 2 onboarding drove higher Q1 promotional expense
$60
Prior to NPH$37
NPH$23
• $10 of Onboarding• $12 of Cash Assistance• $1 of Loan Amortization
Prior to NPH$34
NPH$33
Promotional ($ millions)
• $10 of Onboarding• $19 of Cash Assistance• $4 of Loan Amortization
$67
Prior to NPH
NPH: ~$7 • Primarily from Loan Amortization
• +$6 of Conference Expense• +/- Change in Transition
Assistance based on Recruiting

LPL Financial Member FINRA/SIPC
19
Initial Outlook Actuals Through Q1 2018& Q2-Q4 Estimate
Initial Outlook Actuals throughQ1 2018
NPH onboarding costs and financial assistance through Q1 2018 were consistent with initial outlook
Onboarding Costs ($ millions) Financial Assistance ($ millions)
$40-$60
2017$20
Roughly $100
Cash $12
Loans$32
$97
Cash $19
Loans$34
2017 Actuals: $44
Q1 2018 Actuals:$53
Promo: $10Core G&A*: $10
Promo: $10Core G&A*: $6
Q2-Q4 2018TBD
Total financial assistance substantially complete
• $36 through Q1• Anticipate final onboarding
costs in the lower half of the $40-$60M range
Q1 2018$16
LPL Financial Member FINRA/SIPC
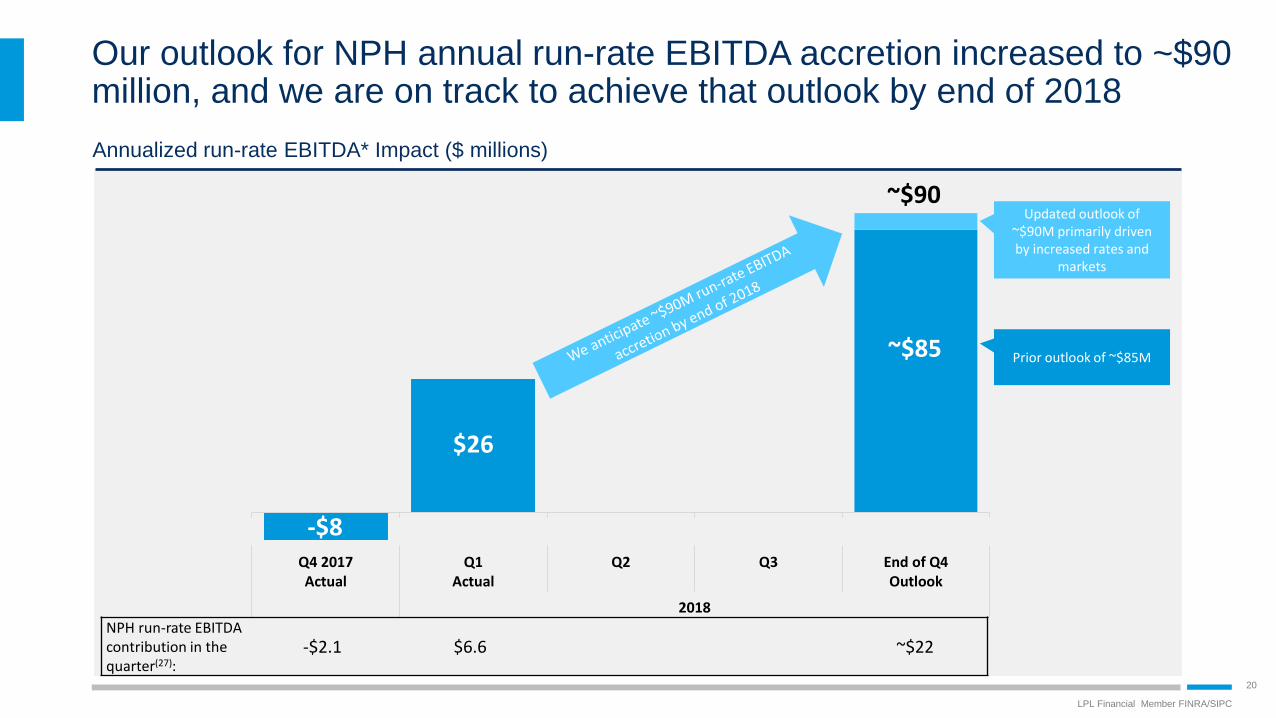
20
Q4 2017Actual
Q1Actual
Q2 Q3 End of Q4Outlook
2018
Our outlook for NPH annual run-rate EBITDA accretion increased to ~$90 million, and we are on track to achieve that outlook by end of 2018
Annualized run-rate EBITDA* Impact ($ millions)
$26
-$8
~$85
NPH run-rate EBITDA contribution in the quarter(27):
-$2.1 $6.6 ~$22
~$90Updated outlook of
~$90M primarily driven by increased rates and
markets
Prior outlook of ~$85M
LPL Financial Member FINRA/SIPC
21
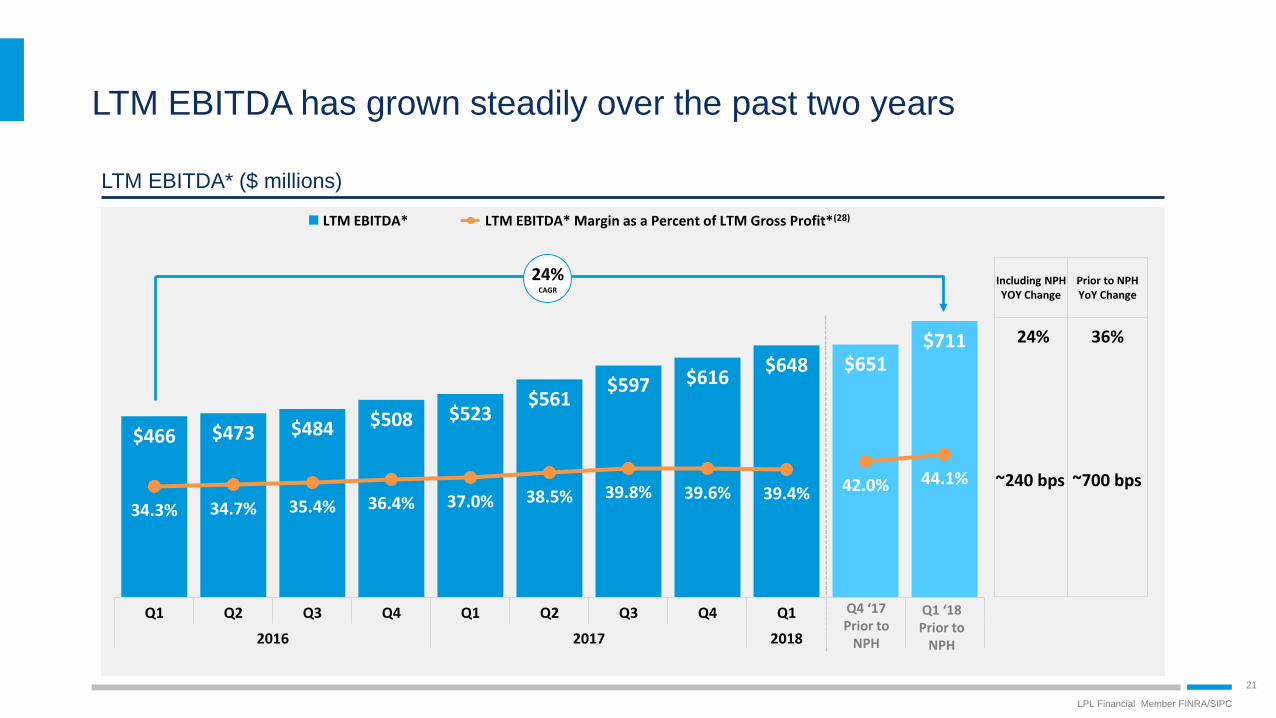
LTM EBITDA has grown steadily over the past two years
LTM EBITDA* ($ millions)
Q4 ‘17 Prior to
NPH
Q1 ‘18 Prior to
NPH
24%CAGR
Including NPHYOY Change
Prior to NPHYoY Change
~240 bps ~700 bps
24% 36%
LTM EBITDA* LTM EBITDA* Margin as a Percent of LTM Gross Profit*(28)
$466 $473 $484 $508 $523 $561
$597 $616 $648 $651
$711
34.3% 34.7% 35.4% 36.4% 37.0% 38.5% 39.8% 39.6% 39.4% 42.0% 44.1%
Q1 Q2 Q3 Q4 Q1 Q2 Q3 Q4 Q1
2016 2017 2018

LPL Financial Member FINRA/SIPC
2222
Appendix
LPL Financial Member FINRA/SIPC
23
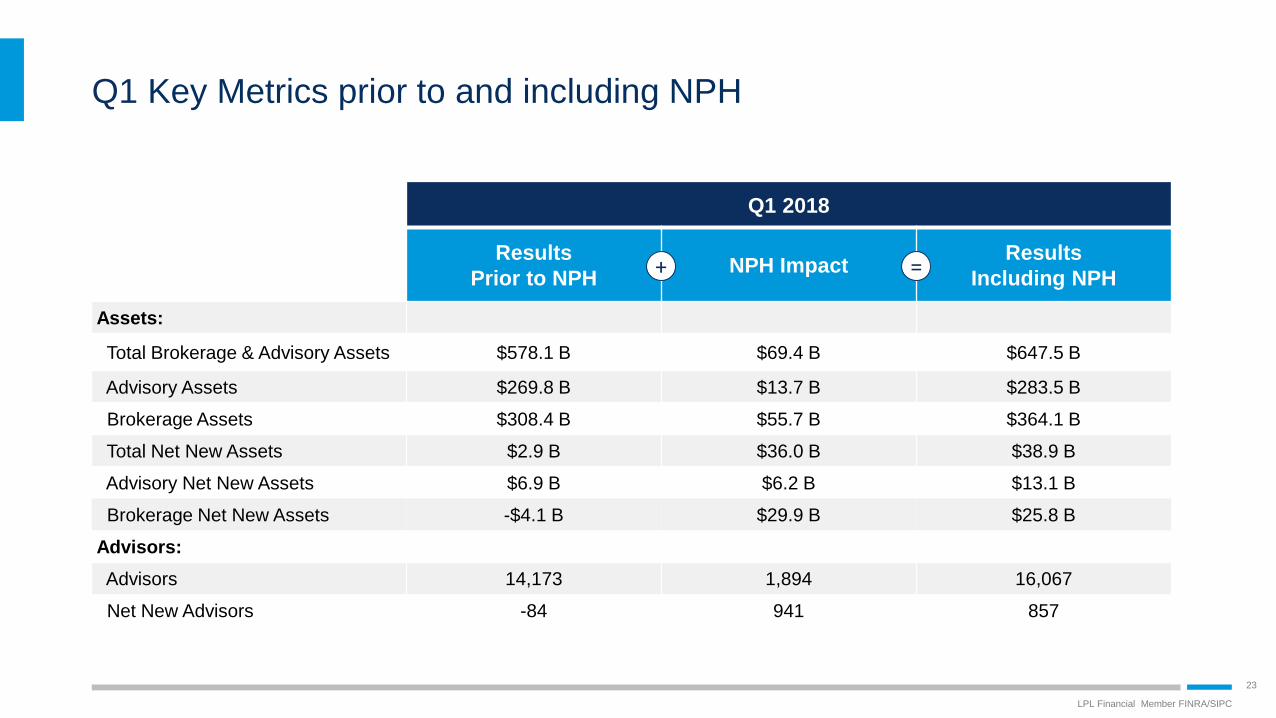
Q1 Key Metrics prior to and including NPH
Q1 2018
Results
Prior to NPHNPH Impact
Results
Including NPH
Assets:
Total Brokerage & Advisory Assets $578.1 B $69.4 B $647.5 B
Advisory Assets $269.8 B $13.7 B $283.5 B
Brokerage Assets $308.4 B $55.7 B $364.1 B
Total Net New Assets $2.9 B $36.0 B $38.9 B
Advisory Net New Assets $6.9 B $6.2 B $13.1 B
Brokerage Net New Assets -$4.1 B $29.9 B $25.8 B
Advisors:
Advisors 14,173 1,894 16,067
Net New Advisors -84 941 857
+ =

LPL Financial Member FINRA/SIPC
24
Calculation of Gross Profit
Gross profit is a non-GAAP financial measure. Please see a description of gross profit under “Non-GAAP Financial Measures” on page 3 of this release for
additional information.
Set forth below is a calculation of Gross Profit for the periods presented on pages 5 and 10-12.
$ in millions Q1 2018 Q4 2017 Q3 2017 Q2 2017 Q1 2017 Q4 2016 Q3 2016 Q2 2016 Q1 2016
Total Net Revenue $1,242 $1,116 $1,064 $1,066 $1,035 $1,007 $1,017 $1,019 $1,005
Commission & Advisory Expense 762 698 664 663 645 $647 $657 $661 $636
Brokerage, Clearing, & Exchange 16 15 13 14 14 $14 $13 $14 $14
Gross Profit $464 $403 $387 $389 $376 $347 $347 $345 $356
NPH Gross Profit 24 4
Gross Profit Prior to NPH $440 $399
LPL Financial Member FINRA/SIPC
25
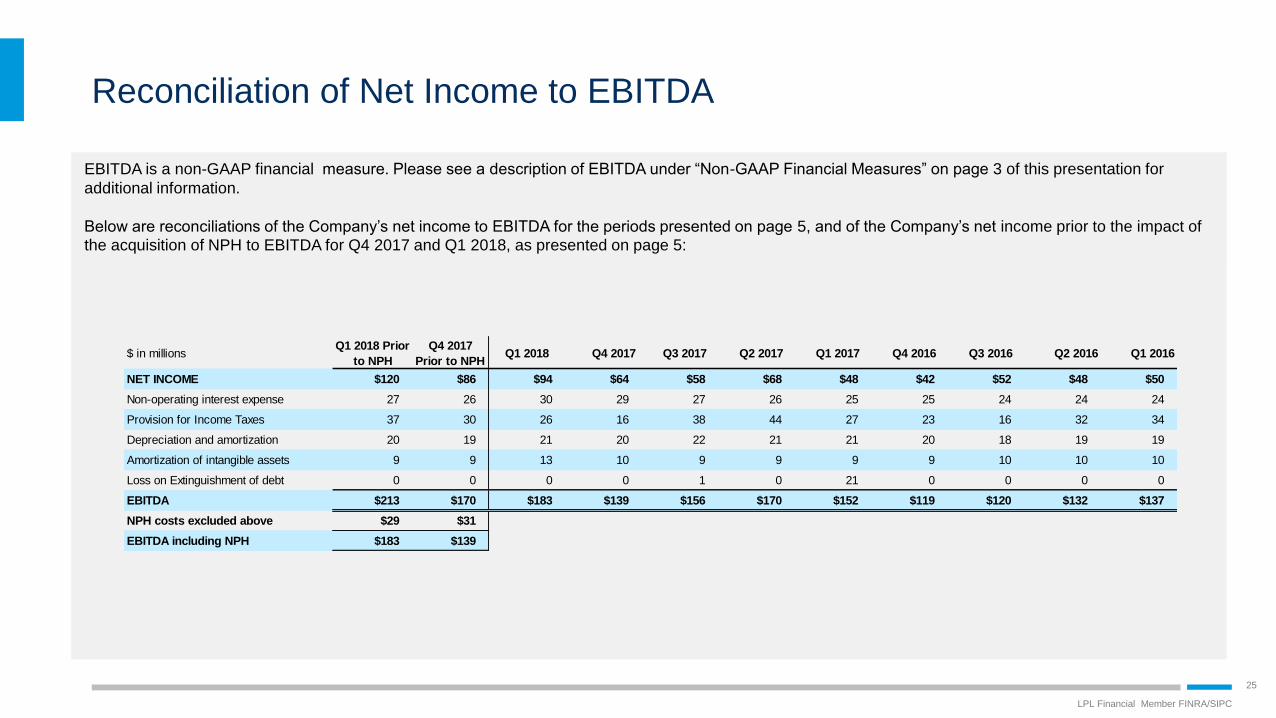
Reconciliation of Net Income to EBITDA
EBITDA is a non-GAAP financial measure. Please see a description of EBITDA under “Non-GAAP Financial Measures” on page 3 of this presentation for
additional information.
Below are reconciliations of the Company’s net income to EBITDA for the periods presented on page 5, and of the Company’s net income prior to the impact of the acquisition of NPH to EBITDA for Q4 2017 and Q1 2018, as presented on page 5:
$ in millionsQ1 2018 Prior
to NPH
Q4 2017
Prior to NPHQ1 2018 Q4 2017 Q3 2017 Q2 2017 Q1 2017 Q4 2016 Q3 2016 Q2 2016 Q1 2016
NET INCOME $120 $86 $94 $64 $58 $68 $48 $42 $52 $48 $50
Non-operating interest expense 27 26 30 29 27 26 25 25 24 24 24
Provision for Income Taxes 37 30 26 16 38 44 27 23 16 32 34
Depreciation and amortization 20 19 21 20 22 21 21 20 18 19 19
Amortization of intangible assets 9 9 13 10 9 9 9 9 10 10 10
Loss on Extinguishment of debt 0 0 0 0 1 0 21 0 0 0 0
EBITDA $213 $170 $183 $139 $156 $170 $152 $119 $120 $132 $137
NPH costs excluded above $29 $31
EBITDA including NPH $183 $139
LPL Financial Member FINRA/SIPC
26
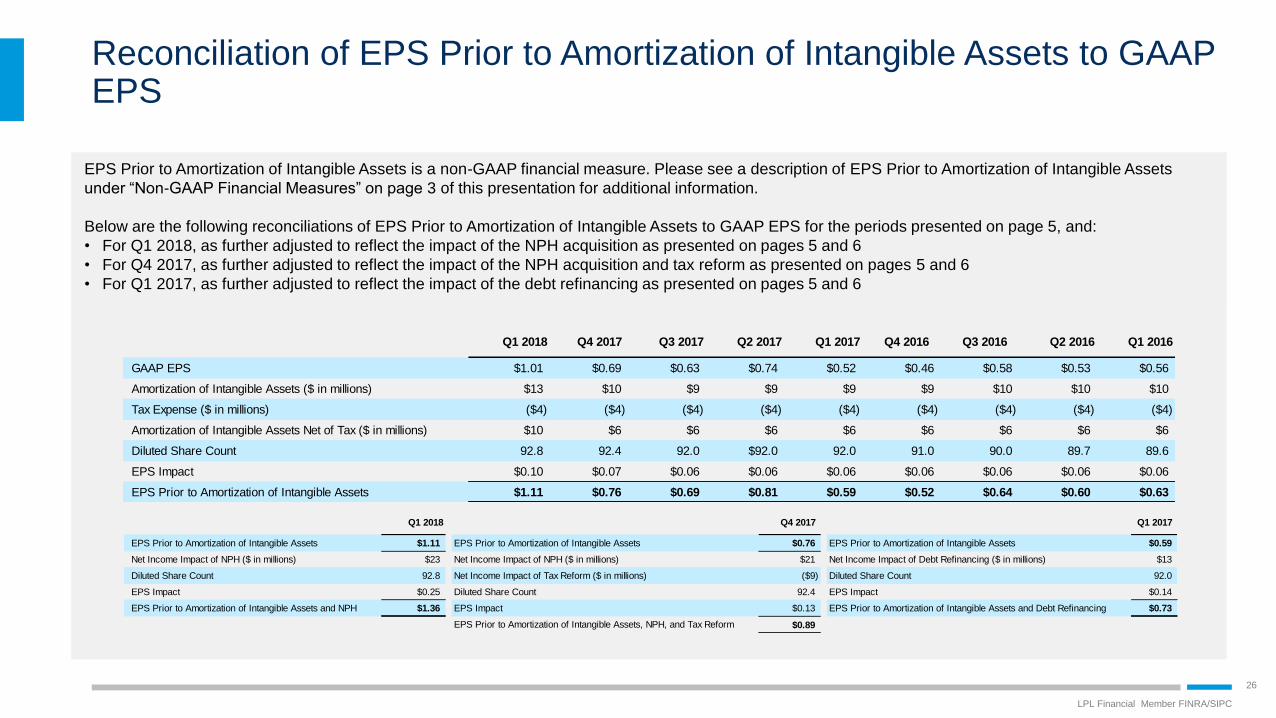
Reconciliation of EPS Prior to Amortization of Intangible Assets to GAAP EPS
EPS Prior to Amortization of Intangible Assets is a non-GAAP financial measure. Please see a description of EPS Prior to Amortization of Intangible Assets
under “Non-GAAP Financial Measures” on page 3 of this presentation for additional information.
Below are the following reconciliations of EPS Prior to Amortization of Intangible Assets to GAAP EPS for the periods presented on page 5, and:
• For Q1 2018, as further adjusted to reflect the impact of the NPH acquisition as presented on pages 5 and 6
• For Q4 2017, as further adjusted to reflect the impact of the NPH acquisition and tax reform as presented on pages 5 and 6
• For Q1 2017, as further adjusted to reflect the impact of the debt refinancing as presented on pages 5 and 6
Q1 2018 Q4 2017 Q3 2017 Q2 2017 Q1 2017 Q4 2016 Q3 2016 Q2 2016 Q1 2016
GAAP EPS $1.01 $0.69 $0.63 $0.74 $0.52 $0.46 $0.58 $0.53 $0.56
Amortization of Intangible Assets ($ in millions) $13 $10 $9 $9 $9 $9 $10 $10 $10
Tax Expense ($ in millions) ($4) ($4) ($4) ($4) ($4) ($4) ($4) ($4) ($4)
Amortization of Intangible Assets Net of Tax ($ in millions) $10 $6 $6 $6 $6 $6 $6 $6 $6
Diluted Share Count 92.8 92.4 92.0 $92.0 92.0 91.0 90.0 89.7 89.6
EPS Impact $0.10 $0.07 $0.06 $0.06 $0.06 $0.06 $0.06 $0.06 $0.06
EPS Prior to Amortization of Intangible Assets $1.11 $0.76 $0.69 $0.81 $0.59 $0.52 $0.64 $0.60 $0.63
Q1 2018 Q4 2017 Q1 2017
EPS Prior to Amortization of Intangible Assets $1.11 $0.76 $0.59
Net Income Impact of NPH ($ in millions) $23 $21 $13
Diluted Share Count 92.8 ($9) 92.0
EPS Impact $0.25 92.4 $0.14
EPS Prior to Amortization of Intangible Assets and NPH $1.36 $0.13 $0.73
$0.89EPS Prior to Amortization of Intangible Assets, NPH, and Tax Reform
EPS Prior to Amortization of Intangible Assets and Debt Refinancing
EPS Prior to Amortization of Intangible Assets
Net Income Impact of Debt Refinancing ($ in millions)
Diluted Share Count
EPS Impact
EPS Prior to Amortization of Intangible Assets
EPS Impact
Diluted Share Count
Net Income Impact of Tax Reform ($ in millions)
Net Income Impact of NPH ($ in millions)

LPL Financial Member FINRA/SIPC
27
Reconciliation of Core G&A to total operating expenses
Core G&A is a non-GAAP financial measure. Please see a description of Core G&A under “Non-GAAP Financial Measures” on page 3 of this presentation for
additional information.
Below are reconciliations of Core G&A to the Company’s total operating expenses for the periods presented on pages 13-14, and of Core G&A prior to the
impact of the acquisition of NPH to the Company’s total operating expense for Q4 2017, Full Year 2017, and Q1 2018 as presented on page 17:
$ in millionsFY 2017
Prior to NPH
Q1 2018
Prior to NPH
Q4 2017
Prior to NPHQ1 2018 Q4 2017 Q3 2017 Q2 2017 Q1 2017 Q4 2016 Q3 2016 Q2 2016 Q1 2016
Core G&A $712 $182 183 201 $195 $179 $176 $177 $181 $175 $168 $175
Regulatory charges 21 6 5 6 5 4 5 5 6 4 $6 1
Promotional 162 34 37 67 60 43 32 37 36 43 $35 36
Employee share-based compensation 19 6 4 6 4 5 5 5 5 4 $5 6
Total G&A 914 227 229 281 264 231 219 224 228 227 $213 219
Commissions and advisory 2,670 708 688 762 698 664 663 645 647 657 $661 636
Depreciation & amortization 84 20 19 21 20 22 21 21 20 18 $19 19
Amortization of intangible assets 38 9 9 13 10 9 9 9 9 10 $10 10
Brokerage, clearing and exchange 57 15 15 16 15 13 14 14 14 13 $14 14
Total operating expenses $3,763 $979 $960 $1,092 $1,008 $940 $926 $914 $918 $925 $916 $897
LPL Financial Member FINRA/SIPC
28
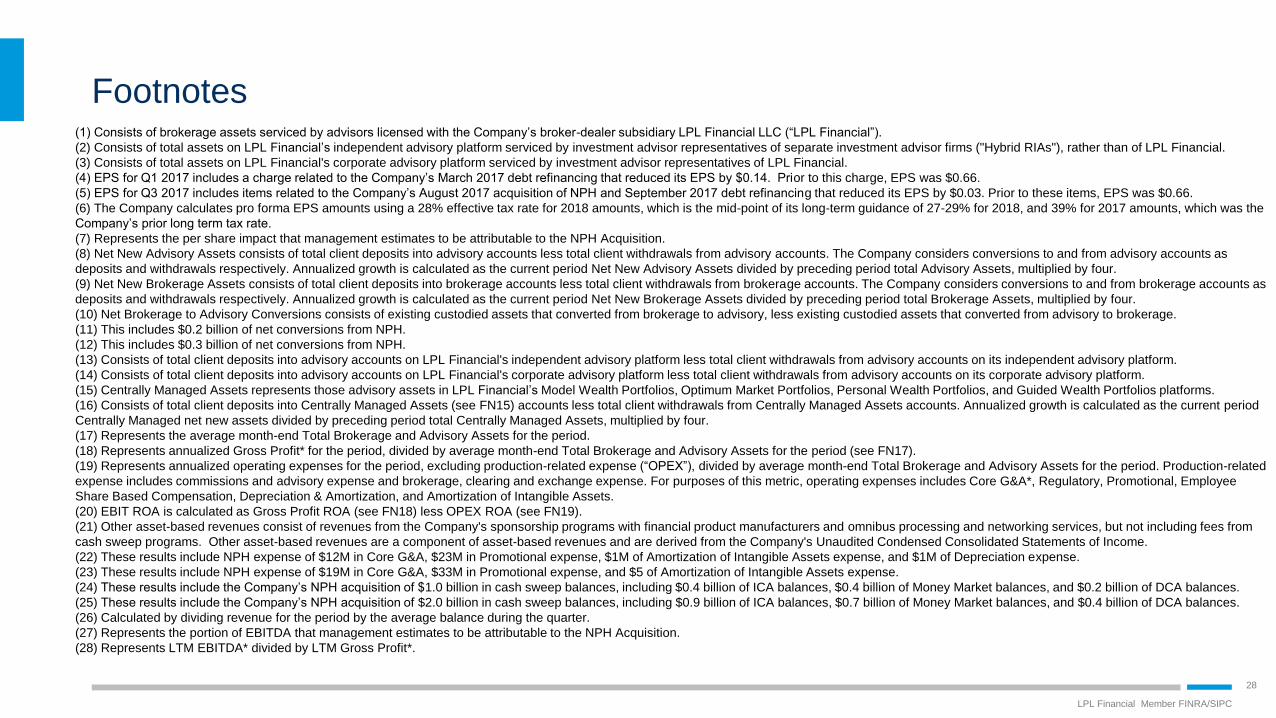
Footnotes(1) Consists of brokerage assets serviced by advisors licensed with the Company’s broker-dealer subsidiary LPL Financial LLC (“LPL Financial”).
(2) Consists of total assets on LPL Financial’s independent advisory platform serviced by investment advisor representatives of separate investment advisor firms ("Hybrid RIAs"), rather than of LPL Financial.
(3) Consists of total assets on LPL Financial's corporate advisory platform serviced by investment advisor representatives of LPL Financial.
(4) EPS for Q1 2017 includes a charge related to the Company’s March 2017 debt refinancing that reduced its EPS by $0.14. Prior to this charge, EPS was $0.66.
(5) EPS for Q3 2017 includes items related to the Company’s August 2017 acquisition of NPH and September 2017 debt refinancing that reduced its EPS by $0.03. Prior to these items, EPS was $0.66.
(6) The Company calculates pro forma EPS amounts using a 28% effective tax rate for 2018 amounts, which is the mid-point of its long-term guidance of 27-29% for 2018, and 39% for 2017 amounts, which was the
Company’s prior long term tax rate.
(7) Represents the per share impact that management estimates to be attributable to the NPH Acquisition.
(8) Net New Advisory Assets consists of total client deposits into advisory accounts less total client withdrawals from advisory accounts. The Company considers conversions to and from advisory accounts as
deposits and withdrawals respectively. Annualized growth is calculated as the current period Net New Advisory Assets divided by preceding period total Advisory Assets, multiplied by four.
(9) Net New Brokerage Assets consists of total client deposits into brokerage accounts less total client withdrawals from brokerage accounts. The Company considers conversions to and from brokerage accounts as
deposits and withdrawals respectively. Annualized growth is calculated as the current period Net New Brokerage Assets divided by preceding period total Brokerage Assets, multiplied by four.
(10) Net Brokerage to Advisory Conversions consists of existing custodied assets that converted from brokerage to advisory, less existing custodied assets that converted from advisory to brokerage.
(11) This includes $0.2 billion of net conversions from NPH.
(12) This includes $0.3 billion of net conversions from NPH.
(13) Consists of total client deposits into advisory accounts on LPL Financial's independent advisory platform less total client withdrawals from advisory accounts on its independent advisory platform.
(14) Consists of total client deposits into advisory accounts on LPL Financial's corporate advisory platform less total client withdrawals from advisory accounts on its corporate advisory platform.
(15) Centrally Managed Assets represents those advisory assets in LPL Financial’s Model Wealth Portfolios, Optimum Market Portfolios, Personal Wealth Portfolios, and Guided Wealth Portfolios platforms.
(16) Consists of total client deposits into Centrally Managed Assets (see FN15) accounts less total client withdrawals from Centrally Managed Assets accounts. Annualized growth is calculated as the current period
Centrally Managed net new assets divided by preceding period total Centrally Managed Assets, multiplied by four.
(17) Represents the average month-end Total Brokerage and Advisory Assets for the period.
(18) Represents annualized Gross Profit* for the period, divided by average month-end Total Brokerage and Advisory Assets for the period (see FN17).
(19) Represents annualized operating expenses for the period, excluding production-related expense (“OPEX”), divided by average month-end Total Brokerage and Advisory Assets for the period. Production-related
expense includes commissions and advisory expense and brokerage, clearing and exchange expense. For purposes of this metric, operating expenses includes Core G&A*, Regulatory, Promotional, Employee
Share Based Compensation, Depreciation & Amortization, and Amortization of Intangible Assets.
(20) EBIT ROA is calculated as Gross Profit ROA (see FN18) less OPEX ROA (see FN19).
(21) Other asset-based revenues consist of revenues from the Company's sponsorship programs with financial product manufacturers and omnibus processing and networking services, but not including fees from
cash sweep programs. Other asset-based revenues are a component of asset-based revenues and are derived from the Company's Unaudited Condensed Consolidated Statements of Income.
(22) These results include NPH expense of $12M in Core G&A, $23M in Promotional expense, $1M of Amortization of Intangible Assets expense, and $1M of Depreciation expense.
(23) These results include NPH expense of $19M in Core G&A, $33M in Promotional expense, and $5 of Amortization of Intangible Assets expense.
(24) These results include the Company’s NPH acquisition of $1.0 billion in cash sweep balances, including $0.4 billion of ICA balances, $0.4 billion of Money Market balances, and $0.2 billion of DCA balances.
(25) These results include the Company’s NPH acquisition of $2.0 billion in cash sweep balances, including $0.9 billion of ICA balances, $0.7 billion of Money Market balances, and $0.4 billion of DCA balances.
(26) Calculated by dividing revenue for the period by the average balance during the quarter.
(27) Represents the portion of EBITDA that management estimates to be attributable to the NPH Acquisition.
(28) Represents LTM EBITDA* divided by LTM Gross Profit*.
Related Documents