2016 SAAA National Teaching and Learning and Regional Conference Proceedings ISBN 978-0-620-74761-5 1 2016 Southern African Accounting Association (SAAA) National Teaching and Learning and Regional Conference Proceedings ISBN number: 978-0-620-74761-5 REGIONAL SAAA CONFERENCES WESTERN CAPE CPUT, The Cape Town Hotel School, Granger Bay, Cape Town Friday, 2 September 2016 KWA-ZULU NATAL Durban University of Technology Faculty of Accounting & Informatics, Elangeni Southern Sun Hotel, Durban Wednesday, 30 November 2016 GAUTENG University of the Witwatersrand School of Accountancy Building, West Campus, Johannesburg Friday, 2 December 2016 NATIONAL TEACHING AND LEARNING University of the Witwatersrand School of Accountancy Building, West Campus, Johannesburg Friday, 2 December 2016 The refereed papers included in the conference proceedings were accepted after a double blind peer reviewed process.

Welcome message from author
This document is posted to help you gain knowledge. Please leave a comment to let me know what you think about it! Share it to your friends and learn new things together.
Transcript
2016 SAAA National Teaching and Learning and Regional Conference Proceedings
ISBN 978-0-620-74761-5
1
2016 Southern African Accounting
Association (SAAA)
National Teaching and Learning and
Regional Conference Proceedings
ISBN number: 978-0-620-74761-5
REGIONAL SAAA CONFERENCES
WESTERN CAPE CPUT, The Cape Town
Hotel School, Granger
Bay, Cape Town
Friday, 2 September
2016
KWA-ZULU NATAL Durban University of
Technology
Faculty of Accounting &
Informatics,
Elangeni Southern Sun
Hotel, Durban
Wednesday, 30
November 2016
GAUTENG University of the
Witwatersrand
School of Accountancy
Building, West Campus,
Johannesburg
Friday, 2 December
2016
NATIONAL TEACHING
AND LEARNING
University of the
Witwatersrand
School of Accountancy
Building, West Campus,
Johannesburg
Friday, 2 December
2016
The refereed papers included in the conference proceedings were accepted
after a double blind peer reviewed process.
2016 SAAA National Teaching and Learning and Regional Conference Proceedings
ISBN 978-0-620-74761-5
2
Preface The 2016 SAAA Regional and Teaching & Learning Conferences were presented in
partnership with the Southern African Accounting Association.
Objective of these conferences The SAAA Regional and Teaching & Learning Conferences aims to contribute towards the
achievement of the SAAA vision of promoting excellence in Accountancy Higher Education
and Research in Southern Africa. By providing a research and information-sharing platform
that focuses on teaching and learning in Accountancy, academics can play an active and
leading role in Accounting Education in Southern Africa.
Review process and comments All papers submitted for the ‘refereed category’ were subjected to a rigorous process of blind
peer review. The papers were submitted to two experts at an independent South African
University for blind review. Comments and suggested amendments from the reviewers were
communicated to authors and the reviewers decided on the acceptance of the papers for
presentation at the conference and inclusion in the conference proceedings. Experts also
declined certain papers and these were not included in these conference proceedings.
SAAA Executive Scientific Committee
Prof Elmarie
Papageorgiou
President: SAAA and convener of the SAAA Gauteng
Regional Conference
Prof Ilse Lubbe
Vice President: SAAA, guest editor of Accounting Education
and convener of the SAAA Teaching and Learning Conference
Magda Turner Chairman: SAAA Gauteng Region
Andre Neethling Chairman: SAAA Western Cape Region
Shelly Herbert Vice-chairman: SAAA Western Cape Region
Tanya Thompson Secretary: SAAA and co-ordinator of SAAA KwaZulu-Natal
regional conference
Brian Ngiba SAAA subject representative: Financial Accounting, and co-
ordinator of KwaZulu-Natal regional conference
Riley Carpenter SAAA subject representative: Taxation
Prof Lourens Erasmus SAAA subject representative: Public Sector
Jack Jonck SAAA subject representative: Auditing
Jolandi Gevers SAAA subject representative: Management Accounting and
Finance

2016 SAAA National Teaching and Learning and Regional Conference Proceedings
ISBN 978-0-620-74761-5
3
LIST OF REVIEWERS
FIRST NAME UNIVERSITY EMAIL ADDRESS
Andre Hamel University of Western Cape [email protected]
Andre Neethling Cape Peninsula University of Technology [email protected]
Andres Merino University of Witwatersrand [email protected]
Anthony Jodwana Nelson Mandela Metropolitan University [email protected]
Carol Cairney University of Western Cape [email protected]
Edna Hamel University of Western Cape [email protected]
Francois Steyn University of Western Cape [email protected]
George Goldswain UNISA [email protected]
Graham Myers Durban University of Technology (retired) [email protected]
Heinrich Dixon Tshwane University of Technology [email protected]
Houdini Fourie Nelson Mandela Metropolitan University [email protected]
Ilse Lubbe University of Cape Town [email protected]
Jack Jonck North-West University [email protected]
Jaco Barnard Nelson Mandela Metropolitan University [email protected]
Jacques Siebrits University of Western Cape [email protected]
Jacqui-Lyn McIntyre North-West University [email protected]
James Anthony University of Cape Town [email protected]
Janine Christian Nelson Mandela Metropolitan University [email protected]
Jobo Dubihlela Cape Peninsula University of Technology [email protected]
Johnathan Dillon Nelson Mandela Metropolitan University [email protected]
Jolandi Gevers University of Cape Town [email protected]
JP Bruwer Cape Peninsula University of Technology [email protected]
Lana Hanner Weldon University of Fort Hare [email protected]
Leandi Steenkamp Central University of Technology [email protected]
Leon Loxton University of Western Cape [email protected]
Liza-Mari Sahd Stellenbosch University [email protected]
Lizel Bester Nelson Mandela Metropolitan University [email protected]
Lynn Schoemann Nelson Mandela Metropolitan University [email protected]
Magda Turner University of Witwatersrand [email protected]
Marina Chalmers Nelson Mandela Metropolitan University [email protected]
Minga Negash University of Witwatersrand [email protected]
Mmudi David Shaku Tshwane University of Technology [email protected]
Nebbel Motubatse Tshwane University of Technology [email protected]
Nestene Botha University of Cape Town [email protected]
Peta Myers Rhodes University [email protected]
Phillip De Jager University of Cape Town [email protected]
Rayghana Abrahams Nelson Mandela Metropolitan University [email protected]
Riaan Rudman Stellenbosch University [email protected]

2016 SAAA National Teaching and Learning and Regional Conference Proceedings
ISBN 978-0-620-74761-5
4
Rikus De Villiers North-West University [email protected]
Riley Carpenter University of Cape Town [email protected]
Ronald Arendse University of Western Cape [email protected]
Solomon Mayo Tshwane University of Technology [email protected]
Tabitha Grace
Mukeredzi
Durban University of Technology [email protected]
Tasneem Joosub University of Witwatersrand [email protected]
Wayne Van Zijl University of Witwatersrand [email protected]
2016 SAAA National Teaching and Learning and Regional Conference Proceedings
ISBN 978-0-620-74761-5
5
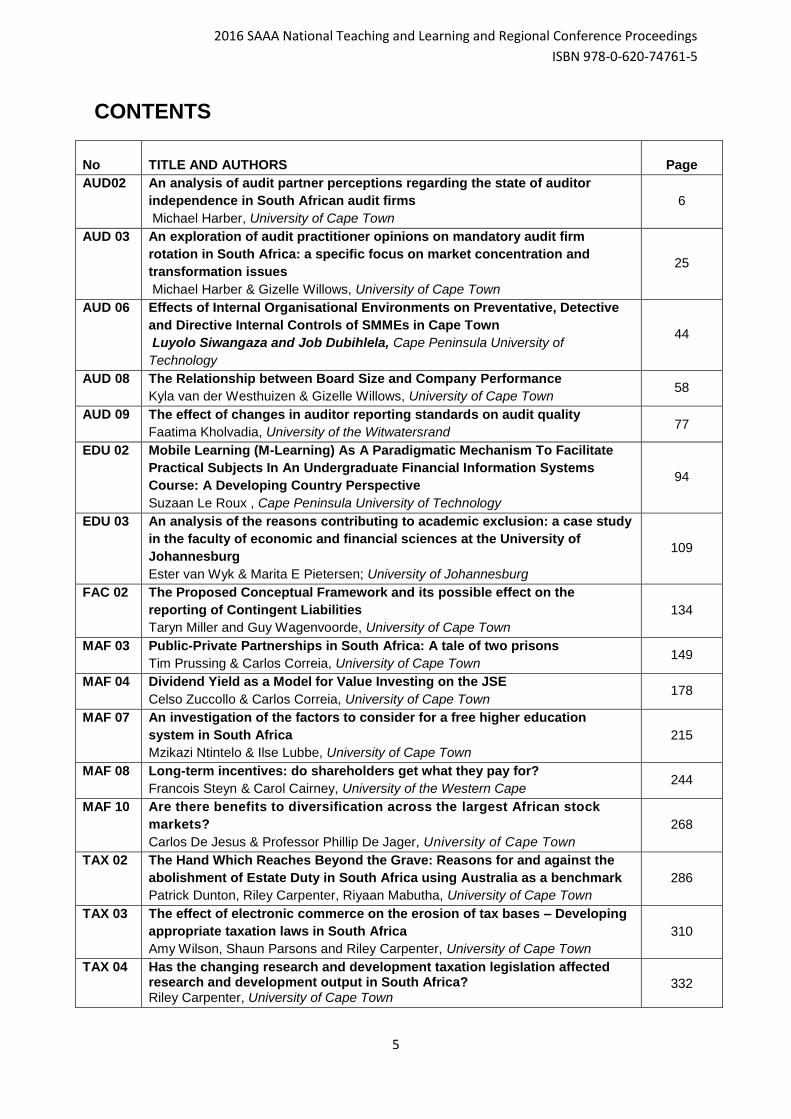
CONTENTS
No TITLE AND AUTHORS Page
AUD02 An analysis of audit partner perceptions regarding the state of auditor
independence in South African audit firms
Michael Harber, University of Cape Town
6
AUD 03 An exploration of audit practitioner opinions on mandatory audit firm
rotation in South Africa: a specific focus on market concentration and
transformation issues
Michael Harber & Gizelle Willows, University of Cape Town
25
AUD 06 Effects of Internal Organisational Environments on Preventative, Detective
and Directive Internal Controls of SMMEs in Cape Town
Luyolo Siwangaza and Job Dubihlela, Cape Peninsula University of
Technology
44
AUD 08 The Relationship between Board Size and Company Performance
Kyla van der Westhuizen & Gizelle Willows, University of Cape Town 58
AUD 09 The effect of changes in auditor reporting standards on audit quality
Faatima Kholvadia, University of the Witwatersrand 77
EDU 02 Mobile Learning (M-Learning) As A Paradigmatic Mechanism To Facilitate
Practical Subjects In An Undergraduate Financial Information Systems
Course: A Developing Country Perspective
Suzaan Le Roux , Cape Peninsula University of Technology
94
EDU 03 An analysis of the reasons contributing to academic exclusion: a case study
in the faculty of economic and financial sciences at the University of
Johannesburg
Ester van Wyk & Marita E Pietersen; University of Johannesburg
109
FAC 02 The Proposed Conceptual Framework and its possible effect on the
reporting of Contingent Liabilities
Taryn Miller and Guy Wagenvoorde, University of Cape Town
134
MAF 03 Public-Private Partnerships in South Africa: A tale of two prisons
Tim Prussing & Carlos Correia, University of Cape Town 149
MAF 04 Dividend Yield as a Model for Value Investing on the JSE
Celso Zuccollo & Carlos Correia, University of Cape Town 178
MAF 07 An investigation of the factors to consider for a free higher education
system in South Africa
Mzikazi Ntintelo & Ilse Lubbe, University of Cape Town
215
MAF 08 Long-term incentives: do shareholders get what they pay for?
Francois Steyn & Carol Cairney, University of the Western Cape 244
MAF 10 Are there benefits to diversification across the largest African stock
markets?
Carlos De Jesus & Professor Phillip De Jager, University of Cape Town
268
TAX 02 The Hand Which Reaches Beyond the Grave: Reasons for and against the
abolishment of Estate Duty in South Africa using Australia as a benchmark
Patrick Dunton, Riley Carpenter, Riyaan Mabutha, University of Cape Town
286
TAX 03 The effect of electronic commerce on the erosion of tax bases – Developing
appropriate taxation laws in South Africa
Amy Wilson, Shaun Parsons and Riley Carpenter, University of Cape Town
310
TAX 04 Has the changing research and development taxation legislation affected research and development output in South Africa? Riley Carpenter, University of Cape Town
332
2016 SAAA National Teaching and Learning and Regional Conference Proceedings
ISBN 978-0-620-74761-5
6
2016 Southern African Accounting
Association (SAAA)
National Teaching and Learning and
Regional Conference Proceedings
ISBN number: 978-0-620-74761-5
AUD 02: An analysis of audit partner perceptions
regarding the state of auditor independence in South
African audit firms
Author: Michael Harber CA (SA), University of Cape Town
Email: [email protected]
Abstract
The provision of assurance services, most notably the audit function, is an activity of public
protection that requires a high degree of independence between the auditor and the audit client
to ensure audit quality is achieved. In the European Union, there is now a legislated move
towards mandatory audit firm rotation (MAFR) to ensure auditor independence. South Africa
is currently faced with the decision of whether to change legislation and follow suit. In addition,
the 2014/2015 Public Inspections Report was recently released by the Independent Regulatory
Board for Auditors (IRBA) and it revealed worrying statistics of ethical practice and disclosure
non-compliance by audit firms, again highlighting the concerns around independence between
auditor and client.
Using a qualitative and descriptive methodology, through the use of semi-structured and open
interviews with experienced South African audit partners, the views of the profession around
auditor independence is explored.
This study will therefore present the opinions of a small group of experienced audit partners,
most being regional or national managing partners, from audit firms that perform public interest
entity audits. The views of these audit practitioners indicate that the South African audit
profession does not believe that any changes to regulations are necessary to address auditor
independence as any problem with auditor independence is one of perception, not reality. The
partners expressed a concern that the public inspections process needs to be revised by the
regulator and the audit committee’s role in appointing suitably independent auditors is crucially
important and a role that should be strengthened before more regulation is imposed on the
audit profession.
2016 SAAA National Teaching and Learning and Regional Conference Proceedings
ISBN 978-0-620-74761-5
7
Introduction and Literature Review
Though auditors should regard the investing public as their client, they tend to kowtow
instead to the managers who choose them and dole out their pay. Whose bread I eat,
his song I sing. (Buffet and Clark, 2006)
The provision of assurance services, most notably the audit function, is an activity of
public protection. In the eyes of the public, especially the investing public and all
stakeholders of the company, the audit function provides the much needed stamp of
credibility and assurance as to the fair presentation of the company’s financial
reporting. Auditor independence is important because it has an impact on the quality
of the audit. DeAngelo (1981) suggests that audit quality is defined as the probability
that:
(a) The auditor will uncover a breach of statutory or regulatory requirement and
(b) Report the breach to the appropriate parties.
If auditors do not remain independent, they might be less likely to report irregularities
or insist that financial statements be prepared to their satisfaction, thus, impairing audit
quality (Carey and Simnett, 2006). This potentially lessens the credibility of the
financial reporting process and hence why regulations are imposed to ensure the
professional standards and the independence of the external audit function. Most
countries, including South Africa, have moved away from self-regulation the audit
profession, to a system of using an independent regulatory body. In South Africa this
regulatory authority is the Independent Regulatory Board for Auditors (IRBA).
Many studies on the topic of auditor independence have been performed to date
(Carey and Simnett, 2006; Daniels and Booker, 2011; Tepalagul and Lin, 2015), in
significant economic jurisdictions such as the United States and Europe, which is
understandable given its importance to the quality of the audit. If auditors do not remain
independent, they might be less likely to report irregularities, through the various
reporting channels available. The most notable reporting channel is via the audit
opinion and audit report, and therefore a lack of independence could impair the quality
of the audit report provided to the public and stakeholders of the company. Recent
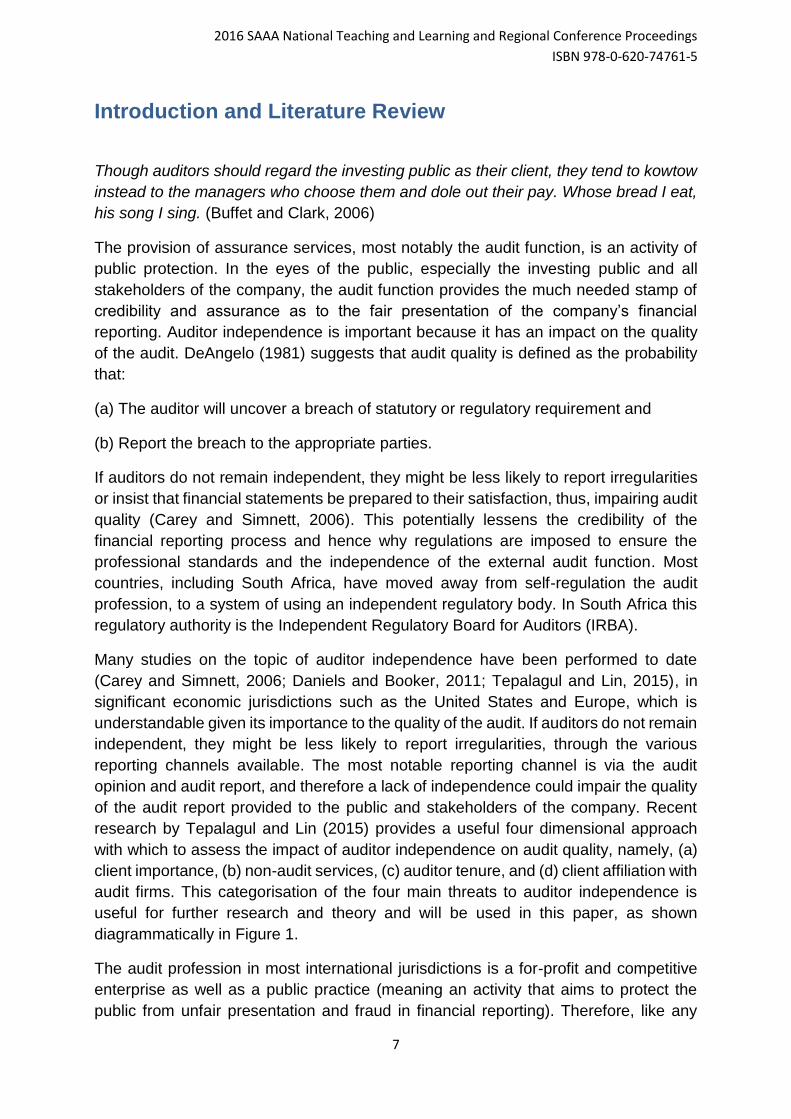
research by Tepalagul and Lin (2015) provides a useful four dimensional approach
with which to assess the impact of auditor independence on audit quality, namely, (a)
client importance, (b) non-audit services, (c) auditor tenure, and (d) client affiliation with
audit firms. This categorisation of the four main threats to auditor independence is
useful for further research and theory and will be used in this paper, as shown
diagrammatically in Figure 1.
The audit profession in most international jurisdictions is a for-profit and competitive
enterprise as well as a public practice (meaning an activity that aims to protect the
public from unfair presentation and fraud in financial reporting). Therefore, like any
2016 SAAA National Teaching and Learning and Regional Conference Proceedings
ISBN 978-0-620-74761-5
8
business, the auditors have profit incentives to yield to client pressure to retain their
business, especially the business of their most significant clients, which in turn
compromises auditor independence (Tepalagul and Lin, 2015). Added to this potential
compromise of independence is the reality that many audit clients require non-
assurance services from their auditors, which are often more lucrative than the audit
fee (Tepalagul and Lin, 2015), possibly resulting again in compromised independence
in the audit engagement (Tepalagul and Lin, 2015). These threats to independence
are explained at length in the IFAC Code of Professional Conduct in which numerous
guidelines are provided to enable the auditor to manage these conflicts of interest.
Long auditor-client tenure and client affiliation with audit firms create familiarity
between the parties as relationships form (International Federation of Accountants
(IFAC), 2006). The profits from non-audit services create self-interest threats to
independence. These threats may threaten auditor independence and audit quality.
Source: Tepalagul and Lin (2015)
As can also be seen from Figure 1, audit quality, which results in quality financial
reporting of companies, is a function of the capabilities and the independence of the
auditor. However, the threats to auditor independence negatively impact on this quality.
Per discussion with the CEO of the IRBA in December 2015 (the transcript of which is
available upon request), the national regulator is concerned with the state of actual and
perceived auditor independence in South Africa and is actively considering means of
addressing this concern. Part of the reason for this concern is the recently published
2014/2015 IRBA Public Inspections Report.
The Public Inspections Report
The IRBA performs inspections on selected firms to evaluate their performance on a
selection of audit engagements, as well as the design and effectiveness of their quality
2016 SAAA National Teaching and Learning and Regional Conference Proceedings
ISBN 978-0-620-74761-5
9
control policies and procedures. The report provides an analysis of key findings arising
from firm and engagement inspections performed by the Inspections Department of
the IRBA. The latest report was published in December 2015 and covers audits for the
year ended 31 March 2015, and also includes an overview of the scope of the IRBA’s
inspections. (IRBA, 2015c)
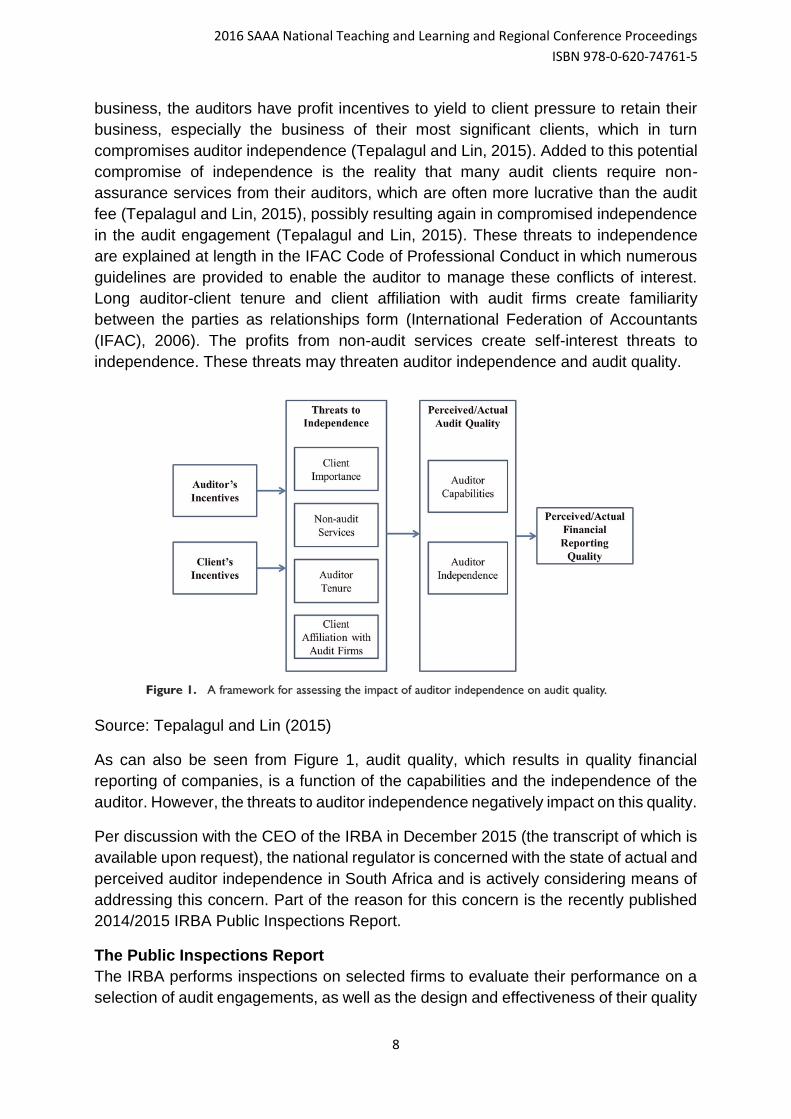
The IRBA is concerned that a significant portion of the findings relate to relevant ethical
requirements (refer below to Figure 2), and more specifically issues where
independence may be considered the root cause. A root cause was identified as
“Failure to fortify the importance of professional scepticism and the independence of
the engagement team so as to overcome the threats that could develop as a result of
their relationship with clients”, as well as “Failure to strengthen and maintain
independence as an underlying principle for high audit quality.” (IRBA, 2015c)
Figure 2
Source: IRBA 2014/2015 Public Inspections Report (IRBA, 2015c)
The above graph (Figure 2) from the latest 2014/2015 Public Inspections Report shows
indicates a significant breach by auditors in South Africa of ethical requirements, both
relative to other issues, but also in the comparison made to International Forum of
Independent Audit Regulators (IFIAR) Inspections Workshop. The IFIAR inspection
findings are based on a survey of 29 member countries and present as a percentage
the amount of inspected firms with deficiencies found per ISQC1. It should be noted
that the IFIAR results represent the largest six global network firms, whereas the
results for South Africa span the entire population of large, medium and small auditing
firms that were inspected.
2016 SAAA National Teaching and Learning and Regional Conference Proceedings
ISBN 978-0-620-74761-5
10
Per the IRBA Newsletter 32 – December 2015:
The IRBA Inspection Committee reported on 37 audit firm and 375 audit engagement
inspections for the year (IRBA, 2015c, 2015d). Most firms showed one or more
deficiencies, including ethics (independence), engagement performance and
monitoring, which require urgent improvement. A significant number of individual audit
engagement files also showed deficiencies that need urgent attention. A total of 16%
of firms and 6% of engagement partners were referred to the Investigating Committee
of the IRBA due to fundamental or continued noncompliance with international auditing
and financial reporting standards, professional codes and legislative requirements. The
report also emphasises the need for audit firms to urgently address ethics and
independence matters, as well as engagement quality. (IRBA, 2015c, 2015d)
The IRBA is of the opinion that high-quality auditing and accounting practices are not
only essential for reliable financial reporting, but are also critical in protecting the public
interest and boosting investor confidence. According to the IRBA, compliance with
auditing standards, ethics, financial reporting standards and legislative requirements
is fundamental in ensuring a reliable profession that can effectively compete
internationally (IRBA, 2015a). Therefore the IRBA is considering advocating a change
in South African legislation in order to follow the direction of the European Union in
requiring periodic rotation of the audit firm. This system is called mandatory audit firm
rotation (MAFR) and its primary purpose is to protect audit quality through promoting
the independence of the auditor from the audit client by way of full audit firm rotations
every few years. According to the IRBA CEO and 2015 consultation paper issued by
the IRBA (entitled “Measures to strengthen auditor independence”), the main reasons
that the IRBA Board should consider further measures to strengthen auditor
independence are (1) to strengthen auditor independence and so protect the public
and investors, (2) address market concentration of audit services and create a more
competitive environment; and (3) promote transformation by creating more
opportunities for small and mid-tier audit firms to enter certain markets.
(IRBA, 2015b; SAICA, 2016)
Mandating disclosure of audit tenure
In December 2015, the Regulatory Board (IRBA), in terms of its powers provided by
the Auditing Profession Act, Act 26 of 2005, published a Rule in the Government
Gazette which makes it mandatory that all auditor′s reports on Annual Financial
Statements shall disclose the number of years which the audit firm (or sole practitioner)
has been the auditor of the entity (audit tenure). The rule (Government Gazette Nr
39475 of 04 December 2015), effective for periods ending on or after 31 December
2015, applies to audit reports issued on the Annual Financial Statements of all public
companies, as defined in Section 1 of the Companies Act of 2008, which also meet the
definition of a public interest entity as per paragraphs 290.25 and 290.26 of the IRBA
Code of Professional Conduct for Registered Auditors (IRBA, 2015e, 2016). The
2016 SAAA National Teaching and Learning and Regional Conference Proceedings
ISBN 978-0-620-74761-5
11
reason for this requirement was to strengthen auditor independence and was disclosed
by the IRBA as follows:
“The Regulatory Board made the decision to require the mandatory disclosure of audit
tenure in the context of strengthening auditor independence which is consistent with
measures implemented in other jurisdictions. This disclosure of audit tenure will lead
to transparency of association between audit firms and audit clients.” (IRBA, 2015e)
International regulatory developments
According to Hay (2015), current and recent auditing reforms internationally can be
classified into those that that aim to improve independence, and those intended to
increase competence. In recent years, most notably since the collapse of Enron in
2001, regulators have expressed concerns about auditor independence and taken
actions to mitigate those concerns (Laurion, Lawrence, & Ryans, 2015). These include
the passage of the 2002 Sarbanes–Oxley (SOX) Act, also known as the "Public
Company Accounting Reform and Investor Protection Act", which is United States (US)
legislation that, among many other requirements, prohibits the auditor (in a US context)
from providing most non-audit services to its clients. More specifically, SOX imposes
a one-year “cooling-off period” for former auditors taking employment at their previous
audit clients and requires audit partners to rotate every five years. In terms of SOX, the
US also shifted from a seven-year rotation with a two-year cooling-off period (before
SOX), to a stricter five-year rotation and five-year cooling-off period for audit
engagements. More specifically the requirement is to rotate (1) the partner having
primary responsibility for the audit and (2) the partner responsible for reviewing the
audit every five years. The audit committee is required to ensure that the requisite
rotation actually takes place (Tepalagul and Lin, 2015).
In the European Union (EU), regulations have also recently changed. The European
Parliament in 2014 voted in favour of Directive 2014/56/EU, amending Directive
2006/43/EC on statutory audits of annual accounts and consolidated accounts
(European Commission, 2015). These new rules force European companies to hire
new audit firms at 10- to 24-year intervals, depending on certain criteria,
bringing mandatory audit firm rotation into one of the world’s most significant economic
regions (KPMG, 2014). More specifically, public interest entities have to appoint a new
firm of auditors every 10 years. However, member states have the option to extend
this maximum period to 20 years (24 if there is a joint audit) provided the audit is subject
to a public tender carried out after 10 years. It is expected that the United Kingdom
(UK) may also implement mandatory firm rotation in the near future (KPMG, 2014). In
2012, the Financial Reporting Council in the UK introduced a provision in the UK
Corporate Governance Code for FTSE 350 companies to consider tendering their audit
appointment every 10 years, on a comply or explain basis. The Competition and
Markets Authority finished their long running investigation of the UK large company
statutory audit market in October 2013, concluding that tendering of the audit
appointment should be mandatory for FTSE 350 companies at least every 10 years
(PWC, 2014).
2016 SAAA National Teaching and Learning and Regional Conference Proceedings
ISBN 978-0-620-74761-5
12
As can be seen in the comparison between the US regulations of auditor rotation and
the recently adopted EU and the UK audit firm rotation regulations, there is a difference
between auditor rotation i.e. audit engagement partner and audit firm rotation (MAFR),
although sometimes the terms are used loosely and the distinction is lost. Auditor
rotation, as in the US and South Africa, refers to the mandatory rotation of the
engagement audit partner after a prescribed five years. Under auditor rotation the audit
firm retains the client, providing a different audit partner to the engagement. There is
then a “cooling-off” period (five years in the US, two years in South Africa) whereby the
rotated audit partner must wait until being allowed to be reappointed as engagement
partner on that client. However, audit firm rotation, as is now being adopted in 2016 by
the EU, is a step further than this. It requires a change of the audit firm, not simply the
audit partner. The audit firm effectively loses the business of the audit client, regardless
of the partners in the firm being capable of performing the audit. The EU has adopted
this in an attempt to further mitigate the threats (particularly familiarity) to
independence (KPMG, 2014). Other than the more significant recent examples of the
UK and the EU, other countries such as Brazil, India, Italy, Spain, Singapore and South
Korea have required, and some still do require, audit firm rotation (MAFR) after a
maximum specified period (Cameran, Vincenzo, Merlotti, and Cameran, 2005). As
mentioned, the US is a notable exception against this international trend and the
European Union therefore remains the largest economic jurisdiction to apply MAFR
rules. Other examples include the UK, Australia and New Zealand (SAICA, 2016).
The context in South Africa
Currently South Africa does not legislate the mandatory audit firm rotation laws as have
been implemented in the EU, but rather follows a system similar to the US, with auditor
rotation (i.e. individual audit partner) required every five years. This includes a cooling-
off period of two years, as prescribed by section 92 of the Companies Act, 2008 (Act
No. 71 of 2008). The profession in South Africa also places a large degree of reliance
on the ethical standards in order to internally assess (or self-assess) threats to its
independence as auditor. These standards are contained in the International
Standards on Auditing (ISAs), as well as the Code of Ethics for Professional
Accountants issued by the International Federation of Accountants (the IFAC Code).
These are internationally recognised auditing standards for which the auditor can use
as a guide to self-assess their independence from the audit client.
In South Africa there is also regulation and guidance provided to the audit committee
of public interest entities to assess the independence of the auditor. This is legislated
in the South African Companies Act, 2008 (Act No. 71 of 2008), as well as the King
Report on Governance (King III), which is the South African standard on issues of
corporate governance. As an example, the Companies Act requires the audit
committee to formally assess the independence of the auditor. However, legislation,
standards and regulations of the Johannesburg Stock Exchange (JSE) have all
stopped short of requiring mandatory audit firm tendering or audit firm rotation as is
now being implemented in the EU and the UK.
2016 SAAA National Teaching and Learning and Regional Conference Proceedings
ISBN 978-0-620-74761-5
13
According to Hay (2015) the research of the effects of rotation of audit firms, including
systems of joint audits, is very much in its infancy and requires significant attention,
especially considering the recent international focus.
The purpose of this study is to examine the perceptions of leading and senior audit
practitioners about the state of auditor independence in public interest entity audits in
South Africa. Is there a problem with auditor independence in reality and/or in
perception i.e. in the minds of the public? If so, how could this be best addressed so
as to promote high quality financial reporting and therefore the protection of the public
interest? These questions must first be addressed before considering whether
regulatory change is required in South Africa in order to strengthen auditor
independence.
Perception of auditor independence and audit quality is important, as described in the
International Federation of Accountants (IFAC) Code of Ethics for auditors (section
290:8), because of the need for the auditor to have independence in both mind and
appearance to a third party (International Federation of Accountants (IFAC), 2006).
The audit opinion provides assurance to the market and the public of the credibility of
the financial statements, as explained in the International Standards on Auditing (ISA
200, paragraph 3), and therefore this independence of the auditor in the eyes of the
market is necessary. According to ISA 200, the audit enhances “the degree of
confidence of intended users in the financial statements” (ISA 200, paragraph 3).
Mixed Results in the Literature
A study by Tepalagul and Lin (2015) consisted of a comprehensive review of academic
research pertaining to auditor independence and audit quality. Through a review of
published articles during the period 1976-2013 in nine leading journals related to
auditing, most studies concluded that long auditor tenure does not impair
independence (Tepalagul & Lin, 2015), although there are some mixed results.
According to Tepalagul & Lin (2015), some studies even find that long tenure actually
improves audit quality and that short tenure is associated with lower audit quality. In
addition, this study concluded that there is limited evidence that auditor independence
is compromised in the presence of a high degree of client importance and non-audit
services provided.
There is very extensive research on the effects of non-audit services by auditors, as
reviewed by Sharma (2014, p.85). Sharma (2014, p.85) analyses 45 research studies
on this topic and finds that there is a lack of evidence that auditors lose their
independence, but that policy makers often feel an urge to regulate anyway, despite
criticism from the accounting profession and corporate executives.
As an example of the mixed results around auditor independence, conflicting results
were identified by Johnson et al. (2002) who examined whether the length of the
relationship between a company and an audit firm (audit firm tenure) is associated with
financial reporting quality. Johnson et al. (2002) categorised auditor-client relationships
2016 SAAA National Teaching and Learning and Regional Conference Proceedings
ISBN 978-0-620-74761-5
14
into periods of short, medium and long tenures. Using two proxies for financial reporting
quality, based on accounting accruals, and a sample of large audit firm clients matched
on industry and size, Johnson et al. (2002) found that, relative to medium audit firm
tenures of four to eight years, short audit firm tenures of two to three years are
associated with lower-quality financial reporting. Again, in contrast to the shorter
periods, Johnson et al. (2002) found no evidence of reduced financial reporting quality
for longer audit firm tenures of nine or more years.
Bamber and Iyer (2007) used a theory-based measure for the extent to which auditors
identify with a client, which was then used to directly measure auditors' attachment to
the client and consequently the threat of this attachment to auditors' objectivity. The
responses of 252 practicing auditors were obtained, providing support for the
predictions of Bamber and Iyer (2007). Specifically, Bamber and Iyer (2007) found that
auditors do identify with their clients and that auditors who identify more with a client
are more likely to agree with the client preferred position on an audit and financial
reporting matter. However, more experienced auditors and auditors who exhibit higher
levels of professional identification are less likely to acquiesce to the client's position.
Differing incentives were identified for the partner in comparison to the firm. The
incentive of the individual audit partner may conflict with that of the audit firm so that
long partner tenure increases the likelihood of the auditor acquiescing to the client’s
preferences, whereas audit firm tenure is associated with the decreased likelihood of
auditor concessions (Bamber & Iyer, 2007). By looking at the differing incentives of the
firm as a whole, compared to that of the individual partner in the firm, the results imply
that, unlike an audit partner, an audit firm may have stronger reputational incentives to
remain independent. Therefore, rotating the firm, as opposed to the partner, may not
be the best means to achieve independence and audit quality.
The mixed results in the academic literature are clear and it cannot be concluded with
certainty that long audit tenures or non-assurance services measurably impair auditor
independence and audit quality.
Research Methodology This is a descriptive study that employs a qualitative research methodology. Qualitative
studies aim to explain the ways in which people come to understand and account for
issues, events and behaviours in their lives. Therefore the data gathered covers the
perceptions, opinions and reasoning of the participants based on their unique
experiences of areas related to the topic studied (DiCicco-Bloom & Crabtree, 2006).
The purpose of this study is to examine the perceptions of senior audit practitioners
about the state of auditor independence in public interest entity audits in South Africa.
To achieve this semi-structured interviews were performed with experienced partners,
ranging between seven and thirty-three years as a practicing registered auditor, across
a number of audit firms nationally. A semi-structured interview is a qualitative method
of inquiry that combines a pre-determined set of open-ended questions (questions that
2016 SAAA National Teaching and Learning and Regional Conference Proceedings
ISBN 978-0-620-74761-5
15
prompt discussion), with the opportunity for the researcher to explore particular themes
or responses further. This type of interview does not limit respondents to a set of pre-
determined answers, unlike a structured questionnaire for example (Dearnley, 2005).
Semi-structured in-depth interviews are the most widely used interviewing format for
qualitative research and can occur either with an individual or in groups (DiCicco-
Bloom and Crabtree, 2006). The open nature of the questions encourages depth and
vitality in the responses by the interviewees and allows new concepts to emerge over
the course of the interviews (Dearnley, 2005).
The population and the selection
This study employs a purposive sampling technique, also known as judgemental,
selective or subjective sampling. Purposive sampling is a type of non-probability
sampling which focuses on sampling techniques where the units that are investigated
are based on the judgement of the researcher, rather than on statistical techniques
(Lærd Dissertation, 2016). Purposive sampling technique is most effective when one
needs to study a certain domain which contains knowledgeable experts. In choosing a
sampling method for informant selection, the question the researcher is interested in
answering is of utmost importance and it is especially important to be clear on
informant qualifications when using purposive sampling (Tongco, 2007).
Fourteen practicing “registered auditors” (audit partners) were selected from nine
different audit firms in order to perform the interview (refer to table below). According
to the book entitled “The Long Interview” by McCracken (1988), as cited in DiCicco-
Bloom and Crabtree (2006), in-depth interviews are used to discover shared
understandings of a particular group and the sample of interviewees should be fairly
homogenous and share critical similarities related to the research question. This
selection of audit partners is therefore a homogenous group that share critical
experience related to the research question. The selection is also considered to be
fairly representative of the population of registered auditors in South Africa, especially
considering that the audit partners selected were involved in the senior leadership of
their respective audit practices and were considered sufficiently experienced as audit
practitioners, having worked for many years in the capacity of audit partner (ranging
between seven and thirty-three years as a practicing registered auditors).
The commonly agreed and recognised distinction between the audit firms (Marx, 2009;
Rapoport, 2016) has been used in this study and is as follows:
“Big four” audit firms refer to the largest four accounting and audit firms globally,
namely Deloitte, PricewaterhouseCoopers (PwC), Ernst & Young (EY) and
KPMG. These four firms are also referred to as “large-tier” firms (ICAEW,
2016a).
The non-big four firms are either mid-tier or small-tier firms depending on their
respective global size, global presence and capabilities as an audit firm in terms
of resources (ICAEW, 2016b; Rapoport, 2016).
2016 SAAA National Teaching and Learning and Regional Conference Proceedings
ISBN 978-0-620-74761-5
16
The researcher and the participants in this study will use these terms in the interview
discussions. The following is a description of the fourteen practitioners interviewed:
All the partners were considered senior and highly experienced, ranging
between seven years as a practicing audit partner and thirty-three years. The
average number of years as a practicing registered auditor of all interviewees is
22 years.
Seven of the partners were either regional or national managing partners in the
firms and therefore in key leadership and strategic roles. The remainder were
senior partners who also held significant leadership responsibilities and
portfolios within their respective firms or network of firms.
The audit firms were selected from Johannesburg and Cape Town offices of the
network firms.
Of the fourteen partners, two were women.
The two largest black audit firms in South Africa, namely SizweNtsalubaGobodo
Inc. and Nkonki Inc. were represented. These two firms are the largest “black-
owned” audit firms in South Africa and have grown to considerable size to rival
the traditional “mid-tier” firms.
Five partners were from the “big four” international audit firms.
The remaining partners were from the “mid-tier” audit firms (including the “black-
owned” medium size firms) who also perform audit services of public interest
entities.
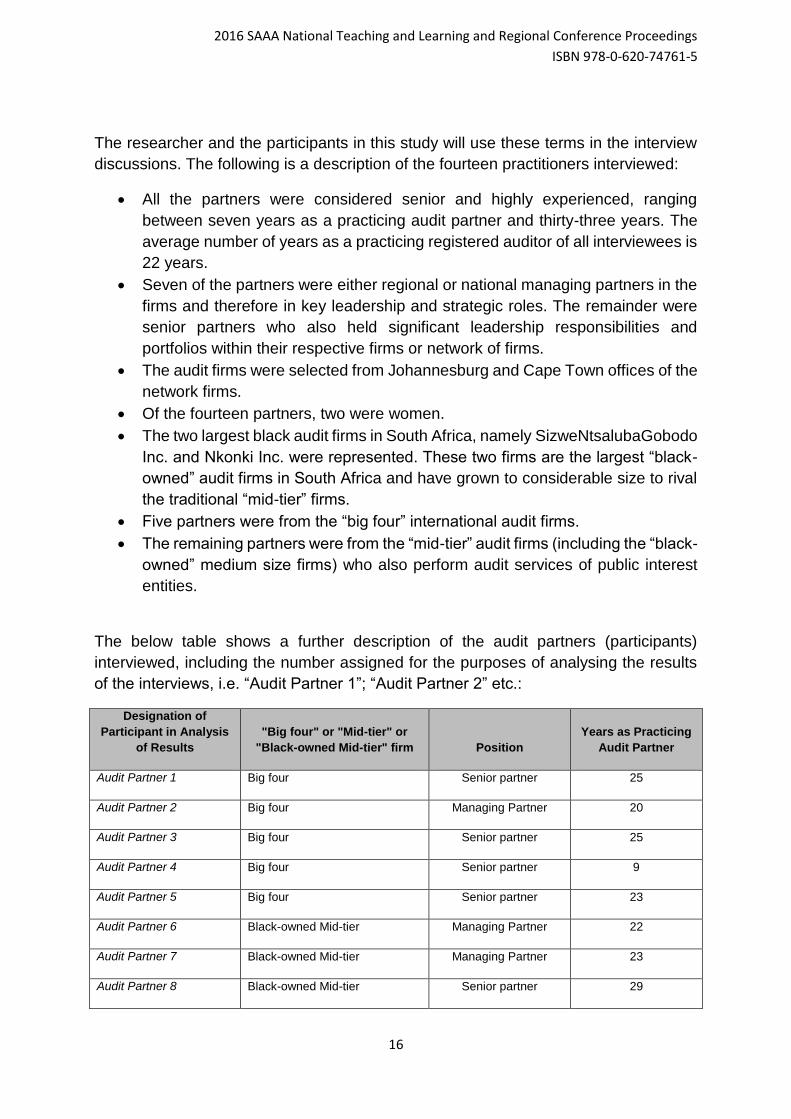
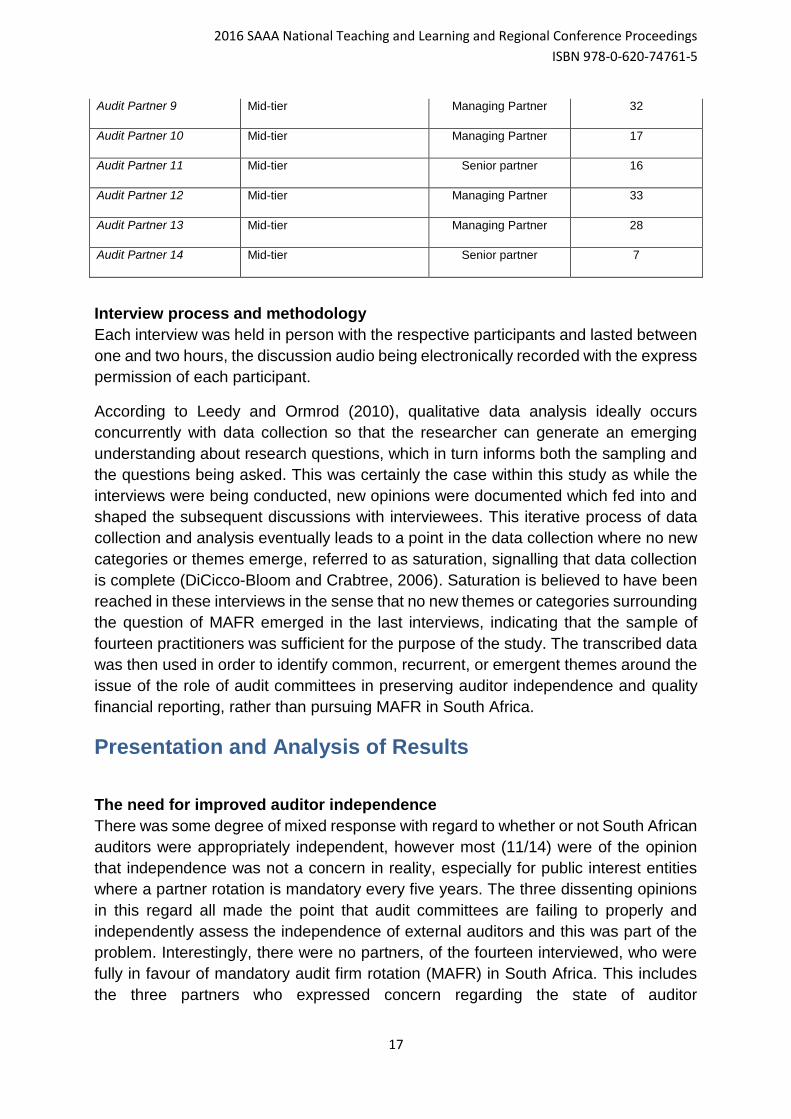
The below table shows a further description of the audit partners (participants)
interviewed, including the number assigned for the purposes of analysing the results
of the interviews, i.e. “Audit Partner 1”; “Audit Partner 2” etc.:
Designation of
Participant in Analysis
of Results
"Big four" or "Mid-tier" or
"Black-owned Mid-tier" firm Position
Years as Practicing
Audit Partner
Audit Partner 1 Big four Senior partner 25
Audit Partner 2 Big four Managing Partner 20
Audit Partner 3 Big four Senior partner 25
Audit Partner 4 Big four Senior partner 9
Audit Partner 5 Big four Senior partner 23
Audit Partner 6 Black-owned Mid-tier Managing Partner 22
Audit Partner 7 Black-owned Mid-tier Managing Partner 23
Audit Partner 8 Black-owned Mid-tier Senior partner 29
2016 SAAA National Teaching and Learning and Regional Conference Proceedings
ISBN 978-0-620-74761-5
17
Audit Partner 9 Mid-tier Managing Partner 32
Audit Partner 10 Mid-tier Managing Partner 17
Audit Partner 11 Mid-tier Senior partner 16
Audit Partner 12 Mid-tier Managing Partner 33
Audit Partner 13 Mid-tier Managing Partner 28
Audit Partner 14 Mid-tier Senior partner 7
Interview process and methodology
Each interview was held in person with the respective participants and lasted between
one and two hours, the discussion audio being electronically recorded with the express
permission of each participant.
According to Leedy and Ormrod (2010), qualitative data analysis ideally occurs
concurrently with data collection so that the researcher can generate an emerging
understanding about research questions, which in turn informs both the sampling and
the questions being asked. This was certainly the case within this study as while the
interviews were being conducted, new opinions were documented which fed into and
shaped the subsequent discussions with interviewees. This iterative process of data
collection and analysis eventually leads to a point in the data collection where no new
categories or themes emerge, referred to as saturation, signalling that data collection
is complete (DiCicco-Bloom and Crabtree, 2006). Saturation is believed to have been
reached in these interviews in the sense that no new themes or categories surrounding
the question of MAFR emerged in the last interviews, indicating that the sample of
fourteen practitioners was sufficient for the purpose of the study. The transcribed data
was then used in order to identify common, recurrent, or emergent themes around the
issue of the role of audit committees in preserving auditor independence and quality
financial reporting, rather than pursuing MAFR in South Africa.
Presentation and Analysis of Results
The need for improved auditor independence
There was some degree of mixed response with regard to whether or not South African
auditors were appropriately independent, however most (11/14) were of the opinion
that independence was not a concern in reality, especially for public interest entities
where a partner rotation is mandatory every five years. The three dissenting opinions
in this regard all made the point that audit committees are failing to properly and
independently assess the independence of external auditors and this was part of the
problem. Interestingly, there were no partners, of the fourteen interviewed, who were
fully in favour of mandatory audit firm rotation (MAFR) in South Africa. This includes
the three partners who expressed concern regarding the state of auditor
2016 SAAA National Teaching and Learning and Regional Conference Proceedings
ISBN 978-0-620-74761-5
18
independence. Most were against MAFR on the grounds that (1) it would not achieve
improved auditor independence and (2) that there were too many significant negative
consequences to changing legislation in favour of MAFR.
After expressing that independence in their experience was not a real concern, i.e. that
the degree of auditor independence in their audits was sufficient, one partner
expressed the following qualification:
“But then you say on the flipside, you know the counter argument against that, when
the client is such a dominant number in your world - you know, four or five percent of
your fees - you can never be independent. In reality with any client paying fees to the
practitioner you can never be independent, so you get to the heart of it because I’m
ultimately coming back to the client for my fee discussion and I can’t be independent.
And so whether you do that rotate [MAFR] it’s not going to make a difference.” (Audit
Partner 12)
The point being made here was that in a regime of partner rotation or MAFR, the
partner and the firm will always be dependent on the client for the audit fee and the
audit fees are often significant to the auditor. Therefore MAFR would not be solving
the problem entirely in any case. However, this partner agreed with most of the
interviewees that independence was not actually a significant problem in reality.
One partner (Audit Partner 10) felt that, as a mid-tier firm partner, there are many
medium size businesses that are considered public interest entities in South Africa but
are relatively small private companies. These businesses are often family owned and
management (who are the owners) will often rely on the professional advice of their
auditors and over time will develop a good relationship with the partners at the audit
firm. This good relationship with the client and the professional advice offered by audit
firm should not be automatically considered an independence problem as the firm
manages its conflicts of interests as guided by the Code of Professional Conduct and
the integrity that comes with being a professional. Too often, in their opinion, the public
assumes a lack of independence when in reality there is no such thing.
The partner who expressed this view also made the point that the public interest score,
as it is currently contained in the Regulations to the Companies Act 71 of 2008, results
in too many smaller businesses being labelled as public interest entities. However, this
partner’s point was that regulation like MAFR may force a greater degree of
independence but that would lead to other unintended consequences on the profession
and on audit quality. Nearly all partners interviewed expressed a strong concern that
the implementation of MAFR will not improve audit quality, even if it may improve
auditor independence. The concerns expressed were in regard to the unintended
consequences and effects of MAFR, which are not discussed for the purposes of this
paper.
2016 SAAA National Teaching and Learning and Regional Conference Proceedings
ISBN 978-0-620-74761-5
19
Public perception of independence
Most audit partners (11/14) agreed that there is a significant difference between the
public perception of independence and the reality of auditor independence, with the
public’s perception being significantly worse (i.e. perception of an independence or
audit quality problem) than what was in reality the case (in their opinion). These
partners are all in favour of pursuing means of addressing public misconceptions about
the audit function and about auditor independence before making a decision on MAFR.
In their opinion the regulator (IRBA) should look at means of addressing the perception
problem before looking to change legislation in the profession. A number of partners
illustrated this point with the example of how, in their experience of discussing their
work with company stakeholders and the general public, it is not uncommon for people
to express their understanding that it is the auditor’s role to guarantee the accuracy of
the financial statements and to detect all forms of fraud and mismanagement. These
experiences are evidence that the public does indeed misunderstand the role and
value added of the auditor. In the opinion of these partners, MAFR should not be
adopted in response to public perception per se, but rather other more effective and
perhaps less damaging methods (to audit quality and the profession) should be
pursued by both the IRBA and the profession to educate public understanding of the
limitations of the audit function.
“If there were let’s say, an error. We had, I’m thinking of last year, let’s say, we had an
error with a set of listed companies [a group of companies]. I think it’s an easy
scapegoat to say “ah, you guys have been for thirty years the auditors and that’s why
you missed it!” I think they [the public] missed completely the point. I think there’s no
correlation between an error and how long you’ve been their auditor. It’s mainly because
you just missed something the last year, you must understand, it’s not because you’ve
been here for thirty years because the partners are only there five years. That’s
definitely for me a perception - that is not a reality. If you want a fresh perspective, we
do see that where the partner rotates… The partner comes in with new ideas and so I
think that gets actually done.” (Audit Partner 2)
Expressing their concern around reacting to the public’s perception one partner stated:
“I’m just a bit concerned that there’s a degree of over-reaction around things and that
really worries me. I mean, we are professionals at the end of the day. Independence
ethics is the cornerstone of what we do… you know, the firms have their policies and
procedures in place around ethics and independence and it’s taken very seriously. So,
I mean we have, ours [referring to the firm] is even narrower than most and likewise
what IRBA and the codes have got in place, so it’s extremely rigid. I’m just a bit worried
that this heightened focus, too much focus on it...by all and sundry, various
stakeholders. I’m worried that the regulator’s jumping onto something because this is
what’s happened overseas. We’re number one in terms of World Bank Risk Report.”
(Audit Partner 5)
A number of partners raised the point that there is a high degree of ethical
standards – at a professional level and at a firm level – that the audit
2016 SAAA National Teaching and Learning and Regional Conference Proceedings
ISBN 978-0-620-74761-5
20
practitioners need to adhere to. And in their opinions they find that the partners
take this very seriously. In addition, the fact that South African audit partners
are required by local regulations to place their personal name on the audit report
and sign, together with the firm name, was raised as a further reason for the
partner to guard his or her independence. The international audit standards do
not require the name of the engagement partner on the signed audit report.
“You’re personally invested. It’s my name. I’ve signed. You’re out there in the public...
You’re holding yourself out there. It’s me, it’s not [firm name], I’m signing there as well.”
(Audit Partner 5)
The Public Inspections Report
All the partners interviewed expressed varying degrees of unhappiness and concern
regarding the IRBA public inspections process. The common feeling was that the
reviews are too harsh on the profession and do not allow for sufficient professional
judgment to be exercised by the auditor, as is the allowance and indeed the
requirement of the International Standards on Auditing (ISAs). Partners described the
IRBA inspections as too much of a tick-boxing exercise that does not properly account
for professional judgement exercised by the audit team.
All the audit partners interviewed expressed concern over the degree of regulation in
the profession. In fact, the issue of over-regulation resulted in the strongest opinions
and even frustration amongst the partners. Many were particularly concerned over the
nature of the public inspections process as performed by the IRBA and feared that
additional regulation was damaging the ability of the practitioners to make professional
judgement calls, something absolutely necessary in performing an audit, and which
the International Standards of Auditing (ISAs) strongly require of the auditor. The
concern was simply that MAFR would be another unnecessary regulation in an already
over-burdened profession.
“So I’m saying there’s a lot there that’s going to lighten or reduce the expectation gap
when it comes to stakeholders and users, because they’ll be able to read each audit
report [which] will be specific. It’s not going to be a template. They will be able to
understand... And independence and all of that, rather than just coming with a rule if it’s
mandatory. We are principles-based at the end of the day. And we’re relying on
judgement from the profession and from the Audit Committee. Both sides of the
engagement are applying their minds and their skills and they’re qualified to do so…
Doesn’t that make us a profession? That fact that we exercise professional judgement?
We don’t tick boxes. The more we tick boxes… that will directly affect the quality of what
we do. That’s where the regulator needs to get a balance... I hope common sense
prevails. I think we’ve got a lot of checks and balances in place. I mean enhancing
existing structures and I’m not one in favour of rules. We are principle-based, we must
deal with it and the King Codes have done tremendous work over the years with the
Institute of Directors.” (Audit Partner 5)
2016 SAAA National Teaching and Learning and Regional Conference Proceedings
ISBN 978-0-620-74761-5
21
The role of the audit committee
All the audit partners (14/14) agreed that the audit engagement and the choice of the
auditor, as well as any non-assurance services required, is a decision of both the audit
committee, being those charged with governance by the shareholders, as well as the
auditors themselves. The audit committee, whose existence is a legislative
requirement in South Africa for a public interest entity (refer to section 94 of the
Companies Act 71 of 2008), is ultimately responsible for the recommendation for the
nomination and the replacement of the auditor, subject to approval by the
shareholders. The decision of whether or not to ask the auditors for non-assurance
services and whether or not to put the audit out for tender, is ultimately in the hands of
the audit committee, being those charged with governance by the shareholders.
All the partners interviewed (14/14) agreed with the reasoning that the best means of
improving auditor independence is actually to improve the quality of corporate
governance in the audit clients, rather than through regulation. Improving the quality of
the non-executives on the audit committees, possibly through education and promotion
of King III Report principles of corporate governance (soon to be replaced by King IV),
was believed to be a means of having a greater impact on auditor independence and
audit quality.
In the opinion of one partner, “the Audit Committees that I have served on over the
years and continue to serve on now take auditor independence very seriously.
Our firm and my experience of the other big firms, I can’t talk for the smaller and
medium sized firms… the audit firms themselves take auditor independence
extremely seriously… If you just consider that South Africa is the pre-eminent
market as far as implementation of corporate governance King III etcetera is
concerned, it really is at the top of its game. And those Audit Committees are
very diligent and they take all of the issues - not just auditor independence, all
of their budgetary duties… very seriously.” (Audit Partner 1)
The pointing to instances of strong audit committees was this partner’s way of
explaining that when the opposite is the case, i.e. weak governance by the audit
committee, this is when there is the greatest potential for independence of the auditor
and audit quality to be compromised exists. Auditor independence is a function of both
parties and both sides to the engagement letter need to be independent and
professional. The audit committee must remain independent of management and
professional in their execution of their role. The auditor must remain independent of
the client and professional in their execution of their role.
Summary and Conclusion
Most audit partners do not believe that any changes to regulations are necessary to
address auditor independence and the policies and structures in place currently are
2016 SAAA National Teaching and Learning and Regional Conference Proceedings
ISBN 978-0-620-74761-5
22
sufficient. The profession must be allowed the freedom to exercise its professional
judgement and adherence to the ethical codes of conduct. Regulation restricts their
ability to do that.
The partners expressed a strong belief that the public inspections process itself needs
to be re-looked at by the regulator and moved in a direction that allows professional
judgement and less compliance focus.
The audit committee’s role in appointing suitably independent auditors and continually
assessing any factors such as tenure and non-assurance fees, that may compromise
that independence, is crucial.
Most audit partners (11/14) expressed the view that there is no problem with auditor
independence in reality, but rather that public perception and public misunderstanding
of the audit function, was the issue. Rather than respond with more regulation (such a
MAFR), they would have the regulator address public understanding of the role (and
the limitations) of the audit function.
Areas for further research
Auditor independence, including public perception thereof, as well as regulatory
responses, requires more attention by South African auditing academics. This
research will be followed by a national survey of the South African audit profession in
order to provide a representative view from the profession on auditor independence,
and particularly the IRBA’s intention to address it with regulation. The IRBA is currently
considering mandatory audit firm rotation legislation (MAFR) as a possible response,
similar to that enacted in the European Union. The impact on, and the opinions of,
other stakeholders such as audit committee members, management and investment
professionals in these matters need to be understood as well. Research also needs to
be performed around the effectiveness of the regulator’s public inspections. A direct
response to the 2014/2015 Public Inspections Report from the profession in this
respect is also recommended.
Bibliography
Bamber, E. M., & Iyer, V. M. (2007). Auditors’ identification with their clients and its effect on auditors’
objectivity. Auditing: A Journal of Practice & Theory, 26(2), 1–24.
Buffet, M., & Clark, D. (2006). The Tao of Warren Buffett. New Yory, NY: Scribner.
Cameran, M., Vincenzo, D. Di, & Merlotti, E. (2005). The Audit Firm Rotation Rule : A Review of the
Literature. SDA Bocconi Research Paper, (September).
Carey, P., & Simnett, R. (2006). Audit Partner Tenure and Audit Quality. The Accounting Review,
81(4), 653–676.
Daniels, B. W., & Booker, Q. (2011). The effects of audit firm rotation on perceived auditor
2016 SAAA National Teaching and Learning and Regional Conference Proceedings
ISBN 978-0-620-74761-5
23
independence and audit quality. Research in Accounting Regulation, 23, 78–82.
DeAngelo, L. E. (1981). Auditor size and audit quality. Journal of Accounting and Economics, 3, 183–
199.
Dearnley, C. (2005). A reflection on the use of semi-structured interviews. Nurse Researcher, 13.1.
DiCicco-Bloom, B., & Crabtree, B. F. (2006). The qualitative research interview. Medical Education,
40(4), 314–321.
European Commission. (2015). Directorate-General for Financial Stability. Retrieved May 2, 2016,
from https://www.unodc.org/unodc/en/drug-trafficking/legal-framework.html
Hay, D. (2015). The frontiers of auditing research. Meditari Accountancy Research, 23(2), 158–174.
ICAEW. (2016a). Accountancy firms. Retrieved May 24, 2016, from http://www.icaew.com/en/about-
icaew/what-is-chartered-accountancy/accountancy-firms
ICAEW. (2016b). Accountancy firms (ICAEW). Retrieved from
http://www.icaew.com/en/membership/regulations-standards-and-guidance/practice-
management/use-of-chartered-accountants-regulations
International Federation of Accountants (IFAC). (2006). Code of Ethics for Professional Accountants.
IFAC (2006 revised). Retrieved from
http://scholar.google.com/scholar?hl=en&btnG=Search&q=intitle:Code+of+Ethics+for+Profession
al+Accountants#4
International Federation of Accountants (IFAC). (2009). International Standard on Auditing 200. ISA
200. Retrieved from http://www.ifac.org/sites/default/files/publications/files/2012 IAASB
Handbook Part I_Web.pdf
IRBA. (2015a). Consultation Paper: Measures to Strengthen Auditor Independence.
IRBA. (2015b). Consultation paper: Measures to Strengthen Auditor Independence. Retrieved from
http://www.irba.co.za/news-headlines/press-releases
IRBA. (2015c). IRBA 2014/2015 Public Inspections Report. Retrieved from
http://www.paab.co.za/dmdocuments/Public Inspections Report 2015.pdf
IRBA. (2015d). IRBA Newsletter 32. Retrieved from http://www.irba.co.za/index.php/publications-
mainmenu-121/newsletters-mainmenu-123?task=section
IRBA. (2015e). IRBA Strengthens Auditor Independence by Mandating Disclosure of Audit Tenure.
Retrieved from http://www.irba.co.za/guidance-for-ras/general-guidance/audit-tenure
IRBA. (2016). Frequently Asked Questions on Disclosure of Audit Tenure. Retrieved from
http://www.irba.co.za/guidance-for-ras/general-guidance/audit-tenure
ISA 200. (n.d.). IFAC: International Standard on Auditing 200. ISA 200.
Johnson, V. E., Khurana, I. K., & Kenneth Reynolds, J. (2002). Audit- firm tenure and the quality of
financial reports. Contemporary Accounting Research, 19(4), 637–660.
KPMG. (2014). EU Audit Reform. Retrieved from
https://www.kpmg.com/BE/en/IssuesAndInsights/ArticlesPublications/Documents/EU-Audit-
Reform-Fact-Sheet-MFR.pdf
2016 SAAA National Teaching and Learning and Regional Conference Proceedings
ISBN 978-0-620-74761-5
24
Lærd Dissertation. (2016). Purposive Sampling. http://doi.org/10.4135/9781412950589.n774
Laurion, H., Lawrence, A., & Ryans, J. (2015). U . S . Audit Partner Rotations. Haas School of
Business.
Leedy, Paul D; Ormrod, J. E. (2010). Practical Research: Planning and Design. Practical Research -
Planning & Design.
Marx, B. (2009). Challenges Facing the Modern Day Auditing Profession. Accountancy SA, 16–19.
Retrieved from
http://search.proquest.com.ezproxy.canterbury.ac.nz/docview/215224897?accountid=14499
PWC. (2014). Audit firm rotation and tendering in the UK: Piecing together the jigsaw puzzle.
Retrieved from http://hb.betterregulation.com/external/Audit firm rotation and tendering in the
UK.pdf
Rapoport, M. (2016). Auditing the Auditors : U.S. Rethinks Approach. Wall Street Journal, (May).
Retrieved from http://www.wsj.com/articles/u-s-government-rethinks-how-it-audits-auditors-
1462440600
SAICA. (2016). Discussion Paper: Considering Mandatory Audit Firm Rotation (MAFR). Retrieved
from
http://www.saica.co.za/Portals/0/documents/MAFRDiscussionPaper.pdf?Reference_ID=4501838
4
Sharma, D. S. (2014). The Routledge Companion to Auditing. (K. Hay & J. Willekens, Eds.).
Routledge, Abingdon.
Tepalagul, N., & Lin, L. (2015). Auditor Independence and Audit Quality: A Literature Review. Journal
of Accounting, Auditing & Finance, 30(1), 101–121.
Tongco, M. D. C. (2007). Purposive sampling as a tool for informant selection. Ethnobotany Research
and Applications, 5, 147–158.
2016 SAAA National Teaching and Learning and Regional Conference Proceedings
ISBN 978-0-620-74761-5
25
2016 Southern African Accounting
Association (SAAA)
National Teaching and Learning and
Regional Conference Proceedings
ISBN number: 978-0-620-74761-5
AUD 03: An exploration of audit practitioner opinions on
mandatory audit firm rotation in South Africa: a specific focus on
market concentration and transformation issues
Authors: Michael Harber and Gizelle Willows, University of Cape Town
Email: [email protected]
Abstract The provision of assurance services, most notably the audit function, is an activity of public protection
that requires a high degree of independence between the auditor and the audit client to ensure audit
quality is achieved. Internationally, especially in the European Union, there is a legislated move
towards mandatory audit firm rotation (MAFR) to ensure auditor independence. South Africa is
currently faced with the decision of whether to change legislation and follow suit.
The three main reasons why the IRBA are considering further measures, such as MAFR, to strengthen
auditor independence are (1) to strengthen auditor independence and so protect the public and
investors, (2) address market concentration of audit services and create a more competitive
environment; and (3) promote transformation by creating more opportunities for small and mid-tier audit
firms to enter certain markets. Internationally, the primary reason that MAFR is considered is to achieve
auditor independence and therefore ensure audit quality.
Therefore research is needed to assess the credibility of the IRBA’s additional reasons, as well as the
impact of MAFR on these factors, namely market competition and transformation in the audit
profession. Using a qualitative and descriptive methodology, through the use of semi-structured and
open interviews with experienced South African audit partners, two of the three key reasons in favour
of MAFR, as provided by the IRBA, were explored.
The research objective is to document the opinions of a select group of experienced audit practitioners
regarding the credibility of the IRBA’s additional reasons, as well as the impact of MAFR on these
factors, namely market competition and transformation in the audit profession.
The results show that the partners interviewed have mixed opinion regarding the ability of MAFR
legislation to achieve these two goals appropriately. There is significant concern as to whether MAFR
will not actually reduce market concentration amongst the large company audits. MAFR was generally
not regarded as South Africa’s best option to achieve IRBA’s stated goals of increased competition
and transformation in the audit profession. There is some difference of opinion between those partners
from big four firms compared to those in mid-tier firms.
2016 SAAA National Teaching and Learning and Regional Conference Proceedings
ISBN 978-0-620-74761-5
26
Introduction and Literature Review
Introduction
The provision of assurance services, most notably the audit function, is an activity of public
protection. In the eyes of the public, especially the investing public and all stakeholders of the
company, the audit function provides the much needed stamp of credibility and assurance as
to the fair presentation of the company’s financial reporting. Auditor independence is important
because it has an impact on audit quality. DeAngelo (1981) suggests that audit quality is
defined as the probability that:
(a) The auditor will uncover a breach of statutory or regulatory requirement and
(b) Report the breach to the appropriate parties.
If auditors do not remain independent, they might be less likely to report irregularities or insist
that financial statements be prepared to their satisfaction, thus, impairing audit quality (Carey
and Simnett, 2006). This potentially lessens the credibility of the financial reporting process
and hence why regulations are imposed to ensure the professional standards and the
independence of the external audit function. Most countries, including South Africa, have
moved away from self-regulation the audit profession, to a system of using an independent
regulatory body. In South Africa this regulatory authority is the Independent Regulatory Board
for Auditors (IRBA).
Per discussion with the CEO of the IRBA in December 2015, the transcript of which is available
upon request, the national regulator is considering advocating a change in South African
legislation in order to follow the direction of the European Union in requiring rotation of the
audit firm periodically. This system is called mandatory audit firm rotation (MAFR) and its
primary purpose is to protect audit quality through promoting the independence of the auditor
from the audit client by way of full audit firm rotations every few years. According to the IRBA
CEO and consultation paper issued by the IRBA, the main reasons why the IRBA Board must
consider further measures to strengthen auditor independence are (1) to strengthen auditor
independence and so protect the public and investors, (2) address market concentration of
audit services and create a more competitive environment; and (3) promote transformation by
creating more opportunities for small and mid-tier audit firms to enter certain markets.
(IRBA, 2015)
International developments
In recent years, most notably since the collapse of Enron in 2001, regulators have expressed
concerns about auditor independence and taken actions to mitigate those concerns (Laurion,
Lawrence, & Ryans, 2015). These include the passage of the 2002 Sarbanes–Oxley (SOX)
Act, also known as the "Public Company Accounting Reform and Investor Protection
Act", which is United States (US) legislation that, among many other requirements, prohibits
the auditor (in a US context) from providing most non-audit services to its clients.
In the European Union (EU), regulations have also recently changed. The European
Parliament in 2014 voted in favour of Directive 2014/56/EU, amending Directive 2006/43/EC
on statutory audits of annual accounts and consolidated accounts (European Commission,
2016 SAAA National Teaching and Learning and Regional Conference Proceedings
ISBN 978-0-620-74761-5
27
2015). These new rules force European companies to hire new audit firms at 10- to 24-year
intervals, depending on certain criteria, bringing mandatory audit firm rotation into one of the
world’s most significant economic regions (KPMG, 2014).
Other than the more significant recent examples of the UK and the EU, other countries such
as Brazil, India, Italy, Spain, Singapore and South Korea have required, and some still do
require, audit firm rotation (MAFR) after a maximum specified period (Cameran, Vincenzo,
Merlotti, and Cameran, 2005). The US is a notable exception against this international trend
and the European Union therefore remains the largest economic jurisdiction to apply MAFR
rules.
The context in South Africa
Currently South Africa does not legislate the mandatory audit firm rotation laws as have been
implemented in the EU, but rather follows a system similar to the US, with auditor rotation (i.e.
individual audit partner) required every five years. This includes a cooling-off period of two
years, as prescribed by section 92 of the Companies Act, 2008 (Act No. 71 of 2008). The
profession in South Africa also places a large degree of reliance on the ethical standards in
order to internally assess (or self-assess) threats to its independence as auditor. These
standards are contained in the International Standards on Auditing (ISAs), as well as the Code
of Ethics for Professional Accountants issued by the International Federation of Accountants
(the IFAC Code). These are internationally recognised standards for which the auditor can
assess their independence from the audit client.
In South Africa there is also regulation and guidance provided to the audit committee of public
interest entities to assess the independence of the auditor. This is legislated in the South
African Companies Act, 2008 (Act No. 71 of 2008), as well as the King Report on Governance
(King III), which is the South African standard on issues of corporate governance. As an
example, the Companies Act requires the audit committee to formally assess the
independence of the auditor. However, legislation, standards and regulations of the
Johannesburg Stock Exchange (JSE) have all stopped short of requiring mandatory audit firm
tendering or audit firm rotation as is now being implemented in the EU and the UK.
According to Hay (2015) the research of the effects of rotation of audit firms, including systems
of joint audits, is very much in its infancy and requires significant attention, especially
considering the recent international focus.
The position of the Independent Regulatory Board for Auditors (IRBA)
At the forefront of IRBA’s mind in the MAFR debate, is the need to pursue a solution that (1)
meets the objective of IRBA, but also (2) to be consistent with the priorities set out in the “four
key pillars”.
IRBA’s objective is to endeavour to protect the financial interests of the South African public
and international investors in South Africa through the effective and appropriate regulation of
audits conducted by registered auditors, in accordance with internationally recognised
standards and processes. Therefore the financial interest of the public is utmost priority in the
MAFR decision.
However the four key pillars are also important, namely:
1. Comprehensive regulator
2016 SAAA National Teaching and Learning and Regional Conference Proceedings
ISBN 978-0-620-74761-5
28
2. Independence. Strengthening both the independence of the IRBA and the
independence of registered auditors.
3. Leadership in Africa.
4. Transformed profession. Influencing the advancement of transformation in the
profession.
(IRBA, 2015)
As part of IRBA’s initiative to strengthen auditor independence in South Africa, the regulator
has embarked on a series of national workshops and has issued a consultation paper to
specifically consider MAFR. Given the importance of responding to the need to strengthen
auditor independence, the IRBA Board had a workshop in July 2015 and received comment
from audit firms. IRBA also issued a consultation paper in October 2015, requesting
comment from executive and non-executive directors. (IRBA, 2015)
According to the consultation paper, the main reasons why the Board must consider further
measures to strengthen auditor independence are the following:
It will strengthen auditor independence and so protect the public and investors, which
is part of the IRBA’s strategy;
It will address market concentration of audit services and create a more competitive
environment, which will positively influence audit quality; and
It will promote transformation by creating more opportunities for small and mid-tier audit
firms to enter certain markets, provided they are competent to audit in those markets.
(IRBA, 2015)
Black economic empowerment (transformation / affirmative action initiatives) is a specific
priority in the economy, acknowledged by both business and government as an ethical and
urgent national priority. South Africa’s history of Apartheid and its impact on the economy and
society today has resulted in a widespread desire to “level the playing field” and redress the
inequalities of Apartheid by giving previously disadvantaged groups of South African citizens’
economic privileges previously not available to them. This has significant impact on the MAFR
debate in South Africa.
The purpose of this study is to examine the effects that a system of mandatory audit firm
rotation (MAFR), if imposed in South Africa, would have on the South African national priority
of transformation as it applies to the audit profession, as well as competition in the audit
industry.
Literature Review
The following literature review will examine the impact of audit firm rotation (MAFR) in the few
countries that have implemented it through legislation. More studies have been performed on
audit tenure in comparison to full audit firm rotation (MAFR), owing to the relatively recent
move of jurisdictions such as the European Union and the UK towards MAFR. This review will
only focus on mandatory audit firm rotation.
The effect of audit firm rotation on audit quality
A study by Tepalagul and Lin (2015) consisted of a comprehensive review of academic
research pertaining to auditor independence and audit quality. Through a review of published
articles during the period 1976-2013 in nine leading journals related to auditing, most studies
2016 SAAA National Teaching and Learning and Regional Conference Proceedings
ISBN 978-0-620-74761-5
29
concluded that long auditor tenure does not impair independence (Tepalagul & Lin, 2015),
although there are some mixed results.
As mentioned above, recent studies have mostly concerned themselves with audit partner
(auditor) rotation (Bowlin et al., 2014; Daugherty et al., 2012; Laurion et al., 2015; Tepalagul &
Lin, 2015), rather than audit firm rotation. According to the South African Independent
Regulatory Board for Auditors (IRBA), since the audit failures associated with Enron, larger
corporates in South Africa and major financial institutions across the globe, the independence
of auditors and regulators have become a focal point for governments and oversight structures
(IRBA, 2015). It is for this reason that the recent European Union legislation concentrates on
improving independence rotation of audit firms after a fixed period of 20 years; a cap on the
amount of fees for non-audit services at 70 per cent of the audit fee; and encouragement for
companies to adopt joint audits (Hay, 2015). Investors and the public are also demanding more
information and transparency and have become more aware of their rights to be protected
(IRBA, 2015). However, there is very little research on the effectiveness and consequences of
audit firm rotation specifically. According to Hay (2015) the rotation of audit firms is a difficult
area to research because there are so few practical situations where it has been enforced. As
a result, “there is no clear evidence about whether it is effective” (Hay, 2015). According to the
“The Routledge Companion to Auditing” (2014), as quoted by Hay (2015), “academic research
has been unable to provide clear answers about the consequences of mandatory audit firm
rotation”.
Two leading studies that have been performed in this area of mandatory audit firm rotation
(MAFR), namely 1) Jackson, Moldrich, and Roebuck (2008) and 2) Ruiz-Barbadillo, Gómez-
Aguilar, and Carrera (2009) are not in favour of pursuing mandatory audit firm rotation. Jackson
et al. (2008) investigated the effect of mandatory audit firm rotation in Australia on audit quality.
However, only actual audit quality was examined and while the results suggest that actual audit
quality is associated with the length of audit firm tenure, the perception of audit quality by
market participants was not addressed. Perception of audit quality is important, as described
in the International Federation of Accountants (IFAC) Code of Ethics for auditors (section
290:8), as the need for the auditor to have independence in both mind and in appearance to a
third party (International Federation of Accountants (IFAC), 2006). The audit opinion provides
assurance to the market and the public of the credibility of the financial statements, as
explained in the International Standards on Auditing, ISA 200 (International Federation of
Accountants (IFAC), 2009), and therefore this independence of the auditor in the eyes of the
market is necessary. According to ISA 200, the audit enhances “the degree of confidence of
intended users in the financial statements” (International Federation of Accountants (IFAC),
paragraph 3, 2009). Ruiz-Barbadillo et al. (2009) suggested that auditors’ incentives to protect
their reputation has a positive impact on the likelihood of them reporting going concern
uncertainties. In addition, auditors’ incentives to retain existing clients did not impact on their
decisions in both the mandatory rotation (1991-1994) and post-mandatory rotation (1995-
2000) periods in Spain.
Therefore the research of Jackson et al. (2008) and Ruiz-Barbadillo et al. (2009), both provide
evidence against pursuing mandatory firm rotation. However, no studies have been found that
explore the impact mandatory firm rotation on audit market competition nor demographic or
employee transformation.
2016 SAAA National Teaching and Learning and Regional Conference Proceedings
ISBN 978-0-620-74761-5
30
Competition in the audit industry
Internationally, professional and academic circles acknowledge the fact that there are a
dominant set of audit firms, commonly called “the big four”. A large body of academic literature
interprets the dominant audit firms in audit markets to be high quality, differentiated suppliers
who command higher audit fees (Chu, Simunic, Ye, & Zhang, 2015). According to Gerokos
and Syverson (2015), the market’s supply side in the audit industry is highly concentrated.
Among publicly traded companies in the United States, for example, the majority of audit
engagements and almost all audit fees involve just four audit firms (the “Big four”: Ernst &
Young, Deloitte, KPMG, and PricewaterhouseCoopers). In 2010, the Big 4 handled 67% of
audit engagements and collected over 94% of audit fees in the US (Gerokos & Syverson,
2015). As discussed by Velte and Stiglbauer (2012), audit markets in many other developed
economies exhibit similar concentration, namely an audit market concentration of listed firms
which is characterized by an oligopoly of “Big Four” audit firms.
According to Velte and Stiglbauer (2012) this concentration of suppliers on the audit market,
is often assessed negatively from the point of view of competition policy, since
The incentives to ensure cost efficiency and appropriate audit quality are decreasing,
Higher barriers of entry for small and medium-sized audit firms exist and
A strong influence from the Big Four on the development of international accounting-
and audit standards (IFRS and ISA) must be assumed.
This lack of competition may result in monopolistic pricing, a decline in the quality of audits
and of the services provided by audit firms, a decrease in the stability of capital markets and
in investor confidence, and the impact on economies of corporate failures.
Literature review conclusion
There is a move towards mandatory audit firm rotation in many developed economies, with the
most significant and recent change in that direction being the European Union in 2014, with
the United Kingdom likely to follow suit. The literature reviewed presents mixed results
regarding the impact of audit tenure on audit quality and auditor independence, with most
studies indicating that independence is not impaired as auditor tenure increases.
Little research has been performed specifically on the link between firm rotation and audit
quality, mostly because the move towards firm rotation regulations is very recent and therefore
the impact of such regulations is yet to be seen. The studies that have analysed audit firm
rotation in countries that have adopted it, such as Australia and Spain, are not in favour of
audit firm rotation and do not show clear links to the improvement of auditor independence or
audit quality.
The indirect and unintended consequences of a move to mandatory firm rotation has not been
studied, nor the perceptions of the various stakeholders involved in the audit process. In
addition, no studies appear to have been published in a South African context around
mandatory firm rotation. The impact of any proposed system of firm rotation (MAFR) on
employment transformation in the audit industry and on competition in the industry, which
represent two of IRBA’s three key reasons for pursuing MAFR, must also be researched.
It is generally acknowledged that a lack of market competition is not desirable in any market.
However, will MAFR help to decrease this state of dominance by the “big four” audit firms? Will
MAFR lower market concentration in the audit industry?
2016 SAAA National Teaching and Learning and Regional Conference Proceedings
ISBN 978-0-620-74761-5
31
It is generally acknowledged that racial transformation is a specific and urgent ethical and
national priority in the South African economy, and therefore the audit industry, like other
industries must seek to become more representative of the South African demographic.
However, will MAFR help to achieve this goal?
Problem Statement and Research Objective
The three main reasons why the IRBA are considering further measures, such as MAFR, to
strengthen auditor independence are (1) to strengthen auditor independence and so protect
the public and investors, (2) address market concentration of audit services and create a more
competitive environment; and (3) promote transformation by creating more opportunities for
small and mid-tier audit firms to enter certain markets. Internationally, the primary reason, if
not the only reason, that MAFR is considered is to achieve auditor independence and therefore
ensure audit quality. Therefore there is a degree of scepticism in reaction to IRBA’s
announcement to pursue MAFR as a means to also transform the audit industry and increase
competition.
Therefore the research objective is to document the opinions of a select group of experienced
audit practitioners regarding the credibility of these additional objectives, as well as the impact
MAFR will have on these objectives, namely market competition and transformation in the audit
profession.
Research Methodology This is a descriptive study that employs a qualitative research methodology. Qualitative studies
aim to explain the ways in which people come to understand and account for issues, event
and behaviours in their lives. Therefore the data gathered covers the perceptions, opinions
and reasoning of the participants based on their unique experiences of areas related to the
topic studied.
The purpose of this study is to explore the perceptions and opinions of the South African audit
practitioners regarding the proposed move towards mandatory audit firm rotation (MAFR), and
whether it will achieve the goals intended by the IRBA. To achieve this semi-structured
interviews were performed with experienced partners across a number of audit firms nationally.
A semi-structured interview is a qualitative method of inquiry that combines a pre-determined
set of open-ended questions (questions that prompt discussion), with the opportunity for the
researcher to explore particular themes or responses further. This type of interview does not
limit respondents to a set of pre-determined answers, unlike a structured questionnaire for
example (Dearnley, 2005).
The purpose of the semi-structured interviews is to understand the breadth of issues and
opinions around adopting MAFR in South Africa, as well as opinions regarding possible
alternatives to, and unintended consequences of, MAFR. Therefore this study aims to
document the breadth of the issues and opinions using a small sample of audit partners so as
to allow the second natural step in the research, which is produce and implement a
comprehensive and appropriate field survey of the audit profession. This survey is to be sent
more broadly to the profession where the intention will be to receive responses from a much
larger sample of audit practitioners, i.e. audit partners around the country. Note that the second
step is not the purpose of this paper, but rather an important area for further research based
on this study.
2016 SAAA National Teaching and Learning and Regional Conference Proceedings
ISBN 978-0-620-74761-5
32
Semi-structured in-depth interviews are the most widely used interviewing format for qualitative
research and can occur either with an individual or in groups (DiCicco-Bloom and Crabtree,
2006). The open nature of the questions encourages depth and vitality in the responses by the
interviewees and allows new concepts to emerge over the course of the interviews (Dearnley,
2005).
The population and the selection
This study employs a purposive sampling technique, also known as judgemental, selective or
subjective sampling. Purposive sampling is a type of non-probability sampling which focuses
on sampling techniques where the units that are investigated are based on the judgement of
the researcher, rather than on statistical techniques (Lærd Dissertation, 2016). Purposive
sampling technique is most effective when one needs to study a certain domain which contains
knowledgeable experts. In choosing a sampling method for informant selection, the question
the researcher is interested in answering is of utmost importance and it is especially important
to be clear on informant qualifications when using purposive sampling (Tongco, 2007).
Fourteen experienced practicing “registered auditors” (audit partners) were selected from nine
different audit firms in order to perform the interview (refer to table below). According to the
book entitled “The Long Interview” by McCracken (1988), as cited in DiCicco-Bloom and
Crabtree (2006), in-depth interviews are used to discover shared understandings of a particular
group and the sample of interviewees should be fairly homogenous and share critical
similarities related to the research question. This selection of audit partners is therefore the
homogenous group that share critical experience related to the research question. The
selection is also considered to be fairly representative of the population of registered auditors
in South Africa, especially considering that the audit partners selected were involved in the
senior leadership of their respective audit practices and were considered sufficiently
experienced as audit practitioners, having worked for many years in the capacity of audit
partner.
The commonly agreed and recognised distinction between the audit firms (Marx, 2009;
Rapoport, 2016) has been used in this study and is as follows:
“Big four” audit firms refer to the largest four accounting and audit firms globally, namely
Deloitte, PricewaterhouseCoopers (PwC), Ernst & Young (EY) and KPMG. These four
firms are also referred to as “large-tier” firms (ICAEW, 2016).
The non-big four firms are either mid-tier or small-tier firms depending on their
respective global size, global presence and capabilities as an audit firm in terms of
resources (ICAEW, 2016; Rapoport, 2016).
The researcher and the participants in this study will use these terms in the interview
discussions. The following is a description of the fourteen practitioners interviewed:
All the partners were considered senior and highly experienced, ranging between
seven years as a practicing audit partner and thirty-three years. The average number
of years as a practicing registered auditor of all interviewees is 22 years.
Seven of the partners were either a regional or a national managing partner in the firm
and therefore in key leadership and strategic roles within their respective firms. The
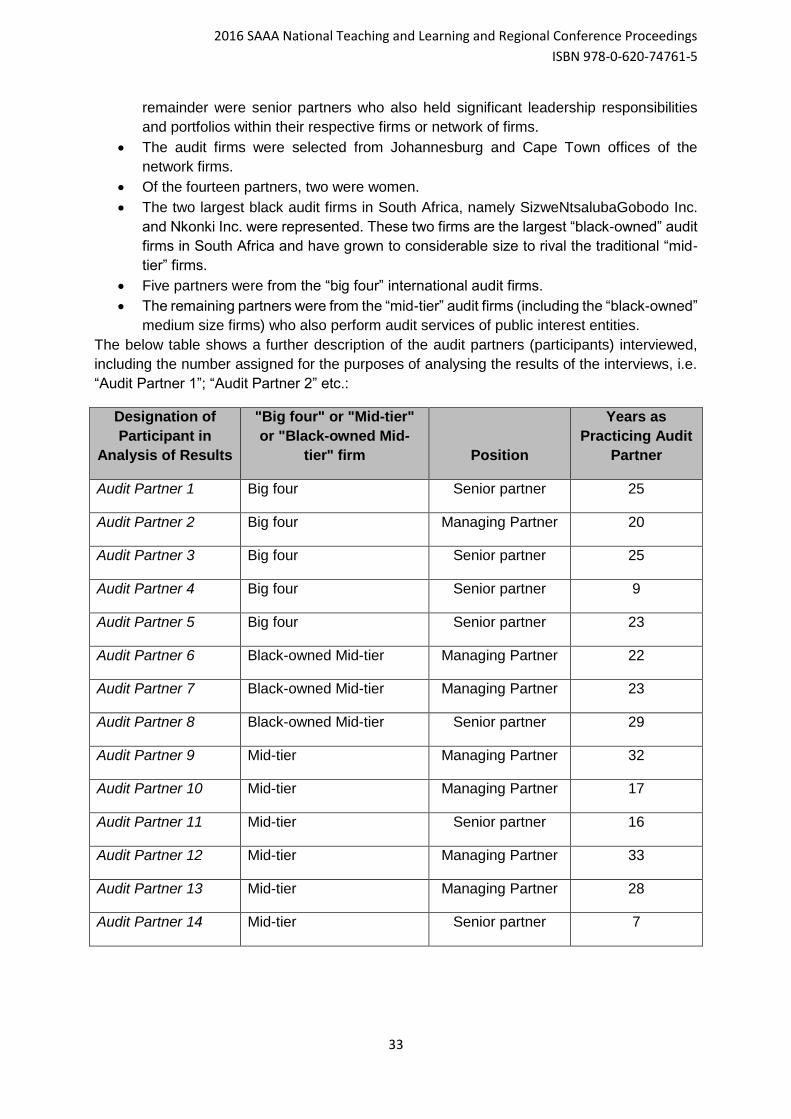
2016 SAAA National Teaching and Learning and Regional Conference Proceedings
ISBN 978-0-620-74761-5
33
remainder were senior partners who also held significant leadership responsibilities
and portfolios within their respective firms or network of firms.
The audit firms were selected from Johannesburg and Cape Town offices of the
network firms.
Of the fourteen partners, two were women.
The two largest black audit firms in South Africa, namely SizweNtsalubaGobodo Inc.
and Nkonki Inc. were represented. These two firms are the largest “black-owned” audit
firms in South Africa and have grown to considerable size to rival the traditional “mid-
tier” firms.
Five partners were from the “big four” international audit firms.
The remaining partners were from the “mid-tier” audit firms (including the “black-owned”
medium size firms) who also perform audit services of public interest entities.
The below table shows a further description of the audit partners (participants) interviewed,
including the number assigned for the purposes of analysing the results of the interviews, i.e.
“Audit Partner 1”; “Audit Partner 2” etc.:
Designation of
Participant in
Analysis of Results
"Big four" or "Mid-tier"
or "Black-owned Mid-
tier" firm Position
Years as
Practicing Audit
Partner
Audit Partner 1 Big four Senior partner 25
Audit Partner 2 Big four Managing Partner 20
Audit Partner 3 Big four Senior partner 25
Audit Partner 4 Big four Senior partner 9
Audit Partner 5 Big four Senior partner 23
Audit Partner 6 Black-owned Mid-tier Managing Partner 22
Audit Partner 7 Black-owned Mid-tier Managing Partner 23
Audit Partner 8 Black-owned Mid-tier Senior partner 29
Audit Partner 9 Mid-tier Managing Partner 32
Audit Partner 10 Mid-tier Managing Partner 17
Audit Partner 11 Mid-tier Senior partner 16
Audit Partner 12 Mid-tier Managing Partner 33
Audit Partner 13 Mid-tier Managing Partner 28
Audit Partner 14 Mid-tier Senior partner 7
2016 SAAA National Teaching and Learning and Regional Conference Proceedings
ISBN 978-0-620-74761-5
34
Interview process and methodology
Each interview was held in person with the respective participants and lasted between one
and two hours, the discussion audio being electronically recorded with the express permission
of each participant.
According to Leedy and Ormrod (2010), qualitative data analysis ideally occurs concurrently
with data collection so that the researcher can generate an emerging understanding about
research questions, which in turn informs both the sampling and the questions being asked.
This was certainly the case within this study as the interviews process was being conducted,
as new opinions documented fed into and shaped the subsequent discussions with
interviewees. This iterative process of data collection and analysis eventually leads to a point
in the data collection where no new categories or themes emerge, referred to as saturation,
signalling that data collection is complete (DiCicco-Bloom and Crabtree, 2006). Saturation is
believed to have been reached in these interviews in the sense that no new themes or
categories surrounding the question of MAFR emerged in the last interviews, indicating that
the sample of fourteen practitioners was sufficient for the purpose of the study. The
transcribed data was then used in order to identify common, recurrent, or emergent themes
around the issue of the role of audit committees is preserving auditor independence and
quality financial reporting, rather than pursuing MAFR in South Africa.
Presentation and Analysis of Results
Competing objectives
It was clear that the mid-tier audit partners, especially the representatives of black-owned
emerging audit firms, were mostly of the opinion that MAFR, or maybe an alternative such as
combined audits, would improve competition (market concentration) and transformation in the
audit industry. In response to this argument other partners, mostly comprising of the big four
audit partners, pointed out that the IRBA needs to be clear as to what exactly any change in
regulation is trying to achieve. Is the IRBA attempting to improve audit quality or are there other
priorities driving the agenda, such as market concentration and transformation objectives?
More than one partner was sceptical that the IRBA claims that MAFR or any alternative to
MAFR is primarily being considered to improve audit quality in the interest of public protection.
IRBA has explicitly stated that there are three reasons for pursuing MAFR, however, the
primary reason is to enhance audit quality (IRBA, 2016).
The participants who expressed this sceptical view around the IRBA’s priorities, believed that
there were better ways to achieve the other objectives, namely healthy market competition and
economic transformation, rather than imposing such significant additional regulation on the
industry. In their view any discussion on MAFR (or an alternative) should only be considered
if it did indeed improve audit quality as the only objective. These partners were adamant that
by pursuing other objectives (in addition to audit quality) in the decision around MAFR could
actually result in a loss of audit quality.
Addressing market concentration
All the audit partners expressed concern, despite their other differing opinions on other related
matters, that a significant unintended consequence of forcing MAFR on South Africa would be

2016 SAAA National Teaching and Learning and Regional Conference Proceedings
ISBN 978-0-620-74761-5
35
the likelihood that the audit of large companies (particularly the listed companies) would simply
rotate around the big four audit firms and therefore actually reduce competition rather than
grow it.
There was significant disagreement as to whether market concentration was a concern. As
could perhaps be expected, none of the big four partners believed that market concentration
was a problem or that it was the regulator’s (IRBA) place to step in to actively address it. Of
the partners who agreed that market concentration was a problem, all were in favour of a
system of joint (combined) audits rather than MAFR as a means to improve competition. It is
fair to say, and a significant observation, that there was no person interviewed who was in
favour of a direct move from the current system to one of MAFR, either to improve
independence or to improve competition in the audit industry.
In response to being asked whether MAFR will allow mid-tier to compete for the larger
company (public interest entity) audits, one big four partner’s response was as follows:
“I think all you’re going to do is have ‘the shifting of the deck chairs’. The big four will
remain the big four. There might be the transformation angle so maybe the big five. You
know I’m saying, given the South African avenue here and you might, let’s be fair, call
it the big five, that it’s going to be a ‘shifting of the deck chairs’. That’s all that’s going
to happen. Is the Audit Committee, given the strength of the Audit Committee, are they
honestly going to appoint a firm that clearly hasn’t had the experience, doesn’t have the
resources, the staff, to do a large listed company audit? No disrespect to the second
tier firms or let’s call it the next tier. I mean, clients expecting us to have the depth and
breadth of skill and how these smaller firms going to acquire that skills and also have
the ability to deliver seamless service across numerous jurisdictions. Our clients
expect us to be in every location where they’re located and they want us to speak with
one voice. How are these other firms going to do that? If you look at what has gone
out to tender, the, from what I understand in the UK and the likes, it’s really just shifting
it around and there’s no major... So when they, and those that have gone out to tender,
where has it gone? You’ll most probably find that the smaller firms, one of them will get
invited to come and tender, but they’ll fall out somewhere along the process. [It is not
going to address market concentration], it’s just going to shift between the big five, put
it that way. That’s honestly the way I see it.” (Audit Partner 5)
Referring to the larger listed multi-national companies, one partner made the point that in their
opinion, having been involved in a few companies of this size and geographic diversity, the
mid-tier firms could not possibly perform assurance services on that scale. In that sense MAFR
would actually reduce competition as these audits would have to move from the one big four
firm to one of the other three.
“Because there’s only going to be three left. There’s no way that a mid-tier firm will do
the [company name] audit in 130 countries within the next twenty years.” (Audit Partner
2)
This opinion is also shared by some mid-tier audit partners. The concern is simply that the
audit committee, when faced with having to choose another audit firm during a mandatory
rotation is likely to stay with a big four firm, rather than risk negative stakeholder perception by
moving away from the big four.
2016 SAAA National Teaching and Learning and Regional Conference Proceedings
ISBN 978-0-620-74761-5
36
“But what I want to come to, is typically when we get an opportunity to make a proposal
for a big public company that’s audited by the big four, and you go there and you
really… I mean, in this one instance we really went to town with the presentation. And
in the meeting you can pick up that people are quite positive, and then you get the letter
saying no, they’re staying with the current big four auditor. So on reflection, think about
it, you’re an independent, non-executive director on an Audit Committee where you’re
at risk. So are you really going to change the incumbent… to ‘Joe Soap’? To a non-big
four? Or just change from the big four? Let’s say they do it. Let’s say they’ve got that
type of appetite for risk, or perceived risk. And they do it, and it’s a stuff-up. [Then their
heads are on the block.] If they had moved from big four firm to big four firm then…
nobody could fault that. You would went from the same to another… you’re just going
to go in a circle. That’s not going to improve market concentration at all. You may even
see a movement up to the bigger firms.” (Audit Partner 14)
In the experience of a big four audit partner:
“I’ll give you an example… I have just gone through a proposal process. It’s not a large
firm. It’s actually mid-market firm. I went to see the chair of the Audit Committee
afterwards and he gave me the feedback and one of the things he specifically said was,
it was clear to them, the Audit Committee and the panel. It was not just the Audit
Committee - management was a part of the panel. That there was a big difference in the
quality of the whole process and the documents and the presentations. Between the big
four and the next tier. That was clear [to them]. He then immediately said “forget about
anything below the big four”.” (Audit Partner 3)
Considering the risk involved and the experience, skills and size of mid-tier firms, why would
the audit committees of large companies award the audit to a non-big four firm? Is this a
realistic expectation? This was a common question raised by audit partners, of both large and
mid-tier firms and it is a serious concern for the ability of MAFR to improve participation of the
mid-tier firms in large public interest entity audits, especially JSE listed companies. Audit
committees of larger companies would be less inclined in their opinion, for reasons of
perceived risk or quality or resources, to award tenders to non-big four firms, regardless of
whether MAFR was introduced.
One partner expressed, regarding large listed companies in particular, that the current system
of five year partner rotation, together with the audit committee and shareholders having the
power to put the audit out for tender, allows all four big four audit firms (or all firms for that
matter) to bid for appointment – including the incumbent big four firm. However, the effect of
MAFR would change this significantly. Under MAFR regulations the audit committee and
shareholders will be required to rotate the incumbent big four firm, but the incumbent will not
be allowed to bid for the tender i.e. to bid for reappointment. Therefore, since the audit
committee will likely only favour another big four firm (as it is a listed company), this results in
only three possible choices for auditor - as opposed to four in the current system. So the
thinking is that MAFR in effect will actually reduce competition in practice. Can the audit
committee of a large listed company realistically be expected to award the tender to a non-big
four audit firm, considering stakeholder perceptions and the size and experience of the mid-
tier firms? The majority of the audit partners interviewed agreed with this reasoning as far as
it applied to large listed entities. This effect will therefore be to reduce market competition in
the audit industry.

2016 SAAA National Teaching and Learning and Regional Conference Proceedings
ISBN 978-0-620-74761-5
37
Another argument that MAFR would actually reduce competition was expressed by mid-tier
audit partners, with the point that the smaller firms do not currently have the skills, experience
or resources to service the large complex companies. Many of the big four partners made this
point as well. And how could the leadership of the audit firm gear up to responsibly perform
such audits if firstly they may not be awarded the tender and secondly they will only have the
client for the rotation period, whatever period that may be legislated under MAFR?
“We don’t have the skillset for the banks and then the insurance companies as well -
unless they are really small, so you can pick on a mega insurance company. You know
we don’t have the manpower and then to gear up the manpower for five years you
know… [from a business perspective] you can’t, commercially…” (Audit Partner 12)
This partner went on to express that because of the problem that the incoming audit firms will
need to urgently procure the skills and experience to perform the audit professionally, the firm
will be tempted to offer the staff from the outgoing audit firm jobs on their audit team. This was
referred to by the partner as “cheating the system” of MAFR.
“What can happen is you know the guys will cheat like they are cheating on the section
90 [of the Companies Act], they will loan their teams around or a team will come and
they will be here for five years and the guy will bring his team along and you will find
the same people will do [the audit]… a kind of secondment.” (Audit Partner 12)
An example of this was then given with the internal audit function of a large South African state-
owned entity that outsourced this function to one of the big four audit firms. What then
happened according to this audit partner was that the audit firm then employed most of the
state-owned entity’s internal audit staff, with the effect that they left the company to work for
the audit firm but to perform the same services as the internal audit function. In the words of
the partner, “it’s the same team but they had different houses, so the guys have to have
the economic necessity to do that. So I really don’t have a warm feeling or a strong
recommendation for mandatory audit rotation and I really don’t think that audit
independence is such a huge issue in South Africa.” (Audit Partner 12)
The same opinion was expressed by Audit Partner 4:
“I think it was, it could be Brazil… What happened when they realised that a big team,
let’s say a [company name] team will do the audit and then a year before the whole firm
has moved to let’s say to [firm name] or another firm, the other firm starts headhunting
them and then effectively, that whole team is moving and his partner is moving across
to the new firm. Now how’s that for independence? It is just under a different umbrella
somewhere and another firm must sign it, but it’s the same team. So to overcome this
cost and knowledge and all those things, this team just moves over.” (Audit Partner 4)
Will MAFR rotation result in this kind of “headhunting” and employment relocation? If so, the
will it occur to such a degree as to negate the added independence that MAFR is intended to
produce. The partners who expressed this concern made the point that it would be an
economic necessity and make good strategic sense to source the staff who were involved in
the audit before the rotation. In their opinion this has already been happening, albeit in a very
limited capacity, under the current partner rotation scheme. MAFR would perhaps incentivise
the firms to do it on a larger scale.
2016 SAAA National Teaching and Learning and Regional Conference Proceedings
ISBN 978-0-620-74761-5
38
Transformation considerations
All the partners interviewed who were not members of the black emerging audit firms (11/14)
expressed serious concern regarding whether the black-owned firms who have been awarded
large public tenders have the resources, skills and experience to audit such large public
interest entities. The concern was that if a firm is under resourced for the job, or has no prior
experience with a specific industry, then a drop in the quality of the audit process and audit
outcome is inevitable. Government, in their opinion, has been far too quick to award such large
tenders to the black-owned audit firms and should have either sought joint audit arrangements
for longer or promoted the ability of existing audit firms to transform from within as a better
method of achieving transformation objectives. This concern expressed is very similar to that
which all the mid- and large-tier firm partners expressed regarding the upskilling required of
non-big four firms before they are sufficiently capable to service the large listed companies.
Therefore the opinion expressed was that MAFR poses a significant risk to audit quality if a
smaller audit firm, whether black-owned or not, is placed in a position too soon to audit a large
company or group of companies. Here we see the possibility of MAFR to either result in
reduced audit quality if this situation occurs. Or it could result in the audit committees not
awarding the audit to smaller (non-big four) firms and MAFR causing reduced competition as
the large company audits rotate around the big four firms only. All these possible
consequences would be contrary to the IRBA’s intentions of reduced concentration and
increased transformation.
So what were the opinions of the black-owned firm audit partners about their ability to service
larger and more complex companies? When asked whether non-big four audit firms, including
the black-owned firms, had the skills and resources to handle the larger and more complex
company audits, the managing director of a black-owned firm (Audit Partner 7) responded that
there is a problem with perception rather than with reality. In their opinion the mid-tier firms can
audit the larger entities and it is wrong to simply assume that they don’t have the skills or
resources because they are not big four firms. This partner expressed how difficult it was for
them to just be appointed as a service provider to large companies for non-assurance work,
because there is such a strong perception that their firm lacks the skills and resources.
However, they believed that the perceptions are slowly changing as they prove themselves in
the non-assurance work and in joint audit arrangements. This opinion by a black-owned audit
firm partner is in contrast to the big four partner and some mid-tier partner opinions, which hold
that the smaller firms cannot yet audit the bigger listed entities, many of which are multi-
national companies.
Again the concerns expressed in this regard contrasted the differing objectives of improving
audit quality so as to achieve sufficient public protection on the one hand, and achieving black
economic empowerment (transformation) in the profession. If regulation changes are pursued
with too many objectives in mind, or with too little research and stakeholder consultation, then
the unintended consequence of a loss of audit quality may result. As many partners pointed
out, surely public protection through enhanced audit quality should be the only reason for
changing reason in favour of MAFR? And if so, most, if not all partners interviewed, believed
that MAFR was not going to achieve improved audit quality.
Of particular interest was the fact that all the non-big four partners were of the opinion that
market concentration of the public interest company audits was a problem in South Africa and
2016 SAAA National Teaching and Learning and Regional Conference Proceedings
ISBN 978-0-620-74761-5
39
needed to be addressed for the good of the profession and the public. Many admitted that this
was not a South African specific problem by any means, however South Africa was in a unique
position whereby transformation was also a high priority in business, across all industries in
the economy. By addressing market concentration appropriately in the profession through
whatever means was considered most appropriate, it would also thereby improve
transformation, as it would allow the smaller black-owned emerging firms to compete in the
private sector, together with the other non-big four firms. The big question that was raised
numerous times was the question of whether MAFR was the best means to achieve this
transformation. None of the partners, including those from black-owned firms believed it was
the best means. As mentioned already, there was one black-owned partner (Audit Partner 7),
who was tentatively in favour of MAFR, but only if significant corporate governance
weaknesses were addressed first and it was pursued carefully and in a slow staged process,
such as via a period of requiring joint audits, to allow the non-big four firms time to gain
experience with the larger more complex companies.
A common concern from the mid-tier firms, referred to by one partner as a “chicken before the
egg story”, was the constraint around gearing up your audit firm to service large
companies. This improved capacity in the mid-tier is one of the IRBA’s clear intentions
for MAFR i.e. improve competition in the audit sector, including the ability of black-
owned firms to compete, which promotes transformation as well. However, how do
mid-tier and black-owned firms upskill and increase their resources so as to
responsibly and professionally provide audit services to large private companies? How
do they afford to do so without first being appointed as auditors? How, from a pure
business perspective, can they justify the cost and the risk of increasing staff and other
resources on the hope that their firm will be appointed as the auditor? This was seen
as a significant restraint to MAFR achieving improved competition and transformation.
One partner from a mid-tier firm (Audit Partner 10) expressed the concern that simply
increasing staff numbers in expectation of MAFR and in expectation of receiving more
appointments (referring to mid-tier and black-owned firms), is dangerous as you need
the right skills and the right experience, not simply the numbers and the technology.
Or else the sacrifice will be reduced audit quality. A number of partners expressed that
this is perhaps what has already occurred by the appointment of the emerging black-
owned audit firms to the large public sector and state-owned enterprise audits. Do they
(or did they when first appointed) have sufficient skill, experience and resources for
such large, high audit risk, high public risk entities?
Some partners suggested that either promoting transformation within the existing firms
or allowing mergers with the black-owned firms was preferable to MAFR in promoting
transformation. One partner who was not from one of the emerging black-owned audit
firms acknowledged that although many consider mergers of these audit firms with the
“more established firms” as a solution to promoting transformation in the audit
profession, it may not be wise.
“We can’t just take a black firm and a traditional western firm and merge them because
of transformation and think it would be the right thing to do. There are still certain things
that those of us from a privileged background maybe just don’t understand about the
way people work and the issues that they’ve had to deal with that we are not used to.”
(Audit Partner 10)
2016 SAAA National Teaching and Learning and Regional Conference Proceedings
ISBN 978-0-620-74761-5
40
This person went on to state that therefore joint audits may be a better solution than pursuing
MAFR or a simple mergers of firms. Joint audits better allow for a mentoring process and skills
transfer to emerging black firms, while preserving their autonomy and growth as a separate
firm in the market.
Perhaps in disagreement over the regulator’s (IRBA) thinking around transformation through
growth of the emerging black-owned firms, the big four audit partners were quick to point out
that their firms, and others, were transforming and this should be recognised by the regulator.
One managing partner (Audit Partner 2) of a big four firm stated that their target at the moment
in the near future is to reach 70% black staff and they were currently on an actual number of
around 50%. This partner went on to state that other big four firms may be doing even better
and that would mean that the largest “black firms” in terms of number of staff were actually the
big four firms, not the so-called “black-owned firms”. The main point being made was that the
IRBA needed to recognise these transformation achievements at the firms and therefore no
focus on changing legislation to achieve transformation, especially not through MAFR.
Two of the partners interviewed were managing partners of leading South African black-owned
firms and so their opinion on MAFR is particularly significant in light of the IRBA’s
transformation objectives. The one managing partner of a black-owned firm (Audit Partner 7)
was of the opinion that MAFR rotation was good for South Africa, and was the only partner of
the fourteen interviewed in favour of MAFR, albeit tentatively in favour. They were in favour
provided that significant corporate governance weaknesses were addressed first, most
importantly being the dominance of management in the appointment and managing of the
external auditor, and if MAFR was pursued carefully and in a slow staged process, such as via
a period of requiring joint audits, to allow the non-big four firms time to gain experience with
the larger more complex companies. In their opinion, if these issues are not addressed, then
MAFR will not improve transformation nor auditor independence and audit quality. The other
qualification this partner made was that the period of the rotation must be carefully determined
so as not to encourage unfamiliarity and lack of institutional knowledge of the client (if too
short) or promote familiarity threats (if too long).
The other black-owned firm managing partner (Audit Partner 6) was of the opinion that MAFR
was not the right answer for South Africa, mostly because it would result in a loss of institutional
knowledge built by the firm. This partner was of the opinion that five year partner rotation was
sufficient as it allowed the firm to retain the institutional knowledge and experience and
professionally manage any independence threats through its own firm and professional codes
and practices.
“But my personal view is I don’t believe in mandatory audit environments and I’ll tell
you why. To a very large extent, especially in large complex operations, it takes time for
one to really fully get to grips with the environment. And I see you’ve got other
subsequent questions around we should rotate the senior, the entire senior leadership
or just the, the lead partner as such. And frankly, for one to have proper institutional
knowledge of that, which is institutionalised, you would need them to be there… I’m
saying I’m not supporting mandatory firm rotation. One, because frankly I don’t think it
has a bearing on independence. Like I say, I think we’ve got enough safeguards in the
current systems to manage and govern independence.” (Audit Partner 6)
2016 SAAA National Teaching and Learning and Regional Conference Proceedings
ISBN 978-0-620-74761-5
41
In addition to these concerns expressed above, this partner was also concerned with the
likelihood that MAFR will simply become a “game of musical chairs” amongst the big four firms,
thereby reducing market competition, as well as promoting low-balling of fees to secure the
appointments.
These opinions from the two managing partners of South Africa’s largest black-owned audit
firms is significant to the MAFR debate, certainly as far as transformation and market
concentration aspects are concerned.
Summary and Conclusion There was considerable mixed opinion regarding the effect that MAFR legislation may have
on the priorities of increasing market concentration and economic empowerment
(transformation) in the audit industry. Significantly, all partners interviewed were in agreement
that MAFR is not the best option for South Africa if audit and financial reporting quality is the
only objective. Many partners criticised IRBA’s competing objectives of audit quality, improving
competition and transformation as they believed that MAFR must be pursued for audit quality
reasons or not at all. In their opinions, pursuing competing objectives will likely result in actually
reducing audit quality.
Most audit partners believe that MAFR will, counter to the IRBA’s intention, reduce auditor
competition for the large public interest entities, rather than improve it. This is mostly because
the outgoing big four firm will not be allowed to tender for the appointment and most audit
committees will only consider the “big three” firms who tender. There is some disagreement
among mid-tier firms as to whether they have the resources and experience to audit the larger
companies on the JSE. Some believe they simply do not, other believe that they will easily
upskill and it will not result in a sacrifice of audit quality.
None of the big four audit partners believe that MAFR will improve transformation, but rather
believe that transformation is best addressed in the existing firms with the existing set of
regulations. The managing partners of the two largest black-owned audit firms in South Africa
did not believe that MAFR legislation was the best route for South Africa, with one quite firmly
against it, and the other tentatively for MAFR if done slowly and only after deficiencies in the
functioning of audit committees was addressed first.
These findings show clearly that key leaders of audit firms are against MAFR as a means of
addressing any objectives other than audit quality itself. There are better means to address
concerns around competition and economic transformation in the audit industry. The
unintended consequences of MAFR have the potential to actually cause a reduction in audit
quality. It is recommended that the IRBA clearly articulate how, in their view, MAFR is intended
to address market concentration and transformation; and respond to the many concerns that
the audit practitioners have in this regard. More dialogue with key stakeholders, especially the
audit practitioners themselves, as well as research around unintended consequences, is
required before a final decision can be made by the regulator.
Areas for further research
MAFR has not been extensively researched internationally and certainly not in a South African
context. This research is not intended to be representative of the population of audit
practitioners in South Africa. A national survey of the South African audit profession is
necessary in order to provide a representative view from the profession on the issues
2016 SAAA National Teaching and Learning and Regional Conference Proceedings
ISBN 978-0-620-74761-5
42
surrounding MAFR, especially the likelihood and nature of unintended consequences. The
impact on, and the opinions of, other stakeholders such as audit committee members,
management and investment professionals needs to be understood as well. The impact of
MAFR in other key international jurisdictions such as the European Union also needs to be
explored.
Bibliography Bowlin, K. O., Hobson, J. L., & Piercey, M. D. (2014). The Effects of Auditor Rotation, Professional
Skepticism, and Interactions with Managers on Audit Quality. The Accounting Review, 90(4).
http://doi.org/10.2139/ssrn.1914557
Cameran, M., Vincenzo, D. Di, & Merlotti, E. (2005). The Audit Firm Rotation Rule : A Review of the
Literature. SDA Bocconi Research Paper, (September).
Carey, P., & Simnett, R. (2006). Audit Partner Tenure and Audit Quality. The Accounting Review,
81(4), 653–676.
Chu, L., Simunic, D. A., Ye, M., & Zhang, P. (2015). Transaction Costs and Competition among Audit
Firms in Local Markets. Social Science Research Network, 1–54. Retrieved from
http://papers.ssrn.com/sol3/papers.cfm?abstract_id=2378039
Daugherty, B. E., Dickins, D., Hatfield, R. C., & Higgs, J. L. (2012). An Examination of Partner
Perceptions of Partner Rotation: Direct and Indirect Consequences to Audit Quality. Auditing: A
Journal of Practice & Theory, 31(1), 97–114. http://doi.org/10.2308/ajpt-10193
DeAngelo, L. E. (1981). Auditor size and audit quality. Journal of Accounting and Economics, 3, 183–
199. http://doi.org/10.1016/0165-4101(81)90002-1
Dearnley, C. (2005). A reflection on the use of semi-structured interviews. Nurse Researcher, 13.1.
DiCicco-Bloom, B., & Crabtree, B. F. (2006). The qualitative research interview. Medical Education,
40(4), 314–321. http://doi.org/10.1111/j.1365-2929.2006.02418.x
European Commission. (2015). Directorate-General for Financial Stability. Retrieved May 2, 2016,
from https://www.unodc.org/unodc/en/drug-trafficking/legal-framework.html
Gerokos, J., & Syverson, C. (2015). Competition in the Audit Market: Policy Implications. Journal of
Accounting Research, 53(4), 725–775. http://doi.org/10.1111/1475-679X.12087
Hay, D. (2015). The frontiers of auditing research. Meditari Accountancy Research, 23(2), 158–174.
http://doi.org/10.1108/MEDAR-12-2014-0062
ICAEW. (2016). Accountancy firms. Retrieved May 24, 2016, from http://www.icaew.com/en/about-
icaew/what-is-chartered-accountancy/accountancy-firms
International Federation of Accountants (IFAC). (2006). Code of Ethics for Professional Accountants.
IFAC (2006 revised). Retrieved from
http://scholar.google.com/scholar?hl=en&btnG=Search&q=intitle:Code+of+Ethics+for+Profession
al+Accountants#4
International Federation of Accountants (IFAC). (2009). International Standard on Auditing 200. ISA
200. Retrieved from http://www.ifac.org/sites/default/files/publications/files/2012 IAASB
Handbook Part I_Web.pdf
IRBA. (2015). Consultation paper: Measures to Strengthen Auditor Independence. Retrieved from
2016 SAAA National Teaching and Learning and Regional Conference Proceedings
ISBN 978-0-620-74761-5
43
http://www.irba.co.za/news-headlines/press-releases
IRBA. (2016). Discussion Paper: Considering Mandatory Audit Firm Rotation (MAFR). Retrieved from
http://www.saica.co.za/Portals/0/documents/MAFRDiscussionPaper.pdf?Reference_ID=4499700
7
Jackson, A. B., Moldrich, M., & Roebuck, P. (2008). Mandatory audit firm rotation and audit quality.
Managerial Auditing Journal, 23(5), 420–437. http://doi.org/10.1108/02686900810875271
KPMG. (2014). EU Audit Reform. Retrieved from
https://www.kpmg.com/BE/en/IssuesAndInsights/ArticlesPublications/Documents/EU-Audit-
Reform-Fact-Sheet-MFR.pdf
Lærd Dissertation. (2016). Purposive Sampling. http://doi.org/10.4135/9781412950589.n774
Laurion, H., Lawrence, A., & Ryans, J. (2015). U . S . Audit Partner Rotations. Haas School of
Business. Retrieved from http://dx.doi.org/10.2139/ssrn.2515586
Leedy, Paul D; Ormrod, J. E. (2010). Practical Research: Planning and Design. Practical Research -
Planning & Design.
Marx, B. (2009). Challenges Facing the Modern Day Auditing Profession. Accountancy SA, 16–19.
Retrieved from
http://search.proquest.com.ezproxy.canterbury.ac.nz/docview/215224897?accountid=14499
Rapoport, M. (2016). Auditing the Auditors : U.S. Rethinks Approach. Wall Street Journal, (May).
Retrieved from http://www.wsj.com/articles/u-s-government-rethinks-how-it-audits-auditors-
1462440600
Ruiz-Barbadillo, E., Gómez-Aguilar, N., & Carrera, N. (2009). Does mandatory audit firm rotation
enhance auditor independence? Evidence from Spain. Auditing: A Journal of Practice and
Theory, 28(1), 113–135. http://doi.org/10.2308/aud.2009.28.1.113
Tepalagul, N., & Lin, L. (2015). Auditor Independence and Audit Quality: A Literature Review. Journal
of Accounting, Auditing & Finance, 30(1), 101–121. http://doi.org/10.1177/0148558X14544505
Tongco, M. D. C. (2007). Purposive sampling as a tool for informant selection. Ethnobotany Research
and Applications, 5, 147–158.
Velte, P., & Stiglbauer, M. (2012). Audit Market Concentration in Europe and its Influence on Audit
Quality. International Business Research, 5(11), 146–161. http://doi.org/10.5539/ibr.v5n11p146
2016 SAAA National Teaching and Learning and Regional Conference Proceedings
ISBN 978-0-620-74761-5
44
2016 Southern African Accounting
Association (SAAA)
National Teaching and Learning and
Regional Conference Proceedings
ISBN number: 978-0-620-74761-5
AUD 06: Effects of Internal Organisational Environments
on Preventative, Detective and Directive Internal Controls
of SMMEs in Cape Town
Luyolo Siwangaza1 and Job Dubihlela2
Luyolo Siwangaza1
School of Accounting Sciences,
Cape Peninsula University of Technology,
Cape Town Campus
Corner of Keizersgracht and Tennant Street,
Zonnebloem, South Africa, 8000
Tel: +27 21 460 3477
Job Dubihlela2 (Corresponding author)
School of Accounting Sciences,
Cape Peninsula University of Technology,
Cape Town Campus
Corner of Keizersgracht and Tennant Street,
Zonnebloem, South Africa, 8000
Tel: +27 21 460 3477
Tel: +27 21 460 3266
Email: [email protected]
ABSTRACT
In spite of the remarkable contributions made by Small, Medium and Micro Enterprises (SMMEs),
particularly in developing economies such as South Africa, sustainability remains a major challenge.
One root cause of the failure is the absence of adequate and effective internal controls to mitigate a
variety of risks that small businesses face. The implementation of adequate and effective internal
controls is dependent on how conducive the internal control environment is, which is believed to be the
foundation of any system of internal controls. This study which fell within the ambit of positivistic research
paradigm, sought to determine the effect of internal control environment (ICEn) on the implementation
of detective (DetC), preventative (PreC) and directive (DirC) internal controls within SMMEs. The study
employs an empirical survey approach, conducted with 107 SMMEs located within the Cape Peninsula.
Descriptive statistical analysis was conducted to run preliminary data and test for reliability and validity
of the scales and regression analysis was used to test the proposed hypotheses. This study confirms
that internal control environments (ICEn) of SMMEs are essential for successful implementation of DetC,
PreC and DirC, whereas robust internal controls are known to enhance enterprise risk management and
reduce operational risk. The paper contributes to research by advancing the understanding of internal
control environments for SMMEs in South Africa, possibly providing practitioners with managerial
insights. Limitations and directions for future research are also reported in the paper.
Keywords: Internal control environment, SMMEs, Sustainability, Risk control, South Africa.
2016 SAAA National Teaching and Learning and Regional Conference Proceedings
ISBN 978-0-620-74761-5
45
1. Introduction
In many developing economies SMMEs are touted as ‘the backbone’, ‘the engine’, ‘the fuel’
and ‘the lifeblood’ of the national economy (Cant et al., 2014:566; SBP, 2014; Lekhanya,
2015:412; Chimucheka & Mandipaka , 2015:309; Kemp et al., 2015:2). In South Africa,
SMMEs operating within the economy are commended for their remarkable contribution to
GDP, creation of employment and reduction of poverty (Chimucheka & Mandipaka ,
2015:309). Ramukumba (2014:19) puts the important role played by SMMEs into perspective
when reporting that over 90% of African business operations can be ascribed to this sector;
which contributes alone over 50% towards the GDP and employment creation. In South Africa,
SMMEs account for up to 55% of all jobs (Ramukumba, 2014:19) Despite these notable
contributions, prior research (Bruwer, 2010; Cant et al., 2014:565; SBP, 2014; Ngubane,
2015:384; Garg and Makukule, 2015:71) shows that the South African SMME failure rate has
frequently been cited as one of the highest in the world.
Lekhanya (2015:412) and Bowler et al. (2007) as cited by Ramukumba (2014:19) report the
40% failure rate of new establishments in this sector to lie within the first 12 months of start-
up, while 60% cease to exist in their second year of trade and a staggering 90% failing to
operate beyond the 10th anniversary. In a more recent study, Garg and Makukule (2015:71)
confirm the PwC (2015) report that approximately 75% of newly established SMMEs cannot
be salvaged from the risk of business failure. A plethora of previous studies have identified a
host of SMME challenges, which are attributed to the weak SMME failure rate. These
challenges are grouped by Bruwer (2010) and Siwangaza (2014) into two broad categories,
namely macro-economic factors (external forces which the business has little or no control
over such as crime, fluctuating interest and inflation rates, etc.) and micro-economic factors
(internal forces which the business has full control over such as the circumvention of
established internal controls by management, incompetent staff, etc.). One of the micro-
economic factors which have been identified and confirmed as a root cause of SMMEs failure
rate is the absence of adequate and effective internal controls to mitigate a variety of risks that
SMMEs face (Siwangaza et al., 2014:163; Prinsloo et al., 2015:66).
The global institute of internal auditors (IIA, 2012) describes internal control as any action or
process executed by those charged with governance of the business and other key
stakeholders to manage a variety of risks that threaten the attainment of business objectives.
According to formal guidelines (IIA, 2012; COSO, 2013) an effective system of internal control
can only provide reasonable (not absolute) assurance regarding the attainment of business
objectives. Gordon et al. (2014:38) holds the view that a system of internal control can only be
effective if it is supplemented by a conducive and robust internal control environment, which is
globally accepted to be the foundation of any system of internal control. In essence, the control
environment is concerned with the operating style and philosophy of those charged with
governance (including management), attitude of those charged with governance (including
management) towards risk and control, management’s commitment to ethics, integrity, values,
responsibility and accountability, the assignment of authority and the establishment of sound
human resources practices (COSO, 2004; COSO, 2013, Reding et al., 2013; Coetzee et al.,
2014; Nyakundi et al., 2014:5). The problem which characterizes many small businesses, more
2016 SAAA National Teaching and Learning and Regional Conference Proceedings
ISBN 978-0-620-74761-5
46
often than not, is that there is an absence of adequate internal controls (Sankoloba & Swami,
2014:87). The probable cause for this is that those charged with governance of these entities
often lack a commitment towards internal control, thus not setting an appropriate tone at the
top, which is believed to be a key attribute of a robust internal control environment (Nyakundi
et al., 2014:11). From the forgoing, a perception was formulated that SMMEs are not as
sustainable as they ought to be, due to inadequate use of effective internal controls. The latter
is as a result of a weak internal control environment, a problem which characterizes many
SMMEs.
2. Literature Review
2.1. Overview of South African SMMEs
Although small businesses have been in existence for many years and their growth being a
topic of discussion for a number of years (Maye, 2014), SMMEs, in South Africa, were formally
recognised in 1995 through the publication of the Department of Trade and Industry (DTI)
National Strategy, which was geared towards the development and promotion of these entities
(DTI, 1995). In the following year, the South African Parliament gazetted the National Small
Business Act No. 102 of 1996, as amended in 2004. In this piece of legislation, SMMEs are
regarded as distinct business entities which are managed by those charged with the
governance of their respective businesses. According to the afore-mentioned Act, SMMEs
can be operated in any sector or subsector of the South African economy and further be
classified in terms of their respective sizes as “micro”, “very small”, “small” and “medium”. The
criteria for classification of SMMEs in terms of their sizes vary by industry and take into
consideration the total number of full-time salaried employees, total revenue generated during
a full financial year and total gross value of the business assets, excluding the value of fixed
properties.
Bruwer et al. (2013:1005) point out that SMMEs continue to receive considerable amounts of
attention from government through the provision of advisory and financial support services.
The aforementioned policy documents provided for the establishment of various government
institutions and service providers to help SMMEs by providing a plethora of support services,
which take on the form of financial and non-financial services (DTI, 1995; South Africa, 2004).
In addition, the DTI launched a monthly national newspaper; called the Small Business
Connect aimed at providing pertinent information on how these enterprises can access
markets, leverage emerging technologies, glean insight on business improvement resources
and take advantage of networking opportunities (DTI, 2013). All in all, this newspaper
transmits empowering information for those charged with the governance of SMME to enhance
their understanding of the business environment, stay ahead of all the latest developments in
the sector and improve their business operations as a whole (DTI, 2013). In recent times the
support provided by government to SMMEs manifested itself into a newly established
Department of Small Business Development which will, among other things, address a
plethora of challenges faced by this sector, which includes, but is not limited to difficulties in
accessing markets, access to finance, access to information, regulatory red tape, skills
shortages, etc. (Maye, 2014; SBP, 2014). The latter confirms government’s efforts in building
a sector which is renowned for making valuable contributions in the stimulations of the national
economy.
2016 SAAA National Teaching and Learning and Regional Conference Proceedings
ISBN 978-0-620-74761-5
47
According to prior research (Chimucheka and Mandipaka, 2015:309; Chakabva, 2015; Kemp
et al. 2015:2; Prinsloo et al. 2015:64; Ngubane et al. 2015:382; Hendricks et al. 2015:87; Cant
et al. 2014:566; Ramukumba, 2014:19 Cant & Wiid, 2013:707) South African SMMEs are
playing an increasingly important role in socio-economic development; significantly
contributing to the GDP, employment formation and poverty alleviation. The importance of
these entities in a developing economy such as South Africa is affirmed by the Global
Entrepreneurship Monitor (2014) when stating that SMMEs are instrumental in providing
employment opportunities, driving economic growth and achieving equity. The Bureau for
Economic Research (2016) reaffirms the latter when reporting that in the second quarter of the
2015 fiscal year there were approximately over 2,25 million South African SMMEs, making
contributions of approximately 42% to the country’s GDP. Aigbavboa, et al. (2014) as quoted
by Mthabela (2015), report that roughly 91% of businesses in this country can be attributed to
SMMEs, which account for up to 61% of formal employment. The significant role played by
SMMEs is further fortified in the Vision 2030 of the South African National Development plan
where it is estimating that 90% of new jobs in 2030 will be provided by this sector (SAICA,
2015; SBP, 2014). However, despite these remarkable contributions, the high failure rate of
these entities is a matter of concern.
2.2. SMME failure
Despite a number of government interventions in the form advisory and financial support
services procured from various South African institutions to aid in the advancement of SMMEs,
the failure of these entities continues to rise in rank (Olawale & Garwe, 2010:731; Cant & Wiid,
2013:707; Lekhanya, 2015:412). The sentiments on the SMME failure rates is supported by
SBP (2014) when stating that the growth of SMME in South Africa is very stagnant despite
government offering a helping hand to stimulate the growth of this sector; which implies that
government’s efforts have rendered very limited results. Previous studies (Mahembe, 2013;
Maye, 2014; Cant et al., 2014:565; Garg & Makukule, 2015:71) have confirmed that the growth
of SMMEs remain a major challenge in South Africa, with the failure of a majority of these
businesses reported to be within the first year of trade. Lekhanya (2015:412) and SBP (2014)
report that in South Africa the SMME failure rate is in the region of 70% and 80%. A plethora
of factors can be ascribed to the remarkably high SMME failure rate (Kemp et al., 2015:3;
Chimucheka & Mandipaka, 2015:309; Cant and Wiid, 2013:708 - 709).
2.3. Factors affecting SMME Sustainability
According to Cant et al. (2014:570), Garg and Makukule (2015:71) SMMEs are faced with a
variety of challenges which can adversely affect the sustainability or cause these entities not
to grow and succeed as they ought to. Furthermore, Chimucheka and Mandipaka (2015:309)
points out that these challenges obstruct the establishment, survival and growth of SMMEs,
thus barricading these businesses from attaining success and achieving the ‘going concern’
status. Bruwer (2010) and Siwangaza (2014) go on further to state that the challenges faced
by SMMEs can be broken down into two broad categories, namely macro-economic factors
and micro-economic factors as previously stated in the introduction. Previous authors such as
Kunene (2008), Bruwer (2010), Grimsholm and Poblete (2010) and Siwangaza (2014)
describe macro-economic factors as external events which the business has little or no control
over, while micro economic factors are regarded as internal events which the business has full
control over. Against this background, examples of macro-economic factors which affect the
2016 SAAA National Teaching and Learning and Regional Conference Proceedings
ISBN 978-0-620-74761-5
48
sustainability of SMMEs include, but are not limited to rigid and onerous legislation, licencing
and registration, market and economic conditions, crime, inflation, interest and exchange rates,
taxation, politics, demand and supply of goods, infrastructure, technology, and competition,
while on the other hand examples of micro-economic factors are lack of finance, insufficient
managerial skills and experience, staff competency, lack of business acumen and marketing
strategies, wasteful spending, lack of risk management, lack of internal control, to mention but
a few (Maye, 2014; Kemp et al., 2015:3; Prinsloo et al.; 2015:66; Cant et al., 2014:570;
Chimucheka & Mandipaka, 2015:309; Cant & Wiid, 2013:708-709; Lekhanya, 2015:417;
SAICA, 2015; SBP, 2014; Garg & Makukule, 2015:71-73).
Moreover, Prinsloo et al. (2015:66) is of the opinion that the afore-mentioned factors may
attract a variety of risks especially if they are not effectively managed, and when these risks
are realised, they could threaten the ability of these entities to continue operating as a going
concern (Bureau for economic research, 2016). To mitigate such risks, the design and
implementation of internal controls is warranted.
2.4. The concept of internal control
According to COSO (2013) the term internal control pertains to a set of measures, which are
instituted by those charged with governance, to provide reasonable (but not absolute)
assurance regarding the attainment of business objectives. These business objectives are
briefly explained below (IIA, 2012; COSO, 2013; Reding et al., 2013; Coetzee et al., 2014):
Operational objectives: These objectives ensure that business operations are efficient and
effective, while also ensuring that business assets are safeguarded.
Reporting objectives: These objectives are concerned with the integrity, reliability,
timeliness and transparency of financial and non-financial reporting (internally and
externally).
Compliance objectives: These objectives have their main intention of ensuring that the
business conforms to all applicable laws, rules, regulations, policies and procedures.
The significance of internal control in any business environment is underscored by Coetzee et
al. (2014) when stating that the non-existence of adequate and effective internal controls will
result in the sustainability of a business being negatively impacted upon. The latter is supported
by Oseifuah and Gyeke (2013:241) who share the view that the lack of robust internal controls
is one of the root causes for a number of business failures. To help businesses in designing,
implementing and assessing the adequacy and effectiveness of internal controls, the COSO’s
(2013) internal control integrated framework is a useful tool with the most comprehensive
approach (Protiviti, 2016). The framework comprises of five interrelated elements, that were
reviewed by various researchers (Teketel & Berhanu, 2009; Reding et al., 2013; Oseifuah &
Gyeke, 2013:244-246; Coetzee et al., 2014; Siwangaza, 2014; Bruwer & Van Den Berg,
2015:54), and are briefly explained as follows:
Control environment: This element is touted as the foundation upon which any system of
internal control is built. The operating effectiveness of any system of internal control is
influenced by this element. The key aspects of this element are discussed below in section
2.5.
Risk assessment: Those charged with governance and/or management should identify
risks from internal and external sources (for example, criminal activities). This is because
risks threaten the attainment of business objectives and as result these risks should be
2016 SAAA National Teaching and Learning and Regional Conference Proceedings
ISBN 978-0-620-74761-5
49
identified and assessed in terms of their likelihood of occurring and the potential impact
should they occur.
Control activities: Control activities are put in place by management to mitigate the
identified risks down to an acceptable level. These control activities will either prevent
(known as preventative internal controls) or detect (known as detective internal controls)
the risks identified. In addition, directive controls (e.g. management directives) should also
be designed and implemented. Examples of popular control activities are management
reviews, authorisations / approvals, segregation of duties, reconciliations, limiting access
to authorised personnel only, etc.
Information and communication: Important information, including risk and control
information, should be communicated to all business stakeholders. Communication is
critical in any business as it ensures that internal controls are operating effectively.
Monitoring: The internal control system in its entirety must be monitored and its operating
effectiveness (performance) be assessed on an on-going and periodic basis.
2.5. Internal control environment
A robust internal control environment is like a solid foundation of a building structure - without
the solid foundation, the building will cease to exist. As the control environment forms the
basis of any system of internal control (COSO, 2013), it influences the manner in which the
entire business is managed and controlled (Oseifuah & Gyeke, 2013:244). Furthermore, the
internal control environment is about those charged with governance (including management)
setting an appropriate tone at the top, demonstrating their attitude and commitment towards
internal controls (COSO, 2013). The attitude of those charged with governance (including
management) towards internal controls is fundamental; particularly because employees are
likely to observe the attitude of management towards internal controls and if this attitude proves
to be lax, employees will in turn, not adhere to established internal controls (Coetzee et al.
2014). Jackson and Stent (2007) concur with the latter when stating if management is remiss
towards internal control, employees will soon follow suit. Previous research studies and policy
documents (Teketel & Berhanu, 2009; Oseifuah & Gyeke, 2013:244; COSO, 2013; Reding
et al., 2013; Coetzee et al., 2014; Bruwer & Coetzee, 2016:195) concur that the internal control
environment should include, among other things, the following rudiments: The operating style
and philosophy of management, the commitment of management to ethics, values, integrity,
competency, delegation of authority, responsibility and accountability, reporting structures and
development of human resources policies and procedures.
3. Problem Statement
Based on the established theoretical scenario, it became apparent that SMMEs are playing a
vital part in the realisation of socio-economic objectives. Despite a number of government
initiatives and support measures to help these enterprises to grow and succeed a large number
of SMMEs continue to fail. Previous studies have identified a host of challenges which can be
ascribed to the weak SMME failure rate. These challenges have been grouped by prior
research as macro-economic and micro-economic factors. These economic factors, if not well
managed, attract a variety of risks which can be detrimental to the success of any business.
To mitigate a variety of risks which SMMEs face, an effective internal control system is needed.
Of concern, the lack of adequate and effective internal controls, which is regarded as a micro-
economic factor, has been cited as one of the root causes to a number of business failures.
2016 SAAA National Teaching and Learning and Regional Conference Proceedings
ISBN 978-0-620-74761-5
50
The implementation of an adequate and effective system of internal control is greatly
influenced by the internal control environment, which is the foundation of any system of internal
control.
Fundamentally, the internal control environment is about the attitudes and commitment of
those charged with governance issues on risks, controls, ethics, values and integrity. It can
then be said that sustainable internal controls of SMMEs are always affected by internal
organisational environments which in turn influence the effective utilisation of internal control
systems. Against this background, the internal control environments can be ‘blamed’ for the
often defective implementation of internal control constructs within SMMEs.
4. Methodology
The research study conducted was empirical in nature and fell within the ambit of positivistic
research paradigm. The main objective of this study was to determine the effect of the internal
organisational control environment (ICEn) on the implementation of detective (DetC),
preventative (PreC) and directive (DirC) internal controls within SMMEs. Data collected from
107 SMMEs located within the Cape Peninsula using a structured questionnaire were
aggregated and analysed (Saunders et al, 2007). The sampling techniques employed were
the non-probability purposive and convenience sampling since the size of the population was
unknown. All the survey respondents had to comply with a strict delineation criteria, namely
that of 1) respondents had to be classified as SMMEs in conformance with the Small Business
Act, No. 102 of 1996, 2) respondents had to be SMME owners and/or managers, 3) these
SMMEs had to be non-franchised and in existence not less than one year, 4) respondents had
to operate their respective businesses in the fast moving consumer goods industry and, 5)
lastly all SMMEs had to be located within the Cape Peninsula. Descriptive statistical analysis
was conducted to run preliminary data and test for reliability and validity of the scales,
regression analysis was used to test the hypothesised construct relationships.
5 Measurement and Data Analysis
5.1 Correlation analysis
The first step in the data analysis involved a rigorous data screening process as suggested by
Malhotra (2012), whose intention was to ensure clean data before performing both the
descriptive and inferential statistical analysis. In accordance with study objectives outlined, it
was imperative to examine the component inter-relationships between internal control
environment (ICEn), detective internal controls (DetC), preventative internal controls (PreC)
and directive internal controls (DirC). Therefore, it was necessary to employ correlations
analysis among the mentioned constructs to determine the strength of the underlying
relationships. The Pearson correlation coefficient (r) was used to measure the degree of linear
association between the variables in line with Malhotra (2012). The composite correlation is
reported in Table 1.
Table 1: Correlations: internal control environment (ICEn), detective controls (DetC),
preventative controls (PreC) and directive controls (DirC)
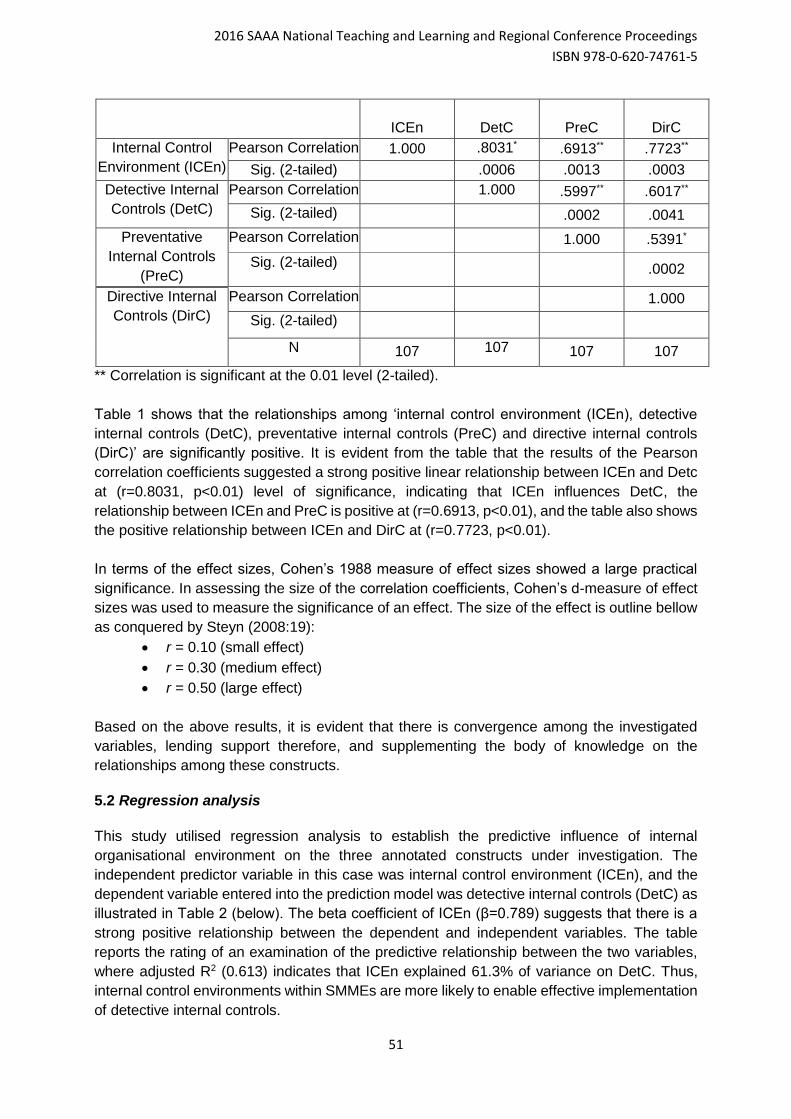
2016 SAAA National Teaching and Learning and Regional Conference Proceedings
ISBN 978-0-620-74761-5
51
ICEn
DetC PreC DirC
Internal Control
Environment (ICEn)
Pearson Correlation 1.000 .8031* .6913** .7723**
Sig. (2-tailed) .0006 .0013 .0003
Detective Internal
Controls (DetC)
Pearson Correlation 1.000 .5997** .6017**
Sig. (2-tailed) .0002 .0041
Preventative
Internal Controls
(PreC)
Pearson Correlation 1.000 .5391*
Sig. (2-tailed) .0002
Directive Internal
Controls (DirC)
Pearson Correlation 1.000
Sig. (2-tailed)
N 107 107 107 107
** Correlation is significant at the 0.01 level (2-tailed).
Table 1 shows that the relationships among ‘internal control environment (ICEn), detective
internal controls (DetC), preventative internal controls (PreC) and directive internal controls
(DirC)’ are significantly positive. It is evident from the table that the results of the Pearson
correlation coefficients suggested a strong positive linear relationship between ICEn and Detc
at (r=0.8031, p<0.01) level of significance, indicating that ICEn influences DetC, the
relationship between ICEn and PreC is positive at (r=0.6913, p<0.01), and the table also shows
the positive relationship between ICEn and DirC at (r=0.7723, p<0.01).
In terms of the effect sizes, Cohen’s 1988 measure of effect sizes showed a large practical
significance. In assessing the size of the correlation coefficients, Cohen’s d-measure of effect
sizes was used to measure the significance of an effect. The size of the effect is outline bellow
as conquered by Steyn (2008:19):
r = 0.10 (small effect)
r = 0.30 (medium effect)
r = 0.50 (large effect)
Based on the above results, it is evident that there is convergence among the investigated
variables, lending support therefore, and supplementing the body of knowledge on the
relationships among these constructs.
5.2 Regression analysis
This study utilised regression analysis to establish the predictive influence of internal
organisational environment on the three annotated constructs under investigation. The
independent predictor variable in this case was internal control environment (ICEn), and the
dependent variable entered into the prediction model was detective internal controls (DetC) as
illustrated in Table 2 (below). The beta coefficient of ICEn (β=0.789) suggests that there is a
strong positive relationship between the dependent and independent variables. The table
reports the rating of an examination of the predictive relationship between the two variables,
where adjusted R2 (0.613) indicates that ICEn explained 61.3% of variance on DetC. Thus,
internal control environments within SMMEs are more likely to enable effective implementation
of detective internal controls.
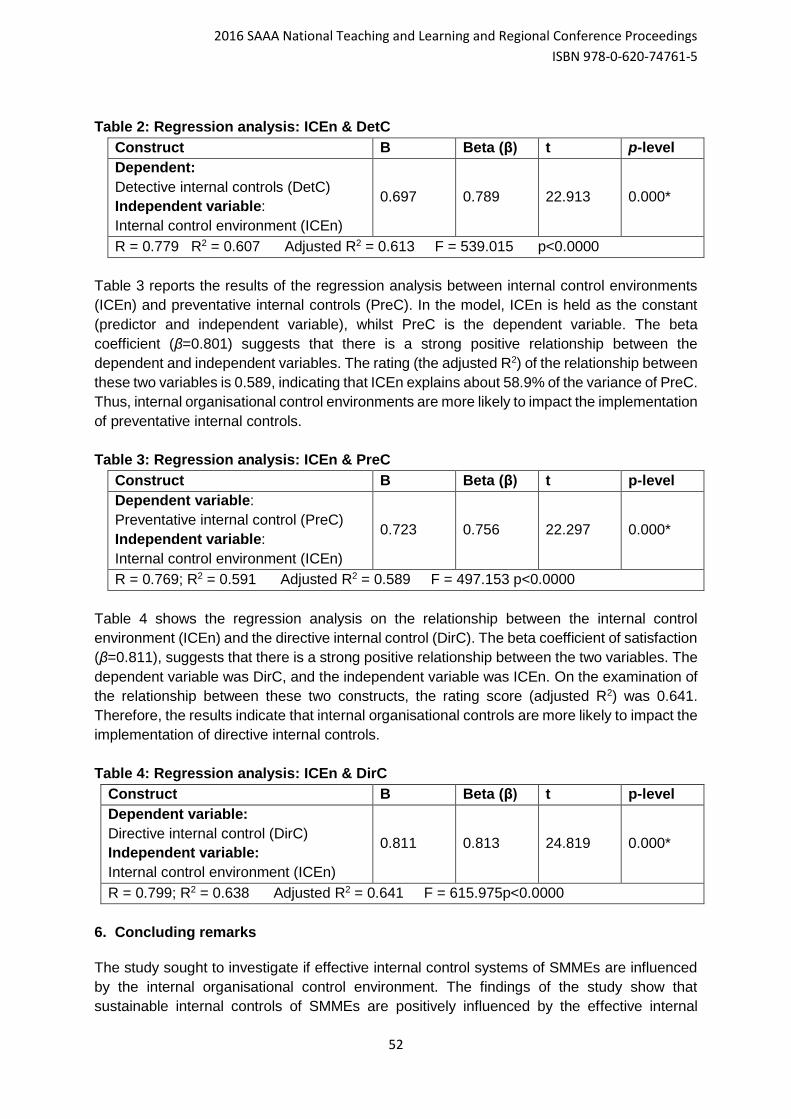
2016 SAAA National Teaching and Learning and Regional Conference Proceedings
ISBN 978-0-620-74761-5
52
Table 2: Regression analysis: ICEn & DetC
Construct B Beta (β) t p-level
Dependent:
Detective internal controls (DetC)
Independent variable:
Internal control environment (ICEn)
0.697 0.789 22.913 0.000*
R = 0.779 R2 = 0.607 Adjusted R2 = 0.613 F = 539.015 p<0.0000
Table 3 reports the results of the regression analysis between internal control environments
(ICEn) and preventative internal controls (PreC). In the model, ICEn is held as the constant
(predictor and independent variable), whilst PreC is the dependent variable. The beta
coefficient (β=0.801) suggests that there is a strong positive relationship between the
dependent and independent variables. The rating (the adjusted R2) of the relationship between
these two variables is 0.589, indicating that ICEn explains about 58.9% of the variance of PreC.
Thus, internal organisational control environments are more likely to impact the implementation
of preventative internal controls.
Table 3: Regression analysis: ICEn & PreC
Construct B Beta (β) t p-level
Dependent variable:
Preventative internal control (PreC)
Independent variable:
Internal control environment (ICEn)
0.723 0.756 22.297 0.000*
R = 0.769; R2 = 0.591 Adjusted R2 = 0.589 F = 497.153 p<0.0000
Table 4 shows the regression analysis on the relationship between the internal control
environment (ICEn) and the directive internal control (DirC). The beta coefficient of satisfaction
(β=0.811), suggests that there is a strong positive relationship between the two variables. The
dependent variable was DirC, and the independent variable was ICEn. On the examination of
the relationship between these two constructs, the rating score (adjusted R2) was 0.641.
Therefore, the results indicate that internal organisational controls are more likely to impact the
implementation of directive internal controls.
Table 4: Regression analysis: ICEn & DirC
Construct B Beta (β) t p-level
Dependent variable:
Directive internal control (DirC)
Independent variable:
Internal control environment (ICEn)
0.811 0.813 24.819 0.000*
R = 0.799; R2 = 0.638 Adjusted R2 = 0.641 F = 615.975p<0.0000
6. Concluding remarks
The study sought to investigate if effective internal control systems of SMMEs are influenced
by the internal organisational control environment. The findings of the study show that
sustainable internal controls of SMMEs are positively influenced by the effective internal
2016 SAAA National Teaching and Learning and Regional Conference Proceedings
ISBN 978-0-620-74761-5
53
organisational environments. The significance of the internal control environment is underlined
by IIA (2011) when stating that the majority of business failures can be blamed on poor internal
control environments. These results are consistent with the findings of a study conducted by
Jiang and Li (2010:215) which found that the internal control environments of small
businesses, although largely defective, are essential for organisational risk performance. In
this study, researchers went further to measure the predictive impact on each of the three
outcome components (DetC, PreC and DirC). The results illustrated in the previous sections
confirm that ICEn positively influences the outcome variables in a strongly significant way. The
observations noted in two recent studies by Bruwer and Van Den Berg (2015:61) as well as
Bruwer and Coetzee (2016:197) only concluded that the control environment of South African
SMMEs were poor, blaming it on poor implementation of internal control activities. Based on
the results in the current study, it can further be argued that the issue is not only on poor
implementation but rather on the internal organisational environments of SMMEs which do not
support sustainable implementation of any nature on internal controls.
7. Limitations of the study
Like many other studies, this study also had limitations. One of the limitations was the fact that
the survey was confined to only SMMEs in Cape Town. Further studies should consider the
SMMEs in other parts of South Africa. The study employed a quantitative research approach.
Future research could consider using triangulation methodology where a qualitative design
could be used in generating rich ideas and explanations. Another limitation could be the fact
that the method of data collection relied on accurate introspection of responses that are subject
to some degree of bias. Despite these limitations, the study advances knowledge regarding
effective implementation of internal controls within SMMEs environments, considering that
there is a noticeable absence of prior research on this subject within the South African context.
REFERENCES
Bureau for Economic Research, 2016. The Small, Medium and Micro Enterprise Sector of
South Africa. The Small Enterprise Development Agency Research Note.
Bruwer, J-P. 2010. Sustainability of South African FMGC Retail businesses in the cape
peninsula. A dissertation submitted in full fulfilment of the requirements for the degree of
Magister Technologiae: Internal Auditing in the Faculty of Business at the Cape Peninsula
University of Technology.
Bruwer, J-P. & Coetzee, P. 2016. A literature review of the sustainability, the managerial
conduct of management and the internal control systems evident in South African Small,
Medium and Micro Enterprises. Problems and Perspectives in Management, 14(2):190-200.
Bruwer, J-P, Masama, B., Mgidi, A., Myezo, M., Nqayi, P., Nzuza, N., Phangwa, M.,
Sibanyoni, S. & Va, N. 2013. The need for a customised risk management framework for
small enterprises Southern African Accounting Association: Conference Proceedings. 26
June 2013.
2016 SAAA National Teaching and Learning and Regional Conference Proceedings
ISBN 978-0-620-74761-5
54
Bruwer, J-P & Van Den Berg, A. 2015. The influence of the control environment on the
sustainability of fast food Micro and Very Small Enterprises operating in the Northern
suburbs. Journal of Leadership and Management Studies, 2(1), pp 50-63.
Cant, M.C. & Wiid, J.A. 2013. Establishing The Challenges Affecting South African SMEs.
International Business & Economics Research Journal, 12(6), pp. 707 -716.
Cant, M.C., Erdis, C. & Sephapo, C.M. 2014. Business Survival: The Constraints
Experienced by South African SMEs in the Financial Sector. International Journal of
Academic Research in Business and Social Sciences, 4(10), pp. 565 – 579
Chakabva, O. 2015. The Effectiveness of Risk Management Practices of Small, Medium and
Micro Enterprises (SMMEs) which Provide Microfinance in the Cape Metropole, South Africa.
A dissertation submitted in full fulfilment of the requirements for the degree of Magister
Technologiae: Internal Auditing in the Faculty of Business at the Cape Peninsula University
of Technology.
Chimucheka, T. & Mandipaka,F. 2014. Challenges Faced By Small, Medium And Micro
Enterprises In The Nkonkobe Municipality. International Business & Economics Research
Journal, 14(2), pp. 309
Coetzee, P., Du Bruyn, R., Fourie, H. & Plant, K. 2014. lnternal Auditing: An introduction.
Johannesburg: LexisNexis.
COSO, 2004. Enterprise Risk Management – Integrated Framework Executive Summary.
[Online]. Available from: http://www.coso.org/documents/coso_erm_executivesummary.pdf
[Accessed on 17/05/2016]
COSO, 2013. Internal Control – Integrated Framework Executive Summary. [Online].
Available from:
http://www.coso.org/documents/990025p_executive_summary_final_may20_e.pdf [Accessed
on 01/06/2016]
Department of Trade and Industry (DTI), 1995. The White Paper on National Strategy for the
Development and Promotion of Small Business in South Africa. Parliament of the Republic of
South Africa.
DTI, 2013. Minister Davies Launches New National SMME Newspaper. [Online]. Available
from: http://www.thedti.gov.za/editmedia.jsp?id=2811 [Accessed 20/04/2016)
Garg, A.K. & Makukule, P. 2015. Business risk management – the key success factor:
evidence from shebeens and taverns in Soshanguve Township. Problems and Perspectives
in Management, 13(2), pp. 71-81
Global Entrepreneurship Monitor, 2014. GEM South Africa Report South Africa: The
crossroads – a goldmine or a time bomb? [Online]. Available from:
http://www.gemconsortium.org/country-profile/108 (Accessed 20/04/2016)
Gordon, C., Baatjies, V., Johannes, L., Samaai, S., Sonto, J., Smit, Y., Bruwer, J. 2014.The
control environment of fast food micro and very small entities in the Cape Metropole.
Topclass Journal of Business Management and Innovations. 1(2), pp 37-46.
2016 SAAA National Teaching and Learning and Regional Conference Proceedings
ISBN 978-0-620-74761-5
55
Grimsholm, E., & Poblete, L. 2010. Internal and External factors hampering SME growth - A
qualitative case study of SMEs in Thailand. A dissertation submitted in fulfillment of the
requirements for the degree of Master in Business Administration: International Management
in the Faculty of Social Sciences at the Gotland University.
Hendricks, B., Hendricks, G., Johnson, R., Manuel, A., Maritz, R., Theron, L & Bruwer,
J.P.2015. The Influence of “Sin Tax” on the Economic Sustainability of Small, Medium and
Micro Liquor Store Enterprises in the Northern Suburbs of the Cape Metropolis, South Africa.
Journal of Economics, 6(2), pp.87-101
IIA. 2011. IPPF – Practice Guide Auditing the Control Environment [Online]. Available from:
http://www.iia.nl/Sitefiles/IIA_leden/Auditing_the_Control_Environment[1].pdf [Accessed on
15/ 05/ 2016]
IIA. 2012. International Standards For The Professional Practice of Internal Auditing
(Standards). [Online]. Avaialble from: https://na.theiia.org/standards-
guidance/Public%20Documents/IPPF%202013%20English.pdf [Accessed on 16/ 05/ 2016]
Jackson, R., Stent, W. Auditing Notes for South African Students. 2007. Durban:LexisNexis
Jiang, L. & Li, X. 2010. Discussions on the Improvement of the Internal Control in SMEs.
International Journal of Business and Management. 5(9), pp 214-216.
Kemp, A., Bowman, A., Blom, B., Visser, C., Bergoer, D., Fullard, D., Moses, G., Brown, S.-
L., Bornman, J. and Bruwer, J.-P., 2015. The usefulness of cash budgets in micro, very small
and small retail enterprises operating in the Cape Metropolis. Expert Journal of Business and
Management, 3(1), pp.1-12
Kunene, T. R. 2008. A critical analysis of entrepreneurial and business skills in SMEs in the
textile and clothing industry in Johannesburg, South Africa. A dissertation submitted in full
fulfilment of the requirement for the degree of Philosophiae Doctor: Entrepreneurship in the
Faculty of Economic and Management Sciences at the University of Pretoria.
Lekhanya, L.M. 2015. Public Outlook on Small and Medium Enterprises as a Strategic Tool
for Economic growth and Job Creation in South Africa. Journal of Governance and
Regulation, 4(4), pp. 412 - 418
Mahembe, E. 2013. Research Study to Identify Needs, Opportunities and Challenges of
SMEs in the Chemicals and Plastics and Sector Prepared for Small Enterprises
Development Agency (SEDA). Underhill Corporate Solutions (UCS).
Malhotra, N. K. 2012. Basic marketing research: Integration of social media. Pearson
Publishers.
Maye, M. 2014. Small Business in South Africa: What the Department of Small Business
Development Can Do to Stimulate Growth. Southern African Catholic Bishop’s Conference.
Parliamentary Liaison Office. Occasional Paper 35.
Mthabela, T.E. 2015. Assessing the Causal Failures of Emerging Manufacturing SMEs in
Johannesburg. A research report submitted in partial fulfilment of the requirements for the
degree of Master of Management specialising in Entrepreneurship and New Venture
2016 SAAA National Teaching and Learning and Regional Conference Proceedings
ISBN 978-0-620-74761-5
56
Creation: Internal Auditing in the Faculty of Commerce, Law and Management at the
University of the Witwatersrand.
Ngubane, N., Mayekiso, S., Sikota, S., Fitshane, S., Matsotso, M & Bruwer, J-P.2015.
Inventory Management Systems used by Manufacturing Small Medium and Micro
Enterprises in Cape Town. Mediterranean Journal of Social Sciences, 6(1), pp. 382-390
Nyakundi, D.O., Nyamita, M.O. * Tinega, T.M. 2014. Effect of Internal Control Systems on
Financial Performance of Small and Medium Scale Business Enterprises in Kisumu City,
Kenya. International Journal of Social Sciences and Entrepreneurship, 1(11), pp. 1-15
Olawale, F & Garwe, D. 2010. Obstacles to the growth of new SMEs in South Africa: A
principal component analysis approach. African Journal of Business Management, 4(5), pp.
729 – 738
Oseifuah, E. & Gyekye, B. 2013. Internal control in small and microenterprises in the
Vhembe district, Limpopo province, South Africa. Eur. Sci. J. 9(4)
PwC. 2015. Focus on South Africa’s emerging companies and entrepreneurial landscape
2015 Working together, moving forward Emerging companies and the ecosystem. [Online]
Available from: https://www.pwc.co.za/en/assets/pdf/emerging-companies-and-the-
ecosystem.pdf [Accessed on 21/05/2016]
Prinsloo, S., Walker, C., Botha, L., Bruwer, J-P. & Smit, Y., 2015. The Influence of Combined
Assurance Initiatives on the Efficiency of Risk Management in Retail Small and Very Small
Enterprises in Bellville, South Africa. Expert Journal of Business and Management, 3(2),
pp.63-81
Protiviti, 2016. Singapore Quick Guide to the COSO Enteprise Risk Management and
Internal Control Frameworks. [Online] Available from: http://www.protiviti.com/Singapore-
en/Documents/SG-Quick-Guide-COSO-ERM-Internal-Control-Frameworks-2016Ed.pdf
[Accessed on 18/05/2016]
Ramukumba, T. 2014. Overcoming SMEs Challenges Through Critical Success Factors: A
Case of SMEs in the Western Cape Province, South Africa, Economic and Business Review,
16(1), pp. 19-38
Reding, K.F, Sobel, P.J., Andersen, U.L., Head, M.J, Ramamoorti, S., Salamasick, M.,
Riddle, C. 2013. Internal Auditing: Assurance & Consulting. Florida: The Institute of Internal
Auditors Research Foundation
SAICA, 2015. SME Insights Report. [Online]. Available from: http://www.saica.co.za/portals
/0/documents/saica_sme.pdf [Accessed on 18/05/2016]
Sankoloba, T. & Swami, B.N., 2014. Impact of Internal Controls in Managing Resources of
Small Business: Case Study of Botswana. Journal of Small Business and Entrepreneurship
Development, 2(2), pp. 87-105
Saunders, M.N.K, Lewis, P & Thornhill, A. 2007. Research Methods for Business
Studies.London:Pitman Publishing.
2016 SAAA National Teaching and Learning and Regional Conference Proceedings
ISBN 978-0-620-74761-5
57
SBP, 2014. Examining the challenges facing small businesses in South Africa. [Online].
Available
from:http://www.sbp.org.za/uploads/media/SBP_Alert__Examining_the_challenges_facing_s
mall_businesses_in_SA_01.pdf [Accessed on 19/05/2016]
Siwangaza, L. 2014. The status of internal controls in fast moving consumer goods SMMEs
in the Cape Peninsula. Dissertation submitted for the fulfilment for a MTech: Internal
Auditing. Cape Peninsula University of Technology.
Siwangaza, L., Smit, Y., Bruwer, J-P. & Ukpere, W. 2014. The Status of lnternal Controls in
Fast Moving Consumer Goods Enterprises within the Cape Peninsula. Mediterranean
Journal of Social Sciences, 5(10), pp. 163-175
Steyn, G.M. 2008. Continuing professional development for teachers in South Africa and
social learning systems: conflicting conceptual frameworks of learning. Koers, 73(1), pp.15-
31.
South Africa. 1996. Small Business Act No. 102 of 1996. Pretoria: Government Printers
South Africa. 2004. National Small Business Amendment Act, No. 29 of 2004. Pretoria:
Government Printer.
Teketel, T. & Berhanu, Z. 2009. Internal Controls in Swedish Small and Medium Size
enterprises. A dissertation submitted in full fulfilment of the requirement for the degree of
Masters in Business Administration at the University of Umea.
2016 SAAA National Teaching and Learning and Regional Conference Proceedings
ISBN 978-0-620-74761-5
58
2016 Southern African Accounting
Association (SAAA)
National Teaching and Learning and
Regional Conference Proceedings
ISBN number: 978-0-620-74761-5
AUD 08: The Relationship between Board Size and
Company Performance
Kyla van der Westhuizen
University of Cape Town
Gizelle Willows
University of Cape Town
A South African Study
Abstract
This paper evaluates the relationship between the size of the board of directors (‘the board’)
and company performance. Presented in this study are the findings that the size of the board
has no significant relationship/effect on the financial performance of the JSE Top 40
companies in South Africa. With Tobin’s Q used as the variable that measures the performance
of the companies in 2014, and the independent variables – additional to board size – being
company size, return on assets, and non-executive directors, the relationship was analysed
using an Ordinary Least Squared Regression. The lack of a relationship is suggested to be
due to the high quality of corporate governance in South Africa as well as the inefficiencies of
information transfers in emerging markets.
Introduction
Corporate governance has been known to have a large impact on the financial performance
of a company. Financial performance (“performance”) is defined as the overall financial health
of the company at a specific time1 (Bhunia, Mukhuti & Roy, 2011). In this study, the emphasis
will be placed on profitability and efficiency influenced by the board, and it will be further
detailed as the ratio of market value of assets to its book value (Kusnadi & Maka, 2005).
Notable examples of corporate governance impacting performance are the demise of Enron,
where the concerns regarding the composition and size of the board of directors were
1 The use of company performance is in line with prior studies, such as Bulan et al. (2009), Horváth et al. (2012), Kartika et al. (2012), as well as Muchemwa, M (2014).
2016 SAAA National Teaching and Learning and Regional Conference Proceedings
ISBN 978-0-620-74761-5
59
highlighted (Vinten, 2002) and the more recent failure of African Bank, that could possibly have
been prevented through the correct corporate governance structures (Mushangwe, 2014).
Therefore, it should be determined how much of an impact the size of the board has on
company performance in order to identify its impact on failures such as these.
King III insinuates that the size of the board has a positive relationship with the probability of a
company complying with corporate governance. This is because a larger company is more
likely to have the required number and proportion of non-executive directors on its board
(South African Institute of Chartered Accountants, 2014). This study aims to identify how
significant this relationship’s effect is on the company’s performance. By finding the optimal
level of board members (or finding out that there is none) in relation to performance, a company
can prioritise their members by quality instead of quantity, which can improve the quality and
performance of the company.
Literature Review
The downfall of Enron in the early 2000’s has been believed to be caused by a list of factors,
one of which being a lack of corporate governance (Munzig, 2003). This can be considered to
be due to issues such as lack of communication on the board, which could be affected by its
size, an unclear direction of how to come to a conclusion with regards to the most effective
way to make business decisions, as well as intimidation tactics to ensure that the board voted
a certain way instead of in a way that was in shareholders’ best interests (Munzig, 2003). In a
similar light, African Bank was said to have had issues with corporate governance in the
banking industry (Mushangwe, 2014). This was caused by, firstly, having a higher board size
than other banks, and with that higher size, a larger portion were executive directors
(Mushangwe, 2014). This was an issue due to the fact that banks are required to be highly
independent, and with a ratio of 36% of executive directors, compared to the norm of 18%,
African Bank had the executive directors leading the decisions of the board (Mushangwe,
2014).
Looking at the board in detail, the characteristics of a company’s board has been found to be
a largely influential factor in such company’s performance (Bulan, Snyal, & Zhipeng, 2009).
Three main board characteristics have been considered in literature, namely 1) the size of the
board 2) the size of the company, and 3) the proportion of non-executive directors (Bulan et
al., 2009). According to Bulan et al. (2009), performance has a negative relationship with board
size, as well as a negative relationship with company size, whereas the proportion of non-
executive directors is directly related to performance (Bulan et al., 2009).
Prior literature, which focuses on each of these three factors, along with other supporting
factors, will be reviewed and discussed in more detail to follow. Thereafter, the composition of
the board of directors within a South African regulatory framework will be assessed.
2016 SAAA National Teaching and Learning and Regional Conference Proceedings
ISBN 978-0-620-74761-5
60
Board Size
Although much debate exists around the optimal size of a company’s board, it is believed that
the smaller the size of the board, the better its monitoring abilities over the company (Coles,
Daniel, & Naveen, 2008). Furthermore, Muchemwa (2014) stated that the more directors that
sit on a board, the higher the risk that there is less control and structure in a board meeting,
which could consequently result in less effective decision-making for the company.
Contrary literature, in support of larger board sizes, has found that a larger board size was
better for the CEO, as it meant that he/she would receive more feedback and could obtain
more expert advice from outside members rather than just from members of his/her staff (Coles
et al., 2008).
A large factor that is believed to be the explanation of the influence of board size on company
performance is the ‘resource dependency theory’ (Muchemwa, 2014). This theory relies on the
assumption that when a board appoints a director, it does so with the expectation that the new
member will support the company and concern himself with its issues, as well as try and
resolve them whenever it is possible (Muchemwa, 2014). Therefore, under this theory, the
more directors appointed to the company, the higher improved performance of the company
as the directors add their necessary resources (i.e. time, skill, and other capital) to the company
(Muchemwa, 2014). However, Muchemwa (2014) and Horváth et al. (2012) state that there is
also the risk of ‘free-riders’ on the board, where directors may not use their resources to
increase the performance of the company. This meets the definition of ‘free-riding’, as it is seen
as benefiting from the work of others without partaking in said work (Pasour, 1981).
Finally, Muchemwa (2014) found another alternative, being that although there is a relationship
similar to that in the case of Kusnadi et al. (2005), there is no significance between board size
and company performance (Muchemwa, 2014). As the study by Muchemwa (2014) was
completed in a South African context, it implies that companies in South Africa might not be
using its board size advantageously to improve its performance.
Company Size
The size effect anomaly has stated that there is an inverse relationship between the size of the
company and its performance (Okada, 2006). The anomaly has also found that the size of the
company and the size of the returns (i.e. the performance of the investments) are inversely
related (Okada, 2006). The size effect anomaly was opposed by Bulan et al. (2009), who found
that company size had a significantly ‘U-shaped’ impact on the performance of the company.
It was evidenced that there are generally smaller boards in smaller companies, which caused
an increase in productivity and performance (Bulan et al., 2009). This same outcome was
found in the research done by Guest (2009), which strengthened the argument concerning this
relationship.
2016 SAAA National Teaching and Learning and Regional Conference Proceedings
ISBN 978-0-620-74761-5
61
Hawawini et al. (2001) found that the size of the company creates a competitive advantage as
larger companies are seen to be more efficient than smaller ones. However, Okada (2006)
argued that there is little to no effect of company size on company performance.
Non-Executive Directors
Bulan et al. (2009) believes that one of the main factors that positively influence company
performance is the independence of the board. Independence in this case was measured as
the proportion of non-executive directors in the company (Bulan et al., 2009).
Owing to the potential independent monitoring that can be achieved by non-executive directors
and that these directors have more objective insights into company decisions, having a higher
proportion of non-executives could have a direct impact on the performance of the company
(Jung & Wook, 2011). However, it could also be argued that the costs of additional non-
executive directors could reach the point where they outweigh the benefit (or in smaller
companies they may not be affordable) in which case it may have an inverse relationship to
performance (Jung & Wook, 2011).
Looking at the relationship between board composition and company performance, Guest
(2009) found that the more non-executive directors on a board, the more chance the directors
can identify and manage ineffective directors who are not working efficiently. Guest (2009) also
stated that the more non-executive directors there are on the board, the higher the chance that
those directors can sway the board to act in favour of shareholders interest.
Coles et al. (2008) found that when holding executive directors constant, Tobin’s Q (as a proxy
for company performance) increased with an increase in non-executive directors. This
strengthens the argument that a higher proportion of non-executive directors causes company
performance to increase. However, Cole et al. (2008) further noted that the most effective
proportion of non-executive directors and size of the board is dependent on the size of the
company, complexity, and need for company-specific knowledge. The more complex or large
the company, the better it is for it to have non-executive directors that can provide an outsiders
perspective and a larger range of skills required for decision making (Coles et al., 2008). The
optimal composition of the board would not be a set number for every company, as different
complexities and amounts of internal knowledge and skills are required.
The South African Context
According to King III, all South African listed companies should follow King III guidance on the
structure of the board of directors (South African Institute of Chartered Accountants, 2014).
This structure is that the board should consist of at least two executives (being the Chief
Executive Officer (CEO) and the Chief Financial Officer (CFO)), with the majority of the board
being non-executives, and the majority of the non-executives being independent (South
African Institute of Chartered Accountants, 2014). Therefore, to comply with King III, a
company should ensure that no matter how big its board is, the majority of the board should
2016 SAAA National Teaching and Learning and Regional Conference Proceedings
ISBN 978-0-620-74761-5
62
be non-executives. With this guidance, a company should have no less than five members (i.e.
executive and non-executive directors) on its board. With the majority being non-executives
there is likely to be a great deal of monitoring on company boards and objective decisions
being made (Horváth & Spirollari, 2012; South African Institute of Chartered Accountants,
2014). However, according to Klein (1998) there is also the risk that the more non-executives
there are, the less company-specific knowledge they have, leading to less effective decision
making – and lower company performance.
South African listed companies are labelled as some of the best governed companies in
emerging markets (Muchemwa, 2014). The benefits to complying with King III is that good
corporate governance increases investor trust in companies, which in turn allows them to
perceive the company as less risky and reduce the cost of equity, as they would expect a lower
rate of return (Bauer, Gunster, & Otten, 2003). Following a lower cost of equity, would be a
lower weighted average cost of equity, which would cause the company valuation to increase
(Bauer et al., 2003). Therefore, there appears to be a positive relationship between corporate
governance compliance and company performance.
Methodology The literature reviewed revealed unclear conclusions regarding the effect of board size on
company performance. Furthermore, much of the research is outdated and not in a South
African context, allowing this paper to determine the current outcome of this question in South
Africa.
The research question for this paper is thus: Does the size of the board of director’s impact the
performance of the company in South Africa?
The null (𝐻0) and alternative (𝐻1) and (𝐻2) hypotheses for this research question are as
follows:
𝐻0: There is no statistically significant relationship between the size of the board of directors
and the performance of the company.
𝐻1: There is a statistically significant positive relationship between the size of the board of
directors and the performance of the company.
𝐻2: There is a statistically significant negative relationship between the size of the board of
directors and the performance of the company.
Research Approach
In order to assess the relationship (if any) between the size of the board of directors and the
performance of the company, a sample of companies was selected for testing. This sample
consisted of all 40 companies listed on the JSE Top 40 Index as seen in Appendix A. This
sample was chosen as a replication of the Yermack (1996) and Kusnadi et al. (2005) studies,
which included the Forbes Top 100 companies. Furthermore, a range of prior studies done in
South Africa have shown the JSE Top 40 to be a suitable sampling population (Hearn, 2009;
Hindley, 2012; Mare & Wentzel, 2007).
2016 SAAA National Teaching and Learning and Regional Conference Proceedings
ISBN 978-0-620-74761-5
63
The most recent audited Annual Financial Statements available up until April 2015 were
sourced for each company, being the 2014-year-end results. Each company must have been
listed for a period of at least three consecutive years prior to the study. This would limit any
survivorship bias (Kusnadi & Maka, 2005). All of the JSE Top 40 companies selected had at
least three consecutive years on the JSE, thus they were all valid for the sample base.
Relying on prior literature from Kusnadi et al. (2005) and Guest (2009), company performance
was measured using Tobin’s Q. This measure hypothesises that the market value of the assets
should be equivalent to the book value (otherwise referred to as the replacement value). The
result of this ratio is used to demonstrate whether the assets are more or less ‘expensive’ on
the market relative to its replacement cost (i.e. a ratio above one indicates it is viewed as more
valuable on the market). The ratio is calculated as follows:
𝑇𝑜𝑏𝑖𝑛′𝑠 𝑄 = 𝑀𝑎𝑟𝑘𝑒𝑡 𝑉𝑎𝑙𝑢𝑒 𝐴𝑠𝑠𝑒𝑡𝑠
𝐵𝑜𝑜𝑘 𝑉𝑎𝑙𝑢𝑒 𝐴𝑠𝑠𝑒𝑡𝑠
𝑀𝑎𝑟𝑘𝑒𝑡 𝑉𝑎𝑙𝑢𝑒 𝐴𝑠𝑠𝑒𝑡𝑠
= 𝑀𝑎𝑟𝑘𝑒𝑡 𝐶𝑎𝑝𝑖𝑡𝑎𝑙𝑖𝑠𝑎𝑡𝑖𝑜𝑛 + 𝐵𝑜𝑜𝑘 𝑉𝑎𝑙𝑢𝑒 𝐿𝑖𝑎𝑏𝑖𝑙𝑖𝑡𝑖𝑒𝑠 + 𝑃𝑟𝑒𝑓𝑒𝑟𝑒𝑛𝑐𝑒 𝑆ℎ𝑎𝑟𝑒𝑠
The market value of assets was calculated by taking the market capitalisation at financial year-
end, the book value of the liabilities, and the liquidation value of the preference shares (Kusnadi
& Maka, 2005). This is due to a company’s assets being funded by equity (i.e. market
capitalisation and preference shares) and liabilities – so the total asset value can be calculated
by aggregating these factors. The reason for the use of book value liabilities is that prior
literature can support that the slight deviation from market value liabilities, which is used in the
original Tobin’s Q formula, would not be large enough to tamper with the final result (Chung &
Pruitt, 1994). This therefore allows an acceptable simplification in using book value (Chung &
Pruitt, 1994).
The liquidation value of the preference shares was calculated by taking the par value of the
equity preference shares (which was calculated as the number of shares in issue multiplied by
the par value of preference shares) from the Annual Financial Statements of each company.
This way of calculating the asset market value for Tobin’s Q is in line with the method followed
by Chung and Pruitt (1994).
The ‘Book Value Assets’ were taken directly from the Annual Financial Statements at their face
value.
It should be noted that the company’s market value can be linked to performance due to the
fact that when company performance increases, the share price in the market increases, which
in turn increases the company’s market capitalisation – and, therefore, its company value
(Kartika, Puspitasari, & Sudiyatno, 2012). This increases the argument by Kusnadi et al.
(2005) of the suitability of Tobin’s Q as the measurement for company performance.
2016 SAAA National Teaching and Learning and Regional Conference Proceedings
ISBN 978-0-620-74761-5
64
Research Method
An ordinary least squares ‘OLS’ regression analysis is performed to test for any relationship
between the size of the board of directors and the company’s performance. The company’s
performance, as measured by Tobin’s Q will be the dependent variable. Owing to the limited
sample of 40 companies, a maximum of three independent variables could be selected at any
time.
Multiple stage testing will be performed, with the first stage only including the size of the board
as the independent variable in order to initially test the 𝐻0. Following from that, the second and
third stage of testing will include two additional control variables. The first control variable will
be ROA, as it is often used as a measure for performance (Hawawini, Subramanian, & Verdin,
2001). In stage two, the second control variable will be the size of the company, as it appears
to have a large influence on company performance upon reviewing the relevant literature
(Coles et al, 2008; Horváth et al., 2012; Kusnadi et al., 2005). In stage three, this control
variable will be replaced with the proportion of non-executive directors, which was also found
to be influential in the literature reviewed (Coles et al., 2008; Guest, 2009; Horváth et al, 2012;
Kusnadi et al.,2005).
The formulae used to the 𝐻0, whilst controlling for other factors is as follows:
Test One:
Stage One:
𝐶𝑜𝑚𝑝𝑎𝑛𝑦 𝑃𝑒𝑟𝑓𝑜𝑟𝑚𝑎𝑛𝑐𝑒 = 𝐵𝑜𝑎𝑟𝑑 𝑆𝑖𝑧𝑒𝑥𝐴0 + 𝑒𝑖,𝑡
Stage Two:
𝐶𝑜𝑚𝑝𝑎𝑛𝑦 𝑃𝑒𝑟𝑓𝑜𝑟𝑚𝑎𝑛𝑐𝑒 = 𝐵𝑜𝑎𝑟𝑑 𝑆𝑖𝑧𝑒𝑥𝐴0 + 𝑅𝑂𝐴𝑥𝐴1 + 𝐶𝑜𝑚𝑝𝑎𝑛𝑦 𝑆𝑖𝑧𝑒𝐴2 + 𝑒𝑖,𝑡
Stage Three:
𝐶𝑜𝑚𝑝𝑎𝑛𝑦 𝑃er𝑓𝑜𝑟𝑚𝑎𝑛𝑐𝑒 = 𝐵𝑜𝑎𝑟𝑑 𝑆𝑖𝑧𝑒𝑥𝐴0 + 𝑅𝑂𝐴𝑥𝐴1 + 𝑁𝑜𝑛 𝐸𝑥𝑒𝑐𝑢𝑡𝑖𝑣𝑒 𝐷𝑖𝑟𝑒𝑐𝑡𝑜𝑟𝑠𝑥𝐴3 + 𝑒𝑖,𝑡
Where ‘𝑨𝟎−𝟓’ are the relationships between the control variables and the dependent variable
and ‘𝒆𝒊,𝒕′ is the residual (which contains random or fixed effects on company performance that
are not brought about by either of the three control variables).
Each variable used is measured as follows:
Company Performance is measured using Tobin’s Q as previously explained. This is in line
with prior papers, as discussed in the literature.
Return on assets ‘ROA’ is measured as the operating income over the total assets of each
company for each of its year-ends. This ratio represents how efficiently the company generates
income through the use of assets.
Company size is measured as the market capitalisation of each company at its financial year-
end, translated into ZAR if necessary at the ruling exchange rate at the reporting date. The
ruling exchange rate was sourced from the Reserve Bank, whilst the share prices at year-end
were taken from Bloomberg.
2016 SAAA National Teaching and Learning and Regional Conference Proceedings
ISBN 978-0-620-74761-5
65
Board size is measured as the total number of executive and non-executive directors in each
company at year-end.
Non-Executive Directors are measured as those directors not involved in the management
of the company (i.e. all directors that aren’t executives).
As this study is done in a South African context, the analysis will be further split up into the
effects of the independent variables on Tobin’s Q (i.e. company performance) within the
respective sectors in which each company operates (Ruland & Zhou, 2006). From the literature
reviewed, it was argued that the complexity of the company, the company size, and the
composition of the board can all influence company performance. Therefore, it is possible that
in different sectors, companies may be grouped into their level of complexity and structure,
etc. With this in mind it could be possible that when the companies are grouped into their
sectors, the size of the board could have different effects on the performance of the company.
The sectors that will be the focus of this study will be those that are the most common on the
JSE. According to the JSE SA Sector categories (2015), the three sectors, based on company
revenue, are Resources, Financials, and Industrials (i.e. other) (JSE, 2015).
Test Two:
𝐶𝑜𝑚𝑝𝑎𝑛𝑦 𝑃𝑒𝑟𝑓𝑜𝑟𝑚𝑎𝑛𝑐𝑒 = 𝐵𝑜𝑎𝑟𝑑 𝑆𝑖𝑧𝑒𝑥𝐴0 + 𝑆𝑒𝑐𝑡𝑜𝑟𝑇𝑦𝑝𝑒𝑥𝐴4 + 𝑒𝑖,𝑡
Results
Before analysing the results from the OLS regression, the average (mean) and range of the
boards are calculated to indicate their possible level of King III compliance. It should be noted
that a limitation of this study would be that by using the JSE Top 40, there would be a likelihood
of companies having similar structure and board size, which would skew the results. However,
the results from calculating the mean and range of the board showed that the sizes range from
9 to 21 members, with the average size of a board being 13,98, with a median of 13,5 members
(Appendix B). With King III in mind, the minimum number of directors on the board was 9
(above the minimum required of five) showing adherence to King III and thus being an indicator
of good corporate governance. This could, again, lead to a limitation of scope, as with the
minimum number of directors on the board being 9, it is unlikely that any of these companies
would not adhere to King III, whereas if one were to examine smaller companies a lack of
adherence may be more likely (as the board size would likely decline).
The impact of board size, and other factors, on company performance in three different stages,
is shown in Table 1.
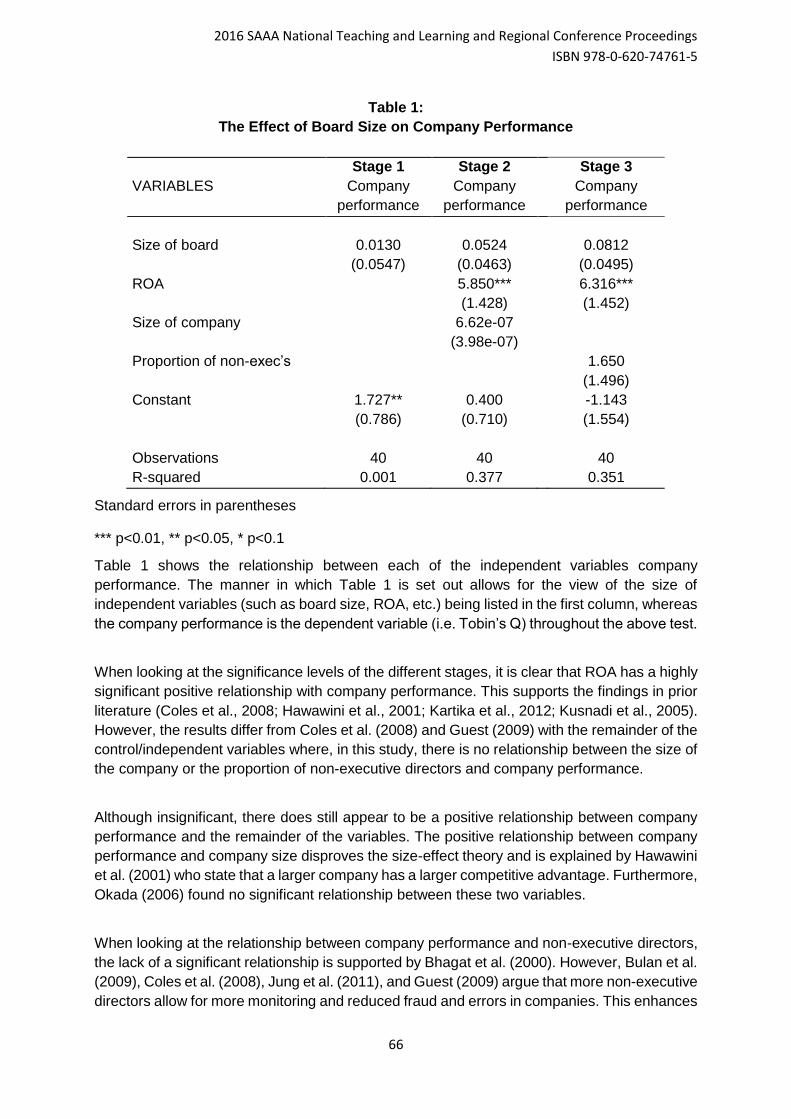
2016 SAAA National Teaching and Learning and Regional Conference Proceedings
ISBN 978-0-620-74761-5
66
Table 1:
The Effect of Board Size on Company Performance
Stage 1 Stage 2 Stage 3
VARIABLES Company
performance
Company
performance
Company
performance
Size of board 0.0130 0.0524 0.0812
(0.0547) (0.0463) (0.0495)
ROA 5.850*** 6.316***
(1.428) (1.452)
Size of company 6.62e-07
(3.98e-07)
Proportion of non-exec’s 1.650
(1.496)
Constant 1.727** 0.400 -1.143
(0.786) (0.710) (1.554)
Observations 40 40 40
R-squared 0.001 0.377 0.351
Standard errors in parentheses
*** p<0.01, ** p<0.05, * p<0.1
Table 1 shows the relationship between each of the independent variables company
performance. The manner in which Table 1 is set out allows for the view of the size of
independent variables (such as board size, ROA, etc.) being listed in the first column, whereas
the company performance is the dependent variable (i.e. Tobin’s Q) throughout the above test.
When looking at the significance levels of the different stages, it is clear that ROA has a highly
significant positive relationship with company performance. This supports the findings in prior
literature (Coles et al., 2008; Hawawini et al., 2001; Kartika et al., 2012; Kusnadi et al., 2005).
However, the results differ from Coles et al. (2008) and Guest (2009) with the remainder of the
control/independent variables where, in this study, there is no relationship between the size of
the company or the proportion of non-executive directors and company performance.
Although insignificant, there does still appear to be a positive relationship between company
performance and the remainder of the variables. The positive relationship between company
performance and company size disproves the size-effect theory and is explained by Hawawini
et al. (2001) who state that a larger company has a larger competitive advantage. Furthermore,
Okada (2006) found no significant relationship between these two variables.
When looking at the relationship between company performance and non-executive directors,
the lack of a significant relationship is supported by Bhagat et al. (2000). However, Bulan et al.
(2009), Coles et al. (2008), Jung et al. (2011), and Guest (2009) argue that more non-executive
directors allow for more monitoring and reduced fraud and errors in companies. This enhances
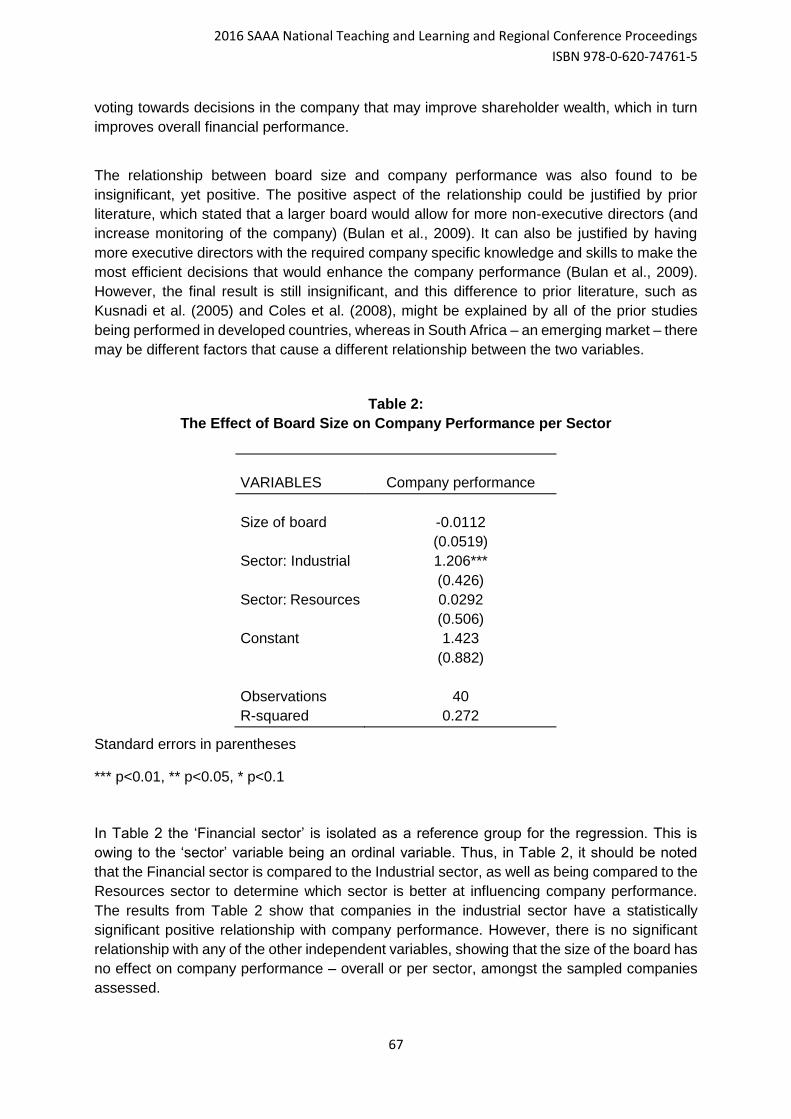
2016 SAAA National Teaching and Learning and Regional Conference Proceedings
ISBN 978-0-620-74761-5
67
voting towards decisions in the company that may improve shareholder wealth, which in turn
improves overall financial performance.
The relationship between board size and company performance was also found to be
insignificant, yet positive. The positive aspect of the relationship could be justified by prior
literature, which stated that a larger board would allow for more non-executive directors (and
increase monitoring of the company) (Bulan et al., 2009). It can also be justified by having
more executive directors with the required company specific knowledge and skills to make the
most efficient decisions that would enhance the company performance (Bulan et al., 2009).
However, the final result is still insignificant, and this difference to prior literature, such as
Kusnadi et al. (2005) and Coles et al. (2008), might be explained by all of the prior studies
being performed in developed countries, whereas in South Africa – an emerging market – there
may be different factors that cause a different relationship between the two variables.
Table 2:
The Effect of Board Size on Company Performance per Sector
VARIABLES Company performance
Size of board -0.0112
(0.0519)
Sector: Industrial 1.206***
(0.426)
Sector: Resources 0.0292
(0.506)
Constant 1.423
(0.882)
Observations 40
R-squared 0.272
Standard errors in parentheses
*** p<0.01, ** p<0.05, * p<0.1
In Table 2 the ‘Financial sector’ is isolated as a reference group for the regression. This is
owing to the ‘sector’ variable being an ordinal variable. Thus, in Table 2, it should be noted
that the Financial sector is compared to the Industrial sector, as well as being compared to the
Resources sector to determine which sector is better at influencing company performance.
The results from Table 2 show that companies in the industrial sector have a statistically
significant positive relationship with company performance. However, there is no significant
relationship with any of the other independent variables, showing that the size of the board has
no effect on company performance – overall or per sector, amongst the sampled companies
assessed.
2016 SAAA National Teaching and Learning and Regional Conference Proceedings
ISBN 978-0-620-74761-5
68
Discussion
The majority of the literature review that found significant relationships between the board size
and company performance were performed in developed economies. This might indicate that
the relationship is dependent on the developmental stage of the country, and this study in
South Africa would find variant results. Within emerging markets, markets are not as efficient,
thus investor information is not often reflected in the share price when it becomes newly
available (BlackRock, 2015). To explain the insignificant relationship using this information, it
is acknowledged that Tobin’s Q is used as one of the measurement variables, and Tobin’s Q
consists of market capitalisation. Thus, the lack of efficiency in transferring company
information into the market value could result in the lack of a statistically significant relationship
between the two variables – therefore, it would suggest reasoning’s behind the difference in
the relationship found between this study and prior literature. With this, emerging markets also
appear to have under-developed communication foundations compared to developed markets
(Khanna & Palepu, 1997). Therefore, it is inferred that the size of the board may have no
relationship with company performance as the size will not impact the ability to communicate
and make informed decisions due to emerging markets poor communication skills.
Another possible reason behind this difference is explained by Bauer et al. (2003) who suggest
that the constructs relationship is often stronger with companies that have less developed
governance standards. This suggests that a weaker relationship exists between company
performance and a more highly developed corporate governance standard (Bauer et al., 2003).
Thus, this could imply that having a strong corporate governance system could add little
increased performance for a company.
Furthermore, Klein (1998) noted that the higher the level of non-executive directors, the less
company specific knowledge they have that might be required. Most South African companies
are compliant with King III – giving them a higher proportion of non-executive directors. In
addition, there is the likelihood of a great deal of the JSE Top 40 companies being complex
due to their size and specialised nature (i.e. mining, financial, etc.). Therefore, there is the
possibility that the performance added due to the monitoring by non-executive directors could
be counteracted by the lack of company specific knowledge these directors have with regards
to decision making. This would cause the end result to be that there is no significant
relationship in either direction when it comes to board size and company performance. The
likelihood of this being the reason is strengthened due to the average proportion of non-
executive directors from the JSE Top 40 being 76% (Appendix B).
Conclusion
The results show that return on assets has a statistically significant positive relationship with
company performance, as measured by Tobin’s Q, which is in support of prior literature.
However, no statistically significant relationship between non-executive directors and company
performance, as well as company size and its performance was found, which is contrary to
prior literature. This was suggested to be owing to South Africa being an emerging market, as
emerging markets lack efficiency in communication and information transfer. Another possible
reason given was the high level of corporate governance in South Africa, which increases the
2016 SAAA National Teaching and Learning and Regional Conference Proceedings
ISBN 978-0-620-74761-5
69
monitoring effectiveness of the non-executive directors whilst counteracting the lack of
executives required for company specific skills and knowledge for decision-making. Finally,
the relationship between board size and company performance, which was undetermined,
appears to also show no statistically significant relationship.
In conclusion, there appears to be no significant relationship between board size and company
performance within the JSE Top 40 companies in South Africa. South Africa may have a high
level of corporate governance, but this is not linked to the performance of the company when
looking at board size in this case. Therefore, although the lack of corporate governance and
inefficient board size and composition had a large impact on the downfall of Enron and African
Bank, the suggestion in this study is that the incorrect board size may increase the chances of
‘unexpected’ failure of the company as was seen with these two situations, but the size of the
board will not cause a company’s performance to change significantly – i.e. a larger board size
will not be a factor in the increased profitability of the company.
Recommendations
The results of this study imply that incurring additional costs to obtain the most efficient and
objective board might not positively impact company performance in South Africa. Therefore it
is recommended that the size of the board be kept to a minimum but that King III considerations
should be complied with to ensure the company meets the standards of corporate governance.
A smaller board not only reduces total director remuneration, but also allows for prudency by
appointing only those directors that can increase company performance. The communication
between directors would also be more efficient. Therefore, a smaller, but flexible, board with
highly qualified staff is recommended whilst maintaining a high level of corporate governance.
Bibliography
Bauer, R., Gunster, N., & Otten, R. (2003). Empirical Evidence on Corporate Governance in
Europe. Journal of Asset Management, (October), 1–24. doi:10.2139/ssrn.444543
Bhagat, S., & Black, B. (2000). Board Independence and Long-Term Firm Performance.
Social Science Research Network Electriconic Journal, (February), 1–44. Retrieved
from
http://www.researchgate.net/profile/Sanjai_Bhagat/publication/228230283_The_Non-
Correlation_Between_Board_Independence_and_Long-
Term_Firm_Performance/links/004635307445468f0f000000.pdf
BlackRock. (2015). Capitalising on Market Inefficiencies in Global Stock Markets. Retrieved
June 5, 2015, from
https://www.blackrock.com/investing/resources/education/alternative-investments-
education-center/how-can-i-use-alternative-investments/capitalizing-on-market-
inefficiencies-in-global-stock-markets
Bulan, L., Snyal, P., & Zhipeng, Y. (2009). Directors, Outsiders and Efficiency: An Analysis of
How Board Characteristics Influence Firm Productivity. Journal of Economics and
2016 SAAA National Teaching and Learning and Regional Conference Proceedings
ISBN 978-0-620-74761-5
70
Business, (August), 1–38. Retrieved from
http://people.brandeis.edu/~lbulan/prodBoard.pdf
Chung, K. H., & Pruitt, S. W. (1994). A Simple Approximation of Tobin’s q. Journal of the
Financial Management. Memphis: Wiley. doi:10.2307/3665623
Coles, J. L., Daniel, N. D., & Naveen, L. (2008). Boards: Does one size fit all? Journal of
Financial Economics, 87(February), 329–356. doi:10.1016/j.jfineco.2006.08.008
Guest, P. M. (2009). The Impact of Board Size on Firm Performance: Evidence from the UK.
Journal of Asset Management, 15(4), 385–404. Retrieved from
https://dspace.lib.cranfield.ac.uk/bitstream/1826/4169/4/The_impact_of_board_size_on_
firm_performance.pdf
Hawawini, G., Subramanian, V., & Verdin, P. (2001). Is performance driven by industry - or
industry- or firm-specific factors? A new look at the evidence Venkat Subramanian Paul
Verdin. Strategic Management Journal, 24(January), 1–16. Retrieved from
http://www.readcube.com/articles/10.1002/smj.278?r3_referer=wol&tracking_action=pre
view_click&show_checkout=1&purchase_site_license=LICENSE_DENIED
Hearn, B. (2009). Liquidity estimation in major African equity markets. Journal of Economic
Literature, 44, 1–36. Retrieved from
http://stage.cassknowledge.com/sites/default/files/article-
attachments/173~~173_brucehearn_liquidity_estimation_in_major_african_equity_mark
ets.pdf
Hindley, A. T. (2012). Integrated reporting compliance with the Global Reporting Initiative
framework: An analysis of the South African mining industry. The International Business
& Economics Research Journal. North-West University. Retrieved from
http://dspace.nwu.ac.za/bitstream/handle/10394/8701/Hindley_AT.pdf?sequence=1
JSE. (2015). SA Sector. Retrieved June 5, 2015, from https://www.jse.co.za/services/market-
data/indices/ftse-jse-africa-index-series/sa-sector
Horváth, R., & Spirollari, P. (2012). Do the Board of Directors’ Characteristics Influence
Firm's Performance? The U.S. Evidence. Journal of Economic Literature, 4, 470–486.
Retrieved from http://www.vse.cz/polek/download.php?jnl=pep&pdf=435.pdf
Jung, J., & Wook, S. (2011). Effects of Independent and Friendly Outside Directors. Journal
of Economic Literature, 1–42. Retrieved from
http://www.ifc.org/wps/wcm/connect/5b21b30048a7e5bca34fe76060ad5911/Effects+of+
Independent+and+Friendly+Outside+Directors.pdf?MOD=AJPERES&CACHEID=5b21b
30048a7e5bca34fe76060ad5911
Kartika, A., Puspitasari, E., & Sudiyatno, B. (2012). The Company’s Policy, Firm
Performance, and Firm Value: An Empirical Research on Indonesia Stock Exchange.
American International Journal of Contemporary Research, 2(12), 30–40. Retrieved
from http://www.aijcrnet.com/journals/Vol_2_No_12_December_2012/4.pdf
2016 SAAA National Teaching and Learning and Regional Conference Proceedings
ISBN 978-0-620-74761-5
71
Maka, Y. T., & Kusnadi, Y. (2005). Size really matters: Further evidence on the negative
relationship between board size and firm value. Pacific-Basin Finance Journal, 13(3).
Retrieved from http://www.sciencedirect.com/science/article/pii/S0927538X04000733
Mare, E., & Wentzel, D. C. (2007). Extreme value theory – An application to the South
African equity market. Investment Analysts Journal, 36(66), 73–77. Retrieved from
http://www.iassa.co.za/wp-content/uploads/2009/06/0615WentzelMare66No5final.pdf
Muchemwa, M. R. (2014). The Relationship between Board Composition and Firm
Performance: A Study of South African Public Companies. University of the
Witwatersrand. Retrieved from
http://146.141.12.21/bitstream/handle/10539/15133/Raymond Research Report - Board
Composition and Firm Performance Final Report - corrected V1.pdf?sequence=2
Munzig, P. G. (2003). Enron and the Economics of Corporate Governance. Stanford
University. Retrieved from
http://economics.stanford.edu/files/Theses/Theses_2003/Munzig.pdf
Okada, K. (2006). Size Effect and Firm Size. Security Analysts Journal, 44(7), 1–24.
Retrieved from https://www.saa.or.jp/english/publications/kengoOkada.pdf
Pasour, E. C. J. (1981). The Free Rider as a Basis for Government Intervention. Journal of
Libertarian Studies, 5(4), 453–464. Retrieved from https://mises.org/library/free-rider-
basis-government-intervention-0
Ruland, W., & Zhou, P. (2006). Dividend Payout and Future Earnings Growth. Financial
Analysts Journal, 62(3). Retrieved from
http://www.cfapubs.org/doi/abs/10.2469/faj.v62.n3.4157
South African Institute of Chartered Accountants. (2014). King Report of Governance.
LexisNexis (Vol. 2D). South Africa.
Vinten, G. (2002). The corporate governance lessons of Enron. Corporate Governance: The
International Journal of Business in Society, 2(4), 4–9.
doi:10.1108/14720700210447632
Yermack, D. (1996). Higher Market Valuation of Companies with a Small Board of Directors.
Journal of Financial Economics, 40(2), 185–211. Retrieved from
http://www.fdp.hse.ru/data/086/482/1225/Sept 16 Higher market valuation of companies
with a small board of directors.pdf
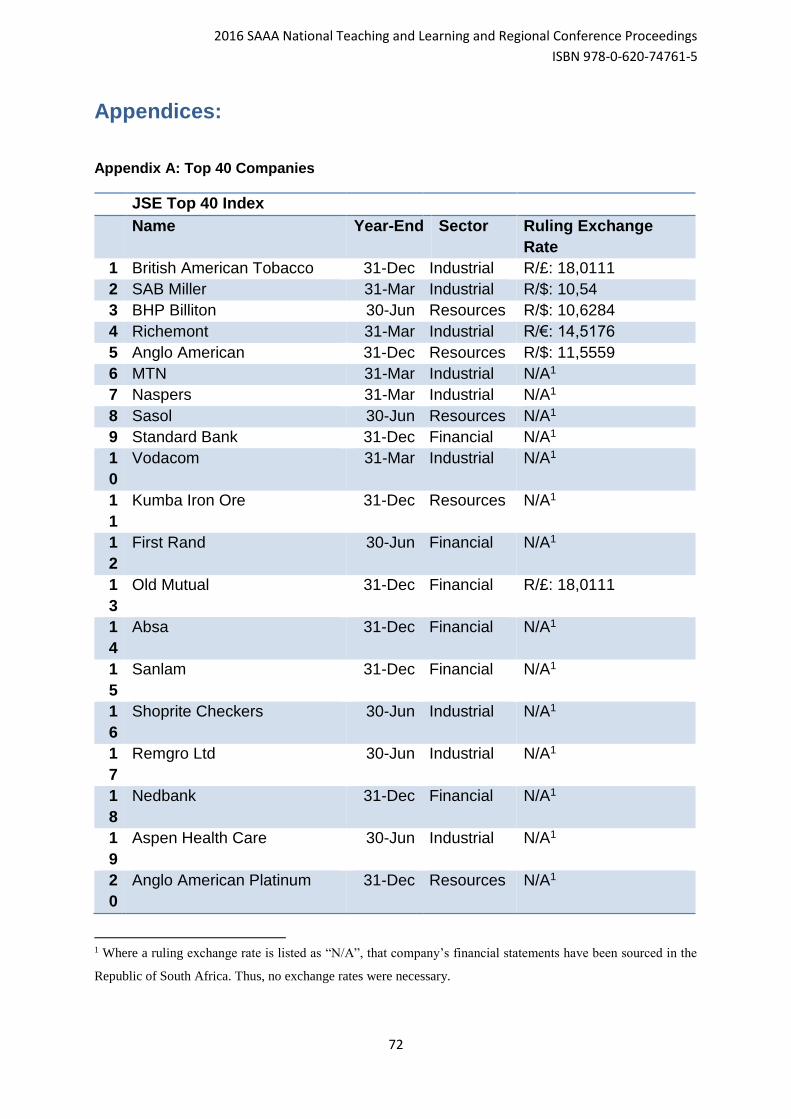
2016 SAAA National Teaching and Learning and Regional Conference Proceedings
ISBN 978-0-620-74761-5
72
Appendices:
Appendix A: Top 40 Companies
JSE Top 40 Index
Name Year-End Sector Ruling Exchange
Rate
1 British American Tobacco 31-Dec Industrial R/£: 18,0111
2 SAB Miller 31-Mar Industrial R/$: 10,54
3 BHP Billiton 30-Jun Resources R/$: 10,6284
4 Richemont 31-Mar Industrial R/€: 14,5176
5 Anglo American 31-Dec Resources R/$: 11,5559
6 MTN 31-Mar Industrial N/A1
7 Naspers 31-Mar Industrial N/A1
8 Sasol 30-Jun Resources N/A1
9 Standard Bank 31-Dec Financial N/A1
1
0
Vodacom 31-Mar Industrial N/A1
1
1
Kumba Iron Ore 31-Dec Resources N/A1
1
2
First Rand 30-Jun Financial N/A1
1
3
Old Mutual 31-Dec Financial R/£: 18,0111
1
4
Absa 31-Dec Financial N/A1
1
5
Sanlam 31-Dec Financial N/A1
1
6
Shoprite Checkers 30-Jun Industrial N/A1
1
7
Remgro Ltd 30-Jun Industrial N/A1
1
8
Nedbank 31-Dec Financial N/A1
1
9
Aspen Health Care 30-Jun Industrial N/A1
2
0
Anglo American Platinum 31-Dec Resources N/A1
1 Where a ruling exchange rate is listed as “N/A”, that company’s financial statements have been sourced in the
Republic of South Africa. Thus, no exchange rates were necessary.

2016 SAAA National Teaching and Learning and Regional Conference Proceedings
ISBN 978-0-620-74761-5
73
2
1
Bidvest 30-Jun Industrial N/A1
2
2
AngloGold Ashanti 30-Jun Resources R/$: 10,6284
Appendix A: Top 40 Companies (Continued)
2
3
Impala Platinum 30-Jun Resource
s
N/A1
2
4
Woolworths 30-Jun Industrial N/A1
2
5
Tiger Brands 30-Sep Industrial N/A1
2
6
Mediclinic 31-Mar Industrial N/A1
2
7
Exxaro 31-Dec Resource
s
N/A1
2
8
RMB 30-Jun Financial N/A1
2
9
Intu Properties PLC 31-Dec Industrial R/£: 18,0111
3
0
Growthpoint 30-Jun Industrial N/A1
3
1
Discovery Ltd 30-Jun Financial N/A1
3
2
Gold Fields 30-Jun Resource
s
R/$: 10,6284
3
3
Mondi Plc 31-Dec Industrial R/€: 13,9903
3
4
Steinhoff 30-Jun Industrial N/A1
3
5
Assore 30-Jun Resource
s
N/A1
3
6
Investec PLC 31-Mar Financial R/£: 17,5649
3
7
Massmart Holdings Ltd 31-Dec Industrial N/A1
3
8
Imperial Holdings 30-Jun Industrial N/A1
3
9
Truworths International 30-Jun Industrial N/A1
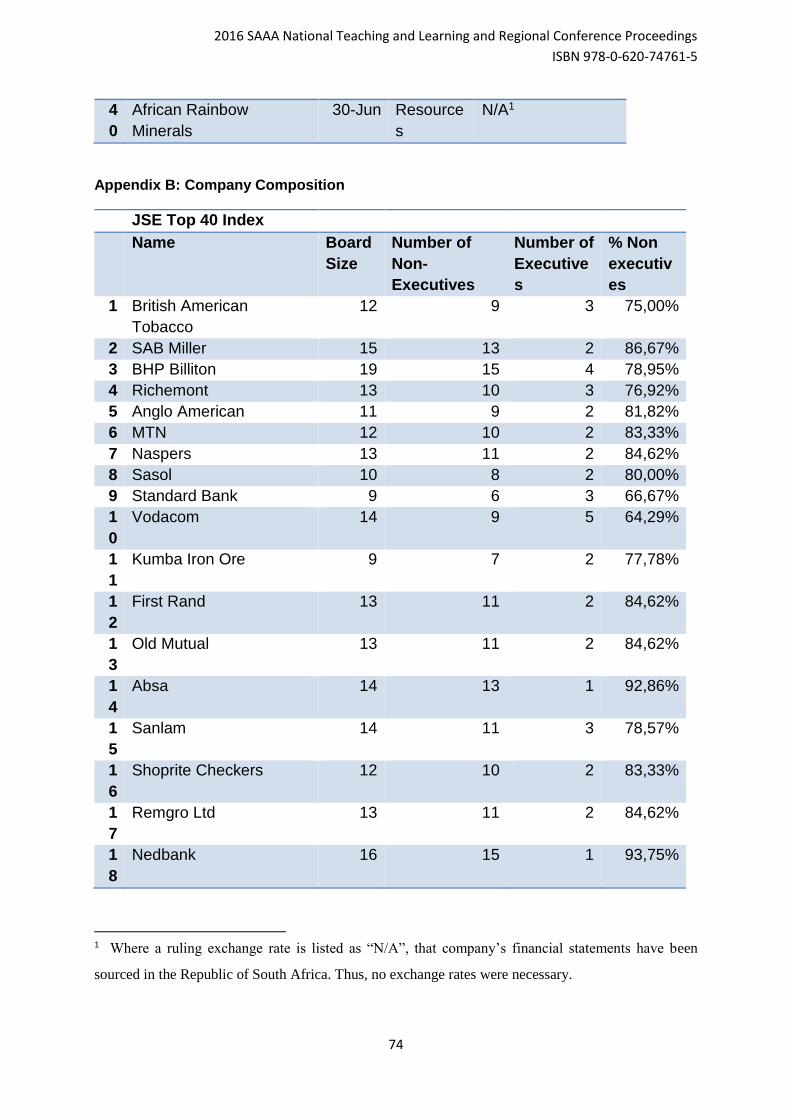
2016 SAAA National Teaching and Learning and Regional Conference Proceedings
ISBN 978-0-620-74761-5
74
4
0
African Rainbow
Minerals
30-Jun Resource
s
N/A1
Appendix B: Company Composition
JSE Top 40 Index
Name Board
Size
Number of
Non-
Executives
Number of
Executive
s
% Non
executiv
es
1 British American
Tobacco
12 9 3 75,00%
2 SAB Miller 15 13 2 86,67%
3 BHP Billiton 19 15 4 78,95%
4 Richemont 13 10 3 76,92%
5 Anglo American 11 9 2 81,82%
6 MTN 12 10 2 83,33%
7 Naspers 13 11 2 84,62%
8 Sasol 10 8 2 80,00%
9 Standard Bank 9 6 3 66,67%
1
0
Vodacom 14 9 5 64,29%
1
1
Kumba Iron Ore 9 7 2 77,78%
1
2
First Rand 13 11 2 84,62%
1
3
Old Mutual 13 11 2 84,62%
1
4
Absa 14 13 1 92,86%
1
5
Sanlam 14 11 3 78,57%
1
6
Shoprite Checkers 12 10 2 83,33%
1
7
Remgro Ltd 13 11 2 84,62%
1
8
Nedbank 16 15 1 93,75%
1 Where a ruling exchange rate is listed as “N/A”, that company’s financial statements have been
sourced in the Republic of South Africa. Thus, no exchange rates were necessary.
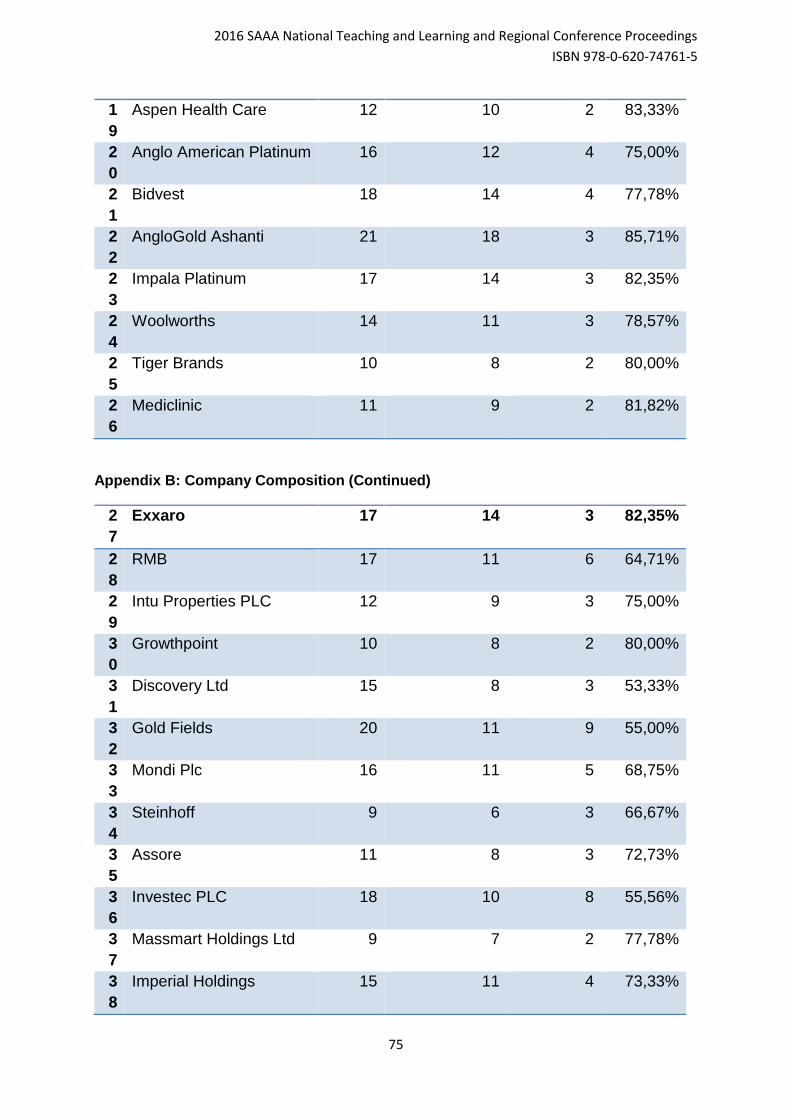
2016 SAAA National Teaching and Learning and Regional Conference Proceedings
ISBN 978-0-620-74761-5
75
1
9
Aspen Health Care 12 10 2 83,33%
2
0
Anglo American Platinum 16 12 4 75,00%
2
1
Bidvest 18 14 4 77,78%
2
2
AngloGold Ashanti 21 18 3 85,71%
2
3
Impala Platinum 17 14 3 82,35%
2
4
Woolworths 14 11 3 78,57%
2
5
Tiger Brands 10 8 2 80,00%
2
6
Mediclinic 11 9 2 81,82%
Appendix B: Company Composition (Continued)
2
7
Exxaro 17 14 3 82,35%
2
8
RMB 17 11 6 64,71%
2
9
Intu Properties PLC 12 9 3 75,00%
3
0
Growthpoint 10 8 2 80,00%
3
1
Discovery Ltd 15 8 3 53,33%
3
2
Gold Fields 20 11 9 55,00%
3
3
Mondi Plc 16 11 5 68,75%
3
4
Steinhoff 9 6 3 66,67%
3
5
Assore 11 8 3 72,73%
3
6
Investec PLC 18 10 8 55,56%
3
7
Massmart Holdings Ltd 9 7 2 77,78%
3
8
Imperial Holdings 15 11 4 73,33%

2016 SAAA National Teaching and Learning and Regional Conference Proceedings
ISBN 978-0-620-74761-5
76
3
9
Truworths International 21 11 10 52,38%
4
0
African Rainbow
Minerals
18 9 9 50,00%
2016 SAAA National Teaching and Learning and Regional Conference Proceedings
ISBN 978-0-620-74761-5
77
2016 Southern African Accounting
Association (SAAA)
National Teaching and Learning and
Regional Conference Proceedings
ISBN number: 978-0-620-74761-5
AUD 09: THE EFFECT OF CHANGES IN AUDITOR
REPORTING STANDARDS ON AUDIT QUALITY
Faatima Kholvadia
University of the Witwatersrand
ABSTRACT
The expectation and information gaps have driven many changes in the auditing profession
over the last few decades. These gaps combined with corporate collapses involving auditors
and the more recent financial crisis have called for changes to restore credibility to the auditing
profession. The response has been a series of changes to the auditing standards. The new
Framework on Audit Quality issued in 2013 is aimed at addressing performance deficiencies
in auditors thereby decreasing the expectation gap. The series of changes to reporting
standards issued in 2015 are designed to allow users to gain insights on the company through
the eyes of the auditor so as to reduce the expectations of users and bridge the information
gap. This paper analyses the impact of the changes in auditing standards on the expectation
and information gaps and audit quality. The method used was a literature review on the events
that precipitated the issue of the new auditor reporting standards and the Framework on Audit
Quality and a literature analysis of how these standards have bridged the expectation and
information gaps. The analysis found that as the Framework on Audit Quality is not prescriptive
and is dependent on the auditors’ commitment to quality while simultaneously promoting
transparency on audit quality, the Framework addresses only some components of the
expectation gap. The study further found that changes in reporting standards do not reduce
components of the expectation gap but reduce the information gap by providing entity-specific
information to users of the financial statements in the form of Key Audit Matters.
Keywords: audit quality, information gap, expectation gap, audit report
2016 SAAA National Teaching and Learning and Regional Conference Proceedings
ISBN 978-0-620-74761-5
78
INTRODUCTION
At the start of the millennium the auditing profession underwent global change
following the collapse of Enron and with it one of the largest auditing firms, Arthur
Andersen (Fisher, 2003). Litigation against Arthur Andersen created the need to
restore public confidence in the auditing profession. The result was the globalisation
and acceptance of International Standards on Auditing (ISA), specific independence
and ethical requirements and greater regulation for auditors (Fisher, 2003). Despite
these measures, which bolstered the reputation of the auditing profession, the spate
of lawsuits against audit firms since the demise of Arthur Andersen has spiked (Porter,
2009). Lawsuits against auditors most commonly follow corporate collapses or
corporate malpractice and arise from the auditors’ failure - either through poor quality
audits, negligence or fraud - to provide early warning signals to users (Porter, 2009).
The rise in lawsuits against auditors is attributed to the gap between auditors’
understanding of their function and the role users and society at large expects auditors
to play (Leung & Chau, 2001). This gap, called the ‘expectation gap’, is particularly
prevalent in users’ perceptions about the auditors’ ability to detect financial statement
fraud and the auditors’ responsibility regarding fraud under existing standards (IAASB,
2011). Prior academic research suggests that the expectation gap is a consequence
of the manner in which audit findings are communicated to users (IAASB, 2011). The
only communication from the auditor to the user is the current standardised audit
report, which does not explain the full extent of the audit effort (IAASB, 2011). Other
academic research indicates that user perceptions of audit quality are also impacted
by the communicative value of the audit report (IAASB, 2011). Due to the standardised
wording of the current audit report, the current audit report does little to influence or
change user perceptions about the extent of audit work performed and the quality of
the audit (IAASB, 2011).
Users of audited financial statements identify a gap between the information needed
to make investment and fiduciary decisions and the information available to them,
creating the ‘information gap’ (IAASB, 2011). This information gap impacts the
efficiency of capital markets and affects the allocation of scarce economic resources
(IAASB, 2011). While some research suggests that this relates to deficiencies in the
financial reporting framework adopted by the company, there is a perception that more
transparency about the audit performed and key areas of audit risk would narrow the
gap (IAASB, 2011).
The worldwide financial crisis of 2008 brought into question the role of the auditor
(Welch, 2010). While the financial crisis is not generally viewed as being triggered by
audit failure nor has deficient auditing standards been identified as a contributing
factor; changes in auditing standards and regulations are an inevitable response from
auditors to maintain their influence and enhance their credibility (The future of audits –
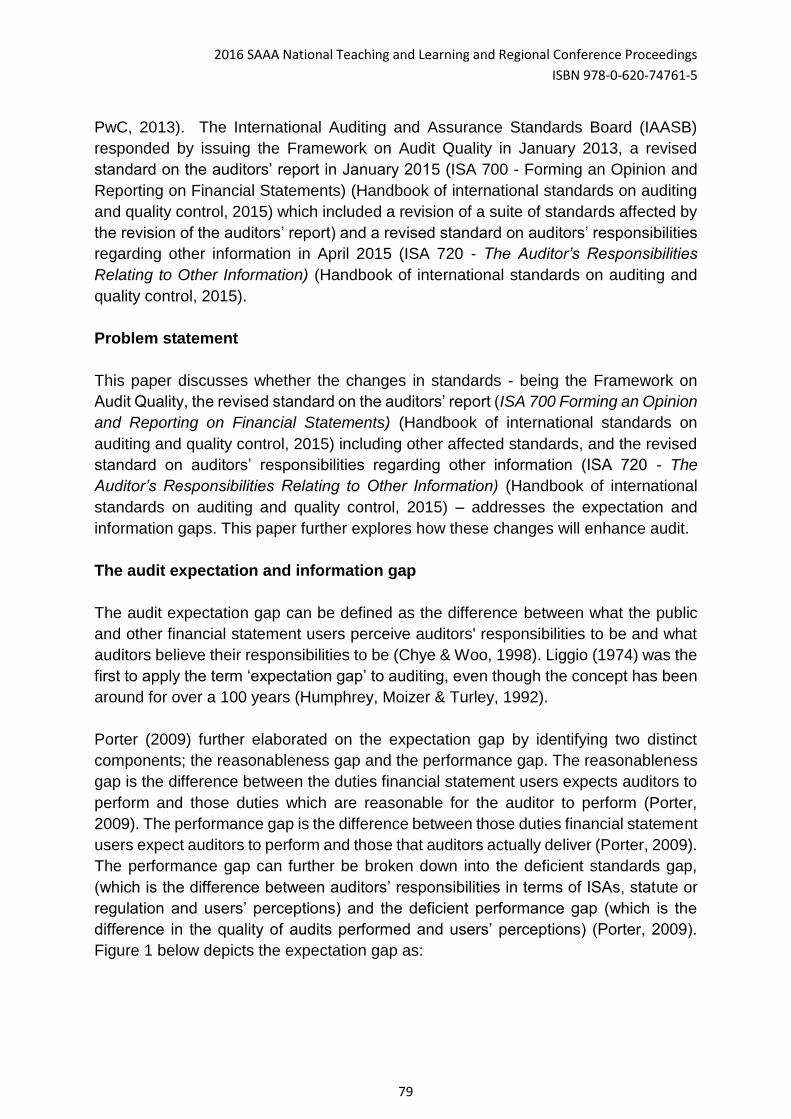
2016 SAAA National Teaching and Learning and Regional Conference Proceedings
ISBN 978-0-620-74761-5
79
PwC, 2013). The International Auditing and Assurance Standards Board (IAASB)
responded by issuing the Framework on Audit Quality in January 2013, a revised
standard on the auditors’ report in January 2015 (ISA 700 - Forming an Opinion and
Reporting on Financial Statements) (Handbook of international standards on auditing
and quality control, 2015) which included a revision of a suite of standards affected by
the revision of the auditors’ report) and a revised standard on auditors’ responsibilities
regarding other information in April 2015 (ISA 720 - The Auditor’s Responsibilities
Relating to Other Information) (Handbook of international standards on auditing and
quality control, 2015).
Problem statement
This paper discusses whether the changes in standards - being the Framework on
Audit Quality, the revised standard on the auditors’ report (ISA 700 Forming an Opinion
and Reporting on Financial Statements) (Handbook of international standards on
auditing and quality control, 2015) including other affected standards, and the revised
standard on auditors’ responsibilities regarding other information (ISA 720 - The
Auditor’s Responsibilities Relating to Other Information) (Handbook of international
standards on auditing and quality control, 2015) – addresses the expectation and
information gaps. This paper further explores how these changes will enhance audit.
The audit expectation and information gap
The audit expectation gap can be defined as the difference between what the public
and other financial statement users perceive auditors' responsibilities to be and what
auditors believe their responsibilities to be (Chye & Woo, 1998). Liggio (1974) was the
first to apply the term ‘expectation gap’ to auditing, even though the concept has been
around for over a 100 years (Humphrey, Moizer & Turley, 1992).
Porter (2009) further elaborated on the expectation gap by identifying two distinct
components; the reasonableness gap and the performance gap. The reasonableness
gap is the difference between the duties financial statement users expects auditors to
perform and those duties which are reasonable for the auditor to perform (Porter,
2009). The performance gap is the difference between those duties financial statement
users expect auditors to perform and those that auditors actually deliver (Porter, 2009).
The performance gap can further be broken down into the deficient standards gap,
(which is the difference between auditors’ responsibilities in terms of ISAs, statute or
regulation and users’ perceptions) and the deficient performance gap (which is the
difference in the quality of audits performed and users’ perceptions) (Porter, 2009).
Figure 1 below depicts the expectation gap as:
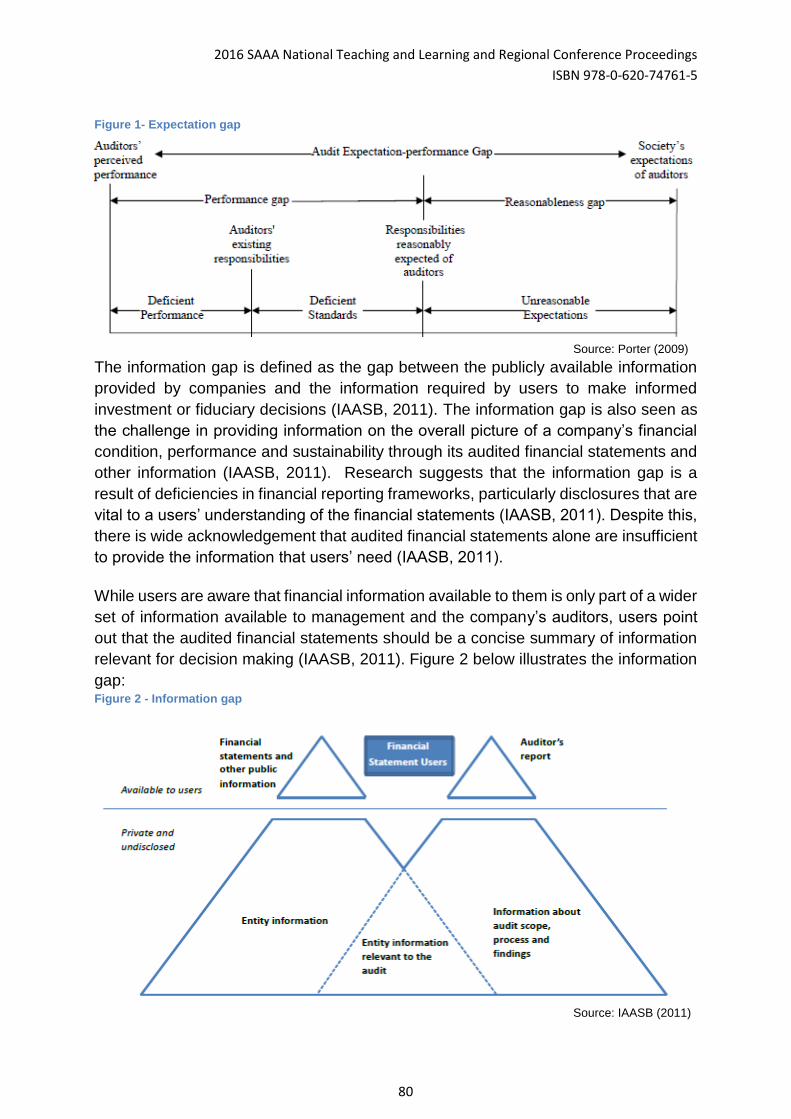
2016 SAAA National Teaching and Learning and Regional Conference Proceedings
ISBN 978-0-620-74761-5
80
Figure 1- Expectation gap
Source: Porter (2009)
The information gap is defined as the gap between the publicly available information
provided by companies and the information required by users to make informed
investment or fiduciary decisions (IAASB, 2011). The information gap is also seen as
the challenge in providing information on the overall picture of a company’s financial
condition, performance and sustainability through its audited financial statements and
other information (IAASB, 2011). Research suggests that the information gap is a
result of deficiencies in financial reporting frameworks, particularly disclosures that are
vital to a users’ understanding of the financial statements (IAASB, 2011). Despite this,
there is wide acknowledgement that audited financial statements alone are insufficient
to provide the information that users’ need (IAASB, 2011).
While users are aware that financial information available to them is only part of a wider
set of information available to management and the company’s auditors, users point
out that the audited financial statements should be a concise summary of information
relevant for decision making (IAASB, 2011). Figure 2 below illustrates the information
gap: Figure 2 - Information gap
Source: IAASB (2011)
2016 SAAA National Teaching and Learning and Regional Conference Proceedings
ISBN 978-0-620-74761-5
81
Method
The following sections will discuss whether the Framework on Audit Quality as issued
by the IAASB in January 2013 addresses the expectation performance gap (deficient
performance and deficient standards gap) and whether the revised standard on the
auditor’s report (ISA 700 - Forming an Opinion and Reporting on Financial Statements)
(Handbook of international standards on auditing and quality control, 2015) and the
revised standard on auditors’ responsibilities regarding other information (ISA 720 -
The Auditor’s Responsibilities Relating to Other Information) (Handbook of
international standards on auditing and quality control, 2015) addresses the
expectation reasonableness gap and the information gap. The discussion is based
solely on review of the above literature.
The Framework on Audit Quality
The Framework on Audit Quality was issued in January 2013 by the IAASB in response
to the financial crisis of 2008 which highlighted the critical importance of high-quality
and credible financial information (IAASB, 2013). One of the objectives of the
Framework on Audit Quality is to challenge auditors on how they can increase audit
quality (IAASB, 2013). Another objective is to prompt discussion on whether there are
areas in the currently issued ISAs and International Standard on Quality Control
(ISQC) 1 which require revision (IAASB, 2013).
This far no globally recognised and accepted definition or analysis of audit quality
exists, mostly due to its complexity and multi-faceted nature (IAASB, 2013). The
IAASB’s definition of audit quality is described as:
‘…a quality audit is likely to be achieved when the auditors’ opinion on the
financial statements can be relied upon as it was based on sufficient,
appropriate audit evidence obtained by an engagement team that: exhibited
appropriate values, ethics and attitudes; was sufficiently knowledgeable and
experienced and had sufficient time allocated to perform the audit work; applied
a rigorous audit process and quality control procedures; provided valuable and
timely reports; and interacted appropriately with a variety of stakeholders.’
(IAASB, 2013)
As can be seen from the above definition, many factors contribute to a quality audit
being performed (IAASB, 2013). The Framework on Audit Quality describes the input,
processes and output factors which affect audit quality and also demonstrate the
importance of interactions with stakeholders and contextual factors (IAASB, 2013).
These will be discussed in more detail below.
Inputs
2016 SAAA National Teaching and Learning and Regional Conference Proceedings
ISBN 978-0-620-74761-5
82
Inputs refer to the qualities an auditor takes into the audit such as the knowledge, skill
and experience and includes the values, ethics and attitudes of each auditor (IAASB,
2013). Another input to audit quality is the time available for the audit team to complete
the audit and is influenced by the culture in an audit firm (IAASB, 2013).
Deficient audit performance occurs when there is a deterioration of input qualities at
an audit engagement, audit firm or national level (IAASB, 2013). For example, poor
quality audits would result if audit teams are not adequately staffed in terms of relevant
levels of knowledge, skills and experience, and if audit firms incentivise staff based on
recoveries (which would result in audit teams compromising quality to achieve targeted
recoveries) and if regulators perform infrequent reviews (IAASB, 2013).
Processes
The audit process is fundamental to the quality of the audit but is dependent on the
quality of the inputs (IAASB, 2013). Factors that influence audit quality processes at
the audit engagement level are compliance with ISAs and ISQC1 and interactions
between the audit team and experts (IAASB, 2013). Interactions between the audit
team and management are also crucial to a quality audit process as this will determine
the efficiency and effectiveness of an audit (IAASB, 2013).
Audit firms promote compliance with auditing standards and quality control standards
by ensuring that firm methodology and practices complies with these standards
(IAASB, 2013). However, deficient audit performance still occurs even if firm
methodology and performance complies with ISAs and ISQC 1, due to the high level
of judgement exercised by auditors (IAASB, 2013).
Nationally, standard setters influence audit quality by making clear the minimum audit
requirements and the underlying objectives of those requirements (IAASB, 2013).
Regulators can influence audit quality by inspecting compliance with standards and
also challenging judgements made by auditors (Redmayne & Bradbury, 2010).
Disciplinary action meted out by regulators to auditors for poor judgements and non-
compliance with ISAs may provide an incentive to audit firms to increase quality
(Redmayne & Bradbury, 2010; IAASB, 2014).
Outputs
Outputs at an audit engagement level are the only tangible documents widely available
from which audit quality can be deduced (IAASB, 2013). These include outputs from
the auditor such as the audit report, reports to Those Charged With Governance,
reports to management and reports to financial and prudential regulators; outputs from
the entity such as audited financial statements and reports from Those Charged With
Governance (like Audit Committees); and outputs from regulators on individual audits
(IAASB, 2013).
2016 SAAA National Teaching and Learning and Regional Conference Proceedings
ISBN 978-0-620-74761-5
83
The audit report is not considered to be an indicator of audit quality due to its generic
nature, however, the revision of ISA 700 - Forming an Opinion and Reporting on
Financial Statements (Handbook of international standards on auditing and quality
control, 2015) has seen the inclusion of Key Audit Matters which will provide users with
the auditor’s insight into matters of audit significance and may enhance audit quality
(Redmayne & Bradbury, 2010). The auditors’ reports to Those Charged With
Governance and management are not widely available but robust and elaborate
disclosures in these reports influence perceptions of audit quality (IAASB, 2013).
Users of audited annual financial statements deduce audit quality from the quality of
the financial statements (IAASB, 2013). Financial statements which contain
arithmetical errors, inconsistencies and vague disclosure may lead users to deduce
that a poor quality audit was performed (IAASB, 2103). Financial statements which are
restated for changes in estimates or to correct prior period errors are not differentiated
and are often perceived by users to be as a result of audit failure (IAASB, 2013).
Outputs at an audit firm and national level include transparency reports, annual and
other reports and aggregate results of firm inspections (IAASB, 2013). The more widely
available these reports, the greater their influence on audit quality (IAASB, 2013).
Key interactions with the financial reporting supply chain
As part of the audit process, this paper mentioned interactions between the auditor and
management as crucial to audit quality (IAASB, 2013). There are several other key
interactions, namely interactions between the auditor and Those Charged With
Governance, users and regulators; interaction between management and Those
Charged With Governance, users and regulators; interactions between Those Charged
With Governance and users and regulators; and interactions between users and
regulators (IAASB, 2013).
Most of these interactions are already in existence, some in more detailed capacity
than others which creates potential for each of these interactions to be improved and
to specifically include an agenda of audit quality (IAASB, 2013). Meaningful
interactions between all parties listed strengthen the cohesion of the audit process and
may be the first step in reducing the information gap (IAASB, 2013).
Contextual factors
There are several contextual factors affecting audit quality which vary from jurisdiction
to jurisdiction depending on the sophistication of the economy and the business culture
(Francis, 2011). Contextual factors include business practices and commercial law,
laws and regulations relating to financial reporting, the applicable financial reporting
framework, corporate governance, information systems, broader cultural factors,
financial reporting timelines, attracting talent, litigation environment and audit
2016 SAAA National Teaching and Learning and Regional Conference Proceedings
ISBN 978-0-620-74761-5
84
regulation (IAASB, 2013). All these factors lead to varied perceptions about audit
quality (IAASB, 2013).
The Framework on Audit Quality was not issued as guidance or as a prescriptive
standard which should be applied by all auditors, but rather a departure point from
where auditors can reflect on the quality of their current audits and use those reflections
to engage within the audit firm and with stakeholders outside the audit firm on how to
improve the quality of audits (IAASB, 2013). As such The Framework on Audit Quality
addresses the expectation performance gap by promoting the transparency of the audit
process through formal conceptualisation of the factors which influence both users’
perceptions of audit quality and audit quality itself.
The revised ISA 700 - Forming an Opinion and Reporting on Financial
Statements and affected standards
Until the 1990’s, the auditing profession sought to address expectation reasonableness
gap of financial statement users through educating users about the nature and
limitations of an audit (Porter, 2009). The standard auditors’ report was used as a tool
to educate users (Porter, 2009). Before 1988, the ‘short form’ audit report did little more
than identify the financial statements which had been audited and expressed the audit
opinion thereon (Porter, 2009).
In 1988, the Cohen Commission sought to educate users and reduce the expectation
reasonableness gap and recommended the introduction of the ‘long form’ audit report
which included a paragraph explaining the respective responsibilities of the auditees
management and the auditor for the financial statements (Porter, 2009). By the 1990’s
the long form report was widely adopted and became the international norm (Porter,
2009). Research on whether the long form report met its educational objectives found
that users had an increased understanding of the auditors’ role and function in financial
reporting (Porter, 2009). Critics, however, questioned whether a few sentences in an
audit adequately conveyed the essence of the audit process (Porter, 2009).
The long form audit report was expanded further over the years, particularly with
regards to the auditors’ responsibilities and new requirements by company law and
stock exchange listings making the audit report long and complex (Porter, 2009). In
2004, the IAASB issued a revised ISA 700 (Revised) – The Independent Auditors
Report on a Complete Set of Financial Statements (Handbook of international
standards on auditing and quality control, 2015). The revised report had a two-part
structure; the first relating to the audit of the financial statements, and the second to
the auditors’ legal and regulatory responsibilities (Porter, 2009). In addition to the two-
part structure the word ‘independent’ was introduced in the title of the audit report and
the description of the audit process was expanded to include that the selection of audit
2016 SAAA National Teaching and Learning and Regional Conference Proceedings
ISBN 978-0-620-74761-5
85
procedures involved auditor judgement and that the auditor considers internal control
relevant to the financial statements when designing audit procedures (Porter, 2009).
Critics of the revised auditors report were mainly concerned about the continued
standardised wording which did not differ from year to year or from company to
company and made shareholders feel excluded from what they perceived to be the
‘real’ findings of the audit (Porter, 2009). The audit report had come to be treated as a
symbol, rather than read as Porter (2009) quotes one critic:
‘One effect of using a standard report is that as a person becomes familiar with
its words, he tends to stop reading it each time he sees it. He relies on his
memory of what it says and his impression of what it means and merely glances
to see that it is included and that it does not contain a departure from the usual
language, that is, an exception. The entire report comes to be interpreted as a
single, although complex, symbol that is no longer read.’
Research conducted on auditor reporting after 2004 found that shareholders believed
that they should be provided with much of the information auditors provide to the Audit
Committee which included: more information about emphases of matter and
references to uncertainties and future risk; discussion of material issues encountered
during the audit and how they were resolved; tailored company-specific information
rather than standardised reports; discussion of alternative accounting treatments
considered and the reasons for selecting the treatments adopted; and more
information on material areas of judgement and difficult, sensitive or contentious issues
(Porter, 2009). There was also a call for the auditor to make more positive statements
in the audit report, such as ‘adequate accounting records have been kept’ (Porter,
2009). Another research recommendation was to change the format of the auditor
report so that important information such as the audit opinion would be displayed first
(Porter, 2009).
Further research conducted on the audited report found that detailed explanations in
the audit report of auditor and management responsibilities as well as the nature,
scope and procedures of the audit did not reduce the expectation gap (Gold,
Gronewold & Pott, 2012). This indicated that either explanations need to be more
explicitly or clearly formulated or that users’ perceptions were not influenced by
explanations in the audit report (Gold et.al, 2012). The latter indication is supported
by Gray, Turner, Coram & Mock (2011) who found that financial statement users only
consider the actual opinion and disregard all other information, which suggests wording
changes in the audit report is not the solution to reducing the expectation gap.
The new auditors report was issued in January 2015 as a revision to ISA 700 - Forming
an Opinion and Reporting on Financial Statements, and with it one new standard was
issued being ISA - 701 Communicating Key Audit Matters in the Independent Auditor’s
Report in response the call for the auditor’s report to be more informative and relevant
2016 SAAA National Teaching and Learning and Regional Conference Proceedings
ISBN 978-0-620-74761-5
86
(IAASB, 2015a). Four other standards were revised as a result; namely, ISA 705 -
Modifications to the Opinion in the Independent Auditor’s Report, ISA 706 - Emphasis
of Matter Paragraphs and Other Matter Paragraphs in the Independent Auditor’s
Report, ISA 720 The Auditor’s Responsibilities Relating to Other Information, ISA 570
Going Concern and ISA 260 Communication with Those Charged with Governance
(Handbook of international standards on auditing and quality control, 2015; IAASB,
2015a).
Key changes in the new auditors’ report are split between those applicable only to
listed entities and those applicable to all entities (IAASB, 2015a). Changes pertaining
to listed entities are the introduction of a new section to communicate non-standard,
Key Audit Matters (KAM) which the auditor judges to be of most significance for the
current year audit; and disclosure of the name of the engagement partner responsible
for the audit in the signature (IAASB, 2015a). Changes which apply to all entities are:
a restructuring of the audit report which allows the audit opinion section to be presented
first; followed by the Basis of Opinion section to allow prominence to the opinion;
enhanced reporting over going concern; a positive statement confirming the auditors’
independence and fulfilment of ethical responsibilities; and enhanced description of
the responsibilities of the auditor (IAASB, 2015a).
The introduction of KAM has emphasised the debate of consistency versus relevance
as KAM’s will differ from entity to entity (IAASB, 2015a). The IAASB has acknowledged
that there should be consistency in determining which matters should be reported as
KAM, whilst the communication of KAM should be as entity-specific and relevant as
possible (IAASB, 2015a). ISA 701 Communicating Key Audit Matters in the
Independent Auditor’s Report aids this by setting out a decision framework for auditors
with the starting point being the communication with those charged with governance
(IAASB, 2015a). From the matters communicated to those charged with governance,
the auditor should determine those matters which required significant auditor attention,
paying particular attention to: areas of higher material misstatement or areas of
significant risk as determined using ISA 315 (Revised) - Identifying and Assessing the
Risks of Material Misstatement through Understanding the Entity and Its Environment;
significant auditor judgement on areas in the financial statements over which
management exercised significant judgement, particularly areas of high estimation
uncertainty; and significant transactions or events that occurred during the year
(IAASB, 2015a). KAM are therefore the most significant matters that required audit
attention during the year and the auditors’ process at determining a KAM is depicted
in Figure 3 below (IAASB, 2015a):
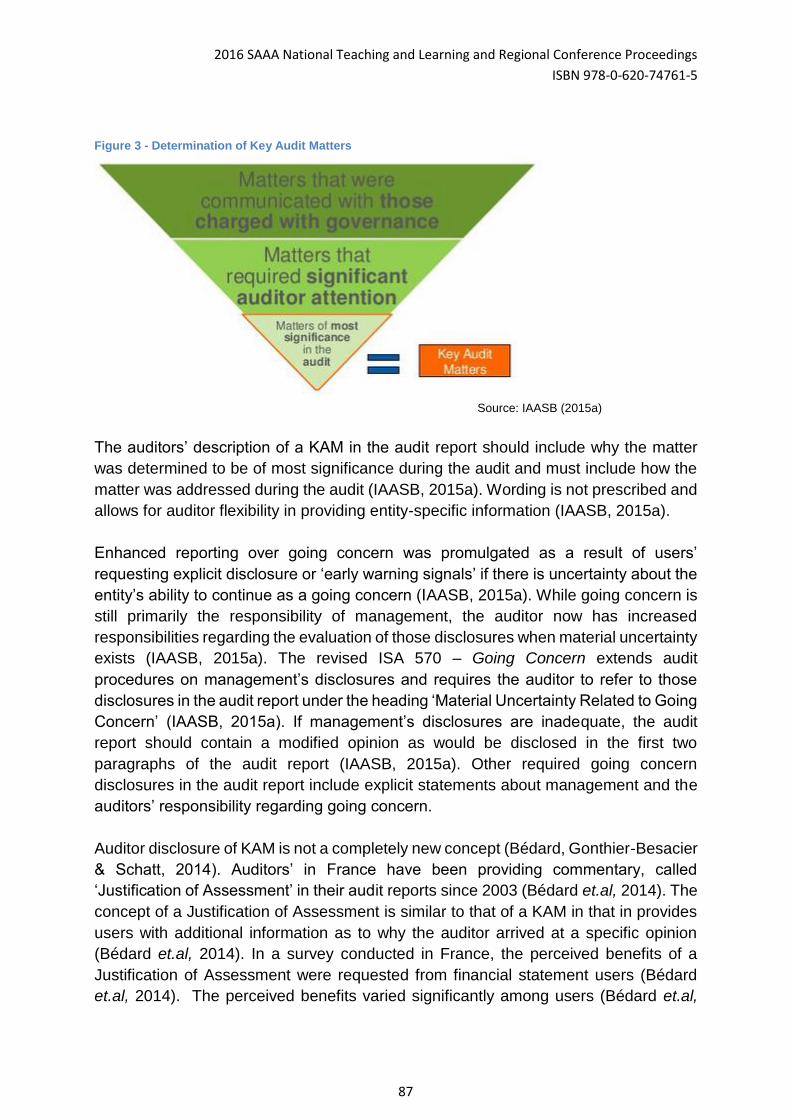
2016 SAAA National Teaching and Learning and Regional Conference Proceedings
ISBN 978-0-620-74761-5
87
Figure 3 - Determination of Key Audit Matters
Source: IAASB (2015a)
The auditors’ description of a KAM in the audit report should include why the matter
was determined to be of most significance during the audit and must include how the
matter was addressed during the audit (IAASB, 2015a). Wording is not prescribed and
allows for auditor flexibility in providing entity-specific information (IAASB, 2015a).
Enhanced reporting over going concern was promulgated as a result of users’
requesting explicit disclosure or ‘early warning signals’ if there is uncertainty about the
entity’s ability to continue as a going concern (IAASB, 2015a). While going concern is
still primarily the responsibility of management, the auditor now has increased
responsibilities regarding the evaluation of those disclosures when material uncertainty
exists (IAASB, 2015a). The revised ISA 570 – Going Concern extends audit
procedures on management’s disclosures and requires the auditor to refer to those
disclosures in the audit report under the heading ‘Material Uncertainty Related to Going
Concern’ (IAASB, 2015a). If management’s disclosures are inadequate, the audit
report should contain a modified opinion as would be disclosed in the first two
paragraphs of the audit report (IAASB, 2015a). Other required going concern
disclosures in the audit report include explicit statements about management and the
auditors’ responsibility regarding going concern.
Auditor disclosure of KAM is not a completely new concept (Bédard, Gonthier-Besacier
& Schatt, 2014). Auditors’ in France have been providing commentary, called
‘Justification of Assessment’ in their audit reports since 2003 (Bédard et.al, 2014). The
concept of a Justification of Assessment is similar to that of a KAM in that in provides
users with additional information as to why the auditor arrived at a specific opinion
(Bédard et.al, 2014). In a survey conducted in France, the perceived benefits of a
Justification of Assessment were requested from financial statement users (Bédard
et.al, 2014). The perceived benefits varied significantly among users (Bédard et.al,
2016 SAAA National Teaching and Learning and Regional Conference Proceedings
ISBN 978-0-620-74761-5
88
2014). Some of the advantages of Justification of Assessment disclosures included:
an increased in the communicative value of the audit report and a complement to the
nature of the audit opinion; assisted users in navigating complex and voluminous
financial statements; alerted readers to the more judgemental areas in the financial
statements; and enabled the auditor to better explain the focus of the audit (Bédard
et.al, 2014). Among the disadvantages of the Justification of Assessment disclosures
were: the technical language of the disclosures made it difficult for users’ not schooled
in accounting and financial reporting to understand what was being said; were
sometimes complex to read; and became standardised over time in relation to an
entity. The survey further indicated that auditors should be careful not to provide
information already disclosed in the financial statements which means that the auditor
would need to engage extensively with management and those charged with
governance to clear disclosures in the audit report (Bédard et.al, 2014).
By expanding the auditors reporting responsibilities, particularly with regards to KAM
and going concern, the auditor may be forced to focus on these issues which are critical
to users’ understanding of the financial statements, thereby enhancing perceptions of
audit quality (IAASB, 2011). Critics have debated the benefit of additional reporting
disclosures versus the cost to the auditor and have concluded that even though there
are no changes in the scope of the audit, the additional reporting responsibilities
increase cost (IAASB, 2011). If these increased costs do not translate to higher fees,
it may create pressure to reduce work in other areas thereby negatively impacting audit
quality (IAASB, 2011).
The inclusion of KAM in the new audit report is a measure to reduce the information
gap and provide transparency in the audit process (IAASB, 2011). Users’ are able to
make more informed decisions as a result of a better understanding of corporate
reporting using specific information about the entity as provided by the auditor (IAASB,
2011). There is, however, concern that additional information may cloud, instead of
clear, users’ understanding of the entity by adding to the complex and voluminous
information already provided (IAASB, 2011). KAM, if disclosed properly, should
improve the quality of information received by users rather than just its quantity (IAASB,
2011). Another concern is that the additional disclosures by the auditor in the audit
report may widen the expectation gap, however, this may be mitigated by greater
transparency about the audit process which would improve perceptions about audit
quality as well (IAASB, 2011). For example, if users were informed through a KAM
about a significant area of auditor judgement in the financial statements, and the
thought process followed by the auditor in arriving at the judgement, the user would
have a better understanding of the audit opinion on the financial statements as a whole
as well as a better perception on the quality of the audit that was conducted (IAASB,
2011).
2016 SAAA National Teaching and Learning and Regional Conference Proceedings
ISBN 978-0-620-74761-5
89
The revised ISA 720 - The Auditor’s Responsibilities Relating to Other
Information
Other information refers to:
‘… information that accompanies financial statements as part of an entity’s
financial reporting. It explains the main trends and factors underlying the
development, performance and position of the entity’s business during the
period covered by the financial statements. It also explains the main trends and
factors that are likely to affect the entity’s future development, performance and
position’ (IASB, 2005 p.15)
The provision of other information is in response to concerns from financial statement
users that financial statements do not provide sufficient information to enable them to
understand the performance and position of modern companies (Rowbottom & Lymer,
2010). The most common examples of other information are the Management
Discussion and Analysis (MD&A) required by Securities Exchange Commission in the
United States and Operating and Financial Review (OFR) required by the London
Stock Exchange in the United Kingdom (Rowbottom & Lymer, 2010). The collapse of
Enron in the early 2000’s prompted regulatory responses from stock exchanges which
lead to revisions in narrative reporting guidance in an attempt to strengthen corporate
reporting (Rowbottom & Lymer, 2010). The enactment of Sarbanes Oxley legislation
in 2002 resulted in an increase in the scope, content and disclosures of the MD&A
(Rowbottom & Lymer, 2010).
Over the last few years, there has been significant development in corporate reporting,
especially with regards to the extent of other information contained in the annual report
(IAASB, 2015b). Other information disclosed ranges from descriptions of the entity’s
business model to risk exposures and uncertainties (IAASB, 2015b). Other information,
through sheer volume, has the ability to undermine the credibility of the financial
statements and the auditor’s report if not consistent with information disclosed in these
documents (IAASB, 2015b). ISA 720 - The Auditor’s Responsibilities Relating to Other
Information was revised so as to reflect the changes in corporate reporting and to align
users’ expectations and auditors’ responsibilities (IAASB, 2015b).
The key changes to ISA 720 - The Auditor’s Responsibilities Relating to Other
Information are the improved scope of the standards clarifying what other information
is; providing explicit guidance on the extent of the auditors work effort relating to other
information; and providing transparency by requiring reporting on the auditors’ work
relating to other information (IAASB, 2015b). The scope clarifies other information as
financial and non-financial information which accompanies the annual financial
statements and the audit report, as either one document or a collection of documents
(IAASB, 2015b). The extent of auditor effort is a consideration of material
inconsistencies between other information and the financial statements and between
2016 SAAA National Teaching and Learning and Regional Conference Proceedings
ISBN 978-0-620-74761-5
90
other information and the auditors’ knowledge of the entity (IAASB, 2015b). The
revised auditor reporting on other information will include a statement that
management is responsible for the preparation of other information; identification of
other information; a statement that the audit opinion does not cover the other
information; a description of the auditors’ responsibility to read other information for
material inconsistencies with the financial statements and auditors report; and the
results of the auditors reading, namely, if material inconsistencies were identified or
not (IAASB, 2015b).
The revised ISA 720 - The Auditor’s Responsibilities Relating to Other Information
reduces the information gap as it provides auditors’ assessment on the consistency of
other information with the financial statements (IAASB, 2015b). Critics have challenged
whether the wording of the extent of the work performed by auditors could potentially
widen the expectation gap (IAASB, 2015b).
Conclusion
The ‘expectation gap’ as applied to the auditing profession by Liggio (1974) indicates
that the role of the auditor is not in congruence with the expectations of the users (Chye
Koh & Woo, 1998). Porter (2009) has identified three main causes of the expectation
gap: firstly, the nature of auditing, its various roles and responsibilities and the
probabilistic nature of audit practice is not understood by users resulting in users
having unrealistic expectations about an audit (called the expectation-reasonableness
gap); secondly, there are time lags between the economic conditions and the auditing
profession’s response in the form of revised standards applicable to the audit process
resulting in the deficient standards performance gap; and thirdly, the perception of poor
quality audits resulting in corporate collapses (called the deficient performance gap)
(Porter, 2009). Another gap was identified and explained by the IAASB, being the
information gap (IAASB, 2015a). The information gap is the difference between the
information needed by users to make decisions and the information available to them
(IAASB, 2015a)
This paper explored to what extent the Framework on Audit Quality as issued by the
IAASB addressed the deficient performance gap. The findings indicated that the
Framework on Audit Quality is a document that conceptualises the factors that affect
audit quality and was issued to challenge auditors to reflect on the factors identified
and improve on factors identified to improve overall audit quality. As this Framework
on Audit Quality is not prescriptive, the extent to which auditors reflect on their audit
quality shortcomings and implement corrective measures will depend on the auditors’
commitment to quality. The Framework addresses the deficient performance gap by
promoting transparency of the drivers of audit quality which provides users of financial
statements and audit committees with information to better engage with auditors on
the auditors’ responsibility to improve audit quality. The Framework for Audit Quality is
2016 SAAA National Teaching and Learning and Regional Conference Proceedings
ISBN 978-0-620-74761-5
91
not issued to auditors as guidance and due to its non-prescriptive nature does not
address the deficient standards gap.
This paper continued to the assessment of whether the auditors’ report addressed the
expectation reasonableness gap and the information gap. Findings indicate that the
change in auditor reporting from the short-form to the long-form report in 1988 did much
to increase the understanding of the auditors’ role and function in financial reporting
for users of the financial statements, thereby addressing the expectation
reasonableness gap (Porter, 2009). Since 1988, there were several revisions to the
auditors’ report and, in particular, expansion of the auditors’ role and responsibility but
this did not increase users’ understanding of roles and responsibilities, in fact the
standardised wording had the effect of the auditor report being treated as a symbol,
rather than being read (Porter, 2009). The new ISA 700 - Forming an Opinion and
Reporting on Financial Statements and the assessment of the introduction of Key Audit
Matters in the audit report (ISA - 701 Communicating Key Audit Matters in the
Independent Auditor’s Report) issued in 2015 does not reduce the expectation
reasonableness gap but reduces the information gap by providing entity-specific
information to users of the financial statements in the form of Key Audit Matters. There
is, however, concern that the new auditors’ report may widen the expectation gap,
however, this may be mitigated by greater transparency about the audit process which
would improve perceptions about audit quality as well (IAASB, 2011).
The revision of ISA 720 - The Auditor’s Responsibilities Relating to Other Information
further reduces the information gap, by mandating that the auditor; firstly, identifies
other information and secondly, reports on other information in the auditors’ report
(IAASB, 2015b). This indicates to users that other information is consistent with the
financial statements. While reporting on other information may reduce the information
gap, there is concern that the extent of the auditors’ work on other information may be
misinterpreted, thereby widening the expectation reasonableness gap.
The expectation and information gaps have proved resilient against solutions in the
past and may reduce for a short period of time before widening again (Humphrey, et.al,
1992). The above measures put in place by the IAASB to reduce the expectation and
information gaps may prove effective for the short to medium term; however, auditors
need to continually be alert for economic, regulatory and political changes which may,
again, widen the gap.
Future researchers may wish to obtain empirical evidence from users of audit reports
and auditor regulators regarding the effect of the new auditor reporting standards and
the Framework on Audit Quality on the expectation and information gaps.
2016 SAAA National Teaching and Learning and Regional Conference Proceedings
ISBN 978-0-620-74761-5
92
References
Bédard, J., Gonthier-Besacier, N., & Schatt, A., (2014). Cost and benefits of reporting
key audit matters in the audit report: The French experience. Working Paper,
Laval University.
Chye Koh, H., & Woo, E. S. (1998). The expectation gap in auditing. Managerial
Auditing Journal, 13(3), 147-154.
Fisher, R. W. (2003) The 103th American Assembly, The future of the accounting
profession, THE AMERICAN ASSEMBLY COLUMBIA UNIVERSITY
Firer, S., & Swartz, G. (2006). An empirical analysis of the external audit fee in the
“new” South Africa: The basic model. SA Journal of Accounting Research
Vol, 20(1).
Fulop, M. T., & Pintea, M. O. (2014). Effects of the new regulation and corporate
governance of the audit profession. SEA-Practical Application of Science, (4),
545-554.
Gold, A., Gronewold, U., & Pott, C. (2012). The ISA 700 auditor's report and the audit
expectation gap–Do explanations matter? International Journal of
Auditing, 16(3), 286-307.
Gray, G. L., Turner, J. L., Coram, P. J., & Mock, T. J. (2011). Perceptions and
misperceptions regarding the unqualified auditor's report by financial statement
preparers, users, and auditors. Accounting Horizons, 25(4), 659-684.
Humphrey, C., Moizer, P., & Turley, S. (1992). The audit expectations gap—plus ca
change, plus c'est la meme chose? Critical perspectives on accounting,3(2),
137-161.
International Accounting Standards Board (2005). Discussion paper: management
commentary, United Kingdom: International Accounting Standards Committee
Foundation.
International Auditing and Assurance Standards Board (2011). Consultation Paper:
Enhancing the Value of Auditor Reporting: Exploring Options for Change, New
York: International Federation of Accountants.
International Auditing and Assurance Standards Board (2013). A framework for audit
quality: Key elements that create an environment for audit quality, New York:
International Federation of Accountants.
International Auditing and Assurance Standards Board (2015a). At a Glance: New
and Revised Auditor Reporting Standards and Related Conforming
Amendments, New York: International Federation of Accountants.
International Auditing and Assurance Standards Board (2015b). At a Glance: ISA™
720 (Revised), The Auditor’s Responsibilities Relating to Other Information,
New York: International Federation of Accountants.
International Standards A 260 Communication with Those Charged with Governance
Handbook of international standards on auditing and quality control (2015b) New
York: Intl Federation Of Accoun.
2016 SAAA National Teaching and Learning and Regional Conference Proceedings
ISBN 978-0-620-74761-5
93
Leung, P., & Chau, G. (2001). The problematic relationship between audit reporting
and audit expectations: Some evidence from Hong Kong. Advances in
International Accounting, 14, 181-200.
Liggio, C. D. (1974). EXPECTATION GAP-ACCOUNTANTS LEGAL
WATERLOO. Journal of Contemporary Business, 3(3), 27-44.
Prada, M. (2007), Transcript: Quality of public company audits from a regulatory
perspective, International Organisation of Securities Commissions
Porter, B. (2009). Report on research conducted in the United Kingdom and New
Zealand in 2008: Investigating the audit expectation-performance gap and
users’ understanding of and desired improvements to, the auditors’
report (Doctoral dissertation, School of Accounting and Commercial Law,
Victoria University, Wellington, New Zealand).
Redmayne, N. B., Bradbury, M. E., & Cahan, S. F. (2010). The effect of political
visibility on audit effort and audit pricing. Accounting & Finance, 50(4), 921-939.
Rowbottom, N., & Lymer, A. (2010). Exploring the use and users of narrative
reporting in the online annual report. Journal of Applied Accounting
Research,11(2), 90-108.
The Future of Audit." PwC. http://www.pwc.com/gx/en/audit-services/the-future-of-
audit.jhtml. [Web accessed. 18 Aug. 2015]
Welch, I., Accountancy Futures (2010), Reshaping the audit for the new global
economy, THE ASSOCIATION OF CHARTERED CERTIFIED ACCOUNTANTS
2016 SAAA National Teaching and Learning and Regional Conference Proceedings
ISBN 978-0-620-74761-5
94
2016 Southern African Accounting
Association (SAAA)
National Teaching and Learning and
Regional Conference Proceedings
ISBN number: 978-0-620-74761-5
EDU 02: Mobile Learning (M-Learning) As A Paradigmatic
Mechanism To Facilitate Practical Subjects In An Undergraduate
Financial Information Systems Course: A Developing Country
Perspective
Suzaan Le Roux
Cape Peninsula University of Technology, Faculty of Business and Management Sciences
P.O. Box 652, Cape Town, South Africa, 8000
+27 21 4603732 (t), +27 21 4603719 (f), [email protected]
ABSTRACT
A plethora of obstacles impede on students’ ability to successfully complete practical subjects in an
undergraduate Financial Information Systems course (FIS), especially in a developing country such as
South Africa. This is mainly attributed to four key encumbrances, namely the limited accessibility of
computers on campus, the lack of software needed to complete assignments off campus, the limited
availability of Internet access and bandwidth off campus, and its prohibitive cost to students. As the
preponderance of these students are from previously disadvantaged communities and can merely not
meet the expense of computers, Internet connections, and relatively costly commercial software, they
are reliant on campus computer laboratories, whose access are not always practical due to time,
distance, and location constraints. It could therefore be argued that current learning mechanisms to
facilitate practical subjects in a FIS course do not comply with the demands faced by higher education
(HE) institutions in developing countries. In order to ascertain the aforementioned, an action research
study was conducted to investigate whether m-learning can serve as a paradigmatic mechanism to
bridge existing learning gaps in practical subjects in an undergraduate FIS course in HE institutions of
developing countries. Data were collected from 79 students who had to adhere to a set of delineation
criteria. Stemming from the results and discussion, key findings indicate that m-learning can broaden
educational opportunities for disadvantaged and marginalised students, extend the availability of
educators outside the boundaries of the classroom, address student requirements for mobility, flexibility,
and ubiquity, assist in bridging existing learning gaps in practical subjects, and increase throughput and
success rates in a FIS course.
KEYWORDS: Mobile learning, Mobile technology, Mobile device, Practical subject, Developing country,
Accounting
2016 SAAA National Teaching and Learning and Regional Conference Proceedings
ISBN 978-0-620-74761-5
95
1. INTRODUCTION
The use of mobile technologies (i.e. mobile/smartphones, tablets, mobile computers
and digital media devices that readily fit into ones pocket) is gradually drawing a great
deal of attention across all education sectors in both developed and developing
countries. These technologies facilitate the connection to a variety of information
sources and enable communication almost anywhere, and at any time. M-learning is
viewed as “learning across multiple contexts, through social and content interactions,
using personal electronic devices” (Crompton, 2013:4). According to Cochrane
(2010:134), m-learning distinguishes itself from traditional learning environments by its
potential to bridge pedagogically designed learning contexts, facilitate learner-
generated contexts, and content (both personal and collaborative) while providing
personalisation and ubiquitous social connectedness.
The development of technology has brought a variety of changes to the accounting
environment. This has created a need for the services of an accounting person with
specialist knowledge of high-technology commercial data processing. The Financial
Information Systems (FIS) course offered at the Cape Peninsula University of
Technology (CPUT) contains large components of accounting and programming,
which leaves open the possibility of specialisation in either field. Students enrolled for
practical subjects (subjects that necessitate the use of a computer preloaded with
required software) within the FIS course encounter numerous barriers to successfully
practice their subject-related skills, as well as to electronically complete and submit
assignments. As a result, the formative and summative assessment marks of these
students indicate a concerning downward trend year on year. This is primarily
attributed to four key encumbrances, namely the limited accessibility of computers on
campus, the absence of the required software needed to complete assignments and
tasks off campus, the limited availability of Internet access and bandwidth off campus,
and its prohibitive cost to students. Since the majority of these students are from
previously disadvantaged communities and can simply not afford computers
(hardware), Internet connections and relatively expensive commercial software
applications, they are dependent on campus computer laboratories, whose access is
not always practical due to time, distance and location constraints. In quintessence, a
broad base analogy can be drawn that students are not availed the freedom to choose
when, where, and how they study, consequently creating the requirement for mobility.
Stemming from the above, the perception was formulated that currently learning
mechanisms to facilitate practical subjects in a FIS course do not comply with the
demands (providing access to learning while on the move from any location at any
time) faced by HE institutions of developing countries which, in turn, have an adverse
influence on student performance; the research question which was addressed
through this research study reads as follows:
2016 SAAA National Teaching and Learning and Regional Conference Proceedings
ISBN 978-0-620-74761-5
96
How effective is mobile learning in bridging the existing learning gap to facilitate
practical subjects in a Financial Information Systems course in a Higher Education
institution in a developing country?
For the remainder of this paper, discussion takes place under the following headings:
1) literature review, 2) methodology, results and discussion, 3) benefits and barriers of
m-learning in accounting education, and 4) conclusion.
2. LITERATURE REVIEW
2.1 The shift form e-learning to m-learning
M-learning is viewed as an extension of e-learning, where the focus is on the use of
mobile devices that allow a greater degree of access to learning resources (Gupta,
2012). One of the primary reasons why m-learning is such a popular alternative
compared to e-learning, is that the immobility of personal computers restricts students
to the potential of making use of anywhere, anytime learning (Rawlinson & Bartel,
2006). Within an e-learning environment, students are limited to the use of a personal
computer and/or Internet at an immobile location (Motiwalla, Tello & Carter, 2006) and
as a result cannot access any course-related material or assignments while on the
move. Conversely, m-learning allows students to interact with educators and peers and
complete course work at their own pace and at any time and location of their choice,
thus taking learning away from a fixed location.
2.2 M-learning in developing countries
A worldwide assessment of the use of m-learning in HE has brought into sharp focus
the ever increasing use of mobile technologies in HE across the globe. Mobile
technology provides more tools to accounting professionals and has forever changed
the manner in which data can be accessed and shared by these professionals from
any device or location at any time (Drew, 2015). However, the integration of mobile
technology into accounting education has not kept pace with the technology-based
business environment due to lack of faculty time, knowledge, and resources to
implement innovation in accounting courses (Baldwin, 20142 cited by Staples et al.,
2016).
Although m-learning is moving away from small-scale pilot studies into institution-wide
implementation worldwide, it typically does not reflect the current situation in
developing countries. The majority of research studies focus on conceptions of m-
learning based on the culture and affordances of developed countries. Despite the
increasing popularity of m-learning, a review of relevant literature indicates that most
educational research focuses on conceptions of m-learning initiatives in especially field
work, literacy education, and mathematics education in developed countries, and that
2 Baldwin, A. (2014). Lessons Learned from Integrating iPads into the Accounting Classroom. Paper presented at American
Accounting Association 2014 Annual Meeting.
2016 SAAA National Teaching and Learning and Regional Conference Proceedings
ISBN 978-0-620-74761-5
97
there is little academic support on how mobile technologies can be utilised in practical
subjects within accounting education from a developing country perspective.
Gnanasekar, Mieyappan and Rajesh (2016) note that in India, interactive m-learning
anywhere and at any time after face-to-face lectures could enhance students’
understanding of lectures and improve learning. Similar results were found by
Suryaningrum, Wuryani and Purbasari (2015), when they investigated the
effectiveness of mobile based learning technology versus face-to-face learning of
accounting information systems. Research results indicate that mobile based learning
technology is more effective than face-to-face learning for additional learning of
accounting information systems. In contrast with the aforementioned findings, Kutluk
and Gülmez (2013) conducted research on m-learning perspectives of accounting
students at a university in Turkey, and found that though mobile devices have not yet
been effectively utilised for accounting lessons, students are interested in using these
devices in the case of technological support and as an alternative to access to
knowledge anytime and anywhere.
Today there is little doubt that mobile technologies can be utilised as a successful
educational medium. Despite the growing demand of mobile technology in the
developing world, the potential to address educational challenges through Information
and Communication Technologies (ICT) is restricted by the level of technology
adoption and resource constraints in the South African education environment. The
developing country dispensation is subject to caveats such as, low level of technology
penetration, poor infrastructure, lack of reliable and affordable Internet access, narrow
bandwidth, limited Wi-Fi availability, logistics and deployment challenges, social,
economic and cultural issues (Adam et al., 2011), financial resources and academic
preparedness, as well as robbery/crime (Le Roux, 2015). For technology to be used in
education, it must be affordable and accessible, but this remains a barrier for many HE
institutions, educators and students in especially developing countries. Staples et al.
(2016) postulate that challenges from integrating mobile devices into accounting
education are diverse, and that institutional guidance and technological support are
important aspects that must be addressed in order to ensure that m-learning succeed.
Despite these barriers, the ubiquity of mobile technology suggests that it could be
meaningfully applied in an educational environment of developing countries in order to
provide equal access to remote resources while 'on the move', and potential
collaboration with educators and peers outside the boundaries of the classroom, and
hence broaden educational opportunities for disadvantaged and marginalised students
(Mafenya, n.d).
2.2.1 M-learning in South African accounting education
The majority of research available on m-learning use in accounting education was
conducted in developed countries. Conversely, there is a dearth of published material
on m-learning in South African accounting education, with only one article and a single
2016 SAAA National Teaching and Learning and Regional Conference Proceedings
ISBN 978-0-620-74761-5
98
conference paper that could be found where learners where exposed to m-learning in
an accounting subject. In the aforementioned article, students’ views and experiences
on the integration of social network sites, mobile messaging applications and podcasts
were investigated in a second-year accounting course at the University of South Africa.
It was found that students have an enthusiasm for some technologies and a limited
interest in others, suggesting that technologies in South Africa is unique when
compared to developed countries and need to be taken into consideration by educators
if the potential benefits of technologies are to be used effectively in South Africa
education (Van Rooyen, 2012). In an earlier study, Van Rooyen (2010) found that the
effective use of mobile technology can enrich the learning experience of accounting
students and offer them a more satisfying and successful experience. Henceforth, it is
imperative to further explore the affordances of m-learning in specifically accounting
education.
3. METHODOLOGY
This research study was empirical in nature and combined qualitative and quantitative
forms of analysis. Primary quantitative data were obtained from two distinct student
groups (undergraduate first-year students enrolled for a FIS course at the CPUT) by
means of a combination of quantitative (questionnaires, formative and summative
assessments, academic student journals) and qualitative (observation, focus groups,
academic student journals, synchronous and asynchronous communication)
techniques. Action research (plan, act, observe, reflect) was used to glean data
pertaining to m-learning implementation and whether it can bridge the existing learning
gap to facilitate practical subjects in a FIS course in HE institutions in developing
countries.
True to the characteristics of action research, this research study moved through two
cycles over a period of two consecutive years (one cycle during the second semester
of each year) using successive groups of undergraduate first-year FIS students (Year
1: Cycle 1, n = 33; Year 2: Cycle 2, n = 48). Respondents had to adhere to the following
delineation criteria:
Each respondent had to be a full-time undergraduate first-year student enrolled within the Financial
Information Systems course at the CPUT.
Each respondent in Cycle 1 could only utilise mobile devices (tablets) on campus and not outside
the boundaries of the institution..
Moreover, relevant ethical considerations were taken into consideration throughout this
research study (Collis & Hussey, 2009). Respondents were safeguarded from physical
harm and were guaranteed of anonymity and the confidential treatment of information
provided. Furthermore, all respondents voluntarily participated in this research study
and were informed that they could withdraw from it at any point in time (should they so
wish).
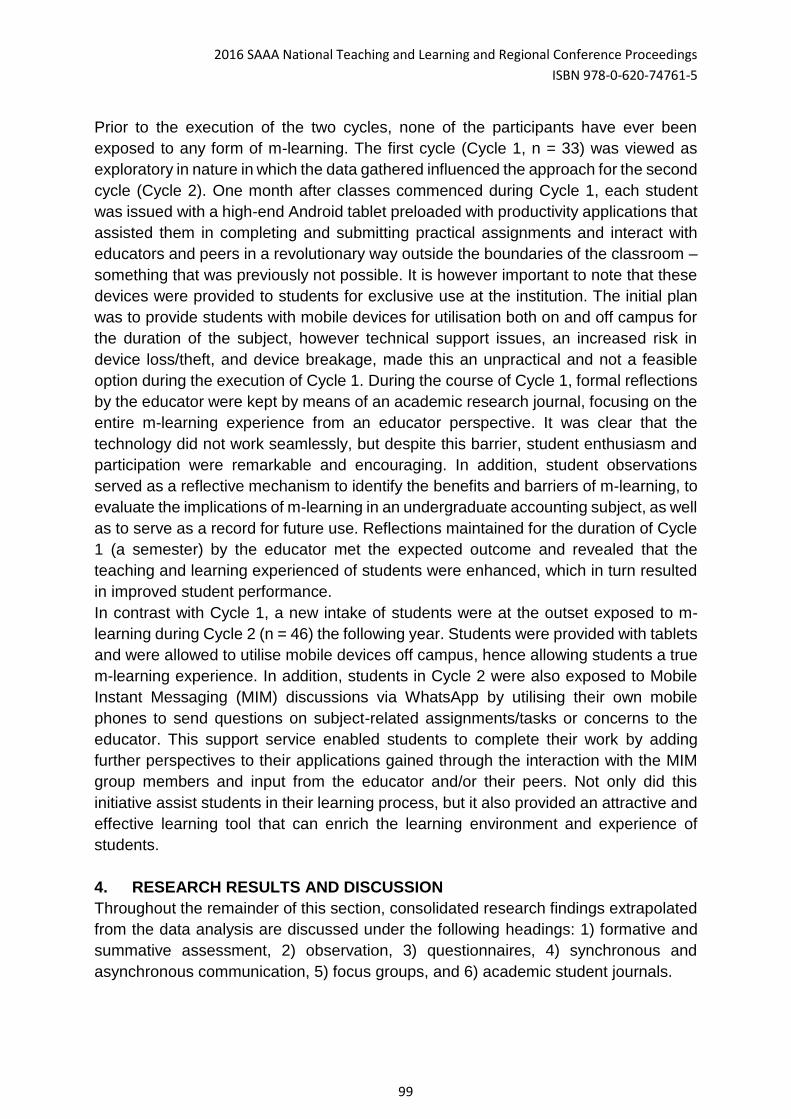
2016 SAAA National Teaching and Learning and Regional Conference Proceedings
ISBN 978-0-620-74761-5
99
Prior to the execution of the two cycles, none of the participants have ever been
exposed to any form of m-learning. The first cycle (Cycle 1, n = 33) was viewed as
exploratory in nature in which the data gathered influenced the approach for the second
cycle (Cycle 2). One month after classes commenced during Cycle 1, each student
was issued with a high-end Android tablet preloaded with productivity applications that
assisted them in completing and submitting practical assignments and interact with
educators and peers in a revolutionary way outside the boundaries of the classroom –
something that was previously not possible. It is however important to note that these
devices were provided to students for exclusive use at the institution. The initial plan
was to provide students with mobile devices for utilisation both on and off campus for
the duration of the subject, however technical support issues, an increased risk in
device loss/theft, and device breakage, made this an unpractical and not a feasible
option during the execution of Cycle 1. During the course of Cycle 1, formal reflections
by the educator were kept by means of an academic research journal, focusing on the
entire m-learning experience from an educator perspective. It was clear that the
technology did not work seamlessly, but despite this barrier, student enthusiasm and
participation were remarkable and encouraging. In addition, student observations
served as a reflective mechanism to identify the benefits and barriers of m-learning, to
evaluate the implications of m-learning in an undergraduate accounting subject, as well
as to serve as a record for future use. Reflections maintained for the duration of Cycle
1 (a semester) by the educator met the expected outcome and revealed that the
teaching and learning experienced of students were enhanced, which in turn resulted
in improved student performance.
In contrast with Cycle 1, a new intake of students were at the outset exposed to m-
learning during Cycle 2 (n = 46) the following year. Students were provided with tablets
and were allowed to utilise mobile devices off campus, hence allowing students a true
m-learning experience. In addition, students in Cycle 2 were also exposed to Mobile
Instant Messaging (MIM) discussions via WhatsApp by utilising their own mobile
phones to send questions on subject-related assignments/tasks or concerns to the
educator. This support service enabled students to complete their work by adding
further perspectives to their applications gained through the interaction with the MIM
group members and input from the educator and/or their peers. Not only did this
initiative assist students in their learning process, but it also provided an attractive and
effective learning tool that can enrich the learning environment and experience of
students.
4. RESEARCH RESULTS AND DISCUSSION
Throughout the remainder of this section, consolidated research findings extrapolated
from the data analysis are discussed under the following headings: 1) formative and
summative assessment, 2) observation, 3) questionnaires, 4) synchronous and
asynchronous communication, 5) focus groups, and 6) academic student journals.
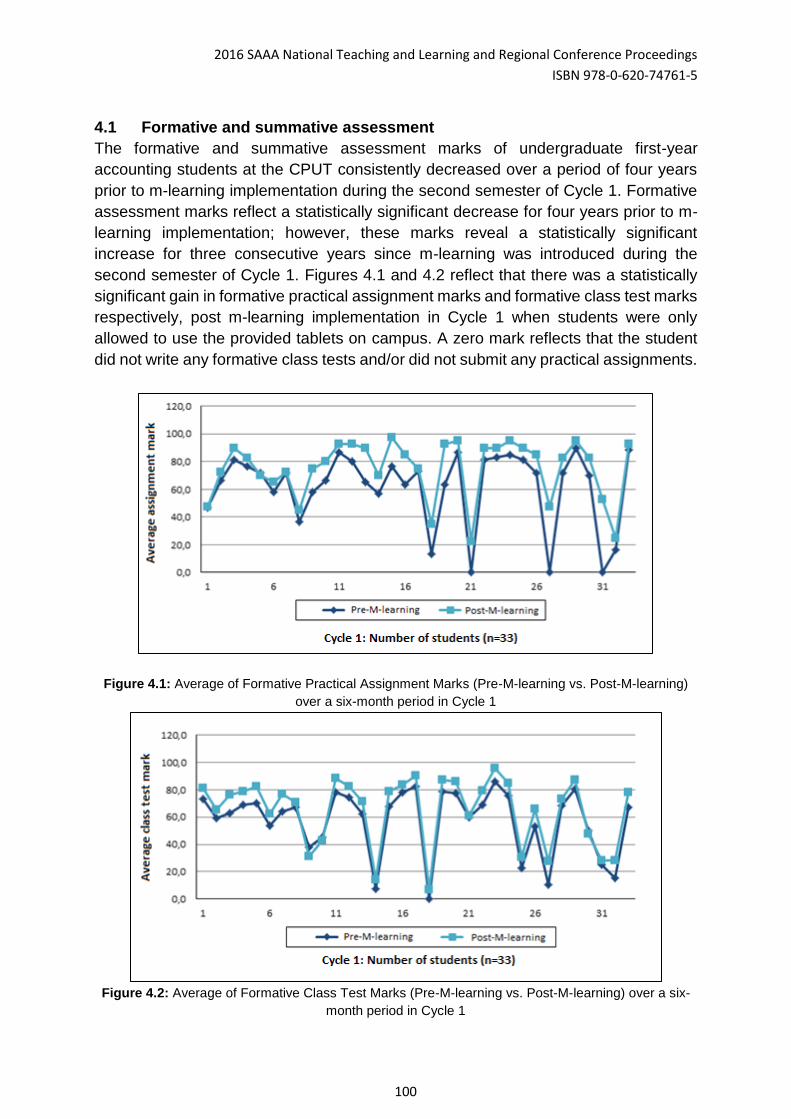
2016 SAAA National Teaching and Learning and Regional Conference Proceedings
ISBN 978-0-620-74761-5
100
4.1 Formative and summative assessment
The formative and summative assessment marks of undergraduate first-year
accounting students at the CPUT consistently decreased over a period of four years
prior to m-learning implementation during the second semester of Cycle 1. Formative
assessment marks reflect a statistically significant decrease for four years prior to m-
learning implementation; however, these marks reveal a statistically significant
increase for three consecutive years since m-learning was introduced during the
second semester of Cycle 1. Figures 4.1 and 4.2 reflect that there was a statistically
significant gain in formative practical assignment marks and formative class test marks
respectively, post m-learning implementation in Cycle 1 when students were only
allowed to use the provided tablets on campus. A zero mark reflects that the student
did not write any formative class tests and/or did not submit any practical assignments.
Figure 4.1: Average of Formative Practical Assignment Marks (Pre-M-learning vs. Post-M-learning)
over a six-month period in Cycle 1
Figure 4.2: Average of Formative Class Test Marks (Pre-M-learning vs. Post-M-learning) over a six-
month period in Cycle 1
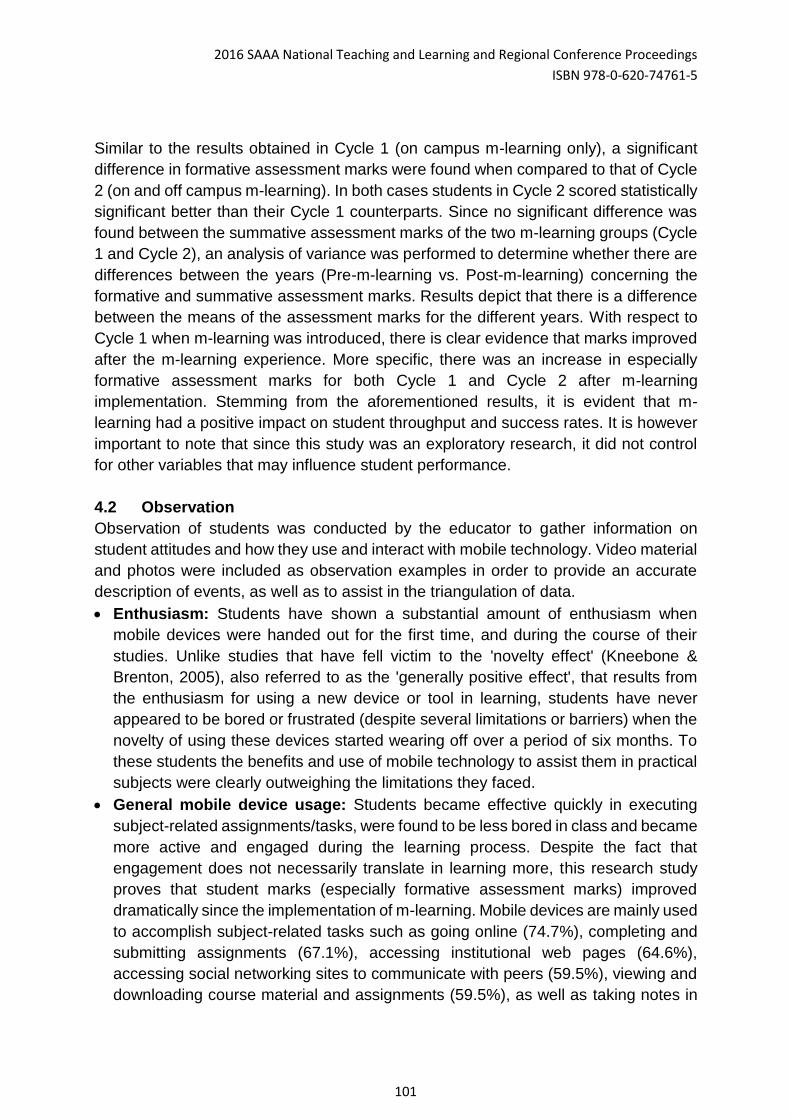
2016 SAAA National Teaching and Learning and Regional Conference Proceedings
ISBN 978-0-620-74761-5
101
Similar to the results obtained in Cycle 1 (on campus m-learning only), a significant
difference in formative assessment marks were found when compared to that of Cycle
2 (on and off campus m-learning). In both cases students in Cycle 2 scored statistically
significant better than their Cycle 1 counterparts. Since no significant difference was
found between the summative assessment marks of the two m-learning groups (Cycle
1 and Cycle 2), an analysis of variance was performed to determine whether there are
differences between the years (Pre-m-learning vs. Post-m-learning) concerning the
formative and summative assessment marks. Results depict that there is a difference
between the means of the assessment marks for the different years. With respect to
Cycle 1 when m-learning was introduced, there is clear evidence that marks improved
after the m-learning experience. More specific, there was an increase in especially
formative assessment marks for both Cycle 1 and Cycle 2 after m-learning
implementation. Stemming from the aforementioned results, it is evident that m-
learning had a positive impact on student throughput and success rates. It is however
important to note that since this study was an exploratory research, it did not control
for other variables that may influence student performance.
4.2 Observation
Observation of students was conducted by the educator to gather information on
student attitudes and how they use and interact with mobile technology. Video material
and photos were included as observation examples in order to provide an accurate
description of events, as well as to assist in the triangulation of data.
Enthusiasm: Students have shown a substantial amount of enthusiasm when
mobile devices were handed out for the first time, and during the course of their
studies. Unlike studies that have fell victim to the 'novelty effect' (Kneebone &
Brenton, 2005), also referred to as the 'generally positive effect', that results from
the enthusiasm for using a new device or tool in learning, students have never
appeared to be bored or frustrated (despite several limitations or barriers) when the
novelty of using these devices started wearing off over a period of six months. To
these students the benefits and use of mobile technology to assist them in practical
subjects were clearly outweighing the limitations they faced.
General mobile device usage: Students became effective quickly in executing
subject-related assignments/tasks, were found to be less bored in class and became
more active and engaged during the learning process. Despite the fact that
engagement does not necessarily translate in learning more, this research study
proves that student marks (especially formative assessment marks) improved
dramatically since the implementation of m-learning. Mobile devices are mainly used
to accomplish subject-related tasks such as going online (74.7%), completing and
submitting assignments (67.1%), accessing institutional web pages (64.6%),
accessing social networking sites to communicate with peers (59.5%), viewing and
downloading course material and assignments (59.5%), as well as taking notes in
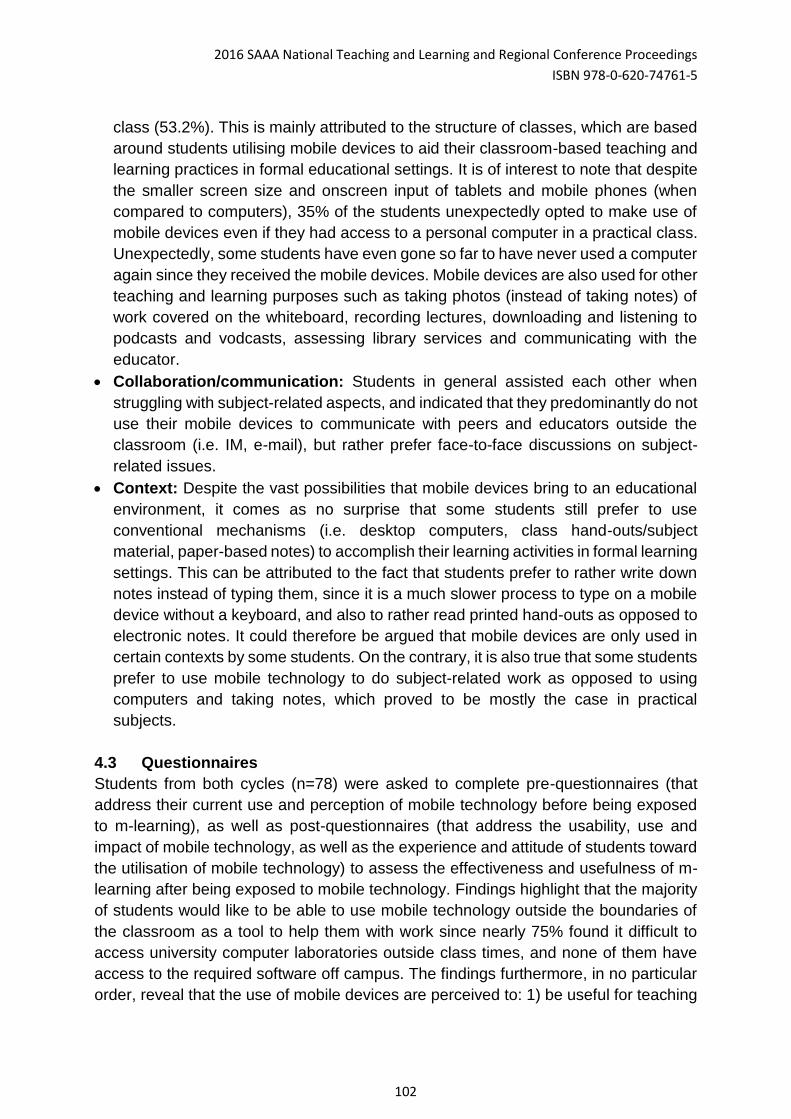
2016 SAAA National Teaching and Learning and Regional Conference Proceedings
ISBN 978-0-620-74761-5
102
class (53.2%). This is mainly attributed to the structure of classes, which are based
around students utilising mobile devices to aid their classroom-based teaching and
learning practices in formal educational settings. It is of interest to note that despite
the smaller screen size and onscreen input of tablets and mobile phones (when
compared to computers), 35% of the students unexpectedly opted to make use of
mobile devices even if they had access to a personal computer in a practical class.
Unexpectedly, some students have even gone so far to have never used a computer
again since they received the mobile devices. Mobile devices are also used for other
teaching and learning purposes such as taking photos (instead of taking notes) of
work covered on the whiteboard, recording lectures, downloading and listening to
podcasts and vodcasts, assessing library services and communicating with the
educator.
Collaboration/communication: Students in general assisted each other when
struggling with subject-related aspects, and indicated that they predominantly do not
use their mobile devices to communicate with peers and educators outside the
classroom (i.e. IM, e-mail), but rather prefer face-to-face discussions on subject-
related issues.
Context: Despite the vast possibilities that mobile devices bring to an educational
environment, it comes as no surprise that some students still prefer to use
conventional mechanisms (i.e. desktop computers, class hand-outs/subject
material, paper-based notes) to accomplish their learning activities in formal learning
settings. This can be attributed to the fact that students prefer to rather write down
notes instead of typing them, since it is a much slower process to type on a mobile
device without a keyboard, and also to rather read printed hand-outs as opposed to
electronic notes. It could therefore be argued that mobile devices are only used in
certain contexts by some students. On the contrary, it is also true that some students
prefer to use mobile technology to do subject-related work as opposed to using
computers and taking notes, which proved to be mostly the case in practical
subjects.
4.3 Questionnaires
Students from both cycles (n=78) were asked to complete pre-questionnaires (that
address their current use and perception of mobile technology before being exposed
to m-learning), as well as post-questionnaires (that address the usability, use and
impact of mobile technology, as well as the experience and attitude of students toward
the utilisation of mobile technology) to assess the effectiveness and usefulness of m-
learning after being exposed to mobile technology. Findings highlight that the majority
of students would like to be able to use mobile technology outside the boundaries of
the classroom as a tool to help them with work since nearly 75% found it difficult to
access university computer laboratories outside class times, and none of them have
access to the required software off campus. The findings furthermore, in no particular
order, reveal that the use of mobile devices are perceived to: 1) be useful for teaching
2016 SAAA National Teaching and Learning and Regional Conference Proceedings
ISBN 978-0-620-74761-5
103
and learning purposes; 2) have mobility and 3) have social interaction value; 4) have
an enjoyment factor; 5) be easy to use; 6) improve student attitudes; 7) have certain
access barriers; and 8) the behavioural intention to use mobile devices is perceived to
be positive. Most of the students use mobile devices on a daily basis for at least 30
minutes at a time for mainly formal subject-related activities, and indicated that it should
be mandatory for students to utilise mobile technology within Financial programmes.
Students find it acceptable to learn practical subjects with mobile device access only
and felt more enthusiastic about the use of mobile devices after being exposed to m-
learning.
4.4 Synchronous and asynchronous communication (Cycle 2)
Synchronous and asynchronous communication was introduced during Cycle 2 and
entailed records of comments and thoughts generated by learners by means of MIM
(WhatsApp) and e-mail. WhatsApp is a synchronous communication tool where text
messages can be sent and delivered instantaneously between users. A major
advantage of this type of communication is its minimal cost ranging from 97% - 99%
less than text messages or Short Message Service (SMS), thus providing learners the
opportunity to interact and collaborate with their peers regarding subject-related
issues, and to access professional educator support in an affordable manner. The
support service was at students’ disposal 7 days a week/24 hours a day (24/7).
Students were initially excited and keen about the idea of using MIM within the FIS
course, however it was found that only a few (30.4%) made use of this unique
opportunity. Students used this service mainly to: 1) Ask subject content-related
questions before formative and summative tests; 2) ask for assistance with
assignments/tasks; 3) be assisted with subject administrative queries; and 4) resolve
technical difficulties experienced with mobile devices. MIM were received and
answered any time during the day and night, with the earliest being at 05:59 am and
the latest at 00:59 am. From an educator perspective, MIM proved to be quite a
challenge to use when answering student queries, since it is a relatively time-
consuming process to answer queries using the different input mechanisms of a mobile
phone.
4.5 Focus groups (Cycle 2)
Focus groups took place during Cycle 2 only, after all the questionnaires have been
conducted and were based upon the further exploration of issues that had emerged
from questionnaire data. It focused on students’ experience with mobile technologies
and how they use and interact with these technologies. Student responses were
collected for qualitative analysis similar to research conducted by Boone (1995:95), i.e.
for "Comments", "What did you like?", "What did you dislike?", etc.
The majority of the focus groups (89%) indicated that they have found it extremely
easy and fair to complete and submit assignments utilising mobile technology
anywhere, anytime without the need of a computer and expensive commercial
2016 SAAA National Teaching and Learning and Regional Conference Proceedings
ISBN 978-0-620-74761-5
104
software. Most students (63%) found it acceptable to exclusively use mobile
devices in a practical subject.
All the groups highlighted the usefulness of mobile devices that could be used
anywhere on campus to complete programme-related work, in contrast to the
constant unavailability of overpopulated computer laboratories.
The majority of the groups viewed mobile devices as an educational investment
and indicated that they would buy a mobile device if it could aid them in their
studies, or if it would be a course requirement.
It is a harsh reality that theft and robbery in South Africa are severe problems,
especially for mobile devices that are carried on a person. Because of the danger
of using mobile devices in South African public spaces, most students did not utilise
mobile technology while commuting. On the other hand, some students, although
by far the minority, indicated that they have used mobile technology while travelling,
but that it was dependent on the location, time of day, and travelling time.
4.6 Academic student journals (Cycle 2)
Academic student journals were kept by students during Cycle 2 to reflect on their m-
learning experience, activities and thoughts during mobile technology utilisation.
Student journals addressed issues relating to the when, where, for how long, for which
event/activity, and by whom the mobile technology was used. In addition, it also
provided students with the opportunity to comment on any high or low aspects
experienced during mobile technology utilisation. Journal entries were reviewed and
assisted in:
Identifying common trends in mobile technology utilisation amongst students.
Isolating areas where problems regularly occur.
Identifying where more work needed to be done or where real strengths have
been developed and some obstacles have been overcome.
During educator reflection in the second cycle, the aforementioned observations
assisted in identifying the typical potential usage patterns for m-learning learners, and
in setting new goals for future research projects and developments. Most students
used mobile technology in the mornings and the afternoons for 10 minutes to an hour
per session for formal subject-related activities.
5. BENEFITS AND BARRIERS OF M-LEARNING IN ACCOUNTING
EDUCATION
The following benefits were identified during the reflection processes of the educator
during the two action research cycles, as well as from extensive data gathered with
regard to the implementation of m-learning within accounting education:
All students (regardless of their culture, social- and financial background) could
electronically complete and submit assignments/tasks from anywhere, and at any
time without the necessity of a computer or being on campus.
2016 SAAA National Teaching and Learning and Regional Conference Proceedings
ISBN 978-0-620-74761-5
105
Student marks improved statistically significantly after the implementation of m-
learning.
Students had 24/7 access to their educator via IM to address any subject-related
issues.
Students have rarely subverted formal education by engaging in activities that are
not related to the lecture, proving that mobile devices can effectively be used to
facilitate learning in formal and informal educational settings, without necessarily
distracting the teaching and learning process.
Students expressed and were confronted by several barriers that kept them from
enjoying a true m-learning experience:
On campus access only (Cycle 1): Students were only allowed to utilise mobile
technology exclusively on campus, therefore not allowing them a true m-learning
experience. These students had restricted opportunities compared with other m-
learning programmes in which students usually have access to mobile devices
24/7.
Uploading assignments onto the Learner Management Systems (LMS):
Students were required to connect (synchronise) their mobile devices to an
Internet-enabled computer (via cables) in order to upload their assignments onto
the LMS (Blackboard) since the CPUT is not in possession of a mobile LMS
(Blackboard Mobile) site license that would allow them to upload assignments
directly from a mobile device.
Limited or no Wi-Fi availability: Several Wi-Fi related issues were experienced,
which included extremely weak or no Wi-Fi signals on campus and at university
residences. These issues had a severe and critical impact on students' ability to
access the Internet, and most importantly subject-related work via mobile devices.
Lost/stolen devices: A major concern throughout the duration of the m-learning
initiative was the constant anticipation for lost or stolen devices. This was the main
and exclusive reason for not allowing students to use mobile devices off campus
during the pilot study (Cycle 1). This proved to be successful as all the students
returned their devices in working order. On the other hand, during Cycle 2, where
the m-learning group was allowed to utilise mobile devices off campus, one student
lost a mobile device on an airplane, another provided a police statement indicating
that the mobile device was stolen after a car break in, and two students
disappeared from all enrolled classes and as a result have never returned the
devices.
Limited access to computer laboratories: Despite the fact that students were
required to have access to an Internet-enabled computer in order to upload
assignments/tasks onto the LMS, several students were also confronted with the
fact that they could not access computer laboratories on campus, especially in the
morning, when they wanted to upload and submit assignments before the
submission deadline. This once again proved that by not affording students a true
2016 SAAA National Teaching and Learning and Regional Conference Proceedings
ISBN 978-0-620-74761-5
106
m-learning experience by enabling them to complete and electronically submit
assignments/tasks outside the boundaries of the classroom before the due date
and time, it could potentially have a negative impact on their academic
performance.
No Wi-Fi enabled printers: Students could not directly print subject-related
material from their mobile devices, as there were no Wi-Fi enabled printers
available on campus. Students were therefore forced to use the old-fashioned
method of synchronising the mobile device with an Internet-enabled computer in
order to print – clearly defeating the objective of providing students with a true m-
learning experience.
6. CONCLUSION
This research study is concerned with exploring whether m-learning can serve as a
paradigmatic mechanism to bridge existing learning gaps to facilitate practical subjects
in a FIS course in a developing country. In many respects, the findings of this research
study juxtapose and strengthen what the literature in the field of m-learning already
suggests. However, this research study has taken earlier notions one step further, by
attempting to identify by means of a mixed-method data gathering approach, the
effectiveness and usefulness of m-learning, as well as the benefit and barriers related
to m-learning in practical subjects within a FIS course. Key findings indicate that mobile
devices can be utilised as an acceptable additional technology in practical subjects In
a FIS course, and that it can assist in bridging existing learning gaps by extending the
availability of educators outside the boundaries of the classroom, addressing student
requirements for mobility, flexibility and ubiquity, and improving student throughput and
success rates. Results indicate that student marks have improved statistically
significant after m-learning implementation, and that student reactions toward these
devices are positive and may increase their enthusiasm and motivation to work and
learn. Nonetheless, despite the vast number of benefits that mobile technology brings
to teaching and learning in accounting education, it is important to recognise that
mobile devices still cannot entirely replace traditional methods of instruction and
assessment, and thus should be combined with face-to-face education in developing
countries. Equally, it is important to ensure that mobile technology is used in a
pragmatic way by focusing on the advantages of mobile devices, rather than to
endeavour and replicate the functionality of a computer, allowing traditional instruction
and the utilisation of mobile technology to complement each other (Le Roux, 2015).
The research results of this study contribute to the knowledge base of m-learning in
accounting education, especially in a developing country such as South Africa. The
author of this paper suggests that further research is conducted on providing a better
understanding as to how m-learning in accounting education, work in great detail. By
doing so, HE institutions, educators and students, among others, may glean more
insight into how m-learning can be effectively implemented to provide sustainable,
affordable and reliable accounting education. Not only can this research assist in
placing HE institutions at the forefront of pedagogical practice, but it can most
2016 SAAA National Teaching and Learning and Regional Conference Proceedings
ISBN 978-0-620-74761-5
107
importantly broaden educational opportunities for disadvantaged and marginalised
students, extend the availability of educators outside the boundaries of the classroom,
address student requirements for mobility, flexibility and ubiquity, and increase
throughput and success rates.
REFERENCES
Adam, L., Butcher, N., Tusubira, F.F. & Sibthorpe, C. 2011. Transformation-Ready:
The strategic application of information and communication technologies in Africa:
Education Sector Study (Final Report). African Development Bank, World Bank, ICT
Development Associates Ltd. http://mil.unaoc.org/wp-
content/uploads/2012/12/Education_Fullreport.pdf [24 June 2015].
Cochrane, T.D. 2010. Exploring mobile learning success factors. ALT-J, 18(2):133-
Collis, J. & Hussey, R. 2009. Business research: A practical guide for undergraduate
and post graduate students. Palgrave: Macmillan.
Crompton, H. 2013. A historical overview of mobile learning: Towards learner-
centered education. In Berge, Z.L. & Muilenburg, L.Y. (eds.) Handbook of mobile
learning, Routledge, Florence: 3-25.
Drew, J. 2015. Beyond Spreadsheets. Journal of Accountancy, 219(4):36-39.
Gnanasekar, J.M., Mieyappan, D. & Rajesh, M. 2016. Face to face and online mobile
learning system. The Online Journal of Distance Education and e-Learning 4(3):33-
41.
Kneebone, R. & Brenton, H. 2005. Training Perioperative Specialist Practitioners. In
Kukulska-Hulme, A. & Traxler, J. (eds.) Mobile learning: A Handbook for educators
and trainers, Routledge: London: 106-115.
Le Roux, S. 2015. Mobile learning (m-learning) as a paradigmatice mechanism to
facilitate technology-based learning in a developing country. In Crompton, H. &
Traxler, J. (eds.) Mobile learning and STEM: Case studies in practice, Routledge,
New York: 220-233.
Mafenya, N.P. n.d. Increasing Throughput and Success Rate in Open and Distance
Learning using Mobile Technology: A Case Study.
http://www.docstoc.com/docs/100702959/Paper---SAIDE [7 December 2012].
Motiwalla, L., Tello, S. & Carter, K. 2006. Outcome Assessment of Learning
Objectives: A Case for using e-Learning Software. Proceedings of the 12th Americas
Conference on Information Systems, Acapulco, Mexico, 4-6 August 2006.
http://faculty.uml.edu/stello/amcis2006_final.pdf [7 July 2011].
2016 SAAA National Teaching and Learning and Regional Conference Proceedings
ISBN 978-0-620-74761-5
108
Rawlinson, D.R. & Bartel, K. 2006. Implementing Wireless PDA Technology in the IT
Curriculum. Educause Quarterly, 29(1):41-47.
Staples, J., Collum, T. & McFry, K. 2016. Mobile devices in the accounting
classroom. http://blog.cengage.com/wp-content/uploads/2016/05/Spring-
2016_Staples-Collum-McFry_Mobile-Devices-in-the-Accounting-Classroom_5.pdf [14
September 2016].
Suryaningrum, D.H., Wuryani, E. & Purbasari, I.J. 2015. The effectiveness of mobile
based learning technology versus face-to-face learning of accounting information
systems. Business Education & Accreditation, 7(1):67-76.
Van Rooyen, A. 2010. Effective integration of SMS communication into a distance
education accounting module. Meditari Accountancy Research, 18(1):47-57.
Van Rooyen, A. 2012. Student experiences of technology integration in an
Accounting course.
http://uir.unisa.ac.za/bitstream/handle/10500/8610/van%20rooyen_a_ODL_024_201
2.pdf?sequence=1 [15 September 2016].
2016 SAAA National Teaching and Learning and Regional Conference Proceedings
ISBN 978-0-620-74761-5
109
2016 Southern African Accounting
Association (SAAA)
National Teaching and Learning and
Regional Conference Proceedings
ISBN number: 978-0-620-74761-5
EDU 03: AN ANALYSIS OF THE REASONS CONTRIBUTING
TO ACADEMIC EXCLUSION: A CASE STUDY IN THE
FACULTY OF ECONOMIC AND FINANCIAL SCIENCES AT
THE UNIVERSITY OF JOHANNESBURG
Authors: Ester van Wyk; Marita E Pietersen; University of Johannesburg
Corresponding author; [email protected]
ABSTRACT The purpose of this research paper is to analyse the reasons academically excluded
undergraduate (UG) students provided, as contributing factors, that led to their unsatisfactory
academic performance resulting in their academic exclusion from the Faculty of Economic and
Financial Sciences (FEFS) at the University of Johannesburg (UJ). The research method used
was a case study.
Students can appeal their academic exclusion. Results obtained from the electronic appeals
process in June/July 2015 and January 2016 were used to extract the reasons provided by
these UG students that led to their academic exclusion. The reasons were categorised, as
being academic or non-academic, and were then further divided into seven areas. Overall the
main reasons provided by the students that contributed to their academic exclusion was
financial difficulty followed by academic difficulty.
The findings from the study could indicate to the Faculty the high risk of allowing students to
enter the Faculty without knowing their ability to sustain their studies financially. A practical
implication of the findings will allow the Faculty to create a more inclusive environment by
supporting the students it accepts. A limitation is that the findings are based on students that
appealed their academic exclusion in FEFS at UJ and can therefore not be generalised. This
study could, however, contribute value by providing lessons for developing countries in Africa
relating to the admission of students.
Keywords: academic exclusion, undergraduate students, unsatisfactory academic
performance, on line appeals process, financial difficulty, academic difficulty
2016 SAAA National Teaching and Learning and Regional Conference Proceedings
ISBN 978-0-620-74761-5
110
INTRODUCTION
The University of Johannesburg (UJ) is an urban residential comprehensive university
in Johannesburg South Africa. UJ has nine faculties of which the Faculty of Economic
and Financial Sciences (FEFS) is the largest in terms of student numbers. According
to the Academic Rules and Regulations of the University of Johannesburg 2016 (UJ
ARR 2016, 6.13), students are allowed to register annually on the condition that they
have passed a certain number of modules, as specified by the specific Faculty’s
Qualifications and Regulations.
The overall undergraduate (UG) enrolment in FEFS for 2015 was 20% of the overall
UG enrolment of UJ. The Faculty had 9 361 full time UG students registered in 20151.
The overall number of diploma students (inclusive of the advanced diploma students)
were 3 360 (36%) and 6 001 (64%)1 degree (inclusive of extended degree) students.
The faculty offers four undergraduate degree programmes, three extended
undergraduate degree programmes, two diploma programmes and four advanced
diploma programmes. Advanced diploma students were excluded from this study
because of relatively small enrolment numbers and those being students enrolled for
a second qualification.
In FEFS, every student’s academic performance is assessed at the end of each
semester. A result code (status) (see Table 1) is allocated to them, based on their
academic performance at the end of the semester and subsequent supplementary
exam (if relevant). Their academic performance reflects on the Tertiary Software
Administrative System (ITS) system, their academic record, the student portal and
their result letters.
A FEFS student may register for the following academic year if they have passed at
least 60% of their modules in the previous year of study (FEFS) Qualifications and
Regulations 2016 (FEFS QR) 2016, EF.5). If a student passes less than 40% of their
modules they will receive an academic warning. An E1 (proceed pass all courses
November) result code will be awarded after semester one or an E2 (proceed pass all
courses June) after semester two.
Despite passing less than 40% of their modules students are given the opportunity to
continue with their studies in the following semester, subject to the following
conditions. Firstly, they have to attend the Study and Read programme (free of
charge), offered by the Academic Development Centre (ADC). Secondly, the student
has to pass all modules for which they are enrolled for or allowed to register for in the
following semester. These students are often also referred to the Centre for
Psychological Services and Career Development (PsyCaD) for personal and career
counselling. The Study and Read programme offered by the ADC assist students on
2016 SAAA National Teaching and Learning and Regional Conference Proceedings
ISBN 978-0-620-74761-5
111
an academic warning with reading strategies, academic skills and academic support
such as study guidance, literacy skills and writing skills. Students on an academic
warning are not allowed to cancel any module(s) during the semester while they are
on an academic warning. If the student fails to meet these mentioned conditions, they
are academically excluded from further studies within FEFS. Their academic exclusion
is indicated by an F7 (re-admission refused) result code awarded after semester one
or a BF (re-admission refused) result code after semester two. Students who have
been academically excluded are given the opportunity to appeal their academic
exclusion.
In the past students had to manually submit their BF/F7 appeal forms at the Faculty
office. The high student numbers in the Faculty led to the development of an online
appeal process for students that were academically excluded (awarded a BF/F7 result
code). The online pilot project was conducted after the first semester of 2015 and
repeated after the second semester of 2015. The online process allowed students to
appeal, off campus, from anywhere as long as they had internet access with a
smartphone or any other electronic device. This streamlined the appeals process and
was subsequently easier to manage, by both students and Faculty alike, than the
related paper process.
Once received appeals are reviewed and considered, at Faculty level, by the Faculty
Appeals Committee. This committee reviews all appeals and consideration will be
given to any mitigating circumstances provided by the students that contributed to their
unsatisfactory academic performance and resulted in academic exclusion (BF/F7), as
well as investigating their academic records in detail. The Faculty Appeals Committee
will either re-admit the student or retain their academic exclusion from the Faculty. The
decision of the committee is final and no further appeals are allowed (UJ ARR 2016,
6.13 (e)). All students that had a successful appeal after either the first or second
semester of 2015, were placed on an academic warning (FEFS QR 2016, EF. 7). The
conditions of the academic warning as explained above needs to be met, in order for
the student to be allowed to continue with his/her studies. If re-admitted and the
student fails to meet the set conditions, as explained to them when they were re-
admitted, the student will be refused continuation of their studies (academically
excluded) and no further appeals will be allowed (UJ ARR 2016, 6.9).
CLASSIFICATION OF ACADEMIC PERFORMANCE
A result code is allocated based on a student’s academic performance in the relevant
semester and/or academic year. This is calculated according to the promotion
requirements of the Faculty which are based on the number of registered modules
passed for the specific semester.
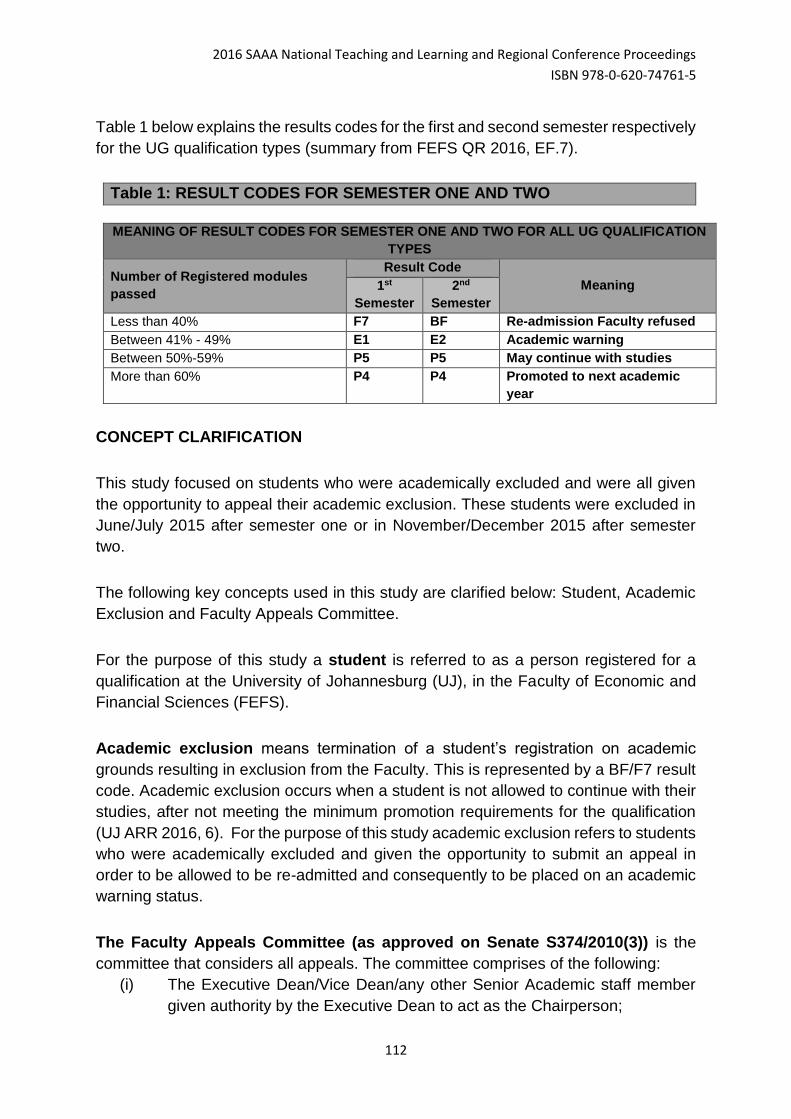
2016 SAAA National Teaching and Learning and Regional Conference Proceedings
ISBN 978-0-620-74761-5
112
Table 1 below explains the results codes for the first and second semester respectively
for the UG qualification types (summary from FEFS QR 2016, EF.7).
Table 1: RESULT CODES FOR SEMESTER ONE AND TWO
MEANING OF RESULT CODES FOR SEMESTER ONE AND TWO FOR ALL UG QUALIFICATION
TYPES
Number of Registered modules
passed
Result Code
Meaning 1st
Semester
2nd
Semester
Less than 40% F7 BF Re-admission Faculty refused
Between 41% - 49% E1 E2 Academic warning
Between 50%-59% P5 P5 May continue with studies
More than 60% P4 P4 Promoted to next academic
year
CONCEPT CLARIFICATION
This study focused on students who were academically excluded and were all given
the opportunity to appeal their academic exclusion. These students were excluded in
June/July 2015 after semester one or in November/December 2015 after semester
two.
The following key concepts used in this study are clarified below: Student, Academic
Exclusion and Faculty Appeals Committee.
For the purpose of this study a student is referred to as a person registered for a
qualification at the University of Johannesburg (UJ), in the Faculty of Economic and
Financial Sciences (FEFS).
Academic exclusion means termination of a student’s registration on academic
grounds resulting in exclusion from the Faculty. This is represented by a BF/F7 result
code. Academic exclusion occurs when a student is not allowed to continue with their
studies, after not meeting the minimum promotion requirements for the qualification
(UJ ARR 2016, 6). For the purpose of this study academic exclusion refers to students
who were academically excluded and given the opportunity to submit an appeal in
order to be allowed to be re-admitted and consequently to be placed on an academic
warning status.
The Faculty Appeals Committee (as approved on Senate S374/2010(3)) is the
committee that considers all appeals. The committee comprises of the following:
(i) The Executive Dean/Vice Dean/any other Senior Academic staff member
given authority by the Executive Dean to act as the Chairperson;
2016 SAAA National Teaching and Learning and Regional Conference Proceedings
ISBN 978-0-620-74761-5
113
(ii) The Programme Advisor acts as the secretary noting all the decisions; and
(iii) A representative from the Student Advisory Council (SAC)/Student
Representative Council (SRC). This member only serves in an advisory
capacity on the Faculty Appeals Committee meeting.
The decision whether or not to retain the BF/F7 result code is made by the
Chairperson; the decision of the committee is final.
AIM OF THE STUDY
The aim of this study is to provide an analysis of the reasons provided by UG students,
with a further focus on first year students that contributed to their academic exclusion
in FEFS at UJ in 2015. The reasons were categorised into seven areas being
academic difficulty, family problems, financial difficulty, health problems, personal
problems, transport problems and other problems. Information obtained from the
electronic appeal forms, from both the June/July 2015 and January 2016 appeals
process, was used to elaborate on certain assumptions.
One certainty in life is that everything is subject to change; this is also the case within
the higher education environment in which students find themselves. To be able to
address reasons contributing to academic exclusion, it is necessary to understand the
type of environment students live in. Certain aspects needs to be taken into
consideration such as, how they experience their environment, as well as what their
problems are that is making it difficult for them to study, and to progress in their chosen
programme. Therefore, these aspects should be considered in order to determine their
contribution to the students’ difficulties which resulted in academic exclusion.
LITERATURE REVIEW
“High attrition and low graduation rates largely neutralized important gains” (Council
on Higher Education (CHE), 2013) in the South African higher education system.
Fischer and Scott (2011) as cited by the CHE (2013), describes the South African
Higher Education system as a “low participating high attrition system”. To proof this
fact the CHE then states that roughly only one in four degree students (17% for
diploma students) in contact institution graduate in regulation (minimum) time. The
CHE continues to say that only 48% of contact students graduate within five years.
This leads to a high rate of attrition (40%) by the end of regulation time. This report
also indicates that first-year attrition, a longstanding problem in South Africa, is very
high – one in every three students whom entered the higher education system in 2006
were lost after their first year of study for various reasons. One of these include bad
academic performance.
2016 SAAA National Teaching and Learning and Regional Conference Proceedings
ISBN 978-0-620-74761-5
114
There are numerous factors such as race, gender, age and socio-economic status that
affect a students’ academic performance (Shoukat, Haider, Khan & Ahmed, 2013). A
large number of factors thus have a causative effect on whether or not a student drops
out from university studies (Murry, 2014).
Students’ poor academic performance in South Africa’s higher education system is
well documented. A 2008 study by Letseka and Maile found that the overall graduation
rate of South Africa is amongst the lowest in the world (15% across all South African
based Universities). Their finding suggests that lack of available funding as well as the
articulation gap between secondary education and higher education were the main
cause of high dropout rates.
Following Letseka (2009) and Murry (2014), for the purpose of this research, a
university dropout is defined as a student who for whatever reason chooses not to re-
register for their chosen qualification. A student’s academic performance affects
whether the student will become a dropout (St John, Gabrera, Nora & Asker, 2000).
Poor academic performances thus make it more likely for students to become dropouts
(Neethling, 2015). Research by Ishitani and DesJardin (2002), Stratton, O’Toole and
Wentzel (2008) as well as Sampaio (2012) indicates that financial aid is an important
factor impacting student dropout. Financial aid typically includes loans which students
have to repay. Murry’s (2014) research findings also indicate that financial aid status
is an important determinant of student dropout.
Literature provides definitions for two types of dropouts; the first being a voluntary
dropout where a student with a good academic record decides to discontinue their
studies and secondly an involuntary dropout, where a students’ discontinuation of
academic studies is because of academic exclusion (Murry, 2014). A student can be
academically excluded from studying further because of unsatisfactory academic
performance. Reasons for voluntary dropout may include poor academic performance
before any major exams are written, the influence of factors such as family or financial
problems or realising that they have registered for a degree that is unsuitable or
incompatible. Reasons for involuntary dropout can be because a student failed the
same module a number of times, or because the student did not meet the annual
progression requirements for their degree (Neethling, 2015).
Poor academic performance could lead to involuntary dropout (academic exclusion).
With this context in mind, it is important for FEFS to try and identify the reasons
contributing to academic exclusion. These reasons can help FEFS to identify factors
that will define a dropout-prone student. Efforts to better support these students can
aid FEFS in reducing the academic exclusion (dropout) rate.
2016 SAAA National Teaching and Learning and Regional Conference Proceedings
ISBN 978-0-620-74761-5
115
RESEARCH METHODOLOGY
This section discusses and justifies the methodology that was used for this paper.
Research design
This case study was done at UJ – an urban residential comprehensive university in
Johannesburg, South Africa. FEFS is the largest of the nine faculties of UJ by on
average contributing 22% of the overall student number of 48 500 students that are
spread across four campuses.
FEFS offers both UG and Post Graduate (PG) programmes. UG programmes offered
consists of four undergraduate degree programmes, three extended undergraduate
degree programmes, two diploma programmes and four advanced diploma
programmes. Advanced diploma students were excluded from this study because of
relatively small enrolment numbers and those being students enrolled for a second
qualification.
The case study design was used for this study. Godfrey (2012:8) defines a case study
design as a design that focuses on a phenomenon to be studied, the case, unit of
analysis and the focus of the study. In this paper the phenomenon is the reasons that
contribute to academic exclusion and the case is academically excluded students.
Academically excluded students that appealed their academic exclusion in FEFS at
UJ 2015/2016 were the unit of analysis. The focus of this study is the reasons
(phenomenon) that contributed to academic exclusion.
Case studies are widely used in organisational studies and across the social sciences
(Kohlbacher, 2006:2). Case studies allow researchers to obtain a holistic and
meaningful understanding of real-life events (Yin, 2003:2). A case study research
design is thus best suited to gain an understanding of the reasons contributing to
academic exclusion. Case studies are often the preferred method when the “how” and
“why” questions are being asked, when the researchers have little control over the
events, and the focus is on an existing phenomenon within a real life context
(Kolhbacher, 2006:4). Therefore, the case study design enabled the researchers to
gain an understanding of the reasons that contributed to academic exclusion from the
information obtained from the electronic appeal form.
The case study design adopted for this study consisted of both qualitative and
quantitative methods of data collection. The quantitative part of the study examined
the association between variables such as gender, race, age grouping and previous
year’s activity. The qualitative part of the research design (reasons listed by students)
2016 SAAA National Teaching and Learning and Regional Conference Proceedings
ISBN 978-0-620-74761-5
116
attempted to explore why these reasons contributed to their academic exclusion being
the dependent variable.
Population of the study
The population for this study consisted of 976 students that appealed their academic
exclusion in FEFS at UJ in 2015/2016.
Sampling
Participants for this study were selected using purposive sampling. It was a non-
probability sampling procedure in which the researcher purposely decided which
participants to select, that would be relevant to the research topic (Godfrey, 2012:9).
Table 3 indicates that from the population of 1 423 UG students, 409 students were
first year students that were academically excluded in FEFS 2015/2016. The
researchers purposively included only the 976 students, of which 167 were first year
students, which appealed their academic exclusion. Purposive sampling enabled the
researchers to focus the research on the participants who supplied reasons that
contributed to their academic exclusion.
Method of data collection
More general/overall data were collected from the ITS system, Management
Information System (MIS) and the Higher Educator Data Analyser (HEDA). Detailed
data was also collected for this case study from the electronic appeal forms of students
academically excluded in the first and second semester of 2015 that completed the
appeals process. Data used to develop a more comprehensive picture of an
academically excluded student, included demographic information (race, gender and
age grouping), number of students academically excluded, number of UG students
that appealed their academic exclusion, number of first year students that appealed
their academic exclusion, students’ previous year activity, the contributing reasons that
lead to unsatisfactory academic performance and their NSFAS status.
All students that wanted to appeal their academic exclusion had to complete an online
appeal form. The appeal form is of a qualitative nature and it assisted in identifying the
reasons that contributed to UG students’ academic exclusions.
The online appeal form asked questions about issues not evident from their academic
records. This included questions relating to the main reason(s) that contributed to their
unsatisfactory academic performance, how these reasons affected their academic
performance, their plan(s) to resolve the problem(s) and whether they enrolled for a
different qualification previously or studied at a another tertiary institution.
2016 SAAA National Teaching and Learning and Regional Conference Proceedings
ISBN 978-0-620-74761-5
117
Content analysis
Qualitative content analysis can be viewed as a comprehensive approach to data
analysis, which seems to be especially suitable for case study research (Kolbacher,
2006:18). The examination of content recorded information is involved in content
analysis (Godfrey, 2012:12). The reasons contributing to academic exclusion were
analysed from the information obtained in the electronic appeal form. This made the
content analysis very useful for studying reasons contributing to academic exclusion.
Content analysis also enables the researchers to compare first and second semester
appeals, the students’ age grouping and previous year’s activity as well as their
NSFAS status. The data from the content analysis was used to cross check the
trustworthiness of the data. Another advantage of content analysis is that, unlike
humans, documents are non-reactive (Godrey, 2012:12) and as a result, the data that
has been gathered is reliable.
Ethical clearance
The researchers obtained consent from the FEFS Ethics committee to execute this
study.
Limitations of the study
The disadvantage of this case study is that the findings are based on students that
appealed their academic exclusion in FEFS at UJ and therefore cannot be
generalised. The findings of this study are therefore generalisable to all academically
excluded students in FEFS at UJ. However, the findings illuminate the reasons
contributing to academic exclusion which might be similar for students in other
Faculties and/or Universities. A limitation of the study was that students that did not
appeal their academic exclusion were not included in the study. A second limitation
was that these students were not contacted to find out what they would have indicated
as the reason(s) that contributed to their unsatisfactory academic performance.
DEVELOPMENT OF THE ELECTRONIC APPEAL FORM
Based on past experience and with reference to the paper based BF/F7 appeals
process, an electronic appeal process and related electronic appeals form (template
to be completed) was developed whereby students were allowed to follow an online
process to appeal against their academic exclusion.
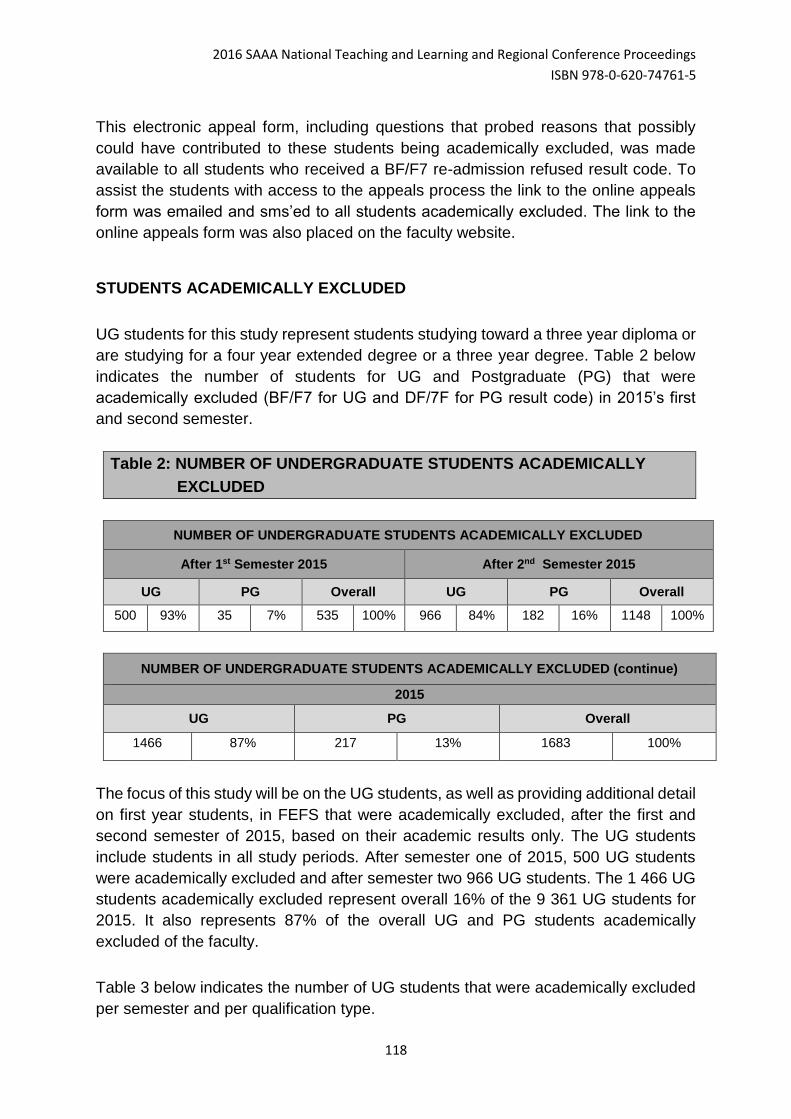
2016 SAAA National Teaching and Learning and Regional Conference Proceedings
ISBN 978-0-620-74761-5
118
This electronic appeal form, including questions that probed reasons that possibly
could have contributed to these students being academically excluded, was made
available to all students who received a BF/F7 re-admission refused result code. To
assist the students with access to the appeals process the link to the online appeals
form was emailed and sms’ed to all students academically excluded. The link to the
online appeals form was also placed on the faculty website.
STUDENTS ACADEMICALLY EXCLUDED
UG students for this study represent students studying toward a three year diploma or
are studying for a four year extended degree or a three year degree. Table 2 below
indicates the number of students for UG and Postgraduate (PG) that were
academically excluded (BF/F7 for UG and DF/7F for PG result code) in 2015’s first
and second semester.
Table 2: NUMBER OF UNDERGRADUATE STUDENTS ACADEMICALLY
EXCLUDED
NUMBER OF UNDERGRADUATE STUDENTS ACADEMICALLY EXCLUDED
After 1st Semester 2015 After 2nd Semester 2015
UG PG Overall UG PG Overall
500 93% 35 7% 535 100% 966 84% 182 16% 1148 100%
NUMBER OF UNDERGRADUATE STUDENTS ACADEMICALLY EXCLUDED (continue)
2015
UG PG Overall
1466 87% 217 13% 1683 100%
The focus of this study will be on the UG students, as well as providing additional detail
on first year students, in FEFS that were academically excluded, after the first and
second semester of 2015, based on their academic results only. The UG students
include students in all study periods. After semester one of 2015, 500 UG students
were academically excluded and after semester two 966 UG students. The 1 466 UG
students academically excluded represent overall 16% of the 9 361 UG students for
2015. It also represents 87% of the overall UG and PG students academically
excluded of the faculty.
Table 3 below indicates the number of UG students that were academically excluded
per semester and per qualification type.
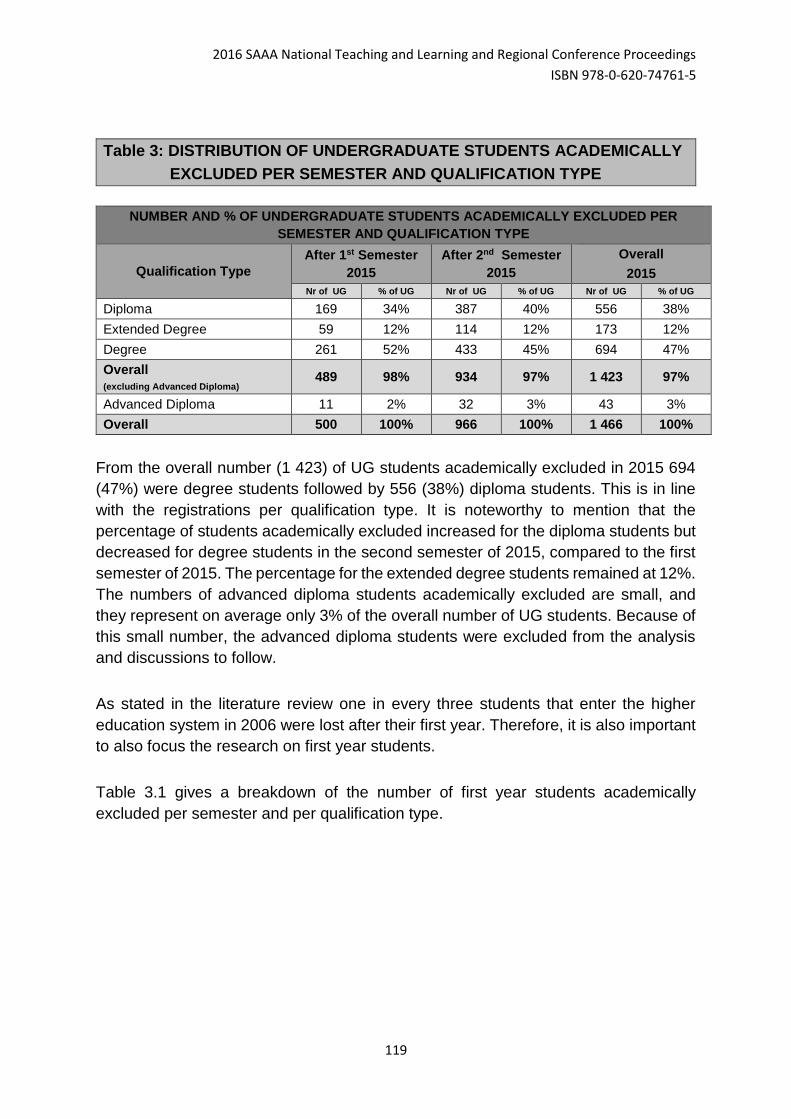
2016 SAAA National Teaching and Learning and Regional Conference Proceedings
ISBN 978-0-620-74761-5
119
Table 3: DISTRIBUTION OF UNDERGRADUATE STUDENTS ACADEMICALLY
EXCLUDED PER SEMESTER AND QUALIFICATION TYPE
NUMBER AND % OF UNDERGRADUATE STUDENTS ACADEMICALLY EXCLUDED PER
SEMESTER AND QUALIFICATION TYPE
Qualification Type
After 1st Semester
2015
After 2nd Semester
2015
Overall
2015
Nr of UG % of UG Nr of UG % of UG Nr of UG % of UG
Diploma 169 34% 387 40% 556 38%
Extended Degree 59 12% 114 12% 173 12%
Degree 261 52% 433 45% 694 47%
Overall
(excluding Advanced Diploma) 489 98% 934 97% 1 423 97%
Advanced Diploma 11 2% 32 3% 43 3%
Overall 500 100% 966 100% 1 466 100%
From the overall number (1 423) of UG students academically excluded in 2015 694
(47%) were degree students followed by 556 (38%) diploma students. This is in line
with the registrations per qualification type. It is noteworthy to mention that the
percentage of students academically excluded increased for the diploma students but
decreased for degree students in the second semester of 2015, compared to the first
semester of 2015. The percentage for the extended degree students remained at 12%.
The numbers of advanced diploma students academically excluded are small, and
they represent on average only 3% of the overall number of UG students. Because of
this small number, the advanced diploma students were excluded from the analysis
and discussions to follow.
As stated in the literature review one in every three students that enter the higher
education system in 2006 were lost after their first year. Therefore, it is also important
to also focus the research on first year students.
Table 3.1 gives a breakdown of the number of first year students academically
excluded per semester and per qualification type.
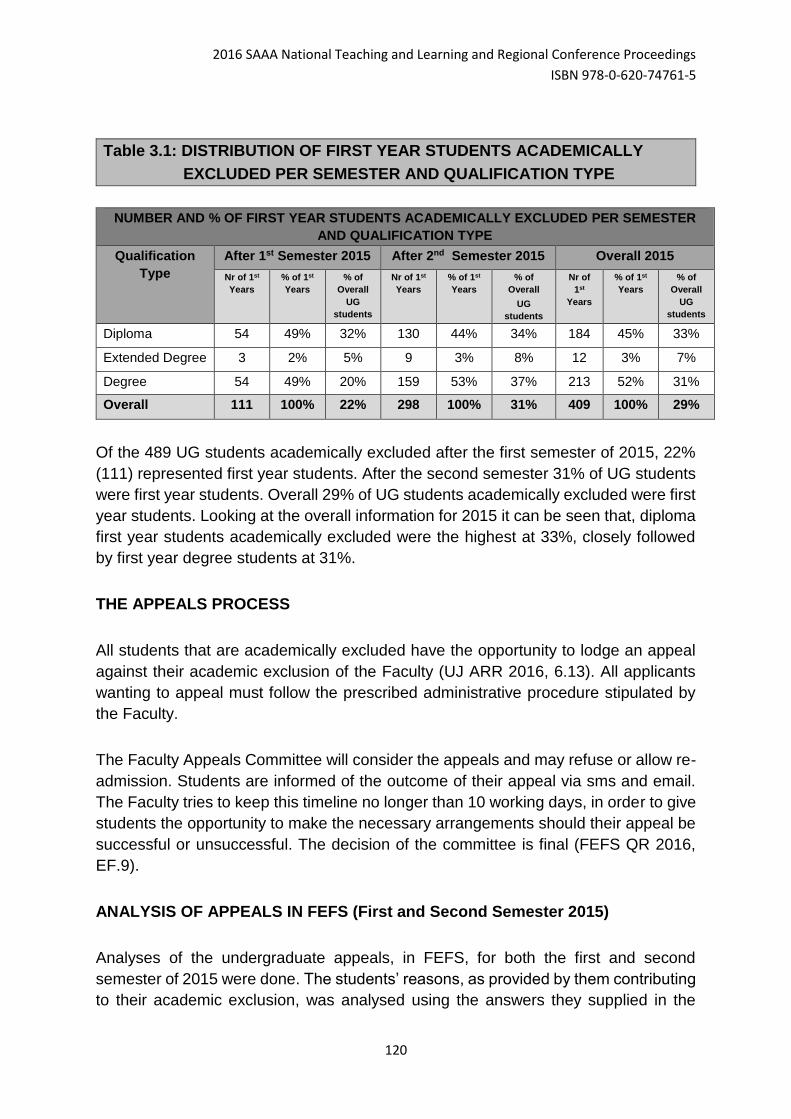
2016 SAAA National Teaching and Learning and Regional Conference Proceedings
ISBN 978-0-620-74761-5
120
Table 3.1: DISTRIBUTION OF FIRST YEAR STUDENTS ACADEMICALLY
EXCLUDED PER SEMESTER AND QUALIFICATION TYPE
NUMBER AND % OF FIRST YEAR STUDENTS ACADEMICALLY EXCLUDED PER SEMESTER
AND QUALIFICATION TYPE
Qualification
Type
After 1st Semester 2015 After 2nd Semester 2015 Overall 2015
Nr of 1st
Years % of 1st
Years % of
Overall
UG
students
Nr of 1st
Years % of 1st
Years % of
Overall
UG
students
Nr of
1st
Years
% of 1st
Years % of
Overall
UG
students
Diploma 54 49% 32% 130 44% 34% 184 45% 33%
Extended Degree 3 2% 5% 9 3% 8% 12 3% 7%
Degree 54 49% 20% 159 53% 37% 213 52% 31%
Overall 111 100% 22% 298 100% 31% 409 100% 29%
Of the 489 UG students academically excluded after the first semester of 2015, 22%
(111) represented first year students. After the second semester 31% of UG students
were first year students. Overall 29% of UG students academically excluded were first
year students. Looking at the overall information for 2015 it can be seen that, diploma
first year students academically excluded were the highest at 33%, closely followed
by first year degree students at 31%.
THE APPEALS PROCESS
All students that are academically excluded have the opportunity to lodge an appeal
against their academic exclusion of the Faculty (UJ ARR 2016, 6.13). All applicants
wanting to appeal must follow the prescribed administrative procedure stipulated by
the Faculty.
The Faculty Appeals Committee will consider the appeals and may refuse or allow re-
admission. Students are informed of the outcome of their appeal via sms and email.
The Faculty tries to keep this timeline no longer than 10 working days, in order to give
students the opportunity to make the necessary arrangements should their appeal be
successful or unsuccessful. The decision of the committee is final (FEFS QR 2016,
EF.9).
ANALYSIS OF APPEALS IN FEFS (First and Second Semester 2015)
Analyses of the undergraduate appeals, in FEFS, for both the first and second
semester of 2015 were done. The students’ reasons, as provided by them contributing
to their academic exclusion, was analysed using the answers they supplied in the
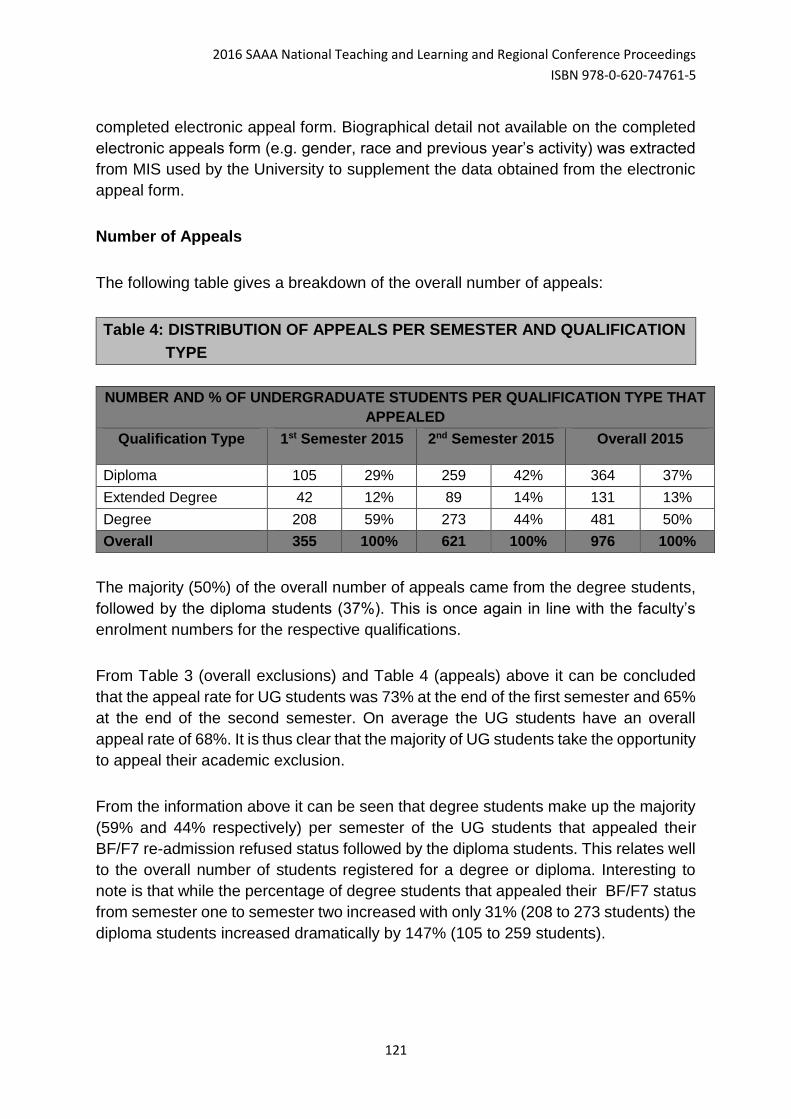
2016 SAAA National Teaching and Learning and Regional Conference Proceedings
ISBN 978-0-620-74761-5
121
completed electronic appeal form. Biographical detail not available on the completed
electronic appeals form (e.g. gender, race and previous year’s activity) was extracted
from MIS used by the University to supplement the data obtained from the electronic
appeal form.
Number of Appeals
The following table gives a breakdown of the overall number of appeals:
Table 4: DISTRIBUTION OF APPEALS PER SEMESTER AND QUALIFICATION
TYPE
NUMBER AND % OF UNDERGRADUATE STUDENTS PER QUALIFICATION TYPE THAT
APPEALED
Qualification Type 1st Semester 2015 2nd Semester 2015 Overall 2015
Diploma 105 29% 259 42% 364 37%
Extended Degree 42 12% 89 14% 131 13%
Degree 208 59% 273 44% 481 50%
Overall 355 100% 621 100% 976 100%
The majority (50%) of the overall number of appeals came from the degree students,
followed by the diploma students (37%). This is once again in line with the faculty’s
enrolment numbers for the respective qualifications.
From Table 3 (overall exclusions) and Table 4 (appeals) above it can be concluded
that the appeal rate for UG students was 73% at the end of the first semester and 65%
at the end of the second semester. On average the UG students have an overall
appeal rate of 68%. It is thus clear that the majority of UG students take the opportunity
to appeal their academic exclusion.
From the information above it can be seen that degree students make up the majority
(59% and 44% respectively) per semester of the UG students that appealed their
BF/F7 re-admission refused status followed by the diploma students. This relates well
to the overall number of students registered for a degree or diploma. Interesting to
note is that while the percentage of degree students that appealed their BF/F7 status
from semester one to semester two increased with only 31% (208 to 273 students) the
diploma students increased dramatically by 147% (105 to 259 students).
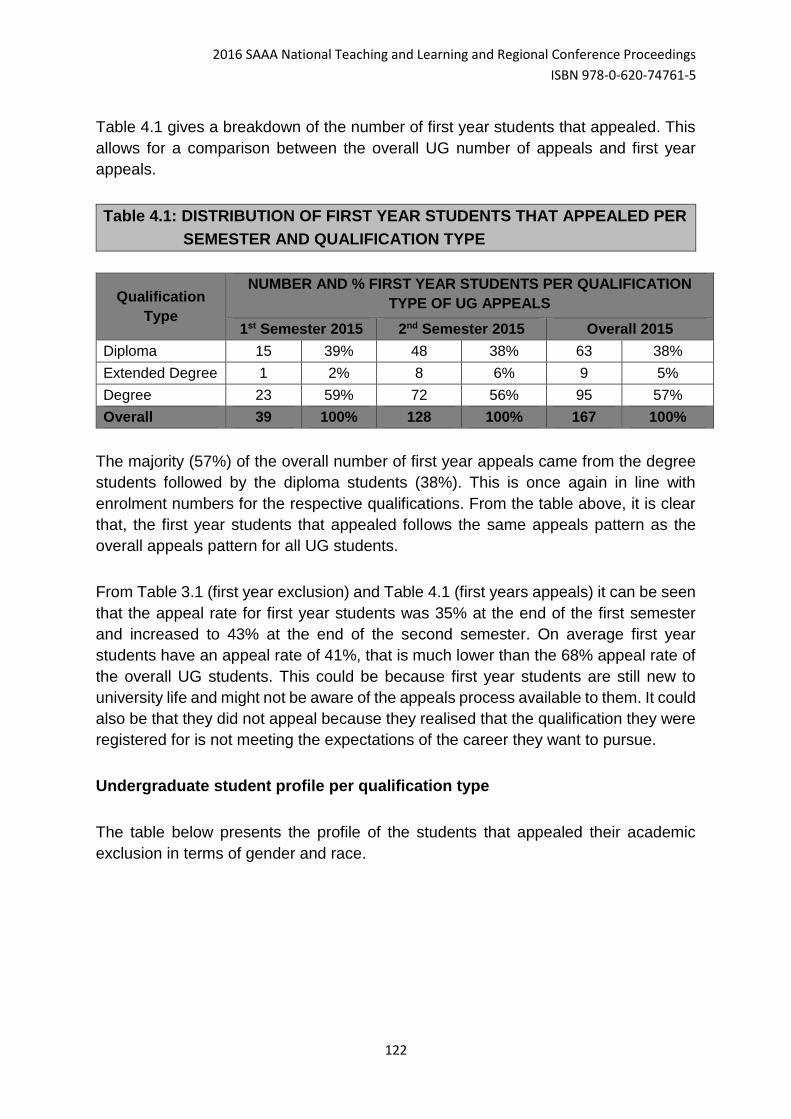
2016 SAAA National Teaching and Learning and Regional Conference Proceedings
ISBN 978-0-620-74761-5
122
Table 4.1 gives a breakdown of the number of first year students that appealed. This
allows for a comparison between the overall UG number of appeals and first year
appeals.
Table 4.1: DISTRIBUTION OF FIRST YEAR STUDENTS THAT APPEALED PER
SEMESTER AND QUALIFICATION TYPE
Qualification
Type
NUMBER AND % FIRST YEAR STUDENTS PER QUALIFICATION
TYPE OF UG APPEALS
1st Semester 2015 2nd Semester 2015 Overall 2015
Diploma 15 39% 48 38% 63 38%
Extended Degree 1 2% 8 6% 9 5%
Degree 23 59% 72 56% 95 57%
Overall 39 100% 128 100% 167 100%
The majority (57%) of the overall number of first year appeals came from the degree
students followed by the diploma students (38%). This is once again in line with
enrolment numbers for the respective qualifications. From the table above, it is clear
that, the first year students that appealed follows the same appeals pattern as the
overall appeals pattern for all UG students.
From Table 3.1 (first year exclusion) and Table 4.1 (first years appeals) it can be seen
that the appeal rate for first year students was 35% at the end of the first semester
and increased to 43% at the end of the second semester. On average first year
students have an appeal rate of 41%, that is much lower than the 68% appeal rate of
the overall UG students. This could be because first year students are still new to
university life and might not be aware of the appeals process available to them. It could
also be that they did not appeal because they realised that the qualification they were
registered for is not meeting the expectations of the career they want to pursue.
Undergraduate student profile per qualification type
The table below presents the profile of the students that appealed their academic
exclusion in terms of gender and race.
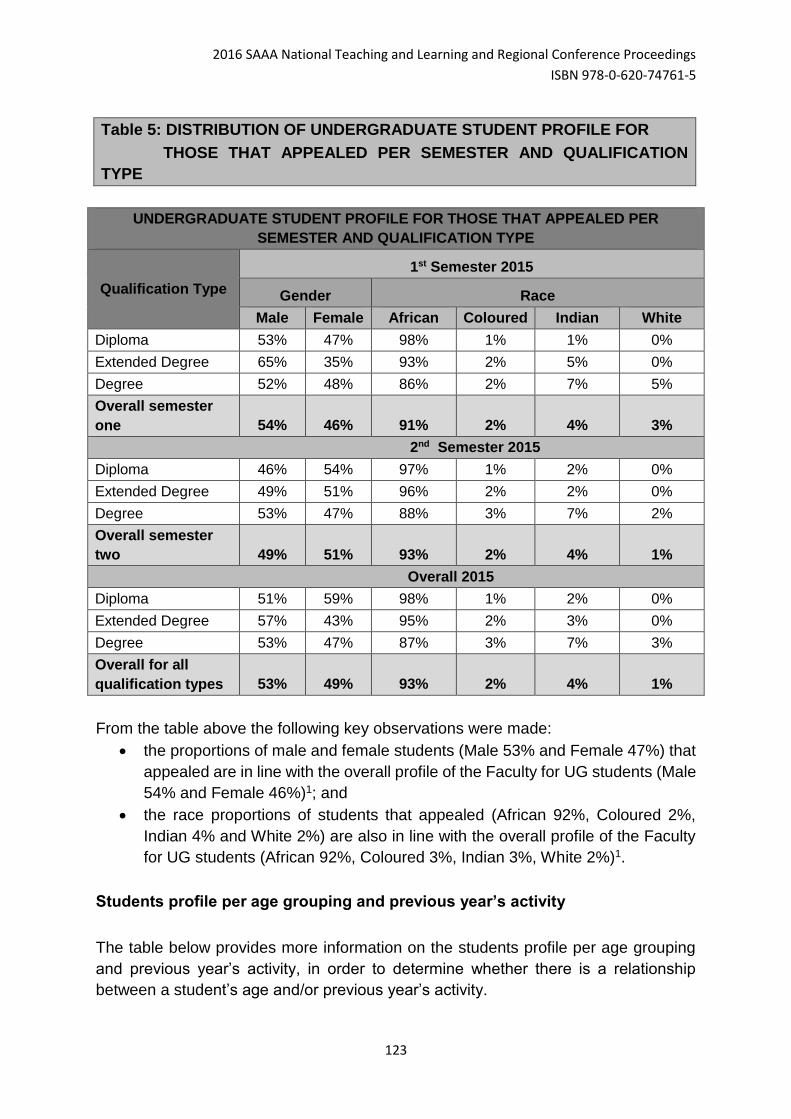
2016 SAAA National Teaching and Learning and Regional Conference Proceedings
ISBN 978-0-620-74761-5
123
Table 5: DISTRIBUTION OF UNDERGRADUATE STUDENT PROFILE FOR
THOSE THAT APPEALED PER SEMESTER AND QUALIFICATION
TYPE
UNDERGRADUATE STUDENT PROFILE FOR THOSE THAT APPEALED PER
SEMESTER AND QUALIFICATION TYPE
Qualification Type
1st Semester 2015
Gender Race
Male Female African Coloured Indian White
Diploma 53% 47% 98% 1% 1% 0%
Extended Degree 65% 35% 93% 2% 5% 0%
Degree 52% 48% 86% 2% 7% 5%
Overall semester
one 54% 46% 91% 2% 4% 3%
2nd Semester 2015
Diploma 46% 54% 97% 1% 2% 0%
Extended Degree 49% 51% 96% 2% 2% 0%
Degree 53% 47% 88% 3% 7% 2%
Overall semester
two 49% 51% 93% 2% 4% 1%
Overall 2015
Diploma 51% 59% 98% 1% 2% 0%
Extended Degree 57% 43% 95% 2% 3% 0%
Degree 53% 47% 87% 3% 7% 3%
Overall for all
qualification types 53% 49% 93% 2% 4% 1%
From the table above the following key observations were made:
the proportions of male and female students (Male 53% and Female 47%) that
appealed are in line with the overall profile of the Faculty for UG students (Male
54% and Female 46%)1; and
the race proportions of students that appealed (African 92%, Coloured 2%,
Indian 4% and White 2%) are also in line with the overall profile of the Faculty
for UG students (African 92%, Coloured 3%, Indian 3%, White 2%)1.
Students profile per age grouping and previous year’s activity
The table below provides more information on the students profile per age grouping
and previous year’s activity, in order to determine whether there is a relationship
between a student’s age and/or previous year’s activity.
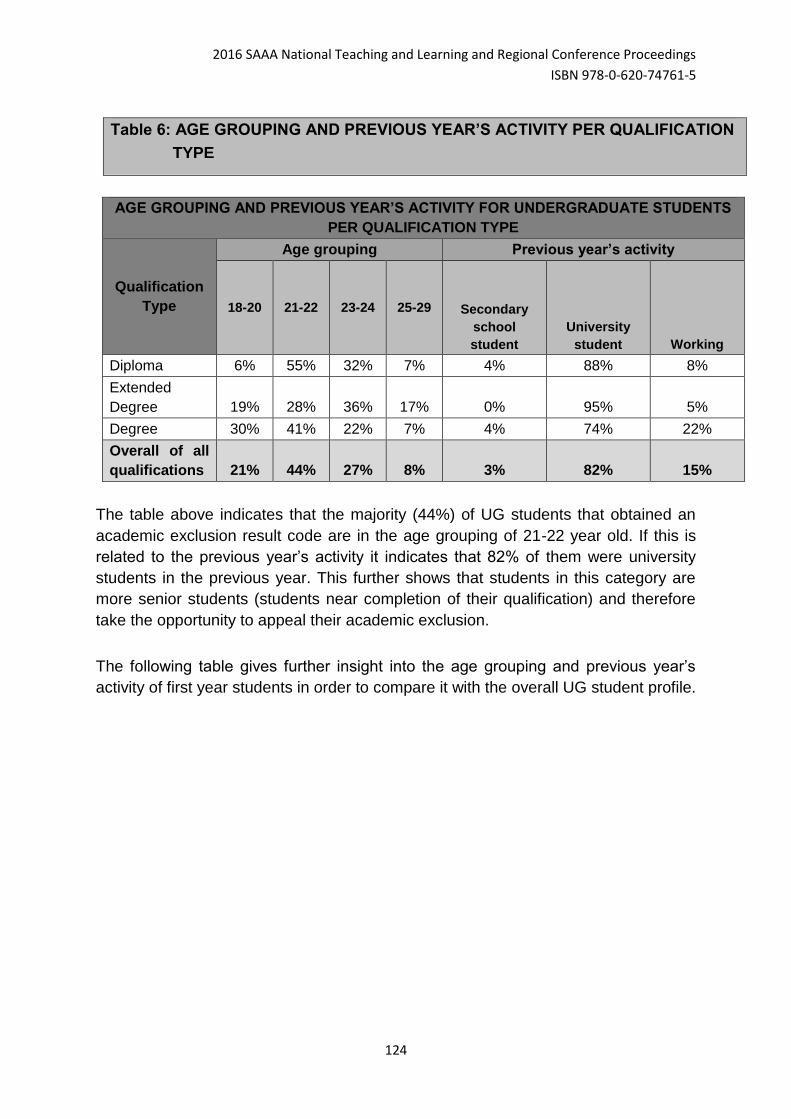
2016 SAAA National Teaching and Learning and Regional Conference Proceedings
ISBN 978-0-620-74761-5
124
Table 6: AGE GROUPING AND PREVIOUS YEAR’S ACTIVITY PER QUALIFICATION
TYPE
AGE GROUPING AND PREVIOUS YEAR’S ACTIVITY FOR UNDERGRADUATE STUDENTS
PER QUALIFICATION TYPE
Qualification
Type
Age grouping Previous year’s activity
18-20 21-22 23-24 25-29 Secondary
school
student
University
student Working
Diploma 6% 55% 32% 7% 4% 88% 8%
Extended
Degree 19% 28% 36% 17% 0% 95% 5%
Degree 30% 41% 22% 7% 4% 74% 22%
Overall of all
qualifications 21% 44% 27% 8% 3% 82% 15%
The table above indicates that the majority (44%) of UG students that obtained an
academic exclusion result code are in the age grouping of 21-22 year old. If this is
related to the previous year’s activity it indicates that 82% of them were university
students in the previous year. This further shows that students in this category are
more senior students (students near completion of their qualification) and therefore
take the opportunity to appeal their academic exclusion.
The following table gives further insight into the age grouping and previous year’s
activity of first year students in order to compare it with the overall UG student profile.
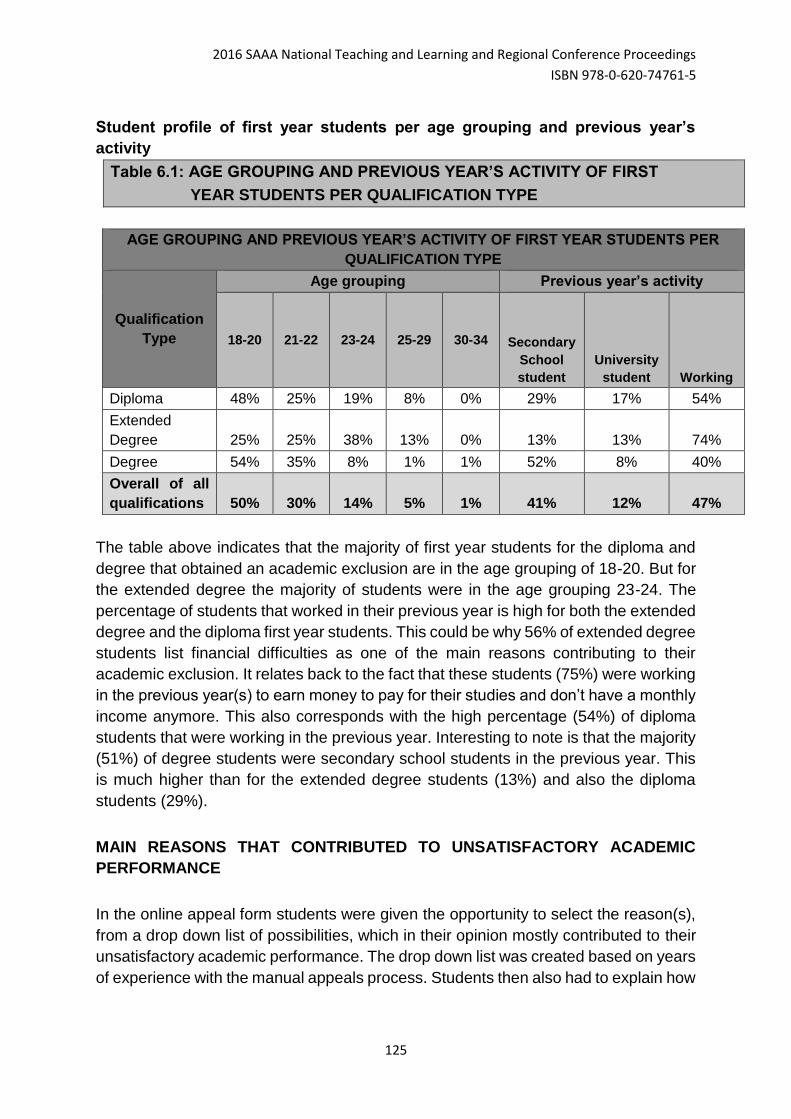
2016 SAAA National Teaching and Learning and Regional Conference Proceedings
ISBN 978-0-620-74761-5
125
Student profile of first year students per age grouping and previous year’s
activity
Table 6.1: AGE GROUPING AND PREVIOUS YEAR’S ACTIVITY OF FIRST
YEAR STUDENTS PER QUALIFICATION TYPE
AGE GROUPING AND PREVIOUS YEAR’S ACTIVITY OF FIRST YEAR STUDENTS PER
QUALIFICATION TYPE
Qualification
Type
Age grouping Previous year’s activity
18-20 21-22 23-24 25-29 30-34 Secondary
School
student
University
student Working
Diploma 48% 25% 19% 8% 0% 29% 17% 54%
Extended
Degree 25% 25% 38% 13% 0% 13% 13% 74%
Degree 54% 35% 8% 1% 1% 52% 8% 40%
Overall of all
qualifications 50% 30% 14% 5% 1% 41% 12% 47%
The table above indicates that the majority of first year students for the diploma and
degree that obtained an academic exclusion are in the age grouping of 18-20. But for
the extended degree the majority of students were in the age grouping 23-24. The
percentage of students that worked in their previous year is high for both the extended
degree and the diploma first year students. This could be why 56% of extended degree
students list financial difficulties as one of the main reasons contributing to their
academic exclusion. It relates back to the fact that these students (75%) were working
in the previous year(s) to earn money to pay for their studies and don’t have a monthly
income anymore. This also corresponds with the high percentage (54%) of diploma
students that were working in the previous year. Interesting to note is that the majority
(51%) of degree students were secondary school students in the previous year. This
is much higher than for the extended degree students (13%) and also the diploma
students (29%).
MAIN REASONS THAT CONTRIBUTED TO UNSATISFACTORY ACADEMIC
PERFORMANCE
In the online appeal form students were given the opportunity to select the reason(s),
from a drop down list of possibilities, which in their opinion mostly contributed to their
unsatisfactory academic performance. The drop down list was created based on years
of experience with the manual appeals process. Students then also had to explain how
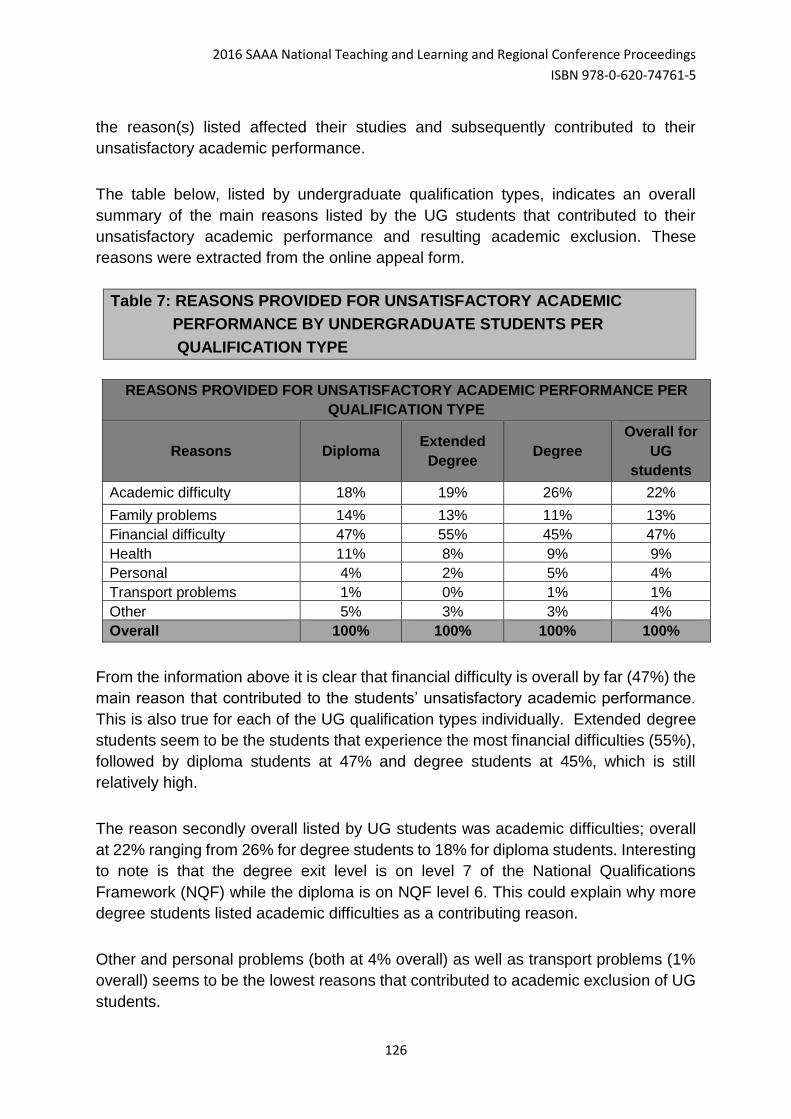
2016 SAAA National Teaching and Learning and Regional Conference Proceedings
ISBN 978-0-620-74761-5
126
the reason(s) listed affected their studies and subsequently contributed to their
unsatisfactory academic performance.
The table below, listed by undergraduate qualification types, indicates an overall
summary of the main reasons listed by the UG students that contributed to their
unsatisfactory academic performance and resulting academic exclusion. These
reasons were extracted from the online appeal form.
Table 7: REASONS PROVIDED FOR UNSATISFACTORY ACADEMIC
PERFORMANCE BY UNDERGRADUATE STUDENTS PER
QUALIFICATION TYPE
REASONS PROVIDED FOR UNSATISFACTORY ACADEMIC PERFORMANCE PER
QUALIFICATION TYPE
Reasons Diploma Extended
Degree Degree
Overall for
UG
students
Academic difficulty 18% 19% 26% 22%
Family problems 14% 13% 11% 13%
Financial difficulty 47% 55% 45% 47%
Health 11% 8% 9% 9%
Personal 4% 2% 5% 4%
Transport problems 1% 0% 1% 1%
Other 5% 3% 3% 4%
Overall 100% 100% 100% 100%
From the information above it is clear that financial difficulty is overall by far (47%) the
main reason that contributed to the students’ unsatisfactory academic performance.
This is also true for each of the UG qualification types individually. Extended degree
students seem to be the students that experience the most financial difficulties (55%),
followed by diploma students at 47% and degree students at 45%, which is still
relatively high.
The reason secondly overall listed by UG students was academic difficulties; overall
at 22% ranging from 26% for degree students to 18% for diploma students. Interesting
to note is that the degree exit level is on level 7 of the National Qualifications
Framework (NQF) while the diploma is on NQF level 6. This could explain why more
degree students listed academic difficulties as a contributing reason.
Other and personal problems (both at 4% overall) as well as transport problems (1%
overall) seems to be the lowest reasons that contributed to academic exclusion of UG
students.
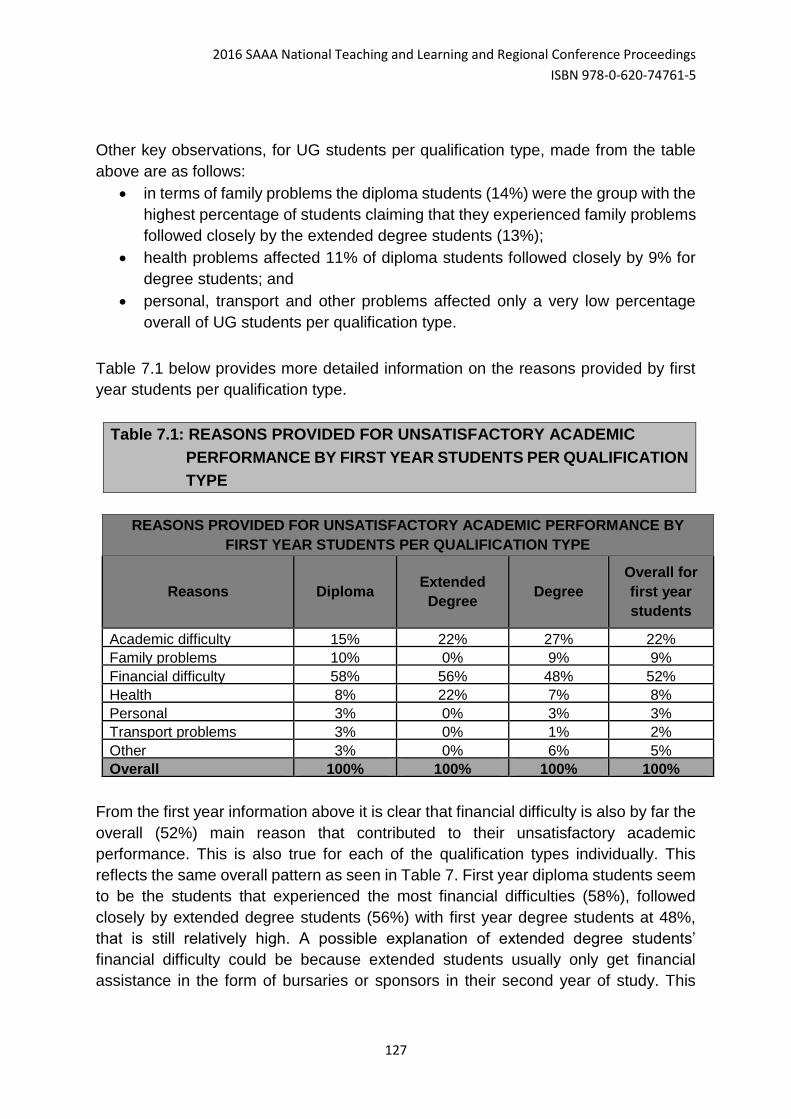
2016 SAAA National Teaching and Learning and Regional Conference Proceedings
ISBN 978-0-620-74761-5
127
Other key observations, for UG students per qualification type, made from the table
above are as follows:
in terms of family problems the diploma students (14%) were the group with the
highest percentage of students claiming that they experienced family problems
followed closely by the extended degree students (13%);
health problems affected 11% of diploma students followed closely by 9% for
degree students; and
personal, transport and other problems affected only a very low percentage
overall of UG students per qualification type.
Table 7.1 below provides more detailed information on the reasons provided by first
year students per qualification type.
Table 7.1: REASONS PROVIDED FOR UNSATISFACTORY ACADEMIC
PERFORMANCE BY FIRST YEAR STUDENTS PER QUALIFICATION
TYPE
REASONS PROVIDED FOR UNSATISFACTORY ACADEMIC PERFORMANCE BY
FIRST YEAR STUDENTS PER QUALIFICATION TYPE
Reasons Diploma Extended
Degree Degree
Overall for
first year
students
Academic difficulty 15% 22% 27% 22%
Family problems 10% 0% 9% 9%
Financial difficulty 58% 56% 48% 52%
Health 8% 22% 7% 8%
Personal 3% 0% 3% 3%
Transport problems 3% 0% 1% 2%
Other 3% 0% 6% 5%
Overall 100% 100% 100% 100%
From the first year information above it is clear that financial difficulty is also by far the
overall (52%) main reason that contributed to their unsatisfactory academic
performance. This is also true for each of the qualification types individually. This
reflects the same overall pattern as seen in Table 7. First year diploma students seem
to be the students that experienced the most financial difficulties (58%), followed
closely by extended degree students (56%) with first year degree students at 48%,
that is still relatively high. A possible explanation of extended degree students’
financial difficulty could be because extended students usually only get financial
assistance in the form of bursaries or sponsors in their second year of study. This
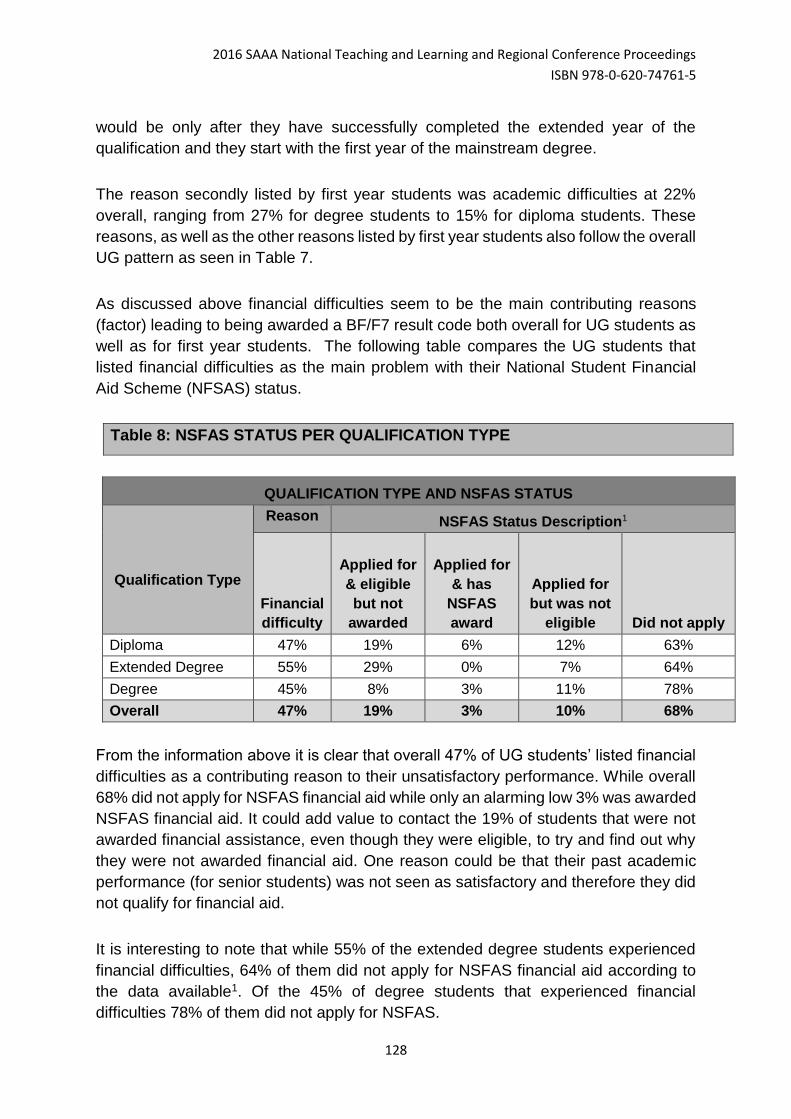
2016 SAAA National Teaching and Learning and Regional Conference Proceedings
ISBN 978-0-620-74761-5
128
would be only after they have successfully completed the extended year of the
qualification and they start with the first year of the mainstream degree.
The reason secondly listed by first year students was academic difficulties at 22%
overall, ranging from 27% for degree students to 15% for diploma students. These
reasons, as well as the other reasons listed by first year students also follow the overall
UG pattern as seen in Table 7.
As discussed above financial difficulties seem to be the main contributing reasons
(factor) leading to being awarded a BF/F7 result code both overall for UG students as
well as for first year students. The following table compares the UG students that
listed financial difficulties as the main problem with their National Student Financial
Aid Scheme (NFSAS) status.
Table 8: NSFAS STATUS PER QUALIFICATION TYPE
QUALIFICATION TYPE AND NSFAS STATUS
Qualification Type
Reason NSFAS Status Description1
Financial
difficulty
Applied for
& eligible
but not
awarded
Applied for
& has
NSFAS
award
Applied for
but was not
eligible Did not apply
Diploma 47% 19% 6% 12% 63%
Extended Degree 55% 29% 0% 7% 64%
Degree 45% 8% 3% 11% 78%
Overall 47% 19% 3% 10% 68%
From the information above it is clear that overall 47% of UG students’ listed financial
difficulties as a contributing reason to their unsatisfactory performance. While overall
68% did not apply for NSFAS financial aid while only an alarming low 3% was awarded
NSFAS financial aid. It could add value to contact the 19% of students that were not
awarded financial assistance, even though they were eligible, to try and find out why
they were not awarded financial aid. One reason could be that their past academic
performance (for senior students) was not seen as satisfactory and therefore they did
not qualify for financial aid.
It is interesting to note that while 55% of the extended degree students experienced
financial difficulties, 64% of them did not apply for NSFAS financial aid according to
the data available1. Of the 45% of degree students that experienced financial
difficulties 78% of them did not apply for NSFAS.
2016 SAAA National Teaching and Learning and Regional Conference Proceedings
ISBN 978-0-620-74761-5
129
The large number of students that experience financial difficulties is alarming; it means
that the majority of their families are responsible for their financial needs. Research by
Fowler (2003), shows that students with financial difficulties not only have to pay for
their class fees but they are also liable for books and transport. The parents and
community generally assist with the payment of the registration fee. The students then
have to make adequate plans for the payment of the bigger amounts of fees still
outstanding. Students are then usually strapped for cash and have to manage their
finances carefully; they often take up part time jobs to assist them with their financial
needs. The part time jobs can cause students to miss classes. Students with financial
difficulties often remain on campus all day long in order to avoid paying unnecessary
transport fees. Students sometimes make use of the overnight study facility to sleep
in just to ensure that they save on transport money and use the money to buy food. It
could add value to determine whether adequate study areas and other facilities are
available for students that have to stay on campus all day long.
WHAT CAN BE DONE TO AVOID POTENTIAL ACADEMIC EXCLUSION?
Students should only be finally excluded on account of poor academic performance
as a last resort, after all other avenues have failed to restore their academic
performance to the required level, and provided that the necessary academic support
to assist students was given. It is also clear that alternative means of financial support
(not only NSFAS) for students’ needs to be investigated.
It is the responsibility of both the staff (academic and support) and students of FEFS
to ensure that as many students as possible are given the opportunity to be successful
in their studies.
Staff have the responsibility of selecting, admitting and orientating students carefully;
delivering excellent teaching and fair assessment; ensuring that students have the
opportunity and means to assess and monitor their performance on a regular basis;
and providing appropriate academic support and feedback to students.
Students have the responsibility of committing themselves fully to their studies;
monitoring their performance in their studies; and utilising all the available support
resources (academic counselling by PhyCaD, academic support by the ADC as well
as career and personal counselling) to successfully complete their studies. This should
preferably be done in the minimum time for their qualification but not exceeding the
maximum time allowed.
2016 SAAA National Teaching and Learning and Regional Conference Proceedings
ISBN 978-0-620-74761-5
130
Faculties should implement some initiatives to try and alleviate the academic as well
as financial problems that students are experiencing. FEFS already has good
measures in place to assist students academically.
To try and assist students with their financial problems it can be useful to consider
some of the following:
the possibility of other types of funding mechanisms available (Fowler,
2003:16);
investigate the alternatives of more innovative and entrepreneurial ways to
guide students to provide their own funding needs;
provide students with practical budgeting guidelines to assist them in planning
their finances; and
assist students with financial difficulties with a meal a day to ensure they do not
have to study or attempt assessment opportunities while being hungry.
SUMMARY AND POSSIBLE FUTURE STUDIES
This paper presented a case study in the form of an analysis of the reasons
contributing to academic exclusion in FEFS at UJ. It was shown that after the first
semester 93% of the total number of UG and PG students that were academically
excluded were UG students and 84% were UG students after the second semester of
2015. Overall for 2015 it was mostly degree students (47%) followed by diploma
students (38%) that were academically excluded for 2015. The same can be seen for
first year students, where 52% of the first year students that were academically
excluded represented degree students followed by diploma students at 45%.
Overall UG students have an appeal rate of 68%; this indicates that the majority of UG
students take the opportunity to appeal their academic exclusion. The majority of
overall appeals came from degree students (50%) followed by diploma students
(37%). This is in line with the faculty’s enrolment numbers per qualification type. First
year students have an appeal rate of only 41% compared to the overall appeal UG
rate of 68%. It could add value to determine why the appeal rates for first year students
are lower when comparted to the overall UG appeal rate.
The analysis of the reasons contributing to students being academically excluded lead
to two important conclusions:
47% of UG students listed financial difficulties as the main reason contributing
to their unsatisfactory academic performance. Extended degree students seem
to be the students that experience the most (55%) financial difficulties. First
year students also indicated that financial difficulties were by far overall (52%)
the main contributing reason; and
2016 SAAA National Teaching and Learning and Regional Conference Proceedings
ISBN 978-0-620-74761-5
131
academically difficulty at 22%, overall ranging from 36% for degree students to
18% for diploma students, was the second highest reason listed by UG
academically excluded students. First year students indicated that academic
difficulties, also at 22% overall, were the second highest contributing reason.
The results of this study suggest that the Faculty and possibly the University should
implement some initiatives to try and alleviate the financial as well as the academic
difficulties students are experiencing.
Extracting and analysing the data obtained from the BF/F7 online appeals process
should be part of an on-going research project within the Faculty and possibly the
University. If more data is obtained relating to the academic exclusion of students the
sooner solutions to the problems, being academically or non-academically, could be
found and this could possibly positively influence the graduation rate of the Faculty.
Future studies could include the following:
obtain information from the students that did not appeal their academic
exclusion to find out their reasons; and
track the progress of students, that had their BF/F7 lifted and subsequently
received an academic warning, to monitor their academic performance in order
to see if the academic warning received and subsequent interventions assisted
them in improving their academic performance.
Future studies in these areas could assist the Faculty and University to design and
implement strategies and innovations specific to the needs of academically excluded
students, based on the data extracted from the online academic appeals process.
2016 SAAA National Teaching and Learning and Regional Conference Proceedings
ISBN 978-0-620-74761-5
132
REFERENCES
Council on Higher Education (CHE). 2013. A proposal for undergraduate curriculum
reform in South Africa: The case for a flexible curriculum structure. Council on Higher
Education, Pretoria, 2013.
Fowler, M. 2003. Student retention problems in Higher Education in a Developing
Country. Pretoria: Strategic Information & Planning.
Godfrey, J. 2012. An exploratory study of the interface of child-headed households
and academic performance: A Case study of primary school students in Beatrice
resettlement area, Zimbabwe: University of Zimbabwe.
Higher Education Data Analyser (HEDA), University of Johannesburg, 2016. Data
extracted on 19 April 2016.
Ishitani, TT and DesJardins, SL. 2002. A Longitudinal Investigation of Dropout from
College in the United States. Paper presented at the 2002 Annual Meeting of the
Association for Institutional Research.
Kohlbacher, F. 2006. The use of Qualitative Content Analysis in Case study Research.
Forum: Qualitative Social Research. 7(1).
Letseka, M. 2009 University dropout and researching (lifelong) learning and work.
Hsrcpress.ac.za 88-105.
Letseka, M and Maile, S. 2008. High university dropout rates: A threat to South Africa’s
future. Pretoria: Human Science Research Council; 1–7.
Murry, M. 2014. Factors affecting graduation and student dropout rates at the
University of KwaZulu-Natal. South African Journal of Science. 2014: 110-112.
Neethling, L. 2015. The determinants of academic outcomes: A competing risks
approach. Paper presented at the 2015 Conference of the Economic Society of South
Africa.
Qualifications and Regulations of the University of Johannesburg, Faculty of Economic
and Financial Sciences (FEFS QR), 2016.
Sampaio, G. 2012. Three Essays on the Economics of Education. PhD Thesis,
University of Illinois at Urbana Champaign.
2016 SAAA National Teaching and Learning and Regional Conference Proceedings
ISBN 978-0-620-74761-5
133
Shoukat A, Haider Z, Khan H and Ahmed A. 2013. Factors Contributing to the
Students’ Academic Performance: A Case Study of Islamaia University Sub-Campus.
American Journal of Educational Research 2013: 1(8) 283-289.
St John E, Cabrera A, Nora A and Asker E. (2000). Economic influences on
persistence reconsidered: How can finance research inform the reconceptualization
of persistence models. In J. Braxton (Ed.), Reworking the student Departure Puzzle
(29-47). Nashville, TN: Vanderbilt: University Press.
Stratton L, O'Toole D and Wetzel J. 2008. A multinomial logit model of college stopout
and dropout behaviour. Economics of Education Review, 27, 319-331.
University of Johannesburg. 2016. Academic Rules and Regulations of the University
of Johannesburg (UJ ARR).
University of Johannesburg Senate, S374/2010(3), 2010.
Yin, RK. 2003. Case Study Research Design and Methods. Thousand Oaks, C.A.
SAGE.
2016 SAAA National Teaching and Learning and Regional Conference Proceedings
ISBN 978-0-620-74761-5
134
2016 Southern African Accounting
Association (SAAA)
National Teaching and Learning and
Regional Conference Proceedings
ISBN number: 978-0-620-74761-5
FAC 02: The Proposed Conceptual Framework and its
possible effect on the reporting of Contingent Liabilities
AUTHORS: Taryn Miller and Guy Wagenvoorde,
University of Cape Town; [email protected]
Abstract
This paper examines the International Accounting Standards Board’s (“IASB’s”)
proposed changes to liabilities within the Exposure Draft of the revised Conceptual
Framework3, and the implications of these changes for the reporting of contingent
liabilities, in the event that IAS 374 were to be amended to align with the Draft
Framework’s proposals. This paper finds that the Draft Framework’s liability definition
has very few notable changes, yet the Draft Framework’s recognition criteria will likely
impact the number of obligations to be recognised in the future. Specifically, contingent
liabilities that are considered to be ‘present obligations’ but fail the existing recognition
criteria, may in future meet both the definition and recognition criteria for liabilities. This
will impact key financial statement indicators such as an entity’s net asset value and
net profit. The results of this paper are therefore useful to a broad array of financial
statement users as well as the IASB who are presently engaging various stakeholders
on whether to take on an active project to amend IAS 37.
Keywords: contingent liability, recognition
3 The revised Conceptual Framework is hereinafter referred to as the “Draft Conceptual Framework” or
the “Draft Framework”. 4 International Accounting Standard 37: Provisions, Contingent Liabilities and Contingent Assets
2016 SAAA National Teaching and Learning and Regional Conference Proceedings
ISBN 978-0-620-74761-5
135
Introduction
The Conceptual Framework for Financial Reporting (the “Conceptual Framework” or
“the Framework”) “describes the objective of, and the concepts for, general purpose
financial reporting” (IASB, 2015a, par. IN1). It also forms a basis for the development
of International Financial Reporting Standards (“IFRS”). The Conceptual Framework
has been under extensive review since 2004 and one of the key areas subject to
development has been the definitions of assets and liabilities, and the related
recognition criteria.
There are numerous issues associated with the existing Framework that the IASB has
sought to address in their update project. One area of concern is the existing
recognition principles that potentially result in the inappropriate reporting of an entity’s
obligations. In particular, contingent liabilities as defined in IAS 37 are never
recognised on the statement of financial position. This research paper investigates
whether or not contingent liabilities would be reported any differently, in the event that
the proposed definition and recognition principles for liabilities within the Draft
Framework were to be incorporated into IAS 37. A direct implication of this would result
in entities reflecting a lower (or higher) net asset value.
This research paper may be of benefit to the IASB as they currently deliberate on the
direction of the Conceptual Framework project and whether or not IAS 37 merits being
added to their active project agenda (IASB, 2015c, par. 8).
1. Background: The Conceptual Framework
The IASB and the Financial Accounting Standards Board5 initiated a joint project in
2004 to overhaul their existing Conceptual Frameworks. Since the project’s inception
there have been two chapters of the Draft Framework released – Chapter 1 (The
Objective of General Purpose Financial Statements) and Chapter 3 (Qualitative
Characteristics of Useful Financial Information). These chapters became effective
within the existing Conceptual Framework in 2010.
The exposure draft of the Conceptual Framework, which forms the focus of this
research paper, was issued in May 2015, and was open for public comment until
November 2015. At the time of finalising this paper, the comment period had closed
and the IASB staff were reviewing the comment letters. This will inform a decision by
the IASB on the future direction of the Conceptual Framework project.
5 Financial Accounting Standards Board: The Financial Reporting Standards setting board in the United
States of America.
2016 SAAA National Teaching and Learning and Regional Conference Proceedings
ISBN 978-0-620-74761-5
136
1.1. The Qualitative characteristics of useful financial information
The 2010 updates to the Conceptual Framework included revisions to the qualitative
characteristics of useful financial information. These characteristics are intended to
inform what financial information should be reported.
The qualitative characteristics comprise:
(a) Fundamental qualitative characteristics, namely:
Relevance and
Faithful representation, and
(b) Enhancing characteristics, namely:
Comparability
Timeliness
Verifiability, and
Understandability (IFRS Foundation, 2014a, par. QC19).
The IASB seeks to maximise these qualities to the greatest extent possible (IFRS
Foundation, 2014a, par. QC33). Information needs to be both relevant and faithfully
represented, to be useful. These characteristics, together with the additional
enhancing characteristics, represent an ideal financial information-set that the
developed IFRS are expected to help achieve. At all times, the benefit of obtaining the
information with these characteristics needs to outweigh the cost of obtaining the
information. This is known as the ‘cost constraint’, and is a pervasive constraint that is
constantly reflected on by the IASB as they develop IFRS.
An understanding and awareness of these characteristics, and the cost constraint, is
critical when evaluating the effects of the proposed changes in the Draft Framework,
and indeed, any IFRS.
2. The relevance of contingent liabilities in practice
In public finance practice, information on contingent liabilities has aided the analysis
of sovereign risk (Cebotari, 2008). This has proven to be particularly useful in
assessing the “true financial position of the public sector” (Cebotari, 2008). For
example, there are “implicit contingent liabilities [that] governments take on during
periods of financial and economic distress by bailing out banks…or even private
enterprises” (Cebotari, 2008). Furthermore, there has been a larger focus by credit
rating agencies, such as Standard & Poor’s and Moody’s, in incorporating this
information in their credit risk assessment of various economies (Cebotari, 2008).
2016 SAAA National Teaching and Learning and Regional Conference Proceedings
ISBN 978-0-620-74761-5
137
Adequate contingent liability disclosure for the purpose of making risk
assessments can also fulfil a vital role in the private sector. The objective of
general purpose financial reporting extends its meaning to aiding the users of
financial statements in assessing the risks, timing and uncertainty of an entity’s
future net cash flows (IFRS Foundation, 2014f, par. OB3). There is greater need
for the appropriate representation of these obligations if these users
incorporate contingent liability disclosure in their risk assessment of an entity.
Therefore, just as the information on contingent liability disclosure is
incorporated in a public finance sphere, the decision to appropriately represent
a liability in the financial statements is pivotal in fulfilling the objective of general
purpose financial reporting.
3. IAS 37 & Contingent Liabilities IAS 37 contains specific guidance on accounting for the recognition, measurement,
presentation and disclosure of provisions, contingent liabilities and contingent assets.
This guidance is generally consistent with the principles embedded in the existing
Conceptual Framework relating to defining and recognising liabilities.
IAS 37 defines a provision as a ‘liability of uncertain timing or amount’ (IFRS
Foundation, 2014d, par. 10).
Provisions are recognised on the statement of financial position if they meet the
general recognition criteria for liabilities i.e. a reliable estimate of the outflow can be
made, and it is considered probable that the outflow will occur.
IAS 37 further states that the term “probable” means “more likely than not to occur”
(IFRS Foundation, 2014d, par. 24). Accordingly, if there is a greater than 50% chance
of an outflow occurring, a provision for the best (reliable) estimate of the outflow is
recognised. If an outflow is not considered more than likely to occur, or if a reliable
estimate cannot be made, the obligation is known as a contingent liability. Contingent
liabilities can also arise due to a possible (as opposed to ‘present’) obligation, as
discussed in the next section.
3.1. Contingent liabilities in IAS 37
Per IAS 37, a contingent liability is defined as:
“ (a) a possible obligation that arises from past events and whose existence will be
confirmed only by the occurrence or non-occurrence of one or more uncertain
future events not wholly within the control of the entity; or
(b) a present obligation that arises from past events but is not recognised
because:
2016 SAAA National Teaching and Learning and Regional Conference Proceedings
ISBN 978-0-620-74761-5
138
i. it is not probable that an outflow6 of resources embodying economic
benefits will be required to settle the obligation; or
ii. the amount of the obligation cannot be measured with sufficient
reliability” (IFRS Foundation, 2014d, par. 10).
IAS 37 requires that a contingent liability be “disclosed…unless the possibility of an
outflow of resources embodying economic benefits is remote” (IFRS Foundation,
2014d, par. 28). Accordingly, contingent liabilities are never recognised as liabilities
on the statement of financial position and will therefore have no direct impact on the
net assets nor financial performance of an entity. However, the relevant details relating
to these items appear as disclosure in the notes to the financial statements.
The IASB emphasised the importance of recognition in satisfying the objective of
general purpose financial reporting: “The failure to recognise an asset or a liability is
not rectified by disclosure… If some assets or liabilities are not recognised, the
resulting depiction of the entity’s resources and obligations would be incomplete and
would thus provide a less faithful representation of the entity’s financial position”
(IASB, 2013a, par. 4.24). The recognition decision is thus fundamental when
assessing the information needs of users7.
It can be seen that the definition of a contingent liability is comprised of two
components, a “possible obligation” and a “present obligation” that is unrecognised.
These two components require separate consideration. In order to do so effectively,
each component of the contingent liability definition will be dealt with independently
and hereinafter referred to as “type (a)”, being a contingent liability that is a “possible
obligation”, and “type (b)”, a contingent liability that is a “present obligation” that is
unrecognised.
3.2. Problems with the existing recognition criteria
A concern with the probability criterion8 within the existing recognition criteria is its
inconsistent interpretation and application within various Standards. “Some existing
Standards do not apply a probability recognition criterion, for example, IFRS 9
Financial Instruments. Those that do apply such a criterion use different probability
thresholds. These include ‘probable’, ‘more likely than not’, ‘virtually certain’ and
‘reasonably possible’. The use of the different terms indicates a lack of consistency in
6 “Outflow” refers to the outflow of future economic benefits in all cases
7 This research paper does not analyse the relative appropriateness of recognition versus disclosure in
respect of reporting contingent liabilities. Rather, this paper simply identifies the IASB’s amendments to the Conceptual Framework and the potential reporting outcomes for contingent
liabilities. 8 The probability criterion in the existing recognition criteria: “It is probable that any future economic
benefit associated with the item will flow to or from the entity” (IFRS Foundation, 2014b, par. 4.38).
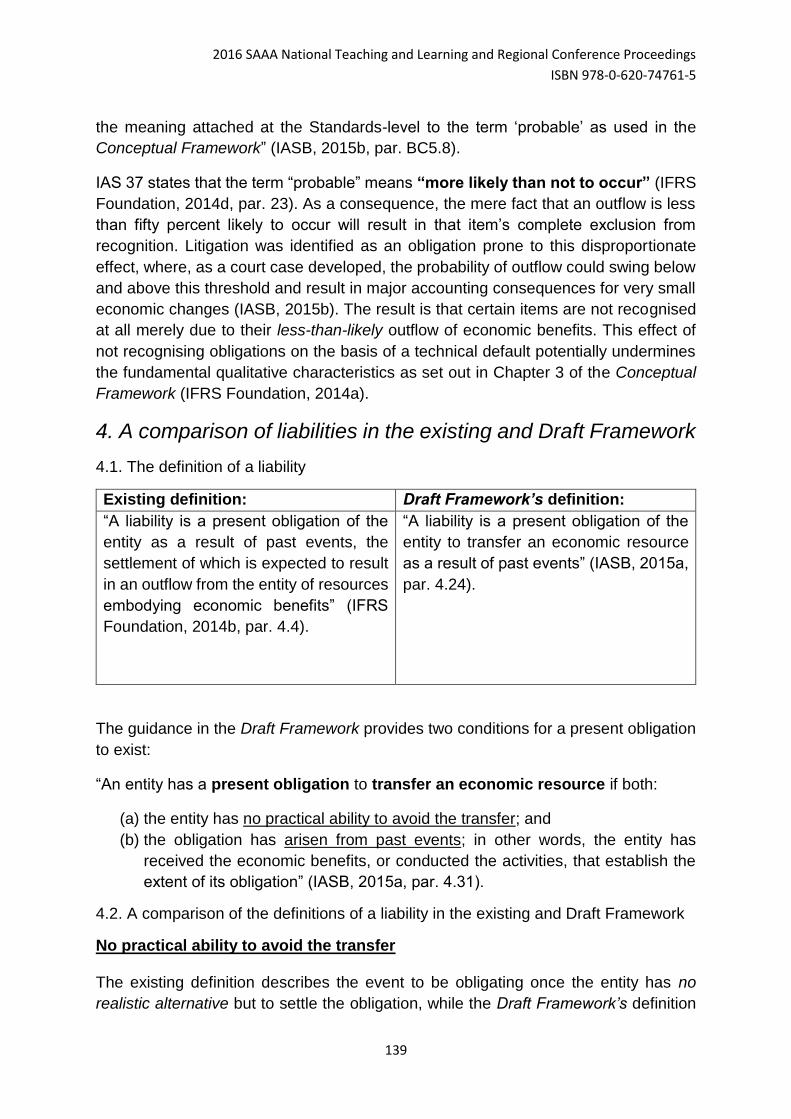
2016 SAAA National Teaching and Learning and Regional Conference Proceedings
ISBN 978-0-620-74761-5
139
the meaning attached at the Standards-level to the term ‘probable’ as used in the
Conceptual Framework” (IASB, 2015b, par. BC5.8).
IAS 37 states that the term “probable” means “more likely than not to occur” (IFRS
Foundation, 2014d, par. 23). As a consequence, the mere fact that an outflow is less
than fifty percent likely to occur will result in that item’s complete exclusion from
recognition. Litigation was identified as an obligation prone to this disproportionate
effect, where, as a court case developed, the probability of outflow could swing below
and above this threshold and result in major accounting consequences for very small
economic changes (IASB, 2015b). The result is that certain items are not recognised
at all merely due to their less-than-likely outflow of economic benefits. This effect of
not recognising obligations on the basis of a technical default potentially undermines
the fundamental qualitative characteristics as set out in Chapter 3 of the Conceptual
Framework (IFRS Foundation, 2014a).
4. A comparison of liabilities in the existing and Draft Framework
4.1. The definition of a liability
Existing definition: Draft Framework’s definition:
“A liability is a present obligation of the
entity as a result of past events, the
settlement of which is expected to result
in an outflow from the entity of resources
embodying economic benefits” (IFRS
Foundation, 2014b, par. 4.4).
“A liability is a present obligation of the
entity to transfer an economic resource
as a result of past events” (IASB, 2015a,
par. 4.24).
The guidance in the Draft Framework provides two conditions for a present obligation
to exist:
“An entity has a present obligation to transfer an economic resource if both:
(a) the entity has no practical ability to avoid the transfer; and
(b) the obligation has arisen from past events; in other words, the entity has
received the economic benefits, or conducted the activities, that establish the
extent of its obligation” (IASB, 2015a, par. 4.31).
4.2. A comparison of the definitions of a liability in the existing and Draft Framework
No practical ability to avoid the transfer
The existing definition describes the event to be obligating once the entity has no
realistic alternative but to settle the obligation, while the Draft Framework’s definition
2016 SAAA National Teaching and Learning and Regional Conference Proceedings
ISBN 978-0-620-74761-5
140
describes this rather as a practical inability to avoid the transfer of economic
resources. The latter definition provides a seemingly greater extent of leeway through
its use of the word “practical” as opposed to “realistic”. The IASB has, however, noted
that these two terms are similar in meaning, but chose to propose the term “no practical
ability to avoid” because [it thought] that it most effectively [conveyed] the need to
identify what the entity [was] able to do, instead of what the probable outcome will be.
Furthermore, it [mirrors] the term ‘practical ability’, which [is] applied in some existing
Standards in assessing whether an entity has control of an asset” (IASB, 2015b).
Therefore, the emphasis in the Draft Framework’s approach has been shifted to the
entity identifying whether it has committed an act sufficient enough to be an obligating
event.
Arisen from past events
Both the existing and Draft Framework’s liability definitions require the occurrence of
a past event to give rise to a present obligation of the entity. In both cases, therefore,
the recognition of a liability is not dependent on the future actions of the entity. The
emphasis has therefore remained on an entity’s past actions and whether those
actions are sufficient enough to give rise to an obligation.
There could, however, be considerable uncertainty as to what is sufficient for this
purpose. The Draft Framework distinguishes between two forms of uncertainty:
“ (a) uncertainty about whether an asset or a liability exists (‘existence
uncertainty’)
(b) uncertainty about whether an asset or a liability will result in any inflow or
outflow (‘outcome uncertainty’)” (IASB, 2015a).
An example of existence uncertainty is in relation to litigation where an entity has
committed an act but it is unclear whether they will be obliged to pay damages or a
fine for their related actions (IASB, 2013a). This extends to the uncertainty in how the
law applies to those particular events (IASB, 2010a:5).
The uncertainty inherent in the existing and Draft Framework’s liability definitions is
primarily centred on existence uncertainty. Outcome uncertainty is more relevant to
the recognition criteria (which is yet to be discussed).
To summarise, it is apparent that the definitions in the existing and Draft Framework
are largely similar. The effect of the proposed change in the definition of a liability will
be discussed further in Chapter 6, which analyses the effect of the proposed change
for contingent liabilities.
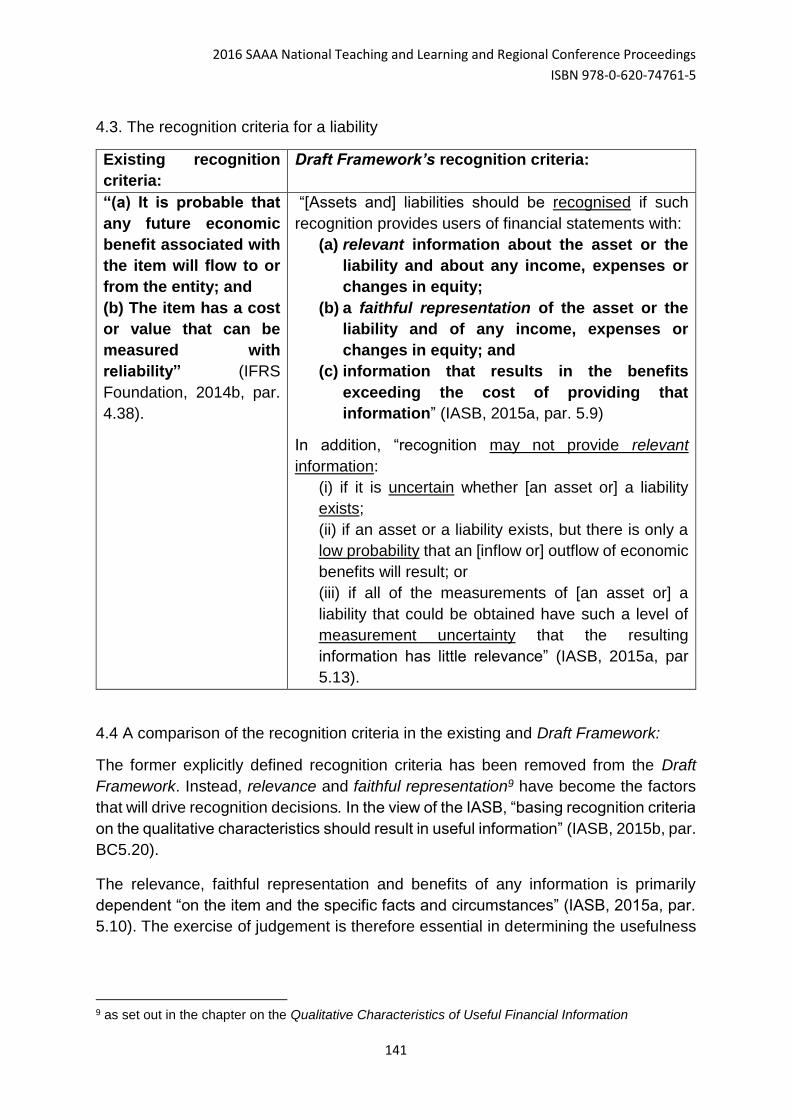
2016 SAAA National Teaching and Learning and Regional Conference Proceedings
ISBN 978-0-620-74761-5
141
4.3. The recognition criteria for a liability
Existing recognition
criteria:
Draft Framework’s recognition criteria:
“(a) It is probable that
any future economic
benefit associated with
the item will flow to or
from the entity; and
(b) The item has a cost
or value that can be
measured with
reliability” (IFRS
Foundation, 2014b, par.
4.38).
“[Assets and] liabilities should be recognised if such
recognition provides users of financial statements with:
(a) relevant information about the asset or the
liability and about any income, expenses or
changes in equity;
(b) a faithful representation of the asset or the
liability and of any income, expenses or
changes in equity; and
(c) information that results in the benefits
exceeding the cost of providing that
information” (IASB, 2015a, par. 5.9)
In addition, “recognition may not provide relevant
information:
(i) if it is uncertain whether [an asset or] a liability
exists;
(ii) if an asset or a liability exists, but there is only a
low probability that an [inflow or] outflow of economic
benefits will result; or
(iii) if all of the measurements of [an asset or] a
liability that could be obtained have such a level of
measurement uncertainty that the resulting
information has little relevance” (IASB, 2015a, par
5.13).
4.4 A comparison of the recognition criteria in the existing and Draft Framework:
The former explicitly defined recognition criteria has been removed from the Draft
Framework. Instead, relevance and faithful representation9 have become the factors
that will drive recognition decisions. In the view of the IASB, “basing recognition criteria
on the qualitative characteristics should result in useful information” (IASB, 2015b, par.
BC5.20).
The relevance, faithful representation and benefits of any information is primarily
dependent “on the item and the specific facts and circumstances” (IASB, 2015a, par.
5.10). The exercise of judgement is therefore essential in determining the usefulness
9 as set out in the chapter on the Qualitative Characteristics of Useful Financial Information
2016 SAAA National Teaching and Learning and Regional Conference Proceedings
ISBN 978-0-620-74761-5
142
of information when applying the Draft Framework’s recognition criteria. A detailed
discussion of this criteria follows:
Relevant information
The Draft Framework’s recognition criteria incorporates three considerations for
whether or not recognising the liability will result in relevant information. Information is
not considered to be relevant when:
i. It is uncertain whether an asset exists, or is separable from goodwill, or whether
a liability exists:
The interpretations of the Draft Framework’s liability definition establishes that
existence uncertainty is a significant consideration for whether an entity has a
present obligation. The presence of this type of uncertainty will likely result in
an obligation not meeting the Draft Framework’s definition of a liability.
However, notwithstanding this practical filter within the Draft Framework’s
liability definition, an obligation would further fail to meet the Draft Framework’s
recognition criteria as a result of this additional consideration in the recognition
criteria.
ii. There is only a low probability that an inflow or outflow of economic benefits will
result:
In certain cases, the probability of outflow could be so low that recognition of
the liability would lead to irrelevant information, if estimated and recognised in
the financial statements. In other situations, however, recognition of a liability
even when there is a low probability of an outflow occurring may provide
relevant information, especially if the measurement of the asset or the liability
reflects the low probability and is accompanied by explanatory disclosures”
(IASB, 2015a:53). Determining how probable the outflow is, may in itself be
difficult to determine, especially where there is no observable transaction or
price. This is particularly evident in the case of litigation as a result of its non-
transactional nature. Ultimately, the probability of the outflow occurring assists
in determining whether the reported information would be relevant or not.
iii. A measurement of an asset or a liability is available (or can be obtained) but
the level of measurement uncertainty is so high that the resulting information
has little relevance and no other relevant measure is available (or can be
obtained):
The recognition of an obligation requires the measurement thereof. The existing
recognition criteria refers to the cost or value of an outflow as being “reliably
measurable”. Despite any unobservable transaction or price, the outflow can
still be deemed to be reliably measurable through the use of estimation. There
2016 SAAA National Teaching and Learning and Regional Conference Proceedings
ISBN 978-0-620-74761-5
143
are various measurement bases suggested in terms of the Draft Framework
that could be used to obtain a reliable estimate (IASB, 2015a).
However, where the estimate of the amount of the potential outflow is subject
to significant uncertainty, the “resulting information [has] little relevance, even
if the estimate is properly described and disclosed. This may be the case when
the range of possible outcomes is extremely wide and the likelihood of each
outcome is exceptionally difficult to estimate, [or] measuring the resource or
obligation requires unusually difficult or exceptionally subjective allocations of
cash flows that do not relate solely to the item being measured” (IASB,
2015a:54).
Faithful representation
Just as faithful representation is equally as meaningful as relevance in providing useful
financial information in the existing Framework, it has equivalent prominence within in
the Draft Framework’s recognition criteria. It is apparent that the IASB has sought for
the preparers of financial statements to balance these criteria, giving commensurate
weight to each when making recognition decisions. However, many respondents to
the Discussion Paper (IASB, 2013a) argued that “faithful representation” is redundant
in the context of recognition. These respondents argued that “there are no
circumstances when recognising an asset or a liability would provide information that
is relevant but yet could not result in a faithful representation” (IASB, 2015b:68). The
IASB, however, continued to affirm their view that faithful representation is necessary
when making recognition decisions. This view was derived from the need for an
entirely consistent application of the Qualitative Characteristics within the Draft
Conceptual Framework (IASB, 2015b:68).
Cost constraint
This cost constraint was already captured in Chapter 3: Qualitative Characteristics of
Useful Financial Information (IFRS Foundation, 2014a:A30). Albeit having a greater
prominence within the Draft Framework’s recognition criteria, this term has not
deviated in meaning from the existing Framework.
5. Additional literature
The subject matter of this research paper was primarily guided by the Conceptual
Framework, both in its existing and revised Draft form, as well as IAS 37. Relevant
additional literature includes the following:
2016 SAAA National Teaching and Learning and Regional Conference Proceedings
ISBN 978-0-620-74761-5
144
5.1. IASB staff papers on the implication of the Draft Framework for the reporting of
liabilities
The IASB staff have issued a number of agenda papers that address the likely impact
of the Draft Framework on the recognition of liabilities (IASB, 2015c; 2015d; 2015e).
In these papers, a number of familiar examples, such as provisions for restructuring
costs, legal requirements to install smoke detectors, and provisions for bonuses, are
applied to the proposed liability definition and recognition criteria, with the conclusion
drawn that the proposed amendments would not result in a change in the timing of the
recognition of liabilities (IASB, 2015e, par. 2.17-2.20). The only exception to this is an
example dealing with a provision for government levies payable, which would probably
result in an outcome that is different to the current requirements of IFRIC 21 Levies,
an interpretation that has been heavily criticised in any event (IASB 2015e, par. 1.18-
1.19).
However, none of the examples in these agenda papers address the possible
consequences of the Draft Framework for contingent liabilities. Hence this research
paper fills a void in the current available guidance.
5.2. Contingent liabilities in IFRS 3
There is a notable exception in IFRS 310 to the recognition requirements of IAS 37 in
relation to contingent liabilities. It is explicitly mentioned that the acquirer shall
recognise contingent liabilities assumed in a business combination if “it is a present
obligation that arises from past events and its fair value can be measured reliably”
(IFRS Foundation, 2014c, par. 23). This is seemingly contrary to the general
recognition criteria as a contingent liability should be recognised in a business
combination “even if it is not probable that an outflow of resources would be required
to settle that obligation” (IFRS Foundation, 2014c, par. 23). However, the expected
probability of the obligation outflow was said to be encompassed in the fair value
measurement of the contingent liability (IFRS Foundation, 2014e, par. 33). Therefore,
despite the difficulty in measuring or estimating a probability for the outflow of these
obligations, this exception implies that the IASB acknowledges the relevance in
recognising these obligations, albeit with the use of a different measurement basis.
5.3. Literature conclusion
The purpose of this research paper is to investigate whether or not the proposed
liability definition and recognition criteria within the Draft Framework would result in
contingent liabilities being reported any differently in future, should the proposed
criteria ultimately be incorporated into IAS 37. Such an investigation is by its nature,
a highly technical analysis of a financial reporting concept. The literature mentioned
thus far therefore contains the extent of the relevant technical concepts and principles
10 International Financial Reporting Standard 3: Business Combinations
2016 SAAA National Teaching and Learning and Regional Conference Proceedings
ISBN 978-0-620-74761-5
145
that inform the outcome of this investigation, and therefore no further literature is
considered to be relevant for the purpose of this study.
6. Application of the proposed changes within the Draft
Framework to contingent liabilities
6.1. The definition of liabilities
In spite of the changed terminology and supporting guidance, the liability definition in
both the existing and the Draft Conceptual Frameworks are largely equivalent in
meaning. The proposed liability definition will now be applied to the existing definitions
of contingent liabilities, in order to determine whether or not what are currently known
as ‘contingent liabilities’ would in future meet the formal (proposed) definition of a
‘liability’.
Recall that there are currently two types of contingent liabilities, namely “type (a)11”
and “type (b)12” contingent liabilities. Recall further that the Draft Framework’s liability
definition encompasses the term “present obligation”:
“ A liability is a present obligation of the entity to transfer an economic
resource as a result of past events” (IASB, 2015a).
Accordingly, since type (a) contingent liabilities are merely possible obligations, they
fail to meet the existing liability definition, and therefore similarly fail to meet the Draft
Framework’s liability definition. As such, no change in the accounting treatment of type
(a) contingent liabilities is expected.
However, for type (b) contingent liabilities, where a present obligation does exist but
where the probability of outflow is uncertain or cannot be reliably estimated, the
accounting treatment may differ in future.
6.2. The recognition criteria
“Type (b)” contingent liabilities:
An issue identified following the release of the Discussion Paper (IASB, 2013a) with
the Draft Framework’s recognition criteria was that the range of assets and liabilities
to be recognised will likely increase. The IASB have, however, noted that their aim
11 a possible obligation that arises from past events and whose existence will be confirmed only by
the occurrence or non-occurrence of one or more uncertain future events not wholly within the control
of the entity” (IFRS Foundation, 2014d). 12 a present obligation that arises from past events but is not recognised because:
i. it is not probable that an outflow of resources embodying economic benefits will be required to settle the
obligation; or
ii. the amount of the obligation cannot be measured with sufficient reliability” (IFRS Foundation, 2014d).
2016 SAAA National Teaching and Learning and Regional Conference Proceedings
ISBN 978-0-620-74761-5
146
“has been solely to develop tools that enable it to take decisions based on a more
coherent set of principles, which result in useful information. The IASB has not had,
and does not have, an objective of either increasing or decreasing the range of assets
and liabilities recognised” (IASB, 2015b, par. BC5.13).
Nonetheless, despite the IASB’s stated objective in revising the recognition criteria,
the Draft Framework’s recognition criteria could affect the recognition of “type (b)”
contingent liabilities. Most notably, contingent liabilities that were previously
unrecognised as a result of a less-than-fifty percent probability of outflow could
forthwith be considered for recognition if the resultant effect provides relevant
information to users that is faithfully represented, and the cost of preparing such
information does not outweigh the benefits to be derived from its recognition.
It is clear that a thorough evaluation of the qualitative characteristics is necessary in
order to determine which of the existing type (b) contingent liabilities would be required
to be recognised (according to the proposed recognition principles). It is only once all
of the facts and circumstances unique to each obligation are considered that it will it
be possible to judge whether that obligation should be recognised.
However we can conclude that the Draft Framework’s definition and recognition
criteria will likely lead to a greater number of obligations being recognised in
future.
7. Conclusion
In their Conceptual Framework update project, the IASB sought to address numerous
concerns with the existing Framework. One concern that was investigated in this
research paper was the outdated recognition principles that fail to reflect the current
thinking of the IASB. The Draft Framework’s recognition principles have been
established with direct reference to the Qualitative Characteristics of Useful Financial
Information. In the view of the IASB, “basing recognition criteria on the qualitative
characteristics should result in useful information” (IASB, 2015b, par. BC5.20).
It is clear that in doing so, more judgement will be required when making recognition
decisions based on the Draft Framework. However, the link that has been established
between the qualitative characteristics of financial information and the recognition
criteria provides the recognition criteria with more meaningful context within the
broader objective of financial reporting.
Although the IASB staff has issued a number of agenda papers that address the likely
impact of the Draft Framework on the recognition of liabilities, none of the examples
in these agenda papers address the possible consequences of the Draft Framework
for contingent liabilities. Hence the findings of this research paper assist in providing
additional guidance on the possible consequences of the proposals within the Draft
Framework.
2016 SAAA National Teaching and Learning and Regional Conference Proceedings
ISBN 978-0-620-74761-5
147
This paper shows that the proposed changes to the existing definition and recognition
principles for liabilities will likely impact the way contingent liabilities are reported in
the future, should the IASB amend IAS 37 to align with these principles. Specifically,
present obligations that are ‘contingent liabilities’ and are not currently recognised,
could meet the proposed definition and recognition criteria of a liability. The recognition
of more liabilities would impact key financial statement indicators such as the net asset
value and net profit of an entity.
The extensive use of judgement will likely have a knock-on effect for the assurance
providers of financial statements. Such professions will need to place greater
emphasis on their assessment of the judgements applied in the preparation of the
financial statements
References:
Cebotari, A., 2008. IMF Working Paper – Fiscal Affairs Department: Contingent Liabilities: Issues and
Practice. (Working Paper Abstract). p. 3.
InvestorWords. (2015). Investor Words: Economic Benefit. [Online]. Available at:
http://www.investorwords.com/16380/economic_benefit.html [Last accessed 08 July 2015]
Sources from the Papers released by the International Accounting Standards Board (IASB):
2015 a: International Accounting Standards Board (IASB). 2015. Conceptual Framework for
Financial Reporting: Exposure Draft (May), 1–92. [Online]. Available at:
http://www.ifrs.org/Current-Projects/IASB-Projects/Conceptual-
Framework/Documents/May%202015/ED_CF_MAY%202015.pdf [Last accessed 08 June
2015]
b: International Accounting Standards Board (IASB). 2015. Conceptual Framework for
Financial Reporting: Basis for Conclusions Exposure Draft (May), 1–134. [Online]. Available at:
http://www.ifrs.org/Current-Projects/IASB-Projects/Conceptual-
Framework/Documents/May%202015/Basis-to-ED_CF_MAY%202015.pdf [Last accessed 08
June 2015]
c: International Accounting Standards Board (IASB) Staff Paper. 2015. Agenda Paper
14A Research – provisions, contingent liabilities and contingent assets. Project overview.
[Online]. Available at: http://www.ifrs.org/Meetings/MeetingDocs/IASB/2015/June/AP14A-
Research%20IAS%2037.pdf [Last accessed 03 December 2015]
d: International Accounting Standards Board (IASB) Staff Paper. 2015. Agenda Paper
14B Research – provisions, contingent liabilities and contingent assets. Possible problems with
IAS 37. [Online]. Available at:
http://www.ifrs.org/Meetings/MeetingDocs/IASB/2015/June/AP14B-Research-IAS%2037.pdf
[Last accessed 03 December 2015]
e: International Accounting Standards Board (IASB) Staff Paper. 2015. Agenda Paper
14C Research – provisions, contingent liabilities and contingent assets. Implications of
Conceptual Framework proposals. [Online]. Available at:
http://www.ifrs.org/Meetings/MeetingDocs/IASB/2015/June/AP14C-
Research%20IAS%2037.pdf [Last accessed 03 December 2015]
2016 SAAA National Teaching and Learning and Regional Conference Proceedings
ISBN 978-0-620-74761-5
148
2014 a: International Accounting Standards Board (IASB). 2014. Conceptual Framework:
Agenda Reference 10A: Summary of Tentative Decisions, Staff Paper, (November), 1–23.
[Online]. Available at:
http://www.ifrs.org/Meetings/MeetingDocs/IASB/2014/November/AP10A-CF.pdf [Last
accessed 30 May 2015]
b: International Accounting Standards Board (IASB). 2014. Conceptual Framework:
Agenda Reference 10D: Summary of Potential Inconsistencies, Staff Paper, (October), 1–14.
[Online]. Available at: http://www.ifrs.org/Meetings/MeetingDocs/IASB/2014/October/AP10D-
Conceptual-Framework.pdf [Last accessed 30 May 2015]
c: International Accounting Standards Board (IASB). 2014. Conceptual Framework:
Agenda Reference 10B: Recognition, Staff Paper, (May), 1-33. [Online]. Available at:
http://www.ifrs.org/Meetings/MeetingDocs/IASB/2014/May/AP10B-
Conceptual%20Framework.pdf [Last accessed 30 May 2015]
d: International Accounting Standards Board (IASB). 2014. Conceptual Framework:
Agenda Reference 10B: Measurement – Measurement Bases, Staff Paper, (October), 1-16.
[Online]. Available at: http://www.ifrs.org/Meetings/MeetingDocs/IASB/2014/October/AP10B-
Conceptual%20Framework.pdf [Last accessed 30 May 2015]
2013 a: International Accounting Standards Board (IASB). 2013. Discussion Paper: A Review
of the Conceptual Framework for Financial Reporting. [Online]. Available at:
http://www.ifrs.org/Current-Projects/IASB-Projects/Conceptual-Framework/Discussion-Paper-
July-2013/Documents/Discussion-Paper-Conceptual-Framework-July-2013.pdf [Last
accessed 30 May 2015]
2010 a: International Accounting Standards Board (IASB). 2010. Working Draft: Liabilities (Feb
2010). [Online]. Available at: http://www.ifrs.org/Current-Projects/IASB-
Projects/Liabilities/Documents/IFRSLiabilitiesWorkingDraftFeb10.pdf [Last accessed 24 May
2015]
Sources from A Guide through International Financial Reporting Standards (IFRS Foundation):
2014 a: IFRS Foundation. 2014. Chapter 3: Qualitative Characteristics of Useful Financial
Information. A Guide through International Financial Reporting Standards. London. pp. A25-
A31.
b: IFRS Foundation. 2014. Chapter 4: The Framework. A Guide through International
Financial Reporting Standards. London. pp. A33-A44.
c: IFRS Foundation. 2014. International Financial Reporting Standard 3: Business
Combinations. A Guide through International Financial Reporting Standards. London. pp.
A139-A196.
d: IFRS Foundation. 2014. International Accounting Standard 37: Provisions, Contingent
Liabilities and Contingent Assets. A Guide through International Financial Reporting Standards.
London. pp. A1291-A1315.
e: IFRS Foundation. 2014. International Accounting Standard 38: Intangible Assets. A
Guide through International Financial Reporting Standards. London. pp. A1317-A1354.
f: IFRS Foundation. 2014. Chapter 1: The objective of general purpose financial
reporting. A Guide through International Financial Reporting Standards. London. pp. A19-A22.
2016 SAAA National Teaching and Learning and Regional Conference Proceedings
ISBN 978-0-620-74761-5
149
2016 Southern African Accounting
Association (SAAA)
National Teaching and Learning and
Regional Conference Proceedings
ISBN number: 978-0-620-74761-5
MAF 03: Public-Private Partnerships in South Africa: A
tale of two prisons
Tim Prussing
Department of Finance & Tax, University of Cape Town
Carlos Correia*
College of Accounting, University of Cape Town
Contact details:
*Professor Carlos Correia
College of Accounting
University of Cape Town
South Africa
Email: [email protected]
Abstract
A public-private partnership is a contractual arrangement between a public entity and the private
sector in order to enable the provision of services relating to infrastructure-based projects. A PPP
project will include a concession agreement with an SPV, which will enter into contracts to finance,
build and operate an infrastructure project for a fixed period of time. In order to overcome the
significant overcrowding of prisons, the Departments of Correctional Services and Public Works
adopted a procurement model of privately built and operated prisons from the UK. The South African
government entered into two contracts for maximum-security prisons in Bloemfontein and Louis
Trichardt with a concession period of 25 years. However, these prisons have been criticised due to
the significantly higher costs of operating these PPP prisons.
This study analyses the project economics and funding arrangements of these two prisons to evaluate
whether the costs, terms and financing rates were fair. The study analyses the NPV of the total costs
of each prison as well as the cost per inmate and undertakes a comparable analysis of the IRRs, the
costs of equity and implied equity premiums of these prisons in relation to PPP UK prisons and
hospitals. The study also compares the cost per inmate in relation to PPP UK prisons. The cost per
inmate for the South African prisons compares favourably to the cost per inmate in the UK, both on a
capital expenditure and on an operating cost basis. However, the costs compare unfavourably to the
costs of the public prison system.
2016 SAAA National Teaching and Learning and Regional Conference Proceedings
ISBN 978-0-620-74761-5
150
The two South African prisons were highly geared and use was made of long term fixed rate debt at a
time of historically high interest rates. The equity IRR and equity premium of Bloemfontein was
significantly higher than Louis Trichardt and the latter’s equity premium was aligned to equity
premiums reported for PPP hospitals in the UK around the same time. The study benchmarks the
total costs and financing costs and indicates how financing costs were impacted by unfavourable
market conditions at the time of procurement. These projects were locked into high real interest rate
yields and the use of floating rates or CPI-linked debt would have reduced costs over time. However,
floating interest rates would have resulted in exposure to interest rate risk and significant cash flow
and tax risks unless such risks were factored into contract prices.
1. Introduction
If structured and procured properly, Public Private Partnerships (PPPs) allow governments
to pursue infrastructure projects in an efficient and cost effective way, offering value for
money to the public and in some cases even enabling the development of infrastructure
assets where traditional procurement would otherwise not have been possible (CBI, 2011).
Definitions for PPPs vary by country, framework and author. For the purposes of this paper,
we understand a PPP to refer to a partnership between the public and private sector, where
a private sector party participates in or provides support for the provision of infrastructure-
based services (Ng and Loosemore, 2007). Delivery of the project is done through special
purpose vehicle set up and typically financed from equity and debt in a highly leveraged
structure (Spackman, 2002). As part of the partnership, the private party bears responsibility
for financing, designing, building, operating and/or maintaining an infrastructure project for a
set period of time (Kwak, 2009). This study explores South African prison PPPs as a case
study.
Problem statement
The problem of overcrowding and the cost of prisons in South Africa has been a key issue
for government policy and funding in an environment of budgetary constraints and
competing developmental objectives. A number of recommendations were made to reduce
the cost of South Africa’s prison services, including entering into PPPs to reduce costs and
improve operating efficiencies.
This study analyses the two prison PPPs in order to determine whether these PPPs
managed to achieve cost efficiencies and whether the PPPs led to a lower cost of prison
services, including the cost of financing of these two prison projects.
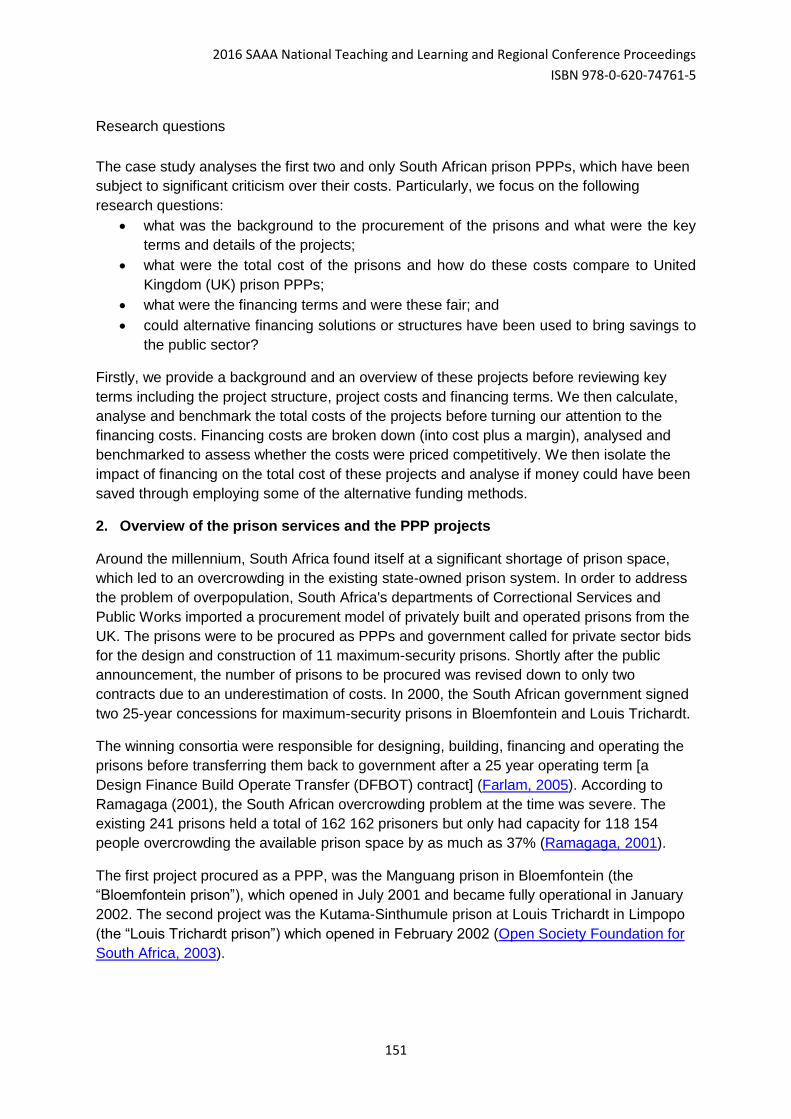
2016 SAAA National Teaching and Learning and Regional Conference Proceedings
ISBN 978-0-620-74761-5
151
Research questions
The case study analyses the first two and only South African prison PPPs, which have been
subject to significant criticism over their costs. Particularly, we focus on the following
research questions:
what was the background to the procurement of the prisons and what were the key
terms and details of the projects;
what were the total cost of the prisons and how do these costs compare to United
Kingdom (UK) prison PPPs;
what were the financing terms and were these fair; and
could alternative financing solutions or structures have been used to bring savings to
the public sector?
Firstly, we provide a background and an overview of these projects before reviewing key
terms including the project structure, project costs and financing terms. We then calculate,
analyse and benchmark the total costs of the projects before turning our attention to the
financing costs. Financing costs are broken down (into cost plus a margin), analysed and
benchmarked to assess whether the costs were priced competitively. We then isolate the
impact of financing on the total cost of these projects and analyse if money could have been
saved through employing some of the alternative funding methods.
2. Overview of the prison services and the PPP projects
Around the millennium, South Africa found itself at a significant shortage of prison space,
which led to an overcrowding in the existing state-owned prison system. In order to address
the problem of overpopulation, South Africa's departments of Correctional Services and
Public Works imported a procurement model of privately built and operated prisons from the
UK. The prisons were to be procured as PPPs and government called for private sector bids
for the design and construction of 11 maximum-security prisons. Shortly after the public
announcement, the number of prisons to be procured was revised down to only two
contracts due to an underestimation of costs. In 2000, the South African government signed
two 25-year concessions for maximum-security prisons in Bloemfontein and Louis Trichardt.
The winning consortia were responsible for designing, building, financing and operating the
prisons before transferring them back to government after a 25 year operating term [a
Design Finance Build Operate Transfer (DFBOT) contract] (Farlam, 2005). According to
Ramagaga (2001), the South African overcrowding problem at the time was severe. The
existing 241 prisons held a total of 162 162 prisoners but only had capacity for 118 154
people overcrowding the available prison space by as much as 37% (Ramagaga, 2001).
The first project procured as a PPP, was the Manguang prison in Bloemfontein (the
“Bloemfontein prison”), which opened in July 2001 and became fully operational in January
2002. The second project was the Kutama-Sinthumule prison at Louis Trichardt in Limpopo
(the “Louis Trichardt prison”) which opened in February 2002 (Open Society Foundation for
South Africa, 2003).
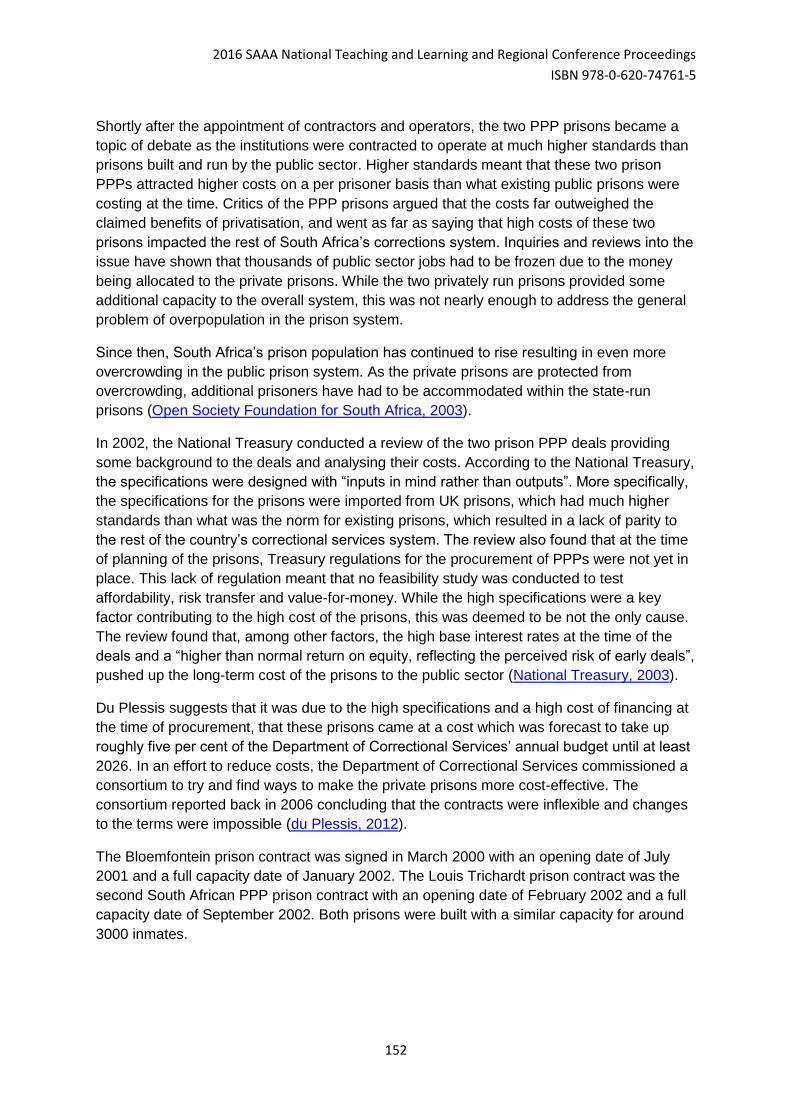
2016 SAAA National Teaching and Learning and Regional Conference Proceedings
ISBN 978-0-620-74761-5
152
Shortly after the appointment of contractors and operators, the two PPP prisons became a
topic of debate as the institutions were contracted to operate at much higher standards than
prisons built and run by the public sector. Higher standards meant that these two prison
PPPs attracted higher costs on a per prisoner basis than what existing public prisons were
costing at the time. Critics of the PPP prisons argued that the costs far outweighed the
claimed benefits of privatisation, and went as far as saying that high costs of these two
prisons impacted the rest of South Africa’s corrections system. Inquiries and reviews into the
issue have shown that thousands of public sector jobs had to be frozen due to the money
being allocated to the private prisons. While the two privately run prisons provided some
additional capacity to the overall system, this was not nearly enough to address the general
problem of overpopulation in the prison system.
Since then, South Africa’s prison population has continued to rise resulting in even more
overcrowding in the public prison system. As the private prisons are protected from
overcrowding, additional prisoners have had to be accommodated within the state-run
prisons (Open Society Foundation for South Africa, 2003).
In 2002, the National Treasury conducted a review of the two prison PPP deals providing
some background to the deals and analysing their costs. According to the National Treasury,
the specifications were designed with “inputs in mind rather than outputs”. More specifically,
the specifications for the prisons were imported from UK prisons, which had much higher
standards than what was the norm for existing prisons, which resulted in a lack of parity to
the rest of the country’s correctional services system. The review also found that at the time
of planning of the prisons, Treasury regulations for the procurement of PPPs were not yet in
place. This lack of regulation meant that no feasibility study was conducted to test
affordability, risk transfer and value-for-money. While the high specifications were a key
factor contributing to the high cost of the prisons, this was deemed to be not the only cause.
The review found that, among other factors, the high base interest rates at the time of the
deals and a “higher than normal return on equity, reflecting the perceived risk of early deals”,
pushed up the long-term cost of the prisons to the public sector (National Treasury, 2003).
Du Plessis suggests that it was due to the high specifications and a high cost of financing at
the time of procurement, that these prisons came at a cost which was forecast to take up
roughly five per cent of the Department of Correctional Services’ annual budget until at least
2026. In an effort to reduce costs, the Department of Correctional Services commissioned a
consortium to try and find ways to make the private prisons more cost-effective. The
consortium reported back in 2006 concluding that the contracts were inflexible and changes
to the terms were impossible (du Plessis, 2012).
The Bloemfontein prison contract was signed in March 2000 with an opening date of July
2001 and a full capacity date of January 2002. The Louis Trichardt prison contract was the
second South African PPP prison contract with an opening date of February 2002 and a full
capacity date of September 2002. Both prisons were built with a similar capacity for around
3000 inmates.
2016 SAAA National Teaching and Learning and Regional Conference Proceedings
ISBN 978-0-620-74761-5
153
3. Ownership structures and contractual relationships
The Bloemfontein prison
Bloemfontein’s PPP contract carried a 25-year operating term. Five equity investors each
financed the project obtaining a 20% stake in the project. Notably, a large portion of the
equity finance was financed by loans from empowerment lenders to the equity providers.
Effectively, this increased the overall gearing on a look-through basis from an equity/debt
ratio of 11:89 to a ratio of 5:95. The lenders provided financing to the SPV through a special
trust, which was set up to provide debt finance to the project.
Construction and operations were subcontracted to separate providers out of the project
SPV. Overall, the structure resembled that of a standard PPP. While the project gearing was
high, this is not uncommon for projects receiving an availability payment based revenue
stream (National Treasury, 2003). Figure 1 depicts the ownership structure of the
Bloemfontein PPP project.
Figure 1: Bloemfontein prison PPP ownership structure
Source: National Treasury (2003)
The Louis Trichardt prison
The Louis Trichardt PPP contract also carried a 25-year operating term. Two equity
investors financed the project, each obtaining a 50% stake in the project. The lenders
provided financing to the SPV through a special trust set up to provide debt finance to the
project. As with the Bloemfontein PPP, construction and operations were subcontracted to
separate providers out of the project SPV. As with the Bloemfontein contract, the structure
for the project also resembled that of a standard PPP contract (National Treasury, 2003).
Figure 2 depicts the ownership structure of the Louis Trichardt PPP project.
RSA
GOVERNMENT
BLOEMFONTEIN
CORRECTIONAL
CONTRACTS
(PTY) LTD
SHAREHOLDERS
Murray & Roberts (20%)
Group 4 Correction Services (20%)
10 Alliance Mangaung (20%)
Fikile Mangaung (20%)
Ikhwezi Community Trust (20%)
CONSTRUCTION
SUBCONTRACTOR
M & R Buildings (Pty) Ltd
Fikile Projects CC
OPERATING
SUBCONTRACTOR
Group 4 Correction Services
(Bloemfontein) (Pty) Ltd
BLOEMFONTEIN
PRISON
FINANCE
TRUST
LENDERS
Investec Bank Ltd
ABSA Bank Ltd
EMPOWERMENT
LENDERS
Investec Bank Ltd
ABSA Bank Ltd
Afrox Healthcare
Workshops
R437m
25 year
custodial services
R54m
R270m R32m
2016 SAAA National Teaching and Learning and Regional Conference Proceedings
ISBN 978-0-620-74761-5
154
Figure 2: Louis Trichardt prison PPP ownership structure
Source: National Treasury (2003)
3. Methodology
This study follows a case study methodology by undertaking a detailed analysis of two
related projects, being the analysis of the costs and financing of the two PPP prisons in
South Africa, which may affect public policy in the future. Case studies can be exploratory,
explanatory and descriptive (Yin, 1993). Creswell (2003) defines the case study approach
as the exploration in depth of a program, an event, an activity, a process, or one or more
individuals and further states that the case is limited to a specific time period and activity.
This study undertakes a triangulation of data sources in relation to the structure and costs of
two PPP prisons. This study applies macroeconomic data at the time and undertakes a
comparative analysis by evaluating the costs of the South African PPP prisons to the costs
of UK prisons and other PPP projects. Furthermore, corporate finance theory is applied to
the data, as set out by the National Treasury, in order to derive some generalisations in
regards to the costs of operating and financing of prisons using the PPP model.
4. Data Analysis
4.1 Project economics
The total capital expenditure for the Bloemfontein prison was R435 million (approximately
R954 million in real 2014 terms) of which R270 million (approximately R592 million in real
2014 terms) related to construction costs. Total capital expenditure for the Limpopo prison
was R392 million (approximately R829 million in real 2014 terms) of which R303 million
(approximately R640 million in real 2014 terms) related to construction costs. On a per
RSA
GOVERNMENT
SOUTH AFRICAN
CUSTODIAL
SERVICES
(PTY) LTD
SHAREHOLDERS
Wackenhut Corrections
Corporation (50%)
Wackenhut Corrections
Corporation (USA)
Kensani Corrections (50%)
CONSTRUCTION
SUBCONTRACTOR (CGM Joint Venture)
Concor Holdings (Pty) Ltd
Group Five Construction (Pty) Ltd
Makhosi Holdings (Pty) Ltd
Shumisanani Building and Civil Construction,
FMW Building Construction
NKN Construction CC
Mposa, Sikhwai and Tshibisi Construction CC
OPERATING
SUBCONTRACTOR
South African Custodial Management (Pty) Ltd
Kensani Corrections Management (Louis Trichardt)
(Pty) Ltd
Royal Food Correctional Services (Pty) Ltd
SOUTH AFRICAN
CUSTODIAL
SERVICES
SECURITY TRUST
LENDERS
FirstRand Bank Ltd
BOE Merchant Bank
R353m
R303m
R53m
25 year
custodial services
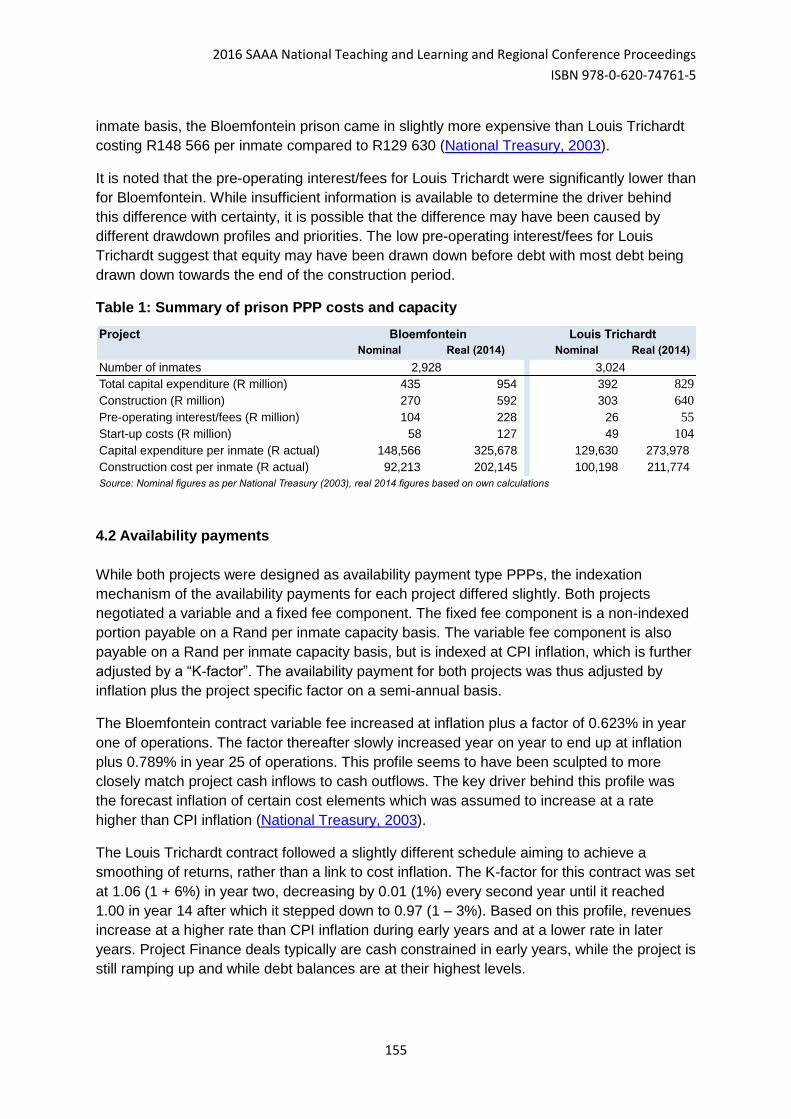
2016 SAAA National Teaching and Learning and Regional Conference Proceedings
ISBN 978-0-620-74761-5
155
inmate basis, the Bloemfontein prison came in slightly more expensive than Louis Trichardt
costing R148 566 per inmate compared to R129 630 (National Treasury, 2003).
It is noted that the pre-operating interest/fees for Louis Trichardt were significantly lower than
for Bloemfontein. While insufficient information is available to determine the driver behind
this difference with certainty, it is possible that the difference may have been caused by
different drawdown profiles and priorities. The low pre-operating interest/fees for Louis
Trichardt suggest that equity may have been drawn down before debt with most debt being
drawn down towards the end of the construction period.
Table 1: Summary of prison PPP costs and capacity
4.2 Availability payments
While both projects were designed as availability payment type PPPs, the indexation
mechanism of the availability payments for each project differed slightly. Both projects
negotiated a variable and a fixed fee component. The fixed fee component is a non-indexed
portion payable on a Rand per inmate capacity basis. The variable fee component is also
payable on a Rand per inmate capacity basis, but is indexed at CPI inflation, which is further
adjusted by a “K-factor”. The availability payment for both projects was thus adjusted by
inflation plus the project specific factor on a semi-annual basis.
The Bloemfontein contract variable fee increased at inflation plus a factor of 0.623% in year
one of operations. The factor thereafter slowly increased year on year to end up at inflation
plus 0.789% in year 25 of operations. This profile seems to have been sculpted to more
closely match project cash inflows to cash outflows. The key driver behind this profile was
the forecast inflation of certain cost elements which was assumed to increase at a rate
higher than CPI inflation (National Treasury, 2003).
The Louis Trichardt contract followed a slightly different schedule aiming to achieve a
smoothing of returns, rather than a link to cost inflation. The K-factor for this contract was set
at 1.06 (1 + 6%) in year two, decreasing by 0.01 (1%) every second year until it reached
1.00 in year 14 after which it stepped down to 0.97 (1 – 3%). Based on this profile, revenues
increase at a higher rate than CPI inflation during early years and at a lower rate in later
years. Project Finance deals typically are cash constrained in early years, while the project is
still ramping up and while debt balances are at their highest levels.
Project
Nominal Real (2014) Nominal Real (2014)
Number of inmates
Total capital expenditure (R million) 435 954 392 829
Construction (R million) 270 592 303 640
Pre-operating interest/fees (R million) 104 228 26 55
Start-up costs (R million) 58 127 49 104
Capital expenditure per inmate (R actual) 148,566 325,678 129,630 273,978
Construction cost per inmate (R actual) 92,213 202,145 100,198 211,774
Source: Nominal figures as per National Treasury (2003), real 2014 figures based on own calculations
Bloemfontein Louis Trichardt
2,928 3,024
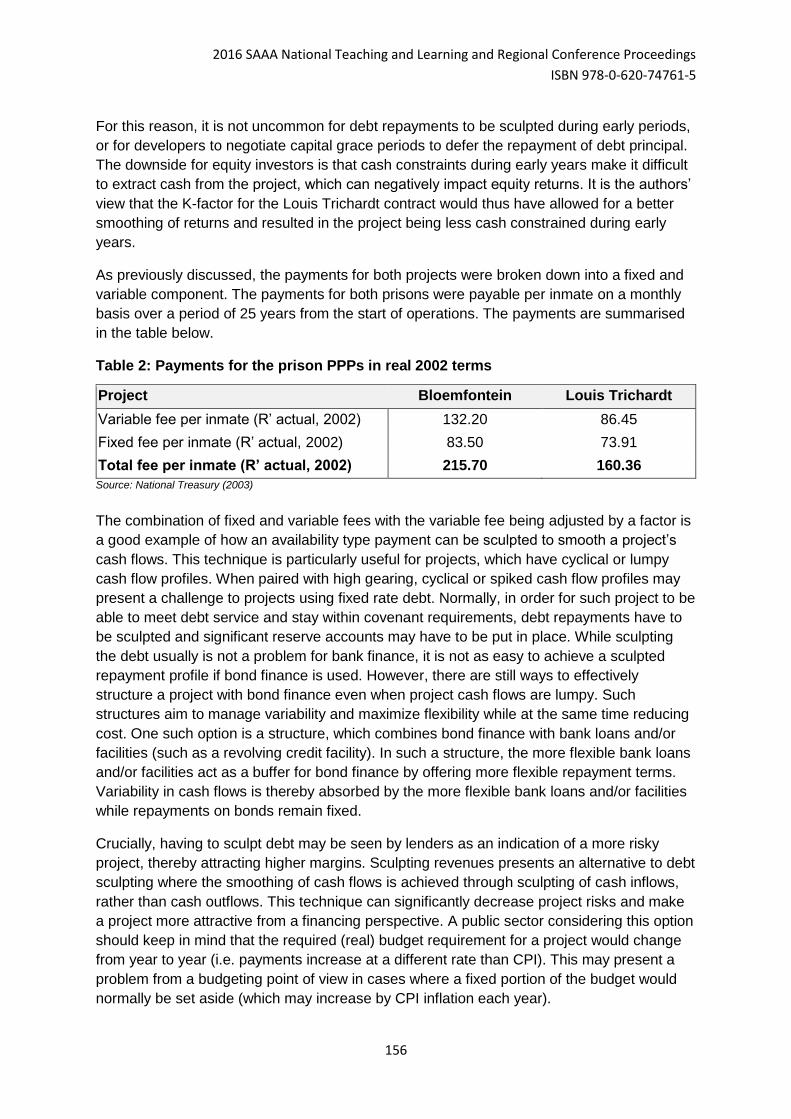
2016 SAAA National Teaching and Learning and Regional Conference Proceedings
ISBN 978-0-620-74761-5
156
For this reason, it is not uncommon for debt repayments to be sculpted during early periods,
or for developers to negotiate capital grace periods to defer the repayment of debt principal.
The downside for equity investors is that cash constraints during early years make it difficult
to extract cash from the project, which can negatively impact equity returns. It is the authors’
view that the K-factor for the Louis Trichardt contract would thus have allowed for a better
smoothing of returns and resulted in the project being less cash constrained during early
years.
As previously discussed, the payments for both projects were broken down into a fixed and
variable component. The payments for both prisons were payable per inmate on a monthly
basis over a period of 25 years from the start of operations. The payments are summarised
in the table below.
Table 2: Payments for the prison PPPs in real 2002 terms
Project Bloemfontein Louis Trichardt
Variable fee per inmate (R’ actual, 2002) 132.20 86.45
Fixed fee per inmate (R’ actual, 2002) 83.50 73.91
Total fee per inmate (R’ actual, 2002) 215.70 160.36
Source: National Treasury (2003)
The combination of fixed and variable fees with the variable fee being adjusted by a factor is
a good example of how an availability type payment can be sculpted to smooth a project’s
cash flows. This technique is particularly useful for projects, which have cyclical or lumpy
cash flow profiles. When paired with high gearing, cyclical or spiked cash flow profiles may
present a challenge to projects using fixed rate debt. Normally, in order for such project to be
able to meet debt service and stay within covenant requirements, debt repayments have to
be sculpted and significant reserve accounts may have to be put in place. While sculpting
the debt usually is not a problem for bank finance, it is not as easy to achieve a sculpted
repayment profile if bond finance is used. However, there are still ways to effectively
structure a project with bond finance even when project cash flows are lumpy. Such
structures aim to manage variability and maximize flexibility while at the same time reducing
cost. One such option is a structure, which combines bond finance with bank loans and/or
facilities (such as a revolving credit facility). In such a structure, the more flexible bank loans
and/or facilities act as a buffer for bond finance by offering more flexible repayment terms.
Variability in cash flows is thereby absorbed by the more flexible bank loans and/or facilities
while repayments on bonds remain fixed.
Crucially, having to sculpt debt may be seen by lenders as an indication of a more risky
project, thereby attracting higher margins. Sculpting revenues presents an alternative to debt
sculpting where the smoothing of cash flows is achieved through sculpting of cash inflows,
rather than cash outflows. This technique can significantly decrease project risks and make
a project more attractive from a financing perspective. A public sector considering this option
should keep in mind that the required (real) budget requirement for a project would change
from year to year (i.e. payments increase at a different rate than CPI). This may present a
problem from a budgeting point of view in cases where a fixed portion of the budget would
normally be set aside (which may increase by CPI inflation each year).
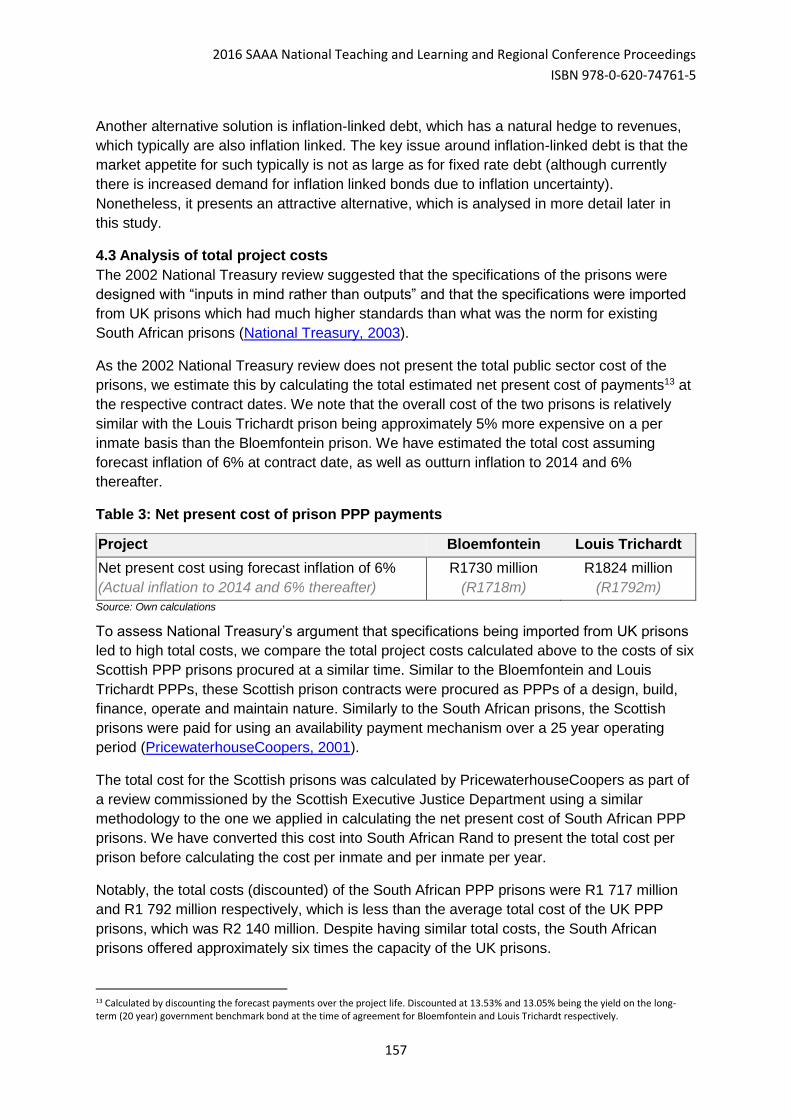
2016 SAAA National Teaching and Learning and Regional Conference Proceedings
ISBN 978-0-620-74761-5
157
Another alternative solution is inflation-linked debt, which has a natural hedge to revenues,
which typically are also inflation linked. The key issue around inflation-linked debt is that the
market appetite for such typically is not as large as for fixed rate debt (although currently
there is increased demand for inflation linked bonds due to inflation uncertainty).
Nonetheless, it presents an attractive alternative, which is analysed in more detail later in
this study.
4.3 Analysis of total project costs
The 2002 National Treasury review suggested that the specifications of the prisons were
designed with “inputs in mind rather than outputs” and that the specifications were imported
from UK prisons which had much higher standards than what was the norm for existing
South African prisons (National Treasury, 2003).
As the 2002 National Treasury review does not present the total public sector cost of the
prisons, we estimate this by calculating the total estimated net present cost of payments13 at
the respective contract dates. We note that the overall cost of the two prisons is relatively
similar with the Louis Trichardt prison being approximately 5% more expensive on a per
inmate basis than the Bloemfontein prison. We have estimated the total cost assuming
forecast inflation of 6% at contract date, as well as outturn inflation to 2014 and 6%
thereafter.
Table 3: Net present cost of prison PPP payments
Project Bloemfontein Louis Trichardt
Net present cost using forecast inflation of 6%
(Actual inflation to 2014 and 6% thereafter)
R1730 million
(R1718m)
R1824 million
(R1792m)
Source: Own calculations
To assess National Treasury’s argument that specifications being imported from UK prisons
led to high total costs, we compare the total project costs calculated above to the costs of six
Scottish PPP prisons procured at a similar time. Similar to the Bloemfontein and Louis
Trichardt PPPs, these Scottish prison contracts were procured as PPPs of a design, build,
finance, operate and maintain nature. Similarly to the South African prisons, the Scottish
prisons were paid for using an availability payment mechanism over a 25 year operating
period (PricewaterhouseCoopers, 2001).
The total cost for the Scottish prisons was calculated by PricewaterhouseCoopers as part of
a review commissioned by the Scottish Executive Justice Department using a similar
methodology to the one we applied in calculating the net present cost of South African PPP
prisons. We have converted this cost into South African Rand to present the total cost per
prison before calculating the cost per inmate and per inmate per year.
Notably, the total costs (discounted) of the South African PPP prisons were R1 717 million
and R1 792 million respectively, which is less than the average total cost of the UK PPP
prisons, which was R2 140 million. Despite having similar total costs, the South African
prisons offered approximately six times the capacity of the UK prisons.
13 Calculated by discounting the forecast payments over the project life. Discounted at 13.53% and 13.05% being the yield on the long-term (20 year) government benchmark bond at the time of agreement for Bloemfontein and Louis Trichardt respectively.
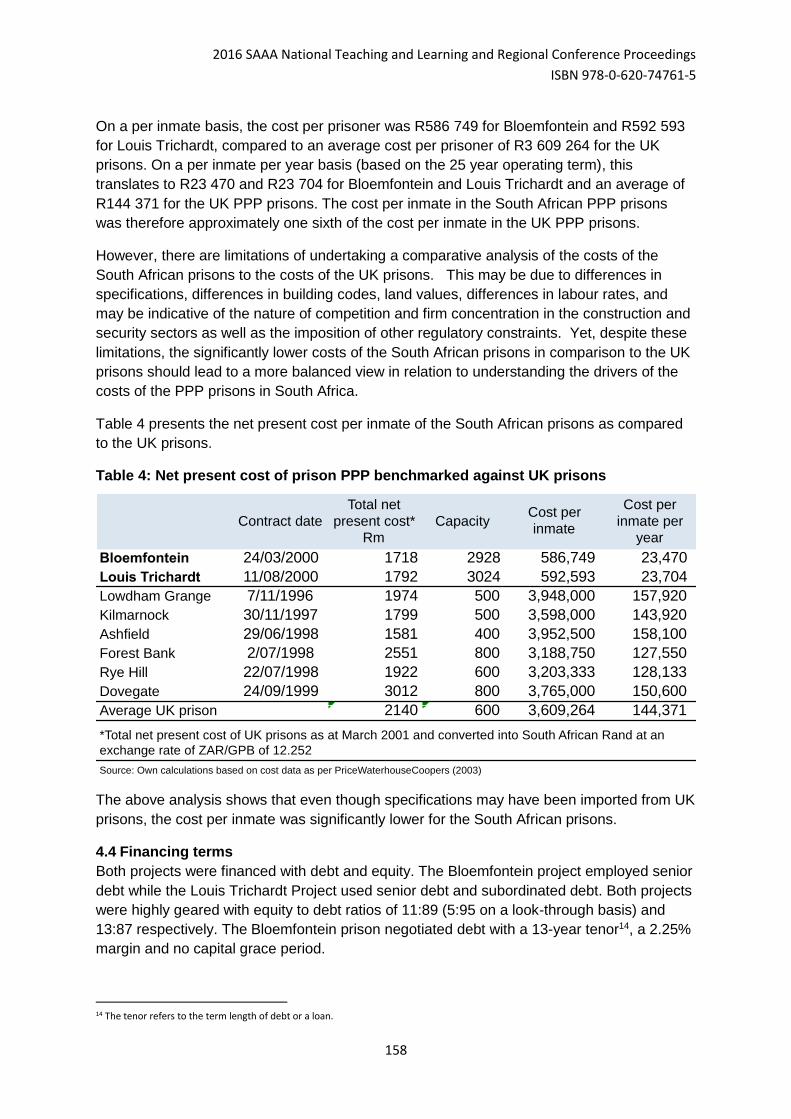
2016 SAAA National Teaching and Learning and Regional Conference Proceedings
ISBN 978-0-620-74761-5
158
On a per inmate basis, the cost per prisoner was R586 749 for Bloemfontein and R592 593
for Louis Trichardt, compared to an average cost per prisoner of R3 609 264 for the UK
prisons. On a per inmate per year basis (based on the 25 year operating term), this
translates to R23 470 and R23 704 for Bloemfontein and Louis Trichardt and an average of
R144 371 for the UK PPP prisons. The cost per inmate in the South African PPP prisons
was therefore approximately one sixth of the cost per inmate in the UK PPP prisons.
However, there are limitations of undertaking a comparative analysis of the costs of the
South African prisons to the costs of the UK prisons. This may be due to differences in
specifications, differences in building codes, land values, differences in labour rates, and
may be indicative of the nature of competition and firm concentration in the construction and
security sectors as well as the imposition of other regulatory constraints. Yet, despite these
limitations, the significantly lower costs of the South African prisons in comparison to the UK
prisons should lead to a more balanced view in relation to understanding the drivers of the
costs of the PPP prisons in South Africa.
Table 4 presents the net present cost per inmate of the South African prisons as compared
to the UK prisons.
Table 4: Net present cost of prison PPP benchmarked against UK prisons
The above analysis shows that even though specifications may have been imported from UK
prisons, the cost per inmate was significantly lower for the South African prisons.
4.4 Financing terms
Both projects were financed with debt and equity. The Bloemfontein project employed senior
debt while the Louis Trichardt Project used senior debt and subordinated debt. Both projects
were highly geared with equity to debt ratios of 11:89 (5:95 on a look-through basis) and
13:87 respectively. The Bloemfontein prison negotiated debt with a 13-year tenor14, a 2.25%
margin and no capital grace period.
14 The tenor refers to the term length of debt or a loan.
Contract date
Total net
present cost*
Rm
CapacityCost per
inmate
Cost per
inmate per
year
Bloemfontein 24/03/2000 1718 2928 586,749 23,470
Louis Trichardt 11/08/2000 1792 3024 592,593 23,704
Lowdham Grange 7/11/1996 1974 500 3,948,000 157,920
Kilmarnock 30/11/1997 1799 500 3,598,000 143,920
Ashfield 29/06/1998 1581 400 3,952,500 158,100
Forest Bank 2/07/1998 2551 800 3,188,750 127,550
Rye Hill 22/07/1998 1922 600 3,203,333 128,133
Dovegate 24/09/1999 3012 800 3,765,000 150,600
Average UK prison 2140 600 3,609,264 144,371
*Total net present cost of UK prisons as at March 2001 and converted into South African Rand at an
exchange rate of ZAR/GPB of 12.252
Source: Own calculations based on cost data as per PriceWaterhouseCoopers (2003)
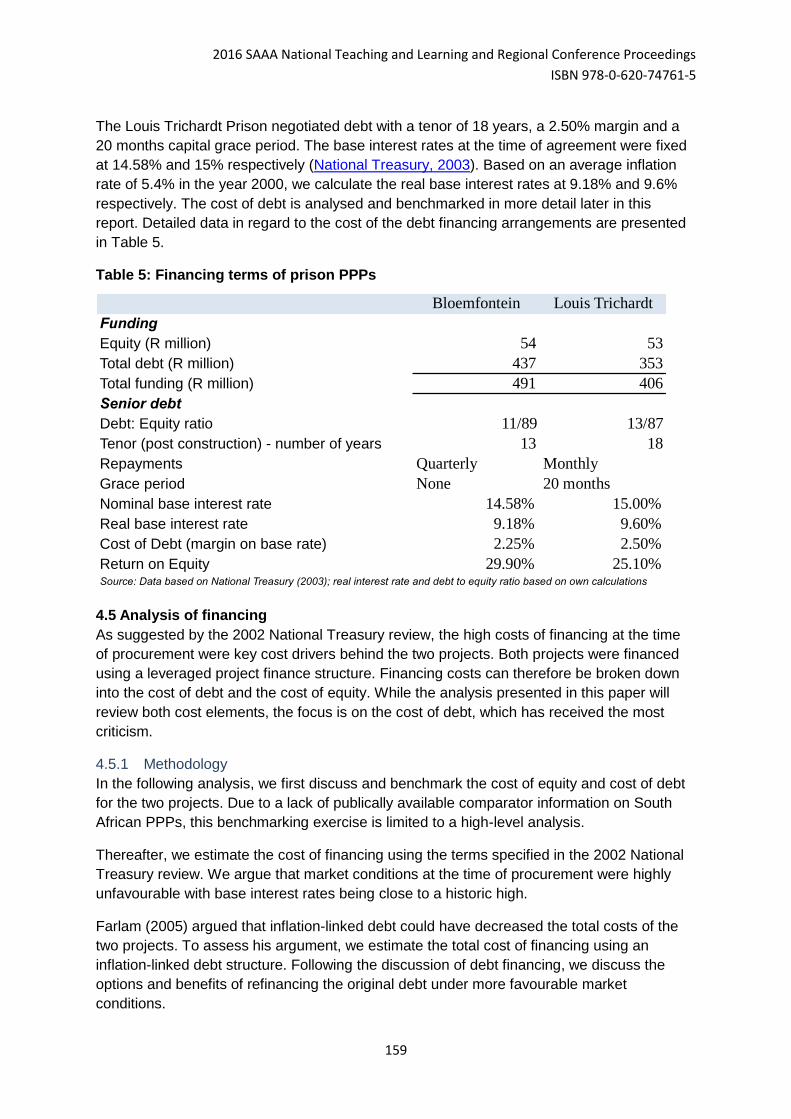
2016 SAAA National Teaching and Learning and Regional Conference Proceedings
ISBN 978-0-620-74761-5
159
The Louis Trichardt Prison negotiated debt with a tenor of 18 years, a 2.50% margin and a
20 months capital grace period. The base interest rates at the time of agreement were fixed
at 14.58% and 15% respectively (National Treasury, 2003). Based on an average inflation
rate of 5.4% in the year 2000, we calculate the real base interest rates at 9.18% and 9.6%
respectively. The cost of debt is analysed and benchmarked in more detail later in this
report. Detailed data in regard to the cost of the debt financing arrangements are presented
in Table 5.
Table 5: Financing terms of prison PPPs
4.5 Analysis of financing
As suggested by the 2002 National Treasury review, the high costs of financing at the time
of procurement were key cost drivers behind the two projects. Both projects were financed
using a leveraged project finance structure. Financing costs can therefore be broken down
into the cost of debt and the cost of equity. While the analysis presented in this paper will
review both cost elements, the focus is on the cost of debt, which has received the most
criticism.
4.5.1 Methodology
In the following analysis, we first discuss and benchmark the cost of equity and cost of debt
for the two projects. Due to a lack of publically available comparator information on South
African PPPs, this benchmarking exercise is limited to a high-level analysis.
Thereafter, we estimate the cost of financing using the terms specified in the 2002 National
Treasury review. We argue that market conditions at the time of procurement were highly
unfavourable with base interest rates being close to a historic high.
Farlam (2005) argued that inflation-linked debt could have decreased the total costs of the
two projects. To assess his argument, we estimate the total cost of financing using an
inflation-linked debt structure. Following the discussion of debt financing, we discuss the
options and benefits of refinancing the original debt under more favourable market
conditions.
Bloemfontein Louis Trichardt
Funding
Equity (R million) 54 53
Total debt (R million) 437 353
Total funding (R million) 491 406
Senior debt
Debt: Equity ratio 11/89 13/87
Tenor (post construction) - number of years 13 18
Repayments Quarterly Monthly
Grace period None 20 months
Nominal base interest rate 14.58% 15.00%
Real base interest rate 9.18% 9.60%
Cost of Debt (margin on base rate) 2.25% 2.50%
Return on Equity 29.90% 25.10%Source: Data based on National Treasury (2003); real interest rate and debt to equity ratio based on own calculations
2016 SAAA National Teaching and Learning and Regional Conference Proceedings
ISBN 978-0-620-74761-5
160
Lastly, we consider some of the alternative financing solutions discussed earlier in this paper
and discuss whether any of these could have presented an alternative lower cost financing
solution. We give particular focus to the option of a government contribution.
We perform the analysis of debt by isolating the estimated total debt service from the
remainder of the project, as insufficient detail was available to model the entire project cash
flows in detail. As the Department of Correctional Services gave bidders the option of a
partially indexed availability payment with a K-factor, the profile of cash in- and outflows
would have matched very closely, with project revenues following the overall cost profile.
The close matching of project cash in- and outflows means that there should be limited
interaction effects between individual cash flows, allowing us assess and compare individual
cash flows in isolation. The costs calculated in this exercise can therefore be directly
compared among scenarios.
4.5.2 Benchmarking the Cost of Equity
Equity returns for Bloemfontein and Louis Trichardt were shown to be 29.9% and 25.1%
nominal (National Treasury, 2003), implying real equity returns of 23.2% and 18.6%
respectively15. With 20-year government benchmark bonds yielding 13.53% on 24 March
2000 and 13.05% on 11 August 2000 (at the contract dates), the respective equity premia for
Bloemfontein and Louis Trichardt can be calculated at 16.4% and 11.9% respectively. To
test whether the equity returns were market related, an equity return benchmarking exercise
should have been conducted during the feasibility study.
It is important to note that at the time of procurement and due to the prison PPPs being the
first South African PPPs, no or limited comparable transaction information would have been
available at the time. The returns would therefore have had to be benchmarked against a
different group of assets or projects.
Today there is limited potential to analyse the returns in hindsight by considering comparable
project finance transactions, which have taken place since then. Some comparators can be
obtained from the South African REIPPPP (Renewable Energy Independent Power Producer
Procurement Programme), which, according to Eberhard, Kolker and Leigland (2014),
targeted 17% real equity returns in the first procurement round. This equates to
approximately 24% nominal based on 6% CPI inflation16. To isolate the effect of underlying
market rates at the time, we calculate and base the benchmarking on the equity premium.
The equity premium is the excess equity return over and above a risk-free benchmark rate.
The implied equity premium can therefore be calculated by subtracting a benchmark risk-
free interest rate (such as the yield to maturity on a government bond with a similar maturity)
from the total equity return as measured by the nominal equity internal rate of return (IRR).
This can be illustrated by the following equation where ERP presents the equity premium,
E(r) the equity return and E(rf) the risk free rate.
𝐸𝑅𝑃 = 𝐸(𝑟) − 𝐸(𝑟𝑓)
15 Based on an average inflation rate of 5.4% in the year 2000. 16 Based on the upper band of the target inflation rate and historical rates, which have been close to 6% in recent years.
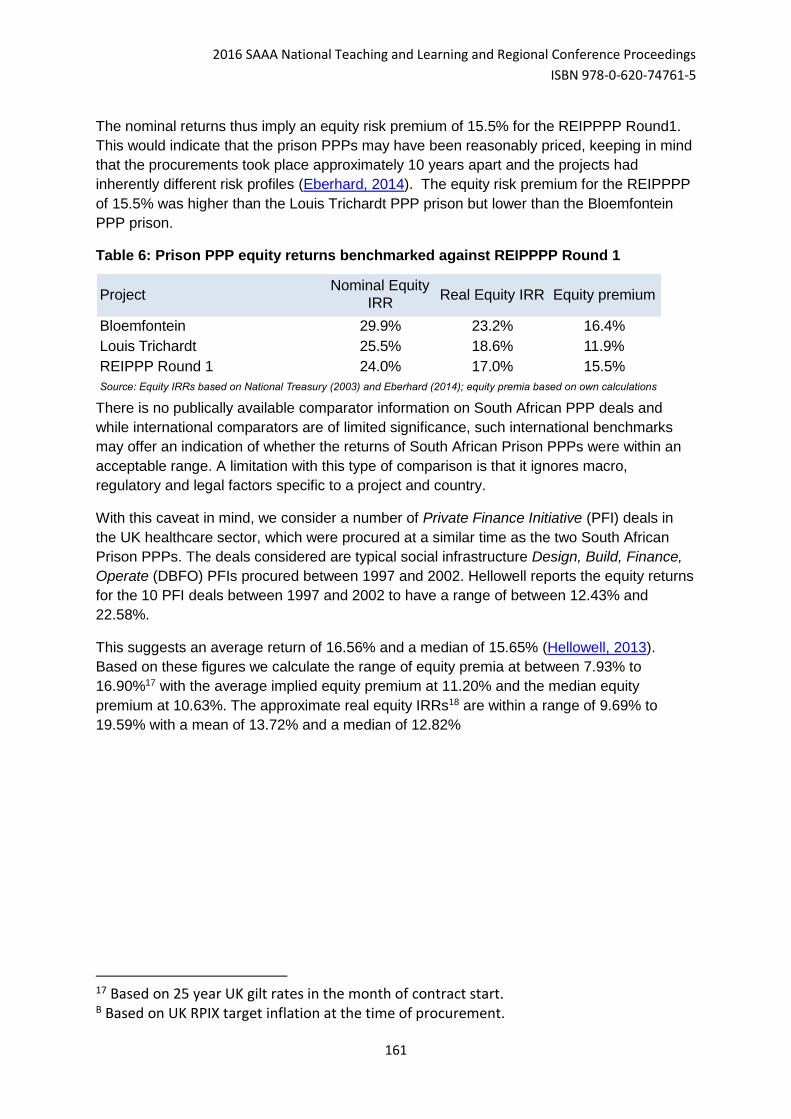
2016 SAAA National Teaching and Learning and Regional Conference Proceedings
ISBN 978-0-620-74761-5
161
The nominal returns thus imply an equity risk premium of 15.5% for the REIPPPP Round1.
This would indicate that the prison PPPs may have been reasonably priced, keeping in mind
that the procurements took place approximately 10 years apart and the projects had
inherently different risk profiles (Eberhard, 2014). The equity risk premium for the REIPPPP
of 15.5% was higher than the Louis Trichardt PPP prison but lower than the Bloemfontein
PPP prison.
Table 6: Prison PPP equity returns benchmarked against REIPPPP Round 1
There is no publically available comparator information on South African PPP deals and
while international comparators are of limited significance, such international benchmarks
may offer an indication of whether the returns of South African Prison PPPs were within an
acceptable range. A limitation with this type of comparison is that it ignores macro,
regulatory and legal factors specific to a project and country.
With this caveat in mind, we consider a number of Private Finance Initiative (PFI) deals in
the UK healthcare sector, which were procured at a similar time as the two South African
Prison PPPs. The deals considered are typical social infrastructure Design, Build, Finance,
Operate (DBFO) PFIs procured between 1997 and 2002. Hellowell reports the equity returns
for the 10 PFI deals between 1997 and 2002 to have a range of between 12.43% and
22.58%.
This suggests an average return of 16.56% and a median of 15.65% (Hellowell, 2013).
Based on these figures we calculate the range of equity premia at between 7.93% to
16.90%17 with the average implied equity premium at 11.20% and the median equity
premium at 10.63%. The approximate real equity IRRs18 are within a range of 9.69% to
19.59% with a mean of 13.72% and a median of 12.82%
17 Based on 25 year UK gilt rates in the month of contract start. B Based on UK RPIX target inflation at the time of procurement.
ProjectNominal Equity
IRRReal Equity IRR Equity premium
Bloemfontein 29.9% 23.2% 16.4%
Louis Trichardt 25.5% 18.6% 11.9%
REIPPP Round 1 24.0% 17.0% 15.5%
Source: Equity IRRs based on National Treasury (2003) and Eberhard (2014); equity premia based on own calculations
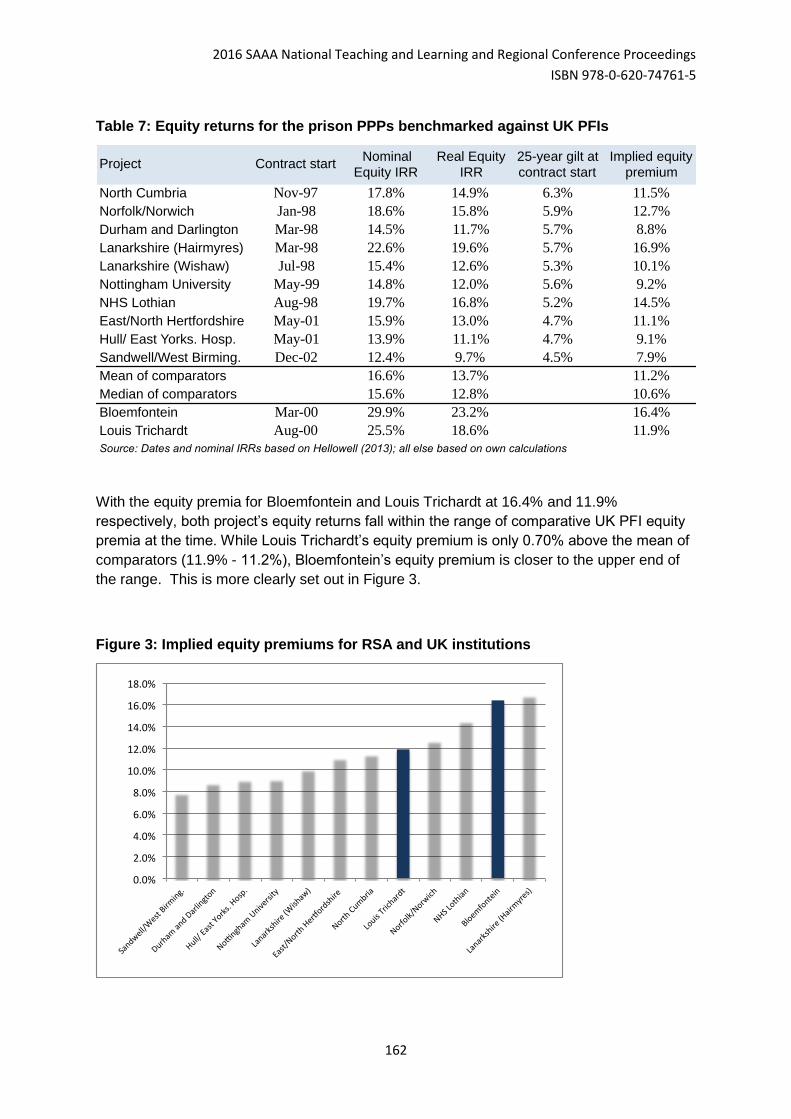
2016 SAAA National Teaching and Learning and Regional Conference Proceedings
ISBN 978-0-620-74761-5
162
Table 7: Equity returns for the prison PPPs benchmarked against UK PFIs
With the equity premia for Bloemfontein and Louis Trichardt at 16.4% and 11.9%
respectively, both project’s equity returns fall within the range of comparative UK PFI equity
premia at the time. While Louis Trichardt’s equity premium is only 0.70% above the mean of
comparators (11.9% - 11.2%), Bloemfontein’s equity premium is closer to the upper end of
the range. This is more clearly set out in Figure 3.
Figure 3: Implied equity premiums for RSA and UK institutions
Project Contract startNominal
Equity IRR
Real Equity
IRR
25-year gilt at
contract start
Implied equity
premium
North Cumbria Nov-97 17.8% 14.9% 6.3% 11.5%
Norfolk/Norwich Jan-98 18.6% 15.8% 5.9% 12.7%
Durham and Darlington Mar-98 14.5% 11.7% 5.7% 8.8%
Lanarkshire (Hairmyres) Mar-98 22.6% 19.6% 5.7% 16.9%
Lanarkshire (Wishaw) Jul-98 15.4% 12.6% 5.3% 10.1%
Nottingham University May-99 14.8% 12.0% 5.6% 9.2%
NHS Lothian Aug-98 19.7% 16.8% 5.2% 14.5%
East/North Hertfordshire May-01 15.9% 13.0% 4.7% 11.1%
Hull/ East Yorks. Hosp. May-01 13.9% 11.1% 4.7% 9.1%
Sandwell/West Birming. Dec-02 12.4% 9.7% 4.5% 7.9%
Mean of comparators 16.6% 13.7% 11.2%
Median of comparators 15.6% 12.8% 10.6%
Bloemfontein Mar-00 29.9% 23.2% 16.4%
Louis Trichardt Aug-00 25.5% 18.6% 11.9%
Source: Dates and nominal IRRs based on Hellowell (2013); all else based on own calculations
0.0%
2.0%
4.0%
6.0%
8.0%
10.0%
12.0%
14.0%
16.0%
18.0%
Sandwell/W
estBirming.
DurhamandDarlington
Hull/EastYorks.Hosp.
NonghamUniversity
Lanarkshire(Wishaw)
East/NorthHer
ordshire
NorthCumbria
LouisTrichardt
Norfolk/Norwich
NHSLothian
Bloemfontein
Lanarkshire(Hairmyres)
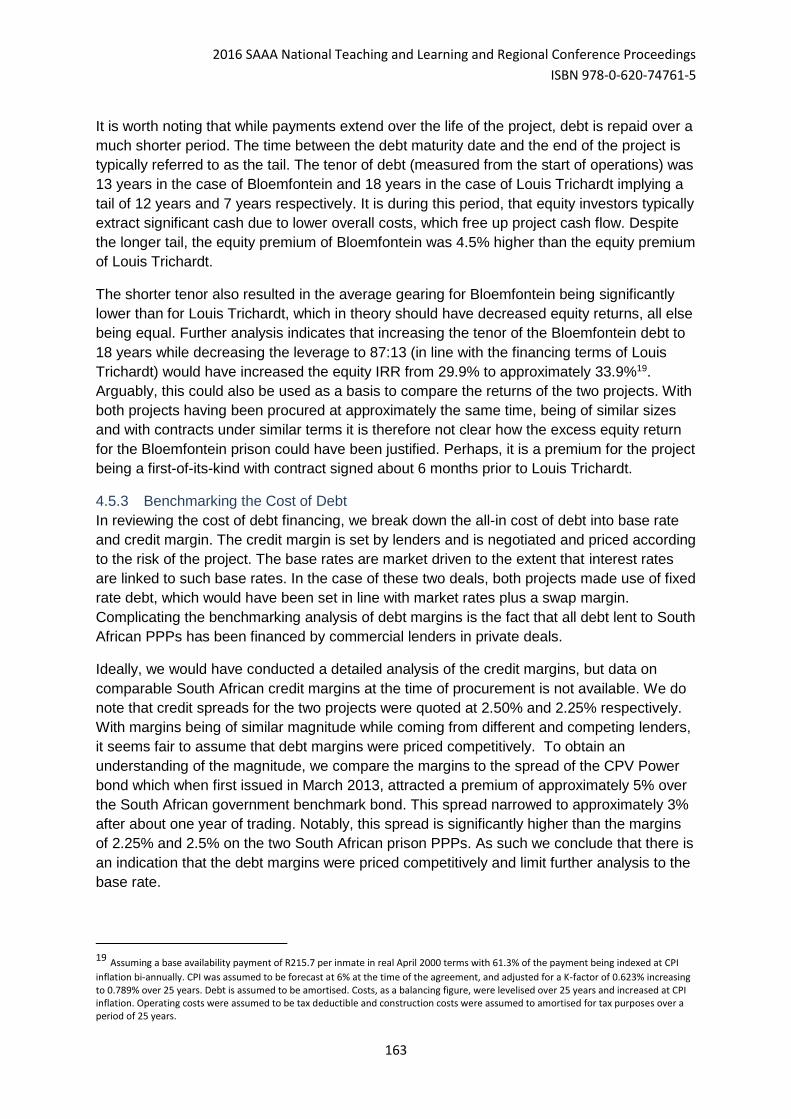
2016 SAAA National Teaching and Learning and Regional Conference Proceedings
ISBN 978-0-620-74761-5
163
It is worth noting that while payments extend over the life of the project, debt is repaid over a
much shorter period. The time between the debt maturity date and the end of the project is
typically referred to as the tail. The tenor of debt (measured from the start of operations) was
13 years in the case of Bloemfontein and 18 years in the case of Louis Trichardt implying a
tail of 12 years and 7 years respectively. It is during this period, that equity investors typically
extract significant cash due to lower overall costs, which free up project cash flow. Despite
the longer tail, the equity premium of Bloemfontein was 4.5% higher than the equity premium
of Louis Trichardt.
The shorter tenor also resulted in the average gearing for Bloemfontein being significantly
lower than for Louis Trichardt, which in theory should have decreased equity returns, all else
being equal. Further analysis indicates that increasing the tenor of the Bloemfontein debt to
18 years while decreasing the leverage to 87:13 (in line with the financing terms of Louis
Trichardt) would have increased the equity IRR from 29.9% to approximately 33.9%19.
Arguably, this could also be used as a basis to compare the returns of the two projects. With
both projects having been procured at approximately the same time, being of similar sizes
and with contracts under similar terms it is therefore not clear how the excess equity return
for the Bloemfontein prison could have been justified. Perhaps, it is a premium for the project
being a first-of-its-kind with contract signed about 6 months prior to Louis Trichardt.
4.5.3 Benchmarking the Cost of Debt
In reviewing the cost of debt financing, we break down the all-in cost of debt into base rate
and credit margin. The credit margin is set by lenders and is negotiated and priced according
to the risk of the project. The base rates are market driven to the extent that interest rates
are linked to such base rates. In the case of these two deals, both projects made use of fixed
rate debt, which would have been set in line with market rates plus a swap margin.
Complicating the benchmarking analysis of debt margins is the fact that all debt lent to South
African PPPs has been financed by commercial lenders in private deals.
Ideally, we would have conducted a detailed analysis of the credit margins, but data on
comparable South African credit margins at the time of procurement is not available. We do
note that credit spreads for the two projects were quoted at 2.50% and 2.25% respectively.
With margins being of similar magnitude while coming from different and competing lenders,
it seems fair to assume that debt margins were priced competitively. To obtain an
understanding of the magnitude, we compare the margins to the spread of the CPV Power
bond which when first issued in March 2013, attracted a premium of approximately 5% over
the South African government benchmark bond. This spread narrowed to approximately 3%
after about one year of trading. Notably, this spread is significantly higher than the margins
of 2.25% and 2.5% on the two South African prison PPPs. As such we conclude that there is
an indication that the debt margins were priced competitively and limit further analysis to the
base rate.
19 Assuming a base availability payment of R215.7 per inmate in real April 2000 terms with 61.3% of the payment being indexed at CPI
inflation bi-annually. CPI was assumed to be forecast at 6% at the time of the agreement, and adjusted for a K-factor of 0.623% increasing to 0.789% over 25 years. Debt is assumed to be amortised. Costs, as a balancing figure, were levelised over 25 years and increased at CPI inflation. Operating costs were assumed to be tax deductible and construction costs were assumed to amortised for tax purposes over a period of 25 years.
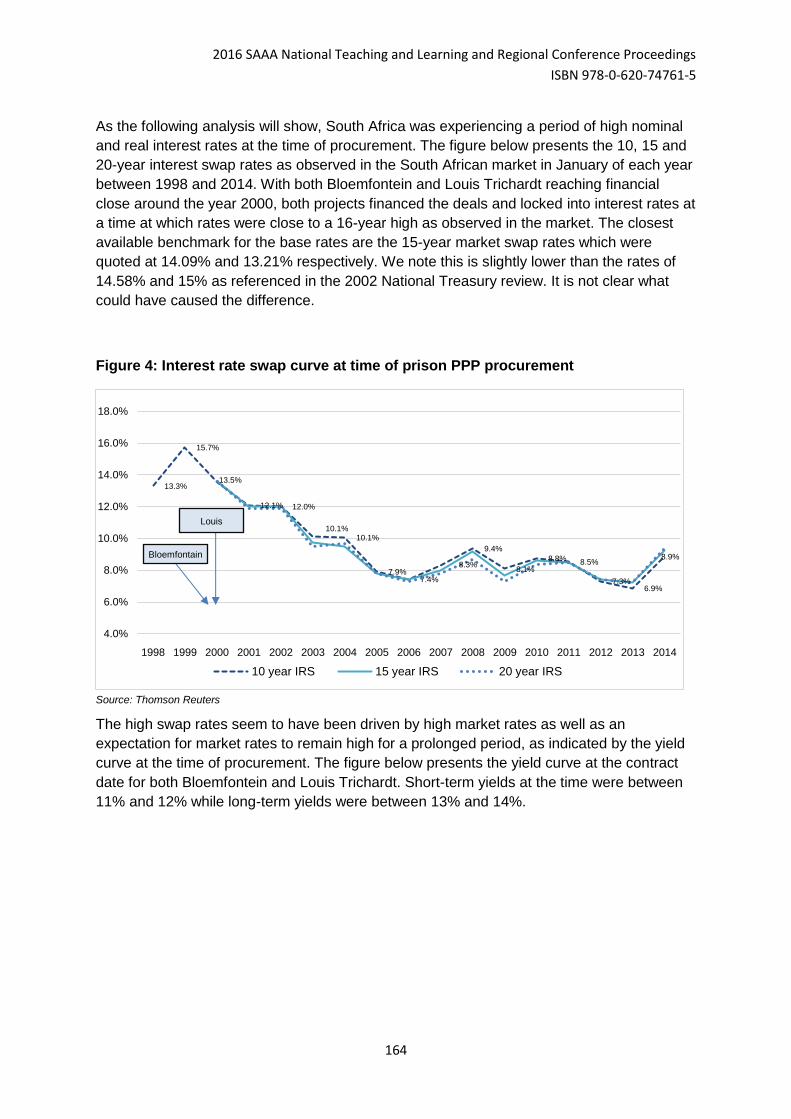
2016 SAAA National Teaching and Learning and Regional Conference Proceedings
ISBN 978-0-620-74761-5
164
As the following analysis will show, South Africa was experiencing a period of high nominal
and real interest rates at the time of procurement. The figure below presents the 10, 15 and
20-year interest swap rates as observed in the South African market in January of each year
between 1998 and 2014. With both Bloemfontein and Louis Trichardt reaching financial
close around the year 2000, both projects financed the deals and locked into interest rates at
a time at which rates were close to a 16-year high as observed in the market. The closest
available benchmark for the base rates are the 15-year market swap rates which were
quoted at 14.09% and 13.21% respectively. We note this is slightly lower than the rates of
14.58% and 15% as referenced in the 2002 National Treasury review. It is not clear what
could have caused the difference.
Figure 4: Interest rate swap curve at time of prison PPP procurement
Source: Thomson Reuters
The high swap rates seem to have been driven by high market rates as well as an
expectation for market rates to remain high for a prolonged period, as indicated by the yield
curve at the time of procurement. The figure below presents the yield curve at the contract
date for both Bloemfontein and Louis Trichardt. Short-term yields at the time were between
11% and 12% while long-term yields were between 13% and 14%.
13.3%
15.7%
13.5%
12.1% 12.0%
10.1%10.1%
7.9%7.4%
8.3%
9.4%
8.1%
8.8% 8.5%
7.3%6.9%
8.9%
4.0%
6.0%
8.0%
10.0%
12.0%
14.0%
16.0%
18.0%
1998 1999 2000 2001 2002 2003 2004 2005 2006 2007 2008 2009 2010 2011 2012 2013 2014
10 year IRS 15 year IRS 20 year IRS
Louis
Bloemfontain
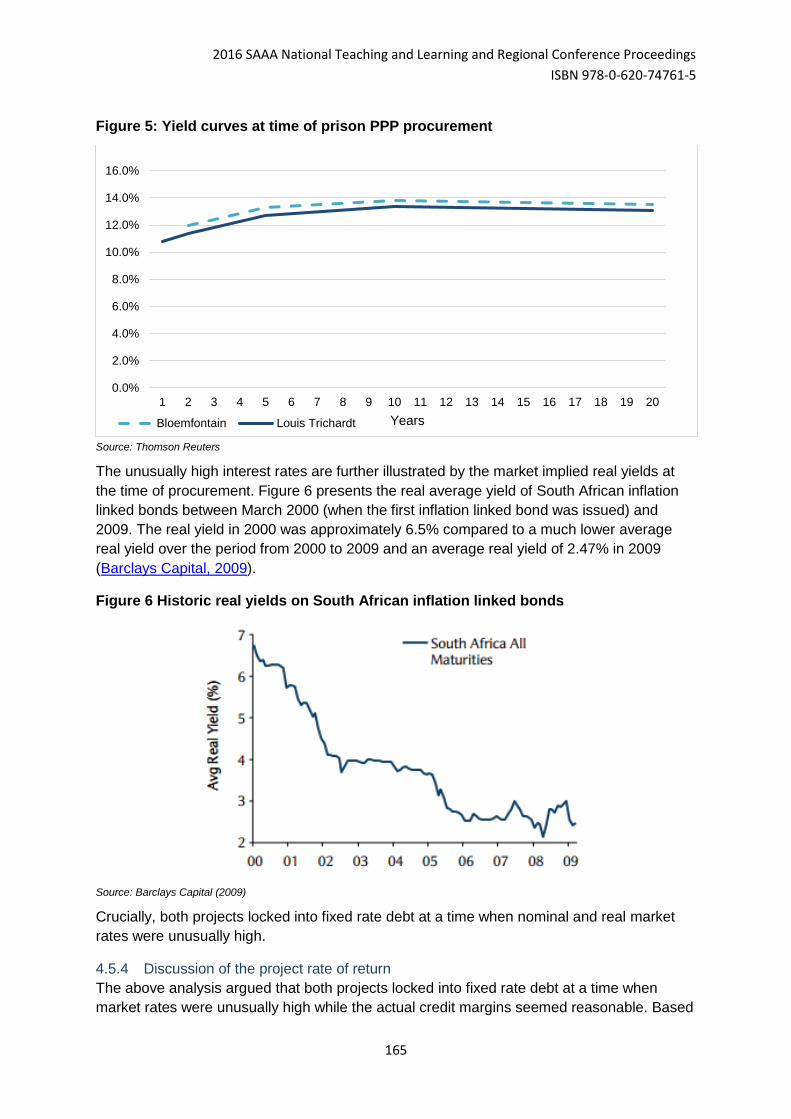
2016 SAAA National Teaching and Learning and Regional Conference Proceedings
ISBN 978-0-620-74761-5
165
Figure 5: Yield curves at time of prison PPP procurement
Source: Thomson Reuters
The unusually high interest rates are further illustrated by the market implied real yields at
the time of procurement. Figure 6 presents the real average yield of South African inflation
linked bonds between March 2000 (when the first inflation linked bond was issued) and
2009. The real yield in 2000 was approximately 6.5% compared to a much lower average
real yield over the period from 2000 to 2009 and an average real yield of 2.47% in 2009
(Barclays Capital, 2009).
Figure 6 Historic real yields on South African inflation linked bonds
Source: Barclays Capital (2009)
Crucially, both projects locked into fixed rate debt at a time when nominal and real market
rates were unusually high.
4.5.4 Discussion of the project rate of return
The above analysis argued that both projects locked into fixed rate debt at a time when
market rates were unusually high while the actual credit margins seemed reasonable. Based
0.0%
2.0%
4.0%
6.0%
8.0%
10.0%
12.0%
14.0%
16.0%
1 2 3 4 5 6 7 8 9 10 11 12 13 14 15 16 17 18 19 20
YearsBloemfontain Louis Trichardt
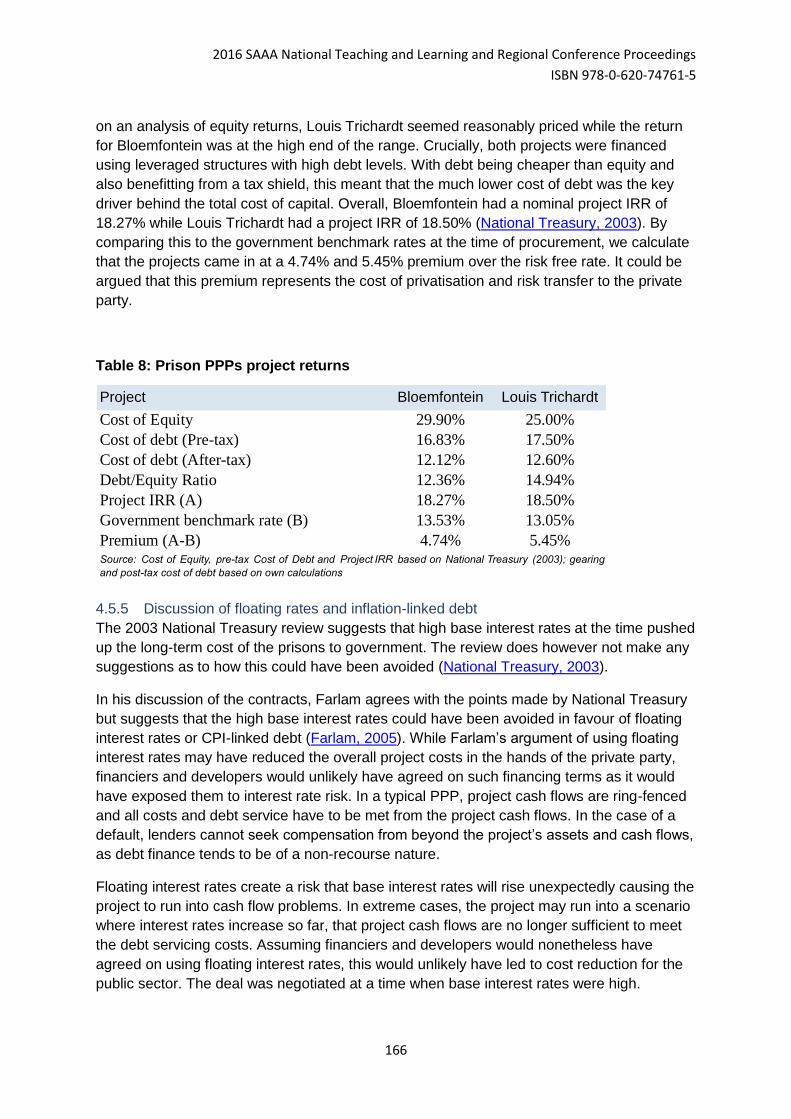
2016 SAAA National Teaching and Learning and Regional Conference Proceedings
ISBN 978-0-620-74761-5
166
on an analysis of equity returns, Louis Trichardt seemed reasonably priced while the return
for Bloemfontein was at the high end of the range. Crucially, both projects were financed
using leveraged structures with high debt levels. With debt being cheaper than equity and
also benefitting from a tax shield, this meant that the much lower cost of debt was the key
driver behind the total cost of capital. Overall, Bloemfontein had a nominal project IRR of
18.27% while Louis Trichardt had a project IRR of 18.50% (National Treasury, 2003). By
comparing this to the government benchmark rates at the time of procurement, we calculate
that the projects came in at a 4.74% and 5.45% premium over the risk free rate. It could be
argued that this premium represents the cost of privatisation and risk transfer to the private
party.
Table 8: Prison PPPs project returns
4.5.5 Discussion of floating rates and inflation-linked debt
The 2003 National Treasury review suggests that high base interest rates at the time pushed
up the long-term cost of the prisons to government. The review does however not make any
suggestions as to how this could have been avoided (National Treasury, 2003).
In his discussion of the contracts, Farlam agrees with the points made by National Treasury
but suggests that the high base interest rates could have been avoided in favour of floating
interest rates or CPI-linked debt (Farlam, 2005). While Farlam’s argument of using floating
interest rates may have reduced the overall project costs in the hands of the private party,
financiers and developers would unlikely have agreed on such financing terms as it would
have exposed them to interest rate risk. In a typical PPP, project cash flows are ring-fenced
and all costs and debt service have to be met from the project cash flows. In the case of a
default, lenders cannot seek compensation from beyond the project’s assets and cash flows,
as debt finance tends to be of a non-recourse nature.
Floating interest rates create a risk that base interest rates will rise unexpectedly causing the
project to run into cash flow problems. In extreme cases, the project may run into a scenario
where interest rates increase so far, that project cash flows are no longer sufficient to meet
the debt servicing costs. Assuming financiers and developers would nonetheless have
agreed on using floating interest rates, this would unlikely have led to cost reduction for the
public sector. The deal was negotiated at a time when base interest rates were high.
Project Bloemfontein Louis Trichardt
Cost of Equity 29.90% 25.00%
Cost of debt (Pre-tax) 16.83% 17.50%
Cost of debt (After-tax) 12.12% 12.60%
Debt/Equity Ratio 12.36% 14.94%
Project IRR (A) 18.27% 18.50%
Government benchmark rate (B) 13.53% 13.05%
Premium (A-B) 4.74% 5.45%Source: Cost of Equity, pre-tax Cost of Debt and Project IRR based on National Treasury (2003); gearing
and post-tax cost of debt based on own calculations
2016 SAAA National Teaching and Learning and Regional Conference Proceedings
ISBN 978-0-620-74761-5
167
Furthermore, market forecasts, as shown by the long-term swap curve as well as the yield
curve at the time, were for interest rates to remain high.
As such, developers would have priced the deal under the assumption that interest rates
would remain high for years to come. All else equal, the best estimate of interest rates at the
time would have been the long term yield curve in which case pricing would have been
similar under both floating and fixed rates. Arguably, some saving could have been achieved
through the saving of the swap margin that would have been avoided by financing the
project using floating rates. Offsetting this saving would have been higher credit margins and
equity return requirements reflecting the increased risk around the uncertainty of interest
rates. It may have been possible for the state to take on the risk of floating interest rates but
it is submitted that this was unlikely at the time.
On a net basis, the use of floating rates would likely have outweighed the benefits of fixed
rates while it is questionable if lenders would have agreed to such a structure in the first
place. Assuming the project had still been financed using floating interest rates and without
any increase in costs, a fall in base interest rates would only have reduced the costs in the
hands of the private party and not the public sector, unless this was factored into the
contract with the state.
If the public sector was prepared to structure payments on the basis of floating rates, then
this may have enabled the use of floating rate debt. However, it is unlikely that the public
sector would wish to take on interest rate risk, which may have led to budgetary constraints.
As there was no way of predicting the future drop in interest rates at the time of agreement,
the project would have been priced under the high base rates and, without a gain share, a
drop in interest rates would have been to the benefit of the private party only.
While using floating rates may not have been an option, it is our view that the overall
economic environment should still have been considered more carefully. At the time of
procurement there was no way of knowing that interest rates would fall in future but such a
scenario should at least have been considered. The analysis would have shown the impact
on the project including the potential gains of a refinancing at more favourable conditions.
Refinancing of debt is a common practise among PPPs with the contracts normally
specifying terms for gain-shares to the public party. While the benefit of a gain-share can
easily be identified in hindsight, it has to be acknowledged that gain-share clauses were not
a common feature of PPPs in the early 2000s, even in developed markets.
It is our view that while using floating interest rates presents a risk to developers and
financiers, inflation-linked debt can reduce risks by creating a natural hedge between interest
and project revenues where such revenues escalate in line with inflation. For the two PPPs,
linking interest rates to CPI inflation would have had the benefit of interest costs being
hedged to the availability payments. To hedge the CPI exposure, bidders would likely have
asked for a lower fixed and a higher indexed payment, which would have reduced the costs
to the public sector under a scenario of low or falling inflation. Quantifying the impact of
financing the deal using CPI linked debt is not straightforward. While there is clear benefit to
the reduced risk from hedging interest rates through revenues, the overall impact is a
function of various factors including the all in cost of debt. The scenario of financing the
project with CPI linked debt is analysed in more detail in section 4.5.6.2.
2016 SAAA National Teaching and Learning and Regional Conference Proceedings
ISBN 978-0-620-74761-5
168
4.5.6 Estimated cost of debt financing under original terms
4.5.6.1 Assumptions
We estimate debt finance costs as at project start date and under original project terms,
where available. A number of simplifying assumptions have had to be made where
information published was insufficient. Specifically, no information on the repayment terms
beyond what is summarised in Table 5 has been published for either project. As such it is
unclear what repayment profiles have been applied to the senior debt. Therefore, the
following analysis is subject to this limitation.
Repayment profiles for bank debt in a project finance deal can take various forms including
annuity style amortisation (keeping total debt service fixed), straight-line payments (keeping
principal repayments fixed), bullet repayments as well as sculpted repayments. Additionally,
some deals make use of a cash sweep, which uses excess cash to repay some of the
outstanding debt early, thereby changing the overall debt repayment profile. For the
purposes of this analysis and in absence of any additional information, senior debt we
assumed an annuity style amortisation profile.
Such a repayment profile assumes total debt payments consisting of principal and interest to
be the same in each repayment period. During earlier debt service periods, interest
payments make up the majority of total debt service while principal repayments are the
balancing figure. Over time and as principal is paid down, the principal portion of the total
payment increases and the interest portion declines while the overall payment remains
constant.
4.5.6.2 Estimated costs at the time of agreement
The table below presents the total debt service for the Bloemfontein prison. In net present
value terms, we calculate total debt service in 2001 for Bloemfontein as at R503 million20 (an
equivalent of R1 103 million in 2014 real terms). The net present value for the Louis
Trichardt facility is estimated at R446 million21 (an equivalent of R943 million in 2014 real
terms). For Bloemfontein, the net present cost of interest only is calculated at R351 million22
(an equivalent of R789 million in 2014 real terms). The interest cost for the Louis Trichardt
facility is estimated at R367 million23 (an equivalent of R801 million in 2014 real terms).
Measured as a percentage of total project costs24, interest on debt made up approximately
20.3% in the case of Bloemfontein and 20.1% in the case of Louis Trichardt.
20 Discounted at 13.53% being the yield on the long-term (20 year) government benchmark bond at the time of agreement. 21 Discounted at 13.05% being the yield on the long-term (20 year) government benchmark bond at the time of agreement. 22 Discounted at 13.53% being the yield on the long-term (20 year) government benchmark bond at the time of agreement. 23 Discounted at 13.05% being the yield on the long-term (20 year) government benchmark bond at the time of agreement. 24 As measured by the NPV of payments, see section 4.2.
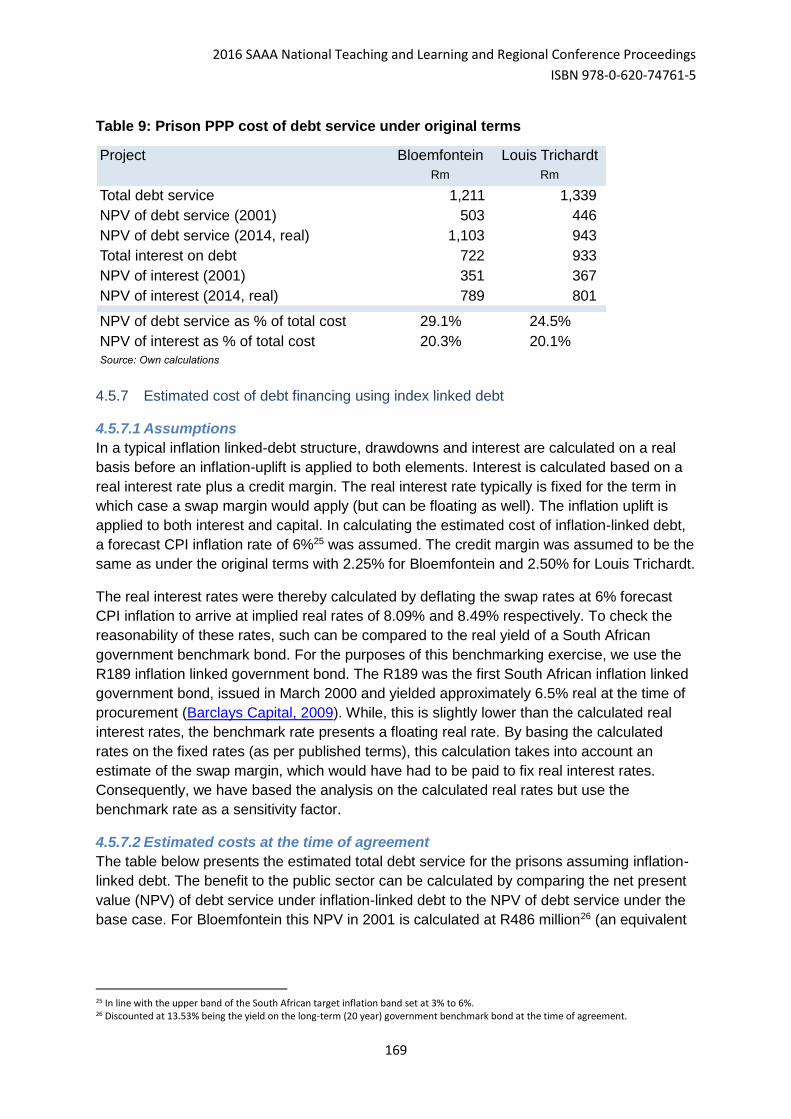
2016 SAAA National Teaching and Learning and Regional Conference Proceedings
ISBN 978-0-620-74761-5
169
Table 9: Prison PPP cost of debt service under original terms
4.5.7 Estimated cost of debt financing using index linked debt
4.5.7.1 Assumptions
In a typical inflation linked-debt structure, drawdowns and interest are calculated on a real
basis before an inflation-uplift is applied to both elements. Interest is calculated based on a
real interest rate plus a credit margin. The real interest rate typically is fixed for the term in
which case a swap margin would apply (but can be floating as well). The inflation uplift is
applied to both interest and capital. In calculating the estimated cost of inflation-linked debt,
a forecast CPI inflation rate of 6%25 was assumed. The credit margin was assumed to be the
same as under the original terms with 2.25% for Bloemfontein and 2.50% for Louis Trichardt.
The real interest rates were thereby calculated by deflating the swap rates at 6% forecast
CPI inflation to arrive at implied real rates of 8.09% and 8.49% respectively. To check the
reasonability of these rates, such can be compared to the real yield of a South African
government benchmark bond. For the purposes of this benchmarking exercise, we use the
R189 inflation linked government bond. The R189 was the first South African inflation linked
government bond, issued in March 2000 and yielded approximately 6.5% real at the time of
procurement (Barclays Capital, 2009). While, this is slightly lower than the calculated real
interest rates, the benchmark rate presents a floating real rate. By basing the calculated
rates on the fixed rates (as per published terms), this calculation takes into account an
estimate of the swap margin, which would have had to be paid to fix real interest rates.
Consequently, we have based the analysis on the calculated real rates but use the
benchmark rate as a sensitivity factor.
4.5.7.2 Estimated costs at the time of agreement
The table below presents the estimated total debt service for the prisons assuming inflation-
linked debt. The benefit to the public sector can be calculated by comparing the net present
value (NPV) of debt service under inflation-linked debt to the NPV of debt service under the
base case. For Bloemfontein this NPV in 2001 is calculated at R486 million26 (an equivalent
25 In line with the upper band of the South African target inflation band set at 3% to 6%. 26 Discounted at 13.53% being the yield on the long-term (20 year) government benchmark bond at the time of agreement.
Project Bloemfontein Louis Trichardt
Rm Rm
Total debt service 1,211 1,339
NPV of debt service (2001) 503 446
NPV of debt service (2014, real) 1,103 943
Total interest on debt 722 933
NPV of interest (2001) 351 367
NPV of interest (2014, real) 789 801
NPV of debt service as % of total cost 29.1% 24.5%
NPV of interest as % of total cost 20.3% 20.1%
Source: Own calculations
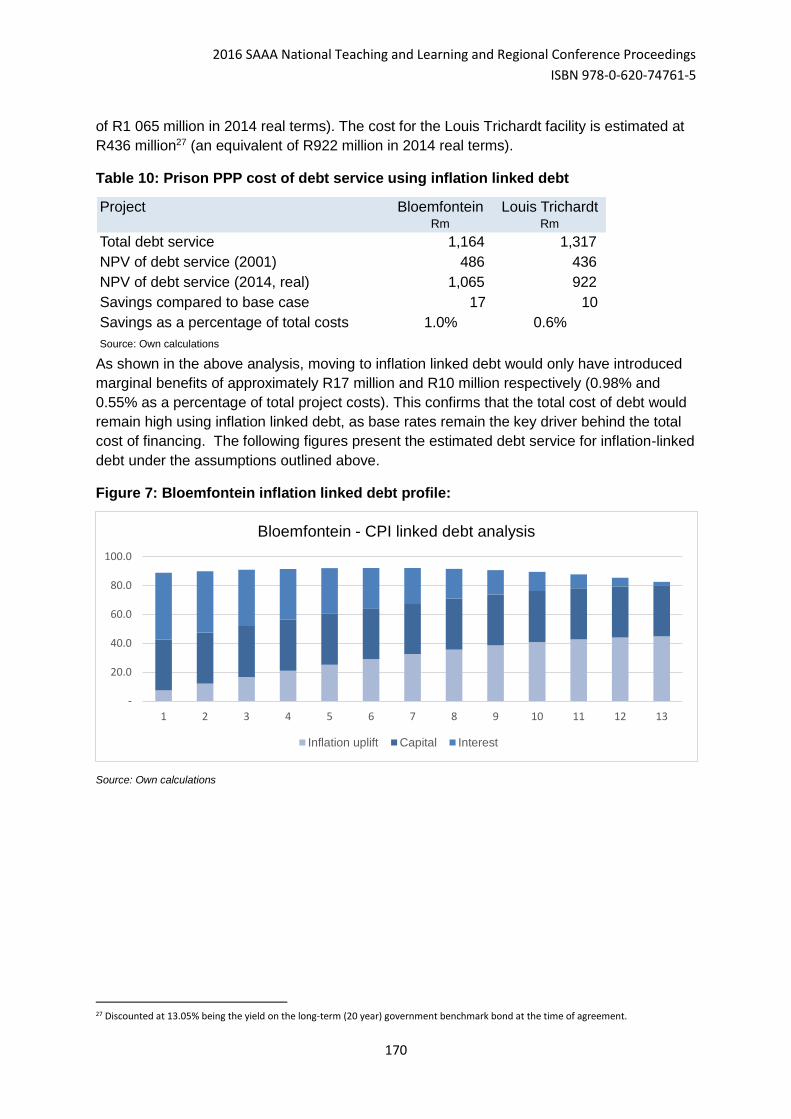
2016 SAAA National Teaching and Learning and Regional Conference Proceedings
ISBN 978-0-620-74761-5
170
of R1 065 million in 2014 real terms). The cost for the Louis Trichardt facility is estimated at
R436 million27 (an equivalent of R922 million in 2014 real terms).
Table 10: Prison PPP cost of debt service using inflation linked debt
As shown in the above analysis, moving to inflation linked debt would only have introduced
marginal benefits of approximately R17 million and R10 million respectively (0.98% and
0.55% as a percentage of total project costs). This confirms that the total cost of debt would
remain high using inflation linked debt, as base rates remain the key driver behind the total
cost of financing. The following figures present the estimated debt service for inflation-linked
debt under the assumptions outlined above.
Figure 7: Bloemfontein inflation linked debt profile:
Source: Own calculations
27 Discounted at 13.05% being the yield on the long-term (20 year) government benchmark bond at the time of agreement.
Project Bloemfontein Louis TrichardtRm Rm
Total debt service 1,164 1,317
NPV of debt service (2001) 486 436
NPV of debt service (2014, real) 1,065 922
Savings compared to base case 17 10
Savings as a percentage of total costs 1.0% 0.6%
Source: Own calculations
-
20.0
40.0
60.0
80.0
100.0
1 2 3 4 5 6 7 8 9 10 11 12 13
Bloemfontein - CPI linked debt analysis
Inflation uplift Capital Interest
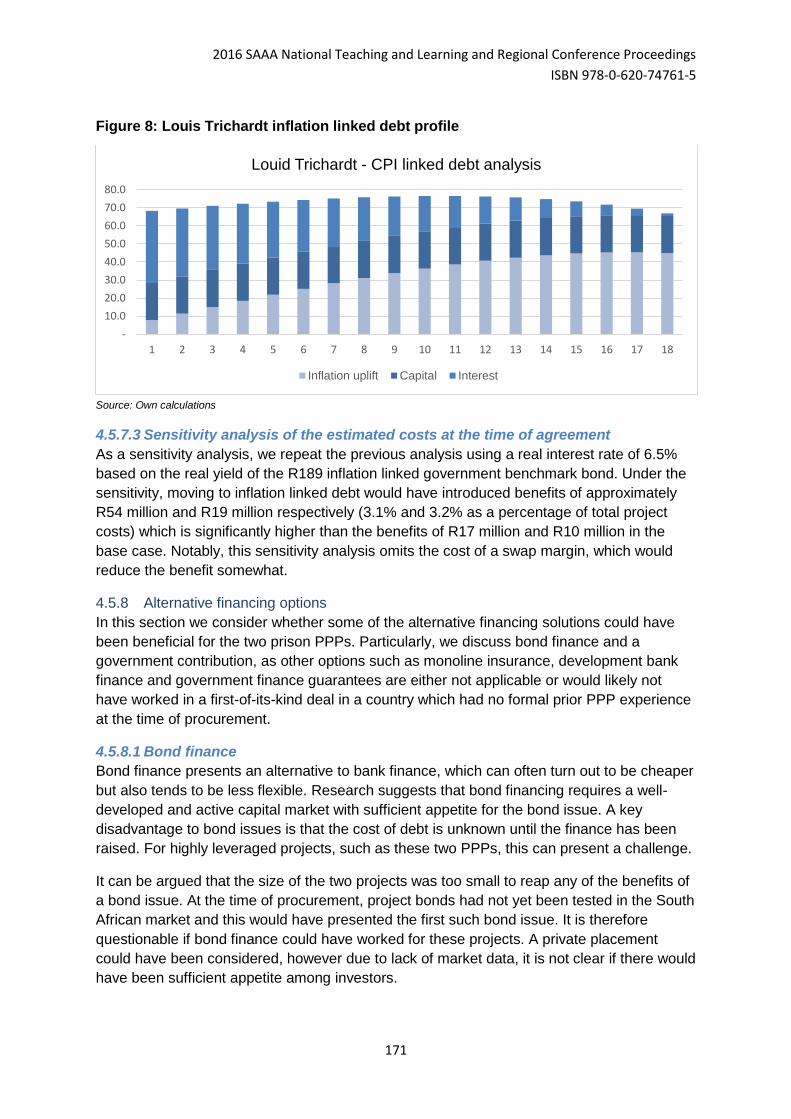
2016 SAAA National Teaching and Learning and Regional Conference Proceedings
ISBN 978-0-620-74761-5
171
Figure 8: Louis Trichardt inflation linked debt profile
Source: Own calculations
4.5.7.3 Sensitivity analysis of the estimated costs at the time of agreement
As a sensitivity analysis, we repeat the previous analysis using a real interest rate of 6.5%
based on the real yield of the R189 inflation linked government benchmark bond. Under the
sensitivity, moving to inflation linked debt would have introduced benefits of approximately
R54 million and R19 million respectively (3.1% and 3.2% as a percentage of total project
costs) which is significantly higher than the benefits of R17 million and R10 million in the
base case. Notably, this sensitivity analysis omits the cost of a swap margin, which would
reduce the benefit somewhat.
4.5.8 Alternative financing options
In this section we consider whether some of the alternative financing solutions could have
been beneficial for the two prison PPPs. Particularly, we discuss bond finance and a
government contribution, as other options such as monoline insurance, development bank
finance and government finance guarantees are either not applicable or would likely not
have worked in a first-of-its-kind deal in a country which had no formal prior PPP experience
at the time of procurement.
4.5.8.1 Bond finance
Bond finance presents an alternative to bank finance, which can often turn out to be cheaper
but also tends to be less flexible. Research suggests that bond financing requires a well-
developed and active capital market with sufficient appetite for the bond issue. A key
disadvantage to bond issues is that the cost of debt is unknown until the finance has been
raised. For highly leveraged projects, such as these two PPPs, this can present a challenge.
It can be argued that the size of the two projects was too small to reap any of the benefits of
a bond issue. At the time of procurement, project bonds had not yet been tested in the South
African market and this would have presented the first such bond issue. It is therefore
questionable if bond finance could have worked for these projects. A private placement
could have been considered, however due to lack of market data, it is not clear if there would
have been sufficient appetite among investors.
-
10.0
20.0
30.0
40.0
50.0
60.0
70.0
80.0
1 2 3 4 5 6 7 8 9 10 11 12 13 14 15 16 17 18
Louid Trichardt - CPI linked debt analysis
Inflation uplift Capital Interest
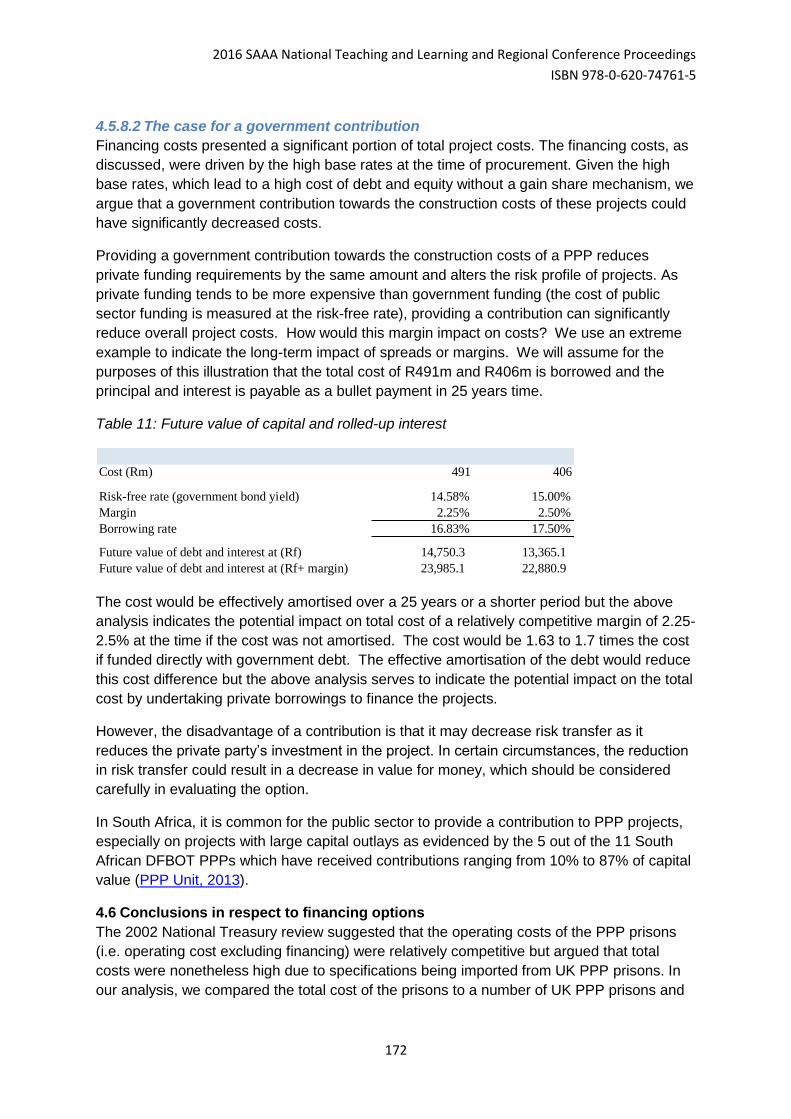
2016 SAAA National Teaching and Learning and Regional Conference Proceedings
ISBN 978-0-620-74761-5
172
4.5.8.2 The case for a government contribution
Financing costs presented a significant portion of total project costs. The financing costs, as
discussed, were driven by the high base rates at the time of procurement. Given the high
base rates, which lead to a high cost of debt and equity without a gain share mechanism, we
argue that a government contribution towards the construction costs of these projects could
have significantly decreased costs.
Providing a government contribution towards the construction costs of a PPP reduces
private funding requirements by the same amount and alters the risk profile of projects. As
private funding tends to be more expensive than government funding (the cost of public
sector funding is measured at the risk-free rate), providing a contribution can significantly
reduce overall project costs. How would this margin impact on costs? We use an extreme
example to indicate the long-term impact of spreads or margins. We will assume for the
purposes of this illustration that the total cost of R491m and R406m is borrowed and the
principal and interest is payable as a bullet payment in 25 years time.
Table 11: Future value of capital and rolled-up interest
The cost would be effectively amortised over a 25 years or a shorter period but the above
analysis indicates the potential impact on total cost of a relatively competitive margin of 2.25-
2.5% at the time if the cost was not amortised. The cost would be 1.63 to 1.7 times the cost
if funded directly with government debt. The effective amortisation of the debt would reduce
this cost difference but the above analysis serves to indicate the potential impact on the total
cost by undertaking private borrowings to finance the projects.
However, the disadvantage of a contribution is that it may decrease risk transfer as it
reduces the private party’s investment in the project. In certain circumstances, the reduction
in risk transfer could result in a decrease in value for money, which should be considered
carefully in evaluating the option.
In South Africa, it is common for the public sector to provide a contribution to PPP projects,
especially on projects with large capital outlays as evidenced by the 5 out of the 11 South
African DFBOT PPPs which have received contributions ranging from 10% to 87% of capital
value (PPP Unit, 2013).
4.6 Conclusions in respect to financing options
The 2002 National Treasury review suggested that the operating costs of the PPP prisons
(i.e. operating cost excluding financing) were relatively competitive but argued that total
costs were nonetheless high due to specifications being imported from UK PPP prisons. In
our analysis, we compared the total cost of the prisons to a number of UK PPP prisons and
Cost (Rm) 491 406
Risk-free rate (government bond yield) 14.58% 15.00%
Margin 2.25% 2.50%
Borrowing rate 16.83% 17.50%
Future value of debt and interest at (Rf) 14,750.3 13,365.1
Future value of debt and interest at (Rf+ margin) 23,985.1 22,880.9

2016 SAAA National Teaching and Learning and Regional Conference Proceedings
ISBN 978-0-620-74761-5
173
found that the cost per inmate was approximately six times less expensive than the cost per
inmate for UK prisons built around the same time.
Some have criticised the financing costs and suggested that these were a key driver behind
the overall costs of the prisons. While our analysis confirmed that the financing costs of the
PPP prisons were high, this seems to have largely been driven by unfavourable market
conditions at the time of procurement, and not by excessive returns. Once we isolated the
impact of high base interest rates at the time of procurement, we found, that financing costs
seemed reasonably priced.
While alternative funding solutions, such as inflation linked debt or bond finance, may either
not have been possible or not have been able to bring significant cost savings, there is a
strong argument that the Department of Correctional Services should have explored other
financing structures more closely and thereby should also have considered the option of a
government contribution. While we acknowledge that the impact on risk transfer and value
for money would also have had to be considered, our analysis showed that a government
contribution could have resulted in significant cost savings.
4.7 Lessons learned
A key issue with the two deals was the inflexibility of contract terms, which locked the public
sector into payments driven by the high initial costs. Failure to consider and include clauses
for gain-share mechanisms meant that there is no upside or claw back mechanism for the
public sector. However, both prisons were procured at a time when gain share mechanisms
were not common practise among PPPs, even in developed PPP markets.
While we have not discussed or examined the output specifications as part of this paper, the
review done by National Treasury suggests that the specifications were set unnecessarily
high. Thus, the Department of Correctional Services should possibly have considered a
more flexible and cheaper prison design. A more flexible and structured financing solution
that included a government contribution would have reduced the total costs of the prisons.
4.8 The future of PPP prisons in South Africa
According to du Plessis, the future for PPP prisons in South Africa does not look bright.
Following the procurement and building of the first two PPP prisons in Louis Trichardt and
Bloemfontein, former president Thabo Mbeki, in his 2002 State of the Nation Address,
announced the building of the next four new prisons in Nigel, Klerksdorp, Leeuwkop and
Kimberley, with 3,000 bed spaces each.
The announcement came a few months after the completion of the first two prison PPPs, but
there was no indication of whether these new facilities would be state-controlled or be run as
PPPs. Only the Kimberly prison was built as a public sector initiative financed and run by
the state, and not as a PPP. In 2006, Mbeki announced the building of four more prisons in
Paarl, Port Shepstone, East London and Polokwane. None of these prisons have been built
to date.
By 2008, the Department of Correctional Services decided to go ahead with four different
prisons, all of which were in new locations being Klerksdorp, East London, Nigel and Paarl.
These prisons were to be procured as PPPs and four consortiums were shortlisted. In
November 2011, Correctional Services Minister Mapisa-Nqakula called a press conference
2016 SAAA National Teaching and Learning and Regional Conference Proceedings
ISBN 978-0-620-74761-5
174
to announce that the procurement of the new PPP prisons was cancelled because the
tender requirements had changed to such an extent that bids fell short of the new criteria. It
was estimated that each consortium had spent R20 million on their bids which were not
recoverable (du Plessis, 2012).
While the unrecoverable bid costs most certainly were a large cost to the consortia, the
actual cost of cancelling the projects may have had a more significant impact causing a lack
of credibility for the public sector and the South African PPP framework. Bidders already
have to bear significant risks in bidding for a contract and may choose not to tender for
future projects if there is a lack of credibility and risk of procurements being cancelled.
5. Conclusions and summary
Given the highly levered nature of a typical PPP, debt plays a key role in the financing of
PPPs. We therefore focussed on debt financing solutions and discussed the various options
available. Comparing this to the financing solutions used on South African projects, we
found that the South African market is heavily reliant on bank debt. While the South African
PPP framework is well developed, the number of projects procured under the framework has
been too low for the market to properly develop a deep available PPP financing market. Li
found that such an available financial market was one of the top three factors required for
the development of successful PPPs in the UK (Li, 2005). The lack of alternative funding
solutions for South African PPPs may be hindering the development of future projects and
driving up costs.
While the recent REIPPPP cannot technically be classified as a South African PPP, the
programme shared numerous similarities with PPPs. The REIPPPP was a positive
development for the financing market as it caused an increase in interest among institutional
investors and development banks, both local and international. The increase in involvement
by such parties may be signalling that investors are slowly opening up to South African
infrastructure project finance deals. The issue of the first investment grade infrastructure
project bond, in particular, is a strong indication that the South African infrastructure project
finance market may be developing and readying itself for alternative financing solutions.
In this study, we assessed the various criticisms of the PPP prisons but found, that the total
cost (on a per inmate basis) was significantly lower than the cost of UK PPP prisons at the
time, although such comparisons are subject to limitations. We also found that financing
costs, which received significant criticism, were driven by unfavourable market conditions at
the time. Once we isolated the unusually high market interest rates, we found that financing
costs for the prisons seemed to have been priced competitively. It is submitted that a
government contribution could have brought significant savings to the public sector. We do
however note that the prisons were procured before South African Treasury Regulations for
PPPs were put in place. Currently, South Africa requires the Treasury to approve PPPs
proposals in a four stage process before the signing of a contract (Irwin, 2010). A feasibility
study is conducted as part of the approvals process which aims to assess costs and value
for money under various financing options (PPP Unit, 2004). It should be noted that while
this process, in theory, should result in more optimally structured deals, the final cost is still
heavily impacted by the state and availability of suitable and effective financing solutions.
2016 SAAA National Teaching and Learning and Regional Conference Proceedings
ISBN 978-0-620-74761-5
175
Hence, a deep and available financial market should be one of the key objectives for policy
makers and industry participants.
Recommendations for further research
The success of the Renewable Energy Independent Power Producer (REIPPP) programme,
which has resulted in the investment of over R100 billion in three years up to 2010, stands in
stark contrast to the lack of the success of the PPP prisons. It would be relevant to research
the factors that led to the success of the REIPPP programme, undertake a comprehensive
comparative analysis in relation to the PPP prisons and derive policies and the management
strategies that may be applied in other PPP projects.
This study employed data that was publicly available and it would be useful to use a more
extensive data set in order to undertake a more precise analysis of the costs of the PPP
prisons in relation to the costs of publicly operated prisons. In particular, the effective cost
subsidy of overcrowding in the current public prisons should be taken into account in making
comparisons.
This study focused on a limited comparative analysis of PPP prisons to the UK experience.
This comparative analysis can be extended to other countries such as the USA, which has a
long experience with privately owned and operated prisons.
Conclusion
This study provides equity benchmark returns for early South African PPP projects by
comparing such project returns to both local and international comparators. It provides a
response to some of the critics of the South African prison PPPs and expands on areas,
which the 2002 National Treasury review did not review or evaluate. Furthermore, this study
calculates the total cost of the South African prison PPPs and benchmarks this against a set
of international comparators. Subject to limitations, the conclusions of this study indicate that
costs and returns implicit within the PPP prisons were not unreasonable in relation to the UK
PPP projects, and simply reflect high market interest rates at the time. Spreads and equity
premiums appeared to be reasonable, particularly for the Louis Trichardt prison. Whilst, the
objective of the study was not to compare costs and returns in relation to the public prisons,
the lower costs of the public prisons may also reflect the impact of overcrowding on the
relative costs per inmate. Whilst PPP prisons may not be optimum in terms of public policy,
an analysis of the costs and returns of such prisons should lead to a more accurate
assessment of PPP projects in South Africa.
References
AKBIYIKLI, R., EATON, D. & TURNER, A. 2006. Project finance and the private finance
initiative (PFI). The Journal of Structured Finance, 12, 67-75.
ASENOVA, D. & BECK, M. 2003. The UK financial sector and risk management in PFI
projects: a survey. Public Money and Management, 23, 195-202.
BARCLAYS CAPITAL 2009. South Africa Government Inflation-linked Bond Index Guide.
Johannesburg.
2016 SAAA National Teaching and Learning and Regional Conference Proceedings
ISBN 978-0-620-74761-5
176
BOVAIRD, T. 2004. Public–private partnerships: from contested concepts to prevalent
practice. International Review of Administrative Sciences, 70, 199-215.
CBI 2011. Written evidence submitted to UK House of Commons Select Committee on Private
Finance Initiative funding. "House of Commons Committee news", Confederation of
British Industry evidence.
CRESWELL, J.W. 2003. Research Design: Qualitative, Quantitative and Mixed Approaches,
2nd edition, Sage Publications, Thousand Oaks, California
DAVIES, P. & EUSTICE, K. 2005. Delivering the PPP promise: A review of PPP issues and
activity. London: PWC.
DEPARTMENT OF ENERGY 2011-2013. REIPPPP Tender Notices and Briefing Notes.
accessed online at http://www.ipp-renewables.co.za.
DU PLESSIS, C. 2012. How The Private Prisons Were Barred. Criminal Justice Initiative of
Open Society Foundation for South Africa.
EBERHARD, A., KOLKER, J. & LEIGLAND, J. 2014. South Africa’s Renewable Energy IPP
Procurement Program: Success Factors and Lessons. PPIAF.
ESTY, B. C. 2004. Why study large projects? An introduction to research on project finance.
European Financial Management, 10, 213-224.
FARLAM, P. 2005. Working together: assessing public-private partnerships in Africa, South
African Institute of International Affairs.
GRIMSEY, D. & LEWIS, M. K. 2002. Evaluating the risks of public private partnerships for
infrastructure projects. International Journal of Project Management, 20, 107-118.
HELLOWELL, M. 2013. What return for risk? The price of equity capital in public-private
partnerships. Rethinking Public-Private Partnerships: Strategies for Turbulent Times,
Routledge, Oxon, 57-77.
HM TREASURY 2002. Refinancing of early PFI transactions: code of conduct. London, UK.
IRWIN, T. 2010. Managing Contingent Liabilities in Public-Private Partnerships. Washington
DC: The World Bank, PPIAF.
KWAK, Y. H., CHIH, Y. & IBBS, C. W. 2009. Towards a comprehensive understanding of
public private partnerships for infrastructure development. California Management
Review, 51, 51-78.
LI, B., AKINTOYE, A., EDWARDS, P. J. & HARDCASTLE, C. 2005. Critical success factors
for PPP/PFI projects in the UK construction industry. Construction management and
economics, 23, 459-471.
NATIONAL TREASURY 2003. Review of the Public Private Partnership Prison Contracts:
National Treasury briefing to Portfolio Committee on Correctional Services. Pretoria:
National Treasury.
NG, A. & LOOSEMORE, M. 2007. Risk allocation in the private provision of public
infrastructure. International Journal of Project Management, 25, 66-76.
NGAMLANA, P. X. 2009. Improving public-private partnership deal flow for infrastructure
delivery in South Africa: the role of National Treasury. Stellenbosch: University of
Stellenbosch.
OPEN SOCIETY FOUNDATION FOR SOUTH AFRICA. Prison Privatisation. Prison
Privatisation, 2003 Cape Town.
PPP UNIT 2004. Public Private Partnership Manual. In: TREASURY, N. (ed.). Pretoria, South
Africa.
2016 SAAA National Teaching and Learning and Regional Conference Proceedings
ISBN 978-0-620-74761-5
177
PPP UNIT 2013. PPP Projects signed in terms of Treasury Regulation 16, AS AT. Pretoria,
South Africa: National Treasury.
PRICEWATERHOUSECOOPERS 2001. Financial Review of Scottish Prison Service Estates
Review.
RAMAGAGA, T. 2001. Lessons from Prisons & Public-Private Partnerships in South Africa.
National & International Perspectives on Crime and Criminal Justice, Crime and
Justice Programme, Institute for Security Studies, Conference presentation, National
& International Perspectives on Crime and Criminal Justice, 1-2 December, 2011,
Johannesburg.
REGAN, M., SMITH, J. & LOVE, P. E. 2010. Impact of the capital market collapse on public-
private partnership infrastructure projects. Journal of construction engineering and
management, 137, 6-16.
SPACKMAN, M. 2002. Public–private partnerships: lessons from the British approach.
Economic Systems, 26, 283-301.
THE WORLD BANK 2012. Focus on Public-Private Partnerships.
YIN, R. (1993). Applications of case study research. Newbury Park, CA: Sage Publishing.
ZHANG, X. 2005. Criteria for selecting the private-sector partner in public–private
partnerships. Journal of construction engineering and management, 131, 631-644.
2016 SAAA National Teaching and Learning and Regional Conference Proceedings
ISBN 978-0-620-74761-5
178
2016 Southern African Accounting
Association (SAAA)
National Teaching and Learning and
Regional Conference Proceedings
ISBN number: 978-0-620-74761-5
MAF 04: Dividend Yield as a Model for Value Investing on
the JSE
Celso Zuccollo
College of Accounting, University of Cape Town
Carlos Correia*
College of Accounting, University of Cape Town
Contact details:
*Professor Carlos Correia
College of Accounting
University of Cape Town
South Africa
Email: [email protected]
ABSTRACT
In terms of the efficient market hypothesis, equity prices reflect all available relevant
information and evidence indicates that active investing is not able to consistently offer
higher returns than a strategy of passive investing. Yet a value investing strategy, following
on the principles of Graham and Dodd and further expanded by Buffett and other value
investors, implies that searching for and investing in companies trading below intrinsic value
provides higher risk adjusted returns than comparable market proxies. Value investing may
include a number of strategies such as investing in low P/E companies and investing in
companies trading below net tangible value. Another value investing strategy involves
finding and investing in high dividend yield companies or investing in companies offering
dividend yields at least equal to 2/3 of the long-term government bond yield. The objective of
this study is to evaluate whether investing in a portfolio of high dividend yield companies
provides significantly greater returns than investing in a relevant market proxy or a portfolio
of low dividend yield companies. This study ranks shares on the basis of dividend yields and
back-tests share returns of investing in a portfolio of high dividend yield shares in relation to
a relevant market proxy and/or investing in a portfolio of low dividend yield shares. In order
to address to some extent the issue of survivorship bias, the relative returns of investing in
high dividend yield shares as identified in prior published research reports are compared to
the returns of investing in a relevant market proxy.
2016 SAAA National Teaching and Learning and Regional Conference Proceedings
ISBN 978-0-620-74761-5
179
1. Introduction In the book “Security Analysis,” Benjamin Graham and David Dodd (1934) introduced the
strategy of value investing which has subsequently become one of the most widely-accepted
strategies in the investment community. Value Investing is the search for companies that are
trading at a price which is less than the intrinsic value of the assets that the business
currently has in place (Damodaran, 2012).
The purpose of this study is to evaluate whether value-investing strategies outperform the
market index by selecting high dividend yielding shares to construct a value portfolio.
These “value” stocks are thought to be created as a result of the “Overreaction Theory,”
which proposes that equity investors often overreact to new information, resulting in some
security prices deviating meaningfully from their intrinsic values, for a prolonged period. This
overreaction is then followed by “mean reversion,” as these securities trade back to their
intrinsic values over time, thereby allowing investors to attain abnormal returns should they
correctly identify these mispriced stocks. De Bondt and Thaler (1985) found long-term
negative serial dependence, consistent with investor overreaction for the NYSE. Cubbin,
Eidne, Firer, and Gilbert (2006) found significant evidence of investor overreaction for the
JSE, which suggests that investors could potentially attain abnormal risk-adjusted returns by
following a value investment strategy on the JSE.
In order to identify “value” stocks, Graham (1949) suggested a number of investment
screens28, based on underlying company fundamentals. The most widely-used of these
screens identify companies that have high dividend yields, low price/earnings ratios and low
price/tangible net asset value (“Price/Book”) ratios (Visscher & Filbeck, 2003). Studies have
tested the effectiveness of these screens in allowing investors to produce abnormal returns,
and persistent, significant evidence has led academics to conclude that it is difficult to deny
the existence of the value effect (Fama & French, 1998). The question, however, is whether
this value effect is an invalidation of the Efficient Market Hypothesis (EMH), or evidence of
risk factors that are not accurately captured by CAPM (Lintner, 1965; Mossin, 1966; Sharpe,
1964; Treynor, 1961). This therefore means that the performance of value stocks should be
analysed on the basis of relative returns and risk-adjusted returns.
The majority of studies on value investing have been conducted on stock markets in
developed economies. The majority of value investing research studies have focused on the
price/earnings (Basu, 1977) and price/book screens (Fama & French, 1992; Lakonishok,
Shleifer, & Vishny, 1994); or these screens in conjunction with a dividend yield screen. This
means that the effectiveness of value investing strategies based on dividend yields alone
remains a relatively under-researched area. Due to the ease and lack of investment
expertise required to implement such a strategy, evidence that it could provide abnormal
risk-adjusted returns could provide a valuable tool for the equity market investor.
The purpose of this study, therefore, is to analyse the effectiveness of value investing in a
South African emerging market context. The study focuses specifically on the use of the high
28 A screen is a technique to filter a large number of possible investments based on values for selected variables. For example, an
investment screen may be constructed to identify shares with a dividend yield above 5%. Alternatively, an investment screen could be constructed to select shares with a price to book ratio of less than one.
2016 SAAA National Teaching and Learning and Regional Conference Proceedings
ISBN 978-0-620-74761-5
180
dividend yield screen as a measure to identify value stocks, and therefore obtain abnormal
risk-adjusted returns on the JSE. A back-test of a portfolio of the 30 highest dividend yielding
stocks on the JSE is performed over the period from 1 January 2006 to 31 December 2015.
The returns generated by this portfolio are then benchmarked against the returns attained on
the FTSE/JSE J203 All Share Index (ALSI) Total Return Index (TRI) and other relevant
market proxies. These returns are compared on an absolute, and Sharpe (1966) ratio basis,
after adjusting for taxes and transaction costs.
Arguably, the conceptual basis for many of the value indicators may be a puzzle for
academic studies outside the realm of behavioural finance. As a general study of value
investing, the period studied extends the recent study by Van Heerden and Van Rensburg
(2015) on value indicators by four years. In relation to the use of DY specifically, this may
involve different risk-return profiles relative to other value indicators. The results of this
study support this premise when evaluating a high dividend yield investing strategy relative
to investing in the ALSI TRI benchmark. Furthermore, the dividend yield reflects cash flows
to investors which may be indicative of lower operating and financial risks, often in situations
where these companies may be going through difficult times, and which may offset to some
extent the perception implicit in other indicators such as the price to book ratio. This study
focused on the long-term performance of a portfolio of high dividend yield shares.
The study will follow the following structure: Section 2 is a literature review of value investing
in the international and South African context, followed by its interaction with the EMH; and
concludes with an analysis of the effectiveness of dividend yield investment strategies, both
globally and on the JSE. Section 3 provides a description of the test methodology applied,
including an examination of the data. Section 4 analyses the results of the testing, and
Section 5 summarises and concludes the study.
2. Literature Review Benjamin Graham and David Dodd introduced the strategy of “Value Investing” to the world
in the 1934 book entitled “Security Analysis.” Graham (1949) subsequently refined the
principles of value investing in "The Intelligent Investor" . Since then, eminent investors such
as Warren Buffett, Walter Schloss, Seth Klarman, Christopher Browne and Irving Kahn have
made themselves known as value investors. The underpinning principle of this investment
strategy is to purchase stocks that are trading at a price below their intrinsic value, after the
market has overreacted to the release of adverse company information (Visscher & Filbeck,
2003). The investor then sells the stocks once they have traded back to their intrinsic values,
obtaining an abnormal return whilst taking on little additional risk (Lakonishok et al., 1994).
Identifying stocks that are trading at below their intrinsic values, however, is far more difficult
than this may suggest and value investors often have to sustain long periods of
underperformance. In order to identify such stocks, Graham (1949) provided 10 definitive
“screens,” based on underlying company fundamentals. Over the years, these screens have
been widely accepted by the academic community as indicators of value, yet these screens
are generally applied more loosely than indicated by Graham (1949). Resultantly, value
stocks can be identified as having low price/earnings [PE] ratios, high book/market [B/M]
ratios and high dividend yields (Visscher & Filbeck, 2003).
2016 SAAA National Teaching and Learning and Regional Conference Proceedings
ISBN 978-0-620-74761-5
181
Efficient Market Hypothesis
Samuelson (1965) suggested that security price changes are completely independent of one
another, and therefore that security prices follow a “random walk.” The implication of this is
that future price changes should be impossible to predict, as they have no relationship with
the past. Eugene Fama (1965 & 1970) proposed that all security prices fully reflect all
available information in an efficient market, which gave birth to the “Efficient Market
Hypothesis” [EMH]. Fama described 3 forms of market efficiency - weak-form, semi-strong
form and strong form efficiency. Under this model investors are therefore only compensated
for the risk that they take on, and abnormal risk-adjusted returns are unattainable. Jensen
(1978) and Malkiel (2003) then went as far as to suggest that a trading strategy that
consistently produces positive risk-adjusted returns does not necessarily refute the EMH,
unless it does so after trading costs and throughout various different time periods. As value
investing relies on the fact that stock prices can deviate meaningfully from their intrinsic
values, it is in direct contradiction with the theory of EMH, particularly weak-form and semi-
strong form of market efficiency.
In their seminal study, however, De Bondt and Thaler (1985) investigated the presence of
the “Overreaction Theory” in equity markets. This theory suggests that investors regularly
overreact to both positive and adverse new company information, leading to inaccurate
market pricing, and therefore a degree of market inefficiency. A phenomenon called “Mean
Reversion” then occurs, as stock returns revert to a relevant mean return. De Bondt and
Thaler (1985) analysed the difference in the returns between 2 portfolios over the period
from 1926-1982 on the New York Stock Exchange [NYSE]. The first portfolio consisted of
the 35 stocks with the highest PE ratios on the market, known as the “winners” as their
prices had previously performed very well. The second, “loser,” portfolio represented the
bottom 35 PE stocks. Over the period of the study it was found that the loser portfolio, on
average, outperformed the winner portfolio by over 25% in a 3-year measurement period,
whilst also being significantly less risky. This provided conclusive evidence that the NYSE
was not an efficient market over the period of the study.
Chopra, Lakonishok, and Ritter (1992) reperformed this study on the same data set, whilst
adjusting for market risk and the size effect. It was found that the loser portfolios still
outperformed the winners by between 5% and 10% per year over the measurement period.
Cubbin et al (2006) then applied the methodology developed by De Bondt and Thaler to the
JSE over the period from 1983 to 2005. Again it was found that the loser portfolio
outperformed the winner portfolio by an average of 11% per year. This provided compelling
evidence that the JSE is not a perfectly informationally efficient market, and therefore that it
could be possible for a value investment strategy to attain excess risk-adjusted returns.
This being said, however, tests of market efficiency are inherently limited by a phenomenon
known as the “Joint Hypothesis Problem” (Fama & French, 1996). This is because an
equilibrium asset pricing model is used to calculate the expected returns that act as the
benchmark when testing market efficiency. As CAPM (Lintner, 1965; Mossin, 1966; Sharpe,
1964; Treynor, 1961) is often used as this asset pricing model, tests that seemingly refute
market efficiency can either present evidence of an inefficient market, or risk factors that are
not captured by CAPM. The outperformance of loser portfolios discussed above, could
therefore just be commensurate return for risk taken on that is not effectively measured by
2016 SAAA National Teaching and Learning and Regional Conference Proceedings
ISBN 978-0-620-74761-5
182
CAPM, and not evidence of market inefficiency. Fama and French (1996) indicate that the
size effect and market to book ratios capture the risks not captured by CAPM.
International Evidence
Basu (1977) studied the effectiveness of the PE ratio value screen on NYSE industrial
stocks over the period from 1957 to 1971. Basu created portfolios of high and low PE stocks,
and compared their returns to randomly constructed portfolios of equivalent risk, as
measured by CAPM. It was found that the low PE portfolios significantly outperformed the
randomly constructed portfolios, whilst the high PE portfolios were unable to outperform.
Basu considered this an invalidation of semi-strong form market efficiency, and termed it the
“value effect.”
In 1992, Fama and French conducted a study that tested the ability of a firm’s book/market
[BM] ratio to predict future stock returns. They tested NYSE and NASDAQ listed stocks over
the period from 1962 to 1989 and found that there was a significantly positive relationship
between BM ratios and stock returns. High BM ratios generally resulted in high future stock
returns, consistent with the value investing approach to selecting shares. Fama and French
(1992), however, contested that the higher returns attained were merely compensation for
holding riskier stocks, and that BM ratios captured risks not considered by CAPM. The
results of Lakonishok et al (1994), however, provide strong evidence against this assertion.
Lakonishok et al (1994) tested the same data set as the Fama and French study, finding that
the increased return on value stocks, as identified by high BM ratios, was not matched by a
commensurate increase in risk. Lakonishok et al. (1994) stated that the higher returns for
high BM shares were due to the behavioural biases of investors, who extrapolate past
performance too far into the future. This leads to high BM firms becoming under-priced,
creating opportunities to purchase shares below their intrinsic value.
In one of the more recent seminal value investing papers, Fama and French (1998) tested
the presence of the value premium in several global equity markets from 1975-1995. They
found evidence of such a value premium in 12 of the 13 major markets tested. Value
screens based on the BM ratio, earnings yield, cash flow yield and dividend yield were all
found to be significant. Importantly, this study also found a significant value premium in 16
emerging markets that were studied. South Africa, however, was not included in the
analysis.
South African Evidence
Prior to 2001, value investing had been a significantly neglected area of research in South
Africa, specifically given its extensive coverage internationally and its reputation as a
profitable investment strategy (M. Graham & Uliana, 2001). The first South African value
investing study was undertaken by Plaistowe and Knight in 1986 who found evidence that
the BM ratio significantly predicted returns on the JSE between 1973 and 1980.
Klerck and Maritz (1997) then tested the effectiveness of Benjamin Graham’s (1949) stock
selection criteria on industrial shares traded on the JSE, between 1977 and 1994. A “value
portfolio” was created, consisting of all stocks that met Graham’s PE, dividend yield and debt
screens. This portfolio significantly outperformed the market index, but was also found to be
riskier. Once risk-adjusted, however, the returns to Graham’s (1949) value investing strategy
2016 SAAA National Teaching and Learning and Regional Conference Proceedings
ISBN 978-0-620-74761-5
183
were still significantly greater than the market proxy, suggesting the increase in risk was not
commensurate to the extra return attained.
Graham and Uliana (2001) then tested the BM effect again, but only considered industrial
shares due to the differing definitions of BM in various JSE market sectors. No conclusive
evidence of a value premium was found, as high BM stocks failed to outperform low BM
stocks between 1987 and 1996. High BM stocks, however, were actually found to be less
risky, and outperformed on a risk-adjusted basis. This suggested that Fama and French’s
(1992) assertion that high BM stocks exhibited risk factors not captured by CAPM did not
necessarily hold for the JSE. Mutooni and Muller (2007) replicated this study, testing data
from 1986 to 2006. Again, significant evidence of the BM value effect was found, even after
adjusting for the size effect. This is backed-up by Basiewicz and Auret (2009) who found that
the BM effect even survived adjustments for transaction costs and thin trading on the JSE.
Rousseau and Van Rensburg (2003) tested the PE ratio value effect, comparing the returns
on a series of portfolios of the lowest PE industrial stocks on the JSE to portfolios of the
highest PE stocks. The low PE portfolios outperformed over all time periods tested between
1982 and 1998. Interestingly, it was found that the outperformance of the low PE portfolios
increased as the holding period of the portfolios increased; providing evidence that value
investing is a long-term strategy.
It can be seen that the body of research in South Africa finds overwhelming evidence of a
value premium on the JSE. Auret and Cline (2011), however, found no significant evidence
of the value effect between 1988 and 2006. Their study, however, considered all shares on
the JSE, whilst all previous studies had focused only on the industrials sector. This suggests
that the value effect previously found could be time-dependent (Malkiel, 2003) or not extend
to the entire body of JSE shares. This leaves scope for more research on the entire body of
JSE shares and the existence of the value effect in more recent times.
In addition to this, the landmark JSE value investing studies have mainly focused on the BM
and PE value screens, leaving the effectiveness of a dividend yield strategy relatively under-
researched. This gives weight to the need for this study, as it considers a dividend yield
investment strategy, over the entire body of JSE listed shares, during a recent time period.
Dividend Theories
Benjamin Graham’s (1949) screen for identifying value stocks based on a high dividend
yield, has become one of the most widely-accepted value investing screens in the
investment community (Visscher & Filbeck, 2003). Initially, Graham (1949) suggested that
value stocks were characterised by a dividend yield which is greater than two-thirds of the
AAA corporate bond yield (Damodaran, 2012). This is roughly analogous to the long-term
government bond yield, which in South Africa is currently 8.82%; meaning that value stocks
should have a dividend yield of greater than 5.88% (based on the R186 SA government
bond – 30/06/2016)(Bloomberg, 2016). As discussed, this screen is often relaxed in the
investment community, requiring stocks to have only a “high” dividend yield in order to
qualify as a value stock. For dividend yields to be an effective screen of value stocks,
however, there needs to be a relationship between dividends and intrinsic firm value, which
begs the question as to why this relationship exists (Fakir, 2013).

2016 SAAA National Teaching and Learning and Regional Conference Proceedings
ISBN 978-0-620-74761-5
184
In a 1961 study, Miller and Modigliani put forward their famous “Dividend Irrelevance
Theory.” This theory explained that dividends bore no relationship to firm value as they did
not impact on a firm’s earning potential, and that investors are therefore indifferent to the
levels of dividend pay-outs. This theory was created under the restrictive assumptions of no
transactions costs and taxes, perfect information, efficient equity markets, rational investor
behaviour and several more. These assumptions often break down in the real world. This
theory, however, is somewhat supported by Warren Buffett (2013) who argues that
dividends are irrelevant due to investors’ ability to create “synthetic dividends” by selling
shares, as and when their income needs arise. Black and Scholes (1974) added weight to
this dividend irrelevance argument. Black and Scholes found no evidence that differences in
dividend yields led to differences in stock returns, and it was therefore concluded that
dividend policy does not affect stock returns. According to this, dividend yields should
therefore have no power in forecasting future stock returns, and dividend yield strategies will
not allow the investor to attain abnormal risk-adjusted returns.
In contrast to this, Miller and Rock (1985) found significant evidence of the “Dividend
Signalling Theory.” This theory relaxes the assumption of perfect information, admitting that
there is an asymmetry of information between company managers and investors. As
managers hold far more information regarding the future prospects of the company, it is
thought that dividends are a signal of this information to the public. High (low) dividend levels
can therefore be thought of as optimistic (pessimistic) signals about the company’s future
earnings potential, which in turn should lead to stock price appreciation
(depreciation)(Erasmus, 2013).
The fact that dividends must be paid out of free cash flows is also an indicator of a
company’s underlying financial health and quality of earnings, although companies can and
do borrow at times in order to meet dividend requirements. Earnings are subject to
accounting manipulation, whilst dividends offer a more positive indication of a company’s
future cash generating ability (Tweedy Browne Company LLC, 2014). Higher dividend levels
can therefore indicate increased future cash flows, and increased valuations, allowing
investors to obtain abnormal risk-adjusted returns by investing in high dividend yielding
companies. In more recent times, companies have also increased share repurchases as a
way of distributing cash to its shareholders. However, this study focuses on dividend yields.
Whilst both dividend irrelevance and relevance theories have been discussed above, the
body of academic research strongly suggests that dividends are relevant to firm value, and
therefore that they can be used as a predictor of future stock returns. This literature is
discussed below.
Dividend Yield as a Value Investing Strategy
International Evidence
In their 1974 paper, Black and Scholes (1974) tested the ability of dividend yields to predict
future stock returns. The entire universe of stocks listed on the NYSE from 1947 to 1966 was
tested. Over the time period analysed, the returns on 25 portfolios of the highest dividend
yielding stocks on the exchange, were compared to those portfolios of the lowest dividend
yielding stocks. The high dividend yield portfolios did not significantly outperform the low
yield portfolios, either before or after adjustment for taxes. Black and Scholes therefore
2016 SAAA National Teaching and Learning and Regional Conference Proceedings
ISBN 978-0-620-74761-5
185
advised that dividend yields should be ignored when making investment decisions; and
suggested that investors should rather attempt to reduce risk through improving
diversification in order to attain improved risk-adjusted returns.
This study is partly supported by Fama and French (1988), which performed a regression of
dividend yields against stock returns, in order to measure their forecasting power. Consistent
with Black and Scholes, it was found that less than 5% of monthly and quarterly return
variation is explained by a stock’s dividend yield, as measured by the regression’s R2.
Contrary to this, however, dividend yields explain a significant portion of stock returns
(greater than 25%) when the return period is extended to between 2 and 4 years. This gives
evidence to the ability of a value investing strategy based on dividend yields to outperform a
market proxy. It also strongly supports the assertion of Rousseau and Van Rensburg (2003)
that value investing is a long-term strategy. A study by Litzenberger and Ramaswamy (1979)
found a “strong positive relationship between before-tax expected returns and the dividend
yields of common stocks” on the NYSE between 1952 and 1977.
In an influential paper in favour of the efficient market hypothesis, Fama and French (1996)
tested the existence of the value premium using several value screens, with equilibrium
returns being measured using the “Fama and French 3 Factor Model” instead of the CAPM.
The 3 factor model attempts to better capture asset risk, and calculates asset equilibrium
returns as a function of market risk (β), the small firm premium and the value premium (as
measured by the BM ratio). It was found that significant abnormal risk-adjusted returns could
no longer be attained using a dividend yield investment strategy. Fama and French therefore
argued that the dividend yield value effect is not an invalidation of the EMH, but rather is
evidence of investors attaining increased returns by taking on commensurate increased
levels of risk. This places some doubt on the effectiveness of a dividend yield strategy to
produce abnormal risk-adjusted returns.
In recent times, however, investing based on dividend yield strategies has continued to gain
momentum, and one of the most popular strategies has become known as “The Dogs of the
Dow” (Visscher & Filbeck, 2003). In terms of this strategy, the investor purchases the 10
highest dividend yielding stocks within a large-capitalisation index on an exchange at the
end of the calendar year. The portfolio is then held for a year, before rebalancing takes
place. Visscher & Filbeck (2003) studied the results of implementing this strategy on the
Canadian Toronto 35 index from 1987 to 1997. The results showed that the “dogs” strategy
outperformed the Toronto 35 index and the TSE 300 (market proxy) by a compound annual
return of 6.13% and 6.46%, respectively. In addition, this outperformance was statistically
significant, even after adjusting for taxes and transaction costs. Brzeszczynski and Gajdka
(2008) replicated this study for the Polish stock market, and Brzeszczynski, Archibald,
Brzeszczynska, and Gajdka (2008) tested dividend yield investing for the London Stock
Exchange. Again, these studies found that the “dogs” strategy significantly outperformed the
relevant market proxy, even after adjusting for taxes and transaction costs.
South African Evidence
In 2004, Hendrik Wolmarans decided to test a high dividend yield investing strategy for the
JSE (colourfully referred to as the “Dogs of the Dow” strategy) . Whilst several variations of
this strategy were also tested, it was shown that the original high dividend yield (“dogs”)
strategy managed to outperform the ALSI by an average annual rate of 9.8% from 1985-
2016 SAAA National Teaching and Learning and Regional Conference Proceedings
ISBN 978-0-620-74761-5
186
1998. This proved to be significant even after an adjustment for risk was made. In addition,
several variations of the “dogs” strategy, all based on high dividend yields, managed to
significantly outperform the ALSI on a risk adjusted basis. This gave strong evidence to the
effectiveness of high dividend yield strategies for the JSE.
The first study on the presence of the dividend yield value effect on the JSE, was conducted
by Fraser and Page (2000). This study sorted all industrial shares into 5 portfolios, by
dividend yield and BM ratios. The highest BM and dividend yield portfolio (value) was found
to outperform the lowest BM and dividend yield portfolio (growth) by approximately 8% per
annum from 1973 to 1997. The study also found that dividend yields could significantly
predict share returns on the JSE, although its predictive power was weaker than the BM
ratio.
Van Rensburg and Robertson (2003) applied a multiple regression methodology to
determine the capability of 24 company-specific fundamental factors to explain the average
monthly returns of that company over the period from 1990 to 2000. They found that
dividend yield was one of only 6 significant explanatory variables over this time period,
suggesting that dividend yields can significantly predict returns on the JSE. This study was
then replicated by Auret and Sinclaire (2006), including the BM ratio, which had previously
been ignored. It was found, however, that the BM ratio completely subsumed the dividend
yield effect when included in the regression analysis, making it a better predictor of future
stock returns. In a prior study, Van Rensburg (2001) had found that the earnings yield and
the dividend yield were both significant indicators of value.
Muller and Ward (2013) again tested for significant explanatory variables of equity returns,
but used an improved data set, from 1985 to 2011, including all shares listed on the JSE,
whereas previous studies had only focused on industrial shares. A graphical time-series
approach was used to test these variables. They formed 5 portfolios of 32 shares each,
based on each attribute and tracked each portfolio’s return over the measurement period. It
was found that the highest dividend yield portfolio outperformed the lowest dividend yield
portfolio by an average of 12.6% per annum, whilst also outperforming the ALSI total return
index by an average of 5.5% per annum. This study therefore found that a “dividend yield
style [effect] does exist” on the JSE.
Kruger and Toerien (2014), however, noted that the majority of these South African tests on
the value effect had been done during stable market conditions, and therefore tested to see
whether these anomalies were consistent over the sub-prime mortgage financial crisis of
2008. Their tests showed that the dividend effect failed to be significant over this crisis
period, and therefore that this effect may be time dependent. Despite all of the previous
literature that has shown significant evidence of the dividend value effect, it may not be an
invalidation of the EMH due to this time dependency, as this effect cannot be exploited to
attain abnormal risk-adjusted returns if it does not persist into the future (Malkiel, 2003).
These findings, however, are contradicted by the findings of Fakir (2013), who specifically
tested the performance of high dividend yield portfolios over a 9-year holding period,
beginning in 2004 and ending in 2012, and therefore including the financial crisis period.
Firstly, Fakir separated the 160 biggest shares on the JSE (based on market capitalisation)
into high and low dividend yield portfolios. Over the holding period, the high yield portfolio
2016 SAAA National Teaching and Learning and Regional Conference Proceedings
ISBN 978-0-620-74761-5
187
returned 1.78 times more than the low yield portfolio, although this was not found to be
statistically significant. In a second test, the returns on the 10 highest dividend yielding
stocks were compared to those of the JSE Top 40 Index (used as the market proxy). Here,
the top 10 stocks outperformed the market proxy by a statistically significant 1.45 times, after
the top 10 portfolio was adjusted for risk and taxes. This provided more strong evidence of
the potential that a value investment strategy, based solely on dividend yields, has on the
JSE.
A comprehensive study of value and momentum effects for the JSE was undertaken by Van
Heerden and Van Rensburg (2015) for the period 1994 to 2011 and this study included
price-to-earnings (P/E), price-to-book(P/B), price-to-cash flow (P/CF) and price-to-sales
(P/S), as well as dividend yield (D/Y), as value indicators. Van Heerden and Van Rensburg
(2015) found that value factors were found to be the most significant in explaining the cross
section of returns on the JSE. The cash flow to price ratio followed by the book value to
market ratio were found to best capture the value effect. In contrast to other studies (Cubbin
et al., 2006, Strugnell et al., 2011), the price earnings ratio was not found to be as
significant. Van Heerden and Van Rensburg tested two sub-periods, 1994 to 2002 and 2003
to 2011. Although the dividend yield was not significant for the first sub-period as well as the
whole period 1994-2011, the results for the second period of 2003-2011 indicate that
dividend yield was very close to being significant indictor of value (t-statistic of 1.999). The
latter period includes some overlap with the period analysed for this study, which was 2006-
2015.
Conclusions
Due to the results of several seminal studies that have focused on value investing
(Basiewicz & Auret, 2009; Fama & French, 1992 and 1998), it would be difficult to refute the
claim that value investing has historically been able to attain abnormal equity market returns,
both internationally and in the South African, emerging market context. This evidence also
suggests that the EMH may not hold, at least to some degree. The value premium often
survives adjustment for transaction costs, risk, taxes and has tended to persist over time
(Basiewicz & Auret, 2009). This means that it is difficult to argue that the EMH holds, even
by Jensen (1978) and Malkiel's (2003) definitions.
Globally, the literature appears to suggest that the most significant value investment screen
has been based on the book/market ratio (Auret & Sinclaire, 2006; Fama & French, 1998).
The evidence concerning the dividend yield screen is less convincing, especially within
South Africa. Many studies, however, have found evidence that implementing a high
dividend yield strategy has led to significant, risk-adjusted outperformance (Fakir, 2013;
Wolmarans, 2004). It is against the backdrop of this research literature that this study
evaluates dividend yield investing strategy on the JSE.
2016 SAAA National Teaching and Learning and Regional Conference Proceedings
ISBN 978-0-620-74761-5
188
3. Research Methodology
Research Question
The research question is as follows: Can an individual investor outperform the JSE market
(an investible proxy for the market) in the long run, after adjusting for risk, taxes and
transaction costs, by following a value investing strategy focused solely on investing in
shares with a high dividend yield?
Hypothesis
H0: The compound annual return on the high dividend yield portfolio ≤ the compound annual
return on the ALSI TRI, after appropriate adjustments
H1: The compound annual return on the high dividend yield portfolio > the compound annual
return on the ALSI TRI, after appropriate adjustments
In testing this hypothesis, this study has combined the methodologies employed by Fakir
(2013) and Muller & Ward (2013). This involves measuring cumulative returns and wealth
relatives and assuming the reinvestment of dividends.
A 10-year time period, starting on 1 January 2006 and ending on 31 December 2015, has
been selected. This is in accordance with the suggestions made by Rousseau and Van
Rensburg (2003) that value investing is a long-term strategy, and that outperformance tends
to improve as the investment period is increased. This time period also includes the financial
crisis; therefore allowing the opportunity to analyse the performance of a dividend yield value
investing strategy before, during and after a major financial crisis. This may offer evidence to
either help refute or strengthen any time-dependency argument, especially that put forth by
Kruger and Toerien (2014).
The value portfolio was made up of the 30 highest dividend-yielding stocks on the JSE, from
a pool of the 160 largest stocks, as measured by market capitalisation (“market cap”). The
study was limited to this group as they make up the All Share Index, representing roughly
99% of the JSE’s market cap. Shares that fall outside of this range also exhibit far greater
illiquidity (Muller & Ward, 2013), and data for these companies is far more difficult to come
by and often less precise. In addition, Real Estate Investment Trusts [REITs] were excluded
from the universe of JSE stocks. This is due to the fact that REITs are characterised by
unusually high dividend yields, as they are exempt from paying income taxes on earnings
that are immediately distributed to shareholders in South Africa. This means that, in the
case of REITs, high dividend yields are not necessarily an indicator of value.
In order to monitor long-term performance, this study did not follow a rebalancing strategy
each year. This is in line with the general premise that value investing is a long-term
strategy. Renowned value investors such as Walter Shloss and Seth Klarman have referred
to a holding period of 4 to 6 years.
The decision to include 30 companies in the value portfolio was based on the study done by
Bradfield and Kgomari (2004), which found that a minimum of 30 shares is required to
achieve diversification for the JSE, due to the effects of single-stock concentration on the
market.
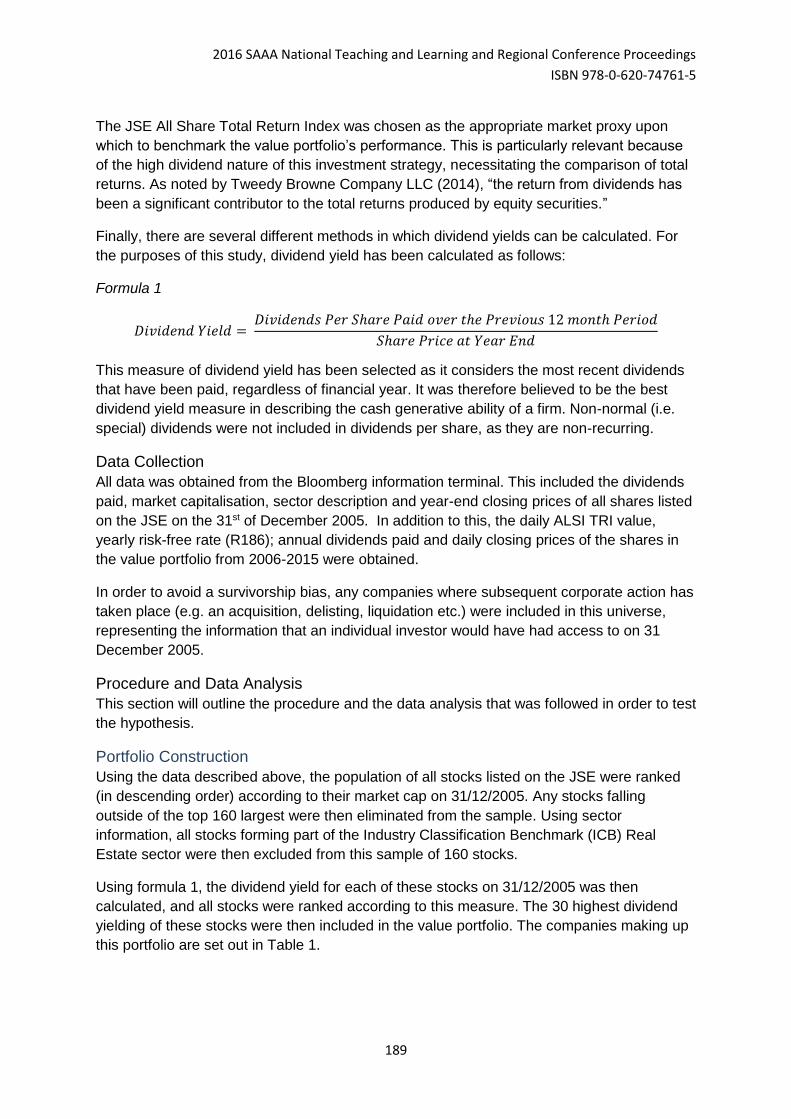
2016 SAAA National Teaching and Learning and Regional Conference Proceedings
ISBN 978-0-620-74761-5
189
The JSE All Share Total Return Index was chosen as the appropriate market proxy upon
which to benchmark the value portfolio’s performance. This is particularly relevant because
of the high dividend nature of this investment strategy, necessitating the comparison of total
returns. As noted by Tweedy Browne Company LLC (2014), “the return from dividends has
been a significant contributor to the total returns produced by equity securities.”
Finally, there are several different methods in which dividend yields can be calculated. For
the purposes of this study, dividend yield has been calculated as follows:
Formula 1
𝐷𝑖𝑣𝑖𝑑𝑒𝑛𝑑 𝑌𝑖𝑒𝑙𝑑 = 𝐷𝑖𝑣𝑖𝑑𝑒𝑛𝑑𝑠 𝑃𝑒𝑟 𝑆ℎ𝑎𝑟𝑒 𝑃𝑎𝑖𝑑 𝑜𝑣𝑒𝑟 𝑡ℎ𝑒 𝑃𝑟𝑒𝑣𝑖𝑜𝑢𝑠 12 𝑚𝑜𝑛𝑡ℎ 𝑃𝑒𝑟𝑖𝑜𝑑
𝑆ℎ𝑎𝑟𝑒 𝑃𝑟𝑖𝑐𝑒 𝑎𝑡 𝑌𝑒𝑎𝑟 𝐸𝑛𝑑
This measure of dividend yield has been selected as it considers the most recent dividends
that have been paid, regardless of financial year. It was therefore believed to be the best
dividend yield measure in describing the cash generative ability of a firm. Non-normal (i.e.
special) dividends were not included in dividends per share, as they are non-recurring.
Data Collection
All data was obtained from the Bloomberg information terminal. This included the dividends
paid, market capitalisation, sector description and year-end closing prices of all shares listed
on the JSE on the 31st of December 2005. In addition to this, the daily ALSI TRI value,
yearly risk-free rate (R186); annual dividends paid and daily closing prices of the shares in
the value portfolio from 2006-2015 were obtained.
In order to avoid a survivorship bias, any companies where subsequent corporate action has
taken place (e.g. an acquisition, delisting, liquidation etc.) were included in this universe,
representing the information that an individual investor would have had access to on 31
December 2005.
Procedure and Data Analysis
This section will outline the procedure and the data analysis that was followed in order to test
the hypothesis.
Portfolio Construction
Using the data described above, the population of all stocks listed on the JSE were ranked
(in descending order) according to their market cap on 31/12/2005. Any stocks falling
outside of the top 160 largest were then eliminated from the sample. Using sector
information, all stocks forming part of the Industry Classification Benchmark (ICB) Real
Estate sector were then excluded from this sample of 160 stocks.
Using formula 1, the dividend yield for each of these stocks on 31/12/2005 was then
calculated, and all stocks were ranked according to this measure. The 30 highest dividend
yielding of these stocks were then included in the value portfolio. The companies making up
this portfolio are set out in Table 1.
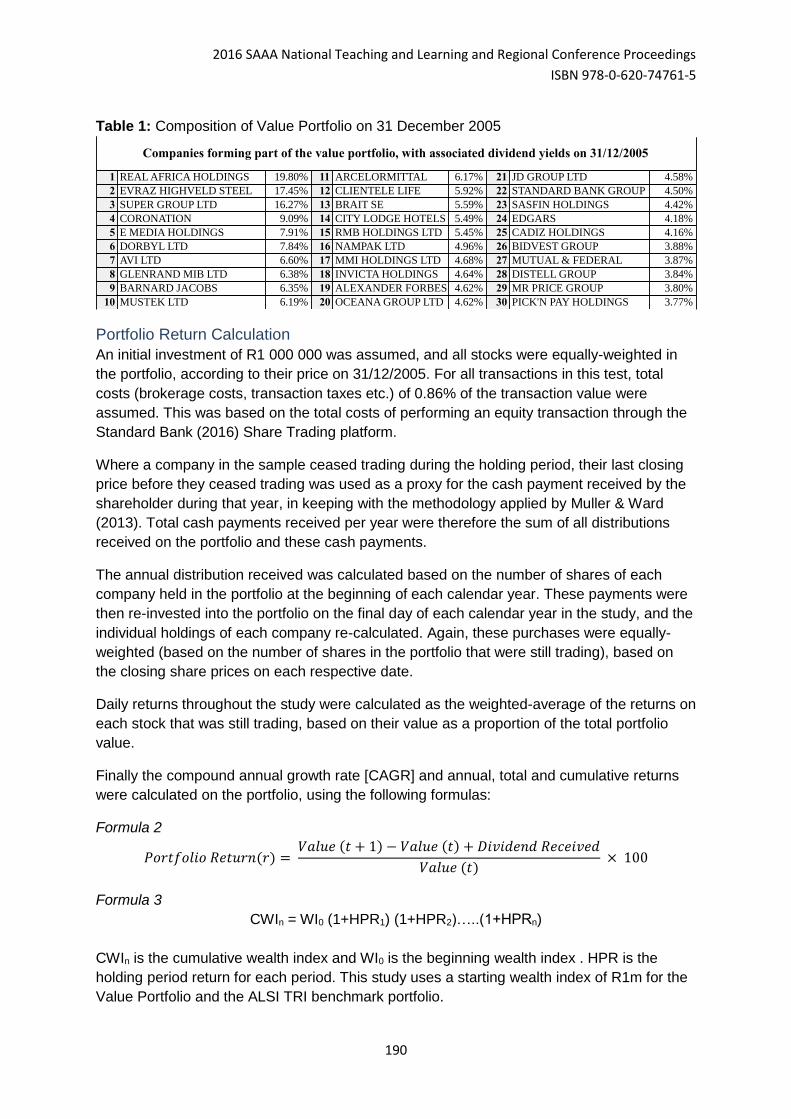
2016 SAAA National Teaching and Learning and Regional Conference Proceedings
ISBN 978-0-620-74761-5
190
Table 1: Composition of Value Portfolio on 31 December 2005
Portfolio Return Calculation
An initial investment of R1 000 000 was assumed, and all stocks were equally-weighted in
the portfolio, according to their price on 31/12/2005. For all transactions in this test, total
costs (brokerage costs, transaction taxes etc.) of 0.86% of the transaction value were
assumed. This was based on the total costs of performing an equity transaction through the
Standard Bank (2016) Share Trading platform.
Where a company in the sample ceased trading during the holding period, their last closing
price before they ceased trading was used as a proxy for the cash payment received by the
shareholder during that year, in keeping with the methodology applied by Muller & Ward
(2013). Total cash payments received per year were therefore the sum of all distributions
received on the portfolio and these cash payments.
The annual distribution received was calculated based on the number of shares of each
company held in the portfolio at the beginning of each calendar year. These payments were
then re-invested into the portfolio on the final day of each calendar year in the study, and the
individual holdings of each company re-calculated. Again, these purchases were equally-
weighted (based on the number of shares in the portfolio that were still trading), based on
the closing share prices on each respective date.
Daily returns throughout the study were calculated as the weighted-average of the returns on
each stock that was still trading, based on their value as a proportion of the total portfolio
value.
Finally the compound annual growth rate [CAGR] and annual, total and cumulative returns
were calculated on the portfolio, using the following formulas:
Formula 2
𝑃𝑜𝑟𝑡𝑓𝑜𝑙𝑖𝑜 𝑅𝑒𝑡𝑢𝑟𝑛(𝑟) = 𝑉𝑎𝑙𝑢𝑒 (𝑡 + 1) − 𝑉𝑎𝑙𝑢𝑒 (𝑡) + 𝐷𝑖𝑣𝑖𝑑𝑒𝑛𝑑 𝑅𝑒𝑐𝑒𝑖𝑣𝑒𝑑
𝑉𝑎𝑙𝑢𝑒 (𝑡) × 100
Formula 3
CWIn = WI0 (1+HPR1) (1+HPR2)…..(1+HPRn)
CWIn is the cumulative wealth index and WI0 is the beginning wealth index . HPR is the
holding period return for each period. This study uses a starting wealth index of R1m for the
Value Portfolio and the ALSI TRI benchmark portfolio.
1 REAL AFRICA HOLDINGS 19.80% 11 ARCELORMITTAL 6.17% 21 JD GROUP LTD 4.58%
2 EVRAZ HIGHVELD STEEL 17.45% 12 CLIENTELE LIFE 5.92% 22 STANDARD BANK GROUP 4.50%
3 SUPER GROUP LTD 16.27% 13 BRAIT SE 5.59% 23 SASFIN HOLDINGS 4.42%
4 CORONATION 9.09% 14 CITY LODGE HOTELS 5.49% 24 EDGARS 4.18%
5 E MEDIA HOLDINGS 7.91% 15 RMB HOLDINGS LTD 5.45% 25 CADIZ HOLDINGS 4.16%
6 DORBYL LTD 7.84% 16 NAMPAK LTD 4.96% 26 BIDVEST GROUP 3.88%
7 AVI LTD 6.60% 17 MMI HOLDINGS LTD 4.68% 27 MUTUAL & FEDERAL 3.87%
8 GLENRAND MIB LTD 6.38% 18 INVICTA HOLDINGS 4.64% 28 DISTELL GROUP 3.84%
9 BARNARD JACOBS 6.35% 19 ALEXANDER FORBES 4.62% 29 MR PRICE GROUP 3.80%
10 MUSTEK LTD 6.19% 20 OCEANA GROUP LTD 4.62% 30 PICK'N PAY HOLDINGS 3.77%
Companies forming part of the value portfolio, with associated dividend yields on 31/12/2005
2016 SAAA National Teaching and Learning and Regional Conference Proceedings
ISBN 978-0-620-74761-5
191
Formula 4
𝐶𝑜𝑚𝑝𝑜𝑢𝑛𝑑 𝐴𝑛𝑛𝑢𝑎𝑙 𝐺𝑟𝑜𝑤𝑡ℎ 𝑅𝑎𝑡𝑒 = ((𝐸𝑛𝑑 𝑉𝑎𝑙𝑢𝑒
𝐵𝑒𝑔𝑖𝑛𝑛𝑖𝑛𝑔 𝑉𝑎𝑙𝑢𝑒)
1𝑛
− 1) × 100
Portfolio Risk Calculation
Using the calculated daily portfolio returns, the daily standard deviations for each individual
year, and for the entire period of the study, were computed. The following formula was used:
Formula 5
𝑆𝑡𝑎𝑛𝑑𝑎𝑟𝑑 𝐷𝑒𝑣𝑖𝑎𝑡𝑖𝑜𝑛 (𝜎) = √∑(𝑥 − 𝜇)2
𝑛 − 1
These values were then converted to match their respective time periods using the following
formula:
Formula 6
𝑃𝑒𝑟𝑖𝑜𝑑 𝜎 = 𝐷𝑎𝑖𝑙𝑦 𝜎 × √𝑇𝑟𝑎𝑑𝑖𝑛𝑔 𝐷𝑎𝑦𝑠 𝑖𝑛 𝑃𝑒𝑟𝑖𝑜𝑑
Benchmark Return and Risk Calculation
Using the daily ALSI TRI values that were obtained, the CAGR and daily, annual, total and
cumulative returns were calculated on the benchmark for the period starting on 01/01/2006
and ending on 31/12/2015. This was done using formulas 2, 3 and 4. Using the calculated
daily benchmark returns, the daily standard deviations for each individual year, and for the
entire period of the study, were computed (formula 5).
Formula 6 was again used to convert these daily values to match their respective time
periods.
Calculation of Annual Sharpe Ratios
Annual and total portfolio and benchmark Sharpe ratios were also calculated using the
Sharpe Ratio, which measures a portfolio’s excess return in relation to a portfolio’s standard
deviation. This enables the determination of a risk-adjusted return and the Sharpe ratio has
become the standard measure of a portfolio’s return relative to its level of risk as indicated
by the volatility of returns.
Formula 7
𝑆ℎ𝑎𝑟𝑝𝑒 𝑅𝑎𝑡𝑖𝑜 =𝑅𝑃 − 𝑅𝑓
𝜎𝑝
This study also followed the graphical time-series approach used by Muller & Ward (2013),
so that the cumulative return index of each portfolio is plotted over the test period in order to
present a visual comparison between the two portfolios.
2016 SAAA National Teaching and Learning and Regional Conference Proceedings
ISBN 978-0-620-74761-5
192
Limitations of the Study
There are, however, several limitations associated with this study, which are set out below:
The results may be overly dependent on the starting date. In order to evaluate long-
term performance, the study measured the relative performances of a portfolio of high
dividend yield shares constructed on a single date and the ALSI TRI which may solve
one drawback of a rebalancing strategy by creating a disadvantage of an over-
dependence on the starting date29. It is submitted that the results of this study need to
be evaluated with the results of other studies on the use of high dividend yield
strategies.
The effects of both dividend tax and capital gains tax have been ignored. However,
these taxes would impact both the value portfolio and the benchmark portfolio. It may
be argued that the relative tax effects would probably not be material for the findings
of this study, particularly over the longer term.
The assumption that the final closing price of shares that ceased trading can be used
as a proxy for the payment received by shareholders may be unrealistic.
Dividends to determine the portfolio return was included on the final day of each year
and this may impact on relative volatilities for the portfolio in relation to the ALSI TRI
which includes dividends on each payment date.
The results of this study could have been impacted by factors other than just the
differences between dividend yields, which are not considered. This could have either
positively or negatively biased the relationship found between dividend yields and
future stock returns.
The inclusion of the financial crisis in the period studied may have introduced a bias to
the results, which therefore may mean that the dividend yield-stock return relationship
found may not be indicative of normal JSE conditions.
4. Results The results are firstly analysed in terms of the cumulative returns of the Value Portfolio in
relation to the ALSI TRI. Thereafter, the results are set out in terms of comparing the
compound annual returns, standard deviations and Sharpe ratios of the Value Portfolio as
compared to the ALSI TRI.
Figure 1 presents the cumulative returns of investing in the Value Portfolio in relation to
investing in the ALSI TRI over the period January 2006 to 31 December 2015. This simply
tracks the investment of R1m in either the Value Portfolio or the ALSI TRI on 1 January
2006, which factors in movements in share prices and the reinvestment of dividends.
The Value Portfolio of high dividend yield companies would have resulted in a final
cumulative total amount of R5.134m as compared to a final cumulative total amount of
R3.74m by investing in the ALSI TRI benchmark portfolio.
29 However, the portfolio of high dividend yield shares tracked the ALSI TRI closely for most of the period January 2006 to January 2012 (see Figure 1), which is suggestive that the results of this study are not overly dependent on the starting date.
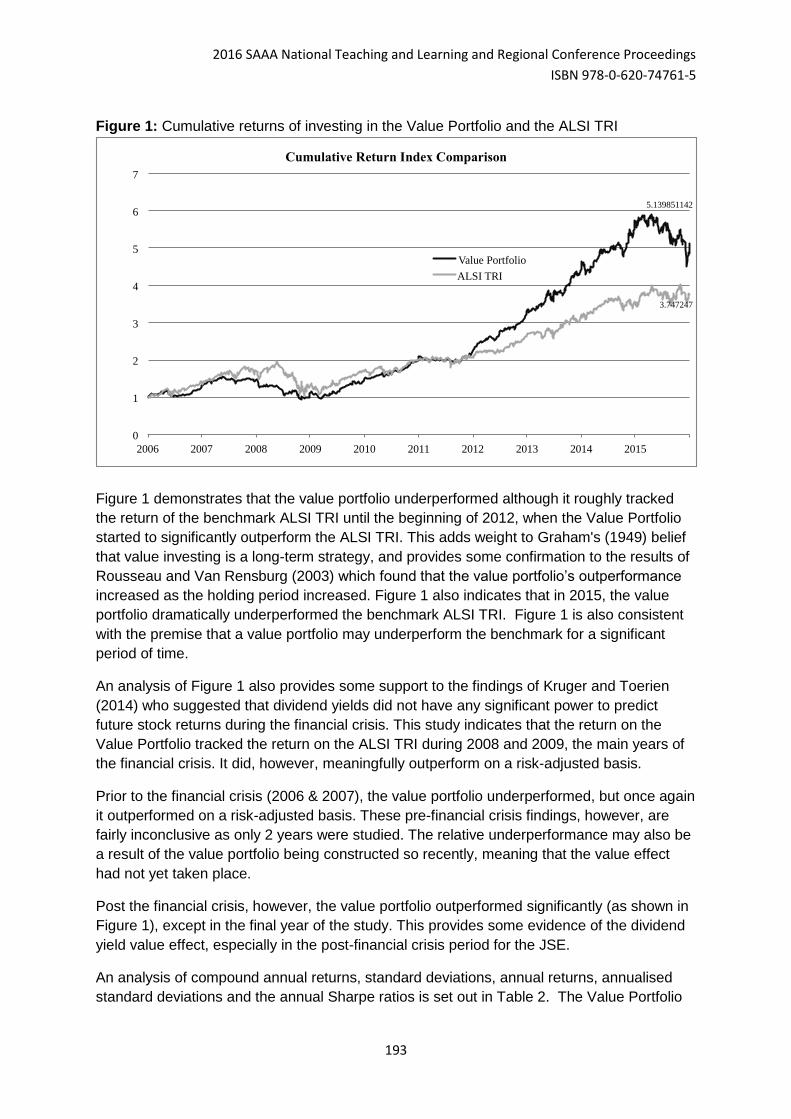
2016 SAAA National Teaching and Learning and Regional Conference Proceedings
ISBN 978-0-620-74761-5
193
Figure 1: Cumulative returns of investing in the Value Portfolio and the ALSI TRI
Figure 1 demonstrates that the value portfolio underperformed although it roughly tracked
the return of the benchmark ALSI TRI until the beginning of 2012, when the Value Portfolio
started to significantly outperform the ALSI TRI. This adds weight to Graham's (1949) belief
that value investing is a long-term strategy, and provides some confirmation to the results of
Rousseau and Van Rensburg (2003) which found that the value portfolio’s outperformance
increased as the holding period increased. Figure 1 also indicates that in 2015, the value
portfolio dramatically underperformed the benchmark ALSI TRI. Figure 1 is also consistent
with the premise that a value portfolio may underperform the benchmark for a significant
period of time.
An analysis of Figure 1 also provides some support to the findings of Kruger and Toerien
(2014) who suggested that dividend yields did not have any significant power to predict
future stock returns during the financial crisis. This study indicates that the return on the
Value Portfolio tracked the return on the ALSI TRI during 2008 and 2009, the main years of
the financial crisis. It did, however, meaningfully outperform on a risk-adjusted basis.
Prior to the financial crisis (2006 & 2007), the value portfolio underperformed, but once again
it outperformed on a risk-adjusted basis. These pre-financial crisis findings, however, are
fairly inconclusive as only 2 years were studied. The relative underperformance may also be
a result of the value portfolio being constructed so recently, meaning that the value effect
had not yet taken place.
Post the financial crisis, however, the value portfolio outperformed significantly (as shown in
Figure 1), except in the final year of the study. This provides some evidence of the dividend
yield value effect, especially in the post-financial crisis period for the JSE.
An analysis of compound annual returns, standard deviations, annual returns, annualised
standard deviations and the annual Sharpe ratios is set out in Table 2. The Value Portfolio
5.139851142
3.747247
0
1
2
3
4
5
6
7
2006 2007 2008 2009 2010 2011 2012 2013 2014 2015
Cumulative Return Index Comparison
Value Portfolio
ALSI TRI
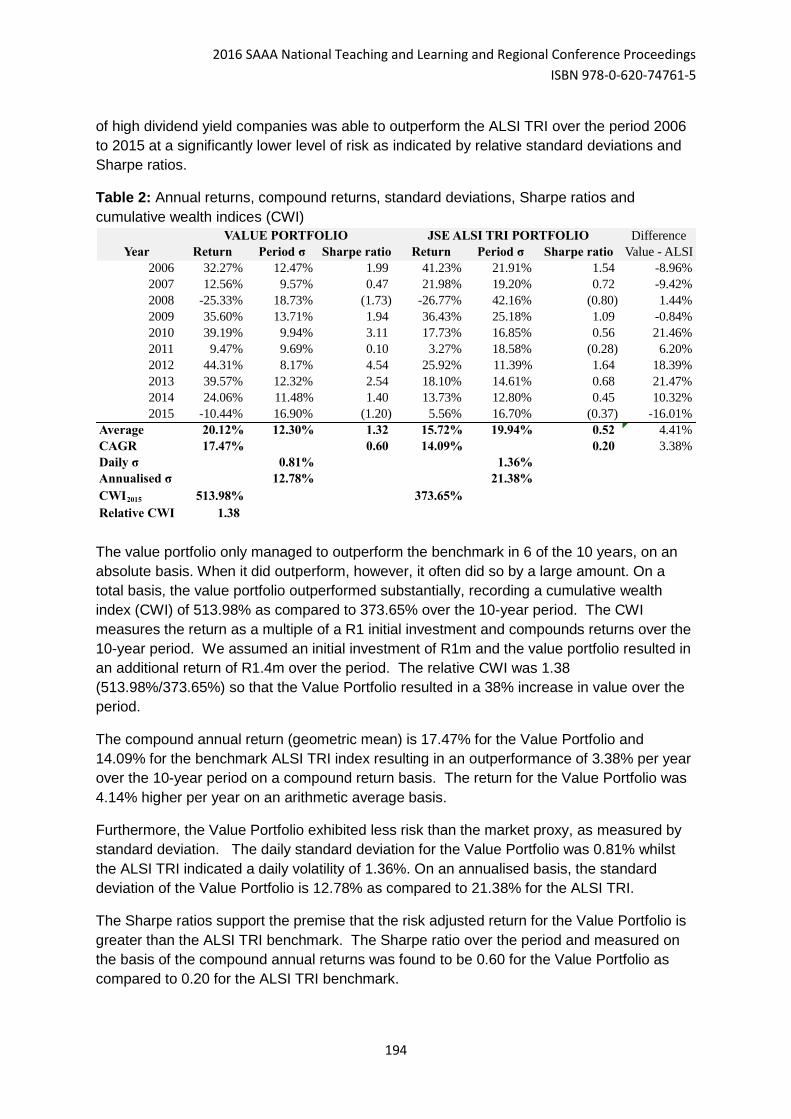
2016 SAAA National Teaching and Learning and Regional Conference Proceedings
ISBN 978-0-620-74761-5
194
of high dividend yield companies was able to outperform the ALSI TRI over the period 2006
to 2015 at a significantly lower level of risk as indicated by relative standard deviations and
Sharpe ratios.
Table 2: Annual returns, compound returns, standard deviations, Sharpe ratios and
cumulative wealth indices (CWI)
The value portfolio only managed to outperform the benchmark in 6 of the 10 years, on an
absolute basis. When it did outperform, however, it often did so by a large amount. On a
total basis, the value portfolio outperformed substantially, recording a cumulative wealth
index (CWI) of 513.98% as compared to 373.65% over the 10-year period. The CWI
measures the return as a multiple of a R1 initial investment and compounds returns over the
10-year period. We assumed an initial investment of R1m and the value portfolio resulted in
an additional return of R1.4m over the period. The relative CWI was 1.38
(513.98%/373.65%) so that the Value Portfolio resulted in a 38% increase in value over the
period.
The compound annual return (geometric mean) is 17.47% for the Value Portfolio and
14.09% for the benchmark ALSI TRI index resulting in an outperformance of 3.38% per year
over the 10-year period on a compound return basis. The return for the Value Portfolio was
4.14% higher per year on an arithmetic average basis.
Furthermore, the Value Portfolio exhibited less risk than the market proxy, as measured by
standard deviation. The daily standard deviation for the Value Portfolio was 0.81% whilst
the ALSI TRI indicated a daily volatility of 1.36%. On an annualised basis, the standard
deviation of the Value Portfolio is 12.78% as compared to 21.38% for the ALSI TRI.
The Sharpe ratios support the premise that the risk adjusted return for the Value Portfolio is
greater than the ALSI TRI benchmark. The Sharpe ratio over the period and measured on
the basis of the compound annual returns was found to be 0.60 for the Value Portfolio as
compared to 0.20 for the ALSI TRI benchmark.
Difference
Year Return Period σ Sharpe ratio Return Period σ Sharpe ratio Value - ALSI
2006 32.27% 12.47% 1.99 41.23% 21.91% 1.54 -8.96%
2007 12.56% 9.57% 0.47 21.98% 19.20% 0.72 -9.42%
2008 -25.33% 18.73% (1.73) -26.77% 42.16% (0.80) 1.44%
2009 35.60% 13.71% 1.94 36.43% 25.18% 1.09 -0.84%
2010 39.19% 9.94% 3.11 17.73% 16.85% 0.56 21.46%
2011 9.47% 9.69% 0.10 3.27% 18.58% (0.28) 6.20%
2012 44.31% 8.17% 4.54 25.92% 11.39% 1.64 18.39%
2013 39.57% 12.32% 2.54 18.10% 14.61% 0.68 21.47%
2014 24.06% 11.48% 1.40 13.73% 12.80% 0.45 10.32%
2015 -10.44% 16.90% (1.20) 5.56% 16.70% (0.37) -16.01%
Average 20.12% 12.30% 1.32 15.72% 19.94% 0.52 4.41%
CAGR 17.47% 0.60 14.09% 0.20 3.38%
Daily σ 0.81% 1.36%
Annualised σ 12.78% 21.38%
CWI2015 513.98% 373.65%
Relative CWI 1.38
VALUE PORTFOLIO JSE ALSI TRI PORTFOLIO

2016 SAAA National Teaching and Learning and Regional Conference Proceedings
ISBN 978-0-620-74761-5
195
The lower standard deviation is in direct contradiction of the suggestions made by Fama &
French (1992) that the increased returns offered by value portfolios are merely
compensation for taking on increased risk. It also supports the results of Graham and Uliana
(2001), who found that the value portfolio was less risky. Over the entire period, the
benchmark’s standard deviation was 1.67 times higher than that of the Value Portfolio.
The value portfolio managed to outperform in 7 of the 10 years, after an adjustment for risk,
as evidenced by its higher Sharpe ratios.
In order to obtain a visual impression of the relative volatilities and to obtain further
assurance in regard to the data, Figure 2 presents volatilities of the Value Portfolio and the
ALSI TRI by plotting the daily returns of the portfolio and the ALSI TRI benchmark.
Figure 2: Relative share returns of the Value Portfolio and the ALSI TRI
Figure 2 indicates that the volatilities of returns of the Value Portfolio, except in the period,
were dominated by the volatilities of the returns of the ALSI TRI. The higher returns for the
Value Portfolio was supported by a lower level of volatility of returns, Figure 2 is a visual
presentation of the daily returns that support the results set out in Table 2.
The maximum daily drawdown for the Value Portfolio was -5.92% over the period. In
contrast, the maximum daily drawdown for the ALSI TRI benchmark portfolio was -10.64%
Figure 3 presents the cumulative returns assuming a R1 investment in each share of the
Value Portfolio. The scale has been capped to a max 10x of the initial investment in order to
obtain a clearer depiction of the relative returns. In fact CML (Coronation Fund Managers)
managed to achieve a height of 20x the initial investment prior to falling back to 10x the
initial investment. The value portfolio is highly dependent on the performance of a few
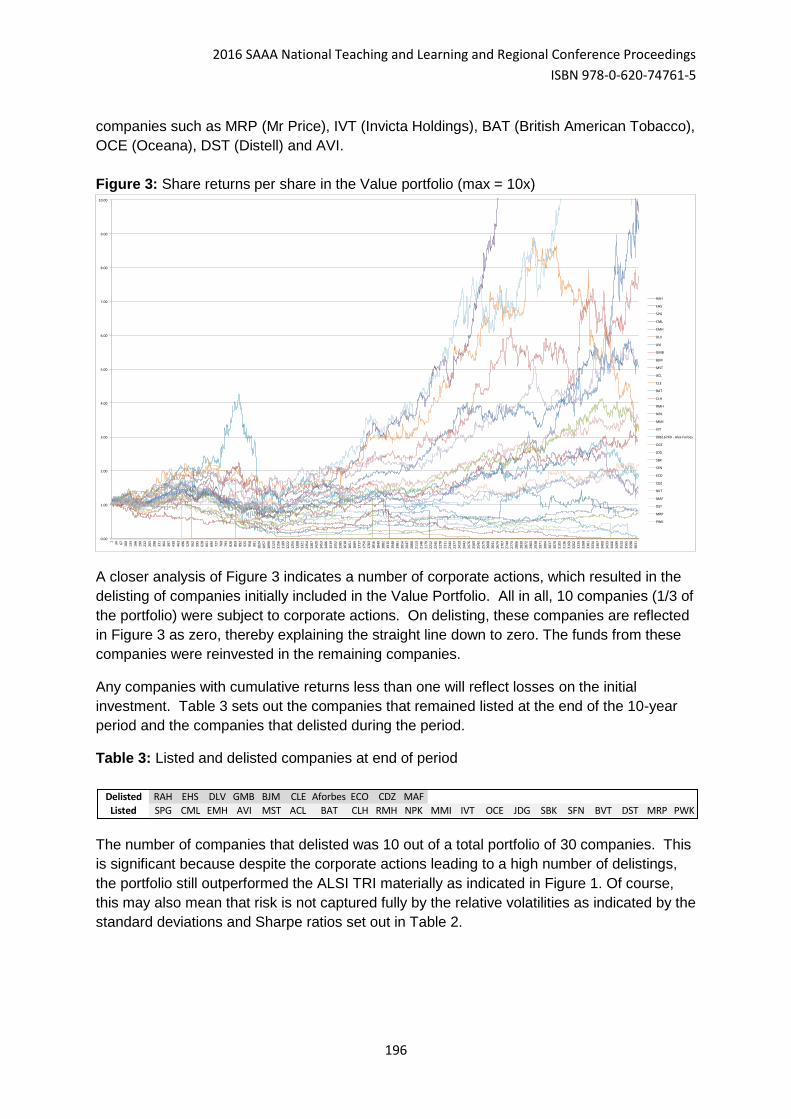
2016 SAAA National Teaching and Learning and Regional Conference Proceedings
ISBN 978-0-620-74761-5
196
companies such as MRP (Mr Price), IVT (Invicta Holdings), BAT (British American Tobacco),
OCE (Oceana), DST (Distell) and AVI.
Figure 3: Share returns per share in the Value portfolio (max = 10x)
A closer analysis of Figure 3 indicates a number of corporate actions, which resulted in the
delisting of companies initially included in the Value Portfolio. All in all, 10 companies (1/3 of
the portfolio) were subject to corporate actions. On delisting, these companies are reflected
in Figure 3 as zero, thereby explaining the straight line down to zero. The funds from these
companies were reinvested in the remaining companies.
Any companies with cumulative returns less than one will reflect losses on the initial
investment. Table 3 sets out the companies that remained listed at the end of the 10-year
period and the companies that delisted during the period.
Table 3: Listed and delisted companies at end of period
The number of companies that delisted was 10 out of a total portfolio of 30 companies. This
is significant because despite the corporate actions leading to a high number of delistings,
the portfolio still outperformed the ALSI TRI materially as indicated in Figure 1. Of course,
this may also mean that risk is not captured fully by the relative volatilities as indicated by the
standard deviations and Sharpe ratios set out in Table 2.
0.00
1.00
2.00
3.00
4.00
5.00
6.00
7.00
8.00
9.00
10.00
1
34
67
100
133
166
199
232
265
298
331
364
397
430
463
496
529
562
595
628
661
694
727
760
793
826
859
892
925
958
991
1024
1057
1090
1123
1156
1189
1222
1255
1288
1321
1354
1387
1420
1453
1486
1519
1552
1585
1618
1651
1684
1717
1750
1783
1816
1849
1882
1915
1948
1981
2014
2047
2080
2113
2146
2179
2212
2245
2278
2311
2344
2377
2410
2443
2476
2509
2542
2575
2608
2641
2674
2707
2740
2773
2806
2839
2872
2905
2938
2971
3004
3037
3070
3103
3136
3169
3202
3235
3268
3301
3334
3367
3400
3433
3466
3499
3532
3565
3598
3631
RAH
EHS
SPG
CML
EMH
DLV
AVI
GMB
BJM
MST
ACL
CLE
BAT
CLH
RMH
NPK
MMI
IVT
0861674D-AlexForbes
OCE
JDG
SBK
SFN
ECO
CDZ
BVT
MAF
DST
MRP
PWK
Delisted RAH EHS DLV GMB BJM CLE Aforbes ECO CDZ MAF
Listed SPG CML EMH AVI MST ACL BAT CLH RMH NPK MMI IVT OCE JDG SBK SFN BVT DST MRP PWK
2016 SAAA National Teaching and Learning and Regional Conference Proceedings
ISBN 978-0-620-74761-5
197
5. Conclusions
Summary and Implications
Graham and Dodd (1934), introduced the concept of value investing to the world in 1934.
Academic research has focused on the ability of value investing to earn abnormal risk-
adjusted returns, as well as measuring the effectiveness of various value screens. The
literature provides evidence both for and against the value effect - internationally, in the
emerging market context, and even on the JSE itself. The majority of research studies,
however, suggest that the value effect does exist, and that the most effective indicator of a
value stock is a high book/market ratio. There is, however, convincing literature to suggest
that the value effect persists when value stocks are screened on a dividend yield basis.
This study therefore sets out to test the effectiveness of the dividend yield value screen on
the JSE, where value investing, especially relating to dividend yields, is relatively less well
researched. It did so by testing the ability of a portfolio of high dividend yielding shares to
outperform the ALSI TRI, after adjusting for risk and transaction costs, over the most recent
10 calendar years. This time frame included a global financial crisis, therefore offering the
opportunity to also study the time-dependency of any dividend yield value effect.
The results showed that the high dividend yield (value) portfolio outperformed the chosen
benchmark by 1.38 times over the study period on the basis of the cumulative wealth index
and by 3.33% per year on an annual compound return basis. The value portfolio failed to
convincingly outperform its benchmark (on an absolute basis) before and during the financial
crisis. After risk adjustment, however, the value portfolio tended to outperform before, during
and after the crisis – giving evidence that it may not be time dependent.
Importantly, these findings present a possible further invalidation of the EMH, at least in its
semi-strong form. The higher returns of the Value Portfolio were matched by a significantly
lower risk as indicated by a lower standard deviation. As the dividend yield effect also
survived adjustment for risk, this study suggests that it is not just an indicator of risk factors
that are not captured by the CAPM (Fama & French, 1992). In addition to this, it appears to
not be time-dependent and may present a profitable trading strategy, even after adjustment
for transaction costs. This study therefore suggests that the JSE is not an efficient market ,
even by Jensen (1978) and Malkiel's (2003) definitions. Importantly, however, this study did
not consider taxes for either holding the benchmark or the Value Portfolio.
Fama & French (1992) suggest that the higher returns of following such value investing
strategies as investing in low market to book ratio companies is due to risk factors not
captured by CAPM. In contrast, Thaler & De Bondt (1985) are of the view that the higher
returns from value investing relate to behavioural factors (thereby implying that markets are
not efficient). The interesting aspect from the results of our study is that the higher returns of
the value portfolio are not matched by higher risks as indicated by the relative volatility of
returns. This may point to the latter behavioural explanation for the higher returns from
investing a portfolio of high dividend yield shares.
Most importantly, however, this study provides evidence that value investing, and more
specifically, a value investing strategy based solely on dividend yields, may work in the long
term on the JSE. Due to the simplicity of this investment strategy, it provides the opportunity
2016 SAAA National Teaching and Learning and Regional Conference Proceedings
ISBN 978-0-620-74761-5
198
for the individual investor to obtain abnormal risk-adjusted returns on the JSE. However,
the lower risk of the Value Portfolio may also be due to constraints in regard to the liquidity of
the underlying shares. As the study focused on daily returns, low levels of volatility for a few
companies may have resulted in a downward effect on the volatility of returns for the Value
Portfolio.
Opportunities for Further Research
Avenues for future research include studying the effects on taxes on relative returns.
Furthermore, the relative liquidities of individual listings should be evaluated. Although, this
may not be a major consideration for small investors, institutions will be highly affected by a
lack of relative liquidity. This study selected 30 high dividend yield companies at
31 December 2005 and tracked the performance of these shares over a period of 10 years.
It would be relevant to apply an annual rebalancing of the portfolio to evaluate whether this
may result in higher returns over the same period. Future research involving an out of
sample testing of a high dividend yield investing strategy would add further credence to the
results of this study. Although, the objective of this study was to evaluate performance over
the long-term of holding a portfolio of high dividend yield shares, future research studies
could include rolling periods over a few years and which require to hold each portfolio for a
period of 4 to 6 years.
References Auret, C., and Cline, R. (2011). Do the value, size and January effects exist on the JSE?
Investment Analysts Journal, (74), 29–37.
Auret, C. J., and Sinclaire, R. a. (2006). Book-to-market ratio and returns on the JSE.
Investment Analysts Journal, 35(63), 31–38.
Basiewicz, P. G., and Auret, C. J. (2009). Another look at the cross-section of average
returns on the JSE. Investment Analysts Journal, 38(69), 23–38.
Basu, S. (1977). Investment Performance of Common Stocks in Relation to Their Price-
Earnings Ratios : A Test of the Efficient Market Hypothesis. The Journal of Finance, 32(3),
663–682.
Black, F., and Scholes, M. (1974). The effects of dividend yield and dividend policy on
common stock prices and returns. Journal of Financial Economics, 1(1), 1–22.
Bloomberg. (2016). Bloomberg Data Terminal.
Bradfield, D., and Kgomari, W. (2004). Concentration - should we be mindful of it? Cadiz
financial strategists, Unpublished research report.
Brzeszczynski, J., Archibald, K., Brzeszczynska, J., and Gajdka, J. (2008). Dividend yield
strategy in the British stock market 1994-2007, (February 28, 2008), Available at SSRN:
http://dx.doi.org/10.2139/ssrn.1100623
Brzeszczynski, J., and Gajdka, J. (2008). Performance of high dividend yield investment
strategy on the Polish Stock Market 1997-2007. Investment Management and Financial
Innovations, 5(2), 86–92.
2016 SAAA National Teaching and Learning and Regional Conference Proceedings
ISBN 978-0-620-74761-5
199
Buffett, W. (2013). Berkshire Hathaway Annual Shareholder Letter. Berkshire Hathaway
Website, 3–24. Available: http://www.berkshirehathaway.com/letters/2013ltr.pdf
Chopra, N., Lakonishok, J., and Ritter, J. (1992). Measuring abnormal performance: Do
Stocks Overreact? Journal of Financial Economics, 31(2), 235–268.
Cubbin, E., Eidne, M., Firer, C., & Gilbert, E. (2006). Mean reversion on the JSE. Investment
Analysts Journal, 35(63), 39–48.
Damodaran, A. (2012). Investing for grown ups? Value Investing. New York University.
Available at SSRN: http://papers.ssrn.com/sol3/papers.cfm?abstract_id=2042657
De Bondt, W., and Thaler, R. (1985). Does the Stock Market Overreact? The Journal of
Finance, 40(3), 793–805.
Erasmus, N. (2013). Dividend Yield Investment Strategies in the South African Stock Market.
Wits Institutional Repository Environment. University of the Witwatersrand. Available:
http://wiredspace.wits.ac.za/bitstream/handle/10539/13073/Nelmarie Erasmus
691106.pdf?sequence=1
Fakir, R. (2013). Dividend yield as a superior investment strategy. University of Pretoria,
Gordon Institute of Business Science, Unpublished MBA dissertation, Available:
http://www.repository.up.ac.za/dspace/bitstream/handle/2263/40563/Fakir_Dividend_2013.p
df?sequence=1
Fama, E. (1965). The Behavior of Stock-Market Prices. The Journal of Business, 38(1), 34–
105.
Fama, E. (1970). Efficient Capital Markets: A Review of Theory and Empirical Work. The
Journal of Finance, 25(2), 383–417.
Fama, E. F., and French, K. (1998). Value Versus Growth: The International Evidence. The
Journal of Finance, 53(6), 1975–1999.
Fama, E. F., and French, K. R. (1988). Dividend yields and expected stock returns. Journal
of Financial Economics, 22(1), 3–25.
Fama, E., and French, K. (1992). The Cross-Section of Expected Stock Returns. The
Journal of Finance, 47(2), 427–465.
Fama, E., & French, K. (1996). Multifactor Explanations of Asset Pricing Anomolies. The
Journal of Finance, 51(1), 55–84.
Fraser, E., and Page, M. (2000). Value and Momentum Strategies: Evidence from the
Johannesburg Stock Exchange. Investment Analysts Journal, 51, 25-35.
Graham, B. (1949). The Intelligent Investor. Harper (First Edit). Harper & Brothers.
2016 SAAA National Teaching and Learning and Regional Conference Proceedings
ISBN 978-0-620-74761-5
200
Graham, B., and Dodd, D. L. (1934). Security Analysis, 2nd ed., McGraw-Hill.
Graham, M., and Uliana, E. (2001). Evidence of a Value-Growth Phenomenon on the
Johannesburg Stock Exchange. Investment Analysts Journal, 53, 1–11.
Jensen, M. C. (1978). Some anomalous evidence regarding market efficiency. Journal of
Financial Economics, 6(2-3), 95–101.
Klerck, W., and Maritz, A. (1997). A Test of Graham’s Stock Selection Criteria on Industrial
Shares Traded on the JSE. Investment Analysts Journal, 45, 25–33.
Kruger, R., and Toerien, F. (2014). The Consistency of Equity Style Anomalies on the JSE
during a Period of Market Crisis. The African Finance Journal, 16(1), 1–18.
Lakonishok, J., Shleifer, A., and Vishny, R. (1994). Contrarion Investment, Extrapolation,
and Risk. The Journal of Finance, 49(5), 1541–1578.
Lintner, J. (1965). The Valuation of Risk Assets and the Selection of Risky Investments in
Stock Portfolios and Capital Budgets. The Review of Economics and Statistics, 47(1), 13–
37.
Litzenberger, R. H., and Ramaswamy, K. (1979). The effect of personal taxes and dividends
on capital asset prices. Theory and empirical evidence. Journal of Financial Economics,
7(2), 163–195.
Malkiel, B. G. (2003). The Efficient Market Hypothesis and Its Critics. Journal of Economic
Perspectives, 17(1), 59–82.
Mcqueen, G., Shields, K., and Thorley, S. R. (1997). Does the “Dow-10 Investment Strategy”
Beat the Dow Statistically and Economically? Financial Analysts Journal, 53(4), 66–72.
Miller, M., and Modigliani, F. (1961). Dividend Policy, Growth, and the Valuation of Shares.
The Journal of Business, 34(4), 411–433.
Miller, M., and Rock, K. (1985). Dividend Policy under Asymmetric Information. The Journal
of Finance, 40(4), 1031–1051.
Mossin, J. (1966). Equilibrium in a Capital Asset Market. Mossin, 34(4), 768–783.
Muller, C., and Ward, M. (2013). Style-based effects on the Johannesburg Stock Exchange:
A graphical time-series approach. Investment Analysts Journal, 77, 1–16.
Mutooni, R., and Muller, C. (2007). Equity Style Timing. Investment Analysts Journal, 65,
15–24.
Plaistowe, T., and Knight, R. (1986). Premium to Book Value may be a contrary indicator.
Investment Analysts Journal, 28, 35–39.
Rousseau, R., and Van Rensburg, P. (2003). Time and the payoff to value investing. Journal
of Asset Management, 4(5), 318–325.
Samuelson, P. (1965). Proof that properly anticipated prices fluctuate randomly. Industrial
2016 SAAA National Teaching and Learning and Regional Conference Proceedings
ISBN 978-0-620-74761-5
201
Management Review, 6(2), 41–49.
Sharpe, W. (1964). Capital Asset Prices: A Theory of Market Equilibrium under Conditions of
Risk. The Journal of Finance, 19(3), 425–442.
Sharpe, W. (1966). Mutual Fund Performance. The Journal of Business, 39(1), 119–138.
Standard Bank. (2016). Standard Bank Online Share Trading. Available:
https://securities.standardbank.co.za/ost/
Strugnell, D., Gilbert, E. and Kruger, R. (2011) Beta, size and value effects on the JSE,
1994-2007. The Investment Analyst Journal, 74, 1-17.
Treynor, J. (1961). Market Value, Time and Risk. Unpublished Manuscript, 95–209.
Available at SSRN: http://dx.doi/10.2139/ssrn.2600356
Tweedy Browne Company LLC. (2014). The High Dividend Yield Return Advantage: An
Examination of Empirical Data Associating Investment in High Dividend Yield Securities with
Attractive Returns Over Long Measurement Periods. Investment Report. Available:
http://www.independentinvestor.info/PDF-Downloads/HOW-TO-INVEST-RETURNS-
INDEXES-02/doc.1457- Tweedy Browne 2003 Dividend investing studies.pdf
Van Heerden, J.D., and Van Rensburg, P., (2015) The cross-section of Johannesburg
Securities Exchange listed equity returns (1994-2011), Studies in Economics and Finance,
32(4), 422-444
Van Rensburg P. 2001. A decomposition of style-based risks on the JSE. Investment
Analysts Journal, 54, 45–60.
Van Rensburg, P., and Robertson, M. (2003). Style Characteristics and the Cross-Section of
JSE Returns. Investment Analysts Journal, 57, 7–15.
Visscher, S., and Filbeck, G. (2003). Dividend-Yield Strategies in the Canadian Stock
Market. Financial Analysts Journal, 59(1), 99–106.
Wolmarans, H. (2004). “Dow Investing” possibilities for the small investor: Evidence from
South Africa. Investment Management and Financial Innovations, 1(3), 40–50.
2016 SAAA National Teaching and Learning and Regional Conference Proceedings
ISBN 978-0-620-74761-5
202
2016 Southern African Accounting
Association (SAAA)
National Teaching and Learning and
Regional Conference Proceedings
ISBN number: 978-0-620-74761-5
MAF 05: The Fight Against Poverty:
Review of the Applicability of the Grameen Bank Model in
South Africa
James McWha
University of Cape Town, South Africa
Gizelle Willows (corresponding author)
University of Cape Town, South Africa
Email: [email protected]
ABSTRACT
This paper reviews the Grameen Bank model by looking at its implementation in Bangladesh
and the key success factors in its alleviation of poverty. The analysis reveals that well trained
staff, a group-based lending program and no need for collateral were contributing success
factors of the model. The practicality of replicating the model is reviewed, with specific focus
on South Africa. The results show that the spirit of Ubuntu and the practices of stokvels in
South Africa have similar characteristics to those that are employed in the Grameen Bank
model. The paper concludes by suggesting that the model be further considered for possible
implementation in South Africa to assist alleviating poverty.
2016 SAAA National Teaching and Learning and Regional Conference Proceedings
ISBN 978-0-620-74761-5
203
1. INTRODUCTION
The existence of poverty in society suggests that there are challenges to eradicate it and in
South Africa this is noticeably true. With slow economic growth as well as high unemployment
and poverty levels, South Africa needs a sustainable solution to combat poverty and empower
the poor. However, without employment opportunities the poor must find other sources of
income to raise themselves out of poverty such as entrepreneurship, social grants or other
expensive forms of credit from moneylenders. Traditionally, the cost of credit available to the
poor is so high that it often keeps them trapped in poverty (Yunus et al. 2010). Social grants
place a burden on the government and taxpayers especially, if the percentage of the
population that lives in poverty is high. Following from this it would seem that sustainable
income-earning structures require an initial financial investment that is likely to be beyond the
financial capabilities of people living in poverty.
Severe poverty in Bangladesh is what led the Grameen Bank, founded by Professor
Muhammad Yunus, to develop a model that seeks to eradicate poverty. This paper seeks to
identify the factors that contributed to the success of this model followed by an analysis of
successful replications in other countries in an attempt to determine whether the Grameen
Bank model could practically be applied to combat poverty in South Africa.
Section two provides a background of the Grameen Bank and its operations. Section three
explains the success factors identified within Bangladesh. Section four discusses other
instances in which the model was replicated and section five deals with the practicality of the
Grameen Bank model in South Africa. This final section assesses the South African culture of
Ubuntu and the use of stokvels, and gives a brief analyses of the already available system of
microfinance in order to provide practical recommendations on the applicability of the
Grameen Bank model in South Africa.
2. BACKGROUND
The Grameen Bank initially started as a research project of Professor Muhammad Yunus in
Chittagong, Bangladesh in 1976 in which he sought to test whether poor people were
creditworthy for small unsecured loans (Dowla 2006). Professor Yunus tested the hypothesis
that providing the poor with affordable financial assistance would create productive
employment without the assistance of an external party (Sarker 2001). After seven years of
experimentation, with assistance from the Nationalised Commercial Banks and eventually
becoming a project of the Central Bank of Bangladesh, the Grameen Bank was formally
established in 1983 as a specialised bank with its own licence to deal exclusively with the poor
(Dowla 2006).
The objective of the Grameen Bank is to provide microloans to the poor who are defined as
individuals that own assets to the value of less than half an acre of cultivatable land (Dowla
2006). The poor are unable to access affordable credit from conventional banks as they have
no credit histories, do not have any collateral to offer or cannot fill out the required paperwork
owing to high illiteracy rates (Yunus et al. 2010). By providing the necessary capital, the
Grameen Bank created the opportunity for entrepreneurs to start businesses that buy and sell
goods on the free market allowing them to generate income to repay the loan and use the
excess to pay daily living expenses (Hulme 2008). The Grameen Bank offers loans averaging
US$100 and in 2006 the Grameen Bank was jointly awarded a Nobel Peace Prize along with

2016 SAAA National Teaching and Learning and Regional Conference Proceedings
ISBN 978-0-620-74761-5
204
its founder Professor Yunus “for their efforts to create social and economic development” using
an inclusive approach at the lowest income bracket of the economy (Nobelprize.org 2015) in
Bangladesh and abroad in other replications of the model.
Sarker (2001) described the organisational structure used by the Grameen Bank to comprise
several levels in the form of a hierarchy. At the top level is the head office in Dhaka, which
supervises the organisation as a whole and makes the broad general management decisions.
The next level comprises the zone offices, which form the pinnacle of the field operations.
Zone offices supervise, monitor and audit around 10 to 15 area offices each which are
themselves responsible for monitoring and coordinating 10 to 15 branches each. The
branches oversee and coordinate around 120 to 150 centres in 15 to 22 villages. Each centre
hosts an average of 8 groups and provides a meeting space for training and weekly payment
collections (Sarker 2001).
The Grameen Bank currently provides four interest-bearing loans including an income-
generating (general) loan at 20%, a housing loan at 8%, a student loan at 5% and a struggling
member loan (or beggar loan) at 0% per annum (Grameen Bank 2015b). The struggling
member program is intended to provide beggars on the streets with capital to purchase items
to sell, gradually teaching them entrepreneurial skills while encouraging them to join a
Grameen Bank centre (Hulme 2008).
Members are also required to pay a once-off deposit of about 5% of the initial loan amount
into a group fund. This deposit, known as a group tax, serves to provide finance to the
Grameen Bank for general operations and to the group members in case of any emergency.
This deposit is not recoverable from the Grameen Bank when members discontinue the
banking services. The Grameen Bank never writes off any loans but rather chooses to
restructure the terms to meet the needs of the individual at risk of defaulting (Hussain et al.
2001).
The Grameen Bank also embraces the social business model devised by Professor Yunus of
“a self-sustaining company that sells goods or services and repays its owners’ investments,
but whose primary purpose is to serve society and improve the lot of the poor” (Yunus et al.,
2010, p.309). It is through these social businesses that the Grameen Bank ideology is
implemented and the model for micro-financing is used to create tailored and area-specific
solutions to the financing needs for the poor. Examples of social businesses include
partnerships such as Grameen Phone, Grameen Veolia and Grameen Danone.
As of April 2015, the Grameen Bank has cumulatively disbursed around US$17 million of
which US$15.5 million has been repaid, a repayment rate of over 98% since inception. Total
membership during April 2015 amounted to 8,673,233 members of which 96% are women
(Grameen Bank 2015a).
3. KEY SUCCESS FACTORS
A number of critical success factors have been identified in the literature, namely: 1) the group-
based lending approach, 2) not requiring collateral, 3) well trained and incentivised staff, and
4) the relationships between the key role players in the organisation (Boysen & Sahlberg,
2008). This section will explain and analyse each success factor.
2016 SAAA National Teaching and Learning and Regional Conference Proceedings
ISBN 978-0-620-74761-5
205
3.1 Group-based lending
The first and most common of the success factors identified is the group-based lending
approach. Members are required to form groups of five people on average with no relatives or
people from the same household being permitted to join the same group (Sarker 2001).
Groups are male or female only.
The Grameen Bank provides the group with training in literacy, entrepreneurial skills and
finance and initially only provides loans to two of the members. After an observation period of
6-8 weeks two more members receive loans. Whilst not formally jointly liable for the loans,
members are allowed to assist the other members of their group if they are unable to make
repayments. This forms a collective responsibility amongst the members of the group for
individual loans.
The Grameen Bank did implement a policy of not furthering additional credit to any individual
member if they were members of a group with a defaulting member. Whilst this policy
succeeded in creating collective responsibility, it is not implemented in practice (Boysen &
Sahlberg 2008). Because members assumed a mutual accountability for the loans, they were
careful when screening group partners as they were under the impression that defaulters could
potentially spoil opportunities for the rest of the members (Hussain et al. 2001).
The group-based approach therefore forms a key component of the Grameen Bank model as
it increases the efficiency of the Grameen Bank’s delivery system by maximising contact
between the bank and the members. This increased level of contact also places the Grameen
Bank in a unique position to make use of a cost-effective monitoring tool that provides the
bank with an in-depth knowledge of their members and facilitates preventative steps to
mitigate the risk of default (Boysen & Sahlberg, 2008). The shared group dynamic also assists
the Grameen Bank in encouraging meaningful participation from the members.
3.2 No collateral
In order to mitigate the risk of unsecured lending, the Grameen Bank instituted less
conventional means of security with the group-based lending approach. The group-based
lending system replaced physical capital with social collateral, such as peer pressure and peer
monitoring (Dowla 2006). Not requiring collateral is an important feature of the Grameen Bank
model because its aim is to assist those stuck in poverty who, by virtue of their circumstances,
are not able to better their living standards and do not have any material possessions to offer
as security for a loan.
3.3 Staff are well trained and incentivised
The staff members of the Grameen Bank are well trained, patriotic and highly motivated. They
played a key role in furthering the social agenda of the bank. The importance of well-trained,
highly motivated, dedicated and loyal staff is apparent for any type of business. However, it is
particularly important for the operation of the Grameen Bank model, as often staff members
will be performing hard work in remote and very poor locations whilst receiving little
compensation. The nature of the work that the Grameen Bank model aims to perform is not
likely to result in the ability to compensate staff with high salaries, which emphasises the
importance of the staff believing in the goals of the Grameen Bank model. Therefore, carefully
designed incentive systems and other forms of motivation such as recognition for the work

2016 SAAA National Teaching and Learning and Regional Conference Proceedings
ISBN 978-0-620-74761-5
206
performed by the staff forms a crucial part of maintaining a strong workforce. The Grameen
Bank has demonstrated that this level of commitment is attainable.
A well designed incentive system contributed towards employees actively promoting the
Grameen Bank and its services (Mamun 2012). At the start of their employment, staff are
informed of the importance of “hard work, staying in the rural areas, honesty, and sincerity”
(Sarker, 2001, p.11). Sarker (2001) described how applicants underwent an extensive on-site
training programme after which only those applicants that were truly committed to the purpose
of the Grameen Bank obtained employment. This commitment translated into a highly
motivated, reliable and hard-working workforce to which the Grameen Bank owes much of its
success (Sarker 2001).
The Grameen Bank typically hires young graduates who had not yet grown accustomed to the
traditional banking practices followed by older employees (Hulme & Moore 2006). A lack of
alternative employment opportunities may potentially contribute to the young employees
adopting a more risk-averse and loyal behaviour towards the Grameen Bank with the
additional benefit of dissuading any potential corruption. Hiring young graduates also assisted
the Grameen Bank in sustaining their practice of challenging the conventional wisdom of
banking entrenched in older bankers by replacing it with innovative thinking from the graduates
(Sarker 2001).
Furthermore, Sarker (2001) noted that the staff motivation was maintained through informal
rewards such as recognition of work, pride in the social objectives of the Grameen Bank,
international recognition (such as the Nobel Peace Prize) and a sense of belonging or identity.
3.4 Relationships
The relationships between the various stakeholders and the Grameen Bank can be split into
three main categories namely: member-to-member, bank-to-member and bank-to-staff.
Member-to-member relationships are formed because members are part of the same group
or social programmes and share a common identity as a Grameen Bank participant. Group
interaction and networking provides members with opportunities and knowledge that may not
have been available otherwise, which also adds to the value derived from joining the Grameen
family (Boysen & Sahlberg, 2008).
Bank-to-member relations form the cornerstone of the Grameen Bank’s culture and strategy.
This relationship focuses on an in-depth knowledge of the members that is achieved through
maintaining close relationships throughout the loan period. The relationship between the
group and the centre is crucial in ensuring assigned tasks are carried out as needed (Sarker
2001). The Grameen Bank focuses solely on their members and their needs to form a
relationship with its members based on trust, whilst encouraging each party to fulfil their
obligations (Dowla 2006).
Lastly, the bank-to-staff relationship is cultivated from the onset of the extensive training
program undergone by staff applicants mentioned earlier. The Grameen Bank instils a great
sense of pride amongst Grameen Bank employees as well as a genuine care for the poor,
partly as a result of the intense training program, but also due to the moral boost from global
recognition of the bank’s work (Dowla 2006).
The social relationship element of the Grameen Bank model can therefore be seen as a crucial
element in winning the loyalty and participation of as many stakeholders as possible in the
2016 SAAA National Teaching and Learning and Regional Conference Proceedings
ISBN 978-0-620-74761-5
207
fight against poverty. With this high level of involvement the Grameen Bank model can reach
far beyond the confines of its membership to improve the lives of non-member or potentially
even entire communities.
4. REPLICATIONS ACROSS THE WORLD
Numerous countries including Australia, the United States of America (USA) as well as
countries in Europe, Asia, Africa and South America, have applied the Grameen Bank model
with varying levels of success. A brief summary of some of these applications is as follows:
In Norway, success was found in using the Grameen Bank model with the Norwegian
Women Network Bank. The Norwegian Women Bank first started in the Lofoten fishing
industry and now has over 200 members (Grameen Bank 2015b).
In India, CASHPOR, a “network of Asia-Pacific Grameen replications” (Hussain et al.,
2001, p.35), successfully implemented the Grameen model as a network institution.
CASHPOR’s main objective is to teach the necessary skills required to replicate the
model on a large scale throughout Asia in a financially viable manner.
In China, the Funding the Poor Cooperative (FPC) was the first microfinance institution.
Launched by the Rural Development Institute (RDI) of the Chinese Academy of Social
Sciences (CASS) it now operates as a non-governmental organization servicing 16
000 active borrowers using the Grameen Bank model, and achieving a 95% repayment
rate using the Grameen Bank model (Hussain et al., 2001) .
These replications show that the Grameen Bank model can be successfully applied in different
countries regardless of their socio-cultural differences.
Whilst the model could be successfully applied in Europe, it would not be without obstacles.
One barrier in western culture is individualism which conflicts with the operation of a peer
group lending system (Hussain et al. 2001). This is supported by the findings of Gould (2010)
who described the difference between a collectivist and an individualist society. In a collectivist
society “the group's welfare is part of an individual member's self-identify and reputation within
his or her community” (Gould, 2010, p.4) and the individual’s mindset is that the well-being of
the group supersedes personal interests (Gould 2010). Individualists are more solitary in their
pursuit to satisfy personal needs. Individualists may be more opposed to cooperation in the
group setting and are more likely to strictly guard financial information. This distinction is
important when attempting to replicate the model in a western culture as the model was
developed in a collectivist society (Gould 2010).
In the USA, the first attempt for the Grameen Bank model was in Arkansas in the late 1980’s
(Gould 2010). In an attempt to recreate the social ties necessary for the group-based system,
a six-week training program was enforced and participants were split into groups. However,
this level of familiarity was insufficient and the bank was unable to achieve a repayment rate
higher than 70 percent owing to a lack of ‘social cohesion’ (Gould 2010). Gould (2010)
concluded that while the model might not have been the most appropriate for micro-lending in
the USA it could still be utilized after making adjustments to the underlying cultural basis of
the model.
Notwithstanding, Grameen America (2015) has subsequently been successfully implemented.
Grameen America (2015) uses the group-based approach and assists members in setting up
businesses such as hair salons, pet grooming, cleaning services, food carts and flower shops.
2016 SAAA National Teaching and Learning and Regional Conference Proceedings
ISBN 978-0-620-74761-5
208
In the 2013 financial year, 26 300 members were granted loans in seven cities creating just
under 57 000 jobs. The financial information provided by Grameen America (2015) indicates
that the majority of income generated is from grants and donations. However, program income
(the income generated from the interest charged on loans) has been steadily increasing from
11.5% of total expenses in 2010 to 24% in 2013 showing increasing sustainability of the
organization (Grameen America 2015).
5. PRACTICABILITY OF THE GRAMEEN BANK MODEL IN
SOUTH AFRICA
As of July 2015, little research has been performed on organisations using the Grameen Bank
model in African countries, with the exception of the Grameen Foundation that operates
predominantly in Northern Africa. South Africa is an example of a country that could potentially
benefit from the use of the Grameen Bank model and it is the aim of this section to determine
whether implementation would be feasible.
Compared to Bangladesh (population of 159 million people), South Africa is a smaller country
with a population of 54 million people (Statistics South Africa 2015). Both countries have high
levels of poverty with 31.5% of Bangladesh’s and 53.8% of South Africa’s population living
below the poverty line (The World Bank 2015).
With a Gini coefficient of 6530, income distribution inequality in South Africa is amongst the
highest in the world. This equates to around 53.8% of the country’s wealth being in the hands
of the top (richest) 10% of the population and only 1.1% of the wealth in the bottom (poorest)
10% of the population (Kiersz 2014). Furthermore, the official unemployment rate in South
Africa, using the broad economic definition, is at 35.8% (Business Tech 2015). This rate is
significantly higher than 4.3% in Bangladesh (Trading Economics 2015).
A lack of employment opportunities and poor income distribution has been a cause for major
strife in South Africa, resulting in numerous labour strikes that severely impact local industry.
Added to this is the high level of crime and corruption in South Africa. There is a need for a
suitable and sustainable model that can assist the creation of jobs to alleviate poverty. As of
July 2015, there is little economic and financial support available to the poorest people in
South Africa from the formal financial institutions. As such the poor must turn to alternative
self-help sources of finance for survival. An example of this is a stokvel (Moliea 2007).
The Grameen Bank model has shown to assist various countries in combatting poverty to
some extent. Certain factors, such as Ubuntu and stokvels, and the similarities they share with
the Grameen Bank model as it is applied in Bangladesh, indicate that the model could be
successfully implemented in South Africa. This section will proceed by explaining and
discussing each factor in turn and conclude on the practicality of adopting a similar approach
in South Africa to that of the Grameen Bank. Furthermore, a brief financial analysis will be
performed to assess whether the performance of the Grameen Bank in Bangladesh, when
compared to banks in South Africa, indicates that the Grameen Bank model will be
commercially viable.
30 The Gini coefficient is a statistical economic measure that illustrates the equality of the distribution of income
in a country. A zero coefficient indicates that perfect equality in income distribution exists and vice versa.
Therefore, a Gini coefficient of 65 indicates that South Africa’s income is poorly distributed.
2016 SAAA National Teaching and Learning and Regional Conference Proceedings
ISBN 978-0-620-74761-5
209
5.1 Ubuntu
For any organisation wanting to commence operations in a foreign country, the local tradition
and culture should inform the policy and procedures of that organisation to allow for a
sustainable practice to be established. Ubuntu is said to underlie the ethical and moral
principles of the majority of indigenous African cultures (Gade 2012). A sound understanding
of Ubuntu would therefore seem crucial to any business operating in South Africa.
When asking the question ‘What is Ubuntu?’ Gade (2012) found two potential definitions,
namely: 1) “the moral quality of a person” and 2) “a phenomenon according to which persons
are interconnected” (Gade, 2012, p.487). For this paper the second definition will be focused
on for the purposes of informing the discussion, although, it is important to note that Ubuntu
potentially influences behaviour on both a personal level and a community level.
Mangaliso (2001) discussed using Ubuntu from a management perspective to build a
sustainable competitive advantage and noted the following about the various aspects of
Ubuntu:
Relationships with others: A symbiotic relationship exists among members of a
community that is driven by a strong sense of interdependence and a suppression of
self-interest. This places a strong emphasis on synergistic teamwork and the
understanding that people working together in a team can accomplish more than if
they had been working as individuals. The phrase ‘umuntu ngumuntu ngabantu’
(roughly translated as ‘a person is a person is a person through others’) (Gade 2012)
emphasises the importance of relationships amongst members of a community as it is
through these relationships that African people identify themselves.
Communication: Under Ubuntu the social aspect of communication is emphasised.
Unity and understanding as well as forming and reinforcing relationships are regarded
more important than the efficiency of communication.
Decision Making: In contrast to the Western approach to decision-making, which is
very linear, under Ubuntu the process is more circular. Strong emphasis is placed on
ensuring that all voices are heard and the decision with the most support is chosen
even if it may not be the most rational or correct choice.
A society that embraces Ubuntu can be interpreted to represent a collectivist society. Aspects
of the Grameen Bank model can therefore be interpreted to closely resemble the key aspects
of Ubuntu. The group-based lending approach would facilitate social interaction between the
members and provide a platform from which meaningful communication could take place
between the prospective bank and its members. Trust and solid relationships are important
aspects of both Ubuntu and the Grameen Bank Model. Similarly, if the members were to own
a portion of the bank that would be sufficient to allow control, the members could ensure that
decisions are made according to the views and needs of the members themselves, much as
is done in Bangladesh. It could therefore be suggested that Ubuntu and the Grameen Bank
model would complement each other if adopted by an organisation in South Africa.
5.2 Stokvels
There is already a practice adopted by the poor in South Africa that shares some
characteristics with the Grameen Bank model. This practice, locally known as stokvels, is
2016 SAAA National Teaching and Learning and Regional Conference Proceedings
ISBN 978-0-620-74761-5
210
strongly underpinned by the principles of Ubuntu and to some extent caters to the financial
needs of the poor in South Africa (Verhoef 2001) but without the Grameen poverty lifting vision.
A stokvel is an informal voluntary saving organisation in which members of a community will
band together and agree to contribute a fixed amount into a fund that can be used for various
purposes. The stokvels in South Africa are most commonly used for subsistence purposes
such as funding day-to-day living expenditure or large events (Verhoef 2008) rather than as a
source of finance for microenterprise, which is more common in other countries and is
practiced by foreign nationals in South Africa (Arko-Achemfuor 2012).
Stokvels exist partially because the poor do not have access to credit or other banking services
from formal banking institutions because they cannot provide collateral or establish a credit
history due to irregular income patterns (Moliea 2007). While access to credit is an important
factor influencing individuals to join a stokvel it is not the only reason, as other incentives to
join exist that are, in some cases, seen as more important. The literature identified the
following incentives to join a stokvel:
Members of stokvels are forced to save a fixed amount on a regular basis. It was noted
that individuals find it easier to default on their obligations with formal institutions, as
the repercussions are seen as less severe than those they would face if they defaulted
on a stokvel payment. High levels of peer pressure, through economic and social
sanction, result in very low default rates. Members see this in a positive light, as they
had no choice but to save for their future (Verhoef 2008).
Perhaps among the most important incentives to join are social in nature. Stokvels
provide members with a chance to expand social connections, exchange business
ideas and survival strategies, or obtain advice from fellow members (Moliea 2007).
For women, membership in a stokvel provides them with a certain level of status and
support. Women in South Africa are most commonly in charge of maintaining the
household with limited income while their husbands are either away working or not
seen as reliable. Stokvels provide them a means with which they can support their
families and improve their households (Verhoef 2001).
Many individuals, especially those that are illiterate, find the formal financial institutions
impersonal and intimidating. Stokvels offer a form of savings that the members are
better able to understand and relate to as they are receiving money from people in
their community that they know and trust and in turn will contribute to assist those
people in the future (Verhoef 2001).
Hosting stokvel gatherings (social occasions at which contributions are collected and
pay-outs made) provides the host with an income earning opportunity through the sale
of food and refreshments or by charging a nominal entrance fee. Hosting opportunities
are rotated between members, or even non-members (Verhoef 2001).
Stokvels offer access to credit without the need for collateral or a credit history as they
are based on trust between members that are already familiar with each other. An
individual seeking to join a stokvel is to some extent screened to ensure that they are
trustworthy and an upstanding member of the community (Moliea 2007).
While stokvels and the Grameen Bank model do have rather different aims, one to cope with
poverty, the other to get people out of poverty, the two models do share many similar features.
The group system and peer pressure is common to both as well as the emphasis on building
2016 SAAA National Teaching and Learning and Regional Conference Proceedings
ISBN 978-0-620-74761-5
211
solid relationships. Physical collateral is not required and membership and lending is based
on trust. However the Grameen Bank model provides members with training and advice that,
along with the regular meetings and a sense of unity with the bank, could potentially align with
the social incentives that increase stokvel membership. This social interaction may also assist
the potential organisation in overcoming the impersonal and intimidating perception given off
by other financial institutions. Lastly, the practice of forced saving observed in stokvels is
similar to the savings required by the Grameen Bank model on a weekly basis.
A key point to note is that stokvels in South Africa focus primarily on funding subsistence
expenditure whereas the Grameen Bank model focuses on providing capital to establish
microenterprises. This key difference shows that there is a large gap between funding
subsistence expenditure and traditional financial capital streams (most of which are
inaccessible to the poor) that the Grameen Bank model could fill.
Next, microfinance in South Africa will be discussed to assess whether any existing financial
institutions are providing services that may bridge the gap and whether the Grameen Bank
model would be able to sustainably operate in the South African low-income market.
5.3 Microfinance in South Africa
Commercial banks have acknowledged the importance of stokvels in South Africa by offering
special accounts to facilitate the safekeeping of stokvel funds, offer multiple signatory rights
and good returns on the invested funds but do not formalise the stokvels themselves (First
National Bank 2015). Furthermore, there are few programs or products provided by the formal
banking sector that are similar to stokvels. The most similar product available to the poor takes
the form of microfinance which is described as the provision of savings and credit to low-
income individuals on a small scale that is targeted at improving the well-being of the poor
(Moliea 2007).
While the intentions of microfinance institutions (MFIs) are similar to those of stokvels and the
Grameen Bank model in that they aim to provide credit to low income earners, certain
challenges exist that may prevent typical commercial microfinance providers from attaining
success. Moliea (2007) noted one such challenge is that microfinance organisations are
argued to be unsustainable without the aid of donations or subsidies. This concern for
sustainability arises from the tendency of poor individuals to use the financing for subsistence
expenditure rather than on forming income-earning structures to repay the loans, which makes
it difficult for the banks to establish reliable revenue streams.
Another issue raised is that MFIs often exist to offer a product rather than focus on the
requirements of the customers. This results in MFIs “offering highly standardised products to
a market which is perceived homogenous, but which in reality is highly variable in its
constituency” (Moliea, 2007, p.15). Other challenges such as a lack of collateral, the high cost
of setting up branches in remote locations and high risk also restrict the ability of MFIs to cater
for the poor from a commercial standpoint.
Many aspects of the challenges faced by traditional microfinance providers are similar to those
that shaped the Grameen Bank model. The organisational structure of the Grameen Bank
allows it to access remote locations at relatively low costs and the lack of collateral and high
risk is compensated for by social capital created through group based lending and peer
pressure. The Grameen Bank model was also developed with the needs of the poor in mind
2016 SAAA National Teaching and Learning and Regional Conference Proceedings
ISBN 978-0-620-74761-5
212
resulting in operations and services offered being designed to achieve a specific purpose
rather than to sell a product.
Capitec Bank (Capitec) is an example of a South African bank that has attempted to access
the lower-income target market through microfinance and has achieved a relatively high level
of success quickly grounding itself as one of the major banks in South Africa’s well-established
banking industry. This success could be attributed to Capitec adopting an approach that
focuses foremost on the needs of their target market rather than on establishing an acceptable
risk profile through effective internal controls. This resulted in simplified financial products,
such as microloans or savings accounts, that the poor are better able to understand and a
relative ease of use of these products (McNulty 2009). Capitec provides the closest and most
appropriate comparison of an institution that caters to a similar target market to that of the
Grameen Bank model.
The analysis of Ubuntu, stokvels and microfinance in South Africa above suggests that the
Grameen Bank model has a high chance of being implemented successfully. The Grameen
Bank model fits in with the cultural elements of Ubuntu and closely resembles the
characteristics of stokvels, but has clearer poverty alleviation goals and might better benefit
South African society if it can be successfully introduced. Microfinance institutions in South
Africa are not able to access a large portion of the low-income bracket and as such there is a
large gap in the market in which an organisation adopting the Grameen Bank model can
operate and expand. Therefore, it would appear that it would be feasible to adopt the Grameen
Bank model in South Africa.
6. CONCLUSION AND RECOMMENDATIONS
Poverty is a vicious cycle of “low income, low savings, low investment and low income”
(Sarker, 2001, p.5). Without access to credit and other financial support the people stuck in
poverty have very few options at their disposal with regards to improving their standard of
living or even for basic survival. In South Africa, unemployment and poverty levels are high
resulting in an increased strain on the taxpaying population.
This paper has found that the Grameen Bank model is a powerful tool for alleviating poverty
in many environments, including both developing and developed countries. The key success
factors of the Grameen Bank model identified from the application in Bangladesh are
sufficiently similar to the culture of Ubuntu and the incentives that individuals have to join
stokvels in South Africa that it is likely that the Grameen Bank model will be able to garner
support and acceptance with the poor South Africans. If the Grameen Bank model were to be
replicated in South Africa the findings of this paper suggest that it will provide an innovative
solution that can be utilised to reduce poverty. Following from this, the Grameen Bank model
can focus on providing the capital for establishing income-earning structures and would
therefore not compete with the service provided by stokvels that primarily focuses on funding
subsistence expenditure.
Further research by means of interviewing and holding panel discussions with relevant
stakeholders is recommended in an attempt to further understand the relevant limitations for
implementation. Further, financial ratio analysis of the financial results of the Grameen Bank
and comparison against Capitec Bank would provide further insight into capital adequacy,
interest margins and relevant costs to income.
2016 SAAA National Teaching and Learning and Regional Conference Proceedings
ISBN 978-0-620-74761-5
213
BIBLIOGRAPHY
Arko-Achemfuor, A., 2012. Financing Small, Medium and Micro-Enterprises (SMMEs) in
Rural South Africa: An exploratory study of stokvels in the Nailed Local Municipality,
North West Province. Journal of Social Anthropology, 3(2), pp.127–133.
Boysen, V. & Sahlberg, R., 2008. The Key Success Factors of Grameen Bank - A Case
Study of Strategic, Cultural and Structural Aspects. Lund University.
Business Tech, 2015. The Real Employment Rate in South Africa.
Dowla, A., 2006. In credit we trust: Building social capital by Grameen Bank in Bangladesh.
Journal of Socio-Economics, 35(1), pp.102–122.
First National Bank, 2015. First National Bank stokvel account.
Gade, C.B.N., 2012. What is Ubuntu ? Different Interpretations among South Africans of
African Descent. South African Journal of Philosophy, 31(3), pp.484–502.
Gould, C., 2010. Grameencredit: One solution for poverty, but maybe not in every country.
UCLA Pacific Basin Law Journal, (c), pp.1–26.
Grameen America, 2015. Grameen America.
Grameen Bank, 2015a. Grameen Bank,
Grameen Bank, 2015b. Interest Rate.
Hulme, D., 2008. From Subsidised Microcredit to Market-based Microfinance November
2008 BWPI Working Paper 60. , (November), pp.1–11.
Hulme, D. & Moore, K., 2006. Why has microfinance been a policy success in Bangladesh
(and beyond)? , p.29.
Hussain, M.M., Maskooki, K. & Gunasekaran, A., 2001. Implications of Grameen banking
system in Europe: prospects and prosperity. European Business Review, 13(1), pp.26–
42.
Kiersz, A., 2014. Here Are The Most Unequal Countries in The World. Business Insider.
Mangaliso, M. P. (2001). Building Competitive Advantage from Ubuntu: Management
Lessons from South Africa. Academy of Management Executive, 15(3), 23–33.
http://doi.org/10.5465/AME.2001.5229453
Mamun, C.A. Al, 2012. Assessing the Factors that Led to the Success of Microfinance in
Bangladesh : A Case Study on Grameen Bank. World Review of Business Research,
2(2), pp.75–90.
2016 SAAA National Teaching and Learning and Regional Conference Proceedings
ISBN 978-0-620-74761-5
214
McNulty, A., 2009. Behind Capitec’s Successful Model. Leader.co.za.
Moliea, H., 2007. Stokvels as Alternative Microfinance Institutions : Conversations with
Women from Venda. University of Pretoria.
Nobelprize.org, 2015. Grameen Bank - Facts.
Sarker, A.E., 2001. The secrets of success: the Grameen Bank experience in Bangladesh.
Labour and Management in Development Journal, 2(1).
Simpson, S.D., 2015. The Banking System: Commercial Banking - Key Ratios/Factors.
Investopedia.
Statistics South Africa, 2015. Mid-year Population Estimates,
The World Bank, 2015. World Bank Data.
Trading Economics, 2015. Bangladesh Unemployment Rate.
Verhoef, G., 2001. Informal Financial Service Institutions for Survival : African Women and
Stokvels in Urban South Africa. Oxford University Press, 2(2), pp.259–296.
Verhoef, G., 2008. Social Capital in Voluntary Savings Organisations in South Africa in
Historical Perspective. University of Johannesburg.
Yunus, M., Moingeon, B. & Lehmann-Ortega, L., 2010. Building social business models:
Lessons from the grameen experience. Long Range Planning, 43(2-3), pp.308–325.
2016 SAAA National Teaching and Learning and Regional Conference Proceedings
ISBN 978-0-620-74761-5
215
2016 Southern African Accounting
Association (SAAA)
National Teaching and Learning and
Regional Conference Proceedings
ISBN number: 978-0-620-74761-5
MAF 07: An investigation of the factors to consider for a
free higher education system in South Africa
Mzikazi Ntintelo & Ilse Lubbe (College of Accounting, University of Cape Town)
Contact: [email protected]
Abstract
South Africa has been at an uproar since the student protests of October 2015 over the
proposed higher education fee increases. The result of which was a 0% fee increment in 2016.
Much speculation within the economy has been around how the government fiscus is going to
cater for the 0% fee increment and going forward, whether the country can afford free higher
education. The overarching issue concerning the goal of increasing higher education
participation is that the cost of higher education continues to increase and the funding thereof
is limited, placing a barrier on those who qualify for higher education opportunities but cannot
afford it.
Against this background, the treasury has allocated an increased amount in its 2016/17 budget
to the Department of Higher Education and Training (DHET). The equitable allocation of a
limited budget to the different spheres of government based on the valid needs of the citizens
of the country remains a challenge. Some argue that the provision of higher education is not
necessarily the role and responsibility of government, and that the necessity for basic
education requires a higher budget allocation. Further, the concept of free higher education
will compromise the quality of the education provided and come at a cost of depriving other
areas of service delivery. This raises the question whether free higher education is affordable
and feasible, and if so, at what cost?
This study describes the considerations for free higher education in similar developing
economies, such as African countries. The South African budget allocation to higher
education is then compared over a period of six years, followed by an analyses of a student’s
cost for studying, and comparing that to the funding that is potentially made available to a
student in need. A case is made that the government is already contributing a large amount
to higher education (in the form of subsidies to universities) as well as funding through the
NSFAS. However, alternative options need to be identified to support students who cannot
afford the study fees in order to prevent exclusion based on financial shortages.
2016 SAAA National Teaching and Learning and Regional Conference Proceedings
ISBN 978-0-620-74761-5
216
Introduction
In the wake of a democratic South Africa, the government pledged to prioritise
education, with basic education being its main responsibility. That being said, basic
education is only the beginning of an academic foundation of any individual and
concerns regarding the rising costs of higher education in South Africa sparked
unrests in late October 2015. The nation’s reaction towards the rise in higher education
fees can be understood at a time when the monetary policy committee (MPC) was
fighting to keep inflation down and manage the cost of living. South Africa finds itself
in a challenging position, as it needs to increase the number of students from
disadvantaged backgrounds in higher education institutions. This should be seen
against the limited government resources and the question: should higher education
be free in South Africa? And if so, at what cost and on what basis?
Since the beginning of the protest action against an increase in higher education fees
in October 2015 across South African higher education institutions, much debate has
circulated about the call for a free higher education system to be implemented within
the country. Amongst the reasons highlighted for this request, are that there is a need
to increase accessibility of higher education opportunities to previously disadvantaged
students and that the continuous increase in study fees will negatively affect that goal.
Arguments for and against the implementation of free higher education have been
raised in South Africa and the standing principle is that the country is in unison about
the need to increase the number of students from previously disadvantaged
backgrounds in higher education institutions, however the manner in which that will be
achieved is where differences in opinion appear.
The plea to cut fee increases for the 2016 academic year was not merely based on
the rising cost of higher education that was exacerbated by inflation, but at ground
level issues that affected poorer students at higher education institutions. Amongst
these ground level issues was financial exclusion of financially challenged students
irrespective of academic performance. The challenge for an institution is that the
failure to collect fee income results in a shortfall of revenue and backlog of costs to
maintain their facilities and resources. The implication of financial exclusion is that
even in the instance of a student being academically capable, the limited availability
of funding directly affects their ability to remain engaged in higher education.
The important factors to note, therefore, are that the students affected by this cycle
are the poorer students who come from impoverished backgrounds and do not have
the means to seek alternative funding for student fee debts. The South African reality
is that students who come from poor socio-economic backgrounds are almost always
the first, in their families, to attend university or a higher education institution. Families
will be depending on those students graduating in record time, so as to provide a
sustainable income for the family and invest back home, what is commonly referred to
as “Black Tax”. If a student is no longer able to continue with their tertiary studies due
2016 SAAA National Teaching and Learning and Regional Conference Proceedings
ISBN 978-0-620-74761-5
217
to exhausted funds and is financially excluded, the expectation is that the student will
seek some form of employment so as to help provide for the needs of the family. Of
great concern is that the employment sought after is usually hard, non-rewarding
labour and very few of these students ever get the opportunity and time to focus on
full time studies again.
So much is wrong with the picture created by this cycle, as the consequence of those
who don’t end up seeking or finding employment is that they become part of the youth
unemployment statistic (Van der Bank & Nkadimeng, 2014). There is a great urgency
in addressing the challenge around funding higher education for students who cannot
afford it, and addressing the question whether as a nation, South Africa is currently
able to adopt a cost free higher education system. An investigation of the factors to
consider for a free higher education system in South Africa will therefore be conducted
by this report.
The literature reviewed in the next section focuses on studies that investigate why
funding higher education is an issue, globally as well as locally, and who are affected
the most. It also considers implications of a free higher education system given the
limited resources available to the South African developing economy. Finally, the
literature provides some suggestions to increase access to higher education in South
Africa.
Literature Review
This literature review concentrates on a few papers, with dominance being placed on
South African literature for the purposes of emphasising the most relevant arguments.
Of importance to note, is the timing of the dominant literature reviewed. Two of the
papers reviewed are by Gerald Wangenge-Ouma (2012, 2010) and are based on
research before the student protest action in South Africa in October 2015, evidencing
that the issue is not a new conundrum, and is a global issue. “Modern Trends in Higher
Education Funding” (Maria & Bleotu, 2013) explains that the issue around higher
education fees is not just a South African issue, but that thus far South Africa has been
better off than most countries on the African continent in funding higher education and
availing access to higher education. Other reviews respond to the issues around the
2015 higher education fee protests in South Africa.
Challenges for funding higher education
There has been a gradual decline in public expenditure on higher education. This
decline is not confined to developing countries, such as South Africa, this trend is
noticeable globally (Tilak, 2005). The majority of countries in the world charge fees in
higher education, in some cases small amounts, while in others reasonably large
amounts. In countries such as Sweden and Finland, there is no charge for higher
education studies (Tilak, 2005). However, developing countries such as India and
2016 SAAA National Teaching and Learning and Regional Conference Proceedings
ISBN 978-0-620-74761-5
218
South Africa have hiked study fees selectively, while providing subsidised higher
education and funding to many students.
African countries that have employed free higher education in the past include Kenya,
Zambia, Mozambique, Nigeria, Burkina Faso, and Egypt. In some countries higher
education remains free, however, most African countries have moved towards
subsidising higher education to a certain extent and making basic education free
(Wangenge-Ouma, 2010). Previously, because the post-colonialism university was
seen the driving force of the spurring African development and that charging fees for
higher education would obstruct the development and power of individuals, higher
education was free in these African nations. It was believed that African economic
transformation was going to be achieved through higher education because of the
level of skill shortage on the continent. The government’s intervention to fully subsidise
higher education was therefore to enable many students to benefit from university
education. In Africa, free university education meant equity of access was achieved.
The implementation and call for free higher education received an overwhelming
response in these countries. As such, local and global support for the movement was
in abundance. The limited number of students and sufficient resources at the time,
made this system possible to implement (Wangenge-Ouma, 2010).
The issue with higher education in these nations was that it became increasingly
expensive and unaffordable by the governments especially due to the decreasing
economic growth in Africa at the time. The combined effect of strained economies and
rising higher education costs lead to these governments decreasing funding for higher
education. This issue was exacerbated by the growing demand in Africa for higher
education as enrolments increased faster than the planned capacity. The result of this
was suboptimal conditions for learning, as decreased government funding created a
shortfall in maintaining capacity (Wangenge-Ouma, 2010).
The 2004 World Bank policy paper on higher education emphasised the importance
of public higher education in national development (Tilak, 2005). However, this and
other similar reports have not made any significant impact on the policies of
governments or international development organisations in relation to funding higher
education. Tilak (2005) argues that the best method of financing education, including
higher education, is financing by the state through its tax and nontax revenues. The
White Paper on higher education (Department of Education, 1997) set a broad
transformation agenda that is underpinned by a core principle of redress of past
inequalities through equity of access and the distribution of achievement along lines
of race, gender, class and geography. Higher education, it is argued, emphasises the
neo-liberal global trend that emphasises contribution to economic development and
global competitiveness by developing a highly skilled labour force and through
innovative knowledge production (McLean and Walker, 2012).
2016 SAAA National Teaching and Learning and Regional Conference Proceedings
ISBN 978-0-620-74761-5
219
In South Africa, the literature reviewed places emphasis on the link between funding
higher education and achieving the goal of increasing the number of previously under-
represented students in higher education institutions. Wangenge-Ouma (2010) has
raised several key issues in “Funding and the Attainment of Transformation Goals in
South Africa’s Higher Education”. The paper addresses the issues around funding
higher education in South Africa and how they can affect access by previously under-
represented racial groups, which the study has strictly defined as “African Blacks” and
“Coloureds”. The study highlights that the cost of higher education has increased due
to the growth in student numbers. The increasing cost is said to harm poorer students
the most as the limited availability of funding leaves them with no option but to drop
out of higher education institutions or to not participate at all.
A current available source of funding is the National Student Financial Aid Scheme
(NSFAS). Student loan programmes, it is argued, seem to create more problems than
what they solve (Tilak, 2005) as it has the underlying assumption that higher education
is “neither a public good nor a social-merit good, but, rather, a highly individualised
private good” (p5), that shifts the responsibility of funding higher education from
society to the families and individual students. Poor rates of recovery of student loans
is an international problem (Tilak, 2005), where several loan programmes were
changed into income-contingent loans, and banks took responsibility for government-
operated loan schemes. While we can appreciate the existence of a funding model
that assists students in financial need, the funding scheme is partly ineffective as it
hardly covers the full cost of studies in most higher education institutions. Because
NSFAS caters for poorer students, the remaining uncovered costs still threaten the
student’s ability to remain in higher education institutions. Funding therefore creates a
huge barrier to access for many students.
Wangenge-Ouma (2010) points to the implication of increasing study fees on access
to higher education, highlighting that there has been an evident general decrease in
the government’s funding for higher education and that the combination of that issue
with increasing study fees magnifies the existence of inequality and socio-economic
imbalances. The breakdown of the national funding framework (NFF) points to an
“institutional factor grant” that is awarded to a higher education institution on the basis
of a large proportion of students registered being students of low socio-economic
backgrounds. With government funding showing a decreasing trend, concerns are
raised that institutions that house a majority of disadvantaged students get lesser
funding, due to decreasing government funding. Those who cannot afford higher
education will suffer the most, especially in institutions where most of the students are
from the previously under-represented groups (Wangenge-Ouma, 2010).
Government’s mandate is to focus on making basic education free and accessible to
all, however, as one of its key priorities, about 5% of the national budget is spent
specifically on higher education (Wangenge-Ouma, 2010). On that point it is
necessary to understand why there has been a gradual decrease (in real terms) in
2016 SAAA National Teaching and Learning and Regional Conference Proceedings
ISBN 978-0-620-74761-5
220
higher education funding by the government. Wangenge-Ouma’s argument is that the
policy around the funding of higher education is based on allocated funding outlined
in the annual budget and not the actual costs for higher education. The consequence
is a shortfall in allocated funding due to the demands of other essential services like
public health, basic education, national defence, etc. Universities has become
concerned about cost recovery, resulting in the introduction of ‘user’ charges for many
other services provided, such as housing, food and transport (Tilak, 2005). The
decrease in government funding has, for example, resulted in the reduction of funding
utilised for constructing new buildings and facilitating repairs and renovations
(Wangenge-Ouma, 2010).
The structure of the NFF policy is criticised in that one of the key funding determinants,
the institutional factor grant, uses race and not socio-economic backgrounds to
determine the part of the government funding allocation to a higher education
institution with previously under-represented students as majority. The contention with
this is that disadvantaged students of other races that fall under previously under-
represented cannot benefit from this funding. Therefore, with a decrease in
government funding and an allocation system that favours some and not all previously
under-represented students, hope of these students gaining access to higher
education in future slowly withers (Wangenge-Ouma, 2010).
This does not only make evident that there’s a decreasing trend in government funding
for higher education, but also emphasises that higher education institutions have to
rely on their own funding (reserves and fee income) or loans for capital expenditure
and the result of that is having to increase study fees. Study fee increases are linked
to a high drop-out rate of these previously under-represented students because
increases in study fees affect the poor students the most. Wangenge-Ouma (2010)
concludes this argument by stating that the implications of study fee increases harm
the equity of access because universities need to sustain themselves through study
fee increases to fulfil their mandate. If government funding decreases over time, much
reliance must be placed on study fee income for the maintenance of higher education
institutions. An increase in the number of enrolments implies that institutions would
need more resources and the inability to grow finances as rapidly to invest in those
resources led to a mediocre higher education system in Africa (Wangenge-Ouma,
2010).
Implications of a free higher education system in South Africa
Different spheres of government, each with its own priorities, all compete for budget
allocations and funding of projects. There is increasing pressure from other spheres
of government, including health, safety and security and public infrastructure that are
all pivotal to the functioning of the state, for larger budget allocations. This, along with
the fact that government’s funding for higher education has not increased in proportion
to the increase in the actual cost of higher education, questions the sustainability of a
2016 SAAA National Teaching and Learning and Regional Conference Proceedings
ISBN 978-0-620-74761-5
221
free higher education system. Wangenge-Ouma (2010) explains the effects of a free
higher education system by emphasising the effect it will have on the same issues that
currently hinder poor students from gaining access into higher education institutions.
The consensus drawn is that free higher education is not sustainable as the
decreasing funding available for government and state of the economy put strains on
budget allocations and funds that are available for higher education (Wangenge-
Ouma, 2010)
The feeling of marginalisation amongst the student body is a burden that they have
carried for quite some time. The issue spread throughout the country when protests
against fee increases were initiated. The unrest was sparked by the #RhodesMustFall
movement established earlier in 2015 at the University of Cape Town. This was
followed by a nation-wide #FeesMustFall movement, in which South Africa’s youth
responded to issues facing students. One of the reasons for the establishment of the
movement was an outrage at the release of proposed university fees for 2016 and
subsequent to that was the widespread publication of the proposed increase in fees
for 2016. The response to issues such as increasing higher education fees is part of
the consequences of this marginalisation. In relaying the implications of free higher
education, this study refers to a paper that was written in response to these
movements. In a Rand Mail article by Stuart Theobald “How to fund university
education for all” (October, 2015) it is explained that a free education system will result
in decreased government funding due to the increased demand for higher education
and increased costs to maintain universities. The resultant decrease in overall
government funding will force study fees to increase to sustain higher education
institutions (because the government grant will have to decrease to ensure fairness in
allocation across all higher education institutions) and thereafter that will decrease the
level of access for poorer students. The free higher education system is detrimental
to the sustainability of an institution and may result in universities resorting to charging
for other services that don’t constitute study, for example internet usage,
transportation/shuttle services, higher residence fees, etc. Free higher education
would make higher education cheaper for the rich in that a cost free higher education
system would only benefit those that can already afford it (Theobald, 2015).
In a response to a media report following the #FeesMustFall movement, Anthony Farr,
CEO of the Allan Gray Orbis Foundation, a fellowship programme that awards up to
100 full scholarships annually, issued a report explaining his views on the impact of
free higher education. The report, titled “Response to media reporting on fees must
fall” (Farr, 2016) states that free higher education in an unequal society does not
achieve access. The current systems of external bursaries and accelerated fee
systems provide access to students who would otherwise not have been able to afford
higher education. The accelerate fee systems result in wealthier students paying the
fees of poorer students as they bear the full cost of study fee increases which provide
means for all to benefit from increased capacity. External funding in the form of
2016 SAAA National Teaching and Learning and Regional Conference Proceedings
ISBN 978-0-620-74761-5
222
bursaries and scholarships would be lost to the industry if the cost-sharing system had
to be eradicated. This report further highlights that the point of access is to ensure that
those who cannot afford fees and have not secured bursaries/scholarships, are still
able to access higher education. The barriers to access within funding itself are not
just funding (limitation thereof in absolute terms) and increasing study costs, but also
the growing demand for funding. Of key importance is the fact that higher education
costs do not only comprise study, but also accommodation, food and living expenses.
Free higher education would require a decrease in the number of students enrolled
and in need of funding in order to cover full costs. If enrolments decrease, access is
directly affected. Thus, if higher education had to be fully funded by the state, higher
education institutions would not be able to sustain large student numbers when there
is no funding to increase capacity (Farr, 2016).
Amongst other significant factors, Farr’s (2016) report draws attention to the fact that
free higher education system is harmful to access of poor students into university. This
is because the majority of students who enrol for university are from middle class
socio-economic backgrounds. A free higher education system will result in capacity
constraints that will in turn limit the amount of spaces available for students in
university. Therefore, in competing for a space in the constrained university
environment, middle-class students will invest in, for instance, top high school grades
to ensure they have a good chance of entry. The result of this would effectively mean
that poorer students are eliminated competitively and crowded out due to the inability
to invest in schooling that will give them that competitive advantage and, in that way,
their access into higher education institutions is harmed (Farr, 2016).
A study that substantiates the preceding point is (Wangenge-Ouma, 2012) “Study
Fees and the Challenge of Making Higher Education a Popular Commodity in South
Africa”. This paper suggests that the positive impact of free higher education in South
Africa specifically will address growth externalities and possibly increase access to the
poor in the midst of rising study costs, which may achieve transformation and social
justice. The study, however, questions whether it would benefit the poor due to the
following issues: NSFAS funding shortages and current funding challenges suggest
that the government cannot afford free higher education. There are concerns around
the impact of free higher education due to the large level of inequalities that exist in
South African schools where majority of poor students attend low-quality schools that
offer limited opportunity for university access, meaning few of the poor students obtain
access. The availability of free higher education would then be futile if such an
opportunity cannot be utilised by those who need it most; the poorer students. The
points raised also emphasise that the fight for free higher education is ineffective if
poorer students receive basic education from schools that do not prepare them
adequately to qualify for entrance in higher education institutions (Wangenge-Ouma,
2012).
2016 SAAA National Teaching and Learning and Regional Conference Proceedings
ISBN 978-0-620-74761-5
223
Both authors, therefore, conclude that the argument should not be one of cost free
higher education, but one of increasing access to higher education i.e. channels of
funding availability so that those who qualify for free higher education may not be held
back by finances.
Suggestions to increase access to higher education in South Africa
The studies reviewed have pointed to mechanisms for higher education access that
are affordable for the government and that will achieve the ultimate goal of
representation from poorer students in higher education institutions. Wangegnge-
Ouma (2010) specifically outlines the following recommendations: that the NSFAS
funding should be increased even though it hardly covers the full cost of study. The
study also points out that there should be a revised model pertaining to NSFAS and
the NFF as the race-based allocation favours only a select few of the poorer students.
Further, the paper motivates for the private sector’s involvement in increasing higher
education access equitably and suggests that private sector companies should be
incentivised to have their own bursaries and to contribute to NSFAS funding by the
government availing tax benefits for such initiatives. The study also encourages the
provision of information regarding available resources for higher education funding for
students in out-skirted areas. The motivation for this is that, while there is a growing
demand for higher education funding, some students fail to apply for entry into higher
education institutions due to a lack of information. Awareness programmes and
mentorship within rural areas to facilitate the flow of information about funding
resources is a necessity motivated by this paper.
A vital point made by this study is the need to improve the basic education system of
South Africa so that more students can qualify for university entrance. There can be
no benefit in available funding if there are no students to utilise that funding. This
statement is based on the paper pointing out that a majority of students, predominantly
black, underperform in university entrance benchmark tests, which is evidence of a
failing basic education system. Wangenge-Ouma (2012) adds that in order for a free
higher education system to be effective whilst inequality is high, funding must be
concentrated at lower schooling levels for poorer students as that will facilitate a larger
amount of access if the funding provides for improved quality schooling.
The only shortfall in the abovementioned literature, which is also a potential area of
research, is that it fails to actively address macroeconomic issues that affect the
government’s ability to increase funding for higher education through altering the
national funding framework. The literature also only focuses on funding as the main
barrier in South Africa to achieving access to higher education by the poorer students.
The literature has pointed to social inequality being a very large part of the issue
regarding underlying barriers to access of higher education by poorer students.
Wangenge-Ouma (2012) substantiates this point by highlighting that internal
inefficiencies like drop-outs, and the failure to graduate on time are the result of other
2016 SAAA National Teaching and Learning and Regional Conference Proceedings
ISBN 978-0-620-74761-5
224
issues that are inherent to poorer students specifically. These issues are relevant
because if poorer students are affected the most, even in the event of funding being
available and if the surface-level issues are not resolved the cycle is bound to continue.
As a way forward in study therefore, the above aspects should be looked into as the
reliance on the government to alter the funding framework for higher education is
currently not plausible given existing pressures.
Research Methodology
This is a descriptive report that draws from investigations and findings in the literature
and recent media coverage. This is followed by a scrutiny of additional information
that is available in the public domain, such as the cost of studying at a university, the
annual budget allocation to higher education, and the NSFAS financial statements.
The methodology will deal with data collected from university documentation, however
it is imperative to note that government’s funding for higher education includes funding
Further Education and Training (FET) institutions. The information obtained is
analysed and interpreted to inform the factors for consideration whether South Africa
should consider the implementation of a free higher education system.
The following methodology was followed to collect information and draw evidence on
the issues around access to higher education and rising higher education fees:
Estimated cost of studying full-time
The cost of higher education for an individual student was determined by obtaining the
cost of a standard 3 year BCom Accounting degree across four South African
universities viz. University of Cape Town, University of Johannesburg, University of
the Witwatersrand and Stellenbosch University. The purpose of using the mentioned
higher education institutions was not for comparison of the cost of the degree across
the different institutions, however it was so as to get an average cost that was used
as a proxy for the cost of study and residence fees for a standard degree nationally.
This cost was then combined with the cost of living in South Africa, which was not
obtained using a formal collection method, but from information presented in the
relevant university cost schedules, with particular reference to student handbooks for
the cost of residence, catering and reference to miscellaneous annual expenses like
travelling. This detail is aimed at arriving at a total cost of educating a student per
annum so as to get an estimate of the cost of higher education with reference to costs
other than study. From that cost estimate the report has highlighted the number of
students in need of funding for higher education and the multiple of the cost and
number of students in need for funding was contrasted with funding allocation
nationally. This cost was derived to be compared to the funding provided by NSFAS
per student so that commentary could be made on the discrepancy between funding
allocated and funding needed and the significance of that discrepancy.
2016 SAAA National Teaching and Learning and Regional Conference Proceedings
ISBN 978-0-620-74761-5
225
Analysis of budget allocations to higher education in South Africa
Commentary on the national budget allocation is meant to provide answers to why this
discrepancy occurs. The critical point to establish is whether the total funding required
is anywhere numerically close to the entire South African budget allocation (national
expenditure as a whole), and establishing an answer to this can form a basis for
arguing whether the South African government can maintain free higher education.
This analysis has aided the comparison of South Africa’s higher education funding
system with that of other developing countries and was contrasted with the system
applied in a developed nation. The aim is to gauge whether South Africa is eligible to
apply similar measures. From this analysis judgement based conclusions can be
drawn as to whether the South African higher education budget allocation is
appropriate to achieve the objective of maximum access to higher education. The
analysis is also to assess the effectiveness of a free higher education system in the
studied African countries and if found to be ineffective, whether South Africa has any
advantages that could absorb the cause of that ineffectiveness. Lastly, the contrast
with a developed nation was used to assess the appropriateness of adopting similar
measures in South Africa to achieve free higher education now or in future.
An analysis of the budget allocation for higher education in South Africa specifically
over the last 5 years was conducted. Of particular interest to this report is to establish
the impact of the 0% fee increment in higher education fees for 2016 on the higher
education budget allocation. This point also serves to establish whether any other
significant service i.e. health, or safety and infrastructure, have suffered as a result of
higher education funding pressures.
Current student funding available in South Africa
Lastly, student funding that is currently available through the National Student
Financial Aid Scheme (NSFAS) is investigated. The information that is available in
the annual reports of NSFAS for the financial years 2011 to 2015 was analysed, with
specific reference to information relating to the numbers of students that receive
financial assistance, and the average amount of financial assistance available to a
student. This information is particularly useful when compared to the estimated cost
of full-time study per year. From the compilation of the number of students in need of
funding, this report has studied whether there is an increasing trend in the number of
financially challenged students. An estimate of how many students are unable to be
financially supported was derived, along with emphasis made on the drop-out rate to
highlight the issue of equitable access. This analysis highlights the need to involve
third parties such as private entities, to finance higher education because the cost of
higher education studies cannot be for the account of the government only.
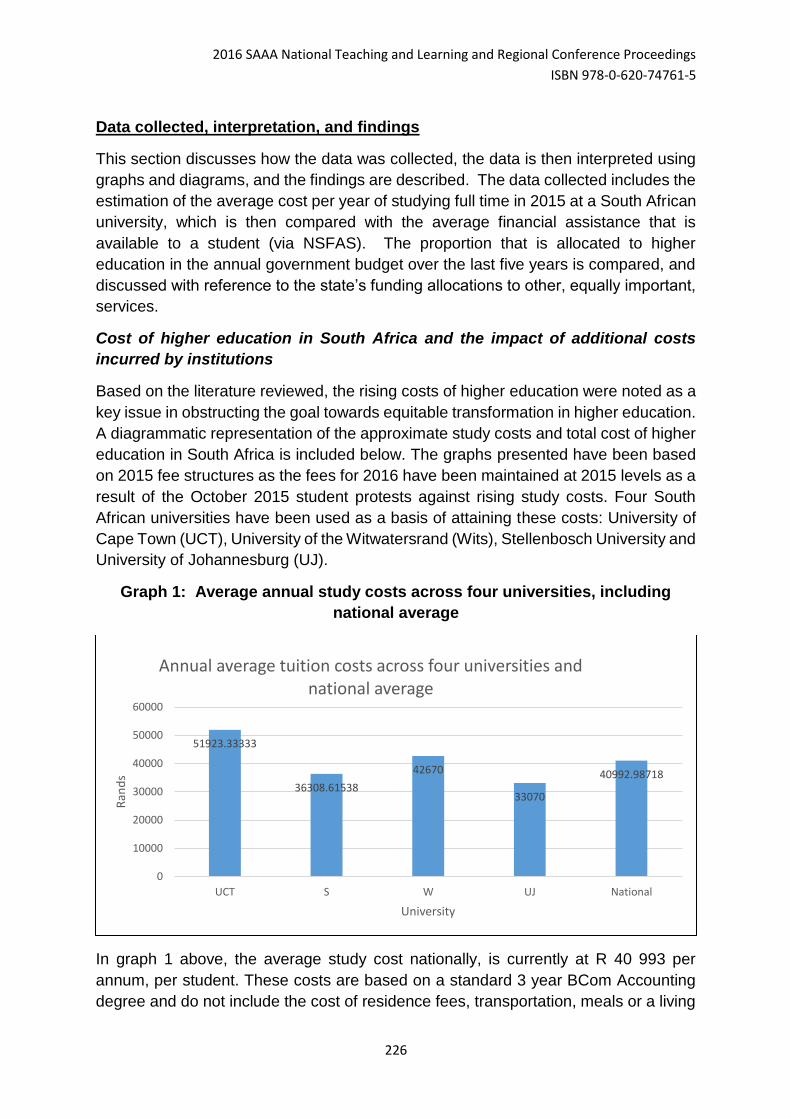
2016 SAAA National Teaching and Learning and Regional Conference Proceedings
ISBN 978-0-620-74761-5
226
Data collected, interpretation, and findings
This section discusses how the data was collected, the data is then interpreted using
graphs and diagrams, and the findings are described. The data collected includes the
estimation of the average cost per year of studying full time in 2015 at a South African
university, which is then compared with the average financial assistance that is
available to a student (via NSFAS). The proportion that is allocated to higher
education in the annual government budget over the last five years is compared, and
discussed with reference to the state’s funding allocations to other, equally important,
services.
Cost of higher education in South Africa and the impact of additional costs
incurred by institutions
Based on the literature reviewed, the rising costs of higher education were noted as a
key issue in obstructing the goal towards equitable transformation in higher education.
A diagrammatic representation of the approximate study costs and total cost of higher
education in South Africa is included below. The graphs presented have been based
on 2015 fee structures as the fees for 2016 have been maintained at 2015 levels as a
result of the October 2015 student protests against rising study costs. Four South
African universities have been used as a basis of attaining these costs: University of
Cape Town (UCT), University of the Witwatersrand (Wits), Stellenbosch University and
University of Johannesburg (UJ).
Graph 1: Average annual study costs across four universities, including
national average
In graph 1 above, the average study cost nationally, is currently at R 40 993 per
annum, per student. These costs are based on a standard 3 year BCom Accounting
degree and do not include the cost of residence fees, transportation, meals or a living
51923.33333
36308.61538
42670
33070
40992.98718
0
10000
20000
30000
40000
50000
60000
UCT S W UJ National
Ran
ds
University
Annual average tuition costs across four universities and national average
2016 SAAA National Teaching and Learning and Regional Conference Proceedings
ISBN 978-0-620-74761-5
227
stipend. For the purposes of highlighting the cost of higher education in South Africa,
reference must be made to these additional costs to highlight the extent to which
higher education fees are an issue for the majority of South Africans. Residence fees
will be discussed separately. As noted in the literature review, the issue around student
fees and the effect it has on access to higher education affects poorer students the
most. To illustrate this point, an analogy is made using facts that are relevant to a
poorer university student:
South African university term breaks are spread around April, June, September and
December. The poorer student can only afford to make means to go home (if studying
at an institution that is far from home, which is ordinarily the case) during the longer
breaks; June and December. Travelling home would be by means of a bus, as this is
the most affordable option. The average bus ticket price over long distances is at R580
(www.computicket.co.za) and having to cover this cost twice a year, for a return trip,
would bring travel costs to approximately R2 320 in the absence of other factors. Due
to the difference in meal cost structures across the different higher education
institutions, and due to some universities not offering catering as part of the costs, it is
necessary to consider the meal costs of the abovementioned institutions only as a
basis of determining average annual meal costs. The meal cost determination would
be based on a standard 3 meals per day, 7 days a week meal plan. The average
annual meal cost for this meal plan at these institutions is R14 000 per student (UCT
student fees handbook, 2016). The meal cost ordinarily covers meals for February to
November annually, bringing it to an approximate monthly cost of R1 400 or R47/day.
Additional sundry expenses that a student must account for are the costs for textbooks
and stationery (R6 000), educational equipment (R3 000), living and sundry expenses,
excluding transportation (R5 180) (UCT student fees handbook, 2016). The additional
sundry expenses are not an accurate measure or representation of sundry expenses
for the average South African student, and should only be used for illustrative
purposes. The cost is based on one institution as it is the only institution with a fee
handbook that breaks down the relevant costs, which may differ marginally for
students in other provinces and institutions. The cost of living is a subjective variable
and, therefore, it is worthy to note that the use of a fee handbook is an aim to reflect
an objective account of costs.
The above break down of costs would bring the total annual cost (study, meals,
travelling, living expenses, educational equipment and textbooks and stationery) of
higher education, excluding accommodation, to R71 493 per student per year. Based
on this projection and consideration for the household that most poor South African
students come from, it is already evident that covering this cost could be challenging.
As mentioned in the literature review, most underprivileged students come from
secondary schools that are under resourced and where most of them have never had
to pay for secondary school fees. How then are South African students, and
specifically poorer students, of which the majority are the “Black” students, expected
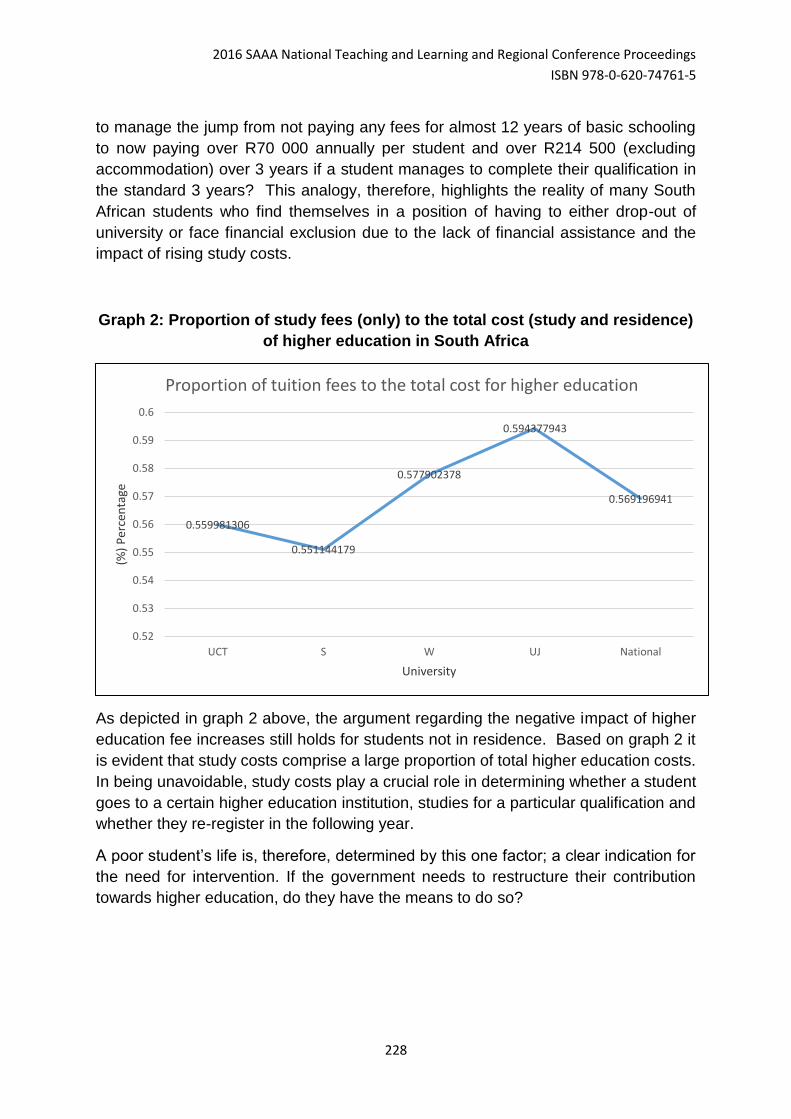
2016 SAAA National Teaching and Learning and Regional Conference Proceedings
ISBN 978-0-620-74761-5
228
to manage the jump from not paying any fees for almost 12 years of basic schooling
to now paying over R70 000 annually per student and over R214 500 (excluding
accommodation) over 3 years if a student manages to complete their qualification in
the standard 3 years? This analogy, therefore, highlights the reality of many South
African students who find themselves in a position of having to either drop-out of
university or face financial exclusion due to the lack of financial assistance and the
impact of rising study costs.
Graph 2: Proportion of study fees (only) to the total cost (study and residence)
of higher education in South Africa
As depicted in graph 2 above, the argument regarding the negative impact of higher
education fee increases still holds for students not in residence. Based on graph 2 it
is evident that study costs comprise a large proportion of total higher education costs.
In being unavoidable, study costs play a crucial role in determining whether a student
goes to a certain higher education institution, studies for a particular qualification and
whether they re-register in the following year.
A poor student’s life is, therefore, determined by this one factor; a clear indication for
the need for intervention. If the government needs to restructure their contribution
towards higher education, do they have the means to do so?
0.559981306
0.551144179
0.577902378
0.594377943
0.569196941
0.52
0.53
0.54
0.55
0.56
0.57
0.58
0.59
0.6
UCT S W UJ National
(%)
Per
cen
tage
University
Proportion of tuition fees to the total cost for higher education
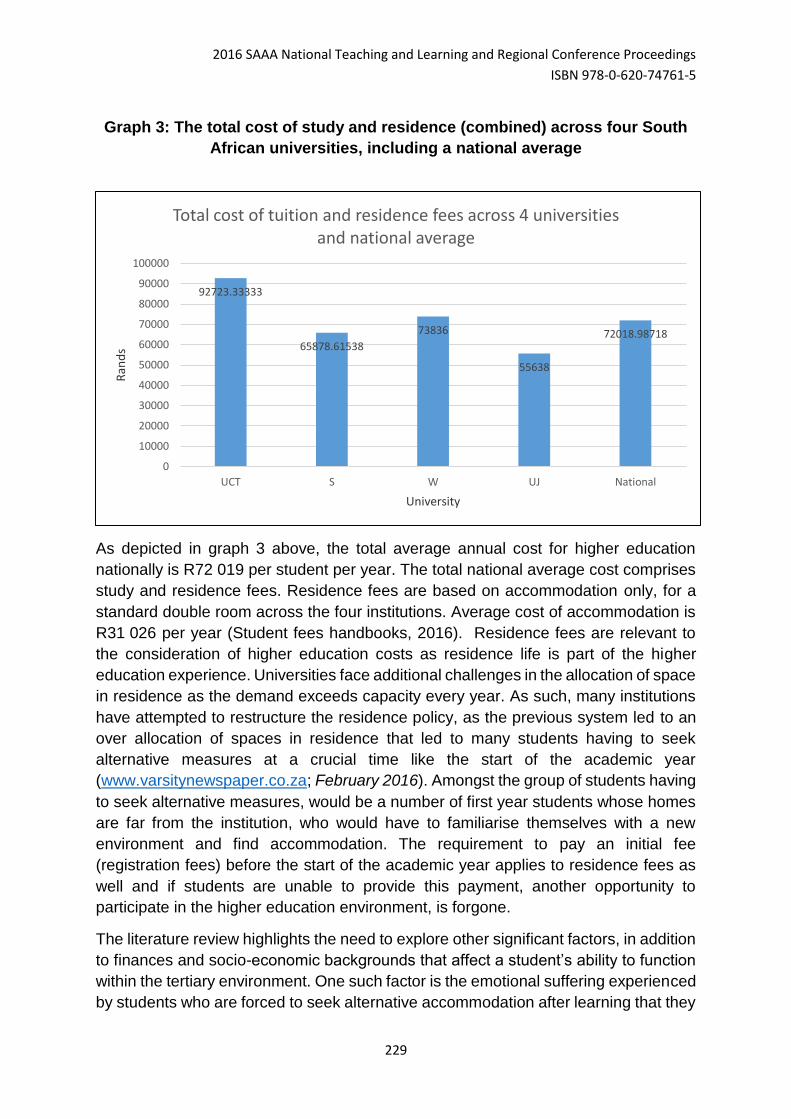
2016 SAAA National Teaching and Learning and Regional Conference Proceedings
ISBN 978-0-620-74761-5
229
Graph 3: The total cost of study and residence (combined) across four South
African universities, including a national average
As depicted in graph 3 above, the total average annual cost for higher education
nationally is R72 019 per student per year. The total national average cost comprises
study and residence fees. Residence fees are based on accommodation only, for a
standard double room across the four institutions. Average cost of accommodation is
R31 026 per year (Student fees handbooks, 2016). Residence fees are relevant to
the consideration of higher education costs as residence life is part of the higher
education experience. Universities face additional challenges in the allocation of space
in residence as the demand exceeds capacity every year. As such, many institutions
have attempted to restructure the residence policy, as the previous system led to an
over allocation of spaces in residence that led to many students having to seek
alternative measures at a crucial time like the start of the academic year
(www.varsitynewspaper.co.za; February 2016). Amongst the group of students having
to seek alternative measures, would be a number of first year students whose homes
are far from the institution, who would have to familiarise themselves with a new
environment and find accommodation. The requirement to pay an initial fee
(registration fees) before the start of the academic year applies to residence fees as
well and if students are unable to provide this payment, another opportunity to
participate in the higher education environment, is forgone.
The literature review highlights the need to explore other significant factors, in addition
to finances and socio-economic backgrounds that affect a student’s ability to function
within the tertiary environment. One such factor is the emotional suffering experienced
by students who are forced to seek alternative accommodation after learning that they
92723.33333
65878.61538
73836
55638
72018.98718
0
10000
20000
30000
40000
50000
60000
70000
80000
90000
100000
UCT S W UJ National
Ran
ds
University
Total cost of tuition and residence fees across 4 universities and national average
2016 SAAA National Teaching and Learning and Regional Conference Proceedings
ISBN 978-0-620-74761-5
230
have no place in residence. This is particularly more challenging on a first year student
who is away from home. In the midst of these challenges, these particular students
would not only have to settle into university/tertiary life, but would have to deal with the
additional emotional challenge of settling into an accommodation setting that might not
have all the necessary facilities that a normal residence has. Bearing in mind that the
above is all happening within the start of the academic year, consideration must be
made for the effect that this could have on a student’s performance as the ability to
adjust timeously is frequently stressed.
Another (added) cost for higher education institutions is the recent call for insourcing
of non-core activities, such as cleaning, maintenance, shuttle transportation and
protection services. Part of the student protests at the end of 2015 against higher
education fee increases was the need to demand an end to outsourcing and the
exploitation of workers that form part of non-core university services by introducing
insourcing. The effect of the introduction of insourcing in higher education institutions
is relevant as this further increases the overall annual expenditure of higher education
institutions. The ripple effect, as noted before in this report, of rising higher education
maintenance costs is that study fees are increased to fund these services and the
maintenance of infrastructure, especially with the increase in the number of students
each year. The issue of addressing increased higher education costs is a challenge
for government, as the rising costs imply that the government would have to allocate
a larger portion of the national budget towards higher education each year to ensure
that the service quality of higher education institutions is maintained. Even though a
large portion of universities’ income is represented by government grants, student fees
seem to account for ever higher proportions.
In an article by Sara Gon, “UCT insourcing: not squaring the circle”
(www.politicsweb.co.za; June 2016), it is stated that insourcing is going to cost the
institution far more that outsourcing as the fulfilment of the cost will require the use of
university reserves for capital expenditure and additional annual operating costs must
now be budgeted for. Dr. Max Price, Vice Chancellor of UCT, is quoted in the article,
stating: “The justification for the austerity measures that are in place is because of a
decreased government subsidy allocation to UCT over the last 5 years”. The
government’s shortfall in the cost increases was approximately R50 million annually;
R250 million cumulatively. The shortfall was compensated for by increasing fee
income at a rate significantly above inflation and even then, the university remains with
a shortfall and additional financial challenges were created by the 0% fee increase for
2016. Insourcing is introduced at a time when institutions can actually not afford it.
An additional concern with the introduction of insourcing is that the additional cost is
towards non-core services and not services that will directly impact the student’s
access to higher education and related resources. Gon (2016) states further that “[t]he
2014 Report on Outsourcing at UCT was commissioned by the UCT Council. The
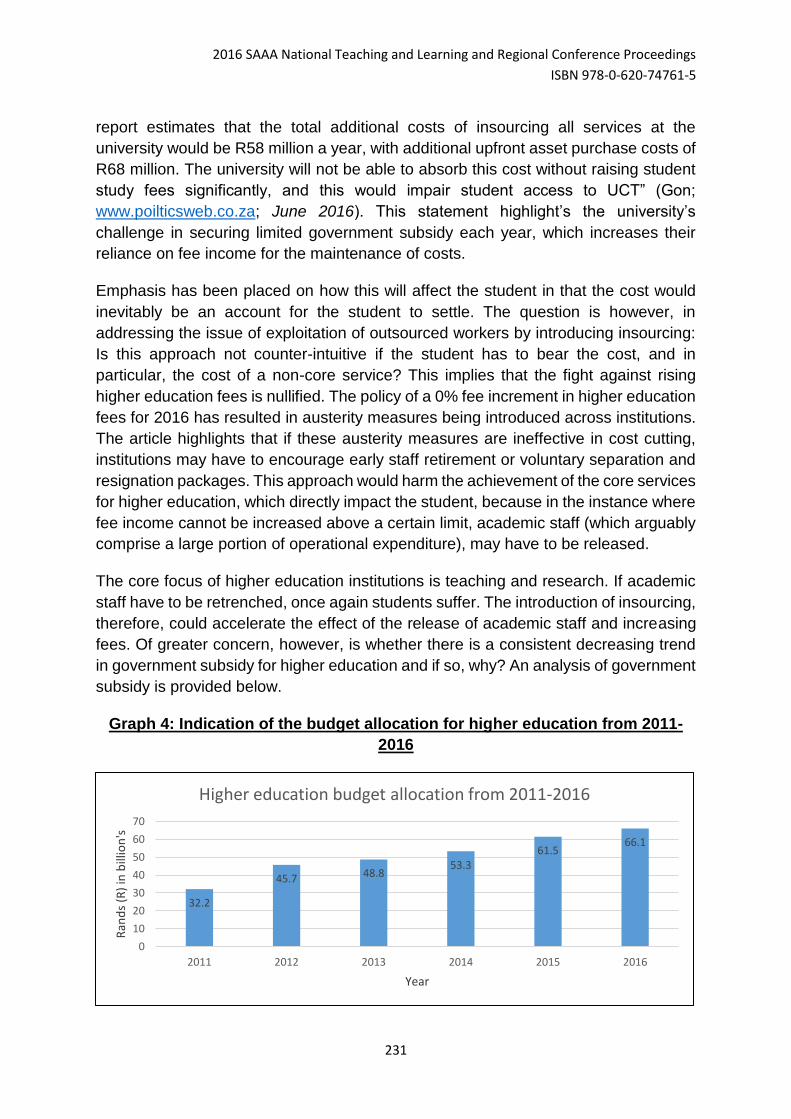
2016 SAAA National Teaching and Learning and Regional Conference Proceedings
ISBN 978-0-620-74761-5
231
report estimates that the total additional costs of insourcing all services at the
university would be R58 million a year, with additional upfront asset purchase costs of
R68 million. The university will not be able to absorb this cost without raising student
study fees significantly, and this would impair student access to UCT” (Gon;
www.poilticsweb.co.za; June 2016). This statement highlight’s the university’s
challenge in securing limited government subsidy each year, which increases their
reliance on fee income for the maintenance of costs.
Emphasis has been placed on how this will affect the student in that the cost would
inevitably be an account for the student to settle. The question is however, in
addressing the issue of exploitation of outsourced workers by introducing insourcing:
Is this approach not counter-intuitive if the student has to bear the cost, and in
particular, the cost of a non-core service? This implies that the fight against rising
higher education fees is nullified. The policy of a 0% fee increment in higher education
fees for 2016 has resulted in austerity measures being introduced across institutions.
The article highlights that if these austerity measures are ineffective in cost cutting,
institutions may have to encourage early staff retirement or voluntary separation and
resignation packages. This approach would harm the achievement of the core services
for higher education, which directly impact the student, because in the instance where
fee income cannot be increased above a certain limit, academic staff (which arguably
comprise a large portion of operational expenditure), may have to be released.
The core focus of higher education institutions is teaching and research. If academic
staff have to be retrenched, once again students suffer. The introduction of insourcing,
therefore, could accelerate the effect of the release of academic staff and increasing
fees. Of greater concern, however, is whether there is a consistent decreasing trend
in government subsidy for higher education and if so, why? An analysis of government
subsidy is provided below.
Graph 4: Indication of the budget allocation for higher education from 2011-
2016
32.2
45.7 48.853.3
61.566.1
0
10
20
30
40
50
60
70
2011 2012 2013 2014 2015 2016
Ran
ds
(R)
in b
illio
n's
Year
Higher education budget allocation from 2011-2016
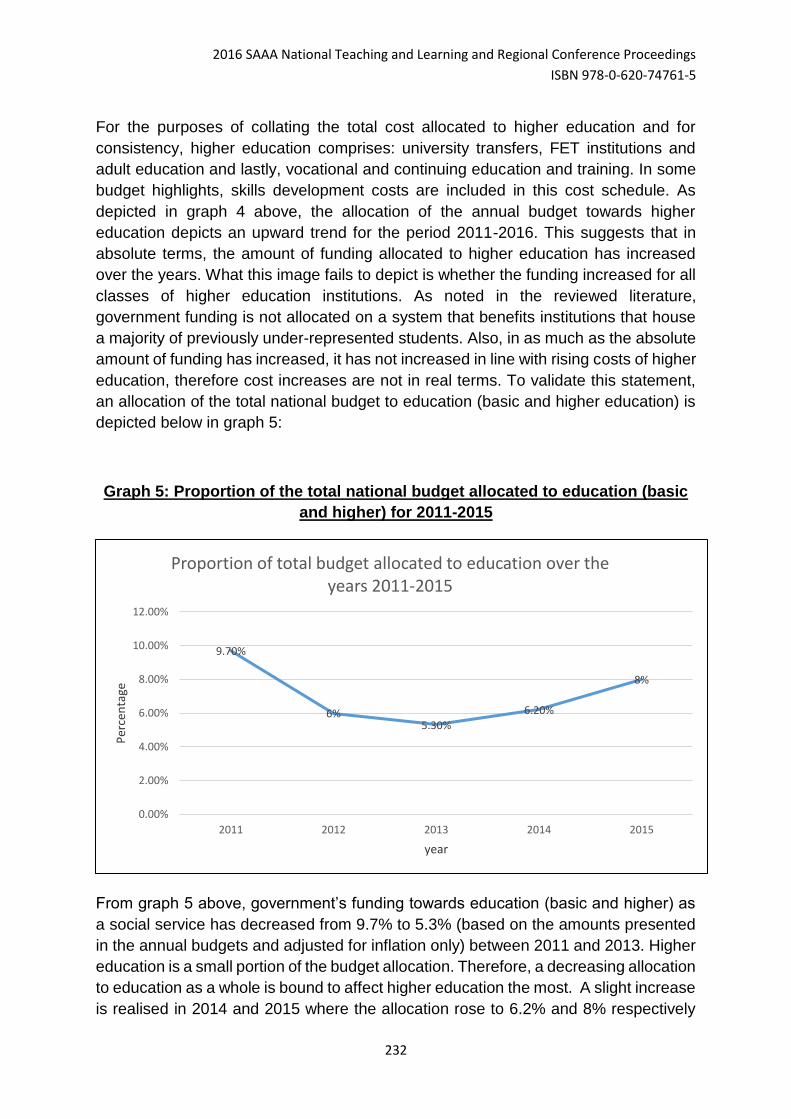
2016 SAAA National Teaching and Learning and Regional Conference Proceedings
ISBN 978-0-620-74761-5
232
For the purposes of collating the total cost allocated to higher education and for
consistency, higher education comprises: university transfers, FET institutions and
adult education and lastly, vocational and continuing education and training. In some
budget highlights, skills development costs are included in this cost schedule. As
depicted in graph 4 above, the allocation of the annual budget towards higher
education depicts an upward trend for the period 2011-2016. This suggests that in
absolute terms, the amount of funding allocated to higher education has increased
over the years. What this image fails to depict is whether the funding increased for all
classes of higher education institutions. As noted in the reviewed literature,
government funding is not allocated on a system that benefits institutions that house
a majority of previously under-represented students. Also, in as much as the absolute
amount of funding has increased, it has not increased in line with rising costs of higher
education, therefore cost increases are not in real terms. To validate this statement,
an allocation of the total national budget to education (basic and higher education) is
depicted below in graph 5:
Graph 5: Proportion of the total national budget allocated to education (basic
and higher) for 2011-2015
From graph 5 above, government’s funding towards education (basic and higher) as
a social service has decreased from 9.7% to 5.3% (based on the amounts presented
in the annual budgets and adjusted for inflation only) between 2011 and 2013. Higher
education is a small portion of the budget allocation. Therefore, a decreasing allocation
to education as a whole is bound to affect higher education the most. A slight increase
is realised in 2014 and 2015 where the allocation rose to 6.2% and 8% respectively
9.70%
6%5.30%
6.20%
8%
0.00%
2.00%
4.00%
6.00%
8.00%
10.00%
12.00%
2011 2012 2013 2014 2015
Per
cen
tage
year
Proportion of total budget allocated to education over the years 2011-2015
2016 SAAA National Teaching and Learning and Regional Conference Proceedings
ISBN 978-0-620-74761-5
233
(appendix 3). Despite the slight increase over the last two years, the allocation is still
well below what it used to be in 2011.
Since higher education comprises a smaller proportion of the total education budget,
the effects of this decreased allocation over the years explain and validate the
conclusion reached by higher education institutions and the reviewed literature, that
government spending on higher education has decreased over the years. In analysing
the exact proportion of the education budget allocated towards higher education: In
2011, 13.5% of the education budget was spent on higher education, increasing to
19.4% in 2012. However, from 2013 onwards, a drastic decrease towards higher
education funding was seen as the proportion fell to 7.25% and 6.8% in 2013 and 2014
respectively (budget review 2013, 2014). This explains the need for higher education
institutions to rely on accelerated fee increases for the maintenance of institutions as
government subsidy decreases while costs are rising.
In 2015 the allocation of the education budget to higher education increased by a
margin to 8.6%. The main reason for decreases in the higher education funding was
for the government to cater for the growing needs of basic education: increasing the
number of schools, school infrastructure, and the increase in teacher’s salaries after
the national teacher’s strike in 2010. All for a system that, as is evident from the
literature, is flawed in its ability to prepare learners adequately for access to higher
education. This, amongst other factors such as the need to respond to other social
services like public health, has exacerbated the funding crisis in higher education. This
report can ascertain therefore from an analysis of the annual budget highlights (based
on the respective year’s budget speech), that government’s inability to prioritise higher
education is also due to the need to focus on other areas of the country. Between 2011
and 2013, the state’s funding for public health, housing, public safety and general
public services decreased notably. The budget allocation towards economic affairs,
however, increased from -5.9% in 2011, to 7.7% and 10.8% in 2012 and 2013
respectively. This was at a time when South Africa was experiencing immense political
instability, coupled with economic pressures as response to the previous neglect of
economic affairs evidenced by the decreased allocation in 2011.
The impact of the 0% fee increment on higher education fees has not gone unnoticed
by the government. Government has seen the largest increase (in absolute terms) in
2016 in the budget for education from R265.7 billion in 2015 to R297.5 billion in 2016
(Budget review, 2015, 2016). The proportion of the education budget for 2016 that will
go towards funding higher education is yet to be confirmed. In analysing the impact
of a 0% fee increment on higher education fees for 2016, it is necessary to isolate the
2016/2017 national budget allocation for higher education. The isolation is to assess
what the government’s strategy regarding the shortfall that the failure to increase
student fees in the current year, has created.
2016 SAAA National Teaching and Learning and Regional Conference Proceedings
ISBN 978-0-620-74761-5
234
According to the 2016 National Budget speech (Annual budget speech 2016), an
additional R16.3 billion has been allocated for higher education for the next three years
(2016-2018). R5.7 billion of this addresses the shortfall that was created by higher
education fees for 2016 remaining the same as that of 2015. R2.5 billion has been
allocated to NSFAS to clear outstanding student debt from 2015, and lastly a further
R8 billion over the medium term to allow currently registered students to complete their
studies. A detailed breakdown per the classes of higher education institutions has not
been given regarding the additional amount of R16.3 billion allocated for 2016-2018
across all higher education institutions. Whether this amount will be sufficient to cater
for the effects of the 0% fee increment, is questionable.
The above conclusions raise concerns as to whether a cost-free higher education
system can exist in South Africa and if so, at what cost? Higher education institutions
are highly dependent on fee income to support the functioning of institutions including
payment of academic staff and maintenance of facilities used by students. If fee
income is to be removed and the above trend in the government’s allocation of the
budget to higher education continues, South Africa runs the risk of possibly harming
any efforts towards achieving equitable access to higher education. If the responsibility
to maintain a cost-free higher education was solely placed on the government, this too
would be impractical and ineffective given other existing social needs and the already
decreasing government subsidy for higher education.
NSFAS and the discrepancy between the cost of higher education and financial
assistance available
To emphasise the impracticality of a cost-free higher education system in the midst of
rising higher education costs, this report will briefly analyse the NSFAS funding model.
The link between the costs of higher education in South Africa noted above and the
financial assistance offered through NSFAS, reflects that even with the existence of
financial assistance, some costs still remain uncovered. In a free higher education
system, institutions would be forced to avoid high operational costs by capping the
amount of students they can provide for, which is against the mandate of achieving
access to higher education, particularly for underprivileged students.
Below is a depiction of the number of students assisted by the distribution of funding
for higher education fees of students in need by NSFAS between 2010 and 2016.
Since 1991, NSFAS has distributed over R50 billion in financial assistance to over 1.5
million students (www.nfsas.co.za) This graph aims to study the trend in the allocation
of funding for the proposed range, to highlight the amount of students who require
financial assistance from NSFAS and the proportion of higher education fees covered
by the financial assistance offered.
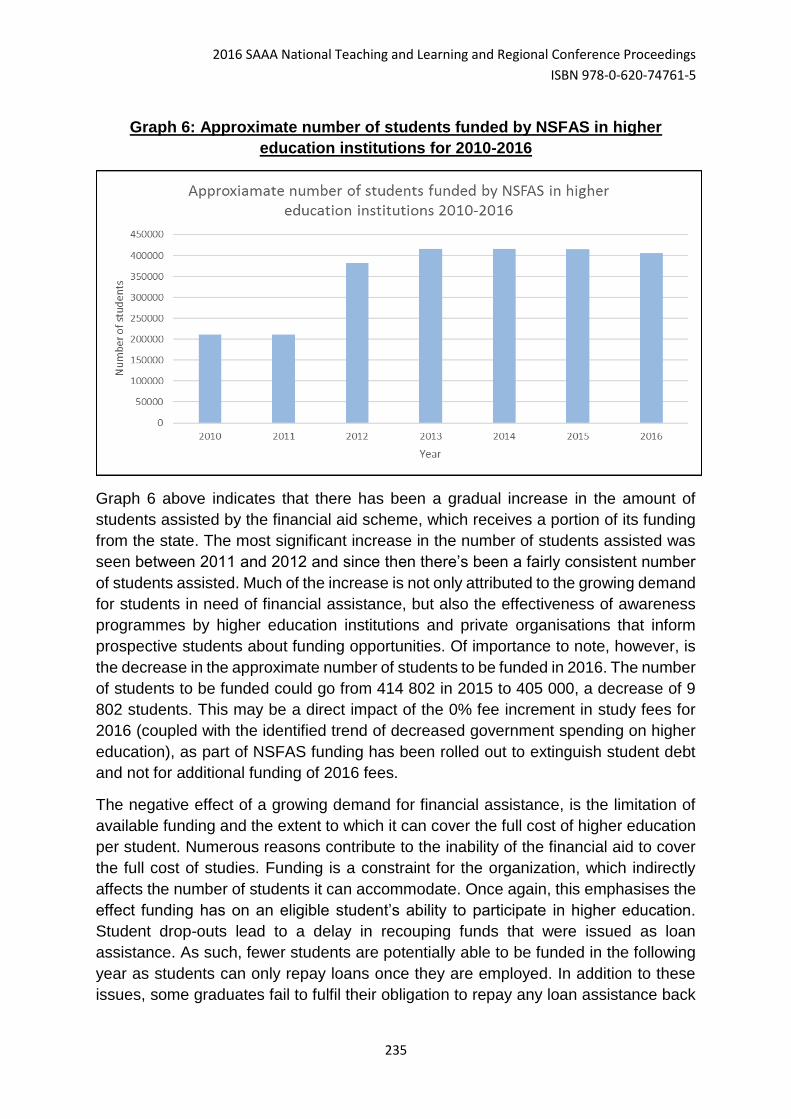
2016 SAAA National Teaching and Learning and Regional Conference Proceedings
ISBN 978-0-620-74761-5
235
Graph 6: Approximate number of students funded by NSFAS in higher
education institutions for 2010-2016
Graph 6 above indicates that there has been a gradual increase in the amount of
students assisted by the financial aid scheme, which receives a portion of its funding
from the state. The most significant increase in the number of students assisted was
seen between 2011 and 2012 and since then there’s been a fairly consistent number
of students assisted. Much of the increase is not only attributed to the growing demand
for students in need of financial assistance, but also the effectiveness of awareness
programmes by higher education institutions and private organisations that inform
prospective students about funding opportunities. Of importance to note, however, is
the decrease in the approximate number of students to be funded in 2016. The number
of students to be funded could go from 414 802 in 2015 to 405 000, a decrease of 9
802 students. This may be a direct impact of the 0% fee increment in study fees for
2016 (coupled with the identified trend of decreased government spending on higher
education), as part of NSFAS funding has been rolled out to extinguish student debt
and not for additional funding of 2016 fees.
The negative effect of a growing demand for financial assistance, is the limitation of
available funding and the extent to which it can cover the full cost of higher education
per student. Numerous reasons contribute to the inability of the financial aid to cover
the full cost of studies. Funding is a constraint for the organization, which indirectly
affects the number of students it can accommodate. Once again, this emphasises the
effect funding has on an eligible student’s ability to participate in higher education.
Student drop-outs lead to a delay in recouping funds that were issued as loan
assistance. As such, fewer students are potentially able to be funded in the following
year as students can only repay loans once they are employed. In addition to these
issues, some graduates fail to fulfil their obligation to repay any loan assistance back
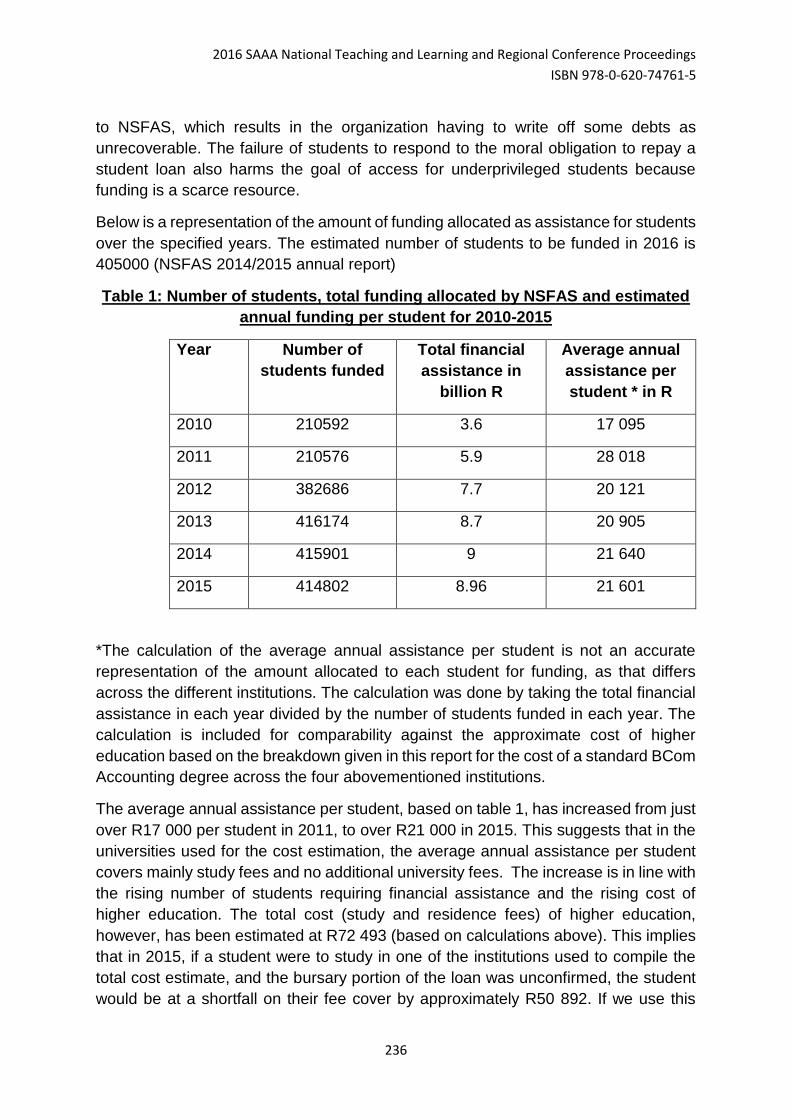
2016 SAAA National Teaching and Learning and Regional Conference Proceedings
ISBN 978-0-620-74761-5
236
to NSFAS, which results in the organization having to write off some debts as
unrecoverable. The failure of students to respond to the moral obligation to repay a
student loan also harms the goal of access for underprivileged students because
funding is a scarce resource.
Below is a representation of the amount of funding allocated as assistance for students
over the specified years. The estimated number of students to be funded in 2016 is
405000 (NSFAS 2014/2015 annual report)
Table 1: Number of students, total funding allocated by NSFAS and estimated
annual funding per student for 2010-2015
Year Number of
students funded
Total financial
assistance in
billion R
Average annual
assistance per
student * in R
2010 210592 3.6 17 095
2011 210576 5.9 28 018
2012 382686 7.7 20 121
2013 416174 8.7 20 905
2014 415901 9 21 640
2015 414802 8.96 21 601
*The calculation of the average annual assistance per student is not an accurate
representation of the amount allocated to each student for funding, as that differs
across the different institutions. The calculation was done by taking the total financial
assistance in each year divided by the number of students funded in each year. The
calculation is included for comparability against the approximate cost of higher
education based on the breakdown given in this report for the cost of a standard BCom
Accounting degree across the four abovementioned institutions.
The average annual assistance per student, based on table 1, has increased from just
over R17 000 per student in 2011, to over R21 000 in 2015. This suggests that in the
universities used for the cost estimation, the average annual assistance per student
covers mainly study fees and no additional university fees. The increase is in line with
the rising number of students requiring financial assistance and the rising cost of
higher education. The total cost (study and residence fees) of higher education,
however, has been estimated at R72 493 (based on calculations above). This implies
that in 2015, if a student were to study in one of the institutions used to compile the
total cost estimate, and the bursary portion of the loan was unconfirmed, the student
would be at a shortfall on their fee cover by approximately R50 892. If we use this
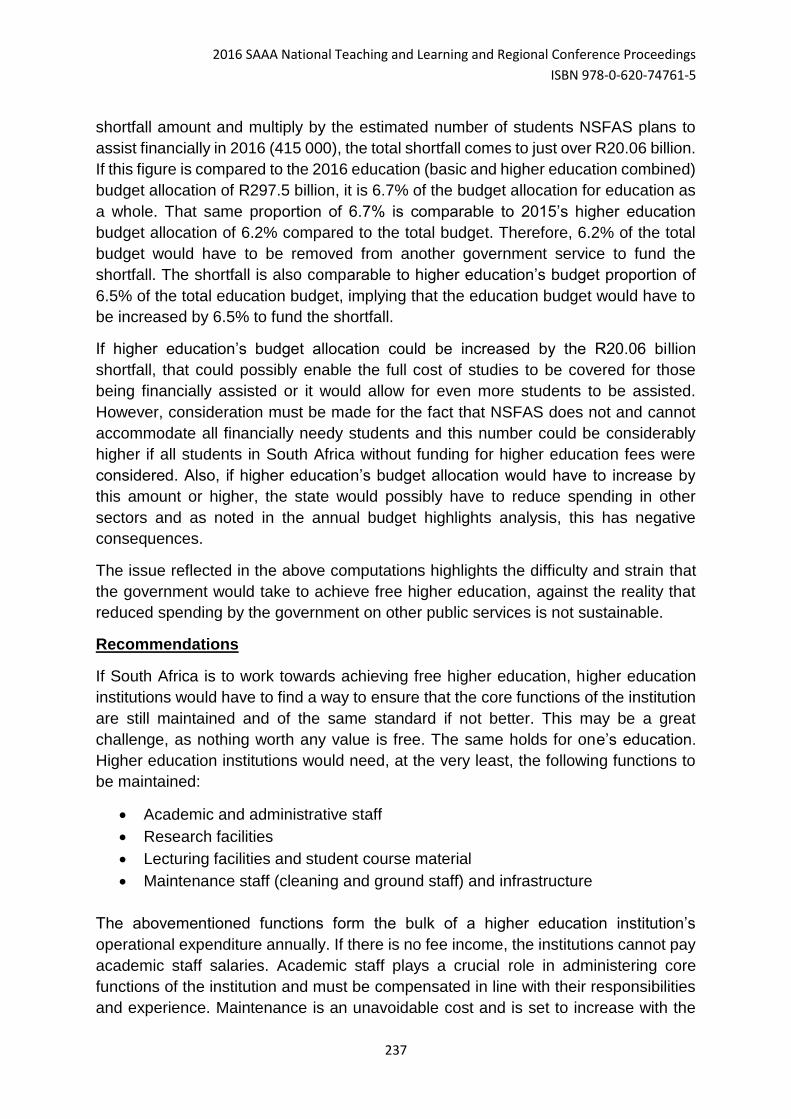
2016 SAAA National Teaching and Learning and Regional Conference Proceedings
ISBN 978-0-620-74761-5
237
shortfall amount and multiply by the estimated number of students NSFAS plans to
assist financially in 2016 (415 000), the total shortfall comes to just over R20.06 billion.
If this figure is compared to the 2016 education (basic and higher education combined)
budget allocation of R297.5 billion, it is 6.7% of the budget allocation for education as
a whole. That same proportion of 6.7% is comparable to 2015’s higher education
budget allocation of 6.2% compared to the total budget. Therefore, 6.2% of the total
budget would have to be removed from another government service to fund the
shortfall. The shortfall is also comparable to higher education’s budget proportion of
6.5% of the total education budget, implying that the education budget would have to
be increased by 6.5% to fund the shortfall.
If higher education’s budget allocation could be increased by the R20.06 billion
shortfall, that could possibly enable the full cost of studies to be covered for those
being financially assisted or it would allow for even more students to be assisted.
However, consideration must be made for the fact that NSFAS does not and cannot
accommodate all financially needy students and this number could be considerably
higher if all students in South Africa without funding for higher education fees were
considered. Also, if higher education’s budget allocation would have to increase by
this amount or higher, the state would possibly have to reduce spending in other
sectors and as noted in the annual budget highlights analysis, this has negative
consequences.
The issue reflected in the above computations highlights the difficulty and strain that
the government would take to achieve free higher education, against the reality that
reduced spending by the government on other public services is not sustainable.
Recommendations
If South Africa is to work towards achieving free higher education, higher education
institutions would have to find a way to ensure that the core functions of the institution
are still maintained and of the same standard if not better. This may be a great
challenge, as nothing worth any value is free. The same holds for one’s education.
Higher education institutions would need, at the very least, the following functions to
be maintained:
Academic and administrative staff
Research facilities
Lecturing facilities and student course material
Maintenance staff (cleaning and ground staff) and infrastructure
The abovementioned functions form the bulk of a higher education institution’s
operational expenditure annually. If there is no fee income, the institutions cannot pay
academic staff salaries. Academic staff plays a crucial role in administering core
functions of the institution and must be compensated in line with their responsibilities
and experience. Maintenance is an unavoidable cost and is set to increase with the
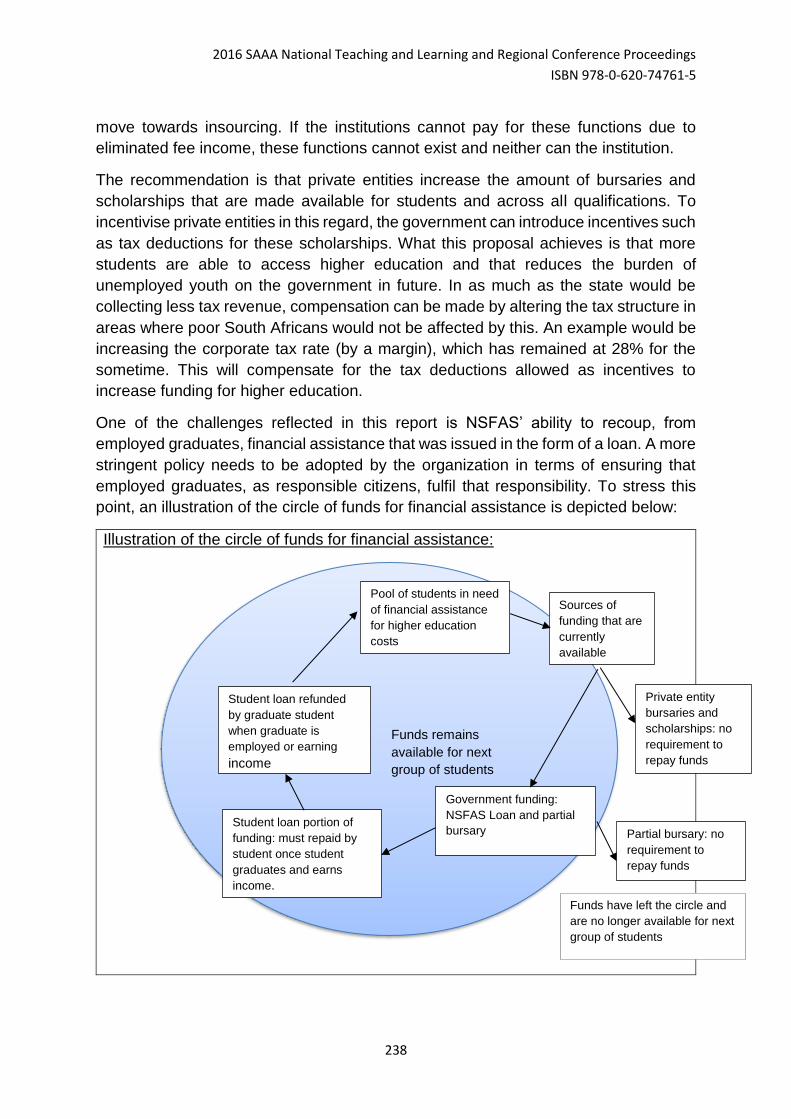
2016 SAAA National Teaching and Learning and Regional Conference Proceedings
ISBN 978-0-620-74761-5
238
move towards insourcing. If the institutions cannot pay for these functions due to
eliminated fee income, these functions cannot exist and neither can the institution.
The recommendation is that private entities increase the amount of bursaries and
scholarships that are made available for students and across all qualifications. To
incentivise private entities in this regard, the government can introduce incentives such
as tax deductions for these scholarships. What this proposal achieves is that more
students are able to access higher education and that reduces the burden of
unemployed youth on the government in future. In as much as the state would be
collecting less tax revenue, compensation can be made by altering the tax structure in
areas where poor South Africans would not be affected by this. An example would be
increasing the corporate tax rate (by a margin), which has remained at 28% for the
sometime. This will compensate for the tax deductions allowed as incentives to
increase funding for higher education.
One of the challenges reflected in this report is NSFAS’ ability to recoup, from
employed graduates, financial assistance that was issued in the form of a loan. A more
stringent policy needs to be adopted by the organization in terms of ensuring that
employed graduates, as responsible citizens, fulfil that responsibility. To stress this
point, an illustration of the circle of funds for financial assistance is depicted below:
Illustration of the circle of funds for financial assistance:
Private entity
bursaries and
scholarships: no
requirement to
repay funds
Partial bursary: no
requirement to
repay funds
Funds have left the circle and
are no longer available for next
group of students
Student loan portion of
funding: must repaid by
student once student
graduates and earns
income.
Student loan refunded
by graduate student
when graduate is
employed or earning
income
Pool of students in need
of financial assistance
for higher education
costs
Sources of
funding that are
currently
available
Funds remains
available for next
group of students
Government funding:
NSFAS Loan and partial
bursary
2016 SAAA National Teaching and Learning and Regional Conference Proceedings
ISBN 978-0-620-74761-5
239
As shown in the above illustration of the circle of funds for financial assistance, the
portion of the NSFAS funding that is allocated as loan assistance is recouped in the
circle of funds so as to assist other students in need of financial aid. There is a
responsibility therefore, for students to pay this money back once they are earning
income. This responsibility is both contractual and ethical. The financial assistance in
the form of a study loan, is the one form of funding that never leaves the circle with
the student, unlike the funding through bursaries and scholarships. It is vital that the
only hindrance to the collection of these funds be the delay in time as result of students
seeking employment or completing their studies and not due to uncollectability (bad
debts).
The cycle reflected above points to many similar experiences in South Africa and the
fear therefore, with implementing a free higher education system is achieving the same
outcome, where the quality of education produced becomes mediocre. Further
conclusions drawn by Wangenge-Ouma, (2010) are that a free higher education
system benefits those that are already privileged. This statement is based on the
consequences of a free higher education system in other nations. Free higher
education in Africa reproduced and reinforced colonial inequalities with regards to the
distribution of schools and beneficiaries of free higher education. Because the
distribution of good schools was uneven, the beneficiaries of free higher education
were select individuals from certain ethnic groups that repeated the same patterns of
colonial inequality. In addition to this, lower levels of education were not free at that
stage and therefore those who couldn’t afford lower levels of education would be left
out of the circle of beneficiaries of free higher education, leaving it for students from
elite backgrounds to benefit from (Wangenge-Ouma, 2010).
In the context of South Africa, this report has noted numerous times the need to invest
in a stronger basic education system. The need for this is evident from the above
information that if lower levels of education create inequalities (poor education quality
and uneven distribution of resources), those inequalities persist and higher education
becomes a commodity that only those who can afford it can have or becomes
accessible by those who could afford to go to private schools at a basic school level.
A developed nation that operates under a “free” higher education system is Sweden
(www.theatlantic.com ; May 2013). The justification for this system in that country
specifically, is that the cost of living is high. The state therefore compensates the
families of students by allowing students to study on a loan account, which is similar
to the South African national student funding model, where students pay that money
back to the state upon graduating and becoming employed. The difference, however,
is the way in which the study funds are repaid to the state. Students who become
employed graduates either pay the money back through adjusted taxes that account
for the repayment that must go to the state or through paying in the form of a low
interest loan. Both repayment terms are structured such that graduates are still able
to have a reasonable disposable income.
2016 SAAA National Teaching and Learning and Regional Conference Proceedings
ISBN 978-0-620-74761-5
240
Employing a similar system in South Africa would require an adjustment to be made
in the tax administration system to tax graduates accordingly. Whether or not this is
possible, is an area of further study. Of importance to note, is that even in the context
of a developed country, there is a cost for higher education, it is not free. This validates,
therefore, the concern about whether South Africa, as a developing country, is ready
to adopt a cost free higher education system, given the system’s failures in the past
under similar conditions as the South African environment.
Lastly, there is a great need to initiate awareness programmes about the availability
of funding for all qualifications. Life Orientation is a subject done throughout the basic
education syllabus (www.education.gov.za ) and is a subject used to expose learners
to career guidance in Grade 11. A recommendation is that school visits by funding
institutions (government and private) be included in the Life Orientation career
guidance programmes so that learners are aware ahead of time of what funding
mechanisms are available. This will allow learners to prepare mentally and
academically to work towards attaining both access to higher education and funding.
Areas of further research
This report has noted a number of key issues that have affected the government’s
ability to maintain and increase its spending on higher education. The South African
tax administration is known to be very efficient. A recommended area of research
therefore, would be a more beneficial revenue collectability model for the government.
The government’s ability to collect tax revenues from areas where tax is being evaded,
could be beneficial in enabling the economy to be more robust and maintain a cost
free higher education system in years to come.
Based on the issues identified in the literature, it is also necessary to further study the
additional factors that contribute to a student’s ability to remain in the higher education
system. Financial constraints have been highlighted as the dominant cause, however
in an instance where finances have been provided for, the objective to maximize
access is still hindered by a high drop-out rate from poorer students.
Much investigation needs to go into the basic education system of South Africa. The
foundation phase of a child’s education has been noted to be a very critical stage in
their learning. It is, therefore, of great importance that the country moves towards
prioritising the resources in this area too, as basic education is the government’s
responsibility.
Conclusion
The evidence of decreased government funding over recent years questions the
sustainability of a free higher education system and whether the government can in
fact afford a cost free higher education system. The prevalence of a current deficit,
evaluation of the country as junk status as a foreign investment designation and a
2016 SAAA National Teaching and Learning and Regional Conference Proceedings
ISBN 978-0-620-74761-5
241
currency that is in jeopardy are just a few of the external pressures evidencing that the
government may not be able to sustain free higher education at the moment.
It goes without saying that the cost of higher education in South Africa is paramount
and with the increasing demand for higher education, those who need financing suffer
the most from fee increases. The challenge therefore, is that in the midst of a country
that is currently not ready to take on a cost free higher education system (based on
the research), and with higher education institutions needing to fund their operations
predominantly through fee income, who should take responsibility for the cost when
students are unable to qualify for access to higher education due to financial
constraints?
Based on the 3 responsible agents for higher education costs (the financially
challenged students, the institutions and the government), it is clear that no one can
in fact afford the cost of higher education. While cost free higher education would be
the solution to many transformation and socio economic issues in the country, higher
education institutions cannot be administered in such a system. If higher education
institutions cannot afford to maintain core services like academic staff and continuous
research, which depend highly on fee income, the existence of institutions could be
compromised in the long run, if not the quality of education and graduates produced.
As a nation, South Africa needs to address the country’s sensitivity to changes in the
higher education system by assessing what the country is ready to lose and what the
country can afford to maintain. As is, the government is not fully equipped financially
to sustain a cost free higher education system. This is based on its inability to meet
the growing demands of higher education over the recent years. Higher education
institutions cannot operate without revenue (mainly fee income) to fund its operations
and provide resources that are used by the growing number of tertiary students.
The interim solution lies in maximizing on the funding that is available to achieve
maximum access to higher education by eligible students. This will enable more
graduates to contribute to the economy by improving the youth employment rates as
more graduates become employed. Increasing youth employment can contribute to
the growth in the country’s economy. In that way, the government can gradually
increase spending on higher education, implying that more students with financial
difficulty can be supported and that access to higher education can be improved. It is
worth noting that there are other issues that the country needs to address to prepare
itself for free higher education. The level of corruption and its impact on the economy,
the quality of basic education and investing in resources like infrastructure and skills
development for educators are but a few of the areas that need focus. Prioritising basic
education will also ensure that learners are prepared for higher education.
This report does not take a position against free higher education in South Africa,
neither is the conclusion that South Africa should not implement such a system. The
standpoint is that South Africa needs time to rectify what has gone wrong at a basic
2016 SAAA National Teaching and Learning and Regional Conference Proceedings
ISBN 978-0-620-74761-5
242
education level, so that if a free higher education system is implemented, maximum
access can be achieved by those most affected by the rising higher education costs.
The country also needs time to develop further as an economy and rebuild its statute
as the powerhouse of Africa. The time will allow the economy to adjust and possibly
alter its revenue collection structure so that the state is prepared to adopt an equitable
higher education system, which is more sustainable than a free higher education
system.
REFERENCE LIST:
Academic fees; other fees and levies. (2016). University of Cape Town student fees 2016 (pp. 7-8-16)
Altbach, P. G. (2015). Perspectives on internationalizing higher education, International Higher
Education, 27, 6–8.
Annual report 2011. (2011). Cape Town: National Student Financial Aid Scheme.
Annual report 2012. (2012). Cape Town: National Student Financial Aid Scheme.
Annual report 2013. (2013). Cape Town: National Student Financial Aid Scheme.
Annual report 2014. (2014). Cape Town: National Student Financial Aid Scheme.
Annual report 2015. (2015). Cape Town: National Student Financial Aid Scheme.
Budget review 2011. (2011). Pretoria: Department of National Treasury.
Budget review 2012. (2012). Pretoria: Department of National Treasury.
Budget review 2013. (2013). Pretoria: Department of National Treasury.
Budget review 2014. (2014). Pretoria: Department of National Treasury.
Budget review 2015. (2015). Pretoria: Department of National Treasury.
Budget review 2016. (2016). Pretoria: Department of National Treasury.
Department of Education (South Africa) (1997). Education White Article 3: A Programme for Higher
Education.
Gordhan, P. (2016). 2016 Budget speech. Cape Town: National Treasury. doi:17/2016
Lebeau, Y., Stumpf, R., Brown, R., Lucchesi, M. A. S., & Kwiek, M. (2012). Who shall pay for the
public good? Comparative trends in the funding crisis of public higher education. Compare: A
Journal of Comparative and International Education, 42(1), 137-157.
2016 SAAA National Teaching and Learning and Regional Conference Proceedings
ISBN 978-0-620-74761-5
243
McLean, M., & Walker, M. (2012). The possibilities for university-based public-good professional
education: a case-study from South Africa based on the “capability approach.” Studies in Higher
Education, 37(5), 585–601. http://doi.org/10.1080/03075079.2010.531461
Ntshoe, I., & De Villiers, P. (2013). Funding sources for public higher education in South Africa:
Institutional responses. Perspectives in Education, 31(4), 71.
Theobald, S. (2015). How to fund university education for all: How do we create something that
ensures that every capable individual in South Africa is able to study? Rand Daily Mail.
Tilak, J.B.G. (2005). Global trends in funding higher education. International Higher Education. 5-6
Maria, T. D., & Bleotu, V. (2014). Modern Trends in Higher Education Funding. Procedia-Social and
Behavioral Sciences, 116, 2226-2230.
Study fees. (2016). University of Johannesburg student fees 2016 (pp. 4-5, 8, 14)
Gon, S. (2016). UCT insourcing: Not squaring the circle. Politicsweb (www.politicsweb.co.za)
University of Stellenbosch Student fees (2016). Stellenbosch: University of Stellenbosch.
Van der Bank, C., & Nkadimeng, M. (2014). Exploring funding in higher education to eliminate poverty
in South Africa.3(1), 353-354-357. doi:Doi:10.5901/ajis.2014.v3n1p353
Walker, M., McLean, M., Dison, A., & Vaughan, R. (2010). Higher education and poverty reduction:
the formation of public good professionals in universities. Studies in Higher Education, 17.
Wangenge-Ouma, G. (2010). Funding and the attainment of transformation goals in South Africa's
higher education.36(4), 481-482-497. doi:10.1080/03054985.2010.491181
Wangenge-Ouma, G. (2012). Study fees and the challenge of making higher education a popular
commodity in South Africa.64, 831-832-844. doi:10.1007/s10734-012-9531-6
www.nsfas.co.za
http://www.rdm.co.za/politics/2015/10/22/how-to-fund-university-education-for-all
http://www.politicsweb.co.za/opinion/uct-insourcing-not-squaring-the-circle
http://varsitynewspaper.co.za/news/4396-student-housing-crisis
www.theatlantic.com
2016 SAAA National Teaching and Learning and Regional Conference Proceedings
ISBN 978-0-620-74761-5
244
2016 Southern African Accounting Association (SAAA) National Teaching and Learning and Regional Conference Proceedings ISBN number: 978-0-620-74761-5
MAF 08: LONG-TERM INCENTIVES: DO SHAREHOLDERS
GET WHAT THEY PAY FOR?
Francois Steyn & Carol Cairney – University of the Western Cape
E-mail: [email protected]
Abstract
As a result of high economic inequality, executive remuneration has long been a fierce topic of debate
in South Africa (SA). The high levels of long-term incentives awarded are often highlighted as a
source of discontent amongst stakeholders. The literature offers various theories surrounding
executive pay: Labour market theory suggest that high pay is required to secure the talent required for
better company performance, while optimal contracting theory advocates the use of long-term
incentive compensation (LIC) to achieve goal congruence between managers and shareholders.
The findings of international studies on the link between CEO pay and future company performance,
however, cast doubt over the efficacy of LIC to motivate shareholder value creation. Excess CEO-
compensation was found to be negatively associated with abnormal future total shareholder returns
for up to five years (Balafas & Florackis, 2014; Cooper, Gulen & Rau, 2014; Core, Holthausen and
Larcker, 1999). Due to the difficulty in valuing LIC, it tends to be neglected in South African studies.
The relationship between CEO pay and future company performance has also not been investigated
in the local context.
This paper aimed to contribute to the field in two ways: 1) establishing the significance of LIC pay
levels and the proportion of LIC to total compensation for the top 100 JSE listed companies, overall
and by size grouping, 2) by investigating the relationship between excess LIC and future abnormal
total shareholder return (TSR).
The findings show that while LIC makes up a significant proportion of pay in SA, there seems to be no
clear relationship between the levels of excess LIC and abnormal future TSR.
Key words: Pay-performance sensitivity; Optimal contracting; Agency theory; Executive remuneration;
Long-term incentives; South Africa
2016 SAAA National Teaching and Learning and Regional Conference Proceedings
ISBN 978-0-620-74761-5
245
Introduction
The level of compensation earned by executive managers of companies in the private sector
is a contentious issue worldwide. Discontent is fuelled by the increasing disparity in
compensation between executives and the average worker (AFL-CIO, 2015; COSATU,
2014). Long-term incentive plans, specifically, have driven executive pay up to “unwarranted
levels” without delivering the same improvement in company performance (Garside, 2015).
Cooper et al. (2014) found that companies in the United States (U.S.) that pay their CEOs in
the top ten percent of excess pay earn negative abnormal returns of nearly -8% in the
subsequent three years. This casts doubt over the economic justification for ever increasing
executive compensation, and similar results in SA would be concerning.
On the other end of the debate, proponents of labour market theory argue that in a
competitive environment good leaders are required (Chalmers, Koh and Stapleton, 2006)
and companies need to compensate CEOs adequately in order to retain quality talent
(Bizjak, Lemmon & Naveen, 2008). According to agency theory, once the appropriate talent
has been secured, management needs to be incentivised to act in the best interest of the
shareholders of the company. It is further argued that if companies perform well, they
contribute to the economy and more jobs are created.
South African studies that investigate this link between company performance and executive
pay ignore long-term incentives due the difficulty of determining the values, as well as the
insignificance of LIC in some industries (Shaw, 2011). This study aims to establish the
significance of long-term incentive compensation of CEOs in South Africa, and whether there
is a positive association between CEO long-term incentive compensation and future
company performance.
Background and literature review
Most of the studies that investigate executive remuneration mainly focus on the
compensation of the highest paid individual, the CEO (Balafas & Florackis, 2014; Chalmers
et al., 2006; Cooper et al., 2014; Core et al., 1999; Edmans & Gabaix, 2009; Jensen &
Murphy, 1990a; Jensen & Murphy, 1990b; Tosi & Gomez-Mejia, 1994) and as a result this
study excludes compensation of other executives.
The literature review is arranged as follows: First a brief explanation of the various theories
that aim to explain CEO compensation, followed by defining the components of CEO pay
and measures of company performance. A short summary of international and local pay-
performance sensitivity studies are presented, before the research objectives are
formulated.
Theories explaining managerial pay
There are various theories that try to explain the levels of CEO compensation. Agency
theory arose due to the separation of the control and ownership of companies, which might
cause self-serving managers pursue their personal goals above that of the company (Jones
& Ville, 1996). These undesirable activities of the managers can be limited by establishing
appropriate incentives for the managers (Jensen & Meckling, 1976). Optimal contracting
2016 SAAA National Teaching and Learning and Regional Conference Proceedings
ISBN 978-0-620-74761-5
246
theory suggests that a well-designed pay package should attract the right CEOs; incentivise
them to exert effort and exploit growth opportunities; and reject wasteful projects while
limiting the cost of doing so (Edmans & Gabaix, 2009). Optimal contracting theory suggests
that the problem of appropriate CEO compensation is not just a question of how much the
executive managers should be paid, but also how their compensation packages should be
structured (Jensen & Murphy, 1990b). Labour market theory views CEO compensation
levels as the efficient outcome of a labour market in which companies optimally compete for
managerial talent (Frydman & Jenter, 2010). A positive association between pay and future
performance would support agency theory, optimal contracting and labour market theory.
Compensation and company performance variables
Studies that investigate the sensitivity of CEO compensation to company performance –
pay-performance sensitivity studies – have to decide on how to measure CEO compensation
and company performance respectively.
Total compensation (TC) is made up of two major components, namely: short-term cash
compensation (SCC) and long-term incentive compensation (LIC). SCC mainly comprises
base salary, other benefits and cash bonus, while LIC is made up of one or more of the
following: deferred short-term incentives, performance shares, share options and gains on
shares held. The value of the SCC earned by the CEO is readily available from annual
reports and databases such as INETBFA. The value of LIC in South Africa is however only
disclosed by a handful of the largest listed companies and has to be calculated for the
remainder of the companies using the information published in remuneration reports, a time
consuming exercise.
Company performance may be measured in various ways that can be broadly categorised
as either accounting measures or market-related measures of company performance.
Accounting measures include absolute measures such as revenue or profit, or ratios,
including earnings per share (EPS), return on equity (ROE) and return on assets (ROA). The
basic problem with using accounting measures as an indication of company performance is
that accounting measures do not measure shareholder value (Correia, Flynn, Uliana &
Wormald, 2013) and it may be manipulated in various ways (Healy, 1985). Due to the
shortcomings of accounting ratios as a measure of company performance the trend in the
pay-performance sensitivity literature is moving towards a market related measure of
shareholder wealth: total shareholder return (TSR) (Abowd, 1990; Conyon & Leech, 1994;
Main, Bruce & Buck, 1996; Masson, 1971; Murphy, 1986; Stathopoulus, Espenlaub &
Walker, 2005). TSR is generally regarded as the best indicator of company performance,
since it combines capital growth (gain in share price) and cash flow (dividends) to provide
ultimate shareholder returns (O’Neill & Iob, 1999). A study that aims to investigate the link,
between CEO pay and company performance, would be most valuable if LIC is included in
CEO pay and company performance is measured in terms of TSR.
The link between CEO pay and company performance
Early studies on the link between company performance and CEO pay found that the size of
the company is more closely related to the level of CEO compensation than the performance
(McGuire, Chiu & Elbing, 1962; Roberts, 1959). Later studies rejected this theory of sales
2016 SAAA National Teaching and Learning and Regional Conference Proceedings
ISBN 978-0-620-74761-5
247
maximisation, reporting that executive compensation is primarily related to share market
returns (Lewellen & Huntsman, 1970; Masson, 1971).
Studies that exclude LIC report a weak relationship between pay and performance in large
listed companies (Benito & Conyon, 1999; Conyon & Leech, 1994). Girma, Thompson &
Wright (2007) also exclude long-term incentives from compensation and use accounting-
based measures of company performance and found a weak pay-performance relationship.
In contrast to studies that focus on SCC, studies that include LIC and measure company
performance in terms of TSR, report a positive relationship between pay and performance
(Jensen & Murphy, 1990a; Main et al., 1996; Murphy, 1986; Stathopoulos et al., 2005).
Barber, Ghiselli and Deale (2006) similarly report a positive but weak correlation among
CEO compensation (including long-term share-based incentives), sales, profit and share
price in the U.S. restaurant industry.
Eichholtz, Kok and Otten (2008) use both accounting and market-related measures of
performance, and include long-term incentive compensation and report that compensation is
strongly linked to company size (similar to the findings of Girma et al. (2007)). Eichholtz et al.
(2008) also report that long-term incentives – but not cash pay – are explained by
performance, consistent with the earlier studies of Lewellen and Huntsman (1970), and
Masson (1971).
One study, however, reported an inverse relationship between compensation (including
share options) and TSR over the previous five years and concluded that job size and
complexity largely determine compensation (O’Neill & Iob, 1999). The results reported by
pay-performance sensitivity studies are as varied as the measures of pay and performance
that are included. It is, however, clear that the inclusion of LIC and some market related
measure of company performance is preferable. These studies all investigated the effect of
company performance on CEO pay, without considering the effect that the pay package has
on the future performance of the company.
Pay for future performance
How performance affects compensation is well researched, but limited research exist on the
reciprocal relationship of how compensation affects future performance (Murphy, 1999), in
other words: whether shareholders get what they pay for.
Abowd (1990) investigated whether the sensitivity of cash based compensation to company
performance is positively related to company performance in the subsequent year and
reports that where there was a stronger relationship between company performance and
CEO pay in the base year, companies performed better in the subsequent year. Other
studies that investigated whether CEOs that earn in excess of their peers perform better, all
report a negative association between abnormal future share returns and excess CEO
compensation (Balafas & Florackis, 2014; Cooper et al, 2014; Core et al, 1999). If similar
results were to be found in South Africa, where pay inequality is arguably more severe, it
would be very concerning.
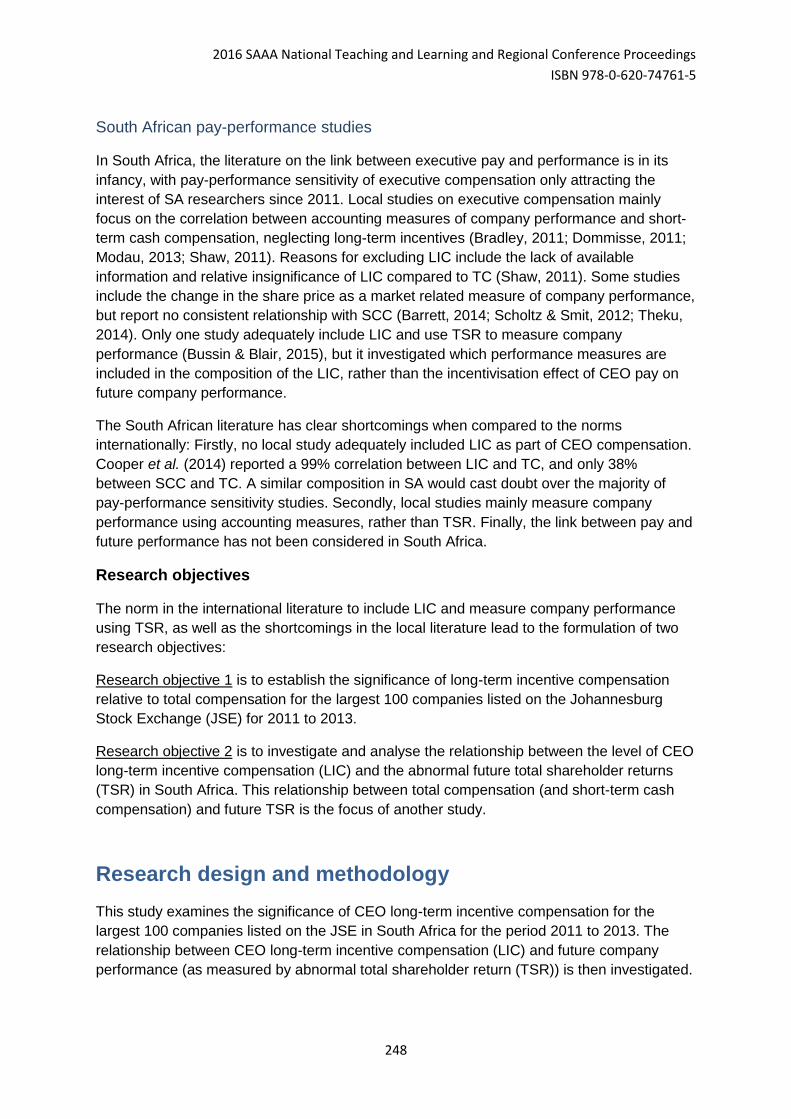
2016 SAAA National Teaching and Learning and Regional Conference Proceedings
ISBN 978-0-620-74761-5
248
South African pay-performance studies
In South Africa, the literature on the link between executive pay and performance is in its
infancy, with pay-performance sensitivity of executive compensation only attracting the
interest of SA researchers since 2011. Local studies on executive compensation mainly
focus on the correlation between accounting measures of company performance and short-
term cash compensation, neglecting long-term incentives (Bradley, 2011; Dommisse, 2011;
Modau, 2013; Shaw, 2011). Reasons for excluding LIC include the lack of available
information and relative insignificance of LIC compared to TC (Shaw, 2011). Some studies
include the change in the share price as a market related measure of company performance,
but report no consistent relationship with SCC (Barrett, 2014; Scholtz & Smit, 2012; Theku,
2014). Only one study adequately include LIC and use TSR to measure company
performance (Bussin & Blair, 2015), but it investigated which performance measures are
included in the composition of the LIC, rather than the incentivisation effect of CEO pay on
future company performance.
The South African literature has clear shortcomings when compared to the norms
internationally: Firstly, no local study adequately included LIC as part of CEO compensation.
Cooper et al. (2014) reported a 99% correlation between LIC and TC, and only 38%
between SCC and TC. A similar composition in SA would cast doubt over the majority of
pay-performance sensitivity studies. Secondly, local studies mainly measure company
performance using accounting measures, rather than TSR. Finally, the link between pay and
future performance has not been considered in South Africa.
Research objectives
The norm in the international literature to include LIC and measure company performance
using TSR, as well as the shortcomings in the local literature lead to the formulation of two
research objectives:
Research objective 1 is to establish the significance of long-term incentive compensation
relative to total compensation for the largest 100 companies listed on the Johannesburg
Stock Exchange (JSE) for 2011 to 2013.
Research objective 2 is to investigate and analyse the relationship between the level of CEO
long-term incentive compensation (LIC) and the abnormal future total shareholder returns
(TSR) in South Africa. This relationship between total compensation (and short-term cash
compensation) and future TSR is the focus of another study.
Research design and methodology
This study examines the significance of CEO long-term incentive compensation for the
largest 100 companies listed on the JSE in South Africa for the period 2011 to 2013. The
relationship between CEO long-term incentive compensation (LIC) and future company
performance (as measured by abnormal total shareholder return (TSR)) is then investigated.
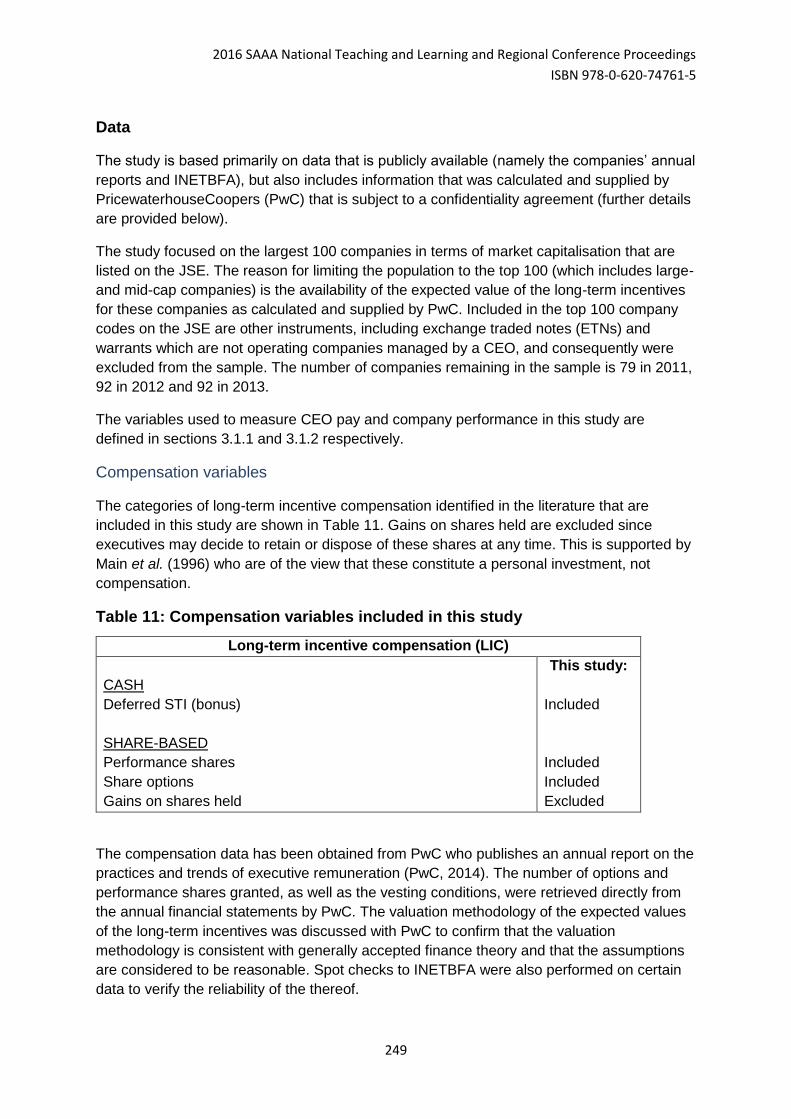
2016 SAAA National Teaching and Learning and Regional Conference Proceedings
ISBN 978-0-620-74761-5
249
Data
The study is based primarily on data that is publicly available (namely the companies’ annual
reports and INETBFA), but also includes information that was calculated and supplied by
PricewaterhouseCoopers (PwC) that is subject to a confidentiality agreement (further details
are provided below).
The study focused on the largest 100 companies in terms of market capitalisation that are
listed on the JSE. The reason for limiting the population to the top 100 (which includes large-
and mid-cap companies) is the availability of the expected value of the long-term incentives
for these companies as calculated and supplied by PwC. Included in the top 100 company
codes on the JSE are other instruments, including exchange traded notes (ETNs) and
warrants which are not operating companies managed by a CEO, and consequently were
excluded from the sample. The number of companies remaining in the sample is 79 in 2011,
92 in 2012 and 92 in 2013.
The variables used to measure CEO pay and company performance in this study are
defined in sections 3.1.1 and 3.1.2 respectively.
Compensation variables
The categories of long-term incentive compensation identified in the literature that are
included in this study are shown in Table 11. Gains on shares held are excluded since
executives may decide to retain or dispose of these shares at any time. This is supported by
Main et al. (1996) who are of the view that these constitute a personal investment, not
compensation.
Table 11: Compensation variables included in this study
Long-term incentive compensation (LIC)
CASH
Deferred STI (bonus)
SHARE-BASED
Performance shares
Share options
Gains on shares held
This study:
Included
Included
Included
Excluded
The compensation data has been obtained from PwC who publishes an annual report on the
practices and trends of executive remuneration (PwC, 2014). The number of options and
performance shares granted, as well as the vesting conditions, were retrieved directly from
the annual financial statements by PwC. The valuation methodology of the expected values
of the long-term incentives was discussed with PwC to confirm that the valuation
methodology is consistent with generally accepted finance theory and that the assumptions
are considered to be reasonable. Spot checks to INETBFA were also performed on certain
data to verify the reliability of the thereof.
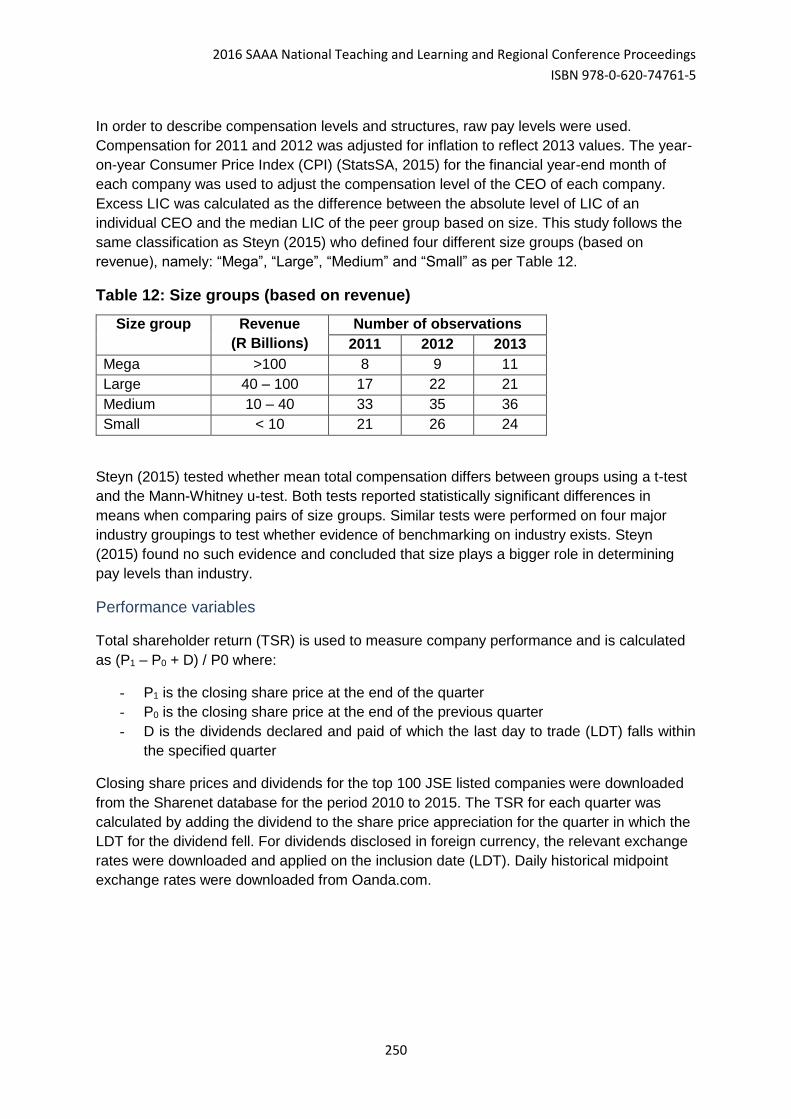
2016 SAAA National Teaching and Learning and Regional Conference Proceedings
ISBN 978-0-620-74761-5
250
In order to describe compensation levels and structures, raw pay levels were used.
Compensation for 2011 and 2012 was adjusted for inflation to reflect 2013 values. The year-
on-year Consumer Price Index (CPI) (StatsSA, 2015) for the financial year-end month of
each company was used to adjust the compensation level of the CEO of each company.
Excess LIC was calculated as the difference between the absolute level of LIC of an
individual CEO and the median LIC of the peer group based on size. This study follows the
same classification as Steyn (2015) who defined four different size groups (based on
revenue), namely: “Mega”, “Large”, “Medium” and “Small” as per Table 12.
Table 12: Size groups (based on revenue)
Size group Revenue
(R Billions)
Number of observations
2011 2012 2013
Mega >100 8 9 11
Large 40 – 100 17 22 21
Medium 10 – 40 33 35 36
Small < 10 21 26 24
Steyn (2015) tested whether mean total compensation differs between groups using a t-test
and the Mann-Whitney u-test. Both tests reported statistically significant differences in
means when comparing pairs of size groups. Similar tests were performed on four major
industry groupings to test whether evidence of benchmarking on industry exists. Steyn
(2015) found no such evidence and concluded that size plays a bigger role in determining
pay levels than industry.
Performance variables
Total shareholder return (TSR) is used to measure company performance and is calculated
as (P1 – P0 + D) / P0 where:
- P1 is the closing share price at the end of the quarter
- P0 is the closing share price at the end of the previous quarter
- D is the dividends declared and paid of which the last day to trade (LDT) falls within
the specified quarter
Closing share prices and dividends for the top 100 JSE listed companies were downloaded
from the Sharenet database for the period 2010 to 2015. The TSR for each quarter was
calculated by adding the dividend to the share price appreciation for the quarter in which the
LDT for the dividend fell. For dividends disclosed in foreign currency, the relevant exchange
rates were downloaded and applied on the inclusion date (LDT). Daily historical midpoint
exchange rates were downloaded from Oanda.com.
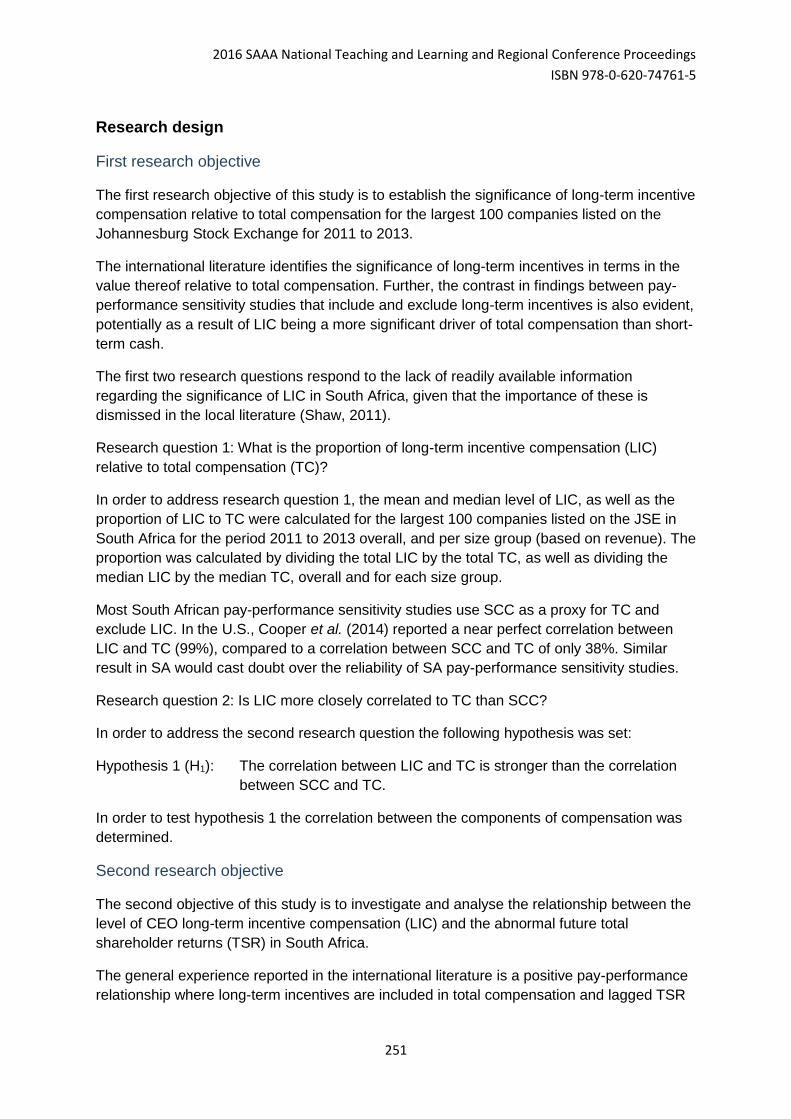
2016 SAAA National Teaching and Learning and Regional Conference Proceedings
ISBN 978-0-620-74761-5
251
Research design
First research objective
The first research objective of this study is to establish the significance of long-term incentive
compensation relative to total compensation for the largest 100 companies listed on the
Johannesburg Stock Exchange for 2011 to 2013.
The international literature identifies the significance of long-term incentives in terms in the
value thereof relative to total compensation. Further, the contrast in findings between pay-
performance sensitivity studies that include and exclude long-term incentives is also evident,
potentially as a result of LIC being a more significant driver of total compensation than short-
term cash.
The first two research questions respond to the lack of readily available information
regarding the significance of LIC in South Africa, given that the importance of these is
dismissed in the local literature (Shaw, 2011).
Research question 1: What is the proportion of long-term incentive compensation (LIC)
relative to total compensation (TC)?
In order to address research question 1, the mean and median level of LIC, as well as the
proportion of LIC to TC were calculated for the largest 100 companies listed on the JSE in
South Africa for the period 2011 to 2013 overall, and per size group (based on revenue). The
proportion was calculated by dividing the total LIC by the total TC, as well as dividing the
median LIC by the median TC, overall and for each size group.
Most South African pay-performance sensitivity studies use SCC as a proxy for TC and
exclude LIC. In the U.S., Cooper et al. (2014) reported a near perfect correlation between
LIC and TC (99%), compared to a correlation between SCC and TC of only 38%. Similar
result in SA would cast doubt over the reliability of SA pay-performance sensitivity studies.
Research question 2: Is LIC more closely correlated to TC than SCC?
In order to address the second research question the following hypothesis was set:
Hypothesis 1 (H1): The correlation between LIC and TC is stronger than the correlation
between SCC and TC.
In order to test hypothesis 1 the correlation between the components of compensation was
determined.
Second research objective
The second objective of this study is to investigate and analyse the relationship between the
level of CEO long-term incentive compensation (LIC) and the abnormal future total
shareholder returns (TSR) in South Africa.
The general experience reported in the international literature is a positive pay-performance
relationship where long-term incentives are included in total compensation and lagged TSR
2016 SAAA National Teaching and Learning and Regional Conference Proceedings
ISBN 978-0-620-74761-5
252
is used to measure company performance. The pay-performance sensitivity relationship
using this combination of variables has not been tested in South Africa.
A handful of studies in the international literature extend the investigation of the pay-
performance relationship to consider future company performance. Surprisingly, most of
these studies found the association between LIC and future abnormal TSR to be negative
(Balafas & Florackis, 2014; Cooper et al., 2014; Core et al., 1999).
The third research question considers this un-researched relationship in the South African
context, questioning whether a positive relationship between long-term incentive
compensation and future company performance (measured by TSR) exists.
Research question 3: Does a positive relationship between LIC and future company
performance (as measured by TSR) exist?
The relationship between LIC and TSR was investigated in terms of excess LIC and
abnormal future TSR. It was necessary to use excess compensation – that is, the absolute
value of LIC less the median of LIC of the peer group – rather than the absolute value of LIC
in order to control for the effect of benchmarking on compensation. The peer groups are
based on size groupings defined by Steyn (2015) as previously described in section 3.1.1.
Abnormal TSR was used in order to eliminate the effect of general share market
movements, calculated as the TSR of each company less the benchmark of the equally
weighted (EW) TSR of the top 100 JSE listed companies. In order to address research
question 3, the following hypothesis was set:
Hypothesis 2 (H2): A positive relationship between excess long-term incentive
compensation (LIC) and abnormal future total shareholder return
(TSR) exists.
The approach taken to test hypothesis 2 was to firstly analyse the situation descriptively in
order to establish the apparent relationship between excess LIC and abnormal TSR. This
relationship was then tested statistically in order to confirm or reject the hypothesis.
Descriptive relationship
The approach taken in the descriptive analysis was to first compare the abnormal returns of
the extreme cases of excess pay, since the distinction would be clearest when contrasting
the situations of companies with highest and lowest excess pay relative to peers, given the
obvious existence of other factors affecting abnormal returns. In order to do this, companies
were ranked on excess LIC and decile portfolios were formed. The abnormal TSR of the top
and bottom deciles of excess pay were compared.
In order to investigate whether the relationship between excess compensation and abnormal
returns was consistent across the remaining deciles, with abnormal returns declining as
excess pay diminished, the remaining deciles were taken into consideration. The groupings
were progressively broadened to include the next highest/lowest decile and the average
abnormal returns for the larger groups were calculated. This process was repeated until the
entire sample was split into two groups, being the top and the bottom half. A steadily
2016 SAAA National Teaching and Learning and Regional Conference Proceedings
ISBN 978-0-620-74761-5
253
decreasing abnormal return across groupings from highest to lowest decile would indicate a
consistently positive relationship between excess LIC and abnormal TSR.
The abnormal future TSR was calculated for the top and bottom decile portfolios of excess
LIC. The return holding period was limited to nine quarters due the availability of
compensation data. Even though the incentivisation effect of compensation on company
performance may take several years to manifest, international studies on the pay for future
company performance relationship have reported significant results for holding periods as
short as one year (Cooper et al., 2014; Core et al., 1999).
Decile portfolios were formed at the start of the calendar year in which the CEO
compensation was reported. The companies’ actual financial years were disregarded for
simplicity of the calculation. This simplification is supported by the findings of Cooper et al.
(2014) who report that a similar relationship between pay and future performance exists
regardless of forming portfolios on calendar year ends or financial year ends. Steyn (2015)
also reports a similar relationship between SCC and future abnormal TSR regardless of
calendar year-end or financial year-end portfolio formation. Portfolios were created at the
start of the calendar year, since it is argued that a CEO will be aware of how his/her
compensation package is structured at the start of the year and any incentivisation effect
would commence immediately. The equally weighted abnormal TSR for the companies in
the top and bottom deciles of excess compensation were then calculated. Equal weighting
eliminates the disproportionate effect that large companies may have on portfolio returns.
In order to investigate whether the relationship appears to be consistent when testing the
relationship in different ways, an alternative measure of future returns, as well as an
alternative measure of excess pay was tested, as follows:
Due to the variability in share returns, the relationship may be skewed by the effect of
extreme cases. The median abnormal TSR was calculated for the top and bottom
deciles of excess compensation in order to eliminate the effect of outliers.
As a result of the small sample size and the high variability in total compensation,
calculating excess pay using different cut-off points between size groups may affect
the relationship between pay and future performance. In order to eliminate the effect
of different size groupings, LIC was regressed on company revenue and the resultant
residual plots of each observation were used as excess pay. Excess pay calculated in
this manner is referred to as “residual pay” for the remainder of this study, to distinguish
this approach from the primary method determining excess pay used in this study.
Abnormal returns were equally-weighted and portfolios formed on calendar years.
A summary of the various descriptive analyses performed and the sections in which the
results can be found is presented in
Table 13 below.

2016 SAAA National Teaching and Learning and Regional Conference Proceedings
ISBN 978-0-620-74761-5
254
Statistical relationship
In order to test the statistical significance of any relationships that appear to exist in the
descriptive analysis, the Pearson’s r was calculated to measure the linear correlation
between the excess long-term incentive compensation (in terms of the median per size
group) and the abnormal TSR for quarter. Due to the large variation in LIC in the population,
the Spearman’s Rho is also calculated for corroborative purposes. The abnormal returns
were calculated from the start of the financial year to which the total compensation relates, in
order to better match the compensation and return periods.
As a result of the small sample size, the Pearson’s r and the Spearman’s Rho were re-
calculated by defining excess LIC as the residual plots, relative to the predicted LIC, when
regressing LIC on revenue. A summary of the statistical tests performed is presented in
Table 13 below.
Table 13: Summary of various descriptive analyses and statistical tests
Panel A: Descriptive analyses
Abnormal total shareholder
return
Excess total compensation Results
Weighting Year-end Basis for determining excess Section
Equal Calendar Absolute vs. median per size
group
5.1.1
Median Calendar Absolute vs. median per size
group
5.1.1
Equal Calendar Residual vs. predicted 5.1.1
Panel B: Statistical tests
Test Abnormal
total
shareholder
return
Excess total compensation Results
Correlation Year-end Basis for determining excess Section
Pearson’s r Financial Absolute vs. median per size
group
5.1.2
Spearman’s Rho Financial Absolute vs. median per size
group
5.1.2
Pearson’s r Financial Residual vs. predicted 5.1.2
Spearman’s Rho Financial Residual vs. predicted 5.1.2
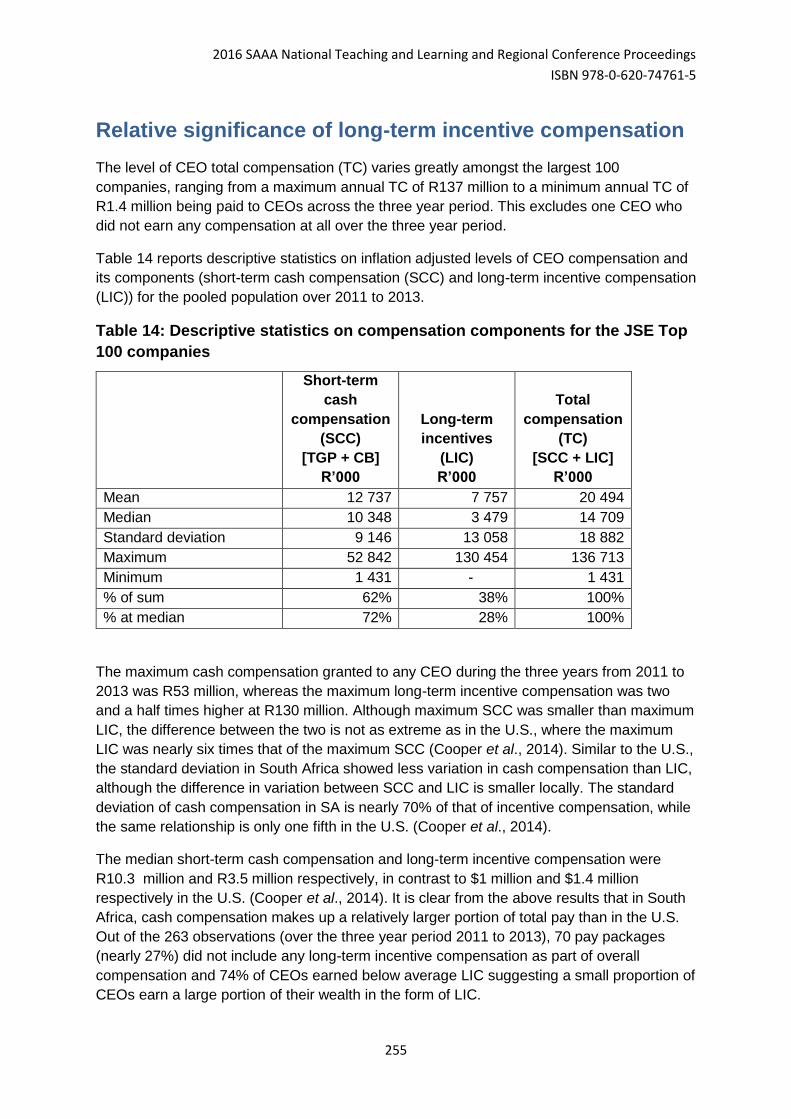
2016 SAAA National Teaching and Learning and Regional Conference Proceedings
ISBN 978-0-620-74761-5
255
Relative significance of long-term incentive compensation
The level of CEO total compensation (TC) varies greatly amongst the largest 100
companies, ranging from a maximum annual TC of R137 million to a minimum annual TC of
R1.4 million being paid to CEOs across the three year period. This excludes one CEO who
did not earn any compensation at all over the three year period.
Table 14 reports descriptive statistics on inflation adjusted levels of CEO compensation and
its components (short-term cash compensation (SCC) and long-term incentive compensation
(LIC)) for the pooled population over 2011 to 2013.
Table 14: Descriptive statistics on compensation components for the JSE Top
100 companies
Short-term
cash
compensation
(SCC)
[TGP + CB]
R’000
Long-term
incentives
(LIC)
R’000
Total
compensation
(TC)
[SCC + LIC]
R’000
Mean 12 737 7 757 20 494
Median 10 348 3 479 14 709
Standard deviation 9 146 13 058 18 882
Maximum 52 842 130 454 136 713
Minimum 1 431 - 1 431
% of sum 62% 38% 100%
% at median 72% 28% 100%
The maximum cash compensation granted to any CEO during the three years from 2011 to
2013 was R53 million, whereas the maximum long-term incentive compensation was two
and a half times higher at R130 million. Although maximum SCC was smaller than maximum
LIC, the difference between the two is not as extreme as in the U.S., where the maximum
LIC was nearly six times that of the maximum SCC (Cooper et al., 2014). Similar to the U.S.,
the standard deviation in South Africa showed less variation in cash compensation than LIC,
although the difference in variation between SCC and LIC is smaller locally. The standard
deviation of cash compensation in SA is nearly 70% of that of incentive compensation, while
the same relationship is only one fifth in the U.S. (Cooper et al., 2014).
The median short-term cash compensation and long-term incentive compensation were
R10.3_million and R3.5 million respectively, in contrast to $1 million and $1.4 million
respectively in the U.S. (Cooper et al., 2014). It is clear from the above results that in South
Africa, cash compensation makes up a relatively larger portion of total pay than in the U.S.
Out of the 263 observations (over the three year period 2011 to 2013), 70 pay packages
(nearly 27%) did not include any long-term incentive compensation as part of overall
compensation and 74% of CEOs earned below average LIC suggesting a small proportion of
CEOs earn a large portion of their wealth in the form of LIC.
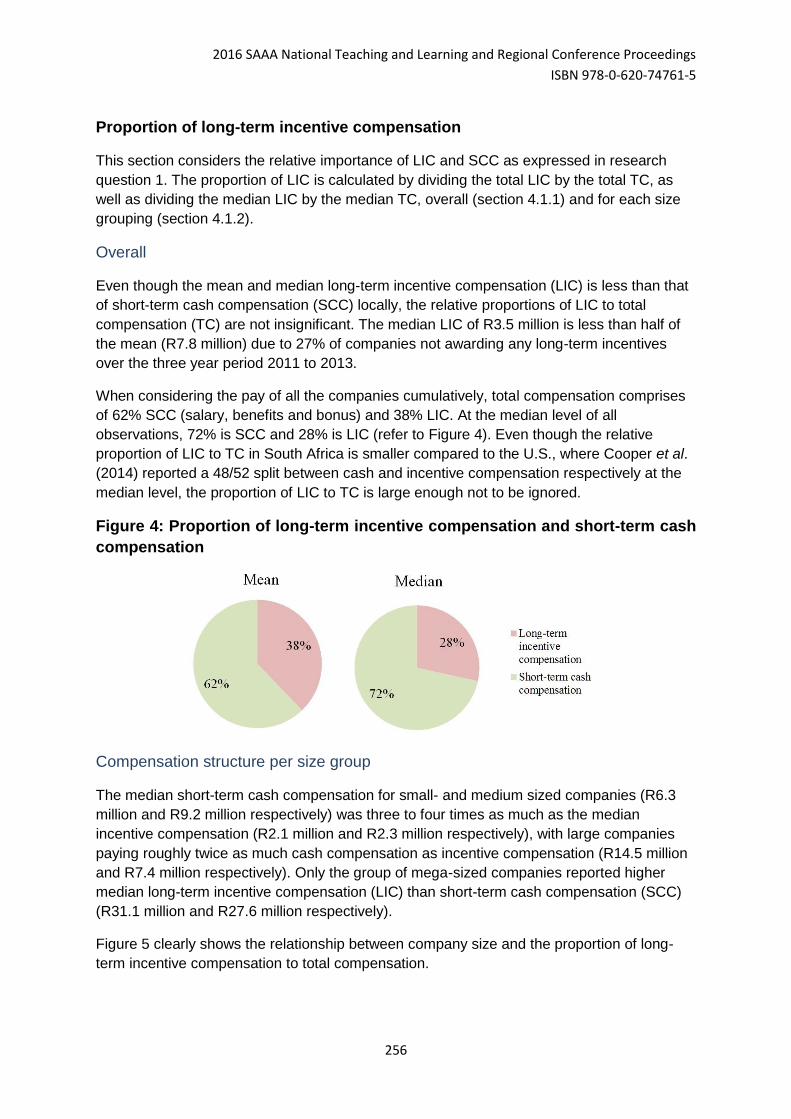
2016 SAAA National Teaching and Learning and Regional Conference Proceedings
ISBN 978-0-620-74761-5
256
Proportion of long-term incentive compensation
This section considers the relative importance of LIC and SCC as expressed in research
question 1. The proportion of LIC is calculated by dividing the total LIC by the total TC, as
well as dividing the median LIC by the median TC, overall (section 4.1.1) and for each size
grouping (section 4.1.2).
Overall
Even though the mean and median long-term incentive compensation (LIC) is less than that
of short-term cash compensation (SCC) locally, the relative proportions of LIC to total
compensation (TC) are not insignificant. The median LIC of R3.5 million is less than half of
the mean (R7.8 million) due to 27% of companies not awarding any long-term incentives
over the three year period 2011 to 2013.
When considering the pay of all the companies cumulatively, total compensation comprises
of 62% SCC (salary, benefits and bonus) and 38% LIC. At the median level of all
observations, 72% is SCC and 28% is LIC (refer to Figure 4). Even though the relative
proportion of LIC to TC in South Africa is smaller compared to the U.S., where Cooper et al.
(2014) reported a 48/52 split between cash and incentive compensation respectively at the
median level, the proportion of LIC to TC is large enough not to be ignored.
Figure 4: Proportion of long-term incentive compensation and short-term cash
compensation
Compensation structure per size group
The median short-term cash compensation for small- and medium sized companies (R6.3
million and R9.2 million respectively) was three to four times as much as the median
incentive compensation (R2.1 million and R2.3 million respectively), with large companies
paying roughly twice as much cash compensation as incentive compensation (R14.5 million
and R7.4 million respectively). Only the group of mega-sized companies reported higher
median long-term incentive compensation (LIC) than short-term cash compensation (SCC)
(R31.1 million and R27.6 million respectively).
Figure 5 clearly shows the relationship between company size and the proportion of long-
term incentive compensation to total compensation.
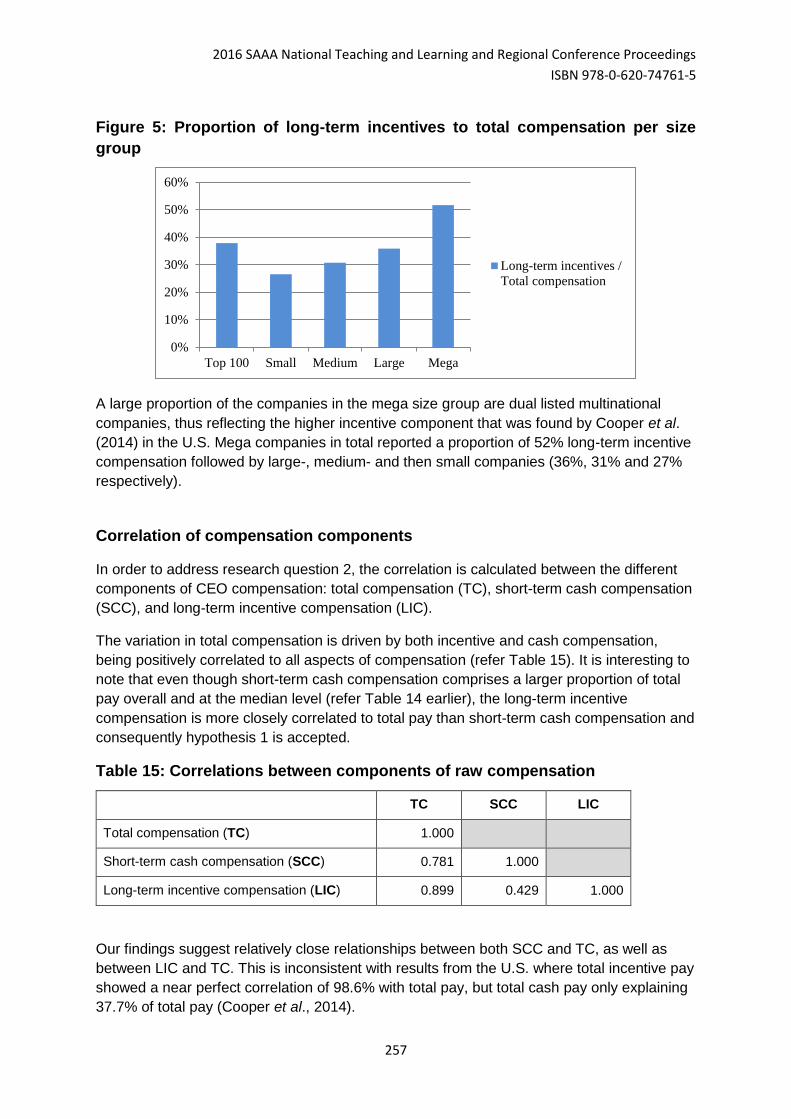
2016 SAAA National Teaching and Learning and Regional Conference Proceedings
ISBN 978-0-620-74761-5
257
Figure 5: Proportion of long-term incentives to total compensation per size
group
A large proportion of the companies in the mega size group are dual listed multinational
companies, thus reflecting the higher incentive component that was found by Cooper et al.
(2014) in the U.S. Mega companies in total reported a proportion of 52% long-term incentive
compensation followed by large-, medium- and then small companies (36%, 31% and 27%
respectively).
Correlation of compensation components
In order to address research question 2, the correlation is calculated between the different
components of CEO compensation: total compensation (TC), short-term cash compensation
(SCC), and long-term incentive compensation (LIC).
The variation in total compensation is driven by both incentive and cash compensation,
being positively correlated to all aspects of compensation (refer Table 15). It is interesting to
note that even though short-term cash compensation comprises a larger proportion of total
pay overall and at the median level (refer Table 14 earlier), the long-term incentive
compensation is more closely correlated to total pay than short-term cash compensation and
consequently hypothesis 1 is accepted.
Table 15: Correlations between components of raw compensation
TC SCC LIC
Total compensation (TC) 1.000
Short-term cash compensation (SCC) 0.781 1.000
Long-term incentive compensation (LIC) 0.899 0.429 1.000
Our findings suggest relatively close relationships between both SCC and TC, as well as
between LIC and TC. This is inconsistent with results from the U.S. where total incentive pay
showed a near perfect correlation of 98.6% with total pay, but total cash pay only explaining
37.7% of total pay (Cooper et al., 2014).
0%
10%
20%
30%
40%
50%
60%
Top 100 Small Medium Large Mega
Long-term incentives /
Total compensation
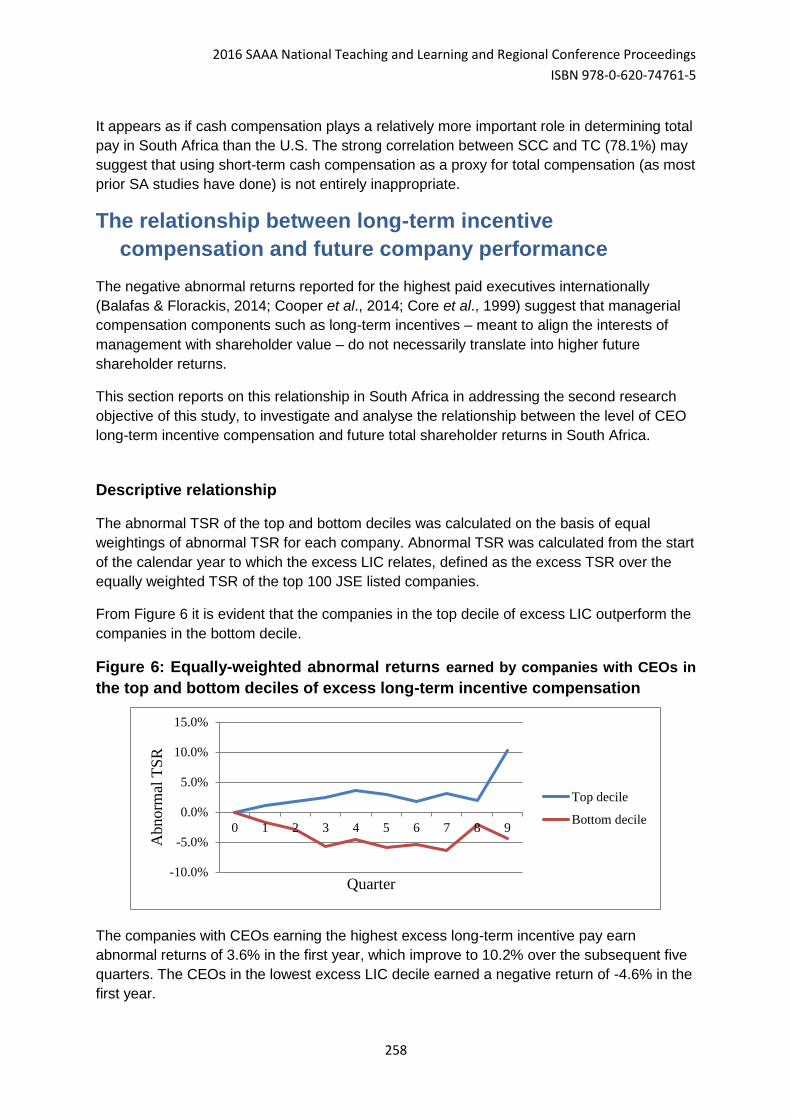
2016 SAAA National Teaching and Learning and Regional Conference Proceedings
ISBN 978-0-620-74761-5
258
It appears as if cash compensation plays a relatively more important role in determining total
pay in South Africa than the U.S. The strong correlation between SCC and TC (78.1%) may
suggest that using short-term cash compensation as a proxy for total compensation (as most
prior SA studies have done) is not entirely inappropriate.
The relationship between long-term incentive
compensation and future company performance
The negative abnormal returns reported for the highest paid executives internationally
(Balafas & Florackis, 2014; Cooper et al., 2014; Core et al., 1999) suggest that managerial
compensation components such as long-term incentives – meant to align the interests of
management with shareholder value – do not necessarily translate into higher future
shareholder returns.
This section reports on this relationship in South Africa in addressing the second research
objective of this study, to investigate and analyse the relationship between the level of CEO
long-term incentive compensation and future total shareholder returns in South Africa.
Descriptive relationship
The abnormal TSR of the top and bottom deciles was calculated on the basis of equal
weightings of abnormal TSR for each company. Abnormal TSR was calculated from the start
of the calendar year to which the excess LIC relates, defined as the excess TSR over the
equally weighted TSR of the top 100 JSE listed companies.
From Figure 6 it is evident that the companies in the top decile of excess LIC outperform the
companies in the bottom decile.
Figure 6: Equally-weighted abnormal returns earned by companies with CEOs in
the top and bottom deciles of excess long-term incentive compensation
The companies with CEOs earning the highest excess long-term incentive pay earn
abnormal returns of 3.6% in the first year, which improve to 10.2% over the subsequent five
quarters. The CEOs in the lowest excess LIC decile earned a negative return of -4.6% in the
first year.
-10.0%
-5.0%
0.0%
5.0%
10.0%
15.0%
0 1 2 3 4 5 6 7 8 9
Abnorm
al T
SR
Quarter
Top decile
Bottom decile
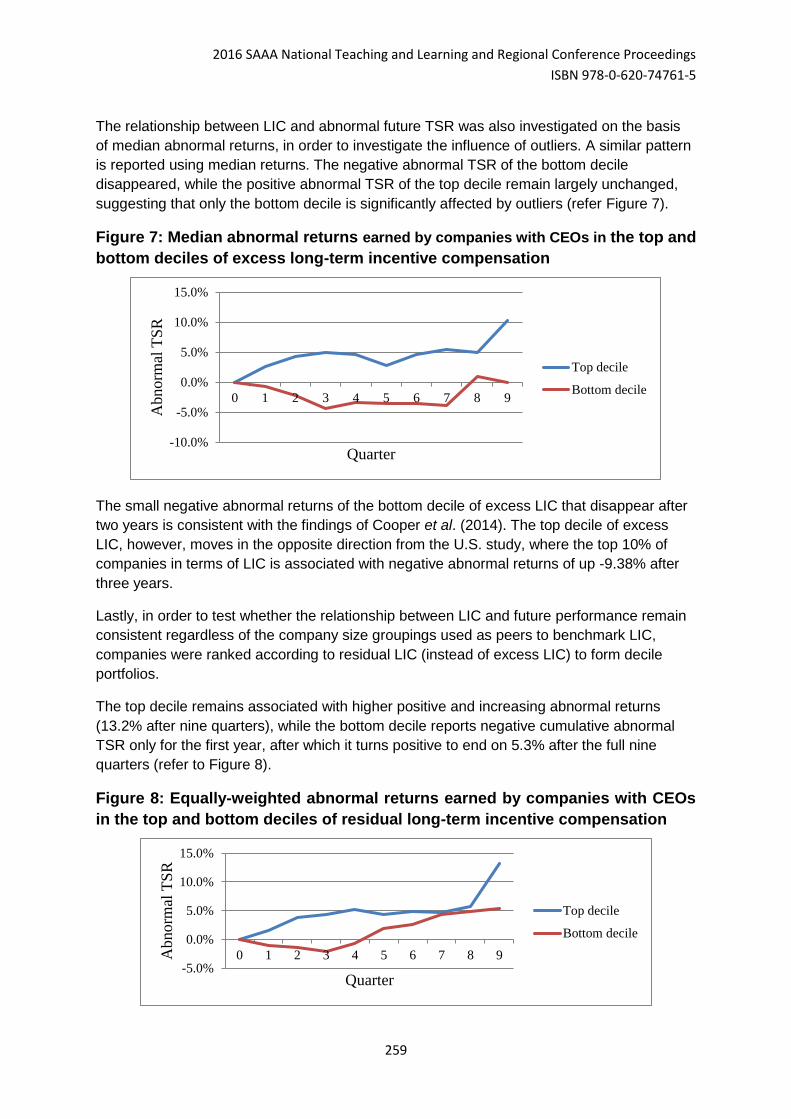
2016 SAAA National Teaching and Learning and Regional Conference Proceedings
ISBN 978-0-620-74761-5
259
The relationship between LIC and abnormal future TSR was also investigated on the basis
of median abnormal returns, in order to investigate the influence of outliers. A similar pattern
is reported using median returns. The negative abnormal TSR of the bottom decile
disappeared, while the positive abnormal TSR of the top decile remain largely unchanged,
suggesting that only the bottom decile is significantly affected by outliers (refer Figure 7).
Figure 7: Median abnormal returns earned by companies with CEOs in the top and
bottom deciles of excess long-term incentive compensation
The small negative abnormal returns of the bottom decile of excess LIC that disappear after
two years is consistent with the findings of Cooper et al. (2014). The top decile of excess
LIC, however, moves in the opposite direction from the U.S. study, where the top 10% of
companies in terms of LIC is associated with negative abnormal returns of up -9.38% after
three years.
Lastly, in order to test whether the relationship between LIC and future performance remain
consistent regardless of the company size groupings used as peers to benchmark LIC,
companies were ranked according to residual LIC (instead of excess LIC) to form decile
portfolios.
The top decile remains associated with higher positive and increasing abnormal returns
(13.2% after nine quarters), while the bottom decile reports negative cumulative abnormal
TSR only for the first year, after which it turns positive to end on 5.3% after the full nine
quarters (refer to Figure 8).
Figure 8: Equally-weighted abnormal returns earned by companies with CEOs
in the top and bottom deciles of residual long-term incentive compensation
-10.0%
-5.0%
0.0%
5.0%
10.0%
15.0%
0 1 2 3 4 5 6 7 8 9
Ab
no
rmal
TS
R
Quarter
Top decile
Bottom decile
-5.0%
0.0%
5.0%
10.0%
15.0%
0 1 2 3 4 5 6 7 8 9Abnorm
al T
SR
Quarter
Top decile
Bottom decile
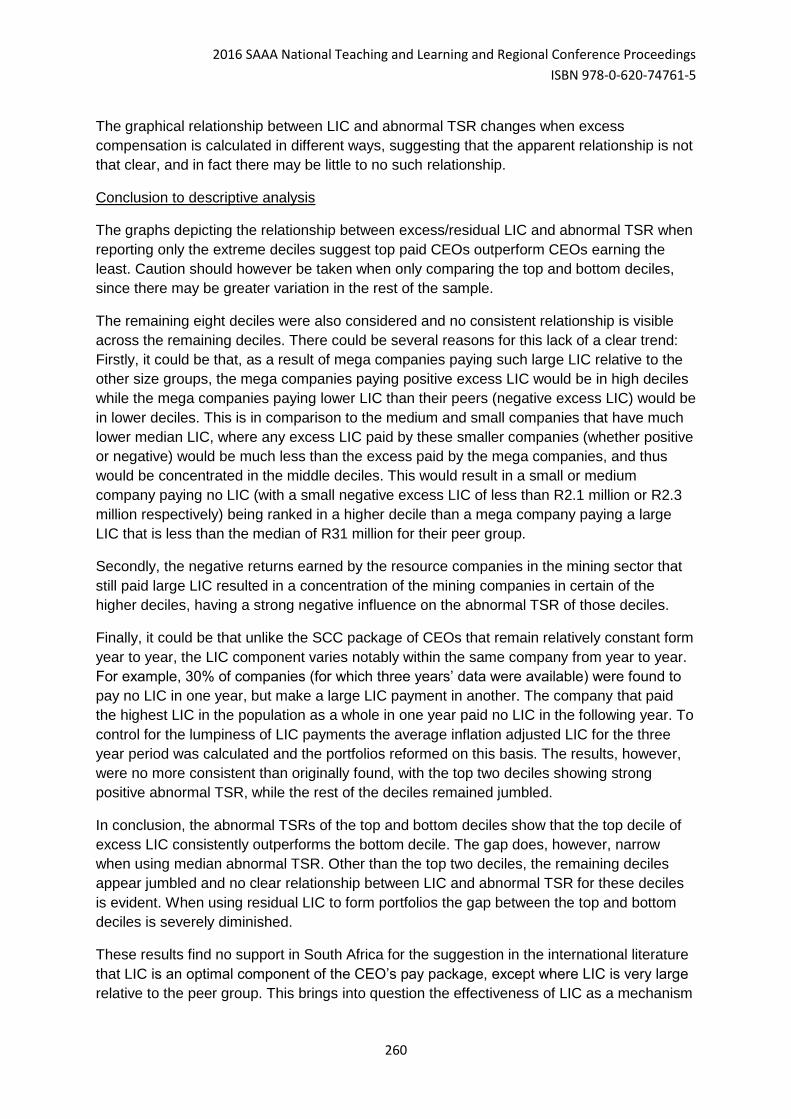
2016 SAAA National Teaching and Learning and Regional Conference Proceedings
ISBN 978-0-620-74761-5
260
The graphical relationship between LIC and abnormal TSR changes when excess
compensation is calculated in different ways, suggesting that the apparent relationship is not
that clear, and in fact there may be little to no such relationship.
Conclusion to descriptive analysis
The graphs depicting the relationship between excess/residual LIC and abnormal TSR when
reporting only the extreme deciles suggest top paid CEOs outperform CEOs earning the
least. Caution should however be taken when only comparing the top and bottom deciles,
since there may be greater variation in the rest of the sample.
The remaining eight deciles were also considered and no consistent relationship is visible
across the remaining deciles. There could be several reasons for this lack of a clear trend:
Firstly, it could be that, as a result of mega companies paying such large LIC relative to the
other size groups, the mega companies paying positive excess LIC would be in high deciles
while the mega companies paying lower LIC than their peers (negative excess LIC) would be
in lower deciles. This is in comparison to the medium and small companies that have much
lower median LIC, where any excess LIC paid by these smaller companies (whether positive
or negative) would be much less than the excess paid by the mega companies, and thus
would be concentrated in the middle deciles. This would result in a small or medium
company paying no LIC (with a small negative excess LIC of less than R2.1 million or R2.3
million respectively) being ranked in a higher decile than a mega company paying a large
LIC that is less than the median of R31 million for their peer group.
Secondly, the negative returns earned by the resource companies in the mining sector that
still paid large LIC resulted in a concentration of the mining companies in certain of the
higher deciles, having a strong negative influence on the abnormal TSR of those deciles.
Finally, it could be that unlike the SCC package of CEOs that remain relatively constant form
year to year, the LIC component varies notably within the same company from year to year.
For example, 30% of companies (for which three years’ data were available) were found to
pay no LIC in one year, but make a large LIC payment in another. The company that paid
the highest LIC in the population as a whole in one year paid no LIC in the following year. To
control for the lumpiness of LIC payments the average inflation adjusted LIC for the three
year period was calculated and the portfolios reformed on this basis. The results, however,
were no more consistent than originally found, with the top two deciles showing strong
positive abnormal TSR, while the rest of the deciles remained jumbled.
In conclusion, the abnormal TSRs of the top and bottom deciles show that the top decile of
excess LIC consistently outperforms the bottom decile. The gap does, however, narrow
when using median abnormal TSR. Other than the top two deciles, the remaining deciles
appear jumbled and no clear relationship between LIC and abnormal TSR for these deciles
is evident. When using residual LIC to form portfolios the gap between the top and bottom
deciles is severely diminished.
These results find no support in South Africa for the suggestion in the international literature
that LIC is an optimal component of the CEO’s pay package, except where LIC is very large
relative to the peer group. This brings into question the effectiveness of LIC as a mechanism
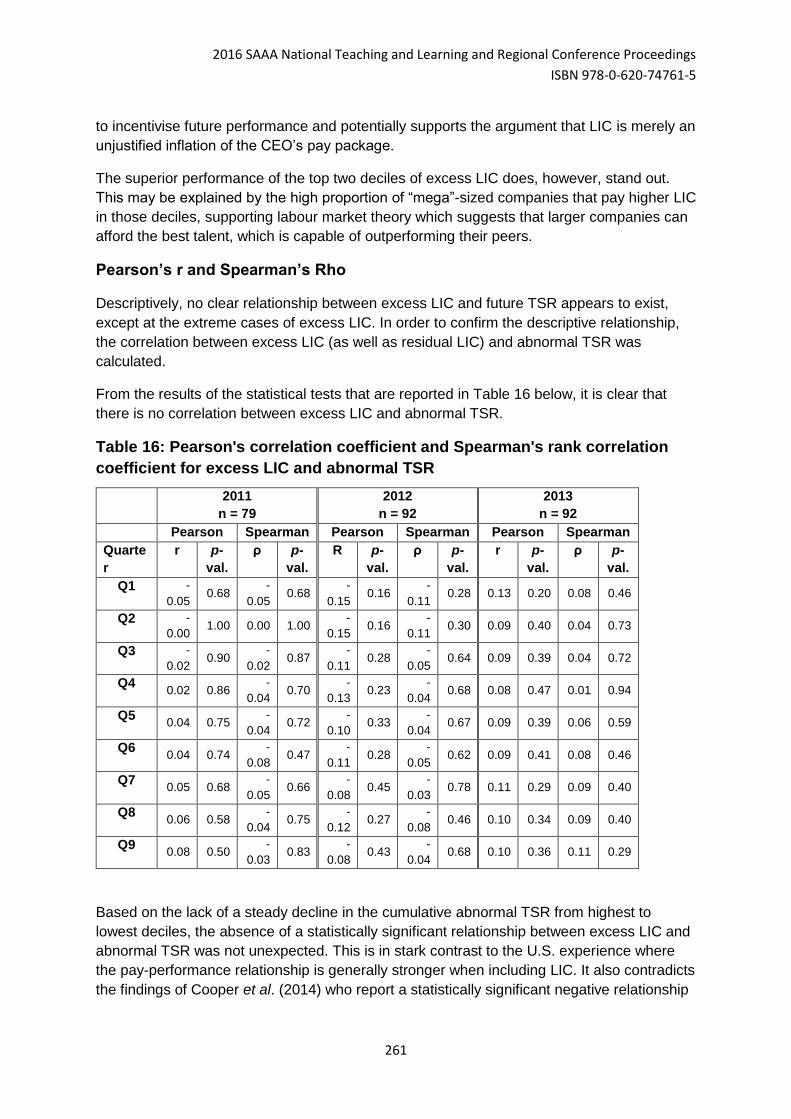
2016 SAAA National Teaching and Learning and Regional Conference Proceedings
ISBN 978-0-620-74761-5
261
to incentivise future performance and potentially supports the argument that LIC is merely an
unjustified inflation of the CEO’s pay package.
The superior performance of the top two deciles of excess LIC does, however, stand out.
This may be explained by the high proportion of “mega”-sized companies that pay higher LIC
in those deciles, supporting labour market theory which suggests that larger companies can
afford the best talent, which is capable of outperforming their peers.
Pearson’s r and Spearman’s Rho
Descriptively, no clear relationship between excess LIC and future TSR appears to exist,
except at the extreme cases of excess LIC. In order to confirm the descriptive relationship,
the correlation between excess LIC (as well as residual LIC) and abnormal TSR was
calculated.
From the results of the statistical tests that are reported in Table 16 below, it is clear that
there is no correlation between excess LIC and abnormal TSR.
Table 16: Pearson's correlation coefficient and Spearman's rank correlation
coefficient for excess LIC and abnormal TSR
2011
n = 79
2012
n = 92
2013
n = 92
Pearson Spearman Pearson Spearman Pearson Spearman
Quarte
r
r p-
val.
ρ p-
val.
R p-
val.
ρ p-
val.
r p-
val.
ρ p-
val.
Q1 -
0.05 0.68
-
0.05 0.68
-
0.15 0.16
-
0.11 0.28 0.13 0.20 0.08 0.46
Q2 -
0.00 1.00 0.00 1.00
-
0.15 0.16
-
0.11 0.30 0.09 0.40 0.04 0.73
Q3 -
0.02 0.90
-
0.02 0.87
-
0.11 0.28
-
0.05 0.64 0.09 0.39 0.04 0.72
Q4 0.02 0.86
-
0.04 0.70
-
0.13 0.23
-
0.04 0.68 0.08 0.47 0.01 0.94
Q5 0.04 0.75
-
0.04 0.72
-
0.10 0.33
-
0.04 0.67 0.09 0.39 0.06 0.59
Q6 0.04 0.74
-
0.08 0.47
-
0.11 0.28
-
0.05 0.62 0.09 0.41 0.08 0.46
Q7 0.05 0.68
-
0.05 0.66
-
0.08 0.45
-
0.03 0.78 0.11 0.29 0.09 0.40
Q8 0.06 0.58
-
0.04 0.75
-
0.12 0.27
-
0.08 0.46 0.10 0.34 0.09 0.40
Q9 0.08 0.50
-
0.03 0.83
-
0.08 0.43
-
0.04 0.68 0.10 0.36 0.11 0.29
Based on the lack of a steady decline in the cumulative abnormal TSR from highest to
lowest deciles, the absence of a statistically significant relationship between excess LIC and
abnormal TSR was not unexpected. This is in stark contrast to the U.S. experience where
the pay-performance relationship is generally stronger when including LIC. It also contradicts
the findings of Cooper et al. (2014) who report a statistically significant negative relationship
2016 SAAA National Teaching and Learning and Regional Conference Proceedings
ISBN 978-0-620-74761-5
262
between excess LIC and abnormal TSR for the top three deciles as a result of CEO
overconfidence.
In order to test whether the calculation of excess LIC affected the relationship, the Pearson’s
and Spearman’s correlations are recalculated using residual LIC instead of excess LIC. The
results confirm that there is no statistically significant relationship between LIC and future
company performance, for the three year period.
Conclusion to research objective 2
Even though the top decile in terms of excess LIC outperforms the bottom decile, the
abnormal TSRs of the remaining deciles are jumbled and the statistical tests indicate that
there is no relationship between excess LIC and abnormal TSR and hypothesis 2 is rejected.
These results are largely corroborative of those of Cooper et al. (2014), who similarly found
a lack of a relationship between LIC and company performance, (other than for companies
paying in the top deciles of excess compensation, where a negative relationship exists).
These results however are in contradiction to those of other international studies who find
that CEO LIC is negatively associated with future company performance (Balafas &
Florackis, 2014; Cooper et al., 2014; ore et al, 1999).
Limitations and scope restrictions
This study only covers three years (2011 to 2013) due to the limited data available on LIC.
Future returns are also limited to nine quarters. International studies include up to 18 years
of CEO compensation (Cooper et al., 2014) and return holding periods of up to five years
(Balafas & Florackis, 2014; Cooper et al., 2014). Core et al. (1999), however, report a
significant relationship for a sample including only three years and some studies report
significant relationships for holding periods as short as one year (Cooper et al., 2014; Core
et al., 1999).
International studies regularly include very large sample sizes, but despite the limitation of
this study to the top 100 companies, it contributes to the literature by extending the
population size over prior local studies (Bradley, 2011; Shaw, 2011; Theku, 2014).
Furthermore, the largest 100 companies represents 94% of the total JSE capitalisation as at
7 May 2015 (calculated using fundamentals data downloaded from the Sharenet database).
This study is limited to the relationship between excess LIC and abnormal future TSR and
ignores other potential variables that may affect CEO pay (for example CEO age, CEO
tenure and composition of the board of directors) as well as other factors that may affect the
abnormal TSR (for example the slump in commodity prices in the resources industry). This
study also focuses on TSR as a measure of company performance, since accounting
measures do not measure shareholder value.
2016 SAAA National Teaching and Learning and Regional Conference Proceedings
ISBN 978-0-620-74761-5
263
Conclusion and areas for future research
Even though it seems that South African companies rely less on long-term incentive
compensation than companies in the U.S., long-term incentive compensation (LIC) is not
insignificant in the local context and cannot be ignored in studies investigating the link
between CEO pay and company performance. While LIC is more closely correlated to total
compensation (TC) than short-term cash compensation (SCC), both SCC and LIC is highly
(positively) correlated to TC.
The link relationship between excess LIC and abnormal future total shareholder returns
(TSR) is non-existent, which presents a disturbing picture: Long-term incentives are intended
by corporates to provide incentivisation regarding long-term company performance and
represents substantial amounts of cash. If LIC is a generally ineffective (or negatively
effective) form of incentivisation, or only sporadically effective (as the broad distributions,
non-linear relationship and lack of statistical significance suggest), then the question must be
asked – why? It is beyond the ability of quantitative empirical research to answer this
question and it is suggested that qualitative research into the question of why LIC schemes
may lack effectiveness (or even be detrimental to company performance, as Cooper et al.
(2014) suggest) is required. The interpretive approach intrinsic in qualitative research would
be helpful in allowing the reality of the causal effects of long-term incentive schemes to show
themselves freely, without conditioning it by the parameters set in place by quantitative
empirical research, contributing to generating new knowledge that explains the inconclusive
and sometimes contradictory results reported in the body of existing literature (Ciao, 2010).
Due to the time it takes for the potential influence of a CEO in the performance of a
company, a similar study that covers a longer time frame and an extended return holding
period might provide more reliable results.
2016 SAAA National Teaching and Learning and Regional Conference Proceedings
ISBN 978-0-620-74761-5
264
References
Abowd, J. M. (1990). Does performance-based managerial compensation affect
corporate performance? Industrial and Labor Relations Review, Vol. 43(3): 52S-73S.
AFL-CIO America’s Unions. (2015). Executive pay watch. High paid CEOs and the
low-wage economy. [Online]. Available from: <http://www.aflcio.org/Corporate-
Watch/Paywatch-2015>. [8 June 2015].
Balafas, N. & Florackis, C. (2014). CEO compensation and future shareholder
returns: Evidence from the London Stock Exchange. Journal of Empirical Finance,
27: 97-115.
Barber, N., Ghiselli, R. & Deale, C. (2006). Assessing the relationship of CEO
compensation and company financial performance in the restaurant segment of the
hospitality industry. Journal of Foodservice Business Research, 9(4): 65-82.
Barrett, S. (2014). Effects of race on CEO pay-performance sensitivities. Masters of
Business Administration dissertation. Pretoria: University of Pretoria.
Benito, A. & Conyon, M. J. (1999). The governance of directors’ pay: Evidence form
UK companies. Journal of Management and Governance, 3: 117-136.
Bizjak, J. M., Lemmon, M. L. & Naveen, L. (2008). Does the use of peer groups
contribute to higher pay and less efficient compensation? Journal of Financial
Economics, 90: 152-168.
Bradley, S. (2011). Chief executive officer compensation and the effect on company
performance in a South African context. MCom dissertation in Accounting. Rhodes:
Rhodes University.
Bussin, M. (2011). The remuneration handbook for Africa. Knowres Publishing.
Randburg. South Africa.
Chalmers, K., Koh, P. -S. & Stapleton, G. (2006). The determinants of CEO
compensation: Rent extraction or labour demand? The Bristish Accounting Review,
38: 259-257.
Ciao, B. (2010). Qualitative Approach for Management Studies: Collecting
Methodological Choices and Reflections from a Research Experience. Presented at
EIASM “Workshop in-depth and case studies in entrepreneurship and small
business management”. Brussels.
2016 SAAA National Teaching and Learning and Regional Conference Proceedings
ISBN 978-0-620-74761-5
265
Conyon, M. J. & Leech, D. (1994). Top pay, company performance and corporate
governance. Oxford Bulletin of Economics and Statistics. Vol. 56(3): 229-247.
Cooper, M. J., Gulen, H. & Rau, P. R. (October 1, 2014). Performance for pay? The
relation between CEO incentive compensation and future stock price performance.
[Online]. Available from: <http://ssrn.com/abstract=1572085>
or <http://dx.doi.org/10.2139/ssrn.1572085>. [3 June 2015].
Core, J. E., Holthausen, R. W. & Larcker, D. F. (1999). Corporate governance, chief
executive officer compensation, and firm performance. Journal of Financial
Economics, 51: 371-406.
Correia, C., Flynn, D., Uliana, E. & Wormald, M. (2013). Financial Management,
Seventh Edition. Juta and Company Ltd. Cape Town, South Africa.
COSATU. (30 April, 2014). COSATU condemns exorbitant executive pay. [Online].
Available from: <http://www.cosatu.org.za/show.php?ID=8705>. [29-5-2015].
Dommisse, J. (2011). Is die vergoeding van die uitvoerende hoofde van die 120 top-
maatskappye van die Johannesburgse Aandelebeurs in verhouding tot hul omset,
inkomste of wins voor rente en belasting geregverdig? Masters of Business
Administration dissertation. Stellenbosch: University of Stellenbosch.
Edmans, A. & Gabaix, X. (2009). Is CEO pay really inefficient? A survey of new
optimal contracting theories. European Financial Management, Vol. 15(3): 486-496.
Eichholtz, P. M. A., Kok, N. & Otten, R. (2008). Executive compensation in UK
property companies. Journal of Real Estate Finance & Economics, 36: 405-426.
Frydman, C. & Jenter, D. (2010). CEO Compensation. (Working Paper 16585).
Massachusetts: National Bureau of Economic Research.
Garside, J. (2015). Long-term incentive plans for bosses 'damage firms'. Mail &
Guardian. [Online]. Available from:
<https://www.theguardian.com/business/2015/may/13/long-term-incentive-plans-for-
bosses-damage-firms>. [15 April 2016].
Girma, S., Thompson, S. & Wright, P. W. (2007). Corporate governance reforms and
executive compensation determination: Evidence from the UK. The Manchester
School, Vol 75(1): 65-81.
Healy, P. M. (1985). The effect of bonus schemes on accounting decisions. Journal
of Accounting and Economics, 7: 85-107.
2016 SAAA National Teaching and Learning and Regional Conference Proceedings
ISBN 978-0-620-74761-5
266
Jensen, M. C. & Meckling, W. H. (1976). Theory of the firm: Managerial behavior,
agency costs and ownership structure. Journal of Economics, Vol. 3(4): 305-360.
Jensen, M. C. & Murphy, K. J. (1990a). Performance pay and top-management
incentives. Journal of Political Economy, Vol.98(2): 225-264.
Jensen, M. C. & Murphy, K. J. (1990b). CEO incentives – It’s not how much you pay,
but how. Harvard Business Review, No.3: 138-153.
Jones, S. R. H. & Ville, S. P. (1996). Efficient transactors or rent-seeking
monopolists? The rationale for early chartered trading companies. The Journal of
Economic History. 56(4): 898-915.
Lewellen, W. G. & Huntsman, B. (1970). Managerial pay and corporate performance.
The American Economic Review, Vol. 60(4): 710-720.
Main, B. G. M., Bruce, A. & Buck, T. (1996). Total board remuneration and company
performance. The Economic Journal, Vol. 106(439): 1627-1644.
Malmendier, U. & Tate, G. (2008). Who makes acquisitions? CEO overconfidence
and the market's reaction, Journal of Financial Economics, 89: 20-43.
Masson, R. T. (1971). Executive motivations, earnings and consequent equity
performance. Journal of Political Economy, 79: 1278-1292.
McGuire, J. W., Chiu, J. S. Y. & Elbing, A. O. (1962). Executive income, sales and
profits. The American Economic Review, Vol. 52(4): 753-761.
Modau, M. F. (2013), “The relationship between Chief Executive Officer (CEO)
remuneration and financial performance of an organisation”, Masters of Business
Administration dissertation, Gordon Institute of Business Science, University of
Pretoria, Pretoria.
Murphy, K. J. (1986). Incentives, leaning, and compensation: A theoretical and
empirical investigation of managerial labor contracts. The RAND Journal of
Economics, Vol.17(1): 59-76.
Murphy, K. (1999). Executive compensation. In: Ashenfelter, O., Card, D. (Eds.),
Handbook of Labor Economics, vol. 3B: 2485-2563.
O’Neill, G. L. & Iob, M. (1999). Determinants of executive remuneration in Australian
organizations: An exploratory study. Asia Pacific Journal of Human Resources,
37(1): 56-75.
2016 SAAA National Teaching and Learning and Regional Conference Proceedings
ISBN 978-0-620-74761-5
267
PricewaterhouseCoopers Inc. (“PwC”) (2014). Executive Directors’ Remuneration -
Practices and Trends Report. Sixth Edition. South Africa – July 2014.
PricewaterhouseCoopers, the South African firm.
Roberts, D. R. (1959). Executive compensation. Glencoe, Illinois. Free Press.
Scholtz, H. E. & Smit, A. (2012). Executive remuneration and company performance
for South African companies listed on the Alternative Exchange (AltX). South African
Business Review, Vol.16(1).
Shaw, P. (2011). CEO pay-performance sensitivity in South African financial services
companies. Masters of Business Administration dissertation. Pretoria: University of
Pretoria.
Stathopoulos, K., Espenlaub, S. & Walker, M. (2005). The compensation of UK
executive directors: Lots of carrots but are there any sticks? Competition & Change,
Vol. 9(1): 89-105.
Statistics South Africa (“StatsSA”). (2015). CPT History: 1960 onwards. [Online].
Available from: <http://www.statssa.gov.za/publications/P0141/CPIHistory.pdf?>. [1
July 2015].
Steyn, G. F. (2015). The relationship between CEO compensation and future share
returns in South Africa. Masters of Commerce dissertation. Bellville: University of the
Western Cape.
Theku, M. (2014). CEO compensation sensitivity to performance in the South African
mining industry. Masters of Business Administration dissertation. Pretoria: University
of Pretoria.
Tosi, Jr., H. L. & Gomez-Mejia, L. R. (1994). CEO compensation monitoring and firm
performance. Academy of Management Journal, Vol.37(4): 1002-1016.
2016 SAAA National Teaching and Learning and Regional Conference Proceedings
ISBN 978-0-620-74761-5
268
2016 Southern African Accounting Association (SAAA) National Teaching and Learning and Regional Conference Proceedings ISBN number: 978-0-620-74761-5
MAF 10: Are there benefits to diversification across the
largest African stock markets?
Carlos De Jesus and Professor Phillip De Jager
University of Cape Town
Email: [email protected]
ABSTRACT: This study examines the co-movements of selected African stock exchanges, including
Nigeria, Morocco, Egypt and South Africa, as well as the USA, in local currency and in USD
terms, for the period January 2004 to June 2014. The study sheds light on African market
cointegration before, during, and post the financial crises of 2007/2008 to identify whether
there are benefits to diversification in stock exchanges across Africa and how this has
changed over time. Only the four biggest exchanges are examined, to eliminate the effects
of illiquidity and ensuring the size of indices used result in conclusions that are practical to
investors. This study looks at long term relationships using cointegration, and the direction
of the relationships using causality tests. We find no consistent cointegration relationships
over the periods tested. There are no consistent causality relationships between the various
countries. The implication of these results are that there are likely benefits to diversification
across the four African exchanges examined.
Keywords:
Cointegration, African Exchanges, Diversification in Africa, Investment in Africa.
2016 SAAA National Teaching and Learning and Regional Conference Proceedings
ISBN 978-0-620-74761-5
269
1. INTRODUCTION “The benefits of international diversification have been recognized for decades”
(French & Poterba, 1991)
Stock market integration can be defined as a condition in which stock markets move
together and have the same expected risk adjusted returns (Sharma & Seth, 2012). The
benefits of international diversification can only be realised if the markets do not move
together.
As will be discussed in the literature review below, often tests for integration are performed
around crises, for example: the 1987s equities crisis (Arshanapalli & Doukas, 1993; Longin &
Solnik, 1995; Butler & Joaquin, 2002; Meric & Meric, 1989) or the Asian crisis in 1997
(Ghosh, Johnson & Saidi, 1999; Kamin, 1999; Wang, Yang & Bessler, 2003), as this is when
the main benefits from diversification are gained (Butler & Joaquin, 2002). Diversification
aims to decrease variance of returns (Markowitz 1952), and during a crisis the market has a
high variance from expected returns and thus benefits can be had from diversification.
Given the above benefits of diversification, the objective of this paper is to shed light
on whether a diversification benefit can be gained from investing across Africa, from
a practical perspective. Practical in this sense, implying an investor is investing in just
equities, and on a global basis. As these diversification benefits are most needed in
times of financial crisis, this study thus examines whether there are the benefits
discussed above, before during and after the financial crisis of 2007/2008 by investing
across the four largest African exchanges. This is relevant as due to globalisation
markets have become more cointegrated and the benefits are potentially being lost.
This study aims to test the cointegration, and causality relationships among four of
Africa’s largest and most liquid exchanges to determine whether there are
diversification benefits to international and African investors investing across the
continent. More specifically this paper examines the long-term relationships between
indices in the different markets, and the strengths of these interactions, as well as the
direction of the relationships. The results of the tests performed will be useful for
investors in the compilation of a diversified portfolio, specifically using exchanges
within Africa. The outcome of this study should also increase our understanding of
how the different large African markets react with respect to each other, especially in
times of a global crisis, as this is when the benefits of diversification are most
necessary.
This study examines four African stock markets, namely the Johannesburg Stock Exchange
(JSE), Nigeria Stock Exchange (NSE), Casablanca Stock Exchange (CSE), and the
Egyptian Stock Exchange (EGX). These are compared with US stock exchanges,
represented by Standard & Poor’s 500 index (S&P 500). The objective is to establish where
there are benefits to investing across Africa from a local perspective, examining the
relationships among the African exchanges. We then look from an international perspective
examining the relationships between the African exchanges and the S&P 500.
2016 SAAA National Teaching and Learning and Regional Conference Proceedings
ISBN 978-0-620-74761-5
270
The four exchanges were selected because of their size and liquidity, which make them a
viable investment option for large institutional and foreign investment. All four exchanges are
also members of the World Federation of Exchanges (WFE). Being registered with the WFE
is significant as of the end of 2012 only four African stock exchanges have fulfilled the
criteria entitling them to become members of this regulatory body (Riscura, 2013).
The reasons for the inclusion of the S&P 500 are twofold: Firstly, the United States Dollar
(USD) is used as a proxy for relative value across the African exchanges, enabling us to see
in USD terms if they are integrated. The USD was chosen because it is the “dominant
medium for international transactions” (Goldberg, 2010), and is arguably the most obvious
choice as a base for value movements. International investors needing to compare the
performance of African stocks to other international investments would require the returns to
have a relative value base, and in this case the USD is being used as that base. Raj and
Dahl (2008) also test stock prices in local and USD terms, and find the currency
denomination used affected their cointegration results. This could be of specific benefit to
international investors.
According to Graham et al. (2013), “The diversification benefits, if any, may be contaminated
by foreign exchange risk when returns from prices denominated in local currency are used”.
This study thus also attempts to remove the effects of currency depreciation and exchange
rate changes, although imperfectly.
A significant benefit of this study, when compared to previous literature, is that this study has
real-world application. The indices used in this study have the required size and liquidity to
make them viable investment options, as they represent the largest and most liquid stocks.
The aforementioned factors result in this study having application value to institutional and
larger individual investors. In previous studies, Graham et al. (2013) use the Morgan Stanley
Capital International (MSCI) indices, Collins and Biekpe (2003) use local benchmark indices,
and Chen et al. (2014) use MSCI, Russell’s’ Frontier markets and the S&P indices.
The results of this study are similar to other African studies. No relationships are found
over the full period January 2004 to June 2014, using either the Johansen or Engle-
Granger cointegration tests, and no cointegration relationships for longer than a single
sub-period are found using the Engle-Granger or Johansen tests for cointegration.
The remainder of this study will be organised as follows. Section 2 provides a review
of the literature relating to market integration in order to give the study the required
context and background. Sections 3 and 4 deal with the data collected in the study, as
well as the research approach. Section 5 provides an analysis of the results found
from the data, and Section 6 brings the information together in a summary of the
outcomes of the research and a conclusion. Appendix A has unit root tests results
referred to in section 5 below and Appendix B has a complete list of Acronyms and
abbreviations used in this study.
2016 SAAA National Teaching and Learning and Regional Conference Proceedings
ISBN 978-0-620-74761-5
271
2. REVIEW OF RELATED LITERATURE
In our introduction we discussed the need for diversification when building an
optimum portfolio. As stated by Markowitz (1952), “Diversification is both observed
and sensible; a rule of behavior which does not imply the superiority of diversification
must be rejected both as a hypothesis and as a maxim.”
2.1 Integration of African stock markets
2.1.1 Why African stock markets?
High growth in emerging and frontier markets attracts foreign direct investment (Speidell,
2011). Investing in a frontier market is associated with risk. Thus if the African frontier
markets are cointegrated with emerging or developed markets it may be beneficial to invest
in the less risky emerging or developed markets.
Market integration of developing African stock exchanges is fundamental to economic
development (Jefferis, 1995; Kenny & Moss, 1998; Piesse & Hearn, 2002; Bekaert, Harvey
& Lumsdaine, 2002). The degree to which these African stock exchanges are globally
integrated is important for this primary goal, as this attracts foreign direct investment (Kenny
& Moss, 1998).
Financial development has also been proven to have a causal effect on the rate of economic
growth (Irving, 2005). Financial integration also has implications for financial stability
(Sharma & Bodla, 2010), with markets that are more integrated also being more financially
stable. Consequently, such well-integrated stock exchanges can play an important role in the
promotion of African economic growth. Research aimed at understanding the financial
integration of African stock markets is therefore important for the future growth and success
of Africa.
2.1.2 Findings from previous literature on emerging markets
Since the early 1990s emerging markets have become a more viable asset class, leading to
a growing interest in African market integration. During the 1990s several significant events
occurred, including the Mexican peso crisis, the Asian crisis, and the Russian and Brazilian
bond defaults. These have provided data and spurred further interest in the integration of
emerging and global markets (Collins & Biekpe, 2003). Harvey argues that emerging
markets are segmented from world markets because their returns are influenced by local
rather than international factors (Harvey, 1995). The same study finds that including
emerging market equities in a portfolio can increase returns and decrease volatility (Harvey,
1995).
Alagidede, Panagiotidis and Zhang (2011) explore the implications of integration
among African economies and stock exchanges to assess the effectiveness of
portfolio diversification. They find few long term relationships between African
countries and even between African countries and the rest of the world. They conclude
that investors could diversify their portfolios by including African stocks, because
international stock market shocks would have little effect on African stock markets
because of this lack of integration. Alagidede et al. (2011) also show the relevance of
2016 SAAA National Teaching and Learning and Regional Conference Proceedings
ISBN 978-0-620-74761-5
272
research in deciding whether African shares should be used to diversify an investment
portfolio. However, much research still needs to be done in terms of African stock
market integration.
Previous studies seem to focus on specific regions rather than Africa as a continent,
thus this study is relevant for global investors looking to invest in Africa.
2.1.3 Previous literature on African market cointegration
Adjasi and Biekpe (2006) show that long term relationships exist between several African
stock markets. South Africa was shown to be affected in the long term by reactions from
other markets, such as Egypt, Kenya, Mauritius, Nigeria, and Ghana. The South African
market must regularly monitor developments in these other markets, due to their long run
impacts. They also showed that South Africa, being the larger market, was helping to correct
any disequilibrium and that the country had a significant effect on the relatively inactive
Ghanaian market. This study brings to light not only the presence of South Africa as a major
influence in Africa, but also the extent to which economies affect each other. Egypt, in
particular, has been shown to have a long running effect on South Africa. This study will
ascertain whether this long term effect still exists.
Graham et al. (2012) tests the strength of co-movements between the US and 22 Emerging
markets, including Egypt, Morocco, and South Africa, using the Wavelet analysis tool. The
key findings from the study were as follows: Stock market integration is constantly changing
over time and there is more of a trend of co-movements over the long term, and more short
term co-movements after 2006. Thus there are still benefits to American investors to
investing in emerging markets, but more so in the short-term.
Middle East and North Africa region (MENA) market integration has been tested by Yu and
Hassan (2008), and Graham et al. (2013). Yu and Hassan (2008) compare MENA stock
exchanges to those in the USA, UK, and France to see if the market returns are
cointegrated, for the period 1 January 1999 to 31 December 2005. They find cointegration
between the Gulf Cooperation Council (GCC) and Non-GCC markets tested, and well as the
US stock market exhibiting Granger causality with non-GCC markets.
The study by Graham et al. (2013) is similar to this study, in that it looks at co-movements
with the USA and co-movements within the MENA region. Using data from June 2002 to
June 2010, this study finds there are co-movements with the USA (S&P 500) in the long
term. However, the relationship does not exist in the short term, implying the benefits of
diversification in the short term (Graham et al., 2013). This study by Graham et al. (2013)
also finds a rise in co-movements after the onset of the financial crisis in 2008. This is
consistent with other research on increased cointegration in times of greater volatility.
2016 SAAA National Teaching and Learning and Regional Conference Proceedings
ISBN 978-0-620-74761-5
273
3. DATA The following indices were used to represent the four African countries equities markets:
Johannesburg Stock Exchange Top 40 Index (JSE Top 40 – representing South Africa);
Nigeria Stock Exchange Allshare Index (NGSE – representing Nigeria) and Nigeria Stock
Exchange Top 30 Index (NSE 30 – representing Nigeria); Egyptian Stock Exchange Top 30
(EGX 30 – representing Egypt); Casablanca Stock Exchange Top 25 (CFG 25 –
representing Morocco). The data used was the weekly closing prices of the respective
indices. Liquidity and the index being practically investable are key in this study and thus
weekly tests were run to include the NSE 30 which best represents liquid and practically
investable stocks.
The period of analysis is from 1 January 2004 to 30 June 2014. This period is further
divided into three sub-periods to address the potential impact of the global financial
crisis on the African stock exchanges, as well as their integration with global markets.
The crisis period for the purposes of this study is considered to run from October 2007
to the end of March 2009, with the post-crisis period starting at the beginning of April
2009. It is difficult to pinpoint the exact start and end of the crisis. However, using the
S&P 500 as a proxy for US stocks it can be seen that the decline in the S&P 500 index
started in October 2007 and the S&P 500 reached a low in March 2009. Most of the
benefits of diversification would be gained during the crisis period. Analysis of the
preceding and subsequent periods provides further insight into whether there has
been a change in the relationship between the African exchanges, and those in the
USA.
The reasons for having the longer periods are twofold. Firstly, the number of
observations decreased substantially which required a longer period to get a
statistically significant number of observations. Secondly, weekly data was only
available for the NSE 30 from 1 January 2007. Thus is made sense to split the data
into three periods to get an even observation distribution over the period tested.
The periods for the weekly data have been split as follows:
Period 1: January 2004 – December 2006
Period 2: January 2007 – December 2010
Period 3: January 2011 – June 2014
3.1 Data Issues
It is important to note than in using an index, there is always the issue of “capping”. As with
most indices, the maximum weighting of a stock in an index is limited. This means by using
an index we are not capturing the complete movement of stocks in the movement of the
index. This affects the cointegration relationships between various exchanges.
In 2011 the Egyptian stock market struggled, largely due to political unrest in the country.
The market capitalisation dropped from approximately 500 billion at the beginning of January
2011 to 374 billion in March 2011 and 291 billion in December 2011 (EGX, 2013). Our
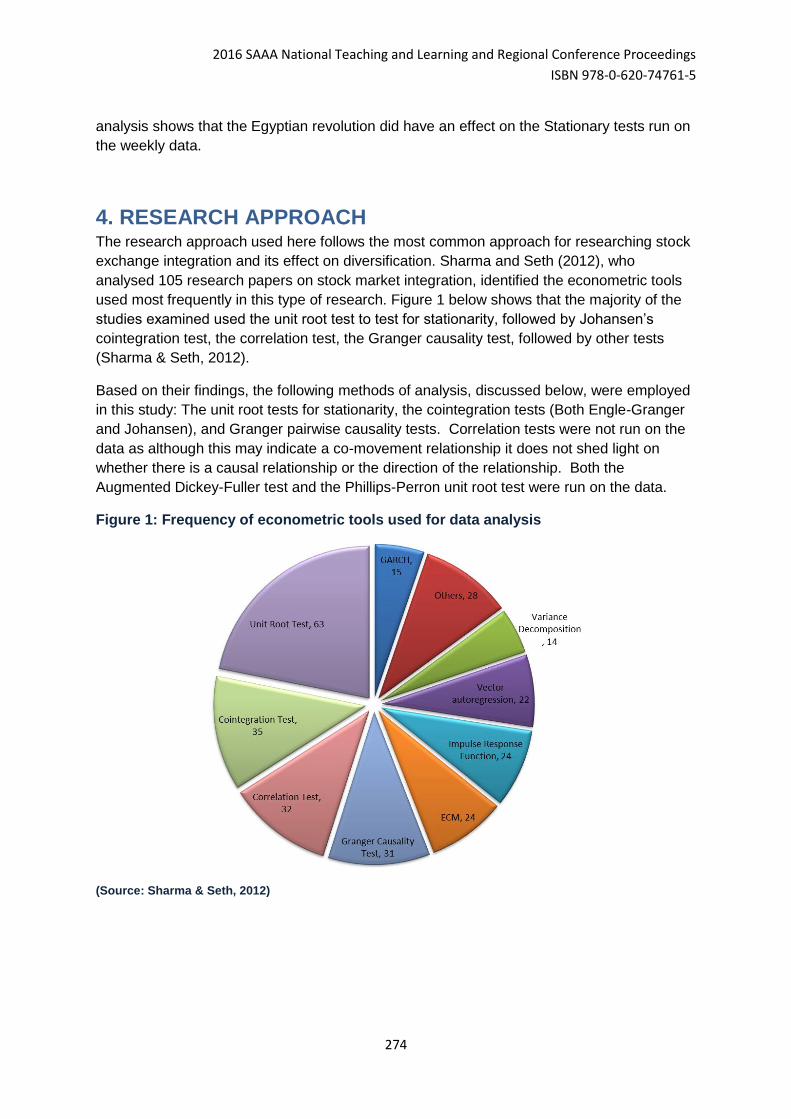
2016 SAAA National Teaching and Learning and Regional Conference Proceedings
ISBN 978-0-620-74761-5
274
analysis shows that the Egyptian revolution did have an effect on the Stationary tests run on
the weekly data.
4. RESEARCH APPROACH The research approach used here follows the most common approach for researching stock
exchange integration and its effect on diversification. Sharma and Seth (2012), who
analysed 105 research papers on stock market integration, identified the econometric tools
used most frequently in this type of research. Figure 1 below shows that the majority of the
studies examined used the unit root test to test for stationarity, followed by Johansen’s
cointegration test, the correlation test, the Granger causality test, followed by other tests
(Sharma & Seth, 2012).
Based on their findings, the following methods of analysis, discussed below, were employed
in this study: The unit root tests for stationarity, the cointegration tests (Both Engle-Granger
and Johansen), and Granger pairwise causality tests. Correlation tests were not run on the
data as although this may indicate a co-movement relationship it does not shed light on
whether there is a causal relationship or the direction of the relationship. Both the
Augmented Dickey-Fuller test and the Phillips-Perron unit root test were run on the data.
Figure 1: Frequency of econometric tools used for data analysis
(Source: Sharma & Seth, 2012)
2016 SAAA National Teaching and Learning and Regional Conference Proceedings
ISBN 978-0-620-74761-5
275
4.1 Unit root tests for stationarity A unit root test looks at whether a time series, such as a stock exchange index, is stationary,
using an autoregressive model. The time series is stationary if the roots of its characteristic
polynomial lie strictly inside the unit circle (Alexander, 2008). Testing for a unit root and
cointegration can also determine market efficiency (Arshanapalli & Doukas, 1993). The null
hypothesis implies that the data need to be differenced to make it stationary, while the
alternative hypothesis states that the data is stationary. If we reject the above null
hypothesis, we can conclude that the series is indeed integrated of order 1, rather than
having a higher order of integration (Alexander, 2008).
4.2 Cointegration and causality
Cointegration is a measure of long term dependency between two stock exchange
indices or other financial assets and is used to examine the co-movement of index
prices in this paper. The null hypothesis for the cointegration tests is that the two
indices are not cointegrated.
The Engle-Granger methodology performs an ordinary least square (OLS) regression
of one integrated variable on the other integrated variables, and is used in this study
to determine the extent of cointegration. The Johansen test is a vector autoregression
(VAR) based cointegration test using the methodology developed in Johansen (IHS
Global Inc., 2013).
Finally, once the error correction model (ECM) has been defined, it may to be used to
test the Granger causality flows. Granger causality measures the lead-lag relationship
between the two indices (Alexander, 2008).
The above tests indicate whether diversification benefits could be had by investing in
the exchanges analysed in this study, as discussed in the introduction above.
5. RESULTS Below see the results of this study, including graphical representations of the various
indices, the results of unit root, cointegration, and causality tests run on the weekly logged
data in both local currency and USD.
5.1 Tests performed and tests results found on weekly logged closing price
data
Unit root testing is a prerequisite for testing cointegration between the stock exchanges. The
implication of cointegration is that, individually, the series may be non-stationary, while their
linear combination may be stationary (IHS Global Inc., 2013). Thus below the test results
begin with the unit root test results followed by the cointegration and Granger causality tests.
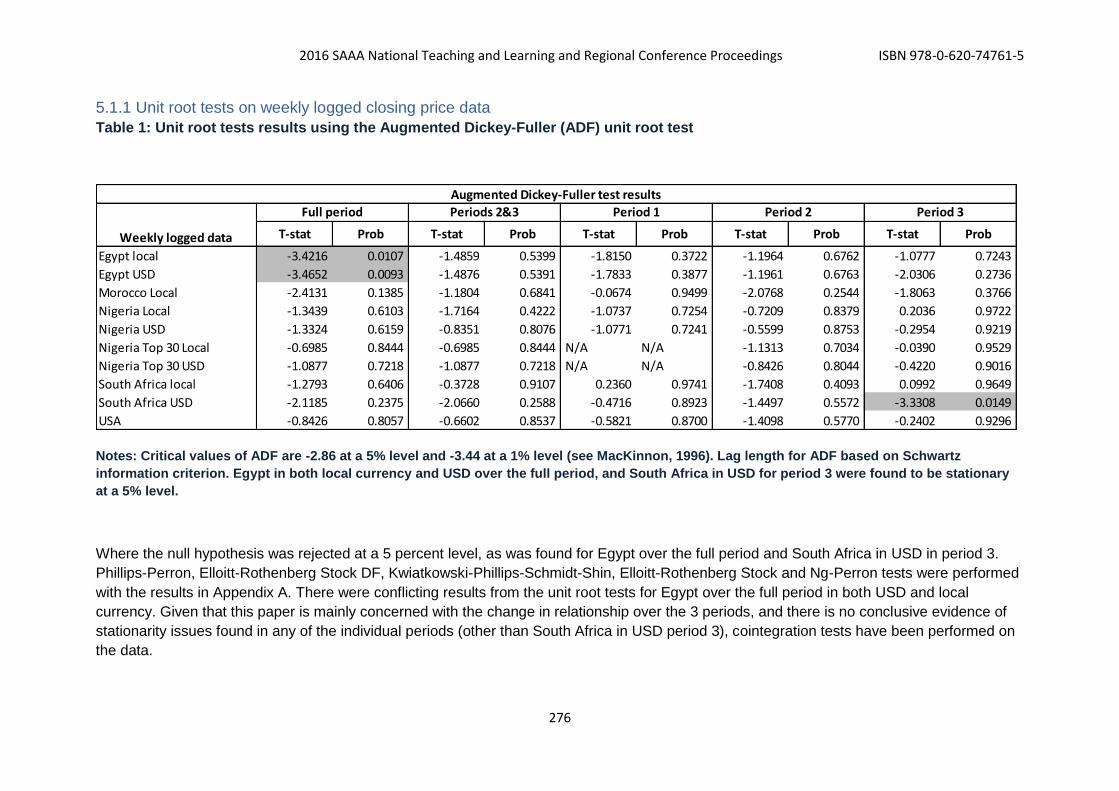
2016 SAAA National Teaching and Learning and Regional Conference Proceedings ISBN 978-0-620-74761-5
276
5.1.1 Unit root tests on weekly logged closing price data
Table 1: Unit root tests results using the Augmented Dickey-Fuller (ADF) unit root test
Notes: Critical values of ADF are -2.86 at a 5% level and -3.44 at a 1% level (see MacKinnon, 1996). Lag length for ADF based on Schwartz
information criterion. Egypt in both local currency and USD over the full period, and South Africa in USD for period 3 were found to be stationary
at a 5% level.
Where the null hypothesis was rejected at a 5 percent level, as was found for Egypt over the full period and South Africa in USD in period 3.
Phillips-Perron, Elloitt-Rothenberg Stock DF, Kwiatkowski-Phillips-Schmidt-Shin, Elloitt-Rothenberg Stock and Ng-Perron tests were performed
with the results in Appendix A. There were conflicting results from the unit root tests for Egypt over the full period in both USD and local
currency. Given that this paper is mainly concerned with the change in relationship over the 3 periods, and there is no conclusive evidence of
stationarity issues found in any of the individual periods (other than South Africa in USD period 3), cointegration tests have been performed on
the data.
T-stat Prob T-stat Prob T-stat Prob T-stat Prob T-stat Prob
Egypt local -3.4216 0.0107 -1.4859 0.5399 -1.8150 0.3722 -1.1964 0.6762 -1.0777 0.7243
Egypt USD -3.4652 0.0093 -1.4876 0.5391 -1.7833 0.3877 -1.1961 0.6763 -2.0306 0.2736
Morocco Local -2.4131 0.1385 -1.1804 0.6841 -0.0674 0.9499 -2.0768 0.2544 -1.8063 0.3766
Nigeria Local -1.3439 0.6103 -1.7164 0.4222 -1.0737 0.7254 -0.7209 0.8379 0.2036 0.9722
Nigeria USD -1.3324 0.6159 -0.8351 0.8076 -1.0771 0.7241 -0.5599 0.8753 -0.2954 0.9219
Nigeria Top 30 Local -0.6985 0.8444 -0.6985 0.8444 N/A N/A -1.1313 0.7034 -0.0390 0.9529
Nigeria Top 30 USD -1.0877 0.7218 -1.0877 0.7218 N/A N/A -0.8426 0.8044 -0.4220 0.9016
South Africa local -1.2793 0.6406 -0.3728 0.9107 0.2360 0.9741 -1.7408 0.4093 0.0992 0.9649
South Africa USD -2.1185 0.2375 -2.0660 0.2588 -0.4716 0.8923 -1.4497 0.5572 -3.3308 0.0149
USA -0.8426 0.8057 -0.6602 0.8537 -0.5821 0.8700 -1.4098 0.5770 -0.2402 0.9296
Notes: Critical values of ADF are -2.86 at a 5% level and -3.44 at a 1% level. (see MacKinnon, 1996). Lag length for ADF based on Schwartz information criterion.
Egypt in both local currency and USD over the full period, and South Africa in USD for period 3 were found to be stationary at a 5% level.
Period 3Period 2Period 1Periods 2&3Full period
Augmented Dickey-Fuller test results
Weekly logged data
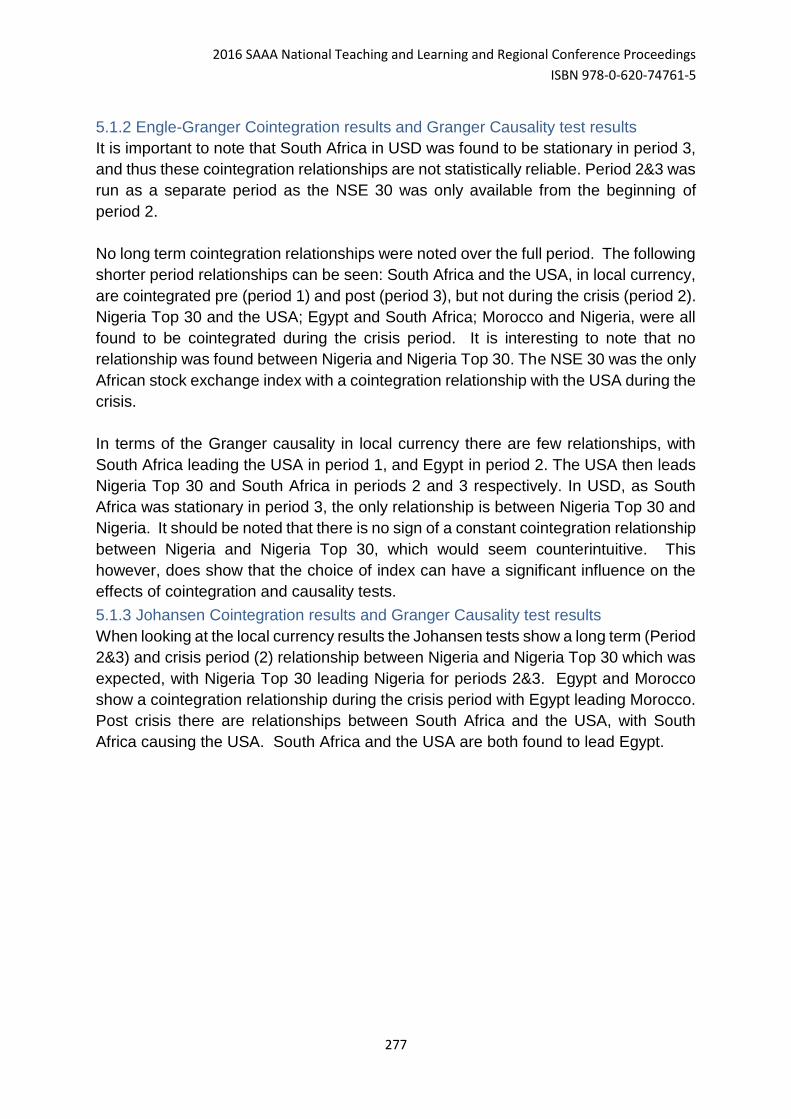
2016 SAAA National Teaching and Learning and Regional Conference Proceedings
ISBN 978-0-620-74761-5
277
5.1.2 Engle-Granger Cointegration results and Granger Causality test results
It is important to note that South Africa in USD was found to be stationary in period 3,
and thus these cointegration relationships are not statistically reliable. Period 2&3 was
run as a separate period as the NSE 30 was only available from the beginning of
period 2.
No long term cointegration relationships were noted over the full period. The following
shorter period relationships can be seen: South Africa and the USA, in local currency,
are cointegrated pre (period 1) and post (period 3), but not during the crisis (period 2).
Nigeria Top 30 and the USA; Egypt and South Africa; Morocco and Nigeria, were all
found to be cointegrated during the crisis period. It is interesting to note that no
relationship was found between Nigeria and Nigeria Top 30. The NSE 30 was the only
African stock exchange index with a cointegration relationship with the USA during the
crisis.
In terms of the Granger causality in local currency there are few relationships, with
South Africa leading the USA in period 1, and Egypt in period 2. The USA then leads
Nigeria Top 30 and South Africa in periods 2 and 3 respectively. In USD, as South
Africa was stationary in period 3, the only relationship is between Nigeria Top 30 and
Nigeria. It should be noted that there is no sign of a constant cointegration relationship
between Nigeria and Nigeria Top 30, which would seem counterintuitive. This
however, does show that the choice of index can have a significant influence on the
effects of cointegration and causality tests.
5.1.3 Johansen Cointegration results and Granger Causality test results
When looking at the local currency results the Johansen tests show a long term (Period
2&3) and crisis period (2) relationship between Nigeria and Nigeria Top 30 which was
expected, with Nigeria Top 30 leading Nigeria for periods 2&3. Egypt and Morocco
show a cointegration relationship during the crisis period with Egypt leading Morocco.
Post crisis there are relationships between South Africa and the USA, with South
Africa causing the USA. South Africa and the USA are both found to lead Egypt.
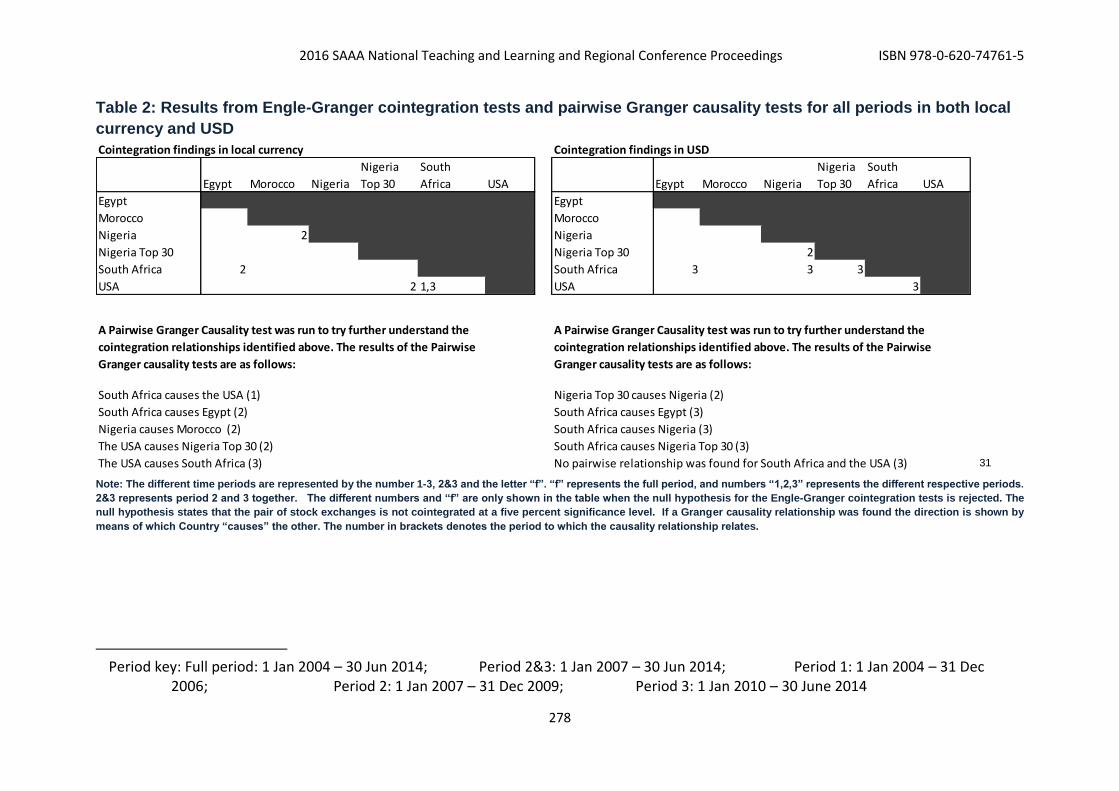
2016 SAAA National Teaching and Learning and Regional Conference Proceedings ISBN 978-0-620-74761-5
278
Table 2: Results from Engle-Granger cointegration tests and pairwise Granger causality tests for all periods in both local
currency and USD
31 Note: The different time periods are represented by the number 1-3, 2&3 and the letter “f”. “f” represents the full period, and numbers “1,2,3” represents the different respective periods.
2&3 represents period 2 and 3 together. The different numbers and “f” are only shown in the table when the null hypothesis for the Engle-Granger cointegration tests is rejected. The
null hypothesis states that the pair of stock exchanges is not cointegrated at a five percent significance level. If a Granger causality relationship was found the direction is shown by
means of which Country “causes” the other. The number in brackets denotes the period to which the causality relationship relates.
Period key: Full period: 1 Jan 2004 – 30 Jun 2014; Period 2&3: 1 Jan 2007 – 30 Jun 2014; Period 1: 1 Jan 2004 – 31 Dec 2006; Period 2: 1 Jan 2007 – 31 Dec 2009; Period 3: 1 Jan 2010 – 30 June 2014
Cointegration findings in local currency Cointegration findings in USD
Egypt Morocco Nigeria
Nigeria
Top 30
South
Africa USA Egypt Morocco Nigeria
Nigeria
Top 30
South
Africa USA
Egypt Egypt
Morocco Morocco
Nigeria 2 Nigeria
Nigeria Top 30 Nigeria Top 30 2
South Africa 2 South Africa 3 3 3
USA 2 1,3 USA 3
South Africa causes the USA (1) Nigeria Top 30 causes Nigeria (2)
South Africa causes Egypt (2) South Africa causes Egypt (3)
Nigeria causes Morocco (2) South Africa causes Nigeria (3)
The USA causes Nigeria Top 30 (2) South Africa causes Nigeria Top 30 (3)
The USA causes South Africa (3) No pairwise relationship was found for South Africa and the USA (3)
A Pairwise Granger Causality test was run to try further understand the
cointegration relationships identified above. The results of the Pairwise
Granger causality tests are as follows:
A Pairwise Granger Causality test was run to try further understand the
cointegration relationships identified above. The results of the Pairwise
Granger causality tests are as follows:
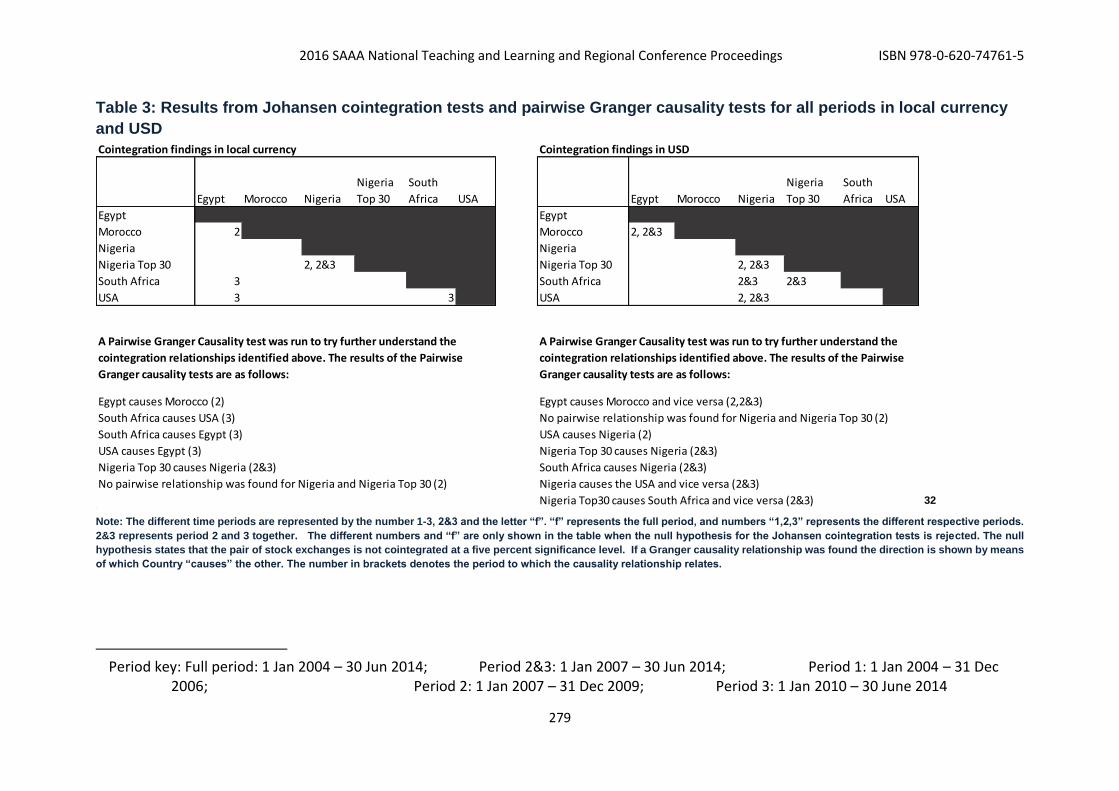
2016 SAAA National Teaching and Learning and Regional Conference Proceedings ISBN 978-0-620-74761-5
279
Table 3: Results from Johansen cointegration tests and pairwise Granger causality tests for all periods in local currency
and USD
32 Note: The different time periods are represented by the number 1-3, 2&3 and the letter “f”. “f” represents the full period, and numbers “1,2,3” represents the different respective periods.
2&3 represents period 2 and 3 together. The different numbers and “f” are only shown in the table when the null hypothesis for the Johansen cointegration tests is rejected. The null
hypothesis states that the pair of stock exchanges is not cointegrated at a five percent significance level. If a Granger causality relationship was found the direction is shown by means
of which Country “causes” the other. The number in brackets denotes the period to which the causality relationship relates.
Period key: Full period: 1 Jan 2004 – 30 Jun 2014; Period 2&3: 1 Jan 2007 – 30 Jun 2014; Period 1: 1 Jan 2004 – 31 Dec 2006; Period 2: 1 Jan 2007 – 31 Dec 2009; Period 3: 1 Jan 2010 – 30 June 2014
Cointegration findings in local currency Cointegration findings in USD
Egypt Morocco Nigeria
Nigeria
Top 30
South
Africa USA Egypt Morocco Nigeria
Nigeria
Top 30
South
Africa USA
Egypt Egypt
Morocco 2 Morocco 2, 2&3
Nigeria Nigeria
Nigeria Top 30 2, 2&3 Nigeria Top 30 2, 2&3
South Africa 3 South Africa 2&3 2&3
USA 3 3 USA 2, 2&3
Egypt causes Morocco (2) Egypt causes Morocco and vice versa (2,2&3)
South Africa causes USA (3) No pairwise relationship was found for Nigeria and Nigeria Top 30 (2)
South Africa causes Egypt (3) USA causes Nigeria (2)
USA causes Egypt (3) Nigeria Top 30 causes Nigeria (2&3)
Nigeria Top 30 causes Nigeria (2&3) South Africa causes Nigeria (2&3)
No pairwise relationship was found for Nigeria and Nigeria Top 30 (2) Nigeria causes the USA and vice versa (2&3)
Nigeria Top30 causes South Africa and vice versa (2&3)
A Pairwise Granger Causality test was run to try further understand the
cointegration relationships identified above. The results of the Pairwise
Granger causality tests are as follows:
A Pairwise Granger Causality test was run to try further understand the
cointegration relationships identified above. The results of the Pairwise
Granger causality tests are as follows:
2016 SAAA National Teaching and Learning and Regional Conference Proceedings
ISBN 978-0-620-74761-5
280
In USD terms we see some noteworthy results, as this shows several long term
relationships between the different indices. Nigeria Top 30 as well as South Africa are
found to lead Nigeria for period 2&3 (January 2007 to June 2014). Nigeria Top 30 and
South Africa are found to be cointegrated and have a causality effect on each other.
Nigeria and the USA also are found to cause each for period 2&3. Egypt and Morocco
also share this a long term relationship, both having a causality effect on each other.
Running a Johansen test offered very different results to those of the Engle-Granger
test for cointegration. Two relationships appear quite prevalent in the results: Nigeria
and Nigeria Top 30 appear to be cointegrated and Nigeria Top 30 leads Nigeria. Egypt
is found to lead Morocco in local and USD terms.
5.2 Results discussion
Cointegration results when both Johansen and Engle-Granger Cointegration tests are
combined show only two instances of cointegration. This is consistent with the results
from Alagidede et al. (2011) and Jefferis and Okeahalam (1999:44), who suggest there
were few or no long term relationships to be found respectively.
The first is the USA and South Africa in period 3 in local currency, where the USA was
found to lead South Africa. This relationship is intuitive, as during this period the global
markets saw large drops in value and this movement did start in the USA. The second
case is between Nigeria and Nigeria Top 30 in period 2 in USD, where it was found
that Nigeria Top 30 caused the movement in Nigeria. However, one would expect to
see a relationship between Nigeria Top 30 and Nigeria, and it is interesting to note
there was only a relationship found for one period.
Collins and Biekpe (2003) find contagion in Egypt and South Africa and also that other
smaller African markets did offer diversification to more developed markets, and also that
African market interactions appeared to be regional. The findings of this study support the
finding that African markets do offer diversification benefits, but there is little evidence to
support regional market integration.
Wang et al. (2003), studying the same countries but also including Zimbabwe, found limited
cointegration between African countries and also between African countries and the USA.
There was some cointegration between South Africa and the USA as well as Nigeria and the
USA, but this was very limited. Graham et al. (2013), looking at the MENA region, did find
long term linkages with the USA and Egypt was included in their sample. This differs from
the results in this study, where cointegration between the Egypt and the USA was only
evident in period 3 and only using the Johansen cointegration test.
Chen et al. (2014) find there was integration, and the US market caused frontier market
movements, and supported the leading market hypothesis. They also expected the leading
markets to become more integrated with frontier markets in the future. This is supported by
the results of the Johansen cointegration test run on the data in USD. However, in local
2016 SAAA National Teaching and Learning and Regional Conference Proceedings
ISBN 978-0-620-74761-5
281
currency terms, or using both Johansen and Engle-Granger tests, this study’s results do not
support the conclusion of Chen et al. (2014).
6. CONCLUSION AND AREAS FOR FURTHER RESEARCH
6.1 Conclusion
The cointegration tests on the weekly logged closing prices offer several long term
relationships for the period 1 January 2007 – 30 June 2014 in USD. These
relationships did not show in local currency except for Nigeria and Nigerian Top 30.
These long term relationships were only shown when using the Johansen tests.
There might be a variety of reasons explaining the movement in the various exchanges
and this study is limited to looking at cointegration with some brief explanations as to
the reasons. The use of local currency verses USD offered differing results. The
number of cointegration relationships over time did not tend to increase. These results
imply that there are potential benefits from diversification, which could be obtained by
investors, over the long term, across the four African exchanges, with this finding being
practical due to the size and liquidity of the indices used.
6.2 Areas for further research
In addition to running the tests on logged data the tests were also run on unlogged data and
yielded differing results thus the effect of logging should be investigated further. As with
logging, capping the weightings of stocks in an index would also have an effect on the
results, which has not been noted in this study but should be explored further. It has also
been noted through discussions with emerging market analysts that the stationarity found
between South Africa and the USA in period 3 is an emerging market phenomenon that is
not limited to South Africa (Wales, personal communication 2015, June 17). This would be
an interesting topic to research further. The extent of the link between the Nigerian All Share
index and the Nigerian Top 30 index would also be interesting to explore further.
REFERENCES Adjasi, C. & Biekpe, N. 2006. Cointegration and the dynamic causal links amongst
African stock markets . Investment Management and Financial Innovations. 3(4):102-
119.
Alagidede, P., Panagiotidis, T. & Zhang, X. 2011. Why a diversified portfolio should
include African assets. Applied Economics Letters. 18(14):1333-1340.
Alexander, C. 2008. Market Risk Analysis: quantitative methods in finance. Vol. 1.
West Sussex, England: John Wiley & Sons Ltd.
Arshanapalli, B. & Doukas, J. 1993. International stock market linkages: evidence from the
pre-and post-October 1987 period. Journal of Banking & Finance. 17(1):193-208.
2016 SAAA National Teaching and Learning and Regional Conference Proceedings
ISBN 978-0-620-74761-5
282
Bekaert, G., Harvey, C.R. & Lumsdaine, R.L. 2002. Dating the integration of world equity
markets. Journal of Financial Economics. 65(2):203-247.
Butler, K.C. & Joaquin, D.C. 2002. Are the gains from international portfolio
diversification exaggerated? The influence of downside risk in bear markets. Journal
of International Money and Finance. 21(7):981-1011.
Chen, M.P., Chen, P.F. & Lee, C.C. 2014. Frontier stock market integration and the global
financial crisis. The North American Journal of Economics and Finance. 29:84-103.
Collins, D. & Biekpe, N. 2003. Contagion: a fear for African equity markets? Journal of
Economics and Business. 55(3):285-297.
Engle, R. & Granger, W. 1987. Cointegration and error correction: representation,
estimation and testing. Econometrica. 55(2):251-276.
French, K.R. & Poterba, J.M. 1991. Investor diversification and international equity markets.
The American Economic Review. 81(2):222-226.
Ghosh, A., Johnson, K. & Saidi, R. 1999. Who Moves the Asia-Pacific Stock Markets-
US or Japan ? Empirical Evidence Based on the Theory of Cointegration. The
Financial Review. 34(1):159-169.
Goldberg, L.S. 2010. Is the international role of the Dollar changing? Current Issues in
Economics and Finance. 16(1):1-7
Graham, M., Kiviaho, J. & Nikkinen, J. 2012. Integration of 22 emerging stock markets: a
three-dimensional analysis. Global Finance Journal. 23(1):34-47.
Graham, M., Kiviaho, J., Nikkinen, J. & Omran, M., 2013. Global and regional co-movement
of the MENA stock markets. Journal of Economics and Business. 65:86-100.
Harvey, C.R. 1995. Predictable risk and returns in emerging markets. Review of Financial
studies. 8(3):773-816.
IHS Global Inc. 2013. Eviews 8 user guide II. Irvine, United States of America: IHS Global
Inc. Available:
http://www.eviews.com/EViews8/EViews8/EViews%208%20Users%20Guide%20II.p
df
Irving, M.J. 2005. Regional Integration of Stock Exchanges in Eastern and Southern Africa:
progress and prospects (IMF working paper; no. 5-122). (s.l.): International Monetary
Fund.
Jefferis, K.R. 1995. The Botswana share market and its role in financial and economic
development. World Development. 23(4):663-678.
Jefferis, K.R. & Okeahalam, C.C. 1999. International stock market linkages in
Southern Africa. South African Journal of Accounting Research. 13(2):27-51.
Johansen, S. 2007. Correlation, regression, and cointegration of nonstationary economic
time series. (CREATES research paper; 2007-35). University of Aarhus, Denmark: Center
for Research in Econometric Analysis of Time Series.
2016 SAAA National Teaching and Learning and Regional Conference Proceedings
ISBN 978-0-620-74761-5
283
Kamin, S.B. 1999. The current international financial crisis: how much is new? Journal
of International Money and Finance. 18:501-514.
Kenny, C.J. & Moss, T.J. 1998. Stock markets in Africa: emerging lions or white
elephants? World Development. 26(5):829-843.
Longin, F. & Solnik, B. 1995. Is the correlation in international equity returns constant: 1960–
1990? Journal of international money and finance. 14(1):3-26.
MacKinnon, J.G. (1996). Numerical Distribution Functions for Unit Root and
Cointegration Tests. Journal of Applied Econometrics. 11(6):601-618
Markowitz, H. 1952. Portfolio selection*. The Journal of Finance. 7(1):77-91.
Meric, I. & Meric, G. 1989. Potential gains from international portfolio diversification and
inter-temporal stability and seasonality in international stock market relationships.
Journal of Banking and Finance. 13(4):627-640.
Piesse, J. & Hearn, B. 2002. Equity market integration versus segmentation in three
dominant markets of the Southern African Customs Union: cointegraion and causality
tests. Applied Economics. 34(14):1711-22.
Raj, J. & Dhal, S., 2008. Integration of India’s stock market with global and major regional
markets. Press & Communications CH 4002 Basel, Switzerland: 202.
Riscura. 2013. Bright Africa: A look at equity investment across the continent.
(Research report). Cape Town, South Africa. Available:
http://www.riscura.com/brightafrica/wp-content/uploads/2015/07/RisCura-Bright-
Africa-2013.pdf [2016, January 07].
Sharma, A. & Seth, N. 2012. Literature review of stock market integration: a global
perspective. Qualitative Research in Financial Markets. 4(1):84-122.
Sharma, G.D. & Bodla, B.S. 2010. Are the Global Stock Markets Inter-linked?
Evidence from the Literature. Global Journal of Management and Business Research.
10(1):29-40.
Speidell, L. 2011. Frontier market equity investing: finding the winners of the future.
Available: http://www.cfapubs.org/doi/abs/10.2470/rf.v2011.n2.1 [2015, December
15].
The Egyptian Exchange. 2013. The Egyptian Stock Exchange: market capitalisation
historical data. Available: http://www.egx.com.eg/English/MCData.aspx [2014, July
20].
Wang, Z., Yang, J. & Bessler, D.A. 2003. Financial crisis and African stock market
integration. Applied Economics Letters. 10(9):527-533.
Yu, J.S. & Hassan, M.K. 2008. Global and regional integration of the Middle East and North
African (MENA) stock markets. The Quarterly Review of Economics and Finance.
48(3):482-504.
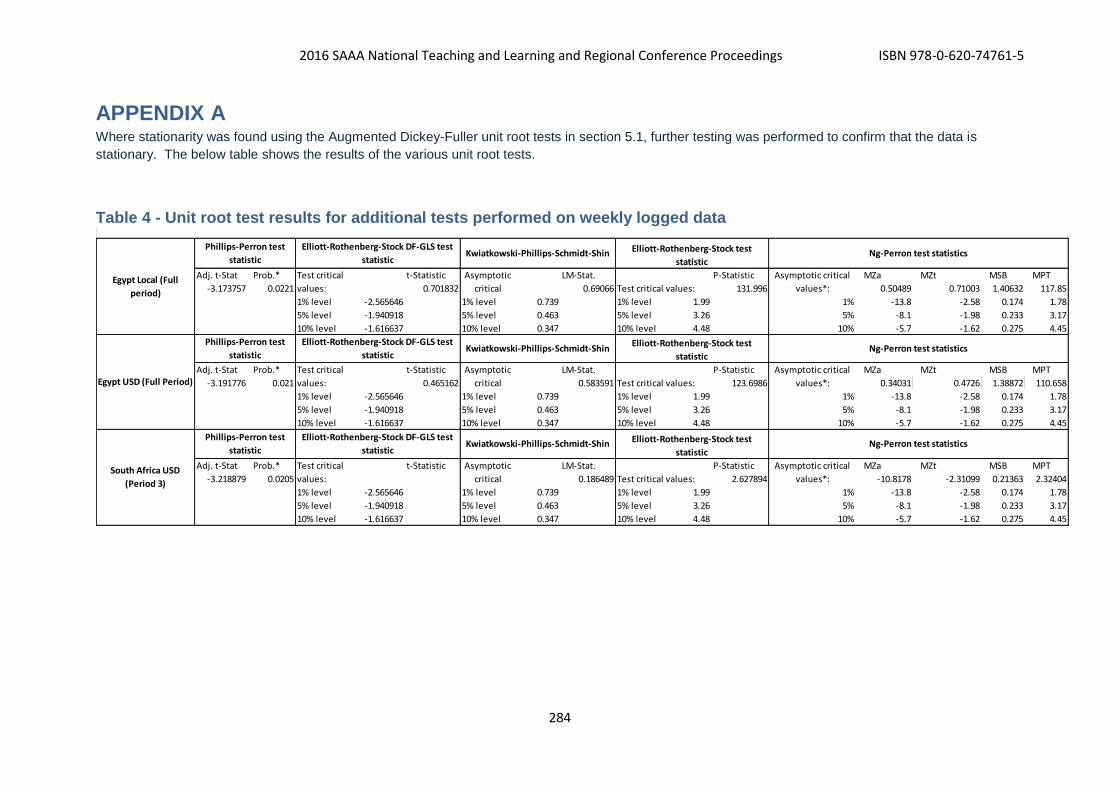
2016 SAAA National Teaching and Learning and Regional Conference Proceedings ISBN 978-0-620-74761-5
284
APPENDIX A Where stationarity was found using the Augmented Dickey-Fuller unit root tests in section 5.1, further testing was performed to confirm that the data is
stationary. The below table shows the results of the various unit root tests.
Table 4 - Unit root test results for additional tests performed on weekly logged data
Adj. t-Stat Prob.* t-Statistic LM-Stat. P-Statistic MZa MZt MSB MPT
-3.173757 0.0221 0.701832 0.69066 Test critical values: 131.996 0.50489 0.71003 1.40632 117.85
1% level -2.565646 1% level 0.739 1% level 1.99 1% -13.8 -2.58 0.174 1.78
5% level -1.940918 5% level 0.463 5% level 3.26 5% -8.1 -1.98 0.233 3.17
10% level -1.616637 10% level 0.347 10% level 4.48 10% -5.7 -1.62 0.275 4.45
Adj. t-Stat Prob.* t-Statistic LM-Stat. P-Statistic MZa MZt MSB MPT
-3.191776 0.021 0.465162 0.583591 Test critical values: 123.6986 0.34031 0.4726 1.38872 110.658
1% level -2.565646 1% level 0.739 1% level 1.99 1% -13.8 -2.58 0.174 1.78
5% level -1.940918 5% level 0.463 5% level 3.26 5% -8.1 -1.98 0.233 3.17
10% level -1.616637 10% level 0.347 10% level 4.48 10% -5.7 -1.62 0.275 4.45
Adj. t-Stat Prob.* t-Statistic LM-Stat. P-Statistic MZa MZt MSB MPT
-3.218879 0.0205 0.186489 Test critical values: 2.627894 -10.8178 -2.31099 0.21363 2.32404
1% level -2.565646 1% level 0.739 1% level 1.99 1% -13.8 -2.58 0.174 1.78
5% level -1.940918 5% level 0.463 5% level 3.26 5% -8.1 -1.98 0.233 3.17
10% level -1.616637 10% level 0.347 10% level 4.48 10% -5.7 -1.62 0.275 4.45
South Africa USD
(Period 3)
Phillips-Perron test
statistic
Elliott-Rothenberg-Stock DF-GLS test
statisticKwiatkowski-Phillips-Schmidt-Shin Elliott-Rothenberg-Stock test
statistic
Test critical
values:
Asymptotic
critical
Egypt Local (Full
period)
Phillips-Perron test
statistic
Elliott-Rothenberg-Stock DF-GLS test
statisticKwiatkowski-Phillips-Schmidt-Shin Elliott-Rothenberg-Stock test
statisticNg-Perron test statistics
Test critical
values:
Asymptotic
critical
Asymptotic critical
values*:
Ng-Perron test statistics
Asymptotic critical
values*:
Test critical
values:
Asymptotic
critical
Asymptotic critical
values*:
Ng-Perron test statistics
Egypt USD (Full Period)
Phillips-Perron test
statistic
Elliott-Rothenberg-Stock DF-GLS test
statisticKwiatkowski-Phillips-Schmidt-Shin
Elliott-Rothenberg-Stock test
statistic

2016 SAAA National Teaching and Learning and Regional Conference Proceedings ISBN 978-
0-620-74761-5
285
APPENDIX B - ACRONYMS AND ABBREVIATIONS Below is a list of the acronyms and abbreviations used throughout the study for ease of reference.
ADF Augmented Dickey-Fuller
CSE Casablanca Stock Exchange
CFG 25 Casablanca Stock Exchange Top 25 Index
ECM Error correction model
EGX Egyptian Stock Exchange
EGX 30 Egyptian Exchange Top 30 Index
GCC Gulf Cooperation Council
JSE Johannesburg Stock Exchange
JSE Top 40 Johannesburg Stock Exchange Top 40 Index
MENA Middle East and North Africa region
MSCI Morgan Stanley Capital International
NGSE Nigerian Stock Exchange All Shares Index
NSE Nigeria Stock Exchange
NSE 30 Nigeria Stock Exchange Top 30 Index
OLS Ordinary Least Square
S&P 500 Standard and Poor’s 500
SMF Stock Exchange of Mauritius
USD United States Dollar
VAR Vector Autoregressions
WFE World Federation of Exchanges
2016 SAAA National Teaching and Learning and Regional Conference Proceedings ISBN 978-
0-620-74761-5
286
2016 Southern African Accounting Association (SAAA) National Teaching and Learning and Regional Conference Proceedings ISBN number: 978-0-620-74761-5
TAX 02: The Hand Which Reaches Beyond the Grave: Reasons
for and against the abolishment of Estate Duty in South Africa
using Australia as a benchmark
Authors:
Patrick Dunton, Riley Carpenter,
Riyaan Mabutha (University of Cape Town)
Contact: [email protected]
ABSTRACT
This paper analysed the current position of the treatment of death as a taxable event in
South Africa and Australia, by means of a high level overview. Greater detail of the reasons
and arguments for and against Australia’s abolishment of its death duties in 1978 were
considered, and the relevant current literature regarding South Africa’s Estate Duty Act. This
paper then sought to determine whether the reasoning offered during the deliberations over
Australia’s abolishment could be applied in a South African context to the Estate Duty Act,
by taking the Australian arguments, both for and against abolishment of death duties, and
analysing the literature on South Africa’s estate duty and whether any points or facts from
the South African literature could be linked to the arguments presented during Australia’s
abolishment of death duties deliberations. The study found that some arguments drawn from
Australia’s abolishment of death duties could potentially be applied to estate duty in South
Africa. However the results were not conclusive, several similarities were highlighted and
potential arguments that could be applied in a South African context were evident.
Key words: Estate duty, capital gains tax, death taxes, double tax
2016 SAAA National Teaching and Learning and Regional Conference Proceedings ISBN 978-
0-620-74761-5
287
INTRODUCTION AND RESEARCH OBJECTIVE
The treatment of death as a taxable event in South Africa has been under considerable
scrutiny since the introduction of capital gains tax in 2001. This is evidenced by the South
African Treasury delegating to a committee the task of determining “the continued relevance
of Estate Duty” and also focusing on the “interaction between CGT and estate duty” in 2013
(The Davis Tax Committee, 2015).
Much has also been written about the current South African position on death as a taxable
event, with some questioning the value of the Estate Duty Act and some defending the use
of the legislation. (Muller, 2010; Roeleveld, 2012, Thorpe 2015).
Roeleveld (2012) proposed an argument that either death should not constitute a capital
gains tax event, or that estate duty should be abolished altogether. The reason for this
argument was that estate duty and capital gains tax are levied on the same assets, and it
was further elaborated that capital gains tax could essentially fill the role of estate duty and
there was therefore no need for estate duty as an additional tax.
In order to analyse these concerns further, in particular the relevance and merits of estate
duty and the perceived double tax that arises on death, this paper analyses the treatment
of an individual’s assets on death from a South African tax perspective. This is then
contrasted to Australia, considering whether the reasons for and against the abolition of
Australia’s death duties can be applied to a South African context with regards to the Estate
Duty Act
Comparable Country Selection of Australia
In order to compare South Africa’s treatment on death against that of another country,
certain criteria would have to be met in order for the study to carry value. Australia was
determined to be the country that came closest to meeting the necessary criteria for the
following reasons:
Australia previously had a form of death tax that was abolished. This allows for the
analysis for the reasoning of the abolishment, and whether that reasoning could be
applicable to South Africa, a country which still has a form of death tax, that being
estate duty. It also allows for a control variable in the comparison that would not
necessarily be available from a country which never had a form of death tax or
currently still has a form of death tax in force.
South African Income Tax legislation was derived from Australian source legislation.
The first Income Tax Act of South Africa (The Income Tax Act No. 28 of 1914) was
derived from the New South Wales Act of 1895 (Haupt, 2014). This allows for a
necessary degree of comparability that may not be viable from another country where
the legislation is derived from a completely different source, and has no similarities
or origins, and therefore, no comparability.
2016 SAAA National Teaching and Learning and Regional Conference Proceedings ISBN 978-
0-620-74761-5
288
When Australia abolished its death duties it was considered to be very controversial,
as it resulted in Australia being the first member country of the Organisation of
Economic Cooperation and Development (OECD) to not have any form of tax on
capital appreciation. This resulted in much literature being written on the topic by
academics and social commentators. This large amount of literature provides greater
understanding and completeness to the study that one does not necessarily achieve
with other countries (Pedrick, 1982).
Australia had death duties as a taxing mechanism at a federal and state level. This
had the effect of an asset being subject to tax at these two different levels on death,
resulting in what was effectively a double taxation on the asset. South Africa currently
has a similar situation with estate duty and capital gains tax, which enhances the
comparability between the two countries.
The following was considered to be a limiting factor of using Australia as the comparable
country:
It could be considered that South Africa has a greater degree of inequality and poverty then
Australia. Although this limitation cannot be disregarded, its effect on the comparison is
expected to be minimal due to the abatement (essentially up to R3.5 million of the net value
of the deceased’s estate is tax free from estate duty) provided by the Estate Duty Act
(section 4A), therefore effectively ruling out a significant portion of the South African
population, and minimising to a limited extent the effects of the differing levels of inequality
on the comparison
RESEARCH METHOD
A literature review was performed on the various types of death taxes applicable in South
Africa and Australia. The literature review included a survey of the literature for and against
the abolishment of Australia’s death duties. The paper then analyses the reasons for and
against the abolishment of Australia’s death duties against literature on South Africa’s estate
duty. It is in turn determined whether they have some relevance or can be applied currently
to South African context with regards to estate duty. This paper then concludes considering
recent developments in South Africa as it relates to estate duty including the work of the
various tax review commissions established in South Africa.
SOUTH AFRICAN TAXES PAYABLE ON DEATH
In South Africa, there are several forms of taxation that are applicable to individuals, the
most relevant being, for the purposes of this paper, estate duty and capital gains tax which
is levied at death.
Estate Duty:
Estate duty is governed by the Estate Duty Act of 1955 and applies to all individuals who
are ordinarily resident in South Africa on the date of their death, or who are not ordinarily
resident but owned assets in the Republic on the date of their death (section 2(2)). The
2016 SAAA National Teaching and Learning and Regional Conference Proceedings ISBN 978-
0-620-74761-5
289
provisions of the Estate Duty Act apply to all property held worldwide by residents and the
definition of property is very broad and includes items which are deemed to be property
(section 3(3)). The Estate Duty Act requires that a duty be levied at a flat rate of 20% on the
total net value of assets that form part of a deceased South African resident’s estate, subject
to certain exemptions and deductions.
Intention of Estate Duty in South Africa:
Estate duty is first and foremost a wealth tax, as only individuals who own assets of a high
enough value will be subject to it. This is achieved by the Estate Duty Act allowing the
deceased to apply a R3,5 million abatement (section 4A) against the net value of their
estate.
In South Africa, where just under 60% of the population are deemed to be living in varying
forms of poverty (Statistics South Africa, 2015), the abatement rules out a vastly significant
portion of the population from ever being subject to estate duty, therefore, only a wealthy
minority will be subject to the tax.
Estate Duties usefulness in generating tax revenue is very limited. In 2014, estate duty only
contributed to 0.1224% of total tax revenue (South African Revenue Service & National
Treasury, 2014).
Capital Gains Tax:
Capital gains tax is governed by the Income Tax Act of 1962 and came into effect in 2001.
The Eighth Schedule of the Income Tax Act stipulates that any gains in the form of capital
appreciation that arise on disposal of assets owned by a South African resident, or fixed
property of a non-resident, will be subject to an inclusion, at a rate of 33.3% in the calculation
of a natural person’s taxable income. For the purposes of this paper, capital gains effecting
companies are disregarded, as companies do not attract death taxes.
The Eighth Schedule in the Income Tax Act requires that for capital gains tax to be triggered,
there must be a disposal, “death” is included in the definition of disposal. The implications
of this is that when a resident of the Republic, or a non-resident who owns qualifying property
in terms of the Eighth Schedule, becomes deceased, the deceased disposes of all their
property, at a value equal to the prevailing market value on the date of their death.
Intention of Capital Gains:
Capital gains tax is intended to be a mechanism for the SARS to tax capital appreciation
that would not normally fall in the scope of the income tax net due to the appreciation being
capital in nature, this was intended to “strengthen the ideals of fairness and impartiality” of
the South African tax system (Thorpe, 2015). The total amount of revenue generated by
capital gains tax in 2014 was R11,603 million which equated to only 1,28% of total tax
revenue (Thorpe, 2015).
2016 SAAA National Teaching and Learning and Regional Conference Proceedings ISBN 978-
0-620-74761-5
290
Recent Developments on South African Taxes on Death
Three committees have been set up to review the tax structure of South Africa, these were
the Margo, Katz and Davis Commissions, and each highlighted particular insights and issues
relating to estate duty. The Margo and Katz commission were held before the introduction
of capital gains tax and therefore their relevance with regard to this paper is limited and are
therefore are only dealt with briefly.
The Margo Commission was tasked with reviewing the state of the South African tax system
in 1987, and by virtue of this detailed particular insights into Estate Duty Act.
The Margo Commission suggested that a pure form of capital gains tax was not required,
but rather that a capital transfer tax be implemented and that this would take the place of
estate duty, allowing for it then to be abolished (Margo Commission, 1987). It has been
suggested that the transfer tax that was proposed is very similar to the capital gains tax that
was implemented in 2001 (Roeleveld, 2012). The fact that the commission suggested that
the capital transfer tax, which as stated, is very similar to the current capital gains tax
legislation, take the place of estate duty, is relevant because it is evident that the commission
specifically wanted to avoid the scenario where there are two forms of taxation on capital
appreciation.
The Katz Commission (1994) supported the view that there was a need for a wealth tax. It
adjudged, based on the reasons above, that some form of wealth tax was necessary in the
South African tax legislation. It identified that it would want to implement a wealth tax that
would yield approximately 1-1.5% of total tax revenue, and wanted to avoid high
administration costs of implementing this tax. The commission also raised the point that it
did not want savings and capital accumulation to be adversely affected by such a tax (Katz
Commission, 1994).
Having taken the factors discussed above into account, the Katz Commission (1994)
concurred with the Margo Commission and also favoured a capital transfer tax that would
encompass estate duty and donations tax, but did not recommend that it be implemented
immediately, but rather after more consideration and study.
The Davis Commission was established in 2013 and released a report in early 2015 dealing
exclusively with estate duty, in particular “the role and continued relevance of estate duty”
and the “interaction between CGT and estate duty” (The Davis Tax Committee, 2015). The
Davis Tax Commission (2015) suggested that South Africa is currently underperforming with
regards to revenue generation from estate duty relative to other countries’ death duties
revenue generation and suggested that there is “scope to improve performance in this
regard” (The Davis Tax Committee, 2015). Stemming from this low revenue generation, the
Davis Tax Committee (2015) identified certain issues regarding the current Estate Duty Act:
2016 SAAA National Teaching and Learning and Regional Conference Proceedings ISBN 978-
0-620-74761-5
291
It is inefficient.
It displays various aspects that are inequitable. This point was justified by pointing
out that the wealthy are “easily able to plan and implement estate duty planning
mechanisms” (The Davis Tax Committee, 2015).
It is overly complex, time consuming and inconvenient.
It lacks transparency due the wealthy’s ability to mitigate their tax liability through
adequate planning.
Based on the shortfalls discussed above, the Davis Tax Committee (2015) concluded that
the following was action that could be taken
Abolish the Estate Duty Act completely, “moving away from treating death as a
taxable event” (The Davis Tax Committee, 2015). This is an option also suggested
by Roeleveld (2012).
Amend the Estate Duty Act to correct its flaws.
Replace the present Estate Duty Act with a new form of wealth tax.
The Davis Tax Committee (2015) suggested that because of the significant inequality
currently in South Africa, it would be difficult to motivate the abolishment of the only tax tool
that is a direct tax on the wealthy in South Africa.
Having ruled out the other two options, and utilising several arguments against abolishment
put forward by the Katz Commission, the Davis Tax Committee (2015) recommended that
the estate duty legislation should remain in place and with appropriate amending, could
“achieve many of the objectives” (The Davis Tax Committee, 2015) that it is intended to
achieve
AUSTRALIAN TAXES PAYABLE ON DEATH
Death Duties
Australia currently has no death tax, it was abolished at a federal level in 1978 and
eventually at a state level in all six states of Australia in 1982 (Grossman, 1990). The
movement towards this abolishment was mostly due to the view that death duties “weighed
heavily on even very modest estates, with inflation exacerbating the problem of low
exemptions” (Gilding, 2010). Australia was seen to be relatively progressive with this move,
as it was the first of the OECD countries at the time to make this type of tax reform (Pedrick,
1982), being no tax on capital appreciation, as capital gains tax was only introduced into
Australian legislation in 1985 (Flynn & Stewart, 2010).
In 1975, the Asprey Commission was formed to review the Australian taxation system and
to make any recommendations that were required to update the Australian tax system
(Commonwealth Taxation Review Committee, 1975). The Death Duties Act of Australia
received considerable focus, as it had not been reviewed since the 1950’s (Gilding, 2010).
The commission made several recommendations regarding death duties but never
considered abolition as a solution to the legislation’s shortcomings. (Commonwealth
Taxation Review Committee, 1975).
2016 SAAA National Teaching and Learning and Regional Conference Proceedings ISBN 978-
0-620-74761-5
292
Even before the Asprey Commission, the trajectory towards abolition of death duties in
Australia had begun to gain momentum. The initial pressure was mostly generated from the
general public, as Australian citizens began to believe that the tax was inherently unfair.
(Duff, 2005; Pedrick, 1982). Right wing political parties took advantage of this public
sentiment to generate support, by proposing the abolition while focusing on the economic
merits for the Australian citizen of doing so, this was especially prevalent at a state level
(Grossman, 1990).
The following reasons were raised in favour of abolition:
Undue harshness- Some of the perceived harshness was partly attributed to the fact
that exemptions were very low, with a basic exemption of AUS$40 000 at a federal
level, and sometimes as low as AUS$20 000 at a state level, depending on which
state the deceased was resident in (Pedrick, 1982). The insufficiencies of these
exemptions are illustrated when contrasted against the net value of estates taken
from a sample in 1973. In the sample of 16 734 estates, 87 percent of these estates
where greater than the value of AUS$20 000 and approximately 44 percent of these
estates had a value greater than the AUS$40 000 exemption provided at a federal
level, approximately ten percent of estates were considered to have a greater value
of AUS$120 000 as of 1973 (Commonwealth Taxation Review Committee, 1975). An
explanation for these inadequate exemptions was that they had not been adjusted
adequately for inflation over the years (Pedrick, 1982). Low exemptions detracted
from Australia’s death duties being primarily a wealth tax, as it would even “apply to
relatively modest estates”, therefore not necessarily being a tax on wealth (Duff,
2005).
Duplication of the tax at Federal and State Level- Death duties were effective at a
federal and state level in Australia, with all residents of Australia being subject to the
federal tax and each state instituting its own form of death tax at a state level, with its
own provisions and exemptions. This had the unpopular effect of duplicating the tax
payable on the estate of the deceased.
This duplicative system of wealth tax increased compliance costs for all estates but
the relative burden was “likely higher for small and medium sized estates” (Duff,
2005). Several recommendations were made to allocate the revenue from death
duties to either the Commonwealth or the state level but the double tax remained until
the final abolition of death duties at the federal level in 1978 (Duff, 2005).
Queensland was the first Australian state to fully abolish its state death duties in 1977.
The loss of revenue anticipated was AUS$25 million, but the attractiveness for
citizens of other states to invest their assets or even relocate to Queensland in order
to evade the state duties in their current state was expected to be very high and bring
an inflow of investment and citizens to Queensland as a result of the newly acquired
competitive position of the state (Grossman, 1990). The expectations proved to be
2016 SAAA National Teaching and Learning and Regional Conference Proceedings ISBN 978-
0-620-74761-5
293
correct, with AUS$11 million transferred in a single year between Tasmania and
Queensland alone (Pedrick, 1982).
The other states, fearing the exodus of capital and pressure to also abolish their death
duties or risk unhappiness of its citizens, eventually all followed Queensland’s suit in
the move to abolish its state duties (Duff, 2005). Tasmania was the last state to
abolish their death duties in 1982 (Pedrick, 1982).
The political popularity by Queensland’s move to abolish death duties was correctly
recognised as a potentially powerful political tool at a federal level and therefore the
attractiveness to support federal abolition in order to garner political strength was
potentially a significant consideration taken into account when considering the
abolition decision (Duff, 2005).
Complexity- The Asprey Commission (1975) acknowledged that the system of death
duties at a state and federal level lead to many complexities, for both the taxpayer
and receiver. The complexities resulted in great difficulty in administering the tax,
resulting in large costs being incurred by the Australian Tax office in order to try and
enforce the tax, as well as determine the value of assets which did not actively trade.
This proved contentious and problematic (Commonwealth Taxation Review
Committee, 1975). The Asprey Commission noted that due to the complexity that
resulted in a very small net revenue yield due to the costs that resulted, many factions
in Australia believed it was best to do away with the tax altogether (Commonwealth
Taxation Review Committee, 1975).
Ease of Avoidance- Individuals with a high enough level of tax knowledge were able
to avoid the tax liability of death duties significantly as a consequence of the many
loopholes found within the Death Duties Act. The Asprey Commission (1975)
acknowledged this significant shortcoming in its report by stating the following: “It is
certainly at present a tax which can be avoided by well-advised persons with ease,
and which might almost be said to be paid principally from the estates of those who
died unexpectedly or who had failed to attend to their affairs with proper skill”
(Commonwealth Taxation Review Committee, 1975). Several of the
recommendations made by the Asprey Commission were directed towards removing
several of these loopholes.
A common example of avoidance was the use of a discretionary trust. This had the
effect of deferring payment of death duties from generation to generation into
perpetuity if the estate planning was maintained and the property remained in the
trust (Duff, 2005).
2016 SAAA National Teaching and Learning and Regional Conference Proceedings ISBN 978-
0-620-74761-5
294
The arguments against abolition were the following:
Part of modern fiscal system- As mentioned above, Australia was considered to be
very progressive with regard to the move to abolish their death tax, as it was
considered an integral part of a modern fiscal policy, and to abolish it was considered
somewhat of an anomaly (Gilding, 2010). The main arguments behind this point was
that without death duties, there would be no tax at all in Australia on capital
appreciation of assets, and that Australia would stand unique in the industrialised
Western world because of this. Death duty therefore formed a “quite essential role to
play in the tax structure as a whole” (Pedrick, 1982). When Australia did finally make
the decision to abolish death duties it was the only country of the 21 OECD countries
to not have a tax on capital appreciation (Pedrick, 1982).
Tax revenue- At a federal level, between 1977-1978, the Australian death duties
produced AUS$100 million, and at a state level produced a significantly higher
AUS$240 million. It can therefore be seen that death duties were more valuable as a
fiscal tool at a state level then a federal level in terms of revenue generation
(Grossman, 1990). Total tax revenue generated by Australia during this period was
AUS$21.428 million, of which death duties contributed 1.59% (The Treasury of
Australia, 2012). This is in line with the prevailing trend at the time that death and gift
duties contributed approximately 1-3% towards tax receipts (Pedrick, 1982).
An issue began to arise with revenue yield produced by the death duties, as a result
of the low exemptions offered. As more estates became subject to death duties due
to the low exemptions, the administration costs of the death duties legislation
increased at a greater proportion than the additional revenue produced by the smaller
estates that now fell in the death duties scope. This greatly hampered the revenue
yield of the Death Duties Act (Duff, 2005).
It was argued at the time, that even though the amount raised was not a significant
amount, it was still useful when the government was engaged in special projects
which required this additional revenue, and the loss of this revenue through abolition
would have to result in other forms of tax becoming more onerous in order to recoup
the lost revenue (Pedrick, 1982).
Equity through the tax system/Against accumulated wealth- During the 1970’s in
Australia there was a significant amount of wealth concentration (Pedrick, 1982). A
study conducted in the year that the death duties in Australia were abolished, 1978,
suggested that the top one percent of the Australian population held approximately
22 percent of the country’s wealth, and that the top five percent of Australians held
fifty percent of the country’s wealth (Raskall, 1978).
Being a wealth tax, death duties was seen as a form of taxation policy that could look
to rectify this large concentration of wealth and bring greater equity to the residents
2016 SAAA National Teaching and Learning and Regional Conference Proceedings ISBN 978-
0-620-74761-5
295
of Australia. If it were to be abolished there would be no tax mechanism in place to
confront this. However, the effectiveness of its ability to do this was highly disputed
due to the growing increase in wealth concentration in Australia from the 1960’s to
the 1970’s (Katic & Leigh, 2015).
It was felt that the role of death taxes served as a symbol to the Australian people
that the legislation was committed to bringing equality to the people of Australia and
providing equal opportunity through the redistribution of significant wealth (Pedrick,
1982). In essence, it was felt that the Death Duties Act was a symbol of Australia’s
commitment to progressive equality, and to abolish it would be tantamount to
signalling that wealth distribution and equal opportunity was not a priority in Australia.
Capital Gains Tax
Australia introduced capital gains tax in 1985 in an attempt to generate some form of tax
revenue from capital appreciation of a taxpayer’s assets. The appreciation in value of these
assets had not been subject to any form of taxation since the Australian authorities made
the move to abolish its Death Duties Act in 1978 (Flynn & Stewart, 2010).
It was originally planned that when capital gains tax was introduced into Australian law,
death would result in a deemed disposal of the deceased’s assets and the capital
appreciation of these assets would therefore be realised and fall into the capital gains net.
The government at the time, however, decided against instituting it, as they feared it would
be seen by the general public as a form of death tax being incorporated into income tax law
(Flynn & Stewart, 2010).
The final decision regarding capital gains tax and its implications with regards to death was
that the appreciation in value of the asset and the associated liability that would arise from
such appreciation, in the form of capital gains, would be passed on to the successors or the
inheritors of such assets, through various rollover provisions, and would only fall into the
income tax net when such entity had sold or disposed of it themselves (Flynn & Stewart,
2010). These collective rollover provisions only apply when the assets of an Australian
resident will still be subject to Australian tax once they have been bequeathed. In the case
where assets are bequeathed to an entity which will render the assets not subject to
Australian tax (such as an asset foreign to Australia being inherited by a non-resident), the
gain will be subject to capital gains tax and included in the deceased’s final tax return (Flynn
& Stewart, 2010). This exception to the rollover rules are in place to ensure that Australia
will not lose out on revenue that could be derived from capital appreciation by bequests
taking certain assets out of their tax jurisdiction.
From this it can be seen that death in itself does not lead directly to capital gains, and by
virtue of that, income tax implications.
2016 SAAA National Teaching and Learning and Regional Conference Proceedings ISBN 978-
0-620-74761-5
296
Recent Developments on Australian Taxes on Death
Since Australia’s introduction of capital gains tax in 1985, the need for a death tax has been
greatly reduced as there is now a mechanism to tax capital appreciation in Australia. There
have still been, however, occasional calls for the reintroduction of a death tax as many public
finance economists and tax policy experts believe it is a valuable tax mechanism (Flynn &
Stewart, 2010).
A review into the Australian tax system was recently conducted and reported in 2010. Prior
to the release of the final report, drafts made reference to the benefits that a wealth tax,
such as death duties, can have, by stating that a tax on wealth “may help to promote equality
of economic opportunity by taxing large fortunes handed down from generation to
generation and by limiting the acquisition of wealth without personal effort” (The Treasury of
Australia, 2009). The report, however, counters this sentiment soon after by stating that
“bequest taxes may fall disproportionately on families where a death is unexpected” (The
Treasury of Australia, 2009).
In the final report it is acknowledged that a bequest tax is an “economically efficient way of
raising revenue” and the tax “could have a progressive element.” This suggests that most of
the revenue that could be raised from a bequest tax could be generated by the top 10% of
households in Australia (The Treasury of Australia, 2010). Despite this, due to Australia’s
“controversial” history with regards to past wealth taxes, the report does not recommend the
reintroduction of a wealth transfer tax, but rather suggests that there should be “full
community discussion and consideration of the options available” in this regard (The
Treasury of Australia, 2010).
Based on this report it appears unlikely that Australia will revise its stance on death and
wealth taxes in the immediate future, but may do so in the medium to long term.
ANALYSIS
Using the reasons described above for and against the abolishment of Australia’s death
duties each reason is analysed against literature on South Africa’s estate duty. It is then
considered whether this can have some relevance or can be applied currently to the South
African context with regards to estate duty.
Reasons for Abolishment:
Undue Harshness
Australian death duties was seen not to provide adequate relief in the form of exemptions
to the estates that were subject to it, and in particular it was severely harsh on the surviving
spouse of the deceased, with inter-spousal relief only coming into effect briefly before the
decision for abolishment was enacted (Duff, 2005; Pedrick, 1982).
The Estate Duty Act of South Africa, in contrast, does provide sufficient inter-spousal relief
as all assets left to the surviving spouse are deducted from the value of the deceased’s
estate and are therefore not subject to estate duty (section 4(3)(lA)). The abatement of R3.5
2016 SAAA National Teaching and Learning and Regional Conference Proceedings ISBN 978-
0-620-74761-5
297
million provided could potentially be seen to be more generous than the rebates provided in
Australia purely due to the fact that the abatement provided has not drawn as much, if any,
criticism or discussion over its sufficiency relative to the Australian abatements. Australia’s
abatements were the subject of severe criticism and were considered so insufficient that the
Asprey Commission felt a particular need to focus on their harshness (Commonwealth
Taxation Review Committee, 1975; Pedrick, 1982).
South Africa’s abatement is also subject to frequent revisions, having been increased from
R1 million to R2.5 million in 2005 and finally to R3.5 million in 2007. The Davis Tax
Committee has also recommended that this abatement be increased to R6 million in its 2015
Report (The Davis Tax Committee, 2015). This is contrasted against Australia where one
major problem was that the death duty’s exemptions had not been adjusted for inflation as
frequently as was deemed necessary (Duff, 2005).
Muller (2010) suggested that wealth taxes, such as estate duty, only enhance the
progressivity of the tax system when they are imposed on the very wealthy. Granting
adequate exemptions ensures this. When these exemptions are not adjusted appropriately
for inflation, less wealthy individuals begin to fall into the scope of the tax as a result of the
inflation, and not through increases in real wealth. This leads to social unrest and
unpopularity of the tax. It’s progressivity is also then undermined as a result (Muller, 2010).
It has been put forward however that to abolish the tax would be much more detrimental to
equity in society then the slight inequity that arises due to not adjusting the exemptions,
therefore highlighting the need for the tax to bring equity to society (Graetz, 2010).
It would not be appropriate to draw conclusions over the generosity of the abatements in
South Africa and the exemptions in Australia offered under each tax system based on
proportionate revenue generated. These numbers have the potential of being distorted by
pieces of tax legislation that apply to one country but not the other, hence reducing the
comparability.
It is therefore evident that this argument would not necessarily be as strong an argument
against estate duty as it was against Australia’s death duties.
Duplication of tax at a state and federal level
Although in the South African context death duties is not replicated at a provincial and
national level, it is evident that the tax on capital appreciation is replicated through capital
gains tax and estate duty, effectively resulting in a similar effect that produced this argument
against Australia’s death duties. It is therefore considered possible to potentially advance
the argument given during Australia’s deliberations over abolishment towards South Africa’s
Estate Duty Act, due to assets being subject to two taxes.
An example (Appendix 1) which illustrated that poor estate planning could result in an
excessive tax charge on death, largely as a result of the double nature of the taxes, and
evidenced the “confiscatory” nature that having two transfer taxes on capital can have
(Roeleveld, 2012). The term “confiscatory” is assumed by this paper to allude to the fact
2016 SAAA National Teaching and Learning and Regional Conference Proceedings ISBN 978-
0-620-74761-5
298
that generally the assets that the taxes are placed on have to be sold by the beneficiary in
order to generate the cash to satisfy the tax liability that arises on the death of the deceased.
This is suggested as being contrary to the objective of estate duty of creating an equitable
situation, as having a double tax on assets could be considered “unfair and punitive”
(Independent Green Voice, 2006). To elaborate further on what the paper is suggesting, any
tax should not be unduly heavy or harsh on a particular taxpayer in order to try and create
an equitable situation for other citizens, and society in general, because in doing so, it
creates an inequitable or unfair situation for the original taxpayer (Thorpe, 2015).
The Davis Tax Committee did not concur with Roeleveld (2012) that there is a need to rectify
the double nature of tax that arises on death. The reasoning behind this rejection is that
Roeleveld (2012) bases the conclusion it reaches on the premise that capital gains tax and
estate duty are both “wealth taxes” and the Davis Tax Committee stipulates that capital
gains tax is an income tax, hence the rejection (The Davis Tax Committee, 2015) Although,
the Davis Tax Committee (2015) disputes the validity of the double tax argument in South
Africa, there is still sufficient concern from the general public for it to still carry significant
weight (Muller, 2010; Roeleveld, 2012). This point was also evident in Australia where the
Asprey Commission did not believe that the double tax that arose at a state and federal level
needed to be rectified but public sentiment drove the movement towards abolishment
(Commonwealth Taxation Review Committee, 1975; Pedrick, 1982).
The fact that the duplication is not a verbatim copy of the same tax at differing legislative
levels as was in Australia, does not appear to harm the argument in anyway if it were put
forward in South Africa, as the argument’s premise was based on the capital being taxed
twice as opposed to arguing against the medium through which it was taxed.
Complexity
The Estate Duty Act of South Africa does not appear to be a very complex tax relative to
Australia’s death duties. This is shown by the lack of any significant case law that would
presumably have arisen if it were a contentious tax as a result of complexity (Roeleveld,
2012). The fact that it is not administered at a national and provincial level, in South Africa,
also appears to have the effect of avoiding the main source of complexity that arose in the
Australian instance.
The Katz Commission, however, identified that as the net value of the dutiable estate is
based on the market values of the assets at the time of death, these market values could
be contentious, as many of the assets would not necessarily be trading on an active
exchange. Therefore, a degree of complexity could potentially play a part in determining the
net value of the estate. A similar issue was raised by the Australian Asprey Commission with
regards to the valuing of assets (Commonwealth Taxation Review Committee, 1975). The
Margo Commission and Davis Tax Commission both stated that estate duty was “complex”
(Margo Commission, 1987; The Davis Tax Committee, 2015) They did not, however,
elaborate further on this point.
2016 SAAA National Teaching and Learning and Regional Conference Proceedings ISBN 978-
0-620-74761-5
299
Therefore, the point of complexity as an argument could potentially be substantiated with
reference to the difficulty in determining market values. This is significantly undermined by
very little case law dealing with this point in South Africa.
Ease of avoidance
The Asprey Commission noted that the Australian death duties legislation was riddled with
loopholes and therefore could easily be avoided by individuals with a high enough level of
tax knowledge (Commonwealth Taxation Review Committee, 1975). Those with sufficient
tax knowledge were also able to mitigate their death duties liability substantially through the
use of trusts (Duff, 2005). Loopholes do not appear to be an issue with South Africa’s estate
duty legislation as there are several provisions in place which bring assets that were
disposed of before death into the estate duty net. The Margo Commission did, however,
note particular instances where individuals would make provisions to avoid estate duty
(Margo Commission, 1987). The Davis Tax Committee also noted that individuals were able
to mitigate their tax liability by implementing “estate duty planning mechanisms” (The Davis
Tax Committee, 2015).
The repercussions of avoidance in South Africa are not as severe as they would have been
in Australia, as individuals would generally still be subject to capital gains in their attempts
to avoid estate duty, albeit at a lower rate.
This therefore seems not to be a sufficiently significant argument for abolition.
Reasons against Abolishment
Part of Modern Fiscal system:
In 1978, when Australia’s death duties were abolished, as mentioned previously in the study,
it was seen as a very controversial decision. This is because Australia was the first nation
of the OECD countries to not have any tax on capital appreciation (Pedrick, 1982) and the
death duties mechanism was seen as an important and powerful fiscal tool (Gilding, 2010).
In order to determine whether death duties is still considered a valuable fiscal tool, it is worth
analysing what other countries’ approaches and policies regarding death taxes are currently.
Many modern Western countries have made the move to either abolish their death taxes all
together or to limit the importance and application of such. Eleven countries and two tax
jurisdictions have abolished their death duties since 2000 (Appendix 2), seven of which are
OECD countries. Furthermore, no country has moved to implement death taxes since 2000
(Cole, 2015).
Furthermore as of 2004, an example of this trend is further evidenced by thirty of the
American states having effectively eliminated death taxes since 1976, and many others
having made moves to reduce them (Conway & Rork, 2004). As of 2014, only 19 of
America’s 51 state’s still retained a form of death taxes, but eight of these states were in the
process of reviewing their legislation over death (Ebeling, 2014). At a federal level in
America, the House of Representatives voted to abolish death taxes in America in 2015, a
2016 SAAA National Teaching and Learning and Regional Conference Proceedings ISBN 978-
0-620-74761-5
300
vote seen to be a significant step towards federal level abolishment (Goodman, 2015). The
reason why America’s changing policy to death taxes has been especially highlighted is that
it currently has the fourth highest death tax rate in the world, and there has been much
written on the topic, making it particularly useful to analyse (Cole, 2015).
As is evidenced by the above, there appears to be a strong movement or consensus towards
abolishment of death taxes. This therefore undermines the importance of death taxes as a
part of a countries modern fiscal system, as it can be seen that the “fiscal benefits of levying
such a tax are eventually outweighed by the administrative, political and economic costs”
(Cole, 2015).
It would therefore not be unreasonable to conclude that this argument against abolishment
of South Africa’s estate duty would not be a valid one.
Tax Revenue
South Africa’s estate duty brings in a much smaller proportion of total South African tax
revenue, being only 0.1224%, compared to what Australia’s death duties brought in in 1978,
being 1.59% of the total Australian tax revenue (South African Revenue Service & National
Treasury, 2014; The Treasury of Australia, 2012). Therefore it could possibly be perceived
that this argument against the abolishment of estate duty would hold much less weight as it
did when it was put forward in Australia, as a result of this much lower proportional amount
of revenue generated, being approximately a thirteenth of the proportional amount that was
generated in Australia.
The revenue argument itself was not necessarily a strong one when initially presented in
Australia due to the relatively minor amount of revenue it did generate (Gilding, 2010).
Despite this, it did carry some weight, as death duties was the only mechanism with which
the Australian Treasury had in place with which to generate revenue from the accumulated
wealth of individuals.
This point would also carry very little weight in an argument in favour of the retention of
estate duty as capital gains tax in South Africa renders the point redundant.
Equity through the Tax System and Breaking down of Accumulated Wealth
As death duties were the only form of tax on capital appreciation in Australia in 1978, it was
essentially the only tool that could be used to break down accumulated wealth and provide
equity through the tax system, although its effectiveness at doing this has been disputed
(Katic & Leigh, 2015).
Roeleveld (2012) presented the argument that having both estate duty and capital gains tax
in place was counterintuitive to bringing equity through the tax system, due to the
confiscatory effect that arose as a result of having two taxes in place over the same assets
(Appendix 1) as discussed above.
2016 SAAA National Teaching and Learning and Regional Conference Proceedings ISBN 978-
0-620-74761-5
301
The Davis Tax Committee disputed the validity of capital gains tax being a “wealth tax” and
propositioned that since estate duty is currently the only wealth tax in South Africa, “it would
be hard to justify a repeal” as it is the only taxing mechanism that is geared to the
redistribution of wealth (The Davis Tax Committee, 2015). Muller (2010) further highlighted
that the purpose of estate duty was a means to bring equity to society. Both papers do
concede, however, that the current estate duty legislation does require revisions in order for
it to effectively achieve its objectives (Muller, 2010; The Davis Tax Committee, 2015).
The need for estate duty to bring equity to society is therefore a potentially valid argument
against the abolishment of estate duty in South Africa. The current form of the estate duty
legislation, however, in combination with capital gains tax, does not appear to achieve its
objectives. This was also highlighted by Roeleveld (2012) and the need for revisions in order
to achieve its objectives, highlighted by Muller (2010) and the Davis Tax Committee (2015),
supports this point.
SUMMARY OF RESULTS
The above analysis shows that there are reasonable grounds to advance some of the
arguments for and against the abolishment of death duties in Australia towards the Estate
Duty Act in South Africa (Appendix 3). The argument which carried significant weight and
was most applicable to estate duty was the duplication which arises as a result of capital
gains tax and estate duty being levied on the same assets. The importance of this argument
is slightly undermined by the Davis Tax Commission not viewing it as a major concern (The
Davis Tax Committee, 2015), but there is strong public sentiment in South Africa to rectify
this (Muller, 2010; Roeleveld, 2012).
The arguments of complexity and ease of avoidance are also applicable to estate duty as
issues have been raised in South Africa, mainly through the various tax commissions, which
highlighted these as problem areas. The problems may not be at the same significance level
that was present in Australia, but they are still applicable and carry weight in South Africa
currently.
The arguments put forward against abolition of death duties in Australia were significantly
weaker when applied in a South African context. Death duties, and by association, estate
duty, is no longer viewed as an important fiscal tool in a South African or global context and
therefore is a weak argument against abolition of death taxes worldwide, and in South Africa.
The revenue argument is critically undermined in South Africa as a result of capital gains
tax effectively neutralizing the argument that death duties is the only means to generate
revenue from capital appreciation. The amount of proportional revenue generated in South
Africa from estate duty is also significantly less than what the proportional amount in
Australia was from death duties.
Finally, the need for estate duty to break down accumulated wealth and bring equity to
society is greatly disputed in South Africa. There is clearly a need for a mechanism to bridge
the inequality gap and provide equity, but it is very questionable as to whether estate duty
2016 SAAA National Teaching and Learning and Regional Conference Proceedings ISBN 978-
0-620-74761-5
302
achieves this goal. Based on this sentiment, it is inconclusive as to whether this could be
provided as an argument against the abolition of estate duty in South Africa. After the
revisions suggested by the Davis Tax Commission have been enacted, this argument could
potentially become a strong argument against abolition of estate duty, if such revisions do
in fact allow the estate duty legislation to better achieve its objectives.
SUGGESTED SOLUTIONS TO REMEDY ‘DOUBLE TAX’
As the results above suggest, there is reason to believe that there could potentially be a
more effective method of how death is treated as a taxable event, some of these alternatives
are presented below.
In order to resolve the double tax situation, there appear to be three reasonable actions to
take; either to abolish estate duty; disregard death from the capital gains tax net, in order to
solve the inequitable situation that arose from the double tax; or keeping estate duty and
implementing variation to the base cost determination for capital gains system on death.
The first option, as suggested by Ger (2012), was to abolish estate duty altogether. The first
point raised in favour of this option was that the revenue raised by estate duty was not worth
the cost of administration. Estate duty only raises approximately 0.1224%, as mentioned
earlier, of total tax revenue and raising this revenue can prove to be a costly exercise,
resulting in a negligible yield (Roeleveld, 2012). However, it has also been suggested that
the existing collection structure through the Master’s offices requires very little administration
and is therefore cost efficient (Muller, 2010).
Regardless of its expenses to administer, the intention of estate duty is clearly not geared
towards revenue generation but rather the breaking down of condensed wealth. The point
of its low revenue generating ability, therefore, may not be considered a viable argument. A
potential counter-argument to this is that because the separate piece of legislation only
generates insignificant amounts, would it not prove more efficient and potentially less costly
to abolish estate duty altogether and amend the capital gains legislation to recoup any
revenue that would have been lost through the abolishment?
The next significant point raised in the argument in favour of the abolishment of estate duty
and the retention for capital gains tax is that capital gains tax is the superior tax. Several
points to support this claim are listed below:
The definition of a “disposal” has been given a very wide meaning. This is a significant
point because from this it can be seen that capital gains tax draws all assets that
would be subject to estate duty into its tax net due to its broad disposal definition
therefore very little or no amendment would be required.
Capital gains tax is an easier tax to collect due to being aggregated/integrated into
an individual’s taxable income (Ger, 2012).
2016 SAAA National Teaching and Learning and Regional Conference Proceedings ISBN 978-
0-620-74761-5
303
Using a sliding scale of tax, as is the case with capital gains tax, creates a much more
equitable situation than a case where an individual is taxed at a flat rate, as with
estate duty (Mccaffery, 1999). This may not be considered equitable as there is not
a single class of wealth, but rather several different brackets of society that would be
classified within “wealthy”. The actual wealth of the individuals in these brackets
varies substantially from wealth bracket to wealth bracket (Roeleveld, 2012).
An important advantage of keeping capital gains tax as opposed to estate duty is that
capital gains tax is covered by most existing double tax agreements that South Africa
has in place with other foreign countries (South African Revenue Service, 2015). This
is not the case with estate duty because many other foreign countries do not have a
form of death taxes and therefore death model treaties are not common in these
countries (Roeleveld, 2012). The problem with this is that South African residents
may not get total relief if the asset in question is taxed both in South Africa, under
estate duty, and a foreign tax jurisdiction.
The second alternative to the current treatment of death as a taxable event presented by
Thorpe (2015) would be to disregard death as a capital gains tax event. This would be done
by altering what constitutes a deemed disposal in paragraph 40 of the Eighth Schedule to
exclude death. It is suggested that adopting this approach will have the lowest impact on
the revenue generated on the death of an individual, as the current capital gains tax
legislation already provides several provisions, such as roll-over relief on the death of a
spouse and a primary residence exclusion (Roeleveld, 2012). Issues arise with this
approach because the administration effects that would need to be implemented in order to
amend other legislation to avoid tax inefficiencies would be significant (Roeleveld, 2012).
Van Jaarsveld (2013) suggested a third possibility of keeping estate duty as is and rather
implementing a variation of the capital gains system on death. The proposed variation is
either using a “stepped-up” approach, which means the asset’s base cost is revised up to
market value at death and no capital gains is payable, or a “carry-over” approach, which
means the beneficiary who receives the asset essentially takes the place of the deceased
and no capital gains is payable until the asset is subsequently disposed of. (Van Jaarsveld,
2013). The amendments were suggested to try and rectify the double tax situation that arises
on death.
Roeleveld (2012) concludes that capital gains tax on death should be retained, and that
estate duty should be abolished, as capital gains tax is “far reaching and more beneficial to
the fiscus”. Thorpe (2015) also highlighted that South Africa was one of a very few number
of countries that had implemented a form of double taxation on death and this needed to be
addressed and potentially resolved through the abolishment. Muller (2010) concurred that
the double taxation that arises, while not feasible, should not merit abolition, but rather an
alternative or legislative change which rectifies the double tax situation be found.
2016 SAAA National Teaching and Learning and Regional Conference Proceedings ISBN 978-
0-620-74761-5
304
CONCLUSION AND AREAS FOR FUTURE RESEARCH
The paper has detailed current literature that exists for South Africa and Australia with
regards to their respective positions on death as a taxable event, with the focus primarily
being on death taxes. The research question was not conclusively answered as instances
arose where some arguments put forward for Australia’s abolishment proceedings were
supported in a South African context and other instances where the arguments put forward
were not. The paper however has illustrated that there are some arguments that could
potentially be drawn from Australia’s motivations for their abolishment of their death duties
in 1978 for the abolishment of estate duty in South Africa. Perhaps even more significant
from the results is that the arguments put forward opposing the abolishment in Australia are
generally either not applicable or their importance is greatly diminished in a South African
context. This could be seen to further promote the position of abolishment due to the weak
nature of the counter-arguments. The Davis Tax Commission’s recommendations could
potentially align the Estate Duty Act with its supposed objectives and correct the double tax
situation that arises on death, the paper also presents several potential alternatives or
adjustments to estate duty that have been suggested by academics. If this is done the calls
for abolishment will surely diminish, until that time however, this paper has determined that
there are currently potentially valid arguments for the Estate Duty Act to be abolished in
South Africa, or the treatment of death as a taxable event to at least be revised.
The study has provided some useful analysis but could be improved by expanding the
number of countries in the comparison. This could potentially improve the analysis of how
South Africa treats death as a taxable event relative to other countries, and whether any of
those approaches adopted would be applicable or potentially preferable in a South African
context. The study could also focus on past cases of other countries which had two
independent taxes in place, which taxed the same capital appreciation and the reasoning
as to why this situation existed and the deliberations which took place to resolve it.
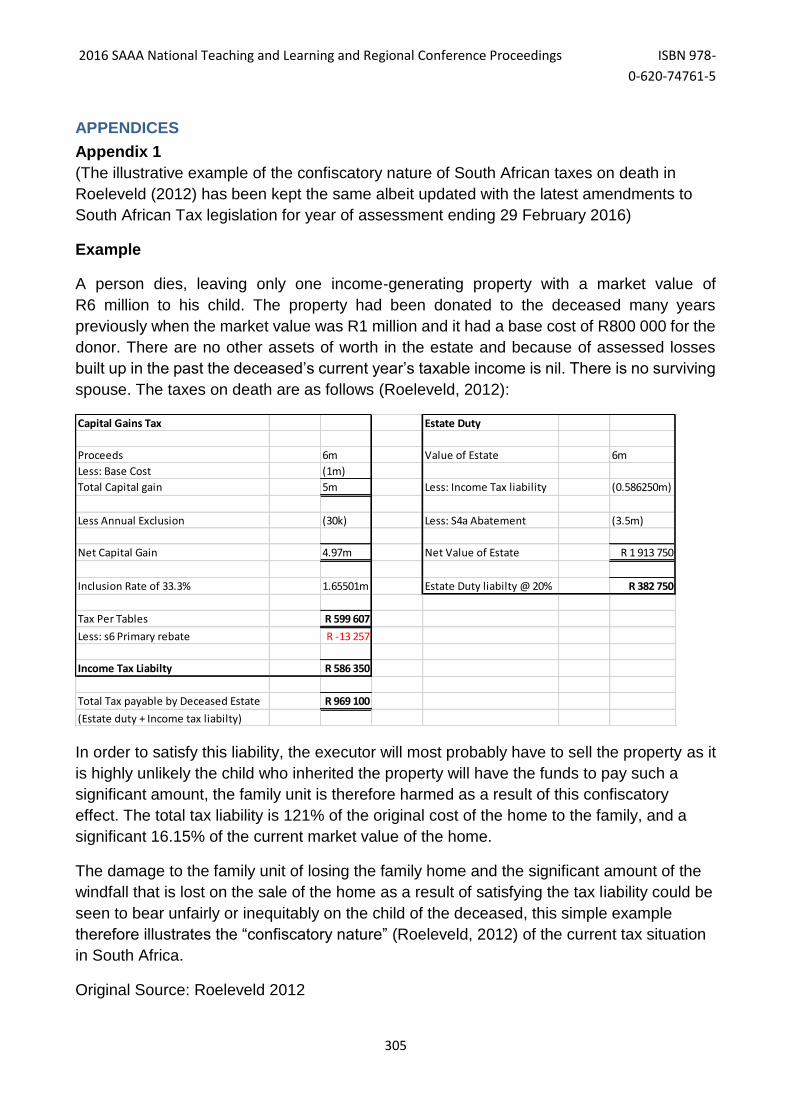
2016 SAAA National Teaching and Learning and Regional Conference Proceedings ISBN 978-
0-620-74761-5
305
APPENDICES
Appendix 1
(The illustrative example of the confiscatory nature of South African taxes on death in
Roeleveld (2012) has been kept the same albeit updated with the latest amendments to
South African Tax legislation for year of assessment ending 29 February 2016)
Example
A person dies, leaving only one income-generating property with a market value of
R6 million to his child. The property had been donated to the deceased many years
previously when the market value was R1 million and it had a base cost of R800 000 for the
donor. There are no other assets of worth in the estate and because of assessed losses
built up in the past the deceased’s current year’s taxable income is nil. There is no surviving
spouse. The taxes on death are as follows (Roeleveld, 2012):
In order to satisfy this liability, the executor will most probably have to sell the property as it
is highly unlikely the child who inherited the property will have the funds to pay such a
significant amount, the family unit is therefore harmed as a result of this confiscatory
effect. The total tax liability is 121% of the original cost of the home to the family, and a
significant 16.15% of the current market value of the home.
The damage to the family unit of losing the family home and the significant amount of the
windfall that is lost on the sale of the home as a result of satisfying the tax liability could be
seen to bear unfairly or inequitably on the child of the deceased, this simple example
therefore illustrates the “confiscatory nature” (Roeleveld, 2012) of the current tax situation
in South Africa.
Original Source: Roeleveld 2012
Capital Gains Tax Estate Duty
Proceeds 6m Value of Estate 6m
Less: Base Cost (1m)
Total Capital gain 5m Less: Income Tax liability (0.586250m)
Less Annual Exclusion (30k) Less: S4a Abatement (3.5m)
Net Capital Gain 4.97m Net Value of Estate R 1 913 750
Inclusion Rate of 33.3% 1.65501m Estate Duty liabilty @ 20% R 382 750
Tax Per Tables R 599 607
Less: s6 Primary rebate R -13 257
Income Tax Liabilty R 586 350
Total Tax payable by Deceased Estate R 969 100
(Estate duty + Income tax liabilty)
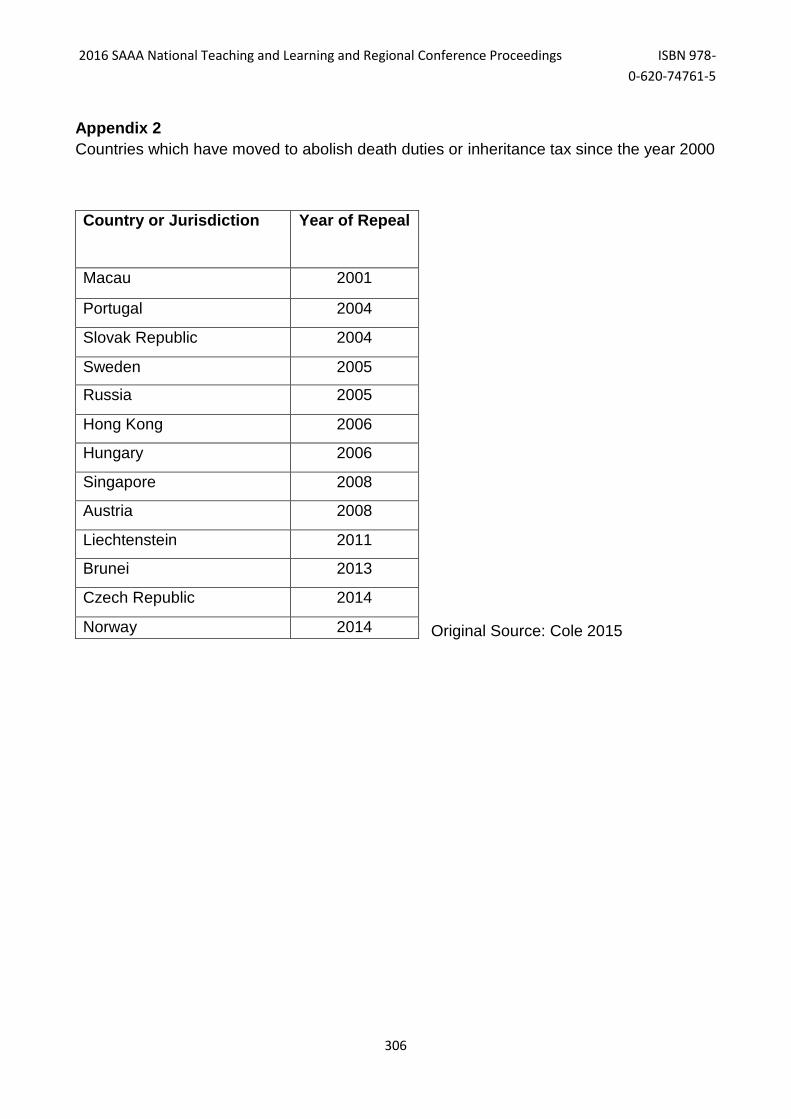
2016 SAAA National Teaching and Learning and Regional Conference Proceedings ISBN 978-
0-620-74761-5
306
Appendix 2
Countries which have moved to abolish death duties or inheritance tax since the year 2000
Original Source: Cole 2015
Country or Jurisdiction Year of Repeal
Macau 2001
Portugal 2004
Slovak Republic 2004
Sweden 2005
Russia 2005
Hong Kong 2006
Hungary 2006
Singapore 2008
Austria 2008
Liechtenstein 2011
Brunei 2013
Czech Republic 2014
Norway 2014

2016 SAAA National Teaching and Learning and Regional Conference Proceedings ISBN 978-
0-620-74761-5
307
Appendix 3
Table illustrating the results of the study at a high level.
Source: Authors own construction
Points Raised in Australia
Arguments for Abolition Reason 1 Applicable to SA? Reason 2 Applicable to SA? Reason 3 Applicable to SA?
Arguments Against Abolition
Only means to generate revenue
from capital appreciation NO
Only tool to tax accumulated
wealth Disputed
YES
Easily avoided by those with tax
knowledge YES Significant Loop holes NO
Death Duties was regarded
globally as important fiscal tool NO
Can Points Raised be Applied to estate duty in South Africa?
Duplication of tax on same asset YES
Strong Public
Sentiment YES
Complexity at federal and state
level NO
Difficulty in valuing
assets
Equity through the tax system and breaking
down of accumulated wealth
Low Exemptions NOSignificant burden on
surviving spouse NO
YES
Tax Commissions
cited it as "complex"
Undue Harshness
Duplication of tax at State and Federal level
Complexity
Ease of Avoidance
Part of Modern Fiscal System
Tax Revenue
2016 SAAA National Teaching and Learning and Regional Conference Proceedings ISBN 978-
0-620-74761-5
308
REFERENCES
1. Cole, A. (2015). Estate and Inheritance Taxes Around the World. Retrieved from
http://taxfoundation.org/article/estate-and-inheritance-taxes-around-world
2. Commonwealth Taxation Review Committee. (1975). Final Report. Retrieved from
http://adc.library.usyd.edu.au/view?docId=law/xml-main-texts/p00087.xml
3. Conway, K. S., & Rork, J. C. (2004). Diagnosis murder: The Death of State Death
Taxes. Economic Inquiry, 42(4), 537–559. http://doi.org/10.1093/ei/cbh080
4. The Davis Tax Committee. (2015). Estate Duty: A Discussion Document. Pretoria.
5. Duff, D. G. (2005). The Abolition of Wealth Transfer Taxes: Lessons from Canada,
Australia and New Zealend. Pittsburgh Tax Review, 3(72), 72–120. Retrieved from
http://papers.ssrn.com/sol3/papers.cfm?abstract_id=719744
6. Ebeling, A. (2014). Where Not to Die in 2015. Retrieved from
http://www.forbes.com/sites/ashleaebeling/2014/09/11/where-not-to-die-in-2015/
7. Flynn, M., & Stewart, M. (2010). Death as a Taxable Event and Its International
Ramifications. Cahiers de Troit Fiscal International, 97–120.
8. Ger, B. (2012). Time for Estate Duty to go. De Rebus, 59–60.
9. Gilding, M. (2010). The Abolition of Death Duties in Australia : A Comparative
Perspective. Retrieved from https://www.tasa.org.au/wpcontent/uploads/2011/01/
Gilding-Michael.pdf
10. Goodman, J. (2015). Why Do We Have a Death Tax? Retrieved July 15, 2015, from
http://www.forbes.com/sites/johngoodman/2015/04/27/why-do-we-have-a-death-tax/
11. Graetz, M. (2010). It’s Fair, and We Need the Revenue. Retrieved June 21, 2016,
from http://www.wsj.com/articles/SB10001424052748704358904575477593075638
722
12. Grossman, P. J. (1990). Fiscal Competition Among States in Australia : The Demise
of Death Duties. Publius, 20(4), 145–159. Retrieved from http://www.jstor.org/
stable/3330297?seq=1#page_scan_tab_contents
13. Haupt, P. (2014). Notes on South African Income tax (33rd ed.). Roggebaai: H & H
Publications.
14. Independant Green Voice. (2006). ABOLISH THE DEATH TAX. Retrieved June 21,
2016, from http://www.sovereignty.org.uk/features/articles/manifesto07/iht.html
15. Katic, P., & Leigh, A. (2015). Top Wealth Shares in Australia 1915-2012 *. Review of
Income and Wealth. http://doi.org/10.1111/roiw.12177
16. Katz Commission. (1994). Third Interim Report of the Commission of Inquiry into
Certain Aspects of the Tax Structure of South Africa. Pretoria.
17. Margo Commission. (1987). Report of the Commission of Inquiry into the Tax
Structure of the Republic of South Africa. Pretoria.
18. Mccaffery, E. J. (1999). Grave Robbers: The Moral Case against the Death Tax,
(353). Retrieved from http://www.cato.org/sites/cato.org/files/pubs/pdf/pa353.pdf
19. Muller, E. (2010). A Framework For Wealth Transfer Taxation in South Africa.
University of Pretoria. Retrieved from http://repository.up.ac.za/bitstream/handle/
2263/28572/Complete.pdf?sequence=8&isAllowed=y
2016 SAAA National Teaching and Learning and Regional Conference Proceedings ISBN 978-
0-620-74761-5
309
20. Pedrick, W. H. (1982). Oh, to Die Down Under! Abolition of Death and Gift Duties in
Australia. Western Australia Law Review, 6(August), 438–48. Retrieved from
http://heinonline.org/HOL/LandingPage?handle=hein.journals/uwatlw14&div=29&id
=&page=
21. Raskall, P. (1978). Who’s Got What in Australia: The Distribution of Wealth. The
Journal Of Australian Political Economy, (2), 3–16. Retrieved from
http://search.informit.com.au/documentSummary;dn=800220684;res=IELAPA
22. Roeleveld, J. (2012). An Argument for Either Excluding Death as a Capital Gains Tax
Event or Abolishing Estate Duty. South African Journal of Accounting Research,
26(1), 143–164. Retrieved from http://www.tandfonline.com/doi/abs/10.1080/
10291954.2012.11435167?journalCode=rsar20#.Vbj7
23. South African Revenue Service. (2015). Summary of all Treaties for the Avoidance
of Double Taxation. Retrieved July 27, 2015, from http://www.sars.gov.za/AllDocs/
LegalDoclib/Agreements/LAPD-IntA-DTA-2013-01 - Status Overview of All DTAs
and Protocols.pdf
24. South African Revenue Service, & National Treasury. (2014). Tax Statistics
Database. Retrieved 29 April 2015 from www.oecd-ilibrary.org
25. Statistics South Africa. (2015). Stats SA. Retrieved April 29, 2015, from
http://www.statssa.gov.za/?page_id=739&id=1
26. The Treasury of Australia. (2009). Australia’s Future Tax System - Consultation
Paper. Retrieved from http://www.taxreview.treasury.gov.au/content/Consultation
Paper.aspx?doc=html/Publications/Papers/Consultation_Paper/index.htm
27. The Treasury of Australia. (2010). Australia’s Future Tax System - Final Report Part
2-Detailed Analysis-Volume 1. Retrieved from http://www.taxreview.treasury.gov.au/
content/FinalReport.aspx?doc=html/Publications/Papers/Final_Report_Part_2/index
.htm
28. The Treasury of Australia. (2012). Mid-Year Economic and Fiscal Outlook 2012-13.
Retrieved from http://www.budget.gov.au/2011-12/content/myefo/html/prelims.htm
29. Thorpe, L. L. (2015). Is it time to abolish estate duty in South Africa? A comparative
look at global trends in levying death taxes and the feasibility of suggested changes
to South Africa' s current regime. University of Cape Town. Retrieved 7 June 2016
from http://hdl.handle.net/11427/15186
30. Van Jaarsveld, J. (2013). The Levying of Capital Gains Tax at Death. University of
Johannesburg. Retrieved from https://ujdigispace.uj.ac.za/handle/10210/8595
2016 SAAA National Teaching and Learning and Regional Conference Proceedings ISBN 978-
0-620-74761-5
310
2016 Southern African Accounting Association (SAAA) National Teaching and Learning and Regional Conference Proceedings ISBN number: 978-0-620-74761-5
TAX 03: The effect of electronic commerce on the erosion of
tax bases – Developing appropriate taxation laws in South
Africa
Authors:
Amy Wilson, Shaun Parsons and Riley Carpenter
University of Cape Town
E-mail: [email protected]
Abstract:
In response to concerns about the erosion of tax bases caused by a lack of adequate taxation
laws to govern the digital economy, this paper considers the issues that have arisen around
the taxation of electronic commerce.
Significant issues relating to classification, residency, permanent establishment and source of
income that arise from the presence of technology and electronic commerce are identified and
explored, though analysis of the considerations, discussions and actions of the Organisation
of Economic Co-operation and Development as well as countries around the world. The
relevance of issues are then applied to a South African context.
This study recommends that South Africa continue to follow the actions of the Organisation of
Economic Co-operation and Development, along with those of the United Kingdom, the
United States, New Zealand and Australia, in order to appropriately respond to this growing
sector of the economy.
2016 SAAA National Teaching and Learning and Regional Conference Proceedings
ISBN 978-0-620-74761-5
311
1. Introduction
In the past two decades, the world has seen massive growth in electronic commerce
(e-commerce). Not only has e-commerce become a useful tool through which to
conduct business, for some businesses it has become an essential part of their
income earning structure. E-commerce has created a new trading platform and has
introduced an entirely new economy, the digital economy. Some industries have
been forced to completely transform the way they conduct business. For example,
the magazine and newspaper industry has seen a trend towards the discontinuation
of traditional print media and the launch of digital versions of these products online.
Tax authorities around the world have considered the issues that have arisen from
the introduction of e-commerce that have been caused by the unfamiliarity of e-
commerce transactions. Since these transactions do not fit perfectly into the current
tax regimes, they challenge certain concepts and sometimes fall outside the reach of
laws, causing transactions to go untaxed by any jurisdiction (Cox, Doernberg, &
Hinnekens, 2013).
Not only does this issue have the potential to significantly erode the tax bases of
countries all around the globe, but it also could have the effect of causing inequality
within industries, thus challenging the concept of a free market. This arises when
transactions over the internet offer the same products as ‘traditional bricks and
mortar’ stores. If the online transactions are not taxed, but the traditional traders are,
there is an opportunity for price differentiation between these two businesses as
online retailers could charge a price proportionately lower than their competitors
since they do not have to incorporate tax into the price. This unfair competitive
advantage contradicts the concept of tax neutrality, which implies that all
substantially similar transactions should be taxed equally (Chan, 2000).
In 1998, the US government signed a law introducing the Internet Tax Freedom Act
(ITFA), which placed a temporary moratorium on the introduction of new taxes on e-
commerce transactions. The rationale behind this was to promote the endless
potential that the internet offered and encourage growth in this industry (Bruce, Fox,
& Murray, 2003). Since then the digital economy has grown to a size where
continuing to allow these transactions to remain untaxed could lead to a large
opportunity cost of lost tax revenue. The Davis Committee, an advisory tax panel in
South Africa, recently released an article identifying the fact that South Africa needs
to create policies around the taxation of e-commerce in order to seize the opportunity
to increase tax revenue in the Republic (Estor, 2014). These policies are necessary
to ‘level the playing field between local and international companies dealing with
electronic goods and services’ (Estor, 2014).
2016 SAAA National Teaching and Learning and Regional Conference Proceedings
ISBN 978-0-620-74761-5
312
2. Literature Review
E-commerce presents a unique problem to tax authorities for many different reasons.
These challenges arise because the nature of e-commerce transactions differs
significantly from traditional transactions around which tax authorities have based
their rules (Lau & Halkyard, 2003). Beyond the administrative and technical problems
of taxing e-commerce, there are also several other issues around the current tax
rules upon which the tax laws are based, namely, issues around income
classification, residency, permanent establishment and source (Azam, 2007). These
issues are discussed below.
2.1 Why electronic commerce presents a unique problem
According to the Organisation for Economic Co-operation and Development (OECD),
e-commerce is defined as ‘the sale or purchase of goods or services, conducted
over computer mediated networks’, narrowly defined as ‘internet transactions’, with
the main network being the internet (OECD, 2002). These transactions can occur
between any two parties that have access to the internet, regardless of their location
around the globe, thereby transcending territorial boundaries (Azam, 2013). This
ability to trade without the confines of geographical borders creates a world that
undermines the legitimacy and feasibility of the tax laws that were created around
the concept of the physical separation of countries (Cox et al., 2013). The internet
creates a mobility of capital and almost real-time availability of information that
causes volatile changes in taxable resources (Lau & Halkyard, 2003). This, along
with the increasing mobility of intangible assets, users and business functions, has
posed challenges to tax authorities all around the world (Cox et al., 2013). The
taxation of these cross border transactions is becoming increasingly difficult,
especially if state and country tax laws are not uniform (Mclure, 2015).
E-commerce has fundamentally changed the way business is conducted on a
national and international level. The presence of a virtual business platform has
allowed businesses to create innovative ways to streamline core business functions
over the internet and to obtain resources in a manner that is more efficient (Lau &
Halkyard, 2003). The growth in the digital economy has caused a convergence of
resources making technologies cheaper, more powerful and widely standardised.
This enhances innovation across many business sectors. For example, retailers can
gather and analyse customer information from online sales in order to improve their
reach to the target markets, the financial services industry can provide its customers
with the ability to manage and track returns online, and the news and media industry
has had to adapt to the rapid expansion of non-traditional mediums through which to
communicate news while user participation has increased through the use of social
networks and user-generated content (Cox et al., 2013). These innovations, together
with the high mobility of capital through e-commerce, could see resident companies
migrating to low tax jurisdictions by incorporating offshore companies through which
business is performed (Cox et al., 2013).
2016 SAAA National Teaching and Learning and Regional Conference Proceedings
ISBN 978-0-620-74761-5
313
The matters presented above create challenges around the administration and
enforcement of tax on e-commerce transactions. The ability of tax authorities to
collect tax is dependent on the identification, location, and verification of taxpayers
and their corresponding taxable transactions (Young, 2012). The increasing level of
anonymity created by the internet has caused complexities to arise around merely
identifying the appropriate taxpayer (Azam, 2013). Furthermore, with the global
increase in information security and confidentiality, tax authorities may need to find a
balance between the various privacy laws and regulations and the need to ensure
tax compliance (Lau & Halkyard, 2003). However, the virtual nature of online
transactions makes monitoring and controlling e-commerce transactions across
borders difficult. Additionally, tax authorities need to consider the appropriate country
in which certain taxpayers will be taxed. This may pose a problem when companies
lack substantial physical presence in any country but are virtually present in multiple
countries (Azam, 2007).
Another administrative challenge would be developing an efficient mechanism for tax
collection from sellers, in particular remote sellers and non-residents (Lau &
Halkyard, 2003). Some remote sellers may be burdened by the administrative cost of
registering for tax and may not be able to meet the tax burden on top of other costs
such as shipping and handling costs and time costs due to delivery lags (Bruce et
al., 2003). Although compliance costs may seem to be disproportionately higher for
smaller businesses, Bruce et al. (2003), discuss how the difference between local
and remote sellers should continuously erode as the internet grows and online
transactions become an increasingly important component of consumer life.
A further issue arises from the creation of different payment methods such as the
use of e-wallets or cyber-wallets that are charged in advance with credits and used
online as an alternative to a credit card (OECD, 2014). This is enhanced by the
creation of virtual currencies, such as Bitcoin (Cox et al., 2013). Bitcoin is defined as
the use of ‘peer-to-peer technology to operate with no central authority or banks’
(Bitcoin Foundation, 2015). The lack of a central authority makes it seemingly
impossible to track every transaction made by each individual owner of the currency
in order to impose tax on these (Cox et al., 2013). Furthermore, individual taxpayers
may abuse the anonymity of Bitcoin ownership and transactions by not declaring
related income (Parsons, 2014).
In order to approach these challenges tax authorities should consider the benefits
that have been created from the internet and the administrative advantages that can
be extracted from this medium. An opportunity has arisen where a new range of
tools is available to be used in order to ensure compliance with legislation and other
tax rules as well as assist with the collection of taxes and improve taxpayer services
(Lau & Halkyard, 2003).
2016 SAAA National Teaching and Learning and Regional Conference Proceedings
ISBN 978-0-620-74761-5
314
2.2 Important issues identified around the taxation of e-commerce
The unique problem e-commerce presents to tax authorities arises because the
nature of these transactions creates room for warped interpretations of certain areas
of current tax legislation. Transactions of a virtual nature put pressure on certain tax
concepts that require physical presence for distinct classification (Azam, 2007). The
main areas of concern are income classification, residency, permanent
establishment and source rules.
2.2.1 Income Classification
The introduction of information technology has created numerous new products,
services and methods of doing business. These products and services can
sometimes blur the lines of income classification (Azam, 2007). Traditionally tax
authorities have imposed different types of tax regimes on different classes of cross-
border income. The transmission of digital goods and services, however, may not
provide a clear indication as to what is actually being transferred, whether a good
has been delivered, a service performed or an intangible asset licensed (Cockfield,
2006). The digital revolution has made it possible to record multimedia forms of
interactive sounds and images that are of a high quality. This has created an
opportunity to sell the same item in both tangible and intangible forms. For example,
instead of purchasing a physical CD, one can purchase the mp3 version and
download it from the internet (Mclure, 2015). Additionally, new business models,
such as cloud computing, have arisen relying on the new digital economy and these
models have made the ability to classify certain income even more challenging (Cox
et al., 2013).
2.2.2 Residency
Many countries worldwide use a residence-based tax system where, if a taxpayer is
a resident of the country, the taxpayer will be taxed on worldwide income regardless
of its source. Generally, a universal perspective is taken that for a company to be
classified as a resident, generally, there are two tests, namely, the ‘place of
incorporation’ test and the ‘place of effective management’ test (OECD, 2001).
Under the ‘place of incorporation test’, if a company is incorporated in a country, it is
considered a resident of that country, regardless of where the major economic
activities take place (Cockfield, 2006). The justification for this system is that the
company should compensate the country in which it was incorporated as this country
contributes to the abilities of the company to produce income through providing
resources and services (Azam, 2013). Since this test does not require the company
to maintain economic presence within the country of incorporation, residency can
change simply by changing the country of incorporation (OECD, 2001). The mobility
and flexibility of the internet and other computer-mediated networks has removed
most of the challenges around managing a company’s operations from an offshore
2016 SAAA National Teaching and Learning and Regional Conference Proceedings
ISBN 978-0-620-74761-5
315
country (Lee, 2006). As a consequence, the ‘place of incorporation test’ could be
used as a tax avoidance opportunity if internet companies were to incorporate in low
tax jurisdictions, such as Ireland, or in tax havens, such as Bermuda, and escape
taxation altogether (Cockfield, 2006).
Under the ‘place of central/effective management and control test’, the place where a
company’s major economic decisions are made is deemed to be that company’s
country of residence. This generally involves analysing where the company’s board
of directors meet on a regular basis and where the head office of the company is
situated (Cockfield, 2006). However, the internet has created the ability for directors,
employees and business partners to communicate seamlessly while maintaining
physical presence in their various countries of personal residence (Lau & Halkyard,
2003). This gives rise to a possible manipulation of the residence-based taxation
system in order to achieve tax avoidance (Azam, 2007).
2.2.3 Permanent Establishment
A company could be a non-resident of a country but may still have to pay tax in that
country on a portion of its income. This is required if the company establishes and
operates through a permanent establishment in the country. The tax payable would
be imposed on the income attributable to that permanent establishment (Chan,
2000). The permanent establishment concept has been the basis on which to
determine whether a particular country has the right to tax the profits made by a non-
resident transacting in the country. The digital economy, however, is placing
pressure on the concept of a permanent establishment, dependent as it is on a
substantial physical presence in the country (Cox et al., 2013).
Article 5 of the OECD Model Tax Convention addresses the concept of permanent
establishment and provides a definition on which many tax laws rely when
considering this concept (Laursen, 2010). Article 5 states that ‘the term permanent
establishment” means a fixed place of business through which the business of an
enterprise is wholly or partly carried on’ (OECD, 2003). The word ‘permanent’ does
not require the company’s presence in a country to be forever. Laursen (2009)
discusses how in most cases, a period of six months is usually sufficient to constitute
a permanent nature in terms of the permanent establishment concept. The definition
alludes to the fact that to be considered a permanent establishment, the place must
be a ‘fixed’ place and must be a place through which business is carried on.
Paragraph 2 includes especially a place of management, a branch, an office, a
factory, workshop or a mine (OECD, 2003). This supports the court-determined
definition of ‘nexus’, which requires substantial physical presence by a company
before being defined as a permanent establishment or being obligated to pay tax on
a portion of its profit (Bruce et al., 2003).
2016 SAAA National Teaching and Learning and Regional Conference Proceedings
ISBN 978-0-620-74761-5
316
E-commerce challenges the concept of a permanent establishment because it gives
a company the potential ability to have digital presence in a country without having
the burden of paying tax because of the lack of substantial nexus (Cadesky,
Rinninsland, & Lobo, 2014). This is because internet transactions and other digital
platforms reduce the need for physical presence in a country in order to transact and
conduct business in that jurisdiction. This places questions around the assumption of
the need for physical presence in order carry out value-generating economic
activities within a country and suggests that the digital economy has caused this
concept to become outdated (Cox et al., 2013). A company could potentially be
present in hundreds of different countries around the world at one time in a purely
virtual manner (Azam, 2013).
This concept can be demonstrated further by using as an example. Google’s mission
is to ‘to organize the world’s information and make it universally accessible and
useful’ (Google, 2015). In pursuit of this, Google maintains more than 180 domains
in countries around the world but only operate offices in 40 of these countries. While
more than half of Google’s revenue is generated outside of the United States of
America, the ability to classify the proportion of revenue generated in each individual
country in order to share fairly all pieces of the tax pie, is almost impossible. This
process is made more challenging in the countries where Google has no physical
office or presence of any type, other than in the computer servers that feed the
domains within each country (Azam, 2013).
From this, one can see that the introduction of internet transactions, there may be an
opportunity for a company to achieve double non-taxation due to the lack of nexus in
the source country together with the lack of taxation in the resident country arising
from a double taxation agreement (Cox et al., 2013).
The lack of physical presence needed for generating income in any economy and
the rise in the ease of cross-border commercial transactions has been enabled by
the use of computer servers. A computer server is a computer that has been
networked to the internet and, in some cases, eliminates the need for traditional
business intermediaries such as retail stores (Cockfield, 2006). The current
legislation does not adequately consider the issues around the virtual and
independent nature of a server. A server has the potential to perform integral
economic activities within the business without requiring any human involvement
(OECD Committee on Fiscal Affairs, 2000). Furthermore, since virtual distance is not
proportional to physical distance, the actual location of each server could be
challenging to pinpoint. This shows the challenges that arise from the digital
economy and may indicate that the concept of a permanent establishment may be
outdated and in need of revision (Lau & Halkyard, 2003).
2016 SAAA National Teaching and Learning and Regional Conference Proceedings
ISBN 978-0-620-74761-5
317
2.2.4 Source
If a company is a non-resident, the general rule is that the company will be taxed in a
jurisdiction on income that is derived from a source within that specific jurisdiction.
The rationale behind source-based taxation is that the source country provides the
company with infrastructure and other facilities that contribute to the income-
generating ability of the business (Azam, 2007). The source country usually takes
precedent over the resident country and although both countries may impose tax on
the company, generally, double taxation agreements lead to a credit being issued by
the resident country, leaving the final tax benefit with the source country (Chan,
2000).
E-commerce makes the identification of ‘what is done in which country’ and the
original cause of the income significantly more challenging and exposes a potential
weakness of the current source-based rules (Lau & Halkyard, 2003). All types of e-
commerce transactions have some sort of virtual aspect to them, as physical
existence outside the internet may be limited or non-existent. This makes it difficult to
identify the specific geographical location of an e-commerce transaction as the
technical location of the transaction could be ‘on the internet’, making the
identification of the source of the income more challenging (Azam, 2007).
Additionally, determining the source of e-commerce transactions is made more
challenging as the existence of a virtual trading platform causes certain income to be
linked with several countries, with no clear indication of a country that provides a
dominant contribution (Azam, 2013). As the internet has provided almost
instantaneous access to a large volume of information, companies can use this to
gather information and generate data on consumers, competitors and target markets
within the industry. This causes the attribution of taxable profits to a particular source
country to become particularly challenging as the value is derived from the
generation of information that is collected from digital goods and services from
sources around the world. The ability to separate each bit of information and
determine a value attached to that specific piece of information may prove to be
nearly impossible (Cox et al., 2013).
These challenges around the enforcement of source rules cause a number of
possible tax avoidance opportunities to arise and may lead to avoidance becoming
widespread and easy for many companies participating in information generation
and other trades (Azam, 2013). This suggests that special attention toward source-
based rules may be required by tax authorities before the growth in e-commerce
causes a significant erosion of tax bases around the world (Azam, 2013).
2016 SAAA National Teaching and Learning and Regional Conference Proceedings
ISBN 978-0-620-74761-5
318
2.3 Current considerations and responses by the OECD and other countries on
the taxation of electronic commerce
The issues discussed above has been cause for consideration for the past two
decades by authorities such as the OECD, the US National Treasury and other tax
authorities around the globe (Cox et al., 2013).
2.3.1 The OECD actions and recommendations
Throughout the last few decades, the OECD has considered the issues around the
taxation of e-commerce. The Ottawa Ministerial Conference on Electronic
Commerce was held in 1998, where leaders from both member and non-member
countries participated in a discussion around the promotion and development of e-
commerce around the world. At this conference, a set of tax principles was
established on which the OECD and other tax authorities would base their
considerations around the taxation of the digital economy (OECD, 2014). This
framework provided that taxation between different forms of commerce must be
neutral and equitable, achieving effectiveness and fairness while remaining simple
and certain. The compliance and collection costs must be efficiently minimised as far
as possible as well as have the ability to keep up with the flexible and continuously
evolving technologies in the digital economy (Cockfield, 2006).
After the Ottawa conference, the Committee on Fiscal Affairs created Technical
Advisory Groups, consisting of business, scientific and governmental representatives
from around the globe, to discuss further the issues surrounding the digital economy
and present possible recommendations (OECD, 2014). In 2013, the OECD launched
an Action Plan on Base Erosion and Profit Shifting, followed by a discussion draft on
Action 1: Address the tax challenges of the digital economy, released in April 2014.
Some of the considerations and recommendations that have arisen are discussed
below.
Residency: There was a proposal to amend the determination of residency under
the ‘place of central/effective management and control test’. If the taxpayer’s
activities indicate more than one country, or indicate no clear country of residence,
the place of effective management would be determined by considering three
options. The place of effective management would be either the country in which the
taxpayer substantially makes use of the economic, financial, physical and legal
resources of the country; that in which the activities performed by the taxpayer are
the most substantial and relevant; or the country in which the clear majority of
decisions by the Board of Directors are made and the location of the head offices of
the corporation (OECD, 2002). This amendment would eliminate the challenges
around identifying the resident country of a taxpayer through the ‘place of
central/effective management and control test’, thereby decreasing the opportunity to
escape the imposition of taxation.
2016 SAAA National Teaching and Learning and Regional Conference Proceedings
ISBN 978-0-620-74761-5
319
Permanent Establishment: The OECD established certain guidelines around the
definition of a permanent establishment, including an amendment of the commentary
on Article 5 of the Model Tax Convention (OECD Committee on Fiscal Affairs, 2000).
The clarification on the application of the permanent establishment definition in e-
commerce considers separately whether computer equipment, websites and servers
could constitute permanent establishments. It also considers the issues around
Internet Service Providers (ISPs). The responses around these issues are as
follows:
- Computer equipment: A permanent establishment may exist in a location where
computer equipment is used regardless of whether the location requires human
presence or not. If the equipment carries out core functions of the business that
are substantial and significant, a permanent establishment will exist. However, if
the activities carried out by the computer equipment are preparatory or auxiliary,
further evidence would be needed in order to determine whether the equipment
constitutes a permanent establishment (OECD Committee on Fiscal Affairs,
2000).
- Websites: The commentary on Article 5 states that a website, in itself, does not
constitute a permanent establishment. This is because the website is an
intangible item that cannot be classified as ‘computer equipment’ and therefore
does not fall into the above category (OECD Committee on Fiscal Affairs, 2000).
- Servers: According to the OECD Committee on Fiscal Affairs (2000), a server, if
owned or leased by a non-resident company, could classify as a permanent
establishment as it is equipment with a physical location. The server will
constitute a permanent establishment if it performs an integral part of the cross-
border transactions of an enterprise and is in a fixed location for an adequate
period of time (Cockfield, 2006).
- ISPs: If an enterprise’s website, through which business is conducted, is hosted
on the server of an ISP, the enterprise usually does not have control over where
the server is located. Therefore the only presence the enterprise has in a country
is through its website, which, as seen above, will not constitute a permanent
establishment (OECD Committee on Fiscal Affairs, 2000).
- Nexus: A new nexus rule was proposed where a resident transacting with a non-
resident would be required to withhold tax from the payment that has been made
from the resident bank to the non-resident company (OECD, 2014).
- Virtual Permanent Establishment: As an alternative to the new nexus rule, a
proposal was made to amend or extend the definition of a permanent

2016 SAAA National Teaching and Learning and Regional Conference Proceedings
ISBN 978-0-620-74761-5
320
establishment. This would allow for servers and specific virtual presence of a
company to be considered a permanent establishment, thus eliminating the
possible avoidance of tax imposition through a lack of substantial physical
presence (OECD, 2014).
Countries around the world, both members and non-members of the OECD, have
been following the OECD’s commentaries, and implementing reactions in order to
adequately deal with this taxation issue (Cockfield, 2006). The responses of the
United States (US), Australia, New Zealand, Canada and the UK have been
considered and analysed below. The analysis will occur on these specific countries
because of the sophisticated taxation systems along with the presence of a fair
amount of e-commerce in each of these developed economies.
2.3.2 The United States
The US established the Digital Economic Task Force (DETF) in September 2013,
which seeks to promote a balanced analysis of the taxation of the digital economy.
Although there was little support from the DETF on the implementation of a ‘virtual
permanent establishment’ definition, the task force does recognize the complexities
around the taxation of e-commerce. Along with an organisation of worldwide in-
house corporate tax executives (the Tax Executive Institute), the DETF suggests
inequitable taxation implications could occur from an improper application of tax
initiatives. This could lead to multiple tax impositions on the same transaction. The
groups suggest that the appropriate response to these issues may be achieved
through the proper application of the existing taxation rules (Cadesky et al., 2014).
Although very little action seems to have taken place in addressing this issue, the
US, in all its agreements with various countries, maintains that taxation of e-
commerce should be clear, consistent and non-discriminatory (Cockfield, 2006).
2.3.3 Canada
Initially, the Canada Revenue Agency maintained a status quo on both the direct and
indirect taxation of e-commerce transactions. Canada used an approach that
consisted of examining the place of contracting and the location of physical assets of
a business (Ault & Arnold, 2004). The country’s tax authority did not deal with issues
around service providers and servers and deemed these not to be permanent
establishments as they were not physically located within Canada. Therefore no tax
was imposed on these transactions on a physical presence basis.
However, from 2013 onwards, the Canada Revenue Agency has issued tax and
reporting requirements for corporations, partnerships and self-employed individuals
who earn income from one or more internet webpages or websites. Corporations are
required to submit a ‘Schedule 88, Internet Business Activities’ report along with their
corporate tax returns. Partnerships are not yet required to report the above income
2016 SAAA National Teaching and Learning and Regional Conference Proceedings
ISBN 978-0-620-74761-5
321
and self-employed individuals are required to report an ‘Internet Business Section’ of
a specific tax form and submit it with their income tax and benefit returns (Canada
Revenue Agency, 2015).
2.3.4 The United Kingdom
In 2000, after considering the OECD’s release of the Clarification of Article 5 of the
Model
Tax Convention and the discussion within that indicated when servers, computer
equipment and websites could be considered a permanent establishment, Her
Majesty’s Treasury (HM Treasury) issued a press release on the matter. The stance
that the HM Treasury took was that servers in themselves will never constitute a
permanent establishment of a non-resident (HM Treasury & HM Revenue &
Customs, 2014) .
In March 2014, the HM Treasury issued a report showing its support of the OECD’s
Task Force on the Digital Economy. The HM Treasury’s view is that fair and
consistent tax treatment must be applied to digital enterprises as well as traditional
enterprises that have incorporated digital technology into their business operations.
The HM Treasury has considered the revised definition of permanent establishments
and states that it will need to be applied to all companies, not just those that are
digital.
The ultimate approach of the HM Treasury is to continuously follow the work done by
the OECD and ‘propose supplementary rules to tackle specific issues raised by
digitisation if progress on updating the existing international framework fails to
materialise’ (HM Treasury & HM Revenue & Customs, 2014).
2.3.5 Australia
Australia’s tax jurisdiction usually revolves around two doctrines, namely, the benefit
doctrine and the economic allegiance doctrine. The benefit doctrine places taxation
rights based of the benefits derived, by residents and non-residents, from Australia,
whereas the economic allegiance doctrine uses the relationship between the income
generating ability of the taxpayer and the country. The Australian Treasury notes that
these doctrines may be inadequate to determine taxation rights relating to the digital
economy, and is considering the concepts of source, residence and permanent
establishment (The Australian Government Treasury, 2013).
The Australian Treasury has identified a number of different responses to the risk of
base erosion and profit shifting caused by the digital economy. One response is to
improve the enforcement of existing tax laws by increasing the exchange of
information through expanded networks and providing the necessary training for tax
auditors. Another response is to improve tax transparency by requiring large
2016 SAAA National Teaching and Learning and Regional Conference Proceedings
ISBN 978-0-620-74761-5
322
corporate entities to disclose certain tax information. However, a cost-benefit
analysis may be necessary before this takes place. Furthermore, the Treasury
recommends that a review of Australia’s bilateral and multilateral agreements with
other countries should be performed at least once a decade to ensure that the terms
of the agreements continue to be for the national benefit and fairness to the taxpayer
(The Australian Government Treasury, 2013).
2.3.6 New Zealand
New Zealand has continuously provided guidance on the issue of cross border
taxation and internet transactions. The Inland Revenue Department of New Zealand
(Te Tari Taake, referred to as the ‘Inland Revenue’) has stated that e-commerce
transactions will be treated within the current laws and interpretations of New
Zealand (Inland Revenue, 2004).
According to the Inland Revenue (2004), New Zealand has followed the OECD’s
recommendations of determining whether a server is a permanent establishment, as
discussed earlier, provided all the facts and circumstances are assessed on a case-
by-case basis. This shows how the Inland Revenue has taken the OECD’s
comments and recommendations into account and applied some of these responses
to their local tax laws.
2.4. Identification of arguments opposing the taxation of the digital economy
In 1998, the US government signed a law introducing the Internet Tax Freedom Act
(ITFA). This ITFA was created, and extended until 2003, in order to promote and
preserve the commercial, educational and informational potential that the internet
provided by placing a moratorium on taxing internet transactions. States were
allowed to apply current tax laws to e-commerce transactions but were prohibited
from created any new or discriminatory laws explicitly targeted at internet sales
(Bruce et al., 2003). In 2003, the ITFA Coalition proposed the introduction of a
permanent ITFA, stating that it would ‘benefit America’s consumers and innovators
and ultimately lead to higher economic growth and job creation’. This argument was
based on the premise of tax neutrality and suggested that this would protect the
internet from unfair taxation (ITFA Coalition, 2015).
The ITFA was developed when most online sales were by remote sellers in the US
and therefore fueled the argument that a tax differential between remote and local
sellers would be an incentive to purchase remotely, thereby fostering the growth and
development of remote purchasing mechanisms such as the internet (Bruce et al.,
2003). This argument, however, has gradually become less sound as internet
transactions and globalisation has become a large part of the business world today
(Bruce et al., 2003).
Zodrow (2003) explains how the implementation and development of separate tax
laws dealing with the internet may have compliance and cost issues. The costs of
2016 SAAA National Teaching and Learning and Regional Conference Proceedings
ISBN 978-0-620-74761-5
323
developing sound laws, communicating them to all companies, including remote
sellers and collecting the tax may prove more costly than the benefit arising from the
extra tax revenue received from these transactions (Zodrow, 2003). A cost-benefit
analysis may need to be performed on the issues mentioned above in order to
ensure that the costs do not outweigh the benefits. This may be an area for further
research.
Many countries are in co-operation to develop a fair and efficient method of taxing
the digital economy. Some countries may be slightly more hesitant or less equipped
to implement changes at the moment but should still be participating in the
discussions and suggestions of the OECD (Cockfield, 2006). There are many
different approaches that have been implemented by different countries around the
world and these are continuously monitored alongside the actions of the OECD.
3. Research Methodology
Analysis of the literature has identified issues relating to income classification,
residency, permanent establishments and source of income as well as compliance
and administration concerns and costs. The reactions of the United States of
America (US), the United Kingdom (UK), Australia, Canada and New Zealand, along
with that of the OECD were explored. These issues will be applied to a South African
context and a recommendation will be developed from the findings.
4. Research Question: How should South Africa approach the taxing of e-
commerce?
While South Africa is not a member of the OECD, it is one of the many non-member
countries with which the OECD has a working relationship. South Africa has
generally recognised and adopted the OECD Commentary on its Model Tax
Convention (Jardine, Owens, & Sanger, 2014). In 2007, the OECD adopted a
resolution to strengthen its relationship with South Africa among other non-member
countries. This brings about a relationship of mutual advantage as ‘South Africa is
Africa’s largest economy, and typically the ‘prime mover’ for OECD activities…
especially on taxation, investment and competition policy’ (OECD, 2015).
4.1 South Africa’s reactions to date
In 2000, the Department of Communications of the Republic of South Africa issued a
report titled ‘The National Green Paper on Electronic Commerce’. This was neither
academic literature nor a government policy statement but was a platform on which
to translate topical issues around e-commerce into government policy. The paper
was of a discursive nature and dealt with many of the unconventional issues that e-
commerce brought into the marketplace (Department of Communications Republic of
South Africa, 2000).
The paper established the underlying principles towards the development of e-
commerce policy, which were similar to those established by the OECD in 1998.
2016 SAAA National Teaching and Learning and Regional Conference Proceedings
ISBN 978-0-620-74761-5
324
These goals supported the principles of flexibility of regulation and governance,
technological neutrality and international benchmarking. The paper continues to
analyse certain issues that needed to be considered by the policy makers, including
how to recognize e-commerce transactions, the threats that arise from the existence
of cyber cash and multilateral trading systems. The ultimate objective of the green
paper was to develop a policy that equitably imposed tax on e-commerce
transactions, considering administration and compliance issues, as well as ensuring
the citizens of South Africa’s rights to privacy (Department of Communications
Republic of South Africa, 2000).
Since then, the Value Added Tax (VAT) Act has recently been amended to
incorporate the compulsory registration for VAT of foreign suppliers of e-commerce.
The South African Revenue Service (SARS) has amended the VAT Act in order to
account for the lack of VAT levied on e-commerce between foreign suppliers and
South African customers (Strydom & Hare, 2014).
4.2 Analysis of the Income Tax Act and other legislation
A revision of the Income Tax Act No. 58 of 1962 (The Income Tax Act) dealing with
the taxation of e-commerce transactions and the digital economy has yet to be
implemented. The current income tax laws in South Africa show that South Africa’s
current approach is similar to that of the OECD. An analysis of the Act should
indicate whether it is currently adequate to deal with the issues of taxing e-
commerce.
Presently, e-commerce transactions between two residents of South Africa do not
pose a unique threat to SARS’ tax collection on these revenues. This is because if a
taxpayer is a resident, the taxpayer is taxed on worldwide income, which will
incorporate all income, regardless of the source. However, when a South African
resident transacts with a non-resident, several issues arise. These concerns are
similar to those already identified, being residency, permanent establishment and
source of the income arising from e-commerce transactions.
Residency:
A resident is defined in section 1 of the Income Tax Act as any natural person who is
ordinarily resident in the Republic or, if not, meets specific requirements of a
‘physical presence test’. For a company, the Income Tax Act defines a resident as
‘any person (other than a natural person) which is incorporated, established or
formed in the Republic or which has its place of effective management in the
Republic (Income Tax Act, 2015).
The term ‘place of effective management’ is not defined in the Income Tax Act
therefore SARS looks to the ordinary meaning of the words, while considering
international precedent and interpretation. The term ‘effective management’ does not
2016 SAAA National Teaching and Learning and Regional Conference Proceedings
ISBN 978-0-620-74761-5
325
have a universal meaning and countries around the world, as well as the OECD,
attach different interpretations to the word. SARS has issued an interpretation
clarifying that, while considering all the relevant facts and circumstances on a case-
to-case basis, the general approach will be that ‘the place of effective management
is the place where the company is managed on a regular or day-to-day basis by the
directors or senior management of the company, irrespective of where the overriding
control is exercised, or where the board of directors meets’ (South African Revenue
Services, 2002).
Although the interpretation of the place of effective management differs slightly from
that of the OECD and other international interpretations, some of the underlying
issues that arise from e-commerce are still present in both interpretations. However,
the ability to avoid being defined as a place of effective management, by using
technologies such as video conferencing, has been hindered by this interpretation
(Cox et al., 2013). This is because the day-to-day, routine transactions generally
need to be made where the operations of the business are occurring. However, the
virtual nature of internet companies could still cause the artificial avoidance of being
defined as a permanent establishment due to lack of physical presence in the
Republic.
Permanent establishment:
The issues around establishing a permanent establishment are identical to those
identified by the OECD. This is because a permanent establishment is defined in
section 1 of the Income Tax Act (2014/2015) as ‘a permanent establishment as
defined from time to time in Article 5 of the Model Tax Convention on Income and on
Capital of the Organisation of Economic Co-operation and Development’.
Source:
Section 9 of the Income Tax Act (2015) determines which receipts and accruals are
derived from a source within South Africa as well as stipulating those derived from a
source outside South Africa. Section 9(2)(a)-(l) describes amounts received by or
accrued to the taxpayer that are from a source within South Africa. These define the
source relating to the income received in the form of: local dividends; interest;
royalties; payments for imparting scientific, technical, industrial or commercial
knowledge or information; payment for services rendered on behalf of certain
resident employers; receipts of any lump sums, pensions or annuities in respect of
services rendered within South Africa; sale of immovable property; sale of assets
other than immoveable property and exchange differences (Income Tax Act, 2015).
If certain income does not fall within these sections in the Act, a taxpayer must look
to case law in order to determine the source of the income. Under the case of CIR v
Lever Brothers and Unilever Ltd 1946, in order to determine the source of income,
the taxpayer must first establish the quid pro quo given in return for what the
2016 SAAA National Teaching and Learning and Regional Conference Proceedings
ISBN 978-0-620-74761-5
326
taxpayer has supplied. The source of the income is then determined by identifying
the originating cause of the income is and then determining where that originating
cause is located (The Appellate Division, 1946). The Black v CIT case indicated that
the source of the income is determined by considering where the dominant or main
or substantial cause of income originated (Young, 2012).
When applying the principles established by these cases to e-commerce
transactions, neither the issue around income classification nor around source is
solved. This is because the originating cause of the income could be from a service
provided over the internet or an intangible good supplied. Therefore determining the
location of this cause may be a challenge, as the internet has no specific location.
There are no other interpretation notes to the Income Tax Act that reference the
internet. There are also no cases regarding source or residency relating to the
internet (South African Revenue Service, 2015). This suggests that South Africa
needs to look towards developing an approach to this issue, either by adopting the
views of the OECD or developing an independent approach.
4.3. Davis Committee opinions and suggestions
The Davis Committee recognises the need for South Africa to address the issues of
base erosion and profit shifting. The committee has issued an interim report
regarding the OECD’s action plan on Base Erosion and Profit Shifting (BEPS). The
report does not specifically deal with the taxation of the digital economy, but rather
considers the entire BEPS action plan in a South African context. The taxation of the
digital economy is action one of fifteen actions in the plan (OECD, 2013). The
committee identifies the challenges that arise around the amendment of taxation
policies. This is because tax policy changes could produce unintentional distortions
on cross-border trade, which could disadvantage domestic businesses (Jardine et
al., 2014). The committee also recognizes the OECD’s warning to be wary of taking
unilateral action that may lead to multiple taxation, causing South Africa to become a
less attractive country for foreign direct investment (Jardine et al., 2014).
The Davis Committee notes that although South Africa is not a member of the
OECD, Section 233 of the Constitution states ‘when interpreting legislation, every
court must prefer any reasonable interpretation of the legislation that is consistent
with international law over any alternative interpretation that is inconsistent with
international law’ (Jardine et al., 2014). This suggests that South African law should
consider the views of the OECD and other international policies when creating policy
regarding the issue of the taxation of the digital economy. The Davis committee
emphasizes that South Africa needs to be aware of its position in the global market
as an emerging economy and create tax policies that will allow the country to be a
good platform for future economic growth, development and investment into South
Africa and the rest of Africa (Jardine et al., 2014).
2016 SAAA National Teaching and Learning and Regional Conference Proceedings
ISBN 978-0-620-74761-5
327
4.4 The total size and stage of development of the virtual economy in South
Africa
Director of the International Telecommunication Union (ITU), Brahima Sanou, states
that ‘technological progress, infrastructure deployment, and falling prices have
brought unexpected growth in ICT [information and communication technologies]
access and connectivity to billions of people around the world’ (International
Telecommunications Union, 2015). According to the ITU world facts and figures of
2015, the number of internet users in developed countries has increased from 300
million users in 2005 to 1 billion in 2015, whereas the internet users in developing
countries has increased from 100 million to 2.2 billion, respectively (International
Telecommunications Union, 2015). This demonstrates the immense growth of the
digital world and its infiltration into the world’s population and business processes.
Since 43% of the world’s population has access to the internet, there is still potential
for growth in the digital economy in the future (International Telecommunications
Union, 2015).
According to Internet Live Statistics (2015), 46.88% of South Africa’s population has
access to the internet, representing growth of 14% from 2013. The largest growth in
internet penetration in a country from the year 2013 to 2014 was 17% in countries
such as Uganda, Angola and Zimbabwe and 16% in countries such as Kenya,
Mozambique and Madagascar (Internet Live Statistics, 2014). This shows the degree
of internet penetration that gives the South African population access to e-commerce
transactions and the significant growth of this in developing countries in Africa. This
suggests that the size of the e-commerce market in South Africa is continuing to
grow and the digital economy is potentially becoming of greater importance to
policymakers within South Africa. Therefore, even if e-commerce transactions have
not eroded South Africa’s tax base immensely in the past, there is great potential for
this to become a large issue in South Africa, and may cause the country to forgo an
opportunity to increase its tax revenue.
5. Area for future research
As stated above, implementing and developing separate tax laws could create a
greater burden on compliance and an increase in costs (Zodrow, 2003). An analysis
on the cost-benefit of developing the laws, communicating them to taxpayers,
including remote sellers and collecting the tax could be performed.
6. Conclusion and recommendations
Some countries automatically adopt the OECD views, while others either adopt an
independent view that parallels that of the OECD, intentionally elect an alternative
route or believe their current system to be adequate to deal with the issues under
consideration. The US, Australia and Canada have elected not to follow the view of
the OECD. The US believes that more stringent enforcement of their current tax laws
should be adequate to tackle the issue. Canada has not taken much action towards
2016 SAAA National Teaching and Learning and Regional Conference Proceedings
ISBN 978-0-620-74761-5
328
solving the issues of digital taxation, its only action being an update of the legislation
around declaring income from certain internet businesses. Australia intends to
review its existing laws and improve enforcement of its current tax system. Both New
Zealand and the UK have each chosen to implement systems that use the OECD as
a guide, but are independent of the OECD’s views, focusing on different aspects of
both current and new laws.
South Africa’s approach, to date, has been to follow that of the OECD, adjusting its
approach to suit the SA environment more appropriately (Jardine et al., 2014). South
Africa’s green paper issued in 2000 shows its commitment to keep up with worldwide
policymakers regarding this issue. South Africa’s reactions to the issues around the
taxation of the digital economy have been similar to those of other countries such as
New Zealand and the UK. South Africa has followed the views and changes of the
OECD, almost automatically adopting its views around some issues in the digital
economy.
It is recommended that South Africa continue to follow the actions of the OECD, as
well as those of the UK, US, New Zealand and Australia, in order to develop a sound
understanding of the issues around the taxation of e-commerce, as well as to keep
constantly updated with new developments. By closely following the actions of the
OECD and constantly commenting on these developments, South Africa can slowly
start to develop policies that will be consistent with the goals of the country’s taxation
policies. South Africa should not rush the development of these policies that could
create a unilateral response to the issue, causing a strain on competition and a
disadvantage for local businesses, but should rather consider the value that could be
created by developing an internationally coordinated approach (Jardine et al., 2014).
In line with the OECD’s Model Tax Convention, South Africa should continue to
update its interpretation notes and other tax legislation in order to slowly integrate
the taxation of the digital economy into tax policies. Although this may be a slow
approach to tackling this issue, it will allow e-commerce to contribute to the tax base
of the country in the medium to long term, as well as encourage entrepreneurship
and development of industry.
If South Africa considers its options, in line with developments from the OECD, and
creates an approach in cooperation with other international countries, the issue of
taxing the digital economy can be addressed, while also creating new or
strengthening old relationships with countries in the worldwide economy.
2016 SAAA National Teaching and Learning and Regional Conference Proceedings
ISBN 978-0-620-74761-5
329
References
Ault, H. J., & Arnold, B. (2004). Comparative Income Taxation: A Structural Analysis
(2nd ed.). The Hague: Kluwer Law International.
Azam, R. (2007). E-commerce taxation and cyberspace law: The integrative
adaptation model. Va. JL & Tech., 12, 1..
Azam, R. (2013). Global Taxation of Cross-Border Ecommerce Income. Virginia Tax
Review. 31(4).
Bitcoin Foundation. (2015). Bitcoin is an innovative payment network and a new kind
of money. Retrieved May 29, 2015, from https://bitcoin.org/en/
Bruce, D., Fox, W., & Murray, M. (2003). To tax or not to tax? The case of electronic
commerce. Western Economic Association International, 21(1), 25–40.
Cadesky, M., Rinninsland, R., & Lobo, K. (2014). The U.S. View on BEPS.
Presented to AOTCA 2014 Conference October 2014, (October).
Canada Revenue Agency. (2015). Reporting Internet business activities. Retrieved
May 29, 2015, from http://www.cra-arc.gc.ca/tx/bsnss/tpcs/cmm/ncm/wbncm-
eng.html
Chan, C. W. (2000). Taxation of Global E-Commerce on the Internet: The Underlying
Issues and Proposed Plans. Minn J Global Trade, 9, 233.
http://doi.org/http://www.winthrop.com/Portals/0/PDF/claytonchan.pdf
Cockfield, A. J. (2006). The Rise of the OECD as informal “World Tax Organization”
through national responses to e-commerce tax challenges. Yale Journal of Law
and Technology, 8(1), 137–187.
Commissioner for Inland revenue vs Lever Brothers & Unilever Ltd 1946 AD 441
Cox, N., Doernberg, R., & Hinnekens, L. (2013). Adressing Base Erosion and Profit
Shifting in South Africa. Davis Committee Interim Report, (2001), 1–56.
Department of Communications Republic of South Africa. (2000). Green paper on
electronic commerce for South Africa. Retrieved from
http://www.info.gov.za/view/DownloadFileAction?id=68917
Estor, L. (2014). BDlive - SA must not miss out on e-commerce tax revenue, says
Davis Committee.pdf. BDlive - Print Article, 1–2.
Google. (2015). About Google. Retrieved May 30, 2015, from
http://www.google.com/about/
HM Treasury, & HM Revenue & Customs. (2014). Tackling aggressive tax planning
2016 SAAA National Teaching and Learning and Regional Conference Proceedings
ISBN 978-0-620-74761-5
330
in the global economy : UK prorities for the G20-OECD project for countering
Base Erosion and Profit Shifting.
Income Tax Act, No 58 of 1962, as amended. (2016). SAICA Student Handbook
2015/2016, Vol. 3. Cape Town: LexisNexis.
Inland Revenue. (2004). E-commerce and income tax. Retrieved May 29, 2015, from
http://www.ird.govt.nz/ecommerce-tax/ecommerce-incometax/
International Telecommunications Union. (2015). Facts & Figures.
Internet Live Statistics. (2014). Internet users by country (2014). Retrieved July 18,
2015, from http://www.internetlivestats.com/internet-users-by-country/
ITFA Coalition. (2015). About the Internet Tax Freedom Act Coalition. Retrieved May
30, 2015, from http://itfacoalition.org/
Jardine, M., Owens, J., & Sanger, C. (2014). Addressing Base Erosion and Profit
Shifting in South Africa. Davis Committee Interim Report, 1–39.
Lau, C., & Halkyard, A. (2003). From E-Commerce to E-Business Taxation. Asia-
Pacific Tax Bulletin, (January 2003), 2–13.
Laursen, A. N. (2010). Permanent Establishment – an Analysis of Article 5 of the
OECD Model Tax Convention, 94(2009).
Lee, S.-H. (2006). Price Competition between online and offline firms in an electronic
commerce market and discriminatory taxation. Hitotsubashi Journal of
Economics, 47, 37–49.
Mclure, C. E. (2015). National Tax Association. National Tax Journal, 50(4), 731–
749. Retrieved from http://www.jstor.org/stable/41789713
OECD. (2001). The Impact of the Communications Revolution on the Application of
“Place of Effective Management” As a Tie Breaker Rule. Retrieved from
http://www.oecd.org/ctp/treaties/1923328.pdf
OECD. (2002). Measuring the Information Economy. Retrieved from
http://www.ingentaconnect.com/content/oecd/16080270/2002/00002002/000000
14/9202151e
OECD. (2003). Articles of the model convention with respect to taxes on income and
on capital. OECD Model Tax Convention, (January).
OECD. (2013). Action Plan on Base Erosion and Profit Shifting. OECD Publishing,
43. Retreived from http://doi.org/10.1787/9789264202719-en
OECD. (2014). Public Discussion Draft BEPS action 1: Address the tax challenges of
2016 SAAA National Teaching and Learning and Regional Conference Proceedings
ISBN 978-0-620-74761-5
331
the digital economy. Public Discussion Draft, (April). Retreived from
https://www.oecd.org/ctp/tax-challenges-digital-economy-discussion-draft-
march-2014.pdf
OECD. (2015). South Africa and the OECD. Retrieved July 18, 2015, from
http://www.oecd.org/southafrica/south-africa-and-oecd.htm
OECD Committee on Fiscal Affairs. (2000). Clarification on the application of the
Permanent Establishment definition in E-Commerce: Changes to the
Commentary on the Model Conventin on Article 5.
Parsons, S. (2014). What is Bitcoin? The potential tax consequences of transacting
in virtual currency in South Africa. Southern African Accounting Association
2014 annual conference.
South African Revenue Service. (2002). Interpretation Note: No.6: Resident: Place of
effective management (persons other than natural) (Vol. 1962).
Strydom, B., & Hare, R. (2014). South Africa’s VAT changes: the impact on e-
commerce, (February), 16.
The Australian Government Treasury. (2013). Risks to the Sustainability of Australia
’ s Corporate Tax Base.
Young, N. (2012). The Effect of Global E Commerce on Taxation Legiuslation and
The Permanent Establishment Concept in South Africa. International Journal of
Economics and Finance, 3, 10–12.
Zodrow, G. R. (2003). Network Externalities and Indirect Tax Preferences. Kluwer
Academic Publishers, 79–97.
2016 SAAA National Teaching and Learning and Regional Conference Proceedings
ISBN 978-0-620-74761-5
332
2016 Southern African Accounting Association (SAAA) National Teaching and Learning and Regional Conference Proceedings ISBN number: 978-0-620-74761-5
TAX 04: Has the changing research and development
taxation legislation affected research and development
output in South Africa?
Riley Carpenter
University of Cape Town
ABSTRACT
National Treasury and the South African Revenue Service introduced section 11D into the
Income Tax Act No. 58 of 1962 in the 2007 Taxation Laws Amendment Act, effective from
November 2006. This section incentivises investment in research and development through
an attractive tax regime for qualifying expenditure. Since section 11D’s introduction into the
Income Tax Act, it has undergone multiple amendments. These amendments have
attempted to meet the section’s objective of higher domestic productivity, economic growth,
increased employment levels and better skills development through creating a more robust
definition of research and development, improving the innovative nature of research and
development and shifting the focus to more scientific and technological pursuits. The
objectives as defined in the Explanatory Memorandum on the Taxation Laws Amendment
Acts have been met, but evidence from the Department of Science and Technology and the
South African Revenue Service indicate that research and development output has
increased only marginally, and may have been significantly lower had there been no tax
incentive.
Keywords: income tax, taxation, research and development, section 11D, innovation,
National Survey of Research and Experimental Development, Department of Science and
Technology
2016 SAAA National Teaching and Learning and Regional Conference Proceedings
ISBN 978-0-620-74761-5
333
INTRODUCTION AND RESEARCH OBJECTIVE
Section 11D33 of the South African Income Tax Act No. 58 of 1962 (“the Income Tax
Act”) has been a topical issue over the past few years. This is due to the potentially
large tax incentive for research and development (“R&D”) that it affords the taxpayer,
the number of amendments the section has undergone since it was introduced into
legislation and its relevance to the general shift in business towards a more
knowledge-based economy.
The changes that have occurred in the last few amendments to the Income Tax Act
affect the operation of the tax incentive regime and shed clarity on issues where the
intention of the legislation was not coming to pass in practice. The R&D Tax
Incentive is supposed to support economic growth through innovation promotion and
competitiveness enhancement (Department of Science and Technology, 2016b).
But have the objectives of the tax incentive regime been met and is there a greater
output of R&D expenditure since its introduction?
There are reports which provide information regarding the R&D output in South
Africa. These reports could be used to provide further insight into R&D.
The annual survey results from the National Survey of Research and Experimental
Development, conducted on behalf of the Department of Science and Technology by
the Centre for Science, Technology and Innovation Indicators at the Human
Sciences Research Council provide some insight into whether the broader economic
objectives of the legislation are being met.
The Tax Statistics, an annual joint publication between National Treasury and the
South African Revenue Service (“SARS”), provides clarity on how companies’
profitability is forever changing (South African Revenue Service, 2016). This includes
the statistics of the companies in the research and scientific institutes sector.
The annual Report to Parliament on the Performance of the Research and
Development Tax Incentive Programme provides statistics on the uptake of the R&D
tax incentive programme, tax revenue forgone, expenditure on R&D and the number
of R&D personnel (Department of Science and Technology, 2015).
33 All references in this paper to sections refer to sections of the South African Income Tax Act No. 58 of 1962 (as amended)
2016 SAAA National Teaching and Learning and Regional Conference Proceedings
ISBN 978-0-620-74761-5
334
RESEARCH METHOD
A literature review was performed on section 11D of the Income Tax Act and its
specific amendments. These amendments are then assessed as part of a doctrinal
study to determine whether they are in line with the objectives of the legislation.
The success of any tax incentive is difficult to measure. The section 11D R&D
Incentive was introduced into the Income Tax Act, on 2 November 2006.
The reports mentioned above were analysed to identify the changes in R&D output
over time:
The National Survey of Research and Experimental Development, from 2007
to 201434,
The Tax Statistics, from 2007 to 201435, and
The Reports to Parliament on the Performance of the Research and
Development Tax Incentive Programme, from 2007 to 2015.
LIMITATIONS OF THE RESEARCH
This paper focuses on section 11D of the Income Tax Act (as amended). Its
predecessor, section 11B was effective for years of assessment commencing on or
after 1 January 2004 until it was repealed when section 11D replaced it on
2 November 2006. Section 11B applied to R&D performed by the taxpayer.
The R&D Tax Incentive measures analysed are focused on the increase in R&D, and
not for what reason the incentive and expenditure is being used. The types of
research output have not been specifically identified.
Had there been no tax incentive, businesses may not have incurred the expenditure
on R&D. The paper does not investigate whether the business expenditure on R&D
would have remained the same had there been no tax incentive. No research on this
topic has been performed in South Africa to date (Köhler, Laredo, & Rammer, 2012).
34 The latest R&D Survey, published on 24 May 2016. 35 The 2015 Tax Statistics, published in November 2015, includes data up till the 2014 tax year.
2016 SAAA National Teaching and Learning and Regional Conference Proceedings
ISBN 978-0-620-74761-5
335
THE LEGISLATION
Definition
The section 11D R&D Incentive was introduced into the Income Tax Act, in 2006 to
replace the previous R&D rule that existed in terms of section 11B.
The Taxation Laws Amendment Acts promulgated in 2011 and 2013 contained
several changes and enhancements to the legislation with respect to the R&D
incentive that is available to taxpayers. A pre-approval process for R&D activities
undertaken after 1 October 2012 was included. Prior to this date, only retrospective
approval could be given.
One of the main objectives of the amendments to section 11D was to ensure that the
definition of R&D is more robust, and requires the activities that qualify for the
incentive to be innovative in nature (National Treasury, 2013). This was reflected in
the various additions to the definition, as well as the stylistic changes and
reorganisation of the subsections within section 11D, as detailed below.
The definition of R&D in section 11D(1) is three-fold, with the first part relating to
discovery, creation or development, the second relating to improvements and the
last part to medical research (creating or developing a product or conducting a
clinical trial). The newer versions of the definition have introduced the requirement of
“systematic investigative or systematic experimental activities of which the result is
uncertain…” (National Treasury, 2013) to be applicable to both parts of the R&D
definition as opposed to only the first part as it was in the 2011 amendment. The
Taxation Laws Amendment Act (2013), promulgated on 12 December 2013,
contained medical research subsections 11D(1)(d) and (e) which included the
creating or developing of a multisource pharmaceutical product and conducting a
clinical trial.
R&D activities should lead to the creation or development of an invention, functional
design, computer program or knowledge essential to the use of these items. The
latter activity has been clarified to exclude “creating or developing operating manuals
or instruction manuals or documents of similar nature…” (National Treasury, 2013) to
ensure that the outcome of the R&D is not only an integral part of the intellectual
property that has been created, but also that such intellectual property should be
intended for a more expansive use than the internal business operations of that
entity or a connected person (Taxation Laws Amendment Act, 2013).
Both of the above amendments to the definition show an increased emphasis on
innovation for the purpose of the incentive, as well a move towards R&D activities
which have a scientific or technological focus.
2016 SAAA National Teaching and Learning and Regional Conference Proceedings
ISBN 978-0-620-74761-5
336
Research and development exclusions
In previous amendments, expenditures which were disallowed for the purpose of the
R&D deduction were detailed in section 11D(8). The revised definition of R&D in
section 11D now encompass these exclusions within the proviso, with two minor
changes. The exclusions now forming part of section 11D(1)’s proviso indicate that
the expenditure should be viewed by the taxpayer as falling outside the scope of the
definition of R&D as opposed to a prohibition of a deduction.
The section 11D(1) proviso (b) relating to the development of internal business
processes has now been expanded to clarify that no deduction shall be allowed for
such expenditure unless those business processes are intended for use by persons
“who are not connected parties in relation to the person carrying on that research
and development” (Taxation Laws Amendment Act, 2013). This further emphasises
the intention of the legislature to incentivise the creation of intellectual property which
is intended for sale to or use by third parties in relation to the taxpayer that carried
out such R&D.
The other change relates to overhead and indirect costs which may be incurred in
the process of R&D, such as financing and administrative costs, are not included in
the proviso’s but disallowed in terms of section 11D(2)(b)(ii). Such expenditures do
not form part of an activity that is outside the scope of the definition, but are instead
a denial of the deduction as detailed in that subsection, and thus the movement.
Research and development deduction
Prior to the promulgation on 12 December 2013 of the Taxation Laws Amendment
Act of 2013, section 11D(2) provided for an automatic deduction of 100% of
qualifying expenditure that is incurred by the taxpayer in respect of R&D. This
deduction could be claimed by such taxpayer without pre-approval provided that the
expenditure is incurred solely and directly in respect of R&D activities which are
undertaken in the Republic, are incurred in the production of income and in carrying
on of any trade (National Treasury, 2012). Taxpayers could then potentially receive
an additional deduction of 50% of the original qualifying expenditure if the
expenditure is approved by the adjudication committee of the Department of Science
and Technology, and the expenditure was incurred in respect of R&D activities that
were undertaken on or after the date of receipt of the application for approval by the
Department of Science and Technology (National Treasury, 2012).
An objective of the revised incentive regime, as stated in the Explanatory
Memorandum on the Taxation Laws Amendment Bill (2013), is to align the
previously separate 100% and 50% deductions. It was noted during the approval
process that taxpayers had taken the view that expenditure which met the definition
2016 SAAA National Teaching and Learning and Regional Conference Proceedings
ISBN 978-0-620-74761-5
337
of R&D in section 11D(1) would automatically receive the 50% additional deduction,
while it was intended that the approval process for the uplift (additional deduction)
should require further effort on the part of the taxpayer to ensure that the R&D
activities which ultimately are subsidised by the government are those which would
not have occurred in the ordinary course of business (National Treasury, 2013). To
this end, there have been numerous changes to the wording of the subsections
which deal with the available deductions under the incentive. Importantly, there is no
longer an automatic deduction, and section 11D(2)(a) of the new amendment to the
Income Tax Act requires that the taxpayer apply and receive approval from the
Department of Science and Technology in order to be afforded a deduction of the full
150% of qualifying expenditure incurred on R&D activities which are undertaken after
the date of successful application (National Treasury, 2013). The requirements that
the expenditure be incurred directly and solely in respect of R&D activities
undertaken in the Republic, in the production of income and in the carrying on of any
trade have remained unchanged in section 11D(2)(a).
Disallowed deductions
The 2011 amendment to section 11D made no reference to items which are capital
in nature and the potential deduction available in respect of such expenditures. As it
stands, all expenditures on R&D activities are thus deductible provided that they
meet the requirements within section 11D. While it is understandable that R&D
activities which may culminate in a capitalised asset are deductible (since entities
may undertake R&D for the purpose of developing an intangible asset that will be
sold to, or the right of use granted to, third parties), this left open the possibility that
capital assets such as plant, machinery and immovable property could qualify for the
deduction under section 11D notwithstanding that they are provided for in sections
12C and 13(1) of the Income Tax Act.
While R&D expenditure that is of a capital nature is still deductible in terms of the
2013 Tax Laws Amendment Act, the proposed relief has dealt with the capital assets
ambiguity in section 11D(2)(b) which states explicitly that no deduction is allowable
under the section for “expenditure incurred in respect of immovable property,
machinery, plant, implements, utensils or articles excluding any prototype or pilot
plant…” (Taxation Laws Amendment Act, 2013). This section also disallows any
deduction for financing, administration, compliance and similar costs. These costs
were previously dealt with under the list of excluded items in section 11D(8), which
have now been incorporated into the definition of R&D as discussed above.
2016 SAAA National Teaching and Learning and Regional Conference Proceedings
ISBN 978-0-620-74761-5
338
Accelerated capital allowances under section 12C and section 13(1) of the
Income Tax Act
Given that section 11D(2)(b) has disallowed the deduction of plant, machinery and
immovable property and related expenditure, the taxpayer is only allowed to seek
relief in the other sections of the Income Tax Act where accelerated capital
allowances for these items are provided for, namely section 12C and section 13(1).
There had been some ambiguity in the rates applicable in section 12C, but this was
remedied in the 2013 amendment. Section 12C(1) proviso (d) provides for an
accelerated allowance of 50%, 30% and 20% in three successive years.
Section 13(1)(b), (d), (dA) and (e), through the inclusion of the R&D option on top of
a process of manufacture, permits the taxpayer an allowance on buildings used for
R&D.
Third party funding of research and development activity
The requirements and allowable deductions in section 11D(4) for taxpayers who
incur expenditure to fund R&D of another entity who undertakes such R&D on behalf
of the entity that provides the funding has not changed, in effect, in the last two
amendments to the section.
In the last three amendments of the legislation, the party who funds the R&D is
entitled to the deduction allowable (i.e. 150%) provided that the R&D activities are
approved by the Minister of Science and Technology, the expenditure is incurred by
the party who receives the funding to undertake such R&D activities after the date of
receipt of a successful application by the Department of Science and Technology,
and to the extent that the party who carries out the R&D is exempt from normal tax
under section 10(1)(cA) or is a company forming part of the same group of
companies as defined in section 41, which has not claimed the deduction itself.
To the extent that the party that undertakes the R&D forms part of the same group of
companies that funds such R&D, the deduction available to the funding company is
limited to 150% of the expenditure actually incurred by the party undertaking the
R&D, directly and solely for the purpose of R&D (National Treasury, 2012). This
effectively eliminates the possibility of the funding party deducting any profit element
which is charged to them by the party who carries out the R&D activities. This
section 11D(2)(a) has been amended in the latest amendment of the legislation in
order to align all deductions and allowances with the 150%. The previous percentage
under section 11D(3), which has since been deleted, was 50%.
Given that section 11D(2) grants the taxpayer who undertakes R&D the potential
deduction under the incentive, and section 11D(4) grants the deduction to the party
2016 SAAA National Teaching and Learning and Regional Conference Proceedings
ISBN 978-0-620-74761-5
339
who funds the R&D in the event that it is carried out by another party on behalf of the
funder, section 11D(6) has clarified which party shall be considered the party to
undertake or carry out the R&D activities.
A person who is carrying on R&D is the person who has control over the R&D
process by virtue of possessing the ability to determine or alter the methodology in
terms of which the R&D is carried out (Köhler et al., 2012).
The section 11D(6)(b) amendment has broadened the scope of the above by
allowing the Minister of Science and Technology to designate certain categories of
R&D by way of government regulations which will be published in the Government
Gazette (Taxation Laws Amendment Act, 2013). While the above rule regarding the
research methodology will provide sufficient guidance in most circumstances, there
are certain instances where complexities arise, and it is submitted that it is for this
reason that the legislature has afforded the Minister of Science and Technology this
outlet (Department of Science and Technology, 2016b).
The amendment to section 11D(6)(b) has also made it clear that while the incentive
is only available for R&D activity undertaken within South Africa, the activities that
are taking place within the Republic must have some level of significance to the R&D
endeavour as a whole (National Treasury, 2013). This speaks to the overall intention
of the taxation legislation, noting that it is intended to encourage local skills
development, and this can only occur if some significant activity occurs in South
Africa (National Treasury, 2013).
There may be some exceptions to the above in the pharmaceuticals and Information
and Communications Technology (ICT) sectors given the nature of the operations of
these sectors (National Treasury, 2013). This further highlights the necessity to
amend the section to allow the Minster of Science and Technology the power to
prescribe criteria by which one can evaluate which types of R&D will be eligible for
the incentive. It is expected that more guidance will be provided in the regulations
regarding the pharmaceuticals and ICT sector specifically (National Treasury, 2013).
Government and quasi-governmental funding
In terms of previous legislation, where an amount was received by way of a
government grant, such amount was not eligible for a deduction under the additional
uplift incentive (the extra 50%) provided for in section 11D. This is intended to
prevent double dipping by virtue of the grant being exempt in the hands of the
recipient while still allowing an additional deduction to the taxpayer (National
Treasury, 2012).
2016 SAAA National Teaching and Learning and Regional Conference Proceedings
ISBN 978-0-620-74761-5
340
Given that the purpose of the introduction of the incentive regime was to encourage
private sector funding of R&D activity, the application of this limitation in respect of
government grants was thought to be too narrow (National Treasury, 2013). The
2013 amendment thus broadened this provision to be applicable to not only exempt
government grants, but also funding received from any quasi-governmental agency
such as a public entity which is listed under schedule 2 or 3 of the Public Finance
Management Act No. 1 of 1999 or a municipality. Under the current legislation, which
has not changed for section 11D(7), should funding be received from any of the
above entities, the 150% deduction shall not be available to the taxpayer to the
extent of such funding.
Withdrawal of approval
Under previous legislation, section 11D(10) allowed for the withdrawal of the
approval that has been granted in terms of section 11D if the taxpayer had failed to
disclose any material facts that may have had an effect on the approval process if
they had been known at the time it was granted, or if the taxpayer should fail to
submit any of the reports that are required under section 11D.
The 2013 amendment extended the criteria for withdrawal of approval to include the
following circumstances: “the taxpayer on that R&D is guilty of fraud, or
misrepresentation or non-disclosure of material facts which would have had the
effect that approval under section 11D(9) would not have been granted” (Taxation
Laws Amendment Act, 2013).
Administrative provisions
There have been various changes to the administrative subsections of section 11D.
Section 11D(9) deals with the approval process of the R&D Incentive, and has been
amended to allow a person who has been appointed by the Minister of Science and
Technology to approve the applications as opposed to this being the responsibility of
the Minister alone. Previously, the Minister of Science and Technology would
consider the innovative nature of the R&D, the extent to which it will require
specialised skills and other criteria which is prescribed by them in making the
decisions regarding approval. These aspects have been encompassed within a more
robust definition of R&D and the Minister of Science and Technology (or appointed
individual) must consider whether the R&D complies with the criteria that is set out in
the definition of R&D under section 11D(1), or alternatively the criteria which has
been prescribed by the Minister of Finance in consultation with the Minister of
Science and Technology.
2016 SAAA National Teaching and Learning and Regional Conference Proceedings
ISBN 978-0-620-74761-5
341
Section 11D(13) requires that the taxpayer who has been granted approval report to
the committee (as required by section 11D(11)) on an annual basis, within 12
months of the end of the year of assessment of the taxpayer, to present the progress
of the R&D Incentive to date. In addition to this requirement, section 11D(13)
requires that the approval report to the committee should also detail “the extent to
which that research and development requires specialised skills” (Taxation Laws
Amendment Act, 2013). This requirement was previously consideration for the
granting of approval, and again speaks to the intention of the legislation to enhance
skills development in the Republic (National Treasury, 2012).
Section 11D(14) has been amended to allow the Commissioner for SARS
(Commissioner) to disclose to the Minister of Science and Technology any
information in relation to the R&D activities of a taxpayer, if that information is
material with regard to either the granting of approval for the tax incentive or the
withdrawal of approval by the Minister.
Section 11D(16) has been amended to allow a person appointed by the Minister of
Science and Technology (in addition to the Minister) to provide written reasons for
the approval or withdrawal of approval, as well as to service the Commissioner with
information regarding the granting of approval, the withdrawal of approval and the
date on which such events take effect.
The other changes that have been made to section 11D are stylistic and grammatical
in nature.
THE OBJECTIVES OF SECTION 11D
Through an analysis of the amendments to taxation legislation as stated in
Explanatory Memorandums on the Taxation Laws Amendment Bills, an assessment
can be made as to whether the theoretical objectives of the R&D Incentive have
been met. The improvement in R&D in the South African economy must then be
measured and an assessment of whether the overall objective of the introduction of
section 11D into legislation has been met can be made.
The overriding objectives of section 11D are higher domestic productivity, economic
growth, increased employment levels, increased taxable income and better skills
development. The Department of Science and Technology introduced the 150%
deduction incentive to motivate R&D in the business sector to help promote national
competitiveness (Department of Arts, Culture, Science and Technology, 2002).
While all of these still hold, the Explanatory Memorandum on the Taxation Laws
Amendment Bill (2013) states the following:
2016 SAAA National Teaching and Learning and Regional Conference Proceedings
ISBN 978-0-620-74761-5
342
“The existing research and development tax incentive regime has been revised to
achieve the following main objectives:
1. To align the 100% and the 50% deductions.
The additional uplift was intended to force the taxpayer to put in extra
effort to obtain the additional allowance through an application process,
and not assume an automatic uplift if the definition was met. Since this
was not occurring as intended, the application must now be for the full
150%.
2. To ensure a more robust definition of research and development, requiring
that research and development for the purpose of the incentive will be
innovative in nature.
This was necessary as the prior policy of the 50% uplift potentially allowed
for the claiming of expenditure which was never intended to fall within the
ambit of the section.
3. To simplify and streamline the legislation for ease of use.”
The first stated objective has been met. The change in the wording of the legislation
will ensure that it is achieved by forcing taxpayers to apply for the full 150%
deduction. The revision of the definitions in section 11D(1) as well as the other
changes previously discussed have the potential to ensure that R&D activities that
are undertaken are more innovative in nature. However, given this amendment’s
recent date of promulgation (12 December 2013) and the lack of research survey
data, there is no evidence on which to base an assessment of this issue. Therefore,
a limited assessment of whether or not the latest amendment has been simplified
and streamlined must be performed.
There are recurring issues in the previous legislation that were considered pitfalls of
section 11D from the perspective of the taxpayer. These include the following:
The interpretation and implementation of section 11D requires extensive
knowledge of not only tax law but also intellectual property law (Strauss,
2011).
There is contention with regards to the application of the section to the
development of computer programmes. This is related to the fact that SARS is
of the view that computer programmes which automate internal business
processes or create management efficiencies do not qualify for the deduction
even if such programmes are for sale to third parties. This excludes most
software development companies from the claiming the deduction (Strauss,
2011).
Interpretation Note 50, released by SARS in 2009, on the topic of R&D (and
which was needed by taxpayers due to the difficulty in interpretation and
implementation as mentioned above) has been highly criticised (Strauss,
2011). It has been said that it is at odds with the Frascati Manual issued by
2016 SAAA National Teaching and Learning and Regional Conference Proceedings
ISBN 978-0-620-74761-5
343
the Organisation for Economic Co-operation and Development (OECD), and
widely accepted as best practice on the subject. The interpretation note has
also been criticised for misinterpretations of well-established legal principles,
particularly with regard to the concept of “novelty” (Strauss, 2011).
The first issue has been specifically addressed in the new taxation
amendment, and given the changes to the definitions and arrangement of the
section it is possible that the interpretation of the section will be less onerous.
The definitions and details pertaining to software development have also been
updated in the new amendment, although some of the issues regarding
internal business processes are likely to remain. Finally, there has not been
an updated interpretation note on R&D, but the concept of novelty has been
removed from the latest amendment to the section.
MEASURING RESEARCH AND DEVELOPMENT
Prior to the introduction of section 11D, the applicable legislation in respect of R&D
was contained within section 11B, which has since been repealed. The initial draft of
the original section 11D was proposed in October 2006, enacted in February 2007,
and came into operation on 2 November 2006. As discussed above, it has been
amended numerous times since the date it was passed into law, with the first
amendment occurring in February 2007. This is expected to continue until the
objectives of the section have been met (Strauss, 2011). The intentions and
objectives of the introduction of the section can be assessed through review of the
National Surveys of Research and Experimental Development, published by the
Department of Science and Technology.
The overall objective of the introduction of section 11D
It is recognised that innovation and technological advancement are key factors in the
pursuit of higher productivity within a country. South Africa is no different, and with
enhanced productivity, there is the potential for higher economic growth and
improved competitiveness on an international level (National Treasury, 2013). While
many European and Asian countries have established themselves as specialists in
various scientific and technological fields, South Africa has had to pay royalties to
these foreign nations as a result of the lack of innovation and advancement on its
own shores (Williams, 2012). These are contributing factors which have caused
National Treasury and SARS to incentivise investment in R&D through an attractive
tax regime for qualifying expenditure.
In addition to the tax incentives provided by the government for R&D, there are
currently a number of direct subsidies which will aid this cause. However, it is noted
that the main objective of the current tax regime is to encourage private sector
funding and expenditure on R&D (National Treasury, 2012). With this private sector
2016 SAAA National Teaching and Learning and Regional Conference Proceedings
ISBN 978-0-620-74761-5
344
undertaking, South Africa hopes to encourage spending on R&D that would not have
otherwise occurred in the normal course of business (National Treasury, 2013). Thus
the effect of the incentive on the growth of R&D in the country can be measured by
enhanced domestic productivity, economic growth, job creation, skills development
and taxable income (National Treasury, 2013).
Section 11D(17) states that “The Minister of Science and Technology must annually
submit a report to Parliament advising Parliament of the direct benefits of R&D in
terms of economic growth, employment and other broader government objectives
and the aggregate expenditure in respect of such activities without disclosing the
identity of any person”. It is these reports by the Department of Science and
Technology that will be analysed in determining the success of the incentive since its
introduction in 2007.
According to the reports issued by the Department of Science and Technology, the
National Survey of Research and Experimental Development is undertaken annually,
and provides information on the sources of R&D funding, the amount of expenditure
on R&D in institutional sectors as well as information regarding the human capital
that is involved in these R&D activities (Department of Science and Technology,
2013). The survey is carried out in terms of the principles which have been set out in
the Frascati Manual Guidelines (Organisation for Economic Co-operation and
Development, 2002), which was developed by the OECD and is widely considered
best practice on the subject matter (Department of Science and Technology, 2011).
The primary data in the survey is sourced from various public and private sector
organisations. In the public sector, data is collected from universities, science
research councils as well as department based research institutes. Public sector
institutions are normally not taxpaying entities anyway, so would not qualify for
section 11D. In the private sector, the primary data providers are both non-profit
organisations and profit making firms (Department of Science and Technology,
2008).
One of the key indicators that is calculated in the R&D report is the gross
expenditure on R&D (GERD), and GERD as a percentage of Gross Domestic
Product (GDP). Per the R&D report, the target of GERD:GDP reaching 1% by 2008
was set, however a new target of 1.4% by 2015 was set (Department of Science and
Technology, 2008), and the new legislature intended for the amended R&D Incentive
to help attain this goal.
Section 11D came into operation at the end of the 2007 fiscal year. While the
amendment would have been known prior to this, it is submitted that the effect of the
incentive would have had a minimal impact in 2007 and that growth in R&D from
2008 must be assessed and compared to the results of the latest available survey,
being 2013/2014.
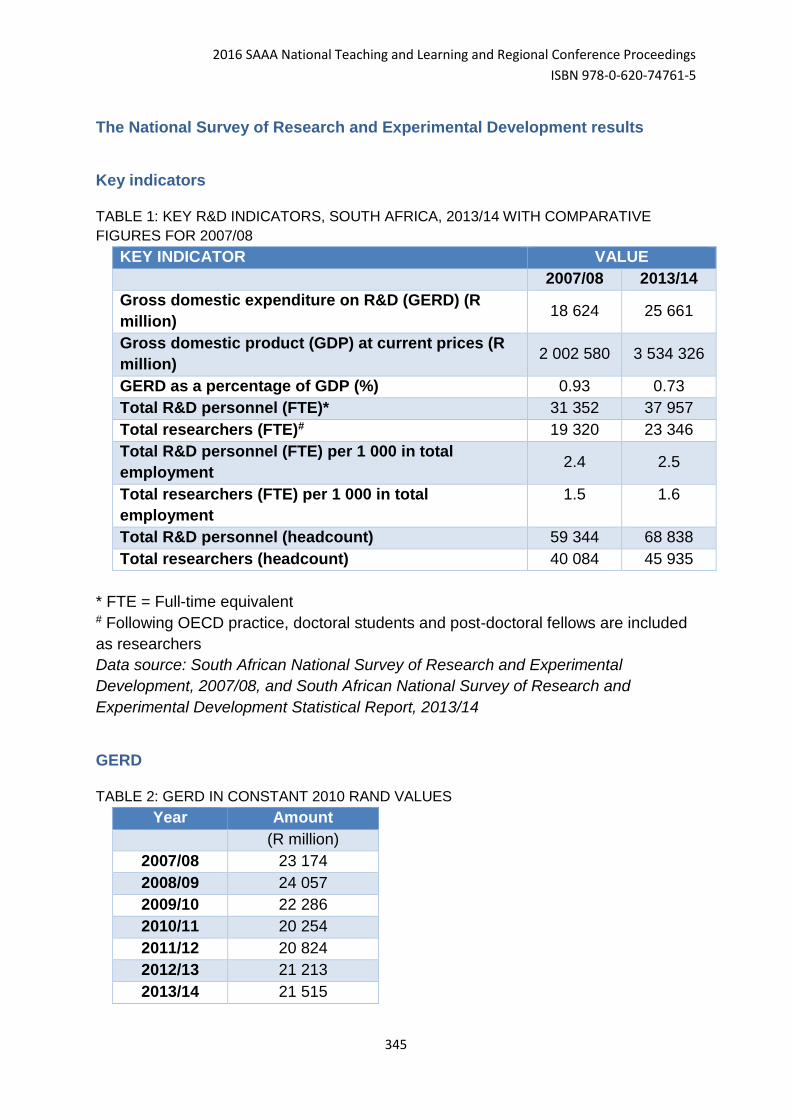
2016 SAAA National Teaching and Learning and Regional Conference Proceedings
ISBN 978-0-620-74761-5
345
The National Survey of Research and Experimental Development results
Key indicators
TABLE 1: KEY R&D INDICATORS, SOUTH AFRICA, 2013/14 WITH COMPARATIVE
FIGURES FOR 2007/08
KEY INDICATOR VALUE 2007/08 2013/14
Gross domestic expenditure on R&D (GERD) (R
million) 18 624 25 661
Gross domestic product (GDP) at current prices (R
million) 2 002 580 3 534 326
GERD as a percentage of GDP (%) 0.93 0.73
Total R&D personnel (FTE)* 31 352 37 957
Total researchers (FTE)# 19 320 23 346
Total R&D personnel (FTE) per 1 000 in total
employment 2.4 2.5
Total researchers (FTE) per 1 000 in total
employment
1.5 1.6
Total R&D personnel (headcount) 59 344 68 838
Total researchers (headcount) 40 084 45 935
* FTE = Full-time equivalent # Following OECD practice, doctoral students and post-doctoral fellows are included
as researchers
Data source: South African National Survey of Research and Experimental
Development, 2007/08, and South African National Survey of Research and
Experimental Development Statistical Report, 2013/14
GERD
TABLE 2: GERD IN CONSTANT 2010 RAND VALUES
Year Amount
(R million)
2007/08 23 174
2008/09 24 057
2009/10 22 286
2010/11 20 254
2011/12 20 824
2012/13 21 213
2013/14 21 515
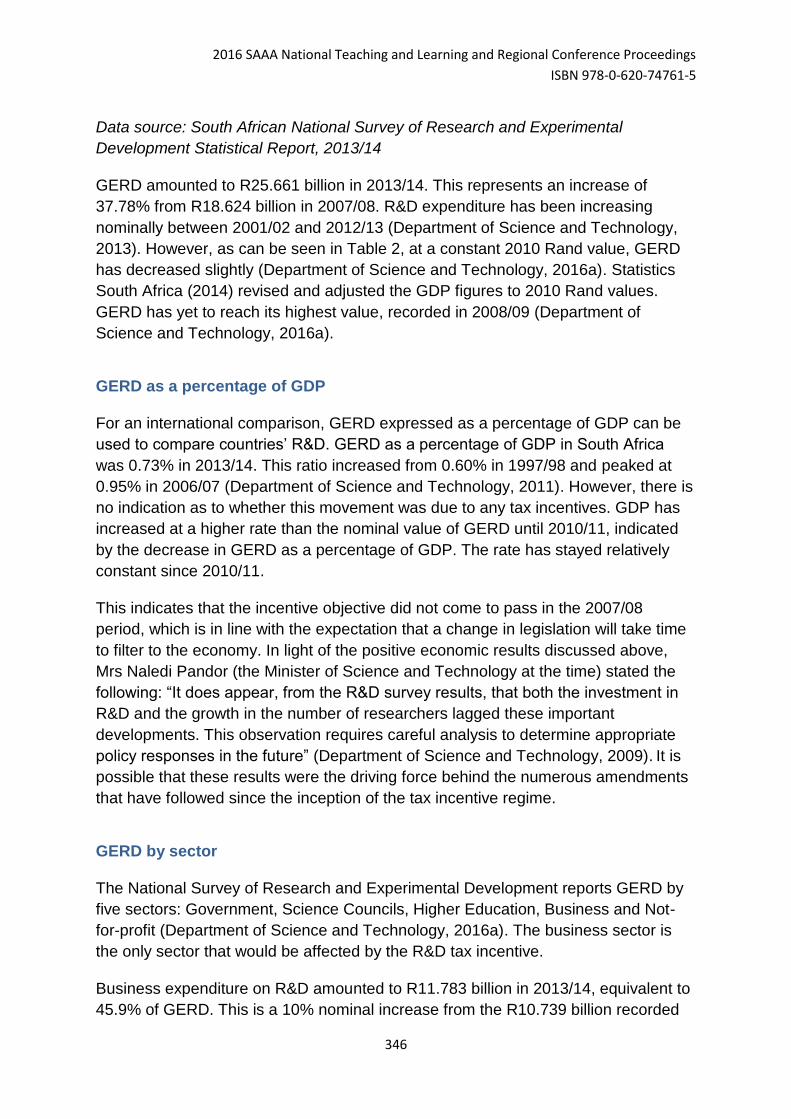
2016 SAAA National Teaching and Learning and Regional Conference Proceedings
ISBN 978-0-620-74761-5
346
Data source: South African National Survey of Research and Experimental
Development Statistical Report, 2013/14
GERD amounted to R25.661 billion in 2013/14. This represents an increase of
37.78% from R18.624 billion in 2007/08. R&D expenditure has been increasing
nominally between 2001/02 and 2012/13 (Department of Science and Technology,
2013). However, as can be seen in Table 2, at a constant 2010 Rand value, GERD
has decreased slightly (Department of Science and Technology, 2016a). Statistics
South Africa (2014) revised and adjusted the GDP figures to 2010 Rand values.
GERD has yet to reach its highest value, recorded in 2008/09 (Department of
Science and Technology, 2016a).
GERD as a percentage of GDP
For an international comparison, GERD expressed as a percentage of GDP can be
used to compare countries’ R&D. GERD as a percentage of GDP in South Africa
was 0.73% in 2013/14. This ratio increased from 0.60% in 1997/98 and peaked at
0.95% in 2006/07 (Department of Science and Technology, 2011). However, there is
no indication as to whether this movement was due to any tax incentives. GDP has
increased at a higher rate than the nominal value of GERD until 2010/11, indicated
by the decrease in GERD as a percentage of GDP. The rate has stayed relatively
constant since 2010/11.
This indicates that the incentive objective did not come to pass in the 2007/08
period, which is in line with the expectation that a change in legislation will take time
to filter to the economy. In light of the positive economic results discussed above,
Mrs Naledi Pandor (the Minister of Science and Technology at the time) stated the
following: “It does appear, from the R&D survey results, that both the investment in
R&D and the growth in the number of researchers lagged these important
developments. This observation requires careful analysis to determine appropriate
policy responses in the future” (Department of Science and Technology, 2009). It is
possible that these results were the driving force behind the numerous amendments
that have followed since the inception of the tax incentive regime.
GERD by sector
The National Survey of Research and Experimental Development reports GERD by
five sectors: Government, Science Councils, Higher Education, Business and Not-
for-profit (Department of Science and Technology, 2016a). The business sector is
the only sector that would be affected by the R&D tax incentive.
Business expenditure on R&D amounted to R11.783 billion in 2013/14, equivalent to
45.9% of GERD. This is a 10% nominal increase from the R10.739 billion recorded
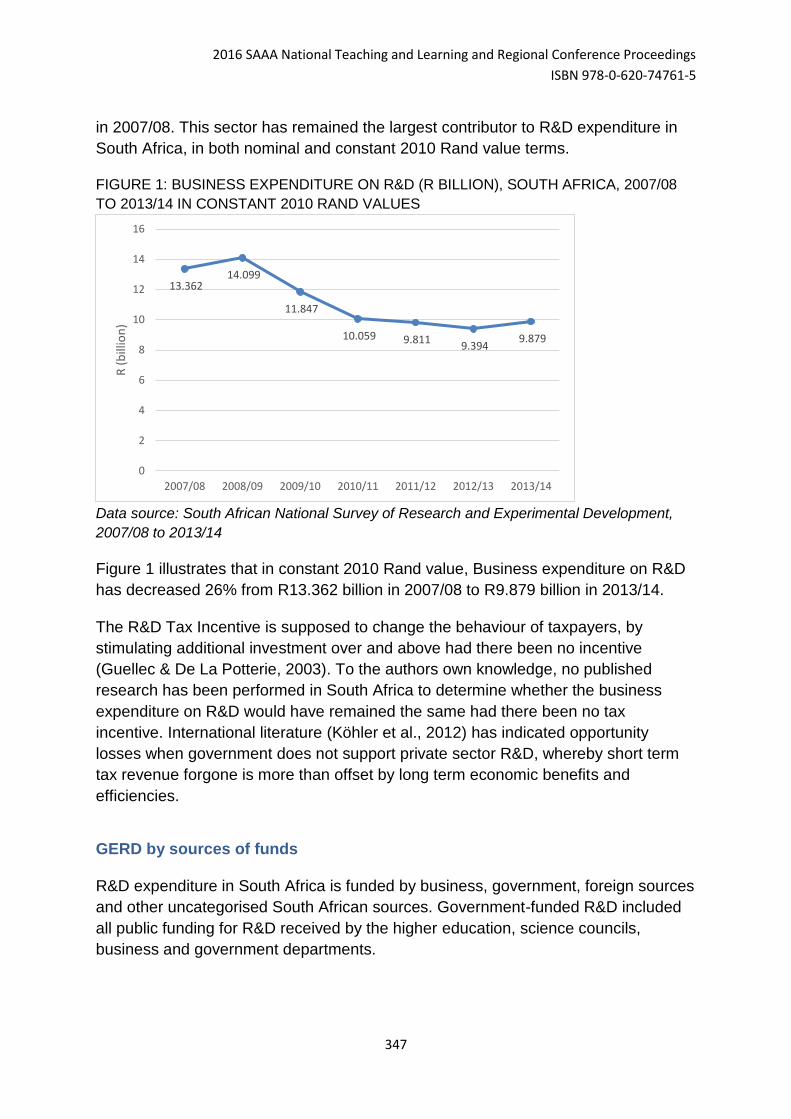
2016 SAAA National Teaching and Learning and Regional Conference Proceedings
ISBN 978-0-620-74761-5
347
in 2007/08. This sector has remained the largest contributor to R&D expenditure in
South Africa, in both nominal and constant 2010 Rand value terms.
FIGURE 1: BUSINESS EXPENDITURE ON R&D (R BILLION), SOUTH AFRICA, 2007/08
TO 2013/14 IN CONSTANT 2010 RAND VALUES
Data source: South African National Survey of Research and Experimental Development,
2007/08 to 2013/14
Figure 1 illustrates that in constant 2010 Rand value, Business expenditure on R&D
has decreased 26% from R13.362 billion in 2007/08 to R9.879 billion in 2013/14.
The R&D Tax Incentive is supposed to change the behaviour of taxpayers, by
stimulating additional investment over and above had there been no incentive
(Guellec & De La Potterie, 2003). To the authors own knowledge, no published
research has been performed in South Africa to determine whether the business
expenditure on R&D would have remained the same had there been no tax
incentive. International literature (Köhler et al., 2012) has indicated opportunity
losses when government does not support private sector R&D, whereby short term
tax revenue forgone is more than offset by long term economic benefits and
efficiencies.
GERD by sources of funds
R&D expenditure in South Africa is funded by business, government, foreign sources
and other uncategorised South African sources. Government-funded R&D included
all public funding for R&D received by the higher education, science councils,
business and government departments.
13.36214.099
11.847
10.059 9.8119.394
9.879
0
2
4
6
8
10
12
14
16
2007/08 2008/09 2009/10 2010/11 2011/12 2012/13 2013/14
R (
bill
ion
)
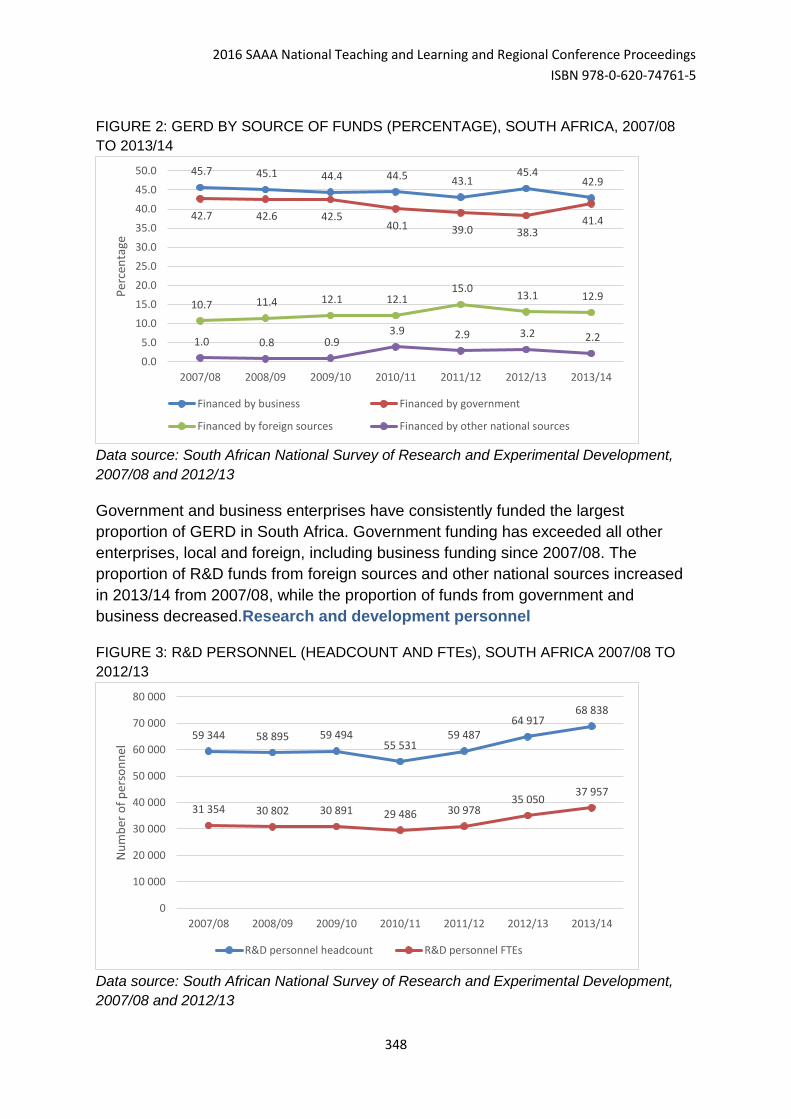
2016 SAAA National Teaching and Learning and Regional Conference Proceedings
ISBN 978-0-620-74761-5
348
FIGURE 2: GERD BY SOURCE OF FUNDS (PERCENTAGE), SOUTH AFRICA, 2007/08
TO 2013/14
Data source: South African National Survey of Research and Experimental Development,
2007/08 and 2012/13
Government and business enterprises have consistently funded the largest
proportion of GERD in South Africa. Government funding has exceeded all other
enterprises, local and foreign, including business funding since 2007/08. The
proportion of R&D funds from foreign sources and other national sources increased
in 2013/14 from 2007/08, while the proportion of funds from government and
business decreased.Research and development personnel
FIGURE 3: R&D PERSONNEL (HEADCOUNT AND FTEs), SOUTH AFRICA 2007/08 TO
2012/13
Data source: South African National Survey of Research and Experimental Development,
2007/08 and 2012/13
45.7 45.1 44.4 44.5 43.145.4
42.9
42.7 42.6 42.540.1 39.0 38.3
41.4
10.7 11.4 12.1 12.115.0
13.1 12.9
1.0 0.8 0.93.9 2.9 3.2 2.2
0.0
5.0
10.0
15.0
20.0
25.0
30.0
35.0
40.0
45.0
50.0
2007/08 2008/09 2009/10 2010/11 2011/12 2012/13 2013/14
Per
cen
tage
Financed by business Financed by government
Financed by foreign sources Financed by other national sources
59 344 58 895 59 49455 531
59 48764 917
68 838
31 354 30 802 30 891 29 486 30 97835 050
37 957
0
10 000
20 000
30 000
40 000
50 000
60 000
70 000
80 000
2007/08 2008/09 2009/10 2010/11 2011/12 2012/13 2013/14
Nu
mb
er o
f p
erso
nn
el
R&D personnel headcount R&D personnel FTEs
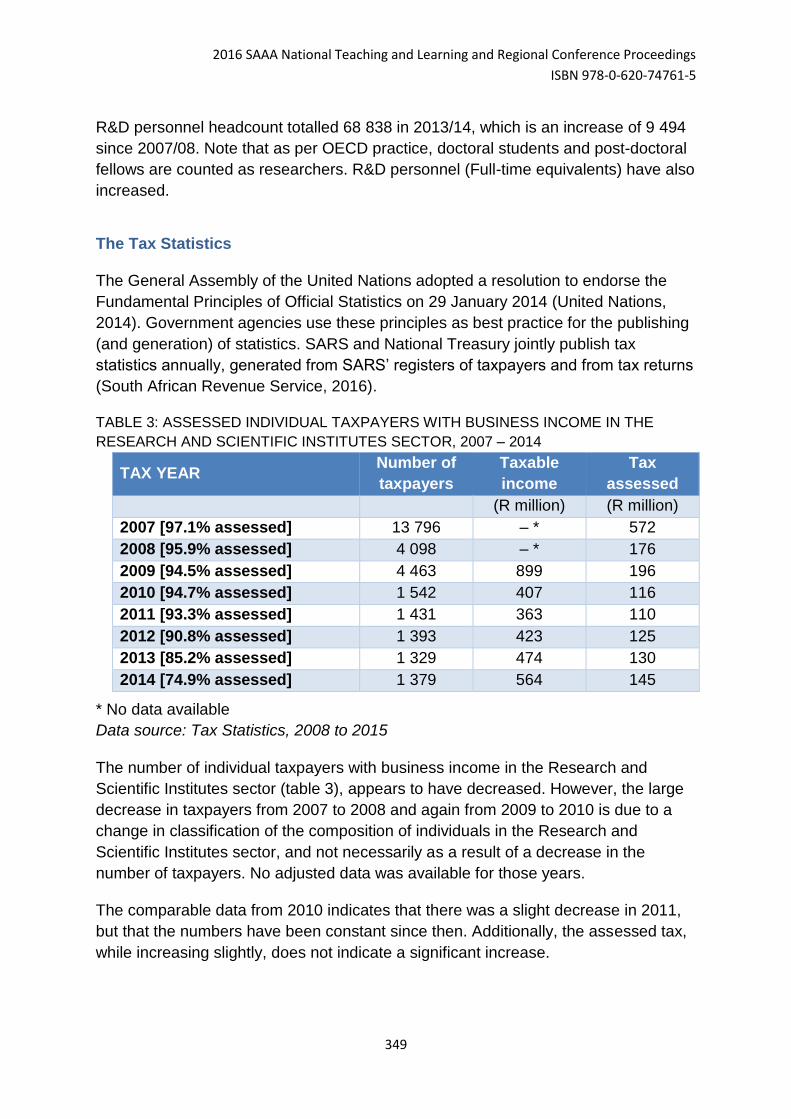
2016 SAAA National Teaching and Learning and Regional Conference Proceedings
ISBN 978-0-620-74761-5
349
R&D personnel headcount totalled 68 838 in 2013/14, which is an increase of 9 494
since 2007/08. Note that as per OECD practice, doctoral students and post-doctoral
fellows are counted as researchers. R&D personnel (Full-time equivalents) have also
increased.
The Tax Statistics
The General Assembly of the United Nations adopted a resolution to endorse the
Fundamental Principles of Official Statistics on 29 January 2014 (United Nations,
2014). Government agencies use these principles as best practice for the publishing
(and generation) of statistics. SARS and National Treasury jointly publish tax
statistics annually, generated from SARS’ registers of taxpayers and from tax returns
(South African Revenue Service, 2016).
TABLE 3: ASSESSED INDIVIDUAL TAXPAYERS WITH BUSINESS INCOME IN THE
RESEARCH AND SCIENTIFIC INSTITUTES SECTOR, 2007 – 2014
TAX YEAR Number of
taxpayers
Taxable
income
Tax
assessed (R million) (R million)
2007 [97.1% assessed] 13 796 – * 572
2008 [95.9% assessed] 4 098 – * 176
2009 [94.5% assessed] 4 463 899 196
2010 [94.7% assessed] 1 542 407 116
2011 [93.3% assessed] 1 431 363 110
2012 [90.8% assessed] 1 393 423 125
2013 [85.2% assessed] 1 329 474 130
2014 [74.9% assessed] 1 379 564 145
* No data available
Data source: Tax Statistics, 2008 to 2015
The number of individual taxpayers with business income in the Research and
Scientific Institutes sector (table 3), appears to have decreased. However, the large
decrease in taxpayers from 2007 to 2008 and again from 2009 to 2010 is due to a
change in classification of the composition of individuals in the Research and
Scientific Institutes sector, and not necessarily as a result of a decrease in the
number of taxpayers. No adjusted data was available for those years.
The comparable data from 2010 indicates that there was a slight decrease in 2011,
but that the numbers have been constant since then. Additionally, the assessed tax,
while increasing slightly, does not indicate a significant increase.
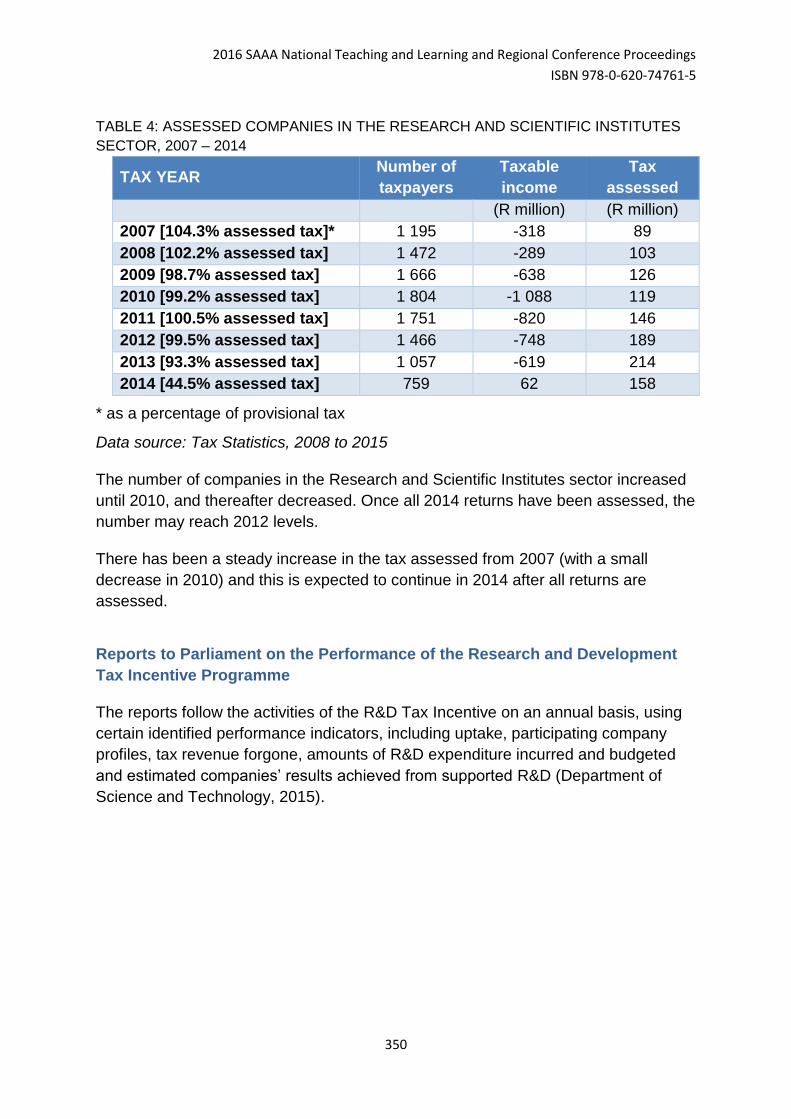
2016 SAAA National Teaching and Learning and Regional Conference Proceedings
ISBN 978-0-620-74761-5
350
TABLE 4: ASSESSED COMPANIES IN THE RESEARCH AND SCIENTIFIC INSTITUTES
SECTOR, 2007 – 2014
TAX YEAR Number of
taxpayers
Taxable
income
Tax
assessed (R million) (R million)
2007 [104.3% assessed tax]* 1 195 -318 89
2008 [102.2% assessed tax] 1 472 -289 103
2009 [98.7% assessed tax] 1 666 -638 126
2010 [99.2% assessed tax] 1 804 -1 088 119
2011 [100.5% assessed tax] 1 751 -820 146
2012 [99.5% assessed tax] 1 466 -748 189
2013 [93.3% assessed tax] 1 057 -619 214
2014 [44.5% assessed tax] 759 62 158
* as a percentage of provisional tax
Data source: Tax Statistics, 2008 to 2015
The number of companies in the Research and Scientific Institutes sector increased
until 2010, and thereafter decreased. Once all 2014 returns have been assessed, the
number may reach 2012 levels.
There has been a steady increase in the tax assessed from 2007 (with a small
decrease in 2010) and this is expected to continue in 2014 after all returns are
assessed.
Reports to Parliament on the Performance of the Research and Development
Tax Incentive Programme
The reports follow the activities of the R&D Tax Incentive on an annual basis, using
certain identified performance indicators, including uptake, participating company
profiles, tax revenue forgone, amounts of R&D expenditure incurred and budgeted
and estimated companies’ results achieved from supported R&D (Department of
Science and Technology, 2015).
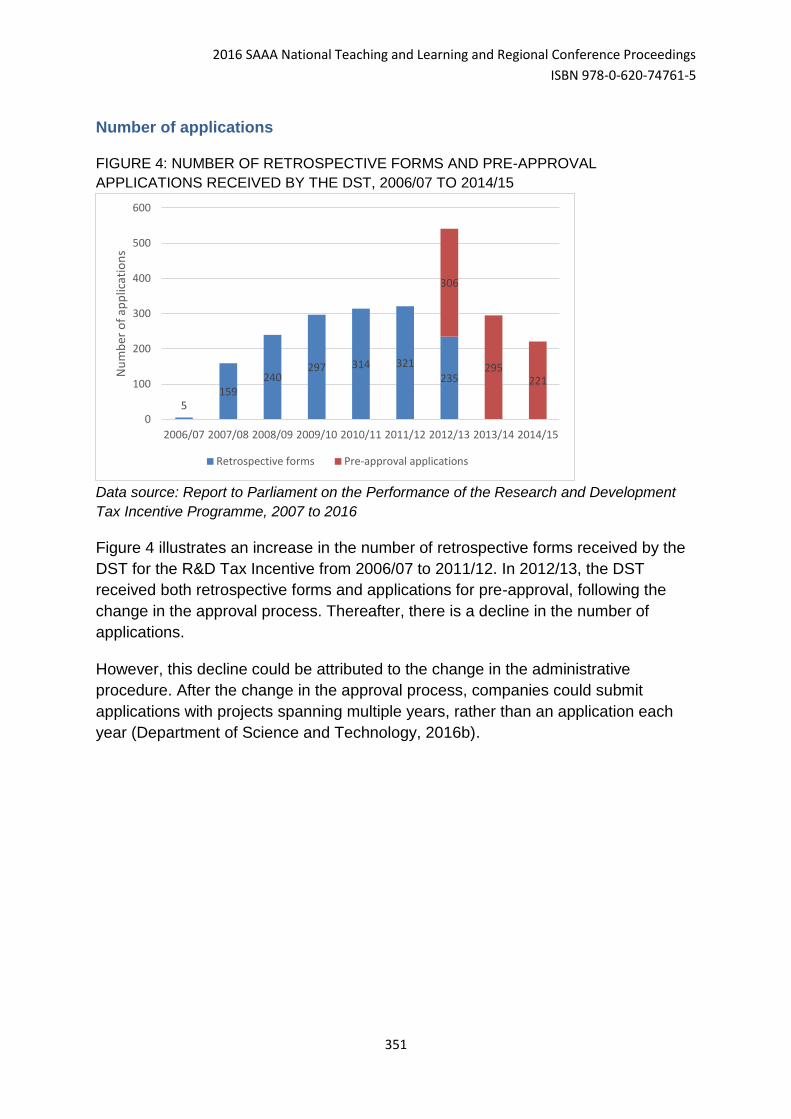
2016 SAAA National Teaching and Learning and Regional Conference Proceedings
ISBN 978-0-620-74761-5
351
Number of applications
FIGURE 4: NUMBER OF RETROSPECTIVE FORMS AND PRE-APPROVAL
APPLICATIONS RECEIVED BY THE DST, 2006/07 TO 2014/15
Data source: Report to Parliament on the Performance of the Research and Development
Tax Incentive Programme, 2007 to 2016
Figure 4 illustrates an increase in the number of retrospective forms received by the
DST for the R&D Tax Incentive from 2006/07 to 2011/12. In 2012/13, the DST
received both retrospective forms and applications for pre-approval, following the
change in the approval process. Thereafter, there is a decline in the number of
applications.
However, this decline could be attributed to the change in the administrative
procedure. After the change in the approval process, companies could submit
applications with projects spanning multiple years, rather than an application each
year (Department of Science and Technology, 2016b).
5159
240297 314 321
235
306
295221
0
100
200
300
400
500
600
2006/07 2007/08 2008/09 2009/10 2010/11 2011/12 2012/13 2013/14 2014/15
Nu
mb
er o
f ap
plic
atio
ns
Retrospective forms Pre-approval applications
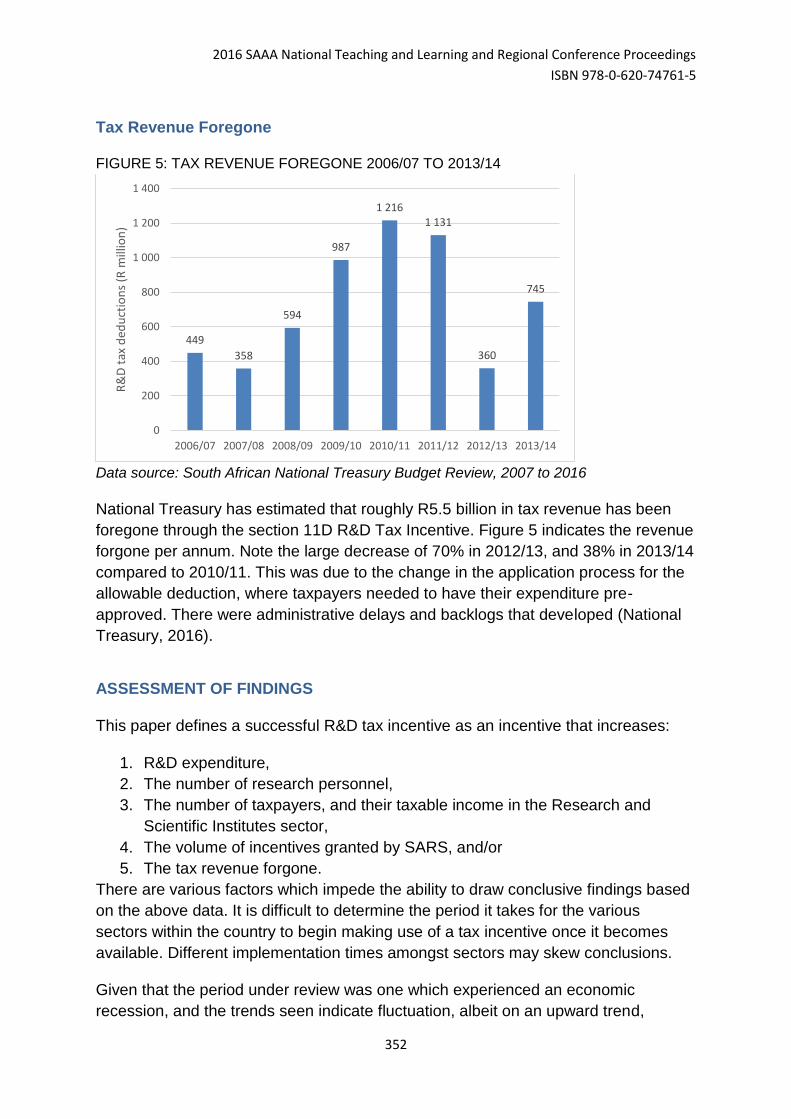
2016 SAAA National Teaching and Learning and Regional Conference Proceedings
ISBN 978-0-620-74761-5
352
Tax Revenue Foregone
FIGURE 5: TAX REVENUE FOREGONE 2006/07 TO 2013/14
Data source: South African National Treasury Budget Review, 2007 to 2016
National Treasury has estimated that roughly R5.5 billion in tax revenue has been
foregone through the section 11D R&D Tax Incentive. Figure 5 indicates the revenue
forgone per annum. Note the large decrease of 70% in 2012/13, and 38% in 2013/14
compared to 2010/11. This was due to the change in the application process for the
allowable deduction, where taxpayers needed to have their expenditure pre-
approved. There were administrative delays and backlogs that developed (National
Treasury, 2016).
ASSESSMENT OF FINDINGS
This paper defines a successful R&D tax incentive as an incentive that increases:
1. R&D expenditure,
2. The number of research personnel,
3. The number of taxpayers, and their taxable income in the Research and
Scientific Institutes sector,
4. The volume of incentives granted by SARS, and/or
5. The tax revenue forgone.
There are various factors which impede the ability to draw conclusive findings based
on the above data. It is difficult to determine the period it takes for the various
sectors within the country to begin making use of a tax incentive once it becomes
available. Different implementation times amongst sectors may skew conclusions.
Given that the period under review was one which experienced an economic
recession, and the trends seen indicate fluctuation, albeit on an upward trend,
449
358
594
987
1 2161 131
360
745
0
200
400
600
800
1 000
1 200
1 400
2006/07 2007/08 2008/09 2009/10 2010/11 2011/12 2012/13 2013/14
R&
D t
ax d
edu
ctio
ns
(R m
illio
n)
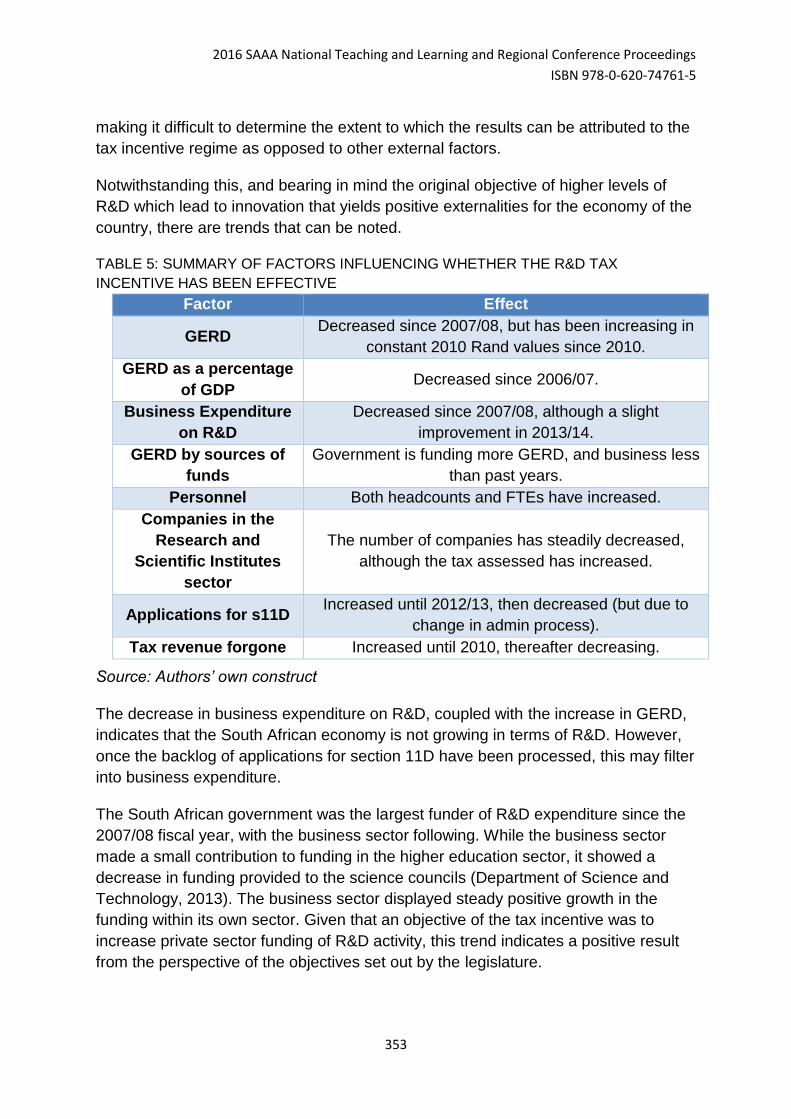
2016 SAAA National Teaching and Learning and Regional Conference Proceedings
ISBN 978-0-620-74761-5
353
making it difficult to determine the extent to which the results can be attributed to the
tax incentive regime as opposed to other external factors.
Notwithstanding this, and bearing in mind the original objective of higher levels of
R&D which lead to innovation that yields positive externalities for the economy of the
country, there are trends that can be noted.
TABLE 5: SUMMARY OF FACTORS INFLUENCING WHETHER THE R&D TAX
INCENTIVE HAS BEEN EFFECTIVE
Factor Effect
GERD Decreased since 2007/08, but has been increasing in
constant 2010 Rand values since 2010.
GERD as a percentage
of GDP Decreased since 2006/07.
Business Expenditure
on R&D
Decreased since 2007/08, although a slight
improvement in 2013/14.
GERD by sources of
funds
Government is funding more GERD, and business less
than past years.
Personnel Both headcounts and FTEs have increased.
Companies in the
Research and
Scientific Institutes
sector
The number of companies has steadily decreased,
although the tax assessed has increased.
Applications for s11D Increased until 2012/13, then decreased (but due to
change in admin process).
Tax revenue forgone Increased until 2010, thereafter decreasing.
Source: Authors’ own construct
The decrease in business expenditure on R&D, coupled with the increase in GERD,
indicates that the South African economy is not growing in terms of R&D. However,
once the backlog of applications for section 11D have been processed, this may filter
into business expenditure.
The South African government was the largest funder of R&D expenditure since the
2007/08 fiscal year, with the business sector following. While the business sector
made a small contribution to funding in the higher education sector, it showed a
decrease in funding provided to the science councils (Department of Science and
Technology, 2013). The business sector displayed steady positive growth in the
funding within its own sector. Given that an objective of the tax incentive was to
increase private sector funding of R&D activity, this trend indicates a positive result
from the perspective of the objectives set out by the legislature.
2016 SAAA National Teaching and Learning and Regional Conference Proceedings
ISBN 978-0-620-74761-5
354
The increase in personnel is a clear indication of an increase in research, but
contradicts the decrease in business expenditure. The authors could not find any
literature providing a reason for this incongruity.
While the number of companies in the Research and Scientific Institutes sector has
decreased (with tax assessed increasing), these companies are not all the
companies performing R&D in the economy. The increase of tax assessed is
promising, and hopefully extrapolates into the whole population, even though
business expenditure on R&D decreased.
The applications’ decreasing as much as they have is mainly due to a change in the
administration process. Taxpayers were uncertain of how to apply for R&D tax
incentives and whether they would receive approval. However, the change in the
process from a retrospective application to a pre-approval was more taxing
administratively and resulted in a large backlog of claims (Department of Science
and Technology, 2015).
The Department of Science and Technology (2016b) suggests simplifying the
administrative process through a revised application form, improved information,
assisting all stakeholders in understanding the incentive and helping them
throughout the process. Additionally, a hybrid model of approval, once demonstrable
R&D has been performed, may be another option.
The decrease in tax revenue forgone since 2012 is affirmed by the backlog and
additional administration required by the approval process.
Overall, there appears to be a decrease in R&D rather than an increase. This goes
against the objective of a R&D Tax Incentive. As stated previously, no research on
whether R&D would have remained the same had there been no tax incentive has
been performed in South Africa to date (Köhler, Laredo, & Rammer, 2012). However,
it may be prudent to recommend changes to the R&D Tax Incentive. These changes
could include international considerations and expanding the allowable R&D, both in
terms of scope and attraction.
CONCLUSION
Section 11D of the Income Tax Act has undergone multiple changes since it was
introduced into legislation in 2006. It can be seen that most of the changes were to
ensure that the original intention of the legislature is effected, and many of the new
additions to the section have been promulgated with the view to placing an emphasis
on R&D that is scientific and technological in nature.
In looking at the objective of the latest taxation laws amendment, it was noted that
conclusive findings cannot be drawn based on the fact that it is not yet in operation.
2016 SAAA National Teaching and Learning and Regional Conference Proceedings
ISBN 978-0-620-74761-5
355
Some of the issues that plagued the previous versions of the section have been
addressed in the new amendment, while certain others are likely to remain
contentious.
Based on the results obtained from the National Survey of Research and
Experimental Development, the Tax Statistics and the Reports to Parliament on the
Performance of the Research and Development Tax Incentive Programme, there is
evidence of a marginal decrease in R&D in South Africa. However, had the R&D Tax
Incentive not been in existence, it is possible that there would be significantly less
expenditure on R&D.
Improvements to both the legislation and administrative process would help increase
the level of R&D in South Africa.
References
Department of Arts Culture Science and Technology. (2002). National Research and
Development Strategy. Pretoria.
Department of Science and Technology. (2008). National Survey of Research and
Experimental Development, High-level key results, 2006/07. Pretoria.
Department of Science and Technology. (2009). National Survey of Research and
Experimental Development, High-level key results, 2007/08. Pretoria.
Department of Science and Technology. (2011). National Survey of Research and
Experimental Development, 2007/08. Pretoria.
Department of Science and Technology. (2013). National Survey of Research and
Experimental Development, High-level key results, 2009/10. Pretoria.
Department of Science and Technology. (2015). Performance of the Research and
Development Tax Incentive Programme, Report to Parliament 2013/14. Pretoria.
Retrieved from http://www.dst.gov.za/index.php/services/41-rad-tax-incentives-
programme/1288-reports-to-parliament-20132014
Department of Science and Technology. (2016a). National Survey of Research and
Experimental Development, Statistical Report, 2013/14. Pretoria.
Department of Science and Technology. (2016b). Report of the Joint Government
Industry Task Team on the Research and Development Tax Incentive. Pretoria.
Retrieved from http://www.dst.gov.za/index.php/services/the-rad-tax-incentives-
programme
Guellec, D., & De La Potterie, B. V. P. (2003). The Impact of Public R&D
2016 SAAA National Teaching and Learning and Regional Conference Proceedings
ISBN 978-0-620-74761-5
356
Expenditure on Business R&D. Economics of Innovation and New Technology,
12(3), 225–243.
Köhler, C., Laredo, P., & Rammer, C. (2012). The Impact and Effectiveness of Fiscal
Incentives for R&D. NESTA Compendium of Evidence on Innovation Policy
Intervention. Retrieved from http://www.innovation-policy.net/compendium/
National Treasury. (2012). Explanatory Memorandum on the Taxation Laws
Amendment Bill, 2011.
National Treasury. (2013). Explanatory Memorandum on the Taxation Laws
Amendment Bill, 2013.
National Treasury. (2016). Budget Review 2016. Pretoria. Retrieved from
http://www.treasury.gov.za/documents/national budget/2016/review/default.aspx
Organisation for Economic Co-operation and Development. (2002). Frascati Manual:
Proposed Standard Practice for Surveys on Research and Experimental
Development. The Measurement of Scientific and Technological Activities (6th
ed.). France. http://doi.org/10.1787/9789264199040-en
Republic of South Africa. Taxation Laws Amendment Act No. 31 of 2013,
Government Gazette (2013). Republic of South Africa. http://doi.org/102GOU/B
South African Revenue Service. (2016). Tax Statistics 2015. Pretoria.
Statistics South Africa. (2014). Gross Domestic Product. Pretoria.
Strauss, C. (2011). An Analysis of Sections 11D(1)(a) and 11D(5)(b) of the Income
Tax Act No. 58 of 1962 as Amended. University of Stellenbosch.
United Nations. (2014). General Assembly Resolution A/RES/68/261. Retrieved from
http://unstats.un.org/unsd/dnss/gp/fundprinciples.aspx
Williams, R. (2012). Research and development expenditure - the 150% deduction.
Pwc Synopsis - Tax Today, (February 2012). Retrieved from
https://www.pwc.co.za/en/assets/pdf/synopsis-february-2012.pdf
Related Documents