Massachusetts School and District Profiles George R Martin George R Martin (02650007) Bartholomew Lush, Principal Mailing Address: 445 Cole Street Seekonk, MA 02771-5812 Phone: (508) 336-7558 FAX: (508) 336-0309 Website: http://www.seekonk.k12.ma.us Organization Description: The mission of the George R. Martin Elementary School is to provide the finest possible education for students in an environment where they may achieve their potential through a partnership of home, child, and school. This report card contains information required by the federal Elementary and Secondary Education Act (ESEA) for our school and district including: student enrollment and teacher qualifications, student achievement, accountability, and the progress our school is making toward narrowing proficiency gaps for different groups of students. Enrollment and Educator Data (2015-16 School Year) About the Data Enrollment (2015-16) School District State Total Count 447 1,973 953,429 Race/Ethnicity (%) African American or Black 2.0 1.4 8.8 Asian 2.5 2.8 6.5 Hispanic or Latino 6.5 4.3 18.6 Multi-race, Non-Hispanic 3.1 2.5 3.2 Native American 0.2 0.1 0.2 Native Hawaiian or Pacific Islander 0.0 0.0 0.1 White 85.7 88.9 62.7 Gender (%) Male 51.9 48.8 51.2 Female 48.1 51.2 48.8 Selected Populations (%) English Language Learner 5.1 2.3 9.0 Economically Disadvantaged 17.2 13.8 27.4 Students w/Disabilities 11.4 15.7 17.2 First Language Not English 6.9 4.4 19.0 Grades Offered: K, 01, 02, 03, 04, 05 Educator Data (2015-16) School District State Total # of Teachers 33.5 150.6 72,384.1 Percentage of Teachers Licensed in Teaching Assignment 100.0 99.9 97.4 Total Number of Classes in Core Academic Areas 136 611 348,472 Percentage of Core Academic Classes Taught by Teachers Who are Highly Qualified 100.0 99.3 96.3 Percentage of Core Academic Classes Taught by Teachers Who are Not Highly Qualified 0.0 0.7 3.7 Student/Teacher Ratio 13.4 to 1 13.1 to 1 13.2 to 1 Percentage of Public Elementary and Secondary School Teachers Issued Waivers - 0.0 0.9 2016 MCAS Results by Subgroup by Grade and Subject NOTE: First-year ELL students are not included in achievement level or CPI results. However, first-year ELL students who took the ACCESS for ELLs test are counted as ELA participants; in addition, first-year ELL students who are present for Mathematics/Science and Technology/Engineering are counted as Mathematics/Science and Technology/Engineering participants. Please see the principal's administration manual (PAM) for details. NOTE: Spring 2016 results in grades 3-8 ELA and Mathematics are not reported because all students in this organization participated in the PARCC test. More about the data

Welcome message from author
This document is posted to help you gain knowledge. Please leave a comment to let me know what you think about it! Share it to your friends and learn new things together.
Transcript

Massachusetts School and District ProfilesGeorge R Martin
George R Martin (02650007)Bartholomew Lush, PrincipalMailing Address: 445 Cole StreetSeekonk, MA 02771-5812Phone: (508) 336-7558FAX: (508) 336-0309Website: http://www.seekonk.k12.ma.usOrganization Description: The mission of the George R. Martin Elementary School is toprovide the finest possible education for students in an environment where they mayachieve their potential through a partnership of home, child, and school.
This report card contains information required by the federal Elementary and SecondaryEducation Act (ESEA) for our school and district including: student enrollment and teacherqualifications, student achievement, accountability, and the progress our school is makingtoward narrowing proficiency gaps for different groups of students.
Enrollment and Educator Data (2015-16 School Year)About the Data
Enrollment (2015-16)
School District StateTotal Count 447 1,973 953,429Race/Ethnicity (%)African American orBlack
2.0 1.4 8.8
Asian 2.5 2.8 6.5Hispanic or Latino 6.5 4.3 18.6Multi-race,Non-Hispanic
3.1 2.5 3.2
Native American 0.2 0.1 0.2Native Hawaiian orPacific Islander
0.0 0.0 0.1
White 85.7 88.9 62.7Gender (%)Male 51.9 48.8 51.2Female 48.1 51.2 48.8Selected Populations (%)English LanguageLearner
5.1 2.3 9.0
EconomicallyDisadvantaged
17.2 13.8 27.4
Students w/Disabilities 11.4 15.7 17.2First Language NotEnglish
6.9 4.4 19.0
Grades Offered:K, 01, 02, 03, 04, 05
Educator Data (2015-16)
School District StateTotal # of Teachers 33.5 150.6 72,384.1Percentage of TeachersLicensed in TeachingAssignment
100.0 99.9 97.4
Total Number of Classesin Core Academic Areas
136 611 348,472
Percentage of CoreAcademic ClassesTaught by TeachersWho are Highly Qualified
100.0 99.3 96.3
Percentage of CoreAcademic ClassesTaught by TeachersWho are Not HighlyQualified
0.0 0.7 3.7
Student/Teacher Ratio 13.4 to 1 13.1 to 1 13.2 to 1Percentage of PublicElementary andSecondary SchoolTeachers IssuedWaivers
- 0.0 0.9
2016 MCAS Results by Subgroup by Grade and SubjectNOTE: First-year ELL students are not included in achievement level or CPI results. However, first-year ELLstudents who took the ACCESS for ELLs test are counted as ELA participants; in addition, first-year ELLstudents who are present for Mathematics/Science and Technology/Engineering are counted asMathematics/Science and Technology/Engineering participants. Please see the principal's administration manual(PAM) for details.
NOTE: Spring 2016 results in grades 3-8 ELA and Mathematics are not reported because all students in thisorganization participated in the PARCC test.
More about the data
Data Last Updated on September 26, 2016
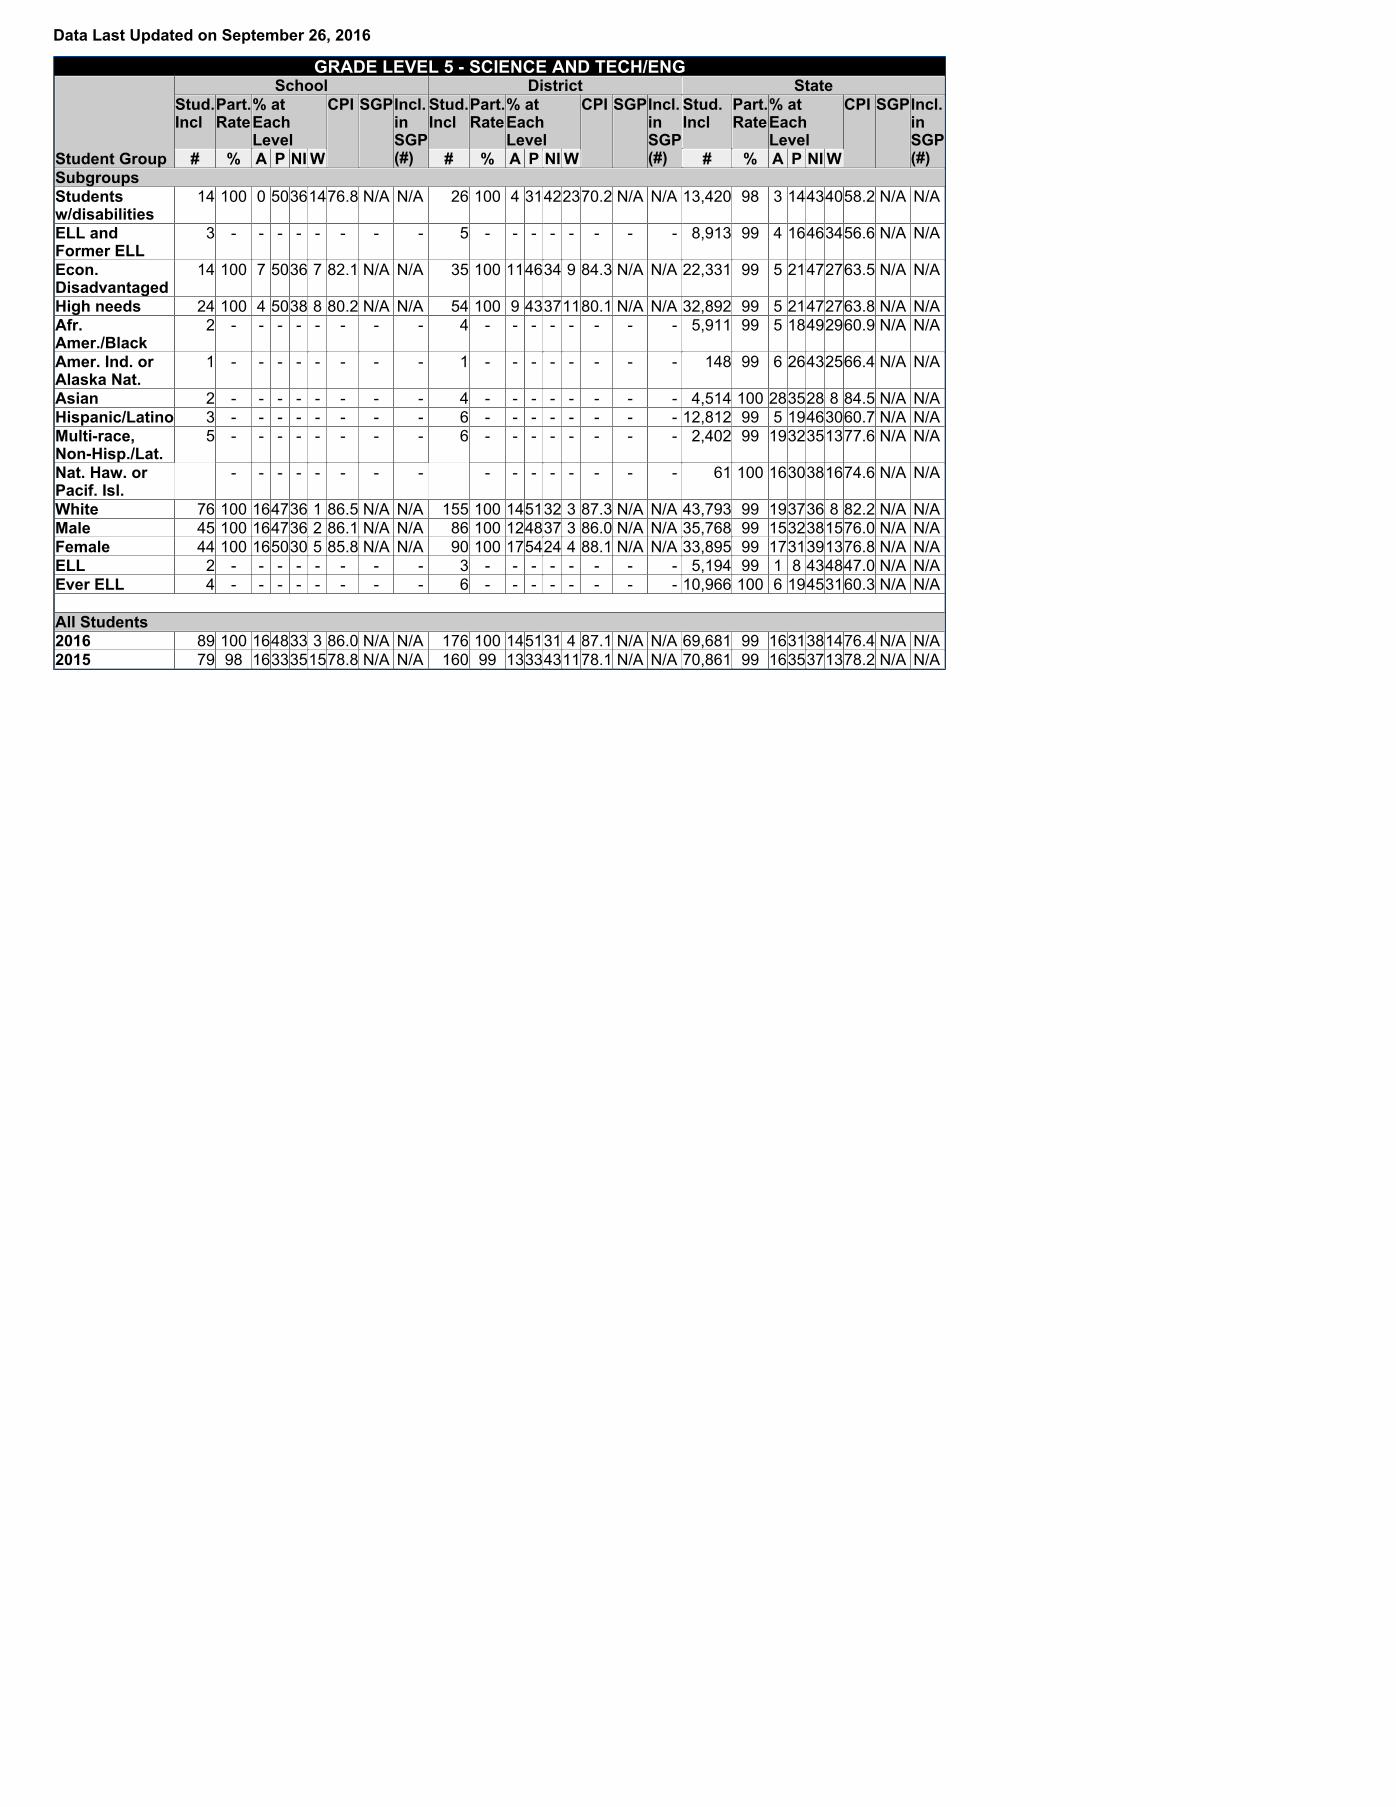
GRADE LEVEL 5 - SCIENCE AND TECH/ENG
Student Group
School District StateStud.Incl
Part.Rate
% atEachLevel
CPI SGPIncl.inSGP(#)
Stud.Incl
Part.Rate
% atEachLevel
CPI SGPIncl.inSGP(#)
Stud.Incl
Part.Rate
% atEachLevel
CPI SGPIncl.inSGP(#)# % A P NI W # % A P NI W # % A P NI W
SubgroupsStudentsw/disabilities
14 100 0 50361476.8 N/A N/A 26 100 4 31422370.2 N/A N/A 13,420 98 3 14434058.2 N/A N/A
ELL andFormer ELL
3 - - - - - - - - 5 - - - - - - - - 8,913 99 4 16463456.6 N/A N/A
Econ.Disadvantaged
14 100 7 5036 7 82.1 N/A N/A 35 100 114634 9 84.3 N/A N/A 22,331 99 5 21472763.5 N/A N/A
High needs 24 100 4 5038 8 80.2 N/A N/A 54 100 9 43371180.1 N/A N/A 32,892 99 5 21472763.8 N/A N/A Afr.Amer./Black
2 - - - - - - - - 4 - - - - - - - - 5,911 99 5 18492960.9 N/A N/A
Amer. Ind. orAlaska Nat.
1 - - - - - - - - 1 - - - - - - - - 148 99 6 26432566.4 N/A N/A
Asian 2 - - - - - - - - 4 - - - - - - - - 4,514 100 283528 8 84.5 N/A N/A Hispanic/Latino 3 - - - - - - - - 6 - - - - - - - - 12,812 99 5 19463060.7 N/A N/A Multi-race,Non-Hisp./Lat.
5 - - - - - - - - 6 - - - - - - - - 2,402 99 1932351377.6 N/A N/A
Nat. Haw. orPacif. Isl.
- - - - - - - - - - - - - - - - 61 100 1630381674.6 N/A N/A
White 76 100 164736 1 86.5 N/A N/A 155 100 145132 3 87.3 N/A N/A 43,793 99 193736 8 82.2 N/A N/A Male 45 100 164736 2 86.1 N/A N/A 86 100 124837 3 86.0 N/A N/A 35,768 99 1532381576.0 N/A N/A Female 44 100 165030 5 85.8 N/A N/A 90 100 175424 4 88.1 N/A N/A 33,895 99 1731391376.8 N/A N/A ELL 2 - - - - - - - - 3 - - - - - - - - 5,194 99 1 8 434847.0 N/A N/A Ever ELL 4 - - - - - - - - 6 - - - - - - - - 10,966 100 6 19453160.3 N/A N/A All Students2016 89 100 164833 3 86.0 N/A N/A 176 100 145131 4 87.1 N/A N/A 69,681 99 1631381476.4 N/A N/A 2015 79 98 1633351578.8 N/A N/A 160 99 1333431178.1 N/A N/A 70,861 99 1635371378.2 N/A N/A

ALL GRADES - SCIENCE AND TECH/ENG
Student Group
School District StateStud.Incl
Part.Rate
% atEachLevel
CPI SGPIncl.inSGP(#)
Stud.Incl
Part.Rate
% atEachLevel
CPI SGPIncl.inSGP(#)
Stud.Incl
Part.Rate
% atEachLevel
CPI SGPIncl.inSGP(#)# % A P NI W # % A P NI W # % A P NI W
SubgroupsStudentsw/disabilities
14 100 0 50361476.8 N/A N/A 78 98 3 26472465.4 N/A N/A 38,109 98 3 18413859.7 N/A N/A
ELL andFormer ELL
3 - - - - - - - - 9 - - - - - - - - 18,594 99 3 16433954.1 N/A N/A
Econ.Disadvantaged
14 100 7 5036 7 82.1 N/A N/A 90 99 133939 9 81.7 N/A N/A 61,476 98 6 26432565.8 N/A N/A
High needs 24 100 4 5038 8 80.2 N/A N/A 147 99 1036411377.0 N/A N/A 89,857 98 6 25432665.4 N/A N/A Afr.Amer./Black
2 - - - - - - - - 7 - - - - - - - - 17,761 99 5 24442763.9 N/A N/A
Amer. Ind. orAlaska Nat.
1 - - - - - - - - 1 - - - - - - - - 422 98 9 33401971.9 N/A N/A
Asian 2 - - - - - - - - 10 100 302050 0 85.0 N/A N/A 13,043 99 303923 7 86.8 N/A N/A Hispanic/Latino 3 - - - - - - - - 18 100 1728441175.0 N/A N/A 35,316 99 5 24422862.9 N/A N/A Multi-race,Non-Hisp./Lat.
5 - - - - - - - - 10 100 306010 0 97.5 N/A N/A 6,053 99 1936331279.5 N/A N/A
Nat. Haw. orPacif. Isl.
- - - - - - - - - - - - - - - - 208 100 1832321875.8 N/A N/A
White 76 100 164736 1 86.5 N/A N/A 439 100 195126 4 88.6 N/A N/A 135,382 99 204230 8 84.1 N/A N/A Male 45 100 164736 2 86.1 N/A N/A 230 99 194731 4 87.2 N/A N/A 106,211 99 1737331478.4 N/A N/A Female 44 100 165030 5 85.8 N/A N/A 255 100 195224 5 88.7 N/A N/A 102,022 99 1737341279.1 N/A N/A ELL 2 - - - - - - - - 6 - - - - - - - - 11,822 98 1 8 395145.3 N/A N/A Ever ELL 4 - - - - - - - - 13 100 8 23541567.3 N/A N/A 33,065 99 8 25402764.2 N/A N/A All Students2016 89 100 164833 3 86.0 N/A N/A 485 100 194927 4 88.0 N/A N/A 208,262 99 1737331378.7 N/A N/A 2015 79 98 1633351578.8 N/A N/A 477 99 174233 8 83.6 N/A N/A 210,454 99 1539331279.4 N/A N/A
2016 PARCC Results by Subgroup by Grade and SubjectAchievement Levels:L5 = Level 5: Exceeded Expectations (varies by grade - 850)L4 = Level 4: Met Expectations (750 - varies by grade)L3 = Level 3: Approached Expectations (725-749)L2 = Level 2: Partially met Expectations (700-724)L1 = Level 1: Did not meet Expectations (650-699)
Trans. SGP = Transitional Student Growth Percentilegenerated using current PARCC and prior MCAS scoresTrans. CPI = Transitional Composite Performance Indexgenerated using linked PARCC and MCAS scores
NOTE: Since only a portion of students in grades 3-8 participated in 2016 PARCC in ELA/L and Mathematics, a representativesample of students from across Massachusetts was used to estimate student achievement at the state level in those subjects.NOTE: Students who took the Alternate Assessment are included in Mean CPI, but not in achievement level or growth results.Data Last Updated on September 24, 2016

GRADE 3 ELA/L
Student Group
School District StateIncludedPart.
Rate% at EachLevel
Trans.CPI
Trans.SGP
Incl.inSGP(#)
IncludedPart.Rate
% at EachLevel
Trans.CPI
Trans.SGP
Incl.inSGP(#)
IncludedPart.Rate
% at EachLevel
Trans.CPI
Trans.SGP
Incl.inSGP(#)# % L5L4L3L2L1 # % L5L4L3L2L1 # % L5L4L3L2L1
SubgroupsHigh needs 32 100 0 22252528 62.5 -- -- 52 100 0 33252319 71.6 -- -- - - - - - - - - - -Econ. disadvantaged 14 100 0 29362114 73.2 -- -- 27 100 0 483015 7 83.3 -- -- - - - - - - - - - -ELL/Formerly ELL 7 -- -- 8 -- -- - - - - - - - - - -Students w/disablities 18 100 0 22171744 55.6 -- -- 27 100 0 22192633 62.0 -- -- - - - - - - - - - -Afr. Amer./Black 2 -- -- 2 -- -- - - - - - - - - - -Asian 3 -- -- 3 -- -- - - - - - - - - - -Hispanic/Latino 5 -- -- 9 -- -- - - - - - - - - - -Multi-race, Non-Hisp./Lat. 4 -- -- 6 -- -- - - - - - - - - - -White 76 100 4 5918 7 12 84.2 -- -- 140 100 3 6121 7 7 88.2 -- -- - - - - - - - - - -Male 56 100 2 4825 9 16 79.5 -- -- 95 100 1 5525 8 11 84.7 -- -- - - - - - - - - - -Female 34 100 6 711212 0 91.9 -- -- 65 100 5 6917 9 0 93.5 -- -- - - - - - - - - - -Title I 30 100 0 37272313 75.0 -- -- 30 100 0 37272313 75.0 -- -- - - - - - - - - - -Non-Disabled 72 100 4 6521 8 1 91.3 -- -- 133 100 3 6823 5 1 93.6 -- -- - - - - - - - - - -Non-Econ. disadvantaged 76 100 4 6217 8 9 86.2 -- -- 133 100 3 6320 8 6 89.3 -- -- - - - - - - - - - -ELL 7 -- -- 8 -- -- - - - - - - - - - -Ever ELL 7 -- -- 8 -- -- - - - - - - - - - -All Students2016 90 100 3 57201010 84.2 -- -- 160 100 3 6122 9 6 88.3 -- -- - - - - - - - - - -
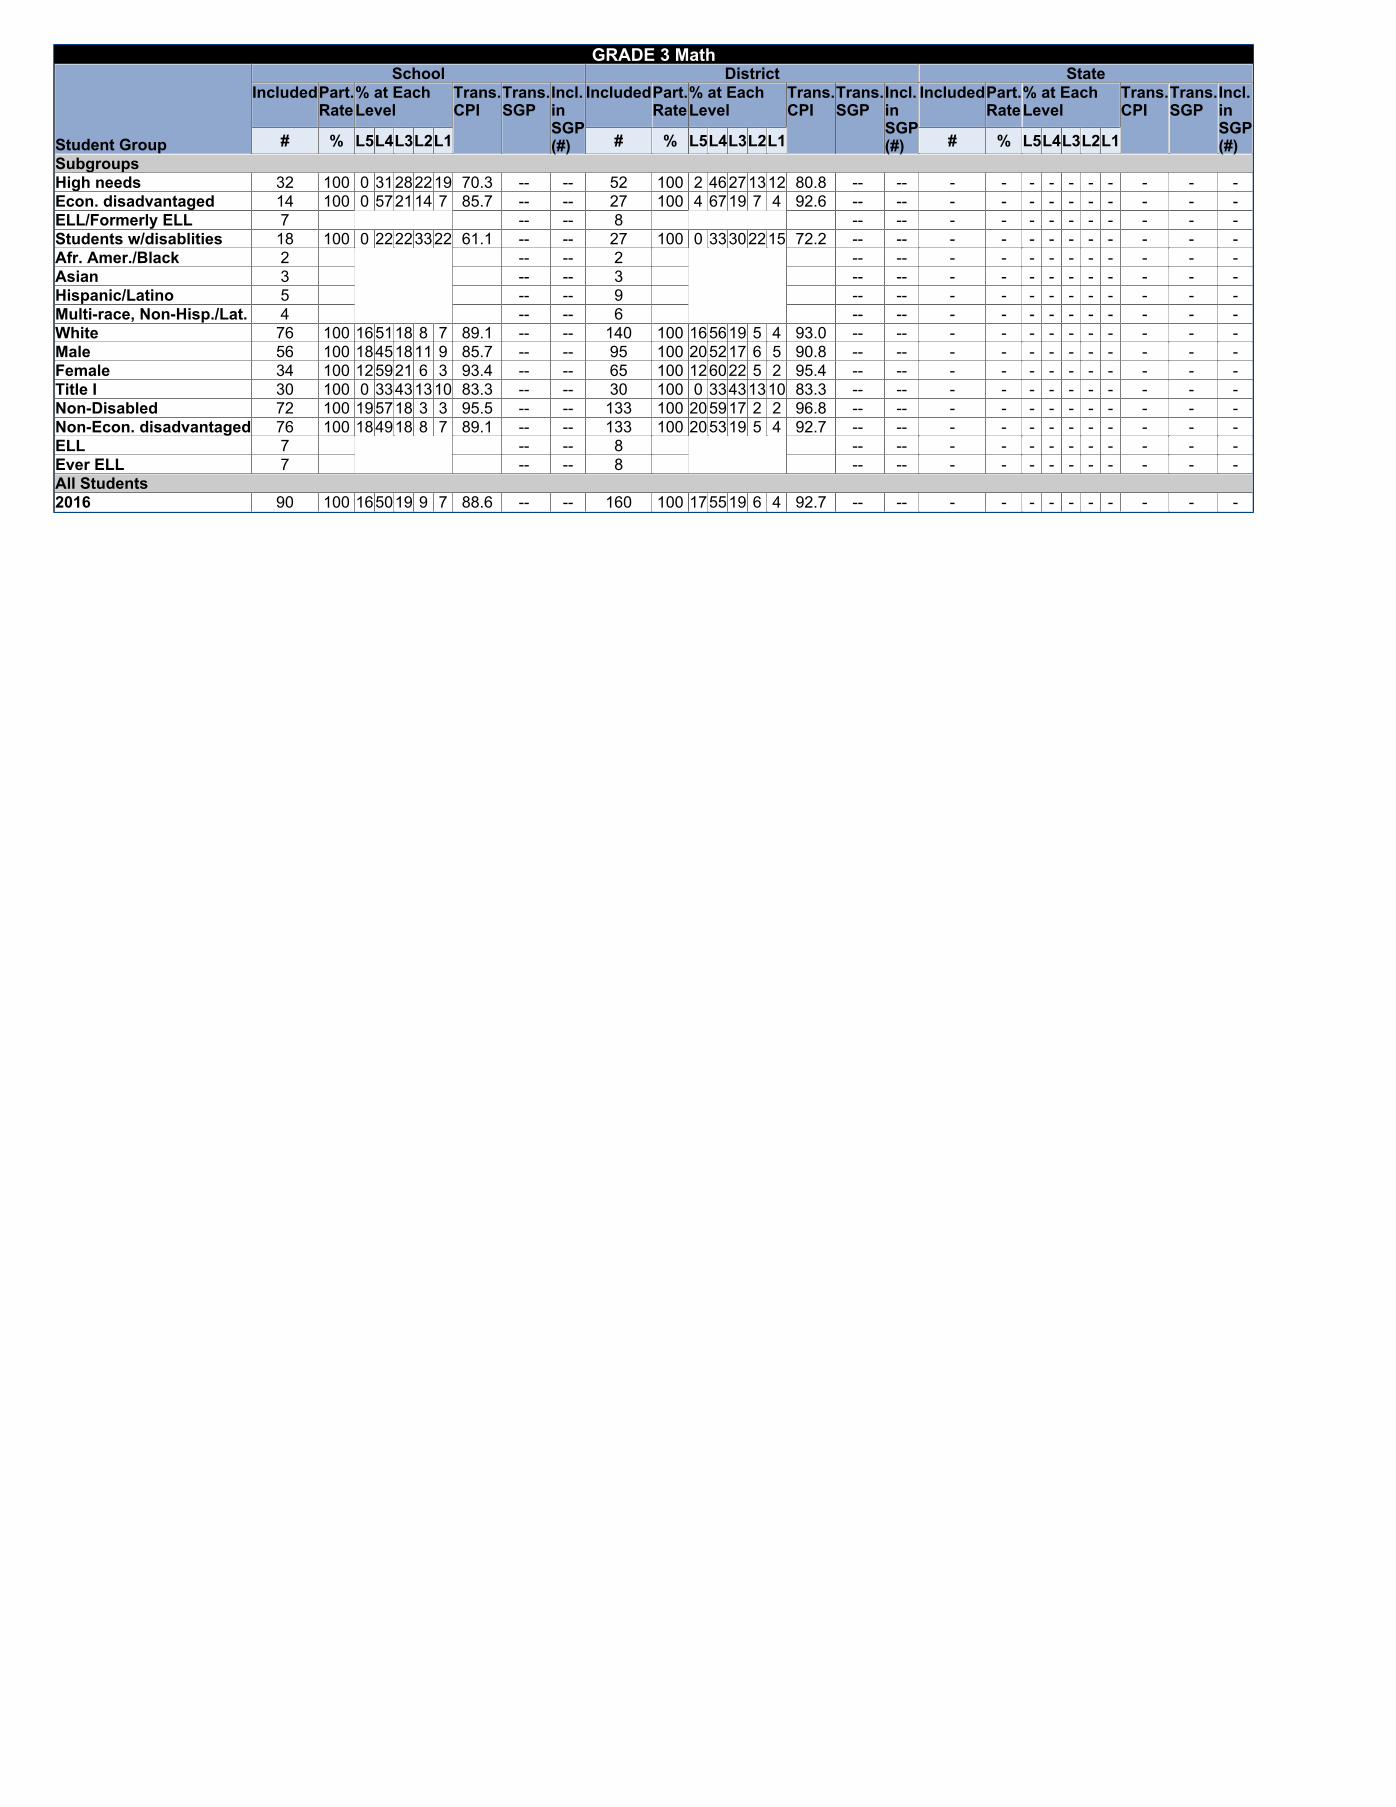
GRADE 3 Math
Student Group
School District StateIncludedPart.
Rate% at EachLevel
Trans.CPI
Trans.SGP
Incl.inSGP(#)
IncludedPart.Rate
% at EachLevel
Trans.CPI
Trans.SGP
Incl.inSGP(#)
IncludedPart.Rate
% at EachLevel
Trans.CPI
Trans.SGP
Incl.inSGP(#)# % L5L4L3L2L1 # % L5L4L3L2L1 # % L5L4L3L2L1
SubgroupsHigh needs 32 100 0 31282219 70.3 -- -- 52 100 2 46271312 80.8 -- -- - - - - - - - - - -Econ. disadvantaged 14 100 0 572114 7 85.7 -- -- 27 100 4 6719 7 4 92.6 -- -- - - - - - - - - - -ELL/Formerly ELL 7 -- -- 8 -- -- - - - - - - - - - -Students w/disablities 18 100 0 22223322 61.1 -- -- 27 100 0 33302215 72.2 -- -- - - - - - - - - - -Afr. Amer./Black 2 -- -- 2 -- -- - - - - - - - - - -Asian 3 -- -- 3 -- -- - - - - - - - - - -Hispanic/Latino 5 -- -- 9 -- -- - - - - - - - - - -Multi-race, Non-Hisp./Lat. 4 -- -- 6 -- -- - - - - - - - - - -White 76 100 165118 8 7 89.1 -- -- 140 100 165619 5 4 93.0 -- -- - - - - - - - - - -Male 56 100 18451811 9 85.7 -- -- 95 100 205217 6 5 90.8 -- -- - - - - - - - - - -Female 34 100 125921 6 3 93.4 -- -- 65 100 126022 5 2 95.4 -- -- - - - - - - - - - -Title I 30 100 0 33431310 83.3 -- -- 30 100 0 33431310 83.3 -- -- - - - - - - - - - -Non-Disabled 72 100 195718 3 3 95.5 -- -- 133 100 205917 2 2 96.8 -- -- - - - - - - - - - -Non-Econ. disadvantaged 76 100 184918 8 7 89.1 -- -- 133 100 205319 5 4 92.7 -- -- - - - - - - - - - -ELL 7 -- -- 8 -- -- - - - - - - - - - -Ever ELL 7 -- -- 8 -- -- - - - - - - - - - -All Students2016 90 100 165019 9 7 88.6 -- -- 160 100 175519 6 4 92.7 -- -- - - - - - - - - - -

GRADE 4 ELA/L
Student Group
School District StateIncludedPart.
Rate% at EachLevel
Trans.CPI
Trans.SGP
Incl.inSGP(#)
IncludedPart.Rate
% at EachLevel
Trans.CPI
Trans.SGP
Incl.inSGP(#)
IncludedPart.Rate
% at EachLevel
Trans.CPI
Trans.SGP
Incl.inSGP(#)# % L5L4L3L2L1 # % L5L4L3L2L1 # % L5L4L3L2L1
SubgroupsHigh needs 38 100 3 26371816 59.2 33.0 35 62 100 3 32371611 64.1 37.0 51 - - - - - - - - - -Econ. disadvantaged 22 100 0 4141 9 9 70.5 38.0 21 30 100 3 4043 7 7 71.8 42.0 26 - - - - - - - - - -ELL/Formerly ELL 6 -- 5 10 100 0 30402010 62.5 -- 6 - - - - - - - - - -Students w/disablities 19 100 5 5 372626 43.4 -- 18 36 100 3 17422217 53.3 33.0 30 - - - - - - - - - -Afr. Amer./Black 1 -- 1 2 -- 2 - - - - - - - - - -Asian 3 -- 3 6 -- 4 - - - - - - - - - -Hispanic/Latino 6 -- 5 9 -- 8 - - - - - - - - - -Multi-race, Non-Hisp./Lat. 1 -- 1 3 -- 3 - - - - - - - - - -White 70 100 144723 9 7 78.9 49.0 66 129 99 155122 7 5 81.5 54.0 117 - - - - - - - - - -Male 43 100 9 4028 9 14 70.9 34.0 38 75 100 114031 9 9 74.0 46.0 66 - - - - - - - - - -Female 38 100 185321 8 0 86.8 64.0 38 74 99 186216 4 0 89.5 65.0 68 - - - - - - - - - -Title I 13 100 0 314623 0 67.3 -- 12 13 100 0 314623 0 67.3 -- 12 - - - - - - - - - -Non-Disabled 62 100 165821 3 2 89.1 57.0 58 113 99 186218 2 1 91.2 59.0 104 - - - - - - - - - -Non-Econ. disadvantaged 59 100 194719 8 7 81.4 55.0 55 119 99 175418 7 4 84.2 58.0 108 - - - - - - - - - -ELL 6 -- 5 8 -- 5 - - - - - - - - - -Ever ELL 6 -- 5 10 100 0 30402010 62.5 -- 6 - - - - - - - - - -All Students2016 81 100 144625 9 7 78.4 53.0 76 149 99 145123 7 5 81.6 55.0 134 - - - - - - - - - -

GRADE 4 Math
Student Group
School District StateIncludedPart.
Rate% at EachLevel
Trans.CPI
Trans.SGP
Incl.inSGP(#)
IncludedPart.Rate
% at EachLevel
Trans.CPI
Trans.SGP
Incl.inSGP(#)
IncludedPart.Rate
% at EachLevel
Trans.CPI
Trans.SGP
Incl.inSGP(#)# % L5L4L3L2L1 # % L5L4L3L2L1 # % L5L4L3L2L1
SubgroupsHigh needs 38 100 3 29322116 69.1 33.0 35 62 100 2 40291910 75.0 49.0 51 - - - - - - - - - -Econ. disadvantaged 22 100 5 413614 5 79.5 36.0 21 30 100 3 473017 3 81.5 46.0 26 - - - - - - - - - -ELL/Formerly ELL 6 -- 5 10 100 0 303040 0 72.5 -- 6 - - - - - - - - - -Students w/disablities 19 100 0 11263232 53.9 -- 18 36 100 0 31252817 67.1 46.0 30 - - - - - - - - - -Afr. Amer./Black 1 -- 1 2 -- 2 - - - - - - - - - -Asian 3 -- 3 6 -- 4 - - - - - - - - - -Hispanic/Latino 6 -- 5 9 -- 8 - - - - - - - - - -Multi-race, Non-Hisp./Lat. 1 -- 1 3 -- 3 - - - - - - - - - -White 69 100 104923 9 9 82.6 54.0 65 128 99 106017 8 5 87.4 59.0 116 - - - - - - - - - -Male 43 100 7 47211412 79.1 36.0 38 75 100 7 562011 7 84.4 51.0 66 - - - - - - - - - -Female 37 100 115427 5 3 87.2 63.0 37 73 99 116715 5 1 91.8 66.0 67 - - - - - - - - - -Title I 12 100 0 175033 0 70.8 -- 11 12 100 0 175033 0 70.8 -- 11 - - - - - - - - - -Non-Disabled 61 100 116223 3 0 91.8 54.0 57 112 99 127115 2 0 95.1 63.0 103 - - - - - - - - - -Non-Econ. disadvantaged 58 100 105319 9 9 84.1 52.0 54 118 99 106514 6 4 89.7 62.0 107 - - - - - - - - - -ELL 6 -- 5 8 -- 5 - - - - - - - - - -Ever ELL 6 -- 5 10 100 0 303040 0 72.5 -- 6 - - - - - - - - - -All Students2016 80 100 9 502410 8 82.8 49.0 75 148 99 9 6118 8 4 88.0 58.0 133 - - - - - - - - - -
GRADE 5 ELA/L
Student Group
School District StateIncludedPart.
Rate% at EachLevel
Trans.CPI
Trans.SGP
Incl.inSGP(#)
IncludedPart.Rate
% at EachLevel
Trans.CPI
Trans.SGP
Incl.inSGP(#)
IncludedPart.Rate
% at EachLevel
Trans.CPI
Trans.SGP
Incl.inSGP(#)# % L5L4L3L2L1 # % L5L4L3L2L1 # % L5L4L3L2L1
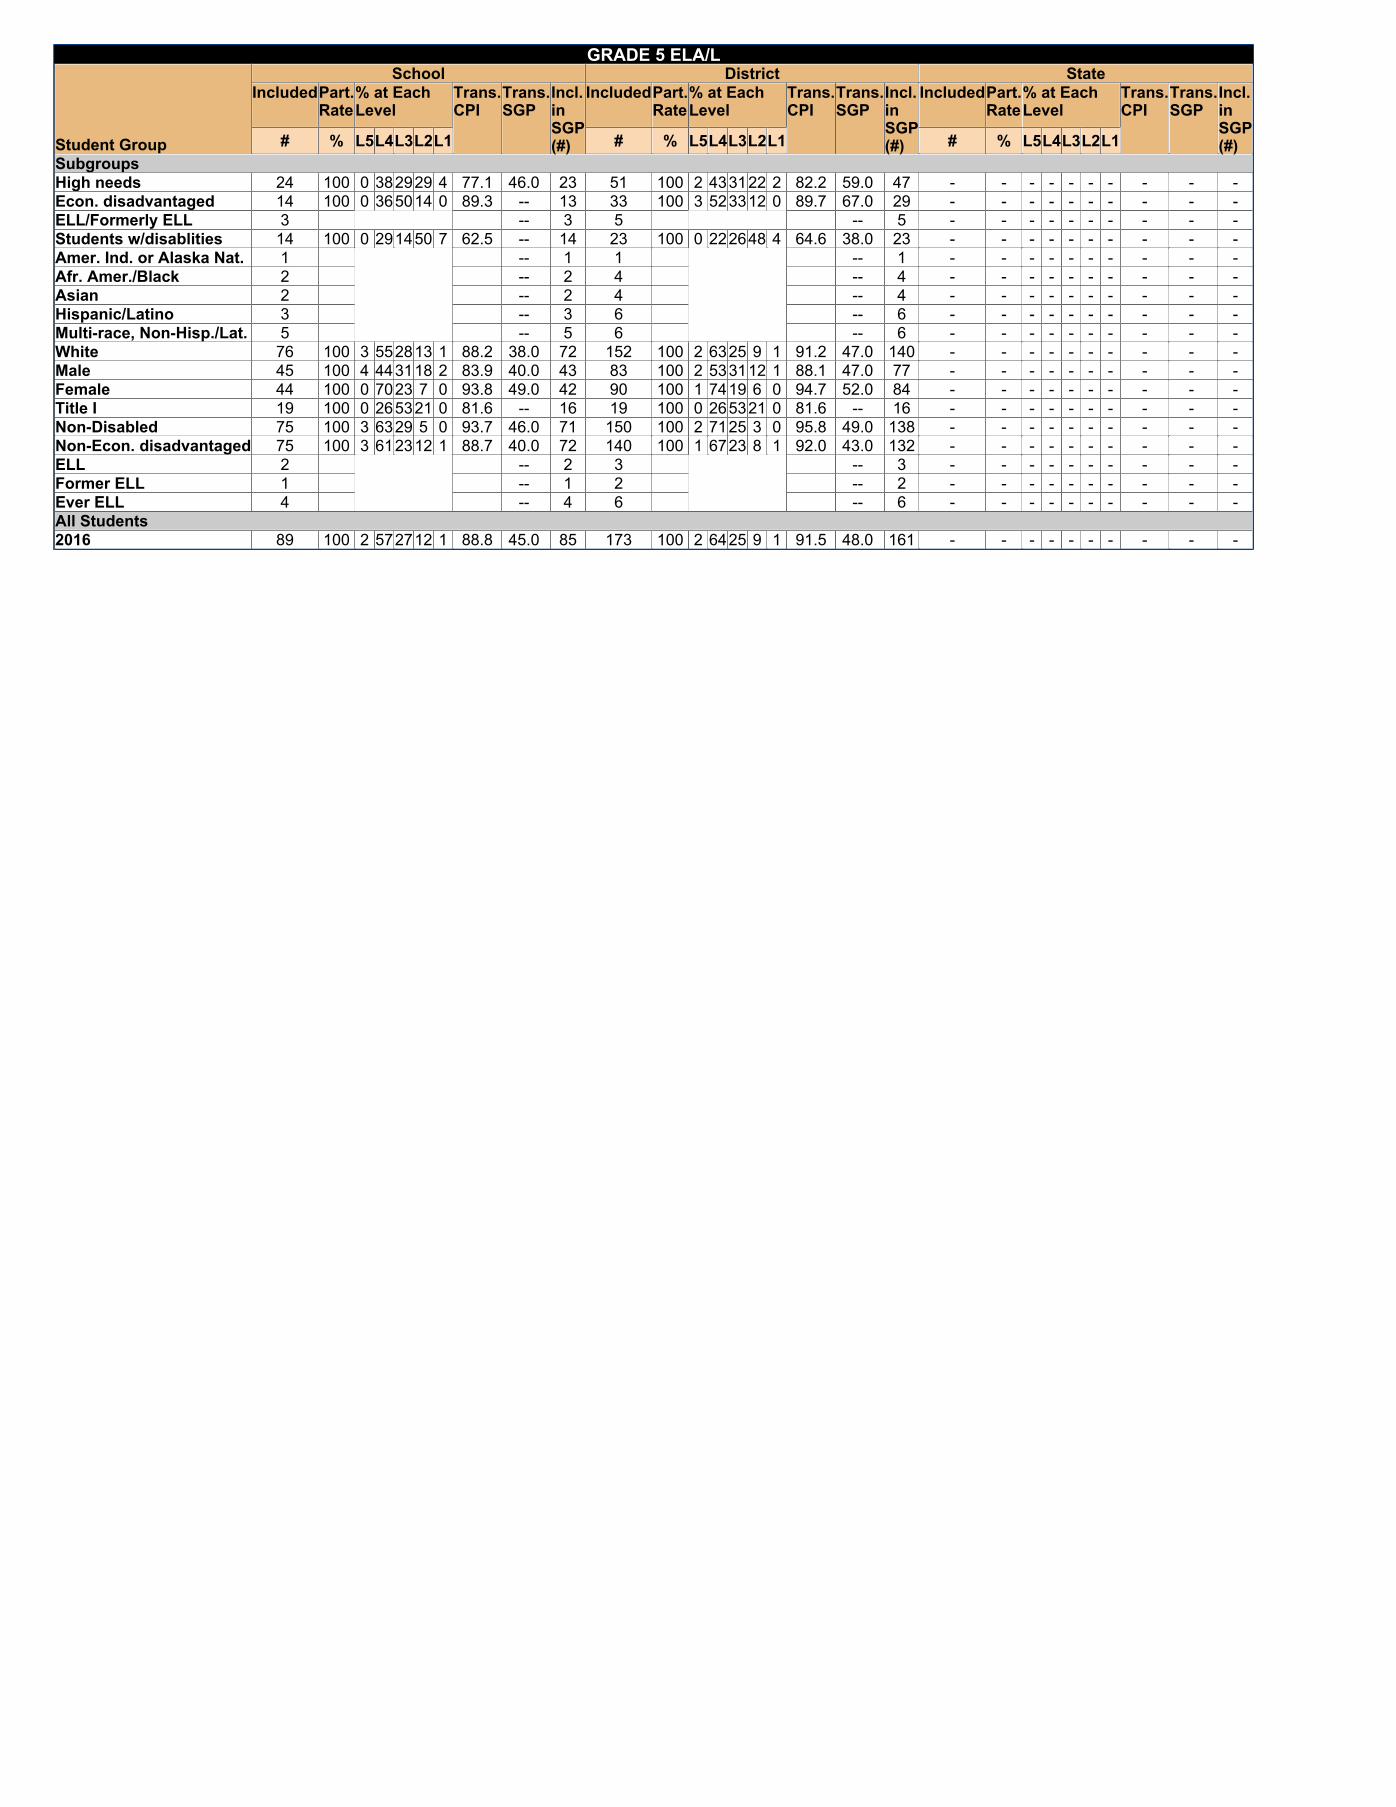
SubgroupsHigh needs 24 100 0 382929 4 77.1 46.0 23 51 100 2 433122 2 82.2 59.0 47 - - - - - - - - - -Econ. disadvantaged 14 100 0 365014 0 89.3 -- 13 33 100 3 523312 0 89.7 67.0 29 - - - - - - - - - -ELL/Formerly ELL 3 -- 3 5 -- 5 - - - - - - - - - -Students w/disablities 14 100 0 291450 7 62.5 -- 14 23 100 0 222648 4 64.6 38.0 23 - - - - - - - - - -Amer. Ind. or Alaska Nat. 1 -- 1 1 -- 1 - - - - - - - - - -Afr. Amer./Black 2 -- 2 4 -- 4 - - - - - - - - - -Asian 2 -- 2 4 -- 4 - - - - - - - - - -Hispanic/Latino 3 -- 3 6 -- 6 - - - - - - - - - -Multi-race, Non-Hisp./Lat. 5 -- 5 6 -- 6 - - - - - - - - - -White 76 100 3 552813 1 88.2 38.0 72 152 100 2 6325 9 1 91.2 47.0 140 - - - - - - - - - -Male 45 100 4 443118 2 83.9 40.0 43 83 100 2 533112 1 88.1 47.0 77 - - - - - - - - - -Female 44 100 0 7023 7 0 93.8 49.0 42 90 100 1 7419 6 0 94.7 52.0 84 - - - - - - - - - -Title I 19 100 0 265321 0 81.6 -- 16 19 100 0 265321 0 81.6 -- 16 - - - - - - - - - -Non-Disabled 75 100 3 6329 5 0 93.7 46.0 71 150 100 2 7125 3 0 95.8 49.0 138 - - - - - - - - - -Non-Econ. disadvantaged 75 100 3 612312 1 88.7 40.0 72 140 100 1 6723 8 1 92.0 43.0 132 - - - - - - - - - -ELL 2 -- 2 3 -- 3 - - - - - - - - - -Former ELL 1 -- 1 2 -- 2 - - - - - - - - - -Ever ELL 4 -- 4 6 -- 6 - - - - - - - - - -All Students2016 89 100 2 572712 1 88.8 45.0 85 173 100 2 6425 9 1 91.5 48.0 161 - - - - - - - - - -

GRADE 5 Math
Student Group
School District StateIncludedPart.
Rate% at EachLevel
Trans.CPI
Trans.SGP
Incl.inSGP(#)
IncludedPart.Rate
% at EachLevel
Trans.CPI
Trans.SGP
Incl.inSGP(#)
IncludedPart.Rate
% at EachLevel
Trans.CPI
Trans.SGP
Incl.inSGP(#)# % L5L4L3L2L1 # % L5L4L3L2L1 # % L5L4L3L2L1
SubgroupsHigh needs 24 100 4 423317 4 84.4 68.0 23 51 100 4 432920 4 81.3 61.0 47 - - - - - - - - - -Econ. disadvantaged 14 100 7 5729 7 0 92.9 -- 13 33 100 6 5530 9 0 91.9 67.0 29 - - - - - - - - - -ELL/Formerly ELL 3 -- 3 5 -- 5 - - - - - - - - - -Students w/disablities 14 100 0 362929 7 76.8 -- 14 23 100 0 262243 9 63.5 55.0 23 - - - - - - - - - -Amer. Ind. or Alaska Nat. 1 -- 1 1 -- 1 - - - - - - - - - -Afr. Amer./Black 2 -- 2 4 -- 4 - - - - - - - - - -Asian 2 -- 2 4 -- 4 - - - - - - - - - -Hispanic/Latino 3 -- 3 6 -- 6 - - - - - - - - - -Multi-race, Non-Hisp./Lat. 5 -- 5 6 -- 6 - - - - - - - - - -White 76 100 7 5926 7 1 92.4 55.0 72 152 100 8 6122 8 1 91.8 54.0 140 - - - - - - - - - -Male 45 100 7 5333 7 0 92.2 45.0 43 83 100 8 542810 0 91.4 49.0 77 - - - - - - - - - -Female 44 100 7 6123 7 2 93.2 67.0 42 90 100 7 6719 6 2 93.3 58.0 84 - - - - - - - - - -Title I 19 100 0 216811 0 86.8 -- 16 19 100 0 216811 0 86.8 -- 16 - - - - - - - - - -Non-Disabled 75 100 8 6128 3 0 95.7 55.0 71 150 100 9 6623 2 0 97.0 55.0 138 - - - - - - - - - -Non-Econ. disadvantaged 75 100 7 5728 7 1 92.7 53.0 72 140 100 8 6221 7 1 92.5 50.0 132 - - - - - - - - - -ELL 2 -- 2 3 -- 3 - - - - - - - - - -Former ELL 1 -- 1 2 -- 2 - - - - - - - - - -Ever ELL 4 -- 4 6 -- 6 - - - - - - - - - -All Students2016 89 100 7 5728 7 1 92.7 55.0 85 173 100 8 6123 8 1 92.4 55.0 161 - - - - - - - - - -

GRADES 3-8 ELA/L
Student Group
School District StateIncludedPart.
Rate% at EachLevel
Trans.CPI
Trans.SGP
Incl.inSGP(#)
IncludedPart.Rate
% at EachLevel
Trans.CPI
Trans.SGP
Incl.inSGP(#)
IncludedPart.Rate
% at EachLevel
Trans.CPI
Trans.SGP
Incl.inSGP(#)# % L5L4L3L2L1 # % L5L4L3L2L1 # % L5L4L3L2L1
SubgroupsHigh needs 94 100 1 28312317 64.9 38.0 58 323 99 4 40272010 77.1 46.0 241 - - - - - - - - - -Econ. disadvantaged 50 100 0 364214 8 76.5 46.0 34 170 98 5 502515 5 83.9 46.0 127 - - - - - - - - - -ELL/Formerly ELL 16 100 0 6 314419 54.7 -- 8 30 100 0 23333013 66.9 -- 15 - - - - - - - - - -Students w/disablities 51 100 2 18242927 52.9 24.0 32 188 99 3 24292915 67.4 45.0 144 - - - - - - - - - -Amer. Ind. or Alaska Nat. 1 -- 1 1 -- 1 - - - - - - - - - -Afr. Amer./Black 5 -- 3 13 93 0 6238 0 0 94.2 -- 11 - - - - - - - - - -Asian 8 -- 5 27 100 115919 4 7 87.5 -- 19 - - - - - - - - - -Hispanic/Latino 14 100 7 362929 0 80.4 -- 8 50 98 8 482614 4 87.3 47.0 36 - - - - - - - - - -Multi-race, Non-Hisp./Lat. 10 100 0 801010 0 92.5 -- 6 25 100 126812 4 4 93.0 -- 17 - - - - - - - - - -White 222 100 7 5423 9 7 83.9 42.0 138 885 100 165618 7 3 90.7 54.0 695 - - - - - - - - - -Male 144 100 5 44281211 78.3 35.0 81 510 100 105323 9 5 87.2 48.0 380 - - - - - - - - - -Female 116 100 8 6519 9 0 90.9 55.0 80 491 99 205915 5 1 94.1 57.0 399 - - - - - - - - - -Title I 62 100 0 323923 6 75.4 50.0 28 168 98 2 393517 7 80.4 54.0 130 - - - - - - - - - -Non-Disabled 209 100 7 6224 6 1 91.5 53.0 129 813 100 186317 2 0 96.2 55.0 635 - - - - - - - - - -Non-Econ. disadvantaged 210 100 8 582010 6 85.7 46.0 127 831 100 175718 6 3 91.9 55.0 652 - - - - - - - - - -ELL 15 100 0 0 334720 51.7 -- 7 22 100 0 18323614 64.1 -- 10 - - - - - - - - - -Former ELL 1 -- 1 8 -- 5 - - - - - - - - - -Ever ELL 17 100 0 12294118 57.4 -- 9 36 100 0 31312514 70.9 55.0 21 - - - - - - - - - -All Students2016 260 100 6 532410 6 83.9 46.0 161 1,001 99 155619 7 3 90.5 54.0 779 - - - - - - - - - -2015 241 100 9 4927 9 6 83.3 36.0 155 978 99 165121 8 3 89.1 43.0 791 - - - - - - - - - -

GRADES 3-8 MATH
Student Group
School District StateIncludedPart.
Rate% at EachLevel
Trans.CPI
Trans.SGP
Incl.inSGP(#)
IncludedPart.Rate
% at EachLevel
Trans.CPI
Trans.SGP
Incl.inSGP(#)
IncludedPart.Rate
% at EachLevel
Trans.CPI
Trans.SGP
Incl.inSGP(#)# % L5L4L3L2L1 # % L5L4L3L2L1 # % L5L4L3L2L1
SubgroupsHigh needs 94 100 2 33312014 73.4 49.0 58 322 99 1 38292210 73.6 48.0 239 - - - - - - - - - -Econ. disadvantaged 50 100 4 503012 4 85.0 57.0 34 169 98 2 492914 5 83.0 55.0 126 - - - - - - - - - -ELL/Formerly ELL 16 100 0 13383813 64.1 -- 8 30 100 0 20303317 62.1 -- 15 - - - - - - - - - -Students w/disablities 51 100 0 22253122 62.7 43.0 32 188 99 0 24253515 61.8 43.0 143 - - - - - - - - - -Amer. Ind. or Alaska Nat. 1 -- 1 1 -- 1 - - - - - - - - - -Afr. Amer./Black 5 -- 3 13 93 0 543115 0 92.3 -- 11 - - - - - - - - - -Asian 8 -- 5 27 100 155622 4 4 91.1 -- 19 - - - - - - - - - -Hispanic/Latino 14 100 7 432921 0 83.9 -- 8 49 96 2 512712 8 80.0 43.0 35 - - - - - - - - - -Multi-race, Non-Hisp./Lat. 10 100 10503010 0 95.0 -- 6 24 96 175817 8 0 93.8 -- 16 - - - - - - - - - -White 221 100 115323 8 5 88.2 55.0 137 883 99 9 5822 8 3 88.5 50.0 692 - - - - - - - - - -Male 144 100 11482410 7 85.8 42.0 81 510 100 9 552310 4 86.9 47.0 380 - - - - - - - - - -Female 115 100 105823 6 3 91.3 63.0 79 487 99 8 6022 8 2 89.8 56.0 394 - - - - - - - - - -Title I 61 100 0 265216 5 82.0 49.0 27 167 98 0 234626 6 70.8 49.0 128 - - - - - - - - - -Non-Disabled 208 100 136023 3 1 94.5 55.0 128 809 99 116522 2 0 94.9 53.0 631 - - - - - - - - - -Non-Econ. disadvantaged 209 100 125322 8 5 89.0 53.0 126 828 99 105921 7 3 89.4 50.0 648 - - - - - - - - - -ELL 15 100 0 7 404013 61.7 -- 7 22 100 0 9 413614 63.0 -- 10 - - - - - - - - - -Former ELL 1 -- 1 8 -- 5 - - - - - - - - - -Ever ELL 17 100 6 12353512 66.2 -- 9 36 100 3 22312817 65.5 43.0 21 - - - - - - - - - -All Students2016 259 100 105324 8 5 88.2 54.0 160 997 99 9 5722 9 3 88.3 51.0 774 - - - - - - - - - -2015 240 100 6 5230 9 3 87.2 46.0 155 976 99 6 5627 9 2 86.9 47.0 791 - - - - - - - - - -

2016 Accountability Data - George R Martin
Accountability InformationAccountability and Assistance Level
Level 1 2016 Level held harmless
This school's overall performance relative to other schools in same school type (School percentiles: 1-99)Allstudents:
62Lowestperforming
Highestperforming
This school’s progress toward narrowing proficiency gaps (Cumulative Progress and Performance Index: 1-100)Student Group
(Click group to viewsubgroup data)
On Target = 75 or higher -Less progress More progress
All students 73 Did Not Meet TargetHigh needs 75 Met Target
Econ. Disadvantaged -ELL and Former ELL -Students w/disabilities 41 Did Not Meet TargetAmer. Ind. or Alaska Nat. -Asian -Afr. Amer./Black -Hispanic/Latino -Multi-race, Non-Hisp./Lat. -Nat. Haw. or Pacif. Isl. -White 71 Did Not Meet Target
George R Martin:Accountability Data Detail
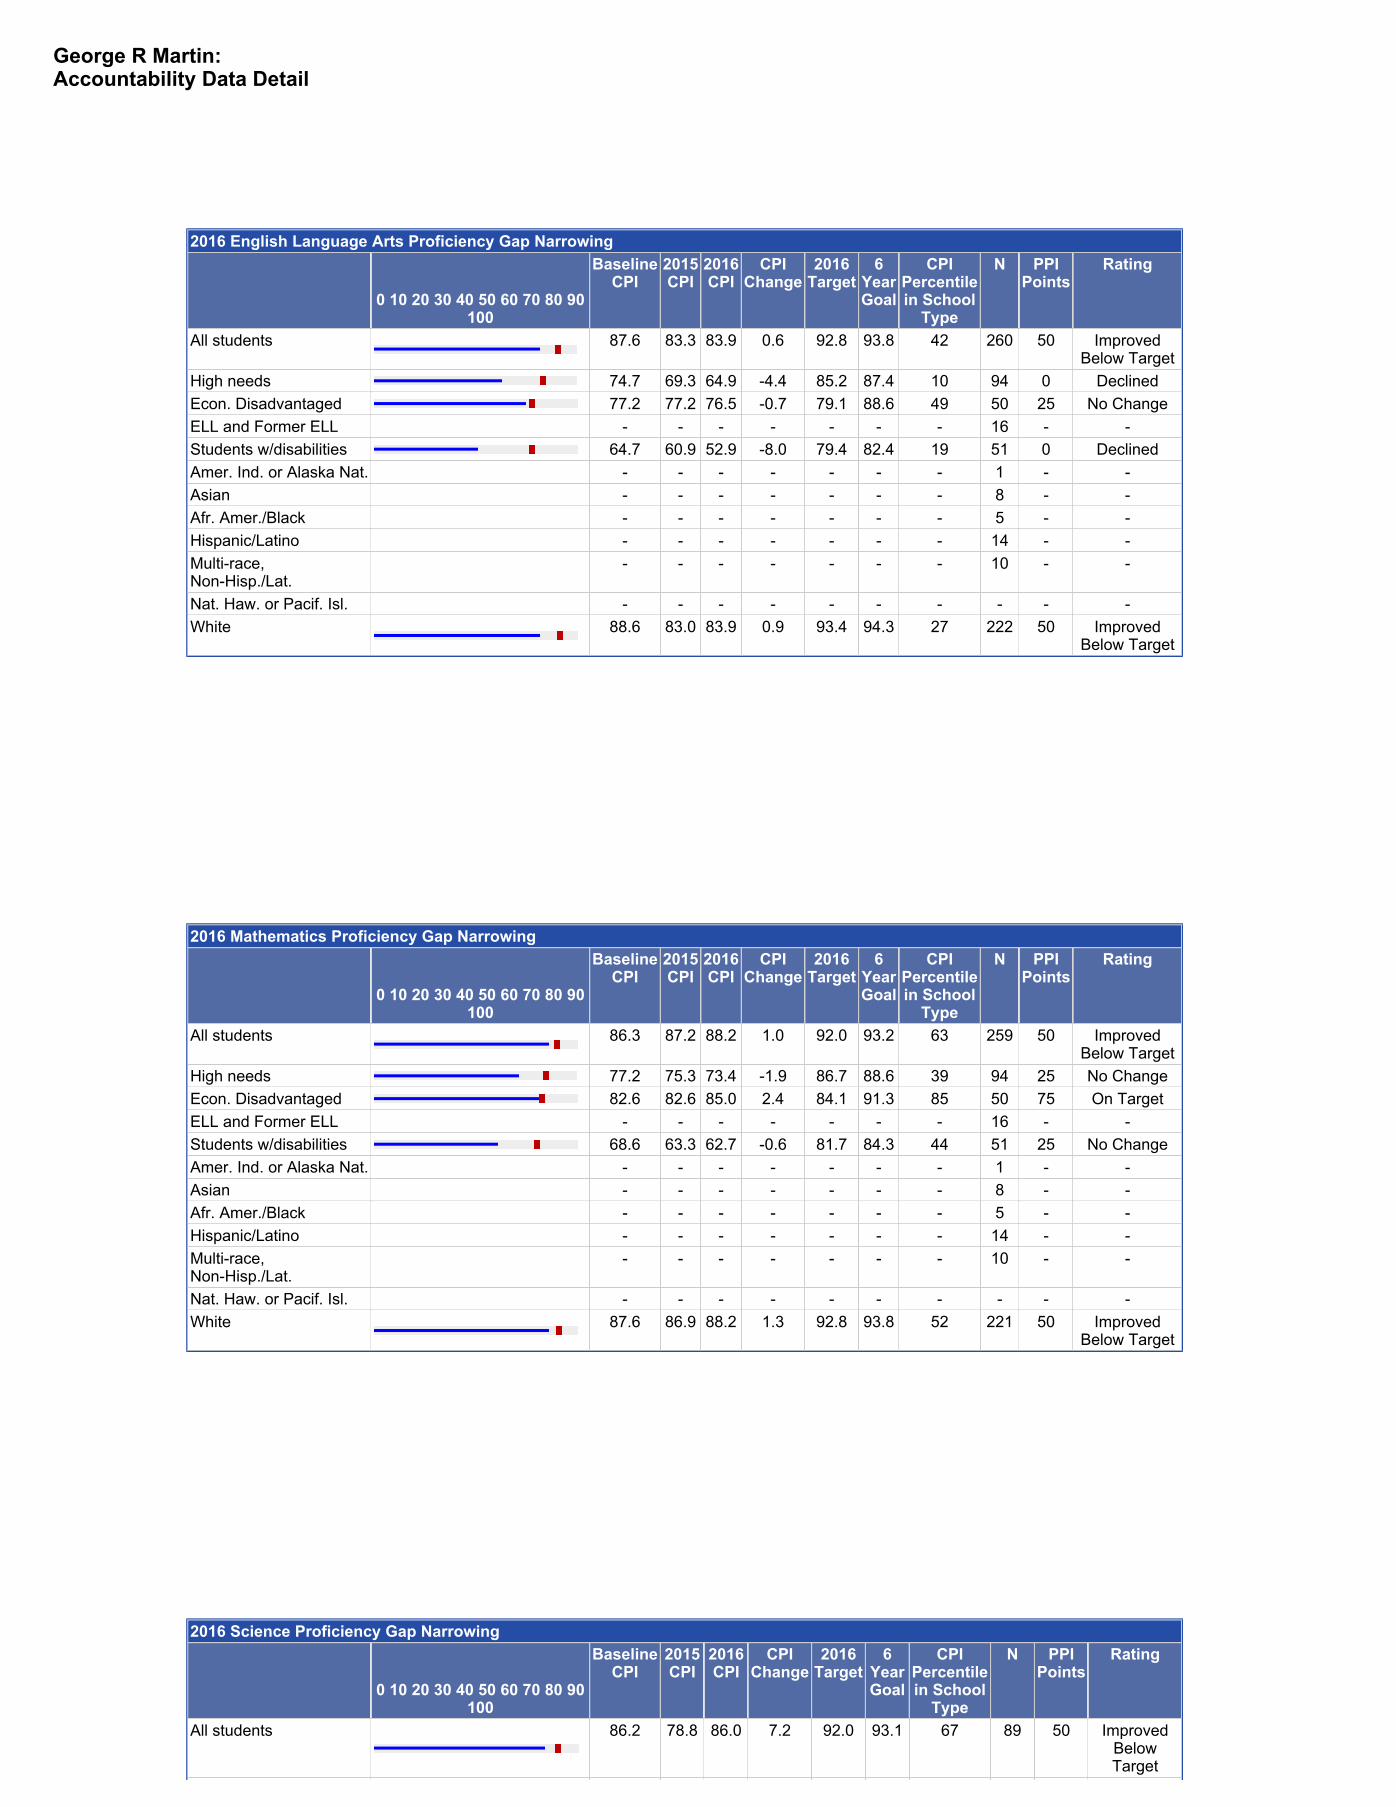
2016 English Language Arts Proficiency Gap Narrowing
0 10 20 30 40 50 60 70 80 90100
BaselineCPI
2015CPI
2016CPI
CPIChange
2016Target
6YearGoal
CPIPercentilein School
Type
N PPIPoints
Rating
All students 87.6 83.3 83.9 0.6 92.8 93.8 42 260 50 ImprovedBelow Target
High needs 74.7 69.3 64.9 -4.4 85.2 87.4 10 94 0 DeclinedEcon. Disadvantaged 77.2 77.2 76.5 -0.7 79.1 88.6 49 50 25 No ChangeELL and Former ELL - - - - - - - 16 - -Students w/disabilities 64.7 60.9 52.9 -8.0 79.4 82.4 19 51 0 DeclinedAmer. Ind. or Alaska Nat. - - - - - - - 1 - -Asian - - - - - - - 8 - -Afr. Amer./Black - - - - - - - 5 - -Hispanic/Latino - - - - - - - 14 - -Multi-race,Non-Hisp./Lat.
- - - - - - - 10 - -
Nat. Haw. or Pacif. Isl. - - - - - - - - - -White 88.6 83.0 83.9 0.9 93.4 94.3 27 222 50 Improved
Below Target
2016 Mathematics Proficiency Gap Narrowing
0 10 20 30 40 50 60 70 80 90100
BaselineCPI
2015CPI
2016CPI
CPIChange
2016Target
6YearGoal
CPIPercentilein School
Type
N PPIPoints
Rating
All students 86.3 87.2 88.2 1.0 92.0 93.2 63 259 50 ImprovedBelow Target
High needs 77.2 75.3 73.4 -1.9 86.7 88.6 39 94 25 No ChangeEcon. Disadvantaged 82.6 82.6 85.0 2.4 84.1 91.3 85 50 75 On TargetELL and Former ELL - - - - - - - 16 - -Students w/disabilities 68.6 63.3 62.7 -0.6 81.7 84.3 44 51 25 No ChangeAmer. Ind. or Alaska Nat. - - - - - - - 1 - -Asian - - - - - - - 8 - -Afr. Amer./Black - - - - - - - 5 - -Hispanic/Latino - - - - - - - 14 - -Multi-race,Non-Hisp./Lat.
- - - - - - - 10 - -
Nat. Haw. or Pacif. Isl. - - - - - - - - - -White 87.6 86.9 88.2 1.3 92.8 93.8 52 221 50 Improved
Below Target
2016 Science Proficiency Gap Narrowing
0 10 20 30 40 50 60 70 80 90100
BaselineCPI
2015CPI
2016CPI
CPIChange
2016Target
6YearGoal
CPIPercentilein School
Type
N PPIPoints
Rating
All students 86.2 78.8 86.0 7.2 92.0 93.1 67 89 50 ImprovedBelowTarget

High needs 76.0 65.6 80.2 14.6 86.0 88.0 88 24 50 ImprovedBelowTarget
Econ. Disadvantaged - - - - - - - 14 - -ELL and Former ELL - - - - - - - 3 - -Students w/disabilities - - - - - - - 14 - -Amer. Ind. or Alaska Nat. - - - - - - - 1 - -Asian - - - - - - - 2 - -Afr. Amer./Black - - - - - - - 2 - -Hispanic/Latino - - - - - - - 3 - -Multi-race,Non-Hisp./Lat.
- - - - - - - 5 - -
Nat. Haw. or Pacif. Isl. - - - - - - - - - -White 86.5 79.2 86.5 7.3 92.1 93.3 57 76 50 Improved
BelowTarget
2016 English Language Arts Extra Credit Extra credit for increasing % Advanced (10% or
more)Extra credit for decreasing % Warning/Failing (10% or
more)2015
% Advanced2016
% AdvancedN PPI Points 2015
%Warning/Failing
2016%
Warning/Failing
N PPI Points
All students 10.2 7.7 260 0 7.4 8.8 260 0High needs 1.1 1.1 94 0 20.5 24.5 94 0Econ. Disadvantaged 0.0 2.0 50 25 10.9 12.0 50 0ELL and Former ELL - - 16 - - - 16 -Students w/disabilities 2.2 0.0 51 0 34.8 37.3 51 0Amer. Ind. or Alaska Nat. - - 1 - - - 1 -Asian - - 8 - - - 8 -Afr. Amer./Black - - 5 - - - 5 -Hispanic/Latino - - 14 - - - 14 -Multi-race, Non-Hisp./Lat. - - 10 - - - 10 -Nat. Haw. or Pacif. Isl. - - - - - - - -White 10.6 8.1 222 0 7.7 9.5 222 0
2016 Mathematics Extra Credit Extra credit for increasing % Advanced (10% or
more)Extra credit for decreasing % Warning/Failing (10% or
more)2015
% Advanced2016
% AdvancedN PPI Points 2015
%Warning/Failing
2016%
Warning/Failing
N PPI Points
All students 26.7 35.9 259 25 4.5 6.6 259 0High needs 12.6 10.6 94 0 11.5 18.1 94 0Econ. Disadvantaged 17.4 16.0 50 0 8.7 4.0 50 25ELL and Former ELL - - 16 - - - 16 -Students w/disabilities 8.9 3.9 51 0 17.8 29.4 51 0Amer. Ind. or Alaska Nat. - - 1 - - - 1 -Asian - - 8 - - - 8 -Afr. Amer./Black - - 5 - - - 5 -Hispanic/Latino - - 14 - - - 14 -Multi-race, Non-Hisp./Lat. - - 10 - - - 10 -Nat. Haw. or Pacif. Isl. - - - - - - - -White 26.2 38.0 221 25 4.9 7.2 221 0

2016 Science Extra Credit Extra credit for increasing % Advanced (10% or
more)Extra credit for decreasing % Warning/Failing (10% or
more)2015
% Advanced2016
% AdvancedN PPI Points 2015
%Warning/Failing
2016%
Warning/Failing
N PPI Points
All students 16.5 15.7 89 0 11.4 3.4 89 25High needs 3.1 4.2 24 25 25.0 8.3 24 25Econ. Disadvantaged - - 14 - - - 14 -ELL and Former ELL - - 3 - - - 3 -Students w/disabilities - - 14 - - - 14 -Amer. Ind. or Alaska Nat. - - 1 - - - 1 -Asian - - 2 - - - 2 -Afr. Amer./Black - - 2 - - - 2 -Hispanic/Latino - - 3 - - - 3 -Multi-race, Non-Hisp./Lat. - - 5 - - - 5 -Nat. Haw. or Pacif. Isl. - - - - - - - -White 18.2 15.8 76 0 10.6 1.3 76 25
2016 English Language Arts Growth
0 10 20 30 40 50 60 70 80 90100
2015SGP
2016SGP
SGPChange
6YearGoal
MetSafe
Harbor?
N PPIPoints
Rating
All students 36.0 46.0 10.0 51.0 Yes 161 75 On TargetHigh needs 35.0 37.5 2.5 51.0 No 58 50 Below TargetEcon. Disadvantaged 33.0 45.5 12.5 51.0 No 34 75 On TargetELL and Former ELL - - - 51.0 - 8 - -Students w/disabilities 35.0 24.0 -11.0 51.0 No 32 0 Below TargetAmer. Ind. or Alaska Nat. - - - 51.0 - 1 - -Asian - - - 51.0 - 5 - -Afr. Amer./Black - - - 51.0 - 3 - -Hispanic/Latino - - - 51.0 - 8 - -Multi-race,Non-Hisp./Lat.
- - - 51.0 - 6 - -
Nat. Haw. or Pacif. Isl. - - - 51.0 - - - -White 34.0 42.0 8.0 51.0 Yes 138 75 On Target
2016 Mathematics Growth
0 10 20 30 40 50 60 70 80 90100
2015SGP
2016SGP
SGPChange
6YearGoal
MetSafe
Harbor?
N PPIPoints
Rating
All students 46.0 53.5 7.5 51.0 Yes 160 75 On TargetHigh needs 47.0 49.0 2.0 51.0 No 58 50 Below TargetEcon. Disadvantaged 49.0 57.0 8.0 51.0 Yes 34 75 On TargetELL and Former ELL - - - 51.0 - 8 - -Students w/disabilities 34.0 42.5 8.5 51.0 Yes 32 75 On TargetAmer. Ind. or Alaska Nat. - - - 51.0 - 1 - -Asian - - - 51.0 - 5 - -Afr. Amer./Black - - - 51.0 - 3 - -

Hispanic/Latino - - - 51.0 - 8 - -Multi-race, Non-Hisp./Lat. - - - 51.0 - 6 - -Nat. Haw. or Pacif. Isl. - - - 51.0 - - - -White 40.0 55.0 15.0 51.0 Yes 137 100 Above Target
2016 Extra credit for English language proficiency growth 2016 SGPA 2016 Target SGPA N Included PPI Points
All students - 60.0 15 -High needs - 60.0 15 -ELL and Former ELL - 60.0 15 -
2016 Assessment Participation English Language Arts Mathematics Science
Enrolled Assessed % MetTarget(95%)
Enrolled Assessed % MetTarget(95%)
Enrolled Assessed % MetTarget(95%)
All students 268 268 100 Yes 267 267 100 Yes 91 91 100 YesHigh needs 99 99 100 Yes 99 99 100 Yes 25 25 100 YesEcon. Disadvantaged 54 54 100 Yes 54 54 100 Yes 15 - - -ELL and Former ELL 16 - - - 16 - - - 3 - - -Students w/disabilities 53 53 100 Yes 53 53 100 Yes 14 - - -Amer. Ind. or Alaska Nat. 1 - - - 1 - - - 1 - - -Asian 9 - - - 9 - - - 2 - - -Afr. Amer./Black 5 - - - 5 - - - 2 - - -Hispanic/Latino 14 - - - 14 - - - 3 - - -Multi-race, Non-Hisp./Lat. 10 - - - 10 - - - 5 - - -Nat. Haw. or Pacif. Isl. - - - - - - - - - - - -White 229 229 100 Yes 228 228 100 Yes 78 78 100 Yes
NOTE: In 2016, assessment participation was calculated two ways: First, the 2016 participation rate for each subgroup in each subject areatest was calculated. If the actual 2016 participation rate was lower than 95 percent for any group in any subject, that rate was compared tothe average of the most recent two years of assessment participation data for that group and subject. The higher of the two resulting rateswas factored into the assignment of the school or district's 2016 accountability and assistance level.
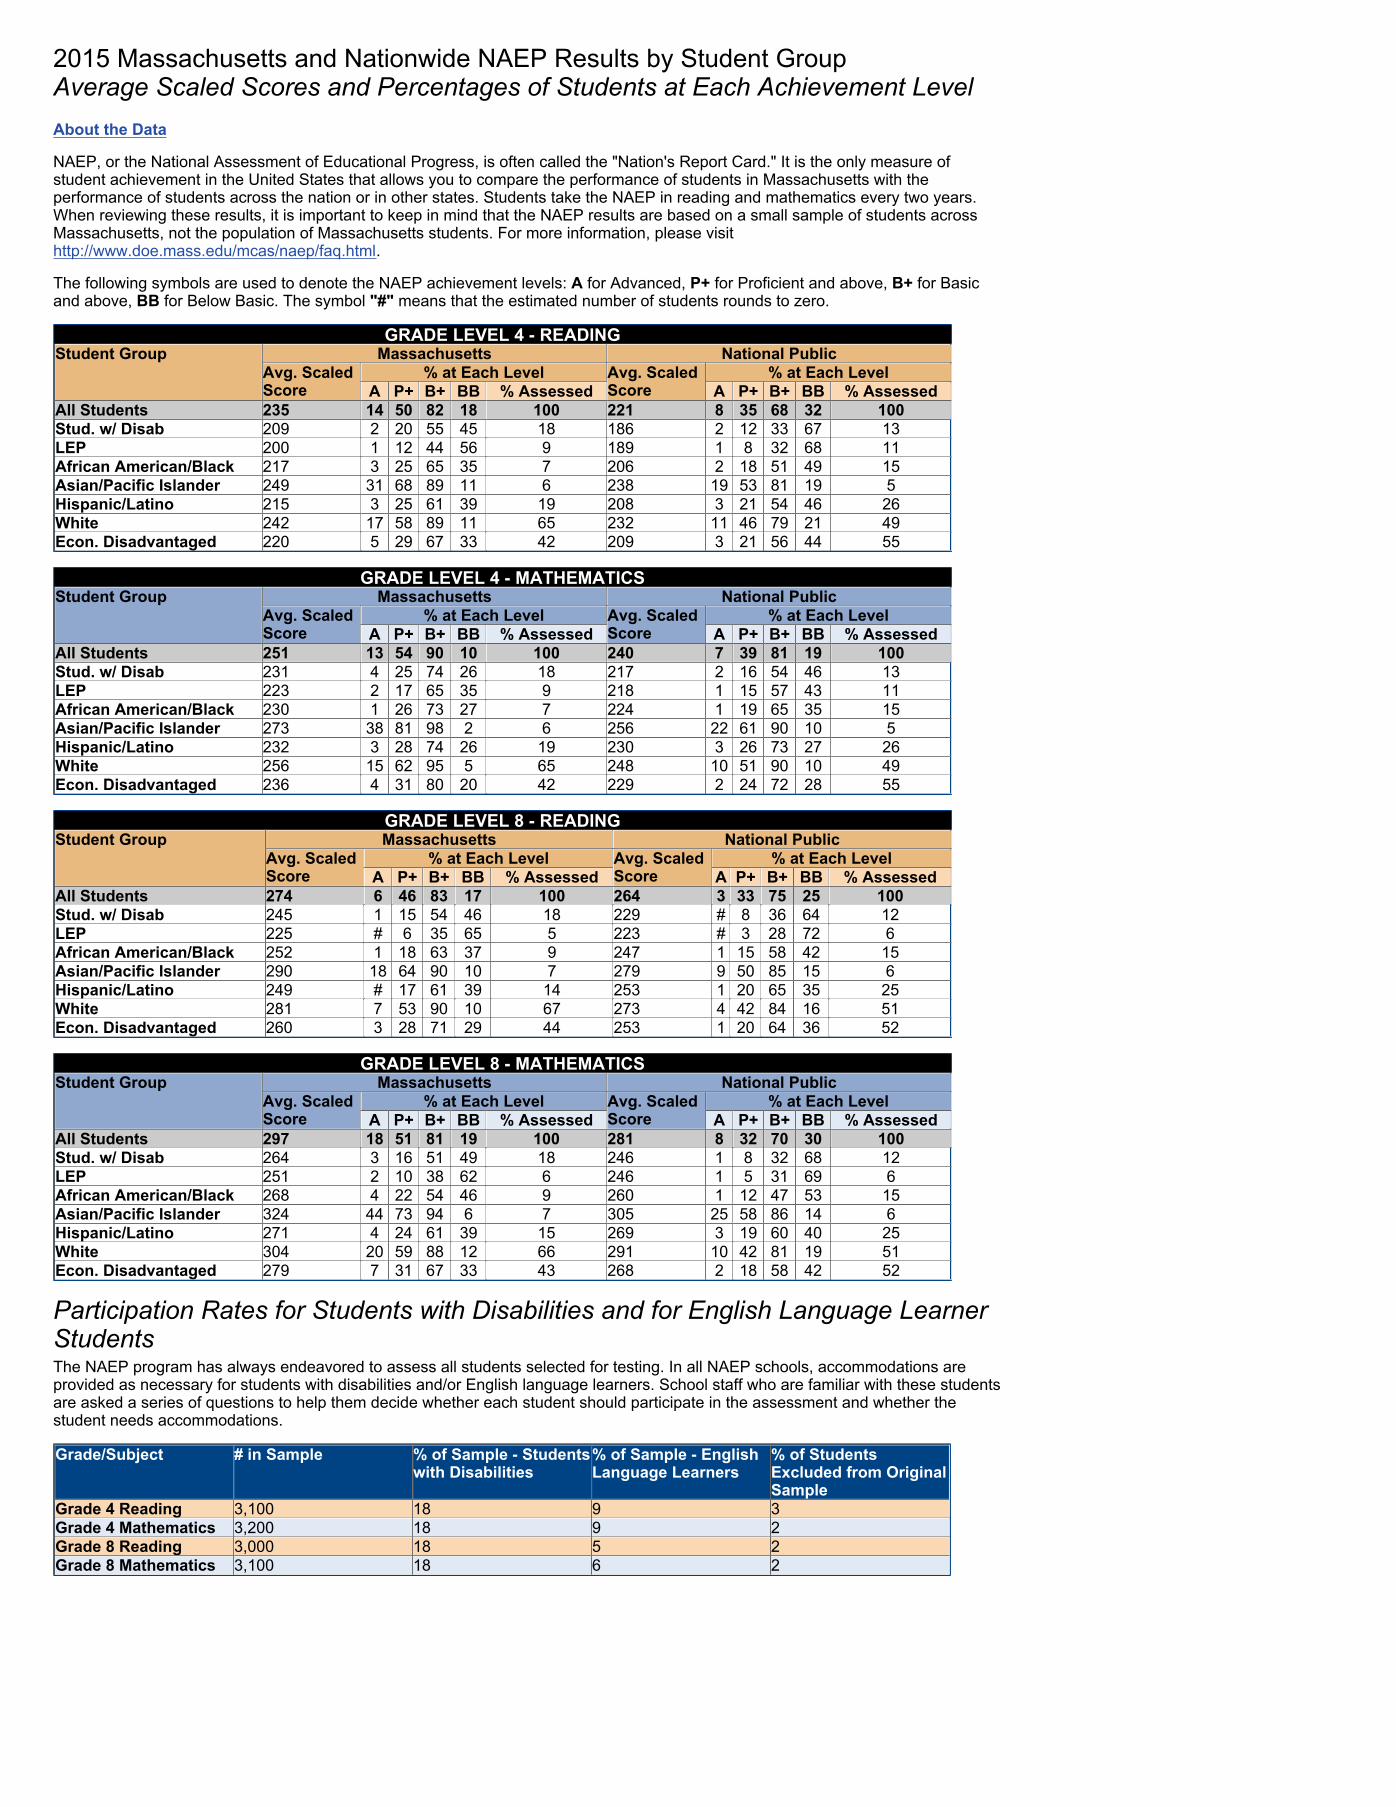
2015 Massachusetts and Nationwide NAEP Results by Student GroupAverage Scaled Scores and Percentages of Students at Each Achievement LevelAbout the Data
NAEP, or the National Assessment of Educational Progress, is often called the "Nation's Report Card." It is the only measure ofstudent achievement in the United States that allows you to compare the performance of students in Massachusetts with theperformance of students across the nation or in other states. Students take the NAEP in reading and mathematics every two years.When reviewing these results, it is important to keep in mind that the NAEP results are based on a small sample of students acrossMassachusetts, not the population of Massachusetts students. For more information, please visithttp://www.doe.mass.edu/mcas/naep/faq.html.
The following symbols are used to denote the NAEP achievement levels: A for Advanced, P+ for Proficient and above, B+ for Basicand above, BB for Below Basic. The symbol "#" means that the estimated number of students rounds to zero.
GRADE LEVEL 4 - READINGStudent Group Massachusetts National Public
Avg. ScaledScore
% at Each Level Avg. ScaledScore
% at Each LevelA P+ B+ BB % Assessed A P+ B+ BB % Assessed
All Students 235 14 50 82 18 100 221 8 35 68 32 100Stud. w/ Disab 209 2 20 55 45 18 186 2 12 33 67 13LEP 200 1 12 44 56 9 189 1 8 32 68 11African American/Black 217 3 25 65 35 7 206 2 18 51 49 15Asian/Pacific Islander 249 31 68 89 11 6 238 19 53 81 19 5Hispanic/Latino 215 3 25 61 39 19 208 3 21 54 46 26White 242 17 58 89 11 65 232 11 46 79 21 49Econ. Disadvantaged 220 5 29 67 33 42 209 3 21 56 44 55
GRADE LEVEL 4 - MATHEMATICSStudent Group Massachusetts National Public
Avg. ScaledScore
% at Each Level Avg. ScaledScore
% at Each LevelA P+ B+ BB % Assessed A P+ B+ BB % Assessed
All Students 251 13 54 90 10 100 240 7 39 81 19 100Stud. w/ Disab 231 4 25 74 26 18 217 2 16 54 46 13LEP 223 2 17 65 35 9 218 1 15 57 43 11African American/Black 230 1 26 73 27 7 224 1 19 65 35 15Asian/Pacific Islander 273 38 81 98 2 6 256 22 61 90 10 5Hispanic/Latino 232 3 28 74 26 19 230 3 26 73 27 26White 256 15 62 95 5 65 248 10 51 90 10 49Econ. Disadvantaged 236 4 31 80 20 42 229 2 24 72 28 55
GRADE LEVEL 8 - READINGStudent Group Massachusetts National Public
Avg. ScaledScore
% at Each Level Avg. ScaledScore
% at Each LevelA P+ B+ BB % Assessed A P+ B+ BB % Assessed
All Students 274 6 46 83 17 100 264 3 33 75 25 100Stud. w/ Disab 245 1 15 54 46 18 229 # 8 36 64 12LEP 225 # 6 35 65 5 223 # 3 28 72 6African American/Black 252 1 18 63 37 9 247 1 15 58 42 15Asian/Pacific Islander 290 18 64 90 10 7 279 9 50 85 15 6Hispanic/Latino 249 # 17 61 39 14 253 1 20 65 35 25White 281 7 53 90 10 67 273 4 42 84 16 51Econ. Disadvantaged 260 3 28 71 29 44 253 1 20 64 36 52
GRADE LEVEL 8 - MATHEMATICSStudent Group Massachusetts National Public
Avg. ScaledScore
% at Each Level Avg. ScaledScore
% at Each LevelA P+ B+ BB % Assessed A P+ B+ BB % Assessed
All Students 297 18 51 81 19 100 281 8 32 70 30 100Stud. w/ Disab 264 3 16 51 49 18 246 1 8 32 68 12LEP 251 2 10 38 62 6 246 1 5 31 69 6African American/Black 268 4 22 54 46 9 260 1 12 47 53 15Asian/Pacific Islander 324 44 73 94 6 7 305 25 58 86 14 6Hispanic/Latino 271 4 24 61 39 15 269 3 19 60 40 25White 304 20 59 88 12 66 291 10 42 81 19 51Econ. Disadvantaged 279 7 31 67 33 43 268 2 18 58 42 52
Participation Rates for Students with Disabilities and for English Language LearnerStudentsThe NAEP program has always endeavored to assess all students selected for testing. In all NAEP schools, accommodations areprovided as necessary for students with disabilities and/or English language learners. School staff who are familiar with these studentsare asked a series of questions to help them decide whether each student should participate in the assessment and whether thestudent needs accommodations.
Grade/Subject # in Sample % of Sample - Studentswith Disabilities
% of Sample - EnglishLanguage Learners
% of StudentsExcluded from OriginalSample
Grade 4 Reading 3,100 18 9 3Grade 4 Mathematics 3,200 18 9 2Grade 8 Reading 3,000 18 5 2Grade 8 Mathematics 3,100 18 6 2
Related Documents