Country Ridge Water – WS 0430070 1 2016 Consumer Confidence Report (CCR) 2016 Consumer Confidence Report (CCR) Annual Drinking Water Quality Report Period of January 1 to December 31, 2016 Country Ridge Water - WS 0430070 Our Drinking Water Meets or Exceeds All Federal (EPA) Drinking Water Requirements This report is a summary of the quality of the water the City of Melissa provides to our customers. The analysis was made by using the data from the most recent U.S. Environmental Protection Agency (EPA) required tests and is presented in the at- tached pages. The City of Melissa hopes this infor- mation helps you become more knowledgeable about what is in your drinking water. En Español: Este informe contiene informacion muy importante sobre el agua que usted bebe. Traduzcalo o hable con alguien que lo entienda bien. For more information regarding this report contact: Jeff Cartwright, Director of Public Works, City of Melissa Cell: 469/853-9788 [email protected] Source Water Assessment A Source Water Assessment for your drinking water source(s) is currently being conducted by the TCEQ and should be provided to us this year. The report will describe the susceptibility and types of constituents that may come into contact with your drinking water source based on human activities and natural conditions. The information in this assessment will allow us to focus our source water protection strategies onds to 2 minutes before using water for drinking or cooking. If you are concerned about lead in your water, you may wish to have your water tested. Information on lead in drinking water, testing methods, and steps you can take to minimize exposure is available from the safe drinking water hotline at (800) 426-4791 or http://www.epa.gov/ safewater/lead. You may be more vulner- able than the general population to certain mi- crobial contaminants, such as Cryptosporidium, in drinking water. Infants, some elderly or immuno- compromised such as those undergoing chemo- therapy for cancer, those who have undergone organ transplants, those who are undergoing treatment with steroids, and people with other immune system disorders can be particularly at risk of infections. You should seek advice about drinking water from your physician or health care provider. Additional guidelines and appropri- ate means to lessen the risk of infection by Cryp- tosporidium are availa- ble from the safe drink- ing water hotline at (800) 426-4791. Required additional health information for lead: If present, elevat- ed levels of lead can cause serious health problems, especially for pregnant women and young children. Lead in drinking water is primar- ily from materials and components associated with service lines and home plumbing. The City of Melissa cannot control the variety of materials used in plumbing compo- nents. When your water has been sitting for sev- eral hours, you can mini- mize the potential for lead exposure by flush- ing your tap for 30 sec- Important Health Information

Welcome message from author
This document is posted to help you gain knowledge. Please leave a comment to let me know what you think about it! Share it to your friends and learn new things together.
Transcript

Country Ridge Water – WS 0430070 1 2016 Consumer Confidence Report (CCR)
2016 Consumer Confidence Report (CCR)
Annual Drinking Water Quality Report Period of January 1 to December 31, 2016
Country Ridge Water - WS 0430070
Our Drinking Water
Meets or Exceeds All
Federal (EPA) Drinking
Water Requirements
This report is a summary of
the quality of the water the
City of Melissa provides to
our customers. The analysis
was made by using the data
from the most recent U.S.
Environmental Protection
Agency (EPA) required tests
and is presented in the at-
tached pages. The City of
Melissa hopes this infor-
mation helps you become
more knowledgeable about
what is in your drinking
water.
En Español: Este informe
contiene informacion muy
importante sobre el agua
que usted bebe. Traduzcalo
o hable con alguien que lo
entienda bien.
For more information
regarding this report
contact: Jeff Cartwright,
Director of Public Works,
City of Melissa
Cell: 469/853-9788
Source Water Assessment A Source Water Assessment for your drinking water source(s) is currently being
conducted by the TCEQ and should be provided to us this year. The report will
describe the susceptibility and types of constituents that may come into contact with
your drinking water source based on human activities and natural conditions. The
information in this assessment will allow us to focus our source water protection
strategies
onds to 2 minutes before
using water for drinking
or cooking. If you are
concerned about lead in
your water, you may
wish to have your water
tested. Information on
lead in drinking water,
testing methods, and
steps you can take to
minimize exposure is
available from the safe
drinking water hotline at
(800) 426-4791 or
http://www.epa.gov/
safewater/lead.
You may be more vulner-
able than the general
population to certain mi-
crobial contaminants,
such as Cryptosporidium,
in drinking water. Infants,
some elderly or immuno-
compromised such as
those undergoing chemo-
therapy for cancer, those
who have undergone
organ transplants, those
who are undergoing
treatment with steroids,
and people with other
immune system disorders
can be particularly at
risk of infections. You
should seek advice about
drinking water from your
physician or health care
provider. Additional
guidelines and appropri-
ate means to lessen the
risk of infection by Cryp-
tosporidium are availa-
ble from the safe drink-
ing water hotline at
(800) 426-4791.
Required additional
health information for
lead: If present, elevat-
ed levels of lead can
cause serious health
problems, especially for
pregnant women and
young children. Lead in
drinking water is primar-
ily from materials and
components associated
with service lines and
home plumbing. The City
of Melissa cannot control
the variety of materials
used in plumbing compo-
nents. When your water
has been sitting for sev-
eral hours, you can mini-
mize the potential for
lead exposure by flush-
ing your tap for 30 sec-
Important Health Information

Country Ridge Water – WS 0430070 2 2016 Consumer Confidence Report (CCR)
Where Does Our Drinking Water Come From?
The source of drinking water used by COUNTRY RIDGE WATER is
Groundwater from the Woodbine aquifer located in Collin County. The
WOODBINE AQUIFER is a minor aquifer located in northeast Texas. The
aquifer overlies the Trinity Aquifer and consists of sandstone interbedded
with shale and clay that form three distinct water-bearing zones. The
Woodbine Aquifer reaches 600 feet in thickness in subsurface areas, and
freshwater saturated thickness averages about 160 feet. Water quality
and yield vary with the depth of the aquifer. The lower zones of the aq-
uifer typically yield the most water, whereas the upper zone yields limited
water that tends to be very high in iron. In general, water to a depth of
1,500 feet is fresh, containing less than 1,000 milligrams per liter of
total dissolved solids. Water at depths below 1,500 feet is slightly to moderately saline, containing from
1,000 to 4,000 milligrams per liter of total dissolved solids. The aquifer provides water for municipal, industri-
al, domestic, livestock, and small irrigation supplies. Large water level declines, due to heavy municipal and
industrial pumping in the Sherman-Denison area of Grayson County, have moderated in the past decade as
suppliers have switched to surface water.
The population of the NTMWD service area is expected to more than
double between the years 2010 and 2070 from 1.6 million to an esti-
mated 3.7 million served. To meet future water demands, NTMWD is in
the final stages of the permitting process for the proposed Lower Bois
d’Arc Creek Reservoir in Fannin County, which will eventually provide
120,000 acre-feet of water per year to residents in North Texas. The
projected completion date is 2020.
Conservation and reuse are key strategies in the NTMWD long-range
water supply plan. NTMWD and its Member Cities and customers are
recognized as leaders in water conservation and reuse and have robust
programs and innovative projects to help maximize available supplies.
However, conservation and reuse alone cannot reliably meet our com-
munities’ needs beyond 2021. One-quarter of future supplies must come
from new sources. That new source is the proposed Lower Bois d’Arc
Creek Reservoir. Learn more about this project at:
https://www.ntmwd.com/projects/lower-bois-darc-creek-reservoir/ Lower Bois d’Arc Creek Reservoir
In the higher demand Summer months, Country Ridge water supply may be supplemented with CITY OF MELISSA
surface water which is purchased from North Texas Municipal Water District (NTMWD). NTMWD gets raw water from
Lavon Lake and treats it at the Wylie Water Treatment Plant. Please visit www.ntmwd.com or call NTMWD at
(972) 442.5405 for detailed information on this water source, treatment processes and more.
Future Water Supply
Country Ridge Water – WS 0430070 3 2016 Consumer Confidence Report (CCR)
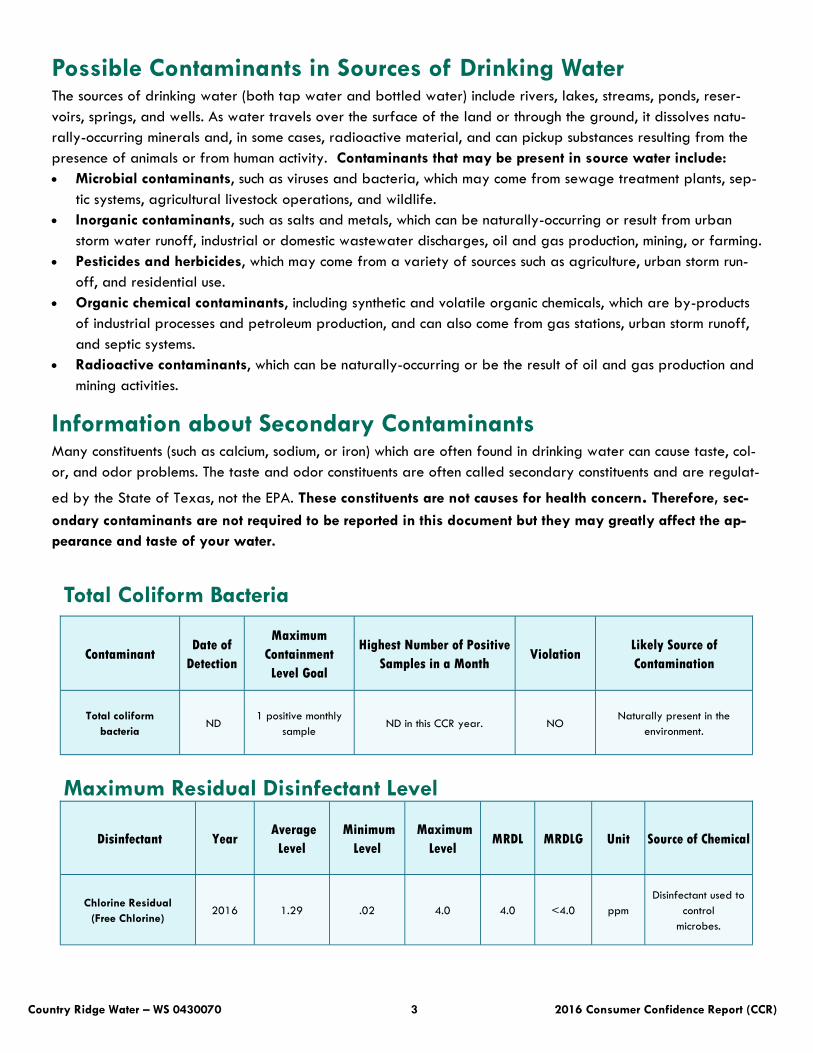
Possible Contaminants in Sources of Drinking Water The sources of drinking water (both tap water and bottled water) include rivers, lakes, streams, ponds, reser-
voirs, springs, and wells. As water travels over the surface of the land or through the ground, it dissolves natu-
rally-occurring minerals and, in some cases, radioactive material, and can pickup substances resulting from the
presence of animals or from human activity. Contaminants that may be present in source water include:
Microbial contaminants, such as viruses and bacteria, which may come from sewage treatment plants, sep-
tic systems, agricultural livestock operations, and wildlife.
Inorganic contaminants, such as salts and metals, which can be naturally-occurring or result from urban
storm water runoff, industrial or domestic wastewater discharges, oil and gas production, mining, or farming.
Pesticides and herbicides, which may come from a variety of sources such as agriculture, urban storm run-
off, and residential use.
Organic chemical contaminants, including synthetic and volatile organic chemicals, which are by-products
of industrial processes and petroleum production, and can also come from gas stations, urban storm runoff,
and septic systems.
Radioactive contaminants, which can be naturally-occurring or be the result of oil and gas production and
mining activities.
Information about Secondary Contaminants Many constituents (such as calcium, sodium, or iron) which are often found in drinking water can cause taste, col-
or, and odor problems. The taste and odor constituents are often called secondary constituents and are regulat-
ed by the State of Texas, not the EPA. These constituents are not causes for health concern. Therefore, sec-
ondary contaminants are not required to be reported in this document but they may greatly affect the ap-
pearance and taste of your water.
Contaminant Date of
Detection
Maximum
Containment
Level Goal
Highest Number of Positive
Samples in a Month Violation
Likely Source of
Contamination
Total coliform
bacteria ND
1 positive monthly
sample ND in this CCR year. NO
Naturally present in the
environment.
Disinfectant Year Average
Level
Minimum
Level
Maximum
Level MRDL MRDLG Unit Source of Chemical
Chlorine Residual
(Free Chlorine) 2016 1.29 .02 4.0 4.0 <4.0 ppm
Disinfectant used to
control
microbes.
Maximum Residual Disinfectant Level
Total Coliform Bacteria

Country Ridge Water – WS 0430070 4 2016 Consumer Confidence Report (CCR)
Contaminant Collection
Date
Highest
Level
Detected
Range of
Levels
Detected
MCLG MCL Unit Violation Likely Source of
Contamination
Aluminum 2015 0.057 0.057-0.057 0.2 0.2 ppm No
Moderately abundant naturally occurring element used in the
metal industry.
Antimony 2015 <0.0002 0.0-0.0002 .006 0.006 ppm No
Discharge from petrole-um refineries; fire re-tardants; ceramics;
electronics; solder
Arsenic 2015 <0.0007 0.0-0.0007 0 0.01 ppm No
Erosion of natural de-posits; runoff from or-chards; runoff from glass and electronics
production wastes.
Barium 2015 0.058 0.000-0.0058 2 2 ppm No
Discharge from drilling wastes; discharge from metal refineries; ero-
sion of natural deposits.
Beryllium 2015 <0.0002 0.0-0.0002 0.004 0.004 ppm No
Discharge from metal refineries and coal-
burning factories; dis-charge from electrical, aerospace, and de-
fense industries.
Cadmium 2015 <0.0004 0.0-0.0004 0.005 0.005 ppm No
Corrosion of galva-nized pipes; erosion of natural deposits; dis-charge from metal
refineries; runoff from waste batteries and
paints.
Calcium 2015 <0.07 0.0-0.07 N/A N/A ppm No Abundant naturally occurring element.
Chromium 2015 <0.0004 0.0-0.0004 0.1 0.1 ppm No
Discharge from steel and pulp mills; Erosion
of natural deposits.
Chloride 2015 32.5 32.5-32.5 300 300 ppm No
Abundant naturally occurring element; used in water purification;
by-product of oil field activity.
Inorganic Contaminants

Country Ridge Water – WS 0430070 5 2016 Consumer Confidence Report (CCR)
Contaminant Collection
Date
Highest
Level
Detected
Range of
Levels
Detected
MCLG MCL Unit Violation Likely Source of
Contamination
Copper 2015 0.0045 0.0-0.0045 1.3 1.3 ppm No
Erosion of natural deposits; leaching from wood pre-servatives; corrosion of household plumbing sys-
tems.
Fluoride 2015 0.894 0.894-0.894 4 4 ppm No
Erosion of natural deposits; Water additive which pro-
motes strong teeth; Dis-charge from fertilizer and
aluminum factories.
Hardness 2015 <0.0 0.0-0.0 N/A N/A ppm No Naturally occurring
calcium.
Iron 2015 0.0997 0.0-0.0997 0.3 0.3 ppm No
Erosion of natural deposits; iron or steel water delivery
equipment of facilities.
Lead 2015 <0.0004 0.0-0.0004 0.015 0.015 ppm No
Corrosion of household plumbing systems; erosion
of natural deposits.
Nitrite (measured as
Nitrogen) 2014 <0.0004 0.00-0.0004 1 1 ppm No
Runoff from fertilizer use; Leaching from septic tanks, sewage; Erosion of natural
deposits.
Nitrate
(measured as
Nitrogen)
2016 0.0395 0.0-0.0395 10 10 ppm No
Runoff from fertilizer use; Leaching from septic tanks, sewage; Erosion of natural
deposits.
Sulfate 2015 66.1 66.1-66.1 300 300 ppm No
Moderately abundant natu-rally occurring element used
in the metal industry.
Magnesium 2015 0.0976 0.0-0.976 N/A N/A ppm No Abundant naturally occur-
ring element.
Manganese 2015 0.0059 0.0059-0.0059 0.05 0.05 ppm No Abundant naturally occur-
ring element.
Mercury 2015 <0.00007 0.0-0.00007 0.002 0.002 ppm No
Erosion of natural deposits; discharge from refineries and factories; runoff from
landfills; runoff from cropland.
Nickel 2015 <0.0004 0.0-0.0004 0.1 0.1 ppm No Erosion of natural
deposits.
Potassium 2015 0.673 0.0-0.673 N/A N/A ppm No Abundant naturally occur-
ring element.
Inorganic Contaminants Cont.

Country Ridge Water – WS 0430070 6 2016 Consumer Confidence Report (CCR)
Inorganic Contaminants Cont.
Contaminant Collection
Date
Highest Level
Detected
Range of
Levels
Detected
MCLG MCL Units Violation Likely Source of
Contamination
2,4,5-TP 2015 <0.200 0.0-<0.200 50 50 ppt NO Residue of banned
herbicide.
2,4,-D 2015 <0.100 0.0-<0.100 70 70 ppt NO Runoff from herbicide
used on row crops.
Alachlor 2016 ND 0.0-<0.100 0 2 ppb NO Runoff from herbicide
used on row crops.
Aldicarb Sulfoxide 2015 <0.500 0.0-<0.500 4 4 ppt NO
Aldicarb Sulfone 2015 <0.800 0.0-<0.800 2 2 ppt NO
Aldicarb 2015 <0.500 0.0-<0.500 3 3 ppt NO
Atrazine 2016 0.19 0.0-<0.100 3 3 ppb NO Runoff from herbicide
used on row crops.
Contaminant Collection
Date
Highest
Level
Detected
Range of
Levels
Detected
MCLG MCL Unit Violation Likely Source of
Contamination
Selenium 2015 <0.001 0.0-0.001 0.05 0.05 ppm No
Discharge from petroleum and metal refineries; ero-sion of natural deposits; discharge from mines.
Sodium 2015 163 0.0-163 N/A N/A ppm No
Erosion of natural deposits;
by-product of oil field ac-
tivity.
Silver 2015 <0.0004 0.0-0.0004 0.1 0.1 ppm No Erosion of natural deposits
Thallium 2015 <0.0002 0.0-0.0002 0.001 0.002 ppm No
Leaching from ore pro-
cessing sites; Discharge
from electronics, glass, and
drug factories.
Zinc 2015 0.0028 0.0-0.0028 5 5 ppm No
Moderately abundant natu-
rally occurring element
used in the metal industry.
Synthetic Organic Contaminants including Pesticides and Herbicides

Country Ridge Water – WS 0430070 7 2016 Consumer Confidence Report (CCR)
Synthetic Organic Contaminants inc. Pesticides and Herbicides Cont.
Contaminant Collection
Date
Highest
Level
Detected
Range of
Levels
Detected
MCLG MCL Units Violation Likely Source of
Contamination
Benzo(a)pyrene
(PAH) 2016 <0.02 0-<0.02 0 200 ppt NO
Leaching from linings of water storage
tanks and distribution
lines.
Carbofuran 2015 <0.900 0.0-0.9 40 40 ppb NO
Leaching of soil fumi-gant used on rice and
alfalfa.
Chlordane 2016 <0.100 0.0-<0.100 0 2 ppb NO Residue of banned
termiticide.
Dalapon 2015 <1.00 0.00-<1.00 200 200 ppb NO Runoff from herbicide used on rights of way.
Di(2-ethylhexyl)
adipate 2016 0.5 0-<0.5 400 400 ppb NO
Discharge from chemi-
cal factories.
Di(2-ethylhexyl)
phthalate 2016 0.5 0-<0.5 0 6 ppb NO
Discharge from rubber and chemical facto-
ries.
1,2-Dibromoethane 2015 <0.01 0.0-<0.01 50 50 ppt NO Discharge from petro-
leum refineries.
Dibromochloropro-
pane 2015 <0.01 0.0-<0.01 0 200 ppt NO
Runoff/leaching from soil fumigant used on
soybeans, cotton, pineapples, and or-
chards.
Dinoseb 2015 <0.2 0.0-<0.2 7 7 ppb NO
Runoff from herbicide used on soybeans and
vegetables.
Endrin 2016 <0.100 0-<0.100 2 2 ppb NO Residue of banned
insecticide.
Ethylene dibromide 2013 ND 0-0 0 50 ppt NO Discharge from petro-
leum refineries.
Heptachlor 2016 <0.03 0-<0.03 0 400 ppt NO Residue of banned
termiticide.
Heptachlor epoxide 2016 <0.02 0-<0.02 0 200 ppt NO Breakdown of hepta-
chlor.
Hexachlorobenzene 2016 <0.1 0-<0.1 0 1 ppb NO
Discharge from metal refineries and agricul-tural chemical facto-
ries.

Country Ridge Water – WS 0430070 8 2016 Consumer Confidence Report (CCR)
Synthetic Organic Contaminants inc. Pesticides and Herbicides Cont.
Contaminant Collection
Date
Highest Level
Detected
Range of
Levels
Detected
MCLG MCL Units Violation Likely Source of
Contamination
Hexachlorocyclo-
pentadiene 2016 <0.1 0-<0.1 50 50 ppb NO
Discharge from chemi-
cal factories.
Lindane 2015 ND 0-0 200 200 ppt NO
Runoff/leaching from insecticide used on
cattle, lumber, gardens.
Methoxychlor 2016 <0.1 0-<0.1 40 40 ppb NO
Runoff/leaching from insecticide used on
fruits, vegetables, al-falfa, livestock.
Oxamyl 2015 <1.00 0.0-<1.00 200 200 ppt NO
Pentachlorophenol 2015 <0.04 0.0-<0.04 0 1 ppb NO Discharge from wood
preserving factories.
Picloram 2015 <0.10 0.0-<0.10 7 7 ppb NO Herbicide runoff.
Simazine 2016 <0.05 0-<0.05 4 4 ppb NO Herbicide runoff.
Toxaphene 2016 <0.1 0-<0.1 0 3 ppb NO
Runoff/leaching from insecticide used on cotton and cattle.
Contaminant Year Highest Level
Detected
Range of
Levels
Detected
MCLG MCL Units Violation Likely Source of
Contamination
Chloroform 2016 17.9 2.29-2.29 N/A N/A ppb NO Byproduct of drinking water disin-
fection.
Bromoform 2016 <1.00 0-<1.00 N/A N/A ppb NO Byproduct of drinking water disin-
fection
Bromodichloro-methane
2016 11.0 11.0-11.0 N/A N/A ppb NO Byproduct of drinking water disin-
fection
Dibromochloro-methane
2016 3.72 3.72-3.72 N/A N/A ppb NO Byproduct of drinking water disin-
fection
Unregulated Contaminants

Country Ridge Water – WS 0430070 9 2016 Consumer Confidence Report (CCR)
Contaminant Collection
Date
Highest
Level
Detected
Range of
Levels
Detected
MCLG MCL Units Violation Likely Source of
Contamination
Benzene 2016 <0.500 0.0-0.500 0 5 ppb NO
Discharge from factories; Leaching from gas storage
tanks and landfills.
Carbon tetrachloride 2016 <0.500 0.0-0.500 0 5 ppb NO
Discharge from chemical plants and other industrial
activities.
Chlorobenzene 2016 <0.500 0.0-0.500 100 100 ppb NO
Discharge from chemical and agricultural chemical facto-
ries.
1,2-Dichlorobenzene 2016 <0.500 0.0-0.500 600 600 ppb NO Discharge from industrial
chemical factories.
1,4-Dichlorobenzene 2016 <0.500 0.0-0.500 75 75 ppb NO Discharge from industrial
chemical factories.
1,2-Dichloroethane 2016 <0.500 0.0-0.500 0 5 ppb NO Discharge from industrial
chemical factories.
1,1-Dichloroethene 2016 <0.500 0.0-0.500 7 7 ppb NO Discharge from industrial
chemical factories.
Cis-1,2-Dichloroethene 2016 <0.500 0.0-0.500 70 70 ppb NO Discharge from industrial
chemical factories.
Trans-1,2-
Dichloroethene 2016 <0.500 0.0-0.500 100 100 ppb NO
Discharge from industrial
chemical factories.
Methylene chloride 2016 <0.500 0.0-0.500 0 5 ppb NO Discharge from pharmaceuti-
cal and chemical factories.
1,2-Dichloropropane 2016 <0.500 0.0-0.500 0 5 ppb NO Discharge from industrial
chemical factories.
Ethyl Benzene 2016 <0.500 0.0-0.500 700 700 ppb NO Discharge from petroleum
refineries.
Styrene 2016 <0.500 0.0-0.500 100 100 ppb NO
Discharge from rubber and plastic factories; Leaching
from landfills.
Tetrachloroethene 2016 <0.500 0.0-0.500 0 5 ppb NO
Leaching from PVC pipes; Discharge from factories and
dry cleaners.
1,2,4-
Trichlorobenzene 2016 <0.500 0.0-0.500 70 70 ppb NO
Discharge from textile finish-
ing factories.
1,1,1-Trichloroethane 2016 <0.500 0.0-0.500 200 200 ppb NO
Discharge from metal de-greasing sites and other fac-
tories.
1,1,2-Trichloroethane 2016 <0.500 0.0-0.500 3 5 ppb NO Discharge from industrial
chemical factories.
Volatile Organic Contaminants

Country Ridge Water – WS 0430070 10 2016 Consumer Confidence Report (CCR)
Volatile Organic Contaminants
Contaminant Collection
Date
Highest
Level
Detected
Range of
Levels
Detected
MCLG MCL Units Violation Likely Source of
Contamination
Trichloroethene 2016 <0.500 0.0-0.500 0 5 ppb NO
Discharge from metal de-greasing sites and other fac-
tories.
Toluene 2016 <0.500 0.0-0.500 1 1 ppm NO Discharge from petroleum
factories.
Vinyl Chloride 2016 <0.500 0.0-0.500 0 2 ppb NO
Leaching from PVC piping; Discharge from plastics facto-
ries.
Xylenes (total) 2016 <0.500 0.0-0.500 10 10 ppm NO
Discharge from petroleum factories; Discharge from
chemical factories.
Disinfectants and Disinfection By-Products
Name Disinfection By-Products
Collection Date
Highest Lev-el
Detected
Range of Levels
Detected MCLG Units MCL Violation
Likely Source of Contamination
Total Haloacetic acids (HAA5)
9/2016 22.3 22.3-22.3 n/a ppb 60 NO By-product of drinking
water disinfection.
Total Trihalome-thanes (TThm)
9/2016 32.7 32.7-32.7 n/a ppb 80 NO By-product of drinking
water disinfection.
Radioactive Contaminants
Contaminant Collection
Date
Highest
Level
Detected
Range of
Levels
Detected
MCLG MCL Units Violation Likely Source of
Contamination
Beta/photon emitters 5/2/2016 5.6 5.6-5.6 0 50 pCi/L No Decay of natural and
man-made deposits.
Gross alpha exclud-
ing radon and
uranium
5/2/2016
Levels lower
than detect lev-
el
0-0 0 15 pCi/L No Erosion of natural
deposits.
Radium 5/2/2016
Levels lower
than detect lev-
el
0-0 0 5 pCi/L No Erosion of natural
deposits.

Country Ridge Water – WS 0430070 11 2016 Consumer Confidence Report (CCR)
YOU MAKE THE DIFFERENCE - PROTECT OUR WATERSHED
The majority of source water pollution occurs during rain events, when storm
water runoff picks up debris, dirt, and other pollutants and carries the
pollutants to area streams, creeks and lakes. Because all storm drains are
directly connected to natural drainage ways with no treatment, anything left
on the ground becomes source water pollution.
Pollution
Nitrogen and phosphorus and potassium are all nutrients we apply annually to
improve our turf. Those same nutrients grow algae when allowed to enter into
our streams, creeks, and lakes.
Source Fertilizing your lawn Pet waste
Solution Strictly follow directions and never use
rain events to “water it in”.
Pick up your pet waste before it dissolves in the rain
and gets washed off into the storm drain.
Pollution
Biodegradable means the soap or detergent breaks down into basic elements.
But, to do so, the soaps take oxygen out of the water. Removing oxygen in the
water can suffocate fish and wildlife.
Source Washing the car Power-washing pavement
Solution
Take the car to a car wash facility or wash
the car in the yard, where the grass will
capture much of the runoff.
Divert or capture the flow. You can pump the power-wash
water into a container and let it soak into the ground
or put it in the sewer system.
Lavon Lake Watershed
HUMAN SOURCES OF SOURCE WATER POLLUTION

Country Ridge Water – WS 0430070 12 2016 Consumer Confidence Report (CCR)
Lead and Copper
ADDITIONAL HEALTH INFORMATION FOR LEAD:
If present, elevated levels of lead can cause serious health problems,
especially for pregnant women and young children. Lead in drinking wa-
ter is primarily from materials and components associated with service
lines and home plumbing. The City of Melissa is responsible for provid-
ing high quality drinking water, but cannot control the variety of materi-
als used in plumbing components. When you water has been sitting for several hours, you can minimize the
potential for lead exposure by flushing your tap for 30 seconds to 2 minutes before using water for drinking
or cooking. If you are concerned about lead in your water, you may wish to have your water tested. Infor-
mation on lead in drinking water, testing methods, and steps you can take to minimize exposure is available
from the ‘Safe Drinking Water’ hotline or at http://www.epa.gov//safewater//lead.
Violation Type Violation Begin Violation End Violation Explanation
There were no violations for the COUNTRY RIDGE WATER SYSTEM during this CCR year and any previous violations have been cor-
rected in accordance with TCEQ.
Violations:
Lead or Copper
Collection Date
The 90th Percentile Value of the Most Recent Round
of Sampling
Number of Sites Exceeding
Action Level
Action Level
Unit Violation Source of
Contaminant
Lead 2016 0.640 mg/L 0 15 ppb NO
Corrosion of household plumbing systems; Erosion
of natural deposits.
Copper 2016 0.00461 mg/L 0 1.3 ppm NO
Corrosion of household plumbing systems; Erosion
of natural deposits.
Lead and Copper

Country Ridge Water – WS 0430070 13 2016 Consumer Confidence Report (CCR)
Significant upgrades to the city’s water
infrastructure have been taken over the last two
years including the replacement of all aging
water meters with newer ones utilizing AMI
technology to help improve water conservation
and provide the data required to better manage
water usage and minimize water loss, not being
captured by older meters. AMI technology
provides automatic, accurate and consistent water meter reads without the need for
manual meter reads and manual data entry. This data then feeds into a customer
information system that provides a platform through which residents can accurately track
their water usage, which may help identify irregular water use such as a leak much
sooner. Benefits of this system include advanced data recording of all water
consumption on an hourly basis, historical consumption data for residents, and leak
detection capabilities.
Customers can sign-up for this access and setup customized usage alerts to receive
notification by email and/or text message based on established usage thresholds,
allowing more direct control over their own water usage and subsequent bill.
Put the Power of Data in Your Hands and Sign-up Today!
Water Loss: Texas Legislature requires the City to file an annual water loss report with the Texas Water Development Board and
to notify customers of the results. This notice is intended to meet the notification requirement.
Water Loss is unaccounted for water produced by the water system. This is the difference between the wa-
ter produced and registered at the customer’s meter. Leaks, line breaks, unmetered fire protection, hydrant
flushing for health and safety, and other activities all contribute to water loss.
The City of Melissa - Country Ridge Water System has approximately 9.7 miles of distribution water lines
serving 212 connections. The City of Melissa - Country Ridge Water System had a total of 3,111,838 gallons
of water loss due to water leaks and unauthorized water usage.
One of the most important tools in accurately measuring water loss and insuring accurate utility billing is the
water meters throughout the city. The City of Melissa Water Department’s goal is to conform to the American
Water Works Association (AWWA) accuracy standard of 98.5% to 101.5%.
Advanced Metering Infrastructure (AMI)
Country Ridge Water – WS 0430070 14 2016 Consumer Confidence Report (CCR)
Terms to Know TCEQ – Texas Commission on Environmental Quality, the State Agency.
Maximum Contaminant Level (MCL) – The highest permissible level of a contaminant in drinking water. MCLs are set as close
to the MCLGs as feasible using the best available treatment technology.
Maximum Contaminant Level Goal (MCLG) – The level of a contaminant in drinking water below which there is no known or
expected health risk. MCLGs allow for a margin of safety.
Maximum Residual Disinfectant Level (MRDL) – The highest level of disinfectant allowed in drinking water. There is convinc-
ing evidence that addition of disinfectant is necessary for control of microbial contaminants.
Maximum Residual Disinfectant Level Goal (MRDLG) – The level of a drinking water disinfectant below which there is no
known or expected risk to health. MRDLGs do not reflect the benefits of the use of disinfectants to control microbial contaminants.
Treatment Technique (TT) – A required process intended to reduce the level of a contaminant in drinking water.
Action Level (AL) – The concentration of a contaminant which, if exceeded, triggers treatment or other requirement which a water
system must follow.
NTU – Nephelometric Turbidity Units. This is the unit to measure water turbidity.
Turbidity – A measure of water’s clarity. Turbidity has no health effects; however, turbidity can interfere with disinfection and
provide a medium for microbial growth. Water with lower turbidity is clearer than water with higher turbidity.
pCi/L – picocuries per liter ( a measure of radioactivity).
ppm – parts per million, or milligrams per liter (mg/L). One part per million is equal to one drop of red dye in 26 gallons of water.
ppb – parts per billion, or micrograms per liter. One part per billion is equal to one drop of red dye in 26,000 gallons of water.
ppt – parts per trillion.
THM – Trihalomethanes – a by-product of disinfection of water. Some people who drink water containing Trihalomethanes in ex-
cess of the MCL over many years may experience problems with their liver, kidneys, or central nervous system, and may have an
increased risk of getting cancer.
HAA – Haloacetic Acid – a by-product of disinfection.
TOC – Total Organic Carbon.
ND – None Detected.
Cysts/L – Cysts per liter
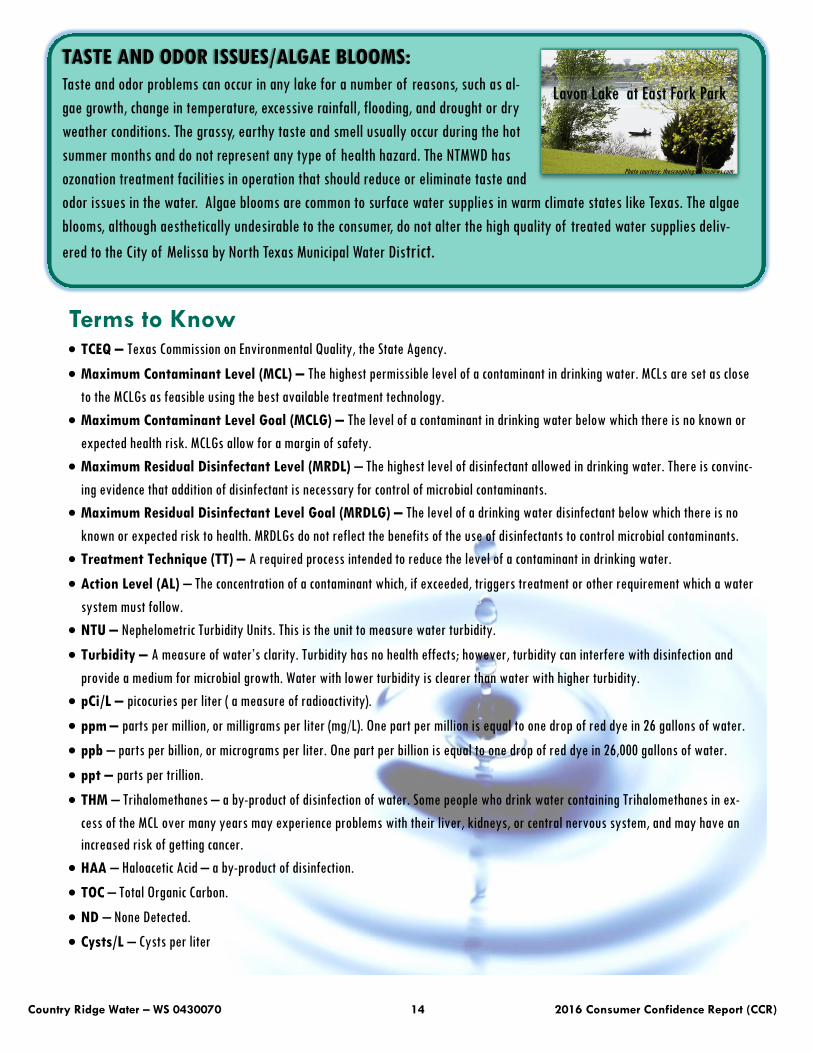
TASTE AND ODOR ISSUES/ALGAE BLOOMS:
Taste and odor problems can occur in any lake for a number of reasons, such as al-
gae growth, change in temperature, excessive rainfall, flooding, and drought or dry
weather conditions. The grassy, earthy taste and smell usually occur during the hot
summer months and do not represent any type of health hazard. The NTMWD has
ozonation treatment facilities in operation that should reduce or eliminate taste and
odor issues in the water. Algae blooms are common to surface water supplies in warm climate states like Texas. The algae
blooms, although aesthetically undesirable to the consumer, do not alter the high quality of treated water supplies deliv-
ered to the City of Melissa by North Texas Municipal Water District.
Lavon Lake at East Fork Park
Photo courtesy: thescoopblog.dallasnews.com

Country Ridge Water – WS 0430070 15 2016 Consumer Confidence Report (CCR)
Defend Your Drains! Many products don't belong in your drains (meaning your kitchen drain, toilet drain, bathtub
drain, or any other household drain). These products range from wipes to dental floss and medi-
cines to cleaning products. Do your part to help prevent plumbing problems and to protect the
quality of our lakes, rivers, and streams. Defend your drains, defend your pipes, and defend
your environment by using proper disposal methods.
TRASH IT: Wipes, paper towels, and other items that don't break down in water can clog your
pipes, resulting in sewer backups and expensive repairs. Even items labeled "flushable" can clog
sewer pipes. Defend your drains by disposing of these products in the trash (where they belong)
before they cause unpleasant and expensive problems.
DISPOSE RESPONSIBLY: Medicines. Large amounts of
cleaning products. Paint and pesticides. Fats, oils, and
grease. While all these things shouldn't go down the drain,
they also shouldn't be put in the trash. Why? Some of these
products can pose a hazard to water quality, and others
can be turned into something beneficial.
www.defendyourdrainsnorthtexas.com
City of Melissa Weather Station Part of the WaterMyYard Network
The City of Melissa purchased a Campbell Scientific Weather Station in compliance with the
TexasET Network requirements and the Weather Station was setup by Texas A&M Agrilife Staff
in March 2016. Located at the former Country Ridge Well #2 site near the corner of Fannin
Road and Palo Pinto Drive, the weather station is now a part of the TexasET Network sponsored
by the North Texas Municipal Water District. The Benefit to the City is that the Weather station
provides LOCAL weather data for MELISSA to aid our water customers in determining HOW
MUCH and WHEN they NEED to water their landscape based on local temperatures, effective
rainfall, solar radiation, relative humidity, and wind.
Sign-up to receive weekly
watering notifications at:
www.WaterMyYard.org
Country Ridge Water – WS 0430070 16 2016 Consumer Confidence Report (CCR)
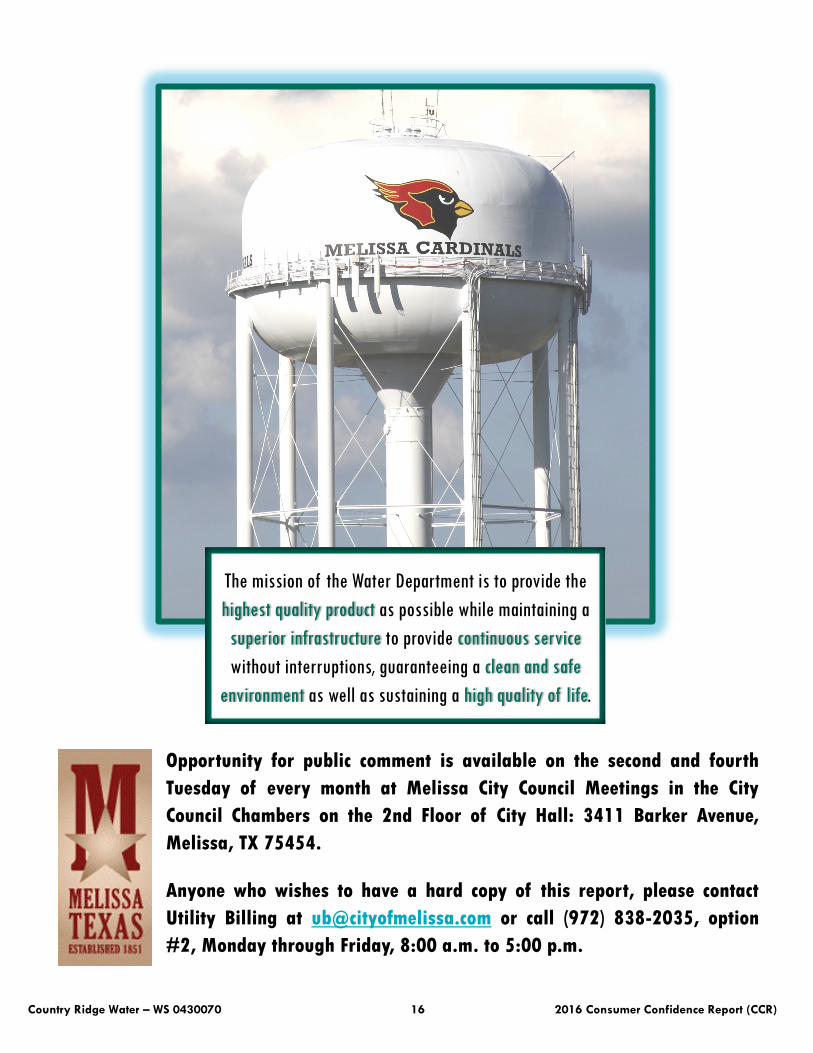
The mission of the Water Department is to provide the
highest quality product as possible while maintaining a
superior infrastructure to provide continuous service
without interruptions, guaranteeing a clean and safe
environment as well as sustaining a high quality of life.
Opportunity for public comment is available on the second and fourth
Tuesday of every month at Melissa City Council Meetings in the City
Council Chambers on the 2nd Floor of City Hall: 3411 Barker Avenue,
Melissa, TX 75454.
Anyone who wishes to have a hard copy of this report, please contact
Utility Billing at [email protected] or call (972) 838-2035, option
#2, Monday through Friday, 8:00 a.m. to 5:00 p.m.
Related Documents