City of Raleigh 2020 Consumer Confidence Report System ID: 03-92-010

Welcome message from author
This document is posted to help you gain knowledge. Please leave a comment to let me know what you think about it! Share it to your friends and learn new things together.
Transcript
City of Raleigh
2020 Consumer
Confidence
Report System ID: 03-92-010
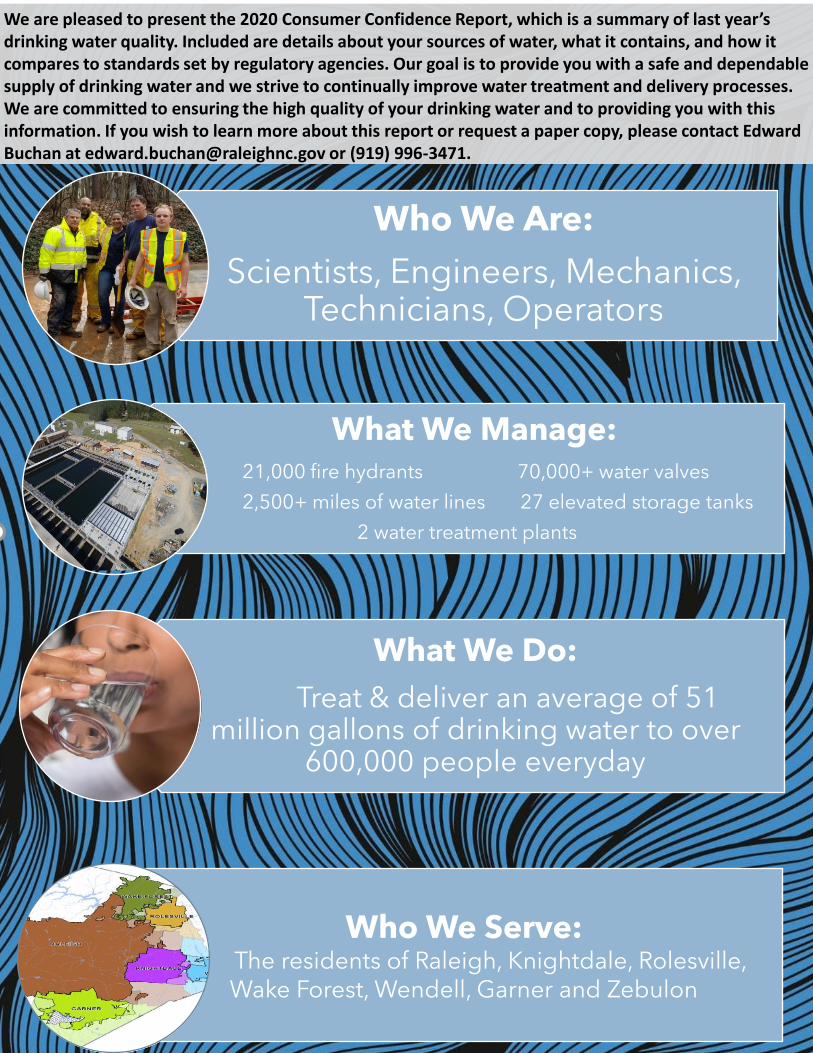
Who We Are:
Scientists, Engineers, Mechanics, Technicians, Operators
What We Manage:21,000 fire hydrants 70,000+ water valves
2,500+ miles of water lines 27 elevated storage tanks
2 water treatment plants
What We Do:
Treat & deliver an average of 51 million gallons of drinking water to over
600,000 people everyday
We are pleased to present the 2020 Consumer Confidence Report, which is a summary of last year’s drinking water quality. Included are details about your sources of water, what it contains, and how it compares to standards set by regulatory agencies. Our goal is to provide you with a safe and dependable supply of drinking water and we strive to continually improve water treatment and delivery processes. We are committed to ensuring the high quality of your drinking water and to providing you with this information. If you wish to learn more about this report or request a paper copy, please contact Edward Buchan at [email protected] or (919) 996-3471.
Who We Serve: The residents of Raleigh, Knightdale, Rolesville, Wake Forest, Wendell, Garner and Zebulon
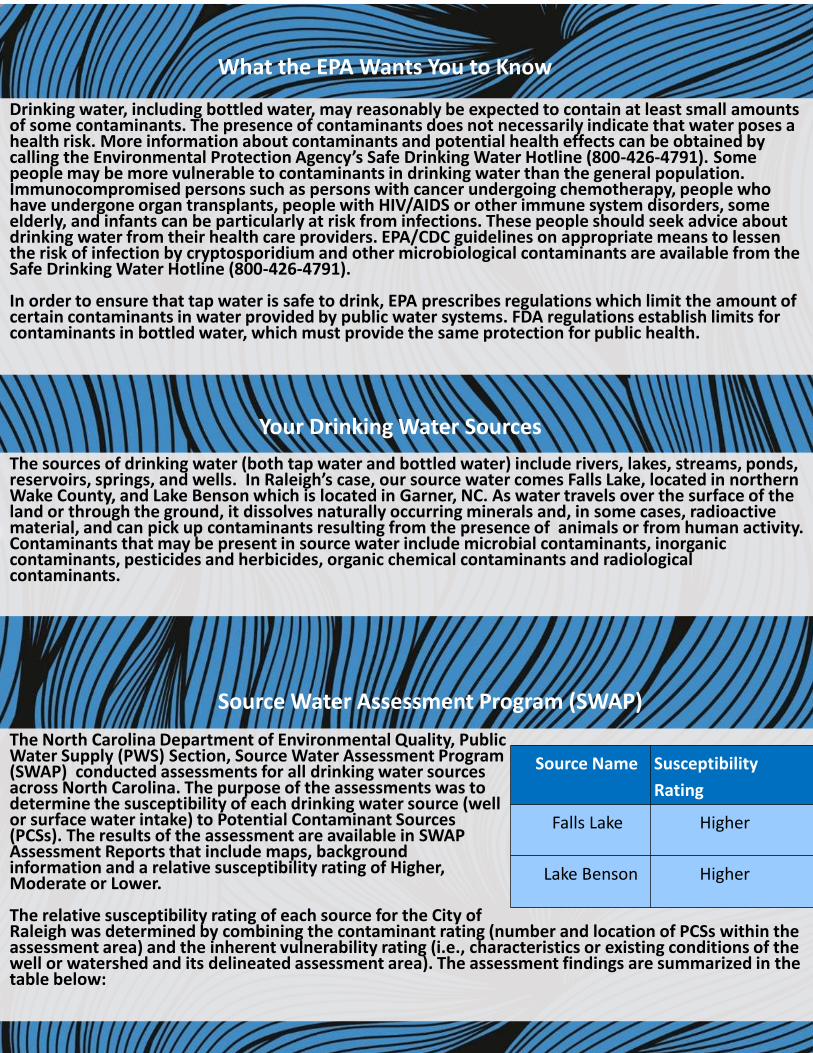
The North Carolina Department of Environmental Quality, Public Water Supply (PWS) Section, Source Water Assessment Program (SWAP) conducted assessments for all drinking water sources across North Carolina. The purpose of the assessments was to determine the susceptibility of each drinking water source (well or surface water intake) to Potential Contaminant Sources (PCSs). The results of the assessment are available in SWAP Assessment Reports that include maps, background information and a relative susceptibility rating of Higher, Moderate or Lower.
The relative susceptibility rating of each source for the City of Raleigh was determined by combining the contaminant rating (number and location of PCSs within the assessment area) and the inherent vulnerability rating (i.e., characteristics or existing conditions of the well or watershed and its delineated assessment area). The assessment findings are summarized in the table below:
The sources of drinking water (both tap water and bottled water) include rivers, lakes, streams, ponds, reservoirs, springs, and wells. In Raleigh’s case, our source water comes Falls Lake, located in northern Wake County, and Lake Benson which is located in Garner, NC. As water travels over the surface of the land or through the ground, it dissolves naturally occurring minerals and, in some cases, radioactive material, and can pick up contaminants resulting from the presence of animals or from human activity. Contaminants that may be present in source water include microbial contaminants, inorganic contaminants, pesticides and herbicides, organic chemical contaminants and radiological contaminants.
Your Drinking Water Sources
Source Water Assessment Program (SWAP)
Source Name Susceptibility
Rating
Falls Lake Higher
Lake Benson Higher
Drinking water, including bottled water, may reasonably be expected to contain at least small amounts of some contaminants. The presence of contaminants does not necessarily indicate that water poses a health risk. More information about contaminants and potential health effects can be obtained by calling the Environmental Protection Agency’s Safe Drinking Water Hotline (800-426-4791). Some people may be more vulnerable to contaminants in drinking water than the general population. Immunocompromised persons such as persons with cancer undergoing chemotherapy, people who have undergone organ transplants, people with HIV/AIDS or other immune system disorders, some elderly, and infants can be particularly at risk from infections. These people should seek advice about drinking water from their health care providers. EPA/CDC guidelines on appropriate means to lessen the risk of infection by cryptosporidium and other microbiological contaminants are available from the Safe Drinking Water Hotline (800-426-4791).
In order to ensure that tap water is safe to drink, EPA prescribes regulations which limit the amount of certain contaminants in water provided by public water systems. FDA regulations establish limits for contaminants in bottled water, which must provide the same protection for public health.
What the EPA Wants You to Know
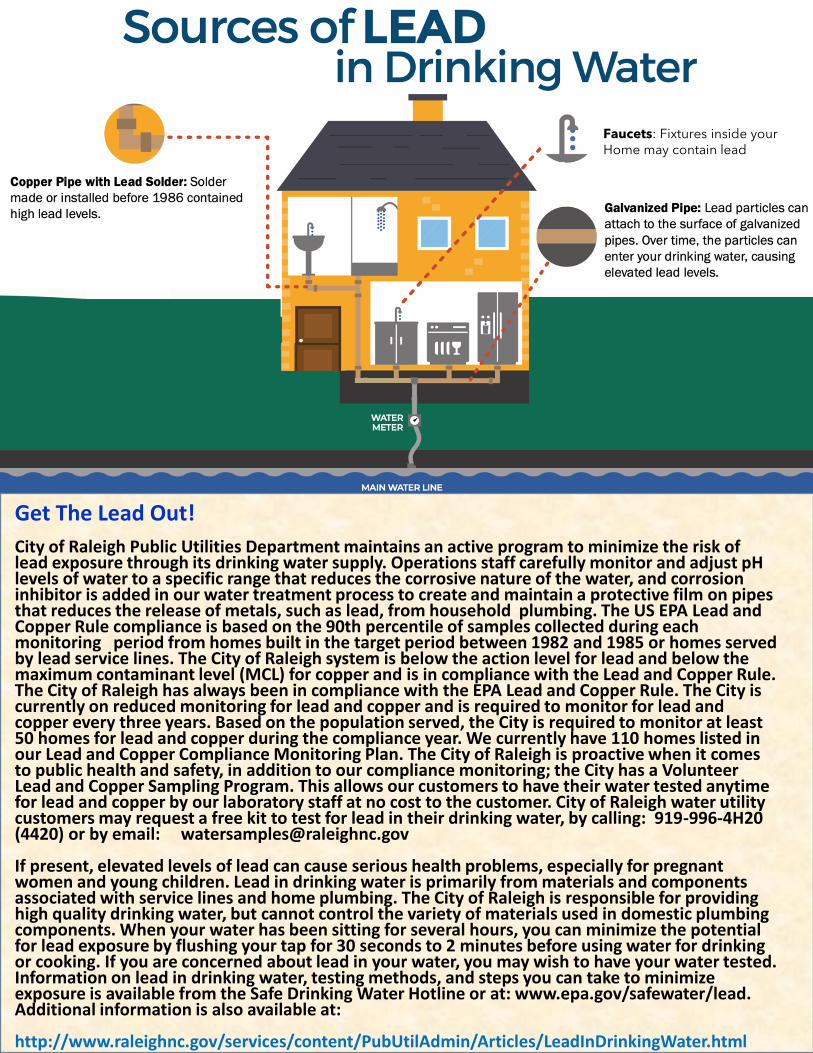
Get The Lead Out!
City of Raleigh Public Utilities Department maintains an active program to minimize the risk of lead exposure through its drinking water supply. Operations staff carefully monitor and adjust pH levels of water to a specific range that reduces the corrosive nature of the water, and corrosion inhibitor is added in our water treatment process to create and maintain a protective film on pipes that reduces the release of metals, such as lead, from household plumbing. The US EPA Lead and Copper Rule compliance is based on the 90th percentile of samples collected during each monitoring period from homes built in the target period between 1982 and 1985 or homes served by lead service lines. The City of Raleigh system is below the action level for lead and below the maximum contaminant level (MCL) for copper and is in compliance with the Lead and Copper Rule. The City of Raleigh has always been in compliance with the EPA Lead and Copper Rule. The City is currently on reduced monitoring for lead and copper and is required to monitor for lead and copper every three years. Based on the population served, the City is required to monitor at least 50 homes for lead and copper during the compliance year. We currently have 110 homes listed in our Lead and Copper Compliance Monitoring Plan. The City of Raleigh is proactive when it comes to public health and safety, in addition to our compliance monitoring; the City has a Volunteer Lead and Copper Sampling Program. This allows our customers to have their water tested anytime for lead and copper by our laboratory staff at no cost to the customer. City of Raleigh water utility customers may request a free kit to test for lead in their drinking water, by calling: 919-996-4H20 (4420) or by email: [email protected]
If present, elevated levels of lead can cause serious health problems, especially for pregnant women and young children. Lead in drinking water is primarily from materials and components associated with service lines and home plumbing. The City of Raleigh is responsible for providing high quality drinking water, but cannot control the variety of materials used in domestic plumbing components. When your water has been sitting for several hours, you can minimize the potential for lead exposure by flushing your tap for 30 seconds to 2 minutes before using water for drinking or cooking. If you are concerned about lead in your water, you may wish to have your water tested. Information on lead in drinking water, testing methods, and steps you can take to minimize exposure is available from the Safe Drinking Water Hotline or at: www.epa.gov/safewater/lead. Additional information is also available at:
http://www.raleighnc.gov/services/content/PubUtilAdmin/Articles/LeadInDrinkingWater.html
Faucets: Fixtures inside yourHome may contain lead
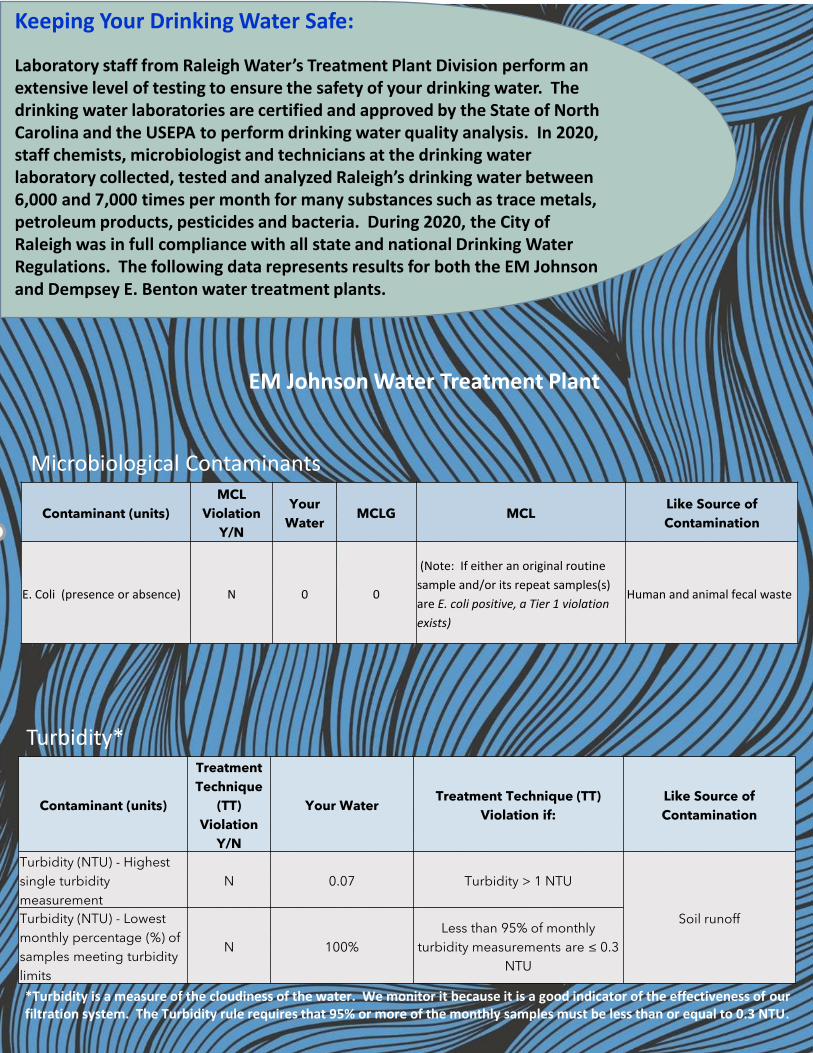
Keeping Your Drinking Water Safe:
Laboratory staff from Raleigh Water’s Treatment Plant Division perform an extensive level of testing to ensure the safety of your drinking water. The drinking water laboratories are certified and approved by the State of North Carolina and the USEPA to perform drinking water quality analysis. In 2020, staff chemists, microbiologist and technicians at the drinking water laboratory collected, tested and analyzed Raleigh’s drinking water between 6,000 and 7,000 times per month for many substances such as trace metals, petroleum products, pesticides and bacteria. During 2020, the City of Raleigh was in full compliance with all state and national Drinking Water Regulations. The following data represents results for both the EM Johnson and Dempsey E. Benton water treatment plants.
Contaminant (units)
MCL
Violation
Y/N
Your
WaterMCLG MCL
Like Source of
Contamination
E. Coli (presence or absence) N 0 0
(Note: If either an original routine
sample and/or its repeat samples(s)
are E. coli positive, a Tier 1 violation
exists)
Human and animal fecal waste
Contaminant (units)
Treatment
Technique
(TT)
Violation
Y/N
Your WaterTreatment Technique (TT)
Violation if:
Like Source of
Contamination
Turbidity (NTU) - Highest
single turbidity
measurement
N 0.07 Turbidity > 1 NTU
Soil runoffTurbidity (NTU) - Lowest
monthly percentage (%) of
samples meeting turbidity
limits
N 100%
Less than 95% of monthly
turbidity measurements are ≤ 0.3
NTU
*Turbidity is a measure of the cloudiness of the water. We monitor it because it is a good indicator of the effectiveness of our filtration system. The Turbidity rule requires that 95% or more of the monthly samples must be less than or equal to 0.3 NTU.
EM Johnson Water Treatment Plant
Microbiological Contaminants
Turbidity*
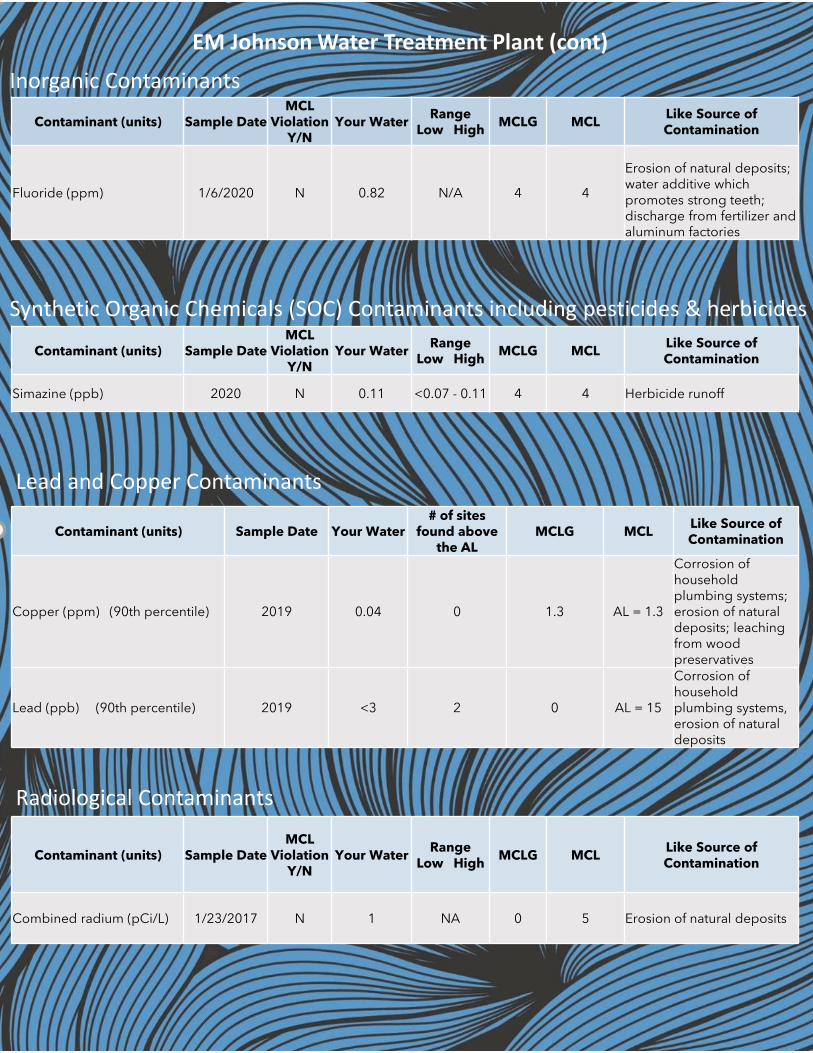
EM Johnson Water Treatment Plant (cont)
Contaminant (units) Sample DateMCL
Violation Y/N
Your Water Range
Low HighMCLG MCL
Like Source of Contamination
Fluoride (ppm) 1/6/2020 N 0.82 N/A 4 4
Erosion of natural deposits; water additive which promotes strong teeth; discharge from fertilizer and aluminum factories
Inorganic Contaminants
Contaminant (units) Sample DateMCL
Violation Y/N
Your Water Range
Low HighMCLG MCL
Like Source of Contamination
Simazine (ppb) 2020 N 0.11 <0.07 - 0.11 4 4 Herbicide runoff
Lead and Copper Contaminants
Synthetic Organic Chemicals (SOC) Contaminants including pesticides & herbicides
Contaminant (units) Sample Date Your Water # of sites
found above the AL
MCLG MCLLike Source of Contamination
Copper (ppm) (90th percentile) 2019 0.04 0 1.3 AL = 1.3
Corrosion of household plumbing systems; erosion of natural deposits; leaching from wood preservatives
Lead (ppb) (90th percentile) 2019 <3 2 0 AL = 15
Corrosion of household plumbing systems, erosion of natural deposits
Contaminant (units) Sample DateMCL
Violation Y/N
Your Water Range
Low HighMCLG MCL
Like Source of Contamination
Combined radium (pCi/L) 1/23/2017 N 1 NA 0 5 Erosion of natural deposits
Radiological Contaminants
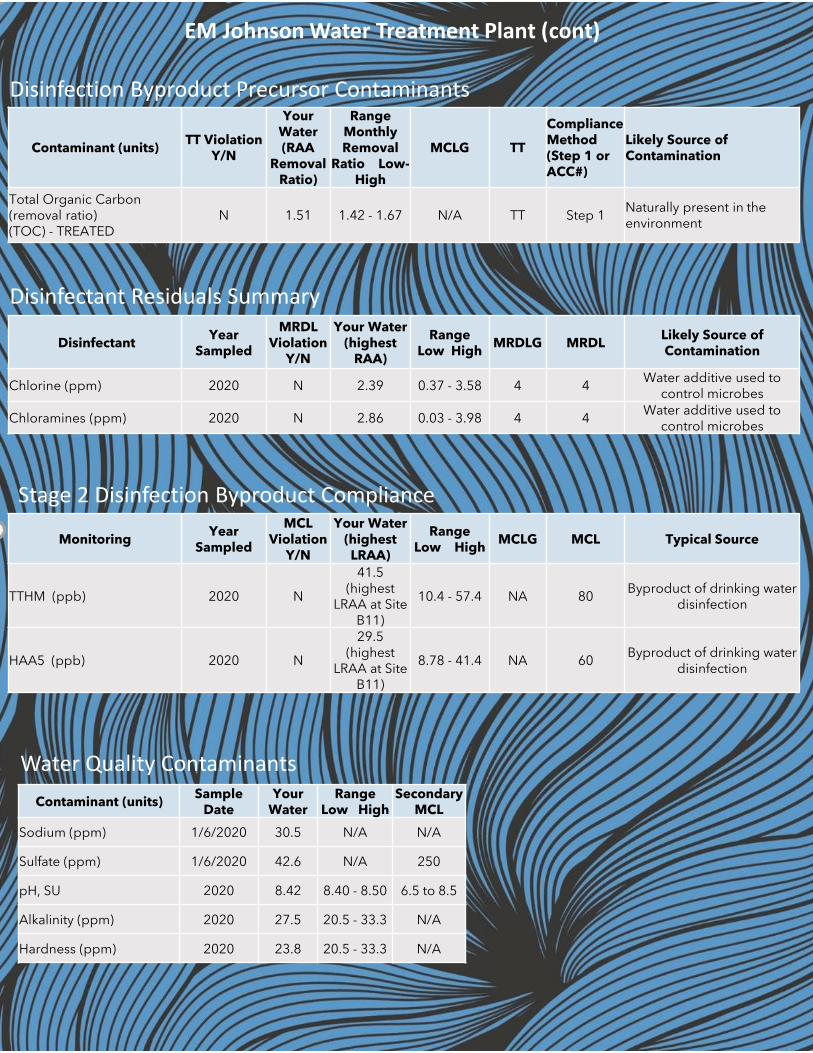
EM Johnson Water Treatment Plant (cont)
Contaminant (units)TT Violation
Y/N
Your Water (RAA
Removal Ratio)
Range Monthly Removal
Ratio Low-High
MCLG TT
Compliance Method (Step 1 or ACC#)
Likely Source of Contamination
Total Organic Carbon (removal ratio) (TOC) - TREATED
N 1.51 1.42 - 1.67 N/A TT Step 1Naturally present in the environment
DisinfectantYear
Sampled
MRDL Violation
Y/N
Your Water (highest
RAA)
Range Low High
MRDLG MRDLLikely Source of Contamination
Chlorine (ppm) 2020 N 2.39 0.37 - 3.58 4 4Water additive used to
control microbes
Chloramines (ppm) 2020 N 2.86 0.03 - 3.98 4 4Water additive used to
control microbes
Disinfection Byproduct Precursor Contaminants
Disinfectant Residuals Summary
MonitoringYear
Sampled
MCL Violation
Y/N
Your Water (highest LRAA)
Range Low High
MCLG MCL Typical Source
TTHM (ppb) 2020 N
41.5 (highest
LRAA at Site B11)
10.4 - 57.4 NA 80Byproduct of drinking water
disinfection
HAA5 (ppb) 2020 N
29.5 (highest
LRAA at Site B11)
8.78 - 41.4 NA 60Byproduct of drinking water
disinfection
Stage 2 Disinfection Byproduct Compliance
Water Quality Contaminants
Contaminant (units)Sample
DateYour
WaterRange
Low HighSecondary
MCL
Sodium (ppm) 1/6/2020 30.5 N/A N/A
Sulfate (ppm) 1/6/2020 42.6 N/A 250
pH, SU 2020 8.42 8.40 - 8.50 6.5 to 8.5
Alkalinity (ppm) 2020 27.5 20.5 - 33.3 N/A
Hardness (ppm) 2020 23.8 20.5 - 33.3 N/A
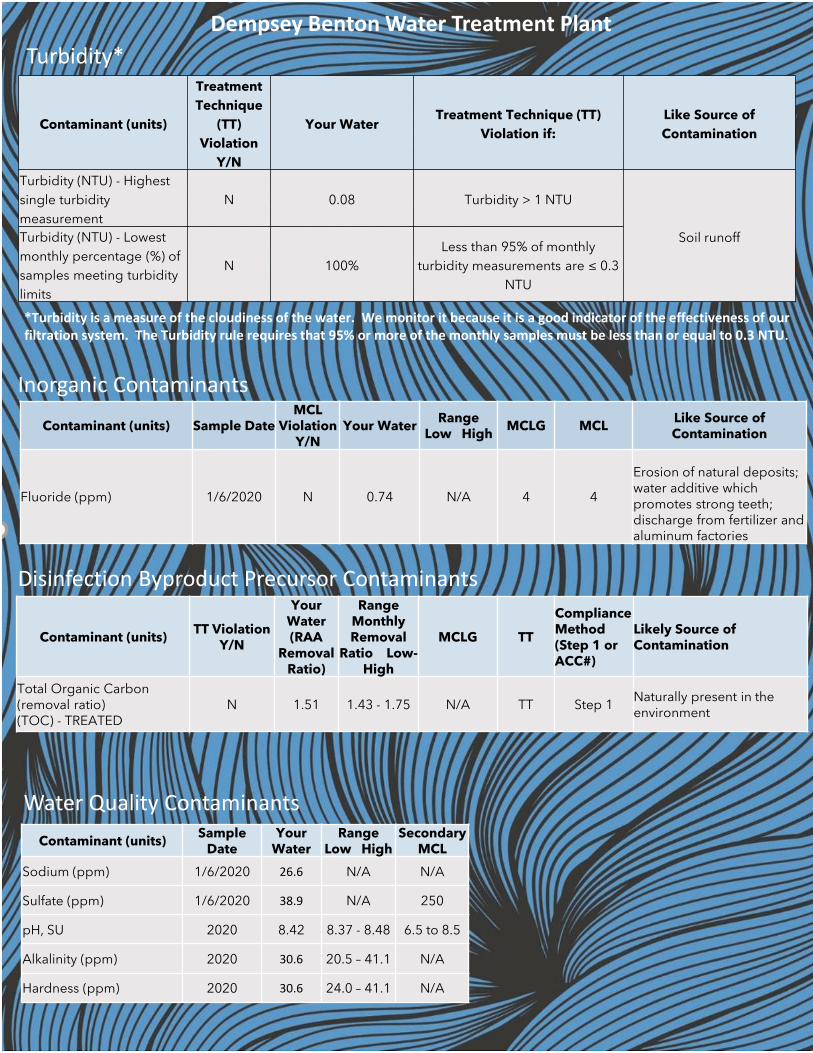
Contaminant (units)
Treatment
Technique
(TT)
Violation
Y/N
Your WaterTreatment Technique (TT)
Violation if:
Like Source of
Contamination
Turbidity (NTU) - Highest
single turbidity
measurement
N 0.08 Turbidity > 1 NTU
Soil runoffTurbidity (NTU) - Lowest
monthly percentage (%) of
samples meeting turbidity
limits
N 100%
Less than 95% of monthly
turbidity measurements are ≤ 0.3
NTU
*Turbidity is a measure of the cloudiness of the water. We monitor it because it is a good indicator of the effectiveness of our filtration system. The Turbidity rule requires that 95% or more of the monthly samples must be less than or equal to 0.3 NTU.
Dempsey Benton Water Treatment Plant
Turbidity*
Contaminant (units)TT Violation
Y/N
Your Water (RAA
Removal Ratio)
Range Monthly Removal
Ratio Low-High
MCLG TT
Compliance Method (Step 1 or ACC#)
Likely Source of Contamination
Total Organic Carbon (removal ratio) (TOC) - TREATED
N 1.51 1.43 - 1.75 N/A TT Step 1Naturally present in the environment
Disinfection Byproduct Precursor Contaminants
Contaminant (units) Sample DateMCL
Violation Y/N
Your Water Range
Low HighMCLG MCL
Like Source of Contamination
Fluoride (ppm) 1/6/2020 N 0.74 N/A 4 4
Erosion of natural deposits; water additive which promotes strong teeth; discharge from fertilizer and aluminum factories
Inorganic Contaminants
Water Quality Contaminants
Contaminant (units)Sample
DateYour
WaterRange
Low HighSecondary
MCL
Sodium (ppm) 1/6/2020 26.6 N/A N/A
Sulfate (ppm) 1/6/2020 38.9 N/A 250
pH, SU 2020 8.42 8.37 - 8.48 6.5 to 8.5
Alkalinity (ppm) 2020 30.6 20.5 – 41.1 N/A
Hardness (ppm) 2020 30.6 24.0 – 41.1 N/A
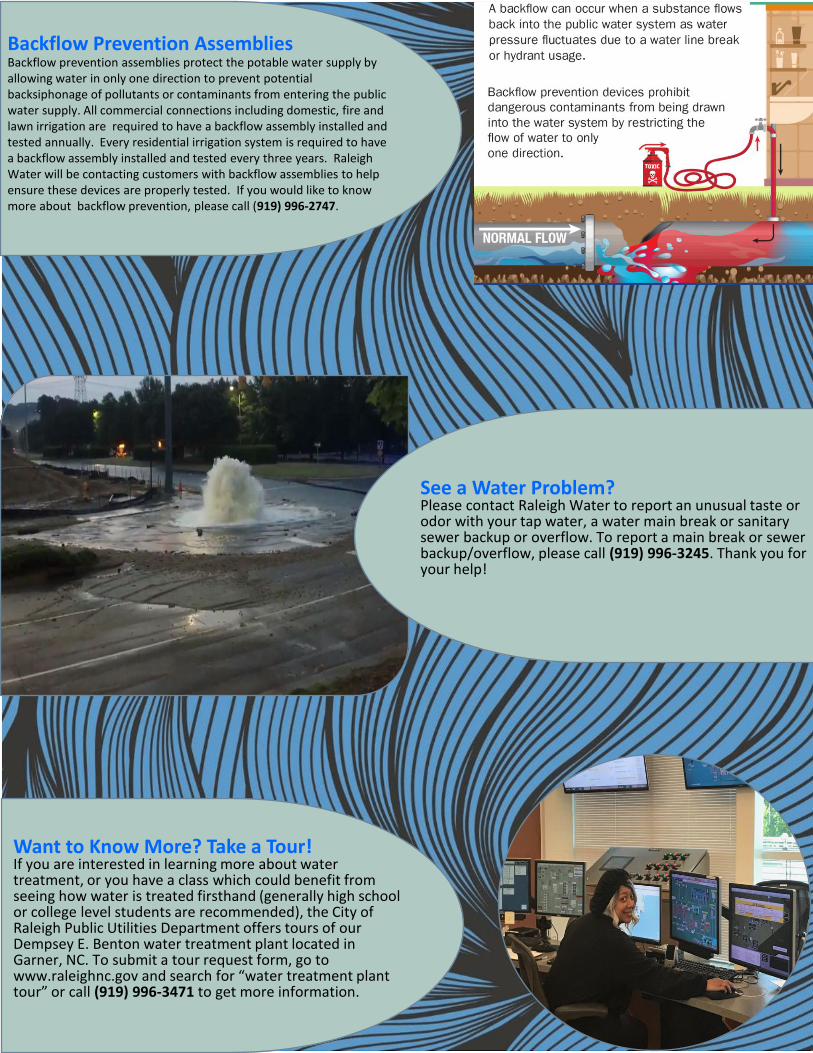
Backflow Prevention Assemblies Backflow prevention assemblies protect the potable water supply by allowing water in only one direction to prevent potential backsiphonage of pollutants or contaminants from entering the public water supply. All commercial connections including domestic, fire and lawn irrigation are required to have a backflow assembly installed and tested annually. Every residential irrigation system is required to have a backflow assembly installed and tested every three years. Raleigh Water will be contacting customers with backflow assemblies to help ensure these devices are properly tested. If you would like to know more about backflow prevention, please call (919) 996-2747.
Want to Know More? Take a Tour! If you are interested in learning more about water treatment, or you have a class which could benefit from seeing how water is treated firsthand (generally high school or college level students are recommended), the City of Raleigh Public Utilities Department offers tours of our Dempsey E. Benton water treatment plant located in Garner, NC. To submit a tour request form, go to www.raleighnc.gov and search for “water treatment plant tour” or call (919) 996-3471 to get more information.
See a Water Problem? Please contact Raleigh Water to report an unusual taste or odor with your tap water, a water main break or sanitary sewer backup or overflow. To report a main break or sewer backup/overflow, please call (919) 996-3245. Thank you for your help!
Related Documents