FAO’s forest product statistics present figures for the production and trade (quantity and value) of forest products, covering 55 product categories, 21 product groups, and 245 countries and territories. Final statistics are released at the end of each year and can be found in from the FAOSTAT-Forestry database in December, before they are published in the Yearbook of Forest Products the following April. The database has statistics from 1961 onwards, and the yearbooks date back to 1947. For the very first time, data on wood production and trade in Europe and North America since 1913 are now also available online. Highlights of 2011—2015 This note presents highlights and recent trends in data for each of the main product groups, as well as a short summary of recent changes or improvements in statistics. Some of the main points are highlighted below. • The recovery from the economic downturn of 2008–2009 is evident in the statistics gathered over the period from 2011–2015. Globally, production of all major products (industrial roundwood, sawnwood, wood- based panels, pulp and paper) has been gradually recovering in 2011–2015. Production in 2015 was higher than in 2014 (and pre-crisis 2007 level) for all of the product groups (pulp and paper 1 percent; sawnwood and panels both 3 percent). The fastest growth was in Asia-Pacific and Northern America. • China has grown in importance as both a producer and consumer of forest products, and has recently overtaken a number of other big players in different product groups (e.g. overtaking Canada in sawnwood production and United States of America in sawnwood consumption). The country is by far the largest producer and consumer of wood-based panels and paper. It is also highly significant in international trade of forest products, being the world’s largest importer of industrial roundwood, sawnwood and fibre furnish (pulp and recovered paper), and the largest exporter of wood-based panels. In 2015, China’s imports of industrial roundwood declined by 14 percent (back to the level in 2013) while sawnwood and paper production and consumption continued to grow. • Wood pellets production has increased dramatically in recent years, mainly owing to demand created generated from bioenergy targets set by the European Commission. In 2015, global production grew by another 8 percent, reaching 28 million tonnes, of which more than half (16 million tonnes) was traded internationally. Europe and Northern America accounted for almost all global production (59 percent and 33 percent respectively) and consumption (78 percent and 12 percent respectively). Trade in pellets from Northern America to Europe (mainly the UK) grew by another 15 percent to reach 6 million tonnes in 2015. • Production and consumption of wood pellets in Asia increased by almost 10 percent, but not as fast as in previous years (doubled in 2014). The Republic of Korea remained the fourth largest wood pellets importer (as in 2014), driving up wood pellets production in many countries in the region (especially Viet Nam, Malaysia, Indonesia and Thailand). Imports to the Republic of Korea saw a sharp decline by 20 percent in 2015, however this decline was offset by growth in production and consumption in China and Japan. • In 2014-15, India became the world’s fifth largest paper and paperboard producer by overtaking the Republic of Korea and the fourth largest fibre furnish (pulp and recovered paper) importer by overtaking the Republic of Korea and Italy. • Wood-based panel and sawnwood production (combined) grew in all five regions around the world in 2015. Global production of both panels and sawnwood increased by 3 percent while trade grew at a lower rate (2 percent for both products). Global production of panels was record high (399 million m³) and sawnwood registered the highest production (452 million m³) since 1990. • The Russian Federation has recently overtaken Canada and Germany to become the world’s third-largest producer and consumer of wood-based panels, and Thailand to become fifth-largest exporter in 2015. Canada saw double digit growth in production and exports of sawnwood and panels thanks to increased sales to the USA (due to a recovering economy and housing market). • South America has continued expanding wood pulp production with an increasing number of new pulp mills being built in Brazil, Chile and Uruguay. These three countries currently account for 14 percent of global wood pulp production and 74 percent of exports. In 2014, Brazil overtook Canada for the first time as the world’s fourth largest country in fibre furnish production. • In 2015, paper production stagnated in Africa and Europe but declined in Northern America while it grew modestly in Latin America and the Caribbean and Asia-Pacific. • Global production and trade of pulp and paper grew at a modest annual rate of one percent over the 2011–2015 period. 2015 Global Forest Products Facts and Figures

Welcome message from author
This document is posted to help you gain knowledge. Please leave a comment to let me know what you think about it! Share it to your friends and learn new things together.
Transcript
FAO’s forest product statistics present figures for the production and trade (quantity and value) of forest products, covering 55 product categories, 21 product groups, and 245 countries and territories. Final statistics are released at the end of each year and can be found in from the FAOSTAT-Forestry database in December, before they are published in the Yearbook of Forest Products the following April. The database has statistics from 1961 onwards, and the yearbooks date back to 1947. For the very first time, data on wood production and trade in Europe and North America since 1913 are now also available online.
Highlights of 2011—2015
This note presents highlights and recent trends in data for each of the main product groups, as well as a short summary of recent changes or improvements in statistics. Some of the main points are highlighted below.
• The recovery from the economic downturn of2008–2009 is evident in the statistics gathered over the period from 2011–2015. Globally, production of all major products (industrial roundwood, sawnwood, wood- based panels, pulp and paper) has been gradually recovering in 2011–2015. Production in 2015 was higher than in 2014 (and pre-crisis 2007 level) for all of the product groups (pulp and paper 1 percent; sawnwood and panels both 3 percent). The fastest growth was in Asia-Pacific and Northern America.
• China has grown in importance as both a producerand consumer of forest products, and has recently overtaken a number of other big players in different product groups (e.g. overtaking Canada in sawnwood production and United States of America in sawnwood consumption). The country is by far the largest producer and consumer of wood-based panels and paper. It is also highly significant in international trade of forest products, being the world’s largest importer of industrial roundwood, sawnwood and fibre furnish (pulp and recovered paper), and the largest exporter of wood-based panels. In 2015, China’s imports of industrial roundwood declined by 14 percent (back to the level in 2013) while sawnwood and paper production and consumption continued to grow.
• Wood pellets production has increased dramaticallyin recent years, mainly owing to demand created generated from bioenergy targets set by the European Commission. In 2015, global production grew by another 8 percent, reaching 28 million tonnes, of which more than half (16 million tonnes) was traded internationally. Europe and Northern America accounted for almost all global production (59 percent and 33 percent respectively) and consumption (78 percent and 12 percent respectively). Trade in pellets from Northern America to Europe (mainly the UK) grew by another 15 percent to reach 6 million tonnes in 2015.
• Production and consumption of wood pellets in Asiaincreased by almost 10 percent, but not as fast as in previous years (doubled in 2014). The Republic
of Korea remained the fourth largest wood pellets importer (as in 2014), driving up wood pellets production in many countries in the region (especially Viet Nam, Malaysia, Indonesia and Thailand). Imports to the Republic of Korea saw a sharp decline by 20 percent in 2015, however this decline was offset by growth in production and consumption in China and Japan.
• In 2014-15, India became the world’s fifth largestpaper and paperboard producer by overtaking the Republic of Korea and the fourth largest fibre furnish (pulp and recovered paper) importer by overtaking the Republic of Korea and Italy.
• Wood-based panel and sawnwood production(combined) grew in all five regions around the world in 2015. Global production of both panels and sawnwood increased by 3 percent while trade grew at a lower rate (2 percent for both products). Global production of panels was record high (399 million m³) and sawnwood registered the highest production (452 million m³) since 1990.
• The Russian Federation has recently overtakenCanada and Germany to become the world’s third-largest producer and consumer of wood-based panels, and Thailand to become fifth-largest exporter in 2015. Canada saw double digit growth in production and exports of sawnwood and panels thanks to increased sales to the USA (due to a recovering economy and housing market).
• South America has continued expanding wood pulpproduction with an increasing number of new pulp mills being built in Brazil, Chile and Uruguay. These three countries currently account for 14 percent of global wood pulp production and 74 percent of exports. In 2014, Brazil overtook Canada for the first time as the world’s fourth largest country in fibre furnish production.
• In 2015, paper production stagnated in Africa andEurope but declined in Northern America while it grew modestly in Latin America and the Caribbean and Asia-Pacific.
• Global production and trade of pulp and paper grewat a modest annual rate of one percent over the 2011–2015 period.
2015 Global Forest Products Facts and Figures
2
Industrial roundwood
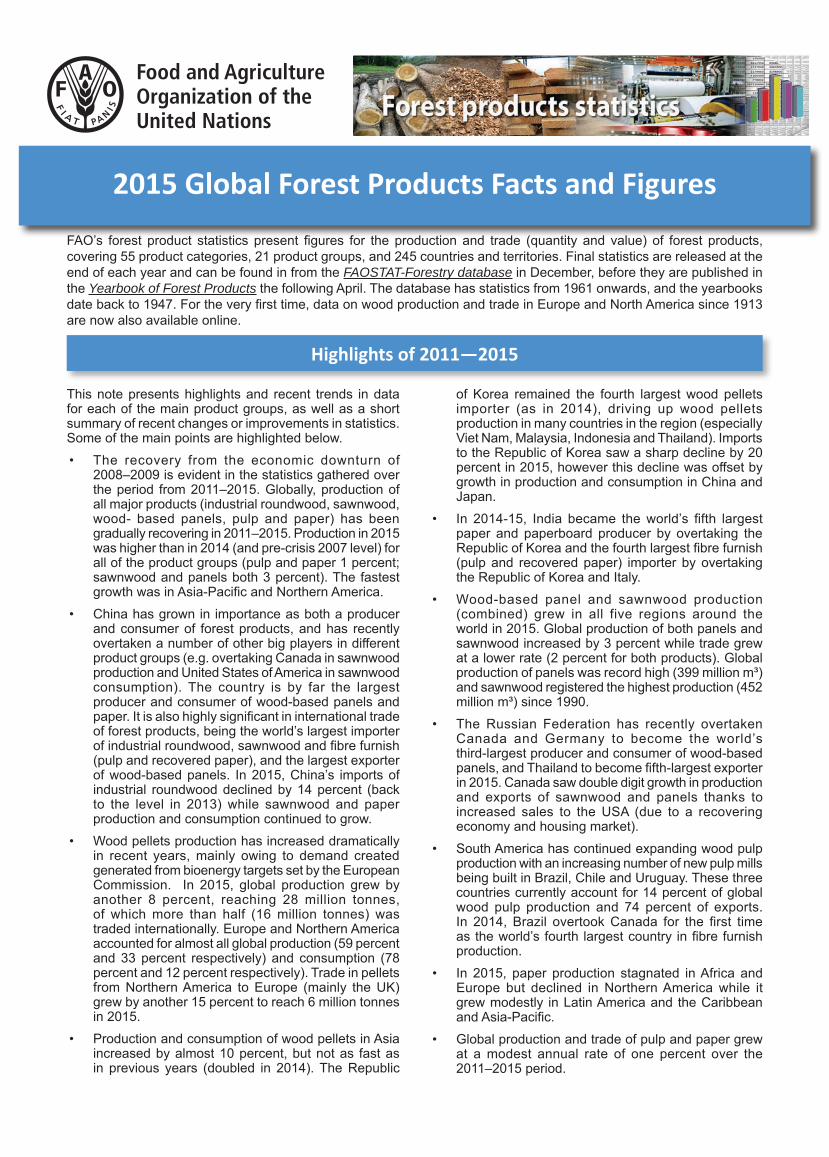
Industrial roundwood is all roundwood used for any purpose other than energy. It comprises: pulpwood; sawlogs and veneer logs; and other industrial roundwood (e.g. roundwood used for fence posts and telegraph poles). This product group is also divided into roundwood from coniferous and non-coniferous species.
0
200
400
600
800
1000
1200
1400
1600
1800
2000
20152014201320122011
0
10
20
30
40
20152014201320122011
-40
-30
-20
-10
0
20152014201320122011
In 2015, global industrial roundwood production amounted to 1 848 million m³. This is an increase of 1.6 percent compared to 2014 (1 818 million m³) and 4.4 percent compared to the level in 2011 (Figure 1a).
Most of the growth occurred in Asia-Pacific, Europe and Northern America, which, in 2015, jointly produced 5 percent more than in 2011. Production in Africa and Latin America and the Caribbean did not change significantly during this period.
In 2015, production in each region was as follows: Europe (including Russian Federation) - 579 million m³ (31 percent); Northern America (USA and Canada) - 520 million m³ (28 percent); Asia and the Pacific - 451 million m³ (24 percent); Latin America and Caribbean - 225 million m³ (12 percent); and Africa - 72 million m³ (4 percent).
In 2015, global trade in industrial roundwood amounted to 123 million m³ (equal to about 7 percent of production). Trends in total trade and net trade over the observed period showed a decline of 6 percent in 2012, an increase of 13 and 5 percent in 2013 and 2014 respectively (Figure 1b) and an 8 percent decline in 2015. At a regional level, Asia-Pacific is a net importer of industrial roundwood, and all other regions
are net exporters. In 2015, net imports of 31 million m³ accounted for about 6 percent of consumption in the Asia-Pacific region. Europe and Northern America are the main net exporters of industrial roundwood, with net exports in 2015 of 13 million m³ and 12 million m³ respectively. Both regions reported sharp decline in net exports in 2015 (14 percent and 24 percent respectively).
At the country level, the five largest producers of industrial roundwood are the USA, the Russian Federation, China, Canada and Brazil (Figure 2a). Together, these countries produced 1 014 million m³ in 2015, or 55 percent of total global production. The USA is by far the largest producer in the world (369 million m³ in 2015), production declined slightly in 2012, but recovered in the following three years. Production in the Russian Federation and Canada increased from 2011. Production in China remained quite stable while declining by 3 percent in Brazil from 2011 to 2015.
Owing to the relatively small volumes of international trade in industrial roundwood, the five largest producers are also the five largest consumers. China is the second-largest consumer (212 million m³ of roundwood in 2015), with a 14 percent decline in imports in 2015. The Russian Federation is in third place (at 171 million
Mill
ion
cubi
c m
etre
s
Figure 1a: Industrial roundwood production
Northern AmericaLatin America and CaribbeanEuropeAsia-Paci�cAfrica
Figure 1b: Industrial roundwood net trade
© F
AO
/A. L
ebed
ys
© F
AO
/A. L
ebed
ys

3
0
50
100
150
200
250
300
350
400
20152014201320122011Russia CanadaChina BrazilUSA
0
5
10
15
20
25
20152014201320122011AustraliaCanadaUSANew ZealandRussia
0
50
100
150
200
250
300
350
400
20152014201320122011Canada BrazilRussiaChinaUSA
0
10
20
30
40
50
60
20152014201320122011FinlandSwedenGermanyAustriaChina
Figure 2a: Industrial roundwood production Figure 2b: Industrial roundwood exportsM
illio
n cu
bic
met
res
Mill
ion
cubi
c m
etre
s
Sawnwood
Sawnwood encompasses planks, beams, boards, laths, etc. that exceed 5 mm in thickness. It includes sawnwood that is planed, unplaned, grooved, chamfered, beaded, etc., but it does not include wooden flooring. FAO statistics subdivide this category into coniferous and non-coniferous sawnwood.
Figure 3a: Industrial roundwood consumption Figure 3b: Industrial roundwood imports
© F
AO
/A. L
ebed
ys
© F
AO
/A. L
ebed
ys
m³) (Figure 3a). Since 2011, consumption has increased in all major consumer countries except Brazil.
As Figure 3b shows, imports make up about 21 percent (45 million m³ in 2015) of China’s industrial roundwood consumption. A large share of these imports comes from the Russian Federation, although other countries, especially New Zealand, are growing in importance. After
China, other major importers of industrial roundwood are Germany, Sweden, Austria and Finland. Together, these five countries imported 74 million m³ of industrial roundwood in 2015 (equivalent to 60 percent of all imports). Finland overtook India to become the fifth-largest importer in 2015.
4
0
50
100
150
200
250
300
350
400
450
20152014201320122011
0102030405060
20152014201320122011
-60-50-40-30-20-10
0
20152014201320122011
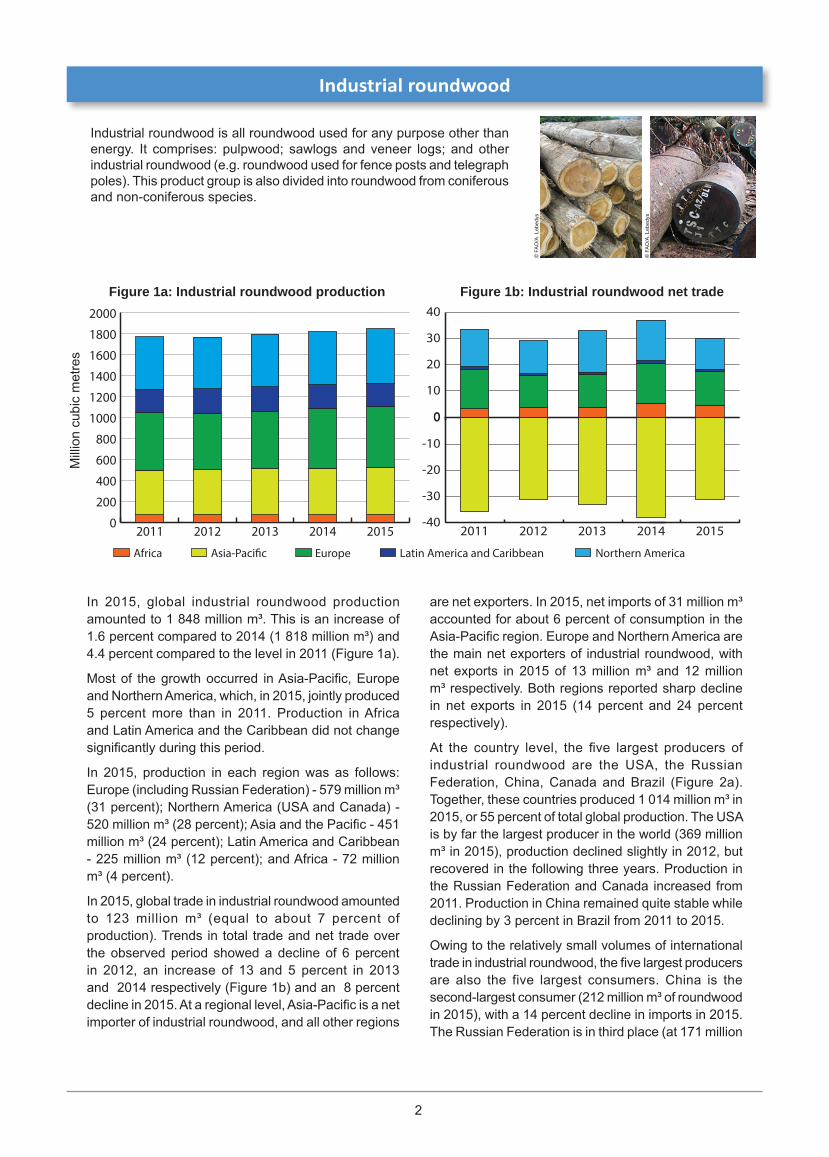
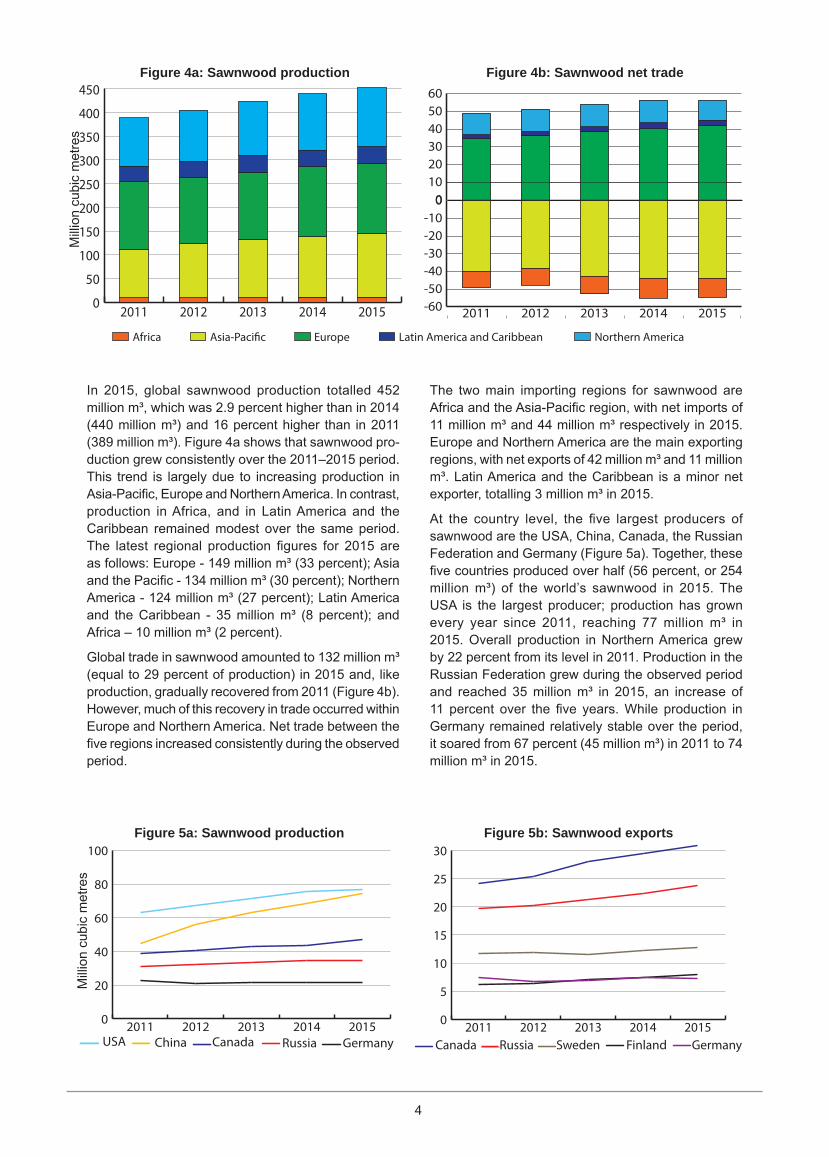
In 2015, global sawnwood production totalled 452 million m³, which was 2.9 percent higher than in 2014 (440 million m³) and 16 percent higher than in 2011 (389 million m³). Figure 4a shows that sawnwood pro-duction grew consistently over the 2011–2015 period. This trend is largely due to increasing production in Asia-Pacific, Europe and Northern America. In contrast, production in Africa, and in Latin America and the Caribbean remained modest over the same period. The latest regional production figures for 2015 are as follows: Europe - 149 million m³ (33 percent); Asia and the Pacific - 134 million m³ (30 percent); Northern America - 124 million m³ (27 percent); Latin America and the Caribbean - 35 million m³ (8 percent); and Africa – 10 million m³ (2 percent).
Global trade in sawnwood amounted to 132 million m³ (equal to 29 percent of production) in 2015 and, like production, gradually recovered from 2011 (Figure 4b). However, much of this recovery in trade occurred within Europe and Northern America. Net trade between the five regions increased consistently during the observed period.
The two main importing regions for sawnwood are Africa and the Asia-Pacific region, with net imports of 11 million m³ and 44 million m³ respectively in 2015. Europe and Northern America are the main exporting regions, with net exports of 42 million m³ and 11 million m³. Latin America and the Caribbean is a minor net exporter, totalling 3 million m³ in 2015.
At the country level, the five largest producers of sawnwood are the USA, China, Canada, the Russian Federation and Germany (Figure 5a). Together, these five countries produced over half (56 percent, or 254 million m³) of the world’s sawnwood in 2015. The USA is the largest producer; production has grown every year since 2011, reaching 77 million m³ in 2015. Overall production in Northern America grew by 22 percent from its level in 2011. Production in the Russian Federation grew during the observed period and reached 35 million m³ in 2015, an increase of 11 percent over the five years. While production in Germany remained relatively stable over the period, it soared from 67 percent (45 million m³) in 2011 to 74 million m³ in 2015.
Mill
ion
cubi
c m
etre
sFigure 4a: Sawnwood production Figure 4b: Sawnwood net trade
0
20
40
60
80
100
GermanyRussiaCanadaChina20152014201320122011
USA
0
5
10
15
20
25
30
GermanyFinlandSwedenRussiaCanada20152014201320122011
Figure 5a: Sawnwood production Figure 5b: Sawnwood exports
Mill
ion
cubi
c m
etre
s
Northern AmericaLatin America and CaribbeanEuropeAsia-Paci�cAfrica

5
Three of the largest sawnwood producers are also the major exporters (Canada, the Russian Federation and Germany); the other two main exporters are Sweden and Finland (Figure 5b). Together, these five countries exported 82 million m³ (62 percent of all exports) in 2015. Canada’s exports grew steadily since 2011, and the country remained the top exporter in 2015 (exporting 31 million m³). This was largely due to increasing sales to the recovering market in the USA. Exports from Sweden, Finland and Germany remained relatively stable with a slight increase over the period, but those from the Russian Federation increased consistently.
As well as being the largest producers, China and the USA were the two main consumers of sawnwood in 2015, consuming 102 million m³ and 95 million m³ respectively (Figure 6a). Consumption in the
USA increased by 4 percent in 2015, and China’s consumption grew by approximately 52 percent over the five-year period (7 percent in 2015). The other three main consumers of sawnwood in the world are Germany, Japan and Canada, where consumption remained quite stable.
With respect to imports, China overtook the USA in 2011 to become the largest importer of sawnwood; in 2015, the two countries imported 28 million m³ and 24 million m³ respectively (Figure 6b). Other major sawnwood importers are the UK, Japan and Egypt. Together, these five countries imported 70 million m³ of sawnwood (equal to 54 percent of all imports) in 2015, and in all of these countries, imports account for a significant share of sawnwood consumption (27 percent in China, 26 percent in the USA and 39 percent in Japan alone).
0
20
40
60
80
100
Canada20152014201320122011
JapanGermanyUSAChina
0
5
10
15
20
25
30EgyptJapanUKUSAChina
20152014201320122011EgyptJapanUKUSAChina
Figure 6a: Sawnwood consumption Figure 6b: Sawnwood importsM
illio
n cu
bic
met
res
Wood-based panels
The wood-based panels’ product category consists of veneer sheets, plywood (including blockboard), particleboard (includ-ing Oriented Strand Board - OSB) and fibreboard. Fibreboard is also subdivided in FAO’s statistics into hardboard, medium/high density fibreboard (MDF/HDF) and other fibreboard, based on the density and manufacturing process of these panels.
In 2015, global wood-based panel production reached 399 million m³, a 3 percent increase over the previous year (388 million m³) and a 26 percent increase over the observed period (Figure 7a). Wood-based panels was the product category that saw the fastest growth in production, owing to the rapid and consistent growth in the Asia-Pacific region. Production surged by 40 percent in the region during 2011-2015 while it grew modestly by 8 percent in the other four regions over the same period. ©
FA
O/A
. Leb
edys
© IT
TO/J
-C. C
laud
on
6
0
50
100
150
200
250
300
350
400
20152014201320122011
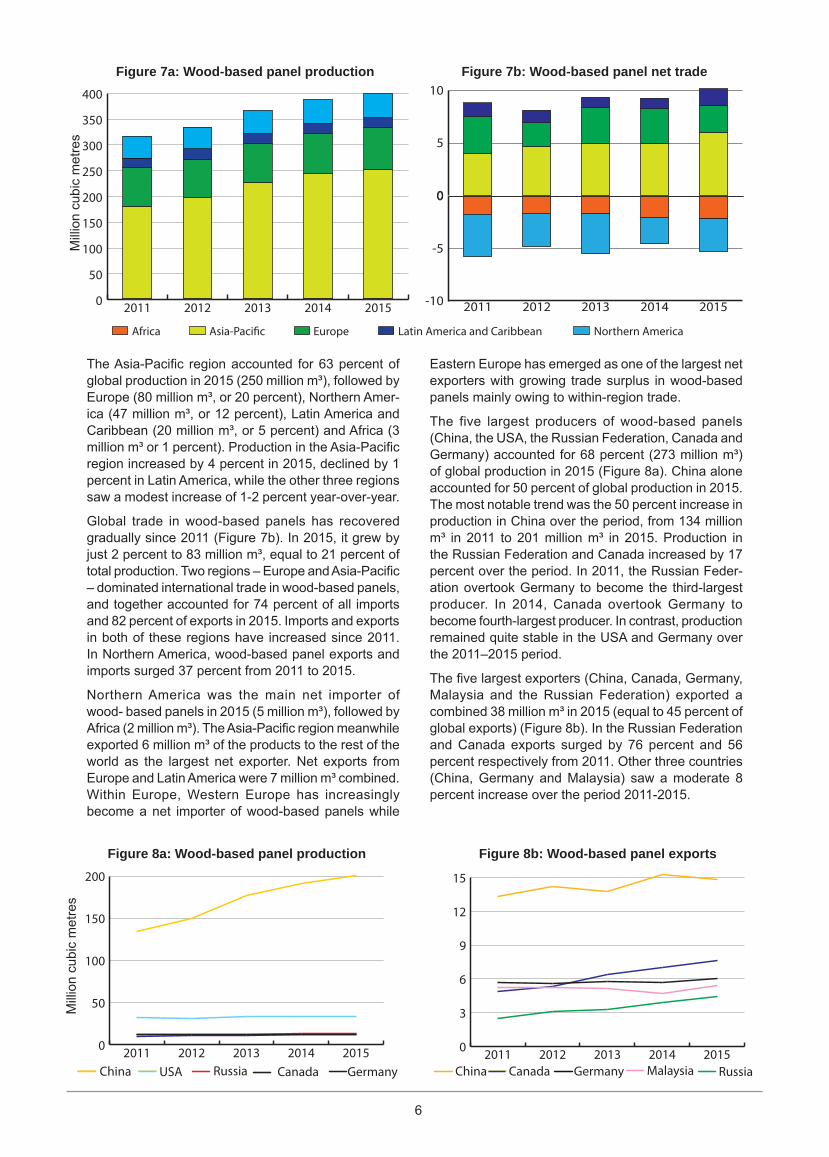
The Asia-Pacific region accounted for 63 percent of global production in 2015 (250 million m³), followed by Europe (80 million m³, or 20 percent), Northern Amer-ica (47 million m³, or 12 percent), Latin America and Caribbean (20 million m³, or 5 percent) and Africa (3 million m³ or 1 percent). Production in the Asia-Pacific region increased by 4 percent in 2015, declined by 1 percent in Latin America, while the other three regions saw a modest increase of 1-2 percent year-over-year.
Global trade in wood-based panels has recovered gradually since 2011 (Figure 7b). In 2015, it grew by just 2 percent to 83 million m³, equal to 21 percent of total production. Two regions – Europe and Asia-Pacific – dominated international trade in wood-based panels, and together accounted for 74 percent of all imports and 82 percent of exports in 2015. Imports and exports in both of these regions have increased since 2011. In Northern America, wood-based panel exports and imports surged 37 percent from 2011 to 2015.
Northern America was the main net importer of wood- based panels in 2015 (5 million m³), followed by Africa (2 million m³). The Asia-Pacific region meanwhile exported 6 million m³ of the products to the rest of the world as the largest net exporter. Net exports from Europe and Latin America were 7 million m³ combined. Within Europe, Western Europe has increasingly become a net importer of wood-based panels while
Eastern Europe has emerged as one of the largest net exporters with growing trade surplus in wood-based panels mainly owing to within-region trade.
The five largest producers of wood-based panels (China, the USA, the Russian Federation, Canada and Germany) accounted for 68 percent (273 million m³) of global production in 2015 (Figure 8a). China alone accounted for 50 percent of global production in 2015. The most notable trend was the 50 percent increase in production in China over the period, from 134 million m³ in 2011 to 201 million m³ in 2015. Production in the Russian Federation and Canada increased by 17 percent over the period. In 2011, the Russian Feder-ation overtook Germany to become the third-largest producer. In 2014, Canada overtook Germany to become fourth-largest producer. In contrast, production remained quite stable in the USA and Germany over the 2011–2015 period.
The five largest exporters (China, Canada, Germany, Malaysia and the Russian Federation) exported a combined 38 million m³ in 2015 (equal to 45 percent of global exports) (Figure 8b). In the Russian Federation and Canada exports surged by 76 percent and 56 percent respectively from 2011. Other three countries (China, Germany and Malaysia) saw a moderate 8 percent increase over the period 2011-2015.
Figure 7a: Wood-based panel production Figure 7b: Wood-based panel net tradeM
illio
n cu
bic
met
res
Northern AmericaLatin America and CaribbeanEuropeAsia-Paci�cAfrica
0
50
100
150
200GermanyCanadaRussiaUSAChina
20152014201320122011CanadaRussia GermanyUSAChina
0
3
6
9
12
15
20152014201320122011 RussiaGermany MalaysiaCanadaChina
Figure 8a: Wood-based panel production Figure 8b: Wood-based panel exports
Mill
ion
cubi
c m
etre
s
0
5
10
20152014201320122011
-10
-5
0
20152014201320122011
7
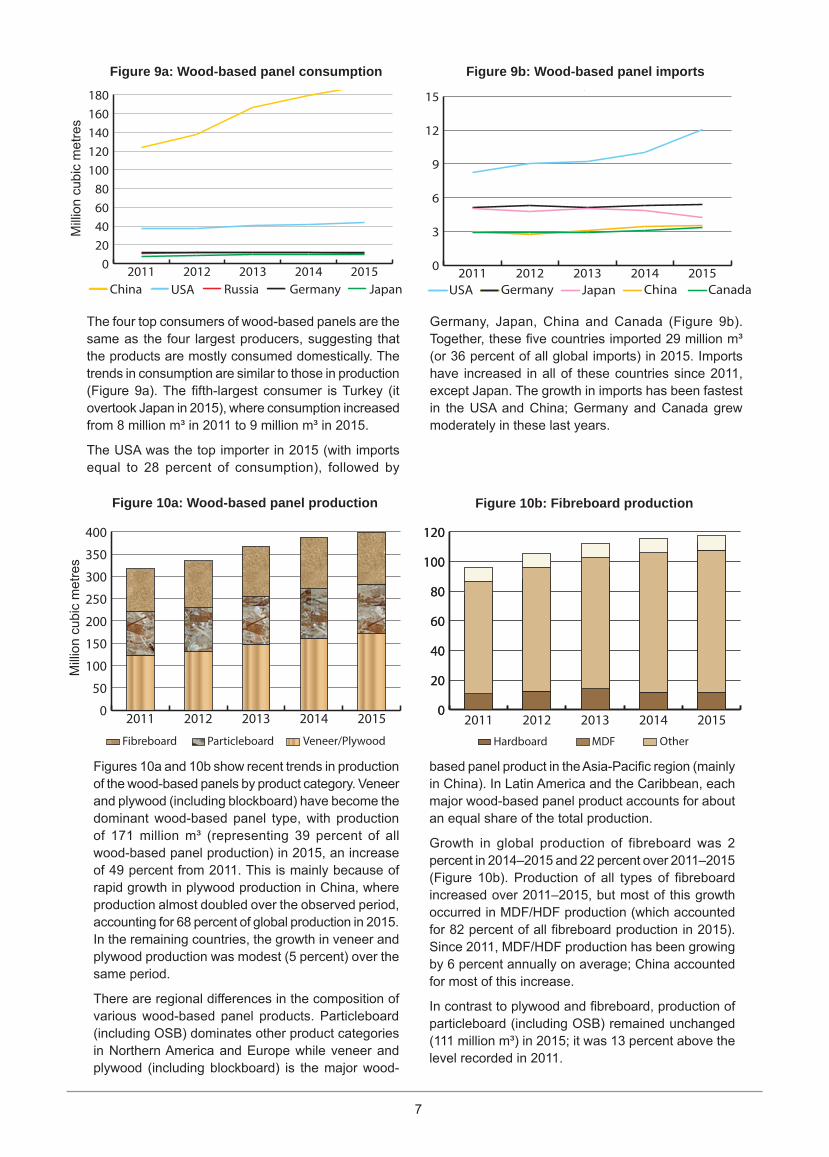
The four top consumers of wood-based panels are the same as the four largest producers, suggesting that the products are mostly consumed domestically. The trends in consumption are similar to those in production (Figure 9a). The fifth-largest consumer is Turkey (it overtook Japan in 2015), where consumption increased from 8 million m³ in 2011 to 9 million m³ in 2015.
The USA was the top importer in 2015 (with imports equal to 28 percent of consumption), followed by
Germany, Japan, China and Canada (Figure 9b). Together, these five countries imported 29 million m³ (or 36 percent of all global imports) in 2015. Imports have increased in all of these countries since 2011, except Japan. The growth in imports has been fastest in the USA and China; Germany and Canada grew moderately in these last years.
020406080
100120140160180
20152014201320122011JapanGermanyRussiaUSAChina
0
3
6
9
12
15CanadaChinaJapanGermanyUSA
20152014201320122011CanadaChinaJapanGermanyUSA
Figure 9a: Wood-based panel consumption Figure 9b: Wood-based panel importsM
illio
n cu
bic
met
res
Figures 10a and 10b show recent trends in production of the wood-based panels by product category. Veneer and plywood (including blockboard) have become the dominant wood-based panel type, with production of 171 million m³ (representing 39 percent of all wood-based panel production) in 2015, an increase of 49 percent from 2011. This is mainly because of rapid growth in plywood production in China, where production almost doubled over the observed period, accounting for 68 percent of global production in 2015. In the remaining countries, the growth in veneer and plywood production was modest (5 percent) over the same period.
There are regional differences in the composition of various wood-based panel products. Particleboard (including OSB) dominates other product categories in Northern America and Europe while veneer and plywood (including blockboard) is the major wood-
based panel product in the Asia-Pacific region (mainly in China). In Latin America and the Caribbean, each major wood-based panel product accounts for about an equal share of the total production.
Growth in global production of fibreboard was 2 percent in 2014–2015 and 22 percent over 2011–2015 (Figure 10b). Production of all types of fibreboard increased over 2011–2015, but most of this growth occurred in MDF/HDF production (which accounted for 82 percent of all fibreboard production in 2015). Since 2011, MDF/HDF production has been growing by 6 percent annually on average; China accounted for most of this increase.
In contrast to plywood and fibreboard, production of particleboard (including OSB) remained unchanged (111 million m³) in 2015; it was 13 percent above the level recorded in 2011.
0
50
100
150
200
250
300
350
400
201520142013201220110
20
40
60
80
100
120
0
20
40
60
80
100
120
20152014201320122011
Figure 10a: Wood-based panel production Figure 10b: Fibreboard production
Mill
ion
cubi
c m
etre
s
Fibreboard Particleboard Veneer/Plywood Hardboard MDF Other
8
Fibre furnish
In FAO’s forest product statistics, the fibre used to manufacture paper and paperboard is referred to as “fibre furnish”. This includes recovered paper (wastepaper), other fibre pulp and the wood pulp used to make paper. The latter includes mechanical, chemical and semi-chemical wood pulp, but not dissolving pulp (which is used for other purposes). Chemical wood pulp is also sub-divided in the statistics into bleached or unbleached and sulphite or sulphate wood pulp, and various combi-nations of these different products are presented as product groups in FAOSTAT and the Yearbook.
0
50
100
150
200
250
300
350
400
450
20152014201320122011
01020304050
60
20152014201320122011
-60-50-40-30-20-10
0
20152014201320122011
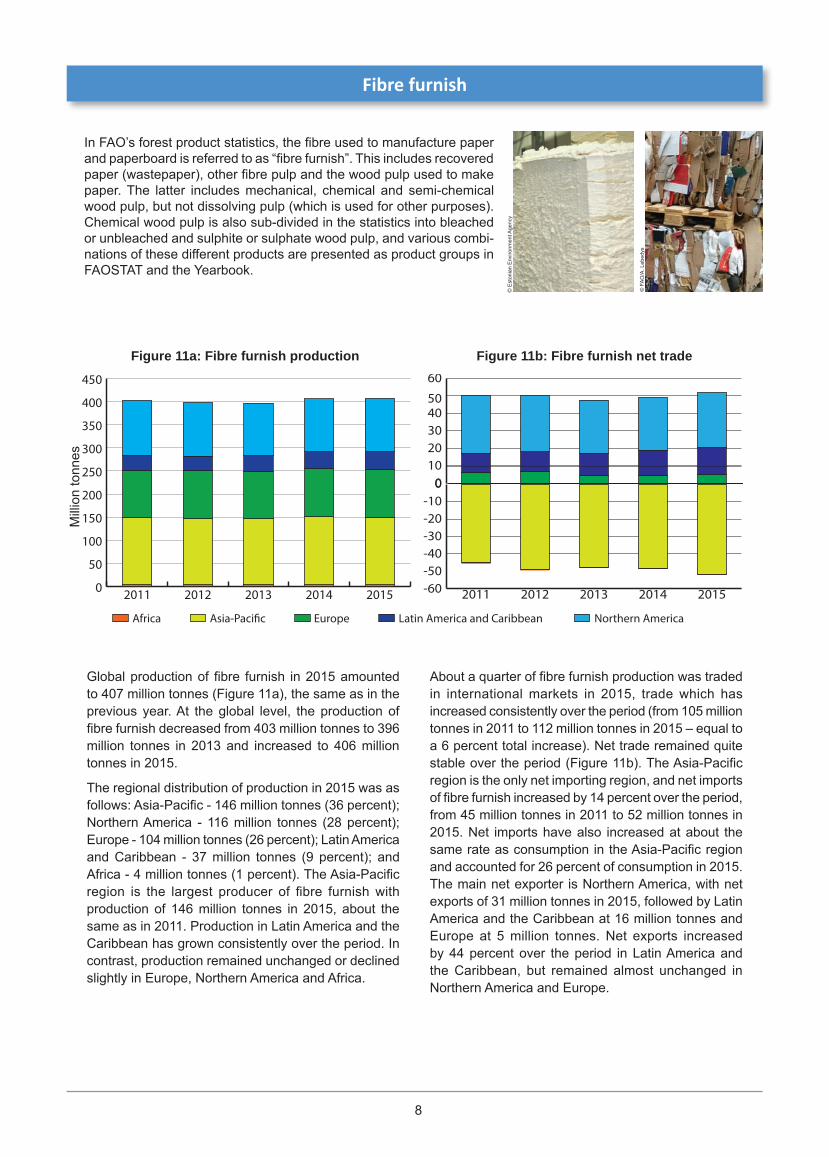
Global production of fibre furnish in 2015 amounted to 407 million tonnes (Figure 11a), the same as in the previous year. At the global level, the production of fibre furnish decreased from 403 million tonnes to 396 million tonnes in 2013 and increased to 406 million tonnes in 2015.
The regional distribution of production in 2015 was as follows: Asia-Pacific - 146 million tonnes (36 percent); Northern America - 116 million tonnes (28 percent); Europe - 104 million tonnes (26 percent); Latin America and Caribbean - 37 million tonnes (9 percent); and Africa - 4 million tonnes (1 percent). The Asia-Pacific region is the largest producer of fibre furnish with production of 146 million tonnes in 2015, about the same as in 2011. Production in Latin America and the Caribbean has grown consistently over the period. In contrast, production remained unchanged or declined slightly in Europe, Northern America and Africa.
About a quarter of fibre furnish production was traded in international markets in 2015, trade which has increased consistently over the period (from 105 million tonnes in 2011 to 112 million tonnes in 2015 – equal to a 6 percent total increase). Net trade remained quite stable over the period (Figure 11b). The Asia-Pacific region is the only net importing region, and net imports of fibre furnish increased by 14 percent over the period, from 45 million tonnes in 2011 to 52 million tonnes in 2015. Net imports have also increased at about the same rate as consumption in the Asia-Pacific region and accounted for 26 percent of consumption in 2015. The main net exporter is Northern America, with net exports of 31 million tonnes in 2015, followed by Latin America and the Caribbean at 16 million tonnes and Europe at 5 million tonnes. Net exports increased by 44 percent over the period in Latin America and the Caribbean, but remained almost unchanged in Northern America and Europe.
Figure 11a: Fibre furnish production Figure 11b: Fibre furnish net trade
Mill
ion
tonn
es
Northern AmericaLatin America and CaribbeanEuropeAsia-Paci�cAfrica
© E
ston
ian
Env
ironm
ent A
genc
y
© F
AO
/A. L
ebed
ys
9
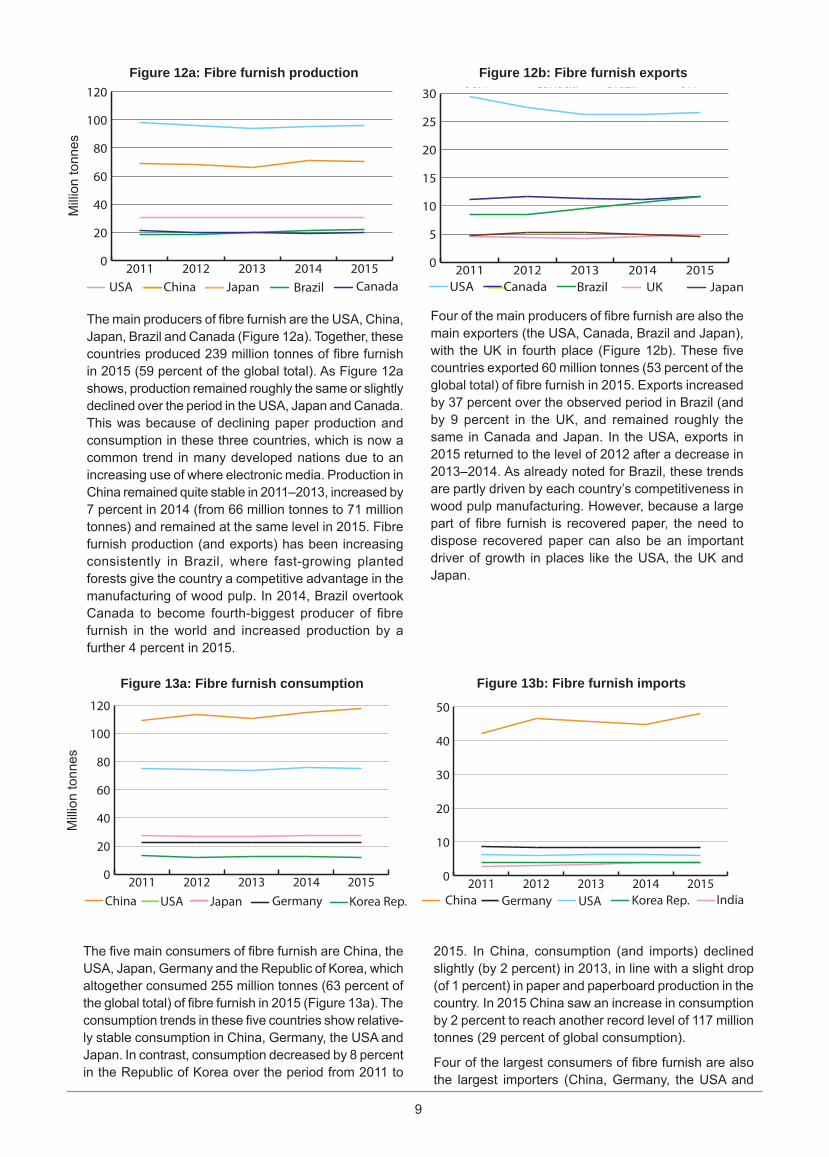
The main producers of fibre furnish are the USA, China, Japan, Brazil and Canada (Figure 12a). Together, these countries produced 239 million tonnes of fibre furnish in 2015 (59 percent of the global total). As Figure 12a shows, production remained roughly the same or slightly declined over the period in the USA, Japan and Canada. This was because of declining paper production and consumption in these three countries, which is now a common trend in many developed nations due to an increasing use of where electronic media. Production in China remained quite stable in 2011–2013, increased by 7 percent in 2014 (from 66 million tonnes to 71 million tonnes) and remained at the same level in 2015. Fibre furnish production (and exports) has been increasing consistently in Brazil, where fast-growing planted forests give the country a competitive advantage in the manufacturing of wood pulp. In 2014, Brazil overtook Canada to become fourth-biggest producer of fibre furnish in the world and increased production by a further 4 percent in 2015.
0
20
40
60
80
100
120
20152014201320122011Brazil CanadaJapanChinaUSA
0
5
10
15
20
25
30JapanUKBrazilCanadaUSA
20152014201320122011 Japan UKBrazilCanadaUSA
0
20
40
60
80
100
120
20152014201320122011Korea Rep.GermanyJapanUSAChina
0
10
20
30
40
50Korea Rep.IndiaUSAGermanyChina
20152014201320122011IndiaKorea Rep.USAGermanyChina
The five main consumers of fibre furnish are China, the USA, Japan, Germany and the Republic of Korea, which altogether consumed 255 million tonnes (63 percent of the global total) of fibre furnish in 2015 (Figure 13a). The consumption trends in these five countries show relative-ly stable consumption in China, Germany, the USA and Japan. In contrast, consumption decreased by 8 percent in the Republic of Korea over the period from 2011 to
2015. In China, consumption (and imports) declined slightly (by 2 percent) in 2013, in line with a slight drop (of 1 percent) in paper and paperboard production in the country. In 2015 China saw an increase in consumption by 2 percent to reach another record level of 117 million tonnes (29 percent of global consumption).
Four of the largest consumers of fibre furnish are also the largest importers (China, Germany, the USA and
Figure 12a: Fibre furnish production Figure 12b: Fibre furnish exportsM
illio
n to
nnes
Figure 13a: Fibre furnish consumption Figure 13b: Fibre furnish imports
Mill
ion
tonn
es
Four of the main producers of fibre furnish are also the main exporters (the USA, Canada, Brazil and Japan), with the UK in fourth place (Figure 12b). These five countries exported 60 million tonnes (53 percent of the global total) of fibre furnish in 2015. Exports increased by 37 percent over the observed period in Brazil (and by 9 percent in the UK, and remained roughly the same in Canada and Japan. In the USA, exports in 2015 returned to the level of 2012 after a decrease in 2013–2014. As already noted for Brazil, these trends are partly driven by each country’s competitiveness in wood pulp manufacturing. However, because a large part of fibre furnish is recovered paper, the need to dispose recovered paper can also be an important driver of growth in places like the USA, the UK and Japan.
10
0
50
100
150
200
250
300
350
400
20152014201320122011 0
10
20
30
40
50
60
70
20152014201320122011
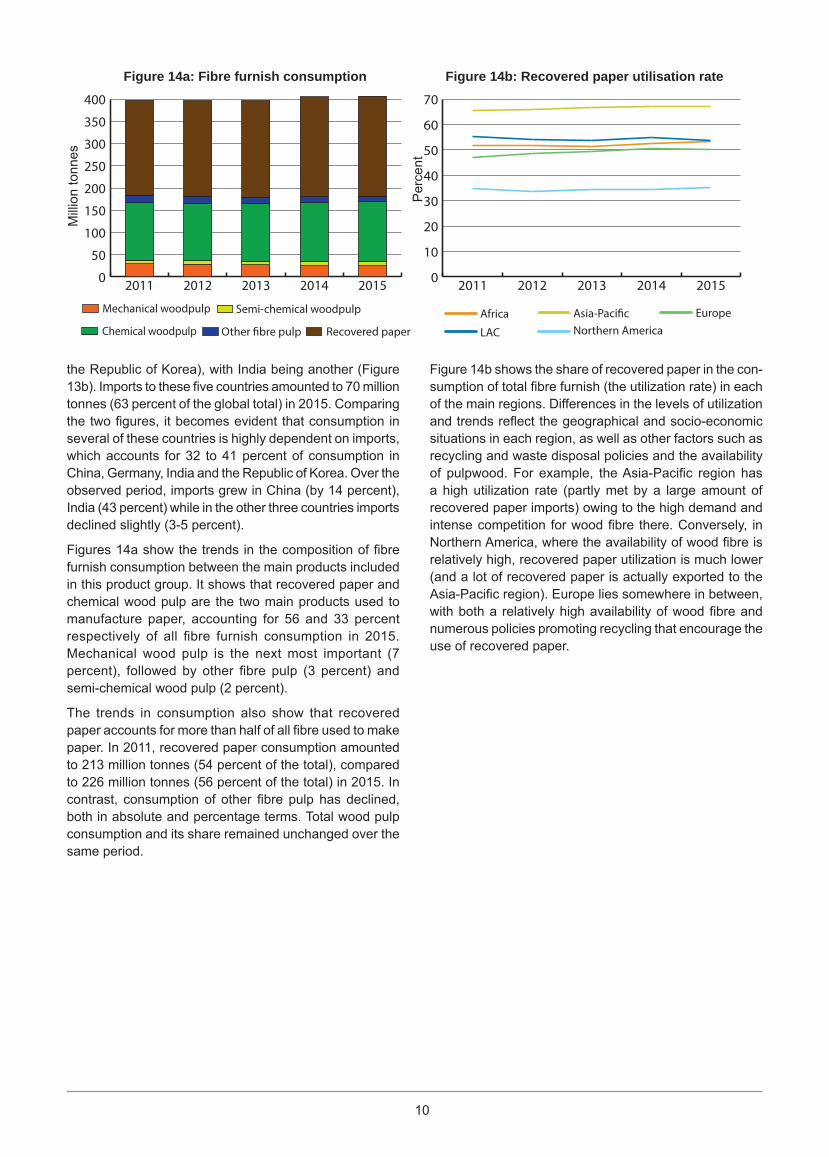
the Republic of Korea), with India being another (Figure 13b). Imports to these five countries amounted to 70 million tonnes (63 percent of the global total) in 2015. Comparing the two figures, it becomes evident that consumption in several of these countries is highly dependent on imports, which accounts for 32 to 41 percent of consumption in China, Germany, India and the Republic of Korea. Over the observed period, imports grew in China (by 14 percent), India (43 percent) while in the other three countries imports declined slightly (3-5 percent).
Figures 14a show the trends in the composition of fibre furnish consumption between the main products included in this product group. It shows that recovered paper and chemical wood pulp are the two main products used to manufacture paper, accounting for 56 and 33 percent respectively of all fibre furnish consumption in 2015. Mechanical wood pulp is the next most important (7 percent), followed by other fibre pulp (3 percent) and semi-chemical wood pulp (2 percent).
The trends in consumption also show that recovered paper accounts for more than half of all fibre used to make paper. In 2011, recovered paper consumption amounted to 213 million tonnes (54 percent of the total), compared to 226 million tonnes (56 percent of the total) in 2015. In contrast, consumption of other fibre pulp has declined, both in absolute and percentage terms. Total wood pulp consumption and its share remained unchanged over the same period.
Figure 14b shows the share of recovered paper in the con-sumption of total fibre furnish (the utilization rate) in each of the main regions. Differences in the levels of utilization and trends reflect the geographical and socio-economic situations in each region, as well as other factors such as recycling and waste disposal policies and the availability of pulpwood. For example, the Asia-Pacific region has a high utilization rate (partly met by a large amount of recovered paper imports) owing to the high demand and intense competition for wood fibre there. Conversely, in Northern America, where the availability of wood fibre is relatively high, recovered paper utilization is much lower (and a lot of recovered paper is actually exported to the Asia-Pacific region). Europe lies somewhere in between, with both a relatively high availability of wood fibre and numerous policies promoting recycling that encourage the use of recovered paper.
Recovered paperOther �bre pulpChemical woodpulp
Semi-chemical woodpulpMechanical woodpulp
Figure 14a: Fibre furnish consumption Figure 14b: Recovered paper utilisation rateM
illio
n to
nnes
LAC
EuropeAsia-Paci�cAfricaNorthern America
Per
cent
11
Paper and paperboard
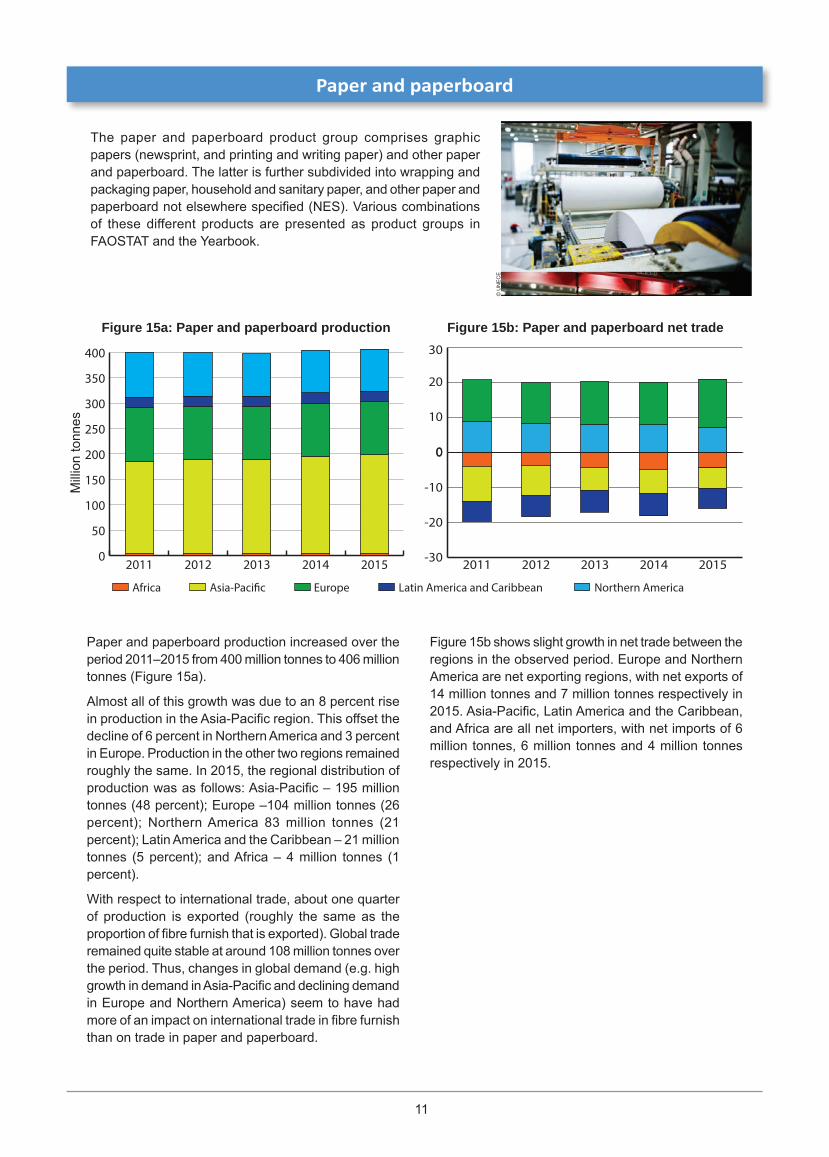
The paper and paperboard product group comprises graphic papers (newsprint, and printing and writing paper) and other paper and paperboard. The latter is further subdivided into wrapping and packaging paper, household and sanitary paper, and other paper and paperboard not elsewhere specified (NES). Various combinations of these different products are presented as product groups in FAOSTAT and the Yearbook.
0
50
100
150
200
250
300
350
400
20152014201320122011
0
10
20
30
20152014201320122011
-30
-20
-10
0
20152014201320122011
Paper and paperboard production increased over the period 2011–2015 from 400 million tonnes to 406 million tonnes (Figure 15a).
Almost all of this growth was due to an 8 percent rise in production in the Asia-Pacific region. This offset the decline of 6 percent in Northern America and 3 percent in Europe. Production in the other two regions remained roughly the same. In 2015, the regional distribution of production was as follows: Asia-Pacific – 195 million tonnes (48 percent); Europe –104 million tonnes (26 percent); Northern America 83 million tonnes (21 percent); Latin America and the Caribbean – 21 million tonnes (5 percent); and Africa – 4 million tonnes (1 percent).
With respect to international trade, about one quarter of production is exported (roughly the same as the proportion of fibre furnish that is exported). Global trade remained quite stable at around 108 million tonnes over the period. Thus, changes in global demand (e.g. high growth in demand in Asia-Pacific and declining demand in Europe and Northern America) seem to have had more of an impact on international trade in fibre furnish than on trade in paper and paperboard.
Figure 15b shows slight growth in net trade between the regions in the observed period. Europe and Northern America are net exporting regions, with net exports of 14 million tonnes and 7 million tonnes respectively in 2015. Asia-Pacific, Latin America and the Caribbean, and Africa are all net importers, with net imports of 6 million tonnes, 6 million tonnes and 4 million tonnes respectively in 2015.
Figure 15a: Paper and paperboard production Figure 15b: Paper and paperboard net trade
Mill
ion
tonn
es
Northern AmericaLatin America and CaribbeanEuropeAsia-Paci�cAfrica
© U
NE
CE
12
0
20
40
60
80
100
120IndiaGermanyJapanUSAChina
20152014201320122011IndiaGermanyJapanUSAChina
0
5
10
15CanadaSwedenFinlandUSAGermany
20152014201320122011CanadaFinland SwedenUSAGermany
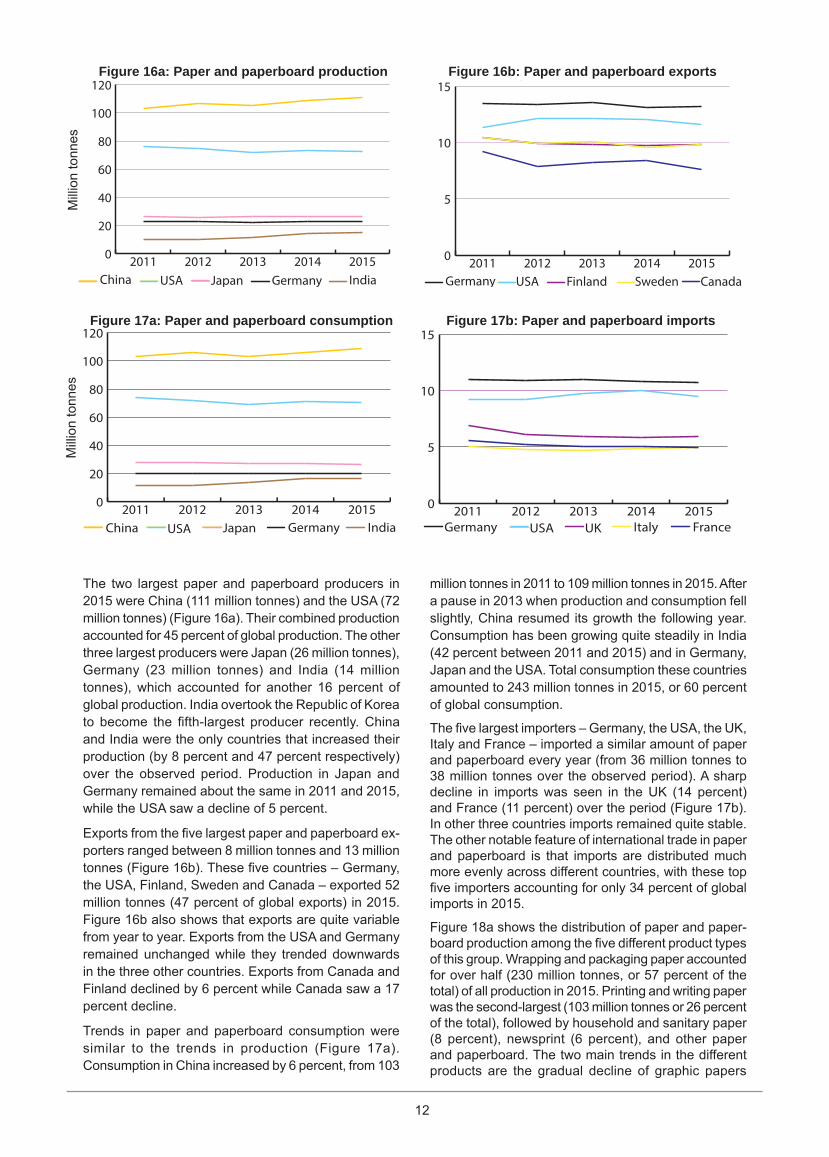
The two largest paper and paperboard producers in 2015 were China (111 million tonnes) and the USA (72 million tonnes) (Figure 16a). Their combined production accounted for 45 percent of global production. The other three largest producers were Japan (26 million tonnes), Germany (23 million tonnes) and India (14 million tonnes), which accounted for another 16 percent of global production. India overtook the Republic of Korea to become the fifth-largest producer recently. China and India were the only countries that increased their production (by 8 percent and 47 percent respectively) over the observed period. Production in Japan and Germany remained about the same in 2011 and 2015, while the USA saw a decline of 5 percent.
Exports from the five largest paper and paperboard ex-porters ranged between 8 million tonnes and 13 million tonnes (Figure 16b). These five countries – Germany, the USA, Finland, Sweden and Canada – exported 52 million tonnes (47 percent of global exports) in 2015. Figure 16b also shows that exports are quite variable from year to year. Exports from the USA and Germany remained unchanged while they trended downwards in the three other countries. Exports from Canada and Finland declined by 6 percent while Canada saw a 17 percent decline.
Trends in paper and paperboard consumption were similar to the trends in production (Figure 17a). Consumption in China increased by 6 percent, from 103
million tonnes in 2011 to 109 million tonnes in 2015. After a pause in 2013 when production and consumption fell slightly, China resumed its growth the following year. Consumption has been growing quite steadily in India (42 percent between 2011 and 2015) and in Germany, Japan and the USA. Total consumption these countries amounted to 243 million tonnes in 2015, or 60 percent of global consumption.
The five largest importers – Germany, the USA, the UK, Italy and France – imported a similar amount of paper and paperboard every year (from 36 million tonnes to 38 million tonnes over the observed period). A sharp decline in imports was seen in the UK (14 percent) and France (11 percent) over the period (Figure 17b). In other three countries imports remained quite stable. The other notable feature of international trade in paper and paperboard is that imports are distributed much more evenly across different countries, with these top five importers accounting for only 34 percent of global imports in 2015.
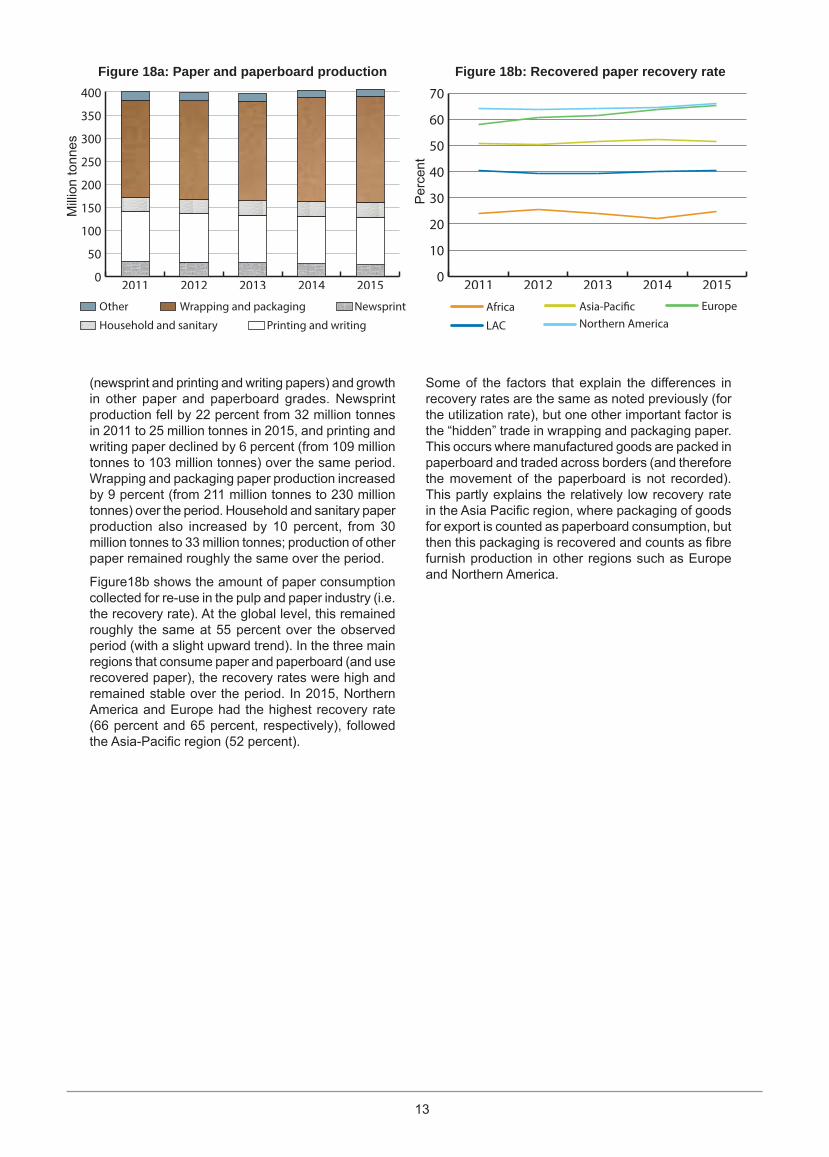
Figure 18a shows the distribution of paper and paper-board production among the five different product types of this group. Wrapping and packaging paper accounted for over half (230 million tonnes, or 57 percent of the total) of all production in 2015. Printing and writing paper was the second-largest (103 million tonnes or 26 percent of the total), followed by household and sanitary paper (8 percent), newsprint (6 percent), and other paper and paperboard. The two main trends in the different products are the gradual decline of graphic papers
0
20
40
60
80
100
120
20152014201320122011IndiaGermanyJapanUSAChina
0
5
10
15FranceItalyUKUSAGermany
20152014201320122011Italy FranceUKUSAGermany
Figure 16a: Paper and paperboard production Figure 16b: Paper and paperboard exportsM
illio
n to
nnes
Figure 17a: Paper and paperboard consumption Figure 17b: Paper and paperboard imports
Mill
ion
tonn
es
13
0
50
100
150
200
250
300
350
400
201520142013201220110
10
20
30
40
50
60
70
20152014201320122011
Figure 18a: Paper and paperboard production Figure 18b: Recovered paper recovery rateM
illio
n to
nnes
Other Wrapping and packaging
Household and sanitary Printing and writing
Newsprint
LAC
EuropeAsia-Paci�cAfricaNorthern America
Per
cent
(newsprint and printing and writing papers) and growth in other paper and paperboard grades. Newsprint production fell by 22 percent from 32 million tonnes in 2011 to 25 million tonnes in 2015, and printing and writing paper declined by 6 percent (from 109 million tonnes to 103 million tonnes) over the same period. Wrapping and packaging paper production increased by 9 percent (from 211 million tonnes to 230 million tonnes) over the period. Household and sanitary paper production also increased by 10 percent, from 30 million tonnes to 33 million tonnes; production of other paper remained roughly the same over the period.
Figure18b shows the amount of paper consumption collected for re-use in the pulp and paper industry (i.e. the recovery rate). At the global level, this remained roughly the same at 55 percent over the observed period (with a slight upward trend). In the three main regions that consume paper and paperboard (and use recovered paper), the recovery rates were high and remained stable over the period. In 2015, Northern America and Europe had the highest recovery rate (66 percent and 65 percent, respectively), followed the Asia-Pacific region (52 percent).
Some of the factors that explain the differences in recovery rates are the same as noted previously (for the utilization rate), but one other important factor is the “hidden” trade in wrapping and packaging paper. This occurs where manufactured goods are packed in paperboard and traded across borders (and therefore the movement of the paperboard is not recorded). This partly explains the relatively low recovery rate in the Asia Pacific region, where packaging of goods for export is counted as paperboard consumption, but then this packaging is recovered and counts as fibre furnish production in other regions such as Europe and Northern America.
14
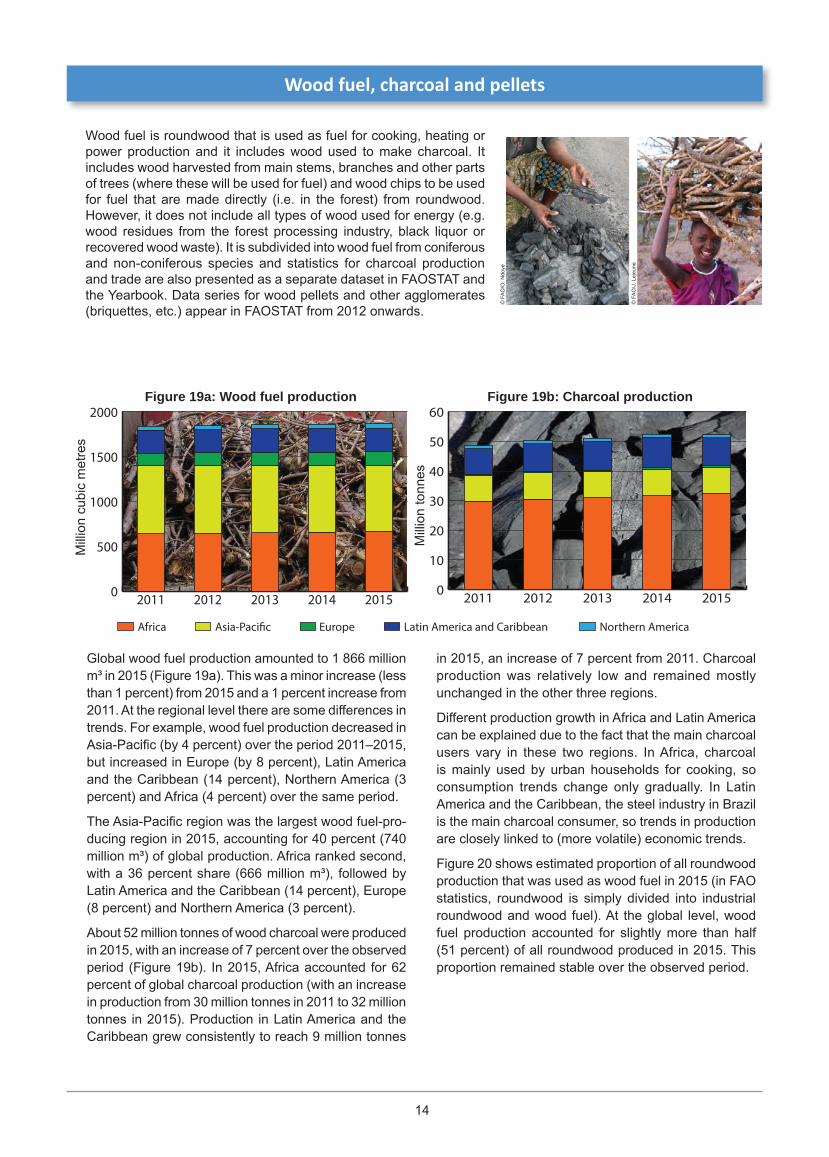
Wood fuel, charcoal and pellets
Wood fuel is roundwood that is used as fuel for cooking, heating or power production and it includes wood used to make charcoal. It includes wood harvested from main stems, branches and other parts of trees (where these will be used for fuel) and wood chips to be used for fuel that are made directly (i.e. in the forest) from roundwood. However, it does not include all types of wood used for energy (e.g. wood residues from the forest processing industry, black liquor or recovered wood waste). It is subdivided into wood fuel from coniferous and non-coniferous species and statistics for charcoal production and trade are also presented as a separate dataset in FAOSTAT and the Yearbook. Data series for wood pellets and other agglomerates (briquettes, etc.) appear in FAOSTAT from 2012 onwards.
0
500
1000
1500
2000
201520142013201220110
10
20
30
40
50
60
20152014201320122011
Global wood fuel production amounted to 1 866 million m³ in 2015 (Figure 19a). This was a minor increase (less than 1 percent) from 2015 and a 1 percent increase from 2011. At the regional level there are some differences in trends. For example, wood fuel production decreased in Asia-Pacific (by 4 percent) over the period 2011–2015, but increased in Europe (by 8 percent), Latin America and the Caribbean (14 percent), Northern America (3 percent) and Africa (4 percent) over the same period.
The Asia-Pacific region was the largest wood fuel-pro-ducing region in 2015, accounting for 40 percent (740 million m³) of global production. Africa ranked second, with a 36 percent share (666 million m³), followed by Latin America and the Caribbean (14 percent), Europe (8 percent) and Northern America (3 percent).
About 52 million tonnes of wood charcoal were produced in 2015, with an increase of 7 percent over the observed period (Figure 19b). In 2015, Africa accounted for 62 percent of global charcoal production (with an increase in production from 30 million tonnes in 2011 to 32 million tonnes in 2015). Production in Latin America and the Caribbean grew consistently to reach 9 million tonnes
in 2015, an increase of 7 percent from 2011. Charcoal production was relatively low and remained mostly unchanged in the other three regions.
Different production growth in Africa and Latin America can be explained due to the fact that the main charcoal users vary in these two regions. In Africa, charcoal is mainly used by urban households for cooking, so consumption trends change only gradually. In Latin America and the Caribbean, the steel industry in Brazil is the main charcoal consumer, so trends in production are closely linked to (more volatile) economic trends.
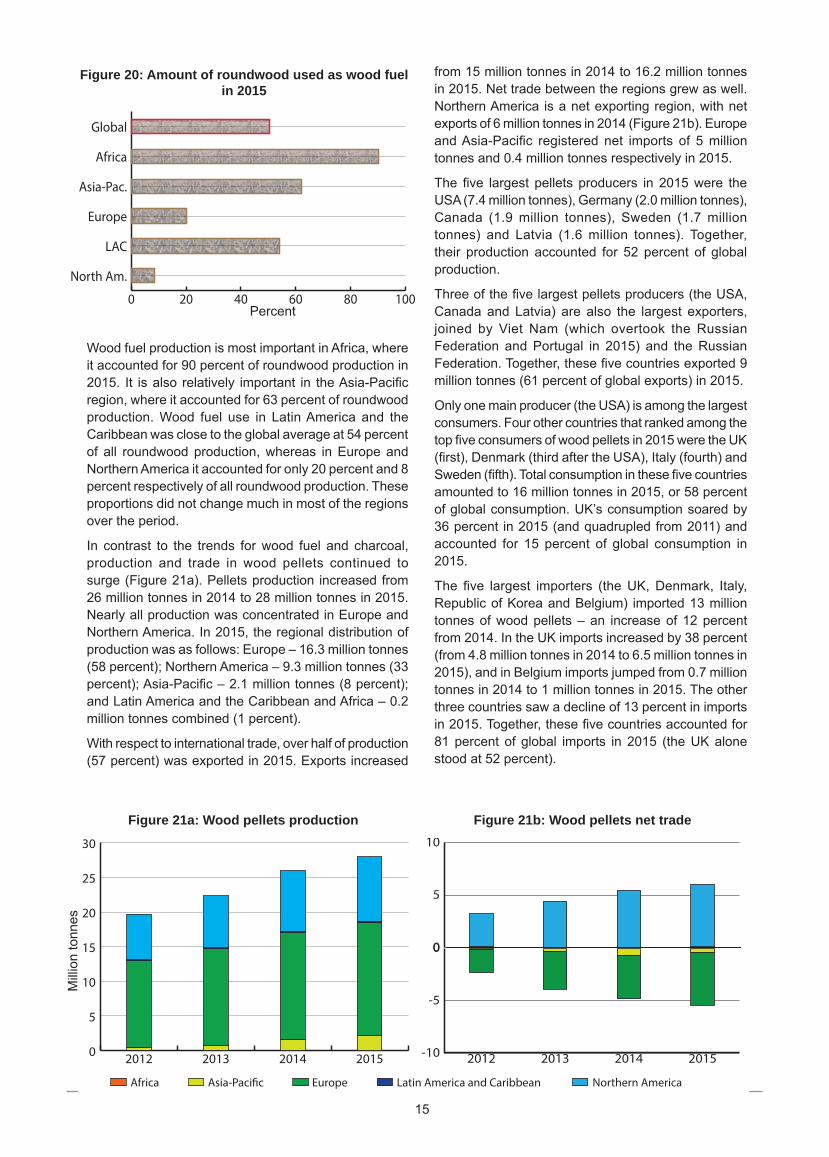
Figure 20 shows estimated proportion of all roundwood production that was used as wood fuel in 2015 (in FAO statistics, roundwood is simply divided into industrial roundwood and wood fuel). At the global level, wood fuel production accounted for slightly more than half (51 percent) of all roundwood produced in 2015. This proportion remained stable over the observed period.
Figure 19a: Wood fuel production Figure 19b: Charcoal production
Mill
ion
cubi
c m
etre
s
Mill
ion
tonn
es
Northern AmericaLatin America and CaribbeanEuropeAsia-Paci�cAfrica
© F
AO
/O. N
doye
© F
AO
/J. L
ejeu
ne
15
0 20 40 60 80 100
North Am.
LAC
Europe
Asia-Pac.
Africa
Global
Wood fuel production is most important in Africa, where it accounted for 90 percent of roundwood production in 2015. It is also relatively important in the Asia-Pacific region, where it accounted for 63 percent of roundwood production. Wood fuel use in Latin America and the Caribbean was close to the global average at 54 percent of all roundwood production, whereas in Europe and Northern America it accounted for only 20 percent and 8 percent respectively of all roundwood production. These proportions did not change much in most of the regions over the period.
In contrast to the trends for wood fuel and charcoal, production and trade in wood pellets continued to surge (Figure 21a). Pellets production increased from 26 million tonnes in 2014 to 28 million tonnes in 2015. Nearly all production was concentrated in Europe and Northern America. In 2015, the regional distribution of production was as follows: Europe – 16.3 million tonnes (58 percent); Northern America – 9.3 million tonnes (33 percent); Asia-Pacific – 2.1 million tonnes (8 percent); and Latin America and the Caribbean and Africa – 0.2 million tonnes combined (1 percent).
With respect to international trade, over half of production (57 percent) was exported in 2015. Exports increased
Figure 20: Amount of roundwood used as wood fuel in 2015
Percent
0
5
10
15
20
25
30
2015201420132012
0
5
10
2015201420132012
-10
-5
0
2015201420132012
Figure 21a: Wood pellets production Figure 21b: Wood pellets net trade
Mill
ion
tonn
es
Northern AmericaLatin America and CaribbeanEuropeAsia-Paci�cAfrica
from 15 million tonnes in 2014 to 16.2 million tonnes in 2015. Net trade between the regions grew as well. Northern America is a net exporting region, with net exports of 6 million tonnes in 2014 (Figure 21b). Europe and Asia-Pacific registered net imports of 5 million tonnes and 0.4 million tonnes respectively in 2015.
The five largest pellets producers in 2015 were the USA (7.4 million tonnes), Germany (2.0 million tonnes), Canada (1.9 million tonnes), Sweden (1.7 million tonnes) and Latvia (1.6 million tonnes). Together, their production accounted for 52 percent of global production.
Three of the five largest pellets producers (the USA, Canada and Latvia) are also the largest exporters, joined by Viet Nam (which overtook the Russian Federation and Portugal in 2015) and the Russian Federation. Together, these five countries exported 9 million tonnes (61 percent of global exports) in 2015.
Only one main producer (the USA) is among the largest consumers. Four other countries that ranked among the top five consumers of wood pellets in 2015 were the UK (first), Denmark (third after the USA), Italy (fourth) and Sweden (fifth). Total consumption in these five countries amounted to 16 million tonnes in 2015, or 58 percent of global consumption. UK’s consumption soared by 36 percent in 2015 (and quadrupled from 2011) and accounted for 15 percent of global consumption in 2015.
The five largest importers (the UK, Denmark, Italy, Republic of Korea and Belgium) imported 13 million tonnes of wood pellets – an increase of 12 percent from 2014. In the UK imports increased by 38 percent (from 4.8 million tonnes in 2014 to 6.5 million tonnes in 2015), and in Belgium imports jumped from 0.7 million tonnes in 2014 to 1 million tonnes in 2015. The other three countries saw a decline of 13 percent in imports in 2015. Together, these five countries accounted for 81 percent of global imports in 2015 (the UK alone stood at 52 percent).

Development of FAO’s forest products statistics
This final section presents some details of recent changes to FAO’s forest products statistics, the results of capacity-building efforts, and improvements in the collection and dissemination of statistics. Below are some highlights from 2016.
• Enhancing dissemination of forest products statistics
— FAO’s Forest products statistics website has been regularly updated and is available in Arabic, Chinese, English, French, Russian and Spanish.
— Global data series on OSB annual production and trade (from 1995) were launched in the FAOSTAT-Forestry database for the first time. This shows that global production and trade of OSB panels were 27 million m³ and 9 million m³ respectively in 2015. Further details of production and trade at the country level from 1995 can be found in the FAOSTAT Forestry database.
— Labels for forest products in FAOSTAT-Forestry database were revised in the latest data release. There are two main improvements in product labels: (1) abbreviations were replaced with long names, and (2) the product list in the drop-down menu is now in line with value chain of forest products i.e. starts from raw materials (roundwood) and ends with finished products (sawnwood, panels, paper and paperboard).
— A new and revamped FAOSTAT website was launched in December. The updated website tool, now in its fourth edition, includes a host of behind-the-scenes technological improvements as well as user-friendly innovations such as full compatibility with mobile devices and superior download options.
• Improvinginternationalstatisticalclassificationsandstandards
— FAO, in collaboration with the International Tropical Timber Organization (ITTO), United Nations Economic Commission for Europe (UNECE) and the Statistical Office of the European Union (Eurostat) has contributed to significant improvements in wood products classification in the Harmonized System (HS) through their proposal to the World Customs Organization (WCO) for the HS 2017 revision. It will enter into force on 1 January 2017. More information about FAO’s contribution to HS2017 is available in the following links:
1) WCO note on amendments to the HS Nomenclature effective from 1 January 20172) HS Nomenclature 2017 Edition3) Article for the Meeting of the Expert Group on International Statistical Classifications (UN Statistics Division, May 2015)4) Amendments to HS Nomenclature 2017 initiated by FAO
— The review of HS codes for tropical species in HS nomenclature revealed the need to update the existing nomenclature of tropical wood which had not changed since 1982. In response to this, in 2014-2015, FAO supported the work of the International Tropical Timber Association (ATIBT) on the new version of the nomenclature. General Nomenclature of Tropical Timber, 7th edition was finalized and made available online in 2016.
— FAO and UNECE prepared a draft proposal for forest product codes (HS nomenclature revision 2022, or HS 2022) and sent it to member countries for consultation. This work will continue in the 1st quarter of 2017, and the proposal for amendments in HS 2017 will be submitted in March 2017.
— As a part of an ongoing effort to improve statistics on non-wood forest products (NWFPs), FAO has developed a document on NWFPs in the current national and international statistical classification systems. An open consultation on the document was held in mid-2016. A final report is being finalized based on feedback from expert consultations and results of the open consultation.
— In 2015, FAO’s Forest Products Programme launched two projects with a main focus on improving developing countries’ capacity to collect statistics on forest products: one is to develop methodologies of incorporating a wood fuel module into existing national household surveys; the other is to develop guidelines on collecting forest products statistics for developing countries. Both projects are co-funded by the Global Strategy to Improve Rural and Agricultural Statistics. As a result of these ongoing projects, the following outputs were produced in 2016:
- technical report on national statistics related to woodfuel production and consumption in developing countries, survey-based woodfuel studies, and international recommendations on woodfuel surveys;
- proposal for updating the Classification and Definitions of Forest Products, published by FAO and the UNECE in 1982. Many items in the major international product and activities classification systems (e.g., CPC, HS, SITC) have been changed and updated several times since then.
• Strengthening national statistical capacities
IIn collaboration with ITTO, the International Renewable Energy Agency (IRENA) and UNECE, two statistical capacity building workshops were held:
- Subregional workshop of forest products statistics for countries in the Caribbean (Trinidad and Tobago, 12-14 April).
- Workshop on bioenergy from forest sector for countries in Europe (Budapest, Hungary, 6-8 December).
For more information about FAO’s forest products statistics, please contact:Arvydas LebedysForestry Officer (Statistics)
Forestry Policy and Products DivisionFAO Forestry DepartmentE-mail: [email protected] Website: http://www.fao.org/forestry/statistics
©FA
O, 2
016
I666
9EN
/1/1
2.16
Related Documents