Application No.: Exhibit No.: SCE-06, Vol. 02, Pt. 2 Witnesses: A. Peterson 2015 General Rate Case Human Resources (HR) Volume 2, Part 2 – Total Compensation Study Before the Public Utilities Commission of the State of California Rosemead, California November 2013

Welcome message from author
This document is posted to help you gain knowledge. Please leave a comment to let me know what you think about it! Share it to your friends and learn new things together.
Transcript
Application No.: Exhibit No.: SCE-06, Vol. 02, Pt. 2 Witnesses: A. Peterson
2015 General Rate Case
Human Resources (HR) Volume 2, Part 2 – Total Compensation Study
Before the
Public Utilities Commission of the State of California
Rosemead, CaliforniaNovember 2013
Consulting Performance, Rewards and Talent
2015 General Rate Case— Total Compensation Study Report—Final Southern California Edison
September 2013
Aon Hewitt Consulting | Performance, Rewards and Talent 1 01551/RPT001AAP.DOCX/PR&T-SF-15008 09/2013
Introduction On December 10, 2012, the Commission issued SCE’s 2012 Rate Case Decision, D.12-11-051. D.12-11-051 required “DRA and SCE to jointly hold a workshop open to all parties, within 90 days of the date the decision is adopted, to discuss whether design modifications should be made to the next TCS or an alternative method of data gathering should be utilized for the next SCE rate case.”1
Pursuant to ordering paragraph 30 of Decision (D.) 12-11-051, a Total Compensation Study (TCS) Workshop was held on January 23, 2013 in San Francisco, CA. At the conclusion of the workshop DRA and SCE agreed to: 1) proceed with securing a vendor for the 2015 GRC Total Compensation Study and 2) incorporate consideration of any proposed designed modifications into the RFP for the vendor.
In 2013 Southern California Edison (“SCE”) and the Division of Ratepayer Advocates (“DRA”) of the California Public Utilities Commission (“CPUC”) selected Aon Hewitt (“Aon Hewitt”) to conduct a competitive analysis of SCE’s total compensation. This 2015 GRC Total Compensation Study (the “Study”) was conducted in conjunction with SCE’s 2015 General Rate Case submittal in compliance with CPUC decisions D.87-12-066, D.89-12-057, D.96-01-011, and D.07-07-004.
Working together as the GRC Study Team (the Team), representatives of SCE, DRA, and Aon Hewitt developed the Study methodology. Aon Hewitt applied this methodology to obtain competitive total compensation data and then compared that data to SCE’s total compensation levels.
The Team made major project methodology decisions by consensus. Although many issues were raised and discussed, the Team attained agreement regarding the Study approach. The major methodology decisions and the rationale for making them are included in this report and are also referenced in the meeting notes and work-papers. Areas of agreement, as well as varying points of view, are described in the meeting notes.
The Team members included the following:
� Stacey Hunter–DRA
� Marek Kanter—DRA
� Patricia L. Adams—SCE
� Mark Bennett—SCE
� George DeMaria—SCE
� Stephen Lumel—SCE
� Michelle Ricard—SCE
� Kathy Miller—Aon Hewitt, Project Consultant
� Blake Murphy—Aon Hewitt, Project Consultant
� Chelsea G. Penaloza—Aon Hewitt, Project Consultant
� Alison A. Peterson—Aon Hewitt, Study Project Manager
This report contains Study results and a description of the Study methodology.
1 D.12-11-051, p. 444, also Ordering Paragraph 30. (Note: Ordering Paragraph 30 requires DRA and SCE to hold a workshop within 6 months of the effective date of D.12-11-051.)
Aon Hewitt Consulting | Performance, Rewards and Talent 2 01551/RPT001AAP.DOCX/PR&T-SF-15008 09/2013
Contents
Study Results 3
Study Methodology 9
Appendix A: Benchmark Jobs 25
Appendix B: Comparator List 36
Appendix C: Detailed Results by Category 40
Appendix D: Competitive Analysis Summary 51
Appendix E: Generic Job Methodology 55
Appendix F: LTI Study Positions 61
Appendix G: Benefit Calculation Samples (SCE and Comparator Company) 64
Appendix H: Meeting Notes 72
Appendix I: Measurement of Error 73
Appendix J: Glossary of Terms 76

Aon Hewitt Consulting | Performance, Rewards and Talent 3 01551/RPT001AAP.DOCX/PR&T-SF-15008 09/2013
Study Results

Aon Hewitt Consulting | Performance, Rewards and Talent 4 01551/RPT001AAP.DOCX/PR&T-SF-15008 09/2013
Study Results The Study results—overall and by job category—are shown in Table 1:
Table 1: Competitive Summary (SCE versus Market) SCE vs. Market
Job Category
SCE Population2
SCE Payroll Dollars
($000s)3Payroll
WeightingBase
Pay
Total Cash
Comp4 LTI5 Benefits PTOTotal
Comp6
Physical/ Technical 4,592 $407,055.6 24% 8.8% 11.3% — -1.1% 90.5% 9.2%
Clerical 3,740 $243,146.2 14.3% -0.5% -1.6% — 1.9% -25.7% -1.1%
Professional/ Technical 5,406 $599,599.0 35.3% -10.9% -11.9% -100% -2.8% -40.3% -12.3%
Manager/ Supervisor 2,795 $428,597.1 25.2% -8.3% -10.4% -97.2% -6.3% -18.9% -15.9%
Executive 41 $21,123.0 1.2% -3.0% 13.4% -34.1% 114.3% -1.0% 9.5%
Overall7 16,574 $1,699,520.8 100% -3.3% -3.7% -15.0% -1.2% 2.6% -5.0%
This table presents SCE’s competitive status for each major element of total compensation (base pay, total cash compensation, long-term incentives (LTI), and benefits). Note that LTI grants are included only for those positions that were found to be eligible for LTI awards in the competitive analysis of pay practices.
The Study estimates that SCE total compensation levels are below market by 5.0 percent. Discussion of the Study results, by SCE job category, follows below.
Each element of total compensation was compared to a sample of the competitive market. Similar to the 2012 GRC Total Compensation Study (the 2012 Study), these 2015 Study results are intended to be a reasonable estimate of true competitive posture. Due to normal survey error, true market position could be above or below the estimate. Aon Hewitt assumes the degree of accuracy to be within plus or minus 5 percent of the estimate.
The results of the 2012 Study were deemed to be valid for estimating the competitiveness of SCE’s total compensation levels. The 2015 Study includes refinements to methodology that are believed to achieve the same or increased validity, transparency, and clarity. Transparency and greater clarity were achieved by providing significant detail, both in this report and in the meeting notes, in describing the methodology and decisions made during Team meetings.
2 SCE’s population is as of December 31, 2012. 3 Payroll dollars include base pay as of December 31, 2012, and annual incentives (as defined on page 16), paid in 2012 for 2011 performance.
4 Total Cash Compensation reflects base pay plus actual short-term (annual) incentives for all categories, adjusted to December 31, 2012.
5 Total Compensation includes long-term incentives (LTI) for 13 Executive, 36 Manager/Supervisor, and 10 Professional/Technical jobs.
6 For Study purposes, total compensation is defined as total cash compensation, benefits, PTO, and actual LTI. 7 Results are weighted by SCE payroll dollars for all jobs; both benchmark and non-benchmark.
Aon Hewitt Consulting | Performance, Rewards and Talent 5 01551/RPT001AAP.DOCX/PR&T-SF-15008 09/2013
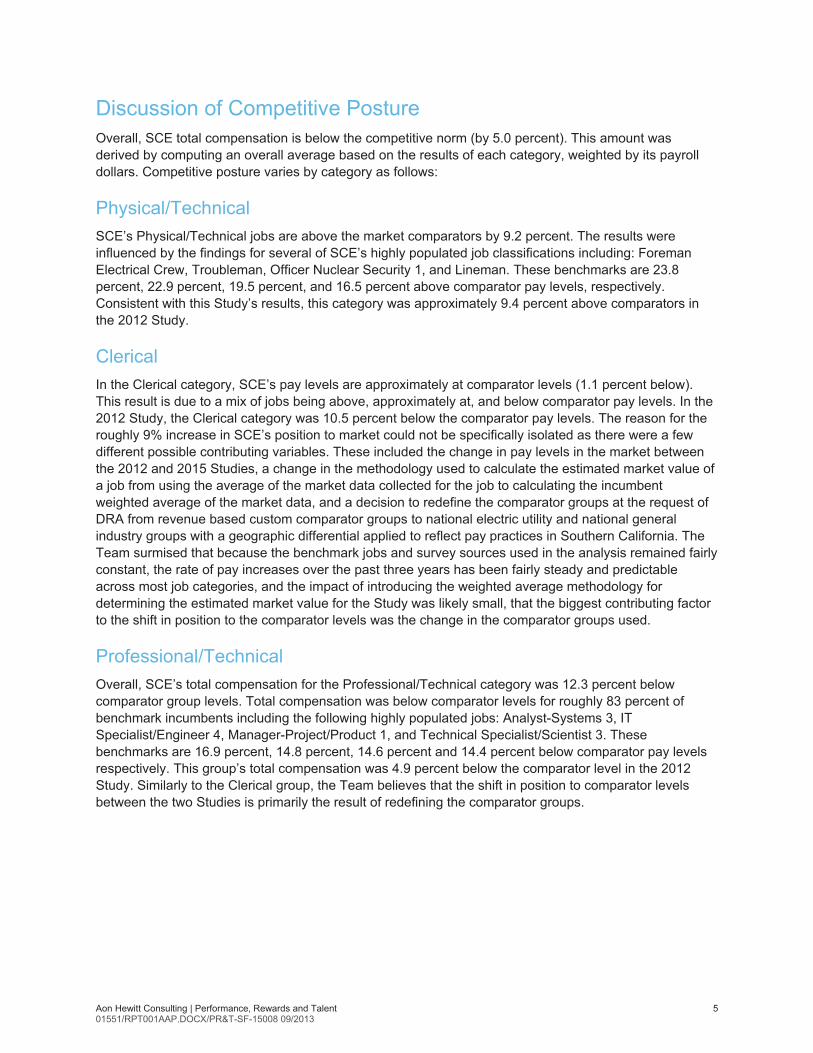
Discussion of Competitive Posture Overall, SCE total compensation is below the competitive norm (by 5.0 percent). This amount was derived by computing an overall average based on the results of each category, weighted by its payroll dollars. Competitive posture varies by category as follows:
Physical/Technical SCE’s Physical/Technical jobs are above the market comparators by 9.2 percent. The results were influenced by the findings for several of SCE’s highly populated job classifications including: Foreman Electrical Crew, Troubleman, Officer Nuclear Security 1, and Lineman. These benchmarks are 23.8 percent, 22.9 percent, 19.5 percent, and 16.5 percent above comparator pay levels, respectively. Consistent with this Study’s results, this category was approximately 9.4 percent above comparators in the 2012 Study.
Clerical In the Clerical category, SCE’s pay levels are approximately at comparator levels (1.1 percent below). This result is due to a mix of jobs being above, approximately at, and below comparator pay levels. In the 2012 Study, the Clerical category was 10.5 percent below the comparator pay levels. The reason for the roughly 9% increase in SCE’s position to market could not be specifically isolated as there were a few different possible contributing variables. These included the change in pay levels in the market between the 2012 and 2015 Studies, a change in the methodology used to calculate the estimated market value of a job from using the average of the market data collected for the job to calculating the incumbent weighted average of the market data, and a decision to redefine the comparator groups at the request of DRA from revenue based custom comparator groups to national electric utility and national general industry groups with a geographic differential applied to reflect pay practices in Southern California. The Team surmised that because the benchmark jobs and survey sources used in the analysis remained fairly constant, the rate of pay increases over the past three years has been fairly steady and predictable across most job categories, and the impact of introducing the weighted average methodology for determining the estimated market value for the Study was likely small, that the biggest contributing factor to the shift in position to the comparator levels was the change in the comparator groups used.
Professional/Technical Overall, SCE’s total compensation for the Professional/Technical category was 12.3 percent below comparator group levels. Total compensation was below comparator levels for roughly 83 percent of benchmark incumbents including the following highly populated jobs: Analyst-Systems 3, IT Specialist/Engineer 4, Manager-Project/Product 1, and Technical Specialist/Scientist 3. These benchmarks are 16.9 percent, 14.8 percent, 14.6 percent and 14.4 percent below comparator pay levels respectively. This group’s total compensation was 4.9 percent below the comparator level in the 2012 Study. Similarly to the Clerical group, the Team believes that the shift in position to comparator levels between the two Studies is primarily the result of redefining the comparator groups.
Aon Hewitt Consulting | Performance, Rewards and Talent 6 01551/RPT001AAP.DOCX/PR&T-SF-15008 09/2013
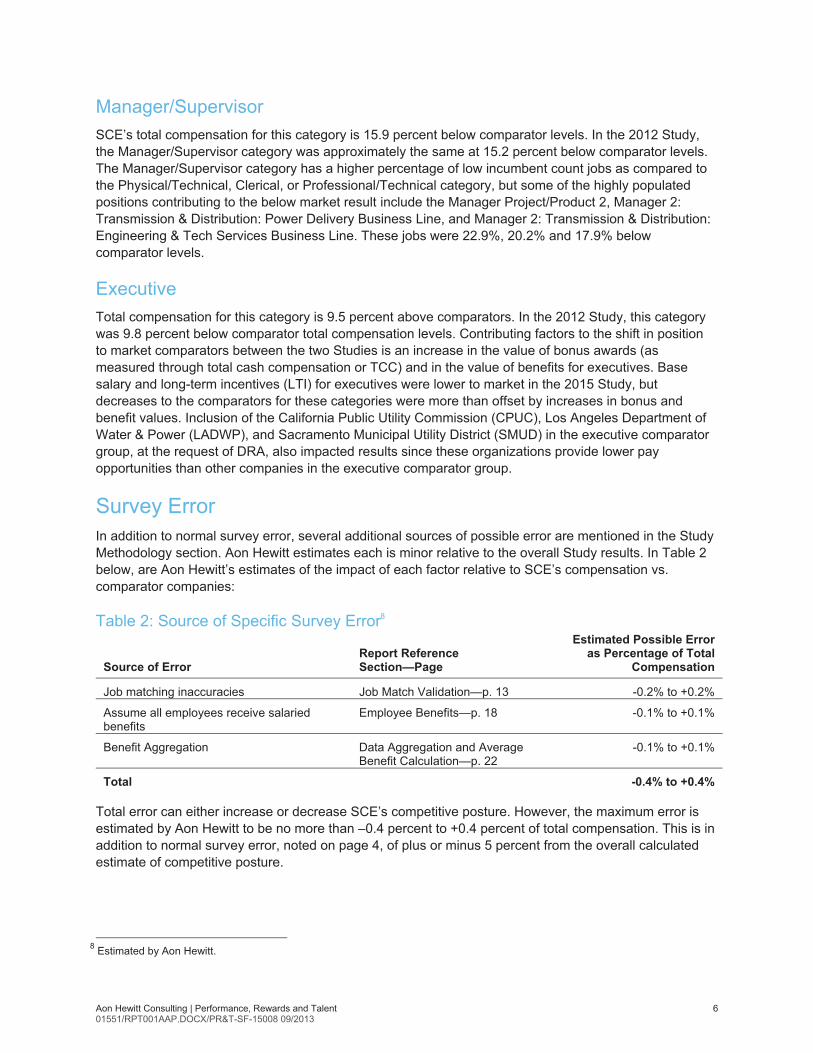
Manager/Supervisor SCE’s total compensation for this category is 15.9 percent below comparator levels. In the 2012 Study, the Manager/Supervisor category was approximately the same at 15.2 percent below comparator levels. The Manager/Supervisor category has a higher percentage of low incumbent count jobs as compared to the Physical/Technical, Clerical, or Professional/Technical category, but some of the highly populated positions contributing to the below market result include the Manager Project/Product 2, Manager 2: Transmission & Distribution: Power Delivery Business Line, and Manager 2: Transmission & Distribution: Engineering & Tech Services Business Line. These jobs were 22.9%, 20.2% and 17.9% below comparator levels.
Executive Total compensation for this category is 9.5 percent above comparators. In the 2012 Study, this category was 9.8 percent below comparator total compensation levels. Contributing factors to the shift in position to market comparators between the two Studies is an increase in the value of bonus awards (as measured through total cash compensation or TCC) and in the value of benefits for executives. Base salary and long-term incentives (LTI) for executives were lower to market in the 2015 Study, but decreases to the comparators for these categories were more than offset by increases in bonus and benefit values. Inclusion of the California Public Utility Commission (CPUC), Los Angeles Department of Water & Power (LADWP), and Sacramento Municipal Utility District (SMUD) in the executive comparator group, at the request of DRA, also impacted results since these organizations provide lower pay opportunities than other companies in the executive comparator group.
Survey Error In addition to normal survey error, several additional sources of possible error are mentioned in the Study Methodology section. Aon Hewitt estimates each is minor relative to the overall Study results. In Table 2 below, are Aon Hewitt’s estimates of the impact of each factor relative to SCE’s compensation vs. comparator companies:
Table 2: Source of Specific Survey Error8
Source of Error Report Reference Section—Page
Estimated Possible Error as Percentage of Total
Compensation
Job matching inaccuracies Job Match Validation—p. 13 -0.2% to +0.2%
Assume all employees receive salaried benefits
Employee Benefits—p. 18 -0.1% to +0.1%
Benefit Aggregation Data Aggregation and Average Benefit Calculation—p. 22
-0.1% to +0.1%
Total -0.4% to +0.4% Total error can either increase or decrease SCE’s competitive posture. However, the maximum error is estimated by Aon Hewitt to be no more than –0.4 percent to +0.4 percent of total compensation. This is in addition to normal survey error, noted on page 4, of plus or minus 5 percent from the overall calculated estimate of competitive posture.
8 Estimated by Aon Hewitt.

Aon Hewitt Consulting | Performance, Rewards and Talent 7 01551/RPT001AAP.DOCX/PR&T-SF-15008 09/2013
Benchmark Jobs As noted above, this competitive Study was an analysis of total compensation for a statistically significant portion of the SCE organization. Because of the high number of SCE employees in benchmark jobs, Aon Hewitt is confident the Study accurately estimates competitive posture for the entire company.
Table 3 below presents the amount of coverage the Study provides as a percentage of SCE population. It shows the number of total SCE employees and job titles in each employee category compared with the number of SCE jobs and incumbents that are Study benchmarks.
“Benchmark” jobs are those classification titles that are common across comparator organizations and are found in surveys of competitive data (generally these are “high population” jobs).
The process used to determine benchmark jobs is detailed in the next section. Table 3 shows that the Study covers 75.7 percent of the SCE workforce. Compared with similar studies Aon Hewitt has conducted, this is high coverage and, in Aon Hewitt’s opinion, a sound basis for determining the competitiveness of total compensation.
Table 3: Study Coverage of SCE Population In Total In Study
Job Category SCE
Population # of
Jobs # of SCE
Incumbents % of SCE
Population # of Jobs % of SCE
Jobs
Physical/Technical 4,592 200 3,113 67.8% 44 22.0%
Clerical 3,740 115 3,114 83.3% 26 22.6%
Professional/Technical 5,406 141 4,446 82.2% 49 34.8%
Manager/Supervisor 2,795 468 1,857 66.4% 92 19.7%
Executive 41 41 13 31.7% 13 31.7%
Overall 16,574 965 12,543 75.7% 224 23.2%
Supporting Materials The appendices are key references in understanding Study results:
� Appendix A presents the benchmark jobs in each category. It also presents jobs initially selected as benchmarks but not included in the Study due to a lack of data or appropriate survey match, as indicated.
� Appendix B is the list of comparator companies used in the Study.
� Appendix C presents the results for each benchmark job within each category. Subtotals are provided at the end of each category and are presented in Table 1 above.
� Appendix D explains how the percentages in Table 1 above were derived. It shows average compensation dollars by category and pay element (Table D-2) and estimated total compensation dollars by category and pay element (Table D-3).
� Appendix E is a summary of the approach used to match incumbents in SCE’s “generic” job titles to survey sources.
� Appendix F lists the benchmark Study positions that include LTI values.

Aon Hewitt Consulting | Performance, Rewards and Talent 8 01551/RPT001AAP.DOCX/PR&T-SF-15008 09/2013
� Appendix G contains examples of the benefit valuation for SCE and a sample comparator company. This section should be reviewed in conjunction with the methodology section, pages 18 to 21 describing the approach used to value benefits.
� Appendix H is documentation summarizing each Team meeting and teleconference.
� Appendix I is a description of the methodology used to measure error in the Study results.
� Appendix J is a glossary of terms used in this report.

Aon Hewitt Consulting | Performance, Rewards and Talent 9 01551/RPT001AAP.DOCX/PR&T-SF-15008 09/2013
Study Methodology
Aon Hewitt Consulting | Performance, Rewards and Talent 10 01551/RPT001AAP.DOCX/PR&T-SF-15008 09/2013
Study Methodology
Overview In general, the principles behind the Study methodology were the following:
� To collect and analyze data on a company-specific basis in order to ensure that the levels of total compensation (for SCE and for each comparator company) were captured accurately; and
� To express both cash and benefit elements of compensation on an equivalent basis for SCE and comparator companies as of a common point in time.
Aon Hewitt obtained and valued pay and benefits information from comparator companies and SCE. Aon Hewitt then calculated SCE’s competitive posture vs. comparator companies.
Job Categories For the purpose of this Study, SCE and Aon Hewitt placed SCE jobs into one of five categories agreed upon by the Team (these five categories were used in the 2012 Study). The Study results include subtotals for each of these five categories:
� Physical/Technical. Usually, these are field jobs requiring physical activities that are repetitive in nature. They are found more frequently in utility companies and are typically covered by a collective bargaining agreement (at SCE and at other comparator utilities). Physical jobs often have a formal apprenticeship program and typically do not require college study. Technical jobs are individual contributor jobs that may require some college study, but a college degree is not required. These jobs are subject to the Fair Labor Standards Act9 (“FLSA”) and are categorized as nonexempt.
� Clerical. These jobs are nonexempt under the FLSA, typically include work in an office environment, and require activities that are generally routine and clerical in nature. The exception is the Meter Reader, which works in the field. These jobs may require some college study, but a college degree is not required. These jobs may be organized, but most are not—neither at SCE nor at most other comparator companies.
� Professional/Technical. These jobs are individual contributor jobs that are typically exempt from the FLSA. Usually, these jobs require a college degree, and the nature of the work involves analytical thought and independent judgment.
� Manager/Supervisor. These jobs are exempt from the FLSA; these jobs are primarily responsible for the direction and final product of the work of others.
� Executive. This category contains the limited group of company top executives who are responsible for overall direction of the company.
The Team discussed preliminary assignment of job categories made by SCE. One job was reclassified to better align it to the category that best matches the job accountabilities based on job detail provided by SCE, including, job description, job posting, organization charts, and verbal description of the job function.
9 The Fair Labor Standards Act (FLSA) of 1938 established overtime, record keeping, and a floor for minimum wage. It also determined the type of positions that are exempt from the overtime provisions. Federal law requires that “nonexempt” positions receive overtime pay for hours in excess of 40 worked in a week. Some states (e.g., California) require overtime pay for nonexempt positions for hours in excess of 8 worked in one day.

Aon Hewitt Consulting | Performance, Rewards and Talent 11 01551/RPT001AAP.DOCX/PR&T-SF-15008 09/2013
The category change made from the 2012 Study was:
� Construction/Material Crdntr 3 (Changed from Professional/Technical to Clerical)
Benchmark Job Selection and Job Matching In this Study, Aon Hewitt attempted to assess competitive posture for enough jobs so that the Team could be confident there was adequate coverage of each category.
The benchmark job selection process included a review by the Team of all benchmark jobs covered in the 2012 Study with consideration of the number of incumbents by job and coverage by job category. The Team agreed to use the 2012 benchmark jobs as a starting point in identifying benchmarks for the 2015 Study and add likely benchmarks with a high-incumbent count to increase the Study coverage.
Aon Hewitt then met in a series of three meetings with SCE staff familiar with SCE jobs to identify survey matches. During the matching process, Aon Hewitt and SCE performed the following activities:
� Aon Hewitt identified initial job matches based on a review of the 2012 Study benchmark jobs, SCE job descriptions, and compensation survey databases.
� Aon Hewitt confirmed matches with SCE staff, which in some cases included conducting additional discussions with individuals knowledgeable about a specific job and its actual job duties. Based on the discussions, Aon Hewitt adjusted some job matches.
� Aon Hewitt made these matches to surveys where it deemed job duties to be 80 percent comparable to the survey job (Aon Hewitt follows this 80 percent guideline as an industry standard).
Similar to the 2012 Study, the Team decided to include SCE’s broadly defined “generic” jobs.
SCE generic job titles are meant to be broad and cover similar activities in different functional areas/departments which are the same level of work. The following SCE generic job titles and levels were examined:
� Manager 1 and 2
� Supervisor 1, 2, 3, and 4
� Technical Specialist 1, 2, 3, and 4
� Information Technology Specialist 2, 3, and 4
� Manager, Project/Product 1, 2, and 3
� Manager, Program/Contract 1, 2, and 3
The Team discussed the nature of these jobs, which, while broadly defined, could be compared to a variety of survey benchmarks also performing a similar level of work at comparator organizations. The survey benchmarks would likely be found in several departments at Study comparator companies.
The Team agreed to include these jobs in the Study, using the approach described in Appendix E.
When Aon Hewitt completed the benchmarking process, the coverage of SCE incumbents ranged from 31.7 percent (Executive) to 83.3 percent (Clerical). Overall, there was 75.7 percent coverage of SCE employees by benchmark jobs. This provides a statistically significant level of employee coverage, sufficient for Aon Hewitt to be confident of the validity of Study results.
Appendix A shows the specific benchmark titles, by category, included in the Study with the number of SCE incumbents.

Aon Hewitt Consulting | Performance, Rewards and Talent 12 01551/RPT001AAP.DOCX/PR&T-SF-15008 09/2013
Labor Market and Comparator Companies For base salary, TCC and LTI, the Team selected comparator companies or comparator groups found in existing survey databases. Generally, the comparators included other utilities for roles specific to the industry, general industry organizations for roles that are not utility-specific, or a blend of utility and general industry. For executives, the Team agreed to use the same comparator group used in the 2012 Study with the addition of CPUC, LADWP, and SMUD. That group consists of comparably sized U.S. based utilities and general industry companies.
For each job category, it was determined to use the following labor markets:
� Physical/Technical, Clerical, Professional/Technical, and Manager/Supervisor
– For utility-specific jobs (e.g., Lineman, Meter Reader, roles found in Operations, and roles found in Transmission and Distribution): national energy utilities including those found in the western United States and California.
– For non-utility-specific jobs (e.g., roles found in Finance, Human Resources, and Information Technology): a national group of general industry companies or a blend of utility and general industry if the jobs are found broadly in both.
� Executive
– For utility-specific jobs (e.g. VP Energy Supply & Management, VP Power Production): national energy utilities with revenues between $5 billion and $20 billion plus CPUC, LADWP, and SMUD.
– For non-utility-specific jobs (e.g., SVP Chief Financial Officer, VP Tax): national general industry employers with revenues between $5 billion to $20 billion.
Selecting specific companies for use for executive jobs in the Study allowed Aon Hewitt to obtain total compensation amounts for each comparator by matching average cash compensation with average benefits for each Study job.
Because the survey databases used in the Study to cover base salary, bonus, TCC, and LTI do not also include benefits, the Team agreed to use the comparator group used in the 2012 Study to value benefits. This comparator group is made up of utilities and general industry companies, with a particular focus on including employers from Southern California. Aon Hewitt calculated benefits values for each Study company based on information contained in its database of benefit specifications. Aon Hewitt required both cash compensation and benefits data from comparators in order to determine a total compensation value. Therefore, participation in the Aon Hewitt Benefits database was required for Study inclusion. PUC, LADWP, and SMUD all agreed to participate in the database and so were included in determining benefits values.
The comparator companies are shown in Appendix B. The company revenue shown reflects 2012 information, which is the effective date of compensation data used for comparator companies and SCE.
Aon Hewitt Consulting | Performance, Rewards and Talent 13 01551/RPT001AAP.DOCX/PR&T-SF-15008 09/2013
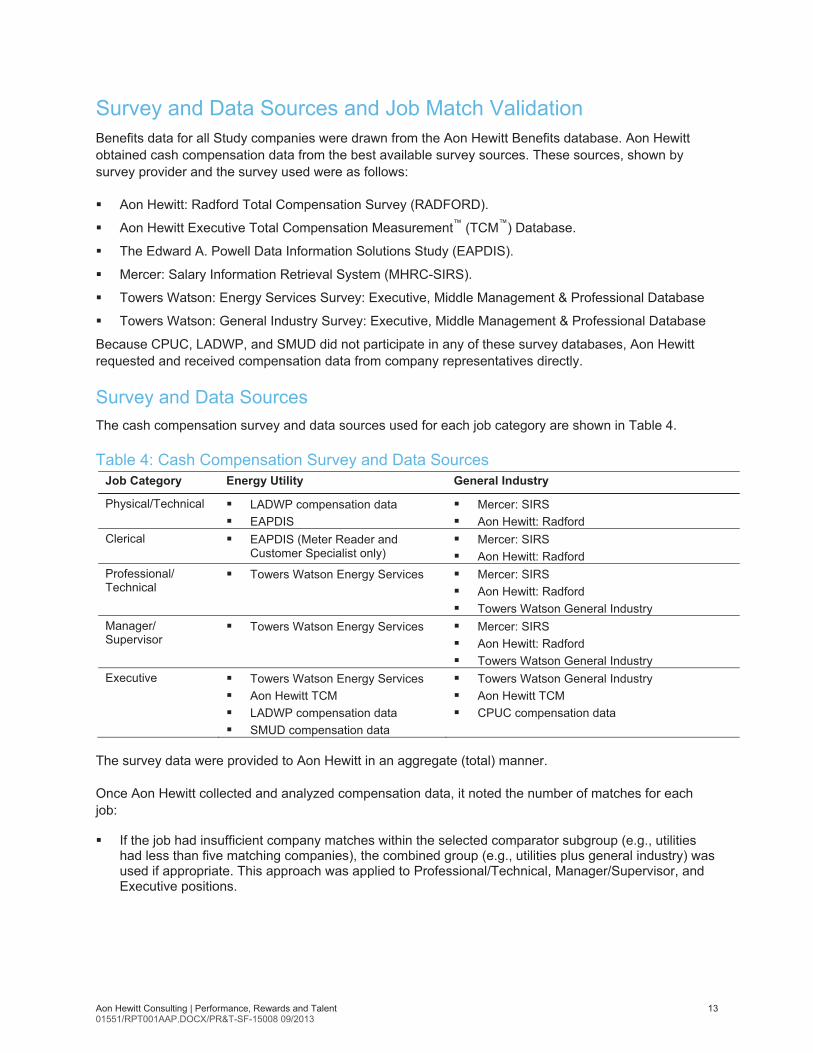
Survey and Data Sources and Job Match Validation Benefits data for all Study companies were drawn from the Aon Hewitt Benefits database. Aon Hewitt obtained cash compensation data from the best available survey sources. These sources, shown by survey provider and the survey used were as follows:
� Aon Hewitt: Radford Total Compensation Survey (RADFORD).
� Aon Hewitt Executive Total Compensation Measurement™ (TCM™) Database.
� The Edward A. Powell Data Information Solutions Study (EAPDIS).
� Mercer: Salary Information Retrieval System (MHRC-SIRS).
� Towers Watson: Energy Services Survey: Executive, Middle Management & Professional Database
� Towers Watson: General Industry Survey: Executive, Middle Management & Professional Database
Because CPUC, LADWP, and SMUD did not participate in any of these survey databases, Aon Hewitt requested and received compensation data from company representatives directly.
Survey and Data Sources The cash compensation survey and data sources used for each job category are shown in Table 4.
Table 4: Cash Compensation Survey and Data Sources Job Category Energy Utility General Industry
Physical/Technical � LADWP compensation data � EAPDIS
� Mercer: SIRS � Aon Hewitt: Radford
Clerical � EAPDIS (Meter Reader and Customer Specialist only)
� Mercer: SIRS � Aon Hewitt: Radford
Professional/ Technical
� Towers Watson Energy Services � Mercer: SIRS � Aon Hewitt: Radford � Towers Watson General Industry
Manager/ Supervisor
� Towers Watson Energy Services � Mercer: SIRS � Aon Hewitt: Radford � Towers Watson General Industry
Executive � Towers Watson Energy Services � Aon Hewitt TCM � LADWP compensation data � SMUD compensation data
� Towers Watson General Industry � Aon Hewitt TCM � CPUC compensation data
The survey data were provided to Aon Hewitt in an aggregate (total) manner.
Once Aon Hewitt collected and analyzed compensation data, it noted the number of matches for each job:
� If the job had insufficient company matches within the selected comparator subgroup (e.g., utilities had less than five matching companies), the combined group (e.g., utilities plus general industry) was used if appropriate. This approach was applied to Professional/Technical, Manager/Supervisor, and Executive positions.

Aon Hewitt Consulting | Performance, Rewards and Talent 14 01551/RPT001AAP.DOCX/PR&T-SF-15008 09/2013
� If both the comparator group and the combined group had fewer than five companies matching a job, then Aon Hewitt excluded the job from the Study.10
Job Match Validation Aon Hewitt reviewed a list of benchmark jobs including incumbent counts with the Team. The DRA selected jobs from this list for review in the job match validation process. Once the DRA selected the list of jobs for validation, Aon Hewitt compiled the SCE job descriptions and survey source job descriptions for use in validating matches.
The DRA selected thirty SCE jobs (12 percent of total jobs) covering 6,900 employees (53 percent of the benchmark population) for review in the validation process (see Table 6 below). The Team met to review the job descriptions and survey descriptions and validate the level of match of the job. Through this process, the Team agreed to modify matches for two positions including dropping one of the survey matches used for the Training Specialist 3 job and dropping a match for the Manager-Project/Product 1 job. These changes did not change SCE’s position against the comparator group.
Aon Hewitt assumes that if DRA had reviewed all remaining 195 (225 total jobs – 30 for which job matches were validated = 195) jobs (covering 6,001 SCE incumbents), other changes in job matches might have occurred. Aon Hewitt estimates such changes would not materially affect overall Study results.
Table 5: Summary of Jobs Covered by Job Match Validation Process
Validated Job
Matches
Validated Jobs as % of
Benchmark Jobs
Validated Job Match
Incumbents
Validated as % of
BenchmarkIncumbents
Total Benchmark11
Jobs
Total Benchmark11
IncumbentsTotal SCE
Population
Physical/Technical 6 13% 1,749 55% 46 3,183 4,592Clerical 9 35% 2,014 65% 26 3,114 3,740Professional/Technical 8 15% 2,211 48% 55 4,644 5,406Manager/Supervisor 6 6% 925 48% 103 1,945 2,795Executive 1 7% 1 7% 15 15 41Total 30 12% 6,900 53% 245 12,901 16,574
10 This threshold complies with the antitrust survey guidelines established by the U. S. Department of Justice and Federal Trade Commission regarding surveys of salaries, wages, and benefits (Statement 6A from the September 1994 “Statements of Antitrust Enforcement Policies”).
11 Represents the benchmark jobs and incumbents included in the results only. Does not include the jobs selected as benchmark but not included in the Study due to lack of data.
Aon Hewitt Consulting | Performance, Rewards and Talent 15 01551/RPT001AAP.DOCX/PR&T-SF-15008 09/2013
Elements of Total Compensation
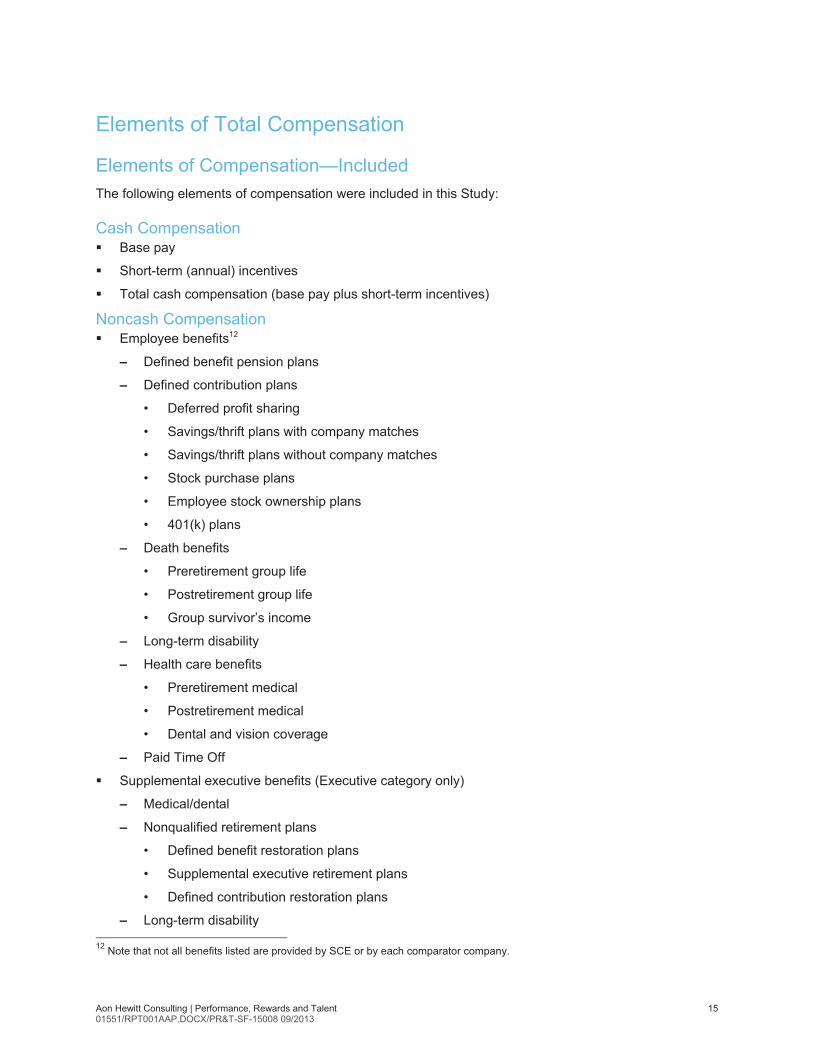
Elements of Compensation—Included The following elements of compensation were included in this Study:
Cash Compensation � Base pay
� Short-term (annual) incentives
� Total cash compensation (base pay plus short-term incentives)
Noncash Compensation � Employee benefits12
– Defined benefit pension plans
– Defined contribution plans
• Deferred profit sharing
• Savings/thrift plans with company matches
• Savings/thrift plans without company matches
• Stock purchase plans
• Employee stock ownership plans
• 401(k) plans
– Death benefits
• Preretirement group life
• Postretirement group life
• Group survivor’s income
– Long-term disability
– Health care benefits
• Preretirement medical
• Postretirement medical
• Dental and vision coverage
– Paid Time Off
� Supplemental executive benefits (Executive category only)
– Medical/dental
– Nonqualified retirement plans
• Defined benefit restoration plans
• Supplemental executive retirement plans
• Defined contribution restoration plans
– Long-term disability 12 Note that not all benefits listed are provided by SCE or by each comparator company.
Aon Hewitt Consulting | Performance, Rewards and Talent 16 01551/RPT001AAP.DOCX/PR&T-SF-15008 09/2013
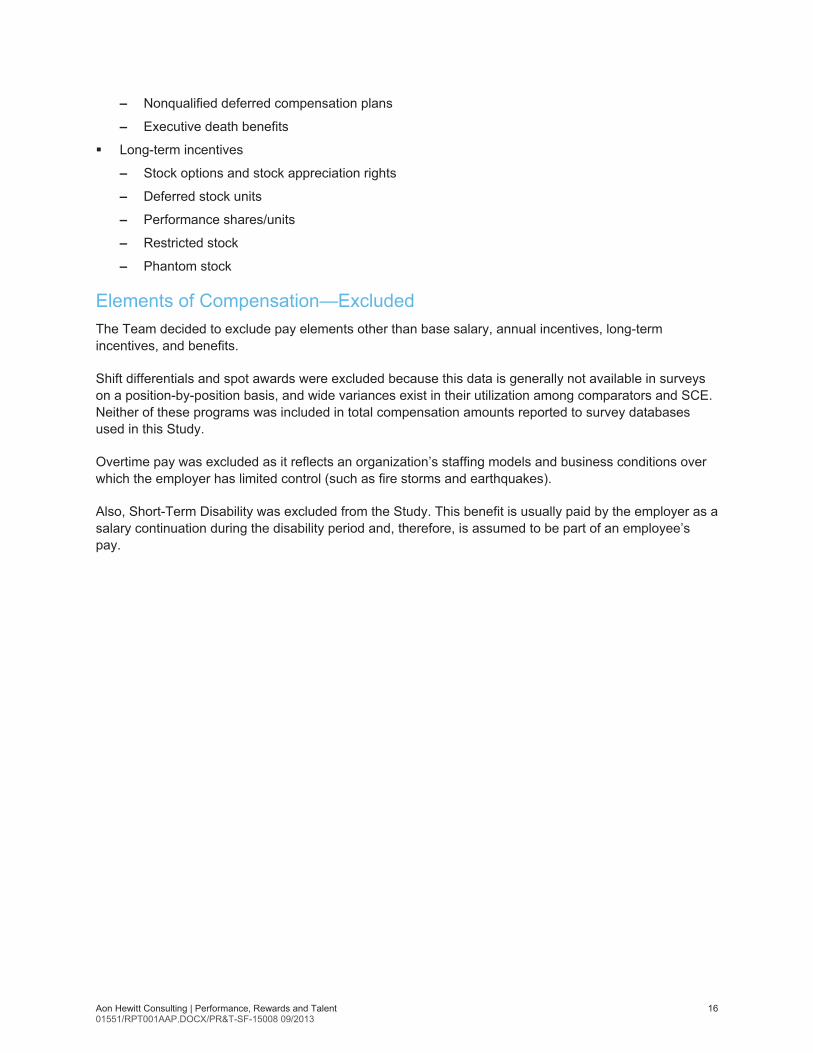
– Nonqualified deferred compensation plans
– Executive death benefits
� Long-term incentives
– Stock options and stock appreciation rights
– Deferred stock units
– Performance shares/units
– Restricted stock
– Phantom stock
Elements of Compensation—Excluded The Team decided to exclude pay elements other than base salary, annual incentives, long-term incentives, and benefits.
Shift differentials and spot awards were excluded because this data is generally not available in surveys on a position-by-position basis, and wide variances exist in their utilization among comparators and SCE. Neither of these programs was included in total compensation amounts reported to survey databases used in this Study.
Overtime pay was excluded as it reflects an organization’s staffing models and business conditions over which the employer has limited control (such as fire storms and earthquakes).
Also, Short-Term Disability was excluded from the Study. This benefit is usually paid by the employer as a salary continuation during the disability period and, therefore, is assumed to be part of an employee’s pay.
Aon Hewitt Consulting | Performance, Rewards and Talent 17 01551/RPT001AAP.DOCX/PR&T-SF-15008 09/2013
Valuation of Total Compensation Elements
Base Pay Average base pay data were obtained from SCE and comparators for incumbents in each benchmark job. Hourly pay data were annualized as needed by multiplying by 2,080 hours.
The Team developed a compensation adjustment factor or “aging factor” by reviewing competitive pay increase data provided by Aon Hewitt. Using actual 2012 salary increase rates reported by companies in SCE’s comparator groups to Aon Hewitt’s annual Salary Increase Survey, Aon Hewitt developed an average salary increase factor for each job category (Physical/Technical, Clerical, etc.) within the utility industry and general industry. Then a weighted average adjustment factor was developed for the utility industry (2.6 percent) and the general industry group (2.7 percent). Aon Hewitt’s recommended approach was to apply the utility industry factor to utility survey data and the general industry factor to the general industry survey data to adjust the survey data to the effective date of the Study (December 31, 2012). SCE agreed with this market-based approach. DRA requested that SCE use the CPUC approved labor escalation factor of 2.625% for purposes of adjusting the market data. Both Aon Hewitt and SCE disagree with use of the labor escalation factor as it is not a relevant measure of the rate of change of pay in the general industry and utility industry. However, because the difference between the Aon Hewitt recommended adjustment factor of 2.7% and the DRA labor escalation factor of 2.625% is well within the defined limits of acceptable survey error for the Study of plus or minus 5.0%, the 2.625% factor was accepted and used in the Study.
To illustrate the application of the adjustment factor, general industry survey data that needed to be adjusted by 3 months was increased by 3/12 of the annual rate of 2.625%, or 0.65625 percent.
SCE base salary information was effective December 31, 2012 so it was not adjusted.
Short-Term (Annual) Incentives (Bonus) Average annual cash incentive payments were collected, by position, from each survey source for comparators and for SCE. Similar to base pay, survey amounts were adjusted by the aging factor to December 31, 2012. SCE amounts, which were paid in March, 2012, were also adjusted to the same date.
SCE and survey company incentives were actual amounts paid (not planned or “target” amounts) in 2012 (for 2011 performance) and may include cash profit sharing, gainsharing awards, or other lump-sum payments from ongoing incentive plans requested by each survey. As noted earlier, spot award payments were excluded.
For SCE, these amounts included the employee Results Sharing program, Management Incentive Program, and Executive Incentive Compensation Program awards. This Study did not examine the operation of these programs; rather, it examined the magnitude of awards provided by SCE to its employees as reported to Aon Hewitt.
Total Cash Compensation Base pay and short-term incentives, as reported by the comparators and SCE, were totaled for incumbents in each Study position to obtain total cash compensation.
Aon Hewitt Consulting | Performance, Rewards and Talent 18 01551/RPT001AAP.DOCX/PR&T-SF-15008 09/2013
Employee Benefits Benefit values have been computed by Aon Hewitt’s application of its Benefit Index® methodology. All values are net of employee contributions. Aon Hewitt uses this proprietary methodology to value each type of employee benefit. (Note that the specific formulae used cannot be shared with third parties, due to potential loss of Aon Hewitt’s competitive advantage.)
In the 2012 Study, at the request of the DRA and with agreement from SCE, the Team developed benefit values using two demographic models and assumptions. These were:
� Aon Hewitt’s standard demographic model based on a broad cross section of companies in Aon Hewitt’s database, and reflecting age, gender, years of service, etc., and standard actuarial assumptions. These assumptions included mortality for group life insurance values and rates of disability based on studies from the Society of Actuaries, assumptions about the percentage of employees opting out of health care coverage, and retirement age. Aon Hewitt applied this demographic model and assumptions to both SCE’s and the comparator companies’ benefit designs to isolate, as best as possible, the impact on benefit values resulting from differences in plan design and minimize the impact on benefit values resulting from differences in employee demographics.
� SCE’s actual demographic profile based on employee and retiree data including, age, gender, years of service, rate of opt-out from health care coverage, etc., as well as economic and other assumptions used in valuing SCE’s Retirement Plan and Post-retirement Benefits Other than Pensions (PBOPs) such as projected salary increases, average retirement age, and rates of disability. Aon Hewitt applied SCE’s demographic profile and assumptions to both SCE’s and the comparator companies’ benefit designs to as explained above, isolate as best as possible the impact on benefit values resulting from differences in plan design.
In the 2012 Study, the Team agreed that using SCE’s demographic profile and assumptions would better reflect SCE’s benefit values since they are based on the company’s employee data and benefit utilization experience.
In the 2015 Study, the benefit values were determined using the SCE demographic profile.
For each job that was included in the Study (for all companies, including SCE), the average total cash compensation level of the incumbents in that position was used as the basis for benefit valuation.
Aon Hewitt obtained a detailed description of each comparator company’s benefit program in effect, which it used to value benefits.
Benefits may differ by employee group. For Study purposes, Aon Hewitt used the primary salaried employee benefit plans. There were no material differences in benefits between employee groups for SCE but there were differences in benefits between employee groups for approximately 20 percent of the Study companies. In most of these cases, this difference was limited to the health care contribution for represented employees, who are primarily found in the Physical/Technical category. For simplicity and cost-effectiveness, the Team asked Aon Hewitt to use salaried benefits for all Study jobs. This introduces a small amount of error in the Study. Aon Hewitt estimates this decision understates the competitors’ total compensation value by less than 0.1 percent of total compensation for most Study positions.
The assumptions used to value benefits using the SCE demographic profiles and assumptions are reflected in annual SCE Retirement Plan and postretirement benefit actuarial valuations, and represent the signing actuaries’ best estimates of the future plan experience, taking into consideration past experience and reasonable future expectations. These actuarial valuations are used to determine pension and postretirement benefit expense under Financial Accounting Standards Board Statements Nos. 87 and 106, as well as pension funding policy contributions and minimum funding requirements under the
Aon Hewitt Consulting | Performance, Rewards and Talent 19 01551/RPT001AAP.DOCX/PR&T-SF-15008 09/2013
Pension Protection Act. Demographic actuarial assumptions, including rates of retirement and employment termination, postretirement health benefit claims and trend assumptions, are reviewed periodically based on actual plan experience and insurance premiums, as well as plan design features and national trends. All actuarial assumptions are reviewed each year for general consistency with emerging plan experience.
In general, the value of each benefit provided by SCE or a comparator company was determined in one of two ways:
� Not every benefit is received by every employee in every year. Thus, for each individual in the standard population, the probability of an event, such as disability, is multiplied by the lump-sum value of all amounts to be paid arising from that event. This approach is used for all benefits for which value may be received in the current year; or
� Certain benefits are commitments to provide a payment after active employment has ended. These are valued by establishing the benefit as a percentage of pay for the current year. This approach is used to calculate a discounted present value for a future promise.
These values are determined as (1) a percentage of cash compensation (for pay-related benefits such as pensions) or (2) flat-dollar amounts (for programs such as medical coverage). Where compensation data are necessary to determine the value for a particular benefit at a given company, the appropriate actual cash compensation level is used.
Benefit values were calculated using each company’s plan features in place for calendar-year 2012.
Specific comments on valuation methodology for benefit elements are provided below, and examples are provided in Appendix G:
� Defined Benefit Pension: Values for each position in the Study were determined by performing a standard pension valuation of qualified and, if applicable, nonqualified plans on the population. (Qualified plans are those that comply with Internal Revenue Code requirements of funding, vesting, and broad employee participation. Employers make tax-deductible contributions to trusts to provide for the future benefits to their employees. Nonqualified plans are generally provided for select management and highly compensated employees and are not subject to the same funding, vesting, and participation requirements as qualified plans. Employers generally pay such benefits as they come due.) The most important factors considered include the benefit formula, definition of covered pay, early retirement subsidies, subsidized payment forms, and the existence of benefit restoration plans.
Ultimately, pension values represent a consistent annual employer contribution that would be required to provide the promised benefit at retirement.
� Capital Accumulation and Defined Contribution: Profit sharing, 401(k), matched savings, broad-based stock purchase, and employee stock ownership plans were included in this area. Employer contributions were adjusted only for eligibility and the possibility of forfeiture.
� Group Life: The value of this benefit for each incumbent was determined as the amount of the benefit times the probability of that person dying in the next year, minus any employee contributions. The benefits included were noncontributory and contributory qualified plans, supplemental programs, accidental death and dismemberment coverage, and continuation of benefits on disability.
� Survivor Income Annuity Benefits: These programs were valued the same way as group life benefits, except that the benefit amount is converted to the lump-sum value of the annuity stream of payments that would be paid. Benefits paid from a pension upon death of an active employee were included, as were annuities not paid from the pension plan.
Aon Hewitt Consulting | Performance, Rewards and Talent 20 01551/RPT001AAP.DOCX/PR&T-SF-15008 09/2013
� Postretirement Death Benefits: Values for postretirement death benefits were determined through a pension valuation approach, except that the benefit being funded was not an annuity payable while the retiree is alive, but a lump sum payable at death. Annuities paid from a pension to the beneficiary upon the retiree’s death were included in the pension value rather than the postretirement death value.
� Long-Term Disability: This benefit captures the value to the employee of coverage for disability that is longer than six months. The value of the benefit to each incumbent equals the probability of disability times the annuity value of the benefits received, minus employee contributions (if any). Both qualified and nonqualified plans were included. In addition, pension benefits paid to disabled employees prior to normal retirement were included in this category of benefits.
� Health Care: The value of the preretirement medical, dental, hearing, and vision plans was based on expected claims determined using a rate-making manual, taking into account the utilization associated with each employee group, adjusted for the net effect of persons waiving coverage.
Health care claims values are based on SCE’s actual costs. Plan values for each study company are aggregated using the plan enrollment distribution for that company. The study aggregates all various plans of the same delivery model type and allows Aon Hewitt to quantify each delivery model’s purchasing efficiency. Definitions of the various delivery models are illustrated below in order of purchasing efficiency to the employer.
– Health Maintenance Organization (HMO): A “prepaid” medical group plan consisting of a defined panel of physicians and facilities. Patients must follow the HMO’s protocols in order to obtain coverage (the primary care physician must approve all care and provides referrals to specialists when necessary). Generally, no benefits are paid for care obtained outside the designated provider panel.
– Exclusive Provider Option (EPO): A medical group plan that mirrors the HMO concept, but is self-funded by an employer. Claims are paid as they are incurred; medical care is not “prepaid.”
– Point-of-Service (POS): A medical group plan with two levels of benefits: in-network and out-of-network. Typically, in-network benefits mirror HMO benefits (patients must follow HMO-like protocols). Out-of-network benefits are available, but are less comprehensive and typically are subject to higher deductibles and lower coverage levels.
– Preferred Provider Option (PPO): A medical group plan with two levels of benefits similar to a POS plan. The key difference is that the in-network benefits are not subject to HMO-like protocols. Patients can access specialists directly, referrals are not required, and medical utilization reviews are less stringent than in HMOs.
– Indemnity: A medical group plan without any provider networks or stringent utilization controls.
A purchasing efficiency adjustment was applied to each comparator company based on the medical plan enrollment distribution for that company. Employee contributions, if any, were subtracted from total values to determine the employer paid value.
� Retiree Medical: Postretirement medical benefit values were calculated in a manner similar to pensions and postretirement death benefits. In 2003, SCE announced retiree health care changes that would affect all of its employees. Equivalent changes were negotiated with the Unions representing employees in 2004 and 2005. Some employees were “grandfathered” under the prior plan; the remaining employees will receive a different level of retiree medical benefits. The grandfathered percentage of SCE employees is small and not considered in this Study. Also, Aon Hewitt statistically determined that employees in benchmark jobs have approximately the same age and service as employees in non-benchmark jobs. Therefore, retiree medical values for SCE benchmarks are representative of the entire workforce.
Aon Hewitt Consulting | Performance, Rewards and Talent 21 01551/RPT001AAP.DOCX/PR&T-SF-15008 09/2013
� Flexible Credits: Each company’s program is structured differently. Most often, however, flexible credits are granted by benefit type. For example, a company may give $3,000 toward the purchase of medical coverage, $500 toward the cost of dental coverage, enough flexible credits to purchase a 50 percent LTD plan, and enough credits to purchase two-times-pay life insurance. Credits were allocated back to the benefit types for which they were intended and were treated as offsets to employee contributions. Thus, using the flexible credits in the example above, if the overall medical price tag was $4,000, the $3,000 of flexible credits effectively reduced the employee contribution to $1,000. If the credits for a given benefit area exceeded the price tag for that benefit, the extra credits that result were allocated to other areas where such credits were not sufficient to pay the entire cost. If the flexible credits in total were more than sufficient to purchase all eligible benefits, the excess credits were allocated to health care spending accounts, defined contribution accounts, or cash, depending on the terms of the program.
� Paid Time Off
DRA requested that PTO be valued and reported separately from other benefits for the 2015 Study. In prior Studies, the value of PTO was assumed to be covered in base pay since the value to the employee is reflected in the base pay they earn while on PTO. DRA argued that unused PTO has additional value since the employee can receive payment for unused days upon termination or retirement.
The Team agreed to develop a value for PTO in two parts (based on SCE’s utilization as applied to each company’s schedule of PTO days).
– Part 1: Days used during the year: The lesser of the number of PTO days provided by each company and the number of PTO days used by SCE employees were valued using Aon Hewitt’s current PTO methodology and included implicitly in salary. This is a consistent treatment for all PTO days up to the utilization assumption. Any PTO days provided above the utilization assumption would be included in Part 2.
– Part 2: Days in excess of used days during the year: Because days provided in excess of those used during the year are eligible for cash out when the employee leaves the company, these days were valued similar to a pension benefit as a lump sum at projected termination/retirement. PTO value is based on final salary and the number of unpaid days. This is consistent treatment for all PTO days above the utilization assumption. The value is added to the total benefit value.

Aon Hewitt Consulting | Performance, Rewards and Talent 22 01551/RPT001AAP.DOCX/PR&T-SF-15008 09/2013
Data Aggregation and Average Benefit Calculation As noted earlier in this report, data from survey providers was provided in aggregated form. This means that Aon Hewitt did not have access to the base salaries and short-term incentives paid by each company. Instead, Aon Hewitt had only the total number of incumbents, average base salary, bonus, and total cash compensation (in aggregate) for each survey job.
Based on this information, Aon Hewitt used the following process to calculate benefit values for each survey benchmark:
� For each job, Aon Hewitt used incumbent-weighted average (aggregated) base salary and bonus data.
� Benefits for each comparator company and SCE were valued for each job category.
� These values were averaged for utility, general industry, and the combined groups.
� These averages were applied to appropriate total cash levels in each job category.
� Aon Hewitt summed the average base salary, bonus, long-term incentives (where eligible), benefit and PTO values to determine an average total compensation figure for the job.
In past studies, Aon Hewitt conducted test analyses using data provided in both aggregated and non-aggregated form to determine the significance of the differences between averaging benefits across each Study group and calculating benefits values separately for each company.
In the past analyses, Aon Hewitt found the difference between the approaches was minor, and that the variance was sometimes positive and sometimes negative. Thus, over the group of survey benchmarks, variances offset each other, and the overall differences were negligible.
Aon Hewitt believes that while error is possible, it would not affect Study results by more than 0.1 percent of the total compensation in either direction.
Long-Term Incentives LTI compensation programs include such plans as:
� Stock options;
� Deferred stock units/performance units;
� Stock appreciation rights;
� Restricted stock; and
� Phantom stock.
In determining which benchmark jobs were eligible for LTI awards and, therefore, should include LTI values in the 2015 Study, the Team examined eligibility data that reported the percentage of comparator companies that granted LTI for each benchmark job. Similar to the 2012 Study, the Team agreed to include LTI values for jobs that were eligible for LTI at 50% or more of the comparator companies. A total of 59 benchmark jobs met this criteria including: 10 Professional/Technical positions, 36 Manager/Supervisor positions, and 13 Executive positions.
Aon Hewitt employed our proprietary method to value LTI. This methodology is applied to the most recent annual long-term grants made by the comparator companies in Aon Hewitt’s Total Compensation
Aon Hewitt Consulting | Performance, Rewards and Talent 23 01551/RPT001AAP.DOCX/PR&T-SF-15008 09/2013
Measurement (TCM) Database and SCE (in most cases, this was a company’s grant made in 2012). All comparator companies had stock options or other long-term incentive programs.
The general principle behind the valuation method is to arrive at a figure that corresponds as closely as possible to the intrinsic (economic) value of the long-term incentive award on the date of grant.
� Stock Options: To recognize the potential value inherent in stock option grants, Aon Hewitt used an option-pricing model. Aon Hewitt’s model is based on the Black-Scholes option pricing approach, adjusted for a variety of elements unique to employee stock options. This model does not assume a particular growth in stock price, but rather values the right to buy stock at a fixed price for a certain period of time. The model takes into account several factors in assigning a value to the option. These factors include the following:
– Option price;
– Fair market value on the date of grant;
– Length of exercise period;
– Vesting restrictions on the exercise of options;
– Stock price volatility;
– Projected dividend stream;
– Reasonable discount factor; and
– Recipient turnover.
The character of a stock is largely defined by its dividend yield and price volatility. The pricing model recognizes these characteristics in the valuation of stock options. Simply expressed, an option on a stable security (high dividend yield, relatively little fluctuation in price) is worth less, as a percent of stock price, than an option on an active, growth-oriented stock, which may not pay dividends. An option holder benefits from a stock in which the majority of the investment returns lies in appreciation; the holder of most stock options derives no benefit from dividends on the stock until after exercise of the option occurs.
The design of a stock option plan can have a material impact on an option’s value. An option with a ten-year term, for instance, is worth more than a five-year option, primarily because the recipient has a longer time period over which to benefit from relative stock price volatility.
Other plan design features incorporated into the valuation include dividend equivalents (payment of dividends as if the recipient held the stock), extension of the exercise period beyond termination of employment, and the frequency of grants.
Among Study comparators, Aon Hewitt has found that utility companies are more likely to pay dividends and their stock price tends to be less volatile than general industry companies. Therefore, the per stock option value (assuming the same exercise price and other design features) we ascribe for a utility company would typically be lower (i.e., 20-25% of stock price at grant) than we ascribe to a stock option of a general industry company (i.e., 30-40% of stock price at grant).
Aon Hewitt Consulting | Performance, Rewards and Talent 24 01551/RPT001AAP.DOCX/PR&T-SF-15008 09/2013
� Deferred Stock Units/Performance Units: The data obtained from each company in the Study includes: actual grant size (in number of shares or units) for each position, target (expected) and maximum award opportunities, performance requirements necessary to earn target and maximum awards, and the related performance measurement period for each grant. The starting point for deferred stock/performance unit valuations generally equals the market price of the company’s stock on the date of award, reduced for the probability of goal attainment. In cases where a performance share plan does not provide for the payment or accrual of dividends, the value is reduced further. The calculated unit or share value then is multiplied by grant size to determine the final grant value. Both deferred stock units, performance shares and units are valued to reflect:
– Volatility of performance;
– Maximum award levels;
– Length of performance period; and
– Recipient turnover.
If a deferred stock unit/performance share has the same design characteristics, Aon Hewitt’s calculated value will be similar across industries.
� Stock Appreciation Rights: Similar to stock options, stock appreciation rights (SARs) allow the recipient to obtain the gain from stock price appreciation, but require no recipient payment. Generally, SARs are valued in the same manner as stock options.
� Restricted Stock: The total value of each restricted stock grant is obtained by multiplying the number of shares granted by the value of the stock on the date of grant. This value is then reduced by an amount equal to the assumed turnover for the period of restriction. In cases where the plan does not provide for the payment or accrual of dividends on restricted shares, or where the recipient has to make cash payment for such shares, the value is reduced further. If a restricted share has the same design characteristics, Aon Hewitt’s calculated value will be similar across industries.
� Phantom Stock: Phantom stock programs are valued in one of two ways. If the recipient obtains the full value of the phantom share or unit, then the valuation methodology is similar to that used for restricted stock. Alternatively, if the phantom stock award is based solely on the appreciation in the stock price, then the methodology is similar to that used for stock appreciation rights.
Project workpapers are submitted along with SCE’s GRC filing. The project workpapers provide additional clarity regarding the Study process. The workpapers, combined with this Study report, provide a clear picture of how the Study was conducted, the decisions made by the Team, and the calculated results. The workpapers include:
� A list of all SCE jobs (by job category) used to select Study benchmark jobs.
� SCE job descriptions.
� A list of survey job matches for each Study benchmark, which includes SCE department identifiers used to match manager and supervisor jobs to surveys (as described in Appendix E).

Aon Hewitt Consulting | Performance, Rewards and Talent 25 01551/RPT001AAP.DOCX/PR&T-SF-15008 09/2013
Appendix A: Benchmark Jobs
Aon Hewitt Consulting | Performance, Rewards and Talent 26 01551/RPT001AAP.DOCX/PR&T-SF-15008 09/2013
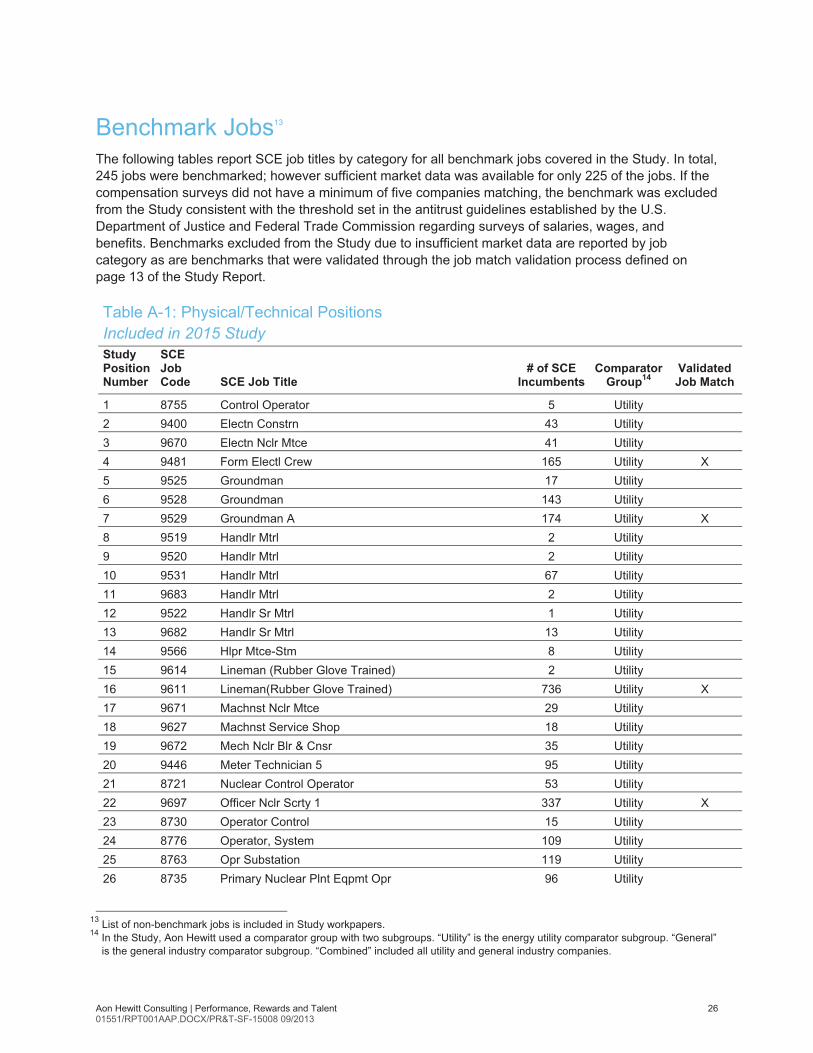
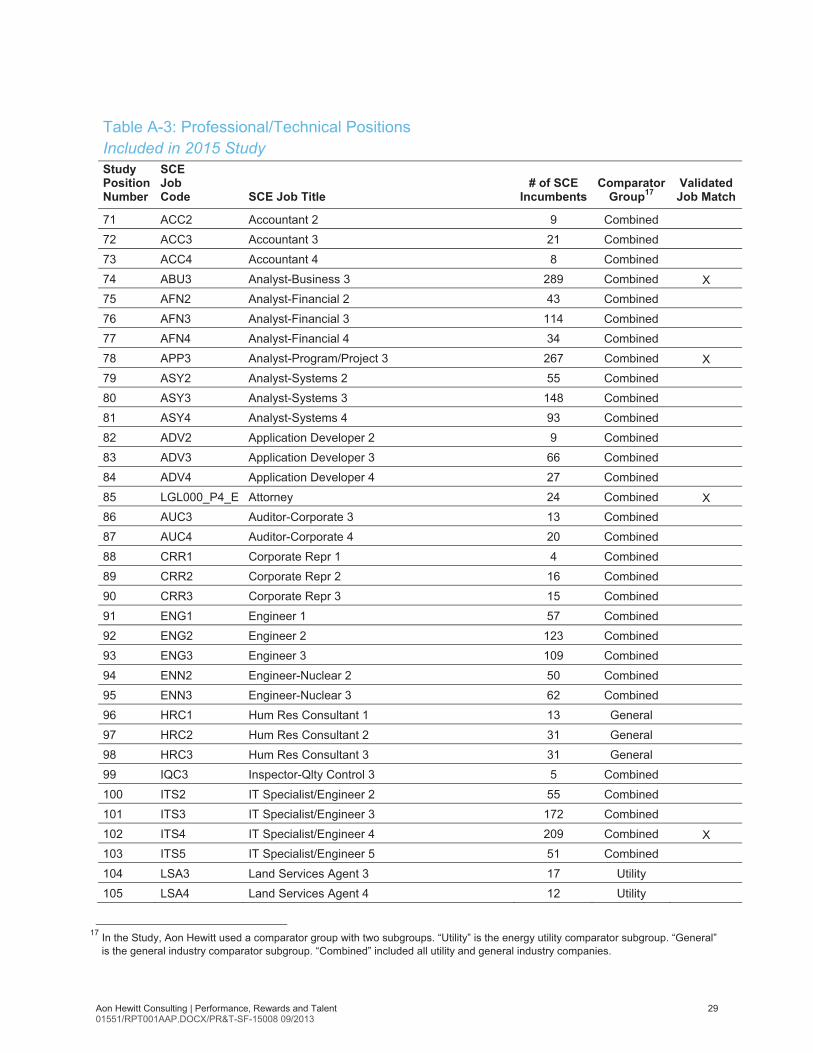
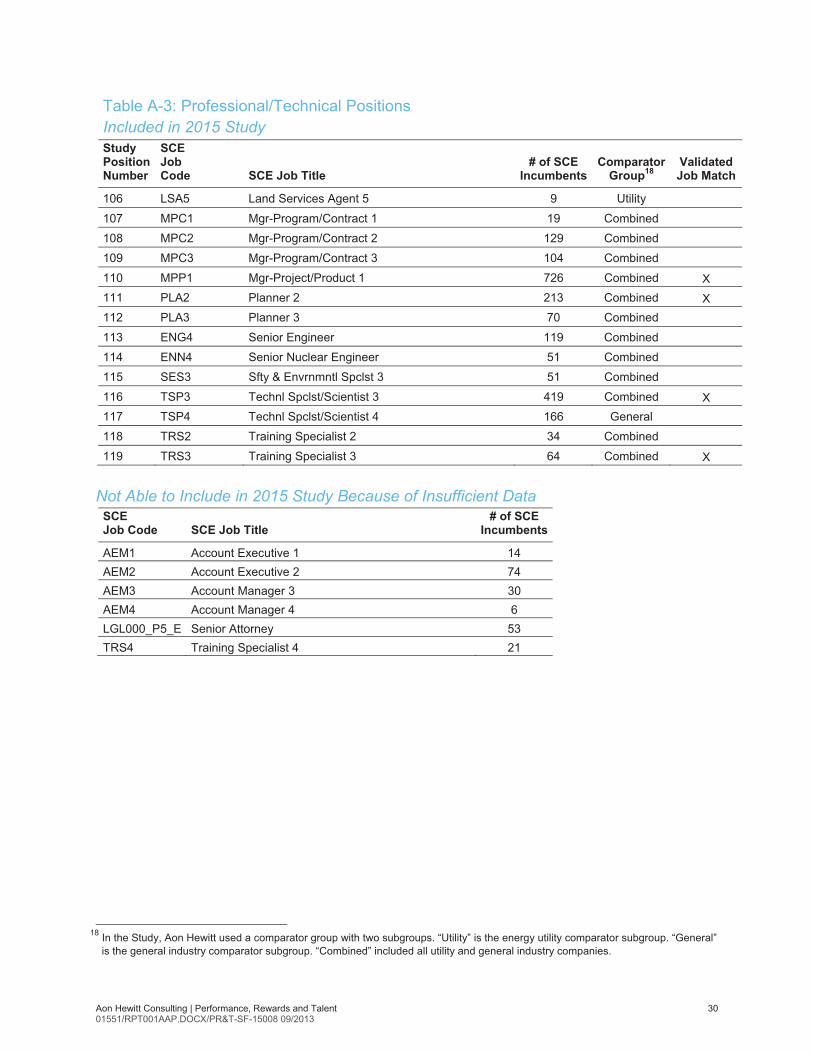
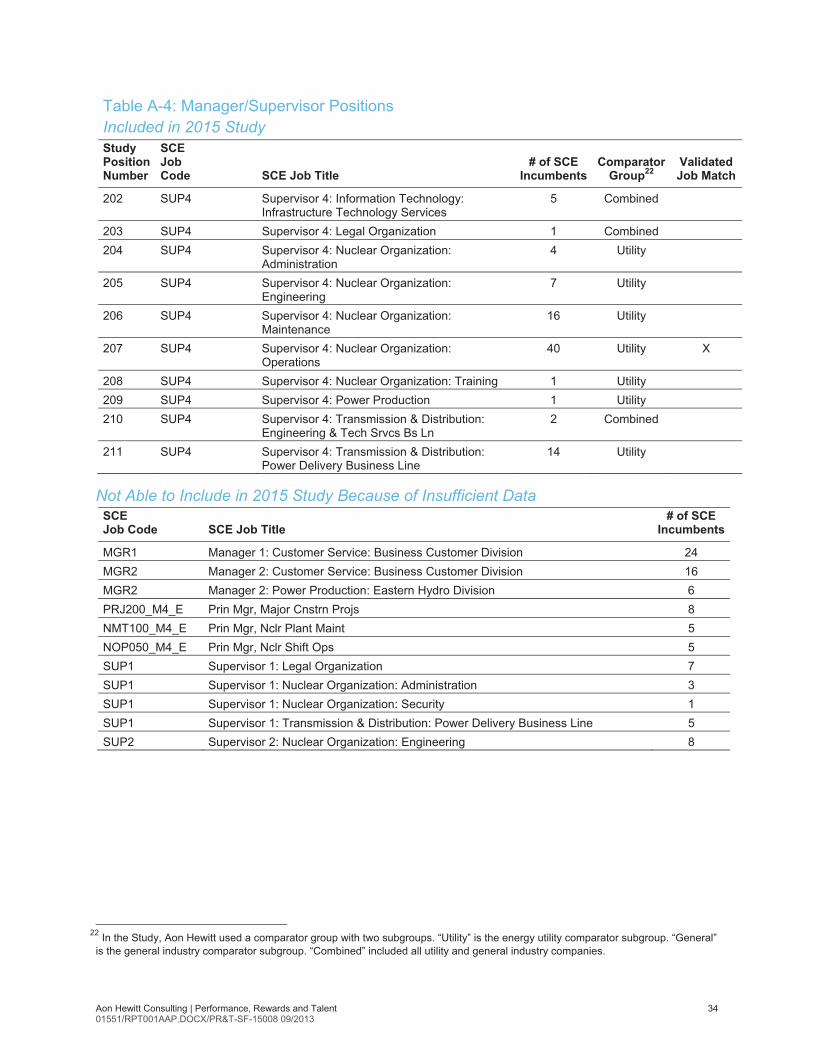
Benchmark Jobs13 The following tables report SCE job titles by category for all benchmark jobs covered in the Study. In total, 245 jobs were benchmarked; however sufficient market data was available for only 225 of the jobs. If the compensation surveys did not have a minimum of five companies matching, the benchmark was excluded from the Study consistent with the threshold set in the antitrust guidelines established by the U.S. Department of Justice and Federal Trade Commission regarding surveys of salaries, wages, and benefits. Benchmarks excluded from the Study due to insufficient market data are reported by job category as are benchmarks that were validated through the job match validation process defined on page 13 of the Study Report.
Table A-1: Physical/Technical Positions Included in 2015 Study Study Position Number
SCE Job Code SCE Job Title
# of SCE Incumbents
Comparator Group14
Validated Job Match
1 8755 Control Operator 5 Utility 2 9400 Electn Constrn 43 Utility 3 9670 Electn Nclr Mtce 41 Utility 4 9481 Form Electl Crew 165 Utility X 5 9525 Groundman 17 Utility 6 9528 Groundman 143 Utility 7 9529 Groundman A 174 Utility X 8 9519 Handlr Mtrl 2 Utility 9 9520 Handlr Mtrl 2 Utility 10 9531 Handlr Mtrl 67 Utility 11 9683 Handlr Mtrl 2 Utility 12 9522 Handlr Sr Mtrl 1 Utility 13 9682 Handlr Sr Mtrl 13 Utility 14 9566 Hlpr Mtce-Stm 8 Utility 15 9614 Lineman (Rubber Glove Trained) 2 Utility 16 9611 Lineman(Rubber Glove Trained) 736 Utility X 17 9671 Machnst Nclr Mtce 29 Utility 18 9627 Machnst Service Shop 18 Utility 19 9672 Mech Nclr Blr & Cnsr 35 Utility 20 9446 Meter Technician 5 95 Utility 21 8721 Nuclear Control Operator 53 Utility 22 9697 Officer Nclr Scrty 1 337 Utility X 23 8730 Operator Control 15 Utility 24 8776 Operator, System 109 Utility 25 8763 Opr Substation 119 Utility 26 8735 Primary Nuclear Plnt Eqpmt Opr 96 Utility
13 List of non-benchmark jobs is included in Study workpapers. 14 In the Study, Aon Hewitt used a comparator group with two subgroups. “Utility” is the energy utility comparator subgroup. “General”
is the general industry comparator subgroup. “Combined” included all utility and general industry companies.
Aon Hewitt Consulting | Performance, Rewards and Talent 27 01551/RPT001AAP.DOCX/PR&T-SF-15008 09/2013
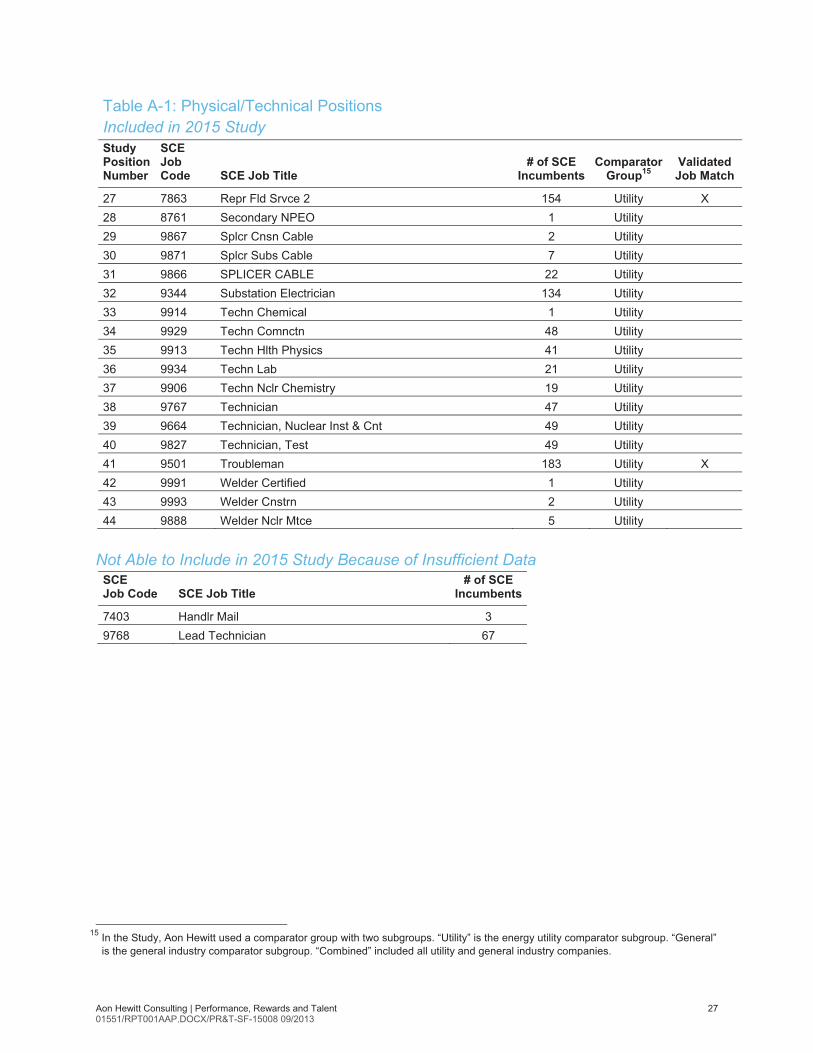
Table A-1: Physical/Technical Positions Included in 2015 Study Study Position Number
SCE Job Code SCE Job Title
# of SCE Incumbents
Comparator Group15
Validated Job Match
27 7863 Repr Fld Srvce 2 154 Utility X 28 8761 Secondary NPEO 1 Utility 29 9867 Splcr Cnsn Cable 2 Utility 30 9871 Splcr Subs Cable 7 Utility 31 9866 SPLICER CABLE 22 Utility 32 9344 Substation Electrician 134 Utility 33 9914 Techn Chemical 1 Utility 34 9929 Techn Comnctn 48 Utility 35 9913 Techn Hlth Physics 41 Utility 36 9934 Techn Lab 21 Utility 37 9906 Techn Nclr Chemistry 19 Utility 38 9767 Technician 47 Utility 39 9664 Technician, Nuclear Inst & Cnt 49 Utility 40 9827 Technician, Test 49 Utility 41 9501 Troubleman 183 Utility X 42 9991 Welder Certified 1 Utility 43 9993 Welder Cnstrn 2 Utility 44 9888 Welder Nclr Mtce 5 Utility
Not Able to Include in 2015 Study Because of Insufficient Data
SCE Job Code SCE Job Title
# of SCE Incumbents
7403 Handlr Mail 3 9768 Lead Technician 67
15 In the Study, Aon Hewitt used a comparator group with two subgroups. “Utility” is the energy utility comparator subgroup. “General”
is the general industry comparator subgroup. “Combined” included all utility and general industry companies.
Aon Hewitt Consulting | Performance, Rewards and Talent 28 01551/RPT001AAP.DOCX/PR&T-SF-15008 09/2013
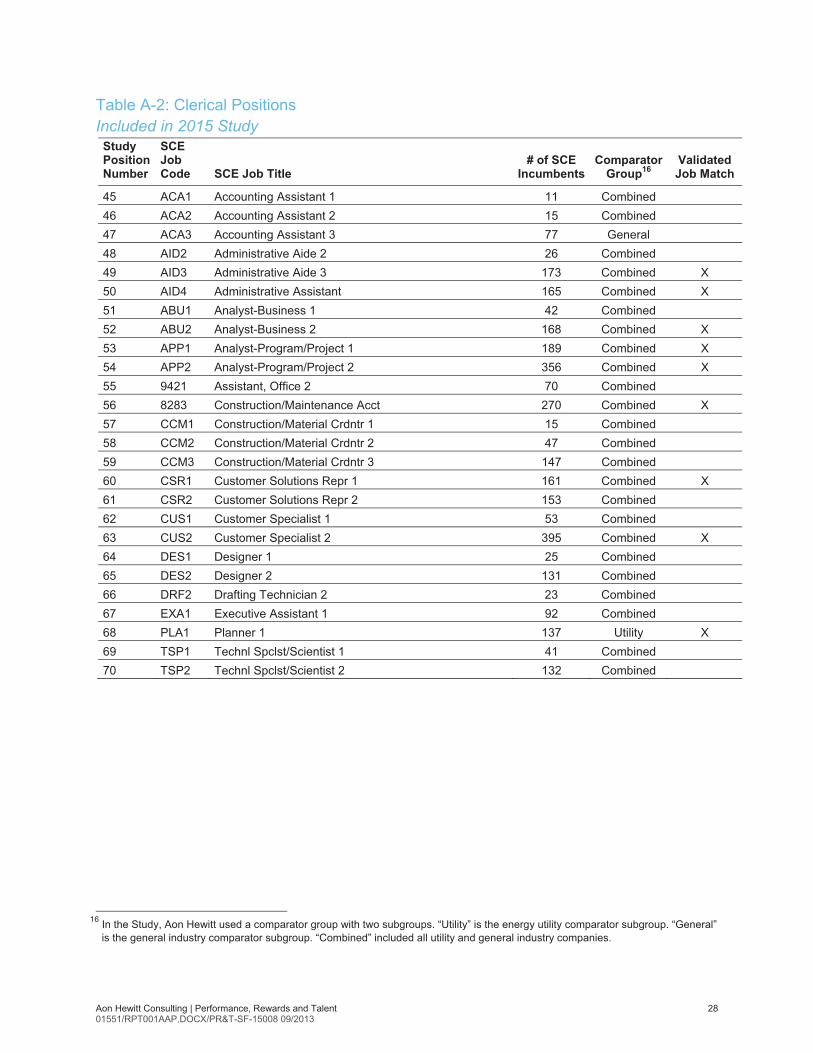
Table A-2: Clerical Positions Included in 2015 Study
Study Position Number
SCE Job Code SCE Job Title
# of SCE Incumbents
Comparator Group16
Validated Job Match
45 ACA1 Accounting Assistant 1 11 Combined 46 ACA2 Accounting Assistant 2 15 Combined 47 ACA3 Accounting Assistant 3 77 General 48 AID2 Administrative Aide 2 26 Combined 49 AID3 Administrative Aide 3 173 Combined X 50 AID4 Administrative Assistant 165 Combined X 51 ABU1 Analyst-Business 1 42 Combined 52 ABU2 Analyst-Business 2 168 Combined X 53 APP1 Analyst-Program/Project 1 189 Combined X 54 APP2 Analyst-Program/Project 2 356 Combined X 55 9421 Assistant, Office 2 70 Combined 56 8283 Construction/Maintenance Acct 270 Combined X 57 CCM1 Construction/Material Crdntr 1 15 Combined 58 CCM2 Construction/Material Crdntr 2 47 Combined 59 CCM3 Construction/Material Crdntr 3 147 Combined 60 CSR1 Customer Solutions Repr 1 161 Combined X 61 CSR2 Customer Solutions Repr 2 153 Combined 62 CUS1 Customer Specialist 1 53 Combined 63 CUS2 Customer Specialist 2 395 Combined X 64 DES1 Designer 1 25 Combined 65 DES2 Designer 2 131 Combined 66 DRF2 Drafting Technician 2 23 Combined 67 EXA1 Executive Assistant 1 92 Combined 68 PLA1 Planner 1 137 Utility X 69 TSP1 Technl Spclst/Scientist 1 41 Combined 70 TSP2 Technl Spclst/Scientist 2 132 Combined
16 In the Study, Aon Hewitt used a comparator group with two subgroups. “Utility” is the energy utility comparator subgroup. “General”
is the general industry comparator subgroup. “Combined” included all utility and general industry companies.
Aon Hewitt Consulting | Performance, Rewards and Talent 29 01551/RPT001AAP.DOCX/PR&T-SF-15008 09/2013
Table A-3: Professional/Technical Positions Included in 2015 Study Study Position Number
SCE Job Code SCE Job Title
# of SCE Incumbents
Comparator Group17
Validated Job Match
71 ACC2 Accountant 2 9 Combined 72 ACC3 Accountant 3 21 Combined 73 ACC4 Accountant 4 8 Combined 74 ABU3 Analyst-Business 3 289 Combined X 75 AFN2 Analyst-Financial 2 43 Combined 76 AFN3 Analyst-Financial 3 114 Combined 77 AFN4 Analyst-Financial 4 34 Combined 78 APP3 Analyst-Program/Project 3 267 Combined X 79 ASY2 Analyst-Systems 2 55 Combined 80 ASY3 Analyst-Systems 3 148 Combined 81 ASY4 Analyst-Systems 4 93 Combined 82 ADV2 Application Developer 2 9 Combined 83 ADV3 Application Developer 3 66 Combined 84 ADV4 Application Developer 4 27 Combined 85 LGL000_P4_E Attorney 24 Combined X 86 AUC3 Auditor-Corporate 3 13 Combined 87 AUC4 Auditor-Corporate 4 20 Combined 88 CRR1 Corporate Repr 1 4 Combined 89 CRR2 Corporate Repr 2 16 Combined 90 CRR3 Corporate Repr 3 15 Combined 91 ENG1 Engineer 1 57 Combined 92 ENG2 Engineer 2 123 Combined 93 ENG3 Engineer 3 109 Combined 94 ENN2 Engineer-Nuclear 2 50 Combined 95 ENN3 Engineer-Nuclear 3 62 Combined 96 HRC1 Hum Res Consultant 1 13 General 97 HRC2 Hum Res Consultant 2 31 General 98 HRC3 Hum Res Consultant 3 31 General 99 IQC3 Inspector-Qlty Control 3 5 Combined 100 ITS2 IT Specialist/Engineer 2 55 Combined 101 ITS3 IT Specialist/Engineer 3 172 Combined 102 ITS4 IT Specialist/Engineer 4 209 Combined X 103 ITS5 IT Specialist/Engineer 5 51 Combined 104 LSA3 Land Services Agent 3 17 Utility 105 LSA4 Land Services Agent 4 12 Utility
17 In the Study, Aon Hewitt used a comparator group with two subgroups. “Utility” is the energy utility comparator subgroup. “General”
is the general industry comparator subgroup. “Combined” included all utility and general industry companies.
Aon Hewitt Consulting | Performance, Rewards and Talent 30 01551/RPT001AAP.DOCX/PR&T-SF-15008 09/2013
Table A-3: Professional/Technical Positions Included in 2015 Study Study Position Number
SCE Job Code SCE Job Title
# of SCE Incumbents
Comparator Group18
Validated Job Match
106 LSA5 Land Services Agent 5 9 Utility 107 MPC1 Mgr-Program/Contract 1 19 Combined 108 MPC2 Mgr-Program/Contract 2 129 Combined 109 MPC3 Mgr-Program/Contract 3 104 Combined 110 MPP1 Mgr-Project/Product 1 726 Combined X 111 PLA2 Planner 2 213 Combined X 112 PLA3 Planner 3 70 Combined 113 ENG4 Senior Engineer 119 Combined 114 ENN4 Senior Nuclear Engineer 51 Combined 115 SES3 Sfty & Envrnmntl Spclst 3 51 Combined 116 TSP3 Technl Spclst/Scientist 3 419 Combined X 117 TSP4 Technl Spclst/Scientist 4 166 General 118 TRS2 Training Specialist 2 34 Combined 119 TRS3 Training Specialist 3 64 Combined X
Not Able to Include in 2015 Study Because of Insufficient Data
SCE Job Code SCE Job Title
# of SCE Incumbents
AEM1 Account Executive 1 14 AEM2 Account Executive 2 74 AEM3 Account Manager 3 30 AEM4 Account Manager 4 6 LGL000_P5_E Senior Attorney 53 TRS4 Training Specialist 4 21
18 In the Study, Aon Hewitt used a comparator group with two subgroups. “Utility” is the energy utility comparator subgroup. “General”
is the general industry comparator subgroup. “Combined” included all utility and general industry companies.

Aon Hewitt Consulting | Performance, Rewards and Talent 31 01551/RPT001AAP.DOCX/PR&T-SF-15008 09/2013
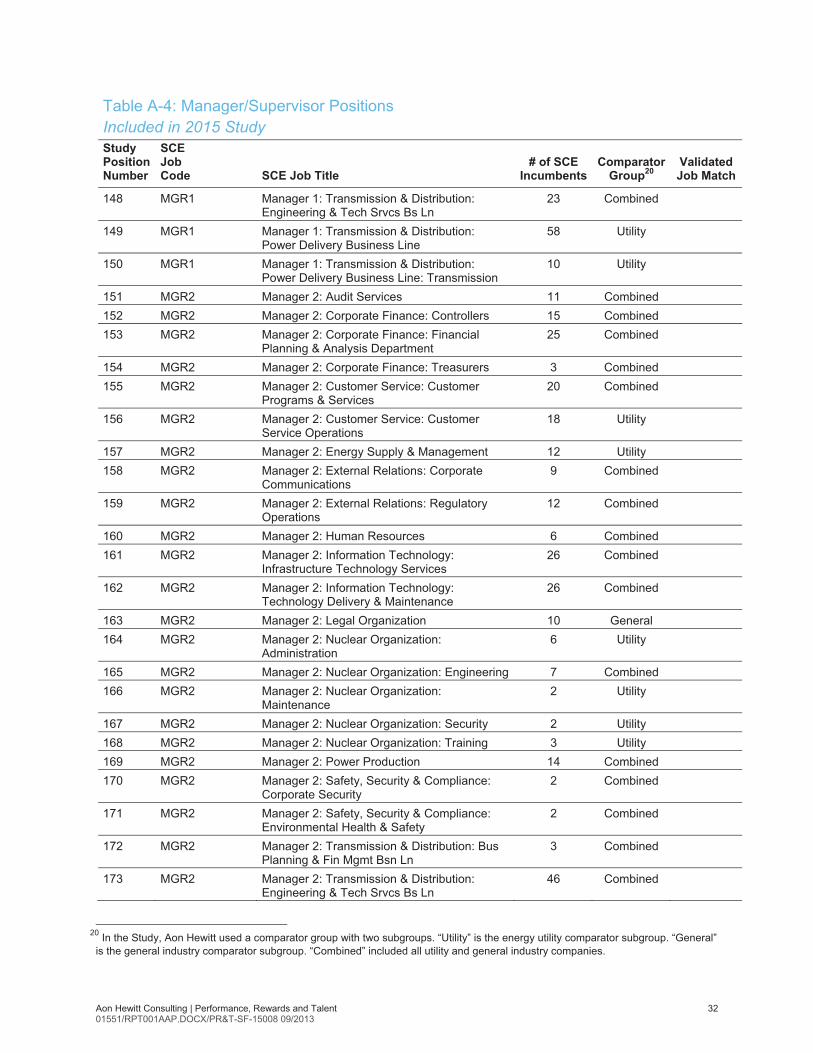
Table A-4: Manager/Supervisor Positions Included in 2015 Study Study Position Number
SCE Job Code SCE Job Title
# of SCE Incumbents
Comparator Group19
Validated Job Match
120 2278 Assistant Treasurer 1 Combined 121 228 Corporate Medical Director 1 General 122 307 Dir Corp Sec & Bus Cntnuty Mgt 1 Combined 123 109 Dir Corporate Budgets 1 Combined 124 339 Dir Tax 1 Combined X 125 Dir&MA Director & Managing Attorney 12 General X 126 2364 HR SBP (Power Delivery Services & SONGS) 1 General 127 MGR1 Manager 1: Corporate Finance: Controllers 15 Combined 128 MGR1 Manager 1: Corporate Finance: Financial
Planning & Analysis Department 21 Combined
129 MGR1 Manager 1: Corporate Finance: Supply Management
10 Combined
130 MGR1 Manager 1: Customer Service: Customer Programs & Services
35 Combined
131 MGR1 Manager 1: Customer Service: Customer Service Operations
42 Combined
132 MGR1 Manager 1: External Relations: Corporate Communications
1 Combined
133 MGR1 Manager 1: Human Resources 11 Combined 134 MGR1 Manager 1: Human Resources: Leadership,
Learning & Org Effectiveness 11 Combined
135 MGR1 Manager 1: Information Technology: Infrastructure Technology Services
26 Combined
136 MGR1 Manager 1: Information Technology: Technology Delivery & Maintenance
11 Combined
137 MGR1 Manager 1: Legal Organization 2 Combined 138 MGR1 Manager 1: Nuclear Organization:
Administration 5 Utility
139 MGR1 Manager 1: Nuclear Organization: Engineering 5 Utility 140 MGR1 Manager 1: Nuclear Organization:
Maintenance 1 Utility
141 MGR1 Manager 1: Nuclear Organization: Operations 2 Utility 142 MGR1 Manager 1: Nuclear Organization: Security 7 Utility 143 MGR1 Manager 1: Nuclear Organization: Training 9 Utility 144 MGR1 Manager 1: Power Production 4 Utility 145 MGR1 Manager 1: Safety, Security & Compliance:
Corporate Security 3 Combined
146 MGR1 Manager 1: Safety, Security & Compliance: Environmental Health & Safety
2 Combined
147 MGR1 Manager 1: Transmission & Distribution: Bus Planning & Fin Mgmt Bsn Ln
3 Combined
19 In the Study, Aon Hewitt used a comparator group with two subgroups. “Utility” is the energy utility comparator subgroup. “General” is the general industry comparator subgroup. “Combined” included all utility and general industry companies.
Aon Hewitt Consulting | Performance, Rewards and Talent 32 01551/RPT001AAP.DOCX/PR&T-SF-15008 09/2013
Table A-4: Manager/Supervisor Positions Included in 2015 Study Study Position Number
SCE Job Code SCE Job Title
# of SCE Incumbents
Comparator Group20
Validated Job Match
148 MGR1 Manager 1: Transmission & Distribution: Engineering & Tech Srvcs Bs Ln
23 Combined
149 MGR1 Manager 1: Transmission & Distribution: Power Delivery Business Line
58 Utility
150 MGR1 Manager 1: Transmission & Distribution: Power Delivery Business Line: Transmission
10 Utility
151 MGR2 Manager 2: Audit Services 11 Combined 152 MGR2 Manager 2: Corporate Finance: Controllers 15 Combined 153 MGR2 Manager 2: Corporate Finance: Financial
Planning & Analysis Department 25 Combined
154 MGR2 Manager 2: Corporate Finance: Treasurers 3 Combined 155 MGR2 Manager 2: Customer Service: Customer
Programs & Services 20 Combined
156 MGR2 Manager 2: Customer Service: Customer Service Operations
18 Utility
157 MGR2 Manager 2: Energy Supply & Management 12 Utility 158 MGR2 Manager 2: External Relations: Corporate
Communications 9 Combined
159 MGR2 Manager 2: External Relations: Regulatory Operations
12 Combined
160 MGR2 Manager 2: Human Resources 6 Combined 161 MGR2 Manager 2: Information Technology:
Infrastructure Technology Services 26 Combined
162 MGR2 Manager 2: Information Technology: Technology Delivery & Maintenance
26 Combined
163 MGR2 Manager 2: Legal Organization 10 General 164 MGR2 Manager 2: Nuclear Organization:
Administration 6 Utility
165 MGR2 Manager 2: Nuclear Organization: Engineering 7 Combined 166 MGR2 Manager 2: Nuclear Organization:
Maintenance 2 Utility
167 MGR2 Manager 2: Nuclear Organization: Security 2 Utility 168 MGR2 Manager 2: Nuclear Organization: Training 3 Utility 169 MGR2 Manager 2: Power Production 14 Combined 170 MGR2 Manager 2: Safety, Security & Compliance:
Corporate Security 2 Combined
171 MGR2 Manager 2: Safety, Security & Compliance: Environmental Health & Safety
2 Combined
172 MGR2 Manager 2: Transmission & Distribution: Bus Planning & Fin Mgmt Bsn Ln
3 Combined
173 MGR2 Manager 2: Transmission & Distribution: Engineering & Tech Srvcs Bs Ln
46 Combined
20 In the Study, Aon Hewitt used a comparator group with two subgroups. “Utility” is the energy utility comparator subgroup. “General” is the general industry comparator subgroup. “Combined” included all utility and general industry companies.
Aon Hewitt Consulting | Performance, Rewards and Talent 33 01551/RPT001AAP.DOCX/PR&T-SF-15008 09/2013
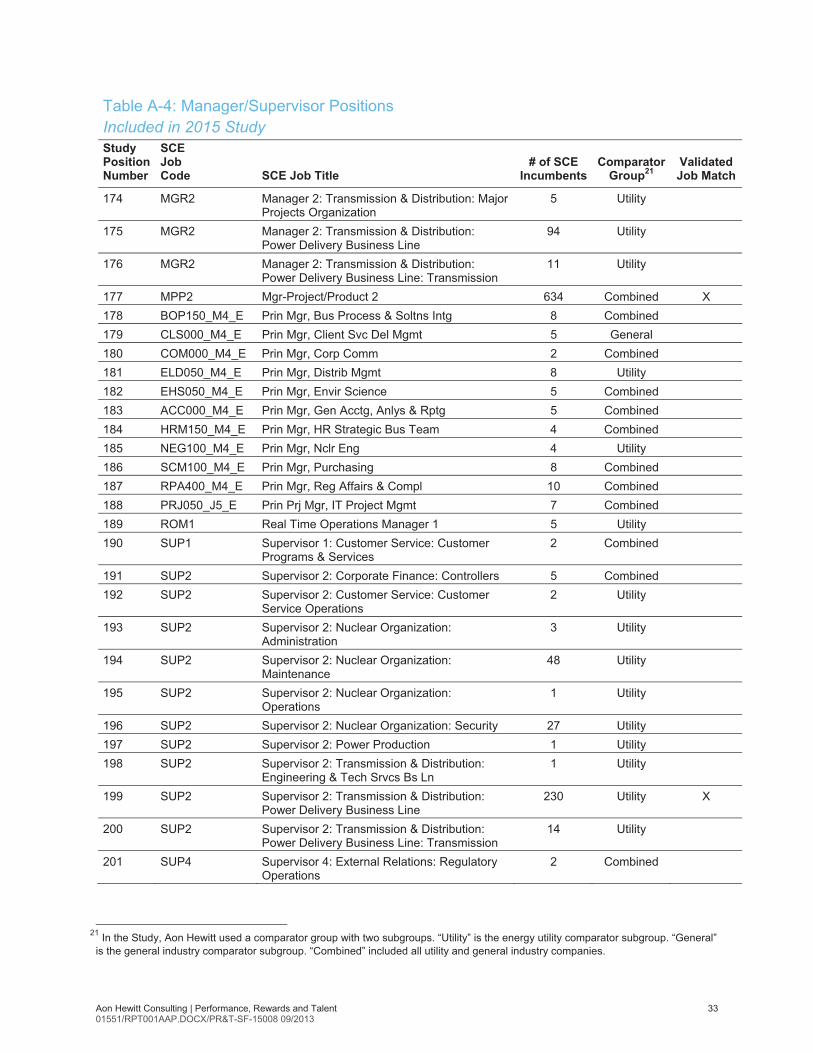
Table A-4: Manager/Supervisor Positions Included in 2015 Study Study Position Number
SCE Job Code SCE Job Title
# of SCE Incumbents
Comparator Group21
Validated Job Match
174 MGR2 Manager 2: Transmission & Distribution: Major Projects Organization
5 Utility
175 MGR2 Manager 2: Transmission & Distribution: Power Delivery Business Line
94 Utility
176 MGR2 Manager 2: Transmission & Distribution: Power Delivery Business Line: Transmission
11 Utility
177 MPP2 Mgr-Project/Product 2 634 Combined X 178 BOP150_M4_E Prin Mgr, Bus Process & Soltns Intg 8 Combined 179 CLS000_M4_E Prin Mgr, Client Svc Del Mgmt 5 General 180 COM000_M4_E Prin Mgr, Corp Comm 2 Combined 181 ELD050_M4_E Prin Mgr, Distrib Mgmt 8 Utility 182 EHS050_M4_E Prin Mgr, Envir Science 5 Combined 183 ACC000_M4_E Prin Mgr, Gen Acctg, Anlys & Rptg 5 Combined 184 HRM150_M4_E Prin Mgr, HR Strategic Bus Team 4 Combined 185 NEG100_M4_E Prin Mgr, Nclr Eng 4 Utility 186 SCM100_M4_E Prin Mgr, Purchasing 8 Combined 187 RPA400_M4_E Prin Mgr, Reg Affairs & Compl 10 Combined 188 PRJ050_J5_E Prin Prj Mgr, IT Project Mgmt 7 Combined 189 ROM1 Real Time Operations Manager 1 5 Utility 190 SUP1 Supervisor 1: Customer Service: Customer
Programs & Services 2 Combined
191 SUP2 Supervisor 2: Corporate Finance: Controllers 5 Combined 192 SUP2 Supervisor 2: Customer Service: Customer
Service Operations 2 Utility
193 SUP2 Supervisor 2: Nuclear Organization: Administration
3 Utility
194 SUP2 Supervisor 2: Nuclear Organization: Maintenance
48 Utility
195 SUP2 Supervisor 2: Nuclear Organization: Operations
1 Utility
196 SUP2 Supervisor 2: Nuclear Organization: Security 27 Utility 197 SUP2 Supervisor 2: Power Production 1 Utility 198 SUP2 Supervisor 2: Transmission & Distribution:
Engineering & Tech Srvcs Bs Ln 1 Utility
199 SUP2 Supervisor 2: Transmission & Distribution: Power Delivery Business Line
230 Utility X
200 SUP2 Supervisor 2: Transmission & Distribution: Power Delivery Business Line: Transmission
14 Utility
201 SUP4 Supervisor 4: External Relations: Regulatory Operations
2 Combined
21 In the Study, Aon Hewitt used a comparator group with two subgroups. “Utility” is the energy utility comparator subgroup. “General” is the general industry comparator subgroup. “Combined” included all utility and general industry companies.
Aon Hewitt Consulting | Performance, Rewards and Talent 34 01551/RPT001AAP.DOCX/PR&T-SF-15008 09/2013
Table A-4: Manager/Supervisor Positions Included in 2015 Study Study Position Number
SCE Job Code SCE Job Title
# of SCE Incumbents
Comparator Group22
Validated Job Match
202 SUP4 Supervisor 4: Information Technology: Infrastructure Technology Services
5 Combined
203 SUP4 Supervisor 4: Legal Organization 1 Combined 204 SUP4 Supervisor 4: Nuclear Organization:
Administration 4 Utility
205 SUP4 Supervisor 4: Nuclear Organization: Engineering
7 Utility
206 SUP4 Supervisor 4: Nuclear Organization: Maintenance
16 Utility
207 SUP4 Supervisor 4: Nuclear Organization: Operations
40 Utility X
208 SUP4 Supervisor 4: Nuclear Organization: Training 1 Utility 209 SUP4 Supervisor 4: Power Production 1 Utility 210 SUP4 Supervisor 4: Transmission & Distribution:
Engineering & Tech Srvcs Bs Ln 2 Combined
211 SUP4 Supervisor 4: Transmission & Distribution: Power Delivery Business Line
14 Utility
Not Able to Include in 2015 Study Because of Insufficient Data
SCE Job Code SCE Job Title
# of SCE Incumbents
MGR1 Manager 1: Customer Service: Business Customer Division 24 MGR2 Manager 2: Customer Service: Business Customer Division 16 MGR2 Manager 2: Power Production: Eastern Hydro Division 6 PRJ200_M4_E Prin Mgr, Major Cnstrn Projs 8 NMT100_M4_E Prin Mgr, Nclr Plant Maint 5 NOP050_M4_E Prin Mgr, Nclr Shift Ops 5 SUP1 Supervisor 1: Legal Organization 7 SUP1 Supervisor 1: Nuclear Organization: Administration 3 SUP1 Supervisor 1: Nuclear Organization: Security 1 SUP1 Supervisor 1: Transmission & Distribution: Power Delivery Business Line 5 SUP2 Supervisor 2: Nuclear Organization: Engineering 8
22 In the Study, Aon Hewitt used a comparator group with two subgroups. “Utility” is the energy utility comparator subgroup. “General” is the general industry comparator subgroup. “Combined” included all utility and general industry companies.
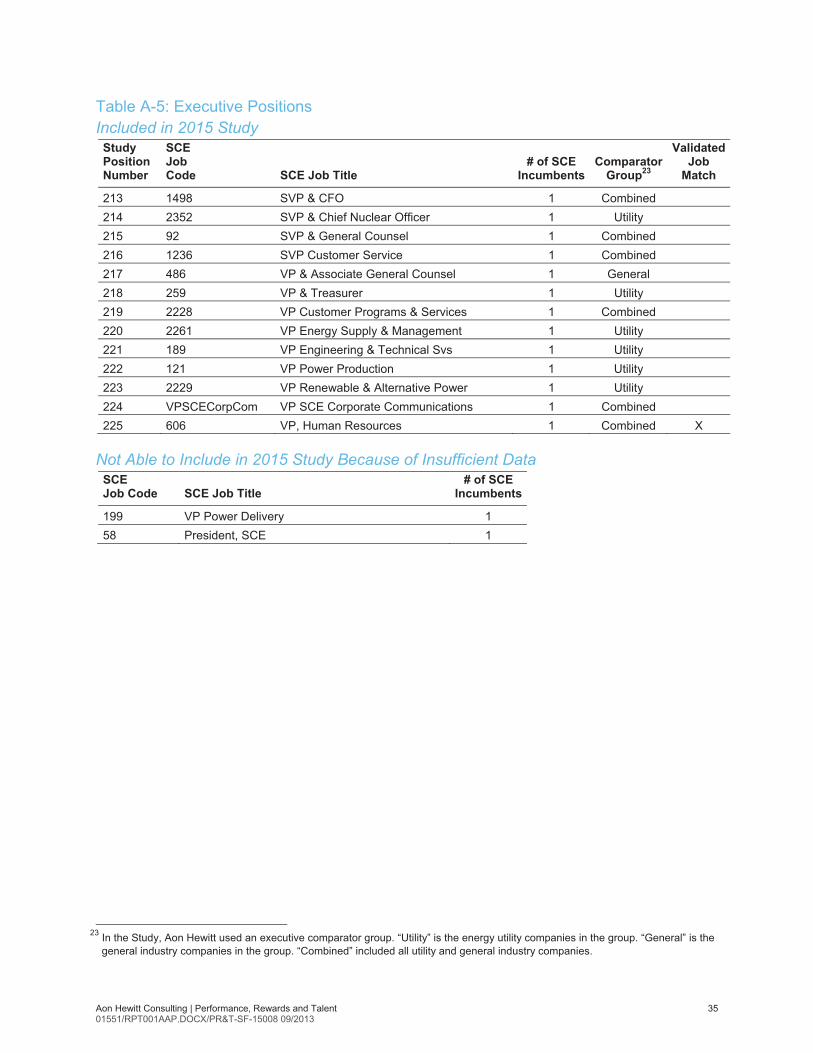
Aon Hewitt Consulting | Performance, Rewards and Talent 35 01551/RPT001AAP.DOCX/PR&T-SF-15008 09/2013
Table A-5: Executive Positions Included in 2015 Study
Study Position Number
SCE Job Code SCE Job Title
# of SCE Incumbents
Comparator Group23
Validated Job
Match
213 1498 SVP & CFO 1 Combined 214 2352 SVP & Chief Nuclear Officer 1 Utility 215 92 SVP & General Counsel 1 Combined 216 1236 SVP Customer Service 1 Combined 217 486 VP & Associate General Counsel 1 General 218 259 VP & Treasurer 1 Utility 219 2228 VP Customer Programs & Services 1 Combined 220 2261 VP Energy Supply & Management 1 Utility 221 189 VP Engineering & Technical Svs 1 Utility 222 121 VP Power Production 1 Utility 223 2229 VP Renewable & Alternative Power 1 Utility 224 VPSCECorpCom VP SCE Corporate Communications 1 Combined 225 606 VP, Human Resources 1 Combined X
Not Able to Include in 2015 Study Because of Insufficient Data
SCE Job Code SCE Job Title
# of SCE Incumbents
199 VP Power Delivery 1 58 President, SCE 1
23 In the Study, Aon Hewitt used an executive comparator group. “Utility” is the energy utility companies in the group. “General” is the
general industry companies in the group. “Combined” included all utility and general industry companies.

Aon Hewitt Consulting | Performance, Rewards and Talent 36 01551/RPT001AAP.DOCX/PR&T-SF-15008 09/2013
Appendix B: Comparator List
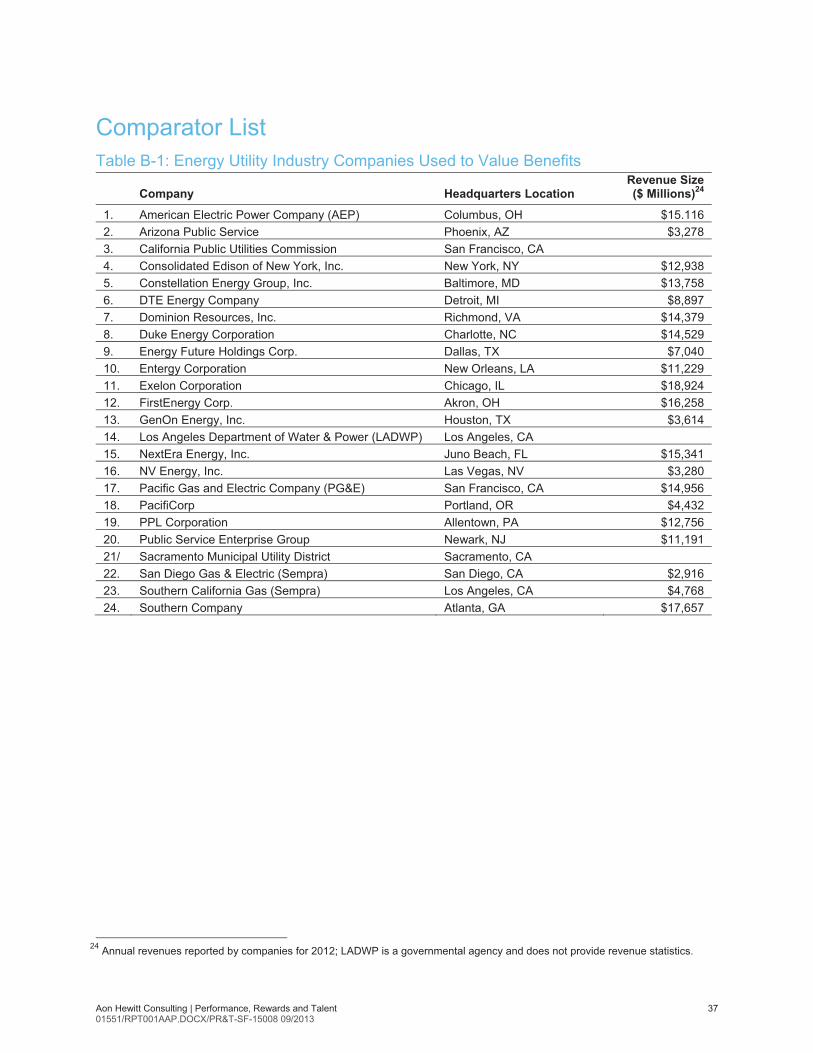
Aon Hewitt Consulting | Performance, Rewards and Talent 37 01551/RPT001AAP.DOCX/PR&T-SF-15008 09/2013
Comparator List Table B-1: Energy Utility Industry Companies Used to Value Benefits
Company Headquarters Location Revenue Size($ Millions)24
1. American Electric Power Company (AEP) Columbus, OH $15.116 2. Arizona Public Service Phoenix, AZ $3,278 3. California Public Utilities Commission San Francisco, CA 4. Consolidated Edison of New York, Inc. New York, NY $12,938 5. Constellation Energy Group, Inc. Baltimore, MD $13,758 6. DTE Energy Company Detroit, MI $8,897 7. Dominion Resources, Inc. Richmond, VA $14,379 8. Duke Energy Corporation Charlotte, NC $14,529 9. Energy Future Holdings Corp. Dallas, TX $7,040 10. Entergy Corporation New Orleans, LA $11,229 11. Exelon Corporation Chicago, IL $18,924 12. FirstEnergy Corp. Akron, OH $16,258 13. GenOn Energy, Inc. Houston, TX $3,614 14. Los Angeles Department of Water & Power (LADWP) Los Angeles, CA 15. NextEra Energy, Inc. Juno Beach, FL $15,341 16. NV Energy, Inc. Las Vegas, NV $3,280 17. Pacific Gas and Electric Company (PG&E) San Francisco, CA $14,956 18. PacifiCorp Portland, OR $4,432 19. PPL Corporation Allentown, PA $12,756 20. Public Service Enterprise Group Newark, NJ $11,191 21/ Sacramento Municipal Utility District Sacramento, CA 22. San Diego Gas & Electric (Sempra) San Diego, CA $2,916 23. Southern California Gas (Sempra) Los Angeles, CA $4,768 24. Southern Company Atlanta, GA $17,657
24 Annual revenues reported by companies for 2012; LADWP is a governmental agency and does not provide revenue statistics.
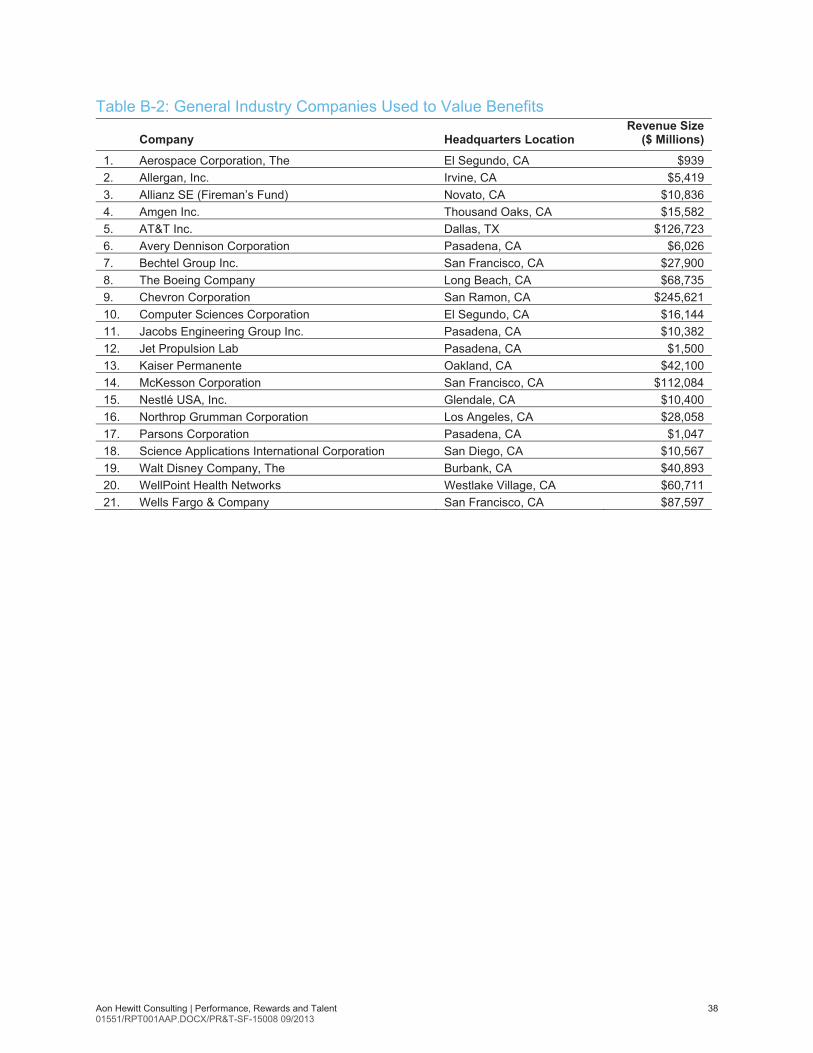
Aon Hewitt Consulting | Performance, Rewards and Talent 38 01551/RPT001AAP.DOCX/PR&T-SF-15008 09/2013
Table B-2: General Industry Companies Used to Value Benefits
Company Headquarters Location Revenue Size
($ Millions)
1. Aerospace Corporation, The El Segundo, CA $939 2. Allergan, Inc. Irvine, CA $5,419 3. Allianz SE (Fireman’s Fund) Novato, CA $10,836 4. Amgen Inc. Thousand Oaks, CA $15,582 5. AT&T Inc. Dallas, TX $126,723 6. Avery Dennison Corporation Pasadena, CA $6,026 7. Bechtel Group Inc. San Francisco, CA $27,900 8. The Boeing Company Long Beach, CA $68,735 9. Chevron Corporation San Ramon, CA $245,621 10. Computer Sciences Corporation El Segundo, CA $16,144 11. Jacobs Engineering Group Inc. Pasadena, CA $10,382 12. Jet Propulsion Lab Pasadena, CA $1,500 13. Kaiser Permanente Oakland, CA $42,100 14. McKesson Corporation San Francisco, CA $112,084 15. Nestlé USA, Inc. Glendale, CA $10,400 16. Northrop Grumman Corporation Los Angeles, CA $28,058 17. Parsons Corporation Pasadena, CA $1,047 18. Science Applications International Corporation San Diego, CA $10,567 19. Walt Disney Company, The Burbank, CA $40,893 20. WellPoint Health Networks Westlake Village, CA $60,711 21. Wells Fargo & Company San Francisco, CA $87,597
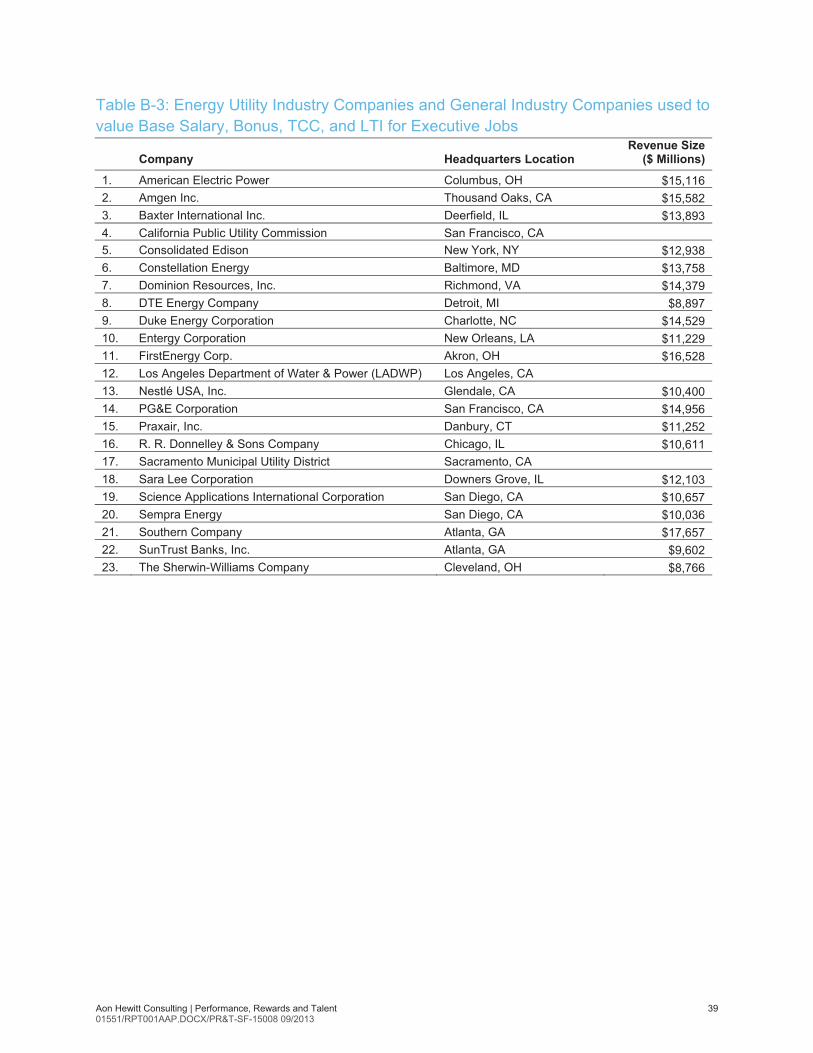
Aon Hewitt Consulting | Performance, Rewards and Talent 39 01551/RPT001AAP.DOCX/PR&T-SF-15008 09/2013
Table B-3: Energy Utility Industry Companies and General Industry Companies used to value Base Salary, Bonus, TCC, and LTI for Executive Jobs
Company Headquarters Location Revenue Size
($ Millions)
1. American Electric Power Columbus, OH $15,116 2. Amgen Inc. Thousand Oaks, CA $15,582 3. Baxter International Inc. Deerfield, IL $13,893 4. California Public Utility Commission San Francisco, CA 5. Consolidated Edison New York, NY $12,938 6. Constellation Energy Baltimore, MD $13,758 7. Dominion Resources, Inc. Richmond, VA $14,379 8. DTE Energy Company Detroit, MI $8,897 9. Duke Energy Corporation Charlotte, NC $14,529 10. Entergy Corporation New Orleans, LA $11,229 11. FirstEnergy Corp. Akron, OH $16,528 12. Los Angeles Department of Water & Power (LADWP) Los Angeles, CA 13. Nestlé USA, Inc. Glendale, CA $10,400 14. PG&E Corporation San Francisco, CA $14,956 15. Praxair, Inc. Danbury, CT $11,252 16. R. R. Donnelley & Sons Company Chicago, IL $10,611 17. Sacramento Municipal Utility District Sacramento, CA 18. Sara Lee Corporation Downers Grove, IL $12,103 19. Science Applications International Corporation San Diego, CA $10,657 20. Sempra Energy San Diego, CA $10,036 21. Southern Company Atlanta, GA $17,657 22. SunTrust Banks, Inc. Atlanta, GA $9,602 23. The Sherwin-Williams Company Cleveland, OH $8,766

Aon Hewitt Consulting | Performance, Rewards and Talent 40 01551/RPT001AAP.DOCX/PR&T-SF-15008 09/2013
Appendix C: Detailed Results by Category
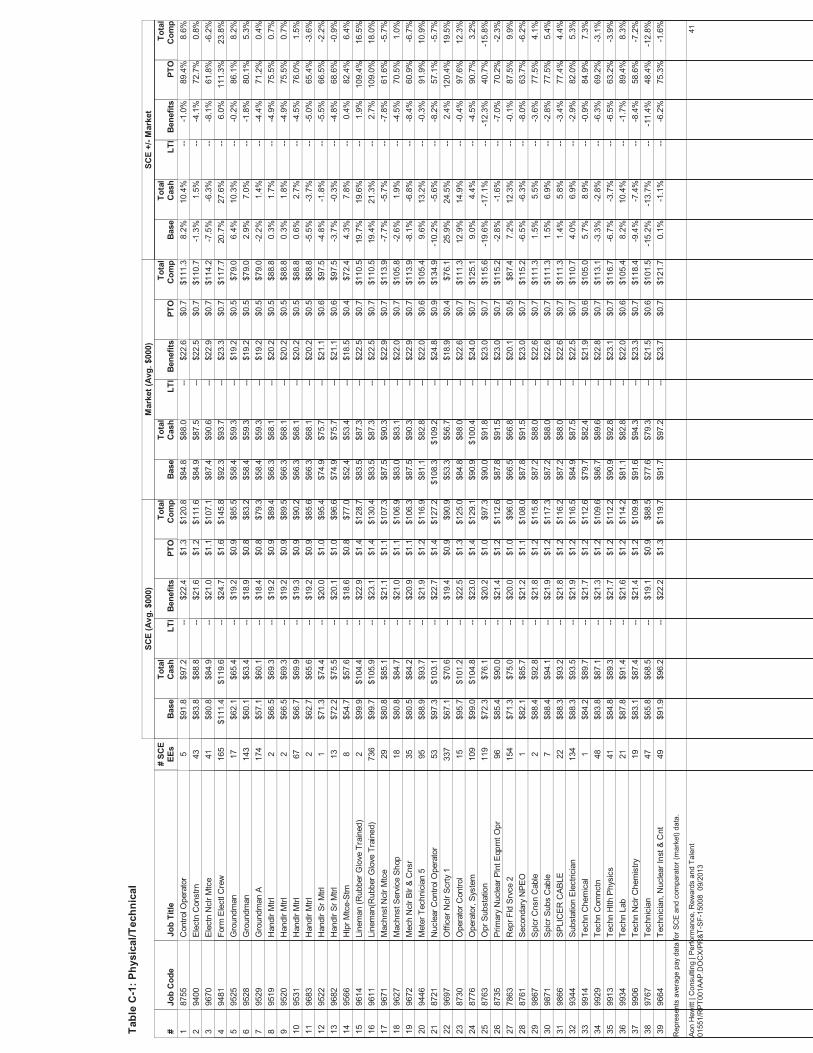
Job
Cod
eBa
se
SCE
(Avg
. $00
0)To
tal
Cas
hLT
IBe
nefit
sPT
O#
SCE
EEs
Base
Mar
ket (
Avg.
$00
0)To
tal
Cas
hLT
IBe
nefit
sPT
OBa
se
SCE
+/- M
arke
tTo
tal
Cas
hLT
IBe
nefit
sPT
O
Tab
le C
-1: P
hysi
cal/T
echn
ical
Tota
lC
omp
Tota
lC
omp
Tota
lC
omp
Job
Title
#87
55C
ontro
l Ope
rato
r$9
1.8
$97.
2--
$84.
8$8
8.0
--8.
2%10
.4%
--$2
2.4
$22.
6-1
.0%
$1.3
$0.7
89.4
%5
8.6%
$111
.3$1
20.8
194
00El
ectn
Con
strn
$83.
8$8
8.8
--$8
4.9
$87.
5--
-1.3
%1.
5%--
$21.
6$2
2.5
-4.1
%$1
.2$0
.772
.7%
430.
8%$1
10.7
$111
.62
9670
Elec
tn N
clr M
tce
$80.
8$8
4.9
--$8
7.4
$90.
6--
-7.5
%-6
.3%
--$2
1.0
$22.
9-8
.1%
$1.1
$0.7
61.8
%41
-6.2
%$1
14.2
$107
.13
9481
Form
Ele
ctl C
rew
$111
.4$1
19.6
--$9
2.3
$93.
7--
20.7
%27
.6%
--$2
4.7
$23.
36.
0%$1
.6$0
.711
1.3%
165
23.8
%$1
17.7
$145
.84
9525
Gro
undm
an$6
2.1
$65.
4--
$58.
4$5
9.3
--6.
4%10
.3%
--$1
9.2
$19.
2-0
.2%
$0.9
$0.5
86.1
%17
8.2%
$79.
0$8
5.5
595
28G
roun
dman
$60.
1$6
3.4
--$5
8.4
$59.
3--
2.9%
7.0%
--$1
8.9
$19.
2-1
.8%
$0.8
$0.5
80.1
%14
35.
3%$7
9.0
$83.
26
9529
Gro
undm
an A
$57.
1$6
0.1
--$5
8.4
$59.
3--
-2.2
%1.
4%--
$18.
4$1
9.2
-4.4
%$0
.8$0
.571
.2%
174
0.4%
$79.
0$7
9.3
795
19H
andl
r Mtrl
$66.
5$6
9.3
--$6
6.3
$68.
1--
0.3%
1.7%
--$1
9.2
$20.
2-4
.9%
$0.9
$0.5
75.5
%2
0.7%
$88.
8$8
9.4
895
20H
andl
r Mtrl
$66.
5$6
9.3
--$6
6.3
$68.
1--
0.3%
1.8%
--$1
9.2
$20.
2-4
.9%
$0.9
$0.5
75.5
%2
0.7%
$88.
8$8
9.5
995
31H
andl
r Mtrl
$66.
7$6
9.9
--$6
6.3
$68.
1--
0.6%
2.7%
--$1
9.3
$20.
2-4
.5%
$0.9
$0.5
76.0
%67
1.5%
$88.
8$9
0.2
1096
83H
andl
r Mtrl
$62.
7$6
5.6
--$6
6.3
$68.
1--
-5.5
%-3
.7%
--$1
9.2
$20.
2-5
.0%
$0.9
$0.5
65.4
%2
-3.6
%$8
8.8
$85.
611
9522
Han
dlr S
r Mtrl
$71.
3$7
4.4
--$7
4.9
$75.
7--
-4.8
%-1
.8%
--$2
0.0
$21.
1-5
.5%
$1.0
$0.6
66.5
%1
-2.2
%$9
7.5
$95.
412
9682
Han
dlr S
r Mtrl
$72.
2$7
5.5
--$7
4.9
$75.
7--
-3.7
%-0
.3%
--$2
0.1
$21.
1-4
.8%
$1.0
$0.6
68.6
%13
-0.9
%$9
7.5
$96.
613
9566
Hlp
r Mtc
e-St
m$5
4.7
$57.
6--
$52.
4$5
3.4
--4.
3%7.
8%--
$18.
6$1
8.5
0.4%
$0.8
$0.4
82.4
%8
6.4%
$72.
4$7
7.0
1496
14Li
nem
an (R
ubbe
r Glo
ve T
rain
ed)
$99.
9$1
04.4
--$8
3.5
$87.
3--
19.7
%19
.6%
--$2
2.9
$22.
51.
9%$1
.4$0
.710
9.4%
216
.5%
$110
.5$1
28.7
1596
11Li
nem
an(R
ubbe
r Glo
ve T
rain
ed)
$99.
7$1
05.9
--$8
3.5
$87.
3--
19.4
%21
.3%
--$2
3.1
$22.
52.
7%$1
.4$0
.710
9.0%
736
18.0
%$1
10.5
$130
.416
9671
Mac
hnst
Ncl
r Mtc
e$8
0.8
$85.
1--
$87.
5$9
0.3
---7
.7%
-5.7
%--
$21.
1$2
2.9
-7.8
%$1
.1$0
.761
.6%
29-5
.7%
$113
.9$1
07.3
1796
27M
achn
st S
ervic
e Sh
op$8
0.8
$84.
7--
$83.
0$8
3.1
---2
.6%
1.9%
--$2
1.0
$22.
0-4
.5%
$1.1
$0.7
70.5
%18
1.0%
$105
.8$1
06.9
1896
72M
ech
Ncl
r Blr
& C
nsr
$80.
5$8
4.2
--$8
7.5
$90.
3--
-8.1
%-6
.8%
--$2
0.9
$22.
9-8
.4%
$1.1
$0.7
60.9
%35
-6.7
%$1
13.9
$106
.319
9446
Met
er T
echn
icia
n 5
$88.
9$9
3.7
--$8
1.1
$82.
8--
9.6%
13.2
%--
$21.
9$2
2.0
-0.3
%$1
.2$0
.691
.9%
9510
.9%
$105
.4$1
16.9
2087
21N
ucle
ar C
ontro
l Ope
rato
r$9
7.3
$103
.1--
$108
.3$1
09.2
---1
0.2%
-5.6
%--
$22.
7$2
4.8
-8.2
%$1
.4$0
.957
.1%
53-5
.7%
$134
.9$1
27.2
2196
97O
ffice
r Ncl
r Scr
ty 1
$67.
1$7
0.6
--$5
3.3
$56.
7--
25.9
%24
.5%
--$1
9.4
$18.
92.
4%$0
.9$0
.412
0.4%
337
19.5
%$7
6.1
$90.
922
8730
Ope
rato
r Con
trol
$95.
7$1
01.2
--$8
4.8
$88.
0--
12.9
%14
.9%
--$2
2.5
$22.
6-0
.4%
$1.3
$0.7
97.6
%15
12.3
%$1
11.3
$125
.023
8776
Ope
rato
r, Sy
stem
$99.
0$1
04.8
--$9
0.9
$100
.4--
9.0%
4.4%
--$2
3.0
$24.
0-4
.5%
$1.4
$0.7
90.7
%10
93.
2%$1
25.1
$129
.124
8763
Opr
Sub
stat
ion
$72.
3$7
6.1
--$9
0.0
$91.
8--
-19.
6%-1
7.1%
--$2
0.2
$23.
0-1
2.3%
$1.0
$0.7
40.7
%11
9-1
5.8%
$115
.6$9
7.3
2587
35Pr
imar
y N
ucle
ar P
lnt E
qpm
t Opr
$85.
4$9
0.0
--$8
7.8
$91.
5--
-2.8
%-1
.6%
--$2
1.4
$23.
0-7
.0%
$1.2
$0.7
70.2
%96
-2.3
%$1
15.2
$112
.626
7863
Rep
r Fld
Srv
ce 2
$71.
3$7
5.0
--$6
6.5
$66.
8--
7.2%
12.3
%--
$20.
0$2
0.1
-0.1
%$1
.0$0
.587
.5%
154
9.9%
$87.
4$9
6.0
2787
61Se
cond
ary
NPE
O$8
2.1
$85.
7--
$87.
8$9
1.5
---6
.5%
-6.3
%--
$21.
2$2
3.0
-8.0
%$1
.1$0
.763
.7%
1-6
.2%
$115
.2$1
08.0
2898
67Sp
lcr C
nsn
Cab
le$8
8.4
$92.
8--
$87.
2$8
8.0
--1.
5%5.
5%--
$21.
8$2
2.6
-3.6
%$1
.2$0
.777
.5%
24.
1%$1
11.3
$115
.829
9871
Splc
r Sub
s C
able
$88.
4$9
4.1
--$8
7.2
$88.
0--
1.5%
6.9%
--$2
1.9
$22.
6-2
.8%
$1.2
$0.7
77.5
%7
5.4%
$111
.3$1
17.3
3098
66SP
LIC
ER C
ABLE
$88.
3$9
3.2
--$8
7.2
$88.
0--
1.4%
5.8%
--$2
1.8
$22.
6-3
.4%
$1.2
$0.7
77.4
%22
4.4%
$111
.3$1
16.2
3193
44Su
bsta
tion
Elec
trici
an$8
8.3
$93.
5--
$84.
9$8
7.5
--4.
0%6.
9%--
$21.
9$2
2.5
-2.9
%$1
.2$0
.782
.0%
134
5.3%
$110
.7$1
16.5
3299
14Te
chn
Che
mic
al$8
4.2
$89.
7--
$79.
7$8
2.4
--5.
7%8.
9%--
$21.
7$2
1.9
-0.9
%$1
.2$0
.684
.9%
17.
3%$1
05.0
$112
.633
9929
Tech
n C
omnc
tn$8
3.8
$87.
1--
$86.
7$8
9.6
---3
.3%
-2.8
%--
$21.
3$2
2.8
-6.3
%$1
.2$0
.769
.2%
48-3
.1%
$113
.1$1
09.6
3499
13Te
chn
Hlth
Phy
sics
$84.
8$8
9.3
--$9
0.9
$92.
8--
-6.7
%-3
.7%
--$2
1.7
$23.
1-6
.5%
$1.2
$0.7
63.2
%41
-3.9
%$1
16.7
$112
.235
9934
Tech
n La
b$8
7.8
$91.
4--
$81.
1$8
2.8
--8.
2%10
.4%
--$2
1.6
$22.
0-1
.7%
$1.2
$0.6
89.4
%21
8.3%
$105
.4$1
14.2
3699
06Te
chn
Ncl
r Che
mis
try$8
3.1
$87.
4--
$91.
6$9
4.3
---9
.4%
-7.4
%--
$21.
4$2
3.3
-8.4
%$1
.2$0
.758
.6%
19-7
.2%
$118
.4$1
09.9
3797
67Te
chni
cian
$65.
8$6
8.5
--$7
7.6
$79.
3--
-15.
2%-1
3.7%
--$1
9.1
$21.
5-1
1.4%
$0.9
$0.6
48.4
%47
-12.
8%$1
01.5
$88.
538
9664
Tech
nici
an, N
ucle
ar In
st &
Cnt
$91.
9$9
6.2
--$9
1.7
$97.
2--
0.1%
-1.1
%--
$22.
2$2
3.7
-6.2
%$1
.3$0
.775
.3%
49-1
.6%
$121
.7$1
19.7
39
41Ao
n H
ewitt
| C
onsu
lting
| Pe
rform
ance
, Rew
ards
and
Tal
ent
0155
1/R
PT00
1AAP
.DO
CX/
PR&T
-SF-
1500
8 0
9/20
13
Rep
rese
nts
aver
age
pay
data
for S
CE
and
com
para
tor (
mar
ket)
data
.

Job
Cod
eBa
se
SCE
(Avg
. $00
0)To
tal
Cas
hLT
IBe
nefit
sPT
O#
SCE
EEs
Base
Mar
ket (
Avg.
$00
0)To
tal
Cas
hLT
IBe
nefit
sPT
OBa
se
SCE
+/- M
arke
tTo
tal
Cas
hLT
IBe
nefit
sPT
O
Tab
le C
-1: P
hysi
cal/T
echn
ical
Tota
lC
omp
Tota
lC
omp
Tota
lC
omp
Job
Title
#98
27Te
chni
cian
, Tes
t$8
7.4
$92.
7--
$86.
6$8
9.3
--0.
9%3.
8%--
$21.
8$2
2.7
-4.3
%$1
.2$0
.776
.6%
492.
6%$1
12.7
$115
.740
9501
Trou
blem
an$1
08.3
$116
.9--
$89.
9$9
2.4
--20
.4%
26.6
%--
$24.
3$2
3.1
5.3%
$1.5
$0.7
110.
8%18
322
.9%
$116
.2$1
42.8
4199
91W
elde
r Cer
tifie
d$8
4.2
$88.
2--
$83.
9$8
5.0
--0.
4%3.
8%--
$21.
5$2
2.2
-3.2
%$1
.2$0
.775
.7%
12.
8%$1
07.9
$110
.942
9993
Wel
der C
nstrn
$84.
2$8
9.1
--$8
3.9
$85.
0--
0.4%
4.8%
--$2
1.6
$22.
2-2
.7%
$1.2
$0.7
75.7
%2
3.7%
$107
.9$1
11.8
4398
88W
elde
r Ncl
r Mtc
e$8
0.8
$85.
1--
$91.
0$9
4.5
---1
1.2%
-10.
0%--
$21.
1$2
3.4
-9.8
%$1
.1$0
.755
.4%
5-9
.6%
$118
.6$1
07.2
44
$85.
5$9
0.5
--$7
8.5
$81.
3--
8.8%
11.3
%--
$21.
6$2
1.8
-1.1
%$1
.2$0
.690
.5%
3,11
39.
2%$1
03.7
$113
.3
42Ao
n H
ewitt
| C
onsu
lting
| Pe
rform
ance
, Rew
ards
and
Tal
ent
0155
1/R
PT00
1AAP
.DO
CX/
PR&T
-SF-
1500
8 0
9/20
13
Rep
rese
nts
aver
age
pay
data
for S
CE
and
com
para
tor (
mar
ket)
data
.
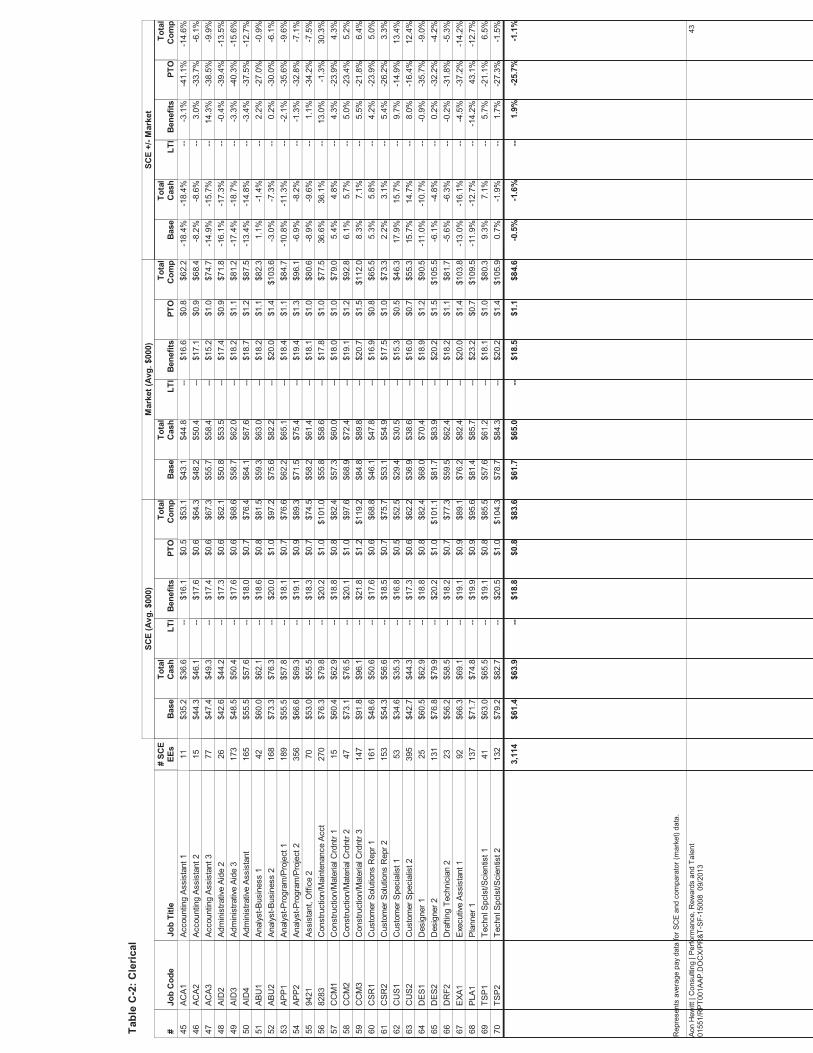
Job
Cod
eBa
se
SCE
(Avg
. $00
0)To
tal
Cas
hLT
IBe
nefit
sPT
O#
SCE
EEs
Base
Mar
ket (
Avg.
$00
0)To
tal
Cas
hLT
IBe
nefit
sPT
OBa
se
SCE
+/- M
arke
tTo
tal
Cas
hLT
IBe
nefit
sPT
O
Tab
le C
-2: C
leric
al
Tota
lC
omp
Tota
lC
omp
Tota
lC
omp
Job
Title
#AC
A1Ac
coun
ting
Assi
stan
t 1$3
5.2
$36.
6--
$43.
1$4
4.8
---1
8.4%
-18.
4%--
$16.
1$1
6.6
-3.1
%$0
.5$0
.8-4
1.1%
11-1
4.6%
$62.
2$5
3.1
45AC
A2Ac
coun
ting
Assi
stan
t 2$4
4.3
$46.
1--
$48.
2$5
0.4
---8
.2%
-8.6
%--
$17.
6$1
7.1
3.0%
$0.6
$0.9
-33.
7%15
-6.1
%$6
8.4
$64.
346
ACA3
Acco
untin
g As
sist
ant 3
$47.
4$4
9.3
--$5
5.7
$58.
4--
-14.
9%-1
5.7%
--$1
7.4
$15.
214
.3%
$0.6
$1.0
-38.
5%77
-9.9
%$7
4.7
$67.
347
AID
2Ad
min
istra
tive
Aide
2$4
2.6
$44.
2--
$50.
8$5
3.5
---1
6.1%
-17.
3%--
$17.
3$1
7.4
-0.4
%$0
.6$0
.9-3
9.4%
26-1
3.5%
$71.
8$6
2.1
48AI
D3
Adm
inis
trativ
e Ai
de 3
$48.
5$5
0.4
--$5
8.7
$62.
0--
-17.
4%-1
8.7%
--$1
7.6
$18.
2-3
.3%
$0.6
$1.1
-40.
3%17
3-1
5.6%
$81.
2$6
8.6
49AI
D4
Adm
inis
trativ
e As
sist
ant
$55.
5$5
7.6
--$6
4.1
$67.
6--
-13.
4%-1
4.8%
--$1
8.0
$18.
7-3
.4%
$0.7
$1.2
-37.
5%16
5-1
2.7%
$87.
5$7
6.4
50AB
U1
Anal
yst-B
usin
ess
1$6
0.0
$62.
1--
$59.
3$6
3.0
--1.
1%-1
.4%
--$1
8.6
$18.
22.
2%$0
.8$1
.1-2
7.0%
42-0
.9%
$82.
3$8
1.5
51AB
U2
Anal
yst-B
usin
ess
2$7
3.3
$76.
3--
$75.
6$8
2.2
---3
.0%
-7.3
%--
$20.
0$2
0.0
0.2%
$1.0
$1.4
-30.
0%16
8-6
.1%
$103
.6$9
7.2
52AP
P1An
alys
t-Pro
gram
/Pro
ject
1$5
5.5
$57.
8--
$62.
2$6
5.1
---1
0.8%
-11.
3%--
$18.
1$1
8.4
-2.1
%$0
.7$1
.1-3
5.6%
189
-9.6
%$8
4.7
$76.
653
APP2
Anal
yst-P
rogr
am/P
roje
ct 2
$66.
6$6
9.3
--$7
1.5
$75.
4--
-6.9
%-8
.2%
--$1
9.1
$19.
4-1
.3%
$0.9
$1.3
-32.
8%35
6-7
.1%
$96.
1$8
9.3
5494
21As
sist
ant,
Offi
ce 2
$53.
0$5
5.5
--$5
8.2
$61.
4--
-8.9
%-9
.6%
--$1
8.3
$18.
11.
1%$0
.7$1
.0-3
4.2%
70-7
.5%
$80.
6$7
4.5
5582
83C
onst
ruct
ion/
Mai
nten
ance
Acc
t$7
6.3
$79.
8--
$55.
8$5
8.6
--36
.6%
36.1
%--
$20.
2$1
7.8
13.0
%$1
.0$1
.0-1
.3%
270
30.3
%$7
7.5
$101
.056
CC
M1
Con
stru
ctio
n/M
ater
ial C
rdnt
r 1$6
0.4
$62.
9--
$57.
3$6
0.0
--5.
4%4.
8%--
$18.
8$1
8.0
4.3%
$0.8
$1.0
-23.
9%15
4.3%
$79.
0$8
2.4
57C
CM
2C
onst
ruct
ion/
Mat
eria
l Crd
ntr 2
$73.
1$7
6.5
--$6
8.9
$72.
4--
6.1%
5.7%
--$2
0.1
$19.
15.
0%$1
.0$1
.2-2
3.4%
475.
2%$9
2.8
$97.
658
CC
M3
Con
stru
ctio
n/M
ater
ial C
rdnt
r 3$9
1.8
$96.
1--
$84.
8$8
9.8
--8.
3%7.
1%--
$21.
8$2
0.7
5.5%
$1.2
$1.5
-21.
8%14
76.
4%$1
12.0
$119
.259
CSR
1C
usto
mer
Sol
utio
ns R
epr 1
$48.
6$5
0.6
--$4
6.1
$47.
8--
5.3%
5.8%
--$1
7.6
$16.
94.
2%$0
.6$0
.8-2
3.9%
161
5.0%
$65.
5$6
8.8
60C
SR2
Cus
tom
er S
olut
ions
Rep
r 2$5
4.3
$56.
6--
$53.
1$5
4.9
--2.
2%3.
1%--
$18.
5$1
7.5
5.4%
$0.7
$1.0
-26.
2%15
33.
3%$7
3.3
$75.
761
CU
S1C
usto
mer
Spe
cial
ist 1
$34.
6$3
5.3
--$2
9.4
$30.
5--
17.9
%15
.7%
--$1
6.8
$15.
39.
7%$0
.5$0
.5-1
4.9%
5313
.4%
$46.
3$5
2.5
62C
US2
Cus
tom
er S
peci
alis
t 2$4
2.7
$44.
3--
$36.
9$3
8.6
--15
.7%
14.7
%--
$17.
3$1
6.0
8.0%
$0.6
$0.7
-16.
4%39
512
.4%
$55.
3$6
2.2
63D
ES1
Des
igne
r 1$6
0.5
$62.
9--
$68.
0$7
0.4
---1
1.0%
-10.
7%--
$18.
8$1
8.9
-0.9
%$0
.8$1
.2-3
5.7%
25-9
.0%
$90.
5$8
2.4
64D
ES2
Des
igne
r 2$7
6.8
$79.
9--
$81.
7$8
3.9
---6
.1%
-4.8
%--
$20.
2$2
0.2
0.2%
$1.0
$1.5
-32.
2%13
1-4
.2%
$105
.5$1
01.1
65D
RF2
Dra
fting
Tec
hnic
ian
2$5
6.2
$58.
5--
$59.
5$6
2.4
---5
.6%
-6.3
%--
$18.
2$1
8.2
-0.2
%$0
.7$1
.1-3
1.8%
23-5
.3%
$81.
7$7
7.3
66EX
A1Ex
ecut
ive A
ssis
tant
1$6
6.3
$69.
1--
$76.
2$8
2.4
---1
3.0%
-16.
1%--
$19.
1$2
0.0
-4.5
%$0
.9$1
.4-3
7.2%
92-1
4.2%
$103
.8$8
9.1
67PL
A1Pl
anne
r 1$7
1.7
$74.
8--
$81.
4$8
5.7
---1
1.9%
-12.
7%--
$19.
9$2
3.2
-14.
2%$0
.9$0
.743
.1%
137
-12.
7%$1
09.5
$95.
668
TSP1
Tech
nl S
pcls
t/Sci
entis
t 1$6
3.0
$65.
5--
$57.
6$6
1.2
--9.
3%7.
1%--
$19.
1$1
8.1
5.7%
$0.8
$1.0
-21.
1%41
6.5%
$80.
3$8
5.5
69TS
P2Te
chnl
Spc
lst/S
cien
tist 2
$79.
2$8
2.7
--$7
8.7
$84.
3--
0.7%
-1.9
%--
$20.
5$2
0.2
1.7%
$1.0
$1.4
-27.
3%13
2-1
.5%
$105
.9$1
04.3
70
$61.
4$6
3.9
--$6
1.7
$65.
0--
-0.5
%-1
.6%
--$1
8.8
$18.
51.
9%$0
.8$1
.1-2
5.7%
3,11
4-1
.1%
$84.
6$8
3.6
43Ao
n H
ewitt
| C
onsu
lting
| Pe
rform
ance
, Rew
ards
and
Tal
ent
0155
1/R
PT00
1AAP
.DO
CX/
PR&T
-SF-
1500
8 0
9/20
13
Rep
rese
nts
aver
age
pay
data
for S
CE
and
com
para
tor (
mar
ket)
data
.
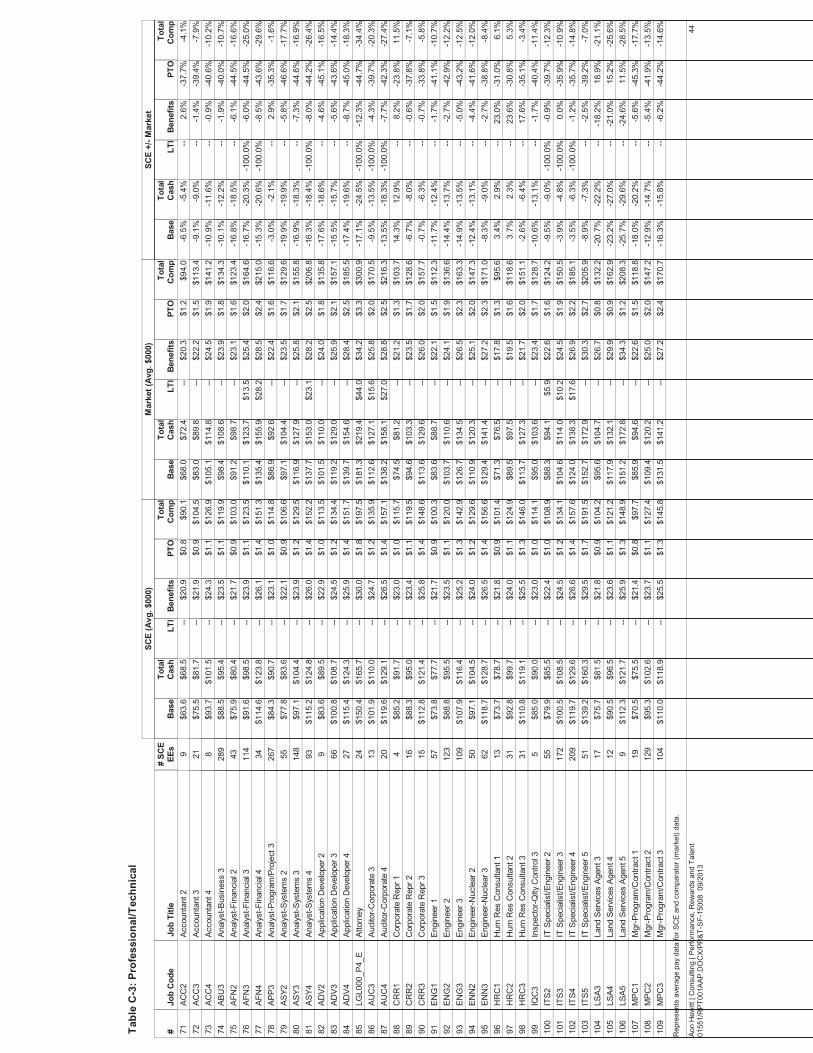
Job
Cod
eBa
se
SCE
(Avg
. $00
0)To
tal
Cas
hLT
IBe
nefit
sPT
O#
SCE
EEs
Base
Mar
ket (
Avg.
$00
0)To
tal
Cas
hLT
IBe
nefit
sPT
OBa
se
SCE
+/- M
arke
tTo
tal
Cas
hLT
IBe
nefit
sPT
O
Tab
le C
-3: P
rofe
ssio
nal/T
echn
ical
Tota
lC
omp
Tota
lC
omp
Tota
lC
omp
Job
Title
#AC
C2
Acco
unta
nt 2
$63.
6$6
8.5
--$6
8.0
$72.
4--
-6.5
%-5
.4%
--$2
0.9
$20.
32.
6%$0
.8$1
.2-3
7.7%
9-4
.1%
$94.
0$9
0.1
71AC
C3
Acco
unta
nt 3
$75.
5$8
1.7
--$8
3.0
$89.
8--
-9.1
%-9
.0%
--$2
1.9
$22.
2-1
.4%
$0.9
$1.5
-39.
4%21
-7.9
%$1
13.4
$104
.572
ACC
4Ac
coun
tant
4$9
3.7
$101
.5--
$105
.1$1
14.8
---1
0.9%
-11.
6%--
$24.
3$2
4.5
-0.9
%$1
.1$1
.9-4
0.6%
8-1
0.2%
$141
.2$1
26.9
73AB
U3
Anal
yst-B
usin
ess
3$8
8.5
$95.
4--
$98.
4$1
08.6
---1
0.1%
-12.
2%--
$23.
5$2
3.9
-1.9
%$1
.1$1
.8-4
0.0%
289
-10.
7%$1
34.3
$119
.974
AFN
2An
alys
t-Fin
anci
al 2
$75.
9$8
0.4
--$9
1.2
$98.
7--
-16.
8%-1
8.5%
--$2
1.7
$23.
1-6
.1%
$0.9
$1.6
-44.
5%43
-16.
6%$1
23.4
$103
.075
AFN
3An
alys
t-Fin
anci
al 3
$91.
6$9
8.5
--$1
10.1
$123
.7$1
3.5
-16.
7%-2
0.3%
-100
.0%
$23.
9$2
5.4
-6.0
%$1
.1$2
.0-4
4.5%
114
-25.
0%$1
64.6
$123
.576
AFN
4An
alys
t-Fin
anci
al 4
$114
.6$1
23.8
--$1
35.4
$155
.9$2
8.2
-15.
3%-2
0.6%
-100
.0%
$26.
1$2
8.5
-8.5
%$1
.4$2
.4-4
3.6%
34-2
9.6%
$215
.0$1
51.3
77AP
P3An
alys
t-Pro
gram
/Pro
ject
3$8
4.3
$90.
7--
$86.
9$9
2.6
---3
.0%
-2.1
%--
$23.
1$2
2.4
2.9%
$1.0
$1.6
-35.
3%26
7-1
.6%
$116
.6$1
14.8
78AS
Y2An
alys
t-Sys
tem
s 2
$77.
8$8
3.6
--$9
7.1
$104
.4--
-19.
9%-1
9.9%
--$2
2.1
$23.
5-5
.8%
$0.9
$1.7
-46.
6%55
-17.
7%$1
29.6
$106
.679
ASY3
Anal
yst-S
yste
ms
3$9
7.1
$104
.4--
$116
.9$1
27.9
---1
6.9%
-18.
3%--
$23.
9$2
5.8
-7.3
%$1
.2$2
.1-4
4.6%
148
-16.
9%$1
55.8
$129
.580
ASY4
Anal
yst-S
yste
ms
4$1
15.2
$124
.8--
$137
.7$1
53.0
$23.
1-1
6.3%
-18.
4%-1
00.0
%$2
6.0
$28.
2-8
.0%
$1.4
$2.5
-44.
2%93
-26.
4%$2
06.8
$152
.281
ADV2
Appl
icat
ion
Dev
elop
er 2
$83.
6$8
9.5
--$1
01.5
$110
.0--
-17.
6%-1
8.6%
--$2
2.9
$24.
0-4
.6%
$1.0
$1.8
-45.
1%9
-16.
5%$1
35.8
$113
.582
ADV3
Appl
icat
ion
Dev
elop
er 3
$100
.8$1
08.7
--$1
19.2
$129
.0--
-15.
5%-1
5.7%
--$2
4.5
$25.
9-5
.6%
$1.2
$2.1
-43.
6%66
-14.
4%$1
57.1
$134
.483
ADV4
Appl
icat
ion
Dev
elop
er 4
$115
.4$1
24.3
--$1
39.7
$154
.6--
-17.
4%-1
9.6%
--$2
5.9
$28.
4-8
.7%
$1.4
$2.5
-45.
0%27
-18.
3%$1
85.5
$151
.784
LGL0
00_P
4_E
Atto
rney
$150
.4$1
65.7
--$1
81.3
$219
.4$4
4.0
-17.
1%-2
4.5%
-100
.0%
$30.
0$3
4.2
-12.
3%$1
.8$3
.3-4
4.7%
24-3
4.4%
$300
.9$1
97.5
85AU
C3
Audi
tor-C
orpo
rate
3$1
01.9
$110
.0--
$112
.6$1
27.1
$15.
6-9
.5%
-13.
5%-1
00.0
%$2
4.7
$25.
8-4
.3%
$1.2
$2.0
-39.
7%13
-20.
3%$1
70.5
$135
.986
AUC
4Au
dito
r-Cor
pora
te 4
$119
.6$1
29.1
--$1
38.2
$158
.1$2
7.0
-13.
5%-1
8.3%
-100
.0%
$26.
5$2
8.8
-7.7
%$1
.4$2
.5-4
2.3%
20-2
7.4%
$216
.3$1
57.1
87C
RR
1C
orpo
rate
Rep
r 1$8
5.2
$91.
7--
$74.
5$8
1.2
--14
.3%
12.9
%--
$23.
0$2
1.2
8.2%
$1.0
$1.3
-23.
8%4
11.5
%$1
03.7
$115
.788
CR
R2
Cor
pora
te R
epr 2
$88.
3$9
5.0
--$9
4.6
$103
.3--
-6.7
%-8
.0%
--$2
3.4
$23.
5-0
.6%
$1.1
$1.7
-37.
8%16
-7.1
%$1
28.6
$119
.589
CR
R3
Cor
pora
te R
epr 3
$112
.8$1
21.4
--$1
13.6
$129
.6--
-0.7
%-6
.3%
--$2
5.8
$26.
0-0
.7%
$1.4
$2.0
-33.
8%15
-5.8
%$1
57.7
$148
.690
ENG
1En
gine
er 1
$73.
8$7
7.7
--$8
3.6
$88.
7--
-11.
7%-1
2.4%
--$2
1.7
$22.
1-1
.7%
$0.9
$1.5
-41.
1%57
-10.
7%$1
12.3
$100
.391
ENG
2En
gine
er 2
$88.
8$9
5.5
--$1
03.7
$110
.6--
-14.
4%-1
3.7%
--$2
3.5
$24.
1-2
.7%
$1.1
$1.9
-42.
9%12
3-1
2.2%
$136
.6$1
20.0
92EN
G3
Engi
neer
3$1
07.9
$116
.4--
$126
.7$1
34.5
---1
4.9%
-13.
5%--
$25.
2$2
6.5
-5.0
%$1
.3$2
.3-4
3.2%
109
-12.
5%$1
63.3
$142
.993
ENN
2En
gine
er-N
ucle
ar 2
$97.
1$1
04.5
--$1
10.9
$120
.3--
-12.
4%-1
3.1%
--$2
4.0
$25.
1-4
.4%
$1.2
$2.0
-41.
6%50
-12.
0%$1
47.3
$129
.694
ENN
3En
gine
er-N
ucle
ar 3
$118
.7$1
28.7
--$1
29.4
$141
.4--
-8.3
%-9
.0%
--$2
6.5
$27.
2-2
.7%
$1.4
$2.3
-38.
8%62
-8.4
%$1
71.0
$156
.695
HR
C1
Hum
Res
Con
sulta
nt 1
$73.
7$7
8.7
--$7
1.3
$76.
5--
3.4%
2.9%
--$2
1.8
$17.
823
.0%
$0.9
$1.3
-31.
0%13
6.1%
$95.
6$1
01.4
96H
RC
2H
um R
es C
onsu
ltant
2$9
2.8
$99.
7--
$89.
5$9
7.5
--3.
7%2.
3%--
$24.
0$1
9.5
23.6
%$1
.1$1
.6-3
0.8%
315.
3%$1
18.6
$124
.997
HR
C3
Hum
Res
Con
sulta
nt 3
$110
.8$1
19.1
--$1
13.7
$127
.3--
-2.6
%-6
.4%
--$2
5.5
$21.
717
.6%
$1.3
$2.0
-35.
1%31
-3.4
%$1
51.1
$146
.098
IQC
3In
spec
tor-Q
lty C
ontro
l 3$8
5.0
$90.
0--
$95.
0$1
03.6
---1
0.6%
-13.
1%--
$23.
0$2
3.4
-1.7
%$1
.0$1
.7-4
0.4%
5-1
1.4%
$128
.7$1
14.1
99IT
S2IT
Spe
cial
ist/E
ngin
eer 2
$79.
9$8
5.5
--$8
8.3
$94.
1$5
.9-9
.5%
-9.0
%-1
00.0
%$2
2.4
$22.
6-0
.9%
$1.0
$1.6
-39.
7%55
-12.
3%$1
24.2
$108
.910
0IT
S3IT
Spe
cial
ist/E
ngin
eer 3
$100
.5$1
08.5
--$1
04.6
$114
.0$1
0.2
-3.9
%-4
.8%
-100
.0%
$24.
5$2
4.5
0.0%
$1.2
$1.9
-35.
9%17
2-1
0.9%
$150
.5$1
34.1
101
ITS4
IT S
peci
alis
t/Eng
inee
r 4$1
19.7
$129
.6--
$124
.0$1
38.3
$17.
6-3
.5%
-6.3
%-1
00.0
%$2
6.6
$26.
9-1
.2%
$1.4
$2.2
-35.
7%20
9-1
4.8%
$185
.1$1
57.6
102
ITS5
IT S
peci
alis
t/Eng
inee
r 5$1
39.2
$160
.3--
$152
.7$1
72.9
---8
.9%
-7.3
%--
$29.
5$3
0.3
-2.5
%$1
.7$2
.7-3
9.2%
51-7
.0%
$205
.9$1
91.5
103
LSA3
Land
Ser
vices
Age
nt 3
$75.
7$8
1.5
--$9
5.6
$104
.7--
-20.
7%-2
2.2%
--$2
1.8
$26.
7-1
8.2%
$0.9
$0.8
18.9
%17
-21.
1%$1
32.2
$104
.210
4LS
A4La
nd S
ervic
es A
gent
4$9
0.5
$96.
5--
$117
.9$1
32.1
---2
3.2%
-27.
0%--
$23.
6$2
9.9
-21.
0%$1
.1$0
.915
.2%
12-2
5.6%
$162
.9$1
21.2
105
LSA5
Land
Ser
vices
Age
nt 5
$112
.3$1
21.7
--$1
51.2
$172
.8--
-25.
7%-2
9.6%
--$2
5.9
$34.
3-2
4.6%
$1.3
$1.2
11.5
%9
-28.
5%$2
08.3
$148
.910
6M
PC1
Mgr
-Pro
gram
/Con
tract
1$7
0.5
$75.
5--
$85.
9$9
4.6
---1
8.0%
-20.
2%--
$21.
4$2
2.6
-5.6
%$0
.8$1
.5-4
5.3%
19-1
7.7%
$118
.8$9
7.7
107
MPC
2M
gr-P
rogr
am/C
ontra
ct 2
$95.
3$1
02.6
--$1
09.4
$120
.2--
-12.
9%-1
4.7%
--$2
3.7
$25.
0-5
.4%
$1.1
$2.0
-41.
9%12
9-1
3.5%
$147
.2$1
27.4
108
MPC
3M
gr-P
rogr
am/C
ontra
ct 3
$110
.0$1
18.9
--$1
31.5
$141
.2--
-16.
3%-1
5.8%
--$2
5.5
$27.
2-6
.2%
$1.3
$2.4
-44.
2%10
4-1
4.6%
$170
.7$1
45.8
109
44Ao
n H
ewitt
| C
onsu
lting
| Pe
rform
ance
, Rew
ards
and
Tal
ent
0155
1/R
PT00
1AAP
.DO
CX/
PR&T
-SF-
1500
8 0
9/20
13
Rep
rese
nts
aver
age
pay
data
for S
CE
and
com
para
tor (
mar
ket)
data
.
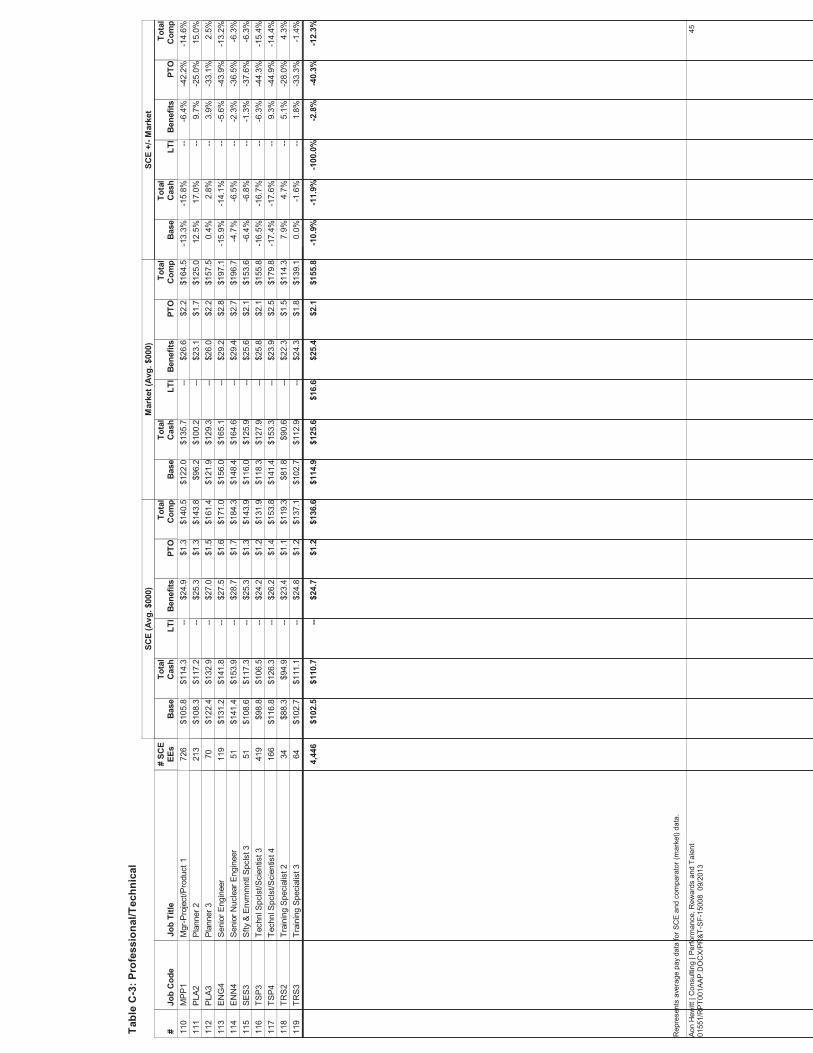
Job
Cod
eBa
se
SCE
(Avg
. $00
0)To
tal
Cas
hLT
IBe
nefit
sPT
O#
SCE
EEs
Base
Mar
ket (
Avg.
$00
0)To
tal
Cas
hLT
IBe
nefit
sPT
OBa
se
SCE
+/- M
arke
tTo
tal
Cas
hLT
IBe
nefit
sPT
O
Tab
le C
-3: P
rofe
ssio
nal/T
echn
ical
Tota
lC
omp
Tota
lC
omp
Tota
lC
omp
Job
Title
#M
PP1
Mgr
-Pro
ject
/Pro
duct
1$1
05.8
$114
.3--
$122
.0$1
35.7
---1
3.3%
-15.
8%--
$24.
9$2
6.6
-6.4
%$1
.3$2
.2-4
2.2%
726
-14.
6%$1
64.5
$140
.511
0PL
A2Pl
anne
r 2$1
08.3
$117
.2--
$96.
2$1
00.2
--12
.5%
17.0
%--
$25.
3$2
3.1
9.7%
$1.3
$1.7
-25.
0%21
315
.0%
$125
.0$1
43.8
111
PLA3
Plan
ner 3
$122
.4$1
32.9
--$1
21.9
$129
.3--
0.4%
2.8%
--$2
7.0
$26.
03.
9%$1
.5$2
.2-3
3.1%
702.
5%$1
57.5
$161
.411
2EN
G4
Seni
or E
ngin
eer
$131
.2$1
41.8
--$1
56.0
$165
.1--
-15.
9%-1
4.1%
--$2
7.5
$29.
2-5
.6%
$1.6
$2.8
-43.
9%11
9-1
3.2%
$197
.1$1
71.0
113
ENN
4Se
nior
Nuc
lear
Eng
inee
r$1
41.4
$153
.9--
$148
.4$1
64.6
---4
.7%
-6.5
%--
$28.
7$2
9.4
-2.3
%$1
.7$2
.7-3
6.5%
51-6
.3%
$196
.7$1
84.3
114
SES3
Sfty
& E
nvrn
mnt
l Spc
lst 3
$108
.6$1
17.3
--$1
16.0
$125
.9--
-6.4
%-6
.8%
--$2
5.3
$25.
6-1
.3%
$1.3
$2.1
-37.
6%51
-6.3
%$1
53.6
$143
.911
5TS
P3Te
chnl
Spc
lst/S
cien
tist 3
$98.
8$1
06.5
--$1
18.3
$127
.9--
-16.
5%-1
6.7%
--$2
4.2
$25.
8-6
.3%
$1.2
$2.1
-44.
3%41
9-1
5.4%
$155
.8$1
31.9
116
TSP4
Tech
nl S
pcls
t/Sci
entis
t 4$1
16.8
$126
.3--
$141
.4$1
53.3
---1
7.4%
-17.
6%--
$26.
2$2
3.9
9.3%
$1.4
$2.5
-44.
9%16
6-1
4.4%
$179
.8$1
53.8
117
TRS2
Trai
ning
Spe
cial
ist 2
$88.
3$9
4.9
--$8
1.8
$90.
6--
7.9%
4.7%
--$2
3.4
$22.
35.
1%$1
.1$1
.5-2
8.0%
344.
3%$1
14.3
$119
.311
8TR
S3Tr
aini
ng S
peci
alis
t 3$1
02.7
$111
.1--
$102
.7$1
12.9
--0.
0%-1
.6%
--$2
4.8
$24.
31.
8%$1
.2$1
.8-3
3.3%
64-1
.4%
$139
.1$1
37.1
119
$102
.5$1
10.7
--$1
14.9
$125
.6$1
6.6
-10.
9%-1
1.9%
-100
.0%
$24.
7$2
5.4
-2.8
%$1
.2$2
.1-4
0.3%
4,44
6-1
2.3%
$155
.8$1
36.6
45Ao
n H
ewitt
| C
onsu
lting
| Pe
rform
ance
, Rew
ards
and
Tal
ent
0155
1/R
PT00
1AAP
.DO
CX/
PR&T
-SF-
1500
8 0
9/20
13
Rep
rese
nts
aver
age
pay
data
for S
CE
and
com
para
tor (
mar
ket)
data
.

Job
Cod
eBa
se
SCE
(Avg
. $00
0)To
tal
Cas
hLT
IBe
nefit
sPT
O#
SCE
EEs
Base
Mar
ket (
Avg.
$00
0)To
tal
Cas
hLT
IBe
nefit
sPT
OBa
se
SCE
+/- M
arke
tTo
tal
Cas
hLT
IBe
nefit
sPT
O
Tab
le C
-4: M
anag
er/S
uper
viso
r
Tota
lC
omp
Tota
lC
omp
Tota
lC
omp
Job
Title
#22
78As
sist
ant T
reas
urer
$187
.4$2
61.1
$66.
4$2
08.3
$283
.6$7
5.6
-10.
0%-7
.9%
-12.
2%$4
1.7
$44.
5-6
.3%
$2.4
$3.7
-35.
0%1
-8.8
%$4
07.4
$371
.512
022
8C
orpo
rate
Med
ical
Dire
ctor
$206
.5$2
96.2
--$2
56.9
$370
.8--
-19.
6%-2
0.1%
--$4
5.1
$43.
73.
2%$2
.7$4
.6-4
2.0%
1-1
7.9%
$419
.2$3
44.0
121
307
Dir
Cor
p Se
c &
Bus
Cnt
nuty
Mgt
$193
.8$2
54.0
$68.
6$2
11.7
$286
.9$6
6.3
-8.4
%-1
1.5%
3.5%
$40.
8$4
4.8
-8.9
%$2
.5$3
.8-3
3.9%
1-8
.9%
$401
.8$3
65.9
122
109
Dir
Cor
pora
te B
udge
ts$2
00.7
$283
.8--
$213
.0$2
90.7
---5
.8%
-2.4
%--
$44.
0$4
5.3
-2.8
%$2
.6$3
.8-3
2.0%
1-2
.8%
$339
.8$3
30.4
123
339
Dir
Tax
$217
.8$3
50.0
$106
.1$2
43.2
$379
.8$1
43.1
-10.
5%-7
.8%
-25.
9%$5
0.9
$53.
0-4
.0%
$2.8
$4.4
-35.
3%1
-12.
2%$5
80.3
$509
.812
4D
ir&M
AD
irect
or &
Man
agin
g At
torn
ey$2
12.2
$303
.1$7
6.1
$243
.3$3
34.1
$95.
7-1
2.8%
-9.3
%-2
0.5%
$45.
9$4
2.0
9.3%
$2.8
$4.4
-37.
0%12
-10.
2%$4
76.2
$427
.912
523
64H
R S
BP (P
ower
Del
iver
y S
ervic
es &
SO
NG
S)$2
06.5
$334
.7$8
7.8
$211
.3$2
77.1
$94.
9-2
.3%
20.8
%-7
.5%
$49.
5$3
8.1
30.0
%$2
.7$3
.8-2
9.4%
114
.7%
$413
.9$4
74.6
126
MG
R1
Man
ager
1: C
orpo
rate
Fin
ance
: Con
trolle
rs$1
17.8
$127
.7--
$117
.0$1
30.1
--0.
7%-1
.9%
--$2
9.7
$28.
83.
2%$1
.5$2
.1-2
7.3%
15-1
.3%
$161
.1$1
59.0
127
MG
R1
Man
ager
1: C
orpo
rate
Fin
ance
: Fin
anci
al
Plan
ning
& A
nalys
is D
epar
tmen
t$1
15.4
$124
.9--
$128
.7$1
45.5
---1
0.3%
-14.
1%--
$29.
4$3
0.6
-4.0
%$1
.5$2
.3-3
5.2%
21-1
2.7%
$178
.3$1
55.8
128
MG
R1
Man
ager
1: C
orpo
rate
Fin
ance
: Sup
ply
Man
agem
ent
$119
.1$1
28.4
--$1
14.3
$128
.1--
4.2%
0.2%
--$2
9.9
$28.
73.
9%$1
.5$2
.1-2
4.7%
100.
6%$1
58.9
$159
.812
9
MG
R1
Man
ager
1: C
usto
mer
Ser
vice
: Cus
tom
er
Prog
ram
s &
Serv
ices
$112
.5$1
22.2
--$9
4.6
$105
.1--
18.9
%16
.3%
--$2
9.8
$26.
114
.1%
$1.5
$1.7
-14.
1%35
15.5
%$1
32.9
$153
.513
0
MG
R1
Man
ager
1: C
usto
mer
Ser
vice
: Cus
tom
er
Serv
ice
Ope
ratio
ns$1
17.1
$127
.7--
$123
.3$1
45.4
---5
.0%
-12.
2%--
$29.
8$3
0.6
-2.7
%$1
.5$2
.2-3
1.4%
42-1
0.8%
$178
.2$1
59.0
131
MG
R1
Man
ager
1: E
xter
nal R
elat
ions
: Cor
pora
te
Com
mun
icat
ions
$111
.0$1
20.4
--$1
18.3
$132
.6--
-6.2
%-9
.2%
--$2
9.5
$29.
11.
3%$1
.4$2
.1-3
2.3%
1-7
.6%
$163
.8$1
51.3
132
MG
R1
Man
ager
1: H
uman
Res
ourc
es$1
21.7
$133
.2--
$122
.8$1
39.9
---0
.9%
-4.8
%--
$30.
5$2
9.9
2.0%
$1.6
$2.2
-28.
4%11
-3.9
%$1
72.0
$165
.313
3M
GR
1M
anag
er 1
: Hum
an R
esou
rces
: Lea
ders
hip,
Le
arni
ng &
Org
Effe
ctive
ness
$118
.1$1
29.2
--$1
15.9
$131
.2--
1.9%
-1.5
%--
$30.
0$2
8.9
3.5%
$1.5
$2.1
-26.
4%11
-0.9
%$1
62.2
$160
.713
4
MG
R1
Man
ager
1: I
nfor
mat
ion
Tech
nolo
gy:
Infra
stru
ctur
e Te
chno
logy
Ser
vices
$119
.3$1
30.3
--$1
36.7
$155
.1--
-12.
7%-1
6.0%
--$3
0.1
$31.
7-4
.9%
$1.6
$2.5
-36.
9%26
-14.
4%$1
89.2
$162
.013
5
MG
R1
Man
ager
1: I
nfor
mat
ion
Tech
nolo
gy:
Tech
nolo
gy D
elive
ry &
Mai
nten
ance
$117
.7$1
25.9
--$1
39.6
$158
.2--
-15.
7%-2
0.4%
--$2
9.5
$32.
0-7
.9%
$1.5
$2.5
-39.
1%11
-18.
6%$1
92.8
$157
.013
6
MG
R1
Man
ager
1: L
egal
Org
aniza
tion
$124
.7$1
35.0
--$1
20.4
$136
.7$1
5.2
3.6%
-1.3
%-1
00.0
%$3
0.8
$29.
64.
1%$1
.6$2
.2-2
5.2%
2-8
.9%
$183
.7$1
67.4
137
MG
R1
Man
ager
1: N
ucle
ar O
rgan
izatio
n:
Adm
inis
tratio
n$1
21.9
$134
.5--
$139
.6$1
60.3
---1
2.7%
-16.
1%--
$30.
7$3
6.5
-15.
8%$1
.6$1
.141
.9%
5-1
5.7%
$197
.9$1
66.8
138
MG
R1
Man
ager
1: N
ucle
ar O
rgan
izatio
n: E
ngin
eerin
g$1
26.6
$137
.9--
$141
.1$1
61.9
---1
0.3%
-14.
8%--
$30.
5$3
6.7
-16.
8%$1
.6$1
.145
.8%
5-1
4.9%
$199
.7$1
70.1
139
MG
R1
Man
ager
1: N
ucle
ar O
rgan
izatio
n:
Mai
nten
ance
$133
.2$1
44.7
--$1
42.3
$166
.3--
-6.4
%-1
3.0%
--$3
1.5
$37.
3-1
5.5%
$1.7
$1.1
52.1
%1
-13.
1%$2
04.7
$177
.914
0
MG
R1
Man
ager
1: N
ucle
ar O
rgan
izatio
n: O
pera
tions
$119
.0$1
28.7
--$1
44.3
$171
.7--
-17.
5%-2
5.1%
--$2
9.9
$38.
0-2
1.3%
$1.5
$1.2
34.0
%2
-24.
1%$2
10.8
$160
.114
1M
GR
1M
anag
er 1
: Nuc
lear
Org
aniza
tion:
Sec
urity
$108
.8$1
18.0
--$1
15.4
$130
.4--
-5.7
%-9
.5%
--$2
9.1
$32.
7-1
1.0%
$1.4
$0.9
53.2
%7
-9.5
%$1
64.0
$148
.514
2M
GR
1M
anag
er 1
: Nuc
lear
Org
aniza
tion:
Tra
inin
g$1
29.6
$140
.9--
$141
.1$1
63.9
---8
.2%
-14.
1%--
$30.
9$3
6.9
-16.
3%$1
.7$1
.149
.2%
9-1
4.1%
$202
.0$1
73.5
143
MG
R1
Man
ager
1: P
ower
Pro
duct
ion
$119
.8$1
28.0
--$1
24.3
$142
.3--
-3.6
%-1
0.0%
--$2
9.8
$34.
3-1
3.3%
$1.6
$1.0
56.6
%4
-10.
3%$1
77.6
$159
.414
4M
GR
1M
anag
er 1
: Saf
ety,
Sec
urity
& C
ompl
ianc
e:
Cor
pora
te S
ecur
ity$1
09.9
$117
.2--
$115
.8$1
26.2
---5
.0%
-7.1
%--
$29.
0$2
8.4
2.3%
$1.4
$2.1
-31.
4%3
-5.8
%$1
56.7
$147
.714
5
MG
R1
Man
ager
1: S
afet
y, S
ecur
ity &
Com
plia
nce:
En
viron
men
tal H
ealth
& S
afet
y$1
19.1
$129
.0--
$124
.1$1
39.7
---4
.0%
-7.6
%--
$29.
9$2
9.9
0.1%
$1.5
$2.2
-30.
7%2
-6.6
%$1
71.8
$160
.514
6
MG
R1
Man
ager
1: T
rans
mis
sion
& D
istri
butio
n: B
us
Plan
ning
& F
in M
gmt B
sn L
n$1
23.2
$133
.6--
$127
.9$1
39.7
---3
.6%
-4.4
%--
$30.
6$2
9.9
2.3%
$1.6
$2.3
-30.
4%3
-3.6
%$1
71.9
$165
.814
7
46Ao
n H
ewitt
| C
onsu
lting
| Pe
rform
ance
, Rew
ards
and
Tal
ent
0155
1/R
PT00
1AAP
.DO
CX/
PR&T
-SF-
1500
8 0
9/20
13
Rep
rese
nts
aver
age
pay
data
for S
CE
and
com
para
tor (
mar
ket)
data
.
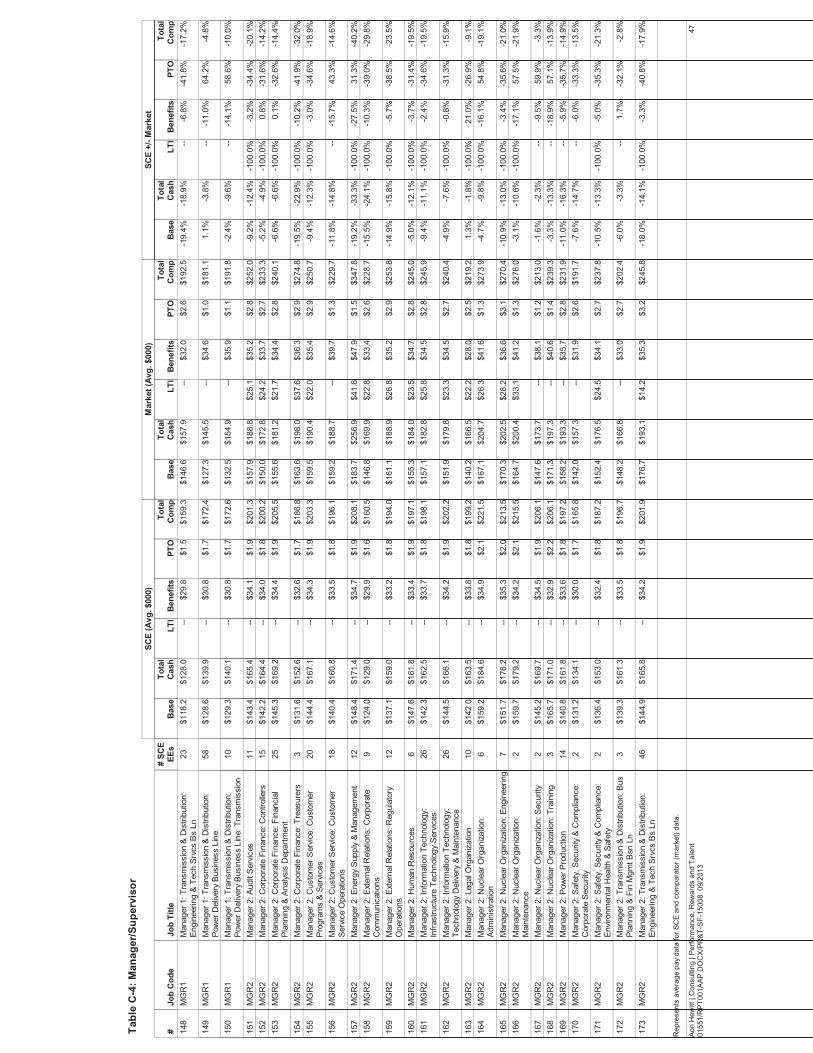
Job
Cod
eBa
se
SCE
(Avg
. $00
0)To
tal
Cas
hLT
IBe
nefit
sPT
O#
SCE
EEs
Base
Mar
ket (
Avg.
$00
0)To
tal
Cas
hLT
IBe
nefit
sPT
OBa
se
SCE
+/- M
arke
tTo
tal
Cas
hLT
IBe
nefit
sPT
O
Tab
le C
-4: M
anag
er/S
uper
viso
r
Tota
lC
omp
Tota
lC
omp
Tota
lC
omp
Job
Title
#M
GR
1M
anag
er 1
: Tra
nsm
issi
on &
Dis
tribu
tion:
En
gine
erin
g &
Tech
Srv
cs B
s Ln
$118
.2$1
28.0
--$1
46.6
$157
.9--
-19.
4%-1
8.9%
--$2
9.8
$32.
0-6
.8%
$1.5
$2.6
-41.
8%23
-17.
2%$1
92.5
$159
.314
8
MG
R1
Man
ager
1: T
rans
mis
sion
& D
istri
butio
n:
Pow
er D
elive
ry B
usin
ess
Line
$128
.6$1
39.9
--$1
27.3
$145
.5--
1.1%
-3.8
%--
$30.
8$3
4.6
-11.
0%$1
.7$1
.064
.2%
58-4
.8%
$181
.1$1
72.4
149
MG
R1
Man
ager
1: T
rans
mis
sion
& D
istri
butio
n:
Pow
er D
elive
ry B
usin
ess
Line
: Tra
nsm
issi
on$1
29.3
$140
.1--
$132
.5$1
54.9
---2
.4%
-9.6
%--
$30.
8$3
5.9
-14.
1%$1
.7$1
.158
.6%
10-1
0.0%
$191
.8$1
72.6
150
MG
R2
Man
ager
2: A
udit
Serv
ices
$143
.4$1
65.4
--$1
57.9
$188
.8$2
5.1
-9.2
%-1
2.4%
-100
.0%
$34.
1$3
5.2
-3.2
%$1
.9$2
.8-3
4.4%
11-2
0.1%
$252
.0$2
01.3
151
MG
R2
Man
ager
2: C
orpo
rate
Fin
ance
: Con
trolle
rs$1
42.2
$164
.4--
$150
.0$1
72.8
$24.
2-5
.2%
-4.9
%-1
00.0
%$3
4.0
$33.
70.
8%$1
.8$2
.7-3
1.6%
15-1
4.2%
$233
.3$2
00.2
152
MG
R2
Man
ager
2: C
orpo
rate
Fin
ance
: Fin
anci
al
Plan
ning
& A
nalys
is D
epar
tmen
t$1
45.3
$169
.2--
$155
.6$1
81.2
$21.
7-6
.6%
-6.6
%-1
00.0
%$3
4.4
$34.
40.
1%$1
.9$2
.8-3
2.6%
25-1
4.4%
$240
.1$2
05.5
153
MG
R2
Man
ager
2: C
orpo
rate
Fin
ance
: Tre
asur
ers
$131
.6$1
52.6
--$1
63.6
$198
.0$3
7.6
-19.
5%-2
2.9%
-100
.0%
$32.
6$3
6.3
-10.
2%$1
.7$2
.9-4
1.9%
3-3
2.0%
$274
.8$1
86.8
154
MG
R2
Man
ager
2: C
usto
mer
Ser
vice
: Cus
tom
er
Prog
ram
s &
Serv
ices
$144
.4$1
67.1
--$1
59.5
$190
.4$2
2.0
-9.4
%-1
2.3%
-100
.0%
$34.
3$3
5.4
-3.0
%$1
.9$2
.9-3
4.6%
20-1
8.9%
$250
.7$2
03.3
155
MG
R2
Man
ager
2: C
usto
mer
Ser
vice
: Cus
tom
er
Serv
ice
Ope
ratio
ns$1
40.4
$160
.8--
$159
.2$1
88.7
---1
1.8%
-14.
8%--
$33.
5$3
9.7
-15.
7%$1
.8$1
.343
.3%
18-1
4.6%
$229
.7$1
96.1
156
MG
R2
Man
ager
2: E
nerg
y S
uppl
y &
Man
agem
ent
$148
.4$1
71.4
--$1
83.7
$256
.9$4
1.6
-19.
2%-3
3.3%
-100
.0%
$34.
7$4
7.9
-27.
5%$1
.9$1
.531
.3%
12-4
0.2%
$347
.8$2
08.1
157
MG
R2
Man
ager
2: E
xter
nal R
elat
ions
: Cor
pora
te
Com
mun
icat
ions
$124
.0$1
29.0
--$1
46.8
$169
.9$2
2.8
-15.
5%-2
4.1%
-100
.0%
$29.
9$3
3.4
-10.
3%$1
.6$2
.6-3
9.0%
9-2
9.8%
$228
.7$1
60.5
158
MG
R2
Man
ager
2: E
xter
nal R
elat
ions
: Reg
ulat
ory
Ope
ratio
ns$1
37.1
$159
.0--
$161
.1$1
88.9
$26.
8-1
4.9%
-15.
8%-1
00.0
%$3
3.2
$35.
2-5
.7%
$1.8
$2.9
-38.
5%12
-23.
5%$2
53.8
$194
.015
9
MG
R2
Man
ager
2: H
uman
Res
ourc
es$1
47.6
$161
.8--
$155
.3$1
84.0
$23.
5-5
.0%
-12.
1%-1
00.0
%$3
3.4
$34.
7-3
.7%
$1.9
$2.8
-31.
4%6
-19.
5%$2
45.0
$197
.116
0M
GR
2M
anag
er 2
: Inf
orm
atio
n Te
chno
logy
: In
frast
ruct
ure
Tech
nolo
gy S
ervic
es$1
42.3
$162
.5--
$157
.1$1
82.8
$25.
8-9
.4%
-11.
1%-1
00.0
%$3
3.7
$34.
5-2
.4%
$1.8
$2.8
-34.
6%26
-19.
5%$2
45.9
$198
.116
1
MG
R2
Man
ager
2: I
nfor
mat
ion
Tech
nolo
gy:
Tech
nolo
gy D
elive
ry &
Mai
nten
ance
$144
.5$1
66.1
--$1
51.9
$179
.8$2
3.3
-4.9
%-7
.6%
-100
.0%
$34.
2$3
4.5
-0.8
%$1
.9$2
.7-3
1.3%
26-1
5.9%
$240
.4$2
02.2
162
MG
R2
Man
ager
2: L
egal
Org
aniza
tion
$142
.0$1
63.5
--$1
40.2
$166
.5$2
2.2
1.3%
-1.8
%-1
00.0
%$3
3.8
$28.
021
.0%
$1.8
$2.5
-26.
9%10
-9.1
%$2
19.2
$199
.216
3M
GR
2M
anag
er 2
: Nuc
lear
Org
aniza
tion:
Ad
min
istra
tion
$159
.2$1
84.6
--$1
67.1
$204
.7$2
6.3
-4.7
%-9
.8%
-100
.0%
$34.
9$4
1.6
-16.
1%$2
.1$1
.354
.8%
6-1
9.1%
$273
.9$2
21.5
164
MG
R2
Man
ager
2: N
ucle
ar O
rgan
izatio
n: E
ngin
eerin
g$1
51.7
$176
.2--
$170
.3$2
02.5
$28.
2-1
0.9%
-13.
0%-1
00.0
%$3
5.3
$36.
6-3
.4%
$2.0
$3.1
-35.
6%7
-21.
0%$2
70.4
$213
.516
5M
GR
2M
anag
er 2
: Nuc
lear
Org
aniza
tion:
M
aint
enan
ce$1
59.7
$179
.2--
$164
.7$2
00.4
$33.
1-3
.1%
-10.
6%-1
00.0
%$3
4.2
$41.
2-1
7.1%
$2.1
$1.3
57.5
%2
-21.
9%$2
76.0
$215
.516
6
MG
R2
Man
ager
2: N
ucle
ar O
rgan
izatio
n: S
ecur
ity$1
45.2
$169
.7--
$147
.6$1
73.7
---1
.6%
-2.3
%--
$34.
5$3
8.1
-9.5
%$1
.9$1
.259
.9%
2-3
.3%
$213
.0$2
06.1
167
MG
R2
Man
ager
2: N
ucle
ar O
rgan
izatio
n: T
rain
ing
$165
.7$1
71.0
--$1
71.3
$197
.3--
-3.3
%-1
3.3%
--$3
2.9
$40.
6-1
8.9%
$2.2
$1.4
57.1
%3
-13.
9%$2
39.3
$206
.116
8M
GR
2M
anag
er 2
: Pow
er P
rodu
ctio
n$1
40.8
$161
.8--
$158
.2$1
93.3
---1
1.0%
-16.
3%--
$33.
6$3
5.7
-5.9
%$1
.8$2
.8-3
5.7%
14-1
4.9%
$231
.9$1
97.2
169
MG
R2
Man
ager
2: S
afet
y, S
ecur
ity &
Com
plia
nce:
C
orpo
rate
Sec
urity
$131
.2$1
34.1
--$1
42.0
$157
.3--
-7.6
%-1
4.7%
--$3
0.0
$31.
9-6
.0%
$1.7
$2.6
-33.
3%2
-13.
5%$1
91.7
$165
.817
0
MG
R2
Man
ager
2: S
afet
y, S
ecur
ity &
Com
plia
nce:
En
viron
men
tal H
ealth
& S
afet
y$1
36.4
$153
.0--
$152
.4$1
76.5
$24.
5-1
0.5%
-13.
3%-1
00.0
%$3
2.4
$34.
1-5
.0%
$1.8
$2.7
-35.
3%2
-21.
3%$2
37.8
$187
.217
1
MG
R2
Man
ager
2: T
rans
mis
sion
& D
istri
butio
n: B
us
Plan
ning
& F
in M
gmt B
sn L
n$1
39.3
$161
.3--
$148
.2$1
66.8
---6
.0%
-3.3
%--
$33.
5$3
3.0
1.7%
$1.8
$2.7
-32.
1%3
-2.8
%$2
02.4
$196
.717
2
MG
R2
Man
ager
2: T
rans
mis
sion
& D
istri
butio
n:
Engi
neer
ing
& Te
ch S
rvcs
Bs
Ln$1
44.9
$165
.8--
$176
.7$1
93.1
$14.
2-1
8.0%
-14.
1%-1
00.0
%$3
4.2
$35.
3-3
.3%
$1.9
$3.2
-40.
8%46
-17.
9%$2
45.8
$201
.917
3
47Ao
n H
ewitt
| C
onsu
lting
| Pe
rform
ance
, Rew
ards
and
Tal
ent
0155
1/R
PT00
1AAP
.DO
CX/
PR&T
-SF-
1500
8 0
9/20
13
Rep
rese
nts
aver
age
pay
data
for S
CE
and
com
para
tor (
mar
ket)
data
.

Job
Cod
eBa
se
SCE
(Avg
. $00
0)To
tal
Cas
hLT
IBe
nefit
sPT
O#
SCE
EEs
Base
Mar
ket (
Avg.
$00
0)To
tal
Cas
hLT
IBe
nefit
sPT
OBa
se
SCE
+/- M
arke
tTo
tal
Cas
hLT
IBe
nefit
sPT
O
Tab
le C
-4: M
anag
er/S
uper
viso
r
Tota
lC
omp
Tota
lC
omp
Tota
lC
omp
Job
Title
#M
GR
2M
anag
er 2
: Tra
nsm
issi
on &
Dis
tribu
tion:
M
ajor
Pro
ject
s O
rgan
izat
ion
$132
.7$1
53.0
--$1
78.5
$214
.1--
-25.
6%-2
8.5%
--$3
2.6
$42.
4-2
3.0%
$1.7
$1.4
20.8
%5
-27.
3%$2
57.9
$187
.417
4
MG
R2
Man
ager
2: T
rans
mis
sion
& D
istri
butio
n:
Pow
er D
elive
ry B
usin
ess
Line
$141
.6$1
62.2
--$1
52.3
$182
.5$2
4.9
-7.0
%-1
1.1%
-100
.0%
$33.
7$3
9.2
-14.
2%$1
.8$1
.251
.1%
94-2
0.2%
$247
.8$1
97.7
175
MG
R2
Man
ager
2: T
rans
mis
sion
& D
istri
butio
n:
Pow
er D
elive
ry B
usin
ess
Line
: Tra
nsm
issi
on$1
43.4
$158
.8--
$162
.6$2
02.5
---1
1.8%
-21.
6%--
$33.
2$4
1.5
-20.
0%$1
.9$1
.343
.3%
11-2
1.0%
$245
.3$1
93.9
176
MPP
2M
gr-P
roje
ct/P
rodu
ct 2
$130
.9$1
50.2
--$1
52.3
$176
.1$2
6.0
-14.
1%-1
4.7%
-100
.0%
$32.
2$3
4.1
-5.4
%$1
.7$2
.7-3
7.9%
634
-22.
9%$2
38.9
$184
.117
7BO
P150
_M4_
EPr
in M
gr, B
us P
roce
ss &
Sol
tns
Intg
$176
.4$2
14.5
--$1
80.7
$218
.4$4
0.7
-2.4
%-1
.8%
-100
.0%
$36.
5$3
8.1
-4.2
%$2
.3$3
.3-2
9.5%
8-1
5.7%
$300
.5$2
53.3
178
CLS
000_
M4_
EPr
in M
gr, C
lient
Svc
Del
Mgm
t$1
67.9
$204
.8--
$169
.3$1
90.2
$19.
5-0
.8%
7.7%
-100
.0%
$37.
2$3
0.3
22.5
%$2
.2$3
.0-2
8.4%
50.
4%$2
43.1
$244
.217
9C
OM
000_
M4_
EPr
in M
gr, C
orp
Com
m$1
61.2
$194
.5--
$176
.8$2
16.8
$41.
3-8
.8%
-10.
3%-1
00.0
%$3
6.1
$37.
9-4
.8%
$2.1
$3.2
-34.
2%2
-22.
2%$2
99.3
$232
.718
0EL
D05
0_M
4_E
Prin
Mgr
, Dis
trib
Mgm
t$1
74.5
$210
.3--
$184
.2$2
34.5
$44.
0-5
.3%
-10.
3%-1
00.0
%$3
7.8
$45.
0-1
5.9%
$2.3
$1.5
53.9
%8
-22.
9%$3
24.9
$250
.418
1EH
S050
_M4_
EPr
in M
gr, E
nvir
Scie
nce
$167
.3$2
02.5
--$1
60.3
$191
.4$6
9.7
4.4%
5.8%
-100
.0%
$36.
9$3
5.5
3.8%
$2.2
$2.9
-24.
6%5
-19.
4%$2
99.5
$241
.518
2AC
C00
0_M
4_E
Prin
Mgr
, Gen
Acc
tg, A
nlys
& R
ptg
$170
.2$2
05.9
--$1
71.3
$209
.3$4
3.3
-0.6
%-1
.6%
-100
.0%
$37.
3$3
7.3
-0.1
%$2
.2$3
.1-2
8.2%
5-1
6.2%
$293
.0$2
45.4
183
HR
M15
0_M
4_E
Prin
Mgr
, HR
Stra
tegi
c B
us T
eam
$164
.1$1
98.9
--$1
80.0
$224
.5$4
9.3
-8.8
%-1
1.4%
-100
.0%
$36.
7$3
8.8
-5.5
%$2
.1$3
.2-3
4.1%
4-2
4.7%
$315
.8$2
37.7
184
NEG
100_
M4_
EPr
in M
gr, N
clr E
ng$1
73.5
$203
.9--
$206
.4$2
75.0
$49.
1-1
5.9%
-25.
9%-1
00.0
%$3
7.0
$48.
8-2
4.1%
$2.3
$1.7
36.6
%4
-35.
1%$3
74.5
$243
.218
5SC
M10
0_M
4_E
Prin
Mgr
, Pur
chas
ing
$174
.7$2
12.6
--$1
70.8
$210
.1$3
7.4
2.3%
1.2%
-100
.0%
$38.
1$3
7.4
1.9%
$2.3
$3.1
-26.
1%8
-12.
1%$2
88.0
$253
.018
6R
PA40
0_M
4_E
Prin
Mgr
, Reg
Affa
irs &
Com
pl$1
69.3
$198
.9--
$194
.8$2
43.4
$55.
5-1
3.1%
-18.
3%-1
00.0
%$3
6.4
$40.
6-1
0.4%
$2.2
$3.5
-37.
2%10
-30.
7%$3
43.0
$237
.518
7PR
J050
_J5_
EPr
in P
rj M
gr, I
T Pr
ojec
t Mgm
t$1
60.0
$193
.0--
$144
.8$1
65.1
--10
.5%
16.9
%--
$35.
9$3
2.8
9.5%
$2.1
$2.6
-20.
2%7
15.2
%$2
00.6
$231
.018
8R
OM
1R
eal T
ime
Ope
ratio
ns M
anag
er 1
$145
.0$1
70.7
--$1
46.2
$191
.5--
-0.8
%-1
0.8%
--$3
4.8
$40.
4-1
3.8%
$1.9
$1.2
61.2
%5
-11.
0%$2
33.1
$207
.518
9SU
P1Su
perv
isor
1: C
usto
mer
Ser
vice:
Cus
tom
er
Prog
ram
s &
Serv
ices
$72.
6$7
8.5
--$7
2.5
$78.
4--
0.0%
0.1%
--$2
4.6
$23.
06.
9%$0
.9$1
.3-2
7.8%
21.
3%$1
02.7
$104
.019
0
SUP2
Supe
rvis
or 2
: Cor
pora
te F
inan
ce: C
ontro
llers
$86.
6$9
3.5
--$7
6.6
$83.
4--
13.0
%12
.2%
--$2
6.0
$23.
610
.3%
$1.1
$1.4
-18.
4%5
11.4
%$1
08.4
$120
.719
1SU
P2Su
perv
isor
2: C
usto
mer
Ser
vice:
Cus
tom
er
Serv
ice
Ope
ratio
ns$8
4.4
$89.
8--
$83.
6$9
1.9
--1.
0%-2
.2%
--$2
5.9
$27.
7-6
.3%
$1.1
$0.7
64.1
%2
-2.8
%$1
20.2
$116
.919
2
SUP2
Supe
rvis
or 2
: Nuc
lear
Org
aniz
atio
n:
Adm
inis
tratio
n$8
3.0
$90.
4--
$114
.0$1
26.5
---2
7.2%
-28.
5%--
$26.
0$3
2.2
-19.
3%$1
.1$0
.918
.3%
3-2
6.4%
$159
.6$1
17.5
193
SUP2
Supe
rvis
or 2
: Nuc
lear
Org
aniz
atio
n:
Mai
nten
ance
$108
.2$1
19.1
--$1
14.4
$129
.0--
-5.4
%-7
.7%
--$2
9.3
$32.
6-1
0.0%
$1.4
$0.9
53.7
%48
-7.8
%$1
62.5
$149
.819
4
SUP2
Supe
rvis
or 2
: Nuc
lear
Org
aniz
atio
n:
Ope
ratio
ns$9
7.6
$107
.9--
$122
.3$1
40.9
---2
0.2%
-23.
4%--
$27.
8$3
4.2
-18.
5%$1
.3$1
.029
.7%
1-2
2.2%
$176
.1$1
37.0
195
SUP2
Supe
rvis
or 2
: Nuc
lear
Org
aniz
atio
n: S
ecur
ity$9
0.1
$99.
1--
$83.
3$9
4.0
--8.
2%5.
4%--
$26.
9$2
7.9
-3.7
%$1
.2$0
.775
.8%
273.
7%$1
22.6
$127
.219
6SU
P2Su
perv
isor
2: P
ower
Pro
duct
ion
$96.
0$1
04.0
--$1
15.8
$126
.5--
-17.
1%-1
7.8%
--$2
7.3
$32.
2-1
5.4%
$1.2
$0.9
34.7
%1
-17.
0%$1
59.6
$132
.519
7SU
P2Su
perv
isor
2: T
rans
mis
sion
& D
istri
butio
n:
Engi
neer
ing
& Te
ch S
rvcs
Bs
Ln$8
8.5
$95.
6--
$109
.1$1
21.8
---1
8.9%
-21.
5%--
$26.
4$3
1.6
-16.
5%$1
.2$0
.931
.9%
1-2
0.2%
$154
.2$1
23.1
198
SUP2
Supe
rvis
or 2
: Tra
nsm
issi
on &
Dis
tribu
tion:
Po
wer
Del
ivery
Bus
ines
s Li
ne$1
17.2
$129
.2--
$107
.2$1
19.0
--9.
3%8.
5%--
$30.
0$3
1.2
-4.0
%$1
.5$0
.977
.7%
230
6.3%
$151
.1$1
60.6
199
SUP2
Supe
rvis
or 2
: Tra
nsm
issi
on &
Dis
tribu
tion:
Po
wer
Del
ivery
Bus
ines
s Li
ne: T
rans
mis
sion
$118
.7$1
33.0
--$1
16.0
$126
.7--
2.3%
5.0%
--$3
0.5
$32.
2-5
.4%
$1.5
$0.9
66.3
%14
3.3%
$159
.8$1
65.1
200
SUP4
Supe
rvis
or 4
: Ext
erna
l Rel
atio
ns: R
egul
ator
y O
pera
tions
$116
.5$1
27.8
--$1
32.2
$149
.4--
-11.
9%-1
4.4%
--$2
9.8
$31.
0-4
.0%
$1.5
$2.4
-36.
4%2
-13.
0%$1
82.8
$159
.120
1
SUP4
Supe
rvis
or 4
: Inf
orm
atio
n Te
chno
logy
: In
frast
ruct
ure
Tech
nolo
gy S
ervic
es$1
14.2
$123
.9--
$136
.7$1
55.1
---1
6.5%
-20.
1%--
$30.
0$3
1.7
-5.2
%$1
.5$2
.5-3
9.7%
5-1
7.9%
$189
.2$1
55.4
202
48Ao
n H
ewitt
| C
onsu
lting
| Pe
rform
ance
, Rew
ards
and
Tal
ent
0155
1/R
PT00
1AAP
.DO
CX/
PR&T
-SF-
1500
8 0
9/20
13
Rep
rese
nts
aver
age
pay
data
for S
CE
and
com
para
tor (
mar
ket)
data
.

Job
Cod
eBa
se
SCE
(Avg
. $00
0)To
tal
Cas
hLT
IBe
nefit
sPT
O#
SCE
EEs
Base
Mar
ket (
Avg.
$00
0)To
tal
Cas
hLT
IBe
nefit
sPT
OBa
se
SCE
+/- M
arke
tTo
tal
Cas
hLT
IBe
nefit
sPT
O
Tab
le C
-4: M
anag
er/S
uper
viso
r
Tota
lC
omp
Tota
lC
omp
Tota
lC
omp
Job
Title
#SU
P4Su
perv
isor
4: L
egal
Org
aniz
atio
n$1
11.5
$120
.6--
$117
.3$1
37.8
---4
.9%
-12.
4%--
$29.
5$2
9.7
-0.6
%$1
.4$2
.1-3
1.3%
1-1
0.6%
$169
.6$1
51.6
203
SUP4
Supe
rvis
or 4
: Nuc
lear
Org
aniz
atio
n:
Adm
inis
tratio
n$1
20.0
$129
.9--
$139
.6$1
60.3
---1
4.1%
-19.
0%--
$30.
1$3
6.5
-17.
6%$1
.6$1
.139
.6%
4-1
8.4%
$197
.9$1
61.5
204
SUP4
Supe
rvis
or 4
: Nuc
lear
Org
aniz
atio
n:
Engi
neer
ing
$127
.1$1
39.4
--$1
41.1
$161
.9--
-9.9
%-1
3.9%
--$3
0.7
$36.
7-1
6.2%
$1.7
$1.1
46.4
%7
-14.
0%$1
99.7
$171
.820
5
SUP4
Supe
rvis
or 4
: Nuc
lear
Org
aniz
atio
n:
Mai
nten
ance
$129
.3$1
42.5
--$1
42.3
$166
.3--
-9.2
%-1
4.3%
--$3
1.2
$37.
3-1
6.4%
$1.7
$1.1
47.6
%16
-14.
4%$2
04.7
$175
.320
6
SUP4
Supe
rvis
or 4
: Nuc
lear
Org
aniz
atio
n:
Ope
ratio
ns$1
18.0
$131
.7--
$144
.3$1
71.7
---1
8.2%
-23.
3%--
$30.
3$3
8.0
-20.
1%$1
.5$1
.232
.9%
40-2
2.4%
$210
.8$1
63.6
207
SUP4
Supe
rvis
or 4
: Nuc
lear
Org
aniz
atio
n: T
rain
ing
$117
.7$1
27.2
--$1
37.8
$160
.1--
-14.
6%-2
0.6%
--$2
9.7
$36.
4-1
8.6%
$1.5
$1.1
38.8
%1
-19.
9%$1
97.7
$158
.420
8SU
P4Su
perv
isor
4: P
ower
Pro
duct
ion
$118
.3$1
30.5
--$1
26.4
$144
.3--
-6.4
%-9
.5%
--$3
0.2
$34.
5-1
2.5%
$1.5
$1.0
52.2
%1
-9.8
%$1
79.8
$162
.220
9SU
P4Su
perv
isor
4: T
rans
mis
sion
& D
istri
butio
n:
Engi
neer
ing
& Te
ch S
rvcs
Bs
Ln$1
18.3
$128
.4--
$128
.7$1
45.9
---8
.1%
-12.
0%--
$29.
8$3
0.6
-2.5
%$1
.5$2
.3-3
3.6%
2-1
0.7%
$178
.9$1
59.8
210
SUP4
Supe
rvis
or 4
: Tra
nsm
issi
on &
Dis
tribu
tion:
Po
wer
Del
ivery
Bus
ines
s Li
ne$1
20.3
$130
.9--
$128
.3$1
47.0
---6
.3%
-11.
0%--
$30.
2$3
4.8
-13.
3%$1
.6$1
.052
.3%
14-1
1.0%
$182
.9$1
62.7
211
$129
.9$1
47.4
$0.7
$141
.7$1
64.6
$27.
4-8
.3%
-10.
4%-9
7.6%
$31.
9$3
4.0
-6.3
%$1
.7$2
.1-1
8.9%
1,85
7-1
5.9%
$216
.1$1
81.7
49Ao
n H
ewitt
| C
onsu
lting
| Pe
rform
ance
, Rew
ards
and
Tal
ent
0155
1/R
PT00
1AAP
.DO
CX/
PR&T
-SF-
1500
8 0
9/20
13
Rep
rese
nts
aver
age
pay
data
for S
CE
and
com
para
tor (
mar
ket)
data
.
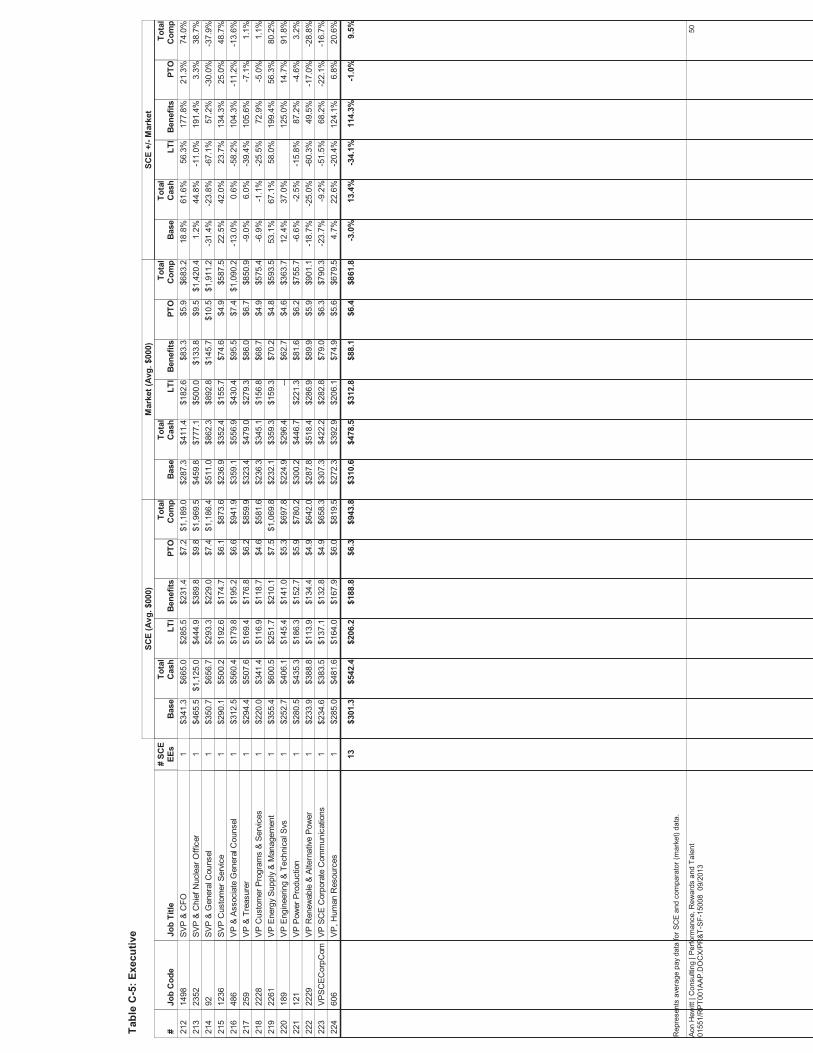
Job
Cod
eBa
se
SCE
(Avg
. $00
0)To
tal
Cas
hLT
IBe
nefit
sPT
O#
SCE
EEs
Base
Mar
ket (
Avg.
$00
0)To
tal
Cas
hLT
IBe
nefit
sPT
OBa
se
SCE
+/- M
arke
tTo
tal
Cas
hLT
IBe
nefit
sPT
O
Tab
le C
-5: E
xecu
tive
Tota
lC
omp
Tota
lC
omp
Tota
lC
omp
Job
Title
#14
98SV
P &
CFO
$341
.3$6
65.0
$285
.5$2
87.3
$411
.4$1
82.6
18.8
%61
.6%
56.3
%$2
31.4
$83.
317
7.8%
$7.2
$5.9
21.3
%1
74.0
%$6
83.2
$1,1
89.0
212
2352
SVP
& C
hief
Nuc
lear
Offi
cer
$465
.5$1
,125
.0$4
44.9
$459
.8$7
77.1
$500
.01.
2%44
.8%
-11.
0%$3
89.8
$133
.819
1.4%
$9.8
$9.5
3.3%
138
.7%
$1,4
20.4
$1,9
69.5
213
92SV
P &
Gen
eral
Cou
nsel
$350
.7$6
56.7
$293
.3$5
11.0
$862
.3$8
92.8
-31.
4%-2
3.8%
-67.
1%$2
29.0
$145
.757
.2%
$7.4
$10.
5-3
0.0%
1-3
7.9%
$1,9
11.2
$1,1
86.4
214
1236
SVP
Cus
tom
er S
ervic
e$2
90.1
$500
.2$1
92.6
$236
.9$3
52.4
$155
.722
.5%
42.0
%23
.7%
$174
.7$7
4.6
134.
3%$6
.1$4
.925
.0%
148
.7%
$587
.5$8
73.6
215
486
VP &
Ass
ocia
te G
ener
al C
ouns
el$3
12.5
$560
.4$1
79.8
$359
.1$5
56.9
$430
.4-1
3.0%
0.6%
-58.
2%$1
95.2
$95.
510
4.3%
$6.6
$7.4
-11.
2%1
-13.
6%$1
,090
.2$9
41.9
216
259
VP &
Tre
asur
er$2
94.4
$507
.6$1
69.4
$323
.4$4
79.0
$279
.3-9
.0%
6.0%
-39.
4%$1
76.8
$86.
010
5.6%
$6.2
$6.7
-7.1
%1
1.1%
$850
.9$8
59.9
217
2228
VP C
usto
mer
Pro
gram
s &
Serv
ices
$220
.0$3
41.4
$116
.9$2
36.3
$345
.1$1
56.8
-6.9
%-1
.1%
-25.
5%$1
18.7
$68.
772
.9%
$4.6
$4.9
-5.0
%1
1.1%
$575
.4$5
81.6
218
2261
VP E
nerg
y Su
pply
& M
anag
emen
t$3
55.4
$600
.5$2
51.7
$232
.1$3
59.3
$159
.353
.1%
67.1
%58
.0%
$210
.1$7
0.2
199.
4%$7
.5$4
.856
.3%
180
.2%
$593
.5$1
,069
.821
918
9VP
Eng
inee
ring
& Te
chni
cal S
vs$2
52.7
$406
.1$1
45.4
$224
.9$2
96.4
--12
.4%
37.0
%$1
41.0
$62.
712
5.0%
$5.3
$4.6
14.7
%1
91.8
%$3
63.7
$697
.822
012
1VP
Pow
er P
rodu
ctio
n$2
80.5
$435
.3$1
86.3
$300
.2$4
46.7
$221
.3-6
.6%
-2.5
%-1
5.8%
$152
.7$8
1.6
87.2
%$5
.9$6
.2-4
.6%
13.
2%$7
55.7
$780
.222
122
29VP
Ren
ewab
le &
Alte
rnat
ive P
ower
$233
.9$3
88.8
$113
.9$2
87.8
$518
.4$2
86.9
-18.
7%-2
5.0%
-60.
3%$1
34.4
$89.
949
.5%
$4.9
$5.9
-17.
0%1
-28.
8%$9
01.1
$642
.022
2VP
SCEC
orpC
omVP
SC
E C
orpo
rate
Com
mun
icat
ions
$234
.6$3
83.5
$137
.1$3
07.3
$422
.2$2
82.8
-23.
7%-9
.2%
-51.
5%$1
32.8
$79.
068
.2%
$4.9
$6.3
-22.
1%1
-16.
7%$7
90.3
$658
.322
360
6VP
, Hum
an R
esou
rces
$285
.0$4
81.6
$164
.0$2
72.3
$392
.9$2
06.1
4.7%
22.6
%-2
0.4%
$167
.9$7
4.9
124.
1%$6
.0$5
.66.
8%1
20.6
%$6
79.5
$819
.522
4
$301
.3$5
42.4
$206
.2$3
10.6
$478
.5$3
12.8
-3.0
%13
.4%
-34.
1%$1
88.8
$88.
111
4.3%
$6.3
$6.4
-1.0
%13
9.5%
$861
.8$9
43.8
50Ao
n H
ewitt
| C
onsu
lting
| Pe
rform
ance
, Rew
ards
and
Tal
ent
0155
1/R
PT00
1AAP
.DO
CX/
PR&T
-SF-
1500
8 0
9/20
13
Rep
rese
nts
aver
age
pay
data
for S
CE
and
com
para
tor (
mar
ket)
data
.

Aon Hewitt Consulting | Performance, Rewards and Talent 51 01551/RPT001AAP.DOCX/PR&T-SF-15008 09/2013
Appendix D: Competitive Analysis Summary
Aon Hewitt Consulting | Performance, Rewards and Talent 52 01551/RPT001AAP.DOCX/PR&T-SF-15008 09/2013
Competitive Analysis Summary � Table D-1—Displays SCE’s competitive status for each element of compensation. This is the same
information presented in Table 1 of the Study Results.
� Table D-2—Displays total compensation by job category and compensation element including base salary, total cash compensation, LTI, and benefits for SCE and the comparator companies. Total compensation for each compensation element is derived by adding together the compensation dollars for each incumbent covered by a benchmark job in the Study.
� Table D-3—Displays average compensation by job category and compensation element for SCE and the comparator companies. Average compensation is derived by dividing the sum of compensation dollars for all incumbents covered by benchmark jobs for each compensation element by the number of SCE incumbents covered by benchmark jobs in the Study.
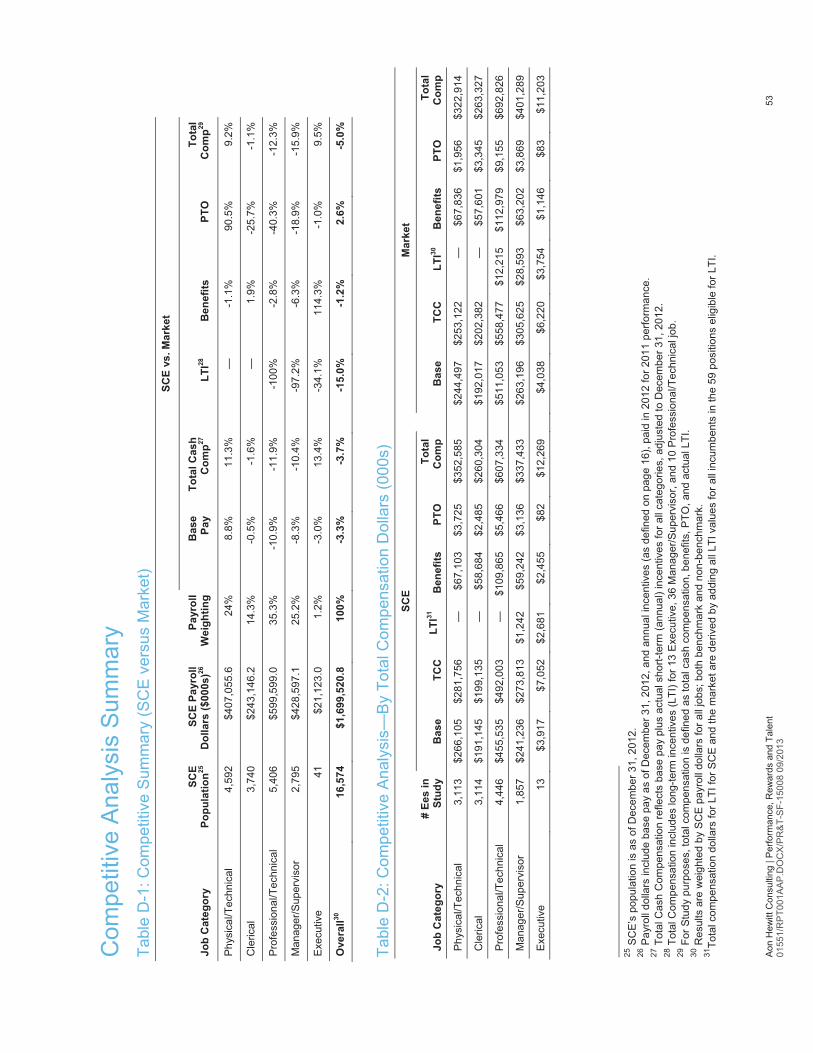
Aon
Hew
itt C
onsu
lting
| P
erfo
rman
ce, R
ewar
ds a
nd T
alen
t 53
01
551/
RP
T001
AAP.
DO
CX
/PR
&T-
SF-
1500
8 09
/201
3
Com
petit
ive
Ana
lysi
s S
umm
ary
Tabl
e D
-1: C
ompe
titiv
e S
umm
ary
(SC
E v
ersu
s M
arke
t) SC
E vs
. Mar
ket
Job
Cat
egor
y SC
E
Popu
latio
n25
SCE
Payr
oll
Dol
lars
($00
0s)26
Payr
oll
Wei
ghtin
gB
ase
Pay
Tota
l Cas
h
Com
p27
LTI28
Ben
efits
PTO
Tota
l C
omp29
Phy
sica
l/Tec
hnic
al
4,59
2 $4
07,0
55.6
24%
8.8%
11.3
%
—-1
.1%
90.5
%9.
2%
Cle
rical
3,
740
$243
,146
.214
.3%
-0.5
%-1
.6%
—
1.9%
-25.
7%-1
.1%
Pro
fess
iona
l/Tec
hnic
al
5,40
6 $5
99,5
99.0
35.3
%-1
0.9%
-11.
9%
-100
%-2
.8%
-40.
3%-1
2.3%
Man
ager
/Sup
ervi
sor
2,79
5 $4
28,5
97.1
25.2
%-8
.3%
-10.
4%
-97.
2%-6
.3%
-18.
9%-1
5.9%
Exe
cutiv
e 41
$2
1,12
3.0
1.2%
-3.0
%13
.4%
-3
4.1%
114.
3%-1
.0%
9.5%
Ove
rall30
16
,574
$1
,699
,520
.810
0%-3
.3%
-3.7
%
-15.
0%-1
.2%
2.6%
-5.0
%
Tabl
e D
-2: C
ompe
titiv
e A
naly
sis—
By
Tota
l Com
pens
atio
n D
olla
rs (0
00s)
# Ee
s in
S
tudy
SCE
M
arke
t
Job
Cat
egor
y B
ase
TCC
LT
I31
Ben
efits
PT
O
Tota
l C
omp
B
ase
TCC
LT
I30
Ben
efits
PT
O
Tota
l C
omp
Phy
sica
l/Tec
hnic
al
3,11
3 $2
66,1
05
$281
,756
—
$6
7,10
3 $3
,725
$3
52,5
85
$2
44,4
97
$253
,122
—
$6
7,83
6 $1
,956
$3
22,9
14
Cle
rical
3,
114
$191
,145
$1
99,1
35
—
$58,
684
$2,4
85
$260
,304
$192
,017
$2
02,3
82
—
$57,
601
$3,3
45
$263
,327
Pro
fess
iona
l/Tec
hnic
al
4,44
6 $4
55,5
35
$492
,003
—
$1
09,8
65
$5,4
66
$607
,334
$511
,053
$5
58,4
77
$12,
215
$112
,979
$9
,155
$6
92,8
26
Man
ager
/Sup
ervi
sor
1,85
7 $2
41,2
36
$273
,813
$1
,242
$5
9,24
2 $3
,136
$3
37,4
33
$2
63,1
96
$305
,625
$2
8,59
3 $6
3,20
2 $3
,869
$4
01,2
89
Exe
cutiv
e 13
$3
,917
$7
,052
$2
,681
$2
,455
$8
2 $1
2,26
9
$4,0
38
$6,2
20
$3,7
54
$1,1
46
$83
$11,
203
25 S
CE
’s p
opul
atio
n is
as
of D
ecem
ber 3
1, 2
012.
26
Pay
roll
dolla
rs in
clud
e ba
se p
ay a
s of
Dec
embe
r 31,
201
2, a
nd a
nnua
l inc
entiv
es (a
s de
fined
on
page
16)
, pai
d in
201
2 fo
r 201
1 pe
rform
ance
. 27
Tot
al C
ash
Com
pens
atio
n re
flect
s ba
se p
ay p
lus
actu
al s
hort-
term
(ann
ual)
ince
ntiv
es fo
r all
cate
gorie
s, a
djus
ted
to D
ecem
ber 3
1, 2
012.
28
Tot
al C
ompe
nsat
ion
incl
udes
long
-term
ince
ntiv
es (L
TI) f
or 1
3 E
xecu
tive,
36
Man
ager
/Sup
ervi
sor,
and
10 P
rofe
ssio
nal/T
echn
ical
job.
29
For
Stu
dy p
urpo
ses,
tota
l com
pens
atio
n is
def
ined
as
tota
l cas
h co
mpe
nsat
ion,
ben
efits
, PTO
, and
act
ual L
TI.
30 R
esul
ts a
re w
eigh
ted
by S
CE
pay
roll
dolla
rs fo
r all
jobs
; bot
h be
nchm
ark
and
non-
benc
hmar
k.
31To
tal c
ompe
nsat
ion
dolla
rs fo
r LTI
for S
CE
and
the
mar
ket a
re d
eriv
ed b
y ad
ding
all
LTI v
alue
s fo
r all
incu
mbe
nts
in th
e 59
pos
ition
s el
igib
le fo
r LTI
.
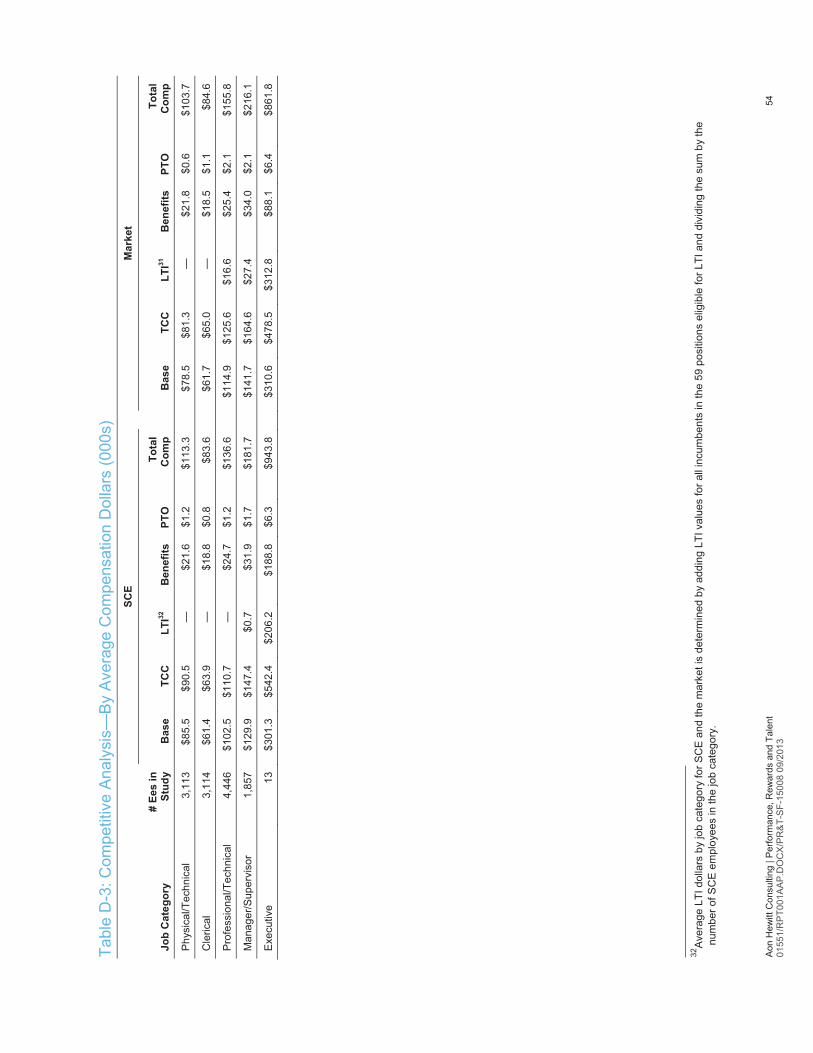
Aon
Hew
itt C
onsu
lting
| P
erfo
rman
ce, R
ewar
ds a
nd T
alen
t 54
01
551/
RP
T001
AAP.
DO
CX
/PR
&T-
SF-
1500
8 09
/201
3
Tabl
e D
-3: C
ompe
titiv
e A
naly
sis—
By
Ave
rage
Com
pens
atio
n D
olla
rs (0
00s)
# Ee
s in
S
tudy
SCE
M
arke
t
Job
Cat
egor
y B
ase
TCC
LT
I32
Ben
efits
PT
O
Tota
l C
omp
B
ase
TCC
LT
I31
Ben
efits
PT
O
Tota
l C
omp
Phy
sica
l/Tec
hnic
al
3,11
3 $8
5.5
$90.
5 —
$2
1.6
$1.2
$1
13.3
$78.
5 $8
1.3
—
$21.
8 $0
.6
$103
.7
Cle
rical
3,
114
$61.
4 $6
3.9
—
$18.
8 $0
.8
$83.
6
$61.
7 $6
5.0
—
$18.
5 $1
.1
$84.
6
Pro
fess
iona
l/Tec
hnic
al
4,44
6 $1
02.5
$1
10.7
—
$2
4.7
$1.2
$1
36.6
$114
.9
$125
.6
$16.
6 $2
5.4
$2.1
$1
55.8
Man
ager
/Sup
ervi
sor
1,85
7 $1
29.9
$1
47.4
$0
.7
$31.
9 $1
.7
$181
.7
$1
41.7
$1
64.6
$2
7.4
$34.
0 $2
.1
$216
.1
Exe
cutiv
e 13
$3
01.3
$5
42.4
$2
06.2
$1
88.8
$6
.3
$943
.8
$3
10.6
$4
78.5
$3
12.8
$8
8.1
$6.4
$8
61.8
32A
vera
ge L
TI d
olla
rs b
y jo
b ca
tego
ry fo
r SC
E a
nd th
e m
arke
t is
dete
rmin
ed b
y ad
ding
LTI
val
ues
for a
ll in
cum
bent
s in
the
59 p
ositi
ons
elig
ible
for L
TI a
nd d
ivid
ing
the
sum
by
the
num
ber o
f SC
E e
mpl
oyee
s in
the
job
cate
gory
.

Aon Hewitt Consulting | Performance, Rewards and Talent 55 01551/RPT001AAP.DOCX/PR&T-SF-15008 09/2013
Appendix E: Generic Job Methodology
Aon Hewitt Consulting | Performance, Rewards and Talent 56 01551/RPT001AAP.DOCX/PR&T-SF-15008 09/2013
Generic Job Methodology This section summarizes the approach used to compare each of SCE’s generic job titles analyzed in this Study to market. For the 2015 Study, the Team agreed upon a method for each generic job described below that would allow Aon Hewitt to match incumbents in generic job titles to survey sources. This approach was also used for the 2012 Study.
Manager (MGR)—2 Levels There are 707 SCE incumbents assigned to a Manager level (MGR 1 or 2). This classification is used to designate general levels of Manager work; each level has a market base salary and an annual incentive (as a percentage of salary) target. SCE assigns jobs to each level based on benchmark market pay data and the level of work required of incumbents. In addition, when making a Manager level assignment, SCE considers reporting relationships, market bonus targets, number and type of subordinates, budget authority, and impact.
The level of work is assumed to vary somewhat for all incumbents at each level, but still reflects the job description for each Manager level.
Supervisor (SUP)—3 Levels33 There are 427 SCE incumbents assigned to a Supervisor level (SUP 1, 2, or 4). This classification is used to designate the level of Supervisor; each level has a market base salary and a bonus target (which is the same percentage of base salary for all levels of Supervisor). SCE assigns jobs to a Supervisor level using market pay data for benchmark jobs. However, similar to the Manager classification, other considerations are also used, including, supervisory responsibility, subordinate pay levels, and number of direct reports and their job titles.
Matching Manager and Supervisor Titles to Market The Manager and Supervisor classifications were broken out into more discrete levels to allow comparison to market. SCE noted that within a function such as “Finance,” there are several departments (such as Controllers, Corporate Budgets, and Treasurers). Within each of these departments are more discrete work units. Aon Hewitt benchmarked these work unit managers and supervisors to market based on their specific responsibility. Aon Hewitt then used that benchmark data for all other Managers and Supervisors at the same level in that department.
For example, within the Controllers department, there are four work units, including, “Corporate Accounting Operations” and “Corporate Accounting Reporting.” The Team decided that if Aon Hewitt was able to benchmark MGR2 jobs in the Controllers’ Corporate Accounting Operations work unit, that data would also be applied to all MGR2 incumbents within the entire Controllers department, such as the Manager for the “Capital Recovery and Valuation” work unit.
33 A fourth level exists, SUP3; however, no benchmarks exist for this job.
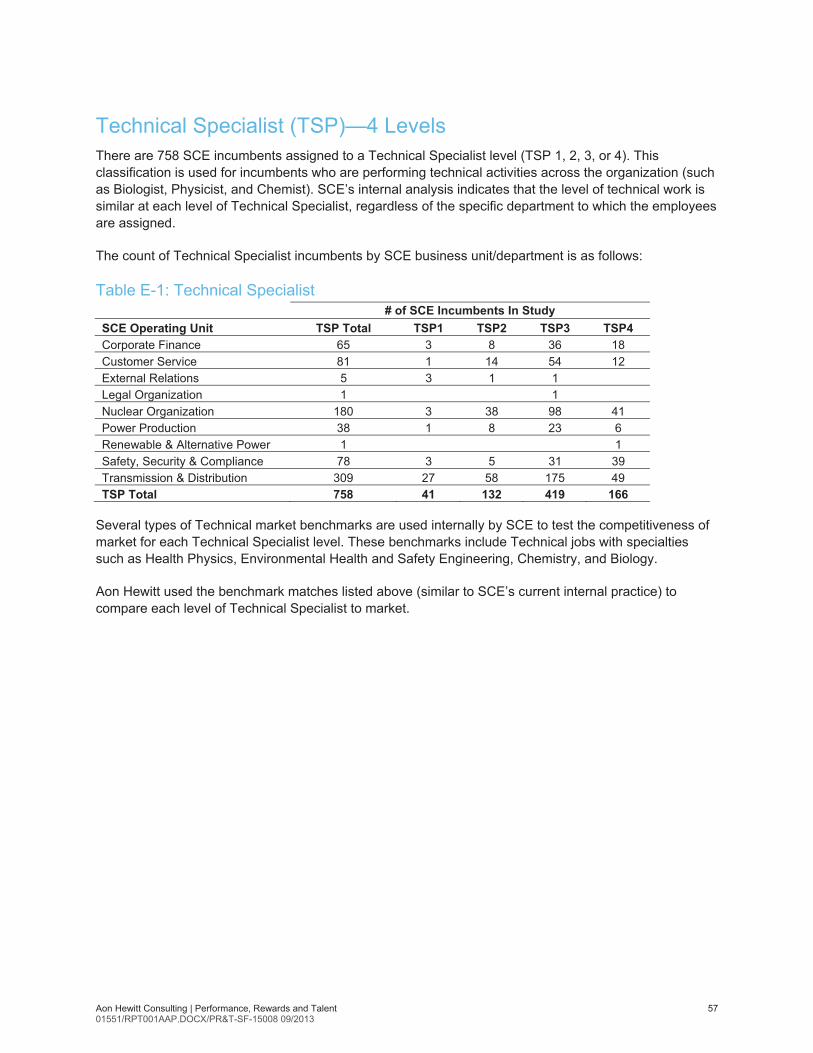
Aon Hewitt Consulting | Performance, Rewards and Talent 57 01551/RPT001AAP.DOCX/PR&T-SF-15008 09/2013
Technical Specialist (TSP)—4 Levels There are 758 SCE incumbents assigned to a Technical Specialist level (TSP 1, 2, 3, or 4). This classification is used for incumbents who are performing technical activities across the organization (such as Biologist, Physicist, and Chemist). SCE’s internal analysis indicates that the level of technical work is similar at each level of Technical Specialist, regardless of the specific department to which the employees are assigned.
The count of Technical Specialist incumbents by SCE business unit/department is as follows:
Table E-1: Technical Specialist # of SCE Incumbents In Study SCE Operating Unit TSP Total TSP1 TSP2 TSP3 TSP4 Corporate Finance 65 3 8 36 18 Customer Service 81 1 14 54 12 External Relations 5 3 1 1 Legal Organization 1 1 Nuclear Organization 180 3 38 98 41 Power Production 38 1 8 23 6 Renewable & Alternative Power 1 1 Safety, Security & Compliance 78 3 5 31 39 Transmission & Distribution 309 27 58 175 49 TSP Total 758 41 132 419 166
Several types of Technical market benchmarks are used internally by SCE to test the competitiveness of market for each Technical Specialist level. These benchmarks include Technical jobs with specialties such as Health Physics, Environmental Health and Safety Engineering, Chemistry, and Biology.
Aon Hewitt used the benchmark matches listed above (similar to SCE’s current internal practice) to compare each level of Technical Specialist to market.

Aon Hewitt Consulting | Performance, Rewards and Talent 58 01551/RPT001AAP.DOCX/PR&T-SF-15008 09/2013
Information Technology Specialist/Engineer (ITS)—5 Levels There are 487 SCE incumbents assigned to an Information Technology Specialist/Engineer level (ITS 1, 2, 3, 4, or 5). This classification is used for IT functions that are not highly populated, such as IT Security, Network Administration, and Database Administration. Similar to the Technical Specialist role, employees are expected to perform similar IT work at each Information Technology Specialist/Engineer level. Aon Hewitt used several IT market benchmarks to assess pay competitiveness for each Information Technology Specialist/Engineer level, including, Network Engineering, IT Security, and Database Administration.
The count of Information Technology Specialist/Engineer incumbents by SCE business unit/department is as follows:
Table E-2: Information Technology Specialist # of SCE Incumbents In Study SCE Operating Unit/Department ITS Total ITS1 ITS2 ITS3 ITS4 ITS5 Client Services & Planning 1 1 Cybersecurity & IT Compliance 18 2 3 9 4 Enterprise Info Mgmt & Architecture 100 8 17 49 26 Infrastructure Technology Services 304 42 133 115 14 Technology Delivery & Maintenance 61 3 19 32 7 Engineering & Tech Srvcs Bs Ln 3 3 ITS Total 487 0 55 172 209 51
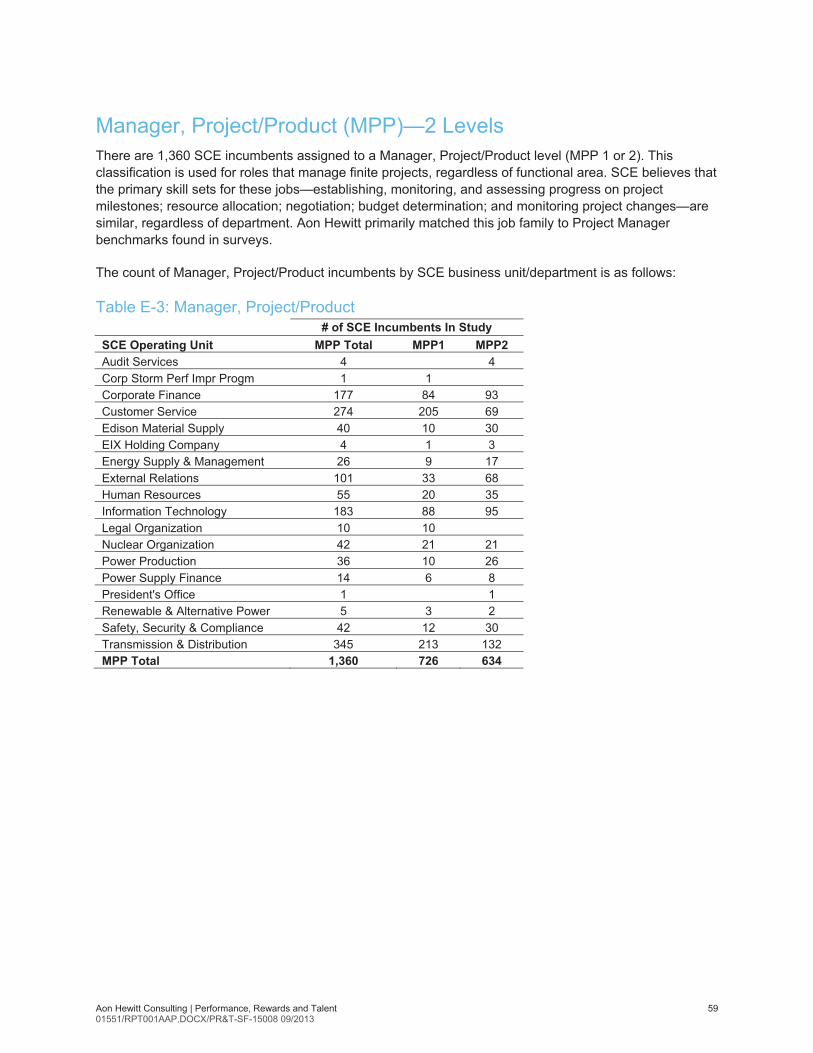
Aon Hewitt Consulting | Performance, Rewards and Talent 59 01551/RPT001AAP.DOCX/PR&T-SF-15008 09/2013
Manager, Project/Product (MPP)—2 Levels There are 1,360 SCE incumbents assigned to a Manager, Project/Product level (MPP 1 or 2). This classification is used for roles that manage finite projects, regardless of functional area. SCE believes that the primary skill sets for these jobs—establishing, monitoring, and assessing progress on project milestones; resource allocation; negotiation; budget determination; and monitoring project changes—are similar, regardless of department. Aon Hewitt primarily matched this job family to Project Manager benchmarks found in surveys.
The count of Manager, Project/Product incumbents by SCE business unit/department is as follows:
Table E-3: Manager, Project/Product # of SCE Incumbents In Study SCE Operating Unit MPP Total MPP1 MPP2 Audit Services 4 4 Corp Storm Perf Impr Progm 1 1 Corporate Finance 177 84 93 Customer Service 274 205 69 Edison Material Supply 40 10 30 EIX Holding Company 4 1 3 Energy Supply & Management 26 9 17 External Relations 101 33 68 Human Resources 55 20 35 Information Technology 183 88 95 Legal Organization 10 10 Nuclear Organization 42 21 21 Power Production 36 10 26 Power Supply Finance 14 6 8 President's Office 1 1 Renewable & Alternative Power 5 3 2 Safety, Security & Compliance 42 12 30 Transmission & Distribution 345 213 132 MPP Total 1,360 726 634

Aon Hewitt Consulting | Performance, Rewards and Talent 60 01551/RPT001AAP.DOCX/PR&T-SF-15008 09/2013
Manager, Program/Contract (MPC)—3 Levels There are 252 SCE incumbents assigned to a Manager, Program/Contract level (MPC 1, 2, or 3). This classification contains jobs that perform purchasing or contract administration activities. Aon Hewitt matched these jobs to survey roles performing this type of work, such as Contracts Administrator and Subcontracts Administrator.
The count of Manager, Program/Contract incumbents by business unit/department is as follows:
Table E-4: Manager, Programs/Contracts # of SCE Incumbents In Study SCE Operating Unit MPC Total MPC1 MPC2 MPC3 Corporate Finance 42 2 24 16 Customer Service 46 8 28 10 Edison Material Supply 54 15 39 External Relations 4 4 Human Resources 7 2 5 Information Technology 2 2 Legal Organization 1 1 Nuclear Organization 13 1 10 2 Power Production 10 3 4 3 Power Supply Finance 7 5 2 Renewable & Alternative Power 6 1 5 Safety, Security & Compliance 1 1 Transmission & Distribution 59 5 38 16 MPC Total 252 19 129 104

Aon Hewitt Consulting | Performance, Rewards and Talent 61 01551/RPT001AAP.DOCX/PR&T-SF-15008 09/2013
Appendix F: LTI Study Positions

Aon Hewitt Consulting | Performance, Rewards and Talent 62 01551/RPT001AAP.DOCX/PR&T-SF-15008 09/2013
Appendix F: LTI Study Positions � SVP & CFO
� SVP & Chief Nuclear Officer
� SVP & General Counsel
� SVP Customer Service
� VP & Associate General Counsel
� VP & Treasurer
� VP Customer Programs & Services
� VP Energy Supply & Management
� VP Engineering & Technical Svs
� VP Power Production
� VP Renewable & Alternative Power
� VP SCE Corporate Communications
� VP, Human Resources
� Assistant Treasurer
� Dir Corp Sec & Bus Continuity Mgt
� Dir Tax
� Director & Managing Attorney
� HR SBP (Power Delivery Services & SONGS)
� Manager 1: Legal Organization
� Manager 2: Audit Services
� Manager 2: Corporate Finance: Controllers
� Manager 2: Corporate Finance: Financial Planning & Analysis Department
� Manager 2: Corporate Finance: Treasurers
� Manager 2: Customer Service: Customer Programs & Services
� Manager 2: Energy Supply & Management
� Manager 2: External Relations: Corporate Communications
� Manager 2: External Relations: Regulatory Operations
� Manager 2: Human Resources
� Manager 2: Information Technology: Infrastructure Technology Services
� Manager 2: Information Technology: Technology Delivery & Maintenance
� Manager 2: Legal Organization
� Manager 2: Nuclear Organization: Administration
� Manager 2: Nuclear Organization: Engineering
� Manager 2: Nuclear Organization: Maintenance

Aon Hewitt Consulting | Performance, Rewards and Talent 63 01551/RPT001AAP.DOCX/PR&T-SF-15008 09/2013
� Manager 2: Safety, Security & Compliance: Environmental Health & Safety
� Manager 2: Transmission & Distribution: Engineering & Tech Srvcs Bs Ln
� Manager 2: Transmission & Distribution: Major Projects Organization
� Manager 2: Transmission & Distribution: Power Delivery Business Line
� Mgr-Project/Product 2
� Prin Mgr, Bus Process & Soltns Intg
� Prin Mgr, Client Svc Del Mgmt
� Prin Mgr, Corp Comm
� Prin Mgr, Distrib Mgmt
� Prin Mgr, Envir Science
� Prin Mgr, Gen Acctg, Anlys & Rptg
� Prin Mgr, HR Strategic Bus Team
� Prin Mgr, Nclr Eng
� Prin Mgr, Purchasing
� Prin Mgr, Reg Affairs & Compl
� Analyst-Financial 3
� Analyst-Financial 4
� Analyst-Systems 4
� Attorney
� Auditor-Corporate 3
� Auditor-Corporate 4
� IT Specialist/Engineer 2
� IT Specialist/Engineer 3
� IT Specialist/Engineer 4
� Land Services Agent 5

Aon Hewitt Consulting | Performance, Rewards and Talent 64 01551/RPT001AAP.DOCX/PR&T-SF-15008 09/2013
Appendix G: Benefit Calculation Samples (SCE and Comparator Company)

Aon Hewitt Consulting | Performance, Rewards and Talent 65 01551/RPT001AAP.DOCX/PR&T-SF-15008 09/2013
Sample Benefit Calculations—SCE The following briefly summarizes the calculation methodology for a sample Professional/Technical SCE employee, using actual benefits.
Sample employee characteristics:
� Age: 44
� Service: 12 years
� Base Salary: $100,000
� Bonus: $9,000
These illustrations do not show the full, complex set of calculations. They are intended to represent the approach Aon Hewitt took to value benefits according to Aon Hewitt’s Benefit Index® methodology utilizing SCE’s demographic profile and assumptions. All values shown are annual amounts.
Defined Contribution Aon Hewitt determined defined contribution plan values based on the amount of company contribution during the plan year.
The SCE plan matches up to 6 percent of base pay at a rate of $1 for each $1 of employee deferrals. All employees are immediately eligible to participate, and after five years of service, all company matching contributions are fully vested. This sample employee has 12 years of service and, therefore, is fully vested in the company match provided this year.
Assuming that this employee defers 5 percent of salary into the plan, SCE’s contribution would equal 5 percent of salary (or $100,000 × 5 percent).
This produces a value of $5,000.
Defined Benefit Pension Under the SCE plan formula, this sample employee has 56 “points” of pension credit (“points” under the formula is a total of age plus service) and is, therefore, eligible for an allocation of 5 percent of base pay, or $5,000 in the current year. A similar calculation was performed for all past and future years and this employee’s account is projected to each assumed retirement age.
Normal Retirement To illustrate the calculations assuming a single point, age 65 retirement, assume that this employee’s account is projected to accumulate to $850,000. At that time, this employee will have 33 years of service. The projected account balance was then spread evenly over each year of service to produce an annual “credit” of $26,000 assigned to this year.
Because this employee is currently age 44, the actuarial present value of this $26,000 credit was determined by discounting this amount for 21 years to reflect the time value of money and the probability of remaining in service to age 65. This discounted value is approximately $10,000.

Aon Hewitt Consulting | Performance, Rewards and Talent 66 01551/RPT001AAP.DOCX/PR&T-SF-15008 09/2013
Early Retirement A similar calculation was performed to determine a value if the employee leaves SCE between the ages 55 to 65. Assume that the sum of these discounted values is approximately $8,000.
If we assume 34 percent of employees retire at age 65 and 66 percent retire prior to age 65, the total value of the defined benefit pension is then ($10,000 x 34 percent) + ($8,000 x 66 percent) = $8,680.
(Additional value is added for terminated vested benefits, disability benefits, $150 per month of service after 1/1/10, etc., as applicable in each plan, but those elements are excluded from this example for simplicity’s sake.)
Death Benefits Death benefits were valued taking into account the probability of an employee dying during the plan year. Several components of death benefits were valued:
Basic and accidental life insurance SCE provides 1 times base pay (maximum $50,000) of life insurance and an additional $50,000 of accidental death coverage. Assuming that the probability of this employee’s death this year is 0.15 percent by natural causes and 0.04 percent by accident, the value of the basic and accidental preretirement life insurance benefit is $50,000 × 0.15 percent + $50,000 × 0.04 percent = $95.
Supplemental life insurance In addition, suppose this employee elects to purchase supplemental coverage equal to 3 times salary. This benefit has a value of 3 × $100,000 × 0.15 percent = $450. Assume that this employee pays a monthly rate of $.07 per thousand dollars of coverage. Therefore, the contribution would be 300 × $.07 × 12 = $252 per year for this benefit. Aon Hewitt calculated the net value of this supplemental coverage at $450 – $252 = $198.
Death benefits from defined benefit plan The value of death benefits from the cash balance pension plan was not included as a retirement benefit, but rather was included in this calculation. Suppose our employee has an account balance of $80,000 at age 44. The death benefit value is $80,000 × 0.15 percent = $120.
Postretirement life insurance The SCE postretirement death benefit is $5,000. Suppose the value at age 65 (taking into account the employee’s life expectancy at age 65) is $2,000. The value assigned to this year is a proportional share of the $2,000. Given that this employee will have 33 years of service at age 65, the amount assigned to this year is $2,000 divided by 33, or $61. Discounting this back to the current age for the time value of money and the probability of working until retirement at age 65, as was done with the pension benefit, produces a value of approximately $17.
Therefore, the total value of death benefits is $95 + $198 + $120 + $17 = $430.
Aon Hewitt Consulting | Performance, Rewards and Talent 67 01551/RPT001AAP.DOCX/PR&T-SF-15008 09/2013
Disability The SCE program offers a choice of disability benefit levels of 50 percent, 60 percent, or 70 percent of pay, minus the primary Social Security benefit. Assume that this employee selects the 60 percent of pay option. Assume that the employee’s primary Social Security benefit is approximately $25,000. Therefore, the disability benefit amount would be approximately 60 percent × $100,000 – $25,000, or $35,000 per year.
Assume that the probability the employee will become disabled this year is 0.5 percent and the actuarial present value of the disability payment stream (i.e., the annuity factor) is 5.14.
The value of the disability benefit, net of flex credits, is $35,000 × 0.5 percent × 5.14 = $900.
Active Health Care Health care is divided into medical, dental, vision and hearing benefits:
Medical Values for a given active employee medical plan option were based on SCE’s actual claims. Overall values were determined by taking a weighted average of the option’s rates based on actual election patterns at SCE and reflecting the percentage of employees who waive coverage. Within each plan, the distribution of family size elections was based on the structure and patterns of SCE’s demographic model.
Aon Hewitt calculated the weighted average rate for all plans at $10,100 and assumes that the employee contributions average $2,525, net of flex credits. The employer-paid value is $10,100 – $2,525 = $7,575.
Dental Aon Hewitt used a similar approach to value dental coverage. Assume the weighted average value of each coverage tier and election is $1,100 and net employee contributions are $200. Therefore, the employer-paid value is $1,100 – $200 = $900.
Vision and hearing Vision and hearing have a combined value of $125 with zero employee contributions.
Therefore, the preretirement health care (medical, dental, vision and hearing) value is $7,575 + $900 + $125 = $8,600.
Retiree Health Care Retiree health benefits were valued in a manner similar to defined benefit pension benefits. The value at retirement is assigned equally to each year worked. Although a distribution of retirement ages is used, to illustrate, assume age 62 retirement.
Pre-Medicare benefits Assume pre-65 retiree medical costs are about $18,600 in 2012. Assume SCE’s share in 2012 is $11,600, which increases each year by the greater of CPI or 50% of plan cost inflation (maximum CPI + 2%). When a person who is age 44 in 2012 reaches age 62 in 2030, assume pre-65 retiree medical costs

Aon Hewitt Consulting | Performance, Rewards and Talent 68 01551/RPT001AAP.DOCX/PR&T-SF-15008 09/2013
are $52,700 per year and SCE’s share is now $22,700. The retiree’s portion is $52,700 - $22,700 = $30,000.
Aon Hewitt assumes the value of this benefit at age 62 is $70,400 for the 3 years of pre-Medicare coverage. Because the employee will have 30 years of service at age 62, we estimate the annual value of $70,400 is divided by 30 = $2,300 per year. Discounting that to the current year for the time value of money and the probability of remaining in service until 62, gives an approximate value of $750.
Medicare-eligible Assume that at age 65 the annual cost will be approximately $24,300 per year, to reflect coordination with Medicare. Assume also that SCE will pay about $5,800 per year. Aon Hewitt estimates the actuarial, lifetime present value at age 65 is approximately $79,100. Spreading this amount over 30 years produces an annual value of $2,600. Discounting this to the current year percent gives an approximate present value of $1,000.
Therefore, the total retiree health value is $750 + $1,000 = $1,750.
Paid Time Off Paid time off benefits in excess of currently used days were valued similar to a pension benefit paid out as a lump sum at retirement/termination. This equals about 1.2 percent of salary.
Therefore, the value of unused paid time off is $100,000 x 1.2 percent = $1,200
Overall Benefit Value The value for this sample SCE employee is approximately:
Benefit Area Benefit Index Value Defined Contribution $5,000 Defined Benefit 8,680 Death 430 Disability 900 Active Health Care 8,600 Retiree Health Care 1,750 Paid Time Off 1,200 Total $26,560
Aon Hewitt Consulting | Performance, Rewards and Talent 69 01551/RPT001AAP.DOCX/PR&T-SF-15008 09/2013
Sample Benefit Calculations—Comparator Company The following briefly summarizes the calculation methodology for a sample employee, using benefits plan features from a company in SCE’s comparator group.
Sample employee characteristics:
� Age: 44
� Service: 12 years
� Base Salary: $100,000
� Bonus: $9,000
These illustrations do not show the full, complex set of calculations. They are intended to represent the approach Aon Hewitt took to value the benefits according to Aon Hewitt’s Benefit Index methodology.
Defined Contribution Defined contribution plan values were determined based on the amount of company contribution during the plan year. The comparator company sponsors an ESOP (employee stock ownership program)/profit sharing plan and a matching 401(k) plan.
401(k) The comparator company matches employee contributions at a rate of $.50 per $1 on the first $2,000 of employee deferrals and $.25 per $1 on deferrals above $2,000. All employees are immediately eligible to participate, and after five years of service all company matching contributions are fully vested. This sample employee has 13 years of service and, therefore, is fully vested in the company match provided this year.
Assuming that this employee defers 2 percent of salary into the plan (2 percent × $100,000 = $2,000), the comparator company’s contribution would equal $1,000 (.50 × $2,000). This produces a value of $1,000.
ESOP The ESOP is assumed to provide contributions of 8 percent of base pay. Therefore, this employee would receive a contribution of $100,000 × 8 percent = $8,000.
The total defined contribution value for this employee is $1,000 + $8,000 = $9,000
Defined Benefit Pension This comparator company does not provide a defined benefit pension plan, so this value is $0.
Death Benefits Death benefits were valued taking into account the probability of an employee dying during the plan year. Several components of death benefits were valued:
Aon Hewitt Consulting | Performance, Rewards and Talent 70 01551/RPT001AAP.DOCX/PR&T-SF-15008 09/2013
Basic and accidental life insurance The comparator company provides a basic death benefit of 2 times salary ($200,000 for this employee) and an additional 1 times salary ($100,000) of accidental death coverage. Assuming that the probability of this employee’s death this year is 0.15 percent by natural causes and 0.04 percent by accident, the value of the basic and accidental preretirement life insurance benefit is $200,000 × 0.15 percent + $100,000 × 0.04 percent = $340.
Supplemental life insurance In addition, suppose this employee elects to purchase supplemental coverage equal to 2 times salary. This benefit has a value of 2 × $100,000 × 0.15 percent = $300. Assume that this employee pays a monthly rate of $.12 per thousand dollars of coverage. Therefore, the contribution would be 200 × $.12 × 12 = $288 per year for this benefit. The net value of this supplemental coverage is $300 – $288 = $12.
Death benefits from defined benefit plan Because the comparator company does not sponsor a defined benefit plan, this value is $0.
Postretirement life insurance The comparator company does not provide a postretirement life insurance benefit. Therefore, this value is $0.
Therefore, the total value of death benefits is $340 + $12 + $0 + $0 = $352.
Disability The comparator company provides a disability benefit equal to 67 percent of annual pay, minus the family Social Security benefit. Assume that the employee’s family Social Security benefit is approximately $40,000. Therefore, the disability benefit amount would be approximately 67 percent × $100,000 – $40,000, or $27,000 per year.
Aon Hewitt assumes that the probability the employee will become disabled this year is 0.5 percent and the actuarial present value of the disability payment stream (i.e., the annuity factor) is 5.14.
The value of the disability benefit is $27,000 × 0.5 percent × 5.14 = $694.
Active Health Care Health care is divided into medical, dental, vision and hearing benefits:
Medical Values for a given active employee medical plan option were based on SCE’s actual claims. Overall values were determined by taking a weighted average of the option’s rates based on actual election patterns at SCE and reflecting the percentage of employees who waive coverage. Within each plan, the distribution of family size elections was based on the structure and patterns of SCE’s demographic model.
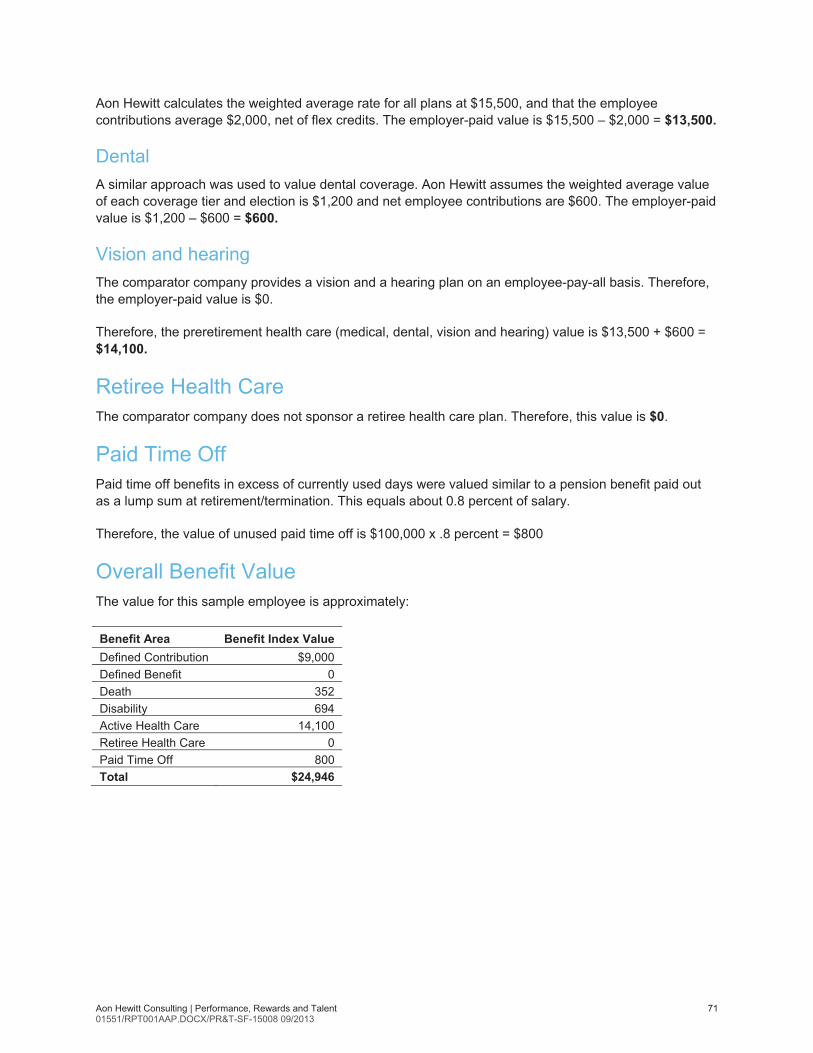
Aon Hewitt Consulting | Performance, Rewards and Talent 71 01551/RPT001AAP.DOCX/PR&T-SF-15008 09/2013
Aon Hewitt calculates the weighted average rate for all plans at $15,500, and that the employee contributions average $2,000, net of flex credits. The employer-paid value is $15,500 – $2,000 = $13,500.
Dental A similar approach was used to value dental coverage. Aon Hewitt assumes the weighted average value of each coverage tier and election is $1,200 and net employee contributions are $600. The employer-paid value is $1,200 – $600 = $600.
Vision and hearing The comparator company provides a vision and a hearing plan on an employee-pay-all basis. Therefore, the employer-paid value is $0.
Therefore, the preretirement health care (medical, dental, vision and hearing) value is $13,500 + $600 = $14,100.
Retiree Health Care The comparator company does not sponsor a retiree health care plan. Therefore, this value is $0.
Paid Time Off Paid time off benefits in excess of currently used days were valued similar to a pension benefit paid out as a lump sum at retirement/termination. This equals about 0.8 percent of salary.
Therefore, the value of unused paid time off is $100,000 x .8 percent = $800
Overall Benefit Value The value for this sample employee is approximately:
Benefit Area Benefit Index Value Defined Contribution $9,000 Defined Benefit 0 Death 352 Disability 694 Active Health Care 14,100 Retiree Health Care 0 Paid Time Off 800 Total $24,946

Aon Hewitt Consulting | Performance, Rewards and Talent 72 01551/RPT001AAP.DOCX/PR&T-SF-15008 09/2013
Appendix H: Meeting Notes
Consulting | Broad-Based Compensation Proprietary & Confidential | SCE/RPT001AAP.DOCX/PR&T-15008 03/2013 1
Date: April 8, 2013
To: The GRC Study Team (the Team)
From: Alison Peterson, Aon Hewitt
Subject: Meeting Notes, April 8, 2013; Revised April 19, 2013
Meeting Attendees Name Organization
Marek Kanter Division of Ratepayers’ Advocates (DRA) Stacey Hunter DRA Pat Adams Southern California Edison (SCE) Mark Bennett SCE – Videoconference George DeMaria SCE – Videoconference Stephen Lumel SCE – Videoconference Michelle Ricard SCE Blake Murphy Aon Hewitt Chelsea Penaloza Aon Hewitt Alison Peterson Aon Hewitt The Team met at SCE’s offices in San Francisco (Kanter, Hunter, Adams, Ricard, Murphy, Penaloza & Peterson), and by videoconference in Rosemead (Bennett, DeMaria, & Lumel).
Discussion Items Opening Remarks and Introductions � All participants introduced themselves.
� Alison outlined the agenda items for the meeting and reviewed the materials that were sent out in advance to provide Team members a chance to prepare for the meeting and to make the meeting as efficient and productive as possible. Materials included:
– Materials to be used to facilitate the meeting
– A roster of the Team with contact information
– A copy of the 2012 Total Compensation Study (TCS) report
– Participant lists from Aon Hewitt’s 2012 Benefits Index (BI) Database and Total Compensation Measurement (TCM) Database
– A list of benchmark jobs covered in the 2012 TCS
– A compensation data request created by Aon Hewitt for SCE
� Alison explained that Aon Hewitt will facilitate this and future meetings with a focus on allowing sufficient time to explore and discuss all topics while also working to stay on track with the aggressive project timeline. She asked that the Team provide feedback to ensure we are meeting everyone’s needs and addressing all topics of interest. She also mentioned that delays in resolving methodology or data questions could result in missing project milestones since there is very little cushion in the project schedule.
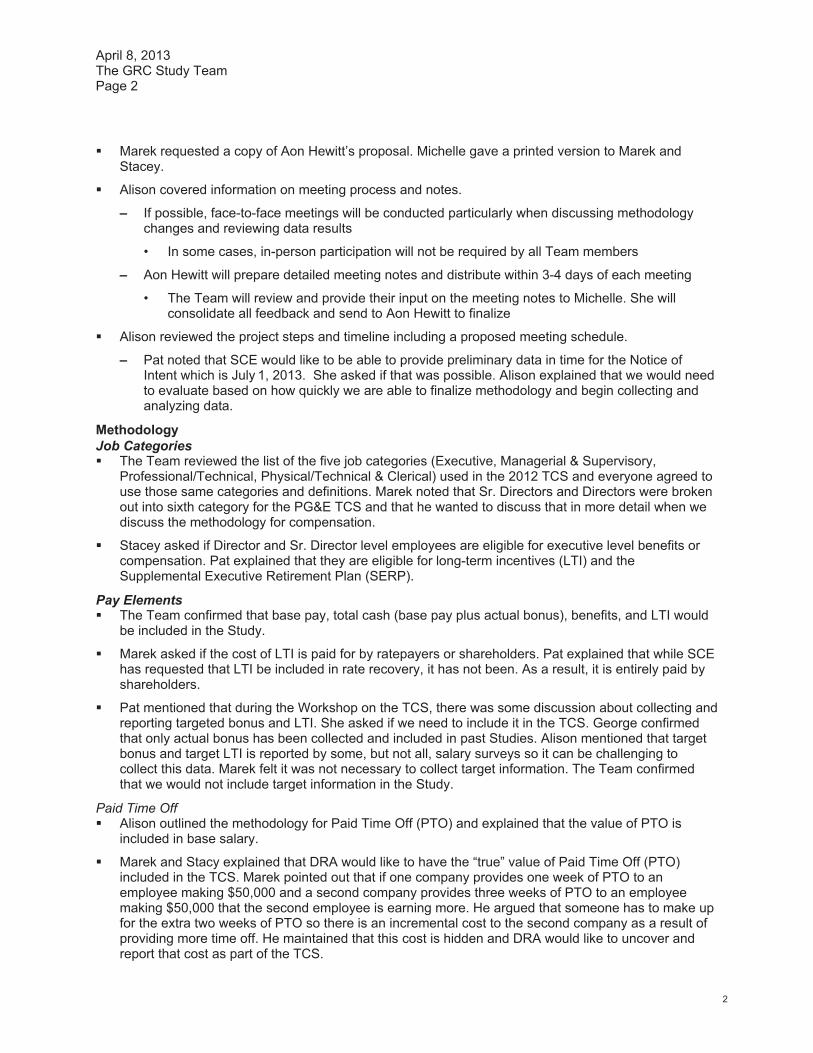
April 8, 2013 The GRC Study Team Page 2
2
� Marek requested a copy of Aon Hewitt’s proposal. Michelle gave a printed version to Marek and Stacey.
� Alison covered information on meeting process and notes.
– If possible, face-to-face meetings will be conducted particularly when discussing methodology changes and reviewing data results
• In some cases, in-person participation will not be required by all Team members
– Aon Hewitt will prepare detailed meeting notes and distribute within 3-4 days of each meeting
• The Team will review and provide their input on the meeting notes to Michelle. She will consolidate all feedback and send to Aon Hewitt to finalize
� Alison reviewed the project steps and timeline including a proposed meeting schedule.
– Pat noted that SCE would like to be able to provide preliminary data in time for the Notice of Intent which is July 1, 2013. She asked if that was possible. Alison explained that we would need to evaluate based on how quickly we are able to finalize methodology and begin collecting and analyzing data.
Methodology Job Categories � The Team reviewed the list of the five job categories (Executive, Managerial & Supervisory,
Professional/Technical, Physical/Technical & Clerical) used in the 2012 TCS and everyone agreed to use those same categories and definitions. Marek noted that Sr. Directors and Directors were broken out into sixth category for the PG&E TCS and that he wanted to discuss that in more detail when we discuss the methodology for compensation.
� Stacey asked if Director and Sr. Director level employees are eligible for executive level benefits or compensation. Pat explained that they are eligible for long-term incentives (LTI) and the Supplemental Executive Retirement Plan (SERP).
Pay Elements � The Team confirmed that base pay, total cash (base pay plus actual bonus), benefits, and LTI would
be included in the Study.
� Marek asked if the cost of LTI is paid for by ratepayers or shareholders. Pat explained that while SCE has requested that LTI be included in rate recovery, it has not been. As a result, it is entirely paid by shareholders.
� Pat mentioned that during the Workshop on the TCS, there was some discussion about collecting and reporting targeted bonus and LTI. She asked if we need to include it in the TCS. George confirmed that only actual bonus has been collected and included in past Studies. Alison mentioned that target bonus and target LTI is reported by some, but not all, salary surveys so it can be challenging to collect this data. Marek felt it was not necessary to collect target information. The Team confirmed that we would not include target information in the Study.
Paid Time Off � Alison outlined the methodology for Paid Time Off (PTO) and explained that the value of PTO is
included in base salary.
� Marek and Stacy explained that DRA would like to have the “true” value of Paid Time Off (PTO) included in the TCS. Marek pointed out that if one company provides one week of PTO to an employee making $50,000 and a second company provides three weeks of PTO to an employee making $50,000 that the second employee is earning more. He argued that someone has to make up for the extra two weeks of PTO so there is an incremental cost to the second company as a result of providing more time off. He maintained that this cost is hidden and DRA would like to uncover and report that cost as part of the TCS.
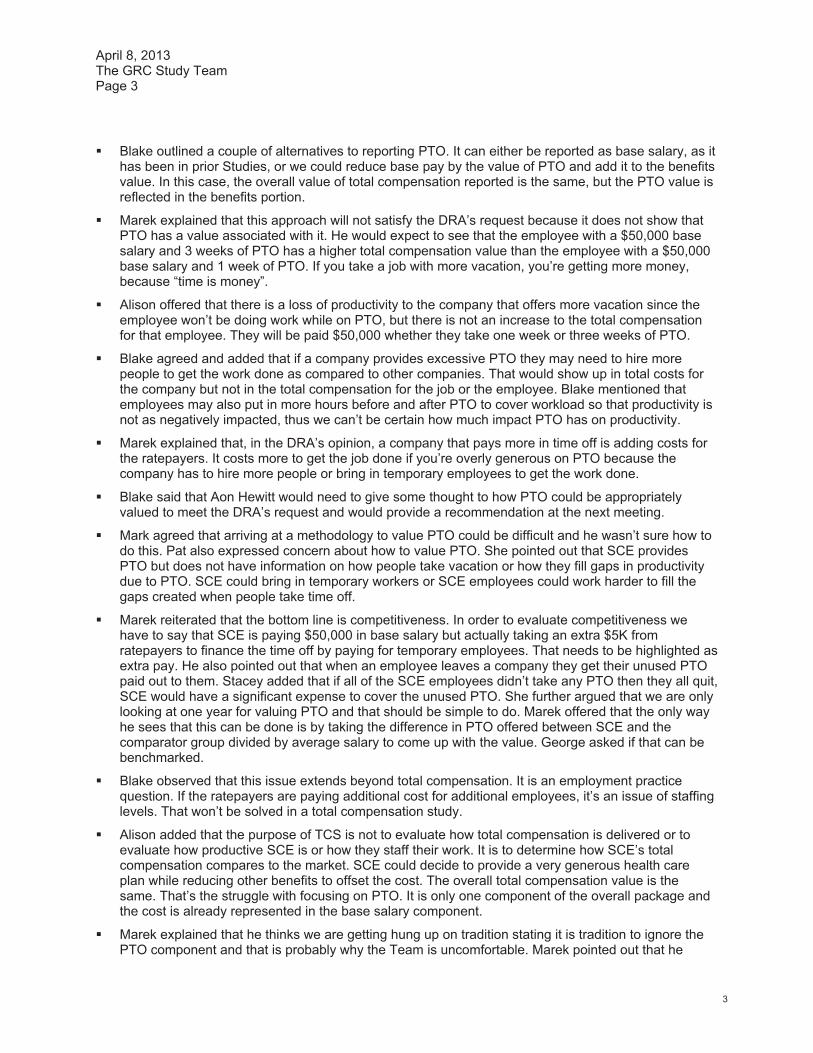
April 8, 2013 The GRC Study Team Page 3
3
� Blake outlined a couple of alternatives to reporting PTO. It can either be reported as base salary, as it has been in prior Studies, or we could reduce base pay by the value of PTO and add it to the benefits value. In this case, the overall value of total compensation reported is the same, but the PTO value is reflected in the benefits portion.
� Marek explained that this approach will not satisfy the DRA’s request because it does not show that PTO has a value associated with it. He would expect to see that the employee with a $50,000 base salary and 3 weeks of PTO has a higher total compensation value than the employee with a $50,000 base salary and 1 week of PTO. If you take a job with more vacation, you’re getting more money, because “time is money”.
� Alison offered that there is a loss of productivity to the company that offers more vacation since the employee won’t be doing work while on PTO, but there is not an increase to the total compensation for that employee. They will be paid $50,000 whether they take one week or three weeks of PTO.
� Blake agreed and added that if a company provides excessive PTO they may need to hire more people to get the work done as compared to other companies. That would show up in total costs for the company but not in the total compensation for the job or the employee. Blake mentioned that employees may also put in more hours before and after PTO to cover workload so that productivity is not as negatively impacted, thus we can’t be certain how much impact PTO has on productivity.
� Marek explained that, in the DRA’s opinion, a company that pays more in time off is adding costs for the ratepayers. It costs more to get the job done if you’re overly generous on PTO because the company has to hire more people or bring in temporary employees to get the work done.
� Blake said that Aon Hewitt would need to give some thought to how PTO could be appropriately valued to meet the DRA’s request and would provide a recommendation at the next meeting.
� Mark agreed that arriving at a methodology to value PTO could be difficult and he wasn’t sure how to do this. Pat also expressed concern about how to value PTO. She pointed out that SCE provides PTO but does not have information on how people take vacation or how they fill gaps in productivity due to PTO. SCE could bring in temporary workers or SCE employees could work harder to fill the gaps created when people take time off.
� Marek reiterated that the bottom line is competitiveness. In order to evaluate competitiveness we have to say that SCE is paying $50,000 in base salary but actually taking an extra $5K from ratepayers to finance the time off by paying for temporary employees. That needs to be highlighted as extra pay. He also pointed out that when an employee leaves a company they get their unused PTO paid out to them. Stacey added that if all of the SCE employees didn’t take any PTO then they all quit, SCE would have a significant expense to cover the unused PTO. She further argued that we are only looking at one year for valuing PTO and that should be simple to do. Marek offered that the only way he sees that this can be done is by taking the difference in PTO offered between SCE and the comparator group divided by average salary to come up with the value. George asked if that can be benchmarked.
� Blake observed that this issue extends beyond total compensation. It is an employment practice question. If the ratepayers are paying additional cost for additional employees, it’s an issue of staffing levels. That won’t be solved in a total compensation study.
� Alison added that the purpose of TCS is not to evaluate how total compensation is delivered or to evaluate how productive SCE is or how they staff their work. It is to determine how SCE’s total compensation compares to the market. SCE could decide to provide a very generous health care plan while reducing other benefits to offset the cost. The overall total compensation value is the same. That’s the struggle with focusing on PTO. It is only one component of the overall package and the cost is already represented in the base salary component.
� Marek explained that he thinks we are getting hung up on tradition stating it is tradition to ignore the PTO component and that is probably why the Team is uncomfortable. Marek pointed out that he

April 8, 2013 The GRC Study Team Page 4
4
could cause the Team to drill down into every component of benefits in this project if that is what is required. He could get that specific if necessary.
� Blake pointed out that Aon Hewitt will need to do some research and determine what approach is sensible and defensible. Since PTO has never been a part of any total compensation study we have done for any company, we will want to evaluate and confirm that we can defend and explain the valuations.
� The Team agreed that Aon Hewitt will present a recommended approach at the next meeting.
� Spot Awards, Shift Differentials and Over Time (OT)
– Alison explained that these components are not included in the TCS because they are not reported in salary surveys. As a result there is no way to value them.
– Marek expressed concern that OT couldn’t be measured. He asked why surveys don’t include OT.
– Alison explained that OT practices vary company to company and that the use of OT is also part of a company’s strategy to cover staffing needs. Some companies may encourage the use of OT up to a point because it would be more costly to add full time employees, once you took into account the cost of benefits. Others may try to limit OT. As a result, surveys collect data on actual base salary or annual wages because they provide a more accurate representation of competitive pay for jobs. .
– Stacey agreed that OT practices vary by company and are not included in surveys.
– Marek asked if SCE could provide the cost of OT.
– Alison asked what the purpose of looking at OT would be since we can’t measure it as part of total compensation and it seems to be outside of the scope of the Study. Marek explained that we would see what was missing in total compensation and include it as a factoid in the Study.
– George said that SCE would be able to develop an estimate of OT by comparing base salary to eligible earnings and determining the difference for non-exempt employees. He asked if that would be sufficient. Marek agreed with that approach.
� Treatment of Edison International (EIX) jobs
– Alison described the approach from prior Studies. EIX employees who spend part of their time doing work for SCE would have a portion of their total compensation allocated to the Study based on the percentage of time spent on SCE accountabilities.
– The Team agreed to this approach.
– Michelle will gather information on these jobs and provide to Aon Hewitt.
Benefits
� Blake highlighted that in the last TCS we used SCE’s employee profile for developing benefit values for all employee groups except executives and we were recommending this approach for the current Study.
� The Executive group would use the standard demographic profile since the SCE employee population of 30 or so employees was too small to be statistically valid. Stacey asked for further explanation around the use of the standard demographic profile for executives.
� Blake explained that there aren’t enough executives at SCE to provide a statistically credible population to apply to the peer companies. In the Study, we want to use the same population assumptions for all companies and we want the population to be large enough that demographics would not be skewed by a few outliers in the group. The small population of SCE executives could be skewed in terms of gender, age, or service.
April 8, 2013 The GRC Study Team Page 5
5
� Marek mentioned that there are two ways to establish statistical validity in the sample. The first is by having a large population as Blake described and the second is by looking at a small population over an extended period of time. If the characteristics of the population do not change, then it becomes more statistically valid or representative. Therefore, he suggested that we look at the executive population for SCE over the past 20 years and determine if the characteristics of the group have stayed the same or changed. If they have stayed the same, the SCE executive population could be valid and applied in the Study.
� Marek asked if a change to the age distribution in the composite would change the benefits value. For example, if the weighting is older would the benefits values be higher? Blake confirmed that that is the case, and that that’s in part why we utilize the larger demographic population to minimize the impact of outliers that could occur with a small population. To be statistically valid we would need thousands of people or many years of data for a small population.
� Marek commented that he’s not sure why Blake thinks we need to have a large population for executives since the methodology uses an average.
� Stacey asked Marek why we’d need to use 20 years of data versus the current executive data for SCE since that seems to be most representative. Marek responded that to be statistically valid we’d need to establish that the characteristics of SCE executives did not fluctuate over a long period of time and from Study to Study. If you can get demographic data that is reasonably consistent over time, then that is preferable. Stacey questioned that if you are using data from the past 20 years you would lose the value of evaluating the current executives SCE has at this point in time and suggested that we should use those people with their age, years of service, and salary.
� Blake explained that the same plan at two different companies can have very different costs based on demographics. If you are offering the same benefit, it should produce the same cost in a total compensation competitiveness study. Our methodology removes the impact of different demographics for each company from the equation so that we are getting to the true underlying value of the benefit – not measuring the impact on cost of having a younger or older population.
� To respond to DRA’s request, Blake suggested that SCE pull 20 years of SCE executive demographic data so that we can assess if there is consistency year to year.
� Mark mentioned that the make up of executives will likely change and that the historical demographic may not be representative of current or future state.
� Marek responded that we’ll look at the data, and see what is most reasonable. Marek stated that we can’t predict the future and that this is all part of the rate case debate. He did not think this is a hindrance to what he suggested with looking at SCE’s demographic historically. So we’ll look at that in a fair way.
� The Team agreed that the next step was for George to collect demographic data on SCE’s executives going back as far as possible and through January 1, 2013. That would include name, gender, age, tenure, title and salary if available.
Comparator Group
� The Team reviewed the comparator group information for benefits from the last TCS. It includes a group of utilities and general industry companies. All but three companies from the last TCS are in the current database.
� Marek asked if we needed to pursue adding more municipal electric companies into the comparator group. Stacey responded that an attempt had been made to get LADWP and SMUD to participate in the benefits analysis for PG&E’s TCS but that they were unwilling to participate.
� Alison asked how important inclusion of municipalities was to DRA and SCE.
April 8, 2013 The GRC Study Team Page 6
6
� The Team agreed that we’d contact LADWP and SMUD to see if they’d be willing to participate. Pat will follow up with these organizations. We will allow up to three weeks of time to see if they will agree to participate.
� Pat mentioned that during the TCS Workshop, it was suggested that we provide the list of comparators to Workshop participants once they have been decided. Marek agreed Pat should provide the list and suggested that she give them 3 days to respond and provide comments.
� Marek suggested that we use only the utility group and exclude the general industry group. Stacey concurred. Alison asked for clarification on why only the utility group would be used. Marek explained he felt that since SCE is a utility only other utility companies should be used. Alison raised the issue that many of SCE’s jobs are matched to general industry in the TCS and it would be preferable to use consistent comparator groups for both pay and benefits. Marek expressed concern that using both groups would dilute the result.
� Alison explained that one core element of the TCS is to measure the appropriate talent pool for SCE’s jobs. In that scenario, we’d have two valuations of benefits based on what the talent pool would be, including one for utility jobs and one for general industry jobs.
� Stacey suggested we use the utility group for utility jobs and a blend of utility and general industry for general industry jobs. Marek clarified that that would require a job-by-job analysis. Alison confirmed that we did apply data on a job by job basis in the last Study.
� The Team agreed that we will value the utility group and apply that to utility jobs and value the combined utility and general industry group and apply that to non-utility jobs.
� Stacey asked if we would solicit participation from any participants who participate for their salaried plans but do not participate for their executive plans. Alison agreed that Aon Hewitt will contact these organizations and determine if they would be willing to participate.
Compensation
� Alison recapped that we benchmarked 273 jobs in the last Study and that data was available for 212 jobs. That allowed us to achieve coverage of about 66% of SCE’s population. Based on parameters on benchmarking included in SCE’s Request for Proposal (RFP) for the TCS, Aon Hewitt included 175 benchmarks in the proposal and in developing fee and timing estimates.
� Marek indicated he would like to include as many benchmarks as possible. Alison explained that adding benchmarks would add cost and time to the Study but would also increase employee coverage and the statistical validity of the Study.
� Michelle asked what the coverage would be if we kept the number of benchmarks at 175. Alison explained that the Team would need to review the prior Study benchmarks and select 175 from that list. At that point, we could determine coverage. George agreed that adding jobs would increase coverage but expressed concern about increasing scope, cost, and time to do so.
� Marek asked what the criteria are for saying there is enough data for a particular job. Alison explained that we like to see at least 8 companies participating and prefer to see more. We also like to use multiple data sources, but for some jobs we will only be able to use one source.
� Marek said this sounds like a broad-based survey. Alison responded that we have used a combination of custom comparator groups and general industry survey cuts based on geographic location and/or revenue for past Studies.
April 8, 2013 The GRC Study Team Page 7
7
� Marek referenced the list of benefits comparators and asked if we used any companies for the compensation analysis that are not on the list. Alison confirmed that for jobs that utilized Radford data, we used a general industry cut of Southern California companies with revenues of more than $5B. We also used a broader cut for EAPDIS since Southern California data is not available. EAPDIS data is applicable to the Physical jobs.
� Marek reiterated that he believes we used broad-based data in the last Study. Alison responded that if he is defining broad-based in the way she just described the Radford and EAPDIS cuts than that is correct. However, custom cuts were used from other survey sources to cover many jobs.
� Marek asked when geographic data was applied. Alison explained that it was applied for jobs that could be hired in the local labor market. Clerical jobs are a good example. Utility jobs would not be limited to geographic data since there are not enough utilities in Southern California to provide a good sample. Alison suggested the Team review the list of benchmarks from the 2012 Study to understand which jobs used the utility comparator group data, which used general industry data, and which used a combination of the two.
� Marek asked again if the compensation data was restricted to the list of comparator companies.
� Alison reiterated that it depended upon the job. Executive jobs used data from the executive comparator group. Managerial jobs and many of the professional and technical jobs used data from the utility and general industry lists. Physical jobs primarily used EAPDIS data. Alison went on to explain that the utility group was identified based on a set of criteria that matched SCE’s characteristics including urban based utilities with revenue of .5x to 2.0x SCE’s revenue. The goal was to replicate the talent pool SCE would pull from when hiring.
� Stacey asked how a Lineman would be paid differently in a rural versus an urban setting. Alison explained that the job responsibilities may be the same, but that pay can be very different depending upon geographic location. For example, pay rates in Los Angeles will be higher than pay rates in rural Nebraska.
� Marek argued that it is preferable to use broad-based cuts of data because the sample size will be better. He stated that when you use a comparator group, your data set is limited.
� Alison agreed that we might achieve a larger participant base by using broad-based data, but you make a trade off in the quality of the data and how representative it is of the SCE population and the talent pool SCE draws from. It is preferable to have a targeted data set utilizing companies of similar size, complexity, scope, and operating environment to SCE versus a general set of data that is not consistent with SCE’s characteristics.
� Marek explained that DRA does not want to be restricted to the comparator groups that have been used in past Studies.
� Alison reinforced that the compensation data should be defined by the talent pool for the job. This is in keeping with the discussion we had about the benefits comparator group and the use of the SCE employee population in valuing benefits. The goal is to as accurately as possible reflect the competitive market for the talent that SCE competes in and to reflect the characteristics of the SCE employee population in the Study. She went on to suggest that the Team review each benchmark job and define the characteristics of the talent pool for that job including whether it requires utility experience or can be found in general industry, if it requires experience working in a large, complex environment, or whether talent can be found locally.
� Marek explained that he does not want to do that up front in the Study. He wants to be able to see the data.
� Pat mentioned that this approach would provide a finer distinction in defining the talent pool then the last Study but would also add to the time and expense of the Study.
April 8, 2013 The GRC Study Team Page 8
8
� Marek explained that in the PG&E Study the Team did look at each job or category. The jobs were broken into six categories and they considered geography, revenue size and utility.
� Alison suggested that the SCE would have to look at the benchmark jobs and define the talent pool. She elaborated that it’s likely that within a job category we would find more than one definition. A supervisory job could be utility specific found nationally or could be found in general industry within the local market. A managerial job could be from large general industry companies.
� Marek said he is not against defining the talent pool further as described.
� Stacey said that she thinks that manager jobs could use the same talent pool definition. .
� Alison disagreed and explained that there will likely be differences between jobs at the Manager level. She referenced Mark Bennett’s job as a senior manager of benefits as an example. Mark described his role as having a budget of about $300M with 16 people. His job has broad impact since he develops the plan designs, manages the financial impact, ensures compliance and oversees the benefits service center. His time horizon for planning is from six months to three to four years. For issues involving the union it is longer. Alison pointed out that SCE would need to recruit from other large employers and possibly other large utilities to find a candidate with the experience and know-how to manage that complex a job. A benefits manager from a $500M company would not have the experience or scope of accountability required to manage benefits at a $12B company with a $300M benefits budget. She reiterated that when we benchmark jobs and define the labor pool we ask questions about budget, number of people managed, time horizon for planning, complexity of the job, and impact on the company to determine the fit with the benchmark and define the talent pool for purposes of determining which cut of compensation data best represents the job.
� Stacey commented that Mark’s job at SCE may be more specialized and narrow than the manager of benefits at a $500M company. She felt that a manager at a smaller company would need to have greater breadth. Therefore, Mark’s job could be narrower. She went on to site her personal experience of working at a job where she did data entry for payroll and earned the same amount of money as a job she had where she was supervising a department.
� Alison explained that there can be differences in breadth and depth between jobs and when that occurs we don’t’ consider them the same benchmark. When we benchmark jobs, we look for an 80% match in accountabilities and scope. That ensures that we are comparing incumbents whose jobs are similar. For a job like Mark’s, we’d want to make sure we are defining a talent pool that includes individuals who have experience managing a large, complex benefits organization since that’s the scope of his role.
� Marek agreed to look at the definition of the talent pool on a job by job basis.
� Alison explained that Aon Hewitt will get updated information on the benchmark jobs from SCE and then provide them with a template to use to define the talent pool for jobs. We will review that at the next meeting. She also confirmed that we will start with 273 jobs from the last Study and target coverage of 60% or more. Benchmarks will require a match of 80% or greater in accountabilities.
� Marek asked SCE if they could provide information on which company’s recent hires were recruited from and the revenue size of those companies.
� George explained that SCE started tracking that data in 2011 and he could provide that for about 500 people who have joined SCE across many levels since 2011. He said they’d need to research the revenue data. Marek requested that SCE provide the name and revenue of the company that new hires at manager level and above were recruited from.
� Alison reviewed the methodology for the generic jobs. There were no questions and the Team agreed to use this methodology for the Study.
� George recommended an effective date for the Study of December 31, 2012. The Team agreed.
April 8, 2013 The GRC Study Team Page 9
9
� Alison outlined the methodology used to develop an escalation factor for the last Study which included calculating a weighted average of salary increase budgets for the five employee groups. The Team agreed to use the same approach for this Study.
� Alison reviewed the list of survey data sources including Towers Watson, Aon Hewitt, Radford, SIRs, and EAPDIS. The Team agreed to this list.
� Alison reviewed the methodology used to determine LTI eligibility in the last Study. Jobs where 50% of more of the participating companies reported that employees were eligible included LTI. In the last Study, 34 jobs met these criteria. The Team agreed to this approach.
Next Steps and Follow-Ups � Alison asked for feedback from the Team on the process used in the meeting and the pace of the
discussion. The Team felt good progress had been made and understood that several of the items require additional discussion and work to get to resolution. As a result that will likely impact timing of the Study and could change methodology, process and cost.
� Action Items for Aon Hewitt include:
– Send an electronic copy of Aon Hewitt’s Technical and Commercial Proposal to Marek and Stacey
– Correct a typo on the Team roster on Chelsea’s email address and distribute to the Team
– Send the data request for benefits to the Team
– Develop a recommended approach to valuing PTO as requested by DRA and present it, as well as cost and timing implications, at the next meeting
– Develop a recommended approach, timing, and fee estimates for valuing benefits using the actual SCE executive employee demographic profile as requested by DRA versus the Aon Hewitt standard demographic profile that was used in the last Study and proposed for the 2015 Study. This will be done after SCE provides demographic data from the past 20 years on the SCE executive team as noted below
– Contact participants in the benefits comparator group who did not provide plan information on executive plans to determine if they will submit that information. Allow up to three weeks to confirm participation.
– Update the list of benchmark jobs with current data to reflect incumbent count and confirm the job still exists. SCE will provide the update to the data as outlined below
– Create a spreadsheet for SCE’s use in defining the appropriate labor market for each benchmark job and provide to SCE
– Develop fee and timing estimates for increasing the number of benchmarks from 175 to 273
– Calculate the weighted average escalation factor once updated employee and job data is provided by SCE
– Develop a revised meeting schedule and determine if meetings will need to be added to resolve and execute changes to methodology on PTO, executive benefits, and increased number of benchmarks
� Action items for SCE include:
– Michelle will gather data on the EIX jobs that have SCE accountabilities and will provide that information to the Team at the next meeting
– Pat will contact LADWP and SMUD to determine if they will participate and provide benefits data
April 8, 2013 The GRC Study Team Page 10
10
– Pat will circulate the proposed list of benefits comparators to the TCS Workshop participants and provide them three days to respond back with comments
– Pat will communicate internally to SCE that given changes in scope and additional analysis identified during this meeting, the Team’s ability to provide data for the July 1 Notice of Intent is in question and our ability to complete the Study by end of July is also in question
– George will provide a download of employee and job data to Aon Hewitt covering the data elements outlined in Aon Hewitt’s data request that was distributed to the Team
– George will develop an estimate of Over Time for 2012 and present that at the next meeting
– George will gather data on executive demographics going back 20 years and present that at the next meeting
� The next Team meeting was scheduled for April 24th at 10 am in SCE’s San Francisco office.
Consulting | Broad-Based Compensation Proprietary & Confidential | SCE/RPT001AAP.DOCX/PR&T-15008 03/2013 1
Date: April 24, 2013
To: The GRC Study Team (the Team)
From: Alison Peterson, Aon Hewitt
Subject: Meeting Notes, April 24, 2013; Revised September 9, 2013
Meeting Attendees Name Organization
Marek Kanter Division of Ratepayers’ Advocates (DRA) Stacey Hunter DRA Pat Adams Southern California Edison (SCE) Mark Bennett SCE – Videoconference George DeMaria SCE – Videoconference Stephen Lumel SCE – Videoconference Mike Marelli SCE Michelle Ricard SCE Blake Murphy Aon Hewitt Chelsea Penaloza Aon Hewitt Alison Peterson Aon Hewitt The Team met at Southern California Edison’s (SCE) offices in San Francisco (Kanter, Hunter, Adams, Marelli, Ricard, Murphy, Penaloza & Peterson), and by videoconference in Rosemead (Bennett, DeMaria & Lumel).
Discussion Items � All participants introduced themselves. Mike Marelli, SCE’s Director, General Rate Case, joined the
team for the morning.
� Alison outlined the agenda items for the meeting and reviewed the materials that were sent out in advance to provide Team members a chance to prepare for the meeting. Materials included:
– Meeting notes from the April 8 meeting
– Historical demographic data on SCE’s executive population
– List of all SCE jobs including:
• Indication if the job is a proposed 2015 Study benchmark
• 2012 Study job number, where applicable
• Definition of labor market for each job provided by SCE
– Information on which companies new hires at the manager and above level were hired from since September 2011
� Marek asked if there was information on which companies’ executives went to when leaving SCE. Michelle replied that SCE does not conduct exit interviews and so does not have that data. Marek commented that there was oftentimes paperwork that had to be completed when an employee leaves a company that would indicate what company they went to, such as benefits documentation. Blake
April 24, 2013 The GRC Study Team Page 2
2
responded that it is common to use the home address instead of a new company address since the home address is more permanent.
� Alison reviewed the follow-up items from the April 8 meeting
� Action items for Aon Hewitt included:
– Send an electronic copy of Aon Hewitt’s Technical and Commercial Proposal to Marek and Stacey (Completed)
– Correct a typo on the Team roster on Chelsea’s email address and distribute to the Team (Completed)
– Send the data request for benefits to the Team (Partially completed; need conclusions on PTO and Execs)
– Develop a recommended approach to valuing PTO as requested by DRA and present it, as well as cost and timing implications, at the next meeting (Completed)
– Develop a recommended approach, timing, and fee estimates for valuing benefits using the actual SCE executive employee demographic profile as requested by DRA versus the Aon Hewitt standard demographic profile that was used in the last Study and proposed for the 2015 Study. This will be done after SCE provides demographic data from the past 20 years on the SCE executive team as noted below (TBD once demographic profile is reviewed)
– Contact participants in the benefits comparator group who did not provide plan information on executive plans to determine if they will submit information. Allow three weeks to confirm participation. (In process)
– Update the list of benchmark jobs with current data to reflect incumbent count and confirm the job still exists. SCE will provide the update to the data. (Completed)
– Create a spreadsheet for SCE’s use in defining the appropriate labor market for each benchmark job and provide to SCE (Completed)
– Develop fee and timing estimates for increasing the number of benchmarks from 175 to 273 (Completed)
– Calculate the weighted average escalation factor once updated employee and job data is provided by SCE (Completed)
– Develop a revised meeting schedule and determine if meetings will need to be added to resolve and execute changes to methodology on PTO, executive benefits, and increased number of benchmarks (In process)
� Action items for SCE include:
– Michelle will gather data on the Edison International (EIX) jobs that have SCE accountabilities and will provide that information to the Team at the next meeting (Completed)
– Pat will contact Los Angeles Department of Water and Power (LADWP) and Sacramento Municipal Utility District (SMUD) to determine if they will participate and provide benefits data (Completed)
• Pat explained that she was not successful at getting a response from SMUD but was successful with the contact she made at LADWP. They indicated they would be willing to share compensation and benefits data for the purposes of the Study.
• Marek asked whether the California Public Utility Commission (PUC) would also be included in the Study as he felt that the PUC was a comparator for SCE benefits and compensation. Alison responded that we could solicit their participation for the benefits valuation but that their compensation data probably was not included in any of the survey sources we are using
April 24, 2013 The GRC Study Team Page 3
3
for the Study. She asked if PUC pay data was publicly available and Stacey indicated that it is published on the PUC website.
• Stacey agreed to identify a contact at the PUC who Aon Hewitt could contact to inquire about their willingness to provide benefits and compensation data for inclusion in the Study.
• Marek indicated that we could limit ourselves to executive level jobs or jobs with high incumbent counts to expedite the process of collecting and incorporating PUC data.
– Pat will circulate the proposed list of benefits comparators to the TCS Workshop participants and provide them three days to respond back with comments (Delayed until list is finalized)
– Pat will communicate internally to SCE that given changes in scope and additional analysis identified during this meeting, the Team’s ability to provide data for the July 1 Notice of Intent is in question and our ability to complete the Study by end of July is also in question (Completed)
– George will provide a download of employee and job data to Aon Hewitt covering the data elements outlined in Aon Hewitt’s data request that was distributed to the Team (Completed)
– George will develop an estimate of Over Time for 2012 and present that at the next meeting (Completed)
– George will gather data on executive demographics going back 20 years and present that at the next meeting (Completed)
– George to provide data on where employees have been hired from since 2011 (Completed)
� The Team confirmed that this completed the list of follow-ups from the April 8 meeting.
� The Team confirmed that there were no additional edits to the April 8 meeting notes and they could be considered final.
� Marek suggested that email notes be consolidated and recorded in full as part of the Study report in an Appendix. Alison confirmed that Aon Hewitt would consolidate all email communication and include it in an Appendix of the Study report.
Methodology Paid Time Off � Blake described Aon Hewitt’s proposed methodology for valuing PTO. Aon Hewitt would evaluate
SCE and each peer company’s PTO schedules and establish the PTO schedule with the lowest number of days as a baseline. This baseline amount would be assumed to be covered in base salary for SCE and all of the comparator companies. Any PTO days above that baseline, would be valued and reported as part of the benefits value.
� To illustrate, if there were three companies in the comparator group and one provided one week of PTO and the other two provided two weeks of PTO, the first company’s PTO schedule of one week would serve as the baseline and all three companies would have that week of PTO valued as part of base salary. The two companies with two weeks of PTO would have the second week valued and reported as part of benefits.
� Marek asked how Aon Hewitt would value the additional weeks of PTO above the baseline. Blake explained that Aon Hewitt would use SCE’s demographics and actual PTO utilization for each employee. This utilization would be determined by the service level for employees in each job (because PTO days tend to vary by service). We would first compare the utilization data to the baseline and if the actual days used by SCE employees at a particular service level was lower than the baseline, we would use the actual days used as the baseline for that job. In other words, the typical utilized days would be included as salary and the provided days in excess of what is utilized would be included as an additional benefit. The unused days could be used in a future year or paid out upon the employee’s termination or retirement. Therefore, these unused days would be valued in
April 24, 2013 The GRC Study Team Page 4
4
a way similar to a pension benefit that takes into account the assumed timing of the payout and the salary on which that payout would be based.
� Marek asked for clarification on why Aon Hewitt’s proposed methodology makes a distinction between used and unused days. Blake responded that it was important to value each type of day according to its unique characteristic, with used days being paid at the current salary level and unused days being paid at a future date at, presumably a different salary level, much like other benefits that are not paid in the current year are not based on current salaries (i.e., pension and retiree life insurance benefits). Aon Hewitt felt this approach most closely met Marek’s desire to include PTO as part of the benefits value.
� Marek rephrased his question asking if the proposed methodology was to separate what employees take today in PTO as salary versus the value of unused PTO an employee would get when they terminate their employment. Marek commented that in the final analysis, as long as the dollars are computed the same way, whether used or not, the bottom line value is the same. He questioned if it was worth the complication of doing this analysis. Blake explained that PTO taken today is valued at today’s base salary, but unused PTO that is used or paid out in the future would be valued based on the employee’s base salary at that future point in time. If the employee’s base salary increases over time, the value of unused PTO increases with it. Blake went on to explain that this approach is similar to the approach for pension benefits.
� Stacey commented that she thought she understood Aon Hewitt’s methodology and was comfortable with it. She outlined her understanding that there is a portion of PTO that employees take this year and that would be valued differently than the PTO that is carried forward and paid out in future years.
� Marek disagreed with Stacey. He explained that in his opinion whether PTO is used or unused it needs to be put all together in the Study results and therefore they needed to be valued on the same basis. He felt that we should take a much simpler approach and assign a value to all of the PTO days provided and compare the difference between SCE and the comparator companies. That amount would be reported in the Study.
� Stacey said she felt Aon Hewitt’s proposed methodology satisfied both her and Marek’s initial request to value PTO as a benefit and would reflect any value that an employee gets if their PTO schedule was more generous. She agreed that the baseline should reflect the days that all companies provide. Marek indicated that in principle, the methodology seemed to make sense but was more complicated than he would like.
� Mark asked again how the methodology would determine the PTO schedule that would be applied. Blake explained that Aon Hewitt would use SCE’s actual demographics to determine the number of PTO days used by employees based on their years of service. Those same demographics would be applied to all of the comparator companies ensuring consistency in approach. The excess of the number of days provided by each company’s schedule over the number of days used would be considered an additional benefit. Mark felt that made sense.
� Blake described that, because Aon Hewitt has never separately valued PTO for a total compensation study, Aon Hewitt will need to gather the demographic data required for the valuation, build a model, and test and validate the model. This would add two to three weeks to the Study time table and add to the cost of the Study.
� Marek maintained that the additional time and cost was not justified and that the simpler valuation he had proposed would be sufficient. He explained that some employees may take all of their PTO and some may save it for later. It would all even out in terms of total cost to the company over a number of years assuming SCE maintains about the same number of employees. He felt that if a company has the same number of employees, in the end, the cost will be more or less the same.
� Blake clarified that Aon Hewitt’s understanding is that we are not trying to measure the cost of SCE’s PTO plan over time in this Study, but rather determine the value of SCE’s total compensation package compared to the packages offered by the comparator companies. He also mentioned that
April 24, 2013 The GRC Study Team Page 5
5
Aon Hewitt developed this methodology to address the needs DRA had raised in our first meeting in which Marek had requested that the Study establish the “additional value” if employees don’t use their PTO but instead receive a payout when they retire. The proposed methodology addresses that issue while Marek’s suggested approach does not.
� Pat commented that we should weigh the ratepayer value of the PTO valuation, in light of the added cost.to the TCS.
� Stacey commented that she felt Mercer’s methodology in the PG&E Study valued PTO as a benefit using current salary. She provided an example that three weeks of PTO would be worth about 3/52 of current salary. Marek asked Stacey for more details to remind him what Mercer’s approach was. Stacey said that she thought Mercer had used an approach similar to what Marek had described and that the results had been reported in an appendix to the Study.
� In response to Pat’s question re: whether the Mercer approach worked for DRA, Stacey explained that the approach Mercer took did not satisfy DRA’s needs, that Mercer didn’t present the data in a way that DRA expected them to and that was a mistake that DRA is trying to correct in this Study. She commented that Aon Hewitt’s methodology seems complicated but believes it does satisfy the DRA’s concerns. DRA wants to be able to recognize the value of PTO relative to what other companies are providing.
� Mike stated that there seemed to be two options. Value PTO using Aon Hewitt’s methodology, or use the approach taken in prior SCE Studies. Michelle pointed out that the Mercer methodology isn’t really an option since it didn’t satisfy the DRA’s need.
� Marek stated that in the interest of moving this forward, we should use the proposed Aon Hewitt methodology.
� The Team agreed to reconvene by conference call in one week to provide all Team members a chance to review the proposed methodology and ensure they have all of their questions addressed.
Executive Population for Benefits Valuations
� Blake described the chart of historical executive demographic data provided by SCE. Tenure and pay were reasonably consistent over the 20 year period of the data, but number of executives did vary year to year and over time.
� Blake asked the Team if they felt the SCE executive data was stable enough to fairly represent the population. Marek commented that he felt the demographic profile was generally consistent from about 2004 through 2012 and that that using the data from that time frame would be acceptable. Stacey felt that the last five years of data were very consistent.
� Blake asked Marek to clarify if he was suggesting using the small current demographic of SCE’s current executive population or using the entire historical demographic.
� Marek commented that the issue is how demographics are used. He asked if Aon Hewitt would “bucket” the age and service demographic data or apply each data point. Blake responded that each data point would be included.
� Marek felt that we could use all of the data points over the roughly 9 year period where the demographic data was stable, even if that meant we counted the same person multiple times since they could show up in several years of data. Stacey expressed that she felt most comfortable using only the last year of data since that was most representative of SCE’s executive current population. Marek responded that using multiple years of data would be representative of the population. Stacey thought the key question was whether we should use the most recent year of actual SCE data or use Aon Hewitt’s standard demographic profile for executives.
� Michelle asked if using the SCE executive population would provide sufficient enough data for the results to be statistically valid.
April 24, 2013 The GRC Study Team Page 6
6
� Blake responded that, while Aon Hewitt prefers to use a large set of data, because in the 2009 Study Aon Hewitt adopted a method of reflecting SCE’s demographics for non-executives, it would be a method change to align the executive benefits valuation with the non-executive valuation. He said that he didn’t disagree with Marek’s suggestion of using multiple years of data and using data from the same person more than once because it increased the number of data points used in the valuation. He explained that Aon Hewitt would disclose the difference in approach and be transparent about the sample size.
� Blake also mentioned that should the demographic profile of SCE’s executives begin to change more markedly, that could influence the approach in future Studies. However, if a multi-year data set is used in future years also, then changes in the SCE executive population will be phased in over time. Mark pointed out the executive count variability as an issue.
� The question to the Team is will the results be enhanced by using the SCE data.
� Mike asked what the difference was between these demographics and Aon Hewitt’s standard demographic. Blake indicated that Aon Hewitt had not looked at that, and the Team indicated that they did not need to see that data.
� Blake then described the impact to timing and fees for changing the executive demographic as requested by DRA.
� Alison confirmed that the Team agrees using SCE’s executive demographic data from 2004 to 2012, but the Team needs to consider the added cost to the Study to use the SCE data.
Compensation � Earlier in the meeting, the Team had discussed their desire to obtain benefit and pay information from
PUC, LADWP, and SMUD. Alison pointed out that because these organizations don’t participate in the survey sources we use in the Study, Aon Hewitt would need to collect data from each of these organizations by obtaining their actual pay data and job descriptions for use in benchmarking jobs, or by asking the organizations to identify or confirm that their jobs are matches to the benchmarks identified for SCE’s jobs. Further, she explained that we would need to use an incumbent weighted methodology for determining base salary, bonus, and total cash compensation for the market comparator group if we were to fold in data from PUC, LADWP, and SMUD. She explained that currently, we collect data from surveys that include multiple companies and multiple incumbents. Because the PUC, LADWP, and SMUD data would only be from one organization, and possibly be for only one incumbent, we would not want to weight that data equally to the survey data that represents multiple companies and incumbents. She illustrated this approach on the white-board so that the Team could understand the current approach of averaging data from multiple survey sources versus applying an incumbent weighted average approach.
� Alison asked Marek to confirm the importance of including the PUC data, factoring in those considerations. Marek replied that for executive jobs it was important, but it was less important for other groups of jobs. Marek further commented that third party interveners will want to know that the Team tried to get as much data as we could from PUC, LADWP, and SMUD for executive jobs.
� Pat agreed that including LADWP and SMUD executive data was important. The Team agreed that we would attempt to get data for executive jobs from all three organizations and would apply an incumbent weighted methodology for use in developing the market data. SCE will make the initial contact to LADWP and SMUD to determine if we can obtain job descriptions. Stacey will find a contact at the PUC and will ask if job descriptions are available. If job descriptions are not available, the process would be to provide LADWP, SMUD, and PUC with the executive benchmark descriptions used for SCE’s positions and ask those organizations to map their jobs to the correct benchmarks.
� Alison reviewed the compensation methodology slides and introduced the job list handout. She highlighted that we are including benchmarks from the last Study and have also identified additional

April 24, 2013 The GRC Study Team Page 7
7
benchmarks with high incumbent counts for consideration by the Team. Using the recommended list of benchmarks, the Study would provide 75% coverage of incumbents.
� Stacey commented that she was comfortable with the proposed incumbent coverage but would like to see the job coverage increase. The Team discussed that many of the jobs not being included are single incumbent jobs. Stacey commented that many of the single incumbent jobs could be paid more than the higher populated jobs. Alison explained that we could add additional jobs to the benchmarking process to address Stacey’s concerns.
� The Team agreed to review the job list and provide any additions or deletions. The Team tentatively scheduled a review meeting for May 1 at 9AM.
� Marek commented that an incumbent weighted average approach is an improvement to the methodology and it should be changed anyway. Alison will come back to the Team with impact to timing and fees to change that approach for all benchmark jobs.
� SCE provided proposed labor market definitions for all SCE benchmark jobs. Alison reviewed this information with the Team. Marek asked about the manager/supervisor category and the jobs where SCE indicated that revenue was an appropriate labor market criteria. Of about 90 jobs, 70 (or 78%) proposed using the local Southern California labor market and 20 or 22% proposed using a national market of large, comparably sized companies. Marek stated that any job with a proposed revenue cut would need to be justified and that SCE would need to show that they have hired an incumbent for that job from a large company. Marek asked what the revenue cut would be, and Alison responded that it would be one-half to two-times SCE’s revenue, or approximately $5B to $20B.
� Alison asked if Marek was suggesting that he would only agree to using a revenue-based cut of data for a job if SCE could demonstrate that they hired an incumbent from such a company into that exact job. Marek said that that was the case. He would not agree to using a revenue-based labor definition unless SCE could show that an incumbent in that job was hired from another large company. Alison pointed out that that would require that SCE have 100% turnover in all of its managerial jobs in the past 18 months in order to satisfy Marek’s request. That seemed like an unreasonable standard. She suggested that a reasonable standard would be to look at the hiring data that was available as an indicator of where talent is coming from and use that information along with SCE’s input about where they recruit talent for each job as the basis for defining the labor market. She directed the team to the hiring data which illustrated that of the six Director level jobs that SCE has hiring data on, 4 (or more than 60%) of them recruited incumbents from companies with more than $5B in revenue. She pointed out that SCE was only requesting use of a revenue-based labor market definition for 20 out of 70 jobs (or less than 30%).
� The Team then reviewed the hiring data SCE provided. Marek proposed looking at Directors separate from Managers. Marek also asked for more historical hiring data. SCE reiterated that it only has data recorded since September 2011 when they implemented a new system that tracked this information for the first time.
� Marek suggested breaking out the hiring data by job level and then proposed that it also be broken down by function.
� Stacey asked for clarification regarding a Nuclear Plant Principal Manager and questioned whether a revenue cut was relevant for that job. Steve explained that it was important to have managers with experience running a large nuclear facility. Stacey argued again that the size of a company doesn’t matter for managing a nuclear plant. Alison explained that scope as measured by revenue and complexity are critical considerations in identifying the talent pool.
� Marek argued that Executives in a large company are cogs and don’t have much complexity. They specialize in a particular area while managers of small companies must wear multiple hats. Alison responded that we deal with matching the scope of a job through the benchmarking process. If a job is narrow in scope, it won’t be matched to a broad benchmark. In addition, it is not accurate to assume that all big company jobs are narrow in scope and all small company jobs are wide in scope.
April 24, 2013 The GRC Study Team Page 8
8
� Stacey argued that if you deal with the scope of a job through benchmarking, then you don’t need to also include a revenue scope. She mentioned that a senior attorney doesn’t need to come from a large company. Alison explained that the benchmarking process ensures we are comparing jobs with comparable accountabilities and breadth. The labor market definition ensures that we are identifying a talent pool that possesses the level of experience required to effectively operate at SCE. If we took two individuals who have the same benchmark job but one works at a $500M company and has a budget of $50M and the other works at a $10B company and has a budget of $300M they have fundamentally different levels of impact and complexity in their jobs. The revenue scope allows us to reflect the impact the job has on customers or rate payers, company operations, risk mitigation, and expenses.
� Marek said we would have to look at these job by job or category by category.
� The Team agreed to schedule an additional review meeting to cover the benchmark jobs with revenue cuts.
� Michelle reviewed the EIX officers with SCE accountabilities slide:
– EIX Executive Officers with SCE Accountabilities
• CEO, EIX - 30% of duties are apportioned to SCE
• CFO, EIX - 30% of duties are apportioned to SCE
• Gen Counsel, EIX - 30% of duties are apportioned to SCE
• VP Investor Relations, EIX - 85% of duties are apportioned to SCE
• VP, Ethics & Compliance, EIX - 54% of duties are apportioned to SCE
– EIX Non-Officer Executives (TCS Manager Category) with SCE Accountabilities
• Director, Risk Management, EIX - 85% of duties are apportioned to SCE
• Director, Talent Planning & Rewards, EIX - 70% of duties are apportioned to SCE
� Alison reviewed the study effective date and escalation factor slide.
� Marek commented that the escalation factor for Utilities seemed high and felt that at this point he would not accept these escalation factors. Alison explained that the escalation factor data came from Aon Hewitt’s Salary Increase Survey from 2012-2013 and included input from over 1,200 companies on actual base salary increases in 2012. She explained that in the last Study, at DRA’s request, we utilized a weighted average approach to developing escalation factors and had used the same approach to develop this escalation factor.
� Marek commented that he thought this was higher than the escalation factor used in the PG&E Study. Alison explained that the factors change each year depending upon market conditions. She also said that she didn’t know what the PG&E factor was so couldn’t comment on it.
� Marek asked if Aon Hewitt could wait until the end of the Study to apply the escalation factor so that he could see the market data. Alison explained that it would be inappropriate to compare un-aged market data to SCE’s pay data. SCE’s pay data will be effective 12/31/2012 so will reflect any pay adjustments made during the year. In contrast, the survey data’s effective dates vary but some of the data could be as old as 2011. In order to compare data on an apples to apples basis we would need to age the market data to the same effective date as SCE’s data.
� Aon Hewitt will review copies of the Salary Increase Survey with the Team at the next meeting.
� Marek asked to delay this issue until a later date.
� George reviewed the overtime expense estimates for 2012. Marek asked how this data was going to be used. Alison responded that Marek had requested the data so wanted to understand how he
April 24, 2013 The GRC Study Team Page 9
9
intended to use the data. Marek said it was an interesting factoid and he would have to consider what to do with the overtime data.
� Alison reviewed the compensation data request for SCE:
– SCE job descriptions for benchmark jobs
– Survey job descriptions in a common format/download from ePrism
• Aon Hewitt to send SCE a list of the surveys for which we need job descriptions based on the surveys used in the 2012 Study
– Survey data from each of the survey houses once scopes have been identified
Next Steps and Follow-Ups The Team � The Team will review the proposed PTO valuation and be prepared to provide comments and
questions on the conference call tentatively scheduled for May 1.
� The Team agreed to review the job list and provide any additions or deletions by May 1.
� The Team agreed to schedule an additional methodology meeting to review the labor market definitions and any other unresolved methodology issues.
Aon Hewitt � Aon Hewitt will proceed with using the SCE executive employee demographic profile for purposes of
valuing executive benefits.
� Once SCE has contacted LADWP and SMUD and confirmed their willingness to participate in providing executive pay data and benefits data, Aon Hewitt will follow-up with those companies to facilitate the collection of data.
� Once the DRA provides contact information for soliciting participation from the PUC, Aon Hewitt will contact the PUC to determine if they will provide benefits data and executive benchmarks and pay data.
� Aon Hewitt will provide timing and fee estimates for collecting benefits and pay data from PUC, LADWP, and SMUD, for applying a weighted average methodology to all jobs, and for adding additional benchmark jobs to the Study once a final count is determined.
� Aon Hewitt will review the results of the 2012/2013 Salary Increase Survey at the next meeting.
� Aon Hewitt to send SCE a list of the surveys for which we need job descriptions based on the surveys used in the 2012 Study.
DRA � Stacey will provide a contact at the PUC who will determine if PUC will provide data in order to value
benefits and determine executive benchmarking and pay levels.
SCE � SCE will contact LADWP and SMUD to determine if they have job descriptions available for executive
jobs. If not, SCE will outline the suggested approach for benchmarking executive jobs and confirm that LADWP will provide mapping of their executive jobs to the SCE executive benchmarks.
� SCE will provide background regarding their labor market definition when the Team convenes to review this data.
Date: May 1, 2013
To: The GRC Study Team (the Team)
From: Alison Peterson, Aon Hewitt
Subject: Meeting Notes, May 1, 2013 Conference Call; Revised May 10, 2013
Meeting Attendees Name Organization
Marek Kanter Division of Ratepayers’ Advocates (DRA) Stacey Hunter DRA Pat Adams Southern California Edison (SCE) Mark Bennett SCE George DeMaria SCE Michelle Ricard SCE Blake Murphy Aon Hewitt Chelsea Penaloza Aon Hewitt Alison Peterson Aon Hewitt
The Team met via conference call on May 1, 2013.
Discussion Items Opening Remarks � Alison reviewed the agenda for the call:
– Discuss additional questions (if any) on PTO valuation methodology presented by Aon Hewitt; Team to decide on whether or not to have Aon Hewitt proceed
– Confirm use of SCE executive population for valuing benefits and decide whether or not to have Aon Hewitt proceed
– Identify adds/deletes to benchmark list
– California Public Utilities Commission (PUC) HR/Compensation Contact
– Outline agenda for third meeting to cover methodology and identify dates:
PTO Valuation � Mark, Stacey and Marek felt the Team should proceed with the proposed PTO valuation
methodology. Pat confirmed that the approach made sense. Marek commented that he may decide to document his thoughts on the methodology via email at a later date, for inclusion in the Study appendix.
� The Team agreed to go forward using Aon Hewitt’s proposed valuation methodology. Alison confirmed timing and fees for this additional work and Blake committed to sending a data request to SCE to begin this work.

May 1, 2013 The GRC Study Team Page 2
2
Executive Benefits Valuation � Alison recapped the DRA’s proposed approach for valuing executive benefits using SCE’s actual
executive demographic data from year end 2004 through year end 2012. Alison asked the Team if there were any questions or comments regarding the approach.
� The Team had none and agreed to proceed. Alison confirmed timing and fees for this change in methodology for executive benefits.
Benchmark Job List � Alison briefly described the benchmark job list that had been provided to the Team at the April 24
meeting. She asked Stacey about her concerns expressed in the last meeting regarding job coverage and Stacy responded that the job coverage is consistent with the previous Studies and so felt comfortable with the list. Alison then asked the Team if there were any additions or deletions to the proposed benchmark job list.
� George felt there was good representative coverage of the population; neither Stacey nor Marek had any changes to the benchmark job list.
� Michelle referenced the SVP Public Affairs on row 119 of the list and asked that it be removed as it was not a job for which SCE requested ratepayer coverage.
� The Team agreed to move forward with the benchmark job list as proposed in the April 24 meeting after removing the SVP Public Affairs job as requested by Michelle.
� Aon Hewitt will send a data request to SCE to gather job descriptions for the benchmark positions.
� Alison confirmed the next steps in the benchmarking process:
– Benchmarking session with Aon Hewitt and SCE to be scheduled
– DRA will then select jobs to sample for validation and the Team will meet to review and validate benchmark matches
CPUC HR/Compensation Contact � Stacey commented that her contact at the California Public Utility Commission (CPUC) sounded
positive about their willingness to provide benefits and executive compensation data for use in the Study. Her contact was checking with others to confirm their interest. Stacey committed to getting back to the Team via email once she received a final answer.
� Later in the call, Stacey posed a question from her CPUC contact regarding the amount of time that would be involved in providing compensation and benefits information. Alison responded that the CPUC would need to complete a Benefits Index questionnaire. Blake offered to collect the Summary Plan Document (SPD) from the CPUC as that would be a faster alternative. Aon Hewitt would complete the Benefits Index questionnaire on the CPUC’s behalf. Alison commented that the estimated time requirement to provide pay data and job descriptions is harder to quantify but she felt a half day to one day of time sounded about right. She clarified that if the CPUC does not have job descriptions for their executive jobs, we would have to ask them to map their executive jobs to the SCE benchmark jobs.
Next Methodology Meeting
� Alison outlined the agenda for the next meeting which would focus on reviewing the proposed labor market definitions for the SCE benchmark jobs. Alison noted that once the labor market has been defined, the Team will discuss the data extracts needed from the each of the surveys.
� Pat expressed concern about the timing of the Study and asked about timing and availability of a new proposed schedule. Alison responded that since we now have resolution on the benefits methodology, Aon Hewitt can update the timeline and proposed schedule for that work. However, since we have not yet finalized the compensation methodology and won’t do that until the next meeting, we will not be able to determine the timeline for compensation at this point.
May 1, 2013 The GRC Study Team Page 3
3
� Alison then described a process for moving the Study forward if the Team is not able to reach consensus on methodology. She suggested that the Team either agree to use the methodology applied in the last Study that was previously accepted by the CPUC or conduct both the previously accepted methodology and the proposed new methodology and include the results in an Appendix to the Study report. The Team agreed to this approach.
� Pat asked how the Team was moving forward on collecting benefits and compensation data from Los Angeles Department of Water and Power (LADWP), Sacramento Municipal Utility District (SMUD) and CPUC. George confirmed that he was making contact with LADWP and SMUD and requesting job descriptions for the executive jobs. If job descriptions are not available, he is asking these organizations if they would be willing to map their executive roles to the SCE benchmark matches. Once this contact has been made, Aon Hewitt will reach out to request the detailed compensation and benefits data.
� George asked for confirmation if LADWP, SMUD and PUC did not have internal job descriptions and survey job descriptions were provided to these companies for matching that an 80% match was required. Alison confirmed this was correct. The team agreed.
� Alison summarized other topics to be covered at the next meeting including discuss and finalize the Study escalation factor and discuss the intended use of Overtime Expense data requested by DRA.
� The Team discussed proposed meeting dates and tentatively scheduled the next meeting for Monday, May 13, 2013 at 10AM. Alison estimated that meeting would require about four hours.
Consulting | Broad-Based Compensation Proprietary & Confidential 1
Date: May 13, 2013
To: The GRC Study Team (the Team)
From: Alison Peterson, Aon Hewitt
Subject: Meeting Notes, May 13, 2013; Revised May 28, 2013
Meeting Attendees Name Organization
Marek Kanter Division of Ratepayers’ Advocates (DRA) Stacey Hunter DRA Pat Adams Southern California Edison (SCE) Mark Bennett SCE – Videoconference George DeMaria SCE – Videoconference Stephen Lumel SCE – Videoconference Michelle Ricard SCE Chelsea Penaloza Aon Hewitt – Videoconference Alison Peterson Aon Hewitt The Team met at Southern California Edison’s (SCE) offices in San Francisco (Kanter, Hunter, Adams, Ricard & Peterson), and by videoconference in Rosemead (Bennett, DeMaria, Lumel & Penaloza).
Discussion Items � The Team confirmed that there were no additional edits to the April 24 meeting notes. The Team also
agreed that there were no additional edits to the May 1 meeting notes, but Michelle asked for clarification on a topic covered in that meeting. On May 1, Alison suggested that the Team agree to an approach we would use should the Team not be able to come to consensus on proposed changes to methodology. The proposed approach was that the Team would either (1) use the methodology that was applied in the last Study or (2) conduct both the previously accepted methodology and the proposed new methodology and include the results in an Appendix to the Study report. Michelle asked which approach the Team would use.
� Alison offered that either approach was viable and clarified that there were several factors that should be considered including:
– Value-add: Does the proposed change in methodology increase the accuracy of the Study by providing more precise data? If we can’t articulate how an alternative approach would add value to the Study, we should not pursue it.
– Cost and time required to design and implement a new methodology: Can the new methodology be developed and implemented within the general timeline for the Study and does it add significant cost to the Study? If the methodology measurably improves the accuracy of the Study then additional cost and time may be warranted. Further, if the new methodology does not impact Study time or costs, it may be worth implementing so that everyone’s needs are represented in the Study. The Team would need to weigh the time and cost impact against the added value to the Study.
– Defensibility: Is the proposed methodology statistically valid, consistent with actuarially sound methods and practices, and supported by best practices in total compensation measurement and methodology? If not, we should not pursue it.
May 13, 2013 The GRC Study Team Page 2
2
� Most of the Team agreed that those considerations make sense. However, Marek stated that he wasn’t sure that he could agree to the two alternative approaches and the suggested criteria. He explained that he wasn’t prepared to agree at this point and wanted the Team to continue on with the meeting. Alison reminded Marek that the two alternatives had been presented during the May 1 conference call and that at that time he had agreed to them. She explained that the reason Aon Hewitt had proposed these alternatives was because the Team had been unable to reach consensus on a number of proposed methodological changes and as a result the project was behind schedule and Study costs were increasing as more meetings were added to continue discussing methodology. Marek didn’t have any further comment, but asked if we could just move on without reaching consensus at this time.
Open Action Items for Aon Hewitt from April 8 Meeting: � Develop a recommended approach, timing, and fee estimates for valuing benefits using the actual
SCE executive employee demographic profile as requested by DRA versus the Aon Hewitt standard demographic profile that was used in the last Study and proposed for the 2015 Study. This will be done after SCE provides demographic data from the past 20 years on the SCE executive team as noted below (Completed)
� Contact participants in the benefits comparator group who did not provide plan information on executive plans to determine if they will submit information. Allow three weeks to confirm participation. (In process)
– Aon Hewitt was able to make contact with all but two of the companies. Aon Hewitt will continue with solicitation efforts. Alison also described the incentives that Aon Hewitt was able to offer these companies to get them to participate which include an executive benefits Programs and Practices report from Aon Hewitt’s 2012 Total Compensation Measurement Database. Aon Hewitt agreed to provide this report free of charge in order to provide an incentive to participants to submit their data.
– Alison commented on timing for collecting all of this data from these companies. The Team previously agreed to three weeks to allow companies to participate. She suggested that we might offer another two weeks (May 13 and May 20) to these companies to increase the odds of participation. The Team agreed to allow companies to submit up until May 28.
� Develop fee and timing estimates for increasing the number of benchmarks from 175 to 273 (Completed)
� Calculate the weighted average escalation factor once updated employee and job data is provided by SCE (Completed)
� Develop a revised meeting schedule and determine if meetings will need to be added to resolve and execute changes to methodology on PTO, executive benefits, and increased number of benchmarks (In process)
Open Action items for SCE from April 8 Meeting: � Pat will circulate the proposed list of benefits comparators to the TCS Workshop participants and
provide them three days to respond back with comments (Completed)
Action items for Aon Hewitt for April 24 meeting include: � Once SCE has contacted LADWP and SMUD and confirmed their willingness to participate in
providing executive pay data and benefits data, Aon Hewitt will follow-up with those companies to facilitate the collection of data (In process)
� Once the DRA provides contact information for soliciting participation from the CPUC, Aon Hewitt will contact the CPUC to determine if they will provide benefits data and executive benchmarks and pay data (In process)

May 13, 2013 The GRC Study Team Page 3
3
� Aon Hewitt will provide timing and fee estimates for collecting benefits and pay data from CPUC, LADWP, and SMUD, for applying a weighted average methodology to all jobs, and for adding additional benchmark jobs to the Study once a final count is determined (Completed)
� Aon Hewitt will review the results of the Salary Increase Survey at the next meeting (Completed)
� Aon Hewitt to send SCE a list of the surveys for which we need job descriptions based on the surveys used in the 2012 Study (Completed)
Action items for SCE from April 24 meeting include: � Pat will circulate the proposed list of benefits comparators to the TCS Workshop participants and
provide them three days to respond back with comments (Completed)
– Pat will send a copy of the email she sent to participants to the full Team. There have been no comments from these companies
� SCE will contact LADWP and SMUD to determine if they will provide executive job descriptions or benchmark matches, executive pay data, and executive and salaried Summary Plan Descriptions (SPDs) (In process)
Action items for DRA from April 24 meeting include: � Stacey will provide a contact at the PUC who will determine if PUC will provide data in order to value
benefits and determine executive benchmarking and pay levels (Completed)
– Stacey will send Aon Hewitt the contact information for her contact at PUC
� DRA will review the benchmark job list and provide any additions or deletions by May 1 (Completed)
Methodology Compensation Escalation Factor � Alison described the purpose of the Study escalation factor and the methodology used in the prior
Study to arrive at the factor. She explained that survey market data is published at different points in time during the year and the escalation factor is applied to the survey data to age it to a common date so that an apples-to-apples comparison is made. For example, if market data is effective April 1, and the Study effective date is December 31, the survey data is aged 9 months (April-Dec) using the escalation factor to adjust the survey data to the effective date of the Study.
� At the April 24 meeting, Marek asked Aon Hewitt to look at the escalation factor used in the last PG&E Study. Alison reported that the PG&E Study utilized an escalation factor for the utility industry of 3.3% and that that factor was applied to all jobs. In contrast, the methodology used in the last SCE Study, which was requested by the DRA for that Study, uses a utility industry escalation factor for utility jobs and a general industry escalation factor for general industry jobs. The overall weighted average escalation factor for this Study would be approximately 3.0% for the current SCE Study using this approach.
� Stacey asked why we would not use a utility industry factor for all jobs since SCE is in the utility industry. Alison explained that SCE has a mix of jobs, some which are only found in utilities and some of which are found in general industry. Further, the Team carefully evaluates each job and defines the labor market in which SCE competes in for talent for those jobs. We target the utility labor market for utility jobs and pull market data for utilities to measure the competitive market. Conversely, we pull general industry data to measure the competitive market for general industry jobs. It would be inconsistent and inappropriate to apply a utility escalation factor to general industry data since we are trying to measure SCE’s pay against the general industry for those jobs.
� Marek asked if SCE had the PUC accepted escalation rate. George reported that the rate case labor escalation factor is 2.625%.
May 13, 2013 The GRC Study Team Page 4
4
� Marek said he felt that the PUC approved rate of 2.625% should be utilized in the TCS Study. He said that that rate best represented SCE’s labor costs. Alison asked how the PUC rate was developed.
� George responded that there were a set of factors used to develop the rate including IHS Global Insight data, union contract information, the employment cost index, and the consumer price index.
� Alison commented that the PUC approved rate of increase for SCE’s rate case is not a relevant consideration in developing an escalation factor to age survey market data. The goal of the Study is to accurately measure market practices for benchmark jobs and compare them to SCE’s pay practices to determine how SCE compares to the market. To do that, we must apply an escalation factor based on the change in pay in the market. The rate case labor escalation factor does not reflect the external market practice.
� Marek commented that just as we are using SCE population to derive weights, we should use their rate case escalation factor as accepted by the PUC to adjust the market data. Marek stated that it is DRA’s contention that market data can be aged based on how the PUC has decided that it would age labor at SCE. Alison replied that in that scenario, we would not be measuring the market accurately for purposes of total compensation.
� George agreed that the rate case escalation factor does not measure the rate of increase in the market.
� Stacey agreed, commenting that if we could get all companies to submit data to us effective December 31, 2012 we wouldn’t be having this discussion.
� Marek asked if we could take a break so that he and Stacey could discuss this issue. The Team agreed to a ten minute break.
� After the break, Marek reported that he wanted to table the discussion on the escalation factor so that he could confer with the head of DRA on this issue. He promised to get back to the Team by Friday, May 17 with input.
� Alison suggested that at this point, in order to avoid further delays, the Team determine which approach they would want to take should DRA request that the rate case escalation factor be used and SCE disagrees. She expressed concern that if agreement was not reached on this issue, we would need to reconvene again to have another discussion on this issue.
� Marek indicated that he was unwilling to discuss what approach the Team should take at this point. In the interest of moving forward the Team agreed to move on to the next topic.
Geographic Adjustments � Alison described that SCE’s labor market definitions include Southern California for a number of jobs.
She explained that some of the surveys will not provide market data for Southern California, and in these cases, we’d suggest collecting national data and applying a geographic differential for Southern California. Stacey commented that she recalled this was the approach that was used in the PG&E Study.
� Alison stated that the Team could use the Bureau of Labor Statistics (BLS) data for geographic adjustments. Stacey replied that she felt the BLS data was a good resource. The Team agreed to use BLS data to determine a geographic adjustment factor.
May 13, 2013 The GRC Study Team Page 5
5
Labor Market � At the April 28 meeting, SCE presented a list of 20 positions below the executive level where the
labor market is defined as large national companies ($5B to $20B). These 20 positions represent approximately 8% of incumbents and about 23% of all jobs in the Manager/Supervisory category. SCE also presented, at the request of DRA, hiring data that reported the names and revenue size of companies from which SCE had hired employees for jobs in this category. The hiring data provided by SCE covered an 18 month period from September 2011 which is the point in time that SCE began tracking and saving this information.
� When this data was presented on April 28, Marek objected to using a national labor market and revenue scope and asked that the Team reconvene to review and discuss these jobs.
� Alison recapped the summary of the hiring analysis data provided by SCE. Roughly 53% of incumbents covered in the hiring data for jobs in the Manager/Supervisor category were hired from companies with revenue greater than $5B.
� Marek commented that there was no question in his mind that revenue cuts should not be used except for Executives and possibly Directors because SCE has hired from both large and small companies. He pointed out that while 53% were hired from large companies, 47% were hired from companies with less than $5B in revenue, and therefore a revenue cut should not apply. Marek commented that in the context of a rate case, SCE has to provide justification for its rate increases. He said that the sample size of hiring data is insufficient and SCE would need to provide data for the specific jobs under review.
� Alison commented that SCE would need to have had turnover in these roles in the past 18 months in order to provide data. She asked for confirmation that DRA would exclude the hiring data as well as the input gathered from SCE’s Compensation team about the labor market for these jobs in making a decision.
� Marek responded that he would not agree to a revenue cut based on the information that had been presented.
� Michelle asked what was done in the last Study. Alison replied that the Team went through a similar process of looking at each job and defining the labor market. Considerations included the scope of the job and impact the incumbent would have on rate payers, operations, employees, and budget. Michelle asked if that has changed since the last Study.
� Marek commented that what has changed since the last Study is that third party interveners complained about the use of revenue data for gathering market data and that DRA must be stronger advocates for rate payers than they have been.
� Alison commented that the Study should fairly and accurately provide a comparison of SCE’s pay practices to the market. She agreed that Aon Hewitt would prefer that more hiring data was available, but that the Team should not disregard the data or the input of the SCE team in defining the labor market. She pointed out that the data that was available confirmed that over 50% of individuals hired into Manager/Supervisor jobs in the past 18 months, were hired by companies with revenue in excess of $5B, and that SCE was asking for only 23% of these jobs to use a labor market definition based on revenue.
� Alison suggested we review the job list and asked George to provide an overview of each job’s accountabilities. Marek felt that he needed job descriptions to review the jobs. SCE provided copies of the job descriptions and the Team began to review the jobs. The Team first reviewed the Assistant Treasurer job including job scope and budget. The Team agreed that this job met the criteria for a revenue cut based on significant scope and complexity.
� The Team next discussed the Principal Manager, Distribution Management at length. George reported that this job was accountable for planning and managing construction and maintenance within a region. This job includes customer interaction. Incumbents oversee management of 200-350
May 13, 2013 The GRC Study Team Page 6
6
employees in each region and have about 6 Managers directly reporting to them. George emphasized that these were complex jobs, with significant impact. Stacey agreed that a revenue cut would apply. Marek referred back to the hiring data and pointed out that only one Principal Manager had been hired by a large company. Stacey reminded Marek that the reason we’re reviewing job descriptions is because he did not want to use the hiring data and that we were now trying to evaluate the jobs one by one. Marek commented that the job description does not talk about what size company the employee needs to be hired from. Alison pointed out that that data is almost never included in a written job description and that we have asked the SCE compensation Team to provide that type of information to help us define the labor market. George commented that a similar job at a smaller company would not have similar scope and complexity including responsibility for 200-350 employees. George added that it would be beneficial to ratepayers to hire experienced, capable people into these roles given the impact on operations. Alison asked for input from the Team on whether a revenue cut could be used. Marek stated that he wanted to think about the job and was not prepared to make a decision. Alison expressed concern about the Team’s ability to complete the task of reviewing the jobs if we were unable to evaluate each one and make a decision after reviewing the job documentation and discussing the accountabilities and scope. Stacey too expressed concern and asked Marek if we could agree to use a revenue cut for this job so that we could make productive progress. Marek reiterated that he was not ready to make a decision and that he wanted to discuss the next job. He said he’d like to understand how many direct reports other Manager level employees had before deciding anything. Stacey commented that she didn’t see how the number of people overseen by other Managers was relevant to evaluating this particular job. Alison concurred with Stacey and pointed out that scope and complexity are measured by several factors. For example, staff roles may not have a large number of direct reports, but could be accountable for critical processes or programs so while we would consider direct reports as one factor, it isn’t the only factor that would determine the labor market. Marek reiterated that he was not ready to make a decision about this job and asked to move on to the next job.
� The Team agreed to review the Senior Attorney role. George described the accountabilities for the job and explained that Senior Attorneys were aligned with different business units or groups (i.e., regulatory, labor relations, contracts, etc.). He described input he had gathered from the General Counsel and hiring managers explaining that SCE hires Senior Attorneys almost exclusively from large companies and law firms. They do this because of the risk, exposure and impact of the issues the Senior Attorneys addresses are significant. Pat confirmed that she was aware of Senior Attorneys hired from large companies. George commented that there are two levels of attorney jobs below this one. Marek pointed out that there are 53 incumbents in the role. He acknowledged that we have hiring data for a Senior Attorney indicating the person was hired from a +15B company, but that he did not want to rely on that one data point. Marek felt this was an example where SCE had not provided enough data. Stacey also commented that there wasn’t anything in the job description that talked about the size of the companies candidates were hired from. George stated that that information is not included in job descriptions, and that based on the information he obtained from the General Counsel, he continues to believe that revenue is important. Stacey said she’d be willing to agree with George as long as his comments are noted. Marek disagreed and argued that more data was required to prove that revenue was important because of the large incumbent count of the job. Stacey asked George if he could obtain additional written information on where Senior Attorneys had been hired from, and if he could she would accept that. George agreed to request this information from the General Counsel. The Team agreed that George would request additional data from General Counsel.
� The Team discussed the Principal Manager, HR Strategic Business Team. This is the senior most HR job within a business unit (e.g. SONGS, Customer Service, and Transmission & Distribution) and it requires broad experience to lead initiatives around hiring, training, performance management, and other HR activities for 1,500 to 6,000 employees. The role has 3 to 5 senior professional level jobs reporting to them. It has operational budget and project budget. Stacey commented that she didn’t see anything in the job description that indicated the job would need to be hired from a large

May 13, 2013 The GRC Study Team Page 7
7
company. George described that SCE would not hire someone at the equivalent level (Manager) from a small company. They would have to hire an individual at a more senior level (Vice President or Director) to find someone with the right breadth of experience. He explained that they would hire a Manager from another large company for this job. Marek and Stacey maintained that a revenue cut was not required for this job. Alison asked SCE if they would concede the revenue cut for this job and George said they felt that it was important to reflect market data from a larger company for this job. Alison indicated that since the Team disagreed on this job, that we should now determine what process the Team would use to move forward. She recapped the two options which were either to use the methodology used in the prior Study (revenue cut) or run the analysis using the prior methodology and the proposed DRA methodology. Marek indicated that he wanted to table that decision for now and discuss the next job.
� Pat asked if these were jobs were important to get into the Study. Alison replied yes in order to ensure coverage at this job level. Pat also described her concern that DRA is discounting the input from the SCE Compensation Team members. Michelle also commented that the Team should take into consideration Alison’s input and her experience and expertise in evaluating the labor market.
� Alison reiterated that given that there are some jobs where SCE and DRA are going to disagree on the labor market definition, that it would be necessary to determine what approach we will agree to take to resolve the discrepancy. She suggested that reviewing each job was not productive if we could not come to agreement on the jobs and would not agree to a path to resolution. She reiterated that the Team was spending significant time on a very small number of jobs and incumbents and that if agreement was not going to be reached, the most productive path for the Team was to agree to disagree and determine what reporting approach they would use to resolve the impasse.
� Marek disagreed. He said he wanted to continue to go through the review of each job and was unprepared to agree to the process we would take to resolution at this point. He also reported that he wanted to make sure that we were going to break out the Director, Manager, and Supervisor groups in the Study report. Alison expressed surprise at this request and indicated that this was the first time she recalled Marek making this request. Marek explained that that was the approach that had been used in the PG&E Study and he wanted to take the same approach.
� Pat added that breaking out the categories would only add more change to the Study without adding value.
� Stacey asked Marek what the point of breaking out the managers would be. She reminded Marek that the reason the Directors were broken out in the PG&E Study was because PG&E and Mercer didn’t evaluate each job to determine if a revenue cut was required the way we are doing in the SCE Study. She elaborated that it would be of little value to have another meeting on this topic and that we should be able to come to consensus as a Team. She accepted that the SCE Compensation team was here to provide expertise about the jobs and if SCE is willing to document that most of the Senior Attorneys came from large companies that she would agree to using a revenue cut for that job. Stacey explained that she had read through all of the job descriptions (some of which she did during the discussion) and felt that SCE may have justified the use of a revenue cut for many of the remaining positions, with the exception of the three nuclear positions. Because we had only been able to come to agreement on two jobs during the 90 minute plus discussion, she felt that the Team needed to make more progress and/or determine acceptable compromises. Marek suggested that the Team had been too casual in their review of the jobs and that he required more time.
� George and Mark asked if the Team could take a ten minute break. The Team agreed. When the Team reconvened, George explained that this Team was commissioned to do a joint study between SCE and DRA with a third party vendor and that our inability to reach consensus was problematic. He felt that we should work together as much as possible to ensure a Study that meets all parties needs. In the interest of moving forward, SCE would agree to use revenue cuts for Director and above jobs and would agree to use local data or utility data for Principal Managers. The one exception is the
May 13, 2013 The GRC Study Team Page 8
8
Senior Attorneys for which SCE will work to provide more data on hiring practices. DRA agreed to this approach.
Estimated Impact Timing and Fees � Alison outlined the changes in methodology the Team had agreed to and outlined the estimated
timing and fee impact on the Study. She asked for approval from the Team to move forward with this work. The Team agreed.
Survey Cuts � Alison reviewed the proposed compensation survey “cuts” to match market definitions. The Team
agreed to the data cuts. Aon Hewitt will send a data request to SCE for the survey data.
Timeline � Alison reviewed the revised meeting schedule and the Team agreed on future meeting dates.
Michelle to send calendar invites for these meetings.
Next Steps and Follow-Ups DRA � Marek will discuss the escalation factor with others at DRA and will provide feedback to the Team on
DRA’s position by May 17.
SCE � George will submit a request to the General Counsel for hiring data on Senior Attorneys and will
respond to the Team by May 24.

Consulting | Broad-Based Compensation Proprietary & Confidential 1
Date: June 5, 2013
To: The GRC Study Team (the Team)
From: Alison Peterson, Aon Hewitt
Subject: Meeting Notes, June 5, 2013; Revised July 8, 2013
Meeting Attendees Name Organization
Marek Kanter Division of Ratepayers’ Advocates (DRA) Stacey Hunter DRA Pat Adams Southern California Edison (SCE) Mark Bennett SCE – Videoconference George DeMaria SCE – Videoconference Stephen Lumel SCE – Videoconference Michelle Ricard SCE Chelsea Penaloza Aon Hewitt – Videoconference Alison Peterson Aon Hewitt The Team met at Southern California Edison’s (SCE) offices in San Francisco (Kanter, Hunter, Adams, Ricard & Peterson), and by videoconference in Rosemead (Bennett, DeMaria, Lumel & Penaloza).
Discussion Items � Alison described the benchmarking meeting process and the process for selecting benchmark jobs
for this validation meeting.
� The Team confirmed there were no changes to the May 13 meeting notes.
Open action Items for Aon Hewitt from April 8 meeting: � Contact participants in the benefits comparator group who did not provide plan information on
executive plans to determine if they will submit information. Allow three weeks to confirm participation. (Completed)
– Ten of 16 of these companies agreed to submit data.
– Marek asked for clarification about how the peer group would be used and Alison described that the benefits peer group that had been reviewed and approved at prior meetings would be used to value benefits for all jobs. Aon Hewitt is collecting the executive benefits from these companies so that we would be able to cover the executive jobs also.
– Marek did not recall that this would be the approach. He asked Stacey if she understood that the benefits peer group would be used for all employee groups. She did not recall that either.
– Alison explained that we were using the same peer group for benefits valuations that was used in the last Study. She mentioned that this group had also been vetted by Pat with the participants in the Total Compensation Workshop that was conducted in January. She confirmed with Marek that he was not clear that the same peer group would be used for executives and non-executive jobs.

June 5, 2013 The GRC Study Team Page 2
2
– Alison further described that from this list, Aon Hewitt’s benefits valuation team will provide calculations for utility jobs and general industry jobs below the executive level. Then the utility valuations would be applied to jobs that had been designated as utility benchmarks and the general industry data to jobs that had been designated as general industry. The executives would use the combined peer group as had been done in the last Study, at DRA’s request.
– Stacey asked about executive pay and thought that we’d using general survey data for pay for those jobs rather than data based on revenue scope. Marek said that the Team had agreed to using revenue based data for the executive jobs and that he was more concerned about using the same group of companies for the benefits valuations for both executives and non-executives. He would like to see the benefits peer group cover a broader set of companies.
– Alison offered to go back to review the meeting notes if there was a disconnect. She provided Stacey and Marek with a copy of the peer group for their review.
– Marek asked about data sources. Alison described that we had selected companies from the Aon Hewitt benefits database for use in valuing benefits. The companies need to submit their benefits data to the database in order to be included. She reminded Marek and Stacey that that was why we were currently soliciting SMUD and PUC to provide their benefits information so they could be included in the Study.
– Marek commented that he thought it might be beneficial to add more companies to the comparator group in order to get a better representation of the general industry. He felt adding 10 utility companies and 10 general industry companies would be sufficient. Alison responded that it would not be hard, but it would extend the time and cost to value the benefits to add companies. She said that the benefits team had already started the process of valuing benefits and that if the Team felt we needed to revisit the peer group we should consider putting a hold on the work so that it does not have to be redone. She offered to gather input on the time and cost associated with adding companies.
– Marek explained that he needed a few days to think about this and promised to provide feedback to the Team via email by Friday, June 7.
– Marek asked if we could compare companies that participate in the compensation surveys to the list of the benefits comparator group to determine how much overlap there is. Alison said that if the participants lists were in an excel file in a comparable format that we could create a comparison fairly quickly. However, she felt it was likely that at least some of the surveys would require manual compilation of the participant lists which would be a timing consuming process. She asked George if he would be able to provide the lists of participants from all the surveys. George agreed to distribute those to the Team.
– Mark asked the Team to think about expanding the peer group and that we’d need to determine if there was value to doing so given that it would increase the cost of the Study and extend the time line.
Open action items for SCE from April 8 meeting: � Pat will circulate the proposed list of benefits comparators to the TCS Workshop participants and
provide them three days to respond back with comments. (Completed)
Open action items for Aon Hewitt for April 24 meeting: � Once SCE has contacted LADWP, SMUD and PUC and confirmed their willingness to participate in
providing executive pay data and benefits data, Aon Hewitt will follow-up with those companies to facilitate the collection of data. (Completed)
– As of Friday, Aon Hewitt had received data from all three companies, but as it just came in, there is some follow-up work on both the benefits and compensation data.
Action items from May 13 meeting: � Marek will discuss the escalation factor with others at DRA and will provide feedback to the Team on
DRA’s position by May 17. (Completed)
June 5, 2013 The GRC Study Team Page 3
3
– Stacey responded via email reporting that DRA would like the Team to use the 2.65% approved labor escalation factor.
– Alison had replied with a recommendation that we pull a utility-specific cut from our database and no one responded to that email. Marek responded that DRA has said what they needed to say on this matter.
– George said that if DRA has stated their position then he didn’t see the value of doing the custom analysis.
– Alison replied that there is value in using a compensation escalation factor to age compensation data. That this is a best practice and the approach that is used in every compensation study that Aon Hewitt completes.
– George and Mark agreed that Aon Hewitt should conduct a custom analysis to extract only data from the utility group.
– Aon Hewitt will conduct this analysis and share the results with the Team.
� George will submit a request to General Counsel for hiring data on Senior Attorneys and will respond to the Team by May 24. (Completed)
– George responded that the General Counsel did some research from the last 10 years, and only hired three externally at this level. He reported that the rest of the employees in the Senior Attorney job were promoted from the lower level Attorney job. Those individuals came to SCE almost exclusively from commercial law firms. In the three cases where the hires were external, one was from a $15B company and the other two were from commercial law firms.
– Marek asked if they knew what the revenue was for these law firms. George responded that they would not be of comparable size to the $5B to $20B scope we have been using. He explained that in the case of the Senior Attorneys at commercial law firms, they need to be able to provide legal counsel on complex issues to very large clients.
– Alison commented that this is similar to consulting companies. Aon Hewitt’s revenues are about $3B, but our consultants lead projects at all different sized companies including very large companies.
– Marek responded that he felt we should not use a revenue cut for these jobs if we could not confirm that employees are hired from companies with greater than $5B in revenue.
– George responded that it would be preferable to get market data from a survey that includes the commercial law firms from which they recruit. He said he had done some research to determine if that data was available but could not locate a survey with those parameters.
– Alison suggested that if we were unable to get survey data for commercial law first, that an alternative was to drop this job as a benchmark in the Study since we couldn’t accurately reflect the labor market for these jobs. Marek agreed that this approach makes sense.
– Aon Hewitt will check to see if there is data available for commercial law firms and will report results to the Team. If that data is not available, we will drop the job from the Study.
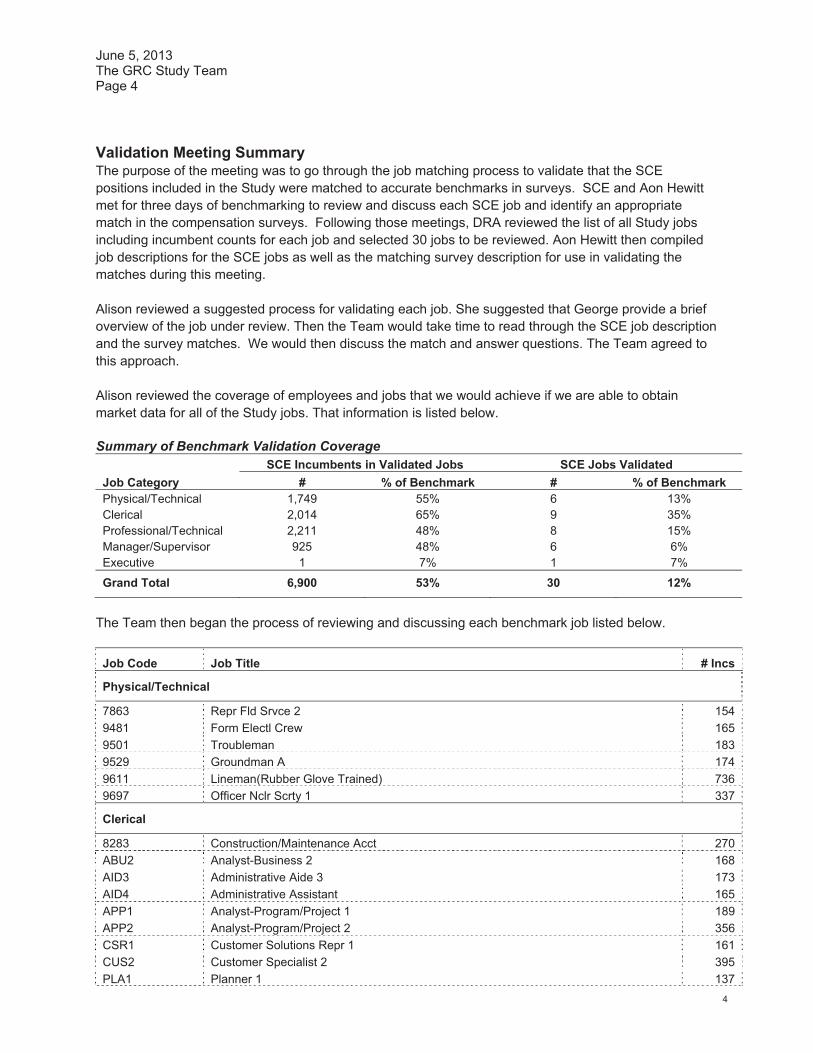
June 5, 2013 The GRC Study Team Page 4
4
Validation Meeting Summary The purpose of the meeting was to go through the job matching process to validate that the SCE positions included in the Study were matched to accurate benchmarks in surveys. SCE and Aon Hewitt met for three days of benchmarking to review and discuss each SCE job and identify an appropriate match in the compensation surveys. Following those meetings, DRA reviewed the list of all Study jobs including incumbent counts for each job and selected 30 jobs to be reviewed. Aon Hewitt then compiled job descriptions for the SCE jobs as well as the matching survey description for use in validating the matches during this meeting.
Alison reviewed a suggested process for validating each job. She suggested that George provide a brief overview of the job under review. Then the Team would take time to read through the SCE job description and the survey matches. We would then discuss the match and answer questions. The Team agreed to this approach.
Alison reviewed the coverage of employees and jobs that we would achieve if we are able to obtain market data for all of the Study jobs. That information is listed below.
Summary of Benchmark Validation Coverage SCE Incumbents in Validated Jobs SCE Jobs Validated Job Category # % of Benchmark # % of Benchmark Physical/Technical 1,749 55% 6 13% Clerical 2,014 65% 9 35% Professional/Technical 2,211 48% 8 15% Manager/Supervisor 925 48% 6 6% Executive 1 7% 1 7%
Grand Total 6,900 53% 30 12%
The Team then began the process of reviewing and discussing each benchmark job listed below.
Job Code Job Title # Incs
Physical/Technical
7863 Repr Fld Srvce 2 154 9481 Form Electl Crew 165 9501 Troubleman 183 9529 Groundman A 174 9611 Lineman(Rubber Glove Trained) 736 9697 Officer Nclr Scrty 1 337
Clerical
8283 Construction/Maintenance Acct 270 ABU2 Analyst-Business 2 168 AID3 Administrative Aide 3 173 AID4 Administrative Assistant 165 APP1 Analyst-Program/Project 1 189 APP2 Analyst-Program/Project 2 356 CSR1 Customer Solutions Repr 1 161 CUS2 Customer Specialist 2 395 PLA1 Planner 1 137
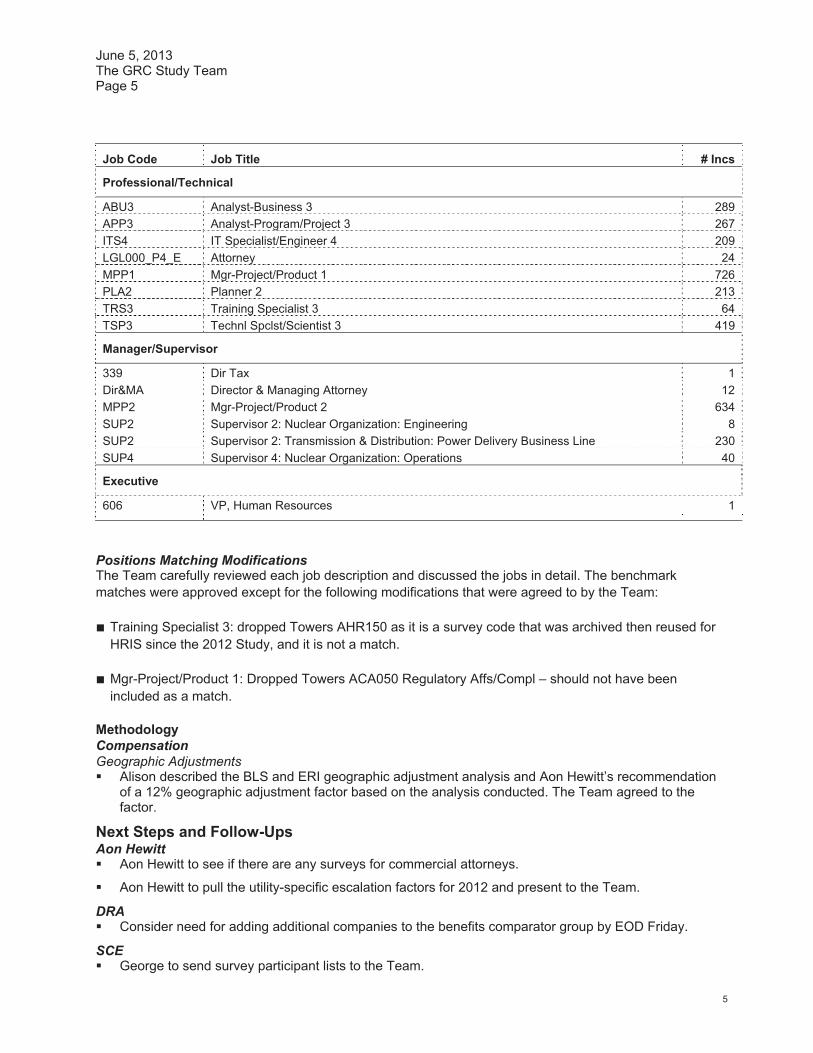
June 5, 2013 The GRC Study Team Page 5
5
Job Code Job Title # Incs
Professional/Technical
ABU3 Analyst-Business 3 289 APP3 Analyst-Program/Project 3 267 ITS4 IT Specialist/Engineer 4 209 LGL000_P4_E Attorney 24 MPP1 Mgr-Project/Product 1 726 PLA2 Planner 2 213 TRS3 Training Specialist 3 64 TSP3 Technl Spclst/Scientist 3 419
Manager/Supervisor
339 Dir Tax 1 Dir&MA Director & Managing Attorney 12 MPP2 Mgr-Project/Product 2 634 SUP2 Supervisor 2: Nuclear Organization: Engineering 8 SUP2 Supervisor 2: Transmission & Distribution: Power Delivery Business Line 230 SUP4 Supervisor 4: Nuclear Organization: Operations 40
Executive
606 VP, Human Resources 1
Positions Matching Modifications The Team carefully reviewed each job description and discussed the jobs in detail. The benchmark matches were approved except for the following modifications that were agreed to by the Team:
� Training Specialist 3: dropped Towers AHR150 as it is a survey code that was archived then reused for HRIS since the 2012 Study, and it is not a match.
� Mgr-Project/Product 1: Dropped Towers ACA050 Regulatory Affs/Compl – should not have been included as a match.
Methodology Compensation Geographic Adjustments � Alison described the BLS and ERI geographic adjustment analysis and Aon Hewitt’s recommendation
of a 12% geographic adjustment factor based on the analysis conducted. The Team agreed to the factor.
Next Steps and Follow-Ups Aon Hewitt � Aon Hewitt to see if there are any surveys for commercial attorneys.
� Aon Hewitt to pull the utility-specific escalation factors for 2012 and present to the Team.
DRA � Consider need for adding additional companies to the benefits comparator group by EOD Friday.
SCE � George to send survey participant lists to the Team.
Consulting | Broad-Based Compensation Proprietary & Confidential 1
Date: June 25, 2013
To: The GRC Study Team (the Team)
From: Alison Peterson, Aon Hewitt
Subject: Meeting Notes, June 25, 2013; Revised July 8, 2013
Meeting Attendees Name Organization
Marek Kanter Division of Ratepayers’ Advocates (DRA) Stacey Hunter DRA Pat Adams Southern California Edison (SCE) Mark Bennett SCE – Videoconference George DeMaria SCE – Videoconference Stephen Lumel SCE – Videoconference Michelle Ricard SCE Chelsea Penaloza Aon Hewitt – Videoconference Alison Peterson Aon Hewitt The Team met at Southern California Edison’s (SCE) offices in San Francisco (Kanter, Hunter, Adams, Ricard & Peterson), and by videoconference in Rosemead (Bennett, DeMaria, Lumel & Penaloza).
Discussion Items � Alison outlined the agenda items for the meeting and reviewed the materials that were sent out in
advance. Agenda and materials included:
– Review/comment on June 5 meeting notes
– Report on status of compensation and benefits data collection and analysis
• Aon Hewitt received final data from SMUD and PUC on Monday, June 24. We extended the due date as long as possible to allow inclusion of these companies in the benefits valuation and as a result we are a few weeks behind on valuing benefits for these organizations. We continue to work toward getting the valuations done in time for the July 10 meeting.
– Present results of Utility Industry salary escalation factor analysis
– Update on availability of commercial law data for Attorneys
• Aon Hewitt was not able to identify a survey source that contained commercial law firm data. The Team agreed to drop this job from the benchmark list since we are not able to find data that reflects the best labor market.
– Review preliminary base salary and total cash compensation results (excluding executives)
� The Team confirmed there were no changes to the May 13 meeting notes.

June 25, 2013 The GRC Study Team Page 2
2
Methodology Compensation Escalation Factor � Alison reviewed the weighted average compensation escalation factor using the utility and general
industry data. It is 2.7% which is just slightly higher than the General Rate Case (GRC) escalation factor recommended by DRA of 2.625%.
� Marek and Stacey confirmed that DRA wants to use the GRC factor. Marek indicated that DRA would not support the TCS results otherwise.
� Alison explained that Aon Hewitt can not support the use of the GRC factor as it is not a measure of the movement of compensation data in the market. The compensation escalation factor is the most reliable way to measure market movement.
� Alison asked SCE what their point of view was on the use of the GRC factor. George stated that from a methodology perspective, SCE agrees that the compensation escalation factor is most appropriate.
� Alison offered that if the Team can’t come to agreement, that we pick a factor and include a disclosure in the Study report describing the issue.
� Pat explained that she felt this was an issue that required discussion with SCE and that she would review the escalation factor alternatives with her manager. She will report back to the Team at the next meeting.
Discussion Preliminary Compensation Results Executive Summary � Alison described the coverage statistics and overall position of SCE to the market. The Study covered
230 benchmark jobs, and data was available for 212 of those jobs. Incumbent coverage is up from 65.8% in the 2012 Study to 75.7% in the current Study.
� The Team did not have any questions on the coverage statistics � Alison explained that overall, SCE is -3.5% to the market on base salary and -4.0% to the market on
total cash compensation. She reminded the Team that this excludes the executive data which will be added in and reviewed at the next meeting.
� The biggest changes in Study results were for the Clerical category which went from -9.5% on base pay in the 2012 Study to -0.5% in the current Study and the Professional/Technical category which went from -1.2% of base pay to -10.9% in the current Study. Alison indicated that we can’t isolate the drivers of change in the categories because there are several possible variables contributing to the change including the change in labor market definitions requested by DRA, the use of the incumbent weighted average methodology for determining the market rate of pay requested by the DRA, and the change in market pay over the past three years. Unless we decided to replicate the methodology used in the 2012 Study, we don’t have a consistent basis for comparing the results to understand what is driving the change. Alison pointed out that the Physical/Technical category results were about the same between the two Studies and this was the one category where the labor market definition stayed the same. Therefore, she concluded that the labor market definition changes are probably the largest contributor to the differences in results between the two Studies.
� Marek asked for clarification of whether the Physical/Technical group labor market definition was the same for both Studies. Alison explained that this group used national data in both the last Study and this Study while the other groups moved from a custom comparator group in the last Study to an all companies/national comparison.
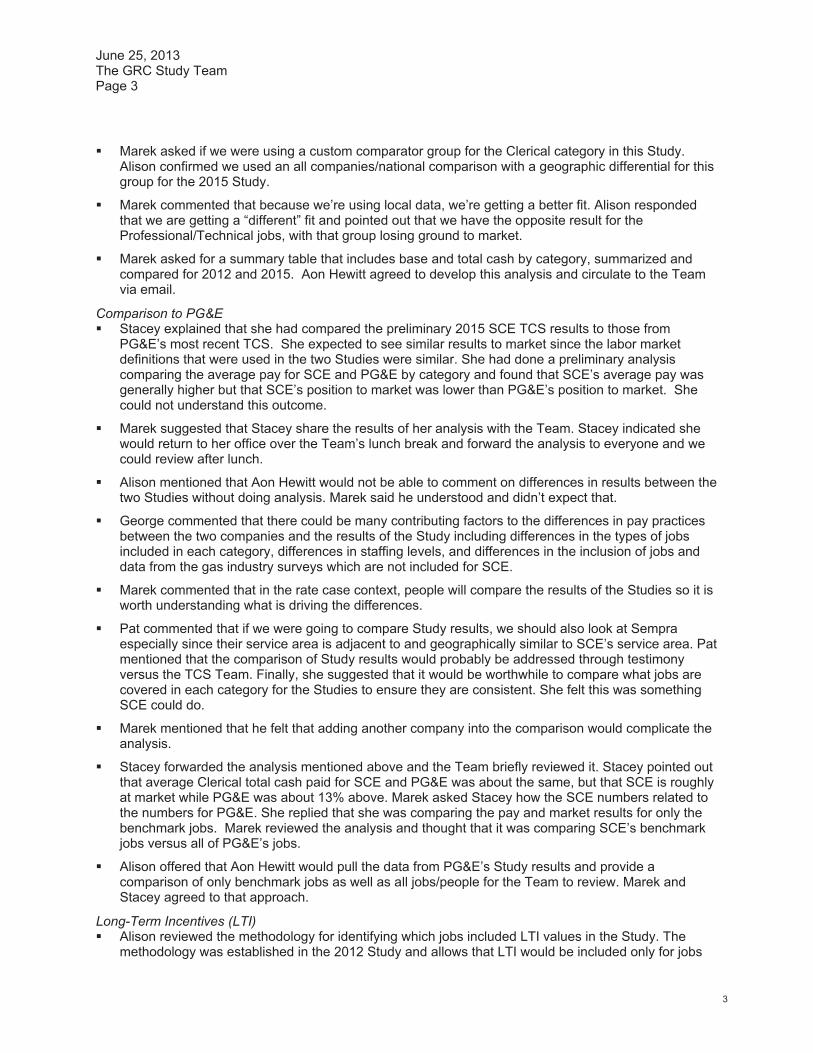
June 25, 2013 The GRC Study Team Page 3
3
� Marek asked if we were using a custom comparator group for the Clerical category in this Study. Alison confirmed we used an all companies/national comparison with a geographic differential for this group for the 2015 Study.
� Marek commented that because we’re using local data, we’re getting a better fit. Alison responded that we are getting a “different” fit and pointed out that we have the opposite result for the Professional/Technical jobs, with that group losing ground to market.
� Marek asked for a summary table that includes base and total cash by category, summarized and compared for 2012 and 2015. Aon Hewitt agreed to develop this analysis and circulate to the Team via email.
Comparison to PG&E � Stacey explained that she had compared the preliminary 2015 SCE TCS results to those from
PG&E’s most recent TCS. She expected to see similar results to market since the labor market definitions that were used in the two Studies were similar. She had done a preliminary analysis comparing the average pay for SCE and PG&E by category and found that SCE’s average pay was generally higher but that SCE’s position to market was lower than PG&E’s position to market. She could not understand this outcome.
� Marek suggested that Stacey share the results of her analysis with the Team. Stacey indicated she would return to her office over the Team’s lunch break and forward the analysis to everyone and we could review after lunch.
� Alison mentioned that Aon Hewitt would not be able to comment on differences in results between the two Studies without doing analysis. Marek said he understood and didn’t expect that.
� George commented that there could be many contributing factors to the differences in pay practices between the two companies and the results of the Study including differences in the types of jobs included in each category, differences in staffing levels, and differences in the inclusion of jobs and data from the gas industry surveys which are not included for SCE.
� Marek commented that in the rate case context, people will compare the results of the Studies so it is worth understanding what is driving the differences.
� Pat commented that if we were going to compare Study results, we should also look at Sempra especially since their service area is adjacent to and geographically similar to SCE’s service area. Pat mentioned that the comparison of Study results would probably be addressed through testimony versus the TCS Team. Finally, she suggested that it would be worthwhile to compare what jobs are covered in each category for the Studies to ensure they are consistent. She felt this was something SCE could do.
� Marek mentioned that he felt that adding another company into the comparison would complicate the analysis.
� Stacey forwarded the analysis mentioned above and the Team briefly reviewed it. Stacey pointed out that average Clerical total cash paid for SCE and PG&E was about the same, but that SCE is roughly at market while PG&E was about 13% above. Marek asked Stacey how the SCE numbers related to the numbers for PG&E. She replied that she was comparing the pay and market results for only the benchmark jobs. Marek reviewed the analysis and thought that it was comparing SCE’s benchmark jobs versus all of PG&E’s jobs.
� Alison offered that Aon Hewitt would pull the data from PG&E’s Study results and provide a comparison of only benchmark jobs as well as all jobs/people for the Team to review. Marek and Stacey agreed to that approach.
Long-Term Incentives (LTI) � Alison reviewed the methodology for identifying which jobs included LTI values in the Study. The
methodology was established in the 2012 Study and allows that LTI would be included only for jobs
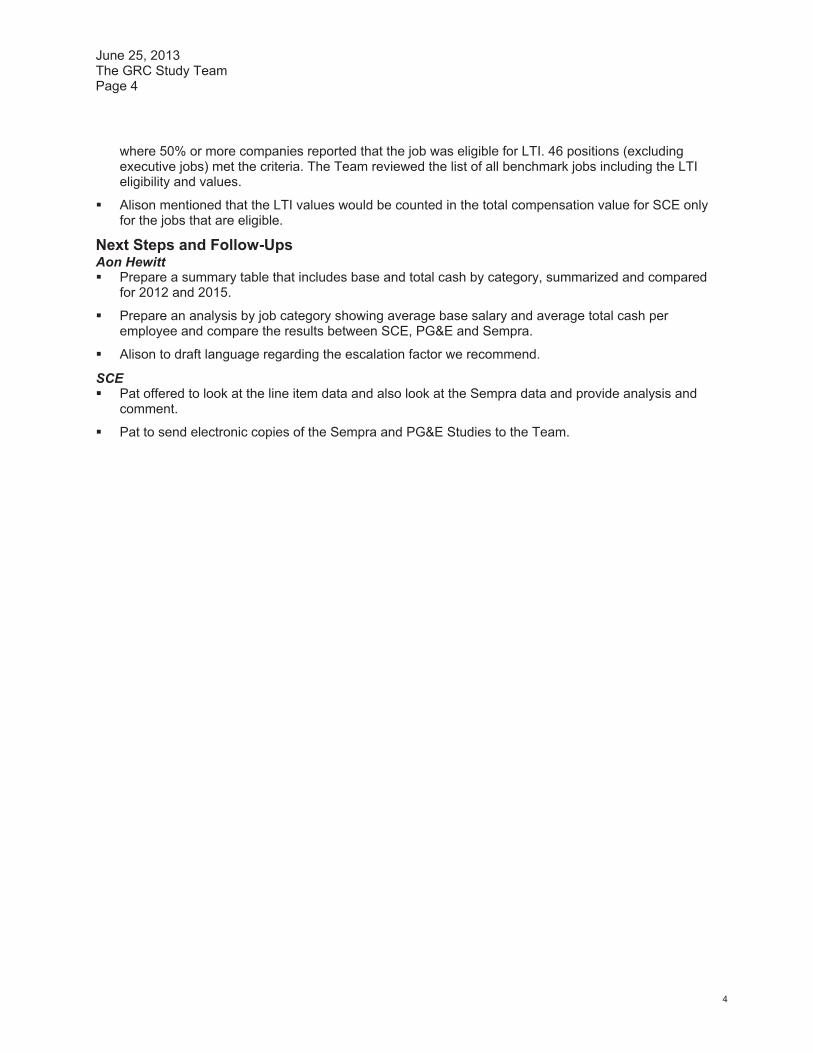
June 25, 2013 The GRC Study Team Page 4
4
where 50% or more companies reported that the job was eligible for LTI. 46 positions (excluding executive jobs) met the criteria. The Team reviewed the list of all benchmark jobs including the LTI eligibility and values.
� Alison mentioned that the LTI values would be counted in the total compensation value for SCE only for the jobs that are eligible.
Next Steps and Follow-Ups Aon Hewitt � Prepare a summary table that includes base and total cash by category, summarized and compared
for 2012 and 2015.
� Prepare an analysis by job category showing average base salary and average total cash per employee and compare the results between SCE, PG&E and Sempra.
� Alison to draft language regarding the escalation factor we recommend.
SCE � Pat offered to look at the line item data and also look at the Sempra data and provide analysis and
comment.
� Pat to send electronic copies of the Sempra and PG&E Studies to the Team.
Consulting | Broad-Based Compensation Proprietary & Confidential 1
Date: July 10, 2013
To: The GRC Study Team (the Team)
From: Alison Peterson, Aon Hewitt
Subject: Meeting Notes, July 10, 2013; Revised September 5, 2013
Meeting Attendees Name Organization
Marek Kanter Division of Ratepayers’ Advocates (DRA) Stacey Hunter DRA Pat Adams Southern California Edison (SCE) – Videoconference Mark Bennett SCE – Videoconference George DeMaria SCE – Videoconference Michelle Ricard SCE Kathy Miller Aon Hewitt – Teleconference Chelsea Penaloza Aon Hewitt – Videoconference Alison Peterson Aon Hewitt The Team met at Southern California Edison’s (SCE) offices in San Francisco (Kanter, Hunter, and Ricard), by videoconference in Rosemead (Bennett, DeMaria, Adams, Murphy, Peterson, and Penaloza), and by teleconference (Miller).
Discussion Items � Alison outlined the agenda items for the meeting and reviewed the materials that were sent out in
advance. Agenda and materials included:
– Finalize June 5 and June 25 meeting notes
– Recap of follow up items from June 25 meeting
– Present summary table comparing 2012 and 2015 Study base salary and total cash by job category as requested by Marek
– Present comparison on SCE 2015 TCS Study to PG&E 2014 TCS Study as requested by Stacey
– Present preliminary results of benefits valuation (excluding executives)
– Present preliminary total compensation summary (excluding executives)
– Discuss next steps
� The Team confirmed there were no changes to the June 5 and June 25 meeting notes.
July 10, 2013 The GRC Study Team Page 2
2
Open action Items for Aon Hewitt from June 25 meeting: � Prepare a summary table that includes base and total cash by category summarized for 2012 and
2015 (completed)
– Alison described the analysis to the Team and highlighted a few points. The Team did not have any comment at this time and Marek felt the analysis met his request.
� Prepare an analysis by job category for SCE’s preliminary 2015 base salary and total cash and PG&E’s 2014 Study base salary and total cash per employee and compare results (completed)
– Alison briefly reviewed the summary analysis conducted by Aon Hewitt. Stacey observed that for the Clerical group, PG&E’s in-study pay practices are higher but the in-study market pay is lower. Pat commented that more analysis needed to be conducted to determine what is driving the differences. For example, she explained that she had reviewed the list of benchmark positions between the two Studies and had found several differences.
– Marek asked Stacey if the analysis was consistent with the comparison she had done and presented at the last meeting. Stacey agreed it was consistent, and also agreed with Pat’s comment that the mix of jobs could be different. She further commented that she had briefly reviewed the benchmark matches between the two Studies and could not find many in common. She felt that there should be some consistency.
– Alison asked for clarification regarding what Stacey meant by a benchmark match. Stacey responded that she had looked at the survey benchmarks used for SCE and PG&E and there weren’t many commonalities between the benchmark matches.
– Alison reminded the Team that we reviewed a sample of the benchmark jobs in our validation process to validate the benchmarks. Alison further commented that Aon Hewitt is happy to help in further analysis but was limited in what could be done unless we had more information about the PG&E Study. Stacey and Marek agreed and said they’d review the analysis in further detail and let the Team know if they had any questions.
� Alison to draft disclosure on escalation factor (in process)
– George stated that SCE felt the correct methodology to use for determining the escalation factor was to use the factor obtained from the Salary Increase Survey (SIS) results that reflects changes in compensation in the market. He pointed out that the difference between the SIS escalation factor of 2.7% and the DRA’s recommended escalation factor of 2.625% which is the factor approved for use in the GRC, was small. He pointed out that the acceptable margin of error reported for the Study is +/- 5% and that the difference in the two escalation factors was well within these limits. As a result, George explained that SCE would agree to the 2.625% factor recognizing that it was close enough to the market factor to be representative.
� Adjust escalation factor from 2.65% to 2.625% (completed).
� Finalize executive pay data (in process)
Open action Items for SCE from June 25 meeting: � Pat to send electronic copies of PG&E’s 2014 TCS Study and Sempra’s last Study to the Team
(completed)
� Pat to discuss the comparison of SCE’s TCS results to PG&E’s and Sempra’s results with SCE GRC team and provide feedback
– Pat commented that SCE and PG&E have differences in the mix of jobs by category, and that SCE could conduct an analysis by job if there is an appetite for that, but it would require research.
July 10, 2013 The GRC Study Team Page 3
3
Discussion Benefit Valuations � Blake described the non-executive benefits valuation overview including highlights in changes in
methods and assumptions from the 2012 Study. � Blake explained benefits are calculated as a percent of pay for pay-related benefits (i.e., pension,
401(k), life and disability) and dollar amounts for non-pay-related benefits (i.e., healthcare). To arrive at the benefit values, total pay is multiplied by the pay-related percent of pay calculation and then the non-pay-related dollar amount is added. He then reviewed examples of these calculations.
� Blake summarized that benefits for non-executives compared to utility industry peers were 5% to 10% below market, depending on job category and pay level. In contrast, benefits for non-executives compared to general industry peers are 15% to 25% above market.
� PTO follows a different pattern. PTO benefits are above market when compared to utilities and below market when compared to general industry.
Medical � Some changes in practices and program design between the 2012 and 2015 Studies will increase
medical values. How companies respond to those increased costs will influence the employer-paid share. Some companies will increase the employee’s share of costs while other companies will assume the increase and not pass it on to employees. Changes that impacted the value of medical benefits between the 2012 and 2015 Studies include:
– Medical inflation increased costs by 30% to 40%.
• Everyone has higher medical costs than before. All medical values are higher than 3 years ago.
– The percentage of employees opting out of SCE’s medical coverage has dropped from the 2012 Study. Since we apply SCE demographics and experience to value the peer group also, the reduction in opt-outs is reflected in both SCE’s results and the market.
• More people are participating in the medical plans which will raise the costs.
– Use of various accounts (HSA/HRA)
• Some companies put money into these accounts for employees. These company contributions are used first. As a result, the company is really paying for first dollar of medical expense vs. the employee paying for it.
� These assumptions are applied to all plans.
� Changes that will decrease medical values include:
– Plan changes. Some employers have increased copays, deductibles, and out-of-pocket limits.
– Some employers increased surcharges, (smokers, and spousal coverage).
� SCE has a very high enrollment in HMOs compared to other companies. This tends to lower SCE’s medical costs compared to the peer companies. Almost 80% of SCE employees are in HMOs, while about 20% of employees at utility peer companies and about 35% of employees at general industry peer companies enrolled in HMOs.
– HMOs have lower costs compared to PPOs, POS, etc. Therefore because SCE has a higher percentage of employees enrolled in these lower cost plans, SCE’s medical costs tend to be lower than those of the peer companies.
Retirement � Changes that will increase pension values include:
July 10, 2013 The GRC Study Team Page 4
4
– SCE’s discount rate was used to value the retirement benefits for all companies. SCE reduced its discount rate from 6.25% in the 2012 study to 4.5% in the 2015 study to reflect the reduction in interest rates in the general market. A lower discount rate means more dollars have to be set aside today to “pay for” a future benefit.
� Marek commented that in 2009, when preparing the 2012 Study, it was very reasonable to expect lower interest rates in the future. But today it seems that it is more difficult to expect low rates to continue and that many people are expecting interest rates to increase. Blake agreed in principle and explained that for a variety of purposes, actuarial valuations are based on current rates and not a forecast of how rates might change in the future.
– SCE’s salary increase assumption was also used to value the retirement benefits for all companies.
• SCE’s salary increase assumption decreased from 5.0% in the prior study to 4.5% in this study which lowers pension costs for benefits related to pay. This partially offsets the impact of the lower discount rate.
Plan Design Changes � Plan design changes for each peer group were reviewed. Plan designs in both groups of peer
companies stayed relatively constant between the 2012 and 2015 Studies. Blake reviewed the plan design information with the Team.
Illustration of Benefit Calculations � The team reviewed sample benefit calculations for each of the 4 job categories compared to each
peer group. The calculations compared benefit values for SCE versus the peer group at different pay levels. They also compared changes in values between the 2012 and 2015 Studies.
� Marek asked if there was a cut-off for illustrating 3 pay levels (high, medium, and low) versus 2 pay levels (high and low). Blake explained that Manager/Supervisor and Professional/Technical job categories consisted of a wider range of pays while pay ranges for Physical/Technical and Clerical job categories are smaller. Showing values at a middle range would not be meaningful.
� Stacey asked how the charts on pages 7-14, which show benefits values by pay level for each job category, correlate to the summary chart which shows consolidated results.
� Blake explained that benefit values on the charts on pages 7-14 are based a fixed pay sample that is the average pay for all jobs in that employee group. The consolidated results cover all jobs in the Study. Factoring in differences in pay can either augment a benefit value difference or moderate that difference when combined in total compensation.
Paid Time Off (PTO) � In the past, no explicit value has been added for PTO. Some portion of PTO is used during the year,
while unused PTO may be paid out after an employee leaves depending on the company you work for, and/or the state you work in. In the 2015 Study, at the DRA’s request, we attempted to assign a value to the incremental PTO benefit which the employee would get paid out if they left the Company.
� We found that SCE’s time off program provided more days, and therefore additional “compensation” than the utility industry peers (1.2% to 1.4% of pay, compared to 0.8% of pay), but fewer days and therefore less compensation than the general industry peers (1.8% of pay). If a job in the Study was deemed to be a utility comparator, we applied the utility valuation to the market. If a job was deemed to be a general industry comparator, we applied the general industry valuation to the market. The combined result moved SCE closer to the market overall.
Total Compensation by Category, Excluding Executives � Marek asked for clarification on when Long-term-incentives (LTI) were included in the Study.
� Alison recapped the methodology that we only include LTI when 50% or more companies reported that a job was eligible for LTI. She further commented that this was a conservative cut-off factor for
July 10, 2013 The GRC Study Team Page 5
5
including LTI in the market that probably meant that the value of LTI in the market was understated and therefore would move Edison’s value relative to market higher. She mentioned that there are more jobs that have some LTI eligibility in the market but since we established a 50% threshold we are excluding those LTI values from the Study results.
� Marek said he could not automatically agree with this conclusion and needed to consider it further.
� Stacey commented that excluding LTI from the Study would deflate SCE’s total compensation value. Alison agreed that if a lower threshold were established for including LTI values, more benchmark jobs would include LTI values. She mentioned that since SCE does not extend eligibility for LTI below the executives, there are a number of jobs in the Manager/Supervisor and Professional/Technical categories that have market LTI values that are being excluded. She went on to explain that Aon Hewitt believes it is methodologically appropriate to exclude some of the LTI values because even when a market value for LTI is reported in the surveys, not all employees in that job receive LTI.
� Marek offered that after this discussion, he agreed with the conclusion that the LTI approach did result in SCE’s total compensation values being lower to market than they would be if we allowed more LTI market values to be included.
Next Steps and Follow-Ups Aon Hewitt � Finalize executive cash, benefits, and total compensation analysis and commentary and integrated
into the analysis by Wednesday, July 17 for a team review on July 22. � After the July 22 meeting, Aon Hewitt will begin drafting the report and distribute to the Team for
review. The Team will then return any minor edits to Aon Hewitt, but more significant changes will be reviewed, discussed and confirmed in a Team meeting.
� Aon Hewitt will package and distribute the consolidated meeting notes for comment before sending the draft report. This will allow the Team time to review and make final edits so we can complete that portion of the Study report early on.

Consulting | Broad-Based Compensation Proprietary & Confidential 1
Date: July 22, 2013
To: The GRC Study Team (the Team)
From: Alison Peterson, Aon Hewitt
Subject: Meeting Notes, July 22, 2013; Revised September 5, 2013
Meeting Attendees Name Organization
Marek Kanter Division of Ratepayers’ Advocates (DRA) Stacey Hunter DRA Pat Adams Southern California Edison (SCE) Mark Bennett SCE – Videoconference George DeMaria SCE – Videoconference Stephen Lumel SCE – Videoconference Michelle Ricard SCE Blake Murphy Aon Hewitt Kathy Miller Aon Hewitt – Teleconference Chelsea Penaloza Aon Hewitt – Videoconference Alison Peterson Aon Hewitt The Team met at Southern California Edison’s (SCE) offices in San Francisco (Adams, Kanter, Hunter, Murphy, Peterson and Ricard), by videoconference in Rosemead (Bennett, DeMaria, Lumel and Penaloza), and by teleconference (Miller).
Discussion Items � Alison outlined the agenda items for the meeting and reviewed the materials that were sent out in
advance. Agenda and materials included:
– Finalize July 10 meeting notes
– Recap of follow up items from June 25 and July 10 meeting
– Total compensation results for all categories
• Marek had a comment regarding the report and asked if we would show the Executives as compared to the utility and general industries. Alison commented that we do not have that data available and that if we did split the data into those two groups, there would likely be even less data available for the executive jobs. Marek asked Aon Hewitt to do what they can to provide some analysis, albeit limited, to provide a data point for reference.
– Study coverage for all categories
– Present preliminary results of executive benefits valuations
– Present preliminary total compensation summary for executives
– Discuss next steps

July 22, 2013 The GRC Study Team Page 2
2
� The Team confirmed there were no additional changes to the July 10 meeting notes, other than the consolidated feedback sent by Michelle on July 19, which were incorporated into updated meeting notes.
Open action Items for SCE from June 25 meeting: � Finalize executive pay data (completed)
Open action Items for SCE from July 10 meeting: � After the July 22 meeting, Aon Hewitt will begin drafting the report and distribute to the Team for
review. The Team will then return any minor edits to Aon Hewitt, but more significant changes will be reviewed, discussed, and confirmed in a Team meeting. (in process)
– Marek reminded the Team to include relevant emails into the report Appendix. Alison agreed that Aon Hewitt will compile the email notes and provide them for review when we circulate the draft of all the other meeting notes for review by the Team.
� Aon Hewitt will package and distribute the consolidated meeting notes for comment before sending the draft report. This will allow the Team time to review and make final edits so we can complete that portion of the Study report early on. (in process)
– The Team agreed to this process.
Discussion Compensation � Alison reviewed the results for the executive category. She commented that the significant increase to
market on TCC, LTI and total compensation is, in part, attributable to the inclusion of CPUC, LADWP, and SMUD since those organizations generally do not pay bonus and/or long-term incentives.
� Alison reviewed the Study coverage tables. The Team had no comments or questions.
� Stacey asked if there was going to be a comparison of in-Study and not-in-Study in the report. Alison confirmed that we would include that table for the Team’s review but that that information had not been included in the prior reports.
Benefit Valuations � George asked about the high benefit values for certain SCE jobs. Blake explained that bonuses are
included in the pay definition for the Supplemental Executive Retirement Plan (SERP). He further explained that SCE has two tiers of benefits in the SERP and that participants receive the same basic formula, but certain participants have bonus included in pay. The retirement benefits for VPs and senior officers includes bonus, while the benefits for director level participants does not include bonus.
� At some of the comparator companies, bonuses may not be an element of covered pay, for some or all of their eligible SERP participants, so the average value for the peer group is lower.
� The Team reviewed a general comparison of the SCE benefit values compared to the peer group. The SCE values are higher compared to market than in the prior Study.
� The incremental value of PTO is comparable to the peer group.
� SCE has a traditional pension SERP. Certain peer companies have 401(k) type SERPs. As with the non-executive benefit plans, SCE lowered the discount rate used to value retirement benefits. This tends to increase the value of SCE’s plans compared to the peer group. The SERP makes up the majority of the benefit value for executives.
� Marek noted that in the last Study, SCE was 70% above market in benefits, and now is 114% above market. Blake confirmed that was the case. He pointed out that SCE didn’t change its plan designs from the last Study but there were changes at some of the peer companies. In addition, three companies were added to the peer group: LADWP, CPUC, and SMUD. Generally, their benefit values were lower than SCE’s, another reason why SCE values increased.
July 22, 2013 The GRC Study Team Page 3
3
� The Team reviewed the benefits value tables. The vast majority of value in this column is from retirement plans. Medical benefits are shown in dollars, and are a much smaller part of the overall benefit value for executives.
� The Team discussed the PTO methodology and impact. The methodology for valuing PTO was the same used for non-executives that was reviewed at the last meeting. The value of PTO for SCE executives is comparable to the value of PTO at the peer companies. This helps bring the overall benefit values for SCE a little closer to the market average.
� The Team completed the review of the executive benefits and PTO valuations and discussed next steps.
Next Steps and Follow-Ups Aon Hewitt � Aon Hewitt will begin drafting the report and distribute to the Team for review by about August 9. The
Team will then return any minor edits to Aon Hewitt, but more significant changes will be reviewed, discussed and confirmed in a Team meeting.
� Aon Hewitt will also package and distribute the consolidated meeting notes and emails for comment. � Alison indicated that we will need to reschedule the meeting that is currently set for August 22nd. The
Team agreed to look for an alternative meeting date.

Consulting | Broad-Based Compensation Proprietary & Confidential 1
To: The GRC Study Team (the Team)
From: Alison Peterson, Aon Hewitt
Subject: Email Communications Related to Southern California Edison’s (SCE) 2015 Total Compensation Study (TCS)
Following are email communications related to SCE’s 2015 TCS covering questions, issues, and conversations related to methodology. These email communications have been included here at the request of DRA. From: Marek Kanter Sent: Tuesday, April 09, 2013 12:35 PM To: Alison Peterson; Marek Kanter; Stacey Hunter; Michelle Ricard; Mark Bennett; George DeMaria; Patricia Adams; Stephen Lumel Cc: Blake Murphy; Chelsea Penaloza; Kathy Miller; Jennifer Casey Subject: RE: Materials for Monday's SCE TCS Kick-off At our meeting yesterday, DRA requested that PG&E provide data regarding new hires at manager level or above, by job, as to in what company they were last working and what was its revenue size. DRA would also like similar data at manager level and above, by job, regarding employees leaving PG&E [Should be SCE] and taking new jobs: as to what company they were moving to and what was its revenue size. The above data would be useful to get some feeling about PG&E’s [Should be SCE] job market. Obviously, the more such data the better. Marek _______________________________________________________________________________ From: Marek Kanter To: Alison Peterson, Stacey Hunter, Michelle Ricard, Mark Bennett, George DeMaria, Patricia Adams, Stephen Lumel, Jacqueline Trapp Cc: Blake Murphy, Chelsea Penaloza, Jennifer Casey, Kathy Miller Date: 04/11/2013 04:08 PM Subject: RE: April 8 SCE TCS Meeting Notes, Revised Team Roster, and Copy of Aon Hewitt Technical Response Is DRA’s request, sent April 9, an action item for PG&E? _______________________________________________________________________________

Email Communication The GRC Study Team Page 2
2
From: Michelle Ricard Sent: Friday, April 12, 2013 8:37 AM To: Kanter, Marek Cc: Alison Peterson; Blake Murphy; Chelsea Penaloza; George DeMaria; Jacqueline Trapp; Jennifer Casey; Kathy Miller; Mark Bennett; Patricia Adams; Hunter, Stacey; Stephen Lumel Subject: RE: April 8 SCE TCS Meeting Notes, Revised Team Roster, and Copy of Aon Hewitt Technical Response Good morning Marek, I'm interpreting DRA's request as pertaining to SCE, not PG&E. With regard to the additional information requested in your April 9 email, we do not conduct exit interviews of parting employees (including executives), and our exit survey of non-executives (post-separation) does not ask the question, so we do not have data relating to where the employees have moved on to. Thank you, ------------------------------------------------------ Michelle Ricard ______________________________________________________________________________ From: Marek Kanter Sent: Friday, April 12, 2013 9:38 AM To: Alison Peterson; Marek Kanter; Stacey Hunter; Michelle Ricard; Mark Bennett; George DeMaria; Patricia Adams; Stephen Lumel Cc: Blake Murphy; Chelsea Penaloza; Kathy Miller; Jennifer Casey Subject: RE: Materials for Monday's SCE TCS Kick-off Following up to my last e-mail, I know of at least one company SCE managers and executives moved to – Peevey, who went to the PUC. Also I know of other instances of PUC managers who went to PG&E [Should be SCE], so it’s likely some went to SCE as well. Bottom line, the PUC is part of SCE’s labor pool and Aon Hewitt should make an effort to contact the PUC at the appropriate level to get whatever wage and benefit data is available. Marek _________________________________________________________________________________
Email Communication The GRC Study Team Page 3
3
From: Marek Kanter Sent: Friday, May 10, 2013 3:16 PM To: Alison Peterson Cc: Hunter, Stacey Subject: RE: Confirm Availability for March 13th 10am Hi Allison, Since we are planning to “study escalation factors” in our next meeting, I suggest that you ask SCE to bring information regarding the latest PUC approved escalation factors they are using and will continue to use until new escalation factors are approved as a consequence of their new rate case. Marek ____________________________________________________________________________ From: Alison Peterson Sent: Friday, May 10, 2013 3:56 PM To: Kanter, Marek; Patricia Adams; Michelle Ricard; George DeMaria; Mark Bennett; Stephen Lumel Cc: Hunter, Stacey; Chelsea Penaloza; Blake Murphy Subject: Escalation Factors Hi Marek, I'm passing along your request to the SCE team here. Have a great weekend and we'll see you on Monday. Alison Peterson ___________________________________________________________________________________
Email Communication The GRC Study Team Page 4
4
From: Stacey Hunter Sent: Friday, May 17, 2013 2:50 PM To: Alison Peterson Cc: Kanter, Marek; Robert M. Pocta Subject: Escalation rates for SCE total compensation study Alison, The escalation rates suggested by Aon Hewitt seem too high. SCE’s presently approved labor escalation factor is 2.625%. This rate was approved as a result of Edison’s 2011 rate case for the attrition period 2012-2014. The fact that the escalation rates suggested by Aon Hewitt use data excluding 0% increases may contribute to their being too high. The proposed figures also rely on surveys as opposed to actual wage increases. The most current Global Insight monthly report (April 2013) reports CPI increases of 1.6% for 2010, 3.1% for 2011, and 2.1% for 2012, and average private hourly earnings increases of 2.4% for 2010, 2.0% for 2011, and 1.5% for 2012. Most recently, DRA has proposed wage increases for PG&E amounting to under 2.5%. In light of this information, DRA has determined that an appropriate and equitable escalation factor for aging data is the same SCE approved labor escalation factor of 2.625%. Sincerely, Stacey Hunter From: Alison Peterson <[email protected]> To: Stacey Hunter, George DeMaria, Mark Bennett, Patricia Adams, Michelle Ricard, Stephen Lumel Cc: Marek Kanter, Robert M. Pocta, Chelsea Penaloza Date: 05/17/2013 06:13 PM Subject: RE: Escalation rates for SCE total compensation study Hi Stacey, Thank you for your response. A couple of comments: 1. The difference between data including and excluding zeros is at most 0.2% for all of the job categories (e.g. All company/general industry data for executives including 0s is 2.9%/ excluding 0s is 3.1%. For salaried exempt its 2.8%/2.9%. Energy follows a similar pattern with executives at 3.7%/3.9% and salaried exempt at 3.7%/3.7%). We used data including zeros to develop the 3.0% weighted average factor as disclosed at our April 8 kick off meeting - however, I did misstate in later materials that we used data excluding zeros. That was an error on my part! 2. The escalation factors are derived from submissions from over 1,200 companies reporting actual base pay increases for 2012. Each participating company submitted their actual overall base salary increase for 2012 by employee group (executive, salaried exempt, salaried non-exempt, nonunion hourly, and hourly). We do not use survey data to develop escalation factors. 3. CPI is not used to measure the rate of change in compensation, therefore we use a data source that does measure that change. 4. We provided a comparison to the escalation factor used for the last PG&E Study (3.3%) to provide DRA with a point of comparison to assess the recommended escalation factor which we project will come
Email Communication The GRC Study Team Page 5
5
in between 2.9% and 3.0% once we finalize the list of benchmark jobs and the mix of utility vs. general industry. We will provide the exact weighted average percentage to the team once we have determined which jobs we are able to obtain market data for. Should the Team be interested, one refinement to developing the escalation factor, would be to extract salary increase data for peer utilities only from the energy industry segment that we used. We don't report this separately, so we would need to request a custom cut of data. We could disclose which utilities are included -but would not be able to disclose the data for each company due to confidentiality requirements. I am copying the SCE Team here so that they can evaluate your input and respond. Best Regards Alison Alison Peterson From: Alison Peterson Sent: Friday, June 07, 2013 3:48 PM To: Kanter, Marek; Hunter, Stacey; Mark Bennett; George DeMaria; Stephen Lumel; Michelle Ricard; Patricia Adams Cc: Blake Murphy; Kathy Miller; Jennifer Casey; Chelsea Penaloza Subject: Impact of Adding Companies to Benefits for SCE TCS Hi everyone, We had a follow up from our meeting on Wednesday to research the impact of adding 10 companies each to the list of the General Industry and Utility peer groups that would be used to value benefits. We are working on quantifying the impact in cost and time (some members of our team are out on vacation today so we will need to provide estimates early next week), but while we were researching the question of how company size impacts the value of benefits, we came across the attached analysis from our 2012 Benefits Index database comparing the value of benefits by: 1. Geography 2. Fortune 1000 ranking (driven by revenue size) 3. Number of employees In summary, this data indicates there is not a clear pattern of the value of benefits decreasing by company size. Interestingly, companies with fewer employees seem to offer benefits that are above the average, while those with larger employee counts offer benefits that are below the average. Regarding revenue size as measured by the Fortune 100, the analysis groups together companies based on their ranking within the Fortune 1000 (0-100, 100-200, 200-300, etc…). The lowest benefits are for the group in the 400-500 category. Benefits values rise in the 500-1,000 category which is counter to the idea that benefit values decrease as revenue decreases. Below you'll find a table listing the current comparator group with revenue and you'll find that the companies in the group include companies from all categories. In conclusion, based on this analysis, we don't believe adding more companies to the comparator group would provide a better measure of the general industry or would result in a significant change to the market value of benefits. One other item to note. when we selected companies for the General Industry group in the last Study, we did so with the intent of selecting employers from California. So as you review the list you'll note that those highlighted in yellow are either headquartered in California or have significant work operations in the state. This was consistent with our desire to reflect companies that SCE may compete with for talent.

Email Communication The GRC Study Team Page 6
6
Please let us know if you concur with our assessment or if we need to convene a call to discuss next week. Thank you, Alison Fortune Ranking Company Revenue 1 Exxon Mobile $453B 100 Nationwide $30.7B 200 Texas Inst $13.7B 300 Discover Fin $8.6B 400 PetSmart $6.1B 500 Moline HealthCare $4.8B
Revenue
Size Company ($ Millions) Los Angeles Department of Water & Power (LADWP) $812 San Diego Gas & Electric (Sempra) $2,916 GenOn Energy (formerly Reliant Energy) $3,614 Southern California Gas (Sempra) $4,768 Allergan, Inc. $5,419 Avery Dennison Corporation $6,026 Energy Future Holdings Corp. (formerly TXU) $7,040 The Sherwin-Williams Company $8,766 DTE Energy Company $8,897 SunTrust Banks, Inc. $9,602 Jacobs Engineering Group Inc. $10,382 Nestlé USA, Inc. $10,400 R. R. Donnelley & Sons Company $10,611 Science Applications International Corporation $10,657 Entergy Corporation $11,229 Praxair, Inc. $11,252 Sara Lee Corporation $12,103 PPL Corporation $12,756 Consolidated Edison $12,938 Constellation Energy $13,758 Baxter International Inc. $13,893 Dominion Resources, Inc. $14,379 Duke Energy Corporation $14,529 PG&E Corporation $14,956 American Electric Power $15,116 NextEra Energy, Inc (formerly FPL) $15,341 Amgen Inc. $15,582 Computer Sciences Corporation $16,144 FirstEnergy Corp. $16,258 Southern Company $17,657 Northrop Grumman Corporation $28,058 The Walt Disney Company $40,893
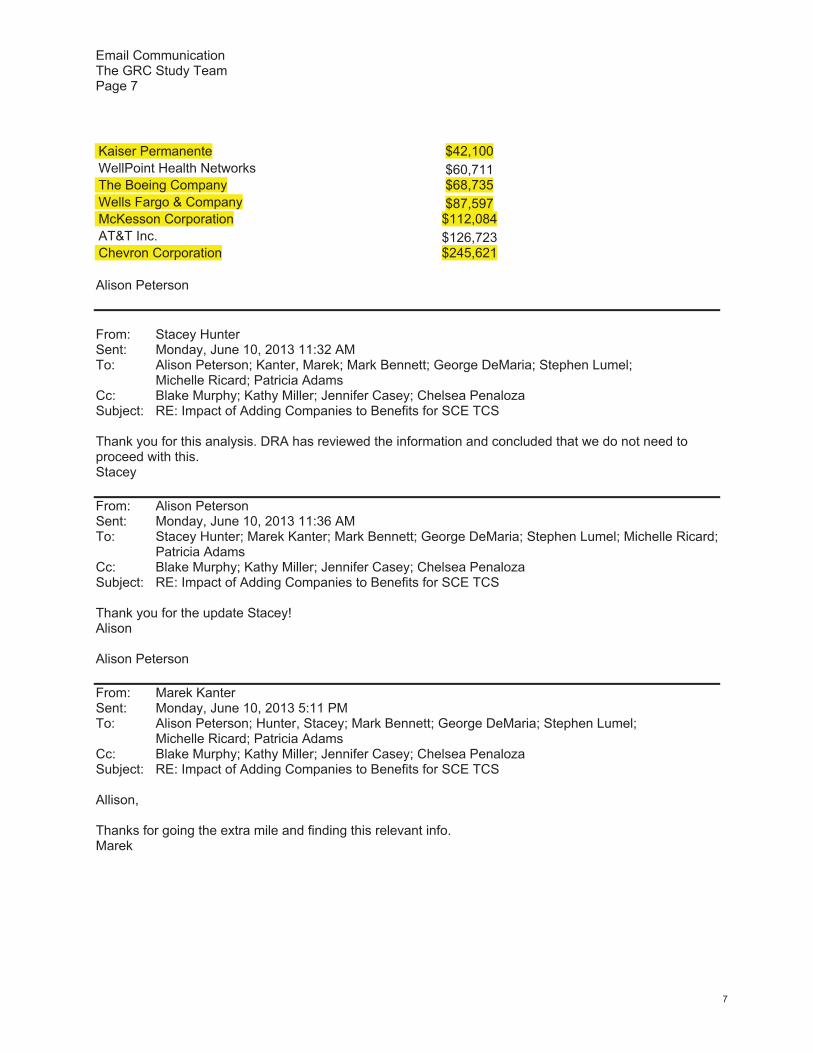
Email Communication The GRC Study Team Page 7
7
Kaiser Permanente $42,100 WellPoint Health Networks $60,711 The Boeing Company $68,735 Wells Fargo & Company $87,597 McKesson Corporation $112,084 AT&T Inc. $126,723 Chevron Corporation $245,621 Alison Peterson From: Stacey Hunter Sent: Monday, June 10, 2013 11:32 AM To: Alison Peterson; Kanter, Marek; Mark Bennett; George DeMaria; Stephen Lumel; Michelle Ricard; Patricia Adams Cc: Blake Murphy; Kathy Miller; Jennifer Casey; Chelsea Penaloza Subject: RE: Impact of Adding Companies to Benefits for SCE TCS Thank you for this analysis. DRA has reviewed the information and concluded that we do not need to proceed with this. Stacey From: Alison Peterson Sent: Monday, June 10, 2013 11:36 AM To: Stacey Hunter; Marek Kanter; Mark Bennett; George DeMaria; Stephen Lumel; Michelle Ricard; Patricia Adams Cc: Blake Murphy; Kathy Miller; Jennifer Casey; Chelsea Penaloza Subject: RE: Impact of Adding Companies to Benefits for SCE TCS Thank you for the update Stacey! Alison Alison Peterson From: Marek Kanter Sent: Monday, June 10, 2013 5:11 PM To: Alison Peterson; Hunter, Stacey; Mark Bennett; George DeMaria; Stephen Lumel; Michelle Ricard; Patricia Adams Cc: Blake Murphy; Kathy Miller; Jennifer Casey; Chelsea Penaloza Subject: RE: Impact of Adding Companies to Benefits for SCE TCS Allison, Thanks for going the extra mile and finding this relevant info. Marek

Aon Hewitt Consulting | Performance, Rewards and Talent 73 01551/RPT001AAP.DOCX/PR&T-SF-15008 09/2013
Appendix I: Measurement of Error
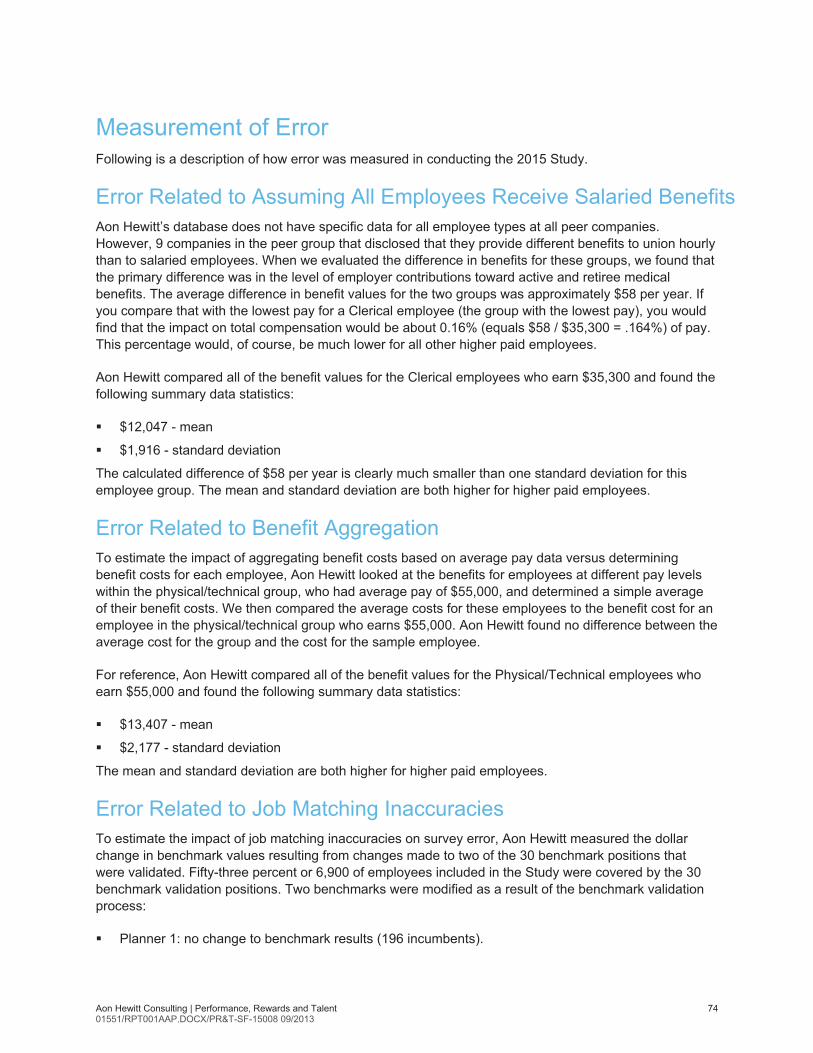
Aon Hewitt Consulting | Performance, Rewards and Talent 74 01551/RPT001AAP.DOCX/PR&T-SF-15008 09/2013
Measurement of Error Following is a description of how error was measured in conducting the 2015 Study.
Error Related to Assuming All Employees Receive Salaried Benefits Aon Hewitt’s database does not have specific data for all employee types at all peer companies. However, 9 companies in the peer group that disclosed that they provide different benefits to union hourly than to salaried employees. When we evaluated the difference in benefits for these groups, we found that the primary difference was in the level of employer contributions toward active and retiree medical benefits. The average difference in benefit values for the two groups was approximately $58 per year. If you compare that with the lowest pay for a Clerical employee (the group with the lowest pay), you would find that the impact on total compensation would be about 0.16% (equals $58 / $35,300 = .164%) of pay. This percentage would, of course, be much lower for all other higher paid employees.
Aon Hewitt compared all of the benefit values for the Clerical employees who earn $35,300 and found the following summary data statistics:
� $12,047 - mean
� $1,916 - standard deviation
The calculated difference of $58 per year is clearly much smaller than one standard deviation for this employee group. The mean and standard deviation are both higher for higher paid employees.
Error Related to Benefit Aggregation To estimate the impact of aggregating benefit costs based on average pay data versus determining benefit costs for each employee, Aon Hewitt looked at the benefits for employees at different pay levels within the physical/technical group, who had average pay of $55,000, and determined a simple average of their benefit costs. We then compared the average costs for these employees to the benefit cost for an employee in the physical/technical group who earns $55,000. Aon Hewitt found no difference between the average cost for the group and the cost for the sample employee.
For reference, Aon Hewitt compared all of the benefit values for the Physical/Technical employees who earn $55,000 and found the following summary data statistics:
� $13,407 - mean
� $2,177 - standard deviation
The mean and standard deviation are both higher for higher paid employees.
Error Related to Job Matching Inaccuracies To estimate the impact of job matching inaccuracies on survey error, Aon Hewitt measured the dollar change in benchmark values resulting from changes made to two of the 30 benchmark positions that were validated. Fifty-three percent or 6,900 of employees included in the Study were covered by the 30 benchmark validation positions. Two benchmarks were modified as a result of the benchmark validation process:
� Planner 1: no change to benchmark results (196 incumbents).

Aon Hewitt Consulting | Performance, Rewards and Talent 75 01551/RPT001AAP.DOCX/PR&T-SF-15008 09/2013
� Mgr-Project/Product 1: $420 increase in benchmark from $140,486 dollars to $140,906 resulting in a change of 0.3% for this job. This increase was applied to pay for the 625 incumbents in the role, changing the market total compensation by $266,632 resulting in a change to the total compensation for all incumbents covered by validated jobs of 0.0296%.

Aon Hewitt Consulting | Performance, Rewards and Talent 76 01551/RPT001AAP.DOCX/PR&T-SF-15008 09/2013
Appendix J: Glossary of Terms
Aon Hewitt Consulting | Performance, Rewards and Talent 77 01551/RPT001AAP.DOCX/PR&T-SF-15008 09/2013
Glossary of Terms The following terms are referenced in this report and are defined in this section for Study purposes.
Annuity A stream of payments, generally payable over a participant’s lifetime, but also payable for a limited time period or over the lives of a participant and beneficiary.
Annuity Factor An amount used to convert an annuity to an equivalent value paid in another form (e.g., single sum), or vice versa.
Average The arithmetic mean of a group of numbers (see “Mean” below).
Base Pay The fixed rate (whether hourly, weekly, monthly or annual), that an employee receives as compensation for work performed. Usually, these amounts are guaranteed.
Base Salary Compensation paid by the week, month or year rather than by the hour. Generally, a salary is a guaranteed amount that is not reduced for time not worked. Generally, salaries apply to higher-level professional or supervisory jobs that are exempt from the provisions of the Fair Labor Standards Act of 1938 (FLSA).
Benchmarking A process by which an organization seeks to identify information about other organizations and analyzes their practices (including pay) for comparison purposes. Benchmark jobs are specific titles used in the benchmarking process. Such jobs are commonly found at most organizations, have a high population, and perform a similar level of work.
Comparator The group of companies against which pay and benefits are compared. Typically includes companies of similar size, in the same industry, that operate in the same geographic location, and with whom the Study company competes for talent.
Deferred Stock Units A form of long-term incentives that includes an award of units that correspond in number and value to a specified number of shares of stock. Units do not represent actual ownership or equity interest and typically are subject to vesting requirements and transferability restrictions.
Aon Hewitt Consulting | Performance, Rewards and Talent 78 01551/RPT001AAP.DOCX/PR&T-SF-15008 09/2013
Defined Benefit Formula/Points A formula is typically used in the calculation of an employee’s pension benefit. Often a point value, usually a combination of age and years of service (e.g., 55 years of age + 20 years of service = 75 ”points”), that influences the amount of benefit received.
Defined Benefit Pension Plan Both the Employee Retirement Income Security Act of 1974 (ERISA) and the Internal Revenue Code (IRC) define any plan that is not an individual account plan as a defined benefit pension plan. It is a pension plan that specifies the benefits, or the methods of determining the benefits, but not the level or rate of contribution. Contributions are determined actuarially on the basis of the pension benefits expected to become payable.
Defined Contribution Plan A defined contribution or individual account plan as defined by the Employee Retirement Income Security Act of 1974 (ERISA) and the Internal Revenue Code (IRC) as a plan that provides for an individual account for each participant and for benefits based solely on (1) the amount contributed to the participant’s account, plus (2) any income, expenses, gains and losses, and forfeitures of accounts of other participants that may be allocated to the participant’s account. The benefit amount actually received by the participant at retirement is unknown.
Demographic Profile and Assumptions Used in Valuing Benefits Since demographics of any group (such as age, marital status, length of service) affect the inherent value of the benefit package, it is important to use information that most closely reflects the experience of that group. To facilitate comparisons that focus on program design while minimizing the impact of differences in incumbent demographics, demographic data was collected from SCE and used to value the benefits for all companies in the Study. The value of benefits is determined by applying each benefit program to each individual in the demographic profile using SCE’s actuarial assumptions for all companies in the Study. Some of these assumptions, such as mortality (used for generating the group life insurance values) and rates of disability (used for generating the long-term disability values) are based on studies from the Society of Actuaries. Economic assumptions, such as interest rates and pay increases, are based on estimates of long-term future expectations.
EAPDIS The Edward A. Powell Data Information Solutions Study survey; formerly, the Edison Electric Institute (EEI) Nonexempt Survey.
EEI Edison Electric Institute.
Employee Benefits A collection of noncash compensation elements, including, but not limited to, income protection, health coverage, retirement savings, and income supplements for employees, provided in whole or in part by employer payments.

Aon Hewitt Consulting | Performance, Rewards and Talent 79 01551/RPT001AAP.DOCX/PR&T-SF-15008 09/2013
FLSA The Fair Labor Standards Act (FLSA) of 1938 established overtime, record keeping, and a floor for minimum wage. It also determined the type of positions that are exempt from the overtime provisions. Federal law requires that “nonexempt” positions receive overtime pay for hours in excess of 40 worked in a week. Some states (e.g., California) require overtime pay for nonexempt positions for hours in excess of 8 worked in one day.
Generic Job This is an SCE job that is broadly defined to include employees performing the same level of work in various parts of the organization. At many other organizations, there would be a variety of unique job titles performing these activities. At SCE, these titles are consolidated into a single job title, encompassing employees in various departments.
Health and Welfare Benefits Plans that provide dental, vision, disability, life insurance, medical, surgical, or hospital care, or benefits in the case of sickness, accident, death or unemployment.
Long-Term Incentives Any incentive plan that requires sustained performance of the firm for a period longer than one fiscal year. Most plans are based on stock value of an organization and may require investment by the participant. Stock options are the most common form of long-term incentive.
Mean A simple arithmetic mean (or average) obtained by adding a set of numbers and then dividing the sum by the number of items in the set. A weighted average is used when there are multiple observations for one or more numbers in the set. In this case, the multiple observations are counted as individual observations and are included in the numerator and the denominator of the average calculation.
Median The median of a set of data is the value that half of the data are above and half of the data are below. If there are an odd number of data points, the median is the value of the middle item when the data are arranged in ascending or descending order. If there are an even number of data points the median is the average of the two middle values when the data are arranged in ascending or descending order.
Performance Share Performance shares are a common form of long-term incentive. Typically, a performance share is a promise to provide a share of stock to a recipient at no cost, subject to achievement of performance goals over a specified time frame. The award of a performance share is usually structured so that the recipient forfeits the share is they terminate employment with the company.
Aon Hewitt Consulting | Performance, Rewards and Talent 80 01551/RPT001AAP.DOCX/PR&T-SF-15008 09/2013
Phantom Stock A long-term incentive, which is based on a hypothetical value of an organization’s equity (stock), rather than its actual equity. The incentive’s value is calculated based on a formula to derive the hypothetical (or phantom) value.
Restricted Stock Restricted stock is a common form of long-term incentive. Typically, a restricted share is a promise to provide a share of stock to a recipient at no cost. The share is usually “restricted” by a vesting schedule, so that the recipient forfeits the share if they terminate employment with the company.
Shift Differentials Shift differentials are a practice of paying a premium to employees who work a less desirable shift (evenings, weekends, holidays, etc…). Shift differentials consist of a base pay rate plus a premium. The base pay rate is typically the pay rate the employee would receive for working during a typical day-time shift.
Short-Term Incentives Usually a lump-sum payment (in cash) made in addition to an employee’s base salary or for a fiscal or calendar year. Generally, these are formula-driven pay plans that are designed to reward the accomplishment of specific results. Plan awards can be based on individual, group, division, business-unit or company-wide performance, or a combination.
Standard Deviation In probability theory and statistics, the standard deviation of a statistical population, a data set, or a probability distribution is the square root of its variance. Standard deviation is a widely used measure of the variability or dispersion. It shows how much variation there is from the "average" (mean, or expected/budgeted value). A low standard deviation indicates that the data points tend to be very close to the mean, whereas high standard deviation indicates that the data is spread out over a large range of values.
Stock Appreciation Rights (SARs) This is a long-term incentive which allows the recipient to receive the increase in stock price of a share of stock over a specified maximum period of time. SARs are typically subject to vesting restrictions. They do not usually require that the recipient actually purchase shares of company stock.
Stock Options Stock options are the most commonly used form of long-term incentive. Stock options allow a recipient to purchase a share of stock at a fixed price, subject to vesting restrictions and contractual term. The recipient executes the purchase by “exercising” the option, allowing them to obtain the share, regardless of current price level, for the fixed contractual price.
Aon Hewitt Consulting | Performance, Rewards and Talent 81 01551/RPT001AAP.DOCX/PR&T-SF-15008 09/2013
Target/Actual Incentive Awards The planned or expected payout from an incentive plan is the target award. Usually, target incentives are expressed as a percentage of base salary. Actual incentive awards may be higher or lower than the target incentive award.
Total Cash Compensation The typical definition was used for this Study: the sum of annual base pay and annual incentives provided by an employer to an employee. In some cases, total cash compensation also includes spot bonuses or other cash awards. For this Study, spot bonuses were excluded due to lack of consistent, reliable data among comparator groups. Additionally, overtime pay was excluded from the Study because it varies with company operating policies and staffing practices.
Total Compensation Total Compensation is the sum of all elements of compensation provided by an employer to an employee. For Study purposes, the Team defined it to include annualized base pay, incentives, and benefit values. In other studies, other extrinsic elements of pay may be included. (For example, overtime pay and shift differentials). In some definitions, intrinsic awards (e.g., job satisfaction) are considered a part of total compensation, but these are not quantifiable and consequently not included in total compensation studies.
Aon Hewitt Consulting | Performance, Rewards and Talent 82 01551/RPT001AAP.DOCX/PR&T-SF-15008 09/2013
About Aon Hewitt Aon Hewitt is the global leader in human resource consulting and outsourcing solutions. The company partners with organizations to solve their most complex benefits, talent and related financial challenges, and improve business performance. Aon Hewitt designs, implements, communicates and administers a wide range of human capital, retirement, investment management, health care, compensation and talent management strategies. With more than 29,000 professionals in 90 countries, Aon Hewitt makes the world a better place to work for clients and their employees. For more information on Aon Hewitt, please visit www.aonhewitt.com. Copyright 2010 Hewitt Associates LLC. This document is intended for general information purposes only and should not be construed as advice or opinions on any specific facts or circumstances. The comments in this summary are based upon Hewitt's preliminary analysis of publicly available information. The content of this document is made available on an “as is” basis, without warranty of any kind. Hewitt disclaims any legal liability to any person or organization for loss or damage caused by or resulting from any reliance placed on that content. Hewitt reserves all rights to the content of this document.

Alison Peterson
Alison is a Partner and national practice leader of Aon Hewitt’s Broad-based Compensation Consulting, Survey, and Compensation Outsourcing businesses in the United States. Alison has 20 years of experience managing our business, leading significant consulting assignments, and working with clients in all facets of talent and compensation management including:
Aligning business and HR strategies;
Building a high performance workforce;
Creating pay for performance systems and incentives, and
Developing, communicating, and implementing total compensation and rewards strategies and programs.
Clients with whom Alison has worked include American Electric Power Company, Inc.; Boston Scientific, Inc.; Charter Manufacturing, Inc.; DIRECTV; LPL Financial Services; Hawaiian Electric Company, McKesson Corporation; OneWest Bank; Southern California Edison
In addition to her extensive consulting experience, Alison has been in leadership positions within Aon Hewitt since 1998 including her current national leadership role for Broad-based Compensation. Alison has led research at Aon Hewitt in evaluating the link between employee engagement and compensation and how top performing companies design compensation systems. She co-founded Aon Hewitt’s proprietary Variable Compensation Measurement Database that includes prevalence and effectiveness information on variable compensation design. She is also a frequent speaker and contributor to compensation journals.
Prior to joining Aon Hewitt, Alison worked for approximately 10 years at Ameritech in a variety of finance and human resource capacities including talent management, human resource strategy, executive and broad-based compensation, and organization design.
Alison holds a B.A. in Finance from the University of Wisconsin and an MBA from Marquette University.
Related Documents