Eye-movement modeling of integrative reading of an illustrated text: Effects on processing and learning Lucia Mason a, *, Patrik Pluchino b , Maria Caterina Tornatora a a Department of Developmental Psychology and Socialization, University of Padova, Padova, Italy b Department of General Psychology, University of Padova, Padova, Italy ARTICLE INFO Article history: Available online 28 January 2015 Keywords: Eye movements Text processing Text comprehension Multimedia learning Example-based learning Video-based modeling A B ST R AC T Integrative processing of verbal and graphical information is crucial when students read an illustrated text to learn from it. This study examines the potential of a novel approach to support the processing of text and graph- ics. We used eye movement modeling example (EMME) in the school context to model students’ integrative processes of verbal and pictorial information by replaying a model’s gazes while reading an illustrated text on a topic different from that of the learning episode. Forty-two 7th graders were randomly assigned to an ex- perimental (EMME) or a control condition (No-EMME) and were asked to read an illustrated science text about the food chain. Online measures of text processing and offline measures of reading outcomes were used. Eye- movement indices indicated that students in the EMME condition showed more integrative processing than students in the No-EMME condition. They also performed better than the latter in the verbal and graphical recall, and in the transfer task. Finally, the relationship between the duration of reprocessing the graphical seg- ments while rereading the correspondent verbal segments and transfer performance was stronger in the EMME condition, after controlling for the individual differences of prior knowledge, reading comprehension, and achieve- ment in science. Overall, the findings suggest the potential of eye-tracking methodology as an instruction tool. © 2015 Elsevier Inc. All rights reserved. 1. Introduction Students mainly rely on reading to learn new knowledge in the school context. Regardless of the presentation format of their information sources, either paper or digital, they should be able to understand written texts. It is therefore not surprising that a fruit- ful line of research in educational psychology is that of learning from text in content areas (Alexander, 2012; Sinatra & Broughton, 2011) and several studies have investigated the effects of text type (e.g., refutation text) on conceptual understanding and change (Cordova, Sinatra, Jones, Taasoobshirazi, & Lombardi, 2014; Diakidoy, Kendeou, & Ioannides, 2003; Diakidoy, Mouskounti, & Ioannides, 2011; Kendeou, Muis, & Fulton, 2011; Mason, Gava, & Boldrin, 2008). In learning from texts students also encounter different types of visualization as textbooks are accompanied by illustrations. It has been documented that images enhance learning (Butcher, 2006; Carney & Levin, 2002; Mayer, 1989), although not always (Mayer & Gallini, 1990). The superiority of an illustrated text over a non- illustrated text depends on a successful integration of verbal and graphical information (Mayer, 2009, 2014; Schnotz, 2002, 2014). Nevertheless, research has also indicated that students may pay little attention to illustrations (Cromley, Snyder-Hogan, & Luciw-Dubas, 2010a; Hannus & Hyönä, 1999) and are often under the illusion that they comprehend them (Schroeder et al., 2011). To help students integrate words and pictorial elements when reading it is therefore very important to enhance not only text comprehension but also learning from illustrated text, given that the association between reading performance and academic per- formance has been documented, especially in the domain of science (Cromley, 2009; Cromley, Snyder-Hogan, & Luciw-Dubas, 2010b). Previous research has focused on the characteristics of learning ma- terials that can better support the integration of text and pictures, in particular the corresponding parts of the two types of external representation, for example using labels and highlights as visual cues (Bartholomé & Bromme, 2009; Florax & Ploetzner, 2010; Mason, Pluchino, & Tornatora, 2013). However, cueing by making relevant information more salient is not necessarily successful, as indi- cated in studies on learning from static (Bartholomé & Bromme, 2009) and animated visualizations (Lowe & Boucheix, 2011). An alternative way to sustain readers’ integration of verbal and graphical information is based on the opportunity of modeling the readers’ processing behavior, that is, to show a novice student the behavior of an expert who reads an illustrated text. A very recent approach in research on learning and instruction supports stu- dents’ orientation of attention in video-based modeling examples by means of eye tracking (Jarodzka, van Gog, Dorr, Scheiter, & Gerjets, * Corresponding author. Department of Developmental Psychology and Socialization, University of Padova, via Venezia 8, Padova 35131, Italy. Fax: +39 049 827 6511. E-mail address: [email protected] (L. Mason). http://dx.doi.org/10.1016/j.cedpsych.2015.01.004 0361-476X/© 2015 Elsevier Inc. All rights reserved. Contemporary Educational Psychology 41 (2015) 172–187 Contents lists available at ScienceDirect Contemporary Educational Psychology journal homepage: www.elsevier.com/locate/cedpsych

2015 - Eye Movement Modeling of Integrative Reading of an Illustrated Text Effects on Processing and Learning
Dec 11, 2015
multimodal
Welcome message from author
This document is posted to help you gain knowledge. Please leave a comment to let me know what you think about it! Share it to your friends and learn new things together.
Transcript
Eye-movement modeling of integrative reading of an illustrated text:Effects on processing and learningLucia Mason a,*, Patrik Pluchino b, Maria Caterina Tornatora a
a Department of Developmental Psychology and Socialization, University of Padova, Padova, Italyb Department of General Psychology, University of Padova, Padova, Italy
A R T I C L E I N F O
Article history:Available online 28 January 2015
Keywords:Eye movementsText processingText comprehensionMultimedia learningExample-based learningVideo-based modeling
A B S T R A C T
Integrative processing of verbal and graphical information is crucial when students read an illustrated text tolearn from it. This study examines the potential of a novel approach to support the processing of text and graph-ics. We used eye movement modeling example (EMME) in the school context to model students’ integrativeprocesses of verbal and pictorial information by replaying a model’s gazes while reading an illustrated text ona topic different from that of the learning episode. Forty-two 7th graders were randomly assigned to an ex-perimental (EMME) or a control condition (No-EMME) and were asked to read an illustrated science text aboutthe food chain. Online measures of text processing and offline measures of reading outcomes were used. Eye-movement indices indicated that students in the EMME condition showed more integrative processing thanstudents in the No-EMME condition. They also performed better than the latter in the verbal and graphicalrecall, and in the transfer task. Finally, the relationship between the duration of reprocessing the graphical seg-ments while rereading the correspondent verbal segments and transfer performance was stronger in the EMMEcondition, after controlling for the individual differences of prior knowledge, reading comprehension, and achieve-ment in science. Overall, the findings suggest the potential of eye-tracking methodology as an instruction tool.
© 2015 Elsevier Inc. All rights reserved.
1. Introduction
Students mainly rely on reading to learn new knowledge in theschool context. Regardless of the presentation format of theirinformation sources, either paper or digital, they should be able tounderstand written texts. It is therefore not surprising that a fruit-ful line of research in educational psychology is that of learning fromtext in content areas (Alexander, 2012; Sinatra & Broughton, 2011)and several studies have investigated the effects of text type (e.g.,refutation text) on conceptual understanding and change (Cordova,Sinatra, Jones, Taasoobshirazi, & Lombardi, 2014; Diakidoy, Kendeou,& Ioannides, 2003; Diakidoy, Mouskounti, & Ioannides, 2011;Kendeou, Muis, & Fulton, 2011; Mason, Gava, & Boldrin, 2008).
In learning from texts students also encounter different types ofvisualization as textbooks are accompanied by illustrations. It hasbeen documented that images enhance learning (Butcher, 2006;Carney & Levin, 2002; Mayer, 1989), although not always (Mayer& Gallini, 1990). The superiority of an illustrated text over a non-illustrated text depends on a successful integration of verbaland graphical information (Mayer, 2009, 2014; Schnotz, 2002, 2014).
Nevertheless, research has also indicated that students may pay littleattention to illustrations (Cromley, Snyder-Hogan, & Luciw-Dubas,2010a; Hannus & Hyönä, 1999) and are often under the illusion thatthey comprehend them (Schroeder et al., 2011).
To help students integrate words and pictorial elements whenreading it is therefore very important to enhance not only textcomprehension but also learning from illustrated text, given thatthe association between reading performance and academic per-formance has been documented, especially in the domain of science(Cromley, 2009; Cromley, Snyder-Hogan, & Luciw-Dubas, 2010b).Previous research has focused on the characteristics of learning ma-terials that can better support the integration of text and pictures,in particular the corresponding parts of the two types of externalrepresentation, for example using labels and highlights as visual cues(Bartholomé & Bromme, 2009; Florax & Ploetzner, 2010; Mason,Pluchino, & Tornatora, 2013). However, cueing by making relevantinformation more salient is not necessarily successful, as indi-cated in studies on learning from static (Bartholomé & Bromme,2009) and animated visualizations (Lowe & Boucheix, 2011).
An alternative way to sustain readers’ integration of verbal andgraphical information is based on the opportunity of modeling thereaders’ processing behavior, that is, to show a novice student thebehavior of an expert who reads an illustrated text. A very recentapproach in research on learning and instruction supports stu-dents’ orientation of attention in video-based modeling examplesby means of eye tracking (Jarodzka, van Gog, Dorr, Scheiter, & Gerjets,
* Corresponding author. Department of Developmental Psychology andSocialization, University of Padova, via Venezia 8, Padova 35131, Italy. Fax: +39 049827 6511.
E-mail address: [email protected] (L. Mason).
http://dx.doi.org/10.1016/j.cedpsych.2015.01.0040361-476X/© 2015 Elsevier Inc. All rights reserved.
Contemporary Educational Psychology 41 (2015) 172–187
Contents lists available at ScienceDirect
Contemporary Educational Psychology
journal homepage: www.elsevier.com/ locate /cedpsych
2013). Eye tracking captures a person’s eye position, which is linkedto attention and information processing (Just & Carpenter, 1980;Rayner, 1998, 2009). Eye-tracking methodology has recently re-ceived increased attention in educational research about multimedialearning (van Gog & Scheiter, 2010) to examine the processing oftext and static graphics (Eitel, Scheitel, Schüler, Nyström, & Holmqvist,2013) − especially the time course of this processing (Mason,Pluchino, Tornatora, & Ariasi, 2013) − complex graphics (Canham& Hegarty, 2010), animations (Boucheix & Lowe, 2010), and dynamicstimuli (Jarodzka, Scheiter, Gerjets, & van Gog, 2010). Modern tech-nology related to eye movement recordings not only provides uniqueinformation regarding perceptual and cognitive processes under-lying learning performance, but it also makes gaze replays availablein the form of videos. In standard eye tracking software, fixationson specific information are represented as solid dots: The larger adot, the longer the fixation time on it. Videos of gaze replays canbe used to model a learner’s behavior. In this regard, Eye Move-ment Modeling Examples (EMME) is a recent instructional strategybased on eye position recordings of a skillful expert, which arereplayed to less skillful students with the aim of helping themacquire the desired skills (van Gog, Jarodzka, Scheiter, Gerjets, & Paas,2009).
In the present study we used eye-tracking methodology in thereal school context to model students’ integration of text and graph-ics when interacting with the learning material. The aim was toextend current research on students’ processing and comprehen-sion of illustrated text, taking into account the main issues of twoseparate lines of research, one on multimedia principle, and theother on eye movement modeling examples. In the next sections,relevant issues of these lines of research are briefly reviewed forthe foundation of the current investigation.
1.1. Comprehension of text and picture
The beneficial effects of supplementing texts with pictures havebeen accounted for by the cognitive theory of multimedia learn-ing (Mayer, 2009, 2014). This theory envisages three processes asimportant for a successful comprehension of verbal and graphicalrepresentations. The first is the selection of relevant words fromthe text and relevant elements from the picture. The second is theorganization of selected information in which the material isfurther processed to understand and retain the information.Organization takes place separately for textual and pictorialinformation; therefore a verbal model and a pictorial model are con-structed. The third process is the integration of verbal and pictorialmodels with the help of prior knowledge retrieved from long-term memory.
In his integrated model of text and picture comprehension,Schnotz (2002, 2014; Schnotz & Bannert, 2003) developed Mayer’stheory to take into consideration the representational nature of atext and a picture as two different sign systems, distinguishingbetween the processing of descriptions and depictions. Texts areconsidered to be descriptive representations with a higher repre-sentational power than depictive representations. Paivio’s (1986)dual-coding theory is applied to the processing of images and texts.However, in contrast to this traditional theory, the integrated modelof text and picture comprehension posits that multiple represen-tations are constructed during text and picture comprehension.During text comprehension, the reader first generates a re-presentation of the text surface structure, then a propositionalrepresentation of the semantic content − which is a representa-tion of the ideas conveyed in the text at a conceptual level − andfinally a mental model of the subject matter presented in the text.Propositional representations and mental models interact con-tinuously through processes of model construction and model
inspection guided by schemata that have selective and organiza-tional functions.
Similarly, in picture comprehension, an individual first gener-ates a visual representation of the graphic visualization via perceptualprocessing and then a mental model, as well as a propositional rep-resentation of the content through semantic processing (Schnotz,2002, 2014; Schnotz & Bannert, 2003). Structural mapping pro-cesses are essential to the formation of a coherent mental modelof an illustrated text from the continuous interactions between thepropositional representation and the mental model, both in textcomprehension and picture comprehension. The mapping processtakes place when graphical entities are mapped onto mentalentities and spatial relations are mapped onto semantic relations.The resulting mental mappings are integrated conceptually with priorknowledge and enable the use of acquired knowledge in varioussituations.
To exemplify, if a student reads that “Some migrant birds fly tothe south of Europe for wintering” (Schnotz, 2014), she constructsa first representation of the text surface structure, which cannot beconsidered understanding, but allows repetition of the content read.A propositional representation derived from the surface represen-tation leads to a conceptual organization of the content around theproposition “fly”, which is independent of the sentence wording andsyntax. Further, the readers construct a mental model of the textcontent, for example a mental map of Europe with a north–southbird transfer. Similarly, if a student inspects a map of bird migra-tion in Europe, an internal visual image of the map is formed first,then a mental model of bird migration in Europe, complementedby a propositional representation, as an effect of selection and elab-oration of information through structure mapping (Schnotz, 2014).
According to both the cognitive theory of multimedia learningand the integrated model of text and picture comprehension, in-tegration processes are essential for learning from illustrated texts,after selecting and organizing relevant information. How can inte-grative processing of verbal and graphical information be enhancedto facilitate text comprehension and learning from text? To answerthis question, research on multimedia learning has examined variouscharacteristics of the learning material. For example, the potentialof visual cueing in the form of labeling has been investigated.In a study with university students, labeling included either thepresentation of numerical labels to mark each central concept inthe text and the corresponding unit in the graphics, or colored high-lights of the central areas of the texts and the corresponding areasof the graphics (Bartholomé & Bromme, 2009). Numerical label-ing was more effective than highlighting, at least in one of the variousknowledge measures at posttest, a classification task, when otherprompts were not provided. In a study with lower secondary schoolstudents, labeling referred to the presence of only one or two keywords placed near each part of a picture (Mason et al., 2013). Resultsshowed that only for the transfer performance, did participants whostudied the text illustrated by a labeled picture outperform thosewho interacted with the same text visualized by an unlabeled picture,or text only. Moreover, the labeled illustration promoted strongerintegrative processing of the learning material, as revealed by theeye-fixation index of the time spent refixating text segments whilereinspecting the illustration (look-from illustration to text) duringthe second-pass reading and inspection. It is worth underliningthat this study examined the time course of text and pictureprocessing and indicated that their integration occurs during thesecond-pass reading and is related to deeper learning. The latter out-comes confirmed those of a correlational study with fourth graders,which indicates that the greater integrative processing of an illus-trated text was associated with higher learning performance (Mason,Tornatora, & Pluchino, 2013).
Another potentially advantageous characteristic of learning ma-terials that has been examined is spatial contiguity. It entails placing
173L. Mason et al./Contemporary Educational Psychology 41 (2015) 172–187

texts and pictures close to, rather than far from, the page or screen(Mayer, 2009, 2014). Spatial contiguity has been proven to enhanceretention and transfer in two of three studies with university stu-dents (Johnson & Mayer, 2012). Picture labeling in the forms of wordslocated near the graphical elements was investigated in relation tospatial contiguity and text segmentation in another study withuniversity students. Findings revealed that retention, but notcomprehension, improved through segmentation of the verbalrepresentation and, to a lesser extent, through picture labeling(Florax & Ploetzner, 2010).
Overall, although there is evidence that visual cueing in the formof labeling can be effective in multimedia learning, the results are notconclusive, especially regarding the level of learning – superficial ordeeper – that can be enhanced.
Another approach to support an effective processing of text andgraphics is to focus on the learners, who can be empowered to in-teract more effectively with multiple representations, for exampleby teaching them a learning strategy. In two outcome-focusedstudies, sixth graders’ selection, organization, and integration pro-cesses were supported through the direct verbal presentation of astrategy to be used to learn from text and pictures (Schlag &Ploetzner, 2011). Half the students were provided with written in-structions on a worksheet regarding the various steps of the strategythat they had to carry out. Findings revealed that the strategyinstructions were effective in promoting factual, conceptual, andtransfer knowledge.
Are only verbal instructions effective in supporting text andpicture integration? In the study reported below, we adopted a teach-ing strategy approach but in an indirect and innovative way, focusingon both the process and outcomes of illustrated text reading. Thestudy was not based on explicitly teaching the various steps of asuccessful strategy through written instructions as in previousstudies, but rather on giving learners the opportunity to observean example of how a successful reader processes an illustrated textvia the position of her/his eyes moving through the learning ma-terial. Relevant issues of research on example-based instruction,especially on eye movement modeling examples, are now intro-duced to illustrate the innovative approach adopted in the study.
1.2. Eye movement modeling examples
Research has documented that example-based instruction is pow-erful. Providing students with examples as tools which show howthey should solve a problem or perform a given task, helps theirperformance (see Atkinson, Derry, Renkl, & Wortham, 2000; van Gog& Rummel, 2010, for reviews). The fruitful area of investigation onworked-out examples has clearly documented that they substan-tially support novice learners (Renkl, 1997; Stark, Kopp, & Fischer,2011; van Gog, Paas, & van Merriënboer, 2006). An importantadvantage of example-based instruction is that learners can savecognitive resources as they should not try a possible solution butrather, they should concentrate on the correct solution, or way toperform a task, which is provided.
In example-based instruction, examples are not presented in awritten format only, they are also in videos. Video-based model-ing examples have been used increasingly in educational contexts,for example to model writing performance (Braaksma, Rijlaarsdam,& van den Bergh, 2002), problem solving (van Gog, 2011), andcreativity in verbal and visual domains (Groenendijk, Janssen,Rijlaarsdam, & van den Bergh, 2013).
Video-based modeling is grounded on observational learning,which was first theorized by Bandura (1977) within the social learn-ing theory. He posited that individuals can learn much by observationif they “attend to, and perceive accurately” (p. 24), the relevantaspects of the modeled behavior. Observation is also an essential
aspect of cognitive apprenticeship in which an expert modelunravels covert processes (Collins, Brown, & Newman, 1989).
In our study we combined the usefulness of instruction by video-based modeling with the benefits of eye-tracking technology tomodel strategic reading of an illustrated text, that is, the integra-tive processing of text and graphics, which is essential for successfullearning.
It should be noted that the entire process of reading an illus-trated text is cued in EMME. In the above-mentioned studies on thecomprehension of texts and graphics, labels were used, for example,to make the correspondences between words and pictorial ele-ments more salient. In EMME the entire process of reading givenmaterial − not only important correspondences between represen-tations − is displayed to show expert behavior throughout theexecution of a task (i.e., reading an illustrated text).
Modeling the reading process by means of the eye movementsof a successful performer may be advantageous for novice learn-ers as they are guided perceptually to direct attention during theexecution of the task. In this regard, the importance of a percep-tual guide for the solution of a well-known problem − Duncker’sradiation problem − has been demonstrated in an eye-trackinginvestigation by Grant and Spivey (2003). In a first study, usingeye-fixation patterns, they identified the critical components ofthe diagram-based problem that was related to insight into problem-solving. In the second study, the authors perceptually highlightedthe identified critical diagram component and this increasedthe frequency of correct solutions. This outcome provides evi-dence of the interactions between the visual environment, attention,and mental processes (Grant & Spivey, 2003). In our study wetheoretically moved from the consideration that it is possible toguide attention and related eye movements through perceptualemphasis on crucial features or components of a representationalstructure.
In the experimental psychology literature there are several studieson the effectiveness of EMME in various areas of investigation, suchas problem solving and diagnosis in medical imaging. The effec-tiveness of seeing the eye movements of another person lookingfor pulmonary nodules has been documented in a series of studieswith radiographers. An interesting outcome is that novice radiog-raphers were better able to identify nodules after seeing the eyemovements of either a naïve or an expert search behavior, but theirperformance did not increase when the model’s eye movements wereunrelated to the search behavior (Litchfield, Ball, Donovan, Manning,& Crawford, 2010).
To date, in research on learning and instruction, which ispertinent to our study, there are only a very few studies that haveinvestigated the use of a model’s eye movements to enhancestudents’ performance. In a study with medical students, videorecordings of the eye movements of the teacher were shown to thestudents to test whether observing these videos would produce moreefficient gaze patterns when detecting task-relevant information onmedical images. Outcomes confirmed that observation of the expert’seye movements improved students’ performance (Seppänen &Gegenfurtner, 2012). In another study with medical students, theirattention was guided through a recording of a model’s eye move-ments superimposed on the case video of patients (Jarodzka et al.,2012). Students were required to learn the skills for an effective visualsearch for symptoms and interpretation of their observations. Themodel’s eye movements were displayed in two ways: By highlight-ing the features focused on by the model through circles, or blurringthe features not focused on by the model, that is, reducing otherinformation (spotlight condition) in a form of anti-cueing, as usedin Lowe and Boucheix’s (2011) study. Results revealed that the lattereffectively guided students’ search of relevant information com-pared with the former and the control condition. Moreover, in thespotlight condition students not only improved their visual search
174 L. Mason et al./Contemporary Educational Psychology 41 (2015) 172–187
with videos of new patients, but also showed better clinicalreasoning (Jarodzka et al., 2012).
In another recent study, EMME was used to guide students’attention in a visually complex perceptual task that required themto distinguish fish locomotion patterns in realistic and dynamicstimuli. The model’s eye movements were displayed in two ways:Through solid dots (adding information) or spotlights (reducing otherinformation). In both conditions eye movements were accompa-nied by verbal explanations, which were necessary to explain whythe information attended by the expert was relevant at a givenmoment. Results revealed that EMME enhanced both visual searchand interpretation of relevant information for novel stimuli com-pared with the control group. In addition, the two displays of eyemovements played a differential role: Spotlight EMME sustainedvisual selection of information, while dot EMME enhanced orga-nization and integration of information with prior knowledge(Jarodzka et al., 2013).
1.3. The current study
In all the above-mentioned studies that have focused on theeffects of eye movement modeling examples, perceptual tasks havebeen modeled. To our knowledge, there is no investigation of thepotential of this perceptual strategy in supporting the execution oftasks that are far from perceptual, although they involve percep-tion processes. To fill this gap and to contribute to the theory onmultimedia learning, in the current study we focus on modeling thereading of an illustrated text to learn from it. As mentioned before,learning from words and pictures entails much more than percep-tual processes which have an important role during the selectionof relevant information. Selection processes should be followed byorganization and integration processes for the multimedia effect tooccur (Mayer, 2009, 2014; Schnotz & Bannert, 2003). Learning fromtext and pictures requires the integration of verbal and graphicalinformation. Modeling the crucial integrative processing of wordsand pictorial elements during reading is particularly relevant, giventhat learning from illustrated texts is one of the most common ac-ademic learning tasks. It seems important to investigate whethermodeling the entire process of reading an illustrated text onlyperceptually, through the gaze replay of an expert, can have posi-tive effects on various postreading outcomes.
From a practical perspective, it should also be noted that onlyuniversity students and professionals were involved in previousstudies on eye movement modeling examples. To extend currentresearch, it is therefore worth investigating whether EMME may alsobe helpful for much younger students in the educational contextto guide them in successfully carrying out a fundamental task, suchas learning concepts from text and picture.
To sum up, the rationale for the study is theoretically groundedon four issues derived from previous research, as mentionedabove: (1) attentional guidance is a way to improve cognitiveperformance involving graphical representations; (2) video-basedmodeling has been proven useful in educational contexts; (3) EMMEhas been effectively used to model the execution of complex tasks,although limited to a perceptual domain; and (4) multimedia learn-ing has been successfully enhanced in young students by teachinga strategy for integrating text and picture.
More specifically, the study investigated the effects of attentionalguidance through eye movement modeling examples to support in-tegrative processing and learning from text and picture in lowersecondary school. A strategy derived from the Bartholomé andBromme (2009) study was modeled for fostering the integrative pro-cessing. Based on the cognitive processes envisioned in the Mayer(2010) and Schnotz (2002) theoretical accounts − selection, orga-nization, and integration – the strategy involves a three-step
sequence of text and picture processing in which the latter isconceptually guided by the former. Text processing initially allowsreaders to use text-based information to better focus their pictureinspection on the most relevant elements. Readers with low priorknowledge in particular seem to adopt a text-guided processingapproach (Canham & Hegarty, 2010).
In concrete terms, in an eye-movement model example to guidestudents in the application of this strategy, the model initially gainsan overview of the whole text to identify central concepts. In thesecond step, the model uses text information to direct the pictureinspection in order to identify the graphical counterparts of the centralconcepts of the text. The model therefore starts relating the text andpicture to each other, shifting from one to the other representationto organize their corresponding parts. In the third step, the modelscontinues relating the verbal and visual representations and thenfocuses on the verbal segments that are not depicted, since themapping between text and picture is inevitably partial.
The following research questions guided the study:
(1) Do students with the opportunity of observing a model’s eyemovements while reading an illustrated text, show greaterintegrative processing than students without this opportu-nity in their own reading of another illustrated text?
(2) Do the former also perform better than the latter inpostreading tasks that measure recall, factual knowledge, andtransfer of newly learned knowledge?
(3) Is there a link between online processing and offline mea-sures of illustrated text reading?
For research question 1, we hypothesized that students who hadthe opportunity to observe the eye movements of a model strate-gically reading an illustrated text, would show more integrativeprocessing of verbal and pictorial information. Higher integrativeprocessing should be evident in the fine-grained eye-fixation indexof look from text to picture and from picture to text fixation time.It is the time a learner spends reinspecting picture segments whilerereading text segments and rereading text segments while rein-specting picture segments during the second-pass processing. Thisindex reflects a less automatic and more purposeful processing ofthe learning material (Hyönä, Lorch, & Kaakinen, 2002; Hyönä &Nurminen, 2006). More specifically, based on previous research onthe time course of text and picture processing mentioned above(Mason, Pluchino et al., 2013 and Mason, Tornatora et al., 2013), wehypothesized that during the second-pass reading EMME stu-dents would show longer fixation times for look-from correspondingtext segments to corresponding picture segments, and vice versa.In other words, they would refixate longer the graphical elementsthat visualize the central text information after gaze shifting fromtext to picture. They would also refixate longer on the central verbalsegments that are visualized in the illustration after gaze shiftingfrom picture to text. Integration would therefore mainly refer to thecorrespondences between words and graphics, as highlighted in themodel’s gaze replay. In contrast, we did not hypothesize differ-ences between EMME and No-EMME students either for the indexof immediate and more automatic first-pass reading, or for the indexof the delayed and less automatic second-pass reading or look-back within text and within picture.
For research question 2, we hypothesized that EMME studentswould also perform better than No-EMME students in the pos-treading transfer task. More than recall and factual knowledge,transfer that reveals deeper conceptual understanding requiresgreater integrative processing of text and graphics, an essentialcondition for successful learning from illustrated text (Mayer,2009; Schnotz, 2002).
For research question 3, based on recent process-oriented re-search on learning from illustrated science texts in grade level
175L. Mason et al./Contemporary Educational Psychology 41 (2015) 172–187
students (Mason, Pluchino et al., 2013 and Mason, Tornatora et al.,2013), we hypothesized that integrative processing of text andgraphics would predict reading performance, in particular in regardto the use of EMME, after controlling for individual characteris-tics. Specifically, given the text-guided processing of the learningmaterial in the model’s gaze replay, the crucial index of look-fromcorresponding text segments to corresponding picture segmentsfixation time should be a predictor of deeper learning in particu-lar, as revealed in the transfer task. In addition, we expected theinteraction term as a predictor of transfer, that is, a strongerrelationship between the look-from corresponding text segmentsto corresponding picture segments and the transfer performance,in participants who observed the gaze replay, compared with thosewho did not have the opportunity of the eye movement modelingexample.
2. Method
2.1. Participants and design
Initially, 53 students attending 7th grade in the second year of twopublic lower secondary schools in a north-eastern region of Italy wereinvolved on a voluntary basis with parental consent during the secondterm of the 2011–2012 school year. Because of the poor eye calibra-tion of 5 participants, 3 participants with learning disabilities, andthe absence of 3 participants at one of the two sessions, we consid-ered the data of 42 students (23 girls), with a mean age of 12.61 years(SD = .49). All were Caucasian, native-born Italians with Italian as theirfirst language and shared a homogeneous middle-class social back-ground. All had normal or corrected-to-normal vision.
At the start of the study, participants were randomly assignedto the experimental condition featuring an eye movement model-ing example (EMME, n = 22) or to the control condition (No-EMME, n = 20). Both conditions involved a pretest–posttest design.
2.2. Materials
2.2.1. Eye tracking equipmentEye movements were collected using the Tobii T120 eye-tracker.
It is integrated into a 17-in TFT monitor with a maximum resolu-tion of 1280 × 1024 pixels. The eye-tracker embeds five near-infrared light emitting diodes (NIR-LEDs) and a high-resolutioncamera with a charge coupled device (CCD) sensor. The camerasamples pupil location and pupil size at the rate of 120 Hz. TheTobii T120 does not require a head stabilization system. Data wererecorded with Tobii-Studio (1.7) software.
2.2.2. Eye movement modeling exampleA short video showing the gaze replay of a model reading an
illustrated text was shown in the EMME condition only. The videowith the gaze trail lasted 2 minutes and 53 seconds. It was createdby instructing a model (a graduate student) to study a one-pageillustrated text on the water cycle while her eye movements wererecorded. The model behaved didactically to deliberately model anintegrative reading strategy. Her eye movements were superim-posed onto the illustrated text as moving solid red dots, the sizeof which changed dynamically according to fixation duration on aposition of the screen. Based on their positive effects in enhancingorganization and integration of knowledge (Jarodzka et al., 2013),we used solid dots for attentional guidance. The eye movements wereshown at their original speed in the video.
The topic of the text read by the model – the water cycle – wasdifferent from the topic of the text used in the learning episode to
avoid participants in the EMME condition being advantaged in termsof exposure to the content to be learned. In this respect, it shouldbe pointed out that the purpose of the video with gaze replay wasto make the procedure of text and picture integration evident, re-gardless of the specific content of the learning material. Anyway,the participants could read the text.
Before presenting the video, learners were only told the follow-ing: “Now you will watch a video that shows the eye movementsof a student who is reading an illustrated science text, that is, a textaccompanied by a picture. This student learned a lot from readingthe text and observing the picture. Look at the video carefully. Inthe video you will see red dots on the text and picture. Each of thesered dots represents how long the student fixated the specificinformation. The larger the red dot, the longer the time spent onthe information.”
The video modeled a successful strategy for learning from anillustrated text. As argued before, the text-guided strategy wastheoretically grounded (Bartholomé & Bromme, 2009). The gazereplay showed that the model initially read the entire text to gainan overview of the verbal part of the learning material. Text infor-mation then guided the model’s picture inspection. The model thusstarted connecting the text and picture to each other, shifting fromone to the other representation of the learning material to makeall the correspondences between them. In fact, the model shifted24 times to relate the text segments to the picture and 24 times torelate the picture to the text segments. The model also focused onthe text segments that were not depicted. The assumption is thatintegration may take place after a reader has explored the text duringthe earlier processing, and has then explored the picture concep-tually guided by the text, making all correspondences between therelevant elements in the verbal and graphical representations, andreprocessing the verbal segments that are not depicted (Bartholomé& Bromme, 2009).
It should be noted that the video with the model’s gaze replaywas shown without simultaneous verbal accompaniment for threereasons: (1) To avoid verbal instructions interfering with observa-tional learning, that is, the desired effects could be attributed to theverbal explanations instead of the modeling in itself; (2) to avoidverbal explanations being redundant with respect to the video mod-eling, having a detrimental effect in tasks that are perceptuallysimple, as happened in van Gog et al.’s (2009) study; (3) to avoidlearners having difficulty attending to both verbal and visual pro-cesses simultaneously. In previous research in which the modeledtask was a complex, purely perceptual task, verbal descriptions ofthe relevant elements to look at accompanied the model’s gazereplays because observers would have had difficulty in visuallysearching for small relevant perceptual aspects of the stimuli (e.g.,Jarodzka et al., 2013). In contrast, what was relevant in the videoof this EMME study was not the perception of a specific smallelement fixated by the model (who read a text on a topic differentfrom the learning topic), but rather a global perception that text andpicture should be attended to, and their information integrated byseveral shifts of attentional focus from one to the other part of thelearning material.
2.2.3. Learning materialThe same illustrated text (also used in another non-EMME study,
Mason, Tornatora, & Pluchino, 2015) was used in both conditions(see Appendix). The topic regarded the food chain, which had notbeen previously presented in any of the science classes attendedby the participants. The text was 214 words long (in Italian) andwas illustrated by a picture (Figure 1). It should be noted that thetext and picture in the video on water cycle with the model’s gazereplay matched the text and picture regarding the learning topicof the food chain. Specifically, text and picture in the video were
176 L. Mason et al./Contemporary Educational Psychology 41 (2015) 172–187
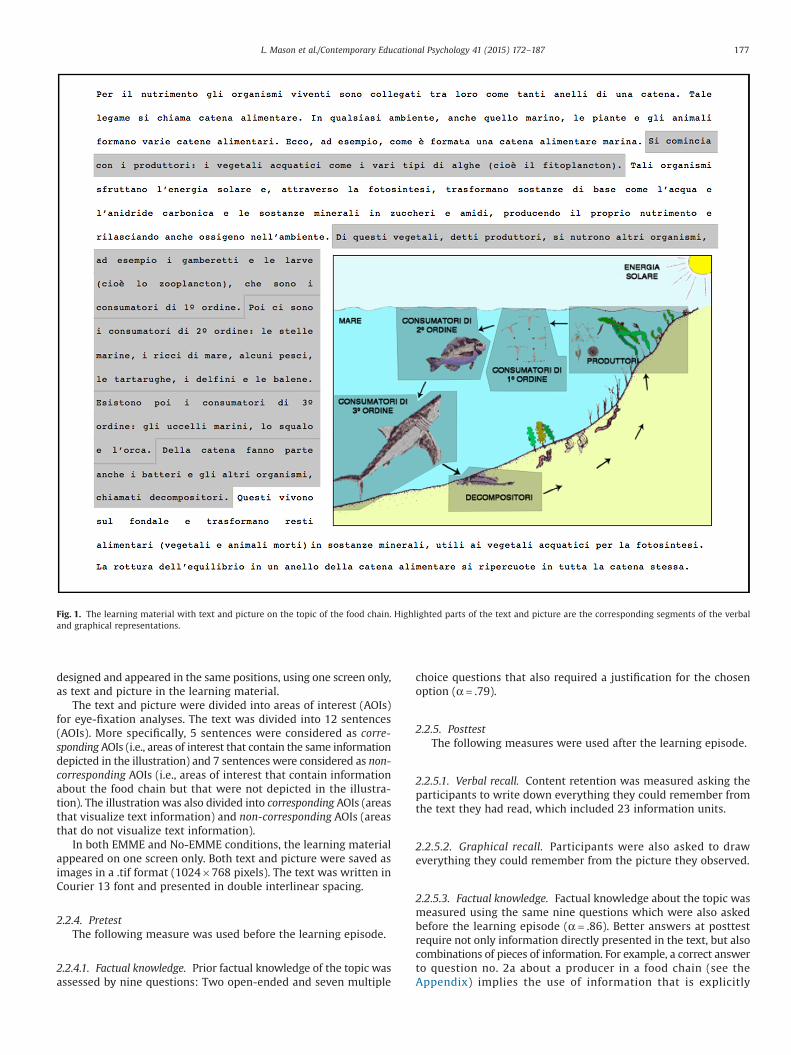
designed and appeared in the same positions, using one screen only,as text and picture in the learning material.
The text and picture were divided into areas of interest (AOIs)for eye-fixation analyses. The text was divided into 12 sentences(AOIs). More specifically, 5 sentences were considered as corre-sponding AOIs (i.e., areas of interest that contain the same informationdepicted in the illustration) and 7 sentences were considered as non-corresponding AOIs (i.e., areas of interest that contain informationabout the food chain but that were not depicted in the illustra-tion). The illustration was also divided into corresponding AOIs (areasthat visualize text information) and non-corresponding AOIs (areasthat do not visualize text information).
In both EMME and No-EMME conditions, the learning materialappeared on one screen only. Both text and picture were saved asimages in a .tif format (1024 × 768 pixels). The text was written inCourier 13 font and presented in double interlinear spacing.
2.2.4. PretestThe following measure was used before the learning episode.
2.2.4.1. Factual knowledge. Prior factual knowledge of the topic wasassessed by nine questions: Two open-ended and seven multiple
choice questions that also required a justification for the chosenoption (α = .79).
2.2.5. PosttestThe following measures were used after the learning episode.
2.2.5.1. Verbal recall. Content retention was measured asking theparticipants to write down everything they could remember fromthe text they had read, which included 23 information units.
2.2.5.2. Graphical recall. Participants were also asked to draweverything they could remember from the picture they observed.
2.2.5.3. Factual knowledge. Factual knowledge about the topic wasmeasured using the same nine questions which were also askedbefore the learning episode (α = .86). Better answers at posttestrequire not only information directly presented in the text, but alsocombinations of pieces of information. For example, a correct answerto question no. 2a about a producer in a food chain (see theAppendix) implies the use of information that is explicitly
Fig. 1. The learning material with text and picture on the topic of the food chain. Highlighted parts of the text and picture are the corresponding segments of the verbaland graphical representations.
177L. Mason et al./Contemporary Educational Psychology 41 (2015) 172–187
conveyed in the text. In fact, it states that the producers are watervegetation. A correct answer to question no. 7 (see the Appendix),instead, requires information that is not directly provided in the text,although it describes the role of decomposers. Readers should inferthat the organisms that transform organic substances are the “lastring” of a food chain.
2.2.5.4. Transfer. Participants’ near transfer at posttest was mea-sured using a task that focuses on the ability to apply the newlylearned factual knowledge. The task included eight questions, fouropen questions and four multiple-choice questions that also re-quired a justification for the chosen option (α = .79). Answers to thequestions implied the use of acquired declarative knowledge to newsituations or phenomena that were similar but not identical to thoseprovided in the text (Haskell, 2001). Near transfer is the deeper levelof reading outcomes measured in the study.
2.2.6. Control variablesTo ensure the equivalence of the groups in the two conditions,
other participant characteristics that could influence text process-ing and learning were also measured.
2.2.6.1. Reading comprehension ability. This was measured using theMT (Italian) test for seventh grade (Cornoldi & Colpo, 1995), whichentails reading an informational text and answering 14 questions.Reliability of this instrument has been reported in the range of .73to .82 (Cronbach’s alpha). In the present study the reliability coef-ficient was = .75.
2.2.6.2. Verbal working memory capacity. This was measured usingthe Italian version of Daneman and Carpenter’s (1980) Reading SpanTest (Pazzaglia, Palladino, & De Beni, 2000), which evaluates thesimultaneous processing and storage of unrelated information andis, therefore, considered a complex span text. The split-half relia-bility coefficient for the index “words” (in Italian) has been reportedas = .76, based on a Cronbach’s α = .72 (Pazzaglia et al., 2000). In thepresent study the Cronbach’s α was = .70.
2.2.6.3. Visuo-spatial working memory capacity. It was measuredusing the Corsi Span Test (Corsi, 1972), which evaluates thevisuo-spatial memory span and implicit visuo-spatial learning.Test–retest reliability for this instrument has been reported as = .74(Mammarella, Toso, Pazzaglia, & Cornoldi, 2008). The reliabilitycoefficient for Italian third and fourth graders has been reportedas = .79 (Mammarella, Pazzaglia, & Cornoldi, 2008). In the presentstudy the Cronbach’s alpha was = .77.
2.2.6.4. Spatial ability. This was measured using the Mental Rota-tion Test (Vandenberg & Kuse, 1978), which requires visuo-spatialability to mentally rotate two- and three-dimensional objects quicklyand accurately. The reported split-half reliability coefficient for sub-jects ranging from the 5th to 13th grade is .80 and the Cronbach’sα = .87 (Geiser, Lehmann, & Eid, 2006). In the present study, theCronbach’s α was = .83.
2.2.6.5. Achievement in science. This was measured using stu-dents’ most recent grade in this subject (midterm of the school year).In the Italian school system, grades range from 1 to 10 (highestgrade = 10).
2.2.6.6. Perception of text easiness and interestingness. After readingthe learning text, participants rated text easiness (1 = easy, 5 = dif-ficult) and interestingness (1 = interesting, 5 = uninteresting) on afive-point Likert scale.
2.2.6.7. Baseline eye movements. While reading an illustrated texton a different topic (greenhouse effect), which had not yet beenpresented in the science classes they attended, participants’ eyemovements were also measured to have baseline data on text andpicture processing. It should be pointed out that the text and pictureused for the baseline measures had the same size and level ofdifficulty as that used in the learning session.
We computed the same eye-fixation indices described below forthe learning text to measure their illustrated text processing at thestart of the study. We also measured learners’ prior knowledge onthe topic of the greenhouse effect and their perception of texteasiness and interestingness, which may influence text processing.
2.2.7. Interviews for manipulation checkThe video was deliberately shown without any verbal accom-
paniment and no information about the aim was explicitly givento participants. To ensure that they had perceived the integrativebehavior of the model and the purpose of the gaze replay, they wereasked three questions in an individual interview at the end of theposttest. The questions were: (1) “In your opinion, how did the modelread the page?”; (2) “How did you understand this?”; and (3) “Inyour opinion, why did we show the video with the eye move-ments of a successful student reading?”.
2.3. Data scoring
2.3.1. Eye-fixation indicesWe computed indices (in milliseconds) of first and second-
pass fixation times (Hyönä & Lorch, 2004; Hyönä et al., 2002; Hyönä,Lorch, & Rinck, 2003; Hyönä & Nurminen, 2006).
2.3.1.1. First-pass fixation times. First-pass fixation time on text wascomputed by summing the duration of all fixations on the verbalpart when it was read for the first time. First-pass fixation time onthe picture was also computed by summing the duration of allfixations on the visualization during the first inspection.
2.3.1.2. Second-pass fixation times. We first computed the look-back on text and picture by summing the durations of all refixationson the verbal and graphical part, respectively. We then computedthe look-from fixation time as an index of integrative processing.Look-from text to picture was computed for the corresponding andnon-corresponding AOIs by summing the duration of all refixationsthat “took off” from a segment (AOI) of the text, either correspond-ing or non-corresponding, and “landed” on a segment (AOI) of thepicture, either corresponding and non-corresponding. Similarly, thelook-from picture to text was computed by summing the dura-tions of all reinspections that “took off” from a segment of the picture,either corresponding or non-corresponding and “landed” on asegment of the text, either corresponding or non-corresponding.Look-from measures offer an index of the extent to which a textsegment is used as an “anchor point” for processing the picture seg-ments, or the picture is used as an “anchor point” for processingtext segments, which is essential for integrating the two parts ofthe learning material. We also computed the average look-from fix-ation time by dividing the total duration by the number of transitionsduring the second-pass, that is, the gaze shifts from one part of thelearning material to the other. Regarding the average look-frommeasures, also transitions were computed from the correspond-ing and non-corresponding text segments to the corresponding andnon-corresponding picture segments and vice versa.
All measures of eye movements (duration in milliseconds) werelogarithmically transformed in order to control for the large inter-individual variance that leads to non-normal distributions.
178 L. Mason et al./Contemporary Educational Psychology 41 (2015) 172–187
2.3.2. Pre and posttestTwo independent raters scored the pre and posttests. Disagree-
ment between them was resolved in the presence of the first author.Answers to the open-ended questions to assess prior factual knowl-edge were awarded 0–2 points depending on their correctness andcompleteness. Answers to the multiple-choice questions were scored1–2 only when a correct justification was given. Inter-rater relia-bility for scoring the former and the latter, as measured by Cohen’sk, was .90. Examples of questions to measure factual knowledge,as well as examples of scoring, are reported in the Appendix. Verbalrecalls were scored according to the number of correct informa-tion units they reported. Inter-rater agreement was .91. Graphicalrecalls were scored 0–2 depending on the conceptual relevance ofthe depicted elements. No points were awarded when the produc-ers, which are the basis of any food chain, were not included. Onepoint was awarded when the consumers or decomposers were alsoincluded, as well as the producers. Two points were awarded whenproducers, consumers, and decomposers were included and cor-rectly connected. Inter-rater reliability was .98. Examples of graphicalrecalls are reported in the Appendix.
Posttest answers to questions regarding factual knowledge werescored in the same way as those at pretest. Inter-rater reliability forcoding the answers to the open-ended questions and the justifi-cations for the answers to the multiple-choice questions, as measuredby Cohen’s k, was .95. Answers to the open-ended questions for thetransfer performance were also awarded 0–2 points depending ontheir correctness and completeness. Answers to the multiple-choice questions were scored 1–2 only when a correct justificationwas given. Inter-rater reliability for coding the justifications, as mea-sured by Cohen’s k, was .96. Examples of questions to measure thetransfer performance, as well as examples of scoring, are reportedin the Appendix.
2.3.3. Interviews for manipulation checkA qualitative analysis of the responses to the three interview ques-
tions for manipulation check was also coded by the two independentraters. Their agreement, as measured by Cohen’s k for each ques-tion, ranged from .93 to .98. The response categories to the firstquestion (“In your opinion, how did the model read the page?”) were:(a) He connected text and picture (e.g., “He first read, then he readagain and matched the images to the text, then he reread match-ing the images to the text, and then he looked at the things thathe had not understood and matched them to the picture to under-stand more”) and (b) He read the text and also looked at the picture(e.g., “He read everything the first time, then he reread jumpingfrom one piece to another and also looked at the picture whenrereading”). Responses in the first category emphasized morethe integrative process. The response categories to the secondquestion (“How did you understand this?”) were: (a) for the cor-respondences between words and image (e.g., “He looked at bothtext and picture and made connections between text and picture,and re-fixated some parts to understand well. When he read somewords, he shifted to the picture to see the correspondence”) and(b) for repeated readings and looks at the picture (e.g., “He read thesentences, then reread and looked at the picture and then reread”).The response categories to the third question (“In your opinion, whydid we show the video with the eye movements of a successfulstudent reading?”) were: (a) to see how to read and learn well (“Youshowed the video to make us understand a study method that wecan use to learn something from reading a text and seeing a figure”)and (b) to see how to read well (e.g., “You showed the video to makeus understand how we should read a text with a figure”).
To sum up, for the first question, 17 out of 22 participants in theEMME condition gave responses that emphasized the connectionbetween text and picture, while 5 perceived in any case that the
model read the text and looked at the picture. For the second ques-tion, 19 out the 22 participants explicitly appealed to the variouscorrespondences between words and pictorial elements made bythe model to justify their perception that the model connected verbaland visual information. Only 3 students referred to multiple read-ings of the texts and reinspections of the picture without pointingout the links between the two parts of the learning material. Forthe third research question, 16 out of the 22 participants re-sponded explicitly relating both reading and learning when referringto the perceived purpose of the video they had watched, while 6students explicitly mentioned only reading an illustrated text.
Overall, students’ answers to the interview indicated that theyhad sufficiently perceived the crucial aspects of the model’s visualbehavior and the eye movement replay.
2.4. Procedure
Data collection took place in two sessions. In the first session,in the classroom, participants were collectively administered thepretest questions on the topic of the text read to record baselineeye movements, as well as on the topic of the text of the learningepisode. Reading comprehension and spatial ability tests were alsoadministered. This collective part took about 1 hour.
During the second session, which took place in a quiet room inthe school, the eye tracker was calibrated for each participant usingthe 9-points procedure. After calibration and before the learningepisode, each participant in both conditions read an illustrated texton the topic of the greenhouse effect while her/his visual behav-ior was recorded to collect a sample of baseline eye movements.Participants in both conditions then performed the Corsi Span testwhich also served as a distracter after the baseline reading task andbefore the main reading task in the No-EMME condition, and beforeshowing the gaze replay in the EMME condition. Next, only in thelatter condition did participants observe a replay of the eye move-ments of a model who read an illustrated text on the topic of thewater cycle. In both conditions, the eye tracker was then cali-brated again. After recalibration, each participant was instructed toread carefully and silently the material on the computer screen, asshe or he would be asked to answer some questions. Participantsread the instructional material at their own pace while eye move-ments were recorded again. After reading, they rated the text easinessand interestingness. Next, they performed the Reading Span Testthat also served as a distracter after the reading task and before thelearning performance. Then, they carried out all posttests, that is,the verbal recall, graphical recall, and answers to the questions forlearning and transfer. The posttest part of this session took about30–40 minutes.
Finally, at the end of the second session all participants in theEMME condition were individually interviewed to ensure that theyhad perceived the model’s integrative visual behavior and were awarethat the gaze replay was presented to show how to read an illus-trated text effectively. This session took 70–80 minutes.
3. Results
3.1. Preliminary analyses
3.1.1. Individual characteristicsThe equivalence of the readers in the two conditions for all ex-
amined control variables was tested first. We performed a MANOVAthat included condition (EMME vs. No-EMME) as the independentvariable and students’ scores for the various measures of individ-ual characteristics as dependent variables. The main effect did notemerge, F < 1. The two groups did not differ for any of the individ-ual differences examined, that is, prior knowledge, reading
179L. Mason et al./Contemporary Educational Psychology 41 (2015) 172–187
comprehension, verbal working memory, visuo-spatial memory,spatial ability, grade in science, perception of text easiness and in-terestingness, and total learning time. In univariate tests, F valueswere < 1 except for visuo-spatial memory, F(1, 40) = 1.66, p = .204,spatial ability, F(1, 40) = 2.35, p = .133, and learning time, F(1,40) = 1.98, p = .167.
3.1.2. Baseline eye movementsParticipants’ baseline eye movements were recorded while
reading an illustrated text on a different topic, the greenhouse effect.To ensure (as reasonably as possible) that at the onset of the learn-ing episode, students in the EMME condition were not spontaneouslymore capable of integrative processing of text and graphics thanlearners in the No-EMME condition, we carried out the same anal-yses on the various processing indices of this text that are reportedbelow (see data for research question 1) for the learning text aboutthe food chain. No significant effect of condition emerged forthe first-pass and second-pass fixation times on text and picture,Wilks’ Lambda = .85, F(4, 37) = 1.63, p = .187. Similarly, conditiondid not differentiate the total look-from corresponding andnon-corresponding text segments to corresponding and non-corresponding picture segments fixation times and vice versa, F < 1,and the average duration of the refixations on the picture after tran-sitions (gaze shifts) from the text and the average duration of therefixations on the text after transitions from the picture, F < .1.
The data on the baseline processing of an illustrated text indi-cated that participants in the EMME and No-EMME conditions didnot differ in any of the examined eye-movement measures.
The easiness and interestingness of the text on the greenhouseeffect was perceived at substantially the same level as the text usedin the learning episode, by learners in both the EMME and No-EMME conditions, as indicated by a MANOVA for repeated measuresthat revealed no differences for type of text or condition, all Fs < 1.In addition, participants’ prior knowledge of the topic of the green-house effect, which might have influenced text processing, was alsoequivalent in the two conditions, F < 1.
Overall, these data indicate that at the onset of the study par-ticipants in the EMME and No-EMME conditions were similar in the
ways they read an illustrated science text, for their prior knowl-edge of the text topic, and their perception of the easiness andinterestingness of the text read.
3.2. Research question 1: effects on integrative processing of textand picture
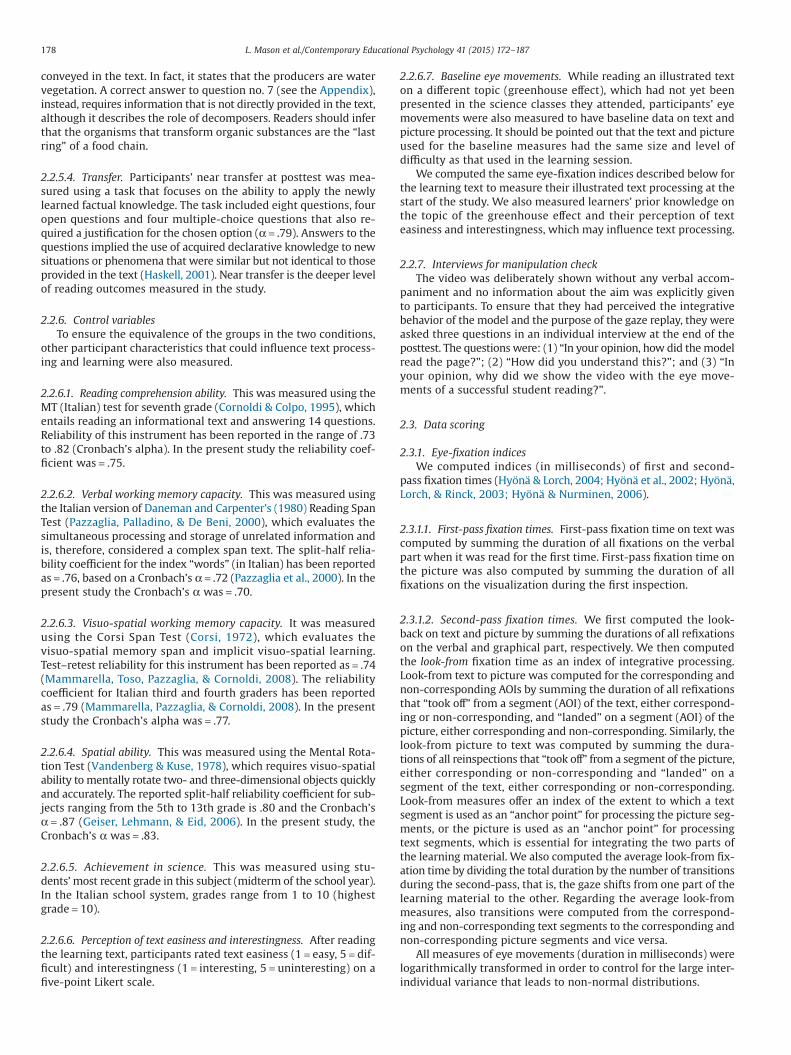
Research question 1 asked whether students in the EMME con-dition would show better integrative processing than participantswho did not have the opportunity to observe the model’s eyemovements. To answer this question, we examined the variouseye-fixation indices reported in Table 1. Our hypothesis was thatdifferences between the two conditions would emerge during themore strategic and purposeful second-pass reading, as revealed byintegrative processing of verbal and graphical information, whichwas emphasized in the model’s gaze replay.
3.2.1. First-pass and second-pass fixation times on text and pictureWe carried out a MANOVA with condition as independent vari-
able and the indices of total first and second-pass (look-back) fixationtimes for both text and picture as dependent variables. The maineffect of condition did not emerge from the analysis, Wilks’Lambda = .80, F(4, 37) = 2.28, p = .078. Modeled and un-modeledlearners did not differentiate for the time spent attending andre-attending each of the two parts of the learning material.
3.2.2. Look-from text to picture and from picture to textfixation times
When examining the integrative processing, the pattern of resultswas different. We considered the duration of look-from correspond-ing and non-corresponding text segments to corresponding andnon-corresponding picture segments (and vice versa) fixation times.A MANOVA revealed a large effect of condition, Wilks’ Lambda = .62,F(8, 33) = 2.43, p = .035, η2
p = .37. Univariate tests showed signifi-cant differences for the look-from corresponding, F(1, 40) = 4.14,MSE = 7.07, p = .048, η2 =.09, and non-corresponding, F(1, 40) = 18.42,
Table 1Means and confidence intervals of eye-movement indices (frequency and durations in milliseconds) before log-transformation and means and standard deviations afterlog-transformation as a function of condition.
Index No-EMME (n = 20) EMME (n = 22)
M (95% CI) Log-transformed
M (95% CI) Log-transformed
M SD M SD
First-pass fixation time onText 12,396.45 (8536.39–16,256.51) 9.01 1.08 9242.32 (5561.89–12,922.74) 8.88 .80Picture 5152.85 (3816.28–6489.42) 8.35 .74 4578.73 (3304.36–5853.10) 8.16 .79
Second-pass fixation time onText 242,373.70 (168,426.70–316,320.70) 12.14 .73 229,130.18 (158,624.49–299,635.88) 12.20 .53Picture 39,092.20 (10,699.76–67,484.64) 9.69 1.26 52,028.14 (24,957.01–79,099.26) 10.59 .76
Averagedurationa
Averagedurationa
Total look-from fixation timeFrom C_TXT to C_PICT 2272.10 (−2849.07–7393.27) 517.41 6.25 2.46 11,211.56 (6328.70–16,094.39) 1171.99 7.93 2.82From NC_TXT to C_PICT 1302.65 (−81.55–2686.85) 371.34 3.69 3.89 3734.05 (2414.26–5053.83) 948.87 7.50 1.41From C_TXT to NC_PICT 3035.30 (1329.42–4741.18) 1742.14 5.45 3.84 2273.77 (647.28–3900.27) 1230.82 6.64 2.34From NC_TXT to NC_PICT 1120.15 (306.16–1934.14) 271.64 5.50 2.60 2230.45 (1454.35–3006.56) 491.36 7.12 1.80From C_PICT to C_TXT 11,356.50 (1700.56–21,012.44) 3596.59 7.75 3.00 26,737.14 (17,530.56–35,943.71) 2914.54 9.29 2.36From NC_PICT to C_TXT 28,735.80 (18,908.20–38,563.40) 9286.52 8.32 3.85 17,426.64 (8056.39–26,796.89) 5520.02 9.29 1.13From C_PICT to NC_TXT 8832.25 (71.59–17,592.91) 2543.12 6.61 4.09 19,611.00 (11,258.04–27,963.96) 3582.31 8.60 3.00From NC_PICT to NC_TXT 12,585.60 (5407.74–19,763.46) 9247.29 7.03 3.53 14,197.00 (7353.18–21,040.82) 8729.35 8.78 2.24
Note: C_TXT = corresponding text segments; NC_TXT = non-corresponding text segments; C_PICT = corresponding picture segments; NC_PICT = non-corresponding picturesegments.
a The average duration of look-from fixation time is the total fixation time divided by the number of transitions (gaze shifts).
180 L. Mason et al./Contemporary Educational Psychology 41 (2015) 172–187
MSE = 8.24, p < .001, η2 = .31, text segments to corresponding picturesegments, as well as for the look-from non-corresponding text seg-ments to non-corresponding picture segments, F(1, 40) = 5.62,MSE = 4.91, p = .023, η2 = .12. All look-from fixation times were longerfor learners in the EMME condition. These outcomes indicate thatlearners who observed the model’s eye movements spent more timerefixating the relevant parts of the visualization while rereading thecorresponding and non-corresponding text segments than learn-ers who did not see the model’s gaze replay. In addition, they alsoattended more the non-corresponding picture segments whilerefixating the non-corresponding text segments, perhaps check-ing whether there were further depictions of verbal information.
3.2.3. Average look-from text to picture and from picture to textfixation times
A MANOVA with the average duration (total duration divided by thenumber of transitions) of look-from text to picture and look-from pictureto text fixation times for corresponding and non-corresponding verbaland graphical segments did not reveal the effect of condition, Wilks’Lambda = .77, F(8, 33) = 1.21, p = .322. This outcome indicates that in bothconditions the length of look-from fixation time per transition was sub-stantial the same as when learners made many, or few, gaze shifts fromtext segments to picture segments and vice versa.
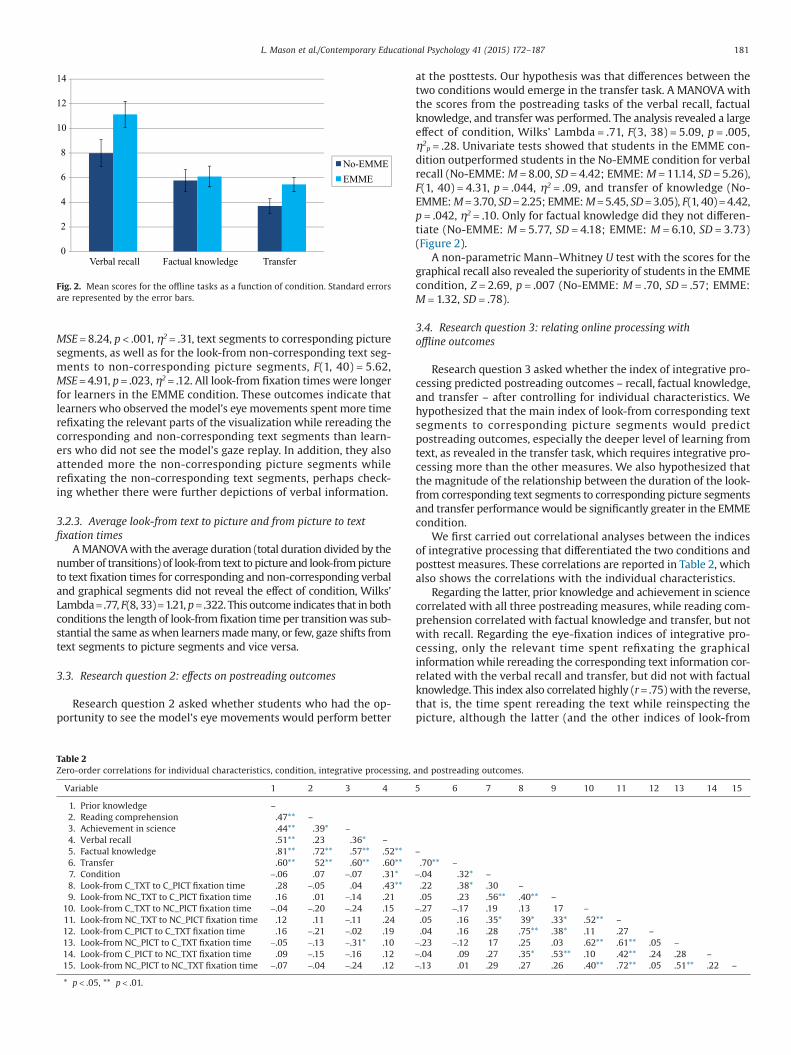
3.3. Research question 2: effects on postreading outcomes
Research question 2 asked whether students who had the op-portunity to see the model’s eye movements would perform better
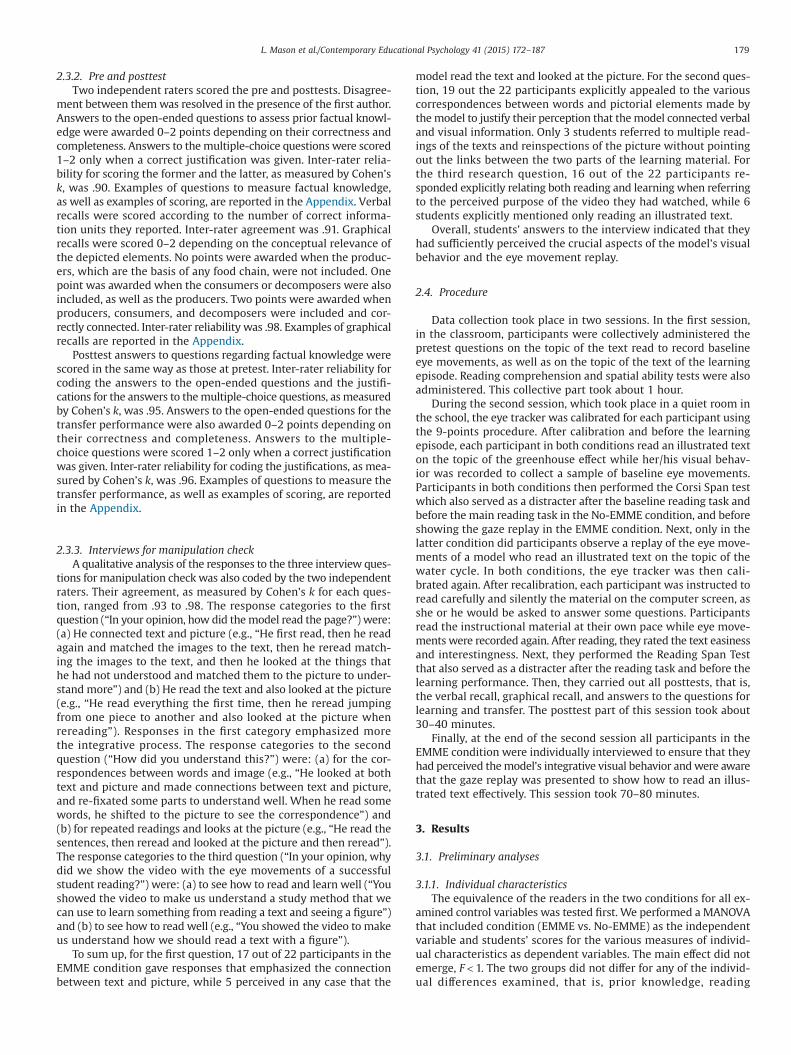
at the posttests. Our hypothesis was that differences between thetwo conditions would emerge in the transfer task. A MANOVA withthe scores from the postreading tasks of the verbal recall, factualknowledge, and transfer was performed. The analysis revealed a largeeffect of condition, Wilks’ Lambda = .71, F(3, 38) = 5.09, p = .005,η2
p = .28. Univariate tests showed that students in the EMME con-dition outperformed students in the No-EMME condition for verbalrecall (No-EMME: M = 8.00, SD = 4.42; EMME: M = 11.14, SD = 5.26),F(1, 40) = 4.31, p = .044, η2 = .09, and transfer of knowledge (No-EMME: M = 3.70, SD = 2.25; EMME: M = 5.45, SD = 3.05), F(1, 40) = 4.42,p = .042, η2 = .10. Only for factual knowledge did they not differen-tiate (No-EMME: M = 5.77, SD = 4.18; EMME: M = 6.10, SD = 3.73)(Figure 2).
A non-parametric Mann–Whitney U test with the scores for thegraphical recall also revealed the superiority of students in the EMMEcondition, Z = 2.69, p = .007 (No-EMME: M = .70, SD = .57; EMME:M = 1.32, SD = .78).
3.4. Research question 3: relating online processing withoffline outcomes
Research question 3 asked whether the index of integrative pro-cessing predicted postreading outcomes – recall, factual knowledge,and transfer – after controlling for individual characteristics. Wehypothesized that the main index of look-from corresponding textsegments to corresponding picture segments would predictpostreading outcomes, especially the deeper level of learning fromtext, as revealed in the transfer task, which requires integrative pro-cessing more than the other measures. We also hypothesized thatthe magnitude of the relationship between the duration of the look-from corresponding text segments to corresponding picture segmentsand transfer performance would be significantly greater in the EMMEcondition.
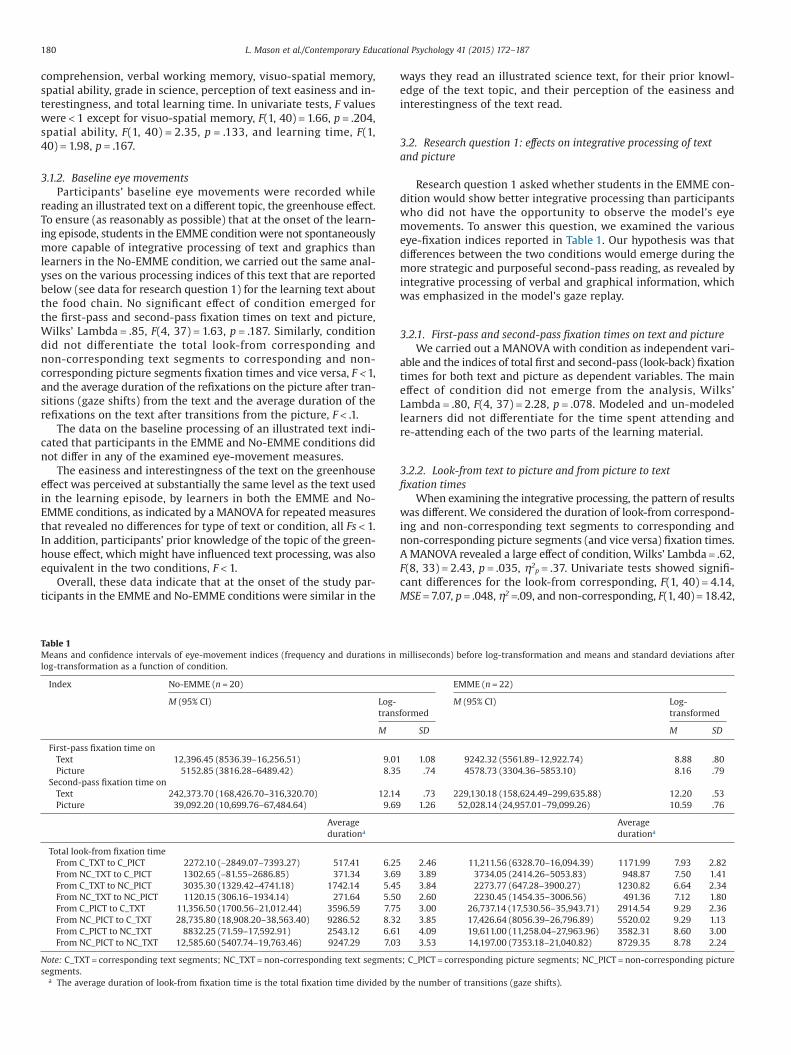
We first carried out correlational analyses between the indicesof integrative processing that differentiated the two conditions andposttest measures. These correlations are reported in Table 2, whichalso shows the correlations with the individual characteristics.
Regarding the latter, prior knowledge and achievement in sciencecorrelated with all three postreading measures, while reading com-prehension correlated with factual knowledge and transfer, but notwith recall. Regarding the eye-fixation indices of integrative pro-cessing, only the relevant time spent refixating the graphicalinformation while rereading the corresponding text information cor-related with the verbal recall and transfer, but did not with factualknowledge. This index also correlated highly (r = .75) with the reverse,that is, the time spent rereading the text while reinspecting thepicture, although the latter (and the other indices of look-from
0
2
4
6
8
10
12
14
Verbal recall Factual knowledge Transfer
No-EMME
EMME
Fig. 2. Mean scores for the offline tasks as a function of condition. Standard errorsare represented by the error bars.
Table 2Zero-order correlations for individual characteristics, condition, integrative processing, and postreading outcomes.
Variable 1 2 3 4 5 6 7 8 9 10 11 12 13 14 15
1. Prior knowledge –2. Reading comprehension .47** –3. Achievement in science .44** .39* –4. Verbal recall .51** .23 .36* –5. Factual knowledge .81** .72** .57** .52** –6. Transfer .60** 52** .60** .60** .70** –7. Condition −.06 .07 −.07 .31* −.04 .32* –8. Look-from C_TXT to C_PICT fixation time .28 −.05 .04 .43** .22 .38* .30 –9. Look-from NC_TXT to C_PICT fixation time .16 .01 −.14 .21 .05 .23 .56** .40** –
10. Look-from C_TXT to NC_PICT fixation time −.04 −.20 −.24 .15 −.27 −.17 .19 .13 17 –11. Look-from NC_TXT to NC_PICT fixation time .12 .11 −.11 .24 .05 .16 .35* 39* .33* .52** –12. Look-from C_PICT to C_TXT fixation time .16 −.21 −.02 .19 .04 .16 .28 .75** .38* .11 .27 –13. Look-from NC_PICT to C_TXT fixation time −.05 −.13 −.31* .10 −.23 −.12 17 .25 .03 .62** .61** .05 –14. Look-from C_PICT to NC_TXT fixation time .09 −.15 −.16 .12 −.04 .09 .27 .35* .53** .10 .42** .24 .28 –15. Look-from NC_PICT to NC_TXT fixation time −.07 −.04 −.24 .12 −.13 .01 .29 .27 .26 .40** .72** .05 .51** .22 –
* p < .05, ** p < .01.
181L. Mason et al./Contemporary Educational Psychology 41 (2015) 172–187
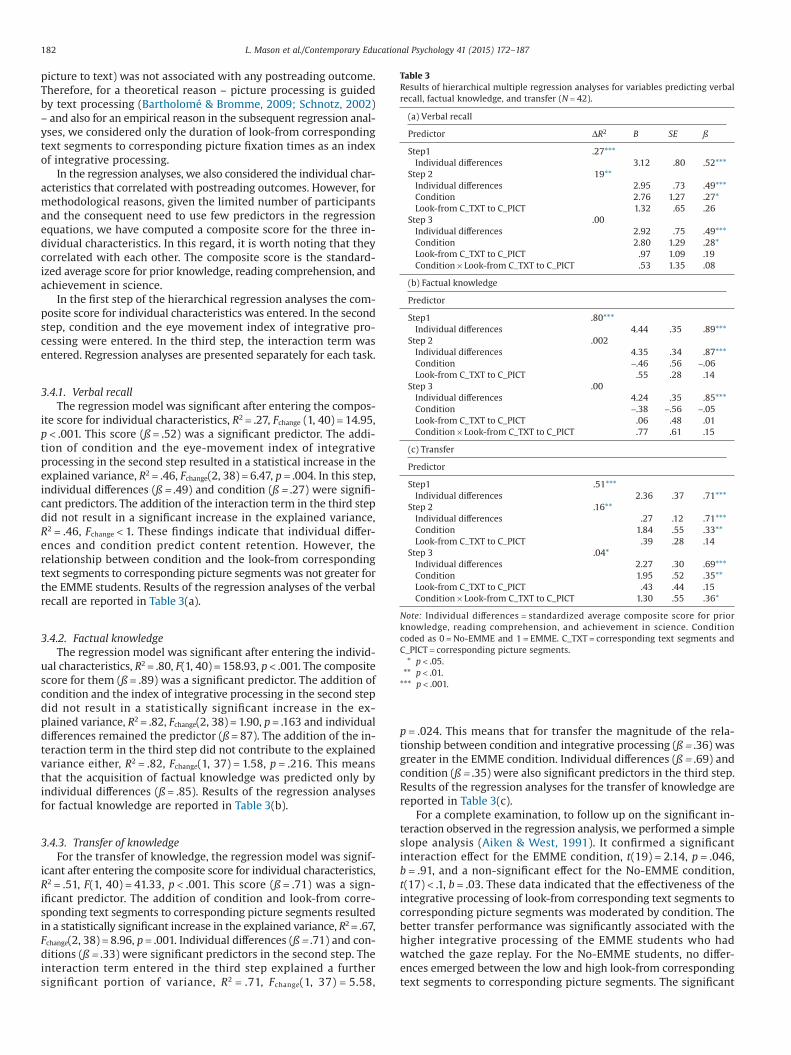
picture to text) was not associated with any postreading outcome.Therefore, for a theoretical reason – picture processing is guidedby text processing (Bartholomé & Bromme, 2009; Schnotz, 2002)– and also for an empirical reason in the subsequent regression anal-yses, we considered only the duration of look-from correspondingtext segments to corresponding picture fixation times as an indexof integrative processing.
In the regression analyses, we also considered the individual char-acteristics that correlated with postreading outcomes. However, formethodological reasons, given the limited number of participantsand the consequent need to use few predictors in the regressionequations, we have computed a composite score for the three in-dividual characteristics. In this regard, it is worth noting that theycorrelated with each other. The composite score is the standard-ized average score for prior knowledge, reading comprehension, andachievement in science.
In the first step of the hierarchical regression analyses the com-posite score for individual characteristics was entered. In the secondstep, condition and the eye movement index of integrative pro-cessing were entered. In the third step, the interaction term wasentered. Regression analyses are presented separately for each task.
3.4.1. Verbal recallThe regression model was significant after entering the compos-
ite score for individual characteristics, R2 = .27, Fchange (1, 40) = 14.95,p < .001. This score (ß = .52) was a significant predictor. The addi-tion of condition and the eye-movement index of integrativeprocessing in the second step resulted in a statistical increase in theexplained variance, R2 = .46, Fchange(2, 38) = 6.47, p = .004. In this step,individual differences (ß = .49) and condition (ß = .27) were signifi-cant predictors. The addition of the interaction term in the third stepdid not result in a significant increase in the explained variance,R2 = .46, Fchange < 1. These findings indicate that individual differ-ences and condition predict content retention. However, therelationship between condition and the look-from correspondingtext segments to corresponding picture segments was not greater forthe EMME students. Results of the regression analyses of the verbalrecall are reported in Table 3(a).
3.4.2. Factual knowledgeThe regression model was significant after entering the individ-
ual characteristics, R2 = .80, F(1, 40) = 158.93, p < .001. The compositescore for them (ß = .89) was a significant predictor. The addition ofcondition and the index of integrative processing in the second stepdid not result in a statistically significant increase in the ex-plained variance, R2 = .82, Fchange(2, 38) = 1.90, p = .163 and individualdifferences remained the predictor (ß = 87). The addition of the in-teraction term in the third step did not contribute to the explainedvariance either, R2 = .82, Fchange(1, 37) = 1.58, p = .216. This meansthat the acquisition of factual knowledge was predicted only byindividual differences (ß = .85). Results of the regression analysesfor factual knowledge are reported in Table 3(b).
3.4.3. Transfer of knowledgeFor the transfer of knowledge, the regression model was signif-
icant after entering the composite score for individual characteristics,R2 = .51, F(1, 40) = 41.33, p < .001. This score (ß = .71) was a sign-ificant predictor. The addition of condition and look-from corre-sponding text segments to corresponding picture segments resultedin a statistically significant increase in the explained variance, R2 = .67,Fchange(2, 38) = 8.96, p = .001. Individual differences (ß = .71) and con-ditions (ß = .33) were significant predictors in the second step. Theinteraction term entered in the third step explained a furthersignificant portion of variance, R2 = .71, Fchange(1, 37) = 5.58,
p = .024. This means that for transfer the magnitude of the rela-tionship between condition and integrative processing (ß = .36) wasgreater in the EMME condition. Individual differences (ß = .69) andcondition (ß = .35) were also significant predictors in the third step.Results of the regression analyses for the transfer of knowledge arereported in Table 3(c).
For a complete examination, to follow up on the significant in-teraction observed in the regression analysis, we performed a simpleslope analysis (Aiken & West, 1991). It confirmed a significantinteraction effect for the EMME condition, t(19) = 2.14, p = .046,b = .91, and a non-significant effect for the No-EMME condition,t(17) < .1, b = .03. These data indicated that the effectiveness of theintegrative processing of look-from corresponding text segments tocorresponding picture segments was moderated by condition. Thebetter transfer performance was significantly associated with thehigher integrative processing of the EMME students who hadwatched the gaze replay. For the No-EMME students, no differ-ences emerged between the low and high look-from correspondingtext segments to corresponding picture segments. The significant
Table 3Results of hierarchical multiple regression analyses for variables predicting verbalrecall, factual knowledge, and transfer (N = 42).
(a) Verbal recall
Predictor ΔR2 B SE ß
Step1 .27***Individual differences 3.12 .80 .52***
Step 2 19**Individual differences 2.95 .73 .49***Condition 2.76 1.27 .27*Look-from C_TXT to C_PICT 1.32 .65 .26
Step 3 .00Individual differences 2.92 .75 .49***Condition 2.80 1.29 .28*Look-from C_TXT to C_PICT .97 1.09 .19Condition × Look-from C_TXT to C_PICT .53 1.35 .08
(b) Factual knowledge
Predictor
Step1 .80***Individual differences 4.44 .35 .89***
Step 2 .002Individual differences 4.35 .34 .87***Condition −.46 .56 −.06Look-from C_TXT to C_PICT .55 .28 .14
Step 3 .00Individual differences 4.24 .35 .85***Condition −.38 −.56 −.05Look-from C_TXT to C_PICT .06 .48 .01Condition × Look-from C_TXT to C_PICT .77 .61 .15
(c) Transfer
Predictor
Step1 .51***Individual differences 2.36 .37 .71***
Step 2 .16**Individual differences .27 .12 .71***Condition 1.84 .55 .33**Look-from C_TXT to C_PICT .39 .28 .14
Step 3 .04*Individual differences 2.27 .30 .69***Condition 1.95 .52 .35**Look-from C_TXT to C_PICT .43 .44 .15Condition × Look-from C_TXT to C_PICT 1.30 .55 .36*
Note: Individual differences = standardized average composite score for priorknowledge, reading comprehension, and achievement in science. Conditioncoded as 0 = No-EMME and 1 = EMME. C_TXT = corresponding text segments andC_PICT = corresponding picture segments.
* p < .05.** p < .01.
*** p < .001.
182 L. Mason et al./Contemporary Educational Psychology 41 (2015) 172–187
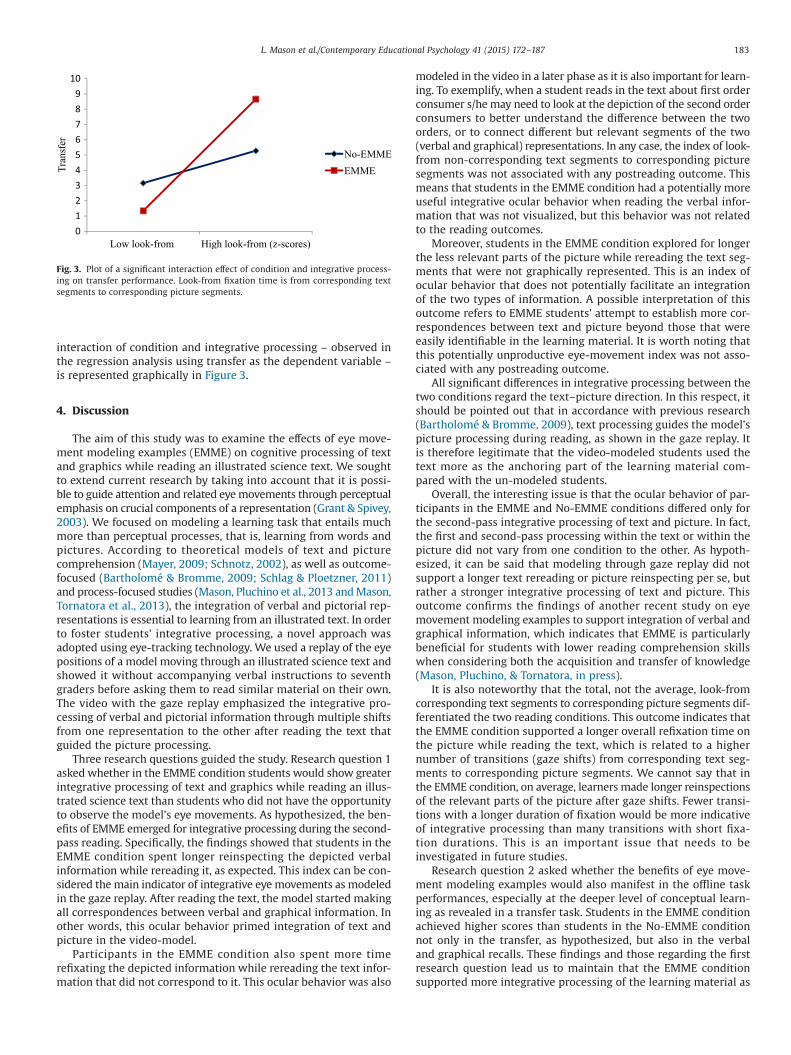
interaction of condition and integrative processing – observed inthe regression analysis using transfer as the dependent variable –is represented graphically in Figure 3.
4. Discussion
The aim of this study was to examine the effects of eye move-ment modeling examples (EMME) on cognitive processing of textand graphics while reading an illustrated science text. We soughtto extend current research by taking into account that it is possi-ble to guide attention and related eye movements through perceptualemphasis on crucial components of a representation (Grant & Spivey,2003). We focused on modeling a learning task that entails muchmore than perceptual processes, that is, learning from words andpictures. According to theoretical models of text and picturecomprehension (Mayer, 2009; Schnotz, 2002), as well as outcome-focused (Bartholomé & Bromme, 2009; Schlag & Ploetzner, 2011)and process-focused studies (Mason, Pluchino et al., 2013 and Mason,Tornatora et al., 2013), the integration of verbal and pictorial rep-resentations is essential to learning from an illustrated text. In orderto foster students’ integrative processing, a novel approach wasadopted using eye-tracking technology. We used a replay of the eyepositions of a model moving through an illustrated science text andshowed it without accompanying verbal instructions to seventhgraders before asking them to read similar material on their own.The video with the gaze replay emphasized the integrative pro-cessing of verbal and pictorial information through multiple shiftsfrom one representation to the other after reading the text thatguided the picture processing.
Three research questions guided the study. Research question 1asked whether in the EMME condition students would show greaterintegrative processing of text and graphics while reading an illus-trated science text than students who did not have the opportunityto observe the model’s eye movements. As hypothesized, the ben-efits of EMME emerged for integrative processing during the second-pass reading. Specifically, the findings showed that students in theEMME condition spent longer reinspecting the depicted verbalinformation while rereading it, as expected. This index can be con-sidered the main indicator of integrative eye movements as modeledin the gaze replay. After reading the text, the model started makingall correspondences between verbal and graphical information. Inother words, this ocular behavior primed integration of text andpicture in the video-model.
Participants in the EMME condition also spent more timerefixating the depicted information while rereading the text infor-mation that did not correspond to it. This ocular behavior was also
modeled in the video in a later phase as it is also important for learn-ing. To exemplify, when a student reads in the text about first orderconsumer s/he may need to look at the depiction of the second orderconsumers to better understand the difference between the twoorders, or to connect different but relevant segments of the two(verbal and graphical) representations. In any case, the index of look-from non-corresponding text segments to corresponding picturesegments was not associated with any postreading outcome. Thismeans that students in the EMME condition had a potentially moreuseful integrative ocular behavior when reading the verbal infor-mation that was not visualized, but this behavior was not relatedto the reading outcomes.
Moreover, students in the EMME condition explored for longerthe less relevant parts of the picture while rereading the text seg-ments that were not graphically represented. This is an index ofocular behavior that does not potentially facilitate an integrationof the two types of information. A possible interpretation of thisoutcome refers to EMME students’ attempt to establish more cor-respondences between text and picture beyond those that wereeasily identifiable in the learning material. It is worth noting thatthis potentially unproductive eye-movement index was not asso-ciated with any postreading outcome.
All significant differences in integrative processing between thetwo conditions regard the text–picture direction. In this respect, itshould be pointed out that in accordance with previous research(Bartholomé & Bromme, 2009), text processing guides the model’spicture processing during reading, as shown in the gaze replay. Itis therefore legitimate that the video-modeled students used thetext more as the anchoring part of the learning material com-pared with the un-modeled students.
Overall, the interesting issue is that the ocular behavior of par-ticipants in the EMME and No-EMME conditions differed only forthe second-pass integrative processing of text and picture. In fact,the first and second-pass processing within the text or within thepicture did not vary from one condition to the other. As hypoth-esized, it can be said that modeling through gaze replay did notsupport a longer text rereading or picture reinspecting per se, butrather a stronger integrative processing of text and picture. Thisoutcome confirms the findings of another recent study on eyemovement modeling examples to support integration of verbal andgraphical information, which indicates that EMME is particularlybeneficial for students with lower reading comprehension skillswhen considering both the acquisition and transfer of knowledge(Mason, Pluchino, & Tornatora, in press).
It is also noteworthy that the total, not the average, look-fromcorresponding text segments to corresponding picture segments dif-ferentiated the two reading conditions. This outcome indicates thatthe EMME condition supported a longer overall refixation time onthe picture while reading the text, which is related to a highernumber of transitions (gaze shifts) from corresponding text seg-ments to corresponding picture segments. We cannot say that inthe EMME condition, on average, learners made longer reinspectionsof the relevant parts of the picture after gaze shifts. Fewer transi-tions with a longer duration of fixation would be more indicativeof integrative processing than many transitions with short fixa-tion durations. This is an important issue that needs to beinvestigated in future studies.
Research question 2 asked whether the benefits of eye move-ment modeling examples would also manifest in the offline taskperformances, especially at the deeper level of conceptual learn-ing as revealed in a transfer task. Students in the EMME conditionachieved higher scores than students in the No-EMME conditionnot only in the transfer, as hypothesized, but also in the verbaland graphical recalls. These findings and those regarding the firstresearch question lead us to maintain that the EMME conditionsupported more integrative processing of the learning material as
0123456789
10
Low look-from High look-from (z-scores)
Tra
nsfe
r
No-EMME
EMME
Fig. 3. Plot of a significant interaction effect of condition and integrative process-ing on transfer performance. Look-from fixation time is from corresponding textsegments to corresponding picture segments.
183L. Mason et al./Contemporary Educational Psychology 41 (2015) 172–187
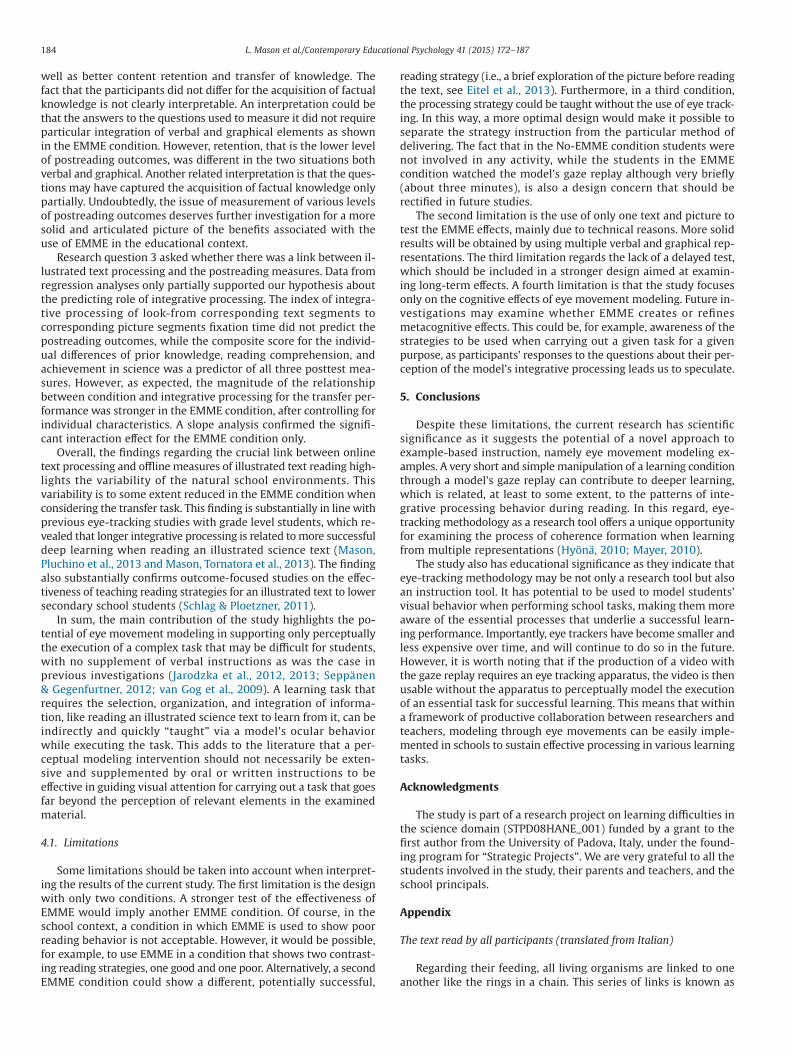
well as better content retention and transfer of knowledge. Thefact that the participants did not differ for the acquisition of factualknowledge is not clearly interpretable. An interpretation could bethat the answers to the questions used to measure it did not requireparticular integration of verbal and graphical elements as shownin the EMME condition. However, retention, that is the lower levelof postreading outcomes, was different in the two situations bothverbal and graphical. Another related interpretation is that the ques-tions may have captured the acquisition of factual knowledge onlypartially. Undoubtedly, the issue of measurement of various levelsof postreading outcomes deserves further investigation for a moresolid and articulated picture of the benefits associated with theuse of EMME in the educational context.
Research question 3 asked whether there was a link between il-lustrated text processing and the postreading measures. Data fromregression analyses only partially supported our hypothesis aboutthe predicting role of integrative processing. The index of integra-tive processing of look-from corresponding text segments tocorresponding picture segments fixation time did not predict thepostreading outcomes, while the composite score for the individ-ual differences of prior knowledge, reading comprehension, andachievement in science was a predictor of all three posttest mea-sures. However, as expected, the magnitude of the relationshipbetween condition and integrative processing for the transfer per-formance was stronger in the EMME condition, after controlling forindividual characteristics. A slope analysis confirmed the signifi-cant interaction effect for the EMME condition only.
Overall, the findings regarding the crucial link between onlinetext processing and offline measures of illustrated text reading high-lights the variability of the natural school environments. Thisvariability is to some extent reduced in the EMME condition whenconsidering the transfer task. This finding is substantially in line withprevious eye-tracking studies with grade level students, which re-vealed that longer integrative processing is related to more successfuldeep learning when reading an illustrated science text (Mason,Pluchino et al., 2013 and Mason, Tornatora et al., 2013). The findingalso substantially confirms outcome-focused studies on the effec-tiveness of teaching reading strategies for an illustrated text to lowersecondary school students (Schlag & Ploetzner, 2011).
In sum, the main contribution of the study highlights the po-tential of eye movement modeling in supporting only perceptuallythe execution of a complex task that may be difficult for students,with no supplement of verbal instructions as was the case inprevious investigations (Jarodzka et al., 2012, 2013; Seppänen& Gegenfurtner, 2012; van Gog et al., 2009). A learning task thatrequires the selection, organization, and integration of informa-tion, like reading an illustrated science text to learn from it, can beindirectly and quickly “taught” via a model’s ocular behaviorwhile executing the task. This adds to the literature that a per-ceptual modeling intervention should not necessarily be exten-sive and supplemented by oral or written instructions to beeffective in guiding visual attention for carrying out a task that goesfar beyond the perception of relevant elements in the examinedmaterial.
4.1. Limitations
Some limitations should be taken into account when interpret-ing the results of the current study. The first limitation is the designwith only two conditions. A stronger test of the effectiveness ofEMME would imply another EMME condition. Of course, in theschool context, a condition in which EMME is used to show poorreading behavior is not acceptable. However, it would be possible,for example, to use EMME in a condition that shows two contrast-ing reading strategies, one good and one poor. Alternatively, a secondEMME condition could show a different, potentially successful,
reading strategy (i.e., a brief exploration of the picture before readingthe text, see Eitel et al., 2013). Furthermore, in a third condition,the processing strategy could be taught without the use of eye track-ing. In this way, a more optimal design would make it possible toseparate the strategy instruction from the particular method ofdelivering. The fact that in the No-EMME condition students werenot involved in any activity, while the students in the EMMEcondition watched the model’s gaze replay although very briefly(about three minutes), is also a design concern that should berectified in future studies.
The second limitation is the use of only one text and picture totest the EMME effects, mainly due to technical reasons. More solidresults will be obtained by using multiple verbal and graphical rep-resentations. The third limitation regards the lack of a delayed test,which should be included in a stronger design aimed at examin-ing long-term effects. A fourth limitation is that the study focusesonly on the cognitive effects of eye movement modeling. Future in-vestigations may examine whether EMME creates or refinesmetacognitive effects. This could be, for example, awareness of thestrategies to be used when carrying out a given task for a givenpurpose, as participants’ responses to the questions about their per-ception of the model’s integrative processing leads us to speculate.
5. Conclusions
Despite these limitations, the current research has scientificsignificance as it suggests the potential of a novel approach toexample-based instruction, namely eye movement modeling ex-amples. A very short and simple manipulation of a learning conditionthrough a model’s gaze replay can contribute to deeper learning,which is related, at least to some extent, to the patterns of inte-grative processing behavior during reading. In this regard, eye-tracking methodology as a research tool offers a unique opportunityfor examining the process of coherence formation when learningfrom multiple representations (Hyönä, 2010; Mayer, 2010).
The study also has educational significance as they indicate thateye-tracking methodology may be not only a research tool but alsoan instruction tool. It has potential to be used to model students’visual behavior when performing school tasks, making them moreaware of the essential processes that underlie a successful learn-ing performance. Importantly, eye trackers have become smaller andless expensive over time, and will continue to do so in the future.However, it is worth noting that if the production of a video withthe gaze replay requires an eye tracking apparatus, the video is thenusable without the apparatus to perceptually model the executionof an essential task for successful learning. This means that withina framework of productive collaboration between researchers andteachers, modeling through eye movements can be easily imple-mented in schools to sustain effective processing in various learningtasks.
Acknowledgments
The study is part of a research project on learning difficulties inthe science domain (STPD08HANE_001) funded by a grant to thefirst author from the University of Padova, Italy, under the found-ing program for “Strategic Projects”. We are very grateful to all thestudents involved in the study, their parents and teachers, and theschool principals.
Appendix
The text read by all participants (translated from Italian)
Regarding their feeding, all living organisms are linked to oneanother like the rings in a chain. This series of links is known as
184 L. Mason et al./Contemporary Educational Psychology 41 (2015) 172–187
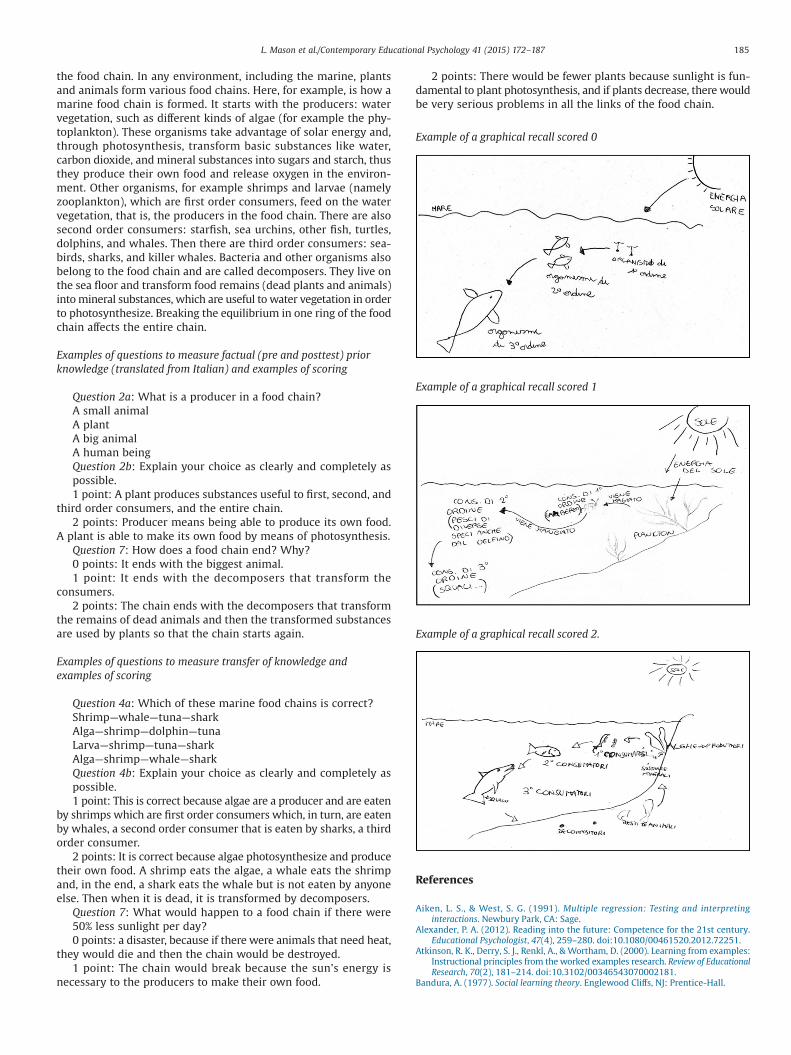
the food chain. In any environment, including the marine, plantsand animals form various food chains. Here, for example, is how amarine food chain is formed. It starts with the producers: watervegetation, such as different kinds of algae (for example the phy-toplankton). These organisms take advantage of solar energy and,through photosynthesis, transform basic substances like water,carbon dioxide, and mineral substances into sugars and starch, thusthey produce their own food and release oxygen in the environ-ment. Other organisms, for example shrimps and larvae (namelyzooplankton), which are first order consumers, feed on the watervegetation, that is, the producers in the food chain. There are alsosecond order consumers: starfish, sea urchins, other fish, turtles,dolphins, and whales. Then there are third order consumers: sea-birds, sharks, and killer whales. Bacteria and other organisms alsobelong to the food chain and are called decomposers. They live onthe sea floor and transform food remains (dead plants and animals)into mineral substances, which are useful to water vegetation in orderto photosynthesize. Breaking the equilibrium in one ring of the foodchain affects the entire chain.
Examples of questions to measure factual (pre and posttest) priorknowledge (translated from Italian) and examples of scoring
Question 2a: What is a producer in a food chain?A small animalA plantA big animalA human beingQuestion 2b: Explain your choice as clearly and completely aspossible.1 point: A plant produces substances useful to first, second, and
third order consumers, and the entire chain.2 points: Producer means being able to produce its own food.
A plant is able to make its own food by means of photosynthesis.Question 7: How does a food chain end? Why?0 points: It ends with the biggest animal.1 point: It ends with the decomposers that transform the
consumers.2 points: The chain ends with the decomposers that transform
the remains of dead animals and then the transformed substancesare used by plants so that the chain starts again.
Examples of questions to measure transfer of knowledge andexamples of scoring
Question 4a: Which of these marine food chains is correct?Shrimp—whale—tuna—sharkAlga—shrimp—dolphin—tunaLarva—shrimp—tuna—sharkAlga—shrimp—whale—sharkQuestion 4b: Explain your choice as clearly and completely aspossible.1 point: This is correct because algae are a producer and are eaten
by shrimps which are first order consumers which, in turn, are eatenby whales, a second order consumer that is eaten by sharks, a thirdorder consumer.
2 points: It is correct because algae photosynthesize and producetheir own food. A shrimp eats the algae, a whale eats the shrimpand, in the end, a shark eats the whale but is not eaten by anyoneelse. Then when it is dead, it is transformed by decomposers.
Question 7: What would happen to a food chain if there were50% less sunlight per day?0 points: a disaster, because if there were animals that need heat,
they would die and then the chain would be destroyed.1 point: The chain would break because the sun’s energy is
necessary to the producers to make their own food.
2 points: There would be fewer plants because sunlight is fun-damental to plant photosynthesis, and if plants decrease, there wouldbe very serious problems in all the links of the food chain.
Example of a graphical recall scored 0
Example of a graphical recall scored 1
Example of a graphical recall scored 2.
References
Aiken, L. S., & West, S. G. (1991). Multiple regression: Testing and interpretinginteractions. Newbury Park, CA: Sage.
Alexander, P. A. (2012). Reading into the future: Competence for the 21st century.Educational Psychologist, 47(4), 259–280. doi:10.1080/00461520.2012.72251.
Atkinson, R. K., Derry, S. J., Renkl, A., & Wortham, D. (2000). Learning from examples:Instructional principles from the worked examples research. Review of EducationalResearch, 70(2), 181–214. doi:10.3102/00346543070002181.
Bandura, A. (1977). Social learning theory. Englewood Cliffs, NJ: Prentice-Hall.
185L. Mason et al./Contemporary Educational Psychology 41 (2015) 172–187
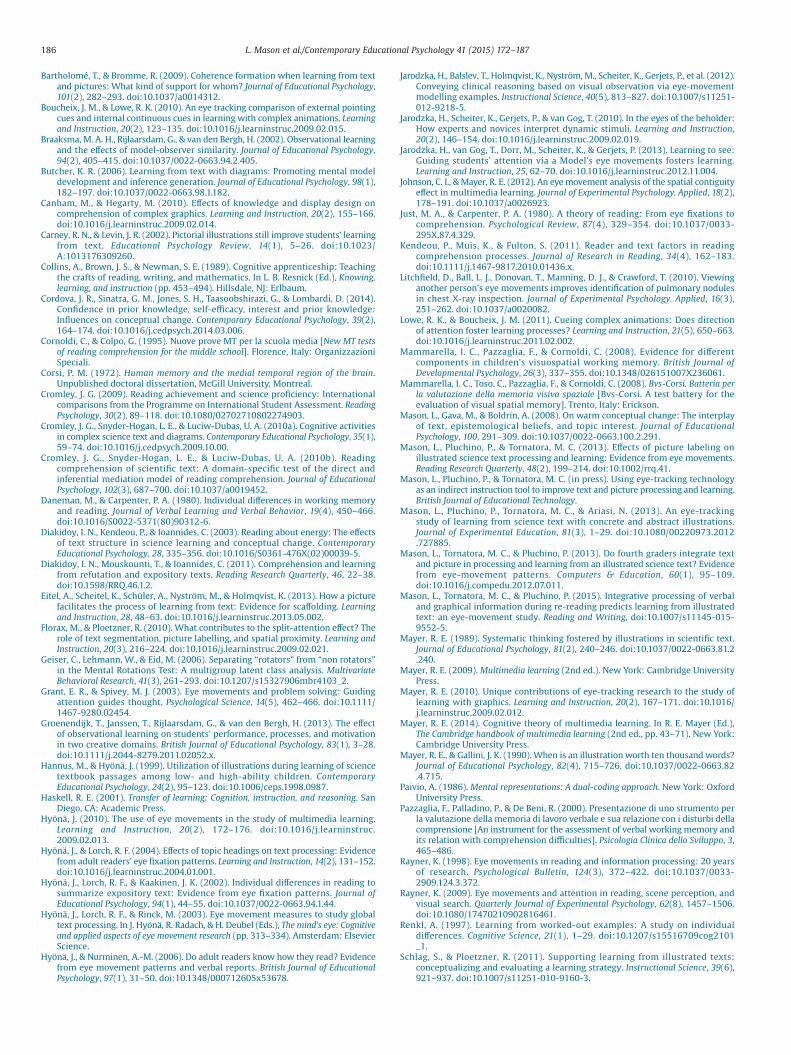
Bartholomé, T., & Bromme, R. (2009). Coherence formation when learning from textand pictures: What kind of support for whom? Journal of Educational Psychology,101(2), 282–293. doi:10.1037/a0014312.
Boucheix, J. M., & Lowe, R. K. (2010). An eye tracking comparison of external pointingcues and internal continuous cues in learning with complex animations. Learningand Instruction, 20(2), 123–135. doi:10.1016/j.learninstruc.2009.02.015.
Braaksma, M. A. H., Rijlaarsdam, G., & van den Bergh, H. (2002). Observational learningand the effects of model-observer similarity. Journal of Educational Psychology,94(2), 405–415. doi:10.1037/0022-0663.94.2.405.
Butcher, K. R. (2006). Learning from text with diagrams: Promoting mental modeldevelopment and inference generation. Journal of Educational Psychology, 98(1),182–197. doi:10.1037/0022-0663.98.1.182.
Canham, M., & Hegarty, M. (2010). Effects of knowledge and display design oncomprehension of complex graphics. Learning and Instruction, 20(2), 155–166.doi:10.1016/j.learninstruc.2009.02.014.
Carney, R. N., & Levin, J. R. (2002). Pictorial illustrations still improve students’ learningfrom text. Educational Psychology Review, 14(1), 5–26. doi:10.1023/A:1013176309260.
Collins, A., Brown, J. S., & Newman, S. E. (1989). Cognitive apprenticeship: Teachingthe crafts of reading, writing, and mathematics. In L. B. Resnick (Ed.), Knowing,learning, and instruction (pp. 453–494). Hillsdale, NJ: Erlbaum.
Cordova, J. R., Sinatra, G. M., Jones, S. H., Taasoobshirazi, G., & Lombardi, D. (2014).Confidence in prior knowledge, self-efficacy, interest and prior knowledge:Influences on conceptual change. Contemporary Educational Psychology, 39(2),164–174. doi:10.1016/j.cedpsych.2014.03.006.
Cornoldi, C., & Colpo, G. (1995). Nuove prove MT per la scuola media [New MT testsof reading comprehension for the middle school]. Florence, Italy: OrganizzazioniSpeciali.
Corsi, P. M. (1972). Human memory and the medial temporal region of the brain.Unpublished doctoral dissertation, McGill University, Montreal.
Cromley, J. G. (2009). Reading achievement and science proficiency: Internationalcomparisons from the Programme on International Student Assessment. ReadingPsychology, 30(2), 89–118. doi:10.1080/02702710802274903.
Cromley, J. G., Snyder-Hogan, L. E., & Luciw-Dubas, U. A. (2010a). Cognitive activitiesin complex science text and diagrams. Contemporary Educational Psychology, 35(1),59–74. doi:10.1016/j.cedpsych.2009.10.00.
Cromley, J. G., Snyder-Hogan, L. E., & Luciw-Dubas, U. A. (2010b). Readingcomprehension of scientific text: A domain-specific test of the direct andinferential mediation model of reading comprehension. Journal of EducationalPsychology, 102(3), 687–700. doi:10.1037/a0019452.
Daneman, M., & Carpenter, P. A. (1980). Individual differences in working memoryand reading. Journal of Verbal Learning and Verbal Behavior, 19(4), 450–466.doi:10.1016/S0022-5371(80)90312-6.
Diakidoy, I. N., Kendeou, P., & Ioannides, C. (2003). Reading about energy: The effectsof text structure in science learning and conceptual change. ContemporaryEducational Psychology, 28, 335–356. doi:10.1016/S0361-476X(02)00039-5.
Diakidoy, I. N., Mouskounti, T., & Ioannides, C. (2011). Comprehension and learningfrom refutation and expository texts. Reading Research Quarterly, 46, 22–38.doi:10.1598/RRQ.46.1.2.
Eitel, A., Scheitel, K., Schüler, A., Nyström, M., & Holmqvist, K. (2013). How a picturefacilitates the process of learning from text: Evidence for scaffolding. Learningand Instruction, 28, 48–63. doi:10.1016/j.learninstruc.2013.05.002.
Florax, M., & Ploetzner, R. (2010). What contributes to the split-attention effect? Therole of text segmentation, picture labelling, and spatial proximity. Learning andInstruction, 20(3), 216–224. doi:10.1016/j.learninstruc.2009.02.021.
Geiser, C., Lehmann, W., & Eid, M. (2006). Separating “rotators” from “non rotators”in the Mental Rotations Test: A multigroup latent class analysis. MultivariateBehavioral Research, 41(3), 261–293. doi:10.1207/s15327906mbr4103_2.
Grant, E. R., & Spivey, M. J. (2003). Eye movements and problem solving: Guidingattention guides thought. Psychological Science, 14(5), 462–466. doi:10.1111/1467-9280.02454.
Groenendijk, T., Janssen, T., Rijlaarsdam, G., & van den Bergh, H. (2013). The effectof observational learning on students’ performance, processes, and motivationin two creative domains. British Journal of Educational Psychology, 83(1), 3–28.doi:10.1111/j.2044-8279.2011.02052.x.
Hannus, M., & Hyönä, J. (1999). Utilization of illustrations during learning of sciencetextbook passages among low- and high-ability children. ContemporaryEducational Psychology, 24(2), 95–123. doi:10.1006/ceps.1998.0987.
Haskell, R. E. (2001). Transfer of learning: Cognition, instruction, and reasoning. SanDiego, CA: Academic Press.
Hyönä, J. (2010). The use of eye movements in the study of multimedia learning.Learning and Instruction, 20(2), 172–176. doi:10.1016/j.learninstruc.2009.02.013.
Hyönä, J., & Lorch, R. F. (2004). Effects of topic headings on text processing: Evidencefrom adult readers’ eye fixation patterns. Learning and Instruction, 14(2), 131–152.doi:10.1016/j.learninstruc.2004.01.001.
Hyönä, J., Lorch, R. F., & Kaakinen, J. K. (2002). Individual differences in reading tosummarize expository text: Evidence from eye fixation patterns. Journal ofEducational Psychology, 94(1), 44–55. doi:10.1037/0022-0663.94.1.44.
Hyönä, J., Lorch, R. F., & Rinck, M. (2003). Eye movement measures to study globaltext processing. In J. Hyönä, R. Radach, & H. Deubel (Eds.), The mind’s eye: Cognitiveand applied aspects of eye movement research (pp. 313–334). Amsterdam: ElsevierScience.
Hyönä, J., & Nurminen, A.-M. (2006). Do adult readers know how they read? Evidencefrom eye movement patterns and verbal reports. British Journal of EducationalPsychology, 97(1), 31–50. doi:10.1348/000712605x53678.
Jarodzka, H., Balslev, T., Holmqvist, K., Nyström, M., Scheiter, K., Gerjets, P., et al. (2012).Conveying clinical reasoning based on visual observation via eye-movementmodelling examples. Instructional Science, 40(5), 813–827. doi:10.1007/s11251-012-9218-5.
Jarodzka, H., Scheiter, K., Gerjets, P., & van Gog, T. (2010). In the eyes of the beholder:How experts and novices interpret dynamic stimuli. Learning and Instruction,20(2), 146–154. doi:10.1016/j.learninstruc.2009.02.019.
Jarodzka, H., van Gog, T., Dorr, M., Scheiter, K., & Gerjets, P. (2013). Learning to see:Guiding students’ attention via a Model’s eye movements fosters learning.Learning and Instruction, 25, 62–70. doi:10.1016/j.learninstruc.2012.11.004.
Johnson, C. I., & Mayer, R. E. (2012). An eye movement analysis of the spatial contiguityeffect in multimedia learning. Journal of Experimental Psychology. Applied, 18(2),178–191. doi:10.1037/a0026923.
Just, M. A., & Carpenter, P. A. (1980). A theory of reading: From eye fixations tocomprehension. Psychological Review, 87(4), 329–354. doi:10.1037/0033-295X.87.4.329.
Kendeou, P., Muis, K., & Fulton, S. (2011). Reader and text factors in readingcomprehension processes. Journal of Research in Reading, 34(4), 162–183.doi:10.1111/j.1467-9817.2010.01436.x.
Litchfield, D., Ball, L. J., Donovan, T., Manning, D. J., & Crawford, T. (2010). Viewinganother person’s eye movements improves identification of pulmonary nodulesin chest X-ray inspection. Journal of Experimental Psychology. Applied, 16(3),251–262. doi:10.1037/a0020082.
Lowe, R. K., & Boucheix, J. M. (2011). Cueing complex animations: Does directionof attention foster learning processes? Learning and Instruction, 21(5), 650–663.doi:10.1016/j.learninstruc.2011.02.002.
Mammarella, I. C., Pazzaglia, F., & Cornoldi, C. (2008). Evidence for differentcomponents in children’s visuospatial working memory. British Journal ofDevelopmental Psychology, 26(3), 337–355. doi:10.1348/026151007X236061.
Mammarella, I. C., Toso, C., Pazzaglia, F., & Cornoldi, C. (2008). Bvs-Corsi. Batteria perla valutazione della memoria visiva spaziale [Bvs-Corsi. A test battery for theevaluation of visual spatial memory]. Trento, Italy: Erickson.
Mason, L., Gava, M., & Boldrin, A. (2008). On warm conceptual change: The interplayof text, epistemological beliefs, and topic interest. Journal of EducationalPsychology, 100, 291–309. doi:10.1037/0022-0663.100.2.291.
Mason, L., Pluchino, P., & Tornatora, M. C. (2013). Effects of picture labeling onillustrated science text processing and learning: Evidence from eye movements.Reading Research Quarterly, 48(2), 199–214. doi:10.1002/rrq.41.
Mason, L., Pluchino, P., & Tornatora, M. C. (in press). Using eye-tracking technologyas an indirect instruction tool to improve text and picture processing and learning.British Journal of Educational Technology.
Mason, L., Pluchino, P., Tornatora, M. C., & Ariasi, N. (2013). An eye-trackingstudy of learning from science text with concrete and abstract illustrations.Journal of Experimental Education, 81(3), 1–29. doi:10.1080/00220973.2012.727885.
Mason, L., Tornatora, M. C., & Pluchino, P. (2013). Do fourth graders integrate textand picture in processing and learning from an illustrated science text? Evidencefrom eye-movement patterns. Computers & Education, 60(1), 95–109.doi:10.1016/j.compedu.2012.07.011.
Mason, L., Tornatora, M. C., & Pluchino, P. (2015). Integrative processing of verbaland graphical information during re-reading predicts learning from illustratedtext: an eye-movement study. Reading and Writing, doi:10.1007/s11145-015-9552-5.
Mayer, R. E. (1989). Systematic thinking fostered by illustrations in scientific text.Journal of Educational Psychology, 81(2), 240–246. doi:10.1037/0022-0663.81.2.240.
Mayer, R. E. (2009). Multimedia learning (2nd ed.). New York: Cambridge UniversityPress.
Mayer, R. E. (2010). Unique contributions of eye-tracking research to the study oflearning with graphics. Learning and Instruction, 20(2), 167–171. doi:10.1016/j.learninstruc.2009.02.012.
Mayer, R. E. (2014). Cognitive theory of multimedia learning. In R. E. Mayer (Ed.),The Cambridge handbook of multimedia learning (2nd ed., pp. 43–71). New York:Cambridge University Press.
Mayer, R. E., & Gallini, J. K. (1990). When is an illustration worth ten thousand words?Journal of Educational Psychology, 82(4), 715–726. doi:10.1037/0022-0663.82.4.715.
Paivio, A. (1986). Mental representations: A dual-coding approach. New York: OxfordUniversity Press.
Pazzaglia, F., Palladino, P., & De Beni, R. (2000). Presentazione di uno strumento perla valutazione della memoria di lavoro verbale e sua relazione con i disturbi dellacomprensione [An instrument for the assessment of verbal working memory andits relation with comprehension difficulties]. Psicologia Clinica dello Sviluppo, 3,465–486.
Rayner, K. (1998). Eye movements in reading and information processing: 20 yearsof research. Psychological Bulletin, 124(3), 372–422. doi:10.1037/0033-2909.124.3.372.
Rayner, K. (2009). Eye movements and attention in reading, scene perception, andvisual search. Quarterly Journal of Experimental Psychology, 62(8), 1457–1506.doi:10.1080/17470210902816461.
Renkl, A. (1997). Learning from worked-out examples: A study on individualdifferences. Cognitive Science, 21(1), 1–29. doi:10.1207/s15516709cog2101_1.
Schlag, S., & Ploetzner, R. (2011). Supporting learning from illustrated texts:conceptualizing and evaluating a learning strategy. Instructional Science, 39(6),921–937. doi:10.1007/s11251-010-9160-3.
186 L. Mason et al./Contemporary Educational Psychology 41 (2015) 172–187
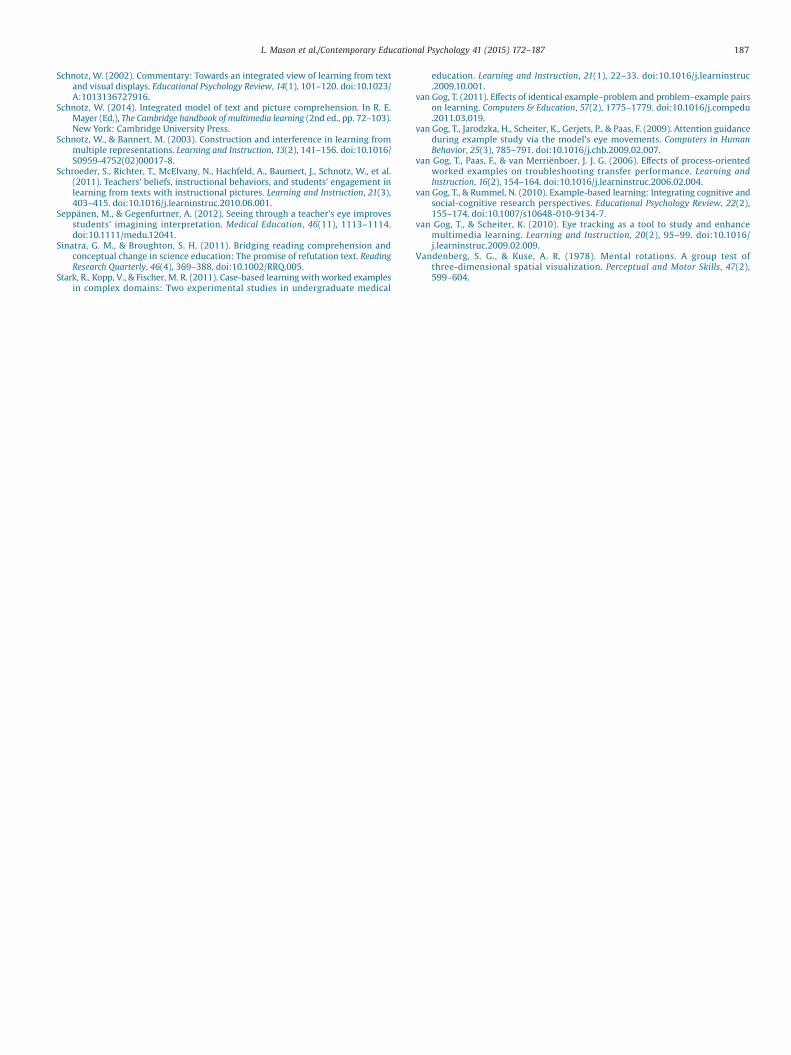
Schnotz, W. (2002). Commentary: Towards an integrated view of learning from textand visual displays. Educational Psychology Review, 14(1), 101–120. doi:10.1023/A:1013136727916.
Schnotz, W. (2014). Integrated model of text and picture comprehension. In R. E.Mayer (Ed.), The Cambridge handbook of multimedia learning (2nd ed., pp. 72–103).New York: Cambridge University Press.
Schnotz, W., & Bannert, M. (2003). Construction and interference in learning frommultiple representations. Learning and Instruction, 13(2), 141–156. doi:10.1016/S0959-4752(02)00017-8.
Schroeder, S., Richter, T., McElvany, N., Hachfeld, A., Baumert, J., Schnotz, W., et al.(2011). Teachers’ beliefs, instructional behaviors, and students’ engagement inlearning from texts with instructional pictures. Learning and Instruction, 21(3),403–415. doi:10.1016/j.learninstruc.2010.06.001.
Seppänen, M., & Gegenfurtner, A. (2012). Seeing through a teacher’s eye improvesstudents’ imagining interpretation. Medical Education, 46(11), 1113–1114.doi:10.1111/medu.12041.
Sinatra, G. M., & Broughton, S. H. (2011). Bridging reading comprehension andconceptual change in science education: The promise of refutation text. ReadingResearch Quarterly, 46(4), 369–388. doi:10.1002/RRQ.005.
Stark, R., Kopp, V., & Fischer, M. R. (2011). Case-based learning with worked examplesin complex domains: Two experimental studies in undergraduate medical
education. Learning and Instruction, 21(1), 22–33. doi:10.1016/j.learninstruc.2009.10.001.
van Gog, T. (2011). Effects of identical example–problem and problem–example pairson learning. Computers & Education, 57(2), 1775–1779. doi:10.1016/j.compedu.2011.03.019.
van Gog, T., Jarodzka, H., Scheiter, K., Gerjets, P., & Paas, F. (2009). Attention guidanceduring example study via the model’s eye movements. Computers in HumanBehavior, 25(3), 785–791. doi:10.1016/j.chb.2009.02.007.
van Gog, T., Paas, F., & van Merriënboer, J. J. G. (2006). Effects of process-orientedworked examples on troubleshooting transfer performance. Learning andInstruction, 16(2), 154–164. doi:10.1016/j.learninstruc.2006.02.004.
van Gog, T., & Rummel, N. (2010). Example-based learning: Integrating cognitive andsocial-cognitive research perspectives. Educational Psychology Review, 22(2),155–174. doi:10.1007/s10648-010-9134-7.
van Gog, T., & Scheiter, K. (2010). Eye tracking as a tool to study and enhancemultimedia learning. Learning and Instruction, 20(2), 95–99. doi:10.1016/j.learninstruc.2009.02.009.
Vandenberg, S. G., & Kuse, A. R. (1978). Mental rotations. A group test ofthree-dimensional spatial visualization. Perceptual and Motor Skills, 47(2),599–604.
187L. Mason et al./Contemporary Educational Psychology 41 (2015) 172–187
Related Documents