This content has been downloaded from IOPscience. Please scroll down to see the full text. Download details: IP Address: 193.204.29.252 This content was downloaded on 13/03/2014 at 08:16 Please note that terms and conditions apply. Differential diagnosis of Raynaud’s phenomenon based on modeling of finger thermoregulation View the table of contents for this issue, or go to the journal homepage for more 2014 Physiol. Meas. 35 703 (http://iopscience.iop.org/0967-3334/35/4/703) Home Search Collections Journals About Contact us My IOPscience

Welcome message from author
This document is posted to help you gain knowledge. Please leave a comment to let me know what you think about it! Share it to your friends and learn new things together.
Transcript
This content has been downloaded from IOPscience. Please scroll down to see the full text.
Download details:
IP Address: 193.204.29.252
This content was downloaded on 13/03/2014 at 08:16
Please note that terms and conditions apply.
Differential diagnosis of Raynaud’s phenomenon based on modeling of finger
thermoregulation
View the table of contents for this issue, or go to the journal homepage for more
2014 Physiol. Meas. 35 703
(http://iopscience.iop.org/0967-3334/35/4/703)
Home Search Collections Journals About Contact us My IOPscience
Institute of Physics and Engineering in Medicine Physiological Measurement
Physiol. Meas. 35 (2014) 703–716 doi:10.1088/0967-3334/35/4/703
Differential diagnosis of Raynaud’sphenomenon based on modeling of fingerthermoregulation
E Ismail1, G Orlando2, M L Corradini3, P Amerio4,G L Romani1 and A Merla1
1 Department of Neuroscience and Imaging and ITAB—Institute of AdvancedBiomedical Technologies, University ‘G. d’Annunzio’—Chieti-Pescara, Italy2 DIIGA, Polytechnic University of Marche, Ancona, Italy3 School of Science and Technology, University of Camerino, Camerino, Italy4 Dipartimento di Medicina e Scienze dellInvecchiamento, University ‘G.d’Annunzio’—Chieti-Pescara, Italy
E-mail: [email protected] (E Ismail)
Received 30 October 2013, revised 29 January 2014Accepted for publication 7 February 2014Published 12 March 2014
AbstractRaynaud’s phenomenon (RP) is a vasospastic disorder of small arteries,pre-capillary arteries, and cutaneous arteriovenous shunts of the extremities,typically induced by cold exposure and emotional stress. RP is either primary(PRP) or secondary to connective tissue diseases such as systemic sclerosis(SSc). Early differential diagnosis is crucial in order to set the proper therapeuticstrategy. To this goal, thermal infrared imaging data from 18 healthy controls(HCs) and 48 RP patients (20 PRP, 28 SSc) were processed through a modelfor a second-order time-invariant system with exponential critically dampeddynamic response. Subject classification on the basis of the model parametersprovides 100% true-positive discrimination for RP patients (PRP and SSc) andhealthy, and 90% of correct classification within the group of patients. Theproposed method may provide useful hints for early differential diagnosis inthe assessment of RP disease.
Keywords: control system, linear time invariant (LTI), cutaneous temperature,thermal infrared (IR), modeling, multinomial logistic regression, Raynaud’sphenomenon (RP)
(Some figures may appear in colour only in the online journal)
0967-3334/14/040703+14$33.00 © 2014 Institute of Physics and Engineering in Medicine Printed in the UK 703

Physiol. Meas. 35 (2014) 703 E Ismail et al
1. Introduction
Raynaud’s phenomenon (RP) is a paroxysmal vasospastic disorder of small arteries, pre-capillary arteries, and cutaneous arteriovenous shunts of the extremities. RP is typicallyinduced by cold exposure and emotional stress (Block and Sequeira 2001). RP usually appearson fingers and toes, however also tongue, nose, ears, and nipples may be involved. Theprevalence of RP varies widely across countries and populations. Non-population based studiesof prevalence show that up to 9%–22.5% of population report alternations of RP (Fraenkel2002). It may be classified into primary RP (PRP) and secondary RP. PRP is more commonin young (usually under 40) women and characterized by bilateral involvement, absenceof serological abnormalities, and normal nailfold capillaries. Secondary RP is commonlyassociated with a connective tissue disease such as lupus, or more frequently, systemic sclerosis(Block and Sequeira 2001) (SSc; scleroderma). Secondary RP typically may precede the onsetof other symptoms and signs of disease in SSc by several years (Block and Sequeira 2001). Thedifference in patient characteristics among the two types of RP is often not so striking and it isimportant to note that there may not be a clear distinction between PRP and secondary RP inearly connective tissue disease. Many RP patients have no sign of systemic disease, althoughpresenting subtle nailfold abnormalities or some serological features. The differential diagnosisof PRP versus secondary RP is therefore of utmost importance before irreversible visceraldamage becomes problematic in order to favor the successful treatment of this condition andany associated underlying disease. RP impacts the finger thermoregulatory system (Mariottiet al 2009). Moreover, due to RP, the local micro-vascular system rearranges its functionaland architectural structure, thus causing modifications in the local skin thermal distribution(Merla et al 2002a). The evaluation of the finger thermoregulatory impairment is crucial inorder to distinguish between PRP and RP secondary to SSc (Merla et al 2002b). Thermalinfrared (IR) imaging is a diagnostic imaging technique that can record a two-dimensionalmap of the cutaneous temperature distribution of given regions of interest. Since the cutaneoustemperature depends on the local blood perfusion and thermal tissue properties, IR imagingprovides important indirect information concerning local circulation and thermal properties.The functional study of vascular reactivity in both basal conditions or in response to stimulican be also studied by means of IR imaging (Mariotti et al 2009, Grossi et al 2010). SeveralIR imaging studies have been performed to differentiate PRP from secondary RP, often incombination with the monitoring of the finger response to a controlled cold challenge (Merlaet al 2002a, 2002b, Grossi et al 2010, Foerster et al 2007, Merla et al 2002c, O’Reilly et al1992). Most of these studies dealt with the classification of RP on the basis of statistical analysisof descriptors of the cutaneous temperature recovery after the cold challenge (lag time, timeconstant, integral curves of temperature, or time to reach a given recovery threshold) (Merlaet al 2002a, 2002b, Foerster et al 2007, Merla et al 2002c, Hahn et al 1999). Mariotti et al(2009) proposed a thermoregulatory model, based on control system theory, to describe thefunctional differences associated with the control of the finger temperature. They found thatthe estimated model parameters could reflect the level of functional impairment expressedin the different forms of the disease, concluding that the automatic control theory could beused to model different thermal responses due to pathological, functional, and morphologicalalterations in the finger thermoregulation system associated to RP. The authors highlightedthe possibility of evaluating the thermoregulatory impairment through the theory of automaticcontrol systems. However, they concluded also that the components of the proposed modelwere hypothetical and that they have been postulated to achieve a sufficient explanation ofthe observed data and accuracy in differential diagnosis. The association between the modelcomponents with the local active rewarming and passive heat exchange remained speculative,
704

Physiol. Meas. 35 (2014) 703 E Ismail et al
given the elevated complexity of the system and the need for a better understanding of thecorrespondence of the model to the actual physiological processes. Therefore, in order todescribe the time domain dynamics of finger thermoregulation in response to a standard coldchallenge, we adopted a prototype second-order control system as a model and proposed todirectly estimate its standard time-domain specifications. In addition, we also evaluate thesubject and the finger-to-finger classification capability of our method in order to distinguishhealthy from pathological condition and to assess its diagnostic specificity.
2. Finger thermoregulatory system
Cutaneous circulation is a major effector of human thermoregulation (LeRoy and Medsger2001). Cutaneous vessels dilate or constrict in response to either ambient or internalbody temperature or changes of psychophysiological states. Exposure to cold stress elicitsgeneralized cutaneous vasoconstriction, which may be extremely pronounced at the fingertipsurface. Cutaneous vasoconstriction is a response mediated by a sympathetic control processtriggered partly by stimulation of the cutaneous cold receptors in the cooled area, and partlyby cooling the blood returning to the general circulation, which stimulates the temperature-regulating center in the anterior hypothalamus (Sawasaki et al 2001). Homeostasis is basicallymaintained by a negative feedback loop, similar to a thermostat (Sato et al 2005), whichregulates the energy exchange at the cutaneous level with the environment through metabolicand hemodynamic processes, thus determining the finger temperature at any given time (Satoet al 2005).
Employing the control system theory, the homeostatic process can be modeled as afeedback controlled system. This kind of system considers a reference signal to produce thedesired output. The reference signal indicates the value that the output has to assume. Thereference value is represented by the superficial basal temperature that can be consideredsteady prior the cold challenge, while the output is the superficial finger temperature. A coldchallenge induces a finger temperature (plant controlled output) change from the basal value(reference value). The difference between the plant controlled output and the reference value(i.e., the output error) prompts the thermoregulatory reaction in order to restore the basalvalue. In other words, the thermoregulatory reaction steers the output error to zero. The time-evolution of the finger temperature can be recorded by means of thermal IR imaging (Merlaet al 2002b). Examples of temperature versus time curves obtained from experimental recoverydata in healthy controls (HCs), SSc, and PRP patients are reported in figure 1.
The finger skin thermoregulatory system was demonstrated to be a second-order time-invariant system with exponential critically damped dynamic response (Merla et al 2002a,Rollins et al 2006). According to the control system theory, differences in the curves of thetemperature depend on the efficacy of the finger thermoregulatory system. By studying thetime domain characteristics of the dynamic responses shown by the recovery curves, we couldbetter understand the functional meanings and the actual values of the model parameters.
3. Materials and methods
3.1. Subjects
28 SSc patients, 20 PRP and 18 HCs participated in this study, which was authorized bythe Human Board Review and Local Ethical Committee of the School of Medicine of theUniversity of Chieti-Pescara. All subjects gave written informed consent before participatingin the study. SSc and PRP patients were classified according to the criteria and the methods
705
Physiol. Meas. 35 (2014) 703 E Ismail et al
0 5 10 15 2015
20
25
30
35
Time (min)
Tem
pera
ture
(°c
)HCS
0 5 10 15 2015
20
25
30
35
Time (min)
Tem
pera
ture
(°c
)
SSc
0 5 10 15 2015
20
25
30
35
Time (min)
Tem
pera
ture
(°c
)
PRP
ThumbIndexMiddleRingLittle
(a) (b) (c)
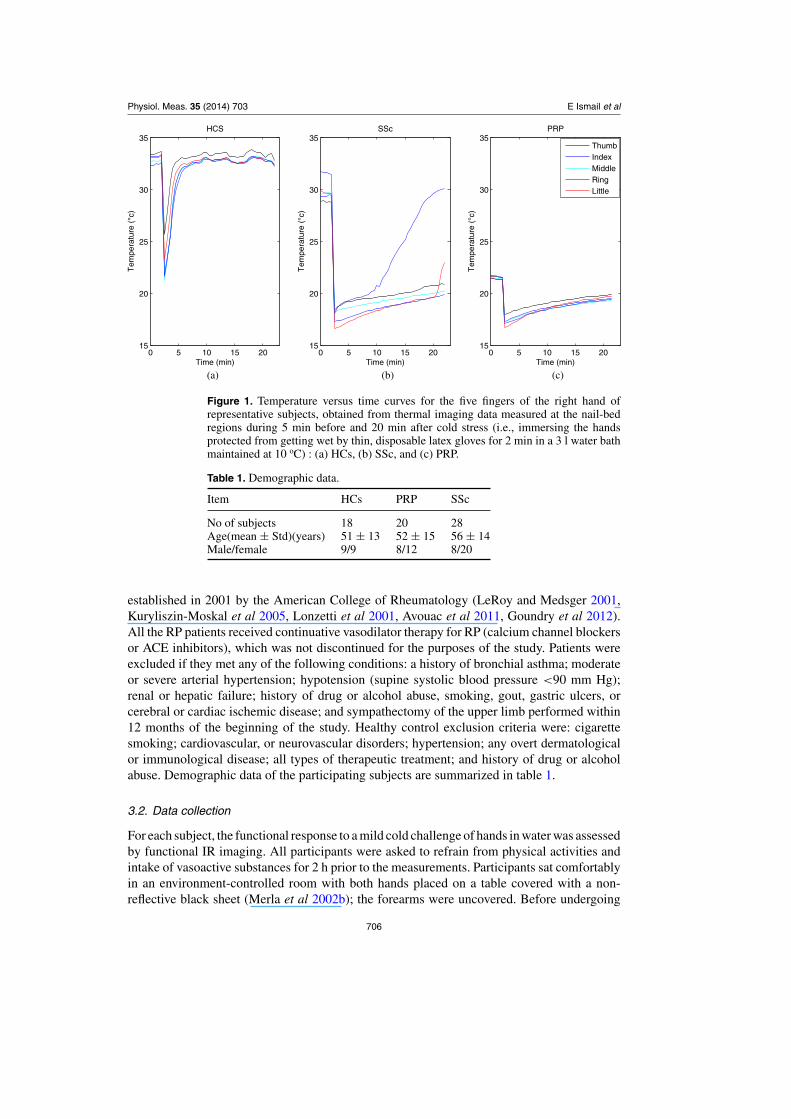
Figure 1. Temperature versus time curves for the five fingers of the right hand ofrepresentative subjects, obtained from thermal imaging data measured at the nail-bedregions during 5 min before and 20 min after cold stress (i.e., immersing the handsprotected from getting wet by thin, disposable latex gloves for 2 min in a 3 l water bathmaintained at 10 oC) : (a) HCs, (b) SSc, and (c) PRP.
Table 1. Demographic data.
Item HCs PRP SSc
No of subjects 18 20 28Age(mean ± Std)(years) 51 ± 13 52 ± 15 56 ± 14Male/female 9/9 8/12 8/20
established in 2001 by the American College of Rheumatology (LeRoy and Medsger 2001,Kuryliszin-Moskal et al 2005, Lonzetti et al 2001, Avouac et al 2011, Goundry et al 2012).All the RP patients received continuative vasodilator therapy for RP (calcium channel blockersor ACE inhibitors), which was not discontinued for the purposes of the study. Patients wereexcluded if they met any of the following conditions: a history of bronchial asthma; moderateor severe arterial hypertension; hypotension (supine systolic blood pressure <90 mm Hg);renal or hepatic failure; history of drug or alcohol abuse, smoking, gout, gastric ulcers, orcerebral or cardiac ischemic disease; and sympathectomy of the upper limb performed within12 months of the beginning of the study. Healthy control exclusion criteria were: cigarettesmoking; cardiovascular, or neurovascular disorders; hypertension; any overt dermatologicalor immunological disease; all types of therapeutic treatment; and history of drug or alcoholabuse. Demographic data of the participating subjects are summarized in table 1.
3.2. Data collection
For each subject, the functional response to a mild cold challenge of hands in water was assessedby functional IR imaging. All participants were asked to refrain from physical activities andintake of vasoactive substances for 2 h prior to the measurements. Participants sat comfortablyin an environment-controlled room with both hands placed on a table covered with a non-reflective black sheet (Merla et al 2002b); the forearms were uncovered. Before undergoing
706

Physiol. Meas. 35 (2014) 703 E Ismail et al
measurements, the subjects observed a 20 min acclimatization period to the recording room,which was set at a standardized temperature (23 oC), humidity (50%–60%), and without directventilation. Thermal IR imaging was performed by means of a digital thermal camera (FLIRSC3000, Flir Systems, Sweden), with a focal plane array of 320 × 240 QWIP detectors,capable of collecting the thermal radiation in the 8–9 μm band, with a 0.02 s time resolution,and 0.02 κ temperature sensitivity. Cutaneous emissivity was estimated as ε ≈ 0.98. Thethermal camera response was blackbody-calibrated to null noise-effects related to the sensordrift/shift dynamics and optical artifacts. Thermal images of the dorsum of each subjects’hands were recorded. The recording was performed for 25 min including both baseline andrecovery phases, acquiring images every 30 s, and recording five thermal images before thecold stress to obtain the baseline of finger temperature. The thermal camera was placed 1.5 maway from the dorsum. The cold stress was achieved by immersing the hands (protected fromgetting wet by thin, disposable latex gloves) for 2 min in a 3 l water bath maintained at 10 oC.After removal of the gloves, the hands were placed in the same position as before the coldstress. For each finger of both hands, the rewarming curve was obtained by averaging thetemperature of the pixels within the nail-bed region (Merla et al 2002b).This region of interestwas defined in the first frame of the image. We corrected for the displacement between imagesframe by frame using anatomical landmarks based on the fingers profile (Dowdall et al 2007,Ebisch et al 2012).
3.3. Direct estimation of the time-domain specifications
The finger thermoregulation system is a highly complex system that can be thought to connectsome input variables (recorded by local and central thermoreceptors) to the output variablesconstituted by the thermoregulatory effectors (De Trafford et al 1982). The wide number ofcomplex processes potentially involved in temperature control and in its alteration suggests toconsider the overall control system as a black box, whose overall structure can be investigatedby analyzing the input–output time-responses (De Trafford et al 1982), either in the healthyand in the pathological conditions. Indeed, standard tools from control system theory cancharacterize the mathematical model of an unknown system by studying its dynamic responsein the time domain or, more specifically, by analyzing certain parameters characterizing thesystem response to canonical inputs (the step input in our case). A first inspection of the healthysubjects data seemed to suggest that the finger skin thermoregulatory system could be describedas a second-order time-invariant system with exponential decay (Merla et al 2002a, Rollinset al 2006). An analogous model seemed able to describe responses obtained with RP patients,although with different time constants. The different dynamics found in the two categoriesof subjects could be thought to be linked to the pathological functional and morphologicalalternations associated with the presence of the RP. When trying to mathematically estimatethe time domain parameters for each study group, it was noticed that the transient response ofHCS curves has a very small (nearly zero) overshoot, thus suggesting that a simple second-order model with unitary damping could be enough to describe the recorded responses (seefigure 1). The same model was used for the PRP and SSc groups. The position of the coincidentreal poles characterizing the time behavior in the complex plane can be estimated using theso-called rise time (tr), i.e. the time required for the step response to rise from 10% to 90% ofits final value, suggesting closed loop poles (S1, and S2 ) given by:
S1, S2 = −1.8
tr. (1)
In addition to closed loop poles, also the delay time (td) (i.e., the time required for the stepresponse to reach 50% of its final value) and the steady-state error (ess) (i.e., the discrepancy
707
Physiol. Meas. 35 (2014) 703 E Ismail et al
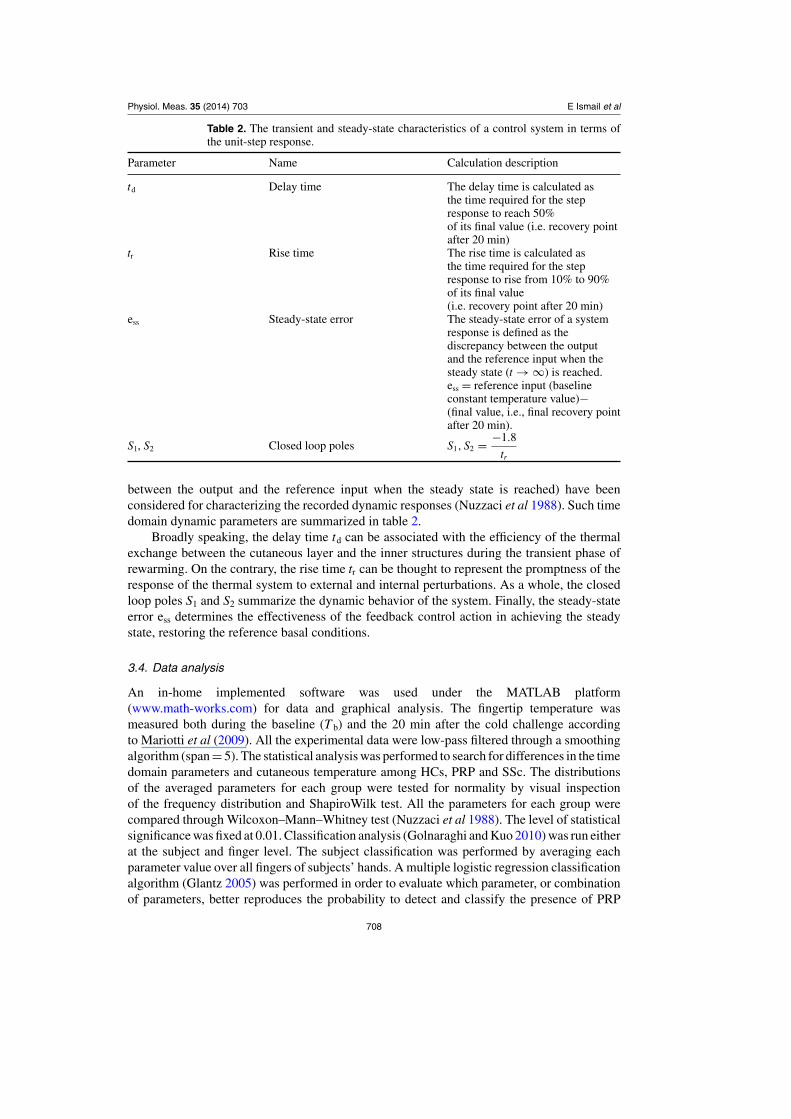
Table 2. The transient and steady-state characteristics of a control system in terms ofthe unit-step response.
Parameter Name Calculation description
td Delay time The delay time is calculated asthe time required for the stepresponse to reach 50%of its final value (i.e. recovery pointafter 20 min)
tr Rise time The rise time is calculated asthe time required for the stepresponse to rise from 10% to 90%of its final value(i.e. recovery point after 20 min)
ess Steady-state error The steady-state error of a systemresponse is defined as thediscrepancy between the outputand the reference input when thesteady state (t → ∞) is reached.ess = reference input (baselineconstant temperature value)−(final value, i.e., final recovery pointafter 20 min).
S1, S2 Closed loop poles S1, S2 = −1.8
tr
between the output and the reference input when the steady state is reached) have beenconsidered for characterizing the recorded dynamic responses (Nuzzaci et al 1988). Such timedomain dynamic parameters are summarized in table 2.
Broadly speaking, the delay time td can be associated with the efficiency of the thermalexchange between the cutaneous layer and the inner structures during the transient phase ofrewarming. On the contrary, the rise time tr can be thought to represent the promptness of theresponse of the thermal system to external and internal perturbations. As a whole, the closedloop poles S1 and S2 summarize the dynamic behavior of the system. Finally, the steady-stateerror ess determines the effectiveness of the feedback control action in achieving the steadystate, restoring the reference basal conditions.
3.4. Data analysis
An in-home implemented software was used under the MATLAB platform(www.math-works.com) for data and graphical analysis. The fingertip temperature wasmeasured both during the baseline (T b) and the 20 min after the cold challenge accordingto Mariotti et al (2009). All the experimental data were low-pass filtered through a smoothingalgorithm (span = 5). The statistical analysis was performed to search for differences in the timedomain parameters and cutaneous temperature among HCs, PRP and SSc. The distributionsof the averaged parameters for each group were tested for normality by visual inspectionof the frequency distribution and ShapiroWilk test. All the parameters for each group werecompared through Wilcoxon–Mann–Whitney test (Nuzzaci et al 1988). The level of statisticalsignificance was fixed at 0.01. Classification analysis (Golnaraghi and Kuo 2010) was run eitherat the subject and finger level. The subject classification was performed by averaging eachparameter value over all fingers of subjects’ hands. A multiple logistic regression classificationalgorithm (Glantz 2005) was performed in order to evaluate which parameter, or combinationof parameters, better reproduces the probability to detect and classify the presence of PRP
708

Physiol. Meas. 35 (2014) 703 E Ismail et al
5
10
15
HCS PRP SSc
Del
ay T
ime
t d (m
in)
5
10
15
HCS PRP SSc
Ris
e T
ime
t r (m
in)
0.2
0.4
0.6
HCS PRP SSc
Clo
sed
Loop
Pol
es S
1,S2
−5
0
5
10
HCS PRP SSc
abso
lute
ste
ady
stat
e er
ror
e s (
°C)
20
25
30
35
HCS PRP SSc
Bas
line
Tem
pera
ture
Tb (
°C)
*
***
***
* *
***
*
*s
Figure 2. Comparison of the group average parameters among groups (whisker boxplot). Median, first, and third quartile, minimum and maximum are reported for eachparameter. The box limits represent the upper and lower quartiles; the line inside the boxrepresents the median value. Whiskers extend from each end of the box to minimumand maximum values in the data. The horizontal bars with asterisk connect the groupswith significant statistical difference.
Table 3. Group subject average values.
Parameter(mean ± standard deviation) HCs PRP SSc
Delay time (td)(min) 4 ± 1 7 ± 2 8 ± 3Rise time (tr)(min) 5 ± 2 14 ± 12 12 ± 3Closed loop poles (S1, S2) 0.4 ± 0.1 0.13 ± 0 0.17 ± 0.1Steady-state error (ess)(oC) 1 ± 1 4 ± 2 4 ± 3Temperature (T b)(oC) 33 ± 3 25 ± 3 29 ± 4
and SSc. The clinical diagnosis was adopted as an independent variable. The cut-off for thebest classification was established by means of a receiver operating characteristic (ROC)analysis (Mariotti et al 2010) applied to the multiple logistic regression model output. ROCanalysis allows the evaluation of the optimal cut-off for a binary classification resulting from acompromise between the 1-specificity, i.e., the false-positive rate, and the sensitivity, i.e., thetrue-positive rate (Mariotti et al 2010).
4. Result
Group mean and standard deviation (Std) for each parameter are reported in table 3. Median,lower, and upper quartile, maximum and minimum of each parameter for each group are shownin figure 2.
All the estimated parameters resulted significantly different between healthy controls andPRP healthy and SSc (see table 4). At the same manner, all the parameters, but the steady-state error, resulted statistically significant between PRP and SSc (see table 4). SSc patients
709
Physiol. Meas. 35 (2014) 703 E Ismail et al
Table 4. Wilcoxon statistical result.
Group
HCs–PRP HCs–SSc PRP–SSc
Parameter W Z P W Z P W Z P
Delay time (td) 195 −4 <0.01 199 −5 <0.01 394 −2 <0.01Rise time (tr) 171 −5 <0.01 200 −5 <0.01 612 2 <0.01Closed loop poles (S1, S2) 531 5 <0.01 635 4 <0.01 358 −2 <0.01Steady state error (ess)(oC) 184 −4 <0.01 226 −4 <0.01 488 −1 >0.01Temperature (T b)(oC) 510 4 <0.01 567 3 <0.01 317 −3 <0.01
Table 5. Discriminant parameters for subject classification.
Model Standardequation parameter β error (SE) Wald Df sig Exp(β)
PRP–HCs Intercept −4.4 23.6 −0.18 1 0.85 0.01td 2.3 1.2 1.9 1 0.1 10tr 0.4 1.1 0.3 1 0.7 1.4S1, S2 −12.2 27.8 −0.4 1 0.6 0.0ess 1.8 0.7 2.6 1 0.01 6.3T b −0.4 0.5 −0.7 1 0.5 0.7
SSc–HCs Intercept −14.3 22.5 −0.6 1 0.5 0.0td 2.8 1.2 2.3 1 0.02 16.3tr 0.1 1.0 0.1 1 0.9 1.1S1, S2 −5.7 22.6 0.3 1 0.8 0.0ess 1.8 0.9 2.6 1 0.01 6T b −0.02 0.5 −0.05 1 0.9 0.9
Table 6. ROC cut-off thresholds used for subject classification.
Groups Cut-off Sensitivity Specificity
HCs–Raynaud’s 0.8133 1 1PRP–SSc 0.327 0.9 0.7143
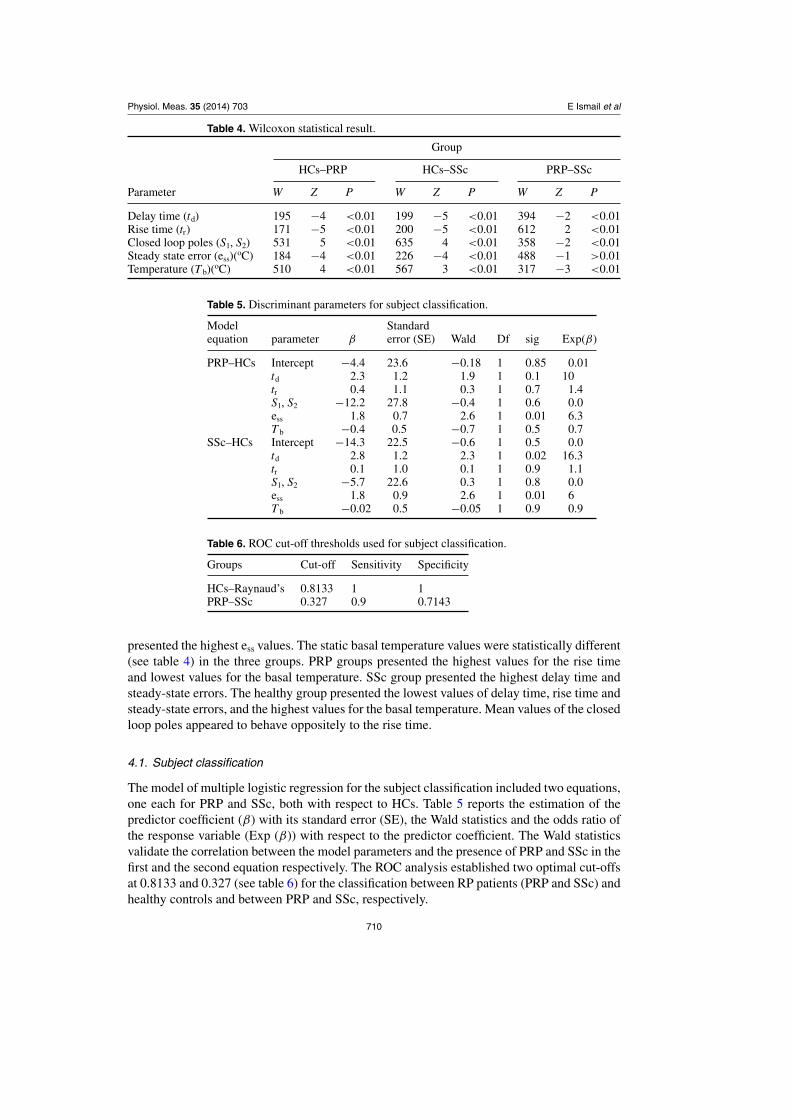
presented the highest ess values. The static basal temperature values were statistically different(see table 4) in the three groups. PRP groups presented the highest values for the rise timeand lowest values for the basal temperature. SSc group presented the highest delay time andsteady-state errors. The healthy group presented the lowest values of delay time, rise time andsteady-state errors, and the highest values for the basal temperature. Mean values of the closedloop poles appeared to behave oppositely to the rise time.
4.1. Subject classification
The model of multiple logistic regression for the subject classification included two equations,one each for PRP and SSc, both with respect to HCs. Table 5 reports the estimation of thepredictor coefficient (β) with its standard error (SE), the Wald statistics and the odds ratio ofthe response variable (Exp (β)) with respect to the predictor coefficient. The Wald statisticsvalidate the correlation between the model parameters and the presence of PRP and SSc in thefirst and the second equation respectively. The ROC analysis established two optimal cut-offsat 0.8133 and 0.327 (see table 6) for the classification between RP patients (PRP and SSc) andhealthy controls and between PRP and SSc, respectively.
710
Physiol. Meas. 35 (2014) 703 E Ismail et al
Table 7. Confusion matrix for subject classification.
Predicted group
Original classification HCs PRP SSc Correctly classified%
HCs 18 0 0 100PRP – 18 2 90SSc – 8 20 71.43Total 87.14
Table 8. Finger-to-finger classification-discriminant parameters.
Model StandardEquation Parameter β error (SE) Wald Df sig Exp(β)
PRP–HCs Intercept 4 3.2 1.2 1 0.2 52.7td 0.3 0.1 2.9 1 0.0 1.3tr 0.2 0.1 1.7 1 0.1 1.3S1, S2 −8.6 6.7 −1.3 1 0.2 0.0ess 0.4 0.1 4.3 1 0.0 1.5T b −0.2 0.1 3.9 1 0.0 0.8
SSc–HCs Intercept −5.2 2.4 −2.2 1 0.03 0.0td 0.5 0.1 6.43 1 0.0 1.7tr 0.1 0.1 1.5 1 0.1 1.1S1, S2 −3.6 2.5 −1.5 1 0.2 0.03ess 0.5 0.08 4.7 1 0.0 1.4T b 0.1 0.1 0.9 1 0.3 1.1
Table 9. ROC cut-off thresholds used for finger-to-finger classification.
Groups Cut-off Sensitivity Specificity
HCs–Raynaud’s 0.1 0.9667 0.8292PRP–SSc 0.2 0.9521 0.4190
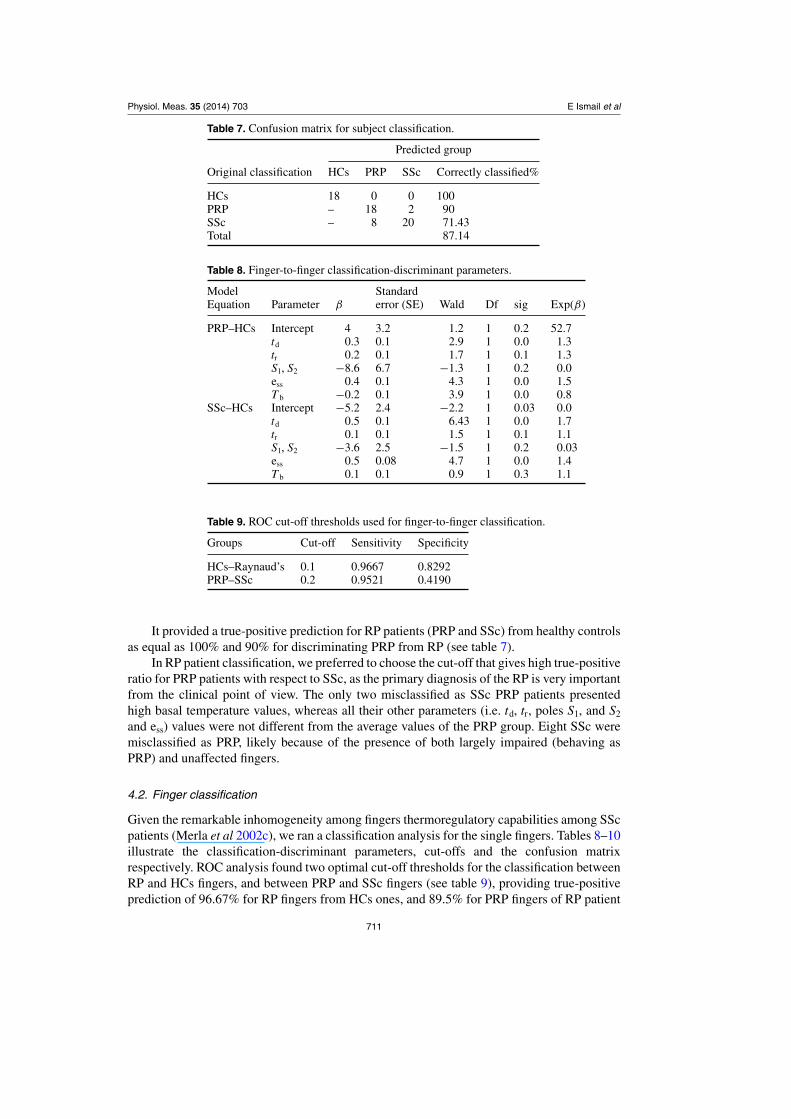
It provided a true-positive prediction for RP patients (PRP and SSc) from healthy controlsas equal as 100% and 90% for discriminating PRP from RP (see table 7).
In RP patient classification, we preferred to choose the cut-off that gives high true-positiveratio for PRP patients with respect to SSc, as the primary diagnosis of the RP is very importantfrom the clinical point of view. The only two misclassified as SSc PRP patients presentedhigh basal temperature values, whereas all their other parameters (i.e. td, tr, poles S1, and S2
and ess) values were not different from the average values of the PRP group. Eight SSc weremisclassified as PRP, likely because of the presence of both largely impaired (behaving asPRP) and unaffected fingers.
4.2. Finger classification
Given the remarkable inhomogeneity among fingers thermoregulatory capabilities among SScpatients (Merla et al 2002c), we ran a classification analysis for the single fingers. Tables 8–10illustrate the classification-discriminant parameters, cut-offs and the confusion matrixrespectively. ROC analysis found two optimal cut-off thresholds for the classification betweenRP and HCs fingers, and between PRP and SSc fingers (see table 9), providing true-positiveprediction of 96.67% for RP fingers from HCs ones, and 89.5% for PRP fingers of RP patient
711
Physiol. Meas. 35 (2014) 703 E Ismail et al
Table 10. Confusion matrix for finger-to-finger classification.
Predicted group
Original classification HCs PRP SSc Correctly classified%
HCs 174 6a 96.67PRP 12 179 9 89.50SSc 70 122 88 31.41a 6 is the total number of HCs fingers misclassified as both PRP and SSc.
Table 11. Misclassified fingers based on finger-to-finger classification.
Groups(total no of fingers) Thumb(%) Index(%) Middle(%) Ring(%) Little(%)
PRP and SSc → HCs (82) 27(32.9) 14(17) 10(12.2) 11(13.4) 18(21.9)PRP → SSc (9) 3(33) 2(22) 2(22) 1(11) 1(11)SSc → PRP (122) 14(11.4) 22(18) 25(20.14) 31(25.4) (24.5)
The symbol (→) means misclassified fingers into group.
Table 12. Finger-to-finger classification-discriminant parameters with excluding thumbs
Model Standardequation parameter β error (SE) Wald Df sig Exp(β)
PRP–HCs Intercept 14.3 4 3.5 1 0.0 0.01td 0.18 0.1 1.7 1 0.08 1.2tr −0.15 0.15 −1 1 0.3 0.9S1, S2 −48.4 12 −4 1 0.0 0.0ess 0.18 0.1 1.9 1 0.05 1.2T b −0.2 0.1 −2.5 1 0.01 0.8
SSc–HCs Intercept −2.8 2.7 −1 1 0.3 0.05td 0.5 0.1 6 1 0.0 1.7tr 0.1 0.1 0.6 1 0.5 1.1S1, S2 −8.2 3.5 −2.3 1 0.0 0.0ess 0.3 0.08 3.4 1 0.0 1.3T b 0.03 0.1 0.5 1 0.6 1
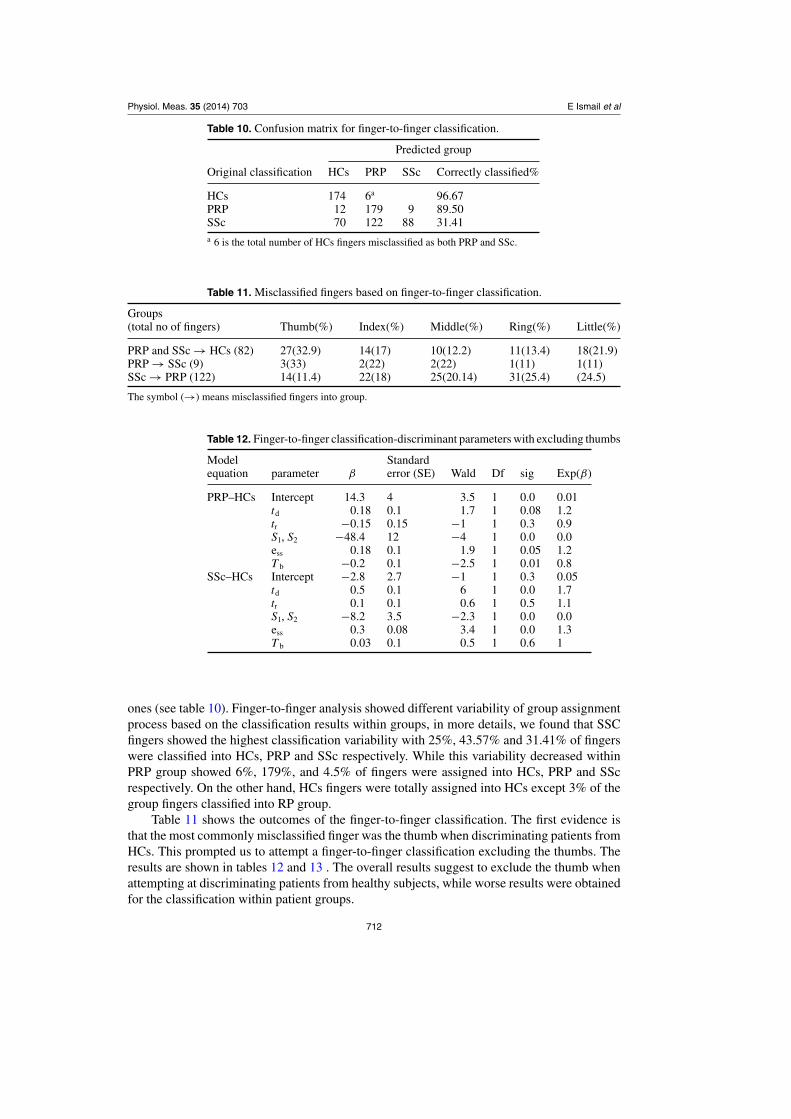
ones (see table 10). Finger-to-finger analysis showed different variability of group assignmentprocess based on the classification results within groups, in more details, we found that SSCfingers showed the highest classification variability with 25%, 43.57% and 31.41% of fingerswere classified into HCs, PRP and SSc respectively. While this variability decreased withinPRP group showed 6%, 179%, and 4.5% of fingers were assigned into HCs, PRP and SScrespectively. On the other hand, HCs fingers were totally assigned into HCs except 3% of thegroup fingers classified into RP group.
Table 11 shows the outcomes of the finger-to-finger classification. The first evidence isthat the most commonly misclassified finger was the thumb when discriminating patients fromHCs. This prompted us to attempt a finger-to-finger classification excluding the thumbs. Theresults are shown in tables 12 and 13 . The overall results suggest to exclude the thumb whenattempting at discriminating patients from healthy subjects, while worse results were obtainedfor the classification within patient groups.
712

Physiol. Meas. 35 (2014) 703 E Ismail et al
Table 13. Confusion matrix for finger-to-finger classification with and without includingthumbs.
Predicted group
Original With No ofgroup thumb HCS(%) PRP(%) SSc(%) fingers
yes 174 (96.67) 6a (3.3) 180HCs no 138 (95.83) 6a (4.16) 144
yes 12 (6) 179(89.5) 9(4.7) 200PRP no 3 (1.8) 144(90.5) 13(8.28) 160
yes 70(25) 122(43.57) 88(31.41) 280SSc no 49(21.87) 108(48.21) 67(29.91) 224a 6 is the total number of HCs fingers misclassified as both PRP and SSc.
5. Discussion
In this paper we introduced some modeling parameters based on the time domain dynamicanalysis of the finger thermoregulation system to describe the functional differences in thethermal recovery from a controlled mild cold stress shown by healthy controls and RP patients.The finger thermoregulation system was modeled through a prototype second-order controlsystem, characterized by its delay time, rise time, poles locations, steady-state error, and thestatic basal temperature values. Our analysis confirmed that healthy subjects, SSc and PRPpatients exhibit different thermoregulatory dynamic responses to the standardized functionalstimulation. The alterations found may be due to the imbalance between vasoconstrictionand vasodilation of the peripheral blood flow the processes which are controlled by thehypothalamus via the sympathetic nervous system (De Trafford et al 1982). Owing to thecomplexity of the system, it was very difficult to isolate the individual functions or impairedprocess (e.g., the thermoreceptor or peripheral responses), and so it is necessary to considerthe system as a black box whose functions can be deduced from the analysis of the relationsbetween the disturbances and responses (De Trafford et al 1982). RP patients appear to exhibitcritically damping dynamic responses (Merla et al 2002a, Rollins et al 2006), which are aspecial case of the prototype second-order control system shown by the healthy subjects (Merlaet al 2002a, Rollins et al 2006). Patients response takes about the double of the time requiredfor healthy subjects to onset the thermoregulatory response, in agreement with previous works(Mariotti et al 2009, Sawasaki et al 2001, De Trafford et al 1982). This observation indicatesthat the presence of RP, especially for SSc, impairs the transient phase of the re-warmingprocess by delaying the onset of active internal controls to immediately recover after the coldstress (Mariotti et al 2009, Merla et al 2002a). This fact is probably due to an abnormal lowerblood flow rate consistently with the onset of critically reduced patency of the arterivenousanastomosis underlying the superficial skin of the fingers during the ischemic phase of RP(Agresti 2002, Westin 2001). PRP may present structural micro-vascular changes, albeit toa lesser degree than those of SSc (Herrick and Clark 1998), thus explaining the lower PRPsdelay time. An increase of skin temperatures was observed immediately after the end of thecold exposure. Scleroderma also appears to reduce the ability to exchange heat by changing thethermal capacity of finger tissue through an altered balance of fibrosis tissue and vascular areas(Merla et al 2002c). RP patients exhibited a very slow re-warming process. Their rise timevalues were longer than HCs ones. This finding is in agreement with previous works (Foersteret al 2007, De Trafford et al 1982) and may be explained by a maintained and/or further
713

Physiol. Meas. 35 (2014) 703 E Ismail et al
vasoconstrictor actions after the cold exposure, together with an increase of basal vascular tone,and impaired endothelium dependent and independent vasodilatation mechanisms (Grossi et al2010). This observation is further supported by the lower basal temperature values of the RPpatients, in agreement with previous work (Schlager et al 2010). The locations of closed looppoles values have, as expected, the inverse trend of rise time. In fact, the dynamic responses ofRP patients have smaller values of closed loop poles with respect to HCs, thus indicating thatRP patients have a less stable system (De Trafford et al 1982). These findings could explainthe higher negative steady-state error values exhibited by RP patients with respect to healthysubjects, indicating that the weakness and instability dynamic behavior of the skin feedbackcontrol system in the presence of RP cannot maintain or save the cutaneous skin temperatureafter the cooled exposure. This observation is in agreement with previous work (Merla et al2002b). Moreover, we did not find a significant difference in steady-state error between PRPand SSc groups, thus suggesting that cutaneous impairment on the homeostatic control mayappear just with the onset of the RP disease and not only at later and chronic stages of SSc.
The actual values of HCs parameters indicate that health thermoregulatory systems arefast and efficient in re-establishing the reference basal conditions as proved by lowest delaytime, rise time, and steady-state error values and the highest closed loop poles. However,the higher the rise time values and lower basal temperature values of PRP with respect toSSc are probably due to the excessive heat exchange with the environment and impairedthermoregulatory capability. Moreover SSc values of delay time and steady-state error arehigher with respect to PRP and healthy, thus suggesting a less effective controller in achievingthe steady state. These findings are in agreement with previous work (Merla et al 2002a). Inorder to compare the classification capabilities of our method with respect to the canonicalclinical evidences for PRP and SSc differential diagnosis, we run both subject and fingerclassification based on the actual values of the modeling parameters.
The overall findings were that no healthy subjects were misclassified, while wrongclassification was attributed to two and eight subjects of PRP and SSc group, respectively.As for the clinical aspects, it is well known that RP may even impact differently each fingerof each hand (Block and Sequeira 2001), leading to an increased level of variability of thefingers rewarming capability, especially for SSc (Mariotti et al 2009, Merla et al 2002a, 2002c,Grossi et al 2010). Therefore our result did not negate the value of the proposed method, butfurther suggests investigating a finger-to-finger classification in order to evaluate the effectof the inhomogeneous finger impairment on the overall subject classification. The rate ofcorrect classifications for the finger-to-finger classification was lower than for the subjectsclassification. SSc group showed the highest classification variability according to previousevidences (Mariotti et al 2009, Merla et al 2002a, 2002c, Grossi et al 2010) likely attributableto inhomogeneous distribution of tissue and vascular impairments within the SSc group.Group variability decreases in the PRP and almost does not exist for healthy. The finger-to-finger classification elucidated that the most commonly misclassified finger was the thumbwhen discriminating patients from HCs, thus highlighting that the thumb appears to be theless affected finger for the thermoregulation, as often reported also for the tissue and vascularimpairments (Block and Sequeira 2001, Merla et al 2002a). These findings suggest consideringwhether to include or not the thumb data for the classification and to quantitatively investigateat a single finger level functional (i.e., thermoregulatory) and morphological (i.e., related tothe capillaroscopy scenario) relationships in order to improve the diagnostic specificity. Asfor the first issue, it seems that excluding the thumb from the classification, as usually donein capillaroscopy (Schaefer et al 2013, Cutolo et al 2013), could lead to a better classificationwhen discriminating patients from healthy subjects, while worse results were obtained forthe classification within patient groups. All the RP patients received continuative vasodilator
714
Physiol. Meas. 35 (2014) 703 E Ismail et al
therapy for RP (calcium channel blockers or ACE inhibitors), which was not discontinuedfor the purpose of the study. This represents a study limitation and suggest that studies onanimal models are necessary to evaluate the impact of the life-long vasodilator treatments onthe blood and on the thermographic temperature observations here reported.
In conclusion, we found that the method of direct estimation of the closed loop dynamicresponse parameters based on time domain analysis, provides an effective description of thefunctional differences among patients and healthy controls in finger thermoregulation. Thesedifferences are solid enough for supporting a proper differential diagnosis of the diseasebased on thermal imaging data and the assessment of the functional impairment after thermalstimulation. However, it should be pointed out that this method is valid within the limit ofthe model itself, which are the assumption of a step response and the adoption of a simpleprototype second-order system. Further study may improve the performance of the method andthe choice of even better models especially with reference to the several forms of scleroderma(limited, diffuse, early, late), age of disease and gender.
Acknowledgments
The authors would like to thank Luigino Di Donato and Daniela Cardone, ITAB, for theirassistance with data acquisition and useful comments, and Luigi Di Carlo, ITAB, for hisadvice on the statistical analysis.
References
Agresti A 2002 Categorical Data Analysis 2nd edn (Hoboken, NJ: Wiley-Interscience) p 165Avouac J, Mogavero G, Guerini H, Drap J, Mathieu A and Kahan A 2011 Predictive factors of hand
radiographic lesions in systemic sclerosis: a prospective study Ann. Rheum. Dis. 70 4–7Block J A and Sequeira W 2001 Raynaud’s phenomenon Lancet 357 2042–8Cutolo M, Sulli A and Smith V 2013 How to perform and interpret capillaroscopy Best Pract. Res. Clin.
Rheumatology 27 237–48De Trafford J C, Lafferty K, Kitney R I, Cotton L T and Roberts V C 1982 Modelling of the human
vasomotor control system and its application to the investigation of arterial disease IEE Proc. A129 646–50
Dowdall J, Pavlidis I and Tsiamyrtzis P 2007 Coalitional tracking Comput. Vis. ImageUnderstand. 106 205–19
Ebisch S J, Aureli T, Bafunno D, Cardone D, Romani G L and Merla A 2012 Mother and child insynchrony: thermal facial imprints of autonomic contagion Biol. Psychol. 89 123–9
Foerster J, Kuerth A, Niederstrasser E, Krautwald E, Pauli R, Paulat R, Eweleit M, Riemekasten Gand Worm M 2007 A cold-response index for the assessment of Raynauds phenomenon J. Dermatol.Sci. 45 113–20
Fraenkel L 2002 Raynauds phenomenon: epidemiology and risk factors Curr. Rheumatol. Rep. 4 123–8Glantz S 2005 Primer of BioStatistics 6th edn (New York: McGraw-Hill) p 353Golnaraghi F and Kuo B C 2010 Automatic Control Systems 9th edn (Hoboken: Wiley) p 256Goundry B, Bell L, Langtree M and Moorthy A 2012 Diagnosis and management of Raynaud’s
phenomenon BMJ 344 e289Grossi G, Mariotti A, Di Donato L, Amerio P, Tulli A, Romani G L and Merla A 2010 Functional
infrared imaging of paroxymal ischemic events in patients with Raynaud’s phenomenon Int. J.Immunopathol. Pharmacol. 23 27–32
Hahn M, Hahn C, Jnger M, Steins A, Zuder D, Klyscz T, Bchtemann A, Rassner G and Blazek V 1999Local cold exposure test with a new arterial photoplethysmography sensor in healthy controls andpatients with secondary Raynaud’s phenomenon Microvasc. Res. 57 187–98
Herrick A L and Clark S 1998 Quantifying digital vascular disease in patients with primary Raynaud’sphenomenon and systemic sclerosis Ann. Rheum. Dis. 57 70–8
715

Physiol. Meas. 35 (2014) 703 E Ismail et al
Kuryliszin-Moskal A, Klimiuk P A and Sierakowski S 2005 Soluble adhesion molecules (sVCAM-1,sE-selectin), vascular endothelial growth factor (VEGF) and endothelin-1 in patient with systemicsclerosis: relationship to organ systemic involvement Clin. Rheumatol. 24 111–16
LeRoy E C and Medsger T A 2001 Criteria for the classification of early systemic sclerosis J. Rheumatol.28 1573–6
Lonzetti L S, Joyal F, Raynauld J P, Roussin A, Goulet J R, Rich E, Choquette D, Raymond Yand Sene’cali J L 2001 Updating the American College of Rheumatology preliminary criteriafor systemic sclerosis: addition of severe nailfold capillaroscopic abnormalities markedly increasessensitivity for limited scleroderma Arthritis Rheum. 44 753–6
Mariotti A, Di Carlo L, Orlando G, Corradini M L, Di Donato L, Pompa P, Iezzi R, Cotroneo A R,Romani G L and Merla A 2010 Scrotal thermoregulatory model and assessment of the impairmentof scrotal temperature control in Varicocele Ann. Biomed. Eng. 39 664–73
Mariotti A, Grossi G, Amerio P, Orlando G, Mattei P A, Tulli A, Romani G L and Merla A 2009 Fingerthermoregulatory model assessing functional impairment in Raynaud’s phenomenon Ann. Biomed.Eng. 37 2631–9
Merla A, Di Donato L, Luzio S D and Romani G L 2002a Quantifying the relevance and stage of diseasewith the Tau image technique: a complementary diagnostic imaging technique based on infraredfunctional imaging IEEE Eng. Med. Biol. Mag. 21 86–91
Merla A, Di Donato L, Pisarri S, Proietti M, Salsano F and Romani G L 2002b Infrared functionalimaging applied to Raynaud’s phenomenon IEEE Eng. Med. Biol. Mag. 21 73–9
Merla A, Romani G L, Di Luzio S, Di Donato L, Farina G, Proietti M, Pisarri S and Salsano S 2002cRaynaud’s phenomenon: infrared functional imaging applied to diagnosis and drug effect Int. J.Immunopathol. Pharmacol. 15 41–52
Nuzzaci G, Pesciullesi E, Lucarelli F, Lucente E, Ferri P, Tonarelli A P, Righi D and Mangoni N 1988Arteriovenous anastomoses’ function and Raynaud’s phenomenon Angiology 39 812–8
O’Reilly D, Taylor L, El-Hadivi K and Jayson M I 1992 Measurement of cold challenge response inprimary Raynaud’s phenomenon and Raynaud’s phenomenon associated with systemic sclerosisAnn. Rheum. Dis. 51 1193–6
Rollins D, Bhabdar N and Hulting S 2006 System identification of the human thermoregulatory systemusing continuous-time block-oriented predictive modelling Chem. Eng. Sci. 61 1516–27
Sato S, Hasegawa M, Takehara K and Tedder T F 2005 Altered B lymphocyte function induces systemicautoimmunity in systemic sclerosis Mol. Immunol. 42 821–31
Sawasaki N, Iwase S and Mano T 2001 Effect of cutaneous sympathetic response to local or systemiccold exposure on thermoregulatory functions in humans Auton. Neurosci. 87 274–81
Schaefer G, Krawczyk B, Doshi N P and Merla A 2013 Scleroderma capillary pattern identificationusing texture descriptors and ensemble classification EMBC’13: 35th Annu. Int. Conf. of the IEEEEngineering in Medicine and Biology Society pp 5473–6
Schlager O, Gschwandtner M E, Herberg K, Frohner T, Schillinger M, Koppensteiner R and Mlekusch W2010 Correlation of infrared thermography and skin perfusion in Raynaud patients and in healthycontrols Microvasc. Res. 80 54–7
Westin L K 2001 Receiver operating characteristic (ROC) analysis: evaluating discriminance effectsamong decision support systems Technical Report (Ume: Department of Computing Science, UmeUniversity)
716
Related Documents