P ENNSYLVANIA C RASH FACTS & S TATISTICS GOVERNOR SECRETARY OF TRANSPORTATION Tom Wolf Leslie S. Richards 2014

Welcome message from author
This document is posted to help you gain knowledge. Please leave a comment to let me know what you think about it! Share it to your friends and learn new things together.
Transcript
PENNSYLVANIA
CRASH FACTS
& STATISTICS
GOVERNOR SECRETARY OF TRANSPORTATION
Tom Wolf Leslie S. Richards
2009
2014
Introduction
The 2014 Pennsylvania Crash Facts and Statistics booklet is a report published by the Bureau of Maintenance
And Operations, Pennsylvania Department of Transportation. Permission is given to freely copy and distribute
this booklet and the information within it. This booklet can now be found on the web at
http://www.dot.state.pa.us. Click on the following set of links to get to the booklet: PennDOT Organizations,
Bureaus & Offices, Bureau of Maintenance and Operations, Highway Safety and Traffic Operations Division,
Crash Information Systems and Analysis, Crash Facts and Statistics Books, and finally click on the year in
which you are interested.
This publication is a statistical review of reportable motor vehicle crashes in the Commonwealth of Pennsylvania
for calendar year 2014. The figures are compiled from the traffic crash reports that are submitted to the
Pennsylvania Department of Transportation by state, county, municipal, and other law enforcement agencies, as
specified in the Pennsylvania Vehicle Code (75 Pa. C.S., Chapter 37, Subchapter C).
Specific questions regarding data presented in this report should be addressed to:
Pennsylvania Department of Transportation
Bureau of Maintenance And Operations
P.O. Box 2047
Harrisburg, PA 17105-2047
E-mail: [email protected]
Phone: (717) 787-2855 Fax: (717) 783-8012
Special Thanks
Quality information is important for creating a highly accurate publication. Our analysts and the police officers
that report the crashes that make it to this publication have dedicated many of their days to providing good data.
Many police departments have taken the plunge to report electronically which has improved the quality and
timeliness of the data we receive. We appreciate everyone’s hard work because without this effort, a book like
this would not be possible.
How to Use This Booklet
This booklet is divided into sections by topic. In most cases, the topics are presented at a general level and
become more specific. This year's booklet is similar to last year's format with only a few minor changes related
to the data. Please read the narrative and notes associated with the tables/graphs to make sure the data presented
are understood.
Look over the Table of Contents on the next page to see the list of topics and sections. If you are trying to find a
particular piece of information, you might be able to locate it more quickly by looking at the Index on page 70.
Skim through the Definitions beginning on page 4. Some terms can be misleading or confusing, even to
experienced readers. For example, an "alcohol-related" crash does not necessarily mean the driver of the vehicle
causing the crash was drunk. The driver of the vehicle not at fault might have been drinking, or even a
pedestrian involved with the crash might have been drinking.
Black squares containing the section title are located near the outer margins to make it easier for you to thumb
through this booklet to find the section you are looking for.
After you have used this booklet, please complete and return the feedback survey form on the last page.
We read every survey returned and consider every response important. We are planning many changes
with this publication in the upcoming year or two and your opinions are vital to determining what is
important to include.
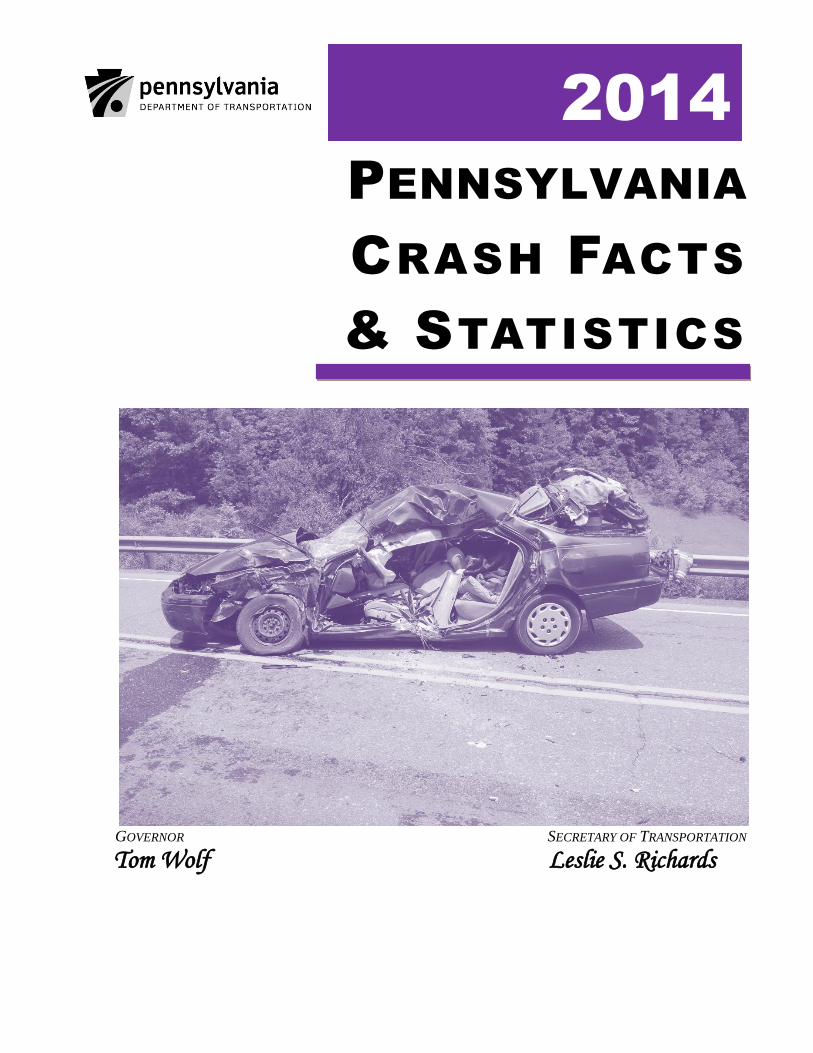
About the Cover
The picture on the front cover shows the result of a crash involving a heavy truck, striking an automobile at an
intersection. In 2014 the percentage of crashes at intersections was 37.2 percent. Crashes at intersections are a
special concern to the Pennsylvania Department of Transportation. PennDOT has recently issued SOL 482-13-
13, which includes guidance for the planning and project development of roundabouts, as part of its modern-
ization plans. Additional information on crashes at intersections can be found on pages 25, 42, 45 and 48.
2014 Pennsylvania Crash Facts and Statistics Table of Contents
Pennsylvania Department of Transportation 1
Table of Contents
Introduction ................................................................................................................inside cover
How to Use This Book ................................................................................................inside cover
Table of Contents ......................................................................................................................... 1
Definitions ..................................................................................................................................... 4
Overview ....................................................................................................................................... 6
All Crashes and Deaths ................................................................................................................ 7
WHO Was Involved ........................................................................................................... 7 Crashes by Injury Severity............................................................................................................................. 7
Deaths and Injuries—Five-Year Trends ........................................................................................................ 8
Economic Loss Due to Reportable Traffic Crashes ....................................................................................... 8
Crashes by Crash Type .................................................................................................................................. 9
Vehicles Involved in Crashes ........................................................................................................................ 9
Driver Involvement in Crashes by Age and Sex .......................................................................................... 10
Highway Crash Historical Data ................................................................................................................... 10
WHAT Conditions Were ................................................................................................. 12 Crashes by Weather and Road Surface Conditions ..................................................................................... 12
Crashes Involving Vehicle Defects.............................................................................................................. 12
Work Zone Crashes ..................................................................................................................................... 13
Work Zone Crashes – Vehicles Involved .................................................................................................... 13
Work Zone Crashes by Road Type – Five-Year Trends .............................................................................. 14
Crashes with Roadside Objects and Animals .............................................................................................. 15
WHERE They Happened ................................................................................................ 16 Crashes by Road Type ................................................................................................................................. 16
Crashes Between Trains and Other Vehicles – Five-Year Trends ............................................................... 17
Train/Vehicle Crashes by Vehicle Type ...................................................................................................... 17
Train/Vehicle Crashes by Road Type .......................................................................................................... 18
Train/Vehicle Crashes by Light Level ......................................................................................................... 18
Train/Vehicle Crashes by County ................................................................................................................ 18
WHEN They Happened .................................................................................................. 19 Crashes by Month ........................................................................................................................................ 19
Crashes by Day of Week ............................................................................................................................. 19
Crashes by Hour of Day .............................................................................................................................. 20
Crashes by Light Level ................................................................................................................................ 21
Crashes by Holiday ...................................................................................................................................... 22
Drivers ......................................................................................................................................... 23 Drivers Overview ........................................................................................................................................ 23
Crashes Involving Driver Error ................................................................................................................... 23
Single and Multiple Vehicle Crashes of Young and Mature Drivers .......................................................... 24
Drivers in Crashes by Age Group ................................................................................................................ 24
Comparison of Young and Mature Drivers by Crash Type ......................................................................... 25
Intersection vs. Non-Intersection Crashes of Young and Mature Drivers ................................................... 25
Table of Contents 2014 Pennsylvania Crash Facts and Statistics
Pennsylvania Department of Transportation 2
Alcohol-Related Crashes ............................................................................................................ 26 Alcohol Overview ....................................................................................................................................... 26
Alcohol Involvement in Crashes ................................................................................................................. 27
Alcohol-Related Crashes – Five-Year Trends ............................................................................................. 27
Victims of Alcohol-Related Fatal Crashes .................................................................................................. 28
Victims of Fatal Crashes by Time of Day ................................................................................................... 28
Victims of Fatal Crashes by Day of Week .................................................................................................. 29
Alcohol-Related Crashes – Day vs. Night ................................................................................................... 29
Alcohol-Related Holiday Crashes ............................................................................................................... 30
Driver Involvement in Alcohol-Related Crashes by Vehicle Type ............................................................. 31
Drinking Drivers in Crashes by Age and Sex ............................................................................................. 31
Drinking Drivers vs. Non-Drinking Drivers Involved in Crashes, by Age Group ...................................... 32
Drinking Driver Deaths as a Percentage of Total Driver Deaths, by Age Group ........................................ 32
Underage Drinking Drivers in Pennsylvania Crashes – Historical Data ..................................................... 33
Seat Belts, Child Safety Seats, and Air Bags ............................................................................ 34 Restraints Overview .................................................................................................................................... 34
Seat Belt Use in Crashes – Total People Involved ...................................................................................... 35
Seat Belt Use in Crashes – Impact of Deaths & Injuries ............................................................................. 36
Seat Belt Use in Crashes – Historical Data ................................................................................................. 37
Seat Belt Use Observational Surveys – Historical Data .............................................................................. 38
Child Passenger Restraints in Crashes – Five Year Data ............................................................................ 38
Air Bag Deployment in Crashes – Injuries and Deaths ............................................................................... 39
Air Bag Deployment by Initial Vehicle Impact Point ................................................................................. 40
Air Bag Deployment by Age Group............................................................................................................ 40
Pedestrian and Bicycle Crashes ................................................................................................ 41 Pedestrian and Bicycles Overview .............................................................................................................. 41
Pedestrian Crashes – Five-Year Trends ...................................................................................................... 41
Pedestrian Related Crashes ......................................................................................................................... 42
Pedestrian Deaths by Age and Sex .............................................................................................................. 43
Pedestrian Injury Severity by Municipality Type ....................................................................................... 43
Pedestrian Deaths and Injuries by Age ........................................................................................................ 44
Pedestrian Deaths and Injuries by Light Level ............................................................................................ 45
Pedestrian Deaths and Injuries by Intersection Type .................................................................................. 45
Pedestrian Deaths and Injuries by Road Type ............................................................................................. 46
Pedestrian Deaths and Injuries by Traffic Control Device .......................................................................... 46
Bicycle Crashes – Five-Year Trends ........................................................................................................... 47
Bicycle Deaths and Injuries by Age ............................................................................................................ 47
Bicycle Deaths and Injuries by Light Level ................................................................................................ 48
Bicycle Deaths and Injuries by Intersection ................................................................................................ 48
Bicycle Deaths and Injuries by Traffic Control Device .............................................................................. 49
Bicycle Deaths and Injuries by Road Type ................................................................................................. 49
Crashes by Motor Vehicle Type ................................................................................................ 50 Vehicle Crashes by Vehicle Types .............................................................................................................. 50
Vehicle Crashes – Single Vehicles Hitting Fixed Objects .......................................................................... 50
Vehicle Crashes – Two-Vehicle Collisions ................................................................................................. 50
Passenger Car Crashes – Five-Year Trends ................................................................................................ 51
Passenger Car Deaths by Seating Position .................................................................................................. 51
Motorcycle Crashes – Five-Year Trends ..................................................................................................... 52
Motorcycle Deaths – Five-Year Trends ...................................................................................................... 52
Motorcycle Helmet Use in Crashes ............................................................................................................. 52
Light Truck / SUV / Van Crashes – Five-Year Trends ............................................................................... 53
2014 Pennsylvania Crash Facts and Statistics Table of Contents
Pennsylvania Department of Transportation 3
Light Truck / SUV / Van Rollovers Compared to Passenger Cars .............................................................. 53
Light Truck / SUV / Van Deaths by Seating Position ................................................................................. 53
Heavy Truck Crashes – Five-Year Trends................................................................................................... 54
Heavy Truck Crashes Involving Vehicle Defects ........................................................................................ 54
Heavy Truck Crashes by Road Type ........................................................................................................... 54
Hazardous Material Crashes by Road Type................................................................................................. 55
Heavy Truck Deaths by Seating Position .................................................................................................... 55
School Bus Crashes ..................................................................................................................................... 56
School Bus Crashes by Road Type .............................................................................................................. 56
School Bus Crashes – Five-Year Trends ..................................................................................................... 57
School Bus Deaths/Injuries by Persons Involved – Five-Year Trends ........................................................ 57
Pennsylvania County Crashes ................................................................................................... 58 County Overview ......................................................................................................................................... 58
Pennsylvania Crashes by County ................................................................................................................. 59
Crashes by County – Five-Year Trends ....................................................................................................... 60
Traffic Deaths by County – Five-Year Trends ............................................................................................ 61
Pedestrian Deaths by County – Five-Year Trends ....................................................................................... 62
Pedestrian Deaths and Injuries by Age Group by County ........................................................................... 63
Percent Seat Belt Use in Crashes by County – Five-Year Trends ............................................................... 64
Alcohol-Related Deaths by County – Five-Year Trends ............................................................................. 65
Pennsylvania Counties ................................................................................................................................. 66
Total Crashes by County ............................................................................................................................. 66
Traffic Deaths by County ............................................................................................................................ 67
Alcohol-Related Deaths by County ............................................................................................................. 67
Percent Seat Belt Use in Crashes by County ............................................................................................... 68
Pedestrian Deaths by County ....................................................................................................................... 68
Crashes by Engineering District .................................................................................................................. 69
Index ............................................................................................................................................ 70
2014 Pennsylvania Crash Facts & Statistics Feedback Survey .................................. last page
Definitions 2014 Pennsylvania Crash Facts and Statistics
Pennsylvania Department of Transportation 4
Definitions Crash: A reportable crash is one in which an injury or a fatality occurs or at least one of the
vehicles involved requires towing from the scene.
General Terms Alcohol-Related Crash: Any reportable crash in which one or more of the drivers was reported to have
been drinking, or a drinking pedestrian was involved.
DUI: Driving Under the Influence – specifically a driver was drinking.
Child Passenger Restraint System: A combination of an approved child safety seat and existing vehicle
safety belt restraints. Mandatory in Pennsylvania for all passengers under age four.
Harmful Event: An action which occurs within a crash (e.g., hitting a tree, hitting a deer, hitting a
pedestrian, hitting another vehicle, etc.) and often results in personal injury or property damage.
Holidays: The holiday weekend begins at 6:00 PM of the last working day before the holiday and ends at
midnight on the last day of the holiday. Pre-holiday weekends and post holiday weekends are time
periods equivalent to that of the weekend before or the weekend after the holiday, respectively. The same
applies to holidays during the middle of the work week where no weekend is involved. It is significant to
look at pre- and post-holiday statistics because, in many instances, the number of crashes and/or
deaths/injuries are equal to, or greater than, those occurring on the actual holiday weekend.
Passive Restraint: A safety restraint, i.e., air bag, automatic lap/shoulder harness, that is not actively
engaged by a vehicle occupant.
Reportable Crash: A crash resulting in a death within 30 days of the crash; or injury in any degree, to
any person involved; or crashes resulting in damage to any vehicle serious enough to require towing.
Speed-Related Crash: Any reportable crash in which speed was listed as a contributing factor, whether
or not the driver was noted as going over the posted speed limit.
TCD: Traffic Control Device. Includes traffic signals, stop signs, yield signs, and railroad crossing
controls.
Vehicle Defect: A fault in the vehicle, due to improper maintenance or other reasons, that can cause the
driver to lose control, possibly resulting in a crash.
Vehicle-Miles of Travel: A measure that indicates the number of miles traveled by vehicles on PA
roadways.
Work Zone: An area, usually marked by signs, barricades, or other devices indicating that highway
construction or maintenance activities are going on.
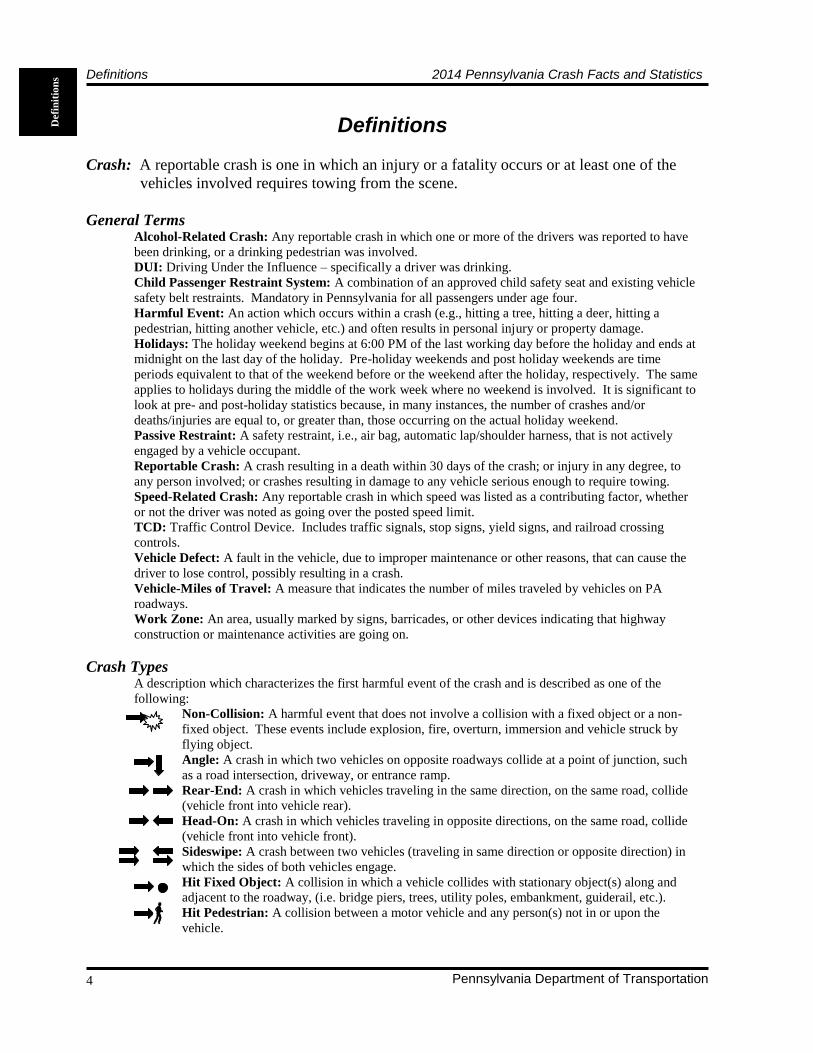
Crash Types A description which characterizes the first harmful event of the crash and is described as one of the
following:
Non-Collision: A harmful event that does not involve a collision with a fixed object or a non-
fixed object. These events include explosion, fire, overturn, immersion and vehicle struck by
flying object.
Angle: A crash in which two vehicles on opposite roadways collide at a point of junction, such
as a road intersection, driveway, or entrance ramp.
Rear-End: A crash in which vehicles traveling in the same direction, on the same road, collide
(vehicle front into vehicle rear).
Head-On: A crash in which vehicles traveling in opposite directions, on the same road, collide
(vehicle front into vehicle front).
Sideswipe: A crash between two vehicles (traveling in same direction or opposite direction) in
which the sides of both vehicles engage.
Hit Fixed Object: A collision in which a vehicle collides with stationary object(s) along and
adjacent to the roadway, (i.e. bridge piers, trees, utility poles, embankment, guiderail, etc.).
Hit Pedestrian: A collision between a motor vehicle and any person(s) not in or upon the
vehicle.
Defi
nit
ion
s
2014 Pennsylvania Crash Facts and Statistics Definitions
Pennsylvania Department of Transportation 5
Crash Severity Fatal Crash: A crash in which one or more of the involved persons died within 30 days of the crash and
the death(s) are attributable to the crash.
Injury Crash: A crash in which none of the involved persons were killed, but at least one was injured.
Property Damage Only (PDO): A reportable crash where no one was killed or injured, but damage
occurred to a vehicle requiring towing.
Injury Severity Death: As used in this booklet, any injury which causes death within 30 days of a crash and that death is
attributable to the crash.
Major Injury: Any injury, other than fatal, which by its severity requires immediate emergency
transport, such as an ambulance, to a hospital or clinic for medical treatment and /or hospitalization.
Major injuries would include amputation of limb(s), severe burns, etc.
Moderate Injury: Any injury which may require some form of medical treatment, but is not life-
threatening or incapacitating. These injuries should be visible. Moderate injuries would include a cut
which requires several stitches, or a broken finger or toe.
Minor Injury: Any injury which can be treated by first aid application, whether at the scene of the crash
or in a medical facility. Complaints of injuries which are not visible, and do not appear to be of any
major or moderate nature, should be considered as minor injuries.
Person Type Driver: The occupant of a vehicle who is in actual physical control of a vehicle in transport or, for an
out-of-control vehicle, the occupant who was in control before control was lost.
Occupant: Any person who is in or upon a vehicle, including the driver, passenger, and person riding on
the outside of the vehicle.
Passenger: Any occupant of a vehicle who is not the driver.
Pedestrian: Any person not in or upon a vehicle.
Road Types Local Roads: Any roadway that is maintained by an entity other than the state. Includes county,
township, town, borough, and private.
State Highway (Interstate): Any state-maintained roadway that carries the interstate designation and is
marked with red, white, and blue shield-shaped sign.
State Highway (Other): Any state-maintained roadway that is not designated as an interstate. Many (but
not all) such roads are marked with a black and white keystone-shaped sign.
Turnpike: The Pennsylvania Turnpike system, which includes the main Turnpike and other toll facilities
maintained by the Pennsylvania Turnpike Commission.
Vehicle Types Passenger Car: Vehicle designed to transport eight people or less. Includes: convertible, hardtop, sedan,
station wagon, limousine, etc.
Light Truck / SUV / Van: Single vehicle designed for carrying a load of property on or in the vehicle.
Includes: pickup truck, sport utility vehicle, van, jeep, tow truck, etc.
Heavy Truck: Single vehicle or tractor-trailer combination designed for carrying a heavy load of
property on or in the vehicle. Includes: single unit trucks (e.g., coal truck), tractor-trailers, motor homes,
etc.
Bus: Vehicle designed to transport more than fifteen people. Includes school bus, cross-country bus,
urban transit, trackless trolley.
Motorcycle: Includes: motorcycle, mo-ped, mini-bike, motor scooter, trike (motorized tricycle), go-cart,
vendor cycle.
Bicycle: As used in this booklet, any non-motorized vehicle propelled by pedaling. Includes: unicycle,
bicycle, tricycle, “Big Wheel”.
Track/Non-Motorized Vehicle: Includes: train, trolley, horse and buggy, horse and rider.
Defin
ition
s

Overview 2014 Pennsylvania Crash Facts and Statistics
Pennsylvania Department of Transportation 6
Overview
The Commonwealth of Pennsylvania consists of 67 counties. Each county includes local
municipalities, a combination of cities, boroughs, first class townships, and/or second class
townships. In total, there are approximately 2,500 municipalities throughout the 67 counties.
One of these municipalities, the Town of Bloomsburg in Columbia County, is the only official
“town” in Pennsylvania.
Pennsylvania has nearly 120,000 miles* of roads and highways; 33% (39,787 miles*) are state
highways maintained by the Pennsylvania Department of Transportation (PennDOT), and the
remaining 67% (80,149 miles*) are maintained by local municipalities and other entities.
Motor-vehicle traffic crashes that occur on Pennsylvania roads and highways are investigated
and reported by both the Pennsylvania State Police and the approximately 1,300 local
municipal police departments. The valuable information originating from these police crash
reports is the basis for the statistics that are presented throughout this booklet.
In 2014, there were 121,317 reportable traffic crashes in Pennsylvania. These crashes claimed
the lives of 1,195 people and injured another 79,758 people. To add some perspective, the
2014 total of reportable traffic crashes is the fourth lowest total since 1950 when 113,748
crashes were reported.
Last year, there were approximately 98.6 billion vehicle-miles* of travel on Pennsylvania’s
roads and highways. The 2014 fatality rate of 1.21 deaths per hundred million vehicle-miles of
travel* was the second lowest ever recorded in Pennsylvania since the department started
keeping records of this in 1935.
2014 Briefs
On Average in Pennsylvania:
Each day 332 reportable traffic crashes occurred (about 14 crashes every hour).
Each day 3 persons were killed in reportable traffic crashes (one death every 7 hours).
Each day 219 persons were injured in reportable crashes (about 9 injuries every hour).
Based on Pennsylvania’s 2013 population (12,787,209 people):
1 out of every 46 people was involved in a reportable traffic crash.
1 out of every 10,701 people was killed in a reportable traffic crash.
1 out of every 160 people was injured in a reportable traffic crash.
* For consistency purposes, the prior year’s data is used at the time of publication because of timing issues. For
this Crash Facts & Statistics book, 2013 information was used.
Ov
ervie
w
2014 Pennsylvania Crash Facts and Statistics All Crashes and Deaths
Pennsylvania Department of Transportation 7
All Crashes and Deaths —WHO WAS INVOLVED—
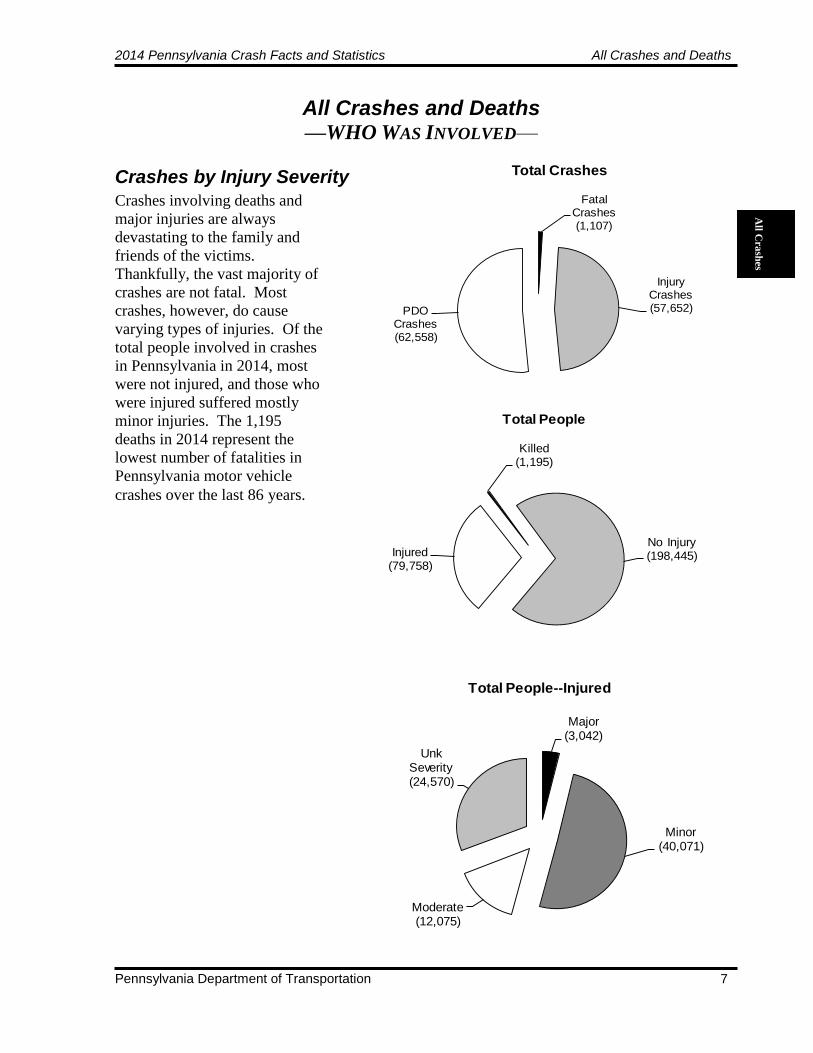
Crashes by Injury Severity
Crashes involving deaths and
major injuries are always
devastating to the family and
friends of the victims.
Thankfully, the vast majority of
crashes are not fatal. Most
crashes, however, do cause
varying types of injuries. Of the
total people involved in crashes
in Pennsylvania in 2014, most
were not injured, and those who
were injured suffered mostly
minor injuries. The 1,195
deaths in 2014 represent the
lowest number of fatalities in
Pennsylvania motor vehicle
crashes over the last 86 years.
Fatal Crashes (1,107)
Injury Crashes (57,652)PDO
Crashes (62,558)
Total Crashes
Injured (79,758)
Killed (1,195)
No Injury (198,445)
Total People
Major (3,042)
Minor (40,071)
Moderate (12,075)
Unk Severity (24,570)
Total People--Injured
All C
rash
es
All Crashes and Deaths 2014 Pennsylvania Crash Facts and Statistics
Pennsylvania Department of Transportation 8
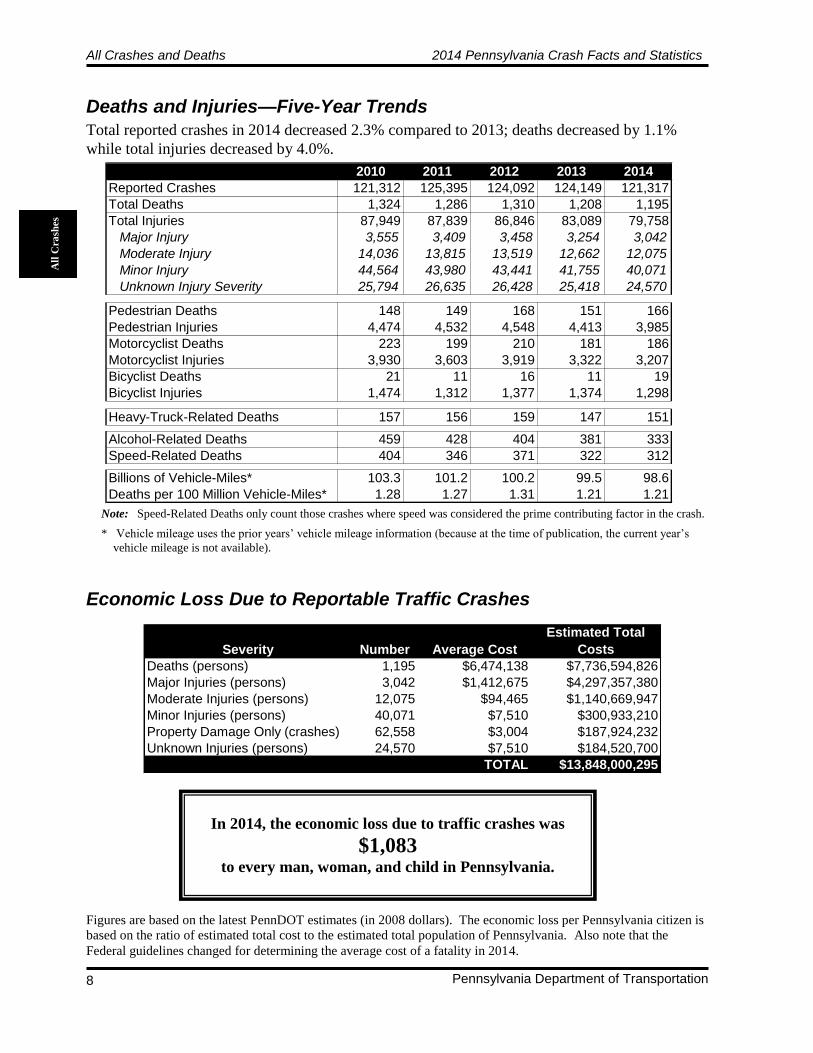
Note: Speed-Related Deaths only count those crashes where speed was considered the prime contributing factor in the crash.
* Vehicle mileage uses the prior years’ vehicle mileage information (because at the time of publication, the current year’s
vehicle mileage is not available).
Deaths and Injuries—Five-Year Trends
Economic Loss Due to Reportable Traffic Crashes
Total reported crashes in 2014 decreased 2.3% compared to 2013; deaths decreased by 1.1%
while total injuries decreased by 4.0%.
2010 2011 2012 2013 2014
Reported Crashes 121,312 125,395 124,092 124,149 121,317
Total Deaths 1,324 1,286 1,310 1,208 1,195
Total Injuries 87,949 87,839 86,846 83,089 79,758
Major Injury 3,555 3,409 3,458 3,254 3,042
Moderate Injury 14,036 13,815 13,519 12,662 12,075
Minor Injury 44,564 43,980 43,441 41,755 40,071
Unknown Injury Severity 25,794 26,635 26,428 25,418 24,570
Pedestrian Deaths 148 149 168 151 166
Pedestrian Injuries 4,474 4,532 4,548 4,413 3,985
Motorcyclist Deaths 223 199 210 181 186
Motorcyclist Injuries 3,930 3,603 3,919 3,322 3,207
Bicyclist Deaths 21 11 16 11 19
Bicyclist Injuries 1,474 1,312 1,377 1,374 1,298
Heavy-Truck-Related Deaths 157 156 159 147 151
Alcohol-Related Deaths 459 428 404 381 333
Speed-Related Deaths 404 346 371 322 312
Billions of Vehicle-Miles* 103.3 101.2 100.2 99.5 98.6
Deaths per 100 Million Vehicle-Miles* 1.28 1.27 1.31 1.21 1.21
All
Cra
shes
Severity Number Average Cost
Estimated Total
Costs
Deaths (persons) 1,195 $6,474,138 $7,736,594,826
Major Injuries (persons) 3,042 $1,412,675 $4,297,357,380
Moderate Injuries (persons) 12,075 $94,465 $1,140,669,947
Minor Injuries (persons) 40,071 $7,510 $300,933,210
Property Damage Only (crashes) 62,558 $3,004 $187,924,232
Unknown Injuries (persons) 24,570 $7,510 $184,520,700
TOTAL $13,848,000,295
Figures are based on the latest PennDOT estimates (in 2008 dollars). The economic loss per Pennsylvania citizen is
based on the ratio of estimated total cost to the estimated total population of Pennsylvania. Also note that the
Federal guidelines changed for determining the average cost of a fatality in 2014.
In 2014, the economic loss due to traffic crashes was
$1,083 to every man, woman, and child in Pennsylvania.
2014 Pennsylvania Crash Facts and Statistics All Crashes and Deaths
Pennsylvania Department of Transportation 9
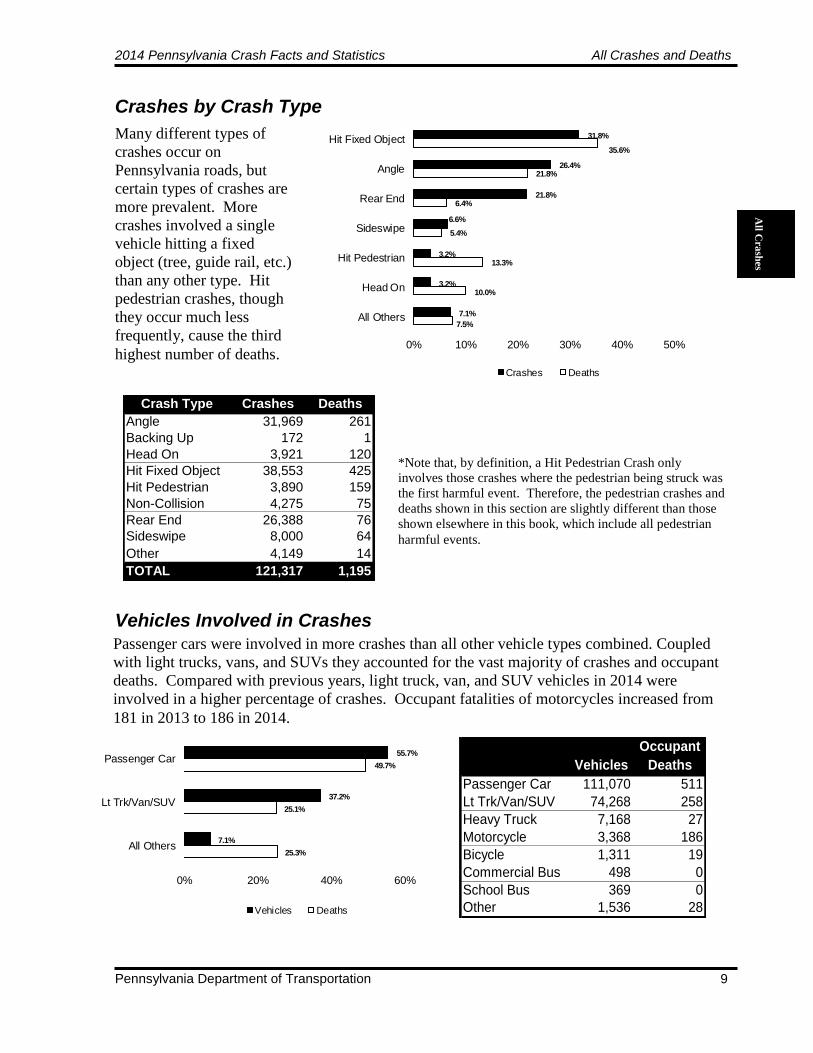
Crashes by Crash Type Vehicles Involved in Crashes
Many different types of
crashes occur on
Pennsylvania roads, but
certain types of crashes are
more prevalent. More
crashes involved a single
vehicle hitting a fixed
object (tree, guide rail, etc.)
than any other type. Hit
pedestrian crashes, though
they occur much less
frequently, cause the third
highest number of deaths.
7.5%
10.0%
13.3%
5.4%
6.4%
21.8%
35.6%
7.1%
3.2%
3.2%
6.6%
21.8%
26.4%
31.8%
0% 10% 20% 30% 40% 50%
All Others
Head On
Hit Pedestrian
Sideswipe
Rear End
Angle
Hit Fixed Object
Crashes Deaths
All C
rash
es
Crash Type Crashes Deaths
Angle 31,969 261
Backing Up 172 1
Head On 3,921 120
Hit Fixed Object 38,553 425
Hit Pedestrian 3,890 159
Non-Collision 4,275 75
Rear End 26,388 76
Sideswipe 8,000 64
Other 4,149 14
TOTAL 121,317 1,195
*Note that, by definition, a Hit Pedestrian Crash only
involves those crashes where the pedestrian being struck was
the first harmful event. Therefore, the pedestrian crashes and
deaths shown in this section are slightly different than those
shown elsewhere in this book, which include all pedestrian
harmful events.
Passenger cars were involved in more crashes than all other vehicle types combined. Coupled
with light trucks, vans, and SUVs they accounted for the vast majority of crashes and occupant
deaths. Compared with previous years, light truck, van, and SUV vehicles in 2014 were
involved in a higher percentage of crashes. Occupant fatalities of motorcycles increased from
181 in 2013 to 186 in 2014.
25.3%
25.1%
49.7%
7.1%
37.2%
55.7%
0% 20% 40% 60%
All Others
Lt Trk/Van/SUV
Passenger Car
Vehicles Deaths
Occupant
Vehicles Deaths
Passenger Car 111,070 511
Lt Trk/Van/SUV 74,268 258
Heavy Truck 7,168 27
Motorcycle 3,368 186
Bicycle 1,311 19
Commercial Bus 498 0
School Bus 369 0
Other 1,536 28
All Crashes and Deaths 2014 Pennsylvania Crash Facts and Statistics
Pennsylvania Department of Transportation 10
0 10,000 20,000 30,000
Over 75
71-75
66-70
61-65
56-60
51-55
46-50
41-45
36-40
31-35
26-30
21-25
16-20
Under 16
Female Male
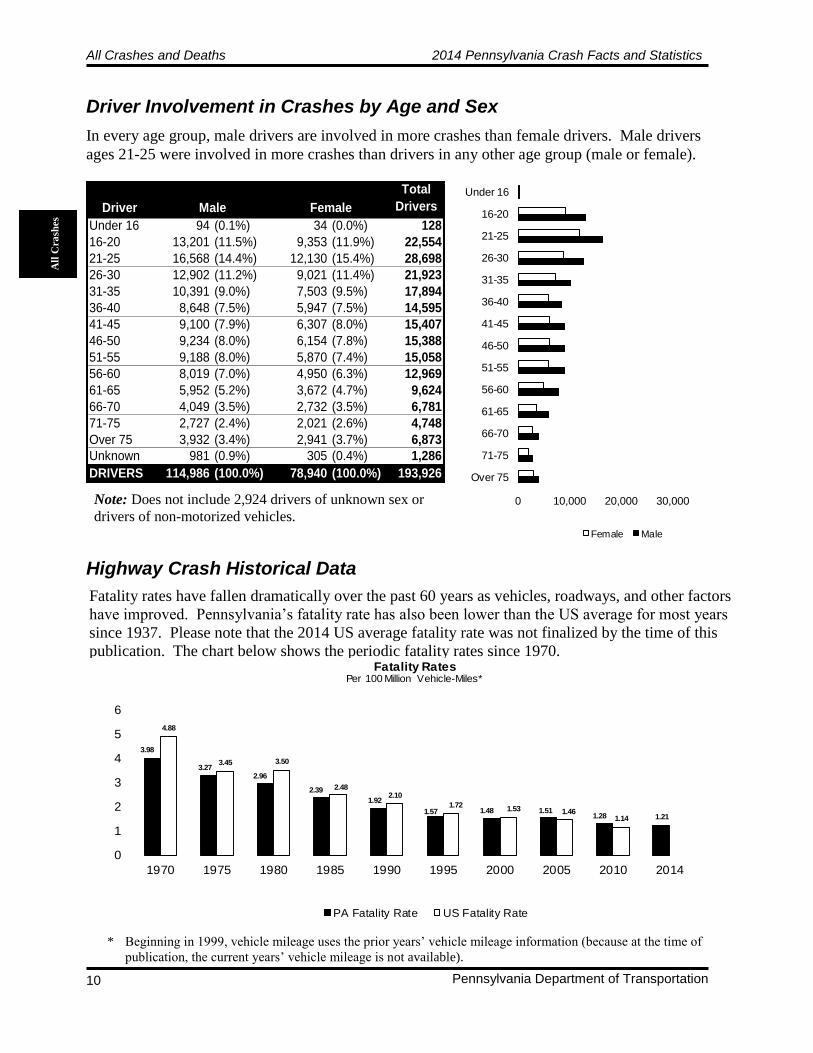
Driver Involvement in Crashes by Age and Sex
Highway Crash Historical Data
All
Cra
shes
Note: Does not include 2,924 drivers of unknown sex or
drivers of non-motorized vehicles.
Fatality rates have fallen dramatically over the past 60 years as vehicles, roadways, and other factors
have improved. Pennsylvania’s fatality rate has also been lower than the US average for most years
since 1937. Please note that the 2014 US average fatality rate was not finalized by the time of this
publication. The chart below shows the periodic fatality rates since 1970.
3.98
3.272.96
2.39
1.92
1.57 1.48 1.511.28 1.21
4.88
3.45 3.50
2.482.10
1.721.53 1.46
1.14
0
1
2
3
4
5
6
1970 1975 1980 1985 1990 1995 2000 2005 2010 2014
Fatality RatesPer 100 Million Vehicle-Miles*
PA Fatality Rate US Fatality Rate
In every age group, male drivers are involved in more crashes than female drivers. Male drivers
ages 21-25 were involved in more crashes than drivers in any other age group (male or female).
Driver
Total
Drivers
Under 16 94 (0.1%) 34 (0.0%) 128
16-20 13,201 (11.5%) 9,353 (11.9%) 22,554
21-25 16,568 (14.4%) 12,130 (15.4%) 28,698
26-30 12,902 (11.2%) 9,021 (11.4%) 21,923
31-35 10,391 (9.0%) 7,503 (9.5%) 17,894
36-40 8,648 (7.5%) 5,947 (7.5%) 14,595
41-45 9,100 (7.9%) 6,307 (8.0%) 15,407
46-50 9,234 (8.0%) 6,154 (7.8%) 15,388
51-55 9,188 (8.0%) 5,870 (7.4%) 15,058
56-60 8,019 (7.0%) 4,950 (6.3%) 12,969
61-65 5,952 (5.2%) 3,672 (4.7%) 9,624
66-70 4,049 (3.5%) 2,732 (3.5%) 6,781
71-75 2,727 (2.4%) 2,021 (2.6%) 4,748
Over 75 3,932 (3.4%) 2,941 (3.7%) 6,873
Unknown 981 (0.9%) 305 (0.4%) 1,286
DRIVERS 114,986 (100.0%) 78,940 (100.0%) 193,926
Male Female
* Beginning in 1999, vehicle mileage uses the prior years’ vehicle mileage information (because at the time of
publication, the current years’ vehicle mileage is not available).
2014 Pennsylvania Crash Facts and Statistics All Crashes and Deaths
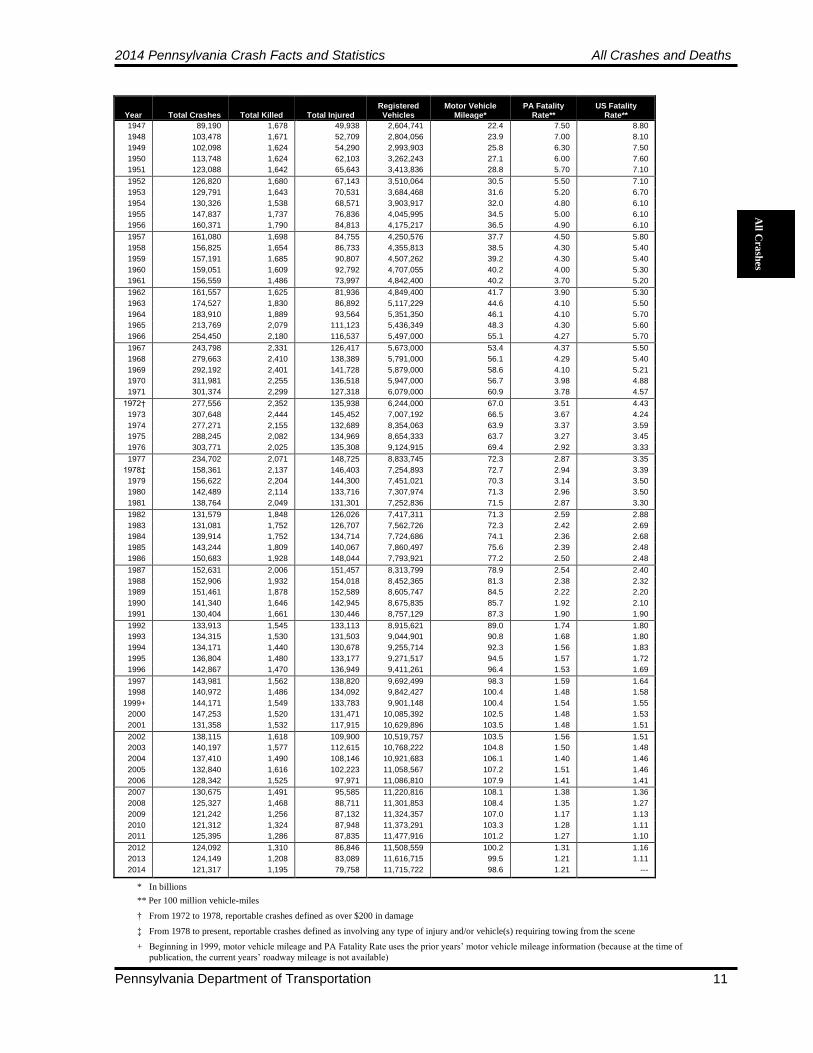
Pennsylvania Department of Transportation 11
Year Total Crashes Total Killed Total Injured Registered
Vehicles Motor Vehicle
Mileage* PA Fatality
Rate** US Fatality
Rate**
1947 89,190 1,678 49,938 2,604,741 22.4 7.50 8.80
1948 103,478 1,671 52,709 2,804,056 23.9 7.00 8.10
1949 102,098 1,624 54,290 2,993,903 25.8 6.30 7.50
1950 113,748 1,624 62,103 3,262,243 27.1 6.00 7.60
1951 123,088 1,642 65,643 3,413,836 28.8 5.70 7.10
1952 126,820 1,680 67,143 3,510,064 30.5 5.50 7.10
1953 129,791 1,643 70,531 3,684,468 31.6 5.20 6.70
1954 130,326 1,538 68,571 3,903,917 32.0 4.80 6.10
1955 147,837 1,737 76,836 4,045,995 34.5 5.00 6.10
1956 160,371 1,790 84,813 4,175,217 36.5 4.90 6.10
1957 161,080 1,698 84,755 4,250,576 37.7 4.50 5.80
1958 156,825 1,654 86,733 4,355,813 38.5 4.30 5.40
1959 157,191 1,685 90,807 4,507,262 39.2 4.30 5.40
1960 159,051 1,609 92,792 4,707,055 40.2 4.00 5.30
1961 156,559 1,486 73,997 4,842,400 40.2 3.70 5.20
1962 161,557 1,625 81,936 4,849,400 41.7 3.90 5.30
1963 174,527 1,830 86,892 5,117,229 44.6 4.10 5.50
1964 183,910 1,889 93,564 5,351,350 46.1 4.10 5.70
1965 213,769 2,079 111,123 5,436,349 48.3 4.30 5.60
1966 254,450 2,180 116,537 5,497,000 55.1 4.27 5.70
1967 243,798 2,331 126,417 5,673,000 53.4 4.37 5.50
1968 279,663 2,410 138,389 5,791,000 56.1 4.29 5.40
1969 292,192 2,401 141,728 5,879,000 58.6 4.10 5.21
1970 311,981 2,255 136,518 5,947,000 56.7 3.98 4.88
1971 301,374 2,299 127,318 6,079,000 60.9 3.78 4.57
1972† 277,556 2,352 135,938 6,244,000 67.0 3.51 4.43
1973 307,648 2,444 145,452 7,007,192 66.5 3.67 4.24
1974 277,271 2,155 132,689 8,354,063 63.9 3.37 3.59
1975 288,245 2,082 134,969 8,654,333 63.7 3.27 3.45
1976 303,771 2,025 135,308 9,124,915 69.4 2.92 3.33
1977 234,702 2,071 148,725 8,833,745 72.3 2.87 3.35
1978‡ 158,361 2,137 146,403 7,254,893 72.7 2.94 3.39
1979 156,622 2,204 144,300 7,451,021 70.3 3.14 3.50
1980 142,489 2,114 133,716 7,307,974 71.3 2.96 3.50
1981 138,764 2,049 131,301 7,252,836 71.5 2.87 3.30
1982 131,579 1,848 126,026 7,417,311 71.3 2.59 2.88
1983 131,081 1,752 126,707 7,562,726 72.3 2.42 2.69
1984 139,914 1,752 134,714 7,724,686 74.1 2.36 2.68
1985 143,244 1,809 140,067 7,860,497 75.6 2.39 2.48
1986 150,683 1,928 148,044 7,793,921 77.2 2.50 2.48
1987 152,631 2,006 151,457 8,313,799 78.9 2.54 2.40
1988 152,906 1,932 154,018 8,452,365 81.3 2.38 2.32
1989 151,461 1,878 152,589 8,605,747 84.5 2.22 2.20
1990 141,340 1,646 142,945 8,675,835 85.7 1.92 2.10
1991 130,404 1,661 130,446 8,757,129 87.3 1.90 1.90
1992 133,913 1,545 133,113 8,915,621 89.0 1.74 1.80
1993 134,315 1,530 131,503 9,044,901 90.8 1.68 1.80
1994 134,171 1,440 130,678 9,255,714 92.3 1.56 1.83
1995 136,804 1,480 133,177 9,271,517 94.5 1.57 1.72
1996 142,867 1,470 136,949 9,411,261 96.4 1.53 1.69
1997 143,981 1,562 138,820 9,692,499 98.3 1.59 1.64
1998 140,972 1,486 134,092 9,842,427 100.4 1.48 1.58
1999+ 144,171 1,549 133,783 9,901,148 100.4 1.54 1.55
2000 147,253 1,520 131,471 10,085,392 102.5 1.48 1.53
2001 131,358 1,532 117,915 10,629,896 103.5 1.48 1.51
2002 138,115 1,618 109,900 10,519,757 103.5 1.56 1.51
2003 140,197 1,577 112,615 10,768,222 104.8 1.50 1.48
2004 137,410 1,490 108,146 10,921,683 106.1 1.40 1.46
2005 132,840 1,616 102,223 11,058,567 107.2 1.51 1.46
2006 128,342 1,525 97,971 11,086,810 107.9 1.41 1.41
2007 130,675 1,491 95,585 11,220,816 108.1 1.38 1.36
2008 125,327 1,468 88,711 11,301,853 108.4 1.35 1.27
2009 121,242 1,256 87,132 11,324,357 107.0 1.17 1.13
2010 121,312 1,324 87,948 11,373,291 103.3 1.28 1.11
2011 125,395 1,286 87,835 11,477,916 101.2 1.27 1.10
2012 124,092 1,310 86,846 11,508,559 100.2 1.31 1.16
2013 124,149 1,208 83,089 11,616,715 99.5 1.21 1.11
2014 121,317 1,195 79,758 11,715,722 98.6 1.21 ---
All C
rash
es
* In billions
** Per 100 million vehicle-miles
† From 1972 to 1978, reportable crashes defined as over $200 in damage
‡ From 1978 to present, reportable crashes defined as involving any type of injury and/or vehicle(s) requiring towing from the scene
+ Beginning in 1999, motor vehicle mileage and PA Fatality Rate uses the prior years’ motor vehicle mileage information (because at the time of
publication, the current years’ roadway mileage is not available)

All Crashes and Deaths 2014 Pennsylvania Crash Facts and Statistics
Pennsylvania Department of Transportation 12
20.9%
13.6%
29.5%
36.0%
10% 15% 20% 25% 30% 35% 40%
All Other Defects
Total SteeringSystem Failure
Brake-Related
Tire/Wheel-Related
—WHAT CONDITIONS WERE—
Crashes by Weather and Road Surface Conditions
Crashes Involving Vehicle Defects
All
Cra
shes
Adverse weather and road surface conditions negatively affect vehicle handling and driver sight.
Interestingly, the vast majority of crashes occurred under no adverse conditions. This can be
attributed to: 1) weather and roads being clear and dry most of the time and 2) drivers failing to
use caution under optimal road conditions. The figures shown in both tables are for all highway
types.
Weather Condition
No Adverse Conditions 95,132 (78.4%) 1,013 (84.8%)
Rain/Rain & Fog 13,870 (11.4%) 115 (9.6%)
Snow/Sleet/Freezing Rain 10,236 (8.4%) 44 (3.7%)
Fog/Smoke, Etc. 694 (0.6%) 11 (0.9%)
Other 1,385 (1.1%) 12 (1.0%)
TOTAL 121,317 (100.0%) 1,195 (100.0%)
Crashes Deaths
Road Surface Condition
Dry 85,844 (70.8%) 944 (79.0%)
Wet 19,343 (15.9%) 170 (14.2%)
Snow/Slush 8,583 (7.1%) 33 (2.8%)
Ice/Ice Patches 6,854 (5.7%) 37 (3.1%)
Other 693 (0.6%) 11 (0.9%)
TOTAL 121,317 (100.0%) 1,195 (100.0%)
Crashes Deaths
Improperly-maintained vehicles can lead to crashes. In 2014, tire/wheel and brake-related
failures again contributed to the majority of vehicle defect related crashes. The percentages in
the graph below refer to the number of crashes involving vehicle defects.
Note: The above list only counts crashes where a vehicle defect was the primary contributing
factor in the crash.
Vehicle Defect Crashes
Tire/Wheel-Related 861
Brake-Related 707
Total Steering System Failure 326
Power Train Failure 248
Suspension 94
Unsecure/Shifted Trailer Load 42
Vehicle Lighting-Related 26
Body/Doors/Hood, Etc. 20
Other Known Defects 71

2014 Pennsylvania Crash Facts and Statistics All Crashes and Deaths
Pennsylvania Department of Transportation 13
All C
rash
es
Work Zone Crashes Work Zone Crashes—Vehicles Involved
Work zones are potentially dangerous areas because conditions are constantly changing.
Drivers do not always anticipate these changes nor exercise the appropriate level of caution.
47 percent of work zone crashes in 2014 contained fatalities or injuries.
Fatal Crashes1.1%
Injury Crashes46.2%
PDO Crashes52.6%
Total Crashes: 1,845
Total Killed: 24 (Workers Killed: 3)
Total Injured: 1,241
Note: “State Highway (Other)” includes state-maintained roads that are not designated as
interstates. Legally parked vehicles are not included in the above table.
Vehicle Type
Passenger Car 512 (48.6%) 934 (52.9%) 169 (41.7%) 108 (51.7%)
Light Truck/SUV 362 (34.4%) 663 (37.5%) 130 (32.1%) 82 (39.2%)
Heavy Truck/Bus 166 (15.8%) 126 (7.1%) 100 (24.7%) 9 (4.3%)
Motorcycle 4 (0.4%) 28 (1.6%) 3 (0.7%) 4 (1.9%)
Other 10 (1.0%) 15 (0.9%) 3 (0.7%) 6 (2.9%)
TOTAL 1,054 (100.0%) 1,766 (100.0%) 405 (100.0%) 209 (100.0%)
State Hwy (Interstate) State Hwy (Other) Turnpike Local Road
All Crashes and Deaths 2014 Pennsylvania Crash Facts and Statistics
Pennsylvania Department of Transportation 14
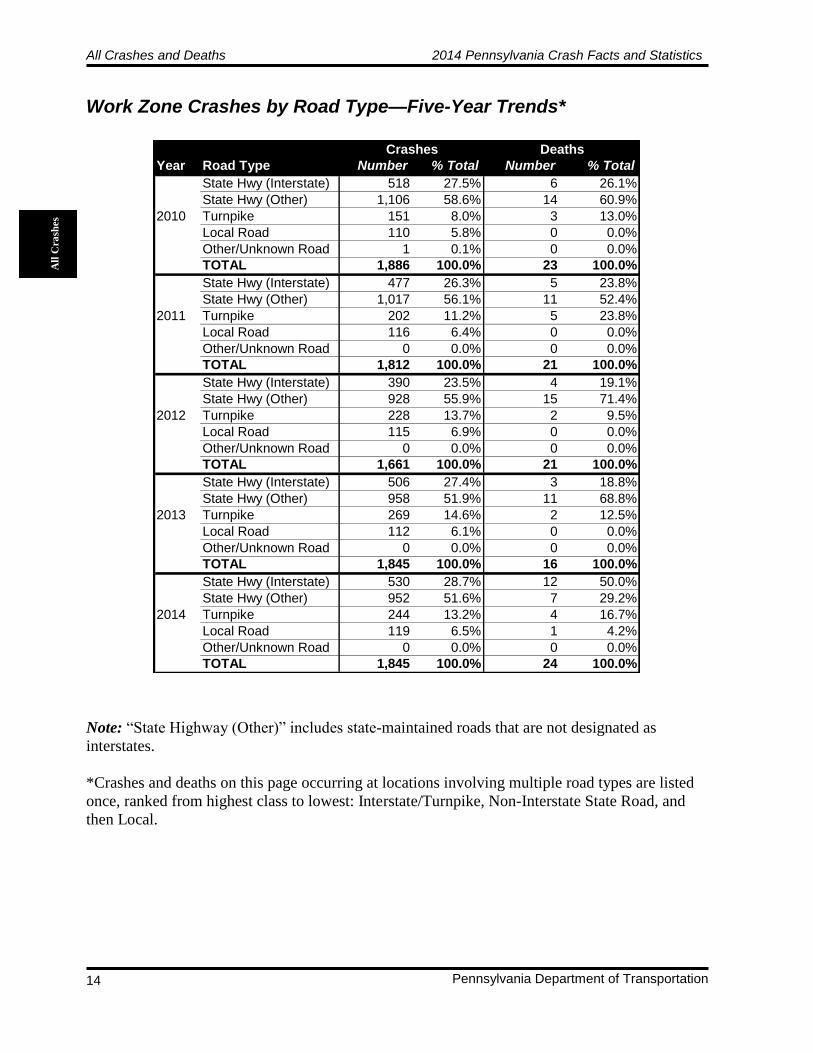
Work Zone Crashes by Road Type—Five-Year Trends*
All
Cra
shes
Year Road Type Number % Total Number % Total
State Hwy (Interstate) 518 27.5% 6 26.1%
State Hwy (Other) 1,106 58.6% 14 60.9%
2010 Turnpike 151 8.0% 3 13.0%
Local Road 110 5.8% 0 0.0%
Other/Unknown Road 1 0.1% 0 0.0%
TOTAL 1,886 100.0% 23 100.0%
State Hwy (Interstate) 477 26.3% 5 23.8%
State Hwy (Other) 1,017 56.1% 11 52.4%
2011 Turnpike 202 11.2% 5 23.8%
Local Road 116 6.4% 0 0.0%
Other/Unknown Road 0 0.0% 0 0.0%
TOTAL 1,812 100.0% 21 100.0%
State Hwy (Interstate) 390 23.5% 4 19.1%
State Hwy (Other) 928 55.9% 15 71.4%
2012 Turnpike 228 13.7% 2 9.5%
Local Road 115 6.9% 0 0.0%
Other/Unknown Road 0 0.0% 0 0.0%
TOTAL 1,661 100.0% 21 100.0%
State Hwy (Interstate) 506 27.4% 3 18.8%
State Hwy (Other) 958 51.9% 11 68.8%
2013 Turnpike 269 14.6% 2 12.5%
Local Road 112 6.1% 0 0.0%
Other/Unknown Road 0 0.0% 0 0.0%
TOTAL 1,845 100.0% 16 100.0%
State Hwy (Interstate) 530 28.7% 12 50.0%
State Hwy (Other) 952 51.6% 7 29.2%
2014 Turnpike 244 13.2% 4 16.7%
Local Road 119 6.5% 1 4.2%
Other/Unknown Road 0 0.0% 0 0.0%
TOTAL 1,845 100.0% 24 100.0%
Crashes Deaths
Note: “State Highway (Other)” includes state-maintained roads that are not designated as
interstates.
*Crashes and deaths on this page occurring at locations involving multiple road types are listed
once, ranked from highest class to lowest: Interstate/Turnpike, Non-Interstate State Road, and
then Local.
2014 Pennsylvania Crash Facts and Statistics All Crashes and Deaths
Pennsylvania Department of Transportation 15
All C
rash
es
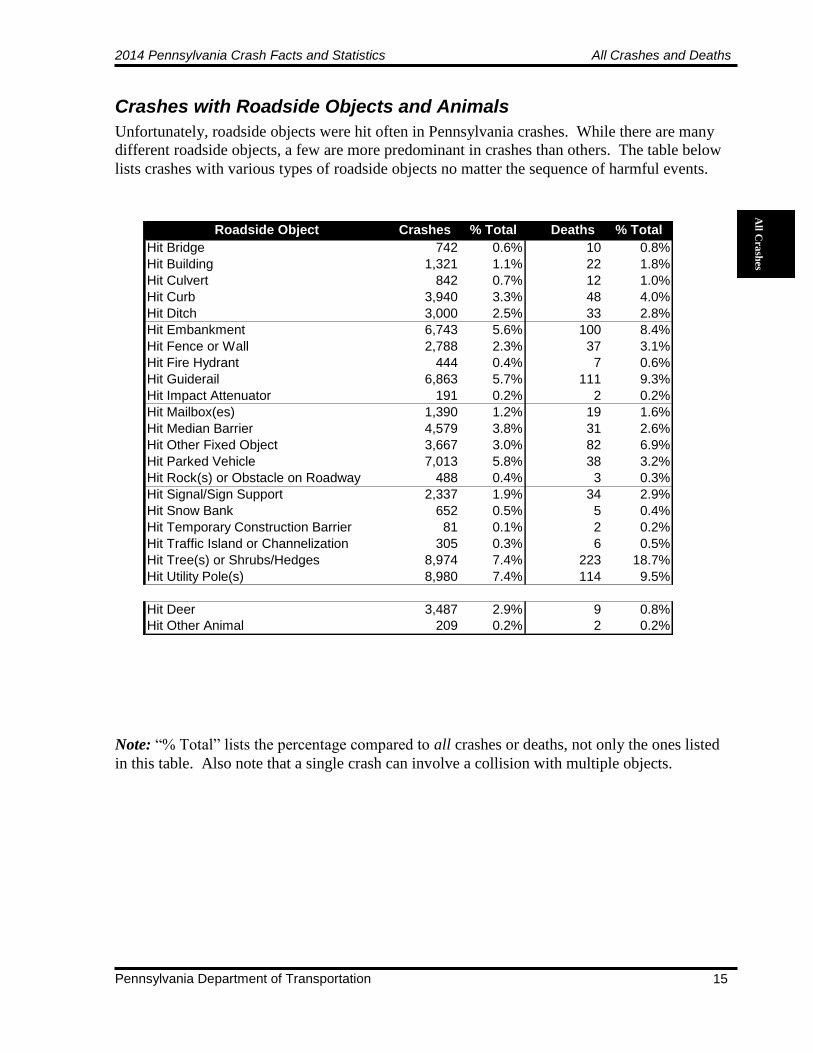
Crashes with Roadside Objects and Animals
Unfortunately, roadside objects were hit often in Pennsylvania crashes. While there are many
different roadside objects, a few are more predominant in crashes than others. The table below
lists crashes with various types of roadside objects no matter the sequence of harmful events.
Note: “% Total” lists the percentage compared to all crashes or deaths, not only the ones listed
in this table. Also note that a single crash can involve a collision with multiple objects.
Roadside Object Crashes % Total Deaths % Total
Hit Bridge 742 0.6% 10 0.8%
Hit Building 1,321 1.1% 22 1.8%
Hit Culvert 842 0.7% 12 1.0%
Hit Curb 3,940 3.3% 48 4.0%
Hit Ditch 3,000 2.5% 33 2.8%
Hit Embankment 6,743 5.6% 100 8.4%
Hit Fence or Wall 2,788 2.3% 37 3.1%
Hit Fire Hydrant 444 0.4% 7 0.6%
Hit Guiderail 6,863 5.7% 111 9.3%
Hit Impact Attenuator 191 0.2% 2 0.2%
Hit Mailbox(es) 1,390 1.2% 19 1.6%
Hit Median Barrier 4,579 3.8% 31 2.6%
Hit Other Fixed Object 3,667 3.0% 82 6.9%
Hit Parked Vehicle 7,013 5.8% 38 3.2%
Hit Rock(s) or Obstacle on Roadway 488 0.4% 3 0.3%
Hit Signal/Sign Support 2,337 1.9% 34 2.9%
Hit Snow Bank 652 0.5% 5 0.4%
Hit Temporary Construction Barrier 81 0.1% 2 0.2%
Hit Traffic Island or Channelization 305 0.3% 6 0.5%
Hit Tree(s) or Shrubs/Hedges 8,974 7.4% 223 18.7%
Hit Utility Pole(s) 8,980 7.4% 114 9.5%
Hit Deer 3,487 2.9% 9 0.8%
Hit Other Animal 209 0.2% 2 0.2%
All Crashes and Deaths 2014 Pennsylvania Crash Facts and Statistics
Pennsylvania Department of Transportation 16
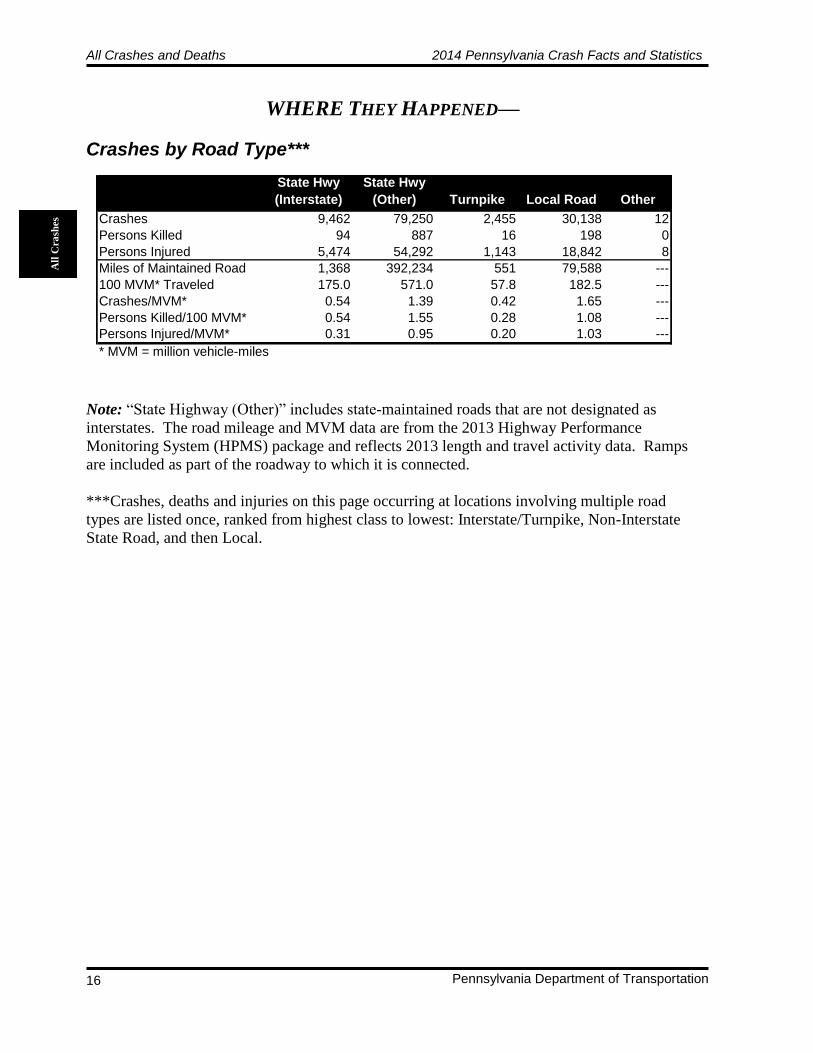
WHERE THEY HAPPENED—
Crashes by Road Type***
All
Cra
shes
State Hwy
(Interstate)
State Hwy
(Other) Turnpike Local Road Other
Crashes 9,462 79,250 2,455 30,138 12
Persons Killed 94 887 16 198 0
Persons Injured 5,474 54,292 1,143 18,842 8
Miles of Maintained Road 1,368 392,234 551 79,588 ---
100 MVM* Traveled 175.0 571.0 57.8 182.5 ---
Crashes/MVM* 0.54 1.39 0.42 1.65 ---
Persons Killed/100 MVM* 0.54 1.55 0.28 1.08 ---
Persons Injured/MVM* 0.31 0.95 0.20 1.03 ---
* MVM = million vehicle-miles
Note: “State Highway (Other)” includes state-maintained roads that are not designated as
interstates. The road mileage and MVM data are from the 2013 Highway Performance
Monitoring System (HPMS) package and reflects 2013 length and travel activity data. Ramps
are included as part of the roadway to which it is connected.
***Crashes, deaths and injuries on this page occurring at locations involving multiple road
types are listed once, ranked from highest class to lowest: Interstate/Turnpike, Non-Interstate
State Road, and then Local.
2014 Pennsylvania Crash Facts and Statistics All Crashes and Deaths
Pennsylvania Department of Transportation 17
All C
rash
es
50.0%
50.0%
0.0%
50.0%
29.6%
18.2%
0% 20% 40% 60% 80% 100%
Passenger Car
Light Truck
Heavy Truck
Crashes Deaths
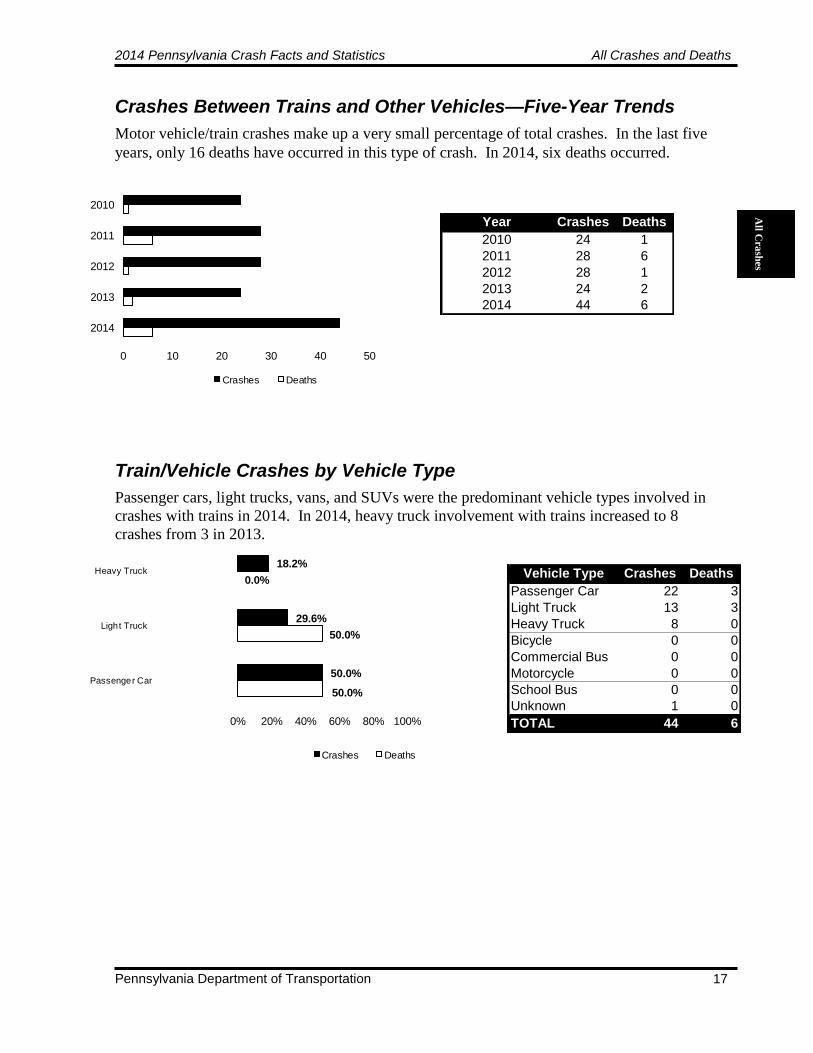
Crashes Between Trains and Other Vehicles—Five-Year Trends Train/Vehicle Crashes by Vehicle Type
Motor vehicle/train crashes make up a very small percentage of total crashes. In the last five
years, only 16 deaths have occurred in this type of crash. In 2014, six deaths occurred.
Passenger cars, light trucks, vans, and SUVs were the predominant vehicle types involved in
crashes with trains in 2014. In 2014, heavy truck involvement with trains increased to 8
crashes from 3 in 2013.
0 10 20 30 40 50
2014
2013
2012
2011
2010
Crashes Deaths
Year Crashes Deaths
2010 24 1
2011 28 6
2012 28 1
2013 24 2
2014 44 6
Vehicle Type Crashes Deaths
Passenger Car 22 3
Light Truck 13 3
Heavy Truck 8 0
Bicycle 0 0
Commercial Bus 0 0
Motorcycle 0 0
School Bus 0 0
Unknown 1 0
TOTAL 44 6
All Crashes and Deaths 2014 Pennsylvania Crash Facts and Statistics
Pennsylvania Department of Transportation 18
0.0%
0.0%
16.7%
16.7%
66.7%
0.0%
2.3%
2.3%
27.3%
68.2%
0% 20% 40% 60% 80% 100%
Dawn
Dusk
Dark (No Street L ights)
Dark (Street Lights)
Daylight
Crashes Deaths
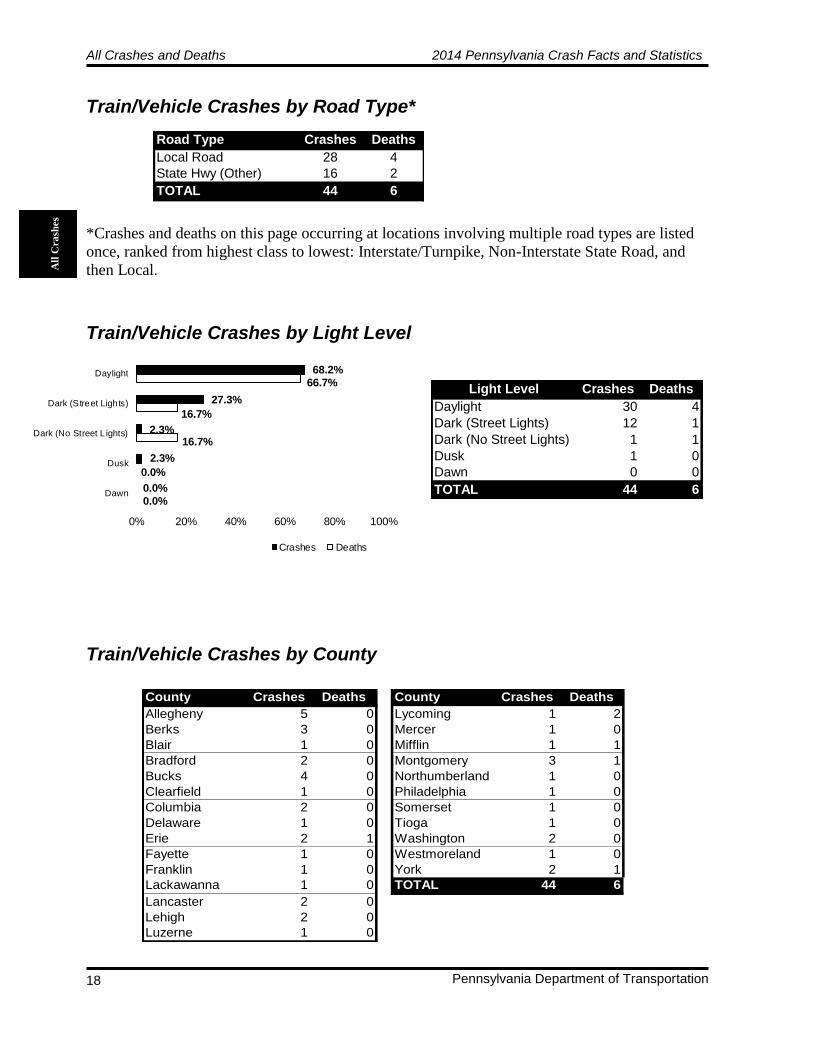
Train/Vehicle Crashes by Road Type* *Crashes and deaths on this page occurring at locations involving multiple road types are listed
once, ranked from highest class to lowest: Interstate/Turnpike, Non-Interstate State Road, and
then Local.
Train/Vehicle Crashes by Light Level Train/Vehicle Crashes by County
All
Cra
shes
Road Type Crashes Deaths
Local Road 28 4
State Hwy (Other) 16 2
TOTAL 44 6
Light Level Crashes Deaths
Daylight 30 4
Dark (Street Lights) 12 1
Dark (No Street Lights) 1 1
Dusk 1 0
Dawn 0 0
TOTAL 44 6
County Crashes Deaths County Crashes Deaths
Allegheny 5 0 Lycoming 1 2
Berks 3 0 Mercer 1 0
Blair 1 0 Mifflin 1 1
Bradford 2 0 Montgomery 3 1
Bucks 4 0 Northumberland 1 0
Clearfield 1 0 Philadelphia 1 0
Columbia 2 0 Somerset 1 0
Delaware 1 0 Tioga 1 0
Erie 2 1 Washington 2 0
Fayette 1 0 Westmoreland 1 0
Franklin 1 0 York 2 1
Lackawanna 1 0 TOTAL 44 6
Lancaster 2 0
Lehigh 2 0
Luzerne 1 0

2014 Pennsylvania Crash Facts and Statistics All Crashes and Deaths
Pennsylvania Department of Transportation 19
All C
rash
es
—WHEN THEY HAPPENED—
Crashes by Month
Crashes by Day of Week
5% 6% 7% 8% 9% 10% 11% 12%
December
November
October
September
August
July
June
May
April
March
February
January
Crashes Deaths
Month Crashes Deaths
January 12,756 (10.5%) 75 (6.3%)
February 10,503 (8.7%) 63 (5.3%)
March 8,928 (7.4%) 91 (7.6%)
April 8,489 (7.0%) 78 (6.5%)
May 9,478 (7.8%) 105 (8.8%)
June 9,419 (7.8%) 103 (8.6%)
July 9,272 (7.6%) 119 (10.0%)
August 9,471 (7.8%) 130 (10.9%)
September 9,367 (7.7%) 100 (8.4%)
October 11,073 (9.1%) 101 (8.5%)
November 11,651 (9.6%) 115 (9.6%)
December 10,910 (9.0%) 115 (9.6%)
TOTAL 121,317 (100.0%) 1,195 (100.0%)
4% 6% 8% 10% 12% 14% 16% 18% 20%
Sunday
Saturday
Friday
Thursday
Wednesday
Tuesday
Monday
Crashes Deaths
Day Crashes Deaths
Monday 16,781 (13.8%) 173 (14.5%)
Tuesday 16,968 (14.0%) 141 (11.8%)
Wednesday 17,793 (14.7%) 149 (12.5%)
Thursday 17,790 (14.7%) 137 (11.5%)
Friday 19,328 (15.9%) 192 (16.1%)
Saturday 17,829 (14.7%) 196 (16.4%)
Sunday 14,828 (12.2%) 207 (17.3%)
TOTAL 121,317 (100.0%) 1,195 (100.0%)
More crashes occurred on Friday and Saturday. The number of deaths on weekends (Saturday
and Sunday) is proportionally greater than the number of crashes. This could be attributed to
alcohol use. (See Victims of Fatal Crashes by Day of Week, page 29).

All Crashes and Deaths 2014 Pennsylvania Crash Facts and Statistics
Pennsylvania Department of Transportation 20
All
Cra
shes
Crashes by Hour of Day
0% 2% 4% 6% 8%
11:00PM
10:00PM
09:00PM
08:00PM
07:00PM
06:00PM
05:00PM
04:00PM
03:00PM
02:00PM
01:00PM
12:00PM
11:00AM
10:00AM
09:00AM
08:00AM
07:00AM
06:00AM
05:00AM
04:00AM
03:00AM
02:00AM
01:00AM
12:00AM
Crashes Deaths
Hour Crashes Deaths
12:00AM 2,886 40
01:00AM 2,599 33
02:00AM 3,062 48
03:00AM 2,021 29
04:00AM 1,681 31
05:00AM 2,505 33
06:00AM 4,093 38
07:00AM 6,307 35
08:00AM 6,110 40
09:00AM 4,902 50
10:00AM 5,109 35
11:00AM 5,603 49
12:00PM 6,295 47
01:00PM 6,271 70
02:00PM 7,180 61
03:00PM 8,781 77
04:00PM 8,716 59
05:00PM 8,941 59
06:00PM 6,482 82
07:00PM 4,912 52
08:00PM 4,476 66
09:00PM 4,306 51
10:00PM 3,816 53
11:00PM 3,326 55
Some hours of the day are more dangerous than others with regard to crashes and deaths. Not
surprisingly, crashes and deaths were higher during peak traffic times. Some hours of the day
experience a low percentage of crashes, but they are much more deadly. For example, only
3.7% of all crashes in 2014 occurred in the 8:00 PM hour, but 5.5% of all deaths—the fourth
highest percentage—occurred then. The higher volume of traffic itself is a factor during peak
traffic hours, particularly the rush-hours.

2014 Pennsylvania Crash Facts and Statistics All Crashes and Deaths
Pennsylvania Department of Transportation 21
All C
rash
es
Other/Unknow n0.3%
Daw n1.1%
Dusk2.5%
Dark (No/Unk Street Lights)
27.5%
Dark (Street Lights)15.2%
Daylight53.4%
Deaths
Other/Unknow n0.2%
Daw n1.7%
Dusk1.8% Dark (No/Unk Street
Lights)
16.2%
Dark (Street Lights)16.9%
Daylight63.3%
Crashes
Crashes by Light Level
In 2014, more crashes occurred in
daylight than all other light levels
combined. This is not surprising,
since more vehicles are on the road
during daylight. However, deaths
in 2014 occurred slightly less often
during non-daylight hours (dark
and dusk/dawn conditions). If
2014 deaths per 1000 crashes are
compared (Daylight—8.3 deaths
per 1000 crashes versus Non-
Daylight—12.5 deaths per 1000
crashes), it is apparent that non-
daylight crashes resulted in deaths
more often than daylight crashes.
Light Level Crashes Deaths
Daylight 76,736 638
Dark (Street Lights) 20,549 181
Dark (No/Unk Street Lights) 19,611 329
Dusk 2,235 30
Dawn 2,001 13
Other/Unknown 185 4
TOTAL 121,317 1,195

All Crashes and Deaths 2014 Pennsylvania Crash Facts and Statistics
Pennsylvania Department of Transportation 22
1.8%
1.9%
2.5%
3.1%
5.9%
6.0%
6.3%
6.6%
6.6%
6.7%
6.9%
6.9%
7.2%
8.6%
10.5%
12.6%
0% 5% 10% 15%
Christmas**
New Years**
Post New Years**
Pre-Christmas**
Labor Day
Indepen dence Day
Memoria l Da y
Post-Labor Day
Post-Indepe ndence Day
Pre-Memorial Day
Post Memorial Day
Pre-Independe nce D ay
Pre-Labor Day
Th anksgiving
Post-Thanksgiving
Pre-Than ksgiving
Crashes
0.0%
1.1%
1.1%
1.1%
5.6%
6.1%
6.7%
6.7%
7.2%
7.2%
7.8%
7.8%
8.3%
8.9%
11.1%
13.3%
0% 5% 10% 15%
New Years**
Christmas**
Pre-Christmas**
Post New Years**
Pre-Thanksgiving
Thanksgiving
Post-Labor Day
Memorial Day
Pre-Independence Day
Pre-Memorial Day
Post-Independence Day
Post Memorial Day
Independence Day
Post-Thanksgiving
Pre-Labor Day
Labor Day
Deaths
All
Cra
shes
Crashes by Holiday
1
* See Holidays under Definitions for
explanation of pre- and post-holiday
weekends.
** Not part of a holiday weekend in 2014.
Period* Crashes Deaths
New Years** 283 0
Post New Years** 363 2
Pre-Memorial Day 975 13
Memorial Day 915 12
Post Memorial Day 1,005 14
Pre-Independence Day 1,008 13
Independence Day 879 15
Post-Independence Day 966 14
Pre-Labor Day 1,044 20
Labor Day 858 24
Post-Labor Day 962 12
Pre-Thanksgiving 1,841 10
Thanksgiving 1,256 11
Post-Thanksgiving 1,531 16
Pre-Christmas** 450 2
Christmas** 263 2
TOTAL 14,599 180
Crashes increased during holiday periods due to the volume of traffic on the roadway. Many
times the weekend before and the weekend after the holiday have nearly as many crashes and
fatalities, and sometimes more. The graphs below illustrate the ranking in descending order, of
total crashes and deaths, respectively, for each holiday period. The table shows a breakdown of
crashes and deaths for each holiday period in 2014.

2014 Pennsylvania Crash Facts and Statistics Drivers
Pennsylvania Department of Transportation 23
Drivers
Drivers Overview
Crashes Involving Driver Error
Every traffic crash involves 3 elements: the driver, roadway, and vehicle. It has been stated
nationally that 85-90% of all traffic crashes involve some sort of driver error that contributes to
the crash. Therefore, as drivers, we can greatly impact traffic safety by driving smart and
driving defensively.
Of all drivers represented in crashes, the young driver and the mature driver are two groups that
stand out. Young drivers (ages 16-21) are the least experienced drivers and they are also prone
to over zealous driving performance, perhaps due to their youth and peer pressure. Mature
drivers (ages 65 & over) on the other hand experience driving difficulties related to
deteriorating physical abilities (eyesight, hearing, head movement, etc.).
Driv
ers
Some form of poor/degraded driver performance is present in the majority of crashes. Alcohol
use and speeding continue to be big contributors to fatal crashes.
Contributing Factor Crashes
Fatal
Crashes
Speed-Related 32,069 434
Drinking Driver 9,609 188
Improper Turning-Related 12,182 72
Proceeded Without Clearance 7,861 68
Careless/Illegal Passing 4,162 61
Distracted Driver 13,964 49
Drowsy Drivers 2,567 20
Tailgating 5,456 9
Note: Drinking driver and drowsy driver factors determined from the driver’s condition field.

Drivers 2014 Pennsylvania Crash Facts and Statistics
Pennsylvania Department of Transportation 24
Single and Multiple Vehicle Crashes of Young and Mature Drivers
Drivers in Crashes by Age Group
Driv
ers
As the table below shows, mature drivers are over-represented in multiple vehicle crashes, due
in part to the loss of physical and cognitive abilities. Younger drivers are also over-represented
in multi-vehicle crashes as younger drivers are more easily distracted while driving.
Looking at the 2014 Pennsylvania driver data, as driver age groups increased in age, the
percentage of Pennsylvania total drivers involved in crashes within each age group decreased
considerably. Note the percentage of 16-year old drivers involved in crashes. This number is
significantly lower than other young driver age groups due to a law enacted in December 1999
that required a mandatory six month waiting period between obtaining a Learner’s Permit and
testing for licensure. It also reflected the limited time 16-year old drivers used the roads and
the more controlled situations in which they are permitted to drive during the permit process.
Driver inexperience and less cautious driving often are attributed characteristics given to the
reason all young driver ages have higher rates.
Number of Young Drivers Mature Drivers Mature DriversVehicles All Drivers (16-21) (65-74) (75+)
Single 46.0% 39.0% 20.8% 21.2%
Vehicle Crash 55,726 crashes 10,504 crashes 2,486 crashes 1,595 crashes
Multiple 54.0% 61.0% 79.2% 78.8%
Vehicle Crash 65,466 crashes 16,442 crashes 9,446 crashes 5,921 crashes
PA Drivers
Involved in *PA Total % Involved
Age Group Crashes Drivers in Crashes
16 1,543 59,768 2.6%
17 4,253 94,171 4.5%
18 4,968 114,163 4.4%
19 5,260 126,053 4.2%
20 5,139 132,283 3.9%
21 5,412 136,593 4.0%
22-24 15,781 433,452 3.6%
25-29 20,933 734,456 2.9%
30-39 30,395 1,378,379 2.2%
40-54 41,289 2,351,050 1.8%
55-59 12,254 883,605 1.4%
60-64 9,376 779,028 1.2%
65-69 6,759 641,657 1.1%
70-74 4,680 454,024 1.0%
75 and Over 7,386 770,036 1.0%
Unknown 27 N/A N/A
* PA Total Drivers includes total PA Licensed Drivers and PA Drivers
who have their Learner’s Permit (no driver’s license).
2014 Pennsylvania Crash Facts and Statistics Drivers
Pennsylvania Department of Transportation 25
Driv
ers
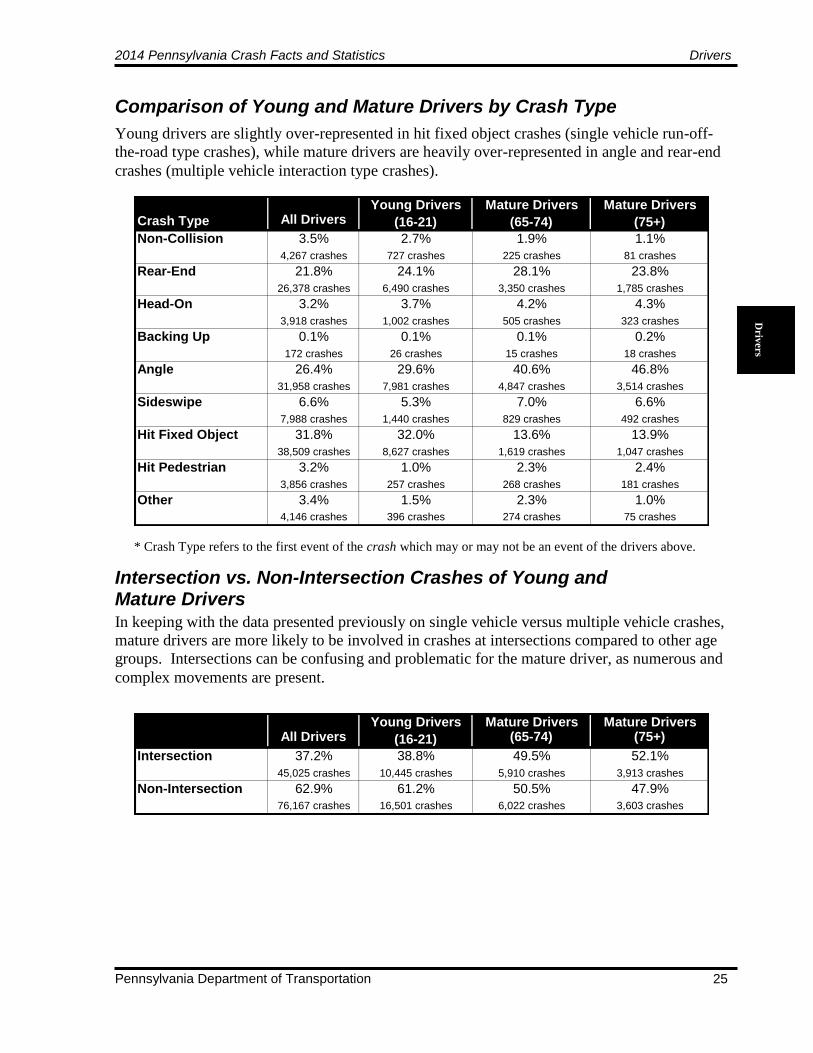
Comparison of Young and Mature Drivers by Crash Type Intersection vs. Non-Intersection Crashes of Young and Mature Drivers
Young drivers are slightly over-represented in hit fixed object crashes (single vehicle run-off-
the-road type crashes), while mature drivers are heavily over-represented in angle and rear-end
crashes (multiple vehicle interaction type crashes).
In keeping with the data presented previously on single vehicle versus multiple vehicle crashes,
mature drivers are more likely to be involved in crashes at intersections compared to other age
groups. Intersections can be confusing and problematic for the mature driver, as numerous and
complex movements are present.
Young Drivers Mature Drivers Mature Drivers
Crash Type All Drivers (16-21) (65-74) (75+)
Non-Collision 3.5% 2.7% 1.9% 1.1%
4,267 crashes 727 crashes 225 crashes 81 crashes
Rear-End 21.8% 24.1% 28.1% 23.8%
26,378 crashes 6,490 crashes 3,350 crashes 1,785 crashes
Head-On 3.2% 3.7% 4.2% 4.3%
3,918 crashes 1,002 crashes 505 crashes 323 crashes
Backing Up 0.1% 0.1% 0.1% 0.2%
172 crashes 26 crashes 15 crashes 18 crashes
Angle 26.4% 29.6% 40.6% 46.8%
31,958 crashes 7,981 crashes 4,847 crashes 3,514 crashes
Sideswipe 6.6% 5.3% 7.0% 6.6%
7,988 crashes 1,440 crashes 829 crashes 492 crashes
Hit Fixed Object 31.8% 32.0% 13.6% 13.9%
38,509 crashes 8,627 crashes 1,619 crashes 1,047 crashes
Hit Pedestrian 3.2% 1.0% 2.3% 2.4%
3,856 crashes 257 crashes 268 crashes 181 crashes
Other 3.4% 1.5% 2.3% 1.0%
4,146 crashes 396 crashes 274 crashes 75 crashes
Young Drivers Mature Drivers Mature DriversAll Drivers (16-21) (65-74) (75+)
Intersection 37.2% 38.8% 49.5% 52.1%
45,025 crashes 10,445 crashes 5,910 crashes 3,913 crashes
Non-Intersection 62.9% 61.2% 50.5% 47.9%
76,167 crashes 16,501 crashes 6,022 crashes 3,603 crashes
* Crash Type refers to the first event of the crash which may or may not be an event of the drivers above.
Alcohol-Related Crashes 2014 Pennsylvania Crash Facts and Statistics
Pennsylvania Department of Transportation 26
Alcohol-Related Crashes
Alcohol Overview
Alc
oh
ol-
Rela
ted
▶ In Pennsylvania, drinking and driving remains a top safety issue. In 2014, alcohol-related
crashes decreased to 10,550 from 11,041 alcohol-related crashes in 2013. In 2014, alcohol-
related deaths decreased to 333 from 381 alcohol-related deaths in 2013.
▶ Of particular concern is the involvement of drinking drivers under the age of 21. 13% of the
driver deaths in the 16-20 age group were drinking drivers, down from 19% in 2013.
Improvement in this age group is a very important need.
▶ Of equal focus is the 21 to 25 age group, in which 43% of the driver deaths were drinking
drivers. This age group had the worst percentage of all groups, and was down from 44% in
2013. The 26 to 30 age group decreased to 31% from 34% in 2013.
▶ In 2014, alcohol-related deaths were 28% of the total traffic deaths, less than in 2010, 2011
and 2012.
▶ Pennsylvania continues to take an aggressive posture to prevent and deter drinking and driving
(particularly through the widespread use of sobriety checkpoints and saturation patrols).
2014 Briefs
▶ 333 people died in alcohol-related crashes.
▶ 87% of the alcohol-related occupant deaths (drivers and passengers) were in the vehicle
driven by the drinking driver; 72% were the drinking drivers themselves.
▶ 74% of the drinking drivers in traffic crashes were male.
▶ 72% of the alcohol-related crashes were during the hours of darkness, usually on
weekends.
▶ On average each day, 29 alcohol-related traffic crashes occurred.
▶ On average each day, 0.9 persons were killed in alcohol-related traffic crashes.
▶ On average each day, 20 persons were injured in alcohol-related traffic crashes.
Note: Beginning with 2003 data, alcohol involvement criteria changed to account for both BAC
levels and suspected involvement when BAC is unknown. The effect can mostly be seen in the
alcohol related fatalities for years 2003 and after.
2014 Pennsylvania Crash Facts and Statistics Alcohol-Related Crashes
Pennsylvania Department of Transportation 27
Alcohol Involvement in Crashes
Alcohol-Related Crashes—Five-Year Trends
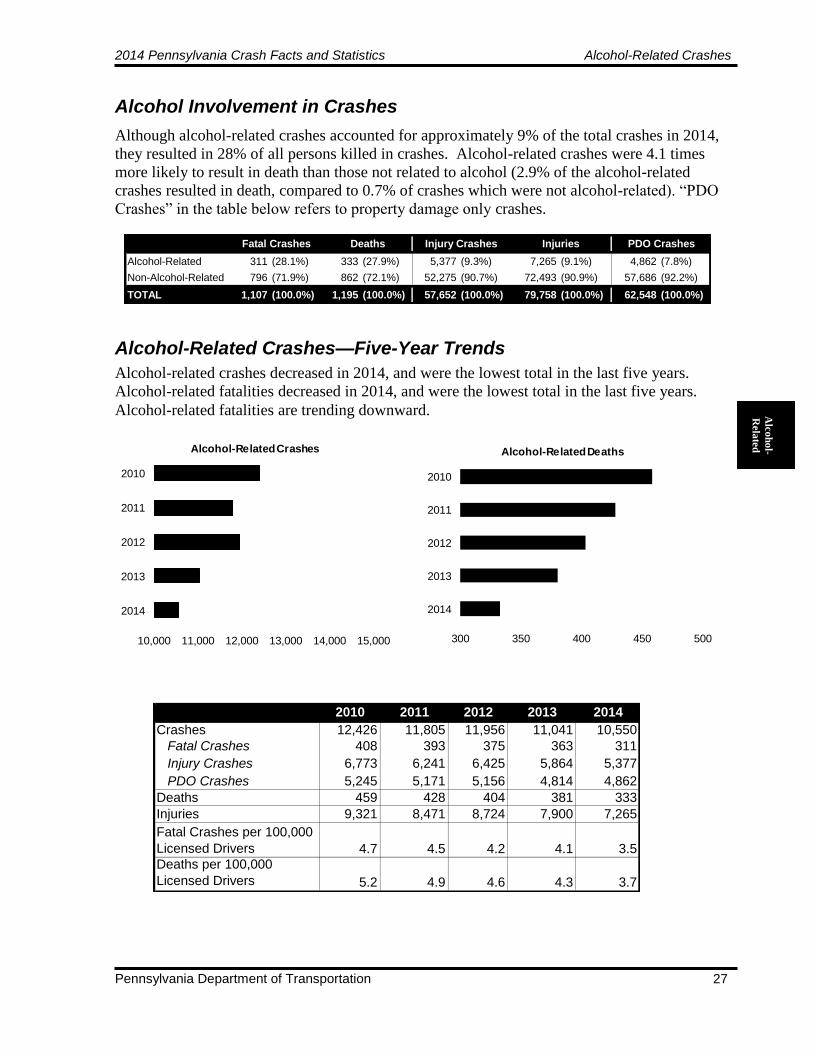
Although alcohol-related crashes accounted for approximately 9% of the total crashes in 2014,
they resulted in 28% of all persons killed in crashes. Alcohol-related crashes were 4.1 times
more likely to result in death than those not related to alcohol (2.9% of the alcohol-related
crashes resulted in death, compared to 0.7% of crashes which were not alcohol-related). “PDO
Crashes” in the table below refers to property damage only crashes.
10,000 11,000 12,000 13,000 14,000 15,000
2014
2013
2012
2011
2010
Alcohol-Related Crashes
Alcohol-related crashes decreased in 2014, and were the lowest total in the last five years.
Alcohol-related fatalities decreased in 2014, and were the lowest total in the last five years.
Alcohol-related fatalities are trending downward.
300 350 400 450 500
2014
2013
2012
2011
2010
Alcohol-Related Deaths
2010 2011 2012 2013 2014
Crashes 12,426 11,805 11,956 11,041 10,550
Fatal Crashes 408 393 375 363 311
Injury Crashes 6,773 6,241 6,425 5,864 5,377
PDO Crashes 5,245 5,171 5,156 4,814 4,862
Deaths 459 428 404 381 333
Injuries 9,321 8,471 8,724 7,900 7,265
Fatal Crashes per 100,000
Licensed Drivers 4.7 4.5 4.2 4.1 3.5Deaths per 100,000
Licensed Drivers 5.2 4.9 4.6 4.3 3.7
Alc
oh
ol-
Rela
ted
Alcohol-Related 311 (28.1%) 333 (27.9%) 5,377 (9.3%) 7,265 (9.1%) 4,862 (7.8%)
Non-Alcohol-Related 796 (71.9%) 862 (72.1%) 52,275 (90.7%) 72,493 (90.9%) 57,686 (92.2%)
TOTAL 1,107 (100.0%) 1,195 (100.0%) 57,652 (100.0%) 79,758 (100.0%) 62,548 (100.0%)
PDO CrashesFatal Crashes Deaths Injury Crashes Injuries
Note: Beginning with 2003 data, alcohol involvement criteria changed to account for both BAC
levels and suspected involvement when BAC is unknown. The effect can mostly be seen in the
alcohol related fatalities for years 2003 and after.

Alcohol-Related Crashes 2014 Pennsylvania Crash Facts and Statistics
Pennsylvania Department of Transportation 28
Victims of Alcohol-Related Fatal Crashes
Victims of Fatal Crashes by Time of Day
There were 282 driver and passenger deaths in alcohol-related crashes in 2014, while 244 (87%)
were the drinking drivers or their passengers.
Alcohol-related crashes occurring between 8:00 PM and 4:00 AM produced the vast majority of
deaths (62% of alcohol-related deaths). In contrast, under half of the deaths (48%) from non-
alcohol-related crashes resulted from crashes occurring between noon and 8:00 PM.
Alc
oh
ol-
Rela
ted
Persons Involved
Drivers 235
Drinking Drivers 203 (86.4%)
Non-Drinking Drivers 32 (13.6%)
Passengers 47
Passengers with Drinking Driver 41 (87.2%)
Passengers with Non-Drinking Driver 6 (12.8%)
Pedestrians 42
Drinking Pedestrian 31 (73.8%)
Non-Drinking Pedestrian 11 (26.2%)
TOTAL DEATHS* 333
*Includes 9 victims, status unknown
Deaths
13.3%
22.2%
25.6%
19.4%
13.1%
6.3%
33.0%
18.3%
10.2%
2.1%
7.2%
28.8%
0% 10% 20% 30% 40%
8:00-11:59 PM
4:00-7:59 PM
Noon-3:59 PM
8:00-11:59 AM
4:00-07:59 AM
Midnight-3:59 AM
Alcohol-Related Non-Alcohol-Related
Time of Occurrence
Non-
Alcohol-
Related
Alcohol-
Related
Midnight-3:59 AM 54 96
4:00-07:59 AM 113 24
8:00-11:59 AM 167 7
Noon-3:59 PM 221 34
4:00-7:59 PM 191 61
8:00-11:59 PM 115 110
Time Unknown 1 1
TOTAL DEATHS 862 333

2014 Pennsylvania Crash Facts and Statistics Alcohol-Related Crashes
Pennsylvania Department of Transportation 29
Alc
oh
ol-
Rela
ted
Victims of Fatal Crashes by Day of Week Alcohol-Related Crashes—Day vs. Night
15.1%
12.7%
16.2%
12.7%
13.1%
13.6%
16.7%
23.1%
26.1%
15.6%
8.4%
10.8%
7.2%
8.7%
0% 10% 20% 30%
Sunday
Saturday
Friday
Thursday
Wednesday
Tuesday
Monday
Alcohol-Related Non-Alcohol-Related
Day of Occurrence
Non-
Alcohol-
Related
Alcohol-
Related
Monday 144 29
Tuesday 117 24
Wednesday 113 36
Thursday 109 28
Friday 140 52
Saturday 109 87
Sunday 130 77
TOTAL DEATHS 862 333
Just under half (49%) of alcohol-related fatal crash victims were the result of crashes
occurring on Saturday and Sunday, while fatal crash victims of non-alcohol-related crashes
tended to be distributed more evenly throughout the work week with the fewest occurring on
Thursday and Saturday.
71.5% of alcohol-related crashes occurred at night. The graph below shows the breakdown of
alcohol-related crashes by day and night.
Day28.5%
Night71.5%

Alcohol-Related Crashes 2014 Pennsylvania Crash Facts and Statistics
Pennsylvania Department of Transportation 30
Alcohol-Related Holiday Crashes
In 2014, 13% of all holiday crashes involved alcohol use; however, 41% of deaths that occurred
during holiday weekends were related to alcohol use. (See Crashes by Holiday, page 22.)
* See Holidays under Definitions for
explanation of pre- and post-holiday
weekends.
** Not part of a holiday weekend in 2014.
Alc
oh
ol-
Rela
ted
Period* Crashes Deaths
New Years** 64 0
Post New Years** 21 0
Pre-Memorial Day 129 7
Memorial Day 123 7
Post Memorial Day 111 7
Pre-Independence Day 138 3
Independence Day 153 7
Post-Independence Day 130 5
Pre-Labor Day 137 6
Labor Day 138 15
Post-Labor Day 114 2
Pre-Thanksgiving 154 3
Thanksgiving 150 5
Post-Thanksgiving 176 4
Pre-Christmas** 38 1
Christmas** 49 1
TOTAL 1,825 73
0.0%
0.0%
1.4%
1.4%
2.7%
4.1%
4.1%
5.5%
6.9%
6.9%
8.2%
9.6%
9.6%
9.6%
9.6%
20.6%
0% 5% 10% 15% 20% 25%
Post New Years**
New Years**
Christmas**
Pre-Christmas**
Post-Labor Day
Pre-Thanksgiving
Pre-Independence Day
Post-Thanksgiving
Thanksgiving
Post-Independence Day
Pre-Labor Day
Independence Day
Post Memoria l Day
Memorial Day
Pre-Memorial Day
Labor Day
Deaths
1.2%
2.1%
2.7%
3.5%
6.1%
6.3%
6.7%
7.1%
7.1%
7.5%
7.6%
7.6%
8.2%
8.4%
8.4%
9.6%
0% 5% 10% 15%
Post New Years**
Pre-Christmas**
Christmas**
New Years**
Post Memoria l Day
Post-Labor Day
Memorial Day
Pre-Memorial Day
Post-Independence Day
Pre-Labor Day
Labor Day
Pre-Independence Day
Thanksgiving
Independence Day
Pre-Thanksgiving
Post-Thanksgiving
Total Crashes
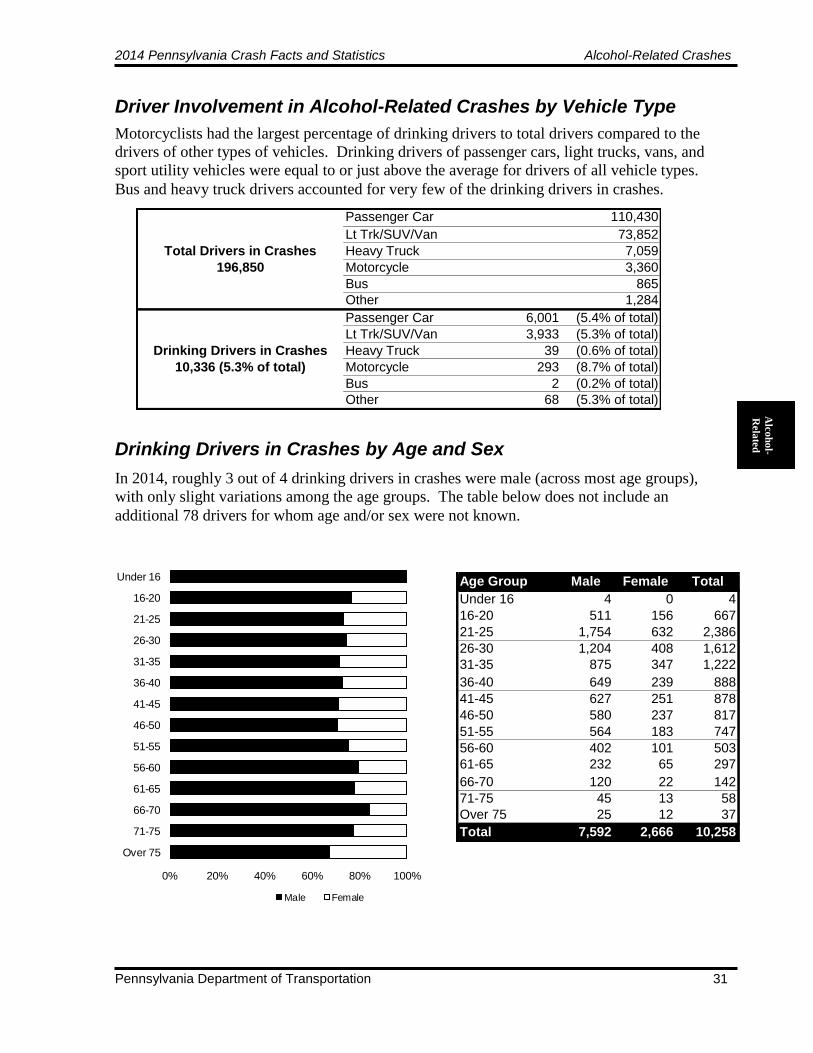
2014 Pennsylvania Crash Facts and Statistics Alcohol-Related Crashes
Pennsylvania Department of Transportation 31
Alc
oh
ol-
Rela
ted
Driver Involvement in Alcohol-Related Crashes by Vehicle Type Drinking Drivers in Crashes by Age and Sex
Motorcyclists had the largest percentage of drinking drivers to total drivers compared to the
drivers of other types of vehicles. Drinking drivers of passenger cars, light trucks, vans, and
sport utility vehicles were equal to or just above the average for drivers of all vehicle types.
Bus and heavy truck drivers accounted for very few of the drinking drivers in crashes.
In 2014, roughly 3 out of 4 drinking drivers in crashes were male (across most age groups),
with only slight variations among the age groups. The table below does not include an
additional 78 drivers for whom age and/or sex were not known.
Passenger Car 110,430
Lt Trk/SUV/Van 73,852
Total Drivers in Crashes Heavy Truck 7,059
196,850 Motorcycle 3,360
Bus 865
Other 1,284
Passenger Car 6,001 (5.4% of total)
Lt Trk/SUV/Van 3,933 (5.3% of total)
Drinking Drivers in Crashes Heavy Truck 39 (0.6% of total)
10,336 (5.3% of total) Motorcycle 293 (8.7% of total)
Bus 2 (0.2% of total)
Other 68 (5.3% of total)
0% 20% 40% 60% 80% 100%
Over 75
71-75
66-70
61-65
56-60
51-55
46-50
41-45
36-40
31-35
26-30
21-25
16-20
Under 16
Male Female
Age Group Male Female Total
Under 16 4 0 4
16-20 511 156 667
21-25 1,754 632 2,386
26-30 1,204 408 1,612
31-35 875 347 1,222
36-40 649 239 888
41-45 627 251 878
46-50 580 237 817
51-55 564 183 747
56-60 402 101 503
61-65 232 65 297
66-70 120 22 142
71-75 45 13 58
Over 75 25 12 37
Total 7,592 2,666 10,258
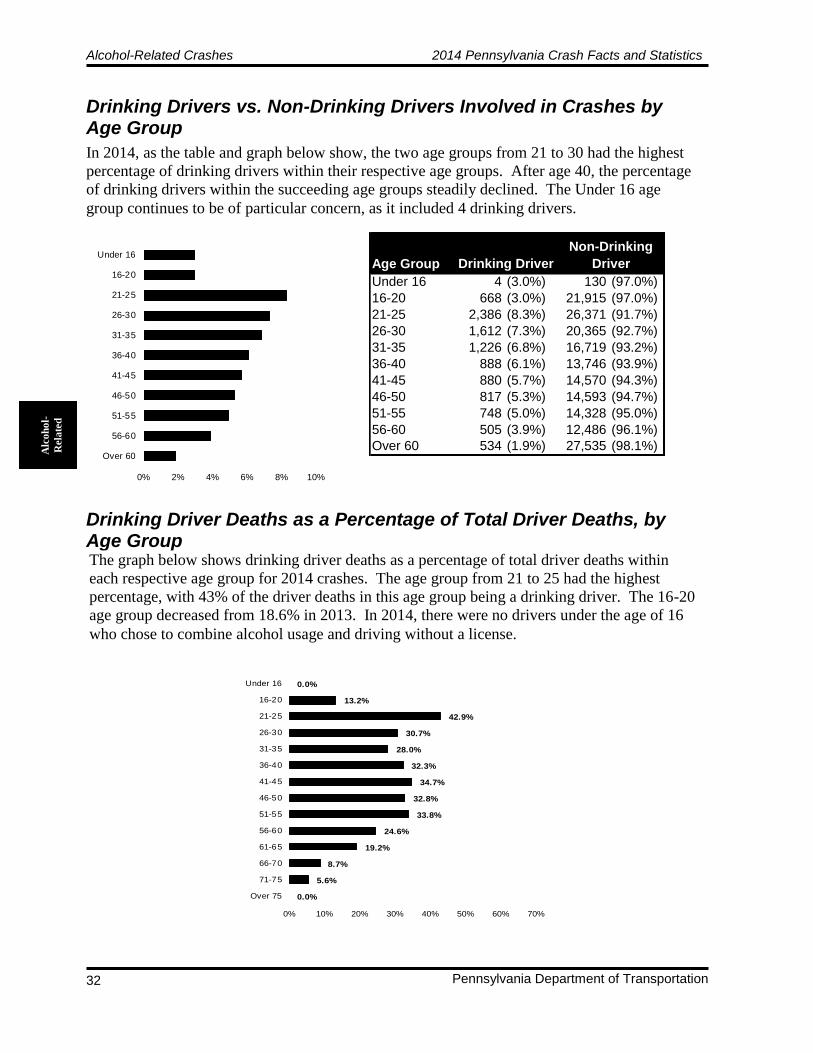
Alcohol-Related Crashes 2014 Pennsylvania Crash Facts and Statistics
Pennsylvania Department of Transportation 32
Drinking Drivers vs. Non-Drinking Drivers Involved in Crashes by Age Group
Drinking Driver Deaths as a Percentage of Total Driver Deaths, by Age Group
In 2014, as the table and graph below show, the two age groups from 21 to 30 had the highest
percentage of drinking drivers within their respective age groups. After age 40, the percentage
of drinking drivers within the succeeding age groups steadily declined. The Under 16 age
group continues to be of particular concern, as it included 4 drinking drivers.
The graph below shows drinking driver deaths as a percentage of total driver deaths within
each respective age group for 2014 crashes. The age group from 21 to 25 had the highest
percentage, with 43% of the driver deaths in this age group being a drinking driver. The 16-20
age group decreased from 18.6% in 2013. In 2014, there were no drivers under the age of 16
who chose to combine alcohol usage and driving without a license.
Alc
oh
ol-
Rela
ted
0% 2% 4% 6% 8% 10%
Over 60
56-60
51-55
46-50
41-45
36-40
31-35
26-30
21-25
16-20
Under 16
Age Group
Under 16 4 (3.0%) 130 (97.0%)
16-20 668 (3.0%) 21,915 (97.0%)
21-25 2,386 (8.3%) 26,371 (91.7%)
26-30 1,612 (7.3%) 20,365 (92.7%)
31-35 1,226 (6.8%) 16,719 (93.2%)
36-40 888 (6.1%) 13,746 (93.9%)
41-45 880 (5.7%) 14,570 (94.3%)
46-50 817 (5.3%) 14,593 (94.7%)
51-55 748 (5.0%) 14,328 (95.0%)
56-60 505 (3.9%) 12,486 (96.1%)
Over 60 534 (1.9%) 27,535 (98.1%)
Drinking Driver
Non-Drinking
Driver
0.0%
5.6%
8.7%
19.2%
24.6%
33.8%
32.8%
34.7%
32.3%
28.0%
30.7%
42.9%
13.2%
0.0%
0% 10% 20% 30% 40% 50% 60% 70%
Over 75
71-75
66-70
61-65
56-60
51-55
46-50
41-45
36-40
31-35
26-30
21-25
16-20
Under 16
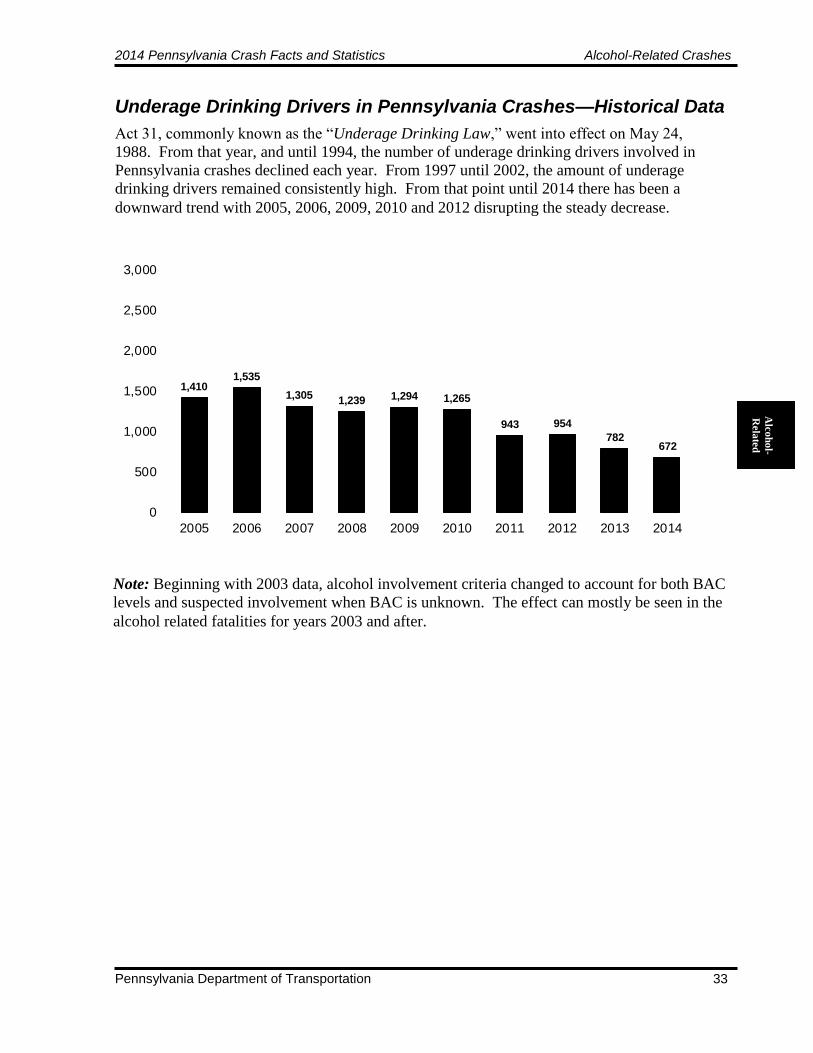
2014 Pennsylvania Crash Facts and Statistics Alcohol-Related Crashes
Pennsylvania Department of Transportation 33
Alc
oh
ol-
Rela
ted
Underage Drinking Drivers in Pennsylvania Crashes—Historical Data
Act 31, commonly known as the “Underage Drinking Law,” went into effect on May 24,
1988. From that year, and until 1994, the number of underage drinking drivers involved in
Pennsylvania crashes declined each year. From 1997 until 2002, the amount of underage
drinking drivers remained consistently high. From that point until 2014 there has been a
downward trend with 2005, 2006, 2009, 2010 and 2012 disrupting the steady decrease.
1,4101,535
1,3051,239 1,294 1,265
943 954
782672
0
500
1,000
1,500
2,000
2,500
3,000
2005 2006 2007 2008 2009 2010 2011 2012 2013 2014
Note: Beginning with 2003 data, alcohol involvement criteria changed to account for both BAC
levels and suspected involvement when BAC is unknown. The effect can mostly be seen in the
alcohol related fatalities for years 2003 and after.

Seat Belts, Child Seats, and Air Bag Usage 2014 Pennsylvania Crash Facts and Statistics
Pennsylvania Department of Transportation 34
Seat Belts, Child Safety Seats, and Air Bags
Restraints Overview
Sea
t B
elts
,
Etc
.
Safety Belts
Pennsylvania’s seat belt law requires that drivers and front seat passengers be properly buckled when riding in a
passenger car, Class 1 and Class 2 truck, or motor home. Children age 8 and older, but under age 18, are required
to be secured in a seat belt system anywhere in the vehicle due to the law becoming effective on February 21, 2003.
A driver under the age of 18 may not operate a motor vehicle when the number of passengers exceeds the number
of available seat belts in the vehicle.
The combination of lap/shoulder seat belts, when used, reduces the risk of fatal injuries to front seat passenger car
occupants by 45% and the risk of moderate-to-critical injuries by 50%. For light truck occupants, seat belts reduce
the risk of fatal injuries by 60% and the risk of moderate-to-critical injuries by 65%.
All passengers should wear a seat belt whenever riding in a motor vehicle—even for short distances. Three out of
four crashes occur within 25 miles of home.
If everyone wore seat belts when riding in a motor vehicle, hundreds of lives in Pennsylvania alone would be saved
(see page 36). Research shows that children are likely to be buckled 92% of the time when adults are buckled and
only 72% of the time when adults are not buckled. Everyone should buckle up, every time!
Child Safety Seats
Pennsylvania law requires that children under the age of 4 to be properly restrained in a child passenger restraint
system when riding anywhere in a vehicle. Children age 4 and older, but under age 8, are required to be in an
appropriately fitting child booster seat when riding anywhere in a vehicle due to the law becoming effective on
February 21, 2003.
Research shows that child safety seats, when properly installed, reduce the risk of death by 71% for infants and
54% for toddlers.
When placing a child safety seat in a vehicle, follow the manufacturer’s instructions for the vehicle and the child
safety seat instructions exactly. There are different types of child safety seats—infant, convertible, and booster.
Children ages 1 to 3 should be kept rear-facing as long as possible…until they reach the top height or weight limit
allowed by the car seat’s manufacturer. Children ages 4 to 7 should be kept forward-facing with a harness until they
reach the top height or weight limit allowed by the car seat’s manufacturer. Children ages 8 to 12 should be kept in
a booster seat until they are big enough to fit the seat belt properly, that is, the lap belt must lie snugly across the
upper thighs and the shoulder belt should lie snugly across the shoulder and chest and not cross the neck or face.
Children should ride in the rear seat whenever possible, and should always be properly buckled.
Air Bag Safety
Driver and front seat passenger air bags have been required in new passenger cars since 1998 and light trucks since
1999. However, air bags are supplemental protection devices. Everyone should still buckle up with both lap and
shoulder belts on every trip.
Child Safety
o Children age 12 and under should ride buckled up in the back seat.
o Infants in rear-facing child safety seats should NEVER ride in the front seat of a vehicle equipped with a
passenger-side air bag.
o If an older child must ride in a front seat equipped with a passenger-side air bag, put the child in a front-facing
seat or belt-positioning booster seat for the proper weight of the child, or use a correctly fitting lap/shoulder
belt, and move the vehicle seat as far back as possible.
Adult Safety
o Everyone should buckle up with both lap and shoulder belts on every trip.
o The lap belt should be worn under the abdomen and low across the hips. The shoulder portion should come
over the collarbone away from the neck and cross over the breastbone.
o Driver and front passenger seats should be moved as far back as practical, particularly for shorter people.
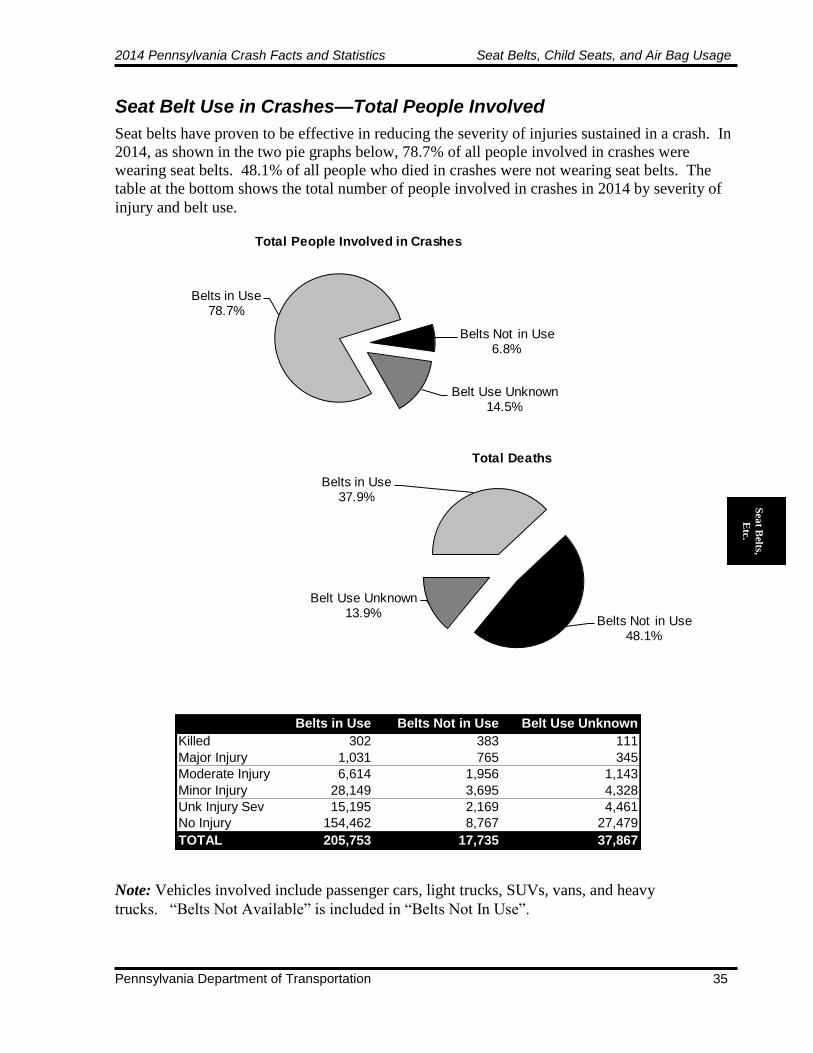
2014 Pennsylvania Crash Facts and Statistics Seat Belts, Child Seats, and Air Bag Usage
Pennsylvania Department of Transportation 35
Seat Belt Use in Crashes—Total People Involved
Seat belts have proven to be effective in reducing the severity of injuries sustained in a crash. In
2014, as shown in the two pie graphs below, 78.7% of all people involved in crashes were
wearing seat belts. 48.1% of all people who died in crashes were not wearing seat belts. The
table at the bottom shows the total number of people involved in crashes in 2014 by severity of
injury and belt use.
Belts in Use78.7%
Belts Not in Use6.8%
Belt Use Unknown14.5%
Total People Involved in Crashes
Belts in Use
37.9%
Belts Not in Use48.1%
Belt Use Unknown13.9%
Total Deaths
Sea
t Belts,
Etc
.
Note: Vehicles involved include passenger cars, light trucks, SUVs, vans, and heavy
trucks. “Belts Not Available” is included in “Belts Not In Use”.
Belts in Use Belts Not in Use Belt Use Unknown
Killed 302 383 111
Major Injury 1,031 765 345
Moderate Injury 6,614 1,956 1,143
Minor Injury 28,149 3,695 4,328
Unk Injury Sev 15,195 2,169 4,461
No Injury 154,462 8,767 27,479
TOTAL 205,753 17,735 37,867
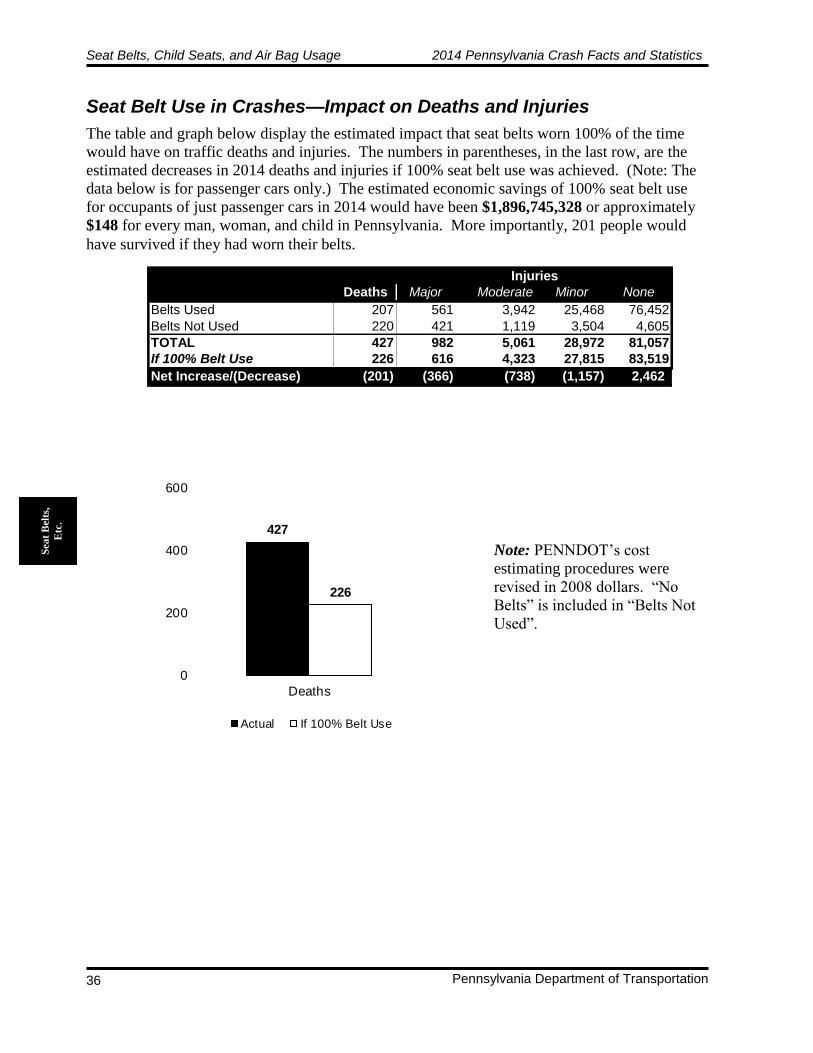
Seat Belts, Child Seats, and Air Bag Usage 2014 Pennsylvania Crash Facts and Statistics
Pennsylvania Department of Transportation 36
Seat Belt Use in Crashes—Impact on Deaths and Injuries
Sea
t B
elts
,
Etc
.
The table and graph below display the estimated impact that seat belts worn 100% of the time
would have on traffic deaths and injuries. The numbers in parentheses, in the last row, are the
estimated decreases in 2014 deaths and injuries if 100% seat belt use was achieved. (Note: The
data below is for passenger cars only.) The estimated economic savings of 100% seat belt use
for occupants of just passenger cars in 2014 would have been $1,896,745,328 or approximately
$148 for every man, woman, and child in Pennsylvania. More importantly, 201 people would
have survived if they had worn their belts.
427
226
0
200
400
600
Deaths
Actual If 100% Belt Use
Note: PENNDOT’s cost
estimating procedures were
revised in 2008 dollars. “No
Belts” is included in “Belts Not
Used”.
Deaths Major Moderate Minor None
Belts Used 207 561 3,942 25,468 76,452
Belts Not Used 220 421 1,119 3,504 4,605
TOTAL 427 982 5,061 28,972 81,057
If 100% Belt Use 226 616 4,323 27,815 83,519
Net Increase/(Decrease) (201) (366) (738) (1,157) 2,462
Injuries

2014 Pennsylvania Crash Facts and Statistics Seat Belts, Child Seats, and Air Bag Usage
Pennsylvania Department of Transportation 37
Sea
t Belts,
Etc
.
Seat Belt Use in Crashes—Historical Data
0%
10%
20%
30%
40%
50%
60%
70%
80%
90%
1986
1987
1988
1989
1990
1991
1992
1993
1994
1995
1996
1997
1998
1999
2000
2001
2002
2003
2004
2005
2006
2007
2008
2009
2010
2011
2012
2013
2014
Perc
ent B
elt
Use
Child Restraint
Law Passed11/1/83
Seat Belt Law
Passed11/23/87
Child Restraint Law
Upgraded 8/21/93
Child Restraint Law
Upgraded 2/21/03
On November 1, 1983, Pennsylvania passed a primary law requiring that drivers secure
children under age 4 in an approved child passenger restraint system when riding in a
passenger car, Class I truck, Class II truck, classic motor vehicle, antique motor vehicle, or
motor home registered in Pennsylvania. Children ages 1 to 4 could be in the back seat in a
child safety belt in lieu of a child passenger restraint system. Fines began taking effect January
1, 1985.
On November 23, 1987, Pennsylvania passed a safety belt law. The law requires that drivers
and front seat passengers of a passenger car, Class I and Class II trucks, or motor home wear a
properly-adjusted and fastened safety belt. The driver is responsible for securing children ages
4 to 18 in a safety belt when riding in the front seat. This is a secondary violation. Fines
began taking effect March 23, 1988.
Effective August 21, 1993, the child passenger restraint law was upgraded requiring that
drivers (not just those with vehicles registered in Pennsylvania) secure a child up to age 4 in a
child passenger restraint system when sitting anywhere in the vehicle.
Effective February 21, 2003, the child passenger restraint law was upgraded requiring that
children ages 4 through 7 be in an appropriately fitting child booster seat and those children
ages 8 through 17 be secured in a seat belt system whenever riding anywhere in a vehicle.
The graph below shows the percentage of seat belt users in Pennsylvania since 1983. A sharp
upward trend was experienced in the year following the passage of the seat belt law. The
recent trend shows that the usage rate is still on the rise in crashes.
Note: Data shown for passenger cars only.

Seat Belts, Child Seats, and Air Bag Usage 2014 Pennsylvania Crash Facts and Statistics
Pennsylvania Department of Transportation 38
Seat Belt Observational Surveys—Historical Data
Child Passenger Restraints i Crashes—Five Year Data
Observed seat belt use (the percent of front seat vehicle occupants wearing seat belts) is based
upon a statewide statistical sampling of front seat occupants in passenger cars and light trucks.
The observed seat belt use in 2008 is slightly lower than the previous 2 years, most likely due to
the redesign of the study methodology in 2008, that provided more detailed accounts.
84.0%
84.0%
83.5%
83.8%
86.0%
87.9%
85.1%
86.7%
86.3%
83.3%
81.8%
79.0%
75.7%
70.5%
70.7%
69.7%
67.8%
64.7%
65.0%
71.0%
71.0%
67.5%
40% 45% 50% 55% 60% 65% 70% 75% 80% 85% 90% 95%
Summer '14
Summer '12
Fall '10
Fall '08
Fall '06
Fall '04
Fall '02
Fall '00
Fall '98
Fall '96
Fall '94
Percent Belt Use
Since August 21, 1993, all drivers traveling in Pennsylvania have been required to secure
children up to age 4 in a child passenger restraint system while sitting anywhere in a vehicle. As
shown in the table below (for 2010-2014 crashes involving children under age 4), the
percentages of deaths and injuries (within restraint type by row) were lower when restraints were
used. From 2010-2014, 82% of the children under age 4 who were involved in crashes and
restrained in a child seat sustained no injury.
Sea
t B
elts
,
Etc
.
Total
Child Restraint Persons
Child Seat In Use 23 (0.1%) 58 (0.2%) 232 (0.9%) 1,901 (7.3%) 2,542 (9.8%) 21,227 (81.7%) 25,983
No Restraint In Use 5 (0.3%) 9 (0.5%) 39 (2.3%) 199 (11.8%) 474 (28.0%) 968 (57.1%) 1,694
Other Restraint In Use 2 (0.1%) 9 (0.6%) 21 (1.5%) 167 (11.9%) 160 (11.4%) 1,044 (74.4%) 1,403
Unknown No Injury
Injuries
Deaths Major Moderate Minor
Note: “Child Seat Not In Use” and “Other Restraint Not In Use” have been
combined into “No Restraint in Use”.

2014 Pennsylvania Crash Facts and Statistics Seat Belts, Child Seats, and Air Bag Usage
Pennsylvania Department of Transportation 39
Sea
t Belts,
Etc
.
Air Bag Deployment in Crashes—Injuries and Deaths
Air bags are becoming more prevalent for vehicles in crashes due to the manufacturing laws of
the late 1990s, however some vehicles in crashes still do not have airbags as there are still older
vehicles in use. Additionally, not all seats in a vehicle have an air bag. The table and graph
below show the safety benefits of wearing a seat belt, both with and without air bag
deployment. (Table percentages are listed within restraint type by row.)
0.1
0.5
0.7
1.4
3.1
6.1
0 1 2 3 4 5 6 7 8
Air Bag Not Deployed/Seat Belt Used
Air Bag Not Deployed/Seat Belt Unknown
Air Bag Deployed/Seat Belt Used
Air Bag Deployed/Seat Belt Unknown
Air Bag Not Deployed/Seat Belt Not Used
Air Bag Deployed/Seat Belt Not Used
Deaths per 100 Crashes
Passive Restaint Seat Belt Total
Status Status Persons
None n/a 209 (0.2%) 615 (0.6%) 2,753 (2.7%) 11,474 (11.1%) 10,437 (10.1%) 77,572 (75.3%) 103,060
Air Bag Deployed Used 190 (0.4%) 589 (1.3%) 3,300 (7.2%) 10,559 (23.0%) 5,691 (12.4%) 25,541 (55.7%) 45,870
Air Bag Deployed Not Used 206 (4.2%) 376 (7.7%) 819 (16.8%) 1,210 (24.9%) 823 (16.9%) 1,430 (29.4%) 4,864
Air Bag Deployed Unknown 50 (0.9%) 147 (2.6%) 435 (7.8%) 1,062 (19.1%) 1,453 (26.1%) 2,419 (43.5%) 5,566
Air Bag Not Deployed Used 40 (0.1%) 186 (0.2%) 1,634 (2.1%) 9,303 (11.9%) 4,767 (6.1%) 62,594 (79.7%) 78,524
Air Bag Not Deployed Not Used 67 (1.9%) 128 (3.5%) 399 (11.0%) 884 (24.4%) 482 (13.3%) 1,659 (45.8%) 3,619
Air Bag Not Deployed Unknown 10 (0.3%) 32 (0.8%) 115 (2.9%) 461 (11.4%) 602 (14.9%) 2,815 (69.8%) 4,035
Unknown If Deployed n/a 21 (1.1%) 24 (1.3%) 109 (5.9%) 278 (15.1%) 290 (15.7%) 1,123 (60.9%) 1,845
Unknown No Injury
Injuries
Deaths Major Moderate Minor
In crashes that are severe enough to deploy an airbag (for vehicles and seats so equipped), the
data below shows that you are 9 times more likely to die if you are not wearing a seat belt (6.1
deaths vs. 0.7 deaths per 100 crashes).
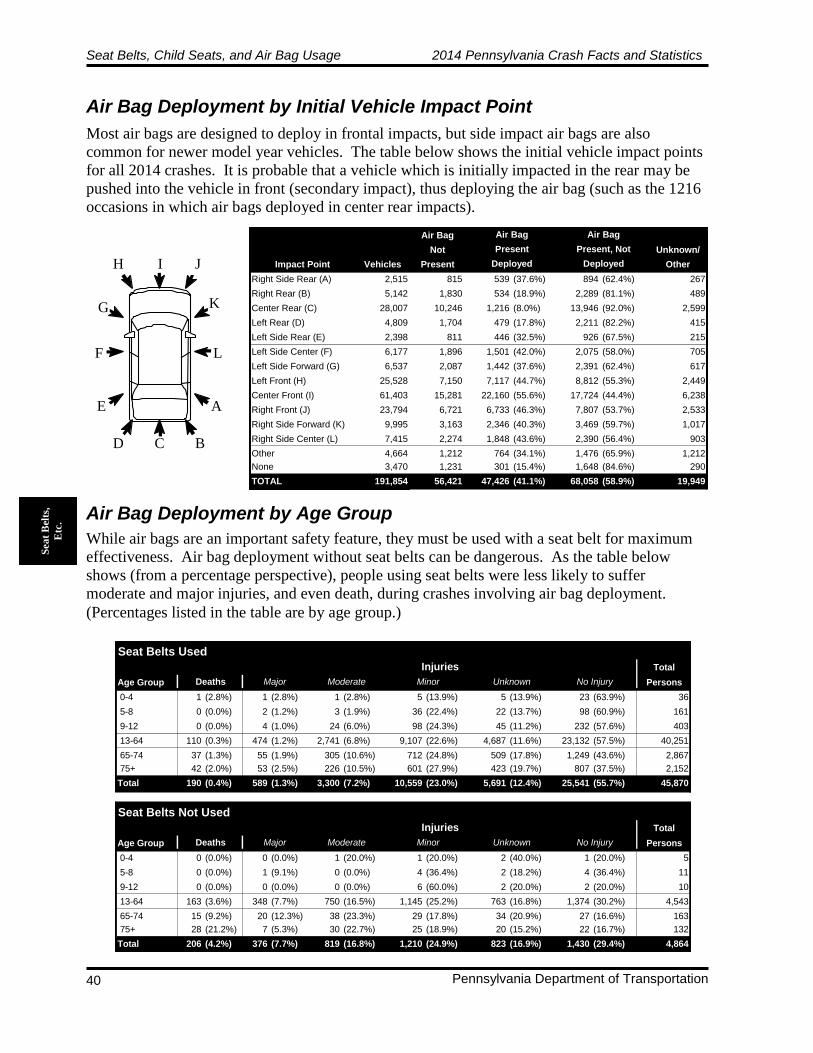
Seat Belts, Child Seats, and Air Bag Usage 2014 Pennsylvania Crash Facts and Statistics
Pennsylvania Department of Transportation 40
Air Bag Deployment by Initial Vehicle Impact Point Air Bag Deployment by Age Group
Most air bags are designed to deploy in frontal impacts, but side impact air bags are also
common for newer model year vehicles. The table below shows the initial vehicle impact points
for all 2014 crashes. It is probable that a vehicle which is initially impacted in the rear may be
pushed into the vehicle in front (secondary impact), thus deploying the air bag (such as the 1216
occasions in which air bags deployed in center rear impacts).
While air bags are an important safety feature, they must be used with a seat belt for maximum
effectiveness. Air bag deployment without seat belts can be dangerous. As the table below
shows (from a percentage perspective), people using seat belts were less likely to suffer
moderate and major injuries, and even death, during crashes involving air bag deployment.
(Percentages listed in the table are by age group.)
Sea
t B
elts
,
Etc
.
B
AE
F
CD
I
G
J
K
H
L
Air Bag
Not Unknown/
Impact Point Vehicles Present Other
Right Side Rear (A) 2,515 815 539 (37.6%) 894 (62.4%) 267
Right Rear (B) 5,142 1,830 534 (18.9%) 2,289 (81.1%) 489
Center Rear (C) 28,007 10,246 1,216 (8.0%) 13,946 (92.0%) 2,599
Left Rear (D) 4,809 1,704 479 (17.8%) 2,211 (82.2%) 415
Left Side Rear (E) 2,398 811 446 (32.5%) 926 (67.5%) 215
Left Side Center (F) 6,177 1,896 1,501 (42.0%) 2,075 (58.0%) 705
Left Side Forward (G) 6,537 2,087 1,442 (37.6%) 2,391 (62.4%) 617
Left Front (H) 25,528 7,150 7,117 (44.7%) 8,812 (55.3%) 2,449
Center Front (I) 61,403 15,281 22,160 (55.6%) 17,724 (44.4%) 6,238
Right Front (J) 23,794 6,721 6,733 (46.3%) 7,807 (53.7%) 2,533
Right Side Forward (K) 9,995 3,163 2,346 (40.3%) 3,469 (59.7%) 1,017
Right Side Center (L) 7,415 2,274 1,848 (43.6%) 2,390 (56.4%) 903
Other 4,664 1,212 764 (34.1%) 1,476 (65.9%) 1,212
None 3,470 1,231 301 (15.4%) 1,648 (84.6%) 290
TOTAL 191,854 56,421 47,426 (41.1%) 68,058 (58.9%) 19,949
Deployed Deployed
Present, Not
Air Bag
Present
Air Bag
Seat Belts Used
Total
Age Group Persons
0-4 1 (2.8%) 1 (2.8%) 1 (2.8%) 5 (13.9%) 5 (13.9%) 23 (63.9%) 36
5-8 0 (0.0%) 2 (1.2%) 3 (1.9%) 36 (22.4%) 22 (13.7%) 98 (60.9%) 161
9-12 0 (0.0%) 4 (1.0%) 24 (6.0%) 98 (24.3%) 45 (11.2%) 232 (57.6%) 403
13-64 110 (0.3%) 474 (1.2%) 2,741 (6.8%) 9,107 (22.6%) 4,687 (11.6%) 23,132 (57.5%) 40,251
65-74 37 (1.3%) 55 (1.9%) 305 (10.6%) 712 (24.8%) 509 (17.8%) 1,249 (43.6%) 2,867
75+ 42 (2.0%) 53 (2.5%) 226 (10.5%) 601 (27.9%) 423 (19.7%) 807 (37.5%) 2,152
Total 190 (0.4%) 589 (1.3%) 3,300 (7.2%) 10,559 (23.0%) 5,691 (12.4%) 25,541 (55.7%) 45,870
Seat Belts Not Used
Total
Age Group Persons
0-4 0 (0.0%) 0 (0.0%) 1 (20.0%) 1 (20.0%) 2 (40.0%) 1 (20.0%) 5
5-8 0 (0.0%) 1 (9.1%) 0 (0.0%) 4 (36.4%) 2 (18.2%) 4 (36.4%) 11
9-12 0 (0.0%) 0 (0.0%) 0 (0.0%) 6 (60.0%) 2 (20.0%) 2 (20.0%) 10
13-64 163 (3.6%) 348 (7.7%) 750 (16.5%) 1,145 (25.2%) 763 (16.8%) 1,374 (30.2%) 4,543
65-74 15 (9.2%) 20 (12.3%) 38 (23.3%) 29 (17.8%) 34 (20.9%) 27 (16.6%) 163
75+ 28 (21.2%) 7 (5.3%) 30 (22.7%) 25 (18.9%) 20 (15.2%) 22 (16.7%) 132
Total 206 (4.2%) 376 (7.7%) 819 (16.8%) 1,210 (24.9%) 823 (16.9%) 1,430 (29.4%) 4,864
Injuries
Deaths Major Moderate Minor Unknown No Injury
Injuries
Deaths Major Moderate Minor Unknown No Injury

2014 Pennsylvania Crash Facts and Statistics Pedestrian and Bicycle Crashes
Pennsylvania Department of Transportation 41
Ped
s &
Bik
es
Pedestrian and Bicycle Crashes
Pedestrian and Bicycles Overview
Pedestrian Crashes—Five-Year Trends
▶ Pedestrian-related crashes represent 3.3% of the total reported traffic crashes; however,
they account for 13.9% of all traffic crash deaths. (See also Pennsylvania County
Crashes, pages 62, 63, and 68.)
▶ Bicycle crashes represent 1.1% of the total reported crashes and 1.6% of all traffic
deaths. Although these percentages are small, they still represent 19 bicyclist deaths
and 1,298 injuries in 2014.
Reported crashes involving pedestrians have decreased in the last year. Pedestrian deaths have
fluctuated over the same period, and have increased in the past year.
4,001
4,375
4,538
4,515
4,454
2014
2013
2012
2011
2010
Total Crashes
166
151
168
149
148
2014
2013
2012
2011
2010
Deaths
Year Total Crashes Deaths
2010 4,454 148
2011 4,515 149
2012 4,538 168
2013 4,375 151
2014 4,001 166

Pedestrian and Bicycle Crashes 2014 Pennsylvania Crash Facts and Statistics
Pennsylvania Department of Transportation 42
EnteringCrossing/Specified
Location41.9%
Walking/Running/Jogging/Playing
31.1%
Standing5.1%
All Others21.9%
Top Crash-Related Pedestrian Actions
Pedestrian-Related Crashes
Ped
s &
Bik
es
Referring to the table and pie charts below, many pedestrian crashes and deaths occurred while
pedestrians were “entering crossing/specified location”. This means that a pedestrian was most
likely crossing the street at an intersection, mid-block crossing, or driveway entrance.
Entering Crossing/Specif ied
Location35.5%
Walking/Running/ Jogging/Playing
31.9%
Standing9.6%
All Others22.9%
Top Fatal Pedestrian Actions
Pedestrians
Pedestrian Action Deaths Involved
Entering Crossing/Specified Location 59 1,762
Walking/Running/Jogging/Playing 53 1,309
Working 3 68
Pushing a Vehicle 0 6
Working on Vehicle 3 20
Standing 16 216
Approaching/Leaving a Vehicle 3 161
Other/Unknown 29 667
Total 166 4,209
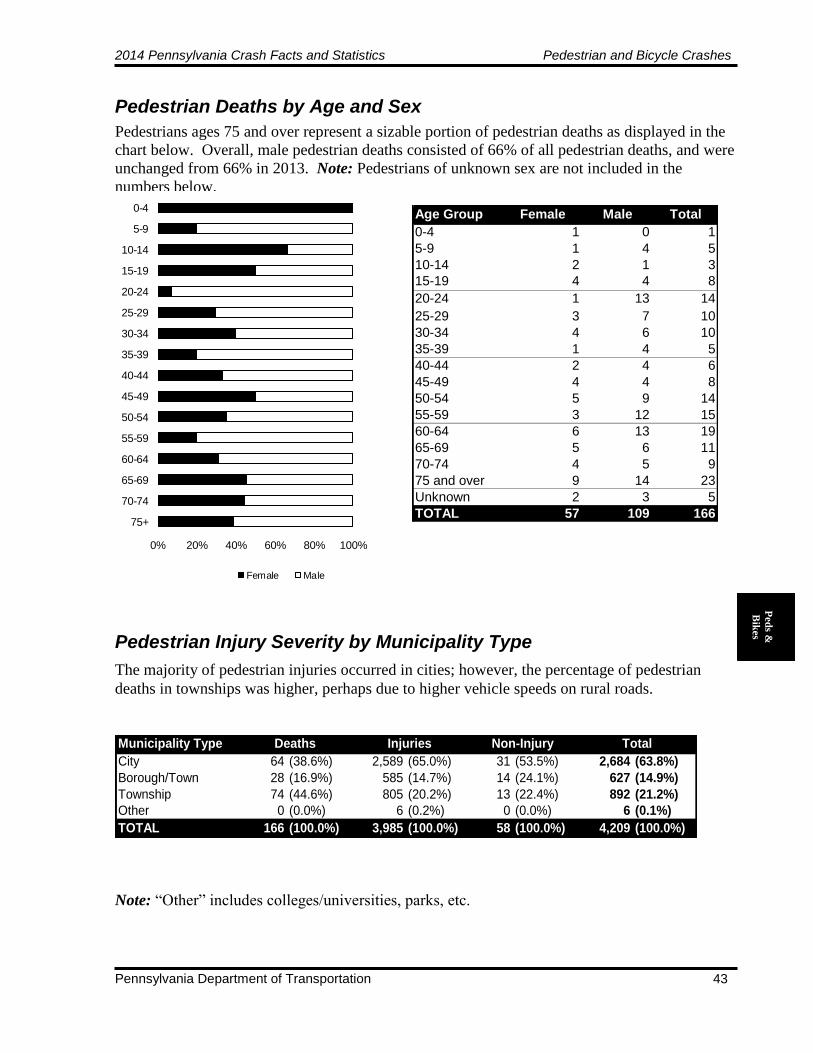
2014 Pennsylvania Crash Facts and Statistics Pedestrian and Bicycle Crashes
Pennsylvania Department of Transportation 43
Ped
s &
Bik
es
Pedestrian Deaths by Age and Sex Pedestrian Injury Severity by Municipality Type
Pedestrians ages 75 and over represent a sizable portion of pedestrian deaths as displayed in the
chart below. Overall, male pedestrian deaths consisted of 66% of all pedestrian deaths, and were
unchanged from 66% in 2013. Note: Pedestrians of unknown sex are not included in the
numbers below.
The majority of pedestrian injuries occurred in cities; however, the percentage of pedestrian
deaths in townships was higher, perhaps due to higher vehicle speeds on rural roads.
Note: “Other” includes colleges/universities, parks, etc.
0% 20% 40% 60% 80% 100%
75+
70-74
65-69
60-64
55-59
50-54
45-49
40-44
35-39
30-34
25-29
20-24
15-19
10-14
5-9
0-4
Female Male
Age Group Female Male Total
0-4 1 0 1
5-9 1 4 5
10-14 2 1 3
15-19 4 4 8
20-24 1 13 14
25-29 3 7 10
30-34 4 6 10
35-39 1 4 5
40-44 2 4 6
45-49 4 4 8
50-54 5 9 14
55-59 3 12 15
60-64 6 13 19
65-69 5 6 11
70-74 4 5 9
75 and over 9 14 23
Unknown 2 3 5
TOTAL 57 109 166
Municipality Type
City 64 (38.6%) 2,589 (65.0%) 31 (53.5%) 2,684 (63.8%)
Borough/Town 28 (16.9%) 585 (14.7%) 14 (24.1%) 627 (14.9%)
Township 74 (44.6%) 805 (20.2%) 13 (22.4%) 892 (21.2%)
Other 0 (0.0%) 6 (0.2%) 0 (0.0%) 6 (0.1%)
TOTAL 166 (100.0%) 3,985 (100.0%) 58 (100.0%) 4,209 (100.0%)
Deaths Injuries Non-Injury Total
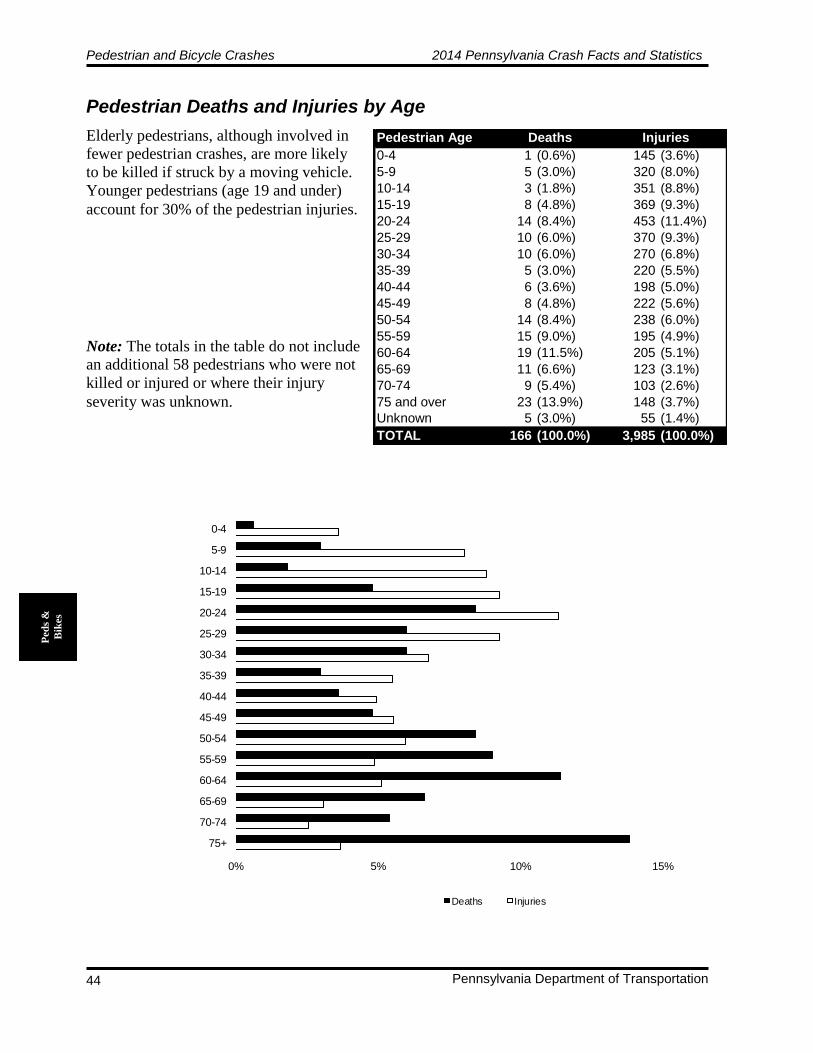
Pedestrian and Bicycle Crashes 2014 Pennsylvania Crash Facts and Statistics
Pennsylvania Department of Transportation 44
Pedestrian Deaths and Injuries by Age
Ped
s &
Bik
es
Elderly pedestrians, although involved in
fewer pedestrian crashes, are more likely
to be killed if struck by a moving vehicle.
Younger pedestrians (age 19 and under)
account for 30% of the pedestrian injuries.
Note: The totals in the table do not include
an additional 58 pedestrians who were not
killed or injured or where their injury
severity was unknown.
Pedestrian Age
0-4 1 (0.6%) 145 (3.6%)
5-9 5 (3.0%) 320 (8.0%)
10-14 3 (1.8%) 351 (8.8%)
15-19 8 (4.8%) 369 (9.3%)
20-24 14 (8.4%) 453 (11.4%)
25-29 10 (6.0%) 370 (9.3%)
30-34 10 (6.0%) 270 (6.8%)
35-39 5 (3.0%) 220 (5.5%)
40-44 6 (3.6%) 198 (5.0%)
45-49 8 (4.8%) 222 (5.6%)
50-54 14 (8.4%) 238 (6.0%)
55-59 15 (9.0%) 195 (4.9%)
60-64 19 (11.5%) 205 (5.1%)
65-69 11 (6.6%) 123 (3.1%)
70-74 9 (5.4%) 103 (2.6%)
75 and over 23 (13.9%) 148 (3.7%)
Unknown 5 (3.0%) 55 (1.4%)
TOTAL 166 (100.0%) 3,985 (100.0%)
Deaths Injuries
0% 5% 10% 15%
75+
70-74
65-69
60-64
55-59
50-54
45-49
40-44
35-39
30-34
25-29
20-24
15-19
10-14
5-9
0-4
Deaths Injuries
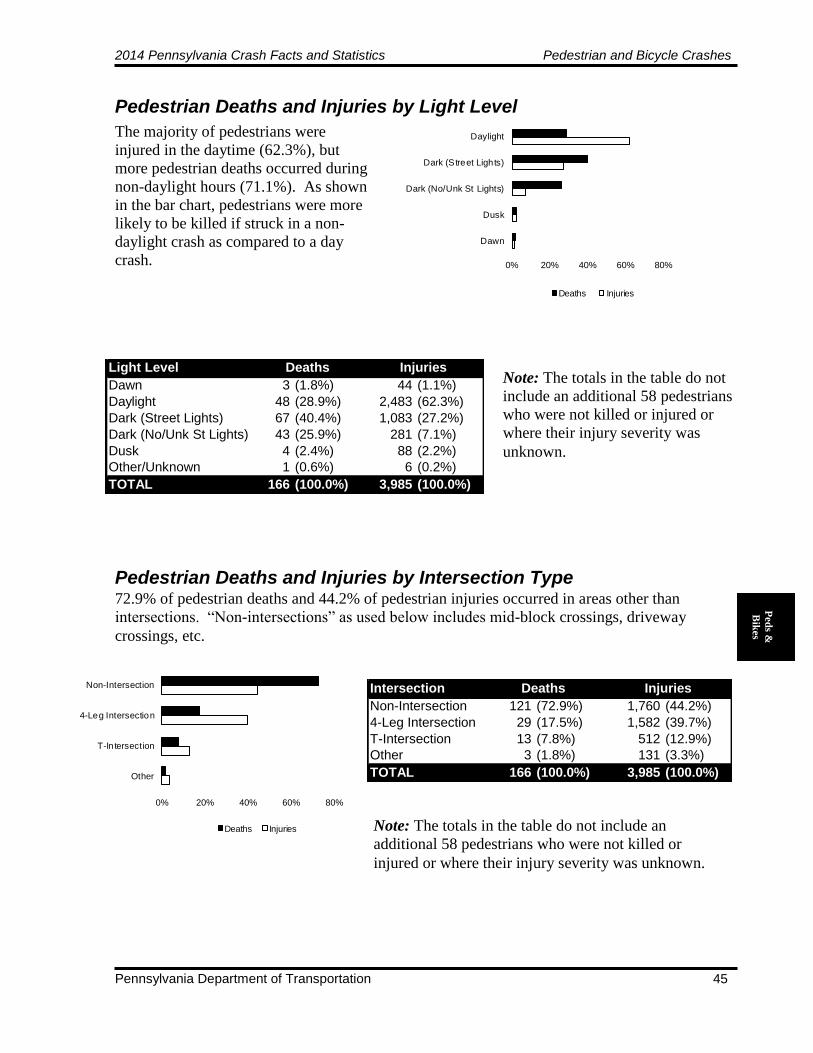
2014 Pennsylvania Crash Facts and Statistics Pedestrian and Bicycle Crashes
Pennsylvania Department of Transportation 45
0% 20% 40% 60% 80%
Dawn
Dusk
Dark (No/Unk St Lights)
Dark (Street Lights)
Daylight
Deaths Injuries
0% 20% 40% 60% 80%
Other
T-In tersection
4-Leg Intersection
Non-Intersection
Deaths Injuries
Pedestrian Deaths and Injuries by Light Level Pedestrian Deaths and Injuries by Intersection Type
The majority of pedestrians were
injured in the daytime (62.3%), but
more pedestrian deaths occurred during
non-daylight hours (71.1%). As shown
in the bar chart, pedestrians were more
likely to be killed if struck in a non-
daylight crash as compared to a day
crash.
Note: The totals in the table do not
include an additional 58 pedestrians
who were not killed or injured or
where their injury severity was
unknown.
72.9% of pedestrian deaths and 44.2% of pedestrian injuries occurred in areas other than
intersections. “Non-intersections” as used below includes mid-block crossings, driveway
crossings, etc.
Note: The totals in the table do not include an
additional 58 pedestrians who were not killed or
injured or where their injury severity was unknown.
Ped
s &
Bik
es
Light Level
Dawn 3 (1.8%) 44 (1.1%)
Daylight 48 (28.9%) 2,483 (62.3%)
Dark (Street Lights) 67 (40.4%) 1,083 (27.2%)
Dark (No/Unk St Lights) 43 (25.9%) 281 (7.1%)
Dusk 4 (2.4%) 88 (2.2%)
Other/Unknown 1 (0.6%) 6 (0.2%)
TOTAL 166 (100.0%) 3,985 (100.0%)
InjuriesDeaths
Intersection
Non-Intersection 121 (72.9%) 1,760 (44.2%)
4-Leg Intersection 29 (17.5%) 1,582 (39.7%)
T-Intersection 13 (7.8%) 512 (12.9%)
Other 3 (1.8%) 131 (3.3%)
TOTAL 166 (100.0%) 3,985 (100.0%)
Deaths Injuries

Pedestrian and Bicycle Crashes 2014 Pennsylvania Crash Facts and Statistics
Pennsylvania Department of Transportation 46
0% 20% 40% 60% 80%
Other
Turnpike
State Hwy (Interstate)
Local
State Hwy (Other)
Deaths Injuries
Road Type
State Hwy (Other) 116 (69.9%) 2,006 (50.3%)
Local 37 (22.3%) 1,930 (48.4%)
State Hwy (Interstate) 12 (7.2%) 37 (0.9%)
Turnpike 1 (0.6%) 11 (0.3%)
Other 0 (0.0%) 1 (0.0%)
TOTAL 166 (100.0%) 3,985 (100.0%)
Deaths Injuries
Pedestrian Deaths and Injuries by Road Type*
*Crashes, deaths and injuries on this page occurring at locations involving multiple road types
are listed once, ranked from highest class to lowest: Interstate/Turnpike, Non-Interstate State
Road, and then Local.
Pedestrian Deaths and Injuries by Traffic Control Device
0% 20% 40% 60% 80%
Other/Unknown
Flashing Traffic Signal
Stop Sign
Traffic Signal
Not Applicable
Deaths Injuries
As the graph shows, just under
half of pedestrians were injured
on local roads, whereas the
majority of pedestrian deaths
occurred on non-interstate state
roadways.
Note: The totals in the table do
not include an additional 58
pedestrians who were not killed
or injured or where their injury
severity was unknown.
As the graph shows, most pedestrian deaths
and injuries occurred in areas without traffic
control devices (TCDs). These areas
accounted for 122 pedestrian deaths and
2,066 injuries.
Note: The totals in the table do not
include an additional 58 pedestrians
who were not killed or injured or
where their injury severity was
unknown.
Ped
s &
Bik
es
Traffic Control Device
Not Applicable 122 (73.5%) 2,066 (51.8%)
Traffic Signal 28 (16.9%) 1,315 (33.0%)
Stop Sign 10 (6.0%) 518 (13.0%)
Flashing Traffic Signal 0 (0.0%) 9 (0.2%)
Other/Unknown 6 (3.6%) 77 (1.9%)
TOTAL 166 (100.0%) 3,985 (100.0%)
Deaths Injuries

2014 Pennsylvania Crash Facts and Statistics Pedestrian and Bicycle Crashes
Pennsylvania Department of Transportation 47
Year Total Crashes Deaths
2010 1,483 21
2011 1,316 11
2012 1,369 16
2013 1,383 11
2014 1,309 19
Bicycle Crashes—Five-Year Trends Bicycle Deaths and Injuries by Age
The total number of bicycle crashes decreased in
2014, but remained very consistent over the last
5 years; bicycle deaths have fluctuated over the
same time period, however in 2011 and 2013
were the lowest.
Children ages 5 to 14 were the most vulnerable to death and injury while riding a bicycle.
Almost a fourth of the injuries involving bicycles were suffered by this age group. 3 of the
19 bicyclist deaths were in this age group. Another vulnerable group, persons ages 15 to 19,
suffered 1 death and accounted for 15.5% of the total injuries.
The totals in the table do not include an additional 3 bicyclists who were not killed or injured or
where their injury severity was unknown.
Ped
s &
Bik
es
1,309
1,383
1,369
1,316
1,483
2014
2013
2012
2011
2010
Total Crashes
19
11
16
11
21
2014
2013
2012
2011
2010
Deaths
Victim's Age
0-4 0 (0.0%) 7 (0.5%)
5-9 2 (10.5%) 94 (7.2%)
10-14 1 (5.3%) 185 (14.3%)
15-19 1 (5.3%) 201 (15.5%)
20-34 4 (21.1%) 425 (32.7%)
35-44 3 (15.8%) 108 (8.3%)
45-54 0 (0.0%) 130 (10.0%)
55-64 4 (21.1%) 98 (7.6%)
65-74 2 (10.5%) 27 (2.1%)
75+ 1 (5.3%) 7 (0.5%)
Unknown 1 (5.3%) 16 (1.2%)
TOTAL 19 (100.0%) 1,298 (100.0%)
Deaths Injuries

Pedestrian and Bicycle Crashes 2014 Pennsylvania Crash Facts and Statistics
Pennsylvania Department of Transportation 48
0% 20% 40% 60%
Other
T-In tersection
4-Leg Intersection
Non-Intersection
Deaths Injuries
Bicycle Deaths and Injuries by Light Level Bicycle Deaths and Injuries by Intersection
The majority of bicyclists’ injuries occurred during daylight hours. However, several of the
deaths occurred during non-daylight conditions. These deaths totaled 47% of total bicyclists’
deaths in 2014 compared to 45% in 2013.
Note: The totals in the table do not include an additional 3 bicyclists who were not killed or
injured or where their injury severity was unknown.
In 2014, the majority of bicyclists were
injured at intersections and killed at non-
intersections.
Note: The totals in the table do not include an additional 3 bicyclists who were not killed or
injured or where their injury severity was unknown.
Ped
s &
Bik
es
Light Level
Dawn 0 (0.0%) 4 (0.3%)
Daylight 10 (52.6%) 975 (75.1%)
Dark (Street Lights) 5 (26.3%) 225 (17.3%)
Dark (No/Unk St Lights) 4 (21.1%) 40 (3.1%)
Dusk 0 (0.0%) 54 (4.2%)
Other/Unknown 0 (0.0%) 0 (0.0%)
TOTAL 19 (100.0%) 1,298 (100.0%)
Deaths Injuries
Intersection
Non-Intersection 10 (52.6%) 459 (35.4%)
4-Leg Intersection 4 (21.1%) 556 (42.8%)
T-Intersection 3 (15.8%) 239 (18.4%)
Other 2 (10.5%) 44 (3.4%)
TOTAL 19 (100.0%) 1,298 (100.0%)
Deaths Injuries
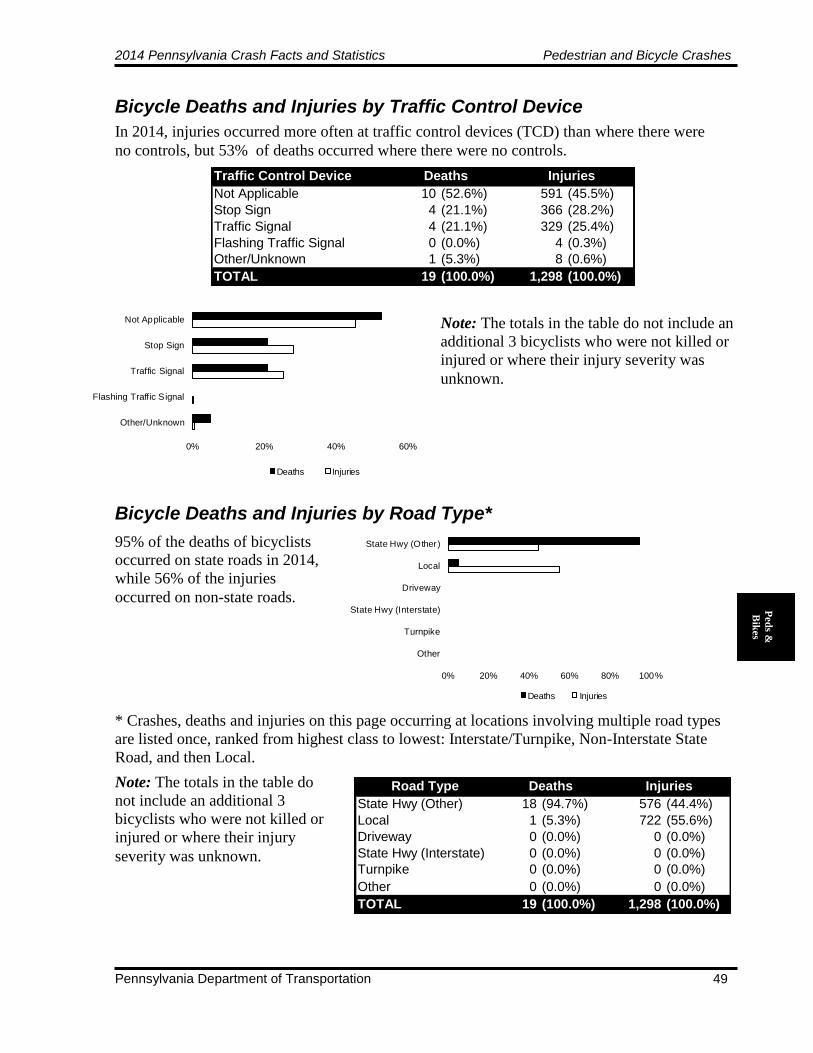
2014 Pennsylvania Crash Facts and Statistics Pedestrian and Bicycle Crashes
Pennsylvania Department of Transportation 49
Ped
s &
Bik
es
0% 20% 40% 60%
Other/Unknown
Flashing Traffic Signal
Traffic Signal
Stop Sign
Not Applicable
Deaths Injuries
Road Type
State Hwy (Other) 18 (94.7%) 576 (44.4%)
Local 1 (5.3%) 722 (55.6%)
Driveway 0 (0.0%) 0 (0.0%)
State Hwy (Interstate) 0 (0.0%) 0 (0.0%)
Turnpike 0 (0.0%) 0 (0.0%)
Other 0 (0.0%) 0 (0.0%)
TOTAL 19 (100.0%) 1,298 (100.0%)
Deaths Injuries
0% 20% 40% 60% 80% 100%
Other
Turnpike
State Hwy (Interstate)
Driveway
Local
State Hwy (Other)
Deaths Injuries
Bicycle Deaths and Injuries by Traffic Control Device Bicycle Deaths and Injuries by Road Type*
* Crashes, deaths and injuries on this page occurring at locations involving multiple road types
are listed once, ranked from highest class to lowest: Interstate/Turnpike, Non-Interstate State
Road, and then Local.
In 2014, injuries occurred more often at traffic control devices (TCD) than where there were
no controls, but 53% of deaths occurred where there were no controls.
Note: The totals in the table do not include an
additional 3 bicyclists who were not killed or
injured or where their injury severity was
unknown.
95% of the deaths of bicyclists
occurred on state roads in 2014,
while 56% of the injuries
occurred on non-state roads.
Note: The totals in the table do
not include an additional 3
bicyclists who were not killed or
injured or where their injury
severity was unknown.
Traffic Control Device
Not Applicable 10 (52.6%) 591 (45.5%)
Stop Sign 4 (21.1%) 366 (28.2%)
Traffic Signal 4 (21.1%) 329 (25.4%)
Flashing Traffic Signal 0 (0.0%) 4 (0.3%)
Other/Unknown 1 (5.3%) 8 (0.6%)
TOTAL 19 (100.0%) 1,298 (100.0%)
Deaths Injuries
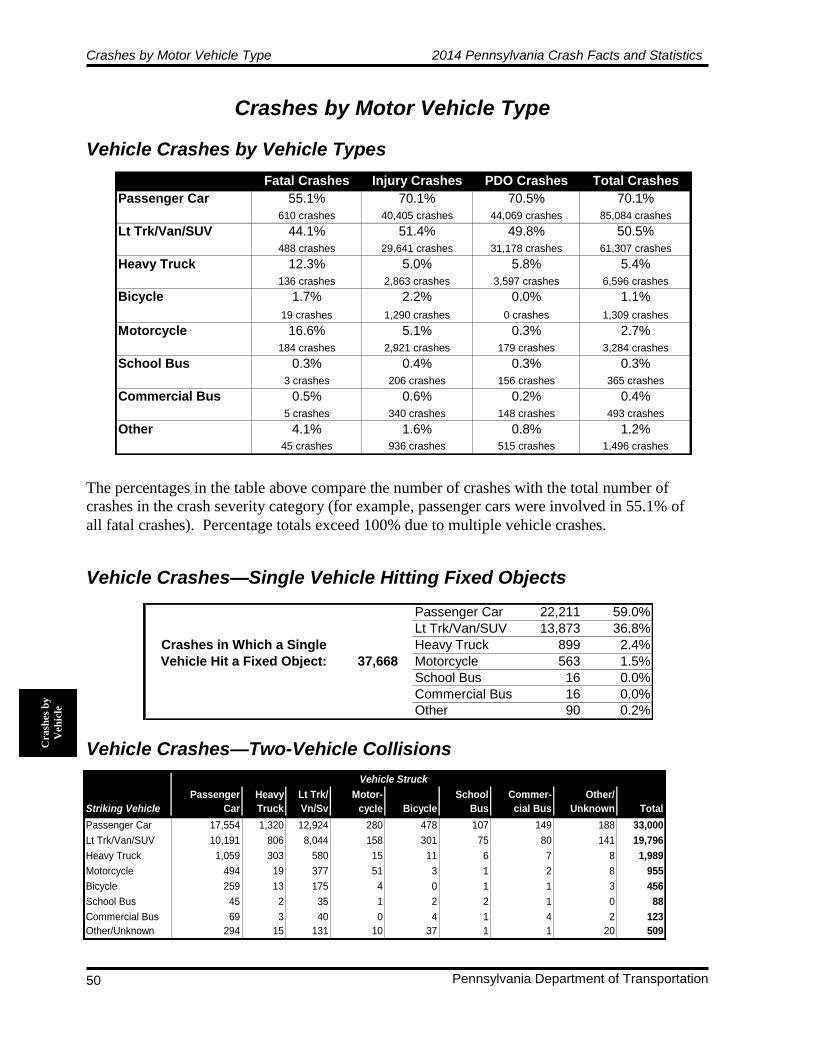
Crashes by Motor Vehicle Type 2014 Pennsylvania Crash Facts and Statistics
Pennsylvania Department of Transportation 50
Crashes by Motor Vehicle Type
Vehicle Crashes by Vehicle Types
Vehicle Crashes—Single Vehicle Hitting Fixed Objects
Vehicle Crashes—Two-Vehicle Collisions
Cra
shes
by
Veh
icle
The percentages in the table above compare the number of crashes with the total number of
crashes in the crash severity category (for example, passenger cars were involved in 55.1% of
all fatal crashes). Percentage totals exceed 100% due to multiple vehicle crashes.
Fatal Crashes Injury Crashes PDO Crashes Total Crashes
Passenger Car 55.1% 70.1% 70.5% 70.1%
610 crashes 40,405 crashes 44,069 crashes 85,084 crashes
Lt Trk/Van/SUV 44.1% 51.4% 49.8% 50.5%
488 crashes 29,641 crashes 31,178 crashes 61,307 crashes
Heavy Truck 12.3% 5.0% 5.8% 5.4%
136 crashes 2,863 crashes 3,597 crashes 6,596 crashes
Bicycle 1.7% 2.2% 0.0% 1.1%
19 crashes 1,290 crashes 0 crashes 1,309 crashes
Motorcycle 16.6% 5.1% 0.3% 2.7%
184 crashes 2,921 crashes 179 crashes 3,284 crashes
School Bus 0.3% 0.4% 0.3% 0.3%
3 crashes 206 crashes 156 crashes 365 crashes
Commercial Bus 0.5% 0.6% 0.2% 0.4%
5 crashes 340 crashes 148 crashes 493 crashes
Other 4.1% 1.6% 0.8% 1.2%
45 crashes 936 crashes 515 crashes 1,496 crashes
Passenger Car 22,211 59.0%
Lt Trk/Van/SUV 13,873 36.8%
Crashes in Which a Single Heavy Truck 899 2.4%
Vehicle Hit a Fixed Object: 37,668 Motorcycle 563 1.5%
School Bus 16 0.0%
Commercial Bus 16 0.0%
Other 90 0.2%
Passenger Heavy Lt Trk/ Motor- School Commer- Other/
Striking Vehicle Car Truck Vn/Sv cycle Bicycle Bus cial Bus Unknown Total
Passenger Car 17,554 1,320 12,924 280 478 107 149 188 33,000
Lt Trk/Van/SUV 10,191 806 8,044 158 301 75 80 141 19,796
Heavy Truck 1,059 303 580 15 11 6 7 8 1,989
Motorcycle 494 19 377 51 3 1 2 8 955
Bicycle 259 13 175 4 0 1 1 3 456
School Bus 45 2 35 1 2 2 1 0 88
Commercial Bus 69 3 40 0 4 1 4 2 123
Other/Unknown 294 15 131 10 37 1 1 20 509
Vehicle Struck

2014 Pennsylvania Crash Facts and Statistics Crashes by Motor Vehicle Type
Pennsylvania Department of Transportation 51
Cra
shes b
y
Veh
icle
Passenger Car Crashes—Five-Year Trends
Passenger Car Deaths by Seating Position
Total passenger car crashes in 2014 and fatal crashes in 2014 were the lowest in the last five
years.
In 2014, 43% of crash deaths involved passenger car occupants. The table below depicts the
passenger car deaths in 2014 by seating position.
“Others” might be passengers in the rearmost seat of a station wagon; persons in a towed unit;
or any person on or attached to the outside of the car.
85,084
88,512
89,509
90,325
88,146
50,000 70,000 90,000 110,000
2014
2013
2012
2011
2010
Total Crashes
610
627
681
649
637
400 600 800 1,000 1,200
2014
2013
2012
2011
2010
Fatal Crashes
1
400 (78.3%)
2
0 (0.0%)
3
75 (14.7%)
Total Deaths 4
511 102 (20.0%) 14 (2.7%)
5
2 (0.4%)
6
11 (2.2%)
9 (1.8%)
Center Rear
Right Rear
Others
Total Passengers
Drivers
Center Front
Right Front
Left Rear1 2 3
4 5 6
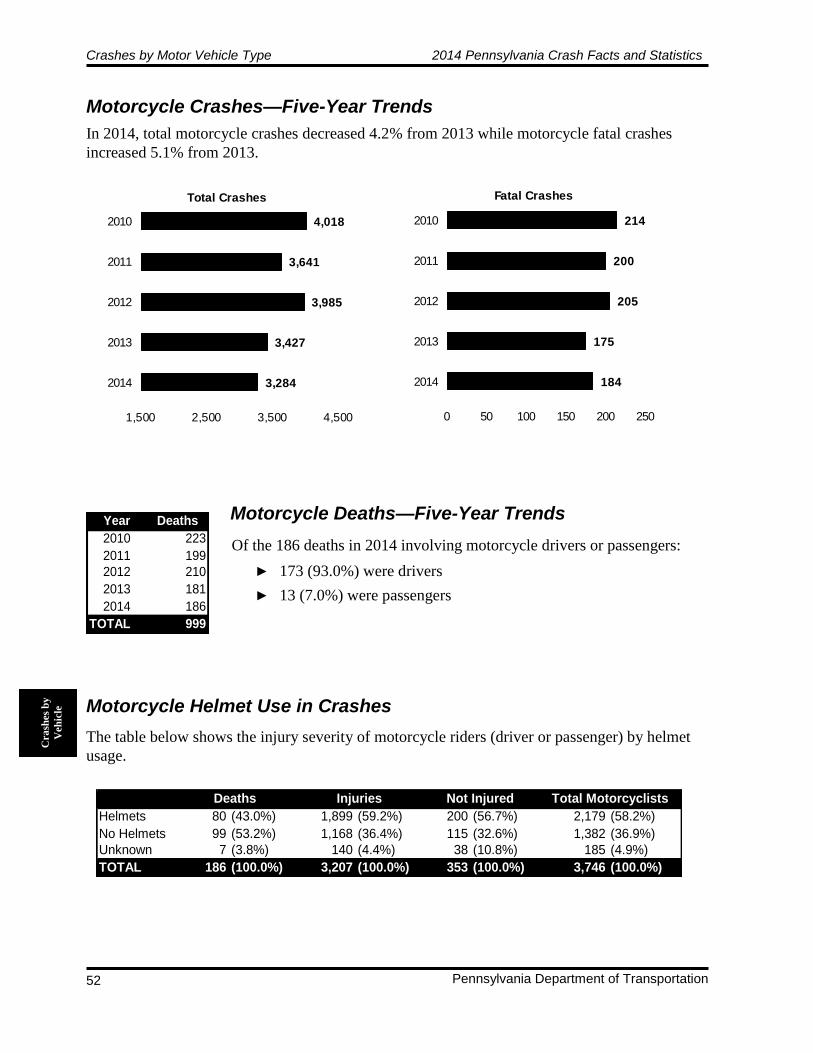
Crashes by Motor Vehicle Type 2014 Pennsylvania Crash Facts and Statistics
Pennsylvania Department of Transportation 52
Motorcycle Crashes—Five-Year Trends
Motorcycle Deaths—Five-Year Trends Motorcycle Helmet Use in Crashes
In 2014, total motorcycle crashes decreased 4.2% from 2013 while motorcycle fatal crashes
increased 5.1% from 2013.
3,284
3,427
3,985
3,641
4,018
1,500 2,500 3,500 4,500
2014
2013
2012
2011
2010
Total Crashes
184
175
205
200
214
0 50 100 150 200 250
2014
2013
2012
2011
2010
Fatal Crashes
Year Deaths
2010 223
2011 199
2012 210
2013 181
2014 186
TOTAL 999
Of the 186 deaths in 2014 involving motorcycle drivers or passengers:
▶ 173 (93.0%) were drivers
▶ 13 (7.0%) were passengers
The table below shows the injury severity of motorcycle riders (driver or passenger) by helmet
usage.
Helmets 80 (43.0%) 1,899 (59.2%) 200 (56.7%) 2,179 (58.2%)
No Helmets 99 (53.2%) 1,168 (36.4%) 115 (32.6%) 1,382 (36.9%)
Unknown 7 (3.8%) 140 (4.4%) 38 (10.8%) 185 (4.9%)
TOTAL 186 (100.0%) 3,207 (100.0%) 353 (100.0%) 3,746 (100.0%)
Deaths Injuries Not Injured Total Motorcyclists
Cra
shes
by
Veh
icle

2014 Pennsylvania Crash Facts and Statistics Crashes by Motor Vehicle Type
Pennsylvania Department of Transportation 53
Cra
shes b
y
Veh
icle
Light Truck / SUV / Van Crashes—Five-Year Trends Light Truck / SUV / Van Rollovers Compared to Passenger Cars Light Truck / SUV / Van Deaths by Seating Position
Pickups, minivans, and sport utility vehicles have become more popular over the last 10 years.
Crashes involving these vehicles increased 1.7% in 2014 from 2013 and remain high in
comparison to other years.
61,307
60,282
59,111
59,998
57,585
5,000 20,000 35,000 50,000 65,000
2014
2013
2012
2011
2010
Total Crashes
488
498
532
546
539
250 350 450 550 650
2014
2013
2012
2011
2010
Fatal Crashes
▶ The percentage of 2014 light truck / SUV / van crashes were higher than passenger cars in
crashes involving rollovers (6.7% of all light
truck / SUV / van crashes compared to 4.0% of
all passenger car crashes).
▶ In 2014 rollover crashes, the percentage of light
truck / SUV / van occupant deaths were nearly 155%
higher than passenger car occupant deaths (40.3% of deaths compared to 15.9%).
Lt Trk/Van/SUV 4,127 (6.7%) 104 (40.3%)
Passenger Cars 3,383 (4.0%) 81 (15.9%)
Rollover Rollover
Crashes Deaths
In 2014, 21.6% of crash deaths involved occupants in light trucks, vans, and sport utility
vehicles. The table below depicts these deaths in 2014 by seating position.
1
194 (75.2%)
2
0 (0.0%)
3
33 (12.8%)
Total Deaths 4
258 60 (23.3%) 12 (4.7%)
5
3 (1.2%)
6
12 (4.7%)
0 (0.0%)
4 (1.6%)
Truck Bed/Cargo Area/Veh Extr
Towed Unit/Other
Center Front
Right Front
Left Rear
Center Rear
Right Rear
Drivers
Total Passengers
1 2 3
4 5 6
1 2 3
4 5 6

Crashes by Motor Vehicle Type 2014 Pennsylvania Crash Facts and Statistics
Pennsylvania Department of Transportation 54
Heavy Truck Crashes—Five Year Trends Heavy Truck Crashes Involving Vehicle Failures Heavy Truck Crashes by Road Type*
6,596
6,124
5,891
6,346
5,846
1,000 3,000 5,000 7,000
2014
2013
2012
2011
2010
Total Crashes
136
136
143
145
145
80 100 120 140 160
2014
2013
2012
2011
2010
Fatal Crashes
The vast majority of primary factors in heavy truck
vehicle failure crashes were related to tires and
wheels, brakes, and unsecured or overloaded
trailers.
Note: “State Highway (Other)” includes state-maintained roads that are not designated as interstates.
*Crashes and deaths on this page occurring at locations involving multiple road types are listed once,
ranked from highest class to lowest: Interstate/Turnpike, Non-Interstate State Road, and then Local.
Cra
shes
by
Veh
icle
Vehicle Defect Crashes
Tire/Wheel-Related 106
Brake-Related 72
Power Train Failure 36
Total Steering System Failure 28
Unsecure Trailer/Overloaded 26
Trailer Hitch/Improper Towing 9
Suspension 4
Exhaust System Failure 2
Other Failure 1
Vehicle Lighting Related 1
Road Type
State Hwy (Interstate) 1,600 (24.3%) 12 (44.4%)
State Hwy (Other) 3,820 (57.9%) 11 (40.7%)
Turnpike 481 (7.3%) 3 (11.1%)
Local Road 695 (10.5%) 1 (3.7%)
Other 0 (0.0%) 0 (0.0%)
TOTAL 6,596 (100.0%) 27 (100.0%)
Crashes Occupant Deaths
Total crashes involving heavy trucks in 2014 were the highest since 2010. Fatal crashes in 2014
were the lowest over the last 5 years. The totals for fatal crashes have stayed somewhat consistent
over a number of years.
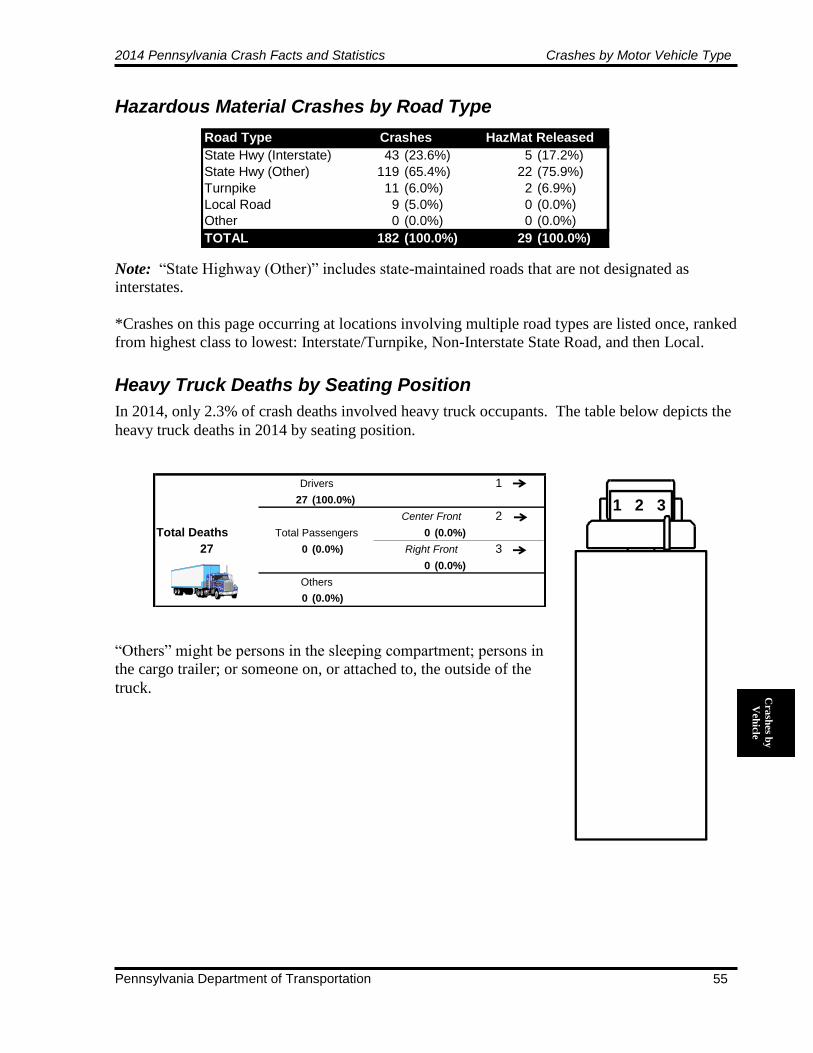
2014 Pennsylvania Crash Facts and Statistics Crashes by Motor Vehicle Type
Pennsylvania Department of Transportation 55
Cra
shes b
y
Veh
icle
Hazardous Material Crashes by Road Type Heavy Truck Deaths by Seating Position
Road Type
State Hwy (Interstate) 43 (23.6%) 5 (17.2%)
State Hwy (Other) 119 (65.4%) 22 (75.9%)
Turnpike 11 (6.0%) 2 (6.9%)
Local Road 9 (5.0%) 0 (0.0%)
Other 0 (0.0%) 0 (0.0%)
TOTAL 182 (100.0%) 29 (100.0%)
Crashes HazMat Released
Note: “State Highway (Other)” includes state-maintained roads that are not designated as
interstates.
*Crashes on this page occurring at locations involving multiple road types are listed once, ranked
from highest class to lowest: Interstate/Turnpike, Non-Interstate State Road, and then Local.
In 2014, only 2.3% of crash deaths involved heavy truck occupants. The table below depicts the
heavy truck deaths in 2014 by seating position.
1
27 (100.0%)
2
Total Deaths 0 (0.0%)
27 0 (0.0%) 3
0 (0.0%)
0 (0.0%)
Others
Center Front
Right Front
Drivers
Total Passengers
1 2 3
“Others” might be persons in the sleeping compartment; persons in
the cargo trailer; or someone on, or attached to, the outside of the
truck.
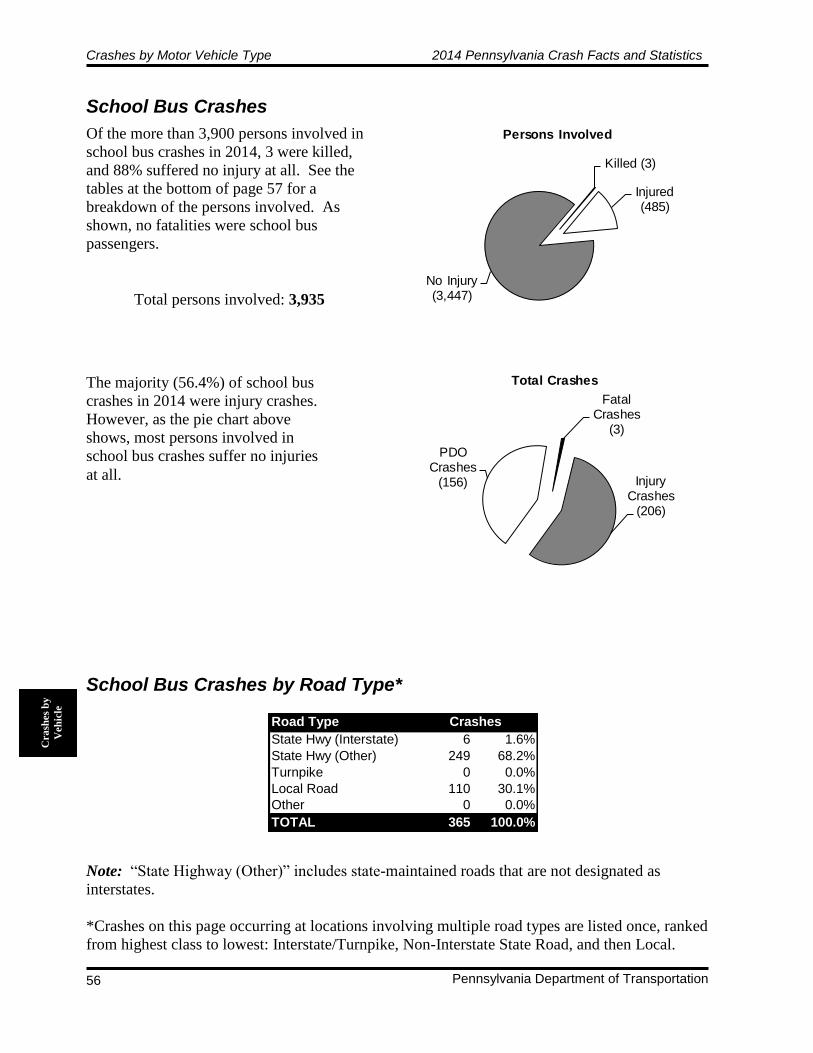
Crashes by Motor Vehicle Type 2014 Pennsylvania Crash Facts and Statistics
Pennsylvania Department of Transportation 56
School Bus Crashes School Bus Crashes by Road Type*
Of the more than 3,900 persons involved in
school bus crashes in 2014, 3 were killed,
and 88% suffered no injury at all. See the
tables at the bottom of page 57 for a
breakdown of the persons involved. As
shown, no fatalities were school bus
passengers.
Total persons involved: 3,935
Killed (3)
Injured (485)
No Injury (3,447)
Persons Involved
The majority (56.4%) of school bus
crashes in 2014 were injury crashes.
However, as the pie chart above
shows, most persons involved in
school bus crashes suffer no injuries
at all.
Fatal Crashes
(3)
Injury Crashes
(206)
PDO Crashes
(156)
Total Crashes
Road Type
State Hwy (Interstate) 6 1.6%
State Hwy (Other) 249 68.2%
Turnpike 0 0.0%
Local Road 110 30.1%
Other 0 0.0%
TOTAL 365 100.0%
Crashes
Note: “State Highway (Other)” includes state-maintained roads that are not designated as
interstates.
*Crashes on this page occurring at locations involving multiple road types are listed once, ranked
from highest class to lowest: Interstate/Turnpike, Non-Interstate State Road, and then Local.
Cra
shes
by
Veh
icle

2014 Pennsylvania Crash Facts and Statistics Crashes by Motor Vehicle Type
Pennsylvania Department of Transportation 57
365
389
393
387
368
2014
2013
2012
2011
2010
Total Crashes
3
5
3
1
6
2014
2013
2012
2011
2010
Total Deaths
School Bus Crashes—Five-Year Trends School Bus Deaths/Injuries by Persons Involved—Five-Year Trends
The total number of school bus crashes and the involved deaths decreased in 2014. School bus
related deaths were 0.3% of total fatalities in 2014. None of the persons killed were school bus
passengers at the time of the crash, and none were school bus drivers.
Year Fatal Injury PDO Total Deaths Injuries
2010 6 215 147 368 6 463
2011 1 195 191 387 1 393
2012 3 207 183 393 3 515
2013 5 203 181 389 5 397
2014 3 206 156 365 3 485
TOTAL 18 1,026 858 1,902 18 2,253
Crash Severity
The tables below show the breakdown of persons killed and injured in school bus crashes. None
of the persons who were killed in these crashes were school bus passengers.
Cra
shes b
y
Veh
icle
DEATHS Driver/
School Bus School Bus School-Age Other Passenger of Other/ Total
Year Drivers Passengers Pedestrians Pedestrians Other Vehicle Unknown Deaths
2010 0 0 1 0 5 0 6
2011 1 0 0 0 0 0 1
2012 0 0 0 1 2 0 3
2013 0 0 0 3 2 0 5
2014 0 0 0 1 2 0 3
TOTAL 1 0 1 5 11 0 18
INJURIES Driver/
School Bus School Bus School-Age Other Passenger of Other/ Total
Year Drivers Passengers Pedestrians Pedestrians Other Vehicle Unknown Injuries
2010 49 231 8 8 166 1 463
2011 31 193 4 3 151 11 393
2012 33 297 6 8 163 7 514
2013 38 198 5 8 142 6 397
2014 36 266 3 5 170 5 485
TOTAL 187 1,185 26 32 792 30 2,252

Pennsylvania County Crashes 2014 Pennsylvania Crash Facts and Statistics
Pennsylvania Department of Transportation 58
Pennsylvania County Crashes
County Overview
*Information provided by PENNDOT’s Bureau of Planning and Research, Performance Monitoring Division. For
consistency purposes, the prior year’s data is used at the time of publication because of timing issues. For this Crash
Facts & Statistics book, 2013 information was used.
Co
un
ties
The Commonwealth of Pennsylvania consists of 67 counties. Each county includes local
municipalities, a combination of cities, boroughs, first class townships, and/or second class
townships. In total, there are approximately 2,500 municipalities throughout the 67 counties. In
2014, Pennsylvania’s total population was 12,787,209 people.
The ten most populated counties were:
Philadelphia (12.2%) Allegheny (9.6%) Montgomery (6.4%)
Bucks (4.9%) Delaware (4.4%) Lancaster (4.2%)
Chester (4.0%) York (3.4%) Berks (3.2%)
Westmoreland (2.8%) See page 59.
The ten least populated counties were:
Cameron (0.04%) Sullivan (0.05%) Forest (0.06%)
Fulton (0.11%) Potter (0.14%) Montour (0.15%)
Juniata (0.19%) Wyoming (0.22%) Elk (0.24%)
Greene (0.30%) See page 59.
The ten counties with the most miles of state highways (maintained by PENNDOT) were:*
Westmoreland (2.98%) Allegheny (2.96%) York (2.85%)
Washington (2.74%) Lancaster (2.62%) Chester (2.56%)
Bucks (2.42%) Crawford (2.29%) Bradford (2.25%)
Somerset (2.21%)
The ten counties with the most miles of local roads and streets (maintained by local
municipalities) were:*
Allegheny (5.93%) Montgomery (3.65%) Lancaster (3.61%)
York (3.40%) Chester (3.30%) Bucks (3.21%)
Westmoreland (3.09%) Berks (3.07%) Philadelphia (2.84%)
Luzerne (2.30%)
The ten counties with the most reported traffic crashes were:
Allegheny (10.0%) Philadelphia (8.6%) Montgomery (6.7%)
Bucks (4.8%) Lancaster (4.4%) Chester (3.9%)
Berks (3.8%) Delaware (3.8%) Lehigh (3.7%)
York (3.6%) See page 59.
The ten counties with the most traffic-related deaths were:
Philadelphia (8.1%) Lancaster (5.2%) Allegheny (4.9%)
York (3.8%) Bucks (3.7%) Luzerne (3.2%)
Montgomery (3.2%) Lehigh (3.1%) Westmoreland (2.9%)
Chester (2.9%) See page 61.

2014 Pennsylvania Crash Facts and Statistics Pennsylvania County Crashes
Pennsylvania Department of Transportation 59
Co
un
ties
Pennsylvania Crashes by County
The percentages compare the number to the statewide total at the bottom of the columns.
County
Adams 101,714 (0.8%) 6 (0.5%) 452 (0.8%) 568 (0.9%) 1,026 (0.9%)
Allegheny 1,231,255 (9.6%) 57 (5.2%) 5,460 (9.5%) 6,637 (10.6%) 12,154 (10.0%)
Armstrong 67,785 (0.5%) 10 (0.9%) 239 (0.4%) 277 (0.4%) 526 (0.4%)
Beaver 169,392 (1.3%) 10 (0.9%) 587 (1.0%) 807 (1.3%) 1,404 (1.2%)
Bedford 48,946 (0.4%) 13 (1.2%) 282 (0.5%) 355 (0.6%) 650 (0.5%)
Berks 413,691 (3.2%) 30 (2.7%) 1,975 (3.4%) 2,588 (4.1%) 4,593 (3.8%)
Blair 125,955 (1.0%) 13 (1.2%) 545 (1.0%) 719 (1.2%) 1,277 (1.1%)
Bradford 61,784 (0.5%) 8 (0.7%) 288 (0.5%) 354 (0.6%) 650 (0.5%)
Bucks 626,685 (4.9%) 43 (3.9%) 2,654 (4.6%) 3,082 (4.9%) 5,779 (4.8%)
Butler 185,943 (1.5%) 24 (2.2%) 837 (1.5%) 1,090 (1.7%) 1,951 (1.6%)
Cambria 137,732 (1.1%) 13 (1.2%) 527 (0.9%) 678 (1.1%) 1,218 (1.0%)
Cameron 4,805 (0.0%) 1 (0.1%) 20 (0.0%) 35 (0.1%) 56 (0.1%)
Carbon 64,441 (0.5%) 6 (0.5%) 278 (0.5%) 406 (0.7%) 690 (0.6%)
Centre 158,742 (1.2%) 11 (1.0%) 552 (1.0%) 647 (1.0%) 1,210 (1.0%)
Chester 512,784 (4.0%) 33 (3.0%) 1,899 (3.3%) 2,744 (4.4%) 4,676 (3.9%)
Clarion 38,821 (0.3%) 5 (0.5%) 227 (0.4%) 219 (0.4%) 451 (0.4%)
Clearfield 81,191 (0.6%) 14 (1.3%) 382 (0.7%) 444 (0.7%) 840 (0.7%)
Clinton 39,745 (0.3%) 8 (0.7%) 184 (0.3%) 248 (0.4%) 440 (0.4%)
Columbia 67,122 (0.5%) 10 (0.9%) 307 (0.5%) 410 (0.7%) 727 (0.6%)
Crawford 87,175 (0.7%) 13 (1.2%) 340 (0.6%) 504 (0.8%) 857 (0.7%)
Cumberland 243,762 (1.9%) 23 (2.1%) 1,009 (1.8%) 1,361 (2.2%) 2,393 (2.0%)
Dauphin 271,453 (2.1%) 16 (1.5%) 1,307 (2.3%) 1,646 (2.6%) 2,969 (2.5%)
Delaware 562,960 (4.4%) 26 (2.4%) 2,230 (3.9%) 2,290 (3.7%) 4,546 (3.8%)
Elk 31,194 (0.2%) 7 (0.6%) 140 (0.2%) 180 (0.3%) 327 (0.3%)
Erie 278,443 (2.2%) 29 (2.6%) 1,302 (2.3%) 1,405 (2.3%) 2,736 (2.3%)
Fayette 134,086 (1.1%) 15 (1.4%) 575 (1.0%) 594 (1.0%) 1,184 (1.0%)
Forest 7,518 (0.1%) 0 (0.0%) 35 (0.1%) 33 (0.1%) 68 (0.1%)
Franklin 152,892 (1.2%) 24 (2.2%) 680 (1.2%) 737 (1.2%) 1,441 (1.2%)
Fulton 14,632 (0.1%) 6 (0.5%) 99 (0.2%) 141 (0.2%) 246 (0.2%)
Greene 37,843 (0.3%) 11 (1.0%) 173 (0.3%) 198 (0.3%) 382 (0.3%)
Huntingdon 45,750 (0.4%) 10 (0.9%) 170 (0.3%) 178 (0.3%) 358 (0.3%)
Indiana 87,706 (0.7%) 9 (0.8%) 371 (0.6%) 399 (0.6%) 779 (0.6%)
Jefferson 44,638 (0.4%) 5 (0.5%) 192 (0.3%) 234 (0.4%) 431 (0.4%)
Juniata 24,796 (0.2%) 4 (0.4%) 111 (0.2%) 145 (0.2%) 260 (0.2%)
Lackawanna 212,719 (1.7%) 15 (1.4%) 1,209 (2.1%) 1,356 (2.2%) 2,580 (2.1%)
Lancaster 533,320 (4.2%) 57 (5.2%) 2,481 (4.3%) 2,801 (4.5%) 5,339 (4.4%)
Lawrence 88,771 (0.7%) 10 (0.9%) 339 (0.6%) 392 (0.6%) 741 (0.6%)
Lebanon 136,359 (1.1%) 6 (0.5%) 642 (1.1%) 708 (1.1%) 1,356 (1.1%)
Lehigh 357,823 (2.8%) 35 (3.2%) 2,101 (3.6%) 2,365 (3.8%) 4,501 (3.7%)
Luzerne 318,829 (2.5%) 34 (3.1%) 1,596 (2.8%) 1,667 (2.7%) 3,297 (2.7%)
Lycoming 116,508 (0.9%) 16 (1.5%) 438 (0.8%) 637 (1.0%) 1,091 (0.9%)
McKean 42,554 (0.3%) 8 (0.7%) 169 (0.3%) 221 (0.4%) 398 (0.3%)
Mercer 114,884 (0.9%) 14 (1.3%) 554 (1.0%) 648 (1.0%) 1,216 (1.0%)
Mifflin 46,552 (0.4%) 4 (0.4%) 166 (0.3%) 196 (0.3%) 366 (0.3%)
Monroe 166,314 (1.3%) 18 (1.6%) 981 (1.7%) 1,164 (1.9%) 2,163 (1.8%)
Montgomery 816,857 (6.4%) 38 (3.4%) 3,747 (6.5%) 4,319 (6.9%) 8,104 (6.7%)
Montour 18,641 (0.2%) 2 (0.2%) 86 (0.2%) 133 (0.2%) 221 (0.2%)
Northampton 300,654 (2.4%) 26 (2.4%) 1,436 (2.5%) 1,465 (2.3%) 2,927 (2.4%)
Northumberland 93,944 (0.7%) 6 (0.5%) 365 (0.6%) 378 (0.6%) 749 (0.6%)
Perry 45,634 (0.4%) 6 (0.5%) 216 (0.4%) 276 (0.4%) 498 (0.4%)
Philadelphia 1,560,297 (12.2%) 89 (8.0%) 7,788 (13.5%) 2,750 (4.4%) 10,627 (8.8%)
Pike 56,191 (0.4%) 9 (0.8%) 240 (0.4%) 342 (0.6%) 591 (0.5%)
Potter 17,206 (0.1%) 0 (0.0%) 54 (0.1%) 44 (0.1%) 98 (0.1%)
Schuylkill 145,797 (1.1%) 26 (2.4%) 612 (1.1%) 735 (1.2%) 1,373 (1.1%)
Snyder 40,323 (0.3%) 7 (0.6%) 146 (0.3%) 180 (0.3%) 333 (0.3%)
Somerset 76,218 (0.6%) 14 (1.3%) 307 (0.5%) 389 (0.6%) 710 (0.6%)
Sullivan 6,339 (0.1%) 1 (0.1%) 26 (0.1%) 43 (0.1%) 70 (0.1%)
Susquehanna 41,920 (0.3%) 10 (0.9%) 204 (0.4%) 309 (0.5%) 523 (0.4%)
Tioga 42,274 (0.3%) 10 (0.9%) 189 (0.3%) 208 (0.3%) 407 (0.3%)
Union 44,874 (0.4%) 7 (0.6%) 167 (0.3%) 176 (0.3%) 350 (0.3%)
Venango 53,529 (0.4%) 7 (0.6%) 257 (0.5%) 283 (0.5%) 547 (0.5%)
Warren 40,703 (0.3%) 3 (0.3%) 179 (0.3%) 200 (0.3%) 382 (0.3%)
Washington 208,187 (1.6%) 28 (2.5%) 859 (1.5%) 1,069 (1.7%) 1,956 (1.6%)
Wayne 51,401 (0.4%) 9 (0.8%) 193 (0.3%) 226 (0.4%) 428 (0.4%)
Westmoreland 359,320 (2.8%) 33 (3.0%) 1,453 (2.5%) 1,786 (2.9%) 3,272 (2.7%)
Wyoming 28,131 (0.2%) 7 (0.6%) 122 (0.2%) 193 (0.3%) 322 (0.3%)
York 440,755 (3.5%) 39 (3.5%) 1,901 (3.3%) 2,472 (4.0%) 4,412 (3.6%)
TOTAL 12,787,209 (100.0%) 1,107 (100.0%) 57,652 (100.0%) 62,558 (99.9%) 121,317 (99.9%)
Total CrashesPopulation Fatal Crashes Injury Crashes PDO Crashes

Pennsylvania County Crashes 2014 Pennsylvania Crash Facts and Statistics
Pennsylvania Department of Transportation 60
Crashes by County—Five-Year Trends
Co
un
ties
The percentages compare the number to the statewide total at the bottom of the columns.
County
Adams 1,007 (0.8%) 1,076 (0.9%) 995 (0.8%) 1,063 (0.9%) 1,026 (0.9%)Allegheny 11,234 (9.3%) 12,115 (9.7%) 12,109 (9.8%) 11,952 (9.6%) 12,154 (10.0%)
Armstrong 577 (0.5%) 550 (0.4%) 527 (0.4%) 624 (0.5%) 526 (0.4%)
Beaver 1,524 (1.3%) 1,408 (1.1%) 1,458 (1.2%) 1,459 (1.2%) 1,404 (1.2%)
Bedford 653 (0.5%) 724 (0.6%) 669 (0.5%) 665 (0.5%) 650 (0.5%)
Berks 4,466 (3.7%) 4,690 (3.7%) 4,704 (3.8%) 4,573 (3.7%) 4,593 (3.8%)
Blair 1,319 (1.1%) 1,388 (1.1%) 1,374 (1.1%) 1,400 (1.1%) 1,277 (1.1%)
Bradford 770 (0.6%) 847 (0.7%) 776 (0.6%) 662 (0.5%) 650 (0.5%)
Bucks 6,094 (5.0%) 6,174 (4.9%) 5,900 (4.8%) 5,891 (4.8%) 5,779 (4.8%)
Butler 1,713 (1.4%) 1,833 (1.5%) 1,969 (1.6%) 2,092 (1.7%) 1,951 (1.6%)
Cambria 1,388 (1.1%) 1,352 (1.1%) 1,212 (1.0%) 1,293 (1.0%) 1,218 (1.0%)
Cameron 68 (0.1%) 70 (0.1%) 57 (0.1%) 60 (0.1%) 56 (0.1%)
Carbon 744 (0.6%) 712 (0.6%) 702 (0.6%) 722 (0.6%) 690 (0.6%)
Centre 1,208 (1.0%) 1,320 (1.1%) 1,287 (1.0%) 1,242 (1.0%) 1,210 (1.0%)
Chester 4,256 (3.5%) 4,541 (3.6%) 4,310 (3.5%) 4,517 (3.6%) 4,676 (3.9%)
Clarion 479 (0.4%) 458 (0.4%) 466 (0.4%) 496 (0.4%) 451 (0.4%)
Clearfield 956 (0.8%) 927 (0.7%) 955 (0.8%) 940 (0.8%) 840 (0.7%)
Clinton 417 (0.3%) 439 (0.4%) 428 (0.3%) 446 (0.4%) 440 (0.4%)
Columbia 755 (0.6%) 826 (0.7%) 748 (0.6%) 717 (0.6%) 727 (0.6%)
Crawford 874 (0.7%) 897 (0.7%) 874 (0.7%) 963 (0.8%) 857 (0.7%)
Cumberland 2,497 (2.1%) 2,450 (2.0%) 2,620 (2.1%) 2,564 (2.1%) 2,393 (2.0%)
Dauphin 2,867 (2.4%) 3,017 (2.4%) 2,878 (2.3%) 3,025 (2.4%) 2,969 (2.5%)
Delaware 4,379 (3.6%) 4,593 (3.7%) 4,573 (3.7%) 4,611 (3.7%) 4,546 (3.8%)
Elk 290 (0.2%) 299 (0.2%) 300 (0.2%) 325 (0.3%) 327 (0.3%)
Erie 2,668 (2.2%) 2,714 (2.2%) 2,608 (2.1%) 2,719 (2.2%) 2,736 (2.3%)
Fayette 1,185 (1.0%) 1,136 (0.9%) 1,178 (1.0%) 1,185 (1.0%) 1,184 (1.0%)
Forest 85 (0.1%) 70 (0.1%) 86 (0.1%) 84 (0.1%) 68 (0.1%)
Franklin 1,397 (1.2%) 1,469 (1.2%) 1,452 (1.2%) 1,370 (1.1%) 1,441 (1.2%)
Fulton 267 (0.2%) 279 (0.2%) 281 (0.2%) 286 (0.2%) 246 (0.2%)
Greene 387 (0.3%) 397 (0.3%) 411 (0.3%) 367 (0.3%) 382 (0.3%)
Huntingdon 373 (0.3%) 406 (0.3%) 378 (0.3%) 392 (0.3%) 358 (0.3%)
Indiana 845 (0.7%) 821 (0.7%) 786 (0.6%) 781 (0.6%) 779 (0.6%)
Jefferson 443 (0.4%) 452 (0.4%) 438 (0.4%) 508 (0.4%) 431 (0.4%)
Juniata 241 (0.2%) 249 (0.2%) 258 (0.2%) 287 (0.2%) 260 (0.2%)
Lackawanna 2,558 (2.1%) 2,586 (2.1%) 2,588 (2.1%) 2,636 (2.1%) 2,580 (2.1%)
Lancaster 5,057 (4.2%) 5,417 (4.3%) 5,249 (4.2%) 5,251 (4.2%) 5,339 (4.4%)
Lawrence 773 (0.6%) 782 (0.6%) 740 (0.6%) 748 (0.6%) 741 (0.6%)
Lebanon 1,296 (1.1%) 1,446 (1.2%) 1,403 (1.1%) 1,458 (1.2%) 1,356 (1.1%)
Lehigh 4,424 (3.7%) 4,479 (3.6%) 4,633 (3.7%) 4,632 (3.7%) 4,501 (3.7%)
Luzerne 3,395 (2.8%) 3,382 (2.7%) 3,336 (2.7%) 3,360 (2.7%) 3,297 (2.7%)
Lycoming 1,226 (1.0%) 1,324 (1.1%) 1,248 (1.0%) 1,187 (1.0%) 1,091 (0.9%)
McKean 318 (0.3%) 360 (0.3%) 351 (0.3%) 383 (0.3%) 398 (0.3%)
Mercer 1,259 (1.0%) 1,356 (1.1%) 1,280 (1.0%) 1,287 (1.0%) 1,216 (1.0%)
Mifflin 385 (0.3%) 386 (0.3%) 354 (0.3%) 418 (0.3%) 366 (0.3%)
Monroe 2,439 (2.0%) 2,375 (1.9%) 2,256 (1.8%) 2,269 (1.8%) 2,163 (1.8%)
Montgomery 8,284 (6.8%) 8,457 (6.7%) 8,385 (6.8%) 8,332 (6.7%) 8,104 (6.7%)
Montour 202 (0.2%) 227 (0.2%) 224 (0.2%) 211 (0.2%) 221 (0.2%)
Northampton 2,760 (2.3%) 2,843 (2.3%) 3,026 (2.4%) 2,954 (2.4%) 2,927 (2.4%)
Northumberland 630 (0.5%) 742 (0.6%) 707 (0.6%) 710 (0.6%) 749 (0.6%)
Perry 470 (0.4%) 508 (0.4%) 477 (0.4%) 508 (0.4%) 498 (0.4%)
Philadelphia 10,965 (9.0%) 10,876 (8.7%) 11,336 (9.1%) 11,146 (9.0%) 10,627 (8.8%)
Pike 667 (0.6%) 633 (0.5%) 593 (0.5%) 579 (0.5%) 591 (0.5%)
Potter 148 (0.1%) 136 (0.1%) 120 (0.1%) 144 (0.1%) 98 (0.1%)
Schuylkill 1,356 (1.1%) 1,421 (1.1%) 1,464 (1.2%) 1,425 (1.2%) 1,373 (1.1%)
Snyder 386 (0.3%) 408 (0.3%) 366 (0.3%) 382 (0.3%) 333 (0.3%)
Somerset 844 (0.7%) 851 (0.7%) 793 (0.6%) 808 (0.7%) 710 (0.6%)
Sullivan 105 (0.1%) 95 (0.1%) 93 (0.1%) 75 (0.1%) 70 (0.1%)
Susquehanna 471 (0.4%) 514 (0.4%) 511 (0.4%) 533 (0.4%) 523 (0.4%)
Tioga 552 (0.5%) 610 (0.5%) 511 (0.4%) 483 (0.4%) 407 (0.3%)
Union 345 (0.3%) 361 (0.3%) 345 (0.3%) 382 (0.3%) 350 (0.3%)
Venango 571 (0.5%) 582 (0.5%) 606 (0.5%) 539 (0.4%) 547 (0.5%)
Warren 372 (0.3%) 414 (0.3%) 405 (0.3%) 412 (0.3%) 382 (0.3%)
Washington 1,934 (1.6%) 2,036 (1.6%) 2,084 (1.7%) 1,972 (1.6%) 1,956 (1.6%)
Wayne 588 (0.5%) 538 (0.4%) 490 (0.4%) 507 (0.4%) 428 (0.4%)
Westmoreland 3,128 (2.6%) 3,405 (2.7%) 3,326 (2.7%) 3,209 (2.6%) 3,272 (2.7%)
Wyoming 346 (0.3%) 361 (0.3%) 348 (0.3%) 371 (0.3%) 322 (0.3%)
York 4,506 (3.7%) 4,627 (3.7%) 4,442 (3.6%) 4,472 (3.6%) 4,412 (3.6%)
TOTAL 121,312 (99.9%) 125,395 (99.9%) 124,092 (99.8%) 124,149 (99.9%) 121,317 (99.9%)
2014 Crashes2010 Crashes 2011 Crashes 2012 Crashes 2013 Crashes

2014 Pennsylvania Crash Facts and Statistics Pennsylvania County Crashes
Pennsylvania Department of Transportation 61
Co
un
ties
Traffic Deaths by County—Five-Year Trends
The percentages compare the number to the statewide totals at the bottom of the columns.
County
Adams 16 (1.2%) 16 (1.2%) 14 (1.1%) 5 (0.4%) 6 (0.5%)
Allegheny 70 (5.3%) 64 (5.0%) 67 (5.1%) 65 (5.4%) 59 (4.9%)
Armstrong 13 (1.0%) 14 (1.1%) 10 (0.8%) 6 (0.5%) 14 (1.2%)
Beaver 10 (0.8%) 24 (1.9%) 19 (1.5%) 12 (1.0%) 10 (0.8%)
Bedford 13 (1.0%) 15 (1.2%) 17 (1.3%) 12 (1.0%) 13 (1.1%)
Berks 39 (3.0%) 46 (3.6%) 50 (3.8%) 42 (3.5%) 33 (2.8%)
Blair 20 (1.5%) 12 (0.9%) 19 (1.5%) 24 (2.0%) 13 (1.1%)
Bradford 20 (1.5%) 10 (0.8%) 15 (1.2%) 15 (1.2%) 8 (0.7%)
Bucks 45 (3.4%) 61 (4.7%) 65 (5.0%) 44 (3.6%) 44 (3.7%)
Butler 29 (2.2%) 17 (1.3%) 28 (2.1%) 18 (1.5%) 25 (2.1%)
Cambria 14 (1.1%) 18 (1.4%) 17 (1.3%) 11 (0.9%) 13 (1.1%)
Cameron 2 (0.2%) 0 (0.0%) 2 (0.2%) 2 (0.2%) 1 (0.1%)
Carbon 13 (1.0%) 8 (0.6%) 6 (0.5%) 16 (1.3%) 10 (0.8%)
Centre 11 (0.8%) 18 (1.4%) 14 (1.1%) 12 (1.0%) 12 (1.0%)
Chester 32 (2.4%) 40 (3.1%) 31 (2.4%) 33 (2.7%) 34 (2.9%)
Clarion 11 (0.8%) 9 (0.7%) 7 (0.5%) 12 (1.0%) 5 (0.4%)
Clearfield 24 (1.8%) 11 (0.9%) 20 (1.5%) 15 (1.2%) 14 (1.2%)
Clinton 7 (0.5%) 5 (0.4%) 12 (0.9%) 9 (0.8%) 9 (0.8%)
Columbia 17 (1.3%) 12 (0.9%) 9 (0.7%) 6 (0.5%) 11 (0.9%)
Crawford 14 (1.1%) 12 (0.9%) 15 (1.2%) 29 (2.4%) 14 (1.2%)
Cumberland 24 (1.8%) 23 (1.8%) 18 (1.4%) 15 (1.2%) 25 (2.1%)
Dauphin 40 (3.0%) 32 (2.5%) 24 (1.8%) 25 (2.1%) 17 (1.4%)
Delaware 23 (1.7%) 20 (1.6%) 28 (2.1%) 27 (2.2%) 26 (2.2%)
Elk 7 (0.5%) 10 (0.8%) 4 (0.3%) 8 (0.7%) 7 (0.6%)
Erie 39 (3.0%) 32 (2.5%) 28 (2.1%) 35 (2.9%) 30 (2.5%)
Fayette 19 (1.4%) 27 (2.1%) 20 (1.5%) 17 (1.4%) 18 (1.5%)
Forest 4 (0.3%) 0 (0.0%) 1 (0.1%) 5 (0.4%) 0 (0.0%)
Franklin 22 (1.7%) 24 (1.9%) 19 (1.5%) 20 (1.7%) 26 (2.2%)
Fulton 8 (0.6%) 5 (0.4%) 4 (0.3%) 1 (0.1%) 9 (0.8%)
Greene 7 (0.5%) 9 (0.7%) 16 (1.2%) 8 (0.7%) 12 (1.0%)
Huntingdon 11 (0.8%) 12 (0.9%) 5 (0.4%) 14 (1.2%) 11 (0.9%)
Indiana 23 (1.7%) 16 (1.2%) 8 (0.6%) 15 (1.2%) 9 (0.8%)
Jefferson 7 (0.5%) 6 (0.5%) 9 (0.7%) 8 (0.7%) 5 (0.4%)
Juniata 10 (0.8%) 2 (0.2%) 3 (0.2%) 6 (0.5%) 5 (0.4%)
Lackawanna 19 (1.4%) 19 (1.5%) 16 (1.2%) 23 (1.9%) 17 (1.4%)
Lancaster 65 (4.9%) 51 (4.0%) 47 (3.6%) 45 (3.7%) 62 (5.2%)
Lawrence 11 (0.8%) 13 (1.0%) 11 (0.8%) 7 (0.6%) 10 (0.8%)
Lebanon 15 (1.1%) 25 (1.9%) 16 (1.2%) 18 (1.5%) 8 (0.7%)
Lehigh 22 (1.7%) 24 (1.9%) 42 (3.2%) 30 (2.5%) 37 (3.1%)
Luzerne 30 (2.3%) 41 (3.2%) 35 (2.7%) 39 (3.2%) 38 (3.2%)
Lycoming 22 (1.7%) 19 (1.5%) 15 (1.2%) 10 (0.8%) 18 (1.5%)
McKean 6 (0.5%) 12 (0.9%) 8 (0.6%) 15 (1.2%) 8 (0.7%)
Mercer 13 (1.0%) 21 (1.6%) 17 (1.3%) 28 (2.3%) 14 (1.2%)
Mifflin 8 (0.6%) 9 (0.7%) 4 (0.3%) 9 (0.8%) 5 (0.4%)
Monroe 35 (2.6%) 33 (2.6%) 27 (2.1%) 25 (2.1%) 23 (1.9%)
Montgomery 33 (2.5%) 45 (3.5%) 44 (3.4%) 40 (3.3%) 38 (3.2%)
Montour 1 (0.1%) 1 (0.1%) 0 (0.0%) 1 (0.1%) 2 (0.2%)
Northampton 29 (2.2%) 27 (2.1%) 23 (1.8%) 18 (1.5%) 29 (2.4%)
Northumberland 10 (0.8%) 13 (1.0%) 9 (0.7%) 15 (1.2%) 6 (0.5%)
Perry 15 (1.1%) 8 (0.6%) 18 (1.4%) 9 (0.8%) 7 (0.6%)
Philadelphia 93 (7.0%) 87 (6.8%) 107 (8.2%) 89 (7.4%) 97 (8.1%)
Pike 7 (0.5%) 8 (0.6%) 6 (0.5%) 8 (0.7%) 9 (0.8%)
Potter 1 (0.1%) 3 (0.2%) 2 (0.2%) 3 (0.3%) 0 (0.0%)
Schuylkill 20 (1.5%) 19 (1.5%) 33 (2.5%) 23 (1.9%) 29 (2.4%)
Snyder 9 (0.7%) 5 (0.4%) 8 (0.6%) 4 (0.3%) 7 (0.6%)
Somerset 20 (1.5%) 8 (0.6%) 12 (0.9%) 11 (0.9%) 16 (1.3%)
Sullivan 6 (0.5%) 1 (0.1%) 2 (0.2%) 0 (0.0%) 1 (0.1%)
Susquehanna 12 (0.9%) 11 (0.9%) 15 (1.2%) 8 (0.7%) 10 (0.8%)
Tioga 13 (1.0%) 12 (0.9%) 10 (0.8%) 11 (0.9%) 10 (0.8%)
Union 7 (0.5%) 5 (0.4%) 9 (0.7%) 5 (0.4%) 7 (0.6%)
Venango 10 (0.8%) 11 (0.9%) 18 (1.4%) 5 (0.4%) 8 (0.7%)
Warren 7 (0.5%) 7 (0.5%) 7 (0.5%) 4 (0.3%) 3 (0.3%)
Washington 24 (1.8%) 27 (2.1%) 29 (2.2%) 29 (2.4%) 29 (2.4%)
Wayne 8 (0.6%) 5 (0.4%) 8 (0.6%) 6 (0.5%) 11 (0.9%)
Westmoreland 44 (3.3%) 36 (2.8%) 55 (4.2%) 29 (2.4%) 35 (2.9%)
Wyoming 8 (0.6%) 6 (0.5%) 7 (0.5%) 5 (0.4%) 8 (0.7%)York 37 (2.8%) 44 (3.4%) 26 (2.0%) 44 (3.6%) 45 (3.8%)
TOTAL 1,324 (100.0%) 1,286 (100.0%) 1,310 (100.0%) 1,208 (100.0%) 1,195 (100.0%)
2014 Deaths2010 Deaths 2011 Deaths 2012 Deaths 2013 Deaths

Pennsylvania County Crashes 2014 Pennsylvania Crash Facts and Statistics
Pennsylvania Department of Transportation 62
Pedestrian Deaths by County—Five-Year Trends
County 2010 2011 2012 2013 2014
Adams 0 0 0 1 1
Allegheny 13 7 9 13 11
Armstrong 2 0 2 0 1
Beaver 0 2 3 1 0
Bedford 0 0 1 1 2
Berks 6 4 8 4 5
Blair 5 2 2 2 0
Bradford 0 2 0 0 0
Bucks 8 10 10 6 8
Butler 3 0 2 0 3
Cambria 1 2 1 0 0
Cameron 0 0 0 0 1
Carbon 0 1 0 1 1
Centre 1 1 0 1 2
Chester 1 7 2 5 5
Clarion 0 1 1 0 0
Clearfield 3 0 0 2 0
Clinton 1 1 0 0 2
Columbia 0 0 1 0 0
Crawford 0 2 2 0 0
Cumberland 2 3 2 1 1
Dauphin 6 4 7 2 0
Delaware 4 4 10 3 8
Elk 1 0 0 1 0
Erie 2 6 1 4 3
Fayette 0 2 1 1 0
Forest 0 0 0 0 0
Franklin 0 1 2 2 2
Fulton 0 0 0 0 0
Greene 1 0 1 0 0
Huntingdon 0 0 0 2 2
Indiana 3 2 1 0 0
Jefferson 0 0 0 0 0
Juniata 0 0 1 1 1
Lackawanna 2 1 2 7 3
Lancaster 7 6 3 4 11
Lawrence 0 0 1 2 3
Lebanon 2 1 1 0 1
Lehigh 5 5 10 6 9
Luzerne 6 5 6 8 3
Lycoming 1 1 2 0 2
McKean 1 0 1 0 0
Mercer 1 2 0 2 2
Mifflin 0 0 0 4 1
Monroe 5 4 1 0 1
Montgomery 3 12 11 9 4
Montour 0 0 0 0 0
Northampton 4 1 3 4 6
Northumberland 2 1 0 0 2
Perry 0 0 0 0 0
Philadelphia 30 30 34 37 38
Pike 0 0 1 1 0
Potter 0 1 0 0 0
Schuylkill 2 2 4 1 5
Snyder 0 0 2 1 0
Somerset 0 0 1 0 0
Sullivan 0 0 0 0 1
Susquehanna 0 0 2 0 2
Tioga 0 0 0 0 0
Union 0 0 1 0 0
Venango 1 0 1 0 2
Warren 2 1 0 0 0
Washington 1 1 1 4 4
Wayne 0 1 1 0 1
Westmoreland 4 4 6 0 3
Wyoming 0 0 1 0 0York 6 6 2 7 3
TOTAL 148 149 168 151 166
Co
un
ties
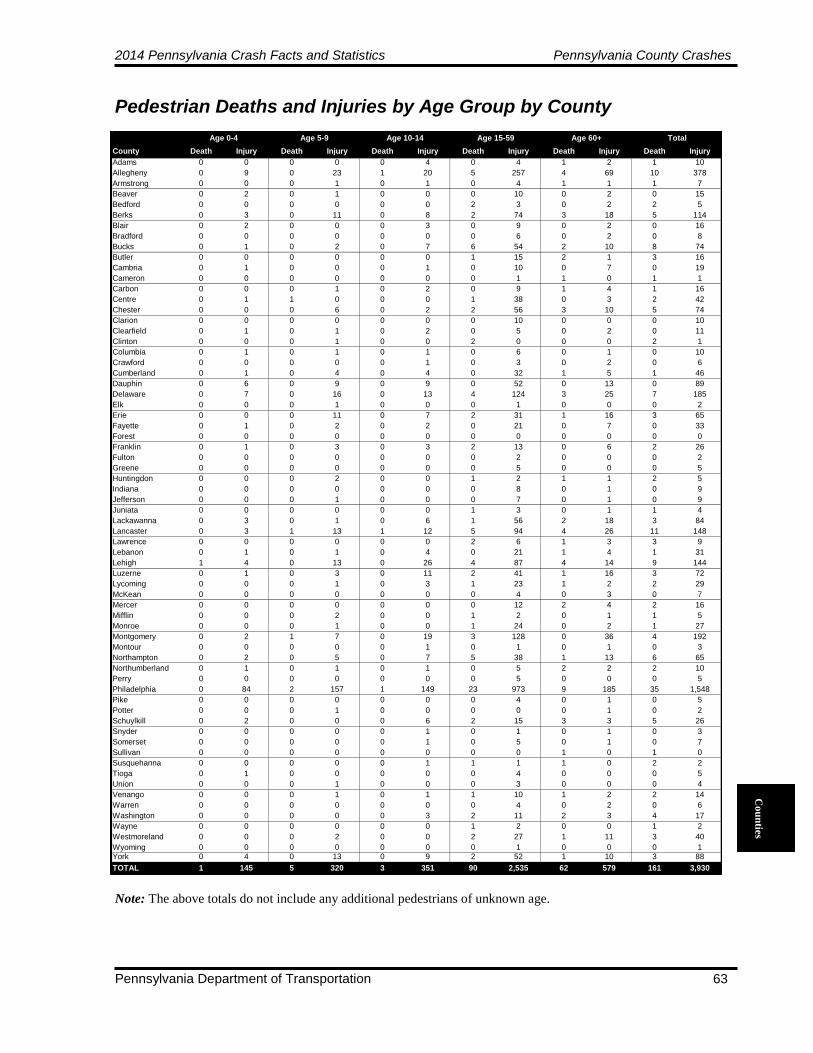
2014 Pennsylvania Crash Facts and Statistics Pennsylvania County Crashes
Pennsylvania Department of Transportation 63
Pedestrian Deaths and Injuries by Age Group by County
County Death Injury Death Injury Death Injury Death Injury Death Injury Death Injury
Adams 0 0 0 0 0 4 0 4 1 2 1 10
Allegheny 0 9 0 23 1 20 5 257 4 69 10 378
Armstrong 0 0 0 1 0 1 0 4 1 1 1 7
Beaver 0 2 0 1 0 0 0 10 0 2 0 15
Bedford 0 0 0 0 0 0 2 3 0 2 2 5
Berks 0 3 0 11 0 8 2 74 3 18 5 114
Blair 0 2 0 0 0 3 0 9 0 2 0 16
Bradford 0 0 0 0 0 0 0 6 0 2 0 8
Bucks 0 1 0 2 0 7 6 54 2 10 8 74
Butler 0 0 0 0 0 0 1 15 2 1 3 16
Cambria 0 1 0 0 0 1 0 10 0 7 0 19
Cameron 0 0 0 0 0 0 0 1 1 0 1 1
Carbon 0 0 0 1 0 2 0 9 1 4 1 16
Centre 0 1 1 0 0 0 1 38 0 3 2 42
Chester 0 0 0 6 0 2 2 56 3 10 5 74
Clarion 0 0 0 0 0 0 0 10 0 0 0 10
Clearfield 0 1 0 1 0 2 0 5 0 2 0 11
Clinton 0 0 0 1 0 0 2 0 0 0 2 1
Columbia 0 1 0 1 0 1 0 6 0 1 0 10
Crawford 0 0 0 0 0 1 0 3 0 2 0 6
Cumberland 0 1 0 4 0 4 0 32 1 5 1 46
Dauphin 0 6 0 9 0 9 0 52 0 13 0 89
Delaware 0 7 0 16 0 13 4 124 3 25 7 185
Elk 0 0 0 1 0 0 0 1 0 0 0 2
Erie 0 0 0 11 0 7 2 31 1 16 3 65
Fayette 0 1 0 2 0 2 0 21 0 7 0 33
Forest 0 0 0 0 0 0 0 0 0 0 0 0
Franklin 0 1 0 3 0 3 2 13 0 6 2 26
Fulton 0 0 0 0 0 0 0 2 0 0 0 2
Greene 0 0 0 0 0 0 0 5 0 0 0 5
Huntingdon 0 0 0 2 0 0 1 2 1 1 2 5
Indiana 0 0 0 0 0 0 0 8 0 1 0 9
Jefferson 0 0 0 1 0 0 0 7 0 1 0 9
Juniata 0 0 0 0 0 0 1 3 0 1 1 4
Lackawanna 0 3 0 1 0 6 1 56 2 18 3 84
Lancaster 0 3 1 13 1 12 5 94 4 26 11 148
Lawrence 0 0 0 0 0 0 2 6 1 3 3 9
Lebanon 0 1 0 1 0 4 0 21 1 4 1 31
Lehigh 1 4 0 13 0 26 4 87 4 14 9 144
Luzerne 0 1 0 3 0 11 2 41 1 16 3 72
Lycoming 0 0 0 1 0 3 1 23 1 2 2 29
McKean 0 0 0 0 0 0 0 4 0 3 0 7
Mercer 0 0 0 0 0 0 0 12 2 4 2 16
Mifflin 0 0 0 2 0 0 1 2 0 1 1 5
Monroe 0 0 0 1 0 0 1 24 0 2 1 27
Montgomery 0 2 1 7 0 19 3 128 0 36 4 192
Montour 0 0 0 0 0 1 0 1 0 1 0 3
Northampton 0 2 0 5 0 7 5 38 1 13 6 65
Northumberland 0 1 0 1 0 1 0 5 2 2 2 10
Perry 0 0 0 0 0 0 0 5 0 0 0 5
Philadelphia 0 84 2 157 1 149 23 973 9 185 35 1,548
Pike 0 0 0 0 0 0 0 4 0 1 0 5
Potter 0 0 0 1 0 0 0 0 0 1 0 2
Schuylkill 0 2 0 0 0 6 2 15 3 3 5 26
Snyder 0 0 0 0 0 1 0 1 0 1 0 3
Somerset 0 0 0 0 0 1 0 5 0 1 0 7
Sullivan 0 0 0 0 0 0 0 0 1 0 1 0
Susquehanna 0 0 0 0 0 1 1 1 1 0 2 2
Tioga 0 1 0 0 0 0 0 4 0 0 0 5
Union 0 0 0 1 0 0 0 3 0 0 0 4
Venango 0 0 0 1 0 1 1 10 1 2 2 14
Warren 0 0 0 0 0 0 0 4 0 2 0 6
Washington 0 0 0 0 0 3 2 11 2 3 4 17
Wayne 0 0 0 0 0 0 1 2 0 0 1 2
Westmoreland 0 0 0 2 0 0 2 27 1 11 3 40
Wyoming 0 0 0 0 0 0 0 1 0 0 0 1York 0 4 0 13 0 9 2 52 1 10 3 88
TOTAL 1 145 5 320 3 351 90 2,535 62 579 161 3,930
Age 60+ TotalAge 0-4 Age 5-9 Age 10-14 Age 15-59
Note: The above totals do not include any additional pedestrians of unknown age.
Co
un
ties
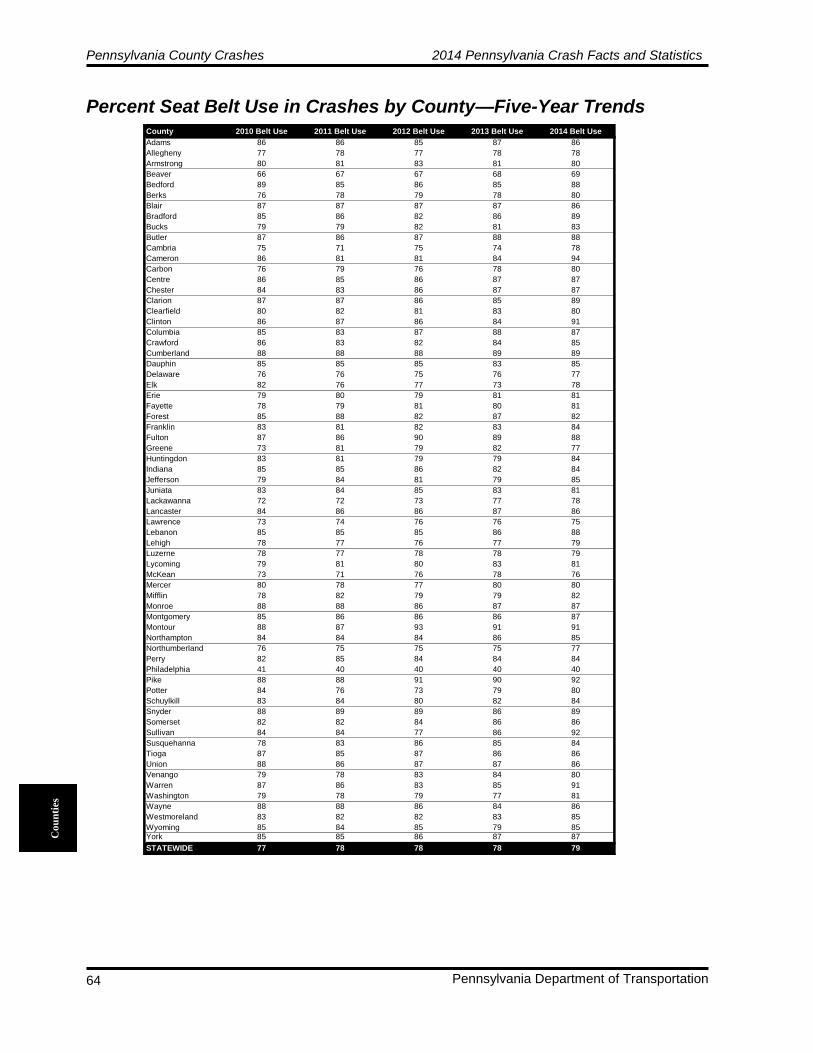
Pennsylvania County Crashes 2014 Pennsylvania Crash Facts and Statistics
Pennsylvania Department of Transportation 64
Percent Seat Belt Use in Crashes by County—Five-Year Trends
County 2010 Belt Use 2011 Belt Use 2012 Belt Use 2013 Belt Use 2014 Belt Use
Adams 86 86 85 87 86
Allegheny 77 78 77 78 78
Armstrong 80 81 83 81 80
Beaver 66 67 67 68 69
Bedford 89 85 86 85 88
Berks 76 78 79 78 80
Blair 87 87 87 87 86
Bradford 85 86 82 86 89
Bucks 79 79 82 81 83
Butler 87 86 87 88 88
Cambria 75 71 75 74 78
Cameron 86 81 81 84 94
Carbon 76 79 76 78 80
Centre 86 85 86 87 87
Chester 84 83 86 87 87
Clarion 87 87 86 85 89
Clearfield 80 82 81 83 80
Clinton 86 87 86 84 91
Columbia 85 83 87 88 87
Crawford 86 83 82 84 85
Cumberland 88 88 88 89 89
Dauphin 85 85 85 83 85
Delaware 76 76 75 76 77
Elk 82 76 77 73 78
Erie 79 80 79 81 81
Fayette 78 79 81 80 81
Forest 85 88 82 87 82
Franklin 83 81 82 83 84
Fulton 87 86 90 89 88
Greene 73 81 79 82 77
Huntingdon 83 81 79 79 84
Indiana 85 85 86 82 84
Jefferson 79 84 81 79 85
Juniata 83 84 85 83 81
Lackawanna 72 72 73 77 78
Lancaster 84 86 86 87 86
Lawrence 73 74 76 76 75
Lebanon 85 85 85 86 88
Lehigh 78 77 76 77 79
Luzerne 78 77 78 78 79
Lycoming 79 81 80 83 81
McKean 73 71 76 78 76
Mercer 80 78 77 80 80
Mifflin 78 82 79 79 82
Monroe 88 88 86 87 87
Montgomery 85 86 86 86 87
Montour 88 87 93 91 91
Northampton 84 84 84 86 85
Northumberland 76 75 75 75 77
Perry 82 85 84 84 84
Philadelphia 41 40 40 40 40
Pike 88 88 91 90 92
Potter 84 76 73 79 80
Schuylkill 83 84 80 82 84
Snyder 88 89 89 86 89
Somerset 82 82 84 86 86
Sullivan 84 84 77 86 92
Susquehanna 78 83 86 85 84
Tioga 87 85 87 86 86
Union 88 86 87 87 86
Venango 79 78 83 84 80
Warren 87 86 83 85 91
Washington 79 78 79 77 81
Wayne 88 88 86 84 86
Westmoreland 83 82 82 83 85
Wyoming 85 84 85 79 85York 85 85 86 87 87
STATEWIDE 77 78 78 78 79
Co
un
ties

2014 Pennsylvania Crash Facts and Statistics Pennsylvania County Crashes
Pennsylvania Department of Transportation 65
Co
un
ties
Alcohol-Related Deaths by County—Five-Year Trends
County 2010 Deaths 2011 Deaths 2012 Deaths 2013 Deaths 2014 Deaths
Adams 7 4 8 3 1
Allegheny 15 17 10 19 19
Armstrong 5 7 1 4 7
Beaver 2 7 6 3 3
Bedford 6 8 4 3 2
Berks 18 16 17 13 6
Blair 5 6 9 8 1
Bradford 7 4 2 7 4
Bucks 14 20 26 11 14
Butler 9 4 9 1 9
Cambria 5 5 8 5 6
Cameron 1 0 1 1 1
Carbon 5 3 1 6 4
Centre 3 7 1 3 2
Chester 12 14 12 17 11
Clarion 2 4 1 6 2
Clearfield 5 2 8 3 2
Clinton 2 2 3 1 4
Columbia 7 3 2 2 3
Crawford 8 5 4 10 5
Cumberland 7 7 3 4 8
Dauphin 12 15 6 5 3
Delaware 8 4 8 7 6
Elk 3 7 2 4 4
Erie 17 12 10 13 9
Fayette 6 15 5 8 5
Forest 2 0 0 1 0
Franklin 13 7 5 2 3
Fulton 1 2 2 0 1
Greene 2 4 3 0 3
Huntingdon 2 5 1 2 6
Indiana 8 5 4 3 3
Jefferson 5 1 3 1 2
Juniata 2 0 2 0 2
Lackawanna 4 5 5 7 5
Lancaster 26 14 15 18 16
Lawrence 2 5 2 2 2
Lebanon 4 4 3 6 1
Lehigh 7 12 13 11 7
Luzerne 7 13 13 13 17
Lycoming 8 7 6 5 9
McKean 4 4 2 5 4
Mercer 5 6 9 8 3
Mifflin 2 3 1 2 0
Monroe 12 11 9 8 8
Montgomery 11 13 19 12 11
Montour 0 1 0 0 1
Northampton 11 8 4 9 8
Northumberland 3 1 2 0 0
Perry 5 4 7 7 0
Philadelphia 25 23 37 22 18
Pike 2 2 0 1 4
Potter 0 1 1 1 0
Schuylkill 8 5 5 5 6
Snyder 3 1 0 2 0
Somerset 14 1 6 7 4
Sullivan 0 0 2 0 0
Susquehanna 7 5 8 5 6
Tioga 7 2 2 2 3
Union 3 2 3 1 2
Venango 0 3 3 1 4
Warren 2 5 1 1 0
Washington 6 10 7 9 12
Wayne 4 2 2 2 1
Westmoreland 15 13 16 16 7
Wyoming 6 2 3 1 2York 20 18 11 16 11
TOTAL 459 428 404 381 333
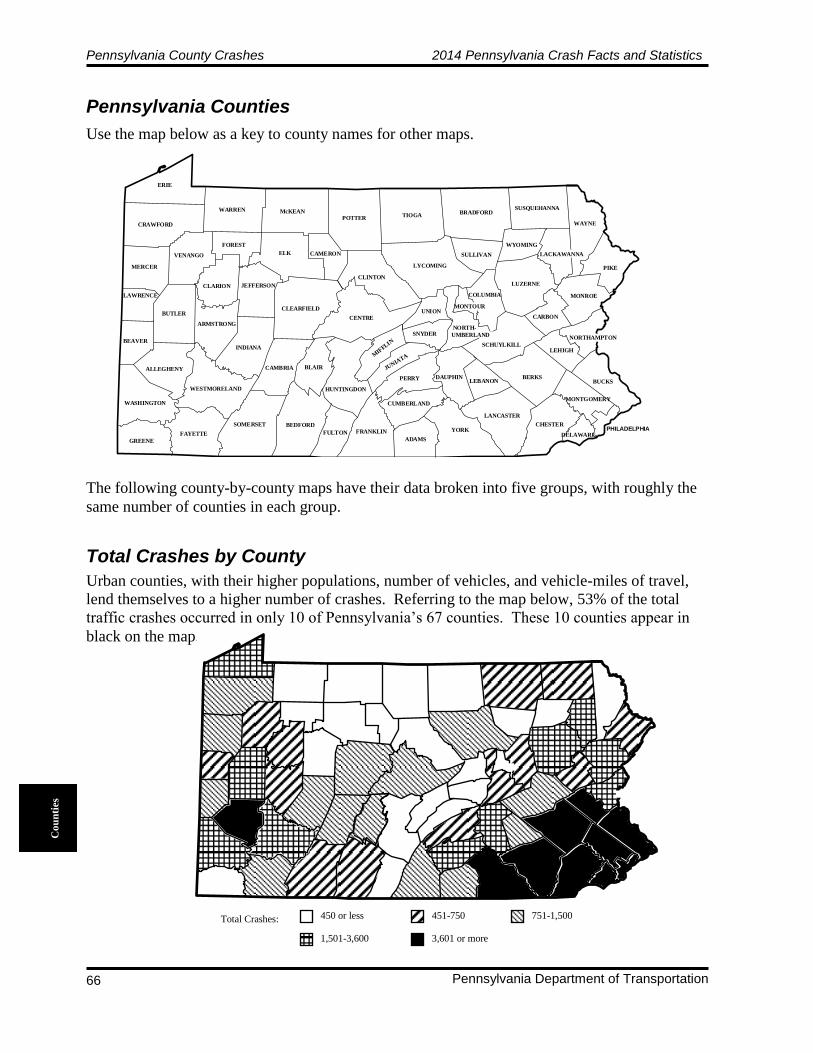
Pennsylvania County Crashes 2014 Pennsylvania Crash Facts and Statistics
Pennsylvania Department of Transportation 66
Pennsylvania Counties Total Crashes by County
Use the map below as a key to county names for other maps.
The following county-by-county maps have their data broken into five groups, with roughly the
same number of counties in each group.
Urban counties, with their higher populations, number of vehicles, and vehicle-miles of travel,
lend themselves to a higher number of crashes. Referring to the map below, 53% of the total
traffic crashes occurred in only 10 of Pennsylvania’s 67 counties. These 10 counties appear in
black on the map.
Co
un
ties
ERIE
CRAWFORD
WARREN
FOREST
McKEANPOTTER
CAMERONELKVENANGO
MERCER
BEDFORD
BLAIR
SOMERSET
CAMBRIA
INDIANA
ARMSTRONG
BUTLER
LAWRENCE
BEAVER
ALLEGHENY
WASHINGTON
GREENE
FAYETTE
WESTMORELAND
JEFFERSON
CLINTON
LYCOMING
SULLIVAN
TIOGABRADFORD
WAYNE
WYOMING
PIKE
LUZERNE
MONROE
SCHUYLKILL
CARBON
LEHIGH
COLUMBIA
BUCKSBERKS
CHESTER
LANCASTER
MONTGOMERY
YORK
LEBANONPERRY
CUMBERLAND
DAUPHIN
JUNIATAM
IFFLIN
UNION
SNYDER
CENTRE
ADAMS
FRANKLINFULTON
HUNTINGDON
CLEARFIELD
CLARION
LACKAWANNA
MONTOUR
NORTH-
UMBERLANDNORTHAMPTON
PHILADELPHIADELAWARE
SUSQUEHANNA
Total Crashes:
450 or less
1,501-3,600
451-750
3,601 or more
751-1,500

2014 Pennsylvania Crash Facts and Statistics Pennsylvania County Crashes
Pennsylvania Department of Transportation 67
Co
un
ties
Traffic Deaths by County Alcohol-Related Deaths by County
Deaths:
8 or less 19-30 9-13 31 or more 14-18
Referring to the map below, 44% of the total traffic deaths occurred in only 11 of Pennsylvania’s
67 counties. These 11 counties appear in black on the map.
Referring to the map below, 29% of the total alcohol-related deaths occurred in only 6 of
Pennsylvania’s 67 counties. These 6 counties appear in black on the map.
Deaths:
2 or less 8-11 3-4 12 or more 5-7

Pennsylvania County Crashes 2014 Pennsylvania Crash Facts and Statistics
Pennsylvania Department of Transportation 68
Percent Seat Belt Use in Crashes by County Pedestrian Deaths by County
Belt Usage:
83% or more
75%-77%
81%-82%
74% or less
78%-80%
Co
un
ties
While the percentage of seat belt use in crashes tended to be lower in counties with major urban
areas, some rural areas also had lower seat belt use in crashes. Below the worst 2 counties
having 74% or less seat belt use in crashes are shown in black on the map.
Referring to the map below, 55% of the total pedestrian deaths occurred in only 7 of
Pennsylvania’s 67 counties. These 7 counties appear in black on the map.
Deaths:
None 4-5 1 6 or more 2-3
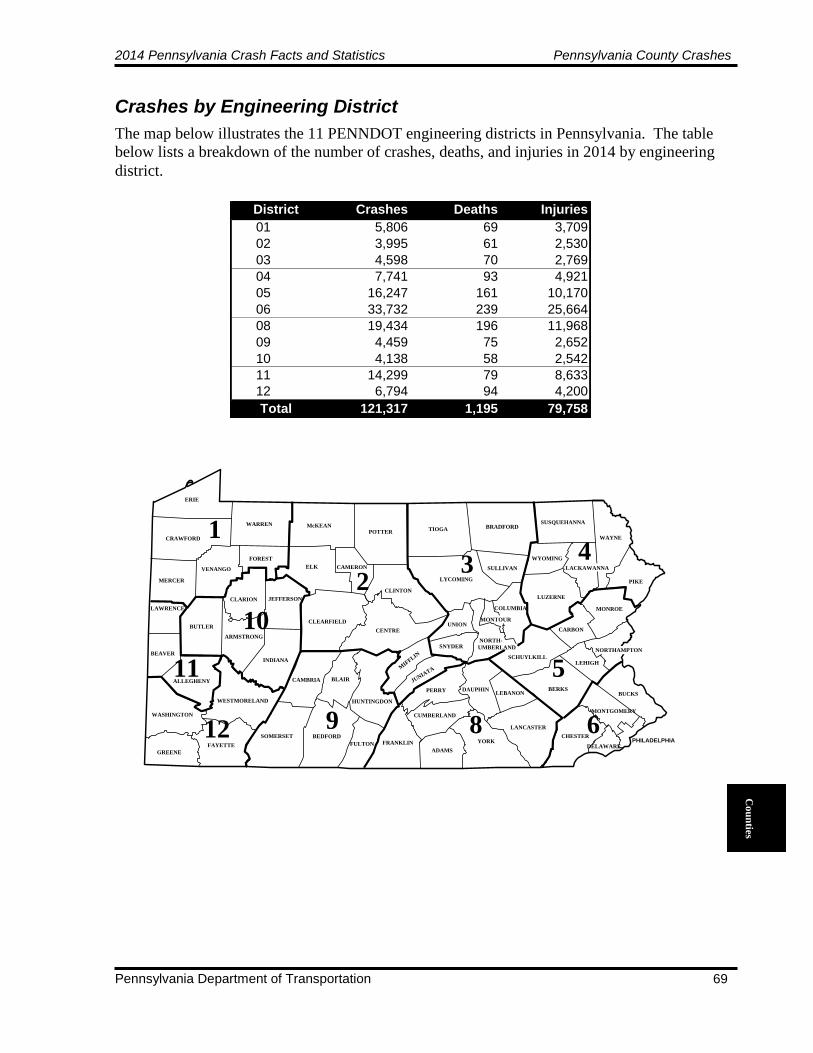
2014 Pennsylvania Crash Facts and Statistics Pennsylvania County Crashes
Pennsylvania Department of Transportation 69
Co
un
ties
Crashes by Engineering District
The map below illustrates the 11 PENNDOT engineering districts in Pennsylvania. The table
below lists a breakdown of the number of crashes, deaths, and injuries in 2014 by engineering
district.
District Crashes Deaths Injuries
01 5,806 69 3,709
02 3,995 61 2,530
03 4,598 70 2,769
04 7,741 93 4,921
05 16,247 161 10,170
06 33,732 239 25,664
08 19,434 196 11,968
09 4,459 75 2,652
10 4,138 58 2,542
11 14,299 79 8,633
12 6,794 94 4,200
Total 121,317 1,195 79,758
ERIE
CRAWFORD
WARREN
FOREST
McKEANPOTTER
CAMERONELKVENANGO
MERCER
BEDFORD
BLAIR
SOMERSET
CAMBRIA
INDIANA
ARMSTRONG
BUTLER
LAWRENCE
BEAVER
ALLEGHENY
WASHINGTON
GREENE
FAYETTE
WESTMORELAND
JEFFERSON
CLINTON
LYCOMING
SULLIVAN
TIOGA BRADFORD
WAYNE
WYOMING
PIKE
LUZERNE
MONROE
SCHUYLKILL
CARBON
LEHIGH
COLUMBIA
BUCKSBERKS
CHESTER
LANCASTER
MONTGOMERY
YORK
LEBANONPERRY
CUMBERLAND
DAUPHIN
JUNIATAM
IFFLIN
UNION
SNYDER
CENTRE
ADAMS
FRANKLINFULTON
HUNTINGDON
CLEARFIELD
CLARION
LACKAWANNA
MONTOUR
NORTH-
UMBERLANDNORTHAMPTON
PHILADELPHIADELAWARE
SUSQUEHANNA
1
10
12
23
4
5
9 8 6
11
Index 2014 Pennsylvania Crash Facts and Statistics
Pennsylvania Department of Transportation 70
Index Age .......................................... 10, 24, 25, 31, 32, 30, 34, 44, 47, 63
Air Bags ........................................................................... 24, 39, 40
Alcohol ................................................................ 4, 8, 26-33, 65, 67
Bicycles ............................................................... 5, 9, 17, 41, 47-50
Buses ............................................................ 5, 9, 13, 17, 31, 56, 57 School Buses .......................................................... 9, 17, 56, 57
Child Restraints ............................................................................ 38
Counties ............................................................................ 18, 58-68 Names ..................................................................................... 66
Crash Types.......................................................................... 4, 9, 25
Crashes
by Age ............................... 10, 24, 25, 31, 32, 40, 43, 44, 47, 63
by Crash Type ..................................................................... 9, 25
by Day of Week ...................................................................... 19
by Hour of Day ....................................................................... 20
by Light Level ...................................................... 18, 21, 45, 48
by Month ................................................................................ 19
by Road Surface Conditions .................................................... 12
by Road Type ............................................ 14, 16, 18, 46, 54-56
by Sex ......................................................................... 10, 31, 43
by Vehicle Type ................................................ 9, 13, 17, 31, 50
by Weather.............................................................................. 12
Economic loss due to ................................................................ 8
Work Zones ............................................................................ 13
Deaths Air Bags ............................................................................ 39, 40
Alcohol-Related ....................................................... 8, 27-30, 32
Bicyclists ....................................................................... 8, 47-49
by Age ................................................................... 40, 43-45, 47
by Crash Type ........................................................................... 9
by Day of Week ................................................................ 19, 29
by Hour of Day ................................................................. 20, 28
by Light Level ............................................................ 18, 21, 45
by Month ................................................................................ 19
by Road Type ................................................. 14, 16, 18, 46, 49
by Sex ..................................................................................... 43
by Vehicle Type .................................................................. 9, 17
Economic loss due to ................................................................ 8
Motorcyclists ...................................................................... 8, 52
Pedestrians ..................................................................... 8, 41-46
Per 100 Million Vehicle-Miles .................................................. 8
Speed-Related ........................................................................... 8
Drinking Drivers .....................................................................31-33
Drivers ......................................................... 5, 10, 23-25, 31-33, 52 Drinking ........................................................................... 31-33
Mature .............................................................................. 24, 25
Young ............................................................................... 24, 25
Economic Loss ............................................................................... 8
Engineering Districts .................................................................... 69
Five-Year Trends Alcohol-Related Crashes......................................................... 27
Alcohol-Related Crashes by County ....................................... 65
Bicycle Crashes ...................................................................... 47
Crashes by County .................................................................. 60
Deaths and Injuries ................................................................... 8
Heavy Truck Crashes .............................................................. 54
Light Truck Crashes................................................................ 53
Motorcycle Crashes ................................................................ 52
Passenger Car Crashes ............................................................ 51
Pedestrian Crashes .................................................................. 41
Pedestrian Deaths by County .................................................. 62
School Bus Crashes ................................................................ 57
School Bus Deaths .................................................................. 57
Seat Belt Use by County ......................................................... 64
Traffic Deaths by County ........................................................ 61
Train/Vehicle Crashes ............................................................. 17
Work Zone Crashes ................................................................ 14
Hazardous Materials .................................................................... 55
Historical Data
Highway Crashes .................................................................... 10
Seat Belt Use .................................................................... 37, 38
Underage Drinking Drivers ..................................................... 33
Holidays..............................................................................4, 22, 30
Injuries .......................................... 7, 8, 27, 35, 36, 38-40, 43-49, 63 Air Bags ............................................................................ 39, 40
Alcohol Related ...................................................................... 27
Bicyclists ....................................................................... 8, 47-49
Child Restraints ...................................................................... 38
Motorcyclists ............................................................................ 8
Pedestrians ............................................................... 8, 43-46, 63
Seat Belt Use .................................................................... 35, 36
Intersections .......................................................... 25, 41, 42, 45, 48
Light Levels ................................................................ 18, 21, 45, 48
Mature Drivers ....................................................................... 24, 25
Motorcycles .................................................. 5, 9, 13, 17, 31, 50, 52
Passenger Cars .............................................. 5, 9, 13, 17, 31, 50, 51
Pedestrians ..................................................... 4, 5, 41-43, 45, 46, 63
Road Surface Conditions ............................................................. 12
Road Types ............................................ 5, 14, 16, 18, 46, 49, 54-56
Roadside Objects ......................................................................... 15
Seat Belts .................................................................... 35-38, 64, 68
Sex (of drivers and/or pedestrians) ...................................10, 31, 43
Speed ................................................................................... 4, 8, 23
Traffic Control Device ........................................................4, 46, 49
Trains ..................................................................................... 17, 18
Trucks Heavy ............................................ 5, 8, 9, 13, 17, 31, 50, 54, 55
Light ........................................................5, 9, 13, 17, 31, 50, 53
Two-Vehicle Collisions ............................................................... 50
Vehicle Types ..................................................... 5, 9, 13, 17, 31, 50
Weather ....................................................................................... 12
Work Zones ........................................................................4, 13, 14
Young Drivers ....................................................................... 24, 25
Ind
ex

NEW 2014 Pennsylvania Crash Facts & Statistics Feedback Survey
The 2014 edition of the Pennsylvania Crash Facts and Statistics booklet continues to use the
format that began with the 1996 edition. In our continuing effort to make this booklet as useful
as possible, we would appreciate your taking the time to fill out this survey. Your opinions will
help shape future editions including a planned major revision in the next few years.
Does this booklet provide information which is useful to you? (check one) Yes No
What information would you like to see included in a new version? ________________________________
___________________________________________________________________________________________________________________
___________________________________________________________________________________________________________________
Is the format easy to follow? (check one) Yes No Keeping in mind a new version
may be electronic and possibly interactive, what suggestions do you have to make the format
better and easier for you?
___________________________________________________________________________________________________________________
___________________________________________________________________________________________________________________
___________________________________________________________________________________________________________________
Please rate the following sections of the booklet as to whether you find them Useful, Somewhat
Useful, or Not Useful.
Useful Somewhat Not Useful
How to Use This Booklet
Definitions
Overview
All Crashes and Deaths
Drivers
Alcohol-Related Crashes
Seat Belt, Child Safety Seats, etc.
Pedestrians and Bicycle Crashes
Crashes by Motor Vehicle Type
Pennsylvania County Crashes
Index
If you had only one suggestion for a new electronic version what would that suggestion be? ___________________________________________________________________________________________________________________
Your name and organization (optional): _________________________________________________________________
Thank you for your involvement and response.
1. Cut this page out of the booklet.
2. Fold along the dotted lines and tape shut.
3. Place a stamp where indicated.
4. Drop into the nearest mailbox.
Pennsylvania Department and Transportation
Bureau of Maintenance And Operations
P.O. Box 2047
Harrisburg, PA 17105-2047
2014 Pennsylvania Crash Facts & Statistics Survey Form
PLACE
STAMP
HERE

Dedication
The Commonwealth of Pennsylvania would like to extend its deepest sympathy to the families and friends of the victims of fatal motor vehicle crashes here in Pennsylvania.
We look to the day when publications such as this will no longer be necessary. Until that time, however, the Commonwealth of
Pennsylvania will continue to strive to make our roads safer.

Pennsylvania Department of Transportation
Bureau of Maintenance And Operations
P.O. Box 2047
Harrisburg, PA 17105-2047
ADDRESS SERVICE REQUESTED
Related Documents