2014 Annual Report

Welcome message from author
This document is posted to help you gain knowledge. Please leave a comment to let me know what you think about it! Share it to your friends and learn new things together.
Transcript

2014 Annual Report
CVS Health, One CVS Drive, Woonsocket, RI 02895 | 401.765.1500 | cvshealth.com
WE ARE
A pharmacy innovation company
OUR STRATEGY
Reinventing pharmacy
OUR PURPOSE
Helping people on their path to better health
OUR VALUES
Innovation Collaboration Caring Integrity Accountability
CVS
Health
2014 A
nnual Rep
ort
The CVS Health 2014 Annual Report achieved the following results by printing on paper containing 10 percent post-consumer recycled content. FSC® is not responsible for any calculations of results from choosing this paper.
Trees Saved
Water Saved
Energy Saved
Solid Waste Not Produced
Greenhouse Gases Not Produced
104fully grown
48,208 gallons
47,000,000 MM BTUs
3,227 pounds
8,889 pounds
Waterborne Waste Not Produced
30 pounds
157033_CVRS.indd 1 3/11/15 7:08 PM157033_CVRS.indd 1 3/12/15 5:02 PM

1 Health is Everything
14 Financial Highlights
15 Letter to Shareholders
20 Prescription for a Better World
21 2014 Financial Report
Shareholder Information
designed and produced by see see eye
Larry J. MerloPresident and Chief Executive Officer
Lisa G. BisacciaExecutive Vice President and Chief Human Resources Officer
Troyen A. Brennan, M.D.Executive Vice President and Chief Medical Officer
David M. DentonExecutive Vice President and Chief Financial Officer
Helena B. FoulkesExecutive Vice President and President – CVS/pharmacy
Stephen J. GoldExecutive Vice President and Chief Information Officer
J. David JoynerExecutive Vice President, Sales and Account Services – CVS/caremark
Per G.H. LofbergExecutive Vice President
Thomas M. MoriartyExecutive Vice President, Chief Health Strategy Officer and General Counsel
Jonathan C. RobertsExecutive Vice President and President – CVS/caremark
Andrew J. Sussman, M.D.Executive Vice President and Associate Chief Medical Officer; President – CVS/minuteclinic
Eva C. BorattoSenior Vice President – Controller and Chief Accounting Officer
John M. BuckleySenior Vice President and Chief Compliance Officer
Nancy R. ChristalSenior Vice President – Investor Relations
Carol A. DeNaleSenior Vice President and Treasurer
John P. KennedySenior Vice President and Chief Tax Officer
Colleen M. McIntoshSenior Vice President and Corporate Secretary
Thomas S. MoffattVice President and Assistant Secretary
OFFICERS’ CERTIFICATIONS The Company has filed the required certifications under Section 302 of the Sarbanes-Oxley Act of 2002 regarding the quality of our public disclosures as Exhibits 31.1 and 31.2 to our annual report on Form 10-K for the fiscal year ended December 31, 2014. After our 2014 annual meeting of stockholders, the Company filed with the New York Stock Exchange the CEO certi-fication regarding its compliance with the NYSE corporate governance listing standards as required by NYSE Rule 303A.12(a).
Officers
Richard M. Bracken (3)
Former Chairman and Chief Executive Officer HCA Holdings, Inc.
C. David Brown II (1) (2)
Chairman of the Firm Broad and Cassel
Alecia A. DeCoudreauxPresident Mills College
Nancy-Ann M. DeParle (3)
Partner Consonance Capital Partners, LLC
David W. Dorman (1) (2)
Chairman of the Board CVS Health Corporation
Anne M. Finucane (2)
Global Chief Strategy and Marketing Officer Bank of America Corporation
Larry J. MerloPresident and Chief Executive Officer CVS Health Corporation
Jean-Pierre Millon (3)
Former President and Chief Executive Officer PCS Health Services, Inc.
Richard J. Swift (3)
Former Chairman, President and Chief Executive Officer Foster Wheeler Ltd.
William C. Weldon (1) (2)
Former Chairman and Chief Executive Officer Johnson & Johnson
Tony L. White (1) (3)
Former Chairman, President and Chief Executive Officer Applied Biosystems, Inc.
(1) Member of the Management Planning and Development Committee
(2) Member of the Nominating and Corporate Governance Committee
(3) Member of the Audit Committee
Directors
Corporate HeadquartersCVS Health Corporation One CVS Drive, Woonsocket, RI 02895 (401) 765-1500
Annual Shareholders’ MeetingMay 7, 2015 CVS Health Corporate Headquarters
Stock Market ListingThe New York Stock Exchange Symbol: CVS
Transfer Agent and RegistrarQuestions regarding stock holdings, certificate replacement/transfer, dividends and address changes should be directed to:
Wells Fargo Shareowner Services P.O. Box 64874 St. Paul, MN 55164-0874 Toll-free: (877) CVS-PLAN (287-7526) International: +1 (651) 450-4064 Email: [email protected] Website: www.shareowneronline.com
Direct Stock Purchase/Dividend Reinvestment ProgramShareowner Services Plus PlanSM provides a convenient and economical way for you to purchase your first shares or additional shares of CVS Health common stock. The program is sponsored and administered by Wells Fargo Bank, N.A. For more information, including an enrollment form, please contact Wells Fargo Bank, N.A. at (877) 287-7526.
Financial and Other Company InformationThe Company’s Annual Report on Form 10-K will be sent without charge to any share-holder upon request by contacting:
Nancy R. Christal Senior Vice President – Investor Relations CVS Health Corporation 670 White Plains Road – Suite 210 Scarsdale, NY 10583 (800) 201-0938
In addition, financial reports and recent filings with the Securities and Exchange Commission, including our Form 10-K, as well as other Company information, are available via the Internet at investors.cvshealth.com.
Shareholder Information
157033_CVRS.indd 23/6/15 1:18 PM
1 Health is Everything
14 Financial Highlights
15 Letter to Shareholders
20 Prescription for a Better World
21 2014 Financial Report
Shareholder Information
des
igne
d a
nd p
rod
uced
by
see s
ee e
ye
Larry J. MerloPresident and Chief Executive Officer
Lisa G. BisacciaExecutive Vice President and Chief Human Resources Officer
Troyen A. Brennan, M.D.Executive Vice President and Chief Medical Officer
David M. DentonExecutive Vice President and Chief Financial Officer
Helena B. FoulkesExecutive Vice President and President – CVS/pharmacy
Stephen J. GoldExecutive Vice President and Chief Information Officer
J. David JoynerExecutive Vice President, Sales and Account Services – CVS/caremark
Per G.H. LofbergExecutive Vice President
Thomas M. MoriartyExecutive Vice President, Chief Health Strategy Officer and General Counsel
Jonathan C. RobertsExecutive Vice President and President – CVS/caremark
Andrew J. Sussman, M.D.Executive Vice President and Associate Chief Medical Officer; President – CVS/minuteclinic
Eva C. BorattoSenior Vice President – Controller and Chief Accounting Officer
John M. BuckleySenior Vice President and Chief Compliance Officer
Nancy R. ChristalSenior Vice President – Investor Relations
Carol A. DeNaleSenior Vice President and Treasurer
John P. KennedySenior Vice President and Chief Tax Officer
Colleen M. McIntoshSenior Vice President and Corporate Secretary
Thomas S. MoffattVice President and Assistant Secretary
OFFICERS’ CERTIFICATIONS The Company has filed the required certifications under Section 302 of the Sarbanes-Oxley Act of 2002 regarding the quality of our public disclosures as Exhibits 31.1 and 31.2 to our annual report on Form 10-K for the fiscal year ended December 31, 2014. After our 2014 annual meeting of stockholders, the Company filed with the New York Stock Exchange the CEO certi-fication regarding its compliance with the NYSE corporate governance listing standards as required by NYSE Rule 303A.12(a).
Officers
Richard M. Bracken (3)
Former Chairman and Chief Executive Officer HCA Holdings, Inc.
C. David Brown II (1) (2)
Chairman of the Firm Broad and Cassel
Alecia A. DeCoudreauxPresident Mills College
Nancy-Ann M. DeParle (3)
Partner Consonance Capital Partners, LLC
David W. Dorman (1) (2)
Chairman of the Board CVS Health Corporation
Anne M. Finucane (2)
Global Chief Strategy and Marketing Officer Bank of America Corporation
Larry J. MerloPresident and Chief Executive Officer CVS Health Corporation
Jean-Pierre Millon (3)
Former President and Chief Executive Officer PCS Health Services, Inc.
Richard J. Swift (3)
Former Chairman, President and Chief Executive Officer Foster Wheeler Ltd.
William C. Weldon (1) (2)
Former Chairman and Chief Executive Officer Johnson & Johnson
Tony L. White (1) (3)
Former Chairman, President and Chief Executive Officer Applied Biosystems, Inc.
(1) Member of the Management Planning and Development Committee
(2) Member of the Nominating and Corporate Governance Committee
(3) Member of the Audit Committee
Directors
Corporate HeadquartersCVS Health Corporation One CVS Drive, Woonsocket, RI 02895 (401) 765-1500
Annual Shareholders’ MeetingMay 7, 2015 CVS Health Corporate Headquarters
Stock Market ListingThe New York Stock Exchange Symbol: CVS
Transfer Agent and RegistrarQuestions regarding stock holdings, certificate replacement/transfer, dividends and address changes should be directed to:
Wells Fargo Shareowner Services P.O. Box 64874 St. Paul, MN 55164-0874 Toll-free: (877) CVS-PLAN (287-7526) International: +1 (651) 450-4064 Email: [email protected] Website: www.shareowneronline.com
Direct Stock Purchase/Dividend Reinvestment ProgramShareowner Services Plus PlanSM provides a convenient and economical way for you to purchase your first shares or additional shares of CVS Health common stock. The program is sponsored and administered by Wells Fargo Bank, N.A. For more information, including an enrollment form, please contact Wells Fargo Bank, N.A. at (877) 287-7526.
Financial and Other Company InformationThe Company’s Annual Report on Form 10-K will be sent without charge to any share-holder upon request by contacting:
Nancy R. Christal Senior Vice President – Investor Relations CVS Health Corporation 670 White Plains Road – Suite 210 Scarsdale, NY 10583 (800) 201-0938
In addition, financial reports and recent filings with the Securities and Exchange Commission, including our Form 10-K, as well as other Company information, are available via the Internet at investors.cvshealth.com.
Shareholder Information
157033_CVRS.indd 2 3/6/15 1:18 PM157033_CVRS.indd 2 3/12/15 5:02 PM
Health is everything. And CVS Health is rethinking the way health care is delivered in the United States to increase access, lower costs, and improve outcomes.
Our new name reflects this broader health care commitment as well as our understanding of the challenges faced by patients, payors, and providers. We’re addressing concerns about cost and helping people on their path to better health through a suite of integrated services, health system affiliations, and the strengths of the following enterprise assets:
CVS/pharmacy®, our retail segment with more than 7,800 retail drug stores across the United States and in Brazil;
CVS/caremark™, a leading pharmacy benefit manager (PBM) and mail service pharmacy serving more than 2,000 clients and their 65 million plan members;
CVS/minuteclinic™, the nation’s largest walk-in medical clinic provider with nearly 1,000 clinics located in our retail drugstores; and
CVS/specialty™, home to our specialty pharmacy management services, Accordant® care management, NovoLogix® automated claims review, Coram® infusion services, and other offerings for patients who require treatment for rare or complex conditions.
CVS Health solutions leverage the capabilities of our more than 26,000 pharmacists, nurses, nurse practitioners, and physician assistants. No matter how health care reform unfolds in the coming years, we have the breadth of assets and the expertise to play a significant and supportive role.
1
20
14
An
nu
al R
ep
ort
157033_NAR.indd 1 3/9/15 10:55 AM
“ Ever since we turned our daughter’s care over to you all, our
quality of life has never been better,” writes a mother to her
Coram team. Coram’s ability to provide infusion services in
the home has made all the difference for this family, allowing
treatment to suit their daughter’s lifestyle instead of the other
way around. “The rest of our family has been liberated, too. No
more days spent at the clinic waiting. No more putting her sisters
on hold while she gets her care. You provide much more than
medical care. You contribute immeasurably to the quality of life
of your patients and all the others who populate their lives!Ӡ
2
CV
S H
ea
lth
Putting care within easy reach. We are making it easier for patients to
obtain their medications and the care they need. And that will help reduce the $300 billion in avoidable
costs due to medication non-adherence the U.S. health care system faces each year. For example,
our infusion services through Coram enable us to provide patients with more convenient, low-cost
alternatives to hospital infusions, whether at the physician’s office, at one of our national network of retail
infusion sites, or even the patient’s home. With the number of CVS/minuteclinic locations on the rise,
we’re also making it easier for patients with acute illnesses and certain chronic conditions to receive
care. Maintenance Choice®, one of the many integrated solutions that only CVS Health offers, gives
CVS/caremark plan members the option of receiving 90-day maintenance prescriptions in the way that
suits them best—through our mail order pharmacies or at any of our CVS/pharmacy locations. Specialty
Connect™ provides a similar in-store pickup option for CVS/specialty patients while our expert specialty
pharmacists provide disease state-specific counseling.
† Throughout this section you will see stories based on actual feedback. Identifying details have been omitted to protect privacy.
157033_NAR.indd 2 3/9/15 10:55 AM

3
20
14
An
nu
al R
ep
ort
157033_NAR.indd 3 3/9/15 10:55 AM
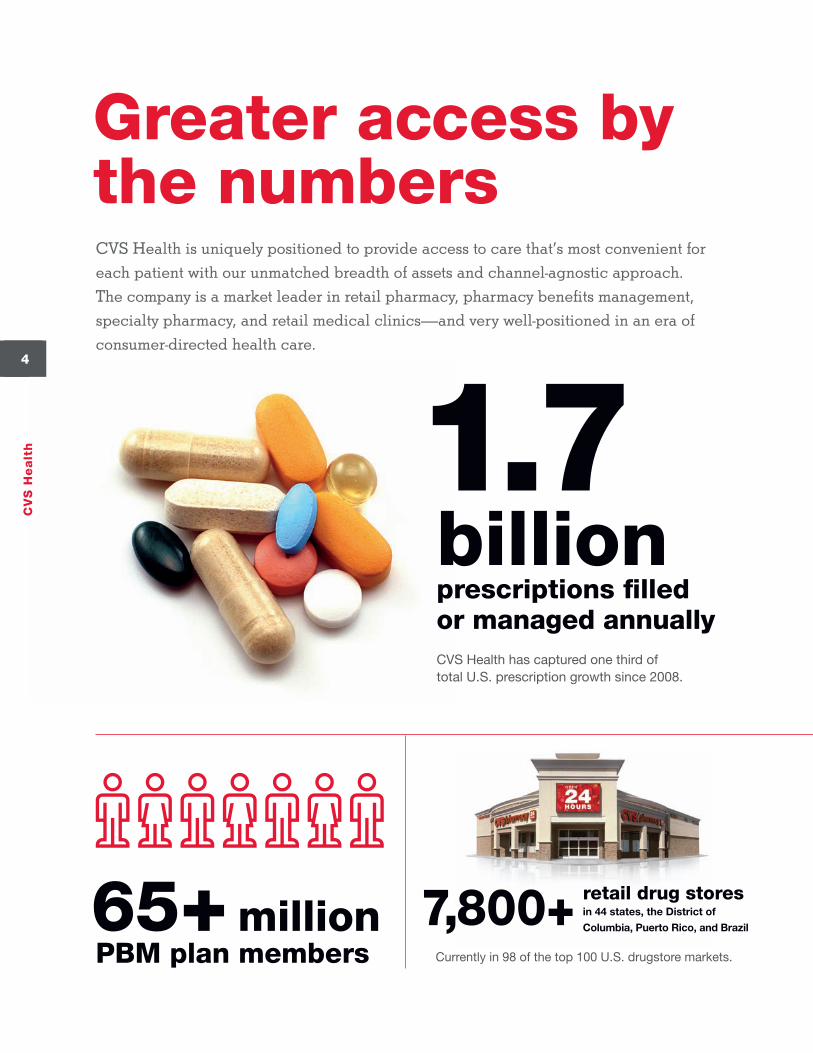
Greater access by the numbersCVS Health is uniquely positioned to provide access to care that’s most convenient for
each patient with our unmatched breadth of assets and channel-agnostic approach.
The company is a market leader in retail pharmacy, pharmacy benefits management,
specialty pharmacy, and retail medical clinics—and very well-positioned in an era of
consumer-directed health care.
1.7billion prescriptions filled or managed annuallyCVS Health has captured one third of total U.S. prescription growth since 2008.
7,800+ retail drug stores in 44 states, the District of
Columbia, Puerto Rico, and Brazil
4
CV
S H
ea
lth
65+ million PBM plan members Currently in 98 of the top 100 U.S. drugstore markets.
157033_NAR.indd 4 3/9/15 10:55 AM
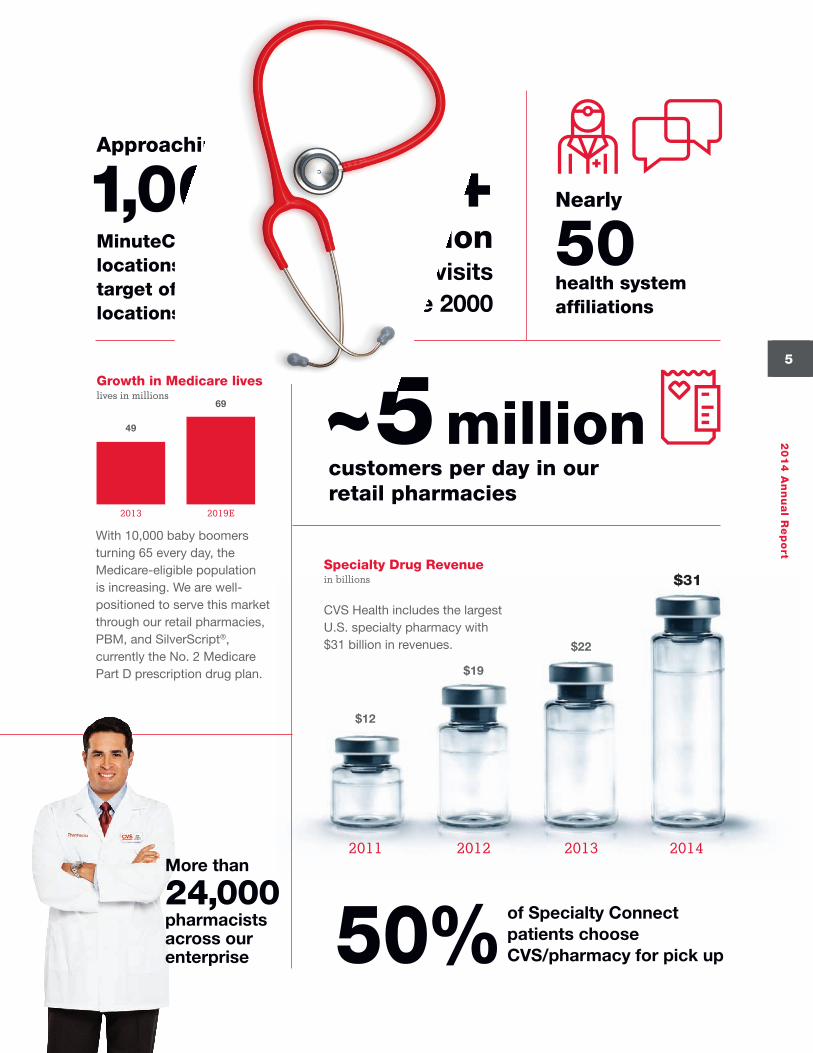
50%2013
$22
2012
$19
2011
$12
2014
$31
Approaching
1,000 MinuteClinic locations with a target of 1,500 locations by 2017
Nearly
50 health system affiliations
of Specialty Connect patients choose CVS/pharmacy for pick up
Specialty Drug Revenuein billions
CVS Health includes the largest U.S. specialty pharmacy with $31 billion in revenues.
With 10,000 baby boomers turning 65 every day, the Medicare-eligible population is increasing. We are well-positioned to serve this market through our retail pharmacies, PBM, and SilverScript®, currently the No. 2 Medicare Part D prescription drug plan.
2013 2019E
69
49
Growth in Medicare lives lives in millions
5
20
14
An
nu
al R
ep
ort
23+ million
patient visitssince 2000
~5 million customers per day in our retail pharmacies
More than
24,000 pharmacistsacross our enterprise
157033_NAR.indd 5 3/9/15 10:55 AM
6
CV
S H
ea
lth
Reduce costs, not care. With U.S. health care and prescription drug spending
on the rise, CVS/caremark offers comprehensive solutions that help clients manage this trend without
sacrificing patient care. With one large health plan client, our entire enterprise is involved and collaborating
with its patient-centered medical home (PCMH) model. At CVS/pharmacy, we provide face-to-face
adherence counseling and provide information directly into the patient’s electronic health record at the
PCMH. CVS/minuteclinic helps providers by combining high-quality care with affordable pricing across a
range of services that include acute care, smoking cessation counseling, and support for chronic conditions
such as diabetes. CVS/caremark provides comprehensive medication reviews for patients identified as
vulnerable and offers recommendations on ways to assist them such as simplifying their medication
regimen or providing multi-dose packaging. Our Specialty Care teams at CVS/specialty, which include
rare disease management nurses, function as extensions of the clinical team for patients with complex
conditions. CVS Health is uniquely able to support and deliver value to plans, providers, and patients who
work within these models by creating innovative solutions that leverage all of our enterprise assets.
“ We have more than 3 million members and one of the largest
patient-centered medical homes in the country,” explains
the CEO of a leading U.S. health plan. “We are very excited
about finding innovative ways to help our clients and mem-
bers lower their costs and improve quality. Collaboration with
CVS Health has been helping us do just that. We’ve been
focused on integrating CVS Health pharmacists and nurses
into our medical home model. That will enhance coordination
of care and quality. As for costs, with this relationship, we’ve
come to see pharmacy as a key area to drive savings and help
control overall health spending. We’re at the beginning stages
of health reform, but we’re making real strides to achieve its
goals with CVS Health.”
157033_NAR.indd 6 3/9/15 10:55 AM

7
20
14
An
nu
al R
ep
ort
157033_NAR.indd 7 3/9/15 10:55 AM
8
CV
S H
ea
lth
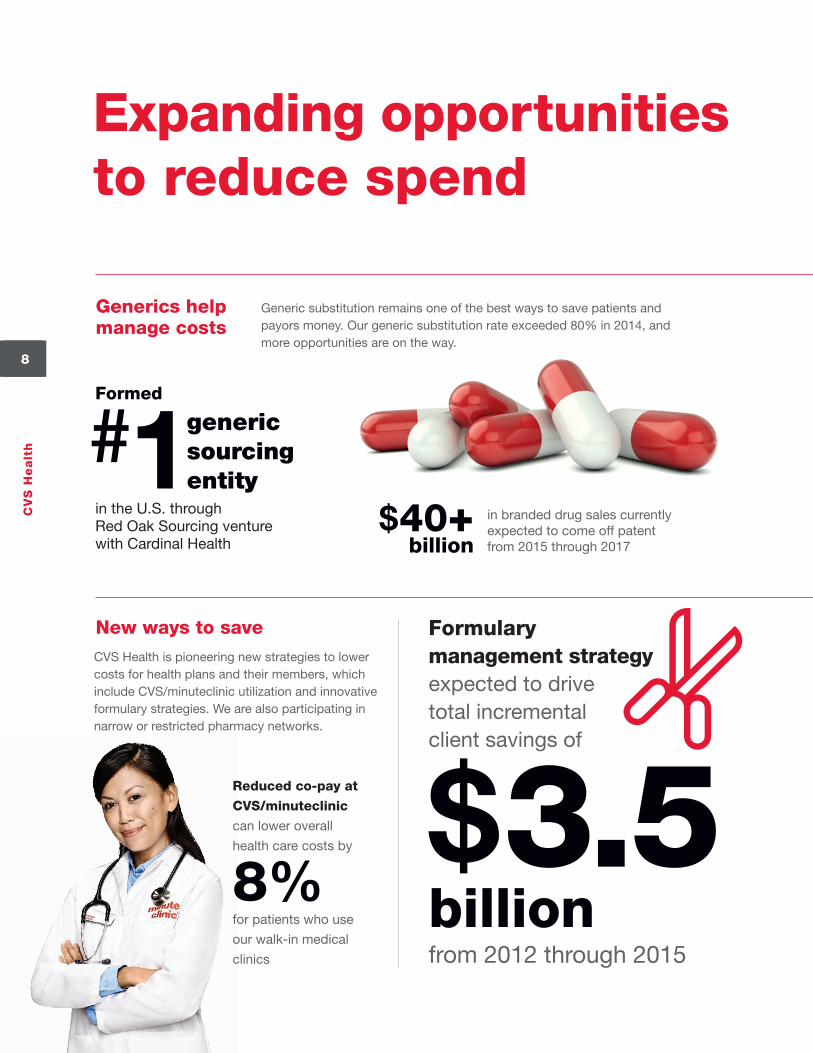
Formulary management strategy expected to drive total incremental client savings of
$3.5billion from 2012 through 2015
Reduced co-pay at
CVS/minuteclinic
can lower overall
health care costs by
8%for patients who use
our walk-in medical
clinics
Formed
#1in the U.S. through Red Oak Sourcing venture with Cardinal Health
generic sourcing entity
in branded drug sales currently expected to come off patent from 2015 through 2017
$40+ billion
Generic substitution remains one of the best ways to save patients and payors money. Our generic substitution rate exceeded 80% in 2014, and more opportunities are on the way.
CVS Health is pioneering new strategies to lower costs for health plans and their members, which include CVS/minuteclinic utilization and innovative formulary strategies. We are also participating in narrow or restricted pharmacy networks.
Generics help manage costs
New ways to save
Expanding opportunities to reduce spend
157033_NAR.indd 8 3/9/15 10:55 AM
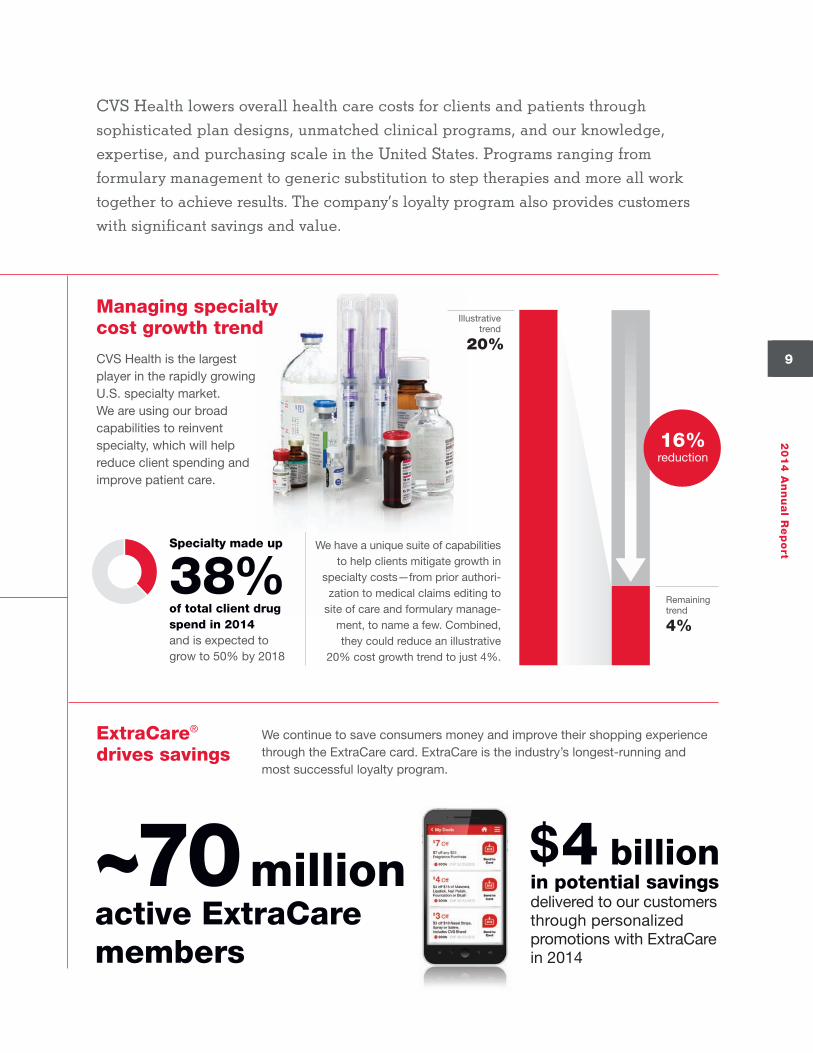
CVS Health lowers overall health care costs for clients and patients through
sophisticated plan designs, unmatched clinical programs, and our knowledge,
expertise, and purchasing scale in the United States. Programs ranging from
formulary management to generic substitution to step therapies and more all work
together to achieve results. The company’s loyalty program also provides customers
with significant savings and value.
9
20
14
An
nu
al R
ep
ort
Specialty made up
38% of total client drug spend in 2014and is expected to grow to 50% by 2018
$4 billion in potential savings delivered to our customers through personalized promotions with ExtraCare in 2014
~70 million active ExtraCare members
We continue to save consumers money and improve their shopping experience through the ExtraCare card. ExtraCare is the industry’s longest-running and most successful loyalty program.
Managing specialty cost growth trend
CVS Health is the largest player in the rapidly growing U.S. specialty market. We are using our broad capabilities to reinvent specialty, which will help reduce client spending and improve patient care.
ExtraCare® drives savings
We have a unique suite of capabilities to help clients mitigate growth in
specialty costs—from prior authori-zation to medical claims editing to
site of care and formulary manage-ment, to name a few. Combined, they could reduce an illustrative
20% cost growth trend to just 4%.
Illustrative trend
20%
Remaining trend
4%
16%reduction
157033_NAR.indd 9 3/9/15 10:55 AM
10
CV
S H
ea
lth
Helping people to stay healthy. Our focus on improving outcomes can
be seen across CVS Health, from our decision to stop selling tobacco products to our clinical programs,
unique specialty capabilities, MinuteClinic locations, and our affiliations with nearly 50 health systems. In
specialty, we provide clinical support and drive superior outcomes through our unparalleled capabilities
to holistically manage the patient, not just the drug. Our innovative solutions work together to support
a better patient experience. Whether the patient chooses to receive a prescription by mail or pick it up
at a local CVS/pharmacy, we provide centralized clinical support from a CareTeam of pharmacists and
nurses that are disease-specific experts to help patients achieve optimal outcomes. Among our other
clinical programs, Pharmacy Advisor® has provided more than 10 million counseling interventions since
its inception. These interventions help identify adherence gaps and counsel patients to get them back on
their medications. Through our health system affiliations, we’re working to share information seamlessly
and electronically to improve patient care. We are also expanding our digital capabilities to create an
integrated pharmacy experience so customers can manage their prescription needs from anywhere and
receive them through their preferred channel.
“ A really good specialty pharmacy makes my job easier by
staying one or two steps ahead of me and my staff,” explains
a prominent rheumatologist. “I think that CVS/specialty
is doing a wonderful job for us.” In addition to the logistical
support given to her staff, this doctor values the help our
specialty pharmacists and nurses provide her patients. “I’ve
heard nothing but positive feedback about the interactions
that they have had. Or a new patient will tell me that a cousin,
relative, or friend used CVS/specialty and ask, ‘Will you be
using that for me?’”
157033_NAR.indd 10 3/9/15 10:55 AM

11
20
14
An
nu
al R
ep
ort
157033_NAR.indd 11 3/9/15 10:55 AM
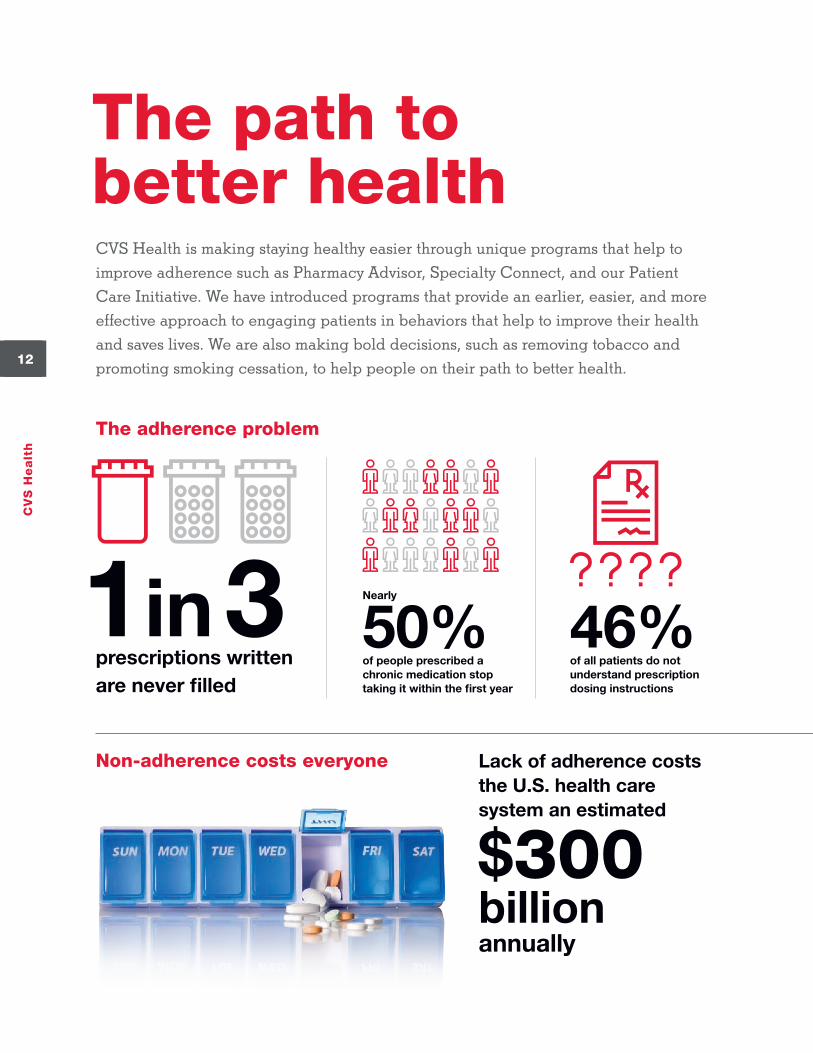
The path to better healthCVS Health is making staying healthy easier through unique programs that help to
improve adherence such as Pharmacy Advisor, Specialty Connect, and our Patient
Care Initiative. We have introduced programs that provide an earlier, easier, and more
effective approach to engaging patients in behaviors that help to improve their health
and saves lives. We are also making bold decisions, such as removing tobacco and
promoting smoking cessation, to help people on their path to better health. 12
CV
S H
ea
lth
46% of all patients do not understand prescription dosing instructions
1in3 prescriptions written are never filled
Nearly
50%of people prescribed a chronic medication stop taking it within the first year
The adherence problem
Non-adherence costs everyone
$300billionannually
Lack of adherence costs the U.S. health care system an estimated
157033_NAR.indd 12 3/9/15 10:55 AM
13
20
14
An
nu
al R
ep
ort
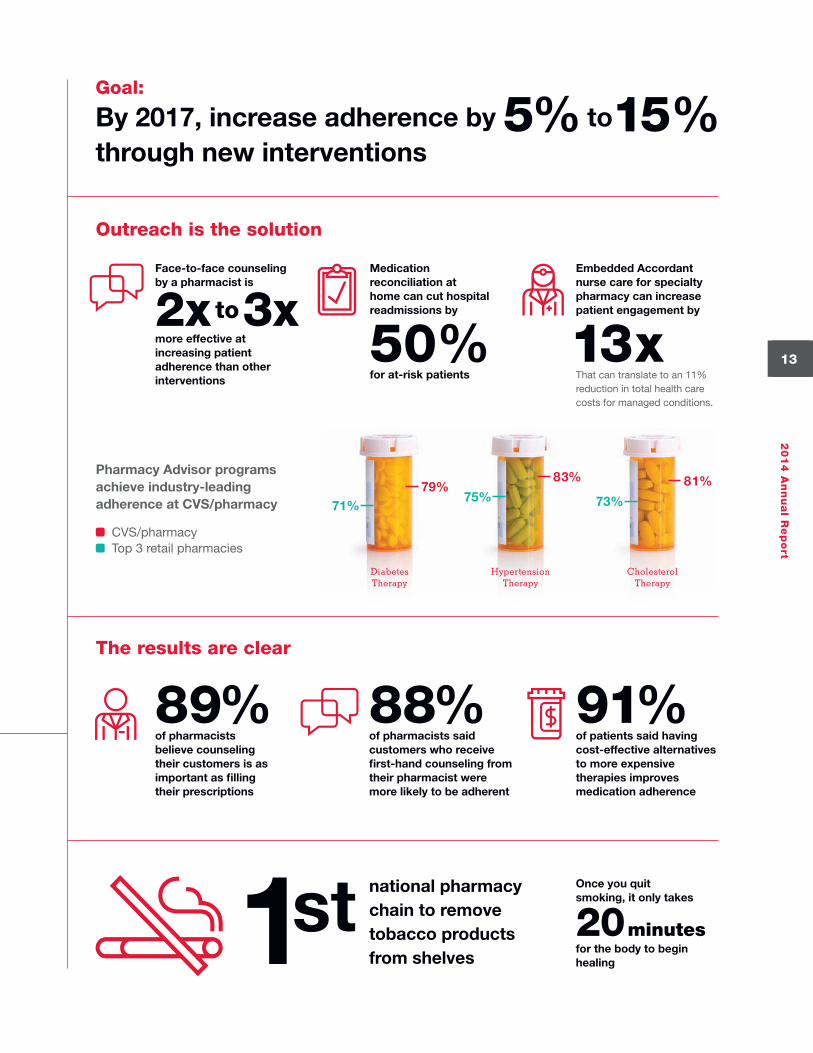
Goal:
By 2017, increase adherence by 5% to15% through new interventions
1st Once you quit smoking, it only takes
20 minutes for the body to begin healing
Outreach is the solution
The results are clear
89% of pharmacists believe counseling their customers is as important as filling their prescriptions
88% of pharmacists said customers who receive first-hand counseling from their pharmacist were more likely to be adherent
91% of patients said having cost-effective alternatives to more expensive therapies improves medication adherence
Face-to-face counseling by a pharmacist is
2x to 3x more effective at increasing patient adherence than other interventions
Embedded Accordant nurse care for specialty pharmacy can increase patient engagement by
13x That can translate to an 11% reduction in total health care costs for managed conditions.
Medication reconciliation at home can cut hospital readmissions by
50% for at-risk patients
Pharmacy Advisor programs achieve industry-leading adherence at CVS/pharmacy
CVS/pharmacy Top 3 retail pharmacies
Hypertension Therapy
75%
83%
Diabetes Therapy
71%79%
Cholesterol Therapy
73%
81%
national pharmacy chain to remove tobacco products from shelves
157033_NAR.indd 13 3/10/15 3:15 PM
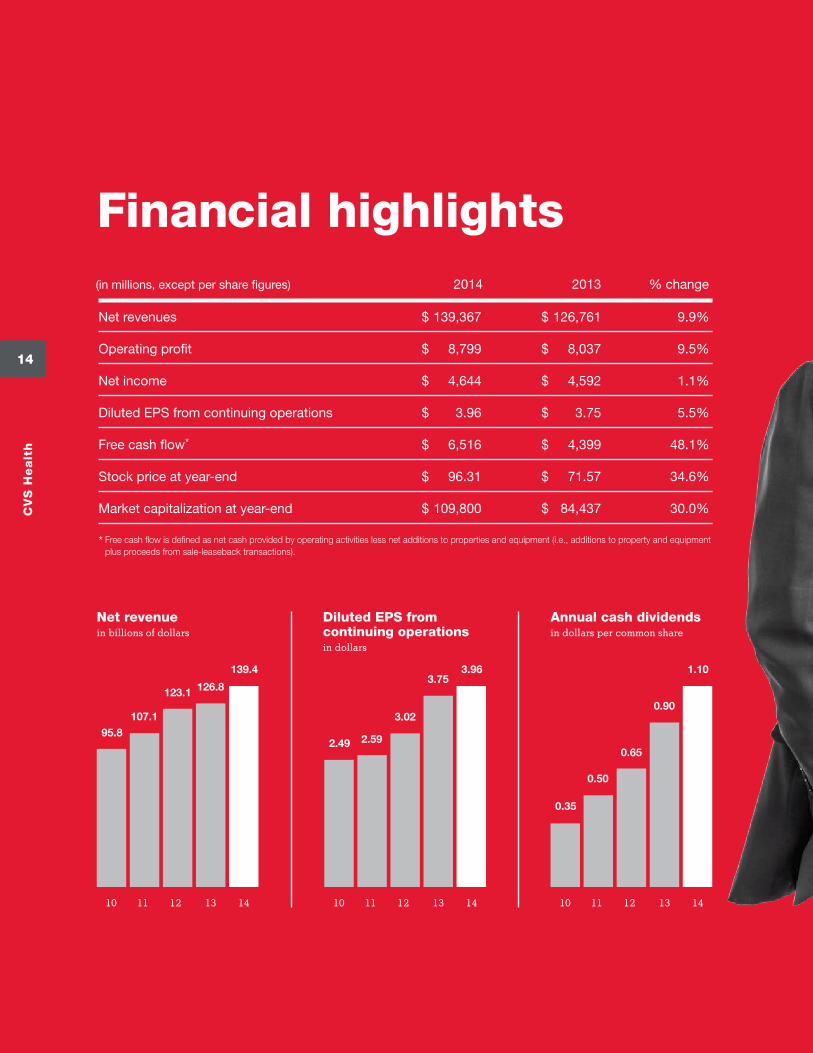
Net revenues $ 139,367 $ 126,761 9.9%
Operating profit $ 8,799 $ 8,037 9.5%
Net income $ 4,644 $ 4,592 1.1%
Diluted EPS from continuing operations $ 3.96 $ 3.75 5.5%
Free cash flow* $ 6,516 $ 4,399 48.1%
Stock price at year-end $ 96.31 $ 71.57 34.6%
Market capitalization at year-end $ 109,800 $ 84,437 30.0%
* Free cash flow is defined as net cash provided by operating activities less net additions to properties and equipment (i.e., additions to property and equipment plus proceeds from sale-leaseback transactions).
Financial highlights
(in millions, except per share figures) 2014 2013 % change
Net revenuein billions of dollars
139.4
126.8123.1
107.195.8
10 11 12 13 14 10 11 12 13 14 10 11 12 13 14
3.963.75
3.02
2.592.49
Diluted EPS from continuing operations in dollars
1.10
0.90
0.65
0.50
0.35
Annual cash dividendsin dollars per common share
14
CV
S H
ea
lth
157033_NAR.indd 14 3/9/15 10:55 AM

Dear Fellow Shareholders:
The past year has been a milestone year for our company as
we continued to broaden our role as a pharmacy innovation
company. The evidence can be seen everywhere—from the
outstanding selling season of our pharmacy benefit manager
(PBM) and formation of new health care alliances to the
ongoing expansion of our retail pharmacies and the
elimination of tobacco products from our stores.
Importantly, we have changed our corporate name
to CVS Health.
Our company is at the forefront of an evolving health care landscape, and our new name underscores our commitment to helping people on their path to better health. We are delivering breakthrough products and services to increase access to care, improve health outcomes, and lower overall health care costs.
We foresaw many of the changes occurring in health care, and we began assembling an unmatched suite of integrated assets back in 2007 that have positioned us to capitalize on the opportunities created, both now and in the future. CVS Health remains a one-of-a-kind company. Ours is the only integrated pharmacy model with a deep understanding of the diverse needs of consumers, payors, and providers, and these insights inform our innovative, channel-agnostic solutions.
We met our 2014 financial targets while creating significant shareholder value
Before expanding on these and other topics, I want to provide a brief overview of our strong financial performance in 2014. Once again, we met or exceeded all our key financial targets through our ongoing focus on the three pillars that we consider
essential to maximizing shareholder value: driving productive, long-term growth; generating significant free cash flow; and optimizing capital allocation.
Net revenues for the year increased nearly 10 percent to a record $139 billion, while adjusted earnings per share from continuing operations rose to $4.49—up 13.5 percent (excluding the loss
Larry J. MerloPresident and Chief Executive Officer
15
20
14
An
nu
al R
ep
ort
157033_NAR.indd 15 3/9/15 10:55 AM
on early extinguishment of debt in 2014 and the gain from a legal settlement in 2013). And we achieved this strong growth even after forgoing approximately 8 cents in earnings per share from exiting the tobacco category. We’ve benefited from a number of growth drivers, especially our ability to increase enterprise share of prescriptions dispensed through our many channels.
We also filled more than 80 percent of prescriptions using generic equivalents, which are more cost effective for patients and payors and are more profitable for us than branded drugs. Looking ahead, more than $40 billion of branded drugs are expected to lose patent protection and effectively be replaced by generic equivalents between 2015 and 2017. Furthermore, we completed the formation of our Red Oak Sourcing venture with Cardinal Health to create the largest generic sourcing entity in the United States. Our combined scale, along with our knowledge and expertise, should lead to even greater savings for our clients, their members, and CVS Health.
We generated $6.5 billion in free cash flow in 2014 and once again returned more than $5 billion to shareholders through dividends and share repurchases. Our board of directors increased our quarterly dividend by 22 percent last year and recently approved a 27 percent increase for 2015. That marks our 12th consecutive year of increases and keeps us solidly on track toward our dividend payout ratio target of 35 percent by 2018.
With our December 2014 announcement of a new $10 billion share repurchase program, we began 2015 with approximately $12.7 billion available to repurchase CVS Health shares when we identify favorable oppor-tunities. More than $7 billion is expected to be returned to our shareholders through dividends and share repurchases in 2015.
CVS Health shares produced a total return of 36.6 per- cent in 2014. Over the same period, the S&P 500 Index and the Dow Jones Industrial Average returned 13.7 percent and 10.0 percent, respectively. We have outperformed these indices on a three-, five-, and 10-year basis as well. Our 2014 stock performance also outpaced the 25.3 percent return of the S&P 500 Health Care Index.
Our core strengths and integrated offerings drove another successful PBM selling season
Our CVS/caremark PBM offers competitive pricing, high levels of service and execution, and unmatched services that continue to resonate with payors. As a result, 2014 revenues increased by 16 percent to $88 billion in our Pharmacy Services segment. After a successful selling
season, we started 2015 with $7.0 billion in gross new business spread among health plans, government payors, and employers. With a 96 percent retention rate, net new business for 2015 totaled $3.6 billion.
Clients value the strength of CVS/caremark’s adherence programs, specialty services, and advanced formulary strategies. Pharmacy Advisor, Maintenance Choice, Specialty Connect, and our other integrated offerings have played an increasingly important role in our ability to win and retain business. At present, no other PBM can offer these differentiated services and capabilities.
Pharmacy Advisor, our industry-leading clinical program for plan members with chronic diseases, currently addresses diabetes, cardiovascular conditions, and eight other disease states. Now available to our Medicare and Medicaid plans as well, it is helping them improve the clinical star measures that impact their reimbursement rates.
With more than 20 million plan members enrolled in Maintenance Choice in 2015, growth in participation has exceeded 85 percent in just three years. We are also seeing growing interest in our new Specialty Connect delivery option. Similar to Maintenance Choice, it offers specialty patients the flexibility to receive their prescrip-tions by mail or at one of our stores.
CVS/caremark’s retail network claims have risen significantly over the past six years, from about 575 mil- lion to 930 million prescriptions. Over the same period, CVS/pharmacy’s share of the CVS/caremark book of business has grown from 19 percent to approximately 31 percent. We are gaining a growing share of a growing business, highlighting the success of our chan-nel-agnostic approach and the power of our integrated business model.
PBM clients are also increasingly incorporating CVS/minuteclinic services into their plans, improving member access to health care while lowering overall costs. For example, our pilot plan to reduce or eliminate co-payments for plan members now covers 1.2 million lives. That’s up from 88,000 in 2012.
We are reinventing specialty with a unique suite of assets to address rising costs
Our specialty pharmacy business continues to grow rapidly, with revenues from the specialty drugs we dispensed and managed across the enterprise totaling $31 billion in 2014. The overall specialty market is projected to reach $235 billion and 50 percent of total drug spend by 2018—compared with just 38 percent this past year—as utilization of costly new therapies
16
CV
S H
ea
lth
157033_NAR.indd 16 3/9/15 10:55 AM
increases. Hepatitis C drugs such as Sovaldi® and Harvoni™ as well as PCSK9 inhibitors, an anticipated new class of drugs for lowering cholesterol, are notable examples of high-cost therapies expected to drive the rapid growth in specialty pharmacy.
This trend imposes a substantial burden on both patients and payors as they seek ways to control costs. Our clients count on us to manage these expensive specialty medications to ensure appropriate utilization through a combination of prior authorization, formulary manage-ment, and other innovative clinical programs. That’s why we’ve been working hard to reinvent specialty pharmacy.
In specialty, we led the market in 2013 with formulary strategies using clinically appropriate and cost-effective solutions and we continued to lead in 2014. We also have unparalleled capabilities to manage specialty patients holistically, not just their drug costs, and our clinical support and site-of-care management helps drive superior outcomes. We’ve integrated our Accordant rare disease care management services to enhance care and reduce costs, rolled out Specialty Connect, and made key acquisitions such as Coram and NovoLogix to broaden our portfolio.
CVS/pharmacy posted solid results despite exit from tobacco category and continued to gain share
CVS/pharmacy continued to gain market share in both the pharmacy and the front of the store in 2014 even as consumers remained cost conscious. Our core pharmacy business has grown three times faster than that of other drug chains over the same period, and we hold a 21 percent share of the U.S. retail prescription drug market.
For the year, same-store sales rose 2.1 percent, with the pharmacy up 4.8 percent and the front of the store down 4.0 percent. Our underlying front store growth was obscured by the negative impact on revenue from exiting the tobacco category. It has now been five
months since we became the first national pharmacy chain to eliminate cigarettes and other tobacco products from our shelves, a move that reflects our corporate purpose and is expected to help drive long-term growth.
As expected, exiting the tobacco category will cost us approximately $2 billion in revenues on an annualized basis—$1.5 billion from tobacco sales specifically and approximately another $500 million from the rest of those shoppers’ baskets. That amounted to about 8 cents in earnings per share in 2014, and it is expected to cost an incremental 8 to 9 cents per share in 2015 for a total annual impact of approximately 17 cents per share. Yet our decision better aligns us with payors and providers as they search for ways to improve health outcomes and control costs. That should make us a more attractive partner for dispensing and other services, ultimately helping us recapture this lost revenue elsewhere across the enterprise.
Health and beauty remained key drivers of front store sales in 2014, with market shares rising to 36 and 40 percent, respectively. Our store brands continued to generate profitable sales growth, accounting for 19 percent of front store sales. Given our success, we’ve set a new goal of increasing store brand penetration to 25 percent of front store sales. Like generic drugs in the pharmacy, store brands provide significantly higher margins than national brands while also saving our customers money. The past year saw our successful launch of the Makeup Academy™ and radiance® PLATINUM lines as well as more than 40 items under the new Gold Emblem Abound™ healthy snack brand.
As we look to the future, we will continue to provide our customers with additional healthy options. Our goal is to make CVS/pharmacy the convenience destination for more, better, and healthier choices. In research we have conducted since the tobacco announcement, custom-ers have made healthy food their number one choice among offerings they would like to see added. More-over, these products are less sensitive to promotion, which aligns with our strategy to drive profitable growth.
Our adherence programs and partnerships are providing value to our PBM and non-PBM patients alike
Our channel-agnostic pharmacy care model has played a key role in enhancing member services and driving share gains. Plan members are embracing our unique offerings, and we’ve also endeavored to improve our value to our retail customers who are covered by other PBMs. They are benefiting from our best-in-class clinical
17
20
14
An
nu
al R
ep
ort
FOCUS ON SHAREHOLDER VALUE
More than $7 billion is expected to be returned to our shareholders through dividends and share repurchases in 2015.
157033_NAR.indd 17 3/9/15 10:55 AM
programs to help treat chronic conditions as well as from the innovative partnerships we have forged with providers and payors.
Adherence to prescription drug regimens is critical to improving patient health and reducing costs, and CVS/pharmacy’s adherence rates lead the industry. For example, our medication possession ratios for custom-ers undergoing therapy for diabetes, high cholesterol, or high blood pressure are eight percentage points higher than those of our top three retail competitors. That translates into lower mortality rates, fewer heart attacks and strokes, better quality of life, and a reduction in overall health care costs.
Among our partnerships, we’re working with hospital providers to ensure that patients have the proper outpatient medications in hand before discharge. We follow up after patients return home to answer questions and confirm medication adherence. With the rise of consumerism driven in large part by the increasing numbers of individuals in consumer-driven health plans, what we’re calling the retailization of health care, CVS/pharmacy has also partnered with a number of health plan clients on a variety of initiatives that help them reach out to consumers directly. For example, we host in-store events to drive member acquisition and have launched a solution that enables health plan members to pay their insurance premiums at their local CVS/pharmacy. We’ve also introduced HeathTag®, which allows us to deliver messages from our health plan partners to patients, such as a reminder to get an A1C blood sugar screening when picking up a prescrip-tion. Importantly, these relationships position us to be anchors in their limited or preferred networks.
We continue to enter new markets and use ExtraCare to drive profitable growth
The vast majority of the U.S. population lives within a few miles of a CVS/pharmacy, and we’ve continued to expand our footprint in existing markets as well as by entering new markets such as Seattle. Overall, we opened or acquired 184 new stores in 2014. Factoring in closings, net units increased by 162 stores. That equates to two percent retail square footage growth for the year, in line with our annual goal.
Our September 2014 acquisition of Miami-based Navarro Discount Pharmacy® has strengthened our position in the Hispanic marketplace, the fastest growing demographic in the United States. Over the next decade, the U.S. Hispanic population is expected to increase by 25 percent to 71 million lives. Navarro has been serving Hispanic consumers for more than 50 years and now
has 33 retail drugstore locations. We are leveraging its expertise to help make CVS/pharmacy stores in Hispanic neighborhoods across the country even more relevant to the customers we serve every day.
In all our locations, the ExtraCare loyalty program con-tinues to play an indispensable role in driving profitable front store sales. The industry’s longest-running loyalty program is now in its 17th year and was used in more than 80 percent of front store sales in 2014. It has allowed us to gather critical consumer insights that we use every day to enhance the CVS/pharmacy shopping experience and to invest in those customers who provide the most value.
For example, we’re now leveraging the knowledge we’ve gained through ExtraCare to deliver personalized offers to our 70 million active cardholders. This includes 25 million e-mails a week and 90 million mail pieces annually. In 2014, cardholders redeemed a total of 38 million personalized coupons. The ongoing decline in newspaper circulation will only increase our advantage over competitors who rely more heavily on circulars to drive trips to their stores. As always, cardholders also get 2 percent back on purchases every day and received $4 billion in ExtraBucks® savings and rewards in 2014.
CVS Health’s robust digital strategy empowers consum-ers to navigate their pharmacy experiences and manage their conditions through our online and mobile tools. This includes the ability to get next-in-line text alerts at CVS/minuteclinic and, in the future, the ability to schedule appointments. Our mobile app has received critical acclaim for ease of use, while our text message program has experienced significant growth.
CVS/minuteclinic excels at customer satisfaction while broadening its preventative and chronic care offerings
CVS/minuteclinic continued its rapid growth, ending the year with more than 970 clinics in 31 states and the District of Columbia, up from 800 clinics in the prior year. Since its inception, CVS/minuteclinic’s 2,700 nurse practitioners and physician assistants have provided care for more than 23 million patient visits. We will continue to add more locations and enter new markets in 2015 and remain on track to reach 1,500 locations by the end of 2017.
Along with our rapid growth, we have continued to deliver the high levels of satisfaction and quality for which CVS/minuteclinic is known. Our net promoter score, a third-party measure of how likely it is that
18
CV
S H
ea
lth
157033_NAR.indd 18 3/9/15 10:55 AM
our services would be recommended to friends or colleagues, has grown over the past two years. Among health care organizations, our scores are unmatched. Our own research published in the October 2014 edition of The American Journal of Managed Care shows that CVS/minuteclinic’s quality performance matches or exceeds that of other ambulatory care settings for three common health conditions.
Although CVS/minuteclinic is largely known for treating sore throats, ear infections, and other acute conditions, we are focused on expanding its scope of services. That includes adding chronic disease monitoring and treatment for conditions such as hypertension and hyperlipidemia. We have expanded our biometric monitoring, tobacco cessation, and weight loss pro-grams. We undertake chronic care only when working with primary care doctors to complement the services they offer. Our affiliations with major health systems throughout the United States—and two-way integration of our electronic medical records—heighten our ability to provide collaborative care. We added 19 health systems in 2014, ending the year with 49 such affiliations.
Growth of government programs and exchanges presents significant opportunities across our enterprise
Government programs represent a tremendous growth opportunity for us, and we have strong positions in both the Medicare and Medicaid markets. The United States is in the midst of what we are calling a “silver tsunami,” with some 10,000 baby boomers turning 65 every day. This means that more than 17 million new people will be eligible for Medicare by 2019. CVS Health serves this market through our SilverScript Medicare Part D prescription drug plan, as the PBM for our health plan Medicare clients, and through Employer Group Waiver Plans.
As a result of the Affordable Care Act, we have seen significant growth in Medicaid over the past year with states expanding eligibility. This growth will likely continue as more states evaluate their Medicaid expansion decisions. At the same time, the growth of managed Medicaid over traditional fee-for-service models has been fueled by states seeking cost savings opportuni-ties. CVS/caremark participates in managed Medicaid through health plan clients, and our 19 percent share makes us an industry leader. Medicaid also currently accounts for 14 percent of prescriptions dispensed at CVS/pharmacy locations. Our retail footprint and capabilities give us an opportunity to gain even greater share as managed Medicaid providers narrow their retail pharmacy networks to save costs.
The next several years are expected to bring continued growth in the number of people seeking insurance through the public exchanges. Additionally, we believe some employers will explore private exchanges as a viable option to reduce health care spending for their retirees. CVS/caremark participates on the public and private exchanges on a carve-in basis with health plan clients. On the private exchanges, we also participate on a carve-out basis as a standalone PBM where we offer prescription benefits directly. We expect the growth in exchange lives to provide an incremental lift to our retail pharmacy as utilization increases.
Clearly, we are seeing tremendous opportunities for growth throughout the enterprise, and I believe that our integrated model will allow us to take full advantage of them. In closing, I want to thank our board of directors and the 217,000 colleagues who work so diligently across CVS Health. They have committed themselves to our unique model of pharmacy care and have given us a compelling advantage in today’s marketplace. To my fellow shareholders, thank you for your continued confidence in our strategy.
Sincerely,
Larry J. Merlo President and Chief Executive Officer
February 10, 2015
19
20
14
An
nu
al R
ep
ort
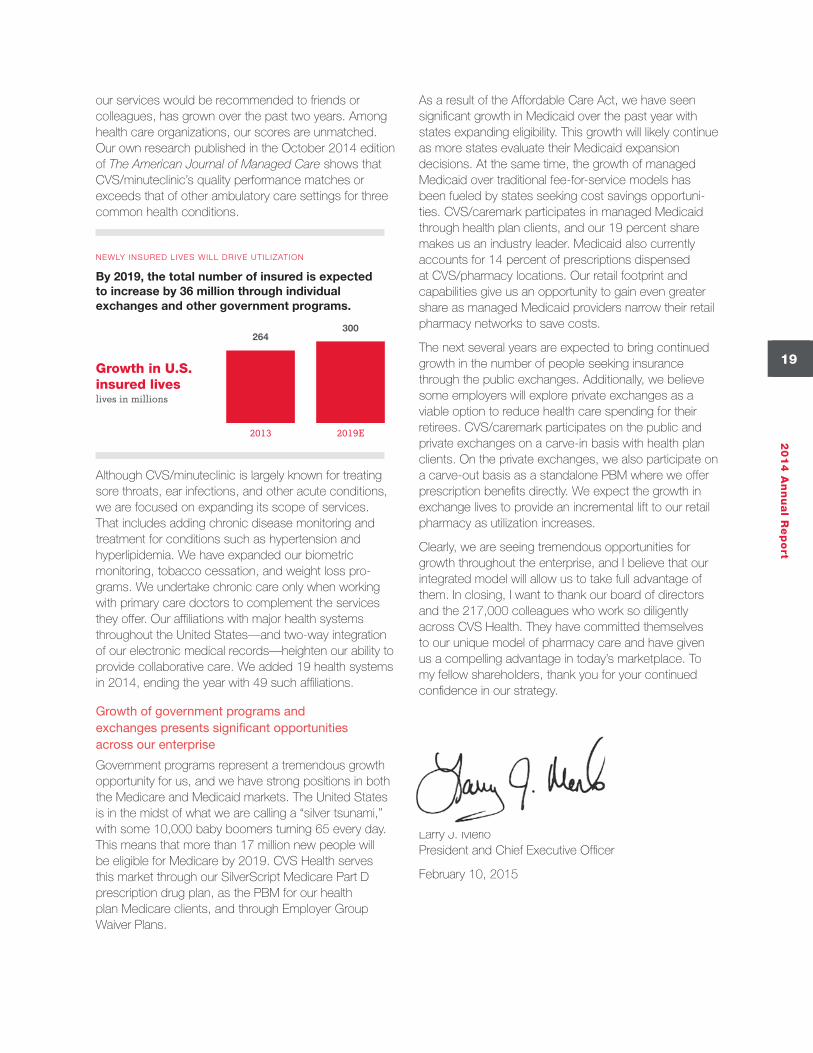
NEWLY INSURED LIVES WILL DRIVE UTILIZATION
By 2019, the total number of insured is expected to increase by 36 million through individual exchanges and other government programs.
2013 2019E
300264
Growth in U.S. insured lives lives in millions
157033_NAR.indd 19 3/9/15 10:55 AM
20
CV
S H
ea
lth
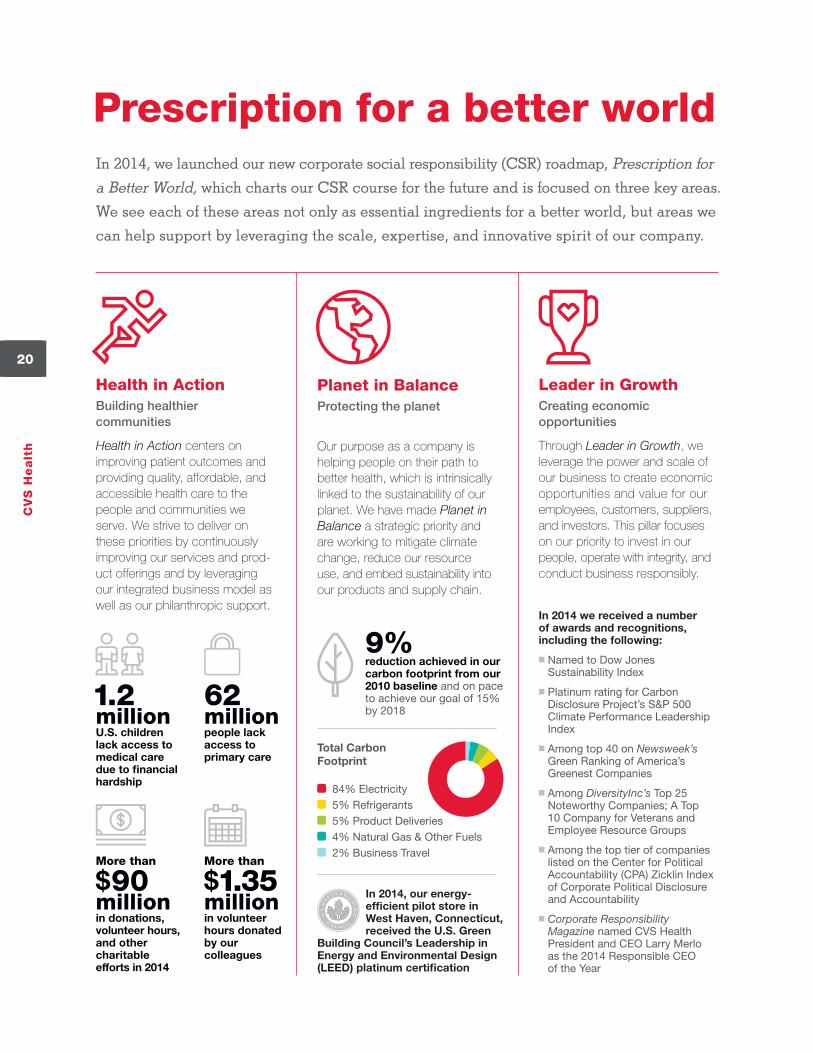
Prescription for a better worldIn 2014, we launched our new corporate social responsibility (CSR) roadmap, Prescription for
a Better World, which charts our CSR course for the future and is focused on three key areas.
We see each of these areas not only as essential ingredients for a better world, but areas we
can help support by leveraging the scale, expertise, and innovative spirit of our company.
Health in ActionBuilding healthier communities
Health in Action centers on improving patient outcomes and providing quality, affordable, and accessible health care to the people and communities we serve. We strive to deliver on these priorities by continuously improving our services and prod-uct offerings and by leveraging our integrated business model as well as our philanthropic support.
Planet in BalanceProtecting the planet
Our purpose as a company is helping people on their path to better health, which is intrinsically linked to the sustainability of our planet. We have made Planet in Balance a strategic priority and are working to mitigate climate change, reduce our resource use, and embed sustainability into our products and supply chain.
Leader in GrowthCreating economic opportunities
Through Leader in Growth, we leverage the power and scale of our business to create economic opportunities and value for our employees, customers, suppliers, and investors. This pillar focuses on our priority to invest in our people, operate with integrity, and conduct business responsibly.
More than
$90 million in donations, volunteer hours, and other charitable efforts in 2014
More than
$1.35 millionin volunteer hours donated by our colleagues
62 million people lack access to primary care
1.2 millionU.S. children lack access to medical care due to financial hardship
In 2014, our energy-efficient pilot store in West Haven, Connecticut, received the U.S. Green
Building Council’s Leadership in Energy and Environmental Design (LEED) platinum certification
In 2014 we received a number of awards and recognitions, including the following:
n Named to Dow Jones Sustainability Index
n Platinum rating for Carbon Disclosure Project’s S&P 500 Climate Performance Leadership Index
n Among top 40 on Newsweek’s Green Ranking of America’s Greenest Companies
n Among DiversityInc’s Top 25 Noteworthy Companies; A Top 10 Company for Veterans and Employee Resource Groups
n Among the top tier of companies listed on the Center for Political Accountability (CPA) Zicklin Index of Corporate Political Disclosure and Accountability
n Corporate Responsibility Magazine named CVS Health President and CEO Larry Merlo as the 2014 Responsible CEO of the Year
9% reduction achieved in our carbon footprint from our 2010 baseline and on pace to achieve our goal of 15% by 2018
Total Carbon Footprint
84% Electricity 5% Refrigerants 5% Product Deliveries 4% Natural Gas & Other Fuels 2% Business Travel
157033_NAR.indd 20 3/9/15 10:55 AM
20
14
An
nu
al R
ep
ort
21
2014 Financial Report
22 Management’s Discussion and Analysis of Financial Condition and Results of Operations
50 Management’s Report on Internal Control Over Financial Reporting
51 Report of Independent Registered Public Accounting Firm
52 Consolidated Statements of Income
53 Consolidated Statements of Comprehensive Income
54 Consolidated Balance Sheets
55 Consolidated Statements of Cash Flows
56 Consolidated Statements of Shareholders’ Equity
57 Notes to Consolidated Financial Statements
88 Five-Year Financial Summary
89 Report of Independent Registered Public Accounting Firm
90 Stock Performance Graph
157033_FIN.indd 21 3/2/15 3:14 PM
Management’s Discussion and Analysis of Financial Condition and Results of Operations
22
CV
S H
ea
lth
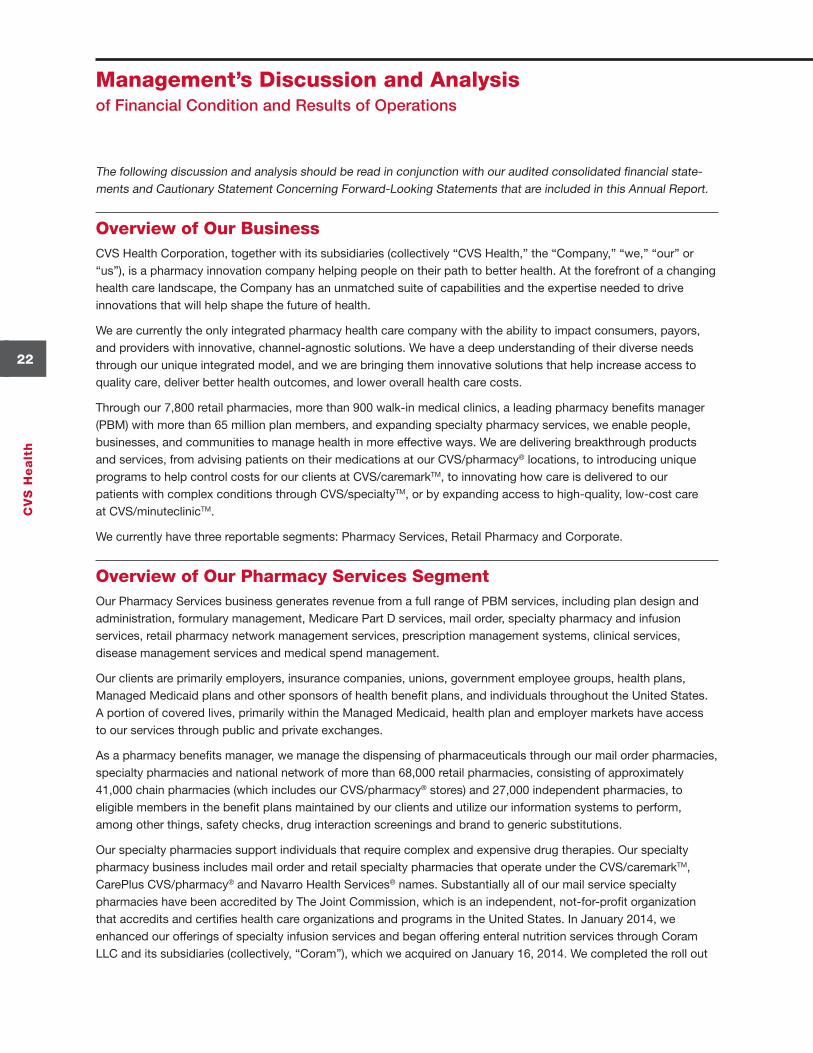
The following discussion and analysis should be read in conjunction with our audited consolidated financial state-ments and Cautionary Statement Concerning Forward-Looking Statements that are included in this Annual Report.
Overview of Our BusinessCVS Health Corporation, together with its subsidiaries (collectively “CVS Health,” the “Company,” “we,” “our” or “us”), is a pharmacy innovation company helping people on their path to better health. At the forefront of a changing health care landscape, the Company has an unmatched suite of capabilities and the expertise needed to drive innovations that will help shape the future of health.
We are currently the only integrated pharmacy health care company with the ability to impact consumers, payors, and providers with innovative, channel-agnostic solutions. We have a deep understanding of their diverse needs through our unique integrated model, and we are bringing them innovative solutions that help increase access to quality care, deliver better health outcomes, and lower overall health care costs.
Through our 7,800 retail pharmacies, more than 900 walk-in medical clinics, a leading pharmacy benefits manager (PBM) with more than 65 million plan members, and expanding specialty pharmacy services, we enable people, businesses, and communities to manage health in more effective ways. We are delivering breakthrough products and services, from advising patients on their medications at our CVS/pharmacy® locations, to introducing unique programs to help control costs for our clients at CVS/caremarkTM, to innovating how care is delivered to our patients with complex conditions through CVS/specialtyTM, or by expanding access to high-quality, low-cost care at CVS/minuteclinicTM.
We currently have three reportable segments: Pharmacy Services, Retail Pharmacy and Corporate.
Overview of Our Pharmacy Services SegmentOur Pharmacy Services business generates revenue from a full range of PBM services, including plan design and administration, formulary management, Medicare Part D services, mail order, specialty pharmacy and infusion services, retail pharmacy network management services, prescription management systems, clinical services, disease management services and medical spend management.
Our clients are primarily employers, insurance companies, unions, government employee groups, health plans, Managed Medicaid plans and other sponsors of health benefit plans, and individuals throughout the United States. A portion of covered lives, primarily within the Managed Medicaid, health plan and employer markets have access to our services through public and private exchanges.
As a pharmacy benefits manager, we manage the dispensing of pharmaceuticals through our mail order pharmacies, specialty pharmacies and national network of more than 68,000 retail pharmacies, consisting of approximately 41,000 chain pharmacies (which includes our CVS/pharmacy® stores) and 27,000 independent pharmacies, to eligible members in the benefit plans maintained by our clients and utilize our information systems to perform, among other things, safety checks, drug interaction screenings and brand to generic substitutions.
Our specialty pharmacies support individuals that require complex and expensive drug therapies. Our specialty pharmacy business includes mail order and retail specialty pharmacies that operate under the CVS/caremarkTM, CarePlus CVS/pharmacy® and Navarro Health Services® names. Substantially all of our mail service specialty pharmacies have been accredited by The Joint Commission, which is an independent, not-for-profit organization that accredits and certifies health care organizations and programs in the United States. In January 2014, we enhanced our offerings of specialty infusion services and began offering enteral nutrition services through Coram LLC and its subsidiaries (collectively, “Coram”), which we acquired on January 16, 2014. We completed the roll out
157033_FIN.indd 22 3/2/15 3:14 PM
23
20
14
An
nu
al R
ep
ort
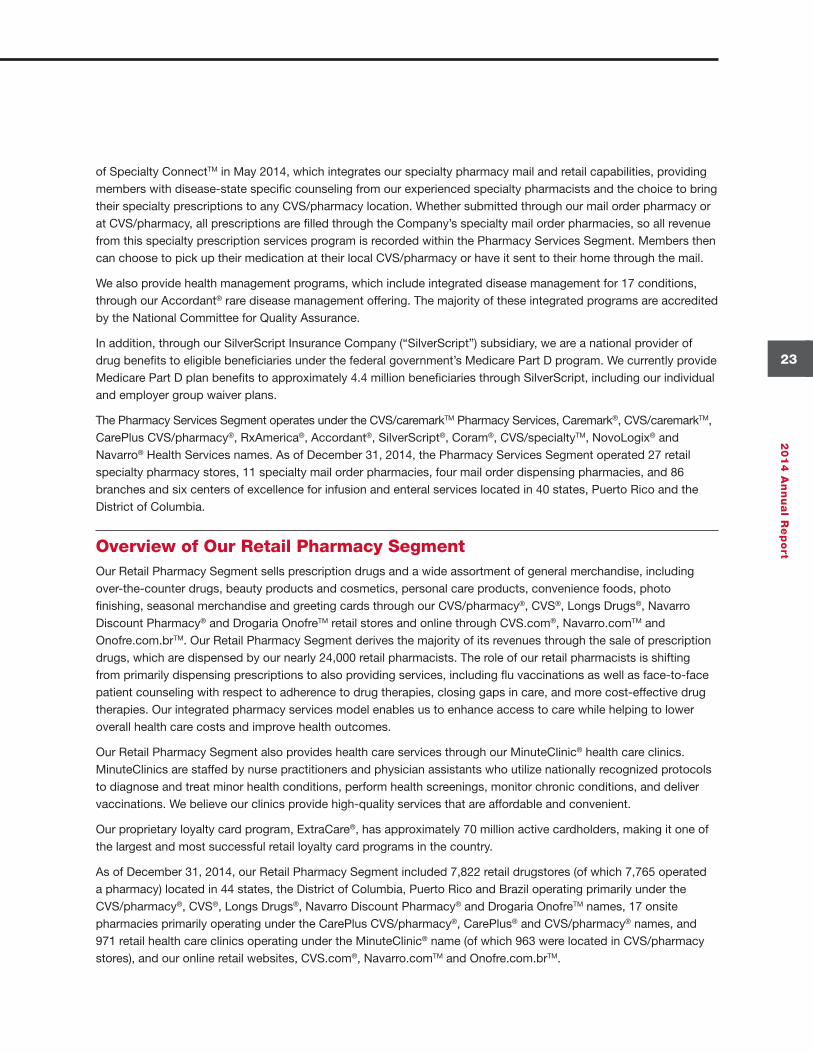
of Specialty ConnectTM in May 2014, which integrates our specialty pharmacy mail and retail capabilities, providing members with disease-state specific counseling from our experienced specialty pharmacists and the choice to bring their specialty prescriptions to any CVS/pharmacy location. Whether submitted through our mail order pharmacy or at CVS/pharmacy, all prescriptions are filled through the Company’s specialty mail order pharmacies, so all revenue from this specialty prescription services program is recorded within the Pharmacy Services Segment. Members then can choose to pick up their medication at their local CVS/pharmacy or have it sent to their home through the mail.
We also provide health management programs, which include integrated disease management for 17 conditions, through our Accordant® rare disease management offering. The majority of these integrated programs are accredited by the National Committee for Quality Assurance.
In addition, through our SilverScript Insurance Company (“SilverScript”) subsidiary, we are a national provider of drug benefits to eligible beneficiaries under the federal government’s Medicare Part D program. We currently provide Medicare Part D plan benefits to approximately 4.4 million beneficiaries through SilverScript, including our individual and employer group waiver plans.
The Pharmacy Services Segment operates under the CVS/caremarkTM Pharmacy Services, Caremark®, CVS/caremarkTM, CarePlus CVS/pharmacy®, RxAmerica®, Accordant®, SilverScript®, Coram®, CVS/specialtyTM, NovoLogix® and Navarro® Health Services names. As of December 31, 2014, the Pharmacy Services Segment operated 27 retail specialty pharmacy stores, 11 specialty mail order pharmacies, four mail order dispensing pharmacies, and 86 branches and six centers of excellence for infusion and enteral services located in 40 states, Puerto Rico and the District of Columbia.
Overview of Our Retail Pharmacy SegmentOur Retail Pharmacy Segment sells prescription drugs and a wide assortment of general merchandise, including over-the-counter drugs, beauty products and cosmetics, personal care products, convenience foods, photo finishing, seasonal merchandise and greeting cards through our CVS/pharmacy®, CVS®, Longs Drugs®, Navarro Discount Pharmacy® and Drogaria OnofreTM retail stores and online through CVS.com®, Navarro.comTM and Onofre.com.brTM. Our Retail Pharmacy Segment derives the majority of its revenues through the sale of prescription drugs, which are dispensed by our nearly 24,000 retail pharmacists. The role of our retail pharmacists is shifting from primarily dispensing prescriptions to also providing services, including flu vaccinations as well as face-to-face patient counseling with respect to adherence to drug therapies, closing gaps in care, and more cost-effective drug therapies. Our integrated pharmacy services model enables us to enhance access to care while helping to lower overall health care costs and improve health outcomes.
Our Retail Pharmacy Segment also provides health care services through our MinuteClinic® health care clinics. MinuteClinics are staffed by nurse practitioners and physician assistants who utilize nationally recognized protocols to diagnose and treat minor health conditions, perform health screenings, monitor chronic conditions, and deliver vaccinations. We believe our clinics provide high-quality services that are affordable and convenient.
Our proprietary loyalty card program, ExtraCare®, has approximately 70 million active cardholders, making it one of the largest and most successful retail loyalty card programs in the country.
As of December 31, 2014, our Retail Pharmacy Segment included 7,822 retail drugstores (of which 7,765 operated a pharmacy) located in 44 states, the District of Columbia, Puerto Rico and Brazil operating primarily under the CVS/pharmacy®, CVS®, Longs Drugs®, Navarro Discount Pharmacy® and Drogaria OnofreTM names, 17 onsite pharmacies primarily operating under the CarePlus CVS/pharmacy®, CarePlus® and CVS/pharmacy® names, and 971 retail health care clinics operating under the MinuteClinic® name (of which 963 were located in CVS/pharmacy stores), and our online retail websites, CVS.com®, Navarro.comTM and Onofre.com.brTM.
157033_FIN.indd 23 3/2/15 3:14 PM
Management’s Discussion and Analysis of Financial Condition and Results of Operations
24
CV
S H
ea
lth
Overview of Our Corporate SegmentThe Corporate Segment provides management and administrative services to support the Company. The Corporate Segment consists of certain aspects of our executive management, corporate relations, legal, compliance, human resources, corporate information technology and finance departments.
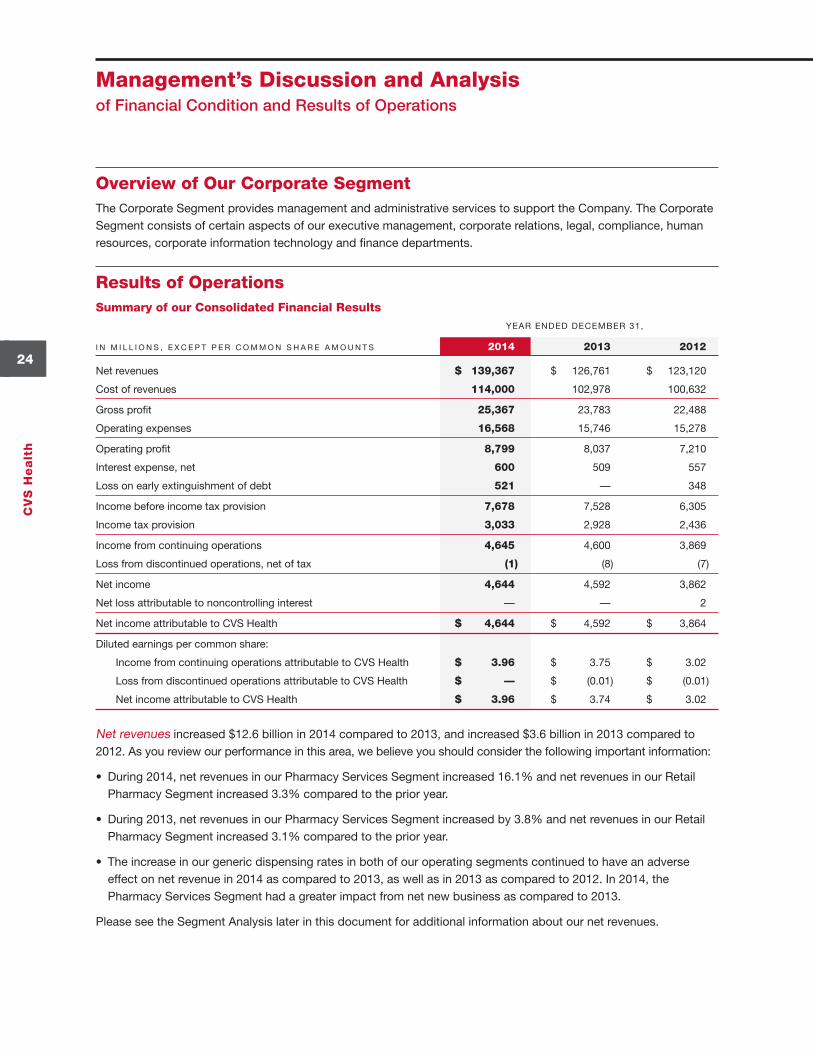
Results of OperationsSummary of our Consolidated Financial Results
YEAR ENDED DECEMBER 31,
I N M I L L I O N S , E X C E P T P E R C O M M O N S H A R E A M O U N T S 2014 2013 2012
Net revenues $ 139,367 $ 126,761 $ 123,120
Cost of revenues 114,000 102,978 100,632
Gross profit 25,367 23,783 22,488
Operating expenses 16,568 15,746 15,278
Operating profit 8,799 8,037 7,210
Interest expense, net 600 509 557
Loss on early extinguishment of debt 521 — 348
Income before income tax provision 7,678 7,528 6,305
Income tax provision 3,033 2,928 2,436
Income from continuing operations 4,645 4,600 3,869
Loss from discontinued operations, net of tax (1) (8) (7)
Net income 4,644 4,592 3,862
Net loss attributable to noncontrolling interest — — 2
Net income attributable to CVS Health $ 4,644 $ 4,592 $ 3,864
Diluted earnings per common share:
Income from continuing operations attributable to CVS Health $ 3.96 $ 3.75 $ 3.02
Loss from discontinued operations attributable to CVS Health $ — $ (0.01) $ (0.01)
Net income attributable to CVS Health $ 3.96 $ 3.74 $ 3.02
Net revenues increased $12.6 billion in 2014 compared to 2013, and increased $3.6 billion in 2013 compared to 2012. As you review our performance in this area, we believe you should consider the following important information:
• During 2014, net revenues in our Pharmacy Services Segment increased 16.1% and net revenues in our Retail Pharmacy Segment increased 3.3% compared to the prior year.
• During 2013, net revenues in our Pharmacy Services Segment increased by 3.8% and net revenues in our Retail Pharmacy Segment increased 3.1% compared to the prior year.
• The increase in our generic dispensing rates in both of our operating segments continued to have an adverse effect on net revenue in 2014 as compared to 2013, as well as in 2013 as compared to 2012. In 2014, the Pharmacy Services Segment had a greater impact from net new business as compared to 2013.
Please see the Segment Analysis later in this document for additional information about our net revenues.
157033_FIN.indd 24 3/2/15 3:14 PM
25
20
14
An
nu
al R
ep
ort
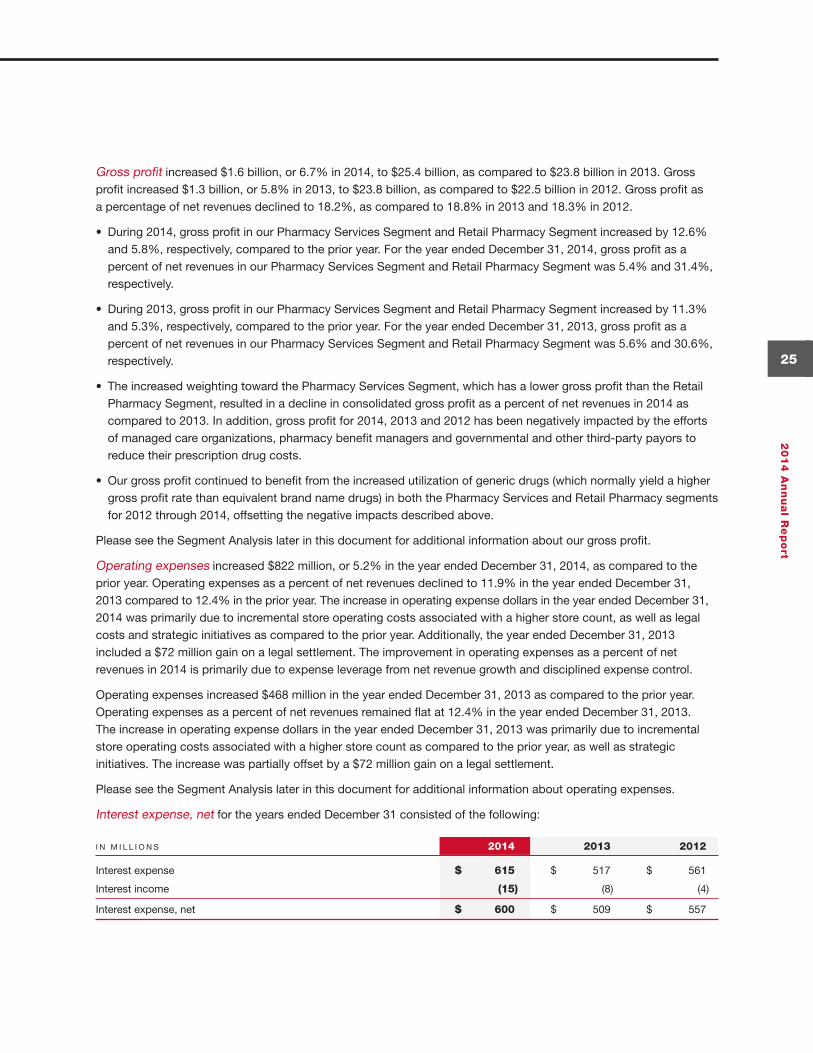
Gross profit increased $1.6 billion, or 6.7% in 2014, to $25.4 billion, as compared to $23.8 billion in 2013. Gross profit increased $1.3 billion, or 5.8% in 2013, to $23.8 billion, as compared to $22.5 billion in 2012. Gross profit as a percentage of net revenues declined to 18.2%, as compared to 18.8% in 2013 and 18.3% in 2012.
• During 2014, gross profit in our Pharmacy Services Segment and Retail Pharmacy Segment increased by 12.6% and 5.8%, respectively, compared to the prior year. For the year ended December 31, 2014, gross profit as a percent of net revenues in our Pharmacy Services Segment and Retail Pharmacy Segment was 5.4% and 31.4%, respectively.
• During 2013, gross profit in our Pharmacy Services Segment and Retail Pharmacy Segment increased by 11.3% and 5.3%, respectively, compared to the prior year. For the year ended December 31, 2013, gross profit as a percent of net revenues in our Pharmacy Services Segment and Retail Pharmacy Segment was 5.6% and 30.6%, respectively.
• The increased weighting toward the Pharmacy Services Segment, which has a lower gross profit than the Retail Pharmacy Segment, resulted in a decline in consolidated gross profit as a percent of net revenues in 2014 as compared to 2013. In addition, gross profit for 2014, 2013 and 2012 has been negatively impacted by the efforts of managed care organizations, pharmacy benefit managers and governmental and other third-party payors to reduce their prescription drug costs.
• Our gross profit continued to benefit from the increased utilization of generic drugs (which normally yield a higher gross profit rate than equivalent brand name drugs) in both the Pharmacy Services and Retail Pharmacy segments for 2012 through 2014, offsetting the negative impacts described above.
Please see the Segment Analysis later in this document for additional information about our gross profit.
Operating expenses increased $822 million, or 5.2% in the year ended December 31, 2014, as compared to the prior year. Operating expenses as a percent of net revenues declined to 11.9% in the year ended December 31, 2013 compared to 12.4% in the prior year. The increase in operating expense dollars in the year ended December 31, 2014 was primarily due to incremental store operating costs associated with a higher store count, as well as legal costs and strategic initiatives as compared to the prior year. Additionally, the year ended December 31, 2013 included a $72 million gain on a legal settlement. The improvement in operating expenses as a percent of net revenues in 2014 is primarily due to expense leverage from net revenue growth and disciplined expense control.
Operating expenses increased $468 million in the year ended December 31, 2013 as compared to the prior year. Operating expenses as a percent of net revenues remained flat at 12.4% in the year ended December 31, 2013. The increase in operating expense dollars in the year ended December 31, 2013 was primarily due to incremental store operating costs associated with a higher store count as compared to the prior year, as well as strategic initiatives. The increase was partially offset by a $72 million gain on a legal settlement.
Please see the Segment Analysis later in this document for additional information about operating expenses.
Interest expense, net for the years ended December 31 consisted of the following:
I N M I L L I O N S 2014 2013 2012
Interest expense $ 615 $ 517 $ 561
Interest income (15) (8) (4)
Interest expense, net $ 600 $ 509 $ 557
157033_FIN.indd 25 3/2/15 3:14 PM
Management’s Discussion and Analysis of Financial Condition and Results of Operations
26
CV
S H
ea
lth
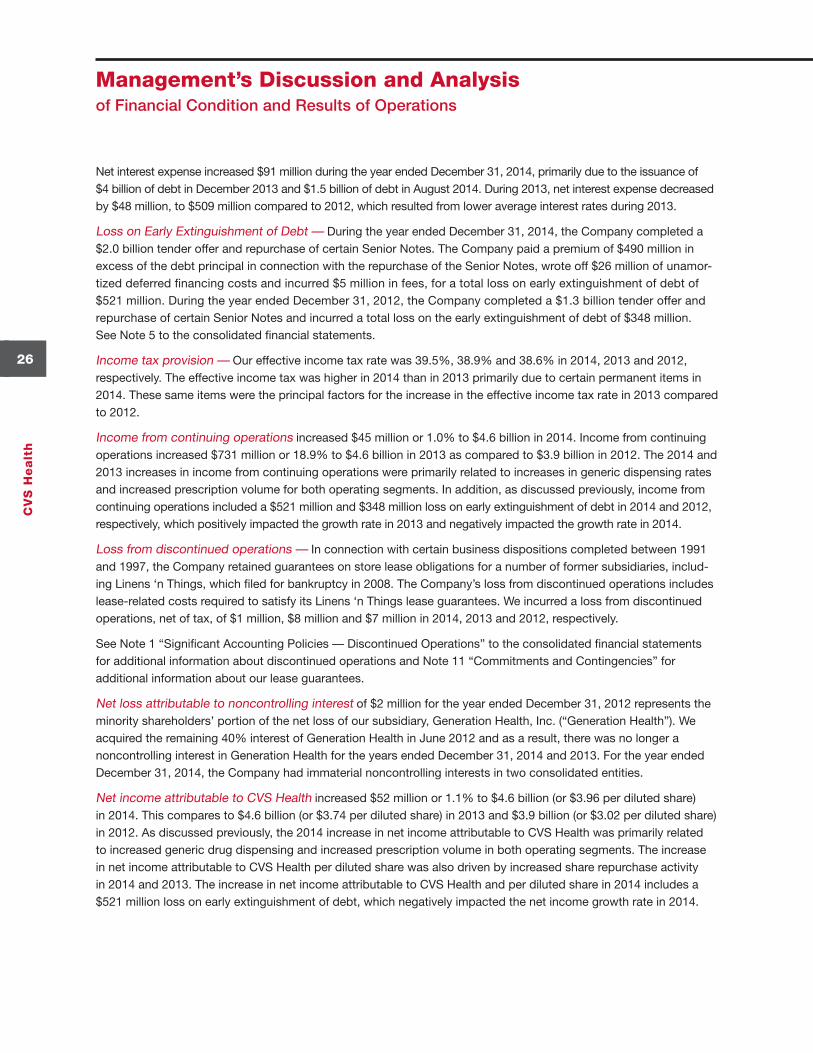
Net interest expense increased $91 million during the year ended December 31, 2014, primarily due to the issuance of $4 billion of debt in December 2013 and $1.5 billion of debt in August 2014. During 2013, net interest expense decreased by $48 million, to $509 million compared to 2012, which resulted from lower average interest rates during 2013.
Loss on Early Extinguishment of Debt — During the year ended December 31, 2014, the Company completed a $2.0 billion tender offer and repurchase of certain Senior Notes. The Company paid a premium of $490 million in excess of the debt principal in connection with the repurchase of the Senior Notes, wrote off $26 million of unamor-tized deferred financing costs and incurred $5 million in fees, for a total loss on early extinguishment of debt of $521 million. During the year ended December 31, 2012, the Company completed a $1.3 billion tender offer and repurchase of certain Senior Notes and incurred a total loss on the early extinguishment of debt of $348 million. See Note 5 to the consolidated financial statements.
Income tax provision — Our effective income tax rate was 39.5%, 38.9% and 38.6% in 2014, 2013 and 2012, respectively. The effective income tax was higher in 2014 than in 2013 primarily due to certain permanent items in 2014. These same items were the principal factors for the increase in the effective income tax rate in 2013 compared to 2012.
Income from continuing operations increased $45 million or 1.0% to $4.6 billion in 2014. Income from continuing operations increased $731 million or 18.9% to $4.6 billion in 2013 as compared to $3.9 billion in 2012. The 2014 and 2013 increases in income from continuing operations were primarily related to increases in generic dispensing rates and increased prescription volume for both operating segments. In addition, as discussed previously, income from continuing operations included a $521 million and $348 million loss on early extinguishment of debt in 2014 and 2012, respectively, which positively impacted the growth rate in 2013 and negatively impacted the growth rate in 2014.
Loss from discontinued operations — In connection with certain business dispositions completed between 1991 and 1997, the Company retained guarantees on store lease obligations for a number of former subsidiaries, includ-ing Linens ‘n Things, which filed for bankruptcy in 2008. The Company’s loss from discontinued operations includes lease-related costs required to satisfy its Linens ‘n Things lease guarantees. We incurred a loss from discontinued operations, net of tax, of $1 million, $8 million and $7 million in 2014, 2013 and 2012, respectively.
See Note 1 “Significant Accounting Policies — Discontinued Operations” to the consolidated financial statements for additional information about discontinued operations and Note 11 “Commitments and Contingencies” for additional information about our lease guarantees.
Net loss attributable to noncontrolling interest of $2 million for the year ended December 31, 2012 represents the minority shareholders’ portion of the net loss of our subsidiary, Generation Health, Inc. (“Generation Health”). We acquired the remaining 40% interest of Generation Health in June 2012 and as a result, there was no longer a noncontrolling interest in Generation Health for the years ended December 31, 2014 and 2013. For the year ended December 31, 2014, the Company had immaterial noncontrolling interests in two consolidated entities.
Net income attributable to CVS Health increased $52 million or 1.1% to $4.6 billion (or $3.96 per diluted share) in 2014. This compares to $4.6 billion (or $3.74 per diluted share) in 2013 and $3.9 billion (or $3.02 per diluted share) in 2012. As discussed previously, the 2014 increase in net income attributable to CVS Health was primarily related to increased generic drug dispensing and increased prescription volume in both operating segments. The increase in net income attributable to CVS Health per diluted share was also driven by increased share repurchase activity in 2014 and 2013. The increase in net income attributable to CVS Health and per diluted share in 2014 includes a $521 million loss on early extinguishment of debt, which negatively impacted the net income growth rate in 2014.
157033_FIN.indd 26 3/2/15 3:14 PM
27
20
14
An
nu
al R
ep
ort
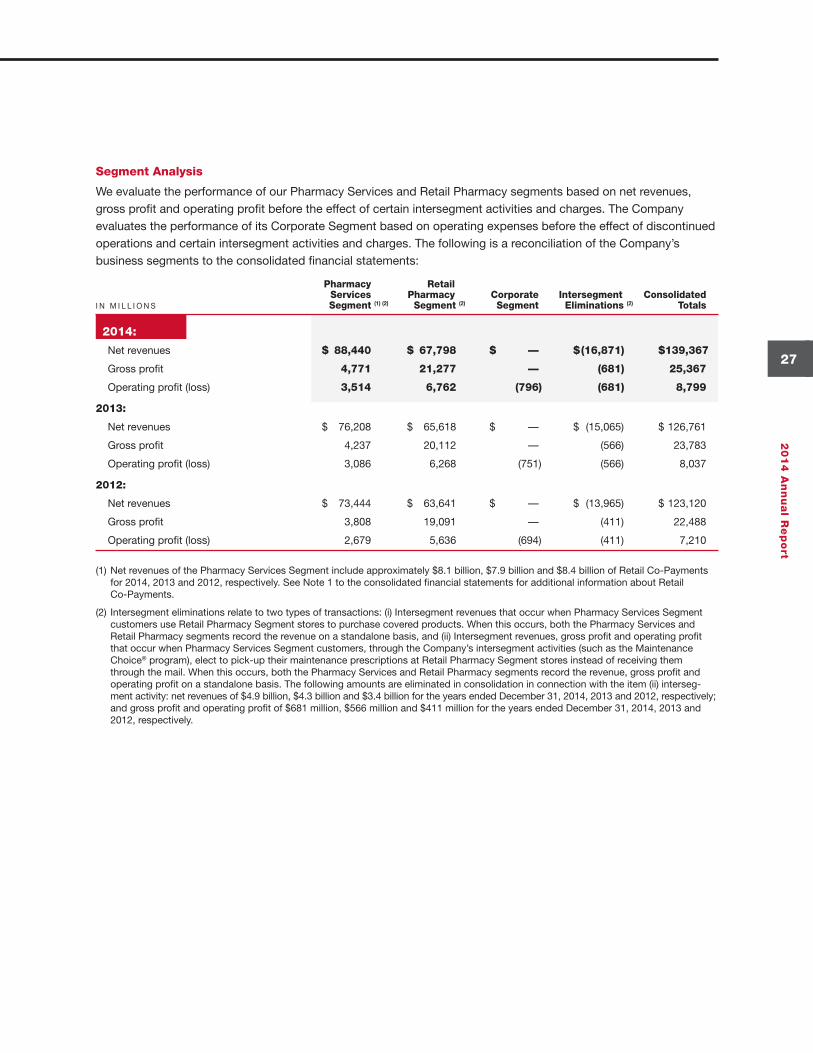
Segment Analysis
We evaluate the performance of our Pharmacy Services and Retail Pharmacy segments based on net revenues, gross profit and operating profit before the effect of certain intersegment activities and charges. The Company evaluates the performance of its Corporate Segment based on operating expenses before the effect of discontinued operations and certain intersegment activities and charges. The following is a reconciliation of the Company’s business segments to the consolidated financial statements:
Pharmacy Retail Services Pharmacy Corporate Intersegment Consolidated I N M I L L I O N S Segment (1) (2) Segment (2) Segment Eliminations (2) Totals
2014:
Net revenues $ 88,440 $ 67,798 $ — $ (16,871) $ 139,367
Gross profit 4,771 21,277 — (681) 25,367
Operating profit (loss) 3,514 6,762 (796) (681) 8,799
2013:
Net revenues $ 76,208 $ 65,618 $ — $ (15,065) $ 126,761
Gross profit 4,237 20,112 — (566) 23,783
Operating profit (loss) 3,086 6,268 (751) (566) 8,037
2012:
Net revenues $ 73,444 $ 63,641 $ — $ (13,965) $ 123,120
Gross profit 3,808 19,091 — (411) 22,488
Operating profit (loss) 2,679 5,636 (694) (411) 7,210
(1) Net revenues of the Pharmacy Services Segment include approximately $8.1 billion, $7.9 billion and $8.4 billion of Retail Co-Payments for 2014, 2013 and 2012, respectively. See Note 1 to the consolidated financial statements for additional information about Retail Co-Payments.
(2) Intersegment eliminations relate to two types of transactions: (i) Intersegment revenues that occur when Pharmacy Services Segment customers use Retail Pharmacy Segment stores to purchase covered products. When this occurs, both the Pharmacy Services and Retail Pharmacy segments record the revenue on a standalone basis, and (ii) Intersegment revenues, gross profit and operating profit that occur when Pharmacy Services Segment customers, through the Company’s intersegment activities (such as the Maintenance Choice® program), elect to pick-up their maintenance prescriptions at Retail Pharmacy Segment stores instead of receiving them through the mail. When this occurs, both the Pharmacy Services and Retail Pharmacy segments record the revenue, gross profit and operating profit on a standalone basis. The following amounts are eliminated in consolidation in connection with the item (ii) interseg-ment activity: net revenues of $4.9 billion, $4.3 billion and $3.4 billion for the years ended December 31, 2014, 2013 and 2012, respectively; and gross profit and operating profit of $681 million, $566 million and $411 million for the years ended December 31, 2014, 2013 and 2012, respectively.
157033_FIN.indd 27 3/2/15 3:14 PM
Management’s Discussion and Analysis of Financial Condition and Results of Operations
28
CV
S H
ea
lth
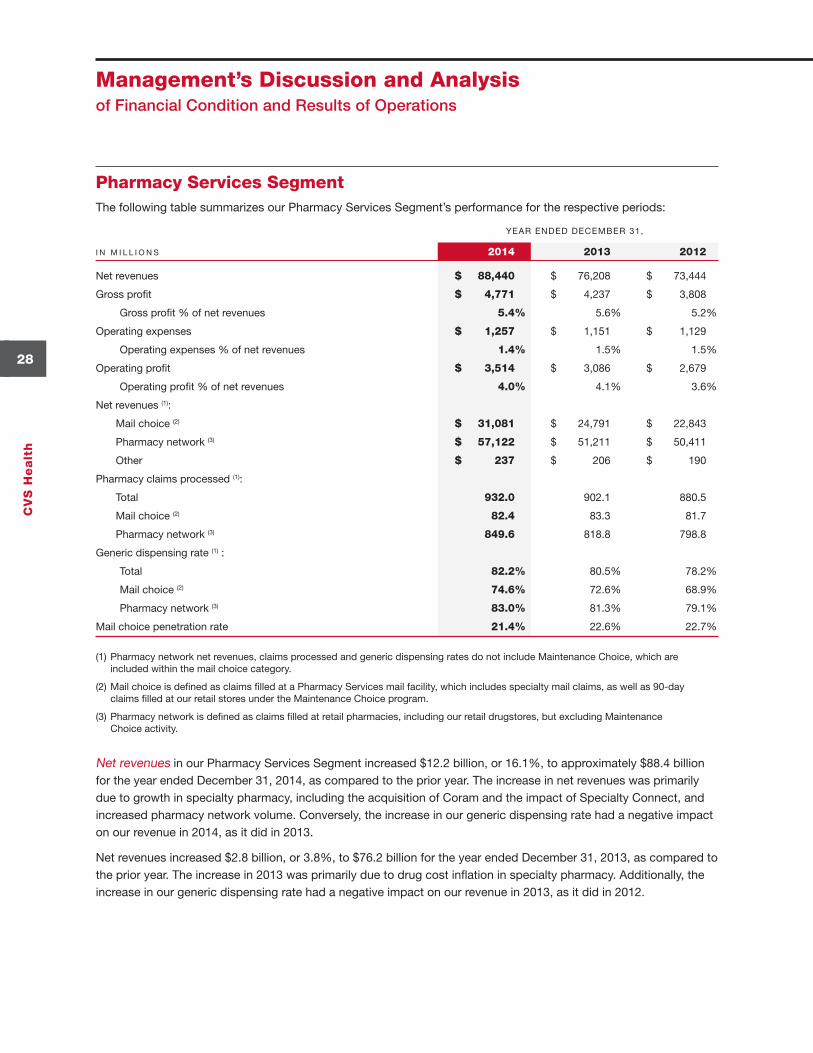
Pharmacy Services SegmentThe following table summarizes our Pharmacy Services Segment’s performance for the respective periods:
YEAR ENDED DECEMBER 31,
I N M I L L I O N S 2014 2013 2012
Net revenues $ 88,440 $ 76,208 $ 73,444
Gross profit $ 4,771 $ 4,237 $ 3,808
Gross profit % of net revenues 5.4 % 5.6 % 5.2 %
Operating expenses $ 1,257 $ 1,151 $ 1,129
Operating expenses % of net revenues 1.4 % 1.5 % 1.5 %
Operating profit $ 3,514 $ 3,086 $ 2,679
Operating profit % of net revenues 4.0 % 4.1 % 3.6 %
Net revenues (1):
Mail choice (2) $ 31,081 $ 24,791 $ 22,843
Pharmacy network (3) $ 57,122 $ 51,211 $ 50,411
Other $ 237 $ 206 $ 190
Pharmacy claims processed (1):
Total 932.0 902.1 880.5
Mail choice (2) 82.4 83.3 81.7
Pharmacy network (3) 849.6 818.8 798.8
Generic dispensing rate (1) :
Total 82.2 % 80.5 % 78.2 %
Mail choice (2) 74.6 % 72.6 % 68.9 %
Pharmacy network (3) 83.0 % 81.3 % 79.1 %
Mail choice penetration rate 21.4 % 22.6 % 22.7 %
(1) Pharmacy network net revenues, claims processed and generic dispensing rates do not include Maintenance Choice, which are included within the mail choice category.
(2) Mail choice is defined as claims filled at a Pharmacy Services mail facility, which includes specialty mail claims, as well as 90-day claims filled at our retail stores under the Maintenance Choice program.
(3) Pharmacy network is defined as claims filled at retail pharmacies, including our retail drugstores, but excluding Maintenance Choice activity.
Net revenues in our Pharmacy Services Segment increased $12.2 billion, or 16.1%, to approximately $88.4 billion for the year ended December 31, 2014, as compared to the prior year. The increase in net revenues was primarily due to growth in specialty pharmacy, including the acquisition of Coram and the impact of Specialty Connect, and increased pharmacy network volume. Conversely, the increase in our generic dispensing rate had a negative impact on our revenue in 2014, as it did in 2013.
Net revenues increased $2.8 billion, or 3.8%, to $76.2 billion for the year ended December 31, 2013, as compared to the prior year. The increase in 2013 was primarily due to drug cost inflation in specialty pharmacy. Additionally, the increase in our generic dispensing rate had a negative impact on our revenue in 2013, as it did in 2012.
157033_FIN.indd 28 3/2/15 3:14 PM
29
20
14
An
nu
al R
ep
ort
As you review our Pharmacy Services Segment’s revenue performance, we believe you should also consider the following important information:
• Our mail choice claims processed decreased 1.1% to 82.4 million claims in the year ended December 31, 2014, compared to 83.3 million claims in the prior year. The decrease in mail choice claims was driven by a decline in traditional mail volumes, which was mostly offset by growth in our Maintenance Choice program and specialty pharmacy. During 2013, our mail choice claims processed increased 1.9% to 83.3 million claims. The increase in mail choice claim volume was primarily due to specialty claim volume and increased claims associated with the continuing client adoption of our Maintenance Choice offerings.
• During 2014 and 2013, our average revenue per mail choice claim increased by 26.8% and 6.5%, compared to 2013 and 2012, respectively. This increase in 2014 was primarily due to the acquisition of Coram and drug inflation particularly in specialty pharmacy, partially offset by increases in the percentage of generic prescription drugs dispensed and changes in client pricing. This increase in 2013 was primarily due to drug inflation particu-larly in specialty pharmacy, partially offset by increases in the percentage of generic prescription drugs dispensed and changes in client pricing.
• Our mail choice generic dispensing rate was 74.6%, 72.6% and 68.9% in the years ended December 31, 2014, 2013 and 2012, respectively. Our pharmacy network generic dispensing rate increased to 83.0% in the year ended December 31, 2014, compared to 81.3% in the prior year. During 2013, our pharmacy network generic dispensing rate increased to 81.3% compared to our pharmacy network generic dispensing rate of 79.1% in 2012. These continued increases in mail choice and pharmacy network generic dispensing rates were primarily due to the impact of new generic drug introductions, primarily in 2012, and our continuous efforts to encourage plan mem-bers to use generic drugs when they are available. We believe our generic dispensing rates will continue to increase in future periods, albeit, at a slower pace. This increase will be affected by, among other things, the number of new generic drug introductions and our success at encouraging plan members to utilize generic drugs when they are available and clinically appropriate.
• Our pharmacy network claims processed increased 3.8% to 849.6 million claims in the year ended December 31, 2014, compared to 818.8 million claims in the prior year. This increase was primarily due to net new business and growth in Managed Medicaid, partially offset by a decrease in Medicare Part D claims. Medicare Part D claims were negatively impacted by the CMS sanctions that were in place during 2013. See “Regulatory and business changes relating to our participation in Medicare Part D” in Part I, Item 1A, Risk Factors within our Form 10-K for the year ended December 31, 2014 (“2014 Form 10-K”), for additional information. During 2013, our pharmacy network claims processed increased 2.5% to 818.8 million compared to 798.8 million pharmacy network claims processed in 2012. This increase was primarily due to higher claims activity associated with our Medicare Part D offering.
• Our average revenue per pharmacy network claim processed increased 7.5% in the year ended December 31, 2014 as compared to the prior year. This increase was primarily due to drug inflation and changes in the drug mix, partially offset by increases in the generic dispensing rate. During 2013, our average revenue per pharmacy network claim processed decreased by 0.9%, compared to 2012. This decrease was primarily due to increases in the generic dispensing rate.
• We completed the roll out of Specialty ConnectTM in May 2014, which integrates the Company’s specialty phar-macy mail and retail capabilities, providing members with the choice to bring their specialty prescriptions to any CVS/pharmacy® location. Whether submitted through our mail order pharmacy or at CVS/pharmacy, all prescrip-tions are filled through the Company’s specialty mail order pharmacies, so all revenue from this specialty prescription services program is recorded within the Pharmacy Services Segment.
157033_FIN.indd 29 3/2/15 3:14 PM
Management’s Discussion and Analysis of Financial Condition and Results of Operations
30
CV
S H
ea
lth
• The Pharmacy Services Segment recognizes revenues for its pharmacy network transactions based on individual contract terms. Our Pharmacy Services Segment contracts are predominantly accounted for using the gross method. See the “Revenue Recognition” description under “Critical Accounting Policies” later in this section for further information on our revenue recognition policy.
Gross profit in our Pharmacy Services Segment includes net revenues less cost of revenues. Cost of revenues includes (i) the cost of pharmaceuticals dispensed, either directly through our mail service and specialty retail pharmacies or indirectly through our pharmacy network, (ii) shipping and handling costs and (iii) the operating costs of our mail service dispensing pharmacies, customer service operations and related information technology support.
Gross profit increased $534 million, or 12.6% to $4.8 billion in the year ended December 31, 2014, as compared to the prior year. Gross profit as a percentage of net revenues decreased to 5.4% for the year ended December 31, 2014, compared to 5.6% in the prior year. The increase in gross profit dollars in the year ended December 31, 2014 was primarily due to volume increases, higher generic dispensing and favorable purchasing economics, partially offset by price compression. The decrease in gross profit as a percentage of net revenues was due to price com-pression, partially offset by favorable generic dispensing and purchasing economics. In addition, gross profit dollars and margin for the year ended December 31, 2014, were positively impacted by $16 million related to the favorable resolution of previously proposed retroactive reimbursement rate changes in the State of California Medicaid program.
During 2013, gross profit increased $429 million, or 11.3%, to $4.2 billion in the year ended December 31, 2013, as compared to the prior year. Gross profit as a percentage of net revenues was 5.6% for the year ended December 31, 2013, compared to 5.2% in the prior year. The increase in gross profit dollars and gross profit as a percentage of net revenues in the year ended December 31, 2013 was primarily due to an increase in generic dispensing.
As you review our Pharmacy Services Segment’s performance in this area, we believe you should consider the following important information:
• Our gross profit dollars and gross profit as a percentage of net revenues continued to be impacted by our efforts to (i) retain existing clients, (ii) obtain new business and (iii) maintain or improve the rebates and/or discounts we received from manufacturers, wholesalers and retail pharmacies. In particular, competitive pressures in the PBM industry have caused us and other PBMs to continue to share a larger portion of rebates and/or discounts received from pharmaceutical manufacturers with clients. In addition, market dynamics and regulatory changes have impacted our ability to offer plan sponsors pricing that includes retail network “differential” or “spread”. We expect these trends to continue. The “differential” or “spread” is any difference between the drug price charged to plan sponsors, including Medicare Part D plan sponsors, by a PBM and the price paid for the drug by the PBM to the dispensing provider. The increased use of generic drugs has positively impacted our gross profit margins but has resulted in third party payors augmenting their efforts to reduce reimbursement payments for prescriptions. This trend, which we expect to continue, reduces the benefit we realize from brand to generic product conversions.
• We review our network contracts on an individual basis to determine if the related revenues should be accounted for using the gross method or net method under the applicable accounting rules. Our Pharmacy Services Segment network contracts are predominantly accounted for using the gross method, which results in higher revenues, higher cost of revenues and lower gross profit rates.
157033_FIN.indd 30 3/2/15 3:14 PM
31
20
14
An
nu
al R
ep
ort
• Our gross profit as a percentage of revenues benefited from the increase in our total generic dispensing rate, which increased to 82.2% and 80.5% in 2014 and 2013, respectively, compared to our generic dispensing rate of 78.2% in 2012. These increases were primarily due to new generic drug introductions and our continued efforts to encourage plan members to use generic drugs when they are available. We expect these trends to continue, albeit at a slower pace.
Operating expenses in our Pharmacy Services Segment, which include selling, general and administrative expenses, depreciation and amortization related to selling, general and administrative activities and retail specialty pharmacy store and administrative payroll, employee benefits and occupancy costs, decreased to 1.4% of net revenues in 2014 compared to 1.5% in 2013 and 2012.
As you review our Pharmacy Services Segment’s performance in this area, we believe you should consider the following important information:
• Operating expenses increased $106 million or 9.2%, to $1.3 billion, in the year ended December 31, 2014, compared to the prior year. The increase in operating expenses is primarily related to increased costs associated with infusion services due to the 2014 acquisition of Coram, as well as an $11 million gain from a legal settlement during the year ended December 31, 2013. The slight decrease in operating expenses as a percentage of net revenues was primarily due to expense leverage from net revenue growth.
• During 2013, the increase in operating expenses of $22 million or 1.9%, to $1.2 billion compared to 2012, is primarily related to costs associated with the remediation of Medicare Part D sanctions and coverage determina-tion issues discussed below. Operating expenses as a percentage of net revenues remained relatively flat.
Medicare Part D — The Company participates in the Medicare Part D program by (1) providing Medicare Part D-related PBM services to our health plan and other clients that have qualified as Medicare Part D plans, and (2) offering Medicare Part D pharmacy benefits through the Company’s SilverScript prescription drug plan (“PDP”), which offers benefits to individual members and through employer group waiver plans. At the beginning of the 2013 Medicare Part D plan year, the Company implemented an enrollment systems conversion process and other actions to consolidate its Medicare Part D PDPs into the Company’s SilverScript PDP. These consolidation efforts impacted certain enrollment and coverage determination services the Company provided to SilverScript enrollees following commencement of the 2013 plan year. Effective January 15, 2013, the Centers for Medicare and Medicaid Services (“CMS”) imposed intermediate sanctions on the SilverScript PDP, consisting of immediate suspension of further plan enrollment and marketing activities. On December 20, 2013, the Company announced that CMS completed its review of the corrective actions taken to address the enrollment processing and related issues resulting from the Company’s plan consolidation efforts and the sanctions were removed. SilverScript began to enroll new choosers with effective dates starting in February 2014 as they aged into Medicare. The low income subsidy (“LIS”) auto- enrollment and annual reassignment exclusion was lifted on February 21, 2014 and SilverScript began receiving LIS enrollees again with effective dates May 1, 2014 and forward.
157033_FIN.indd 31 3/2/15 3:14 PM
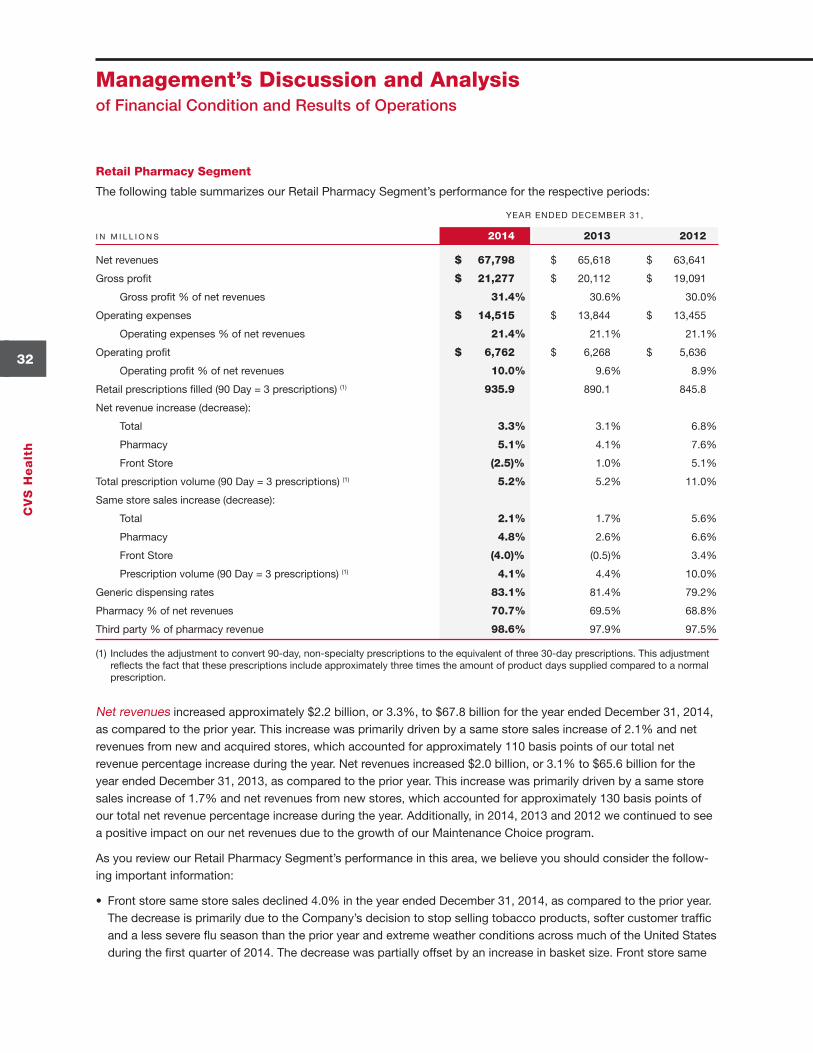
Management’s Discussion and Analysis of Financial Condition and Results of Operations
32
CV
S H
ea
lth
Retail Pharmacy Segment
The following table summarizes our Retail Pharmacy Segment’s performance for the respective periods:
YEAR ENDED DECEMBER 31,
I N M I L L I O N S 2014 2013 2012
Net revenues $ 67,798 $ 65,618 $ 63,641
Gross profit $ 21,277 $ 20,112 $ 19,091
Gross profit % of net revenues 31.4 % 30.6 % 30.0 %
Operating expenses $ 14,515 $ 13,844 $ 13,455
Operating expenses % of net revenues 21.4 % 21.1 % 21.1 %
Operating profit $ 6,762 $ 6,268 $ 5,636
Operating profit % of net revenues 10.0 % 9.6 % 8.9 %
Retail prescriptions filled (90 Day = 3 prescriptions) (1) 935.9 890.1 845.8
Net revenue increase (decrease):
Total 3.3 % 3.1 % 6.8 %
Pharmacy 5.1 % 4.1 % 7.6 %
Front Store (2.5) % 1.0 % 5.1 %
Total prescription volume (90 Day = 3 prescriptions) (1) 5.2 % 5.2 % 11.0 %
Same store sales increase (decrease):
Total 2.1 % 1.7 % 5.6 %
Pharmacy 4.8 % 2.6 % 6.6 %
Front Store (4.0) % (0.5) % 3.4 %
Prescription volume (90 Day = 3 prescriptions) (1) 4.1 % 4.4 % 10.0 %
Generic dispensing rates 83.1 % 81.4 % 79.2 %
Pharmacy % of net revenues 70.7 % 69.5 % 68.8 %
Third party % of pharmacy revenue 98.6 % 97.9 % 97.5 %
(1) Includes the adjustment to convert 90-day, non-specialty prescriptions to the equivalent of three 30-day prescriptions. This adjustment reflects the fact that these prescriptions include approximately three times the amount of product days supplied compared to a normal prescription.
Net revenues increased approximately $2.2 billion, or 3.3%, to $67.8 billion for the year ended December 31, 2014, as compared to the prior year. This increase was primarily driven by a same store sales increase of 2.1% and net revenues from new and acquired stores, which accounted for approximately 110 basis points of our total net revenue percentage increase during the year. Net revenues increased $2.0 billion, or 3.1% to $65.6 billion for the year ended December 31, 2013, as compared to the prior year. This increase was primarily driven by a same store sales increase of 1.7% and net revenues from new stores, which accounted for approximately 130 basis points of our total net revenue percentage increase during the year. Additionally, in 2014, 2013 and 2012 we continued to see a positive impact on our net revenues due to the growth of our Maintenance Choice program.
As you review our Retail Pharmacy Segment’s performance in this area, we believe you should consider the follow-ing important information:
• Front store same store sales declined 4.0% in the year ended December 31, 2014, as compared to the prior year. The decrease is primarily due to the Company’s decision to stop selling tobacco products, softer customer traffic and a less severe flu season than the prior year and extreme weather conditions across much of the United States during the first quarter of 2014. The decrease was partially offset by an increase in basket size. Front store same
157033_FIN.indd 32 3/2/15 3:14 PM
33
20
14
An
nu
al R
ep
ort
store sales would have been approximately 350 basis points higher for the year ended December 31, 2014 if tobacco and the estimated associated basket sales were excluded from both the years ended December 31, 2014 and 2013.
• Pharmacy same store sales rose 4.8% in the year ended December 31, 2014, as compared to the prior year. Pharmacy same store sales were positively impacted by same store script growth of 4.1%, partially offset by the impact of the increase in generic dispensing and reimbursement pressure. Pharmacy same store sales for the year ended December 31, 2014 were negatively impacted by approximately 140 basis points from the implemen-tation of Specialty Connect. Specialty Connect transitioned all specialty prescriptions to the Pharmacy Services Segment, as they are being processed through the Company’s specialty mail order pharmacies. The implementa-tion of Specialty Connect had a greater effect on revenues than on prescription volumes due to the higher dollar value of specialty products. Pharmacy same store sales were also negatively impacted by a lower incidence of flu compared to last year’s strong flu season and extreme weather conditions across much of the United States in the first quarter of 2014, which led to fewer physician visits and prescriptions written.
• Pharmacy revenues continue to be negatively impacted by the conversion of brand name drugs to equivalent generic drugs, which typically have a lower selling price. Pharmacy same store sales were negatively impacted by approximately 160 and 540 basis points for the years ended December 31, 2014 and 2013, respectively, due to recent generic introductions. The decrease in the impact from 2013 to 2014 was primarily due to a smaller impact from new generic drug introductions. In addition, our pharmacy revenue growth has also been affected by continued reimbursement pressure, the lack of significant new brand name drug introductions, as well as an increase in the number of over-the-counter remedies that were historically only available by prescription.
• As of December 31, 2014, we operated 7,822 retail stores compared to 7,660 retail stores as of December 31, 2013 and 7,458 retail stores as of December 31, 2012. Total net revenues from new stores contributed approxi-mately 1.1%, 1.0% and 1.1% to our total net revenue percentage increase in 2014, 2013, and 2012, respectively.
• Pharmacy revenue growth continued to benefit from increased utilization by Medicare Part D beneficiaries, our ability to attract and retain managed care customers and favorable industry trends. These trends include an aging American population; many “baby boomers” are now in their fifties and sixties and are consuming a greater number of prescription drugs, as well as expanded coverage from the Patient Protection and Affordable Care Act and the Health Care and Education Reconciliation Act (collectively, “ACA”). In addition, the increased use of pharmaceuticals as the first line of defense for individual health care also contributed to the growing demand for pharmacy services. We believe these favorable industry trends will continue.
Gross profit in our Retail Pharmacy Segment includes net revenues less the cost of merchandise sold during the reporting period and the related purchasing costs, warehousing costs, delivery costs and actual and estimated inventory losses.
Gross profit increased $1.2 billion, or 5.8%, to $21.3 billion in the year ended December 31, 2014, as compared to the prior year. Gross profit as a percentage of net revenues increased to 31.4% in year ended December 31, 2014, from 30.6% in 2013. Gross profit increased $1.0 billion, or 5.3%, to $20.1 billion for the year ended December 31, 2013, as compared to the prior year. Gross profit as a percentage of net revenues increased to 30.6% for the year ended December 31, 2013, compared to 30.0% for the prior year.
The increase in gross profit dollars in the year ended December 31, 2014, was primarily driven by increases in the generic dispensing rate, same store sales and new store sales, as well as favorable purchasing economics. The increase in gross profit dollars for the year ended December 31, 2013, was primarily driven by increases in the generic dispensing rate, same store sales and new store sales. The increase in gross profit as a percentage of net
157033_FIN.indd 33 3/2/15 3:14 PM
Management’s Discussion and Analysis of Financial Condition and Results of Operations
34
CV
S H
ea
lth
revenues in 2014 and 2013 was primarily driven by increased pharmacy margins due to the positive impact of increased generic dispensing rates and increased front store margins, partially offset by continued reimbursement pressure. The increase in gross profit as a percentage of net revenues in 2014 was also driven by the removal of tobacco products from our stores.
As you review our Retail Pharmacy Segment’s performance in this area, we believe you should consider the follow-ing important information:
• Gross profit dollars and margin for the year ended December 31, 2014 were positively impacted by $53 million related to the favorable resolution of previously proposed retroactive reimbursement rate changes in the State of California’s Medicaid program.
• Sales to customers covered by third party insurance programs are a large component of our total pharmacy business. On average, our gross profit on third party pharmacy revenues is lower than our gross profit on cash pharmacy revenues. Third party pharmacy revenues were 98.6% of pharmacy revenues in 2014, compared to 97.9% and 97.5% of pharmacy revenues in 2013 and 2012, respectively.
• Front store revenues as a percentage of total net revenues for the years ended December 31, 2014, 2013 and 2012 were 28.8%, 30.5% and 31.2%, respectively. The decline in front store revenues as a percentage of total net revenues in 2014 was largely due to the removal of tobacco products and the estimated associated basket sales. On average, our gross profit on front store revenues is generally higher than our gross profit on pharmacy reve-nues. Pharmacy revenues as a percentage of total net revenues increased approximately 120, 60 and 50 basis points in the years ended December 31, 2014, 2013 and 2012, respectively. This shift in sales to the pharmacy had a negative effect on our overall gross profit for the years ended December 31, 2014, 2013 and 2012, respec-tively. The negative effect was offset by increasing generic drug dispensing rates and increased store brand penetration.
• During the year ended December 31, 2014, our front store gross profit as a percentage of net revenues increased compared to the prior year. The increase is primarily related to a change in the mix of products sold, including the removal of tobacco products from our stores, and higher store brand sales.
• Our pharmacy gross profit rates have been adversely affected by the efforts of managed care organizations, pharmacy benefit managers and governmental and other third party payors to reduce their prescription drug costs. In the event this trend continues, we may not be able to sustain our current rate of revenue growth and gross profit dollars could be adversely impacted. The increased use of generic drugs has positively impacted our gross profit margins but has resulted in third party payors augmenting their efforts to reduce reimbursement payments to retail pharmacies for prescriptions. This trend, which we expect to continue, reduces the benefit we realize from brand to generic product conversions.
• ACA made several significant changes to Medicaid rebates and to reimbursement. One of these changes was the proposed revision of the definition of Average Manufacturer Price (“AMP”) and the reimbursement formula for multi-source drugs. Changes in reporting of AMP or other adjustments that may be made regarding the reim-bursement of drug payments by Medicaid and Medicare could impact our pricing to customers and other payors and/or could impact our ability to negotiate discounts or rebates with manufacturers, wholesalers, PBMs or retail and mail pharmacies. See “Efforts to reduce reimbursement levels and alter health care financing practices” in Part I, Item 1A, Risk Factors within our 2014 Form 10-K, for additional information.
Operating expenses in our Retail Pharmacy Segment include store payroll, store employee benefits, store occupancy costs, selling expenses, advertising expenses, depreciation and amortization expense and certain administrative expenses.
157033_FIN.indd 34 3/2/15 3:14 PM
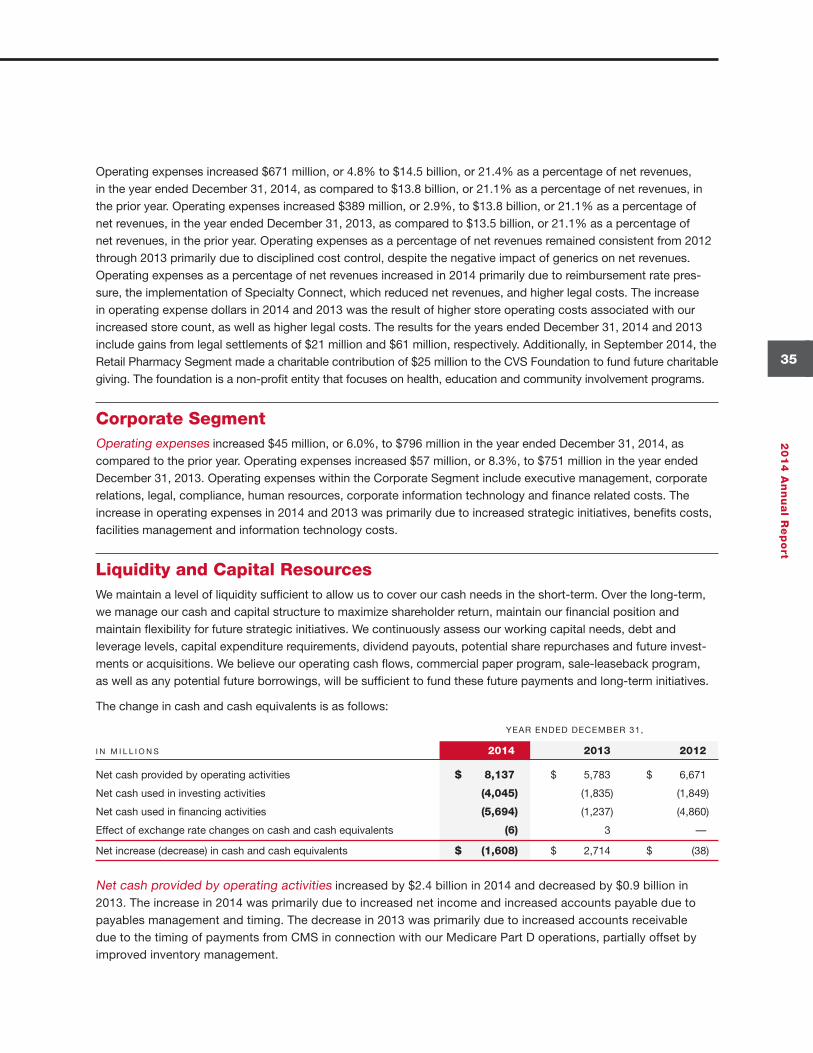
35
20
14
An
nu
al R
ep
ort
Operating expenses increased $671 million, or 4.8% to $14.5 billion, or 21.4% as a percentage of net revenues, in the year ended December 31, 2014, as compared to $13.8 billion, or 21.1% as a percentage of net revenues, in the prior year. Operating expenses increased $389 million, or 2.9%, to $13.8 billion, or 21.1% as a percentage of net revenues, in the year ended December 31, 2013, as compared to $13.5 billion, or 21.1% as a percentage of net revenues, in the prior year. Operating expenses as a percentage of net revenues remained consistent from 2012 through 2013 primarily due to disciplined cost control, despite the negative impact of generics on net revenues. Operating expenses as a percentage of net revenues increased in 2014 primarily due to reimbursement rate pres-sure, the implementation of Specialty Connect, which reduced net revenues, and higher legal costs. The increase in operating expense dollars in 2014 and 2013 was the result of higher store operating costs associated with our increased store count, as well as higher legal costs. The results for the years ended December 31, 2014 and 2013 include gains from legal settlements of $21 million and $61 million, respectively. Additionally, in September 2014, the Retail Pharmacy Segment made a charitable contribution of $25 million to the CVS Foundation to fund future charitable giving. The foundation is a non-profit entity that focuses on health, education and community involvement programs.
Corporate SegmentOperating expenses increased $45 million, or 6.0%, to $796 million in the year ended December 31, 2014, as compared to the prior year. Operating expenses increased $57 million, or 8.3%, to $751 million in the year ended December 31, 2013. Operating expenses within the Corporate Segment include executive management, corporate relations, legal, compliance, human resources, corporate information technology and finance related costs. The increase in operating expenses in 2014 and 2013 was primarily due to increased strategic initiatives, benefits costs, facilities management and information technology costs.
Liquidity and Capital ResourcesWe maintain a level of liquidity sufficient to allow us to cover our cash needs in the short-term. Over the long-term, we manage our cash and capital structure to maximize shareholder return, maintain our financial position and maintain flexibility for future strategic initiatives. We continuously assess our working capital needs, debt and leverage levels, capital expenditure requirements, dividend payouts, potential share repurchases and future invest-ments or acquisitions. We believe our operating cash flows, commercial paper program, sale-leaseback program, as well as any potential future borrowings, will be sufficient to fund these future payments and long-term initiatives.
The change in cash and cash equivalents is as follows:
YEAR ENDED DECEMBER 31,
I N M I L L I O N S 2014 2013 2012
Net cash provided by operating activities $ 8,137 $ 5,783 $ 6,671
Net cash used in investing activities (4,045) (1,835) (1,849)
Net cash used in financing activities (5,694) (1,237) (4,860)
Effect of exchange rate changes on cash and cash equivalents (6) 3 —
Net increase (decrease) in cash and cash equivalents $ (1,608) $ 2,714 $ (38)
Net cash provided by operating activities increased by $2.4 billion in 2014 and decreased by $0.9 billion in 2013. The increase in 2014 was primarily due to increased net income and increased accounts payable due to payables management and timing. The decrease in 2013 was primarily due to increased accounts receivable due to the timing of payments from CMS in connection with our Medicare Part D operations, partially offset by improved inventory management.
157033_FIN.indd 35 3/2/15 3:14 PM
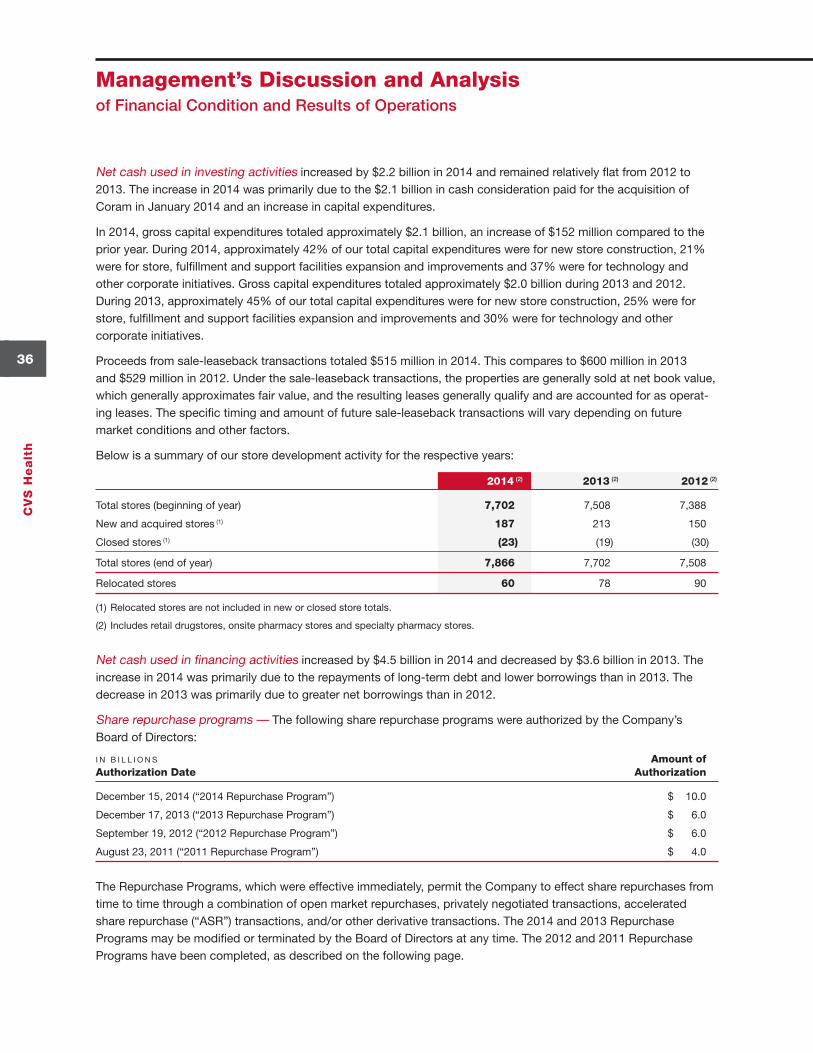
Management’s Discussion and Analysis of Financial Condition and Results of Operations
36
CV
S H
ea
lth
Net cash used in investing activities increased by $2.2 billion in 2014 and remained relatively flat from 2012 to 2013. The increase in 2014 was primarily due to the $2.1 billion in cash consideration paid for the acquisition of Coram in January 2014 and an increase in capital expenditures.
In 2014, gross capital expenditures totaled approximately $2.1 billion, an increase of $152 million compared to the prior year. During 2014, approximately 42% of our total capital expenditures were for new store construction, 21% were for store, fulfillment and support facilities expansion and improvements and 37% were for technology and other corporate initiatives. Gross capital expenditures totaled approximately $2.0 billion during 2013 and 2012. During 2013, approximately 45% of our total capital expenditures were for new store construction, 25% were for store, fulfillment and support facilities expansion and improvements and 30% were for technology and other corporate initiatives.
Proceeds from sale-leaseback transactions totaled $515 million in 2014. This compares to $600 million in 2013 and $529 million in 2012. Under the sale-leaseback transactions, the properties are generally sold at net book value, which generally approximates fair value, and the resulting leases generally qualify and are accounted for as operat-ing leases. The specific timing and amount of future sale-leaseback transactions will vary depending on future market conditions and other factors.
Below is a summary of our store development activity for the respective years:
2014 (2) 2013 (2) 2012 (2)
Total stores (beginning of year) 7,702 7,508 7,388
New and acquired stores (1) 187 213 150
Closed stores (1) (23) (19) (30)
Total stores (end of year) 7,866 7,702 7,508
Relocated stores 60 78 90
(1) Relocated stores are not included in new or closed store totals.
(2) Includes retail drugstores, onsite pharmacy stores and specialty pharmacy stores.
Net cash used in financing activities increased by $4.5 billion in 2014 and decreased by $3.6 billion in 2013. The increase in 2014 was primarily due to the repayments of long-term debt and lower borrowings than in 2013. The decrease in 2013 was primarily due to greater net borrowings than in 2012.
Share repurchase programs — The following share repurchase programs were authorized by the Company’s Board of Directors:
I N B I L L I O N S Amount of Authorization Date Authorization
December 15, 2014 (“2014 Repurchase Program”) $ 10.0
December 17, 2013 (“2013 Repurchase Program”) $ 6.0
September 19, 2012 (“2012 Repurchase Program”) $ 6.0
August 23, 2011 (“2011 Repurchase Program”) $ 4.0
The Repurchase Programs, which were effective immediately, permit the Company to effect share repurchases from time to time through a combination of open market repurchases, privately negotiated transactions, accelerated share repurchase (“ASR”) transactions, and/or other derivative transactions. The 2014 and 2013 Repurchase Programs may be modified or terminated by the Board of Directors at any time. The 2012 and 2011 Repurchase Programs have been completed, as described on the following page.
157033_FIN.indd 36 3/2/15 3:14 PM
37
20
14
An
nu
al R
ep
ort
Pursuant to the authorization under the 2013 Repurchase Programs, effective January 2, 2015, we entered into a $2.0 billion fixed dollar ASR agreement with J.P. Morgan Chase Bank (“JP Morgan”). Upon payment of the $2.0 bil-lion purchase price on January 5, 2015, we received a number of shares of our common stock equal to 80% of the $2.0 billion notional amount of the ASR agreement or approximately 16.8 million shares at a price of $94.49 per share. At the conclusion of the ASR program, the Company may receive additional shares equal to the remaining 20% of the $2.0 billion notional amount. The ultimate number of shares the Company may receive will fluctuate based on changes in the daily volume-weighted average price of the Company’s stock over a period beginning on January 2, 2015 and ending on or before April 26, 2015. If the mean daily volume-weighted average price of the Company’s common stock, less a discount (the “forward price”), during the ASR program falls below $94.49 per share, the Company will receive a higher number of shares from JP Morgan. If the forward price rises above $94.49 per share, the Company will either receive fewer shares from JP Morgan or, potentially have an obligation to JP Morgan which, at the Company’s option, could be settled in additional cash or by issuing shares. Under the terms of the ASR agreement, the maximum number of shares that could be received or delivered is 42.0 million. The initial 16.8 million shares of common stock delivered to the Company by JP Morgan were placed into treasury stock in January 2015.
Pursuant to the authorization under the 2012 Repurchase Program, effective October 1, 2013, we entered into a $1.7 billion fixed dollar ASR agreement with Barclays Bank PLC (“Barclays”). Upon payment of the $1.7 billion purchase price on October 1, 2013, we received a number of shares of our common stock equal to 50% of the $1.7 billion notional amount of the ASR agreement or approximately 14.9 million shares at a price of $56.88 per share. The Company received approximately 11.7 million shares of common stock on December 30, 2013 at an average price of $63.83 per share, representing the remaining 50% of the $1.7 billion notional amount of the ASR agreement and thereby concluding the agreement. The total of 26.6 million shares of common stock delivered to the Company by Barclays over the term of the October 2013 ASR agreement were placed into treasury stock.
Pursuant to the authorizations under the 2011 and 2012 Repurchase Programs, on September 19, 2012, we entered into a $1.2 billion fixed dollar ASR agreement with Barclays. Upon payment of the $1.2 billion purchase price on September 20, 2012, we received a number of shares of our common stock equal to 50% of the $1.2 billion notional amount of the ASR agreement or approximately 12.6 million shares at a price of $47.71 per share. We received approximately 13.0 million shares of common stock on November 16, 2012 at an average price of $46.96 per share, representing the remaining 50% of the $1.2 billion notional amount of the ASR agreement and thereby concluding the agreement, and completing the 2011 Repurchase Program. The total of 25.6 million shares of common stock delivered to us by Barclays over the term of the September 2012 ASR agreement were placed into treasury stock.
During the year ended December 31, 2014, we repurchased an aggregate of 51.4 million shares of common stock for approximately $4.0 billion under the 2013 and 2012 Repurchase Programs. During the years ended December 31, 2013 and 2012, we repurchased an aggregate of 66.2 million and 95.0 million shares of common stock for approxi-mately $4.0 and $4.3 billion, respectively, under the 2012 and 2011 Repurchase Programs. As of December 31, 2014, there remained an aggregate of approximately $12.7 billion available for future repurchases under the 2014 and 2013 Repurchase Programs, $2.0 billion of which was used for the ASR effective January 2, 2015 described previously. As of December 31, 2014, the 2012 and 2011 Repurchase Programs were complete.
Short-term borrowings — We had $685 million of commercial paper outstanding at a weighted average interest rate of 0.55% as of December 31, 2014. In connection with our commercial paper program, we maintain a $1.25 billion, five-year unsecured back-up credit facility, which expires on February 17, 2017, a $1.0 billion, five-year unsecured back-up credit facility, which expires on May 23, 2018, and a $1.25 billion, five-year unsecured back-up credit facility, which expires on July 24, 2019. The credit facilities allow for borrowings at various rates that are dependent, in part, on the Company’s public debt ratings and require the Company to pay a weighted average quarterly facility fee of approximately 0.03%, regardless of usage. As of December 31, 2014, there were no borrow-ings outstanding under the back-up credit facilities.
157033_FIN.indd 37 3/2/15 3:14 PM
Management’s Discussion and Analysis of Financial Condition and Results of Operations
38
CV
S H
ea
lth
Long-term borrowings — On August 7, 2014, the Company issued $850 million of 2.25% unsecured senior notes due August 12, 2019 and $650 million of 3.375% unsecured senior notes due August 12, 2024 (collectively, the “2014 Notes”) for total proceeds of approximately $1.5 billion, net of discounts and underwriting fees. The 2014 Notes pay interest semi-annually and may be redeemed, in whole at any time, or in part from time to time, at the Company’s option at a defined redemption price plus accrued and unpaid interest to the redemption date. The net proceeds of the 2014 Notes were used for general corporate purposes and to repay certain corporate debt.
On August 7, 2014, the Company announced tender offers for any and all of the 6.25% Senior Notes due 2027, and up to a maximum amount of the 6.125% Senior Notes due 2039, the 5.75% Senior Notes due 2041 and the 5.75% Senior Notes due 2017, for up to an aggregate principal amount of $1.5 billion. On August 21, 2014, the Company increased the aggregate principal amount of the tender offers to $2.0 billion and completed the repurchase for the maximum amount on September 4, 2014. The Company paid a premium of $490 million in excess of the debt principal in connection with the tender offers, wrote off $26 million of unamortized deferred financing costs and incurred $5 million in fees, for a total loss on the early extinguishment of debt of $521 million. The loss was recorded in income from continuing operations in the condensed consolidated statement of income for the year ended December 31, 2014.
During the year ended December 31, 2014, the Company repurchased the remaining $41 million of outstanding Enhanced Capital Advantage Preferred Securities (“ECAPS”) at par. The fees and write-off of deferred issuance costs associated with the early extinguishment of the ECAPS were immaterial.
On December 2, 2013, the Company issued $750 million of 1.2% unsecured senior notes due December 5, 2016; $1.25 billion of 2.25% unsecured senior notes due December 5, 2018; $1.25 billion of 4% unsecured senior notes due December 5, 2023; and $750 million of 5.3% unsecured senior notes due December 5, 2043 (the “2013 Notes”) for total proceeds of approximately $4.0 billion, net of discounts and underwriting fees. The 2013 Notes pay interest semi-annually and may be redeemed, in whole at any time, or in part from time to time, at the Company’s option at a defined redemption price plus accrued and unpaid interest to the redemption date. The net proceeds of the 2013 Notes were used to repay commercial paper outstanding at the time of issuance and to fund the acquisition of Coram in January 2014. The remainder was used for general corporate purposes.
On November 26, 2012, we issued $1.25 billion of 2.75% unsecured senior notes due December 1, 2022 (the “2012 Notes”) for total proceeds of approximately $1.24 billion, net of discounts and underwriting fees. The 2012 Notes pay interest semi-annually and may be redeemed, in whole at any time, or in part from time to time, at our option at a defined redemption price plus accrued and unpaid interest to the redemption date. The net proceeds of the 2012 Notes were used for general corporate purposes and to repay certain corporate debt.
Also on November 26, 2012, we announced tender offers for any and all of the 6.6% Senior Notes due 2019, and up to a maximum amount of the 6.125% Senior Notes due 2016 and 5.75% Senior Notes due 2017, for up to an aggregate principal amount of $1.0 billion. In December 2012, we increased the aggregate principal amount of the tender offers to $1.325 billion and completed the repurchase for the maximum amount. We paid a premium of $332 million in excess of the debt principal in connection with the tender offers, wrote off $13 million of unamortized deferred financing costs and incurred $3 million in fees, for a total loss on the early extinguishment of debt of $348 million. The loss was recorded in income from continuing operations on the consolidated statement of income.
Our backup credit facilities and unsecured senior notes (see Note 5 to the Consolidated Financial Statements) contain customary restrictive financial and operating covenants.
157033_FIN.indd 38 3/2/15 3:14 PM
39
20
14
An
nu
al R
ep
ort
These covenants do not include a requirement for the acceleration of our debt maturities in the event of a down-grade in our credit rating. We do not believe the restrictions contained in these covenants materially affect our financial or operating flexibility.
As of December 31, 2014 and 2013, we had no outstanding derivative financial instruments.
Debt Ratings — As of December 31, 2014, our long-term debt was rated “Baa1” by Moody’s with a stable outlook and “BBB+” by Standard & Poor’s with a stable outlook, and our commercial paper program was rated “P-2” by Moody’s and “A-2” by Standard & Poor’s. In assessing our credit strength, we believe that both Moody’s and Standard & Poor’s considered, among other things, our capital structure and financial policies as well as our consolidated balance sheet, our historical acquisition activity and other financial information. Although we currently believe our long-term debt ratings will remain investment grade, we cannot guarantee the future actions of Moody’s and/or Standard & Poor’s. Our debt ratings have a direct impact on our future borrowing costs, access to capital markets and new store operating lease costs.
Quarterly Dividend Increase — In December 2014, our Board of Directors authorized a 27% increase in our quarterly common stock dividend to $0.35 per share effective in 2015. This increase equates to an annual dividend rate of $1.40 per share. In December 2013, our Board of Directors authorized a 22% increase in our quarterly common stock dividend to $0.275 per share. This increase equated to an annual dividend rate of $1.10 per share. In December 2012, our Board of Directors authorized a 38% increase in our quarterly common stock dividend to $0.225 per share. This increase equated to an annual dividend rate of $0.90 per share.
Off-Balance Sheet ArrangementsIn connection with executing operating leases, we provide a guarantee of the lease payments. We also finance a portion of our new store development through sale-leaseback transactions, which involve selling stores to unrelated parties and then leasing the stores back under leases that generally qualify and are accounted for as operating leases. We do not have any retained or contingent interests in the stores, and we do not provide any guarantees, other than a guarantee of the lease payments, in connection with the transactions. In accordance with generally accepted accounting principles, our operating leases are not reflected on our consolidated balance sheets.
Between 1991 and 1997, we sold or spun off a number of subsidiaries, including Bob’s Stores, Linens ‘n Things, Marshalls, Kay-Bee Toys, This End Up and Footstar. In many cases, when a former subsidiary leased a store, the Company provided a guarantee of the store’s lease obligations. When the subsidiaries were disposed of, the Company’s guarantees remained in place, although each initial purchaser agreed to indemnify the Company for any lease obligations the Company was required to satisfy. If any of the purchasers or any of the former subsidiaries were to become insolvent and failed to make the required payments under a store lease, the Company could be required to satisfy these obligations.
As of December 31, 2014, we guaranteed approximately 72 such store leases (excluding the lease guarantees related to Linens ‘n Things), with the maximum remaining lease term extending through 2026. Management believes the ultimate disposition of any of the remaining lease guarantees will not have a material adverse effect on the Company’s consolidated financial condition or future cash flows. Please see “Loss from discontinued operations” previously in this document for further information regarding our guarantee of certain Linens ‘n Things’ store lease obligations.
157033_FIN.indd 39 3/2/15 3:14 PM
Management’s Discussion and Analysis of Financial Condition and Results of Operations
40
CV
S H
ea
lth
Below is a summary of our significant contractual obligations as of December 31, 2014:
PAYMENTS DUE BY PERIOD
2016 to 2018 to I N M I L L I O N S Total 2015 2017 2019 Thereafter
Operating leases $ 27,282 $ 2,279 $ 4,341 $ 3,868 $ 16,794
Lease obligations from discontinued operations 51 16 24 6 5
Capital lease obligations 810 47 94 96 573
Long-term debt 11,879 563 2,276 2,494 6,546
Interest payments on long-term debt (1) 5,173 484 867 689 3,133
Other long-term liabilities reflected in our consolidated balance sheet 652 48 254 100 250
$ 45,847 $ 3,437 $ 7,856 $ 7,253 $ 27,301
(1) Interest payments on long-term debt are calculated on outstanding balances and interest rates in effect on December 31, 2014.
Critical Accounting PoliciesWe prepare our consolidated financial statements in conformity with generally accepted accounting principles, which require management to make certain estimates and apply judgment. We base our estimates and judgments on historical experience, current trends and other factors that management believes to be important at the time the consolidated financial statements are prepared. On a regular basis, we review our accounting policies and how they are applied and disclosed in our consolidated financial statements. While we believe the historical experience, current trends and other factors considered, support the preparation of our consolidated financial statements in conformity with generally accepted accounting principles, actual results could differ from our estimates, and such differences could be material.
Our significant accounting policies are discussed in Note 1 to our consolidated financial statements. We believe the following accounting policies include a higher degree of judgment and/or complexity and, thus, are considered to be critical accounting policies. We have discussed the development and selection of our critical accounting policies with the Audit Committee of our Board of Directors and the Audit Committee has reviewed our disclosures relating to them.
Revenue RecognitionPharmacy Services Segment
Our Pharmacy Services Segment sells prescription drugs directly through our mail service dispensing pharmacies and indirectly through our retail pharmacy network. We recognize revenues in our Pharmacy Services Segment from prescription drugs sold by our mail service dispensing pharmacies and under retail pharmacy network contracts where we are the principal using the gross method at the contract prices negotiated with our clients. Net revenue from our Pharmacy Services Segment includes: (i) the portion of the price the client pays directly to us, net of any volume-related or other discounts paid back to the client, (ii) the price paid to us (“Mail Co-Payments”) or a third party pharmacy in our retail pharmacy network (“Retail Co-Payments”) by individuals included in our clients’ benefit plans, and (iii) administrative fees for retail pharmacy network contracts where we are not the principal. Sales taxes are not included in revenue.
157033_FIN.indd 40 3/2/15 3:14 PM
41
20
14
An
nu
al R
ep
ort
We recognize revenue in the Pharmacy Services Segment when: (i) persuasive evidence of an arrangement exists, (ii) delivery has occurred or services have been rendered, (iii) the seller’s price to the buyer is fixed or determinable, and (iv) collectability is reasonably assured. The following revenue recognition policies have been established for the Pharmacy Services Segment.
• Revenues generated from prescription drugs sold by mail service dispensing pharmacies are recognized when the prescription is delivered. At the time of delivery, the Pharmacy Services Segment has performed substantially all of its obligations under its client contracts and does not experience a significant level of returns or reshipments.
• Revenues generated from prescription drugs sold by third party pharmacies in the Pharmacy Services Segment’s retail pharmacy network and associated administrative fees are recognized at the Pharmacy Services Segment’s point-of-sale, which is when the claim is adjudicated by the Pharmacy Services Segment’s online claims process-ing system.
We determine whether we are the principal or agent for our retail pharmacy network transactions on a contract by contract basis. In the majority of our contracts, we have determined we are the principal due to us: (i) being the primary obligor in the arrangement, (ii) having latitude in establishing the price, changing the product or performing part of the service, (iii) having discretion in supplier selection, (iv) having involvement in the determination of product or service specifications, and (v) having credit risk. Our obligations under our client contracts for which revenues are reported using the gross method are separate and distinct from our obligations to the third party pharmacies included in our retail pharmacy network contracts. Pursuant to these contracts, we are contractually required to pay the third party pharmacies in our retail pharmacy network for products sold, regardless of whether we are paid by our clients. Our responsibilities under these client contracts typically include validating eligibility and coverage levels, communicating the prescription price and the co-payments due to the third party retail pharmacy, identifying possible adverse drug interactions for the pharmacist to address with the physician prior to dispensing, suggesting clinically appropriate generic alternatives where appropriate and approving the prescription for dispensing. Although we do not have credit risk with respect to Retail Co-Payments, we believe that all of the other indicators of gross revenue reporting are present. For contracts under which we act as an agent, we record revenues using the net method.
We deduct from our revenues the manufacturers’ rebates that are earned by our clients based on their members’ utilization of brand-name formulary drugs. We estimate these rebates at period-end based on actual and estimated claims data and our estimates of the manufacturers’ rebates earned by our clients. We base our estimates on the best available data at period-end and recent history for the various factors that can affect the amount of rebates due to the client. We adjust our rebates payable to clients to the actual amounts paid when these rebates are paid or as significant events occur. We record any cumulative effect of these adjustments against revenues as identified, and adjust our estimates prospectively to consider recurring matters. Adjustments generally result from contract changes with our clients or manufacturers, differences between the estimated and actual product mix subject to rebates or whether the product was included in the applicable formulary. We also deduct from our revenues pricing guarantees and guarantees regarding the level of service we will provide to the client or member as well as other payments made to our clients. Because the inputs to most of these estimates are not subject to a high degree of subjectivity or volatility, the effect of adjustments between estimated and actual amounts have not been material to our results of operations or financial condition.
We participate in the federal government’s Medicare Part D program as a PDP through our SilverScript Insurance Company subsidiary. Our net revenues include insurance premiums earned by the PDP, which are determined based on the PDP’s annual bid and related contractual arrangements with CMS. The insurance premiums include a beneficiary premium, which is the responsibility of the PDP member, but is subsidized by CMS in the case of low-income mem-bers, and a direct premium paid by CMS. Premiums collected in advance are initially deferred as accrued expenses and are then recognized ratably as revenue over the period in which members are entitled to receive benefits.
157033_FIN.indd 41 3/2/15 3:14 PM
Management’s Discussion and Analysis of Financial Condition and Results of Operations
42
CV
S H
ea
lth
In addition to these premiums, our net revenues include co-payments, coverage gap benefits, deductibles and co-insurance (collectively, the “Member Co-Payments”) related to PDP members’ actual prescription claims. In certain cases, CMS subsidizes a portion of these Member Co-Payments and we are paid an estimated prospective Member Co-Payment subsidy, each month. The prospective Member Co-Payment subsidy amounts received from CMS are also included in our net revenues. We assume no risk for these amounts, which represented 6.4%, 7.0% and 7.7% of consolidated net revenues in 2014, 2013 and 2012, respectively. If the prospective Member Co-Payment subsidies received differ from the amounts based on actual prescription claims, the difference is recorded in either accounts receivable or accrued expenses. We account for fully insured CMS obligations and Member Co-Payments (including the amounts subsidized by CMS) using the gross method consistent with our revenue recognition policies for Mail Co-Payments and Retail Co-Payments. We have recorded estimates of various assets and liabilities arising from our participation in the Medicare Part D program based on information in our claims management and enrollment systems. Significant estimates arising from our participation in the Medicare Part D program include: (i) estimates of low-income cost subsidy, reinsurance amounts and coverage gap discount amounts ultimately payable to or receivable from CMS based on a detailed claims reconciliation, (ii) an estimate of amounts payable to CMS under a risk-sharing feature of the Medicare Part D program design, referred to as the risk corridor and (iii) estimates for claims that have been reported and are in the process of being paid or contested and for our estimate of claims that have been incurred but have not yet been reported. Actual amounts of Medicare Part D-related assets and liabilities could differ significantly from amounts recorded. Historically, the effect of these adjustments has not been material to our results of operations or financial position.
Retail Pharmacy Segment
Our Retail Pharmacy Segment recognizes revenue from the sale of front store merchandise at the time the merchandise is purchased by the retail customer and recognizes revenue from the sale of prescription drugs when the prescription is picked up by the customer. Customer returns are not material. Revenue generated from the performance of services in our health care clinics is recognized at the time the services are performed. Sales taxes are not included in revenue.
Our customer loyalty program, ExtraCare®, is comprised of two components, ExtraSavingsTM and ExtraBucks® Rewards. ExtraSavings coupons redeemed by customers are recorded as a reduction of revenues when redeemed. ExtraBucks Rewards are accrued as a charge to cost of revenues when earned, net of estimated breakage. We determine breakage based on our historical redemption patterns.
Vendor Allowances and Purchase DiscountsPharmacy Services Segment
Our Pharmacy Services Segment receives purchase discounts on products purchased. Contractual arrangements with vendors, including manufacturers, wholesalers and retail pharmacies, normally provide for the Pharmacy Services Segment to receive purchase discounts from established list prices in one, or a combination, of the following forms: (i) a direct discount at the time of purchase, (ii) a discount for the prompt payment of invoices or (iii) when products are purchased indirectly from a manufacturer (e.g., through a wholesaler or retail pharmacy), a discount (or rebate) paid subsequent to dispensing. These rebates are recognized when prescriptions are dispensed and are generally calculated and billed to manufacturers within 30 days of the end of each completed quarter. Historically, the effect of adjustments resulting from the reconciliation of rebates recognized to the amounts billed and collected has not been material to the results of operations. We account for the effect of any such differences as a change in accounting estimate in the period the reconciliation is completed. The Pharmacy Services Segment also receives additional discounts under its wholesaler contracts if it exceeds contractually defined annual purchase volumes. In addition, the Pharmacy Services Segment receives fees from pharmaceutical manufacturers for adminis-trative services. Purchase discounts and administrative service fees are recorded as a reduction of “Cost of revenues”.
157033_FIN.indd 42 3/2/15 3:14 PM
43
20
14
An
nu
al R
ep
ort
Retail Pharmacy Segment
Vendor allowances received by the Retail Pharmacy Segment reduce the carrying cost of inventory and are recognized in cost of revenues when the related inventory is sold, unless they are specifically identified as a reim-bursement of incremental costs for promotional programs and/or other services provided. Amounts that are directly linked to advertising commitments are recognized as a reduction of advertising expense (included in operating expenses) when the related advertising commitment is satisfied. Any such allowances received in excess of the actual cost incurred also reduce the carrying cost of inventory. The total value of any upfront payments received from vendors that are linked to purchase commitments is initially deferred. The deferred amounts are then amortized to reduce cost of revenues over the life of the contract based upon purchase volume. The total value of any upfront payments received from vendors that are not linked to purchase commitments is also initially deferred. The deferred amounts are then amortized to reduce cost of revenues on a straight-line basis over the life of the related contract.
We have not made any material changes in the way we account for vendor allowances and purchase discounts during the past three years.
InventoryAll prescription drug inventories in the Retail Pharmacy Segment have been valued at the lower of cost or market using the weighted average cost method. The weighted average cost method is used to determine cost of sales and inventory in our mail service and specialty pharmacies in our Pharmacy Services Segment. Front store inventory in our Retail Pharmacy Segment is stated at the lower of cost or market on a first-in-first-out (“FIFO”) basis using the retail method of accounting to determine cost of sales and inventory, and the cost method of accounting on a FIFO basis to determine front store inventory in our distribution centers. Under the retail method, inventory is stated at cost, which is determined by applying a cost-to-retail ratio to the ending retail value of our inventory. Since the retail value of our front store inventory is adjusted on a regular basis to reflect current market conditions, our carrying value should approximate the lower of cost or market. In addition, we reduce the value of our ending inventory for estimated inventory losses that have occurred during the interim period between physical inventory counts. Physical inventory counts are taken on a regular basis in each store and a continuous cycle count process is the primary procedure used to validate the inventory balances on hand in each distribution center and mail facility to ensure that the amounts reflected in the accompanying consolidated financial statements are properly stated. The accounting for inventory contains uncertainty since we must use judgment to estimate the inventory losses that have occurred during the interim period between physical inventory counts. When estimating these losses, we consider a number of factors, which include, but are not limited to, historical physical inventory results on a location-by-location basis and current physical inventory loss trends.
Our total reserve for estimated inventory losses covered by this critical accounting policy was $189 million as of December 31, 2014. Although we believe we have sufficient current and historical information available to us to record reasonable estimates for estimated inventory losses, it is possible that actual results could differ. In order to help you assess the aggregate risk, if any, associated with the uncertainties discussed above, a ten percent (10%) pre-tax change in our estimated inventory losses, which we believe is a reasonably likely change, would increase or decrease our total reserve for estimated inventory losses by about $19 million as of December 31, 2014.
Although we believe that the estimates discussed previously are reasonable and the related calculations conform to generally accepted accounting principles, actual results could differ from our estimates, and such differences could be material.
157033_FIN.indd 43 3/2/15 3:14 PM
Management’s Discussion and Analysis of Financial Condition and Results of Operations
44
CV
S H
ea
lth
Goodwill and Intangible AssetsIdentifiable intangible assets consist primarily of trademarks, client contracts and relationships, favorable leases and covenants not to compete. These intangible assets arise primarily from the determination of their respective fair market values at the date of acquisition.
Amounts assigned to identifiable intangible assets, and their related useful lives, are derived from established valuation techniques and management estimates. Goodwill represents the excess of amounts paid for acquisitions over the fair value of the net identifiable assets acquired.
We evaluate the recoverability of certain long-lived assets, including intangible assets with finite lives, but excluding goodwill and intangible assets with indefinite lives which are tested for impairment using separate tests, whenever events or changes in circumstances indicate that the carrying value of an asset may not be recoverable. We group and evaluate these long-lived assets for impairment at the lowest level at which individual cash flows can be identified. When evaluating these long-lived assets for potential impairment, we first compare the carrying amount of the asset group to the asset group’s estimated future cash flows (undiscounted and without interest charges). If the estimated future cash flows are less than the carrying amount of the asset group, an impairment loss calculation is prepared. The impairment loss calculation compares the carrying amount of the asset group to the asset group’s estimated future cash flows (discounted and with interest charges). If required, an impairment loss is recorded for the portion of the asset group’s carrying value that exceeds the asset group’s estimated future cash flows (dis-counted and with interest charges). Our long-lived asset impairment loss calculation contains uncertainty since we must use judgment to estimate each asset group’s future sales, profitability and cash flows. When preparing these estimates, we consider historical results and current operating trends and our consolidated sales, profitability and cash flow results and forecasts.
These estimates can be affected by a number of factors including, but not limited to, general economic and regula-tory conditions, efforts of third party organizations to reduce their prescription drug costs and/or increased member co-payments, the continued efforts of competitors to gain market share and consumer spending patterns.
Goodwill and indefinitely-lived intangible assets are subject to annual impairment reviews, or more frequent reviews if events or circumstances indicate that the carrying value may not be recoverable.
Indefinitely-lived intangible assets are tested by comparing the estimated fair value of the asset to its carrying value. If the carrying value of the asset exceeds its estimated fair value, an impairment loss is recognized and the asset is written down to its estimated fair value.
Our indefinitely-lived intangible asset impairment loss calculation contains uncertainty since we must use judgment to estimate the fair value based on the assumption that in lieu of ownership of an intangible asset, the Company would be willing to pay a royalty in order to utilize the benefits of the asset. Value is estimated by discounting the hypothetical royalty payments to their present value over the estimated economic life of the asset. These estimates can be affected by a number of factors including, but not limited to, general economic conditions, availability of market information as well as the profitability of the Company.
Goodwill is tested for impairment on a reporting unit basis using a two-step process. The first step of the impairment test is to identify potential impairment by comparing the reporting unit’s fair value with its net book value (or carrying amount), including goodwill. The fair value of our reporting units is estimated using a combination of the discounted cash flow valuation model and comparable market transaction models. If the fair value of the reporting unit exceeds its carrying amount, the reporting unit’s goodwill is not considered to be impaired and the second step of the impair-ment test is not performed. If the carrying amount of the reporting unit exceeds its fair value, the second step of the impairment test is performed to measure the amount of impairment loss, if any. The second step of the impairment test compares the implied fair value of the reporting unit’s goodwill with the carrying amount of the goodwill. If the carrying amount of the reporting unit’s goodwill exceeds the implied fair value of the goodwill, an impairment loss is recognized in an amount equal to that excess.
157033_FIN.indd 44 3/2/15 3:14 PM
45
20
14
An
nu
al R
ep
ort
The determination of the fair value of our reporting units requires the Company to make significant assumptions and estimates. These assumptions and estimates primarily include, but are not limited to, the selection of appropri-ate peer group companies; control premiums and valuation multiples appropriate for acquisitions in the industries in which the Company competes; discount rates, terminal growth rates; and forecasts of revenue, operating profit, depreciation and amortization, capital expenditures and future working capital requirements. When determining these assumptions and preparing these estimates, we consider each reporting unit’s historical results and current operating trends and our consolidated revenues, profitability and cash flow results, forecasts and industry trends. Our estimates can be affected by a number of factors including, but not limited to, general economic and regulatory conditions, our market capitalization, efforts of third party organizations to reduce their prescription drug costs and/or increase member co-payments, the continued efforts of competitors to gain market share and consumer spend-ing patterns.
The carrying value of goodwill and other intangible assets covered by this critical accounting policy was $28.1 billion and $9.8 billion as of December 31, 2014, respectively. We did not record any impairment losses related to goodwill or other intangible assets during 2014, 2013 or 2012. During the third quarter of 2014, we performed our required annual impairment tests of goodwill and indefinitely-lived trademarks. The results of the impairment tests concluded that there was no impairment of goodwill or trademarks. The goodwill impairment test resulted in the fair value of our Pharmacy Services and Retail Pharmacy reporting units exceeding their carrying values by a significant margin. The carrying value of goodwill as of December 31, 2014, in our Pharmacy Services and Retail Pharmacy reporting units was $21.2 billion and $6.9 billion, respectively.
Although we believe we have sufficient current and historical information available to us to test for impairment, it is possible that actual results could differ from the estimates used in our impairment tests.
We have not made any material changes in the methodologies utilized to test the carrying values of goodwill and intangible assets for impairment during the past three years.
Closed Store Lease LiabilityWe account for closed store lease termination costs when a leased store is closed. When a leased store is closed, we record a liability for the estimated present value of the remaining obligation under the noncancelable lease, which includes future real estate taxes, common area maintenance and other charges, if applicable. The liability is reduced by estimated future sublease income.
The initial calculation and subsequent evaluations of our closed store lease liability contain uncertainty since we must use judgment to estimate the timing and duration of future vacancy periods, the amount and timing of future lump sum settlement payments and the amount and timing of potential future sublease income. When estimating these potential termination costs and their related timing, we consider a number of factors, which include, but are not limited to, historical settlement experience, the owner of the property, the location and condition of the property, the terms of the underlying lease, the specific marketplace demand and general economic conditions.
Our total closed store lease liability covered by this critical accounting policy was $268 million as of December 31, 2014. This amount is net of $142 million of estimated sublease income that is subject to the uncertainties discussed previously. Although we believe we have sufficient current and historical information available to us to record reasonable estimates for sublease income, it is possible that actual results could differ.
In order to help you assess the risk, if any, associated with the uncertainties discussed previously, a ten percent (10%) pre-tax change in our estimated sublease income, which we believe is a reasonably likely change, would increase or decrease our total closed store lease liability by about $14 million as of December 31, 2014.
We have not made any material changes in the reserve methodology used to record closed store lease reserves during the past three years.
157033_FIN.indd 45 3/2/15 3:14 PM
46
CV
S H
ea
lth
Management’s Discussion and Analysis of Financial Condition and Results of Operations
Self-Insurance LiabilitiesWe are self-insured for certain losses related to general liability, workers’ compensation and auto liability, although we maintain stop loss coverage with third party insurers to limit our total liability exposure. We are also self-insured for certain losses related to health and medical liabilities.
The estimate of our self-insurance liability contains uncertainty since we must use judgment to estimate the ultimate cost that will be incurred to settle reported claims and unreported claims for incidents incurred but not reported as of the balance sheet date. When estimating our self-insurance liability, we consider a number of factors, which include, but are not limited to, historical claim experience, demographic factors, severity factors and other standard insurance industry actuarial assumptions. On a quarterly basis, we review our self-insurance liability to determine if it is adequate as it relates to our general liability, workers’ compensation and auto liability. Similar reviews are conducted semi-annually to determine if our self-insurance liability is adequate for our health and medical liability.
Our total self-insurance liability covered by this critical accounting policy was $628 million as of December 31, 2014. Although we believe we have sufficient current and historical information available to us to record reasonable estimates for our self-insurance liability, it is possible that actual results could differ. In order to help you assess the risk, if any, associated with the uncertainties discussed previously, a ten percent (10%) pre-tax change in our estimate for our self-insurance liability, which we believe is a reasonably likely change, would increase or decrease our self-insurance liability by about $63 million as of December 31, 2014.
We have not made any material changes in the accounting methodology used to establish our self-insurance liability during the past three years.
Income TaxesIncome taxes are accounted for using the asset and liability method. Deferred tax liabilities or assets are estab-lished for temporary differences between financial and tax reporting bases and are subsequently adjusted to reflect changes in enacted tax rates expected to be in effect when the temporary differences reverse. The deferred tax assets are reduced, if necessary, by a valuation allowance to the extent future realization of those tax benefits is uncertain.
Significant judgment is required in determining the provision for income taxes and the related taxes payable and deferred tax assets and liabilities since, in the ordinary course of business, there are transactions and calculations where the ultimate tax outcome is uncertain. Additionally, our tax returns are subject to audit by various domestic and foreign tax authorities that could result in material adjustments or differing interpretations of the tax laws. Although we believe that our estimates are reasonable and are based on the best available information at the time we prepare the provision, actual results could differ from these estimates resulting in a final tax outcome that may be materially different from that which is reflected in our consolidated financial statements.
The tax benefit from an uncertain tax position is recognized only if it is more likely than not that the tax position will be sustained on examination by the taxing authorities, based on the technical merits of the position. The tax benefits recognized in the consolidated financial statements from such positions are then measured based on the largest benefit that has a greater than 50% likelihood of being realized upon settlement. Interest and/or penalties related to uncertain tax positions are recognized in income tax expense. Significant judgment is required in determining our uncertain tax positions. We have established accruals for uncertain tax positions using our best judgment and adjust these accruals, as warranted, due to changing facts and circumstances.
157033_FIN.indd 46 3/2/15 3:14 PM
47
20
14
An
nu
al R
ep
ort
New Accounting PronouncementIn May 2014, the Financial Accounting Standards Board (“FASB”) issued Accounting Standard Update (“ASU”) No. 2014-09, Revenue from Contracts with Customers (Topic 606). ASU No. 2014-09 outlines a single comprehen-sive model for entities to use in accounting for revenue arising from contracts with customers and supersedes most current revenue recognition guidance, including industry-specific guidance. This new guidance is effective for annual reporting periods (including interim reporting periods within those periods) beginning after December 15, 2016; early adoption is not permitted. Companies have the option of using either a full retrospective or a modified retrospective approach to adopt the guidance. This update could impact the timing and amounts of revenue recognized. The Company is currently evaluating the effect that implementation of this update will have on its consolidated financial position and results of operations upon adoption and the method of transition.
Proposed Lease Accounting Standard UpdateIn May 2013, the FASB issued a revised proposed accounting standard update on lease accounting that will require entities to recognize assets and liabilities arising from lease contracts on the balance sheet. The proposed account-ing standard update states that lessees and lessors should apply a “right-of-use model” in accounting for all leases. Under the proposed model, lessees would recognize an asset for the right to use the leased asset, and a liability for the obligation to make rental payments over the lease term. The lease term is defined as the noncancelable term that takes into account renewal options and termination options if it is reasonably certain an entity will exercise or not exercise the option. The accounting by a lessor would reflect its retained exposure to the risks or benefits of the underlying leased asset. A lessor would recognize an asset representing its right to receive lease payments based on the expected term of the lease. The Company cannot presently determine the potential impact the proposed standard would have on its results of operations. While the Company believes that the proposed standard, as currently drafted, will likely have a material impact on its financial position, it will not have a material impact on its liquidity; however, until the proposed standard is finalized, such evaluation cannot be completed.
Cautionary Statement Concerning Forward-Looking StatementsThis annual report contains forward-looking statements within the meaning of the federal securities laws. In addition, the Company and its representatives may, from time to time, make written or verbal forward-looking statements, including statements contained in the Company’s filings with the U.S. Securities and Exchange Commission (“SEC”) and in its reports to stockholders, press releases, webcasts, conference calls, meetings and other communications. Generally, the inclusion of the words “believe,” “expect,” “intend,” “estimate,” “project,” “anticipate,” “will,” “should” and similar expressions identify statements that constitute forward-looking statements. All statements addressing operating performance of CVS Health Corporation or any subsidiary, events or developments that the Company expects or anticipates will occur in the future, including statements relating to corporate strategy; revenue growth; earnings or earnings per common share growth; adjusted earnings or adjusted earnings per common share growth; free cash flow; debt ratings; inventory levels; inventory turn and loss rates; store development; relocations and new market entries; retail pharmacy business, sales trends and operations; PBM business, sales trends and operations; the Company’s ability to attract or retain customers and clients; Medicare Part D competitive bidding, enrollment and operations; new product development; and the impact of industry developments, as well as statements expressing optimism or pessimism about future operating results or events, are forward-looking statements within the meaning of the federal securities laws.
157033_FIN.indd 47 3/2/15 3:14 PM
Management’s Discussion and Analysis of Financial Condition and Results of Operations
48
CV
S H
ea
lth
The forward-looking statements are and will be based upon management’s then-current views and assumptions regarding future events and operating performance, and are applicable only as of the dates of such statements. The Company undertakes no obligation to update or revise any forward-looking statements, whether as a result of new information, future events, or otherwise.
By their nature, all forward-looking statements involve risks and uncertainties. Actual results may differ materially from those contemplated by the forward-looking statements for a number of reasons as described in our SEC filings, including those set forth in the Risk Factors section within the 2014 Form 10-K, and including, but not limited to:
• Risks relating to the health of the economy in general and in the markets we serve, which could impact consumer purchasing power, preferences and/or spending patterns, drug utilization trends, the financial health of our PBM clients or other payors doing business with the Company and our ability to secure necessary financing, suitable store locations and sale-leaseback transactions on acceptable terms.
• Efforts to reduce reimbursement levels and alter health care financing practices, including pressure to reduce reimbursement levels for generic drugs.
• The possibility of PBM client loss and/or the failure to win new PBM business, including as a result of failure to win renewal of expiring contracts, contract termination rights that may permit clients to terminate a contract prior to expiration and early or periodic renegotiation of pricing by clients prior to expiration of a contract.
• The possibility of loss of Medicare Part D business and/or failure to obtain new Medicare Part D business, whether as a result of the annual Medicare Part D competitive bidding process or otherwise.
• Risks related to the frequency and rate of the introduction of generic drugs and brand name prescription products.
• Risks of declining gross margins in the PBM industry attributable to increased competitive pressures, increased client demand for lower prices, enhanced service offerings and/or higher service levels and market dynamics and regulatory changes that impact our ability to offer plan sponsors pricing that includes the use of retail “differential” or “spread.”
• Regulatory changes, business changes and compliance requirements and restrictions that may be imposed by Centers for Medicare and Medicaid Services (“CMS”), Office of Inspector General or other government agencies relating to the Company’s participation in Medicare, Medicaid and other federal and state government-funded programs, including sanctions and remedial actions that may be imposed by CMS on its Medicare Part D business.
• Risks and uncertainties related to the timing and scope of reimbursement from Medicare, Medicaid and other government-funded programs, including the impact of sequestration, the impact of other federal budget, debt and deficit negotiations and legislation that could delay or reduce reimbursement from such programs and the impact of any closure, suspension or other changes affecting federal or state government funding or operations.
• Possible changes in industry pricing benchmarks used to establish pricing in many of our PBM client contracts, pharmaceutical purchasing arrangements, retail network contracts, specialty payor agreements and other third party payor contracts.
• A highly competitive business environment, including the uncertain impact of increased consolidation in the PBM industry, uncertainty concerning the ability of our retail pharmacy business to secure and maintain contractual relationships with PBMs and other payors on acceptable terms, uncertainty concerning the ability of our PBM business to secure and maintain competitive access, pricing and other contract terms from retail network pharma-cies in an environment where some PBM clients are willing to consider adopting narrow or more restricted retail pharmacy networks.
157033_FIN.indd 48 3/2/15 3:14 PM
49
20
14
An
nu
al R
ep
ort
• The Company’s ability to fully integrate and to realize the planned benefits associated with the acquisition of Coram LLC in accordance with the expected timing.
• The Company’s ability to timely identify or effectively respond to changing consumer preferences and spending patterns, an inability to expand the products being purchased by our customers, or the failure or inability to obtain or offer particular categories of products.
• Risks relating to our ability to secure timely and sufficient access to the products we sell from our domestic and/or international suppliers.
• Reform of the U.S. health care system, including ongoing implementation of ACA, continuing legislative efforts, regulatory changes and judicial interpretations impacting our health care system and the possibility of shifting political and legislative priorities related to reform of the health care system in the future.
• Risks relating to any failure to properly maintain our information technology systems, our information security systems and our infrastructure to support our business and to protect the privacy and security of sensitive cus-tomer and business information.
• Risks related to compliance with a broad and complex regulatory framework, including compliance with new and existing federal, state and local laws and regulations relating to health care, accounting standards, corporate securities, tax, environmental and other laws and regulations affecting our business.
• Risks related to litigation, government investigations and other legal proceedings as they relate to our business, the pharmacy services, retail pharmacy or retail clinic industries or to the health care industry generally.
• Other risks and uncertainties detailed from time to time in our filings with the SEC.
The foregoing list is not exhaustive. There can be no assurance that the Company has correctly identified and appropriately assessed all factors affecting its business. Additional risks and uncertainties not presently known to the Company or that it currently believes to be immaterial also may adversely impact the Company. Should any risks and uncertainties develop into actual events, these developments could have a material adverse effect on the Company’s business, financial condition and results of operations. For these reasons, you are cautioned not to place undue reliance on the Company’s forward-looking statements.
157033_FIN.indd 49 3/2/15 3:14 PM
CV
S H
ea
lth
50
Management’s Report on Internal Control Over Financial Reporting
We are responsible for establishing and maintaining adequate internal control over financial reporting. Our Company’s internal control over financial reporting includes those policies and procedures that pertain to the Company’s ability to record, process, summarize and report a system of internal accounting controls and proce-dures to provide reasonable assurance, at an appropriate cost/benefit relationship, that the unauthorized acquisition, use or disposition of assets are prevented or timely detected and that transactions are authorized, recorded and reported properly to permit the preparation of financial statements in accordance with generally accepted account-ing principles (GAAP) and receipt and expenditures are duly authorized. In order to ensure the Company’s internal control over financial reporting is effective, management regularly assesses such controls and did so most recently for its financial reporting as of December 31, 2014.
We conducted an assessment of the effectiveness of our internal controls over financial reporting based on the criteria set forth in Internal Control — Integrated Framework issued by the Committee of Sponsoring Organizations of the Treadway Commission (2013 Framework). This evaluation included review of the documentation, evaluation of the design effectiveness and testing of the operating effectiveness of controls. Our system of internal control over financial reporting is enhanced by periodic reviews by our internal auditors, written policies and procedures and a written Code of Conduct adopted by our Company’s Board of Directors, applicable to all employees of our Company. In addition, we have an internal Disclosure Committee, comprised of management from each functional area within the Company, which performs a separate review of our disclosure controls and procedures. There are inherent limitations in the effectiveness of any system of internal controls over financial reporting.
Based on our assessment, we conclude our Company’s internal control over financial reporting is effective and provides reasonable assurance that assets are safeguarded and that the financial records are reliable for preparing financial statements as of December 31, 2014.
Ernst & Young LLP, independent registered public accounting firm, is appointed by the Board of Directors and ratified by our Company’s shareholders. They were engaged to render an opinion regarding the fair presentation of our consolidated financial statements as well as conducting an audit of internal control over financial reporting. Their accompanying reports are based upon audits conducted in accordance with the standards of the Public Company Accounting Oversight Board (United States).
February 10, 2015
157033_FIN.indd 50 3/2/15 3:14 PM
51
20
14
An
nu
al R
ep
ort
Report of Independent Registered Public Accounting Firm
The Board of Directors and Shareholders of CVS Health Corporation
We have audited CVS Health Corporation’s internal control over financial reporting as of December 31, 2014, based on criteria established in Internal Control — Integrated Framework issued by the Committee of Sponsoring Organizations of the Treadway Commission (2013 framework) (the COSO criteria). CVS Health Corporation’s management is responsible for maintaining effective internal control over financial reporting, and for its assessment of the effectiveness of internal control over financial reporting included in the accompanying Management’s Report on Internal Control Over Financial Reporting. Our responsibility is to express an opinion on CVS Health Corporation’s internal control over financial reporting based on our audit.
We conducted our audit in accordance with the standards of the Public Company Accounting Oversight Board (United States). Those standards require that we plan and perform the audit to obtain reasonable assurance about whether effective internal control over financial reporting was maintained in all material respects. Our audit included obtaining an understanding of internal control over financial reporting, assessing the risk that a material weakness exists, testing and evaluating the design and operating effectiveness of internal control based on the assessed risk, and performing such other procedures as we considered necessary in the circumstances. We believe that our audit provides a reasonable basis for our opinion.
A company’s internal control over financial reporting is a process designed to provide reasonable assurance regarding the reliability of financial reporting and the preparation of financial statements for external purposes in accordance with generally accepted accounting principles. A company’s internal control over financial reporting includes those policies and procedures that (1) pertain to the maintenance of records that, in reasonable detail, accurately and fairly reflect the transactions and dispositions of the assets of the company; (2) provide reasonable assurance that transactions are recorded as necessary to permit preparation of financial statements in accordance with generally accepted accounting principles, and that receipts and expenditures of the company are being made only in accordance with authorizations of management and directors of the company; and (3) provide reasonable assurance regarding prevention or timely detection of unauthorized acquisition, use, or disposition of the company’s assets that could have a material effect on the financial statements.
Because of its inherent limitations, internal control over financial reporting may not prevent or detect misstate-ments. Also, projections of any evaluation of effectiveness to future periods are subject to the risk that controls may become inadequate because of changes in conditions, or that the degree of compliance with the policies or procedures may deteriorate.
In our opinion, CVS Health Corporation maintained, in all material respects, effective internal control over financial reporting as of December 31, 2014, based on the COSO criteria.
We also have audited, in accordance with the standards of the Public Company Accounting Oversight Board (United States), the consolidated balance sheets of CVS Health Corporation as of December 31, 2014 and 2013, and the related consolidated statements of income, comprehensive income, shareholders’ equity and cash flows for each of the three years in the period ended December 31, 2014 of CVS Health Corporation and our report dated February 10, 2015 expressed an unqualified opinion thereon.
Boston, Massachusetts February 10, 2015
157033_FIN.indd 51 3/2/15 3:14 PM
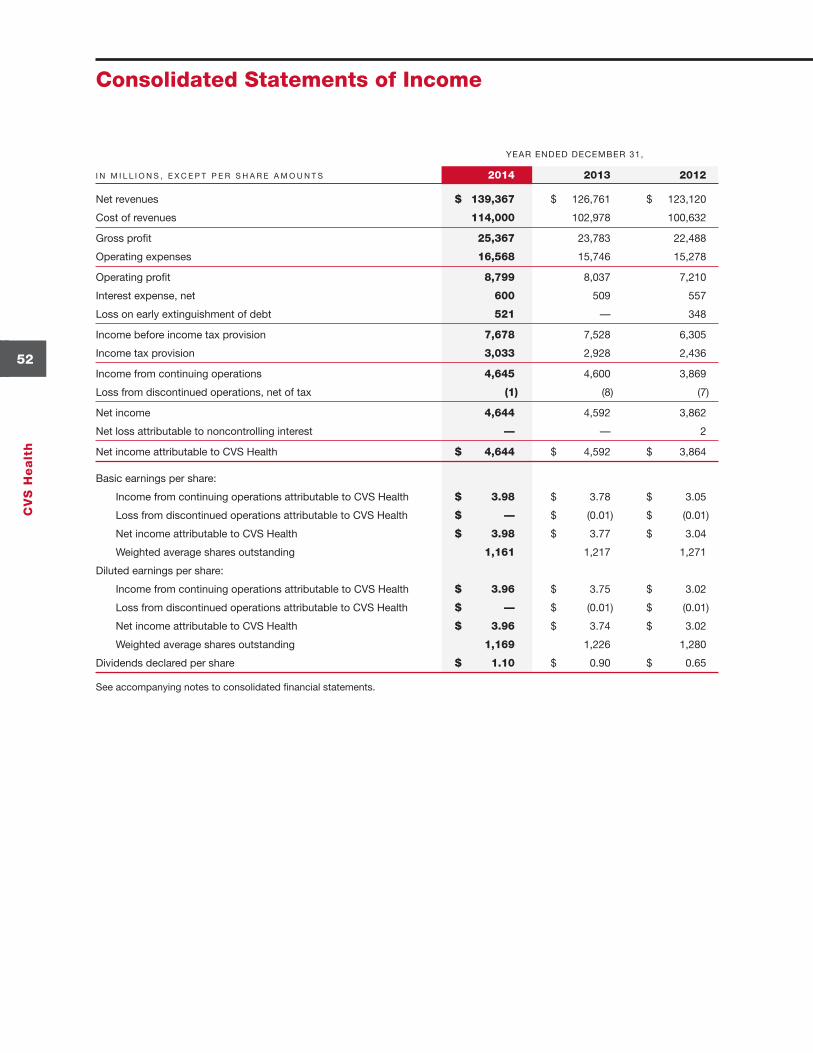
CV
S H
ea
lth
52
Consolidated Statements of Income
YEAR ENDED DECEMBER 31,
I N M I L L I O N S , E X C E P T P E R S H A R E A M O U N T S 2014 2013 2012
Net revenues $ 139,367 $ 126,761 $ 123,120
Cost of revenues 114,000 102,978 100,632
Gross profit 25,367 23,783 22,488
Operating expenses 16,568 15,746 15,278
Operating profit 8,799 8,037 7,210
Interest expense, net 600 509 557
Loss on early extinguishment of debt 521 — 348
Income before income tax provision 7,678 7,528 6,305
Income tax provision 3,033 2,928 2,436
Income from continuing operations 4,645 4,600 3,869
Loss from discontinued operations, net of tax (1) (8) (7)
Net income 4,644 4,592 3,862
Net loss attributable to noncontrolling interest — — 2
Net income attributable to CVS Health $ 4,644 $ 4,592 $ 3,864
Basic earnings per share:
Income from continuing operations attributable to CVS Health $ 3.98 $ 3.78 $ 3.05
Loss from discontinued operations attributable to CVS Health $ — $ (0.01) $ (0.01)
Net income attributable to CVS Health $ 3.98 $ 3.77 $ 3.04
Weighted average shares outstanding 1,161 1,217 1,271
Diluted earnings per share:
Income from continuing operations attributable to CVS Health $ 3.96 $ 3.75 $ 3.02
Loss from discontinued operations attributable to CVS Health $ — $ (0.01) $ (0.01)
Net income attributable to CVS Health $ 3.96 $ 3.74 $ 3.02
Weighted average shares outstanding 1,169 1,226 1,280
Dividends declared per share $ 1.10 $ 0.90 $ 0.65
See accompanying notes to consolidated financial statements.
157033_FIN.indd 52 3/2/15 3:14 PM
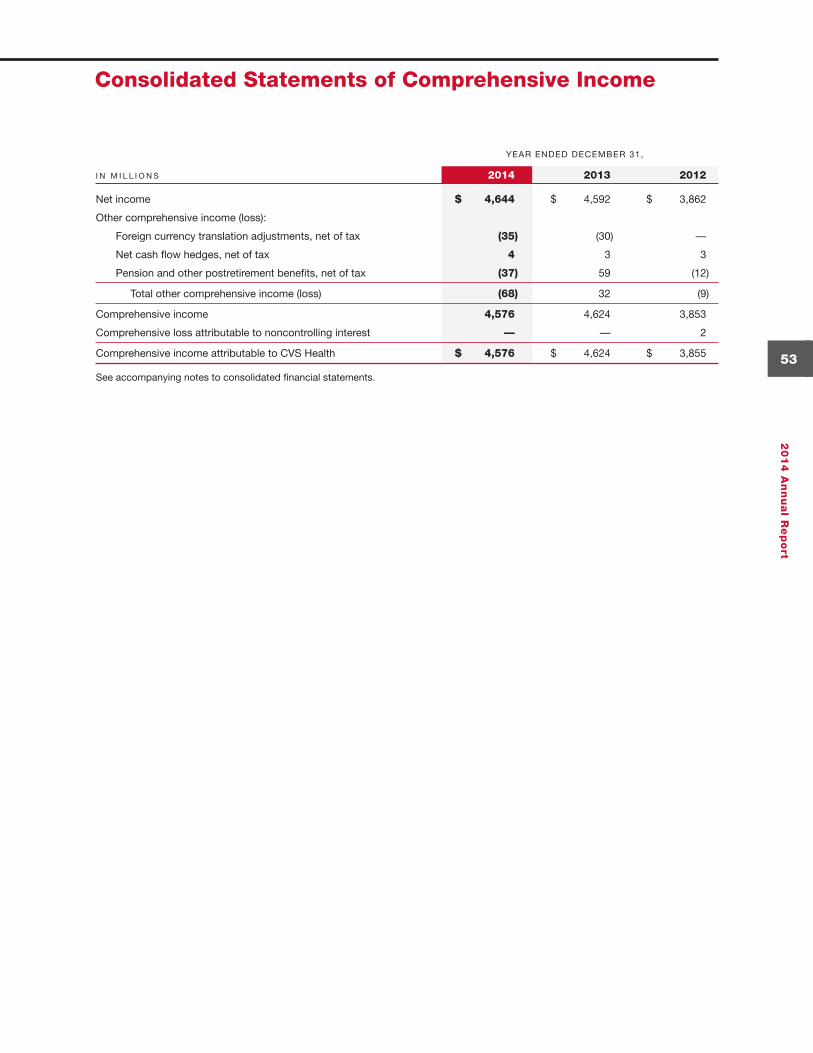
53
20
14
An
nu
al R
ep
ort
Consolidated Statements of Comprehensive Income
YEAR ENDED DECEMBER 31,
I N M I L L I O N S 2014 2013 2012
Net income $ 4,644 $ 4,592 $ 3,862
Other comprehensive income (loss):
Foreign currency translation adjustments, net of tax (35) (30) —
Net cash flow hedges, net of tax 4 3 3
Pension and other postretirement benefits, net of tax (37) 59 (12)
Total other comprehensive income (loss) (68) 32 (9)
Comprehensive income 4,576 4,624 3,853
Comprehensive loss attributable to noncontrolling interest — — 2
Comprehensive income attributable to CVS Health $ 4,576 $ 4,624 $ 3,855
See accompanying notes to consolidated financial statements.
157033_FIN.indd 53 3/2/15 3:14 PM
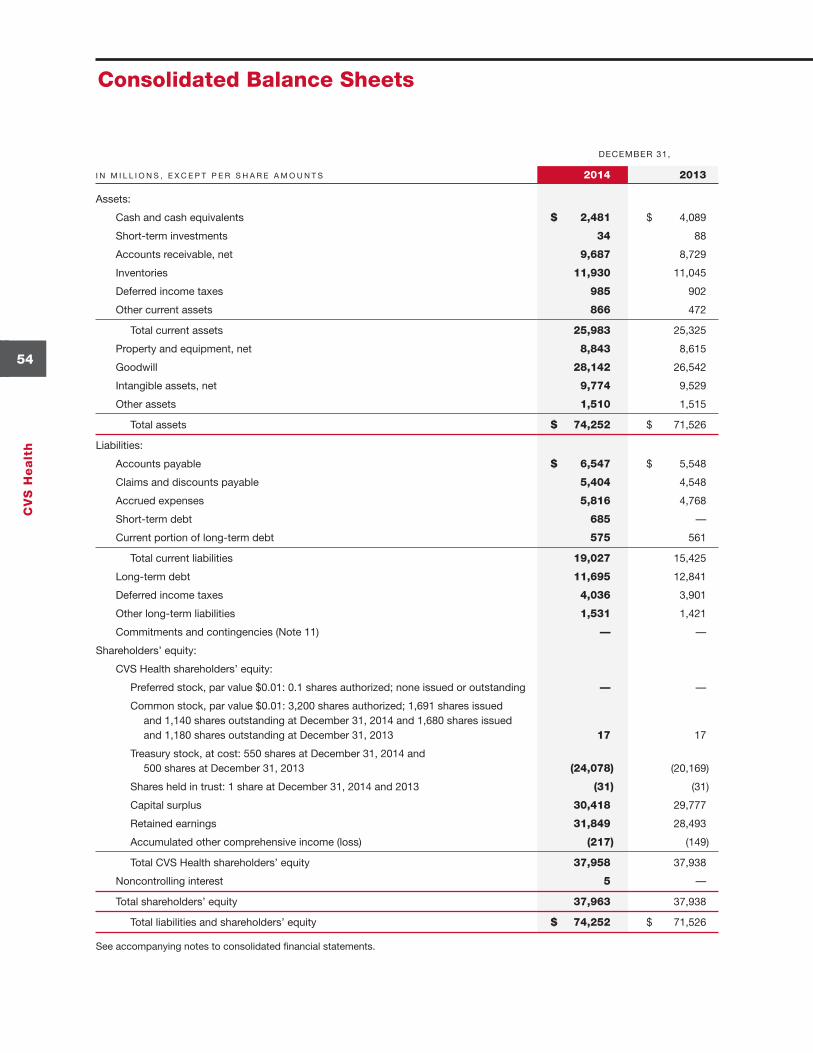
CV
S H
ea
lth
54
DECEMBER 31,
I N M I L L I O N S , E X C E P T P E R S H A R E A M O U N T S 2014 2013
Assets:
Cash and cash equivalents $ 2,481 $ 4,089
Short-term investments 34 88
Accounts receivable, net 9,687 8,729
Inventories 11,930 11,045
Deferred income taxes 985 902
Other current assets 866 472
Total current assets 25,983 25,325
Property and equipment, net 8,843 8,615
Goodwill 28,142 26,542
Intangible assets, net 9,774 9,529
Other assets 1,510 1,515
Total assets $ 74,252 $ 71,526
Liabilities:
Accounts payable $ 6,547 $ 5,548
Claims and discounts payable 5,404 4,548
Accrued expenses 5,816 4,768
Short-term debt 685 —
Current portion of long-term debt 575 561
Total current liabilities 19,027 15,425
Long-term debt 11,695 12,841
Deferred income taxes 4,036 3,901
Other long-term liabilities 1,531 1,421
Commitments and contingencies (Note 11) — —
Shareholders’ equity:
CVS Health shareholders’ equity:
Preferred stock, par value $0.01: 0.1 shares authorized; none issued or outstanding — —
Common stock, par value $0.01: 3,200 shares authorized; 1,691 shares issued and 1,140 shares outstanding at December 31, 2014 and 1,680 shares issued and 1,180 shares outstanding at December 31, 2013 17 17
Treasury stock, at cost: 550 shares at December 31, 2014 and 500 shares at December 31, 2013 (24,078) (20,169)
Shares held in trust: 1 share at December 31, 2014 and 2013 (31) (31)
Capital surplus 30,418 29,777
Retained earnings 31,849 28,493
Accumulated other comprehensive income (loss) (217) (149)
Total CVS Health shareholders’ equity 37,958 37,938
Noncontrolling interest 5 —
Total shareholders’ equity 37,963 37,938
Total liabilities and shareholders’ equity $ 74,252 $ 71,526
See accompanying notes to consolidated financial statements.
Consolidated Balance Sheets
157033_FIN.indd 54 3/2/15 3:14 PM
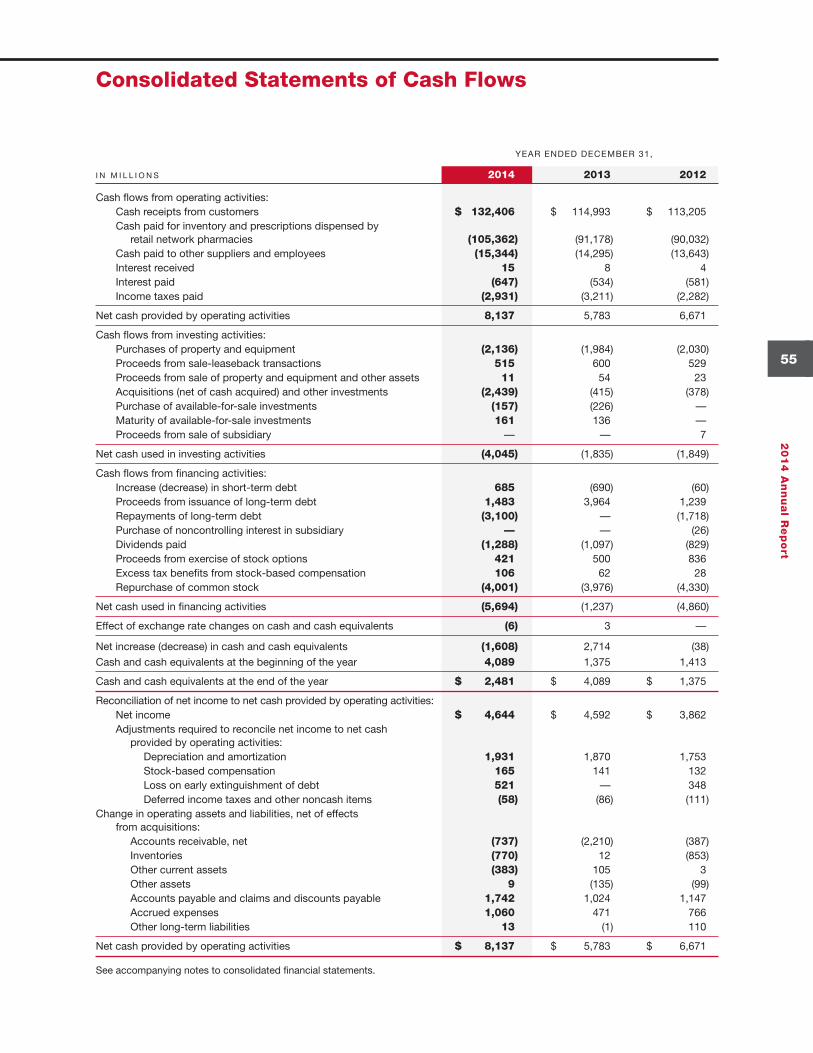
55
20
14
An
nu
al R
ep
ort
YEAR ENDED DECEMBER 31,
I N M I L L I O N S 2014 2013 2012
Cash flows from operating activities: Cash receipts from customers $ 132,406 $ 114,993 $ 113,205 Cash paid for inventory and prescriptions dispensed by retail network pharmacies (105,362) (91,178) (90,032) Cash paid to other suppliers and employees (15,344) (14,295) (13,643) Interest received 15 8 4 Interest paid (647) (534) (581) Income taxes paid (2,931) (3,211) (2,282)
Net cash provided by operating activities 8,137 5,783 6,671
Cash flows from investing activities: Purchases of property and equipment (2,136) (1,984) (2,030) Proceeds from sale-leaseback transactions 515 600 529 Proceeds from sale of property and equipment and other assets 11 54 23 Acquisitions (net of cash acquired) and other investments (2,439) (415) (378) Purchase of available-for-sale investments (157) (226) — Maturity of available-for-sale investments 161 136 — Proceeds from sale of subsidiary — — 7
Net cash used in investing activities (4,045) (1,835) (1,849)
Cash flows from financing activities: Increase (decrease) in short-term debt 685 (690) (60) Proceeds from issuance of long-term debt 1,483 3,964 1,239 Repayments of long-term debt (3,100) — (1,718) Purchase of noncontrolling interest in subsidiary — — (26) Dividends paid (1,288) (1,097) (829) Proceeds from exercise of stock options 421 500 836 Excess tax benefits from stock-based compensation 106 62 28 Repurchase of common stock (4,001) (3,976) (4,330)
Net cash used in financing activities (5,694) (1,237) (4,860)
Effect of exchange rate changes on cash and cash equivalents (6) 3 —
Net increase (decrease) in cash and cash equivalents (1,608) 2,714 (38)
Cash and cash equivalents at the beginning of the year 4,089 1,375 1,413
Cash and cash equivalents at the end of the year $ 2,481 $ 4,089 $ 1,375
Reconciliation of net income to net cash provided by operating activities: Net income $ 4,644 $ 4,592 $ 3,862 Adjustments required to reconcile net income to net cash provided by operating activities: Depreciation and amortization 1,931 1,870 1,753 Stock-based compensation 165 141 132 Loss on early extinguishment of debt 521 — 348 Deferred income taxes and other noncash items (58) (86) (111)Change in operating assets and liabilities, net of effects from acquisitions: Accounts receivable, net (737) (2,210) (387) Inventories (770) 12 (853) Other current assets (383) 105 3 Other assets 9 (135) (99) Accounts payable and claims and discounts payable 1,742 1,024 1,147 Accrued expenses 1,060 471 766 Other long-term liabilities 13 (1) 110
Net cash provided by operating activities $ 8,137 $ 5,783 $ 6,671
See accompanying notes to consolidated financial statements.
Consolidated Statements of Cash Flows
157033_FIN.indd 55 3/2/15 3:14 PM
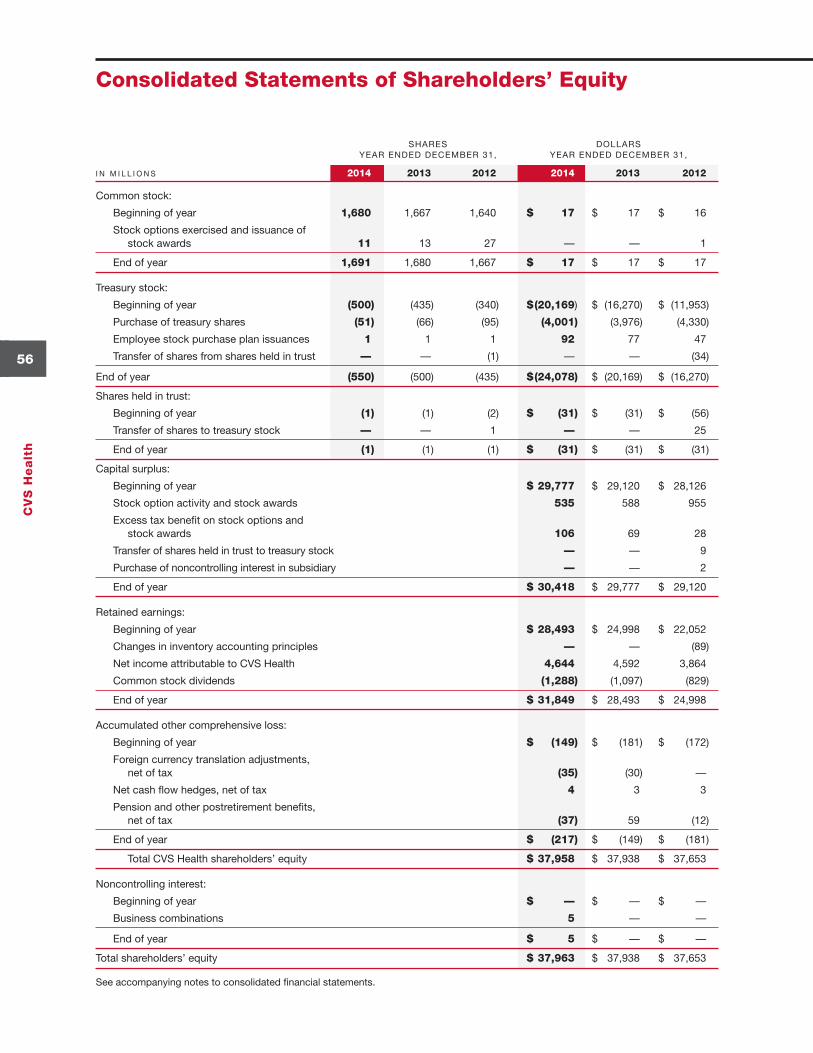
CV
S H
ea
lth
56
Consolidated Statements of Shareholders’ Equity
SHARES DOLLARS YEAR ENDED DECEMBER 31, YEAR ENDED DECEMBER 31,
I N M I L L I O N S 2014 2013 2012 2014 2013 2012
Common stock:
Beginning of year 1,680 1,667 1,640 $ 17 $ 17 $ 16
Stock options exercised and issuance of stock awards 11 13 27 — — 1
End of year 1,691 1,680 1,667 $ 17 $ 17 $ 17
Treasury stock:
Beginning of year (500) (435) (340) $ (20,169) $ (16,270) $ (11,953)
Purchase of treasury shares (51) (66) (95) (4,001) (3,976) (4,330)
Employee stock purchase plan issuances 1 1 1 92 77 47
Transfer of shares from shares held in trust — — (1) — — (34)
End of year (550) (500) (435) $ (24,078) $ (20,169) $ (16,270)
Shares held in trust:
Beginning of year (1) (1) (2) $ (31) $ (31) $ (56)
Transfer of shares to treasury stock — — 1 — — 25
End of year (1) (1) (1) $ (31) $ (31) $ (31)
Capital surplus:
Beginning of year $ 29,777 $ 29,120 $ 28,126
Stock option activity and stock awards 535 588 955
Excess tax benefit on stock options and stock awards 106 69 28
Transfer of shares held in trust to treasury stock — — 9
Purchase of noncontrolling interest in subsidiary — — 2
End of year $ 30,418 $ 29,777 $ 29,120
Retained earnings:
Beginning of year $ 28,493 $ 24,998 $ 22,052
Changes in inventory accounting principles — — (89)
Net income attributable to CVS Health 4,644 4,592 3,864
Common stock dividends (1,288) (1,097) (829)
End of year $ 31,849 $ 28,493 $ 24,998
Accumulated other comprehensive loss:
Beginning of year $ (149) $ (181) $ (172)
Foreign currency translation adjustments, net of tax (35) (30) —
Net cash flow hedges, net of tax 4 3 3
Pension and other postretirement benefits, net of tax (37) 59 (12)
End of year $ (217) $ (149) $ (181)
Total CVS Health shareholders’ equity $ 37,958 $ 37,938 $ 37,653
Noncontrolling interest:
Beginning of year $ — $ — $ —
Business combinations 5 — —
End of year $ 5 $ — $ —
Total shareholders’ equity $ 37,963 $ 37,938 $ 37,653
See accompanying notes to consolidated financial statements.
157033_FIN.indd 56 3/2/15 3:14 PM
57
20
14
An
nu
al R
ep
ort
1 | Significant Accounting PoliciesDescription of business — CVS Health Corporation and its subsidiaries (the “Company”) is the largest integrated pharmacy health care provider in the United States based upon revenues and prescriptions filled. The Company currently has three reportable business segments, Pharmacy Services, Retail Pharmacy and Corporate, which are described below.
Pharmacy Services Segment (the “PSS”) — The PSS provides a full range of pharmacy benefit management services including mail order pharmacy services, specialty pharmacy and infusion services, plan design and admin-istration, formulary management and claims processing. The Company’s clients are primarily employers, insurance companies, unions, government employee groups, health plans, Managed Medicaid plans and other sponsors of health benefit plans and individuals throughout the United States.
As a pharmacy benefits manager, the PSS manages the dispensing of pharmaceuticals through the Company’s mail order pharmacies and national network of more than 68,000 retail pharmacies, consisting of approximately 41,000 chain pharmacies and 27,000 independent pharmacies, to eligible members in the benefits plans maintained by the Company’s clients and utilizes its information systems to perform, among other things, safety checks, drug interaction screenings and brand to generic substitutions.
The PSS’ specialty pharmacies support individuals that require complex and expensive drug therapies. The specialty pharmacy business includes mail order and retail specialty pharmacies that operate under the CVS/caremarkTM, CarePlus CVS/pharmacy® and Navarro® Health Services names. In January 2014, the Company enhanced its offerings of specialty infusion services and began offering enteral nutrition services through Coram LLC and its subsidiaries (See Note 2, “Coram Acquisition”).
The PSS also provides health management programs, which include integrated disease management for 17 condi-tions, through the Company’s Accordant® rare disease management offering.
In addition, through the Company’s SilverScript Insurance Company (“SilverScript”) subsidiary, the PSS is a national provider of drug benefits to eligible beneficiaries under the federal government’s Medicare Part D program.
The PSS generates net revenues primarily by contracting with clients to provide prescription drugs to plan members. Prescription drugs are dispensed by the mail order pharmacies, specialty pharmacies and national network of retail pharmacies. Net revenues are also generated by providing additional services to clients, including administrative services such as claims processing and formulary management, as well as health care related services such as disease management.
The pharmacy services business operates under the CVS/caremarkTM Pharmacy Services, Caremark®, CVS/caremarkTM, CarePlus CVS/pharmacy®, RxAmerica®, Accordant®, SilverScript®, NovoLogix®, Coram®, CVS/specialtyTM and Navarro® Health Services names. As of December 31, 2014, the PSS operated 27 retail specialty pharmacy stores, 11 specialty mail order pharmacies and four mail order dispensing pharmacies, and 86 branches and six centers of excellence for infusion and enteral services located in 40 states, Puerto Rico and the District of Columbia.
Retail Pharmacy Segment (the “RPS”) — The RPS sells prescription drugs and a wide assortment of general merchandise, including over-the-counter drugs, beauty products and cosmetics, photo finishing, seasonal merchandise, greeting cards and convenience foods, through the Company’s CVS/pharmacy®, CVS®, Longs Drugs®, Navarro® Discount Pharmacy and Drogaria Onofre® retail stores and online through CVS.com®, Navarro.comTM and Onofre.com.brTM.
The RPS also provides health care services through its MinuteClinic® health care clinics. MinuteClinics are staffed by nurse practitioners and physician assistants who utilize nationally recognized protocols to diagnose and treat minor health conditions, perform health screenings, monitor chronic conditions and deliver vaccinations.
Notes to Consolidated Financial Statements
157033_FIN.indd 57 3/2/15 3:14 PM
CV
S H
ea
lth
58
Notes to Consolidated Financial Statements
As of December 31, 2014, the retail pharmacy business included 7,822 retail drugstores (of which 7,765 operated a pharmacy) located in 44 states, the District of Columbia, Puerto Rico and Brazil operating primarily under the CVS/pharmacy, CVS, Longs Drugs, Navarro Discount Pharmacy and Drogaria Onofre names, the online retail websites, CVS.com, Navarro.com and Onofre.com.br, and 971 retail health care clinics operating under the MinuteClinic name (of which 963 were located in CVS/pharmacy stores).
Corporate Segment — The Corporate Segment provides management and administrative services to support the Company. The Corporate Segment consists of certain aspects of the Company’s executive management, corporate relations, legal, compliance, human resources, corporate information technology and finance departments.
Principles of consolidation — The consolidated financial statements include the accounts of the Company and its majority-owned subsidiaries and variable interest entities for which the Company is the primary beneficiary. All intercompany balances and transactions have been eliminated.
The Company continually evaluates its investments to determine if they represent variable interests in a variable interest entity (“VIE”). If the Company determines that it has a variable interest in a VIE, the Company then evaluates if it is the primary beneficiary of the VIE. The evaluation is a qualitative assessment as to whether the Company has the ability to direct the activities of a VIE that most significantly impact the entity’s economic performance. The Company consolidates a VIE if it is considered to be the primary beneficiary.
Assets and liabilities of VIEs for which the Company is the primary beneficiary were not significant to the Company’s consolidated financial statements. VIE creditors do not have recourse against the general credit of the Company.
Use of estimates — The preparation of financial statements in conformity with accounting principles generally accepted in the United States of America requires management to make estimates and assumptions that affect the reported amounts in the consolidated financial statements and accompanying notes. Actual results could differ from those estimates.
Fair value hierarchy — The Company utilizes the three-level valuation hierarchy for the recognition and disclosure of fair value measurements. The categorization of assets and liabilities within this hierarchy is based upon the lowest level of input that is significant to the measurement of fair value. The three levels of the hierarchy consist of the following:
• Level 1 — Inputs to the valuation methodology are unadjusted quoted prices in active markets for identical assets or liabilities that the Company has the ability to access at the measurement date.
• Level 2 — Inputs to the valuation methodology are quoted prices for similar assets and liabilities in active markets, quoted prices in markets that are not active or inputs that are observable for the asset or liability, either directly or indirectly, for substantially the full term of the instrument.
• Level 3 — Inputs to the valuation methodology are unobservable inputs based upon management’s best estimate of inputs market participants could use in pricing the asset or liability at the measurement date, including assump-tions about risk.
Cash and cash equivalents — Cash and cash equivalents consist of cash and temporary investments with maturities of three months or less when purchased. The Company invests in short-term money market funds, commercial paper and time deposits, as well as other debt securities that are classified as cash equivalents within the accompanying consolidated balance sheets, as these funds are highly liquid and readily convertible to known amounts of cash. These investments are classified within Level 1 of the fair value hierarchy because they are valued using quoted market prices.
157033_FIN.indd 58 3/6/15 11:12 AM
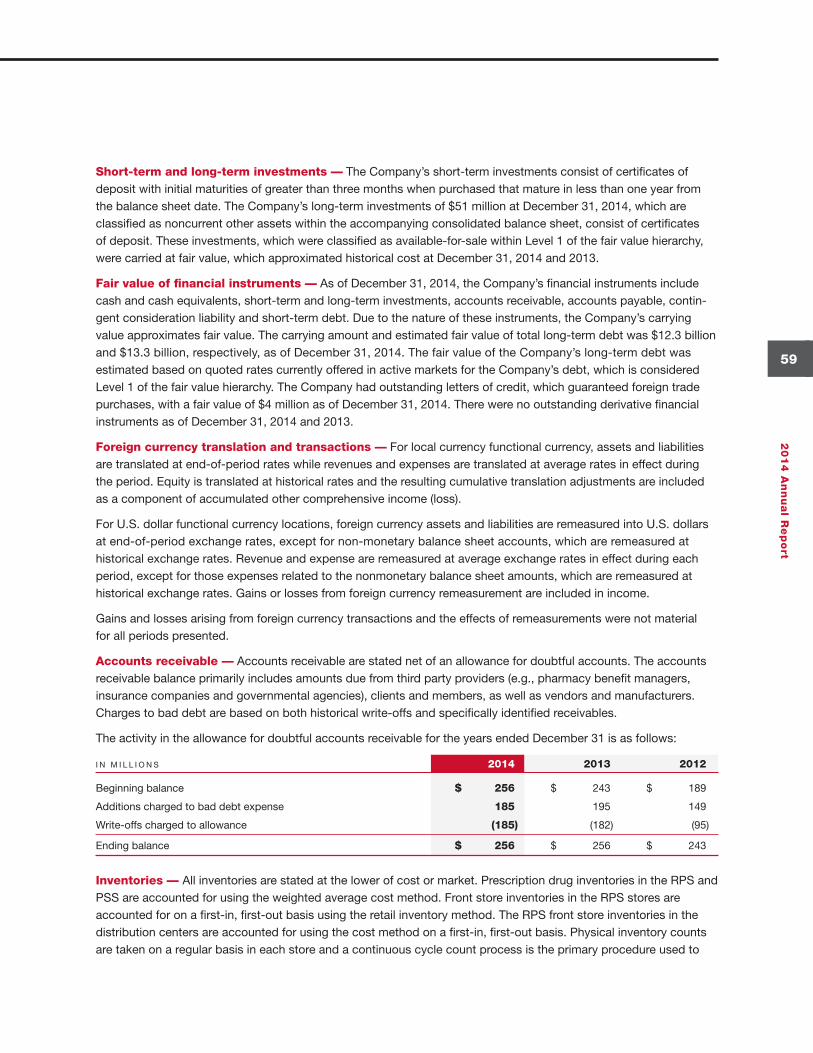
59
20
14
An
nu
al R
ep
ort
Short-term and long-term investments — The Company’s short-term investments consist of certificates of deposit with initial maturities of greater than three months when purchased that mature in less than one year from the balance sheet date. The Company’s long-term investments of $51 million at December 31, 2014, which are classified as noncurrent other assets within the accompanying consolidated balance sheet, consist of certificates of deposit. These investments, which were classified as available-for-sale within Level 1 of the fair value hierarchy, were carried at fair value, which approximated historical cost at December 31, 2014 and 2013.
Fair value of financial instruments — As of December 31, 2014, the Company’s financial instruments include cash and cash equivalents, short-term and long-term investments, accounts receivable, accounts payable, contin-gent consideration liability and short-term debt. Due to the nature of these instruments, the Company’s carrying value approximates fair value. The carrying amount and estimated fair value of total long-term debt was $12.3 billion and $13.3 billion, respectively, as of December 31, 2014. The fair value of the Company’s long-term debt was estimated based on quoted rates currently offered in active markets for the Company’s debt, which is considered Level 1 of the fair value hierarchy. The Company had outstanding letters of credit, which guaranteed foreign trade purchases, with a fair value of $4 million as of December 31, 2014. There were no outstanding derivative financial instruments as of December 31, 2014 and 2013.
Foreign currency translation and transactions — For local currency functional currency, assets and liabilities are translated at end-of-period rates while revenues and expenses are translated at average rates in effect during the period. Equity is translated at historical rates and the resulting cumulative translation adjustments are included as a component of accumulated other comprehensive income (loss).
For U.S. dollar functional currency locations, foreign currency assets and liabilities are remeasured into U.S. dollars at end-of-period exchange rates, except for non-monetary balance sheet accounts, which are remeasured at historical exchange rates. Revenue and expense are remeasured at average exchange rates in effect during each period, except for those expenses related to the nonmonetary balance sheet amounts, which are remeasured at historical exchange rates. Gains or losses from foreign currency remeasurement are included in income.
Gains and losses arising from foreign currency transactions and the effects of remeasurements were not material for all periods presented.
Accounts receivable — Accounts receivable are stated net of an allowance for doubtful accounts. The accounts receivable balance primarily includes amounts due from third party providers (e.g., pharmacy benefit managers, insurance companies and governmental agencies), clients and members, as well as vendors and manufacturers. Charges to bad debt are based on both historical write-offs and specifically identified receivables.
The activity in the allowance for doubtful accounts receivable for the years ended December 31 is as follows:
I N M I L L I O N S 2014 2013 2012
Beginning balance $ 256 $ 243 $ 189
Additions charged to bad debt expense 185 195 149
Write-offs charged to allowance (185) (182) (95)
Ending balance $ 256 $ 256 $ 243
Inventories — All inventories are stated at the lower of cost or market. Prescription drug inventories in the RPS and PSS are accounted for using the weighted average cost method. Front store inventories in the RPS stores are accounted for on a first-in, first-out basis using the retail inventory method. The RPS front store inventories in the distribution centers are accounted for using the cost method on a first-in, first-out basis. Physical inventory counts are taken on a regular basis in each store and a continuous cycle count process is the primary procedure used to
157033_FIN.indd 59 3/6/15 11:12 AM
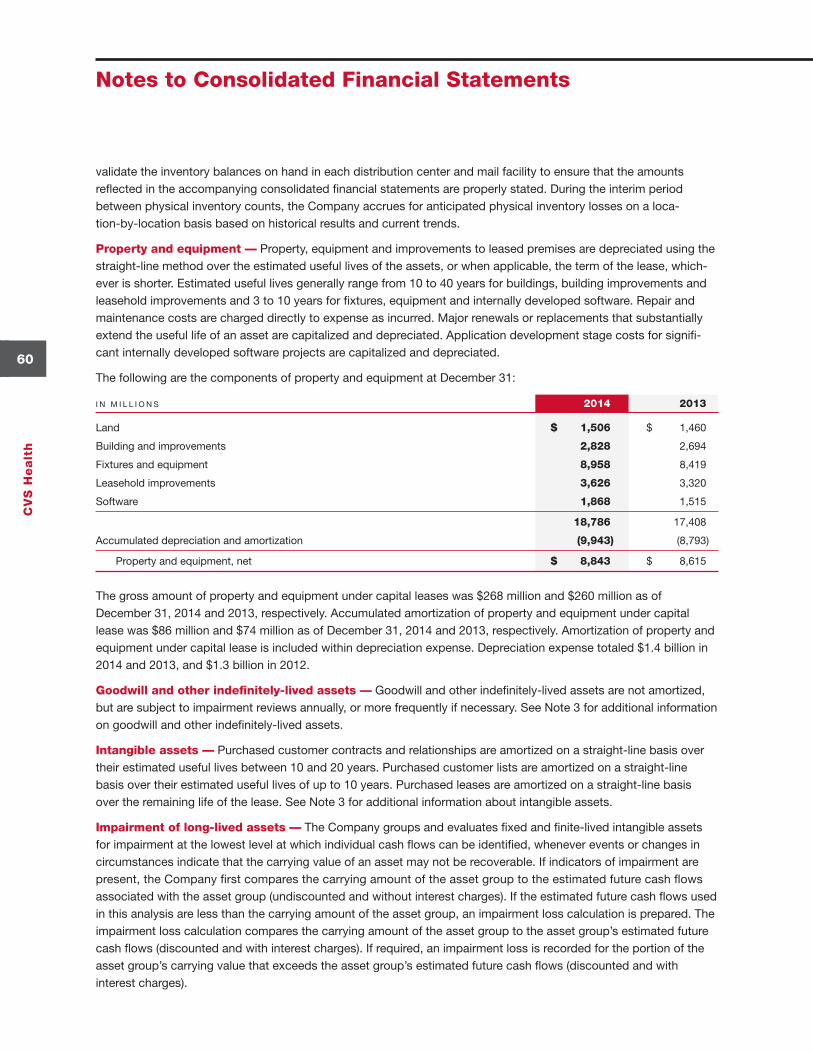
CV
S H
ea
lth
60
Notes to Consolidated Financial Statements
validate the inventory balances on hand in each distribution center and mail facility to ensure that the amounts reflected in the accompanying consolidated financial statements are properly stated. During the interim period between physical inventory counts, the Company accrues for anticipated physical inventory losses on a loca-tion-by-location basis based on historical results and current trends.
Property and equipment — Property, equipment and improvements to leased premises are depreciated using the straight-line method over the estimated useful lives of the assets, or when applicable, the term of the lease, which-ever is shorter. Estimated useful lives generally range from 10 to 40 years for buildings, building improvements and leasehold improvements and 3 to 10 years for fixtures, equipment and internally developed software. Repair and maintenance costs are charged directly to expense as incurred. Major renewals or replacements that substantially extend the useful life of an asset are capitalized and depreciated. Application development stage costs for signifi-cant internally developed software projects are capitalized and depreciated.
The following are the components of property and equipment at December 31:
I N M I L L I O N S 2014 2013
Land $ 1,506 $ 1,460
Building and improvements 2,828 2,694
Fixtures and equipment 8,958 8,419
Leasehold improvements 3,626 3,320
Software 1,868 1,515
18,786 17,408
Accumulated depreciation and amortization (9,943) (8,793)
Property and equipment, net $ 8,843 $ 8,615
The gross amount of property and equipment under capital leases was $268 million and $260 million as of December 31, 2014 and 2013, respectively. Accumulated amortization of property and equipment under capital lease was $86 million and $74 million as of December 31, 2014 and 2013, respectively. Amortization of property and equipment under capital lease is included within depreciation expense. Depreciation expense totaled $1.4 billion in 2014 and 2013, and $1.3 billion in 2012.
Goodwill and other indefinitely-lived assets — Goodwill and other indefinitely-lived assets are not amortized, but are subject to impairment reviews annually, or more frequently if necessary. See Note 3 for additional information on goodwill and other indefinitely-lived assets.
Intangible assets — Purchased customer contracts and relationships are amortized on a straight-line basis over their estimated useful lives between 10 and 20 years. Purchased customer lists are amortized on a straight-line basis over their estimated useful lives of up to 10 years. Purchased leases are amortized on a straight-line basis over the remaining life of the lease. See Note 3 for additional information about intangible assets.
Impairment of long-lived assets — The Company groups and evaluates fixed and finite-lived intangible assets for impairment at the lowest level at which individual cash flows can be identified, whenever events or changes in circumstances indicate that the carrying value of an asset may not be recoverable. If indicators of impairment are present, the Company first compares the carrying amount of the asset group to the estimated future cash flows associated with the asset group (undiscounted and without interest charges). If the estimated future cash flows used in this analysis are less than the carrying amount of the asset group, an impairment loss calculation is prepared. The impairment loss calculation compares the carrying amount of the asset group to the asset group’s estimated future cash flows (discounted and with interest charges). If required, an impairment loss is recorded for the portion of the asset group’s carrying value that exceeds the asset group’s estimated future cash flows (discounted and with interest charges).
157033_FIN.indd 60 3/6/15 11:12 AM
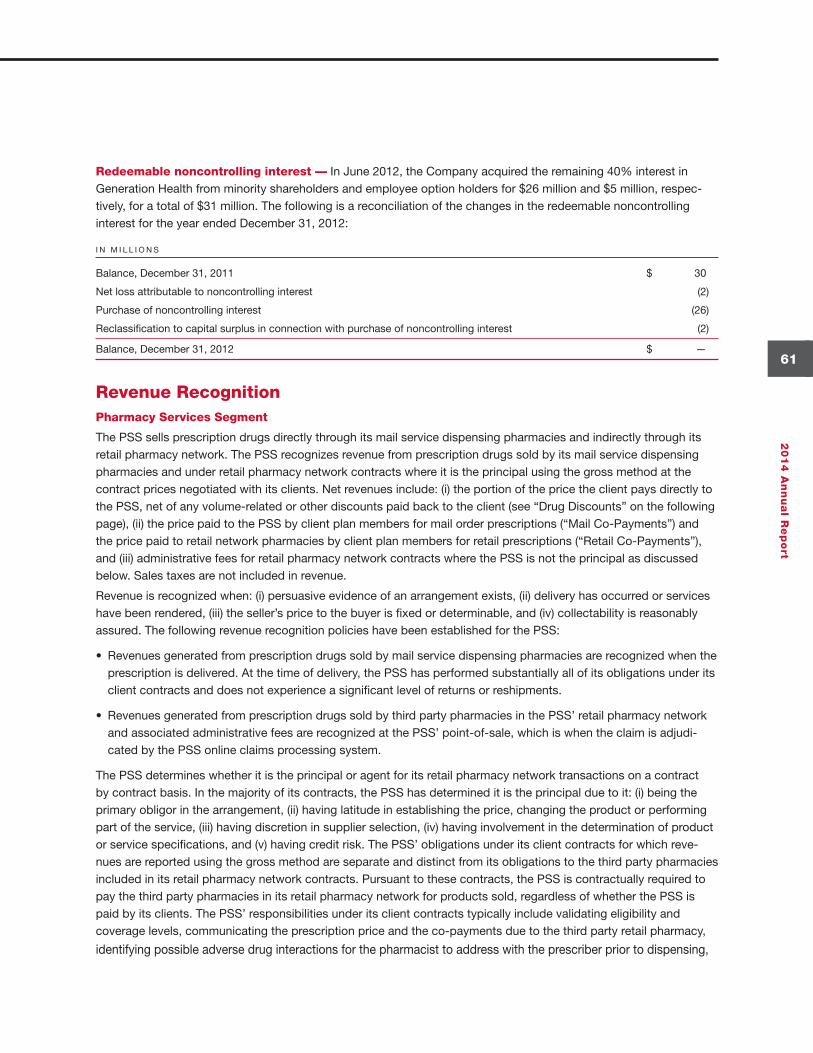
61
20
14
An
nu
al R
ep
ort
Redeemable noncontrolling interest — In June 2012, the Company acquired the remaining 40% interest in Generation Health from minority shareholders and employee option holders for $26 million and $5 million, respec-tively, for a total of $31 million. The following is a reconciliation of the changes in the redeemable noncontrolling interest for the year ended December 31, 2012:
I N M I L L I O N S
Balance, December 31, 2011 $ 30
Net loss attributable to noncontrolling interest (2)
Purchase of noncontrolling interest (26)
Reclassification to capital surplus in connection with purchase of noncontrolling interest (2)
Balance, December 31, 2012 $ —
Revenue RecognitionPharmacy Services Segment
The PSS sells prescription drugs directly through its mail service dispensing pharmacies and indirectly through its retail pharmacy network. The PSS recognizes revenue from prescription drugs sold by its mail service dispensing pharmacies and under retail pharmacy network contracts where it is the principal using the gross method at the contract prices negotiated with its clients. Net revenues include: (i) the portion of the price the client pays directly to the PSS, net of any volume-related or other discounts paid back to the client (see “Drug Discounts” on the following page), (ii) the price paid to the PSS by client plan members for mail order prescriptions (“Mail Co-Payments”) and the price paid to retail network pharmacies by client plan members for retail prescriptions (“Retail Co-Payments”), and (iii) administrative fees for retail pharmacy network contracts where the PSS is not the principal as discussed below. Sales taxes are not included in revenue.
Revenue is recognized when: (i) persuasive evidence of an arrangement exists, (ii) delivery has occurred or services have been rendered, (iii) the seller’s price to the buyer is fixed or determinable, and (iv) collectability is reasonably assured. The following revenue recognition policies have been established for the PSS:
• Revenues generated from prescription drugs sold by mail service dispensing pharmacies are recognized when the prescription is delivered. At the time of delivery, the PSS has performed substantially all of its obligations under its client contracts and does not experience a significant level of returns or reshipments.
• Revenues generated from prescription drugs sold by third party pharmacies in the PSS’ retail pharmacy network and associated administrative fees are recognized at the PSS’ point-of-sale, which is when the claim is adjudi-cated by the PSS online claims processing system.
The PSS determines whether it is the principal or agent for its retail pharmacy network transactions on a contract by contract basis. In the majority of its contracts, the PSS has determined it is the principal due to it: (i) being the primary obligor in the arrangement, (ii) having latitude in establishing the price, changing the product or performing part of the service, (iii) having discretion in supplier selection, (iv) having involvement in the determination of product or service specifications, and (v) having credit risk. The PSS’ obligations under its client contracts for which reve-nues are reported using the gross method are separate and distinct from its obligations to the third party pharmacies included in its retail pharmacy network contracts. Pursuant to these contracts, the PSS is contractually required to pay the third party pharmacies in its retail pharmacy network for products sold, regardless of whether the PSS is paid by its clients. The PSS’ responsibilities under its client contracts typically include validating eligibility and coverage levels, communicating the prescription price and the co-payments due to the third party retail pharmacy,
identifying possible adverse drug interactions for the pharmacist to address with the prescriber prior to dispensing,
157033_FIN.indd 61 3/6/15 11:12 AM
CV
S H
ea
lth
62
Notes to Consolidated Financial Statements
suggesting generic alternatives where clinically appropriate and approving the prescription for dispensing. Although the PSS does not have credit risk with respect to Retail Co-Payments, management believes that all of the other applicable indicators of gross revenue reporting are present. For contracts under which the PSS acts as an agent, revenue is recognized using the net method.
Drug Discounts — The PSS deducts from its revenues any rebates, inclusive of discounts and fees, earned by its clients. Rebates are paid to clients in accordance with the terms of client contracts, which are normally based on fixed rebates per prescription for specific products dispensed or a percentage of manufacturer discounts received for specific products dispensed. The liability for rebates due to clients is included in “Claims and discounts payable” in the accompanying consolidated balance sheets.
Medicare Part D — The PSS, through its SilverScript subsidiary, participates in the federal government’s Medicare Part D program as a Prescription Drug Plan (“PDP”). Net revenues include insurance premiums earned by the PDP, which are determined based on the PDP’s annual bid and related contractual arrangements with the Centers for Medicare and Medicaid Services (“CMS”). The insurance premiums include a direct premium paid by CMS and a beneficiary premium, which is the responsibility of the PDP member, but is subsidized by CMS in the case of low-income members. Premiums collected in advance are initially deferred in accrued expenses and are then recognized in net revenues over the period in which members are entitled to receive benefits.
In addition to these premiums, net revenues include co-payments, coverage gap benefits, deductibles and co-insurance (collectively, the “Member Co-Payments”) related to PDP members’ actual prescription claims. In certain cases, CMS subsidizes a portion of these Member Co-Payments and pays the PSS an estimated pro-spective Member Co-Payment subsidy amount each month. The prospective Member Co-Payment subsidy amounts received from CMS are also included in net revenues. SilverScript assumes no risk for these amounts. If the prospective Member Co-Payment subsidies received differ from the amounts based on actual prescription claims, the difference is recorded in either accounts receivable or accrued expenses.
The PSS accounts for CMS obligations and Member Co-Payments (including the amounts subsidized by CMS) using the gross method consistent with its revenue recognition policies for Mail Co-Payments and Retail Co-Payments (discussed previously in this document).
Retail Pharmacy Segment
The RPS recognizes revenue at the time the customer takes possession of the merchandise. Customer returns are not material. Revenue generated from the performance of services in the RPS’ health care clinics is recognized at the time the services are performed. Sales taxes are not included in revenue.
Loyalty Program — The Company’s customer loyalty program, ExtraCare®, is comprised of two components: ExtraSavingsTM and ExtraBucks® Rewards. ExtraSavings coupons redeemed by customers are recorded as a reduction of revenues when redeemed. ExtraBucks Rewards are accrued as a charge to cost of revenues when earned, net of estimated breakage. The Company determines breakage based on historical redemption patterns.
See Note 12 for additional information about the revenues of the Company’s business segments.
157033_FIN.indd 62 3/6/15 11:12 AM
63
20
14
An
nu
al R
ep
ort
Cost of RevenuesPharmacy Services Segment — The PSS’ cost of revenues includes: (i) the cost of prescription drugs sold during the reporting period directly through its mail service dispensing pharmacies and indirectly through its retail pharmacy network, (ii) shipping and handling costs, and (iii) the operating costs of its mail service dispensing pharmacies and client service operations and related information technology support costs including depreciation and amortization. The cost of prescription drugs sold component of cost of revenues includes: (i) the cost of the prescription drugs purchased from manufacturers or distributors and shipped to members in clients’ benefit plans from the PSS’ mail service dispensing pharmacies, net of any volume-related or other discounts (see “Vendor allowances and purchase discounts” below) and (ii) the cost of prescription drugs sold (including Retail Co-Payments) through the PSS’ retail pharmacy network under contracts where it is the principal, net of any volume-related or other discounts.
Retail Pharmacy Segment — The RPS’ cost of revenues includes: the cost of merchandise sold during the reporting period and the related purchasing costs, warehousing and delivery costs (including depreciation and amortization) and actual and estimated inventory losses.
See Note 12 for additional information about the cost of revenues of the Company’s business segments.
Vendor Allowances and Purchase DiscountsThe Company accounts for vendor allowances and purchase discounts as follows:
Pharmacy Services Segment — The PSS receives purchase discounts on products purchased. The PSS’ contrac-tual arrangements with vendors, including manufacturers, wholesalers and retail pharmacies, normally provide for the PSS to receive purchase discounts from established list prices in one, or a combination, of the following forms: (i) a direct discount at the time of purchase, (ii) a discount for the prompt payment of invoices, or (iii) when products are purchased indirectly from a manufacturer (e.g., through a wholesaler or retail pharmacy), a discount (or rebate) paid subsequent to dispensing. These rebates are recognized when prescriptions are dispensed and are generally calculated and billed to manufacturers within 30 days of the end of each completed quarter. Historically, the effect of adjustments resulting from the reconciliation of rebates recognized to the amounts billed and collected has not been material to the PSS’ results of operations. The PSS accounts for the effect of any such differences as a change in accounting estimate in the period the reconciliation is completed. The PSS also receives additional discounts under its wholesaler contracts if it exceeds contractually defined annual purchase volumes. In addition, the PSS receives fees from pharmaceutical manufacturers for administrative services. Purchase discounts and administrative service fees are recorded as a reduction of “Cost of revenues”.
Retail Pharmacy Segment — Vendor allowances received by the RPS reduce the carrying cost of inventory and are recognized in cost of revenues when the related inventory is sold, unless they are specifically identified as a reimbursement of incremental costs for promotional programs and/or other services provided. Amounts that are directly linked to advertising commitments are recognized as a reduction of advertising expense (included in operating expenses) when the related advertising commitment is satisfied. Any such allowances received in excess of the actual cost incurred also reduce the carrying cost of inventory. The total value of any upfront payments received from vendors that are linked to purchase commitments is initially deferred. The deferred amounts are then amortized to reduce cost of revenues over the life of the contract based upon purchase volume. The total value of any upfront payments received from vendors that are not linked to purchase commitments is also initially deferred. The deferred amounts are then amortized to reduce cost of revenues on a straight-line basis over the life of the related contract. The total amortization of these upfront payments was not material to the accompanying consoli-dated financial statements.
157033_FIN.indd 63 3/6/15 11:12 AM
CV
S H
ea
lth
64
Notes to Consolidated Financial Statements
Insurance — The Company is self-insured for certain losses related to general liability, workers’ compensation and auto liability. The Company obtains third party insurance coverage to limit exposure from these claims. The Company is also self-insured for certain losses related to health and medical liabilities. The Company’s self-insur-ance accruals, which include reported claims and claims incurred but not reported, are calculated using standard insurance industry actuarial assumptions and the Company’s historical claims experience.
Facility opening and closing costs — New facility opening costs, other than capital expenditures, are charged directly to expense when incurred. When the Company closes a facility, the present value of estimated unrecoverable costs, including the remaining lease obligation less estimated sublease income and the book value of abandoned property and equipment, are charged to expense. The long-term portion of the lease obligations associated with facility closings was $207 million and $246 million in 2014 and 2013, respectively.
Advertising costs — Advertising costs are expensed when the related advertising takes place. Advertising costs, net of vendor funding (included in operating expenses), were $212 million, $177 million and $221 million in 2014, 2013 and 2012, respectively.
Interest expense, net — Interest expense, net of capitalized interest, was $615 million, $517 million and $561 mil-lion, and interest income was $15 million, $8 million and $4 million in 2014, 2013 and 2012, respectively. Capitalized interest totaled $19 million, $25 million and $29 million in 2014, 2013 and 2012, respectively.
Shares held in trust — The Company maintains grantor trusts, which held approximately 1 million shares of its common stock at December 31, 2014 and 2013, respectively. These shares are designated for use under various employee compensation plans. Since the Company holds these shares, they are excluded from the computation of basic and diluted shares outstanding.
Accumulated other comprehensive income — Accumulated other comprehensive income (loss) consists of changes in the net actuarial gains and losses associated with pension and other postretirement benefit plans, losses on derivatives from cash flow hedges executed in previous years associated with the issuance of long-term debt, and foreign currency translation adjustments. The amount included in accumulated other comprehensive loss related to the Company’s pension and postretirement plans was $234 million pre-tax ($143 million after-tax) as of December 31, 2014 and $172 million pre-tax ($106 million after-tax) as of December 31, 2013. The net impact on cash flow hedges totaled $16 million pre-tax ($9 million after-tax) and $22 million pre-tax ($13 million after-tax) as of December 31, 2014 and 2013, respectively. Cumulative foreign currency translation adjustments at December 31, 2014 and 2013 were $65 million and $30 million, respectively.
157033_FIN.indd 64 3/6/15 11:12 AM
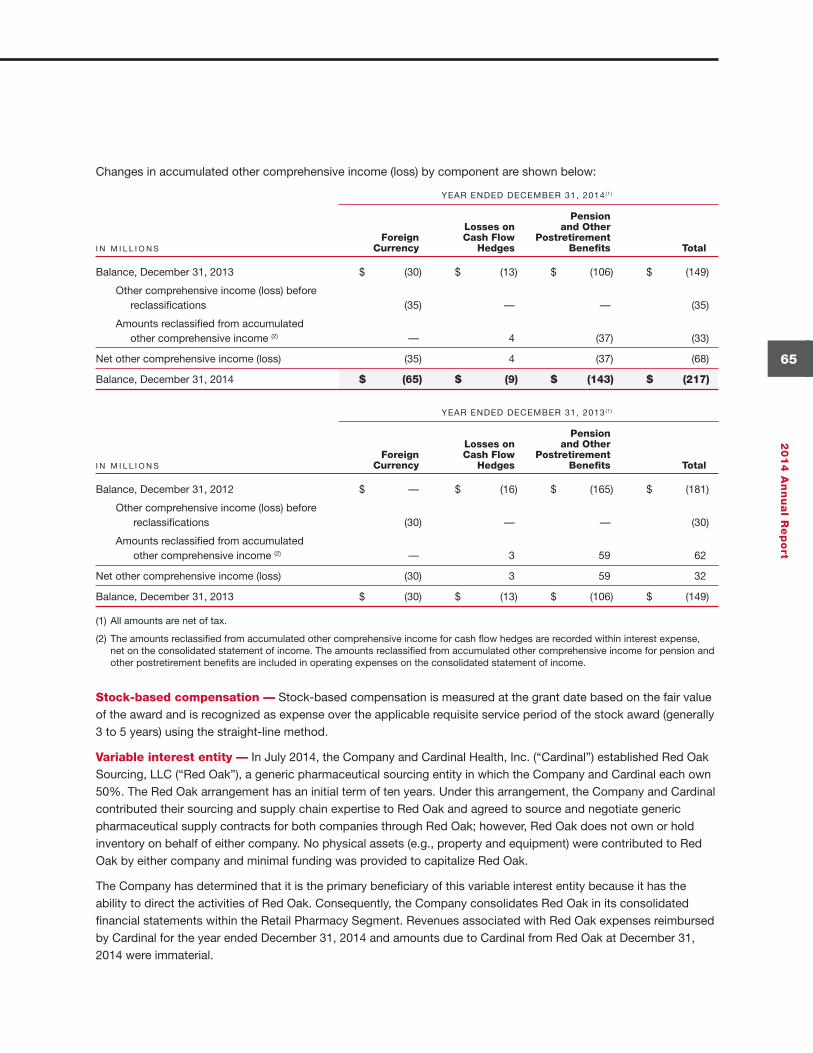
65
20
14
An
nu
al R
ep
ort
Changes in accumulated other comprehensive income (loss) by component are shown below:
YEAR ENDED DECEMBER 31, 2014(1)
Pension Losses on and Other Foreign Cash Flow Postretirement I N M I L L I O N S Currency Hedges Benefits Total
Balance, December 31, 2013 $ (30) $ (13) $ (106) $ (149)
Other comprehensive income (loss) before reclassifications (35) — — (35)
Amounts reclassified from accumulated other comprehensive income (2) — 4 (37) (33)
Net other comprehensive income (loss) (35) 4 (37) (68)
Balance, December 31, 2014 $ (65) $ (9) $ (143) $ (217)
YEAR ENDED DECEMBER 31, 2013(1)
Pension Losses on and Other Foreign Cash Flow Postretirement I N M I L L I O N S Currency Hedges Benefits Total
Balance, December 31, 2012 $ — $ (16) $ (165) $ (181)
Other comprehensive income (loss) before reclassifications (30) — — (30)
Amounts reclassified from accumulated other comprehensive income (2) — 3 59 62
Net other comprehensive income (loss) (30) 3 59 32
Balance, December 31, 2013 $ (30) $ (13) $ (106) $ (149)
(1) All amounts are net of tax.
(2) The amounts reclassified from accumulated other comprehensive income for cash flow hedges are recorded within interest expense, net on the consolidated statement of income. The amounts reclassified from accumulated other comprehensive income for pension and other postretirement benefits are included in operating expenses on the consolidated statement of income.
Stock-based compensation — Stock-based compensation is measured at the grant date based on the fair value of the award and is recognized as expense over the applicable requisite service period of the stock award (generally 3 to 5 years) using the straight-line method.
Variable interest entity — In July 2014, the Company and Cardinal Health, Inc. (“Cardinal”) established Red Oak Sourcing, LLC (“Red Oak”), a generic pharmaceutical sourcing entity in which the Company and Cardinal each own 50%. The Red Oak arrangement has an initial term of ten years. Under this arrangement, the Company and Cardinal contributed their sourcing and supply chain expertise to Red Oak and agreed to source and negotiate generic pharmaceutical supply contracts for both companies through Red Oak; however, Red Oak does not own or hold inventory on behalf of either company. No physical assets (e.g., property and equipment) were contributed to Red Oak by either company and minimal funding was provided to capitalize Red Oak.
The Company has determined that it is the primary beneficiary of this variable interest entity because it has the ability to direct the activities of Red Oak. Consequently, the Company consolidates Red Oak in its consolidated financial statements within the Retail Pharmacy Segment. Revenues associated with Red Oak expenses reimbursed by Cardinal for the year ended December 31, 2014 and amounts due to Cardinal from Red Oak at December 31, 2014 were immaterial.
157033_FIN.indd 65 3/2/15 3:14 PM
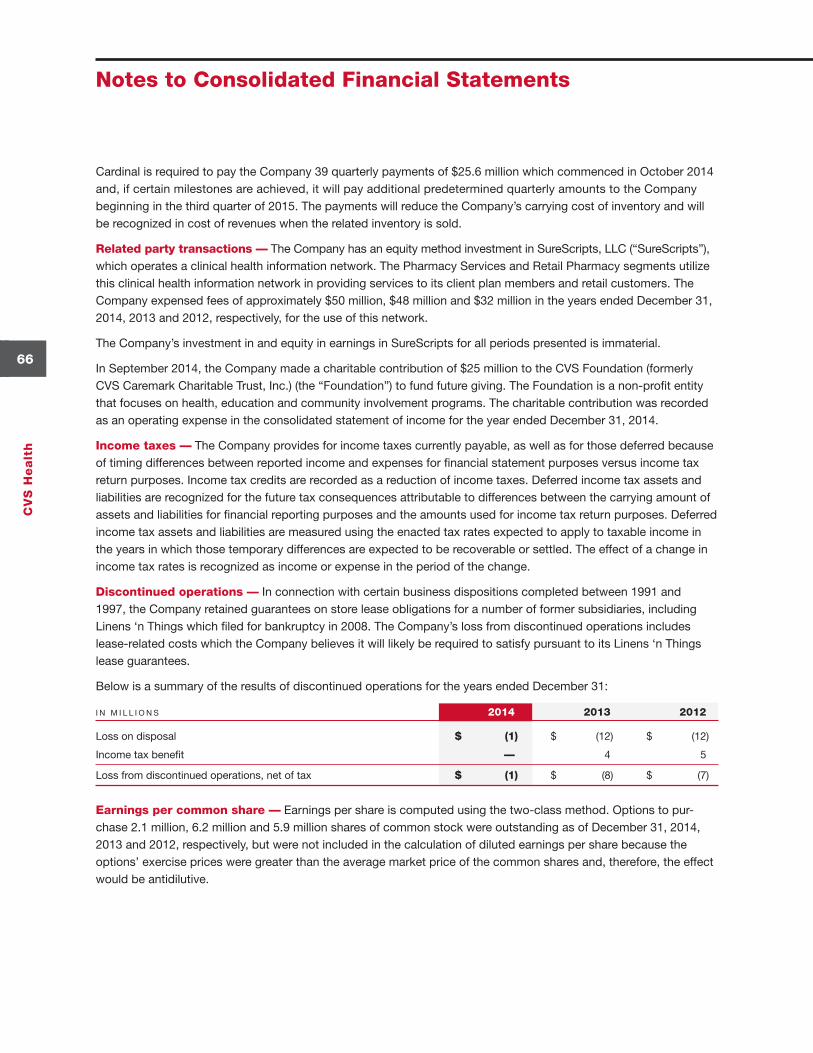
CV
S H
ea
lth
66
Notes to Consolidated Financial Statements
Cardinal is required to pay the Company 39 quarterly payments of $25.6 million which commenced in October 2014 and, if certain milestones are achieved, it will pay additional predetermined quarterly amounts to the Company beginning in the third quarter of 2015. The payments will reduce the Company’s carrying cost of inventory and will be recognized in cost of revenues when the related inventory is sold.
Related party transactions — The Company has an equity method investment in SureScripts, LLC (“SureScripts”), which operates a clinical health information network. The Pharmacy Services and Retail Pharmacy segments utilize this clinical health information network in providing services to its client plan members and retail customers. The Company expensed fees of approximately $50 million, $48 million and $32 million in the years ended December 31, 2014, 2013 and 2012, respectively, for the use of this network.
The Company’s investment in and equity in earnings in SureScripts for all periods presented is immaterial.
In September 2014, the Company made a charitable contribution of $25 million to the CVS Foundation (formerly CVS Caremark Charitable Trust, Inc.) (the “Foundation”) to fund future giving. The Foundation is a non-profit entity that focuses on health, education and community involvement programs. The charitable contribution was recorded as an operating expense in the consolidated statement of income for the year ended December 31, 2014.
Income taxes — The Company provides for income taxes currently payable, as well as for those deferred because of timing differences between reported income and expenses for financial statement purposes versus income tax return purposes. Income tax credits are recorded as a reduction of income taxes. Deferred income tax assets and liabilities are recognized for the future tax consequences attributable to differences between the carrying amount of assets and liabilities for financial reporting purposes and the amounts used for income tax return purposes. Deferred income tax assets and liabilities are measured using the enacted tax rates expected to apply to taxable income in the years in which those temporary differences are expected to be recoverable or settled. The effect of a change in income tax rates is recognized as income or expense in the period of the change.
Discontinued operations — In connection with certain business dispositions completed between 1991 and 1997, the Company retained guarantees on store lease obligations for a number of former subsidiaries, including Linens ‘n Things which filed for bankruptcy in 2008. The Company’s loss from discontinued operations includes lease-related costs which the Company believes it will likely be required to satisfy pursuant to its Linens ‘n Things lease guarantees.
Below is a summary of the results of discontinued operations for the years ended December 31:
I N M I L L I O N S 2014 2013 2012
Loss on disposal $ (1) $ (12) $ (12)
Income tax benefit — 4 5
Loss from discontinued operations, net of tax $ (1) $ (8) $ (7)
Earnings per common share — Earnings per share is computed using the two-class method. Options to pur-chase 2.1 million, 6.2 million and 5.9 million shares of common stock were outstanding as of December 31, 2014, 2013 and 2012, respectively, but were not included in the calculation of diluted earnings per share because the options’ exercise prices were greater than the average market price of the common shares and, therefore, the effect would be antidilutive.
157033_FIN.indd 66 3/2/15 3:14 PM
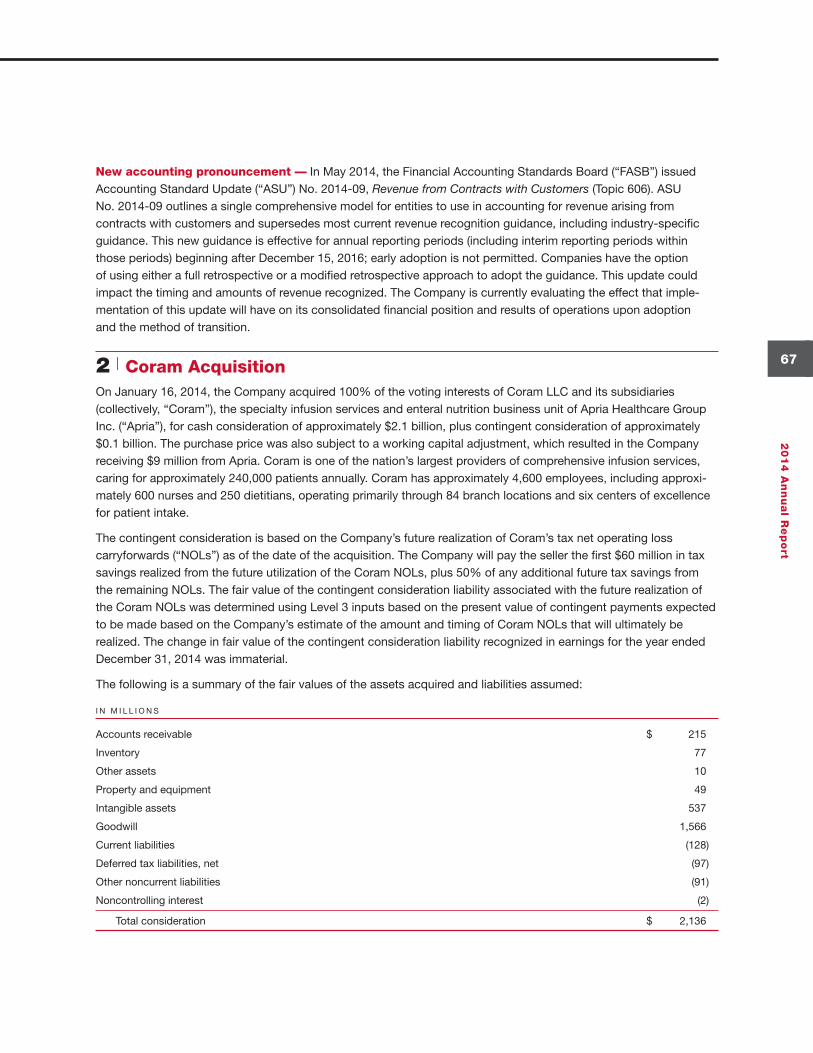
67
20
14
An
nu
al R
ep
ort
New accounting pronouncement — In May 2014, the Financial Accounting Standards Board (“FASB”) issued Accounting Standard Update (“ASU”) No. 2014-09, Revenue from Contracts with Customers (Topic 606). ASU No. 2014-09 outlines a single comprehensive model for entities to use in accounting for revenue arising from contracts with customers and supersedes most current revenue recognition guidance, including industry-specific guidance. This new guidance is effective for annual reporting periods (including interim reporting periods within those periods) beginning after December 15, 2016; early adoption is not permitted. Companies have the option of using either a full retrospective or a modified retrospective approach to adopt the guidance. This update could impact the timing and amounts of revenue recognized. The Company is currently evaluating the effect that imple-mentation of this update will have on its consolidated financial position and results of operations upon adoption and the method of transition.
2 | Coram AcquisitionOn January 16, 2014, the Company acquired 100% of the voting interests of Coram LLC and its subsidiaries (collectively, “Coram”), the specialty infusion services and enteral nutrition business unit of Apria Healthcare Group Inc. (“Apria”), for cash consideration of approximately $2.1 billion, plus contingent consideration of approximately $0.1 billion. The purchase price was also subject to a working capital adjustment, which resulted in the Company receiving $9 million from Apria. Coram is one of the nation’s largest providers of comprehensive infusion services, caring for approximately 240,000 patients annually. Coram has approximately 4,600 employees, including approxi-mately 600 nurses and 250 dietitians, operating primarily through 84 branch locations and six centers of excellence for patient intake.
The contingent consideration is based on the Company’s future realization of Coram’s tax net operating loss carryforwards (“NOLs”) as of the date of the acquisition. The Company will pay the seller the first $60 million in tax savings realized from the future utilization of the Coram NOLs, plus 50% of any additional future tax savings from the remaining NOLs. The fair value of the contingent consideration liability associated with the future realization of the Coram NOLs was determined using Level 3 inputs based on the present value of contingent payments expected to be made based on the Company’s estimate of the amount and timing of Coram NOLs that will ultimately be realized. The change in fair value of the contingent consideration liability recognized in earnings for the year ended December 31, 2014 was immaterial.
The following is a summary of the fair values of the assets acquired and liabilities assumed:
I N M I L L I O N S
Accounts receivable $ 215
Inventory 77
Other assets 10
Property and equipment 49
Intangible assets 537
Goodwill 1,566
Current liabilities (128)
Deferred tax liabilities, net (97)
Other noncurrent liabilities (91)
Noncontrolling interest (2)
Total consideration $ 2,136
157033_FIN.indd 67 3/2/15 3:14 PM
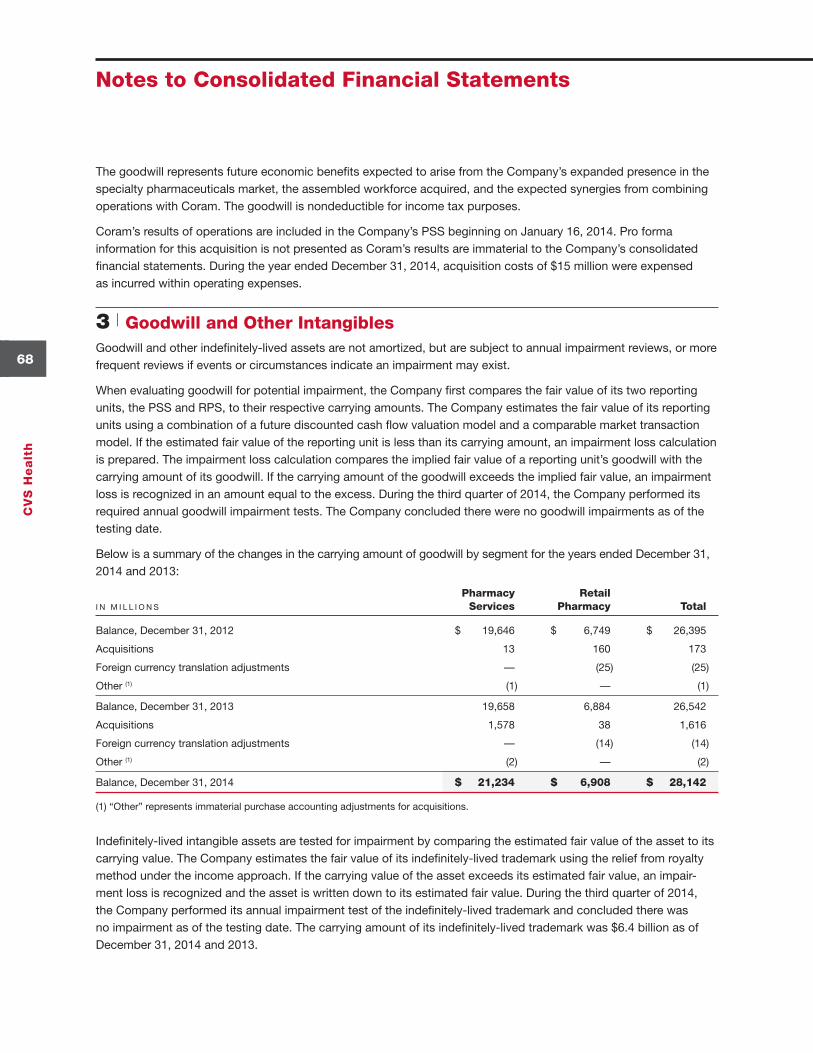
CV
S H
ea
lth
68
Notes to Consolidated Financial Statements
The goodwill represents future economic benefits expected to arise from the Company’s expanded presence in the specialty pharmaceuticals market, the assembled workforce acquired, and the expected synergies from combining operations with Coram. The goodwill is nondeductible for income tax purposes.
Coram’s results of operations are included in the Company’s PSS beginning on January 16, 2014. Pro forma information for this acquisition is not presented as Coram’s results are immaterial to the Company’s consolidated financial statements. During the year ended December 31, 2014, acquisition costs of $15 million were expensed as incurred within operating expenses.
3 | Goodwill and Other IntangiblesGoodwill and other indefinitely-lived assets are not amortized, but are subject to annual impairment reviews, or more frequent reviews if events or circumstances indicate an impairment may exist.
When evaluating goodwill for potential impairment, the Company first compares the fair value of its two reporting units, the PSS and RPS, to their respective carrying amounts. The Company estimates the fair value of its reporting units using a combination of a future discounted cash flow valuation model and a comparable market transaction model. If the estimated fair value of the reporting unit is less than its carrying amount, an impairment loss calculation is prepared. The impairment loss calculation compares the implied fair value of a reporting unit’s goodwill with the carrying amount of its goodwill. If the carrying amount of the goodwill exceeds the implied fair value, an impairment loss is recognized in an amount equal to the excess. During the third quarter of 2014, the Company performed its required annual goodwill impairment tests. The Company concluded there were no goodwill impairments as of the testing date.
Below is a summary of the changes in the carrying amount of goodwill by segment for the years ended December 31, 2014 and 2013:
Pharmacy Retail I N M I L L I O N S Services Pharmacy Total
Balance, December 31, 2012 $ 19,646 $ 6,749 $ 26,395
Acquisitions 13 160 173
Foreign currency translation adjustments — (25) (25)
Other (1) (1) — (1)
Balance, December 31, 2013 19,658 6,884 26,542
Acquisitions 1,578 38 1,616
Foreign currency translation adjustments — (14) (14)
Other (1) (2) — (2)
Balance, December 31, 2014 $ 21,234 $ 6,908 $ 28,142
(1) “Other” represents immaterial purchase accounting adjustments for acquisitions.
Indefinitely-lived intangible assets are tested for impairment by comparing the estimated fair value of the asset to its carrying value. The Company estimates the fair value of its indefinitely-lived trademark using the relief from royalty method under the income approach. If the carrying value of the asset exceeds its estimated fair value, an impair-ment loss is recognized and the asset is written down to its estimated fair value. During the third quarter of 2014, the Company performed its annual impairment test of the indefinitely-lived trademark and concluded there was no impairment as of the testing date. The carrying amount of its indefinitely-lived trademark was $6.4 billion as of December 31, 2014 and 2013.
157033_FIN.indd 68 3/2/15 3:14 PM
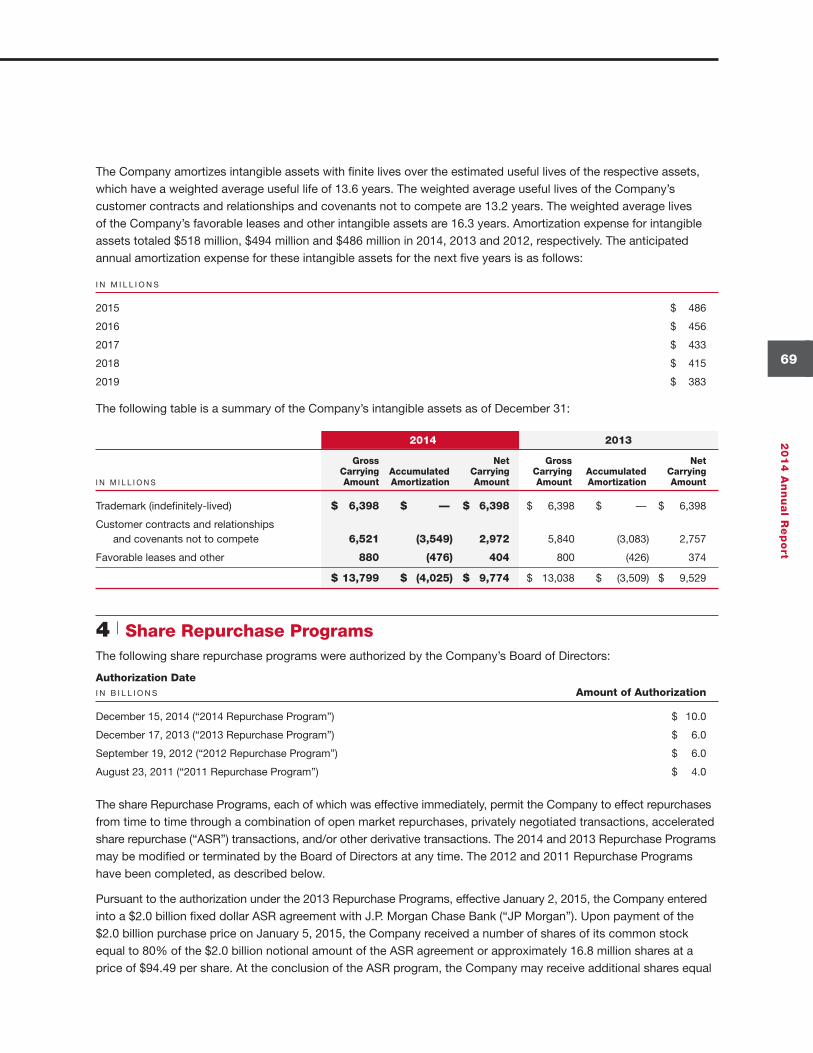
69
20
14
An
nu
al R
ep
ort
The Company amortizes intangible assets with finite lives over the estimated useful lives of the respective assets, which have a weighted average useful life of 13.6 years. The weighted average useful lives of the Company’s customer contracts and relationships and covenants not to compete are 13.2 years. The weighted average lives of the Company’s favorable leases and other intangible assets are 16.3 years. Amortization expense for intangible assets totaled $518 million, $494 million and $486 million in 2014, 2013 and 2012, respectively. The anticipated annual amortization expense for these intangible assets for the next five years is as follows:
I N M I L L I O N S
2015 $ 486
2016 $ 456
2017 $ 433
2018 $ 415
2019 $ 383
The following table is a summary of the Company’s intangible assets as of December 31:
2014 2013
Gross Net Gross Net Carrying Accumulated Carrying Carrying Accumulated Carrying I N M I L L I O N S Amount Amortization Amount Amount Amortization Amount
Trademark (indefinitely-lived) $ 6,398 $ — $ 6,398 $ 6,398 $ — $ 6,398
Customer contracts and relationships and covenants not to compete 6,521 (3,549) 2,972 5,840 (3,083) 2,757
Favorable leases and other 880 (476) 404 800 (426) 374
$ 13,799 $ (4,025) $ 9,774 $ 13,038 $ (3,509) $ 9,529
4 | Share Repurchase ProgramsThe following share repurchase programs were authorized by the Company’s Board of Directors:
Authorization Date I N B I L L I O N S Amount of Authorization
December 15, 2014 (“2014 Repurchase Program”) $ 10.0
December 17, 2013 (“2013 Repurchase Program”) $ 6.0
September 19, 2012 (“2012 Repurchase Program”) $ 6.0
August 23, 2011 (“2011 Repurchase Program”) $ 4.0
The share Repurchase Programs, each of which was effective immediately, permit the Company to effect repurchases from time to time through a combination of open market repurchases, privately negotiated transactions, accelerated share repurchase (“ASR”) transactions, and/or other derivative transactions. The 2014 and 2013 Repurchase Programs may be modified or terminated by the Board of Directors at any time. The 2012 and 2011 Repurchase Programs have been completed, as described below.
Pursuant to the authorization under the 2013 Repurchase Programs, effective January 2, 2015, the Company entered into a $2.0 billion fixed dollar ASR agreement with J.P. Morgan Chase Bank (“JP Morgan”). Upon payment of the $2.0 billion purchase price on January 5, 2015, the Company received a number of shares of its common stock equal to 80% of the $2.0 billion notional amount of the ASR agreement or approximately 16.8 million shares at a price of $94.49 per share. At the conclusion of the ASR program, the Company may receive additional shares equal
157033_FIN.indd 69 3/2/15 3:14 PM
CV
S H
ea
lth
70
Notes to Consolidated Financial Statements
to the remaining 20% of the $2.0 billion notional amount. The ultimate number of shares the Company may receive will fluctuate based on changes in the daily volume-weighted average price of the Company’s stock over a period beginning on January 2, 2015 and ending on or before April 26, 2015. If the mean daily volume-weighted average price of the Company’s common stock, less a discount (the “forward price”), during the ASR program falls below $94.49 per share, the Company will receive a higher number of shares from JP Morgan. If the forward price rises above $94.49 per share, the Company will either receive fewer shares from JP Morgan or, potentially have an obligation to JP Morgan which, at the Company’s option, could be settled in additional cash or by issuing shares. Under the terms of the ASR agreement, the maximum number of shares that could be received or delivered is 42.0 million. The initial 16.8 million shares of common stock delivered to the Company by JP Morgan were placed into treasury stock in January 2015.
Pursuant to the authorization under the 2012 Repurchase Program, effective October 1, 2013, the Company entered into a $1.7 billion fixed dollar ASR agreement with Barclays Bank PLC (“Barclays”). Upon payment of the $1.7 billion purchase price on October 1, 2013, the Company received a number of shares of its common stock equal to 50% of the $1.7 billion notional amount of the ASR agreement or approximately 14.9 million shares at a price of $56.88 per share. The Company received approximately 11.7 million shares of common stock on December 30, 2013 at an average price of $63.83 per share, representing the remaining 50% of the $1.7 billion notional amount of the ASR agreement and thereby concluding the agreement. The total of 26.6 million shares of common stock delivered to the Company by Barclays over the term of the October 2013 ASR agreement were placed into treasury stock.
Pursuant to the authorizations under the 2011 and 2012 Repurchase Programs, on September 19, 2012, the Company entered into a $1.2 billion fixed dollar ASR agreement with Barclays. Upon payment of the $1.2 billion purchase price on September 20, 2012, the Company received a number of shares of its common stock equal to 50% of the $1.2 billion notional amount of the ASR agreement or approximately 12.6 million shares at a price of $47.71 per share. The Company received approximately 13.0 million shares of common stock on November 16, 2012 at an average price of $46.96 per share, representing the remaining 50% of the $1.2 billion notional amount of the ASR agreement and thereby concluding the agreement. The total of 25.6 million shares of common stock delivered to the Company by Barclays over the term of the September 2012 ASR agreement were placed into treasury stock.
Each of the ASR transactions described previously were accounted for as an initial treasury stock transaction and a forward contract. The forward contract was classified as an equity instrument. The initial repurchase of the shares and delivery of the remainder of the shares to conclude each ASR, resulted in an immediate reduction of the outstanding shares used to calculate the weighted average common shares outstanding for basic and diluted earnings per share.
During the year ended December 31, 2014, the Company repurchased an aggregate of 51.4 million shares of common stock for approximately $4.0 billion under the 2013 and 2012 Repurchase Programs. As of December 31, 2014, there remained an aggregate of approximately $12.7 billion available for future repurchases under the 2014 and 2013 Repurchase Programs, $2.0 billion of which was used for the ASR effective January 2, 2015 described previously. As of December 31, 2014, the 2012 Repurchase Program was complete.
During the year ended December 31, 2013, the Company repurchased an aggregate of 66.2 million shares of common stock for approximately $4.0 billion under the 2012 Repurchase Program, which includes shares received from the October 2013 ASR agreement described previously. As of December 31, 2013, there remained an aggre-gate of approximately $6.7 billion available for future repurchases under the 2013 and 2012 Repurchase Programs.
During the year ended December 31, 2012, the Company repurchased an aggregate of 95.0 million shares of common stock for approximately $4.3 billion under the 2012 and 2011 Repurchase Programs, which includes shares received from the September 2012 ASR agreement described above. As of December 31, 2012, the 2011 Repurchase program was complete.
157033_FIN.indd 70 3/2/15 3:14 PM
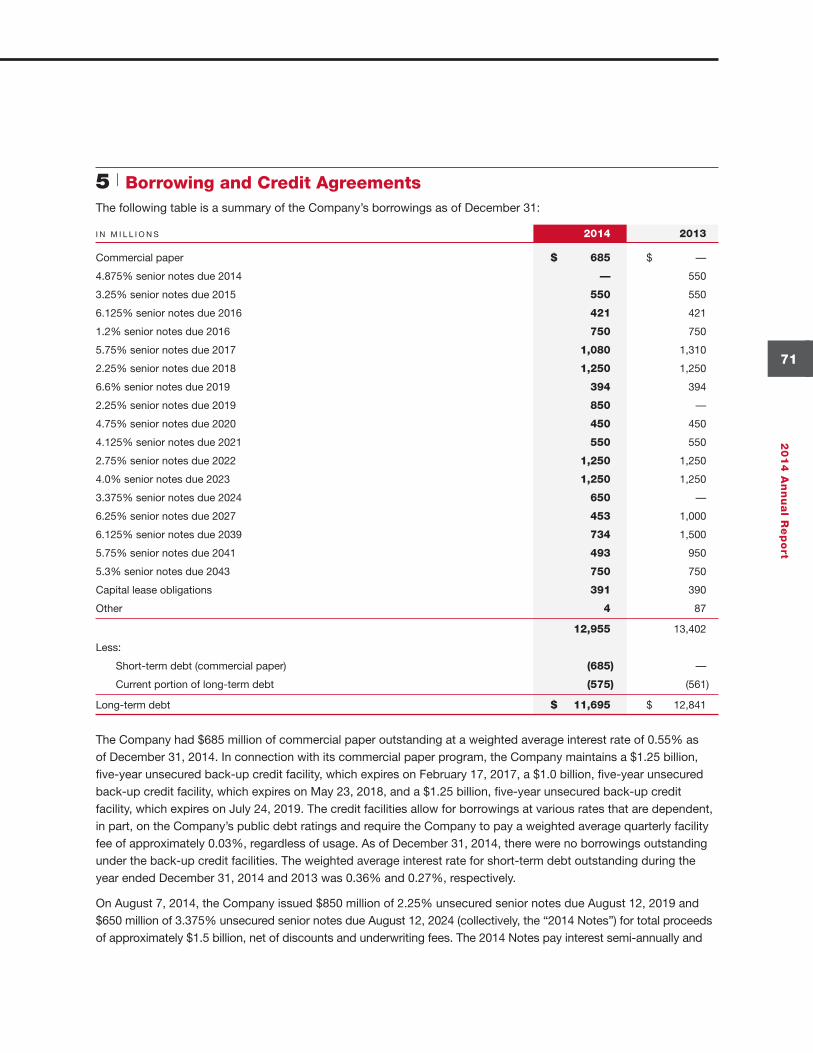
71
20
14
An
nu
al R
ep
ort
5 | Borrowing and Credit AgreementsThe following table is a summary of the Company’s borrowings as of December 31:
I N M I L L I O N S 2014 2013
Commercial paper $ 685 $ —
4.875% senior notes due 2014 — 550
3.25% senior notes due 2015 550 550
6.125% senior notes due 2016 421 421
1.2% senior notes due 2016 750 750
5.75% senior notes due 2017 1,080 1,310
2.25% senior notes due 2018 1,250 1,250
6.6% senior notes due 2019 394 394
2.25% senior notes due 2019 850 —
4.75% senior notes due 2020 450 450
4.125% senior notes due 2021 550 550
2.75% senior notes due 2022 1,250 1,250
4.0% senior notes due 2023 1,250 1,250
3.375% senior notes due 2024 650 —
6.25% senior notes due 2027 453 1,000
6.125% senior notes due 2039 734 1,500
5.75% senior notes due 2041 493 950
5.3% senior notes due 2043 750 750
Capital lease obligations 391 390
Other 4 87
12,955 13,402
Less:
Short-term debt (commercial paper) (685) —
Current portion of long-term debt (575) (561)
Long-term debt $ 11,695 $ 12,841
The Company had $685 million of commercial paper outstanding at a weighted average interest rate of 0.55% as of December 31, 2014. In connection with its commercial paper program, the Company maintains a $1.25 billion, five-year unsecured back-up credit facility, which expires on February 17, 2017, a $1.0 billion, five-year unsecured back-up credit facility, which expires on May 23, 2018, and a $1.25 billion, five-year unsecured back-up credit facility, which expires on July 24, 2019. The credit facilities allow for borrowings at various rates that are dependent, in part, on the Company’s public debt ratings and require the Company to pay a weighted average quarterly facility fee of approximately 0.03%, regardless of usage. As of December 31, 2014, there were no borrowings outstanding under the back-up credit facilities. The weighted average interest rate for short-term debt outstanding during the year ended December 31, 2014 and 2013 was 0.36% and 0.27%, respectively.
On August 7, 2014, the Company issued $850 million of 2.25% unsecured senior notes due August 12, 2019 and $650 million of 3.375% unsecured senior notes due August 12, 2024 (collectively, the “2014 Notes”) for total proceeds of approximately $1.5 billion, net of discounts and underwriting fees. The 2014 Notes pay interest semi-annually and
157033_FIN.indd 71 3/2/15 3:14 PM
CV
S H
ea
lth
72
Notes to Consolidated Financial Statements
may be redeemed, in whole at any time, or in part from time to time, at the Company’s option at a defined redemption price plus accrued and unpaid interest to the redemption date. The net proceeds of the 2014 Notes were used for general corporate purposes and to repay certain corporate debt.
On August 7, 2014, the Company announced tender offers for any and all of the 6.25% Senior Notes due 2027, and up to a maximum amount of the 6.125% Senior Notes due 2039, the 5.75% Senior Notes due 2041 and the 5.75% Senior Notes due 2017, for up to an aggregate principal amount of $1.5 billion. On August 21, 2014, the Company increased the aggregate principal amount of the tender offers to $2.0 billion and completed the repurchase for the maximum amount on September 4, 2014. The Company paid a premium of $490 million in excess of the debt principal in connection with the tender offers, wrote off $26 million of unamortized deferred financing costs and incurred $5 million in fees, for a total loss on the early extinguishment of debt of $521 million. The loss was recorded in income from continuing operations on the consolidated statement of income for the year ended December 31, 2014.
During the year ended December 31, 2014, the Company repurchased the remaining $41 million of outstanding Enhanced Capital Advantage Preferred Securities (“ECAPS”) at par. The fees and write-off of deferred issuance costs associated with the early extinguishment of the ECAPS were immaterial.
On December 2, 2013, the Company issued $750 million of 1.2% unsecured senior notes due December 5, 2016; $1.25 billion of 2.25% unsecured senior notes due December 5, 2018; $1.25 billion of 4.0% unsecured senior notes due December 5, 2023; and $750 million of 5.3% unsecured senior notes due December 5, 2043 (the “2013 Notes”) for total proceeds of approximately $4.0 billion, net of discounts and underwriting fees. The 2013 Notes pay interest semi-annually and may be redeemed, in whole at any time, or in part from time to time, at the Company’s option at a defined redemption price plus accrued and unpaid interest to the redemption date. The net proceeds of the 2013 Notes were used to repay commercial paper outstanding at the time of issuance and to fund the acquisition of Coram LLC in January 2014. The remainder was used for general corporate purposes.
On November 26, 2012, the Company issued $1.25 billion of 2.75% unsecured senior notes due December 1, 2022 (the “2012 Notes”) for total proceeds of approximately $1.24 billion, net of discounts and underwriting fees. The 2012 Notes pay interest semi-annually and may be redeemed, in whole at any time, or in part from time to time, at the Company’s option at a defined redemption price plus accrued and unpaid interest to the redemption date. The net proceeds of the 2012 Notes were used for general corporate purposes and to repay certain corporate debt.
On November 26, 2012, the Company announced tender offers for any and all of the 6.6% Senior Notes due 2019, and up to a maximum amount of the 6.125% Senior Notes due 2016 and 5.75% Senior Notes due 2017, for up to an aggregate principal amount of $1.0 billion. In December 2012, the Company increased the aggregate principal amount of the tender offers to $1.325 billion and completed the repurchase for the maximum amount. The Company paid a premium of $332 million in excess of the debt principal in connection with the tender offers, wrote off $13 million of unamortized deferred financing costs and incurred $3 million in fees, for a total loss on the early extinguishment of debt of $348 million. The loss was recorded in income from continuing operations on the consolidated statement of income for the year ended December 31, 2012.
The credit facilities, back-up credit facilities and unsecured senior notes contain customary restrictive financial and operating covenants. The covenants do not materially affect the Company’s financial or operating flexibility.
The aggregate maturities of long-term debt for each of the five years subsequent to December 31, 2014 are $575 million in 2015, $1.2 million in 2016, $1.1 billion in 2017, $1.3 billion in 2018 and $1.3 billion in 2019.
157033_FIN.indd 72 3/2/15 3:14 PM
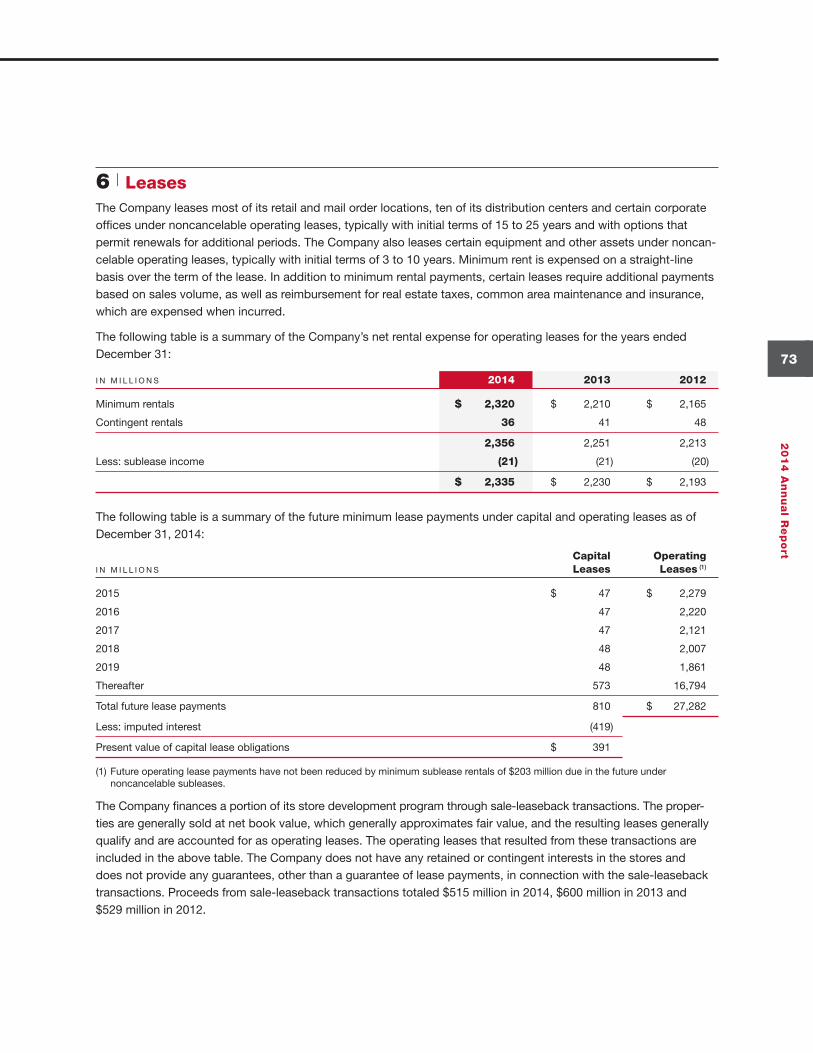
73
20
14
An
nu
al R
ep
ort
6 | LeasesThe Company leases most of its retail and mail order locations, ten of its distribution centers and certain corporate offices under noncancelable operating leases, typically with initial terms of 15 to 25 years and with options that permit renewals for additional periods. The Company also leases certain equipment and other assets under noncan-celable operating leases, typically with initial terms of 3 to 10 years. Minimum rent is expensed on a straight-line basis over the term of the lease. In addition to minimum rental payments, certain leases require additional payments based on sales volume, as well as reimbursement for real estate taxes, common area maintenance and insurance, which are expensed when incurred.
The following table is a summary of the Company’s net rental expense for operating leases for the years ended December 31:
I N M I L L I O N S 2014 2013 2012
Minimum rentals $ 2,320 $ 2,210 $ 2,165
Contingent rentals 36 41 48
2,356 2,251 2,213
Less: sublease income (21) (21) (20)
$ 2,335 $ 2,230 $ 2,193
The following table is a summary of the future minimum lease payments under capital and operating leases as of December 31, 2014:
Capital Operating I N M I L L I O N S Leases Leases (1)
2015 $ 47 $ 2,279
2016 47 2,220
2017 47 2,121
2018 48 2,007
2019 48 1,861
Thereafter 573 16,794
Total future lease payments 810 $ 27,282
Less: imputed interest (419)
Present value of capital lease obligations $ 391
(1) Future operating lease payments have not been reduced by minimum sublease rentals of $203 million due in the future under noncancelable subleases.
The Company finances a portion of its store development program through sale-leaseback transactions. The proper-ties are generally sold at net book value, which generally approximates fair value, and the resulting leases generally qualify and are accounted for as operating leases. The operating leases that resulted from these transactions are included in the above table. The Company does not have any retained or contingent interests in the stores and does not provide any guarantees, other than a guarantee of lease payments, in connection with the sale-leaseback transactions. Proceeds from sale-leaseback transactions totaled $515 million in 2014, $600 million in 2013 and $529 million in 2012.
157033_FIN.indd 73 3/2/15 3:14 PM
CV
S H
ea
lth
74
Notes to Consolidated Financial Statements
7 | Medicare Part DThe Company offers Medicare Part D benefits through SilverScript, which has contracted with CMS to be a PDP and, pursuant to the Medicare Prescription Drug, Improvement and Modernization Act of 2003, must be a risk-bear-ing entity regulated under state insurance laws or similar statutes.
SilverScript is a licensed domestic insurance company under the applicable laws and regulations. Pursuant to these laws and regulations, SilverScript must file quarterly and annual reports with the National Association of Insurance Commissioners (“NAIC”) and certain state regulators, must maintain certain minimum amounts of capital and surplus under a formula established by the NAIC and must, in certain circumstances, request and receive the approval of certain state regulators before making dividend payments or other capital distributions to the Company. The Company does not believe these limitations on dividends and distributions materially impact its financial position.
The Company has recorded estimates of various assets and liabilities arising from its participation in the Medicare Part D program based on information in its claims management and enrollment systems. Significant estimates arising from its participation in this program include: (i) estimates of low-income cost subsidy, reinsurance amounts, and coverage gap discount amounts ultimately payable to or receivable from CMS based on a detailed claims reconciliation that will occur in the following year; (ii) an estimate of amounts receivable from or payable to CMS under a risk-sharing feature of the Medicare Part D program design, referred to as the risk corridor and (iii) estimates for claims that have been reported and are in the process of being paid or contested and for our estimate of claims that have been incurred but have not yet been reported.
As of December 31, 2014 and 2013, amounts due from CMS included in accounts receivable were $1.8 billion and $2.4 billion, respectively.
8 | Pension Plans and Other Postretirement BenefitsDefined Contribution Plans
The Company sponsors voluntary 401(k) savings plans that cover all employees who meet plan eligibility require-ments. The Company makes matching contributions consistent with the provisions of the plans.
At the participant’s option, account balances, including the Company’s matching contribution, can be transferred without restriction among various investment options, including the Company’s common stock fund under one of the defined contribution plans. The Company also maintains a nonqualified, unfunded Deferred Compensation Plan for certain key employees. This plan provides participants the opportunity to defer portions of their eligible compen-sation and receive matching contributions equivalent to what they could have received under the CVS Health 401(k) Plan absent certain restrictions and limitations under the Internal Revenue Code. The Company’s contributions under the above defined contribution plans were $238 million, $235 million and $199 million in 2014, 2013 and 2012, respectively.
Other Postretirement Benefits
The Company provides postretirement health care and life insurance benefits to certain retirees who meet eligibility requirements. The Company’s funding policy is generally to pay covered expenses as they are incurred. For retiree medical plan accounting, the Company reviews external data and its own historical trends for health care costs to determine the health care cost trend rates. As of December 31, 2014 and 2013, the Company’s other postretirement benefits have an accumulated postretirement benefit obligation of $31 million and $27 million, respectively. Net periodic benefit costs related to these other postretirement benefits were $1 million in 2014, $11 million in 2013, and $1 million in 2012. The net periodic benefit costs for 2013 include a settlement loss of $8 million.
157033_FIN.indd 74 3/2/15 3:14 PM
75
20
14
An
nu
al R
ep
ort
Pursuant to various labor agreements, the Company also contributes to multiemployer health and welfare plans that cover certain union-represented employees. The plans provide postretirement health care and life insurance benefits to certain employees who meet eligibility requirements. Total Company contributions to multiemployer health and welfare plans were $58 million, $55 million and $50 million in 2014, 2013 and 2012, respectively.
Pension Plans
During the years ended December 31, 2014, 2013 and 2012, the Company sponsored nine defined benefit pension plans. Four of the plans are tax-qualified plans that are funded based on actuarial calculations and applicable federal laws and regulations. The other five plans are unfunded nonqualified supplemental retirement plans. Most of the plans were frozen in prior periods.
As of December 31, 2014, the Company’s pension plans had a projected benefit obligation of $796 million and plan assets of $635 million. As of December 31, 2013, the Company’s pension plans had a projected benefit obligation of $694 million and plan assets of $568 million. Actual return on plan assets was $75 million and $49 million in 2014 and 2013, respectively. Net periodic pension costs related to these pension plans were $21 million, $19 million and $31 million in 2014, 2013 and 2012, respectively. The net periodic pension costs for 2012 include a curtailment loss of $2 million.
The discount rate is determined by examining the current yields observed on the measurement date of fixed-inter-est, high quality investments expected to be available during the period to maturity of the related benefits on a plan by plan basis. The discount rate for the plans was 4.0% in 2014 and 4.75% in 2013. The expected long-term rate of return on plan assets is determined by using the plan’s target allocation and historical returns for each asset class on a plan by plan basis. The expected long-term rate of return for the plans ranged from 5.75% to 7.25% in 2014 and was 7.25% for all plans in 2013 and 2012.
Historically, the Company used an investment strategy which emphasized equities in order to produce higher expected returns, and in the long run, lower expected expense and cash contribution requirements. The qualified pension plan asset allocation targets were 50% equity and 50% fixed income for 2012. Beginning in 2013, the Company changed its investment strategy to be liability management driven. The qualified pension plan asset allocation targets in 2014 and 2013 were revised to hold more fixed income investments based on the change in the investment strategy. Investment allocations for the four qualified defined benefit plans range from 70% to 85% in fixed income and 15% to 30% in equities as of December 31, 2014.
As of December 31, 2014, the Company’s qualified defined benefit pension plan assets consisted of 18% equity, 81% fixed income and 1% money market securities of which 14% were classified as Level 1 and 86% as Level 2 in the fair value hierarchy. The Company’s qualified defined benefit pension plan assets as of December 31, 2013 consisted of 23% equity, 76% fixed income and 1% money market securities of which 17% were classified as Level 1 and 83% as Level 2 in the fair value hierarchy.
The Company contributed $42 million, $33 million and $36 million to the pension plans during 2014, 2013 and 2012, respectively. The Company plans to make approximately $36 million in contributions to the pension plans during 2015.
The Company also contributes to a number of multiemployer pension plans under the terms of collective-bargaining agreements that cover its union-represented employees. The risks of participating in these multiemployer plans are different from single-employer pension plans in the following aspects: (i) assets contributed to the multiemployer plan by one employer may be used to provide benefits to employees of other participating employers, (ii) if a participat-ing employer stops contributing to the plan, the unfunded obligations of the plan may be borne by the remaining participating employers, and (iii) if the Company chooses to stop participating in some of its multiemployer plans, the Company may be required to pay those plans an amount based on the underfunded status of the plan, referred to as a withdrawal liability.
157033_FIN.indd 75 3/2/15 3:14 PM
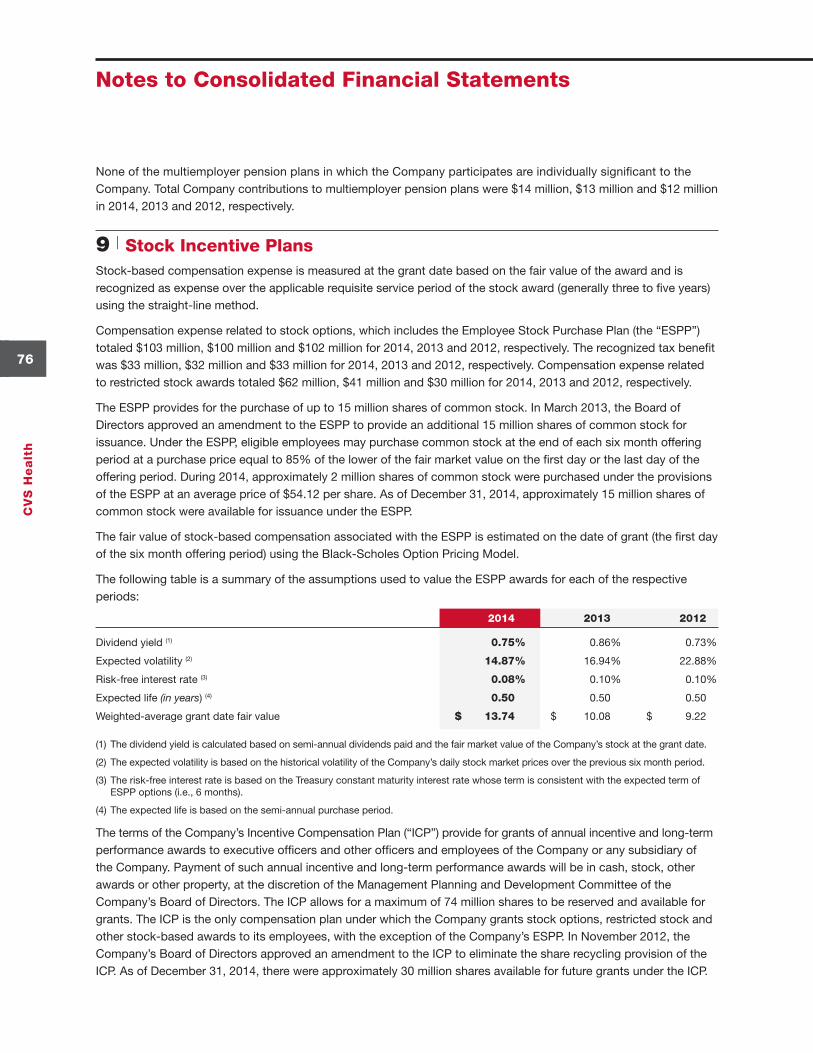
CV
S H
ea
lth
76
Notes to Consolidated Financial Statements
None of the multiemployer pension plans in which the Company participates are individually significant to the Company. Total Company contributions to multiemployer pension plans were $14 million, $13 million and $12 million in 2014, 2013 and 2012, respectively.
9 | Stock Incentive PlansStock-based compensation expense is measured at the grant date based on the fair value of the award and is recognized as expense over the applicable requisite service period of the stock award (generally three to five years) using the straight-line method.
Compensation expense related to stock options, which includes the Employee Stock Purchase Plan (the “ESPP”) totaled $103 million, $100 million and $102 million for 2014, 2013 and 2012, respectively. The recognized tax benefit was $33 million, $32 million and $33 million for 2014, 2013 and 2012, respectively. Compensation expense related to restricted stock awards totaled $62 million, $41 million and $30 million for 2014, 2013 and 2012, respectively.
The ESPP provides for the purchase of up to 15 million shares of common stock. In March 2013, the Board of Directors approved an amendment to the ESPP to provide an additional 15 million shares of common stock for issuance. Under the ESPP, eligible employees may purchase common stock at the end of each six month offering period at a purchase price equal to 85% of the lower of the fair market value on the first day or the last day of the offering period. During 2014, approximately 2 million shares of common stock were purchased under the provisions of the ESPP at an average price of $54.12 per share. As of December 31, 2014, approximately 15 million shares of common stock were available for issuance under the ESPP.
The fair value of stock-based compensation associated with the ESPP is estimated on the date of grant (the first day of the six month offering period) using the Black-Scholes Option Pricing Model.
The following table is a summary of the assumptions used to value the ESPP awards for each of the respective periods:
2014 2013 2012
Dividend yield (1) 0.75 % 0.86 % 0.73 %
Expected volatility (2) 14.87 % 16.94 % 22.88 %
Risk-free interest rate (3) 0.08 % 0.10 % 0.10 %
Expected life (in years) (4) 0.50 0.50 0.50
Weighted-average grant date fair value $ 13.74 $ 10.08 $ 9.22
(1) The dividend yield is calculated based on semi-annual dividends paid and the fair market value of the Company’s stock at the grant date.
(2) The expected volatility is based on the historical volatility of the Company’s daily stock market prices over the previous six month period.
(3) The risk-free interest rate is based on the Treasury constant maturity interest rate whose term is consistent with the expected term of ESPP options (i.e., 6 months).
(4) The expected life is based on the semi-annual purchase period.
The terms of the Company’s Incentive Compensation Plan (“ICP”) provide for grants of annual incentive and long-term performance awards to executive officers and other officers and employees of the Company or any subsidiary of the Company. Payment of such annual incentive and long-term performance awards will be in cash, stock, other awards or other property, at the discretion of the Management Planning and Development Committee of the Company’s Board of Directors. The ICP allows for a maximum of 74 million shares to be reserved and available for grants. The ICP is the only compensation plan under which the Company grants stock options, restricted stock and other stock-based awards to its employees, with the exception of the Company’s ESPP. In November 2012, the Company’s Board of Directors approved an amendment to the ICP to eliminate the share recycling provision of the ICP. As of December 31, 2014, there were approximately 30 million shares available for future grants under the ICP.
157033_FIN.indd 76 3/2/15 3:14 PM
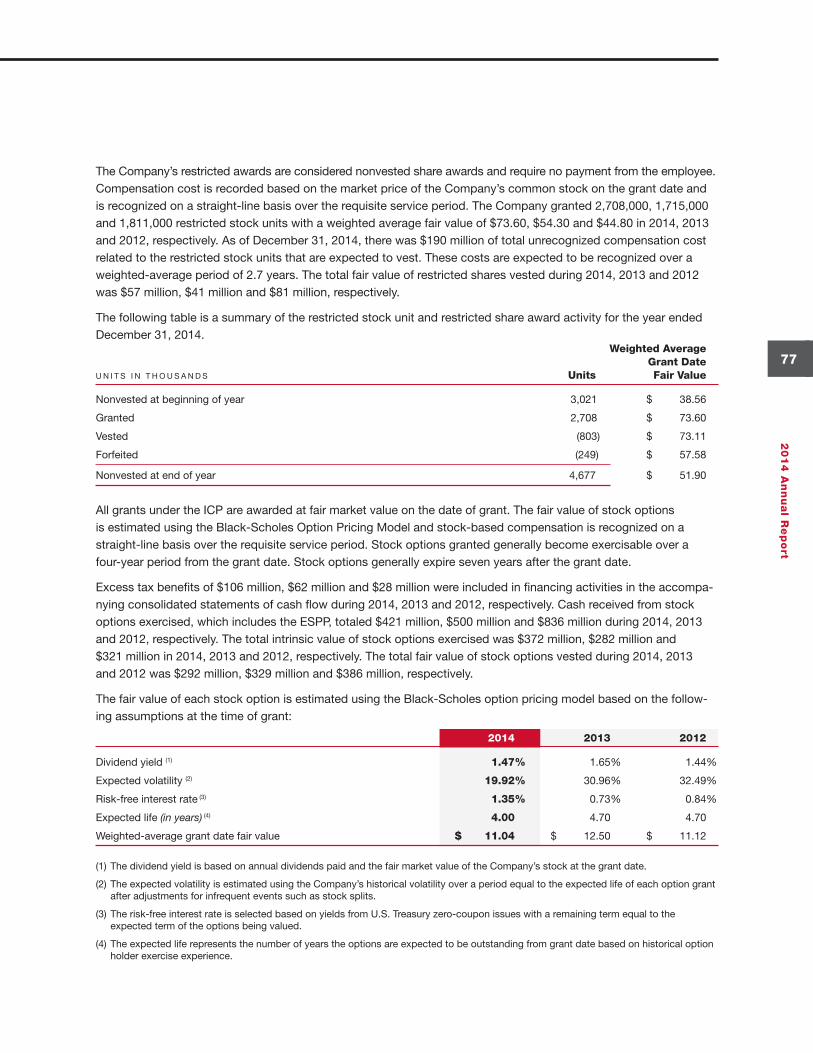
77
20
14
An
nu
al R
ep
ort
The Company’s restricted awards are considered nonvested share awards and require no payment from the employee. Compensation cost is recorded based on the market price of the Company’s common stock on the grant date and is recognized on a straight-line basis over the requisite service period. The Company granted 2,708,000, 1,715,000 and 1,811,000 restricted stock units with a weighted average fair value of $73.60, $54.30 and $44.80 in 2014, 2013 and 2012, respectively. As of December 31, 2014, there was $190 million of total unrecognized compensation cost related to the restricted stock units that are expected to vest. These costs are expected to be recognized over a weighted-average period of 2.7 years. The total fair value of restricted shares vested during 2014, 2013 and 2012 was $57 million, $41 million and $81 million, respectively.
The following table is a summary of the restricted stock unit and restricted share award activity for the year ended December 31, 2014. Weighted Average Grant Date U N I T S I N T H O U S A N D S Units Fair Value
Nonvested at beginning of year 3,021 $ 38.56
Granted 2,708 $ 73.60
Vested (803) $ 73.11
Forfeited (249) $ 57.58
Nonvested at end of year 4,677 $ 51.90
All grants under the ICP are awarded at fair market value on the date of grant. The fair value of stock options is estimated using the Black-Scholes Option Pricing Model and stock-based compensation is recognized on a straight-line basis over the requisite service period. Stock options granted generally become exercisable over a four-year period from the grant date. Stock options generally expire seven years after the grant date.
Excess tax benefits of $106 million, $62 million and $28 million were included in financing activities in the accompa-nying consolidated statements of cash flow during 2014, 2013 and 2012, respectively. Cash received from stock options exercised, which includes the ESPP, totaled $421 million, $500 million and $836 million during 2014, 2013 and 2012, respectively. The total intrinsic value of stock options exercised was $372 million, $282 million and $321 million in 2014, 2013 and 2012, respectively. The total fair value of stock options vested during 2014, 2013 and 2012 was $292 million, $329 million and $386 million, respectively.
The fair value of each stock option is estimated using the Black-Scholes option pricing model based on the follow-ing assumptions at the time of grant:
2014 2013 2012
Dividend yield (1) 1.47 % 1.65 % 1.44 %
Expected volatility (2) 19.92 % 30.96 % 32.49 %
Risk-free interest rate (3) 1.35 % 0.73 % 0.84 %
Expected life (in years) (4) 4.00 4.70 4.70
Weighted-average grant date fair value $ 11.04 $ 12.50 $ 11.12
(1) The dividend yield is based on annual dividends paid and the fair market value of the Company’s stock at the grant date.
(2) The expected volatility is estimated using the Company’s historical volatility over a period equal to the expected life of each option grant after adjustments for infrequent events such as stock splits.
(3) The risk-free interest rate is selected based on yields from U.S. Treasury zero-coupon issues with a remaining term equal to the expected term of the options being valued.
(4) The expected life represents the number of years the options are expected to be outstanding from grant date based on historical option holder exercise experience.
157033_FIN.indd 77 3/2/15 3:14 PM
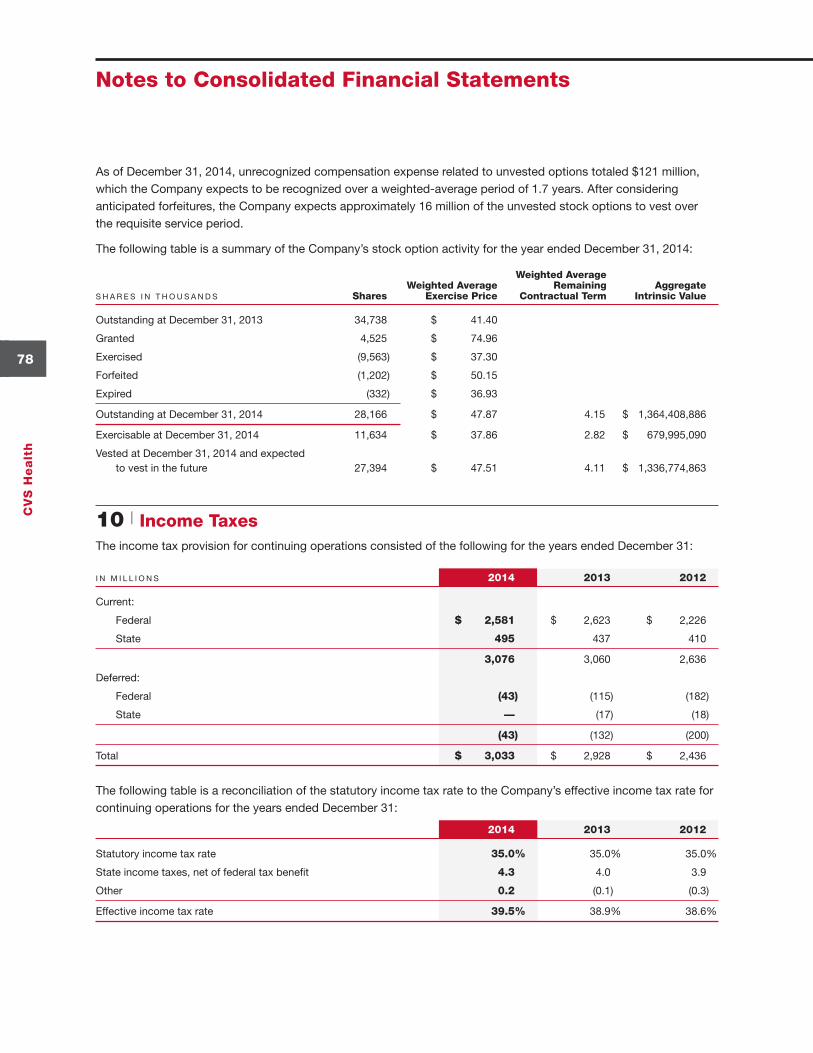
CV
S H
ea
lth
78
Notes to Consolidated Financial Statements
As of December 31, 2014, unrecognized compensation expense related to unvested options totaled $121 million, which the Company expects to be recognized over a weighted-average period of 1.7 years. After considering anticipated forfeitures, the Company expects approximately 16 million of the unvested stock options to vest over the requisite service period.
The following table is a summary of the Company’s stock option activity for the year ended December 31, 2014:
Weighted Average Weighted Average Remaining Aggregate S H A R E S I N T H O U S A N D S Shares Exercise Price Contractual Term Intrinsic Value
Outstanding at December 31, 2013 34,738 $ 41.40
Granted 4,525 $ 74.96
Exercised (9,563) $ 37.30
Forfeited (1,202) $ 50.15
Expired (332) $ 36.93
Outstanding at December 31, 2014 28,166 $ 47.87 4.15 $ 1,364,408,886
Exercisable at December 31, 2014 11,634 $ 37.86 2.82 $ 679,995,090
Vested at December 31, 2014 and expected to vest in the future 27,394 $ 47.51 4.11 $ 1,336,774,863
10 | Income TaxesThe income tax provision for continuing operations consisted of the following for the years ended December 31:
I N M I L L I O N S 2014 2013 2012
Current:
Federal $ 2,581 $ 2,623 $ 2,226
State 495 437 410
3,076 3,060 2,636
Deferred:
Federal (43) (115) (182)
State — (17) (18)
(43) (132) (200)
Total $ 3,033 $ 2,928 $ 2,436
The following table is a reconciliation of the statutory income tax rate to the Company’s effective income tax rate for continuing operations for the years ended December 31:
2014 2013 2012
Statutory income tax rate 35.0 % 35.0 % 35.0 %
State income taxes, net of federal tax benefit 4.3 4.0 3.9
Other 0.2 (0.1) (0.3)
Effective income tax rate 39.5 % 38.9 % 38.6 %
157033_FIN.indd 78 3/2/15 3:14 PM
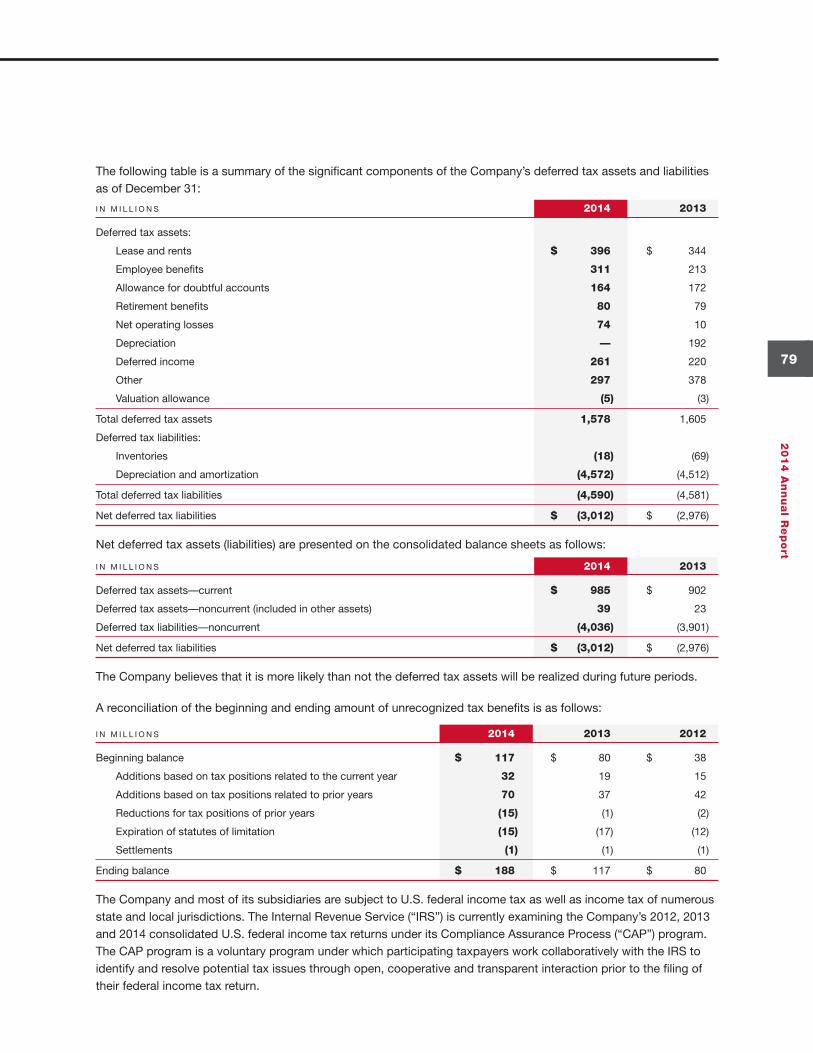
79
20
14
An
nu
al R
ep
ort
The following table is a summary of the significant components of the Company’s deferred tax assets and liabilities as of December 31:
I N M I L L I O N S 2014 2013
Deferred tax assets:
Lease and rents $ 396 $ 344
Employee benefits 311 213
Allowance for doubtful accounts 164 172
Retirement benefits 80 79
Net operating losses 74 10
Depreciation — 192
Deferred income 261 220
Other 297 378
Valuation allowance (5) (3)
Total deferred tax assets 1,578 1,605
Deferred tax liabilities:
Inventories (18) (69)
Depreciation and amortization (4,572) (4,512)
Total deferred tax liabilities (4,590) (4,581)
Net deferred tax liabilities $ (3,012) $ (2,976)
Net deferred tax assets (liabilities) are presented on the consolidated balance sheets as follows:
I N M I L L I O N S 2014 2013
Deferred tax assets—current $ 985 $ 902
Deferred tax assets—noncurrent (included in other assets) 39 23
Deferred tax liabilities—noncurrent (4,036) (3,901)
Net deferred tax liabilities $ (3,012) $ (2,976)
The Company believes that it is more likely than not the deferred tax assets will be realized during future periods.
A reconciliation of the beginning and ending amount of unrecognized tax benefits is as follows:
I N M I L L I O N S 2014 2013 2012
Beginning balance $ 117 $ 80 $ 38
Additions based on tax positions related to the current year 32 19 15
Additions based on tax positions related to prior years 70 37 42
Reductions for tax positions of prior years (15) (1) (2)
Expiration of statutes of limitation (15) (17) (12)
Settlements (1) (1) (1)
Ending balance $ 188 $ 117 $ 80
The Company and most of its subsidiaries are subject to U.S. federal income tax as well as income tax of numerous state and local jurisdictions. The Internal Revenue Service (“IRS”) is currently examining the Company’s 2012, 2013 and 2014 consolidated U.S. federal income tax returns under its Compliance Assurance Process (“CAP”) program. The CAP program is a voluntary program under which participating taxpayers work collaboratively with the IRS to identify and resolve potential tax issues through open, cooperative and transparent interaction prior to the filing of their federal income tax return.
157033_FIN.indd 79 3/2/15 3:14 PM
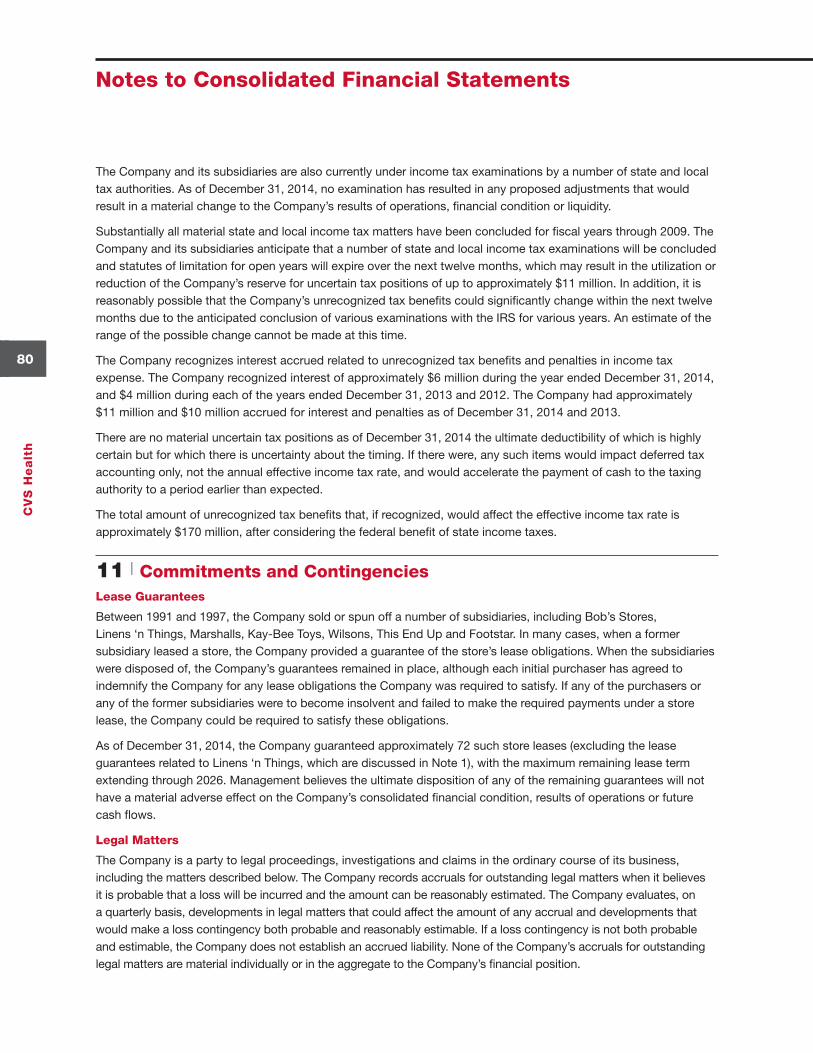
CV
S H
ea
lth
80
Notes to Consolidated Financial Statements
The Company and its subsidiaries are also currently under income tax examinations by a number of state and local tax authorities. As of December 31, 2014, no examination has resulted in any proposed adjustments that would result in a material change to the Company’s results of operations, financial condition or liquidity.
Substantially all material state and local income tax matters have been concluded for fiscal years through 2009. The Company and its subsidiaries anticipate that a number of state and local income tax examinations will be concluded and statutes of limitation for open years will expire over the next twelve months, which may result in the utilization or reduction of the Company’s reserve for uncertain tax positions of up to approximately $11 million. In addition, it is reasonably possible that the Company’s unrecognized tax benefits could significantly change within the next twelve months due to the anticipated conclusion of various examinations with the IRS for various years. An estimate of the range of the possible change cannot be made at this time.
The Company recognizes interest accrued related to unrecognized tax benefits and penalties in income tax expense. The Company recognized interest of approximately $6 million during the year ended December 31, 2014, and $4 million during each of the years ended December 31, 2013 and 2012. The Company had approximately $11 million and $10 million accrued for interest and penalties as of December 31, 2014 and 2013.
There are no material uncertain tax positions as of December 31, 2014 the ultimate deductibility of which is highly certain but for which there is uncertainty about the timing. If there were, any such items would impact deferred tax accounting only, not the annual effective income tax rate, and would accelerate the payment of cash to the taxing authority to a period earlier than expected.
The total amount of unrecognized tax benefits that, if recognized, would affect the effective income tax rate is approximately $170 million, after considering the federal benefit of state income taxes.
11 | Commitments and ContingenciesLease Guarantees
Between 1991 and 1997, the Company sold or spun off a number of subsidiaries, including Bob’s Stores, Linens ‘n Things, Marshalls, Kay-Bee Toys, Wilsons, This End Up and Footstar. In many cases, when a former subsidiary leased a store, the Company provided a guarantee of the store’s lease obligations. When the subsidiaries were disposed of, the Company’s guarantees remained in place, although each initial purchaser has agreed to indemnify the Company for any lease obligations the Company was required to satisfy. If any of the purchasers or any of the former subsidiaries were to become insolvent and failed to make the required payments under a store lease, the Company could be required to satisfy these obligations.
As of December 31, 2014, the Company guaranteed approximately 72 such store leases (excluding the lease guarantees related to Linens ‘n Things, which are discussed in Note 1), with the maximum remaining lease term extending through 2026. Management believes the ultimate disposition of any of the remaining guarantees will not have a material adverse effect on the Company’s consolidated financial condition, results of operations or future cash flows.
Legal Matters
The Company is a party to legal proceedings, investigations and claims in the ordinary course of its business, including the matters described below. The Company records accruals for outstanding legal matters when it believes it is probable that a loss will be incurred and the amount can be reasonably estimated. The Company evaluates, on a quarterly basis, developments in legal matters that could affect the amount of any accrual and developments that would make a loss contingency both probable and reasonably estimable. If a loss contingency is not both probable and estimable, the Company does not establish an accrued liability. None of the Company’s accruals for outstanding legal matters are material individually or in the aggregate to the Company’s financial position.
157033_FIN.indd 80 3/2/15 3:14 PM
81
20
14
An
nu
al R
ep
ort
The Company’s contingencies are subject to significant uncertainties, including, among other factors: (i) the procedural status of pending matters; (ii) whether class action status is sought and certified; (iii) whether asserted claims or allegations will survive dispositive motion practice; (iv) the extent of potential damages, fines or penalties, which are often unspecified or indeterminate; (v) the impact of discovery on the legal process; (vi) whether novel or unsettled legal theories are at issue; (vii) the settlement posture of the parties, and/or (viii) in the case of certain government agency investigations, whether a sealed qui tam lawsuit (“whistleblower” action) has been filed and whether the government agency makes a decision to intervene in the lawsuit following investigation.
Except as otherwise noted, the Company cannot predict with certainty the timing or outcome of the legal matters described below, and is unable to reasonably estimate a possible loss or range of possible loss in excess of amounts already accrued for these matters.
• In December 2007, the Company received a document subpoena from the Office of Inspector General (“OIG”) within the U.S. Department of Health and Human Services, requesting information relating to the processing of Medicaid and certain other government agency claims on behalf of its clients (which allegedly resulted in under-payments from our pharmacy benefit management clients to the applicable government agencies) on one of the Company’s adjudication platforms. In September 2014, the Company settled the OIG’s claims, as well as related claims by the Department of Justice and private plaintiffs, without any admission of liability. The Company is in discussions with the OIG concerning other claim processing issues.
• Caremark (the term “Caremark” being used herein to generally refer to any one or more PBM subsidiaries of the Company, as applicable) was named in a putative class action lawsuit filed in October 2003 in Alabama state court by John Lauriello, purportedly on behalf of participants in the 1999 settlement of various securities class action and derivative lawsuits against Caremark and others. Other defendants include insurance companies that provided coverage to Caremark with respect to the settled lawsuits. The Lauriello lawsuit seeks approximately $3.2 billion in compensatory damages plus other non-specified damages based on allegations that the amount of insurance coverage available for the settled lawsuits was misrepresented and suppressed. A similar lawsuit was filed in November 2003 by Frank McArthur, also in Alabama state court, naming as defendants, among others, Caremark and several insurance companies involved in the 1999 settlement. This lawsuit was stayed as a later-filed class action, but McArthur was subsequently allowed to intervene in the Lauriello action. Following the close of class discovery, the trial court entered an Order on August 15, 2012 that granted the plaintiffs’ motion to certify a class pursuant to Alabama Rule of Civil Procedures 23(b)(3) but denied their request that the class also be certified pursuant to Rule 23(b)(1). In addition, the August 15, 2012 Order appointed class representatives and class counsel. On September 12, 2014, the Alabama Supreme Court affirmed the trial court’s August 15, 2012 Order. The Defendants timely filed an Application for Rehearing asking the Alabama Supreme Court to clarify or modify its September 12, 2014 decision. The proceedings in the trial court remain stayed pending resolution of the rehearing application.
• Various lawsuits have been filed alleging that Caremark has violated applicable antitrust laws in establishing and maintaining retail pharmacy networks for client health plans. In August 2003, Bellevue Drug Co., Robert Schreiber, Inc. d/b/a Burns Pharmacy and Rehn-Huerbinger Drug Co. d/b/a Parkway Drugs #4, together with Pharmacy Freedom Fund and the National Community Pharmacists Association filed a putative class action against Caremark in Pennsylvania federal court, seeking treble damages and injunctive relief. This case was initially sent to arbitra-tion based on the contract terms between the pharmacies and Caremark. In October 2003, two independent pharmacies, North Jackson Pharmacy, Inc. and C&C, Inc. d/b/a Big C Discount Drugs, Inc., filed a putative class action complaint in Alabama federal court against Caremark and two PBM competitors, seeking treble damages and injunctive relief. The North Jackson Pharmacy case against two of the Caremark entities named as defen-dants was transferred to Illinois federal court, and the case against a separate Caremark entity was sent to arbitration based on contract terms between the pharmacies and Caremark. The Bellevue arbitration was then stayed by the parties pending developments in the North Jackson Pharmacy court case.
157033_FIN.indd 81 3/2/15 3:14 PM
CV
S H
ea
lth
82
Notes to Consolidated Financial Statements
In August 2006, the Bellevue case and the North Jackson Pharmacy case were both transferred to Pennsylvania federal court by the Judicial Panel on Multidistrict Litigation for coordinated and consolidated proceedings with other cases before the panel, including cases against other PBMs. Motions for class certification in the coordi-nated cases within the multidistrict litigation, including the North Jackson Pharmacy case, remain pending, and the court has permitted certain additional class discovery and briefing. The consolidated action is now known as the In Re Pharmacy Benefit Managers Antitrust Litigation.
• In November 2009, a securities class action lawsuit was filed in the United States District Court for the District of Rhode Island by Richard Medoff, purportedly on behalf of purchasers of CVS Health Corporation stock between May 5, 2009 and November 4, 2009. The lawsuit names the Company and certain officers as defendants and includes allegations of securities fraud relating to public disclosures made by the Company concerning the PBM business and allegations of insider trading. In addition, a shareholder derivative lawsuit was filed by Mark Wuotila in December 2009 in the same court against the directors and certain officers of the Company. This lawsuit, which has remained stayed pending developments in the related securities class action, includes allegations of, among other things, securities fraud, insider trading and breach of fiduciary duties and further alleges that the Company was damaged by the purchase of stock at allegedly inflated prices under its share repurchase program. In January 2011, both lawsuits were transferred to the United States District Court for the District of New Hampshire.
• In March 2010, the Company learned that various State Attorneys General offices and certain other government agencies were conducting a multi-state investigation of certain of the Company’s business practices similar to those being investigated at that time by the U.S. Federal Trade Commission (“FTC”). Twenty-eight states, the District of Columbia and the County of Los Angeles are known to be participating in this investigation. The prior FTC investigation, which commenced in August 2009, was officially concluded in May 2012 when the consent order entered into between the FTC and the Company became final. The Company has cooperated with the multi-state investigation.
• In March 2010, the Company received a subpoena from the OIG requesting information about programs under which the Company has offered customers remuneration conditioned upon the transfer of prescriptions for drugs or medications to the Company’s pharmacies in the form of gift cards, cash, non-prescription merchandise or discounts or coupons for non-prescription merchandise. The subpoena relates to an investigation of possible false or otherwise improper claims for payment under the Medicare and Medicaid programs. The Company has provided documents and other information in response to this request for information.
• In January 2012, the United States District Court for the Eastern District of Pennsylvania unsealed a first amended qui tam complaint filed in August 2011 by an individual relator, Anthony Spay, who is described in the complaint as having once been employed by a firm providing pharmacy prescription benefit audit and recovery services. The complaint seeks monetary damages and alleges that Caremark’s processing of Medicare claims on behalf of one of its clients violated the federal False Claims Act. The United States declined to intervene in the lawsuit. The case is proceeding.
• In November 2014, the U.S. District Court in the District of Massachusetts unsealed a qui tam lawsuit brought against the Company by a pharmacy auditor and a CVS pharmacist. The lawsuit, which was initially filed under seal in 2011, alleges that the Company violated the federal False Claims Act, as well as the false claims acts of several states, by overcharging state and federal governments in connection with prescription drugs available through the Company’s Health Savings Pass program, a membership-based program that allows enrolled customers special pricing for typical 90-day supplies of various generic prescription drugs. The federal govern-ment, which issued a January 2012 OIG subpoena concerning the Health Savings Pass program, has declined to intervene in the case. The Company is now responding to the declined qui tam complaint. Separately, the
157033_FIN.indd 82 3/2/15 3:14 PM
83
20
14
An
nu
al R
ep
ort
Attorney General of the State of Texas has issued civil investigative demands and other requests in February 2012 and May 2014, and has continued its investigation concerning the Health Savings Pass program and claims for reimbursement from the Texas Medicaid program.
• On October 12, 2012, the Drug Enforcement Agency (“DEA”) Administrator published its Final Decision and Order revoking the DEA license registrations for dispensing controlled substances at two of our retail pharmacy stores in Sanford, Florida. The license revocations for the two stores formally became effective on November 13, 2012. The Company has entered into discussions with the U.S. Attorney’s Office for the Middle District of Florida concerning civil penalties for violations of the Controlled Substances Act arising from the circumstances underlying the action taken against the two Sanford, Florida stores. The Company is also undergoing several audits by the DEA and is in discussions with the DEA and the U.S. Attorney’s Office in several locations. Whether agreements can be reached and on what terms is uncertain.
• In November 2012, the Company received a subpoena from the OIG requesting information concerning automatic refill programs used by pharmacies to refill prescriptions for customers. The Company has been cooperating and providing documents and other information in response to this request for information.
• In January 2014, the U.S. District Court in the Southern District of New York unsealed a qui tam action in which the Company is a defendant. The suit originally was filed under seal in 2011 by relator David Kester, a former employee of Novartis Pharmaceuticals Corp. (“Novartis”). The suit alleges that Novartis, the Company, and other specialty pharmacies violated the federal False Claims Act, as well as the false claims acts of several states, by using pharmacists, nurses and other staff to recommend and increase the sales and market share for certain Novartis specialty drugs in exchange for patient referrals, rebates and discounts provided by Novartis. The federal government has intervened in the case as to some allegations against Novartis but has declined to intervene as to any of the allegations against the Company. The relator has continued to litigate the declined action against the Company and other specialty pharmacies.
• In March 2014, the Company received a subpoena from the United States Attorney’s Office for the District of Rhode Island, requesting documents and information concerning bona fide service fees and rebates received from certain pharmaceutical manufacturers in connection with certain drugs utilized under Part D of the Medicare Program. The Company has been cooperating with the government and collecting documents in response to the subpoena.
The Company is also a party to other legal proceedings, government investigations, inquiries and audits arising in the normal course of its business, none of which is expected to be material to the Company. The Company can give no assurance, however, that its business, financial condition and results of operations will not be materially adversely affected, or that the Company will not be required to materially change its business practices, based on: (i) future enactment of new health care or other laws or regulations; (ii) the interpretation or application of existing laws or regulations as they may relate to the Company’s business, the pharmacy services, retail pharmacy or retail clinic industries or to the health care industry generally; (iii) pending or future federal or state governmental investigations of the Company’s business or the pharmacy services, retail pharmacy or retail clinic industry or of the health care industry generally; (iv) pending or future government enforcement actions against the Company; (v) adverse devel-opments in any pending qui tam lawsuit against the Company, whether sealed or unsealed, or in any future qui tam lawsuit that may be filed against the Company; or (vi) adverse developments in pending or future legal proceedings against the Company or affecting the pharmacy services, retail pharmacy or retail clinic industry or the health care industry generally.
157033_FIN.indd 83 3/2/15 3:14 PM
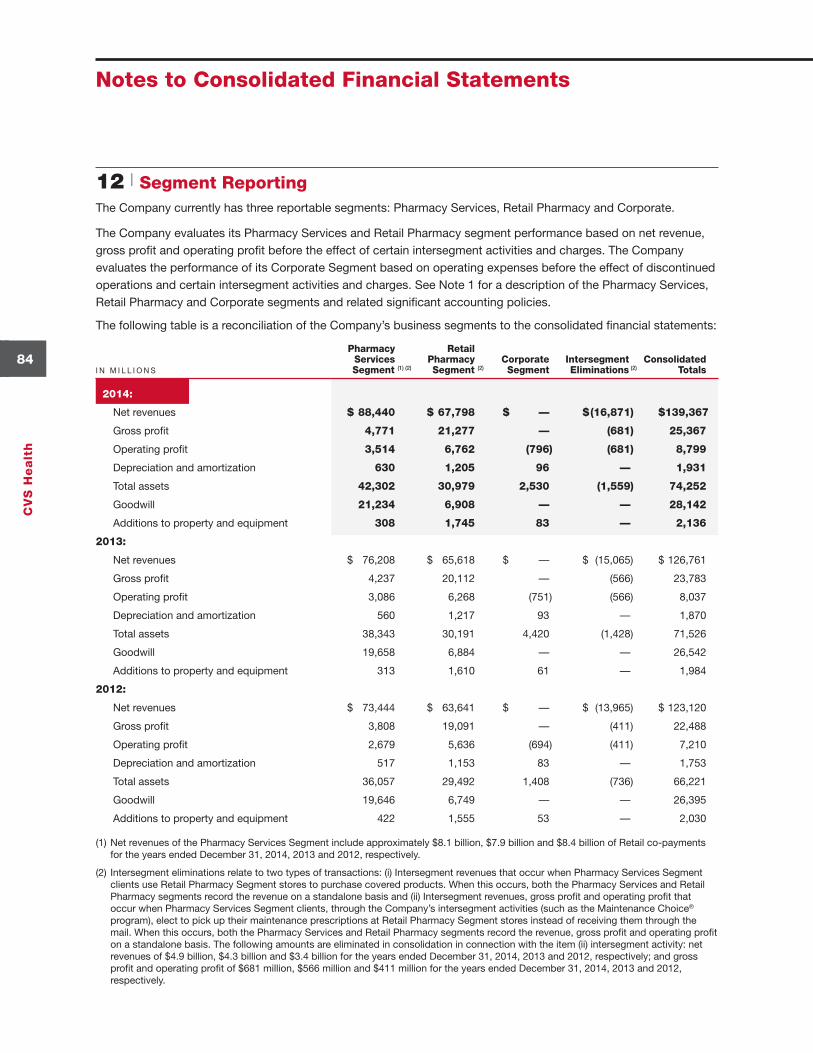
CV
S H
ea
lth
84
Notes to Consolidated Financial Statements
12 | Segment ReportingThe Company currently has three reportable segments: Pharmacy Services, Retail Pharmacy and Corporate.
The Company evaluates its Pharmacy Services and Retail Pharmacy segment performance based on net revenue, gross profit and operating profit before the effect of certain intersegment activities and charges. The Company evaluates the performance of its Corporate Segment based on operating expenses before the effect of discontinued operations and certain intersegment activities and charges. See Note 1 for a description of the Pharmacy Services, Retail Pharmacy and Corporate segments and related significant accounting policies.
The following table is a reconciliation of the Company’s business segments to the consolidated financial statements:
Pharmacy Retail Services Pharmacy Corporate Intersegment Consolidated I N M I L L I O N S Segment (1) (2) Segment (2) Segment Eliminations (2) Totals
2014:
Net revenues $ 88,440 $ 67,798 $ — $ (16,871) $ 139,367
Gross profit 4,771 21,277 — (681) 25,367
Operating profit 3,514 6,762 (796) (681) 8,799
Depreciation and amortization 630 1,205 96 — 1,931
Total assets 42,302 30,979 2,530 (1,559) 74,252
Goodwill 21,234 6,908 — — 28,142
Additions to property and equipment 308 1,745 83 — 2,136
2013:
Net revenues $ 76,208 $ 65,618 $ — $ (15,065) $ 126,761
Gross profit 4,237 20,112 — (566) 23,783
Operating profit 3,086 6,268 (751) (566) 8,037
Depreciation and amortization 560 1,217 93 — 1,870
Total assets 38,343 30,191 4,420 (1,428) 71,526
Goodwill 19,658 6,884 — — 26,542
Additions to property and equipment 313 1,610 61 — 1,984
2012:
Net revenues $ 73,444 $ 63,641 $ — $ (13,965) $ 123,120
Gross profit 3,808 19,091 — (411) 22,488
Operating profit 2,679 5,636 (694) (411) 7,210
Depreciation and amortization 517 1,153 83 — 1,753
Total assets 36,057 29,492 1,408 (736) 66,221
Goodwill 19,646 6,749 — — 26,395
Additions to property and equipment 422 1,555 53 — 2,030
(1) Net revenues of the Pharmacy Services Segment include approximately $8.1 billion, $7.9 billion and $8.4 billion of Retail co-payments for the years ended December 31, 2014, 2013 and 2012, respectively.
(2) Intersegment eliminations relate to two types of transactions: (i) Intersegment revenues that occur when Pharmacy Services Segment clients use Retail Pharmacy Segment stores to purchase covered products. When this occurs, both the Pharmacy Services and Retail Pharmacy segments record the revenue on a standalone basis and (ii) Intersegment revenues, gross profit and operating profit that occur when Pharmacy Services Segment clients, through the Company’s intersegment activities (such as the Maintenance Choice® program), elect to pick up their maintenance prescriptions at Retail Pharmacy Segment stores instead of receiving them through the mail. When this occurs, both the Pharmacy Services and Retail Pharmacy segments record the revenue, gross profit and operating profit on a standalone basis. The following amounts are eliminated in consolidation in connection with the item (ii) intersegment activity: net revenues of $4.9 billion, $4.3 billion and $3.4 billion for the years ended December 31, 2014, 2013 and 2012, respectively; and gross profit and operating profit of $681 million, $566 million and $411 million for the years ended December 31, 2014, 2013 and 2012, respectively.
157033_FIN.indd 84 3/2/15 3:14 PM
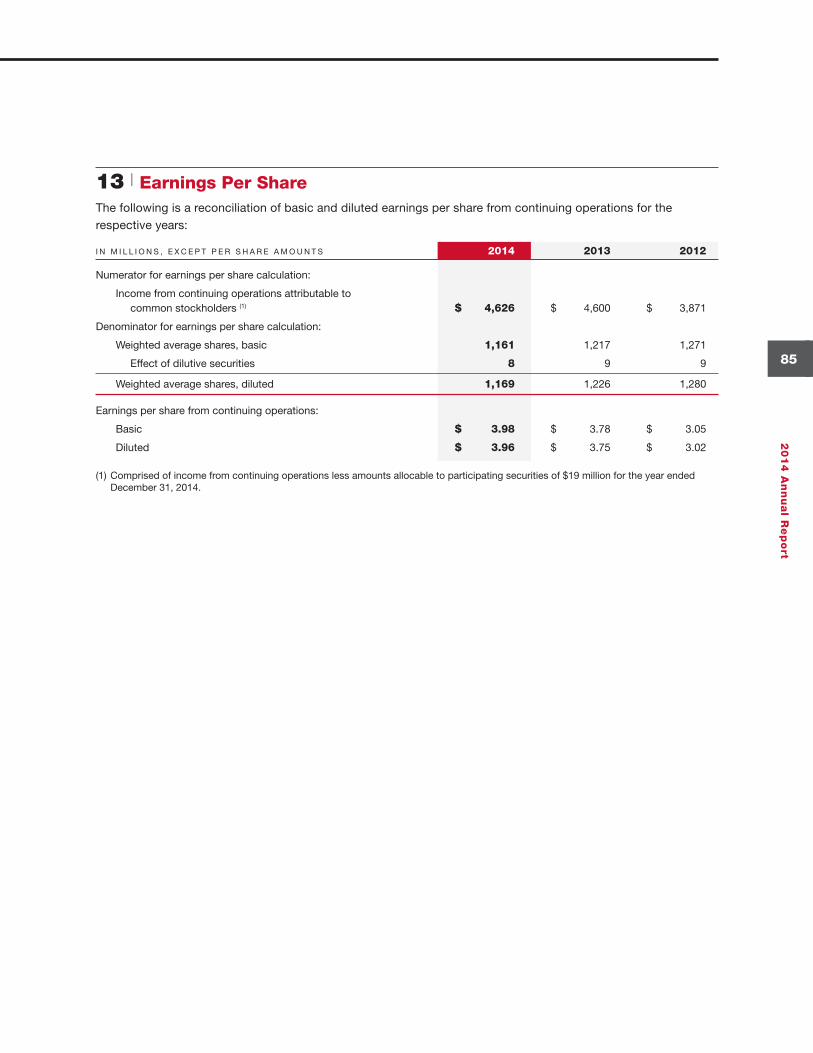
85
20
14
An
nu
al R
ep
ort
13 | Earnings Per ShareThe following is a reconciliation of basic and diluted earnings per share from continuing operations for the respective years:
I N M I L L I O N S , E X C E P T P E R S H A R E A M O U N T S 2014 2013 2012
Numerator for earnings per share calculation:
Income from continuing operations attributable to common stockholders (1) $ 4,626 $ 4,600 $ 3,871
Denominator for earnings per share calculation:
Weighted average shares, basic 1,161 1,217 1,271
Effect of dilutive securities 8 9 9
Weighted average shares, diluted 1,169 1,226 1,280
Earnings per share from continuing operations:
Basic $ 3.98 $ 3.78 $ 3.05
Diluted $ 3.96 $ 3.75 $ 3.02
(1) Comprised of income from continuing operations less amounts allocable to participating securities of $19 million for the year ended December 31, 2014.
157033_FIN.indd 85 3/2/15 3:14 PM
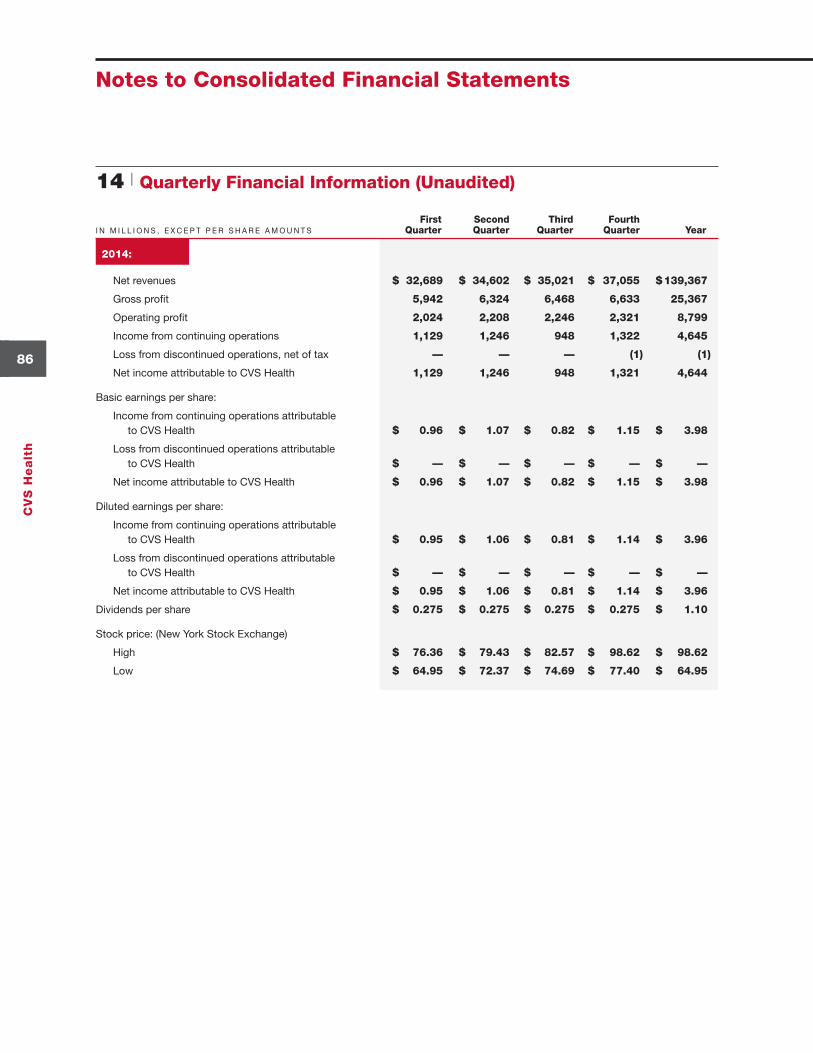
CV
S H
ea
lth
86
Notes to Consolidated Financial Statements
14 | Quarterly Financial Information (Unaudited)
First Second Third Fourth I N M I L L I O N S , E X C E P T P E R S H A R E A M O U N T S Quarter Quarter Quarter Quarter Year
2014:
Net revenues $ 32,689 $ 34,602 $ 35,021 $ 37,055 $ 139,367
Gross profit 5,942 6,324 6,468 6,633 25,367
Operating profit 2,024 2,208 2,246 2,321 8,799
Income from continuing operations 1,129 1,246 948 1,322 4,645
Loss from discontinued operations, net of tax — — — (1) (1)
Net income attributable to CVS Health 1,129 1,246 948 1,321 4,644
Basic earnings per share:
Income from continuing operations attributable to CVS Health $ 0.96 $ 1.07 $ 0.82 $ 1.15 $ 3.98
Loss from discontinued operations attributable to CVS Health $ — $ — $ — $ — $ —
Net income attributable to CVS Health $ 0.96 $ 1.07 $ 0.82 $ 1.15 $ 3.98
Diluted earnings per share:
Income from continuing operations attributable to CVS Health $ 0.95 $ 1.06 $ 0.81 $ 1.14 $ 3.96
Loss from discontinued operations attributable to CVS Health $ — $ — $ — $ — $ —
Net income attributable to CVS Health $ 0.95 $ 1.06 $ 0.81 $ 1.14 $ 3.96
Dividends per share $ 0.275 $ 0.275 $ 0.275 $ 0.275 $ 1.10
Stock price: (New York Stock Exchange)
High $ 76.36 $ 79.43 $ 82.57 $ 98.62 $ 98.62
Low $ 64.95 $ 72.37 $ 74.69 $ 77.40 $ 64.95
157033_FIN.indd 86 3/2/15 3:14 PM
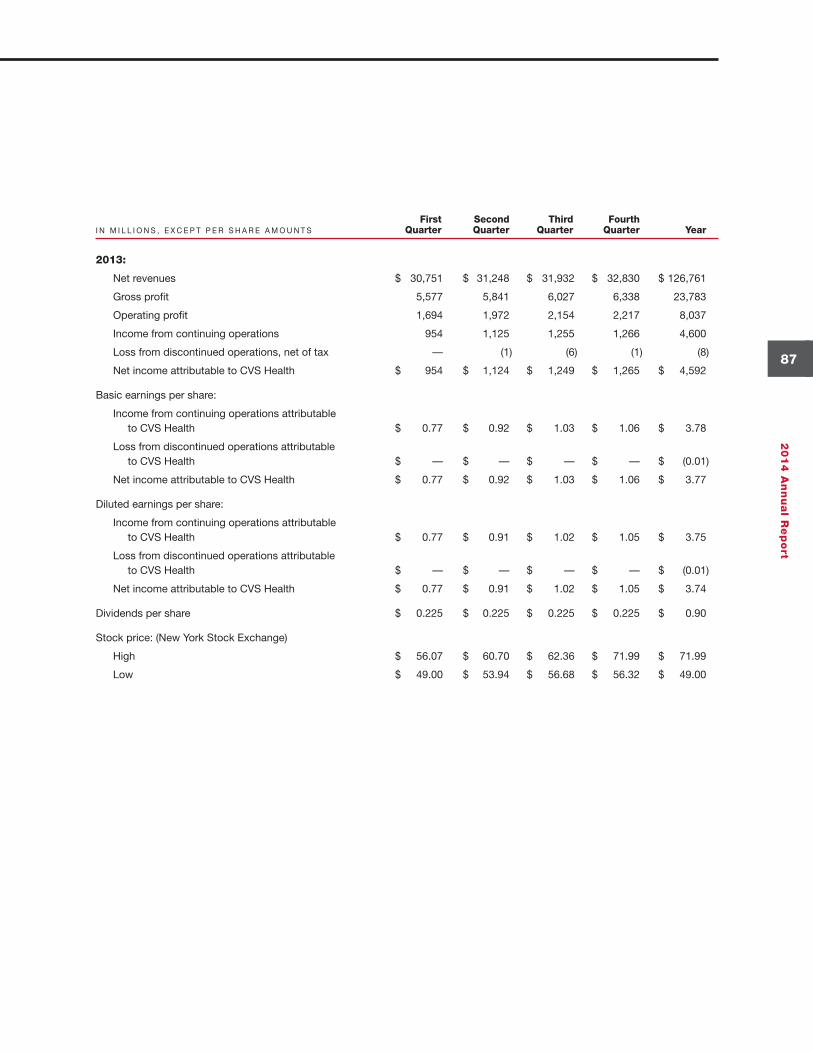
87
20
14
An
nu
al R
ep
ort
First Second Third Fourth I N M I L L I O N S , E X C E P T P E R S H A R E A M O U N T S Quarter Quarter Quarter Quarter Year
2013:
Net revenues $ 30,751 $ 31,248 $ 31,932 $ 32,830 $ 126,761
Gross profit 5,577 5,841 6,027 6,338 23,783
Operating profit 1,694 1,972 2,154 2,217 8,037
Income from continuing operations 954 1,125 1,255 1,266 4,600
Loss from discontinued operations, net of tax — (1) (6) (1) (8)
Net income attributable to CVS Health $ 954 $ 1,124 $ 1,249 $ 1,265 $ 4,592
Basic earnings per share:
Income from continuing operations attributable to CVS Health $ 0.77 $ 0.92 $ 1.03 $ 1.06 $ 3.78
Loss from discontinued operations attributable to CVS Health $ — $ — $ — $ — $ (0.01)
Net income attributable to CVS Health $ 0.77 $ 0.92 $ 1.03 $ 1.06 $ 3.77
Diluted earnings per share:
Income from continuing operations attributable to CVS Health $ 0.77 $ 0.91 $ 1.02 $ 1.05 $ 3.75
Loss from discontinued operations attributable to CVS Health $ — $ — $ — $ — $ (0.01)
Net income attributable to CVS Health $ 0.77 $ 0.91 $ 1.02 $ 1.05 $ 3.74
Dividends per share $ 0.225 $ 0.225 $ 0.225 $ 0.225 $ 0.90
Stock price: (New York Stock Exchange)
High $ 56.07 $ 60.70 $ 62.36 $ 71.99 $ 71.99
Low $ 49.00 $ 53.94 $ 56.68 $ 56.32 $ 49.00
157033_FIN.indd 87 3/2/15 3:14 PM
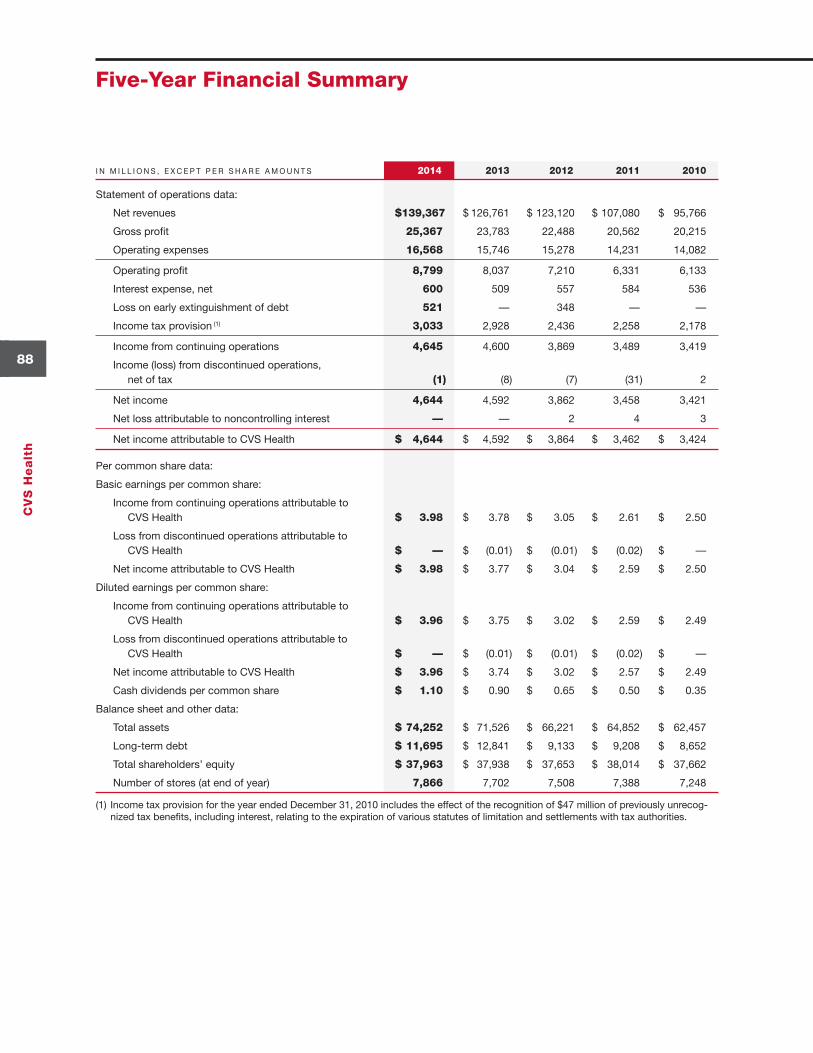
CV
S H
ea
lth
88
Five-Year Financial Summary
I N M I L L I O N S , E X C E P T P E R S H A R E A M O U N T S 2014 2013 2012 2011 2010
Statement of operations data:
Net revenues $ 139,367 $ 126,761 $ 123,120 $ 107,080 $ 95,766
Gross profit 25,367 23,783 22,488 20,562 20,215
Operating expenses 16,568 15,746 15,278 14,231 14,082
Operating profit 8,799 8,037 7,210 6,331 6,133
Interest expense, net 600 509 557 584 536
Loss on early extinguishment of debt 521 — 348 — —
Income tax provision (1) 3,033 2,928 2,436 2,258 2,178
Income from continuing operations 4,645 4,600 3,869 3,489 3,419
Income (loss) from discontinued operations, net of tax (1) (8) (7) (31) 2
Net income 4,644 4,592 3,862 3,458 3,421
Net loss attributable to noncontrolling interest — — 2 4 3
Net income attributable to CVS Health $ 4,644 $ 4,592 $ 3,864 $ 3,462 $ 3,424
Per common share data:
Basic earnings per common share:
Income from continuing operations attributable to CVS Health $ 3.98 $ 3.78 $ 3.05 $ 2.61 $ 2.50
Loss from discontinued operations attributable to CVS Health $ — $ (0.01) $ (0.01) $ (0.02) $ —
Net income attributable to CVS Health $ 3.98 $ 3.77 $ 3.04 $ 2.59 $ 2.50
Diluted earnings per common share:
Income from continuing operations attributable to CVS Health $ 3.96 $ 3.75 $ 3.02 $ 2.59 $ 2.49
Loss from discontinued operations attributable to CVS Health $ — $ (0.01) $ (0.01) $ (0.02) $ —
Net income attributable to CVS Health $ 3.96 $ 3.74 $ 3.02 $ 2.57 $ 2.49
Cash dividends per common share $ 1.10 $ 0.90 $ 0.65 $ 0.50 $ 0.35
Balance sheet and other data:
Total assets $ 74,252 $ 71,526 $ 66,221 $ 64,852 $ 62,457
Long-term debt $ 11,695 $ 12,841 $ 9,133 $ 9,208 $ 8,652
Total shareholders’ equity $ 37,963 $ 37,938 $ 37,653 $ 38,014 $ 37,662
Number of stores (at end of year) 7,866 7,702 7,508 7,388 7,248
(1) Income tax provision for the year ended December 31, 2010 includes the effect of the recognition of $47 million of previously unrecog-nized tax benefits, including interest, relating to the expiration of various statutes of limitation and settlements with tax authorities.
157033_FIN.indd 88 3/2/15 3:14 PM
89
20
14
An
nu
al R
ep
ort
Report of Independent Registered Public Accounting Firm
The Board of Directors and Shareholders of CVS Health Corporation
We have audited the accompanying consolidated balance sheets of CVS Health Corporation as of December 31, 2014 and 2013, and the related consolidated statements of income, comprehensive income, shareholders’ equity, and cash flows for each of the three years in the period ended December 31, 2014. These financial statements are the responsibility of the Company’s management. Our responsibility is to express an opinion on these financial statements based on our audits.
We conducted our audits in accordance with the standards of the Public Company Accounting Oversight Board (United States). Those standards require that we plan and perform the audit to obtain reasonable assurance about whether the financial statements are free of material misstatement. An audit includes examining, on a test basis, evidence supporting the amounts and disclosures in the financial statements. An audit also includes assessing the accounting principles used and significant estimates made by management, as well as evaluating the overall financial statement presentation. We believe that our audits provide a reasonable basis for our opinion.
In our opinion, the financial statements referred to above present fairly, in all material respects, the consolidated financial position of CVS Health Corporation at December 31, 2014 and 2013, and the consolidated results of its operations and its cash flows for each of the three years in the period ended December 31, 2014, in conformity with U.S. generally accepted accounting principles.
We also have audited, in accordance with the standards of the Public Company Accounting Oversight Board (United States), CVS Health Corporation’s internal control over financial reporting as of December 31, 2014, based on criteria established in Internal Control — Integrated Framework issued by the Committee of Sponsoring Organizations of the Treadway Commission (2013 framework) and our report dated February 10, 2015 expressed an unqualified opinion thereon.
Boston, Massachusetts February 10, 2015
157033_FIN.indd 89 3/2/15 3:14 PM
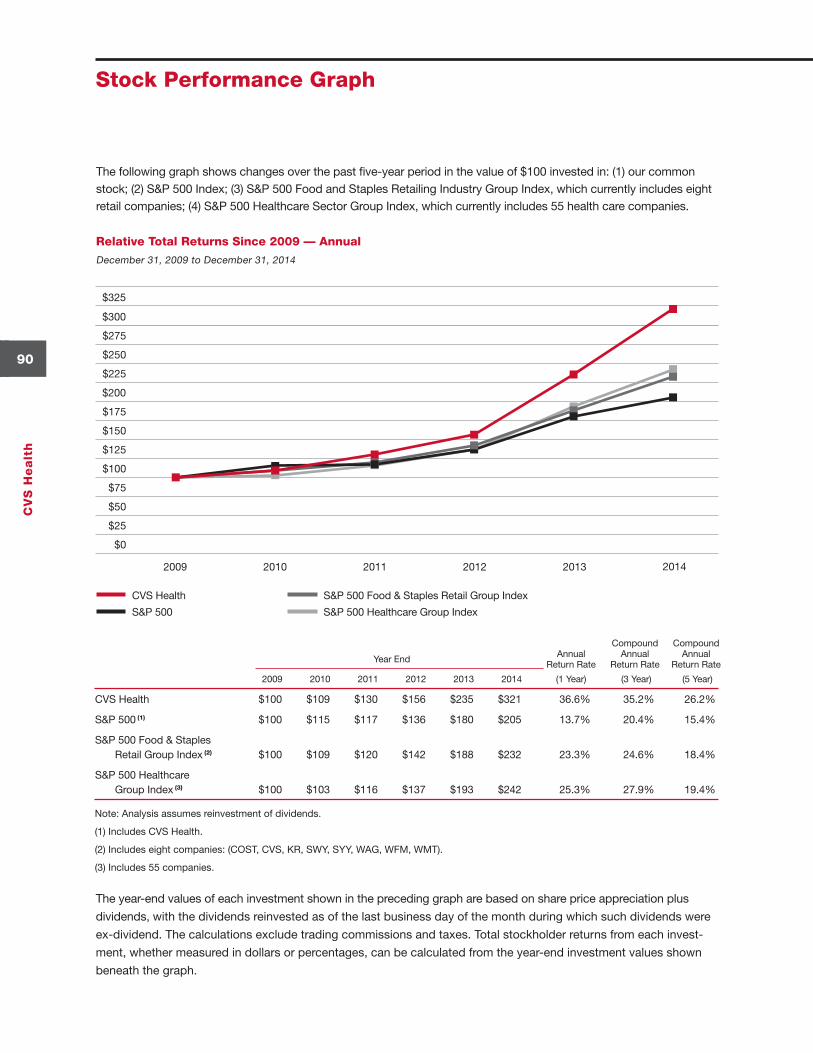
2014
CV
S H
ea
lth
90
Stock Performance Graph
The following graph shows changes over the past five-year period in the value of $100 invested in: (1) our common stock; (2) S&P 500 Index; (3) S&P 500 Food and Staples Retailing Industry Group Index, which currently includes eight retail companies; (4) S&P 500 Healthcare Sector Group Index, which currently includes 55 health care companies.
Relative Total Returns Since 2009 — Annual
December 31, 2009 to December 31, 2014
Compound Compound Annual Annual Annual Year End
Return Rate Return Rate Return Rate
2009 2010 2011 2012 2013 2014 (1 Year) (3 Year) (5 Year)
CVS Health $100 $109 $130 $156 $235 $321 36.6% 35.2% 26.2%
S&P 500 (1) $100 $115 $117 $136 $180 $205 13.7% 20.4% 15.4%
S&P 500 Food & Staples Retail Group Index (2) $100 $109 $120 $142 $188 $232 23.3% 24.6% 18.4%
S&P 500 Healthcare Group Index (3) $100 $103 $116 $137 $193 $242 25.3% 27.9% 19.4%
Note: Analysis assumes reinvestment of dividends.
(1) Includes CVS Health.
(2) Includes eight companies: (COST, CVS, KR, SWY, SYY, WAG, WFM, WMT).
(3) Includes 55 companies.
CVS Health
S&P 500
S&P 500 Food & Staples Retail Group Index
S&P 500 Healthcare Group Index
$300
$325
$200
$225
$250
$275
$150
$175
$125
$100
$75
$50
$25
$0
2009 2010 2011 2012 2013
The year-end values of each investment shown in the preceding graph are based on share price appreciation plus
dividends, with the dividends reinvested as of the last business day of the month during which such dividends were
ex-dividend. The calculations exclude trading commissions and taxes. Total stockholder returns from each invest-
ment, whether measured in dollars or percentages, can be calculated from the year-end investment values shown
beneath the graph.
157033_FIN.indd 90 3/2/15 3:14 PM
1 Health is Everything
14 Financial Highlights
15 Letter to Shareholders
20 Prescription for a Better World
21 2014 Financial Report
Shareholder Information
designed and produced by see see eye
Larry J. MerloPresident and Chief Executive Officer
Lisa G. BisacciaExecutive Vice President and Chief Human Resources Officer
Troyen A. Brennan, M.D.Executive Vice President and Chief Medical Officer
David M. DentonExecutive Vice President and Chief Financial Officer
Helena B. FoulkesExecutive Vice President and President – CVS/pharmacy
Stephen J. GoldExecutive Vice President and Chief Information Officer
J. David JoynerExecutive Vice President, Sales and Account Services – CVS/caremark
Per G.H. LofbergExecutive Vice President
Thomas M. MoriartyExecutive Vice President, Chief Health Strategy Officer and General Counsel
Jonathan C. RobertsExecutive Vice President and President – CVS/caremark
Andrew J. Sussman, M.D.Executive Vice President and Associate Chief Medical Officer; President – CVS/minuteclinic
Eva C. BorattoSenior Vice President – Controller and Chief Accounting Officer
John M. BuckleySenior Vice President and Chief Compliance Officer
Nancy R. ChristalSenior Vice President – Investor Relations
Carol A. DeNaleSenior Vice President and Treasurer
John P. KennedySenior Vice President and Chief Tax Officer
Colleen M. McIntoshSenior Vice President and Corporate Secretary
Thomas S. MoffattVice President and Assistant Secretary
OFFICERS’ CERTIFICATIONS The Company has filed the required certifications under Section 302 of the Sarbanes-Oxley Act of 2002 regarding the quality of our public disclosures as Exhibits 31.1 and 31.2 to our annual report on Form 10-K for the fiscal year ended December 31, 2014. After our 2014 annual meeting of stockholders, the Company filed with the New York Stock Exchange the CEO certi-fication regarding its compliance with the NYSE corporate governance listing standards as required by NYSE Rule 303A.12(a).
Officers
Richard M. Bracken (3)
Former Chairman and Chief Executive Officer HCA Holdings, Inc.
C. David Brown II (1) (2)
Chairman of the Firm Broad and Cassel
Alecia A. DeCoudreauxPresident Mills College
Nancy-Ann M. DeParle (3)
Partner Consonance Capital Partners, LLC
David W. Dorman (1) (2)
Chairman of the Board CVS Health Corporation
Anne M. Finucane (2)
Global Chief Strategy and Marketing Officer Bank of America Corporation
Larry J. MerloPresident and Chief Executive Officer CVS Health Corporation
Jean-Pierre Millon (3)
Former President and Chief Executive Officer PCS Health Services, Inc.
Richard J. Swift (3)
Former Chairman, President and Chief Executive Officer Foster Wheeler Ltd.
William C. Weldon (1) (2)
Former Chairman and Chief Executive Officer Johnson & Johnson
Tony L. White (1) (3)
Former Chairman, President and Chief Executive Officer Applied Biosystems, Inc.
(1) Member of the Management Planning and Development Committee
(2) Member of the Nominating and Corporate Governance Committee
(3) Member of the Audit Committee
Directors
Corporate HeadquartersCVS Health Corporation One CVS Drive, Woonsocket, RI 02895 (401) 765-1500
Annual Shareholders’ MeetingMay 7, 2015 CVS Health Corporate Headquarters
Stock Market ListingThe New York Stock Exchange Symbol: CVS
Transfer Agent and RegistrarQuestions regarding stock holdings, certificate replacement/transfer, dividends and address changes should be directed to:
Wells Fargo Shareowner Services P.O. Box 64874 St. Paul, MN 55164-0874 Toll-free: (877) CVS-PLAN (287-7526) International: +1 (651) 450-4064 Email: [email protected] Website: www.shareowneronline.com
Direct Stock Purchase/Dividend Reinvestment ProgramShareowner Services Plus PlanSM provides a convenient and economical way for you to purchase your first shares or additional shares of CVS Health common stock. The program is sponsored and administered by Wells Fargo Bank, N.A. For more information, including an enrollment form, please contact Wells Fargo Bank, N.A. at (877) 287-7526.
Financial and Other Company InformationThe Company’s Annual Report on Form 10-K will be sent without charge to any share-holder upon request by contacting:
Nancy R. Christal Senior Vice President – Investor Relations CVS Health Corporation 670 White Plains Road – Suite 210 Scarsdale, NY 10583 (800) 201-0938
In addition, financial reports and recent filings with the Securities and Exchange Commission, including our Form 10-K, as well as other Company information, are available via the Internet at investors.cvshealth.com.
Shareholder Information
157033_CVRS.indd 23/6/15 1:18 PM
1 Health is Everything
14 Financial Highlights
15 Letter to Shareholders
20 Prescription for a Better World
21 2014 Financial Report
Shareholder Informationd
esig
ned
and
pro
duc
ed b
y se
e s
ee e
ye
Larry J. MerloPresident and Chief Executive Officer
Lisa G. BisacciaExecutive Vice President and Chief Human Resources Officer
Troyen A. Brennan, M.D.Executive Vice President and Chief Medical Officer
David M. DentonExecutive Vice President and Chief Financial Officer
Helena B. FoulkesExecutive Vice President and President – CVS/pharmacy
Stephen J. GoldExecutive Vice President and Chief Information Officer
J. David JoynerExecutive Vice President, Sales and Account Services – CVS/caremark
Per G.H. LofbergExecutive Vice President
Thomas M. MoriartyExecutive Vice President, Chief Health Strategy Officer and General Counsel
Jonathan C. RobertsExecutive Vice President and President – CVS/caremark
Andrew J. Sussman, M.D.Executive Vice President and Associate Chief Medical Officer; President – CVS/minuteclinic
Eva C. BorattoSenior Vice President – Controller and Chief Accounting Officer
John M. BuckleySenior Vice President and Chief Compliance Officer
Nancy R. ChristalSenior Vice President – Investor Relations
Carol A. DeNaleSenior Vice President and Treasurer
John P. KennedySenior Vice President and Chief Tax Officer
Colleen M. McIntoshSenior Vice President and Corporate Secretary
Thomas S. MoffattVice President and Assistant Secretary
OFFICERS’ CERTIFICATIONS The Company has filed the required certifications under Section 302 of the Sarbanes-Oxley Act of 2002 regarding the quality of our public disclosures as Exhibits 31.1 and 31.2 to our annual report on Form 10-K for the fiscal year ended December 31, 2014. After our 2014 annual meeting of stockholders, the Company filed with the New York Stock Exchange the CEO certi-fication regarding its compliance with the NYSE corporate governance listing standards as required by NYSE Rule 303A.12(a).
Officers
Richard M. Bracken (3)
Former Chairman and Chief Executive Officer HCA Holdings, Inc.
C. David Brown II (1) (2)
Chairman of the Firm Broad and Cassel
Alecia A. DeCoudreauxPresident Mills College
Nancy-Ann M. DeParle (3)
Partner Consonance Capital Partners, LLC
David W. Dorman (1) (2)
Chairman of the Board CVS Health Corporation
Anne M. Finucane (2)
Global Chief Strategy and Marketing Officer Bank of America Corporation
Larry J. MerloPresident and Chief Executive Officer CVS Health Corporation
Jean-Pierre Millon (3)
Former President and Chief Executive Officer PCS Health Services, Inc.
Richard J. Swift (3)
Former Chairman, President and Chief Executive Officer Foster Wheeler Ltd.
William C. Weldon (1) (2)
Former Chairman and Chief Executive Officer Johnson & Johnson
Tony L. White (1) (3)
Former Chairman, President and Chief Executive Officer Applied Biosystems, Inc.
(1) Member of the Management Planning and Development Committee
(2) Member of the Nominating and Corporate Governance Committee
(3) Member of the Audit Committee
Directors
Corporate HeadquartersCVS Health Corporation One CVS Drive, Woonsocket, RI 02895 (401) 765-1500
Annual Shareholders’ MeetingMay 7, 2015 CVS Health Corporate Headquarters
Stock Market ListingThe New York Stock Exchange Symbol: CVS
Transfer Agent and RegistrarQuestions regarding stock holdings, certificate replacement/transfer, dividends and address changes should be directed to:
Wells Fargo Shareowner Services P.O. Box 64874 St. Paul, MN 55164-0874 Toll-free: (877) CVS-PLAN (287-7526) International: +1 (651) 450-4064 Email: [email protected] Website: www.shareowneronline.com
Direct Stock Purchase/Dividend Reinvestment ProgramShareowner Services Plus PlanSM provides a convenient and economical way for you to purchase your first shares or additional shares of CVS Health common stock. The program is sponsored and administered by Wells Fargo Bank, N.A. For more information, including an enrollment form, please contact Wells Fargo Bank, N.A. at (877) 287-7526.
Financial and Other Company InformationThe Company’s Annual Report on Form 10-K will be sent without charge to any share-holder upon request by contacting:
Nancy R. Christal Senior Vice President – Investor Relations CVS Health Corporation 670 White Plains Road – Suite 210 Scarsdale, NY 10583 (800) 201-0938
In addition, financial reports and recent filings with the Securities and Exchange Commission, including our Form 10-K, as well as other Company information, are available via the Internet at investors.cvshealth.com.
Shareholder Information
157033_CVRS.indd 2 3/6/15 1:18 PM157033_CVRS.indd 3 3/12/15 5:03 PM
2014 Annual Report
CVS Health, One CVS Drive, Woonsocket, RI 02895 | 401.765.1500 | cvshealth.com
WE ARE
A pharmacy innovation company
OUR STRATEGY
Reinventing pharmacy
OUR PURPOSE
Helping people on their path to better health
OUR VALUES
Innovation Collaboration Caring Integrity Accountability
CVS
Health
2014 A
nnual Rep
ort
The CVS Health 2014 Annual Report achieved the following results by printing on paper containing 10 percent post-consumer recycled content. FSC® is not responsible for any calculations of results from choosing this paper.
Trees Saved
Water Saved
Energy Saved
Solid Waste Not Produced
Greenhouse Gases Not Produced
104fully grown
48,208 gallons
47,000,000 MM BTUs
3,227 pounds
8,889 pounds
Waterborne Waste Not Produced
30 pounds
157033_CVRS.indd 1 3/11/15 7:08 PM157033_CVRS.indd 4 3/12/15 5:03 PM
Related Documents