PROCEEDINGS OF THE PRECISION DAIRY CONFERENCE AND EXPO MAYO CIVIC CENTER, ROCHESTER, MINNESOTA JUNE 26-27, 2013 A Conference on Precision Dairy Technologies Hosted by the University of Minnesota The first-ever Precision Dairy Management Conference held in the U.S., the Second North American Conference on Precision Dairy Management, and the Third Robotic Milking Conference

Welcome message from author
This document is posted to help you gain knowledge. Please leave a comment to let me know what you think about it! Share it to your friends and learn new things together.
Transcript
COVER 4 COVER 1
PROCEEDINGS OF THE
PRECISION DAIRY CONFERENCE AND EXPO
MAYO CIVIC CENTER, ROCHESTER, MINNESOTA
JUNE 26-27, 2013
A Conference on Precision Dairy Technologies
Hosted by the University of Minnesota
The first-ever Precision Dairy Management Conference held in the U.S., the Second North American Conference on Precision Dairy Management, and
the Third Robotic Milking Conference
Pr
oc
ee
din
gs o
f th
e Pr
ec
ision d
air
y co
nfe
re
nc
e an
d ex
Po
53322_pdm_covers_nk.indd 1 6/7/2013 10:43:32 AM
PROCEEDINGS OF THE PRECISION DAIRY CONFERENCE AND EXPO
MAYO CIVIC CENTER, ROCHESTER, MINNESOTA
JUNE 26-27, 2013
Hosted by the University of Minnesota
i
DeLaval VMS™
A higher level of...
Reliability
Performance
Flexiblity
We have confidence that the robot will milk our herd with consistency 24/7 365 days a year – never calling in sick or not showing up.
The VMS is helping us achieve our goal of being the highest producing farm in the area.
While milking is where we derive our income there are many chores that need to be done.
Peissig Farms
240 cows 4 VMS
Kastenschmidt Farms112 cows 2 VMS
Laufenberg Farms
200 cows 4 VMS
is a registered trademark of Tetra Laval Holdings & Finance S.A. and “DeLaval” is a registered trade/servicemark of DeLaval Holding AB © 2013 DeLaval Inc. DeLaval, 11100 North Congress Avenue, Kansas City, Missouri 64153-1296.
To learn more visit us at the Precision Dairy Conference or visit www.delaval-us.com/vms

Welcome to Precision Dairy 2013!
On behalf of the organizing committee and the University of Minnesota Dairy Extension Team, I welcome you to the first-ever U.S. Precision Dairy Conference and Expo. Today there is more growth and interest in precision technologies than ever before. Minnesota and Wisconsin have more robotic milking farms than many other states in the country. Some of us at the University of Minnesota are conducting research with robotic milking, automated calf feeders, cow sensors, and precision feeding. With this in mind, we thought it was the right time and place to host this event. We partnered with two colleagues from Canada who coordinated the First North American Precision Dairy Conference in Toronto, Canada in 2010, bringing an international perspective to this event and making it the second North American conference on this topic. Adoption of precision technology is really picking up in the U.S. We see quite a bit of growth on cow sensor technologies for disease and heat detection. There is also a lot of interest in data management, precision feeding, automatic milking, and calf feeders. Therefore, precision dairy management is the wave of today and the wave of the future. Let’s have a great time while discovering more about precision technology. Please visit with our sponsors and speakers while you are here. They have much to share, and some came from a long distance to tell us about their research or products. I know some of our attendees also have traveled many hours to get here. Thanks to all of you, near and far, for attending our event. We hope you take advantage of the tremendous networking opportunities while you are here. Best wishes for an enjoyable and educational time at Precision Dairy 2013! Sincerely,
Marcia Endres, Overall Chair Department of Animal Science University of Minnesota, St. Paul
iii
Federal Ag Supply and Artex have partnered to warehouse products at two convenient locations in the Midwest and California. Call 913-387-3203
federalagsupply.com
Bring the Pasture Inside
www.artexbarnsolutions.comYour complete barn solution providers
GatesLoopsCalf ZoneHead LocksAqua DumpsVentilation

Precision Dairy Conference AGENDA June 26 & 27, 2013
DAY TIME LENGTH TITLE
26-June 7:30 AM Continental Breakfast (Exhibit Hall)
PLENARY SESSION(Presentation Hall)
26-June 8:30 AM 10 Opening & Welcome Marcia Endres
8:40 AM 30 Exciting Dairy Breakthroughs: Science Fiction or Precision Dairy Farming?
Jeffrey Bewley
9:10 AM 30 Why Using New Technologies is $ustainable for U.S. Dairies Doyle Waybright
9:40 AM 30 Use of Precision Technologies to Optimize Feed Efficiency for Milk Production
Alex Bach
10:10 AM 10 Q & A All
10:20 AM 40 Break & Trade Show Exhibit Hall
BREAKOUT 1 (a.m.)
ROBOTIC MILKING - 1(Presentation Hall)
26-June 11:00 AM 30 Success Factors for Automatic Milking Jack Rodenburg
11:30 AM 15 Housing, Management and Animal Welfare Characteristics of Farms Using Automatic Milking Systems in the
Upper Midwest U.S.
Jim Salfer
11:45 AM 15 Increased AMS Performance by Optimized Individual Milk Intervals
Rik van der Tol
12:00 PM 10 Q & A All
12:10 PM 80 Lunch, Poster Session & Trade Show Exhibit Hall
BREAKOUT 2 (a.m.)
PARLOR TECHNOLOGY/ FEEDING/ OTHER - 1(Grand Ballroom)
26-June 11:15 AM 15 Using Automated Internet Systems in Farm Data Monitoring Mark Kinsel
11:30 AM 15 Critical Control Point Monitoring of Processes Affecting Milk Quality and Safety
Kristy Campbell
11:45 AM 15 Effects of Pre- versus Post-Milking Supplementation on Cow Traffic and Performance in a Pasture-Based
Automatic Milking System
Nicolas Lyons
12:00 PM 10 Q & A
12:10 PM 80 Lunch, Poster Session & Trade Show
Exhibit Hall
v

Precision Dairy Conference AGENDA June 26 & 27, 2013
DAY TIME LENGTH TITLE
BREAKOUT 1 (p.m.)
ROBOTIC MILKING - 2(Presentation Hall)
26-June 1:30 PM 75 Robotic Milking Producer Panel Bradley Biehl, Erica Kiestra, Tom Oesch, Jake Peissig, Harry VanWieren
2:45 PM 45 Break & Trade Show Exhibit Hall
3:30 PM 15 Individual Pulsation Ratios Increase Average Milk Flow by 8%
Peter Bahlenberg
3:45 PM 15 The Economics of Robotic Milking Systems Kristen Schulte
4:00 PM 15 Economic Comparison of Farms with an Automatic Milking System and a Conventional Milking System
Wilma Steeneveld
4:15 PM 10 Q & A All
4:25 PM 5 Wrap-Up & Instructions
4:25 PM Trade Show Exhibit Hall
BREAKOUT 2 (p.m.)
PARLOR TECHNOLOGY/ FEEDING/ OTHER - 2(Grand Ballroom)
26-June 1:30 PM 15 In-Line Milk Analysis: A Tool for Animal Health Monitoring Tal Schcolnik
1:45 PM 15 Abnormal Progesterone Profiles as a Sign of Functional Imbalance in the Transition Period
Jens Yde Blom
2:00 PM 45 In-Line Milking Parlor Producer Panel Chris Buchner, Eric Diepersloot
2:45 PM 45 Break & Trade Show Exhibit Hall
3:30 PM 15 Potential for Labor Saving and Improved Feeding Management with Automatic Feeding
Cees Jan Hollander
3:45 PM 15 Precision Feeding – Addressing the Human Factor Keith Sather
4:00 PM 15 Multistage Ventilation Controllers: Not Just a Thermostat Kevin Janni
4:15 PM 10 Q & A All
4:25 PM 5 Wrap-Up & Instructions
4:25 PM Trade Show Exhibit Hall
EVENING PROGRAM(DoubleTree by Hilton Hotel)
26-June 6:00 PM Cash Bar Ballroom
7:00 PM Banquet Ballroom
Featured Speaker Lance Fox
vii

Embrace the future and succeed.In the dairy business, automation is not just the future
— it’s the present. Lely innovation and technology are
changing the way producers live their lives and care
for their herd. By embracing the future now, you can
put your dairy in a position to succeed, year after year.
www.lely.com 1-866-LELY USAScan to learn more.
LELY AstronautRobotic Milking System
WANT TO.”
THE COWS
GET MILKED WHEN THEYGET MILKED WHEN THEYEAT, SLEEP &THE COWS“
— STEVE & LISA GROESTCH ALBANY, MN
LELY_0322_A4_PrecisionDairy_7.375x9.75_(Groesch)_MAY.indd 1 5/17/13 10:38 AM
Precision Dairy Conference AGENDA June 26 & 27, 2013
DAY TIME LENGTH TITLE
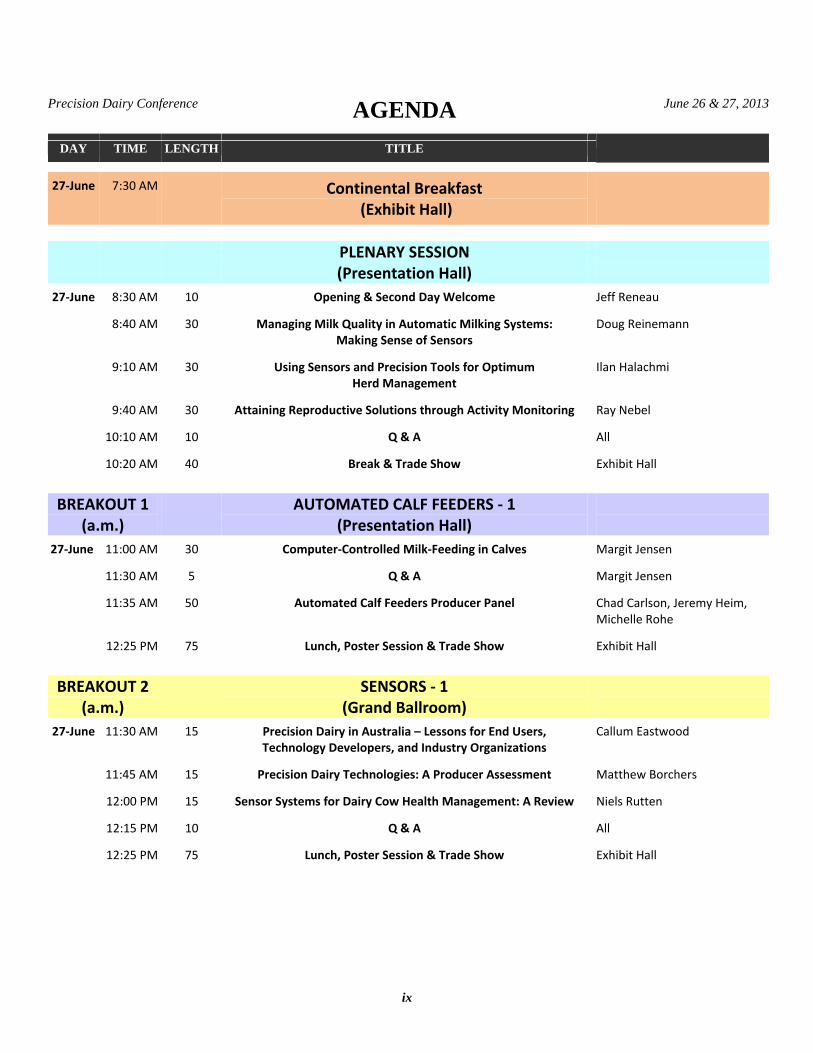
27-June 7:30 AM Continental Breakfast (Exhibit Hall)
PLENARY SESSION(Presentation Hall)
27-June 8:30 AM 10 Opening & Second Day Welcome Jeff Reneau
8:40 AM 30 Managing Milk Quality in Automatic Milking Systems: Making Sense of Sensors
Doug Reinemann
9:10 AM 30 Using Sensors and Precision Tools for Optimum Herd Management
Ilan Halachmi
9:40 AM 30 Attaining Reproductive Solutions through Activity Monitoring Ray Nebel
10:10 AM 10 Q & A All
10:20 AM 40 Break & Trade Show Exhibit Hall
BREAKOUT 1 (a.m.)
AUTOMATED CALF FEEDERS - 1(Presentation Hall)
27-June 11:00 AM 30 Computer-Controlled Milk-Feeding in Calves Margit Jensen
11:30 AM 5 Q & A Margit Jensen
11:35 AM 50 Automated Calf Feeders Producer Panel Chad Carlson, Jeremy Heim, Michelle Rohe
12:25 PM 75 Lunch, Poster Session & Trade Show Exhibit Hall
BREAKOUT 2 (a.m.)
SENSORS - 1(Grand Ballroom)
27-June 11:30 AM 15 Precision Dairy in Australia – Lessons for End Users, Technology Developers, and Industry Organizations
Callum Eastwood
11:45 AM 15 Precision Dairy Technologies: A Producer Assessment Matthew Borchers
12:00 PM 15 Sensor Systems for Dairy Cow Health Management: A Review Niels Rutten
12:15 PM 10 Q & A All
12:25 PM 75 Lunch, Poster Session & Trade Show
Exhibit Hall
ix

Precision Dairy Conference AGENDA June 26 & 27, 2013
DAY TIME LENGTH TITLE
BREAKOUT 1 (p.m.)
SENSORS - 2(Presentation Hall)
27-June 1:40 PM 15 Rumination Time: An Indicator of Health Status and Welfare Condition
Nazzareno Soriani
1:55 PM 15 Energy Balance Estimated Real-Time from Automated On-Farm Live Weights is Associated with Reduced
Reproductive Performance
Vivi Thorup
2:10 PM 70 Cow Sensors Producer Panel Jena Betley, Jeff Funk, Tom Gavin, Kevin Phillips
3:20 PM 10 Break & Trade Show Exhibit Hall
4:00 PM Trade Show Closes
BREAKOUT 2 (p.m.)
AUTOMATED CALF FEEDERS - 2 and SENSORS - 3 (Grand Ballroom)
27-June 1:40 PM 30 Automated Calf Feeders in the Midwest Marcia Endres
2:10 PM 15 The Economics of Automated Calf Feeders Jennifer Bentley
2:25 PM 15 Investment Analysis of Automated Estrus Detection Technologies
Karmella Dolecheck
2:40 PM 15 Accelerometer Use for Detection of Hoof Lesions and Lameness
Janet Higginson-Cutler
2:55 PM 15 Development of a Hoof Lesion Data Collection System for Dairy Cattle
Blair Murray
3:10 PM 10 Q & A All
3:20 PM 10 Break & Trade Show Exhibit Hall
4:00 PM Trade Show Closes
PLENARY WRAP-UP SESSION(Presentation Hall)
27-June 3:30 PM 30 Now What? Some Economic Guidelines for Practical Precision Dairy
Albert DeVries
4:00 PM 30 Integrating it All: Making it Work and Pay at the Farm Henk Hogeveen
4:30 PM 10 Q & A All
4:40 PM 10 Wrap-Up & Adjourn Marcia Endres
Note: Breakout Sessions 1 and 2 run concurrently.
x

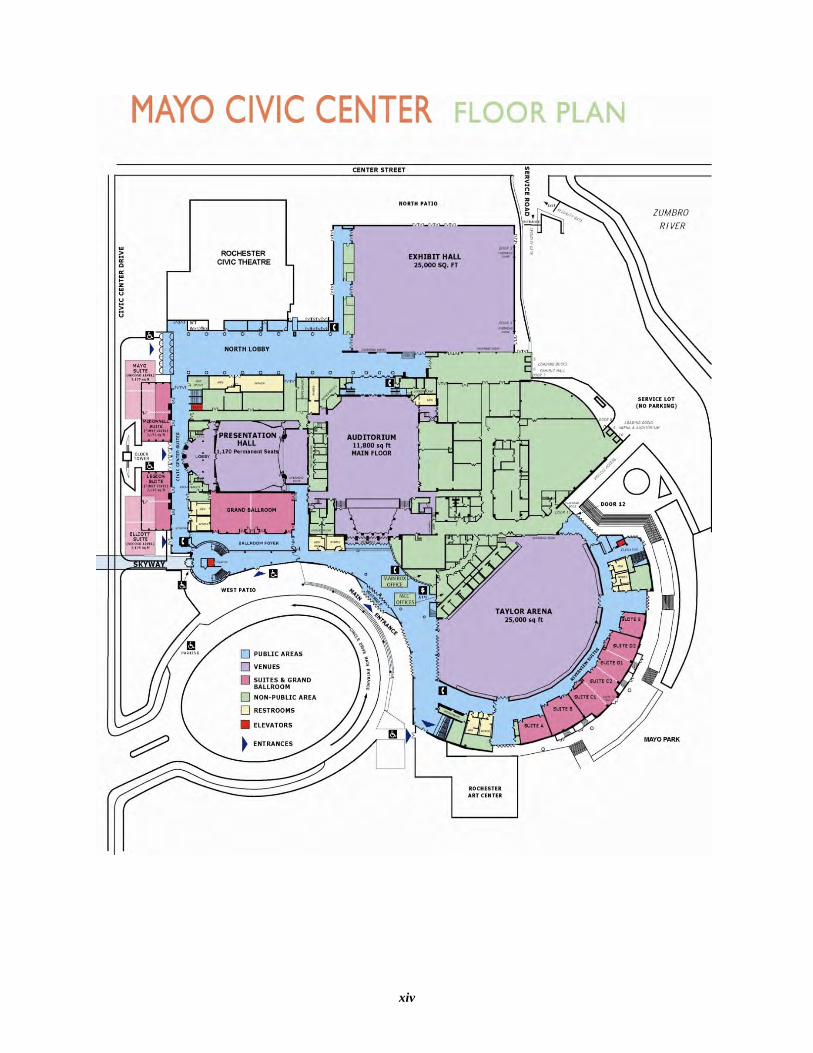
GENERAL INFORMATION Conference Venue
The Mayo Civic Center is located at 30 Civic Center Drive SE in Rochester, Minnesota. It is the largest event venue in southern Minnesota. The facility offers state-of-the-art technology, skyway access to downtown hotels, restaurants and shopping, over 1,700 first class hotel rooms connected by skyway, and 3,900 parking spaces within two blocks as well as an 11-acre park within a short distance of the Civic Center. Presentation Hall and Grand Ballroom will be used for conference sessions. Official Language
The official language of the conference is English. Registration and Information Desk
Located at the North Lobby, Mayo Civic Center.
Hours:
Tuesday, June 25 7:00 a.m. to 9 a.m. and 4:00 p.m. to 6:00 p.m. Wednesday, June 26 7:00 a.m. to 4:00 p.m. Thursday, June 27 7:00 a.m. to 2:00 p.m.
Name Badges
Your name badge is your admission to all presentations and to the Exhibit Hall for the trade show, breakfast, breaks and lunch. Wear it at all times while at the event. Poster and Exhibition Area
The Exhibit Hall is on the ground floor at the Mayo Civic Center. We encourage you to visit the trade show. Internet Access
Complimentary wireless Internet access is available throughout the facility. Certificate of Attendance
Request a Certificate of Attendance at the registration desk if your organization requires one. They will not be automatically distributed to everyone. Refreshment Breaks
Breaks will take place in the Exhibit Hall at times shown on the conference schedule. Lunches
Lunch will be served in the Exhibit Hall.
xi
Banquet at DoubleTree by Hilton Hotel, June 26, 6:00 p.m. (pre-registration is required)
The conference banquet will be held at the DoubleTree by Hilton Hotel, 150 South Broadway, just a short walk from the Civic Center and connected by a skyway system. A cash bar opens at 6:00 p.m. with dinner at 7:00 p.m. The featured speaker is Lance Fox. His presentation, No Place but UP!, will inspire you to pursue your dreams with passion as he shares his experiences on Mount Everest. Getting to Rochester/Transportation Options
By air:
Rochester International Airport (RST). For more information, call 507-282-2328 or visit www.flyrst.com/.
Minneapolis/St. Paul International Airport (MSP). Call 612-726-5555 or visit www.mspairport.com/.
Airport shuttles:
Shuttle van service is available for all flights into the Rochester International Airport. A shuttle meets all incoming flights. Check in at the transportation desk at the airport. Reservations are required for your departing flight pick-up.
Rochester Airport Shuttle: 507-282-2222
Luxury Sedan: 507-429-4222
Shuttle services are available 7 days a week between Rochester and the Minneapolis-St. Paul International Airport (MSP). Shuttle vans pick up and deliver passengers at the Ground Transport area of MSP. Shuttles serve most Rochester hotels. Advance reservations are recommended.
Go Rochester Direct: 800-280-9270 or book on-line at www.GoRochesterDirect.com.
Rochester Shuttle Service: 507-216-6354 or book on-line at rochestershuttleservice.com.
By road:
Rochester is easily accessible by highway. East-West Highway Routes: Interstate 90, U.S. Hwy 14, State Hwy 30, State Hwy 42, State Hwy 296. North-South Highway Routes: Interstate 35, U.S. Hwy 52, U.S. Hwy 63.
By train:
The nearest Amtrak depot is located one hour (45 miles) east of Rochester in Winona, Minnesota. Daily bus service to and from the Amtrak depot is available at the Union Bus Depot. For more information call 800-872-7245 or visit www.amtrak.com.
xii

Emergency Calls
Dial 911 (for emergencies only) if there is a need for an ambulance, the police, or the fire department. Shopping in Rochester
Rochester has a few shopping options located in close proximity to the Civic Center, including:
• Shops at University Square, 111 Broadway Avenue South (approximately 4 blocks from the Civic Center).
• The Grand Shops, 20 SW Second Avenue, are connected to the Kahler Grand and Marriott hotels (approximately 5 blocks from the Civic Center).
• Apache Mall, Highways 52 South and 14 East (approximately 3 miles from the Civic Center).
Map of Surrounding Area
Maps are available at the registration desk.
xiii
xiv

SPECIAL THANK YOU TO OUR PLATINUM SPONSORS
xv

SPECIAL THANK YOU TO OUR GOLD SPONSORS
xvi

xvii
SPECIAL THANK YOU TO OUR SILVER SPONSORS
Afimilk Ltd.
Valley Ag Software (VAS)
Purina Animal Nutrition LLC
Minnesota Milk Producers Association (MMPA)
Select Sires Inc.
Grober Nutrition / Förster Technic
Dairy Records Management Systems (DRMS)
Digi-Star, LLC
Supervisor Systems
Semex
C-Lock Inc. / GreenFeed
Madero Dairy Systems
Valmetal Inc.
Trioliet
Thank you to all of our sponsors!
Without your support, this event would not be possible.
For a complete list of all conference sponsors
and exhibitors, see page 189.
ILLINOISUnverfehrt farm SUpply, Inc.
centralia, Il • 618.493.7357IOWA
valley DaIry farm aUtomatIon, Inc.rock valley, Ia • 712.476.2781
MICHIGANGreat laKeS DaIry SUpplyfalmouth, mI • 231.826.4143
J&m DaIry eQUIpmenthillsdale, mI • 877.563.2479
MINNESOTAB&r DaIry eQUIpment, Inc.Winthrop, mn • 507.647.7000
champIon mIlKInG SyStemS, llcalbany, mn • 320.845.4156
DaIrylanD eQUIpment of menahGamenahga, mn • 218.564.4958
NEW YORKDon’S DaIry SUpply
South Kortright, ny • 607.538.9464
SoUthern tIer DaIry ServIceSconewango valley, ny • 716.358.9152
OHIOBechtel ServIceS, Inc.
Wooster, oh • 330.264.2889
PENNSYLVANIAcentral DaIry & mechanIcalmartinsburg, pa • 814.793.3721
lancaSter DaIry farm aUtomatIonlititz, pa • 800.422.4587
SOUTH DAKOTAStocKholm refrIGeratIon, Inc.
Stockholm, SD • 800.658.3516WISCONSIN
GehrInG SaleS & ServIcerubicon, WI • 262.673.4920
lDS, Inc.chilton, WI • 920.849.2459
trI-coUnty DaIry SUpplyJanesville, Watertown & monroe, WI
800.822.7662
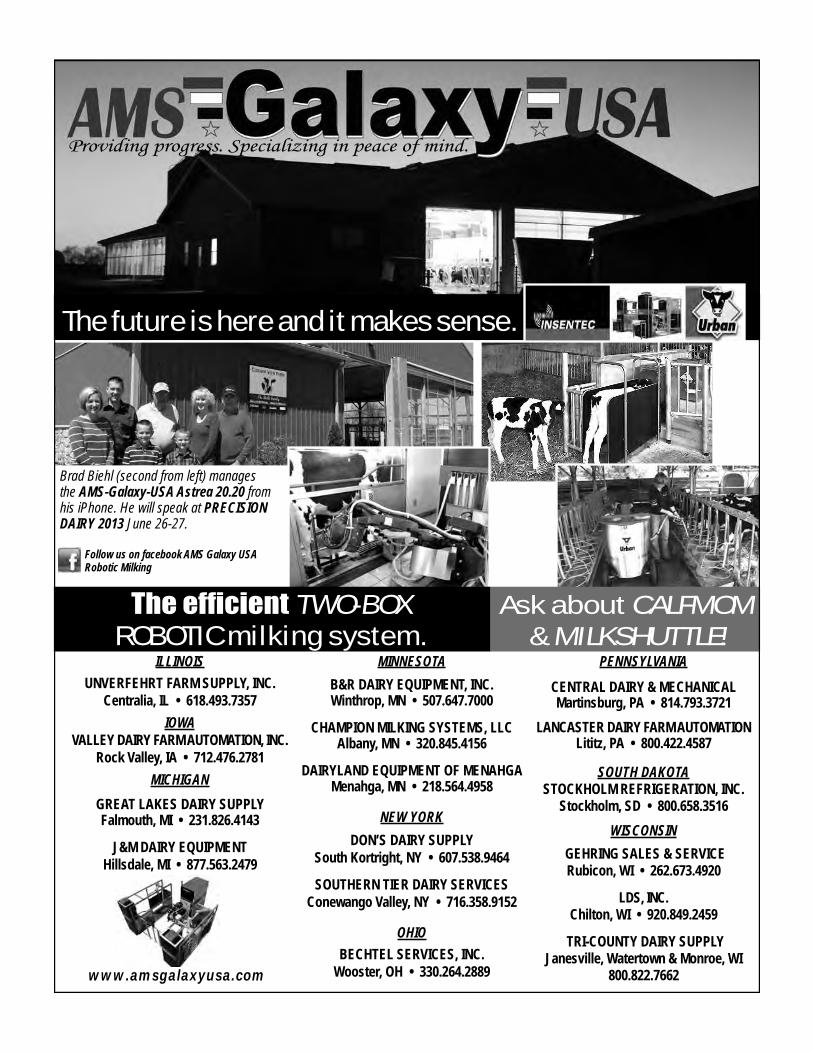
The future is here and it makes sense.
www.amsgalaxyusa.com
Brad Biehl (second from left) manages the AMS-Galaxy-USA Astrea 20.20 from his iPhone. He will speak at PRECISIONDAIRY 2013 June 26-27.
Providing progress. Specializing in peace of mind.
Follow us on facebook AMS Galaxy USA Robotic Milking
The efficient Two-boxRoboTIC milking system.
Ask about CALFMoM & MILKSHUTTLE!
CONFERENCE PLANNING COMMITTEE Marcia Endres Overall Chair Associate Professor Dairy Cattle Production Systems Department of Animal Science University of Minnesota, St. Paul, MN [email protected] Kevin Janni Professor Livestock Housing & Air Quality Department of Bioproducts & Biosystems Engineering University of Minnesota, St. Paul, MN [email protected] Noah Litherland Assistant Professor Dairy Cattle Nutrition Department of Animal Science University of Minnesota, St. Paul, MN [email protected] Blair Murray Consultant Murray Agri Consulting Ontario, Canada [email protected]
Jeff Reneau Professor Dairy Cattle Production Systems Department of Animal Science University of Minnesota, St. Paul, MN [email protected] Jack Rodenburg Consultant DairyLogix Woodstock, Ontario, Canada [email protected] Jim Salfer Extension Professor University of Minnesota Extension St. Cloud, MN [email protected]
xix

engineering for a better world
Are these your goals as a dairy producer?• Create the best possible environment for my cows
• Manage my herd more precisely
• Embrace new technology
• Carve out a more balanced life
• Build a sustainable dairy operation
GEA Farm Technologies can help you attain these
goals and more with the MIone – the no-compromise
robotic milking system to enhance your future in dairying.
Visit our booth to see working MIone robotic
technology without even leaving the conference.
Attend the robotic Milking dAiry Producer PAnel
on Wednesday, June 26th at 1:30 p.m.
chAt with robotic Milking sPeciAlists
to see how your dairy’s goals can be achieved with
automated solutions from GEA Farm Technologies.
GEA Milking & Cooling | WestfaliaSurge
GEA Farm Technologies
1.877.WS.DAIRY www.gea-farmtechnologies.com
PlAtinum SPonSor of PreciSion DAiry 2013
KEYNOTE SPEAKERS Dr. Alex Bach Dr. Alex Bach obtained a veterinary degree from the University Autonomous of Barcelona. He then moved to the U.S. to pursue a M.S. and a Ph.D. in Dairy Science at the University of Minnesota. After graduating, he returned to Spain to work in the research department of a multinational feed company where he built nutritional models for ruminants across Europe. After a few years in the industry, Dr. Bach returned to academia as director of the Department of Ruminant Production of IRTA (Institut de Recerca i Tecnologia Agroalimentàries) devoted to the study of ruminant production systems (nutrition, management, development, etc.). He conducts research on ruminant nutrition and metabolism, and dairy cow and replacement management. Dr. Bach has received several awards in recognition of his research activity, has spoken at more than 80 international congresses, and is author or co-author of more than 70 peer-reviewed publications, more than 80 extension articles, and 8 books. He is section editor and serves on the editorial boards of several scientific journals, is member of several scientific committees, and serves as a scientific expert for the European Food Safety Authority. Dr. Jeffrey Bewley Dr. Jeffrey Bewley is from Rineyville, Kentucky where he grew up working on his grandfather’s dairy farm. He received a B.S. degree in Animal Sciences from the University of Kentucky in 1998, his M.S. in Dairy Science at the University of Wisconsin-Madison in 2000, and his Ph.D. from Purdue University in 2008. Jeffrey’s primary interests are the application of precision dairy farming technologies, economics of decisions on dairy farms, milk quality management, dairy cow comfort and well-being, records management and benchmarking, systems troubleshooting, and strategic dairy business management. Jeffrey’s team of graduate and undergraduate research assistants manages multiple precision dairy research projects. Dr. Albert De Vries Dr. Albert De Vries is an associate professor in the Department of Animal Sciences at the University of Florida. He grew up on a dairy and swine farm in the central part of the Netherlands. He received his B.S. and M.S. in Animal Science with a minor in agricultural economics from Wageningen University in the Netherlands in 1991. In 1995 he came to the U.S. to pursue a Ph.D. in Animal Sciences at the University of Minnesota with a focus on dairy science, applied economics, operations research, and statistics. After graduation in 2001 he accepted a faculty position at the University of Florida. He teaches two undergraduate dairy courses and advises undergraduate dairy students and graduate students. His research interests are in optimization of culling and replacement strategies, statistical process control, economics of reproduction, and precision dairy farming. In his extension role, he works with allied industry and dairy producers on farm financial management and to apply the results of his research.
xxi
Dr. Marcia I. Endres Dr. Marcia Endres is an associate professor and extension dairy scientist in the Department of Animal Science at the University of Minnesota. Her research interests include dairy management, welfare and behavior. She has investigated how various types of housing and management systems can influence health, welfare and performance of dairy cattle. She currently leads a USDA-funded project investigating the welfare of dairy calves when using automated calf feeders and is co-investigator on a large on-farm survey of robotic milking systems in the upper Midwest U.S. Dr. Endres received her Ph.D. from the University of Minnesota, M.Sc. from Iowa State University, and a Veterinary Medicine degree from University Federal of Parana, Brazil. Dr. Ilan Halachmi Dr. Ilan Halachmi is a senior researcher at the Institute of Agricultural Engineering, Agricultural Research Organization (ARO), Volcani Center, Israel. He received a B.Sc. degree in agricultural and mechanical engineering from the Technion - Institute of Technology, Haifa, Israel, a M.Sc. degree in Industrial Engineering and Management from Ben-Gurion University, Israel, and a Ph.D. degree from Wageningen University, the Netherlands. He was the business development manager and acting vice president of R&D in a large commercial company until 2002 when he moved back into academic research. His research areas are in design methodology for a robotic milking barn (modeling, simulation, validation, and optimization), mega-dairy farming systems design and management, precision livestock farming and sensors-based management, model-based decision-making, animal behavior sensors, and image analysis. Dr. Henk Hogeveen Dr. Henk Hogeveen graduated with a M.Sc. from Wageningen Agricultural University in 1989. His M.Sc. thesis work was on the field of epidemiology (cystic ovarian disease) and animal health economics (economics of herd health programs). From 1989 until 1994 he worked as associated researcher at the Department of Herd Health and Reproduction of the Faculty of Veterinary Medicine of Utrecht University, where he received a Ph.D. in the field of mastitis diagnosis. After a short employment at the former Institute for Agricultural and Environmental Engineering in Wageningen, he began working as a scientific researcher in the field of herd health and management at the Applied Cattle Research Institute in Lelystad (nowadays part of the Animal Sciences Group of Wageningen UR), followed by a position as cluster manager welfare, health and milk quality at that institute. Since 2001, Dr. Hogeveen has been working in academia, currently as associate professor at the chair group Business Economics of Wageningen University and the Department of Farm Animal Health of the Faculty of Veterinary Medicine of Utrecht University. His teaching activities are mainly directed at economics of animal health, agricultural business and veterinary business in B.Sc., M.Sc. and Ph.D. courses. His research activities are focused on economics of animal health, focusing mainly on endemic diseases. Within that field, he has
xxiii

The dg precisionFEEDING™ System makesreal-time DM adjustments for each payload!
New research from The Ohio State University shows that substantial day-to-day variability in dry matter, NDF, CP and starch in corn silage and haylage is very large and often as great as month-to-month variation.* Because diets are formulated on a dry matter basis but delivered on an as-fed basis, variation in dry matter could substantially alter diet composition in just one day.
Using NIR technology, the dg precisionFEEDING System measures every payload of feed for dry matter before it is dumped into the batch mixer. Real-time dry matter adjustments mean precise construction of your herd’s prescribed ration to prevent over-or under-feeding. Reports on crude protein, starch, ash, ADF, NDF and crude fat are also available for daily monitoring.
Get the most out of your feed and maximize production with the dg precisionFEEDING System. For more information, contact: [email protected] or 1-715-781-7134.
*WEISS, W.P., ET AL, THE OHIO STATE UNIVERSITY. WITHIN FARM VARIATION IN NUTRIENT COMPOSITION OF FEEDS. 2012 TRI-STATE NUTRITION CONFERENCE.
TURN DM VARIABILITY INTO DM CONSISTENCY.
©2013. dg precisionFEEDING is a trademark of dinamica generale, srl.
www.dinamicagenerale.com
DRY MATTER VARIES
38% DM 42% DM 35% DM 29% DM
DAY BY DAY,
41% DM 33% DM 28% DM 45% DM
PAYLOAD BY PAYLOAD.
46% DM 30% DM 34% DM 36% DM

developed a special interest in the use of sensors and detection models to support decisions on animal health and animal welfare. Besides other memberships of national and international committees, he is chairman of the IDF Standing Committee of Animal Health. Henk Hogeveen has more than 100 scientific publications (peer reviewed journals and books) as well as many publications in scientific proceedings and trade journals. Dr. Margit Bak Jensen Dr. Margit Bak Jensen is a senior researcher at the Department of Animal Science, Aarhus University, Denmark. She received a candidate degree in agricultural science from The Royal Veterinary and Agricultural University Denmark, a M.Sc. degree in Applied Animal Behaviour and Animal Welfare from The University of Edinburgh, Scotland, and a Ph.D. degree in ethology from The Royal Veterinary and Agricultural University, Denmark. Her research interests are in the development of methods to assess behavioral needs, and the effect of housing, feeding and management on behavior and welfare of cattle and swine. This includes the development of milk feeding methods for group-housed dairy calves that minimize competition and behavioral problems, the use of behavioral changes to identify calves at risk of disease, and social behavior in dairy calves. Dr. Ray Nebel Dr. Ray Nebel is Vice President of Technical Services for Select Sires Inc. in Plain City, Ohio. He received a B.S. in Animal Science from Northeast Louisiana University, a M.S. from University of Maryland, and a Ph.D. from Virginia Polytechnic Institute and State University. Between his M.S. and Ph.D., he was a Research Associate at Louisiana Animal Breeders Cooperative where he gained experience in various aspects of the A.I. industry from semen collection and evaluation to insemination training. His current major responsibility is to coordinate the Select Reproductive Solutions™ program for Select Sires Inc. and its nine-member organizations. Activities range from conducting training seminars covering the entire gamut from basic bovine reproduction and A.I. to advanced reproductive management. He was a Professor and a Dairy Extension Specialist in the Department of Dairy Science at Virginia Polytechnic Institute and State University from 1985 to 2005 and received Professor Emeritus status in 2006. Dr. Douglas J. Reinemann Dr. Douglas Reinemann is a world-renowned expert on machine milking. Professor of Biological Systems Engineering at University of Wisconsin-Madison, he has been the director of the UW milking lab as well as working at the interface between energy and agricultural systems for the past 25 years. His research interests include machine milking, milking management, automatic milking, renewable energy, sustainable biofuel production, and stray voltage. He attempts to bring a practical and rational perspective to his research and extension work. As a foundation member of Teat Club International and long-time member and frequent chair of the NMC, IDF, ISO and ASABE milking machine committee, he has been working with
xxv
1.888.337.6265 | www.promatinc.com
Sleeping soundly on her GELMAT DS
Try it out for yourself at our booth!
Precision Dairy MN 2013 - 1-2pg-black-and-white.indd 1 5/13/2013 3:08:45 PM
Boost herd-wide productivity with powerful, individual animal status monitoring
SCR Heatime® Pro System
• Early detection of health issues, enabling preemptive action
• Heat detection reports and actionable information - optimal time window for insemination
• Insight into ration and nutrition issues • Fast insight into the effectiveness of veterinary treatment
• Analyze environmental factors for optimal decision making
www.scrdairy.com | [email protected] South Stoughton Rd. Madison, WI 53716, USA | Tel: +1 608 237 3170/1/2 | Fax: +1 608 237 2173

international experts to develop practical ways to assess and interpret a variety of machine milking performance indicators. Jack Rodenburg After 34 years as a Dairy Extension Specialist in Ontario, Canada, Jack "retired" in 2008 and now consults with dairy producers throughout Europe and North America on barn design and management for robotic milking under the name DairyLogix. The first robotic milking system in North America was installed 20 miles from Jack's office in 1999 and he has been involved in this technology ever since. He chaired the First North American Conference on Robotic Milking in Toronto in 2002, and was coordinator for the First North American Conference on Precision Dairy Management in 2010. He has conducted farm-based surveys and technical trials on such aspects of robotic milking as adoption experiences, service models, heifer training protocols, composition of robot pellets, and cow behavior. His barn designs focus on cow comfort and labor efficiency and are in use throughout Canada as well as in the U.S., the Netherlands, Belgium, Denmark, and Finland. Doyle Waybright Doyle Waybright is co-owner of Mason Dixon Farms, a family-owned and managed dairy farm in Gettysburg, Pennsylvania. He is an eighth generation dairy producer on a farm originally purchased from William Penn's family in 1754. Mr. Waybright has managed the 2,600-cow dairy herd for the past 32 years. The herd includes 1,100 cows milked with 20 robots. The farm also has 2,100 replacements and 3,000 acres to raise forages.
xxvii
xtrae-newsletter
An e-newsletter delivered three times per month with additional information for your operation.
Want to stay up-to-date?Progressive Dairyman & Progressive Forage Grower Extras offer you access to not only the top stories found inside the magazines’ print versions online, but exclusive content that you will only fi nd online at progressivedairy.com and progressiveforage.com
Subscribe today at http://bit.ly/progressive_extra
operation.operation.
xtrae-newsletter
An e-newsletter delivered twice per month with additional information for your operation.
Scan the code above or
visit http://delivr.com/1ct8r
to see current and past
Extra e-newsletters from
Progressive Dairyman and
Progressive Forage Grower.
Table of Contents
Plenary Session Wednesday June 26
Exciting Dairy Breakthroughs: Science Fiction or Precision Dairy Farming? ........................1 Jeffrey M. Bewley
Why Using New Technologies is $ustainable for U.S. Dairies ...................................................7 Doyle Waybright
Use of Precision Technologies to Optimize Feed Efficiency for Milk Production ...................9 Alex Bach
Robotic Milking - 1 (Breakout 1)
Success Factors for Automatic Milking .....................................................................................21 Jack Rodenburg
Housing, Management and Animal Welfare Characteristics of Farms Using Automatic Milking Systems ........................................................................................................35 Jim A Salfer Marcia I Endres David W Kammel
Increased AMS Performance by Optimized Individual Milk Intervals .................................37 Rik van der Tol Peter N Kool Ben J Smink
Parlor Technology / Feeding / Other (Breakout)
Using Automated Internet Systems in Farm Data Monitoring ...............................................39 Mark L Kinsel Jeffrey K Reneau
Critical Control Point Monitoring of Processes Affecting Milk Quality & Safety ................41 Kristy H. Campbell
Effects of Pre versus Post-Milking Supplementation on Cow Traffic and Performance in a Pasture-Based Automatic Milking System .........................................................................43 Nicolas A Lyons Kendra L Kerrisk Sergio C Garcia
xxix
Robotic Milking Producer Panel ................................................................................................45 Bradley Biehl Erica Kiestra Tom Oesch Jake Peissig Harry VanWieren
Robotic Milking - 2 (Breakout 1)
Individual Pulsation Ratios Increase Average Milk Flow By 8% ...........................................47 Peter Bahlenberg
Economics of Automatic Milking Systems ................................................................................49 Larry F Tranel Kristen M Schulte
Economic Comparison of Farms with an Automatic Milking System and a Conventional Milking System .....................................................................................................51 Wilma Steeneveld Loren Tauer Henk Hogeveen Alfons Oude Lansink
Parlor Technology / Feeding / Other (Breakout 2)
In-Line Milk Analysis: A Tool For Animal Health Monitoring, Key In Daily Dairy Farm Management Decisions......................................................................................................53 Tal Schcolnik Ephraim Maltz
Abnormal Progesterone Profiles as a Sign of Functional Imbalance in the Transition Period .........................................................................................................................55 John M Christensen Jens Yde Blom
In-Line Milking Parlor Producer Panel ....................................................................................57 Chris Buchner Eric Diepersloot
Potential for Labor Saving and Improved Feeding Management With Automatic Feeding .......................................................................................................................59 Cees Jan Hollander Trevor DeVries Brian Lang Jack Rodenburg
Precision Feeding - Addressing The Human Factor .................................................................61 Keith M Sather
xxx

Multistage Ventilation Controllers: Not Just a Thermostat ....................................................63 Kevin Janni Larry Jacobson
Plenary Session Thursday June 27
Managing Milk Quality in Automatic Milking Systems ..........................................................65 Douglas Reinemann Claudia Kamphuis
Using Behavior sensors and Precision Tools for Optimum Herd Management; Automatic Detecting Post-Calving Ketosis And Lameness, Application In Robotic Milking Farms .....73 Ilan Halachmi
Attaining Reproductive Solutions through Activity and Health Monitoring ........................75 Raymond L Nebel
Automated Calf Feeders (Breakout 1)
Computer-controlled Milk Feeding in Calves ...........................................................................81 Margit Bak Jensen Anne Marie de Passillé Jeff Rushen
Automated Calf Feeders Producer Panel ..................................................................................83 Chad Carlson Jeremy Heim Michelle Rohe
Sensors - 1 (Breakout 2)
Precision Dairy in Australia – Lessons for End Users, Technology Developers, and Industry Organisations ................................................................................................................85 Callum Eastwood
Precision Dairy Technologies: A Producer Assessment ...........................................................87 Matthew R Borchers Jeffrey M Bewley
Sensor systems for dairy cow health management: A review ..................................................89 Niels Rutten Annet G.J. Velthuis Wilma Steeneveld Henk Hogeveen
xxxi
Sensors - 2 (Breakout 1)
Rumination time: an indicator of health status and welfare condition ..................................91 Nazzareno NS Soriani Doran Bar Luigi Calarari Giacomo Tadini
Energy Balance Estimated Real-time from Automated On-farm Live Weights is Associated with Reduced Reproductive Performance ..............................................................93 Vivi M Thorup Anne M Kjeldsen Jakob M Schmidt Dorte Bossen
Cow Sensors Producer Panel ......................................................................................................95 Jena Betley Jeffrey Funk Tom Gavin
Automated Calf Feeder - 2 and Sensors - 3 (Breakout 2)
Management And Housing Of Automated Calf Feeders In The Midwest US .......................97 Marcia I Endres
The Economics of Automatic Calf Feeders .............................................................................101 Jennifer A Bentley Kristen M Schulte
Investment Analysis of Automated Estrus Detection Technologies ......................................103 Karmella A Dolecheck George Heersche Jr. Jeffrey M Bewley
Accelerometer Use For Detection of Hoof Lesions and Lameness ........................................105 Janet H Higginson Cutler Suzanne T Millman Gerard Cramer Ken E Leslie Anne Marie de Passille Todd F Duffield David F Kelton
Development Of A Hoof Lesion Data System for Dairy Cattle .............................................107 Blair B Murray Steve Mason Vic Daniel Ron Barker
xxxii
Plenary Wrap-up Session
Now What? Some Economic Guidelines for Practical Precision Dairy ................................109 Albert De Vries
Integrating It All: Making It Work And Pay At The Farm ..................................................113 Henk Hogeveen Wilma Steeneveld
Poster Presentations
Planning the Right Robotic System for the Cow.....................................................................123 Michael J Hobbis Poster 1
Planning and construction of a 1.000 cow dairy facility with automatic milking Systems (AMS) in Saxony, Germany Experiences from the first two years of Operation. ...............125 Michael K. Herdt Poster 2
Mastitis Management Tools in AMS ........................................................................................127 Rik van der Tol Poster 3 Peter N Kool Sara McBurney
Effects of bail activation sequence and feed availability on cow traffic and milk harvesting capacity in a robotic rotary dairy .............................................................................................129 Rene Kolbach Nicolas A. Lyons Poster 4
Milking Permission and Milking Intervals in a Pasture-Based Automatic Milking System ...........................................................................................................................131 Nicolas A Lyons Poster 5 Kendra L Kerrisk Sergio C Garcia
Pasture Allocation On A Pasture-Based Farm Achieving A Consistently High Milking Robot Utilisation Rate. ..............................................................................................................133 Alex John Poster 6 Cameron Clark Mark Freeman Kendra Kerrisk Richard Rawnsley Sergio Garcia
xxxiii

Can Breed Selection Impact Voluntary Cow Traffic In Pasture-Based Automatic Milking Systems? .......................................................................................................................135 Cameron Clark Poster 7 Niek Kwinten Danny van Gastel Kendra Kerrisk Nicolas Lyons Sergio Garcia
Land Areas required, associated Walking Distance and milking interval for large herds In Pasture Based Automatic Milking System ..........................................................................137 M R Islam Poster 8 C EF Clark K L Kerrisk S C Garcia N A Lyons
Estimating Pasture Forage Mass for Pasture-Based Dairy Production Systems with Precision Dairy Technology ......................................................................................................139 Bradley J Heins Poster 9 James C Paulson
Smart Dairy Farming Program in The Netherlands ..............................................................141 Hiemke Knijn Poster 10 Hassan Taweel Hanneke Van Wichen Bart Jan Wulfse Matthijs Vonder
Influence of Breed, Milk Yield, and Temperature Humidity Index on Dairy Cow Reticulorumen Temperature, Lying Time, and Rumination Time .......................................143 Amanda E Sterrett Poster 11 Barbara A. Wadsworth Joey D. Clark Jeffrey M. Bewley
Detection of Clinical and Subclinical Mastitis Using Automated Reticulorumen Temperatures ...................................................................................................145 Amanda E. Sterrett Poster 12 Constance L. Wood Kristen J McQuerry Joey D. Clark Jeffrey M. Bewley
xxxiv
Potential Use of Drops in Rumination Time for Real-time Detection of Health Disorders in Dairy Cows .................................................................................................................................147 Pierre Clement Poster 13 Raphael Guatteo Jean-Michel Philipot Jean-Michel Lamy Audrey Chanvallon Guylaine Trou Nathalie Bareille
Validation of Rumination Monitoring Sensors Feeding Four Forage Types .......................149 Malene V. Byskov Poster 14 Peder Nørgaard Martin R. Weisbjerg
Milk Components as Predictors for Ruminal Indigestion in Lactating Dairy Cows ..........151 G. Arthur Donovan Poster 15 Stephanie Kirchman Pablo J. Pinedo Fiona Maunsell Carlos Risco
Precision Dairy Technologies For Evaluating Cow Behavior and Productivity With Different Freestall Bases ............................................................................................................153 Barbara A Wadsworth Poster 16 Amanda E Sterrett Connie L Wood Kristen J McQuerry Joey D Clark Denise L Ray Jeffrey M Bewley
Graphical Applications of Lactation Model Residuals for Monitoring Health in Dairy Cattle ................................................................................................................................155 James L Ehrlich Poster 17
Using Mobile Device Technology to Autogenerate Forms .....................................................157 Mark L Kinsel Poster 18
Effect of Stocking Density on Lying Behavior of Dairy Cows ...............................................159 Karen M Lobeck Poster 19 Marcia I Endres Ana R Dresch Ricardo C Chebel
Low Cost on Farm Predictors of Individual Cow Risk for Ketosis, Fatty Liver, Milk Production and Farm Transition Cow Success. ......................................................................161 Zachary J Sawall Poster 20 Noah B. Litherland
xxxv
Prediction of body condition scores of dairy cows from daily measurements of body weights, milk yield, and milk composition ...............................................................................163 Albert De Vries Poster 21 Keegan D. Gay Lucas F. Barbosa Fei Du Karun Kaniyamattam Ephraim Maltz
Pedometer Activity Predicts Probability of Pregnancy After Timed-Artificial Insemination ..................................................................................................165 Kathy G. Arriola Poster 22 Albert De Vries
Rumination Behavior Improves Activity Based Heat Detection System ..............................167 Hila Kroll Poster 23 Doron Bar
New insight in the Activity data of Dairy Cows ......................................................................169 Tjebbe Huybrechts Poster 24 Bart De Ketelaere Wouter Saeys
Use Of Activity Monitors To Detect Peripartum Diseases .....................................................171 Abigail S. Griffith Poster 25 Emily Yeiser Christina Petersson-Wolfe
Detection of Health Problems and Dairy Cow Welfare Monitoring with the Aid of Behavior Parameters ................................................................................................................173 Eva Ishay Poster 26 Mattia Fustini Alberto Palmonari Alon Arazi
What We Have Learned Using A Computer Calf Feeder for Both Milk and Grain at the University Of Minnesota Southern Research and Outreach Center (SROC) in Waseca ...175 David Ziegler Poster 27 Hugh Chester-Jones
Analysis of investment in an estrus detection system for dairy farms ..................................177 Niels Rutten Poster 28 Wilma Steeneveld Chaidate Inchaisri Henk Hogeveen
xxxvi
Diurnal Variation In Live Weight For Evaluation of Feed Ration Allowance And Intake 179 Dorte Bossen Poster 29 Tinna Hlidarsdottir Vivi M Thorup
Effect of Precision Feeding According to Energy Balance on Performance and Profitability of Early Lactation Dairy Cows .................................................................................................181 Ephraim Maltz Poster 30 Lucas F. Barbosa Phabio Bueno Luis Scagion Karun Kaniyamattam L. F. Greco Albert De Vries Jose E.P. Santos
Effects of Ingredient Dry Matter Adjustment Using Near Infrared Reflectance and Precision Feeding Software on Lactating Cow Performance ................................................183 Dayane N Lobao da Silva Poster 31 Noah B Litherland
Automatic Process Control Concepts and Principles .............................................................185 Kevin Janni Poster 32
Ventilation System Demonstration Trailer .............................................................................187 Larry Jacobson Poster 33 Kevin Janni
Sponsors/Exhibitors ...................................................................................................................189
Author Index ..............................................................................................................................193
xxxvii
Trust the people who know dairy best.
AgStar Financial Services appreciates the complexity of running adairy operation these days. That’s why we customize our full rangeof financial management services as you look to achieve youroptimal economic performance. We’ll bring our local expertisealong with the information you need to take advantage of the bestopportunities for your future.
For more information,please contact one ofour experiencedFinancial ServiceOfficers today.
AgStar Financial Services is an equal opportunity employer and provider. ©2013 All rights reserved.
AgStar.com 866-577-1831
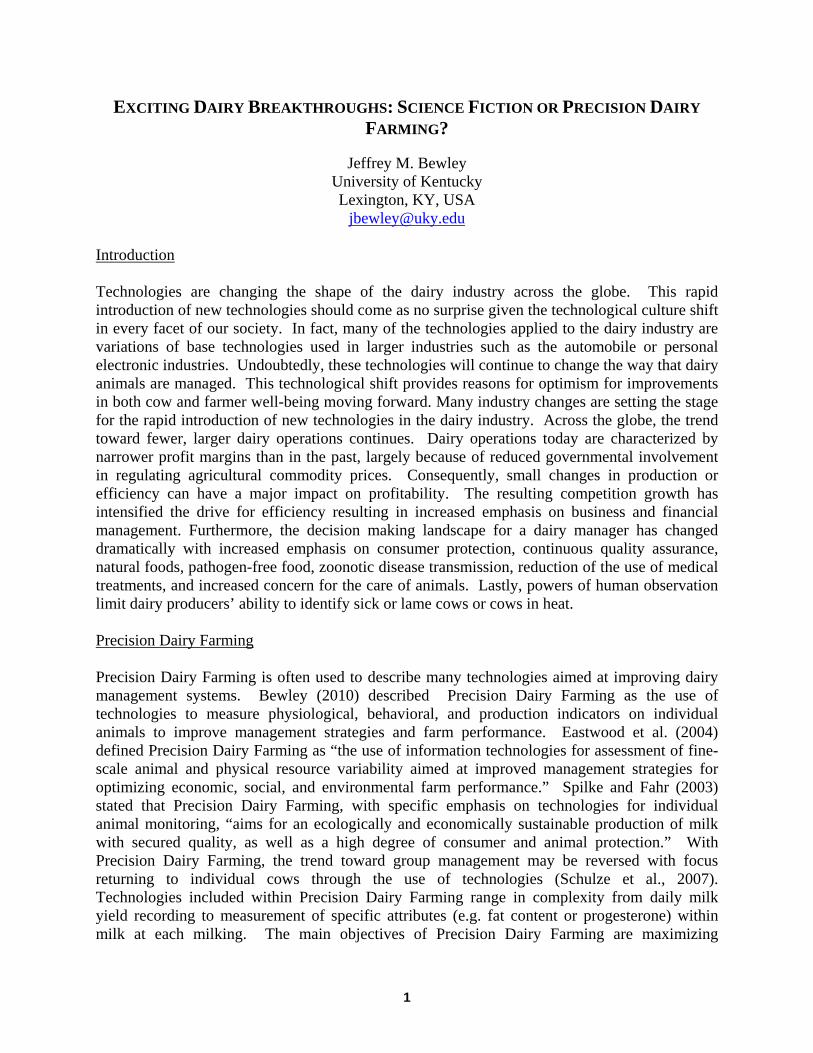
Digester Mixers
Screw Separators
AFI Pumps
Pumps
Mixers
Municipal and agricultural Organic Waste sOlutiOnsFor over half a century, doda has provided Organic Waste solutions by manufacturing a broad
variety of products for agricultural use with strict adherence to cost/benefit advantages.
Digester MixersEffective mixing
for process stability
Screw Separators Separation for bedding,
composting and eliminating solids from lagoons.
Electric or PTO Pumps Chop, emulsify and transfer thick slurryElectric or PTO Mixers Homogenize stubborn pitsAFI Pumps High pressure for long distance pumping and application
Distribution BoxesDigester Tank Inspection WindowsCustom Stainless Steel PipingCustom Pipe Connectors & ValvesSludge Thickeners & More!
EXCITING DAIRY BREAKTHROUGHS: SCIENCE FICTION OR PRECISION DAIRY FARMING?
Jeffrey M. Bewley
University of Kentucky Lexington, KY, USA
[email protected] Introduction Technologies are changing the shape of the dairy industry across the globe. This rapid introduction of new technologies should come as no surprise given the technological culture shift in every facet of our society. In fact, many of the technologies applied to the dairy industry are variations of base technologies used in larger industries such as the automobile or personal electronic industries. Undoubtedly, these technologies will continue to change the way that dairy animals are managed. This technological shift provides reasons for optimism for improvements in both cow and farmer well-being moving forward. Many industry changes are setting the stage for the rapid introduction of new technologies in the dairy industry. Across the globe, the trend toward fewer, larger dairy operations continues. Dairy operations today are characterized by narrower profit margins than in the past, largely because of reduced governmental involvement in regulating agricultural commodity prices. Consequently, small changes in production or efficiency can have a major impact on profitability. The resulting competition growth has intensified the drive for efficiency resulting in increased emphasis on business and financial management. Furthermore, the decision making landscape for a dairy manager has changed dramatically with increased emphasis on consumer protection, continuous quality assurance, natural foods, pathogen-free food, zoonotic disease transmission, reduction of the use of medical treatments, and increased concern for the care of animals. Lastly, powers of human observation limit dairy producers’ ability to identify sick or lame cows or cows in heat. Precision Dairy Farming Precision Dairy Farming is often used to describe many technologies aimed at improving dairy management systems. Bewley (2010) described Precision Dairy Farming as the use of technologies to measure physiological, behavioral, and production indicators on individual animals to improve management strategies and farm performance. Eastwood et al. (2004) defined Precision Dairy Farming as “the use of information technologies for assessment of fine-scale animal and physical resource variability aimed at improved management strategies for optimizing economic, social, and environmental farm performance.” Spilke and Fahr (2003) stated that Precision Dairy Farming, with specific emphasis on technologies for individual animal monitoring, “aims for an ecologically and economically sustainable production of milk with secured quality, as well as a high degree of consumer and animal protection.” With Precision Dairy Farming, the trend toward group management may be reversed with focus returning to individual cows through the use of technologies (Schulze et al., 2007). Technologies included within Precision Dairy Farming range in complexity from daily milk yield recording to measurement of specific attributes (e.g. fat content or progesterone) within milk at each milking. The main objectives of Precision Dairy Farming are maximizing
1
individual animal potential, early detection of disease, and minimizing the use of medication through preventive health measures. Precision Dairy Farming is inherently an interdisciplinary field incorporating concepts of informatics, biostatistics, ethology, economics, animal breeding, animal husbandry, animal nutrition, and engineering (Spilke and Fahr, 2003). The ideal Precision Dairy Farming technology explains an underlying biological process that can be translated into meaningful action with information readily available to the farmer and a reasonable return on investment. Additionally, the best technologies a flexible, robust, reliable and demonstrated effective through research and commercial demonstrations. The list of Precision Dairy Farming technologies used for animal status monitoring and management continues to grow. Because of rapid development of new technologies and supporting applications, Precision Dairy Farming technologies are becoming more feasible. Many Precision Dairy Farming technologies including daily milk yield recording, milk component monitoring (e.g. fat, protein, and SCC), pedometers, automatic temperature recording devices, milk conductivity indicators, accelerometers for monitoring lying behavior, rumination monitors, automatic estrus detection monitors, and daily body weight measurements are already being utilized by dairy producers. Despite its seemingly simplistic nature, the power of accurate milk weights should not be discounted in monitoring cows, as it is typically the first factor that changes when a problem develops (Philpot, 2003). Other new Precision Dairy Farming technologies have been introduced to measure jaw movements, ruminal pH, reticular contractions, heart rate, animal positioning and activity, vaginal mucus electrical resistance, feeding behavior, biological components (enzymes, antibodies, or microorganisms), odor, glucose, acoustics, progesterone, individual milk components, color (as an indicator of cleanliness), infrared udder surface temperatures, gain analysis, and respiration rates. Unfortunately, the development of technologies tends to be driven by availability of a technology, transferred from other industries in market expansion efforts, rather than by need. Relative to some industries, the dairy industry is relatively small, limiting corporate willingness to invest extensively in development of technologies exclusive to dairy farms. Many Precision Dairy Farming technologies measure variables that could be measured manually, while others measure variables that could not have been obtained previously. Realistically, the term “Precision Dairy” should not be limited to monitoring technologies. Perhaps a more encompassing definition of Precision Dairy Management is the use of automated, mechanized technologies toward refinement of dairy management processes, procedures, or information collection. This definition incorporates monitoring technologies, automated milking systems, automated calf feeding systems, and precision feeding systems. Automated milking systems have already been widely adopted in Europe. Adoption rates in North American have increased in recent years. The introduction of robotic milking components to rotary parlors will increase mechanization of milking in larger farms in the near future. Automated calf feeding systems have created a paradigm shift in how to raise dairy calves. Despite initial concerns of increased disease transmission, the benefits to automated calf feeding seem to outweigh the drawbacks when managed properly. New options for monitoring total mixed ration delivery and consumption will also improve how lactating dairy animals are fed. This is a particularly important economic and social concern given increased feed prices and concern for dairy efficiency and greenhouse gas emissions.
2
Benefits Perceived benefits of Precision Dairy Farming technologies include increased efficiency, reduced costs, improved product quality, minimized adverse environmental impacts, and improved animal health and well-being. These technologies are likely to have the greatest impact in the areas of health, reproduction, and quality control (de Mol, 2000). Realized benefits from data summarization and exception reporting are anticipated to be higher for larger herds, where individual animal observation is more challenging and less likely to occur (Lazarus et al., 1990). As dairy operations continue to increase in size, Precision Dairy Farming technologies become more feasible because of increased reliance on less skilled labor and the ability to take advantage of economies of size related to technology adoption. A Precision Dairy Farming technology allows dairy producers to make more timely and informed decisions, resulting in better productivity and profitability (van Asseldonk et al., 1999). Real time data can be used for monitoring animals and creating exception reports to identify meaningful deviations. In many cases, dairy management and control activities can be automated (Delorenzo and Thomas, 1996). Alternatively, output from the system may provide a recommendation for the manager to interpret (Pietersma et al., 1998). Information obtained from Precision Dairy Farming technologies is only useful if it is interpreted and utilized effectively in decision making. Integrated, computerized information systems are essential for interpreting the mass quantities of data obtained from Precision Dairy Farming technologies. This information may be incorporated into decision support systems designed to facilitate decision making for issues that require compilation of multiple sources of data. Historically, dairy producers have used experience and judgment to identify outlying animals. While this skill is invaluable and can never be fully replaced with automated technologies, it is inherently flawed by limitations of human perception of a cow’s condition. Often, by the time an animal exhibits clinical signs of stress or illness, it is too late to intervene. These easily observable clinical symptoms are typically preceded by physiological responses evasive to the human eye (e.g. changes in temperature or heart rate). Thus, by identifying changes in physiological parameters, a dairy manager may be able to intervene sooner. Technologies for physiological monitoring of dairy cows have great potential to supplement the observational activities of skilled herdspersons, which is especially critical as more cows are managed by fewer skilled workers (Hamrita et al., 1997). Dairy producers with good “cow sense” are the ones who will benefit the most from technology adoption. Those who view technologies as a way to do something they don’t like to do will likely struggle. Adoption The list of Precision Dairy Farming technologies used for animal status monitoring and management continues to grow. Despite widespread availability, adoption of these technologies in the dairy industry has been relatively sparse thus far (Gelb et al., 2001, Huirne et al., 1997). Perceived economic returns from investing in a new technology are always a factor influencing technology adoption. Additional factors impacting technology adoption include degree of impact on resources used in the production process, level of management needed to implement the technology, risk associated with the technology, institutional constraints, producer goals and
3

motivations, and having an interest in a specific technology (Dijkhuizen et al., 1997, van Asseldonk, 1999). Characteristics of the primary decision maker that influence technology adoption include age, level of formal education, learning style, goals, farm size, business complexity, increased tenancy, perceptions of risk, type of production, ownership of a non-farm business, innovativeness in production, average expenditure on information, and use of the technology by peers and other family members. Research regarding adoption of Precision Dairy Farming technologies is limited, particularly within North America. To remedy this, a five-page survey was distributed to all licensed milk producers in Kentucky (N=1074) on July 1, 2008. Two weeks after the first mailing, a follow-up postcard was mailed to remind producers to return the survey. On August 1, 2008, the survey was resent to producers who had not returned the survey. A total of 236 surveys were returned; 7 were omitted due to incompletion leaving 229 for subsequent analyses (21%). The survey consisted of questions covering general farm descriptive demographics, extension programming, and decision making behavior. With regard to Precision Dairy Farming the following question was presented to survey participants: “Adoption of automated monitoring technologies (examples: pedometers, electrical conductivity for mastitis detection) in the dairy industry has been slow thus far. Which of the following factors do you feel have impacted these modest adoption rates? (check ALL that apply).” Data were entered into an online survey tool (KeySurvey, Braintree, MA). Statistical analyses were conducted using SAS® (Cary, NC). Surveys were categorized by herd size, production system, operator age, and production level. Least squares means among categories were calculated for quantitative variables using the GLM procedure of SAS®. Statistical differences were considered significant using a 0.05 significance level using Tukey’s test for multiple comparisons. For qualitative variables, χ2 analyses were conducted using the FREQ procedure of SAS®. Statistical differences were considered significant at a 0.05 significance level. Among the 229 respondents, mean herd size was 83.0 ± 101.8 cows and mean producer age was 50.9 ± 12.9. Reasons for modest adoption rates of Precision Dairy Farming technologies and dairy systems software are presented in Table 1. The reasons selected by the highest percentage respondents were (1) not being familiar with technologies that are available (55%), (2) undesirable cost to benefit ratios (42%) and (3) too much information provided without knowing what to do with it (36%%). The high percentage of producers who indicated they were unfamiliar with available technologies indicates that marketing efforts may improve technology adoption. Actual or perceived economic benefits appear to influence adoption rates demonstrating the need for economic models to assess technology benefits and re-examination of retail product prices. As herd size increased, the percentage of producers selecting “poor technical support/training” and “compatibility issues” increased (P <0.05), which may be reflective of past negative experiences. In developing technologies, manufacturers should work with end-users during development and after product adoption to alleviate these customer frustrations. Few significant differences were observed among age groups, though the youngest producers were more likely to select “better alternatives/easier to accomplish manually.” Prior to technology development, market research should be conducted to ensure that new technologies address a real need. Utilizing this insight should help industry Precision Dairy Farming technology manufacturers and industry advisors develop strategies for improving technology
4
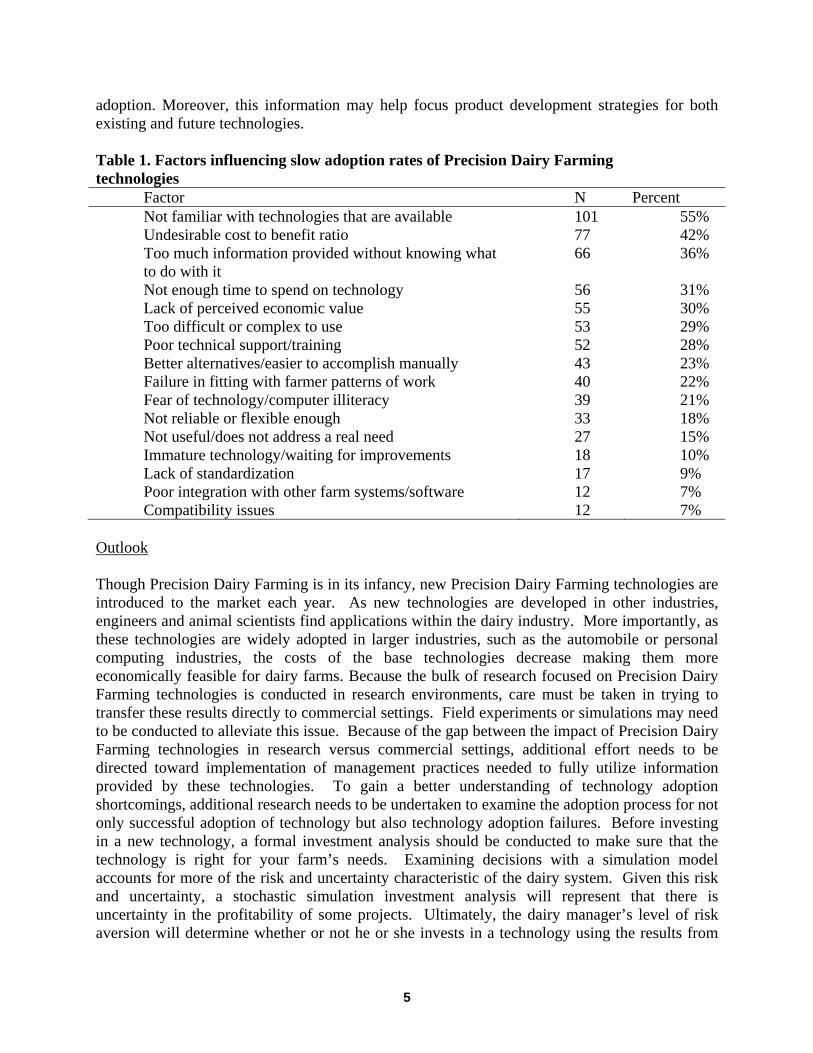
adoption. Moreover, this information may help focus product development strategies for both existing and future technologies. Table 1. Factors influencing slow adoption rates of Precision Dairy Farming technologies
Factor N Percent Not familiar with technologies that are available 101 55% Undesirable cost to benefit ratio 77 42% Too much information provided without knowing what to do with it
66 36%
Not enough time to spend on technology 56 31% Lack of perceived economic value 55 30% Too difficult or complex to use 53 29% Poor technical support/training 52 28% Better alternatives/easier to accomplish manually 43 23% Failure in fitting with farmer patterns of work 40 22% Fear of technology/computer illiteracy 39 21% Not reliable or flexible enough 33 18% Not useful/does not address a real need 27 15% Immature technology/waiting for improvements 18 10% Lack of standardization 17 9% Poor integration with other farm systems/software 12 7% Compatibility issues 12 7%
Outlook Though Precision Dairy Farming is in its infancy, new Precision Dairy Farming technologies are introduced to the market each year. As new technologies are developed in other industries, engineers and animal scientists find applications within the dairy industry. More importantly, as these technologies are widely adopted in larger industries, such as the automobile or personal computing industries, the costs of the base technologies decrease making them more economically feasible for dairy farms. Because the bulk of research focused on Precision Dairy Farming technologies is conducted in research environments, care must be taken in trying to transfer these results directly to commercial settings. Field experiments or simulations may need to be conducted to alleviate this issue. Because of the gap between the impact of Precision Dairy Farming technologies in research versus commercial settings, additional effort needs to be directed toward implementation of management practices needed to fully utilize information provided by these technologies. To gain a better understanding of technology adoption shortcomings, additional research needs to be undertaken to examine the adoption process for not only successful adoption of technology but also technology adoption failures. Before investing in a new technology, a formal investment analysis should be conducted to make sure that the technology is right for your farm’s needs. Examining decisions with a simulation model accounts for more of the risk and uncertainty characteristic of the dairy system. Given this risk and uncertainty, a stochastic simulation investment analysis will represent that there is uncertainty in the profitability of some projects. Ultimately, the dairy manager’s level of risk aversion will determine whether or not he or she invests in a technology using the results from
5
this type of analysis. Precision dairy farming technologies provide tremendous opportunities for improvements in individual animal management on dairy farms. In the future, Precision Dairy Farming technologies will change the way dairy herds are managed. References Bewley, J.M. 2010. Precision dairy farming: advanced analysis solutions for future
profitability. Proceedings of the first North American Conference on Precision Dairy Management, Toronto, Canada.
de Mol, R. M. 2000. Automated detection of oestrus and mastitis in dairy cows. Page 177. Vol. PhD Thesis. Wageningen University, Wageningen, The Netherlands.
Delorenzo, M. A. and C. V. Thomas. 1996. Dairy records and models for economic and financial planning. J Dairy Sci 79(2):337-345.
Dijkhuizen, A. A., R. B. M. Huirne, S. B. Harsh, and R. W. Gardner. 1997. Economics of robot application. Computers and Electronics in Agriculture 17(1):111-121.
Eastwood, C., D. Chapman, and M. Paine. 2004. Precision dairy farming-taking the microscope to dairy farm management.
Gelb, E., C. Parker, P. Wagner, and K. Rosskopf. 2001. Why is the ict adoption rate by farmers still so slow? Pages 40-48 in Proc. Proceedings ICAST, Vol. VI, 2001, Beijing, China.
Hamrita, T. K., S. K. Hamrita, G. Van Wicklen, M. Czarick, and M. P. Lacy. 1997. Use of biotelemetry in measurement of animal responses to environmental stressors.
Huirne, R. B. M., S. B. Harsh, and A. A. Dijkhuizen. 1997. Critical success factors and information needs on dairy farms: The farmer's opinion. Livestock Production Science 48(3):229-238.
Lazarus, W. F., D. Streeter, and E. Jofre-Giraudo. 1990. Management information systems: Impact on dairy farm profitability. North Central Journal of Agricultural Economics 12(2):267-277.
Philpot, W. N. 2003. Role of technology in an evolving dairy industry. Pages 6-14 in Proc. 2003 Southeast Dairy Herd Management Conference, Macon, Georgia.
Pietersma, D., R. Lacroix, and K. M. Wade. 1998. A framework for the development of computerized management and control systems for use in dairy farming. J Dairy Sci 81(11):2962-2972.
Schulze, C., J. Spilke, and W. Lehner. 2007. Data modeling for precision dairy farming within the competitive field of operational and analytical tasks. Computers and Electronics in Agriculture 59(1-2):39-55.
Spilke, J. and R. Fahr. 2003. Decision support under the conditions of automatic milking systems using mixed linear models as part of a precision dairy farming concept. Pages 780-785 in Proc. EFITA 2003 Conference, Debrecen, Hungary.
van Asseldonk, M. A. P. M. 1999. Economic evaluation of information technology applications on dairy farms. Page 123. Vol. PhD. Wageningen Agricultural University.
van Asseldonk, M. A. P. M., A. W. Jalvingh, R. B. M. Huirne, and A. A. Dijkhuizen. 1999. Potential economic benefits from changes in management via information technology applications on dutch dairy farms: A simulation study. Livestock Production Science 60(1):33-44.
6
WHY USING NEW TECHNOLOGIES IS $USTAINABLE FOR US DAIRIES
Doyle Waybright Mason Dixon Farms
Our motto at Mason Dixon Farms is “Success is optional, change is inevitable”. The only way to bring about change ... that is, the only way to make improvements is to be bold and try new things, make changes. Dare to succeed or even dare to fail. Success only comes about by the willingness to fail. Failure doesn’t mean the end but only eliminates one of the options on the way to success. One must have a “can-do-attitude” to have a chance for success. Success many times comes about by going through failure to find what works. Failure causes one to rethink, to ponder new options and try again. Where do the new ideas come from? Well, the old adage goes “Necessity is the mother of invention”. Necessity leads to creation, creation sometimes leads to failure and failure is only a stepping stone to success. So why is Mason Dixon Farms the very first to receive the “Innovative Dairyman of the Year” award in 1999. A little bit of history will help to explain why. Eight generations ago the Waybright ancestors moved to South Central Pennsylvania and homesteaded on frontier land purchased from the Penn family. It is marginal soil for growing crops. Read that to say that yields are poor, non-irrigated corn for a 5 year average will yield 13 ton (32% DM). In order to get high quality forage for the dairy herd, we travel across a lot of acres to get the total tonnage needed. Harvesting—as we’re all too well aware—is time consuming, and in the 1970s and ‘80s there wasn’t efficient enough machinery that suited our needs. In the farm shop we began to build mowers, forage harvesters, hay mergers and trailer containers for transporting the crop. It has taken several generations of equipment designs and engineering to make improvements in the ever evolving process for the equipment we needed to meet our goals for labor efficiency, soil compaction, crop loss and forage quality. My father, Richard Waybright (7th Generation as he and his brother, Horace, are called around the farm) always tinkered in the farm shop at innovative ideas and small fixes. He instilled in the next generation the sense of finding a better way to accomplish a given task. That attitude of “there is a better way” permitted the culture of brainstorming to try new ideas that many times were simply drawn on the shop floor with a soapstone. Besides the forage harvesting equipment, other successful ventures include adapting heifer hutches to a large herd in 1975, a methane digester in 1979, milking cow train on rails in 1995, roof over bunker silos, single slot over a pipe for manure handling in 2004 and robotic milking in 2005 are just to name a few. An example of failure that eventually led to success is with the farm’s rearing of heifer replacements for the dairy herd. In 1969, an enclosed heated calf barn was built to house newborn heifers and grow them to 4 months of age. It incorporated the best ideas available at the time for ventilation, automatic feeding of calves and manure removal with flushing water. That barn was the worst for raising calves which turned into high morbidity and high mortality. By
7
1975 things were getting desperate for an ever increasing herd size and that winter the warm calf barn was deserted for use of simple wooden calf hutches placed outdoors. The natural cold ventilation was a huge success for raising healthy heifers but was uncomfortable for the care takers. That in turn led to the idea of putting a row of hutches together under a roof which violated the principle of one calf touching another that could potentially spread diseases. Under good management the disease factor can be minimized and the roof overhead got the calf crew out of the weather. The failure of a warm enclosed calf barn was turned into a huge success by being innovative with the use of calf hutches. That success spawned opportunities for the milking herd to not only increase in size by means of internal herd growth but also do it with much healthier replacements. New technologies are sustainable for dairy farms. As noted in the example above, it many times becomes the foundation for one improvement upon another. The use of cutting edge technologies can be profitable for a dairy farm. It takes patience and perseverance to find ways to be successful at the use of them.
8
USE OF PRECISION TECHNOLOGIES TO OPTIMIZE FEED EFFICIENCY FOR MILK PRODUCTION
Alex Bach
Department of Ruminant Production, IRTA Barcelona, Spain
[email protected] Introduction
Traditionally, dairy cows have been offered concentrates in the milking parlors. However,
with the introduction of total mixed rations (TMR), feeding in the milking parlor has been progressively abandoned. The introduction of TMRs represented a revolution in feeding and managing of dairy cows. The TMRs have simplified and automatized the feeding of cows and have allowed for substantial increases in milk production. However, feeding TMRs has some limitations, technically, the nutritionist designs one ration for a reference cow” but obviously not all cows that feed the formulated TMR will fit the description of the reference cow, and thus some cows in the group will receive more nutrients and some others less nutrients than they actually need. In an attempt to minimize these deviations some alternatives were introduced in the 80’s such as automatic concentrate feeders, manual top dressing of tight-up cows, or feeding in the parlor. Over time, most operations substituted feeding in the parlor by supplementing cows fed TMRs using automatic concentrate feeders. This technology would allow providing a fixed formulated feed to specific cows that, theoretically, were not meeting the nutrient needs from the basal TMR. However, the use of automatic concentrate feeders has progressively been also abandoned in most diary herds. Ironically, one the most modern (not necessarily the most advantageous) technologies, automatic milking systems (AMS), relies heavily on supplementing cows a fixed-formulated concentrate (some times the systems can handle different feed types) to motivate cows to visit the AMS and minimize the number of cows that need to be fetched (Bach et al., 2007). Thus, with AMS feeding during milking is a necessity rather than a nutritional strategy.
On the other hand, most pasture systems have not abandoned feeding in milking parlor, and
recently and in particular in South Africa and New Zealand, parlors equipped with a rotary have embraced a novel technology that allows to mix two different feeds and offer a “customized” formula for each cow in the parlor based on her level of milk production and in some instances also body weight changes.
Most outlooks indicate that by 2050 food production will have to double from current figures
(Foley, 2011). This increased demand will have to be mainly driven by improved efficiency as the amount of natural resources available is not likely to increase. It is anticipated that feed cost for dairy cattle will continue to rise due to increased prices of feedstuffs. In the last 3 years, for instance, prices for corn or soybean meal have almost doubled in most parts of the world. Interestingly, despite these drastic changes in feed prices, milk price has not changed much, and even more interestingly, the way producers are feeding the dairy herds has also undergone very
9
minor changes. This article will present a new precision feeding system for rotary parlors aimed at maximizing milk efficiency of dairy cattle and minimizing detrimental effects on natural resources and the environment. The advantages and disadvantages of this system will be discussed and compared with more traditional feeding methods.
With the introduction of milking equipment able to measure (with more or less accuracy) milk
components such as fat and protein, in addition to milk volume, now producers can determine the nutrient requirements of each particular cow with much more precision. These advances have lead to the appearance of the system presented herein, which we call dynamic concentrate parlor feeder (DCPF), is a conglomerate of technologies aimed at taking advantage of precision dairy feeding to maximize the efficiency of utilization of natural resources and the economic returns of dairy herds. The system consists of a rotary parlor equipped with radiofrequency identification, electronic milk meters, on-line meters for fat and protein content in milk, an electronic scale to determine body weight (BW) of the cow, and a state-of-the-art feed mill able to mix six different ingredients and deliver the mixed feeds to the parlor en les than 14 seconds. Thus, this equipment allows to literally prepare and deliver as many different feeds (in both quantity and composition) as number of cows are milked in the parlor. The DCPF calculates the individual nutritional needs of each cow as she enters the rotary based on her assigned feed intake (average of the pen where she is; although it can also use the actual individual intake where individual feeders are available), composition of the TMR fed, stage of lactation, parity, BW, BW change, days pregnant, milk yield, and milk components yield, and then creates a least-cost formula using the six feeds which are mix and delivered to the cow onto a through in the parlor (all this in <14 seconds). Then, the cow has about 9 minutes to consume the feed, and as she leaves the carousel, the trough is cleaned with water and becomes ready for the next cow entering the rotary.
Nutritional considerations
Feeding a TMR offers the great advantage of simplicity as it allows feeding large numbers of cows in groups. In addition, theoretically, with TMRs, each mouthful of feed the cow consumes contains a balanced combination of nutrients. However, because cows do sort (Mulfair et al., 2010), the composition of the TMR actually changes throughout the day and the balanced nutrient profile may become imbalanced. Furthermore, cows need to consume both a balanced-nutrient meal of the optimal size. In other words, because intake is variable between cows and also within cows depending on stage of lactation, BW, etc..., a “balanced” mouthful of a TMR for one cow may be an “imbalanced” mouthful for another cow. For example, according to the NRC (2001), a cow producing 27 kg of milk per day needs 38 Mcal of net energy of lactation (NEl) and about 3.2 kg of crude protein (CP). A cow with such a level of milk production would consume 20.6 kg/d, thus the TMR should have a nutrient density of 1.44 Mcal of NEl/kg and 15.4% CP. If that TMR were consumed by a cow producing 30 kg of milk per day, according to NRC (2001), dry matter intake would increase by 1 kg and she would need additional 2 Mcal of NEl and 103 g of additional metabolizable protein. If she consumes 21.6 kg of the TMR balanced for 27 kg of milk per day she would consume 1.42 additional Mcal (while needed 2 additional Mcal) and 35 additional grams of metabolizable protein (while needed additional 103 g). Thus energy and protein consumption is progressively lagging behind needs at different proportions as milk production increases and the cow continues to eat the same TMR (Figure 1). Thus, within a given group of cows consuming the same TMR, as milk yield deviates from the
10
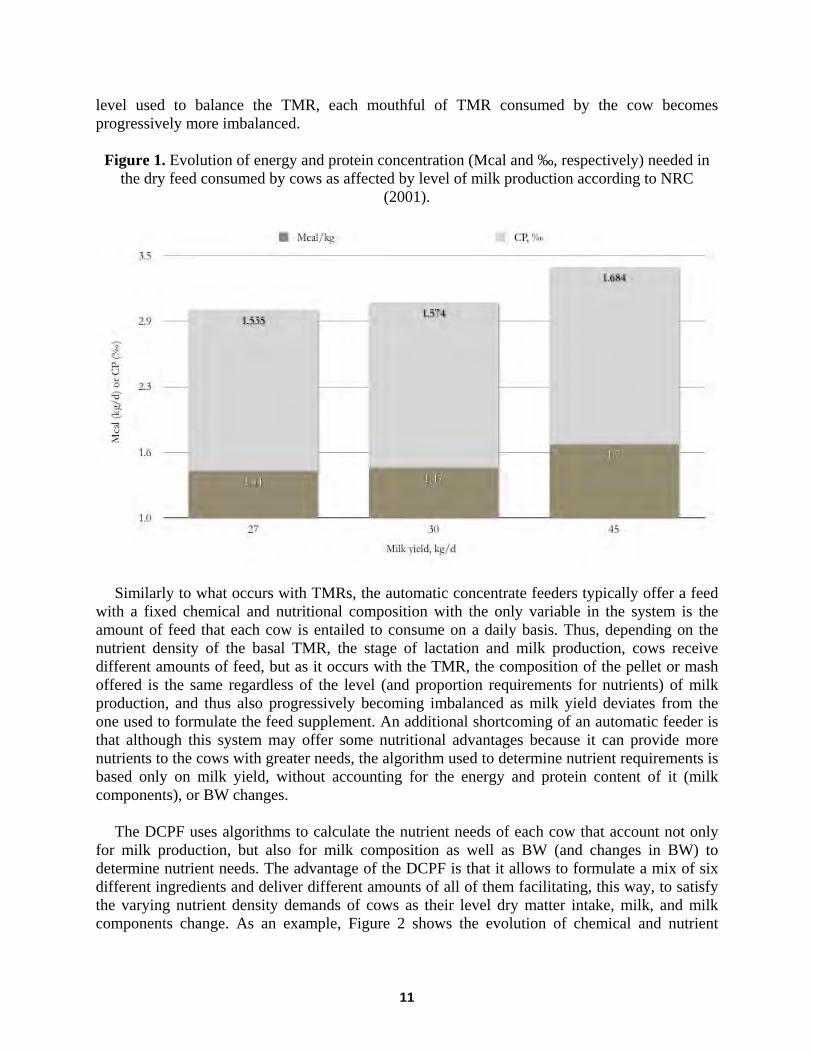
level used to balance the TMR, each mouthful of TMR consumed by the cow becomes progressively more imbalanced.
Figure 1. Evolution of energy and protein concentration (Mcal and ‰, respectively) needed in
the dry feed consumed by cows as affected by level of milk production according to NRC (2001).
Similarly to what occurs with TMRs, the automatic concentrate feeders typically offer a feed with a fixed chemical and nutritional composition with the only variable in the system is the amount of feed that each cow is entailed to consume on a daily basis. Thus, depending on the nutrient density of the basal TMR, the stage of lactation and milk production, cows receive different amounts of feed, but as it occurs with the TMR, the composition of the pellet or mash offered is the same regardless of the level (and proportion requirements for nutrients) of milk production, and thus also progressively becoming imbalanced as milk yield deviates from the one used to formulate the feed supplement. An additional shortcoming of an automatic feeder is that although this system may offer some nutritional advantages because it can provide more nutrients to the cows with greater needs, the algorithm used to determine nutrient requirements is based only on milk yield, without accounting for the energy and protein content of it (milk components), or BW changes.
The DCPF uses algorithms to calculate the nutrient needs of each cow that account not only
for milk production, but also for milk composition as well as BW (and changes in BW) to determine nutrient needs. The advantage of the DCPF is that it allows to formulate a mix of six different ingredients and deliver different amounts of all of them facilitating, this way, to satisfy the varying nutrient density demands of cows as their level dry matter intake, milk, and milk components change. As an example, Figure 2 shows the evolution of chemical and nutrient
11
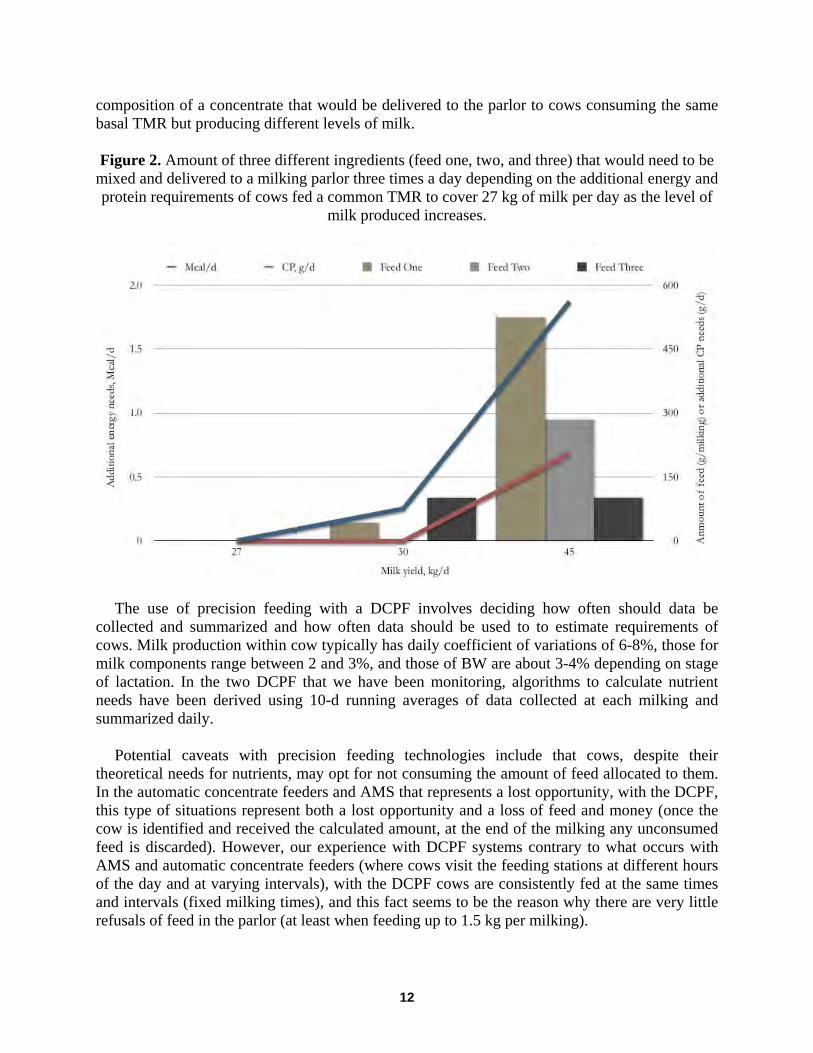
composition of a concentrate that would be delivered to the parlor to cows consuming the same basal TMR but producing different levels of milk.
Figure 2. Amount of three different ingredients (feed one, two, and three) that would need to be
mixed and delivered to a milking parlor three times a day depending on the additional energy and protein requirements of cows fed a common TMR to cover 27 kg of milk per day as the level of
milk produced increases.
The use of precision feeding with a DCPF involves deciding how often should data be
collected and summarized and how often data should be used to to estimate requirements of cows. Milk production within cow typically has daily coefficient of variations of 6-8%, those for milk components range between 2 and 3%, and those of BW are about 3-4% depending on stage of lactation. In the two DCPF that we have been monitoring, algorithms to calculate nutrient needs have been derived using 10-d running averages of data collected at each milking and summarized daily.
Potential caveats with precision feeding technologies include that cows, despite their
theoretical needs for nutrients, may opt for not consuming the amount of feed allocated to them. In the automatic concentrate feeders and AMS that represents a lost opportunity, with the DCPF, this type of situations represent both a lost opportunity and a loss of feed and money (once the cow is identified and received the calculated amount, at the end of the milking any unconsumed feed is discarded). However, our experience with DCPF systems contrary to what occurs with AMS and automatic concentrate feeders (where cows visit the feeding stations at different hours of the day and at varying intervals), with the DCPF cows are consistently fed at the same times and intervals (fixed milking times), and this fact seems to be the reason why there are very little refusals of feed in the parlor (at least when feeding up to 1.5 kg per milking).
12
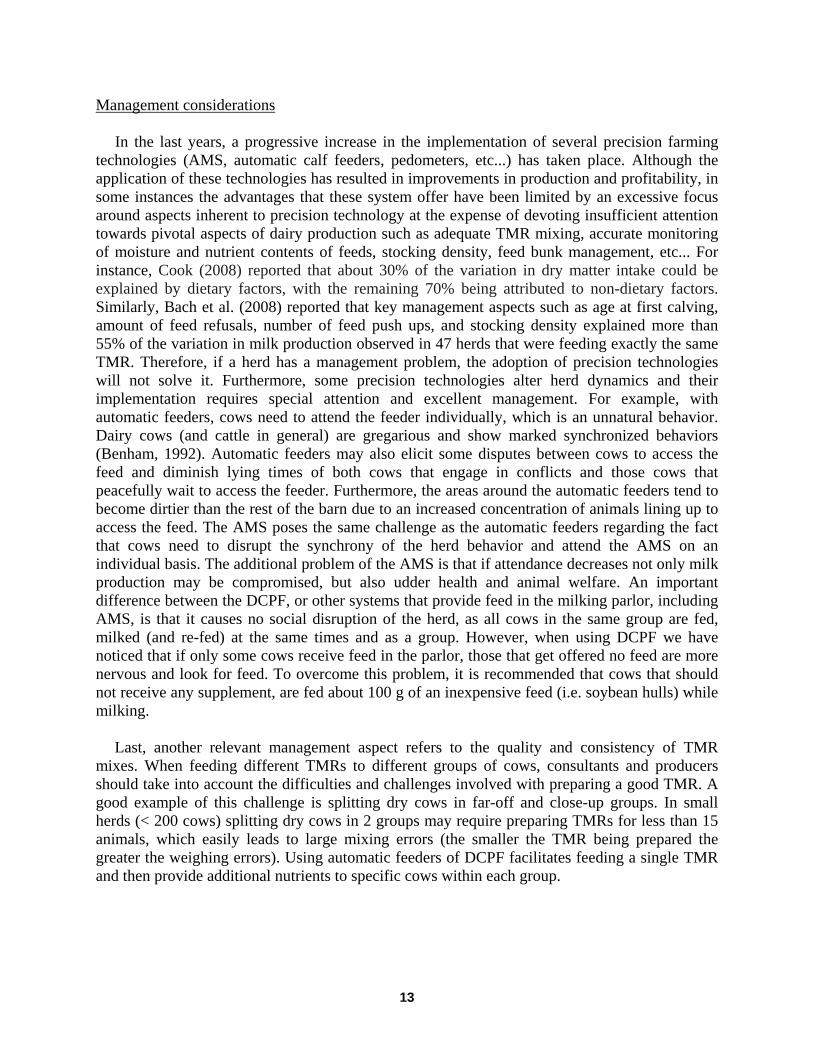
Management considerations In the last years, a progressive increase in the implementation of several precision farming
technologies (AMS, automatic calf feeders, pedometers, etc...) has taken place. Although the application of these technologies has resulted in improvements in production and profitability, in some instances the advantages that these system offer have been limited by an excessive focus around aspects inherent to precision technology at the expense of devoting insufficient attention towards pivotal aspects of dairy production such as adequate TMR mixing, accurate monitoring of moisture and nutrient contents of feeds, stocking density, feed bunk management, etc... For instance, Cook (2008) reported that about 30% of the variation in dry matter intake could be explained by dietary factors, with the remaining 70% being attributed to non-dietary factors. Similarly, Bach et al. (2008) reported that key management aspects such as age at first calving, amount of feed refusals, number of feed push ups, and stocking density explained more than 55% of the variation in milk production observed in 47 herds that were feeding exactly the same TMR. Therefore, if a herd has a management problem, the adoption of precision technologies will not solve it. Furthermore, some precision technologies alter herd dynamics and their implementation requires special attention and excellent management. For example, with automatic feeders, cows need to attend the feeder individually, which is an unnatural behavior. Dairy cows (and cattle in general) are gregarious and show marked synchronized behaviors (Benham, 1992). Automatic feeders may also elicit some disputes between cows to access the feed and diminish lying times of both cows that engage in conflicts and those cows that peacefully wait to access the feeder. Furthermore, the areas around the automatic feeders tend to become dirtier than the rest of the barn due to an increased concentration of animals lining up to access the feed. The AMS poses the same challenge as the automatic feeders regarding the fact that cows need to disrupt the synchrony of the herd behavior and attend the AMS on an individual basis. The additional problem of the AMS is that if attendance decreases not only milk production may be compromised, but also udder health and animal welfare. An important difference between the DCPF, or other systems that provide feed in the milking parlor, including AMS, is that it causes no social disruption of the herd, as all cows in the same group are fed, milked (and re-fed) at the same times and as a group. However, when using DCPF we have noticed that if only some cows receive feed in the parlor, those that get offered no feed are more nervous and look for feed. To overcome this problem, it is recommended that cows that should not receive any supplement, are fed about 100 g of an inexpensive feed (i.e. soybean hulls) while milking.
Last, another relevant management aspect refers to the quality and consistency of TMR
mixes. When feeding different TMRs to different groups of cows, consultants and producers should take into account the difficulties and challenges involved with preparing a good TMR. A good example of this challenge is splitting dry cows in far-off and close-up groups. In small herds (< 200 cows) splitting dry cows in 2 groups may require preparing TMRs for less than 15 animals, which easily leads to large mixing errors (the smaller the TMR being prepared the greater the weighing errors). Using automatic feeders of DCPF facilitates feeding a single TMR and then provide additional nutrients to specific cows within each group.
13
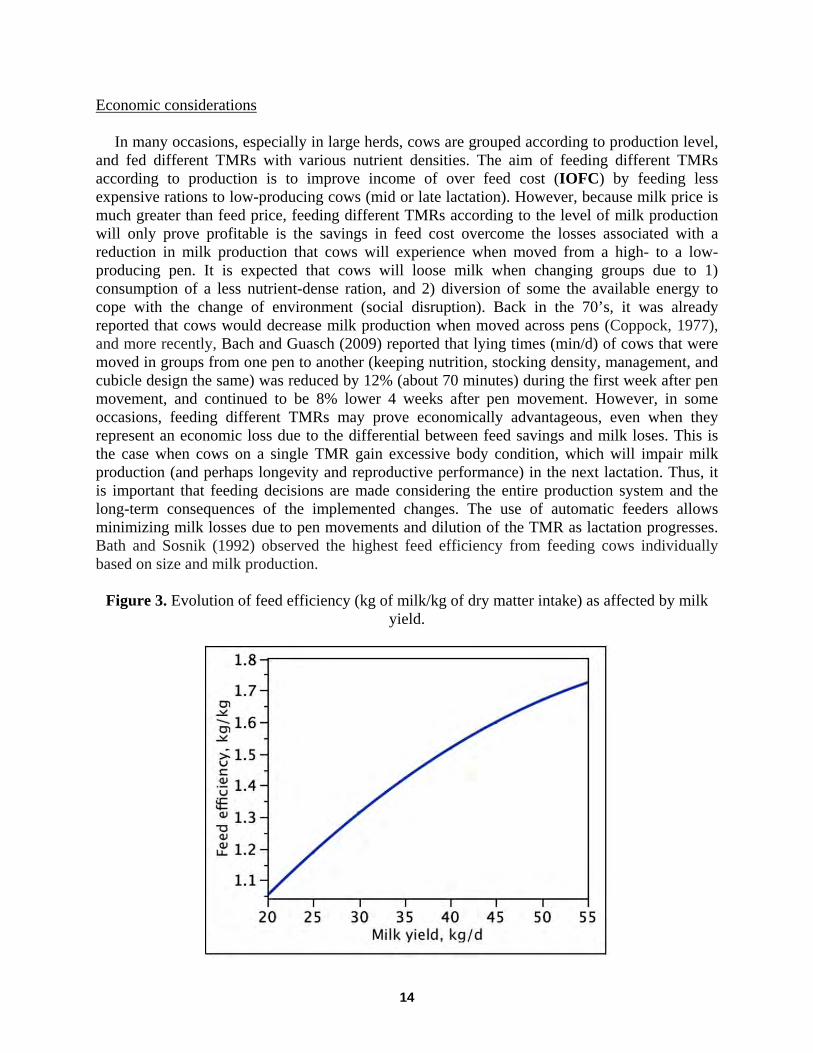
Economic considerations In many occasions, especially in large herds, cows are grouped according to production level,
and fed different TMRs with various nutrient densities. The aim of feeding different TMRs according to production is to improve income of over feed cost (IOFC) by feeding less expensive rations to low-producing cows (mid or late lactation). However, because milk price is much greater than feed price, feeding different TMRs according to the level of milk production will only prove profitable is the savings in feed cost overcome the losses associated with a reduction in milk production that cows will experience when moved from a high- to a low-producing pen. It is expected that cows will loose milk when changing groups due to 1) consumption of a less nutrient-dense ration, and 2) diversion of some the available energy to cope with the change of environment (social disruption). Back in the 70’s, it was already reported that cows would decrease milk production when moved across pens (Coppock, 1977), and more recently, Bach and Guasch (2009) reported that lying times (min/d) of cows that were moved in groups from one pen to another (keeping nutrition, stocking density, management, and cubicle design the same) was reduced by 12% (about 70 minutes) during the first week after pen movement, and continued to be 8% lower 4 weeks after pen movement. However, in some occasions, feeding different TMRs may prove economically advantageous, even when they represent an economic loss due to the differential between feed savings and milk loses. This is the case when cows on a single TMR gain excessive body condition, which will impair milk production (and perhaps longevity and reproductive performance) in the next lactation. Thus, it is important that feeding decisions are made considering the entire production system and the long-term consequences of the implemented changes. The use of automatic feeders allows minimizing milk losses due to pen movements and dilution of the TMR as lactation progresses. Bath and Sosnik (1992) observed the highest feed efficiency from feeding cows individually based on size and milk production.
Figure 3. Evolution of feed efficiency (kg of milk/kg of dry matter intake) as affected by milk
yield.
14
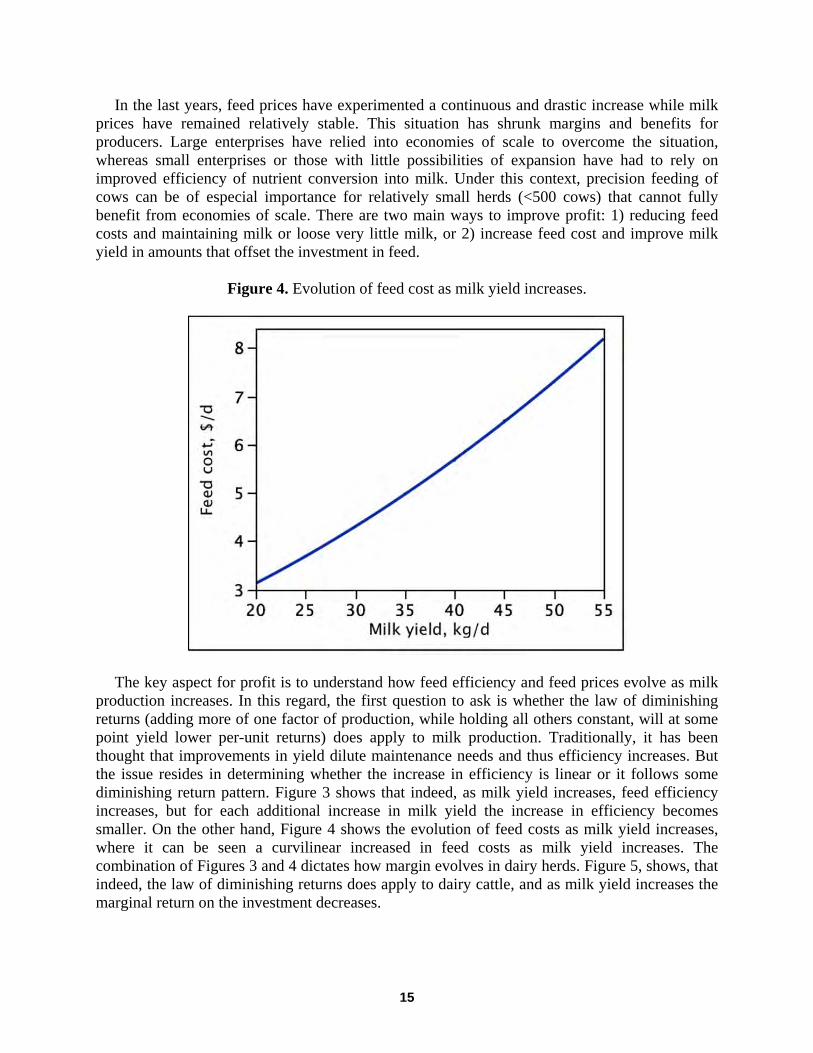
In the last years, feed prices have experimented a continuous and drastic increase while milk prices have remained relatively stable. This situation has shrunk margins and benefits for producers. Large enterprises have relied into economies of scale to overcome the situation, whereas small enterprises or those with little possibilities of expansion have had to rely on improved efficiency of nutrient conversion into milk. Under this context, precision feeding of cows can be of especial importance for relatively small herds (<500 cows) that cannot fully benefit from economies of scale. There are two main ways to improve profit: 1) reducing feed costs and maintaining milk or loose very little milk, or 2) increase feed cost and improve milk yield in amounts that offset the investment in feed.
Figure 4. Evolution of feed cost as milk yield increases.
The key aspect for profit is to understand how feed efficiency and feed prices evolve as milk production increases. In this regard, the first question to ask is whether the law of diminishing returns (adding more of one factor of production, while holding all others constant, will at some point yield lower per-unit returns) does apply to milk production. Traditionally, it has been thought that improvements in yield dilute maintenance needs and thus efficiency increases. But the issue resides in determining whether the increase in efficiency is linear or it follows some diminishing return pattern. Figure 3 shows that indeed, as milk yield increases, feed efficiency increases, but for each additional increase in milk yield the increase in efficiency becomes smaller. On the other hand, Figure 4 shows the evolution of feed costs as milk yield increases, where it can be seen a curvilinear increased in feed costs as milk yield increases. The combination of Figures 3 and 4 dictates how margin evolves in dairy herds. Figure 5, shows, that indeed, the law of diminishing returns does apply to dairy cattle, and as milk yield increases the marginal return on the investment decreases.
15
Knitting nutrition and economics Considering the evolution of feed efficiency with milk yield, and the trend for feed costs,
implementing alternatives to improve feed efficiency (or at least considering feed efficiency within the herd) may prove profitable. Just as an example, dairy cows convert dietary protein to milk protein with an efficiency that ranges between 22 and 38% (Bach et al., 2006). When soybean meal was priced at US$ 200/mT and milk priced at 32 cents a litter, assuming an efficiency of conversion of dietary protein to milk protein of 28%, 1 kg of soybean meal would yield an IOFC of about US$ 1.03. With current market situations, with soybean meal at US$ 550/mT and the same milk price, every kg of soybean meal generates an IOFC of US$ 0.68. If the efficiency of protein utilization was 25 instead of 28%, then the IOFC would be of US$ 0.55. Indeed, feeding soybean meal still provides some marginal return, but it is almost half of what it used to be. Thus, producers who have continued to feed following the same nutritional scheme have incurred a great loss of margin. Under this scenario, producers and nutritionist should think twice about the return on the feed investment. Cabrera et al. (2009) proposed that an effective way to improve IOFC is by making different TMRs according to milk production, but they also reported that formulating a concentrate to supplement specific cows over a single TMR was much more economically advantageous. This would be a similar strategy as using a DCPF. The advantages of DCPF is that a relatively inexpensive TMR can be fed to all cows, and then only those needing more nutrients and being able to “pay” for them receive the necessary nutrients during milking.
Figure 5. Evolution of income over feed cost as milk production increases.
The DCPF utilizes an algorithm that not only ensures the provision of the nutrients required
by each cow but it also makes sure that the expected improvement in milk yield will pay for the additional feeding cost for each particular animal. In other words, if a given feed supplement for
16
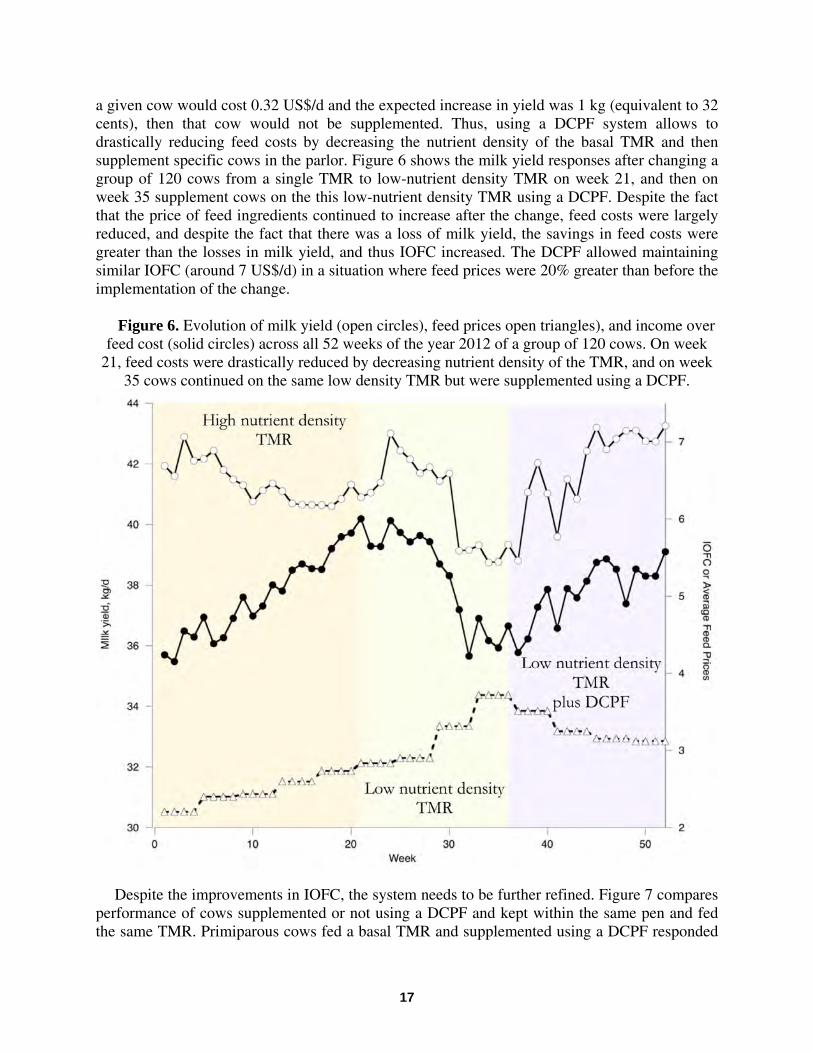
a given cow would cost 0.32 US$/d and the expected increase in yield was 1 kg (equivalent to 32 cents), then that cow would not be supplemented. Thus, using a DCPF system allows to drastically reducing feed costs by decreasing the nutrient density of the basal TMR and then supplement specific cows in the parlor. Figure 6 shows the milk yield responses after changing a group of 120 cows from a single TMR to low-nutrient density TMR on week 21, and then on week 35 supplement cows on the this low-nutrient density TMR using a DCPF. Despite the fact that the price of feed ingredients continued to increase after the change, feed costs were largely reduced, and despite the fact that there was a loss of milk yield, the savings in feed costs were greater than the losses in milk yield, and thus IOFC increased. The DCPF allowed maintaining similar IOFC (around 7 US$/d) in a situation where feed prices were 20% greater than before the implementation of the change.
Figure 6. Evolution of milk yield (open circles), feed prices open triangles), and income over
feed cost (solid circles) across all 52 weeks of the year 2012 of a group of 120 cows. On week 21, feed costs were drastically reduced by decreasing nutrient density of the TMR, and on week
35 cows continued on the same low density TMR but were supplemented using a DCPF.
Despite the improvements in IOFC, the system needs to be further refined. Figure 7 compares performance of cows supplemented or not using a DCPF and kept within the same pen and fed the same TMR. Primiparous cows fed a basal TMR and supplemented using a DCPF responded
17
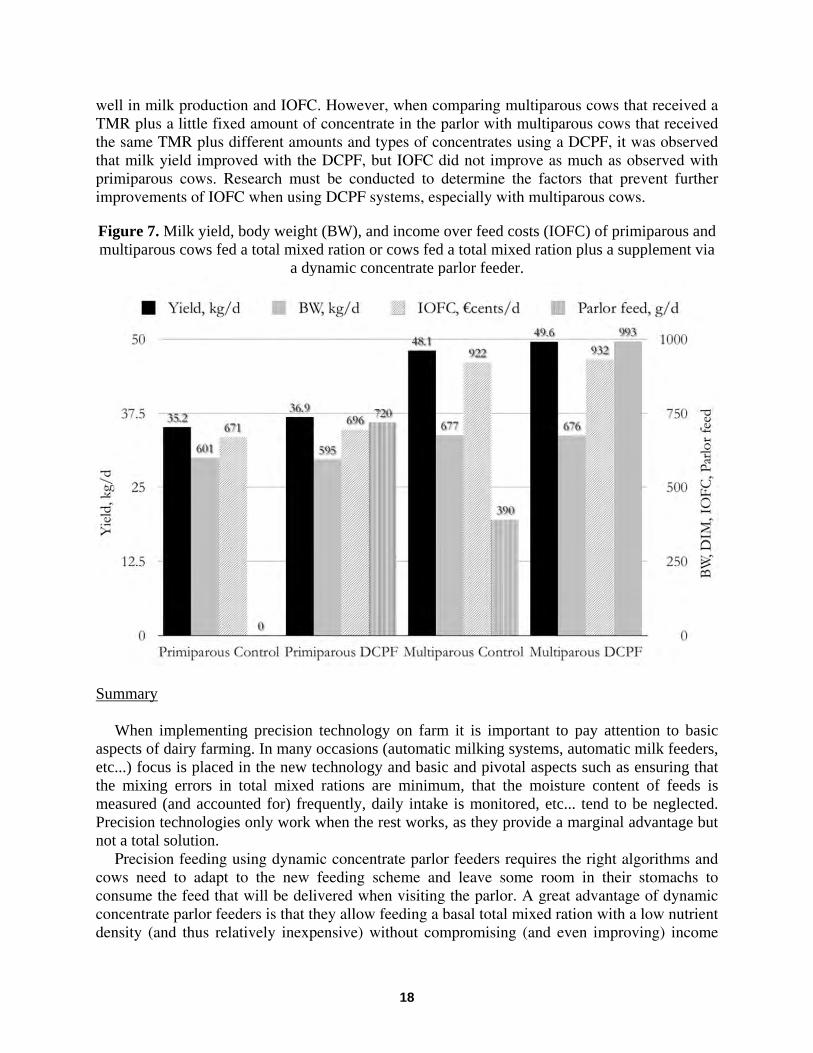
well in milk production and IOFC. However, when comparing multiparous cows that received a TMR plus a little fixed amount of concentrate in the parlor with multiparous cows that received the same TMR plus different amounts and types of concentrates using a DCPF, it was observed that milk yield improved with the DCPF, but IOFC did not improve as much as observed with primiparous cows. Research must be conducted to determine the factors that prevent further improvements of IOFC when using DCPF systems, especially with multiparous cows.
Figure 7. Milk yield, body weight (BW), and income over feed costs (IOFC) of primiparous and multiparous cows fed a total mixed ration or cows fed a total mixed ration plus a supplement via
a dynamic concentrate parlor feeder.
Summary When implementing precision technology on farm it is important to pay attention to basic
aspects of dairy farming. In many occasions (automatic milking systems, automatic milk feeders, etc...) focus is placed in the new technology and basic and pivotal aspects such as ensuring that the mixing errors in total mixed rations are minimum, that the moisture content of feeds is measured (and accounted for) frequently, daily intake is monitored, etc... tend to be neglected. Precision technologies only work when the rest works, as they provide a marginal advantage but not a total solution.
Precision feeding using dynamic concentrate parlor feeders requires the right algorithms and cows need to adapt to the new feeding scheme and leave some room in their stomachs to consume the feed that will be delivered when visiting the parlor. A great advantage of dynamic concentrate parlor feeders is that they allow feeding a basal total mixed ration with a low nutrient density (and thus relatively inexpensive) without compromising (and even improving) income
18
over feed cost thanks to delivery of customized concentrates in the parlor to only those cows that need them.
Bibliography Bach, A., C. Iglesias, S. Calsamiglia, and M. Devant. 2007. Effect of amount of concentrate
offered in automatic milking systems on milking frequency, feeding behavior, and milk production of dairy cattle consuming high amounts of corn silage. J. Dairy Sci. 90:5049–5055.
Bach, A., M. L. Raeth-Knight, M. D. Stern, and J. G. Linn. 2006. Protein and amino acid, and peptide requirements for proper rumen function and milk production. Minnesota Nutrition Conference, September 20th, St. Paul, MN. Pages 67-79.
Bach, A., N. Valls, A. Solans, and T. Torrent. 2008. Associations between nondietary factors and dairy herd performance. J. Dairy Sci. 91:3259–3267.
Bath, D.L., and U. Sosnik. 1992. Formulation, delivery and inventory control of cost-effective rations. Pgs. 709-719 in Large Dairy Herd Management. H. H. Van Horn and C. J. Wilcox ed. Mgmt. Services ADSA. Campaign, IL.
Benham, P.F.J., 1982. Synchronization of behaviour in grazing cattle. Appl. Anim. Ethol. 8: 403–404.
Bishop, J.P., T.R. Smith, and W.A. Knoblauch. 1989. Economic comparison of grouping strategies simulated for free-stall housed Holsteins fed a total- mixed ration. J. Dairy Sci. 72(Suppl. 1):458. (Abstr.)
Cabrera, V.E., and R.D. Shaver. 2009. Wisconsin Feed Cost Evaluator. University of Wisconsin, Madison. http://dairymgt.uwex.edu/tools.php#1.
Cook, N.B. 2008. Makin’ me dizzy – pen moves and facility designs to maximize transition cow health and productivity. Proc. Vermont Large Farm Dairy Conference. Colchester, VT. February 26, 2008.
Coppock, C.E. 1977. Feeding Methods and Grouping Systems. J. Dairy Sci. 60:1327-1336. Foley, J. A. 2011. Can we feed the word and sustain the planet? Scientific Am. 60-65. Guasch, I., and A. Bach. 2009. Effect of group change on lying time and milk yield of dairy
cattle. J. Dairy. Sci. 92(E-Suppl. 1):6. (Abstr.). Maulfair, D.D., G.I. Zanton, M. Fustini, and A.J. Heinrichs. 2010. Effect of feed sorting on
chewing behavior, production, and rumen fermentation in lactating dairy cows. J. Dairy Sci. 93:4791–4803.
19
For over 30 years, VAS has been the industry leader in implementing the use of technology on dairies.
1-888-225-6753 www.vas.com
How success is measured.
DairyComp 305 • FeedWatch • Pocket CowCard
WarmFront™ Calf Milk Replacers and NEW AMPLI‐Calf® Warm Weather Calf Starters from Purina Animal Nutri�on are specically designed with proprietary technologies to improve overall growth and average daily gain in warm temperatures. Combined with ClariFly® larvicide to help control seasonal y challenges, your calves will have everything they need this summer!
WARMER TEMPERATURES CAN NOW MEAN HIGHER PERFORMANCE.
For more informa�on contact a Purina Animal Nutri�on representa�ve or call 1‐800‐237‐9895.
SUCCESS FACTORS FOR AUTOMATIC MILKING
Jack Rodenburg DairyLogix,
Woodstock, Ontario, Canada [email protected]
Introduction Automatic milking has gained widespread acceptance, particularly in western Europe, as a way to reduce labor requirements on dairy farms and improve the lifestyle of dairy farm families milking 40 to 400 cows. At the end of 2009, worldwide, an estimated 8000 commercial dairies used one or more automatic milking systems (AMS) to milk their cows (De Koning, 2010) and it is likely that this number is now well over 10,000. The first commercial robotic milking systems in North America were installed in Ontario, Canada in 1999, and there are close to 1000 farms, predominantly in Canada and the north eastern USA milking with robots today. Although the majority of installations are Lely and DeLaval single box systems, Boumatic Robotics, GEA Farm Technologies, and Insentec also have AMS operating on commercial farms in North America today. Widespread adoption of this technology suggests at least a measure of success in helping dairy farmers achieve greater labor efficiency and a better lifestyle. But field experience, also suggests that there is wide variation in the amount of labor saved and in the overall satisfaction of early North American adopters. There is a substantial body of research to guide us in the management of this technology. Two excellent reviews summarizing the impact of automatic milking on udder health (Hovinen and Pyoralia, 2011) and on cow management, behaviour, health and welfare (Jacobs and Siegford, 2012b) have been published recently. But there is also much to be learned from practical experience in the field. This paper offers a practical overview of success factors contributing to labour efficiency, cow comfort and productivity in AMS herds, with support from research when relevant studies have been published. As a relatively new way of milking cows, this technology continues to improve, and has undergone substantial evolution in the last ten years. Both the technology available today and the management and facilities producers place around it, are more reliable, more cow friendly and more efficient than many of the systems on which data was collected and reported, in formal research projects. As a result much of the historical data in the literature is of limited value in defining the automatic milking experiences of farms who adopt this technology today. Defining Success with AMS In practical terms no discussion of the factors contributing to success can begin without an understanding of what objectives define success for the producers choosing AMS. Improving profitability should be the major driving force for adopting new technology. In a study of Dutch farms investing in either new AMS or a new parlor, (Bijl et. al. 2007) reported that money available for rent, depreciation, interest, labor and profit, was greater "per farm" on conventional dairies by €15,566 but was greater "per full time employee" by €12,953 per year on AMS farms.
21
Labor on AMS farms was 29% less. Labor saving is also an important objective of AMS, but as with profitability, accurate comparable data is not readily available. The success of automatic milking is dependent on the cow and her willingness to visit the automatic milking stall voluntarily with sufficient frequency to support an economic level of milk production. Since the milking herd never leaves the barn, stall maintenance, manure removal, and cattle handling require a different approach than with conventional milking. Capitalizing on the opportunities for labor saving hinges on the ability of AMS farms to achieve frequent voluntary milking and on minimizing the work of cattle handling. The health and comfort of the cow is a major factor in visiting behaviour, making it critical to the success of automatic milking. Since data on profitability and labor saving are difficult to come by, the more common measures of success for comparing the performance of AMS are such factors as milk production per AMS unit, and milk production per cow. There is very little comprehensive published data on average production per AMS but for single box systems 4400 lbs per day, from 60 cows producing 73 lbs per day is often quoted as a reasonable goal. A study of 34 herds in Spain (Castro et. al. 2012) reported average production of 3320 lbs per day from 52.7 cows producing 63 lbs per cow. At the extreme of efficiency, DeLaval (Healey, 2013) recently issued a press release recognizing JTP Farms in Wisconsin for recording a one week average daily production of 6453 lbs of milk per VMS for 4 VMS units milking an average of 62 cows yielding 104.5 lbs of milk. Similarly Lely has several herds in Spain, Italy, USA and Canada over 6000 lbs per stall and over 90 lbs of milk per cow. Another measure of AMS success that is closely monitored by owners is the average milking frequency per cow. Because this average includes a wide range of results from individual cows, this value, typically ranging from 2.2 to 3.2 is in no way comparable to 2x or 3x fixed interval milking. it is well understood and accepted that more frequent milking stimulates higher milk production, but large variation in milking interval decreases milk yield, (Bach and Busto, 2005). The goal in AMS should be both frequent milking and uniform milking intervals. In one trial (Melin et. al. 2005), cows with milking permission every 4 hours were milked 3.2 times daily while cows with milking permission every 8 hours were milked 2.1 times daily and produced 9% less milk. Based on field experience herds switching from 2x timed milking to AMS need to achieve at least 2.3 to 2.4 milkings per cow per day to match their previous production. Since more frequent robotic milking also means more regular milking intervals 3.1 to 3.2 milkings per cow per day will come close to matching 3x timed milking. One of the new labor demands in AMS systems is fetching cows that do not attend voluntarily. Fetching one or two cows per AMS generally requires minimal effort and in barns with logical cow routing and gating it can be combined with cleaning the freestalls. Fetching larger numbers requires labor and also disrupts the voluntary traffic to the AMS. In a Canadian survey producers reported fetching 4 to 25% of cows and the variation between herds was large. (Rodenburg and House, 2007). Minimizing the number of cows to be fetched while maintaining a high level of cow comfort, health and productivity is a criteria for successful automatic milking.
22

Impact of Stocking Rate Since 2010, quota policies in Ontario have made it very difficult to expand and as a result there are a growing number of automatic milking farms with a lower number of cows per milking stall. In one recent study (Deming et.al. 2013) the number of cows per milking stall ranged from 34 to 71 among 13 herds in a field study. Higher stocking densities were associated with fewer milkings. While production per cow was unaffected in this trial, less frequent milking is typically associated with lower production (Melin et.al. 2005). An earlier field study (Rodenburg 2002) reported that the number of cows fetched because of long milking intervals increased when the number of cows per milking stall exceeded 60 and the liters of milk per stall exceeded 1500 liters. While newer AMS may have a higher capacity today, field observations suggest that systems that are under capacity experience more visits and milkings per cow, higher production per cow and fewer fetch cows. More research is needed to quantify the impact of higher numbers of cows, or more accurately, higher occupation rate (OR), defined as the percentage of the day the AMS is actually milking. Historically farmers and manufacturers have put a lot of emphasis on the production per AMS. When the capital cost of the system and interest rates are high, this is logical. In recent years, interest rates have been lower and the capital cost of AMS is declining. High production per cow has traditionally been associated with higher income over feed costs and higher returns to labor. With both feed costs and labor costs on the rise, perhaps a greater emphasis on production per cow and per unit of labor and lesser emphasis on production per AMS unit is appropriate today. Selecting and Managing the Cows Cows with higher milking speed will permit more cows and more milk production per AMS at the same occupation rate. Producers using AMS now or considering it for the future would increase the capacity of their system by selecting cows with a higher milking speed. If the average "machine on time" can be reduced by 1 minute per cow, the capacity of a milking stall can be increased by roughly 12%. Cows with poor udder conformation experience slower attachment and higher incidence of attachment failure and are twice as likely to require fetching (Jacobs and Siegfried 2012a) so selecting for udder conformation is also important. Although information on the genetic predisposition of cows to attend for voluntary milking is currently not recorded or published, a heritability ranging from of 0.16 when measured in early lactation to 0.22 measured in late lactation has been reported. (Konig et. al. 2006). With the growing popularity of robotic milking, individual cow milking frequency data should be collected by milk recording agencies and included in sire proving schemes. Studies have identified a relationship between lameness and decreased AMS visits and higher fetch rates ( Bach et. al. 2007, Borderas et.al 2008). Lameness is a multi-factorial problem influenced by nutrition, cleanliness of the barn, resting behaviour, preventative and corrective treatment and a multitude of other factors including the cow herself. Maintaining excellent claw health should be a priority for AMS farms.
23
Feeding Management and Nutrition If AMS owners in Canada are asked for their opinion on what factors influence voluntary milking frequency and fetch rates, the majority would rank the feeding program as their first and foremost concern. Feeding research related to AMS has been reviewed (Rodenburg, 2011) Feed, is the primary motivation for the cow to visit the robotic milking stall. Highly motivated cows will visit voluntarily thereby decreasing the need to expend labour fetching cows, and they will visit more frequently and regularly leading to higher milk production. Forced cow traffic makes it possible to use forage at the bunk to provide motivation. Research findings and merits of various traffic systems are discussed later in this paper. With free cow traffic, motivation to visit the robot is provided solely by the concentrate fed in the milking box. Hard, dust free pellets (Rodenburg et.al. 2004) made of palatable ingredients such as barley and oats (Madsen et. al., 2010) fed at a rate of 5 to 17 lbs per day result in the highest visit frequency and highest milk production. Limiting the energy density and starch level in the mixed ration fed at the bunk also increases the motivation provided by the concentrate (Rodenburg and Wheeler, 2002) Current recommendations suggest feeding a partial mixed ration formulated for a production level 15 lbs below the mean of the group, combined with 5 to 17 lbs. of pelleted concentrate fed according to production in the robotic milking stall. While the need to use feed to stimulate milking visits creates additional challenges for the nutritionist and feed advisor, the ability to collect a great deal of data on the individual cow and to feed and supplement her individually also creates many new opportunities for more precise and individualized ration delivery. Forced vs. Free Cow Traffic Since the choice of forced vs. free traffic has a substantial impact on both labour efficiency and cow comfort it is an important decision in the design of AMS housing facilities. Since this appears to be a highly controversial topic at the farm level, a thorough review of the literature is included here. Studies have shown that attendance, while no longer “voluntary” in the pure sense, can be improved by forcing the cow to enter the AMS stall or an associated selection gate en route from the resting area to the feed manger or on her return from the manger to the resting area. This is commonly referred to as “forced” cow traffic. There are at least four common variations of “cow traffic” strategies used in AMS herds today. (1) Free cow traffic, where cows can access feeding and resting areas of the barn with no restriction. (2) Forced cow traffic with one way gates blocking the route from the resting area to the feeding area so cows leaving the resting area must enter the milking box, to be milked if the interval since the last milking makes them eligible, or “refused” if the milking interval is too short. After passing through the milking stall, the cow is released to the feeding area and can only return to the resting area through a one-way gate. (3) Forced cow traffic with “pre-selection” adds an entry lane where a sort gate directs cows eligible for milking to the holding area and ineligible cows to the feeding area. This reduces waiting times for milking and for feed because only cows eligible for milking pass through the milking stall. Pre-selection can also be provided by selection gates in crossovers away from the robot, which open only for cows ineligible for milking. (4) Feed first forced traffic is a reversal of (2) which allows cows access to the manger from the resting area via one way gates, but they can only return to the resting area through the robotic milking stall, or through pre-selection gates that direct cows ineligible for milking directly to the free stalls or bedding pack.
24
Numerous studies report slightly higher milking frequency and a much-reduced need to fetch cows with forced traffic. (Hoogeveen et. al., 1998; Van’t Land et. al., 2000). (Harms et. al., 2002) reported 2.29, 2.63 and 2.56 milkings and 15.2, 3.8 and 4.3 fetching acts per day with 49 cows in free, forced and forced with pre-select traffic respectively. The number of meals was higher at 8.9 with free cow traffic, than with either forced or forced with pre-select, where cows consumed 6.6 and 7.4 meals respectively. Forage intake decreased when cows were switched to forced traffic and went back up in the forced with pre-select phase. (Hermans et. al. 2003) reported that cows with free access to forage in the manger spent more time eating and less time standing in freestalls. (Thune et. al., 2002) reported 1.98, 2.56 and 2.39 milkings, and 12.07, 3.86, and 6.46 feeding periods with free, forced and forced with pre-selection traffic respectively. In this study, dominant and timid cows spent an average of 78 and 95 minutes waiting for milking in a free traffic setting vs. 124 and 168 minutes with pre-selection and 140 and 240 minutes with forced traffic. Timid cows waited an average of 4 hours per day for milking because, they are directed into the fetch pen en route to or from the manger, but higher ranking cows continually beat them into the robot, leaving them trapped in the fetch pen for several hours. From a cow comfort perspective this is highly undesirable and may lead poor metabolic health and increased lameness, eventually leading to a further deterioration in visiting behaviour. On Ontario farms with forced cow traffic (Rodenburg and Wheeler, 2002), average number of daily visits per cow, and therefore visits to the manger to consume TMR was 3.40 + 0.44. This is many meals fewer than the 12.1 (Vasilatos, 1980) per day reported in a trial with free access and parlor milking. Fewer meals are associated with lower dry matter intake (Dado and Allan, 1994) and forced cow traffic has been shown to have this effect (Prescott et.al., 1998). Pre-selection systems result in some improvement in feed access but number of meals remains lower than with free traffic. Cows in forced traffic situation also spend more time waiting for milking and less time lying down, (Winter and Hillerton, 1995). It is also of some concern that when a cow is in pain from a clinical case of mastitis or when she is lame, she will avoid milking in a free traffic situation and this alerts the herdsman to her plight. Faced with the choice of starvation or milking this cow is more likely to go unnoticed in a forced traffic setting. Stress responses as measured by heart rate, blood cortisol levels and stepping and kicking during milking have been thoroughly studied and reviewed (Jacobs and Siegford 2012b). A full report of the findings of these studies is beyond the scope of this paper, but as a general summary, the bulk of the studies suggest that milking itself in an AMS involves similar or less stress than parlor milking. Some studies do suggest that in barns with forced cow traffic, cows experience slightly higher stress levels throughout the day. (Wenzel et.al. 2003, Hagen et.al. 2004, Albeni et.al. 2005). (Munksgaard et. al. 2011) reported no differences in any parameter measured between forced and free traffic with 34 cows per AMS, suggesting that when there is a lot of excess capacity available, cows can and do behave identically in both traffic systems. In the most recent comprehensive comparison for the two traffic systems (Bach et. al., 2009), cows were fed a partial mixed ration and up to 6.6 lbs of concentrate in the milking stall. Results summarized in table 1, illustrate that milking behavior, eating behavior and milk composition were all influenced by the choice of traffic system, but total dry matter intake and milk production were similar.
25
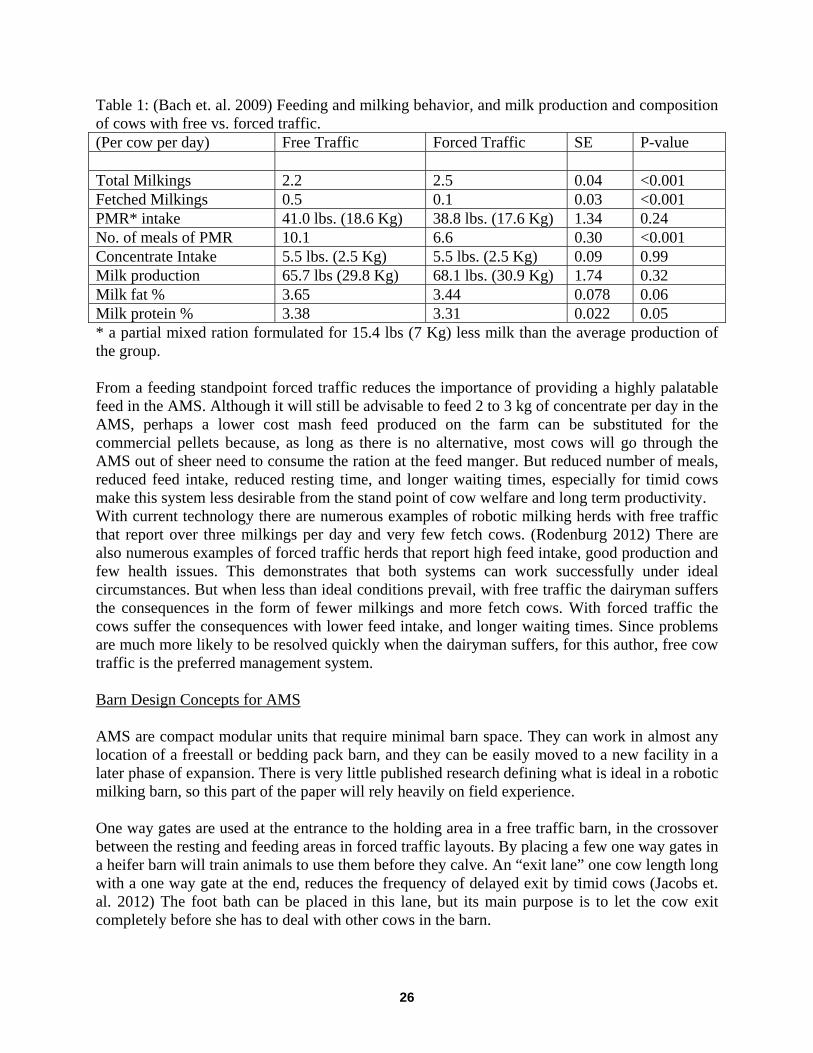
Table 1: (Bach et. al. 2009) Feeding and milking behavior, and milk production and composition of cows with free vs. forced traffic. (Per cow per day) Free Traffic Forced Traffic SE P-value Total Milkings 2.2 2.5 0.04 <0.001 Fetched Milkings 0.5 0.1 0.03 <0.001 PMR* intake 41.0 lbs. (18.6 Kg) 38.8 lbs. (17.6 Kg) 1.34 0.24 No. of meals of PMR 10.1 6.6 0.30 <0.001 Concentrate Intake 5.5 lbs. (2.5 Kg) 5.5 lbs. (2.5 Kg) 0.09 0.99 Milk production 65.7 lbs (29.8 Kg) 68.1 lbs. (30.9 Kg) 1.74 0.32 Milk fat % 3.65 3.44 0.078 0.06 Milk protein % 3.38 3.31 0.022 0.05 * a partial mixed ration formulated for 15.4 lbs (7 Kg) less milk than the average production of the group. From a feeding standpoint forced traffic reduces the importance of providing a highly palatable feed in the AMS. Although it will still be advisable to feed 2 to 3 kg of concentrate per day in the AMS, perhaps a lower cost mash feed produced on the farm can be substituted for the commercial pellets because, as long as there is no alternative, most cows will go through the AMS out of sheer need to consume the ration at the feed manger. But reduced number of meals, reduced feed intake, reduced resting time, and longer waiting times, especially for timid cows make this system less desirable from the stand point of cow welfare and long term productivity. With current technology there are numerous examples of robotic milking herds with free traffic that report over three milkings per day and very few fetch cows. (Rodenburg 2012) There are also numerous examples of forced traffic herds that report high feed intake, good production and few health issues. This demonstrates that both systems can work successfully under ideal circumstances. But when less than ideal conditions prevail, with free traffic the dairyman suffers the consequences in the form of fewer milkings and more fetch cows. With forced traffic the cows suffer the consequences with lower feed intake, and longer waiting times. Since problems are much more likely to be resolved quickly when the dairyman suffers, for this author, free cow traffic is the preferred management system. Barn Design Concepts for AMS AMS are compact modular units that require minimal barn space. They can work in almost any location of a freestall or bedding pack barn, and they can be easily moved to a new facility in a later phase of expansion. There is very little published research defining what is ideal in a robotic milking barn, so this part of the paper will rely heavily on field experience. One way gates are used at the entrance to the holding area in a free traffic barn, in the crossover between the resting and feeding areas in forced traffic layouts. By placing a few one way gates in a heifer barn will train animals to use them before they calve. An “exit lane” one cow length long with a one way gate at the end, reduces the frequency of delayed exit by timid cows (Jacobs et. al. 2012) The foot bath can be placed in this lane, but its main purpose is to let the cow exit completely before she has to deal with other cows in the barn.
26
The design of an AMS barn must recognize that milking cows never leave the barn. Hence it is never convenient to move cows through the space occupied by other groups, and it is important to locate groups strategically or provide lanes for cow movement. Since the logical labour organization of an AMS barn should not require two people in the barn at the same time, cow movement from group to group and to the robot or handling area must be set up to be a one person job. Moving through the barn with equipment to scrape manure or bring in bedding is disruptive. Hence tractor scraping manure is not an option. Bedding delivery is done less frequently and is a less serious issue but automated bedding delivery systems may still be a wise choice. Gel Mats, waterbeds or mattresses that require minimal bedding are recommended. Use of sand bedding will require large equipment, so to minimize the time and disruption involved, layouts should offer straight lines through the barn with doors at each end. Free cow traffic, wide alleys and multiple crossovers that provide escape routes for cows when equipment passes through are recommended. Ensuring the area around the AMS is free of stray voltage by slatting it, or by including an equipotential plane in the concrete is recommended. Ceiling fans over the cow in the AMS help to cool cows keep flies away during milking. Rubber on the floor both in the robot and beside it will improve cow comfort as will positioning the stall so that entry is level or elevated 4 inches or less. In AMS stalls that restrict the cow’s movement with a butt plate and adjustment of the feed manger, it is important to adjust these devices so the cow has adequate space in the stall and can stand comfortably. Since hoof health is critical to success in robotic milking the strategic use of an effective foot bathing routine is essential. Footbaths placed in the exit lanes of the milking stalls can discourage cows from visiting the AMS. In a "tollgate" layout (see figure 4) it may be possible to use a selection gate to send only selected cows through the footbath to avoid extra passes for the frequent visiting cow. An alternative method of foot bathing uses a large bath that is 10 feet long and the full width of a cross over furthest from the AMS, ideally in a location that can be used by all the groups in the barn. A hinged bath can be stored vertically at the end of the row of freestalls and lowered and filled when needed. Once filled, groups of cows are walked through the bath slowly once or twice in a row, once or twice a week. Although this does disturb the cows, it keeps harsh chemicals away from the milk and from the AMS. With less manure exposure, chemical work better and there is a uniform number of passes per cow. Routing for fetching cows should be simple and logical, so that this task can be combined with cleaning freestalls. Gates at the AMS and in crossovers should be designed to eliminate escape routes and it should be possible to close and open them along the fetch route without backtracking. Many popular barn layouts feature robot rooms that include more than one AMS. While this is convenient for cleaning and servicing, air and vacuum leaks and straining bearings and joints are harder to hear than with one AMS per room. Accessing an AMS from more than one barn area and post milking separation are more difficult with more than one AMS per room. Back to back robots on a single room are common with the mirrored two stall Insentec AMS and with the Boumatic Robotics double box. While post milking separation remains an option with this layout as well as with tail to tail robots, routing that allows further milking visits for the separated cow can be challenging. With free traffic layouts a fetch pen for fetched cows is required. An area of 80 to 100 square feet suitable for 4 or 5 cows is recommended for use with a single robot. The fetch pen should not have access to water, feed or freestalls. Gating is required to direct fetched cows into it with
27
no escape routes. A permanent commitment pens which all cows must access prior to milking create additional stress on low ranking cows. A temporary fetch pen is better, but the best option for holding and training fetched cows in a free traffic barn is the "split entry fetch pen" pioneered by DairyLogix. As shown in Figure 1 the fetch pen is used only for fetched cows who access the AMS via a lane beside the milking stall. Cows from the main barn still access the robot via the split entry feature. Using this system, timid fetched cows are not stressed by boss cows coming through the fetch pen. Using the crowding gate attached to the corner of the robot room, one person can easily crowd a new heifer into the AMS entry area and push her in for her first visit. Subsequently the heifer can be cornered by this same gate with a chain behind her to encourage her to go on her own. This can be followed by voluntary entry from the fetch pen which gives her a slight advantage since the AMS opens to her first. With this stepwise training approach, the heifer will move to voluntary attendance quickly. In traditional forced traffic barns with pre-selection cows eligible for milking are directed into a commitment pen, which they can only leave via the robot. After calving it may be beneficial to keep the fresh cow separate from the main herd for 1 day to two weeks depending on her health and condition. Lame cows also benefit from separate housing to shorten their walking distances and permit greater rest in a lower stress environment. Ideally these cows should be housed in a well bedded pack area, close to the AMS with voluntary access. Many of the cows will not go on their own, but fetching them from this pen involves minimal time and walking distance. This is the first and most valuable use of the “second group”. Handling cows in an AMS herd for breeding, pregnancy checking, vaccinations, treatment, clipping, hoof care, flaming udders etc. presents very unique challenges. In parlor herds, cows receive close scrutiny in the parlor, and they can easily be identified and sorted from the herd over a short time span in the return lane. Since they are hungry after milking, when they return to the barn they lock themselves into headlocks for handling at the manger. In an AMS herd, milking times cannot be predicted, so sorting at the AMS will require up to 15 hours of lead time. Hence a good sort pen must provide feed, water, a place to rest, and the opportunity to return for additional milking. Headlocks for robot barns are problematic because many cows are not interested in going to the manger when fresh feed is delivered. Many AMS herds do treatment work by crowding cows into freestalls, chasing them into headlocks, or fetching them into the holding area strictly for timely separation. This aspect of AMS management is poorly defined, in terms of what handling system minimizes operator labour and stress on the cows. Headlocks do offer a very efficient way to perform specific tasks, especially singing udders, which most AMS herds do 5 or 6 times per year to increase udder cleanliness and attachment success rate. Handling and treating cows in the parlor or robot has long been discouraged because it gives cows a bad experience in what should be a goof place. Although I have no research evidence for this handling in headlocks could also add stress to the feeding experience. Since headlocks restrain many cows that are not needed for handling, these cows are stressed unnecessarily. Barn designs that include a large separation area offer the option of not using headlocks. Convenient access to a working chute, or two chutes side by side, or a palpation rail located near the separation area is an alternative. If dry cows are housed behind the AMS a flexible gating can provide a lot of dry cow space and a small separation area when minimal sorting is taking place, and with the gates relocated, this same area could crowd the dry cows for 12 to 15 hours on days when a large group is being sorted. Separation cows are a second valuable use of the “second group option”. A third use of robot access from a second group
28
would be to allow voluntary lead feeding and training of heifers and inexperienced cows prior to calving. In a barn with three or more robots in individual rooms surrounding a central handling area, all three applications can be included. Access by several groups to a central handling facility is easiest if cows do not have to cross a feed alley. Hence AMS barns work best with perimeter feeding, which also keeps rain, sun and frost out of the cow areas further enhancing cow comfort. A 6 to 8 foot wide alley across at least one of the barn permits crossing over inside the barn to push up feed. In a field survey of 11 herds in the Netherlands and 1 in Canada, where cows could access more than one robotic milking stall, it was found that with a variety of layouts, 39% of cows used both robots 40 to 60% of the time, defined as “cross use” and 20% of cows used either one or the other robot more than 90% of the time, defined as “selective use”. In a comparison of layouts it was found that selective use was lowest when all robots faced the same way (Gerlauf et. al. 2009). We have also observed that when cows are moved from one group to another they adapt much easier if the robot in the receiving group is oriented the same as their previous experience. Hence we recommend that all robots on a dairy are oriented the same way if it is practical to do so. Back to back robots in the layout commonly described as a "tollgate" do exhibit reasonable cross use and can be a viable alternative that involves robots with opposite entry points. In a 4 robot barn using the "L" layout described later, using two left handed robots in one group and two rights in the other makes it easy to direct cows to a central handling area. Although a growing number of herds have experience with group sizes ranging from up to 60 cows with one robot to up to 180 cows in a single group accessing three robots, there are no clear answers on what is ideal. Some herds opt for early and late lactation groups, or first and later lactation groups, but most include animals of all ages and stages of lactation. Benefits of keeping groups small and accessing a single robot include easier identification of fetch cows and easier fetching. Benefits of two robots in a group include shorter waiting times and less disruption from washing or maintenance work. Benefits of three robots include simple barn layouts in bigger six row barns. Benefits of grouping by stage of lactation include reduced grain feeding in the TMR to lower producers, allowing more feed in the robot and better attendance, and the ability to reduce feed cost and prevent over conditioning. Benefits of grouping by age include more uniform cow size and the option to vary stall sizes accordingly. Flexible layouts that permit variation in grouping strategies is ideal since there are no clear answers to which strategy is best. Figure 1 presents a free traffic barn layout that includes many of the capabilities discussed above. In order to illustrate the handling areas in a larger scale the ends of the barn are not shown. As illustrated in Figure 2 and Figure 3, this basic two robot barn can be expanded to up to 4 robots while retaining its handling area at the left end. By mirroring this barn to the left 8 robots with central handling are possible. A number of barns have been built using this basic “DairyLogix” design for 2, 3 and 4 robots in Canada, the USA, the Netherlands, Denmark and Finland. It is our goal to learn from the experiences of these producers and to continue to refine the concept to further enhance labour efficiency and cow comfort as we continue our quest for the ideal robotic milking barn.
29
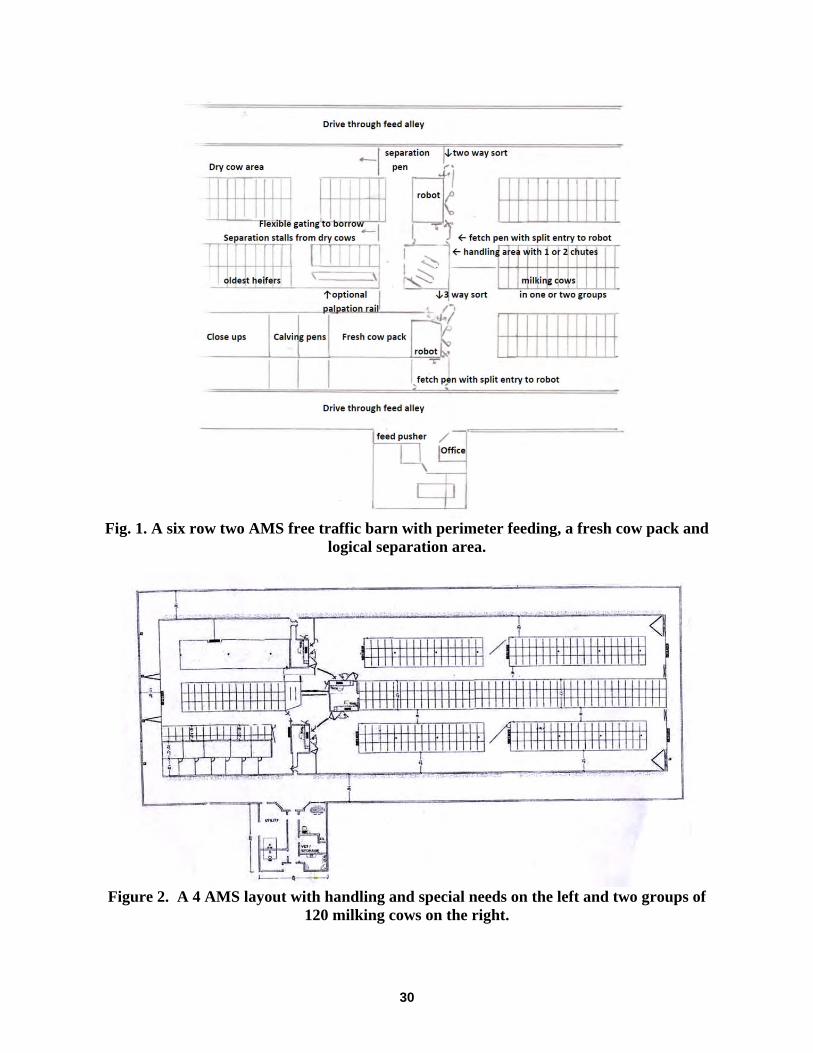
Fig. 1. A six row two AMS free traffic barn with perimeter feeding, a fresh cow pack and
logical separation area.
Figure 2. A 4 AMS layout with handling and special needs on the left and two groups of
120 milking cows on the right.
30
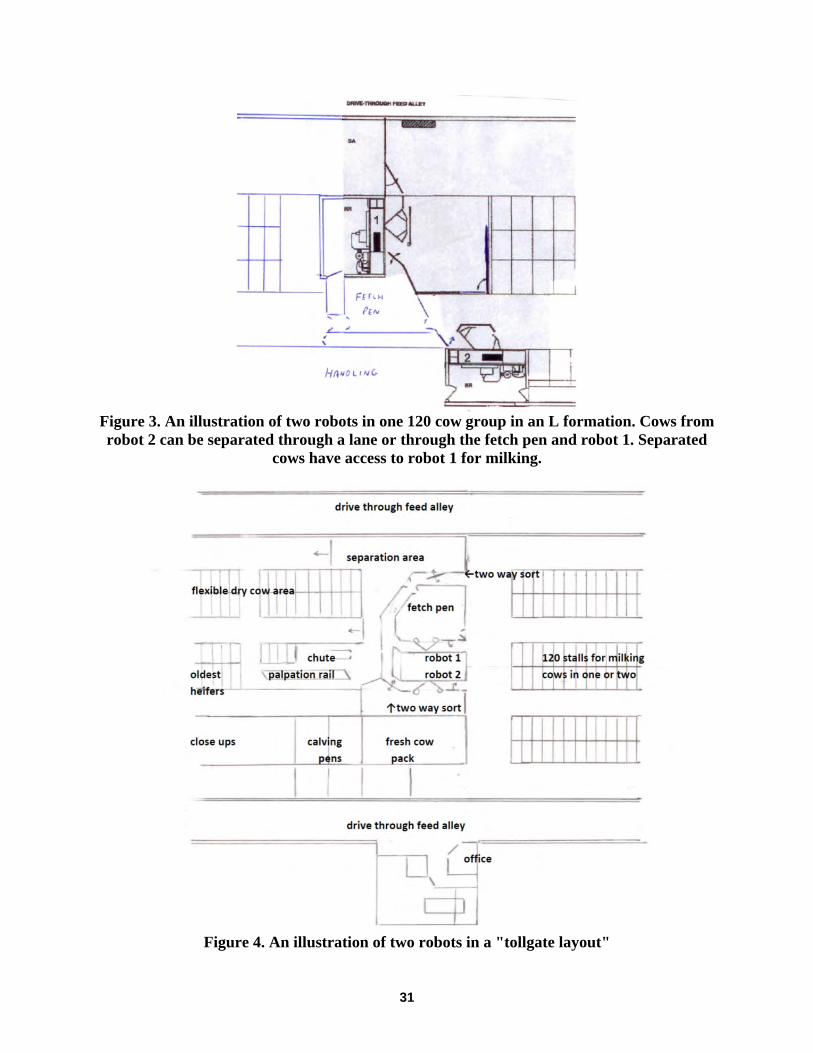
Figure 3. An illustration of two robots in one 120 cow group in an L formation. Cows from robot 2 can be separated through a lane or through the fetch pen and robot 1. Separated
cows have access to robot 1 for milking.
Figure 4. An illustration of two robots in a "tollgate layout"
31
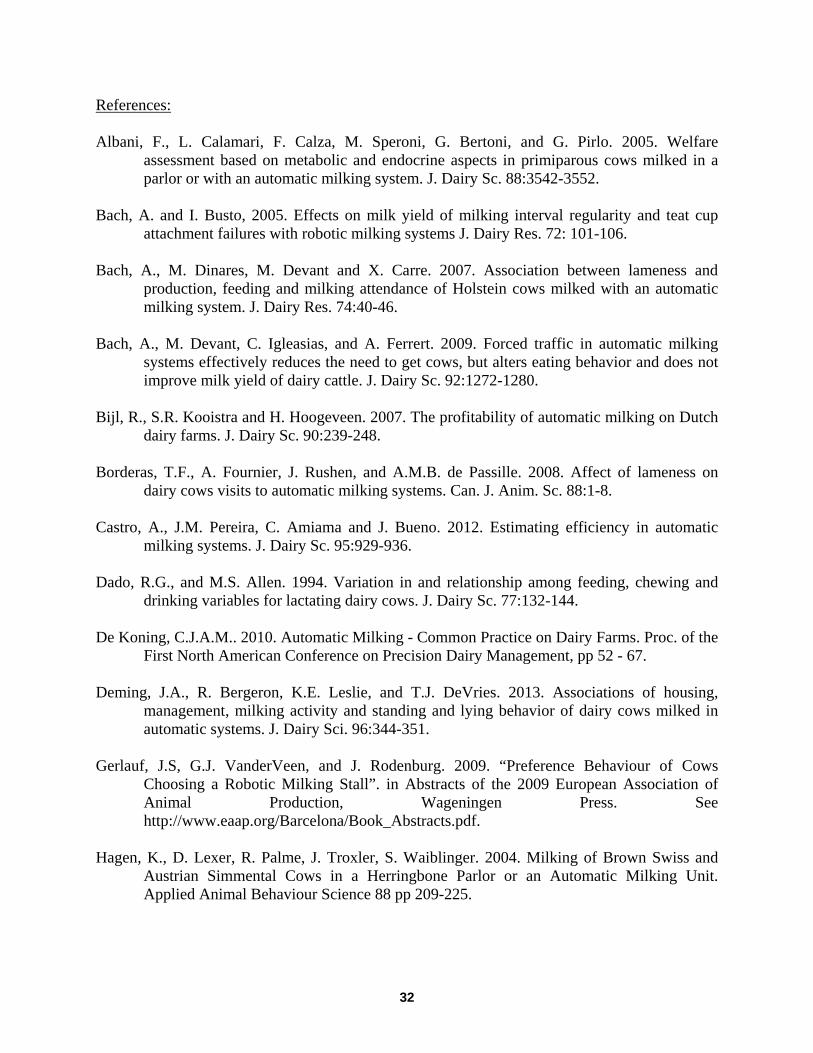
References: Albani, F., L. Calamari, F. Calza, M. Speroni, G. Bertoni, and G. Pirlo. 2005. Welfare
assessment based on metabolic and endocrine aspects in primiparous cows milked in a parlor or with an automatic milking system. J. Dairy Sc. 88:3542-3552.
Bach, A. and I. Busto, 2005. Effects on milk yield of milking interval regularity and teat cup
attachment failures with robotic milking systems J. Dairy Res. 72: 101-106. Bach, A., M. Dinares, M. Devant and X. Carre. 2007. Association between lameness and
production, feeding and milking attendance of Holstein cows milked with an automatic milking system. J. Dairy Res. 74:40-46.
Bach, A., M. Devant, C. Igleasias, and A. Ferrert. 2009. Forced traffic in automatic milking
systems effectively reduces the need to get cows, but alters eating behavior and does not improve milk yield of dairy cattle. J. Dairy Sc. 92:1272-1280.
Bijl, R., S.R. Kooistra and H. Hoogeveen. 2007. The profitability of automatic milking on Dutch
dairy farms. J. Dairy Sc. 90:239-248. Borderas, T.F., A. Fournier, J. Rushen, and A.M.B. de Passille. 2008. Affect of lameness on
dairy cows visits to automatic milking systems. Can. J. Anim. Sc. 88:1-8. Castro, A., J.M. Pereira, C. Amiama and J. Bueno. 2012. Estimating efficiency in automatic
milking systems. J. Dairy Sc. 95:929-936. Dado, R.G., and M.S. Allen. 1994. Variation in and relationship among feeding, chewing and
drinking variables for lactating dairy cows. J. Dairy Sc. 77:132-144. De Koning, C.J.A.M.. 2010. Automatic Milking - Common Practice on Dairy Farms. Proc. of the
First North American Conference on Precision Dairy Management, pp 52 - 67. Deming, J.A., R. Bergeron, K.E. Leslie, and T.J. DeVries. 2013. Associations of housing,
management, milking activity and standing and lying behavior of dairy cows milked in automatic systems. J. Dairy Sci. 96:344-351.
Gerlauf, J.S, G.J. VanderVeen, and J. Rodenburg. 2009. “Preference Behaviour of Cows
Choosing a Robotic Milking Stall”. in Abstracts of the 2009 European Association of Animal Production, Wageningen Press. See http://www.eaap.org/Barcelona/Book_Abstracts.pdf.
Hagen, K., D. Lexer, R. Palme, J. Troxler, S. Waiblinger. 2004. Milking of Brown Swiss and
Austrian Simmental Cows in a Herringbone Parlor or an Automatic Milking Unit. Applied Animal Behaviour Science 88 pp 209-225.
32

Harms, J., G. Wendl, and H Schon. 2002. Influence of Cow Traffic on Milking and Animal Behavior in a Robotic Milking System. in Proceedings of the First North American Conference on Robotic Milking, March 20-22, 2002, Toronto Canada, Wageningen Press, Pp II 9 - 14.
Healey, E., 2013, Wisconsin farm shines as the most productive VMS™ operation in the world,
DeLaval press release, http://www.delaval.ca/About-DeLaval/DeLaval-Newsroom/?nid=107907.
Hermans, G.G.N., A.H. Ipema, J. Stefanowska, and J.H. Metz. 2003. The effect of two traffic
situations on the behaviour and performance of cows in an automatic milking system. J. Dairy Sc. 86:1997-2004.
Hoogeveen, H., A.J.H. van Lent, and C.J. Jagtenberg. 1998. Free and One-Way Cow Traffic in
Combination with Automated Milking. Proceedings of the 4th International Dairy Housing Conference St. Louis Missouri January 28-30 1998 ASAE pp. 80-87.
Hovinen, M, and S. Pyoralia. 2011. Invited review: Udder health of dairy cows in automatic
milking. J. Dairy Sci.94:547-562. Jacobs, J.A., K. Ananyeva, and J. M. Siegford. 2012. Dairy cow behavior affects the availability
of an automatic milking system. J. Dairy Sc. 95:2186-2194. Jacobs, J.A., and J.M. Siegford. 2012a. Lactating dairy cows adapt quickly to being milked by an
automatic milking system. J. Dairy Sci.95:1575-1584. Jacobs, J.A., and J.M. Siegford. 2012b. Invited review: The impact of automatic milking systems
on dairy cow management, behaviour, health and welfare. J. Dairy Sci.95:2227-2247. Konig, S., F. Kohn, K. Kuwan, H. Simianer, and M. Gauly. 2006. Use of repeated measures
analysis for evaluation of genetic background of dairy cattle behaviour in automatic milking systems. J. Dairy Sc. 89:3636-3644.
Madsen, J., M.R. Weisbjerg, and T. Hvelplund. 2010. Concentrate composition for Automatic
Milking Systems- Effect on Milking Frequency. Livestock Science 127, 45-50. Melin, M., K. Svennersten-Sjaunja, and H. Wiktorsson. 2005. Feeding patterns and performance
of cows in controlled cow traffic in automatic milking systems. J. Dairy Sc. 88:3913-3922.
Munksgaard, L., J.A. Rushen, A.M. de Passille, and C.C. Krohn. 2011. Forced vs. free traffic in
an automated milking system. Livestock Science 138:244-250. Prescott, N.B., T.T. Mottram and A.J.F. Webster. 1998. Relative motivations of dairy cows to be
milked or fed in a Y-maze and an automatic milking system. Appl. Anim. Behav. Sci. 57:23-33.
33
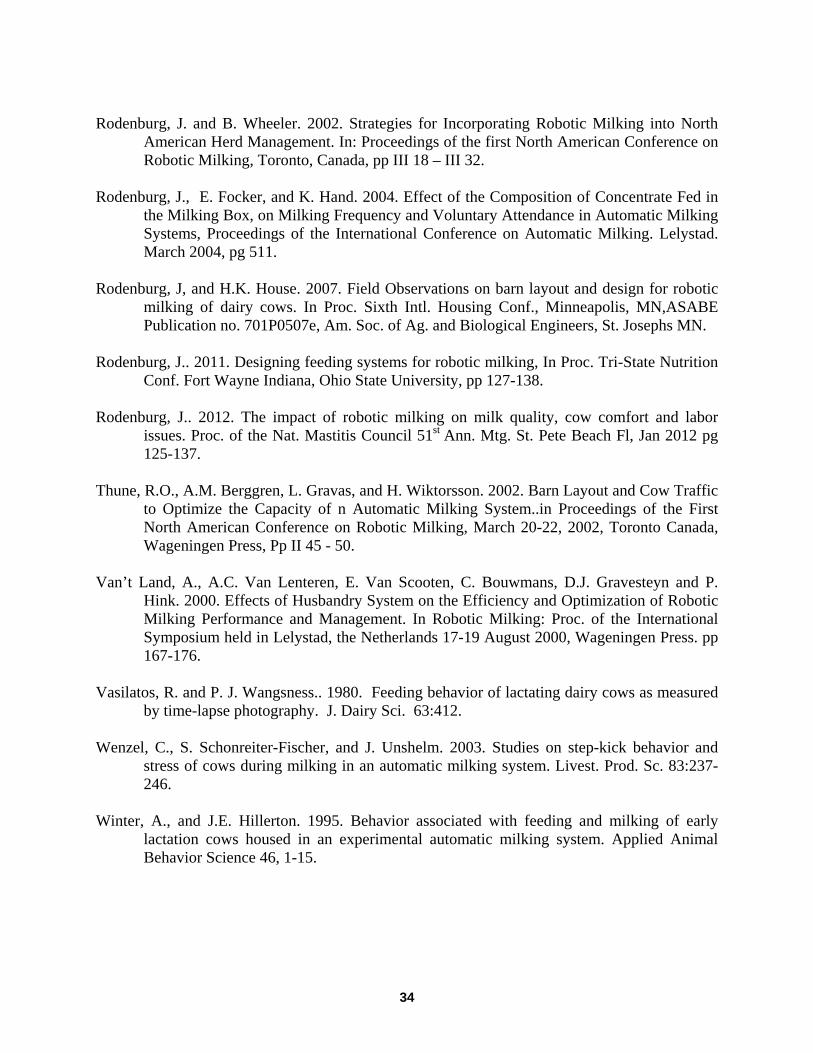
Rodenburg, J. and B. Wheeler. 2002. Strategies for Incorporating Robotic Milking into North
American Herd Management. In: Proceedings of the first North American Conference on Robotic Milking, Toronto, Canada, pp III 18 – III 32.
Rodenburg, J., E. Focker, and K. Hand. 2004. Effect of the Composition of Concentrate Fed in
the Milking Box, on Milking Frequency and Voluntary Attendance in Automatic Milking Systems, Proceedings of the International Conference on Automatic Milking. Lelystad. March 2004, pg 511.
Rodenburg, J, and H.K. House. 2007. Field Observations on barn layout and design for robotic
milking of dairy cows. In Proc. Sixth Intl. Housing Conf., Minneapolis, MN,ASABE Publication no. 701P0507e, Am. Soc. of Ag. and Biological Engineers, St. Josephs MN.
Rodenburg, J.. 2011. Designing feeding systems for robotic milking, In Proc. Tri-State Nutrition
Conf. Fort Wayne Indiana, Ohio State University, pp 127-138. Rodenburg, J.. 2012. The impact of robotic milking on milk quality, cow comfort and labor
issues. Proc. of the Nat. Mastitis Council 51st Ann. Mtg. St. Pete Beach Fl, Jan 2012 pg 125-137.
Thune, R.O., A.M. Berggren, L. Gravas, and H. Wiktorsson. 2002. Barn Layout and Cow Traffic
to Optimize the Capacity of n Automatic Milking System..in Proceedings of the First North American Conference on Robotic Milking, March 20-22, 2002, Toronto Canada, Wageningen Press, Pp II 45 - 50.
Van’t Land, A., A.C. Van Lenteren, E. Van Scooten, C. Bouwmans, D.J. Gravesteyn and P.
Hink. 2000. Effects of Husbandry System on the Efficiency and Optimization of Robotic Milking Performance and Management. In Robotic Milking: Proc. of the International Symposium held in Lelystad, the Netherlands 17-19 August 2000, Wageningen Press. pp 167-176.
Vasilatos, R. and P. J. Wangsness.. 1980. Feeding behavior of lactating dairy cows as measured
by time-lapse photography. J. Dairy Sci. 63:412. Wenzel, C., S. Schonreiter-Fischer, and J. Unshelm. 2003. Studies on step-kick behavior and
stress of cows during milking in an automatic milking system. Livest. Prod. Sc. 83:237-246.
Winter, A., and J.E. Hillerton. 1995. Behavior associated with feeding and milking of early
lactation cows housed in an experimental automatic milking system. Applied Animal Behavior Science 46, 1-15.
34
HOUSING, MANAGEMENT AND ANIMAL WELFARE CHARACTERISTICS OF FARMS USING AUTOMATIC MILKING SYSTEMS
J. A. Salfer1, M. I. Endres1, D. W. Kammel2;
1University of Minnesota, St. Paul, Minnesota, USA 2University of Wisconsin, Madison, Wisconsin, USA
Introduction Although relatively uncommon in the United States, worldwide there were over 8000 automatic milking system (AMS) units in 2009 (De Koning, 2010). However, over the past 5 years there has been a rapid adoption in the use of AMS throughout North America. Very few research studies have been conducted to characterize barn design and animal welfare of farms using AMS units in the upper Midwest. Objectives The objective of this study was to describe housing and management characteristics of farms in Minnesota and Wisconsin using AMS. A second objective was to evaluate the association between stall surface and some animal welfare measurements on farms using AMS. Materials and Methods Fifty-two farms using AMS were visited from June to September 2012. All farms were visited once during the study period. Data were collected on facility layout and design. A random sample of a minimum of 30% of the cows in each pen were scored for locomotion using a 5-point scoring system (1=perfect locomotion; 5=severely lame). Cows scored for locomotion were also scored for hygiene based on the amount of dirt on the udder and lower hind legs on a 5-point system (1 =very clean and 5= very dirty) and severe (swollen or open sores) hock lesions were recorded. Data were analyzed using descriptive statistics (mean, range, standard deviation) for housing and management characteristics. Proc Mixed (SAS 9.2, SAS Institute) was used to evaluate the association between stall surface and animal welfare measurements. Results Farms averaged 2.6±1.6 AMS/farm (range of 1-8 AMS/farm). Farms averaged 1.4 robots/pen (range of 1 to 3 robots/pen). The average number of freestalls per pen was 78 ± 31. Thirty-two barns had new cow housing facilities that were designed specifically for AMS milking. Twenty-three barns retrofitted AMS units in existing barns. Some farms had both retrofit and new facilities. Automatic manure removal systems were preferred. Twenty-five farms had automatic alley scrapers, 11 had slatted floors, 3 were bedded packs and only 14 farms scraped alleys manually.
35
There are two general types of cow flow in AMS - free flow and guided flow. In free flow systems cows are able to access feed, lying areas and the milking box with no restrictions. In guided flow systems, there are one-way gates that allow access to feeding or lying area but block cows from returning back without going through a sort gate. This sort gate identifies the cows and sorts eligible cows to the milking area or ineligible cows to the resting or feeding area. Forty farms had exclusively free flow cow traffic, 12 farms had exclusively guided flow traffic and 1 farm had both a free flow and guided flow cow traffic system in separate barns. Guided flow traffic and number of farms were: freestall to AMS to feed (9), feed to AMS to feed (2), feed to AMS to freestall (2). Most of the farms (47) had total confinement housing, but the majority of the summer forage on 5 farms was pasture, with 4 farms being certified organic. Thirty-five of the farms were naturally ventilated, 11 were tunnel ventilated and 7 were cross-ventilated. Forty-five of the farms had mechanical rotating brushes. Average feed bunk space was 50.5 ± 13.5 cm/cow with a range of 25.9 to 106.7 cm/cow. Open area in front of the robot was 44.7 ± 29.4 m2 and ranged from 11.1 to 187.3 m2. Protected AMS exit lane was 3.1 ± 2.4 m and ranged from 0.3 to 8.5 m. Drinking space was 6 ± 2.8 cm/cow and ranged from 0.5 to 11.8 cm/cow. Eleven of the farms had robotic feed pushers that pushed up the ration on a pre-determined schedule. Animal Welfare Measurements Lying surface and number of farms were: mattresses (M; 22), sand (S; 14), waterbeds (W; 7), mattress and pasture (P; 5) and bedded pack (BP; 3). Lameness prevalence (% locomotion score ≥3) was higher for M (40.9) than P (21.5; P<0.001), S (22.5; P<0.001) and BP (19.0; P=0.006), but similar to W (35.3). Lameness prevalence was similar for BP, P and S. Severe lameness prevalence (% locomotion score ≥4) was lower for P (2.7) than M (8.5; P<0.05) and W (10.2; P=0.03). Severe lameness prevalence tended to be lower for S (4.3) than M and W (P=0.07; P=0.06) and also tended to be lower for BP (1.7) than M and W (P=0.09; P=0.06). Prevalence of dirty cows (hygiene score > 3) was lower for S (16.8) than BP (45.3; P<0.05), M (41.9; P=0.001), P (39.5; P<0.03) and W (46.3; P=0.004). Mattress, S, W and P were all similar. Prevalence of severely dirty (hygiene score >4) cows was lower for S (1.8) than BP (14.6; P<0.05) and W (11.1; P<0.05) and tended to be lower than M (8.5; P=0.06) and P (10.6; P=0.06). Severe hock lesion prevalence was greater for M (17.2) than S (3.8; P<0.001), W (7.8; P=0.02) and BP (1.7; P=0.006), and tended (P=0.06) to be greater than P (9.9). Sand, W, BP, and P were similar. Results indicate that compared to previous studies in the Midwest, cows on AMS farms had higher lameness prevalence than cows housed in similar stall surfaces in other types of barns. This could be due to reduced footbath use on these AMS farms. Results also showed that cows on mattresses had greater prevalence of hock lesions compared to other surfaces. In addition, AMS barn designs were similar in some aspects to other types of cow housing systems. References De Koning, C.J.A.M., 2010, Automatic Milking - Common Practice on Dairy Farms, Proc. of the
First North American Conference on Precision Dairy Management, pp 52 – 67.
36
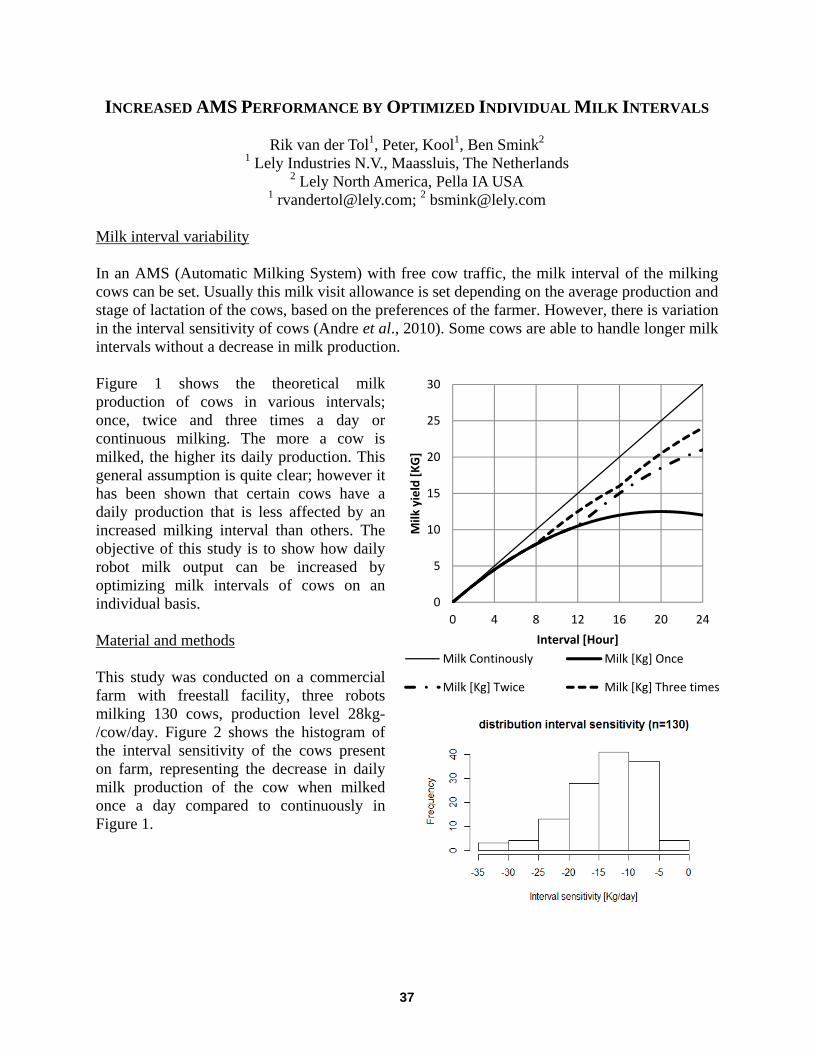
INCREASED AMS PERFORMANCE BY OPTIMIZED INDIVIDUAL MILK INTERVALS
Rik van der Tol1, Peter, Kool1, Ben Smink2 1 Lely Industries N.V., Maassluis, The Netherlands
2 Lely North America, Pella IA USA 1 [email protected]; 2 [email protected]
Milk interval variability In an AMS (Automatic Milking System) with free cow traffic, the milk interval of the milking cows can be set. Usually this milk visit allowance is set depending on the average production and stage of lactation of the cows, based on the preferences of the farmer. However, there is variation in the interval sensitivity of cows (Andre et al., 2010). Some cows are able to handle longer milk intervals without a decrease in milk production. Figure 1 shows the theoretical milk production of cows in various intervals; once, twice and three times a day or continuous milking. The more a cow is milked, the higher its daily production. This general assumption is quite clear; however it has been shown that certain cows have a daily production that is less affected by an increased milking interval than others. The objective of this study is to show how daily robot milk output can be increased by optimizing milk intervals of cows on an individual basis. Material and methods This study was conducted on a commercial farm with freestall facility, three robots milking 130 cows, production level 28kg-/cow/day. Figure 2 shows the histogram of the interval sensitivity of the cows present on farm, representing the decrease in daily milk production of the cow when milked once a day compared to continuously in Figure 1.
0
5
10
15
20
25
30
0 4 8 12 16 20 24
Milk
yie
ld [K
G]
Interval [Hour]Milk Continously Milk [Kg] Once
Milk [Kg] Twice Milk [Kg] Three times
37
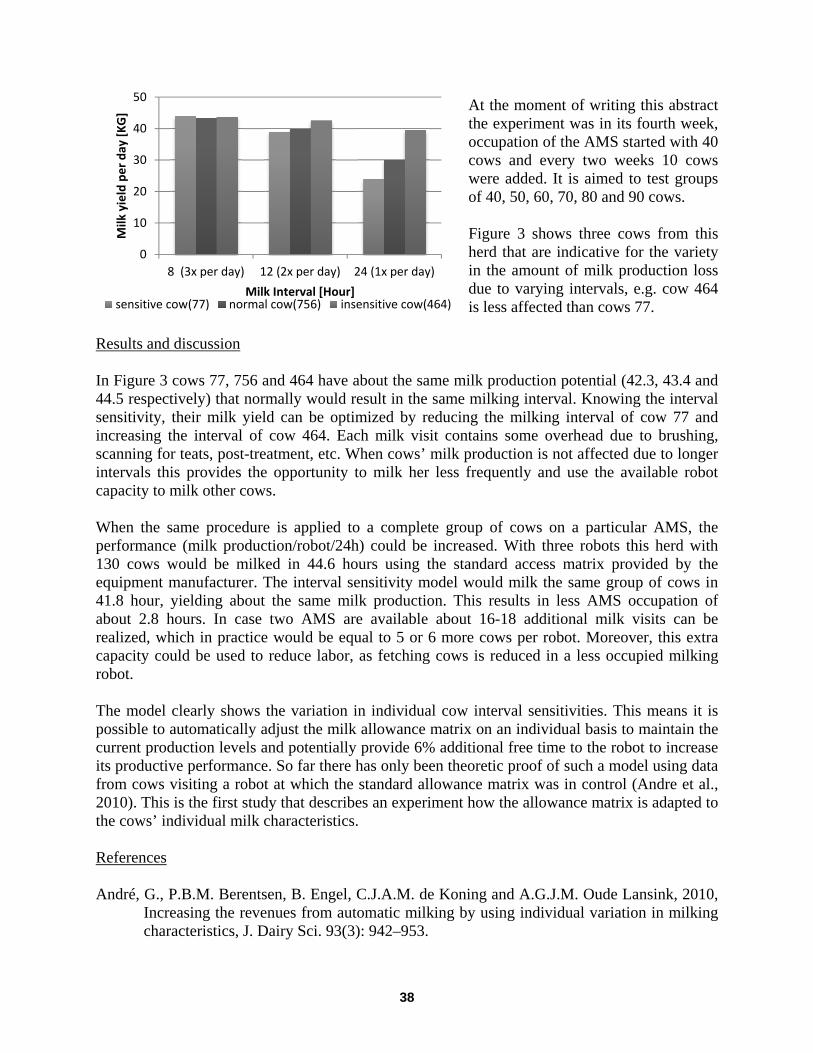
At the moment of writing this abstract the experiment was in its fourth week, occupation of the AMS started with 40 cows and every two weeks 10 cows were added. It is aimed to test groups of 40, 50, 60, 70, 80 and 90 cows. Figure 3 shows three cows from this herd that are indicative for the variety in the amount of milk production loss due to varying intervals, e.g. cow 464 is less affected than cows 77.
Results and discussion In Figure 3 cows 77, 756 and 464 have about the same milk production potential (42.3, 43.4 and 44.5 respectively) that normally would result in the same milking interval. Knowing the interval sensitivity, their milk yield can be optimized by reducing the milking interval of cow 77 and increasing the interval of cow 464. Each milk visit contains some overhead due to brushing, scanning for teats, post-treatment, etc. When cows’ milk production is not affected due to longer intervals this provides the opportunity to milk her less frequently and use the available robot capacity to milk other cows. When the same procedure is applied to a complete group of cows on a particular AMS, the performance (milk production/robot/24h) could be increased. With three robots this herd with 130 cows would be milked in 44.6 hours using the standard access matrix provided by the equipment manufacturer. The interval sensitivity model would milk the same group of cows in 41.8 hour, yielding about the same milk production. This results in less AMS occupation of about 2.8 hours. In case two AMS are available about 16-18 additional milk visits can be realized, which in practice would be equal to 5 or 6 more cows per robot. Moreover, this extra capacity could be used to reduce labor, as fetching cows is reduced in a less occupied milking robot. The model clearly shows the variation in individual cow interval sensitivities. This means it is possible to automatically adjust the milk allowance matrix on an individual basis to maintain the current production levels and potentially provide 6% additional free time to the robot to increase its productive performance. So far there has only been theoretic proof of such a model using data from cows visiting a robot at which the standard allowance matrix was in control (Andre et al., 2010). This is the first study that describes an experiment how the allowance matrix is adapted to the cows’ individual milk characteristics. References André, G., P.B.M. Berentsen, B. Engel, C.J.A.M. de Koning and A.G.J.M. Oude Lansink, 2010,
Increasing the revenues from automatic milking by using individual variation in milking characteristics, J. Dairy Sci. 93(3): 942–953.
0
10
20
30
40
50
8 (3x per day) 12 (2x per day) 24 (1x per day)
Milk
yie
ld p
er d
ay [K
G]
Milk Interval [Hour]sensitive cow(77) normal cow(756) insensitive cow(464)
38
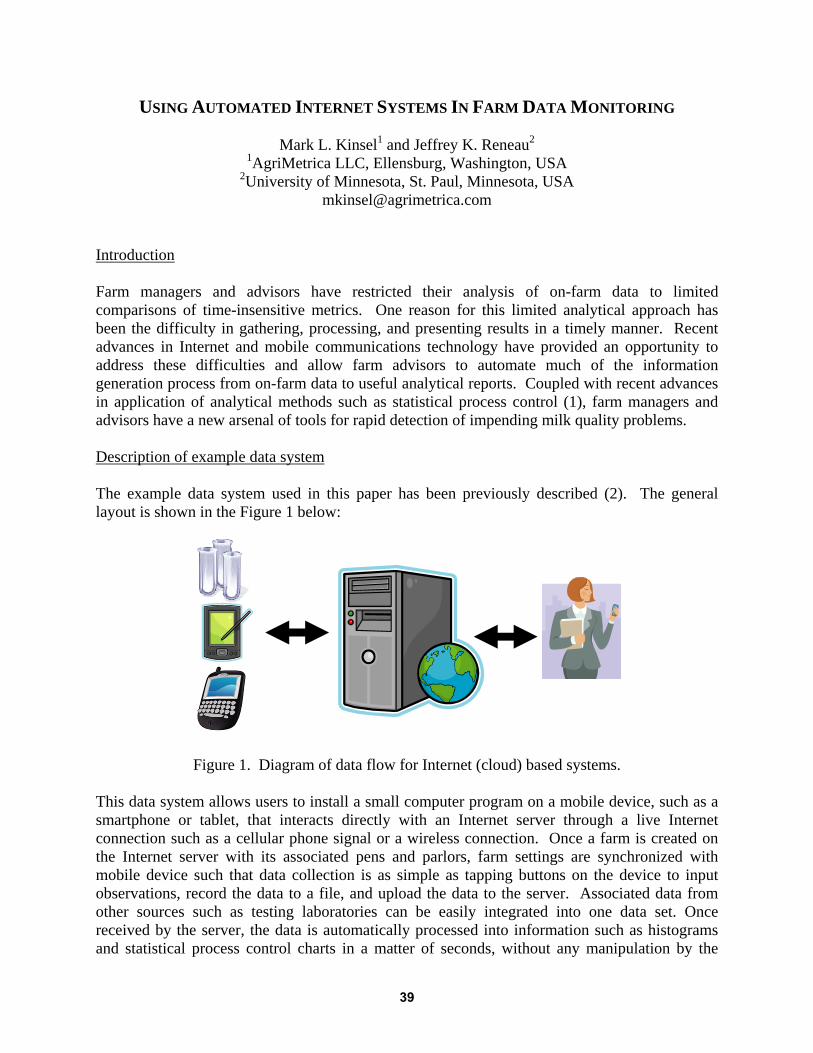
USING AUTOMATED INTERNET SYSTEMS IN FARM DATA MONITORING
Mark L. Kinsel1 and Jeffrey K. Reneau2 1AgriMetrica LLC, Ellensburg, Washington, USA
2University of Minnesota, St. Paul, Minnesota, USA [email protected]
Introduction Farm managers and advisors have restricted their analysis of on-farm data to limited comparisons of time-insensitive metrics. One reason for this limited analytical approach has been the difficulty in gathering, processing, and presenting results in a timely manner. Recent advances in Internet and mobile communications technology have provided an opportunity to address these difficulties and allow farm advisors to automate much of the information generation process from on-farm data to useful analytical reports. Coupled with recent advances in application of analytical methods such as statistical process control (1), farm managers and advisors have a new arsenal of tools for rapid detection of impending milk quality problems. Description of example data system The example data system used in this paper has been previously described (2). The general layout is shown in the Figure 1 below:
Figure 1. Diagram of data flow for Internet (cloud) based systems.
This data system allows users to install a small computer program on a mobile device, such as a smartphone or tablet, that interacts directly with an Internet server through a live Internet connection such as a cellular phone signal or a wireless connection. Once a farm is created on the Internet server with its associated pens and parlors, farm settings are synchronized with mobile device such that data collection is as simple as tapping buttons on the device to input observations, record the data to a file, and upload the data to the server. Associated data from other sources such as testing laboratories can be easily integrated into one data set. Once received by the server, the data is automatically processed into information such as histograms and statistical process control charts in a matter of seconds, without any manipulation by the
39
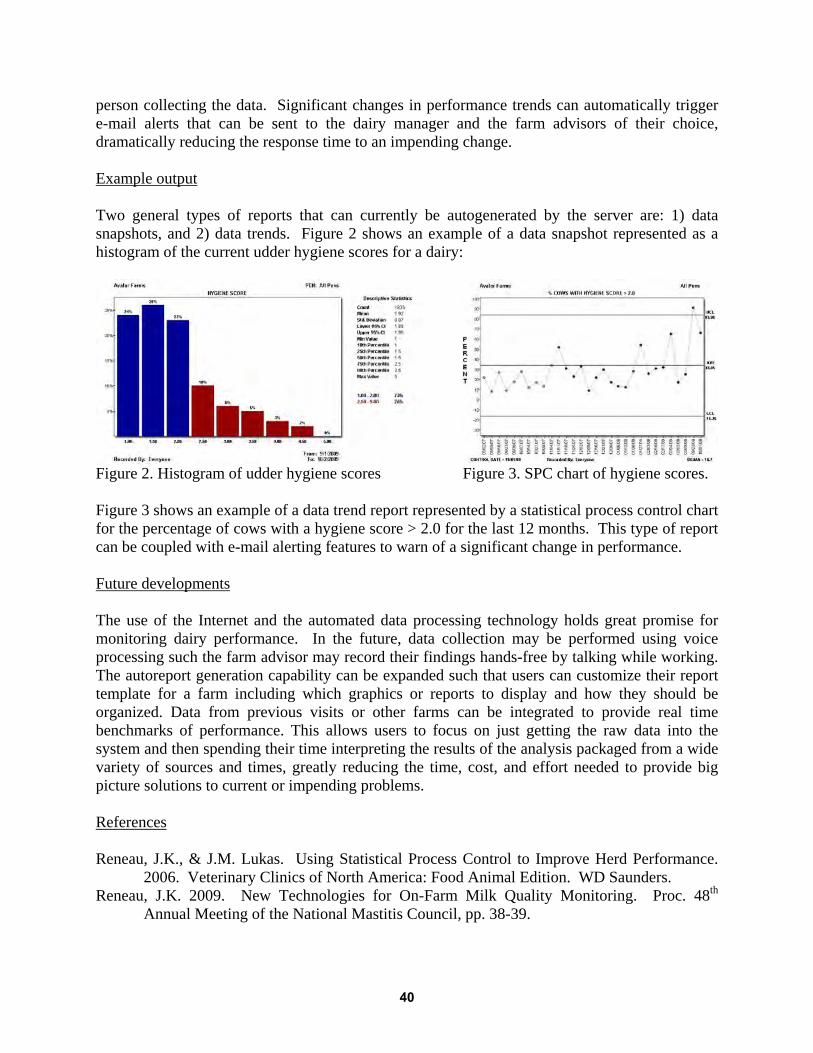
person collecting the data. Significant changes in performance trends can automatically trigger e-mail alerts that can be sent to the dairy manager and the farm advisors of their choice, dramatically reducing the response time to an impending change. Example output Two general types of reports that can currently be autogenerated by the server are: 1) data snapshots, and 2) data trends. Figure 2 shows an example of a data snapshot represented as a histogram of the current udder hygiene scores for a dairy:
Figure 2. Histogram of udder hygiene scores Figure 3. SPC chart of hygiene scores. Figure 3 shows an example of a data trend report represented by a statistical process control chart for the percentage of cows with a hygiene score > 2.0 for the last 12 months. This type of report can be coupled with e-mail alerting features to warn of a significant change in performance. Future developments The use of the Internet and the automated data processing technology holds great promise for monitoring dairy performance. In the future, data collection may be performed using voice processing such the farm advisor may record their findings hands-free by talking while working. The autoreport generation capability can be expanded such that users can customize their report template for a farm including which graphics or reports to display and how they should be organized. Data from previous visits or other farms can be integrated to provide real time benchmarks of performance. This allows users to focus on just getting the raw data into the system and then spending their time interpreting the results of the analysis packaged from a wide variety of sources and times, greatly reducing the time, cost, and effort needed to provide big picture solutions to current or impending problems. References Reneau, J.K., & J.M. Lukas. Using Statistical Process Control to Improve Herd Performance.
2006. Veterinary Clinics of North America: Food Animal Edition. WD Saunders. Reneau, J.K. 2009. New Technologies for On-Farm Milk Quality Monitoring. Proc. 48th
Annual Meeting of the National Mastitis Council, pp. 38-39.
40
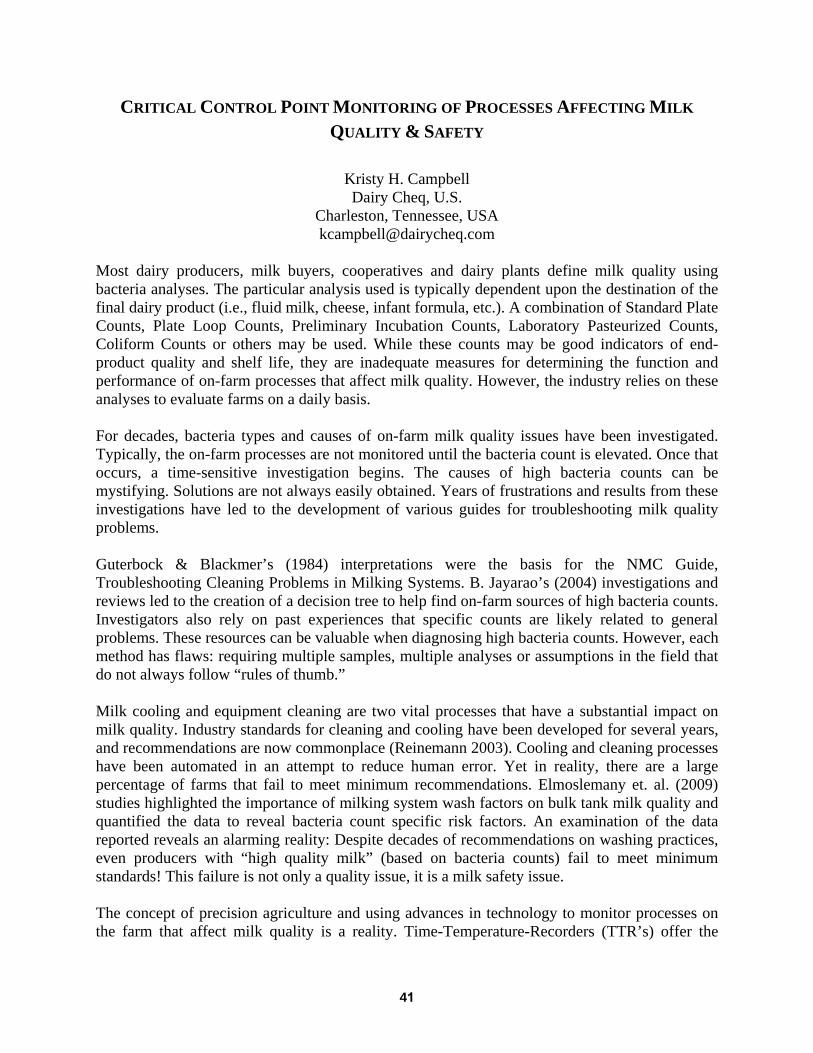
CRITICAL CONTROL POINT MONITORING OF PROCESSES AFFECTING MILK
QUALITY & SAFETY
Kristy H. Campbell Dairy Cheq, U.S.
Charleston, Tennessee, USA [email protected]
Most dairy producers, milk buyers, cooperatives and dairy plants define milk quality using bacteria analyses. The particular analysis used is typically dependent upon the destination of the final dairy product (i.e., fluid milk, cheese, infant formula, etc.). A combination of Standard Plate Counts, Plate Loop Counts, Preliminary Incubation Counts, Laboratory Pasteurized Counts, Coliform Counts or others may be used. While these counts may be good indicators of end-product quality and shelf life, they are inadequate measures for determining the function and performance of on-farm processes that affect milk quality. However, the industry relies on these analyses to evaluate farms on a daily basis. For decades, bacteria types and causes of on-farm milk quality issues have been investigated. Typically, the on-farm processes are not monitored until the bacteria count is elevated. Once that occurs, a time-sensitive investigation begins. The causes of high bacteria counts can be mystifying. Solutions are not always easily obtained. Years of frustrations and results from these investigations have led to the development of various guides for troubleshooting milk quality problems. Guterbock & Blackmer’s (1984) interpretations were the basis for the NMC Guide, Troubleshooting Cleaning Problems in Milking Systems. B. Jayarao’s (2004) investigations and reviews led to the creation of a decision tree to help find on-farm sources of high bacteria counts. Investigators also rely on past experiences that specific counts are likely related to general problems. These resources can be valuable when diagnosing high bacteria counts. However, each method has flaws: requiring multiple samples, multiple analyses or assumptions in the field that do not always follow “rules of thumb.” Milk cooling and equipment cleaning are two vital processes that have a substantial impact on milk quality. Industry standards for cleaning and cooling have been developed for several years, and recommendations are now commonplace (Reinemann 2003). Cooling and cleaning processes have been automated in an attempt to reduce human error. Yet in reality, there are a large percentage of farms that fail to meet minimum recommendations. Elmoslemany et. al. (2009) studies highlighted the importance of milking system wash factors on bulk tank milk quality and quantified the data to reveal bacteria count specific risk factors. An examination of the data reported reveals an alarming reality: Despite decades of recommendations on washing practices, even producers with “high quality milk” (based on bacteria counts) fail to meet minimum standards! This failure is not only a quality issue, it is a milk safety issue. The concept of precision agriculture and using advances in technology to monitor processes on the farm that affect milk quality is a reality. Time-Temperature-Recorders (TTR’s) offer the
41
opportunity to closely monitor processes such as wash temperatures, chemical levels, agitation cycles, rates of cooling and more on a continuous basis. The purpose is to continually record events so that when something occurs outside of a defined range, there is a record. Through critical control point monitoring, anomalies are quickly revealed. The use of TTR’s in the United States is not a novel idea. However, TTR’s have only been required on new bulk tanks since 2000, focusing solely on milk and wash temperatures, which is a very small component of the overall ‘health’ of the system. It is no longer sufficient, responsible or wise to rely solely on bacteria tests to monitor on-farm milk quality and the processes involved with producing high quality milk. Advances in technology allow us to approach this continual challenge from a different angle. Farms of all types, from small to large, from simple to complex, can utilize and benefit from TTR’s with 1) early detection of equipment/personnel malfunctions; 2) improved equipment maintenance and employee training; and ultimately 3) improved quality and safety of milk shipped. Milk buyers benefit from the utilization of TTR’s by receiving a more consistent, higher quality raw product and fewer quality issues that result in significant investments of time and expense to market poorer quality milk. The use of TTRs can make producing high quality milk on a daily basis easier and more economical. References Elmoslemany, A.M., G.P. Keefe, I.R. Dohoo, and B.M. Jayarao. 2009. Risk factors for
bacteriological quality of bulk tank milk in Prince Edward Island dairy herds. Part 1: Overall risk factors. J. Dairy Sci. 92:2634-2643.
Guterbock, W.M., and P.E. Blackmer. 1984. Veterinary Interpretation of Bulk Tank Milk. Vet. Clin. North Am. Large Anim. Pract. Vol. 6:257-268.
Jayarao, B.M. 2004. Bulk Tank Milk Analysis: Diagnostic Tools and Applications to Assess Milk Quality and Herd Health Status – A Review. Presented at Quality Milk Production Services Symposium. Slides retrieved from: http://vbs.psu.edu/extension/resources-repository/presentations/PP-BTMA-Tools-Applications-Jayarao.pdf
Reinemann, D.J., G.M.V.H. Wolters, P. Billon, O. Lind and M.D. Rasmussen. 2003. Review of Practices for Cleaning and Sanitation of Milking Machines. Int. Dairy Fed. Bulletin 381.
42
Effects of Pre versus Post-Milking Supplementation on Cow Traffic and Performance in a Pasture-Based Automatic Milking System
Nicolas A. Lyons, Kendra L. Kerrisk and Sergio C. Garcia
FutureDairy - The University of Sydney Camden, New South Wales, Australia
[email protected] Introduction Cows milked in pasture-based automatic milking systems (AMS) have lower daily milking frequency (MF) in comparison with cows milked in indoor AMS. Milking intervals (MI) exceeding 16 hours have a negative impact on yield (Schmidt, 1960), and udder health (Hammer et al., 2012), and therefore it is important to minimize their occurrence. In pasture-based AMS, about 30% of all milking events can have intervals above 16 h (Lyons, unpublished data). Feed is the most reliable incentive encouraging cow traffic (Prescott et al., 1998), and therefore timing, placement and frequency of allocations have been studied to enhance cow traffic. To date there are no published studies reporting on the impact of location of supplementary feed on either MI in grazing systems, or the time spent in different areas of the farm system. In this study, cows trafficked voluntarily from the paddock to the dairy, and received feed either prior to (PRE) or after (POST) milking. The hypothesis was that PRE cows would have a stronger incentive to return from the paddock to the dairy, due to the expectation of receiving an immediate reward, therefore reducing their MI and increasing daily MF and milk yield. Material and Methods A study was conducted during September and October 2011 at the FutureDairy AMS research dairy (Camden, NSW, Australia). A mixed age herd of 178 cows was randomized into 2 groups, but managed as a single herd. Treatments were allocated to each group in a cross over design trial with 2 periods of 13 days each (7 days adaptation followed by 6 days of data collection). Each animal had a unique electronic transponder to log time spent by individual cows in different areas as well as milk yield. All cows were milked in a 16-bail prototype robotic rotary (AMR, DeLaval, Sweden; Kolbach et al., 2012). Cows were granted access to 2 allocations of pasture per 24-hr period, referred to as ‘day’ and ‘night’ allocations. An active access time of 12 hours per allocation was followed by a 10 hour ‘voluntary exit’ period, in which cows were expected to voluntarily move to the next pasture allocation. Pelleted concentrates were supplied through four automatic feeding stations (FSC400, DeLaval, Sweden), and a PMR ration was offered on an adjacent feeding area. Milking interval was subdivided into 3 main time components: time to return to the dairy, feeding area time, and waiting area time. Milking frequency and daily yield were also explored.
43
Results and Discussion The PRE cows took 1.5 hours less to return to the dairy (PRE = 11:54 vs. POST = 13:16 hrs), but spent 30 minutes longer in each of the feeding area (PRE = 0:56 vs. POST = 0:23 hrs), and pre-milking waiting area (PRE = 1:37 vs. POST = 1:17 hrs). Overall, their milking intervals were 1 hour longer than the POST group (PRE = 15:18 vs. POST = 14:17 hrs). Overall, the PRE group had a lower MF (PRE = 1.58 vs. POST = 1.67 milkings/day) but similar daily milk yield (PRE = 19.29 and POST = 19.45 kg milk/cow/day). Offering supplementary feed before milking appears to be a stronger incentive for cows to walk from the paddock to the dairy. However, the apparent initial advantage of a reduction in return time for PRE cows was offset by an increase in feeding and waiting area times. Given that milking is not a strong reward per se (Prescott et al., 1998), PRE cows may have a reduced motivation to move onto the milking platform, because the access to PRE feed may have been sufficient to abate their appetite, or they engaged in other activities (e.g. ruminating). The lack of a treatment effect on daily milk yield indicates that the impact on milking interval, although significant, was small and not sufficient to affect yield. It is possible that a further reduction in MI could be obtained from a combination of feeding location options, by which some feed is offered PRE and some POST. Design of dairy and feeding layout for AMS installations, should consider the allowance for flexible management for different levels of supplementary feeding. Future research and analysis should focus on trying to reduce the time cows spend in feeding and waiting area. Conclusion In pasture-based AMS and under the conditions of this study, pre-feeding cows reduced time to return to the dairy, but increased time spent in feeding and waiting areas, resulting in a higher overall milking interval, but no change in daily milk yield. The authors acknowledge the support of Dairy Australia, NSW Department of Primary Industries, University of Sydney, and DeLaval as investors in the FutureDairy project. Hammer, J. F., Morton, J. M. and Kerrisk, K. L. 2012. Quarter-milking-, quarter-, udder- and
lactation-level risk factors and indicators for clinical mastitis during lactation in pasture-fed dairy cows managed in an automatic milking system. Aust. Vet. J., 90, 167-174.
Kolbach, R., Kerrisk, K. L., García, S. C. and Dhand, N. K. 2012. Attachment accuracy of a novel prototype robotic rotary and investigation of two management strategies for incomplete milked quarters. Comput. Electron. Agric., 88, 120-124.
Prescott, N. B., Mottram, T. T. and Webster, A. J. F. 1998. Relative motivations of dairy cows to be milked or fed in a Y-maze and an automatic milking system. Appl. Anim. Behav. Sci., 57, 23-33.
Schmidt, G. H. 1960. Effect of milking intervals on the rate of milk and fat secretion. J. Dairy Sci., 43, 213-219.
44
45
ROBOTIC MILKING PRODUCER PANEL
JUNE 26, 1:30 PM
Bradley Biehl
Corner View Farm
Kutztown, Pennsylvania
Bradley Biehl is a fourth generation dairy farmer from Kutztown, Pennsylvania. He partnered with his father, Dalton Biehl, to install the first US Astrea 20.20, 2-stall robotic milking system by AMS Galaxy USA. Brad holds a B.S. and M.S. in mechanical engineering from the Pennsylvania State University and designed the new fully automated facility that milks 120 cows. Brad will share the challenges and successes that a small family dairy can expect when transitioning from a typical 60-cow tie stall operation to an automatic milking system. Doubling the number of cows milked, a 30% increase in production and only adding a fraction of the labor could only be possible with precision technology, which includes programmable and iPhone controlled lighting, curtains, sprinklers, fans, IP cameras, and a single robotic arm that milks cows in 2 stalls.
Erica Kiestra
Kie Farms, Ltd.
St. Mary's, Ontario, Canada
Dirk and Erica Kiestra of Kie Farms milk 90 cows in a new MIone 2-box automatic milking system from GEA Farm Technologies. The Kiestra family has also embraced automated technology in many other areas of their dairy as well. They utilize robotic manure scraping as well as automated climate control and the latest ventilation systems. In addition, many management tasks on their operation can be monitored remotely via an internet camera system. And, the Kiestra’s still put production and milk quality first. They have a 93 lb per cow herd average, with cows milking 3.5 times per day on average. Their SCC is 65,000 and their bactoscan is 5. In the future, the Keistra’s hope to expand their 2-box system to a 4-box system.
Tom Oesch
SwissLane Dairy
Alto, Michigan
SwissLane Dairy Farms is a fourth generation operation established in 1915 in Alto, Michigan. In 2011, the farm broke ground to add an additional facility and started milking in the facility that November. The expansion added 500 cows, eight automatic milking systems (AMS), manure lagoon, dry cow facility, and cropping acres. The freestall barn for the milking cows has 8 Lely Astronaut Milking Robots where the cows are managed in the “Free Flow” environment. Ally scrapers, sprinkler system and fans were also included in the sand bedded freestall barn. The dry cow and heifer freestall barn includes maternity pens. The milk is directly loaded into tankers. There is also a viewing area for visitors to watch the Milking Robots in action. There are 4 full-time and 3 part-time employees. Currently, SwissLane Farms includes 2,000 milking cows, 1,800 replacement heifers, 400 steers, and 4,500 cropping acres. Tom worked as a Dairy Nutrition Consultant before returning to the family farm. Tom oversees the 8-robot dairy and
provides nutritional support for the entire SwissLane Dairy operation. Tom and his wife have 3 children and reside in rural Alto.
Jake Peissig
JTP Farms
Dorchester, Wisconsin
The Peissigs (Jake and Tolea, and Tom and Peggy) own JTP Farms in Dorchester, Wisconsin. Jake and his father Tom farm 500 acres along with managing a 285-cow herd utilizing four Delaval VMS’s. The facility, located on a completely new site, includes 4/56 stall groups, cross-ventilated barn, sand bedding, and a special needs pre-fresh area. Before the robotic dairy was built, the Peissigs were milking 120 cows in an outdated freestall barn with limited stall comfort, and milking in a double-4 flat-barn parlor. When expansion was on the horizon, Jake and Tom realized the benefits of cow comfort, but labor was the selling point on the robotic option. Along with the labor savings, the herd management options are much farther advanced with the future expandability of technology a definite selling point. Since startup in January 2012, JTP has seen a steady growth in milk production, a lower cull rate, and overall better herd health. The Peissigs are able to operate their facility including the raising of all youngstock using only 2 full time people. Currently JTP milks 62 to 67 cows per VMS, consistently averages over 6,000 lb per robot per day across all 4 robots, and 95 to100 lb per cow per day. Paying special attention to cow comfort and operator ease are some of the reasons that make this robotic operation so successful.
Harry VanWieren
Four Clover Dairy Inc.
Thedford, Ontario, Canada
In 2000, the VanWieren family moved to Canada from Holland and bought a 100-acre farm that they currently run. After the dairy facility was built, the milking of 100 cows began. In February 2013, 3 MR-S1 BouMatic Robotics Automated Milkers replaced the double-10 parallel parlor milking 140 cows. Four Clover Dairy Inc. currently owns 300 acres and rents 85 acres to grow hay and corn. The farm is a family run operation, with a tractor driver hired to haul wagons for haylage and corn silage harvests. The dairy barn has 150 freestalls and bedded straw pack for dry and sick cows. The stalls are bedded with sawdust that is applied twice daily. The barn is cooled with fans and sprinklers, and manure is moved out with chain alley scrapers. Cows are TMR fed with supplement, cottonseed, ground corn, brewers grain, haylage, and corn silage. Milk averages 69 lb, 4.3 butterfat, and 3.8 protein.
46
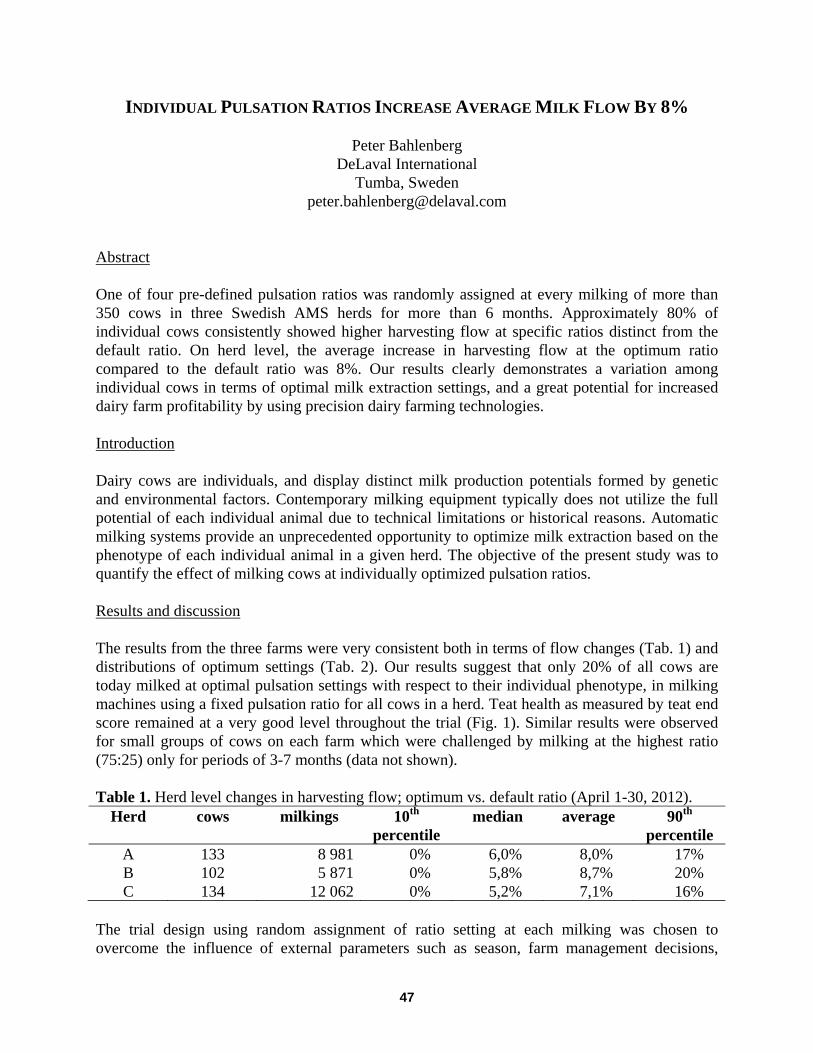
INDIVIDUAL PULSATION RATIOS INCREASE AVERAGE MILK FLOW BY 8%
Peter Bahlenberg DeLaval International
Tumba, Sweden [email protected]
Abstract One of four pre-defined pulsation ratios was randomly assigned at every milking of more than 350 cows in three Swedish AMS herds for more than 6 months. Approximately 80% of individual cows consistently showed higher harvesting flow at specific ratios distinct from the default ratio. On herd level, the average increase in harvesting flow at the optimum ratio compared to the default ratio was 8%. Our results clearly demonstrates a variation among individual cows in terms of optimal milk extraction settings, and a great potential for increased dairy farm profitability by using precision dairy farming technologies. Introduction Dairy cows are individuals, and display distinct milk production potentials formed by genetic and environmental factors. Contemporary milking equipment typically does not utilize the full potential of each individual animal due to technical limitations or historical reasons. Automatic milking systems provide an unprecedented opportunity to optimize milk extraction based on the phenotype of each individual animal in a given herd. The objective of the present study was to quantify the effect of milking cows at individually optimized pulsation ratios. Results and discussion The results from the three farms were very consistent both in terms of flow changes (Tab. 1) and distributions of optimum settings (Tab. 2). Our results suggest that only 20% of all cows are today milked at optimal pulsation settings with respect to their individual phenotype, in milking machines using a fixed pulsation ratio for all cows in a herd. Teat health as measured by teat end score remained at a very good level throughout the trial (Fig. 1). Similar results were observed for small groups of cows on each farm which were challenged by milking at the highest ratio (75:25) only for periods of 3-7 months (data not shown). Table 1. Herd level changes in harvesting flow; optimum vs. default ratio (April 1-30, 2012).
Herd cows milkings 10th percentile
median average 90th percentile
A 133 8 981 0% 6,0% 8,0% 17% B 102 5 871 0% 5,8% 8,7% 20% C 134 12 062 0% 5,2% 7,1% 16%
The trial design using random assignment of ratio setting at each milking was chosen to overcome the influence of external parameters such as season, farm management decisions,
47
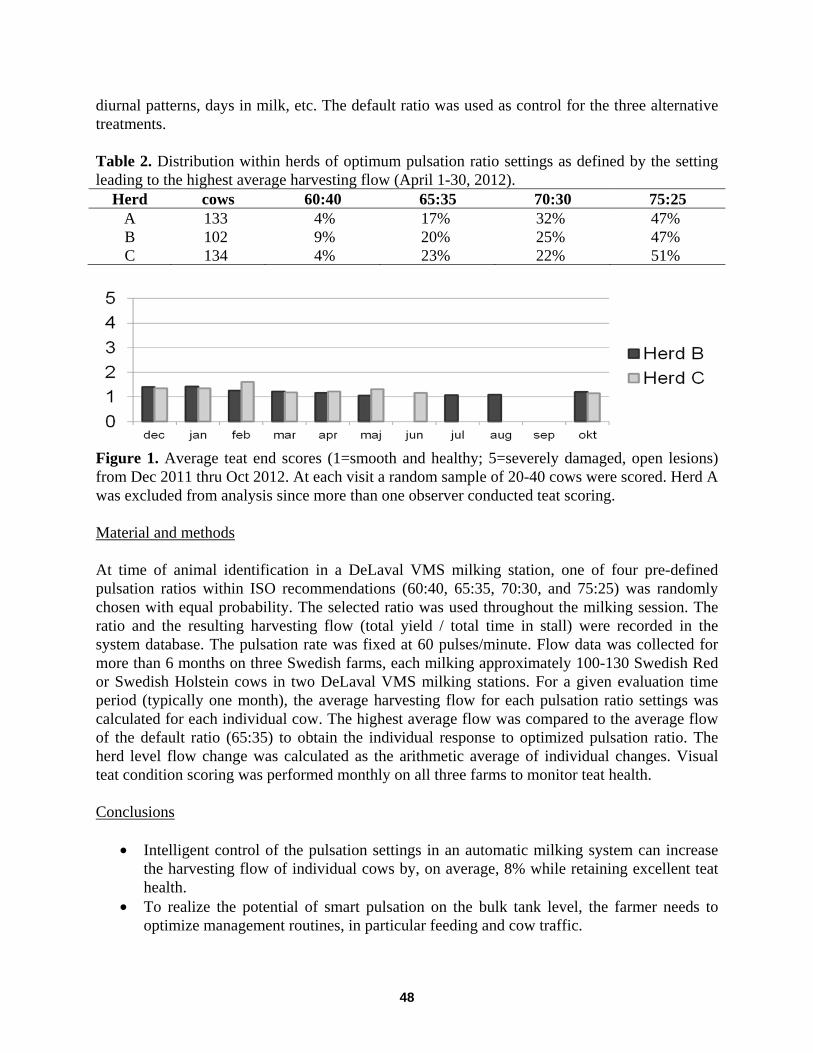
diurnal patterns, days in milk, etc. The default ratio was used as control for the three alternative treatments. Table 2. Distribution within herds of optimum pulsation ratio settings as defined by the setting leading to the highest average harvesting flow (April 1-30, 2012).
Herd cows 60:40 65:35 70:30 75:25 A 133 4% 17% 32% 47% B 102 9% 20% 25% 47% C 134 4% 23% 22% 51%
Figure 1. Average teat end scores (1=smooth and healthy; 5=severely damaged, open lesions) from Dec 2011 thru Oct 2012. At each visit a random sample of 20-40 cows were scored. Herd A was excluded from analysis since more than one observer conducted teat scoring. Material and methods At time of animal identification in a DeLaval VMS milking station, one of four pre-defined pulsation ratios within ISO recommendations (60:40, 65:35, 70:30, and 75:25) was randomly chosen with equal probability. The selected ratio was used throughout the milking session. The ratio and the resulting harvesting flow (total yield / total time in stall) were recorded in the system database. The pulsation rate was fixed at 60 pulses/minute. Flow data was collected for more than 6 months on three Swedish farms, each milking approximately 100-130 Swedish Red or Swedish Holstein cows in two DeLaval VMS milking stations. For a given evaluation time period (typically one month), the average harvesting flow for each pulsation ratio settings was calculated for each individual cow. The highest average flow was compared to the average flow of the default ratio (65:35) to obtain the individual response to optimized pulsation ratio. The herd level flow change was calculated as the arithmetic average of individual changes. Visual teat condition scoring was performed monthly on all three farms to monitor teat health. Conclusions
• Intelligent control of the pulsation settings in an automatic milking system can increase the harvesting flow of individual cows by, on average, 8% while retaining excellent teat health.
• To realize the potential of smart pulsation on the bulk tank level, the farmer needs to optimize management routines, in particular feeding and cow traffic.
48
THE ECONOMICS OF ROBOTIC MILKING SYSTEMS
Larry F. Tranel and Kristen M. Schulte Iowa State University Extension and Outreach
Dubuque, Iowa, USA [email protected]
Introduction Installation of Automatic Milking Systems (AMS) in Iowa is expected to continue. In order to assist dairy producers and their lenders make informed decisions on the economic variables associated with AMS consideration, these authors developed a partial budget and cash flow spreadsheet tool to compare an AMS with an alternative milking system. There are many variables which are “highly variable” meaning that slight changes in milk price or projected change in milk production, for instance, can significantly change the financial impact. There is still limited data for basing parameters or assumptions meaning producers and consultants have limited research data for projecting costs and incomes with high confidence levels. Yet, producers continue to adapt this high investment technology and need tools to help make decisions. AMS Survey Of Herd And Financial Assumptions In 2012, Iowa State University Extension and Outreach surveyed eight AMS producers regarding current versus prior practices relative to their AMS versus their previous system. On average these systems were only eight months old at the time of the survey. This survey data confirmed many previous financial assumptions which increased knowledge of AMS performance. Overall, 100% of producers surveyed agree that the AMS has been a good personal, financial, and management investment. These producers also agree it has improved cash flow, profitability, and improved their quality of life. An AMS has a high investment cost due to the automation of the milking system. Using producer survey data and assuming a 15 year useful life (producers estimated useful life at 13.75 years), an annual investment cost of $336.04 per cow or $1.42/cwt. is expected. If we decrease the years of useful life to 10, it is expected to cost $402.70 per cow or $1.70/cwt. annually. If factoring in the annual investment cost, plus labor cost, producers should expect a total annual investment of $1.77/cwt. for the 15 year life and $2.06/cwt. for the 10 years of useful life. AMS Partial Budget Analysis Tool The following page is an exhibit of a sample 144 cow herd that adapted from a milking parlor to an AMS. The top left portion consists of the “positive impacts” of increased incomes and decreased expenses. The top left portion consists of the “negative impacts” of increased expenses and decreased incomes. There are many variables that come into play. The bottom portions of the spreadsheet would include the input values for this particular herd.
49
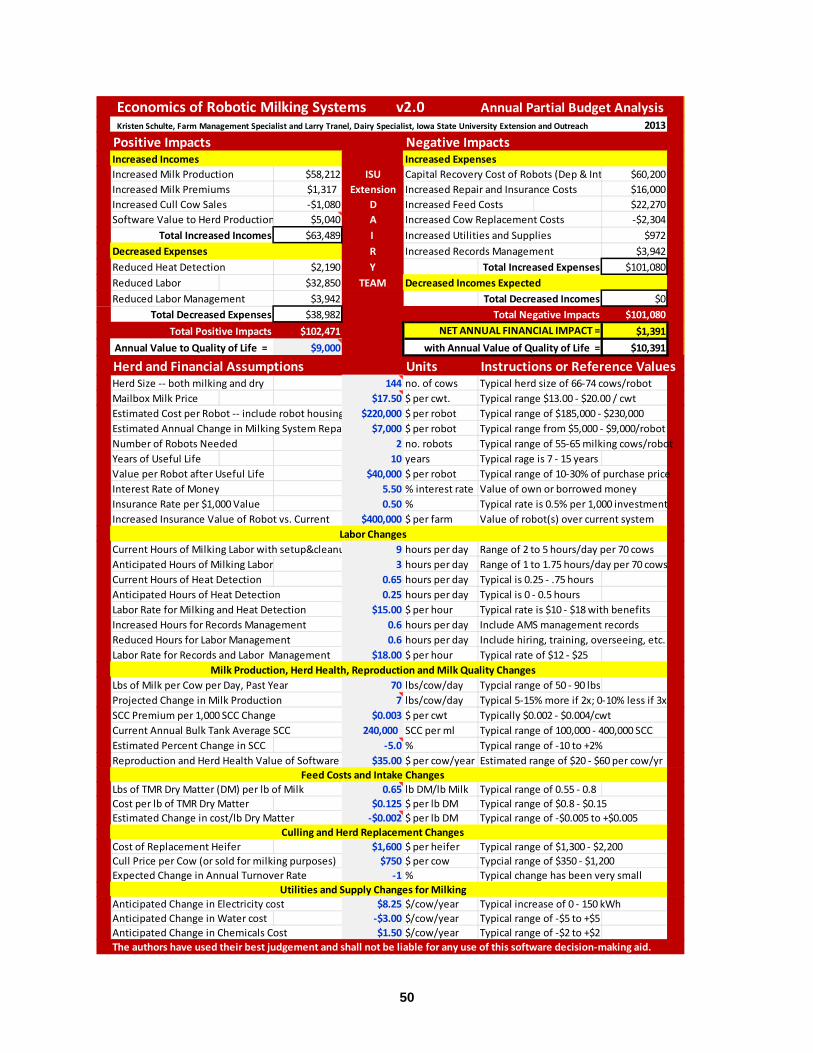
Economics of Robotic Milking Systems v2.0 Annual Partial Budget Analysis Kristen Schulte, Farm Management Specialist and Larry Tranel, Dairy Specialist, Iowa State University Extension and Outreach 2013
Positive Impacts Negative ImpactsIncreased Incomes Increased Expenses Increased Milk Production $58,212 ISU Capital Recovery Cost of Robots (Dep & Int $60,200Increased Milk Premiums $1,317 Extension Increased Repair and Insurance Costs $16,000Increased Cull Cow Sales -$1,080 D Increased Feed Costs $22,270Software Value to Herd Production $5,040 A Increased Cow Replacement Costs -$2,304
Total Increased Incomes $63,489 I Increased Utilities and Supplies $972Decreased Expenses R Increased Records Management $3,942Reduced Heat Detection $2,190 Y Total Increased Expenses $101,080Reduced Labor $32,850 TEAM Decreased Incomes Expected Reduced Labor Management $3,942 Total Decreased Incomes $0
Total Decreased Expenses $38,982 Total Negative Impacts $101,080
Total Positive Impacts $102,471 NET ANNUAL FINANCIAL IMPACT = $1,391
Annual Value to Quality of Life = $9,000 with Annual Value of Quality of Life = $10,391
Herd and Financial Assumptions Units Instructions or Reference ValuesHerd Size -- both milking and dry 144 no. of cows Typical herd size of 66-74 cows/robotMailbox Milk Price $17.50 $ per cwt. Typical range $13.00 - $20.00 / cwt Estimated Cost per Robot -- include robot housing $220,000 $ per robot Typical range of $185,000 - $230,000Estimated Annual Change in Milking System Repa $7,000 $ per robot Typical range from $5,000 - $9,000/robotNumber of Robots Needed 2 no. robots Typical range of 55-65 milking cows/robotYears of Useful Life 10 years Typical rage is 7 - 15 yearsValue per Robot after Useful Life $40,000 $ per robot Typical range of 10-30% of purchase priceInterest Rate of Money 5.50 % interest rate Value of own or borrowed moneyInsurance Rate per $1,000 Value 0.50 % Typical rate is 0.5% per 1,000 investmentIncreased Insurance Value of Robot vs. Current $400,000 $ per farm Value of robot(s) over current system
Labor ChangesCurrent Hours of Milking Labor with setup&cleanu 9 hours per day Range of 2 to 5 hours/day per 70 cowsAnticipated Hours of Milking Labor 3 hours per day Range of 1 to 1.75 hours/day per 70 cowsCurrent Hours of Heat Detection 0.65 hours per day Typical is 0.25 - .75 hoursAnticipated Hours of Heat Detection 0.25 hours per day Typical is 0 - 0.5 hoursLabor Rate for Milking and Heat Detection $15.00 $ per hour Typical rate is $10 - $18 with benefitsIncreased Hours for Records Management 0.6 hours per day Include AMS management recordsReduced Hours for Labor Management 0.6 hours per day Include hiring, training, overseeing, etc.Labor Rate for Records and Labor Management $18.00 $ per hour Typical rate of $12 - $25
Milk Production, Herd Health, Reproduction and Milk Quality ChangesLbs of Milk per Cow per Day, Past Year 70 lbs/cow/day Typcial range of 50 - 90 lbsProjected Change in Milk Production 7 lbs/cow/day Typical 5-15% more if 2x; 0-10% less if 3xSCC Premium per 1,000 SCC Change $0.003 $ per cwt Typically $0.002 - $0.004/cwtCurrent Annual Bulk Tank Average SCC 240,000 SCC per ml Typical range of 100,000 - 400,000 SCC Estimated Percent Change in SCC -5.0 % Typical range of -10 to +2%Reproduction and Herd Health Value of Software $35.00 $ per cow/year Estimated range of $20 - $60 per cow/yr
Feed Costs and Intake ChangesLbs of TMR Dry Matter (DM) per lb of Milk 0.65 lb DM/lb Milk Typical range of 0.55 - 0.8Cost per lb of TMR Dry Matter $0.125 $ per lb DM Typical range of $0.8 - $0.15Estimated Change in cost/lb Dry Matter -$0.002 $ per lb DM Typical range of -$0.005 to +$0.005
Culling and Herd Replacement ChangesCost of Replacement Heifer $1,600 $ per heifer Typical range of $1,300 - $2,200Cull Price per Cow (or sold for milking purposes) $750 $ per cow Typcial range of $350 - $1,200Expected Change in Annual Turnover Rate -1 % Typical change has been very small
Utilities and Supply Changes for MilkingAnticipated Change in Electricity cost $8.25 $/cow/year Typical increase of 0 - 150 kWhAnticipated Change in Water cost -$3.00 $/cow/year Typical range of -$5 to +$5Anticipated Change in Chemicals Cost $1.50 $/cow/year Typical range of -$2 to +$2The authors have used their best judgement and shall not be liable for any use of this software decision-making aid.
50
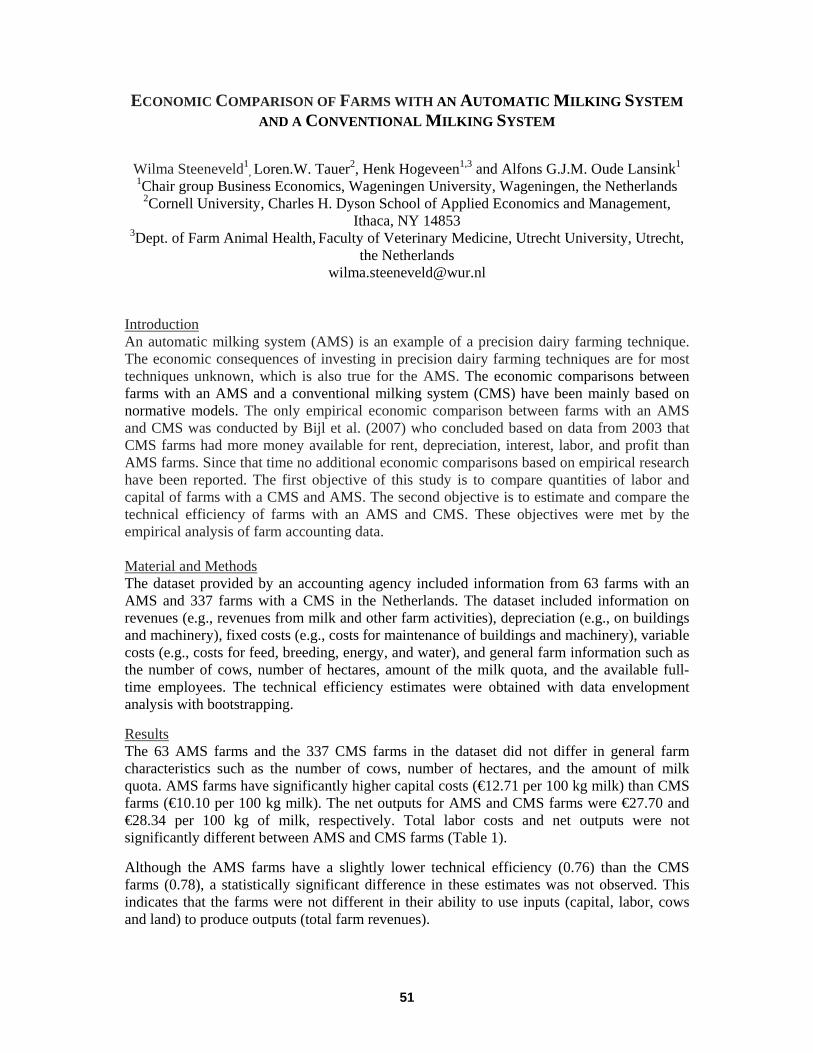
ECONOMIC COMPARISON OF FARMS WITH AN AUTOMATIC MILKING SYSTEM AND A CONVENTIONAL MILKING SYSTEM
Wilma Steeneveld1
, Loren.W. Tauer2, Henk Hogeveen1,3 and Alfons G.J.M. Oude Lansink1 1Chair group Business Economics, Wageningen University, Wageningen, the Netherlands
2Cornell University, Charles H. Dyson School of Applied Economics and Management, Ithaca, NY 14853
3Dept. of Farm Animal Health, Faculty of Veterinary Medicine, Utrecht University, Utrecht, the Netherlands
[email protected] Introduction An automatic milking system (AMS) is an example of a precision dairy farming technique. The economic consequences of investing in precision dairy farming techniques are for most techniques unknown, which is also true for the AMS. The economic comparisons between farms with an AMS and a conventional milking system (CMS) have been mainly based on normative models. The only empirical economic comparison between farms with an AMS and CMS was conducted by Bijl et al. (2007) who concluded based on data from 2003 that CMS farms had more money available for rent, depreciation, interest, labor, and profit than AMS farms. Since that time no additional economic comparisons based on empirical research have been reported. The first objective of this study is to compare quantities of labor and capital of farms with a CMS and AMS. The second objective is to estimate and compare the technical efficiency of farms with an AMS and CMS. These objectives were met by the empirical analysis of farm accounting data. Material and Methods The dataset provided by an accounting agency included information from 63 farms with an AMS and 337 farms with a CMS in the Netherlands. The dataset included information on revenues (e.g., revenues from milk and other farm activities), depreciation (e.g., on buildings and machinery), fixed costs (e.g., costs for maintenance of buildings and machinery), variable costs (e.g., costs for feed, breeding, energy, and water), and general farm information such as the number of cows, number of hectares, amount of the milk quota, and the available full-time employees. The technical efficiency estimates were obtained with data envelopment analysis with bootstrapping.
Results The 63 AMS farms and the 337 CMS farms in the dataset did not differ in general farm characteristics such as the number of cows, number of hectares, and the amount of milk quota. AMS farms have significantly higher capital costs (€12.71 per 100 kg milk) than CMS farms (€10.10 per 100 kg milk). The net outputs for AMS and CMS farms were €27.70 and €28.34 per 100 kg of milk, respectively. Total labor costs and net outputs were not significantly different between AMS and CMS farms (Table 1).
Although the AMS farms have a slightly lower technical efficiency (0.76) than the CMS farms (0.78), a statistically significant difference in these estimates was not observed. This indicates that the farms were not different in their ability to use inputs (capital, labor, cows and land) to produce outputs (total farm revenues).
51
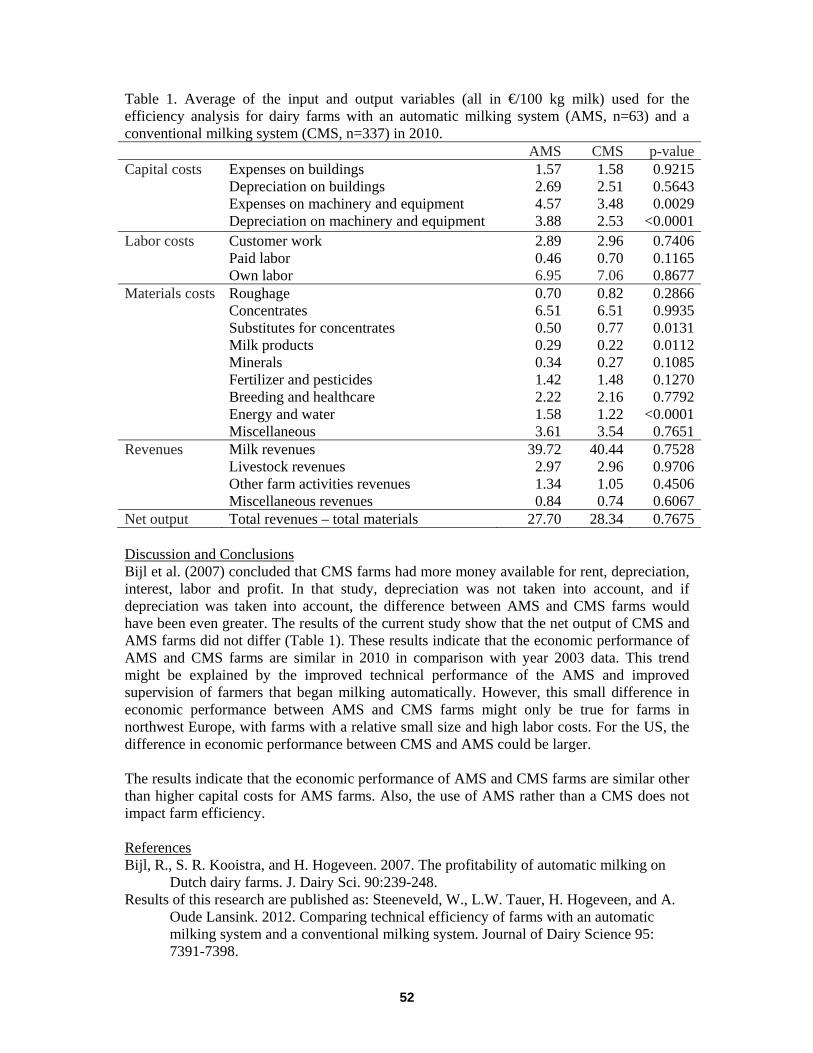
Table 1. Average of the input and output variables (all in €/100 kg milk) used for the efficiency analysis for dairy farms with an automatic milking system (AMS, n=63) and a conventional milking system (CMS, n=337) in 2010. AMS CMS p-value Capital costs Expenses on buildings
Depreciation on buildings Expenses on machinery and equipment Depreciation on machinery and equipment
1.57 2.69 4.57 3.88
1.58 2.51 3.48 2.53
0.9215 0.5643 0.0029
<0.0001Labor costs Customer work
Paid labor Own labor
2.890.46 6.95
2.96 0.70 7.06
0.7406 0.1165 0.8677
Materials costs Roughage Concentrates Substitutes for concentrates Milk products Minerals Fertilizer and pesticides Breeding and healthcare Energy and water Miscellaneous
0.706.510.500.290.341.42 2.221.583.61
0.82 6.51 0.77 0.22 0.27 1.48 2.16 1.22 3.54
0.2866 0.9935 0.0131 0.0112 0.1085 0.1270 0.7792
<0.0001 0.7651
Revenues Milk revenues Livestock revenues Other farm activities revenues Miscellaneous revenues
39.722.97 1.340.84
40.44 2.96 1.05 0.74
0.7528 0.9706 0.4506 0.6067
Net output Total revenues – total materials 27.70 28.34 0.7675 Discussion and Conclusions Bijl et al. (2007) concluded that CMS farms had more money available for rent, depreciation, interest, labor and profit. In that study, depreciation was not taken into account, and if depreciation was taken into account, the difference between AMS and CMS farms would have been even greater. The results of the current study show that the net output of CMS and AMS farms did not differ (Table 1). These results indicate that the economic performance of AMS and CMS farms are similar in 2010 in comparison with year 2003 data. This trend might be explained by the improved technical performance of the AMS and improved supervision of farmers that began milking automatically. However, this small difference in economic performance between AMS and CMS farms might only be true for farms in northwest Europe, with farms with a relative small size and high labor costs. For the US, the difference in economic performance between CMS and AMS could be larger. The results indicate that the economic performance of AMS and CMS farms are similar other than higher capital costs for AMS farms. Also, the use of AMS rather than a CMS does not impact farm efficiency. References Bijl, R., S. R. Kooistra, and H. Hogeveen. 2007. The profitability of automatic milking on
Dutch dairy farms. J. Dairy Sci. 90:239-248. Results of this research are published as: Steeneveld, W., L.W. Tauer, H. Hogeveen, and A.
Oude Lansink. 2012. Comparing technical efficiency of farms with an automatic milking system and a conventional milking system. Journal of Dairy Science 95: 7391-7398.
52
IN-LINE MILK ANALYSIS: A TOOL FOR ANIMAL HEALTH MONITORING, KEY IN DAILY DAIRY FARM MANAGEMENT DECISIONS
Tal Schcolnik1, Ephraim Maltz2 1Afimilk, Kibbutz Afikim, Israel
2Agricultural Research Organization - the Volcani Center, Bet-Dagan, Israel [email protected]
Abstract The last 5 decades of genetic improvements and selection of dairy cows by milk traits have placed milk production as top priority when allocating energy in a cow’s body, even at the cost of harming basic needs of existence and reproduction. During early lactation animals are at a much higher risk for ketosis and fatty liver. In order to produce milk, a cow's body requires three times more energy than the energy required for maintenance. When a cow is unable to consume adequate energy from food, there is excessive mobilization of adipose tissue, and the cow is in a negative energy balance (NEB). Changes in a cow's physical status or nutrition elements, have significant biochemical cost that is reflected in the composition of body fluids and especially in milk. This is most noticeable during early lactation. Body fat degradation products are directed, like other resources, directly to the udder and increases milk fat content, while some fat that accumulates in the liver, causes excessive ketone bodies production and Ketosis. The common methods for detecting excessive levels of ketone bodies are by cow-side tests in the urine, blood or milk. However, since cow's ketone bodies concentration in body fluids depends on metabolic processes characteristic of each cow, feeding time and ration composition, sampling hour may be significant for the results. AfiLab™ (by afimilk) is an optical sensor that measures milk composition (fat, protein and lactose) for each cow individually, during every milking. This device improves cows monitoring capabilities by detecting changes in milk components in real time and allowing the diagnosis and effective treatment of NEB and ketosis, which in turn improves milk production and fertility. The objective of the study was to develop a model, based on AfiLab™ data of real-time milk composition, in order to detect NEB and ketosis. Therefor it was necessary to determine the optimal blood sampling time for diagnosis of ketosis. Blood ketone levels of 18 cows (5-45 days in milk) were measured at three different times throughout the day. Cows with beta – hydroxy-butyric acid (BHBA) above 1.4 mmol / L were considered ketotic. During morning measurements we found two sick cows (11%), while during afternoon and evening measurements the number of sick cows increased to five (28%) and six (33.0% ) respectively (Figure 1). However, no single measurement included all the affected cows together. We concluded that single measurements are not sufficiently effective means for monitoring and preventing ketosis and negative energy balance in cows.
53
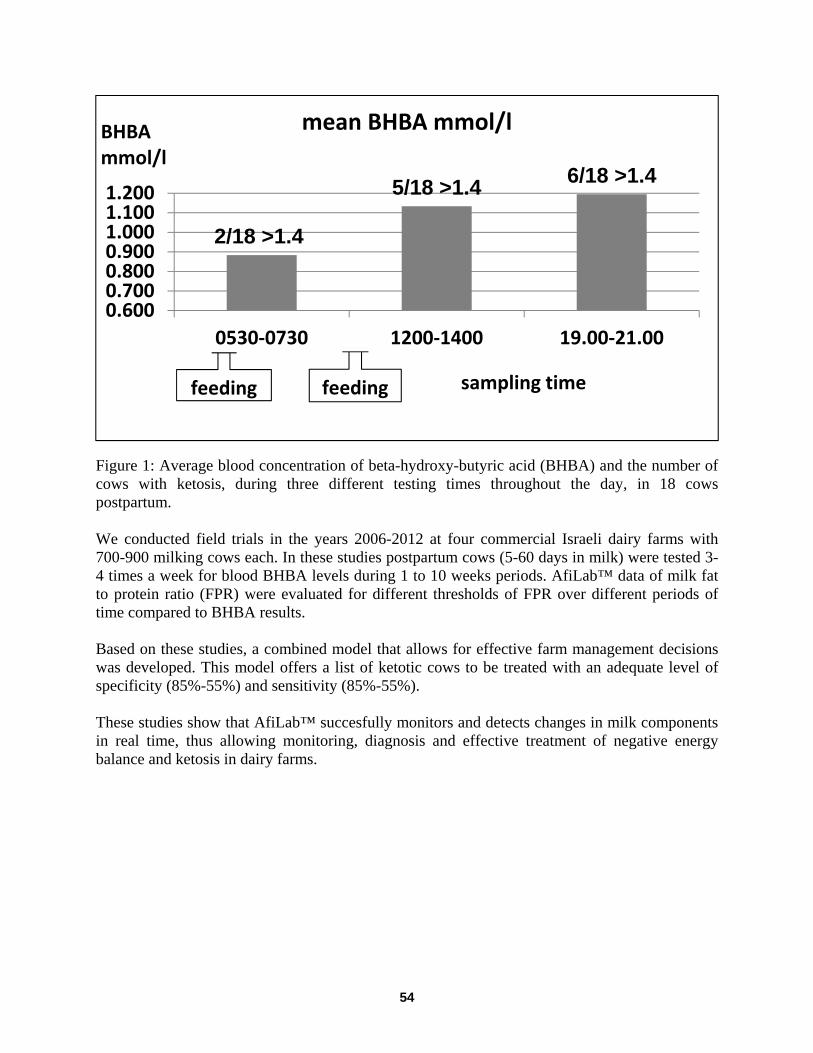
Figure 1: Average blood concentration of beta-hydroxy-butyric acid (BHBA) and the number of cows with ketosis, during three different testing times throughout the day, in 18 cows postpartum. We conducted field trials in the years 2006-2012 at four commercial Israeli dairy farms with 700-900 milking cows each. In these studies postpartum cows (5-60 days in milk) were tested 3-4 times a week for blood BHBA levels during 1 to 10 weeks periods. AfiLab™ data of milk fat to protein ratio (FPR) were evaluated for different thresholds of FPR over different periods of time compared to BHBA results. Based on these studies, a combined model that allows for effective farm management decisions was developed. This model offers a list of ketotic cows to be treated with an adequate level of specificity (85%-55%) and sensitivity (85%-55%). These studies show that AfiLab™ succesfully monitors and detects changes in milk components in real time, thus allowing monitoring, diagnosis and effective treatment of negative energy balance and ketosis in dairy farms.
1.4 >2/18
1.4 >5/18 1.4 >6/18
0.6000.7000.8000.9001.0001.1001.200
0530-0730 1200-1400 19.00-21.00
BHBA mmol/l
sampling time
mean BHBA mmol/l
feeding feeding
54
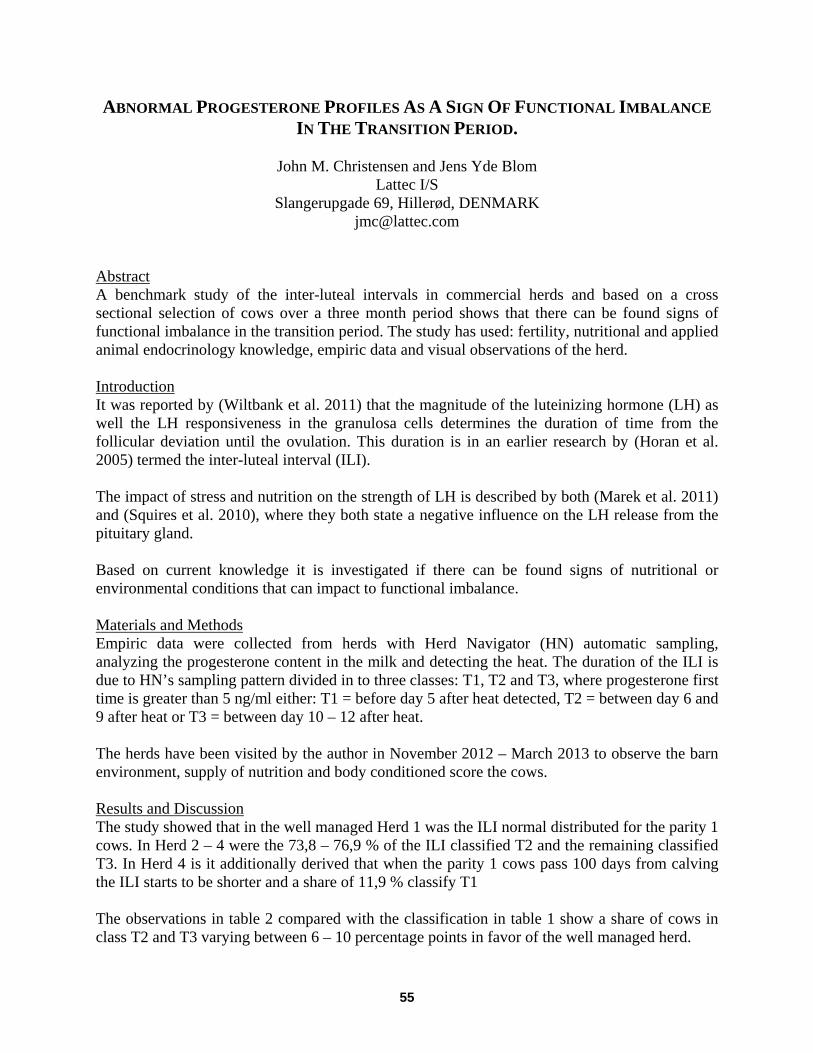
ABNORMAL PROGESTERONE PROFILES AS A SIGN OF FUNCTIONAL IMBALANCE IN THE TRANSITION PERIOD.
John M. Christensen and Jens Yde Blom
Lattec I/S Slangerupgade 69, Hillerød, DENMARK
Abstract A benchmark study of the inter-luteal intervals in commercial herds and based on a cross sectional selection of cows over a three month period shows that there can be found signs of functional imbalance in the transition period. The study has used: fertility, nutritional and applied animal endocrinology knowledge, empiric data and visual observations of the herd. Introduction It was reported by (Wiltbank et al. 2011) that the magnitude of the luteinizing hormone (LH) as well the LH responsiveness in the granulosa cells determines the duration of time from the follicular deviation until the ovulation. This duration is in an earlier research by (Horan et al. 2005) termed the inter-luteal interval (ILI). The impact of stress and nutrition on the strength of LH is described by both (Marek et al. 2011) and (Squires et al. 2010), where they both state a negative influence on the LH release from the pituitary gland. Based on current knowledge it is investigated if there can be found signs of nutritional or environmental conditions that can impact to functional imbalance. Materials and Methods Empiric data were collected from herds with Herd Navigator (HN) automatic sampling, analyzing the progesterone content in the milk and detecting the heat. The duration of the ILI is due to HN’s sampling pattern divided in to three classes: T1, T2 and T3, where progesterone first time is greater than 5 ng/ml either: T1 = before day 5 after heat detected, T2 = between day 6 and 9 after heat or T3 = between day 10 – 12 after heat. The herds have been visited by the author in November 2012 – March 2013 to observe the barn environment, supply of nutrition and body conditioned score the cows. Results and Discussion The study showed that in the well managed Herd 1 was the ILI normal distributed for the parity 1 cows. In Herd 2 – 4 were the 73,8 – 76,9 % of the ILI classified T2 and the remaining classified T3. In Herd 4 is it additionally derived that when the parity 1 cows pass 100 days from calving the ILI starts to be shorter and a share of 11,9 % classify T1 The observations in table 2 compared with the classification in table 1 show a share of cows in class T2 and T3 varying between 6 – 10 percentage points in favor of the well managed herd.
55
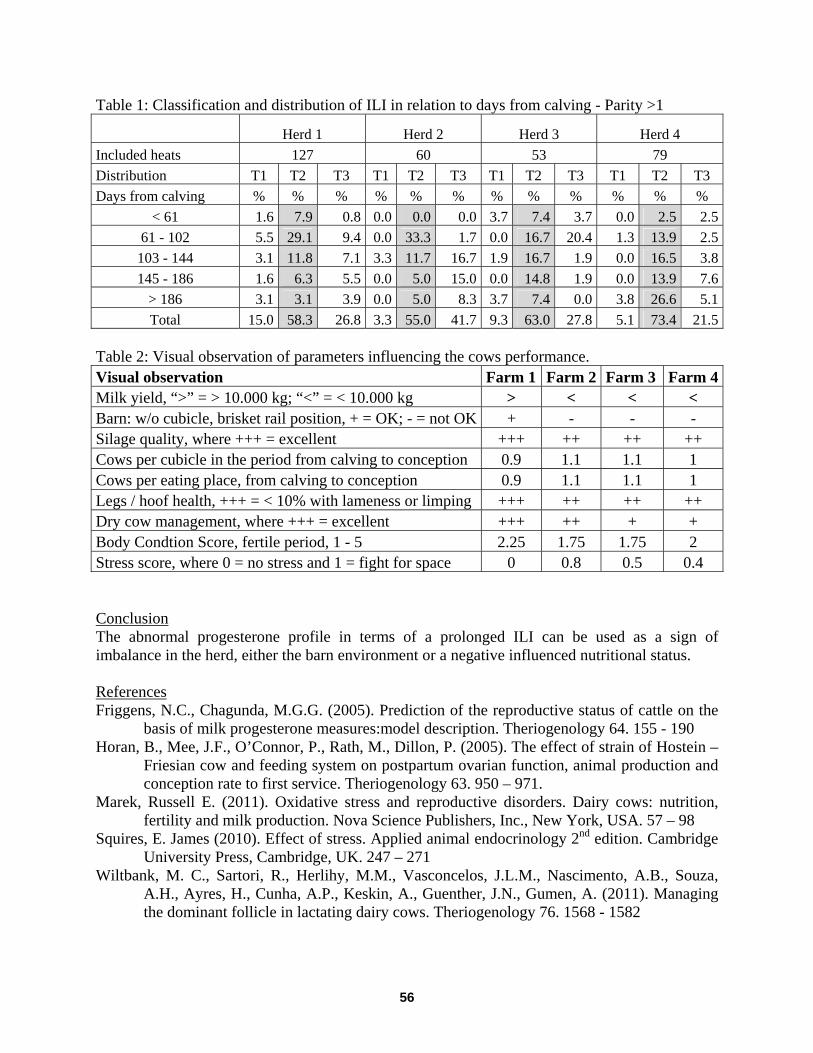
Table 1: Classification and distribution of ILI in relation to days from calving - Parity >1
Herd 1 Herd 2 Herd 3 Herd 4 Included heats 127 60 53 79 Distribution T1 T2 T3 T1 T2 T3 T1 T2 T3 T1 T2 T3 Days from calving % % % % % % % % % % % %
< 61 1.6 7.9 0.8 0.0 0.0 0.0 3.7 7.4 3.7 0.0 2.5 2.561 - 102 5.5 29.1 9.4 0.0 33.3 1.7 0.0 16.7 20.4 1.3 13.9 2.5
103 - 144 3.1 11.8 7.1 3.3 11.7 16.7 1.9 16.7 1.9 0.0 16.5 3.8145 - 186 1.6 6.3 5.5 0.0 5.0 15.0 0.0 14.8 1.9 0.0 13.9 7.6
> 186 3.1 3.1 3.9 0.0 5.0 8.3 3.7 7.4 0.0 3.8 26.6 5.1Total 15.0 58.3 26.8 3.3 55.0 41.7 9.3 63.0 27.8 5.1 73.4 21.5
Table 2: Visual observation of parameters influencing the cows performance. Visual observation Farm 1 Farm 2 Farm 3 Farm 4Milk yield, “>” = > 10.000 kg; “<” = < 10.000 kg > < < < Barn: w/o cubicle, brisket rail position, + = OK; - = not OK + - - - Silage quality, where +++ = excellent +++ ++ ++ ++ Cows per cubicle in the period from calving to conception 0.9 1.1 1.1 1 Cows per eating place, from calving to conception 0.9 1.1 1.1 1 Legs / hoof health, +++ = < 10% with lameness or limping +++ ++ ++ ++ Dry cow management, where +++ = excellent +++ ++ + + Body Condtion Score, fertile period, 1 - 5 2.25 1.75 1.75 2 Stress score, where 0 = no stress and 1 = fight for space 0 0.8 0.5 0.4 Conclusion The abnormal progesterone profile in terms of a prolonged ILI can be used as a sign of imbalance in the herd, either the barn environment or a negative influenced nutritional status. References Friggens, N.C., Chagunda, M.G.G. (2005). Prediction of the reproductive status of cattle on the
basis of milk progesterone measures:model description. Theriogenology 64. 155 - 190 Horan, B., Mee, J.F., O’Connor, P., Rath, M., Dillon, P. (2005). The effect of strain of Hostein –
Friesian cow and feeding system on postpartum ovarian function, animal production and conception rate to first service. Theriogenology 63. 950 – 971.
Marek, Russell E. (2011). Oxidative stress and reproductive disorders. Dairy cows: nutrition, fertility and milk production. Nova Science Publishers, Inc., New York, USA. 57 – 98
Squires, E. James (2010). Effect of stress. Applied animal endocrinology 2nd edition. Cambridge University Press, Cambridge, UK. 247 – 271
Wiltbank, M. C., Sartori, R., Herlihy, M.M., Vasconcelos, J.L.M., Nascimento, A.B., Souza, A.H., Ayres, H., Cunha, A.P., Keskin, A., Guenther, J.N., Gumen, A. (2011). Managing the dominant follicle in lactating dairy cows. Theriogenology 76. 1568 - 1582
56
IN-LINE MILKING PARLOR PRODUCER PANEL
JUNE 26, 2:00 PM
Chris Buchner
Elmwold Farms Ltd.
Brownsville, Ontario, Canada
This family farm is run by 2 brothers, Paul and Chris, who work with 4 cousins, Jennifer, Greg, Derek, and Kevin. There are 540 acres under cultivation half way down Lake Erie’s north shore and 30 miles north. They look after 195 mature Holsteins and 175 followers milking 170 3x daily with the help of 2 part time milkers. There are a number of reasons they looked into the cow side testing offered by Herd Navigator. The first was heat detection as they looked at pedometers. During a change in management through succession, how could production be maintained with a reduction in available time and experience? Working under a quota cap makes increasing efficiency one way to more profit. They were looking for a way to improve their fresh cow monitoring. At the Toronto Precision Dairy Conference in 2011, there was a presentation by DeLaval on the work they were doing with progesterone cow side testing and more. Paul and Chris showed interest in the work being done and decided to wait for Navigator. In that same year, they were approached to be a test farm. By November 2011, Herd Navigator was running in their herd. It made them the first parlor herd in North America and the first 3x herd. The ketone and mastitis testing has helped increase peak production over the last year. Urea testing used in combination with feed watch and every other day bulk tank fat and protein testing has helped to fine-tune feed rations. Progesterone testing helps with breeding; however, it also identifies anestrous, cystic and pregnant cows, which has reduced hormone use and vet costs. There continues to be a learning curve as they become more comfortable with the capabilities of Herd Navigator. There have been savings with more to come as they try to squeeze more milk out of the untapped genetic potential of their cows.
Eric Diepersloot
University of Florida Dairy Unit
Gainesville, Florida
In August of 2007, the University of Florida Dairy Unit was the first dairy in the U.S. to install AfiLab. The software made it easier and more efficient for faculty conducting research, and it provided them with daily fat, protein and lactose content with results immediately after a cow finished milking. It was discovered very quickly how much of an impact the AfiLab was going to have on herd management. Cows with clinical ketosis as well as those with sub-clinical ketosis were identified using the fat:protein ratio. With that knowledge, the Dairy Unit can refine their fresh cow protocols and change their far-off and springing dry cow management as needed. They are currently working with different ratios within the fat, protein and lactose to find sub-clinical acidosis and mastitis, and to make sure the CIP system is working properly. Every day the AfiLab is there to let them know about the health of each cow and whether herd management is on the right track.
57
PCDART delivers advanced dairy management and interfaces for Robotic, AMR and Heat Detection systems including: Lely, Delaval Delpro / Alpro, AfiFarm, GEA Dairyplan, Dairymaster, ENGS, Tru-Test, BouMatic Provantage / SmartDairy / HeatSeeker II, SCR Dataflow 2 and Select Detect.
? ? ?
Excel in precision, mobile and cutting-edge dairying with PCDART! Contact your local DHIA or DRMS at 800.344.3772 for details.
POTENTIAL FOR LABOR SAVING AND IMPROVED FEEDING MANAGEMENT WITH AUTOMATIC FEEDING
Cees Jan Hollander1, Trevor DeVries2, Brian Lang3 and Jack Rodenburg4
1Lely International, Maasluis, The Netherlands, 2University of Guelph, Kemptville Campus, Ontario, Canada, 3Ontario Ministry of Agriculture and Food, Woodstock, Ontario,Canada,
4DairyLogix, Woodstock, Ontario, Canada [email protected]
The Progressive Dairy Operators, in Ontario Canada, conducts a survey of labor costs and labor use on member farms triennially. Their 2010 survey collected information on the time required to mix and deliver feed. 111 Herds, with an average of 174 milking cows, provided the data summarized in Table 1(Rodenburg, 2013). Across all herds time spent feeding was 19 h/wk and 9.5% of the total farm labor, excluding crop production. Of this total 25.2 min/d went to pushing up feed an average of 4.2x/d. At 2013 rates of pay, a robotic feed pusher comes within $1/d of breaking even in labor savings alone on the average survey farm; on farms with 200 cows or more the labour savings would be sufficient to justify robotic feed pushing (Rodenburg, 2013). Most of the survey farms fed 1x/d between 0500 and 1100 h, and the longest time interval between pushing up feed was between 2300 and 0500, when the least amount of feed was left in the manger. DeVries et al. (2003) showed that pushing feed in this time did not alter eating behaviour of parlour-milked cows. However, a recent study of robotic milked herds (Deming et al., 2013) did suggest that more frequent push up increased resting time by 0.4 h per push when feed was pushed up to 5.5 times/d. When even small benefits from pushing up feed more than 4x/d are considered with the labor saving, pushing up feed robotically appears to be economically sound for most of the studied dairies. As illustrated in Table 1 mixing and delivering feed required an average of 111 to 204 min/d, depending on herd size. There is clearly great potential for labor saving by automating these tasks. The average time per batch for components of the process were 3.0 min for parking the mixer, 12.3 min for adding forages, 5.3 min for adding grain, 4.4 min for adding other ingredients, and 11.6 min for mixing and delivering the batch. Commercial systems that "prebatch" small ingredients are in use on some farms, but since mixing these ingredients represents only 27% of the feed handling, labor saving is limited. An automated system, such as the Lely Vector, offers fully automated feed mixing and delivery based on measured feed remaining in the manger 8 to 10 x/d. The largest share of the labor saving with such a system will result from robotic loading of forages (12.3 min/batch, or 34%) and robotic delivery (11.6 min/batch, or 32%). The greater amount of time on larger herds (Table 1) resulted from making more batches of feed for more groups of cows, but larger herds were more likely to feed each group less often. The time required to manage automatic feeding systems is not well defined, and there are many other variables involved, so accurately predicting the cost benefit of automatic feeding on the basis of labor saving is difficult. At Ontario labor costs, it may be practical on typical farms with 175 cows or more based on the feeding frequency of 1.7 x/d across all herds and just 1.1 x/d on larger herds. Published research on feeding frequency suggests it can result in improved health and productivity. Feeding 4 x/d increased milk fat by 0.22 to 0.45% and results
59
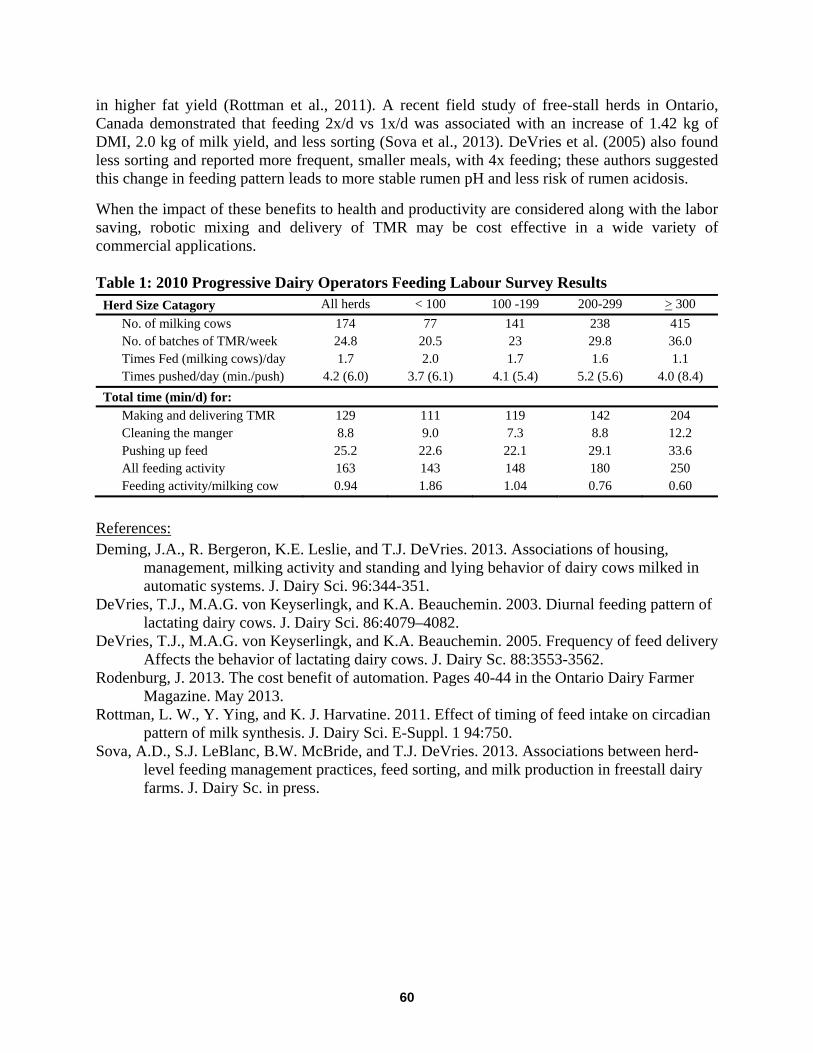
in higher fat yield (Rottman et al., 2011). A recent field study of free-stall herds in Ontario, Canada demonstrated that feeding 2x/d vs 1x/d was associated with an increase of 1.42 kg of DMI, 2.0 kg of milk yield, and less sorting (Sova et al., 2013). DeVries et al. (2005) also found less sorting and reported more frequent, smaller meals, with 4x feeding; these authors suggested this change in feeding pattern leads to more stable rumen pH and less risk of rumen acidosis. When the impact of these benefits to health and productivity are considered along with the labor saving, robotic mixing and delivery of TMR may be cost effective in a wide variety of commercial applications. Table 1: 2010 Progressive Dairy Operators Feeding Labour Survey Results
Herd Size Catagory All herds < 100 100 -199 200-299 > 300 No. of milking cows 174 77 141 238 415 No. of batches of TMR/week 24.8 20.5 23 29.8 36.0 Times Fed (milking cows)/day 1.7 2.0 1.7 1.6 1.1 Times pushed/day (min./push) 4.2 (6.0) 3.7 (6.1) 4.1 (5.4) 5.2 (5.6) 4.0 (8.4)
Total time (min/d) for: Making and delivering TMR 129 111 119 142 204 Cleaning the manger 8.8 9.0 7.3 8.8 12.2 Pushing up feed 25.2 22.6 22.1 29.1 33.6 All feeding activity 163 143 148 180 250 Feeding activity/milking cow 0.94 1.86 1.04 0.76 0.60
References: Deming, J.A., R. Bergeron, K.E. Leslie, and T.J. DeVries. 2013. Associations of housing,
management, milking activity and standing and lying behavior of dairy cows milked in automatic systems. J. Dairy Sci. 96:344-351.
DeVries, T.J., M.A.G. von Keyserlingk, and K.A. Beauchemin. 2003. Diurnal feeding pattern of lactating dairy cows. J. Dairy Sci. 86:4079–4082.
DeVries, T.J., M.A.G. von Keyserlingk, and K.A. Beauchemin. 2005. Frequency of feed delivery Affects the behavior of lactating dairy cows. J. Dairy Sc. 88:3553-3562.
Rodenburg, J. 2013. The cost benefit of automation. Pages 40-44 in the Ontario Dairy Farmer Magazine. May 2013.
Rottman, L. W., Y. Ying, and K. J. Harvatine. 2011. Effect of timing of feed intake on circadian pattern of milk synthesis. J. Dairy Sci. E-Suppl. 1 94:750.
Sova, A.D., S.J. LeBlanc, B.W. McBride, and T.J. DeVries. 2013. Associations between herd-level feeding management practices, feed sorting, and milk production in freestall dairy farms. J. Dairy Sc. in press.
60
PRECISION FEEDING – ADDRESSING THE HUMAN FACTOR
Keith M. Sather Supervisor Systems
Dresser, Wisconsin, USA [email protected]
When feeding dairy cows, how can you be sure the ration so carefully balanced by your nutritionist is the one your cows are actually eating each day? The human factor is one of many obstacles that can prevent us from meeting the goal of delivering to cows the diet that was specially prepared for them. Feed management software systems, such as Feed Supervisor, provide the industry with a unique tool for monitoring and training those responsible for feeding the herd (a.k.a. the “feeder”) – ensuring that every mouthful a cow consumes is properly balanced. Managing your feeder does not mean carrying a big stick, but rather, opening up the lines of communication. Supervisor Systems monitored the performance of several feeders using this type of software in the Midwest and found them to be very accurate. On lactating diets, the average deviation amongst the ten feeders we were tracking was 0.6%. However, when feeding the transition cow group, the same feeders had a deviation of 9%. Early diagnosis labeled the problem as “big truck” syndrome. This occurs when you try to feed a small group of special needs cows with the same equipment used to feed the main herd as quickly as possible. Assessing Operator Performance Was it true that we could not expect our feeders to accurately load all types of feed? We began monitoring the loading accuracy of fourteen feeders during a 30-day period. Using feed management software, we took the average deviation for each ingredient (choosing ingredients that each dairy had in common) accounting for every time that ingredient was placed into the TMR mixer. Loading devices used were either a payloader, telehandler or skid steer. Results were measured in average deviation in pounds. The data showed that accuracy was not affected by the type of equipment being used; instead, operator error was to blame. A high level of accuracy could be achieved using any of the three loading devices. Feeding mistakes were made by operators who were in a hurry to complete the task at hand. A feed management system should be used to monitor, communicate, manage and educate. The following example from a Wisconsin dairy illustrates how this can be done. Using feed management software to record the accuracy of a feeder team on both lactating and transition cow pens, we took into account crude protein, potassium and NDF to monitor the affect that operator error would have on the nutrition of these diets. These nutritional factors were calculated based on the ration, and the daily errors were recorded in the software. Feed was being loaded into the mixer with a payloader.
61
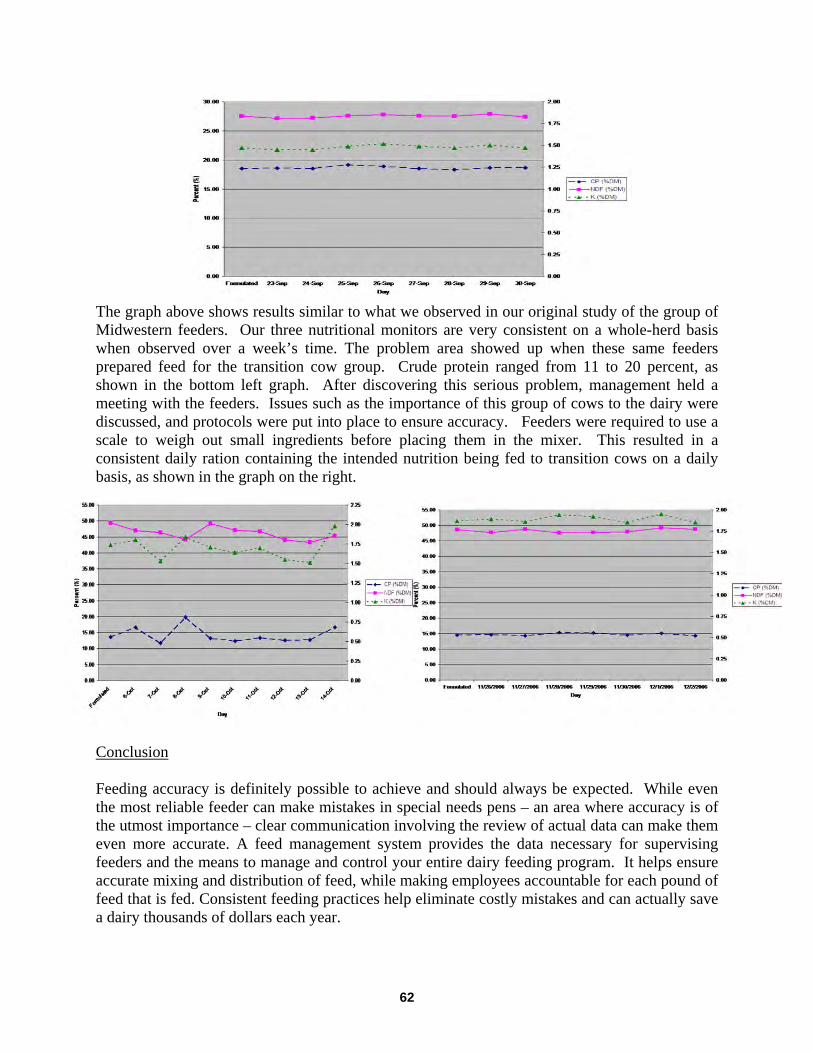
The graph above shows results similar to what we observed in our original study of the group of Midwestern feeders. Our three nutritional monitors are very consistent on a whole-herd basis when observed over a week’s time. The problem area showed up when these same feeders prepared feed for the transition cow group. Crude protein ranged from 11 to 20 percent, as shown in the bottom left graph. After discovering this serious problem, management held a meeting with the feeders. Issues such as the importance of this group of cows to the dairy were discussed, and protocols were put into place to ensure accuracy. Feeders were required to use a scale to weigh out small ingredients before placing them in the mixer. This resulted in a consistent daily ration containing the intended nutrition being fed to transition cows on a daily basis, as shown in the graph on the right.
Conclusion Feeding accuracy is definitely possible to achieve and should always be expected. While even the most reliable feeder can make mistakes in special needs pens – an area where accuracy is of the utmost importance – clear communication involving the review of actual data can make them even more accurate. A feed management system provides the data necessary for supervising feeders and the means to manage and control your entire dairy feeding program. It helps ensure accurate mixing and distribution of feed, while making employees accountable for each pound of feed that is fed. Consistent feeding practices help eliminate costly mistakes and can actually save a dairy thousands of dollars each year.
62
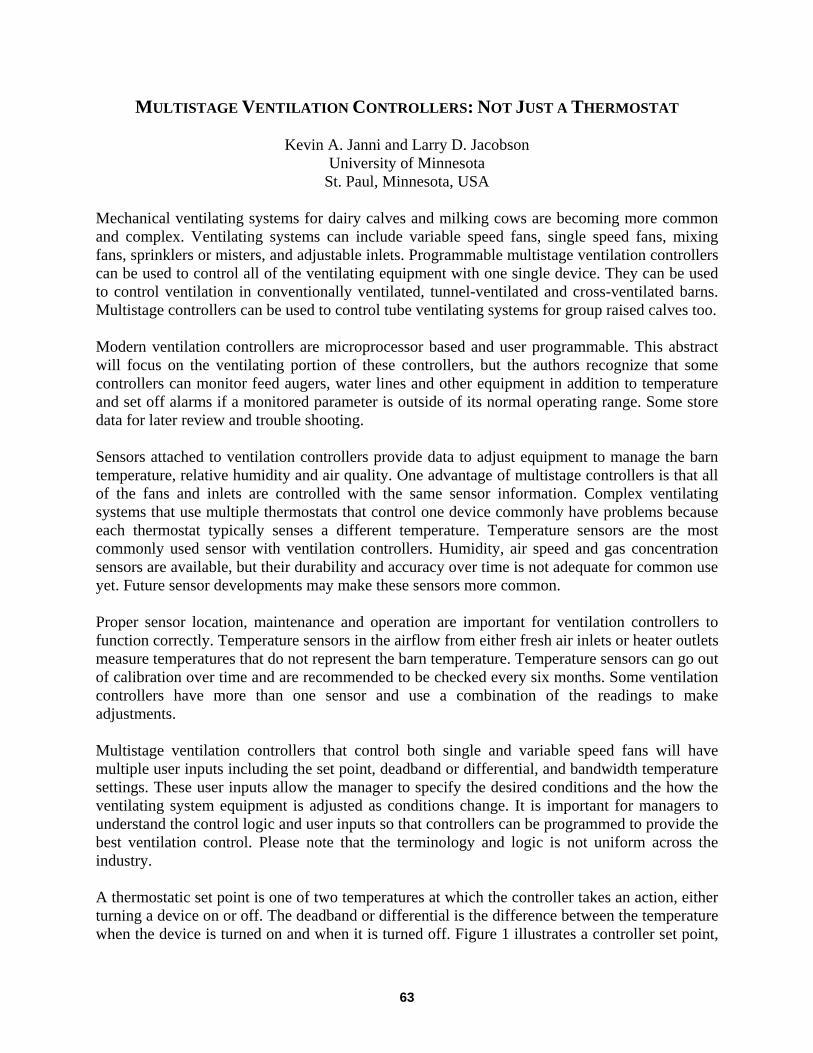
MULTISTAGE VENTILATION CONTROLLERS: NOT JUST A THERMOSTAT
Kevin A. Janni and Larry D. Jacobson University of Minnesota
St. Paul, Minnesota, USA Mechanical ventilating systems for dairy calves and milking cows are becoming more common and complex. Ventilating systems can include variable speed fans, single speed fans, mixing fans, sprinklers or misters, and adjustable inlets. Programmable multistage ventilation controllers can be used to control all of the ventilating equipment with one single device. They can be used to control ventilation in conventionally ventilated, tunnel-ventilated and cross-ventilated barns. Multistage controllers can be used to control tube ventilating systems for group raised calves too. Modern ventilation controllers are microprocessor based and user programmable. This abstract will focus on the ventilating portion of these controllers, but the authors recognize that some controllers can monitor feed augers, water lines and other equipment in addition to temperature and set off alarms if a monitored parameter is outside of its normal operating range. Some store data for later review and trouble shooting. Sensors attached to ventilation controllers provide data to adjust equipment to manage the barn temperature, relative humidity and air quality. One advantage of multistage controllers is that all of the fans and inlets are controlled with the same sensor information. Complex ventilating systems that use multiple thermostats that control one device commonly have problems because each thermostat typically senses a different temperature. Temperature sensors are the most commonly used sensor with ventilation controllers. Humidity, air speed and gas concentration sensors are available, but their durability and accuracy over time is not adequate for common use yet. Future sensor developments may make these sensors more common. Proper sensor location, maintenance and operation are important for ventilation controllers to function correctly. Temperature sensors in the airflow from either fresh air inlets or heater outlets measure temperatures that do not represent the barn temperature. Temperature sensors can go out of calibration over time and are recommended to be checked every six months. Some ventilation controllers have more than one sensor and use a combination of the readings to make adjustments. Multistage ventilation controllers that control both single and variable speed fans will have multiple user inputs including the set point, deadband or differential, and bandwidth temperature settings. These user inputs allow the manager to specify the desired conditions and the how the ventilating system equipment is adjusted as conditions change. It is important for managers to understand the control logic and user inputs so that controllers can be programmed to provide the best ventilation control. Please note that the terminology and logic is not uniform across the industry. A thermostatic set point is one of two temperatures at which the controller takes an action, either turning a device on or off. The deadband or differential is the difference between the temperature when the device is turned on and when it is turned off. Figure 1 illustrates a controller set point,
63
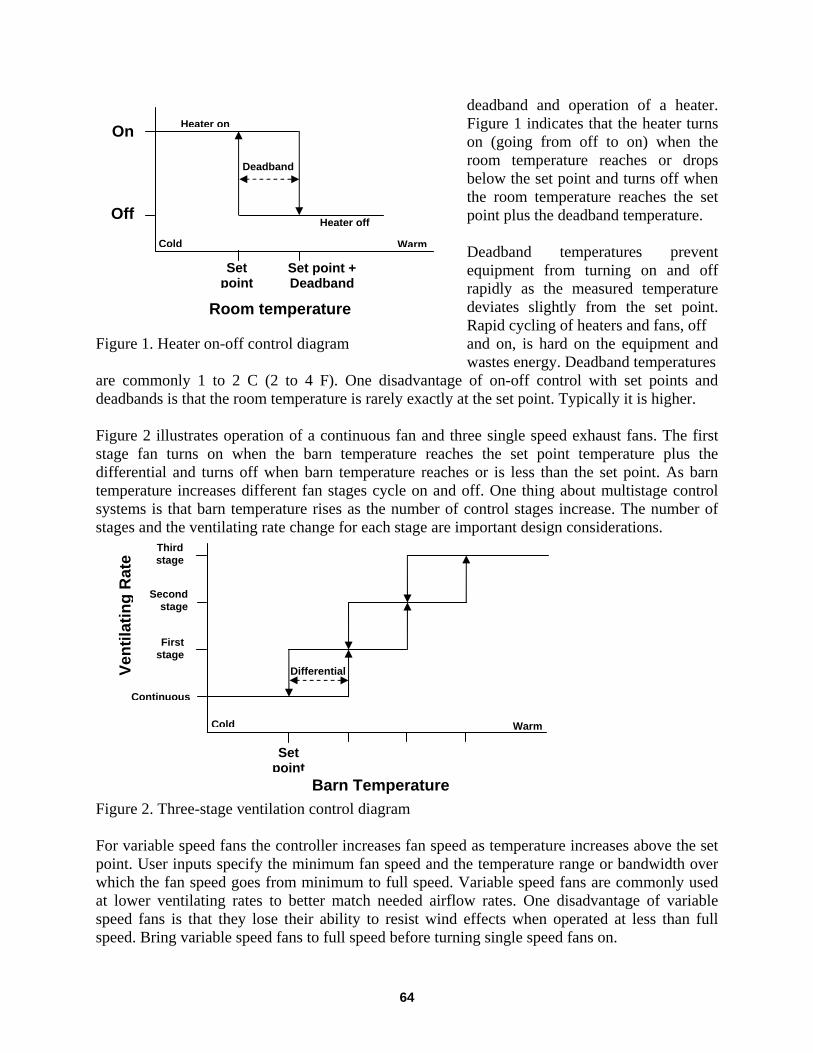
deadband and operation of a heater. Figure 1 indicates that the heater turns on (going from off to on) when the room temperature reaches or drops below the set point and turns off when the room temperature reaches the set point plus the deadband temperature. Deadband temperatures prevent equipment from turning on and off rapidly as the measured temperature deviates slightly from the set point. Rapid cycling of heaters and fans, off
Figure 1. Heater on-off control diagram and on, is hard on the equipment and wastes energy. Deadband temperatures
are commonly 1 to 2 C (2 to 4 F). One disadvantage of on-off control with set points and deadbands is that the room temperature is rarely exactly at the set point. Typically it is higher. Figure 2 illustrates operation of a continuous fan and three single speed exhaust fans. The first stage fan turns on when the barn temperature reaches the set point temperature plus the differential and turns off when barn temperature reaches or is less than the set point. As barn temperature increases different fan stages cycle on and off. One thing about multistage control systems is that barn temperature rises as the number of control stages increase. The number of stages and the ventilating rate change for each stage are important design considerations.
Figure 2. Three-stage ventilation control diagram For variable speed fans the controller increases fan speed as temperature increases above the set point. User inputs specify the minimum fan speed and the temperature range or bandwidth over which the fan speed goes from minimum to full speed. Variable speed fans are commonly used at lower ventilating rates to better match needed airflow rates. One disadvantage of variable speed fans is that they lose their ability to resist wind effects when operated at less than full speed. Bring variable speed fans to full speed before turning single speed fans on.
Vent
ilatin
g R
ate
Set point
Barn Temperature
Differential
First stage
Continuous
Cold
Second stage
Third stage
Warm
On
Off
Set point
Room temperature
Deadband
Heater on
Heater off
Cold Warm
Set point + Deadband
64
MANAGING MILK QUALITY IN AUTOMATIC MILKING SYSTEMS
Douglas J. Reinemann and Claudia Kamphuis University of Wisconsin
Madison, Wisconsin, USA Identifying abnormal milk and cows or quarters with an intramammary infection during unattended milking have been among the most difficult technical challenges in the development of automatic milking technology. ISO standard 20966, Automatic Milking Installations (AMI) – Requirements and Testing, was adopted in 2007. Section 5.5.1 of this standard states that the AMI shall have provisions to divert milk in any of the following three categories before it reaches the bulk tank;
• Undesirable – unsuitable for sale, e.g. milk containing colostrum • Withheld – milk that may contain antibiotic residues • Abnormal – milk that is visibly changed in color or texture
The standard notes that the decision to divert undesirable milk and withheld milk is always taken before milking while the decision to divert abnormal milk can be taken at any time during foremilking, milking or after milking of the animal. The decision to divert withheld milk is made by a person at the time of administering antibiotics to an animal. The decision to divert milk is also commonly made by a person using knowledge of the freshening date of an animal and a predetermined interval to avoid milk containing colostrum from entering the bulk tank. This decision may also be supported by sensor data such as milk color. The criterion for the decision to divert abnormal milk is much more complicated. Section 5.3.3 of the ISO standard, Detection of abnormal milk, states:
Where an automatic milking unit has provisions to detect abnormal milk from an individual animal and prevent its milk from being mixed with milk intended for human consumption, the abnormal milk detection method together with recommended limit values shall be described in the user’s manual.
The language in the ISO standard applies to systems that automatically divert milk from particular cows or quarters. There is no mention of requirements for systems that are used as aids to human decision-making and action with the decision to divert milk being made after milking the animal (as is common practice). A primary concern for auto-divert systems is the specificity of identification. Lower specificity results in more milk being inappropriately diverted (false positive identification). Pietersma and Hogeveen (2004) estimated the costs associated with discarding abnormal milk concluded that the specificity of an automated system to discard abnormal milk must be very high to prevent economic losses due to incorrectly discarding normal milk and the subsequent reluctance of farmers to use such a system. The review by Rutten et al. (2013) defines a sensor system as:
• Device(s) that collect data (various measures of milk quality, animal behavior and animal health), and
65
• Software that processes these data to produce information or advice. Rutten et al (2013) found 37 different sensing systems for automated detection of mastitis reported in research literature. Electrical Conductivity (EC) was the main technology studied followed by EC combined with milk color. Other technologies included NAGase, cell count and cow body temperature. CMT was the predominant gold standard used to assess sensitivity and specificity of these systems, although visual inspection, cell count and treated clinical cases or a combination of these were also used in some studies. Sixteen of the reviewed sensing systems provide mastitis alerts, 12 provided a probability to the mastitis alert, while eight provided only raw data. Sensitivities ranged from 55 to 89% and specificities from 56 to 99%. Some systems were reported to have excellent results but the authors questioned the validation methods and gold standards used. An example of a gold standard and method for evaluating detection systems for milk deemed as abnormal due to the presence of blood is presented in Annex C of the ISO AMI standard. A gold standard has been proposed for evaluating abnormal color and there has been little disagreement or further discussion on this issue. In-line color sensors have proven to be more accurate than human inspection at detecting blood in milk and some AMS automatically divert milk based on these sensors, however, no internationally accepted level of blood in milk has been established. A method of evaluating detection systems for changes in homogeneity is also presented in ISO Annex C. The gold standard proposed for changes in homogeneity at either the quarter or udder level is applied to foremilk and specifies milk with clots larger than 2 mm visible on a 0.1 x 0.1 mm pore filter media and California Mastitis Test (CMT) score >3 as abnormal milk. It is noted in the ISO standard that this matter needs to be evaluated further based on field experience, and new research and new developments. Several papers have been presented in the past six years furthering this discussion (Mein and Rasmussen, 2008; Claycomb et al, 2009, Kamphuis et al 2013). The ISO guidelines for sensor-based detection of abnormal milk are based on detection methods commonly applied by human observers. CMT testing is not performed on every cow at every milking and the ability of the human eye to detect 2 mm clots is highly dependent on.
1. Whether cows are foremilked, 2. Whether foremilk is examined, 3. Whether a device is used to help detect clots (strip cup and/or in-line filter) 4. Light levels in the milking area 5. Diligence in the humans making the observation.
The National Mastitis Council (Smith et al 2001) defines Clinical Mastitis (CM) as the presence of flakes, clots, or other gross alteration in milk appearance, irrespective of its SCC level (although clinically infected quarters will almost always have SCC greater than 200,000 cells/ml). There are no commercial sensing systems that directly assess the appearance of milk as an indicator of CM (although patents have been applied for). Human detection of milk abnormalities has been reported to achieve high as 80% sensitivity and 100% specificity (Hillerton, 2000). It is interesting to note that the use of a number of indicators including cow behavior, smell of cows and/or milk, milk taste, assessment of cow discomfort, udder swelling
66
and temperature and other visual indicators of cow health, milk color and milk texture are used by people to achieve these levels of specificity and sensitivity. Rasmussen (2005) reported that with the use of filters to improve human detection of clots in foremilk a sensitivity of 80% and specificity of 90% could be expected. The ISO Annex C guidelines for interpretation of physical abnormalities in milk state that the sensitivity of the AMS detection system should be >70% and that specificity should be >99%. The evaluation method suggests a minimum sample size (20 cases of abnormal milk) and the following recommendations to provide reasonable certainty of exceeding these sensitivity and specificity levels. These are that at least 16 or 20 abnormal milk samples should be detected and a maximum of 2 of 200 milkings with normal milk are identified for automatic diversion. The sensitivity requirement is often interpreted as 80% (as in Rutten et al 2013) but if a larger sample size were used for evaluation (resulting in more than abnormal samples) sensitivity as low as 70% would presumably be acceptable. Claycomb et al (2009) used the ISO clot detection method to evaluate abnormal milk detection using EC at the quarter level and reached a sensitivity of 83% with 2.3 false alerts per 1000 milkings, or specificity >99%. Kamphuis et al. (2008) using EC at the quarter level and an cell count sensor at the cow level reported a detection method with 80% sensitivity and 2.1 false alerts per 100 cow milking, specificity >99%. Lastly, Kamphuis et al (2010) used EC and color sensors as well as milk yield corrected for the time since the previous milking, all measured at the quarter level. At 10 false alerts per 1000 milkings (specificity of 99%), the detection method had a sensitivity of 69.5%; very close to 70% and validated on 105 cases of CM. Kamphuis et al (2013) presented a review and suggestions for the development of protocols (gold standards, evaluation tests, performance indicators, and performance targets) for automated mastitis detection systems. These authors have presented three primary criteria for the usefulness of automated mastitis detection systems used in AMS or in conventional milking systems.
1) Identify cows with CM promptly and accurately, • For timely treatment, to maximize cure rate, and reduce the spread of infections;
2) Identify cow with high SCC, • To manage BMSCC levels; and
3) Identify end of lactation infection status, • To support dry–cow therapy decisions.
Kamphuis et al (2013) proposed the following a gold standard for CM as the observation of clots (>2 mm in average diameter assessed using in-line filters) at 2 or 3 out of three consecutive cow milkings as a refinement of the ISO recommendation presented by Mein and Rasmussen (2008). This deviates from the ISO recommendation by providing a time window for detection as well as removing the additional requirement of CMT score > 3. Kamphuis et al (2013) noted that most of the research has been directed at the detection of CM, and indeed this is the intent (although not exactly the same) as the regulatory (ISO) requirements. SCC limits are established and enforced for bulk tank milk but not for individual cows so detecting cows with elevated SCC is of direct interest to AMS users and meets the real and enforced regulatory requirement in most countries.
67
From the NMC Guidelines on Normal and Abnormal Raw Milk Based on SCC and Signs of Clinical Mastitis (Smith et al 2001):
Composite milk is the result of the commingling of milk from four independent quarters. Herd bulk tank milk is the commingling of milk from all quarters in the herd, some of which are very likely producing abnormal milk. Composite milk from an individual cow or from a herd of cows is not easily defined on the basis of normal or abnormal. Herd composite milk is best defined on the basis of suitability. Herd bulk tank SCC (BTSCC) are indicators of the percentage of infected quarters in the herd and by inference, the percentage of quarters producing abnormal milk. Thus, the upper limit of SCC, as determined by a regulatory agency, is the determining factor for establishing suitability. Suitability varies among countries and processors. Furthermore, suitability is likely to vary among consumers. Clearly, the fewer quarters producing abnormal milk, the more suitable the product becomes for human consumption
SCC is the most widely used measure of mastitis infection and is typically measured once per month on farms enrolled in milk quality programs. SCC enumeration is a well-developed technology and has recently become available in some markets. SCC is a good indicator of subclinical mastitis but the correlation between SCC and appearance of clinical signs is quite inexact. The detection of “mastitis” based on SCC has several problems. It is important to recognize that the moment of infection is never detected but simply some indicator of inflammation. Subclinical and clinical mastitis are different immune responses. All clinical mastitis is preceded by a subclinical, or pre-clinical phase (although the duration varies among pathogens). Not all subclinical mastitis becomes clinical. The SCC response is very dynamic and when opportunistic pathogens are the cause, disease usually results. Currently, the successful immune responses that remain subclinical are not detected. The use of SCC to indicate abnormal milk (from diseased animals) raises questions of how to handle “false positives” that are based on detection of a successful immune response, and at what SCC level should milk be discarded? Kamphuis et al (2013) propose a gold standard for SCC detection based on a herd level test on at least three commercial farms (with high BMSCC) by calculating and ranking each cow’s contribution to the BMSCC. The automated detection system is then evaluated based on its ranking of individual cow contribution and the number of cows to be removed in sequence to decrease BMSCC by a specified percentage (25% suggested). The suggested performance target for the automated is that no more than twice the percentage of cows be removed than as indicated by the gold standard. In the examples provided in the paper, one system met this target and two did not. The utility of this performance objective will be different in different countries that use different criteria for the administration of antibiotic treatments at drying off. It is suggested that a subsample of cows from a large herd with high BMSCC be used for evaluating this performance goal to balance the cost of bacteriological culture and increase the likelihood of finding infected cows. Complications with contamination of samples used for bacteriological culture (the gold standard problem) and the high cost of these cultures are noted and newer diagnostics tests (PCR) may become useful as a gold standard in the future. Using SCC values to make dry-cow therapy decisions would ensure that almost all cows (91%) that would benefit from therapy
68
would receive it and the use of antimicrobials would be greatly reduced compared to treating all cows, although the prophylactic use of anitmicrobials in herds with a high prevalence of staph infections cannot be ignored. It should be noted that this performance objective is of lesser importance that CM and high SCC detection during lactation but may become more important in the future, and that if these two strategies were effective they would also be useful aids in decisions on use of dry cow therapy. Several sensing systems reported in the literature (Claycomb et al 2009, Kamphuis et al 2010) have approached or exceeded the targets suggested in the ISO standard, however, these systems are not yet available in the market. The shift from sensor assisted to fully automated diversion of abnormal milk may be on the horizon but the level of sensitivity and specificity at which farmers will entrust the decision to divert milk solely to the sensor system remains to be seen. Consider a 500 cow herd milked twice daily with a CM incidence rate of 2 quarters per 100 cows per month. With a specificity of 99% (or 10 false alerts per 1000 milkings), 10 false alerts will occur each day on this farm and 300 by the end of the month. With 500 cows, 10 cases of CM can be expected of which eight will be correctly detected with a sensitivity of 80%. By the end of the month the farmer will have checked 308 alerts (cows) of which eight were correct (a positive predictive value of just 2.6%) Most automatic milking systems (AMS) use several sources of data to help the user manage milk quality and animal health. The systems in use today have proven adequate for motivated users to produce milk of similar or better quality than farms using conventional methods. At this point in the development of sensor systems automatic diversion of milk is practiced for some milk quality indicators (red color indicating blood in milk) but not others (abnormal milk or mastitis). Sensor systems provide a list of cows that may be producing abnormal milk or may have signs of clinical mastitis and human intervention is used to make the final diagnosis and decision to divert milk. The continued sales of AMS and relatively low rate of recidivism suggests that users are generally satisfied with the information provided by the sensing systems in use today. Formal and informal surveys of AMS users have reported that, in addition to mastitis alerts from the sensing system, they also relied heavily on deviations in cow behavior (frequency of visits to the AMS) and deviations in milk yield as supporting information to find clinically infected cows or cows with other health problems and requiring individual inspection and treatment. Users are, therefore, commonly performing 1) data interpretation, 2) data integration and 3) decision making functions that are not currently automated. The conceptual framework for regulatory requirements is based on finding diseased animals (animal welfare concerns) and keeping milk from these animals out of the milk supply. These requirements have been based primarily on 1) detection methods that can be applied by human observers at cow-side before each cow is milked and 2) performance requirements for bulk milk (BMSCC limits). Human detection of abnormal milk and diseased animals is difficult and, in practice, impossible to enforce. Furthermore, the ability of humans to perform this detection task is highly variable and the definition of abnormal milk and diseased animals is not entirely clear. BMSCC limits are easy to measure and are routinely enforced. While there are some sensor
69
systems that can measure quarter SCC directly (DeLaval DCC) or indirectly (automated CMT), most sensor systems rely on detecting indirect measures of mastitis and/or abnormal milk. Systems that incorporate digital image processing of milk and/or animals have or are likely to appear in some markets in the near future. Automated sensing systems have an advantage over human detection in that they can be applied to every cow at every milking and, therefore, provide more consistent and objective surveillance that occurs on many farms that rely on human detection methods. There are some aspects of milk quality for which automated systems offer more accurate results than even the best human observers (blood in milk, SCC and CMT). The goal of meeting the ISO suggested levels of sensitivity and specificity has not generally been met while the goals of mastitis and milk quality management of farms can be met with a combination of existing sensing technology and good human management, aided by these systems. Perhaps the biggest challenge is in the evolution of regulatory requirements that take into account goals related to animal welfare and milk quality as well as the new technologies to help farmers achieve these goals. References Claycomb, R.W., P.T. Johnstone, G.A. Mein, and R.A. Sherlock. 2009. An automated in-line
clinical mastitis detection system using measurement of conductivity from foremilk of individual udder quarters. New Zealand Veterinary Journal. 57: 208-214.
Hillterton, JE, 2000. Detecting Mastitis Cow-Side. Proeedings of the National Mastitis Council
Annual meeting. ISO. 2007. Automatic milking systems – requirements and testing. Annex C: Example of
methods of evaluating detection systems for milk deemed as abnormal due to blood or to changes in homogeneity. ISO 20966:2007. International Organization for Standardization, Geneva, Switzerland.
Kamphuis, C., B. Dela Rue, G. Mein, and J. Jago. 2013. Development of protocols to evaluate
in-line mastitis-detection systems. Journal of Dairy Science. Doi: 10.3168/jds.2012-6190. Kamphuis, C., H. Mollenhorst, J.A.P. Heesterbeek, and H. Hogeveen. 2010. Detection of clinical
mastitis with sensor data from automatic milking systems is improved by using decision-tree induction.
Kamphuis, C., R. Sherlock, J. Jago, G. Mein, and H. Hogeveen. 2008. Automatic detection of
clinical mastitis is improved by in-line monitoring of somatic cell count. Journal of Dairy Science. 91: 4560-4570.
Mein, G., and R.D. Rasmussen. 2008. Perfomance evaluation of systems for automated
monitoring of udder health: would the real gold standard please stand up? Pages 259-266 in Mastitis Control: from science to practice. T.J.G.M. Lam (ed.). Wageningen Academic Publishers, Wageningen, the Netherlands.
70
Pieterma, D., and H. Hogeveen. 2004. Cost of discarding milk with automatic separation of abnormal milk. Pages 221-227 in Automatic Milking: a better understanding. A. Meijering, H. Hogeveen, and T.J.A.M. Lam (eds.). Wageningen Academic Publishers, Wageningen, the Netherlands.
Rasmussen, MD, 2005. Visual Scoring of Clots in Foremilk. J. Dairy Res. 72:406-414. Rutten C.J., A.G.J. Velthuis, W. Steeneveld, and H. Hogeveen. 2013. Invited review: Sensors to
support health management on dairy farms. Journal of Dairy Science. Doi: 10.3168/jds.2012-6107.
Smith, K.L., J.E. Hillerton, and R.J. Harmon. 2001. NMC guidelines on normal and abnormal
raw milk based on SCC and signs of clinical mastitis. National Mastitis Council, Madison, WI.
71

There is an EASIER way!
• Mixinganddeliveryaccuracy
• Easilyadjustrationsbypen
• Calculatesdailyfeedcosts
• Eliminatemanualentries
TMR Tracker is your Feed Management Solution!
Visit Digi-Star’s Booth for details!
quarter page Precision Dairy conf 2013 7.375 x 2.25.indd 1 5/21/2013 7:48:19 AM
(877) 545-ai24 | www.semex.com
The world’s first commercial system to measure Methane and Carbon Dioxide emissions from Ca:le
The Greenfeed emissions measurements allow evalua4on of:
www.c-lockinc.com
TM
• Feed efficiency for individuals and the herd • Impacts of dietary treatments • Animal health and welfare • Sick animals that are off of feed
• Greenhouse gas monitoring and mi4ga4on
/Sort
Individual cow fat, protein, lactose and SCC detection
Individual Supplemental Feeding
Individual Cow Walkover Weigh System
Individual Automatic Cow Drafting
Heat detection/Pedometer
Individual Cow Activity and Rest Time Monitoring
Individual Cow Production, Conductivity and Milking Efficiency
AfiActTM TM
TM
In-parlor Feed System
Specially designed for precision dairy management
USING BEHAVIOR SENSORS AND PRECISION TOOLS FOR OPTIMUM HERD MANAGEMENT; AUTOMATIC DETECTING POST-CALVING KETOSIS AND
LAMENESS, APPLICATION IN ROBOTIC MILKING FARMS
Ilan Halachmi Agricultural Research Organization, ARO
The Volcani Centre, Israel [email protected]
Robotic milking could be the ‘lifeboat’ of the smallholder family farms. A milking robot (a) attracts the young generation to the farm; (b) reduces the routine work (no human involvement in the regular milking process); (c) shifts the workload to more “human timetable”; (d) frees more time to management; (e) contributes to farmers’ self-image - “high tech” instead of “low-tech”, (f) Occasionally local tourism has developed around a milking robot; (g) frequently a robot allows one of the family members to work outside the farm while his spouse may raise the livestock by himself. However, the milking robots should not only replace the farmer’s hands but also the farmer’s eyes. Sensors and models should support the decision making process. Therefore the project was to developed sensors, operational concepts and to provide science-based estimation of the added value to the farmer, Three projects, currently running in the ARO will be explored in the lecture: 1. Detecting post-calving ketosis by sensors and models. The objectives were to analyze
behavior (lying time, lying bouts, rumination time, activity) and performance (milk yield and real time milk composition, cow body weight) variables in relation to post-calving ketosis and to develop a model to detect post-calving ketosis based on these variables. Data from six commercial dairy farms, multiparous cows in early lactation for the first three weeks after calving, were analyzed. Behavior sensors recorded: maximal number of steps per hour, lying bouts and lying time, rumination, neck activity and weighing scale at the exit of the milking parlor. Reference: every cow between 5 to 12 d after calving was examined for ketosis with the help of a Ketostix. Results: Lying time was higher in ketotic (546 ± 3.7 min/day; Mean±Standard Error) than in healthy (503 ± 1.5 min/day) cows. Rumination time was lower in ketotic (36.3 ± 0.6 min/2 h) than in healthy (39.1 ± 0.4 min/2 h) cows. Activity was lower in ketotic (27.9 ± 0.5 units/2 h) than in healthy (30.0 ± 0.3 units/2 h) cows. Milk yield was lower in ketotic (34.4 ± 1.0 kg/d) than in healthy (38.9 ± 0.6 kg/d) cows. No differences in body weight were found between ketotic (644 ± 1.5 kg) and healthy (659 ± 1.3 kg) cows. Based on the changes in behavior and performance variables, a logistic regression model using the sensors daily individual data was developed for post-calving ketosis detection. The best model results were obtained when calibration and validation were performed on data from the same farm: sensitivity ranged from 78 to 90% and specificity ranged from 71 to 74%. Between-farm differences can affect model robustness and it is suggested that including more variables into the model could improve model quality.
73
2. The objective of the second study was to develop automatic lameness detection based on daily measurements of cow’s back posture (computer vision), behavioral sensing and performance variables. The 1,100 Israeli Holstein cows were housed in open, roofed cowsheds with dried manure bedding and no stalls. All cows were equipped with neck activity and ruminating time data loggers. Milk yield was measured with a milk flow sensor. Cow gait recordings were made during four consecutive nighttime milking sessions with a depth image camera. From the videos, two variables related to the back posture were extracted: the “inverse radius (1/R)” of the back posture contour, and the “cow body movement pattern (BMP)”. The reference in this study was 4 consecutive daily live locomotion scores of the animals on a 5-points scale. Applying only one single measurement of only the visual parameters (cow’s back posture – 1/R and BMP) led to a correct classification rate of 53.0% and a misclassification rate of 9.8%. Introducing a logistic regression model based on 4 consecutive 1/Rs and BMPs “obtained a correct classification rate of 60.8% and a misclassification rate of 9.1%. Further development, incorporating logistic regression with behavioral sensing and performance variables reached a sensitivity of 89%, and a specificity of 85%. This study suggests that the combination of image processing and behavioral monitoring has the potential to deliver reliable automatic lameness detection sensors to be applied soon in the farms.
3. The third case-study currently running at the ARO presents a computer-vision tool that automatically estimates cow’s body condition score (BCS). Top-view images of 151 cows were collected in an Israeli research dairy farm using a digital stills camera located at the entrance of the milking parlor. The cow’s tailhead area and its contour were segmented and extracted automatically. Two types of features of the tailhead contour were extracted: (1) the angles and distances between five anatomical points; (2) the cow signature, which is a 1D vector of the Euclidean distances from each point in the contour to the shape center. Two methods were applied to describe the cow’s signature and to reduce its dimension: (1) partial least squares regression, and (2) Fourier descriptors of the signature. Three prediction models were compared to expert’s manual scores. Results suggest that (1) it is possible to automatically extract body condition from color images (R2=0.64) without any manual interference; (2) Fourier descriptors of the cow's signature result in improved performance (with R2 = 0.77). BCS evaluation is a common tool to assess energy reserves of dairy cows and estimate their fatness or thinness. In further research, controlling the BCS at predetermined specific levels depending on cow stage of lactation, applying robot individual feeding capabilities is advised.
Concluding remarks The farms are getting bigger and bigger, more automation (such as milking robots) and more sensors. The onus is now on the (conceptual) management model – what to do with the huge amount of data? The presentation will go through some case studies while drawing attention to the big picture thinking.
74
ATTAINING REPRODUCTIVE SOLUTIONS THROUGH ACTIVITY AND HEALTH MONITORING
Raymond L. Nebel
Select Sires Inc. Plain City, Ohio, USA [email protected]
For a variety of reasons estrus detection rates in North American dairy herds based solely on visual observations are usually near the 50 percent range. Most large dairy operations use tail chalk/paint and once daily observation which is usually superior to visual observations but still allows room for improvement with service rates typically in the mid-60 percent range. Low detection rates led to the successful and profitable adoption of systematic timed A.I. programs (see dcrcouncil.org for industry recommended protocols). Despite the effectiveness of timed A.I. programs, many producers desire to breed cows based on estrus behavior and have mentioned their dislike of frequent injections that are required with timed A.I. protocols or concern about public perception with the use of reproductive hormones.
Increased physical activity is recognized as being associated with estrus, and various automated systems have been developed to detect standing to be mounted or increased activity either as steps or neck movements (Nebel et al., 2000; Firk et al., 2002). Numerous research reports reveal ample evidence that activity systems (pedometers or accelerometers) are able to accurately identify the majority of cow/heifers that are in estrus (van Erdenburg, 2008; Hockey et al., 2010; Kamphuis et al., 2012; Lovendahl and Changunda, 2010; Neves et al., 2012). As a result of technical progress in monitoring cows with the use of computers, automated detection systems have become a practical reality. Results of efficiency and accuracy of detection varied depending on the threshold value to determine when to declare high activity, the number of cows studied, housing and cow comfort, the method of time series analysis, and the number of days and time comparison for establishing a baseline of activity to determine when to declare high activity that should be associated with estrus. Across numerous herds using activity systems that we have evaluated the detection rates obtained range from the mid-70 to 80 percent range.
Affordable advanced computer technology that includes mini printed circuit boards that contain microelectronic circuits that function as an on-board micro-computer that tracks and transmits data, either using radio frequency or infrared technology, to either an on-farm computer based or Web based software package has driven an explosion of available activity systems. Activity monitoring systems allow for individual cow management with unique data collection and interpretation practically in real time. Initially, systems were developed for the detection of estrus but today systems are available that monitor rumination, resting time, temperature, and many other events associated with animal well-being. Activity monitoring has many different approaches, from pedometers that measure walking activity, to accelerometers that measure head movements, and ear tags that monitor activity associated with estrus and rumination and inner ear temperature. Proprietary complex algorithms allow comparison of both individual baseline and for a few systems a group baseline to identify individuals that deviate from normal or expected levels of activity to determine which animals are outside the desired population confidence interval and require management attention and or action. Each system (sensor)
75
records different types of activity. This can greatly affect accuracy. One of the key differentiators between systems is that their level of accuracy and false positives of detection algorithms. All systems include three or more basic components, the sensor on each cow, the hardware receiver to collect the data from the sensors and computer software. Presently sensors are in the form of either an ankle mounted pedometer, collar mounted monitor, an ear tag, or a rump mounted transmitter. All sensors transfer data either wirelessly using radio frequency or infrared technology to some configuration of a reader that transmits the data, usually in binary code, to a coordinator that translates and decodes the signal. The software is either located on an on-farm computer or a server that receives the information via Web based technology where the proprietary algorithms sort the information and determine which individuals need attention. Web apps, email alerts, and smart phone program downloads are available with many of the current systems. Table 1 summarizes the systems available in North America.
Farris (1954) was the first to report using pedometers to measure activity associated with estrus in dairy cows. The data on six cows that had AM and PM pedometer data showed an average increase in activity during estrus of 218 percent. More than twenty years elapsed before research revived interest in pedometry as a practical tool for detection of estrus of dairy cattle (Kiddy, 1977). It was noted that the daily activity for each cow must be monitored and activity associated with estrus compared to that obtained during the other stages of the estrous cycle for pedometry to be most effective in identifying estrus. A second significant finding was that individual cows differed significantly in the amount of activity expressed under the same conditions. The average increase in activity at the time of estrus was 393 percent. For 93 percent of the estrus periods the activity was three standard deviations above the mean activity during diestrus. These two studies were the basis for the development of activity systems. Over the next thirty-five years, numerous scientific studies reported on various properties of activity systems from environmental factors that affect accuracy rates to the ideal timing of insemination. Activity systems transfer data either during milking, using a walk-through portal or with a reader at each stall, or periodically during the day using radio frequency technology. The latest systems are using Internet Cloud service to alleviate the necessity for on-farm software and allow for remote access from almost anywhere. In general, activity data, however it is measured, is examined mathematically to identify cows that deviate from a pre-determined baseline. High or low activity is a reflection of the baseline activity for each cow and some systems account for routine herd movement. Results are available for individual cows and lead to three possible conclusions: cows in estrus, cows that need examination for other signs of estrus, or no action needed. The major limiting factors with activity systems are the type and level of activity used in the mathematical equations that are employed that determine detection and accuracy rates. It is well known that individual cows differ significantly in the amount of activity expressed during estrus even under the same farm conditions. All systems determine an individual baseline of activity that is used to compare current activity to decide if the real-time information is above a preset threshold. This is where the mathematical equations become important to declare the cow in high activity. An adjustment in the threshold level requires a balance between high detection rates and low error rates. All systems have a default threshold level based on the research for that system. After a period of time threshold levels should be adjusted according to specific farm conditions such as size of the pens or corrals, number of milkings per day, walking distance from the barn to the parlor and
76
other activities. The recording of cows not detected by the system and cows detected but not believed to actually be in estrus, is important for establishing an accurate threshold that should optimize service rates and minimize error rates. In many studies different traits have been analyzed for inclusion in activity systems for the detection of estrus. Results of estrus detection varied depending on the used threshold value, the number of cows, housing and treatment of cows and the methods of time series analysis. The detection rate of most investigations is sufficiently high at 80 to 90 percent. Error rates between 17 and 55 percent and specificities between 96 and 98 percent indicate a large number of false positive high activity alerts. A primary goal of most activity systems was to reduce the false positive alerts. In recent years several systems have combined different traits with the objective of improving detection rates. De Mol and Woldt (2001) stated that a detection rate of 100 percent in combination with no false estrus alerts on the basis of computer aided management devices will not be possible. The basic training of new users and continuous support of farm personnel are important to maximize the benefits of an activity system. Experience and training to differentiate a “true” peak of activity caused by a cow in estrus from a “false” peak in activity due to other causes for an increase in activity is closely related to improve reproductive performance, and there is a learning curve with all systems. Getting cows pregnant is complex and requires a comprehensive approach. Reproductive success is measured by confirmed pregnancies. One of the first responses that are noticed by producers is increased palpation pregnancy rates or more pregnant cow at herd checks. With the growing public interest in the living conditions of food producing animals, and the growing objection to any unnecessary use of pharmaceuticals, activity systems have the potential to be useful tools in the reproductive management of dairy herds. There are a growing number of producers who have purchased and use an activity system as a vital component of their reproductive management program. The real proof on how a system improves the reproductive performance is visiting dairy operations or questioning producers who use a system to learn from their experiences.
The costs of activity monitoring systems vary considerably depending on the system, operation needs, barn size, need for a computer, and number of monitors needed. For instance if a producer is just looking to use activity monitoring for estrus detection, monitors can be switched out and only used in 40 to 50 percent of the herd. Producers should compare the cost of activity monitoring to the results of their current reproductive system to help understand how it could impact profitability. The biggest consideration is that these systems are a tool to assist in decision making and should minimize labor associated with identifying cows in heat. There will continue to be enhancements to motion-sensing and health monitoring systems, so it is important the select the system that best fits your objectives. There are some options that are outdated and will not provide enough accuracy to rely on as a sole means of estrus detection. Conversely, there are some options that have not been thoroughly tested in the wide variety of North American dairy operations and may not be a good fit for your operation.
Deciding whether to implement an activity/health monitoring system into the health and reproductive management tool-box, as well as which type of system, is an important decision with several factors to consider. The investment of an activity/health monitoring system will have a different level of return on that investment for each operation. If you are going to invest
77
in an activity system, it is critical that you work with someone who has the expertise to help you manage the system properly including how to best utilize estrous synchronization protocols in combination with the activity system technology to maximize your results. There will be a percentage of cows that will need some hormone intervention to assist them in overcoming anestrous status and a high-performing activity system that provides accurate estrus detection will help you identify the cows that are cycling, so you can focus individual intervention on the cows that need it. That is why it is critical to purchase an activity system from a reproductive specialist that can maximize the investment in the same way that a milking equipment specialist can help maximize milk harvest with the investment in new milking equipment, so work with specialists within their field of expertise.
Take Home Message
• Affordable advanced computer technology that includes mini printed circuit boards that contain microelectronic circuits that function as an on-board micro-computer that track and transmit data has driven an explosion of available activity systems.
• All activity systems include three or more basic components, the sensor on each cow, the hardware receiver to collect the data from the sensors and computer software.
• Activity monitoring systems allow for individual cow management with unique data collection and interpretation practically in real time.
• System specific proprietary complex algorithms allow comparison of both individual and group baselines to identify individuals that deviate from normal or expected levels of activity to determine which animals are outside the desired population confidence interval and require management attention and or action.
• One of the key differentiators between systems is that their level of accuracy and false positives of detection algorithms. Each system records different types of activity. This can greatly affect accuracy of detection.
• The basic training of new users and continuous support of farm personnel are important to maximize the benefits of an activity system.
• There are a growing number of producers who have purchased and use an activity system as a vital component of their reproductive management program.
• Common results of implementing an activity system into the reproductive management program are reduced calving intervals, increased estrus detection and conception rates, increased palpation pregnancy rates, and a reduced reliance on timed A.I. protocols.
• The investment of an activity/health monitoring system will have a different level of return on that investment for each operation. If you are going to invest in an activity system, it is critical that you work with someone who has the expertise to help you manage the system properly.
Citations
De Mol, R.M., Woldt, W.E., 2001. Application of fuzzy logic in automated cow status monitoring. J. Dairy Sci. 84, 400–410.
Farris, E.J. 1954. Activity of dairy cows during estrus. J. American. Vet. Med. Association. 125:117-120.
Firk, R., E. Stamer, W. Junge, and J. Krieter. 2002. Automation of oestrus detection in dairy cows: A review. Livest. Prod. Sci. 75:219-232.
78
Hockey, C., J. Morton, S. Norman, and M. McGowan. 2010. Evaluation of a neck mounted 2-hourly activity meter system for detecting cows about to ovulate in two paddock-based Australian dairy herds. Reproduction in Domestic Animals. 45:e107-e117.
Kamphuis, C., B. DelaRue, C.R. Burke, J. Jago. 2012. Field evaluation of 2 collar-mounted activity meters for detecting cows in estrus on a large pasture-grazed dairy farm. J. Dairy Sci. 95:3045-3056.
Kiddy, C. A.1977. Variation in physical activity as an indication of estrus in dairy cows. J. Dairy Sci. 60:235-243.
Lovendahl, P. and M.G.G. Chagunda. 2010. On the use of physical activity monitoring for estrus detection in dairy cows. J. Dairy Sci. 93:249-259.
Nebel, R.L., M.G.Dransfield, S.M. Jobst, and J.H. Bane. 2000. Automated electronic systems for the detection of oestrus and timing of AI in cattle. Animal Reprod. Sci. 60-61:713-723.
Neves, R. C., K.E. Lesile, J.S. Walton, and S.J. LeBlanc. 2012. Reproductive performance with an automated activity monitoring system versus a synchronization breeding program. J. Dairy Sci. 95:5683-5264.
Van Eerdenburg, F.J.C.M. 2008. The pedometer, an automated aid in the detection of estrus. Vet. Quarterly. 30 (Suppl 1):49-57.
79
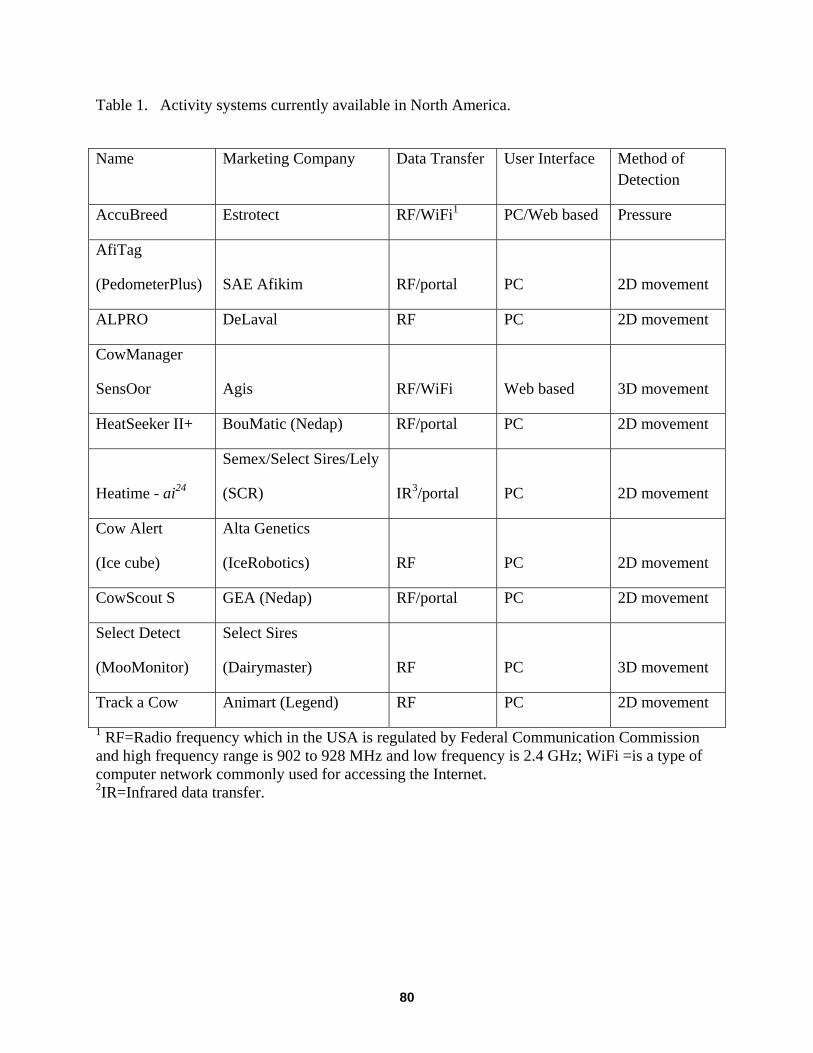
Table 1. Activity systems currently available in North America.
Name Marketing Company Data Transfer User Interface Method of Detection
AccuBreed Estrotect RF/WiFi1 PC/Web based Pressure
AfiTag
(PedometerPlus)
SAE Afikim
RF/portal
PC
2D movement
ALPRO DeLaval RF PC 2D movement
CowManager
SensOor
Agis
RF/WiFi
Web based
3D movement
HeatSeeker II+ BouMatic (Nedap) RF/portal PC 2D movement
Heatime - ai24
Semex/Select Sires/Lely
(SCR)
IR3/portal
PC
2D movement
Cow Alert
(Ice cube)
Alta Genetics
(IceRobotics)
RF
PC
2D movement
CowScout S GEA (Nedap) RF/portal PC 2D movement
Select Detect
(MooMonitor)
Select Sires
(Dairymaster)
RF
PC
3D movement
Track a Cow Animart (Legend) RF PC 2D movement
1 RF=Radio frequency which in the USA is regulated by Federal Communication Commission and high frequency range is 902 to 928 MHz and low frequency is 2.4 GHz; WiFi =is a type of computer network commonly used for accessing the Internet. 2IR=Infrared data transfer.
80
COMPUTER-CONTROLLED MILK FEEDING IN CALVES
Margit Bak Jensen1 Anne Marie de Passillé2 and Jeff Rushen2 1Aarhus University, Blichers Allé 20, Tjele, Denmark
2Pacific Agri-Food Research Centre, Agassiz, British Columbia, Canada [email protected]
Computer-controlled milk feeders enable us to feed individual rations to group-housed calves but measures should be taken to ensure that calves interact with the feeder in a suitable manner. With 20 or more calves sharing a single feeding station there is often competition for access. The feeding station typically has a raceway to access the teat which limits displacements, but disturbance of feeding calves still occurs. Jensen (2004) found that calves were disturbed for 50% of their time in the feeder with 24 calves per feeder compared to 10% of their time with 12 calves per feeder. The rate of milk ingestion was also higher among calves housed in the large groups reflecting increased competition and disturbance. Disturbance of feeding calves is undesirable, not only due to the disturbance of milk ingestion, but also because this competition increases the risk of cross sucking. A gate installed at the entrance to the race can reduce the competition and cross sucking and prevent disturbance of feeding calves (Weber and Wechsler, 2001). However, competition and cross sucking can also be reduced by improving the way these feeders are managed. Milk feeders are typically programmed to provide restricted amounts of milk in several daily portions. Calves offered their daily allowance of 6.4 L in 4 portions, rather than 8 portions, occupied the feeder for less time per day (Jensen, 2004). Irrespective of how much milk the calf gets per meal, the sucking motivation is stimulated at every milk meal (Rushen and Passillé, 1995) and the longer daily occupancy with 8 milk portions is due to calves spending the same amount of time performing non-nutritive sucking at every meal. Offering a daily allowance of 8 L/d in 4 daily portions rather than 8 portions also reduced the occurrence of cross-sucking (Nielsen et al., 2008), which may be due to the sucking motivation being stimulated less frequently, or due to the larger portions providing a better outlet for the sucking motivation. The milk allowance has a marked effect on calves’ use of a computer-controlled milk feeder. Although feeding the calves a high daily milk allowance increases the time the calves spend ingesting milk (Jensen, 2006), a high milk allowance results in a lower daily occupancy of the feeder compared to a low milk allowance (Jensen and Holm, 2003; Jensen, 2006; Vieira et al., 2008; Nielsen et al., 2008; Borderas et al., 2009a) due to a lower frequency and duration of unrewarded visits where the calves are not entitled to milk. The high level of unrewarded visits in low fed calves shows that the calves are trying to get access to more milk and this response is a sign of hunger. An increase in unrewarded visits to the feeder also occurs when calves are being gradually weaned off milk (Jensen, 2006; de Passillé et al., 2011), which is due to the fact that energy intake at weaning is reduced for calves that have trouble switching to solid feed. An advantage of computer-controlled milk and starter feeders is that weaning off milk can be adjusted to each individual calf’s intake of starter, resulting in better growth over the weaning period (de Passillé and Rushen, 2012).
81
When calves suckle the dam the meal size increases and the meal frequency declines from 8-12 to 3-4 meals per day during the first month of life (Jensen, 2003). When artificially reared calves are offered a high milk allowance, with little restriction on the patterning of meals, they show the same changes in meal size and frequency with age (Jensen, 2009). In contrast, calves provided a low milk allowance continue to have a high frequency of milk meals throughout the milk feeding period because they consistently ingested milk as soon as it became available to them, which was likely due to hunger. Is reduced appetite due to disease also reflected in the calves’ use of the feeder? Borderas et al. (2009b) found that among ad libitum fed calves, but not among restricted fed calves, the milk intake was reduced as a consequence of disease Among restricted fed calves, Svensson and Jensen (2007) found no relation between disease and milk intake, but disease was related to a reduction in the number of unrewarded visits, indicating that this measure may be a sign of loss of appetite and disease in restricted fed calves. Thus, different indicators of disease may have to be applied depending on milk allowance in the further development of a computer-controlled milk feeder in health surveillance. References Borderas, T.F. J. Rushen, M. A. G. von Keyserlingk, A. M. B. de Passillé 2009b. Automated
measurement of changes in feeding behaviour of milk-fed calves associated with illness. J. Dairy Sci. 92: 4549–4554.
Borderas, T.F., A.M.B. de Passillé, J. Rushen 2009a. Feeding behavior of calves fed small or large amounts of milk. J. Dairy Sci. 92:2843–2852
de Passillé, A.M., Borderas, T.F., Rushen, J., 2011. Weaning age of calves fed a high milk allowance by automated feeders: Effects on feed, water, and energy intake, behavioral signs of hunger, and weight gains. J Dairy Sci. 94, 1401-1408.
de Passillé, A.M., Rushen, J., 2012. Adjusting the weaning age of calves fed by automated feeders according to individual intakes of solid feed. J Dairy Sci. 95, 5292-5298.
Jensen, M.B. 2003. The effects of feeding method, milk allowance and social factors on milk feeding behaviour and cross-sucking in group housed dairy calves. Appl. Anim. Behav. Sci. 80: 191- 206.
Jensen, M.B. 2006. Computer-controlled milk feeding of group-housed calves, the effect of milk allowance and weaning type. J. Dairy Sci. 89: 201-206
Jensen, M.B. 2009. Short Communication: Milk meal pattern of dairy calves is affected by computer controlled milk feeder set-up. J. Dairy Sci. 92: 2906-2910.
Jensen, M.B., 2004. Computer controlled milk feeding of dairy calves: The effects of number of calves per feeder and number of milk portions on use of feeder and social behaviour. J Dairy Sci 87:3428-3438
Jensen, M.B., L. Holm. 2003. The effect of milk flow rate and milk allowance on feeding related behaviour in dairy calves fed by computer-controlled milk feeders. Appl. Anim. Behav Sci. 82:87-100.
Nielsen, P.P., Jensen, M. B., Lidfors, L. 2008. Milk allowance and weaning method affect the use of a computer controlled milk feeder and the development of cross-sucking in dairy calves. Appl. Anim. Behav. Sci., 109:223-237
Rushen, J. and A.M. de Passillé, 1995. The motivation of non-nutritive sucking in calves, Bos taurus. Anim. Behav. 49: 1503-1510.
Svensson, C, Jensen, M.B. 2007. Identification of diseased calves by use of data from automatic milk feeders J. Dairy Sci. 90: 994-997.
Vieira, A. De Paula, V. Guesdon, A. M. De Passillé, M. A. G. Keyserlingk, D. M. Weary 2008. Behavioural indicators of hunger in dairy calves. Appl. Anim. Behav. Sci. 109:180-189.
Weber, R., Wechsler, B. 2001. Reduction in cross-sucking in calves by the use of a modified automatic teat feeder. Appl. Anim. Behav. Sci. 72, 215-223.
82
AUTOMATED CALF FEEDERS PRODUCER PANEL JUNE 27, 11:35 AM
Chad Carlson Carlson Dairy, LLP Willmar, Minnesota Carlson Dairy, LLP, a 1,250-cow dairy farm near Willmar, Minnesota (approximately 100 miles west of Minneapolis), is run by 3 Carlson families: Curtney and Louise Carlson with their two sons and wives, Chad and Kindra Carlson, and Carl and Kellie Carlson. They have been dairying in partnership as Carlson Dairy, LLP since 1999. Their milking herd is housed in a 10-row, cross-ventilated, sand-bedded freestall facility, and their sand is continuously recycled through sand settling lanes. They milk 3x per day in a double-18 parallel milking parlor using Beco milking equipment. They have 720 tillable acres that are split between corn and alfalfa. The Carlsons have been using an Urban U40 automated calf feeder since April 2012. Approximately 50% of heifer calves born utilize the auto calf feeder while the other half are bucket fed in individual pens. Jeremy Heim Heim’s Hillcrest Dairy Algoma, Wisconsin Heim’s Hillcrest Dairy is a family owned and operated dairy in Algoma, Wisconsin. The dairy has a BouMatic double-12 parallel parlor. Heim’s Hillcrest Dairy recently built a new calf feeding facility. This facility contains a Holm & Laue 100 Automatic Calf Feeder along with a Calf Star Calf Milk Pasteurizer and is housed in a Holm & Laue Igloo Veranda system. Michelle Rohe Rohe Dairy Freeport, Minnesota Rohe Dairy has been in operation for 15 years as a partnership with 3 brothers; however, it is in its third generation as a farm/farming. Rohe Dairy milks on average 250 cows with about 40 dry, and they have an inventory of 340 youngstock. The parlor is a double-12 parallel. A new calf barn was built in 2012 onto an existing barn that originally housed dry cows. They started feeding first calves in July of 2012. The barn is approximately 131 feet long by 30 feet wide with 12-foot ceilings. It has tunnel ventilation with 6 small and 5 larger exhaust fans. There are 4 pens that can house about 20 calves per pen, 1 Lely feeder with 2 nipple sites, a self-enclosed room for the calf feeder and a separate room for the computer and supplies, and waterers in each pen. Calves are brought down via a ramp from the existing barn at about 5 days during the summer and 7 days in the winter with 48 days on program, 5-liter start, 7-liter middle feeding, and 2-liter wean off. A calf candy pellet mix is offered on day 1 of the feeding program. Nipples are changed daily and milk hoses are changed once each week. Weaned calves are moved in groups of 10 to an outside facility. Milker replacer is LOL Amplifermax. Their bedding is a base of sawdust shavings topped with straw. Fresh bedding is provided every 9 to 11 days with daily straw added as needed.
83
Questions ou problèmes, contactez-nous dans les plus brefs délais au : 1 888 959-6352 : Courriel : [email protected]
Nom de fichier et version : 4231_valmetal_precision-dairy_v2_pll
Client :
Modifié :
Format :
Valmetal
7 May 2013 10:26 AM
7,375 in x 2,25 in
Couleurs :
Publication :
Parution :
4 C. Process
Precision Dairy
N.D.
The brillianT way of feeding dairy cows
benefiTs: Timelife qualiTy
moneywell-being
milk qualiTyIt’s proven beyond doubt! The Autoration V+ makes THE difference!
Take conTrol of your producTion... and your profiTs! Follow us TEl 608 374-2206 [email protected]
Advancing the Success of Minnesota Dairy Producers
www.mnmilk.org
Mem
ber
Dev
elop
men
t
Pu
blic
Pol
icy
Con
tin
uin
g Ed
uca
tion
PRECISION DAIRY IN AUSTRALIA – LESSONS FOR END USERS, TECHNOLOGY DEVELOPERS, AND INDUSTRY ORGANISATIONS
Callum R. Eastwood
The University of Melbourne, Melbourne, Victoria, Australia [email protected]
Introduction Australian dairy farming is currently in a phase of increasing technology use to automate manual tasks and collect data on animal and feedbase performance. Previous research (Eastwood et al. 2012) showed the use of precision dairy (PD) technologies in Australian dairy farming is faced with issues around on-farm implementation, effective technology development and integration between technologies. The development and support of these technologies is nested in the commercial (private-good) domain yet most companies don’t have the market share within a relatively small market (7500 farms) to support their products with adequate after-sales farm integration support. The collection of information about individual animal performance along with fine scale monitoring of feedbase performance presents a major opportunity for operational farm management, and also for industry monitoring initiatives such as the centralised data repository concept. However, there is lack of cohesion around developing integrated technologies with functionality for open data exchange, and farmers face challenges to integrate and use PD technologies within their farming system. This 3 year research program was aimed at investigating the role of industry-good organisations in this space, while also examining the broader lessons for integration of high challenge technologies in dairy farm systems. The research was funded by Dairy Australia, an industry-good organisation representing Australian dairy farmers. Methods The research was based around three case studies designed to represent different stages in the technology development process, i.e. established technologies (in-shed precision dairy sensors), emerging technologies (automatic milking systems in Australia) and future technologies (precision pasture measurement). A mixed method social science approach was used, including online surveys, interviews, and workshops with actors within the precision dairy community of practice. Discussion of major findings Lessons for end-users (farmers and service providers) Precision dairy requires fundamental skills in computer use and data management/interpretation by farmers, their staff, and within their networks of practice. Lessons from this research included: farmers need to carefully assess PD investments against their specific needs and current skills and management approach; effective PD implementation can require further training of the farmer and their staff; there are significant opportunities for service providers in a
85
farmer’s ‘network of practice’ to incorporate PD in their business models such as remote access to client herd management databases. Lessons for developers Future precision technologies need to be considered in respect to their end-user context to improve implementation success. A technology development framework was derived from the research outcomes, guided by existing adoption and innovation theory (Hekkert et al. 2007; Meijer et al., 2007; Kuehne et al. 2012) and key functions of successful innovation systems. The framework helps developers consider technology feasibility, target population expectations, and capability and skill requirements. It can be used as a filter to initially highlight aspects including technological feasibility compared to end user needs and private- and industry-good roles. Lessons for industry-good organisations Precision dairy technologies can be classified as ‘high challenge technologies’ as their implementation can be complex and requires a systems approach; they are often controlled by commercial interests with inadequate ability to support them at a farm systems scale; and their successful use presents a significant industry good value. An industry-good organisation’s role around precision dairy involves independent information provision, co-ordination, leadership in guiding new technology development, skills development, and understanding the implications of precision dairy on farming systems. Companies in the precision dairy space have roles to play in technical support of their products and ongoing development of technologies with a commercial value proposition. Conclusions The new technologies now available to dairy farmers present a ‘high challenge’ in their on-farm implementation. Industry-good organisations have a role in working with technology companies to build farmer and service provider capability in the effective use of precision dairy tools and data. ICT use, and using data in decision making, needs to be embedded within industry training programmes. Industry organisations also have a role in providing independent information about precision dairy tools and their appropriate use. References Eastwood, C.R., D.F. Chapman, M.S. Paine (2012). Networks of practice for co-construction of
agricultural decision support systems: Case studies of precision dairy farms in Australia. Agricultural Systems, 108, 10-18.
Hekkert, M. P., R.A.A. Suurs, S.O. Negro, S. Kuhlmann, R.E.H.M. Smits (2007). Functions of innovation systems: A new approach for analysing technological change. Technological Forecasting and Social Change, 74(4), 413-432.
Kuehne, G., C. Nicholson, M. Robertson, R. Llewellyn, C. McDonald (2012). Engaging project proponents in R&D evaluation using bio-economic and socio-economic tools. Agricultural Systems, 108, 94-103.
Meijer, I. S. M., M. P. Hekkert, J. F. M. Koppenjan (2007). How perceived uncertainties influence transitions; the case of micro-CHP in the Netherlands. Technological Forecasting and Social Change, 74(4), 519-537.
86
PRECISION DAIRY TECHNOLOGIES: A PRODUCER ASSESSMENT
Matthew R. Borchers and Jeffrey M. Bewley University of Kentucky, Lexington, Kentucky, USA [email protected] and [email protected]
Introduction Limited information exists on dairy producer use, perception, and understanding of dairy cow monitoring technologies and the parameters they measure. Producer use of technology becomes important as dairy farmers refine their management practices with emphasis on efficiency. The objective of this study was to understand dairy producer needs relative to Precision Dairy technologies. Materials and Methods A survey was distributed through SurveyMonkey® in March of 2013 to dairy farmers. Surveys were distributed and 111 were completed; producers from 10 countries responded to the survey. Statistical analyses were conducted using Microsoft® Excel 2010. Results and Discussion Mean (± SD) herd size (lactating + dry) of the respondents was 600.4 ± 1,469.1. Producer ages were categorized in ranges: 12.2%, < 30; 29.6%, 31 to 40; 26.1%, 41 to 50, 23.5%, 51 to 60; and 8.7%, >60. Producer categories were generated based on respondents’ role on the farm: 71.6%, owner, co-owner, or partner; 1.8%, president or vice president; 23.9%, manager, supervisor, or herdsman; and 2.8%, employees. Producers were asked what kinds of technologies were currently used on their farm from a predetermined list with the most common being: daily milk yield, 47.6%; cow activity, 29.4%; not applicable (meaning no technologies were used), 29.4%; and milk components, 23.8%. The least utilized technologies were: rumen pH, 1.6%; methane emissions, 1.6%; respiration, 2.4%; body condition score, 2.4%; and heart rate, 3.2%. When asked to rank technology usefulness from a predetermined list, producer responses indicated cow activity was most useful; followed by daily milk yield, temperature, standing heat and mastitis (Table 1). In response to criteria producers found important for purchases, producers responded with benefit: cost ratio being most important, followed by total investment cost, simplicity and ease of use, proven performance through independent research, and compatibility with existing practices and systems (Table 2). Conclusions In order to market products, information is needed to identify consumer wants and needs. Precision Dairy technology manufacturers can use this survey to better adapt to the wants and needs of producers and maximize Precision Dairy technology use and implementation.
87
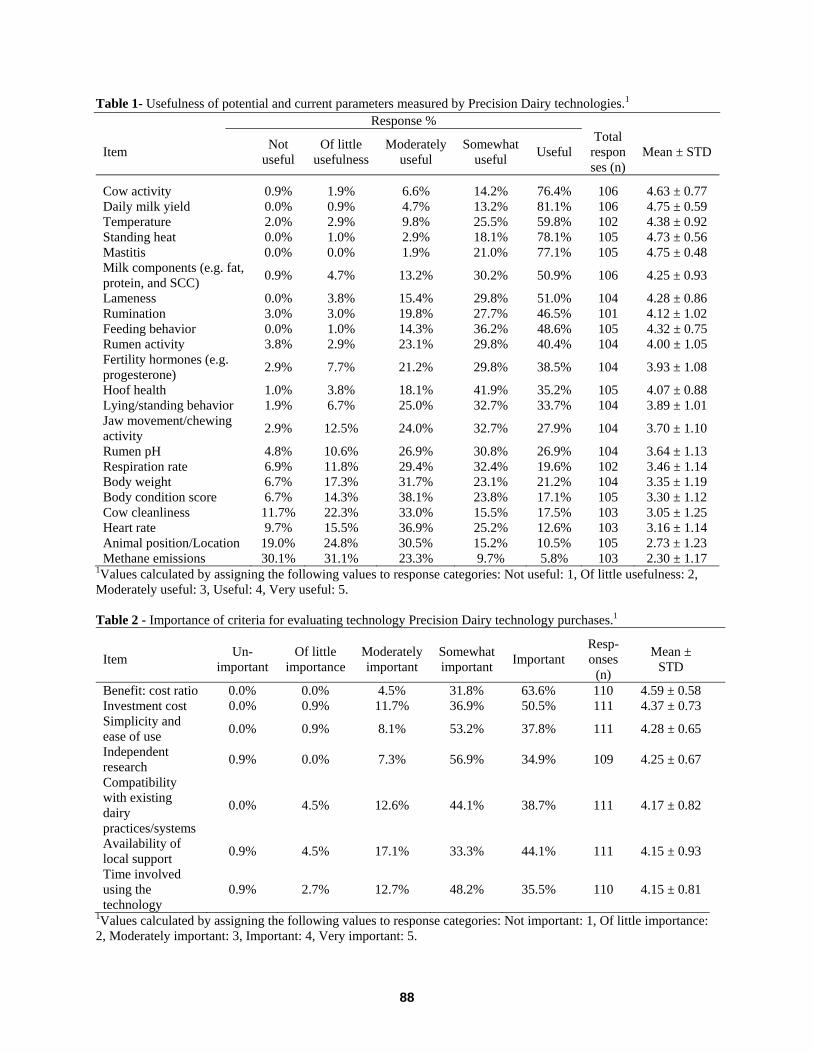
Table 1- Usefulness of potential and current parameters measured by Precision Dairy technologies.1
Response %
Item Not useful
Of little usefulness
Moderately useful
Somewhat useful Useful
Total responses (n)
Mean ± STD
Cow activity 0.9% 1.9% 6.6% 14.2% 76.4% 106 4.63 ± 0.77 Daily milk yield 0.0% 0.9% 4.7% 13.2% 81.1% 106 4.75 ± 0.59 Temperature 2.0% 2.9% 9.8% 25.5% 59.8% 102 4.38 ± 0.92 Standing heat 0.0% 1.0% 2.9% 18.1% 78.1% 105 4.73 ± 0.56 Mastitis 0.0% 0.0% 1.9% 21.0% 77.1% 105 4.75 ± 0.48 Milk components (e.g. fat, protein, and SCC) 0.9% 4.7% 13.2% 30.2% 50.9% 106 4.25 ± 0.93
Lameness 0.0% 3.8% 15.4% 29.8% 51.0% 104 4.28 ± 0.86 Rumination 3.0% 3.0% 19.8% 27.7% 46.5% 101 4.12 ± 1.02 Feeding behavior 0.0% 1.0% 14.3% 36.2% 48.6% 105 4.32 ± 0.75 Rumen activity 3.8% 2.9% 23.1% 29.8% 40.4% 104 4.00 ± 1.05 Fertility hormones (e.g. progesterone) 2.9% 7.7% 21.2% 29.8% 38.5% 104 3.93 ± 1.08
Hoof health 1.0% 3.8% 18.1% 41.9% 35.2% 105 4.07 ± 0.88 Lying/standing behavior 1.9% 6.7% 25.0% 32.7% 33.7% 104 3.89 ± 1.01 Jaw movement/chewing activity 2.9% 12.5% 24.0% 32.7% 27.9% 104 3.70 ± 1.10
Rumen pH 4.8% 10.6% 26.9% 30.8% 26.9% 104 3.64 ± 1.13 Respiration rate 6.9% 11.8% 29.4% 32.4% 19.6% 102 3.46 ± 1.14 Body weight 6.7% 17.3% 31.7% 23.1% 21.2% 104 3.35 ± 1.19 Body condition score 6.7% 14.3% 38.1% 23.8% 17.1% 105 3.30 ± 1.12 Cow cleanliness 11.7% 22.3% 33.0% 15.5% 17.5% 103 3.05 ± 1.25 Heart rate 9.7% 15.5% 36.9% 25.2% 12.6% 103 3.16 ± 1.14 Animal position/Location 19.0% 24.8% 30.5% 15.2% 10.5% 105 2.73 ± 1.23 Methane emissions 30.1% 31.1% 23.3% 9.7% 5.8% 103 2.30 ± 1.17
1Values calculated by assigning the following values to response categories: Not useful: 1, Of little usefulness: 2, Moderately useful: 3, Useful: 4, Very useful: 5. Table 2 - Importance of criteria for evaluating technology Precision Dairy technology purchases.1
Item Un-important
Of little importance
Moderately important
Somewhat important Important
Resp-onses
(n)
Mean ± STD
Benefit: cost ratio 0.0% 0.0% 4.5% 31.8% 63.6% 110 4.59 ± 0.58 Investment cost 0.0% 0.9% 11.7% 36.9% 50.5% 111 4.37 ± 0.73 Simplicity and ease of use 0.0% 0.9% 8.1% 53.2% 37.8% 111 4.28 ± 0.65
Independent research 0.9% 0.0% 7.3% 56.9% 34.9% 109 4.25 ± 0.67
Compatibility with existing dairy practices/systems
0.0% 4.5% 12.6% 44.1% 38.7% 111 4.17 ± 0.82
Availability of local support 0.9% 4.5% 17.1% 33.3% 44.1% 111 4.15 ± 0.93
Time involved using the technology
0.9% 2.7% 12.7% 48.2% 35.5% 110 4.15 ± 0.81
1Values calculated by assigning the following values to response categories: Not important: 1, Of little importance: 2, Moderately important: 3, Important: 4, Very important: 5.
88
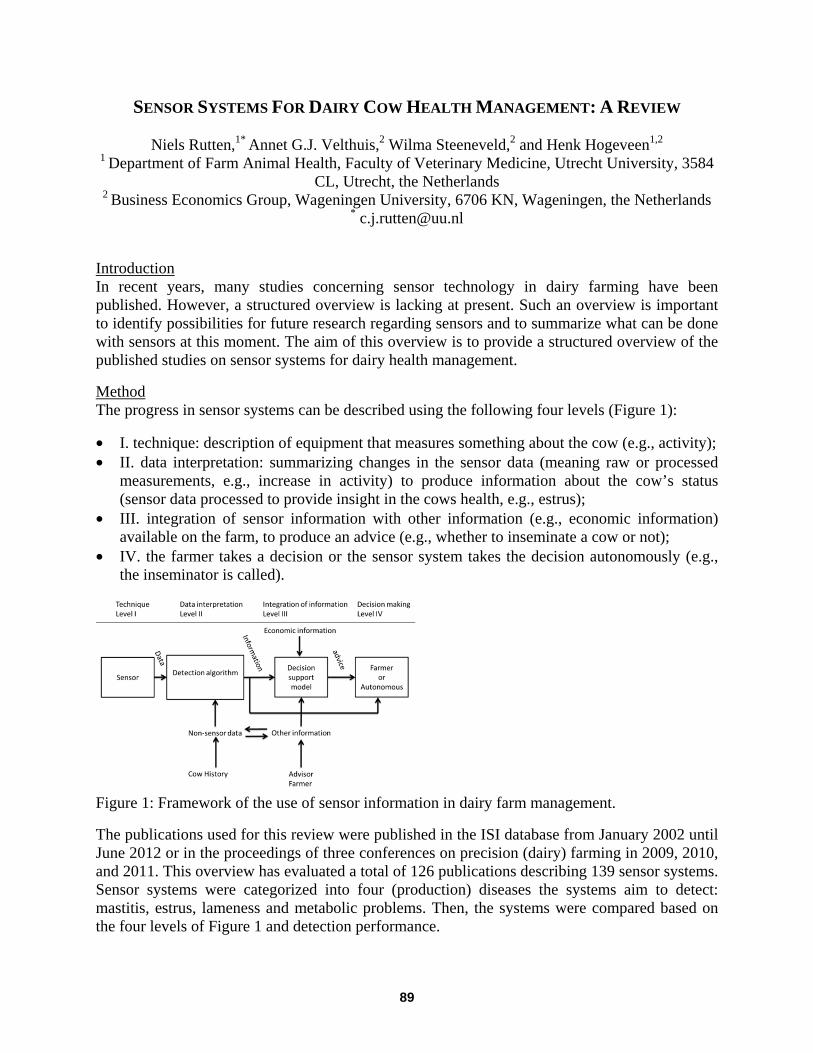
SENSOR SYSTEMS FOR DAIRY COW HEALTH MANAGEMENT: A REVIEW
Niels Rutten,1* Annet G.J. Velthuis,2 Wilma Steeneveld,2 and Henk Hogeveen1,2 1 Department of Farm Animal Health, Faculty of Veterinary Medicine, Utrecht University, 3584
CL, Utrecht, the Netherlands 2 Business Economics Group, Wageningen University, 6706 KN, Wageningen, the Netherlands
Introduction In recent years, many studies concerning sensor technology in dairy farming have been published. However, a structured overview is lacking at present. Such an overview is important to identify possibilities for future research regarding sensors and to summarize what can be done with sensors at this moment. The aim of this overview is to provide a structured overview of the published studies on sensor systems for dairy health management.
Method The progress in sensor systems can be described using the following four levels (Figure 1):
• I. technique: description of equipment that measures something about the cow (e.g., activity); • II. data interpretation: summarizing changes in the sensor data (meaning raw or processed
measurements, e.g., increase in activity) to produce information about the cow’s status (sensor data processed to provide insight in the cows health, e.g., estrus);
• III. integration of sensor information with other information (e.g., economic information) available on the farm, to produce an advice (e.g., whether to inseminate a cow or not);
• IV. the farmer takes a decision or the sensor system takes the decision autonomously (e.g., the inseminator is called).
Figure 1: Framework of the use of sensor information in dairy farm management.
The publications used for this review were published in the ISI database from January 2002 until June 2012 or in the proceedings of three conferences on precision (dairy) farming in 2009, 2010, and 2011. This overview has evaluated a total of 126 publications describing 139 sensor systems. Sensor systems were categorized into four (production) diseases the systems aim to detect: mastitis, estrus, lameness and metabolic problems. Then, the systems were compared based on the four levels of Figure 1 and detection performance.
89
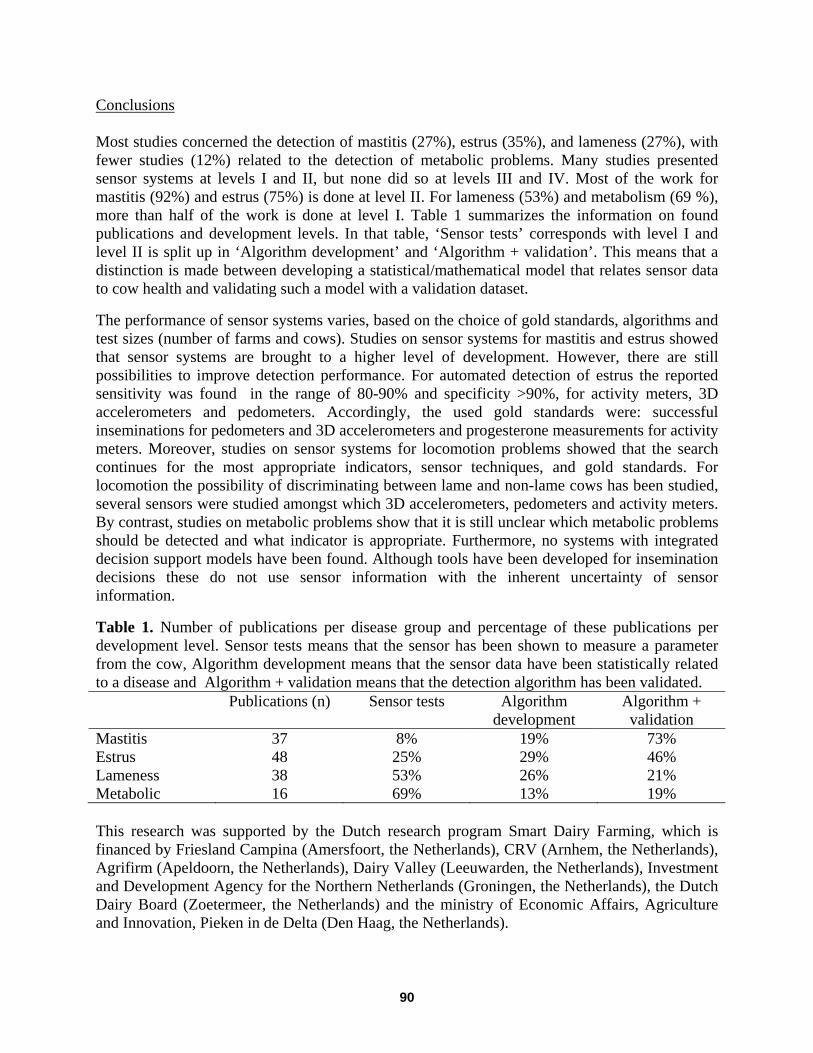
Conclusions Most studies concerned the detection of mastitis (27%), estrus (35%), and lameness (27%), with fewer studies (12%) related to the detection of metabolic problems. Many studies presented sensor systems at levels I and II, but none did so at levels III and IV. Most of the work for mastitis (92%) and estrus (75%) is done at level II. For lameness (53%) and metabolism (69 %), more than half of the work is done at level I. Table 1 summarizes the information on found publications and development levels. In that table, ‘Sensor tests’ corresponds with level I and level II is split up in ‘Algorithm development’ and ‘Algorithm + validation’. This means that a distinction is made between developing a statistical/mathematical model that relates sensor data to cow health and validating such a model with a validation dataset.
The performance of sensor systems varies, based on the choice of gold standards, algorithms and test sizes (number of farms and cows). Studies on sensor systems for mastitis and estrus showed that sensor systems are brought to a higher level of development. However, there are still possibilities to improve detection performance. For automated detection of estrus the reported sensitivity was found in the range of 80-90% and specificity >90%, for activity meters, 3D accelerometers and pedometers. Accordingly, the used gold standards were: successful inseminations for pedometers and 3D accelerometers and progesterone measurements for activity meters. Moreover, studies on sensor systems for locomotion problems showed that the search continues for the most appropriate indicators, sensor techniques, and gold standards. For locomotion the possibility of discriminating between lame and non-lame cows has been studied, several sensors were studied amongst which 3D accelerometers, pedometers and activity meters. By contrast, studies on metabolic problems show that it is still unclear which metabolic problems should be detected and what indicator is appropriate. Furthermore, no systems with integrated decision support models have been found. Although tools have been developed for insemination decisions these do not use sensor information with the inherent uncertainty of sensor information.
Table 1. Number of publications per disease group and percentage of these publications per development level. Sensor tests means that the sensor has been shown to measure a parameter from the cow, Algorithm development means that the sensor data have been statistically related to a disease and Algorithm + validation means that the detection algorithm has been validated. Publications (n) Sensor tests Algorithm
development Algorithm + validation
Mastitis 37 8% 19% 73% Estrus 48 25% 29% 46% Lameness 38 53% 26% 21% Metabolic 16 69% 13% 19% This research was supported by the Dutch research program Smart Dairy Farming, which is financed by Friesland Campina (Amersfoort, the Netherlands), CRV (Arnhem, the Netherlands), Agrifirm (Apeldoorn, the Netherlands), Dairy Valley (Leeuwarden, the Netherlands), Investment and Development Agency for the Northern Netherlands (Groningen, the Netherlands), the Dutch Dairy Board (Zoetermeer, the Netherlands) and the ministry of Economic Affairs, Agriculture and Innovation, Pieken in de Delta (Den Haag, the Netherlands).
90
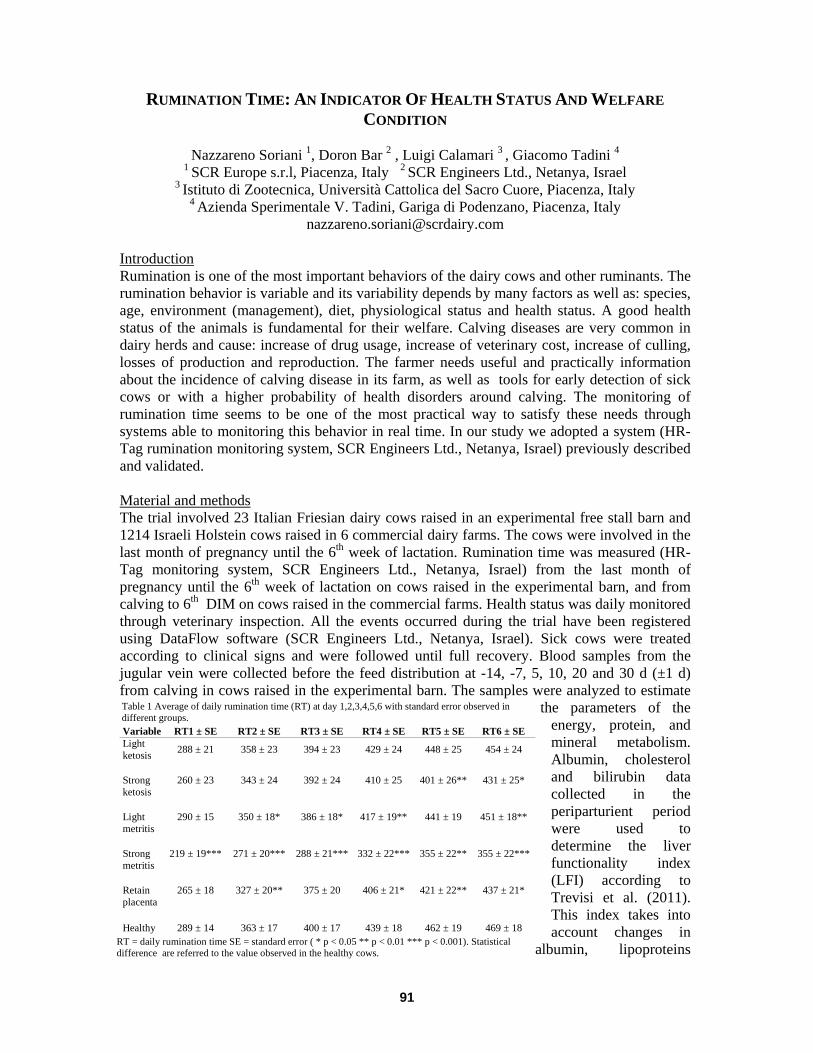
Variable RT1 ± SE RT2 ± SE RT3 ± SE RT4 ± SE RT5 ± SE RT6 ± SE Light ketosis 288 ± 21 358 ± 23 394 ± 23 429 ± 24 448 ± 25 454 ± 24
Strong ketosis
260 ± 23 343 ± 24 392 ± 24 410 ± 25 401 ± 26** 431 ± 25*
Light metritis
290 ± 15 350 ± 18* 386 ± 18* 417 ± 19** 441 ± 19 451 ± 18**
Strong metritis
219 ± 19*** 271 ± 20*** 288 ± 21*** 332 ± 22*** 355 ± 22** 355 ± 22***
Retain placenta
265 ± 18 327 ± 20** 375 ± 20 406 ± 21* 421 ± 22** 437 ± 21*
Healthy 289 ± 14 363 ± 17 400 ± 17 439 ± 18 462 ± 19 469 ± 18
RUMINATION TIME: AN INDICATOR OF HEALTH STATUS AND WELFARE CONDITION
Nazzareno Soriani 1, Doron Bar 2 , Luigi Calamari 3 , Giacomo Tadini 4
1 SCR Europe s.r.l, Piacenza, Italy 2 SCR Engineers Ltd., Netanya, Israel 3 Istituto di Zootecnica, Università Cattolica del Sacro Cuore, Piacenza, Italy
4 Azienda Sperimentale V. Tadini, Gariga di Podenzano, Piacenza, Italy [email protected]
Introduction Rumination is one of the most important behaviors of the dairy cows and other ruminants. The rumination behavior is variable and its variability depends by many factors as well as: species, age, environment (management), diet, physiological status and health status. A good health status of the animals is fundamental for their welfare. Calving diseases are very common in dairy herds and cause: increase of drug usage, increase of veterinary cost, increase of culling, losses of production and reproduction. The farmer needs useful and practically information about the incidence of calving disease in its farm, as well as tools for early detection of sick cows or with a higher probability of health disorders around calving. The monitoring of rumination time seems to be one of the most practical way to satisfy these needs through systems able to monitoring this behavior in real time. In our study we adopted a system (HR-Tag rumination monitoring system, SCR Engineers Ltd., Netanya, Israel) previously described and validated. Material and methods The trial involved 23 Italian Friesian dairy cows raised in an experimental free stall barn and 1214 Israeli Holstein cows raised in 6 commercial dairy farms. The cows were involved in the last month of pregnancy until the 6th week of lactation. Rumination time was measured (HR-Tag monitoring system, SCR Engineers Ltd., Netanya, Israel) from the last month of pregnancy until the 6th week of lactation on cows raised in the experimental barn, and from calving to 6th DIM on cows raised in the commercial farms. Health status was daily monitored through veterinary inspection. All the events occurred during the trial have been registered using DataFlow software (SCR Engineers Ltd., Netanya, Israel). Sick cows were treated according to clinical signs and were followed until full recovery. Blood samples from the jugular vein were collected before the feed distribution at -14, -7, 5, 10, 20 and 30 d (±1 d) from calving in cows raised in the experimental barn. The samples were analyzed to estimate
the parameters of the energy, protein, and mineral metabolism. Albumin, cholesterol and bilirubin data collected in the periparturient period were used to determine the liver functionality index (LFI) according to Trevisi et al. (2011). This index takes into account changes in
albumin, lipoproteins
Table 1 Average of daily rumination time (RT) at day 1,2,3,4,5,6 with standard error observed in different groups.
RT = daily rumination time SE = standard error ( * p < 0.05 ** p < 0.01 *** p < 0.001). Statistical difference are referred to the value observed in the healthy cows.
91
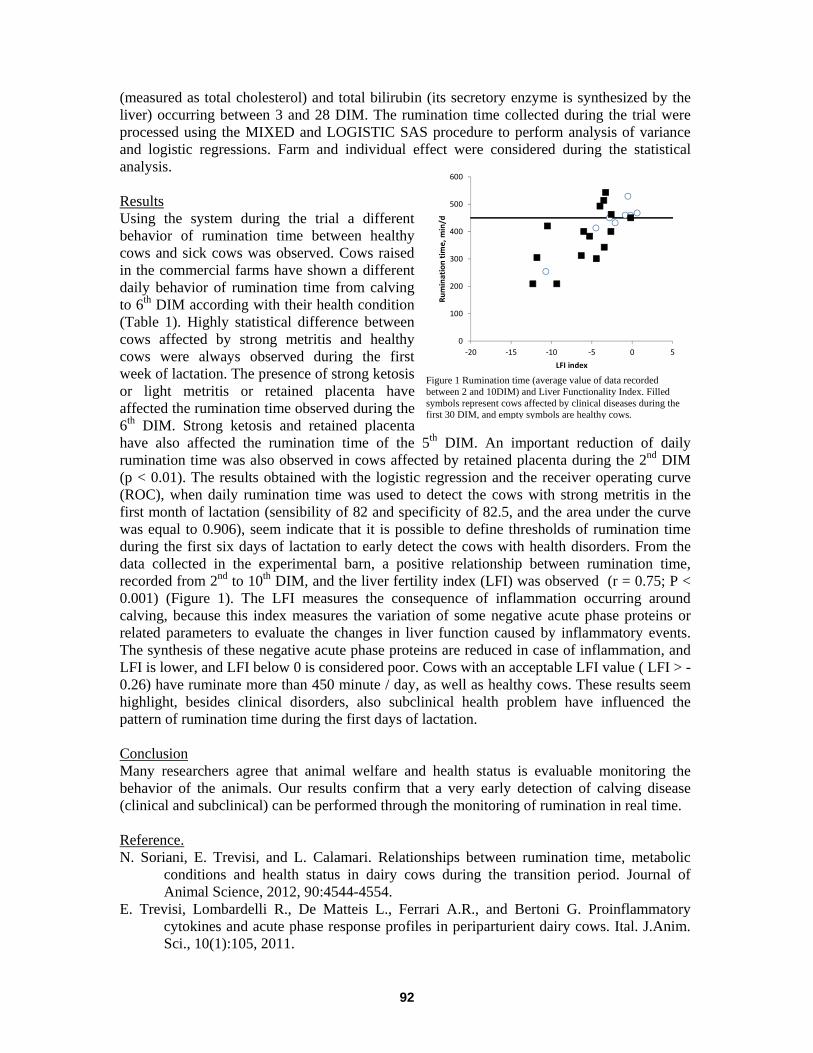
0
100
200
300
400
500
600
-20 -15 -10 -5 0 5
Rum
inat
ion
tim
e, m
in/d
LFI index
(measured as total cholesterol) and total bilirubin (its secretory enzyme is synthesized by the liver) occurring between 3 and 28 DIM. The rumination time collected during the trial were processed using the MIXED and LOGISTIC SAS procedure to perform analysis of variance and logistic regressions. Farm and individual effect were considered during the statistical analysis. Results Using the system during the trial a different behavior of rumination time between healthy cows and sick cows was observed. Cows raised in the commercial farms have shown a different daily behavior of rumination time from calving to 6th DIM according with their health condition (Table 1). Highly statistical difference between cows affected by strong metritis and healthy cows were always observed during the first week of lactation. The presence of strong ketosis or light metritis or retained placenta have affected the rumination time observed during the 6th DIM. Strong ketosis and retained placenta have also affected the rumination time of the 5th DIM. An important reduction of daily rumination time was also observed in cows affected by retained placenta during the 2nd DIM (p < 0.01). The results obtained with the logistic regression and the receiver operating curve (ROC), when daily rumination time was used to detect the cows with strong metritis in the first month of lactation (sensibility of 82 and specificity of 82.5, and the area under the curve was equal to 0.906), seem indicate that it is possible to define thresholds of rumination time during the first six days of lactation to early detect the cows with health disorders. From the data collected in the experimental barn, a positive relationship between rumination time, recorded from 2nd to 10th DIM, and the liver fertility index (LFI) was observed (r = 0.75; P < 0.001) (Figure 1). The LFI measures the consequence of inflammation occurring around calving, because this index measures the variation of some negative acute phase proteins or related parameters to evaluate the changes in liver function caused by inflammatory events. The synthesis of these negative acute phase proteins are reduced in case of inflammation, and LFI is lower, and LFI below 0 is considered poor. Cows with an acceptable LFI value ( LFI > -0.26) have ruminate more than 450 minute / day, as well as healthy cows. These results seem highlight, besides clinical disorders, also subclinical health problem have influenced the pattern of rumination time during the first days of lactation. Conclusion Many researchers agree that animal welfare and health status is evaluable monitoring the behavior of the animals. Our results confirm that a very early detection of calving disease (clinical and subclinical) can be performed through the monitoring of rumination in real time. Reference. N. Soriani, E. Trevisi, and L. Calamari. Relationships between rumination time, metabolic
conditions and health status in dairy cows during the transition period. Journal of Animal Science, 2012, 90:4544-4554.
E. Trevisi, Lombardelli R., De Matteis L., Ferrari A.R., and Bertoni G. Proinflammatory cytokines and acute phase response profiles in periparturient dairy cows. Ital. J.Anim. Sci., 10(1):105, 2011.
Figure 1 Rumination time (average value of data recorded between 2 and 10DIM) and Liver Functionality Index. Filled symbols represent cows affected by clinical diseases during the first 30 DIM, and empty symbols are healthy cows.
92
ENERGY BALANCE ESTIMATED REAL-TIME FROM AUTOMATED ON-FARM LIVE WEIGHTS IS ASSOCIATED WITH REDUCED REPRODUCTIVE PERFORMANCE
Vivi M. Thorup1, Anne M. Kjeldsen2, Jakob M. Schmidt2 and Dorte Bossen3
1Aarhus University, Dept. of Animal Science, Tjele, Denmark 2AgroTech A/S, Aarhus, Denmark
3The Knowledge Centre for Agriculture, Dept. of Dairy & Cattle Farming, Aarhus, Denmark [email protected]
Introduction In many modern dairy herds cow live weights are automatically measured. Attempts have been made to utilise live weights to make inferences about cow health. However, large daily fluctuations in live weight caused by production and excretion of milk, urine, faeces, and not least water and feed intake mask changes in empty body weight. These fluctuations have precluded the use of live weights as a widespread automated management tool. Further, sparse or no knowledge of body condition score has prevented the separation of empty body weight into lipid and protein, which is required to estimate energy balance based on body lipid and body protein reserves (Coffey et al., 2001). New research suggests a standard function of body protein changes over lactation to enable estimation of energy balance without body condition scores, i.e. using only frequent live weight measurements (Thorup et al., 2013). This study utilizes that standard function. Reduced reproduction is costly to dairy farmers and has been associated with increasingly negative energy balance calculated from energy input minus energy output: feed intake – (milk + maintenance + activity + growth + pregnancy) (Roche et al., 2007). However, a tool estimating energy balance using only frequently measured live weights would be simpler to apply on-farm. Thus, we aimed to investigate the association between energy balance estimated from live weights and reproductive performance. Materials and Methods Automated live weights were obtained from 72 Danish Holstein herds with Lely milking robots. Live weight time series from January 2011 to June 2012, and lasting 100 to 305 days were selected, in total 7421 lactations. The live weights were measured at the end of each milking to remove the influence of milk. Across lactation, weights were smoothed double exponentially and asymmetrically (by emphasising weight loss more than gain) to lessen the influence of water and food intake on weight. Also, weights were adjusted for pregnancy and residual gutfill to derive empty body weight. Applying the standard body protein function allowed body lipid and body protein changes to be derived and energy balance to be estimated (MJ effective energy/day). Across lactation energy balance was smoothed double exponentially and symmetrically. Mean energy balance from days 10 to 100 after calving (EB) was calculated. Parity, calving and insemination dates, and energy corrected milk yield (ECM) were obtained from the Danish Cattle Database. As an expression of reproductive performance, days from calving to first insemination (INS) was calculated (n=5628). Descriptive means are reported in Table 1.
93
Spearman correlations were calculated for continuous data, Table 2. INS was grouped; 1: <51 days, 2: 51-70, 3: 71-90, 4: 91-110, 5: >110 days, and ECM was grouped; low: 20-31, medium: 32-39, high: 40-66 l/day. EB was analysed in a mixed model using the lme4 R-package: EBhijkl = µ+ ECMh + Pi + Cj + INSk + hl + ehijkl. µ was the overall mean. Fixed effects were; ECM (h=low, medium, high), parity P (i=1, 2, 3+), calving season C (j=winter, spring, summer, autumn) and INS (k=1, …, 5). Herd h (l=1, …, 72) and the residual ehijkl were random effects. The ECM×parity interaction was tested insignificant and removed from the model. Results and Discussion EB showed large variation, Table 1. As expected, EB was negatively correlated with ECM and with INS, the latter indicating that decreased EB has a negative effect on the time to rebreeding, Table 2. INS, ECM, parity and calving season all affected EB (P<0.001). Least square means for INS groups were: 1: -9.2, 2: -10.1, 3: -11.4, 4: -13.1 and 5: -13.6 MJ/day (s.d.=1.2). INS group 1, 2 and 3 differed from 4 and 5, also group 1 differed from 3 (P=0.05). Days to conception (n=3823) showed similar results. In short, EB calculated from frequent live weights, days to first insemination, days to conception, and mean milk yield during the first 100 days after calving are significantly interrelated. This analysis shows that informative energy balance estimates can be obtained for individual cows in commercial herds without measuring feed intake. References Coffey, M. P., G. C. Emmans and S. Brotherstone. 2001. Genetic evaluation of dairy bulls for energy balance traits using random regression. Anim. Sci. 73: 29-40. Roche, J. R., K. A. Macdonald, C. R. Burke, J. M. Lee and D. P. Berry. 2007. Associations Among Body Condition Score, Body Weight, and Reproductive Performance in Seasonal-Calving Dairy Cattle. J. Dairy Sci. 90(1): 376-391. Thorup, V. M., S. Højsgaard, M. R. Weisbjerg and N. C. Friggens. 2013. Energy balance of cows can be estimated in real-time on-farm using frequent liveweight measures even in the absence of body condition score. Animal (submitted). Table 1. Descriptive means and s.d., ECM=mean from 0 to 100 days, INS=days to first insemination, EB=mean from 10 to 100 days, n=5628. Parity Lactations ECM, l/day INS, days EB, MJ/day 1 2339 29.5+4.5 75+35 -11.8+19.02 1621 37.8+5.9 77+35 -9.0+21.53+ 1668 40.1+6.3 81+37 -17.7+22.5 Table 2. Correlation coefficients (above diagonal) and P-values (below diagonal), n=5628. ECM EB INS ECM - -0.30 0.09 EB <0.001 - -0.10 INS <0.001 <0.001 -
94
COW SENSORS PRODUCER PANEL
JUNE 27, 2:10 PM Jena Betley
Betley Farms
Pulaski, Wisconsin
Betley Farms is a third generation family farm started by Jeff Betley’s grandfather in 1942. Jeff took over the operation from his parents, Jack and Gloria, in 1991. Jeff and his wife, Jena, started a custom heifer raising operation in 2001, which is now solely filled with their own heifers. Heifers are raised at a separate facility until they reach 500 lb and are then sent off to a custom grower. The Betleys are milking 3x per day yielding 98 lb per cow per day with 3.6% fat and 3.15% protein, and a somatic cell count of 95.5 for all of 2012. Their 1,550 milking cows are housed in sand-bedded freestalls. From the parlor to cow flow to the arrangement of the farm and respect from employees, cow comfort is a high priority. The new 50-stall rotary turn-time is a 1-hour maximum for each cow group allowing for quick and reliable milking giving the cows more free time for eating, drinking, resting, and sleeping. The cows are fed a TMR of corn silage, alfalfa silage and a corn/protein mix with all ingredients delivered at the same time – nothing added for specific cows. The Betleys use an AfiFarm Herd Management System to manage dairy cows and heifers. All milking cows have PedoPlus pedometers. Breeding, health, wellness, and rest times are monitored daily. They monitor several metrics in the parlor daily including milker procedure through let-down, flow rates, and irregularities.
Jeff Funk
Funks Midway Dairy
Melrose, Minnesota
Funks Midway Dairy has expanded in phases and currently has a total of 580 cows averaging over 80 lb per day. They use the SCR (AI 24) with both activity and rumination to assist with herd management. They believe in watching and breeding off of natural heats and the AI 24 assists with that. They currently have a 26% pregnancy rate. The activity provides peace of mind knowing they are breeding the cows at the right time. The rumination data helps detect cows with ketosis, mastitis, metritis or stomach problems early, and helps evaluate whether or not cows are responding to treatment.
Tom Gavin
Gav-N-View Farm
Lansing, Iowa
Tom runs the 300-head dairy with his father Pat and uncle Mike. They installed a Select Detect system in February of 2011. The Select Detect system is one of the best investments that they've made in recent years. The pregnancy rate has increased 9 points, and conception rates increased by 16 points for first service and 12 points overall.
95
Kevin Phillips
Home Place; New Hope; Kentmere
Waynesboro, Virginia
Kevin and his brothers own and operate 3 dairy farms in central Virginia. Kevin also has a son that has recently returned to the farms. With the three farms, they have a total of approximately 700 milking head. They utilize the three locations to maximize management and labor savings. For instance, the “Home Place” farm houses all of the fresh cows until they are confirmed pregnant as well as sick cows or otherwise high-maintenance animals. Once cows are confirmed pregnant, they are moved to the “New Hope” farm. At this location, minimal labor is key. There is typically only 1 employee that milks and feeds the animals. The third location “Kentmere” is a bedded-pack barn system. This is where they house any animals that do not perform well in freestalls or may have feet or leg issues. Cows will rotate through these facilities based upon their current needs and stage of lactation. The Phillips brothers are true believers in technology. Technology, such as the cow temperature sensors, allows them to make informed management decisions, even remotely.
96
MANAGEMENT AND HOUSING OF AUTOMATED CALF FEEDERS IN THE MIDWEST US
Marcia I. Endres
University of Minnesota St. Paul, Minnesota, USA
Introduction Precision dairy farming, which includes the use of automated computerized systems to milk or feed dairy cattle, has been increasing steadily in the dairy industry in recent years. These systems represent significant advances in engineering, computing, and manufacturing. One specific example of these technologies is the automated calf feeding system. There are advantages of using automated calf feeders over conventional bucket systems, including increased labor efficiency. Feeding group-housed calves on an automated milk feeding system requires less labor than when calves are housed individually (de Passillé et al., 2004), helping to offset the initial investment cost of the machines (~$20,000 per feeder; one feeder can feed 2 groups of calves of up to 25 calves per group). Surveys in Germany indicated that labor time can be reduced by 30% compared to bucket feeding (Kack and Ziemerink, 2010). Another advantage of using the automated system compared to manually feeding calves twice a day is that the feeders allow for distribution of the total daily milk intake into more meals throughout the day, with no extra labor input, allowing a greater amount of milk to be fed without requiring the calf to drink a large amount at each meal (de Paula Vieira et al., 2008). These automated systems also can monitor the feeding behavior of each calf, such as number and timing of visits, the amount of milk consumed by each calf, and the number of unrewarded visits (when no milk is fed), which can help managers identify sick calves (Borderas et al., 2009). Automated calf feeding systems allow calves to interact with each other in a group setting and drink milk many times a day while reducing labor. However, because of direct calf-to-calf contact, there may be an increased risk for morbidity (disease incidence) and mortality (death loss) on some farms adopting these systems. The traditional recommendation in the US is to house calves individually before weaning. Individual housing can have advantages for animal welfare, such as the reduced transmission of infectious diseases as a result of limited physical contact between calves. In addition, individually housed calves are easier to observe which can result in more effective disease treatment. There is also less competition for food between calves with individual housing. However, there are also potential welfare disadvantages with individual housing. The most obvious ones are the lack of social contact among calves and the limitation of movement by the reduced physical space provided. Feeder Function and Operation Automated feeders can provide pre-weaned calves either cow´s milk or milk replacer and water individually in a controlled manner. Calves are housed in a group and identified using radio
97
frequency identification (RFID) tags. A processor integrated into the feeder ensures that the milk quantity is allocated according to prescribed parameters such as age and dispensed over several feedings per day. The milk replacer concentration, feed quantity per visit and total feed allocation per day can automatically adjust to the calves’ physiological development or age. Cow´s milk alone or combinations of cow’s milk and milk replacer can also be fed, dispensed and adjusted according to a predefined plan. Weaning can be done automatically and gradually according to age or intake of solid food, although the latter would require that an automated starter feeder be part of the setup (which is not commonly done in the US). In addition, the computer records important data relating to animals’ feeding behavior to supplement the daily visual monitoring and to keep records on how much feed is provided per calf. The daily feed consumption and the drinking speed can provide valuable information on calf´s well-being and health (Kack and Ziemerink, 2010). Automated Calf Feeder Project We are currently conducting a field study at the University of Minnesota to evaluate the use of automated calf feeders. The goals of our project are to learn best practices to optimize the utilization of these feeders in the US, to describe animal welfare with these systems, and to estimate their economic impact. These goals will be achieved by completing four objectives: Objective 1: Describe housing, management, and economics of farms using automated calf feeder systems; Objective 2: Document calf welfare (i.e., morbidity, mortality, growth, environmental conditions) in these facilities; Objective 3: Identify risk factors for morbidity (disease risk) and mortality; Objective 4: Develop best management practices for using automated calf feeders to improve animal welfare and dairy farm profitability. Although there has been a good amount of research with automated calf feeders, most studies have been conducted in Europe, where calf group feeding has been more extensively used since the 1990’s, and in housing situations not typical of the US. More recently, interest in automated calf feeders has grown in Minnesota, Wisconsin, Iowa and South Dakota. There are currently over 200 units in place. Previous observations by research team members indicated that some producers have been successful using the system, reporting low mortality rates (less than 5%), whereas others have experienced death losses exceeding 20% of their calves, making the use of the system unsustainable. What makes some work and some not? How can we help producers who want to install these systems? We would like to find answers and improve the success rate of this new technology. It does offer some advantages related to labor costs, calf social interactions, and public preference, but it needs to be used properly. Research has shown that group housing for unweaned calves does not appear to lead to increased health problems if the groups are small (8 to 10 animals) and well managed (Rushen et al., 2008). We need to investigate what group size is most commonly used in US. Dairy producers in the US probably are following the larger group recommendation (25 to 30 calves per group) to dilute the cost of automated feeders. There is increasing competitive pressure in the global market therefore dairy producers are looking for ways to reduce their operating costs and improve profitability. There is a need to document whether large groups of calves are the norm in the US rather than smaller groups of calves as in Europe, where feeder use has been successful.
98
Calves are social animals and appear to need to interact with other calves. Individual housing reduces the opportunities for social contact and provides fewer opportunities for physical exercise, and this can have a negative impact on the overall welfare of the calf. Calves need rest and it can be adequate in both group and individual housing, as long as the calves have sufficient space to adopt appropriate resting postures. Behavioral problems that sometimes are associated with group housing, such as increased aggression, competition, and cross-sucking can be controlled by appropriate management. However, group housing for unweaned calves will not always improve or reduce the welfare of calves. It appears that this will depend upon the details of the housing system, such as the group size and age composition, the space availability, the use and type of bedding, the ventilation, as well as management factors, especially those aimed at protecting calf health. Investigation of housing and management factors used with automated calf feeders in typical US farms was needed. Expected Outcomes of the Study We expect to develop a large database of management practices utilized with automated calf feeders. There is no such database in the US. Producers are eager to learn more about these systems, as interest in purchasing them because of labor savings and potential improved economics keeps increasing in the US. Companies selling the systems have not yet developed guidelines for best practices. For example, previous studies have indicated that calf group size can be an important factor associated with mortality and morbidity. If we have similar findings in our study, an economic analysis of group size will be developed and used to determine ideal size. A detailed economic analysis might indicate that a smaller group size can actually make more economic sense if mortality is reduced. Preliminary Results: Our study involves visiting 36 dairy farms with automated calf feeders every 2 months to collect on farm data. Each visit, a new cohort of calves is enrolled in the study. Our protocol is to visit these operations for 18 months, so we will have 9 cohorts of calves. We are conducting an evaluation of calf health (scoring system), taking environmental measurements (aerial ammonia, air velocity, temperature, humidity, light intensity, bedding moisture assessment, hygiene assessment, etc.), taking milk samples from the feeder to test for microbial counts and nutrient composition, evaluating passive immune transfer (serum total protein in blood of 1 to 5 day old calves), measuring space available per calf, documenting management and housing practices, collecting daily calf behavior information from the computer (number of visits, amount fed, drinking speed), and recording various costs to develop the economic analysis. As of this writing, only cohort 1 is complete. The information available so far indicates the following:
• Number of feeders per farm: Average of 2.1 (range of 1 to 14), with 77% of the farms with one feeder. Most farms have 2 pens and 2 stations per feeder.
• Number of calves per pen: Average of 17.1 for the youngest age pen (range of 7 to 30), with only 4 farms over 25 calves/pen. Average of 19.3 for the oldest age pen (range of 7 to 36), with only 5 farms over 25 calves/pen.
• Amount of milk or milk replacer fed per calf: Average of 7.1 L/day (range of to 5 to 8 L).
99
Acknowledgments This project would not be possible without the help of our research personnel Amber Adams-Progar (Research Associate) and Matthew Jorgensen (PhD Graduate Student and Research Assistant). They have spent many hours so far on the study farms collecting data. Our research team includes colleagues Kevin Janni (co-PI), Jim Salfer, Anne Marie de Passille, Jeffrey Rushen, Sandra Godden, Hugh Chester-Jones, Noah Litherland, and William Lazarus. We appreciate their input on study proposal and protocol development. This project is supported by Agriculture and Food Research Initiative competitive grant no. 2012-67021-19280 from the USDA National Institute of Food and Agriculture. References Cited de Passillé, A. M., J. Rushen, and D. Weary. 2004. Designing good environments and
management for calves. Advances in Dairy Technology 16:75–89. Kack, M. and J. Ziemerink. 2010. Benefits, function and operation of computer-controlled calf
feeders. In: First North American Conference on Precision Dairy Management 2010, Toronto, Canada.
Borderas, T. F., J. Rushen, M.A.G.von Keyserlingk, and A.M.B. de Passillé. 2009. Automated measurement of changes in feeding behavior of milk-fed calves associated with illness. Journal of Dairy Science 92:4549-4554.
Rushen, J., A. M. de Passillé, M.G. von Keyserlingk, and D. Weary. 2008. The welfare of cattle. Springer, Dordretch, the Netherlands.
100
THE ECONOMICS OF AUTOMATIC CALF FEEDERS
Jennifer A. Bentley and Kristen M. Schulte Iowa State University Extension and Outreach
Decorah, Iowa, USA [email protected]
Introduction Individual calf hutches have historically been the industry’s preferred management system for pre-weaned calves. This management system is highly labor intensive and allocates the majority of the labor attention on feeding and cleaning up after each individual calf. Automatic calf feeding systems have been introduced as a way of reallocating labor to monitor and manage calf health and performance on a more flexible schedule. In order to assist dairy producers make informed decisions, these authors have developed a partial budget spreadsheet tool to review anticipated changes with an automatic calf feeder. The profit and financial feasibility for installation of an automatic calf feeder is highly dependent on labor savings, calf health, and changes in consumption. The potential to feed more nutrients may have long term effects associated with increased milk production. Automatic Calf Feeder Financial Variables Decreased expenses have resulted from a reduction in feeding labor and labor management. Calf treatment change is highly variable based on the change in housing and management before and after installation of the automatic calf feeder and therefore can be a positive or negative impact for the operation. Increased expenses result from capital recovery cost of the initial investment; increase in insurance, milk replacer intake, calf starter intake, utilities, supplies, and repairs, and change in records management labor. Research and data is available on a majority of the variables within the analysis, but there is conflicting data on the change in calf health and feed intake and only limited data on the change in utilities and supplies and repairs. There are numerous companies selling automatic calf feeders in the U.S. Feeders can vary widely in sophistication and price ranging from systems which record minimal data and have simple feeding programs to more involved feeder systems with extensive capabilities to program feeding plans and monitor calf performance. Automatic Calf Feeder Partial Budget Analysis Tool The following page is an exhibit of a sample 200 cow herd that adapted to an automatic calf feeding system. The top left portion consists of the “positive impacts” of increased incomes and decreased expenses. The top right portion consists of the “negative impacts” of increased expenses and decreased incomes. The bottom portion of the spreadsheet would include the input values for this particular herd.
101
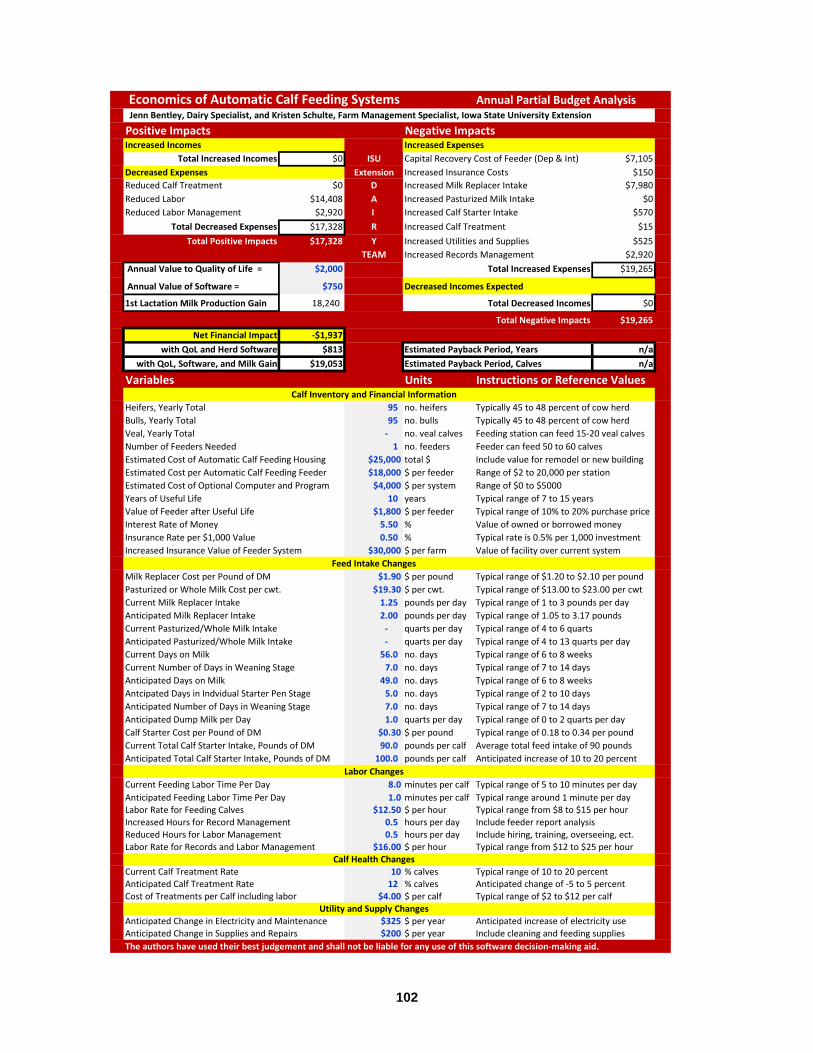
Economics of Automatic Calf Feeding Systems Annual Partial Budget Analysis Jenn Bentley, Dairy Specialist, and Kristen Schulte, Farm Management Specialist, Iowa State University Extension
Positive Impacts Negative ImpactsIncreased Incomes Increased Expenses
Total Increased Incomes $0 ISU Capital Recovery Cost of Feeder (Dep & Int) $7,105Decreased Expenses Extension Increased Insurance Costs $150Reduced Calf Treatment $0 D Increased Milk Replacer Intake $7,980Reduced Labor $14,408 A Increased Pasturized Milk Intake $0Reduced Labor Management $2,920 I Increased Calf Starter Intake $570
Total Decreased Expenses $17,328 R Increased Calf Treatment $15
Total Positive Impacts $17,328 Y Increased Utilities and Supplies $525TEAM Increased Records Management $2,920
Annual Value to Quality of Life = $2,000 Total Increased Expenses $19,265
Annual Value of Software = $750 Decreased Incomes Expected
1st Lactation Milk Production Gain 18,240 Total Decreased Incomes $0
Total Negative Impacts $19,265
Net Financial Impact -$1,937
with QoL and Herd Software $813 Estimated Payback Period, Years n/a
with QoL, Software, and Milk Gain $19,053 Estimated Payback Period, Calves n/a
Variables Units Instructions or Reference ValuesCalf Inventory and Financial Information
Heifers, Yearly Total 95 no. heifers Typically 45 to 48 percent of cow herdBulls, Yearly Total 95 no. bulls Typically 45 to 48 percent of cow herdVeal, Yearly Total - no. veal calves Feeding station can feed 15-20 veal calvesNumber of Feeders Needed 1 no. feeders Feeder can feed 50 to 60 calvesEstimated Cost of Automatic Calf Feeding Housing $25,000 total $ Include value for remodel or new buildingEstimated Cost per Automatic Calf Feeding Feeder $18,000 $ per feeder Range of $2 to 20,000 per stationEstimated Cost of Optional Computer and Program $4,000 $ per system Range of $0 to $5000Years of Useful Life 10 years Typical range of 7 to 15 yearsValue of Feeder after Useful Life $1,800 $ per feeder Typical range of 10% to 20% purchase priceInterest Rate of Money 5.50 % Value of owned or borrowed moneyInsurance Rate per $1,000 Value 0.50 % Typical rate is 0.5% per 1,000 investmentIncreased Insurance Value of Feeder System $30,000 $ per farm Value of facility over current system
Feed Intake ChangesMilk Replacer Cost per Pound of DM $1.90 $ per pound Typical range of $1.20 to $2.10 per poundPasturized or Whole Milk Cost per cwt. $19.30 $ per cwt. Typical range of $13.00 to $23.00 per cwtCurrent Milk Replacer Intake 1.25 pounds per day Typical range of 1 to 3 pounds per dayAnticipated Milk Replacer Intake 2.00 pounds per day Typical range of 1.05 to 3.17 poundsCurrent Pasturized/Whole Milk Intake - quarts per day Typical range of 4 to 6 quarts Anticipated Pasturized/Whole Milk Intake - quarts per day Typical range of 4 to 13 quarts per dayCurrent Days on Milk 56.0 no. days Typical range of 6 to 8 weeksCurrent Number of Days in Weaning Stage 7.0 no. days Typical range of 7 to 14 daysAnticipated Days on Milk 49.0 no. days Typical range of 6 to 8 weeksAntcipated Days in Indvidual Starter Pen Stage 5.0 no. days Typical range of 2 to 10 daysAnticipated Number of Days in Weaning Stage 7.0 no. days Typical range of 7 to 14 daysAnticipated Dump Milk per Day 1.0 quarts per day Typical range of 0 to 2 quarts per dayCalf Starter Cost per Pound of DM $0.30 $ per pound Typical range of 0.18 to 0.34 per poundCurrent Total Calf Starter Intake, Pounds of DM 90.0 pounds per calf Average total feed intake of 90 poundsAnticipated Total Calf Starter Intake, Pounds of DM 100.0 pounds per calf Anticipated increase of 10 to 20 percent
Labor ChangesCurrent Feeding Labor Time Per Day 8.0 minutes per calf Typical range of 5 to 10 minutes per dayAnticipated Feeding Labor Time Per Day 1.0 minutes per calf Typical range around 1 minute per dayLabor Rate for Feeding Calves $12.50 $ per hour Typical range from $8 to $15 per hourIncreased Hours for Record Management 0.5 hours per day Include feeder report analysisReduced Hours for Labor Management 0.5 hours per day Include hiring, training, overseeing, ect.Labor Rate for Records and Labor Management $16.00 $ per hour Typical range from $12 to $25 per hour
Calf Health ChangesCurrent Calf Treatment Rate 10 % calves Typical range of 10 to 20 percentAnticipated Calf Treatment Rate 12 % calves Anticipated change of -5 to 5 percentCost of Treatments per Calf including labor $4.00 $ per calf Typical range of $2 to $12 per calf
Utility and Supply ChangesAnticipated Change in Electricity and Maintenance $325 $ per year Anticipated increase of electricity useAnticipated Change in Supplies and Repairs $200 $ per year Include cleaning and feeding suppliesThe authors have used their best judgement and shall not be liable for any use of this software decision-making aid.
102
INVESTMENT ANALYSIS OF AUTOMATED ESTRUS DETECTION TECHNOLOGIES
Karmella A. Dolecheck, George Heersche Jr., and Jeffrey M. Bewley University of Kentucky, Lexington, Kentucky, USA
[email protected] and [email protected]
Introduction Inefficient or inaccurate estrus detection can result in dairy farm economic losses. Alternative methods to traditional visual detection, such as automated estrus detection technologies, may decrease the labor and skill required for estrus detection. Assessing the economic implications of investing in automated estrus detection technologies can be overwhelming for dairy producers. The objective of this project was to create a producer-friendly dashboard tool for investment analysis of automated estrus detection technologies. Materials and Methods An interactive dashboard was designed to use information input by a user to analyze the potential adoption of an automated estrus detection technology system. Farm specific (FS) inputs adjustable by the user included herd size, milk price, milk yield, feed cost, voluntary waiting period, current estrus detection rate, current conception rate, culling rate, days in milk to stop breeding a cow, cull milk yield, replacement cow cost, and cull cow value. Up to three different automated estrus detection technology systems could be evaluated at one time using start-up cost, unit cost, percentage of units to replace per year, maintenance cost per year, estrus detection rate, and conception rate as inputs. Investment analysis results included the following for each system: days open (DO), reproductive cull percent (RCP), years to break even (BE), and net present value (NPV). Calculations considered the value associated with a change in days open occurring after adoption of each system. To demonstrate model utility within an average dairy farm comparing three systems, FS inputs were collected from DairyMetrics (Dairy Records Management Systems, Raleigh, NC), FAPRI (Food and Agricultural Policy Research Institute, Columbia, MO), and published literature (Table 1). Technology investment and maintenance costs were obtained from technology manufacturers for the AfiTag Pedometer™ Plus (PP; S.A.E. afimilk®, Kibbutz Afikim, Israel), Select Detect™ (SD; Select Sires, Plain City, OH), and Track a Cow (TC; Animart® Inc., Beaver Dam, WI and ENGS, Rosh Pina, Israel) (Table 2). Results and Discussion The modeled DO and RCP before intervention were 150.70 and 9.56%, respectively. The DO, RCP, BE, and NPV after adopting each system were PP: 118.39, 1.99%, 4.99, and $15,928, respectively, SD: 109.56, 0.96%, 7.40, and $7,023, respectively, and TC: 114.07, 1.43%, 3.08, and $28,445, respectively. All three systems analyzed under these conditions resulted in a net present value greater than zero, indicating a profitable investment. Additional break even analysis was conducted to determine the estrus detection rate that would result in a NPV of zero for each system. The resulting estrus detection rates for PP, SD, and TC were 59.79%, 65.07%, and 56.54% respectively. Producers already achieving a high estrus detection rate through visual
103
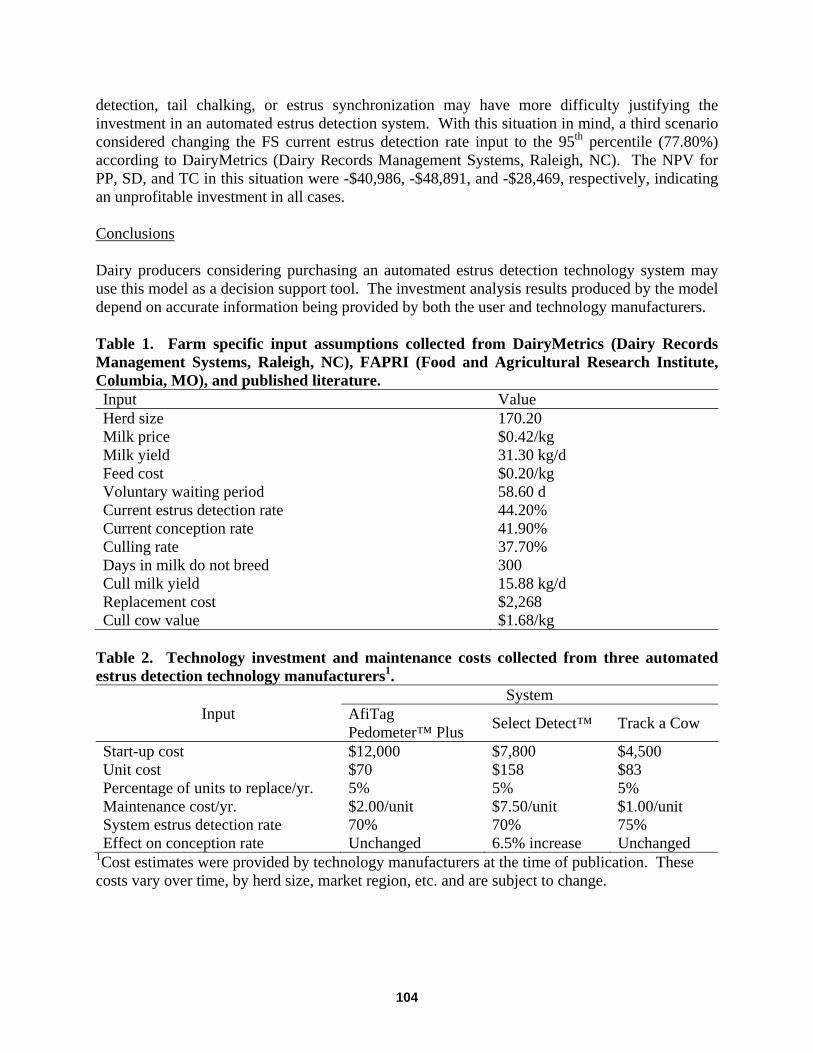
detection, tail chalking, or estrus synchronization may have more difficulty justifying the investment in an automated estrus detection system. With this situation in mind, a third scenario considered changing the FS current estrus detection rate input to the 95th percentile (77.80%) according to DairyMetrics (Dairy Records Management Systems, Raleigh, NC). The NPV for PP, SD, and TC in this situation were -$40,986, -$48,891, and -$28,469, respectively, indicating an unprofitable investment in all cases. Conclusions Dairy producers considering purchasing an automated estrus detection technology system may use this model as a decision support tool. The investment analysis results produced by the model depend on accurate information being provided by both the user and technology manufacturers. Table 1. Farm specific input assumptions collected from DairyMetrics (Dairy Records Management Systems, Raleigh, NC), FAPRI (Food and Agricultural Research Institute, Columbia, MO), and published literature. Input Value Herd size 170.20 Milk price $0.42/kg Milk yield 31.30 kg/d Feed cost $0.20/kg Voluntary waiting period 58.60 d Current estrus detection rate 44.20% Current conception rate 41.90% Culling rate 37.70% Days in milk do not breed 300 Cull milk yield 15.88 kg/d Replacement cost $2,268 Cull cow value $1.68/kg
Table 2. Technology investment and maintenance costs collected from three automated estrus detection technology manufacturers1.
Input System
AfiTag Pedometer™ Plus Select Detect™ Track a Cow
Start-up cost $12,000 $7,800 $4,500 Unit cost $70 $158 $83 Percentage of units to replace/yr. 5% 5% 5% Maintenance cost/yr. $2.00/unit $7.50/unit $1.00/unit System estrus detection rate 70% 70% 75% Effect on conception rate Unchanged 6.5% increase Unchanged
1Cost estimates were provided by technology manufacturers at the time of publication. These costs vary over time, by herd size, market region, etc. and are subject to change.
104
ACCELEROMETER USE FOR DETECTION OF HOOF LESIONS AND LAMENESS
Janet H. Higginson Cutler1, Suzanne T. Millman2, Gerard Cramer1,3, Ken E. Leslie1, Anne Marie de Passille4, Todd F. Duffield1, David F. Kelton1. 1University of Guelph, Guelph, Ontario, Canada
2Iowa State University, Ames, Iowa, USA 3Cramer Mobile Bovine Veterinary Services, Stratford, Ontario, Canada 4Agriculture and Agri-Food Canada, Agassiz, British Columbia, Canada
Introduction Lameness is one of the greatest economic and welfare concerns in the dairy industry, with high prevalence reported worldwide. North American estimates of prevalence range from 21 to 25% of cows housed in free-stalls (Espejo et al., 2006). Lameness is commonly identified through the process of locomotion or gait scoring, where animals are observed while walking and various kinematic characteristics are identified. However, detection of lame cows is difficult and farm workers appear to be unable to recognize approximately 70% of cows that are lame (Whay et al., 2003; Espejo et al., 2006). Therefore, there is a need for the development and validation of automated methods for lameness detection. The objective of this research was to determine if significant differences in activity and lying behavior between lame and sound cows during development of hoof lesions could be identified using a commercially available accelerometer. Materials and Methods All cows (~120) on a research dairy farm in Guelph, Ontario, Canada were fitted with Afikim Pedometer Plus accelerometers on their left hind legs. The accelerometers were previously validated for use in dairy cattle (Higginson et al., 2009). Accelerometers were read twice daily upon exit from the milking parlour. All cows had their hooves examined every 3-4 months when hoof lesions were recorded and trimming was performed if necessary. Video of cow gait was taken for locomotion scoring (Flower & Weary, 2006) a maximum of four days prior to hoof exam to determine if cows were sound or lame. To determine if activity and lying differed between lame and sound cows, linear mixed models were built, with separate models for activity and lying. To determine if changes due to lameness could be observed within cow, data from periods of time where individual cows were sound and lame were compared. A generalized linear mixed model was used to assess change between the two time periods (approximately 3-4 months apart). Results Eleven cows with ulcers, one cow with digital dermatitis, and three cows with both ulcers and digital dermatitis were identified as being lame and included in the analysis. Their accelerometer output was compared to 11 matched control cows that were sound, with no hoof lesions at the time of examination. Lame cows were less active (p=0.01) than sound cows, with an average
105
activity of 32.8 movements/hour higher in sound cows. Variability in activity measured as the standard deviation for activity, was also higher in sound cows (p=0.03). Lame cows had greater lying duration (11.4 vs 9.8 hours/day; p=0.04) compared to sound cows. No differences were observed by lesion type (p>0.05). When comparing data for cows in periods where they were sound and periods where painful lesions were present, data were available for twenty-two cases of ulcers, ten cases of digital dermatitis, and eight cows with both ulcers and digital dermatitis. Only lying duration differed between the two time periods, with cows lying for 55 minutes more when a painful lesion was present compared to when they did not have a painful lesion (p=0.03), which did not differ by lesion type (p>0.05). Activity and the number of lying bouts did not differ (p>0.05). Discussion Lame cows had a 24% decrease in activity compared to sound cows, which is higher than the 15% observed in a majority of lame cows reported by Mazrier and colleagues (2006). Lying duration has been shown to be higher in lame cows compared to non-lame cows (Chapinal et al., 2009), which was also observed in this study. However, in order to use accelerometers for early detection of lameness, changes within cows during onset of lameness would need to be observed. An increase in lying duration was observed in cows when lame, compared to a period approximately 3 months earlier, when they were sound. This change within cow provides potential for early indication of lameness. Conclusion The Pedometer Plus accelerometer can differentiate between lame and sound cows and within cow when comparing periods lameness compared to earlier sound periods. Early detection could allow for timely treatment and decrease the prevalence of lameness in dairy cattle. References Chapinal, N., A.M. de Passillé, D.M. Weary, M.A.G. von Keyserlingk, and J. Rushen. 2009.
Using gait score, walking speed, and lying behavior to detect hoof lesions in dairy cows. J. Dairy Sci. 92:4365–4374.
Espejo, L.A., M.I. Endres, and J.A. Salfer. 2006. Prevalence of lameness in high-producing Holstein cows housed in freestall barns in Minnesota. J. Dairy Sci. 89:3052–3058.
Flower, F., and D. Weary. 2006. Effect of hoof pathologies on subjective assessments of dairy cow gait. J. Dairy Sci. 89:139–146.
Higginson, J. H., Leslie, K.E., Millman, S.T., and Kelton, D.F. 2009. Evaluation of the Pedometry Plus system for the detection of pedometric activity and lying behaviour in dairy cattle. J. Dairy Sci. 92(E-Suppl.):1.
Mazrier, H., S. Tal, E. Aizinbud, and U. Bargai. 2006. A field investigation of the use of the pedometer for the early detection of lameness in cattle. Can. Vet. J. 47:883.
Whay, H., D. Main, L. Green, and A. Webster. 2003. Assessment of the welfare of dairy cattle using animal-based measurements: direct observations and investigation of farm records. Vet. Rec. 153:197.
106
DEVELOPMENT OF A HOOF LESION DATA SYSTEM FOR DAIRY CATTLE
Blair B. Murray1, Steve B. Mason2, Victor Daniel3, and Ronald A. Barker4
1Murray Agri Consulting, Kemptville ON Canada, 2AgroMedia International Inc, Edmonton AB, 3Vic’s Custom Clips, Stratford ON, 4RAB Animal Health Management, Abbotsford BC.
Dairy cow lameness has a very large economic cost as a result of direct costs of treatment and lost milk production, as well as indirect costs of decreased reproduction and feed intake, and increased mastitis and culling. The cost of each case of lameness is estimated at $452 or $125 million annually in Canada. The relationship between hoof lesions and lameness is imperfect with uncertainty about which lesions cause lameness as well as variation in lameness detection and scoring. More work is required to effect reduction in lameness on dairy farms.
A recent study in the Netherlands analyzed costs related to actual hoof disorders, estimating a loss of $4,899US per year for a herd of 65 cows ($75 per cow on the average). A clinical foot disorder cost on average $95 and a subclinical foot disorder, $18. Highest costs were due to digital dermatitis and the greatest cost factors were milk production loss and culling (Bruijnis, 2010).
Lameness is an animal welfare issue; producers realize they need to deal with lameness in a proactive manner. Resolving foot disorders and lameness issues will have both an economic benefit and a welfare benefit. Past and present programs to counter lameness have not been successful. Most studies and field data indicate 25% prevalence of lameness in dairy herds and a 45 to 70% prevalence of hoof lesions. Owners struggle with implementing lameness or locomotion scoring, usually identifying only a third of the cases of lameness in their own herds.
Professional hoof trimmers examine, trim, and treat the most dairy cows’ hooves, more than most owners (although some owners trim their own cows) and most veterinarians, who tend to see only the most serious cases and not trim feet routinely. Historically cow throughput has been the most important factor in hoof trimming both for the trimmer and the owner, and record keeping has been minimal to non-existent. The advent of easy to use computerized chute-side recording has dramatically changed and elevated the role of the hoof trimmer on dairy farms, made their work more efficient and visible, and resulted in fast accurate records, cow tracking, treatment recording, management reports, and so on.
Sweden was the first to introduce manual chute-side hoof lesion recording by hoof trimmers in 2003. They have since progressed to computerized tablets, and now generate genetic evaluations and bull proofs using hoof lesion data. Computerized data entry using a ruggedized touchscreen tablet for use at chute-side was developed by Denmark in 2010. The system was purchased by Sweden and Finland in 2011 and became the Nordic system used across all 3 countries and will be introduced in Norway in 2013. Genetic evaluations common to the partner countries are calculated, including a claw index.
The Netherlands has developed a computerized hoof lesion data entry system using a PDA and been calculating a hoof health index in genetic evaluations since 2010. Hoof Health Programs are popular in Denmark and The Netherlands: about half of the professional hoof trimmers have purchased the computer equipment and regularly contribute data to the database. Forty, 10, and
107
50 percent of the cows in Denmark, Finland and Sweden respectively were trimmed in 2010 (about 350,000 records in total) with data used in evaluations.
In North America, the first chute-side recording was introduced by Supervisor Systems® of Dresser, WI, using a ruggedized touchscreen tablet that can be bolted to the trim chute. All trimmed cows are recorded, lesions are located and identified according to a Hoof Atlas and 14 categories of lesions, most of which have severity scores of 1 to 3. More recently a hoof lesion recording application has been developed by Dairy Comp® where data is entered via hand held device. A very important feature of these programs is the use of the same Hoof Atlas lesion identification system approved by the International Lameness Committee.
In 2007-2012, projects were carried out in 3 areas in Canada, whereby professional hoof trimmers were assisted with the purchase of the Hoof Supervisor® unit and trained on digitalized hoof lesion recording, lesion identification and interpretation. The computer system generates invoices and management reports for the herd owner. Data were uploaded to a relational database and were matched with DHI and breed records. Over 80,000 individual cow records make up the database. Results are summarized on the Hoof Health website www.hoofhealth.ca Of those cows trimmed, 38 to 60% had at least one hoof lesion. Digital dermatitis was the most prevalent: 35 to 43% of those cows with lesions, followed by non-infectious conditions.
In a preliminary genetic study, Chapinal et al.(2013) reported that hoof lesion heritabilities are low: estimates from 0.01 to 0.09. There is however, genetic variation adequate to make genetic gains from selection. This is generally in agreement with Scandinavian and European research. According to Koenig et al. (2005) genetic progress toward better hoof health can be tripled by direct selection based on observations of hoof lesions versus feet and leg conformation data only. The current practice in genetic evaluation, where these data are available, is to use an index combining hoof lesion, lameness and selected type conformation data.
Computerized hoof lesion recording has been very popular among professional hoof trimmers and their client dairy producers resulting in participation up to 50% of DHI herds in some areas. Trimmers are enthusiastic about having better records of their work and clients are excited to have cow, group and herd records by which to manage a very serious health problem. The Hoof Health projects have resulted in improved facilities design and management, herd biosecurity and cow comfort. Critical to moving forward as an industry is the establishment of a national integrated database to support better herd management, benchmarking and genetic evaluations.
Challenges for precision dairy applications include: how much can we automate and standardize the data observations and collection, RFID tag identification, integration of hoof lesion information thermography, automated lameness detection, and most importantly, integration with smart cow management systems that already include production and various health parameters.
Bruijnis, M., H. Hogeveen, and E. Stassen. 2010. Assessing economic consequences of foot disorders in dairy cattle using a dynamic stochastic simulation model. J. Dairy Sci. 93:2419-32
Chapinal, N., A. Koeck, A. Sewalem, D. Kelton, S.Mason, G. Cramer, F. Miglior. 2013. Genetic parameters for hoof lesions and their relationship with feet and leg traits in Canadian Holstein cows. J. Dairy Sci. 96: 2596-2604.
Koenig, S., A. Sharifi, H. Wentrot, D. Landmann, M. Eise, and H. Simianer. 2005. Genetic parameters of claw and foot disorders estimated with logistic models. J. Dairy Sci. 88:3316-25.
108
NOW WHAT? SOME ECONOMIC GUIDELINES FOR PRACTICAL PRECISION DAIRY
Albert De Vries University of Florida
Gainesville, Florida, USA [email protected]
Introduction One of the descriptions of precision dairy management at this Conference is that it involves the use of sensors to collect information automatically, and the use of robotics and other automation to deliver labor and management tasks automatically, resulting in reduced labor and management time and improved productivity and profitability. Key is that automated technology, often in the form of sensors, is used to measure physiological, morphological, behavioral, or production indicators of individual animals. Examples of such indicators that are now commercially marketed are rumination rate, body condition, morphology, body weight, activity, lying behavior, temperature, location, as well as milk yield and milk components such as fat, protein, lactose, and progesterone. This stream of data is then used to replace or enhance some aspect of dairy management such as detection of estrus or disease, or individual feeding. Automation of tasks that replace work done by people, such as calf feeding or milking could also be considered precision dairy technology. The focus of this paper is on providing some ideas on the value of precision dairy technology in the US context of larger dairy herds. The US context Herds with several hundreds to thousands of cows are not uncommon in the US and their number is quickly growing. Large herds lead to economies of scale such as the fewer tractor hours per cow per year, more milkings per parlor stall per year, and veterinarians who may treat more cows per visit. Larger herds are managed with the help of hired personnel who often conduct specialized tasks such as milking or feeding. The number of cows per full time equivalent worker is not necessarily greater than on smaller farms and varies typically between 50 and 100. Because personnel works in shifts, labor is available 24 hours per day. The cost of hired labor per hour is likely low compared to other developed countries. Other prevailing production system characteristics in the US are more total confinement systems where cows stay under a roof all day long and feeding of total mixed rations without additional supplemental feeding. Ovulation synchronization and timed-artificial insemination are also commonplace. Many large dairy farms apply the KISS principle (“Keep it simple stupid”) because they believe that most systems work best if they are kept simple rather than made complex. Examples of the KISS principle are feeding large groups of cows one ration (which leads to not meeting exactly each cows nutrient requirements), one voluntary waiting period for first insemination (instead of variation based on level of milk production, parity etc.), and bull-of-the-day (instead of matching a cow’s genetic characteristics with a sire’s genetic characteristics). Some of the most profitable herds in Florida apply the KISS principle to the fullest by housing cows outside, feeding on ration to supplement grazing, no parlor technology other than basic
109
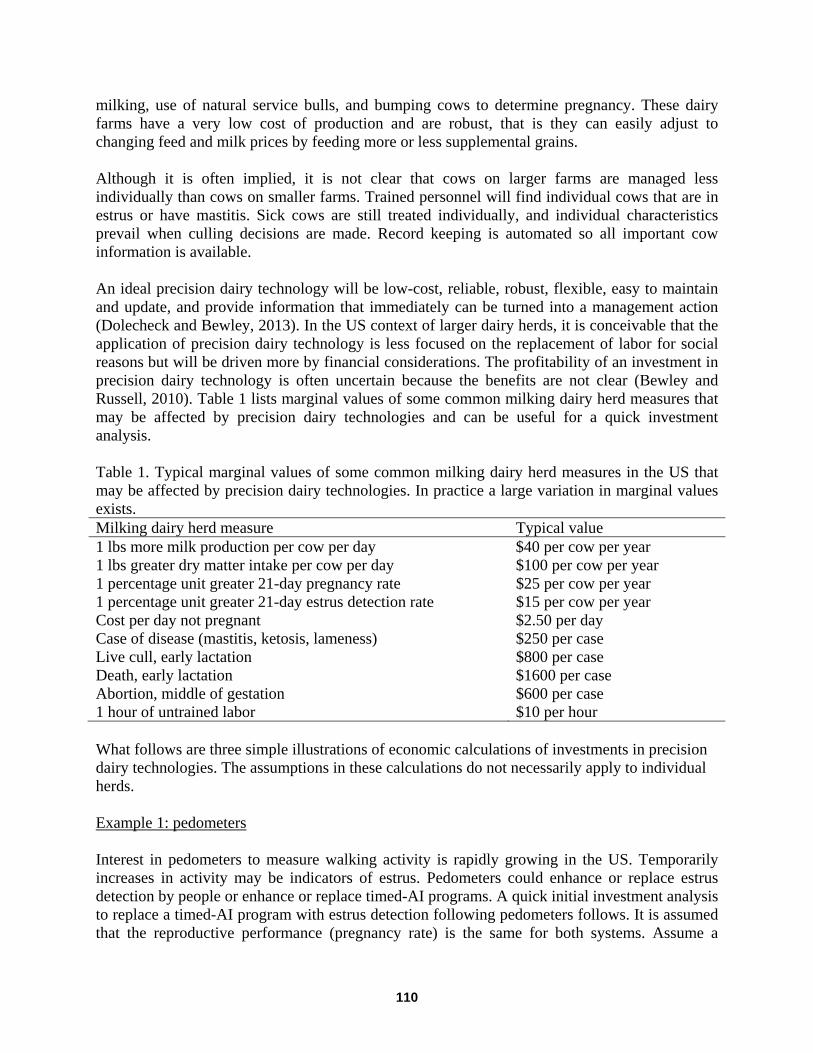
milking, use of natural service bulls, and bumping cows to determine pregnancy. These dairy farms have a very low cost of production and are robust, that is they can easily adjust to changing feed and milk prices by feeding more or less supplemental grains. Although it is often implied, it is not clear that cows on larger farms are managed less individually than cows on smaller farms. Trained personnel will find individual cows that are in estrus or have mastitis. Sick cows are still treated individually, and individual characteristics prevail when culling decisions are made. Record keeping is automated so all important cow information is available. An ideal precision dairy technology will be low-cost, reliable, robust, flexible, easy to maintain and update, and provide information that immediately can be turned into a management action (Dolecheck and Bewley, 2013). In the US context of larger dairy herds, it is conceivable that the application of precision dairy technology is less focused on the replacement of labor for social reasons but will be driven more by financial considerations. The profitability of an investment in precision dairy technology is often uncertain because the benefits are not clear (Bewley and Russell, 2010). Table 1 lists marginal values of some common milking dairy herd measures that may be affected by precision dairy technologies and can be useful for a quick investment analysis. Table 1. Typical marginal values of some common milking dairy herd measures in the US that may be affected by precision dairy technologies. In practice a large variation in marginal values exists. Milking dairy herd measure Typical value 1 lbs more milk production per cow per day $40 per cow per year 1 lbs greater dry matter intake per cow per day $100 per cow per year 1 percentage unit greater 21-day pregnancy rate $25 per cow per year 1 percentage unit greater 21-day estrus detection rate $15 per cow per year Cost per day not pregnant $2.50 per day Case of disease (mastitis, ketosis, lameness) $250 per case Live cull, early lactation $800 per case Death, early lactation $1600 per case Abortion, middle of gestation $600 per case 1 hour of untrained labor $10 per hour What follows are three simple illustrations of economic calculations of investments in precision dairy technologies. The assumptions in these calculations do not necessarily apply to individual herds. Example 1: pedometers Interest in pedometers to measure walking activity is rapidly growing in the US. Temporarily increases in activity may be indicators of estrus. Pedometers could enhance or replace estrus detection by people or enhance or replace timed-AI programs. A quick initial investment analysis to replace a timed-AI program with estrus detection following pedometers follows. It is assumed that the reproductive performance (pregnancy rate) is the same for both systems. Assume a
110
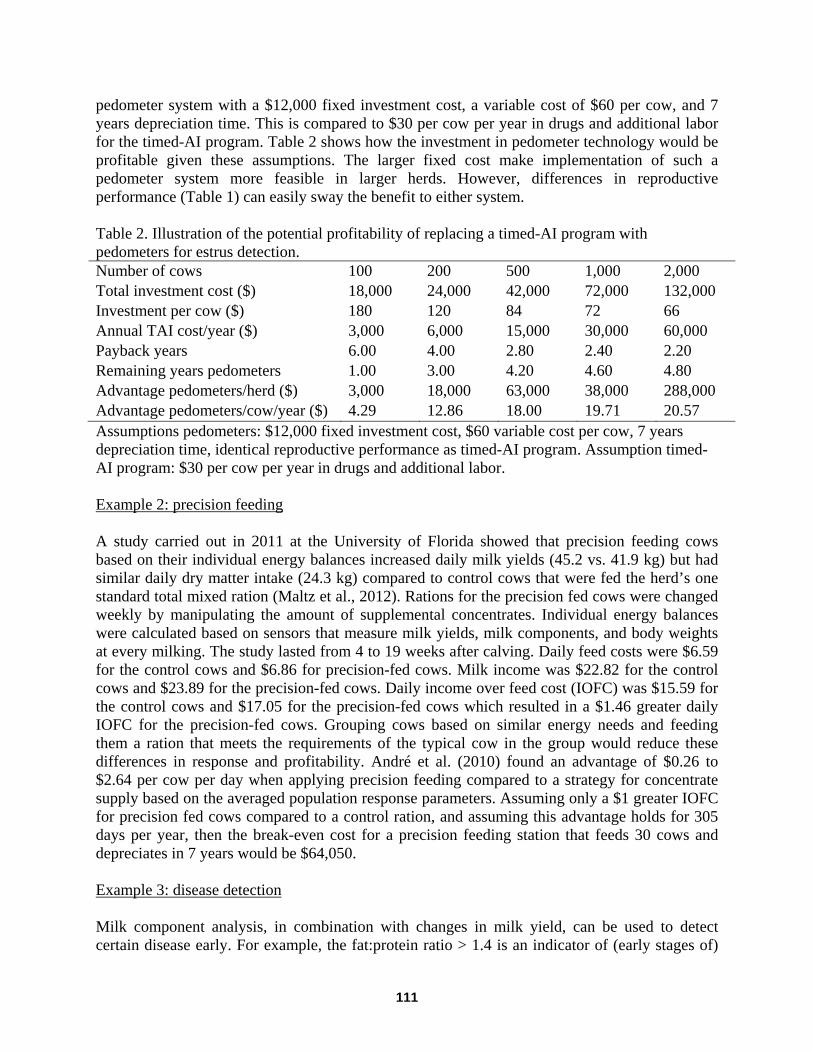
pedometer system with a $12,000 fixed investment cost, a variable cost of $60 per cow, and 7 years depreciation time. This is compared to $30 per cow per year in drugs and additional labor for the timed-AI program. Table 2 shows how the investment in pedometer technology would be profitable given these assumptions. The larger fixed cost make implementation of such a pedometer system more feasible in larger herds. However, differences in reproductive performance (Table 1) can easily sway the benefit to either system. Table 2. Illustration of the potential profitability of replacing a timed-AI program with pedometers for estrus detection. Number of cows 100 200 500 1,000 2,000 Total investment cost ($) 18,000 24,000 42,000 72,000 132,000 Investment per cow ($) 180 120 84 72 66 Annual TAI cost/year ($) 3,000 6,000 15,000 30,000 60,000 Payback years 6.00 4.00 2.80 2.40 2.20 Remaining years pedometers 1.00 3.00 4.20 4.60 4.80 Advantage pedometers/herd ($) 3,000 18,000 63,000 38,000 288,000 Advantage pedometers/cow/year ($) 4.29 12.86 18.00 19.71 20.57 Assumptions pedometers: $12,000 fixed investment cost, $60 variable cost per cow, 7 years depreciation time, identical reproductive performance as timed-AI program. Assumption timed-AI program: $30 per cow per year in drugs and additional labor. Example 2: precision feeding A study carried out in 2011 at the University of Florida showed that precision feeding cows based on their individual energy balances increased daily milk yields (45.2 vs. 41.9 kg) but had similar daily dry matter intake (24.3 kg) compared to control cows that were fed the herd’s one standard total mixed ration (Maltz et al., 2012). Rations for the precision fed cows were changed weekly by manipulating the amount of supplemental concentrates. Individual energy balances were calculated based on sensors that measure milk yields, milk components, and body weights at every milking. The study lasted from 4 to 19 weeks after calving. Daily feed costs were $6.59 for the control cows and $6.86 for precision-fed cows. Milk income was $22.82 for the control cows and $23.89 for the precision-fed cows. Daily income over feed cost (IOFC) was $15.59 for the control cows and $17.05 for the precision-fed cows which resulted in a $1.46 greater daily IOFC for the precision-fed cows. Grouping cows based on similar energy needs and feeding them a ration that meets the requirements of the typical cow in the group would reduce these differences in response and profitability. André et al. (2010) found an advantage of $0.26 to $2.64 per cow per day when applying precision feeding compared to a strategy for concentrate supply based on the averaged population response parameters. Assuming only a $1 greater IOFC for precision fed cows compared to a control ration, and assuming this advantage holds for 305 days per year, then the break-even cost for a precision feeding station that feeds 30 cows and depreciates in 7 years would be $64,050. Example 3: disease detection Milk component analysis, in combination with changes in milk yield, can be used to detect certain disease early. For example, the fat:protein ratio > 1.4 is an indicator of (early stages of)
111
ketosis. A clinical case of ketosis may cost $250. A fat:protein ratio < 1 may indicate subacute ruminal acidosis. At the University of Florida, we use fat:protein ratios obtained at every milking with a milk component analyzer as an indicator of possible ketosis. Cows that have high ratios are diagnosed and treated if needed. The incidence of clinical cases of ketosis has decreased by 50%. Assume that 15% of the cows in the first 7 weeks after calving develop clinical ketosis if not treated early. If 50% of these cases would be detected early and half of cost could be avoided, then the savings from early detection would be 15% * 50% * 50% * $250 = $9.38 per cow per year. The savings would be greater for higher incidences of ketosis. However, the dairy farm would do well to fix the causes of the high ketosis incidence instead of investing in early detection technology. Outlook Sensor technology for precision dairy management will continue to improve and become less costly. Simple partial budgets will indicate whether the technology is potentially profitable or not. Much will depend on how easily the information obtained with sensors will be used to direct management action, in ways that would not be taken without the sensor technology. One area of research may be economic optimization of rules that flag deviations from expected values. Too many flags will likely show false alarms which lead to ignoring the signal also when there is a problem. Too few flags will likely show that problems exist that have not been detected. Methods for economic design of statistical process control charts should be investigated to find the best balance between false alarms and time to signal when a problem occurs. Closely associated with this issue is the need to deliver the best expectation of the biological indicator, for example through a dynamic linear model. Genetics is a new area for precision dairy management. Genomics technology coupled with sexed semen is leading for new opportunities for precision mating not seen before. Mating programs will not only assist choosing sires that prevent inbreeding and “correct” for traits in the calf that is created. Future mating programs will closely match at the cow’s DNA profile with that of candidate sires. Best matches will for example better predict the genetic makeup of the calf, prevent genetic defects, and determine the sex of the calf. References André, G., P. B. M. Berentsen, G. van Duinkerken, B. Engel, and A. G. J. M. Oude Lanselink.
2010. Economic potential of individual variation in milk yield response to concentrate intake of dairy cows. J. Agric. Sci. 148:263-276.
Bewley, J. and R. Russell. 2010. Reasons for slow adoption rates of precision dairy farming technologies: Evidence from a producer survey. Paper presented at The First North American Conference on Precision Dairy Management
Dolecheck, K, and J. Bewley. 2013. Pre-investment considerations for precision dairy farming technologies. Bulletin ASC-208, University of Kentucky Cooperative Extension Service.
Maltz, E., L. F. Barbosa, P. Bueno, L. Scagion, L. F. Greco, K. Kaniyamattam, A. De Vries, and J. E. P. Santos. 2012. Effect of precision feeding on performance, nutrient excretion, and feeding behavior of early lactation dairy cows. J. Anim. Sci. Vol. 90, Suppl. 3/J. Dairy Sci. Vol. 95, Suppl. 2:715 (abstract 799)
112
INTEGRATING IT ALL: MAKING IT WORK AND PAY AT THE FARM
Henk Hogeveen1,2 and Wilma Steeneveld1
1Wageningen University, Wageningen, the Netherlands 2Utrecht University, Utrecht, the Netherlands
Introduction With increasing herd sizes, farmers do not have time manage cows individually and tend to optimize decisions at the group level. However, by optimizing decisions at the group level, even when using proper health and reproduction protocols, the individual animal will not be managed optimally. Precision dairy farming (PDF) may assist optimize the performance of dairy cattle held in large groups at the individual cow level. By replacing group management with individual cow management, the cost price of milk can be decreased. The development of applications for PDF started in the 1970s with the development of electronic cow recognition (Kuip, 1987). Besides the development of individual concentrate supplementation, PDF applications were not implemented at a large scale, although in the 1980s and 1990s work was carried out into PDF applications (e.g., Nielen et al., 1992; Thompson et al., 1995). Currently, PDF applications are finding their way on dairy farms, although there seem to be differences in the uptake of PDF applications between dairy systems. This paper will describe the factors that make PDF applications work at the farm. Illustrations of these success factors on Northwestern European and American dairy farms will be provided. Success factors to make precision dairy farming work Three groups of success factors for PDF applications can be distinguished: System specifications, cost-efficiency and socio-economic factors. System specifications. Recently, many new initiatives are taken in the development of PDF applications. Some of these new initiatives are associated with the introduction of automatic milking, where detection of abnormal milk and clinical mastitis could not be done by visual inspection of the milk and/or udder anymore. Many new initiatives, e.g., introduction of automated estrus detection equipment, are not necessarily associated with automatic milking. New initiatives (sensors or other hardware) that are potentially interesting for application on dairy farms often started from engineers. The development of hardware is, however, only a first step in the development of a PDF system, which consists of four stages (Rutten et al., 2013): (1) technique, (2) data interpretation, (3) integration of information and (4) decision making. A first step in development of a PDF system is the development and description of equipment that measures one or more parameters. Data interpretation is the important second step that transforms data, collected by the PDF systems hardware, into usable information. This is a crucial step, because it involves a clear definition of the animal or farm status that needs to be detected and the gold standard associated with that. Algorithms needs to be developed and validated to transform data into information. This data interpretation can be very tedious
113
(Hogeveen et al., 2010). For instance, because of the decisions that have to be made on interpretation of sensor output. It is clear that a PDF alert for estrus 4 days after estrus took place will be too late. However, a PDF alert for mastitis 4 days after onset of clinical signs might be in time (dependent on the severity of the mastitis case). At the third stage, the information obtained from the hardware can be combined with other on- or off-farm information (e.g., non-sensor cow data and economic data) to support decisions. This third step is not a necessary step in PDF systems, but it will improve the value of a PDF system. Stage four is the actual decision making, either by the herdsman or autonomously by the PDF system. Automated concentrate feeders are, for instance, making decisions autonomously. For a PDF application it is immensely important that it is clear what the application is doing (the golden standard). Applications should at least go to stage 2, data interpretation (alerts). The alerts that a PDF application give, need to be useful for a farmer. Alerts without any appropriate management action or standard operating procedures associated with it, are not useful at all. Cost-efficiency. The second success factor for a PDF application is the cost-efficiency of the investment, and this depends on many different aspects of the PDF application. The economic value of a PDF application depends on the type of application. Many new developments are aimed at improved disease situations (e.g., mastitis, metabolic disorders, claw problems). The costs of disease is then an important first element, because in the costs of disease lies the potential economic value of the PDF system. Although for many endemic dairy cattle diseases cost estimates are available (see for instance Hogeveen et al., 2011, Bruijnis et al., 2010 and Ettema et al., 2010), the benefits of the improved management because of PDF applications is often unknown. Other benefits may be present as well: for example improved production efficiency (e.g., concentrate feeder systems) and reduced labor (e.g., automatic milking). The benefits of improved disease levels, reduced labor, reduced feed costs per kg milk should be weighed against the investment costs of the system. For some PDF systems, economic advantages in the dairy production chain are envisaged. Because the farmer is the one investing, these benefits should be taken out of the equation unless chain partners motivate farmers to invest in PDF systems that benefit the entire chain. Non-economic factors. Even if a PDF application is cost-effective, adoption of the technology is dependent on other factors. A large heterogeneity exists among farmers (micro-level behavior) with regard to the adoption of technology. Economic factors such as size effects, risk preference and variation in the availability of labor and/or capital are factors for adoption of new technology. Also timing and investment irreversibility are important factors for adoption of new technology (Sauer and Zilberman, 2012). Goals of farmers differ and has shown to have an effect on the farmers entrepreneurial behavior (Bergevoet et al., 2004). It might be that behavior with regard to PDF applications also differs between farmers. Preferences of the farmer are often overlooked. Especially on farms where the family provides a large proportion of the labor, goals of farmers go wider than only profit maximization. With, for instance, conjoint analysis, farmers preference for
114
systems can very well be studied (e.g., Mollenhorst et al., 2012). For this type of work, it is necessary to have clear (as SMART as possible) descriptions of the potential PDF applications. The example of automatic milking In 1992, automatic milking was first introduced on commercial dairy farms in the Netherlands. Since that time, automatic milking has received lots of interest. However, from an economic point of view, automatic milking is not cost-effective. Several studies have been published on economic consequences of automatic milking using normative models (Arendzen and van Scheppingen, 2000; Armstrong and Daugherty, 1997; Cooper and Parsons, 1999; Dijkhuizen et al., 1997; Hyde and Engel, 2002; Pellerin et al., 2001; Rotz et al., 2003; Wade et al., 2004). Although results of these studies differed substantially, with some exceptions, the general trend in these studies was that automatic milking has negative effects on the economic performance of the farm when compared with conventional milking. Studies using empirical data are relatively scarce. Table 1 presents the main results of a study that compared farms that invested in an automatic milking system (AMS) with farms that invested in the same year in a conventional milking systems (CMS) (Bijl et al., 2007). Farmers were comparable in terms of size (nr of cows) and intensity (nr of cows per hectare). Milk revenues were higher for CMS farms than for AMS farms (P = 0.003). Although no statistical difference could be found in feed costs, livestock costs and land use costs, these were a little lower for the AMS farms than for the CMS farms. Therefore, the margin on dairy production was nearly identical for both groups of farms. Costs for contractors and costs for gas, water, and electricity were greater for farms with an AMS than for those using a CMS. The AMS farmers used 29% less labor than CMS farms. This might not necessarily only be caused by a reduced amount of labor for milking, but also could be caused by increased use of contractors on the AMS farms. The amount of money available for rent, depreciation, interest, labor and profit (RDILP) was larger (P = 0.046) by € 15,5661 for CMS farms, caused by the smaller amount of non-accountable costs of these farms. These data were on basis of so-called cash accounting. When actual accounting is used, the difference in financial results between a CMS and an AMS farm is likely to be larger, the investment in an AMS is most probably larger than the investment in a CMS. Moreover, the economic lifetime of an AMS is expected to be shorter than of a CMS. More recently, a new study using empirical data of Dutch dairy farms found that AMS farms had a slight, non-significant lower efficiency than CMS farms (Steeneveld et al., 2012). Very recent data (not published) of 1,109 Dutch dairy farms, collected to study the effect of grazing on economic efficiency confirmed these results. However, the combination of grazing with automatic milking did give a statistically significant lower efficiency of AMS farms. Based on the same data, also an analysis was made on gross farm income (Table 2). Farm size had a positive effect on farm income, as well as grazing. There was no significant relationship between AMS and gross farm income. However, the interaction between grazing and adoption of AMS showed that farms that combined grazing with AMS had a lower gross farm income. ______________________ 1 On April 12, 2013, € 1 = $US 1.30
115
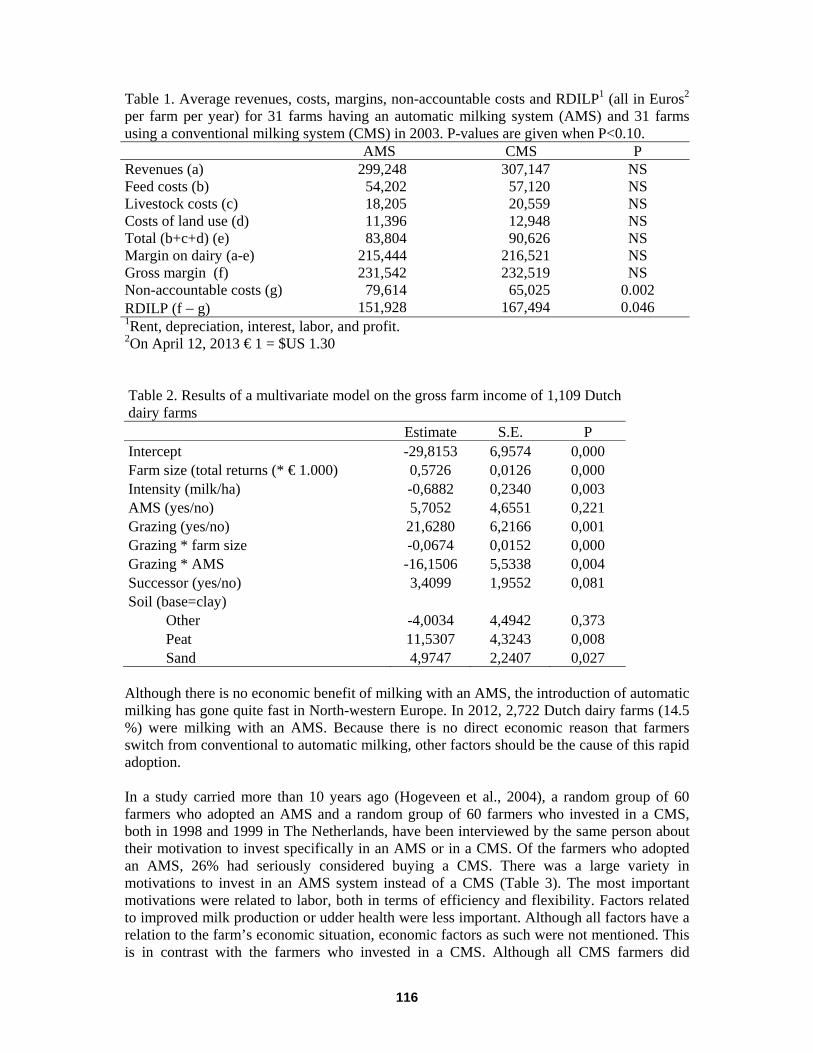
Table 1. Average revenues, costs, margins, non-accountable costs and RDILP1 (all in Euros2 per farm per year) for 31 farms having an automatic milking system (AMS) and 31 farms using a conventional milking system (CMS) in 2003. P-values are given when P<0.10. AMS CMS P Revenues (a) 299,248 307,147 NS Feed costs (b) 54,202 57,120 NS Livestock costs (c) 18,205 20,559 NS Costs of land use (d) 11,396 12,948 NS Total (b+c+d) (e) 83,804 90,626 NS Margin on dairy (a-e) 215,444 216,521 NS Gross margin (f) 231,542 232,519 NS Non-accountable costs (g) 79,614 65,025 0.002 RDILP (f − g) 151,928 167,494 0.046 1Rent, depreciation, interest, labor, and profit. 2On April 12, 2013 € 1 = $US 1.30 Table 2. Results of a multivariate model on the gross farm income of 1,109 Dutch dairy farms Estimate S.E. P Intercept -29,8153 6,9574 0,000 Farm size (total returns (* € 1.000) 0,5726 0,0126 0,000 Intensity (milk/ha) -0,6882 0,2340 0,003 AMS (yes/no) 5,7052 4,6551 0,221 Grazing (yes/no) 21,6280 6,2166 0,001 Grazing * farm size -0,0674 0,0152 0,000 Grazing * AMS -16,1506 5,5338 0,004 Successor (yes/no) 3,4099 1,9552 0,081 Soil (base=clay) Other -4,0034 4,4942 0,373 Peat 11,5307 4,3243 0,008 Sand 4,9747 2,2407 0,027 Although there is no economic benefit of milking with an AMS, the introduction of automatic milking has gone quite fast in North-western Europe. In 2012, 2,722 Dutch dairy farms (14.5 %) were milking with an AMS. Because there is no direct economic reason that farmers switch from conventional to automatic milking, other factors should be the cause of this rapid adoption. In a study carried more than 10 years ago (Hogeveen et al., 2004), a random group of 60 farmers who adopted an AMS and a random group of 60 farmers who invested in a CMS, both in 1998 and 1999 in The Netherlands, have been interviewed by the same person about their motivation to invest specifically in an AMS or in a CMS. Of the farmers who adopted an AMS, 26% had seriously considered buying a CMS. There was a large variety in motivations to invest in an AMS system instead of a CMS (Table 3). The most important motivations were related to labor, both in terms of efficiency and flexibility. Factors related to improved milk production or udder health were less important. Although all factors have a relation to the farm’s economic situation, economic factors as such were not mentioned. This is in contrast with the farmers who invested in a CMS. Although all CMS farmers did
116
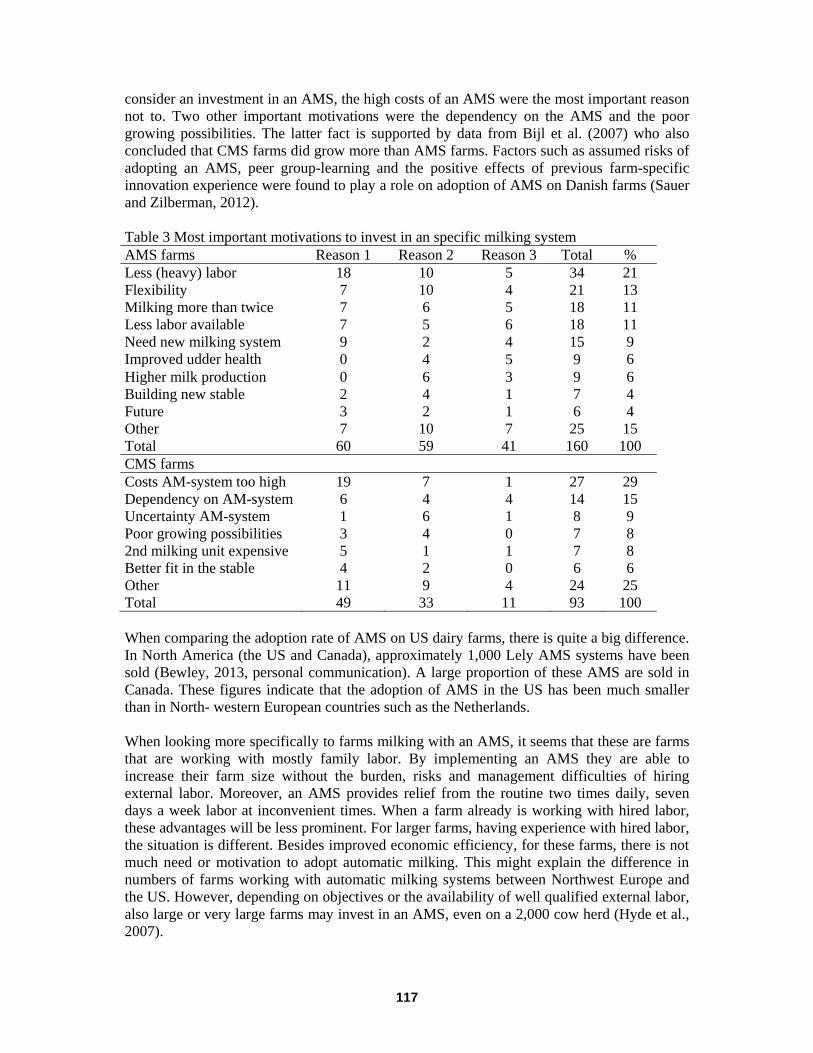
consider an investment in an AMS, the high costs of an AMS were the most important reason not to. Two other important motivations were the dependency on the AMS and the poor growing possibilities. The latter fact is supported by data from Bijl et al. (2007) who also concluded that CMS farms did grow more than AMS farms. Factors such as assumed risks of adopting an AMS, peer group-learning and the positive effects of previous farm-specific innovation experience were found to play a role on adoption of AMS on Danish farms (Sauer and Zilberman, 2012). Table 3 Most important motivations to invest in an specific milking system AMS farms Reason 1 Reason 2 Reason 3 Total % Less (heavy) labor 18 10 5 34 21 Flexibility 7 10 4 21 13 Milking more than twice 7 6 5 18 11 Less labor available 7 5 6 18 11 Need new milking system 9 2 4 15 9 Improved udder health 0 4 5 9 6 Higher milk production 0 6 3 9 6 Building new stable 2 4 1 7 4 Future 3 2 1 6 4 Other 7 10 7 25 15 Total 60 59 41 160 100 CMS farms Costs AM-system too high 19 7 1 27 29 Dependency on AM-system 6 4 4 14 15 Uncertainty AM-system 1 6 1 8 9 Poor growing possibilities 3 4 0 7 8 2nd milking unit expensive 5 1 1 7 8 Better fit in the stable 4 2 0 6 6 Other 11 9 4 24 25 Total 49 33 11 93 100 When comparing the adoption rate of AMS on US dairy farms, there is quite a big difference. In North America (the US and Canada), approximately 1,000 Lely AMS systems have been sold (Bewley, 2013, personal communication). A large proportion of these AMS are sold in Canada. These figures indicate that the adoption of AMS in the US has been much smaller than in North- western European countries such as the Netherlands. When looking more specifically to farms milking with an AMS, it seems that these are farms that are working with mostly family labor. By implementing an AMS they are able to increase their farm size without the burden, risks and management difficulties of hiring external labor. Moreover, an AMS provides relief from the routine two times daily, seven days a week labor at inconvenient times. When a farm already is working with hired labor, these advantages will be less prominent. For larger farms, having experience with hired labor, the situation is different. Besides improved economic efficiency, for these farms, there is not much need or motivation to adopt automatic milking. This might explain the difference in numbers of farms working with automatic milking systems between Northwest Europe and the US. However, depending on objectives or the availability of well qualified external labor, also large or very large farms may invest in an AMS, even on a 2,000 cow herd (Hyde et al., 2007).
117
It is expected that the difference in investment between automatic milking and CMS will decrease over time. The major cost factor of an AMS is not in steel or other materials but in electronics. Price increases will be lower for electronics than for other materials. That means, that in the future, prices of AMS are expected to become relatively lower. Consequently, at a certain moment in time all milking systems will be automatic, because it will be most cost efficient. The example of mastitis detection In the 1980s much research work has been carried out in on-line detection of mastitis (see for an overview Nielen et al., 1992). However, adoption of these systems was low. Partly it was because it was unclear for which purpose these on-line mastitis detection systems could be used. Algorithm development was not aimed at specific goals but merely at generic detection of mastitis (e.g., Maatje et al., 1992). Systems were described as being able to detect clinical mastitis as well as subclinical mastitis. But the associated actions differ between detection of clinical mastitis and subclinical mastitis. The reason to detect clinical mastitis is to treat animals, while the reason for detecting subclinical mastitis is more diffuse. It is partly to have an idea of the herd level of intramammary infections or it might be used for early treatment of mastitis. These differences do require different detection rules (Hogeveen and Ouweltjes, 2003). In order to treat clinical mastitis cases, the alert should be related closely to the onset of clinical mastitis, while for detection of subclinical mastitis cases these requirements are lower. However, even when specifically aimed at the detection of clinical mastitis, detection performance is not great (Hogeveen et al., 2010).Moreover, farmers were already able to detect clinical mastitis. It was and is part of standard milking procedures. For subclinical mastitis, farmers received information through somatic cell count measurements as part of the milk production recording system. In either case, the added value of mastitis detection is unclear. No economic calculations on the use of mastitis detection systems are available. Automated mastitis detection is not expected to replace labor. The economic value should come from better detection and decision making around treatment of mastitis. The total failure costs of mastitis are approximately € 80 per cow per year (Hogeveen et al., 2011) and improved detection and treatment is not expected to reduce these costs with a large proportion. It has even been shown that cow specific treatment of clinical mastitis does not provide any added economic value (Steeneveld et al., 2012). It is, therefore, not surprising that farmers with a CMS did not adopt automated mastitis detection systems, neither in Northwest Europe or North America. With the introduction of AMS there was a sudden need for on-line detection of mastitis because visual inspection of the cow and her milk became very laborious. Despite the relatively bad predictive value of the on-line mastitis detection systems, they were needed in AMS and are now widely implemented. The example of estrus detection In the late 1980’s and early 1990’s, research into the use of pedometers to detect estrus was carried out (e.g., Holdsworth and Markillie, 1982; Redden et al., 1993). More recently, 3D-accelerometers are becoming available and are used to detect estrus (Valenza et al., 2012; Lovendahl and Chagunda, 2010). Besides these activity-based automated estrus detection
118
systems, other systems are also available, for instance a progesterone measuring system (Friggens and Chagunda, 2005). Automated estrus detection systems do have a clear aim: detection of estrus with as associated action the insemination of a cow in estrus. The detection system may be combined with a system to optimize the time of insemination. For some individual cows it can be economically beneficial to extend the time of insemination (Steeneveld et al., 2012). Because of the necessity of timely insemination, the definition of the gold standard in order to evaluate the performance of estrus detection systems is also quite straightforward. Estrus should be detected in time for insemination. The benefits of automatic estrus detection are twofold. First, automated estrus detection can save labor. Visual estrus detection requires a lot of labor. Dutch recommendations are three times daily 20 minutes of visual inspection of the cows. When this activity is automated, a large proportion of this time is saved. The second benefit lies in an increase in the estrus detection rate. Especially because most farmers do not reach the recommended time of visual inspection. An average estrus detection rate of 50% was assumed (Inchaisri et al., 2010). So when the sensitivity of an automated estrus detection system reaches, for instance, 80%, this can be seen as an improvement of estrus detection. As a consequence the average number of open days and the calving interval will reduce. One study is known on the economic effects of automated estrus detection (Ostergaard et al., 2005). In this normative study it was estimated that the break-even price for an automated estrus detection system, based on in-line progesterone measurements was for an average Danish herd of 120 cows was € 45 per cow per year. The break-even price depended on the differences in the type of estrus detection system and herd reproduction management and varied between € 3 and € 81 per cow per year. Both in the US as well as in the Netherlands, farmers are starting to implement automated estrus detection systems. It is estimated that in the US 10 to 15 % of the farmers are utilizing automated estrus detection equipment (Bewley, 2013, personal communication). For the Netherlands this is estimated to be 19-20 % (Knijn, 2013, personal communication). Apparently, the adoption rate of automated estrus detection systems is more or less equal for the different dairy systems in the US and North-west Europe. The reasons for this can be that for estrus detection systems there is a clear goal of the system and there are clear advantages both in terms of reduction of labor as well as in improved herd productivity. Conclusions In order to be successful, PDF applications need to address a clear problem associated with clear actions or standard operating procedures. Economic advantages of PDF applications either come from reduced (labor) costs (the PDF application replaces something else) or increased returns because of improved herd productivity. For PDF applications the economic advantages are rarely studied. Besides economics, also other aspects may play a role, especially on farms with a large proportion of family labor. These aspects may explain the difference in adoption rate of automatic milking in the US and Northwestern Europe. Because of a lack of (monetary) benefits, automated mastitis detection is hardly used on farms that milk with a CMS. Automated estrus detection is starting to be adopted in both the US as well as the Netherlands. Most probably because of clear (monetary) benefits.
119
References Arendzen, I. and A.T.J. van Scheppingen. 2000. Economical sensitivity of four main
parameters defining the room for investment of automatic milking systems on dairy farms. Page 201-211 in: Hogeveen, H. and A. Meijering (editors). Robotic milking. Wageningen Pers, Wageningen, the Netherlands.
Armstrong, D.V. and L.S. Daugherty. 1997. Milking robots in large dairy farms. Computers and Electronics in Agricculture 17:123-128.
Bergevoet, R.H.M., C.J.M. Ondersteijn, H.W. Saatkamp, C.M.J. van Woerkum and R.B.M. Huirne. 2004. Entrepreneurial behaviour of Dutch dairy farmers under a milk quota system: goals, objectives and attitudes. Agricultural Systems 80: 1-21.
Bijl, R., S.R. Kooistra and H. Hogeveen. 2007. The profitability of automatic milking on Dutch dairy farms. Journal of Dairy Science 90: 239-248.
Bruijnis, M.R.N., H. Hogeveen and E.N. 2010. Assessing economic consequences of foot disorders in dairy cattle using a dynamic stochastic simulation model. Journal of Dairy Science 93:2419-2432.
Cooper, K. and D.J. Parsons. 1999. An economic analysis of automatic milking using a simulation model. Journal of Agricultural Engineering Research 73: 311-321.
Dijkhuizen, A.A., R.B.M. Huirne, S.B. Harsh and R.W. Gardner. 1997. Economics of robot application. Computers and Electronics in Agriculture 17: 111-121.
Ettema, J., S. Ostergaard and A.R. Kristensen. 2010. Modelling the economic impact of three lameness causing diseases using herd and cow level evidence. Preventive Veterinary Medicine 95: 64-73.
Friggens, N.C. and M.G.G. Chagunda. 2005. Prediction of the reproductive status of cattle on the basis of milk progesterone measures: model description. Theriogenology 64: 155-190.
Hogeveen H, Heemskerk K, Mathijs E. 2004. Motivations of Dutch farmers to invest in an automatic milking system or a conventional milking parlour. Pp 56-61 in: Meijering A
Hogeveen, H., K. Huijps and T.J.G.M. Lam. 2011. Economic aspects of mastitis: New developments. New Zealand Veterinary Journal 59: 16-23.
Hogeveen, H., C. Kamphuis, W. Steeneveld and H. Mollenhorst 2010. Sensors and clinical mastitis-The quest for the perfect alert. Sensors 10: 7991-8009.
H. Hogeveen and C.J.A.M. de Koning (editors), Automatic milking, a better understanding. Wageningen Academic Publishers, Wageningen, the Netherlands.
Hogeveen, H. and W. Ouweltjes (2003). Sensors and management support in high-tech milking. Journal of Animal Science 81 (Suppl. 3): 1-10.
Hogeveen, H., C. Kamphuis, W. Steeneveld and H. Mollenhorst (2010). Sensors and clinical mastitis – the quest for the perfect alert. Sensors, 10: 7991-8009.
Holdsworth, R.J. and N.A.R. Markillie. 1982. Evaluation of pedometers for estrus detection in dairy cows. Veterinary Record 111: 16-16.
Hyde, J. and P. Engel 2002. Investing in a robotic milking system: A Monte Carlo simulation analysis. Journal of Dairy Science 85:2207-2214.
Kuip, A. 1987. Animal Identification. Page 12-17 in: Third Symposium Automation in Dairying, Wageningen, the Netherlands.
Lovendahl, P. and M.G. G. Chagunda. 2010. On the use of physical activity monitoring for estrus detection in dairy cows. Journal of Dairy Science 93: 249-259.
Maatje, K., P.J.M. Huijsmans, W. Rossing and P.H. Hogewerf. 1992. The efficacy of in-line measurement of quarter milk electrical conductivity, milk yield and milk temperature for the detection of clinical and subclinical mastitis. Livestock Production Science 30: 239-249.
120
Mollenhorst, H., L.J. Rijkaart and H. Hogeveen. 2012. Mastitis alert preferences of farmers milking with automatic milking systems. Journal of Dairy Science 95:2523-2530.
Nielen, M., H. Deluyker, Y.H. Schukken and A. Brand. 1992. Electrical conductivity of milk: Measurement, modifiers and meta analysis of mastitis detection performance. Journal of Dairy Science 75: 606-614.
Ostergaard, S, N.C. Friggens and M.G.G. Chagunda. 2005. Technical and economic effects of an inline progesterone indicator in a dairy herd estimated by stochastic simulation. Theriogenology 64: 819-843.
Pellerin, D., M. Blin, P. Meunier, E. Lapeze, R. LeVallois. 2001. Can you pay a milking robot? (in French). Pages 121-131. Des défis? Des solutions! 25e Symposium sur les bovins laitiers, Saint Hyacinthe, Québec, Canada.
Redden, K.D., A.D. Kennedy, J.R. Ingalls and T.L. Gilson. 1993. Detection of estrus by radiotelemetric monitoring of vaginal and ear skin temperature and pedometer measurements of activity. Journal of Dairy Science 76: 713-721.
Rotz, C.A., C.U. Coiner and K.J. Soder. 2003. Automatic milking systems, farm size, and milk production. Journal of Dairy Science 86: 4167-4177.
Rutten, C.J., A.G.J. Velthuis, W. Steeneveld and H. Hogeveen. 2013. Invited review: Sensors to support health management on dairy farms. Journal of Dairy Science 96: 1928-1952.
Sauer, J. and D. Zilberman. 2012. Sequential technology implementation, network externalities, and risk: the case of automatic milking systems. Agricultural Economics 43: 233-251.
Steeneveld, W. and H. Hogeveen. 2012. The economic optimal decision for a cow in oestrus: inseminate now or delay insemination. The Veterinary Record, 171: 17-22.
Steeneveld, W., L.W. Tauer, H. Hogeveen, A.G.J.M. Oude Lansink. 2012. Comparing technical efficiency of farms with an automatic milking system and a conventional milking system. Journal of Dairy Science 95:7391-7398.
Steeneveld, W., T. van Werven, H.W. Barkema and H. Hogeveen (2011). Cow-specific treatment of clinical mastitis: An economic approach. Journal of Dairy Science, 94: 174-188.
Thompson, P., R. Pulvermacher and L. Timms. 1995. Pedometer use for estrus detection. In: Animal Behavior and the Design of Livestock and Poultry Systems International Conference, Inianapolis IN, U.S.A.
Valenza, A., J.O. Giordano, G. Lopes, L. Vincenti, M.C. Amundson and P.M. Fricke. 2012. Assessment of an accelerometer system for detection of estrus and treatment with gonadotropin-releasing hormone at the tme of insemination in lactating dairy cows. Journal of Dairy Science 95: 7115-7127.
Wade, K.M., M.A.P.M. van Asseldonk, P.B.M. Berentsen, W. Ouweltjes, and H. Hogeveen. 2004. Economic efficiency of automatic milking systems with specific emphasis on increases in milk production. Page 63-67 in: Meijering, A., H. Hogeveen and C.J.A.M. de Koning (editors), Automatic milking, a better understanding. Wageningen Academic Publishers, Wageningen, the Netherlands.
121

Questions ou problèmes, contactez-nous dans les plus brefs délais au : 1 888 959-6352 : Courriel : [email protected]
Nom de fichier et version : 4231_valmetal_precision-dairy_v2_pll
Client :
Modifié :
Format :
Valmetal
7 May 2013 10:26 AM
7,375 in x 2,25 in
Couleurs :
Publication :
Parution :
4 C. Process
Precision Dairy
N.D.
122

PLANNING THE RIGHT ROBOTIC SYSTEM FOR THE COW
Michael J Hobbis Healthy Cows UK
Bristol, South Gloucestershire, GB. [email protected]
In the last few years, established dairy equipment companies have continued to refine robotic dairy technology, launching more advanced robot milking units to the market. With this increase in choice and level of sophistication, dairy producers have a great opportunity to find a robotic system that best suits their individual farms needs. Areas that consultants and producers need to consider when designing a robotic milking unit:
1. The cow. Her genetic potential – expected increase in yield (3x plus milking frequency)
2. Feeding System /Nutrition. Types of forages available – quality and density.
3. Welfare. Herd health – fertility, lameness and cow condition.
All established dairy equipment manufacturers supply effective and reliable robotic milking units that differ in teat preparation and attachment methods, reducing labour costs and freeing up time to more effectively manage the cow. Managing the cow to achieve the required visits and frequency of milkings to keep her healthy and profitable is a key component of making a robotic milking system work effectively. There are three different management systems to optimise cow flow around the barn. Free Access Overview: Cows have free access to cubicles, feed area and unlimited access to milking robots Points to consider:
• Need for very palatable compound feed in robots to ensure optimal milking visits per day.
• Feed bunk ration should be 8 litres below the average daily milk yield of the herd. • System monitored on refused milkings >1 per cow/day. • Late for milking cows can be an issue, up to 10% twice a day to be fetched. • Restricted concentrate at the feed bunk / low density ration (M+22 litres). • High rate / cost of concentrate to be fed in the robot. • Needs very palatable (high net energy) compound feed in robot to maintain cow milk
yield and body condition. • Late lactation / low yielding cows may need to be found for milking. • Cows may become over fat in late lactation due to reduced milking frequency.
123
Feed first Overview: Cows have free access to feed area and a partial TMR. Cows are checked by a selection gate when they return from the feed area and are either directed to the robot for milking or allowed to the rest area-cubicles. A system of one way gates and a selection gate ensures cows visit the robots for milking. Milk first. Overview: Cows have free access to rest area and cubicles. They are checked by a selection gate when they exit the rest area and are either directed to the feed bunk or if they are due for milking diverted to the robots. A system of one way gates plus a selection gate ensures cows visit the robots for milking when they are required and reduces the need to find cows late for milking. Points to consider:
• Allows maximum feed intake at the bunk (M+30 litres). • Looks after higher yielding cows by feeding energy dense ration at feed bunk. • Reduces feed cost by using home-grown cereals and straights. • Reduces the risk of acidosis. • Maintains milking / cow visits throughout the whole lactation. • Guided systems have come in for a lot of criticism in the past, but increasingly research is
showing their benefits on farms, especially when feeding high levels of corn silage. The aim of robotic milking is to be able to milk the cow at the correct frequency during the whole of her lactation. If this is achieved cows will produce milk to their genetic potential and maintain correct body condition, have good reproduction and calve in the right condition for the following lactation. Research carried out on milking frequency provides evidence that can be exploited with today’s robotic milking technology. Frequency of milking. The rate at which milk is secreted is important in determining how much extra milk will be produced when cows are milked more often than twice daily. On average, production will be increased by 20% with 3x compared to 2x. Milking 4x yields a further 5 to 10% increase. The additional yield occurs because the milk secreting cells operate at full capacity for longer and better feeding and management associated with 3x milking(1). Milking 3x in 2 days (skipping 1 out of every 4 milkings) resulted in decreased milk yields of 18% when started in week 4 of lactation and a decrease of 11% when started in week 20(2). 1x milking during late lactation results in 35% less milk yield than 2x milking during that period and 12% less milk for the entire lactation. The average length of lactation was reduced by 12 days(3) References:
1. A W Lishman, Department of Animal Science, University of Natal KwaZulu-Natal Dairying 6.1 1995
2. Eldridge and Clark, 1978, J. Dairy Res. 45:509 3. Radcliffe et al., 1973, J. Dairy Res. 40:247
124
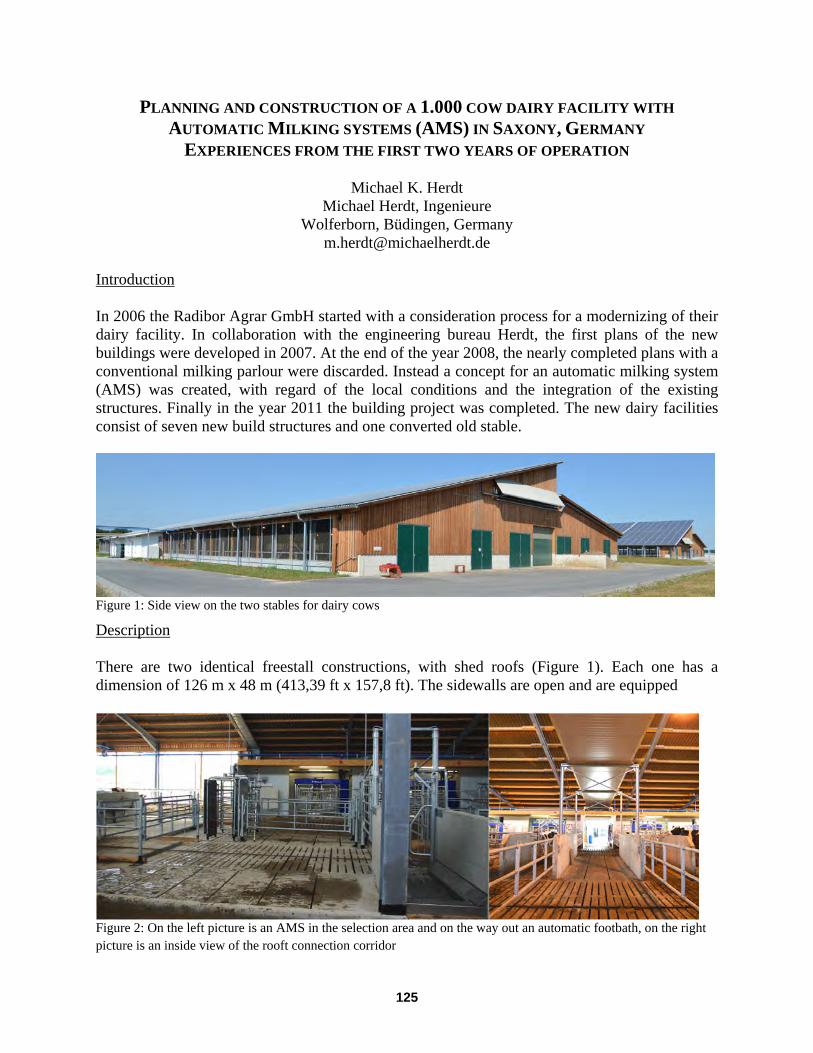
PLANNING AND CONSTRUCTION OF A 1.000 COW DAIRY FACILITY WITH AUTOMATIC MILKING SYSTEMS (AMS) IN SAXONY, GERMANY
EXPERIENCES FROM THE FIRST TWO YEARS OF OPERATION
Michael K. Herdt Michael Herdt, Ingenieure
Wolferborn, Büdingen, Germany [email protected]
Introduction In 2006 the Radibor Agrar GmbH started with a consideration process for a modernizing of their dairy facility. In collaboration with the engineering bureau Herdt, the first plans of the new buildings were developed in 2007. At the end of the year 2008, the nearly completed plans with a conventional milking parlour were discarded. Instead a concept for an automatic milking system (AMS) was created, with regard of the local conditions and the integration of the existing structures. Finally in the year 2011 the building project was completed. The new dairy facilities consist of seven new build structures and one converted old stable.
Figure 1: Side view on the two stables for dairy cows
Description There are two identical freestall constructions, with shed roofs (Figure 1). Each one has a dimension of 126 m x 48 m (413,39 ft x 157,8 ft). The sidewalls are open and are equipped
Figure 2: On the left picture is an AMS in the selection area and on the way out an automatic footbath, on the right picture is an inside view of the rooft connection corridor
125
with curtains to control the airflow inside the stable, for an ideal climate. The under construction is an 8-row configuration with a central feed ally. The manure removal in the walkalleys is handled by wire scrapers to ensure a dry and no slippery floor. In every of these two stables are 508 dairy cows housing which are milked by 8 automatic milking robots from DeLaval. The cows are subdivided into 4 groups with 2 robots in an associated selection-area on slatted floor (Figure 2). On the way out of the area automatic footbaths are placed. A milk precooling system, that’s integrated in the drinking water supply system, is also established. One additional stable, equipped with one robot, is provided only for the special needs cows. Due to the selected ground plan of the stables, it is possible to operate with free or partly guided cow traffic. All the stables and a treatment area are connected through a roofed corridor (Figure 2). Planning Principles The aim is always to optimize a building concept so that the highest productivity could be achieved under the best working conditions and with the lowest possible building costs. The known principles are also valid for stables with AMS. So a clear separation of the different functional areas under the consideration of the needs of labour, cow traffic, cow comfort and climate for animals and technology are required. In favour of short ways and an easy handling all the alleys should be straight. Benchmarks Cows are generally milked more frequently in an AMS than in conventional milking parlour. A high frequency of visits is to aspire. In a profitable facility one AMS should collect at least 2.100kg milk per day. This could be accomplished by 60 to 65 dairy cows. As a consequence one AMS needs to perform 160 to 180 milkings per day. Ideally less than 3% of the cows per day need to be lead to the AMS. In the favour of a lower herd stress level, free cow traffic is the chosen system. Still New Questions To Answer With every increase of knowledge, there are new questions appearing. An issue which is difficult to solve is the question where to treat the special needs cows in such a large operation. Should the capacity of the AMS be exploiting at the maximum? These issues are linked to other questions: in which dimensions are selection areas needed, should the cows be treat as a group or as individual animals? Conclusions It could be considered that AMS are applicable on large dairy facility. It is a solution for some farms but not for all. An AMS can´t solve health problems in the herd or the labour issues. The dairy farmer should be aware that it needs to be paid more attention on the total management system. To convert old buildings leads mostly to suboptimal results. The efficient solutions are always to prefer instead of the cheap solutions. The evaluations concerning labour, animal behaviour and animal health aren´t finished yet but they will be complete until June.
126
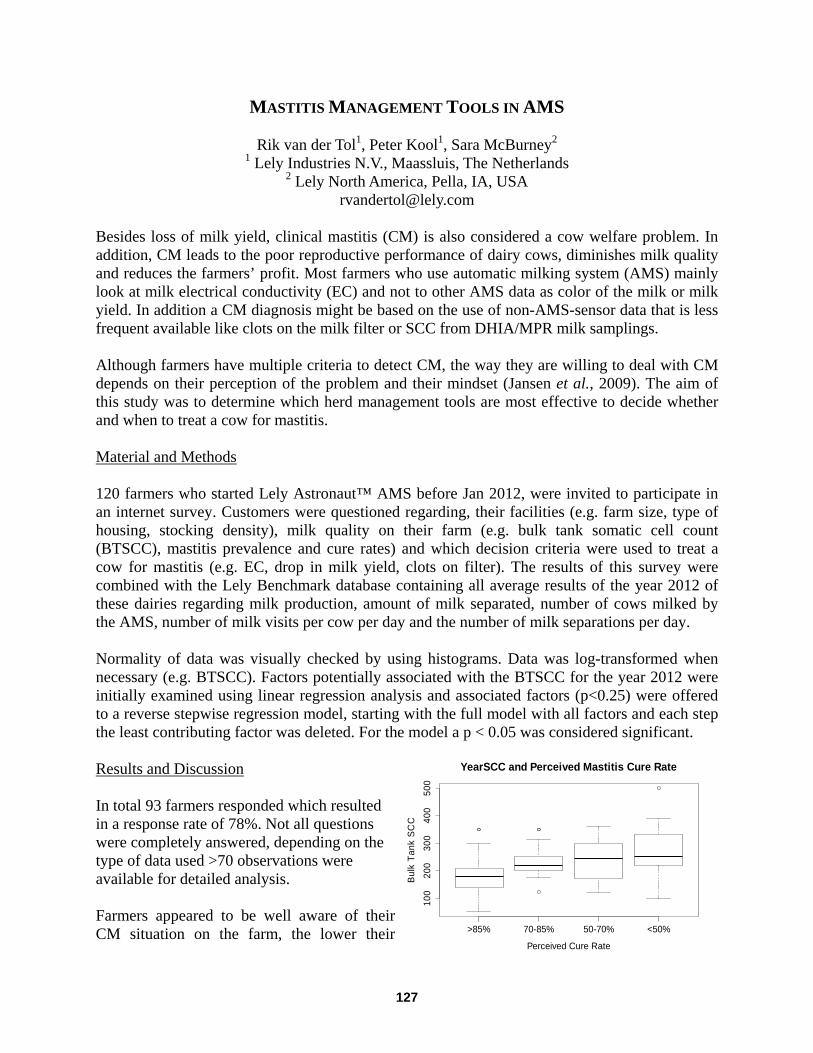
MASTITIS MANAGEMENT TOOLS IN AMS
Rik van der Tol1, Peter Kool1, Sara McBurney2 1 Lely Industries N.V., Maassluis, The Netherlands
2 Lely North America, Pella, IA, USA [email protected]
Besides loss of milk yield, clinical mastitis (CM) is also considered a cow welfare problem. In addition, CM leads to the poor reproductive performance of dairy cows, diminishes milk quality and reduces the farmers’ profit. Most farmers who use automatic milking system (AMS) mainly look at milk electrical conductivity (EC) and not to other AMS data as color of the milk or milk yield. In addition a CM diagnosis might be based on the use of non-AMS-sensor data that is less frequent available like clots on the milk filter or SCC from DHIA/MPR milk samplings. Although farmers have multiple criteria to detect CM, the way they are willing to deal with CM depends on their perception of the problem and their mindset (Jansen et al., 2009). The aim of this study was to determine which herd management tools are most effective to decide whether and when to treat a cow for mastitis. Material and Methods 120 farmers who started Lely Astronaut™ AMS before Jan 2012, were invited to participate in an internet survey. Customers were questioned regarding, their facilities (e.g. farm size, type of housing, stocking density), milk quality on their farm (e.g. bulk tank somatic cell count (BTSCC), mastitis prevalence and cure rates) and which decision criteria were used to treat a cow for mastitis (e.g. EC, drop in milk yield, clots on filter). The results of this survey were combined with the Lely Benchmark database containing all average results of the year 2012 of these dairies regarding milk production, amount of milk separated, number of cows milked by the AMS, number of milk visits per cow per day and the number of milk separations per day. Normality of data was visually checked by using histograms. Data was log-transformed when necessary (e.g. BTSCC). Factors potentially associated with the BTSCC for the year 2012 were initially examined using linear regression analysis and associated factors (p<0.25) were offered to a reverse stepwise regression model, starting with the full model with all factors and each step the least contributing factor was deleted. For the model a p < 0.05 was considered significant. Results and Discussion In total 93 farmers responded which resulted in a response rate of 78%. Not all questions were completely answered, depending on the type of data used >70 observations were available for detailed analysis. Farmers appeared to be well aware of their CM situation on the farm, the lower their >85% 70-85% 50-70% <50%
100
200
300
400
500
YearSCC and Perceived Mastitis Cure Rate
Perceived Cure Rate
Bulk
Tan
k SC
C
127
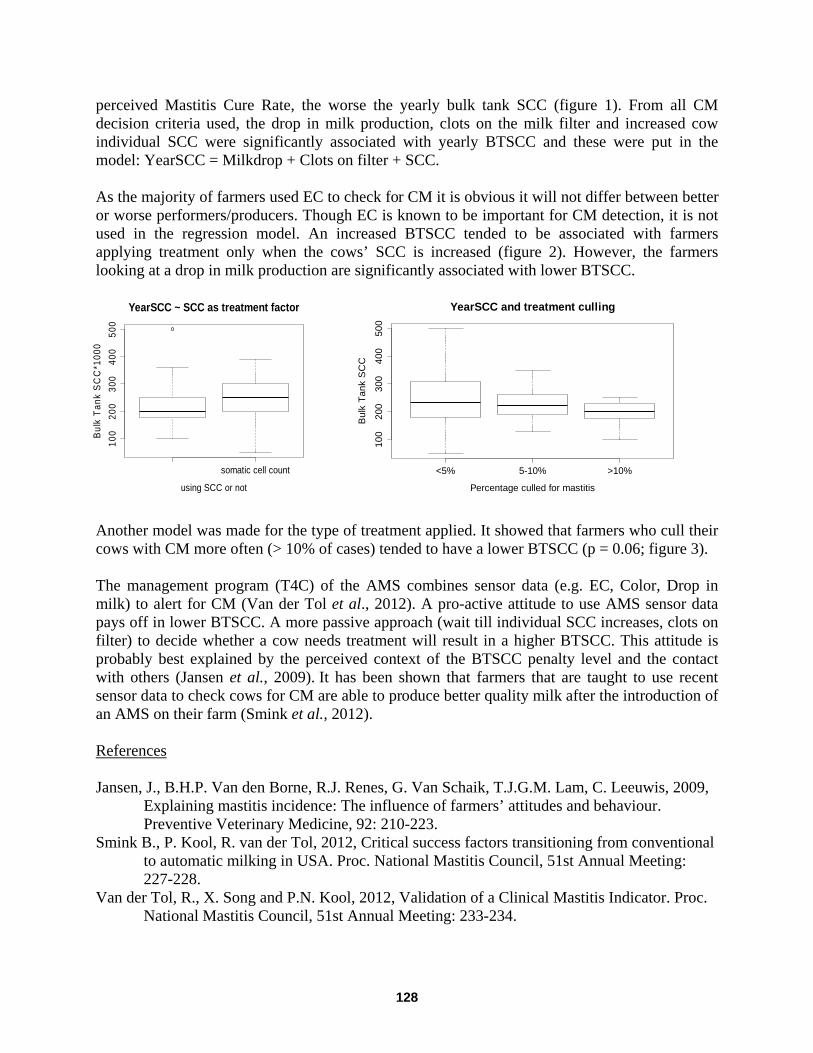
perceived Mastitis Cure Rate, the worse the yearly bulk tank SCC (figure 1). From all CM decision criteria used, the drop in milk production, clots on the milk filter and increased cow individual SCC were significantly associated with yearly BTSCC and these were put in the model: YearSCC = Milkdrop + Clots on filter + SCC. As the majority of farmers used EC to check for CM it is obvious it will not differ between better or worse performers/producers. Though EC is known to be important for CM detection, it is not used in the regression model. An increased BTSCC tended to be associated with farmers applying treatment only when the cows’ SCC is increased (figure 2). However, the farmers looking at a drop in milk production are significantly associated with lower BTSCC.
Another model was made for the type of treatment applied. It showed that farmers who cull their cows with CM more often (> 10% of cases) tended to have a lower BTSCC (p = 0.06; figure 3). The management program (T4C) of the AMS combines sensor data (e.g. EC, Color, Drop in milk) to alert for CM (Van der Tol et al., 2012). A pro-active attitude to use AMS sensor data pays off in lower BTSCC. A more passive approach (wait till individual SCC increases, clots on filter) to decide whether a cow needs treatment will result in a higher BTSCC. This attitude is probably best explained by the perceived context of the BTSCC penalty level and the contact with others (Jansen et al., 2009). It has been shown that farmers that are taught to use recent sensor data to check cows for CM are able to produce better quality milk after the introduction of an AMS on their farm (Smink et al., 2012). References Jansen, J., B.H.P. Van den Borne, R.J. Renes, G. Van Schaik, T.J.G.M. Lam, C. Leeuwis, 2009,
Explaining mastitis incidence: The influence of farmers’ attitudes and behaviour. Preventive Veterinary Medicine, 92: 210-223.
Smink B., P. Kool, R. van der Tol, 2012, Critical success factors transitioning from conventional to automatic milking in USA. Proc. National Mastitis Council, 51st Annual Meeting: 227-228.
Van der Tol, R., X. Song and P.N. Kool, 2012, Validation of a Clinical Mastitis Indicator. Proc. National Mastitis Council, 51st Annual Meeting: 233-234.
somatic cell count
100
200
300
400
500
YearSCC ~ SCC as treatment factor
using SCC or not
Bulk
Tan
k S
CC
*100
0
<5% 5-10% >10%
100
200
300
400
500
YearSCC and treatment culling
Percentage culled for mastitis
Bul
k Ta
nk S
CC
128
EFFECTS OF BAIL ACTIVATION SEQUENCE AND FEED AVAILABILITY ON COW TRAFFIC AND MILK HARVESTING CAPACITY IN A ROBOTIC ROTARY DAIRY
René Kolbach and Nicolas A. Lyons Faculty of Veterinary Science, The University of Sydney,
Camden NSW, Australia [email protected]
Introduction Farms in predominately grazing countries have begun to install automatic milking systems (AMS; K.L. Kerrisk, personal communication). The farms in general have larger herds, lower milk yields and high efficiency of labor utilization than many of the intensively fed and housed farming systems in which AMS are typically installed. In response to the specific requirement of larger scale, pasture–based systems, a novel 16 bail robotic rotary (RR; DeLaval Automatic Milking Rotary—AMR™, Tumba, Sweden) has been developed and was installed at the Elizabeth Macarthur Agricultural Institute (EMAI, Camden NSW, Australia) in 2009. It should be noted that the commercial versions of the RR will have a total of 24 bails on the rotary platform. This study was conducted to investigate the effects of different bail activation sequences in combination with feed availability on cow traffic and harvesting capacity in a prototype, 16 bail, RR. The RR can milk up to 50 cows per hour with two robots (one teat preparation module and one automatic cup attacher; Kolbach et al. 2013). However, in voluntary cow traffic systems, the number of cows presenting may be low at certain times of the day (or during certain months/seasons in seasonal calving systems). In these circumstances the ratio of active bails to the number of cows available may be undesirably high with consequential negative impacts on system efficiency and milk quality (the RR does not flush individual units automatically after each milking or after settable idle periods). Activating only 50% of the bails may be a management strategy chosen to cope with periods of underutilization. Method During the trial, 160 mixed breed (Holstein x Illawarra, Holstein Friesian and Illawarra) dairy cows were managed as a single voluntarily trafficking herd and milked with a prototype RR. The herd consisted of 30% primiparous and 70% multiparous animals, with an average of 3 lactations and 137 days in milk. At the commencement of the trial the 7–day average production level of the cows was 18.5 kg/cow per day, and average milking frequency was 1.7 milkings/cow per day. All the cows had up to 18 months intermittent, regular exposure and experience with the RR prior to the start of the trial. The herd was milked by the RR exclusively for six weeks prior to the commencement of the trial and during the entire data collection period. The cows had access to a day pasture allocation from 0830 to 1800 h and a night pasture allocation from 1800 to 0830 h. Total feed allocation target was 20 kg DM/cow per day, with 6 kg DM/cow per day supplied as partial mixed ration (PMR) on the post–milking feed pad. The PMR consisted of 3.7 kg maize silage, 1.3 kg pelleted concentrate (18% protein), 0.5 kg oaten hay, 0.4 kg lucerne silage and 0.1 kg oaten silage (all as kg DM/cow day). As presence of feed was also investigated during this
129
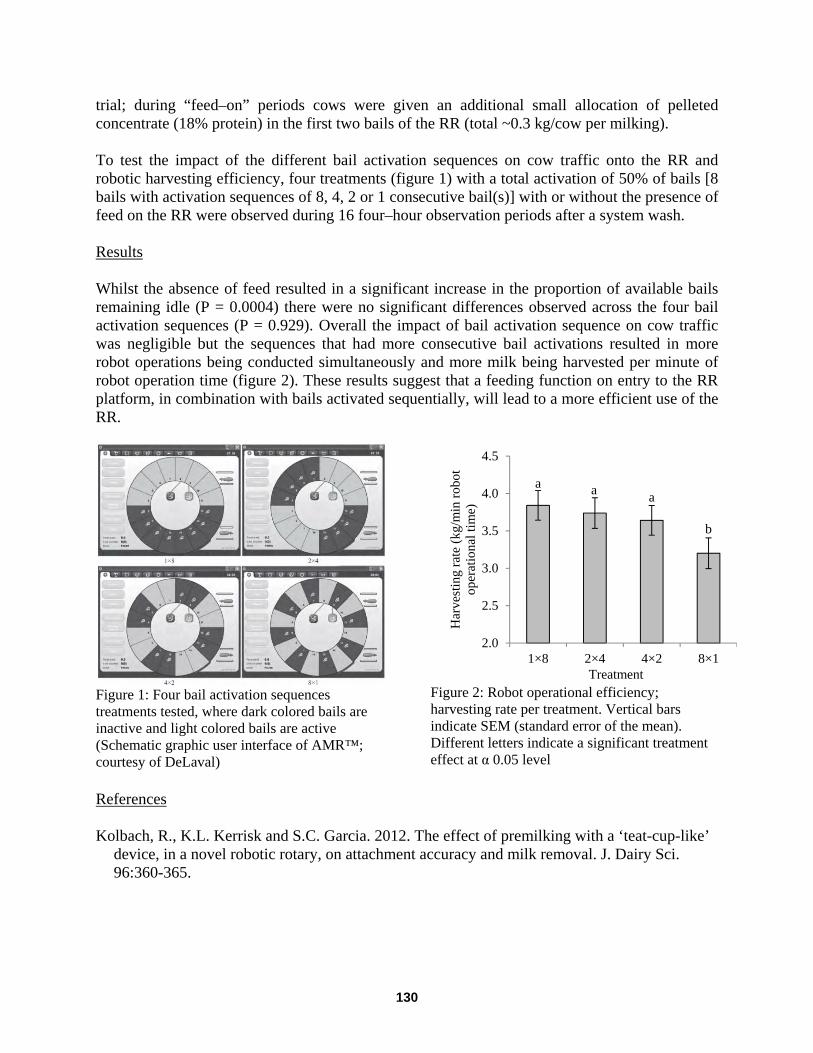
trial; during “feed–on” periods cows were given an additional small allocation of pelleted concentrate (18% protein) in the first two bails of the RR (total ~0.3 kg/cow per milking). To test the impact of the different bail activation sequences on cow traffic onto the RR and robotic harvesting efficiency, four treatments (figure 1) with a total activation of 50% of bails [8 bails with activation sequences of 8, 4, 2 or 1 consecutive bail(s)] with or without the presence of feed on the RR were observed during 16 four–hour observation periods after a system wash. Results Whilst the absence of feed resulted in a significant increase in the proportion of available bails remaining idle (P = 0.0004) there were no significant differences observed across the four bail activation sequences (P = 0.929). Overall the impact of bail activation sequence on cow traffic was negligible but the sequences that had more consecutive bail activations resulted in more robot operations being conducted simultaneously and more milk being harvested per minute of robot operation time (figure 2). These results suggest that a feeding function on entry to the RR platform, in combination with bails activated sequentially, will lead to a more efficient use of the RR.
Figure 1: Four bail activation sequences treatments tested, where dark colored bails are inactive and light colored bails are active (Schematic graphic user interface of AMR™; courtesy of DeLaval)
Figure 2: Robot operational efficiency; harvesting rate per treatment. Vertical bars indicate SEM (standard error of the mean). Different letters indicate a significant treatment effect at α 0.05 level
References Kolbach, R., K.L. Kerrisk and S.C. Garcia. 2012. The effect of premilking with a ‘teat-cup-like’
device, in a novel robotic rotary, on attachment accuracy and milk removal. J. Dairy Sci. 96:360-365.
a a a
b
2.0
2.5
3.0
3.5
4.0
4.5
1×8 2×4 4×2 8×1
Har
vest
ing
rate
(kg/
min
robo
t op
erat
iona
l tim
e)
Treatment
130
MILKING PERMISSION AND MILKING INTERVALS IN A PASTURE-BASED AUTOMATIC MILKING SYSTEM
Nicolas A. Lyons, Kendra L. Kerrisk and Sergio C. Garcia
FutureDairy - The University of Sydney Camden, New South Wales, Australia
Introduction Cows in pasture-based automatic milking systems (AMS) have greater milking intervals (MI) than indoor systems (Davis et al., 2005). Around 30% of all milkings can have extended MI (over 16 h) (Lyons, unpublished results) which have a negative impact on milk yield (Schmidt, 1960) and udder health (Hammer et al., 2012). Therefore the aim is to reduce their occurrence. Milking permission is granted if a minimum amount of time (or expected yield) has elapsed since the previous milking. These criteria are set by the farmer and are influenced by the target milking frequency. Studies have differentiated total daily visits into the number of milking events and the number of refusals or non-milking visits, to gain an understanding of overall cow traffic in AMS (Jago et al., 2007, Bach et al., 2009). Usually those studies refer to the number of refusals, and not to the effect these refusals have on cow traffic.Understanding the impact that a refusal can have on MI is key to establishing effective management practices and thereby achieve production targets. The potentially negative impact of a refusal in a pasture-based AMS is much higher than in indoor systems, given the underlying reduced visitation pattern. The aim of this study was to investigate the impact that a denial of milking permission had on MI. It was hypothesized that cows that were previously refused milking permission would have greater MI and a higher proportion of extended MI. Additionally, previous refusal of milking permission would explain a large proportion of the milkings occurring with extended MI. Material and Methods The study corresponded to the first 43 days (February – March 2011) of voluntary cow traffic using the robotic rotary at the FutureDairy AMS pasture-based research farm (Camden, NSW, Australia). A mixed age herd of 156 cows, was milked using a 16-bail prototype robotic rotary (AMR, DeLaval; Kolbach et al., 2012).The system operated with 2 daily pasture allocations offered to cows. During the study period, approximately 50% of daily diet was supplied as pasture. The remaining was provided as supplementary feed in a post milking feeding area located at the dairy facility. Milking permission was grantedat selection gates if time since the previous milking was > 4 hours for cows less than 70 days in milk, or >8 hours for cows over 70 days in milk. Cows that were denied access to the milking unit were drafted to the corresponding allocation. Results and Discussion During the 43-day study period, 33% of all milking events (3,610 out of 10,800) had an extended MI. A greater (P< 0.001) proportion of the milkings with extended MI had been previously
131
refused, in comparison to those milkings with MI < 16 h (16.3 and 7.0 %, respectively). During the study 10% of all milking events (1,130 out of 10,800) had a previous milking permission refusal, which occurred on average 3 hours after the previous milking. Cows that were refused spent a greater (P = 0.023) total amount of time in the pasture allocation than those that were not refused (15:48 and 12:31 hrs respectively). Furthermore, a greater (P< 0.001) proportion of the milking events that followed a refusal, in comparison to those that did not, had an extended MI (56.1 and 31.9 %, respectively). Although special attention should be placed on cows that return to the dairy before milking permission, because they are likely to have an extended MI, previous refusals are not the main cause of extended MI. Given the current results, management practices that reduce time cows spend on pasture between milkings will most likely cause a reduction in MI and an increase in milk yield. Additionally routines could be put in place to manage those cows that arrive back at the dairy within the set minimum milking interval, for example pre-sorting to a feeding area close to the dairy. This should create another opportunity for drafting to milking within a relatively small number of hours and could thereby assist in reducing the absolute number of extended milking intervals. Conclusion Cows that were refused milking permission were likely to have a subsequent extended MI. However, only a small proportion of the cows that had extended MI had been refused previously. Milking permission settings should take into account that refusal to the dairy may contribute to the generation of undesirably high MI. The authors acknowledge the support of Dairy Australia, NSW Department of Primary Industries, University of Sydney, and DeLaval as investors in the FutureDairy project. Bach, A., Devant, M., Igleasias, C. and Ferrer, A. 2009. Forced traffic in automatic milking
systems effectively reduces the need to get cows, but alters eating behavior and does not improve milk yield of dairy cattle. J. Dairy Sci., 92, 1272-1280.
Davis, K. L., Jago, J. G., Wieliczko, R., Copeman, P. J. A., Bright, K. and Woolford, M. W. 2005. Factors influencing milk harvesting efficiency in an automatic milking system. In: Proceedings of the New Zealand Society of Animal Production, 65, 271-275.
Hammer, J. F., Morton, J. M. and Kerrisk, K. L. 2012. Quarter-milking-, quarter-, udder- and lactation-level risk factors and indicators for clinical mastitis during lactation in pasture-fed dairy cows managed in an automatic milking system. Aust. Vet. J., 90, 167-174.
Jago, J. G., Davis, K. L., Copeman, P. J., Ohnstad, I. and Woolford, M. M. 2007. Supplementary feeding at milking and minimum milking interval effects on cow traffic and milking performance in a pasture-based automatic milking system. J. Dairy Res., 74, 492-499.
Kolbach, R., Kerrisk, K. L., García, S. C. and Dhand, N. K. 2012. Attachment accuracy of a novel prototype robotic rotary and investigation of two management strategies for incomplete milked quarters. Comput. Electron. Agric., 88, 120-124.
Schmidt, G. H. 1960. Effect of milking intervals on the rate of milk and fat secretion. J. Dairy Sci., 43, 213-219.
132
PASTURE ALLOCATION ON A PASTURE-BASED FARM ACHIEVING A CONSISTENTLY HIGH MILKING ROBOT UTILISATION RATE.
Alex J. John2, Cameron E. F. Clark1, Mark Freeman3, Kendra L. Kerrisk1, Richard Rawnsley3
and Sergio C. Garcia1. 1FutureDairy, University of Sydney, Camden, NSW
2 School of Agricultural Science, University of Tasmania, Sandy Bay, Tasmania 3 Tasmanian Institute of Agriculture Dairy Centre, University of Tasmania, Burnie, Tasmania In automatic milking systems (AMS), optimising milking robot utilisation is critical to achieving high levels of throughput (total cow milkings/day) whilst maximising the time that cows are on pasture and minimising the time that cows are queuing to be milked. A distributed milking pattern throughout a 24-hour period is a key factor in achieving high utilisation rates of the milking robot. Typically, AMS dairy cows that are housed and offered a total mixed ration have an evenly distributed milking pattern and a high milking robot utilisation rate (Belle et al., 2012) as these cows eat, drink and loaf throughout a 24-hour period. In contrast, AMS cows grazing pasture have grazing and rumination bouts together with defined times of sleep in the early morning (Davis et al., 2005), reducing levels of robot utilisation. To date the best known way of reducing (although not eliminating) the dip in robot utilisation during this ‘sleep’ time is to provide cows with three breaks of pasture per day instead of two (Lyons, 2012). Despite increasing the numbers of cows milked in the early morning, relative to other times of the day, milking robot utilisation for cows offered three allocations of pasture was still relatively low. In this previous work, equal proportions of pasture were offered in each break and active access time was split equally across a 24-hour period. Data from a commercial AMS farm were collated and analysed to assess levels of robot utilisation when cows were allocated three unequal proportions of pasture allowance in each break. Method This study was conducted on a commercial AMS dairy farm in Tasmania, Australia from 7 January 2013 to 3 March 2013. The farm had three AMS units positioned in the centre of 79 hectares of grazeable pasture which was predominantly perennial ryegrass (Lolium perenne). Pre- (before cows entered the allocation of pasture) and post- (after the last cow exited the allocation of pasture) compressed pasture height were measured three times a week (Monday, Wednesday and Friday) using a Rising Plate Meter. Pasture heights were measured in each of the three pasture allocations offered daily. These compressed pasture heights were converted to DM mass as per Earle and McGowan (1979). The area of each pasture allocation was determined using a geographic positioning system. Feed supplemented in each pasture allocation (silage), grain-based concentrate consumption, gate change times (time that cows had active access to an allocation), the timing of each milking event and number of milking cows in the herd each day were recorded. Feed offered per cow per allocation was determined by subtracting pre-grazing pasture mass (kgDM/ha) from 1500kg DM/ha (target), multiplying by the area allocated and then dividing by total cow number. Results Three allocations of pasture were offered per 24 hours. These three allocations were offered (active access times) between 1730 and 0230h for allocation A, 0230 and 0930h for allocation B and 0930 and 1730h for allocation C. In this regard, active access durations were 9, 7 and 8h for allocations A, B and C, respectively. The pasture, silage and total forage DM offered, and the area and proportion of total forage offered per hour of active access, in each
133
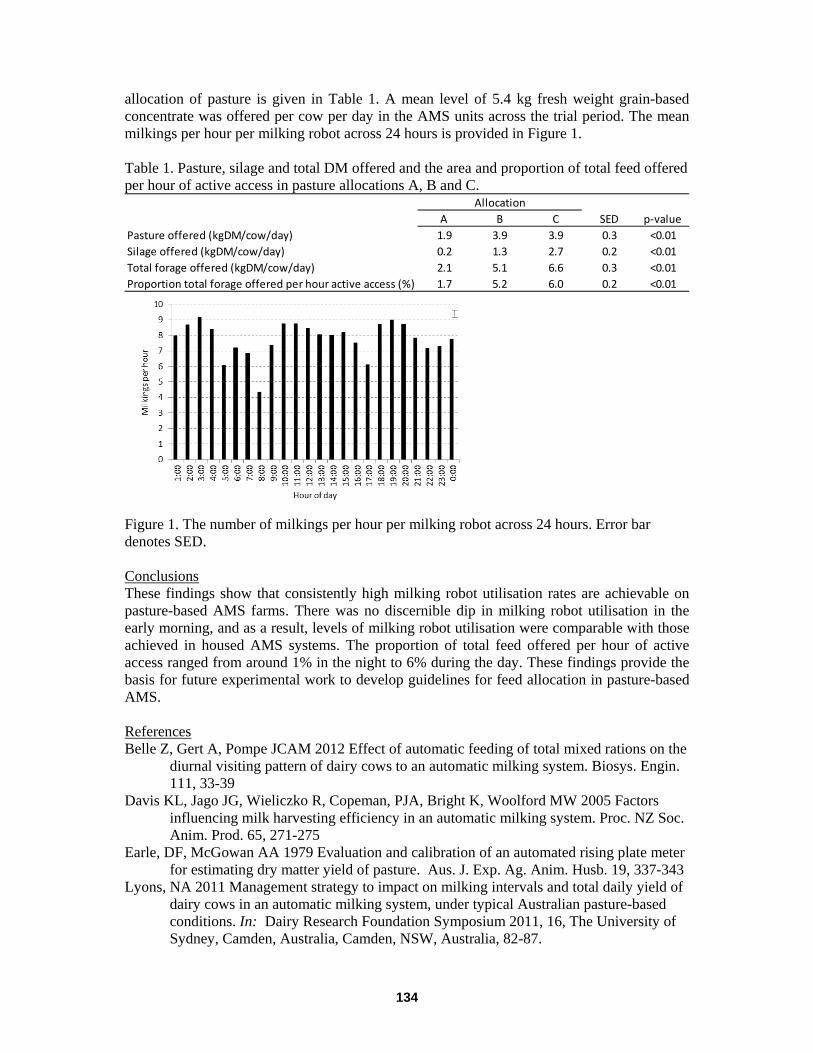
allocation of pasture is given in Table 1. A mean level of 5.4 kg fresh weight grain-based concentrate was offered per cow per day in the AMS units across the trial period. The mean milkings per hour per milking robot across 24 hours is provided in Figure 1. Table 1. Pasture, silage and total DM offered and the area and proportion of total feed offered per hour of active access in pasture allocations A, B and C.
A B C SED p-valuePasture offered (kgDM/cow/day) 1.9 3.9 3.9 0.3 <0.01Silage offered (kgDM/cow/day) 0.2 1.3 2.7 0.2 <0.01Total forage offered (kgDM/cow/day) 2.1 5.1 6.6 0.3 <0.01Proportion total forage offered per hour active access (%) 1.7 5.2 6.0 0.2 <0.01
Allocation
Figure 1. The number of milkings per hour per milking robot across 24 hours. Error bar denotes SED. Conclusions These findings show that consistently high milking robot utilisation rates are achievable on pasture-based AMS farms. There was no discernible dip in milking robot utilisation in the early morning, and as a result, levels of milking robot utilisation were comparable with those achieved in housed AMS systems. The proportion of total feed offered per hour of active access ranged from around 1% in the night to 6% during the day. These findings provide the basis for future experimental work to develop guidelines for feed allocation in pasture-based AMS. References Belle Z, Gert A, Pompe JCAM 2012 Effect of automatic feeding of total mixed rations on the
diurnal visiting pattern of dairy cows to an automatic milking system. Biosys. Engin. 111, 33-39
Davis KL, Jago JG, Wieliczko R, Copeman, PJA, Bright K, Woolford MW 2005 Factors influencing milk harvesting efficiency in an automatic milking system. Proc. NZ Soc. Anim. Prod. 65, 271-275
Earle, DF, McGowan AA 1979 Evaluation and calibration of an automated rising plate meter for estimating dry matter yield of pasture. Aus. J. Exp. Ag. Anim. Husb. 19, 337-343
Lyons, NA 2011 Management strategy to impact on milking intervals and total daily yield of dairy cows in an automatic milking system, under typical Australian pasture-based conditions. In: Dairy Research Foundation Symposium 2011, 16, The University of Sydney, Camden, Australia, Camden, NSW, Australia, 82-87.
134
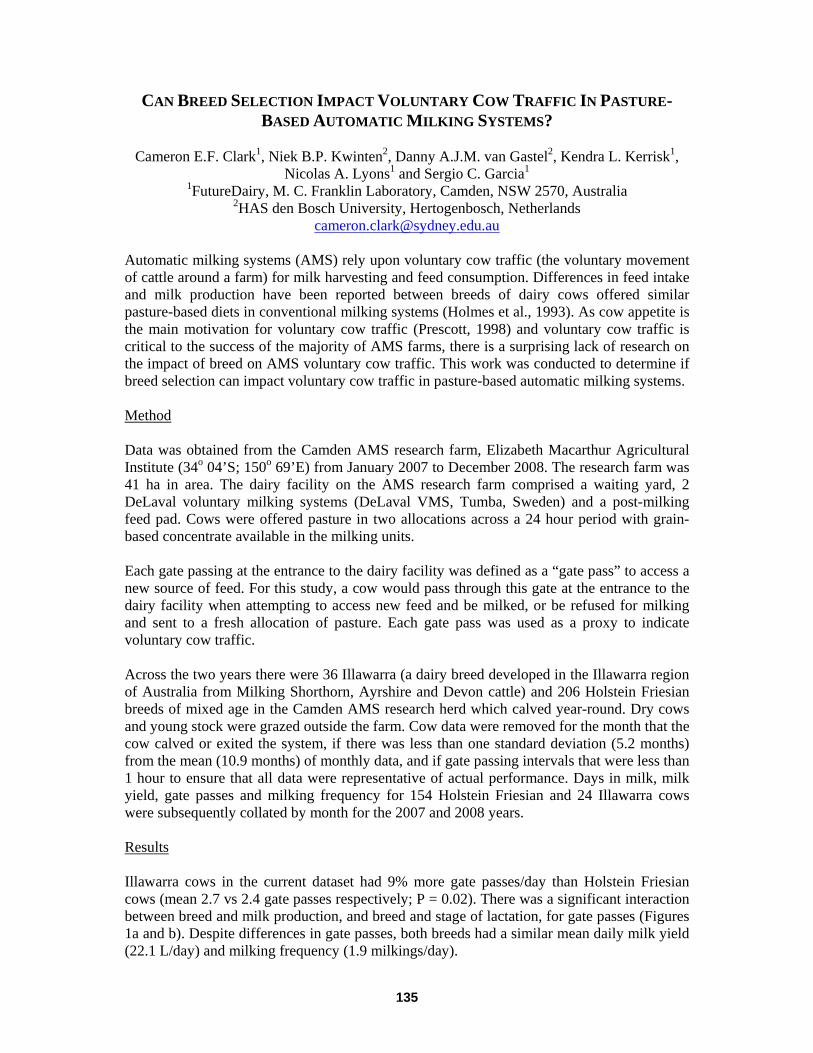
CAN BREED SELECTION IMPACT VOLUNTARY COW TRAFFIC IN PASTURE-BASED AUTOMATIC MILKING SYSTEMS?
Cameron E.F. Clark1, Niek B.P. Kwinten2, Danny A.J.M. van Gastel2, Kendra L. Kerrisk1,
Nicolas A. Lyons1 and Sergio C. Garcia1 1FutureDairy, M. C. Franklin Laboratory, Camden, NSW 2570, Australia
2HAS den Bosch University, Hertogenbosch, Netherlands [email protected]
Automatic milking systems (AMS) rely upon voluntary cow traffic (the voluntary movement of cattle around a farm) for milk harvesting and feed consumption. Differences in feed intake and milk production have been reported between breeds of dairy cows offered similar pasture-based diets in conventional milking systems (Holmes et al., 1993). As cow appetite is the main motivation for voluntary cow traffic (Prescott, 1998) and voluntary cow traffic is critical to the success of the majority of AMS farms, there is a surprising lack of research on the impact of breed on AMS voluntary cow traffic. This work was conducted to determine if breed selection can impact voluntary cow traffic in pasture-based automatic milking systems. Method Data was obtained from the Camden AMS research farm, Elizabeth Macarthur Agricultural Institute (34o 04’S; 150o 69’E) from January 2007 to December 2008. The research farm was 41 ha in area. The dairy facility on the AMS research farm comprised a waiting yard, 2 DeLaval voluntary milking systems (DeLaval VMS, Tumba, Sweden) and a post-milking feed pad. Cows were offered pasture in two allocations across a 24 hour period with grain-based concentrate available in the milking units. Each gate passing at the entrance to the dairy facility was defined as a “gate pass” to access a new source of feed. For this study, a cow would pass through this gate at the entrance to the dairy facility when attempting to access new feed and be milked, or be refused for milking and sent to a fresh allocation of pasture. Each gate pass was used as a proxy to indicate voluntary cow traffic. Across the two years there were 36 Illawarra (a dairy breed developed in the Illawarra region of Australia from Milking Shorthorn, Ayrshire and Devon cattle) and 206 Holstein Friesian breeds of mixed age in the Camden AMS research herd which calved year-round. Dry cows and young stock were grazed outside the farm. Cow data were removed for the month that the cow calved or exited the system, if there was less than one standard deviation (5.2 months) from the mean (10.9 months) of monthly data, and if gate passing intervals that were less than 1 hour to ensure that all data were representative of actual performance. Days in milk, milk yield, gate passes and milking frequency for 154 Holstein Friesian and 24 Illawarra cows were subsequently collated by month for the 2007 and 2008 years. Results Illawarra cows in the current dataset had 9% more gate passes/day than Holstein Friesian cows (mean 2.7 vs 2.4 gate passes respectively; P = 0.02). There was a significant interaction between breed and milk production, and breed and stage of lactation, for gate passes (Figures 1a and b). Despite differences in gate passes, both breeds had a similar mean daily milk yield (22.1 L/day) and milking frequency (1.9 milkings/day).
135
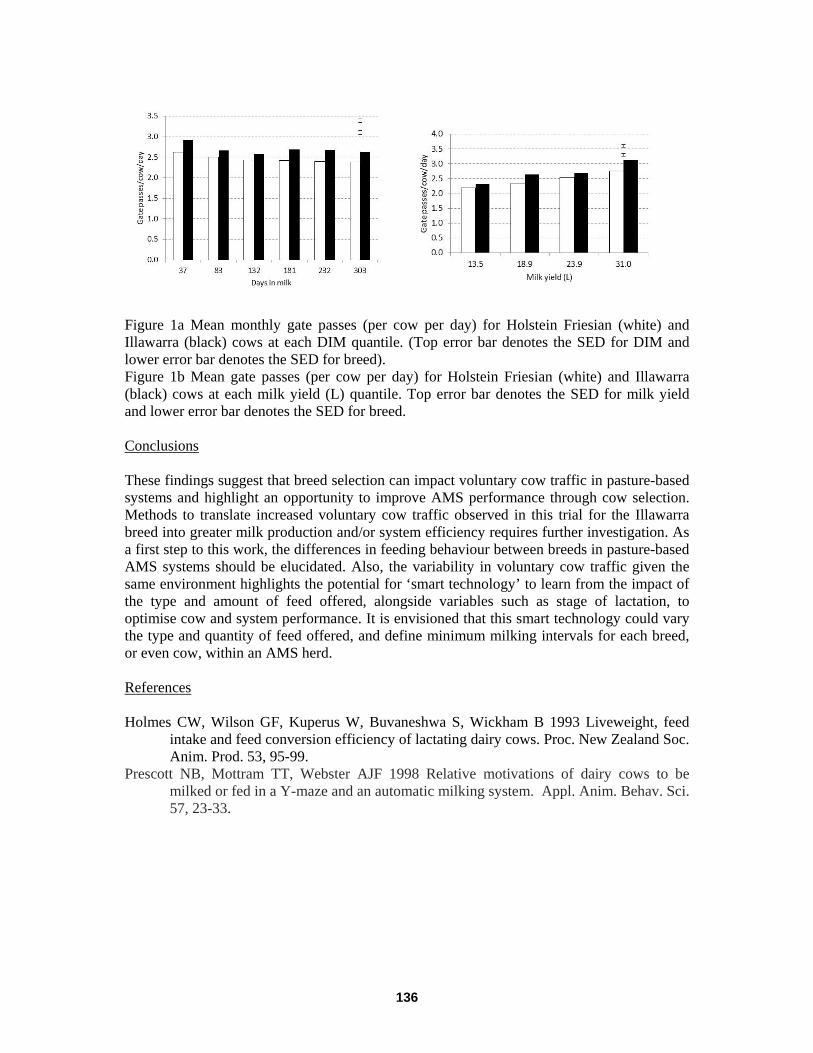
Figure 1a Mean monthly gate passes (per cow per day) for Holstein Friesian (white) and Illawarra (black) cows at each DIM quantile. (Top error bar denotes the SED for DIM and lower error bar denotes the SED for breed). Figure 1b Mean gate passes (per cow per day) for Holstein Friesian (white) and Illawarra (black) cows at each milk yield (L) quantile. Top error bar denotes the SED for milk yield and lower error bar denotes the SED for breed. Conclusions These findings suggest that breed selection can impact voluntary cow traffic in pasture-based systems and highlight an opportunity to improve AMS performance through cow selection. Methods to translate increased voluntary cow traffic observed in this trial for the Illawarra breed into greater milk production and/or system efficiency requires further investigation. As a first step to this work, the differences in feeding behaviour between breeds in pasture-based AMS systems should be elucidated. Also, the variability in voluntary cow traffic given the same environment highlights the potential for ‘smart technology’ to learn from the impact of the type and amount of feed offered, alongside variables such as stage of lactation, to optimise cow and system performance. It is envisioned that this smart technology could vary the type and quantity of feed offered, and define minimum milking intervals for each breed, or even cow, within an AMS herd. References Holmes CW, Wilson GF, Kuperus W, Buvaneshwa S, Wickham B 1993 Liveweight, feed
intake and feed conversion efficiency of lactating dairy cows. Proc. New Zealand Soc. Anim. Prod. 53, 95-99.
Prescott NB, Mottram TT, Webster AJF 1998 Relative motivations of dairy cows to be milked or fed in a Y-maze and an automatic milking system. Appl. Anim. Behav. Sci. 57, 23-33.
136

LAND AREAS REQUIRED, ASSOCIATED WALKING DISTANCE AND MILKING INTERVAL FOR LARGE HERDS IN PASTURE BASED AUTOMATIC MILKING
SYSTEM
Mohammed R. Islam, Cameron E. F. Clark, Kendra L. Kerrisk, Sergio C. Garcia and Nicolas A. Lyons
Dairy Science Group, Faculty of Veterinary Science, The University of Sydney, Camden, NSW, Australia
[email protected] Introduction Increasing the distance that pasture is offered from the milking units in an automatic milking system (AMS) increases milking intervals (Ketelaar-de Lauwere et al., 1999; Lyons, 2013). This presents a unique challenge for pasture-based AMS farmers that wish to maintain grazed pasture as the predominant feed in the diet (Garcia and Fulkerson, 2005), particularly those with large herds. As it would be difficult to investigate combination of herd size and distances in real AMS farms, we used a modelling approach to explore the total land area required and associated walking distance and milking interval for large herds in pasture-based AMS. Methods Six scenarios consisting of 3 AMS herds (400, 600, 800 cows) and 2 pasture utilization levels (current AMS utilization of 15.0 t dry matter [DM]/ha, termed as ‘moderate’; optimum pasture utilization of 19.7 t DM/ha, termed as ‘high’) were investigated. To calculate the distance a cow travels for a particular farm area (ha), a ‘virtual’ modelled AMS farm was divided into 30 equally sized paddocks (110 m length, 92 m wide; 1 ha each). Walking distances (m) were calculated from the dairy (centre of paddock) to the nearest point of each paddock. The relationship between milking interval and walking distance was modelled using outcomes reported by Lyons (2013). Results Areas (ha) required for different herd sizes in pasture-based AMS are show in Table 1. Automatic milking system cows were required to walk greater than 1-km when the farm area was greater than 86 ha (Figure 1). As farm areas increased, distance walking required by AMS cows and milking interval also increased. However, milking interval decreased to 15 hours when distances exceed 900 m (Table 2), suggesting that other factors interact with distance in its effect on milking interval Table 1. Areas (ha) required for different herd sizes in pasture-based automatic milking system when 50% of diet is supplied through grazed pasture Herd size (n) 400 600 800 Moderate pasture utilization (15.0 t DM/ha) 100 150 200 High pasture utilization (19.7 t DM/ha) 80 120 160
Conclusions Increasing farm areas from 86 ha increases walking distances to 1 km was associated with increased milking interval and therefore reduced milking frequency. Further work is required on
137
the impact of walking distance on milking interval and milk yield past 1km distance from the dairy.
Figure 1. Proportion of paddocks in each distance range (distance between dairy and nearest point of grazing paddocks) for farms of varying size (50-200 ha) Table 2. Average walking distance and its impact on milking interval with the associated increase in farm area Area (ha) Walking distance (m) Milking interval (h)α 20 100 14.5 40 300 15.0 60 400 15.0 80 500 15.0 100 600 15.5 120 800 16.0 140 900 16.0 160 1000 15.0
αcalculated from relationships obtained in field experiments at FutureDairy; Lyons (2013) Acknowledgements The authors thank the Dairy Research Foundation for its support of the Dairy Science Group and the investors of the FutureDairy project (Dairy Australia, NSW Department of Primary Industries, The University of Sydney, and DeLaval). References Garcia SC, Fulkerson WJ (2005) Opportunities for future Australian dairy systems: A review.
Aust. J. Exp. Agric. 45, 1041-1055. Ketelaar-de Lauwere CC, Ipema AH, Lokhorst,C, Metz JHM, Noordhuizen J, Schouten WGP,
Smits AC (2000) Effect of sward height and distance between pasture and barn on cows' visits to an automatic milking system and other behaviour. Livest. Prod. Sci. 65, 131-142.
Lyons NA (2013) Investigations on variable milking intervals, cow performance and grazing behaviour in a pasture-based automatic milking system. PhD thesis, Faculty of Veterinary Scinence, The University of Sydney.
0
20
40
60
80
100
50 86 100 150 200
Pro
porti
on o
f pad
dock
s lo
cate
d w
ithin
dis
tanc
e ra
nges
)
Farm area (ha)
2-3 km
1-2 km
up to 1 km
138
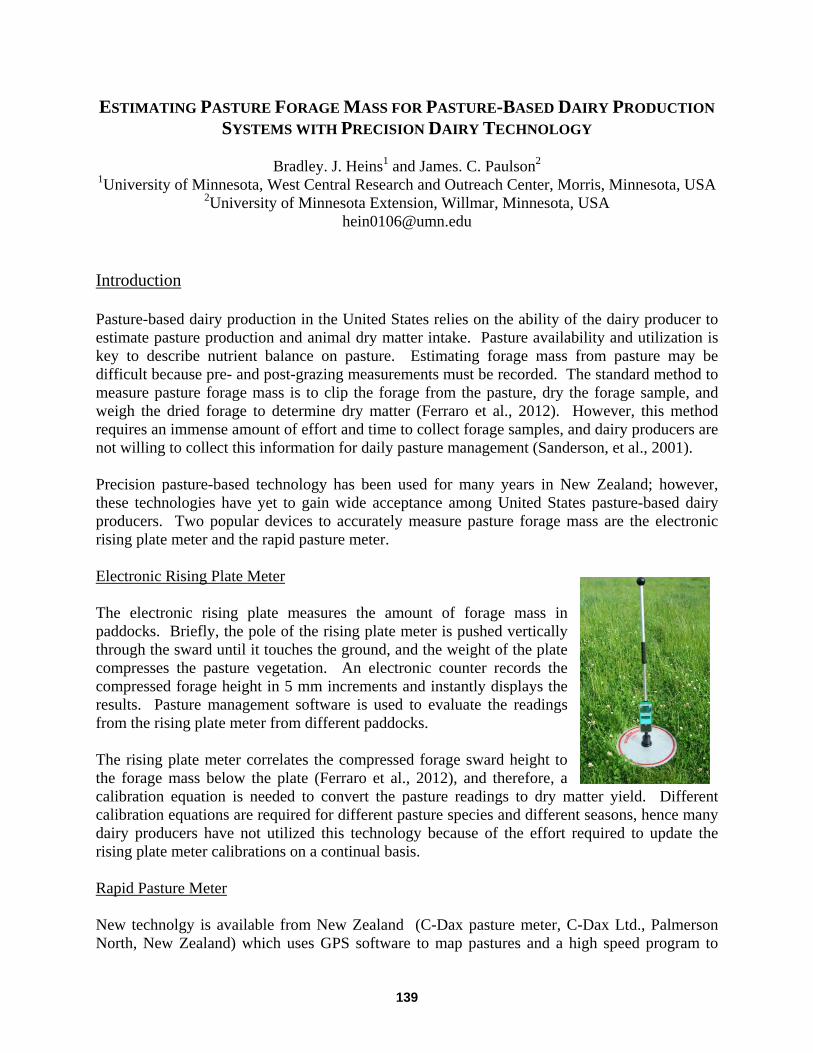
ESTIMATING PASTURE FORAGE MASS FOR PASTURE-BASED DAIRY PRODUCTION SYSTEMS WITH PRECISION DAIRY TECHNOLOGY
Bradley. J. Heins1 and James. C. Paulson2
1University of Minnesota, West Central Research and Outreach Center, Morris, Minnesota, USA 2University of Minnesota Extension, Willmar, Minnesota, USA
[email protected] Introduction Pasture-based dairy production in the United States relies on the ability of the dairy producer to estimate pasture production and animal dry matter intake. Pasture availability and utilization is key to describe nutrient balance on pasture. Estimating forage mass from pasture may be difficult because pre- and post-grazing measurements must be recorded. The standard method to measure pasture forage mass is to clip the forage from the pasture, dry the forage sample, and weigh the dried forage to determine dry matter (Ferraro et al., 2012). However, this method requires an immense amount of effort and time to collect forage samples, and dairy producers are not willing to collect this information for daily pasture management (Sanderson, et al., 2001). Precision pasture-based technology has been used for many years in New Zealand; however, these technologies have yet to gain wide acceptance among United States pasture-based dairy producers. Two popular devices to accurately measure pasture forage mass are the electronic rising plate meter and the rapid pasture meter. Electronic Rising Plate Meter The electronic rising plate measures the amount of forage mass in paddocks. Briefly, the pole of the rising plate meter is pushed vertically through the sward until it touches the ground, and the weight of the plate compresses the pasture vegetation. An electronic counter records the compressed forage height in 5 mm increments and instantly displays the results. Pasture management software is used to evaluate the readings from the rising plate meter from different paddocks. The rising plate meter correlates the compressed forage sward height to the forage mass below the plate (Ferraro et al., 2012), and therefore, a calibration equation is needed to convert the pasture readings to dry matter yield. Different calibration equations are required for different pasture species and different seasons, hence many dairy producers have not utilized this technology because of the effort required to update the rising plate meter calibrations on a continual basis. Rapid Pasture Meter New technolgy is available from New Zealand (C-Dax pasture meter, C-Dax Ltd., Palmerson North, New Zealand) which uses GPS software to map pastures and a high speed program to
139
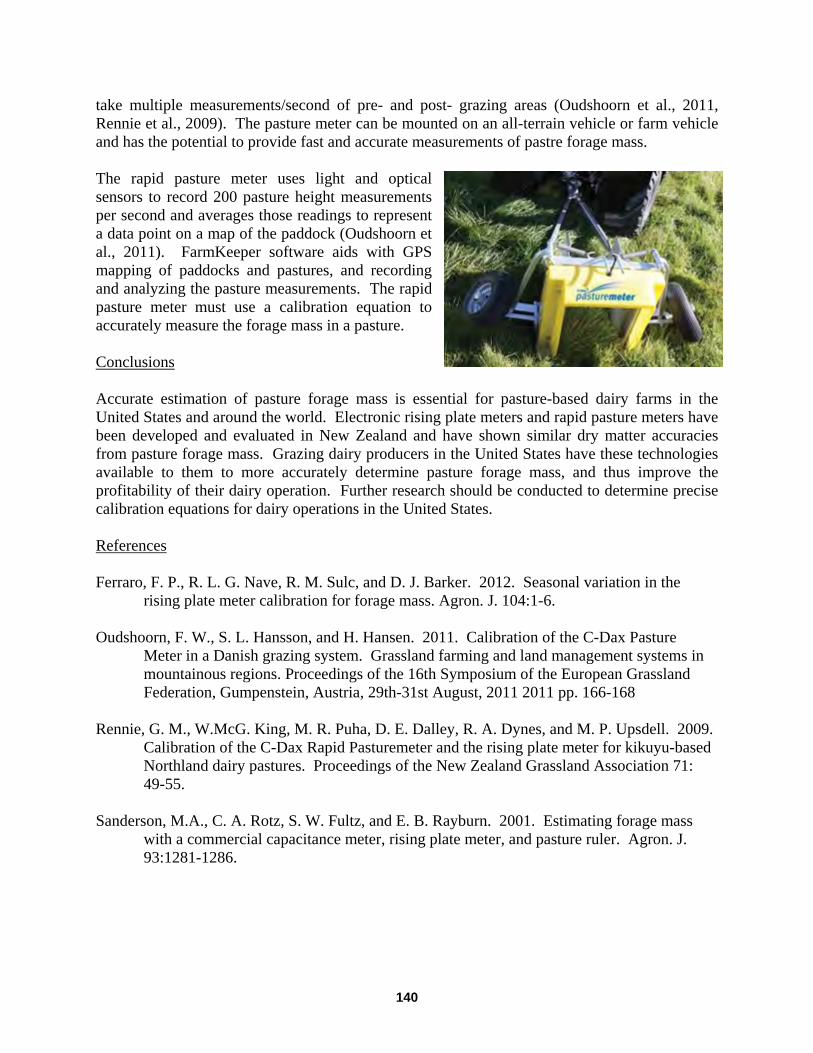
take multiple measurements/second of pre- and post- grazing areas (Oudshoorn et al., 2011, Rennie et al., 2009). The pasture meter can be mounted on an all-terrain vehicle or farm vehicle and has the potential to provide fast and accurate measurements of pastre forage mass. The rapid pasture meter uses light and optical sensors to record 200 pasture height measurements per second and averages those readings to represent a data point on a map of the paddock (Oudshoorn et al., 2011). FarmKeeper software aids with GPS mapping of paddocks and pastures, and recording and analyzing the pasture measurements. The rapid pasture meter must use a calibration equation to accurately measure the forage mass in a pasture. Conclusions Accurate estimation of pasture forage mass is essential for pasture-based dairy farms in the United States and around the world. Electronic rising plate meters and rapid pasture meters have been developed and evaluated in New Zealand and have shown similar dry matter accuracies from pasture forage mass. Grazing dairy producers in the United States have these technologies available to them to more accurately determine pasture forage mass, and thus improve the profitability of their dairy operation. Further research should be conducted to determine precise calibration equations for dairy operations in the United States. References Ferraro, F. P., R. L. G. Nave, R. M. Sulc, and D. J. Barker. 2012. Seasonal variation in the
rising plate meter calibration for forage mass. Agron. J. 104:1-6. Oudshoorn, F. W., S. L. Hansson, and H. Hansen. 2011. Calibration of the C-Dax Pasture
Meter in a Danish grazing system. Grassland farming and land management systems in mountainous regions. Proceedings of the 16th Symposium of the European Grassland Federation, Gumpenstein, Austria, 29th-31st August, 2011 2011 pp. 166-168
Rennie, G. M., W.McG. King, M. R. Puha, D. E. Dalley, R. A. Dynes, and M. P. Upsdell. 2009.
Calibration of the C-Dax Rapid Pasturemeter and the rising plate meter for kikuyu-based Northland dairy pastures. Proceedings of the New Zealand Grassland Association 71: 49-55.
Sanderson, M.A., C. A. Rotz, S. W. Fultz, and E. B. Rayburn. 2001. Estimating forage mass
with a commercial capacitance meter, rising plate meter, and pasture ruler. Agron. J. 93:1281-1286.
140
SMART DAIRY FARMING PROGRAM IN THE NETHERLANDS Hiemke Knijn1, Hassan Taweel2, Hanneke van Wichen3, Bart Jan Wulfse4 and Matthijs Vonder5
1CRV, Arnhem, The Netherlands 2Agrifirm, Apeldoorn, The Netherlands
3FrieslandCampina, Amersfoort, The Netherlands 4Emovare, Haaren, The Netherlands 5TNO, Groningen, The Netherlands
[email protected] Introduction In the dairy sector we see a number of trends:
- increasing herd sizes reduces the time per animal for management; - more staff per farm requires need for Standard Operating Procedures (SOP); - society requires increased transparency for product quality and animal welfare; - lot of technology already available, but not yet widely adapted by farmers;
To help farmers to anticipate on these trends, in 2010, 12 stakeholders in the Dutch dairy sector established the Smart Dairy Farming (SDF) Consortium. The consortium exists of a unique combination of small and large organizations involved in sensor development, breeding, feed, accountancy, dairy industry, research centers and universities. Also a group of dairy farmers is involved. The goal of the consortium is to strengthen the dairy sector and help dairy farmers anticipating for the future by using innovative IT en sensor technology. The SDF program focusses on the individual cow. An important goal is the development of practical management tools for individual cows at large-scale dairy farms. This is done to make the large-scale precision farming both financial profitable as well as socially acceptable. The program is financed by the participating parties as well as the Dutch ministry of Economic Affairs, regional governments and farmers unions. Program Goals The program’s overall aim is to support dairy farmers in the care of individual animals, with the specific goals of a longer productive stay at the farm, with an increased lifetime milk production due to improvement of individual health. SDF will develop sensors and other technological tools, decision models, process descriptions, practical management tools and advisory products for farmers. These deliverables will help farmers making better decisions in the area of health, fertility and nutrition, on the level of an individual cow. Next to this, within SDF an open technical infrastructure and network of relationships is created enabling the exchange of real time data within the dairy production chain. Furthermore, information, experience and knowledge exchange between dairy farmers and partners will become easier and more effective. Transparency within the chain is realized through this infrastructure. The infrastructure will be developed in a way that it will facilitate the exchange of other data within the chain as well, such as data relevant for food safety, carbon footprint etc..
141
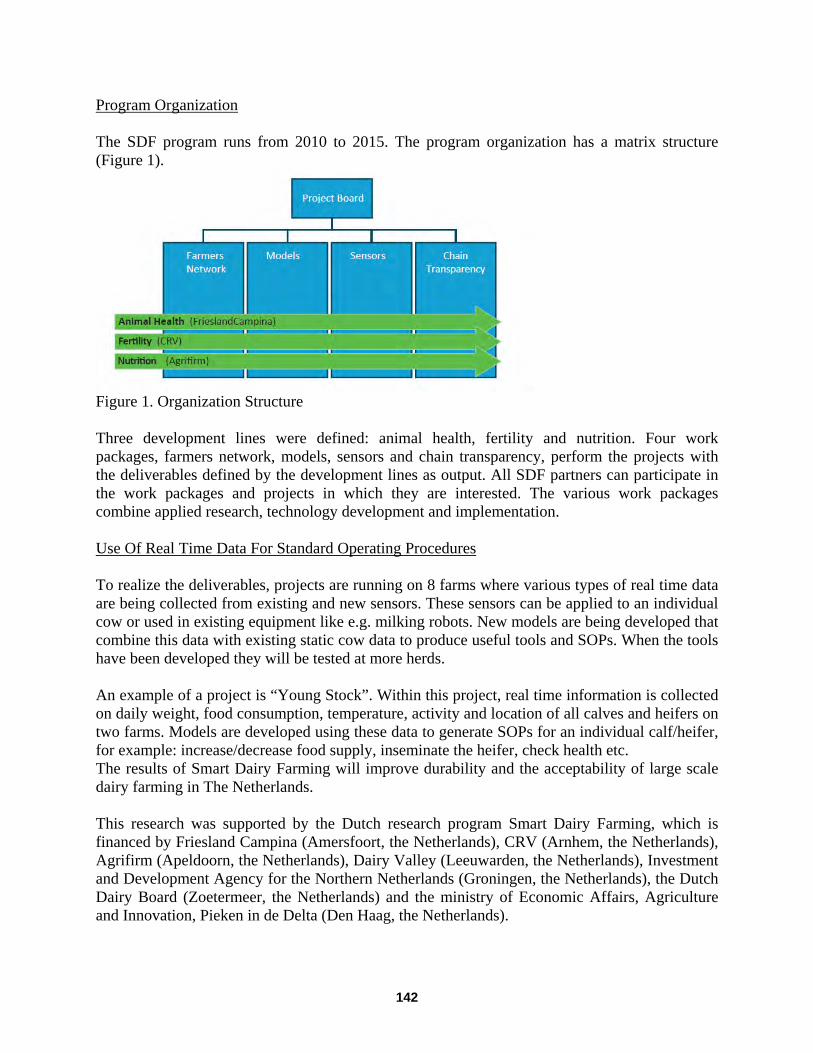
Program Organization The SDF program runs from 2010 to 2015. The program organization has a matrix structure (Figure 1).
Figure 1. Organization Structure Three development lines were defined: animal health, fertility and nutrition. Four work packages, farmers network, models, sensors and chain transparency, perform the projects with the deliverables defined by the development lines as output. All SDF partners can participate in the work packages and projects in which they are interested. The various work packages combine applied research, technology development and implementation. Use Of Real Time Data For Standard Operating Procedures To realize the deliverables, projects are running on 8 farms where various types of real time data are being collected from existing and new sensors. These sensors can be applied to an individual cow or used in existing equipment like e.g. milking robots. New models are being developed that combine this data with existing static cow data to produce useful tools and SOPs. When the tools have been developed they will be tested at more herds. An example of a project is “Young Stock”. Within this project, real time information is collected on daily weight, food consumption, temperature, activity and location of all calves and heifers on two farms. Models are developed using these data to generate SOPs for an individual calf/heifer, for example: increase/decrease food supply, inseminate the heifer, check health etc. The results of Smart Dairy Farming will improve durability and the acceptability of large scale dairy farming in The Netherlands. This research was supported by the Dutch research program Smart Dairy Farming, which is financed by Friesland Campina (Amersfoort, the Netherlands), CRV (Arnhem, the Netherlands), Agrifirm (Apeldoorn, the Netherlands), Dairy Valley (Leeuwarden, the Netherlands), Investment and Development Agency for the Northern Netherlands (Groningen, the Netherlands), the Dutch Dairy Board (Zoetermeer, the Netherlands) and the ministry of Economic Affairs, Agriculture and Innovation, Pieken in de Delta (Den Haag, the Netherlands).
142
INFLUENCE OF BREED, MILK YIELD, AND TEMPERATURE HUMIDITY INDEX ON DAIRY COW RETICULORUMEN TEMPERATURE, LYING TIME, AND RUMINATION
TIME
Amanda E. Sterrett, Barbara A. Wadsworth, Joey D. Clark, and Jeffrey M. Bewley University of Kentucky, Lexington, Kentucky, USA
[email protected] and [email protected] Introduction Studies using precision dairy technologies are generally conducted with Holsteins. These results may not apply directly to other breeds. For example, Jersey milk yields have been shown to be less sensitive to the effects of heat stress than Holsteins (Legates et al., 1991, Rodriquez et al., 1985), which may also be true in crossbreds. Materials and Methods The objective of this study, conducted from October 8, 2012 to January 23, 2013 at the University of Kentucky Coldstream Dairy, was to compare daily lying time (LT), reticulorumen temperature (RT), and rumination time (RU) between 3 breed groups. Cows (n = 36; 12 Holstein (H), 12 crossbred (C), and 12 Jersey (J)) were matched by parity group (PG, 1 or ≥ 2 lactations), DIM, and milk yield (MY). The Milpro P4C™ (Milkline, Gariga di Podenzano, Italy) provided daily milk weights per cow. The DVM Systems, LLC (Boulder, CO) bolus system monitored RT using a passive RFID transponder (Phase IV Engineering, Inc., Boulder, CO) equipped with a temperature sensor queried twice daily by a panel reader placed in parlor entrances. HR Tags™ (SCR Engineers Ltd., Netanya, Israel) measured RU with a microphone and microprocessor, summarized into two-hour time blocks. IceQube® sensors (IceRobotics, Edinburgh, Scotland) recorded daily LT using a 3-axis accelerometer. ProWeatherStation™ (Tycon Power Systems, Bluffdale, UT) weather stations in the freestall barn recorded daily temperature and humidity, which was converted to temperature humidity index (THI). Mean lying time, RU, RT, MY, and maximum temperature-humidity index were averaged for each cow each day. At least 75 days per cow of recorded LT, RU, and RT data was required for study inclusion. The MIXED Procedure of SAS® (SAS Institute, Inc., Cary, NC) was used to evaluate fixed effects of breed, MY, PG, THI, and their interactions on LT, RT, and RU, with cow within breed as subject. Results and Discussion Mean (± SD) daily DIM, LT, MY, RT, RU, THI were 195.2 ± 105.2 days, 10.8 ± 2.4 hours, 27.5 ± 8.9 kg, 38.8 ± 0.6 °C, 6.2 ± 1.6 hours, and 63.3 ± 16.2, respectively. Milk yield x THI, THI x PG, and breed x PG were significant predictors of RT (P < 0.01). These results demonstrate that increasing milk yield and THI increase RT with the relationship varying by breed. Least squares mean RT for H cows was significantly greater than RT for J and C cows for all PG combinations, except for multiparous H cows versus multiparous C cows (Table 1), suggesting that J and C cows may be more heat-tolerant. Breed x PG and MY were significant predictors of RU (P < 0.01). Least squares mean RU for H cows was significantly higher than RU for J and C
143
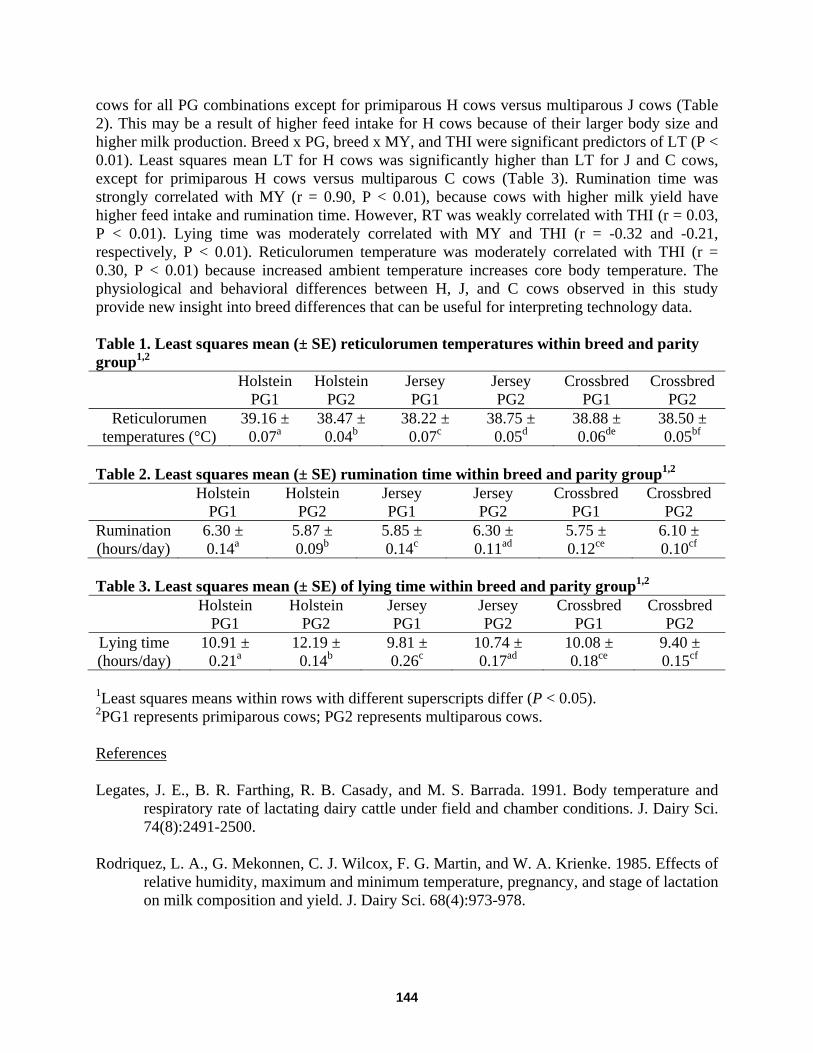
cows for all PG combinations except for primiparous H cows versus multiparous J cows (Table 2). This may be a result of higher feed intake for H cows because of their larger body size and higher milk production. Breed x PG, breed x MY, and THI were significant predictors of LT (P < 0.01). Least squares mean LT for H cows was significantly higher than LT for J and C cows, except for primiparous H cows versus multiparous C cows (Table 3). Rumination time was strongly correlated with MY (r = 0.90, P < 0.01), because cows with higher milk yield have higher feed intake and rumination time. However, RT was weakly correlated with THI (r = 0.03, P < 0.01). Lying time was moderately correlated with MY and THI (r = -0.32 and -0.21, respectively, P < 0.01). Reticulorumen temperature was moderately correlated with THI (r = 0.30, P < 0.01) because increased ambient temperature increases core body temperature. The physiological and behavioral differences between H, J, and C cows observed in this study provide new insight into breed differences that can be useful for interpreting technology data. Table 1. Least squares mean (± SE) reticulorumen temperatures within breed and parity group1,2
Holstein PG1
Holstein PG2
Jersey PG1
Jersey PG2
Crossbred PG1
Crossbred PG2
Reticulorumen temperatures (°C)
39.16 ± 0.07a
38.47 ± 0.04b
38.22 ± 0.07c
38.75 ± 0.05d
38.88 ± 0.06de
38.50 ± 0.05bf
Table 2. Least squares mean (± SE) rumination time within breed and parity group1,2
Holstein PG1
Holstein PG2
Jersey PG1
Jersey PG2
Crossbred PG1
Crossbred PG2
Rumination (hours/day)
6.30 ± 0.14a
5.87 ± 0.09b
5.85 ± 0.14c
6.30 ± 0.11ad
5.75 ± 0.12ce
6.10 ± 0.10cf
Table 3. Least squares mean (± SE) of lying time within breed and parity group1,2
Holstein PG1
Holstein PG2
Jersey PG1
Jersey PG2
Crossbred PG1
Crossbred PG2
Lying time (hours/day)
10.91 ± 0.21a
12.19 ± 0.14b
9.81 ± 0.26c
10.74 ± 0.17ad
10.08 ± 0.18ce
9.40 ± 0.15cf
1Least squares means within rows with different superscripts differ (P < 0.05). 2PG1 represents primiparous cows; PG2 represents multiparous cows. References
Legates, J. E., B. R. Farthing, R. B. Casady, and M. S. Barrada. 1991. Body temperature and respiratory rate of lactating dairy cattle under field and chamber conditions. J. Dairy Sci. 74(8):2491-2500.
Rodriquez, L. A., G. Mekonnen, C. J. Wilcox, F. G. Martin, and W. A. Krienke. 1985. Effects of
relative humidity, maximum and minimum temperature, pregnancy, and stage of lactation on milk composition and yield. J. Dairy Sci. 68(4):973-978.
144
DETECTION OF CLINICAL AND SUBCLINICAL MASTITIS USING AUTOMATED RETICULORUMEN TEMPERATURES
Amanda E. Sterrett, Constance L. Wood, Kristen J. McQuerry, Joey D. Clark, and Jeffrey M.
Bewley University of Kentucky, Lexington, Kentucky, USA
[email protected] and [email protected]
Introduction Early mastitis detection facilitates timely treatment and may prevent high bulk tank SCC (Milner et al., 1997). Rectal temperatures are the gold standard in veterinary practice, but have many limitations, including probe depth and duration, amount of air or feces in the rectum, and stress caused by the procedure. Automated reticular temperature has the potential to detect disease early (Bewley et al., 2008). The main limitation for reticular temperature is the substantial decrease after water intake (Bewley et al., 2008, Small et al., 2008). Materials and Methods The objective of this study, conducted at the University of Kentucky Coldstream Dairy from September 15, 2011 to February 1, 2013, was to examine the relationship between reticulorumen temperature (RT) and subclinical and clinical mastitis events. The DVM Systems, LLC (Boulder, CO) bolus system monitors RT using a passive RFID transponder (Phase IV Engineering, Inc., Boulder, CO) equipped with a temperature sensor queried twice daily by a panel reader placed in parlor entrances. The TempTrack™ (DVM Systems, LLC, Boulder, CO) software package is used to collect, analyze, and view data. A composite milk sample was obtained from each cow in the herd every 14 days for SCC sampling (Fossomatic™ FC somatic cell counter, Foss, Hilleroed, Denmark). Cows with SCC > 200,000 cells/ml were classified as having subclinical mastitis. Clinical mastitis events were recorded at each milking by the milkers. Low and high outliers for each parameter were removed. A minimum of 14 temperatures were required to establish a baseline. A rolling mean RT was calculated using all recorded temperatures within the previous 30 days and the number of SDs from which each respective temperature varied from this baseline was calculated. Results and Discussion Of all RT in the study remaining after outlier removal (n = 225,472), 7% were > 40º C. Forty cases and 281 cases were observed of clinical and subclinical mastitis, respectively. Mean RT for clinical, subclinical, and healthy cows are displayed in Table 1. Although the means and maximum RTs between the three event groups were similar, when RT increases were observed, the spikes were dramatic indicating some potential for RT disease monitoring. The mastitis detection and false positive rates are displayed in Table 2. Wider time windows and lower thresholds produced higher sensitivities and specificities. Early mastitis detection is limited by a lack of clear actions to take with an early mastitis alert. In conclusion, RT may be an indication of subclinical and clinical mastitis. However, natural variation in cow body temperatures may limit the utility of twice-daily reticulorumen temperatures. Even after considerable edits to
145
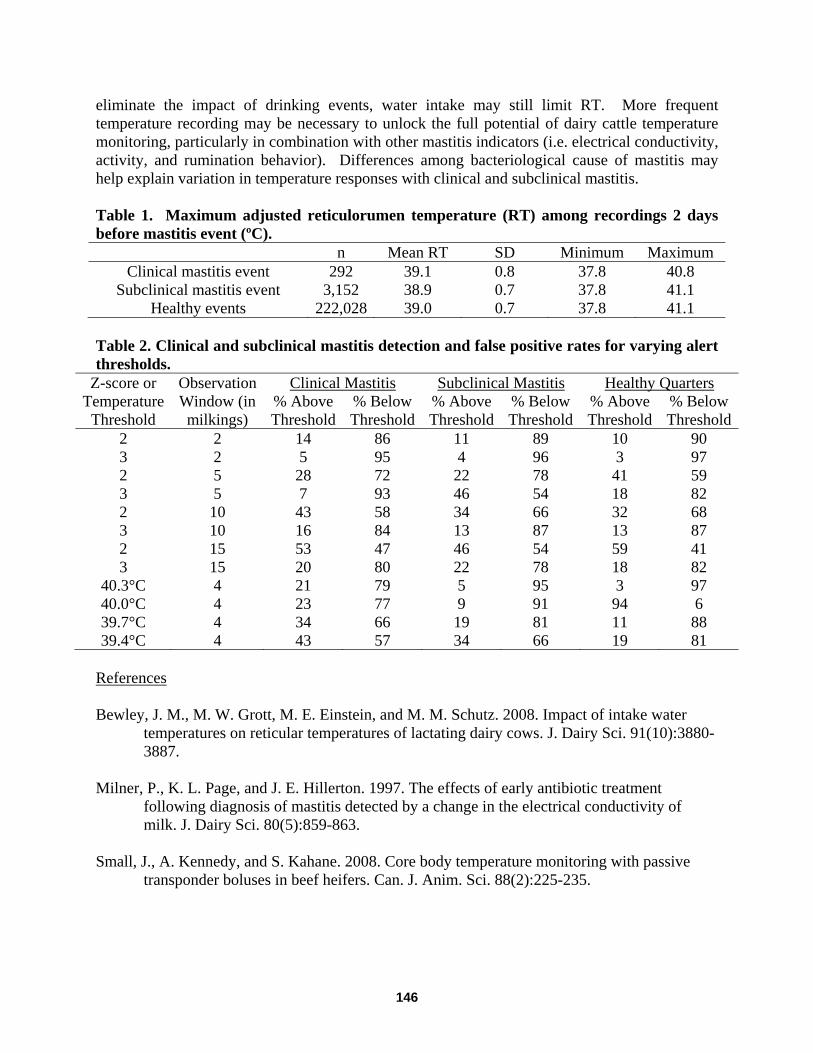
eliminate the impact of drinking events, water intake may still limit RT. More frequent temperature recording may be necessary to unlock the full potential of dairy cattle temperature monitoring, particularly in combination with other mastitis indicators (i.e. electrical conductivity, activity, and rumination behavior). Differences among bacteriological cause of mastitis may help explain variation in temperature responses with clinical and subclinical mastitis. Table 1. Maximum adjusted reticulorumen temperature (RT) among recordings 2 days before mastitis event (ºC). n Mean RT SD Minimum Maximum
Clinical mastitis event 292 39.1 0.8 37.8 40.8 Subclinical mastitis event 3,152 38.9 0.7 37.8 41.1
Healthy events 222,028 39.0 0.7 37.8 41.1 Table 2. Clinical and subclinical mastitis detection and false positive rates for varying alert thresholds.
Z-score or Temperature
Threshold
Observation Window (in milkings)
Clinical Mastitis Subclinical Mastitis Healthy Quarters % Above Threshold
% Below Threshold
% Above Threshold
% Below Threshold
% Above Threshold
% Below Threshold
2 2 14 86 11 89 10 90 3 2 5 95 4 96 3 97 2 5 28 72 22 78 41 59 3 5 7 93 46 54 18 82 2 10 43 58 34 66 32 68 3 10 16 84 13 87 13 87 2 15 53 47 46 54 59 41 3 15 20 80 22 78 18 82
40.3°C 4 21 79 5 95 3 97 40.0°C 4 23 77 9 91 94 6 39.7°C 4 34 66 19 81 11 88 39.4°C 4 43 57 34 66 19 81
References Bewley, J. M., M. W. Grott, M. E. Einstein, and M. M. Schutz. 2008. Impact of intake water
temperatures on reticular temperatures of lactating dairy cows. J. Dairy Sci. 91(10):3880-3887.
Milner, P., K. L. Page, and J. E. Hillerton. 1997. The effects of early antibiotic treatment
following diagnosis of mastitis detected by a change in the electrical conductivity of milk. J. Dairy Sci. 80(5):859-863.
Small, J., A. Kennedy, and S. Kahane. 2008. Core body temperature monitoring with passive
transponder boluses in beef heifers. Can. J. Anim. Sci. 88(2):225-235.
146
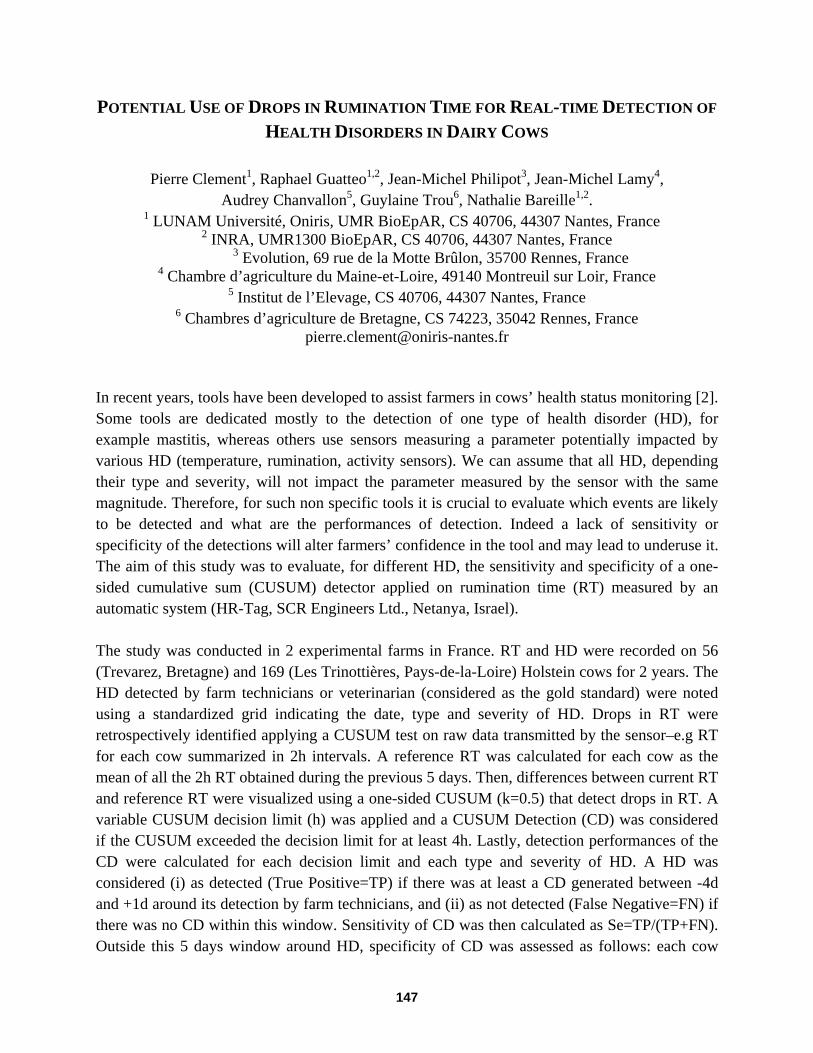
POTENTIAL USE OF DROPS IN RUMINATION TIME FOR REAL-TIME DETECTION OF
HEALTH DISORDERS IN DAIRY COWS
Pierre Clement1, Raphael Guatteo1,2, Jean-Michel Philipot3, Jean-Michel Lamy4, Audrey Chanvallon5, Guylaine Trou6, Nathalie Bareille1,2.
1 LUNAM Université, Oniris, UMR BioEpAR, CS 40706, 44307 Nantes, France 2 INRA, UMR1300 BioEpAR, CS 40706, 44307 Nantes, France
3 Evolution, 69 rue de la Motte Brûlon, 35700 Rennes, France 4 Chambre d’agriculture du Maine-et-Loire, 49140 Montreuil sur Loir, France
5 Institut de l’Elevage, CS 40706, 44307 Nantes, France 6 Chambres d’agriculture de Bretagne, CS 74223, 35042 Rennes, France
[email protected] In recent years, tools have been developed to assist farmers in cows’ health status monitoring [2]. Some tools are dedicated mostly to the detection of one type of health disorder (HD), for example mastitis, whereas others use sensors measuring a parameter potentially impacted by various HD (temperature, rumination, activity sensors). We can assume that all HD, depending their type and severity, will not impact the parameter measured by the sensor with the same magnitude. Therefore, for such non specific tools it is crucial to evaluate which events are likely to be detected and what are the performances of detection. Indeed a lack of sensitivity or specificity of the detections will alter farmers’ confidence in the tool and may lead to underuse it. The aim of this study was to evaluate, for different HD, the sensitivity and specificity of a one-sided cumulative sum (CUSUM) detector applied on rumination time (RT) measured by an automatic system (HR-Tag, SCR Engineers Ltd., Netanya, Israel). The study was conducted in 2 experimental farms in France. RT and HD were recorded on 56 (Trevarez, Bretagne) and 169 (Les Trinottières, Pays-de-la-Loire) Holstein cows for 2 years. The HD detected by farm technicians or veterinarian (considered as the gold standard) were noted using a standardized grid indicating the date, type and severity of HD. Drops in RT were retrospectively identified applying a CUSUM test on raw data transmitted by the sensor–e.g RT for each cow summarized in 2h intervals. A reference RT was calculated for each cow as the mean of all the 2h RT obtained during the previous 5 days. Then, differences between current RT and reference RT were visualized using a one-sided CUSUM (k=0.5) that detect drops in RT. A variable CUSUM decision limit (h) was applied and a CUSUM Detection (CD) was considered if the CUSUM exceeded the decision limit for at least 4h. Lastly, detection performances of the CD were calculated for each decision limit and each type and severity of HD. A HD was considered (i) as detected (True Positive=TP) if there was at least a CD generated between -4d and +1d around its detection by farm technicians, and (ii) as not detected (False Negative=FN) if there was no CD within this window. Sensitivity of CD was then calculated as Se=TP/(TP+FN). Outside this 5 days window around HD, specificity of CD was assessed as follows: each cow
147
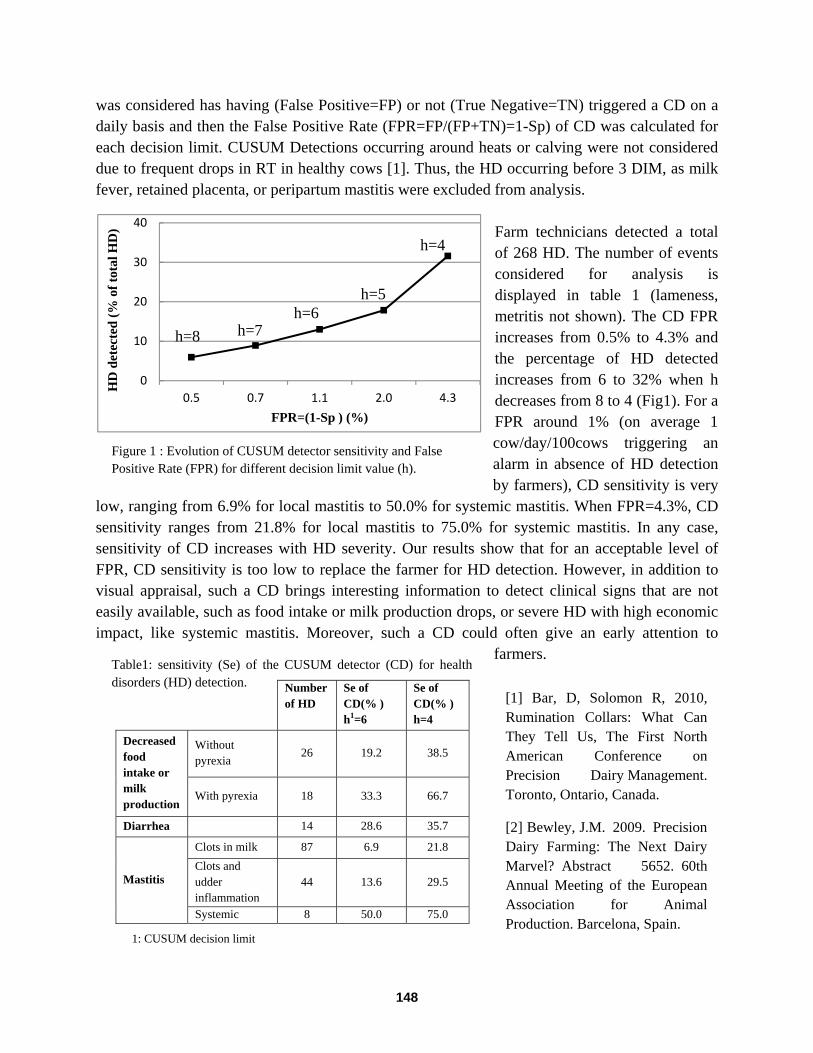
1: CUSUM decision limit
Figure 1 : Evolution of CUSUM detector sensitivity and False Positive Rate (FPR) for different decision limit value (h).
0
10
20
30
40
4.32.01.10.70.5
HD
det
ecte
d (%
of t
otal
HD
)
FPR=(1-Sp ) (%)
h=7h=6
h=5
h=8
h=4
Table1: sensitivity (Se) of the CUSUM detector (CD) for health disorders (HD) detection.
was considered has having (False Positive=FP) or not (True Negative=TN) triggered a CD on a daily basis and then the False Positive Rate (FPR=FP/(FP+TN)=1-Sp) of CD was calculated for each decision limit. CUSUM Detections occurring around heats or calving were not considered due to frequent drops in RT in healthy cows [1]. Thus, the HD occurring before 3 DIM, as milk fever, retained placenta, or peripartum mastitis were excluded from analysis.
Farm technicians detected a total of 268 HD. The number of events considered for analysis is displayed in table 1 (lameness, metritis not shown). The CD FPR increases from 0.5% to 4.3% and the percentage of HD detected increases from 6 to 32% when h decreases from 8 to 4 (Fig1). For a FPR around 1% (on average 1 cow/day/100cows triggering an alarm in absence of HD detection by farmers), CD sensitivity is very
low, ranging from 6.9% for local mastitis to 50.0% for systemic mastitis. When FPR=4.3%, CD sensitivity ranges from 21.8% for local mastitis to 75.0% for systemic mastitis. In any case, sensitivity of CD increases with HD severity. Our results show that for an acceptable level of FPR, CD sensitivity is too low to replace the farmer for HD detection. However, in addition to visual appraisal, such a CD brings interesting information to detect clinical signs that are not easily available, such as food intake or milk production drops, or severe HD with high economic impact, like systemic mastitis. Moreover, such a CD could often give an early attention to
farmers.
Number
of HD Se of CD(% ) h1=6
Se of CD(% ) h=4
Decreased food intake or milk production
Without pyrexia
26 19.2 38.5
With pyrexia 18 33.3 66.7
Diarrhea 14 28.6 35.7
Mastitis
Clots in milk 87 6.9 21.8 Clots and udder inflammation
44 13.6 29.5
Systemic 8 50.0 75.0
[1] Bar, D, Solomon R, 2010, Rumination Collars: What Can They Tell Us, The First North American Conference on Precision Dairy Management. Toronto, Ontario, Canada.
[2] Bewley, J.M. 2009. Precision Dairy Farming: The Next Dairy Marvel? Abstract 5652. 60th Annual Meeting of the European Association for Animal Production. Barcelona, Spain.
148
VALIDATION OF RUMINATION MONITORING SENSORS FEEDING FOUR FORAGE TYPES
Malene V. Byskov1,2, Peder Nørgaard2 and Martin R. Weisbjerg3 1Knowledge Centre for Agriculture, Cattle, Skejby, Denmark,
2University of Copenhagen, Faculty of Health and Medical Sciences, Copenhagen, Denmark, 3Aarhus University, Department of Animal Science, AU-Foulum, Denmark.
[email protected] Introduction Rumination activity is closely related to the intake of physical effective forage fibres. Consequently, different approaches to measure chewing and rumination activity have been developed. Until recently, these methods have only been applicable within research facilities3. A rumination monitoring sensor (RMS) has been developed (SCR Engineers Ltd., Netanya, Israel) to measure rumination activity under practical conditions, to capture sudden changes in rumination activity related to heat or disease detection. The RMS has been validated at two hour intervals, feeding forage according to different stages of lactation2. However, validation considering rumination activity at 24 hour level is needed for examining the accuracy of the RMS on consecutive intervals. Furthermore, potential effect of feeding different types of forage varying in structural fibre content has not yet been determined. Consequently, the purpose of this study was to validate the RMS at 2 and 24 hour level feeding grass/clover silage or hay varying in NDF content. Materials and Methods The study was performed as a 4 x 4 Latin square design; feeding four Jersey heifers of 435±30 kg body weight and four types of forages. The forages were spring growth grass/clover harvested either 9 May (early) or 25 May (late), stored as either silage or hay, creating four types of forages; early harvested silage (ES), early harvested hay (EH), late harvested silage (LS) and late harvested hay (LH). The heifers were kept in tie stalls with rubber mats, and fed 90 % of ad libitum. The rumination activity was measured by the RMS (Qwes-HR, distributed by Lely Scandinavia, Kolding, Denmark), recording rumination activity by the sound of regurgitation of rumen content, and by chewing halters1,3 recording jaw movements (JM). Data was collected for 4 consecutive days. Rumination time recorded by the RMS was displayed in minutes per two hour intervals, with each sensor having individual time stamps for each two hour period. For comparison, the rumination time measured by JM was accumulated within the exact same time stamp frame given by the individual RMS. Statistical analysis was performed in SAS® 9.2 (SAS Institute Inc. 2002-2008). Results The average NDF intake (kg/day) was 2.7, 4.1, 3.0 and 3.6 for ES, EH, LS and LH, respectively. Validation of the RMS was performed at 2 hour level and at 24 hour level, considering the rumination time measured by JM to be the true value of rumination time. The mean difference between rumination time measured by the RMS and JM at 2 hour level (Diff2H) and at 24 hour
149
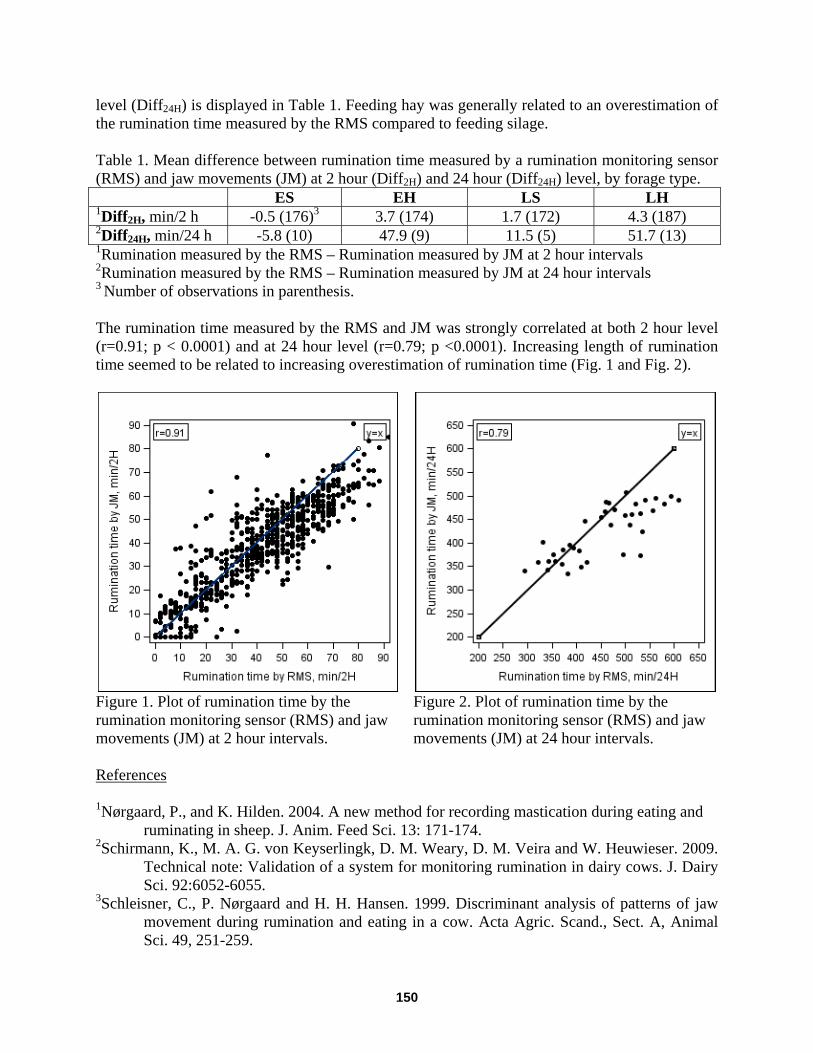
level (Diff24H) is displayed in Table 1. Feeding hay was generally related to an overestimation of the rumination time measured by the RMS compared to feeding silage. Table 1. Mean difference between rumination time measured by a rumination monitoring sensor (RMS) and jaw movements (JM) at 2 hour (Diff2H) and 24 hour (Diff24H) level, by forage type.
ES EH LS LH 1Diff2H, min/2 h -0.5 (176)3 3.7 (174) 1.7 (172) 4.3 (187) 2Diff24H, min/24 h -5.8 (10) 47.9 (9) 11.5 (5) 51.7 (13) 1Rumination measured by the RMS – Rumination measured by JM at 2 hour intervals 2Rumination measured by the RMS – Rumination measured by JM at 24 hour intervals 3 Number of observations in parenthesis. The rumination time measured by the RMS and JM was strongly correlated at both 2 hour level (r=0.91; p < 0.0001) and at 24 hour level (r=0.79; p <0.0001). Increasing length of rumination time seemed to be related to increasing overestimation of rumination time (Fig. 1 and Fig. 2).
Figure 1. Plot of rumination time by the rumination monitoring sensor (RMS) and jaw movements (JM) at 2 hour intervals.
Figure 2. Plot of rumination time by the rumination monitoring sensor (RMS) and jaw movements (JM) at 24 hour intervals.
References 1Nørgaard, P., and K. Hilden. 2004. A new method for recording mastication during eating and
ruminating in sheep. J. Anim. Feed Sci. 13: 171-174. 2Schirmann, K., M. A. G. von Keyserlingk, D. M. Weary, D. M. Veira and W. Heuwieser. 2009.
Technical note: Validation of a system for monitoring rumination in dairy cows. J. Dairy Sci. 92:6052-6055.
3Schleisner, C., P. Nørgaard and H. H. Hansen. 1999. Discriminant analysis of patterns of jaw movement during rumination and eating in a cow. Acta Agric. Scand., Sect. A, Animal Sci. 49, 251-259.
150
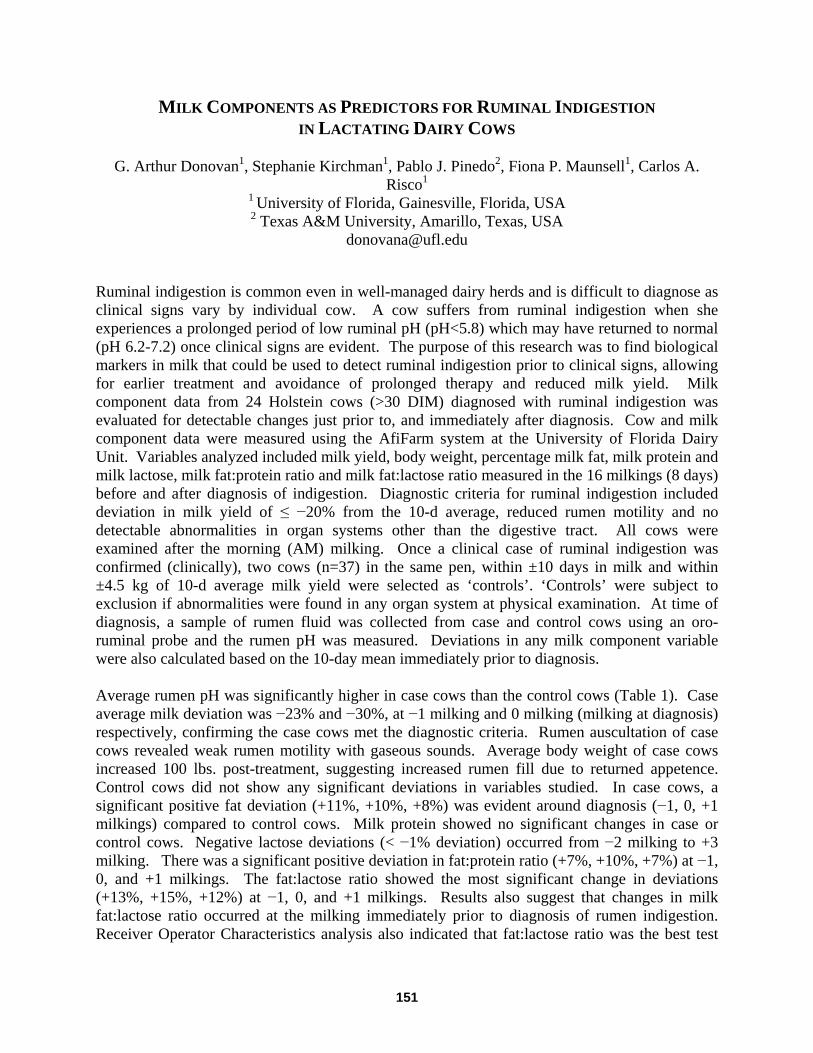
MILK COMPONENTS AS PREDICTORS FOR RUMINAL INDIGESTION IN LACTATING DAIRY COWS
G. Arthur Donovan1, Stephanie Kirchman1, Pablo J. Pinedo2, Fiona P. Maunsell1, Carlos A.
Risco1 1 University of Florida, Gainesville, Florida, USA 2 Texas A&M University, Amarillo, Texas, USA
[email protected] Ruminal indigestion is common even in well-managed dairy herds and is difficult to diagnose as clinical signs vary by individual cow. A cow suffers from ruminal indigestion when she experiences a prolonged period of low ruminal pH (pH<5.8) which may have returned to normal (pH 6.2-7.2) once clinical signs are evident. The purpose of this research was to find biological markers in milk that could be used to detect ruminal indigestion prior to clinical signs, allowing for earlier treatment and avoidance of prolonged therapy and reduced milk yield. Milk component data from 24 Holstein cows (>30 DIM) diagnosed with ruminal indigestion was evaluated for detectable changes just prior to, and immediately after diagnosis. Cow and milk component data were measured using the AfiFarm system at the University of Florida Dairy Unit. Variables analyzed included milk yield, body weight, percentage milk fat, milk protein and milk lactose, milk fat:protein ratio and milk fat:lactose ratio measured in the 16 milkings (8 days) before and after diagnosis of indigestion. Diagnostic criteria for ruminal indigestion included deviation in milk yield of ≤ −20% from the 10-d average, reduced rumen motility and no detectable abnormalities in organ systems other than the digestive tract. All cows were examined after the morning (AM) milking. Once a clinical case of ruminal indigestion was confirmed (clinically), two cows (n=37) in the same pen, within ±10 days in milk and within ±4.5 kg of 10-d average milk yield were selected as ‘controls’. ‘Controls’ were subject to exclusion if abnormalities were found in any organ system at physical examination. At time of diagnosis, a sample of rumen fluid was collected from case and control cows using an oro-ruminal probe and the rumen pH was measured. Deviations in any milk component variable were also calculated based on the 10-day mean immediately prior to diagnosis. Average rumen pH was significantly higher in case cows than the control cows (Table 1). Case average milk deviation was −23% and −30%, at −1 milking and 0 milking (milking at diagnosis) respectively, confirming the case cows met the diagnostic criteria. Rumen auscultation of case cows revealed weak rumen motility with gaseous sounds. Average body weight of case cows increased 100 lbs. post-treatment, suggesting increased rumen fill due to returned appetence. Control cows did not show any significant deviations in variables studied. In case cows, a significant positive fat deviation (+11%, +10%, +8%) was evident around diagnosis (−1, 0, +1 milkings) compared to control cows. Milk protein showed no significant changes in case or control cows. Negative lactose deviations (< −1% deviation) occurred from −2 milking to +3 milking. There was a significant positive deviation in fat:protein ratio (+7%, +10%, +7%) at −1, 0, and +1 milkings. The fat:lactose ratio showed the most significant change in deviations (+13%, +15%, +12%) at −1, 0, and +1 milkings. Results also suggest that changes in milk fat:lactose ratio occurred at the milking immediately prior to diagnosis of rumen indigestion. Receiver Operator Characteristics analysis also indicated that fat:lactose ratio was the best test
151
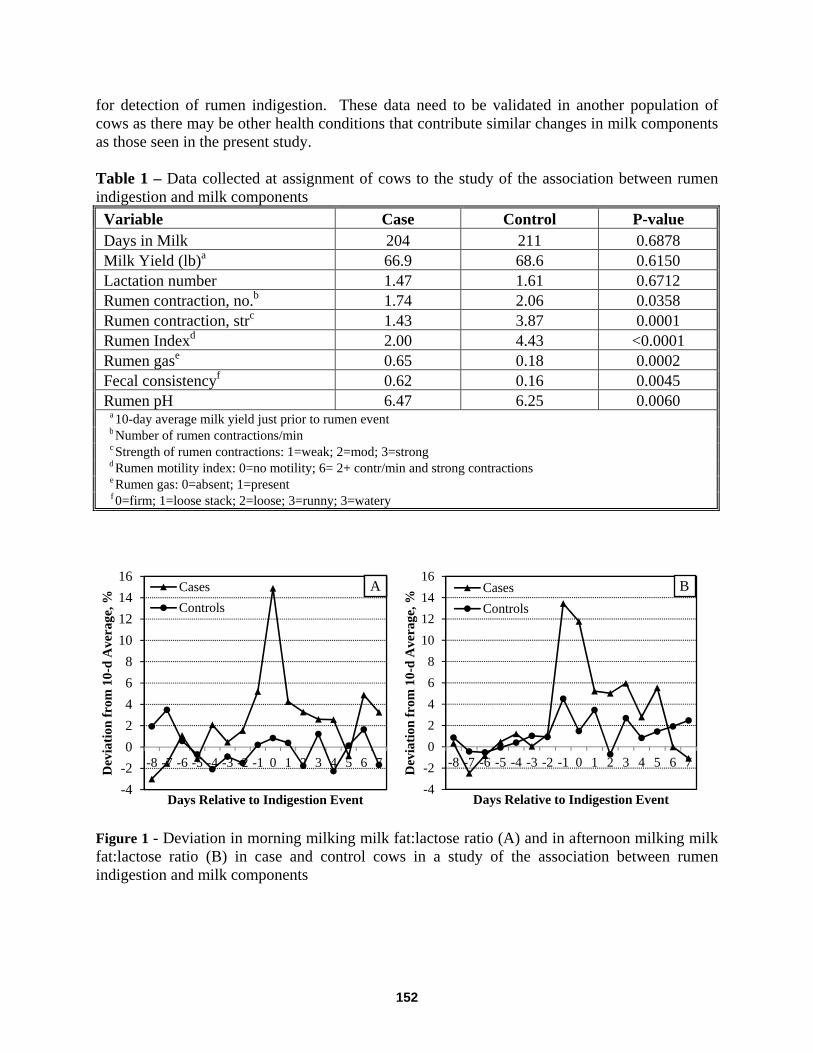
for detection of rumen indigestion. These data need to be validated in another population of cows as there may be other health conditions that contribute similar changes in milk components as those seen in the present study. Table 1 – Data collected at assignment of cows to the study of the association between rumen indigestion and milk components Variable Case Control P-value Days in Milk 204 211 0.6878 Milk Yield (lb)a 66.9 68.6 0.6150 Lactation number 1.47 1.61 0.6712 Rumen contraction, no.b 1.74 2.06 0.0358 Rumen contraction, strc 1.43 3.87 0.0001 Rumen Indexd 2.00 4.43 <0.0001 Rumen gase 0.65 0.18 0.0002 Fecal consistencyf 0.62 0.16 0.0045 Rumen pH 6.47 6.25 0.0060
a 10-day average milk yield just prior to rumen event b Number of rumen contractions/min c Strength of rumen contractions: 1=weak; 2=mod; 3=strong d Rumen motility index: 0=no motility; 6= 2+ contr/min and strong contractions e Rumen gas: 0=absent; 1=present f 0=firm; 1=loose stack; 2=loose; 3=runny; 3=watery
Figure 1 - Deviation in morning milking milk fat:lactose ratio (A) and in afternoon milking milk fat:lactose ratio (B) in case and control cows in a study of the association between rumen indigestion and milk components
-4-202468
10121416
-8 -7 -6 -5 -4 -3 -2 -1 0 1 2 3 4 5 6 7Dev
iatio
n fr
om 1
0-d
Ave
rage
, %
Days Relative to Indigestion Event
CasesControls
-4-202468
10121416
-8 -7 -6 -5 -4 -3 -2 -1 0 1 2 3 4 5 6 7Dev
iatio
n fr
om 1
0-d
Ave
rage
, %
Days Relative to Indigestion Event
CasesControls
AA B
152
PRECISION DAIRY TECHNOLOGIES FOR EVALUATING COW BEHAVIOR AND PRODUCTIVITY WITH DIFFERENT FREESTALL BASES
Barbara A. Wadsworth, Amanda E. Sterrett, Connie L. Wood, Kristen J. McQuerry, Joey D.
Clark, Denise L. Ray, Jeffrey M. Bewley University of Kentucky, Lexington, Kentucky, United States [email protected] and [email protected]
Introduction Precision dairy farming (PDF) technologies measure specific parameters from individual cows (Rutten et al., 2013), such as lying and rumination times. Maximizing individual cow potential is the main objective of PDF (Bewley, 2010). Housing conditions are a public concern (von Keyserlingk et al., 2009) within the dairy industry. Dairy cattle need a comfortable place to rest for 13 h/d (Jensen et al., 2005; Munksgaard et al., 2005). Freestall base type (FSBASE, Reich et al., 2010) may affect lying behavior. Fulwider et al. (2007) reported that dairies using waterbeds had lower culling rates and fewer hock lesions than dairies using rubber-filled mattresses. The objective of this study was to compare lying time (LT), milk yield (MY), and rumination time (RT) between two different FSBASE. Materials and Methods Data was collected from January 18, 2012 to January 18, 2013 in two freestall barns at the University of Kentucky Coldstream Dairy. Barn “W” includes 50 stalls of Dual Chamber Cow Waterbeds© (DCCW, Advanced Comfort Technology, Reedsburg, WI) and barn “R” includes 50 stalls of rubber-filled mattresses (MAT). Both barns were renovated in November 2011 to the industry standard stall size for the largest Holsteins in the herd. The brisket locator was a 7.6 cm schedule 40 PVC pipe, stall lengths were 1.8 m, neck rail heights were 1.2 m, and mean stall widths were 1.2 m. All variables were classified for 96 cows (Holstein (n = 70), Jersey (n = 10), and crossbred (n = 16)). In each barn, the cows were balanced for cow volume, parity and DIM. IceRobotics (Edinburgh, Scotland) IceQube® sensors, which contain a 3-axis accelerometer and hold data up to 60 days, recorded daily LT. Milkline® Milpro P4C system (Milkline® Srl , Gariga di Podenzano, PC, Italy) recorded daily MY. The HR Tag™ (SCR Engineers, Ltd., Israel), which contains a microphone to detect the cow’s rumination, a microprocessor to process the rumination and 24 hour memory to hold the RT, recorded daily RT. The GLM procedure in SAS® (SAS version 9.3, SAS Institute, INC., Cary, NC) was used to evaluate factors influencing LT, MY, and RT. Freestall base, breed, and parity (1 or ≥ 2 lactations) were evaluated for their influence on LT, MY, and RT. All main effects were kept in each model regardless of significance level. Stepwise backward elimination was used to remove non-significant interactions (P ≥ 0.05). Results and Discussion
Daily LT was significantly (P < 0.01) greater for DCCW (10.79 ± 0.20 h/d) than for MAT (10.06 ± 0.22 h/d). Lying time can be an indicator of a comfortable resting area. Comfortable lying
153
areas may improve cow leg and hock condition. Daily MY was not significantly (P = 0.78) different between DCCW (27.55 ± 0.91 Kg/d) and MAT (27.87 ± 0.99 Kg/d). Daily RT was significantly (P < 0.01) greater for MAT (6.37 ± 0.12 h/d) than for DCCW (6.09 ± 0.11 h/d). Precision dairy farming technologies are useful devices to evaluate the effect of different stall bases on cow productivity and well-being. Tri-axial accelerometers and rumination monitors are valuable tools for animal behaviorists (MacKay et al., 2012). These monitors are also valuable on farm tools to follow a cow’s behavior. These monitoring devices open up many possibilities for ethologists to track cow behavior and well-being and the interaction of the cow and her physical environment. Conclusions In this study, LT was greater for cows housed in freestalls with DCCW as a freestall base. Dual Chamber Cow Waterbeds© may provide a more resilient resting surface for dairy cows than rubber-filled mattresses. For this study, PDF technologies were useful in determining cow LT, MY and RT for two different FSBASE. Using PDF technologies to measure cow comfort is a more precise and objective way, to differentiate among housing options than visual observation. References Bewley, J. M. 2010a. Precision dairy farming: Advanced analysis solutions for future
profitability. in Proc. The First North American Conference on Precision Dairy Management, Toronto, Canada.
Fulwider, W. K., T. Grandin, D. J. Garrick, T. E. Engle, W. D. Lamm, N. L. Dalsted, and B. E. Rollin. 2007. Influence of free-stall base on tarsal joint lesions and hygiene in dairy cows. J. Dairy Sci. 90:3559-3566.
Jensen, M. B., L. J. Pedersen, and L. Munksgaard. 2005. The effect of reward duration on demand functions for rest in dairy heifers and lying requirements as measured by demand functions. Appl. Anim. Behav. Sci. 90:207–217.
MacKay, J. R. D., J. M. Deag, and M. J. Haskell. 2012. Establishing the extent of behavioral reactions in dairy cattle to a leg mounted activity monitor. Appl. Anim. Behav. Sci. 139:35-41
Munksgaard, L., M. B. Jensen, L. J. Pedersen, S. W. Hansen, and L. Matthews. 2005. Quantifying behavioural priorities—Effects of time constraints on behaviour of dairy cows. Appl. Anim. Behav. Sci. 92:3–14.
Reich, L. J., D. M. Weary, D. M. Veira, and M. A. G von Keyserlingk. 2010. Effects of sawdust bedding dry matter on lying behavior of dairy cows: A dose-dependent response. J. Dairy Sci. 93:1561-1565.
Rutten C. J., A. G. J. Velthuis, W. Steeneveld and H. Hogeveen. 2013. Invited Review: Sensors to support health management on dairy farms. J. Dairy Sci. 96:1-25. von Keyserlingk, M. A. G., J. Rushen, A. M. de Passille, and D. M. Weary. 2009. Invited
review: The welfare of dairy cattle-Key concepts and the role of science. J. Dairy Sci. 92:4101-4111
154
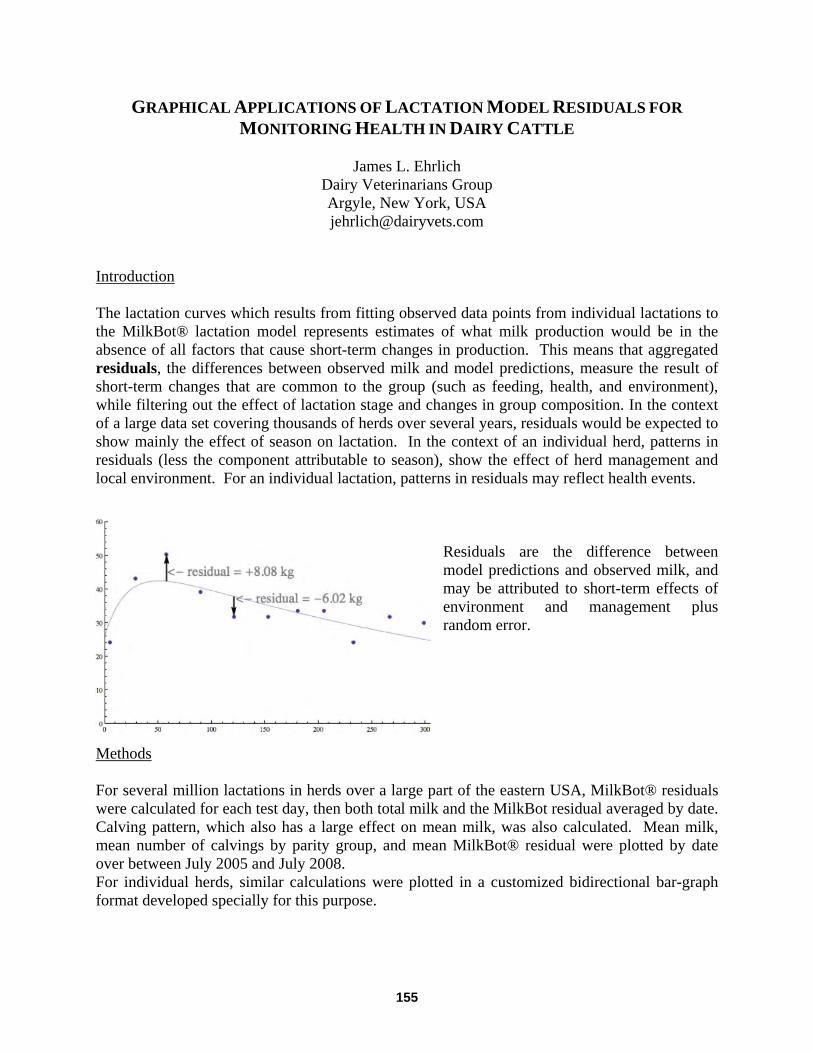
GRAPHICAL APPLICATIONS OF LACTATION MODEL RESIDUALS FOR
MONITORING HEALTH IN DAIRY CATTLE
James L. Ehrlich Dairy Veterinarians Group Argyle, New York, USA [email protected]
Introduction The lactation curves which results from fitting observed data points from individual lactations to the MilkBot® lactation model represents estimates of what milk production would be in the absence of all factors that cause short-term changes in production. This means that aggregated residuals, the differences between observed milk and model predictions, measure the result of short-term changes that are common to the group (such as feeding, health, and environment), while filtering out the effect of lactation stage and changes in group composition. In the context of a large data set covering thousands of herds over several years, residuals would be expected to show mainly the effect of season on lactation. In the context of an individual herd, patterns in residuals (less the component attributable to season), show the effect of herd management and local environment. For an individual lactation, patterns in residuals may reflect health events.
Residuals are the difference between model predictions and observed milk, and may be attributed to short-term effects of environment and management plus random error.
Methods For several million lactations in herds over a large part of the eastern USA, MilkBot® residuals were calculated for each test day, then both total milk and the MilkBot residual averaged by date. Calving pattern, which also has a large effect on mean milk, was also calculated. Mean milk, mean number of calvings by parity group, and mean MilkBot® residual were plotted by date over between July 2005 and July 2008. For individual herds, similar calculations were plotted in a customized bidirectional bar-graph format developed specially for this purpose.
155
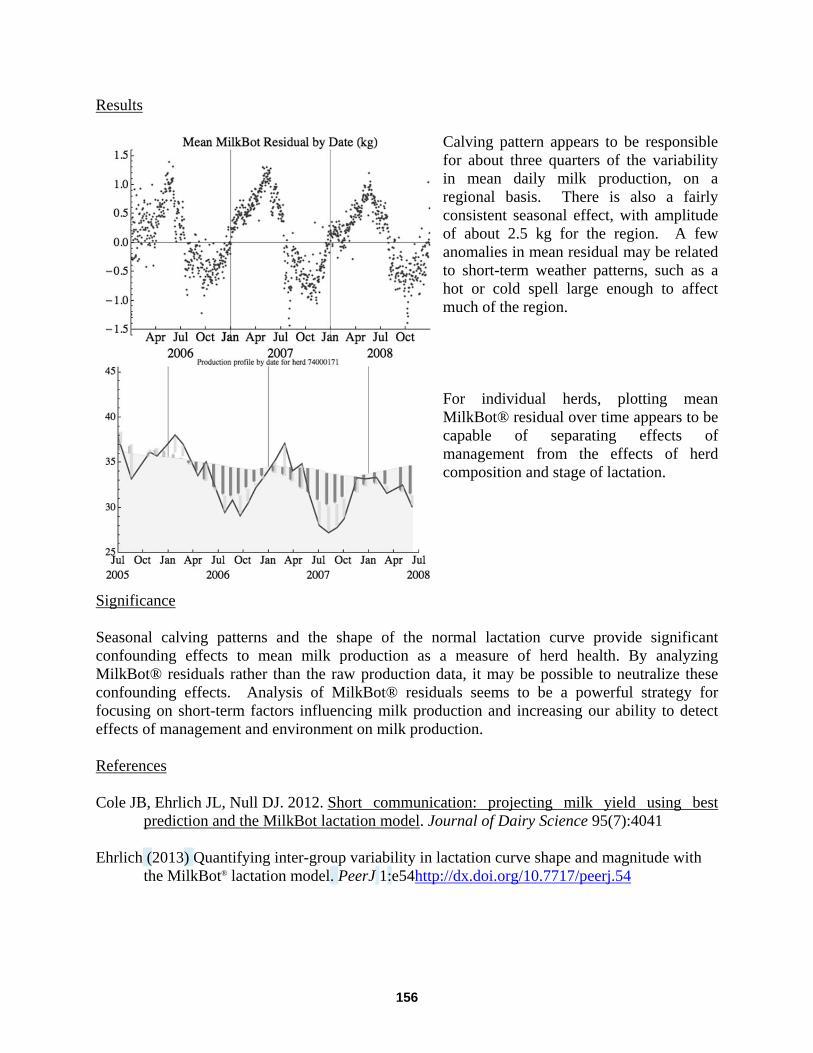
Results
Calving pattern appears to be responsible for about three quarters of the variability in mean daily milk production, on a regional basis. There is also a fairly consistent seasonal effect, with amplitude of about 2.5 kg for the region. A few anomalies in mean residual may be related to short-term weather patterns, such as a hot or cold spell large enough to affect much of the region. For individual herds, plotting mean MilkBot® residual over time appears to be capable of separating effects of management from the effects of herd composition and stage of lactation.
Significance Seasonal calving patterns and the shape of the normal lactation curve provide significant confounding effects to mean milk production as a measure of herd health. By analyzing MilkBot® residuals rather than the raw production data, it may be possible to neutralize these confounding effects. Analysis of MilkBot® residuals seems to be a powerful strategy for focusing on short-term factors influencing milk production and increasing our ability to detect effects of management and environment on milk production. References Cole JB, Ehrlich JL, Null DJ. 2012. Short communication: projecting milk yield using best
prediction and the MilkBot lactation model. Journal of Dairy Science 95(7):4041 Ehrlich (2013) Quantifying inter-group variability in lactation curve shape and magnitude with
the MilkBot® lactation model. PeerJ 1:e54http://dx.doi.org/10.7717/peerj.54
156
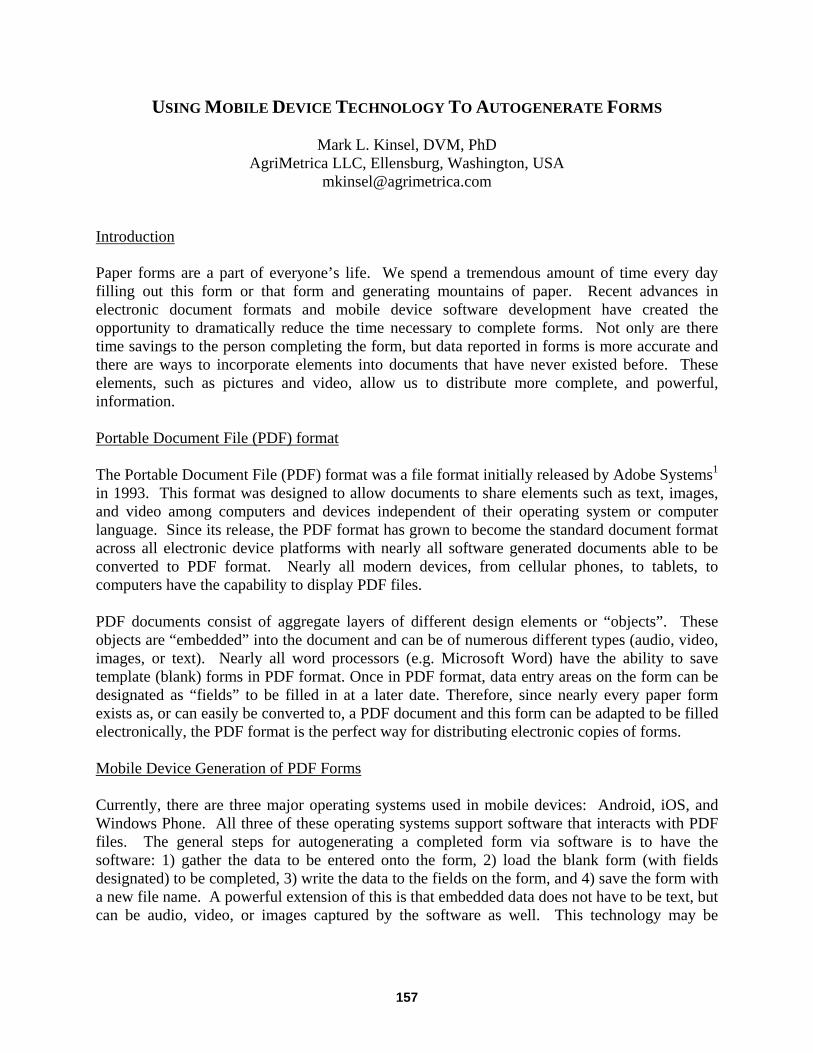
USING MOBILE DEVICE TECHNOLOGY TO AUTOGENERATE FORMS
Mark L. Kinsel, DVM, PhD AgriMetrica LLC, Ellensburg, Washington, USA
Introduction Paper forms are a part of everyone’s life. We spend a tremendous amount of time every day filling out this form or that form and generating mountains of paper. Recent advances in electronic document formats and mobile device software development have created the opportunity to dramatically reduce the time necessary to complete forms. Not only are there time savings to the person completing the form, but data reported in forms is more accurate and there are ways to incorporate elements into documents that have never existed before. These elements, such as pictures and video, allow us to distribute more complete, and powerful, information. Portable Document File (PDF) format The Portable Document File (PDF) format was a file format initially released by Adobe Systems1 in 1993. This format was designed to allow documents to share elements such as text, images, and video among computers and devices independent of their operating system or computer language. Since its release, the PDF format has grown to become the standard document format across all electronic device platforms with nearly all software generated documents able to be converted to PDF format. Nearly all modern devices, from cellular phones, to tablets, to computers have the capability to display PDF files. PDF documents consist of aggregate layers of different design elements or “objects”. These objects are “embedded” into the document and can be of numerous different types (audio, video, images, or text). Nearly all word processors (e.g. Microsoft Word) have the ability to save template (blank) forms in PDF format. Once in PDF format, data entry areas on the form can be designated as “fields” to be filled in at a later date. Therefore, since nearly every paper form exists as, or can easily be converted to, a PDF document and this form can be adapted to be filled electronically, the PDF format is the perfect way for distributing electronic copies of forms. Mobile Device Generation of PDF Forms Currently, there are three major operating systems used in mobile devices: Android, iOS, and Windows Phone. All three of these operating systems support software that interacts with PDF files. The general steps for autogenerating a completed form via software is to have the software: 1) gather the data to be entered onto the form, 2) load the blank form (with fields designated) to be completed, 3) write the data to the fields on the form, and 4) save the form with a new file name. A powerful extension of this is that embedded data does not have to be text, but can be audio, video, or images captured by the software as well. This technology may be
157
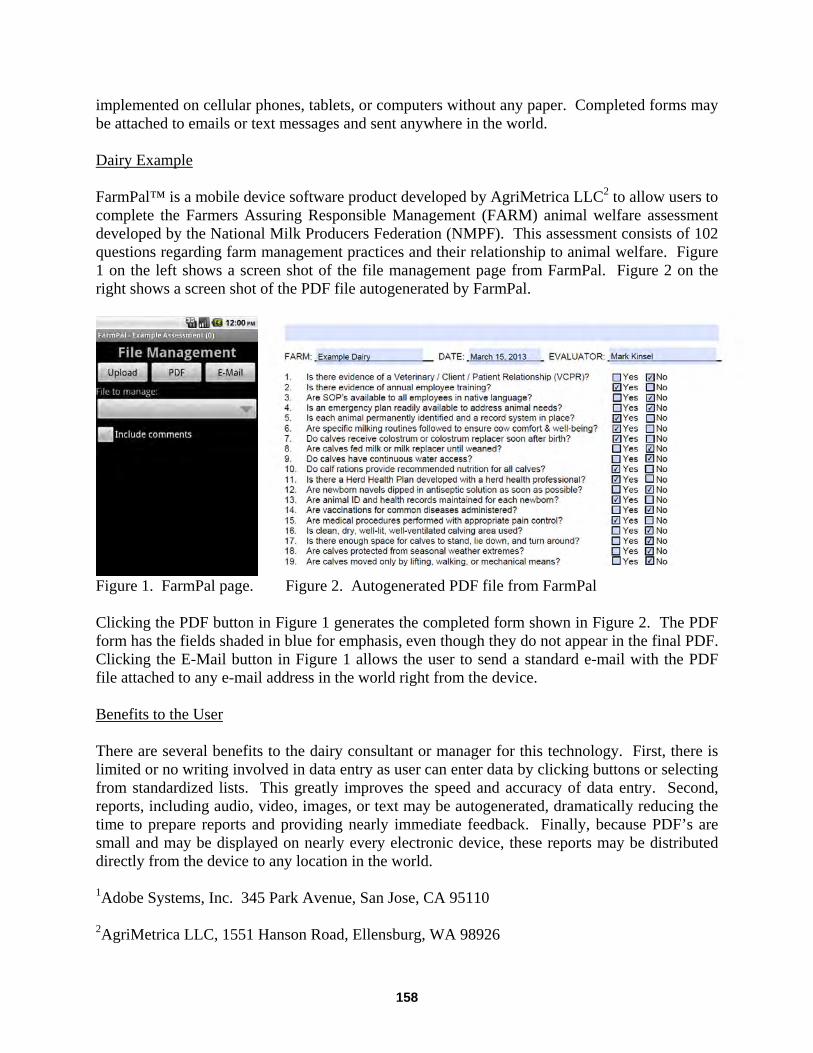
implemented on cellular phones, tablets, or computers without any paper. Completed forms may be attached to emails or text messages and sent anywhere in the world. Dairy Example FarmPal™ is a mobile device software product developed by AgriMetrica LLC2 to allow users to complete the Farmers Assuring Responsible Management (FARM) animal welfare assessment developed by the National Milk Producers Federation (NMPF). This assessment consists of 102 questions regarding farm management practices and their relationship to animal welfare. Figure 1 on the left shows a screen shot of the file management page from FarmPal. Figure 2 on the right shows a screen shot of the PDF file autogenerated by FarmPal.
Figure 1. FarmPal page. Figure 2. Autogenerated PDF file from FarmPal Clicking the PDF button in Figure 1 generates the completed form shown in Figure 2. The PDF form has the fields shaded in blue for emphasis, even though they do not appear in the final PDF. Clicking the E-Mail button in Figure 1 allows the user to send a standard e-mail with the PDF file attached to any e-mail address in the world right from the device. Benefits to the User There are several benefits to the dairy consultant or manager for this technology. First, there is limited or no writing involved in data entry as user can enter data by clicking buttons or selecting from standardized lists. This greatly improves the speed and accuracy of data entry. Second, reports, including audio, video, images, or text may be autogenerated, dramatically reducing the time to prepare reports and providing nearly immediate feedback. Finally, because PDF’s are small and may be displayed on nearly every electronic device, these reports may be distributed directly from the device to any location in the world. 1Adobe Systems, Inc. 345 Park Avenue, San Jose, CA 95110 2AgriMetrica LLC, 1551 Hanson Road, Ellensburg, WA 98926
158
EFFECT OF STOCKING DENSITY ON LYING BEHAVIOR OF DAIRY COWS
Karen M. Lobeck, Marcia I. Endres, Ana R. Dresh, Ricardo C. Chebel University of Minnesota
Introduction The transition period can be a difficult time for the dairy cow. Cows that are unable to successfully transition from nonlactating to lactating are at risk for health events, low milk production, culling and death. Overcrowding dairy cattle has been associated with reduced lying time (Leonard et al., 1996), increased displacements from the feedbunk (DeVries et al., 2004), lameness, and respiratory diseases (Cook and Nordlund, 2004). Transition dairy cows should have adequate feedbunk and resting space while in the close-up dry and fresh pens to allow for adequate dry matter intake and resting time. Based on epidemiological studies transition cows should be provided approximately 0.76 m of feedbunk space per Holstein cow or stocked at 80 percent of total number of 0.61 m headlocks and at least one stall per cow (Nordlund et al., 2006). The objective of this study was to determine the effect of two feedbunk stocking densities on prepartum lying behavior of dairy cows. Materials and Methods The study was conducted at a large commercial dairy farm in south-central Minnesota. Cows were housed in a 12-row low profile cross ventilated barn and were provided a TMR once daily at approximately 0700 h daily. Dimensions of the 4 experimental pens were 31.9 m x 11.3 m with 44 deep sand bedded freestalls (2.29 m x 1.07 m) in a 2-row configuration with 48-0.61 m headlocks. Each of the 3 replicates was 5 weeks long. Jersey cows at 4 wk before expected calving date were assigned randomly to 1 of 2 treatments. Treatments were 80% (38 cows/48 headlocks; 80D) or 100% (48 cows/48 headlocks; 100D) feedbunk stocking density. During each replicate 2 pens of nulliparous cows and 2 pens of a mix of primiparous and multiparous cows, referred as ‘multiparous’, were used in the study. Cows were balanced for body condition score and no cows with a locomotion score greater than 2 (1-5 scale, with 1=normal and 5 =severely lame) were included in the study. One hundred-two 80D and 123 100D cows were selected as lying behavior focal cows. The mean number of focal cows in each pen was 19 with a range of 14-23 cows. Lying behavior was measured using HOBO Pendant G data loggers (Onset Co). Loggers were attached to the cow’s rear leg 1 d after entrance to the pen and were left on for 12 d, removed for 7 d, and reattached for 12 d or until the cow calved. Loggers recorded the g-force on the y and z-axes at 30-second intervals for 11 d. Only full days of data were used in the analysis. The Mixed procedure (SAS Institute) was used to evaluate the effect of stocking density on lying time, lying bouts, and lying bout duration. Animal within treatment was used as a random effect. Least squares means were separated with the PDIFF statement.
159
Results Overall there were no differences between treatments for lying time (12.8 ± 0.04 h/d). Nulliparous cows in the 80D and 100D treatments spent 12.5 and 12.4 h/d lying down, respectively, whereas multiparous cows in the 80D and 100D treatments spent 12.4 and 13.0 h/d lying down, respectively. There was a treatment by lactation interaction for lying time (P = 0.02). Multiparous cows in the 100D treatment pens spent 0.6 h/d more lying down than 100D nulliparous cows (P < 0.01). There were no differences in lying time between lactations in the 80D treatment. There were differences in the number of lying bouts between treatments and lactation number. Multiparous cows in the 100D treatment had 0.91 more bouts/d than 80D cows (14.7 vs. 13.8; P < 0.01). Nulliparous cows had more lying bouts than multiparous cows (16.1 vs. 12.3; P < 0.01). Lying bout duration did not differ between treatments (1.32 ± 0.04 h). Multiparous cows had longer (P < 0.01) lying bout duration (1.54 h) than nulliparous cows (1.13 h). Conclusions The 100 percent feedbunk stocking density only affected the number of lying bouts with no differences between treatments for lying time and lying bout duration. More differences in lying behavior were observed between multiparous and nulliparous cows. Based on these results lying behavior was not adversely affected by 100 percent of feedbunk stocking rate. References Cook, N.B., and K.V. Nordlund. 2004. Behavioral needs of the transition cow and considerations
for special needs facility design. Vet. Clin. Food Anim. 20:495520. DeVries, T.J., M.A.G. von Keyserlingk, and D.M. Weary. 2004. Effect of feeding space on the
inter-cow distance, aggression, and feeding behavior of free-stall housed lactating dairy cows. J. Dairy Sci. 87:1432-1438.
Leonard, F.C., J.M. O’Connell, and K.J. O’Farrell. 1996. Effect of overcrowding on claw health in first-calved Friesian heifers. Br. Vet. J. 152:459-472.
Nordlund, K.V., N.B. Cook, and G. Oetzel. 2006. Commingling dairy cows: pen moves, stocking density, and health. In Proc. 39th Am. Assoc. Bovine Pract. St. Paul, MN. Am. Assoc. Bovine Pract., pg 36-42.
160
LOW COST ON FARM PREDICTORS OF INDIVIDUAL COW RISK FOR KETOSIS, FATTY LIVER, MILK PRODUCTION AND FARM TRANSITION COW SUCCESS
Zachary J. Sawall, Noah B. Litherland
University of Minnesota St. Paul, Minnesota, USA
[email protected], [email protected]
Early lactation data from 3 studies (n=176 cows) were composited to determine on farm prediction tools for cows at risk for elevated serum beta-hydroxy butyrate (BHBA) and non-esterified fatty acids (NEFA) and liver triglycerides (TG), and also to determine the efficacy of utilizing fat to true protein ratio (FPR) as a determinant of success of transition cow management. To evaluate FPR cut point for risk of lipid related disorders, cows were divided into two groups post hoc, < or > 1.4 FPR during the first month postpartum. The objective of this retrospective analysis were to determine if low-cost, on-farm measures of colostrum yield (CY), colostrum specific gravity (CSG) and body condition score (BCS) at calving are good predictors of cow health and production in early lactation, and how can first test FPR be utilized. Analysis for FPR was conducted using PROC MIXED in SAS with model including, year, diet×year and treatments of < or > 1.4 FPR. Pearson correlation coefficients were calculated for CY, CSG, BCS, BHBA, NEFA and ME 305d milk production. Cows with a FPR > 1.4 vs. <1.4 had greater serum beta-hydroxybutyrate (BHBA) mmol/L and non-esterified fatty acids (NEFA) μEq/L on d 1, 7 and 14 postpartum indicating cows > 1.4 FPR had subclinical ketosis. Cows with FPR >1.4 vs. <1.4 had greater liver triacylglycerol % (TAG) on d 7 and 14. Cows with FPR >1.4 lost more kg body weight (BW) through the first four weeks of lactation. Yield of ME 305d milk yield, kg tended to be greater for cows > 1.4 FPR. Utilizing FPR >1.4 as a minimum cut point is an adequate diagnostic tool for detecting suspect cows with a mean BHBA >1.2 mmol/L, which is the lower value for determining subclinical ketosis. CY is a significant predictor of serum BHBA on d 1 and d 7 postpartum. Serum NEFA can be predicted on d 1, 7 and 14 by CSG using Brix refractometer. Both CY and CSG are significantly correlated with liver TG on d 7 and CY and CSG help predict DMI during the first week postpartum. BCS is negatively correlated with serum calcium 24 hrs postpartum and can identify cows at risk for hypocalcaemia. BCS is positively correlated with serum BHBA at d 1 and d 14, serum NEFA at d 7 and d 14 and ME 305 day milk production. Utilizing low cost, on farm measures of CY, CSG and BCS provides insight into rates of body reserve mobilization without blood or liver sample collection. FPR can also aid in the herd detection and management of negative effects such as elevated serum BHBA, NEFA and liver triglycerides as indicated by FPR > 1.4 which has potential to increase ME 305d milk yield. The implementation of these tools together can allow dairy producers to quickly identify cows at risk for hypocalcaemia, ketosis, and low DMI shortly after parturition. Rapid, low cost identification of cows at high risk for these disorders allows for early treatment or implementation of tailored feeding and management strategies to minimize the incidence and severity of subclinical fresh cow disorders.
161
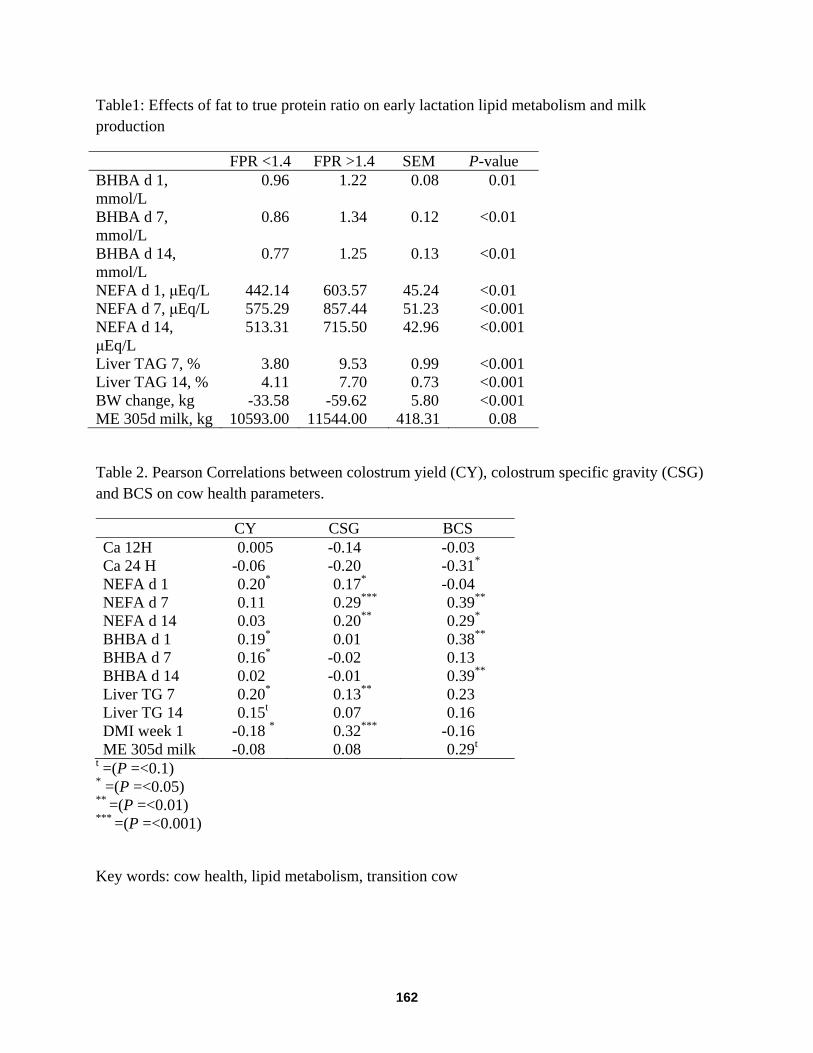
Table1: Effects of fat to true protein ratio on early lactation lipid metabolism and milk production
FPR <1.4 FPR >1.4 SEM P-value BHBA d 1, mmol/L
0.96 1.22 0.08 0.01
BHBA d 7, mmol/L
0.86 1.34 0.12 <0.01
BHBA d 14, mmol/L
0.77 1.25 0.13 <0.01
NEFA d 1, μEq/L 442.14 603.57 45.24 <0.01 NEFA d 7, μEq/L 575.29 857.44 51.23 <0.001 NEFA d 14, μEq/L
513.31 715.50 42.96 <0.001
Liver TAG 7, % 3.80 9.53 0.99 <0.001 Liver TAG 14, % 4.11 7.70 0.73 <0.001 BW change, kg -33.58 -59.62 5.80 <0.001 ME 305d milk, kg 10593.00 11544.00 418.31 0.08
Table 2. Pearson Correlations between colostrum yield (CY), colostrum specific gravity (CSG) and BCS on cow health parameters.
CY CSG BCS Ca 12H 0.005 -0.14 -0.03 Ca 24 H -0.06 -0.20 -0.31* NEFA d 1 0.20* 0.17* -0.04 NEFA d 7 0.11 0.29*** 0.39** NEFA d 14 0.03 0.20** 0.29* BHBA d 1 0.19* 0.01 0.38** BHBA d 7 0.16* -0.02 0.13 BHBA d 14 0.02 -0.01 0.39** Liver TG 7 0.20* 0.13** 0.23 Liver TG 14 0.15t 0.07 0.16 DMI week 1 -0.18 * 0.32*** -0.16 ME 305d milk -0.08 0.08 0.29t
t =(P =<0.1) * =(P =<0.05) ** =(P =<0.01) *** =(P =<0.001)
Key words: cow health, lipid metabolism, transition cow
162
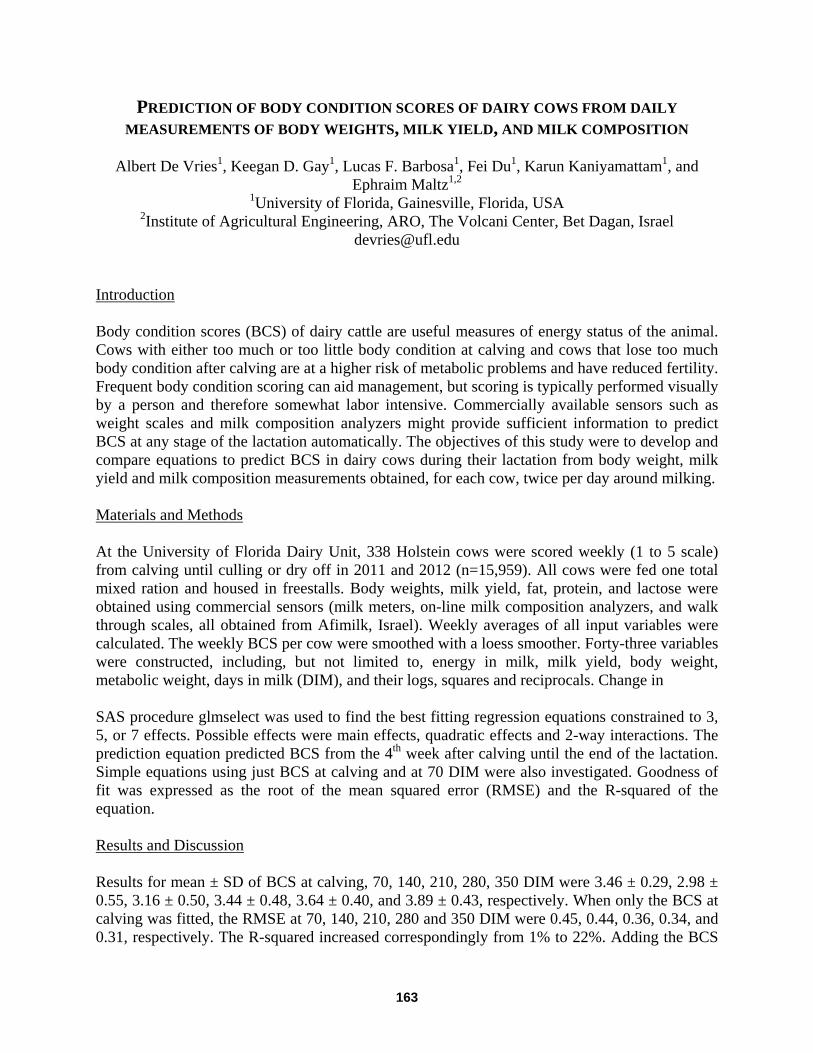
PREDICTION OF BODY CONDITION SCORES OF DAIRY COWS FROM DAILY MEASUREMENTS OF BODY WEIGHTS, MILK YIELD, AND MILK COMPOSITION
Albert De Vries1, Keegan D. Gay1, Lucas F. Barbosa1, Fei Du1, Karun Kaniyamattam1, and
Ephraim Maltz1,2 1University of Florida, Gainesville, Florida, USA
2Institute of Agricultural Engineering, ARO, The Volcani Center, Bet Dagan, Israel [email protected]
Introduction Body condition scores (BCS) of dairy cattle are useful measures of energy status of the animal. Cows with either too much or too little body condition at calving and cows that lose too much body condition after calving are at a higher risk of metabolic problems and have reduced fertility. Frequent body condition scoring can aid management, but scoring is typically performed visually by a person and therefore somewhat labor intensive. Commercially available sensors such as weight scales and milk composition analyzers might provide sufficient information to predict BCS at any stage of the lactation automatically. The objectives of this study were to develop and compare equations to predict BCS in dairy cows during their lactation from body weight, milk yield and milk composition measurements obtained, for each cow, twice per day around milking. Materials and Methods At the University of Florida Dairy Unit, 338 Holstein cows were scored weekly (1 to 5 scale) from calving until culling or dry off in 2011 and 2012 (n=15,959). All cows were fed one total mixed ration and housed in freestalls. Body weights, milk yield, fat, protein, and lactose were obtained using commercial sensors (milk meters, on-line milk composition analyzers, and walk through scales, all obtained from Afimilk, Israel). Weekly averages of all input variables were calculated. The weekly BCS per cow were smoothed with a loess smoother. Forty-three variables were constructed, including, but not limited to, energy in milk, milk yield, body weight, metabolic weight, days in milk (DIM), and their logs, squares and reciprocals. Change in SAS procedure glmselect was used to find the best fitting regression equations constrained to 3, 5, or 7 effects. Possible effects were main effects, quadratic effects and 2-way interactions. The prediction equation predicted BCS from the 4th week after calving until the end of the lactation. Simple equations using just BCS at calving and at 70 DIM were also investigated. Goodness of fit was expressed as the root of the mean squared error (RMSE) and the R-squared of the equation. Results and Discussion Results for mean ± SD of BCS at calving, 70, 140, 210, 280, 350 DIM were 3.46 ± 0.29, 2.98 ± 0.55, 3.16 ± 0.50, 3.44 ± 0.48, 3.64 ± 0.40, and 3.89 ± 0.43, respectively. When only the BCS at calving was fitted, the RMSE at 70, 140, 210, 280 and 350 DIM were 0.45, 0.44, 0.36, 0.34, and 0.31, respectively. The R-squared increased correspondingly from 1% to 22%. Adding the BCS
163
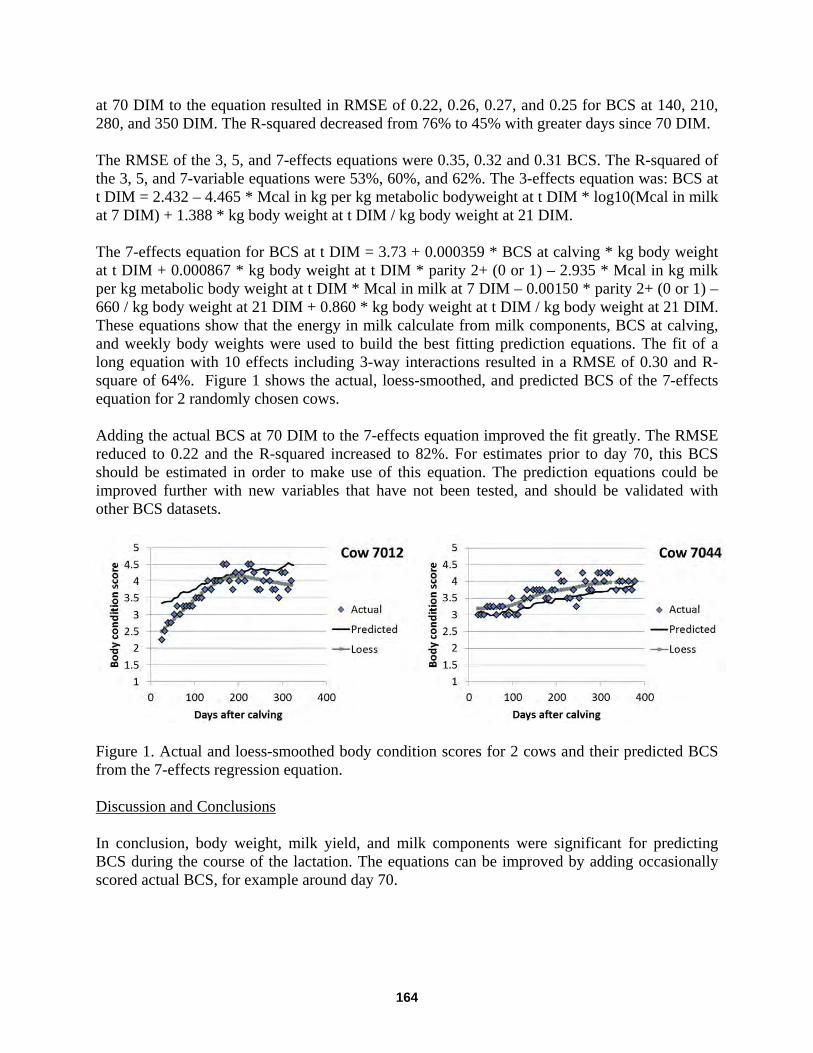
at 70 DIM to the equation resulted in RMSE of 0.22, 0.26, 0.27, and 0.25 for BCS at 140, 210, 280, and 350 DIM. The R-squared decreased from 76% to 45% with greater days since 70 DIM. The RMSE of the 3, 5, and 7-effects equations were 0.35, 0.32 and 0.31 BCS. The R-squared of the 3, 5, and 7-variable equations were 53%, 60%, and 62%. The 3-effects equation was: BCS at t DIM = 2.432 – 4.465 * Mcal in kg per kg metabolic bodyweight at t DIM * log10(Mcal in milk at 7 DIM) + 1.388 * kg body weight at t DIM / kg body weight at 21 DIM. The 7-effects equation for BCS at t DIM = 3.73 + 0.000359 * BCS at calving * kg body weight at t DIM + 0.000867 * kg body weight at t DIM * parity 2+ (0 or 1) – 2.935 * Mcal in kg milk per kg metabolic body weight at t DIM * Mcal in milk at 7 DIM – 0.00150 * parity 2+ (0 or 1) – 660 / kg body weight at 21 DIM + 0.860 * kg body weight at t DIM / kg body weight at 21 DIM. These equations show that the energy in milk calculate from milk components, BCS at calving, and weekly body weights were used to build the best fitting prediction equations. The fit of a long equation with 10 effects including 3-way interactions resulted in a RMSE of 0.30 and R-square of 64%. Figure 1 shows the actual, loess-smoothed, and predicted BCS of the 7-effects equation for 2 randomly chosen cows. Adding the actual BCS at 70 DIM to the 7-effects equation improved the fit greatly. The RMSE reduced to 0.22 and the R-squared increased to 82%. For estimates prior to day 70, this BCS should be estimated in order to make use of this equation. The prediction equations could be improved further with new variables that have not been tested, and should be validated with other BCS datasets.
Figure 1. Actual and loess-smoothed body condition scores for 2 cows and their predicted BCS from the 7-effects regression equation. Discussion and Conclusions In conclusion, body weight, milk yield, and milk components were significant for predicting BCS during the course of the lactation. The equations can be improved by adding occasionally scored actual BCS, for example around day 70.
164
PEDOMETER ACTIVITY PREDICTS PROBABILITY OF PREGNANCY AFTER TIMED-ARTIFICIAL INSEMINATION
Kathy G. Arriola and Albert De Vries
University of Florida, Gainesville, Florida, USA [email protected]
Introduction Cows that are in estrus often display greater walking activity. For example, Kiddy (1977) reported that cows housed in free stalls increased activity about 4 times when cows were in estrus and cows housed in comfort stalls increased activity about 2.7 times, demonstrating that physical activity increased when cows were in estrus. Several studies reported a close relationship between walking activity and fertility in dairy cows using pedometers (Yániz et al., 2003, López-Gatius et al., 2005). Reproductive programs based on timed-artificial insemination (TAI) do not depend on estrus detection, but cows with increased activity at TAI may be more fertile than cows without increased activity. Knowledge of the fertility of a TAI of an individual cow might be useful for precision breeding, such as the use of sexed semen or beef semen. The objective of this study was to investigate how walking activity at TAI was associated with the probability of pregnancy. Materials and Methods Data were collected from a herd of approximately 500 Holstein cows at the University of Florida Dairy Unit from December, 2009 to November, 2012. Cows were fed a TMR ad libitum according to NRC requirements. Cows were housed in free stalls open-sided barns fitted with fans and misters for cooling. Cows were grouped by level of milk production and milked twice daily approximately 12 hours apart. All cows received the Ovsynch56 estrus synchronization protocol. Timed AI was performed 16 h after the second injection of GnRH. Therefore, the earliest insemination time was at 74 DIM. Pregnancy diagnosis was performed 32-60 days post insemination by ultrasound. Each cow was fitted with an AfiTag pedometer from Afimilk, Israel. Pedometer readings were taken at the milking parlor twice daily and stored in a computer database for further analysis. Data were collected from 2525 observations which include a full Ovsynch56 prior to TAI, outcome of the insemination, and twice daily step counts for the 10 days prior to the TAI. The ratio of the steps/hour on the evening before TAI and the average steps/hour on the evenings in the 9 days prior was calculated as a predictor variable. The relationship between walking activity and probability of pregnancy was determined by logistic regression using parity (1 or >1) and ratio as independent variables and outcome of the insemination at pregnancy diagnosis as the dependent variable using procedure Glimmix in SAS. The probability of pregnancy was calculated as 1 / (1 + e-(b0 + b1*ratio)). For the histogram, ratios were rounded to the nearest 0.1.
165
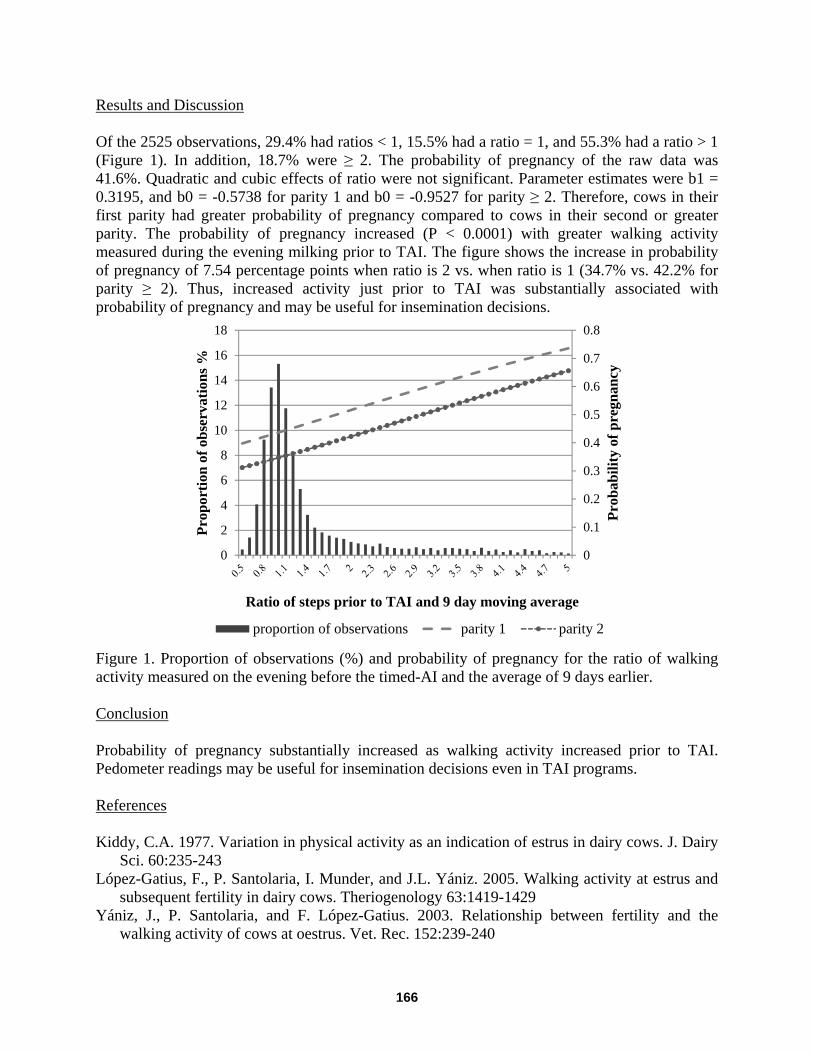
Results and Discussion Of the 2525 observations, 29.4% had ratios < 1, 15.5% had a ratio = 1, and 55.3% had a ratio > 1 (Figure 1). In addition, 18.7% were ≥ 2. The probability of pregnancy of the raw data was 41.6%. Quadratic and cubic effects of ratio were not significant. Parameter estimates were b1 = 0.3195, and b0 = -0.5738 for parity 1 and b0 = -0.9527 for parity ≥ 2. Therefore, cows in their first parity had greater probability of pregnancy compared to cows in their second or greater parity. The probability of pregnancy increased (P < 0.0001) with greater walking activity measured during the evening milking prior to TAI. The figure shows the increase in probability of pregnancy of 7.54 percentage points when ratio is 2 vs. when ratio is 1 (34.7% vs. 42.2% for parity ≥ 2). Thus, increased activity just prior to TAI was substantially associated with probability of pregnancy and may be useful for insemination decisions.
Figure 1. Proportion of observations (%) and probability of pregnancy for the ratio of walking activity measured on the evening before the timed-AI and the average of 9 days earlier. Conclusion Probability of pregnancy substantially increased as walking activity increased prior to TAI. Pedometer readings may be useful for insemination decisions even in TAI programs. References Kiddy, C.A. 1977. Variation in physical activity as an indication of estrus in dairy cows. J. Dairy
Sci. 60:235-243 López-Gatius, F., P. Santolaria, I. Munder, and J.L. Yániz. 2005. Walking activity at estrus and
subsequent fertility in dairy cows. Theriogenology 63:1419-1429 Yániz, J., P. Santolaria, and F. López-Gatius. 2003. Relationship between fertility and the
walking activity of cows at oestrus. Vet. Rec. 152:239-240
0
0.1
0.2
0.3
0.4
0.5
0.6
0.7
0.8
0
2
4
6
8
10
12
14
16
18
Prob
abili
ty o
f pre
gnan
cy
Prop
ortio
n of
obs
erva
tions
%
Ratio of steps prior to TAI and 9 day moving average
proportion of observations parity 1 parity 2
166
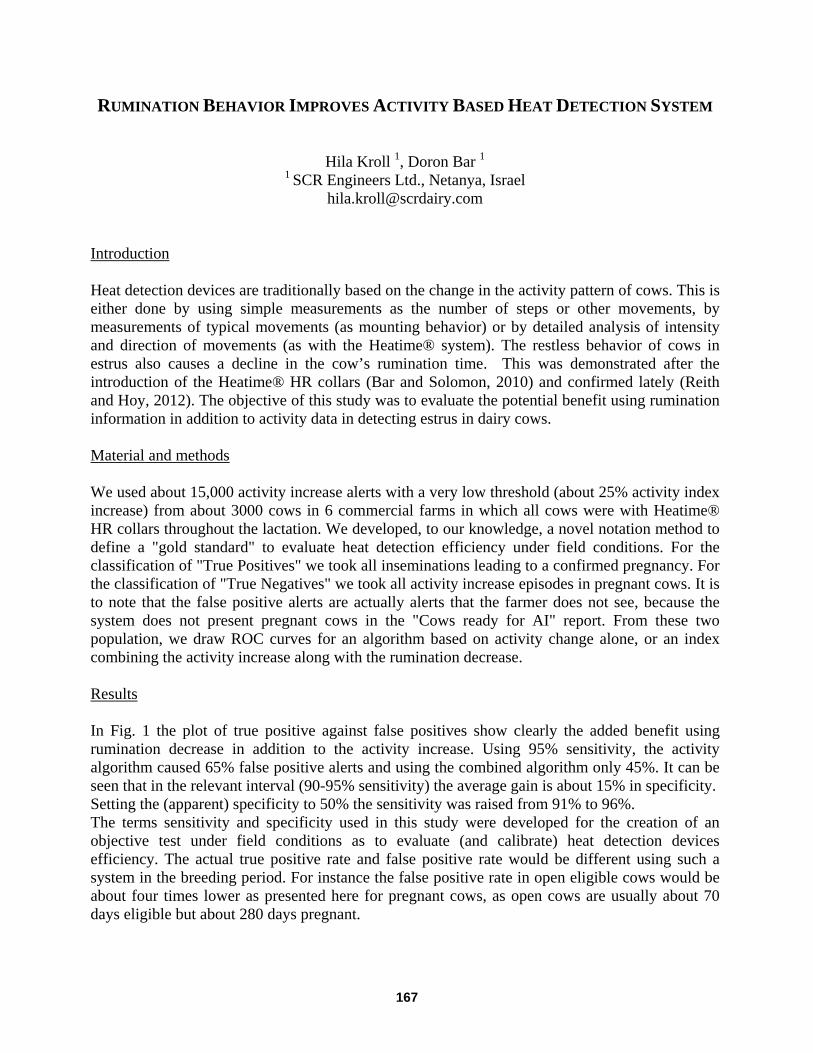
RUMINATION BEHAVIOR IMPROVES ACTIVITY BASED HEAT DETECTION SYSTEM
Hila Kroll 1, Doron Bar 1 1 SCR Engineers Ltd., Netanya, Israel
[email protected] Introduction Heat detection devices are traditionally based on the change in the activity pattern of cows. This is either done by using simple measurements as the number of steps or other movements, by measurements of typical movements (as mounting behavior) or by detailed analysis of intensity and direction of movements (as with the Heatime® system). The restless behavior of cows in estrus also causes a decline in the cow’s rumination time. This was demonstrated after the introduction of the Heatime® HR collars (Bar and Solomon, 2010) and confirmed lately (Reith and Hoy, 2012). The objective of this study was to evaluate the potential benefit using rumination information in addition to activity data in detecting estrus in dairy cows. Material and methods We used about 15,000 activity increase alerts with a very low threshold (about 25% activity index increase) from about 3000 cows in 6 commercial farms in which all cows were with Heatime® HR collars throughout the lactation. We developed, to our knowledge, a novel notation method to define a "gold standard" to evaluate heat detection efficiency under field conditions. For the classification of "True Positives" we took all inseminations leading to a confirmed pregnancy. For the classification of "True Negatives" we took all activity increase episodes in pregnant cows. It is to note that the false positive alerts are actually alerts that the farmer does not see, because the system does not present pregnant cows in the "Cows ready for AI" report. From these two population, we draw ROC curves for an algorithm based on activity change alone, or an index combining the activity increase along with the rumination decrease. Results In Fig. 1 the plot of true positive against false positives show clearly the added benefit using rumination decrease in addition to the activity increase. Using 95% sensitivity, the activity algorithm caused 65% false positive alerts and using the combined algorithm only 45%. It can be seen that in the relevant interval (90-95% sensitivity) the average gain is about 15% in specificity. Setting the (apparent) specificity to 50% the sensitivity was raised from 91% to 96%. The terms sensitivity and specificity used in this study were developed for the creation of an objective test under field conditions as to evaluate (and calibrate) heat detection devices efficiency. The actual true positive rate and false positive rate would be different using such a system in the breeding period. For instance the false positive rate in open eligible cows would be about four times lower as presented here for pregnant cows, as open cows are usually about 70 days eligible but about 280 days pregnant.
167
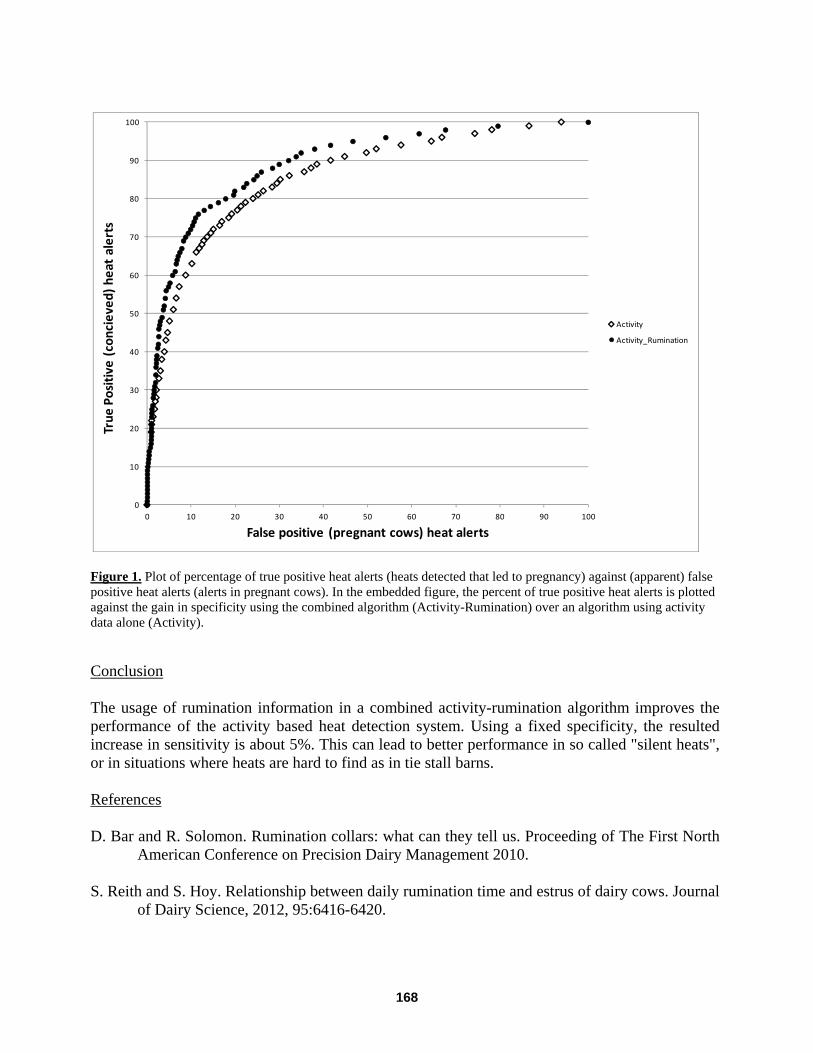
Figure 1. Plot of percentage of true positive heat alerts (heats detected that led to pregnancy) against (apparent) false positive heat alerts (alerts in pregnant cows). In the embedded figure, the percent of true positive heat alerts is plotted against the gain in specificity using the combined algorithm (Activity-Rumination) over an algorithm using activity data alone (Activity).
Conclusion The usage of rumination information in a combined activity-rumination algorithm improves the performance of the activity based heat detection system. Using a fixed specificity, the resulted increase in sensitivity is about 5%. This can lead to better performance in so called "silent heats", or in situations where heats are hard to find as in tie stall barns. References D. Bar and R. Solomon. Rumination collars: what can they tell us. Proceeding of The First North
American Conference on Precision Dairy Management 2010. S. Reith and S. Hoy. Relationship between daily rumination time and estrus of dairy cows. Journal
of Dairy Science, 2012, 95:6416-6420.
0
10
20
30
40
50
60
70
80
90
100
0 10 20 30 40 50 60 70 80 90 100
True
Pos
itive
(co
ncie
ved)
hea
t al
erts
False positive (pregnant cows) heat alerts
Activity
Activity_Rumination
168
NEW INSIGHT IN THE ACTIVITY DATA OF DAIRY COWS
Tjebbe Huybrechts, Bart De Ketelaere and Wouter Saeys
Department of Biosystems, Division of Mechatronics, Biostatistics & Sensors, KU Leuven Leuven, Belgium
[email protected] In a scene of increasing farm size and decreasing fertility in high productive dairy cattle, oestrus detection aids become more and more popular on modern dairy farms. The most used method of automatic oestrus detection is based on the behavioral change occurring in cows in oestrus which is the increase of activity (Roelofs et al., 2005). This increased activity can be measured by pedometers which are, depending on the constructor, fixed to the leg or neck and register activity in 2 or 3 dimensions. The sensitivity of these detection systems is mostly above 80. But the main problem of the automatic oestrus detection system is revealed by the amount of false positive alerts(Firk et al., 2002; Saint-Dizier and Chastant-Maillard, 2012). The difficulty of monitoring activity lies in the diurnal and seasonal pattern of the data. Many monitoring algorithms are based on a simple comparison between a recent and an older mean activity. Roelofs et al. (2005) obtained the best results using a threshold equal to the sum of the mean of the last 10 days and 2.5 times the standard deviation. To work around the diurnal pattern in the activity data, the data are only compared with data registered on the same time during the day. Still, the fact that activity is not normally distributed can be the reason of the unsatisfactory accuracy. In an attempt to improve results, methods borrowed from time series analysis such as smoothed variance, day to day comparison, moving average and exponential smoothing are used on activity data as well (Firk et al., 2002). These techniques do not include any physiological background making them less interpretable. In this study a solution that is based on a physiological model is proposed to model activity data so that they can be used in a monitoring scheme. Data of cows equipped with ALPRO (Delaval Inc., Kansas City, MO) electronic activity tags fixed on neckbands. Cows were followed for more than five years on multiple lactations. In this system the raw data of the activity sensor is converted into an activity index which is registered every hour. Based on a simple physiological basis a new insight was gained on the nonnormal distribution of the activity data that are typically encountered (Figure 1). The nonnormal data were modeled as the mixture of two normal activity distributions, one related to standing and one related to lying. Gaussian Mixture Models (GMM) were used to estimate the means and standard deviations of both distributions, as well as the mixing fraction that is related to the time fraction of laying and standing. The results obtained show that there is a very good accordance between the observed distributions and the Gaussian Mixture. Furthermore, the estimated fraction of laying was 10.5 ± 1.65 hours which is well in accordance with literature (Munksgaard et al., 2005). These results open a range of possibilities to a better understanding and monitoring of cow activity data. The ratio of standing and lying behavior holds important information on the current status of the cow and can increase the accuracy of today’s oestrus detections systems. Also the detection of lameness and other diseases could potentially be detected with the presented technique.
169
Figure 1: Activity histogram of the whole lactation of Cow no.155 with both Standing and Lying activity distributions and overall activity.
References
Firk, R., E. Stamer, W. Junge, and J. Krieter. 2002. Automation of oestrus detection in dairy cows: a review. Livestock Production Science. 75:219–232.
Munksgaard, L., M.B. Jensen, L.J. Pedersen, S.W. Hansen, and L. Matthews. 2005. Quantifying behavioural priorities—effects of time constraints on behaviour of dairy cows, Bos taurus. Applied Animal Behaviour Science. 92:3–14.
Roelofs, J.B., F.J.C.M. van Eerdenburg, N.M. Soede, and B. Kemp. 2005. Pedometer readings for estrous detection and as predictor for time of ovulation in dairy cattle. Theriogenology. 64:1690–703.
Saint-Dizier, M., and S. Chastant-Maillard. 2012. Towards an automated detection of oestrus in dairy cattle. Reproduction in domestic animals = Zuchthygiene. 47:1056–61.
170
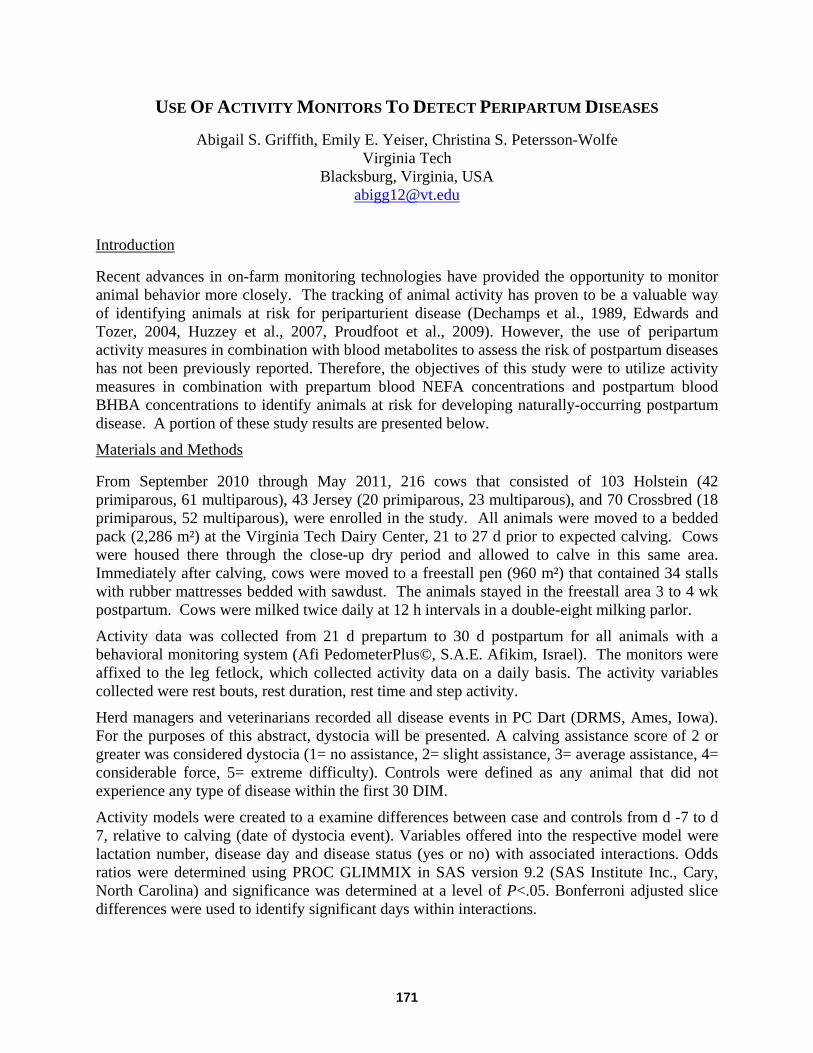
USE OF ACTIVITY MONITORS TO DETECT PERIPARTUM DISEASES
Abigail S. Griffith, Emily E. Yeiser, Christina S. Petersson-Wolfe Virginia Tech
Blacksburg, Virginia, USA [email protected]
Introduction
Recent advances in on-farm monitoring technologies have provided the opportunity to monitor animal behavior more closely. The tracking of animal activity has proven to be a valuable way of identifying animals at risk for periparturient disease (Dechamps et al., 1989, Edwards and Tozer, 2004, Huzzey et al., 2007, Proudfoot et al., 2009). However, the use of peripartum activity measures in combination with blood metabolites to assess the risk of postpartum diseases has not been previously reported. Therefore, the objectives of this study were to utilize activity measures in combination with prepartum blood NEFA concentrations and postpartum blood BHBA concentrations to identify animals at risk for developing naturally-occurring postpartum disease. A portion of these study results are presented below.
Materials and Methods
From September 2010 through May 2011, 216 cows that consisted of 103 Holstein (42 primiparous, 61 multiparous), 43 Jersey (20 primiparous, 23 multiparous), and 70 Crossbred (18 primiparous, 52 multiparous), were enrolled in the study. All animals were moved to a bedded pack (2,286 m²) at the Virginia Tech Dairy Center, 21 to 27 d prior to expected calving. Cows were housed there through the close-up dry period and allowed to calve in this same area. Immediately after calving, cows were moved to a freestall pen (960 m²) that contained 34 stalls with rubber mattresses bedded with sawdust. The animals stayed in the freestall area 3 to 4 wk postpartum. Cows were milked twice daily at 12 h intervals in a double-eight milking parlor.
Activity data was collected from 21 d prepartum to 30 d postpartum for all animals with a behavioral monitoring system (Afi PedometerPlus©, S.A.E. Afikim, Israel). The monitors were affixed to the leg fetlock, which collected activity data on a daily basis. The activity variables collected were rest bouts, rest duration, rest time and step activity.
Herd managers and veterinarians recorded all disease events in PC Dart (DRMS, Ames, Iowa). For the purposes of this abstract, dystocia will be presented. A calving assistance score of 2 or greater was considered dystocia (1= no assistance, 2= slight assistance, 3= average assistance, 4= considerable force, 5= extreme difficulty). Controls were defined as any animal that did not experience any type of disease within the first 30 DIM.
Activity models were created to a examine differences between case and controls from d -7 to d 7, relative to calving (date of dystocia event). Variables offered into the respective model were lactation number, disease day and disease status (yes or no) with associated interactions. Odds ratios were determined using PROC GLIMMIX in SAS version 9.2 (SAS Institute Inc., Cary, North Carolina) and significance was determined at a level of P<.05. Bonferroni adjusted slice differences were used to identify significant days within interactions.
171
Results and Discussion
A total of 16 cows were diagnosed with dystocia (calving assistance score ≥ 2). The interaction of disease day by dystocia was only significant for rest bouts. Animals that experienced dystocia had more rest bouts (13.7 ± 1.3 bouts) than the controls (10.5 ± 0.5 bouts) (Figure 1). This corresponds to a 23.4% increase in rest bouts. These results are consistent with previously published study by Proudfoot et al. (2009) who reported cows with dystocia had an increased number of bouts in the 24 h prior to calving (10.9 ± 0.7 bouts/d) as compared with in the non-diseased group (8.3 ± 0.7 bouts/d), which was equal to a 23.9% increase.
Conclusions
This study showed changes in rest bouts for animals who experienced dystocia compared to their healthy herdmates. As work in this area continues, we hope to examine the effects around other peripartum diseases including subclinical ketosis, milk fever, displaced abomasum and mastitis. The identification of animals at risk for periparturient disease may allow producers to implement a proactive strategy for disease treatment resulting in improved animal well-being and reduced economic losses associated with health problems during the transition period.
References
Dechamps, P., B. Nicks, B. Canart, M. Gielen, and L. Istasse. 1989. A Note on Resting Behavior of Cows before and after Calving in 2 Different Housing Systems. Applied Animal Behaviour Science 23(1-2):99-105.
Edwards, J. L. and P. R. Tozer. 2004. Using activity and milk yield as predictors of fresh cow disorders. J Dairy Sci 87(2):524-531.
Huzzey, J. M., D. M. Veira, D. M. Weary, and M. A. von Keyserlingk. 2007. Prepartum behavior and dry matter intake identify dairy cows at risk for metritis. J Dairy Sci 90(7):3220-3233.
Proudfoot, K. L., J. M. Huzzey, and M. A. von Keyserlingk. 2009. The effect of dystocia on the dry matter intake and behavior of Holstein cows. J Dairy Sci 92(10):4937-4944.
-7 -6 -5 -4 -3 -2 -1 0 1 2 3 4 5 6 70.0
2.5
5.0
7.5
10.0
12.5
15.0
17.5No DystocDystocia
*
Disease day: P<0.0001Disease day x Dystocia YN: NS
PDisease Day
Res
t Bou
ts
A
Figure 1. Comparison of rest bouts (#/d) from d -7 to d 7 after onset of disease between cows that experienced dystocia (n=16) and those that were not diseased (n=94)
172
DETECTION OF HEALTH PROBLEMS AND DAIRY COW WELFARE MONITORING WITH THE AID OF BEHAVIOR PARAMETERS
Eva Ishay1, Mattia Fustini2, Alberto Palmonari2 and Alon Arazi1 1afimilk, Afikim, Israel
2University of Bologna, Bologna, Italy [email protected]
Introduction
Maintaining good health and comfortable conditions are needed in order to ensure cows' productivity and fertility. Adequate cow rest time is vital to ensure cows' health and welfare. Different works have shown the relation of cow's rest time with milk production, feed consumption, rumination efficiency and health, particularly hoof health. Rest behavior (rest time and rest bout duration) was found as a potential indicator for detecting health disorders in general and lame cows in particular. A new model for detecting lame cows based on cows' rest behavior was developed (Ishay, 2012 unpublished data). The objective of this study was evaluating the accuracy of the “lameness detection” model under commercial dairy herds conditions. The model was tested during the end of 2012 in three commercial herds and one research dairy unit. Initial results from one of the commercial herds are presented here.
Material and Methods
Animals: 1530 milking cows commercial Spanish herd. The cows were milked three times a day, feed TMR and housed in free stalls pens. Study design: Behavior tags (Pedometer PlusTM, afimilk, Israel) were fitted to 651 of the milking cows. These cows were selected randomly by the herd's manager. For seven consecutive weeks (30/9/2012-17/11/2012) weekly lists of cows suspected for lameness, based on the recorded rest parameters, were created. These cows were scored on the same week for locomotion score (LS) scaled 1-5 (1 sound, 5 severe lame) by the herd's staff. In addition any lame cow or cow with hoof damage, which was observed by the herd's staff during that week, was recorded and considered as "lame cow". Every "suspected" cow that was found with LS≥2 (mildly lame-arched back while walking) was removed from the subsequent weeks of the study. Only cows with rest data for at least one week were included. Data analysis: every week cows with LS ≥2 and cow reported lame by the herd's staff were classified as lameness event (LS+). All cows with LS=1 (sound - walk with level back) or cows with no LS records on that week were classified not lame (LS-). All cows detected by the model were classified model score positive (MS+), cows not detected by the model was classified model score negative (MS-). The accuracy of the model (sensitivity, specificity, positive predictive value, negative predictive value and accuracy) for detecting lame cows with LS≥2 or LS≥3 (moderate lame – short strides of one or more legs) were evaluated, both for cow by week event (CBW) and for cow by study event (CBS).
173
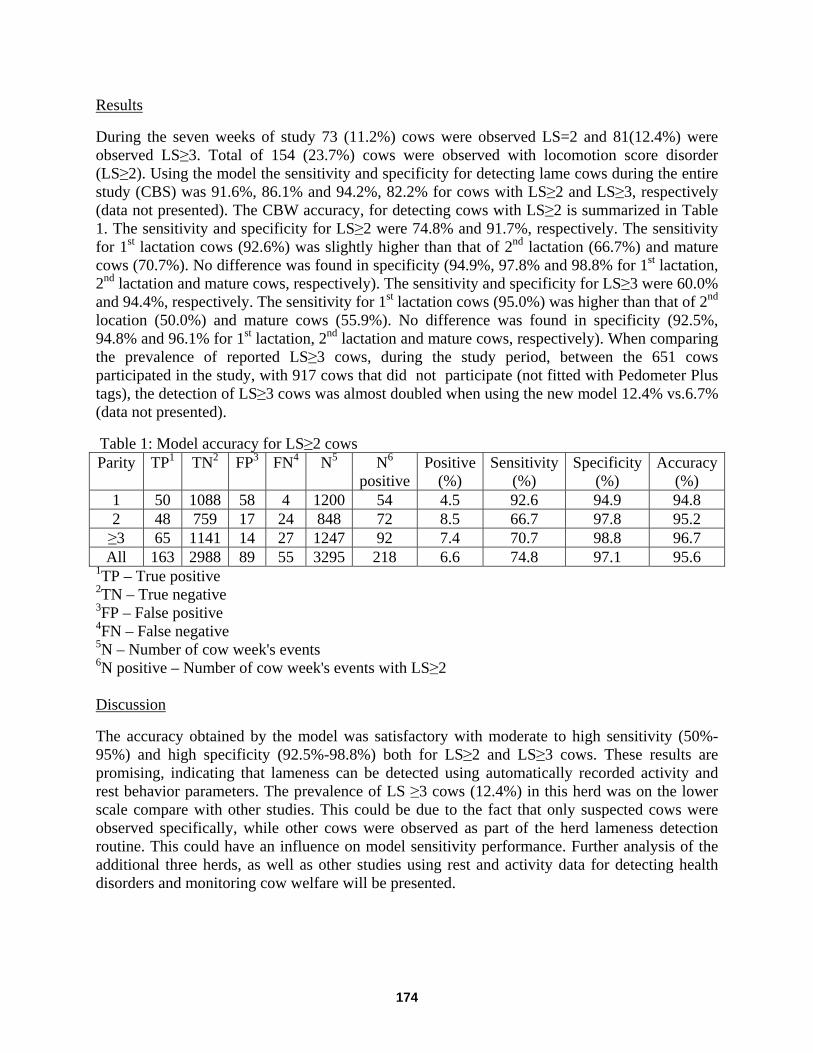
Results
During the seven weeks of study 73 (11.2%) cows were observed LS=2 and 81(12.4%) were observed LS≥3. Total of 154 (23.7%) cows were observed with locomotion score disorder (LS≥2). Using the model the sensitivity and specificity for detecting lame cows during the entire study (CBS) was 91.6%, 86.1% and 94.2%, 82.2% for cows with LS≥2 and LS≥3, respectively (data not presented). The CBW accuracy, for detecting cows with LS≥2 is summarized in Table 1. The sensitivity and specificity for LS≥2 were 74.8% and 91.7%, respectively. The sensitivity for 1st lactation cows (92.6%) was slightly higher than that of 2nd lactation (66.7%) and mature cows (70.7%). No difference was found in specificity (94.9%, 97.8% and 98.8% for 1st lactation, 2nd lactation and mature cows, respectively). The sensitivity and specificity for LS≥3 were 60.0% and 94.4%, respectively. The sensitivity for 1st lactation cows (95.0%) was higher than that of 2nd location (50.0%) and mature cows (55.9%). No difference was found in specificity (92.5%, 94.8% and 96.1% for 1st lactation, 2nd lactation and mature cows, respectively). When comparing the prevalence of reported LS≥3 cows, during the study period, between the 651 cows participated in the study, with 917 cows that did not participate (not fitted with Pedometer Plus tags), the detection of LS≥3 cows was almost doubled when using the new model 12.4% vs.6.7% (data not presented).
Table 1: Model accuracy for LS≥2 cows Parity TP1 TN2 FP3 FN4 N5 N6
positive Positive
(%) Sensitivity
(%) Specificity
(%) Accuracy
(%) 1 50 1088 58 4 1200 54 4.5 92.6 94.9 94.8 2 48 759 17 24 848 72 8.5 66.7 97.8 95.2 ≥3 65 1141 14 27 1247 92 7.4 70.7 98.8 96.7 All 163 2988 89 55 3295 218 6.6 74.8 97.1 95.6
1TP – True positive 2TN – True negative 3FP – False positive 4FN – False negative 5N – Number of cow week's events 6N positive – Number of cow week's events with LS≥2 Discussion
The accuracy obtained by the model was satisfactory with moderate to high sensitivity (50%-95%) and high specificity (92.5%-98.8%) both for LS≥2 and LS≥3 cows. These results are promising, indicating that lameness can be detected using automatically recorded activity and rest behavior parameters. The prevalence of LS ≥3 cows (12.4%) in this herd was on the lower scale compare with other studies. This could be due to the fact that only suspected cows were observed specifically, while other cows were observed as part of the herd lameness detection routine. This could have an influence on model sensitivity performance. Further analysis of the additional three herds, as well as other studies using rest and activity data for detecting health disorders and monitoring cow welfare will be presented.
174
WHAT WE HAVE LEARNED USING A COMPUTER CALF FEEDER FOR BOTH MILK AND GRAIN AT THE UNIVERSITY OF MINNESOTA SOUTHERN RESEARCH AND
OUTREACH CENTER (SROC) IN WASECA
David M. Ziegler and Hugh Chester-Jones University of Minnesota SROC
Waseca, Minnesota, USA [email protected]; [email protected]
Background In 2011, SROC purchased an Urban U40-Twin feeder for feeding calves milk replacer and two grain feeding stations1. The U40 twin has two feeding stations with the ability to use 2 different milk replacers at the same time and the ability to distribute a dry medication or additive at the time of mixing. In preparation for the autofeeder project, a room that had been used for elevated calf stalls was remodeled. Two pens, housing 23 calves in each, were designed to provide approximately 32 to 33 sq ft/calf. One automatic waterer was accessible to calves in each pen. The existing barn ventilation units were modified to allow a positive pressure system. A thermostat controlled the heating and air movement. In the winter months the room was heated to 45 oF . In the warmer spring and summer months the room was maintained at comfortable temperatures by increasing air exchanges. The pens were well-bedded using sawdust over concrete floor. The room is power-washed and cleaned between calf groups. The automatic calf feeder room is used as a 5th room in a calf housing rotation. Since September 2011 approximately 300 calves or 7 calf groups have been through the room. In the SROC calf raising project, calves are raised from 3 different commercial dairies and picked up twice weekly week at 2 to 5 days of age. When the automatic feeder calf room is open in the rotation, calves will be placed directly onto the feeder upon arrival. SROC goals for using the automatic feeder These include evaluation of: - an automatic grain feeder vs. bunk feeding; calf performance and health with different milk feeding rates; ventilation system affects on health and different management schemes in training calves to use the feeder. Grain feeder vs. bunk results For the first group of calves in September 2011, we used one grain feeding station with each milk feeding station. It was soon apparent that one feeding station is not enough for 23 calves. As many as 9 calves were waiting at a time to get into the feeding station after weaning. Prior to the second group of calves, two grain feeding stations were placed in one pen (10 to 11 calves per feeding station) and a wooden bunk was built for the group of calves in the second pen. This worked much better although the intake was a little lower for the grain feeder vs. the bunk. Calves learned very quickly to nibble grain from the bunk and they liked the social aspect of eating together. Two calf groups were managed in this configuration. It was determined that even though the grain feeder had lower in intake vs. the bunk, we still had acceptable calf growth with the grain feeder. The main advantage for using the grain feeders was the ability to monitor
175

individual feed intakes for research. To make proper use of the grain feeders in each pen we needed to purchase 2 additional grain feeders but the cost was prohibitive. We decided to remove the grain feeders and use the bunk in each pen for much less investment. Performance and health results The initial calf milk feeding system with the automatic feeder was focused on our standard feeding rate of 1.25 lb of a 20% protein: 20% fat milk replacer powder per calf for 35 days and cutting this amount in half until weaning at day 42. This gave us a direct comparison to the individually-fed calves. Milk intake from the automatic feeder was summarized biweekly. We observed that consistently missed the target intake the first 2 weeks on the feeder by as much as 10 to 20%. Some calves adapted quickly to using the feeder but even with manual help, many did not during the first 2 weeks. The number of reasons for missing the target included: timid calves, sick calves, stocking density (early calves in the group learn quicker) and settings on the machine. Health costs in the automatic feeder groups from have been as high as or higher than our conventional individual feeding system. Our experience using our standard program indicated calves do not do as well under group vs. individual feeding. We suspect the main reason is calves regress too much during the learning curve the first 2 weeks on the feeder. Also calves may be getting more exercise. After 2 weeks all calves have adapted well to the feeder and gains are as expected. However, there is more of a range of performance especially among calves that do not adapt to the feeder. The milk feeding system has been re-assessed a number of times. Milk replacers have included a 20:20 and 24:20. Feeding rates we have used include 1.25, 1.56 (6 liters volume), 1.65, 1.88 (7 liter volume) and 2.19 (8 liter volume) lbs/hd daily. .Mixing rates have ranged from 12.5% to 14.7% solids and amounts available per feeding have ranged from 2 to 4 lbs of mix. The higher feeding rates have resulted in higher calf performances but there is still more milk intake variation during the first 2 weeks than we expected. Grain intake from the bunk has been excellent. To overcome some of the social and age concerns within pens we tried individual pens for 1 week before putting calves onto the feeder vs. putting calves directly on the feeder. Calves did a little better when they were penned individually for 1 week but the calves still have to learn how to use the feeder after 1 week. We determined the extra labor involved was not economical. Summary Using an automatic milk feeding system can be very challenging. It will be easier to consistently raise better calves in a conventional system, less margin for error. It is easier to find sick calves in individual pens. Managers with good husbandry skills will make an automatic feeder work well but it will come at a higher feed cost and possibly health costs. If systems are not designed with proper ventilation it can be a disaster. There is not much labor savings the first 2 weeks but after the calves have learned how to use the feeder some labor savings are realized. We have a lot to learn and there is potential for improvements in health and economic efficiencies as we better manage these units. 1Financial support from Hubbard Feeds, Inc. and Milk Products was much appreciated.
176
ANALYSIS OF INVESTMENT IN AN ESTRUS DETECTION SYSTEM FOR DAIRY FARMS
Niels Rutten,1* Wilma Steeneveld,2 Chaidate Inchaisri3 and Henk Hogeveen1,2
1 Department of Farm Animal Health, Faculty of Veterinary Medicine, Utrecht University, 3584 CL, Utrecht, the Netherlands
2 Business Economics Group, Wageningen University, 6706 KN, Wageningen, the Netherlands 3 Department of Veterinary Medicine, Faculty of Veterinary Science, Chulalongkorn University,
10330, Bangkok, Thailand * [email protected]
Introduction Activity meters have been studied and are used in practice for the automated detection of estrus in dairy farming. Whereas, information on the economic consequences of using activity meters for automated detection of estrus is lacking. This information is, however, important for farmers to make an informed investment decision and for sensor manufacturers to explain the value of their product to farmers. The current study analyses the economic benefits of a sensor system for the detection of estrus, discusses its financial feasibility and appraises the investment in such a system. Method A herd level stochastic dynamic simulation model (adapted from Inchasiri et al. [1]) was used to simulate reproductive performance (including reproductive diseases) of a dairy herd. In short, this model simulates the reproductive status of a cow in weekly time steps and calculates the resulting milk production and number of calves born. The number of cow places is fixed to 130, therefore the model starts with 130 randomly drawn cows (in a Monte Carlo process) and simulates calvings and replacement of these cows in subsequent years. The herd is simulated over a ten year period for 385 herds. Default herd characteristics were a conception rate of 50%, an 8 week dry off period. A Wood lactation curve was adjusted for the cows parity and milk production level (average 8310 kg/cow/305 days). As pregnancy will decrease milk production, the milk production was corrected for each weak in gestation. Model inputs were derived from real farm data, obtained from Cattle Breeding Company, CRV. The distributions used for milk production and length of the recovery period after a reproductive disease were not available in the farm data, and were based on expertise. For the analysis, visual detection by the farmer is compared to automated detection with a sensor, in this case activity meters. For visual estrus detection, an estrus detection rate of 50% with an specificity of 100% was assumed. Accordingly, for automated estrus detection, an estrus detection rate of 80% with a specificity of 95% was assumed. The detection rate of activity meters was based on available literature. Price used to calculate the cash flow for the investment analysis were based on literature and expertise. The following prices were used, milk price 0.32 €/kg, feed cost 0.16188 €/kVEM, 30.23 €/insemination, calving management152 €/calf, calf sales 100 €/calf, labor cost 18 €/hr and replacement costs based on slaughter values and replacement heifer prices. Results Results (Table 1) show that an estrus detection rate of 50% results in an average calving interval of 419 days and an average yearly milk production of 1,032,278 kg. For activity meters, the results show that an estrus detection rate of 80% result in an average calving interval of 403
177
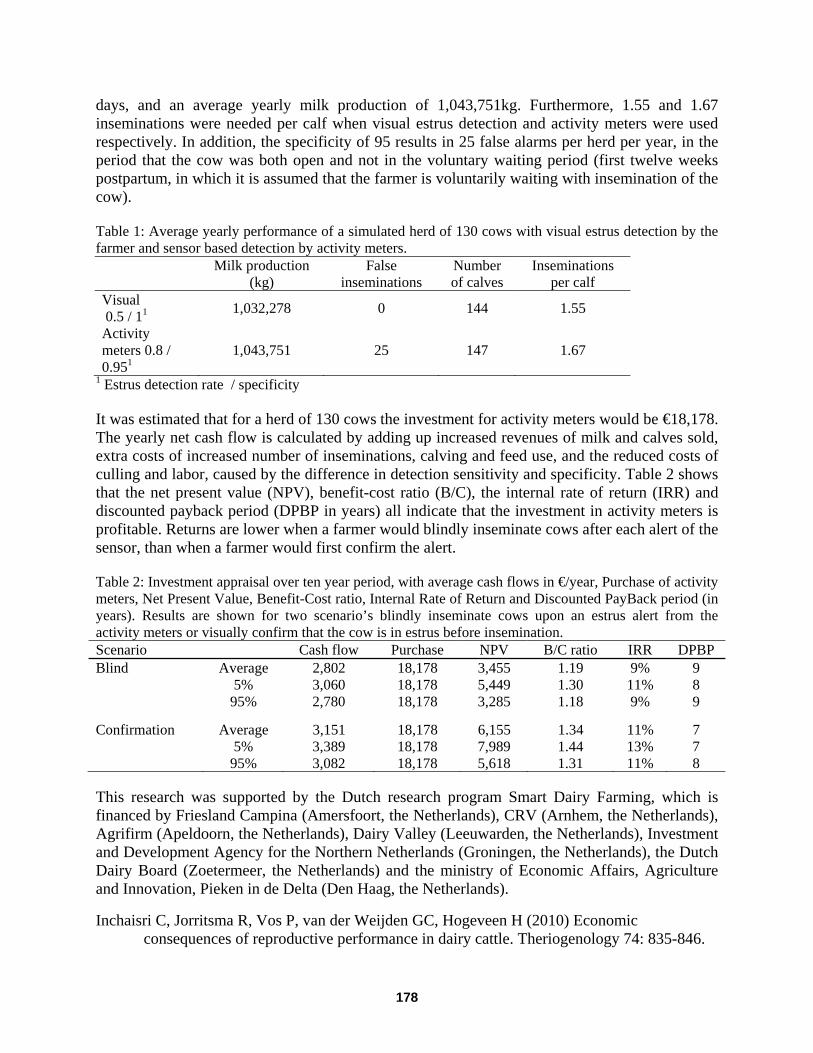
days, and an average yearly milk production of 1,043,751kg. Furthermore, 1.55 and 1.67 inseminations were needed per calf when visual estrus detection and activity meters were used respectively. In addition, the specificity of 95 results in 25 false alarms per herd per year, in the period that the cow was both open and not in the voluntary waiting period (first twelve weeks postpartum, in which it is assumed that the farmer is voluntarily waiting with insemination of the cow). Table 1: Average yearly performance of a simulated herd of 130 cows with visual estrus detection by the farmer and sensor based detection by activity meters.
Milk production
(kg) False
inseminations Number of calves
Inseminations per calf
Visual 0.5 / 11 1,032,278 0 144 1.55
Activity meters 0.8 / 0.951
1,043,751 25 147 1.67
1 Estrus detection rate / specificity It was estimated that for a herd of 130 cows the investment for activity meters would be €18,178. The yearly net cash flow is calculated by adding up increased revenues of milk and calves sold, extra costs of increased number of inseminations, calving and feed use, and the reduced costs of culling and labor, caused by the difference in detection sensitivity and specificity. Table 2 shows that the net present value (NPV), benefit-cost ratio (B/C), the internal rate of return (IRR) and discounted payback period (DPBP in years) all indicate that the investment in activity meters is profitable. Returns are lower when a farmer would blindly inseminate cows after each alert of the sensor, than when a farmer would first confirm the alert. Table 2: Investment appraisal over ten year period, with average cash flows in €/year, Purchase of activity meters, Net Present Value, Benefit-Cost ratio, Internal Rate of Return and Discounted PayBack period (in years). Results are shown for two scenario’s blindly inseminate cows upon an estrus alert from the activity meters or visually confirm that the cow is in estrus before insemination. Scenario Cash flow Purchase NPV B/C ratio IRR DPBP Blind Average 2,802 18,178 3,455 1.19 9% 9 5% 3,060 18,178 5,449 1.30 11% 8 95% 2,780 18,178 3,285 1.18 9% 9
Confirmation Average 3,151 18,178 6,155 1.34 11% 7 5% 3,389 18,178 7,989 1.44 13% 7 95% 3,082 18,178 5,618 1.31 11% 8 This research was supported by the Dutch research program Smart Dairy Farming, which is financed by Friesland Campina (Amersfoort, the Netherlands), CRV (Arnhem, the Netherlands), Agrifirm (Apeldoorn, the Netherlands), Dairy Valley (Leeuwarden, the Netherlands), Investment and Development Agency for the Northern Netherlands (Groningen, the Netherlands), the Dutch Dairy Board (Zoetermeer, the Netherlands) and the ministry of Economic Affairs, Agriculture and Innovation, Pieken in de Delta (Den Haag, the Netherlands).
Inchaisri C, Jorritsma R, Vos P, van der Weijden GC, Hogeveen H (2010) Economic consequences of reproductive performance in dairy cattle. Theriogenology 74: 835-846.
178
DIURNAL VARIATION IN LIVE WEIGHT FOR EVALUATION OF FEED RATION ALLOWANCE AND INTAKE
Dorte Bossen1, Tinna Hlidarsdottir2 and Vivi M. Thorup3
1Knowledge Centre of Agriculture, Aarhus, Denmark 2AgroTech, Aarhus, Denmark
3 Aarhus University, Dept. of Animal Science, Foulum, Denmark [email protected]
Introduction The potential of live weight measurements as management aid has long been recognised (e.g. Maltz et al, 1997). In Denmark automatic live weight measurement is carried out in approximately 400 dairy herds using Lely milking robots. Since the beginning of 2011 live weight registrations from many of these herds have been uploaded to the Danish Central Cattle database and analysis of these data in order to provide different frames for interpretation is going on (Thorup et al, 2013). This analysis has shown a herd specific diurnal pattern in live weight of the dairy cows related to feeding practise presented in the following. Materials and Methods Dairy cow live weight measurements (in total 19,049,108 observations) from Lely milking robots in 78 commercial Danish dairy herds from January 2011 until September 2012 were uploaded from the individual herds robotic management system to the Central Danish Cattle Database. Data was combined with information on lactation number and calving date and then passed an outlier detection program identifying and removing: 1) Obvious outliers (0.01 % of the measurements), 2) Days with deviating data on single robot level (0.2 % of the total number of measurements. Approximately 60% of the herds had 0-51 days with deviating data on single robot level out of at least 200 days of live weight registrations) and 3) Outliers on individual cow basis (0.08% of the measurements, identified by smoothing data within cow and robot using the Lowess function in R (Anonymous, 2012), identifying the standard deviation, classifying outliers as live weight measurements exceeding 3 times the standard deviation). In figure 1 the gray circles and black stars show live weight registrations of a cow daily visiting robot no. 1 and no. 2, respectively, from June 2011 until January 2012. A difference in the scaling of the two robot weighing scales is seen. In order to use live weight measurements obtained from different robots within herd, a correction for robot scale level was made. The absolute scale level is unknown, and therefore this analysis focused on live weight changes, not on absolute weight. Results and Discussion As examples figure 2 shows the diurnal pattern of live weights of primi- and multiparous cows in four herds. Approximate time of feeding is marked with short horizontal lines for each herd. The horizontal pattern is related to the pattern of feed delivery within herd. The data analysis revealed a herd specific diurnal pattern with an average peak-to-nadir amplitude of 38±13 kg and 32±8 kg for primiparous and multiparous cows, respectively. Assuming that the amplitude reflects the
179
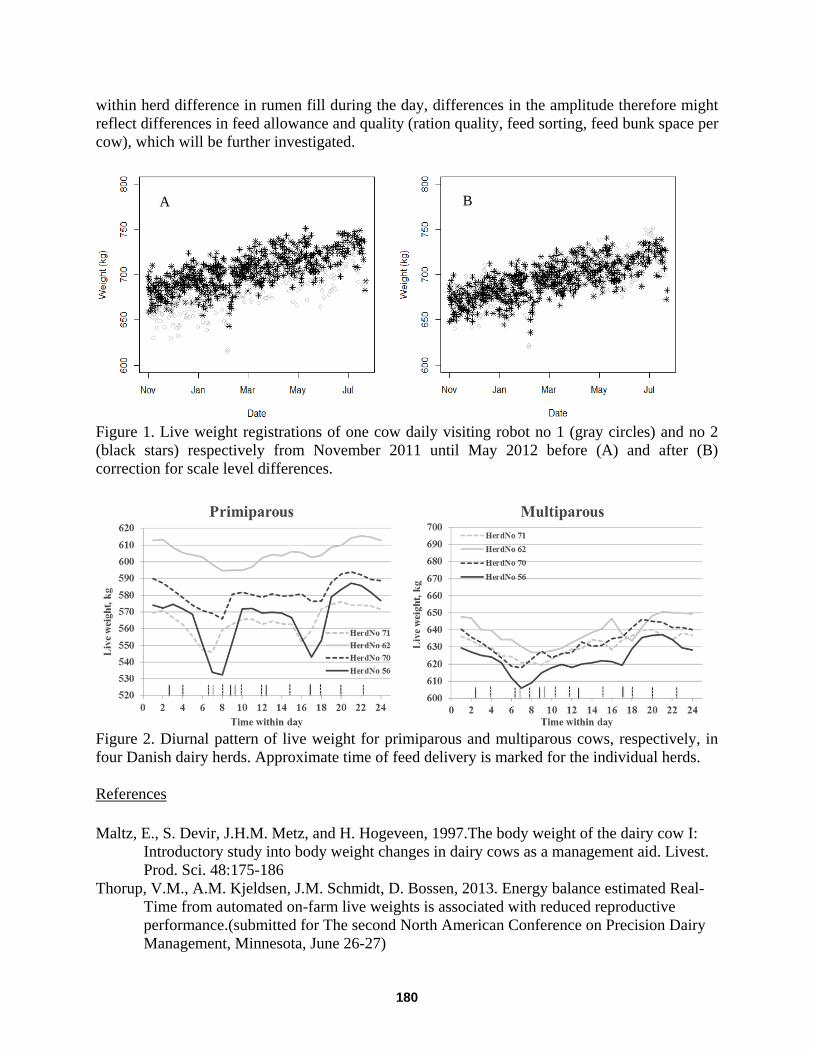
within herd difference in rumen fill during the day, differences in the amplitude therefore might reflect differences in feed allowance and quality (ration quality, feed sorting, feed bunk space per cow), which will be further investigated.
Figure 1. Live weight registrations of one cow daily visiting robot no 1 (gray circles) and no 2 (black stars) respectively from November 2011 until May 2012 before (A) and after (B) correction for scale level differences.
Figure 2. Diurnal pattern of live weight for primiparous and multiparous cows, respectively, in four Danish dairy herds. Approximate time of feed delivery is marked for the individual herds. References Maltz, E., S. Devir, J.H.M. Metz, and H. Hogeveen, 1997.The body weight of the dairy cow I:
Introductory study into body weight changes in dairy cows as a management aid. Livest. Prod. Sci. 48:175-186
Thorup, V.M., A.M. Kjeldsen, J.M. Schmidt, D. Bossen, 2013. Energy balance estimated Real-Time from automated on-farm live weights is associated with reduced reproductive performance.(submitted for The second North American Conference on Precision Dairy Management, Minnesota, June 26-27)
A B
180
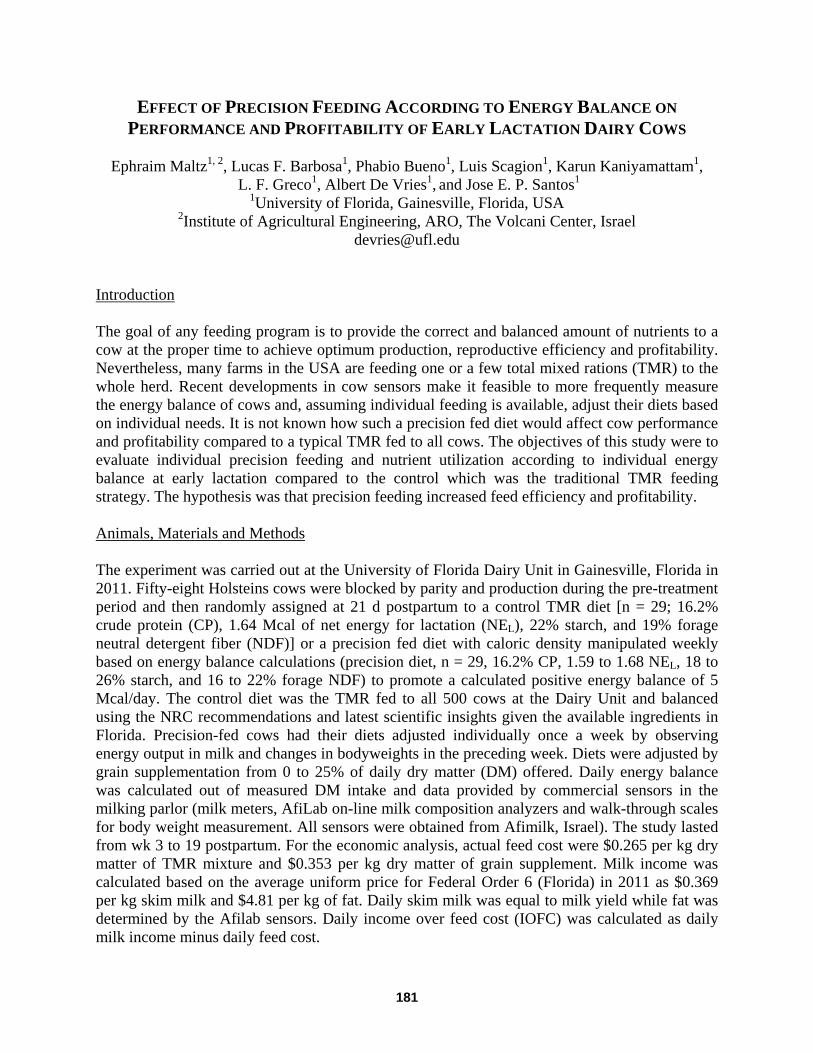
EFFECT OF PRECISION FEEDING ACCORDING TO ENERGY BALANCE ON PERFORMANCE AND PROFITABILITY OF EARLY LACTATION DAIRY COWS
Ephraim Maltz1, 2, Lucas F. Barbosa1, Phabio Bueno1, Luis Scagion1, Karun Kaniyamattam1,
L. F. Greco1, Albert De Vries1, and Jose E. P. Santos1 1University of Florida, Gainesville, Florida, USA
2Institute of Agricultural Engineering, ARO, The Volcani Center, Israel [email protected]
Introduction The goal of any feeding program is to provide the correct and balanced amount of nutrients to a cow at the proper time to achieve optimum production, reproductive efficiency and profitability. Nevertheless, many farms in the USA are feeding one or a few total mixed rations (TMR) to the whole herd. Recent developments in cow sensors make it feasible to more frequently measure the energy balance of cows and, assuming individual feeding is available, adjust their diets based on individual needs. It is not known how such a precision fed diet would affect cow performance and profitability compared to a typical TMR fed to all cows. The objectives of this study were to evaluate individual precision feeding and nutrient utilization according to individual energy balance at early lactation compared to the control which was the traditional TMR feeding strategy. The hypothesis was that precision feeding increased feed efficiency and profitability. Animals, Materials and Methods The experiment was carried out at the University of Florida Dairy Unit in Gainesville, Florida in 2011. Fifty-eight Holsteins cows were blocked by parity and production during the pre-treatment period and then randomly assigned at 21 d postpartum to a control TMR diet [n = 29; 16.2% crude protein (CP), 1.64 Mcal of net energy for lactation (NEL), 22% starch, and 19% forage neutral detergent fiber (NDF)] or a precision fed diet with caloric density manipulated weekly based on energy balance calculations (precision diet, n = 29, 16.2% CP, 1.59 to 1.68 NEL, 18 to 26% starch, and 16 to 22% forage NDF) to promote a calculated positive energy balance of 5 Mcal/day. The control diet was the TMR fed to all 500 cows at the Dairy Unit and balanced using the NRC recommendations and latest scientific insights given the available ingredients in Florida. Precision-fed cows had their diets adjusted individually once a week by observing energy output in milk and changes in bodyweights in the preceding week. Diets were adjusted by grain supplementation from 0 to 25% of daily dry matter (DM) offered. Daily energy balance was calculated out of measured DM intake and data provided by commercial sensors in the milking parlor (milk meters, AfiLab on-line milk composition analyzers and walk-through scales for body weight measurement. All sensors were obtained from Afimilk, Israel). The study lasted from wk 3 to 19 postpartum. For the economic analysis, actual feed cost were $0.265 per kg dry matter of TMR mixture and $0.353 per kg dry matter of grain supplement. Milk income was calculated based on the average uniform price for Federal Order 6 (Florida) in 2011 as $0.369 per kg skim milk and $4.81 per kg of fat. Daily skim milk was equal to milk yield while fat was determined by the Afilab sensors. Daily income over feed cost (IOFC) was calculated as daily milk income minus daily feed cost.
181
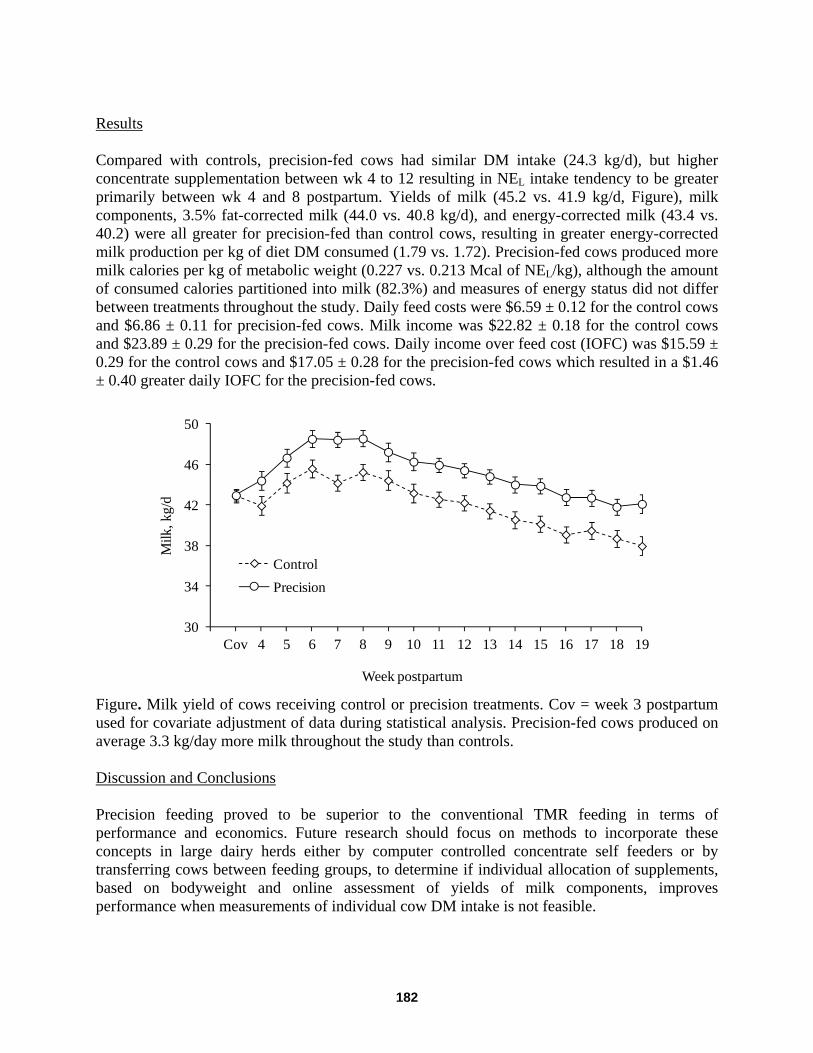
Results Compared with controls, precision-fed cows had similar DM intake (24.3 kg/d), but higher concentrate supplementation between wk 4 to 12 resulting in NEL intake tendency to be greater primarily between wk 4 and 8 postpartum. Yields of milk (45.2 vs. 41.9 kg/d, Figure), milk components, 3.5% fat-corrected milk (44.0 vs. 40.8 kg/d), and energy-corrected milk (43.4 vs. 40.2) were all greater for precision-fed than control cows, resulting in greater energy-corrected milk production per kg of diet DM consumed (1.79 vs. 1.72). Precision-fed cows produced more milk calories per kg of metabolic weight (0.227 vs. 0.213 Mcal of NEL/kg), although the amount of consumed calories partitioned into milk (82.3%) and measures of energy status did not differ between treatments throughout the study. Daily feed costs were $6.59 ± 0.12 for the control cows and $6.86 ± 0.11 for precision-fed cows. Milk income was $22.82 ± 0.18 for the control cows and $23.89 ± 0.29 for the precision-fed cows. Daily income over feed cost (IOFC) was $15.59 ± 0.29 for the control cows and $17.05 ± 0.28 for the precision-fed cows which resulted in a $1.46 ± 0.40 greater daily IOFC for the precision-fed cows.
Figure. Milk yield of cows receiving control or precision treatments. Cov = week 3 postpartum used for covariate adjustment of data during statistical analysis. Precision-fed cows produced on average 3.3 kg/day more milk throughout the study than controls. Discussion and Conclusions Precision feeding proved to be superior to the conventional TMR feeding in terms of performance and economics. Future research should focus on methods to incorporate these concepts in large dairy herds either by computer controlled concentrate self feeders or by transferring cows between feeding groups, to determine if individual allocation of supplements, based on bodyweight and online assessment of yields of milk components, improves performance when measurements of individual cow DM intake is not feasible.
30
34
38
42
46
50
Cov 4 5 6 7 8 9 10 11 12 13 14 15 16 17 18 19
Milk
, kg/
d
Week postpartum
ControlPrecision
182
EFFECTS OF INGREDIENT DRY MATTER ADJUSTMENT USING NEAR INFRARED REFLECTANCE AND PRECISION FEEDING SOFTWARE ON LACTATING COW
PERFORMANCE
Dayane N. Lobão da Silva1, and Noah B. Litherland1
1University of Minnesota St. Paul, Minnesota,USA
Routine measurement and correction of ingredient DM on farms presents an opportunity to improve the consistency of feed delivery. Failure to correct changes in ingredient DM due to ingredient variability or due to climate can result in changes in final nutrient composition of the diet and total amount of DM offered. In addition to shifts in nutrient composition, ingredient variability can result in overfeeding DM where excessive feed refusals occur or underfeeding DM where DMI is limited by the amount of TMR available prior to the next feeding. Current on farm strategies to control variation in ingredient DM include hand sampling of forages and submission of samples to a commercial testing laboratory or on farm DM analysis. Frequency of on farm DM adjustments is highly variable among farms. New affordable and reliable technology, such as the Intelligent Ration Monitoring System (IRM) (Dinamica Generale,Inc. Montova, IT) is now available that allows dairy producers to improve the accuracy and precision of TMR preparation. The objectives of this study were to determine the effects of method and frequency, daily versus weekly, of wet ingredient dry matter (DM) adjustment on reducing variation of nutrient composition of the TMR, DM consistency of the TMR, milk production and milk components. Two pens averaging 250 Holstein cows per pen on a commercial dairy farm were used in a crossover design with 9 week periods. Milk and milk components production from cows (n = 104) were analyzed to determine the effects of dietary treatments which consisted of 1) once weekly DM amount adjustment of wet ingredients (corn silage, alfalfa silage, and high moisture corn) dried for 12 h in a 100°C oven (Control) or 2) real time (during ingredient addition prior to feeding correction DM of wet ingredients (corn silage, alfalfa silage, and high moisture corn) using a bucket-mounted near infrared reflectance spectroscopy (NIRS) analyzer system – precision dry matter measurements (PDM). We hypothesized that real time DM correction of wet ingredients using PDM would reduce variation of TMR compared with Control. Pens were balanced by milk yield (52.9 and 51.8 ± 1.4 kg) and DIM (110.5 and 111.8 ± 1.3d) for Control and PDM pens respectively. Analysis of weekly TMR samples indicated that method of measuring ingredient DM were similar between treatments. Correlation analysis indicated strong correlation between Control and PDM with r-value of 0.70, 0.79 and 0.66 for corn silage, alfalfa silage and high moisture corn respectively. Variation in ingredient DM was smaller than expected and there were no detectable differences in the nutrient composition of the TMR’s. Yield of 3.5% fat corrected milk was similar among treatments and averaged 53.4 and53.9 ± 1.4 kg/d for Control and PDM respectively.
183
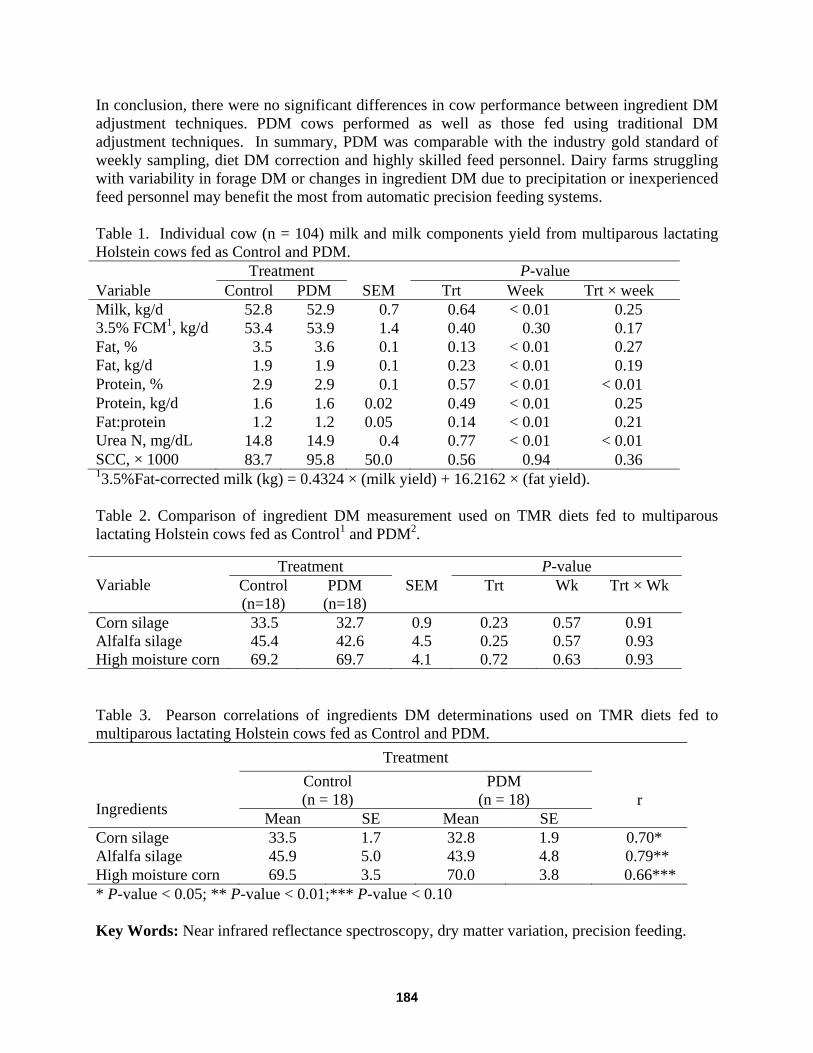
In conclusion, there were no significant differences in cow performance between ingredient DM adjustment techniques. PDM cows performed as well as those fed using traditional DM adjustment techniques. In summary, PDM was comparable with the industry gold standard of weekly sampling, diet DM correction and highly skilled feed personnel. Dairy farms struggling with variability in forage DM or changes in ingredient DM due to precipitation or inexperienced feed personnel may benefit the most from automatic precision feeding systems. Table 1. Individual cow (n = 104) milk and milk components yield from multiparous lactating Holstein cows fed as Control and PDM. Treatment P-value Variable Control PDM SEM Trt Week Trt × week Milk, kg/d 52.8 52.9 0.7 0.64 < 0.01 0.25 3.5% FCM1, kg/d 53.4 53.9 1.4 0.40 0.30 0.17 Fat, % 3.5 3.6 0.1 0.13 < 0.01 0.27 Fat, kg/d 1.9 1.9 0.1 0.23 < 0.01 0.19 Protein, % 2.9 2.9 0.1 0.57 < 0.01 < 0.01 Protein, kg/d 1.6 1.6 0.02 0.49 < 0.01 0.25 Fat:protein 1.2 1.2 0.05 0.14 < 0.01 0.21 Urea N, mg/dL 14.8 14.9 0.4 0.77 < 0.01 < 0.01 SCC, × 1000 83.7 95.8 50.0 0.56 0.94 0.36 13.5%Fat-corrected milk (kg) = 0.4324 × (milk yield) + 16.2162 × (fat yield). Table 2. Comparison of ingredient DM measurement used on TMR diets fed to multiparous lactating Holstein cows fed as Control1 and PDM2.
Variable Treatment P-value
Control (n=18)
PDM (n=18)
SEM Trt Wk Trt × Wk
Corn silage 33.5 32.7 0.9 0.23 0.57 0.91 Alfalfa silage 45.4 42.6 4.5 0.25 0.57 0.93 High moisture corn 69.2 69.7 4.1 0.72 0.63 0.93 Table 3. Pearson correlations of ingredients DM determinations used on TMR diets fed to multiparous lactating Holstein cows fed as Control and PDM. Treatment
Ingredients
Control (n = 18)
PDM (n = 18) r
Mean SE Mean SE Corn silage 33.5 1.7 32.8 1.9 0.70* Alfalfa silage 45.9 5.0 43.9 4.8 0.79** High moisture corn 69.5 3.5 70.0 3.8 0.66*** * P-value < 0.05; ** P-value < 0.01;*** P-value < 0.10 Key Words: Near infrared reflectance spectroscopy, dry matter variation, precision feeding.
184
AUTOMATIC PROCESS CONTROL CONCEPTS AND PRINCIPLES
Kevin A. Janni University of Minnesota
St. Paul, Minnesota, USA Many dairy producers are using automated process control to enhance their productivity and reduce energy use. Automation allows process adjustments to keep the process functioning near optimum without constant human intervention. Well designed and properly functioning automated systems can increase productivity, improve product quality and uniformity, use energy and other inputs efficiently and reduce wastes. Owners and managers that understand process control concepts and principles are able to better utilize, manage and trouble shoot automated systems. Advances in technology, controller hardware, sensors and actuators are expected to expand the availability and use of automatic process control. Common automated systems used by dairy producers include: lighting systems that turn lights on and off with timers and photocells in series to provide extended day lighting; ventilating systems with single and variable speed fans, adjustable inlets and cooling sprinklers controlled with a multistage ventilation controller; milking systems with variable speed drives on vacuum pumps and variable speed drives on milk pumps to control milk flow through plate coolers; milking units with automatic take-offs; milking robots and automatic calf feeders. All automated systems have sensors that provide information that the controller uses to adjust process inputs to keep the process output within desired specifications. For example vacuum pumps with variable speed drives measure the vacuum level and adjust the speed of the motor driving the vacuum pump to supply just the amount of vacuum needed. As vacuum needs change when milking units are added or removed and during pipeline cleaning the motor speed is adjusted to provide the vacuum needed. Without an automated variable speed drive the motor on the vacuum pump runs full speed, the speed needed to provide vacuum during pipeline cleaning, well above the speed needed during milking which wastes energy. Similarly milk levels in receiver jars are measured and used by the controller to adjust the variable speed drive on the milk pump to adjust milk flow through plate coolers. Another example is the temperature measured by ventilation controllers and used to adjust fans, inlets and cooling systems. Milking robots have sensors that locate teats and monitor milking to adjust the milk harvesting process. Proper sensor location, maintenance and operation are important for good process control. Sensors provide data to make process adjustments. Incorrect readings lead to incorrect adjustments. Temperature sensors located in the airflow from either fresh air inlets or heater outlets measure temperatures that do not represent the barn. Photocells located where they sense light from either interior or exterior lights will not control lights properly. Automated systems have microprocessor based and programmable controllers that use sensor data to adjust process inputs. The controller program can use simple on-off control or it can use more complex programming to continuously adjust inputs. Examples of on-off control include lights that are turned on or off with a timer and photocell; a heater that turns on as the temperature in the milk room drops and turns off after the temperature increases; or a single
185
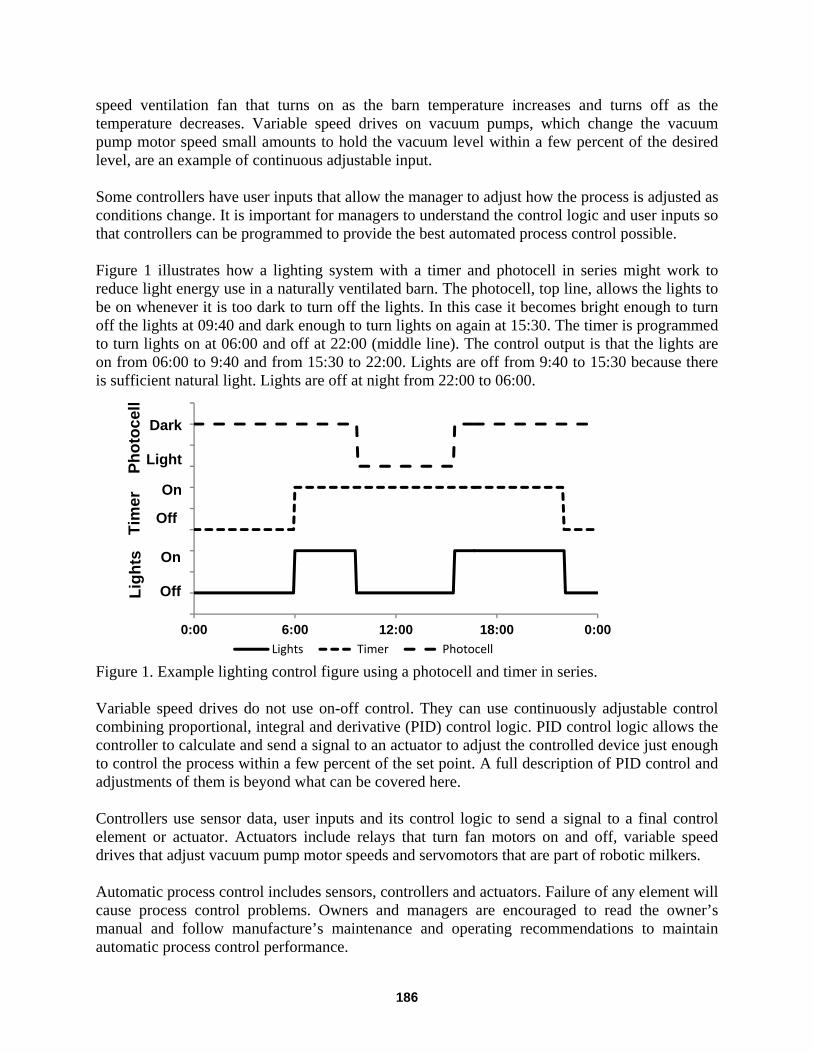
speed ventilation fan that turns on as the barn temperature increases and turns off as the temperature decreases. Variable speed drives on vacuum pumps, which change the vacuum pump motor speed small amounts to hold the vacuum level within a few percent of the desired level, are an example of continuous adjustable input. Some controllers have user inputs that allow the manager to adjust how the process is adjusted as conditions change. It is important for managers to understand the control logic and user inputs so that controllers can be programmed to provide the best automated process control possible. Figure 1 illustrates how a lighting system with a timer and photocell in series might work to reduce light energy use in a naturally ventilated barn. The photocell, top line, allows the lights to be on whenever it is too dark to turn off the lights. In this case it becomes bright enough to turn off the lights at 09:40 and dark enough to turn lights on again at 15:30. The timer is programmed to turn lights on at 06:00 and off at 22:00 (middle line). The control output is that the lights are on from 06:00 to 9:40 and from 15:30 to 22:00. Lights are off from 9:40 to 15:30 because there is sufficient natural light. Lights are off at night from 22:00 to 06:00.
Figure 1. Example lighting control figure using a photocell and timer in series. Variable speed drives do not use on-off control. They can use continuously adjustable control combining proportional, integral and derivative (PID) control logic. PID control logic allows the controller to calculate and send a signal to an actuator to adjust the controlled device just enough to control the process within a few percent of the set point. A full description of PID control and adjustments of them is beyond what can be covered here. Controllers use sensor data, user inputs and its control logic to send a signal to a final control element or actuator. Actuators include relays that turn fan motors on and off, variable speed drives that adjust vacuum pump motor speeds and servomotors that are part of robotic milkers. Automatic process control includes sensors, controllers and actuators. Failure of any element will cause process control problems. Owners and managers are encouraged to read the owner’s manual and follow manufacture’s maintenance and operating recommendations to maintain automatic process control performance.
0:00 6:00 12:00 18:00 0:00Lights Timer Photocell
On
Tim
er
On
Off
OffLigh
tsPh
otoc
ell
Dark
Light
186
VENTILATION SYSTEM DEMONSTRATION TRAILER
Larry D. Jacobson and Kevin A. Janni University of Minnesota
St. Paul, Minnesota, USA Dairy producers have more mechanical ventilating system options now than in the past when naturally ventilated calf hutches, open front sheds and curtain-sided freestall barns were the most common housing types used. Today dairy producers can use tube systems to mechanically ventilate calf barns. They can also use conventional, tunnel or cross-ventilation systems to ventilate freestall and stall barns. Mechanically ventilated barns have exhaust fans, air inlets and controllers. Some barns have evaporative cooling pads, misting systems or sprinkler systems to provide cooling. Properly matching fans, inlets, cooling equipment, if used, and controllers is critical to managing calf and cow barn environments. Ventilating systems are used to provide air exchange and manage temperature, relative humidity and air quality. In cold weather air exchange between inside and outside the barn removes moisture, gases and airborne pathogens. Insufficient air exchange in cold weather can lead to increased humidity, cold and clammy conditions, condensation on cold surfaces and unhealthy conditions for the calves and cows. In warm and hot weather ventilating systems exchange air to remove animal heat and solar heat that gets into the barn. Hot weather ventilation removes moisture, gases and airborne pathogens too. Mixing fans are sometimes used to help reduce heat stress by creating a draft past the cows. Evaporative pads, sprinklers that wet the cows and high pressure misting systems can provide cooling. Controllers play a key role in mechanical ventilating systems adjusting and turning devices on and off based on controller settings and sensor inputs. Modern multistage ventilation controllers can manage one or more heaters, exhaust fans and adjustable inlets. Controllers usually have temperature sensors but some can have other environmental inputs (ex. humidity, static pressure) or timers. They can be used to manage the barn temperature, ventilating rate (air exchange) and inlet air speed. These modern controllers have several user set adjustments including set point temperatures, differential temperatures and fan speed adjustments if variable speed fans are used. These controllers are more complicated than simple thermostats that have only a single user adjustable set point temperature. A properly set multistage controller can sequence all of the heaters, fans and cooling equipment and save energy. Understanding how a mechanical ventilation system and its controller work is essential to managing a system to effectively provide a healthy environment for calves, cows and workers. To demonstrate how complex environmental control or ventilation systems operate and how they need to be managed, a ventilation demonstration trailer was built by agricultural engineers from the four state (MN, IA, NE, and SD) region in 2010. The trailer, shown in Figure 1, consists of an enclosed space with four different exhaust fans located in the rear end-wall of the trailer (Figure 2 left). The trailer also has four different styles of air inlets taking air from an attic space between the trailer roof and an interior space ceiling (Figure 2 right). The exhaust fans and at least two of the four types of inlets in the unit are regulated with an electronic controller that is accessed from outside of the room/trailer (Figure 1). Static pressure taps are located throughout
187
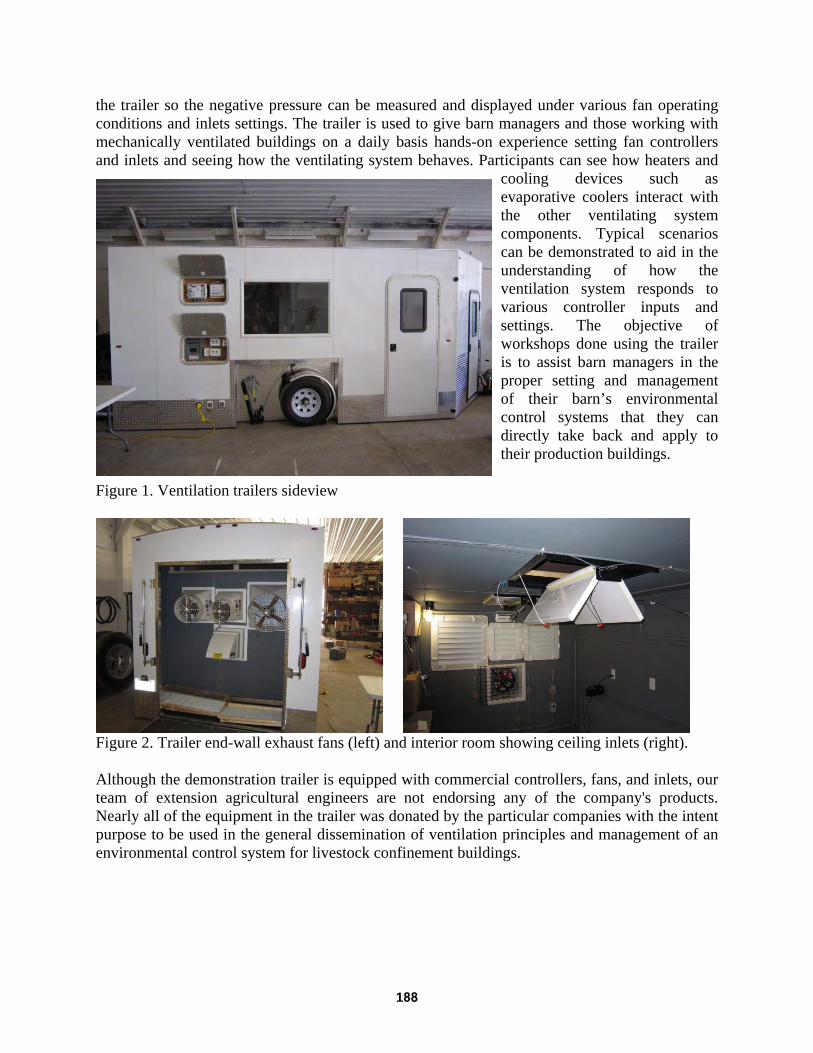
the trailer so the negative pressure can be measured and displayed under various fan operating conditions and inlets settings. The trailer is used to give barn managers and those working with mechanically ventilated buildings on a daily basis hands-on experience setting fan controllers and inlets and seeing how the ventilating system behaves. Participants can see how heaters and
cooling devices such as evaporative coolers interact with the other ventilating system components. Typical scenarios can be demonstrated to aid in the understanding of how the ventilation system responds to various controller inputs and settings. The objective of workshops done using the trailer is to assist barn managers in the proper setting and management of their barn’s environmental control systems that they can directly take back and apply to their production buildings.
Figure 1. Ventilation trailers sideview
Figure 2. Trailer end-wall exhaust fans (left) and interior room showing ceiling inlets (right). Although the demonstration trailer is equipped with commercial controllers, fans, and inlets, our team of extension agricultural engineers are not endorsing any of the company's products. Nearly all of the equipment in the trailer was donated by the particular companies with the intent purpose to be used in the general dissemination of ventilation principles and management of an environmental control system for livestock confinement buildings.
188
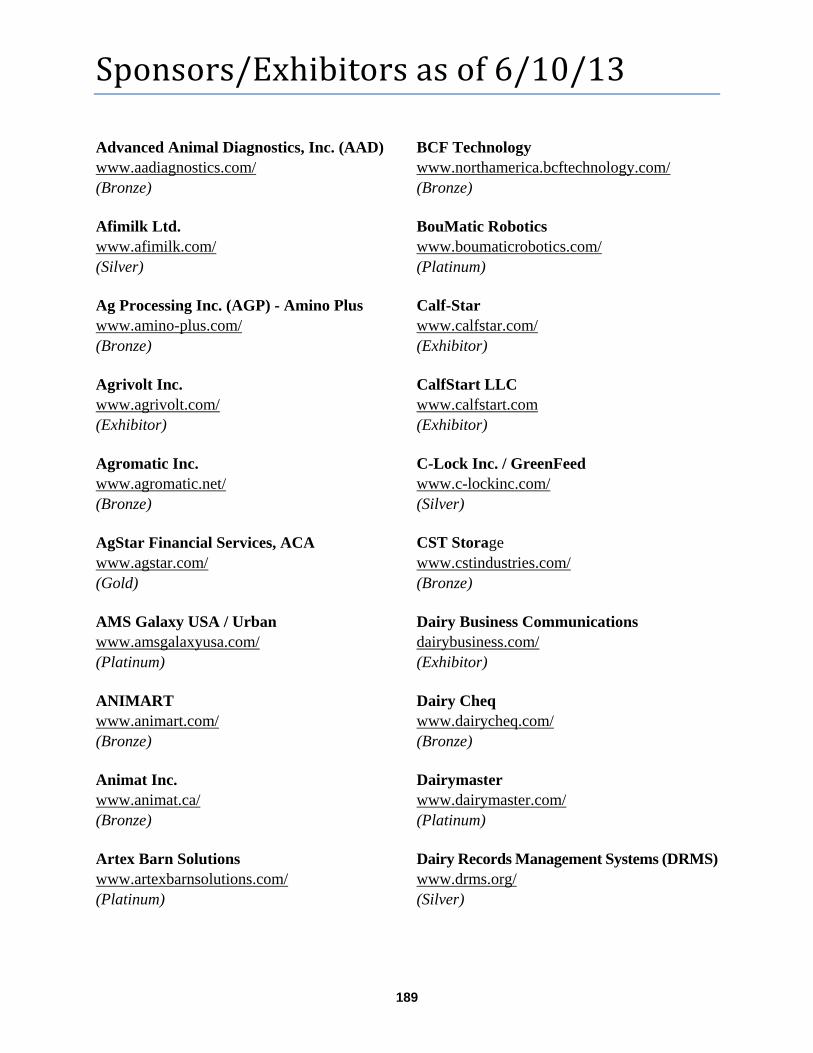
Sponsors/Exhibitorsasof6/10/13
Advanced Animal Diagnostics, Inc. (AAD) www.aadiagnostics.com/ (Bronze) Afimilk Ltd. www.afimilk.com/ (Silver) Ag Processing Inc. (AGP) - Amino Plus www.amino-plus.com/ (Bronze) Agrivolt Inc. www.agrivolt.com/ (Exhibitor) Agromatic Inc. www.agromatic.net/ (Bronze) AgStar Financial Services, ACA www.agstar.com/ (Gold) AMS Galaxy USA / Urban www.amsgalaxyusa.com/ (Platinum) ANIMART www.animart.com/ (Bronze) Animat Inc. www.animat.ca/ (Bronze) Artex Barn Solutions www.artexbarnsolutions.com/ (Platinum)
BCF Technology www.northamerica.bcftechnology.com/ (Bronze) BouMatic Robotics www.boumaticrobotics.com/ (Platinum) Calf-Star www.calfstar.com/ (Exhibitor) CalfStart LLC www.calfstart.com (Exhibitor) C-Lock Inc. / GreenFeed www.c-lockinc.com/ (Silver) CST Storage www.cstindustries.com/ (Bronze) Dairy Business Communications dairybusiness.com/ (Exhibitor) Dairy Cheq www.dairycheq.com/ (Bronze) Dairymaster www.dairymaster.com/ (Platinum) Dairy Records Management Systems (DRMS) www.drms.org/ (Silver)
189
SPONSORS/EXHIBITORS AS OF 6/10/13 (CONTINUED)
Dairy Star www.dairystar.com/ (Exhibitor) DCC Waterbeds www.dccwaterbeds.com (Gold) DeLaval www.delaval.com/ (Platinum) DHI-Provo / EZfeed www.dhiprovo.com/solutions/ezfeed.asp (Exhibitor) Digi-Star, LLC digi-star.com/ (Silver) dinamica generale www.dinamicagenerale.com/ (Gold) DODA USA, Inc. www.doda.com/ (Gold) EasyFix www.easyfixrubberna.com/ (Bronze) Edstrom Inc. www.edstrom.com/ (Exhibitor) E. I. Medical Imaging www.eimedical.com/ (Bronze)
Elanco Animal Health www.elanco.us/ (Bronze) Faromor www.faromor.com/ (Bronze) GEA Farm Technologies www.gea-farmtechnologies.com/ (Platinum) Grandview Concrete Grooving Inc. www.cowcomfort.com/ (Bronze) Grober Nutrition / Förster Technik www.grobernutrition.com/ (Silver) Harvest Energy Solutions www.harvestenergysolutions.com/ (Exhibitor) Hoard’s Dairyman www.hoards.com/ (Exhibitor) I.D.ology www.id-ology.com/ (Bronze) J & D Manufacturing www.jdmfg.com/ (Bronze) Leedstone www.leedstone.com/ (Bronze)
190
SPONSORS/EXHIBITORS AS OF 6/10/13 (CONTINUED)
Lely www.lely.com/ (Platinum) Madero Dairy Systems www.maderodairysystems.com/ (Silver) MARGINSMART www.marginsmart.com/ (Bronze) Minnesota Milk Producers Association (MMPA) www.mnmilk.org/ (Silver) MTECH Dairy Solutions (Exhibitor) North West Rubber www.northwestrubber.com/ (Exhibitor) Orion Energy Systems www.oesx.com/ (Bronze) Progressive Dairyman www.progressivedairy.com/ (Gold) Promat Inc. www.promatinc.com/ (Gold) Purina Animal Nutrition LLC www.purinamills.com/ (Silver)
Quality Liquid Feeds (QLF) www.qlf.com/ (Bronze) Roll-O-Matic Curtains - Development Resources of Iowa, Inc. www.rollomaticcurtains.com/ (Exhibitor) SCR Dairy Inc. www.scrdairy.com/ (Gold) Select Sires Inc. www.selectsires.com/ (Silver) SEMA Equipment, Inc. www.semaequip.com/ (Exhibitor) Semex www.semex.com/ (Silver) Supervisor Systems www.supervisorsystems.com/ (Silver) Trioliet www.trioliet.com/ (Silver) Valley Ag Software (VAS) www.vas.com/ (Silver) Valmetal Inc. www.valmetal.com/ (Silver)
191

Notes
192
Author Index
A Arazi, Alon ...............................................173 Arriola, Kathy, G. ....................................165
B Bach, Alex....................................................9 Bahlenberg, Peter .......................................43 Bar, Doran ..........................................91, 167 Barbosa, Lucas, F. ............................163, 181 Bareille, Nathalie .....................................147 Barker, Ron ..............................................107 Bentley, Jennifer, A .................................101 Betley, Jena ................................................95 Bewley, Jeffrey, M ......................................... ................................1, 103, 143, 145, 153, 87 Biehl, Bradley ............................................45 Blom, Jens Yde ..........................................55 Borchers, Matthew, R ................................87 Bossen, Dorte .....................................179, 93 Buchner, Chris ...........................................57 Bueno, Phabio ..........................................181 Byskov, Malene, V. .................................149
C Calarari, Luigi ............................................91 Campbell, Kristy, H. ..................................41 Carlson, Chad .............................................83 Chanvallon, Audrey .................................147 Chebel, Ricardo, C ...................................159 Chester-Jones, Hugh ................................175 Christensen, John, M..................................55 Clark, C, EF .............................................137 Clark, Cameron ................................133, 135 Clark, Joey, D ..........................143, 145, 153 Clement, Pierre ........................................147 Cramer, Gerard ........................................105
D Daniel, Vic ...............................................107 De Ketelaere, Bart ....................................169 de Passille, Anne Marie .....................81, 105 De Vries, Albert ...............109, 163, 165, 181 DeVries, Trevor .........................................59 Diepersloot, Eric ........................................57 Dolecheck, Karmella, A ...........................103
Donovan, G. Arthur .................................151 Dresch, Ana, R .........................................159 Du, Fei......................................................163 Duffield, Todd, F .....................................105
E Eastwood, Callum ......................................85 Ehrlich, James, L......................................155 Endres, Marcia, I ..........................159, 35, 97
F Freeman, Mark .........................................133 Funk, Jeffrey ..............................................95 Fustini, Mattia ..........................................173
G Garcia, S, C ..............................................137 Garcia, Sergio ..................................133, 135 Garcia, Sergio, C ................................131, 43 Gavin, Tom ................................................95 Gay, Keegan, D. .......................................163 Greco, L., F. .............................................181 Griffith, Abigail, S. ..................................171 Guatteo, Raphael ......................................147
H Halachmi, Ilan ............................................73 Heersche Jr., George ................................103 Heim, Jeremy .............................................83 Heins, Bradley, J ......................................139 Herdt, Michael, K. ...................................125 Higginson Cutler, Janet, H .......................105 Hlidarsdottir, Tinna ..................................179 Hobbis, Michael, J ...................................123 Hogeveen, Henk ...................113, 177, 51, 89 Hollander, Cees Jan ...................................59 Huybrechts, Tjebbe ..................................169
I Inchaisri, Chaidate ...................................177 Ishay, Eva .................................................173 Islam, M, R ..............................................137
193
Author Index
J Jacobson, Larry ..................................187, 63 Janni, Kevin ...............................185, 187, 63 Jensen, Margit Bak .....................................81 John, Alex ................................................133
K Kammel, David, W ....................................35 Kamphuis, Claudia .....................................65 Kaniyamattam, Karun ......................163, 181 Kelton, David, F .......................................105 Kerrisk, K, L ............................................137 Kerrisk, Kendra ................................133, 135 Kerrisk, Kendra, L .............................131, 43 Kiestra, Erica..............................................45 Kinsel, Mark, L ..................................157, 39 Kirchman, Stephanie ................................151 Kjeldsen, Anne, M .....................................93 Knijn, Hiemke ..........................................141 Kolbach, Rene ..........................................129 Kool, Peter, N ....................................127, 37 Kroll, Hila ................................................167 Kwinten, Niek ..........................................135
L Lamy, Jean-Michel ..................................147 Lang, Brian ................................................59 Leslie, Ken, E ...........................................105 Litherland, Noah, B..........................161, 183 Lobao da Silva, Dayane, N ......................183 Lobeck, Karen, M ....................................159 Lyons, Nicolas, A ......47, 129, 131, 135, 137
M Maltz, Ephraim ..........................163, 181, 53 Mason, Steve ............................................107 Maunsell, Fiona........................................151 McBurney, Sara .......................................127 McQuerry, Kristen, J........................145, 153 Millman, Suzanne, T ................................105 Murray, Blair, B .......................................107
N Nebel, Raymond, L ....................................75 Nørgaard, Peder .......................................149
O Oesch, Tom ................................................45 Oude Lansink, Alfons ................................51
P Palmonari, Alberto ...................................173 Paulson, James, C ....................................139 Peissig, Jake ...............................................45 Petersson-Wolfe, Christina ......................171 Philipot, Jean-Michel ...............................147 Pinedo, Pablo, J. .......................................151
Q
R Rawnsley, Richard ...................................133 Ray, Denise, L..........................................153 Reinemann, Douglas ..................................65 Reneau, Jeffrey, K ......................................39 Risco, Carlos ............................................151 Rodenburg, Jack ...................................21, 59 Rohe, Michelle ...........................................83 Rushen, Jeff................................................81 Rutten, Niels ......................................177, 89
S Saeys, Wouter ..........................................169 Salfer, Jim, A .............................................35 Santos, Jose, E.P. .....................................181 Sather, Keith, M .........................................61 Sawall, Zachary, J ....................................161 Scagion, Luis............................................181 Schcolnik, Tal ............................................53 Schmidt, Jakob, M .....................................93 Schulte, Kristen, M ............................101, 49 Smink, Ben, J .............................................37 Soriani, Nazzareno, NS ..............................91 Steeneveld, Wilma ...............113, 177, 51, 89 Sterrett, Amanda, E ..................143, 145, 153
194
Author Index
T Tadini, Giacomo ........................................91 Tauer, Loren ...............................................51 Taweel, Hassan ........................................141 Thorup, Vivi, M .................................179, 93 Tranel, Larry, F ..........................................49 Trou, Guylaine .........................................147
U
V van der Tol, Rik .................................127, 37 van Gastel, Danny ....................................135 Van Wichen, Hanneke .............................141 VanWieren, Harry ......................................45 Velthuis, Annet, G.J. ..................................89 Vonder, Matthijs ......................................141
W Wadsworth, Barbara, A ....................143, 153 Waybright, Doyle .........................................7 Weisbjerg, Martin, R................................149 Wood, Connie, L ......................................153 Wood, Constance, L. ................................145 Wulfse, Bart Jan .......................................141
X
Y Yeiser, Emily ...........................................171
Z Ziegler, David ..........................................175
195

The University of Minnesota’s mission, carried out on multiple campuses and throughout the state, is threefold: research and discovery, teaching and learning, and outreach and public service.
The University of Minnesota is committed to the policy that all persons shall have equal access to its programs, facilities and employment without regard to race, color, creed, religion, national origin, sex, age, marital status, disability, public assistance status, veteran status or sexual orientation. DISCLAIMER: References to commercial products or services are intended for informational and educational purposes only, and do not necessarily reflect the views or opinions of the Department of Animal Science, University of Minnesota Extension, or the University of Minnesota as a whole.
Related Documents