2012 opening meeting slide show
Jul 18, 2015
Welcome message from author
This document is posted to help you gain knowledge. Please leave a comment to let me know what you think about it! Share it to your friends and learn new things together.
Transcript


Numbers and Data

787,033
396,815
296,943
287,208
199,110
144,527
81,601

787,033 639,215
396,815 505,616
296,943 364,040
287,208 332,983
199,110 223,142
144,527 182,422
81,601 87,876

Columbus 787,033 639,215
396,815 505,616
296,943 364,040
287,208 332,983
199,110 223,142
144,527 182,422
81,601 87,876

Columbus 787,033 639,215
Cleveland 396,815 505,616
296,943 364,040
287,208 332,983
199,110 223,142
144,527 182,422
81,601 87,876

Columbus 787,033 639,215
Cleveland 396,815 505,616
Cincinnati 296,943 364,040
287,208 332,983
199,110 223,142
144,527 182,422
81,601 87,876
Columbus 787,033 639,215
Cleveland 396,815 505,616
Cincinnati 296,943 364,040
Toledo 287,208 332,983
199,110 223,142
144,527 182,422
81,601 87,876

Columbus 787,033 639,215
Cleveland 396,815 505,616
Cincinnati 296,943 364,040
Toledo 287,208 332,983
Akron 199,110 223,142
144,527 182,422
81,601 87,876

Columbus 787,033 639,215
Cleveland 396,815 505,616
Cincinnati 296,943 364,040
Toledo 287,208 332,983
Akron 199,110 223,142
Dayton 144,527 182,422
81,601 87,876

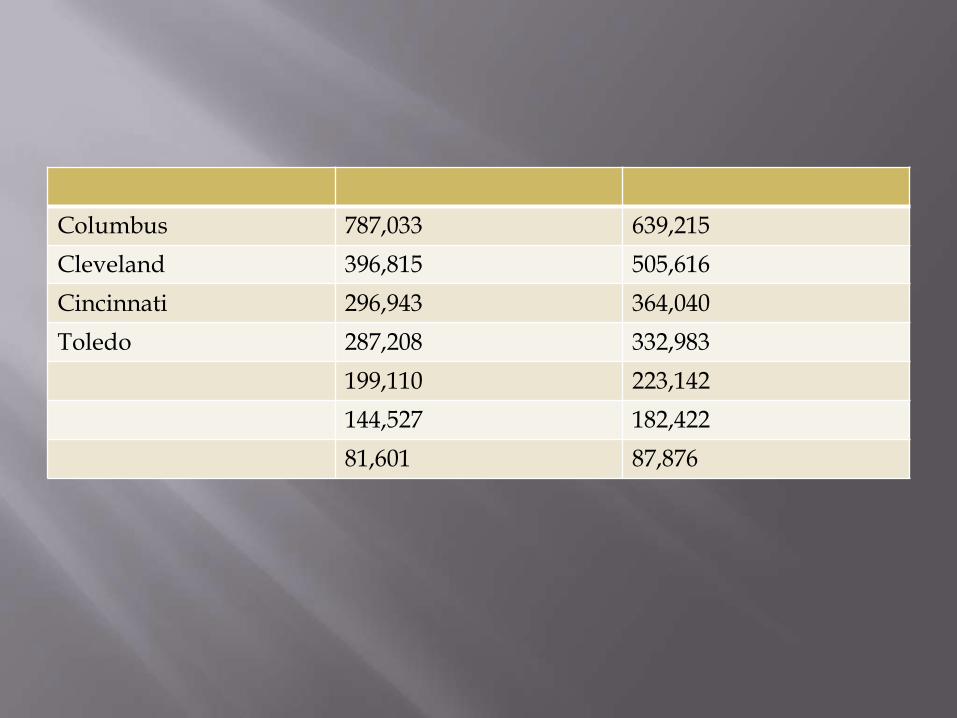
Cities 2010 Population 1990 Population
Columbus 787,033 639,215
Cleveland 396,815 505,616
Cincinnati 296,943 364,040
Toledo 287,208 332,983
Akron 199,110 223,142
Dayton 144,527 182,422
Parma 81,601 87,876
New Faces
Enrollment and Class List
Schedules
Communication Expectations
Monthly Calendar
Meeting Schedule

1st Monday (Faculty Meeting/ Math)
2nd Monday (Student Learning*/Coordinators)
3rd Monday (Faculty Meeting/Writing)
4th Monday (Student Life/Technology)
*Student Learning an additional meeting per month

The most important point I took away from my training is…
The most important point from my training that I believe would be of value to MV is …
A great resource I encourage you to interact with is …

Rules vs. Agreements

Critical Thinking
Collaboration
Creativity
Communication
Creativity
Cosmopolitism

Few in number
Concisely written
Refer to how something is done
Collaboratively composed
Binding on all participants
Clarify responsibilities
Increase consistency and reliability of best practice

What Should Our Lower School Faculty
Agreements Be?

Think about what your team agreements need to be
Be ready to share a trait you like about your peers,
Be ready to share a trait you would like to improve to better help the team be successful,
What you need from Mark to assist the team in being successful.

Extracurricular

Fountas /Pinnell End of Year Results
Year Below At Above
2010 32% 10% 58%
2011 18% 14% 68%
2012 15% 8% 77%

Scholastic Reading Inventory
Year Below At Above
2010 4% 47% 49%
2011 5% 42% 53%
2012 5% 27% 68%

ERB Test Scores
Year Below Ind. School Average
At Ind. SchoolAverage
Above Ind.SchoolAverage
2010 7 2 24
2011 3 2 28
2012 1 1 31
Related Documents