Fraunhofer IZM CODDE Bio IS DUH Page - 1 - EuP Preparatory Study Lot 6 “Standby and Off-mode Losses” Final Report Compiled by Fraunhofer IZM Contractor: Fraunhofer Institute for Reliability and Microintegration, IZM, Berlin Department Environmental Engineering Dr.-Ing. Nils F. Nissen Gustav-Meyer-Allee 25, 13355 Berlin, Germany Contact: Tel.: +49-30-46403-132 Fax: +49-30-46403-131 Email: [email protected] Berlin, 2 nd of October 2007

Welcome message from author
This document is posted to help you gain knowledge. Please leave a comment to let me know what you think about it! Share it to your friends and learn new things together.
Transcript

Fraunhofer IZM CODDE Bio IS DUH Page - 1 -
EuP Preparatory Study Lot 6 “Standby and Off-mode Losses”
Final Report
Compiled by Fraunhofer IZM
Contractor: Fraunhofer Institute for Reliability and Microintegration, IZM, Berlin
Department Environmental Engineering
Dr.-Ing. Nils F. Nissen
Gustav-Meyer-Allee 25, 13355 Berlin, Germany
Contact:
Tel.: +49-30-46403-132
Fax: +49-30-46403-131
Email: [email protected]
Berlin, 2nd of October 2007

Fraunhofer IZM CODDE Bio IS DUH Page - 2 -
Consortium List
IZM Fraunhofer Institute for Reliability and Microintegration, Department Environmental Engineering, Berlin, Germany (http://www.izm.fraunhofer.de)
Bio IS Bio Intelligence Service S.A., Ivry-sur-Seine, France (http://www.biois.com)
CODDE Conception Developpement Durable Environnement, Paris, France (http://ww.codde.fr)
DUH Deutsche Umwelthilfe e.V., Berlin, Germany (http://www.duh.de)
Individual Authors (in alphabetical order)
Christian Ciaglia, Miklas Hahn, Eric Labouze, Eva Leonhardt, Linda Lescuyer, Veronique Monier, Shailendra Mudgal, Nils F. Nissen, Elodie Pechenart, Marina Proske, Karsten Schischke, Alexander Schlösser, Lutz Stobbe, Lea Turunen.
Acknowledgements We would like to thank all active stakeholders for constructive and critical input, the European Commission for continued support throughout the study and the consortium partners for effective and harmonious collaboration.

Fraunhofer IZM CODDE Bio IS DUH Page - 3 -
Overview of the Parts of the Final Report 0. Cover Sheets (this document)
1. Definition (Task 1) 1-1 – 1-46
2. Market Data (Task 2) 2-1 – 2-50
3. Consumer Behaviour and Local Infrastructure (Task 3) 3-1 – 3-21
4. Technical Analysis Existing Products (Task 4) 4-1 – 4-29
5. Definition of Base Case (Task 5) 5-1 – 5-73
6. Technical Analysis BAT (Task 6) 6-1 – 6-28
7. Improvement Potential (Task 7) 7-1 – 7-40
8. Scenario, Policy, Impact and Sensitivity Analysis (Task 8) 8-1 – 8-40
9. Literature 9-1 – 9-10
Annexes 10-1 – 10-37 Annex 1–1: Product Naming and Classification Annex 1–2: International and European test standards (Task 1.2) Annex 1–3: Other test procedures (Task 1.2) Annex 1–4: Detailed comparison of the parameters extracted from the main test standards. (Task 1.2) Annex 1–5: Mandatory requirements on standby and off-modes power consumption. (Task 1.3) Annex 1–6: Mandatory requirements on standby and off-modes losses labelling. (Task 1.3) Annex 1–7: Voluntary programs related to standby and off-modes losses. (Task 1.3) Annex 1–8: Ecolabel and ecolabelling program related to standby and off-modes losses. (Task 1.3) Annex 1–9: Legislation, voluntary program and ecolabel having an indirect impact on standby and off mode
losses reduction (Task 1.3) Annex 2–1 (2–1 to 2–6 Tables for Task 2) Annex 3–1 (3–1 to 3–5 Using times of devices not covered by the product cases)
11. Feedback List 11-1 – 11-54
Disclaimer for all published parts
The findings presented in the final report are results of the research conducted by the IZM consortium and the continuous feedback from a wide range of stakeholders. The statements and recommendations presented in the final report however are not to be perceived as the opinion of the European Commission.

Report for Tender No. TREN/D1/40 Lot 6 -2005 EuP Lot 6 - Task 1 2nd of October 2007
Fraunhofer IZM CODDE Bio IS DUH Final Report Page 1-i
EuP Preparatory Study Lot 6 Standby and Off-mode Losses
Task 1 Definition Final Report
Compiled by Fraunhofer IZM
Contractor: Fraunhofer Institute for Reliability and Microintegration, IZM, Berlin
Department Environmental Engineering
Dr.-Ing. Nils F. Nissen
Gustav-Meyer-Allee 25, 13355 Berlin, Germany
Contact:
Tel.: +49-30-46403-132
Fax: +49-30-46403-131
Email: [email protected]
Berlin, 2nd of October 2007
Disclaimer
The findings presented in this report are results of the research conducted by the IZM consortium and the continuous feedback from a wide range of stakeholders. The statements and recommendations presented in the final report however are not to be perceived as the opinion of the European Commission.

Report for Tender No. TREN/D1/40 Lot 6 -2005 EuP Lot 6 - Task 1 2nd of October 2007
Fraunhofer IZM CODDE Bio IS DUH Final Report Page 1-ii
Contents 1. Definition (Task 1) ........................................................................................................ 1-1
1.1. Product Category and Performance Assessment (Task 1.1) ........................................... 1-1 1.1.1. Introduction ............................................................................................................... 1-1 1.1.2. Definition results overview ....................................................................................... 1-1 1.1.3. Detailed definition of Lot 6 terminology................................................................... 1-7 1.1.4. Analysis and discussion of definition approaches ................................................... 1-16 1.1.5. Product-use-cluster (PUC)....................................................................................... 1-20 1.1.6. Scope of investigated products ................................................................................ 1-22
1.2. Test Standards (Task 1.2) ............................................................................................. 1-33 1.2.1. Identification and description of main test standards .............................................. 1-34 1.2.2. Evaluation of main test standards............................................................................ 1-35 1.2.3. Conclusions Task 1.2............................................................................................... 1-38
1.3. Existing Requirements on Standby and Off-mode Losses (Task 1.3) .......................... 1-38 1.3.1. Mandatory requirements on standby and off-modes ............................................... 1-39 1.3.2. Non mandatory requirements on standby and off-modes........................................ 1-40 1.3.3. Other requirements on energy efficiency and energy consumption ........................ 1-43 1.3.4. Conclusions Task 1.3............................................................................................... 1-43
1.4. Task 1 Conclusions....................................................................................................... 1-44
Report for Tender No. TREN/D1/40 Lot 6 -2005 EuP Lot 6 - Task 1 2nd of October 2007
Fraunhofer IZM CODDE Bio IS DUH Final Report Page 1-1
1. Definition (Task 1)
1.1. Product Category and Performance Assessment (Task 1.1)
1.1.1. Introduction
For investigating standby and off-mode losses, Task 1.1 with the definition and scope questions is a central issue. There are many historically separate uses and definitions of the term "standby" and sometimes the common goal of describing and reducing unnecessary energy uses of products may be obscured by contradicting definitions. What is unnecessary or necessary for future products is of course the next line of contention. More than anything else the definition of this task is a compromise between existing views (and use of terms), practical considerations for the study duration and beyond for the implementation into requirements.
The results of the definition process are summarised in the first chapter (1.1.2). Chapter 1.1.3 gives the more detailed and exact view of the Lot 6 terminology and mode definitions, and 1.1.4 analyses and compares with existing approaches and definitions. As a principle, the definition part applies to all EuPs. In Chapter 1.1.6 the scope of products to be investigated within the Lot 6 study will be explained.
The intention of looking at standby and off-mode losses is primarily to minimise the power draw on electricity networks occurring when products are not actively used. The relevance of these power consumptions or losses results from
the increasing numbers of devices, for which such energy consumptions may occur, and the long duration of such power consumption, often invisible to the user.
The intention within the Lot 6 preparatory study is to achieve a broad coverage of standby issues by structuring the energy uses by functions offered during standby. Standby energy consumption is understood not as an energy loss, but as a service offered to the user, which should be supplied as efficiently as possible. Off-mode losses are a separate issue, because energy is consumed without delivering a function. In cases, where valid reasons for off-mode energy consumption exist, the energy level in the off-mode should be as low as possible.
The function-based approach offers the possibility to cover a wide range of dissimilar products, to include future product convergences or previously unknown combinations and to some degree to cover technologies and applications yet unknown. More accurately, the approach is based on function clusters, because energy uses for individual functions are not differentiated throughout the investigations.
1.1.2. Definition results overview
The definition of Lot 6 standby and off-mode losses follows a stringent differentiation of functions and their allocation to defined modes. This distinction is based on a hierarchy of energy demand (e.g. from maximum power consumption for main function operation to lowest power consumption still providing a function to lowest or no power consumption). The approach also reflects predefined or user defined time durations, in which a function is provided.
Product modes describe “operating conditions or states”, in which a product provides a certain spectrum of functions, a single function or no function at all. A function is the intended operation, for which a product is designed. A function always requires a certain amount of energy.
For the purpose of this study we distinguish seven modes:
Disconnected mode 0 Watt off-mode Off-mode with losses

Report for Tender No. TREN/D1/40 Lot 6 -2005 EuP Lot 6 - Task 1 2nd of October 2007
Fraunhofer IZM CODDE Bio IS DUH Final Report Page 1-2
Lot 6 passive standby mode Lot 6 networked standby mode Transition to standby and off-mode Active mode
Passive standby mode and networked standby mode are often referenced together as Lot 6 standby mode. To avoid ambiguity with existing definitions the preface "Lot 6" is used with the standby modes especially in this task, where other standby concepts and definitions are also referenced.
The differentiation of these modes is deemed necessary, as potential ecodesign options need to address also the possibility to change an EuP from one mode to a mode with lower energy consumption. For the Lot 6 investigation the strict separation between disconnected and 0 W off (both consume no energy), and between 0 W off and off-mode with losses (both supply no function) is not always necessary, but it adds clarity when describing the mode durations, i.e. also the durations outside the Lot 6 scope.
Disconnected mode
This mode defines the condition, in which all connections to power sources of the EuP are removed or interrupted. The common terms “unplugged” or “cut off from mains” may apply to this definition as well.
0 Watt off-mode
This mode defines the condition, in which the EuP is connected to a power source but not drawing energy. The common terms “hard-off”, "primary side hard-off switch" or “galvanically switched off” may apply to this definition as well. In reality, "near zero watt off-mode" can also apply, if for example the losses in the mains cables are very accurately measured.
Off-mode with losses
This mode defines the condition, in which the EuP is connected to a power source, and is drawing energy although not providing any function (for completeness a switch on the main part of the EuP has to be allowed as a function). All energy drawn from the energy supply during that time shall be considered as off-mode losses. The common term “lowest power consumption” could apply to this definition as well, although it should preferably be differentiated between “lowest mode offering no function” and “lowest mode offering a function”. Another common term would be “soft off”. Off-mode with losses is indeed most often caused by soft switches, secondary side switching or by external power supplies staying in a no-load condition. However, also other product configurations can lead to off-mode losses, where no function is offered.
Lot 6 standby
This mode defines the condition, in which the EuP is connected to a power source, draws energy and offers a selection of the following reactivation and continuity functions:
Reactivation function provided by soft or hard switch, remote control, internal sensor, timer, or network command,
Continuity function: information or status displays including clocks, Continuity function: information storage (volatile memory), Continuity function: sensor-based safety functions, Network functions limited to network integrity communication.
When at least one network function is available (reactivation via network command or network integrity communication) the mode is called Lot 6 networked standby, otherwise Lot 6 passive standby. This set of functions is defining the spectrum of Lot 6 standby and the associated energy

Report for Tender No. TREN/D1/40 Lot 6 -2005 EuP Lot 6 - Task 1 2nd of October 2007
Fraunhofer IZM CODDE Bio IS DUH Final Report Page 1-3
consumption. The common terms “passive standby” and “active standby low” (e.g. IEC 62087) may apply to this definition as well.
To base the definition on functions is also important for the later analysis of design measures, which will need to address two main issues:
Functions offered / modes to be realised with a minimum amount of energy consumption (Re)activation functions, automatisms and the time duration of modes
The conscious choice of the functions active in standby, or the choice to offer a mode without any function sets the baseline for the Lot 6 energy consumption of a product.
Comment
As noted already above, the various uses and interpretations of the term “standby” can lead to confusion. This study uses “Lot 6 standby” as a term, when referring to the above scope of standby. This is especially relevant for Task 1, where other “standby” definitions and standards are referenced. In later steps of the EuP process it may however be inconvenient to always reference back to the original lot number.
Using the sleep and wake-up metaphors is another option, which will increasingly be used in user interfaces of information and communication equipment. Due to the title of this study we will continue to use "standby", however.
Transition to standby and off-mode
This mode defines the condition, in which the EuP is connected to a power source, has been activated previously by any means (switch, remote control, timer, etc.), and has been manually or automatically switched to a reduced set of functions, in order to either be reactivated soon after or to traverse into lower power modes after some time. Transitional modes are handled according to the above definition: when only “Lot 6 standby functions” are active, the product is considered in standby mode, otherwise the transitional mode is still separate, or counts as a part of the active operation. The EuP should however switch as fast as possible to a Lot 6 standby or off-mode. The common terms “energy save mode”, “ready”, “idle”, “sleep” may apply to this mode as well. Furthermore, we will subordinate “active standby high” (i.e. unsupervised download of electronic program guides according to IEC 62087) in this condition.
Active mode
This mode defines the condition, in which the EuP is connected to a power source, has been activated and provides one or more main functions. The common terms “on”, “in-use”, “normal operation” may apply to this definition as well.

Report for Tender No. TREN/D1/40 Lot 6 -2005 EuP Lot 6 - Task 1 2nd of October 2007
Fraunhofer IZM CODDE Bio IS DUH Final Report Page 1-4
Table 1-1: Main Lot 6 modes and allocation to most relevant IEC standards
Revision differentiating at least “standby” and “off” modes under way.
IEC Standard
(not covered)(not covered)Energy saving / lowest power
Energy savingFull on, normal loadIEC 62018
No loadHard offSoft offEnergy savingEnergy savingOn idle
On max On normal
IEC 62075 (CDV)
DisconnectedOff-Mode0 Watt
Off-Modelosses
Lot 6 standby(Passive or Networked)
Transition to standby and off-mode
Active ModesLot 6 Modes
(not covered)If lowest power mode then equals standby
If lowest power mode then equals standby
If lowest power mode then equals standby
On / activeIEC 62301
OffPassive Standby, Active Standby Low (with network)
Active StandbyHigh
On playOn record
IEC 62087
No function(except reactivation switch)
Reactivation Function:Remote Control, Sensor, Timer, SwitchesContinuity Function:Display, Memory, SafetyNetwork ( Networked standby)Wake-up and status only
One or more main functions are off (typical energy save or ready modes)
Active Network Download
At least one main function continuously on / activeTime limited function cycle, programmable job
Functions
Table 1-1 illustrates the definition of functions and modes. We have also allocated modes or names from the most relevant IEC standards with respect to the standby issue.
A detailed description of terminology and modes as well as a discussion of existing definition approaches follows in Chapters 1.1.3 and 1.1.4.
After discussions with stakeholders regarding the definition of standby and off-mode losses for the purpose of the EuP preparatory study Lot 6 some adjustments to the first proposal (first public Lot 6 discussion paper from 30.8.2006) have been made. Since the second version of the Lot 6 definition published in January 2007 only minor modifications and clarifications have been introduced.
Most of the discussion occurred in conjunction with an intended or necessary harmonization of existing definitions and common terminology. The status is that a globally harmonised understanding of standby (and off-modes) is necessary but not yet reachable.
It is outside the scope of this study to achieve this harmonization. The discussions so far have led to a definition, which is partially compatible with existing standards, but not identical to either of the existing definitions. Understandably, various feedback asked for joining with either of the existing definitions, which are sometimes leading in opposite directions. The goal of this study is to investigate the significance of standby use and off-mode losses within the European Union, and to develop the framework for promoting or regulating ecodesign in this area.
To our understanding it was not suitable for the Lot 6 goals to accede to one existing standby definition completely. There is some movement in the standby community, because the revision of IEC 62301 is specifically targeting a broadening of the included definition. On the one hand the measurement procedure was always meant to be usable without the included standby definition, and this will certainly continue to be the case. On the other hand, a definition, which does separate off-mode from "true standby" (or should that be true sleep according to another faction), is on the agenda. It seems there is a great chance now that the mode definitions from this study will at least partially be included in the revised standard. But it also might happen that the "spirit" of this definition is only incorporated, or that the same modes are used, but with slightly changed definitions in detail.
Main performance characteristics

Report for Tender No. TREN/D1/40 Lot 6 -2005 EuP Lot 6 - Task 1 2nd of October 2007
Fraunhofer IZM CODDE Bio IS DUH Final Report Page 1-5
Products and product classes can be distinguished according to the modes they offer. Provided that each product must have at least one main function (active mode) and can in principle be disconnected, the following combinations of modes can be clustered.
Only Active and Disconnect
Active, Off and Disconnect, but no Lot 6 standby
Complex products offering at least one Lot 6 standby mode.
The last group can be further subdivided according to whether automated transitions to standby or off-mode can occur. This depends on whether the product is – at least partially – job-based or running a function cycle. The resulting product distinctions are shown in Table 1-2. Table 1-2: Clustering available modes defines the Product-use-cluster (PUC)
XXXX (with network capability)possibleOn / Standby (PUC 2 (net))
XXXXXJob-based (PUC 3)
XXXX (with network capability)possibleXJob-based (PUC 3 (net))
DisconnectedOff-Mode0 Watt
Off-Modelosses
Lot 6 standby(Passive or Networked)
Transition to standby and off-mode
Active ModesLot 6 Modes
XXXXOn / Standby (PUC 2)
XXXOn / Off (PUC 1)
XAlways On (PUC 0)Product Distinction by Modes =Product-Use- Cluster (PUC)
No function(except reactivation switch)
Reactivation Function:Remote Control, Sensor, Timer, SwitchesContinuity Function:Display, Memory, SafetyNetwork ( Networked standby)Wake-up and status only
Active network download(time limited exchange of data)
One or more main functions are off (typical energy save or ready modes)
Present for all products and PUCs
Functions
Within the Lot 6 study these clusters will be called “Product-use-clusters (PUC)” and will be used to structure Tasks 2 through 5.
For shorter referencing the abbreviation PUC will be used in this study, with the following numbering
PUC 0: Always On products
PUC 1: On / Off products
PUC 2: On / Standby products
PUC 3: Job-based products
Products in the same PUC share some characteristics or limitations and therefore the PUCs are a means of structuring discussions from "simple" to "complex" products. One product of a PUC is, however, not a representative for all other products of the same PUC.
The possible existence of lower modes is always implicit, i.e. “disconnected” is an option in all PUCs, and off-modes can be available in PUC 2 and 3 configurations as well. For a more detailed explanation of the product-use-clusters, see Section 1.1.5.
The PUCs are especially useful for exploring Task 3. Always On products (PUC 0) will be outside the scope of Lot 6, since they are attributed neither Lot 6 standby power consumption nor off-mode losses. Nevertheless, PUC 0 is useful as a concept for referencing this behaviour in later discussions.
As an outlook to likely ecodesign options these “Product-use-clusters” and the differentiation of modes still has to be seen as a simplification of reality. Complex interactions play an important role: When more complex functions are integrated, the user might be given control over enabling or disabling some of the functions via user settings. There is a danger, or at least a potential trade-off, between offering more control via user settings, ease of use or complexity of the user interface and the potential for "misuse" of these settings by the user.

Report for Tender No. TREN/D1/40 Lot 6 -2005 EuP Lot 6 - Task 1 2nd of October 2007
Fraunhofer IZM CODDE Bio IS DUH Final Report Page 1-6
Where possible – and this particularly applies to job-based products – the automatic transition to a very low mode is an improvement option. The behaviour of the EuP is best optimised, if the user, potential administrators and even the manufacturer (!) and potential resellers cannot change minimal settings. Where automatisms are not possible, the user might at least be given as much information as possible and as much control for powering down as possible, although relying on the user to achieve optimal power savings is not realistic.
The influence a user has and the potential for informing or educating the user will be discussed further in Task 3.
Functional unit
Correlated with the reactivation and continuity functions an EuP provides while being in standby according to the definition of this study, the functional unit has to take into account this variety of functions:
Reactivation functions, Information or status displays including clocks, Information storage (volatile memory), Safety functions, Network integrity communication
Consequently, there is a single functional unit for standby of EuP only on a very general level, namely: providing any of the above mentioned standby functions for a given period of time. This functional unit can serve for comparisons only, when the same function or combination of functions is fulfilled. Notice that the listed functions in detail might come with a broad variety of specified requirements, such as:
Information or status displays: Amount of information, size of letters etc., self-emissive or reflective,
Information storage: Maximum time the data has to be stored, amount of data to be stored, read/write cycles, environmental conditions,
Reactivation over network: Depending on the type and speed of connection, a reactivation might occur through simple analogue signal detection or may require the decoding of a digital stream to find reactivation commands addressed to the specific EuP.
Off-mode losses per definition (no function) cannot be correlated with a functional unit.1
Additional technical parameters may be needed to convey the comparability of modes more correctly in practice. In later steps of this study the following two aspects have been added to distinguish further: the rated power output when dealing with power supplies and the speed of different network types.
1 Paradoxically, two products causing off-mode losses can be compared environmentally much more easily than for standby modes. The remaining power consumption is the single metric for comparing. The power range and the reason or the type of circuitry leading to off-mode losses may be useful as secondary distinctions.
Report for Tender No. TREN/D1/40 Lot 6 -2005 EuP Lot 6 - Task 1 2nd of October 2007
Fraunhofer IZM CODDE Bio IS DUH Final Report Page 1-7
1.1.3. Detailed definition of Lot 6 terminology
General terms definition
Function A function is a predetermined operation triggered by an interaction (of the user, of other technical systems, of the system itself, of a measurable input from the environment). A set of related functions needed to operate one aspect of a product is often called functionality. A simple example functionality is a clock, which needs functions for clock display, the actual clock drive or circuit and functions to set the clock.
Function cycle A set of predetermined or programmed functions running sequentially and making up the intended use (or service) of a product. The function cycle may also be termed a job. A function cycle may be influenced by sensory data or may be overruled by intervention of the user.
Network / network capability
Networks in this context are information / communication networks: telephone networks, internet and other computer networks, TV broadcasting networks (the latter are usually unidirectional networks). Device-to-device connections (such as SCART) can also provide network capability.
Energy networks are always given their full name (e.g. electricity network, gas supply network).
Reactivation A function, which allows to switch the EuP from standby or off-mode into one of the active modes. Reactivation functions can be triggered by the user or from a connected technical system.
Remote reactivation
Either remote control reactivation or remote network reactivation.
Remote control reactivation
Reactivation by pressing a switch on a remote control. Remote control is understood to use wireless transmission of the command, such as via infrared or radio frequency.
Remote network reactivation
Reactivation command or signal received via a network connection. In the context of computers also called wake-up over network or wake-up on LAN.
Self reactivation A reactivation, which is initiated by the EuP itself, i.e. through an integrated sensor or a timer.
Reactivation on main part of the EuP
In contrast to remote reactivation, this case covers only switches located on the main part of the EuP and operated by the user.
Although a remote control is part of the EuP “as delivered”, it is never the main part of the EuP.
Sensor-based safety function
A continuously running sensor circuitry necessary to monitor safety related status of the product or the environment (unless the sensing is the main function of the EuP). Examples: Heat sensor to warn against hot cooking plates or water leak sensor in washing machines.
Network integrity communication
Minimal network communication needed to maintain network integrity, i.e. a periodic short burst of status data.

Report for Tender No. TREN/D1/40 Lot 6 -2005 EuP Lot 6 - Task 1 2nd of October 2007
Fraunhofer IZM CODDE Bio IS DUH Final Report Page 1-8
Information or status display functions
Displays might be active, which are not by themselves main functions, such as a clock. The same display can of course have additional functions in active mode. Also status displays (e.g. charge state or connectivity) are included, unless the only feature would be to indicate the state of the EuP without any other functionality. A LED showing that a soft switch is in the “off position” would not change the classification as off-mode.
Information storage (volatile memory)
Information storage in this context refers to memory types, which continuously or periodically need electrical energy to keep the stored information intact. This is also known as volatile memory. The typical example would be RAM memory, which is "refreshed" by reading and rewriting the information periodically. Components, which do not need energy for keeping the information intact, are not considered, such as flash memory or hard disk drives.
Preheating Preheating is used to describe functions, which continuously keep part of the EuP or of media within the EuP at an elevated temperature. This is done to achieve a faster reactivation time. The energy demand may in practice be periodic or sensor controlled, but the preheating function is nevertheless continuous.
Switch User interface element to connect or disconnect electric lines. In the context of this study, switches are always power switches, which directly or indirectly change the power distribution to or within the EuP.
Hard switch A switch, which galvanically disconnects (or connects) the electric lines.
Soft switch A switch, which is monitored by an analog or digital circuit, which then in turn activates or deactivates an electronic power switch or for example a relay.
Primary side hard switch
A hard switch, which galvanically cuts off all electric energy input at the mains level to the EuP. Sometimes “hard off switch” is used for this configuration as well (but this should not include secondary side switches).
Secondary side hard switch
A hard switch, which is located after the power transformation (internal or external power supply).
Lot 6 Mode Definitions
i. When all connections to power sources are removed or interrupted (e.g. via an external switch) the EuP is considered as disconnected.
Disconnected
ii. An EuP is considered in off-mode, when it is connected to a power source but is not offering any function to the user.2 All energy drawn from the energy supply during that time shall be considered as off-mode losses. If no energy is used, the product is in “0 W off-mode”.
Off-mode; off-mode losses, 0 W off-mode
2 Excepting the function(s) to turn the EuP back on, which are located on the main part of the EuP.

Report for Tender No. TREN/D1/40 Lot 6 -2005 EuP Lot 6 - Task 1 2nd of October 2007
Fraunhofer IZM CODDE Bio IS DUH Final Report Page 1-9
iii. An EuP is considered to be in Lot 6 standby mode, when it is connected to a power source and offers a reactivation function (remote reactivation, self reactivation or switch reactivation). Additional functions, which may be active and consuming energy, are the following continuously running functions ● information or status display, such as displaying the time, ● information storage needing continuous energy supply, ● sensor-based safety functions, ● network integrity communication. In addition to the reactivation possibilities a deactivation function (from standby to a lower standby or from standby to off-mode) may be offered. The above function types shall be termed Lot 6 standby functions. The associated energy consumption is the Lot 6 standby energy consumption.
Lot 6 standby & Lot 6 standby energy consumption
iv. When the EuP is in Lot 6 standby according to (iii.) and offers either a remote network reactivation and/or network integrity communication, then the product is considered to be in networked standby mode.
Networked standby
v. Otherwise (Lot 6 standby determined according to iii.) the mode shall be termed passive standby mode.
Passive standby
vi. Main functions (also often called primary functions) are those, which in combination represent the intended service of the EuP, for which the EuP is acquired. An EuP may have more than one main function (esp. multifunctional devices) and a function may consist of more than one phase of operation (i.e. a function cycle).
Main functions
vii. When one or more main functions are active, the EuP is considered to be in active mode. Different modes for different parts of a product shall not be regarded. Each device in its entirety should either be considered as being in standby mode, off-mode or active mode. If one part of a product is active to fulfil one or more main functions, all energy consumption from that phase will be outside the scope of this study.
Lot 6 active mode
viii. When a request for a main function is triggered – either manually or electronically – from a standby or off-mode, it may take some time before the EuP provides its main function(s). This “transition to on” phase will not be part of standby or off-mode, starting from the time of the trigger event.
Transition to on
ix. When a request to go into standby or off-mode is triggered – either manually or electronically – the EuP may go through a series of transitional modes before reaching a standby mode or off-mode (unless an activation request breaks the sequence). Transitional modes are handled according to the above definition: when only “Lot 6 standby functions” are active, the product is considered in standby mode, otherwise the transitional mode is still a part of the active operation.
Transition to standby/off
Report for Tender No. TREN/D1/40 Lot 6 -2005 EuP Lot 6 - Task 1 2nd of October 2007
Fraunhofer IZM CODDE Bio IS DUH Final Report Page 1-10
Further explanations to parts of the definition 3
Explanation for section (ii) off-mode:
In off-mode it is the intention of the user not to use the EuP for some time, or the EuP has deducted with an internal algorithm (i.e. a timer, or by monitoring recent activities) that the EuP will likely not be needed for some time. The (intended) time of inactivity helps to pinpoint typical off-mode occurrences, but is not in itself a defining feature.
The no-load condition of external power supplies (EPS, as covered in Lot 7) is included in Lot 6 off-mode losses. Battery chargers according to the Lot 7 separation may exhibit off-mode losses as well, when the batteries are fully charged.
In practice "0 W off-mode" may include minimal measurable losses ("near 0 W") as long as there are no components or circuits placed before the first switch with galvanic separation inside the EuP. Since the component placement will not be visible from the outside of the product, a threshold value could be defined in accordance with measurement standards. Possibly, EuPs with less than 10 mW off-mode losses may fall under the "0 W off-mode" to simplify the procedure. Nevertheless, there should be a clear preference for "true 0 W" with galvanic separation for reasons of product safety and because many users still would want this as a feature.
Explanation for section (iii) standby:
Lot 6 Standby mode is similar to off-mode, because in this mode the EuP will not be needed or used for some duration. However, during standby a subset of functions of the EuP is still active and consuming energy. The type of functions considered as standby functions have been narrowed down to achieve a practical definition. Compared to off-mode either the reactivation on the main part of the EuP must be combined with one of the listed function types or one of the other reactivation possibilities must be available. At least one reactivation function must be offered.
The circuitry needed to offer the standby function(s) also belong to the standby cluster, even if they are not explicitly named. A microcontroller running to supply or aid the sensor function is of course included without naming the microcontroller as a possible standby function.
The same functional elements (e.g. a display) can be in use during active mode. That is why the continuous functions by themselves are not a distinguishing feature to determine standby mode. They must be combined with some type of reactivation.
A typical example not within the standby definition would be the refrigerator. Some refrigerators can be switched off, so refrigerators are not "always on" products. Once the refrigerator is not in the off position, there is no further reactivation available, however, so the refrigerator does not exhibit Lot 6 standby.
Explanation for section (ix.) transition to standby/off:
“Ready” or “idle” are typical transitional modes, for which a decision based on the offered functions has to be made. A ready mode with preheating is not considered a Lot 6 standby mode.
Even though the power consumption within a transitional mode may be outside of the Lot 6 scope, the EuP should switch as fast as possible from a high transitional mode to Lot 6 Standby or Off-Mode. This is why it can be helpful to distinguish the transitional modes from the active operation, even though both are ultimately the "on-mode consumption" in the view of this study.
Examples for transitional modes, which are not considered as Lot 6 standby: laser printer preheating, coffee machines with continuously heated water supply (hot plates are also not standby), power fan of projectors, while cooling down.
3 The explanations are not part of the definition, but clarify some reoccurring examples at this point.

Report for Tender No. TREN/D1/40 Lot 6 -2005 EuP Lot 6 - Task 1 2nd of October 2007
Fraunhofer IZM CODDE Bio IS DUH Final Report Page 1-11
Active mode(s)
Scope of lot 6 study:Standby and off-mode losses
Off-mode losses
0 Woff-modes
Passivestandby
Main Function(s) Standby functions No Function
disc
onne
ctedNetworked
standby
Transitionto standbyor off-mode
Figure 1-1: Mode distinctions following from the definition
With the sub-division of “networked standby” and “passive standby” (the reason for which will be to differentiate by complexity, especially in Task 3) we have defined a total of seven modes, as illustrated in Figure 1-1.
Two of these – 0 W off-mode and disconnected – do not consume energy and therefore are not environmentally relevant for this study. They are needed, however, to distinguish general product use patterns and averaged times spent in the different modes later on.
Networked standby and passive standby together are the Lot 6 standby mode. The functions covered by these modes (the Lot 6 standby function cluster) falls into three categories: (re)activation functions, continuity functions and limited network functions. Figure 1-2 shows the logical structure behind the standby function cluster, which is based on distinguishing possible function clusters related to “input”, “output” and “internal” and on distinguishing different types of reactivation functions and a limited set of other functions contributing to standby.
Input EuP
Self / Internal
Output
Reactivation on the device
Remote control reactivation
Display (without interaction)
Network remote reactivation
Integrated timer reactivation
Integrated sensor reactivation
Maintain memory/settings
Sensor-based safety functions
Network integrity communication
Network integrity communication
Network integrity communication
Figure 1-2: Visualization of function types for standby definition – divided into input, output and internal functions. The gray (chequered) function types apply only to networked standby.
As has been noted with the functional unit (see in Section 1.1.2) the inclusion of technical parameters may be needed in addition to the mode/functional differentiation proposed in the definition. In the Task 8 recommendations the following parameters are used
rated output power of the power supply speed classification of network types
It is not seen as necessary to include these differentiations in the Lot 6 definition, but it is practical to introduce these concepts at this early stage of the report – even though it was the outcome of much later analysis and discussions.
Power rating dependency
For some power consumptions a dependence on the maximum rated power level seems probable, even if no actual correlation is known. Devices in the higher power range may need stronger
Report for Tender No. TREN/D1/40 Lot 6 -2005 EuP Lot 6 - Task 1 2nd of October 2007
Fraunhofer IZM CODDE Bio IS DUH Final Report Page 1-12
switches, and in the case of electronic switches, relays and secondary side switches, the losses of either the electronic switch or of the circuit still connected to power (the first power conversion stage, but possibly also EMC circuitry) are likely to be higher than for smaller products. The design effort and sometimes the choice of more costly technologies (such as laptop technology in the computing area) are at least equally important factors. The magnitude of the switched or converted power does seem to have an influence, nevertheless.
The dependency can be expressed in relation to rated input power (this applies to all devices in principle), to rated output power (this applies to power supplies or power conversion mainly) or in relation to typical, measurable input power levels. The last option would obviously make matters more complicated and is not considered further.
Comparing with the Lot 7 results for EPS the rated output power of the power supply is the most logical choice. For external power supplies this is a typical specification available for practically all EPS. For internal power supplies, however, this specification is not always available, nor is there always one precise point of measurement. Internal power supplies have no clear-cut interface for defining the output power and may be organised in multiple stages or distributed throughout the product. Nevertheless, the rated output of the main power supply stage is considered the best indication for the power level of the whole device, to stay compatible with the Lot 7 recommendations.
Speed dependency for network interfaces
Higher speed networks still operational during standby similarly will need higher power consumption to some extent. The difficulty is to gauge the network speed with one suitable metric for all network types and link the network speed with the power consumption during Lot 6 networked standby, not only with the power consumption of full speed operation, which would be slightly easier to document.
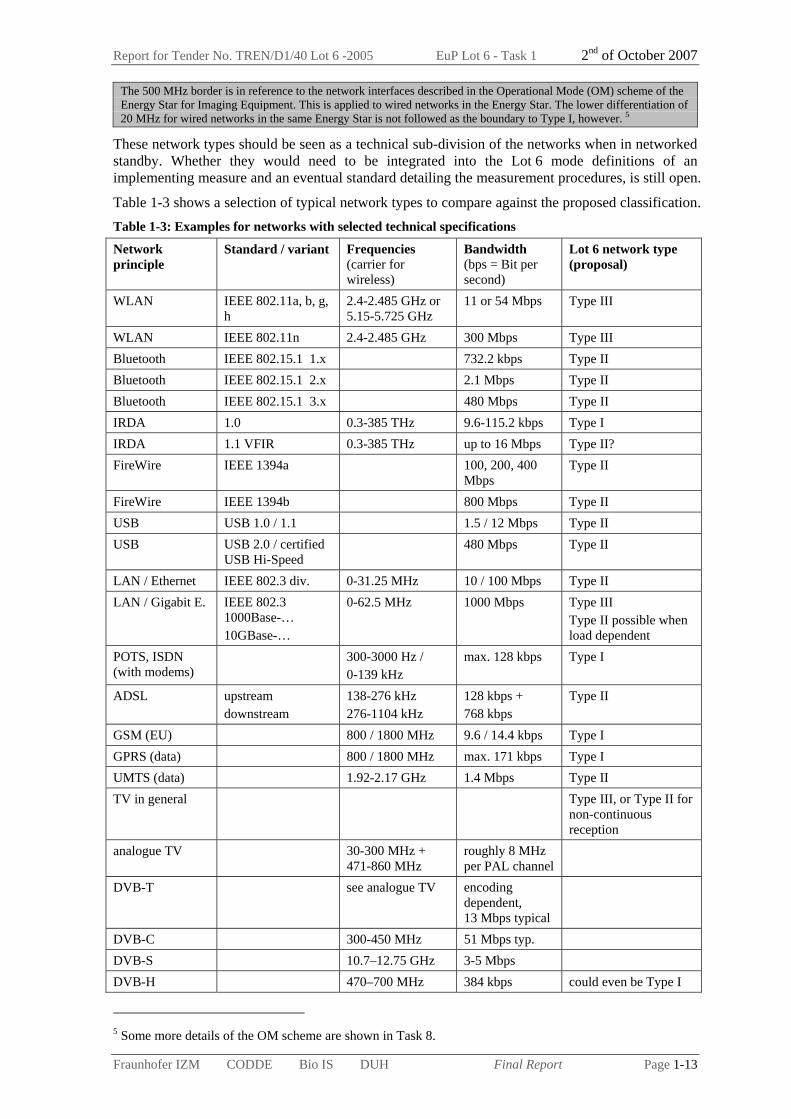
One typical but simplified metric is the maximum frequency of the network, another would be the maximum data rate in bps (bits per second) that can be transferred per connected device. Both are not uniform in their treatment between wired or wireless networks. The maximum transmission rate in bps is proposed as the main metric here, but example frequencies are proposed in parallel and are also listet in Table 1-3.
For differentiating networks more clearly, we propose the following distinctions:
Type I, "Simple networks": Analogue signalling and signal detection4 , and low speed connections (<0.5 Mbps or <5 MHz, such as IrDA or a phone line without DSL).
Type II, "Standard range networks": Standard data networks, lower speed wireless and non-continuous broadcast reception.
Type III, "High speed networks": Data networks (Gbps range or >500 MHz), higher speed wireless (all WLAN types) and continuous broadcast reception.
In essence, Type II will cover all networks (bidirectional and for broadcasting and inter-product signalling also unidirectional), except those falling into the Type I or Type III cases. Type III specifically has to capture those high speed networks, which are not able to power down in periods of low traffic.
4 On a lower technical level all networks are analogue transmissions, of course. Signalling and signal detection refers to the level of a signal as the means to transport information, not a sequence of levels or waveforms, as is the case with digital encoding.
Report for Tender No. TREN/D1/40 Lot 6 -2005 EuP Lot 6 - Task 1 2nd of October 2007
Fraunhofer IZM CODDE Bio IS DUH Final Report Page 1-13
The 500 MHz border is in reference to the network interfaces described in the Operational Mode (OM) scheme of the Energy Star for Imaging Equipment. This is applied to wired networks in the Energy Star. The lower differentiation of 20 MHz for wired networks in the same Energy Star is not followed as the boundary to Type I, however. 5
These network types should be seen as a technical sub-division of the networks when in networked standby. Whether they would need to be integrated into the Lot 6 mode definitions of an implementing measure and an eventual standard detailing the measurement procedures, is still open.
Table 1-3 shows a selection of typical network types to compare against the proposed classification. Table 1-3: Examples for networks with selected technical specifications
Network principle
Standard / variant Frequencies (carrier for wireless)
Bandwidth (bps = Bit per second)
Lot 6 network type (proposal)
WLAN IEEE 802.11a, b, g, h
2.4-2.485 GHz or 5.15-5.725 GHz
11 or 54 Mbps Type III
WLAN IEEE 802.11n 2.4-2.485 GHz 300 Mbps Type III Bluetooth IEEE 802.15.1 1.x 732.2 kbps Type II Bluetooth IEEE 802.15.1 2.x 2.1 Mbps Type II Bluetooth IEEE 802.15.1 3.x 480 Mbps Type II IRDA 1.0 0.3-385 THz 9.6-115.2 kbps Type I IRDA 1.1 VFIR 0.3-385 THz up to 16 Mbps Type II? FireWire IEEE 1394a 100, 200, 400
Mbps Type II
FireWire IEEE 1394b 800 Mbps Type II USB USB 1.0 / 1.1 1.5 / 12 Mbps Type II USB USB 2.0 / certified
USB Hi-Speed 480 Mbps Type II
LAN / Ethernet IEEE 802.3 div. 0-31.25 MHz 10 / 100 Mbps Type II LAN / Gigabit E. IEEE 802.3
1000Base-… 10GBase-…
0-62.5 MHz 1000 Mbps Type III Type II possible when load dependent
POTS, ISDN (with modems)
300-3000 Hz / 0-139 kHz
max. 128 kbps Type I
ADSL upstream downstream
138-276 kHz 276-1104 kHz
128 kbps + 768 kbps
Type II
GSM (EU) 800 / 1800 MHz 9.6 / 14.4 kbps Type I GPRS (data) 800 / 1800 MHz max. 171 kbps Type I UMTS (data) 1.92-2.17 GHz 1.4 Mbps Type II TV in general Type III, or Type II for
non-continuous reception
analogue TV 30-300 MHz + 471-860 MHz
roughly 8 MHz per PAL channel
DVB-T see analogue TV encoding dependent, 13 Mbps typical
DVB-C 300-450 MHz 51 Mbps typ. DVB-S 10.7–12.75 GHz 3-5 Mbps DVB-H 470–700 MHz 384 kbps could even be Type I
5 Some more details of the OM scheme are shown in Task 8.
Report for Tender No. TREN/D1/40 Lot 6 -2005 EuP Lot 6 - Task 1 2nd of October 2007
Fraunhofer IZM CODDE Bio IS DUH Final Report Page 1-14
As of yet, this is certainly not an overview of all existing network types and how they have to be classified according to these types. Also, in principle future networks and revisions of current specifications have to fit into this structure (some are indicated in the table). An error-free and all-encompassing classification of networks is not possible in this study.
Flow Chart Representation
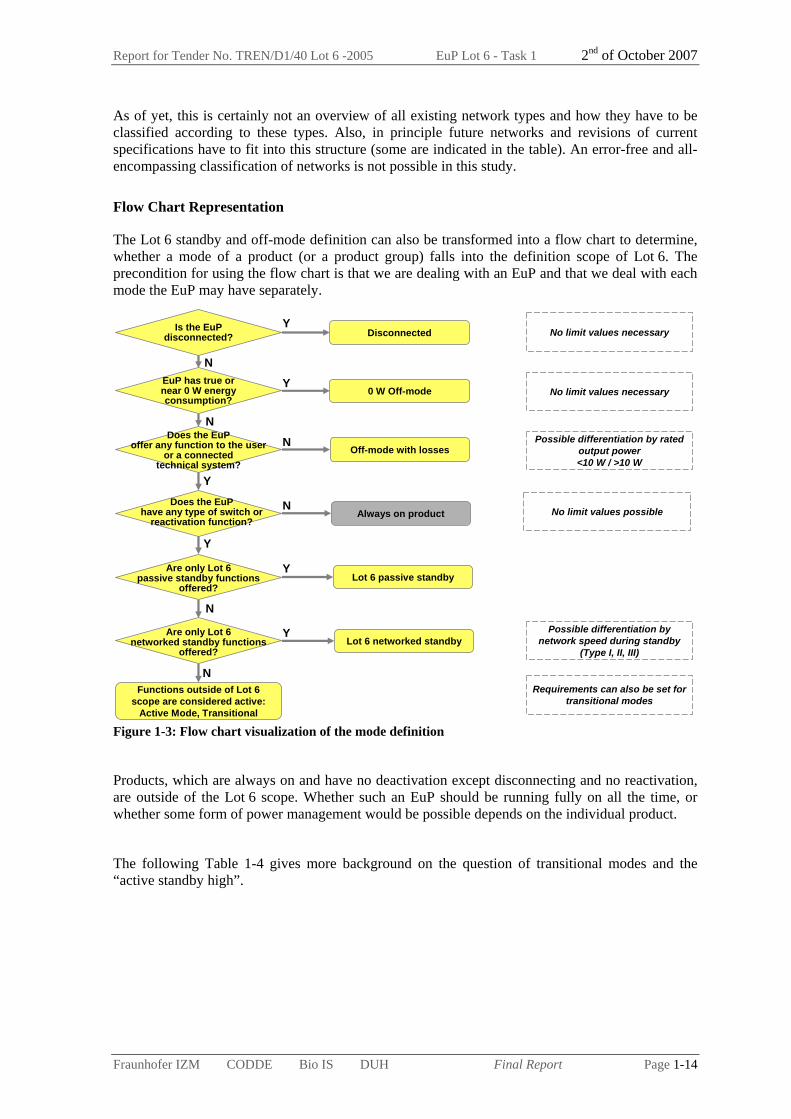
The Lot 6 standby and off-mode definition can also be transformed into a flow chart to determine, whether a mode of a product (or a product group) falls into the definition scope of Lot 6. The precondition for using the flow chart is that we are dealing with an EuP and that we deal with each mode the EuP may have separately.
Is the EuP disconnected?
EuP has true or near 0 W energy consumption?
Disconnected
0 W Off-mode
Off-mode with losses
Always on product
Lot 6 passive standby
Lot 6 networked standby
Functions outside of Lot 6 scope are considered active:
Active Mode, Transitional
Y
Y
Y
Y
Y
N
N
N
N
N
N
Y
Does the EuPoffer any function to the user
or a connected technical system?
Does the EuPhave any type of switch or
reactivation function?
Possible differentiation by rated output power<10 W / >10 W
Possible differentiation by network speed during standby
(Type I, II, III)
Requirements can also be set for transitional modes
No limit values necessary
No limit values necessary
No limit values possible
Are only Lot 6 passive standby functions
offered?
Are only Lot 6 networked standby functions
offered?
Figure 1-3: Flow chart visualization of the mode definition
Products, which are always on and have no deactivation except disconnecting and no reactivation, are outside of the Lot 6 scope. Whether such an EuP should be running fully on all the time, or whether some form of power management would be possible depends on the individual product.
The following Table 1-4 gives more background on the question of transitional modes and the “active standby high”.

Report for Tender No. TREN/D1/40 Lot 6 -2005 EuP Lot 6 - Task 1 2nd of October 2007
Fraunhofer IZM CODDE Bio IS DUH Final Report Page 1-15
Table 1-4: Explanation of transitional modes DisconnectedOff-Mode
0 WattOff-Modelosses
Lot 6 standbyNetwork Active
Transition to standby and off-mode
Active ModesModes
Mode transitions
(A) Transition to standby/off
(B) Active networkdownload
No function(except reactivation switch)
Reactivation Function:Remote Control, Sensor, Switches, Timer Continuity Function:Display, Memory, SafetyNetworkWake-up and status
Part of active operation – not Lot 6 standby
Part of active operation – not Lot 6 standby
At least one main function continuously on;Time limited function cycle, programmable job
Functions
DisconnectedOff-Mode0 Watt
Off-Modelosses
Lot 6 standbyNetwork Active
Transition to standby and off-mode
Active ModesModes
Mode transitions
(A) Transition to standby/off
(B) Active networkdownload
No function(except reactivation switch)
Reactivation Function:Remote Control, Sensor, Switches, Timer Continuity Function:Display, Memory, SafetyNetworkWake-up and status
Part of active operation – not Lot 6 standby
Part of active operation – not Lot 6 standby
At least one main function continuously on;Time limited function cycle, programmable job
Functions
Wake-up over network
Deactivate to networked standby
E.g. „ready“
Ready to active possible
Case (A) Transitional modes to standby/off can be outside of the scope of Lot 6 standby. Whether the transitional mode is part of Lot 6 is determined according to the Lot 6 standby mode definition. Even if the transitional mode (e.g. a ready mode employing preheating) is out of scope for Lot 6 standby, it is evident that two factors have to be incorporated into product design and use:
1. Make sure that a lower power mode (Lot 6 standby or off-mode) is available,
2. Make sure that the lower power modes are reached and that the EuP is not reactivated without need.
Transitional modes are linked to automatic switching from active to standby or off. This behaviour is used to further distinguish the more complex products in the product-use-clusters (i.e. job-based products).
Case (B) Active network downloads are considered to be an active operation phase. Even though IEC 62087 distinguished this mode as “active standby high”, it is now excluded from the Lot 6 standby scope. In essence, the EuP is reactivated over a network (from networked standby), is then performing the download or update and can (and should) return into networked standby afterwards. Because the return to Lot 6 standby (waiting for a new download signal) is implicit, the wording “transitional” actually fits to this type of download behaviour, although it is not a transit from "on" to standby or off.
Network downloads in the background can also occur while the EuP is actively used, in which case it would likewise not be classified as Lot 6 standby (nor as IEC 62087 "active standby high").

Report for Tender No. TREN/D1/40 Lot 6 -2005 EuP Lot 6 - Task 1 2nd of October 2007
Fraunhofer IZM CODDE Bio IS DUH Final Report Page 1-16
1.1.4. Analysis and discussion of definition approaches
This section compares with existing standby definitions and approaches in more detail. For readers intent on capturing the essential results and implications of Lot 6 only it might be advisable to skip directly to Chapter 1.1.6.
There are three basic approaches for defining standby (either with separate or including off-modes), which are especially relevant when looking at existing standards and labelling requirements.
The lowest power mode of a product (including 0 W) is called standby. Standby is, when the product is using energy, but no main function (one of the functions,
for which the product is originally bought) is running. When a product is waiting for something to happen, it is not effectively delivering a
service/main function. Such “readiness” modes are standby, even when they are essential aspects of the product (example answering machines ready to receive a call).
or "Readiness" modes are outside of standby scope. Standby (or "idle losses") applies, when a product is not effectively delivering a main
function to a user (or a connected system). Effective delivery means that not only is the main function running, it is received by the user (or a technical recipient).
Depending on whether the “standby” definition already covers a range of modes, the additional modes “below” and “above” standby must be defined: most usually “On” or “Active”, “Off” and “Disconnected”.
Within standby, further subdivisions may be present, most notably “passive standby”, “active standby”, “active standby high/low”, “suspend”, “readiness”, “idle”.
As a separate view, product modes can be grouped as “low power modes”, “energy saving modes” or “sleep modes” first of all, without directly linking this to classification as “standby” or “off”. This is most likely combined with the first approach, where “standby” does not denote a specific behaviour or function-based mode, but rather always the lowest power mode available.
The Lot 6 definition largely follows the "no main function" approach. However, the definition is built upon the functions offered during standby (or not offered during Off-mode), not only on the absence of main functions.
There have been numerous proposals for defining standby. Systematic investigations on standby as an environmental issue started in the 1990s (for summaries see [Harris 2003], [Schlomann 2005]). Table 1-5 gives a compressed overview of a selection of different studies, standards and label criteria related to standby (the last column indicates the type of the source). The table was developed based on a similar comparison in [Schlomann 2005], therefore the main columns are ordered with the headings from that study, even though not all approaches fit into the exact same columns.

Report for Tender No. TREN/D1/40 Lot 6 -2005 EuP Lot 6 - Task 1 2nd of October 2007
Fraunhofer IZM CODDE Bio IS DUH Final Report Page 1-17
Table 1-5: Comparison of existing standby definitions (based on [Schlomann 2005], with own additions)
Perceived off-mode(Scheinausbetrieb)
Off(Aus)
Disconnected (if separate)
Ready-Mode Standby-Mode Sleep-Mode Off-Modeenergy consumption
slightly reducedenergy consumption
reducedenergy consumption
much reduceddelivers no function, seems
to be swiched off but there is still a energy consumption
delivers no function, zero energy consumption
not separate
Rath et al. 1997 (UBA Text Nr. 45/97)
"Normal operation"
(Normalbetrieb)Off
stud
y
Device not fully switched off (Gerät nicht
richtig ausschaltbar)
Swiched off (power used while performing no function)
MEEuP Product Cas- es Report, 2005 (TV) st
udy
Rosen/Meier 2000 Standby (unit is plugged in and appears off to the user)
Disconnected (plugged off) st
udy
Roth et al. 2002/04 Suspend (Device not ready to carry out intended operation,
but on)
Off (Device not turned on but plugged in) Unplugged
stud
y
Active Standby (on, but not playing or
recording)
Delay Start (timer programmed start)
Passive Standby (ready to be switched
on or secondary function)
Off(no wake-up with remote
control; some internal functions possible)
Unplugged
additionally EPS when charging
additionally EPS when not charging
IEC 62018 Power consumption if ITE - Measurement methods, 2003-06
IEC 62301 Household electrical appliances - Measurement of standby power, 2005-06
Standby (lowest power consumption, which cannot
be switched off by user)
Zero standby, if off switch exists
Active Standby-high (and is
exchanging/receiving data with/from an external source)
Active Standby-low (additional
switched in other mode by external
signal)
Passive Standby (swiched on with remote control, internal signal)
US FEMP
gov.
pro
gram
switched offGED 2002 Sleep-Mode la
bel
Off-Mode with losses 0 W Off-mode Disconnected
Full-on mode (all functions are fully
powered)
On
On
Idle / standby / readiness for operation(Leerlauf, Standby, Betriebsbereitschaft)
Device delivers at least one function, but not the main function; device is waiting for new task
labe
lTCO´03 Displays, B.7.0.1.1 (Sweden)
IEA 1999, Bertoldi et al.
Sleep Mode/Low Power
Idle (unit is on, but not active; includes sleep modes e.g. PC)
Standby (Wartezustand)
Off-Mode/Standby
Normal operation(Normalbetrieb)
On Mode/Active Power
Passive Standby (remote access) Off
Standbynot performing main function
Standby (the user not the machine has to switch into standby-mode and must manually turn it back on)
Active Mode (main functions)
On
Active (unit is performing a requested service)
"On""In-use"
Disconnected
FhG ISI, 2005[Schlomann 2005]
In readiness or standby(Bereitschaftsbetrieb)
Standby
Not performing main function (lowest power mode while performing at least one function)
Device in readiness (Gerät in Bereitschaft)
Wortmann et al. 2001, 2002
Standby
Normal operation(Normalbetrieb)
Main functionenergy consumption 100 %
stud
yst
udy
stud
yla
bel
stan
dard
stud
yDisconnected
Active (Device carrying out intended
operation)
Standby (device ready to, but not carrying out intended operation)
Australian standby studies [NAEEEP 2006]
Energy saving mode (one or more functions are switched off)
Off
Off (connected to a power source, no function, cannot be swiched on with remote control or internal signal)
Disconnected (from all external power sources)
EU 2006, Stand-by Initiative
Low power modes; Standby, if no lower mode exists
Lot 6 Lot 6 Standby and Off-mode Losses
Lot 6 Standby (passive or networked)
Hard Off Mode (switch)
IEC 62087 Methods of measurement for the power consumption of audio, video and related equipment, 2002-03
On (play), On (record)
On
On
The main question for the further discussion would be the dividing line between “standby and off-mode losses” and “energy use in the active/transitional modes”, the latter of which are not covered by this preparatory study. The following sections take up the arguments of approaches, which are either wider in scope or narrower compared to the Lot 6 definition.
1.1.4.1. "Idle losses" concept (enlarged scope)
Some approaches promote a comparatively wider scope of looking at “leaking or wasted energy”. One possible discussion point would be that a product, which is offering a functionality in its main active mode but where no-one is making use of the offer (e.g. a running TV set, where no-one is watching), is a waste of energy strongly related to standby or leaking electricity. This idea is for example promoted by the German UBA and has been developed and published in “Rath et al. 1997” and subsequent publications (see Table 1-5). The wording “idle losses” (Leerlaufverluste) is used to describe this wider scope. Thus under this supposition, the active
Report for Tender No. TREN/D1/40 Lot 6 -2005 EuP Lot 6 - Task 1 2nd of October 2007
Fraunhofer IZM CODDE Bio IS DUH Final Report Page 1-18
mode would need to be further divided depending on the benefit received from the system rather than the technical state of operation. This approach will be explored here shortly.
Table 1-6: Result of differentiating “idle losses” as a non-productive part of the active mode
Standby mode(s) Off-mode with losses
0 W Off-mode Active mode – power consumption during main function(s) of the product operation, therefore completely out of scope of Lot 6 Lot 6 relevant energy consumption Functionality is used (by user or another technical system)
Offered functionality is not used
… … …
Wider scope idle losses Dividing line would need to be defined, possibly for each product type and
use scenario
While the approach is ecologically sound (it includes more types of energy waste), we do not think the differentiation within the active mode would be possible within this study. In comparison to the other definitions this wasted energy would not be considered a standby power issue, but one belonging to the general optimization of the product efficiency or use patterns. In product category specific lots these arguments might have to be considered – with both the technical properties of the product and the actual user behaviour as influencing factors.
1.1.4.2. "Lowest power mode" (narrow scope of standby)
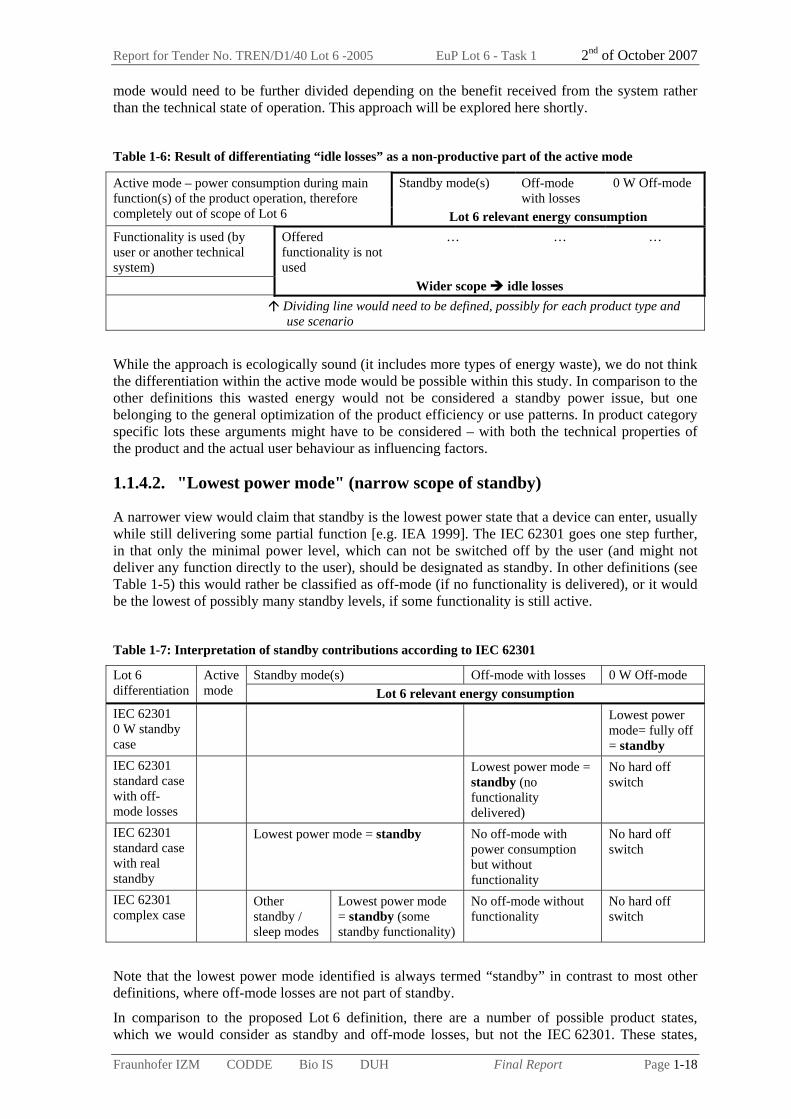
A narrower view would claim that standby is the lowest power state that a device can enter, usually while still delivering some partial function [e.g. IEA 1999]. The IEC 62301 goes one step further, in that only the minimal power level, which can not be switched off by the user (and might not deliver any function directly to the user), should be designated as standby. In other definitions (see Table 1-5) this would rather be classified as off-mode (if no functionality is delivered), or it would be the lowest of possibly many standby levels, if some functionality is still active.
Table 1-7: Interpretation of standby contributions according to IEC 62301
Standby mode(s) Off-mode with losses 0 W Off-mode Lot 6 differentiation
Active mode Lot 6 relevant energy consumption
IEC 62301 0 W standby case
Lowest power mode= fully off = standby
IEC 62301 standard case with off-mode losses
Lowest power mode = standby (no functionality delivered)
No hard off switch
IEC 62301 standard case with real standby
Lowest power mode = standby No off-mode with power consumption but without functionality
No hard off switch
IEC 62301 complex case
Other standby / sleep modes
Lowest power mode = standby (some standby functionality)
No off-mode without functionality
No hard off switch
Note that the lowest power mode identified is always termed “standby” in contrast to most other definitions, where off-mode losses are not part of standby.
In comparison to the proposed Lot 6 definition, there are a number of possible product states, which we would consider as standby and off-mode losses, but not the IEC 62301. These states,
Report for Tender No. TREN/D1/40 Lot 6 -2005 EuP Lot 6 - Task 1 2nd of October 2007
Fraunhofer IZM CODDE Bio IS DUH Final Report Page 1-19
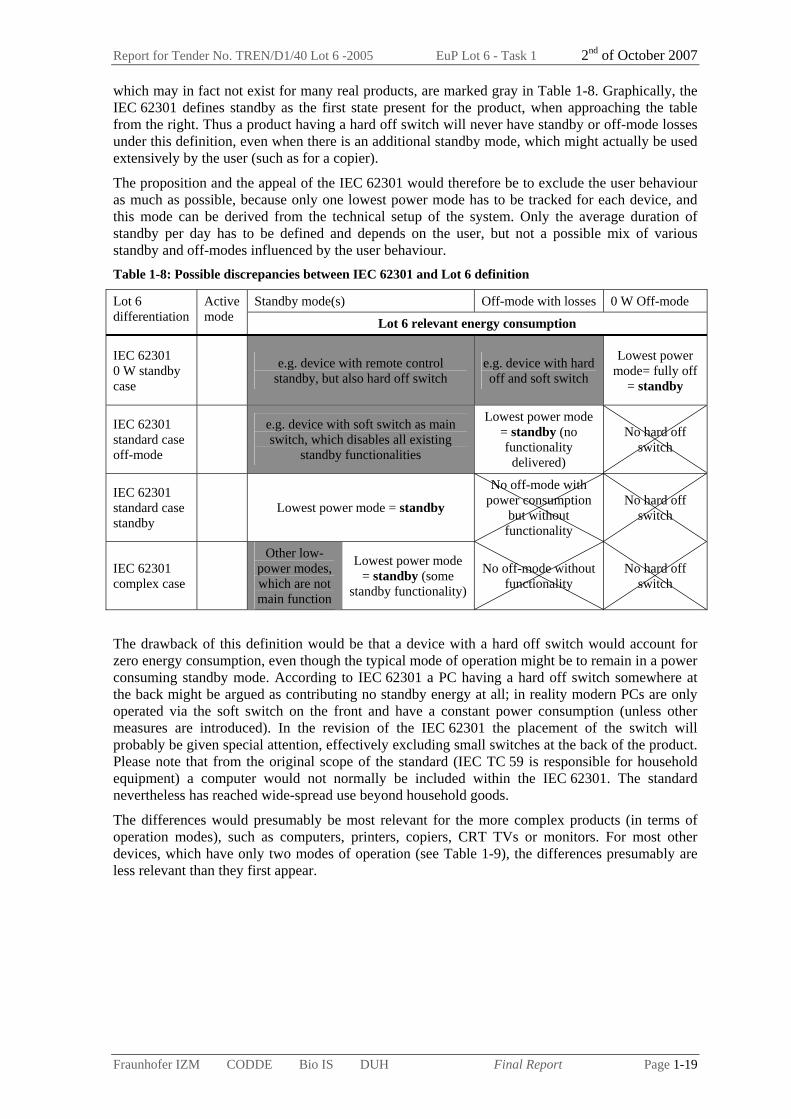
which may in fact not exist for many real products, are marked gray in Table 1-8. Graphically, the IEC 62301 defines standby as the first state present for the product, when approaching the table from the right. Thus a product having a hard off switch will never have standby or off-mode losses under this definition, even when there is an additional standby mode, which might actually be used extensively by the user (such as for a copier).
The proposition and the appeal of the IEC 62301 would therefore be to exclude the user behaviour as much as possible, because only one lowest power mode has to be tracked for each device, and this mode can be derived from the technical setup of the system. Only the average duration of standby per day has to be defined and depends on the user, but not a possible mix of various standby and off-modes influenced by the user behaviour. Table 1-8: Possible discrepancies between IEC 62301 and Lot 6 definition
Standby mode(s) Off-mode with losses 0 W Off-mode Lot 6 differentiation
Active mode Lot 6 relevant energy consumption
IEC 62301 0 W standby case
e.g. device with remote control standby, but also hard off switch
e.g. device with hard off and soft switch
Lowest power mode= fully off
= standby
IEC 62301 standard case off-mode
e.g. device with soft switch as main switch, which disables all existing
standby functionalities
Lowest power mode = standby (no functionality
delivered)
No hard off switch
IEC 62301 standard case standby
Lowest power mode = standby
No off-mode with power consumption
but without functionality
No hard off switch
IEC 62301 complex case
Other low-power modes, which are not main function
Lowest power mode = standby (some
standby functionality)
No off-mode without functionality
No hard off switch
The drawback of this definition would be that a device with a hard off switch would account for zero energy consumption, even though the typical mode of operation might be to remain in a power consuming standby mode. According to IEC 62301 a PC having a hard off switch somewhere at the back might be argued as contributing no standby energy at all; in reality modern PCs are only operated via the soft switch on the front and have a constant power consumption (unless other measures are introduced). In the revision of the IEC 62301 the placement of the switch will probably be given special attention, effectively excluding small switches at the back of the product. Please note that from the original scope of the standard (IEC TC 59 is responsible for household equipment) a computer would not normally be included within the IEC 62301. The standard nevertheless has reached wide-spread use beyond household goods.
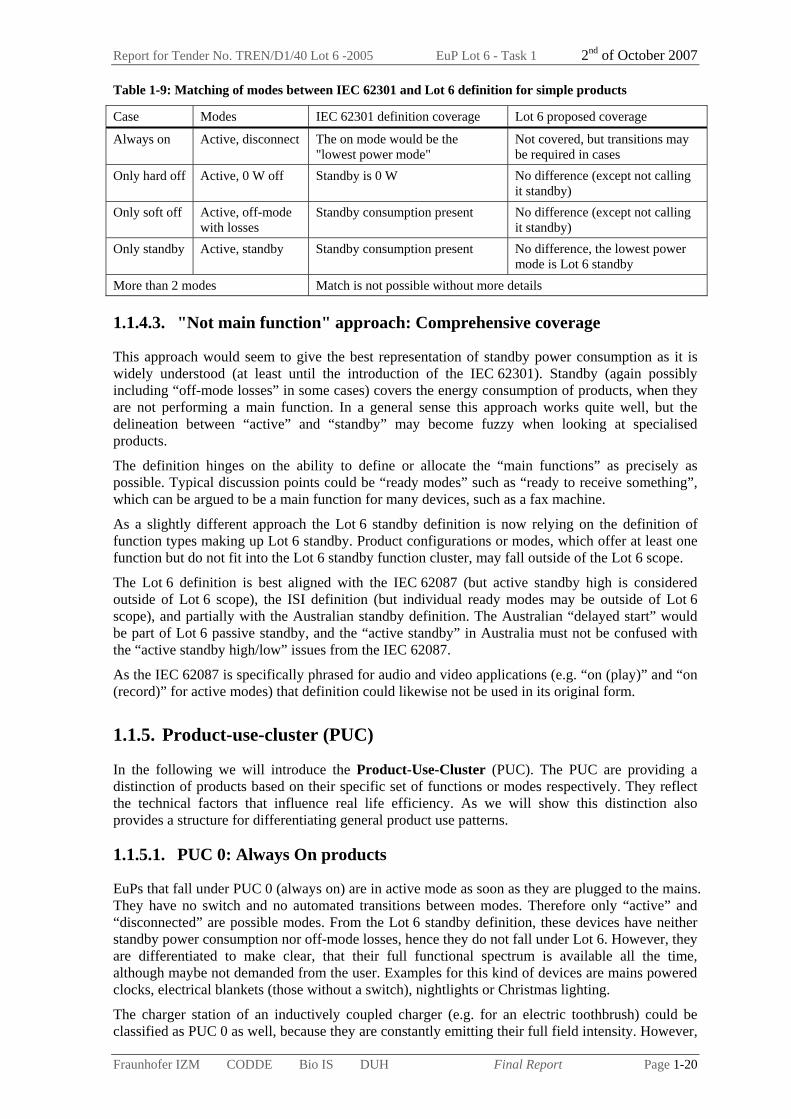
The differences would presumably be most relevant for the more complex products (in terms of operation modes), such as computers, printers, copiers, CRT TVs or monitors. For most other devices, which have only two modes of operation (see Table 1-9), the differences presumably are less relevant than they first appear.
Report for Tender No. TREN/D1/40 Lot 6 -2005 EuP Lot 6 - Task 1 2nd of October 2007
Fraunhofer IZM CODDE Bio IS DUH Final Report Page 1-20
Table 1-9: Matching of modes between IEC 62301 and Lot 6 definition for simple products
Case Modes IEC 62301 definition coverage Lot 6 proposed coverage
Always on Active, disconnect The on mode would be the "lowest power mode"
Not covered, but transitions may be required in cases
Only hard off Active, 0 W off Standby is 0 W No difference (except not calling it standby)
Only soft off Active, off-mode with losses
Standby consumption present No difference (except not calling it standby)
Only standby Active, standby Standby consumption present No difference, the lowest power mode is Lot 6 standby
More than 2 modes Match is not possible without more details
1.1.4.3. "Not main function" approach: Comprehensive coverage
This approach would seem to give the best representation of standby power consumption as it is widely understood (at least until the introduction of the IEC 62301). Standby (again possibly including “off-mode losses” in some cases) covers the energy consumption of products, when they are not performing a main function. In a general sense this approach works quite well, but the delineation between “active” and “standby” may become fuzzy when looking at specialised products.
The definition hinges on the ability to define or allocate the “main functions” as precisely as possible. Typical discussion points could be “ready modes” such as “ready to receive something”, which can be argued to be a main function for many devices, such as a fax machine.
As a slightly different approach the Lot 6 standby definition is now relying on the definition of function types making up Lot 6 standby. Product configurations or modes, which offer at least one function but do not fit into the Lot 6 standby function cluster, may fall outside of the Lot 6 scope.
The Lot 6 definition is best aligned with the IEC 62087 (but active standby high is considered outside of Lot 6 scope), the ISI definition (but individual ready modes may be outside of Lot 6 scope), and partially with the Australian standby definition. The Australian “delayed start” would be part of Lot 6 passive standby, and the “active standby” in Australia must not be confused with the “active standby high/low” issues from the IEC 62087.
As the IEC 62087 is specifically phrased for audio and video applications (e.g. “on (play)” and “on (record)” for active modes) that definition could likewise not be used in its original form.
1.1.5. Product-use-cluster (PUC)
In the following we will introduce the Product-Use-Cluster (PUC). The PUC are providing a distinction of products based on their specific set of functions or modes respectively. They reflect the technical factors that influence real life efficiency. As we will show this distinction also provides a structure for differentiating general product use patterns.
1.1.5.1. PUC 0: Always On products
EuPs that fall under PUC 0 (always on) are in active mode as soon as they are plugged to the mains. They have no switch and no automated transitions between modes. Therefore only “active” and “disconnected” are possible modes. From the Lot 6 standby definition, these devices have neither standby power consumption nor off-mode losses, hence they do not fall under Lot 6. However, they are differentiated to make clear, that their full functional spectrum is available all the time, although maybe not demanded from the user. Examples for this kind of devices are mains powered clocks, electrical blankets (those without a switch), nightlights or Christmas lighting.
The charger station of an inductively coupled charger (e.g. for an electric toothbrush) could be classified as PUC 0 as well, because they are constantly emitting their full field intensity. However,

Report for Tender No. TREN/D1/40 Lot 6 -2005 EuP Lot 6 - Task 1 2nd of October 2007
Fraunhofer IZM CODDE Bio IS DUH Final Report Page 1-21
when such a cradle is not charging it could also be argued to be in off-mode (using energy, but not supplying a function). With this argument off-mode losses could occur for devices, which have no off switch at all, moving the chargers (and EPS) into the PUC 1 cluster.
Conclusion: EuPs of PUC 0 are not considered under Lot 6. Chargers and EPS in no-load condition (including inductively coupled charger cradles) have off-mode losses and are not PUC 0.
1.1.5.2. PUC 1: On/Off products
EuPs that fall under PUC 1 (on/off) are in active mode when a switch was manually operated and the device is plugged into mains. They have distinct “on”, “off” (and “disconnected”) modes discernible to the user. The off-mode may consume energy, for example due to a soft switch. PUC 1 includes many EuPs, which are usually stored (disconnected) in the household and taken out for operation. Typical products are power tools, small household appliances such as mixers or vacuum cleaners, but also stand-alone radios or lighting. PUC 1 also includes products with an off switch, but where the switch is seldom used. An example would be refrigerators, although some do not have an off position. Only the “0” or “Off” position of such devices would potentially contribute to off-mode losses; the different power levels in normal operation are not considered as Lot 6 standby.
EPS and chargers (when viewed as individual EuPs or when they are considered a major characteristic of another EuP) in no-load condition also belong to PUC 1, because the no-load power consumption is considered as off-mode losses.
Off-mode-losses are a relevant aspect regarding PUC 1. Ecodesign should focus on further reduction or avoidance of off-mode losses. Products with internal power supply should possibly provide a hard off switch, which fully disconnects it from the grid.
Conclusion: EuPs of PUC 1 are considered under Lot 6 regarding off-mode-losses.
1.1.5.3. PUC 2: On/Standby products
EuPs that fall under PUC 2 (on/standby) are devices, for which on-mode has to be activated and changed very conveniently. They have “on”, “standby”, and “disconnected” modes discernible to the user. If a soft or hard switch is provided off-modes may occur. PUC 2 includes products that typically feature a remote control such as TVs, set-top-boxes, or some Hifi equipment. They are frequently used and manually activated from a standby mode and deactivated into a standby mode. It is possible that a functional loss occurs (loss of program settings, memory) when a device is disconnected or fully switched off from mains. With the introduction of networked standby (network communication) the off-mode options may also not be provided anymore. Another typical group of products in PUC 2 would be cordless phones, which are in networked standby while waiting for calls.
Conclusion: EuPs of PUC 2 are considered under Lot 6 regarding standby and off-mode-losses. If networked standby needs to be differentiated, then “PUC 2 (net)” can be used as a short form.
1.1.5.4. PUC 3: Job-based on
EuPs that fall under PUC 3 (job-based) are devices, which run a defined “function cycle” or “job” in active mode. After finishing a job the device reduces the set of functions by changing into a transitional mode. The device may stay ready (high power level with quick reactivation) or starts a power save scheme typically leading to standby or sleep modes. Under the definition of Lot 6 we summarise these modes into the term “transition into standby and off-mode”. This indicates that after a certain period of time, when a device is not actively used (active mode), the device should automatically change into standby and off-modes in order to save energy. The modes can also be changed manually by pushbuttons or switches. It is also possible to disconnect the device, however this might lead to a loss of function.
PUC 3 comprises products such as printers, copiers, scanners, personal computers and similar equipment, DVD and video equipment, facsimile machines and telephone answering machines,

Report for Tender No. TREN/D1/40 Lot 6 -2005 EuP Lot 6 - Task 1 2nd of October 2007
Fraunhofer IZM CODDE Bio IS DUH Final Report Page 1-22
microwave ovens and washing machines. Job-based products have the widest range and are very relevant to standby and off-mode losses.
Conclusion: EuPs of PUC 3 are considered under Lot 6 regarding transition modes, standby and off-mode-losses.
1.1.6. Scope of investigated products
The Lot 6 mode definition covers all EuPs. However, the investigation to determine the relevance of standby and off-mode losses has to be based on more specific product types and cannot cover all EuPs numerically or statistically. It is not possible to analyze every single product and all specific product cases. So a number of criteria have to be defined for pre-selection of the most relevant product groups regarding the postulated scope of Lot 6.
The first distinction is based on different energy types. The second distinction comprises the perspective of application sectors. The third distinction takes a closer look at special product configurations like EPS and battery based operation. These are the main three distinctions to achieve a workable product scope. In a later step, products, which fall into these distinctions, but are not expected to have a large contribution to Lot 6 energy consumption, are filtered out with additional criteria. The final goal of this section is a listing of product types to be investigated further.
As an input later in the selection process we first take a look at which product types are typical contributors to standby and off-mode losses according to existing studies.
1.1.6.1. Most relevant product groups according to studies
Table 1-10 and Table 1-11 show summary results of standby and off-mode power consumption in households. These are given for basic orientation regarding the possible amount of standby in households (e.g. 92.2 W per household in the Australian study) and an impression of the product types with potentially the highest relevance. Table 1-10: Summary results from Australian Intrusive Standby Survey 2005 [EES 2006a]
Type of Product Contribution to Total Standby
[W]
Number of Items per Household
Average Watt per Item
Computer and peripherals (e.g. Desktop PC, Notebook, CRT/LCD Display, Modem, Hub, Inkjet printer, Computer Speaker, Scanner)
28.10 5.40 5.20
Other home entertainment (e.g. Portable stereo, Amplifier, Integrated stereo, VCR, DVD Player, AV-Receiver)
19.60 5.00 3.90
Major Appliances (e.g. Clothes Washer, Dishwasher, Water heaters, Microwaves )
11.80 8.50 1.40
Monitoring and continuous appliances (e.g. Clock Radio, Smoke Alarm, Timers)
8.70 7.60 1.10
Telephones other office equipment (e.g. Cordless phone base station, Multifunction devices, Facsimiles, Answering machines)
7.10 2.00 3.60
Televisions (CRT and Plasma TV /no LCD TV)
6.20 1.70 3.60
Other items with a standby mode (e.g. Vacuum cleaners, Lighting, Game Consoles, Rechargeable Toothbrush, Bread Maker, Cordless Drills)
3.90 9.70 0.40
Set-top-boxes 3.50 0.30 12.10External power supplies 3.40 4.70 0.70
Total 92.20 44.90

Report for Tender No. TREN/D1/40 Lot 6 -2005 EuP Lot 6 - Task 1 2nd of October 2007
Fraunhofer IZM CODDE Bio IS DUH Final Report Page 1-23
Table 1-11: Summary results from Fraunhofer ISI standby study (data from [Schlomann 2005])
Standby Off-Mode with
losses
Total consumption (Standby + Off-Mode)
Total consumption incl. stock for
Germany
Device Consump. [kWh/a] Consump. [kWh/a] Consump. [kWh/a] [GWh/a]
CRT Televisions 26.50 2.00 28.50 1515.35
Hifi system 37.60 5.00 42.60 1268.46
PC 21.30 16.90 38.20 1074.72
Integrated stereos 50.10 0.80 50.90 1040.45
Set-top-box sat 54.10 0.00 54.10 1026.60
Oven 25.40 0.00 25.40 833.91
VCRs 33.20 2.10 35.30 738.19
Microwave 26.10 0.00 26.10 672.91
Washing machine 6.30 8.80 15.10 545.73
Inkjet printer 4.20 19.40 23.60 458.10
Answering machine 21.80 0.00 21.80 406.64
CRT Display 10.60 7.60 18.20 348.93
Cordless phone DECT 17.20 0.00 17.20 347.04
Charger mobile phone 4.40 0.00 4.40 313.02
Radio clock 14.70 0.00 14.70 300.64
Fax device 30.60 0.00 30.60 211.29
Scanner 23.60 1.00 24.60 193.16
DVD player 8.50 2.20 10.70 192.60
Laser printer 14.00 14.40 28.40 185.71
Game consoles 0.00 13.50 13.50 162.46
Portable stereos 6.10 3.40 9.50 144.63
PC speaker set 1.30 5.30 6.60 111.41
Set-top-box cable 54.10 0.00 54.10 101.76
LCD Display 2.00 9.20 11.20 100.37
Set-top-box DVB 40.60 0.00 40.60 94.19
Notebook 3.30 13.10 16.40 75.39
Dishwasher 1.80 1.10 2.90 67.34
Video camera 0.70 2.20 2.90 25.85
LCD Television 13.30 2.60 15.90 25.36
Copier 1.00 8.70 9.70 22.21
Digital camera 0.40 1.70 2.10 21.85
PDA 2.40 2.30 4.70 15.50
Projection television 8.80 0.20 9.00 3.15
Plasma Televisions 13.30 2.00 15.30 1.38
According to these two sources PCs (and periphery), Hifi equipment and other media players, and televisions are in the front row. This result is also reinforced by studies of Japan (ECCJ) and Taiwan [Hu 2006]. The Taiwan and Korea study sets a special focus on home networks, which now and for the future (2020) is thought to play an important role for standby consumption of households [Kim 2006]. This is characterized by the key role of ADSL devices in the Taiwanese data. Cordless phones, answering machines, and EPS/chargers left plugged in are identified as secondary culprits. Large household appliances are also relevant as a group in the Australian study, in the 2005 ISI summary data the washing machines are under the top 10 of most relevant standby devices. There are great differences in the absolute consumption per kWh/a results between the studies. For example the Taiwanese studies seem to use very low standby values and diverse standby duration times.

Report for Tender No. TREN/D1/40 Lot 6 -2005 EuP Lot 6 - Task 1 2nd of October 2007
Fraunhofer IZM CODDE Bio IS DUH Final Report Page 1-24
Note that each study potentially uses a different definition for standby and off-mode, and of course a different aggregation of the products may have been applied.
1.1.6.2. Distinction by energy types
Distinction (1) by energy type
non electricalelectrical
other electricity sources
e.g. solar
mixed electricity sources
e.g. solar + gridMains operated
EuPs
Other electricity networks, i.e. low
voltage supply and higher voltages
Figure 1-4: Discussion of product scope according to energy types
The categorization by energy distinction comprises three levels. The first level is the allocation of products to different energy types. There are some products with standby energy consumption, which use other energy than electricity. Possible standby relevant energy sources apart from electricity are gas and chemicals. A well known "gas powered" example is an older water heater with a pilot flame that is constantly running. Another example is gas based welding equipment that is running between the welding jobs on a standby mode with a small flame. Gas powered appliances are in need of gas supply and usually linked to a gas supply network similar to electricity powered devices, which mostly are supplied via the mains electricity network. However the measurement of gas consumption is quite different from electricity. The fact that the market penetration of gas powered devices is considerably lower in comparison to electrical and electronic equipment leads to the suggestion that the energy type gas should be excluded from the scope of the study.
Comment
According to feedback received, gas heaters without electronic ignition should still be an important factor, especially in the new member states of the EU. The Lot 6 study will nevertheless exclude these appliances, because they are targeted by other energy efficiency measures, because they belong to the infrastructure part of the building and because increased replacements are likely over the next years also in the new member states.
For chemically stored energy within the EuP this should be treated in analogy to primary batteries. A possible case would be hydrogen (or methanol) storage for fuel cells, where a standby induced continuous energy conversion would be possible. If standby energy taken from primary batteries is excluded, then other chemical storage should be treated likewise.
Based on these discussions all non electrical products are excluded from this study. On the next level for the distinction by energy there are only electricity powered products left.
If the electrical source is considered there are some special cases for mixed electricity sources e.g. solar power combined with grid power or local windmill power mixed with grid power. Energy generated from renewable sources should possibly have a special role. For devices relying solely on local energy harvesting (e.g. a solar panel) the actual amount of energy use should not be an issue within this lot. Where the device is receiving energy both from local generation and the electricity network a substitution effect would demand that standby energy use can be a relevant factor, because with lower consumption or losses a smaller percentage of the total energy would be taken from the network. For practicality the mixed source electricity will be excluded, however.
Electricity networks
Furthermore the electricity networks can be divided in standard voltage providing networks and other electricity networks with a higher or lower voltage supply. The standard electricity networks have a voltage range from 110 V up to 400 V (the latter with three phase mains connection). All electricity networks and products, which support higher or lower voltages, are not considered in Lot 6. Lower voltage networks, such as for example the conventional telephone network, the

Report for Tender No. TREN/D1/40 Lot 6 -2005 EuP Lot 6 - Task 1 2nd of October 2007
Fraunhofer IZM CODDE Bio IS DUH Final Report Page 1-25
supply of energy to peripherals over USB or over Ethernet, are also not included in Lot 6. The simple reason is that products, which are optimised for those networks are hard to compare with “plugged-in” products. For the lower voltage networks, the network node supplying the power could be investigated, if it fits into the Lot 6 product scope (such as a PC powering USB devices).
In focus are only mains voltage operated EuPs. This means all products that have to be plugged in. Some products, which are traditionally installed by an electrician (no user plug) or which use three phase mains electricity will be included to treat product groups uniformly, especially where 3 phases or 1 phase operation is not apparent to the user, i.e. for ovens. From the outside and from the functionality offered such products are identical to the user.
1.1.6.3. Distinction by application sectors
The second distinction focuses on fields of application. We have divided the fields of application into five aggregated sectors, as shown in Figure 1-5.
Distinction (2) by application sectors
Home appliances
Office equipment
Public, commercial, industrial (excluding offices)
Infrastructure(energy, com)
Building infrastructure
Figure 1-5: Discussion of product scope according to application sectors
The first two sectors – households and offices – will be covered by the Lot 6 study. In the sector household application we have appliances and office equipment that describe nearly every electrical device in and for households as well as potentially office equipment in private use (home office). In the range of this sector are all audio/video, information and telecommunication products as well as small household appliances to mention only a few of the possible products categories.
Office equipment as a separate sector covers EuPs installed directly in the workplace environments and in the possibly adjacent rooms for copiers, printers, document shredders and so on. Office kitchens are in principle included (but have not been investigated in detail). Server rooms or telecommunication installations not intended for permanent presence of staff are not considered offices.
The other three sectorial blocks listed are not covered by Lot 6 especially building infrastructure, energy and communication network infrastructure and the public, commercial and industrial sector. A number of reasons are given below:
Building infrastructure: in general is excluded but it could be included with selected examples. Those examples would be closest to user and to end products. Boundaries between single products and networked installations can lead to difficulties (e.g. NTBA, intercom, smoke detector).
Energy and telecom infrastructure: the power infrastructure is already driven by efficiency requirements and probably not many cases of standby according to the definition are existing. The second case is the data and telecom infrastructure: most appliances here are built for maximum performance and reliability, and are unlikely to include standby or power management to a large extent (e.g. telecommunication access point or mobile phone access points). TV broadcasting infrastructure is subsumed under the telecom infrastructure as well.
Public and transportation infrastructure: Since the transportation sector is outside the scope of the EuP, there is a difficult gray area of installations like ticket vending machines or traffic control systems, which are electronic support systems within the transportation area. Another public area in infrastructure is characterised by vending machines, ATMs and medical equipment (i.e. in public hospitals). Considering the small unit sales for these products, their immense diversity and the fact of the exclusion of the transportation area they are out of scope.
Report for Tender No. TREN/D1/40 Lot 6 -2005 EuP Lot 6 - Task 1 2nd of October 2007
Fraunhofer IZM CODDE Bio IS DUH Final Report Page 1-26
Industrial manufacturing equipment: is out of scope due to the extreme variety in product range, from very small subsystems to very complex networked installations. In addition there is no statistically identifiable mix of standby power levels or common functionalities available. Compared with household products sales and stock figures will be low. The total electricity consumption of this sector is quite significant, but the improvement potentials through targeted efficiency measures on standby and off are considered to be low. Regarding the low power modes in focus, devices in non-operation will normally be fully switched off without standby for product safety reasons.
Referring to the public, commercial and industrial equipment there are some applications such as computers, which could be subject to the same measures in the end as those from the office/home environment. Offices (and office computers) from these application sectors will be part of the "office equipment" investigation, but other types of computers for example in production sites will not be considered specifically.
1.1.6.4. Distinction according to special product configurations
In addition to the broad distinctions above (energy type, application sector) there are some product characteristics needing specific discussion.
Some items of the following list of special cases have already been mentioned under the "energy type" section, i.e. the autarkic energy.
External power supplies are always a commodity part of some kind of end-application. The end-application might have a standby mode, such as set-top-boxes, but for the external power supply this is only one load state among others. The external power supply (EPS) actually is not in standby, as it performs its main function (supply of energy). The EPS is in active mode as long as the end application is consuming energy in whatever mode. In case the end application is disconnected from the external power supply or is in 0 W off-mode, but the EPS is still plugged into the socket, the EPS is considered to be in off-mode, resulting in off-mode losses (this is in compliance with the term “no-load” used in the EuP preparatory study Lot 7 on EPS / battery chargers).
For secondary battery operated devices and especially mobile products the focus should be on the chargers/cradles – not on the (potential) standby mode of the device itself. The energy consumption from secondary batteries will usually be minimised already to allow long use time. This is an inherent design goal. Most devices will have a hard off switch for the same reason, or an extremely low power soft switch as for mobile phones. The mix of active mode and standby consumption will be reflected in the charge cycles (usage patterns) of the charger. However, mobile products, which are used while connected to the charger (or external power supply in that case), might have to be looked at differently (see separate discussion).
Primary battery operated devices shall not be included in the calculation of standby and off-mode losses, although arguably some such devices exist, which have power management features or standby modes. The perspective of the study is to identify and minimise energy use from the electricity network, not to look at the magnitude of standby energy supplied from other sources (see energy type distinctions). The impact of wasting primary batteries to power off-modes or standby modes must be addressed through other means.
Autarkic energy: As mentioned above, energy generated from renewable sources (e.g. solar panel) should be considered "free" regarding Lot 6 energy consumption. A minimisation of energy use is often inherent in the design due to the price for such power supplies.
Mobile devices in principle have been excluded with the above arguments. However, there are some mobile products, which are optionally operated while connected to the power grid. When the energy for operating a mobile device is taken directly from the electricity network, they should in principle be treated similar to non-mobile products, i.e. a differentiation between active mode, standby and off-mode is necessary. According to the availability of data this will however not be done for the main calculations.

Report for Tender No. TREN/D1/40 Lot 6 -2005 EuP Lot 6 - Task 1 2nd of October 2007
Fraunhofer IZM CODDE Bio IS DUH Final Report Page 1-27
“No off switch” or always fully on products: Always On products are excluded from the Lot 6 calculation scope. There is, however, a potential discrepancy in the handling of practically identical products, where one version has different operation modes, i.e. including power management features, and the other version is always fully on. This could be the case for large telecom installations (an example, which is admittedly already out of scope from the sectorial distinction), some of which are fully on independent of the actual work load and which are never switched off in normal operation (only in emergencies or for maintenance). By definition, the non-power-saving version would have zero standby (there being no standby mode), while the “ecologically advanced” version with power saving available could show a significant amount of standby and could fall under a future threshold regulation. Despite excluding “Always On” products at this stage, they are important for discussing user behaviour / user interaction. Therefore Always On is still considered one of the product-use-clusters.
Some of the EuPs mentioned are part of separate product specific lots, but this does not imply that they are not covered in this lot. In fact the product lots have to look at standby issues and off-mode losses as a detailed ecodesign option against the whole life cycle, whereas Lot 6 has to achieve broad coverage for a common base line. Especially the issues surrounding external power supplies and battery chargers are a strong overlap, which will be based on the Lot 7 findings.
Special cases (3) by specific product characteristics
Battery operated (primary, secondary)
Autarkic energy harvesting
Always fully on products
Mobile products, while connected to electricity network
EPS/chargers in no-load condition
Figure 1-6: Discussion of product scope according to specific product characteristics
Summary of main product distinctions
In context of all mentioned discussion points the Lot 6 objective for investigation is only the mains electricity operated household EuPs and mains electricity operated office equipment. All other possible standby relevant products, which are based on other energy types or placed in different application sectors, should be excluded according to the listed criteria. In conclusion to the more specific product attribute discussions only external power supplies and chargers in no-load condition remain fully in this investigation.
1.1.6.5. Product classification and naming
For the further use within this broad study it is important to have a uniform classification and naming of products. A quite extensive product classification has been developed by Bruce Nordman [Nordman 2006]. This classification – covering mains operated products mainly from residential and office use – has been checked and adapted for use in this study.
We have added a very broad categorization suitable for this study with the Lot 6 product categories
ICT&AV Large household appliances Small household appliances Lighting/EPS/UPS HVAC&water Building Infrastructure Other
The full listing with the product group names (i.e. classes) and the categorization according to Nordman and with the Lot 6 main categories is shown in Annex 1-1.

Report for Tender No. TREN/D1/40 Lot 6 -2005 EuP Lot 6 - Task 1 2nd of October 2007
Fraunhofer IZM CODDE Bio IS DUH Final Report Page 1-28
The classification contains a number of products we define as building infrastructure, which will not be included in the detailed investigation, but these have been left in the table to keep the comprehensive listing together.
Filtering criteria
Further criteria were used to filter out products with no or lesser relevance for Lot 6 standby and off-mode losses.
The criteria are
building infrastructure, as explained above,
products most often disconnected, e.g. small household appliances stored in cupboards,
products, which as a group are considered “always on” products,
products, for which neither Lot 6 standby nor off-mode losses are known,
products, for which the household penetration is estimated to be low (or comparatively small unit sales).
Table 1-12 to Table 1-16 show the interim results after the filtering. These are products, which potentially could be included in investigations. A number of chargers and cradles and products with external power supplies are included on the assumption that off-mode losses could occur in a no-load state.

Report for Tender No. TREN/D1/40 Lot 6 -2005 EuP Lot 6 - Task 1 2nd of October 2007
Fraunhofer IZM CODDE Bio IS DUH Final Report Page 1-29
Table 1-12: Candidate product groups in the ICT&AV category
PUC Product Classification Categories by Nordman
PUC 2 Amplifiers Audio
PUC 3 Cassette Deck Audio
PUC 3 CD Player Audio
PUC 2 Receiver (audio) Audio
PUC 1 Tuner Audio
PUC 3 Audio minisystem Audio
PUC 3 Stereo, portable Audio
PUC 1 Radio, table Audio
PUC 1 CD Player, portable Audio
PUC 1 other portable audio players Audio
PUC 2 Home theatre system Audio
PUC 1 Subwoofer Audio
PUC 1 Speakers, powered Audio
PUC 3 Desktop computer Computer
PUC 3 integrated-CRT computer Computer
PUC 3 integrated-LCD computer Computer
PUC 3 Media server Computer
PUC 3 Notebook Computer
PUC 1 Dock, notebook Computer
PUC 1 Charger for PDAs / Smartphones Computer
PUC 1 Cradle for PDAs / Smartphones Computer
PUC 3 Computer display, CRT Display
PUC 3 Computer display, LCD Display
PUC 3 Game console Computer
PUC 3 Game console with internet connectivity Computer
PUC 1 Game console, portable Display
PUC 3 Projector, projector video Display
PUC 2 Television, large CRT Display
PUC 2 Television, standard CRT Display
PUC 2 Television, LCD Display
PUC 2 Television, Plasma Display
PUC 2 Television, rear projection Display
PUC 2 Television, Television/VCR Display
PUC 3 Copiers Imaging
PUC 3 Fax Machines, inkjet Imaging
PUC 3 Fax Machines, laser Imaging
PUC 3 Fax Machines, thermal Imaging
PUC Product Classification Categories by Nordman
PUC 3 Multi-function device, inkjet Imaging
PUC 3 Multi-function device, laser Imaging
PUC 3 Printers, inkjet Imaging
PUC 3 Printers, laser Imaging
PUC 3 Scanner, flatbed Imaging
PUC 3 Scanner, handheld Imaging
PUC 3 Scanner, other Imaging
PUC 3 Modem, cable Networking
PUC 3 Modem, DSL Networking
PUC 3 Modem, POTS Networking
Out DSL splitter Networking
PUC 3 Router, ethernet Networking
PUC 2 Set-top-boxes, analog cable Set-top
PUC 2 Set-top-boxes, digital cable Set-top
PUC 3 Set-top-boxes, digital cable with PVR Set-top
PUC 2 Set-top-boxes, internet Set-top
PUC 2 Set-top-boxes, satellite Set-top
PUC 3 Set-top-boxes, satellite with PVR Set-top
PUC 2 Answering machine Telephony
PUC 1 EPS,(mobile phone) Telephony
PUC 3 Home and SoHo telephone systems Telephony
Out Phone, Standard corded phone Telephony
PUC 2 Phone, Comfort phone / Video phone Telephony
PUC 2 Phone, cordless Telephony
PUC 3 Phone, cordless with answering machine Telephony
PUC 1 Phone, Additional charger cradle Telephony
PUC 3 Phone, Base station with computing/network interface Telephony
PUC 3 DVD, player Video
PUC 3 DVD, recorder Video
PUC 3 HD-Recorder Video
PUC 3 VCR Video

Report for Tender No. TREN/D1/40 Lot 6 -2005 EuP Lot 6 - Task 1 2nd of October 2007
Fraunhofer IZM CODDE Bio IS DUH Final Report Page 1-30
Table 1-13: Candidate product groups in the small household appliances category
PUC Lot 6 Main Categories Product Classification Categories by Nordman PUC 3 Small household appliances Bread makers Electronic housewares
PUC 0 Small household appliances Clock Electronic housewares
PUC 0 Small household appliances Clock, radio Electronic housewares
PUC 3 Small household appliances Coffee makers, residential Electronic housewares
PUC 3 Small household appliances Espresso maker, residential Electronic housewares
PUC 1 Small household appliances Kettle Electronic housewares
PUC 3 Small household appliances Oven, microwave Electronic housewares
PUC 3 Small household appliances Tee maker Electronic housewares
PUC 1 Small household appliances Toaster Electronic housewares
PUC 3 Small household appliances Toaster oven Electronic housewares
PUC 1 Small household appliances Shaver Personal Care
PUC 1 Small household appliances Epilator Personal Care
PUC 1 Small household appliances Toothbrush Personal Care
Table 1-14: Candidate product groups in the large household appliances category
PUC Lot 6 Main Categories Product Classification Categories by Nordman PUC 3 Large household appliances Clothes dryer, electric Major Appliance (Traditional End Uses)
PUC 3 Large household appliances Clothes washer and dryer combination, electric Major Appliance (Traditional End Uses)
PUC 3 Large household appliances Clothes washer, horizontal axis Major Appliance (Traditional End Uses)
PUC 3 Large household appliances Clothes washer, vertical axis Major Appliance (Traditional End Uses)
PUC 1 Large household appliances Cook top, electric Major Appliance (Traditional End Uses)
PUC 3 Large household appliances Dishwashers Major Appliance (Traditional End Uses)
PUC 2 Large household appliances Electric stove Major Appliance (Traditional End Uses)
PUC 2 Large household appliances Oven, electric Major Appliance (Traditional End Uses)
Table 1-15: Candidate product groups in the lighting/EPS/UPS category
PUC Lot 6 Main Categories Product Classification Categories by Nordman PUC 1 Lighting/EPS/UPS Lamp, decorative Lighting
PUC 1 Lighting/EPS/UPS Lighting, residential Lighting (Traditional End Uses)
Table 1-16: Candidate product groups in the "other" category
PUC Lot 6 Main Categories Product Classification Categories by Nordman PUC 3 Other Shredder Business equipment
PUC 3 Other Charger, battery utility
PUC 1 Other Power tool, cordless utility
These lists are however still quite extensive, but they give an overview of product types under consideration.

Report for Tender No. TREN/D1/40 Lot 6 -2005 EuP Lot 6 - Task 1 2nd of October 2007
Fraunhofer IZM CODDE Bio IS DUH Final Report Page 1-31
1.1.6.6. Summary: Focal product types for investigations
For the further investigations a shorter and more aggregated list is needed. It is ordered by the product-use-clusters (PUC) introduced in Section 1.1.2. Within the product-use-clusters exemplary product cases (not necessarily fully representative) were chosen according to the Lot 6 modes typically available for that product group. Some further assumed relevance criteria are included in Table 1-17.
Table 1-17: Product cases for data acquisition with selection criteria
Product-Use-Cluster PUC
Represented behaviour / configuration Product Assumed relevance criteria
PUC 1 No-load losses EPS (mobile phone) high volume with significant "no-load"
PUC 1 Soft switch, off-mode loss Lighting, in particular lamps with transformers
long mode duration, higher wattage
PUC 1 Secondary side hard switch Radio (e.g. table radio, kitchen radio)
long mode duration, lower wattage, often unnoticed
PUC 1 Charging cradle Electric toothbrush long mode duration, lower power charger
PUC 2 On+Standby+off-losses Oven long mode duration
PUC 2 (net) On+Standby(net)+no off Cordless phone long mode duration, high volume
PUC 2 (net) On+EPG+Standby(net)+no off
TV+ (incl. digital set-top-boxes as periphery)
higher wattage, and active EPG download case
PUC 3 Classic function cycle Washing machine high volume, mainly off-mode losses, but job-based
PUC 3 Media player - job-based DVD high volume
PUC 3 Hifi example, increasingly no 0 W off Audio minisystem higher wattage in standby/off
PUC 3 (net) Communication ready, but also job-based Fax machines long mode duration
PUC 3 (net) Transitional sleep / advanced power management
PC+ (office), including monitors and notebooks
high volume and wattage, 0 W off-mode rarely used, complex networked product
PUC 3 (net) Transitional sleep / advanced power management
PC+ (home), including monitors, notebooks and selected peripherals
high volume and wattage, 0 W off-mode rarely used, complex networked product
PUC 3 (net) Transitional ready mode Laser printer higher wattage in standby/off, workgroup scenarios
PUC 3 (net) Job-based, but only soft switch Inkjet printer high volume, long mode duration,
home use scenarios
Where a product group is not uniformly fitting into one PUC, the next higher PUC is usually chosen. Also, the “represented behaviour / configuration” does not necessarily apply to all products within a group, but it should apply to a substantial segment of the product group.
Some products in general cited as relevant for standby do not appear individually, because the selection was made mainly according to use patterns or technical configuration of the products.

Report for Tender No. TREN/D1/40 Lot 6 -2005 EuP Lot 6 - Task 1 2nd of October 2007
Fraunhofer IZM CODDE Bio IS DUH Final Report Page 1-32
The EPS for mobile phones represents also other mobile devices, which use the same category of EPS. The product case name is not a discrimination of mobile phones, but is related to the naming in Lot 7.
Set-top-boxes will be dealt with together with TVs, to be able to deal with the trend of partial integration of set-top-box functionality in digital TVs. Moreover, the use case with the unsupervised download of electronic program guides (EPG) is the same.
Dishwashers and dryers follow the basic pattern covered by the washing machine.
PCs are grouped together with monitors and notebooks in two "PC+" cases – one for office environment and one for computers at home. In-house network devices will partially be covered along with other PC devices; they are too numerous to cover individually. Other peripherals may be added to the PC+ product cases, if they exhibit own separate standby or off-mode issues, such as EPS or secondary side switches.
In summary, despite the possibility to cover very dissimilar products with the function-based approach, a strong focus on electrical products from home and office applications is proposed. To analyse these products, 15 product cases have been defined. 3 of these product cases are in themselves mixtures of individual EuPs, so more than 15 product types are investigated. Other areas and products can only be covered with rough estimations in later tasks (i.e. EU-25 totals extrapolation in Task 5 and Task 8 Sensitivity Analysis).
Report for Tender No. TREN/D1/40 Lot 6 -2005 EuP Lot 6 - Task 1 2nd of October 2007
Fraunhofer IZM CODDE Bio IS DUH Final Report Page 1-33
1.2. Test Standards (Task 1.2)
Preamble
The objective of this chapter is to identify, describe, and compare the harmonised test standards for the power consumption in standby and off-mode. A particular attention is given to the following aspects:
Conditions related to configuration of the tested equipment
Conditions related to the power supply
Conditions related to test instrumentation
Conditions related to environment
Time of measurement
Number of test per equipment
Number of equipment required for test
General Test Standards
A “test standard” is a standard that sets out a test method, but that does not indicate what result is required when performing that test6. Therefore, strictly speaking, a test standard is different from a “technical standard”. Namely, in technical use, a standard is a concrete example of an item or a specification against which all others may be measured or tested. Often it indicates the required performance.
However, “test standards” are also (but not exclusively) defined in the “technical standards” themselves. For example, an ISO standard for a certain product or process gives the detailed technical specifications, which are required in order to conform to this standard. And, it also defines test standards (or rather methods) to be followed for validating any such conformity.
A standard can be either product or sector specific, and it can concern different stages of a product’s life cycle. In the case of test standards for standby and off-modes losses, the stage of life-cycle of concern is the use phase. The scope of the standard is also given for each standard presented below.
EN/CENELEC internal regulations define a standard as a document, established by consensus and approved by a recognised body that provides, for common and repeated use, rules, guidelines or characteristics for activities or their results, aimed at the achievement of the optimum degree of order in a given context. Standards should be based on consolidated results of science, technology and experience, and aimed at the promotion of optimum community benefits. In Europe, standards are documents that have been ratified by one of the three European standards organizations, CEN7, CENELEC8 or ETSI9.
In addition to “official” standards, there are other sector specific procedures for product testing, which could be considered as standard when it becomes recognizable both by the sender and the receiver, that is, when they are using the same parameters or standards. Those procedures are discussed later in this chapter.
6 www.deh.gov.au/settlements/waste/degradables/glossary.html 7 CEN - European Committee for Standardization 8 CENELEC - European Committee for Electrotechnical Standardization; 9 ETSI - European Telecommunications Standards Institute
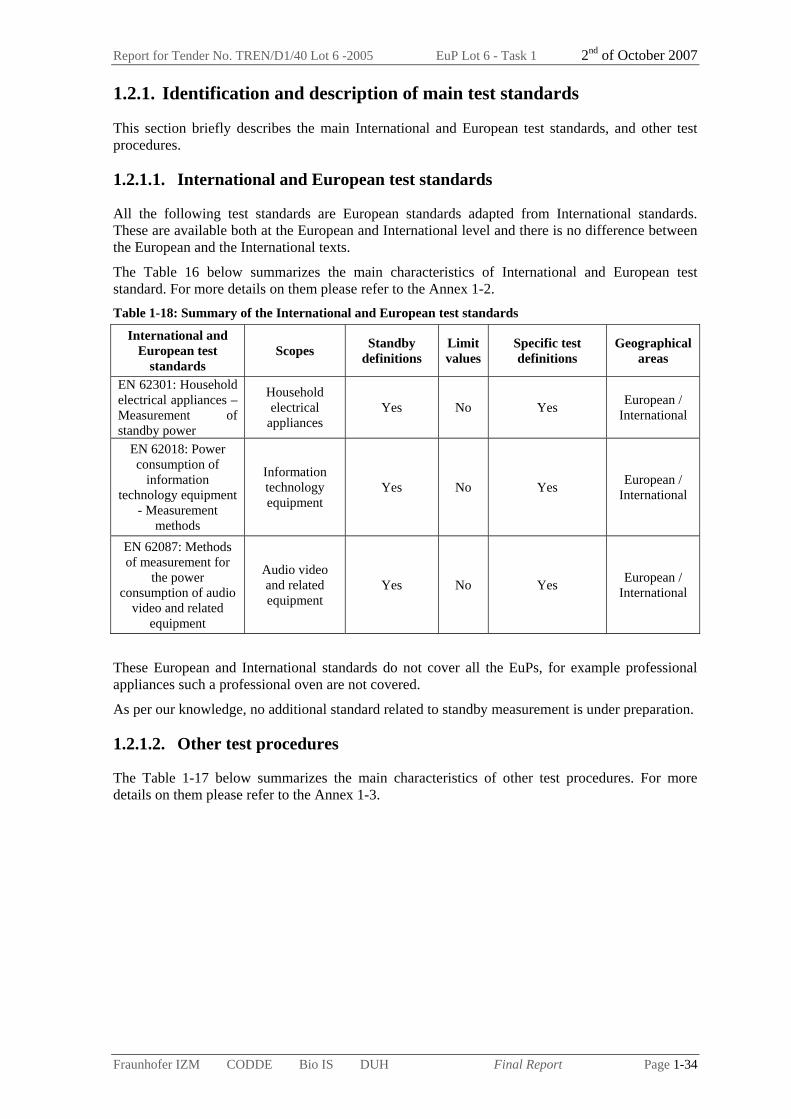
Report for Tender No. TREN/D1/40 Lot 6 -2005 EuP Lot 6 - Task 1 2nd of October 2007
Fraunhofer IZM CODDE Bio IS DUH Final Report Page 1-34
1.2.1. Identification and description of main test standards
This section briefly describes the main International and European test standards, and other test procedures.
1.2.1.1. International and European test standards
All the following test standards are European standards adapted from International standards. These are available both at the European and International level and there is no difference between the European and the International texts.
The Table 16 below summarizes the main characteristics of International and European test standard. For more details on them please refer to the Annex 1-2. Table 1-18: Summary of the International and European test standards
International and European test
standards Scopes Standby
definitions Limit values
Specific test definitions
Geographical areas
EN 62301: Household electrical appliances – Measurement of standby power
Household electrical
appliances Yes No Yes European /
International
EN 62018: Power consumption of
information technology equipment
- Measurement methods
Information technology equipment
Yes No Yes European / International
EN 62087: Methods of measurement for
the power consumption of audio
video and related equipment
Audio video and related equipment
Yes No Yes European / International
These European and International standards do not cover all the EuPs, for example professional appliances such a professional oven are not covered.
As per our knowledge, no additional standard related to standby measurement is under preparation.
1.2.1.2. Other test procedures
The Table 1-17 below summarizes the main characteristics of other test procedures. For more details on them please refer to the Annex 1-3.

Report for Tender No. TREN/D1/40 Lot 6 -2005 EuP Lot 6 - Task 1 2nd of October 2007
Fraunhofer IZM CODDE Bio IS DUH Final Report Page 1-35
Table 1-19: Summary of the main characteristics of other test procedures
Other test procedures Scopes Standby
definitions Limit values
Specific test definitions
Geographical areas
Energy Star test procedures
Depending on the considered
product
Depending on the considered
product Yes Depending on the
considered product
Depending on the considered
product ECMA test
procedures: Technical report / 70: Product-
related environmental declaration
Information and communication technology and
consumer electronics
Yes No
No but references to Energy star test definitions or the IEC 62087:2002
European
FEMP: Guidelines for measurement of
standby power use (in response to executive
order 13221)
All products not covered by
Energy Star specifications
Yes No Yes United States of America
After the description of the different test procedures, we note that for the geographical area of the USA, all products are in principle covered by a test procedure, as the guideline for measurement of standby power use of the American Federal Energy Management Program covers all products not covered by Energy Star specifications.
1.2.1.3. Conclusion
It seems that the Energy Star test procedures are the most used procedures worldwide and their use is expanding in other countries as shown in Annex 1-7 [EU Stand-by Initiative]. After analysing these test procedures, it seems that a majority of the Energy Star test procedures refer to IEC standards and in particular to IEC 62301 for a part of the test specifications.
1.2.2. Evaluation of main test standards
The following documents, which include specific or complete test standards, will be analysed in this Section.
EN 62301: Household electrical appliances – Measurement of standby power,
EN 62018: Power consumption of information technology equipment - Measurement methods,
EN 62087: Methods of measurement for the power consumption of audio video and related equipment,
Energy Star Program Requirement (ESPR) for room air cleaners,
ESPR for water coolers,
ESPR for consumer audio and DVD products,
ESPR for cordless phones,
ESPR for TVs, VCRs, DCR TVs with POD slots, combination units, television monitors, and component television units,
ESPR for computer monitors,
ESPR for computers Final Draft that will be effective on 20th July 2007,
FEMP: Guidelines for measurement of standby power use.

Report for Tender No. TREN/D1/40 Lot 6 -2005 EuP Lot 6 - Task 1 2nd of October 2007
Fraunhofer IZM CODDE Bio IS DUH Final Report Page 1-36
1.2.2.1. Examination of similarities of selected test standards
The reliability of a test “refers to the reproducibility of results with any criteria or methods, (synonym: validity)” [UW 2006] so it is linked to the conditions of the test but also to the percentage of uncertainty.
Conditions and parameters of the test (configuration of the tested equipment, environment conditions, such as ambient temperature, air speed, humidity, networked conditions, equilibration time, duration of measurement, test instrumentation, number of relevant digits, power supply, number of units required for test as well as number of test per equipment) have been compared. Below are exposed only the conclusions. For more details on these conditions comparisons, please refer to the Annex 1-4.
For the time of measurement conditions, some documents (EN 62301, EN 62018, EN 62087, ESPR for consumer audio and DVD products, for cordless phones, and for TVs, VCRs, DCR TVs with POD slots, combination units, television monitors, and component television units) also specify how to operate if there is more than one standby mode. IEC 62301 explains best on time of measurement.
No documents consider all of the aspects (configuration of the tested equipment, environment conditions, such as ambient temperature, air speed, humidity, networked conditions, equilibration time, duration of measurement, test instrumentation, number of relevant digits, power supply, number of units required for test as well as number of test per equipment). Some conditions such as humidity or air speed are presumably not relevant to test some types of products. An agreement on one general uniform test definition to measure standby and off-modes losses, which includes all measurement conditions and requirements in combination, is therefore unlikely. Currently, there are various standards for standby and off-mode losses measurements, which are applied and have evolved in parallel.
It is also interesting to underline that the ESPR document for computer is the only document, which specifies network configuration of the equipment. Because of the increasing number of equipment connected, it could be interesting to add this parameter (connected / not connected / speed of connection) in new standby and off-modes power consumptions test procedures.
1.2.2.2. Evaluation of the adaptability of each test to different devices
The most specific requirements are given by the documents:
EN 62087: Methods of measurement for the power consumption of audio video and related equipment,
ESPR for room air cleaners,
ESPR for water coolers,
ESPR for computers Final Draft,
ESPR for computer monitors.
The specificity of the test procedure is related to the standby definition related to product functionalities (EN 62087), or to particular requirements, which are especially adapted to one product group (ESPR for room air cleaners, water coolers, computers and computer monitors).
General requirements are given by following documents:
EN 62301: Household electrical appliances – Measurement of standby power,
EN 62018: Power consumption of information technology equipment - Measurement methods,
ESPR for consumer audio and DVD products,
ESPR for cordless phones,
Report for Tender No. TREN/D1/40 Lot 6 -2005 EuP Lot 6 - Task 1 2nd of October 2007
Fraunhofer IZM CODDE Bio IS DUH Final Report Page 1-37
ESPR for TVs, VCRs, DCR TVs with POD slots, combination units, television monitors, and component television units,
FEMP: Guidelines for measurement of standby power use.
The adaptability of these documents is related to the wide scope (EN 62301 – FEMP), to the few requirements (EN 62018), to the general requirements (EN 62301, ESPR for consumer audio and DVD products, phones, TV, and FEMP), to the standby definition concentrating on one identifiable mode only (the “lowest power mode” approach of EN 62301), to the number of special cases envisaged (e.g. measuring steady or non-steady power levels, EN 62301).
1.2.2.3. Evaluation of the easiness to understand and to implement each test
The difficulty to implement these test methodologies and protocols could come from the difficulty to understand or interpret the requirements linked to time of measurement and to testing instrumentation. The document, which is the clearest and also quite complete regarding the testing instrumentation aspect, seems to be the EN 62018. Regarding the time of measurement requirements, the document ESPR for room air cleaners is the easier to understand but it does not specify the case where the value measured is not steady. The document EN 62301 considers the two cases (a steady value or non-steady value), but the protocols are not really clear in the case of a non-steady value. Other documents are less precise, less clear, or less complete than these two documents.
Another difficulty could come from a difficulty to understand or interpret the standby and off-mode definitions. For example, IEC 62301 defines low power modes (can be many per product) and exactly one standby mode per product. The IEC62301 “standby” mode may indeed be an off-mode for many devices. At the same time IEC 62087 defines an active standby-high mode, an active standby-low mode, a passive standby mode, and an off-mode. Both standards are in active use. For more details on differences between existing standby and off-mode definitions see the Task 1.1 of this study. Although practical for their intended scope, especially the US FEMP and IEC 62301 definitions have complicated the common understanding in the community of what is considered as standby.
Even with the new Lot 6 definition for standby and off-mode losses (Task 1.1), there is a long way to go towards harmonisation of this understanding and of the existing test procedures.
1.2.2.4. Evaluation of the comparability of the test results
This section evaluates documents, which provide general requirements for standby and off-mode losses measurement protocols.
Firstly, it can be noted that the disparities between existing standby and off-modes definitions induce difficulties to compare results obtained with two methods having different standby and off-modes definitions.
It can also be observed that the three ESPR for consumer audio and DVD products, for cordless phones, and for TVs, VCRs, DCR TVs with POD slots, combination units, television monitors, and component television units, are similar. Results obtained by using these three methodologies can be compared. At the end of this Section, we will call these three similar methods as Energy Star method.
It can also be added that all 6 documents, which provide general requirements (documents listed in Section 1.3.2.2), need similar conditions for environment and tested equipment. Further, a comparison of results obtained by Energy Star method, by EN 62301 method, by EN 62018 method or by FEMP method seems difficult because of numerous parameters, which vary between these methods. Results may however be compared, if all the parameters are clearly identified – that means, which mode or function set has been used in the differing measurements.

Report for Tender No. TREN/D1/40 Lot 6 -2005 EuP Lot 6 - Task 1 2nd of October 2007
Fraunhofer IZM CODDE Bio IS DUH Final Report Page 1-38
1.2.3. Conclusions Task 1.2
All the test procedures do not use the same test definition, or the same definitions for standby and off-modes.
There are additional sources of terminology for modes: industry, energy professionals, or general public. For example, mode definitions used in IEEE1621 (approved on December 8, 2004) are based on commonly used terminology.
Nevertheless, it seems that the IEC test standards are most widely recognised and used as reference by other test procedures. It appears that all the products are not covered by these International test standards, but other test procedures like Energy Star test procedures and FEMP test procedure help to cover all EuPs.
It seems that Energy Star test procedure and IEC 62301 (through Energy Star references) protocols are the most used test procedures. IEC 62301, more general than other IEC standards, allows two approaches for the measurement (chosen depending on the steadiness of the standby mode). It is useful when the standby mode is not steady.
IEC 62301 test procedure is quite complete in particular regarding the following aspects:
Configuration of the tested equipment
Conditions related to the power supply
Conditions related to test instrumentation
Conditions related to environment
Time of measurement
Number of test per equipment
Nevertheless, following aspects may be looked at to improve the existing IEC 62301:
Number of equipment required for the test. This point is more precise in the ESPR document for computer monitors, or in the ESPR document for single voltage external AC- DC power supplies, which gives this additional requirement to complete a test methodology of reference.
Conditions related to environment may be completed by a requirement related to humidity as in the ESPR document for computer monitors.
Number of test per equipment, EN 62301 only recommend several measures if the power vary over a cycle, but it could also specify the number of test per equipment like the ESPR document for computer monitors.
The explanation related to time of measurement could be improved.
To finish, a percent of uncertainty for the result could be specified to clarify misunderstanding.
For Energy Star, the strong points and the weak points depend on the Energy Star procedure being considered.
As shown above, it seems that the weak point of IEC 62301 could be improved by adding some parameters already applied in Energy Star test procedures.
1.3. Existing Requirements on Standby and Off-mode Losses (Task 1.3)
The following section (Section 1.3: Existing requirements on Standby and Off-mode Losses) provides an overview of standby and off-mode losses of existing legislations in different countries, as well as of voluntary agreements and labelling initiatives.

Report for Tender No. TREN/D1/40 Lot 6 -2005 EuP Lot 6 - Task 1 2nd of October 2007
Fraunhofer IZM CODDE Bio IS DUH Final Report Page 1-39
1.3.1. Mandatory requirements on standby and off-modes
This section summarises the different existing legislation requirements, which deal with standby modes or off-modes.
In order to clarify this Section 1.3.1, here is specified the definition of legislation.
Legislation is written and approved law, also known as "statutes" or "acts" [Legislation]. Legislation is mandatory.
1.3.1.1. Mandatory requirements on standby and off-mode power consumption
The following Table 1-18 summarises characteristics of the mandatory requirements on standby and off mode power consumption. For more details on these mandatory requirements, please refer to the Annex 1-5. Table 1-20: Summary of the mandatory requirements on standby and off mode power consumption.
Scopes Life stages concerned
Aspects considered
Geographical area Requirements
Executive order 13221: Energy
efficient standby power devices
(31/07/01)
All electronic and electrical products
purchased by federal executive agencies
Use Energy consumption
United States of America
Mandatory for federal
executive agencies
FEMP: Federal Energy
Management Program
All electronic and electrical products
purchased by federal executive agencies
Use Energy consumption
United States of America
Mandatory for federal
executive agencies
Energy Conservation Law
Vehicles and main electrical and
electronic appliances Use Energy
consumption Japan
Mandatory for household and
private transport sectors
Act on the promotion of the
purchase of Environment
friendly products
Office equipment Audi and Video
equipment and other non electrical
products
Manufacturing – Use – End of
life
Energy consumption – Other primary
resources consumption –
Noise emissions – Pollutant
emissions - Chemical substances limitation
Korea Mandatory for public agencies
Australia standby power strategy
2002-2012
Most of the electrical and
electronic appliances Use Energy
consumption Australia
First stage is voluntary and second stage is
mandatory
Minimum Energy Performance Standard in
Australia and New Zealand
Electric Storage Water Heaters -
Home entertainment products
Use Energy consumption Australia
Mandatory for ESWH
producers and soon
mandatory for home
entertainment equipments producers

Report for Tender No. TREN/D1/40 Lot 6 -2005 EuP Lot 6 - Task 1 2nd of October 2007
Fraunhofer IZM CODDE Bio IS DUH Final Report Page 1-40
The legal basis for dealing with standby in the USA is currently going to change with the "New Direction for Energy Independence, National Security, and Consumer Protection Act " (HR 3221, voted together with the "Renewable Energy and Energy Conservation Tax Act of 2007", HR 2776). Among many other energy aspects and taxation changes, two sections explicitly deal with standby. One is the transposition of the purchasing requirements (the "1 W requirement" of the Executive order 13221) into a legal framework, and the second is a definition of "active mode", "off mode" and "standby mode" – without setting any further requirements.
The definition is a shortened or rather streamlined variation of the Lot 6 definition, which may be slightly vague but is on the other hand quite readable. For standby, a number of function names from the Lot 6 definition are used (deactivation, remote switch, remote control, internal sensor, timer, status displays, sensor-based functions), but the list is not phrased to be complete ("including …").
The real trick of the definition is that there is a built-in provision to align with the most current versions of either IEC 62087 or IEC 62301 at a later stage. Thus the current wording might not be a final version.
The law has been passed by the U.S. House of Representatives on August 4th 2007. The next stage is a vote in the U.S. Senate, and then the president signs the law or he may opt for a veto at that stage. [Pelosi 2007][GovTrack.us 2007]
1.3.1.2. Mandatory requirements on standby and off-mode losses labelling
The following Table 1-19 shows the characteristics of the mandatory requirements on standby and off mode losses labelling. For more details on these mandatory requirements, please refer to the Annex 1-6. Table 1-21: Summary of the mandatory requirements on standby and off mode losses labelling.
Scopes Life stages concerned
Aspects considered
Geographical area Requirements
“Commission directive 2002/40/EC of 8 May 2002
implementing council directive 92/75/EEC with regard to energy labelling
for household electric ovens”
Electric ovens Manufacturing
Energy consumption
labelling Europe Mandatory
1.3.2. Non mandatory requirements on standby and off-modes
This section summarises the different existing voluntary approaches, which deal with standby modes or off-modes.
1.3.2.1. Requirements due to voluntary programs and related to standby and off-mode losses
At first a short definition of the volunteer programs shall be given:
“A volunteer program is an engagement to progress further than mandatory requirements through non mandatory recommendations. Volunteer programs could concern either products or firms and aim at driving the majority of the market size. Three types of volunteer programs could be distinguished: unilateral commitments (defined unilaterally by industry), public voluntary schemes (driven by public bodies and recognised by industry), and negotiated agreements (resulting from negotiations between public authorities and industry). Indeed, voluntary approaches cover a large variety of different arrangements. This is reflected by a rich terminology. Self-regulation, voluntary initiatives, voluntary codes, environmental charters, voluntary accords, voluntary agreements, co-regulation, covenants, and negotiated environmental agreements are just a few of the terms used to refer to voluntary approaches.“ [Börkey 1998].
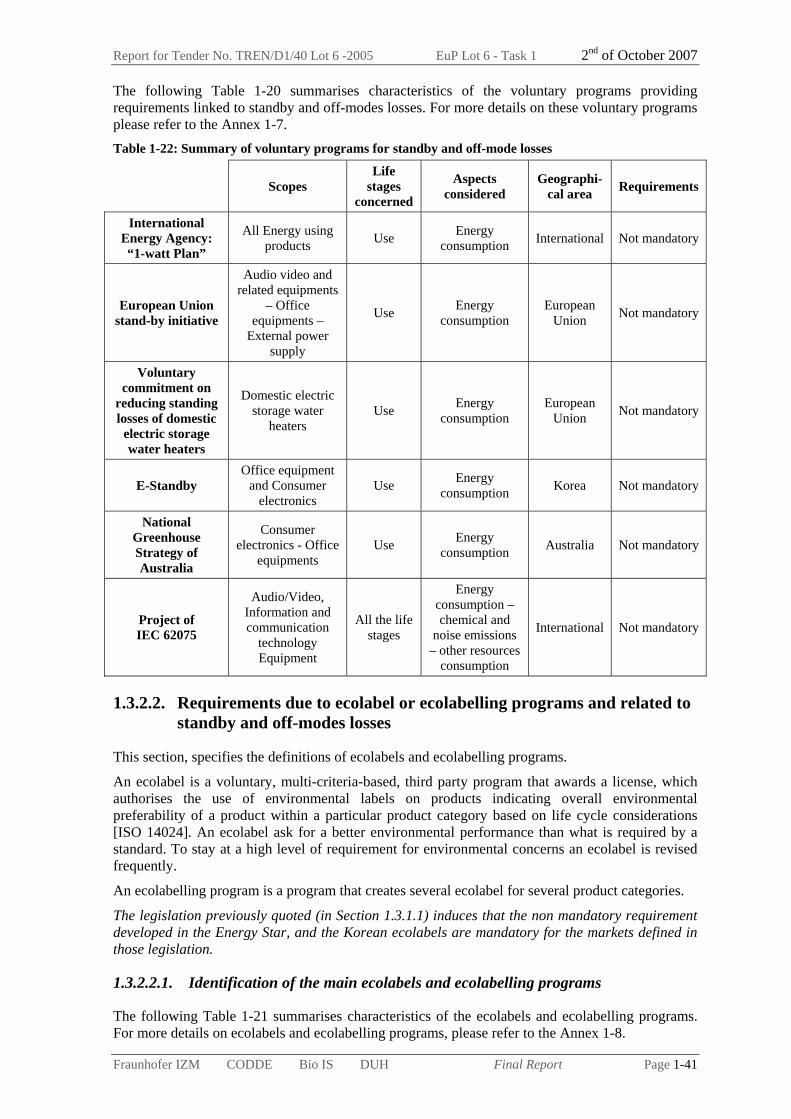
Report for Tender No. TREN/D1/40 Lot 6 -2005 EuP Lot 6 - Task 1 2nd of October 2007
Fraunhofer IZM CODDE Bio IS DUH Final Report Page 1-41
The following Table 1-20 summarises characteristics of the voluntary programs providing requirements linked to standby and off-modes losses. For more details on these voluntary programs please refer to the Annex 1-7. Table 1-22: Summary of voluntary programs for standby and off-mode losses
Scopes Life
stages concerned
Aspects considered
Geographi- cal area Requirements
International Energy Agency: “1-watt Plan”
All Energy using products Use Energy
consumption International Not mandatory
European Union stand-by initiative
Audio video and related equipments
– Office equipments –
External power supply
Use Energy consumption
European Union Not mandatory
Voluntary commitment on
reducing standing losses of domestic
electric storage water heaters
Domestic electric storage water
heaters Use Energy
consumption European
Union Not mandatory
E-Standby Office equipment
and Consumer electronics
Use Energy consumption Korea Not mandatory
National Greenhouse Strategy of Australia
Consumer electronics - Office
equipments Use Energy
consumption Australia Not mandatory
Project of IEC 62075
Audio/Video, Information and communication
technology Equipment
All the life stages
Energy consumption – chemical and
noise emissions – other resources
consumption
International Not mandatory
1.3.2.2. Requirements due to ecolabel or ecolabelling programs and related to standby and off-modes losses
This section, specifies the definitions of ecolabels and ecolabelling programs.
An ecolabel is a voluntary, multi-criteria-based, third party program that awards a license, which authorises the use of environmental labels on products indicating overall environmental preferability of a product within a particular product category based on life cycle considerations [ISO 14024]. An ecolabel ask for a better environmental performance than what is required by a standard. To stay at a high level of requirement for environmental concerns an ecolabel is revised frequently.
An ecolabelling program is a program that creates several ecolabel for several product categories.
The legislation previously quoted (in Section 1.3.1.1) induces that the non mandatory requirement developed in the Energy Star, and the Korean ecolabels are mandatory for the markets defined in those legislation.
1.3.2.2.1. Identification of the main ecolabels and ecolabelling programs
The following Table 1-21 summarises characteristics of the ecolabels and ecolabelling programs. For more details on ecolabels and ecolabelling programs, please refer to the Annex 1-8.

Report for Tender No. TREN/D1/40 Lot 6 -2005 EuP Lot 6 - Task 1 2nd of October 2007
Fraunhofer IZM CODDE Bio IS DUH Final Report Page 1-42
Table 1-23: Summary of the main characteristics of ecolabels and ecolabelling programs on standby and off-mode performance
Scope Life stages concerned Aspects considered Geographica
l area Requirements
European Ecolabel
Household appliances and other
non electrical products
Manufacturing – Use – End of life
Energy consumption – Other primary resources consumption – Chemical
substances limitation
Europe Non mandatory
– Voluntary agreement
GEEA Home electronics
– Office equipments
Use Energy consumption
Swiss, Denmark, Sweden, Austria,
Germany, Netherlands,
France.
Non mandatory – Voluntary agreement
Nordic Swan
Most of the electrical and
electronic equipments and
other non electrical products
Manufacturing –
Use – End of life
Energy consumption – Other primary resources consumption – Chemical substances limitation – Ergonomics – Noise
emissions
Denmark, Finland, Iceland, Norway,
and Sweden
Non mandatory – Voluntary agreement
Energy Star label
Most of the electronic and
electrical products Use Energy consumption
United States of America
but it is becoming
International
Non mandatory – Voluntary agreement
Environmental choice program
Office equipments and other non
electrical products
Manufacturing – Use – End of life
Energy consumption pollutant emissions – Noise
emissions Canada
Non Mandatory – Voluntary agreement
Japanese Eco Mark
Office equipment and other non
electrical products
Manufacturing –
Use – End of life
Energy consumption – Other primary resources consumption (for product and packaging) – Noise emissions – Chemical substances limitation
Japan
Non mandatory – Voluntary agreement
Korean Ecomark
Office equipment Audio and Video equipment and
other non electrical products
Manufacturing –
Use – End of life
Energy consumption – Other primary resources
consumption – Noise emissions – Pollutant emissions - Chemical substances limitation
Korea
Non mandatory –
voluntary agreement
Environmental choice
Office equipment and other non
electrical products
Manufacturing –
Use – End of life
Energy consumption – Other primary resources consumption (for product and packaging) – Noise emissions – Chemical substances limitation –
pollutant emissions
Australia
Non mandatory – Voluntary agreement
TCO Office equipments
and other non electrical products
Manufacturing –
Use – End of life
Energy consumption – Other primary resources consumption – Chemical substances limitation – Ergonomics – Noise
emissions
Sweden but it is valid globally over the world.
Non mandatory – Voluntary agreement
Blue Angel Office equipments
and other non electrical products
Manufacturing –
Use – End of life
Energy consumption – Other primary resources consumption – Chemical substances limitation –
Noise emissions
Germany
Non mandatory – Voluntary agreement

Report for Tender No. TREN/D1/40 Lot 6 -2005 EuP Lot 6 - Task 1 2nd of October 2007
Fraunhofer IZM CODDE Bio IS DUH Final Report Page 1-43
1.3.2.2.2. Comparison and analysis of different ecolabels
After analyzing the other ecolabels:
Once more, the Energy Star standards to measure the standby and off-modes power consumption seems to be the most used.
And the Energy Star requirements linked to standby and off-modes power consumption seems also to be the most used.
Even if studies have already compare ecolabels requirements ([Poll 2001], [SVTC 2004], [IT Eco 2005]), due to the high number of parameters that vary from one label to another, it is difficult to compare them. The varying parameters are:
The standby definition and the number of possible standby modes (active - passive).
The number of cases considered or not considered: (examples: TV analog – TV digital; different sizes of the faxes – different print rate of the multifunctional devices…)
The number of combinations considered: (examples: TV with combination – TV with VCR – TV with set-top-boxes – only set-top-boxes – TV with integrated digital receiver terrestrial – TV with integrated digital receiver satellite – TV with integrated digital receiver cable …)
1.3.3. Other requirements on energy efficiency and energy consumption
A lot of legislations, voluntary programs or ecolabels not directly quoting the standby and off-modes losses but providing requirements on energy efficiency or on energy consumption have an impact on the standby and off-modes losses. They contribute in improving the energy efficiency of the products and because standby and off-mode losses are a part of energy consumption, they contribute also in reducing these losses. For examples of these other legislation voluntary programs or ecolabels, please refers to the Annex 1-9.
1.3.4. Conclusions Task 1.3
To conclude, it is interesting to note that we can distinguish two types of requirements:
the mandatory requirements: for standby these are mainly purchasing requirements addressed to specific markets, (such as public procurement), or as a secondary case labelling requirements such as standby power consumption labelling are in use,
and the voluntary requirements: technical recommendations addressed to the manufacturers.
Both approaches are useful to improve the energy efficiency of the equipments and to reduce their standby and off-modes losses. When labelling is mandatory and includes standby, the procedures for determining and declaring standby already have to be followed, even if no limit values are set.
The first clearly announced limit values covering not just the public procurement area are those in Australia, where a first stage of voluntary limits has already started for many product types. While the voluntary targets are already in place or will start in 2008, the mandatory second stage is announced for 2012.

Report for Tender No. TREN/D1/40 Lot 6 -2005 EuP Lot 6 - Task 1 2nd of October 2007
Fraunhofer IZM CODDE Bio IS DUH Final Report Page 1-44
1.4. Task 1 Conclusions ► Practical Function-based Approach
The basic approach within Lot 6 is function-based. Within Task 1.1 we have defined the boundaries for the Lot 6 study on standby and off-mode losses. The definition is based on a distinction – or better allocation – of specific functions to respective operation modes, which can be attributed to individual products and often to whole product groups. The seven operation modes (disconnected, 0 Watt off-mode, off-mode with losses, Lot 6 passive standby, Lot 6 networked standby, transition to standby and off-mode, active mode) reflect to some extent existing definitions and the allocation of existing terminology and scopes are fairly possible.
Compared to some of the definitions already in use, the modes are narrowed down to the essence of standby. But no single existing definition is fully compatible to the Lot 6 definition. To give some examples, ready or idle modes are excluded from Lot 6 standby (unless they offer only Lot 6 standby functions) and active data transfer over a network, such as the IEC 62087 “active standby high” for unsupervised electronic program guide updates (EPG), is likewise excluded from the generalised standby definition. It is up to the product specific lots, where such functions are employed, to look at the relevance of such and potential efficiency measures.
After a long analysis and discussion process with stakeholders we conclude that a global harmonization of a standby definition and terminology is a necessary requirement in the mid-term. Our function-cluster/mode approach and the resulting Lot 6 definition provides a reasonable solution for assessing the environmental significance and the improvement potential regarding standby power consumption and off-mode losses.
The Lot 6 standby definition is the foundation for all other tasks of Lot 6. The definition of the product modes is largely based on distinguishing functions. Gathering energy data for each individual function mentioned in the definition, and therefore separating the energy use of functions, which are active in parallel, is however not practical. Therefore function clusters have been defined, namely the “passive standby” cluster and the “networked standby” cluster. Networked standby is a super-set of the passive standby functions, therefore all passive standby functions can occur within the networked standby. These function clusters are the backbone of differentiating the Lot 6 modes, with the additional “off-mode with losses” defined through power consumption in the absence of any offered function (excepting an on switch on the main part of the EuP).
As noted in the introduction, it is the aim of these function clusters to achieve a broad applicability across different product types and a principal coverage of future merged or new product types. The Lot 6 standby definition is relatively narrow or “sharp” regarding the function types allocated to standby. On the one hand, this will make the Lot 6 standby definition more precise to handle, on the other hand it incorporates a danger of some product configurations falling outside of the definition.
In order to provide a plausible framework (structure) for product case assessments (Task 4) and the definition of base cases (Task 5) we have also introduced Product-Use-Clusters (PUC). The PUCs in short are
PUC 0: Always On products
PUC 1: On / Off products
PUC 2: On / Standby products
PUC 3: Job-based products
The similarities of products within a cluster will be used to structure the discussions in all following tasks.

Report for Tender No. TREN/D1/40 Lot 6 -2005 EuP Lot 6 - Task 1 2nd of October 2007
Fraunhofer IZM CODDE Bio IS DUH Final Report Page 1-45
► Product scope
While the definition is applicable to all EuPs, the investigations of this study can not cover all types of EuPs. In a first selection step the products, which are principally in the scope of Lot 6 investigations, have been determined.
Figure 1-7 shows the three main distinctions, which are used to describe the product scope of the investigations. The detail distinctions (e.g. aspects of battery operated devices) have been introduced in the previous sections.
by energy type
non electricalelectrical
by application sectors
Home appliances
Office equipment
Public, commercial, industrial (excluding offices)
Infrastructure(energy, com)
Special cases by specific product characteristics
Battery operated (primary, secondary)
Autarkic energy harvesting
Always fully on products
Building infrastructure
Mobile products, while connected to electricity network
other electricity sources
e.g. solar
mixed electricity sources
e.g. solar + grid
Distinction 1
Distinction 2
Distinction 3
Mains operated EuPs
Other electricity networks, i.e. low
voltage supply and higher voltages
EPS/chargers in no-load condition
Figure 1-7: Product distinctions leading to proposed scope limitations (entries in italics are excluded from the investigation scope).
Based on these necessary limitations product cases have been chosen to cover the diversity of the remaining EuPs in terms of standby functions, combinations of modes and use patterns.
► Selected Product Cases to Represent Modes and PUCs
Table 1-24 shows the 15 product cases to be investigated further. The product cases are chosen as examples for the different product-use-clusters. However, due to the diversity of products they are not considered representative products for all other products of the same PUC.
The main role of the product cases is to structure the data acquisition. In detail, more than one sub-product can be included in one product case, either due to technologies which have to be distinguished (CRT versus LCD) or peripheral devices always linked to a main product (such as modems). The sub-products can also be referenced as the "assumption sets" of the study: for each of these, the stock numbers, power consumption levels and use pattern have to be available.

Report for Tender No. TREN/D1/40 Lot 6 -2005 EuP Lot 6 - Task 1 2nd of October 2007
Fraunhofer IZM CODDE Bio IS DUH Final Report Page 1-46
Table 1-24: Product cases for data acquisition
Product-Use-Cluster PUC Product Assumed relevance criteria
PUC 1 EPS (mobile phone) high volume with significant "no-load"
PUC 1 Lighting applications, in particular low voltage halogen lamps long mode duration, higher wattage
PUC 1 Radio (e.g. table radio, kitchen radio) long mode duration, lower wattage, often unnoticed
PUC 1 Electric toothbrush long mode duration, lower power charger
PUC 2 Oven long mode duration
PUC 2 (net) Cordless phone long mode duration, high volume
PUC 2 (net) TV+ higher wattage, and active EPG download case
PUC 3 Washing machine high volume, mainly off-mode losses, but job-based
PUC 3 DVD high volume
PUC 3 Audio minisystem higher wattage in standby/off
PUC 3 (net) Fax machines long mode duration
PUC 3 (net) PC+ (Office) high volume and wattage, complex networked product
PUC 3 (net) PC+ (Home) high volume and wattage, complex networked product
PUC 3 (net) Laser printer higher wattage in standby/off
PUC 3 (net) Inkjet printer high volume, long mode duration
Some of the product groups are in fact also covered by product specific preparatory studies, or will be covered by announced studies. Since the current studies are running in parallel, any exchange will mostly be based on preliminary data. Neither can the other studies supply finished data to Lot 6, nor was it possible for Lot 6 to have a finalised definition as a basis for the other lots. Nevertheless identified good data and sources, and of course the definition part of Lot 6 have been exchanged with the other studies.
In conjunction we also like to clarify the relation between the horizontal approach of Lot 6 and the other product group specific lots. To the current understanding of the contractors, an eventual implementing measure on standby and off-mode resulting from the findings of the Lot 6 study can be superseded by implementing measures for specific products. It will be the goal of the implementing measure to have no special cases and fixed rules within the horizontal scope.
Report for Tender No. TREN/D1/40 Lot 6 -2005 EuP Lot 6 - Task 2 2nd of October 2007
Fraunhofer IZM CODDE Bio IS DUH Final Report Page 2-i
EuP Preparatory Study Lot 6 Standby and Off-mode Losses
Task 2 Market Data Final Report
Compiled by Fraunhofer IZM
Contractor: Fraunhofer Institute for Reliability and Microintegration, IZM, Berlin
Department Environmental Engineering
Dr.-Ing. Nils F. Nissen
Gustav-Meyer-Allee 25, 13355 Berlin, Germany
Contact:
Tel.: +49-30-46403-132
Fax: +49-30-46403-131
Email: [email protected]
Berlin, 2nd of October 2007
Disclaimer
The findings presented in this report are results of the research conducted by the IZM consortium and the continuous feedback from a wide range of stakeholders. The statements and recommendations presented in the final report however are not to be perceived as the opinion of the European Commission.

Report for Tender No. TREN/D1/40 Lot 6 -2005 EuP Lot 6 - Task 2 2nd of October 2007
Fraunhofer IZM CODDE Bio IS DUH Final Report Page 2-ii
Contents 2. Market Data (Task 2) ................................................................................................... 2-1
2.1. Generic Economic Data (Task 2.1)................................................................................. 2-1 2.1.1. Household energy consumption ................................................................................ 2-1 2.1.2. Electricity consumption in the offices ....................................................................... 2-4
2.2. Market and Stock Data (Task 2.2) .................................................................................. 2-5 2.2.1. Methodology for assumptions and estimations ......................................................... 2-5 2.2.2. Results for EPS (mobile phone) ................................................................................ 2-7 2.2.3. Results for Lighting Appliances ................................................................................ 2-9 2.2.4. Results for Radio ..................................................................................................... 2-12 2.2.5. Results for Electric toothbrush ................................................................................ 2-14 2.2.6. Results for Oven...................................................................................................... 2-16 2.2.7. Results for Cordless phone...................................................................................... 2-18 2.2.8. Results for TV+ ....................................................................................................... 2-20 2.2.9. Results for Washing machine.................................................................................. 2-23 2.2.10. Results for DVD...................................................................................................... 2-26 2.2.11. Results for Audio minisystem ................................................................................. 2-27 2.2.12. Results for Fax......................................................................................................... 2-28 2.2.13. Results for PC+ (office)........................................................................................... 2-29 2.2.14. Results for PC+ (home) ........................................................................................... 2-32 2.2.15. Results for Laser printers......................................................................................... 2-35 2.2.16. Results for Inkjet printers ........................................................................................ 2-36 2.2.17. Result summaries .................................................................................................... 2-37
2.3. Market Trends (Task 2.3) ............................................................................................. 2-38 2.3.1. Market trends for product cases .............................................................................. 2-38 2.3.2. Resulting market penetration growth ...................................................................... 2-42
2.4. Consumer Expenditure Base Data (Task 2.4)............................................................... 2-46 2.4.1. Electricity price ....................................................................................................... 2-46 2.4.2. Consumers expenditure on ICT............................................................................... 2-47 2.4.3. Consumers expenditure for large and small household EuPs.................................. 2-47 2.4.4. Interest and inflation rates ....................................................................................... 2-47
2.5. Task 2 Conclusions....................................................................................................... 2-49
Report for Tender No. TREN/D1/40 Lot 6 -2005 EuP Lot 6 - Task 2 2nd of October 2007
Fraunhofer IZM CODDE Bio IS DUH Final Report Page 2-1
2. Market Data (Task 2)
The purpose of this section is to present economic and market analysis for the products relevant for the EuP preparatory study (Lot 6) on standby and off-mode losses.
Standby and off-mode losses result from different functionalities available in a variety of appliances used in households and office environments. The market analysis, therefore, has to study a broad range of products used in these environments and having some kind of standby functionality and/or being responsible of energy losses when in off-mode. The objective of this task is to gather the base data for determining in later tasks the order of magnitude that the “standby and off-mode losses” issue represents in Europe.
In the following sections, economic and market analysis is conducted by considering the 15 product cases presented earlier in Table 1-17 and Table 1-24.
The first section deals with the generic economic data (for standby: population, household and enterprise figures). This is followed by the market and stock data for the selected product cases and by identification of selected market trends. Finally, information on consumer expenditure data is provided.
The following country abbreviations are used in this document:
EU-15 data cover “old” member states i.e. Belgium (BE), Denmark (DK), Germany (DE), Greece (EL), Spain (ES), France (FR), Ireland (IE), Italy (IT), Luxembourg (LU), the Netherlands (NL), Austria (AT), Portugal (PT), Finland (FI), Sweden (SE) and United Kingdom (UK).
NMS data cover “new” member states i.e. Czech Republic (CZ), Estonia (EE), Cyprus (CY), Latvia (LV), Lithuania (LT), Hungary (HU), Malta (MT), Poland (PT), Slovenia (SL) and Slovakia (SK).
2.1. Generic Economic Data (Task 2.1) According to the MEEUP, generic economic data should cover EU statistics on import, export and production in EU-25, as well as the apparent consumption in EU-25. However, standby and off-mode functionalities exist in very broad range of products and PRODCOM classification does not cover all of them. Here the approach is, first, to estimate the number of households and offices and then relate them to the total number of relevant EuPs and to the energy consumption in these environments.
2.1.1. Household energy consumption
To assess the magnitude of the energy consumed by the standby and off-mode functionality of appliances used in households, the total number of households is needed as one base figure. There are about 192 million households in Europe (Table 2-1) on the basis of population and assuming an average size of a European household as 2.4 persons, according to Eurostat data showing a roughly constant size of 2.4 for EU-15 households since 2001. A comparison of average size of households at EU-15 and EU-25 levels show that this value of 2.4 persons per household can be used at the EU-25 level (see Annex 2-1).
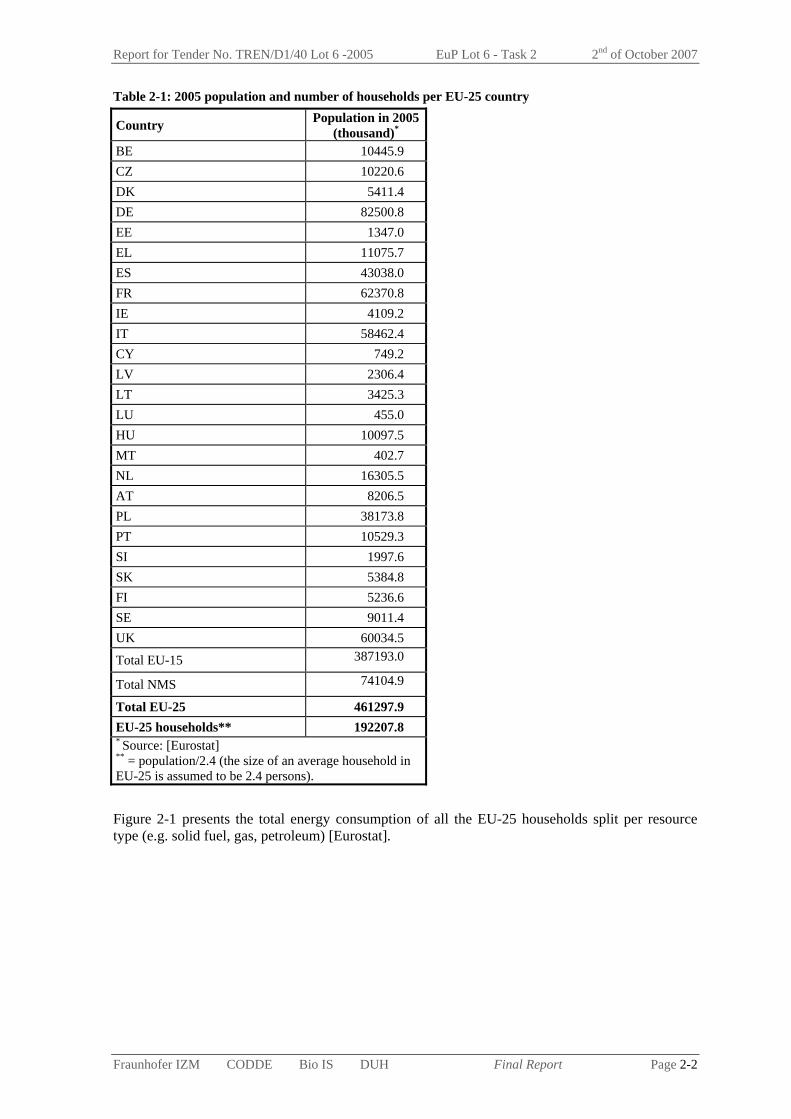
Report for Tender No. TREN/D1/40 Lot 6 -2005 EuP Lot 6 - Task 2 2nd of October 2007
Fraunhofer IZM CODDE Bio IS DUH Final Report Page 2-2
Table 2-1: 2005 population and number of households per EU-25 country
Country Population in 2005 (thousand)*
BE 10445.9 CZ 10220.6 DK 5411.4 DE 82500.8 EE 1347.0 EL 11075.7 ES 43038.0 FR 62370.8 IE 4109.2 IT 58462.4 CY 749.2 LV 2306.4 LT 3425.3 LU 455.0 HU 10097.5 MT 402.7 NL 16305.5 AT 8206.5 PL 38173.8 PT 10529.3 SI 1997.6 SK 5384.8 FI 5236.6 SE 9011.4 UK 60034.5
Total EU-15 387193.0
Total NMS 74104.9
Total EU-25 461297.9 EU-25 households** 192207.8 * Source: [Eurostat] ** = population/2.4 (the size of an average household in EU-25 is assumed to be 2.4 persons).
Figure 2-1 presents the total energy consumption of all the EU-25 households split per resource type (e.g. solid fuel, gas, petroleum) [Eurostat].

Report for Tender No. TREN/D1/40 Lot 6 -2005 EuP Lot 6 - Task 2 2nd of October 2007
Fraunhofer IZM CODDE Bio IS DUH Final Report Page 2-3
Total annual energy consumption of EU-25 households = 3.106 GWh
20.4%
42.9%
3.0%10.1%
23.6%
Solid FuelPetroleumGasElectricityRenewable Energy
Figure 2-1: 2004 annual energy consumption of EU-25 households per resource type
Depending upon the definition of standby and off-mode (Task 1), the estimated energy consumption due to these functionalities may vary. In Germany, standby consumption of information and communication appliances, electrical and infrastructural appliances amounts to 14100 GWh in 2004 [ISI 2005], which represents about 10 % of the electricity consumption of households. Under the hypothesis that the 10 % of electricity can be applied to all EU-25 households, every year 71000 GWh of electricity could be consumed for standby and through off-mode losses. A more detailed analysis of such percentages in relation to household electricity consumption is included in the Task 5 conclusions (Chapter 5.5).
Figure 2-2 shows the household electricity consumption per EU-25 country for 2003 and it can be observed that France, Germany, and UK together represent around 53 % of the total EU-25 domestic electricity consumption (750000 GWh).
0
20000
40000
60000
80000
100000
120000
140000
160000
France
German
y
United
King
dom
ItalySpa
in
Sweden
Belgium
Netherl
ands
Poland
Finlan
d
Austria
GreeceCze
ch
Portug
al
Hunga
ry
Denmark
Irelan
d
Slovak
ia
Sloven
ia
Lithu
ania
Estonia
Latvi
a
Cyprus
Luxe
mbourg
Malta
Dom
estic
ann
ual e
lect
ricity
con
sum
ptio
n (G
Wh)
Figure 2-2: Domestic electricity consumption per EU-25 country for 2003
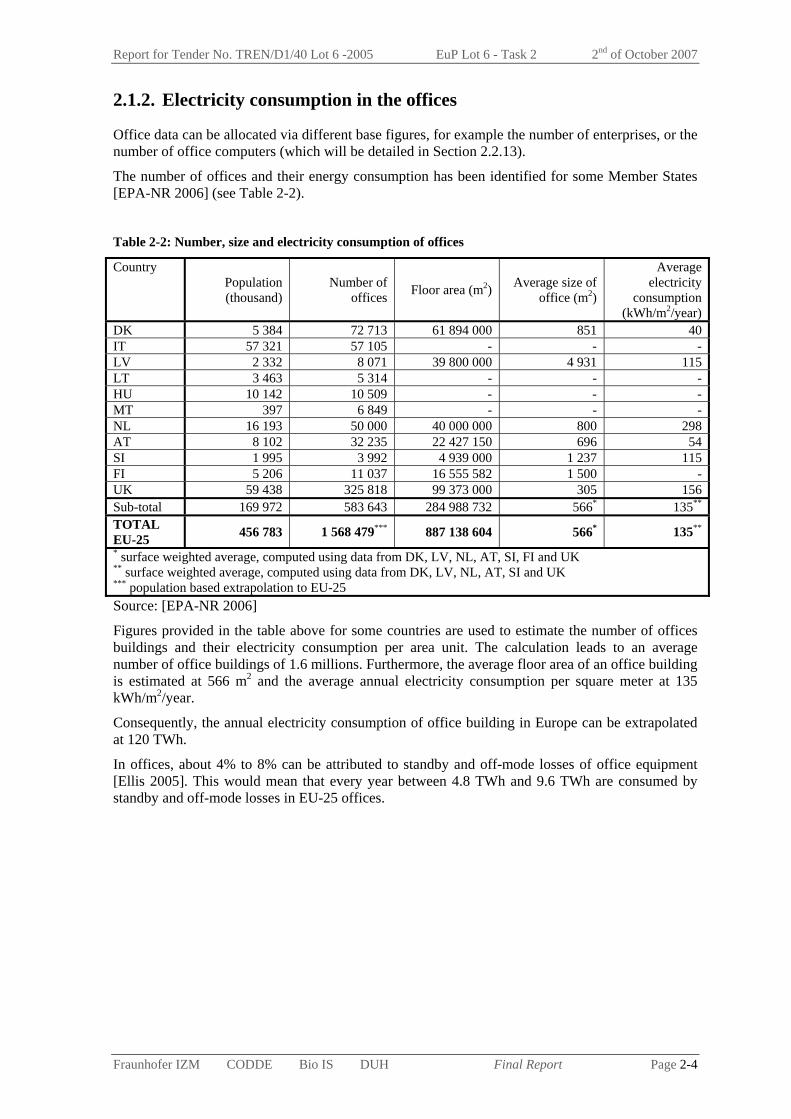
Report for Tender No. TREN/D1/40 Lot 6 -2005 EuP Lot 6 - Task 2 2nd of October 2007
Fraunhofer IZM CODDE Bio IS DUH Final Report Page 2-4
2.1.2. Electricity consumption in the offices
Office data can be allocated via different base figures, for example the number of enterprises, or the number of office computers (which will be detailed in Section 2.2.13).
The number of offices and their energy consumption has been identified for some Member States [EPA-NR 2006] (see Table 2-2).
Table 2-2: Number, size and electricity consumption of offices
Country Population (thousand)
Number of offices Floor area (m2) Average size of
office (m2)
Average electricity
consumption (kWh/m2/year)
DK 5 384 72 713 61 894 000 851 40 IT 57 321 57 105 - - - LV 2 332 8 071 39 800 000 4 931 115 LT 3 463 5 314 - - - HU 10 142 10 509 - - - MT 397 6 849 - - - NL 16 193 50 000 40 000 000 800 298 AT 8 102 32 235 22 427 150 696 54 SI 1 995 3 992 4 939 000 1 237 115 FI 5 206 11 037 16 555 582 1 500 - UK 59 438 325 818 99 373 000 305 156 Sub-total 169 972 583 643 284 988 732 566* 135** TOTAL EU-25 456 783 1 568 479*** 887 138 604 566* 135** * surface weighted average, computed using data from DK, LV, NL, AT, SI, FI and UK ** surface weighted average, computed using data from DK, LV, NL, AT, SI and UK *** population based extrapolation to EU-25 Source: [EPA-NR 2006]
Figures provided in the table above for some countries are used to estimate the number of offices buildings and their electricity consumption per area unit. The calculation leads to an average number of office buildings of 1.6 millions. Furthermore, the average floor area of an office building is estimated at 566 m2 and the average annual electricity consumption per square meter at 135 kWh/m2/year.
Consequently, the annual electricity consumption of office building in Europe can be extrapolated at 120 TWh.
In offices, about 4% to 8% can be attributed to standby and off-mode losses of office equipment [Ellis 2005]. This would mean that every year between 4.8 TWh and 9.6 TWh are consumed by standby and off-mode losses in EU-25 offices.
Report for Tender No. TREN/D1/40 Lot 6 -2005 EuP Lot 6 - Task 2 2nd of October 2007
Fraunhofer IZM CODDE Bio IS DUH Final Report Page 2-5
2.2. Market and Stock Data (Task 2.2) The objective of this sub-task is to quantify the stock of domestic and office EuPs identified earlier in Table 1-17 for the reference year 2005 and estimate the projections for years 2010 and 2020. Such data is available in the literature in two forms:
Penetration rates: for households, penetration rate is the average number of appliances per household in percentage. For example, a penetration rate of 90 % for TV means that on average each household owns 0.9 TV (or 90 % of households own one TV) and a penetration rate of 200 % means that on average each household owns two TVs.
Stock data: total existing number of appliances.
2.2.1. Methodology for assumptions and estimations
2.2.1.1. Filling data gaps
Data compiled from various sources are provided either per country or for the two groups of countries (EU-15 and NMS).
When data for all the EU-25 countries is not available, two types of household penetration rates are assumed, one for the EU-15 group of countries and the other for NMS (new Member States). The following assumptions are made:
1. When no data is available for one or more countries (of EU-15 or NMS), it is assumed that the penetration rate for these countries equals the weighed average penetration rate of the respective country group (EU-15 or NMS) computed with the formulae below.
2. Where no data is available for NMS, the weighted average penetration rate (see formulae below for calculation) for NMS is taken as 80 % of the penetration rate for EU-15, assuming that NMS have reduced access to these appliances. Such pattern is observed for appliances like washing machines (see the following sections).
WAPRy denotes the weighted average penetration rate for the year y.
∑∑ ×
=
i
yi
i
yi
yi
y
pop
popPRWAPR
where : - i: country
- y: year
- popiy: population of country i for the year y
- PRiy: household penetration rate for country i and for the year y
Finally, household penetration rate at the EU-25 level is the weighted average of EU-25 countries penetration rate (or the weighted average of country groups).
2.2.1.2. Stock trend extrapolations
There are two types of trends to identify when determining market trends for household and office appliances:
Rate of population growth: under constant penetration rate, the stock of appliances will grow at the rate of the population for household appliance (under the assumption of a constant household size, the growth in household numbers is exactly the rate of the population growth). The same pattern is assumed for office appliances. The underlying assumption is that the ratio of number of enterprises and offices to population is constant

Report for Tender No. TREN/D1/40 Lot 6 -2005 EuP Lot 6 - Task 2 2nd of October 2007
Fraunhofer IZM CODDE Bio IS DUH Final Report Page 2-6
over time. Table 2-3 and Table 2-4 provide the growth of the number of households (i.e. of the population).
Penetration rate trends: under constant number of households or population, the stock of a given appliance will grow at the rate of the penetration rate growth, illustrating the adaptation of households and/or offices to new technologies.
Forecasting stock data is made using the following formulae: k/55
PRkpopNkN )RG)(1RG(1stockstock ++×=+ :
where : - N: available year
- N+k : year for which data is calculated
- RGpopk: rate of growth of population from year N to year N+k, provided in Table 2-3 and
Table 2-4.
- RGPR5: rate of growth of the penetration rate for the five years, provided in Section 2.3.2.
Table 2-3: Rate of growth for the number of households (%)
2001-2005 2002-2005 2003-2005 2004-2005 EU-25 1.8 1.4 1 0.5 EU-15 1.5 1.1 0.5 -0.1 NMS 3.2 3.4 3.5 3.6 Source : [Eurostat]
Table 2-4: Forecasted rate of growth for the number of households (%)
2005-2010 2005-2020 EU-25 1.2 2.4 EU-15 1.6 3.4 NMS -0.8 -3.0 Source : [Eurostat]
The resulting numbers of household projections used in the calculation of penetration rates are shown in Table 2-5. Table 2-5: Number of households estimation until 2020
2005 2010 2020
EU-15 161.3 162.8 165.7
NMS 30.9 30.6 29.9
EU-25 192.2 193.4 195.6
The penetration rate is the average number of devices of a product class per household. In the Australian standby studies the household penetration is defined as the number of households owning one (or more) of a product type, whereas the saturation denotes the average number per household.

Report for Tender No. TREN/D1/40 Lot 6 -2005 EuP Lot 6 - Task 2 2nd of October 2007
Fraunhofer IZM CODDE Bio IS DUH Final Report Page 2-7
2.2.2. Results for EPS (mobile phone)
Table 2-6: Mobile phone EPS stock and penetration rate in EU-25
EPS (mobile phone) In offices and households PUC 1
EU-25 Stock (million units)
Household penetration rate (%)
2005 780 406
2010 863 446
2020 962 492
2.2.2.1. Discussion for EPS (mobile phone)
► Relevance of EPS (mobile phone) product case
The product case of EPS (mobile phone) covers external power supplies intended to charge mobile phones batteries only. This product case is relevant in term of market size (in 2005, each EU-25 household owns on average already four external power supplies for mobile phones) and comprises the by far largest single category (52 % in units) of the total market of external power supplies/battery chargers.
In terms of user behaviour, EPS for mobile phones are relevant regarding off-mode losses. Actually, some users leave their mobile phone plugged even if the charging is complete and leave EPS powered even if the mobile phone is unplugged.
► Uniformity of product case
According to lot 7 study [BIO 2006], these appliances can be pure EPS if the charging control circuitry is in the battery or phone itself. According to the existing definitions they are ‘EPS’, but confusingly some mobile phone manufacturers, as well as majority of consumers call them ‘chargers’, as they are clearly used for charging a battery. In addition, the technology involved in EPS can be either linear or switch mode.
However, these products are all similar in term of user behaviour and therefore they are included in the same product case.
Most mobile phones are used personalised, therefore a separation between household (personal) use and office use has not been made.
► Literature data and assumptions to derive best estimates
Annual sales of EPS are estimated to be of 260 millions of units. With an average lifetime of 3 years, the derived stock data for 2005 is 780 millions of units [BIO 2006].
► Market trends and stock forecast
The market for external power supplies intended for mobile phones is mainly driven by the end-use application. As expected for U.S.A, mobile phones (and consequently EPS for mobile phones) are expected to increase in EU-25 ownership rate but the large annual shipment volumes are mostly in a replacement mode [CE 2006].
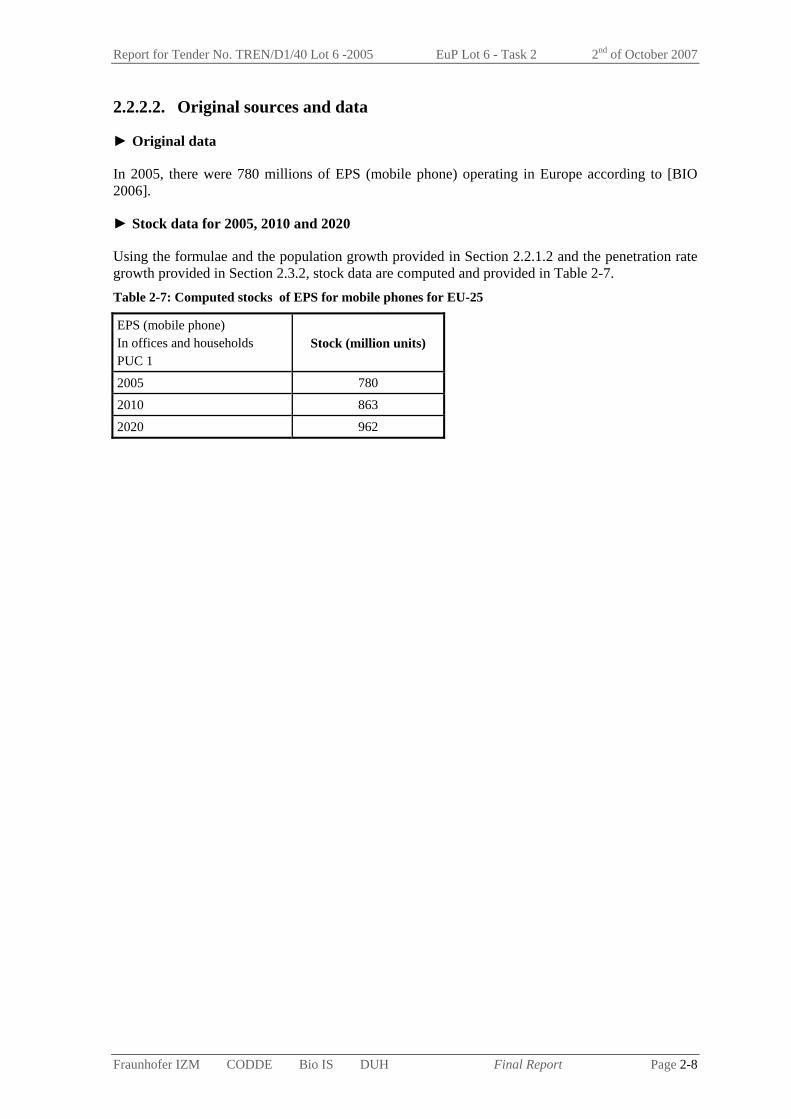
Report for Tender No. TREN/D1/40 Lot 6 -2005 EuP Lot 6 - Task 2 2nd of October 2007
Fraunhofer IZM CODDE Bio IS DUH Final Report Page 2-8
2.2.2.2. Original sources and data
► Original data
In 2005, there were 780 millions of EPS (mobile phone) operating in Europe according to [BIO 2006].
► Stock data for 2005, 2010 and 2020
Using the formulae and the population growth provided in Section 2.2.1.2 and the penetration rate growth provided in Section 2.3.2, stock data are computed and provided in Table 2-7. Table 2-7: Computed stocks of EPS for mobile phones for EU-25
EPS (mobile phone) In offices and households PUC 1
Stock (million units)
2005 780
2010 863
2020 962

Report for Tender No. TREN/D1/40 Lot 6 -2005 EuP Lot 6 - Task 2 2nd of October 2007
Fraunhofer IZM CODDE Bio IS DUH Final Report Page 2-9
2.2.3. Results for Lighting Appliances
Table 2-8: Lighting appliances stock in EU-25 for 2005 and projections for 2010 and 2020
Lighting (households) PUC1
EU-25 Stock (million units)
EU-25 penetration rate (%)
2005 179 93
2010 208 107
2020 279 143
Table 2-8 provides stock and penetration rate for household lighting appliances. The figures are an estimate for low voltage halogen lamps, as explained below.
2.2.3.1. Discussion for lighting appliances
► Relevance of lighting product case
The product case of lighting appliances is investigated via the segment of low voltage halogen lamps first of all. These appliances always come with a transformer. In the case where the switch is behind the transformer, these lamps are responsible for significant energy losses.
► Uniformity of product case
Data provided Table 2-8 encompass low voltage halogen lamps in households. The product case is quite inhomogeneous. This is why one segment had to be chosen. Other lighting appliances of interest would be lamps with dimmers that have no real off position and lamps with soft switches or touch activation, which would also exhibit off-mode losses.
► Literature data and assumptions to derive best estimates
Stock and penetration rate for low voltage halogen lamps are determined based on the results of a measurement campaign in European households [EURECO 2002].
Feedback received indicates that our assumptions are too high, if we only target the low voltage halogen lamps below 55 W (as is assumed in the detailed calculations). For this segment the stock data and the growth trend have to be interpreted as high estimates, because mains voltage halogens are growing much faster on the market. However, the other types of possible off-mode losses mentioned (dimmers, soft switches, touch activations) may also appear with low voltage halogen lamps, so for now the values have not been changed.
2.2.3.2. Original sources and data
► Original data (2000)
The main source of information used here is a measurement campaign of the energy consumption of 400 households in four EU countries [EURECO 2002]. This study provides a lot of useful and detailed information on the state-of-the-art of residential lighting in 2000.
The relevant pieces of information to determine the stock of low voltage halogen lamps in households are provided in Annexes 2-3 to 2-6.
This information includes:
- the share of halogen light bulbs per household
- the number of halogen light bulbs per room and per household
- the average number of light bulb per lamp
- the share of halogen light bulbs per wattage
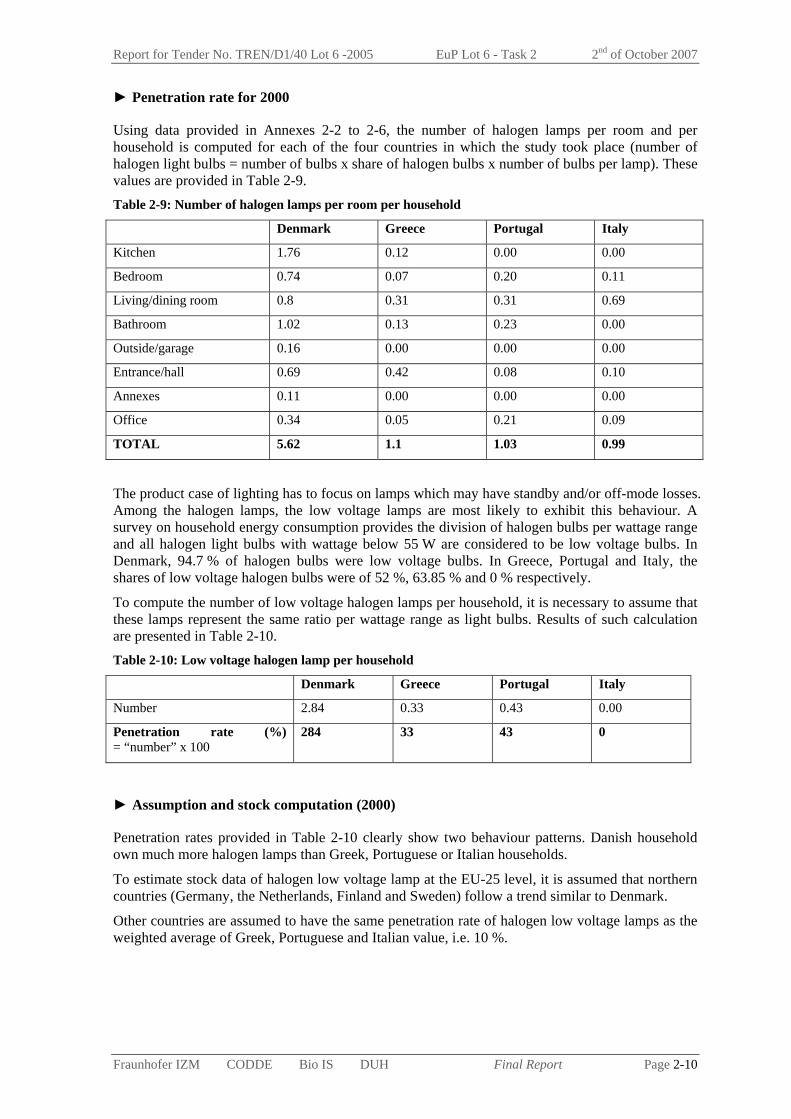
Report for Tender No. TREN/D1/40 Lot 6 -2005 EuP Lot 6 - Task 2 2nd of October 2007
Fraunhofer IZM CODDE Bio IS DUH Final Report Page 2-10
► Penetration rate for 2000
Using data provided in Annexes 2-2 to 2-6, the number of halogen lamps per room and per household is computed for each of the four countries in which the study took place (number of halogen light bulbs = number of bulbs x share of halogen bulbs x number of bulbs per lamp). These values are provided in Table 2-9. Table 2-9: Number of halogen lamps per room per household
Denmark Greece Portugal Italy
Kitchen 1.76 0.12 0.00 0.00
Bedroom 0.74 0.07 0.20 0.11
Living/dining room 0.8 0.31 0.31 0.69
Bathroom 1.02 0.13 0.23 0.00
Outside/garage 0.16 0.00 0.00 0.00
Entrance/hall 0.69 0.42 0.08 0.10
Annexes 0.11 0.00 0.00 0.00
Office 0.34 0.05 0.21 0.09
TOTAL 5.62 1.1 1.03 0.99
The product case of lighting has to focus on lamps which may have standby and/or off-mode losses. Among the halogen lamps, the low voltage lamps are most likely to exhibit this behaviour. A survey on household energy consumption provides the division of halogen bulbs per wattage range and all halogen light bulbs with wattage below 55 W are considered to be low voltage bulbs. In Denmark, 94.7 % of halogen bulbs were low voltage bulbs. In Greece, Portugal and Italy, the shares of low voltage halogen bulbs were of 52 %, 63.85 % and 0 % respectively.
To compute the number of low voltage halogen lamps per household, it is necessary to assume that these lamps represent the same ratio per wattage range as light bulbs. Results of such calculation are presented in Table 2-10. Table 2-10: Low voltage halogen lamp per household
Denmark Greece Portugal Italy
Number 2.84 0.33 0.43 0.00
Penetration rate (%) = “number” x 100
284 33 43 0
► Assumption and stock computation (2000)
Penetration rates provided in Table 2-10 clearly show two behaviour patterns. Danish household own much more halogen lamps than Greek, Portuguese or Italian households.
To estimate stock data of halogen low voltage lamp at the EU-25 level, it is assumed that northern countries (Germany, the Netherlands, Finland and Sweden) follow a trend similar to Denmark.
Other countries are assumed to have the same penetration rate of halogen low voltage lamps as the weighted average of Greek, Portuguese and Italian value, i.e. 10 %.

Report for Tender No. TREN/D1/40 Lot 6 -2005 EuP Lot 6 - Task 2 2nd of October 2007
Fraunhofer IZM CODDE Bio IS DUH Final Report Page 2-11
Table 2-11: Population of “N” and “R” country groups and computation of the stock of low voltage halogen lamps
Country Country type
Population in 2000 (a)
(thousand)
Number of households (b)
(thousand)
Stock of low voltage halogen
lamps (thousand)
BE R 10239.1 CZ R 10278.1 DK N 5330 DE N 82163.5 EE R 1372.1 EL R 10903.8 ES R 40049.7 FR R 60481.6 IE R 3777.8 IT R 56929.5 CY R 690.5 LV R 2381.7 LT R 3512.1 LU R 433.6 HU R 10221.6 MT R 380.2 NL N 15864 AT R 8002.2 PL R 38653.6 PT R 10195 SL R 1987.8 SK R 5398.7 FI N 5171.3 SE N 8861.4 UK R 58785.2 TOTAL N type countries 117390.2 48913 138912(c) TOTAL R type countries 334673.9 139447 13945(d) TOTAL EU-25 152856 N: north, penetration rate of low voltage halogen lamps of 284 % R: rest of EU-25, penetration rate of low voltage halogen lamps of 10 % (a)Source: Eurostat (b) Number of households = population/2.4 (c) stock of low voltage halogen lamps = number of household in the group N x penetration rate for these countries (284 %) (d) stock of low voltage halogen lamps = number of household in the group R x penetration rate for these countries (10 %)
► Stock data for 2005, 2010 and 2020
Assuming an annual growth of 3 % for the low voltage halogen lamp market (see Section 2.3.2), stocks are determined for 2005, 2010 and 2020 as shown in Table 2-8.

Report for Tender No. TREN/D1/40 Lot 6 -2005 EuP Lot 6 - Task 2 2nd of October 2007
Fraunhofer IZM CODDE Bio IS DUH Final Report Page 2-12
2.2.4. Results for Radio
Table 2-12: Radio stock and penetration rates in EU-25 for 2005 and projections for 2010 and 2020
Radio in households PUC1
EU-25 Stock (million units)
EU-25 penetration rate (%)
2005 114.4 60
2010 115.7 60
2020 116.8 60
2.2.4.1. Discussion for Radio
► Relevance of radio as product case
The product case covers simple stand-alone radios, such as table radios or kitchen radios, the majority of which are assumed to have a mains connected power supply, no remote control, no integrated clock and no need for continuously powered memory. These radio types are on/off products for users. However, the off-mode generally consumes energy. When switched off but still connected to the mains, some radio products still consume energy (due to soft switches or secondary side switching). In addition to the off-mode energy consumption, radio is relevant as a product case for this study regarding the market size. More than the half of EU-25 households owns a radio.
► Uniformity of product case
Data provided Table 2-12 encompass many types of radios. As far as could be ascertained radios with an integrated cassette deck or a CD player should not be included (these would be portable stereos or audio minisystems).
In addition, some radios such as kitchen radios might be battery powered or might contain a kitchen timer; whereas other products are plugged to the mains. Separate data for these two types of products could not be provided.
In spite of the variety of products comprised in the stock data provided here, they are similar in terms of user behaviour and it is relevant to cover all these products as one product case.
► Literature data and best estimates derivation
Data available in the literature are the 2001 penetration rates of radios. However, they are not provided for all EU-25. To fill the gaps, it has been assumed that the penetration rates for each EU-15 country and for each NMS are the average penetration rates computed with available data for EU-15 and NMS respectively.
► Market trends and stock forecast
New technologies to broadcast radio emissions such as web radio and radio through cable modem currently emerge. In 2003, around one thousand of web radio stations have been listed [Eurostat audio 2003]. However, these ways of broadcasting radio will probably not replace radio as they require the use of other appliances such as a computer or media server. Nevertheless, they are assumed to contribute to a penetration rate stagnation for the simple radios.

Report for Tender No. TREN/D1/40 Lot 6 -2005 EuP Lot 6 - Task 2 2nd of October 2007
Fraunhofer IZM CODDE Bio IS DUH Final Report Page 2-13
2.2.4.2. Original sources and data
► Original data and estimates for radios
Table 2-13 provides 2001 penetration rates of radios and estimates per EU-25 country. Table 2-13: 2001 penetration rates of radios and estimates per EU-25 country
Country Penetration rates (%)
BE 73.3 CZ 75.0 DK 28.6 DE 44.6 EE 75.0 EL 57.0 ES 60.9 FR 89.9 IE 67 IT 57.0 CY 75.0 LV 75.0 LT 75.0 LU 57.0 HU 72 MT 75.0 NL 74.1 AT 57.0 PL 75.0 PT 57.0 SL 75.0 SK 81.9 FI 66 SE 57.0 UK 17.1 Average EU-15 57.0 Average NMS 75 Data in italics are estimates
► Computation of the data for 2005, 2010 and 2020
Computation of penetration rates and stocks (see Table 2-14) for 2005, 2010 and 2020 have been performed with the formula provided in Section 2.2.1 and the market growth provided in Section 2.3.2 Table 2-14: Computed household penetration rates and stocks of radios per country category and for 2005, 2010 and 2020
Transistor radios household penetration rate (%)
Transistor radios stock (million units)
EU-15 NMS EU-25 EU-15 NMS EU-25 2005 57 75 60 91.3 23.1 114.4
2010 57 75 60 92.8 22.9 115.7
2020 57 75 60 94.4 22.4 116.8
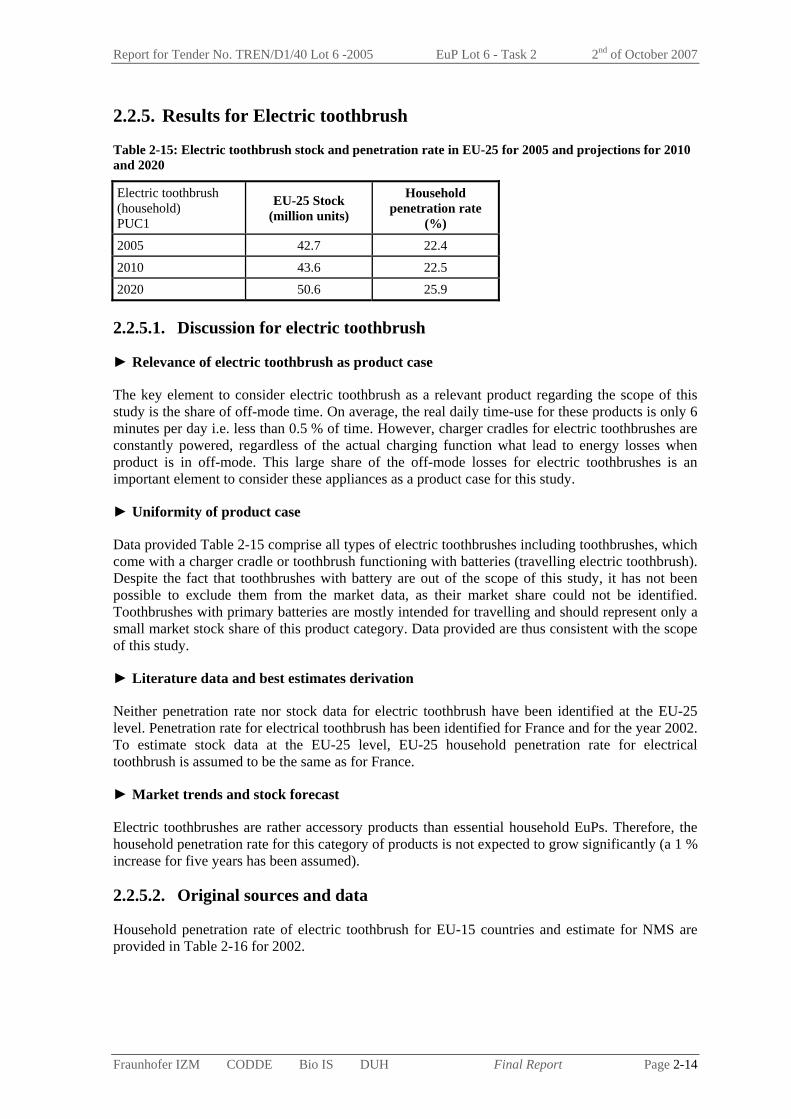
Report for Tender No. TREN/D1/40 Lot 6 -2005 EuP Lot 6 - Task 2 2nd of October 2007
Fraunhofer IZM CODDE Bio IS DUH Final Report Page 2-14
2.2.5. Results for Electric toothbrush
Table 2-15: Electric toothbrush stock and penetration rate in EU-25 for 2005 and projections for 2010 and 2020
Electric toothbrush (household) PUC1
EU-25 Stock (million units)
Household penetration rate
(%)
2005 42.7 22.4
2010 43.6 22.5
2020 50.6 25.9
2.2.5.1. Discussion for electric toothbrush
► Relevance of electric toothbrush as product case
The key element to consider electric toothbrush as a relevant product regarding the scope of this study is the share of off-mode time. On average, the real daily time-use for these products is only 6 minutes per day i.e. less than 0.5 % of time. However, charger cradles for electric toothbrushes are constantly powered, regardless of the actual charging function what lead to energy losses when product is in off-mode. This large share of the off-mode losses for electric toothbrushes is an important element to consider these appliances as a product case for this study.
► Uniformity of product case
Data provided Table 2-15 comprise all types of electric toothbrushes including toothbrushes, which come with a charger cradle or toothbrush functioning with batteries (travelling electric toothbrush). Despite the fact that toothbrushes with battery are out of the scope of this study, it has not been possible to exclude them from the market data, as their market share could not be identified. Toothbrushes with primary batteries are mostly intended for travelling and should represent only a small market stock share of this product category. Data provided are thus consistent with the scope of this study.
► Literature data and best estimates derivation
Neither penetration rate nor stock data for electric toothbrush have been identified at the EU-25 level. Penetration rate for electrical toothbrush has been identified for France and for the year 2002. To estimate stock data at the EU-25 level, EU-25 household penetration rate for electrical toothbrush is assumed to be the same as for France.
► Market trends and stock forecast
Electric toothbrushes are rather accessory products than essential household EuPs. Therefore, the household penetration rate for this category of products is not expected to grow significantly (a 1 % increase for five years has been assumed).
2.2.5.2. Original sources and data
Household penetration rate of electric toothbrush for EU-15 countries and estimate for NMS are provided in Table 2-16 for 2002.

Report for Tender No. TREN/D1/40 Lot 6 -2005 EuP Lot 6 - Task 2 2nd of October 2007
Fraunhofer IZM CODDE Bio IS DUH Final Report Page 2-15
Table 2-16: 2002 households penetration rate for electric toothbrush for EU-25 EU-25 Penetration rate (%) 22* *EU-25 penetration rate is based on penetration rate for France [GIFAM].
Computations of the stock data and penetration rates for electric toothbrush have been performed using the formula provided in Section 2.2.1 and are provided in Table 2-17. Table 2-17: Computed stock and penetration rates for electric toothbrush for 2005, 2010 and 2020.
Electric toothbrush (household) PUC2
Household penetration rate
(%)
Stock (million units)
2005 22.4 42.7
2010 22.5 43.6
2020 25.9 50.6

Report for Tender No. TREN/D1/40 Lot 6 -2005 EuP Lot 6 - Task 2 2nd of October 2007
Fraunhofer IZM CODDE Bio IS DUH Final Report Page 2-16
2.2.6. Results for Oven
Table 2-18: Electric oven stock and penetration rate in EU-25 for 2005 and projections for 2010 and 2020
Electric oven (household) PUC2
EU-25 Stock (million units)
Household penetration rate (%)
2005 73.0 38
2010 73.9 38
2020 74.7 38
2.2.6.1. Discussion for electric oven
► Relevance of electric oven as product case
The key element to consider electric ovens as a relevant product case for Lot 6 is the standby time. Actually, ovens are constantly powered despite the fact that they are only used for approximately 15 minutes per day (i.e. less than 1 % of the product real lifetime) and are in standby mode during the remaining time. Moreover, the penetration rate of electric ovens for 2005 is of 38 % and corresponds to 73.0 million of operating electric ovens (see Table 2-18) and the stock of these appliances is significant.
► Uniformity of product case
Data provided includes all types of electric ovens. Regarding standby and off-mode losses, several types of ovens exist. Ovens come either without clock or with an always-on clock or with a clock that can be deactivated. It has not been possible to separate stock data regarding the clock characteristics and the stock data provided for electric ovens include all these types of oven. Further, electric ovens may come with specific functionalities such as grill or rotisserie and these function specific data has not been analysed because they still remain relevant for this study.
► Literature data and best estimates derivation
Neither penetration rate nor stock data for electric ovens was found at the EU-25 level. Penetration rate for electrical ovens has been identified for France and for 2005. To estimate stock data at the EU-25 level, EU-25 household penetration rate for electrical ovens is assumed to be the same as for France.
► Market trends and stock forecast
Electric ovens annual shipment volumes are mostly replacement sales. Even if an electric oven is a large household appliance, household penetration rate is not expected to reach 100 %, in particular due to the presence of gas ovens. Further, the market for ovens is moving towards multifunctional products, with features such as grill or rotisserie.
2.2.6.2. Original sources and data
Household penetration rate of electric oven for EU-15 countries and estimate for NMS are provided in Table 2-19 for 2005.
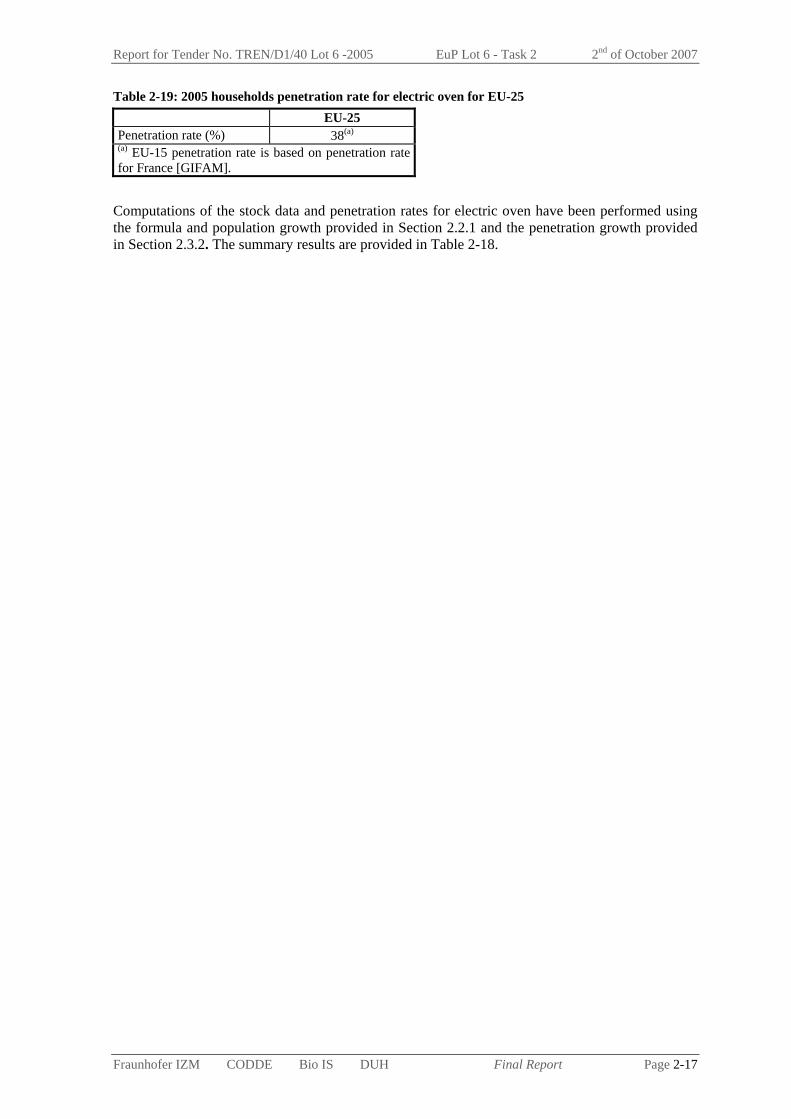
Report for Tender No. TREN/D1/40 Lot 6 -2005 EuP Lot 6 - Task 2 2nd of October 2007
Fraunhofer IZM CODDE Bio IS DUH Final Report Page 2-17
Table 2-19: 2005 households penetration rate for electric oven for EU-25 EU-25 Penetration rate (%) 38(a) (a) EU-15 penetration rate is based on penetration rate for France [GIFAM].
Computations of the stock data and penetration rates for electric oven have been performed using the formula and population growth provided in Section 2.2.1 and the penetration growth provided in Section 2.3.2. The summary results are provided in Table 2-18.

Report for Tender No. TREN/D1/40 Lot 6 -2005 EuP Lot 6 - Task 2 2nd of October 2007
Fraunhofer IZM CODDE Bio IS DUH Final Report Page 2-18
2.2.7. Results for Cordless phone
Table 2-20: Cordless phone stock in EU-25 for 2005 and projections for 2010 and 2020
Cordless phone (office and household) PUC 2 (net)
EU-25 Stock (million units)
2005 179.6 2010 184.0 2020 190.5
2.2.7.1. Discussion for cordless phone
► Relevance of cordless phone as product case
The standby consumption of this product category is the relevant parameter to be considered for including cordless phones as a product case for this study.
External power supplies for cordless phone operate continuously and most of the time under low load conditions. Cordless phones are typically equipped with “slow chargers”. A slow charger applies a fixed small charge for as long as the battery is connected. The battery can be connected to the charger for days or weeks with no need for special shut-off or current-limiting equipment on the charger [BIO 2006].
► Uniformity of product case
Stock data provided Table 2-20 comprises data for both household and office use.
Power supply system for cordless phones has an EPS, which is connected to the phone cradle/stand. The function of this cradle is not always the same. Sometimes, it can be “just a cradle” and the charging circuitry is located in the phone/battery. Else, the cradle can contain the charging circuitry, thus becoming a charger itself.
For some type of cordless products, the charging circuitry is contained within the device itself and the only detachable part of the system is an alternate current power cord. In this case, the standby power/energy is zero. This does not apply to cradle products with a separable cord, as the cradle may still draw some power when the device/battery is removed [BIO 2006].
Products with no standby consumption should a priori be excluded from this product case. No data enabling to exclude these products have been identified but they should represent a small market share of the cordless phone market.
In any case, products covered by this product case are all networked standby what keeps the consistency of the data provided regarding the scope of this study.
► Literature data and best estimates derivation
Stock data for cordless phones have been identified for EU-25 and for 2005 and cover both office and domestic use [BIO 2006]. No other assumption has been made.
► Market trends and stock forecast
Over the last years there has been a growing competition and convergence with the mobile phone market. Home zone charging rates and telephone flat rates allow the use of mobile phones at home without paying full mobile phone rates. On the other hand, technically the cordless phones have become more like mobile phones, with smaller size and weight, additional features such as address books and SMS, and improved displays.
Report for Tender No. TREN/D1/40 Lot 6 -2005 EuP Lot 6 - Task 2 2nd of October 2007
Fraunhofer IZM CODDE Bio IS DUH Final Report Page 2-19
Now, with internet flat rates and triple play offers, wireless VoIP or WLAN phones are probably the fiercest competition for cordless phones.
The upwards trend used for cordless phones in home and office use is therefore threatened by these technologies, whose impact can not yet be estimated.
2.2.7.2. Original sources and data
In 2005, there were 179.6 million of cordless phones operating in Europe [BIO 2006].
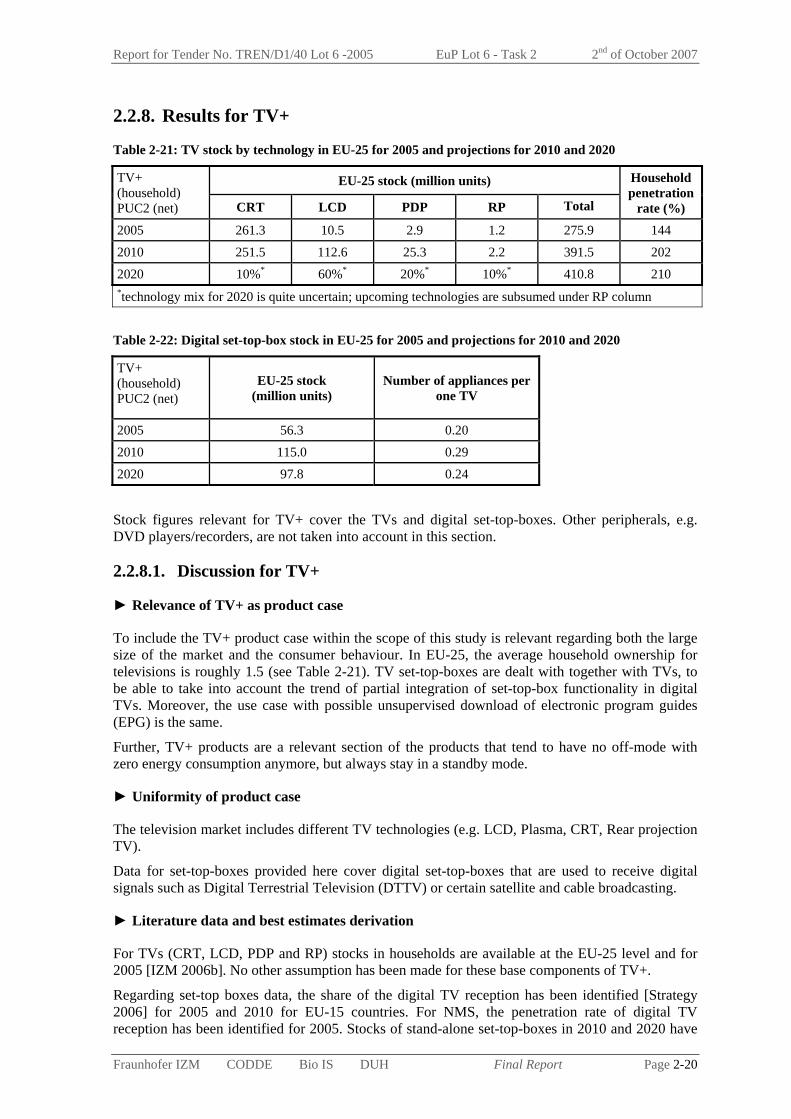
Report for Tender No. TREN/D1/40 Lot 6 -2005 EuP Lot 6 - Task 2 2nd of October 2007
Fraunhofer IZM CODDE Bio IS DUH Final Report Page 2-20
2.2.8. Results for TV+
Table 2-21: TV stock by technology in EU-25 for 2005 and projections for 2010 and 2020
EU-25 stock (million units) TV+ (household) PUC2 (net) CRT LCD PDP RP Total
Household penetration
rate (%)
2005 261.3 10.5 2.9 1.2 275.9 144
2010 251.5 112.6 25.3 2.2 391.5 202
2020 10%* 60%* 20%* 10%* 410.8 210 *technology mix for 2020 is quite uncertain; upcoming technologies are subsumed under RP column
Table 2-22: Digital set-top-box stock in EU-25 for 2005 and projections for 2010 and 2020
TV+ (household) PUC2 (net)
EU-25 stock (million units)
Number of appliances per one TV
2005 56.3 0.20
2010 115.0 0.29
2020 97.8 0.24
Stock figures relevant for TV+ cover the TVs and digital set-top-boxes. Other peripherals, e.g. DVD players/recorders, are not taken into account in this section.
2.2.8.1. Discussion for TV+
► Relevance of TV+ as product case
To include the TV+ product case within the scope of this study is relevant regarding both the large size of the market and the consumer behaviour. In EU-25, the average household ownership for televisions is roughly 1.5 (see Table 2-21). TV set-top-boxes are dealt with together with TVs, to be able to take into account the trend of partial integration of set-top-box functionality in digital TVs. Moreover, the use case with possible unsupervised download of electronic program guides (EPG) is the same.
Further, TV+ products are a relevant section of the products that tend to have no off-mode with zero energy consumption anymore, but always stay in a standby mode.
► Uniformity of product case
The television market includes different TV technologies (e.g. LCD, Plasma, CRT, Rear projection TV).
Data for set-top-boxes provided here cover digital set-top-boxes that are used to receive digital signals such as Digital Terrestrial Television (DTTV) or certain satellite and cable broadcasting.
► Literature data and best estimates derivation
For TVs (CRT, LCD, PDP and RP) stocks in households are available at the EU-25 level and for 2005 [IZM 2006b]. No other assumption has been made for these base components of TV+.
Regarding set-top boxes data, the share of the digital TV reception has been identified [Strategy 2006] for 2005 and 2010 for EU-15 countries. For NMS, the penetration rate of digital TV reception has been identified for 2005. Stocks of stand-alone set-top-boxes in 2010 and 2020 have
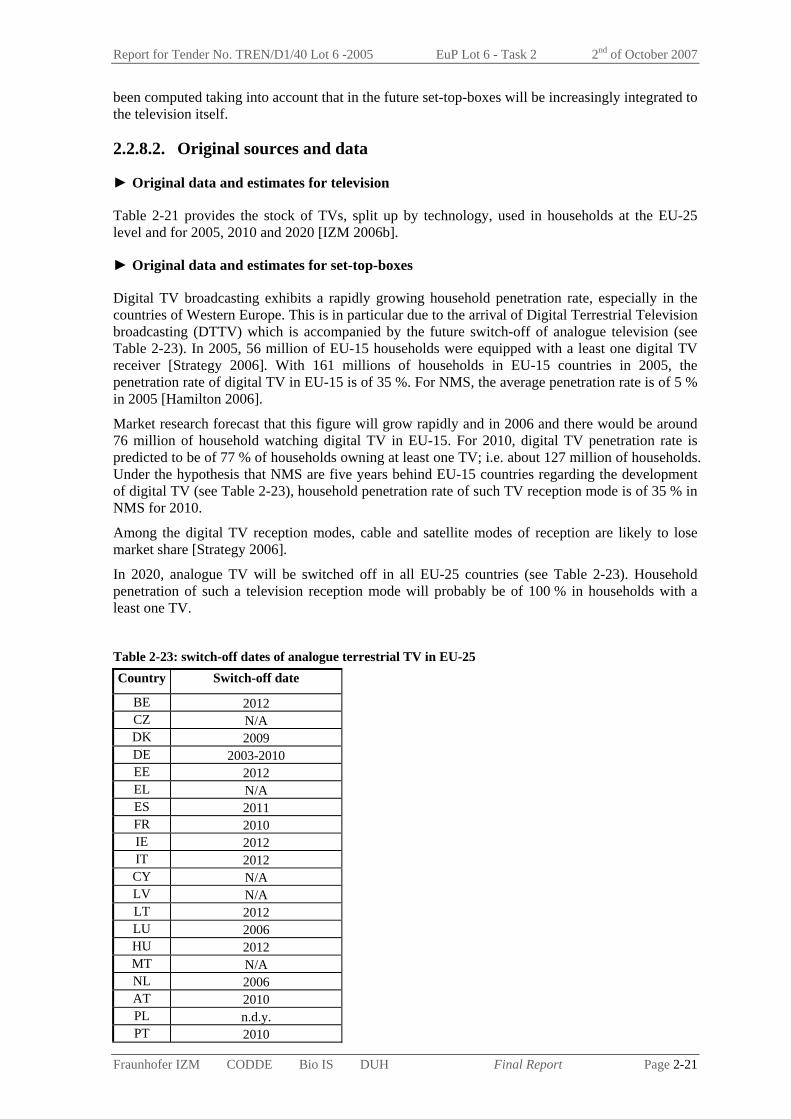
Report for Tender No. TREN/D1/40 Lot 6 -2005 EuP Lot 6 - Task 2 2nd of October 2007
Fraunhofer IZM CODDE Bio IS DUH Final Report Page 2-21
been computed taking into account that in the future set-top-boxes will be increasingly integrated to the television itself.
2.2.8.2. Original sources and data
► Original data and estimates for television
Table 2-21 provides the stock of TVs, split up by technology, used in households at the EU-25 level and for 2005, 2010 and 2020 [IZM 2006b].
► Original data and estimates for set-top-boxes
Digital TV broadcasting exhibits a rapidly growing household penetration rate, especially in the countries of Western Europe. This is in particular due to the arrival of Digital Terrestrial Television broadcasting (DTTV) which is accompanied by the future switch-off of analogue television (see Table 2-23). In 2005, 56 million of EU-15 households were equipped with a least one digital TV receiver [Strategy 2006]. With 161 millions of households in EU-15 countries in 2005, the penetration rate of digital TV in EU-15 is of 35 %. For NMS, the average penetration rate is of 5 % in 2005 [Hamilton 2006].
Market research forecast that this figure will grow rapidly and in 2006 and there would be around 76 million of household watching digital TV in EU-15. For 2010, digital TV penetration rate is predicted to be of 77 % of households owning at least one TV; i.e. about 127 million of households. Under the hypothesis that NMS are five years behind EU-15 countries regarding the development of digital TV (see Table 2-23), household penetration rate of such TV reception mode is of 35 % in NMS for 2010.
Among the digital TV reception modes, cable and satellite modes of reception are likely to lose market share [Strategy 2006].
In 2020, analogue TV will be switched off in all EU-25 countries (see Table 2-23). Household penetration of such a television reception mode will probably be of 100 % in households with a least one TV.
Table 2-23: switch-off dates of analogue terrestrial TV in EU-25 Country Switch-off date
BE 2012 CZ N/A DK 2009 DE 2003-2010 EE 2012 EL N/A ES 2011 FR 2010 IE 2012 IT 2012 CY N/A LV N/A LT 2012 LU 2006 HU 2012 MT N/A NL 2006 AT 2010 PL n.d.y. PT 2010
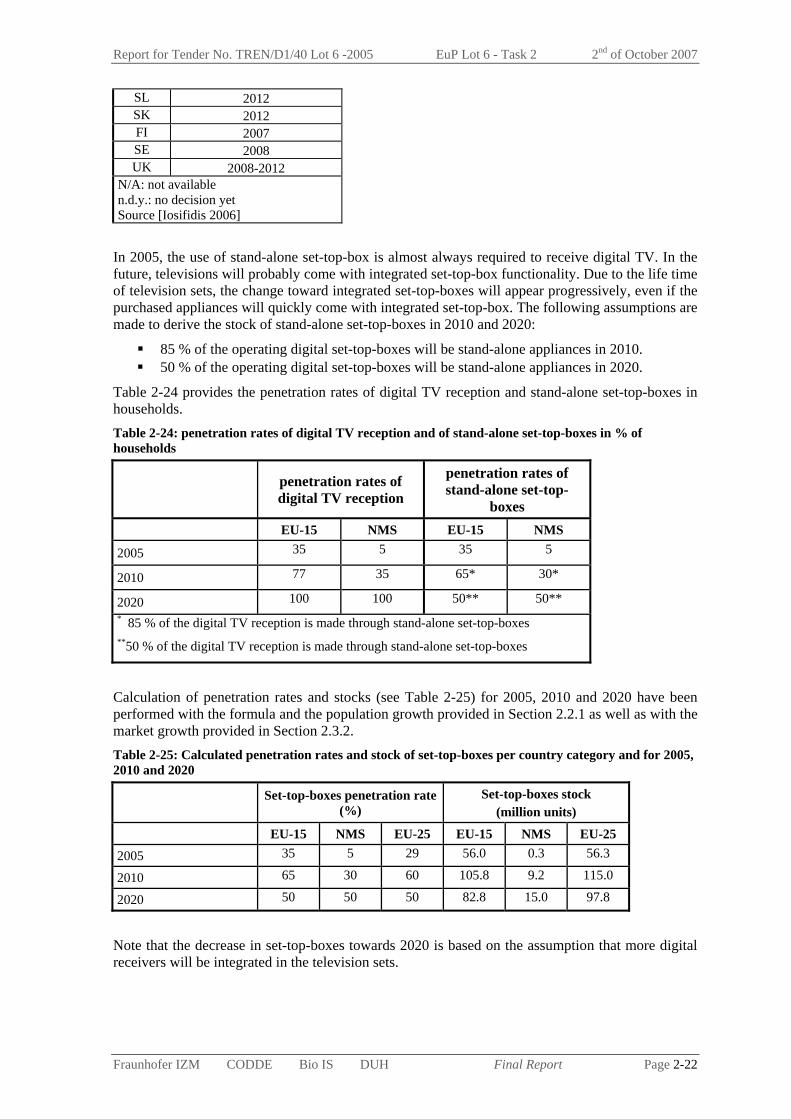
Report for Tender No. TREN/D1/40 Lot 6 -2005 EuP Lot 6 - Task 2 2nd of October 2007
Fraunhofer IZM CODDE Bio IS DUH Final Report Page 2-22
SL 2012 SK 2012 FI 2007 SE 2008 UK 2008-2012
N/A: not available n.d.y.: no decision yet Source [Iosifidis 2006]
In 2005, the use of stand-alone set-top-box is almost always required to receive digital TV. In the future, televisions will probably come with integrated set-top-box functionality. Due to the life time of television sets, the change toward integrated set-top-boxes will appear progressively, even if the purchased appliances will quickly come with integrated set-top-box. The following assumptions are made to derive the stock of stand-alone set-top-boxes in 2010 and 2020:
85 % of the operating digital set-top-boxes will be stand-alone appliances in 2010. 50 % of the operating digital set-top-boxes will be stand-alone appliances in 2020.
Table 2-24 provides the penetration rates of digital TV reception and stand-alone set-top-boxes in households. Table 2-24: penetration rates of digital TV reception and of stand-alone set-top-boxes in % of households
penetration rates of digital TV reception
penetration rates of stand-alone set-top-
boxes
EU-15 NMS EU-15 NMS
2005 35 5 35 5
2010 77 35 65* 30*
2020 100 100 50** 50** * 85 % of the digital TV reception is made through stand-alone set-top-boxes **50 % of the digital TV reception is made through stand-alone set-top-boxes
Calculation of penetration rates and stocks (see Table 2-25) for 2005, 2010 and 2020 have been performed with the formula and the population growth provided in Section 2.2.1 as well as with the market growth provided in Section 2.3.2. Table 2-25: Calculated penetration rates and stock of set-top-boxes per country category and for 2005, 2010 and 2020
Set-top-boxes penetration rate (%)
Set-top-boxes stock (million units)
EU-15 NMS EU-25 EU-15 NMS EU-25 2005 35 5 29 56.0 0.3 56.3
2010 65 30 60 105.8 9.2 115.0
2020 50 50 50 82.8 15.0 97.8
Note that the decrease in set-top-boxes towards 2020 is based on the assumption that more digital receivers will be integrated in the television sets.
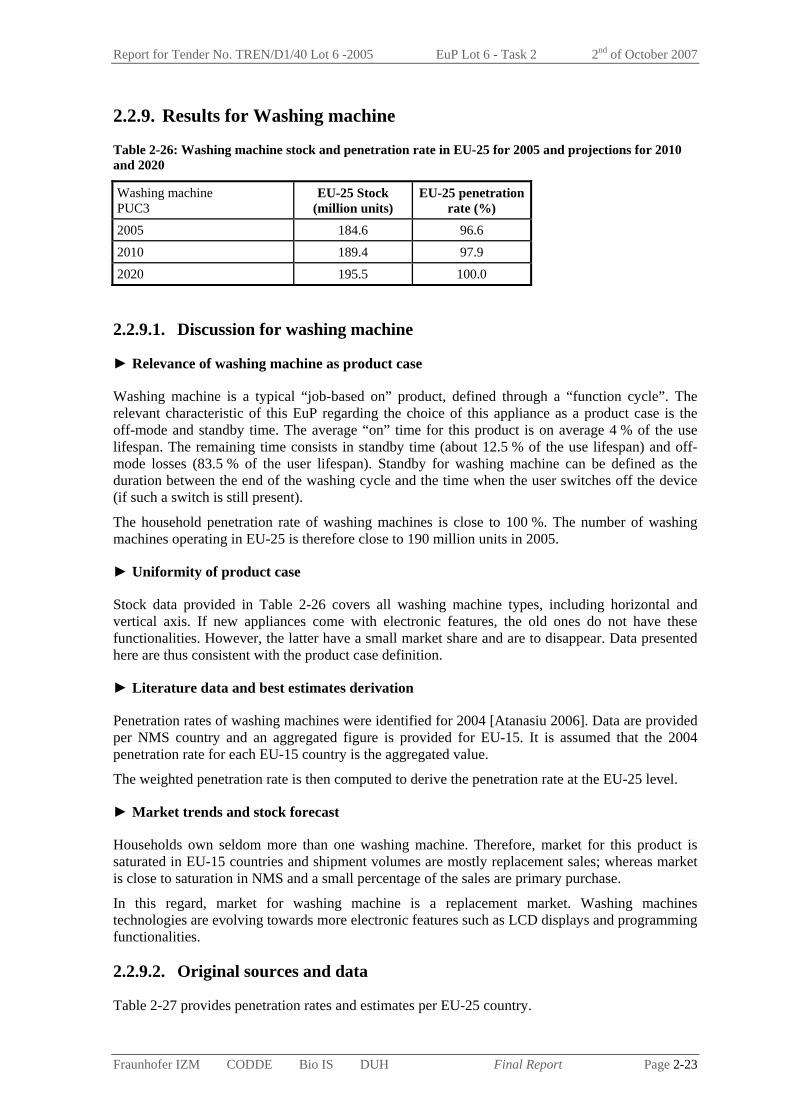
Report for Tender No. TREN/D1/40 Lot 6 -2005 EuP Lot 6 - Task 2 2nd of October 2007
Fraunhofer IZM CODDE Bio IS DUH Final Report Page 2-23
2.2.9. Results for Washing machine
Table 2-26: Washing machine stock and penetration rate in EU-25 for 2005 and projections for 2010 and 2020
Washing machine PUC3
EU-25 Stock (million units)
EU-25 penetration rate (%)
2005 184.6 96.6
2010 189.4 97.9
2020 195.5 100.0
2.2.9.1. Discussion for washing machine
► Relevance of washing machine as product case
Washing machine is a typical “job-based on” product, defined through a “function cycle”. The relevant characteristic of this EuP regarding the choice of this appliance as a product case is the off-mode and standby time. The average “on” time for this product is on average 4 % of the use lifespan. The remaining time consists in standby time (about 12.5 % of the use lifespan) and off-mode losses (83.5 % of the user lifespan). Standby for washing machine can be defined as the duration between the end of the washing cycle and the time when the user switches off the device (if such a switch is still present).
The household penetration rate of washing machines is close to 100 %. The number of washing machines operating in EU-25 is therefore close to 190 million units in 2005.
► Uniformity of product case
Stock data provided in Table 2-26 covers all washing machine types, including horizontal and vertical axis. If new appliances come with electronic features, the old ones do not have these functionalities. However, the latter have a small market share and are to disappear. Data presented here are thus consistent with the product case definition.
► Literature data and best estimates derivation
Penetration rates of washing machines were identified for 2004 [Atanasiu 2006]. Data are provided per NMS country and an aggregated figure is provided for EU-15. It is assumed that the 2004 penetration rate for each EU-15 country is the aggregated value.
The weighted penetration rate is then computed to derive the penetration rate at the EU-25 level.
► Market trends and stock forecast
Households own seldom more than one washing machine. Therefore, market for this product is saturated in EU-15 countries and shipment volumes are mostly replacement sales; whereas market is close to saturation in NMS and a small percentage of the sales are primary purchase.
In this regard, market for washing machine is a replacement market. Washing machines technologies are evolving towards more electronic features such as LCD displays and programming functionalities.
2.2.9.2. Original sources and data
Table 2-27 provides penetration rates and estimates per EU-25 country.

Report for Tender No. TREN/D1/40 Lot 6 -2005 EuP Lot 6 - Task 2 2nd of October 2007
Fraunhofer IZM CODDE Bio IS DUH Final Report Page 2-24
Table 2-27: Washing machine penetration rates data and estimates per country for 2004 Country Penetration rate (a) (%) BE 100 CZ 85 DK 100 DE 100 EE 78 EL 100 ES 100 FR 100 IE 100 IT 100 CY 95 LV 80 LT 82 LU 100 HU 70 MT 103 NL 100 AT 100 PL 74 PT 100 SL 95 SK 60 FI 100 SE 100 UK 100 Average EU-15 100 Average NMS 76
(a) Source: [Atanasiu 2006] Data in italics are estimates for EU-15 using the average figures
Penetration rates (see Table 2-28) and stocks (see Table 2-29) of washing machine for 2005, 2010 and 2020 are computed using the formula presented in Section 2.2.1 and the market growth provided in Section 2.3.2. Table 2-28: Computed penetration rates of washing machines per country category
Washing machine penetration rate (%)
EU-15 NMS EU-25 2005 100.0 79.1 96.6
2010 100.0 87.0 97.9
2020 100.0 99.9 100.0
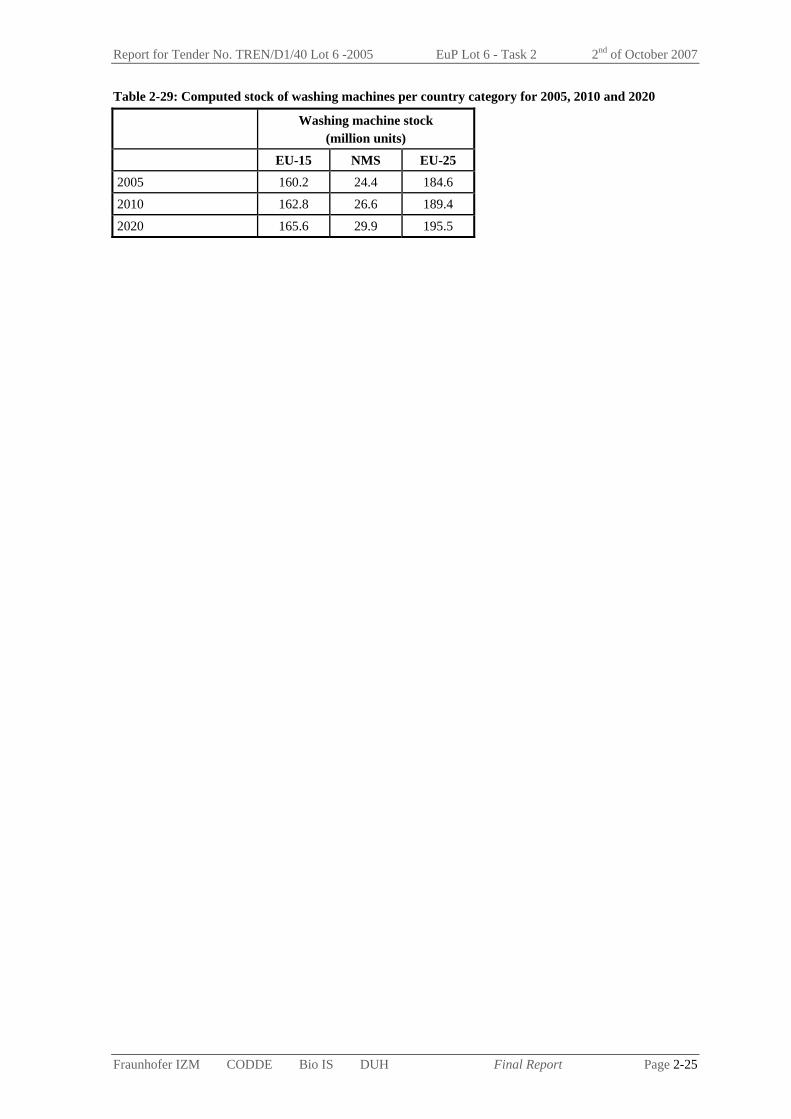
Report for Tender No. TREN/D1/40 Lot 6 -2005 EuP Lot 6 - Task 2 2nd of October 2007
Fraunhofer IZM CODDE Bio IS DUH Final Report Page 2-25
Table 2-29: Computed stock of washing machines per country category for 2005, 2010 and 2020
Washing machine stock (million units)
EU-15 NMS EU-25 2005 160.2 24.4 184.6
2010 162.8 26.6 189.4
2020 165.6 29.9 195.5

Report for Tender No. TREN/D1/40 Lot 6 -2005 EuP Lot 6 - Task 2 2nd of October 2007
Fraunhofer IZM CODDE Bio IS DUH Final Report Page 2-26
2.2.10. Results for DVD
Table 2-30: DVD stock and penetration rate in EU-25 for 2005 and projections for 2010 and 2020
DVD Households, PUC3
EU-25 Stock (million units)
EU-25 penetration rate (%)
2005 143.3 75 2010 174.0 90 2020 253.4 130
The DVD product case covers DVD players and recorders, and the respective video disk successor formats. For 2005 the DVD stock means 90 % DVD players and 10 % DVD recorders. This ratio will change in the coming years and DVD recorders will gain market share. In 2010 12 % of the DVD stock and 2020 15 % are assumed to be DVD recorders.
2.2.10.1. Discussion for DVD
► Relevance of DVD as product case
DVD players are also job-based products for households. However, when DVD players are not used for their primary function (display a DVD), they still consume energy (due to the clock display for example).
In addition to the standby and off-mode energy consumptions, the large household penetration rate is also a key element to consider this EuP as a relevant product case for this study.
► Uniformity of product case
Stock data provided Table 2-30 encompass DVD players and recorders and exactly fit with the product case definition. For successor formats (currently HD DVD and BluRay Disk) a similarity in features and standby behaviour of the players and recorders is assumed.
► Literature data and best estimates derivation
Stock data are robustly estimated using a penetration rate of DVD player and recorder at EU-25 level for 2005 of 75 % [Almeida 2006].
2.2.10.2. Original sources and data
The penetration rate of DVD is 75 % in 2005 [Almeida 2006]
The computations of the penetration rates and stock data (see summary Table 2-30) for 2005, 2010 and 2020 have been performed using the formula and population trends provided in Section 2.2.1 and with the market growth provided in Section 2.3.2.

Report for Tender No. TREN/D1/40 Lot 6 -2005 EuP Lot 6 - Task 2 2nd of October 2007
Fraunhofer IZM CODDE Bio IS DUH Final Report Page 2-27
2.2.11. Results for Audio minisystem
Table 2-31: Audio minisystem stock and penetration rate in EU-25
Audio minisystem PUC3
EU-25 Stock (million units)
EU-25 penetration rate (%)
2005 114.4 60
2010 115.7 60
2020 116.8 60
2.2.11.1. Discussion for audio minisystem
► Relevance of audio minisystem as a product case
Audio minisystem is a relevant product case regarding both penetration rates and the large share of stand-by time. These products come less and less with a real off mode.
► Uniformity of product case
Data for this product case cover all audio minisystems; in other words small all-in-one hifi sets. It covers systems with CD player and/or cassette deck. This product case is uniform regarding the user behaviour.
► Literature data and assumptions to derive best estimates
Penetration rate of audio minisystem are available for 2005 at the EU-25 level [Almeida 2006]. No other assumption as been made.
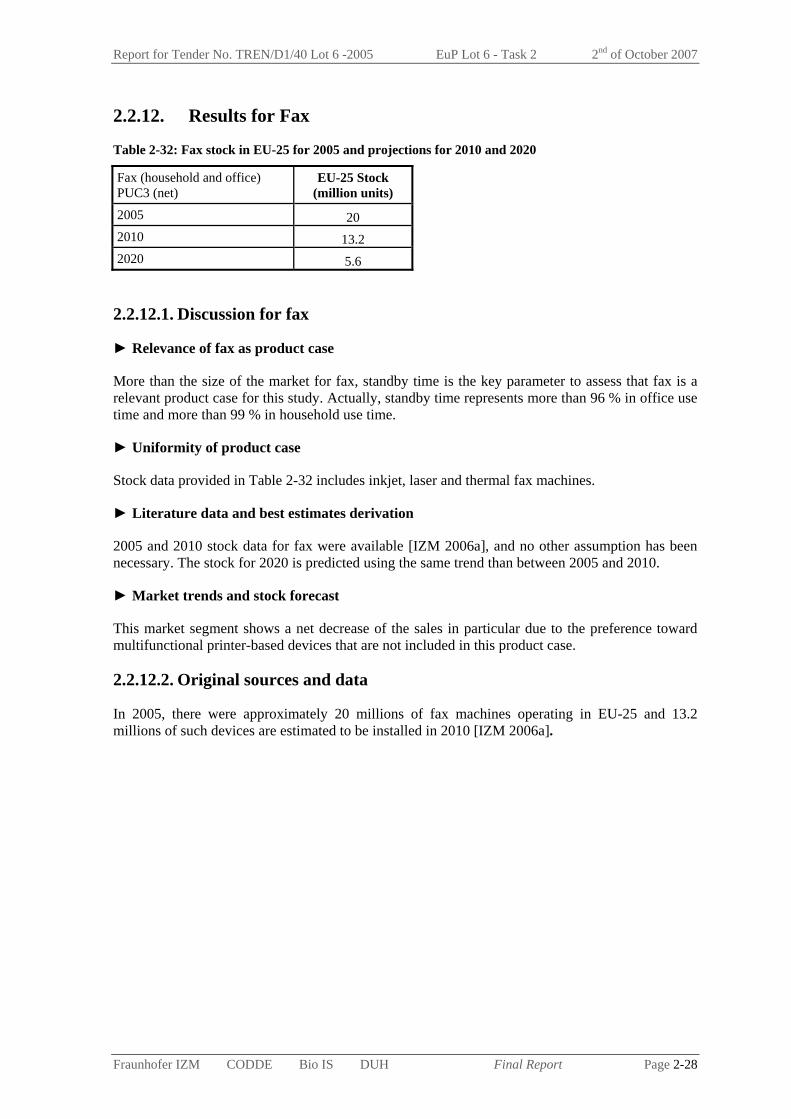
Report for Tender No. TREN/D1/40 Lot 6 -2005 EuP Lot 6 - Task 2 2nd of October 2007
Fraunhofer IZM CODDE Bio IS DUH Final Report Page 2-28
2.2.12. Results for Fax
Table 2-32: Fax stock in EU-25 for 2005 and projections for 2010 and 2020
Fax (household and office) PUC3 (net)
EU-25 Stock (million units)
2005 20 2010 13.2 2020 5.6
2.2.12.1. Discussion for fax
► Relevance of fax as product case
More than the size of the market for fax, standby time is the key parameter to assess that fax is a relevant product case for this study. Actually, standby time represents more than 96 % in office use time and more than 99 % in household use time.
► Uniformity of product case
Stock data provided in Table 2-32 includes inkjet, laser and thermal fax machines.
► Literature data and best estimates derivation
2005 and 2010 stock data for fax were available [IZM 2006a], and no other assumption has been necessary. The stock for 2020 is predicted using the same trend than between 2005 and 2010.
► Market trends and stock forecast
This market segment shows a net decrease of the sales in particular due to the preference toward multifunctional printer-based devices that are not included in this product case.
2.2.12.2. Original sources and data
In 2005, there were approximately 20 millions of fax machines operating in EU-25 and 13.2 millions of such devices are estimated to be installed in 2010 [IZM 2006a].
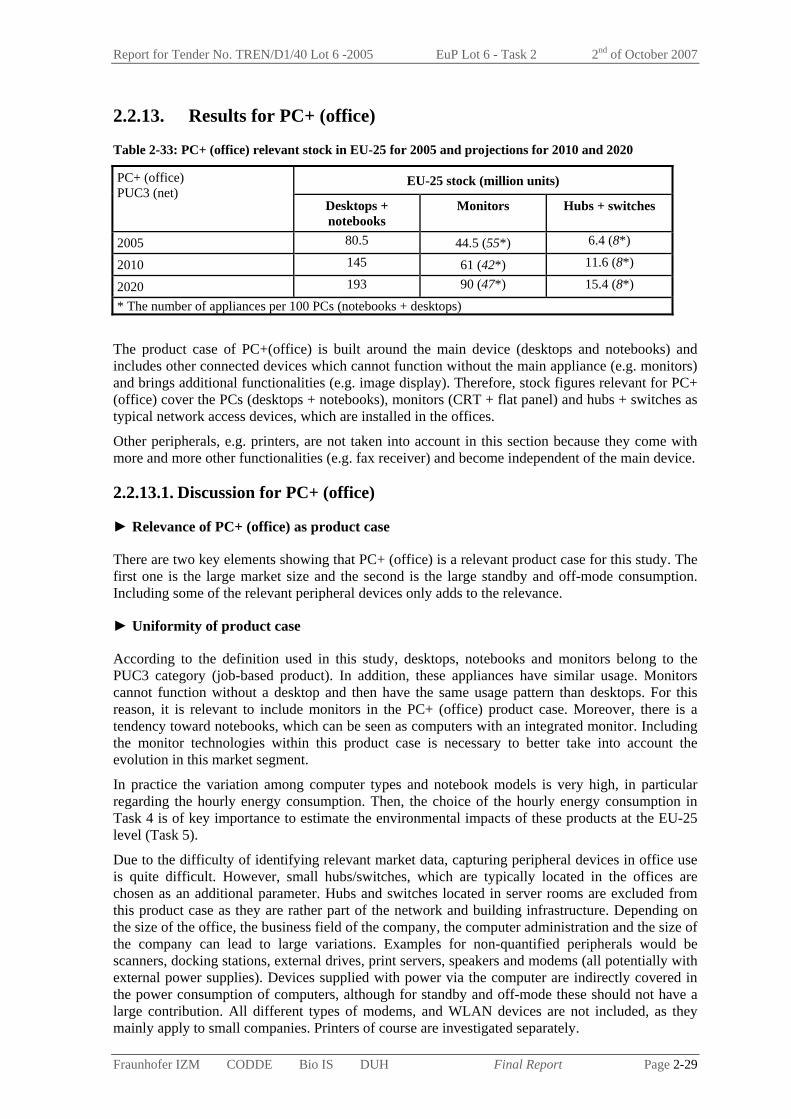
Report for Tender No. TREN/D1/40 Lot 6 -2005 EuP Lot 6 - Task 2 2nd of October 2007
Fraunhofer IZM CODDE Bio IS DUH Final Report Page 2-29
2.2.13. Results for PC+ (office)
Table 2-33: PC+ (office) relevant stock in EU-25 for 2005 and projections for 2010 and 2020
EU-25 stock (million units) PC+ (office) PUC3 (net)
Desktops + notebooks
Monitors Hubs + switches
2005 80.5 44.5 (55*) 6.4 (8*)
2010 145 61 (42*) 11.6 (8*)
2020 193 90 (47*) 15.4 (8*)
* The number of appliances per 100 PCs (notebooks + desktops)
The product case of PC+(office) is built around the main device (desktops and notebooks) and includes other connected devices which cannot function without the main appliance (e.g. monitors) and brings additional functionalities (e.g. image display). Therefore, stock figures relevant for PC+ (office) cover the PCs (desktops + notebooks), monitors (CRT + flat panel) and hubs + switches as typical network access devices, which are installed in the offices.
Other peripherals, e.g. printers, are not taken into account in this section because they come with more and more other functionalities (e.g. fax receiver) and become independent of the main device.
2.2.13.1. Discussion for PC+ (office)
► Relevance of PC+ (office) as product case
There are two key elements showing that PC+ (office) is a relevant product case for this study. The first one is the large market size and the second is the large standby and off-mode consumption. Including some of the relevant peripheral devices only adds to the relevance.
► Uniformity of product case
According to the definition used in this study, desktops, notebooks and monitors belong to the PUC3 category (job-based product). In addition, these appliances have similar usage. Monitors cannot function without a desktop and then have the same usage pattern than desktops. For this reason, it is relevant to include monitors in the PC+ (office) product case. Moreover, there is a tendency toward notebooks, which can be seen as computers with an integrated monitor. Including the monitor technologies within this product case is necessary to better take into account the evolution in this market segment.
In practice the variation among computer types and notebook models is very high, in particular regarding the hourly energy consumption. Then, the choice of the hourly energy consumption in Task 4 is of key importance to estimate the environmental impacts of these products at the EU-25 level (Task 5).
Due to the difficulty of identifying relevant market data, capturing peripheral devices in office use is quite difficult. However, small hubs/switches, which are typically located in the offices are chosen as an additional parameter. Hubs and switches located in server rooms are excluded from this product case as they are rather part of the network and building infrastructure. Depending on the size of the office, the business field of the company, the computer administration and the size of the company can lead to large variations. Examples for non-quantified peripherals would be scanners, docking stations, external drives, print servers, speakers and modems (all potentially with external power supplies). Devices supplied with power via the computer are indirectly covered in the power consumption of computers, although for standby and off-mode these should not have a large contribution. All different types of modems, and WLAN devices are not included, as they mainly apply to small companies. Printers of course are investigated separately.

Report for Tender No. TREN/D1/40 Lot 6 -2005 EuP Lot 6 - Task 2 2nd of October 2007
Fraunhofer IZM CODDE Bio IS DUH Final Report Page 2-30
Including small hubs and switches adds to the relevance of this product case as it allows for capturing the large amount of energy consumed by these network devices when the computers are not in use.
► Literature data and best estimates derivation
For computers (desktops and notebooks) and monitors (CRT and Flat panel) stocks in offices are available at the EU-25 level and for 2005 [IVF 2006]. No other assumption has been made.
For small hubs and switches placed in the offices, the best estimate is that 8 such devices are used per 100 computers. Typically, more than one computer will share these small hubs/switches, and additionally many offices have a full network infrastructure without switches outside the server rooms [Roberson 2004].
► Market trends and stock forecast
Computer technology trends seem to result, in the near future, in a technology improvement involving existing products, which will lead to increased performances of the computers (desktop and notebook) [IVF 2006]. Future notebooks are likely to be thinner and less heavy, which will balance the evolution toward more efficient products.
In addition, the stock trends of monitors are similar to the ones of desktops. Inside this category, there is a strong tendency toward flat panel display.
Further, for small hubs and switches, it is assumed than the number of hubs and switches per 100 computers in offices will remain constant until 2020, capturing both the future increase of internet penetration in offices and the integration of these appliances in the server rooms.
Finally, given the high maturity of the PC+ market in EU-15 countries, a higher increase of the stocks is expected in new member states compared to EU-15 countries. For the latter, the shipment volumes are expected to be mainly replacement sales.
2.2.13.2. Original sources and data
Table 2-34 provides the stock of desktops, notebook, CRT monitor and flat panel monitor used in offices at the EU-25 level and for 2005, 2010 and 2020 [IVF 2006]. Table 2-34: PC+ (office) products stock in EU-25 for 2005 and projections for 2010 and 2020
Office PC+ PUC3 (net) Desktop Notebook CRT monitor Flat panel
monitor
2005 44 36.5 24 20.5
2010 51 94 1 60
2020 68 125 1 89
► Network access devices
Some small hubs and switches may exist in offices next to the computers. An American inventory of appliances in offices found an average of 8 hubs and switches per 100 computers1 (notebook and desktops) [Roberson 2004]. Although this does not exactly represent the smaller hubs and switches installed in offices, it is the best estimate to be used. For 2010 and 2020, the same 8 per 100 ratio is used (see Table 2-4 for calculation of the stock of hubs and switches). It seems reasonable to keep this value for two reasons. The first one is the future expected increase in the penetration rate of
1 This data covers all hubs and switches, from 1 to 80 ports. As large switches are more likely to be in the server room and to be part of the infrastructure, this figure might be an overestimation of the real number of hubs and switches in offices.

Report for Tender No. TREN/D1/40 Lot 6 -2005 EuP Lot 6 - Task 2 2nd of October 2007
Fraunhofer IZM CODDE Bio IS DUH Final Report Page 2-31
internet (and network features) in offices, which would increase the stock of these appliances. On the other hand, with the construction of new buildings, network and internet cables will be part of the building. Small hubs and switches will be then replaced by rack mounted appliances located in the server room.
Table 2-35: PC+ (office) products stock in EU-25 (in million) for 2005 and projections for 2010 and 2020
Hubs and switches Desktops + Notebooks Number of hubs and switches per 100 computer Hubs + Switches
2005 80.5 8 6.4
2010 145 8 11.6
2020 193 8 15.4
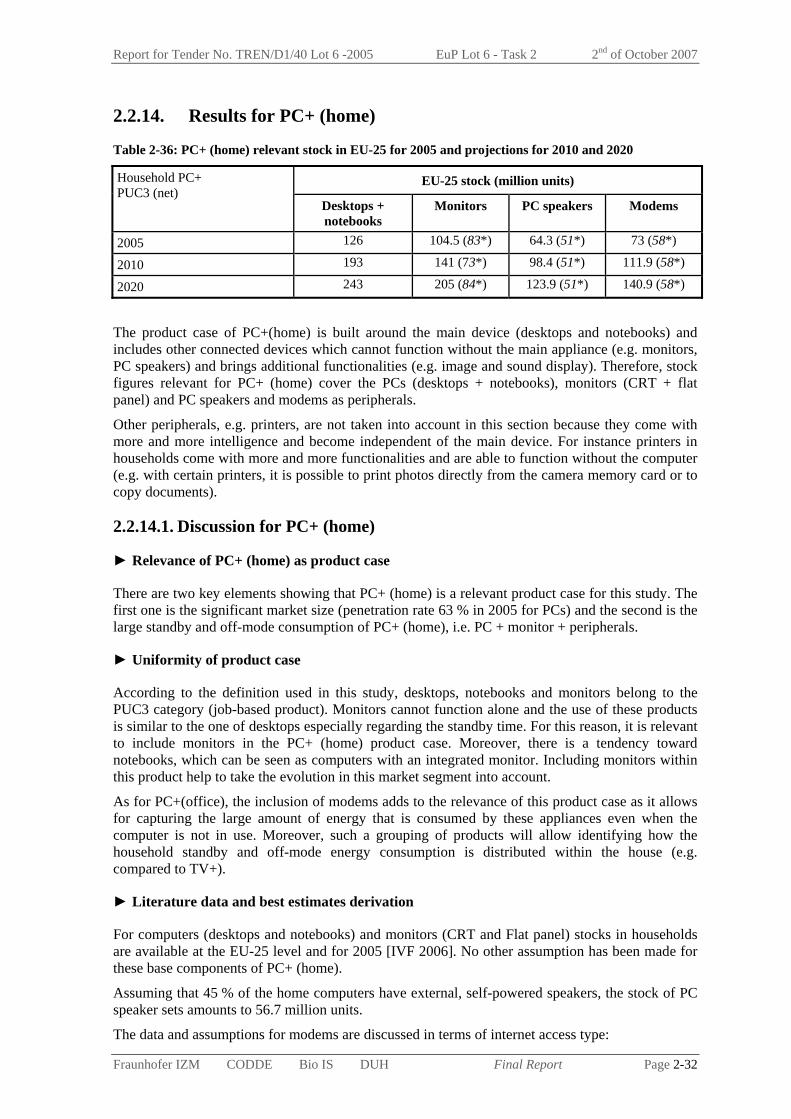
Report for Tender No. TREN/D1/40 Lot 6 -2005 EuP Lot 6 - Task 2 2nd of October 2007
Fraunhofer IZM CODDE Bio IS DUH Final Report Page 2-32
2.2.14. Results for PC+ (home)
Table 2-36: PC+ (home) relevant stock in EU-25 for 2005 and projections for 2010 and 2020
EU-25 stock (million units) Household PC+ PUC3 (net)
Desktops + notebooks
Monitors PC speakers Modems
2005 126 104.5 (83*) 64.3 (51*) 73 (58*)
2010 193 141 (73*) 98.4 (51*) 111.9 (58*)
2020 243 205 (84*) 123.9 (51*) 140.9 (58*)
The product case of PC+(home) is built around the main device (desktops and notebooks) and includes other connected devices which cannot function without the main appliance (e.g. monitors, PC speakers) and brings additional functionalities (e.g. image and sound display). Therefore, stock figures relevant for PC+ (home) cover the PCs (desktops + notebooks), monitors (CRT + flat panel) and PC speakers and modems as peripherals.
Other peripherals, e.g. printers, are not taken into account in this section because they come with more and more intelligence and become independent of the main device. For instance printers in households come with more and more functionalities and are able to function without the computer (e.g. with certain printers, it is possible to print photos directly from the camera memory card or to copy documents).
2.2.14.1. Discussion for PC+ (home)
► Relevance of PC+ (home) as product case
There are two key elements showing that PC+ (home) is a relevant product case for this study. The first one is the significant market size (penetration rate 63 % in 2005 for PCs) and the second is the large standby and off-mode consumption of PC+ (home), i.e. PC + monitor + peripherals.
► Uniformity of product case
According to the definition used in this study, desktops, notebooks and monitors belong to the PUC3 category (job-based product). Monitors cannot function alone and the use of these products is similar to the one of desktops especially regarding the standby time. For this reason, it is relevant to include monitors in the PC+ (home) product case. Moreover, there is a tendency toward notebooks, which can be seen as computers with an integrated monitor. Including monitors within this product help to take the evolution in this market segment into account.
As for PC+(office), the inclusion of modems adds to the relevance of this product case as it allows for capturing the large amount of energy that is consumed by these appliances even when the computer is not in use. Moreover, such a grouping of products will allow identifying how the household standby and off-mode energy consumption is distributed within the house (e.g. compared to TV+).
► Literature data and best estimates derivation
For computers (desktops and notebooks) and monitors (CRT and Flat panel) stocks in households are available at the EU-25 level and for 2005 [IVF 2006]. No other assumption has been made for these base components of PC+ (home).
Assuming that 45 % of the home computers have external, self-powered speakers, the stock of PC speaker sets amounts to 56.7 million units.
The data and assumptions for modems are discussed in terms of internet access type:

Report for Tender No. TREN/D1/40 Lot 6 -2005 EuP Lot 6 - Task 2 2nd of October 2007
Fraunhofer IZM CODDE Bio IS DUH Final Report Page 2-33
Broadband connections Based on the share of internet access types and wireless connections in[EC 2006] the number of wireless broadband modems is estimated at 25.4 million devices, all of which are assumed to be external and self-powered. In addition, based on [EC 2006] there are further 31.0 million broadband modems, which are all assumed to be external and self-powered. A small share of this figure might nevertheless be USB powered but this is not taken into consideration.
In total the number of broadband modems amounts to 56.4 million,
Dial-up standard connections Majority are telephone modems are currently internal (i.e. integrated in the PC); and a some of the external ones are USB-powered. Roughly 18 % are estimated to be external to the computer and self-powered. [NAEEEC 2004c]. ISDN modems are assumed to be all external and self-powered. Based on the data from [EC 2006], this results in 16.6 million devices.
Modems in total
The total stock of modems is estimated at 73 million, i.e. 0.53 modems per 1 computer (desktop + notebook).
► Market trends and stock forecast
Computer technology trends seem to result, in the near future, in a technology improvement of the existing products, which will lead to increased performances of the computers (desktop and notebook) [IVF 2006]. The private market slowly shifts to notebooks, but desktop computers are still expected to grow as a market.
In addition, the stock trends of monitors are similar to the ones of desktops. Inside this category, there is a strong tendency toward flat panel display.
Finally, given the high maturity of the PC+ (home) market in EU-15 countries, a higher increase of the stocks is expected in new member states compared to EU-15 countries. For the latter, the shipment volumes are expected to be mainly replacement sales.
Regarding the peripherals, number of appliances per 100 computers is assumed to stay constant both for PC speakers and modems until 2020.
2.2.14.2. Original sources and data
Table 2-37 provides the stock of desktops, notebook, CRT monitor and flat panel monitor used in households at the EU-25 level and for 2005, 2010 and 2020 [IVF 2006]. Table 2-37: PC+ (home) products stock in EU-25 for 2005 and projections for 2010 and 2020
Household PC+ PUC3 (net) Desktop Notebook CRT monitor Flat panel
monitor
2005 102 24 57 47.5
2010 130 63 1 140
2020 159 84 1 204
Table 2-38 provides the penetration rate computed with the stock data available for 2005 and 2010. Data for 2020 are estimated using the formula provided Section 2.2.1 and the market growth provided Section 2.3.2.
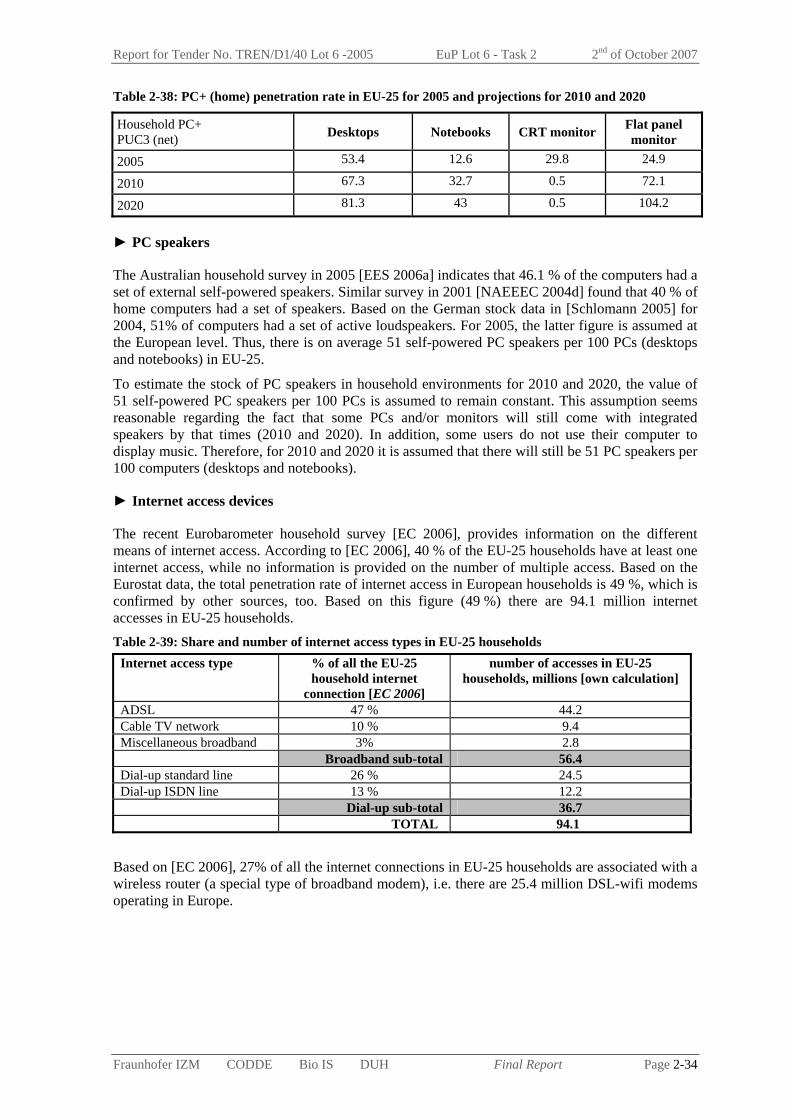
Report for Tender No. TREN/D1/40 Lot 6 -2005 EuP Lot 6 - Task 2 2nd of October 2007
Fraunhofer IZM CODDE Bio IS DUH Final Report Page 2-34
Table 2-38: PC+ (home) penetration rate in EU-25 for 2005 and projections for 2010 and 2020
Household PC+ PUC3 (net) Desktops Notebooks CRT monitor Flat panel
monitor
2005 53.4 12.6 29.8 24.9
2010 67.3 32.7 0.5 72.1
2020 81.3 43 0.5 104.2
► PC speakers
The Australian household survey in 2005 [EES 2006a] indicates that 46.1 % of the computers had a set of external self-powered speakers. Similar survey in 2001 [NAEEEC 2004d] found that 40 % of home computers had a set of speakers. Based on the German stock data in [Schlomann 2005] for 2004, 51% of computers had a set of active loudspeakers. For 2005, the latter figure is assumed at the European level. Thus, there is on average 51 self-powered PC speakers per 100 PCs (desktops and notebooks) in EU-25.
To estimate the stock of PC speakers in household environments for 2010 and 2020, the value of 51 self-powered PC speakers per 100 PCs is assumed to remain constant. This assumption seems reasonable regarding the fact that some PCs and/or monitors will still come with integrated speakers by that times (2010 and 2020). In addition, some users do not use their computer to display music. Therefore, for 2010 and 2020 it is assumed that there will still be 51 PC speakers per 100 computers (desktops and notebooks).
► Internet access devices
The recent Eurobarometer household survey [EC 2006], provides information on the different means of internet access. According to [EC 2006], 40 % of the EU-25 households have at least one internet access, while no information is provided on the number of multiple access. Based on the Eurostat data, the total penetration rate of internet access in European households is 49 %, which is confirmed by other sources, too. Based on this figure (49 %) there are 94.1 million internet accesses in EU-25 households. Table 2-39: Share and number of internet access types in EU-25 households
Internet access type % of all the EU-25 household internet
connection [EC 2006]
number of accesses in EU-25 households, millions [own calculation]
ADSL 47 % 44.2 Cable TV network 10 % 9.4 Miscellaneous broadband 3% 2.8 Broadband sub-total 56.4 Dial-up standard line 26 % 24.5 Dial-up ISDN line 13 % 12.2
Dial-up sub-total 36.7 TOTAL 94.1
Based on [EC 2006], 27% of all the internet connections in EU-25 households are associated with a wireless router (a special type of broadband modem), i.e. there are 25.4 million DSL-wifi modems operating in Europe.
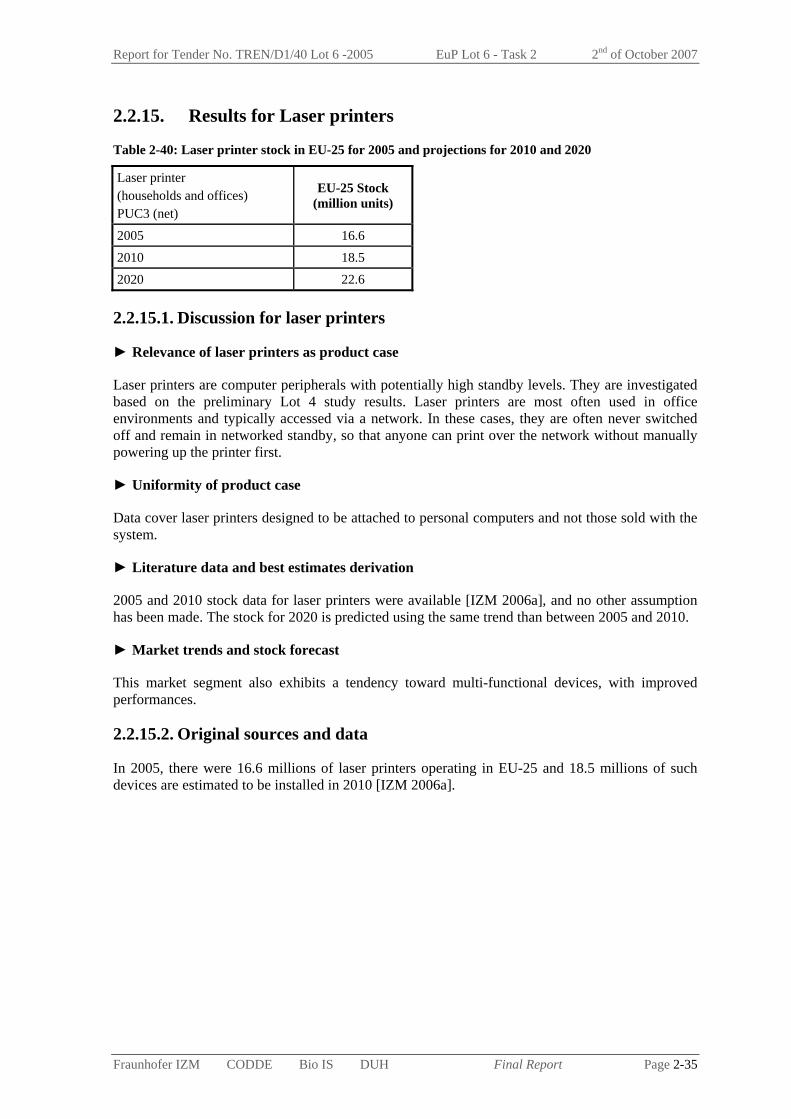
Report for Tender No. TREN/D1/40 Lot 6 -2005 EuP Lot 6 - Task 2 2nd of October 2007
Fraunhofer IZM CODDE Bio IS DUH Final Report Page 2-35
2.2.15. Results for Laser printers
Table 2-40: Laser printer stock in EU-25 for 2005 and projections for 2010 and 2020
Laser printer (households and offices) PUC3 (net)
EU-25 Stock (million units)
2005 16.6
2010 18.5
2020 22.6
2.2.15.1. Discussion for laser printers
► Relevance of laser printers as product case
Laser printers are computer peripherals with potentially high standby levels. They are investigated based on the preliminary Lot 4 study results. Laser printers are most often used in office environments and typically accessed via a network. In these cases, they are often never switched off and remain in networked standby, so that anyone can print over the network without manually powering up the printer first.
► Uniformity of product case
Data cover laser printers designed to be attached to personal computers and not those sold with the system.
► Literature data and best estimates derivation
2005 and 2010 stock data for laser printers were available [IZM 2006a], and no other assumption has been made. The stock for 2020 is predicted using the same trend than between 2005 and 2010.
► Market trends and stock forecast
This market segment also exhibits a tendency toward multi-functional devices, with improved performances.
2.2.15.2. Original sources and data
In 2005, there were 16.6 millions of laser printers operating in EU-25 and 18.5 millions of such devices are estimated to be installed in 2010 [IZM 2006a].

Report for Tender No. TREN/D1/40 Lot 6 -2005 EuP Lot 6 - Task 2 2nd of October 2007
Fraunhofer IZM CODDE Bio IS DUH Final Report Page 2-36
2.2.16. Results for Inkjet printers
Table 2-41: Inkjet printer stock in EU-25 for 2005 and projections for 2010 and 2020
Inkjet printer (households and offices) PUC3 (net)
EU-25 Stock (million units)
2005 90.2
2010 105.0
2020 140.4
2.2.16.1. Discussion for inkjet printers
► Relevance of inkjet printers as product case
Inkjet printers are predominantly installed in home environments. They can have network capabilities and some are employed as workgroup or shared printers, but most are connected to a single PC (or notebook). Compared to laser printers, it is not so much the small segment with networked standby, which is relevant, but rather the majority with off-mode losses, which has to be investigated. Off-mode losses are due to soft switches (no 0 W mode) and the widespread use of EPS (no-load case, even when the printer is fully off).
► Uniformity of product case
Data encompass inkjet printers designed to be attached to personal computers and not those sold with the system. Figures include both single and multifunctional devices. A distinction according to photo capability is not needed. However, this product case is uniform regarding the usage pattern.
► Literature data and best estimates derivation
2005 and 2010 stock data for inkjet printers were available [IZM 2006a], and no other assumption has been necessary. The stock for 2020 is predicted using the same trend than between 2005 and 2010.
► Market trends and stock forecast
A substitution of single function devices by multifunctional devices takes place in this market segment.
2.2.16.2. Original sources and data
In 2005, there were 90.2 millions of inkjet printers operating in EU-25 and 105.0 millions of such devices are estimated to be installed in 2010 [IZM 2006a].
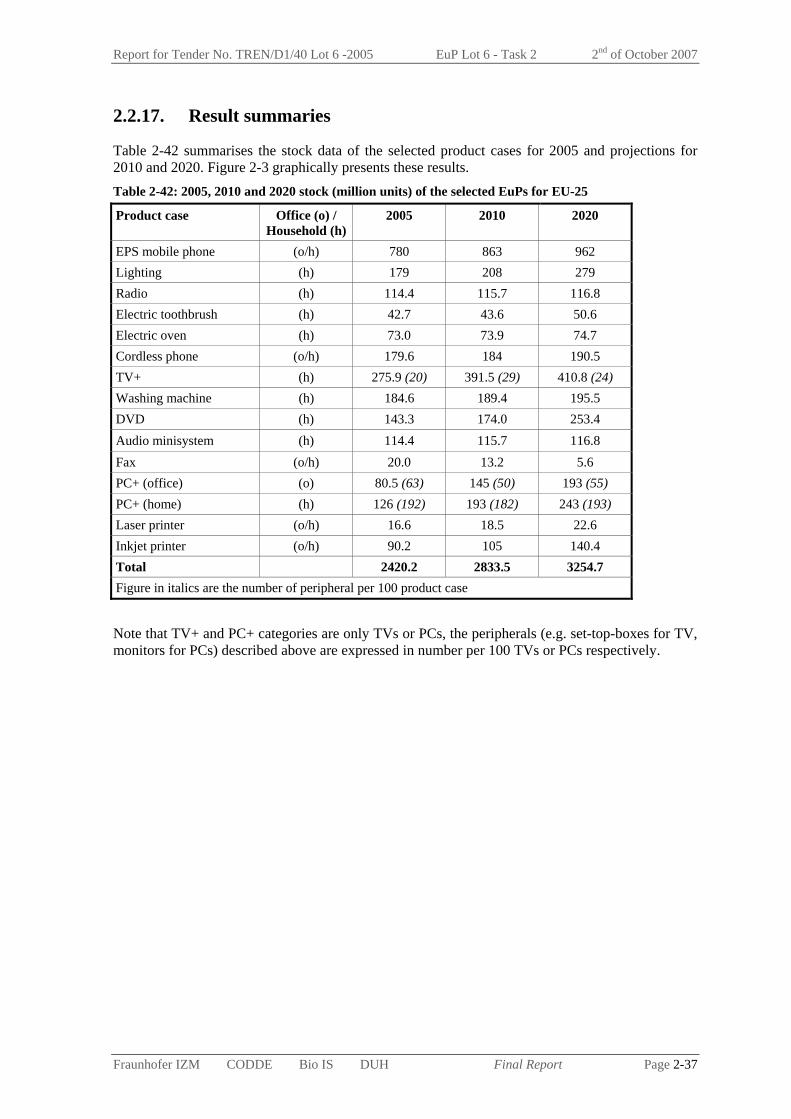
Report for Tender No. TREN/D1/40 Lot 6 -2005 EuP Lot 6 - Task 2 2nd of October 2007
Fraunhofer IZM CODDE Bio IS DUH Final Report Page 2-37
2.2.17. Result summaries
Table 2-42 summarises the stock data of the selected product cases for 2005 and projections for 2010 and 2020. Figure 2-3 graphically presents these results. Table 2-42: 2005, 2010 and 2020 stock (million units) of the selected EuPs for EU-25
Product case Office (o) / Household (h)
2005 2010 2020
EPS mobile phone (o/h) 780 863 962 Lighting (h) 179 208 279 Radio (h) 114.4 115.7 116.8 Electric toothbrush (h) 42.7 43.6 50.6 Electric oven (h) 73.0 73.9 74.7 Cordless phone (o/h) 179.6 184 190.5 TV+ (h) 275.9 (20) 391.5 (29) 410.8 (24) Washing machine (h) 184.6 189.4 195.5 DVD (h) 143.3 174.0 253.4 Audio minisystem (h) 114.4 115.7 116.8 Fax (o/h) 20.0 13.2 5.6 PC+ (office) (o) 80.5 (63) 145 (50) 193 (55) PC+ (home) (h) 126 (192) 193 (182) 243 (193) Laser printer (o/h) 16.6 18.5 22.6 Inkjet printer (o/h) 90.2 105 140.4 Total 2420.2 2833.5 3254.7 Figure in italics are the number of peripheral per 100 product case
Note that TV+ and PC+ categories are only TVs or PCs, the peripherals (e.g. set-top-boxes for TV, monitors for PCs) described above are expressed in number per 100 TVs or PCs respectively.

Report for Tender No. TREN/D1/40 Lot 6 -2005 EuP Lot 6 - Task 2 2nd of October 2007
Fraunhofer IZM CODDE Bio IS DUH Final Report Page 2-38
0 100 200 300 400 500 600 700 800 900 1000
EPS mobile phone
PC+ (home)
TV+
PC+ (office)
Lighting
DVD
Washing machine
Cordless phone
Inkjet printer
Audio minisystem
Radio
Electric oven
Electric toothbrush
Laser printer
Fax
number of units [Mio]
2020
2010
2005
Figure 2-3 : Stock for 2005 and projections for 2010 and 2020 per product case (including peripherals)
2.3. Market Trends (Task 2.3) The purpose of this section is to identify the factors driving the market for the selected appliances in order to estimate the rate of growth of the market.
General trends such as technology and consumer trends are provided focussing on the selected product cases. These trends help to estimate the future evolution of the market for the selected EuPs.
2.3.1. Market trends for product cases
2.3.1.1. General Trends for ICT&AV EuPs
The “new” generation of consumers, familiar with new technologies and adaptations, expects rapid evolution of the products and thus induces some specific trends for this category of EuPs. Consumers are looking for [IBM 2006]:
an involved consumer media control: the new generation of consumers wants to lean forward, towards self-navigation and an increased interactivity
an opening of the content access: the new generation of consumers tends to choose media were content is available through multiple platforms (e.g. through mobile phone).
Combined with demographics, these trends imply that the manufacturers have to deal with two distinct generations of end-users: on the one hand, the new generation waiting for new technologies, and on the other hand, the aging consumers wanting appliances like television to remain an easy-to-use product [Take 2003]. A further consequence, more linked to the desire of consumers for an increased interactivity of the products, is the convergence of ICT and AV appliances (for example video game consoles with internet connectivity, combinations of products like set-top-box with integrated DVD/HD recorder, or PC-based technology serving audio and video streams within a household).

Report for Tender No. TREN/D1/40 Lot 6 -2005 EuP Lot 6 - Task 2 2nd of October 2007
Fraunhofer IZM CODDE Bio IS DUH Final Report Page 2-39
2.3.1.2. Trends for EPS (mobile phone)
Market for the external power supplies of mobile phones is mainly driven by the end-use [BIO 2006]. As market for mobile phone is increasing, EPS market will see similar development.
2.3.1.3. Trends for Lighting
The penetration rate of light bulbs is not expected to change that much in the near future. The number of lighting appliances will probably remain constant in EU households. However, changes are likely to appear inside this product category. In particular, the current increase of Compact Fluorescent Lamps will probably continue until 2020. At the same time, a net decrease of linear fluorescent lamps will occur, these lamps being progressively replaced by halogen [MTP 2006a]. The Market Transformation Program forecast an annual 3 % increase in halogen lamp stocks until 2020, for the UK, with an increasing share of all household lamps [MTP 2006b].
Among all these lamp types, the present study focuses on low voltage halogen lamps. There is a trend towards miniaturisation in halogen light. This trend is being promoted in the “classic” low-voltage sector by smaller and smaller lamps and transformers. They also offer better and better durability, luminous efficacy and economy, for example in the form of innovative energy-saving lamps.
2.3.1.4. Trends for Radio
New technologies to broadcast radio emissions such as web radio and radio through cable modem currently emerge. In 2003, around one million of web radio stations have been listed [Eurostat audio 2003]. However, these ways of broadcasting radio will probably not replace radio as they require the use of other appliances such as computer that are less portable. Nevertheless, they will contribute to the penetration rate stagnation.
2.3.1.5. Trends for Electric toothbrush, Oven and Washing machine
Figure 2-4 shows the evolution in the penetration rates for several household appliances in France [GIFAM].
0
10
20
30
40
50
60
70
80
90
100
1999 2000 2001 2002 2003 2004
Year
Pene
trat
ion
rate
(%)
w ashing machine
oven
toothbrush
Figure 2-4: Evolution in the penetration rates of some domestic appliances in France from 1970 to 2004.
For washing machines, the market is close to saturation in Europe. Thus, market trends consist in more compact, reliable and efficient products.
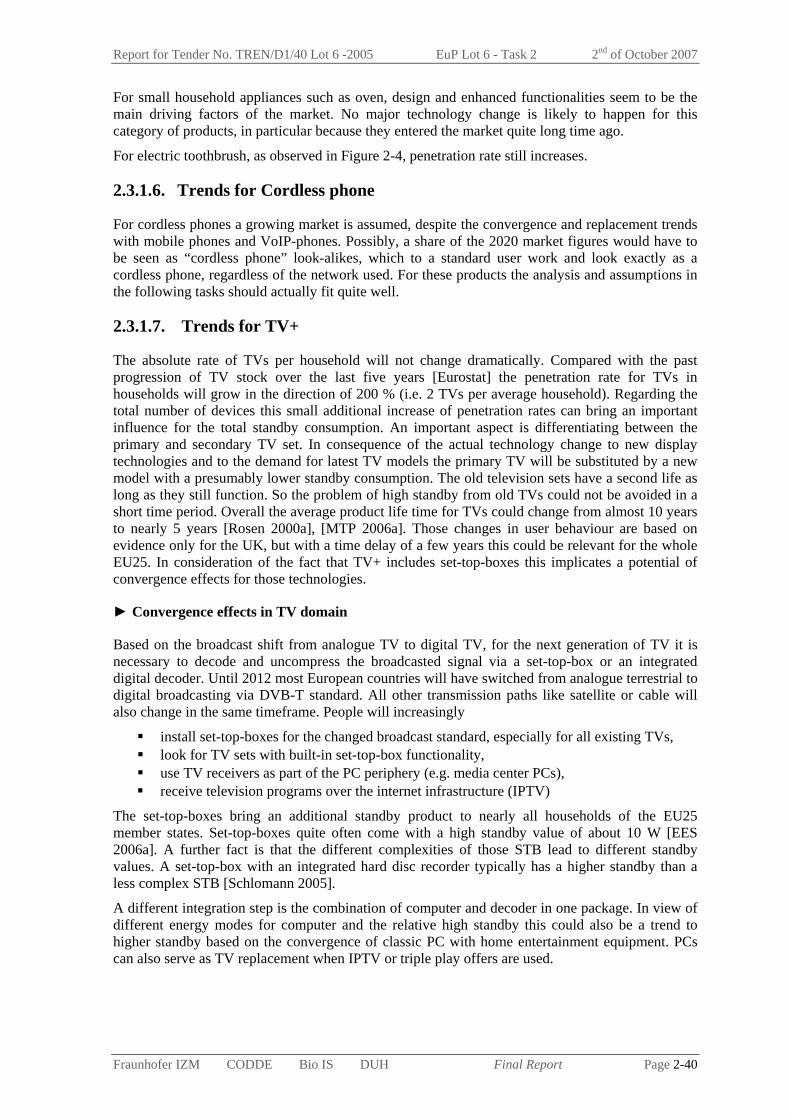
Report for Tender No. TREN/D1/40 Lot 6 -2005 EuP Lot 6 - Task 2 2nd of October 2007
Fraunhofer IZM CODDE Bio IS DUH Final Report Page 2-40
For small household appliances such as oven, design and enhanced functionalities seem to be the main driving factors of the market. No major technology change is likely to happen for this category of products, in particular because they entered the market quite long time ago.
For electric toothbrush, as observed in Figure 2-4, penetration rate still increases.
2.3.1.6. Trends for Cordless phone
For cordless phones a growing market is assumed, despite the convergence and replacement trends with mobile phones and VoIP-phones. Possibly, a share of the 2020 market figures would have to be seen as “cordless phone” look-alikes, which to a standard user work and look exactly as a cordless phone, regardless of the network used. For these products the analysis and assumptions in the following tasks should actually fit quite well.
2.3.1.7. Trends for TV+
The absolute rate of TVs per household will not change dramatically. Compared with the past progression of TV stock over the last five years [Eurostat] the penetration rate for TVs in households will grow in the direction of 200 % (i.e. 2 TVs per average household). Regarding the total number of devices this small additional increase of penetration rates can bring an important influence for the total standby consumption. An important aspect is differentiating between the primary and secondary TV set. In consequence of the actual technology change to new display technologies and to the demand for latest TV models the primary TV will be substituted by a new model with a presumably lower standby consumption. The old television sets have a second life as long as they still function. So the problem of high standby from old TVs could not be avoided in a short time period. Overall the average product life time for TVs could change from almost 10 years to nearly 5 years [Rosen 2000a], [MTP 2006a]. Those changes in user behaviour are based on evidence only for the UK, but with a time delay of a few years this could be relevant for the whole EU25. In consideration of the fact that TV+ includes set-top-boxes this implicates a potential of convergence effects for those technologies.
► Convergence effects in TV domain
Based on the broadcast shift from analogue TV to digital TV, for the next generation of TV it is necessary to decode and uncompress the broadcasted signal via a set-top-box or an integrated digital decoder. Until 2012 most European countries will have switched from analogue terrestrial to digital broadcasting via DVB-T standard. All other transmission paths like satellite or cable will also change in the same timeframe. People will increasingly
install set-top-boxes for the changed broadcast standard, especially for all existing TVs, look for TV sets with built-in set-top-box functionality, use TV receivers as part of the PC periphery (e.g. media center PCs), receive television programs over the internet infrastructure (IPTV)
The set-top-boxes bring an additional standby product to nearly all households of the EU25 member states. Set-top-boxes quite often come with a high standby value of about 10 W [EES 2006a]. A further fact is that the different complexities of those STB lead to different standby values. A set-top-box with an integrated hard disc recorder typically has a higher standby than a less complex STB [Schlomann 2005].
A different integration step is the combination of computer and decoder in one package. In view of different energy modes for computer and the relative high standby this could also be a trend to higher standby based on the convergence of classic PC with home entertainment equipment. PCs can also serve as TV replacement when IPTV or triple play offers are used.
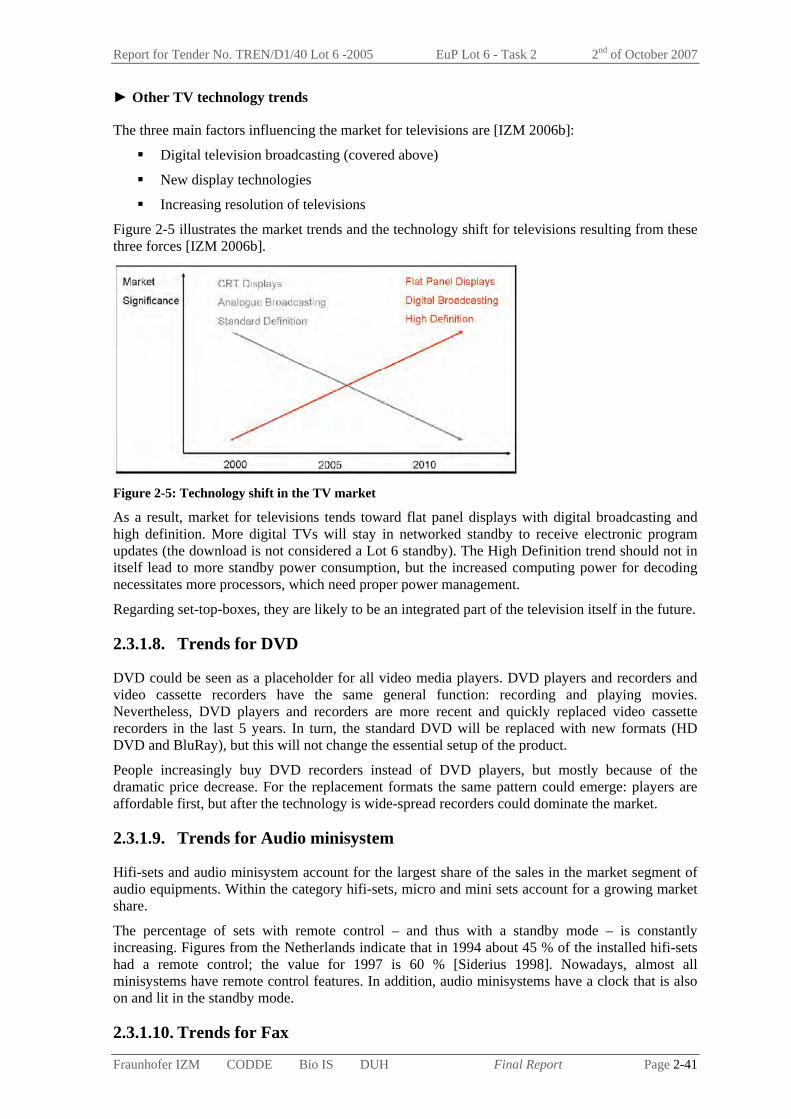
Report for Tender No. TREN/D1/40 Lot 6 -2005 EuP Lot 6 - Task 2 2nd of October 2007
Fraunhofer IZM CODDE Bio IS DUH Final Report Page 2-41
► Other TV technology trends
The three main factors influencing the market for televisions are [IZM 2006b]:
Digital television broadcasting (covered above)
New display technologies
Increasing resolution of televisions
Figure 2-5 illustrates the market trends and the technology shift for televisions resulting from these three forces [IZM 2006b].
Figure 2-5: Technology shift in the TV market
As a result, market for televisions tends toward flat panel displays with digital broadcasting and high definition. More digital TVs will stay in networked standby to receive electronic program updates (the download is not considered a Lot 6 standby). The High Definition trend should not in itself lead to more standby power consumption, but the increased computing power for decoding necessitates more processors, which need proper power management.
Regarding set-top-boxes, they are likely to be an integrated part of the television itself in the future.
2.3.1.8. Trends for DVD
DVD could be seen as a placeholder for all video media players. DVD players and recorders and video cassette recorders have the same general function: recording and playing movies. Nevertheless, DVD players and recorders are more recent and quickly replaced video cassette recorders in the last 5 years. In turn, the standard DVD will be replaced with new formats (HD DVD and BluRay), but this will not change the essential setup of the product.
People increasingly buy DVD recorders instead of DVD players, but mostly because of the dramatic price decrease. For the replacement formats the same pattern could emerge: players are affordable first, but after the technology is wide-spread recorders could dominate the market.
2.3.1.9. Trends for Audio minisystem
Hifi-sets and audio minisystem account for the largest share of the sales in the market segment of audio equipments. Within the category hifi-sets, micro and mini sets account for a growing market share.
The percentage of sets with remote control – and thus with a standby mode – is constantly increasing. Figures from the Netherlands indicate that in 1994 about 45 % of the installed hifi-sets had a remote control; the value for 1997 is 60 % [Siderius 1998]. Nowadays, almost all minisystems have remote control features. In addition, audio minisystems have a clock that is also on and lit in the standby mode.
2.3.1.10. Trends for Fax
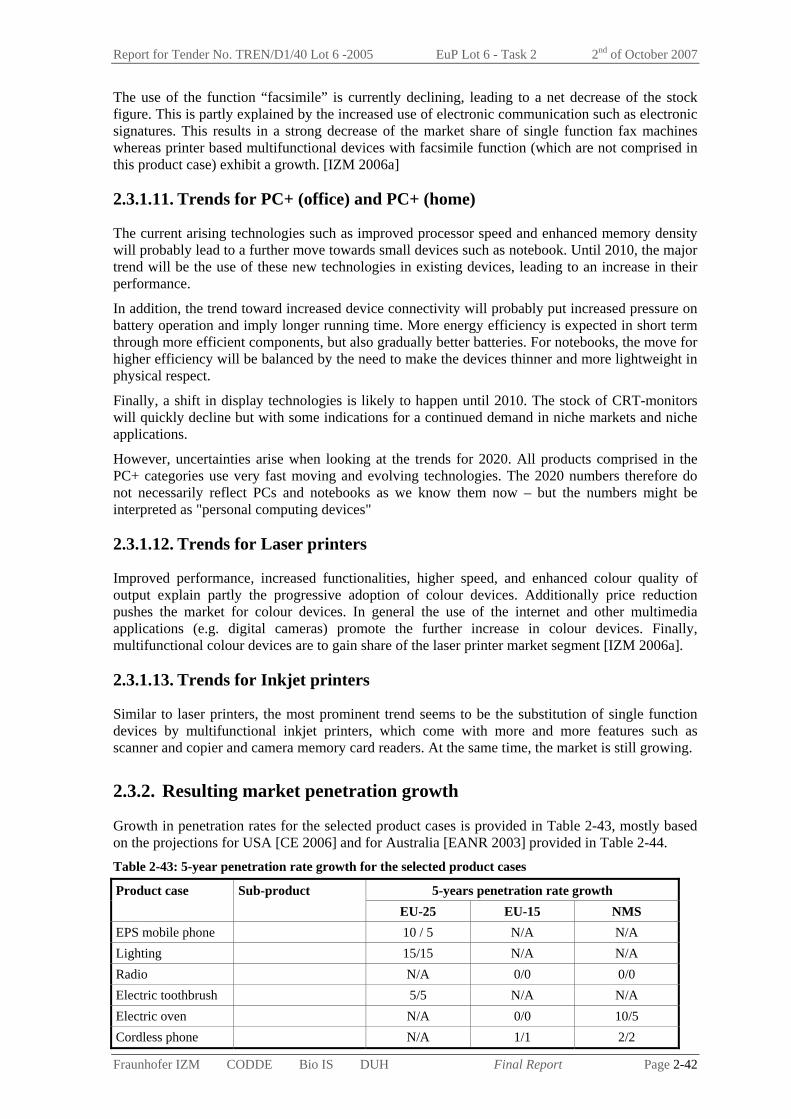
Report for Tender No. TREN/D1/40 Lot 6 -2005 EuP Lot 6 - Task 2 2nd of October 2007
Fraunhofer IZM CODDE Bio IS DUH Final Report Page 2-42
The use of the function “facsimile” is currently declining, leading to a net decrease of the stock figure. This is partly explained by the increased use of electronic communication such as electronic signatures. This results in a strong decrease of the market share of single function fax machines whereas printer based multifunctional devices with facsimile function (which are not comprised in this product case) exhibit a growth. [IZM 2006a]
2.3.1.11. Trends for PC+ (office) and PC+ (home)
The current arising technologies such as improved processor speed and enhanced memory density will probably lead to a further move towards small devices such as notebook. Until 2010, the major trend will be the use of these new technologies in existing devices, leading to an increase in their performance.
In addition, the trend toward increased device connectivity will probably put increased pressure on battery operation and imply longer running time. More energy efficiency is expected in short term through more efficient components, but also gradually better batteries. For notebooks, the move for higher efficiency will be balanced by the need to make the devices thinner and more lightweight in physical respect.
Finally, a shift in display technologies is likely to happen until 2010. The stock of CRT-monitors will quickly decline but with some indications for a continued demand in niche markets and niche applications.
However, uncertainties arise when looking at the trends for 2020. All products comprised in the PC+ categories use very fast moving and evolving technologies. The 2020 numbers therefore do not necessarily reflect PCs and notebooks as we know them now – but the numbers might be interpreted as "personal computing devices"
2.3.1.12. Trends for Laser printers
Improved performance, increased functionalities, higher speed, and enhanced colour quality of output explain partly the progressive adoption of colour devices. Additionally price reduction pushes the market for colour devices. In general the use of the internet and other multimedia applications (e.g. digital cameras) promote the further increase in colour devices. Finally, multifunctional colour devices are to gain share of the laser printer market segment [IZM 2006a].
2.3.1.13. Trends for Inkjet printers
Similar to laser printers, the most prominent trend seems to be the substitution of single function devices by multifunctional inkjet printers, which come with more and more features such as scanner and copier and camera memory card readers. At the same time, the market is still growing.
2.3.2. Resulting market penetration growth
Growth in penetration rates for the selected product cases is provided in Table 2-43, mostly based on the projections for USA [CE 2006] and for Australia [EANR 2003] provided in Table 2-44. Table 2-43: 5-year penetration rate growth for the selected product cases
5-years penetration rate growth Product case Sub-product EU-25 EU-15 NMS
EPS mobile phone 10 / 5 N/A N/A Lighting 15/15 N/A N/A Radio N/A 0/0 0/0 Electric toothbrush 5/5 N/A N/A Electric oven N/A 0/0 10/5 Cordless phone N/A 1/1 2/2

Report for Tender No. TREN/D1/40 Lot 6 -2005 EuP Lot 6 - Task 2 2nd of October 2007
Fraunhofer IZM CODDE Bio IS DUH Final Report Page 2-43
CRT -5/-80(a) N/A N/A LCD 960/60(a) N/A N/A PDP 761/60(a) N/A N/A RP and others 81/364(a) N/A N/A
TV+
Set-top-boxes N/A 85/-16 500/67 Washing machine N/A 0/0 10/5 DVD 20/20 N/A N/A Audio minisystem 0/0 N/A N/A Fax -35(b) / -35 N/A N/A
Desktop 14(c)/14 N/A N/A Notebook 150/15 N/A N/A CRT monitors -96(c)/0 N/A N/A Flat panel monitors 190/20 N/A N/A
PC+ (office)
Hubs and switches 80/15 N/A N/A Desktop 26(c)/10 N/A N/A Notebook 160(c)/15 N/A N/A CRT monitors -98(c)/0 N/A N/A Flat panel monitors 190(c)/20 N/A N/A PC speakers 25/23 N/A N/A
PC+ (home)
Modems 25/23 N/A N/A Laser printer 10(b)/10 N/A N/A Inkjet printer 15(b)/15 N/A N/A (a)Source: [IZM 2006b] (b)Source: [IZM 2006a] (c)Source: [IVF 2006] x/y: x is the 5-year rate of growth between 2005 and 2010 and y the one from 2010 to 2020 N/A : not applicable
Estimated growth are derived either by comparing Europe to Australian and US market or by looking at the past evolution of the market.
► EPS (mobile phone)
In EU-25, the current penetration rate of EPS for mobile phone in households is of 408 %. According to experts, market for mobile phone is expected to grow substantially in the next five years [Darnell 2005]. As a consequence, a significant growth of the penetration rate of 10 % is assumed to forecast 2010 stock. The forecast of 2020 is performed assuming that there will be a stabilisation phase between 2010 and 2020. The five years growth rate is thus assumed to be of 5 %.
► Lighting
Halogen lamps are expected to be more and more used in households. It is assumed that the annual growth of the penetration rate for low voltage halogen lamps is the one forecasted for UK [MTP 2006a], that is 3 %. This results in a 5 year penetration rate of 15 %.
► Radio
For radio, a zero rate of growth of the penetration rate is assumed, the market is assumed to remain constant until 2020.
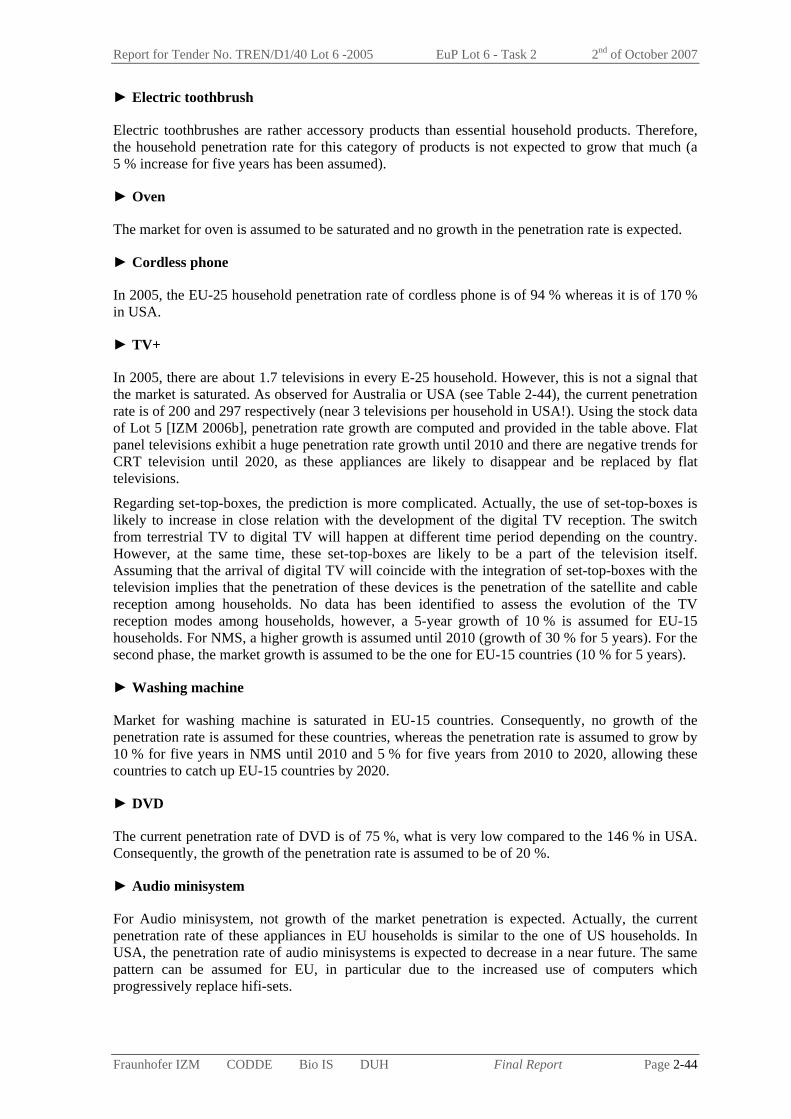
Report for Tender No. TREN/D1/40 Lot 6 -2005 EuP Lot 6 - Task 2 2nd of October 2007
Fraunhofer IZM CODDE Bio IS DUH Final Report Page 2-44
► Electric toothbrush
Electric toothbrushes are rather accessory products than essential household products. Therefore, the household penetration rate for this category of products is not expected to grow that much (a 5 % increase for five years has been assumed).
► Oven
The market for oven is assumed to be saturated and no growth in the penetration rate is expected.
► Cordless phone
In 2005, the EU-25 household penetration rate of cordless phone is of 94 % whereas it is of 170 % in USA.
► TV+
In 2005, there are about 1.7 televisions in every E-25 household. However, this is not a signal that the market is saturated. As observed for Australia or USA (see Table 2-44), the current penetration rate is of 200 and 297 respectively (near 3 televisions per household in USA!). Using the stock data of Lot 5 [IZM 2006b], penetration rate growth are computed and provided in the table above. Flat panel televisions exhibit a huge penetration rate growth until 2010 and there are negative trends for CRT television until 2020, as these appliances are likely to disappear and be replaced by flat televisions.
Regarding set-top-boxes, the prediction is more complicated. Actually, the use of set-top-boxes is likely to increase in close relation with the development of the digital TV reception. The switch from terrestrial TV to digital TV will happen at different time period depending on the country. However, at the same time, these set-top-boxes are likely to be a part of the television itself. Assuming that the arrival of digital TV will coincide with the integration of set-top-boxes with the television implies that the penetration of these devices is the penetration of the satellite and cable reception among households. No data has been identified to assess the evolution of the TV reception modes among households, however, a 5-year growth of 10 % is assumed for EU-15 households. For NMS, a higher growth is assumed until 2010 (growth of 30 % for 5 years). For the second phase, the market growth is assumed to be the one for EU-15 countries (10 % for 5 years).
► Washing machine
Market for washing machine is saturated in EU-15 countries. Consequently, no growth of the penetration rate is assumed for these countries, whereas the penetration rate is assumed to grow by 10 % for five years in NMS until 2010 and 5 % for five years from 2010 to 2020, allowing these countries to catch up EU-15 countries by 2020.
► DVD
The current penetration rate of DVD is of 75 %, what is very low compared to the 146 % in USA. Consequently, the growth of the penetration rate is assumed to be of 20 %.
► Audio minisystem
For Audio minisystem, not growth of the market penetration is expected. Actually, the current penetration rate of these appliances in EU households is similar to the one of US households. In USA, the penetration rate of audio minisystems is expected to decrease in a near future. The same pattern can be assumed for EU, in particular due to the increased use of computers which progressively replace hifi-sets.
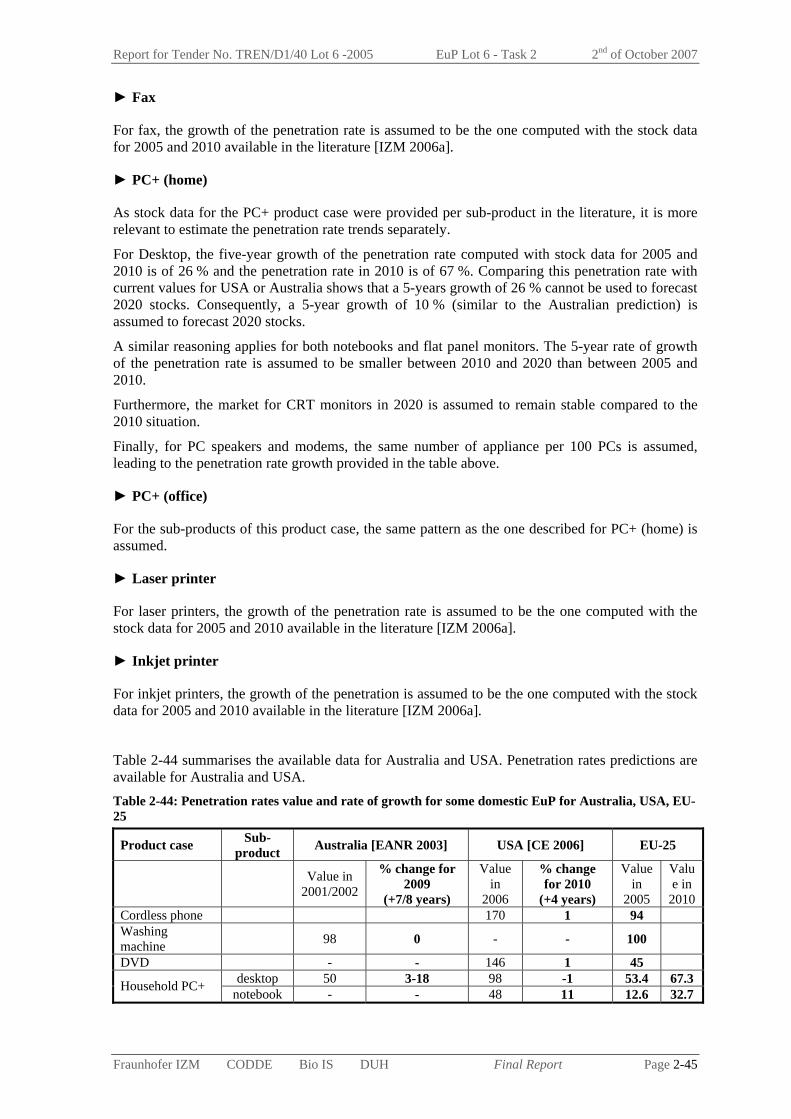
Report for Tender No. TREN/D1/40 Lot 6 -2005 EuP Lot 6 - Task 2 2nd of October 2007
Fraunhofer IZM CODDE Bio IS DUH Final Report Page 2-45
► Fax
For fax, the growth of the penetration rate is assumed to be the one computed with the stock data for 2005 and 2010 available in the literature [IZM 2006a].
► PC+ (home)
As stock data for the PC+ product case were provided per sub-product in the literature, it is more relevant to estimate the penetration rate trends separately.
For Desktop, the five-year growth of the penetration rate computed with stock data for 2005 and 2010 is of 26 % and the penetration rate in 2010 is of 67 %. Comparing this penetration rate with current values for USA or Australia shows that a 5-years growth of 26 % cannot be used to forecast 2020 stocks. Consequently, a 5-year growth of 10 % (similar to the Australian prediction) is assumed to forecast 2020 stocks.
A similar reasoning applies for both notebooks and flat panel monitors. The 5-year rate of growth of the penetration rate is assumed to be smaller between 2010 and 2020 than between 2005 and 2010.
Furthermore, the market for CRT monitors in 2020 is assumed to remain stable compared to the 2010 situation.
Finally, for PC speakers and modems, the same number of appliance per 100 PCs is assumed, leading to the penetration rate growth provided in the table above.
► PC+ (office)
For the sub-products of this product case, the same pattern as the one described for PC+ (home) is assumed.
► Laser printer
For laser printers, the growth of the penetration rate is assumed to be the one computed with the stock data for 2005 and 2010 available in the literature [IZM 2006a].
► Inkjet printer
For inkjet printers, the growth of the penetration is assumed to be the one computed with the stock data for 2005 and 2010 available in the literature [IZM 2006a].
Table 2-44 summarises the available data for Australia and USA. Penetration rates predictions are available for Australia and USA. Table 2-44: Penetration rates value and rate of growth for some domestic EuP for Australia, USA, EU-25
Product case Sub-product Australia [EANR 2003] USA [CE 2006] EU-25
Value in
2001/2002
% change for 2009
(+7/8 years)
Value in
2006
% change for 2010
(+4 years)
Value in
2005
Value in
2010 Cordless phone 170 1 94 Washing machine
98 0 - - 100
DVD - - 146 1 45 desktop 50 3-18 98 -1 53.4 67.3 Household PC+ notebook - - 48 11 12.6 32.7
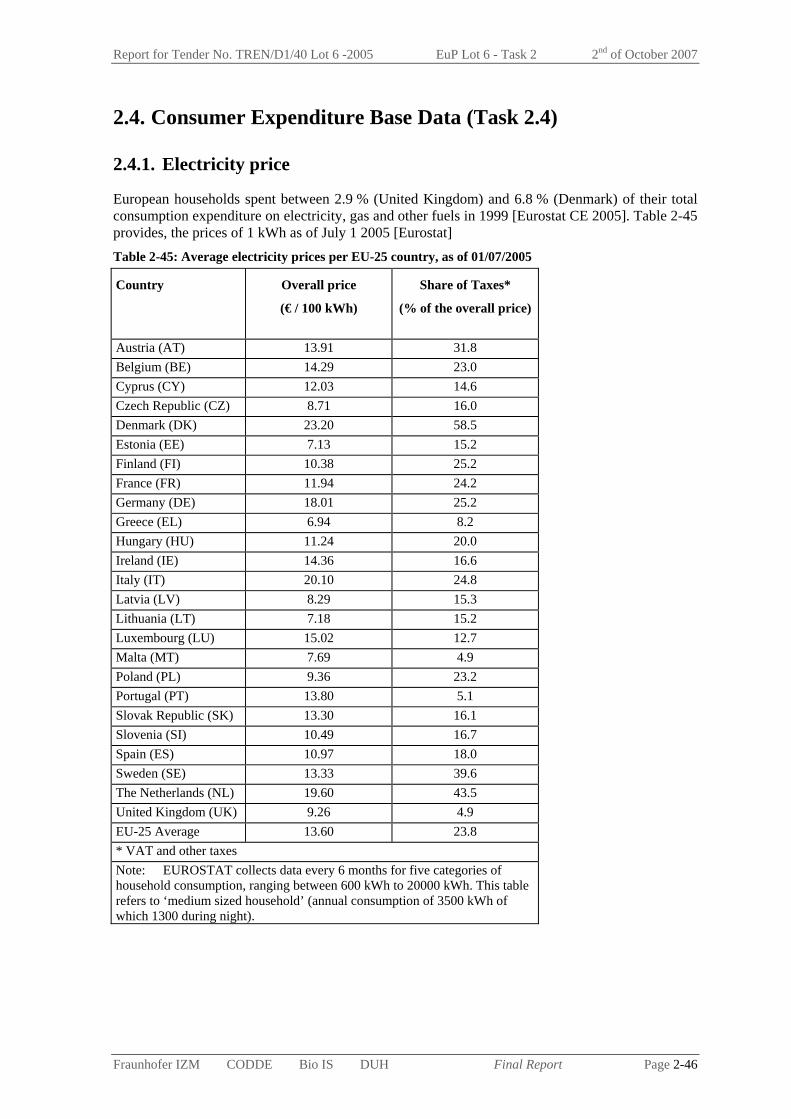
Report for Tender No. TREN/D1/40 Lot 6 -2005 EuP Lot 6 - Task 2 2nd of October 2007
Fraunhofer IZM CODDE Bio IS DUH Final Report Page 2-46
2.4. Consumer Expenditure Base Data (Task 2.4)
2.4.1. Electricity price
European households spent between 2.9 % (United Kingdom) and 6.8 % (Denmark) of their total consumption expenditure on electricity, gas and other fuels in 1999 [Eurostat CE 2005]. Table 2-45 provides, the prices of 1 kWh as of July 1 2005 [Eurostat] Table 2-45: Average electricity prices per EU-25 country, as of 01/07/2005
Country Overall price
(€ / 100 kWh)
Share of Taxes*
(% of the overall price)
Austria (AT) 13.91 31.8 Belgium (BE) 14.29 23.0 Cyprus (CY) 12.03 14.6 Czech Republic (CZ) 8.71 16.0 Denmark (DK) 23.20 58.5 Estonia (EE) 7.13 15.2 Finland (FI) 10.38 25.2 France (FR) 11.94 24.2 Germany (DE) 18.01 25.2 Greece (EL) 6.94 8.2 Hungary (HU) 11.24 20.0 Ireland (IE) 14.36 16.6 Italy (IT) 20.10 24.8 Latvia (LV) 8.29 15.3 Lithuania (LT) 7.18 15.2 Luxembourg (LU) 15.02 12.7 Malta (MT) 7.69 4.9 Poland (PL) 9.36 23.2 Portugal (PT) 13.80 5.1 Slovak Republic (SK) 13.30 16.1 Slovenia (SI) 10.49 16.7 Spain (ES) 10.97 18.0 Sweden (SE) 13.33 39.6 The Netherlands (NL) 19.60 43.5 United Kingdom (UK) 9.26 4.9 EU-25 Average 13.60 23.8 * VAT and other taxes Note: EUROSTAT collects data every 6 months for five categories of household consumption, ranging between 600 kWh to 20000 kWh. This table refers to ‘medium sized household’ (annual consumption of 3500 kWh of which 1300 during night).
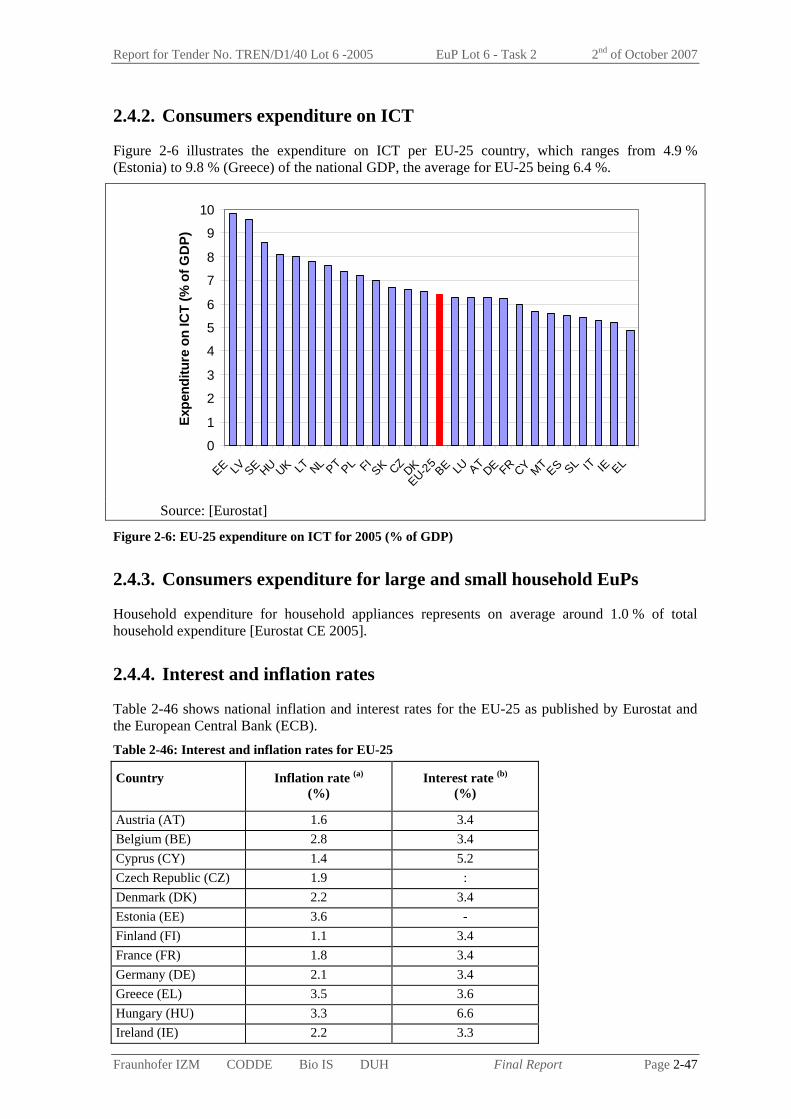
Report for Tender No. TREN/D1/40 Lot 6 -2005 EuP Lot 6 - Task 2 2nd of October 2007
Fraunhofer IZM CODDE Bio IS DUH Final Report Page 2-47
2.4.2. Consumers expenditure on ICT
Figure 2-6 illustrates the expenditure on ICT per EU-25 country, which ranges from 4.9 % (Estonia) to 9.8 % (Greece) of the national GDP, the average for EU-25 being 6.4 %.
0
1
2
3
4
5
6
7
8
9
10
EE LV SE HU UK LT NL PT PL FISK CZ DK
EU-25BE LU AT DE FR CY MT ES SL IT IE EL
Expe
nditu
re o
n IC
T (%
of G
DP)
Source: [Eurostat]
Figure 2-6: EU-25 expenditure on ICT for 2005 (% of GDP)
2.4.3. Consumers expenditure for large and small household EuPs
Household expenditure for household appliances represents on average around 1.0 % of total household expenditure [Eurostat CE 2005].
2.4.4. Interest and inflation rates
Table 2-46 shows national inflation and interest rates for the EU-25 as published by Eurostat and the European Central Bank (ECB). Table 2-46: Interest and inflation rates for EU-25
Country Inflation rate (a) (%)
Interest rate (b) (%)
Austria (AT) 1.6 3.4 Belgium (BE) 2.8 3.4 Cyprus (CY) 1.4 5.2 Czech Republic (CZ) 1.9 : Denmark (DK) 2.2 3.4 Estonia (EE) 3.6 - Finland (FI) 1.1 3.4 France (FR) 1.8 3.4 Germany (DE) 2.1 3.4 Greece (EL) 3.5 3.6 Hungary (HU) 3.3 6.6 Ireland (IE) 2.2 3.3
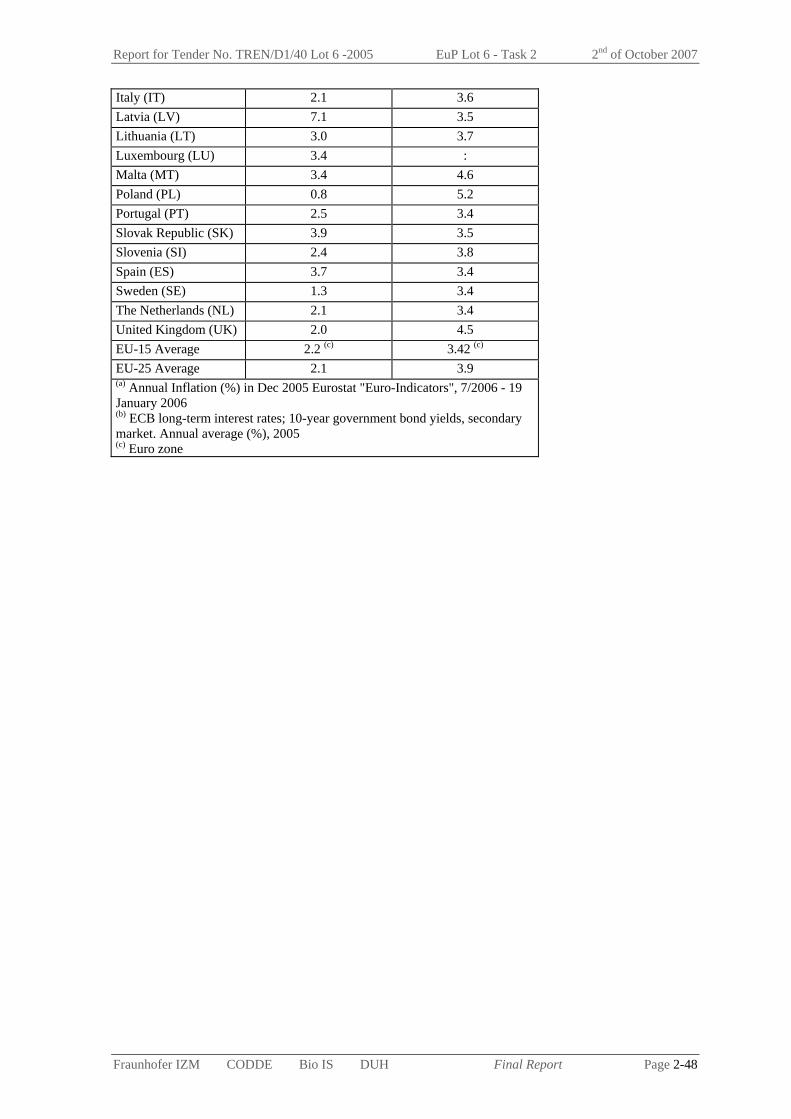
Report for Tender No. TREN/D1/40 Lot 6 -2005 EuP Lot 6 - Task 2 2nd of October 2007
Fraunhofer IZM CODDE Bio IS DUH Final Report Page 2-48
Italy (IT) 2.1 3.6 Latvia (LV) 7.1 3.5 Lithuania (LT) 3.0 3.7 Luxembourg (LU) 3.4 : Malta (MT) 3.4 4.6 Poland (PL) 0.8 5.2 Portugal (PT) 2.5 3.4 Slovak Republic (SK) 3.9 3.5 Slovenia (SI) 2.4 3.8 Spain (ES) 3.7 3.4 Sweden (SE) 1.3 3.4 The Netherlands (NL) 2.1 3.4 United Kingdom (UK) 2.0 4.5 EU-15 Average 2.2 (c) 3.42 (c) EU-25 Average 2.1 3.9 (a) Annual Inflation (%) in Dec 2005 Eurostat "Euro-Indicators", 7/2006 - 19 January 2006 (b) ECB long-term interest rates; 10-year government bond yields, secondary market. Annual average (%), 2005 (c) Euro zone
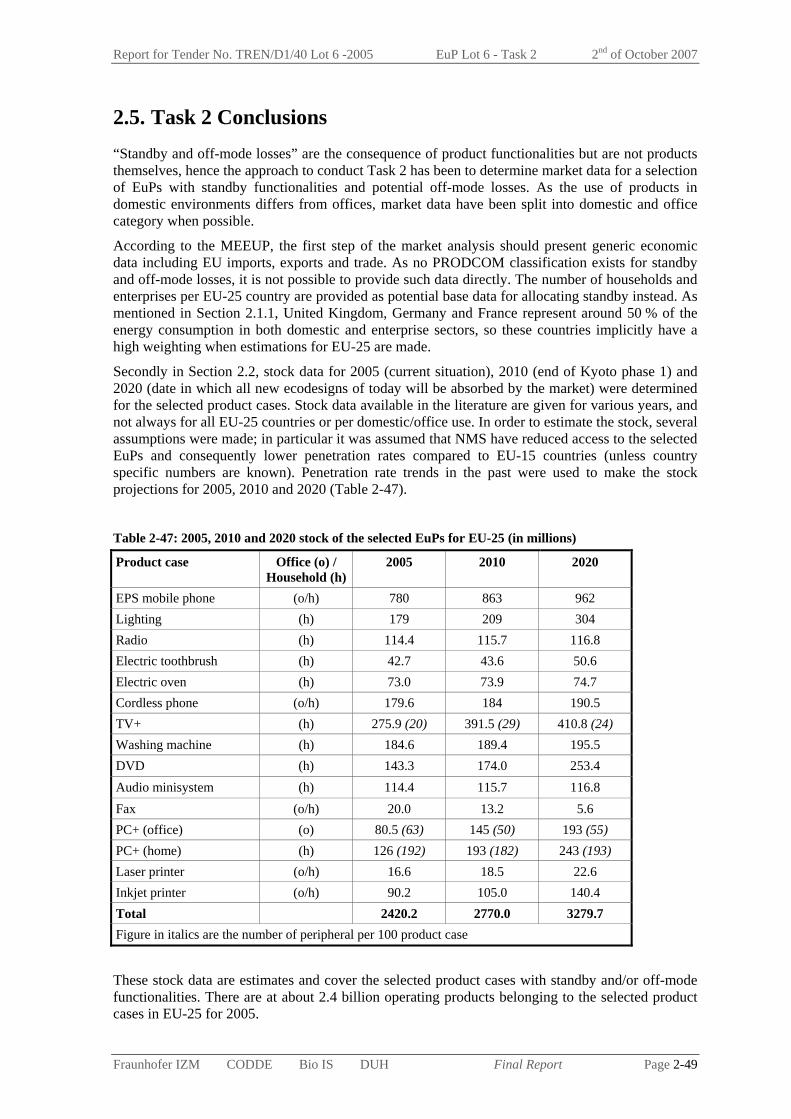
Report for Tender No. TREN/D1/40 Lot 6 -2005 EuP Lot 6 - Task 2 2nd of October 2007
Fraunhofer IZM CODDE Bio IS DUH Final Report Page 2-49
2.5. Task 2 Conclusions “Standby and off-mode losses” are the consequence of product functionalities but are not products themselves, hence the approach to conduct Task 2 has been to determine market data for a selection of EuPs with standby functionalities and potential off-mode losses. As the use of products in domestic environments differs from offices, market data have been split into domestic and office category when possible.
According to the MEEUP, the first step of the market analysis should present generic economic data including EU imports, exports and trade. As no PRODCOM classification exists for standby and off-mode losses, it is not possible to provide such data directly. The number of households and enterprises per EU-25 country are provided as potential base data for allocating standby instead. As mentioned in Section 2.1.1, United Kingdom, Germany and France represent around 50 % of the energy consumption in both domestic and enterprise sectors, so these countries implicitly have a high weighting when estimations for EU-25 are made.
Secondly in Section 2.2, stock data for 2005 (current situation), 2010 (end of Kyoto phase 1) and 2020 (date in which all new ecodesigns of today will be absorbed by the market) were determined for the selected product cases. Stock data available in the literature are given for various years, and not always for all EU-25 countries or per domestic/office use. In order to estimate the stock, several assumptions were made; in particular it was assumed that NMS have reduced access to the selected EuPs and consequently lower penetration rates compared to EU-15 countries (unless country specific numbers are known). Penetration rate trends in the past were used to make the stock projections for 2005, 2010 and 2020 (Table 2-47).
Table 2-47: 2005, 2010 and 2020 stock of the selected EuPs for EU-25 (in millions)
Product case Office (o) / Household (h)
2005 2010 2020
EPS mobile phone (o/h) 780 863 962 Lighting (h) 179 209 304 Radio (h) 114.4 115.7 116.8 Electric toothbrush (h) 42.7 43.6 50.6 Electric oven (h) 73.0 73.9 74.7 Cordless phone (o/h) 179.6 184 190.5 TV+ (h) 275.9 (20) 391.5 (29) 410.8 (24) Washing machine (h) 184.6 189.4 195.5 DVD (h) 143.3 174.0 253.4 Audio minisystem (h) 114.4 115.7 116.8 Fax (o/h) 20.0 13.2 5.6 PC+ (office) (o) 80.5 (63) 145 (50) 193 (55) PC+ (home) (h) 126 (192) 193 (182) 243 (193) Laser printer (o/h) 16.6 18.5 22.6 Inkjet printer (o/h) 90.2 105.0 140.4 Total 2420.2 2770.0 3279.7 Figure in italics are the number of peripheral per 100 product case
These stock data are estimates and cover the selected product cases with standby and/or off-mode functionalities. There are at about 2.4 billion operating products belonging to the selected product cases in EU-25 for 2005.
Report for Tender No. TREN/D1/40 Lot 6 -2005 EuP Lot 6 - Task 2 2nd of October 2007
Fraunhofer IZM CODDE Bio IS DUH Final Report Page 2-50
The third step of the market analysis was to identify the market trends for the selected EuPs and to derive penetration growth. Section 2.3 describes some factors driving the market for the selected EuPs. It was difficult to assess technology shift for all the selected EuPs and thus market trends have been provided for some key EuPs. Comparisons of penetration rates with U.S.A. and Australia were also made to derive penetration trends for some of the selected domestic products.
Finally, consumer expenditure base data are provided in Section 2.4, covering electricity prices and some general expenditure data for ICT and household appliances.

Report for Tender No. TREN/D1/40 Lot 6 -2005 EuP Lot 6 - Task 3 2nd of October 2007
Fraunhofer IZM CODDE Bio IS DUH Final Report Page 3-i
EuP Preparatory Study Lot 6 Standby and Off-mode Losses
Task 3 Consumer Behaviour and Local Infrastructure
Final Report
Compiled by Fraunhofer IZM
Contractor: Fraunhofer Institute for Reliability and Microintegration, IZM, Berlin
Department Environmental Engineering
Dr.-Ing. Nils F. Nissen
Gustav-Meyer-Allee 25, 13355 Berlin, Germany
Contact:
Tel.: +49-30-46403-132
Fax: +49-30-46403-131
Email: [email protected]
Berlin, 2nd of October 2007
Disclaimer
The findings presented in this report are results of the research conducted by the IZM consortium and the continuous feedback from a wide range of stakeholders. The statements and recommendations presented in the final report however are not to be perceived as the opinion of the European Commission.
Report for Tender No. TREN/D1/40 Lot 6 -2005 EuP Lot 6 - Task 3 2nd of October 2007
Fraunhofer IZM CODDE Bio IS DUH Final Report Page 3-ii
Contents 3. Consumer Behaviour and Local Infrastructure (Task 3) ......................................... 3-1
3.1. Real life efficiency (Task 3.1) ........................................................................................ 3-1 3.1.1. Buying decision ......................................................................................................... 3-2 3.1.2. Product use ................................................................................................................ 3-4
3.2. End-of-Life Behaviour (Task 3.2) ................................................................................ 3-16 3.3. Local Infrastructure (Task 3.3) ..................................................................................... 3-19
3.3.1. Implication of networks........................................................................................... 3-19 3.4. Task 3 Conclusions....................................................................................................... 3-20

Report for Tender No. TREN/D1/40 Lot 6 -2005 EuP Lot 6 - Task 3 2nd of October 2007
Fraunhofer IZM CODDE Bio IS DUH Final Report Page 3-1
3. Consumer Behaviour and Local Infrastructure (Task 3)
3.1. Real life efficiency (Task 3.1) In Task 3, factors influencing real life efficiency in the use of EuPs and particularly in respect to the aspect of standby and off-mode losses are investigated. This task focuses on the user interaction with devices and on the user options for an effective utilisation of devices. User interaction during the life cycle of the product is methodically analysed starting from the point of sale or from the buying decision, for which the quality of information on technical features and its availability to user is of crucial importance. The structure of this chapter derives from Task 1, where 15 product cases are described and modelled according to the so-called product-use-clusters. The product-use-clusters (PUC) are generalisations of technical features and use patterns which help to model “access points” for improvement.
As a matter of fact, power consumption in the use phase is the source of the most important environmental impact for many energy-using products. The effectiveness at which a device is used, i.e. the real life efficiency, depends on the following factors:
technical features such as power save options, automated power management, presetting of modes, instant reactivation capability, etc.
user information in support of consumers’ technical knowledge and environmental awareness, advice on efficient use, etc.
user behaviour such as the individual use pattern and functional demand, convenience or motivation to act economically or environmentally conscious.
Energy-using products are designed to provide a set of functionalities for a specific purpose and to satisfy customers’ wishes. However, more and more electronic products are multifunctional and provide an even larger spectrum of functions, which are not necessarily used by the customer either because of lack of awareness, a delayed uptake of new features by some users or because of inappropriate documentation of these functions. Information technology appliances and networked systems can offer a range of services even when the user is not actively interacting with them. Some of these added functions could fall under the Lot 6 standby definition, but not necessarily all unsupervised activities do so.
The provision of digital program downloads for television, which is currently increasing, provides an example to make this important trend more vivid. A device provides this service only when it is kept in standby mode (Lot 6 networked standby). For downloading programs, some components are activated and draw power (a couple of Watts) over a certain period of time (a couple of minutes). In this case, there are two aspects to consider. Firstly, neither the TV manufacturer nor the broadcast provider knows whether the customer specifically demands this service and how vital the service is for him. Secondly, the customer does not know how often this activation occurs while he is not using the TV and what consequence a disconnection from the mains might have.
Another good example is the one of some recent microwave ovens that come with a "hidden" energy saving function. These ovens are able to turn themselves completely off when they are not in use – provided, that the clock display option is not used (in which case the oven will stay continuously in standby). Just because of the habit of setting the time when the device is taken into operation the first time and seeing a clock on the microwave, many users are likely to disable the advanced energy saving function, which could have been very effective in reducing the energy consumption when the appliance is not being actively used.
Although these examples are quite specific, they illustrate the trend that real life efficiency in the use of a device is a complex interaction between technical, information, and behavioural factors.
It has to be acknowledged that the following remarks and examples might not cover the full spectrum of reality. Technical development is occurring rapidly and this will change the conditions on which the current analysis is based. The same applies to the individual user behaviour. The behavioural factor is the weakest link in the assessment. The vagueness of other studies in this field

Report for Tender No. TREN/D1/40 Lot 6 -2005 EuP Lot 6 - Task 3 2nd of October 2007
Fraunhofer IZM CODDE Bio IS DUH Final Report Page 3-2
highlights this problem. In most cases, it is only possible to make reasonable assumptions. This will become obvious when looking into average use patterns for single products and the actual time durations assumed for standby and off-modes.
3.1.1. Buying decision
As a consequence of the design of a device and of its specific features, the energy consumption of an appliance in the different operation modes, including standby and off-mode losses, is already determined to a high extent. So, by buying a certain energy-using product, the consumer already makes an important decision. But there are some necessary preconditions regarding how the consumer takes energy efficiency into account in his buying decision. It cannot be expected that consumers inform themselves on the relevance of standby and off-mode losses before setting out to buy a certain device.
In order to get a clearer impression on the influencing factors for the buying decision, the consortium asked leading manufacturers for TVs and printing equipment on that issue by means of a questionnaire [IZM 2006b] and interviews. While according to the questionnaires environmental issues play a role, interviews with the manufacturers reveal that consumers know about environmental issues in principle but that in most cases these issues do not influence their final buying decision. In practice, when the consumer has to choose between two or more products with different technical parameters, his choice is based on the technical information concerning functions and quality (product performance) and the resulting price or cost factor. If this technical information doesn’t include maximum, average or standby power consumption, and if the consumer is not aware of power consumption issues, then not many people are conscious enough to make an environmentally sound buying decision. The questionnaires also clearly indicate that the cost factor seems to be the single most important aspect for most of the consumers. However, they mostly consider the purchasing price and not the total life cycle cost (i.e. cost-of-ownership including the energy costs throughout the expected use phase). Manufacturers, in the answers to the questionnaires, indicated that due to relatively low running costs for consumer electronics and communication technology, power consumption is not seen as a considerable cost factor.
An example that shows how difficult it is to make the running costs obvious for consumer is the Austrian web page for very energy efficient EuPs www.topprodukte.at. Among other things, this web page lists running costs of appliances over a period of 10 years only. The similar German project www.ecotopten.de in contrast declares the total costs per year referring to the partial life time purchase price and the annual energy costs.
A driving factor to promote “green products” in office environments is green public procurement. Being initiated at the European level and implemented in many Member States, it encourages favouring products that are efficient from environment and energy point of views. This kind of preference by the public authorities may trigger the sale of these “green products” to other professional users and to the general public. At least a set of suitable products is kept in the product portfolio of the larger manufacturers. Several studies aim to identify the integration of environmental requirements into public procurement contracts.
Figure 3-1 illustrates the percentage of public tenders including green specifications [Bouwer 2006] in different Member States. Public tenders are split into four categories according to the number of green specifications:
No criteria (white bar): no green specifications in the tenders Grey: attempts for green specifications, but not followed by a green purchase Light green: one to three clear green specifications Solid green: more than three green specifications
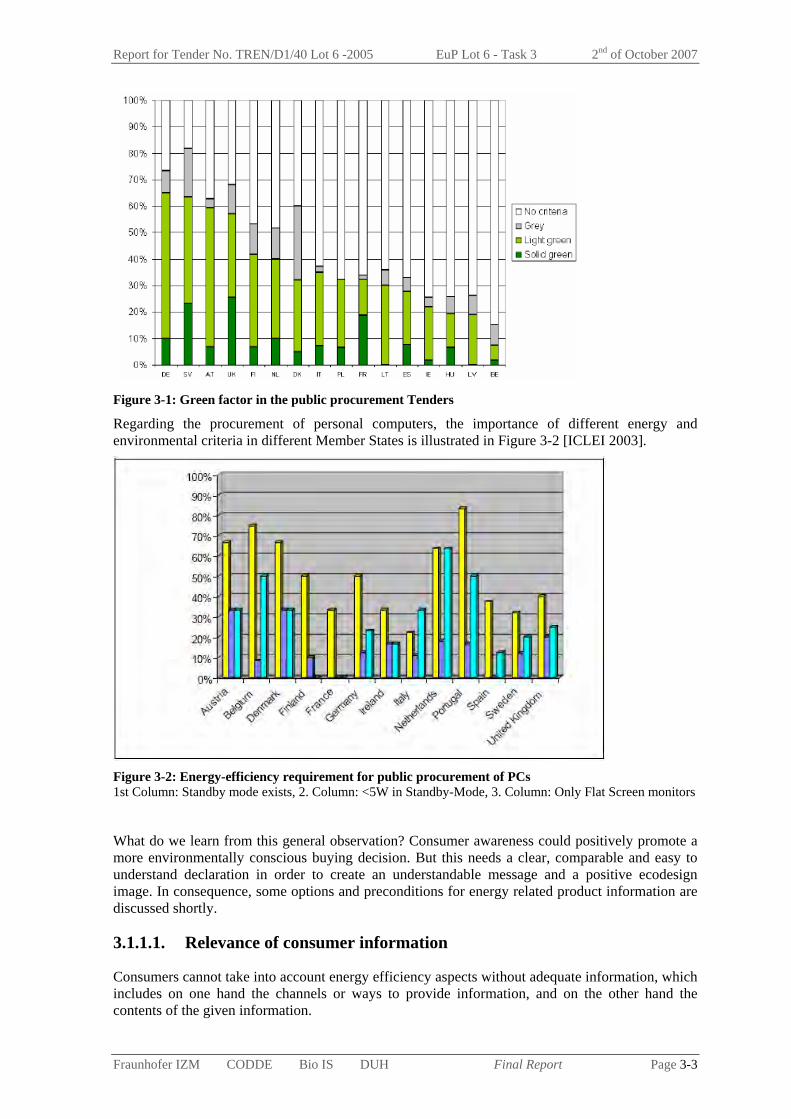
Report for Tender No. TREN/D1/40 Lot 6 -2005 EuP Lot 6 - Task 3 2nd of October 2007
Fraunhofer IZM CODDE Bio IS DUH Final Report Page 3-3
Figure 3-1: Green factor in the public procurement Tenders
Regarding the procurement of personal computers, the importance of different energy and environmental criteria in different Member States is illustrated in Figure 3-2 [ICLEI 2003].
Figure 3-2: Energy-efficiency requirement for public procurement of PCs 1st Column: Standby mode exists, 2. Column: <5W in Standby-Mode, 3. Column: Only Flat Screen monitors
What do we learn from this general observation? Consumer awareness could positively promote a more environmentally conscious buying decision. But this needs a clear, comparable and easy to understand declaration in order to create an understandable message and a positive ecodesign image. In consequence, some options and preconditions for energy related product information are discussed shortly.
3.1.1.1. Relevance of consumer information
Consumers cannot take into account energy efficiency aspects without adequate information, which includes on one hand the channels or ways to provide information, and on the other hand the contents of the given information.

Report for Tender No. TREN/D1/40 Lot 6 -2005 EuP Lot 6 - Task 3 2nd of October 2007
Fraunhofer IZM CODDE Bio IS DUH Final Report Page 3-4
The channels to supply information to the consumer are manifold. In order to show how important it is to provide the necessary information at the right place we give the following example: according to the above-mentioned questionnaire [IZM 2006b] the most substantial provision of information takes place in the product manual. However, it is in the nature of things that the manual – if it is read at all – cannot be read until a product is purchased. Consequently, any information in the manual that could influence the buying decision is of no use, because it becomes available when it is already too late. An example for this is the above-mentioned microwave oven with an energy saving mode, which users are most probably not aware of.
There are not only different communication channels to provide consumers with information regarding energy and standby, but also different options to express the information. In particular, they are based on technical parameters such as a declaration of power consumption for each mode. On the basis of the applied test standard for measurement of power consumption, an average value in Watt can be determined (see Task 1.2 on test standards). In many cases, it is preferable to show use oriented specifications and information on the use of ecodesign features. This means that not only certain values for different modes should be declared, but that the spectrum of functions and the quality of performance over time have also to be considered, e.g. with approaches like an energy efficiency index. For such schemes, a mutual agreement on standards or procedures is necessary. Against the background of the fast technical development in some market segments, the biggest challenge is to keep up with the existing market dynamics. Continuity and frequent review of classification values are a needed precondition.
There are also huge differences between individual purchases (for household use) and public procurement (for business offices). For professional purchasers specific information concerning environmental features could be made available.
3.1.2. Product use
There is a variety of product use patterns in conjunction with standby and off-mode. Basically, the occurrence and duration of standby and off-mode are influenced by:
Product specific or technical factors
User specific or behavioural factors
Technical factors are indicated by the spectrum of product functions and the specific power modes in which these functions are provided by an appliance. This includes the technical means with which a particular product is put into standby or off-mode as well as how it is (re-)activated for main operation.
Behavioural factors are linked to the actual decisions for utilising certain product functions or modes. The user individually determines the frequency, duration and characteristics of product use and through that of course also the patterns of a product in standby or off-mode. Especially in households these may change daily, but in most cases the behaviour is following recurrent habits.
These two aspects are explored in more detail in the following sections.

Report for Tender No. TREN/D1/40 Lot 6 -2005 EuP Lot 6 - Task 3 2nd of October 2007
Fraunhofer IZM CODDE Bio IS DUH Final Report Page 3-5
3.1.2.1. Technical factors
In Task 1.1, different modes were defined in direct conjunction with a particular spectrum of functions. It was also pointed out that the distinction of modes is typically related to particular power consumption or in some cases an overall power management. The modes are reflecting such different power consumption levels ranging from:
maximum or normal power consumption in “active-mode”,
to reduced power consumption (power saving) in “transition to standby and off-modes”,
further reduced power consumption in “Lot 6 standby mode”,
to the lowest power consumption in “off-mode with losses”,
to “0 Watt off-mode” and “disconnected”.
It was concluded that a spectrum of functions – which a user demands when buying a product – is related to a certain level of power consumption. In order to minimise the energy consumption, a fast transition into the lowest level of power consumption and preferably into the zero Watt off-mode after main operation should be facilitated.
Technical factors to consider for the transition into lower power modes are of two types, namely:
The way transitions into low power modes are operated
The existence of a hard-off switch
► Transitions into low power modes
Basically there are two options to facilitate a fast transition into standby and off (0 Watts, if applicable) mode:
Manually operated with direct user interaction
Automatically operated without direct user interaction
The manual interaction is realised with technical features such as pushbuttons (e.g. remote control, keyboard, etc), soft switches or switches for complete galvanic separation (hard switch). If a device is not hardwired, then unplugging or external switches are the final options to disconnect the device. The provision and accessibility of switches has been a considerable issue in the past in conjunction with the topic of full off.
The automatic transition to standby and off-modes are technical features with a clear intention to reduce power consumption of more complex devices. Intended side-effects can be a reduced thermal dissipation (less cooling required) and a longer life time of the product. Timers or sensors are used together with specifically designed electronic circuitries to reduce the spectrum of functions to a complete off (auto-off, if applicable). These automatic actions that are generated by timers or sensors follow a predefined task or time scheme. The schemes are usually programmed by the manufacturer (using presetting) or programmable by the user (through individual settings).
Examples of such schemes are the default time setting for standby of laser printers or of personal computers. The important aspect related to automatic transition into standby and off-modes is the time duration (settings) for changing into lower power modes. For some product functions such as the after-use cooling of video-beamer lamps, the duration of automatic transition is fixed based on technical necessities (product reliability). Much more often, the convenience and particularly the avoidance of time delays (e.g. for booting processes) are determining factors for the presettings of a product. However, in many cases, the automatic transition to standby and off-mode is a very useful feature to reduce power consumption but depends on average use patterns of a product. The automatic powering down to low power levels will also be discussed in the Tasks 4, 6 and 7.
It has to be added that technical means (for manual interaction with the device) influence the practical use of a product, but do not necessarily determine a specific use pattern. Moreover, the existence of an energy saving mode or of a total off switch does not necessarily imply that they are

Report for Tender No. TREN/D1/40 Lot 6 -2005 EuP Lot 6 - Task 3 2nd of October 2007
Fraunhofer IZM CODDE Bio IS DUH Final Report Page 3-6
used. So, in essence, technical solutions that do not need the consumers’ awareness or support need to be discussed later in this study.
In any case, the ultimate manual or automatic transitions into 0 Watt off-mode are directly linked with the existence of hard-off switches on the appliances.
► Existence of the hard-off switch
Due to the increasing network functions, such as information processing, communication as well as audio and video equipment in particular, “active standby” (mostly covered by Lot 6 networked standby) has become a common feature. The particular network function – as for TVs exemplarily shown – has lead to the situation that some manufacturers are not providing “off switches” on their products anymore. However, at the same time, eco-labels and other environmentally oriented initiatives have demanded off switches on all products in order to give the user the option to avoid standby and off-mode losses. Consumers meanwhile address NGOs (like the Deutsche Umwelthilfe) that they miss the total off switch, which at modern flat screen TVs is not offered anymore.
Consequently, there are two opposite aspects to consider. On one hand, standby comes along with the provision of a certain function – e.g. the network function or the readiness to use the remote control. For the TV set example, the standby power consumption decreased considerably over the last years, so that the amount of energy that can be saved by using the total off switch (if it exists) also decreased.
On the other hand, there are consumers that do care about environmentally sound behaviour and they need a clear message, otherwise they lose motivation. It is unrealistic to expect consumers to ask or to search for the specific standby consumption of a certain device and to decide, product by product, if it is low enough to make the use of the hard-off switch unnecessary. So the main environmentally motivated communication would still be that the hard-off switch should be used. In consequence, a hard-off switch should exist when there is no evident reason against it and should be placed so as to be as user-friendly as possible. The more hidden the switch is, the less likely it is going to be used.
Automatic transition into 0 Watt off-modes may also be “hidden” to the consumer. Some years ago, a TV manufacturer produced devices that automatically switched off totally after a certain time, even when the soft switch was used. To our knowledge, this function wasn’t actively communicated and only few users were aware of this technology so that nobody asked for it. The technology didn’t prevail and disappeared from the market. Nevertheless, this example shows that it is quite easy to install such a function, if required.
3.1.2.2. Behavioural factors
Due to the variability of behavioural factors, it is difficult to determine average use patterns. The narrower we define a product group and the product application environment the more precise it is possible to define average use patterns. The objective of Lot 6 is however to investigate use patterns related to standby and off-modes on a generalised level.
In this section, behaviour influencing factors will first be investigated through:
Individual behavioural factors
Global awareness on the use of the hard-off switch
► Individual behavioural factors
User behaviour is influenced by:
Technical knowledge and options
Convenience and motivation
Technical knowledge and the above outlined options for transition into standby and off-modes (including zero power consumption, if applicable) are essential aspects when analysing user

Report for Tender No. TREN/D1/40 Lot 6 -2005 EuP Lot 6 - Task 3 2nd of October 2007
Fraunhofer IZM CODDE Bio IS DUH Final Report Page 3-7
behaviour. It is quite clear that users’ demand for functions and the actual utilisation of functions differ from customer to customer and that the product's design (spectrum and characteristics of functions) reflects a certain compromise between provision of functions and actual demand. People with high technical interest might “play around” with products in order to explore all technical options for optimising their individual use. So, if there is no energy optimised presetting installed, the possibility that energy saving modes are found is higher for these users with high technical interest than for the ones who might just be satisfied with a product “working” with a certain minimum functionality.
In a similar way, the motivation – either convenience (often not reflecting environmental implications) – to act in an environmentally sound manner has an influence on standby and off-mode power consumption. Use patterns and resulting use times are product specific. The same applies to the time duration in which a product remains in a certain mode (e.g. Lot 6 passive standby). Real life efficiency is closely linked to these aspects. If modes can solely be changed manually then the improvement of real life efficiency is only possible when the user is actively involved (e.g. through specific consumer information or consultation). If modes can be changed automatically under “convenient” conditions for the user, then technical improvement and optimised presettings are a valid ecodesign strategy. These possibilities will again be discussed in Tasks 4, 6 and 7.
As outlined before, a particular product functionality as well as the application environment will determine the use of that product. In addition to that, the customer’s age, gender, education (e.g. environmental awareness), financial status and technical preferences are further factors, which make a difference in the individual use pattern [Kukartz 2004; IZM 2006b]. This will be further discussed below in the section on the use of the hard-off switch.
As in the case for the buying decision, the way how information is provided is also of high concern regarding user behaviour. In a current socio-economic study on standby consumption in private homes, Gudbjerg [Gudbjerg 2006] describes an experiment where written information on standby was first given to consumers; afterwards the same households were visited by an energy advisor. The advisor installed measurement devices and explained how EuPs could be used with lower standby consumption. The study came to the conclusion that providing households with written material did not change peoples’ behaviour (as to lower standby consumption). The visit of a supporting energy advisor was much more successful. The households had been questioned on standby issues and user behaviour before, and most replies indicated that standby can be best reduced by technical solutions.
Convenience might be the biggest enemy of environmental friendly behaviour in the standby context. As soon as consumers have to change their behaviour actively in order to do something for the environment – like using a total off switch, an external switch or waiting for the wake-up of a printer – the chances for the energy reduction to happen and to be sustained decrease rapidly.
It can be concluded that the real life efficiency regarding power consumption in connection with standby and off-mode is a complex set of actions based on technical and behavioural factors. The behavioural factors are extremely variable and treated as such. For the estimated use times to be developed in this task, quite high values are assumed in order not to underrate these aspects. As a consequence, when passive standby is activated by a remote control or by a soft off switch, as well as when there is a hard-off switch (galvanic disconnecting), the product will be considered to be used under a scenario where the amount of standby power consumption is predominant. The intensified use of the total off switch will be discussed in the following section and it will be considered in Task 8 (sensitivity analysis) once more.
► Global awareness on the use of the hard-off switch
The use of the hard switch is highly dependent on the consumers’ attitude. Convenience aspects lead more and more to the non-use of the total off-mode. According to [Schötz 2003, forsa 2004] nearly 90 % of German consumers know the term standby but the energy saving potential of this mode is quite unknown. Both studies declare that standby is mostly positively associated with “ready to use”. Consumers mainly do know that devices use energy in standby mode. Only 3-7 %

Report for Tender No. TREN/D1/40 Lot 6 -2005 EuP Lot 6 - Task 3 2nd of October 2007
Fraunhofer IZM CODDE Bio IS DUH Final Report Page 3-8
of consumers consider standby to be a waste of energy, 8% with waste of money. However, more than 82% of the people said to be discontent, if their devices do not have a total off switch. However, the causes for the discontent were not purely environmental but also linked to cost and safety reasons. Even if safety problems are very unlikely, malfunctions in the EuP and lightning strikes or heavy disturbances on the electricity network can cause damage to the devices or even lead to fires. The common solution to prevent this is to use the hard-off switch with galvanic separation.
The surveys also indicate that the readiness to use standby options and avoid standby and off-mode losses depends to a high extent on demographical aspects. According to the study “Environmental Consciousness in Germany” [Kuckartz 2004] 42 % of the respondents stated to always use the total off switch (device-independent). This, however, is mainly due to a disproportionally high percentage of over 60-year old respondents. While 52 % of 60+ years old use the total off button (probably because they use old devices) only 28 % of the 25-29 years old said to use it. Unless the awareness for standby and off-mode losses rises and unless the product design simplifies energy saving behaviour, the natural and uncritical use of EuPs, especially by young people, and technically affine lifestyles will likely lead to a higher use of standby mode instead of off-mode.
The existing awareness of standby has predominantly been examined for television sets, hifi devices and PC peripherals. Other devices like set-top-boxes or cordless phones were not considered regarding the standby issue. Some examples for the use of the total off switch are given in the following table; based on the forsa study [forsa 2004].
Table 3-1: Switch off behaviour for different devices
Remote control
Off switch Off and disconnect plug
Multiway connector (overnight off)
Other
TV 27 % 57 % 3 % 13 % always - Audio system
22 % 60 % 3 % 14 % 1 %
PC monitor - 47 % 3 % 33 % 15 % not separately 2 % other
DSL modem - 17 % - 24 % 52 % never 7 % other
This analysis shows that there are people than do care about standby. It covers only the private use. These results won’t be part of all product case calculations in the next tasks, because such detailed off behaviour is not available for all product cases. The effects will be taken into account when looking at improvement potentials and in the sensitivity analyses.
Some more anecdotal evidence for products not being switched off is given hereafter. An employee of a huge German automobile manufacturer reported that in almost all the company buildings, PCs with monitors and printers are not switched off over night. In addition, at Christmas evening, a consortium member saw from outside of huge administrative buildings in Berlin a capital amount of monitors glowing in “standby”. Even if this is not a representative finding and it is not generally valid for all enterprises or offices, it shows that general solutions for presetting or automatic powering down of a network in the evening should be discussed as a tool to enforce energy efficiency in offices. However, some enterprises expressly order their employees not to switch off their PCs at night in order to make updates or backups. With advanced and well defined interfaces such as wake-up over LAN this should not be a reason to run the whole office equipment non-stop. Here the use of the total off switch is a solution only for printers and monitors. Possible technical solutions for these cases will be discussed in Tasks 6 and 7 while looking at improvement options and BAT.

Report for Tender No. TREN/D1/40 Lot 6 -2005 EuP Lot 6 - Task 3 2nd of October 2007
Fraunhofer IZM CODDE Bio IS DUH Final Report Page 3-9
For the product case calculations, the use patterns with the respective use times are of concern and they necessarily depend on the consumer behaviour. In the following section, the use patterns as a set of technical and behavioural factors that influence the real life efficiency will be examined related to the different PUCs defined in Task 1.
3.1.2.3. PUC 0: Always On products
Products from PUC 0 have only “on”-mode or are “disconnected”. These products have no switch and no transitions between modes. Therefore neither standby power consumption nor off-mode losses apply to PUC 0. Clock radios are an example for PUC 0 as they either provide clock or radio function itself or are being programmed and therefore waiting and ready to perform this function. There are also studies that grade clock radios as standby. But according to the definition in Task 1, these devices only provide main functions – either being a clock, an alarm clock or a radio and they do not have any standby relevant functions.
Hence PUC 0 devices do not fall under Lot 6 and use patterns for such devices will not be defined.
In some studies, internet devices such as modems, hubs and switches are considered as “always on” or “always standby”. However, in accordance with Task 1, internet devices are classified as PUC 3 “job-based on” products.
3.1.2.4. PUC 1: On/Off products
EuPs that fall under PUC 1 are devices that come either with a hard or a soft switch, which allows manual change between “on” and “off” mode. From the Lot 6 point of view, the relevant aspects concerning PUC 1 devices are the off-mode losses.
Ecodesign for PUC 1 devices necessarily includes technical improvements that minimise or prevent off-mode losses as far as possible. This principle can be put into practice for all new products – the only objection might be additional costs.
Devices with EPS are an exception in the sense that off-mode losses occur as soon as the EPS is plugged in the mains (in no-load state).
If consumers have devices with off-mode losses, “unplugging” is the only solution to avoid these losses. This is also relevant for the products with EPS, although the provision of a switched plug connector is an additional option here. “Unplugging” behaviour is more an “end of pipe” solution and needs high awareness efforts.
In Table 3-2, the product cases of PUC 1 on/off products are listed with their specific average daily on-mode time duration as well as with their standby and off-mode time duration. The data for these products are derived from the study [Schlomann 2005]. Own assumptions are presented in italics. It has been chosen to use only the [Schlomann 2005] source (which refers to the situation in Germany) because the definition of standby and off-mode in this study is largely equivalent to the Lot 6 definition. Using other sources might lead to other using times because of different definitions. It is very complicated and not always possible to compare the results of different studies because of standby definition issues, so basing our estimates on one source only is preferable, even if the German data might not always be representative of other countries.

Report for Tender No. TREN/D1/40 Lot 6 -2005 EuP Lot 6 - Task 3 2nd of October 2007
Fraunhofer IZM CODDE Bio IS DUH Final Report Page 3-10
Table 3-2: Average daily use times on/off products (PUC 1)
On/ Off Products (PUC 1)
Product cases Active /On time [h/d]
Off time [h/d]
EPS (mobile phone) 1.4 10.0 (12.6)*
Lighting 0.5 23.5
Radio 1.0 23.0
Electric toothbrush 2.1 21.9 *Figure in parenthesis is the disconnected time
► EPS (mobile phone)
The number of EPS (mobile phone) operating in EU-25 is very high and EPS (mobile phone) will be considered as a further product case in Task 4.
According to [forsa 2004], 13 % of external power supplies for mobile phones are always plugged to the mains, 84 % are only plugged in for charging. This seems to be quite optimistic regarding that many people charge their phones overnight, and the charging takes only a fraction of the night. “Only plugged in for charging” presumably has to include these use patterns.
Following [BIO 2007] the average time when off-mode losses occur can be determined as 10 h/d (according to an EPS manufacturer’s use scenario). The average charge cycle is set as 1.5 h per day, but not all phones are charged regularly, leading to the 1.4 h/d assumption and the remaining part of the day has to be assumed as disconnected. The use cases “use of the EPS without any off-mode losses”, “always off-mode losses after the use of the EPS”, “use of the EPS over night (1.5 h actual charging time, 8.5 h off-mode losses)” are aggregated in the estimate for 10 h/d off-mode losses.
Roughly, the 10 h/d estimate can be calculated from 13 % of products contributing 22.5 h off-mode per day and 84 % contributing 8.5 h off-mode per day. The remaining phones do not contribute to off-mode time with potential losses.
Some of the mobile phones counted in the 2005 stock will not be regularly used anymore, because they are emergency or backup phones. Therefore, the 10 h/d assumption should still be viewed as a high estimate. Likewise the on-mode time (not influencing the further calculations) is quite high, because for most users a daily charge cycle is a worst case.
► Lighting
Including the product case of Lighting (as defined in Task 2, Section 2.2.3) within PUC 1 is relevant regarding the off-mode losses caused by low voltage halogen lamps.
As presented earlier in Task 2, Lighting appliances in general are used in a wide variety of rooms (kitchen, living room, bathroom, bedroom) leading thus to very different use patterns. Some lamps in a household are used very regularly (e.g. lamps in the living room), while others may stay switched off most of the time (e.g. lamps in the garage or laundry room). Furthermore, use patterns may vary depending on the season. With longer days in summer, artificial lighting is needed for shorter periods than in winter. The on-mode time provided in the table above is an estimated average and will be used for product case calculations in the subsequent tasks.
Halogen lamps with dimmers are often responsible for significant energy losses. The ultimate cause for this is that a dimmed halogen lamp may consume almost as much energy as in the highest power mode but provides less light intensity. However, this is neither an issue of standby nor of off-mode losses, so these losses are not taken into consideration. However, there are dimmers, which are not totally switched off in the off position, so here off-mode losses are possible.
Most off-mode losses for lighting with transformers occur in those devices with magnetic (i.e. linear) transformer that cannot be disconnected from the mains (i.e. having only secondary side
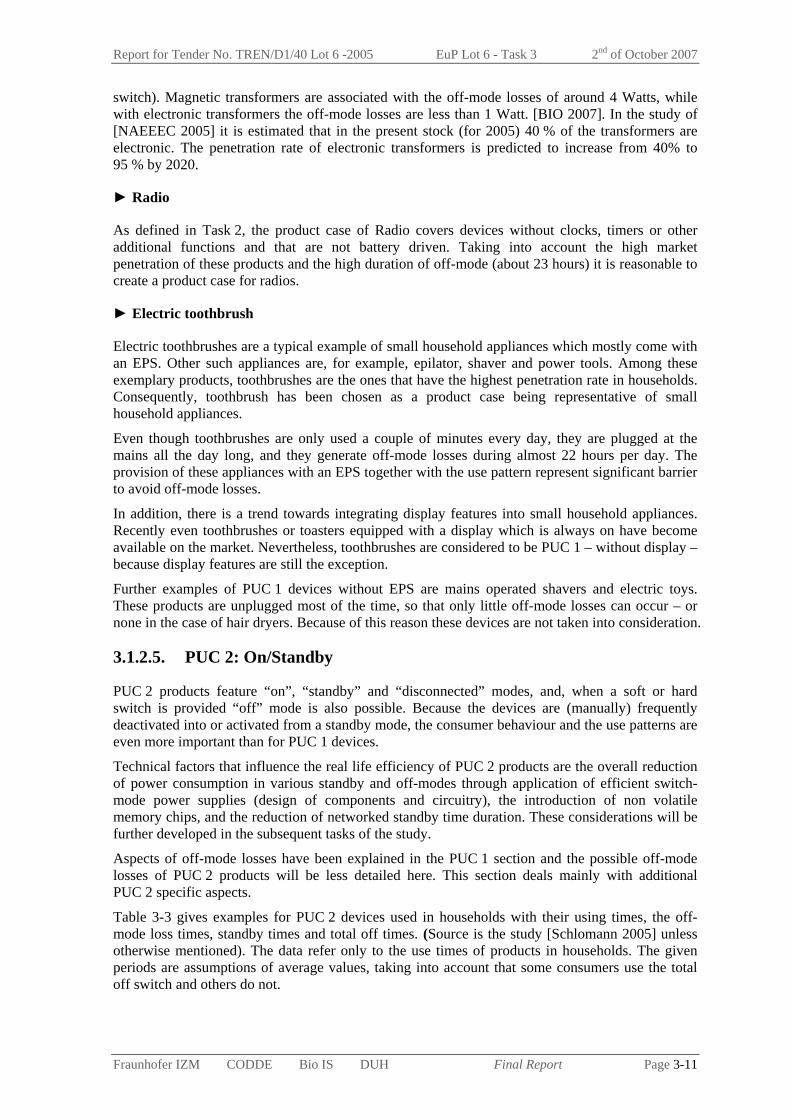
Report for Tender No. TREN/D1/40 Lot 6 -2005 EuP Lot 6 - Task 3 2nd of October 2007
Fraunhofer IZM CODDE Bio IS DUH Final Report Page 3-11
switch). Magnetic transformers are associated with the off-mode losses of around 4 Watts, while with electronic transformers the off-mode losses are less than 1 Watt. [BIO 2007]. In the study of [NAEEEC 2005] it is estimated that in the present stock (for 2005) 40 % of the transformers are electronic. The penetration rate of electronic transformers is predicted to increase from 40% to 95 % by 2020.
► Radio
As defined in Task 2, the product case of Radio covers devices without clocks, timers or other additional functions and that are not battery driven. Taking into account the high market penetration of these products and the high duration of off-mode (about 23 hours) it is reasonable to create a product case for radios.
► Electric toothbrush
Electric toothbrushes are a typical example of small household appliances which mostly come with an EPS. Other such appliances are, for example, epilator, shaver and power tools. Among these exemplary products, toothbrushes are the ones that have the highest penetration rate in households. Consequently, toothbrush has been chosen as a product case being representative of small household appliances.
Even though toothbrushes are only used a couple of minutes every day, they are plugged at the mains all the day long, and they generate off-mode losses during almost 22 hours per day. The provision of these appliances with an EPS together with the use pattern represent significant barrier to avoid off-mode losses.
In addition, there is a trend towards integrating display features into small household appliances. Recently even toothbrushes or toasters equipped with a display which is always on have become available on the market. Nevertheless, toothbrushes are considered to be PUC 1 – without display – because display features are still the exception.
Further examples of PUC 1 devices without EPS are mains operated shavers and electric toys. These products are unplugged most of the time, so that only little off-mode losses can occur – or none in the case of hair dryers. Because of this reason these devices are not taken into consideration.
3.1.2.5. PUC 2: On/Standby
PUC 2 products feature “on”, “standby” and “disconnected” modes, and, when a soft or hard switch is provided “off” mode is also possible. Because the devices are (manually) frequently deactivated into or activated from a standby mode, the consumer behaviour and the use patterns are even more important than for PUC 1 devices.
Technical factors that influence the real life efficiency of PUC 2 products are the overall reduction of power consumption in various standby and off-modes through application of efficient switch-mode power supplies (design of components and circuitry), the introduction of non volatile memory chips, and the reduction of networked standby time duration. These considerations will be further developed in the subsequent tasks of the study.
Aspects of off-mode losses have been explained in the PUC 1 section and the possible off-mode losses of PUC 2 products will be less detailed here. This section deals mainly with additional PUC 2 specific aspects.
Table 3-3 gives examples for PUC 2 devices used in households with their using times, the off-mode loss times, standby times and total off times. (Source is the study [Schlomann 2005] unless otherwise mentioned). The data refer only to the use times of products in households. The given periods are assumptions of average values, taking into account that some consumers use the total off switch and others do not.
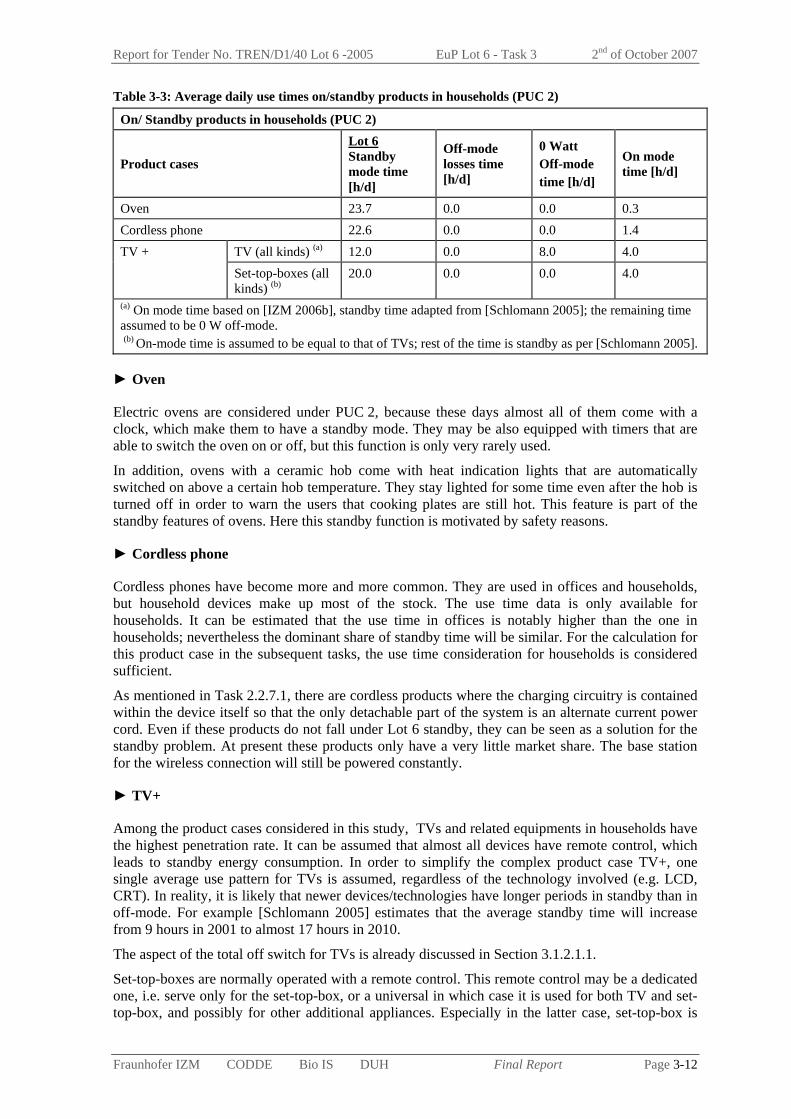
Report for Tender No. TREN/D1/40 Lot 6 -2005 EuP Lot 6 - Task 3 2nd of October 2007
Fraunhofer IZM CODDE Bio IS DUH Final Report Page 3-12
Table 3-3: Average daily use times on/standby products in households (PUC 2)
On/ Standby products in households (PUC 2)
Product cases
Lot 6 Standby mode time [h/d]
Off-mode losses time [h/d]
0 Watt Off-mode time [h/d]
On mode time [h/d]
Oven 23.7 0.0 0.0 0.3 Cordless phone 22.6 0.0 0.0 1.4
TV (all kinds) (a) 12.0 0.0 8.0 4.0 TV + Set-top-boxes (all kinds) (b)
20.0 0.0 0.0 4.0
(a) On mode time based on [IZM 2006b], standby time adapted from [Schlomann 2005]; the remaining time assumed to be 0 W off-mode. (b) On-mode time is assumed to be equal to that of TVs; rest of the time is standby as per [Schlomann 2005].
► Oven
Electric ovens are considered under PUC 2, because these days almost all of them come with a clock, which make them to have a standby mode. They may be also equipped with timers that are able to switch the oven on or off, but this function is only very rarely used.
In addition, ovens with a ceramic hob come with heat indication lights that are automatically switched on above a certain hob temperature. They stay lighted for some time even after the hob is turned off in order to warn the users that cooking plates are still hot. This feature is part of the standby features of ovens. Here this standby function is motivated by safety reasons.
► Cordless phone
Cordless phones have become more and more common. They are used in offices and households, but household devices make up most of the stock. The use time data is only available for households. It can be estimated that the use time in offices is notably higher than the one in households; nevertheless the dominant share of standby time will be similar. For the calculation for this product case in the subsequent tasks, the use time consideration for households is considered sufficient.
As mentioned in Task 2.2.7.1, there are cordless products where the charging circuitry is contained within the device itself so that the only detachable part of the system is an alternate current power cord. Even if these products do not fall under Lot 6 standby, they can be seen as a solution for the standby problem. At present these products only have a very little market share. The base station for the wireless connection will still be powered constantly.
► TV+
Among the product cases considered in this study, TVs and related equipments in households have the highest penetration rate. It can be assumed that almost all devices have remote control, which leads to standby energy consumption. In order to simplify the complex product case TV+, one single average use pattern for TVs is assumed, regardless of the technology involved (e.g. LCD, CRT). In reality, it is likely that newer devices/technologies have longer periods in standby than in off-mode. For example [Schlomann 2005] estimates that the average standby time will increase from 9 hours in 2001 to almost 17 hours in 2010.
The aspect of the total off switch for TVs is already discussed in Section 3.1.2.1.1.
Set-top-boxes are normally operated with a remote control. This remote control may be a dedicated one, i.e. serve only for the set-top-box, or a universal in which case it is used for both TV and set-top-box, and possibly for other additional appliances. Especially in the latter case, set-top-box is

Report for Tender No. TREN/D1/40 Lot 6 -2005 EuP Lot 6 - Task 3 2nd of October 2007
Fraunhofer IZM CODDE Bio IS DUH Final Report Page 3-13
likely to be switched to standby together with the TV. However, set-top-boxes are rarely switched off at mains or unplugged.
There is a trend towards further additional devices like speakers or AV receivers creating a “TV-based media centre” and a trend towards PCs with all additional devices equipped and used as a “PC-based media centre”. Both can lead to increasing standby levels, where so far the most effective possibility for users is the use of external off switches like switched power strips (multiway connectors) or master-slave power strips.
3.1.2.6. PUC 3: Job-based on
PUC 3 EuPs are characterised by changing into a transition mode after running a defined “job” in on-mode. While for PUC 2 devices the standby mode is always activated manually, for PUC 3 devices this can also be done automatically.
Technical factors for influencing the real life efficiency are the overall reduction of power consumption in various standby and off-modes, the fast transition into standby or off-mode, as well as automatically remaining in the lowest power level as long as possible. “False wake-up” problems, e.g. in the case of network printers, will be analysed in Task 5.
Despite the “automation”, the user behaviour is an important factor in determining the real life efficiency. Firstly, the programming of jobs and mode settings of a device is usually done by the user. From the user perspective fast and comfortable reactivation is a typical demand. However, an instant reactivation from standby or off cannot be achieved for all products.
Secondly, the user might deactivate power saving features when the individual usability is restricted by presettings. An exceptional case may be that the user accepts a longer reactivation time when the amount of power consumption (for ready) has considerable financial implications. When a user can save a certain amount of money, he might take some inconveniences into account.
Table 3-4 shows the selected product cases of PUC 3 devices in households and Table 3-5 examples for product cases in offices with their average daily using times in different modes. The data is from [Schlomann 2005] unless otherwise mentioned.
Table 3-4: Average daily use times job-based products in households
Job-based products in households
Product cases Lot 6 Standby mode time [h/d]
Off-mode losses time [h/d]
0 Watt off-mode time [h/d]
On mode time [h/d]
Washing machine 3.0 20.0 0.0 1.0 DVD 15.6 4.0 3.8 0.6 Audio minisystem 17.1 1.4 2.1 3.4 Fax 23.1 0.0 0.0 0.9
Desktop 9.2 11.1 0.0 3.7 Notebook 9.0 11.7 0.0 3.3 Monitors (a) 9.6 11.6 0.0 2.8 PC speakers 2.4 13,4 6.4 1.8 Broadband modem (incl. WLAN)
20.0 0.0 0.0 4.0
PC+
Dial-up modem 2.6 12.0 5.4 4.0 Printers, laser 1.9 13.1 8.9 0.1 Printers, inkjet 1.9 17.7 4.3 0.1 (a) The use pattern is a stock-weighted average of the individual, product-type specific use patterns from [Schlomann 2005].

Report for Tender No. TREN/D1/40 Lot 6 -2005 EuP Lot 6 - Task 3 2nd of October 2007
Fraunhofer IZM CODDE Bio IS DUH Final Report Page 3-14
Table 3-5: Average daily use times job-based products in offices Job-based products in offices
Product cases Lot 6 Standby mode time [h/d]
Off-mode losses time [h/d]
0 Watt off-mode time [h/d]
On modetime [h/d]
Fax Machine (inkjet, laser, thermal) 23.1 0.0 0.0 0.9
Desktop 8.8 9 0.0 6.2
Notebook 9.0 11.7 0.0 3.3
Monitors 10.4 6.5 0.0 7.1 PC+
Hubs 16.0 0.0 0.0 8.0
Printer, inkjet 6.0 14.2 3.5 0.3
Printer laser 5.9 14.2 3.5 0.4 (a) The use pattern is a stock-weighted average of the individual, product-type specific use patterns from the source. (b) The use pattern is calculated based on the assumed on-mode time of 10h per working day (on-mode time is longer than for an individual computer, as the hub is shared by a number of computers), the remaining time being standby mode. There is assumed 52*5 working days per year. The calculation leads to an average of 6 hours in on-mode per day.
► Washing machine
Lot 6 covers washing machines used in households. For the traditional washing machine, the standby power consumption is not related to the energy needs of the washing process or the user convenience. Standby mode is rather implemented due to safety reasons. The danger and consequences of water damage might be evaluated as more substantial than e.g. a couple of Watts standby consumption for continuously running water stop sensors. Increasingly, washing machines are also equipped with soft touch buttons and displays, which are continuously running, also outside of the wash cycle. This means that modern washing machines always remain in standby and only few have an off-mode (with or without losses).
Other transitional and standby modes are timer operated, such as the delay until the door can be opened after a wash cycle and the functions that periodically turn the washing drum at the end of the washing cycle to achieve “wrinkle free” laundry. The future developments in the direction of intelligent home might lead to washing machines equipped with network interfaces, but they are not considered to have substantial sales yet.
► DVD
DVD players are mainly used in households. Their market share is increasing and according to gfu/GfK information from Germany [gfu 2006] there is a trend from DVD players towards DVD recorders. Regarding standby issues, this can lead to higher losses because more functions are provided in standby mode and because the existence of a timer is vital in order to program recordings.
Taking this request as a given precondition, technical solutions seem to be the most effective solution. These will be discussed in Tasks 6 and 7 (BAT and improvement options).
► Audio minisystem
It can be assumed that audio minisystems are also used in households only. They are normally equipped with a continuously running clock display, a remote control and in most cases the single
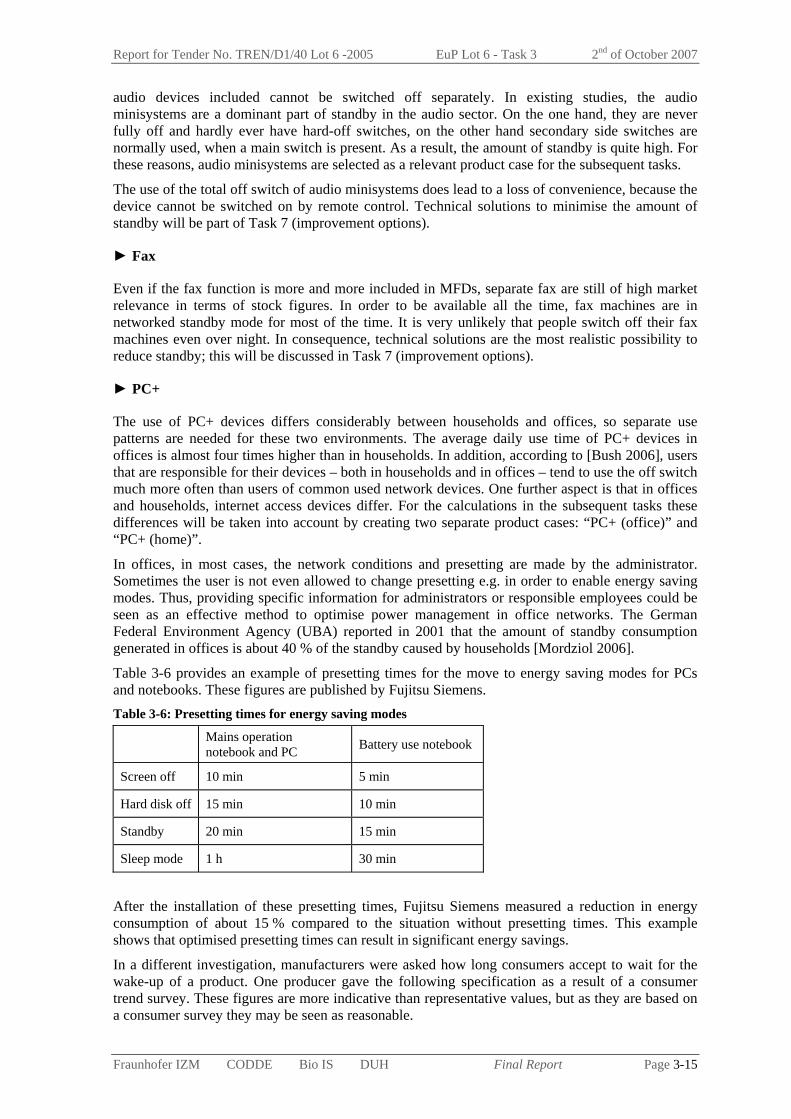
Report for Tender No. TREN/D1/40 Lot 6 -2005 EuP Lot 6 - Task 3 2nd of October 2007
Fraunhofer IZM CODDE Bio IS DUH Final Report Page 3-15
audio devices included cannot be switched off separately. In existing studies, the audio minisystems are a dominant part of standby in the audio sector. On the one hand, they are never fully off and hardly ever have hard-off switches, on the other hand secondary side switches are normally used, when a main switch is present. As a result, the amount of standby is quite high. For these reasons, audio minisystems are selected as a relevant product case for the subsequent tasks.
The use of the total off switch of audio minisystems does lead to a loss of convenience, because the device cannot be switched on by remote control. Technical solutions to minimise the amount of standby will be part of Task 7 (improvement options).
► Fax
Even if the fax function is more and more included in MFDs, separate fax are still of high market relevance in terms of stock figures. In order to be available all the time, fax machines are in networked standby mode for most of the time. It is very unlikely that people switch off their fax machines even over night. In consequence, technical solutions are the most realistic possibility to reduce standby; this will be discussed in Task 7 (improvement options).
► PC+
The use of PC+ devices differs considerably between households and offices, so separate use patterns are needed for these two environments. The average daily use time of PC+ devices in offices is almost four times higher than in households. In addition, according to [Bush 2006], users that are responsible for their devices – both in households and in offices – tend to use the off switch much more often than users of common used network devices. One further aspect is that in offices and households, internet access devices differ. For the calculations in the subsequent tasks these differences will be taken into account by creating two separate product cases: “PC+ (office)” and “PC+ (home)”.
In offices, in most cases, the network conditions and presetting are made by the administrator. Sometimes the user is not even allowed to change presetting e.g. in order to enable energy saving modes. Thus, providing specific information for administrators or responsible employees could be seen as an effective method to optimise power management in office networks. The German Federal Environment Agency (UBA) reported in 2001 that the amount of standby consumption generated in offices is about 40 % of the standby caused by households [Mordziol 2006].
Table 3-6 provides an example of presetting times for the move to energy saving modes for PCs and notebooks. These figures are published by Fujitsu Siemens. Table 3-6: Presetting times for energy saving modes
Mains operation notebook and PC Battery use notebook
Screen off 10 min 5 min
Hard disk off 15 min 10 min
Standby 20 min 15 min
Sleep mode 1 h 30 min
After the installation of these presetting times, Fujitsu Siemens measured a reduction in energy consumption of about 15 % compared to the situation without presetting times. This example shows that optimised presetting times can result in significant energy savings.
In a different investigation, manufacturers were asked how long consumers accept to wait for the wake-up of a product. One producer gave the following specification as a result of a consumer trend survey. These figures are more indicative than representative values, but as they are based on a consumer survey they may be seen as reasonable.

Report for Tender No. TREN/D1/40 Lot 6 -2005 EuP Lot 6 - Task 3 2nd of October 2007
Fraunhofer IZM CODDE Bio IS DUH Final Report Page 3-16
Table 3-7: User expectations of wake-up times for EuPs
Devices and modes: Typical accepted wake-up times for notebooks [s]
Screen 1 s
Hard disk 4 – 5 s
Standby 5 s
Sleep mode 30 s
Regarding wake-up time expectations, there are no huge differences between office and private use. At most it can be estimated that in office use, the time pressure might lead to reduced waiting tolerance – but in home environments unexpectedly long waiting times can likewise be interpreted as a fault of the product, if no feedback is given that the product is in the process of waking up.
► Laser printers
Laser printers are typically used in office environments.
According to field-tests [Bush 2006], quite a high proportion of standby consumption in offices is caused by the use of printers, copiers and MFDs in networks. Reducing this standby consumption in office environment is not mainly a technical problem, because in most cases these devices do have energy saving modes. It is much more a behavioural problem because the users have only very little tolerance to wait for the wake-up of a device when they order a print or copy job. Consequently, the energy saving mode is often disabled or set to long delay times. Yet, the fact that laser printers consume a lot of energy in on-mode and even in transitional “ready” modes strongly supports installation and the strictly use of standby modes. This necessarily includes minimising the wake-up times as far as possible. With every extension of the waiting time, the chance that energy saving modes are disabled increases disproportionately.
► Inkjet printer
While laser printers are more common in office environments than in households, the reverse applies for inkjet printers. A major part of the inkjet printers operating in Europe can be attributed to home usage. In consequence, it seems reasonable to base the use pattern for inkjet printers on a use pattern in home environments.
It is estimated that in households, inkjet printers are predominantly used as single devices and not in a network. The most effective way to reduce standby and off-mode losses here can only be reached by consumer behaviour: the use of the total off-switch as soon as the device is not used, or once more the master-slave power strip as an external option. In the convenience oriented use patterns, inkjet printers should power down as far as possible after each print job (Lot 6 standby) and should possibly detect when the connected computer is switched off (possibly leading to an auto-off as well). Another growing aspect for inkjet printers are external power supplies, leading to off-mode losses even when the printer is switched off.
Possible further technical solutions will be discussed in Task 7 (improvement potential).
In consequence again technical solutions for the minimisation of standby are to be taken into consideration in Task 7 (improvement options).
3.2. End-of-Life Behaviour (Task 3.2) The average economical lifetime of a product – the actual time from purchase to disposal – is an important information for estimating the stock and the specific environmental impact of standby and off-mode losses of relevant products over a longer time period.

Report for Tender No. TREN/D1/40 Lot 6 -2005 EuP Lot 6 - Task 3 2nd of October 2007
Fraunhofer IZM CODDE Bio IS DUH Final Report Page 3-17
The decision of the user to discard a product, to keep it for instance in secondary use (e.g. a TV-set or PC for the children) or to sell or donate the product for second hand use is the main aspect that matters for the issue of standby. Longer use of inefficient products delays the shift to newer products and thus delays the shift to lower standby and off-mode consumptions. Apart from that, it might change the introduction of new types of products, and new functions or new forms of power supply (more EPS, possibly fuel cells) could influence the scenarios to a larger extent.
However, in view of ecodesign measures for reducing standby power consumption there is no considerable impact or direct requirements deriving from the economical lifetime or the end-of-life behaviour.
From the opposite perspective there might be some implications as the following example shows. Some technical measures to reduce standby could lead to a change in end-of-life treatment. If a buffer battery (or a supercap, a solar panel, etc.) were to be used to avoid standby or to achieve a 0 W mode, then the treatment according to the battery directive and (if applicable) the WEEE directive might change.
In the subsequent tasks, most of the Lot 6 calculations are done for one year. For the life time calculations (LCC) and for the scenarios of product replacement rates, simplified life time values are required. Life times figures collected in the literature are provided Table 3-8. Values selected for the subsequent tasks are provided in Table 3-9.

Report for Tender No. TREN/D1/40 Lot 6 -2005 EuP Lot 6 - Task 3 2nd of October 2007
Fraunhofer IZM CODDE Bio IS DUH Final Report Page 3-18
Table 3-8: Use duration for product cases according to various sources Lifetime Source
EPS mobile phone 3 y [Bio 2006]magnetic 5.5 y [Bio 2006]electronic 5.5 y [Bio 2006]
Decken- und Wandleuchten 20 yRadio 8.7 y [Schlomann 2004]
Electric toothbrush 4 y [Bio 2006]
Cooker 13 y [Bauknecht 2005]Elektroeinbauherd mit Backofen 15 y
Cordless phone Cordless phone base station 7.2 y [Schlomann 2004]Cathode ray TV 10.7 y [Schlomann 2004]CRT Television 7.7y [EES 2006a]
Plasma Television 1.8y [EES 2006a]LCD TV 10.7 y [Schlomann 2004]
Plasma TV 10.7 y [Schlomann 2004]TV (avg. 2006) 15 y [Lot 5]TV (avg. future) 12 y [Lot 5]Set-top-boxes 8.7 y [Schlomann 2004]
Washing machine 12.2 y [Schlomann 2004]Clothes washer 7.0 y [EES 2006a]
Washing machine 7 y (low) [Lot 13&14]Washing machine 14 y (high) [Lot 13&14]Washing machine 11 y (avg.) [Lot 13&14]Waschmaschine 15 y
Washing machine 6.5 y [EURECO 2002]DVD player/recorder 8.7 y [Schlomann 2004]
DVD player 1.8y [EES 2006a]DVD recorder 0.7 [EES 2006a]
Audio minisystem Audio compact system 8.7 y [Schlomann 2004]Facsimiles 4.9 y [Schlomann 2004]
Facsimile Machines 8 y [Lot 4]Monitor Cathode ray 5.0 y [Schlomann 2004]
CRT 6.0 y [Lot 3]CRT Computer Monitor 4.6y [EES 2006a]
Monitor LCD 5.0 y [Schlomann 2004]LCD 6.0 y [Lot 3]
LCD Computer Monitor 1.4y [EES 2006a]Computer Notebook 6.2 y [Schlomann 2004]
Laptop 5.0 y [Lot 3]Laptop 2.8y [EES 2006a]
Computer PC 4.5 y [Schlomann 2004]Desktop PC 6.0 y [Lot 3]Computers 3.5y [EES 2006a]
Computer Speaker 3.9 y [EES 2006a]Splitter, Modem, … 4.0 y [Schlomann 2004]
Printer Laser (home) 5.2 y [Schlomann 2004]Printer Laser (office) 4.9 y [Schlomann 2004]
Laser printer 3.6y [EES 2006a]EP Printer 6 y [Lot 4]
Printer Inkjet (home) 5.2 y [Schlomann 2004]Printer Inkjet (office) 4.9 y [Schlomann 2004]
Inkjet Printer 4.4y [EES 2006a]Inkjet Printer 4 y [Lot 4]
Inkjet printer
Fax
PC+(office+home)
Laser printer
PUC 1
PUC 2
PUC 3
DVD
Electric oven
Lighting
Washing machine
TV+

Report for Tender No. TREN/D1/40 Lot 6 -2005 EuP Lot 6 - Task 3 2nd of October 2007
Fraunhofer IZM CODDE Bio IS DUH Final Report Page 3-19
Table 3-9: Selected life times for the 15 product cases considered in this study
Product case Life time (years) Source
EPS (mobile phone) 3.0 [BIO 2007]
Lighting 15.0 Based on [BIO 2007] and [Mietrechtspraxis]
Radio 8.7 [Schlomann 2004]
Electric toothbrush 4.0 [BIO 2007]
Oven 15.0 [Mietrechtspraxis 2007]
Cordless phone 7.2 [Schlomann 2004]
TV+ 10.0 [IZM 2006b]
Washing machine 12.0 [ENEA 2006]
DVD 8.7 [Schlomann 2004]
Audio minisystems 8.7 [Schlomann 2004]
Fax 8.0 [IZM 2006a]
PC+ 6.0 [IVF 2006]
Laser printer 6.0 [IZM 2006a]
Inkjet printer 4.0 [IZM 2006a]
3.3. Local Infrastructure (Task 3.3)
3.3.1. Implication of networks
Increasing overall standby power consumption is somewhat related to information and communication network infrastructures. Networks are linking products and usually provide some functionalities, even while one or more of the connected products are not actively used. The accessibility of a network (workgroup) printer is a typical example. If users can demand the printing service at any time, then the device has to be in networked standby constantly and may not be switched off. However this allows reducing the overall number of printers in an office environment. In this case, standby is a very reasonable feature. But at the same time the printer should be able to stay in a standby mode when not in demand. Constant network control features might lead to a constant ready-mode of the printer. This effect had been observed in the field tests already mentioned. Therefore it is important that PUC 3 products have a fast transition into standby and remain in standby while their main function is not actively in demand.
The trend towards multi function devices (MFD) is also an important aspect. MFDs such as the ones that include facsimile function are always online. In the case of high thermal printing technology such as the laser printer, it is essential that the printing unit, and particularly the fusing unit, is not constantly active (heated). MFDs should be enabled to provide single functions such as waiting and starting to receive a facsimile with the lowest possible standby. The other main function blocks of the MFD should only be activated on real demand (job). One further relevant aspect regarding the energy consumption is the time duration for the heating process for laser products. It is essential that the heating time is minimized as far as possible, and manufacturers have made progress in this direction. Technical solutions will be discussed in Task 6 and 7.
A second aspect is “active standby high” in the case of PUC 2 products such as televisions. Digital TV broadcasting opens the possibility to provide electronic program updates and other downloads

Report for Tender No. TREN/D1/40 Lot 6 -2005 EuP Lot 6 - Task 3 2nd of October 2007
Fraunhofer IZM CODDE Bio IS DUH Final Report Page 3-20
while a device is in standby. In this case the frequency and duration of the active downloading phase is an important factor influencing power consumption. The increasing use of TV peripheral devices such as room antenna (with EPS), digital receiver or decoder set-top-boxes, and video equipment for recording programs needs also to be pointed out. Only the set-top-boxes are currently included in the TV+ product case. The services these products provide are not separated. They work as an infrastructure together in active mode as well as in standby mode.
Another example is the field of telephony, where the use of cordless phones is still increasing, with many of these phones including an answering machine. While the phone is put on the cradle it charges until the phone indicates no further demand. The base station is actively sending and receiving control signals when the phone is off the cradle. The distribution of power consumption in both cases has to be investigated. The trends towards IP telephony – encroaching on the cordless phone markets – are very hard to predict and to integrate in the data. IP telephony is concerned by both issues of constant network activity and charger cradle issues.
The networking aspects become even more significant in the case of “intelligent homes” where all intelligent features in the house are linked to each other via a built-in network. For example, a refrigerator with a touch-sensitive computer screen fitted on the door serves as the platform and communication centre for the networked features; a video camera serves to record messages via broadband communication and via always-on Internet also. Further examples of appliances linked by network are web-based telephones, television and radio. As the kitchen appliances are networked, information about a water leak from the dishwasher, a cooker that has been left on, or an open freezer door, is displayed on a touch-screen terminal by the entrance door and is also sent to a WAP phone and/or by email. Such innovative energy efficiency features may allow saving money by reducing heating and ventilation when nobody is at home. Other features that allow energy and money savings are proximity-activated lightings, that switch themselves automatically off when the family leaves the house, etc. However, all the innovative gadgets may increase significantly the standby consumption of these devices (all in continuous networked standby; practically no switching off of devices) and thus minimising such consumption will render such homes efficient in addition to being intelligent.
3.4. Task 3 Conclusions The real-life efficiency of EuPs considered in this study is highly dependent on the interaction between technical features and consumer behaviour. Considerations on these aspects were specified for each of the PUCs. The specific conclusion for the three PUCs shows diverging relevance of both aspects.
Generally, in order to reduce standby and off-mode losses the user has to be supplied with technical means and relevant information to do so. Basically no consumer asks for unnecessary standby or off-mode losses, because losses as a matter of principle are of no use. But consumers ask for convenient technical solutions and functions, which may require the appliances to have standby functions.
From the user side, there should be two priority strategies:
To give maximum control to users for powering down products
To automate and optimise the PUC 3 products without a need for user intervention
The first priority strategy may include the hard-off switch as an option. However, many arguments against hard-off switches have also been brought up during the product case discussions above (potential loss of function or convenience, necessity of user awareness and intervention, potential increase of production costs).
For PUC 1 devices, a 0 Watt solution can be technically realised with the exception of EPS powered devices. But there are strong reversed trends. The first one is the increasing trend towards EPS that are responsible for constant off-mode losses, except if unplugged or if hard-off switches exist. Secondly, the trend towards an increasing use of small electronic devices tends to move from PUC 1 to PUC 2 (some standby function), and PUC 2 devices tend to get more intelligent and

Report for Tender No. TREN/D1/40 Lot 6 -2005 EuP Lot 6 - Task 3 2nd of October 2007
Fraunhofer IZM CODDE Bio IS DUH Final Report Page 3-21
become networked PUC 3 devices. As a result it is impossible to completely eliminate standby or off-mode losses.
Regarding maximum control to minimise standby times, a galvanic disconnection (hard-off) is an important option, which is still expected by many consumers. At the same time, the power supply of products with standby or soft off switches should be technically improved in order to reduce power draw for specific functions as far as possible. Concrete technical solutions to minimise these losses will be discussed in Tasks 6 and 7 when BAT and improvement options are discussed.
Especially for the office sector, technical solutions for the network use are needed in order to handle the lack of awareness, which causes that many devices in the office use are not switched off at night or at weekends, or are frequently disrupted from standby modes without need. In the future, with increasing home networks, this aspect will be more and more relevant for domestic devices as well.
Furthermore, the provision of the necessary consumer information for private and professional users is of great importance. It obviously makes a difference where and how information is made available. Transparent, easy to understand and comparative information at the point of sales, or even better in marketing or sales conversation, could help the consumers in their buying decision. This support will allow the consumer to take into account standby and off-mode losses issues when buying a new device and can also influence the consumer behaviour in the use phase. Other studies also indicate that consumer awareness regarding the topic of standby and off-mode losses still needs improvement. The aim is to enable users to act environmentally sound. As e.g. the mentioned study [Gudbjerg 2006] revealed, although information campaigns and active consumer education are not cost effective; they are necessary complements to technical solutions, rather than being the solution themselves. To identify the options and priorities regarding technical solutions will be the focus in the further investigations of this study.

Report for Tender No. TREN/D1/40 Lot 6 -2005 EuP Lot 6 - Task 4 2nd of October 2007
Fraunhofer IZM CODDE Bio IS DUH Final Report Page 4-i
EuP Preparatory Study Lot 6 Standby and Off-mode Losses
Task 4 Technical Analysis Existing Products Final Report
Compiled by Fraunhofer IZM
Contractor: Fraunhofer Institute for Reliability and Microintegration, IZM, Berlin
Department Environmental Engineering
Dr.-Ing. Nils F. Nissen
Gustav-Meyer-Allee 25, 13355 Berlin, Germany
Contact:
Tel.: +49-30-46403-132
Fax: +49-30-46403-131
Email: [email protected]
Berlin, 2nd of October 2007
Disclaimer
The findings presented in this report are results of the research conducted by the IZM consortium and the continuous feedback from a wide range of stakeholders. The statements and recommendations presented in the final report however are not to be perceived as the opinion of the European Commission.
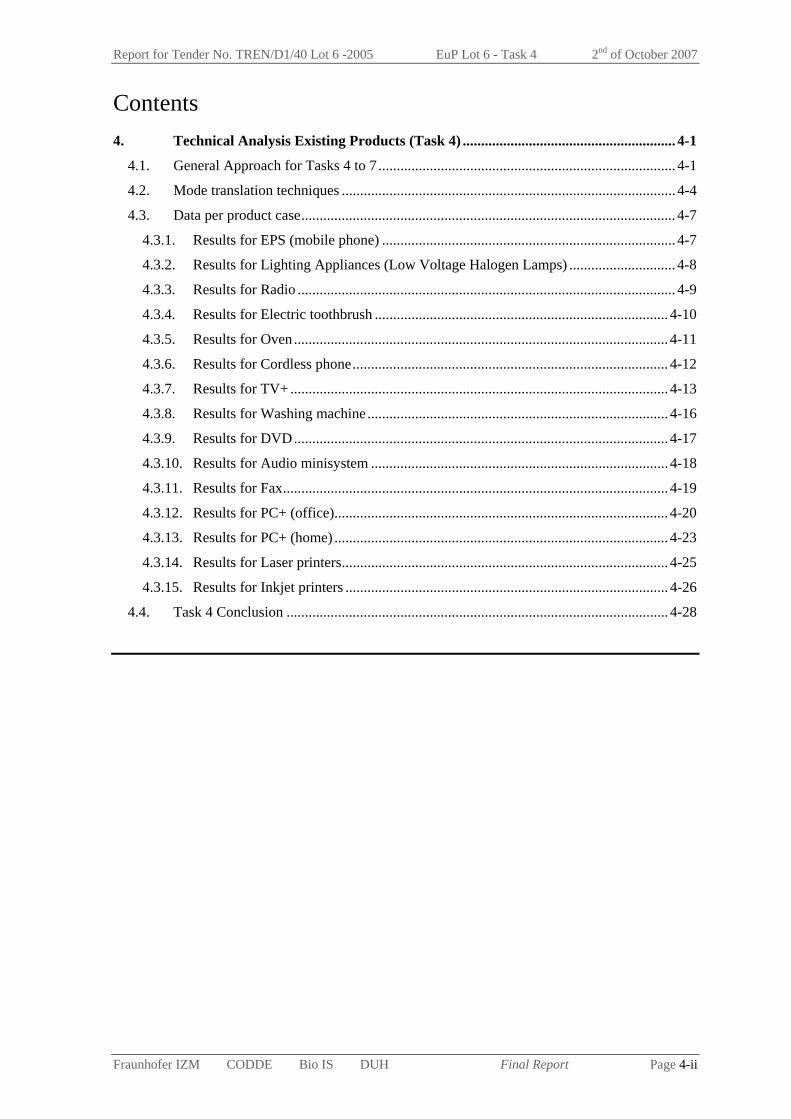
Report for Tender No. TREN/D1/40 Lot 6 -2005 EuP Lot 6 - Task 4 2nd of October 2007
Fraunhofer IZM CODDE Bio IS DUH Final Report Page 4-ii
Contents 4. Technical Analysis Existing Products (Task 4) .......................................................... 4-1
4.1. General Approach for Tasks 4 to 7 ................................................................................. 4-1 4.2. Mode translation techniques ........................................................................................... 4-4 4.3. Data per product case...................................................................................................... 4-7
4.3.1. Results for EPS (mobile phone) ................................................................................ 4-7 4.3.2. Results for Lighting Appliances (Low Voltage Halogen Lamps) ............................. 4-8 4.3.3. Results for Radio ....................................................................................................... 4-9 4.3.4. Results for Electric toothbrush ................................................................................ 4-10 4.3.5. Results for Oven...................................................................................................... 4-11 4.3.6. Results for Cordless phone...................................................................................... 4-12 4.3.7. Results for TV+ ....................................................................................................... 4-13 4.3.8. Results for Washing machine.................................................................................. 4-16 4.3.9. Results for DVD...................................................................................................... 4-17 4.3.10. Results for Audio minisystem ................................................................................. 4-18 4.3.11. Results for Fax......................................................................................................... 4-19 4.3.12. Results for PC+ (office)........................................................................................... 4-20 4.3.13. Results for PC+ (home) ........................................................................................... 4-23 4.3.14. Results for Laser printers......................................................................................... 4-25 4.3.15. Results for Inkjet printers ........................................................................................ 4-26
4.4. Task 4 Conclusion ........................................................................................................ 4-28
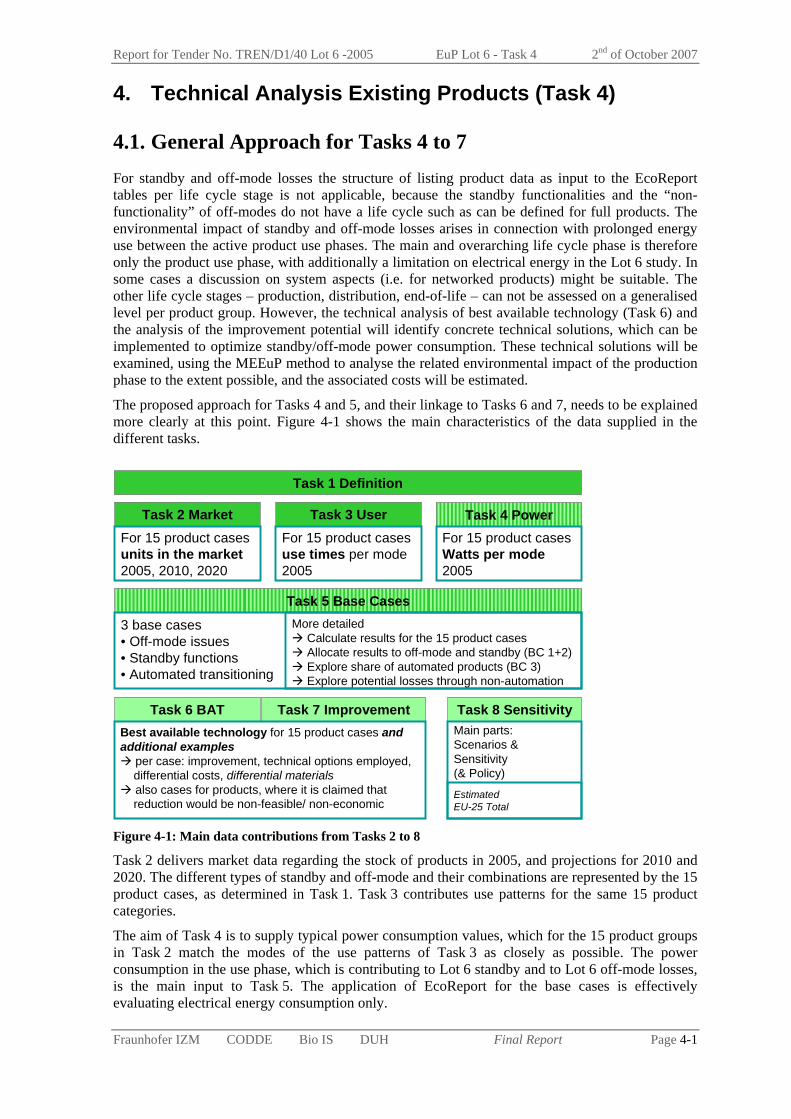
Report for Tender No. TREN/D1/40 Lot 6 -2005 EuP Lot 6 - Task 4 2nd of October 2007
Fraunhofer IZM CODDE Bio IS DUH Final Report Page 4-1
4. Technical Analysis Existing Products (Task 4)
4.1. General Approach for Tasks 4 to 7 For standby and off-mode losses the structure of listing product data as input to the EcoReport tables per life cycle stage is not applicable, because the standby functionalities and the “non-functionality” of off-modes do not have a life cycle such as can be defined for full products. The environmental impact of standby and off-mode losses arises in connection with prolonged energy use between the active product use phases. The main and overarching life cycle phase is therefore only the product use phase, with additionally a limitation on electrical energy in the Lot 6 study. In some cases a discussion on system aspects (i.e. for networked products) might be suitable. The other life cycle stages – production, distribution, end-of-life – can not be assessed on a generalised level per product group. However, the technical analysis of best available technology (Task 6) and the analysis of the improvement potential will identify concrete technical solutions, which can be implemented to optimize standby/off-mode power consumption. These technical solutions will be examined, using the MEEuP method to analyse the related environmental impact of the production phase to the extent possible, and the associated costs will be estimated.
The proposed approach for Tasks 4 and 5, and their linkage to Tasks 6 and 7, needs to be explained more clearly at this point. Figure 4-1 shows the main characteristics of the data supplied in the different tasks.
Task 2 Market Task 3 User Task 4 Power
Task 5 Base Cases
Task 6 BAT Task 7 Improvement Task 8 Sensitivity
For 15 product casesunits in the market2005, 2010, 2020
For 15 product casesuse times per mode2005
Best available technology for 15 product cases and additional examples
per case: improvement, technical options employed,differential costs, differential materialsalso cases for products, where it is claimed thatreduction would be non-feasible/ non-economic
Main parts:Scenarios &Sensitivity(& Policy)
Estimated EU-25 Total
For 15 product casesWatts per mode2005
3 base cases• Off-mode issues• Standby functions• Automated transitioning
More detailedCalculate results for the 15 product casesAllocate results to off-mode and standby (BC 1+2)Explore share of automated products (BC 3)Explore potential losses through non-automation
Task 1 Definition
Figure 4-1: Main data contributions from Tasks 2 to 8
Task 2 delivers market data regarding the stock of products in 2005, and projections for 2010 and 2020. The different types of standby and off-mode and their combinations are represented by the 15 product cases, as determined in Task 1. Task 3 contributes use patterns for the same 15 product categories.
The aim of Task 4 is to supply typical power consumption values, which for the 15 product groups in Task 2 match the modes of the use patterns of Task 3 as closely as possible. The power consumption in the use phase, which is contributing to Lot 6 standby and to Lot 6 off-mode losses, is the main input to Task 5. The application of EcoReport for the base cases is effectively evaluating electrical energy consumption only.

Report for Tender No. TREN/D1/40 Lot 6 -2005 EuP Lot 6 - Task 4 2nd of October 2007
Fraunhofer IZM CODDE Bio IS DUH Final Report Page 4-2
On the other hand Task 7 (improvement potentials) needs to be based on a trade-off between costs over the life cycle and the achievable environmental improvements (to determine the point of Least Life-Cycle Costs, LLCC). For Lot 6 this can be achieved by introducing “differential” costs and “differential” impacts. In most cases the differential environmental impacts will only be determined by a different mix of changed power consumption levels. BAT examples (Task 6) must concentrate on working out the differential costs regarding product price attributable to standby changes and the difference in energy consumption over a typical life cycle. From the energy savings over the life cycle the differential costs to the user (reduced electricity costs) can then additionally be calculated.
In principle, changes in the material composition from the previous product generation to the improved version would also need to be taken into the EcoReport calculation. The differential material bill can be prepared as an input for the EcoReport – and indeed the EcoReport is processing also negative material inputs (i.e. a material reduction “caused” by reducing standby or off-mode, rather than an increase of materials to achieve an energy reduction can also be modelled). For standby, however, it could be that the material changes introduced through optimizing standby can not be separated from other material changes caused by the redesign, and a separate evaluation of the differential environmental impact is possibly not feasible. The differential impact from use energy would still be a possible input to evaluation of the design options.
Task 2Market
Task 3User
Task 4Power
Task 5Base Cases
2005
sto
ck d
ata
for 1
5 pr
oduc
t cas
es
[mill
ions
]
Part 1: EcoReport results for 15 product cases
Part 2: Aggregation and discussion as 3 base cases• Off-mode issues• Standby functions• Automated transitioningA
vg. h
rs p
er m
ode
for 1
5 pr
oduc
t cas
es
[h/d
or h
/y]
Avg
. W p
er m
ode
for 1
5 pr
oduc
t cas
es
[W o
r Wh/
h]
Energy consumption per year, total stock EU-25 for 2005, Lot 6 product cases
0
2
4
6
8
10
12
14
EPS mob
ile ph
one
Lighti
ngRadio
Electric
tooth
brush
Electric
oven
Cordles
s pho
ne
TV+
Was
hing m
achin
eDVD
Audio
minisy
stem
Fax
PC+ (off
ice)
PC+ (ho
me)
Lase
r prin
ter
Inkjet
printer
TWh
per y
ear
Off-ModeLossesPassiveStandbyNetworkedStandby
Figure 4-2: Combining the data from Tasks 2, 3 and 4 to generate Base Cases
Figure 4-2 shows the Lot 6 calculations up to Task 5. Because a variety of sources are used to estimate and validate the average power consumption level in Task 4, specific values have to be transferred from the context of the source to the definition context of Lot 6. These “mode translations” will be introduced in Task 4. Additional incongruities between the modes covered in a product case in Task 4 and the market and user data already published in Tasks 2 and 3 can occur and will be addressed for each product case in Task 4. Examples are modes, which do not apply to all products identified as a market segment in Task 2 (e.g. the percentage of low voltage halogen lights equipped with a secondary side switch) or which might have been oversimplified in the use patterns in Task 3. Effectively, corrective factors can be applicable to either Task 2, Task 3 or Task 4 values, and as long as the correction is only done once, the assessment results will be the same.
The reason this is being addressed now in Task 4 is that the different sources have indeed used different averaging, aggregation and scoping approaches, so the data to be used further on needs to be reconciled at this stage. Some of the corrective factors have been inserted into Task 2 and Task3 during revisions.

Report for Tender No. TREN/D1/40 Lot 6 -2005 EuP Lot 6 - Task 4 2nd of October 2007
Fraunhofer IZM CODDE Bio IS DUH Final Report Page 4-3
The main results in Task 5 will be EcoReport assessments of the 15 product cases and an aggregation of individual mode contributions into 3 base cases.
Task 7Improvement pot.
Task 6BAT
Task 7Selection
Structure into • Options• Differential impacts• Differential costs
• Combine options• Determine LLCC• Determine
theoretical BAT
(Single product view)
Best available technology examples from 15 product cases- differential product cost- differential energy use- implicit energy costs- differential materials
(where possible)
Additional BAT examples from Lot 6 investigation scope (mains connected household + office)
Additional BNAT examples
List technical improvement optionsat least- differential costs- differential energy usenecessary
Choose further usable examples for LLCC
Task 8Scenario AnalysisCheck suitability of LLCC options forgeneralizing to• product cases
or• base cases(Market totals view)
Compare LLCC to "business as usual"
Estimate totals for wider product scope (which have not been covered)
Figure 4-3: Overview of Task 6 and 7 in the context of Lot 6 and the analysis of LLCC in Task 8
The Task 6 investigations will concentrate on industry examples for the 15 product cases, but will take on board other product examples as well. The goal is to show best available product features (already on the market) and best available technologies (on the market in 2-3 years, according to MEEuP method). Task 6 examples will need to include a differential view at energy use and costs and environmental impacts before and after a redesign, as explained above.
Those examples will then be structured in Task 7 into design options and combinations of design options, for which the differential costs and impacts must be quantifiable. For these combinations the LLCC will determine a suitable optimization goal.
The question of whether a quantified improvement potential can be applied for a product case or even for a substantial part of a base case will be investigated in Task 8. For Lot 6 this will be a critical point, because the products contributing to a base case will not automatically have similar improvement potentials, nor are the products cases automatically representative enough to draw conclusions regarding products outside of the product cases. An estimate covering more than the 15 product cases for all EU-25 is part of the Task 5 conclusions.
Following from the 3 base cases (and the 3 PUCs as well) the following areas for investigating improvement options can be separated:
Off-mode issues When and how is (near) 0 W off-mode an option? How to minimize off-mode losses to a minimum otherwise
Standby function clusters Determine minimum power requirements for typical function combinations Examine effects of more standby functions and of function blocks, which can
additionally be disabled (e.g. product settings) Automated transitioning
Make sure that potential PUC 3 products have a suitable low power mode Maximize the time an EuP spends in the lower power modes
It follows from the above explanations that the sections of Task 4 and Task 5 deviate from the chapter structure of the final MEEuP methodology. The order of chapters in Task 4 is for example not following the original structure of MEEuP, but is ordered by the 15 product cases selected for

Report for Tender No. TREN/D1/40 Lot 6 -2005 EuP Lot 6 - Task 4 2nd of October 2007
Fraunhofer IZM CODDE Bio IS DUH Final Report Page 4-4
Lot 6. For each product case the sources, mode translations and assumptions are made clear, to arrive at the typical energy use. Those parts of the MEEuP methodology, which are applicable to Lot 6, are principally covered throughout the differently structured sections.
4.2. Mode translation techniques Using power consumption values from different sources entails the danger, that incompatible measurements are used together. Most literature sources do not explicitly note a standard for their measurements or a complete definition or reference to one.
Differences arise from:
Different mode definitions (sometimes as part of a standard) Different measurement procedures (sometimes according to a standard) Different countries covered (different product mix and user behaviour) Temporal differences (year of data collection, year of publication) Different pre-selection of products, especially in conjunction with averaging Different interpretation of product naming and classification Other statistical deviations, e.g. due to small sample sizes
In this section we will mainly deal with techniques to translate according to differences in the underlying mode definitions.
As an example Figure 4-4 shows the translation from the Australian standby studies (e.g. [EnergyConsult 2006]) to the Lot 6 mode definitions. As this example shows, the translation necessitates a differentiation of possible “sub-modes” in the source and a number of decision points, some of which can be taken according to broad attributes or product group features and some, which would require detailed knowledge about the functions offered by individual products.
Active mode(s)
Lot 6 Modes
Off-mode losses
0 Woff-modes
Passivestandby
disc
onne
cted
Networkedstandby
Transitionto standbyor off-mode
Active mode(s)
Australian standby definition
OffPassivestandby
Activestandby
Delaystart
Connected, but no sound, picture,
transmit, receive, waiting to be switched
on, but no remote control wake-up
Not performing main function, but ready to be
switched on (remote control), or perf. some
secondary function (e.g. display, clock)
Mostly AV, where mechanical drives; On
but not main function e.g. not VCR playing or
recording
Programmed to begin
functioning at a later time
EPS of portable appliances, when the
appliance is being charged
EPS of portable appliances, when the appliance is not being
charged
>0 W?network?
media players faxescharging
Figure 4-4: Example mode translation chart from Australian standby definition to Lot 6 modes
In the following tables (Table 4-1 to Table 4-8) the translations for various important sources and for the standards are summarized.
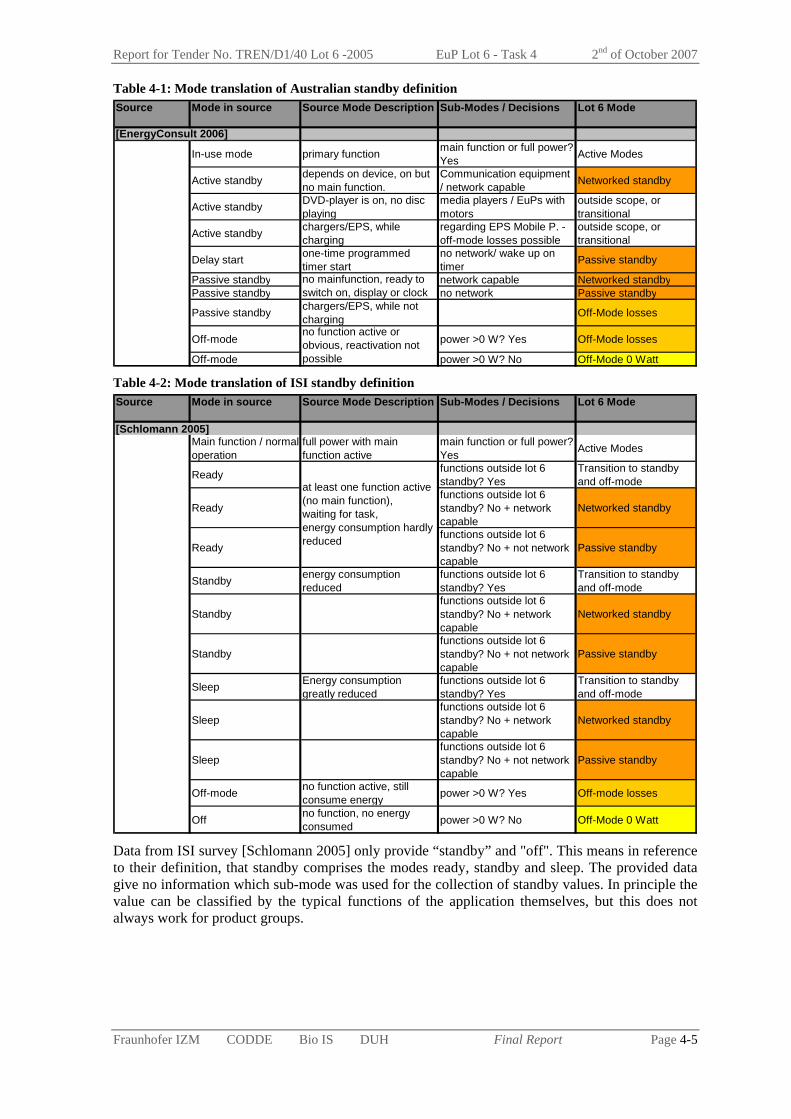
Report for Tender No. TREN/D1/40 Lot 6 -2005 EuP Lot 6 - Task 4 2nd of October 2007
Fraunhofer IZM CODDE Bio IS DUH Final Report Page 4-5
Table 4-1: Mode translation of Australian standby definition Source Mode in source Source Mode Description Sub-Modes / Decisions Lot 6 Mode
In-use mode primary function main function or full power? Yes Active Modes
Active standby depends on device, on but no main function.
Communication equipment / network capable Networked standby
Active standby DVD-player is on, no disc playing
media players / EuPs with motors
outside scope, or transitional
Active standby chargers/EPS, while charging
regarding EPS Mobile P. - off-mode losses possible
outside scope, or transitional
Delay start one-time programmed timer start
no network/ wake up on timer Passive standby
Passive standby network capable Networked standbyPassive standby no network Passive standby
Passive standby chargers/EPS, while not charging Off-Mode losses
Off-mode power >0 W? Yes Off-Mode losses
Off-mode power >0 W? No Off-Mode 0 Watt
[EnergyConsult 2006]
no mainfunction, ready to switch on, display or clock
no function active or obvious, reactivation not possible
Table 4-2: Mode translation of ISI standby definition Source Mode in source Source Mode Description Sub-Modes / Decisions Lot 6 Mode
Main function / normal operation
full power with main function active
main function or full power? Yes Active Modes
Ready functions outside lot 6 standby? Yes
Transition to standby and off-mode
Readyfunctions outside lot 6 standby? No + network capable
Networked standby
Readyfunctions outside lot 6 standby? No + not network capable
Passive standby
Standby energy consumption reduced
functions outside lot 6 standby? Yes
Transition to standby and off-mode
Standbyfunctions outside lot 6 standby? No + network capable
Networked standby
Standbyfunctions outside lot 6 standby? No + not network capable
Passive standby
Sleep Energy consumption greatly reduced
functions outside lot 6 standby? Yes
Transition to standby and off-mode
Sleepfunctions outside lot 6 standby? No + network capable
Networked standby
Sleepfunctions outside lot 6 standby? No + not network capable
Passive standby
Off-mode no function active, still consume energy power >0 W? Yes Off-mode losses
Off no function, no energy consumed power >0 W? No Off-Mode 0 Watt
[Schlomann 2005]
at least one function active (no main function),waiting for task,energy consumption hardly reduced
Data from ISI survey [Schlomann 2005] only provide “standby” and "off". This means in reference to their definition, that standby comprises the modes ready, standby and sleep. The provided data give no information which sub-mode was used for the collection of standby values. In principle the value can be classified by the typical functions of the application themselves, but this does not always work for product groups.

Report for Tender No. TREN/D1/40 Lot 6 -2005 EuP Lot 6 - Task 4 2nd of October 2007
Fraunhofer IZM CODDE Bio IS DUH Final Report Page 4-6
Table 4-3: Mode translation of IEC 62087 standby definition Source Mode in source Source Mode Description Sub-Modes / Decisions Lot 6 Mode
[IEC 62087]
On (play) main function one main function on, time limited possible Active Modes
On (record) record external or internal signal
one main function on, time limited possible Active Modes
Standby-active, high
no main function, exchanging and receiving data + Standby-passive, -active low functions
subordinate standby active high, active network communication
Transition to standby and off-mode
Standby-active, low
switch mode with external signal+ Standby-passive functions
network capable, wake up on netw. Networked standby
Standby-passiveno main function, switch mode by remote control or internal signal
reactivation by internal / external signal no network capable
Passive standby
Off no function, no switch in other mode by any signal
no reactivationpower >0 W? Yes Off-mode losses
Off power >0 W? No Off-Mode 0 Watt
Disconnected disconnect from all ext. power sources Disconnected
Table 4-4: Mode translation of IEC 62075 standby definition Source Mode in source Source Mode Description Sub-Modes / Decisions Lot 6 Mode
[IEC 62075]On-Maximum all options applied full power Active Modes
On-Normal default/standard configuration main function or full power Active Modes
On-Idle min. system load, ready without delay typical ready mode Transition to standby
and off-mode
Power Saving Modes functions outside lot 6 standby? Yes
Transition to standby and off-mode
Power Saving Modes in scope: network capable Networked standby
Power Saving Modes no network, reactivation by timer, switch remote control Passive standby
Soft-Offswitch off manual or automatical/ still consume energy
Off-mode losses
Hard-Off manual switched off / zero power not in scope: zero power Off-mode 0 Watt
No load mode device unplugged not in scope: zero power Disconnected
low power, sleep, deep sleep or standby / ready to switch in operational mode
Table 4-5: Mode translation of 62018 standby definition Source Mode in source Source Mode Description Sub-Modes / Decisions Lot 6 Mode
[IEC 62018]
Full-on mode all functions fully powered functions outside lot 6 standby? Yes Active Modes
Energy saving mode functions outside lot 6 standby? Yes
Transition to standby and off-mode
Energy saving mode in scope: network capable Networked standby
no network, reactivation by timer, switch remote control Passive standby
one or more functions switched off

Report for Tender No. TREN/D1/40 Lot 6 -2005 EuP Lot 6 - Task 4 2nd of October 2007
Fraunhofer IZM CODDE Bio IS DUH Final Report Page 4-7
Table 4-6: Mode translation of 62301 standby definition Source Mode in source Source Mode Description Sub-Modes / Decisions Lot 6 Mode
[IEC 62301]
Operating load main function main function or full power yes Active Modes
Standby modetypical ready modemore than reactivation functions
Transition to standby and off-mode
Standby mode at least passive network activity Networked standby
Standby mode reactivation by internal / external signal: Yes Passive standby
Standby mode no reactivationpower >0 W? Yes Off-mode losses
Standby mode no reactivationpower >0 W? No Off-mode 0 Watt
lowest power mode subsidary function possible
Table 4-7: Mode translation of standby definition from Almeida Source Mode in source Source Mode Description Sub-Modes / Decisions Lot 6 Mode
Operating load main function Active ModesStandby Activ Mode Networked standbyStandby Activ Mode Passive standby
switched off Off-mode Off-mode lossesOff-mode Off-mode 0 Watt
[Almeida 2006]
lowest power mode / ready internal, external signalStandby mode
Table 4-8: Mode translation of standby definition from Sidler Source Mode in source Source Mode Description Sub-Modes / Decisions Lot 6 Mode
[Sidler 2002]
Full-On mode main function with full power Active Modes
idle Networked standbyenergy saving, standby, doze delay start, suspend Passive standby
Off-mode disconnect from source power >0 W? No Off-mode 0 Watt
between Full-On mode and off-modeStandby mode
This is still only a selection of translation approaches for the more relevant literature sources used in this study. In older studies the “standby” consumption is sometimes integrated in the total energy consumption, so no separation of standby energy consumption can be done.
4.3. Data per product case
4.3.1. Results for EPS (mobile phone)
► Summary of selected data
The selected data have mainly been taken from the Lot 7 report [BIO 2006]. There the mix between switched mode EPS and linear EPS for the 2006 stock has been determined as 80 % for the switched mode EPS and 20 % for linear EPS.
The average off-mode losses of EPS (mobile phone) while connected are calculated as 0.3 W. The effective off-mode losses time for these EPS is set as 10 h per day (see below).

Report for Tender No. TREN/D1/40 Lot 6 -2005 EuP Lot 6 - Task 4 2nd of October 2007
Fraunhofer IZM CODDE Bio IS DUH Final Report Page 4-8
► Discussion of modes and uniformity
The market scope in Task 2 and the power consumption chosen here provide a good averaged match. The Lot 7 data covers the typical mix of mobile phone EPS for 2006. The off-mode time from Task 3 still needs to be separated into off-mode with losses (no-load case) and disconnected time (see assumptions below).
► Original data
Table 4-9: PUC 1 EPS (mobile phone)
Standby Passive standby Off-mode, no-load2006 EPS (LOT 7) 0.3 [BIO 2007]2005 external power supplies 1.2 [EES 2006a]2004 EPS (mobile phone) 2.0 [Schlomann 2005]1999 EPS mobile phone 1.5 [Schaltegger 1999]2006 EPS 2.0 - 3.0 [Kim 2006]2005 charger mobile phone 0.1 [Ohkuni 2006]2002 EPS 0.5 - 2.0 [EA NRW 2002]
Standby and off-mode (in the source) power consumption in [W]Year of
data SourceName in source
► Translation and assumptions
The no-load case in Lot 7 [BIO 2007] is equivalent to the Lot 6 off-mode loss.
Following [BIO 2007] the average time when off-mode losses occur can be determined as 10 h/d (according to an EPS manufacturer’s use scenario). As an average the Task 3 data includes the use cases “use of the EPS without any off-mode losses”, “always off-mode losses after the use of the EPS” and “use of the EPS over night (1.5 h actual charging time, 8.5 h off-mode losses)”. Some of the mobile phones counted in the 2005 stock will not be regularly used anymore, because they are emergency or backup phones. Therefore, the 10 h/d assumption should still be viewed as a high estimate.
4.3.2. Results for Lighting Appliances (Low Voltage Halogen Lamps)
► Summary of selected data
The main source for the data for Lighting Appliances (low voltage halogen lamps) is the Lot 7 report [BIO 2006]. But in contrast to the 2006 sales data another percentage of electronic and magnetic transformers has been chosen. Further for the effective off-mode losses some assumptions had to be set (see below).
The effective off-mode losses of Lighting Appliances (low voltage halogen lamps) are calculated as 0.99 Watts which occur 23.5 h/d (see Task 3).
► Discussion of modes and uniformity
Not all halogen lamps have off-mode losses (due to secondary side switches). The product group is quite diverse, without adequate data to split the market further. Therefore assumptions had to be made (see below). Lot 6 standby is principally also possible, such as “touch activation” or continuous status light to help locate a dimmer or floor switch in the dark, but such lamps are not considered a large market share and are not investigated here.
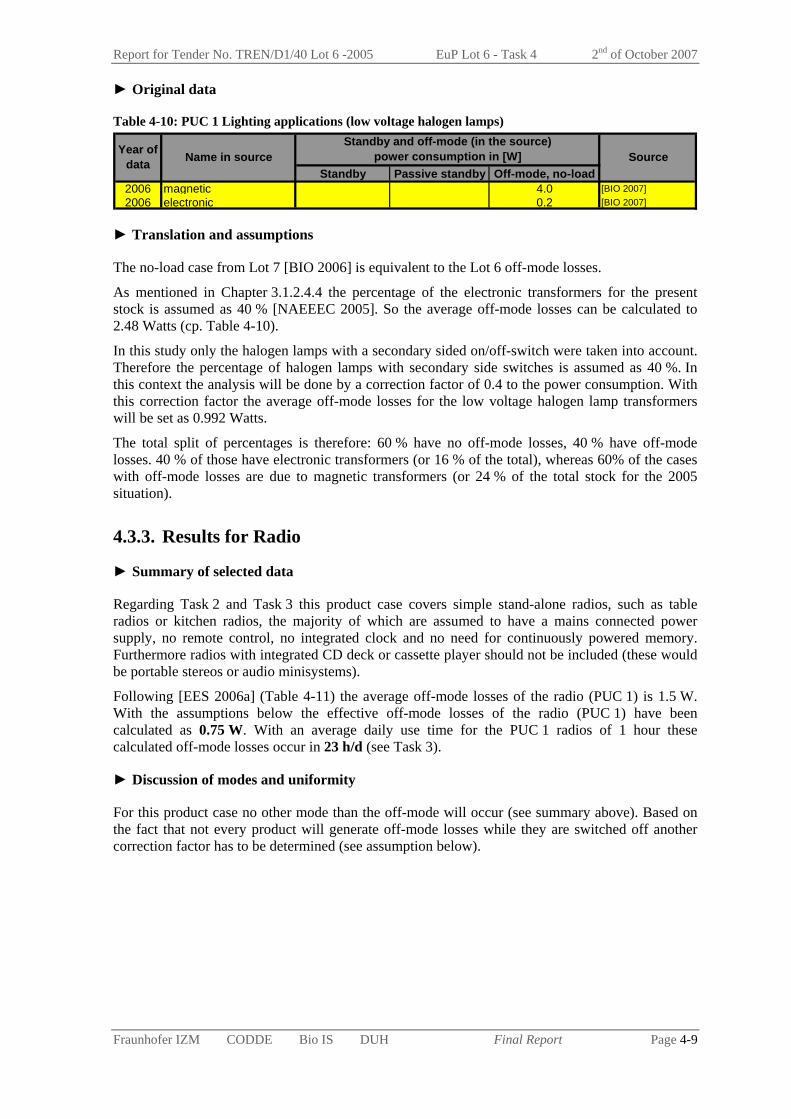
Report for Tender No. TREN/D1/40 Lot 6 -2005 EuP Lot 6 - Task 4 2nd of October 2007
Fraunhofer IZM CODDE Bio IS DUH Final Report Page 4-9
► Original data
Table 4-10: PUC 1 Lighting applications (low voltage halogen lamps)
Standby Passive standby Off-mode, no-load2006 magnetic 4.0 [BIO 2007]2006 electronic 0.2 [BIO 2007]
Standby and off-mode (in the source) power consumption in [W]Year of
data Name in source Source
► Translation and assumptions
The no-load case from Lot 7 [BIO 2006] is equivalent to the Lot 6 off-mode losses.
As mentioned in Chapter 3.1.2.4.4 the percentage of the electronic transformers for the present stock is assumed as 40 % [NAEEEC 2005]. So the average off-mode losses can be calculated to 2.48 Watts (cp. Table 4-10).
In this study only the halogen lamps with a secondary sided on/off-switch were taken into account. Therefore the percentage of halogen lamps with secondary side switches is assumed as 40 %. In this context the analysis will be done by a correction factor of 0.4 to the power consumption. With this correction factor the average off-mode losses for the low voltage halogen lamp transformers will be set as 0.992 Watts.
The total split of percentages is therefore: 60 % have no off-mode losses, 40 % have off-mode losses. 40 % of those have electronic transformers (or 16 % of the total), whereas 60% of the cases with off-mode losses are due to magnetic transformers (or 24 % of the total stock for the 2005 situation).
4.3.3. Results for Radio
► Summary of selected data
Regarding Task 2 and Task 3 this product case covers simple stand-alone radios, such as table radios or kitchen radios, the majority of which are assumed to have a mains connected power supply, no remote control, no integrated clock and no need for continuously powered memory. Furthermore radios with integrated CD deck or cassette player should not be included (these would be portable stereos or audio minisystems).
Following [EES 2006a] (Table 4-11) the average off-mode losses of the radio (PUC 1) is 1.5 W. With the assumptions below the effective off-mode losses of the radio (PUC 1) have been calculated as 0.75 W. With an average daily use time for the PUC 1 radios of 1 hour these calculated off-mode losses occur in 23 h/d (see Task 3).
► Discussion of modes and uniformity
For this product case no other mode than the off-mode will occur (see summary above). Based on the fact that not every product will generate off-mode losses while they are switched off another correction factor has to be determined (see assumption below).

Report for Tender No. TREN/D1/40 Lot 6 -2005 EuP Lot 6 - Task 4 2nd of October 2007
Fraunhofer IZM CODDE Bio IS DUH Final Report Page 4-10
► Original data
Table 4-11: PUC 1 Radio (only radio, no CD etc.)
Active standby Standby Passive
standby Off-mode
2005 radios 1.5 [EES 2006a]
2005 clock radio * 2.1 [EES 2006a]2004 Clock radio * 1.7 [Schlomann 2005]2005 Stereo-Portable * 6.4 2.4 1.6 [EnergyConsult 2006]1999 Stereo-Portable * 1.8 - 4.9 [Schaltegger 1999]
*: does not cover the right market segment
Standby and off-mode (in the source) power consumption in [W]Year of
data Name in source Source
► Translation and assumptions
The passive standby case for PUC 1 radios from [EES 2006a] is equivalent to the Lot 6 off-mode losses because in the case of PUC 1 radios the secondary side switch and the soft off switch only leave the (internal or external) power supply connected to the mains. So the passive standby can be set as an off-mode like the no-load for the EPS (see 4.3.1).
The fact that not every radio which is switched off generates off-mode losses must be taken into account (not every radio is switched off on the secondary side or by a soft-off switch). Therefore a correction factor of 0.5 concerning the power consumption has been assumed (only half of all radios considered in the market figure from Task 2 will exhibit off-mode losses). With this correction factor the effective off-mode losses now will be 0.75 Watts.
4.3.4. Results for Electric toothbrush
► Summary of selected data
For the rechargeable electric toothbrush the data from the 2005 Australian intrusive household survey has been used. The average power consumption, while the toothbrush is not being charged, is 1.4 Watts.
► Discussion of modes and uniformity
The current electric toothbrushes have inductively coupled slow chargers. The charging base is constantly emitting a low frequency electromagnetic field, which is emitted regardless of whether the toothbrush is receiving the energy or not. Most of the time it can be assumed that the toothbrush is not being charged and is therefore in an off-mode according to the Lot 6 definition. There is potentially still a minority of electric toothbrushes operated with primary batteries (for travelling).
A recent trend is towards added functions, such as displays to display the charge status. In this case the toothbrush would exhibit standby instead of off-mode losses, but these are not yet relevant in the 2005 stock.
► Original data
Table 4-12: PUC 1 Electric Toothbrush
Active standby Standby Passive standby
2005 rechargeable toothbrush 1.5 1.4 [EES 2006a]2006 rechargeable toothbrush 1.5 [Ohkuni 2006]2000 toothbrush 1.1 - 3.1 [Sidler 2002]2002 electrical toothbrush 3 - 5 [EA NRW 2002]
Standby and off-mode (in the source) power consumption in [W]Year of
data Name in source Source
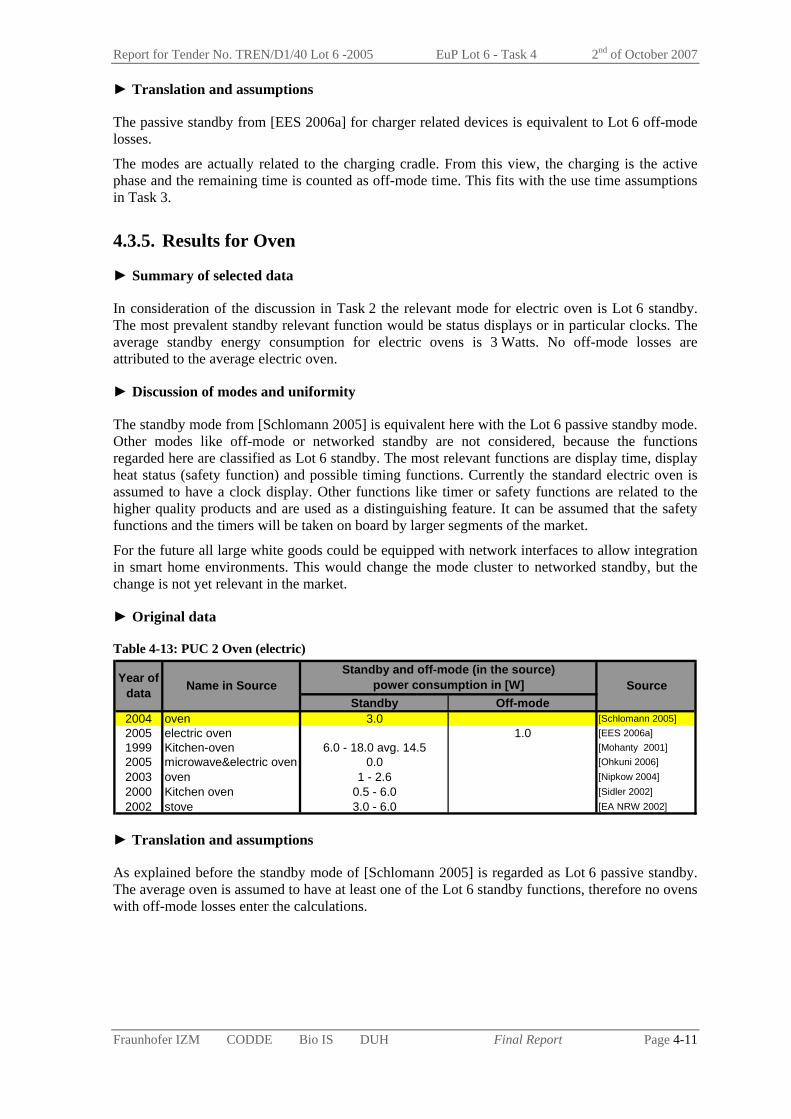
Report for Tender No. TREN/D1/40 Lot 6 -2005 EuP Lot 6 - Task 4 2nd of October 2007
Fraunhofer IZM CODDE Bio IS DUH Final Report Page 4-11
► Translation and assumptions
The passive standby from [EES 2006a] for charger related devices is equivalent to Lot 6 off-mode losses.
The modes are actually related to the charging cradle. From this view, the charging is the active phase and the remaining time is counted as off-mode time. This fits with the use time assumptions in Task 3.
4.3.5. Results for Oven
► Summary of selected data
In consideration of the discussion in Task 2 the relevant mode for electric oven is Lot 6 standby. The most prevalent standby relevant function would be status displays or in particular clocks. The average standby energy consumption for electric ovens is 3 Watts. No off-mode losses are attributed to the average electric oven.
► Discussion of modes and uniformity
The standby mode from [Schlomann 2005] is equivalent here with the Lot 6 passive standby mode. Other modes like off-mode or networked standby are not considered, because the functions regarded here are classified as Lot 6 standby. The most relevant functions are display time, display heat status (safety function) and possible timing functions. Currently the standard electric oven is assumed to have a clock display. Other functions like timer or safety functions are related to the higher quality products and are used as a distinguishing feature. It can be assumed that the safety functions and the timers will be taken on board by larger segments of the market.
For the future all large white goods could be equipped with network interfaces to allow integration in smart home environments. This would change the mode cluster to networked standby, but the change is not yet relevant in the market.
► Original data
Table 4-13: PUC 2 Oven (electric)
Standby Off-mode2004 oven 3.0 [Schlomann 2005]2005 electric oven 1.0 [EES 2006a]1999 Kitchen-oven 6.0 - 18.0 avg. 14.5 [Mohanty 2001]2005 microwave&electric oven 0.0 [Ohkuni 2006]2003 oven 1 - 2.6 [Nipkow 2004]2000 Kitchen oven 0.5 - 6.0 [Sidler 2002]2002 stove 3.0 - 6.0 [EA NRW 2002]
Standby and off-mode (in the source) power consumption in [W]Year of
data Name in Source Source
► Translation and assumptions
As explained before the standby mode of [Schlomann 2005] is regarded as Lot 6 passive standby. The average oven is assumed to have at least one of the Lot 6 standby functions, therefore no ovens with off-mode losses enter the calculations.

Report for Tender No. TREN/D1/40 Lot 6 -2005 EuP Lot 6 - Task 4 2nd of October 2007
Fraunhofer IZM CODDE Bio IS DUH Final Report Page 4-12
4.3.6. Results for Cordless phone
► Summary of selected data
Following the data from [EES 2006a] (2005 Intrusive Residential Standby Survey Report) and inline with the Lot 6 definition the focus is set on the cordless phone base station. The average power consumption; while the phone is not being charged or is off the cradle, is represented by networked standby with 2.4 W. Since the cordless phone base station is never switched off, the existence of an EPS is irrelevant, and does not lead to off-mode losses. EPS losses are included in the power consumption.
► Discussion of modes and uniformity
The base station is connected with the telephone network and waiting for incoming signals. This is exemplary for the networked standby. At the same time the wireless connection to the handset is upheld, which is also covered by the typical Lot 6 networked standby behaviour. Not considered is the active mode of the intrusive survey, which includes the time when the mobile device is being charged (3.3 W instead of 2.4 W without the charging). This mode is out of Lot 6 standby scope, because charging the phone is a main function for cordless phone base station. Most of the time the base station is not charging the phone, so the more important mode is the networked standby according to Lot 6 standby definition.
Furthermore some base stations have an integrated answering machine. This must considered as a special case, which is not covered by the chosen data. Due to the allocation of the answering machines to PUC 3 the whole device would be changed to a job-based networked product. Task 2 and 3 data are also focussed on cordless phones without answering machines.
The differentiation between base stations and extra handsets with charging cradles available in some of the sources has not been used. The whole market size identified by Task 2 is allocated to full base stations, which leads to a slight overestimation. The charging cradles of extra handsets do not contain the circuitry for the wireless transmission, and therefore operate at lower power levels. A charging cradle, which is not currently charging, would be considered as being in off-mode (the corresponding losses of e.g. 1.3 W would be caused by an EPS usually), but this configuration is not in the current calculation.
► Original data
Table 4-14: PUC 2 (net) Cordless phone
Active standby Standby Passive standby
2005 cordless phone base station 3.3 2.4 [EES 2006a]
2005 cordless phone extra handset 2.3 1.3 [EES 2006a]
2005 answering machine 3.1 [EES 2006a]2005 Mobile phone charger 0.9 off-mode 0.4 [Ellis 2005]2005 Hands-free unit 3.1 1.9 [Ellis 2005]2004 phone+base station 2.0 [Schlomann 2005]2002 answering machine 3.0 [Eidenhammer 2002]1999 cordless phone 4.0 [Schaltegger 1999]1999 answering machine 3.2 [Schaltegger 1999]2006 Telephony 3.6 [Harrington 2006b]1999 cordless phone 4.0 [Schaltegger 1999]2000 cordless phone 0.9 - 13.0 [Sidler 2002]
1998-99 cordless phone (n=100) 2.6 [IEA 2001]2002 cordless phone 4.0 - 5.0 [EA NRW 2002]
Year of data
Standby and off-mode (in the source) power consumption in [W] SourceName in source

Report for Tender No. TREN/D1/40 Lot 6 -2005 EuP Lot 6 - Task 4 2nd of October 2007
Fraunhofer IZM CODDE Bio IS DUH Final Report Page 4-13
► Translation and assumptions
For cordless phone the passive standby in Table 4-14 matches with the Lot 6 networked standby. The phone is listening on the telephone network for an incoming signal and at the same time keeping up the network integrity towards the phone handset.
The higher value for active standby (while charging) is not taken into the calculation. The lower power levels of extra handsets with charging cradles are not included, because Task 2 market data does not make this distinction.
4.3.7. Results for TV+
The following summary and discussion is based on the TV+ scenario which contains TV sets and digital set-top-boxes as well.
► Summary of selected data
As explained earlier Task 2, the product case of TV+ is built around TVs and includes set-top-boxes as relevant peripheral. The collected data for TV+ are shown in Table 4-15.
For the TVs, data for CRT, LCD, Plasma and Rear projection from [Schlomann 2005] are chosen (marked in yellow in Table 4-15). They seem to be the most current data compared to the other ones and give a good average for the TV sets.
Taking into account the market share of each TV type1, the average power consumption of one TV is the following:
TV average Lot 6 networked standby: 5.84 W
TV average off-mode losses2: 1.5 W
In addition, the product case of TV+ includes digital set-top-boxes (see Task 2). For the set-top-boxes, the Australian data from [EES 2006a] are chosen due to their recent and broad analysis (37 products have been measured in [EES 2006a]). Thus, the power consumption in standby for set-top-boxes amounts to 10.7 W.
The average daily use time of the TV+ scenario is assessed in Task 3. The Lot 6 standby mode times for the TV+ are:
12h/d in standby for TVs
20h/d in standby for set-top-boxes
► Discussion of modes and uniformity
For the TV sets it has to be mentioned that not every TV set has the same features and modes. Nowadays almost all TVs have a remote control. So they always have standby relevant functions at least. Some of the new and complex TVs have integrated additional functions like DVD-player/recorder, HD-recorder or digital decoder (set-top-boxes), which create different standby power consumptions. There is a trend towards further additional devices like speakers or AV receivers creating a “TV-based media centre” and towards PCs with all additional devices equipped and used as a “PC-based media centre”. Both can lead to increasing standby levels.
1 CRT, LCD, Plasma and Rear projection represent 0.95%, 0.04%, 0.01% and 0.004% of the 2005 TV stock respectively. 2 The data source gives values for off-mode losses, which however do not seem to occur in practice, as the TV currently on the market are either in on-mode, in standby or off (0 W), when they have an off switch. TVs with EPS are considered to represent a very small part of the stock.
Report for Tender No. TREN/D1/40 Lot 6 -2005 EuP Lot 6 - Task 4 2nd of October 2007
Fraunhofer IZM CODDE Bio IS DUH Final Report Page 4-14
Another differentiation is that many of the newer TVs and the most of the set-top-boxes don’t have a hard-off switch any more. So these products either remain in standby all the time, or will have off-mode losses through use of a soft switch – although a soft switch, which deactivates the function of the remote control, is quite unlikely.
Other standby types could accrue due to program updates over the network (both electronic program guide updates, but also firmware and content protection updates in principle). Such download operations will not be considered as Lot 6 standby, but the waiting for an update can be a mix of networked standby (listening to update signatures) or passive standby (where a timer controls, when the tuner is activated).

Report for Tender No. TREN/D1/40 Lot 6 -2005 EuP Lot 6 - Task 4 2nd of October 2007
Fraunhofer IZM CODDE Bio IS DUH Final Report Page 4-15
► Original data
Table 4-15: PUC 2 (net) TV+ (TV, set-top-boxes)
Standby Passive standby Off-mode2004 Cathode ray TV 6.0 1.5 [Schlomann 2005]2004 LCD TV 3.0 2.0 [Schlomann 2005]2004 Plasma TV 3.0 1.5 [Schlomann 2005]2004 Rear-projection-TV 2.0 0.1 [Schlomann 2005]2005 Set-top-boxes 10.7 0.0 [EES 2006a]2005 Plasma 8.2 0.2 [EES 2006a]2005 CRT 7.4 0.1 [EES 2006a]2004 TV projector 7.0 5.0 [Schlomann 2005]2004 SAT-boxes 8.0 0 [Schlomann 2005]2004 DVB-boxes 6.0 0 [Schlomann 2005]2004 Cable-boxes 8.0 0 [Schlomann 2005]2003 Television max. 4.1 [Öko-Test 2003]
2005/06 CRT television 3.4 0.0 [EnergyConsult 2006]2005/06 LCD television 1.6 0.5 [EnergyConsult 2006]2005/06 Projection television 31.4 0.1 [EnergyConsult 2006]2005/06 Plasma television 1.4 0.6 [EnergyConsult 2006]2005/06 Set Top Box active standby 13.2 9.5 0.0 [EnergyConsult 2006]
2005 Television active standby 48.1 4.0 0.9 [Ellis 2005]2002 colour TV 10.0 [Eidenhammer 2002]2002 SAT-receiver 30.0 [Eidenhammer 2002]1999 TV 2.6 - 7.0 [Schaltegger 1999]1999 TV 1-22 avg. 7.3 [Mohanty 2001]1999 hertz TV decoder 9-16 avg. 11 [Mohanty 2001]1999 satellite dish decoder 5-17 avg. 8.5 [Mohanty 2001]1999 cable TV decoder 3 - 23 avg. 9.5 [Mohanty 2001]1999 TV-Tuner 1997 12.25 [Mohanty 2001]2005 Television 3.6 [Harrington 2006b]2005 settop boxes 12.1 [Harrington 2006b]2006 settop boxes 20 - 40 [Kim 2006]2006 digital TV 1 - 5 [Kim 2006]2005 TV set 0.4 [Ohkuni 2006]2005 TV set 0.3 [Ohkuni 2006]2002 Settopboxes avg. 7.5 0.05-1 (n=2) [NAEEEC 2004a]1999 TV Set 2.6 - 6.1 [Schaltegger 1999]1999 SAT receiver avg. 8.4 [Schaltegger 1999]2000 satellite decoder 4.0 - 20 [Sidler 2002]2000 satellite dish decoder 5 - 23 [Sidler 2002]2000 TV 0.5 - 24.8 [Sidler 2002]2005 Settopboxes 0.1 - 17 [Karger 2005]
1998-99 TV avg. 7.3 [IEA 2001]1998-99 satellite dish decoder avg. 8.7 [IEA 2001]1998-99 cable TV decoder avg. 9.5 [IEA 2001]
2006 DVB-T Boxes 0.7 - 13.9 (17.3 max) [STIFWA 2006a]2006 LCD-TV 0.5 - 3.2 0-1.5 [STIFWA 2006b]2006 SAT/cable receiver 0.2 - 9.6 [STIFWA 2006c]2002 TV 0.1 - 12 [EA NRW 2002]2002 SAT receiver 3 - 20 [EA NRW 2002]2000 TV 2.5 - 12 /avg. 6.4 [Ross 2000]2000 Settopboxes 1.5 - 23 / avg. 10.5 [Ross 2000]2004 TV colour analog 7.3 [DEG 2004]2004 Television LCD 4.2 [DEG 2004]2004 Television projection 4.2 [DEG 2004]2004 STB analog cable 11 [DEG 2004]2004 STB digital cable 23 [DEG 2004]2004 satellite receiver 16 [DEG 2004]2004 dtv adapter 8 [DEG 2004]
Year of data
Standby and off-mode (in the source) power consumption in [W]Name in source Source

Report for Tender No. TREN/D1/40 Lot 6 -2005 EuP Lot 6 - Task 4 2nd of October 2007
Fraunhofer IZM CODDE Bio IS DUH Final Report Page 4-16
► Translation and assumptions
For TV sets the Standby in Table 4-15 is equivalent to the Lot 6 networked standby (not all TVs are networked, but all are counted as networked). The “passive” standby for the set-top-boxes is also counted as Lot 6 networked standby, because they may do unsupervised EPG downloads.
For the Australian data it has to be mentioned that these data do not exactly represent the EU25 market. Other sources state standby power consumption between 0.1 and 23 Watts (see Table 4-15).
Further for the calculation the stock data of every product (Task 2) has been taken into account.
4.3.8. Results for Washing machine
► Summary of selected data
The collected data for washing machines are shown in Table 4-16. For this product case, data from [Schlomann 2005] are selected (marked in yellow in Table 4-16). The values provided in this study [Schlomann 2005] appear to be the most relevant energy consumption data compared to other sources. Actually and according to the definition of this product case, the product case of washing machine comes with standby and off usage modes. Therefore, data from the [Schlomann 2005] study fit with the present study definitions and are used in the following.
Consequently, for the product case of washing machine, the values of the energy consumption per mode used in this study and in the subsequent Tasks are:
Washing machine average off-mode losses: 1.2 W
Washing machine average Lot 6 passive standby: 5.7 W
The average daily use time of washing machine products is assessed in Task 3. As a reminder, the Lot 6 passive standby mode time for washing machine is assumed as 3 h/d and the off-mode time with losses is 20 h/d. The remaining 1 hour per day corresponds to the active mode of the appliance that is to say to the washing cycle (from selection of the wash program to the unlocking of the door should be considered the standard function cycle).
► Discussion of modes and uniformity
As explained in Task 3, there is no apparent reason for off-mode consumption for washing machines, but there are reasons for standby power consumption in particular including safety reasons. Standby functions can be safety related, such as a water sensor being powered continuously, or timer related, such as a delayed start of the wash program , but also timers, which periodically turn the drum after the end of the wash cycle (anti-crease or anti-wrinkle feature).
More and more washing machines come with digital and programming features that require a more complex display, which may be powered continuously to show the user that the washing machine is ready to receive commands, but some appliances (the oldest ones generally) are still purely mechanical and do not have any standby. Off-mode losses, if they occur, are most likely linked to EMC or other protective circuitry placed before the main switch, rather than being a result of secondary side switches. Soft switches have been a feature for some time as well (adding to the average off-mode level declared) but would now probably appear in conjunction with the digital interfaces including a display function. Newer machines are likely to have a timer start function as well (delay start in Australian studies). As for all large white goods products including network capability for home network integration are principally available, but are not yet considered relevant on the market.
As a simplification, all the features already in use in 2005 are assumed to be included in the averaged data, whereas newer appliance features (anti-crease, network) are assumed to represent only a small share of the 2005 market. Therefore, using a common power consumption pattern under the passive standby cluster for this product case is still sufficient for this study.

Report for Tender No. TREN/D1/40 Lot 6 -2005 EuP Lot 6 - Task 4 2nd of October 2007
Fraunhofer IZM CODDE Bio IS DUH Final Report Page 4-17
► Original data
Table 4-16: PUC 3 washing machine
Active standby Standby Off-mode2004 Washing Machine 5.7 1.2 [Schlomann 2005]2005 clothes washer 5.8 1.9 [EES 2006a]
2005/05 washing machine (front load) 3.5 delay start 4.0 0.9 [EnergyConsult 2006]
2005/06 washing machine (top load) 3.2 delay start 3.5 1.2 [EnergyConsult 2006]
2005 washing machine 3.9 4.2 1.2 [EnergyConsult 2006]2005 laundry machine 0.0 [Ohkuni 2006]2000 clothes washer 3.1 - 10 [Sidler 2002]
Standby and off-mode (in the source) power consumption in [W]Year of
data Name in source Source
► Translation and assumptions
Active standby and standby as indicated in Table 4-16 both correspond to Lot 6 standby definition. As no washing machine product comes with network reactivation features (so far), these two categories of standby are actually passive Lot 6 standby. In addition, off-mode corresponds to off-mode with losses with the assumption that the indicated off-mode losses apply to the average of all washing machines.
The data selected here (in yellow in Table 4-16) is in the middle range of the values that can be found in the literature and allows for a current stock estimation of the standby electricity consumption in passive standby and off modes for washing machines.
4.3.9. Results for DVD
The DVD product case covers DVD players and recorders.
► Summary of selected data
For DVD player and recorder the data is based on [Almeida 2006] as this source presents the data compatible with the approach of Lot 6. For the Lot 6 standby consideration DVD player and recorder have two modes, passive standby with average power consumption of 4.8 W and the Lot 6 Off-mode with an average loss of 1.5 W.
► Discussion of modes and uniformity
A DVD-player is a job-based product: The device is only active when it plays a DVD. If no DVD is inserted or the drive motor stops, the mode is considered Lot 6 passive standby. The functions which are still active in this mode are the memory, display, remote control and to display the memory status on screen. This corresponds with the definition of PUC 3: When the job (play the DVD) comes to an end the device automatically switches into standby or off-mode. All established DVD-players have a soft switch or change automatically into the off-mode within a predefined time period, signalling to the user, that the device is transferring to off. Only the reactivation function via the soft switch is still active.
As outlined in Section 3.1.2.6.5 the market is shifting from players-only to DVD-recorders with extended functionality. The recording capability means an additional mode of networked standby and a possible transitional mode. Current DVD-recorders integrate the function of automatic recording based on EPG. This implies a permanent check for correct time via EPG. If the device updates its program via EPG it is in transitional mode (also called “active download”). In between the updates the recorder is in networked standby, if it is programmed via EPG.
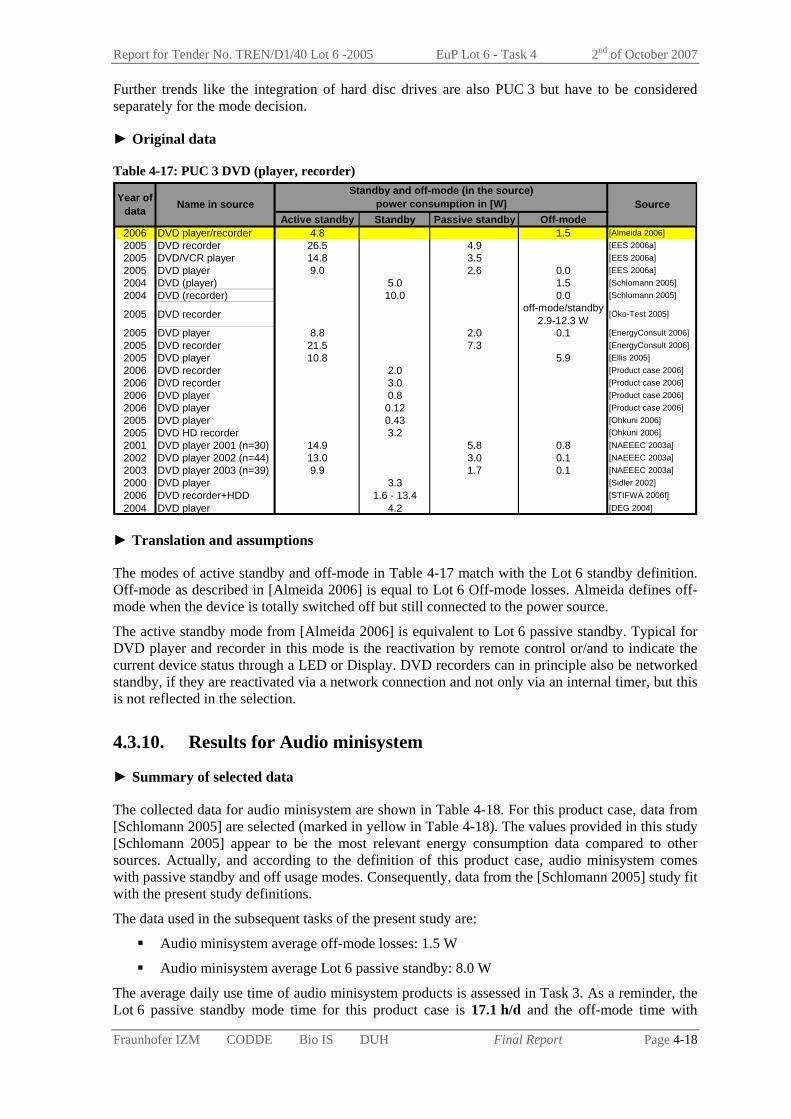
Report for Tender No. TREN/D1/40 Lot 6 -2005 EuP Lot 6 - Task 4 2nd of October 2007
Fraunhofer IZM CODDE Bio IS DUH Final Report Page 4-18
Further trends like the integration of hard disc drives are also PUC 3 but have to be considered separately for the mode decision.
► Original data
Table 4-17: PUC 3 DVD (player, recorder)
Active standby Standby Passive standby Off-mode2006 DVD player/recorder 4.8 1.5 [Almeida 2006]2005 DVD recorder 26.5 4.9 [EES 2006a]2005 DVD/VCR player 14.8 3.5 [EES 2006a]2005 DVD player 9.0 2.6 0.0 [EES 2006a]2004 DVD (player) 5.0 1.5 [Schlomann 2005]2004 DVD (recorder) 10.0 0.0 [Schlomann 2005]
2005 DVD recorder off-mode/standby 2.9-12.3 W
[Öko-Test 2005]
2005 DVD player 8.8 2.0 0.1 [EnergyConsult 2006]2005 DVD recorder 21.5 7.3 [EnergyConsult 2006]2005 DVD player 10.8 5.9 [Ellis 2005]2006 DVD recorder 2.0 [Product case 2006]2006 DVD recorder 3.0 [Product case 2006]2006 DVD player 0.8 [Product case 2006]2006 DVD player 0.12 [Product case 2006]2005 DVD player 0.43 [Ohkuni 2006]2005 DVD HD recorder 3.2 [Ohkuni 2006]2001 DVD player 2001 (n=30) 14.9 5.8 0.8 [NAEEEC 2003a]2002 DVD player 2002 (n=44) 13.0 3.0 0.1 [NAEEEC 2003a]2003 DVD player 2003 (n=39) 9.9 1.7 0.1 [NAEEEC 2003a]2000 DVD player 3.3 [Sidler 2002]2006 DVD recorder+HDD 1.6 - 13.4 [STIFWA 2006f]2004 DVD player 4.2 [DEG 2004]
Standby and off-mode (in the source) power consumption in [W]Year of
data SourceName in source
► Translation and assumptions
The modes of active standby and off-mode in Table 4-17 match with the Lot 6 standby definition. Off-mode as described in [Almeida 2006] is equal to Lot 6 Off-mode losses. Almeida defines off-mode when the device is totally switched off but still connected to the power source.
The active standby mode from [Almeida 2006] is equivalent to Lot 6 passive standby. Typical for DVD player and recorder in this mode is the reactivation by remote control or/and to indicate the current device status through a LED or Display. DVD recorders can in principle also be networked standby, if they are reactivated via a network connection and not only via an internal timer, but this is not reflected in the selection.
4.3.10. Results for Audio minisystem
► Summary of selected data
The collected data for audio minisystem are shown in Table 4-18. For this product case, data from [Schlomann 2005] are selected (marked in yellow in Table 4-18). The values provided in this study [Schlomann 2005] appear to be the most relevant energy consumption data compared to other sources. Actually, and according to the definition of this product case, audio minisystem comes with passive standby and off usage modes. Consequently, data from the [Schlomann 2005] study fit with the present study definitions.
The data used in the subsequent tasks of the present study are:
Audio minisystem average off-mode losses: 1.5 W
Audio minisystem average Lot 6 passive standby: 8.0 W
The average daily use time of audio minisystem products is assessed in Task 3. As a reminder, the Lot 6 passive standby mode time for this product case is 17.1 h/d and the off-mode time with
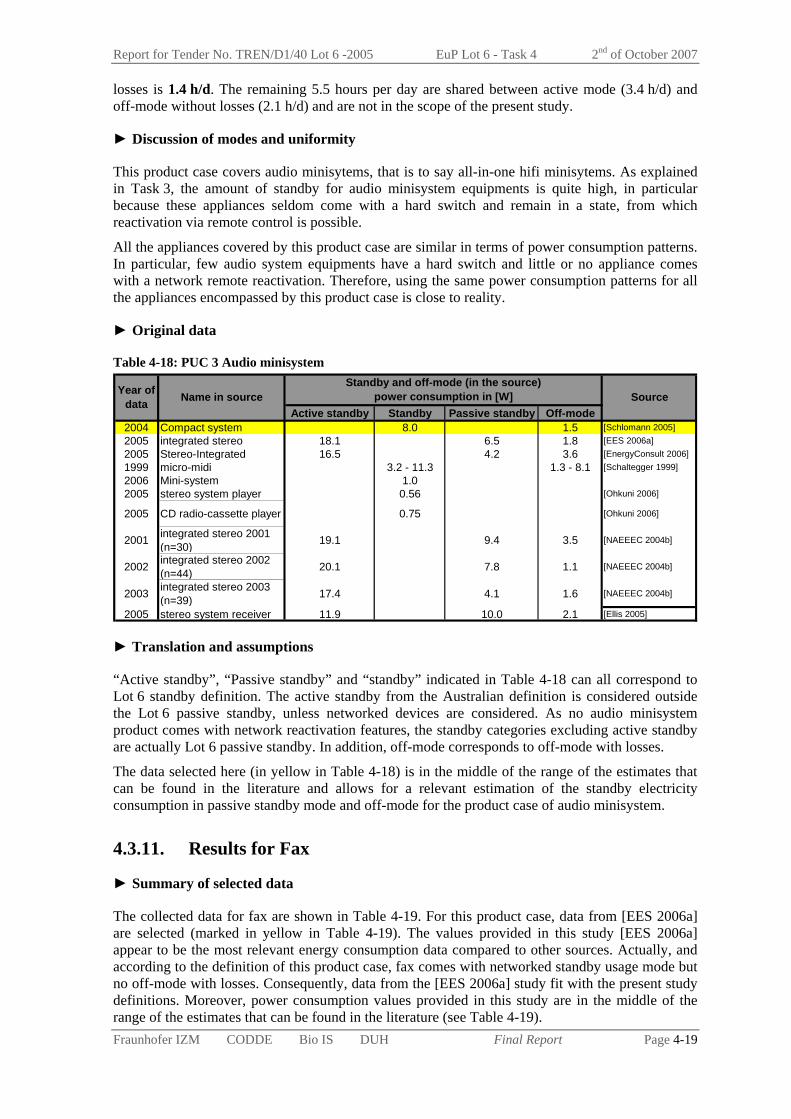
Report for Tender No. TREN/D1/40 Lot 6 -2005 EuP Lot 6 - Task 4 2nd of October 2007
Fraunhofer IZM CODDE Bio IS DUH Final Report Page 4-19
losses is 1.4 h/d. The remaining 5.5 hours per day are shared between active mode (3.4 h/d) and off-mode without losses (2.1 h/d) and are not in the scope of the present study.
► Discussion of modes and uniformity
This product case covers audio minisytems, that is to say all-in-one hifi minisytems. As explained in Task 3, the amount of standby for audio minisystem equipments is quite high, in particular because these appliances seldom come with a hard switch and remain in a state, from which reactivation via remote control is possible.
All the appliances covered by this product case are similar in terms of power consumption patterns. In particular, few audio system equipments have a hard switch and little or no appliance comes with a network remote reactivation. Therefore, using the same power consumption patterns for all the appliances encompassed by this product case is close to reality.
► Original data
Table 4-18: PUC 3 Audio minisystem
Active standby Standby Passive standby Off-mode2004 Compact system 8.0 1.5 [Schlomann 2005]2005 integrated stereo 18.1 6.5 1.8 [EES 2006a]2005 Stereo-Integrated 16.5 4.2 3.6 [EnergyConsult 2006]1999 micro-midi 3.2 - 11.3 1.3 - 8.1 [Schaltegger 1999]2006 Mini-system 1.02005 stereo system player 0.56 [Ohkuni 2006]
2005 CD radio-cassette player 0.75 [Ohkuni 2006]
2001 integrated stereo 2001 (n=30) 19.1 9.4 3.5 [NAEEEC 2004b]
2002 integrated stereo 2002 (n=44) 20.1 7.8 1.1 [NAEEEC 2004b]
2003 integrated stereo 2003 (n=39) 17.4 4.1 1.6 [NAEEEC 2004b]
2005 stereo system receiver 11.9 10.0 2.1 [Ellis 2005]
Year of data Source
Standby and off-mode (in the source) power consumption in [W]Name in source
► Translation and assumptions
“Active standby”, “Passive standby” and “standby” indicated in Table 4-18 can all correspond to Lot 6 standby definition. The active standby from the Australian definition is considered outside the Lot 6 passive standby, unless networked devices are considered. As no audio minisystem product comes with network reactivation features, the standby categories excluding active standby are actually Lot 6 passive standby. In addition, off-mode corresponds to off-mode with losses.
The data selected here (in yellow in Table 4-18) is in the middle of the range of the estimates that can be found in the literature and allows for a relevant estimation of the standby electricity consumption in passive standby mode and off-mode for the product case of audio minisystem.
4.3.11. Results for Fax
► Summary of selected data
The collected data for fax are shown in Table 4-19. For this product case, data from [EES 2006a] are selected (marked in yellow in Table 4-19). The values provided in this study [EES 2006a] appear to be the most relevant energy consumption data compared to other sources. Actually, and according to the definition of this product case, fax comes with networked standby usage mode but no off-mode with losses. Consequently, data from the [EES 2006a] study fit with the present study definitions. Moreover, power consumption values provided in this study are in the middle of the range of the estimates that can be found in the literature (see Table 4-19).
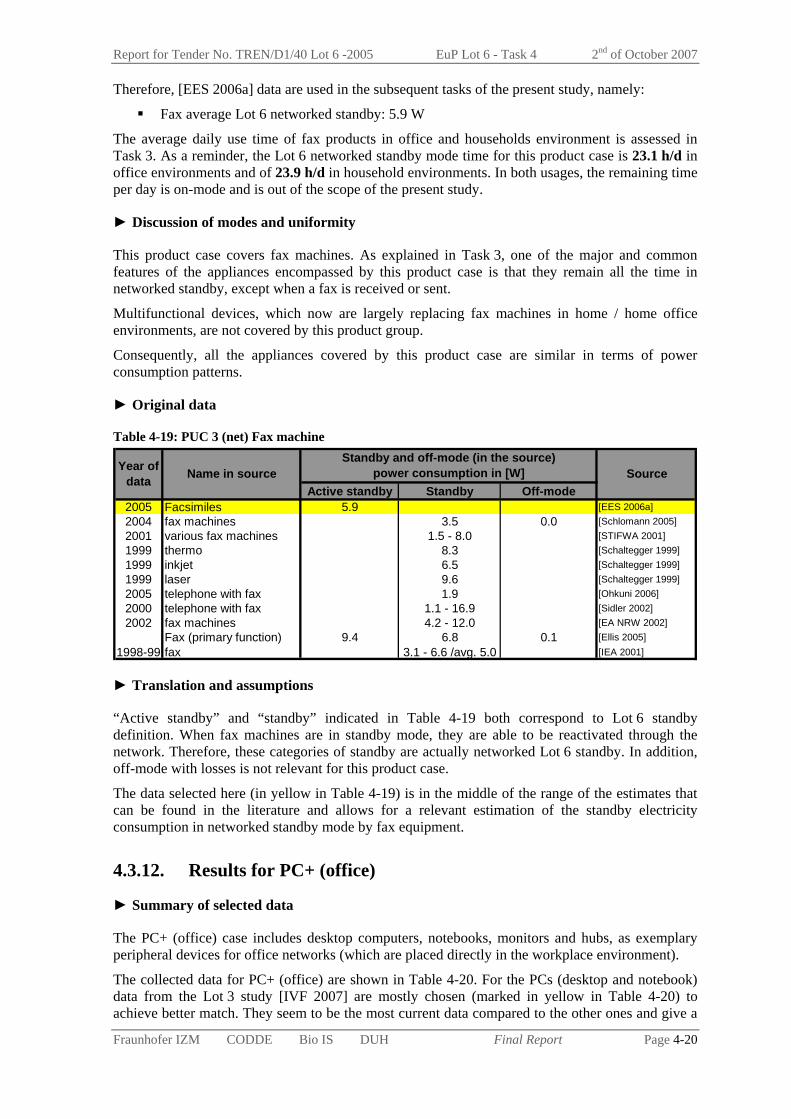
Report for Tender No. TREN/D1/40 Lot 6 -2005 EuP Lot 6 - Task 4 2nd of October 2007
Fraunhofer IZM CODDE Bio IS DUH Final Report Page 4-20
Therefore, [EES 2006a] data are used in the subsequent tasks of the present study, namely:
Fax average Lot 6 networked standby: 5.9 W
The average daily use time of fax products in office and households environment is assessed in Task 3. As a reminder, the Lot 6 networked standby mode time for this product case is 23.1 h/d in office environments and of 23.9 h/d in household environments. In both usages, the remaining time per day is on-mode and is out of the scope of the present study.
► Discussion of modes and uniformity
This product case covers fax machines. As explained in Task 3, one of the major and common features of the appliances encompassed by this product case is that they remain all the time in networked standby, except when a fax is received or sent.
Multifunctional devices, which now are largely replacing fax machines in home / home office environments, are not covered by this product group.
Consequently, all the appliances covered by this product case are similar in terms of power consumption patterns.
► Original data
Table 4-19: PUC 3 (net) Fax machine
Active standby Standby Off-mode2005 Facsimiles 5.9 [EES 2006a]2004 fax machines 3.5 0.0 [Schlomann 2005]2001 various fax machines 1.5 - 8.0 [STIFWA 2001]1999 thermo 8.3 [Schaltegger 1999]1999 inkjet 6.5 [Schaltegger 1999]1999 laser 9.6 [Schaltegger 1999]2005 telephone with fax 1.9 [Ohkuni 2006]2000 telephone with fax 1.1 - 16.9 [Sidler 2002]2002 fax machines 4.2 - 12.0 [EA NRW 2002]
Fax (primary function) 9.4 6.8 0.1 [Ellis 2005]1998-99 fax 3.1 - 6.6 /avg. 5.0 [IEA 2001]
Year of data SourceName in source
Standby and off-mode (in the source) power consumption in [W]
► Translation and assumptions
“Active standby” and “standby” indicated in Table 4-19 both correspond to Lot 6 standby definition. When fax machines are in standby mode, they are able to be reactivated through the network. Therefore, these categories of standby are actually networked Lot 6 standby. In addition, off-mode with losses is not relevant for this product case.
The data selected here (in yellow in Table 4-19) is in the middle of the range of the estimates that can be found in the literature and allows for a relevant estimation of the standby electricity consumption in networked standby mode by fax equipment.
4.3.12. Results for PC+ (office)
► Summary of selected data
The PC+ (office) case includes desktop computers, notebooks, monitors and hubs, as exemplary peripheral devices for office networks (which are placed directly in the workplace environment).
The collected data for PC+ (office) are shown in Table 4-20. For the PCs (desktop and notebook) data from the Lot 3 study [IVF 2007] are mostly chosen (marked in yellow in Table 4-20) to achieve better match. They seem to be the most current data compared to the other ones and give a
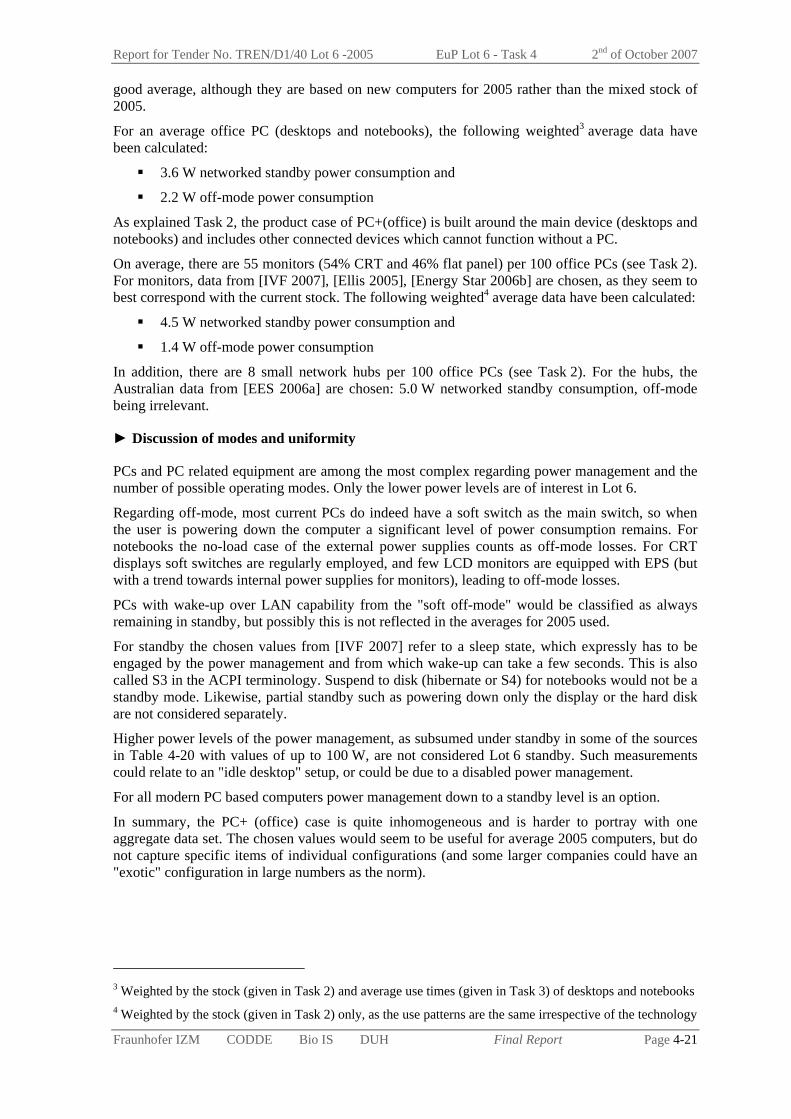
Report for Tender No. TREN/D1/40 Lot 6 -2005 EuP Lot 6 - Task 4 2nd of October 2007
Fraunhofer IZM CODDE Bio IS DUH Final Report Page 4-21
good average, although they are based on new computers for 2005 rather than the mixed stock of 2005.
For an average office PC (desktops and notebooks), the following weighted3 average data have been calculated:
3.6 W networked standby power consumption and
2.2 W off-mode power consumption
As explained Task 2, the product case of PC+(office) is built around the main device (desktops and notebooks) and includes other connected devices which cannot function without a PC.
On average, there are 55 monitors (54% CRT and 46% flat panel) per 100 office PCs (see Task 2). For monitors, data from [IVF 2007], [Ellis 2005], [Energy Star 2006b] are chosen, as they seem to best correspond with the current stock. The following weighted4 average data have been calculated:
4.5 W networked standby power consumption and
1.4 W off-mode power consumption
In addition, there are 8 small network hubs per 100 office PCs (see Task 2). For the hubs, the Australian data from [EES 2006a] are chosen: 5.0 W networked standby consumption, off-mode being irrelevant.
► Discussion of modes and uniformity
PCs and PC related equipment are among the most complex regarding power management and the number of possible operating modes. Only the lower power levels are of interest in Lot 6.
Regarding off-mode, most current PCs do indeed have a soft switch as the main switch, so when the user is powering down the computer a significant level of power consumption remains. For notebooks the no-load case of the external power supplies counts as off-mode losses. For CRT displays soft switches are regularly employed, and few LCD monitors are equipped with EPS (but with a trend towards internal power supplies for monitors), leading to off-mode losses.
PCs with wake-up over LAN capability from the "soft off-mode" would be classified as always remaining in standby, but possibly this is not reflected in the averages for 2005 used.
For standby the chosen values from [IVF 2007] refer to a sleep state, which expressly has to be engaged by the power management and from which wake-up can take a few seconds. This is also called S3 in the ACPI terminology. Suspend to disk (hibernate or S4) for notebooks would not be a standby mode. Likewise, partial standby such as powering down only the display or the hard disk are not considered separately.
Higher power levels of the power management, as subsumed under standby in some of the sources in Table 4-20 with values of up to 100 W, are not considered Lot 6 standby. Such measurements could relate to an "idle desktop" setup, or could be due to a disabled power management.
For all modern PC based computers power management down to a standby level is an option.
In summary, the PC+ (office) case is quite inhomogeneous and is harder to portray with one aggregate data set. The chosen values would seem to be useful for average 2005 computers, but do not capture specific items of individual configurations (and some larger companies could have an "exotic" configuration in large numbers as the norm).
3 Weighted by the stock (given in Task 2) and average use times (given in Task 3) of desktops and notebooks 4 Weighted by the stock (given in Task 2) only, as the use patterns are the same irrespective of the technology
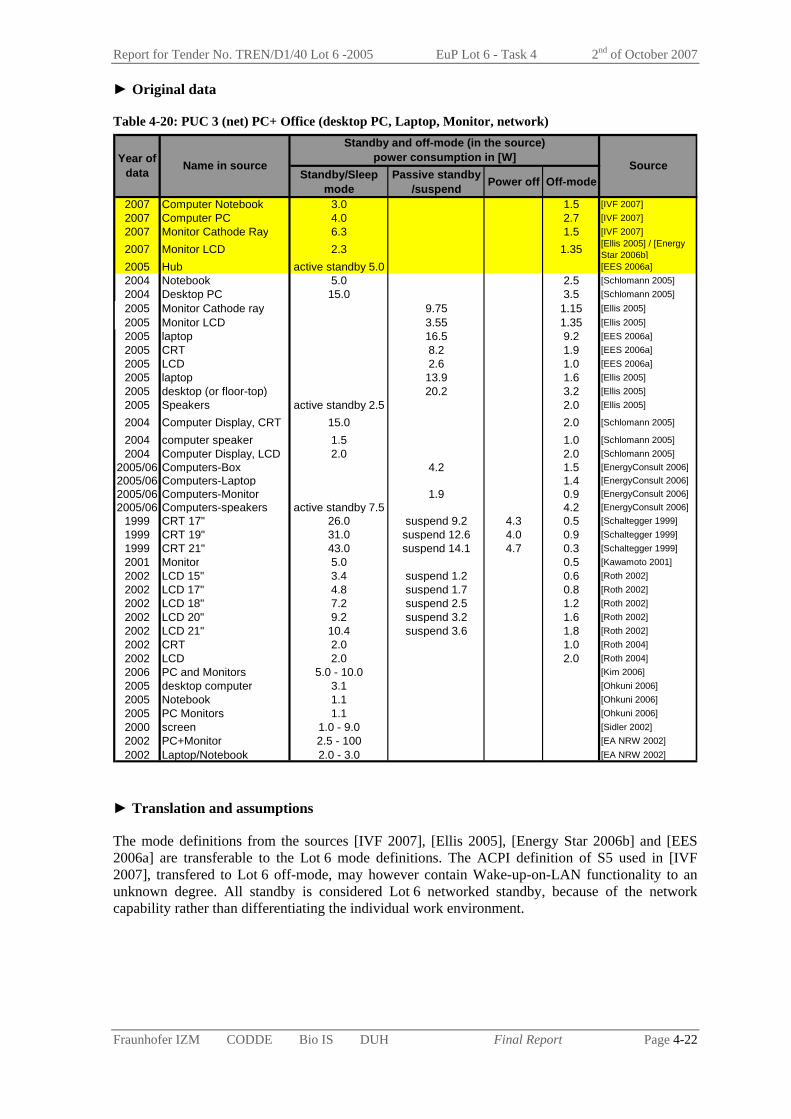
Report for Tender No. TREN/D1/40 Lot 6 -2005 EuP Lot 6 - Task 4 2nd of October 2007
Fraunhofer IZM CODDE Bio IS DUH Final Report Page 4-22
► Original data
Table 4-20: PUC 3 (net) PC+ Office (desktop PC, Laptop, Monitor, network)
Standby/Sleep mode
Passive standby /suspend Power off Off-mode
2007 Computer Notebook 3.0 1.5 [IVF 2007]2007 Computer PC 4.0 2.7 [IVF 2007]2007 Monitor Cathode Ray 6.3 1.5 [IVF 2007]
2007 Monitor LCD 2.3 1.35 [Ellis 2005] / [Energy Star 2006b]
2005 Hub active standby 5.0 [EES 2006a]2004 Notebook 5.0 2.5 [Schlomann 2005]2004 Desktop PC 15.0 3.5 [Schlomann 2005]2005 Monitor Cathode ray 9.75 1.15 [Ellis 2005]2005 Monitor LCD 3.55 1.35 [Ellis 2005]2005 laptop 16.5 9.2 [EES 2006a]2005 CRT 8.2 1.9 [EES 2006a]2005 LCD 2.6 1.0 [EES 2006a]2005 laptop 13.9 1.6 [Ellis 2005]2005 desktop (or floor-top) 20.2 3.2 [Ellis 2005]2005 Speakers active standby 2.5 2.0 [Ellis 2005]
2004 Computer Display, CRT 15.0 2.0 [Schlomann 2005]
2004 computer speaker 1.5 1.0 [Schlomann 2005]2004 Computer Display, LCD 2.0 2.0 [Schlomann 2005]
2005/06 Computers-Box 4.2 1.5 [EnergyConsult 2006]2005/06 Computers-Laptop 1.4 [EnergyConsult 2006]2005/06 Computers-Monitor 1.9 0.9 [EnergyConsult 2006]2005/06 Computers-speakers active standby 7.5 4.2 [EnergyConsult 2006]
1999 CRT 17" 26.0 suspend 9.2 4.3 0.5 [Schaltegger 1999]1999 CRT 19" 31.0 suspend 12.6 4.0 0.9 [Schaltegger 1999]1999 CRT 21" 43.0 suspend 14.1 4.7 0.3 [Schaltegger 1999]2001 Monitor 5.0 0.5 [Kawamoto 2001]2002 LCD 15" 3.4 suspend 1.2 0.6 [Roth 2002]2002 LCD 17" 4.8 suspend 1.7 0.8 [Roth 2002]2002 LCD 18" 7.2 suspend 2.5 1.2 [Roth 2002]2002 LCD 20" 9.2 suspend 3.2 1.6 [Roth 2002]2002 LCD 21" 10.4 suspend 3.6 1.8 [Roth 2002]2002 CRT 2.0 1.0 [Roth 2004] 2002 LCD 2.0 2.0 [Roth 2004] 2006 PC and Monitors 5.0 - 10.0 [Kim 2006]2005 desktop computer 3.1 [Ohkuni 2006]2005 Notebook 1.1 [Ohkuni 2006]2005 PC Monitors 1.1 [Ohkuni 2006]2000 screen 1.0 - 9.0 [Sidler 2002]2002 PC+Monitor 2.5 - 100 [EA NRW 2002]2002 Laptop/Notebook 2.0 - 3.0 [EA NRW 2002]
Standby and off-mode (in the source) power consumption in [W]Year of
data Name in source Source
► Translation and assumptions
The mode definitions from the sources [IVF 2007], [Ellis 2005], [Energy Star 2006b] and [EES 2006a] are transferable to the Lot 6 mode definitions. The ACPI definition of S5 used in [IVF 2007], transfered to Lot 6 off-mode, may however contain Wake-up-on-LAN functionality to an unknown degree. All standby is considered Lot 6 networked standby, because of the network capability rather than differentiating the individual work environment.

Report for Tender No. TREN/D1/40 Lot 6 -2005 EuP Lot 6 - Task 4 2nd of October 2007
Fraunhofer IZM CODDE Bio IS DUH Final Report Page 4-23
4.3.13. Results for PC+ (home)
► Summary of selected data
The PC+ (home) case is in the basic configuration equivalent to the PC+ (office) product case. So it includes desktop computers, notebooks, monitors and the peripheral devices for home internet access. Additionally, external PC speakers are also included.
For the PCs (desktop and notebook) as for the office PCs data from [IVF 2007] are chosen (marked in yellow in Table 4-21) for a better match between the studies.
For an average home PC, the following weighted5 average data have been calculated:
3.8 W networked standby power consumption and
2.5 W off-mode power consumption
As explained Task 2, the product case of PC+(home) is built around the main device (desktops and notebooks) and includes other connected devices which cannot function without a PC (e.g. monitors, PC speakers).
On average, there are 83 monitors (55% CRT and 45% flat panel, according to market data) per 100 home computers (see Task 2). For these devices, again the same sources as for the office monitors are used. The power consumption of a monitor is the following (weighted6 average values)
4.5 W networked standby power consumption and
1.4 W off-mode power consumption
In addition, there are 58 modems per 100 home PCs (see Task 2). For these appliances, the Australian data from [NAEEEC 2004c] are chosen. Based, on the three different modem types, ranging from a “simple” dial-up modem to a complex broadband modem with WLAN functionality, the following power consumption have been calculated (weighted7 average values):
10.2 W networked standby power consumption and
2.6 W off-mode power consumption.
Finally, there are 50 PC speaker sets per 100 home computers. For these peripheral, data from [NAEEEC 2004d] are chosen: 3.6 W standby power consumption and 2.5 W off-mode.
► Discussion of modes and uniformity
The modes are in principle the same for PC+ (home) devices as for PC+ (office) devices and the main difference is the use patterns.
5 Weighted by the stock (given in Task 2) and average use times (given in Task 3) of desktops and notebooks 6 Weighted by the stock (given in Task 2) and average use times (given in Task 3) of CRTs and flat panel monitors 7 Weighted by the stock (given in Task 2) and average use times (given in Task 3) of the modems

Report for Tender No. TREN/D1/40 Lot 6 -2005 EuP Lot 6 - Task 4 2nd of October 2007
Fraunhofer IZM CODDE Bio IS DUH Final Report Page 4-24
► Original data
Table 4-21: PUC 3 (net) PC+ Home (=PC+ home, Modem, W-LAN, router, speakers)
Standby/Sleep mode
Passive standby /suspend Power off Off-mode
2007 Computer Notebook 3.0 1.5 [IVF 2007]2007 Computer PC 4.0 2.7 [IVF 2007]2007 Monitor Cathode ray 6.3 1.5 [IVF 2007]
2007 Monitor LCD 2.3 1.35 [Ellis 2005] / [Energy Star 2006b]
2004 Dialup, external modem, self-powered 5.5 2.6 [NAEEEC 2004c]
2004 Broadband, external modem, self-powered 8.2 7.5 [NAEEEC 2004c]
2004
Broadband external modem, self-powered with network hub and/or wireless connectivity to the PC
13.0 13.0 [NAEEEC 2004c]
2004 Computer speakers 3.6 2.5 [NAEEEC 2004d]2004 Notebook 5.0 2.5 [Schlomann 2005]2004 Desktop PC 15.0 3.5 [Schlomann 2005]2005 Monitor Cathode ray 7.2 1.9 [EES 2006b]2005 Monitor LCD 2.6 1.0 [EES 2006b]2005 computers 35.5 3.5 [EES 2006a]2005 modems active standby 5.9 4.4 2.4 [EES 2006a]2005 computer speakers active standby 4.1 6.0 2.2 [EES 2006a]2005 CRT 8.2 1.9 [EES 2006a]2005 LCD 2.6 1.0 [EES 2006a]
2005/06 Computers-home theatre box 5.4 4.8 [EnergyConsult 2006]
2005/06 Computers-Box 4.2 1.5 [EnergyConsult 2006]2005/06 Computers-Laptop 1.4 [EnergyConsult 2006]2005/06 Computers-Monitor 1.9 0.9 [EnergyConsult 2006]2005/06 Computers-speakers active standby 7.5 4.2 [EnergyConsult 2006]
2004 Computer display, CRT 15.0 2.0 [Schlomann 2005]2004 Computer display, LCD 2.0 2.5 [Schlomann 2005]2004 dialup modem 5.0 3.0 [Schlomann 2005]2004 DSL modem 4.0 3.0 [Schlomann 2005]1999 CRT 17" 26.0 9.2 4.3 0.5 [Schaltegger 1999]1999 CRT 19" 31.0 12.6 4.0 0.9 [Schaltegger 1999]1999 CRT 21" 43.0 14.1 4.7 0.3 [Schaltegger 1999]2001 Monitor 5.0 0.5 [Roth 2002]2002 LCD 15" 3.4 1.2 0.6 [Roth 2002]2002 LCD 17" 4.8 1.7 0.8 [Roth 2002]2002 LCD 18" 7.2 2.5 1.2 [Roth 2002]2002 LCD 20" 9.2 3.2 1.6 [Roth 2002]2002 LCD 21" 10.4 3.6 1.8 [Roth 2002]2002 CRT 2.0 1.0 [Roth 2004] 2002 LCD 2.0 2.0 [Roth 2004]2006 PC and Monitors 5.0 - 10.0 [Kim 2006]2005 desktop computer 3.1 [Ohkuni 2006]2005 Notebook 1.1 [Ohkuni 2006]2005 PC Monitors 1.1 [Ohkuni 2006]2000 modems 1.0 - 5.6 [Sidler 2002]2000 screen 1.0 - 9.0 [Sidler 2002]
1998-99 PC whole unit 6.9 [IEA 2001]1998-99 Modem 4.3 [IEA 2001]1998-99 PC speakers 3.0 [IEA 2001]
2002 PC+Monitor 2.5 - 100 [EA NRW 2002]2002 Laptop/Notebook 2 - 3 [EA NRW 2002]2002 Modem 3.3 - 8.0 [EA NRW 2002]
Year of data Name in source Source
Standby and off-mode (in the source) power consumption in [W]

Report for Tender No. TREN/D1/40 Lot 6 -2005 EuP Lot 6 - Task 4 2nd of October 2007
Fraunhofer IZM CODDE Bio IS DUH Final Report Page 4-25
► Translation and assumptions
As stated for PC+ (office), the mode definitions from the chosen sources, [IVF 2007] etc., are transferable to the Lot 6 mode definitions. Whether off-mode contains wake-up-on-LAN capability to some degree can not be ascertained. All standby is considered Lot 6 networked standby, because of the network capability of the PC rather than differentiating the individual work environment.
4.3.14. Results for Laser printers
► Summary of selected data
For this product case the data of laser printers in private use from [Schlomann 2005] deliver the most fitting values from the Lot 6 standby perspective (see assumptions below for details). Regarding the definition of Lot 6 standby and the description under Section 3.1.2.6.3 this PUC 3 product comes with standby and off-modes.
For the average laser printer the results for the following tasks are as follows:
20 W Lot 6 networked standby power consumption and
3 W Lot 6 off-mode power consumption
► Discussion of modes and uniformity
As in mentioned Task 3 the focus of laser printers is set on office devices. In this case the selected data comes from the household sector, however, since these corresponded best to the terms of the Lot 6 standby. In comparison to other studies the value of 20 Watt for standby fits best with the present study definition. Standby values over 20 Watts suggest that typical “ready” or other less energy saving modes of the equipment are included, like continuous preheating for fast reactivation.
The relevant case in this study is normally a networked standby, which is entered when the device has been waiting for an incoming print job for some time (i.e. after the first power management timeout). The device displays its status with a display or LEDs and intermittently sends its status via the network interface. All other functions like preheating or hold program in memory for fast system boot are deactivated in this mode. A further standby function can be to hold the print job in memory meanwhile the paper box is empty.
For this PUC 3 network product case a special focus has to be set on the transition times and configuration options. Regarding Task 3 common user behaviour is to deactivate the standby function or to increase the transitional times. This leads to the effect that the printers switch infrequently or never into standby mode. Many workgroup printers are also not switched off over night, even though most still do have a hard-off main switch. Considering the period of actual use, the device is not active most of the time and waiting for incoming print jobs.
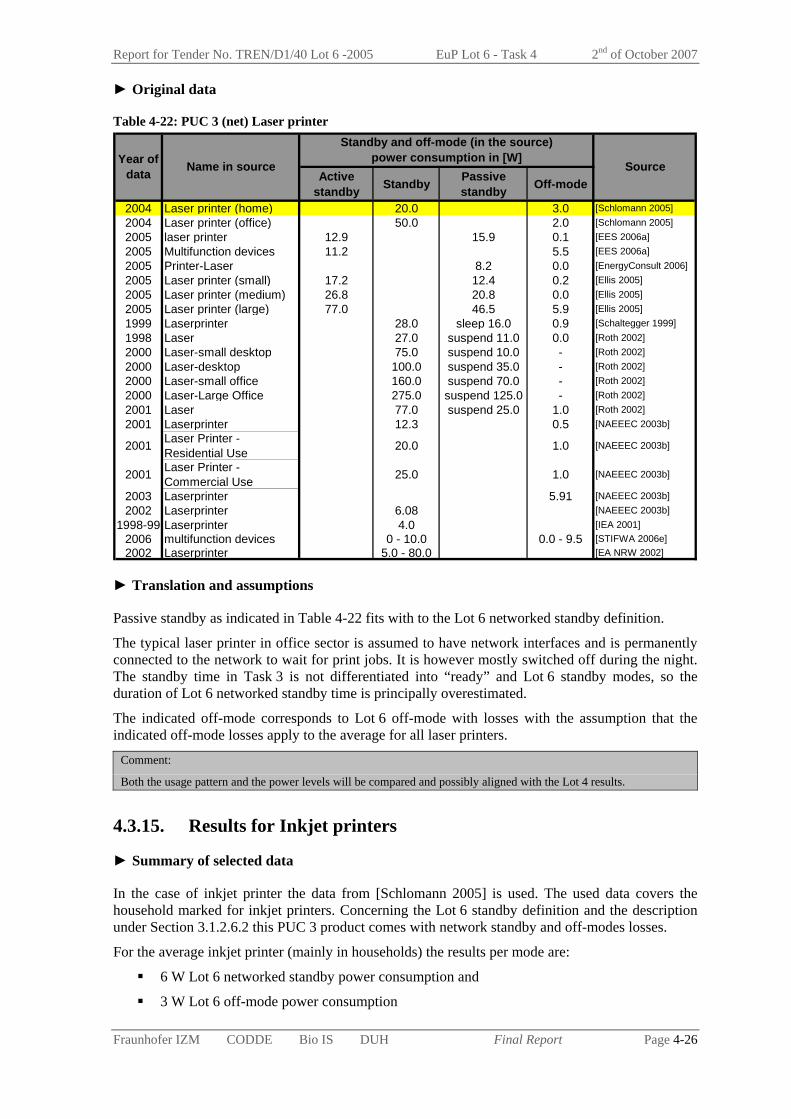
Report for Tender No. TREN/D1/40 Lot 6 -2005 EuP Lot 6 - Task 4 2nd of October 2007
Fraunhofer IZM CODDE Bio IS DUH Final Report Page 4-26
► Original data
Table 4-22: PUC 3 (net) Laser printer
Active standby Standby Passive
standby Off-mode
2004 Laser printer (home) 20.0 3.0 [Schlomann 2005]2004 Laser printer (office) 50.0 2.0 [Schlomann 2005]2005 laser printer 12.9 15.9 0.1 [EES 2006a]2005 Multifunction devices 11.2 5.5 [EES 2006a]2005 Printer-Laser 8.2 0.0 [EnergyConsult 2006]2005 Laser printer (small) 17.2 12.4 0.2 [Ellis 2005]2005 Laser printer (medium) 26.8 20.8 0.0 [Ellis 2005]2005 Laser printer (large) 77.0 46.5 5.9 [Ellis 2005]1999 Laserprinter 28.0 sleep 16.0 0.9 [Schaltegger 1999]1998 Laser 27.0 suspend 11.0 0.0 [Roth 2002] 2000 Laser-small desktop 75.0 suspend 10.0 - [Roth 2002]2000 Laser-desktop 100.0 suspend 35.0 - [Roth 2002]2000 Laser-small office 160.0 suspend 70.0 - [Roth 2002]2000 Laser-Large Office 275.0 suspend 125.0 - [Roth 2002]2001 Laser 77.0 suspend 25.0 1.0 [Roth 2002] 2001 Laserprinter 12.3 0.5 [NAEEEC 2003b]
2001 Laser Printer - Residential Use 20.0 1.0 [NAEEEC 2003b]
2001 Laser Printer - Commercial Use 25.0 1.0 [NAEEEC 2003b]
2003 Laserprinter 5.91 [NAEEEC 2003b]2002 Laserprinter 6.08 [NAEEEC 2003b]
1998-99 Laserprinter 4.0 [IEA 2001]2006 multifunction devices 0 - 10.0 0.0 - 9.5 [STIFWA 2006e]2002 Laserprinter 5.0 - 80.0 [EA NRW 2002]
Standby and off-mode (in the source) power consumption in [W]Year of
data Name in source Source
► Translation and assumptions
Passive standby as indicated in Table 4-22 fits with to the Lot 6 networked standby definition.
The typical laser printer in office sector is assumed to have network interfaces and is permanently connected to the network to wait for print jobs. It is however mostly switched off during the night. The standby time in Task 3 is not differentiated into “ready” and Lot 6 standby modes, so the duration of Lot 6 networked standby time is principally overestimated.
The indicated off-mode corresponds to Lot 6 off-mode with losses with the assumption that the indicated off-mode losses apply to the average for all laser printers.
Comment:
Both the usage pattern and the power levels will be compared and possibly aligned with the Lot 4 results.
4.3.15. Results for Inkjet printers
► Summary of selected data
In the case of inkjet printer the data from [Schlomann 2005] is used. The used data covers the household marked for inkjet printers. Concerning the Lot 6 standby definition and the description under Section 3.1.2.6.2 this PUC 3 product comes with network standby and off-modes losses.
For the average inkjet printer (mainly in households) the results per mode are:
6 W Lot 6 networked standby power consumption and
3 W Lot 6 off-mode power consumption
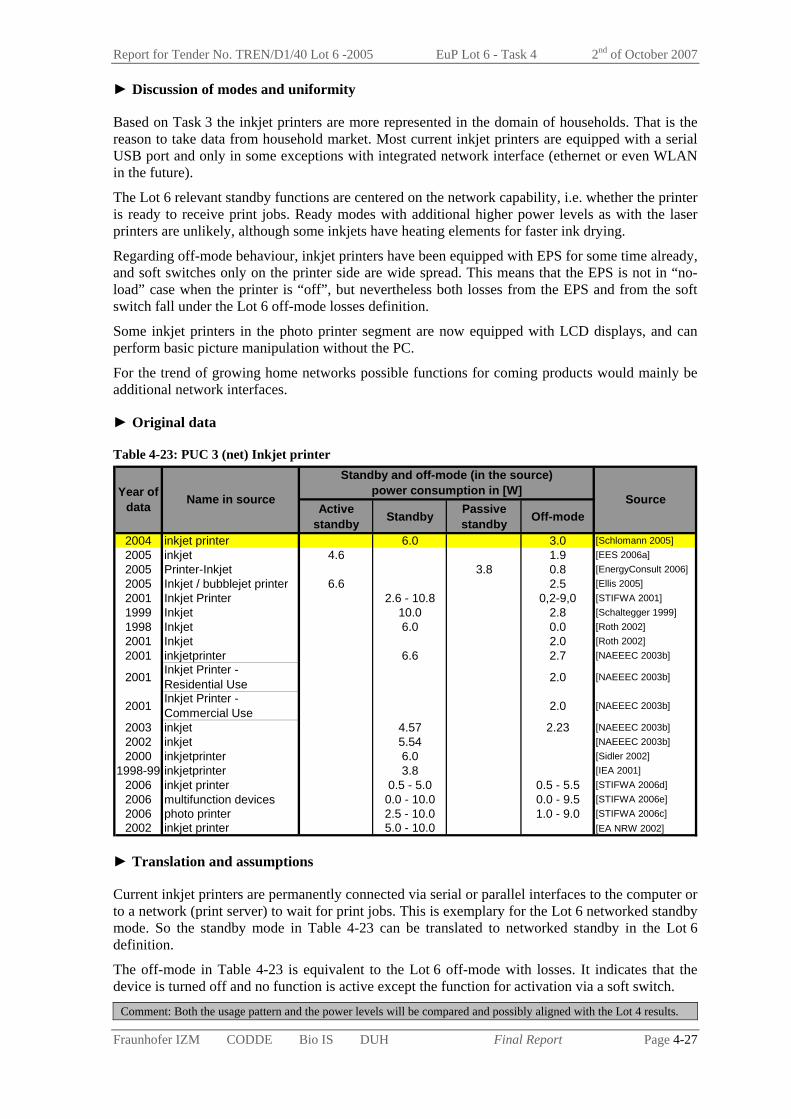
Report for Tender No. TREN/D1/40 Lot 6 -2005 EuP Lot 6 - Task 4 2nd of October 2007
Fraunhofer IZM CODDE Bio IS DUH Final Report Page 4-27
► Discussion of modes and uniformity
Based on Task 3 the inkjet printers are more represented in the domain of households. That is the reason to take data from household market. Most current inkjet printers are equipped with a serial USB port and only in some exceptions with integrated network interface (ethernet or even WLAN in the future).
The Lot 6 relevant standby functions are centered on the network capability, i.e. whether the printer is ready to receive print jobs. Ready modes with additional higher power levels as with the laser printers are unlikely, although some inkjets have heating elements for faster ink drying.
Regarding off-mode behaviour, inkjet printers have been equipped with EPS for some time already, and soft switches only on the printer side are wide spread. This means that the EPS is not in “no-load” case when the printer is “off”, but nevertheless both losses from the EPS and from the soft switch fall under the Lot 6 off-mode losses definition.
Some inkjet printers in the photo printer segment are now equipped with LCD displays, and can perform basic picture manipulation without the PC.
For the trend of growing home networks possible functions for coming products would mainly be additional network interfaces.
► Original data
Table 4-23: PUC 3 (net) Inkjet printer
Active standby Standby Passive
standby Off-mode
2004 inkjet printer 6.0 3.0 [Schlomann 2005]2005 inkjet 4.6 1.9 [EES 2006a]2005 Printer-Inkjet 3.8 0.8 [EnergyConsult 2006]2005 Inkjet / bubblejet printer 6.6 2.5 [Ellis 2005]2001 Inkjet Printer 2.6 - 10.8 0,2-9,0 [STIFWA 2001]1999 Inkjet 10.0 2.8 [Schaltegger 1999]1998 Inkjet 6.0 0.0 [Roth 2002] 2001 Inkjet 2.0 [Roth 2002]2001 inkjetprinter 6.6 2.7 [NAEEEC 2003b]
2001 Inkjet Printer - Residential Use 2.0 [NAEEEC 2003b]
2001 Inkjet Printer - Commercial Use 2.0 [NAEEEC 2003b]
2003 inkjet 4.57 2.23 [NAEEEC 2003b]2002 inkjet 5.54 [NAEEEC 2003b]2000 inkjetprinter 6.0 [Sidler 2002]
1998-99 inkjetprinter 3.8 [IEA 2001]2006 inkjet printer 0.5 - 5.0 0.5 - 5.5 [STIFWA 2006d]2006 multifunction devices 0.0 - 10.0 0.0 - 9.5 [STIFWA 2006e]2006 photo printer 2.5 - 10.0 1.0 - 9.0 [STIFWA 2006c]2002 inkjet printer 5.0 - 10.0 [EA NRW 2002]
Standby and off-mode (in the source)power consumption in [W]Year of
data Name in source Source
► Translation and assumptions
Current inkjet printers are permanently connected via serial or parallel interfaces to the computer or to a network (print server) to wait for print jobs. This is exemplary for the Lot 6 networked standby mode. So the standby mode in Table 4-23 can be translated to networked standby in the Lot 6 definition.
The off-mode in Table 4-23 is equivalent to the Lot 6 off-mode with losses. It indicates that the device is turned off and no function is active except the function for activation via a soft switch.
Comment: Both the usage pattern and the power levels will be compared and possibly aligned with the Lot 4 results.
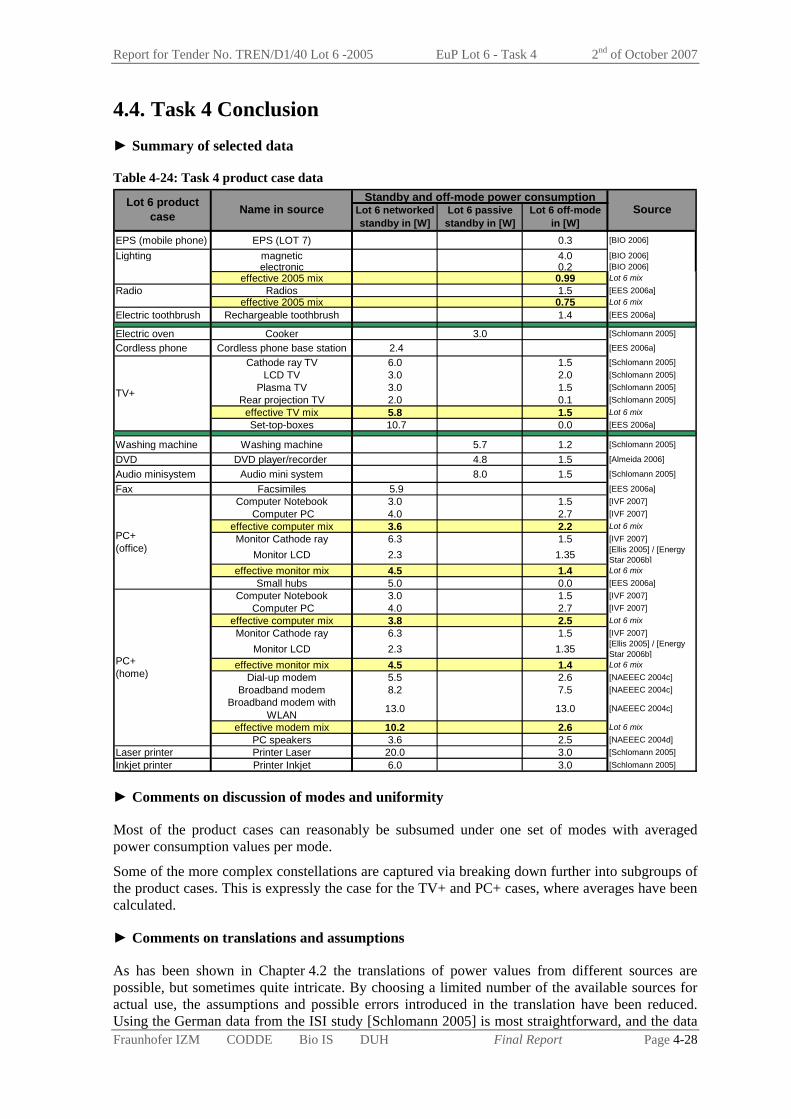
Report for Tender No. TREN/D1/40 Lot 6 -2005 EuP Lot 6 - Task 4 2nd of October 2007
Fraunhofer IZM CODDE Bio IS DUH Final Report Page 4-28
4.4. Task 4 Conclusion ► Summary of selected data
Table 4-24: Task 4 product case data
Lot 6 networked standby in [W]
Lot 6 passive standby in [W]
Lot 6 off-mode in [W]
EPS (mobile phone) EPS (LOT 7) 0.3 [BIO 2006]
Lighting magnetic 4.0 [BIO 2006]electronic 0.2 [BIO 2006]
effective 2005 mix 0.99 Lot 6 mixRadio Radios 1.5 [EES 2006a]
effective 2005 mix 0.75 Lot 6 mix
Electric toothbrush Rechargeable toothbrush 1.4 [EES 2006a]
Electric oven Cooker 3.0 [Schlomann 2005]
Cordless phone Cordless phone base station 2.4 [EES 2006a]
Cathode ray TV 6.0 1.5 [Schlomann 2005]LCD TV 3.0 2.0 [Schlomann 2005]
Plasma TV 3.0 1.5 [Schlomann 2005]Rear projection TV 2.0 0.1 [Schlomann 2005]
effective TV mix 5.8 1.5 Lot 6 mixSet-top-boxes 10.7 0.0 [EES 2006a]
Washing machine Washing machine 5.7 1.2 [Schlomann 2005]
DVD DVD player/recorder 4.8 1.5 [Almeida 2006]
Audio minisystem Audio mini system 8.0 1.5 [Schlomann 2005]
Fax Facsimiles 5.9 [EES 2006a]Computer Notebook 3.0 1.5 [IVF 2007]
Computer PC 4.0 2.7 [IVF 2007]effective computer mix 3.6 2.2 Lot 6 mixMonitor Cathode ray 6.3 1.5 [IVF 2007]
Monitor LCD 2.3 1.35 [Ellis 2005] / [Energy Star 2006b]
effective monitor mix 4.5 1.4 Lot 6 mixSmall hubs 5.0 0.0 [EES 2006a]
Computer Notebook 3.0 1.5 [IVF 2007] Computer PC 4.0 2.7 [IVF 2007]
effective computer mix 3.8 2.5 Lot 6 mixMonitor Cathode ray 6.3 1.5 [IVF 2007]
Monitor LCD 2.3 1.35 [Ellis 2005] / [Energy Star 2006b]
effective monitor mix 4.5 1.4 Lot 6 mixDial-up modem 5.5 2.6 [NAEEEC 2004c]
Broadband modem 8.2 7.5 [NAEEEC 2004c]Broadband modem with
WLAN 13.0 13.0 [NAEEEC 2004c]
effective modem mix 10.2 2.6 Lot 6 mixPC speakers 3.6 2.5 [NAEEEC 2004d]
Laser printer Printer Laser 20.0 3.0 [Schlomann 2005]Inkjet printer Printer Inkjet 6.0 3.0 [Schlomann 2005]
SourceStandby and off-mode power consumption
Name in source
TV+
PC+(office)
PC+(home)
Lot 6 product case
► Comments on discussion of modes and uniformity
Most of the product cases can reasonably be subsumed under one set of modes with averaged power consumption values per mode.
Some of the more complex constellations are captured via breaking down further into subgroups of the product cases. This is expressly the case for the TV+ and PC+ cases, where averages have been calculated.
► Comments on translations and assumptions
As has been shown in Chapter 4.2 the translations of power values from different sources are possible, but sometimes quite intricate. By choosing a limited number of the available sources for actual use, the assumptions and possible errors introduced in the translation have been reduced. Using the German data from the ISI study [Schlomann 2005] is most straightforward, and the data

Report for Tender No. TREN/D1/40 Lot 6 -2005 EuP Lot 6 - Task 4 2nd of October 2007
Fraunhofer IZM CODDE Bio IS DUH Final Report Page 4-29
is close enough to 2005 stock to use without further modifications. Assuming the same feature mix across all Europe based on the German mix is not optimal, but seems to be the best approach, keeping in mind that the 2005 stock represents a mix dominated by older products.
The Australian standby values, using data from the intrusive household studies, needs a bit more differentiation in the translation from the “active standby” mode and for EPS/charger related aspects. Otherwise the Australian data is certainly up-to-date and well prepared, but the question remains, for which products the Australian product stock mix is a good fit for the European market.

Report for Tender No. TREN/D1/40 Lot 6 -2005 EuP Lot 6 - Task 5 2nd of October 2007
Fraunhofer IZM CODDE Bio IS DUH Final Report Page 5-i
EuP Preparatory Study Lot 6 Standby and Off-mode Losses
Task 5 Definition of Base Case Final Report
Compiled by Fraunhofer IZM
Contractor: Fraunhofer Institute for Reliability and Microintegration, IZM, Berlin
Department Environmental Engineering
Dr.-Ing. Nils F. Nissen
Gustav-Meyer-Allee 25, 13355 Berlin, Germany
Contact:
Tel.: +49-30-46403-132
Fax: +49-30-46403-131
Email: [email protected]
Berlin, 2nd of October 2007
Disclaimer
The findings presented in this report are results of the research conducted by the IZM consortium and the continuous feedback from a wide range of stakeholders. The statements and recommendations presented in the final report however are not to be perceived as the opinion of the European Commission.
Report for Tender No. TREN/D1/40 Lot 6 -2005 EuP Lot 6 - Task 5 2nd of October 2007
Fraunhofer IZM CODDE Bio IS DUH Final Report Page 5-ii
Contents 5. Definition of Base Case (Task 5).................................................................................. 5-1
5.1. Task 5 Approach............................................................................................................. 5-1 5.2. Application of the VHK methodology to the product cases ........................................... 5-2
5.2.1. Inputs for the EcoReport ........................................................................................... 5-2 5.2.2. PUC 1: On / Off products.......................................................................................... 5-6 5.2.3. PUC 2: On / Standby products ................................................................................ 5-18 5.2.4. PUC 3: Job-based products ..................................................................................... 5-28
5.3. Base Case Analysis....................................................................................................... 5-57 5.3.1. Base Case 1: Off-mode............................................................................................ 5-57 5.3.2. Base Case 2: Lot 6 Standby..................................................................................... 5-59 5.3.3. Base Case 3: Automated Transitioning ................................................................... 5-61
5.4. EU-25 Total System Impact ......................................................................................... 5-64 5.4.1. Relative impacts of standby and off-mode losses ................................................... 5-64 5.4.2. Contribution of product cases to standby and off-mode losses ............................... 5-65 5.4.3. Standby and off-mode losses per household ........................................................... 5-66 5.4.4. Standby and off-mode losses for office equipment ................................................. 5-67
5.5. Task 5 Conclusions....................................................................................................... 5-68 5.5.1. Estimation of Total Magnitude Standby and Off-mode Losses for EU-25 in 2005 5-70

Report for Tender No. TREN/D1/40 Lot 6 -2005 EuP Lot 6 - Task 5 2nd of October 2007
Fraunhofer IZM CODDE Bio IS DUH Final Report Page 5-1
5. Definition of Base Case (Task 5)
According to the VHK methodology, this task should define one or two average EU product(s) or a representative product category as the “Base Case”. The environmental impact and life cycle cost analysis are built on the base case in this task and throughout the rest of the study it serves as the point-of-reference (e.g. to assess the improvement potential).
As explained in Chapter 4.1, and given the horizontal scope of this study, such a methodology is difficult to follow strictly. The approach used in this task is explained below.
5.1. Task 5 Approach Three base cases are studied:
Base Case 1: Off-mode Issues
Base Case 2: Lot 6 Standby Function Clusters
Base Case 3: Automated Transitioning
The analysis of and the discussions on the Lot 6 base cases will be structured along the three product-use-clusters (PUCs) defined in Task 1 (Section 1.1.5). The PUCs are not identical to the base cases, however. The PUCs are product clusters or product types defined according to the modes offered (effectively, mode combinations). This way, similar complexity and behaviour (both technically and on the user side) can be differentiated for structuring the argumentation.
The PUCs are investigated through 15 example product cases (classified according to the PUCs in Table 21, Chapter 1.4). These will then enable to study the 3 base cases (see Table 5-1). It is important to note that one product case may be relevant for more than one base case in this lot, and that power consumption resulting from Automated Transitioning (Base Case 3) has potential overlaps with Base Case 2, which covers the standby function clusters. In this respect Base Case 3 is not additive to Base Case 2. Table 5-1: Contribution of each product case to the three base cases
Base Case 1 Base Case 2 Base Case 3 PUC Product case Off-mode Passive
Standby Networked
standby Automated
Transitioning EPS (mobile phone) X Lighting X Radio X
PUC 1
Electric toothbrush X Oven X Cordless phone X
PUC 2
TV+ X X Washing machine X X X DVD X X X Audio minisystem X X X Fax machine X X PC+ (office) X X X PC+ (home) X X X Laser printer X X X
PUC 3
Inkjet printer X X X
The first base case covers all PUC 1 examples, but may also extend to PUC 2 and 3 product cases, which exhibit off-mode losses, or have distinct 0 W off-mode solutions.

Report for Tender No. TREN/D1/40 Lot 6 -2005 EuP Lot 6 - Task 5 2nd of October 2007
Fraunhofer IZM CODDE Bio IS DUH Final Report Page 5-2
The second base case addresses all PUC 2 examples, but includes standby function examples from the PUC 3 product cases as well.
PUC 2product cases
Lot 6 Off-mode
Lot 6 Standby
Base Case 1 Base Case 2PUC 3
product cases
PUC 2product cases
Possible shiftto automatedtransitioning
Automated Transitioningin 2005 stock
PUC 3product cases
Base Case 3
PUC 1, 2 & 3 product cases
PUC 1product cases
PUC 0"always on"
Figure 5-1: Graphical representation of the relation between the PUCs and the Base Cases
The third base case covers the additional aspects of PUC 3 "job-based" products. By definition these products have some added intelligence or integrated power management, which allows them to make decisions after the end of a job. Additionally, PUC 0 to 2 products might become PUC 3 products, when more intelligence is added to the product. Base Case 3 has two branches: investigate, what percentage already covered under Base Case 2 is caused by job-based products (Base Case 2 and this part of Base Case 3 should not be added), and the exploration of products, which could be changed into PUC 3 products. With feature-rich and merged products there is a growing trend towards PUC 3 even for simple products. The second part of Base Case 3 will be substantiated with figures later, when such "added automation" or "optimized automation" can be examined and quantified as an improvement potential (Tasks 6 and 7).
5.2. Application of the VHK methodology to the product cases
5.2.1. Inputs for the EcoReport
5.2.1.1. Inputs for the assessment of environmental impacts
The Lot 6 “Standby and off-mode losses” focuses on energy consumption in standby mode and off-mode losses. The major difference with the other lots is that the base cases are not average products but common product features. Additionally, these features cover a large spectrum of technical realisations, sometimes even within each product group. One of the objectives of the present study is to identify potential improvements of standby and off-mode, especially in order to reduce the energy consumption during the use phase (such options will be studied in Task 7).
As a consequence, other phases in the life cycle of the product cases (production, manufacture, distribution as well as disposal and recycling) are not captured for this study. As explained in Chapter 4.1, product changes and costs can still be examined in Tasks 6 and 7 via the differential approach. Consequently, some INPUT sections are left blank in the EcoReport, namely:
Phase “material extraction and production” Phase “manufacturing” Phase “distribution (including final assembly)”
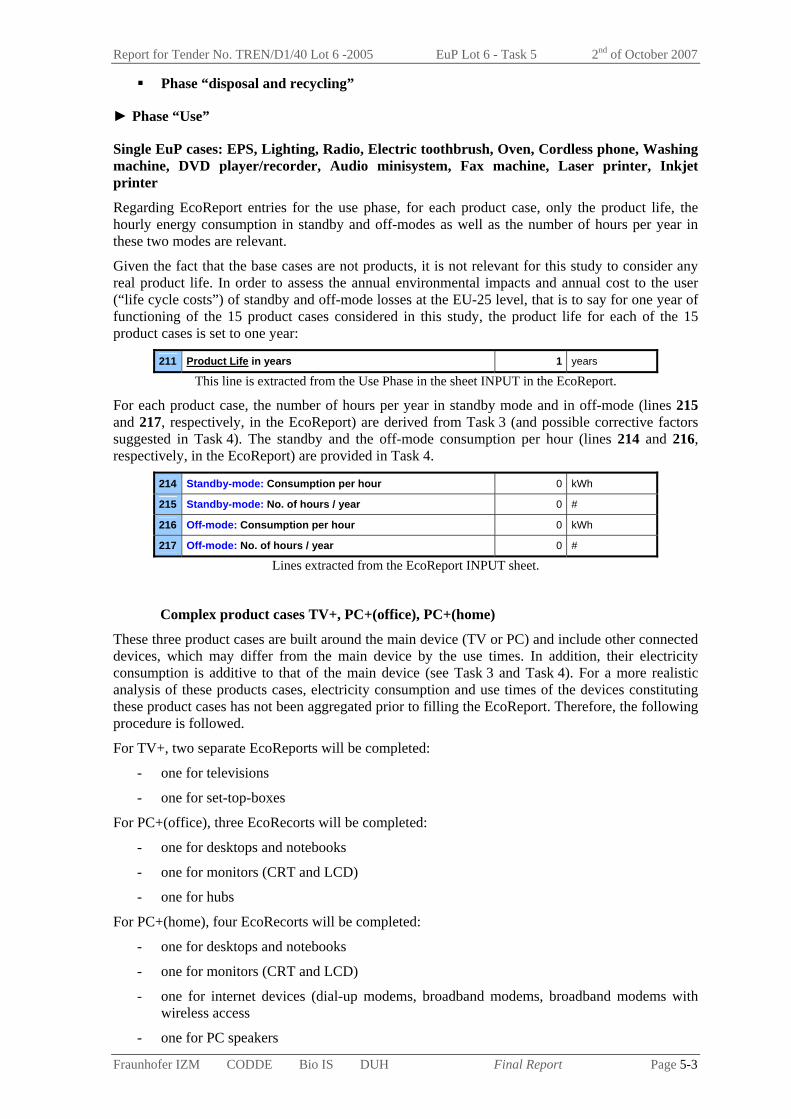
Report for Tender No. TREN/D1/40 Lot 6 -2005 EuP Lot 6 - Task 5 2nd of October 2007
Fraunhofer IZM CODDE Bio IS DUH Final Report Page 5-3
Phase “disposal and recycling”
► Phase “Use”
Single EuP cases: EPS, Lighting, Radio, Electric toothbrush, Oven, Cordless phone, Washing machine, DVD player/recorder, Audio minisystem, Fax machine, Laser printer, Inkjet printer
Regarding EcoReport entries for the use phase, for each product case, only the product life, the hourly energy consumption in standby and off-modes as well as the number of hours per year in these two modes are relevant.
Given the fact that the base cases are not products, it is not relevant for this study to consider any real product life. In order to assess the annual environmental impacts and annual cost to the user (“life cycle costs”) of standby and off-mode losses at the EU-25 level, that is to say for one year of functioning of the 15 product cases considered in this study, the product life for each of the 15 product cases is set to one year:
211 Product Life in years 1 years
This line is extracted from the Use Phase in the sheet INPUT in the EcoReport.
For each product case, the number of hours per year in standby mode and in off-mode (lines 215 and 217, respectively, in the EcoReport) are derived from Task 3 (and possible corrective factors suggested in Task 4). The standby and the off-mode consumption per hour (lines 214 and 216, respectively, in the EcoReport) are provided in Task 4.
214 Standby-mode: Consumption per hour 0 kWh
215 Standby-mode: No. of hours / year 0 #
216 Off-mode: Consumption per hour 0 kWh
217 Off-mode: No. of hours / year 0 #
Lines extracted from the EcoReport INPUT sheet.
Complex product cases TV+, PC+(office), PC+(home)
These three product cases are built around the main device (TV or PC) and include other connected devices, which may differ from the main device by the use times. In addition, their electricity consumption is additive to that of the main device (see Task 3 and Task 4). For a more realistic analysis of these products cases, electricity consumption and use times of the devices constituting these product cases has not been aggregated prior to filling the EcoReport. Therefore, the following procedure is followed.
For TV+, two separate EcoReports will be completed:
- one for televisions
- one for set-top-boxes
For PC+(office), three EcoRecorts will be completed:
- one for desktops and notebooks
- one for monitors (CRT and LCD)
- one for hubs
For PC+(home), four EcoRecorts will be completed:
- one for desktops and notebooks
- one for monitors (CRT and LCD)
- one for internet devices (dial-up modems, broadband modems, broadband modems with wireless access
- one for PC speakers

Report for Tender No. TREN/D1/40 Lot 6 -2005 EuP Lot 6 - Task 5 2nd of October 2007
Fraunhofer IZM CODDE Bio IS DUH Final Report Page 5-4
Then, for TV+, PC+(office) and PC+(home), the results of the separate EcoReports are summed-up and will be presented in the format of EcoReport results in this report.
The specific inputs for the 15 product cases regarding the use phase are summarised in Table 5-2. Table 5-2: Product case specific EcoReport inputs
Electricity consumption in mode(b) Time in mode(c)
Product Stock(a) (million units)
standby (kWh/h)
off (kWh/h)
standby (h/year)
off (h/year)
[line 214] [line 216] [line 215] [line 217] EPS (mobile phone) 0.7800 0 0.3 0 3650 Lighting 0.1790 0 0.99 0 8577.5 Radio 0.1144 0 0.75 0 8395 Electric toothbrush 0.0427 0 1.4 0 7993.5 Oven 0.0730 3 0 8650.5 0 Cordless phone 0.1796 2.4 0 8249 0
Television 0.2759 5.83 0 4380 0 TV+
Set-top-boxes 0.0563 10.7 0 7300 0 Washing machine 0.1846 5.7 1.2 1095 7300 DVD player/recorder 0.1433 4.8 1.5 5694 1460 Audio minisystem 0.1144 8 1.5 6241.5 511 Fax machine 0.0200 5.9 0 8431.5 0
Destkop+notebook 0.0805 3.56 2.17 3112.7 3219 Monitors (CRT+LCD) 0.0445 4.46 1.43 3796 2372.5 PC+
Office Hubs 0.0064 5 0 5840 0 Destkop+notebook 126 3.81 2.46 3344 4093 Monitors (CRT+LCD) 104.5 4.48 1.43 3504 4234 Modems 73 10.2 2.6 5856 996
PC+ Home
PC speakers 64.26 3.6 2.5 876 4891 Laser printer 0.0166 20 3 2153.5 5183 Inkjet printer 0.0902 6 3 693.5 6460.5 (a) For the EcoReport input, the stock estimated in Task 2 is divided by 1000 to compensate the multiplication of electricity consumption data by 1000 (see Section 5.2.3.1) (b) For the EcoReport input, the electricity consumption data is multiplied by 1000 (see Section 5.2.3.1), which is compensated by dividing the stock by 1000. (c)The annual time per mode is computed by multiplying the daily time per mode provided in Task 3 by 365 (= number of days per year).
Other lines for the use phase in the INPUT sheet of the EcoReport are not filled in, because other inputs of the use phase (such as consumables or maintenance) do not have a direct correlation with the standby and off-mode losses.
5.2.1.2. Input for EU totals and life cycle costs
For reasons similar to those presented above, only the following input lines of the EcoReport are provided:
A Product Life 1 years
C EU Stock million Units

Report for Tender No. TREN/D1/40 Lot 6 -2005 EuP Lot 6 - Task 5 2nd of October 2007
Fraunhofer IZM CODDE Bio IS DUH Final Report Page 5-5
G Electricity rate 0.136 Euro/kWh
M Discount rate (interest minus inflation) 1.8 %
N Present Worth Factor (PWF) (calculated automatically) 0.98 (years)
O Overall Improvement Ratio STOCK vs. NEW, Use Phase 1.00
Lines extracted from the EcoReport INPUT sheet
A - As explained in the previous section, the product life is set to 1 year for all the 15 product cases in order to normalise the lifetime given the fact that the base cases are not products. The impact of a product over its full lifetime is of lesser importance for the total significance of standby and off-mode losses. The lifetime view will be taken up again in the Task 7 LCC calculations and in the Task 8 scenarios.
C - The EU Stock data for each of the 15 product cases is provided by Task 2 and the inputs to EcoReport are presented in Table 5-2 above.
G - The Electricity rate is derived from Task 2 – an EU-25 weighed average is used for all product cases.
M - The average discount rate for the EU-25 is calculated as follows for all the 15 example products:
Average discount rate (EU-25) = Average interest rate (EU-25) - Average inflation rate (EU-25)
The average interest rate (EU-25) and the average inflation rate (EU-25) are given in Task 2, they are respectively 3.9% and 2.1%. So the discount rate is equal to 1.8%.
N - The present worth factor (PWF) is automatically calculated as follow:
PWF = 1 – discount rate = 1 – 0.018 = 0.982; rounded to 0.98
When actual lifetimes instead of 1 year are used in Task 7 the PWF will adapt automatically.
O - The default value for the overall improvement ratio is used for all the product cases. This input is not changed for the current yearly calculations.
5.2.1.3. Limits of the EcoReport
► Small ‘per product’ results
Due to the default units in the EcoReport, input data for one EuP results in very small impact and LCC values. Furthermore, due to the default decimal rounding of the EcoReport result values, the results per appliance are mostly zero as the values are less than 0.5. In order to better analyse the results, the calculations are therefore done for 1000 EuPs. The most suitable way to do this in the EcoReport is to multiply the energy consumption in each mode (off-mode or Lot 6 standby) by a factor 1000.
In order to compensate the factor 1000 of the energy consumption in each mode for the calculation of environmental impacts and the total consumer expenditure per EU-25 stock, the EU stock is divided by 1000 in the EcoReport (line C in Section 5.2.1.2) for each product case.
► Electricity model
Electricity consumption is the most important environmental impact to be considered within the scope of this study. The environmental impacts of electricity consumption on the environment depend upon the primary energy source and the electricity production process. Using electricity produced by coal combustion does not have the same impact as using energy produced by wind turbine. As a consequence, the environmental impacts generated through the electricity consumption will depend upon the mix of electricity production in each country. In the EcoReport

Report for Tender No. TREN/D1/40 Lot 6 -2005 EuP Lot 6 - Task 5 2nd of October 2007
Fraunhofer IZM CODDE Bio IS DUH Final Report Page 5-6
tool, only one European electricity model is available, which is based on various sources and assumptions as explained in [MEEuP 2005a].
As for Lot 6 the electricity consumption is the only parameter leading to environmental impacts, the use of a different energy mix may significantly affect the environmental impacts. The sensitivity analysis on this parameter will be analysed in Task 8.
5.2.2. PUC 1: On / Off products
The four product cases belonging to PUC 1 are studied here. This section contains a sub-section for each of the four product cases, providing the environmental impact assessment (EIA) and life cycle costs (LCC) per 1000 product units and per 2005 EU-25 stock. The specific inputs to the EcoReport have already been provided in Table 5-2.

Report for Tender No. TREN/D1/40 Lot 6 -2005 EuP Lot 6 - Task 5 2nd of October 2007
Fraunhofer IZM CODDE Bio IS DUH Final Report Page 5-7
5.2.2.1. EPS (mobile phone)
The product case of EPS (mobile phone) covers external power supplies intended to charge mobile phone batteries and other mobile products, which use the same class of EPS. The standby and off-mode losses in the use phase are calculated with 10 hours per day in off-mode (Task 3) with the electricity consumption of 0.3 Wh/h (Task 4) and 12.6 hours per day disconnected. Standby does not play a role for this product case. See Table 5-2 above for the specific inputs to the EcoReport.
► EIA and LCC for EPS (mobile phone) (1000 units)
Table 5-3: Annual environmental impacts of EPS (mobile phone) (per 1000 product units) Nr Life cycle Impact per 1000 product units: EPS (mobile phone) Date Author
0 01/2007 Lot 6 Life Cycle phases --> Resources Use and Emissions
PRODUCTION
DISTRI- BUTION USE END-
OF-LIFE TOTAL
Materials unit
1 Bulk Plastics g 0 0 02 TecPlastics g 0 0 03 Ferro g 0 0 04 Non-ferro g 0 0 05 Coating g 0 0 06 Electronics g 0 0 07 Misc. g 0 0 0
Total weight g 0 0 0 Other Resources & Waste
8 Total Energy (GER) MJ 0 0 11498 0 114989 of which, electricity (in primary MJ) MJ 0 0 11498 0 11498
10 Water (process) ltr 0 0 767 0 76711 Water (cooling) ltr 0 0 30660 0 3066012 Waste, non-haz./ landfill g 0 0 13331 0 1333113 Waste, hazardous/ incinerated g 0 0 265 0 265
Emissions (Air) 14 Greenhouse Gases in GWP100 kg CO2 eq 0 0 502 0 50215 Ozone Depletion, emissions mg R-11 eq Negligible 16 Acidification, emissions g SO2 eq 0 0 2961 0 296117 Volatile Organic Compounds (VOC) g 0 0 4 0 418 Persistent Organic Pollutants (POP) ng i-Teq 0 0 75 0 7519 Heavy Metals mg Ni eq 0 0 197 0 197
PAHs mg Ni eq 0 0 23 0 2320 Particulate Matter (PM, dust) g 0 0 63 0 63
Emissions (Water) 21 Heavy Metals mg Hg/20 0 0 74 0 7422 Eutrophication g PO4 0 0 0 0 023 Persistent Organic Pollutants (POP) ng i-Teq negligible
The total electricity used by EPS (mobile phone) (1000 units) during the off-mode for one year amounts to 1095 kWh, i.e. 11498 MJ (primary energy). Annual (life cycle) costs for these products are 146 Euros due to the electricity consumption in the off-mode, i.e. the off-mode losses (line F of the EcoReport).

Report for Tender No. TREN/D1/40 Lot 6 -2005 EuP Lot 6 - Task 5 2nd of October 2007
Fraunhofer IZM CODDE Bio IS DUH Final Report Page 5-8
► EU Totals for EPS (mobile phone)
Table 5-4: EU-25 total environmental impacts of the EPS (mobile phone) stock in 2005 Nr EU Impact of EPS (mobile phone) stock in 2005 Date Author
0 01/2007 Lot 6 Life Cycle phases --> Resources Use and Emissions
PRODUCTION
DISTRI- BUTION USE END-
OF-LIFE TOTAL
Materials unit
1 Bulk Plastics kt 0 0 02 TecPlastics kt 0 0 03 Ferro kt 0 0 04 Non-ferro kt 0 0 05 Coating kt 0 0 06 Electronics kt 0 0 07 Misc. kt 0 0 0
Total weight kt 0 0 0 Other Resources & Waste
8 Total Energy (GER) PJ 0 0 9 0 99 of which, electricity (in primary MJ) PJ 0 0 9 0 9
10 Water (process) mln. m3 0 0 1 0 111 Water (cooling) mln. m3 0 0 24 0 2412 Waste, non-haz./ landfill kt 0 0 10 0 1013 Waste, hazardous/ incinerated kt 0 0 0 0 0
Emissions (Air) 14 Greenhouse Gases in GWP100 mt CO2 eq 0 0 0 0 015 Ozone Depletion, emissions t R-11 eq negligible 16 Acidification, emissions kt SO2 eq 0 0 2 0 217 Volatile Organic Compounds (VOC) kt 0 0 0 0 018 Persistent Organic Pollutants (POP) g i-Teq 0 0 0 0 019 Heavy Metals ton Ni eq 0 0 0 0 0
PAHs ton Ni eq 0 0 0 0 020 Particulate Matter (PM, dust) kt 0 0 0 0 0
Emissions (Water) 21 Heavy Metals ton Hg/20 0 0 0 0 022 Eutrophication kt PO4 0 0 0 0 023 Persistent Organic Pollutants (POP) g i-Teq negligible

Report for Tender No. TREN/D1/40 Lot 6 -2005 EuP Lot 6 - Task 5 2nd of October 2007
Fraunhofer IZM CODDE Bio IS DUH Final Report Page 5-9
Table 5-5: Summary of Environmental Impacts by 2005 EU-Stock of EPS (mobile phone) main life cycle indicators value unit Total Energy (GER) 9 PJ
of which, electricity 0.9 TWh Water (process)* 1 mln.m3 Waste, non-haz./ landfill* 10 kton Waste, hazardous/ incinerated* 0 kton Emissions (Air) Greenhouse Gases in GWP100 0 mt CO2eq Acidifying agents (AP) 2 kt SO2eq Volatile Org. Compounds (VOC) 0 kt Persistent Org. Pollutants (POP) 0 g i-Teq Heavy Metals (HM) 0 ton Ni eq PAHs 0 ton Ni eq Particulate Matter (PM, dust) 0 kt Emissions (Water) Heavy Metals (HM) 0 ton Hg/20 Eutrophication (EP) 0 kt PO4
The total electricity used by EPS (mobile phone) stock in EU-25 (2005) during the off-mode for one year is estimated at 0.9 TWh or 9 PJ expressed as primary energy.
Total annual expenditure of the off-mode losses of the EPS (mobile phone) stock in EU-25 (2005) is estimated at 116 million Euros (line F of the EcoReport).
5.2.2.2. Lighting
The product case Lighting encompasses low voltage halogen lamps. These appliances are always supplied with a transformer (similar to an EPS). In case where the off-switch is at the secondary side of the transformer (i.e. between the transformer and the lamp), these lamps are responsible for significant energy losses (in the off-mode). However, standby is not an issue for this product-case.
The off-mode losses in the use phase are calculated with 23.5 hours per day in off-mode (Task 3) with the off-mode consumption of 4 Wh/h for magnetic transformer and 0.2 Wh/h for electronic transformers (Task 4).
The total market for transformers for halogen lighting is composed approximately of 60% of magnetic transformers for halogen lighting and 40% electronic transformers for halogen lighting [BIO 2007]. Additionally, it is assumed that 60 % of all lamps have a primary side hard-off switch. So the average off-mode power consumption for halogen lighting comes to 0.99 Wh/h. See Table 5-2 above for the specific inputs to the EcoReport.

Report for Tender No. TREN/D1/40 Lot 6 -2005 EuP Lot 6 - Task 5 2nd of October 2007
Fraunhofer IZM CODDE Bio IS DUH Final Report Page 5-10
► EIA and LCC for Lighting (1000 units)
Table 5-6: Annual Environmental impacts of Lighting (per 1000 product units) Nr Life cycle Impact per 1000 product units: Lighting Date Author
0 01/2007 Lot 6 Life Cycle phases --> Resources Use and Emissions
PRODUCTION
DISTRI- BUTION USE END-
OF-LIFE TOTAL
Materials unit
1 Bulk Plastics g 0 0 02 TecPlastics g 0 0 03 Ferro g 0 0 04 Non-ferro g 0 0 05 Coating g 0 0 06 Electronics g 0 0 07 Misc. g 0 0 0
Total weight g 0 0 0 Other Resources & Waste
8 Total Energy (GER) MJ 0 0 89163 0 891639 of which, electricity (in primary MJ) MJ 0 0 89163 0 89163
10 Water (process) ltr 0 0 5944 0 594411 Water (cooling) ltr 0 0 237768 0 23776812 Waste, non-haz./ landfill g 0 0 103380 0 10338013 Waste, hazardous/ incinerated g 0 0 2055 0 2055
Emissions (Air) 14 Greenhouse Gases in GWP100 kg CO2 eq 0 0 3891 0 389115 Ozone Depletion, emissions mg R-11 eq Negligible 16 Acidification, emissions g SO2 eq 0 0 22960 0 2296017 Volatile Organic Compounds (VOC) g 0 0 34 0 3418 Persistent Organic Pollutants (POP) ng i-Teq 0 0 584 0 58419 Heavy Metals mg Ni eq 0 0 1530 0 1530
PAHs mg Ni eq 0 0 176 0 17620 Particulate Matter (PM, dust) g 0 0 490 0 490
Emissions (Water) 21 Heavy Metals mg Hg/20 0 0 575 0 57522 Eutrophication g PO4 0 0 3 0 323 Persistent Organic Pollutants (POP) ng i-Teq negligible
The total electricity used by Lighting (1000 units) during the off-mode for one year amounts to 8492 kWh, i.e. 89163 MJ (primary energy). Annual (life cycle) costs for these products are 1134 Euros due to the electricity consumption in the off-mode, i.e. the off-mode losses (line F of the EcoReport).

Report for Tender No. TREN/D1/40 Lot 6 -2005 EuP Lot 6 - Task 5 2nd of October 2007
Fraunhofer IZM CODDE Bio IS DUH Final Report Page 5-11
► EU Totals for Lighting
Table 5-7: EU-25 total environmental impacts of the Lighting stock in 2005 Nr EU Impact of Lighting stock in 2005 Date Author
0 01/2007 Lot 6 Life Cycle phases --> Resources Use and Emissions
PRODUCTION
DISTRI- BUTION USE END-
OF-LIFE TOTAL
Materials unit
1 Bulk Plastics kt 0 0 02 TecPlastics kt 0 0 03 Ferro kt 0 0 04 Non-ferro kt 0 0 05 Coating kt 0 0 06 Electronics kt 0 0 07 Misc. kt 0 0 0
Total weight kt 0 0 0 Other Resources & Waste
8 Total Energy (GER) PJ 0 0 16 0 169 of which, electricity (in primary MJ) PJ 0 0 16 0 16
10 Water (process) mln. m3 0 0 1 0 111 Water (cooling) mln. m3 0 0 43 0 4312 Waste, non-haz./ landfill kt 0 0 19 0 1913 Waste, hazardous/ incinerated kt 0 0 0 0 0
Emissions (Air) 14 Greenhouse Gases in GWP100 mt CO2 eq 0 0 1 0 115 Ozone Depletion, emissions t R-11 eq negligible 16 Acidification, emissions kt SO2 eq 0 0 4 0 417 Volatile Organic Compounds (VOC) kt 0 0 0 0 018 Persistent Organic Pollutants (POP) g i-Teq 0 0 0 0 019 Heavy Metals ton Ni eq 0 0 0 0 0
PAHs ton Ni eq 0 0 0 0 020 Particulate Matter (PM, dust) kt 0 0 0 0 0
Emissions (Water) 21 Heavy Metals ton Hg/20 0 0 0 0 022 Eutrophication kt PO4 0 0 0 0 023 Persistent Organic Pollutants (POP) g i-Teq Negligible
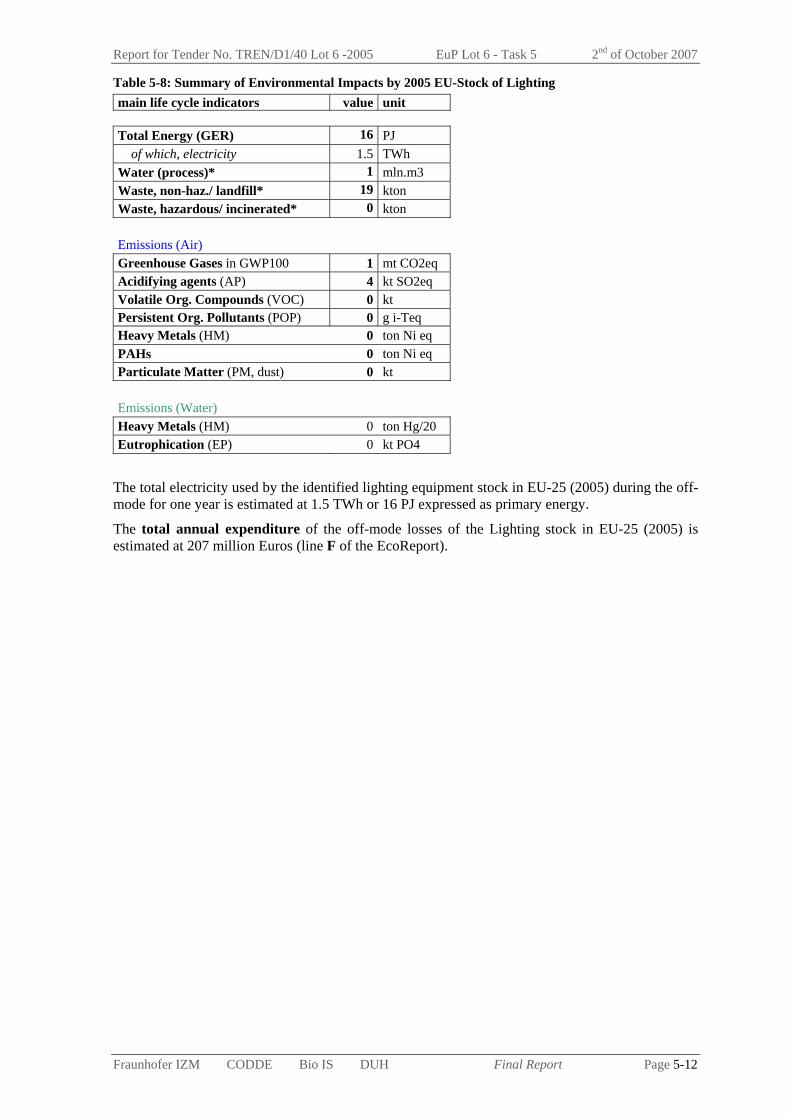
Report for Tender No. TREN/D1/40 Lot 6 -2005 EuP Lot 6 - Task 5 2nd of October 2007
Fraunhofer IZM CODDE Bio IS DUH Final Report Page 5-12
Table 5-8: Summary of Environmental Impacts by 2005 EU-Stock of Lighting main life cycle indicators value unit Total Energy (GER) 16 PJ
of which, electricity 1.5 TWh Water (process)* 1 mln.m3 Waste, non-haz./ landfill* 19 kton Waste, hazardous/ incinerated* 0 kton Emissions (Air) Greenhouse Gases in GWP100 1 mt CO2eq Acidifying agents (AP) 4 kt SO2eq Volatile Org. Compounds (VOC) 0 kt Persistent Org. Pollutants (POP) 0 g i-Teq Heavy Metals (HM) 0 ton Ni eq PAHs 0 ton Ni eq Particulate Matter (PM, dust) 0 kt Emissions (Water) Heavy Metals (HM) 0 ton Hg/20 Eutrophication (EP) 0 kt PO4
The total electricity used by the identified lighting equipment stock in EU-25 (2005) during the off-mode for one year is estimated at 1.5 TWh or 16 PJ expressed as primary energy.
The total annual expenditure of the off-mode losses of the Lighting stock in EU-25 (2005) is estimated at 207 million Euros (line F of the EcoReport).

Report for Tender No. TREN/D1/40 Lot 6 -2005 EuP Lot 6 - Task 5 2nd of October 2007
Fraunhofer IZM CODDE Bio IS DUH Final Report Page 5-13
5.2.2.3. Radio
Radio product case is estimated to be in off-mode (with losses) for 23 hours per day (Task 3), with an off-mode power consumption of 0.75 Wh/h (Task 4). See Table 5-2 above for the specific inputs to the EcoReport.
► EIA and LCC for Radio (1000 units)
Table 5-9: Annual environmental impacts of Radio (per 1000 product units) Nr Life cycle Impact per 1000 product units: Radio Date Author
0 01/2007 Lot 6 Life Cycle phases --> Resources Use and Emissions
PRODUCTION
DISTRI- BUTION USE END-
OF-LIFE TOTAL
Materials unit
1 Bulk Plastics g 0 0 02 TecPlastics g 0 0 03 Ferro g 0 0 04 Non-ferro g 0 0 05 Coating g 0 0 06 Electronics g 0 0 07 Misc. g 0 0 0
Total weight g 0 0 0 Other Resources & Waste
8 Total Energy (GER) MJ 0 0 66111 0 661119 of which, electricity (in primary MJ) MJ 0 0 66111 0 66111
10 Water (process) ltr 0 0 4407 0 440711 Water (cooling) ltr 0 0 176295 0 17629512 Waste, non-haz./ landfill g 0 0 76652 0 7665213 Waste, hazardous/ incinerated g 0 0 1523 0 1523
Emissions (Air) 14 Greenhouse Gases in GWP100 kg CO2 eq 0 0 2885 0 288515 Ozone Depletion, emissions mg R-11 eq negligible 16 Acidification, emissions g SO2 eq 0 0 17023 0 1702317 Volatile Organic Compounds (VOC) g 0 0 25 0 2518 Persistent Organic Pollutants (POP) ng i-Teq 0 0 433 0 43319 Heavy Metals mg Ni eq 0 0 1134 0 1134
PAHs mg Ni eq 0 0 130 0 13020 Particulate Matter (PM, dust) g 0 0 364 0 364
Emissions (Water) 21 Heavy Metals mg Hg/20 0 0 426 0 42622 Eutrophication g PO4 0 0 2 0 223 Persistent Organic Pollutants (POP) ng i-Teq negligible
The total electricity used by Radio (1000 units) during the off-mode for one year is estimated at 6296 kWh, i.e. 66111 MJ (primary energy). Annual (life cycle) costs for these products are 841 Euros due to the electricity consumption in the off-mode, i.e. the off-mode losses (line F of the EcoReport).
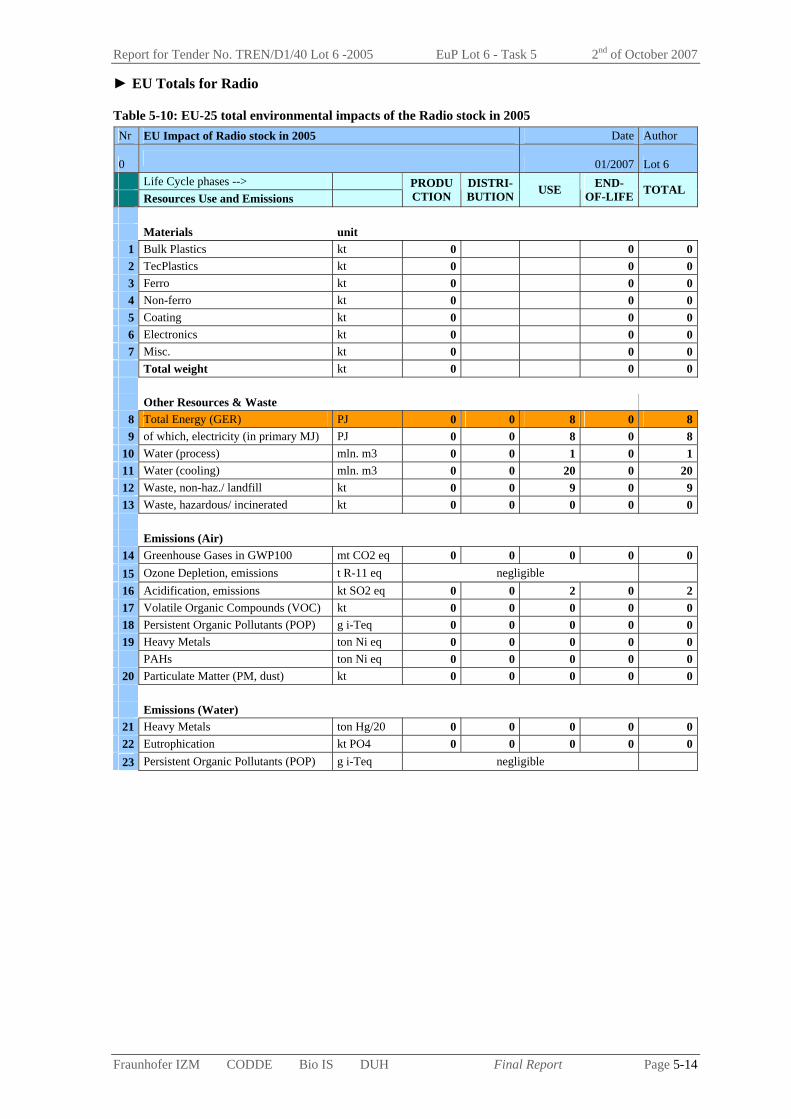
Report for Tender No. TREN/D1/40 Lot 6 -2005 EuP Lot 6 - Task 5 2nd of October 2007
Fraunhofer IZM CODDE Bio IS DUH Final Report Page 5-14
► EU Totals for Radio
Table 5-10: EU-25 total environmental impacts of the Radio stock in 2005 Nr EU Impact of Radio stock in 2005 Date Author
0 01/2007 Lot 6 Life Cycle phases --> Resources Use and Emissions
PRODUCTION
DISTRI- BUTION USE END-
OF-LIFE TOTAL
Materials unit
1 Bulk Plastics kt 0 0 02 TecPlastics kt 0 0 03 Ferro kt 0 0 04 Non-ferro kt 0 0 05 Coating kt 0 0 06 Electronics kt 0 0 07 Misc. kt 0 0 0
Total weight kt 0 0 0 Other Resources & Waste
8 Total Energy (GER) PJ 0 0 8 0 89 of which, electricity (in primary MJ) PJ 0 0 8 0 8
10 Water (process) mln. m3 0 0 1 0 111 Water (cooling) mln. m3 0 0 20 0 2012 Waste, non-haz./ landfill kt 0 0 9 0 913 Waste, hazardous/ incinerated kt 0 0 0 0 0
Emissions (Air) 14 Greenhouse Gases in GWP100 mt CO2 eq 0 0 0 0 015 Ozone Depletion, emissions t R-11 eq negligible 16 Acidification, emissions kt SO2 eq 0 0 2 0 217 Volatile Organic Compounds (VOC) kt 0 0 0 0 018 Persistent Organic Pollutants (POP) g i-Teq 0 0 0 0 019 Heavy Metals ton Ni eq 0 0 0 0 0
PAHs ton Ni eq 0 0 0 0 020 Particulate Matter (PM, dust) kt 0 0 0 0 0
Emissions (Water) 21 Heavy Metals ton Hg/20 0 0 0 0 022 Eutrophication kt PO4 0 0 0 0 023 Persistent Organic Pollutants (POP) g i-Teq negligible
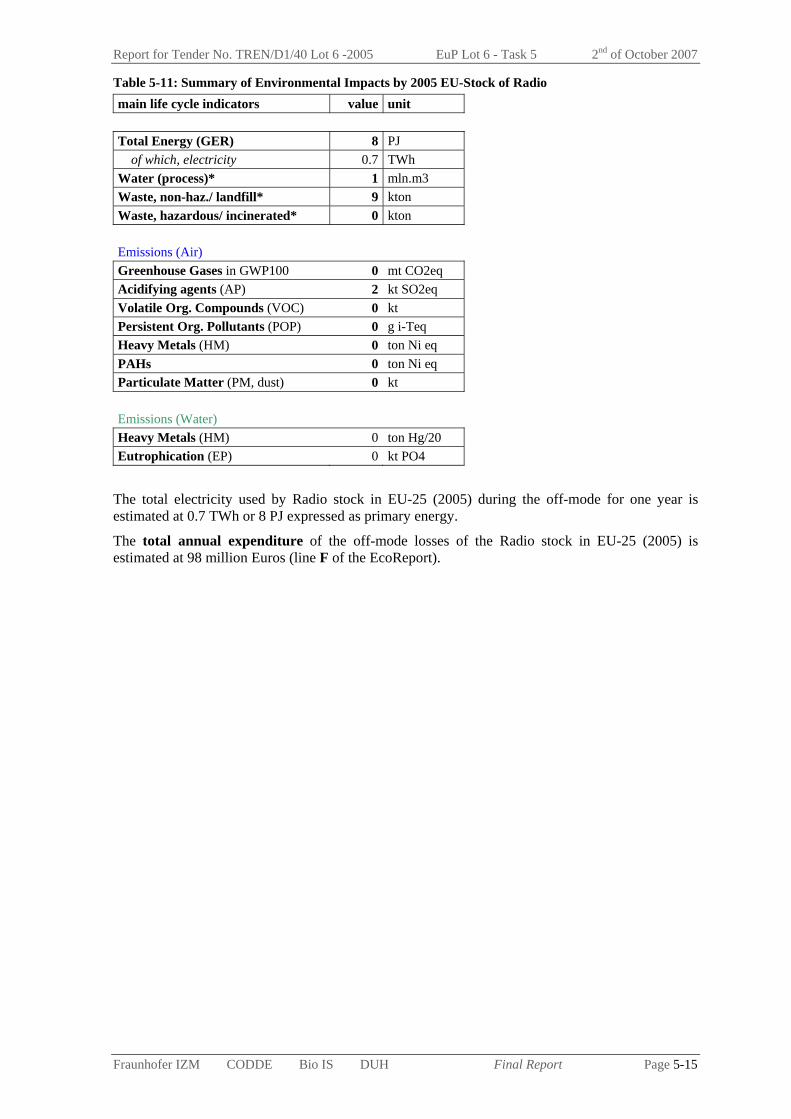
Report for Tender No. TREN/D1/40 Lot 6 -2005 EuP Lot 6 - Task 5 2nd of October 2007
Fraunhofer IZM CODDE Bio IS DUH Final Report Page 5-15
Table 5-11: Summary of Environmental Impacts by 2005 EU-Stock of Radio main life cycle indicators value unit Total Energy (GER) 8 PJ
of which, electricity 0.7 TWh Water (process)* 1 mln.m3 Waste, non-haz./ landfill* 9 kton Waste, hazardous/ incinerated* 0 kton Emissions (Air) Greenhouse Gases in GWP100 0 mt CO2eq Acidifying agents (AP) 2 kt SO2eq Volatile Org. Compounds (VOC) 0 kt Persistent Org. Pollutants (POP) 0 g i-Teq Heavy Metals (HM) 0 ton Ni eq PAHs 0 ton Ni eq Particulate Matter (PM, dust) 0 kt Emissions (Water) Heavy Metals (HM) 0 ton Hg/20 Eutrophication (EP) 0 kt PO4
The total electricity used by Radio stock in EU-25 (2005) during the off-mode for one year is estimated at 0.7 TWh or 8 PJ expressed as primary energy.
The total annual expenditure of the off-mode losses of the Radio stock in EU-25 (2005) is estimated at 98 million Euros (line F of the EcoReport).

Report for Tender No. TREN/D1/40 Lot 6 -2005 EuP Lot 6 - Task 5 2nd of October 2007
Fraunhofer IZM CODDE Bio IS DUH Final Report Page 5-16
5.2.2.4. Electric toothbrush
For Electric toothbrush product case, the standby and off-mode losses in the use phase are calculated with 21.9 hours per day in off-mode (Task 3) with the hourly off-mode consumption of 1.4 Wh/h (Task 4). See Table 5-2 above for the specific inputs to the EcoReport.
► EIA and LCC for Electric toothbrush (1000 units)
Table 5-12: Annual environmental impacts of Electric toothbrush (per 1000 product units) Nr Life cycle Impact per 1000 product units: Electric toothbrush Date Author
0 01/2007 Lot 6 Life Cycle phases --> Resources Use and Emissions
PRODUCTION
DISTRI- BUTION USE END-
OF-LIFE TOTAL
Materials unit
1 Bulk Plastics g 0 0 02 TecPlastics g 0 0 03 Ferro g 0 0 04 Non-ferro g 0 0 05 Coating g 0 0 06 Electronics g 0 0 07 Misc. g 0 0 0
Total weight g 0 0 0 Other Resources & Waste
8 Total Energy (GER) MJ 0 0 117504 0 1175049 of which, electricity (in primary MJ) MJ 0 0 117504 0 117504
10 Water (process) ltr 0 0 7834 0 783411 Water (cooling) ltr 0 0 313345 0 31334512 Waste, non-haz./ landfill g 0 0 136240 0 13624013 Waste, hazardous/ incinerated g 0 0 2708 0 2708
Emissions (Air) 14 Greenhouse Gases in GWP100 kg CO2 eq 0 0 5128 0 512815 Ozone Depletion, emissions mg R-11 eq negligible 16 Acidification, emissions g SO2 eq 0 0 30257 0 3025717 Volatile Organic Compounds (VOC) g 0 0 44 0 4418 Persistent Organic Pollutants (POP) ng i-Teq 0 0 770 0 77019 Heavy Metals mg Ni eq 0 0 2016 0 2016
PAHs mg Ni eq 0 0 231 0 23120 Particulate Matter (PM, dust) g 0 0 646 0 646
Emissions (Water) 21 Heavy Metals mg Hg/20 0 0 758 0 75822 Eutrophication g PO4 0 0 4 0 423 Persistent Organic Pollutants (POP) ng i-Teq negligible
The total electricity used by Electric toothbrush (1000 units) during the off-mode for one year is estimated at 11191 kWh, i.e.117504 MJ (primary energy). Annual (life cycle) costs for these products are 1495 Euros due to the electricity consumption in the off-mode, i.e. the off-mode losses (line F of the EcoReport).
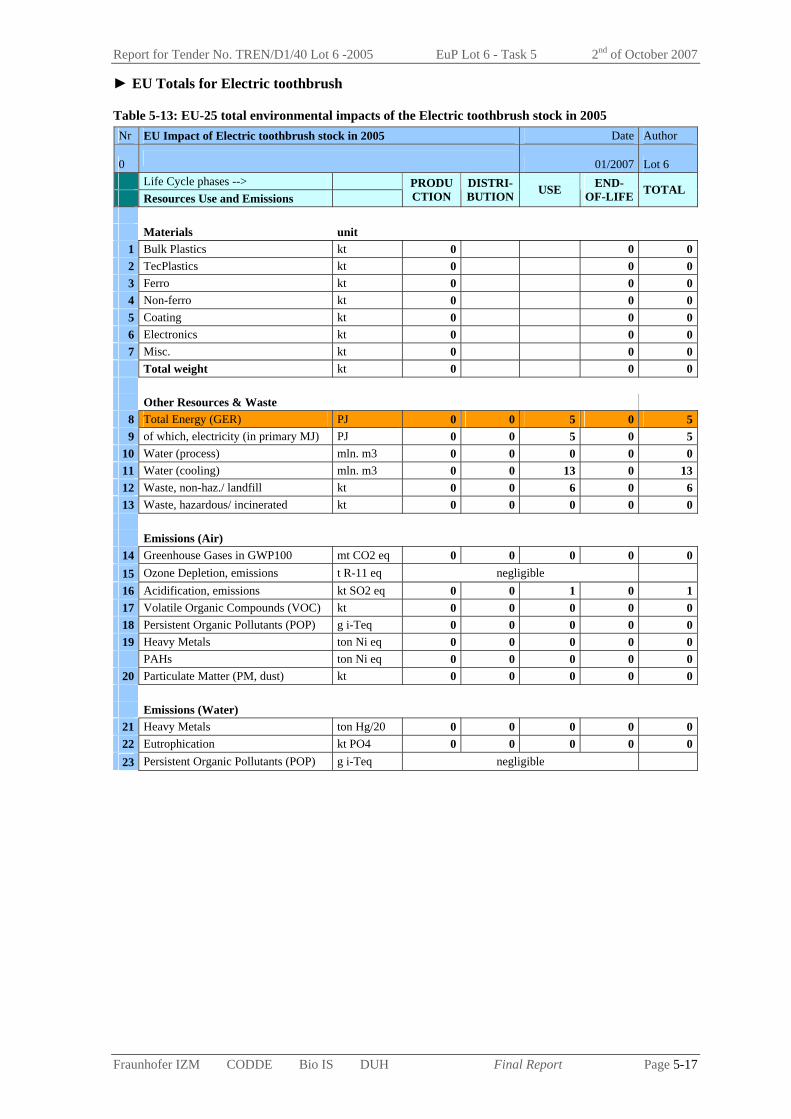
Report for Tender No. TREN/D1/40 Lot 6 -2005 EuP Lot 6 - Task 5 2nd of October 2007
Fraunhofer IZM CODDE Bio IS DUH Final Report Page 5-17
► EU Totals for Electric toothbrush
Table 5-13: EU-25 total environmental impacts of the Electric toothbrush stock in 2005 Nr EU Impact of Electric toothbrush stock in 2005 Date Author
0 01/2007 Lot 6 Life Cycle phases --> Resources Use and Emissions
PRODUCTION
DISTRI- BUTION USE END-
OF-LIFE TOTAL
Materials unit
1 Bulk Plastics kt 0 0 02 TecPlastics kt 0 0 03 Ferro kt 0 0 04 Non-ferro kt 0 0 05 Coating kt 0 0 06 Electronics kt 0 0 07 Misc. kt 0 0 0
Total weight kt 0 0 0 Other Resources & Waste
8 Total Energy (GER) PJ 0 0 5 0 59 of which, electricity (in primary MJ) PJ 0 0 5 0 5
10 Water (process) mln. m3 0 0 0 0 011 Water (cooling) mln. m3 0 0 13 0 1312 Waste, non-haz./ landfill kt 0 0 6 0 613 Waste, hazardous/ incinerated kt 0 0 0 0 0
Emissions (Air) 14 Greenhouse Gases in GWP100 mt CO2 eq 0 0 0 0 015 Ozone Depletion, emissions t R-11 eq negligible 16 Acidification, emissions kt SO2 eq 0 0 1 0 117 Volatile Organic Compounds (VOC) kt 0 0 0 0 018 Persistent Organic Pollutants (POP) g i-Teq 0 0 0 0 019 Heavy Metals ton Ni eq 0 0 0 0 0
PAHs ton Ni eq 0 0 0 0 020 Particulate Matter (PM, dust) kt 0 0 0 0 0
Emissions (Water) 21 Heavy Metals ton Hg/20 0 0 0 0 022 Eutrophication kt PO4 0 0 0 0 023 Persistent Organic Pollutants (POP) g i-Teq negligible

Report for Tender No. TREN/D1/40 Lot 6 -2005 EuP Lot 6 - Task 5 2nd of October 2007
Fraunhofer IZM CODDE Bio IS DUH Final Report Page 5-18
Table 5-14: Summary of Environmental Impacts by 2005 EU Stock of Electric toothbrush main life cycle indicators value unit Total Energy (GER) 5 PJ
of which, electricity 0.5 TWh Water (process)* 0 mln.m3 Waste, non-haz./ landfill* 6 kton Waste, hazardous/ incinerated* 0 kton Emissions (Air) Greenhouse Gases in GWP100 0 mt CO2eq Acidifying agents (AP) 1 kt SO2eq Volatile Org. Compounds (VOC) 0 kt Persistent Org. Pollutants (POP) 0 g i-Teq Heavy Metals (HM) 0 ton Ni eq PAHs 0 ton Ni eq Particulate Matter (PM, dust) 0 kt Emissions (Water) Heavy Metals (HM) 0 ton Hg/20 Eutrophication (EP) 0 kt PO4
The total electricity used by Electric toothbrush stock in EU-25 (2005) during the off-mode for one year is estimated at 0.5 TWh or 5 PJ expressed as primary energy.
The total annual expenditure of the off-mode losses of the Electric toothbrush stock in EU-25 (2005) is estimated at 65 million Euros (line F of the EcoReport).
5.2.3. PUC 2: On / Standby products
The three product cases belong to the PUC 2 are studied here. This section contains a sub-section for each of the three product cases, providing the environmental impact assessment (EIA) and life cycle costs (LCC) per 1000 product units and per 2005 EU-25 stock. The specific inputs to the EcoReport have already been provided in Table 5-2.

Report for Tender No. TREN/D1/40 Lot 6 -2005 EuP Lot 6 - Task 5 2nd of October 2007
Fraunhofer IZM CODDE Bio IS DUH Final Report Page 5-19
5.2.3.1. Oven
For Oven product case, the standby and off-mode losses in the use phase are calculated with 23.7 hours per day in passive standby mode (Task 3) with the hourly passive standby consumption of 3 Wh/h (Task 4). See Table 5-2 above for the specific inputs to the EcoReport.
► EIA and LCC for Oven (1000 units)
Table 5-15: Annual environmental impacts of Oven (per 1000 product units) Nr Life cycle Impact per 1000 product units: Oven Date Author
0 01/2007 Lot 6 Life Cycle phases --> Resources Use and Emissions
PRODUCTION
DISTRI- BUTION USE END-
OF-LIFE TOTAL
Materials unit
1 Bulk Plastics g 0 0 02 TecPlastics g 0 0 03 Ferro g 0 0 04 Non-ferro g 0 0 05 Coating g 0 0 06 Electronics g 0 0 07 Misc. g 0 0 0
Total weight g 0 0 0 Other Resources & Waste
8 Total Energy (GER) MJ 0 0 272491 0 2724919 of which, electricity (in primary MJ) MJ 0 0 272491 0 272491
10 Water (process) ltr 0 0 18166 0 1816611 Water (cooling) ltr 0 0 726642 0 72664212 Waste, non-haz./ landfill g 0 0 315938 0 31593813 Waste, hazardous/ incinerated g 0 0 6279 0 6279
Emissions (Air) 14 Greenhouse Gases in GWP100 kg CO2 eq 0 0 11891 0 1189115 Ozone Depletion, emissions mg R-11 eq negligible 16 Acidification, emissions g SO2 eq 0 0 70166 0 7016617 Volatile Organic Compounds (VOC) g 0 0 103 0 10318 Persistent Organic Pollutants (POP) ng i-Teq 0 0 1786 0 178619 Heavy Metals mg Ni eq 0 0 4675 0 4675
PAHs mg Ni eq 0 0 537 0 53720 Particulate Matter (PM, dust) g 0 0 1499 0 1499
Emissions (Water) 21 Heavy Metals mg Hg/20 0 0 1757 0 175722 Eutrophication g PO4 0 0 8 0 823 Persistent Organic Pollutants (POP) ng i-Teq negligible
The total electricity used by Oven (1000 units) during the standby mode for one year is estimated at 25952 kWh, i.e. 272491 MJ (primary energy). Annual (life cycle) costs for these products are 3467 Euros due to the electricity consumption in the passive standby mode (line F of the EcoReport).
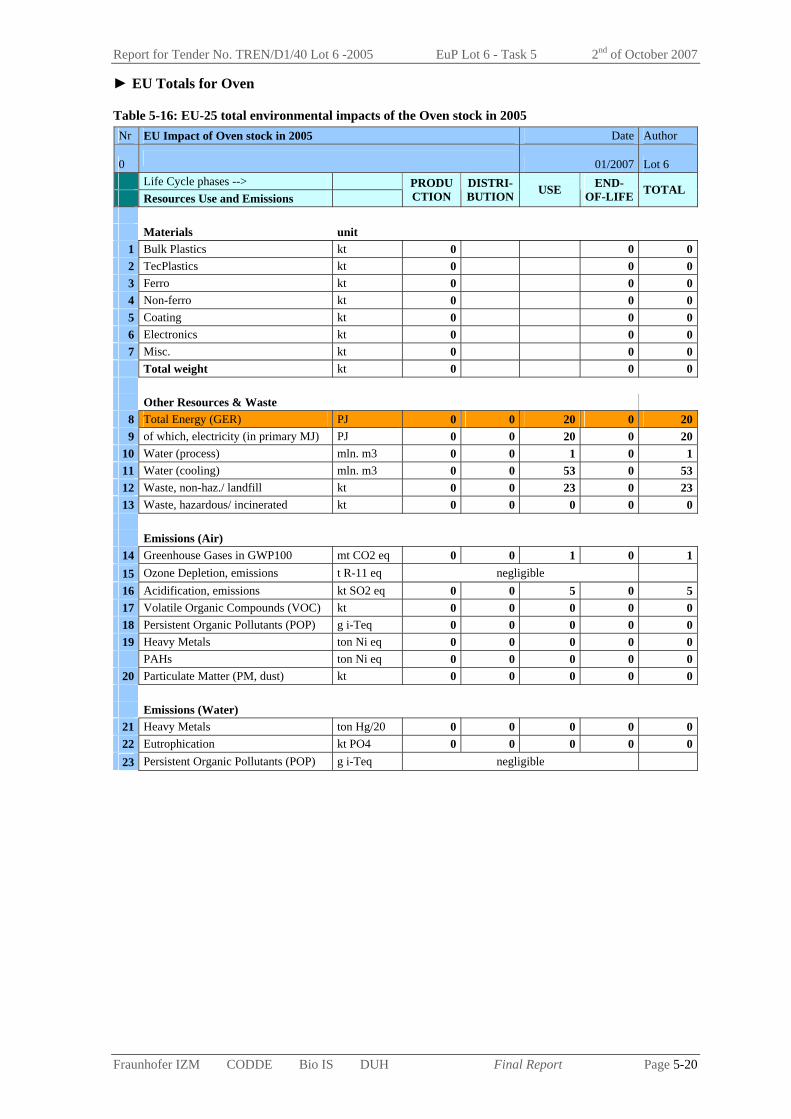
Report for Tender No. TREN/D1/40 Lot 6 -2005 EuP Lot 6 - Task 5 2nd of October 2007
Fraunhofer IZM CODDE Bio IS DUH Final Report Page 5-20
► EU Totals for Oven
Table 5-16: EU-25 total environmental impacts of the Oven stock in 2005 Nr EU Impact of Oven stock in 2005 Date Author
0 01/2007 Lot 6 Life Cycle phases --> Resources Use and Emissions
PRODUCTION
DISTRI- BUTION USE END-
OF-LIFE TOTAL
Materials unit
1 Bulk Plastics kt 0 0 02 TecPlastics kt 0 0 03 Ferro kt 0 0 04 Non-ferro kt 0 0 05 Coating kt 0 0 06 Electronics kt 0 0 07 Misc. kt 0 0 0
Total weight kt 0 0 0 Other Resources & Waste
8 Total Energy (GER) PJ 0 0 20 0 209 of which, electricity (in primary MJ) PJ 0 0 20 0 20
10 Water (process) mln. m3 0 0 1 0 111 Water (cooling) mln. m3 0 0 53 0 5312 Waste, non-haz./ landfill kt 0 0 23 0 2313 Waste, hazardous/ incinerated kt 0 0 0 0 0
Emissions (Air) 14 Greenhouse Gases in GWP100 mt CO2 eq 0 0 1 0 115 Ozone Depletion, emissions t R-11 eq negligible 16 Acidification, emissions kt SO2 eq 0 0 5 0 517 Volatile Organic Compounds (VOC) kt 0 0 0 0 018 Persistent Organic Pollutants (POP) g i-Teq 0 0 0 0 019 Heavy Metals ton Ni eq 0 0 0 0 0
PAHs ton Ni eq 0 0 0 0 020 Particulate Matter (PM, dust) kt 0 0 0 0 0
Emissions (Water) 21 Heavy Metals ton Hg/20 0 0 0 0 022 Eutrophication kt PO4 0 0 0 0 023 Persistent Organic Pollutants (POP) g i-Teq negligible

Report for Tender No. TREN/D1/40 Lot 6 -2005 EuP Lot 6 - Task 5 2nd of October 2007
Fraunhofer IZM CODDE Bio IS DUH Final Report Page 5-21
Table 5-17: Summary of Environmental Impacts by 2005 EU-Stock of Oven main life cycle indicators value unit Total Energy (GER) 20 PJ
of which, electricity 1.9 TWh Water (process)* 1 mln.m3 Waste, non-haz./ landfill* 23 kton Waste, hazardous/ incinerated* 0 kton Emissions (Air) Greenhouse Gases in GWP100 1 mt CO2eq Acidifying agents (AP) 5 kt SO2eq Volatile Org. Compounds (VOC) 0 kt Persistent Org. Pollutants (POP) 0 g i-Teq Heavy Metals (HM) 0 ton Ni eq PAHs 0 ton Ni eq Particulate Matter (PM, dust) 0 kt Emissions (Water) Heavy Metals (HM) 0 ton Hg/20 Eutrophication (EP) 0 kt PO4
The total electricity used by Oven stock in EU-25 (2005) during the standby mode for one year is estimated at 1.9 TWh or 20 PJ expressed as primary energy.
The total annual expenditure of the standby consumption of the Oven stock in EU-25 (2005) is estimated at 258 million Euros (line F of the EcoReport).

Report for Tender No. TREN/D1/40 Lot 6 -2005 EuP Lot 6 - Task 5 2nd of October 2007
Fraunhofer IZM CODDE Bio IS DUH Final Report Page 5-22
5.2.3.2. Cordless phone
For Cordless phone product case, the standby and off-mode losses in the use phase are calculated with 22.6 hours per day in networked standby mode (Task 3) with the hourly networked standby consumption of 2.4 Wh/h (Task 4). See Table 5-2 above for the specific inputs to the EcoReport.
► EIA and LCC for Cordless phone (1000 units)
Table 5-18: Annual environmental impacts of Cordless phone (per 1000 product units) Nr Life cycle Impact per 1000 product units: Cordless phone Date Author
0 01/2007 Lot 6 Life Cycle phases --> Resources Use and Emissions
PRODUCTION
DISTRI- BUTION USE END-
OF-LIFE TOTAL
Materials unit
1 Bulk Plastics g 0 0 02 TecPlastics g 0 0 03 Ferro g 0 0 04 Non-ferro g 0 0 05 Coating g 0 0 06 Electronics g 0 0 07 Misc. g 0 0 0
Total weight g 0 0 0 Other Resources & Waste
8 Total Energy (GER) MJ 0 0 207875 0 2078759 of which, electricity (in primary MJ) MJ 0 0 207875 0 207875
10 Water (process) ltr 0 0 13858 0 1385811 Water (cooling) ltr 0 0 554333 0 55433312 Waste, non-haz./ landfill g 0 0 241019 0 24101913 Waste, hazardous/ incinerated g 0 0 4790 0 4790
Emissions (Air) 14 Greenhouse Gases in GWP100 kg CO2 eq 0 0 9072 0 907215 Ozone Depletion, emissions mg R-11 eq negligible 16 Acidification, emissions g SO2 eq 0 0 53528 0 5352817 Volatile Organic Compounds (VOC) g 0 0 78 0 7818 Persistent Organic Pollutants (POP) ng i-Teq 0 0 1363 0 136319 Heavy Metals mg Ni eq 0 0 3566 0 3566
PAHs mg Ni eq 0 0 410 0 41020 Particulate Matter (PM, dust) g 0 0 1143 0 1143
Emissions (Water) 21 Heavy Metals mg Hg/20 0 0 1340 0 134022 Eutrophication g PO4 0 0 6 0 623 Persistent Organic Pollutants (POP) ng i-Teq negligible
The total electricity used by Cordless phone (1000 units) during the standby mode for one year is estimated at 19798 kWh, i.e. 207875 MJ (primary energy). Annual (life cycle) costs for these products are 2645 Euros due to the electricity consumption in the networked standby mode (line F of the EcoReport).

Report for Tender No. TREN/D1/40 Lot 6 -2005 EuP Lot 6 - Task 5 2nd of October 2007
Fraunhofer IZM CODDE Bio IS DUH Final Report Page 5-23
► EU Totals for Cordless phone
Table 5-19: EU-25 total environmental impacts of the Cordless phone stock in 2005 Nr EU Impact of Cordless phone stock in 2005 Date Author
0 01/2007 Lot 6 Life Cycle phases --> Resources Use and Emissions
PRODUCTION
DISTRI- BUTION USE END-
OF-LIFE TOTAL
Materials unit
1 Bulk Plastics kt 0 0 02 TecPlastics kt 0 0 03 Ferro kt 0 0 04 Non-ferro kt 0 0 05 Coating kt 0 0 06 Electronics kt 0 0 07 Misc. kt 0 0 0
Total weight kt 0 0 0 Other Resources & Waste
8 Total Energy (GER) PJ 0 0 37 0 379 of which, electricity (in primary MJ) PJ 0 0 37 0 37
10 Water (process) mln. m3 0 0 2 0 211 Water (cooling) mln. m3 0 0 100 0 10012 Waste, non-haz./ landfill kt 0 0 43 0 4313 Waste, hazardous/ incinerated kt 0 0 1 0 1
Emissions (Air) 14 Greenhouse Gases in GWP100 mt CO2 eq 0 0 2 0 215 Ozone Depletion, emissions t R-11 eq negligible 16 Acidification, emissions kt SO2 eq 0 0 10 0 1017 Volatile Organic Compounds (VOC) kt 0 0 0 0 018 Persistent Organic Pollutants (POP) g i-Teq 0 0 0 0 019 Heavy Metals ton Ni eq 0 0 1 0 1
PAHs ton Ni eq 0 0 0 0 020 Particulate Matter (PM, dust) kt 0 0 0 0 0
Emissions (Water) 21 Heavy Metals ton Hg/20 0 0 0 0 022 Eutrophication kt PO4 0 0 0 0 023 Persistent Organic Pollutants (POP) g i-Teq negligible
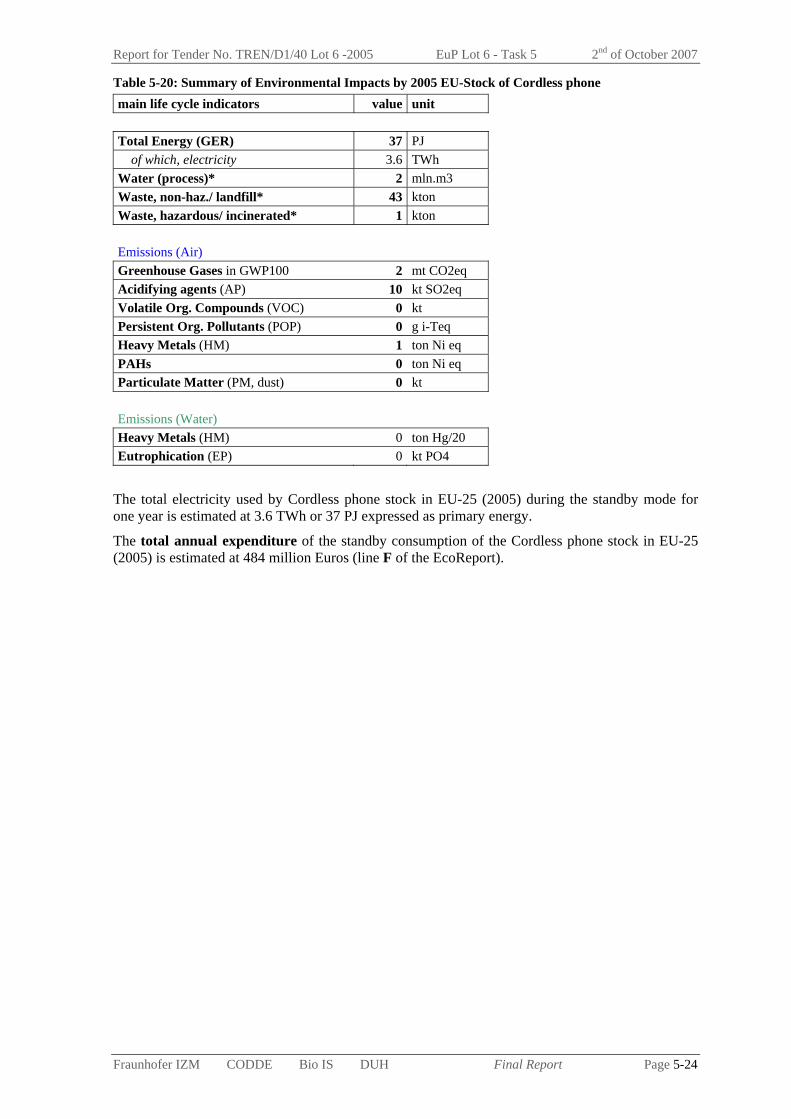
Report for Tender No. TREN/D1/40 Lot 6 -2005 EuP Lot 6 - Task 5 2nd of October 2007
Fraunhofer IZM CODDE Bio IS DUH Final Report Page 5-24
Table 5-20: Summary of Environmental Impacts by 2005 EU-Stock of Cordless phone main life cycle indicators value unit Total Energy (GER) 37 PJ
of which, electricity 3.6 TWh Water (process)* 2 mln.m3 Waste, non-haz./ landfill* 43 kton Waste, hazardous/ incinerated* 1 kton Emissions (Air) Greenhouse Gases in GWP100 2 mt CO2eq Acidifying agents (AP) 10 kt SO2eq Volatile Org. Compounds (VOC) 0 kt Persistent Org. Pollutants (POP) 0 g i-Teq Heavy Metals (HM) 1 ton Ni eq PAHs 0 ton Ni eq Particulate Matter (PM, dust) 0 kt Emissions (Water) Heavy Metals (HM) 0 ton Hg/20 Eutrophication (EP) 0 kt PO4
The total electricity used by Cordless phone stock in EU-25 (2005) during the standby mode for one year is estimated at 3.6 TWh or 37 PJ expressed as primary energy.
The total annual expenditure of the standby consumption of the Cordless phone stock in EU-25 (2005) is estimated at 484 million Euros (line F of the EcoReport).

Report for Tender No. TREN/D1/40 Lot 6 -2005 EuP Lot 6 - Task 5 2nd of October 2007
Fraunhofer IZM CODDE Bio IS DUH Final Report Page 5-25
5.2.3.3. TV+
The TV+ product case covers the main TV technologies that are currently on the market; in addition, digital set-top boxes are taken into account. For the mixed 2005 stock data, televisions with hard-off switches have been taken into account. On average, TVs are assumed to be 8 hours in 0W off mode.
As explained in Section 5.2.1.1., two EcoReports are completed for this product case: one for TVs and one for set-top-boxes
For each of the two EcoReport, the standby and off-mode losses in the use phase are calculated with the device specific use times and electricity consumption provided in Task 3 and Task 4 respectively (Table 5-21). For the specific inputs to the EcoReport, see Table 5-2 above. Table 5-21: Use time and electricity consumption for TV+ devices
Electricity consumption in mode Time in mode
TV+ Stock
(million units) standby
(Wh/h) off
(Wh/h) standby (h/day)
off (h/day)
TV 275.92 5.83 0 12 0 Set-top-boxes 56.3 10.7 0 20 0

Report for Tender No. TREN/D1/40 Lot 6 -2005 EuP Lot 6 - Task 5 2nd of October 2007
Fraunhofer IZM CODDE Bio IS DUH Final Report Page 5-26
► EIA and LCC for TV+ (1000 units)
Table 5-22: Annual environmental impacts of TV+ (per 1000 product units) Nr Life cycle Impact per 1000 product units: TV+ Date Author
0 01/2007 Lot 6 Life Cycle phases --> Resources Use and Emissions
PRODUCTION
DISTRI- BUTION USE END-
OF-LIFE TOTAL
Materials unit
1 Bulk Plastics g 0 0 02 TecPlastics g 0 0 03 Ferro g 0 0 04 Non-ferro g 0 0 05 Coating g 0 0 06 Electronics g 0 0 07 Misc. g 0 0 0
Total weight g 0 0 0 Other Resources & Waste
8 Total Energy (GER) MJ 0 0 435653 0 4356539 of which, electricity (in primary MJ) MJ 0 0 435653 0 435653
10 Water (process) ltr 0 0 29044 0 2904411 Water (cooling) ltr 0 0 1161742 0 116174212 Waste, non-haz./ landfill g 0 0 505115 0 50511513 Waste, hazardous/ incinerated g 0 0 10039 0 10039
Emissions (Air) 14 Greenhouse Gases in GWP100 kg CO2 eq 0 0 19012 0 1901215 Ozone Depletion, emissions mg R-11 eq negligible 16 Acidification, emissions g SO2 eq 0 0 112181 0 11218117 Volatile Organic Compounds (VOC) g 0 0 164 0 16418 Persistent Organic Pollutants (POP) ng i-Teq 0 0 2856 0 285619 Heavy Metals mg Ni eq 0 0 7474 0 7474
PAHs mg Ni eq 0 0 858 0 85820 Particulate Matter (PM, dust) g 0 0 2396 0 2396
Emissions (Water) 21 Heavy Metals mg Hg/20 0 0 2809 0 280922 Eutrophication g PO4 0 0 13 0 1323 Persistent Organic Pollutants (POP) ng i-Teq negligible
The total electricity used by TV+ (1000 average units) during the off-mode and standby mode for one year amounts to 41491 kWh, i.e. 435653 MJ (primary energy). Annual (life cycle) costs for these products are 5543 Euros due to the electricity consumption in off-mode and networked standby mode (line F of the EcoReport).

Report for Tender No. TREN/D1/40 Lot 6 -2005 EuP Lot 6 - Task 5 2nd of October 2007
Fraunhofer IZM CODDE Bio IS DUH Final Report Page 5-27
► EU Totals for TV+
Table 5-23: EU-25 total environmental impacts of the TV+ stock in 2005 Nr EU Impact of TV+ stock in 2005 Date Author
0 01/2007 Lot 6 Life Cycle phases --> Resources Use and Emissions
PRODUCTION
DISTRI- BUTION USE END-
OF-LIFE TOTAL
Materials unit
1 Bulk Plastics kt 0 0 02 TecPlastics kt 0 0 03 Ferro kt 0 0 04 Non-ferro kt 0 0 05 Coating kt 0 0 06 Electronics kt 0 0 07 Misc. kt 0 0 0
Total weight kt 0 0 0 Other Resources & Waste
8 Total Energy (GER) PJ 0 0 120 0 1209 of which, electricity (in primary MJ) PJ 0 0 120 0 120
10 Water (process) mln. m3 0 0 8 0 811 Water (cooling) mln. m3 0 0 321 0 32112 Waste, non-haz./ landfill kt 0 0 139 0 13913 Waste, hazardous/ incinerated kt 0 0 3 0 3
Emissions (Air) 14 Greenhouse Gases in GWP100 mt CO2 eq 0 0 5 0 515 Ozone Depletion, emissions t R-11 eq negligible 16 Acidification, emissions kt SO2 eq 0 0 31 0 3117 Volatile Organic Compounds (VOC) kt 0 0 0 0 018 Persistent Organic Pollutants (POP) g i-Teq 0 0 1 0 119 Heavy Metals ton Ni eq 0 0 2 0 2
PAHs ton Ni eq 0 0 0 0 020 Particulate Matter (PM, dust) kt 0 0 1 0 1
Emissions (Water) 21 Heavy Metals ton Hg/20 0 0 1 0 122 Eutrophication kt PO4 0 0 0 0 023 Persistent Organic Pollutants (POP) g i-Teq negligible

Report for Tender No. TREN/D1/40 Lot 6 -2005 EuP Lot 6 - Task 5 2nd of October 2007
Fraunhofer IZM CODDE Bio IS DUH Final Report Page 5-28
Table 5-24: Summary of Environmental Impacts by 2005 EU-Stock of TV+ main life cycle indicators value unit Total Energy (GER) 120 PJ
of which, electricity 11.4 TWh Water (process)* 8 mln.m3 Waste, non-haz./ landfill* 139 kton Waste, hazardous/ incinerated* 3 kton Emissions (Air) Greenhouse Gases in GWP100 5 mt CO2eq Acidifying agents (AP) 31 kt SO2eq Volatile Org. Compounds (VOC) 0 kt Persistent Org. Pollutants (POP) 1 g i-Teq Heavy Metals (HM) 2 ton Ni eq PAHs 0 ton Ni eq Particulate Matter (PM, dust) 1 kt Emissions (Water) Heavy Metals (HM) 1 ton Hg/20 Eutrophication (EP) 0 kt PO4
The total electricity used by TV+ stock in EU-25 (2005) during the standby mode and off-mode for one year is estimated at 11.4 TWh or 120 PJ expressed as primary energy.
The total annual expenditure of the standby and off-mode consumption of the TV+ stock in EU-25 (2005) is estimated at 1557 million Euros (line F of the EcoReport).
TVs themselves contribute to the standby energy consumption of TV+ by 62% (Figure 5-2). According to the assumptions (see Task 3), TVs and set-top-boxes do not contribute to the off-mode losses.
Set-top-boxes38%
TVs62%
Figure 5-2: Distribution of standby energy consumption of TV+ between the constituent devices
5.2.4. PUC 3: Job-based products
The eight product cases belong to the PUC 3 are studied here. This section contains one sub-section per product case, providing the environmental impact assessment (EIA) and life cycle costs (LCC) per 1000 product units and per 2005 EU-25 stock. The specific inputs to the EcoReport have already been provided in Table 5-2.

Report for Tender No. TREN/D1/40 Lot 6 -2005 EuP Lot 6 - Task 5 2nd of October 2007
Fraunhofer IZM CODDE Bio IS DUH Final Report Page 5-29
5.2.4.1. Washing machine
For Washing machine, the standby and off-mode losses in the use phase are calculated with 20 hours per day in off-mode and 3 hours per day in passive standby mode (Task 3) with an hourly off-mode consumption of 1.2 Wh/h and an hourly passive standby consumption of 5.7 Wh/h (Task 4). See Table 5-2 above for the specific inputs to the EcoReport.
► EIA and LCC for Washing machine (1000 units)
Table 5-25: Annual environmental impacts of Washing machine (per 1000 product units) Nr Life cycle Impact per 1000 product units: Washing machine Date Author
0 01/2007 Lot 6 Life Cycle phases --> Resources Use and Emissions
PRODUCTION
DISTRI- BUTION USE END-
OF-LIFE TOTAL
Materials unit
1 Bulk Plastics g 0 0 02 TecPlastics g 0 0 03 Ferro g 0 0 04 Non-ferro g 0 0 05 Coating g 0 0 06 Electronics g 0 0 07 Misc. g 0 0 0
Total weight g 0 0 0 Other Resources & Waste
8 Total Energy (GER) MJ 0 0 157516 0 1575169 of which, electricity (in primary MJ) MJ 0 0 157516 0 157516
10 Water (process) ltr 0 0 10501 0 1050111 Water (cooling) ltr 0 0 420042 0 42004212 Waste, non-haz./ landfill g 0 0 182631 0 18263113 Waste, hazardous/ incinerated g 0 0 3630 0 3630
Emissions (Air) 14 Greenhouse Gases in GWP100 kg CO2 eq 0 0 6874 0 687415 Ozone Depletion, emissions mg R-11 eq negligible 16 Acidification, emissions g SO2 eq 0 0 40560 0 4056017 Volatile Organic Compounds (VOC) g 0 0 59 0 5918 Persistent Organic Pollutants (POP) ng i-Teq 0 0 1032 0 103219 Heavy Metals mg Ni eq 0 0 2702 0 2702
PAHs mg Ni eq 0 0 310 0 31020 Particulate Matter (PM, dust) g 0 0 866 0 866
Emissions (Water) 21 Heavy Metals mg Hg/20 0 0 1016 0 101622 Eutrophication g PO4 0 0 5 0 523 Persistent Organic Pollutants (POP) ng i-Teq negligible
The total electricity used by Washing machine (1000 units) during the off-mode and standby mode for one year is estimated at 15002 kWh, i.e. 157516 MJ (primary energy). Annual (life cycle) costs for these products are 2004 Euros due to the electricity consumption in the passive standby mode and off-mode (line F of the EcoReport).

Report for Tender No. TREN/D1/40 Lot 6 -2005 EuP Lot 6 - Task 5 2nd of October 2007
Fraunhofer IZM CODDE Bio IS DUH Final Report Page 5-30
► EU Totals for Washing machine
Table 5-26: EU-25 total environmental impacts of the Washing machine stock in 2005 Nr EU Impact of Washing machine stock in 2005 Date Author
0 01/2007 Lot 6 Life Cycle phases --> Resources Use and Emissions
PRODUCTION
DISTRI- BUTION USE END-
OF-LIFE TOTAL
Materials unit
1 Bulk Plastics kt 0 0 02 TecPlastics kt 0 0 03 Ferro kt 0 0 04 Non-ferro kt 0 0 05 Coating kt 0 0 06 Electronics kt 0 0 07 Misc. kt 0 0 0
Total weight kt 0 0 0 Other Resources & Waste
8 Total Energy (GER) PJ 0 0 29 0 299 of which, electricity (in primary MJ) PJ 0 0 29 0 29
10 Water (process) mln. m3 0 0 2 0 211 Water (cooling) mln. m3 0 0 78 0 7812 Waste, non-haz./ landfill kt 0 0 34 0 3413 Waste, hazardous/ incinerated kt 0 0 1 0 1
Emissions (Air) 14 Greenhouse Gases in GWP100 mt CO2 eq 0 0 1 0 115 Ozone Depletion, emissions t R-11 eq negligible 16 Acidification, emissions kt SO2 eq 0 0 7 0 717 Volatile Organic Compounds (VOC) kt 0 0 0 0 018 Persistent Organic Pollutants (POP) g i-Teq 0 0 0 0 019 Heavy Metals ton Ni eq 0 0 0 0 0
PAHs ton Ni eq 0 0 0 0 020 Particulate Matter (PM, dust) kt 0 0 0 0 0
Emissions (Water) 21 Heavy Metals ton Hg/20 0 0 0 0 022 Eutrophication kt PO4 0 0 0 0 023 Persistent Organic Pollutants (POP) g i-Teq negligible

Report for Tender No. TREN/D1/40 Lot 6 -2005 EuP Lot 6 - Task 5 2nd of October 2007
Fraunhofer IZM CODDE Bio IS DUH Final Report Page 5-31
Table 5-27: Summary of Environmental Impacts by 2005 EU-Stock of Washing machine main life cycle indicators value unit Total Energy (GER) 29 PJ
of which, electricity 2.8 TWh Water (process)* 2 mln.m3 Waste, non-haz./ landfill* 34 kton Waste, hazardous/ incinerated* 1 kton Emissions (Air) Greenhouse Gases in GWP100 1 mt CO2eq Acidifying agents (AP) 7 kt SO2eq Volatile Org. Compounds (VOC) 0 kt Persistent Org. Pollutants (POP) 0 g i-Teq Heavy Metals (HM) 0 ton Ni eq PAHs 0 ton Ni eq Particulate Matter (PM, dust) 0 kt Emissions (Water) Heavy Metals (HM) 0 ton Hg/20 Eutrophication (EP) 0 kt PO4
The total electricity used by Washing machine stock in EU-25 (2005) during the standby mode and off-mode for one year is estimated at 2.8 TWh or 29 PJ expressed as primary energy.
The total annual expenditure of the standby and off-mode consumption of the Washing machine stock in EU-25 (2005) is estimated at 337 million Euros (line F of the EcoReport).
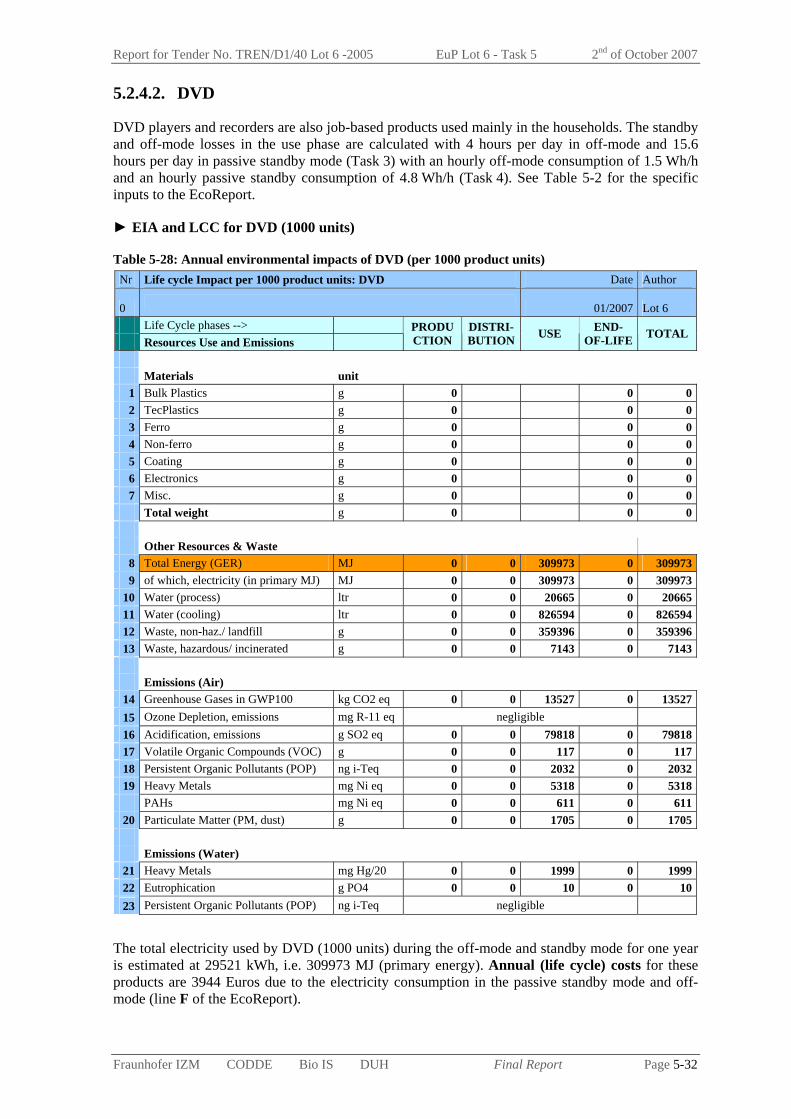
Report for Tender No. TREN/D1/40 Lot 6 -2005 EuP Lot 6 - Task 5 2nd of October 2007
Fraunhofer IZM CODDE Bio IS DUH Final Report Page 5-32
5.2.4.2. DVD
DVD players and recorders are also job-based products used mainly in the households. The standby and off-mode losses in the use phase are calculated with 4 hours per day in off-mode and 15.6 hours per day in passive standby mode (Task 3) with an hourly off-mode consumption of 1.5 Wh/h and an hourly passive standby consumption of 4.8 Wh/h (Task 4). See Table 5-2 for the specific inputs to the EcoReport.
► EIA and LCC for DVD (1000 units)
Table 5-28: Annual environmental impacts of DVD (per 1000 product units) Nr Life cycle Impact per 1000 product units: DVD Date Author
0 01/2007 Lot 6 Life Cycle phases --> Resources Use and Emissions
PRODUCTION
DISTRI- BUTION USE END-
OF-LIFE TOTAL
Materials unit
1 Bulk Plastics g 0 0 02 TecPlastics g 0 0 03 Ferro g 0 0 04 Non-ferro g 0 0 05 Coating g 0 0 06 Electronics g 0 0 07 Misc. g 0 0 0
Total weight g 0 0 0 Other Resources & Waste
8 Total Energy (GER) MJ 0 0 309973 0 3099739 of which, electricity (in primary MJ) MJ 0 0 309973 0 309973
10 Water (process) ltr 0 0 20665 0 2066511 Water (cooling) ltr 0 0 826594 0 82659412 Waste, non-haz./ landfill g 0 0 359396 0 35939613 Waste, hazardous/ incinerated g 0 0 7143 0 7143
Emissions (Air) 14 Greenhouse Gases in GWP100 kg CO2 eq 0 0 13527 0 1352715 Ozone Depletion, emissions mg R-11 eq negligible 16 Acidification, emissions g SO2 eq 0 0 79818 0 7981817 Volatile Organic Compounds (VOC) g 0 0 117 0 11718 Persistent Organic Pollutants (POP) ng i-Teq 0 0 2032 0 203219 Heavy Metals mg Ni eq 0 0 5318 0 5318
PAHs mg Ni eq 0 0 611 0 61120 Particulate Matter (PM, dust) g 0 0 1705 0 1705
Emissions (Water) 21 Heavy Metals mg Hg/20 0 0 1999 0 199922 Eutrophication g PO4 0 0 10 0 1023 Persistent Organic Pollutants (POP) ng i-Teq negligible
The total electricity used by DVD (1000 units) during the off-mode and standby mode for one year is estimated at 29521 kWh, i.e. 309973 MJ (primary energy). Annual (life cycle) costs for these products are 3944 Euros due to the electricity consumption in the passive standby mode and off-mode (line F of the EcoReport).

Report for Tender No. TREN/D1/40 Lot 6 -2005 EuP Lot 6 - Task 5 2nd of October 2007
Fraunhofer IZM CODDE Bio IS DUH Final Report Page 5-33
► EU Totals for DVD
Table 5-29: EU-25 total environmental impacts of the DVD stock in 2005 Nr EU Impact of DVD stock in 2005 Date Author
0 01/2007 Lot 6 Life Cycle phases --> Resources Use and Emissions
PRODUCTION
DISTRI- BUTION USE END-
OF-LIFE TOTAL
Materials unit
1 Bulk Plastics kt 0 0 02 TecPlastics kt 0 0 03 Ferro kt 0 0 04 Non-ferro kt 0 0 05 Coating kt 0 0 06 Electronics kt 0 0 07 Misc. kt 0 0 0
Total weight kt 0 0 0 Other Resources & Waste
8 Total Energy (GER) PJ 0 0 44 0 449 of which, electricity (in primary MJ) PJ 0 0 44 0 44
10 Water (process) mln. m3 0 0 3 0 311 Water (cooling) mln. m3 0 0 118 0 11812 Waste, non-haz./ landfill kt 0 0 52 0 5213 Waste, hazardous/ incinerated kt 0 0 1 0 1
Emissions (Air) 14 Greenhouse Gases in GWP100 mt CO2 eq 0 0 2 0 215 Ozone Depletion, emissions t R-11 eq negligible 16 Acidification, emissions kt SO2 eq 0 0 11 0 1117 Volatile Organic Compounds (VOC) kt 0 0 0 0 018 Persistent Organic Pollutants (POP) g i-Teq 0 0 0 0 019 Heavy Metals ton Ni eq 0 0 1 0 1
PAHs ton Ni eq 0 0 0 0 020 Particulate Matter (PM, dust) kt 0 0 0 0 0
Emissions (Water) 21 Heavy Metals ton Hg/20 0 0 0 0 022 Eutrophication kt PO4 0 0 0 0 023 Persistent Organic Pollutants (POP) g i-Teq negligible

Report for Tender No. TREN/D1/40 Lot 6 -2005 EuP Lot 6 - Task 5 2nd of October 2007
Fraunhofer IZM CODDE Bio IS DUH Final Report Page 5-34
Table 5-30: Summary of Environmental Impacts by 2005 EU-Stock of DVD main life cycle indicators value unit Total Energy (GER) 44 PJ
of which, electricity 4.2 TWh Water (process)* 3 mln.m3 Waste, non-haz./ landfill* 52 kton Waste, hazardous/ incinerated* 1 kton Emissions (Air) Greenhouse Gases in GWP100 2 mt CO2eq Acidifying agents (AP) 11 kt SO2eq Volatile Org. Compounds (VOC) 0 kt Persistent Org. Pollutants (POP) 0 g i-Teq Heavy Metals (HM) 1 ton Ni eq PAHs 0 ton Ni eq Particulate Matter (PM, dust) 0 kt Emissions (Water) Heavy Metals (HM) 0 ton Hg/20 Eutrophication (EP) 0 kt PO4
The total electricity used by DVD stock in EU-25 (2005) during the standby mode and off-mode for one year is estimated at 4.2 TWh or 44 PJ expressed as primary energy.
The total annual expenditure of the standby and off-mode consumption of the DVD stock in EU-25 (2005) is estimated at 575 million Euros (line F of the EcoReport).

Report for Tender No. TREN/D1/40 Lot 6 -2005 EuP Lot 6 - Task 5 2nd of October 2007
Fraunhofer IZM CODDE Bio IS DUH Final Report Page 5-35
5.2.4.3. Audio minisystem
For Audio minisystem, the standby and off-mode losses in the use phase are calculated with 1.4 hours per day in off-mode and 17.1 hours per day in passive standby mode (Task 3) with an hourly off-mode consumption of 1.5 Wh/h and an hourly passive standby consumption of 8 Wh/h (Task 4). See Table 5-2 above for the specific inputs to the EcoReport.
► EIA and LCC for Audio minisystem (1000 units)
Table 5-31: Annual environmental impacts of Audio minisystem (per 1000 product units) Nr Life cycle Impact per 1000 product units: Audio minisystem Date Author
0 01/2007 Lot 6 Life Cycle phases --> Resources Use and Emissions
PRODUCTION
DISTRI- BUTION USE END-
OF-LIFE TOTAL
Materials unit
1 Bulk Plastics g 0 0 02 TecPlastics g 0 0 03 Ferro g 0 0 04 Non-ferro g 0 0 05 Coating g 0 0 06 Electronics g 0 0 07 Misc. g 0 0 0
Total weight g 0 0 0 Other Resources & Waste
8 Total Energy (GER) MJ 0 0 532334 0 5323349 of which, electricity (in primary MJ) MJ 0 0 532334 0 532334
10 Water (process) ltr 0 0 35489 0 3548911 Water (cooling) ltr 0 0 1419558 0 141955812 Waste, non-haz./ landfill g 0 0 617211 0 61721113 Waste, hazardous/ incinerated g 0 0 12267 0 12267
Emissions (Air) 14 Greenhouse Gases in GWP100 kg CO2 eq 0 0 23231 0 2323115 Ozone Depletion, emissions mg R-11 eq negligible 16 Acidification, emissions g SO2 eq 0 0 137076 0 13707617 Volatile Organic Compounds (VOC) g 0 0 200 0 20018 Persistent Organic Pollutants (POP) ng i-Teq 0 0 3489 0 348919 Heavy Metals mg Ni eq 0 0 9133 0 9133
PAHs mg Ni eq 0 0 1049 0 104920 Particulate Matter (PM, dust) g 0 0 2928 0 2928
Emissions (Water) 21 Heavy Metals mg Hg/20 0 0 3432 0 343222 Eutrophication g PO4 0 0 16 0 1623 Persistent Organic Pollutants (POP) ng i-Teq negligible
The total electricity used by Audio minisystem (1000 units) during the off-mode and standby mode for one year is estimated at 50699 kWh, i.e. 532334 MJ (primary energy). Annual (life cycle) costs for these products are 6733 Euros due to the electricity consumption in the passive standby mode and off-mode (line F of the EcoReport).

Report for Tender No. TREN/D1/40 Lot 6 -2005 EuP Lot 6 - Task 5 2nd of October 2007
Fraunhofer IZM CODDE Bio IS DUH Final Report Page 5-36
► EU Totals for Audio minisystem
Table 5-32: EU-25 total environmental impacts of the Audio minisystem stock in 2005 Nr EU Impact of Audio minisystem stock in 2005 Date Author
0 01/2007 Lot 6 Life Cycle phases --> Resources Use and Emissions
PRODUCTION
DISTRI- BUTION USE END-
OF-LIFE TOTAL
Materials unit
1 Bulk Plastics kt 0 0 02 TecPlastics kt 0 0 03 Ferro kt 0 0 04 Non-ferro kt 0 0 05 Coating kt 0 0 06 Electronics kt 0 0 07 Misc. kt 0 0 0
Total weight kt 0 0 0 Other Resources & Waste
8 Total Energy (GER) PJ 0 0 61 0 619 of which, electricity (in primary MJ) PJ 0 0 61 0 61
10 Water (process) mln. m3 0 0 4 0 411 Water (cooling) mln. m3 0 0 162 0 16212 Waste, non-haz./ landfill kt 0 0 71 0 7113 Waste, hazardous/ incinerated kt 0 0 1 0 1
Emissions (Air) 14 Greenhouse Gases in GWP100 mt CO2 eq 0 0 3 0 315 Ozone Depletion, emissions t R-11 eq negligible 16 Acidification, emissions kt SO2 eq 0 0 16 0 1617 Volatile Organic Compounds (VOC) kt 0 0 0 0 018 Persistent Organic Pollutants (POP) g i-Teq 0 0 0 0 019 Heavy Metals ton Ni eq 0 0 1 0 1
PAHs ton Ni eq 0 0 0 0 020 Particulate Matter (PM, dust) kt 0 0 0 0 0
Emissions (Water) 21 Heavy Metals ton Hg/20 0 0 0 0 022 Eutrophication kt PO4 0 0 0 0 023 Persistent Organic Pollutants (POP) g i-Teq negligible

Report for Tender No. TREN/D1/40 Lot 6 -2005 EuP Lot 6 - Task 5 2nd of October 2007
Fraunhofer IZM CODDE Bio IS DUH Final Report Page 5-37
Table 5-33: Summary of Environmental Impacts by 2005 EU-Stock of Audio minisystem main life cycle indicators value unit Total Energy (GER) 61 PJ
of which, electricity 5.8 TWh Water (process)* 4 mln.m3 Waste, non-haz./ landfill* 71 kton Waste, hazardous/ incinerated* 1 kton Emissions (Air) Greenhouse Gases in GWP100 3 mt CO2eq Acidifying agents (AP) 16 kt SO2eq Volatile Org. Compounds (VOC) 0 kt Persistent Org. Pollutants (POP) 0 g i-Teq Heavy Metals (HM) 1 ton Ni eq PAHs 0 ton Ni eq Particulate Matter (PM, dust) 0 kt Emissions (Water) Heavy Metals (HM) 0 ton Hg/20 Eutrophication (EP) 0 kt PO4
The total electricity used by Audio minisystem stock in EU-25 (2005) during the standby mode and off-mode for one year amounts to 5.8 TWh or 61 PJ expressed as primary energy
The total annual expenditure of the standby and off-mode consumption of the Audio minisystem stock in EU-25 (2005) is estimated at 789 million Euros (line F of the EcoReport).
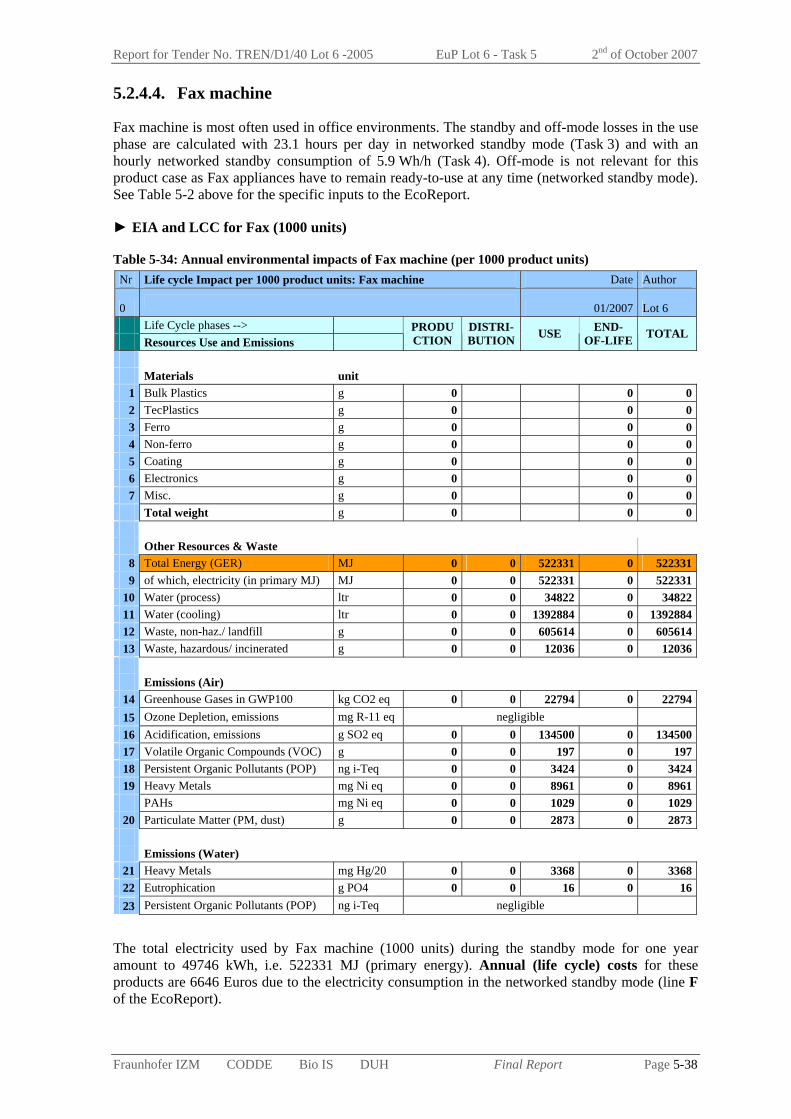
Report for Tender No. TREN/D1/40 Lot 6 -2005 EuP Lot 6 - Task 5 2nd of October 2007
Fraunhofer IZM CODDE Bio IS DUH Final Report Page 5-38
5.2.4.4. Fax machine
Fax machine is most often used in office environments. The standby and off-mode losses in the use phase are calculated with 23.1 hours per day in networked standby mode (Task 3) and with an hourly networked standby consumption of 5.9 Wh/h (Task 4). Off-mode is not relevant for this product case as Fax appliances have to remain ready-to-use at any time (networked standby mode). See Table 5-2 above for the specific inputs to the EcoReport.
► EIA and LCC for Fax (1000 units)
Table 5-34: Annual environmental impacts of Fax machine (per 1000 product units) Nr Life cycle Impact per 1000 product units: Fax machine Date Author
0 01/2007 Lot 6 Life Cycle phases --> Resources Use and Emissions
PRODUCTION
DISTRI- BUTION USE END-
OF-LIFE TOTAL
Materials unit
1 Bulk Plastics g 0 0 02 TecPlastics g 0 0 03 Ferro g 0 0 04 Non-ferro g 0 0 05 Coating g 0 0 06 Electronics g 0 0 07 Misc. g 0 0 0
Total weight g 0 0 0 Other Resources & Waste
8 Total Energy (GER) MJ 0 0 522331 0 5223319 of which, electricity (in primary MJ) MJ 0 0 522331 0 522331
10 Water (process) ltr 0 0 34822 0 3482211 Water (cooling) ltr 0 0 1392884 0 139288412 Waste, non-haz./ landfill g 0 0 605614 0 60561413 Waste, hazardous/ incinerated g 0 0 12036 0 12036
Emissions (Air) 14 Greenhouse Gases in GWP100 kg CO2 eq 0 0 22794 0 2279415 Ozone Depletion, emissions mg R-11 eq negligible 16 Acidification, emissions g SO2 eq 0 0 134500 0 13450017 Volatile Organic Compounds (VOC) g 0 0 197 0 19718 Persistent Organic Pollutants (POP) ng i-Teq 0 0 3424 0 342419 Heavy Metals mg Ni eq 0 0 8961 0 8961
PAHs mg Ni eq 0 0 1029 0 102920 Particulate Matter (PM, dust) g 0 0 2873 0 2873
Emissions (Water) 21 Heavy Metals mg Hg/20 0 0 3368 0 336822 Eutrophication g PO4 0 0 16 0 1623 Persistent Organic Pollutants (POP) ng i-Teq negligible
The total electricity used by Fax machine (1000 units) during the standby mode for one year amount to 49746 kWh, i.e. 522331 MJ (primary energy). Annual (life cycle) costs for these products are 6646 Euros due to the electricity consumption in the networked standby mode (line F of the EcoReport).

Report for Tender No. TREN/D1/40 Lot 6 -2005 EuP Lot 6 - Task 5 2nd of October 2007
Fraunhofer IZM CODDE Bio IS DUH Final Report Page 5-39
► EU Totals for Fax machine
Table 5-35: EU-25 total environmental impacts of the Fax machine stock in 2005 Nr EU Impact of Fax machine stock in 2005 Date Author
0 01/2007 Lot 6 Life Cycle phases --> Resources Use and Emissions
PRODUCTION
DISTRI- BUTION USE END-
OF-LIFE TOTAL
Materials unit
1 Bulk Plastics kt 0 0 02 TecPlastics kt 0 0 03 Ferro kt 0 0 04 Non-ferro kt 0 0 05 Coating kt 0 0 06 Electronics kt 0 0 07 Misc. kt 0 0 0
Total weight kt 0 0 0 Other Resources & Waste
8 Total Energy (GER) PJ 0 0 10 0 109 of which, electricity (in primary MJ) PJ 0 0 10 0 10
10 Water (process) mln. m3 0 0 1 0 111 Water (cooling) mln. m3 0 0 28 0 2812 Waste, non-haz./ landfill kt 0 0 12 0 1213 Waste, hazardous/ incinerated kt 0 0 0 0 0
Emissions (Air) 14 Greenhouse Gases in GWP100 mt CO2 eq 0 0 0 0 015 Ozone Depletion, emissions t R-11 eq negligible 16 Acidification, emissions kt SO2 eq 0 0 3 0 317 Volatile Organic Compounds (VOC) kt 0 0 0 0 018 Persistent Organic Pollutants (POP) g i-Teq 0 0 0 0 019 Heavy Metals ton Ni eq 0 0 0 0 0
PAHs ton Ni eq 0 0 0 0 020 Particulate Matter (PM, dust) kt 0 0 0 0 0
Emissions (Water) 21 Heavy Metals ton Hg/20 0 0 0 0 022 Eutrophication kt PO4 0 0 0 0 023 Persistent Organic Pollutants (POP) g i-Teq negligible

Report for Tender No. TREN/D1/40 Lot 6 -2005 EuP Lot 6 - Task 5 2nd of October 2007
Fraunhofer IZM CODDE Bio IS DUH Final Report Page 5-40
Table 5-36: Summary of Environmental Impacts by 2005 EU-Stock of Fax main life cycle indicators value unit Total Energy (GER) 10 PJ
of which, electricity 1.0 TWh Water (process)* 1 mln.m3 Waste, non-haz./ landfill* 12 kton Waste, hazardous/ incinerated* 0 kton Emissions (Air) Greenhouse Gases in GWP100 0 mt CO2eq Acidifying agents (AP) 3 kt SO2eq Volatile Org. Compounds (VOC) 0 kt Persistent Org. Pollutants (POP) 0 g i-Teq Heavy Metals (HM) 0 ton Ni eq PAHs 0 ton Ni eq Particulate Matter (PM, dust) 0 kt Emissions (Water) Heavy Metals (HM) 0 ton Hg/20 Eutrophication (EP) 0 kt PO4
The total electricity used by Fax stock in EU-25 (2005) during the standby mode for one year is estimated at 1.0 TWh or 10 PJ expressed as primary energy.
The total annual expenditure of the standby consumption of the Fax stock in EU-25 (2005) is estimated at 135 million Euros (line F of the EcoReport).

Report for Tender No. TREN/D1/40 Lot 6 -2005 EuP Lot 6 - Task 5 2nd of October 2007
Fraunhofer IZM CODDE Bio IS DUH Final Report Page 5-41
5.2.4.5. PC+ (office)
The category PC+ (office) covers desktops, notebooks, monitors and hubs intended to be used in office environments. As explained in Section 5.2.1.1., three EcoReports are completed for this product case, namely one for desktops/notebooks, for monitors (LCD and CRT) and for hubs.
For each of the three EcoReports, the standby and off-mode losses in the use phase are calculated with the device specific use times and electricity consumption provided in Task 3 and Task 4 respectively (Table 5-37). For the specific inputs to the EcoReport, see Table 5-2 above. Table 5-37: Use time and electricity consumption for PC+(office) devices
Electricity consumption in mode Time in mode
PC+(office) Stock
(million units) standby
(Wh/h) off
(Wh/h) standby (h/day)
off (h/day)
Desktop+notebook 80.5 3.56 2.17 8.53 8.82 Monitors (LCD+CRT) 44.5 4.46 1.43 10.4 6.5 Hubs 6.4 5 0 16 0
► EIA and LCC for PC+ (office) product case (1000 units)
Table 5-38 provides the Environmental Impact Assessment and the Life Cycle Costs for 1000 units of PC+(office), i.e. for 1000 desktop/laptop + 553 monitors + 80 hubs.
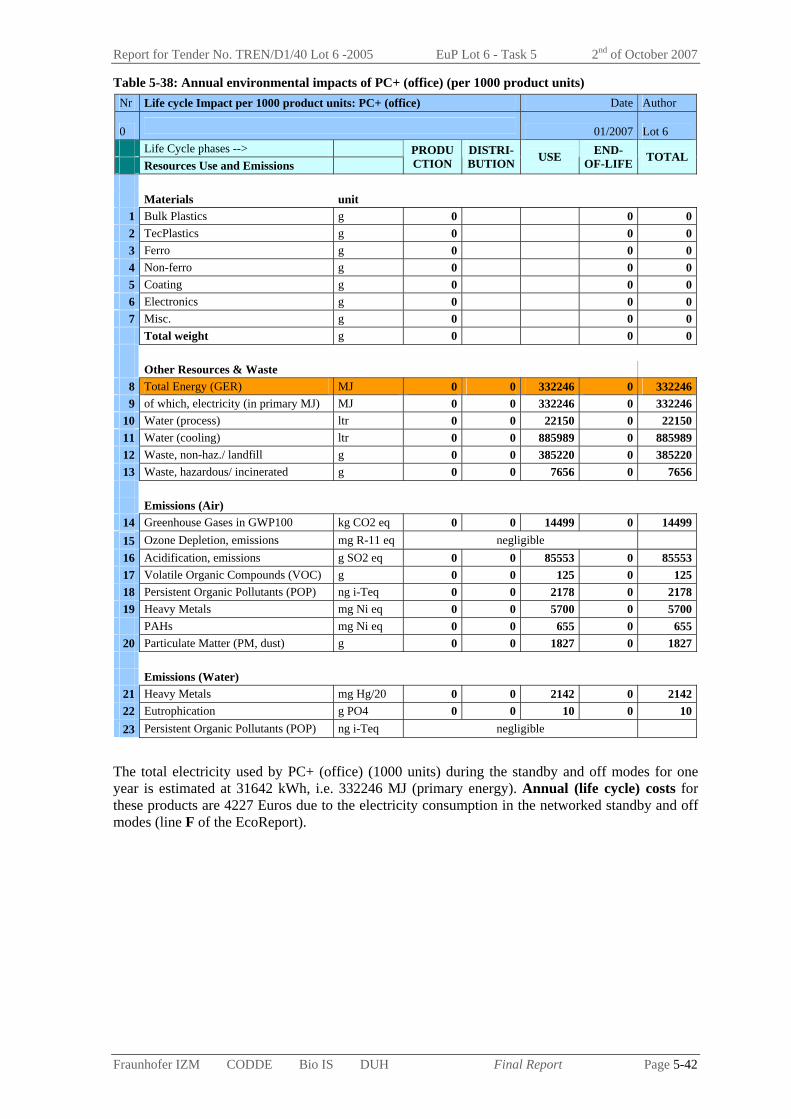
Report for Tender No. TREN/D1/40 Lot 6 -2005 EuP Lot 6 - Task 5 2nd of October 2007
Fraunhofer IZM CODDE Bio IS DUH Final Report Page 5-42
Table 5-38: Annual environmental impacts of PC+ (office) (per 1000 product units) Nr Life cycle Impact per 1000 product units: PC+ (office) Date Author
0 01/2007 Lot 6 Life Cycle phases --> Resources Use and Emissions
PRODUCTION
DISTRI- BUTION USE END-
OF-LIFE TOTAL
Materials unit
1 Bulk Plastics g 0 0 02 TecPlastics g 0 0 03 Ferro g 0 0 04 Non-ferro g 0 0 05 Coating g 0 0 06 Electronics g 0 0 07 Misc. g 0 0 0
Total weight g 0 0 0 Other Resources & Waste
8 Total Energy (GER) MJ 0 0 332246 0 3322469 of which, electricity (in primary MJ) MJ 0 0 332246 0 332246
10 Water (process) ltr 0 0 22150 0 2215011 Water (cooling) ltr 0 0 885989 0 88598912 Waste, non-haz./ landfill g 0 0 385220 0 38522013 Waste, hazardous/ incinerated g 0 0 7656 0 7656
Emissions (Air) 14 Greenhouse Gases in GWP100 kg CO2 eq 0 0 14499 0 1449915 Ozone Depletion, emissions mg R-11 eq negligible 16 Acidification, emissions g SO2 eq 0 0 85553 0 8555317 Volatile Organic Compounds (VOC) g 0 0 125 0 12518 Persistent Organic Pollutants (POP) ng i-Teq 0 0 2178 0 217819 Heavy Metals mg Ni eq 0 0 5700 0 5700
PAHs mg Ni eq 0 0 655 0 65520 Particulate Matter (PM, dust) g 0 0 1827 0 1827
Emissions (Water) 21 Heavy Metals mg Hg/20 0 0 2142 0 214222 Eutrophication g PO4 0 0 10 0 1023 Persistent Organic Pollutants (POP) ng i-Teq negligible
The total electricity used by PC+ (office) (1000 units) during the standby and off modes for one year is estimated at 31642 kWh, i.e. 332246 MJ (primary energy). Annual (life cycle) costs for these products are 4227 Euros due to the electricity consumption in the networked standby and off modes (line F of the EcoReport).
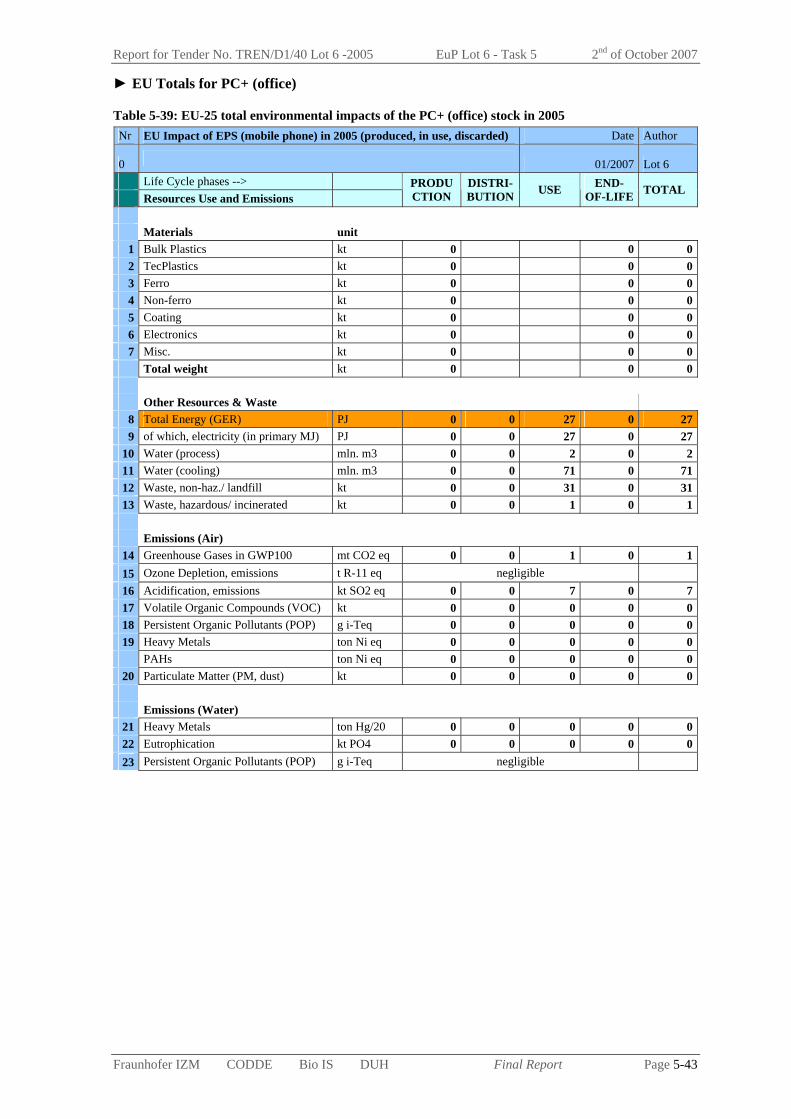
Report for Tender No. TREN/D1/40 Lot 6 -2005 EuP Lot 6 - Task 5 2nd of October 2007
Fraunhofer IZM CODDE Bio IS DUH Final Report Page 5-43
► EU Totals for PC+ (office)
Table 5-39: EU-25 total environmental impacts of the PC+ (office) stock in 2005 Nr EU Impact of EPS (mobile phone) in 2005 (produced, in use, discarded) Date Author
0 01/2007 Lot 6 Life Cycle phases --> Resources Use and Emissions
PRODUCTION
DISTRI- BUTION USE END-
OF-LIFE TOTAL
Materials unit
1 Bulk Plastics kt 0 0 02 TecPlastics kt 0 0 03 Ferro kt 0 0 04 Non-ferro kt 0 0 05 Coating kt 0 0 06 Electronics kt 0 0 07 Misc. kt 0 0 0
Total weight kt 0 0 0 Other Resources & Waste
8 Total Energy (GER) PJ 0 0 27 0 279 of which, electricity (in primary MJ) PJ 0 0 27 0 27
10 Water (process) mln. m3 0 0 2 0 211 Water (cooling) mln. m3 0 0 71 0 7112 Waste, non-haz./ landfill kt 0 0 31 0 3113 Waste, hazardous/ incinerated kt 0 0 1 0 1
Emissions (Air) 14 Greenhouse Gases in GWP100 mt CO2 eq 0 0 1 0 115 Ozone Depletion, emissions t R-11 eq negligible 16 Acidification, emissions kt SO2 eq 0 0 7 0 717 Volatile Organic Compounds (VOC) kt 0 0 0 0 018 Persistent Organic Pollutants (POP) g i-Teq 0 0 0 0 019 Heavy Metals ton Ni eq 0 0 0 0 0
PAHs ton Ni eq 0 0 0 0 020 Particulate Matter (PM, dust) kt 0 0 0 0 0
Emissions (Water) 21 Heavy Metals ton Hg/20 0 0 0 0 022 Eutrophication kt PO4 0 0 0 0 023 Persistent Organic Pollutants (POP) g i-Teq negligible
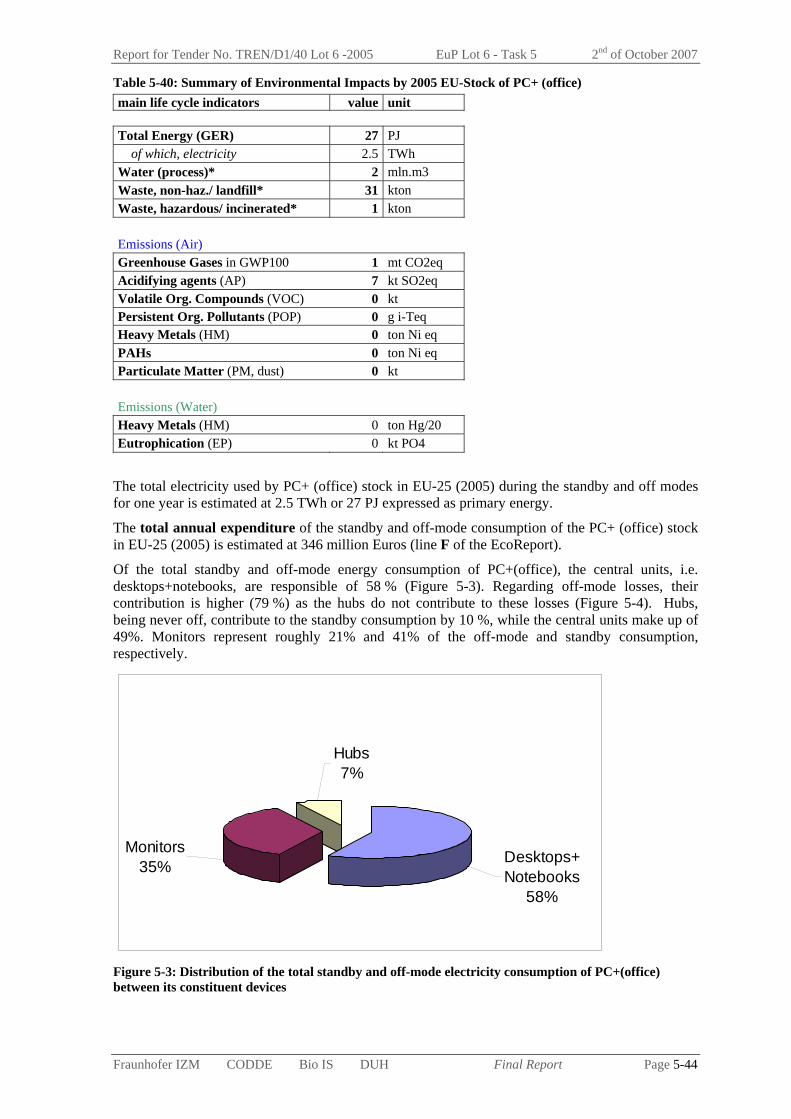
Report for Tender No. TREN/D1/40 Lot 6 -2005 EuP Lot 6 - Task 5 2nd of October 2007
Fraunhofer IZM CODDE Bio IS DUH Final Report Page 5-44
Table 5-40: Summary of Environmental Impacts by 2005 EU-Stock of PC+ (office) main life cycle indicators value unit Total Energy (GER) 27 PJ
of which, electricity 2.5 TWh Water (process)* 2 mln.m3 Waste, non-haz./ landfill* 31 kton Waste, hazardous/ incinerated* 1 kton Emissions (Air) Greenhouse Gases in GWP100 1 mt CO2eq Acidifying agents (AP) 7 kt SO2eq Volatile Org. Compounds (VOC) 0 kt Persistent Org. Pollutants (POP) 0 g i-Teq Heavy Metals (HM) 0 ton Ni eq PAHs 0 ton Ni eq Particulate Matter (PM, dust) 0 kt Emissions (Water) Heavy Metals (HM) 0 ton Hg/20 Eutrophication (EP) 0 kt PO4
The total electricity used by PC+ (office) stock in EU-25 (2005) during the standby and off modes for one year is estimated at 2.5 TWh or 27 PJ expressed as primary energy.
The total annual expenditure of the standby and off-mode consumption of the PC+ (office) stock in EU-25 (2005) is estimated at 346 million Euros (line F of the EcoReport).
Of the total standby and off-mode energy consumption of PC+(office), the central units, i.e. desktops+notebooks, are responsible of 58 % (Figure 5-3). Regarding off-mode losses, their contribution is higher (79 %) as the hubs do not contribute to these losses (Figure 5-4). Hubs, being never off, contribute to the standby consumption by 10 %, while the central units make up of 49%. Monitors represent roughly 21% and 41% of the off-mode and standby consumption, respectively.
Desktops+Notebooks
58%
Monitors35%
Hubs7%
Figure 5-3: Distribution of the total standby and off-mode electricity consumption of PC+(office) between its constituent devices

Report for Tender No. TREN/D1/40 Lot 6 -2005 EuP Lot 6 - Task 5 2nd of October 2007
Fraunhofer IZM CODDE Bio IS DUH Final Report Page 5-45
Monitors21% Desktops+
Notebooks79%
Figure 5-4: Distribution of the off-mode consumption of PC+(office) between its constituent devices
Desktops+Notebooks
49%Monitors
41%
Hubs10%
Figure 5-5: Distribution of the standby consumption of PC+(office) between its constituent devices

Report for Tender No. TREN/D1/40 Lot 6 -2005 EuP Lot 6 - Task 5 2nd of October 2007
Fraunhofer IZM CODDE Bio IS DUH Final Report Page 5-46
5.2.4.6. PC+ (home)
The category PC+ (home) covers desktops, notebooks, monitors, modems and PC speakers intended to be used in home environments. As explained Section 5.2.1.1., four EcoReport are completed for this product case, namely, one for desktop and notebooks, for monitors, for modems and for PC speakers.
For each of the four EcoReports, the standby and off-mode losses in the use phase are calculated with the device specific use times and electricity consumption provided in Task 3 and Task 4 respectively (Table 5-37). For the specific inputs to the EcoReport, see Table 5-2 above. Table 5-41: Use time and electricity consumption for PC+(home) products
Electricity consumption in mode Time in mode
PC+(home) Stock
(million units) standby
(Wh/h) off
(Wh/h) standby (h/day)
off (h/day)
Desktop+notebook 126 3.81 2.46 9.2 11.2 Monitors (LCD+CRT) 104.5 4.48 1.43 9.6 11.6 Modems 73 10.2 2.6 16.0 2.7 PC speakers 64.26 3.6 2.5 2.5 13.4

Report for Tender No. TREN/D1/40 Lot 6 -2005 EuP Lot 6 - Task 5 2nd of October 2007
Fraunhofer IZM CODDE Bio IS DUH Final Report Page 5-47
► EIA and LCC for PC+ (home) (1000 units)
Table 5-42: Annual environmental impacts of PC+ (home) (per 1000 product units) Nr Life cycle Impact of 1000 product units: PC+ (home) Date Author
0 01/2007 Lot 6 Life Cycle phases --> Resources Use and Emissions
PRODUCTION
DISTRI- BUTION USE END-
OF-LIFE TOTAL
Materials unit
1 Bulk Plastics g 0 0 02 TecPlastics g 0 0 03 Ferro g 0 0 04 Non-ferro g 0 0 05 Coating g 0 0 06 Electronics g 0 0 07 Misc. g 0 0 0
Total weight g 0 0 0 Other Resources & Waste
8 Total Energy (GER) MJ 0 0 890076 0 8900769 of which, electricity (in primary MJ) MJ 0 0 890076 0 890076
10 Water (process) ltr 0 0 59338 0 5933811 Water (cooling) ltr 0 0 2373535 0 237353512 Waste, non-haz./ landfill g 0 0 1031992 0 103199213 Waste, hazardous/ incinerated g 0 0 20510 0 20510
Emissions (Air) 14 Greenhouse Gases in GWP100 kg CO2 eq 0 0 38842 0 3884215 Ozone Depletion, emissions mg R-11 eq negligible 16 Acidification, emissions g SO2 eq 0 0 229195 0 22919517 Volatile Organic Compounds (VOC) g 0 0 335 0 33518 Persistent Organic Pollutants (POP) ng i-Teq 0 0 5834 0 583419 Heavy Metals mg Ni eq 0 0 15270 0 15270
PAHs mg Ni eq 0 0 1753 0 175320 Particulate Matter (PM, dust) g 0 0 4895 0 4895
Emissions (Water) 21 Heavy Metals mg Hg/20 0 0 5739 0 573922 Eutrophication g PO4 0 0 27 0 2723 Persistent Organic Pollutants (POP) ng i-Teq negligible
The total electricity used by PC+ (home) product case (1000 units) during the standby and off modes for one year is estimated at 84769 kWh, i.e. 890076 MJ (primary energy). Annual (life cycle) costs for these products are 10891 Euros due to the electricity consumption in the networked standby and off modes (line F of the EcoReport).

Report for Tender No. TREN/D1/40 Lot 6 -2005 EuP Lot 6 - Task 5 2nd of October 2007
Fraunhofer IZM CODDE Bio IS DUH Final Report Page 5-48
► EU Totals for PC+ (home)
Table 5-43: EU-25 total environmental impacts of the PC+ (home) stock in 2005 Nr EU Impact of PC+ (home) stock in 2005 Date Author
0 01/2007 Lot 6 Life Cycle phases --> Resources Use and Emissions
PRODUCTION
DISTRI- BUTION USE END-
OF-LIFE TOTAL
Materials unit
1 Bulk Plastics kt 0 0 02 TecPlastics kt 0 0 03 Ferro kt 0 0 04 Non-ferro kt 0 0 05 Coating kt 0 0 06 Electronics kt 0 0 07 Misc. kt 0 0 0
Total weight kt 0 0 0 Other Resources & Waste
8 Total Energy (GER) PJ 0 0 112 0 1129 of which, electricity (in primary MJ) PJ 0 0 112 0 112
10 Water (process) mln. m3 0 0 7 0 711 Water (cooling) mln. m3 0 0 299 0 29912 Waste, non-haz./ landfill kt 0 0 130 0 13013 Waste, hazardous/ incinerated kt 0 0 3 0 3
Emissions (Air) 14 Greenhouse Gases in GWP100 mt CO2 eq 0 0 5 0 515 Ozone Depletion, emissions t R-11 eq negligible 16 Acidification, emissions kt SO2 eq 0 0 29 0 2917 Volatile Organic Compounds (VOC) kt 0 0 0 0 018 Persistent Organic Pollutants (POP) g i-Teq 0 0 1 0 119 Heavy Metals ton Ni eq 0 0 2 0 2
PAHs ton Ni eq 0 0 0 0 020 Particulate Matter (PM, dust) kt 0 0 1 0 1
Emissions (Water) 21 Heavy Metals ton Hg/20 0 0 1 0 122 Eutrophication kt PO4 0 0 0 0 023 Persistent Organic Pollutants (POP) g i-Teq negligible
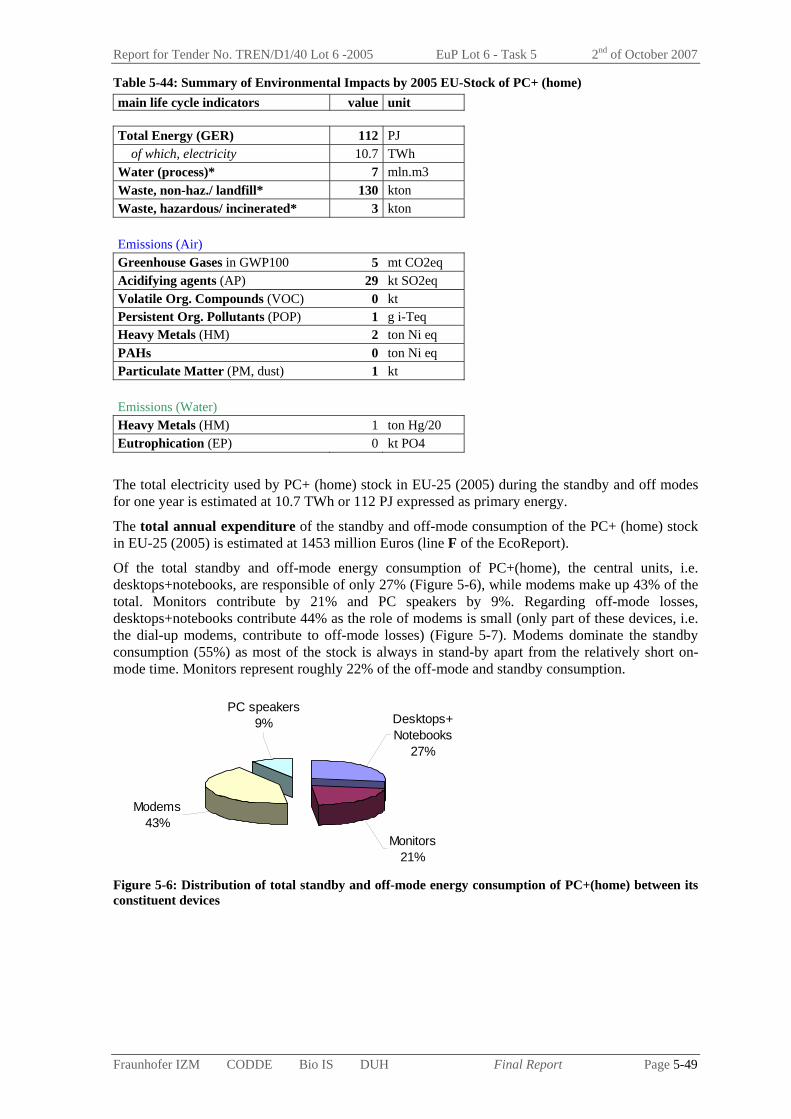
Report for Tender No. TREN/D1/40 Lot 6 -2005 EuP Lot 6 - Task 5 2nd of October 2007
Fraunhofer IZM CODDE Bio IS DUH Final Report Page 5-49
Table 5-44: Summary of Environmental Impacts by 2005 EU-Stock of PC+ (home) main life cycle indicators value unit Total Energy (GER) 112 PJ
of which, electricity 10.7 TWh Water (process)* 7 mln.m3 Waste, non-haz./ landfill* 130 kton Waste, hazardous/ incinerated* 3 kton Emissions (Air) Greenhouse Gases in GWP100 5 mt CO2eq Acidifying agents (AP) 29 kt SO2eq Volatile Org. Compounds (VOC) 0 kt Persistent Org. Pollutants (POP) 1 g i-Teq Heavy Metals (HM) 2 ton Ni eq PAHs 0 ton Ni eq Particulate Matter (PM, dust) 1 kt Emissions (Water) Heavy Metals (HM) 1 ton Hg/20 Eutrophication (EP) 0 kt PO4
The total electricity used by PC+ (home) stock in EU-25 (2005) during the standby and off modes for one year is estimated at 10.7 TWh or 112 PJ expressed as primary energy.
The total annual expenditure of the standby and off-mode consumption of the PC+ (home) stock in EU-25 (2005) is estimated at 1453 million Euros (line F of the EcoReport).
Of the total standby and off-mode energy consumption of PC+(home), the central units, i.e. desktops+notebooks, are responsible of only 27% (Figure 5-6), while modems make up 43% of the total. Monitors contribute by 21% and PC speakers by 9%. Regarding off-mode losses, desktops+notebooks contribute 44% as the role of modems is small (only part of these devices, i.e. the dial-up modems, contribute to off-mode losses) (Figure 5-7). Modems dominate the standby consumption (55%) as most of the stock is always in stand-by apart from the relatively short on-mode time. Monitors represent roughly 22% of the off-mode and standby consumption.
PC speakers9%
Modems43%
Monitors21%
Desktops+Notebooks
27%
Figure 5-6: Distribution of total standby and off-mode energy consumption of PC+(home) between its constituent devices

Report for Tender No. TREN/D1/40 Lot 6 -2005 EuP Lot 6 - Task 5 2nd of October 2007
Fraunhofer IZM CODDE Bio IS DUH Final Report Page 5-50
PC speakers27%
Desktops+Notebooks
44%
Monitors22%
Modems7%
Figure 5-7: Distribution of the off-mode consumption of PC+(home) between its constituent devices
Modems55% Monitors
21%
Desktops+Notebooks
21%
PC speakers3%
Figure 5-8: Distribution of the standby consumption of PC+(home) between its constituent devices

Report for Tender No. TREN/D1/40 Lot 6 -2005 EuP Lot 6 - Task 5 2nd of October 2007
Fraunhofer IZM CODDE Bio IS DUH Final Report Page 5-51
5.2.4.7. Laser printer
Laser printers are most often used in office environments and typically accessed via a network. The standby and off-mode losses in the use phase are calculated with 14.2 hours per day in off-mode and 5.9 hours per day in networked standby mode (Task 3). The hourly off-mode consumption is of 3 Wh/h and the hourly networked standby consumption of 20 Wh/h (Task 4). See Table 5-2 above for the specific inputs to the EcoReport.
► EIA and LCC for Laser printer (1000 units)
Table 5-45: Annual environmental impacts of Laser printer (per 1000 product units) Nr Life cycle Impact of 1000 product units: Laser printer Date Author
0 01/2007 Lot 6 Life Cycle phases --> Resources Use and Emissions
PRODUCTION
DISTRI- BUTION USE END-
OF-LIFE TOTAL
Materials unit
1 Bulk Plastics g 0 0 02 TecPlastics g 0 0 03 Ferro g 0 0 04 Non-ferro g 0 0 05 Coating g 0 0 06 Electronics g 0 0 07 Misc. g 0 0 0
Total weight g 0 0 0 Other Resources & Waste
8 Total Energy (GER) MJ 0 0 615500 0 6155009 of which, electricity (in primary MJ) MJ 0 0 615500 0 615500
10 Water (process) ltr 0 0 41033 0 4103311 Water (cooling) ltr 0 0 1641332 0 164133212 Waste, non-haz./ landfill g 0 0 713637 0 71363713 Waste, hazardous/ incinerated g 0 0 14183 0 14183
Emissions (Air) 14 Greenhouse Gases in GWP100 kg CO2 eq 0 0 26860 0 2686015 Ozone Depletion, emissions mg R-11 eq negligible 16 Acidification, emissions g SO2 eq 0 0 158491 0 15849117 Volatile Organic Compounds (VOC) g 0 0 232 0 23218 Persistent Organic Pollutants (POP) ng i-Teq 0 0 4034 0 403419 Heavy Metals mg Ni eq 0 0 10560 0 10560
PAHs mg Ni eq 0 0 1213 0 121320 Particulate Matter (PM, dust) g 0 0 3385 0 3385
Emissions (Water) 21 Heavy Metals mg Hg/20 0 0 3969 0 396922 Eutrophication g PO4 0 0 19 0 1923 Persistent Organic Pollutants (POP) ng i-Teq negligible
The total electricity used by Laser printers (1000 units) during the standby and off modes for one year amount at 58619 kWh, i.e. 615500 MJ (primary energy). Annual (life cycle) costs for these products are 7831 Euros due to the electricity consumption in the networked standby and off modes (line F of the EcoReport).

Report for Tender No. TREN/D1/40 Lot 6 -2005 EuP Lot 6 - Task 5 2nd of October 2007
Fraunhofer IZM CODDE Bio IS DUH Final Report Page 5-52
► EU Totals for Laser printer
Table 5-46: EU-25 total environmental impacts of the Laser printer stock in 2005 Nr EU Impact of Laser printer stock in 2005 Date Author
0 01/2007 Lot 6 Life Cycle phases --> Resources Use and Emissions
PRODUCTION
DISTRI- BUTION USE END-
OF-LIFE TOTAL
Materials unit
1 Bulk Plastics kt 0 0 02 TecPlastics kt 0 0 03 Ferro kt 0 0 04 Non-ferro kt 0 0 05 Coating kt 0 0 06 Electronics kt 0 0 07 Misc. kt 0 0 0
Total weight kt 0 0 0 Other Resources & Waste
8 Total Energy (GER) PJ 0 0 10 0 109 of which, electricity (in primary MJ) PJ 0 0 10 0 10
10 Water (process) mln. m3 0 0 1 0 111 Water (cooling) mln. m3 0 0 27 0 2712 Waste, non-haz./ landfill kt 0 0 12 0 1213 Waste, hazardous/ incinerated kt 0 0 0 0 0
Emissions (Air) 14 Greenhouse Gases in GWP100 mt CO2 eq 0 0 0 0 015 Ozone Depletion, emissions t R-11 eq negligible 16 Acidification, emissions kt SO2 eq 0 0 3 0 317 Volatile Organic Compounds (VOC) kt 0 0 0 0 018 Persistent Organic Pollutants (POP) g i-Teq 0 0 0 0 019 Heavy Metals ton Ni eq 0 0 0 0 0
PAHs ton Ni eq 0 0 0 0 020 Particulate Matter (PM, dust) kt 0 0 0 0 0
Emissions (Water) 21 Heavy Metals ton Hg/20 0 0 0 0 022 Eutrophication kt PO4 0 0 0 0 023 Persistent Organic Pollutants (POP) g i-Teq negligible

Report for Tender No. TREN/D1/40 Lot 6 -2005 EuP Lot 6 - Task 5 2nd of October 2007
Fraunhofer IZM CODDE Bio IS DUH Final Report Page 5-53
Table 5-47: Summary of Environmental Impacts by 2005 EU-Stock of Laser printer main life cycle indicators value unit Total Energy (GER) 10 PJ
of which, electricity 1.0 TWh Water (process)* 1 mln.m3 Waste, non-haz./ landfill* 12 kton Waste, hazardous/ incinerated* 0 kton Emissions (Air) Greenhouse Gases in GWP100 0 mt CO2eq Acidifying agents (AP) 3 kt SO2eq Volatile Org. Compounds (VOC) 0 kt Persistent Org. Pollutants (POP) 0 g i-Teq Heavy Metals (HM) 0 ton Ni eq PAHs 0 ton Ni eq Particulate Matter (PM, dust) 0 kt Emissions (Water) Heavy Metals (HM) 0 ton Hg/20 Eutrophication (EP) 0 kt PO4
The total electricity used by Laser printer stock in EU-25 (2005) during the standby and off modes for one year is estimated at 1.0 TWh or 10 PJ expressed as primary energy.
The total annual expenditure of the standby and off-mode consumption of the Laser printer stock in EU-25 (2005) is estimated at 132 million Euros (line F of the EcoReport).

Report for Tender No. TREN/D1/40 Lot 6 -2005 EuP Lot 6 - Task 5 2nd of October 2007
Fraunhofer IZM CODDE Bio IS DUH Final Report Page 5-54
5.2.4.8. Inkjet printer
Inkjet printers are predominantly installed in home environments. The standby and off-mode losses in the use phase are calculated with 17.7 hours per day in off-mode and 1.9 hours per day in networked standby mode (Task 3). The hourly off-mode consumption is of 3 Wh/h and the hourly networked standby consumption 6 Wh/h (Task 4). See Table 5-2 above for the specific inputs to the EcoReport.
► EIA and LCC for Inkjet printer (1000 units)
Table 5-48: Annual environmental impacts of Inkjet printer (1000 product units) Nr Life cycle Impact of 1000 product units: Inkjet printer Date Author
0 01/2007 Lot 6 Life Cycle phases --> Resources Use and Emissions
PRODUCTION
DISTRI- BUTION USE END-
OF-LIFE TOTAL
Materials unit
1 Bulk Plastics g 0 0 02 TecPlastics g 0 0 03 Ferro g 0 0 04 Non-ferro g 0 0 05 Coating g 0 0 06 Electronics g 0 0 07 Misc. g 0 0 0
Total weight g 0 0 0 Other Resources & Waste
8 Total Energy (GER) MJ 0 0 247196 0 2471969 of which, electricity (in primary MJ) MJ 0 0 247196 0 247196
10 Water (process) ltr 0 0 16480 0 1648011 Water (cooling) ltr 0 0 659190 0 65919012 Waste, non-haz./ landfill g 0 0 286610 0 28661013 Waste, hazardous/ incinerated g 0 0 5696 0 5696
Emissions (Air) 14 Greenhouse Gases in GWP100 kg CO2 eq 0 0 10788 0 1078815 Ozone Depletion, emissions mg R-11 eq negligible 16 Acidification, emissions g SO2 eq 0 0 63653 0 6365317 Volatile Organic Compounds (VOC) g 0 0 93 0 9318 Persistent Organic Pollutants (POP) ng i-Teq 0 0 1620 0 162019 Heavy Metals mg Ni eq 0 0 4241 0 4241
PAHs mg Ni eq 0 0 487 0 48720 Particulate Matter (PM, dust) g 0 0 1360 0 1360
Emissions (Water) 21 Heavy Metals mg Hg/20 0 0 1594 0 159422 Eutrophication g PO4 0 0 8 0 823 Persistent Organic Pollutants (POP) ng i-Teq negligible
The total electricity used by Inkjet printer product case (1000 units) during the standby and off modes for one year is estimated at 23543 kWh, i.e. 247196 MJ (primary energy). Annual (life cycle) costs for these products are 3145 Euros due to the electricity consumption in the networked standby and off modes (line F of the EcoReport).
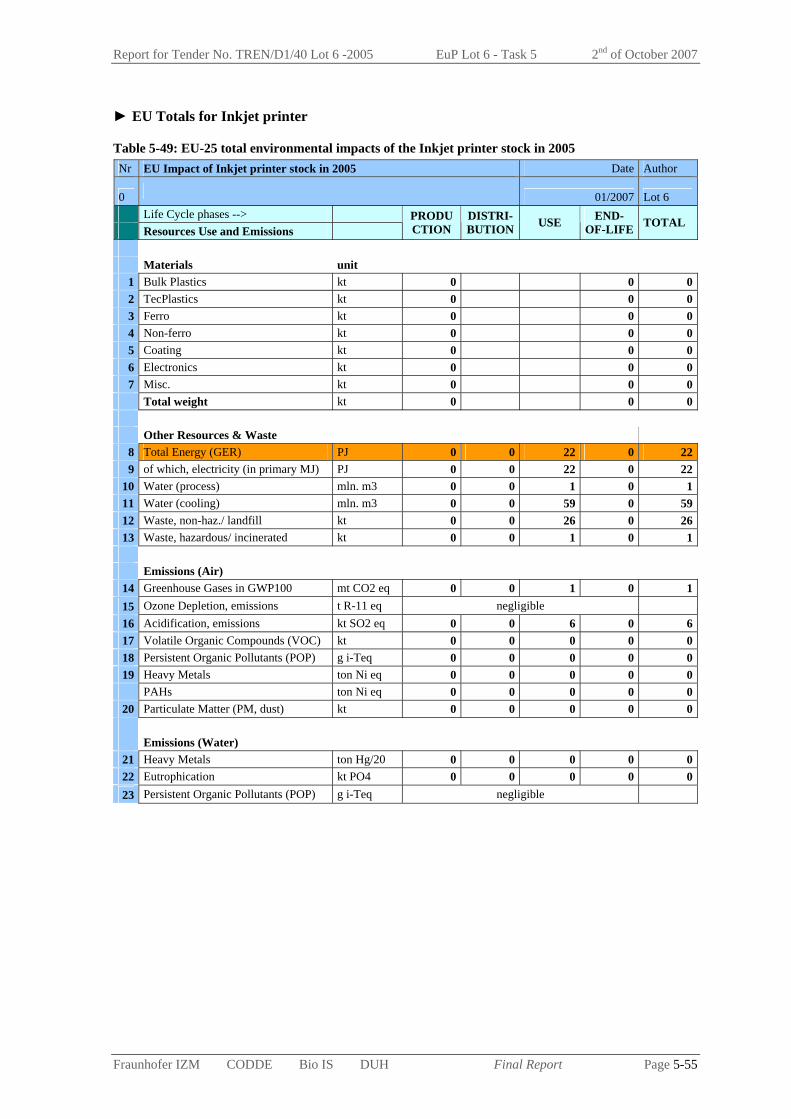
Report for Tender No. TREN/D1/40 Lot 6 -2005 EuP Lot 6 - Task 5 2nd of October 2007
Fraunhofer IZM CODDE Bio IS DUH Final Report Page 5-55
► EU Totals for Inkjet printer
Table 5-49: EU-25 total environmental impacts of the Inkjet printer stock in 2005 Nr EU Impact of Inkjet printer stock in 2005 Date Author
0 01/2007 Lot 6 Life Cycle phases --> Resources Use and Emissions
PRODUCTION
DISTRI- BUTION USE END-
OF-LIFE TOTAL
Materials unit
1 Bulk Plastics kt 0 0 02 TecPlastics kt 0 0 03 Ferro kt 0 0 04 Non-ferro kt 0 0 05 Coating kt 0 0 06 Electronics kt 0 0 07 Misc. kt 0 0 0
Total weight kt 0 0 0 Other Resources & Waste
8 Total Energy (GER) PJ 0 0 22 0 229 of which, electricity (in primary MJ) PJ 0 0 22 0 22
10 Water (process) mln. m3 0 0 1 0 111 Water (cooling) mln. m3 0 0 59 0 5912 Waste, non-haz./ landfill kt 0 0 26 0 2613 Waste, hazardous/ incinerated kt 0 0 1 0 1
Emissions (Air) 14 Greenhouse Gases in GWP100 mt CO2 eq 0 0 1 0 115 Ozone Depletion, emissions t R-11 eq negligible 16 Acidification, emissions kt SO2 eq 0 0 6 0 617 Volatile Organic Compounds (VOC) kt 0 0 0 0 018 Persistent Organic Pollutants (POP) g i-Teq 0 0 0 0 019 Heavy Metals ton Ni eq 0 0 0 0 0
PAHs ton Ni eq 0 0 0 0 020 Particulate Matter (PM, dust) kt 0 0 0 0 0
Emissions (Water) 21 Heavy Metals ton Hg/20 0 0 0 0 022 Eutrophication kt PO4 0 0 0 0 023 Persistent Organic Pollutants (POP) g i-Teq negligible
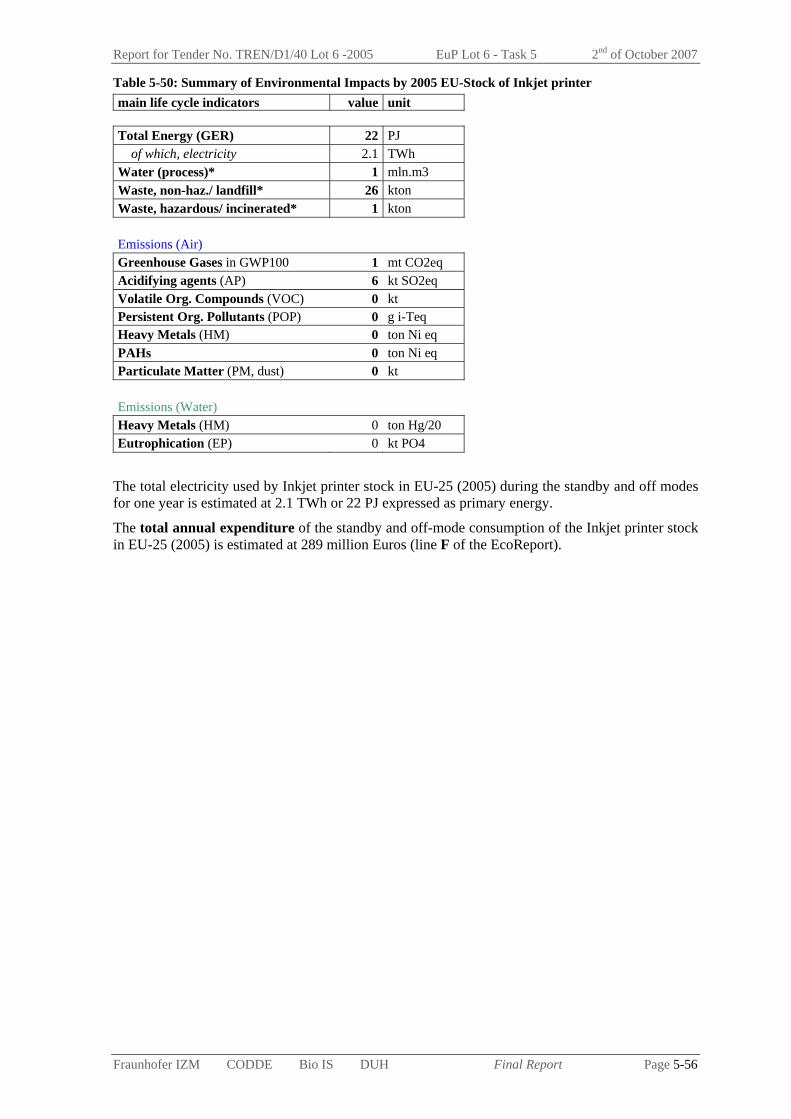
Report for Tender No. TREN/D1/40 Lot 6 -2005 EuP Lot 6 - Task 5 2nd of October 2007
Fraunhofer IZM CODDE Bio IS DUH Final Report Page 5-56
Table 5-50: Summary of Environmental Impacts by 2005 EU-Stock of Inkjet printer main life cycle indicators value unit Total Energy (GER) 22 PJ
of which, electricity 2.1 TWh Water (process)* 1 mln.m3 Waste, non-haz./ landfill* 26 kton Waste, hazardous/ incinerated* 1 kton Emissions (Air) Greenhouse Gases in GWP100 1 mt CO2eq Acidifying agents (AP) 6 kt SO2eq Volatile Org. Compounds (VOC) 0 kt Persistent Org. Pollutants (POP) 0 g i-Teq Heavy Metals (HM) 0 ton Ni eq PAHs 0 ton Ni eq Particulate Matter (PM, dust) 0 kt Emissions (Water) Heavy Metals (HM) 0 ton Hg/20 Eutrophication (EP) 0 kt PO4
The total electricity used by Inkjet printer stock in EU-25 (2005) during the standby and off modes for one year is estimated at 2.1 TWh or 22 PJ expressed as primary energy.
The total annual expenditure of the standby and off-mode consumption of the Inkjet printer stock in EU-25 (2005) is estimated at 289 million Euros (line F of the EcoReport).
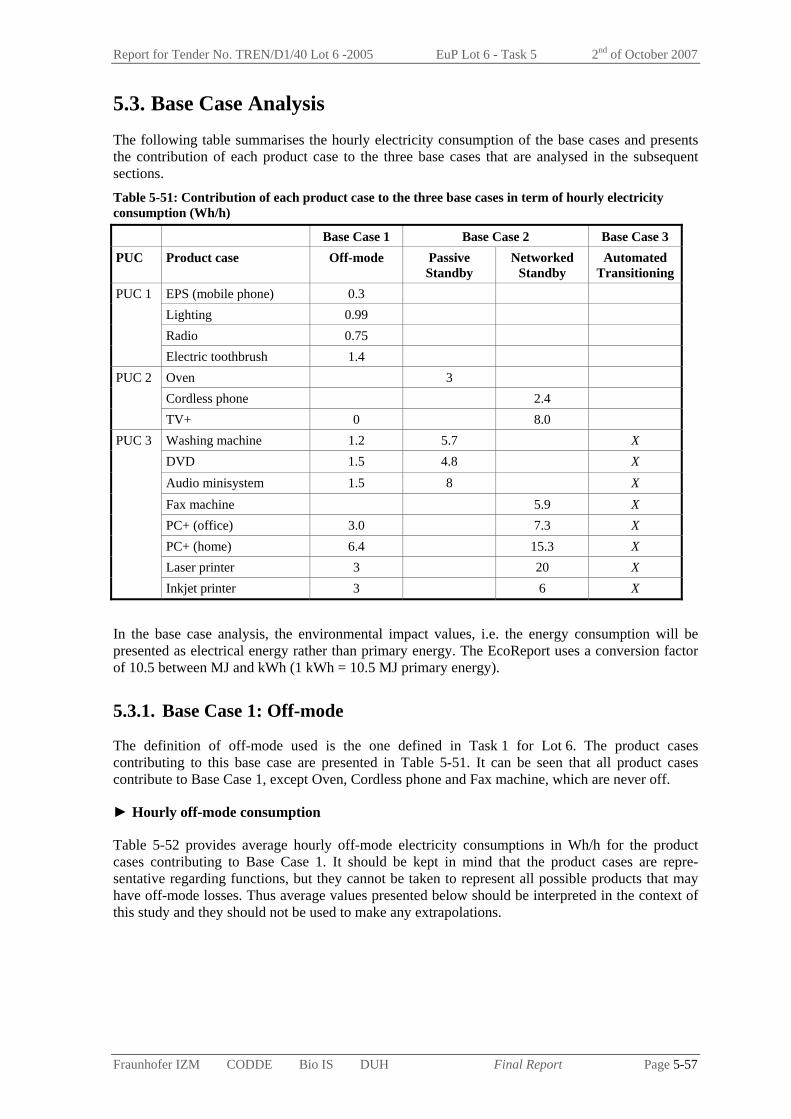
Report for Tender No. TREN/D1/40 Lot 6 -2005 EuP Lot 6 - Task 5 2nd of October 2007
Fraunhofer IZM CODDE Bio IS DUH Final Report Page 5-57
5.3. Base Case Analysis The following table summarises the hourly electricity consumption of the base cases and presents the contribution of each product case to the three base cases that are analysed in the subsequent sections. Table 5-51: Contribution of each product case to the three base cases in term of hourly electricity consumption (Wh/h)
Base Case 1 Base Case 2 Base Case 3 PUC Product case Off-mode Passive
Standby Networked
Standby Automated
Transitioning EPS (mobile phone) 0.3 Lighting 0.99 Radio 0.75
PUC 1
Electric toothbrush 1.4 Oven 3 Cordless phone 2.4
PUC 2
TV+ 0 8.0 Washing machine 1.2 5.7 X DVD 1.5 4.8 X Audio minisystem 1.5 8 X Fax machine 5.9 X PC+ (office) 3.0 7.3 X PC+ (home) 6.4 15.3 X Laser printer 3 20 X
PUC 3
Inkjet printer 3 6 X
In the base case analysis, the environmental impact values, i.e. the energy consumption will be presented as electrical energy rather than primary energy. The EcoReport uses a conversion factor of 10.5 between MJ and kWh (1 kWh = 10.5 MJ primary energy).
5.3.1. Base Case 1: Off-mode
The definition of off-mode used is the one defined in Task 1 for Lot 6. The product cases contributing to this base case are presented in Table 5-51. It can be seen that all product cases contribute to Base Case 1, except Oven, Cordless phone and Fax machine, which are never off.
► Hourly off-mode consumption
Table 5-52 provides average hourly off-mode electricity consumptions in Wh/h for the product cases contributing to Base Case 1. It should be kept in mind that the product cases are repre-sentative regarding functions, but they cannot be taken to represent all possible products that may have off-mode losses. Thus average values presented below should be interpreted in the context of this study and they should not be used to make any extrapolations.
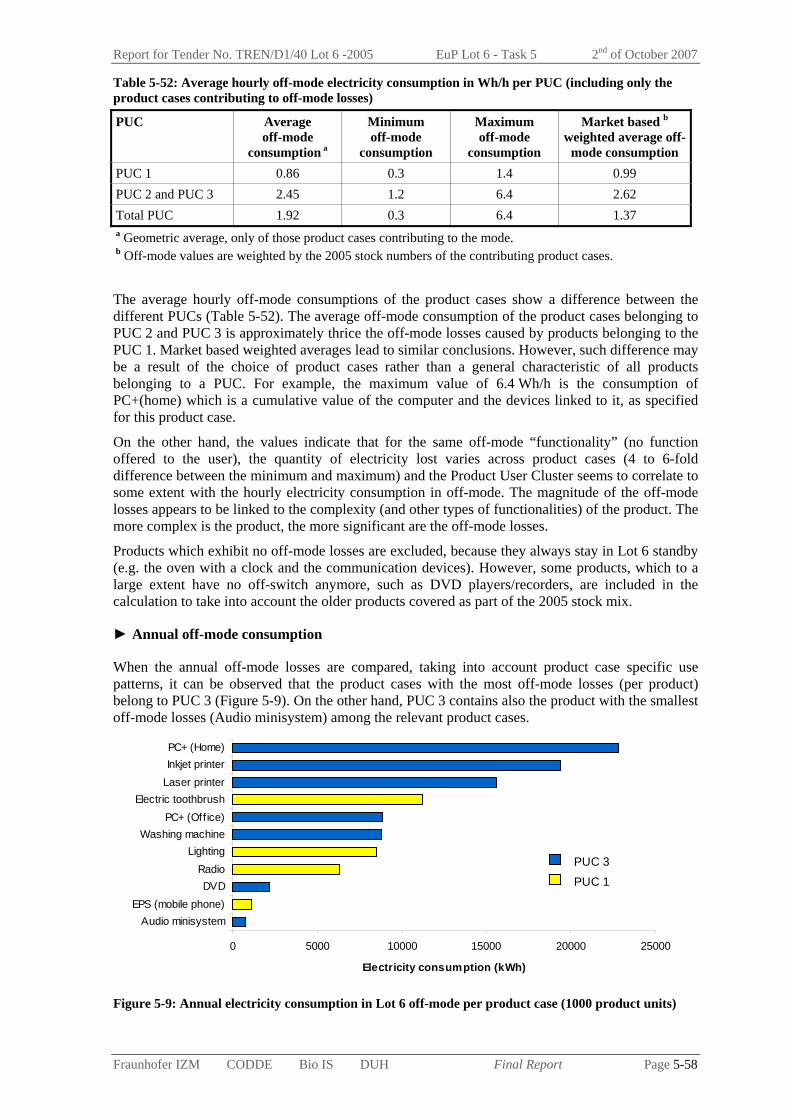
Report for Tender No. TREN/D1/40 Lot 6 -2005 EuP Lot 6 - Task 5 2nd of October 2007
Fraunhofer IZM CODDE Bio IS DUH Final Report Page 5-58
Table 5-52: Average hourly off-mode electricity consumption in Wh/h per PUC (including only the product cases contributing to off-mode losses)
PUC Average off-mode
consumption a
Minimum off-mode
consumption
Maximum off-mode
consumption
Market based b weighted average off-
mode consumption PUC 1 0.86 0.3 1.4 0.99 PUC 2 and PUC 3 2.45 1.2 6.4 2.62 Total PUC 1.92 0.3 6.4 1.37 a Geometric average, only of those product cases contributing to the mode. b Off-mode values are weighted by the 2005 stock numbers of the contributing product cases.
The average hourly off-mode consumptions of the product cases show a difference between the different PUCs (Table 5-52). The average off-mode consumption of the product cases belonging to PUC 2 and PUC 3 is approximately thrice the off-mode losses caused by products belonging to the PUC 1. Market based weighted averages lead to similar conclusions. However, such difference may be a result of the choice of product cases rather than a general characteristic of all products belonging to a PUC. For example, the maximum value of 6.4 Wh/h is the consumption of PC+(home) which is a cumulative value of the computer and the devices linked to it, as specified for this product case.
On the other hand, the values indicate that for the same off-mode “functionality” (no function offered to the user), the quantity of electricity lost varies across product cases (4 to 6-fold difference between the minimum and maximum) and the Product User Cluster seems to correlate to some extent with the hourly electricity consumption in off-mode. The magnitude of the off-mode losses appears to be linked to the complexity (and other types of functionalities) of the product. The more complex is the product, the more significant are the off-mode losses.
Products which exhibit no off-mode losses are excluded, because they always stay in Lot 6 standby (e.g. the oven with a clock and the communication devices). However, some products, which to a large extent have no off-switch anymore, such as DVD players/recorders, are included in the calculation to take into account the older products covered as part of the 2005 stock mix.
► Annual off-mode consumption
When the annual off-mode losses are compared, taking into account product case specific use patterns, it can be observed that the product cases with the most off-mode losses (per product) belong to PUC 3 (Figure 5-9). On the other hand, PUC 3 contains also the product with the smallest off-mode losses (Audio minisystem) among the relevant product cases.
0 5000 10000 15000 20000 25000
Audio minisystemEPS (mobile phone)
DVDRadio
LightingWashing machine
PC+ (Office)Electric toothbrush
Laser printerInkjet printerPC+ (Home)
Electricity consumption (kWh)
PUC 1
PUC 3
Figure 5-9: Annual electricity consumption in Lot 6 off-mode per product case (1000 product units)

Report for Tender No. TREN/D1/40 Lot 6 -2005 EuP Lot 6 - Task 5 2nd of October 2007
Fraunhofer IZM CODDE Bio IS DUH Final Report Page 5-59
► EU Totals for Base Case 1
Base Case 1 electricity consumption amounts to 11.2 TWh annually for the stock of Lot 6 products at the EU-25 level, which corresponds to 1522 million Euros. Of the 15 product cases, PC+ (home) is the highest contributor (26%) to the annual off-mode losses and the associated consumer expenditure.
The rest of the Lot 6 total off-mode losses are distributed between many product cases, three of them (Inkjet printer, Lighting and Washing machine) having a contribution of around 15% each.
DVD3%
Inkjet printer16%
PC+ (Office)6%
PC+ (Home)26%
Audio minisystem1%
Laser printer2% Radio
6%
Washing machine14%
Electric toothbrush4%
Lighting14%
EPS (mobile phone)
8%
Figure 5-10: Contribution of the product cases to Base Case 1, i.e. the Lot 6 Off-mode consumption / consumer expenditure (EU-25 stock, 2005)
5.3.2. Base Case 2: Lot 6 Standby
The definition of standby mode used is the one defined in Task 1 for Lot 6. The differentiation in this chapter is made between the Lot 6 standby function clusters, i.e. networked standby and passive standby, as explained in Task 1. The product cases contributing to this base case are presented in Table 5-51.
► Hourly standby mode consumption
Table 5-53 provides the average hourly standby electricity consumption for the product cases contributing to each of the standby mode type (passive or networked). The average values suggest that there is a difference in the standby consumption depending upon the standby type. On average, the hourly electricity consumption of products in passive standby is around 58% (but already 72% according to market based weighted average) of the hourly consumption of networked standby products. This suggests that the highest networked standby contributors are less relevant in stock numbers.
However, the minimum observed standby consumption is actually higher for passive standby, so a networked standby does not necessarily mean high standby consumption and vice versa. Nevertheless, the highest hourly standby consumptions among the product cases are clearly associated with the networked standby. The fact that the networked standby is more energy consuming than passive standby is related to the functionalities offered by the product case during this standby mode. For example, networked standby is associated with network integrity communication, which involves periodic short burst of status data.

Report for Tender No. TREN/D1/40 Lot 6 -2005 EuP Lot 6 - Task 5 2nd of October 2007
Fraunhofer IZM CODDE Bio IS DUH Final Report Page 5-60
Table 5-53: Average hourly standby electricity consumption in Wh/h per standby type (including only the product cases contributing to each standby mode type)
Standby mode type Average standby
consumption a
Minimum standby
consumption
Maximum standby
consumption
Market based b weighted average
standby consumptionPassive standby 5.38 3.0 8 5.58 Networked standby 9.27 2.4 20 7.79 All standby 7.85 2.4 20 6.92 a Geometric average, only of those product cases contributing to the mode. b Standby values are weighted by the 2005 stock numbers of the contributing product cases.
► Annual standby mode consumption
When the annual standby consumptions, which take into account the product case specific use patterns, are compared, the differences between the passive and networked standby products are even less evident (Figure 5-11).
-5000 5000 15000 25000 35000 45000 55000 65000
Inkjet printer
Cordless phonePC+ (Office)
TV+
Laser printer
Fax machinePC+ (Home)
Washing machine
OvenDVD
Audio minisystem
Electricity consumption (kWh)
Networked standby
Passive standby
Figure 5-11: Annual electricity consumption in Lot 6 standby mode (passive and networked standby) per product case (1000 product units)
► EU Totals for Base Case 2
Base Case 2 electricity consumption amounts to 39 TWh annually for the stock of Lot 6 products at the EU-25 level, which corresponds to 5359 million Euros. Among the products contributing to the Base Case 2, TV+ is the largest contributor (28%) to the annual standby consumption and the associated consumer expenditure of the 15 product cases (see Figure 5-12). Other relatively significant product cases are PC+ (home), Audio minisystem, Cordless phone and DVD, each covering around 10-20% of the Lot 6 total.

Report for Tender No. TREN/D1/40 Lot 6 -2005 EuP Lot 6 - Task 5 2nd of October 2007
Fraunhofer IZM CODDE Bio IS DUH Final Report Page 5-61
TV+28%
PC+ (Home)20%
Fax machine3%
Audio minisystem14%
Inkjet printer1%Laser printer
2%
PC+ (Office)5%
Oven5% Cordless phone
9%
Washing machine3%
DVD10%
Figure 5-12: Contribution of the product cases to Base Case 2, i.e. to the Lot 6 Standby consumption / consumer expenditure (EU-25 stock, 2005)
Job-based (PUC 3) products are responsible for 22.5 TWh of electricity consumption in standby which corresponds to 57% of the total Lot 6 standby consumption. This part will be explored in the following Base Case 3 discussion.
5.3.3. Base Case 3: Automated Transitioning
Base Case 3 is focussing on additional aspects of PUC 3, job-based, products. They run a defined function cycle or job in active mode, after which the set of functions is reduced by changing into a transitional mode (see Section 1.1.5.4).
Depending on the functions still offered this transitional mode can already be a Lot 6 standby mode or it can be a higher level "ready" mode, from which the device will change to lower modes according to implemented procedures. In principle, the automated transition can also lead directly into an off-mode. A wake-up from off-mode is not possible without user interaction, so any product, which should reactivate on demand, must stay in standby all the time.
Automated deactivation is a means to save energy without an active intervention of the user. PUC 3 products are – or could be – aware of when they are not needed. Often the “awareness” is reduced to a timeout after the last action, but even in this case one functional block of the product (the power management) needs to be aware of all possible functions and at which time they stop running.
So, on one hand PUC 3 products are more “intelligent” and may help to lower energy consumption; on the other hand such smart functions require energy and circuitry themselves. It is therefore equally of interest, whether products outside of PUC 3 are missing this intelligence, because it would be too costly or because it would not conform with the use pattern.
The user may have influence on the transitioning via changing pre-defined product settings, possibly including the option to deactivate the transitioning or set the timeout to arbitrary high values.
According to the original hypothesis, the additional complexity of PUC 3 products could result in higher standby electricity consumption. Hourly values (Table 5-51) support this hypothesis to a certain extent, but when typical use patterns and times are taken into account, no clear difference can be observed between PUC 2 and 3 (Figure 5-13). Once again the three PUC 2 product cases (including the dominant TV+ case) should not be taken as a statistical basis. Based on the available data the spread in additional power consumption for the automation or power management cannot be separated from the much larger spread of power consumptions for the different functions implemented in the different product groups.
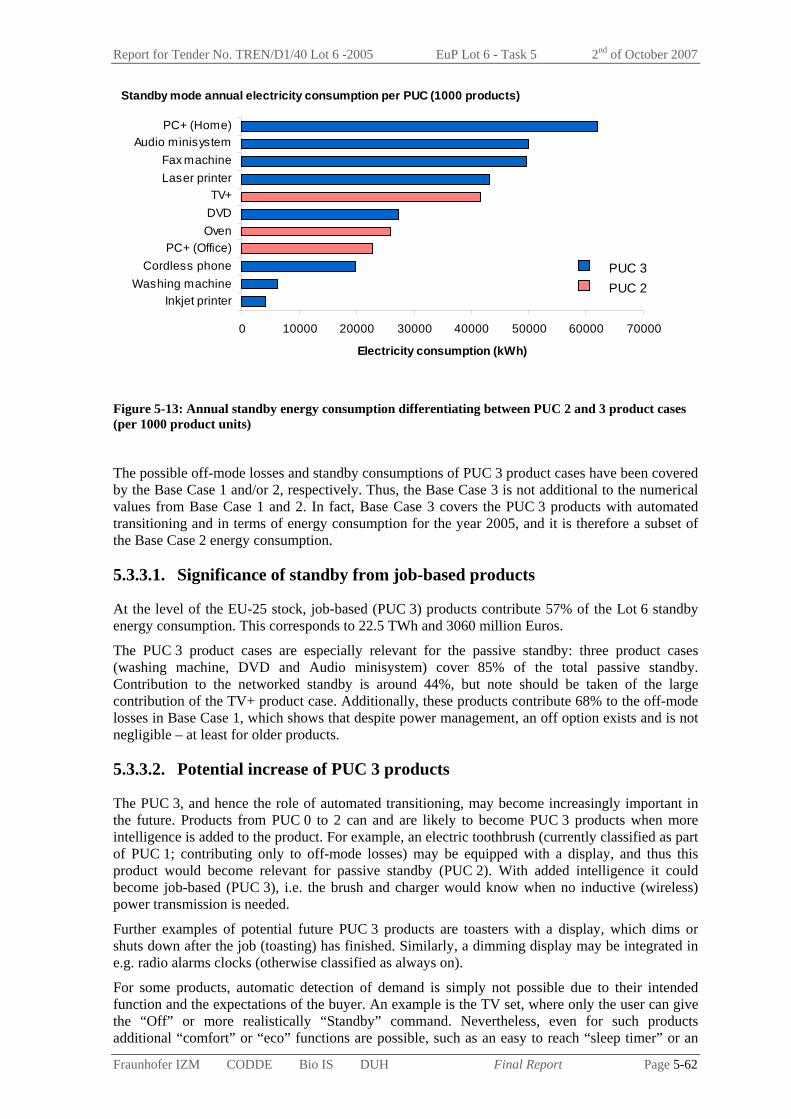
Report for Tender No. TREN/D1/40 Lot 6 -2005 EuP Lot 6 - Task 5 2nd of October 2007
Fraunhofer IZM CODDE Bio IS DUH Final Report Page 5-62
0 10000 20000 30000 40000 50000 60000 70000
Inkjet printerWashing machine
Cordless phonePC+ (Office)
OvenDVDTV+
Laser printerFax machine
Audio minisystemPC+ (Home)
Electricity consumption (kWh)
Standby mode annual electricity consumption per PUC (1000 products)
PUC 2 PUC 3
Figure 5-13: Annual standby energy consumption differentiating between PUC 2 and 3 product cases (per 1000 product units)
The possible off-mode losses and standby consumptions of PUC 3 product cases have been covered by the Base Case 1 and/or 2, respectively. Thus, the Base Case 3 is not additional to the numerical values from Base Case 1 and 2. In fact, Base Case 3 covers the PUC 3 products with automated transitioning and in terms of energy consumption for the year 2005, and it is therefore a subset of the Base Case 2 energy consumption.
5.3.3.1. Significance of standby from job-based products
At the level of the EU-25 stock, job-based (PUC 3) products contribute 57% of the Lot 6 standby energy consumption. This corresponds to 22.5 TWh and 3060 million Euros.
The PUC 3 product cases are especially relevant for the passive standby: three product cases (washing machine, DVD and Audio minisystem) cover 85% of the total passive standby. Contribution to the networked standby is around 44%, but note should be taken of the large contribution of the TV+ product case. Additionally, these products contribute 68% to the off-mode losses in Base Case 1, which shows that despite power management, an off option exists and is not negligible – at least for older products.
5.3.3.2. Potential increase of PUC 3 products
The PUC 3, and hence the role of automated transitioning, may become increasingly important in the future. Products from PUC 0 to 2 can and are likely to become PUC 3 products when more intelligence is added to the product. For example, an electric toothbrush (currently classified as part of PUC 1; contributing only to off-mode losses) may be equipped with a display, and thus this product would become relevant for passive standby (PUC 2). With added intelligence it could become job-based (PUC 3), i.e. the brush and charger would know when no inductive (wireless) power transmission is needed.
Further examples of potential future PUC 3 products are toasters with a display, which dims or shuts down after the job (toasting) has finished. Similarly, a dimming display may be integrated in e.g. radio alarms clocks (otherwise classified as always on).
For some products, automatic detection of demand is simply not possible due to their intended function and the expectations of the buyer. An example is the TV set, where only the user can give the “Off” or more realistically “Standby” command. Nevertheless, even for such products additional “comfort” or “eco” functions are possible, such as an easy to reach “sleep timer” or an

Report for Tender No. TREN/D1/40 Lot 6 -2005 EuP Lot 6 - Task 5 2nd of October 2007
Fraunhofer IZM CODDE Bio IS DUH Final Report Page 5-63
auto-off mechanism with a suitable delay, which does not affect the daily routine of a household (except for using the main switch of the device once or twice per day). These are timer determined standby functions, so they do not necessarily push the product from a PUC 2 to a PUC 3 categorisation. If the instant operation of the remote control is really essential, then additional technical options exist to keep only that part of the product powered while the rest is internally disconnected.
For complex products the most important trade-off to transitioning into very low power modes is usually the additional wake-up time, such as for printers, copiers, PCs and even CRT TVs and monitors. Only where the wake-up time can be reduced by introducing new technologies are fast transitions into ready and standby modes likely to be activated and stay activated in real use.
For simple products the added circuitry and costs are probably the biggest obstacles. Adding a high quality motion sensor to an alarm clock would probably be prohibitive, but adding a very simple motion sensor might be possible.
5.3.3.3. Outlook on optimisation potential regarding transitions
As part of sophisticated power management, automated transitioning to standby (or off-mode) has the potential to reduce devices’ power consumption. However, for most devices power state transitions have a significant cost: typically a transition may consume extra energy (e.g. spinning up a hard disk of a PC), reduce device performance (e.g. unstable wake-up of a PC from hibernation) and possibly reduce its lifetime (e.g. mechanical wear in hard disk spin-up). Therefore all idle periods are not long enough to justify powering down the device. An “aggressive” power management policy (with very short idle times) could end up consuming more energy than operation without power management [Harris 2005, IVF 2006].
Furthermore, automatic transitioning to standby often conflicts with the users. In general, tolerance of users to wait during wake-up times is low – ranging between 10-15 seconds. Consequently, users often manually disable power management settings in devices such as PCs and printers. Or at least the allowed idle times are often set to be long, which makes the automated transitioning almost meaningless. For example, an example in the EuP study on imaging equipment (Lot 4) has shown that laser printers and copiers may never enter sleep mode during a working day, even with relatively short delay times conforming to ENERGY STAR requirements [IZM 2006a].
In the future, pervasive computing can enable more effective power management of home and office machines to significantly reduce overall electricity consumption. For example, location aware power management policies, which detect the presence of the user, can detect user’s identity tags and powered his PC down to standby in his absence; when user is detected again, a wake-up message can be sent to the PC. However, there is a balance between how much energy more sophisticated power management systems can save and how much it will cost both energy wise and monetarily [Harris 2005].
Automated (also called intelligent) homes for example, where the main electric appliances may be connected to and can be controlled through a network, may lead to a situation where all the electric appliances are never in off-mode. Sophisticated power management systems may help to reduce the total electricity consumption (as much standby as possible rather than “always on”), but the importance of standby of the total electricity consumption is expected to increase.
This potential increase can not be quantified in Task 5, but it is an important aspect of the Base Case 3.
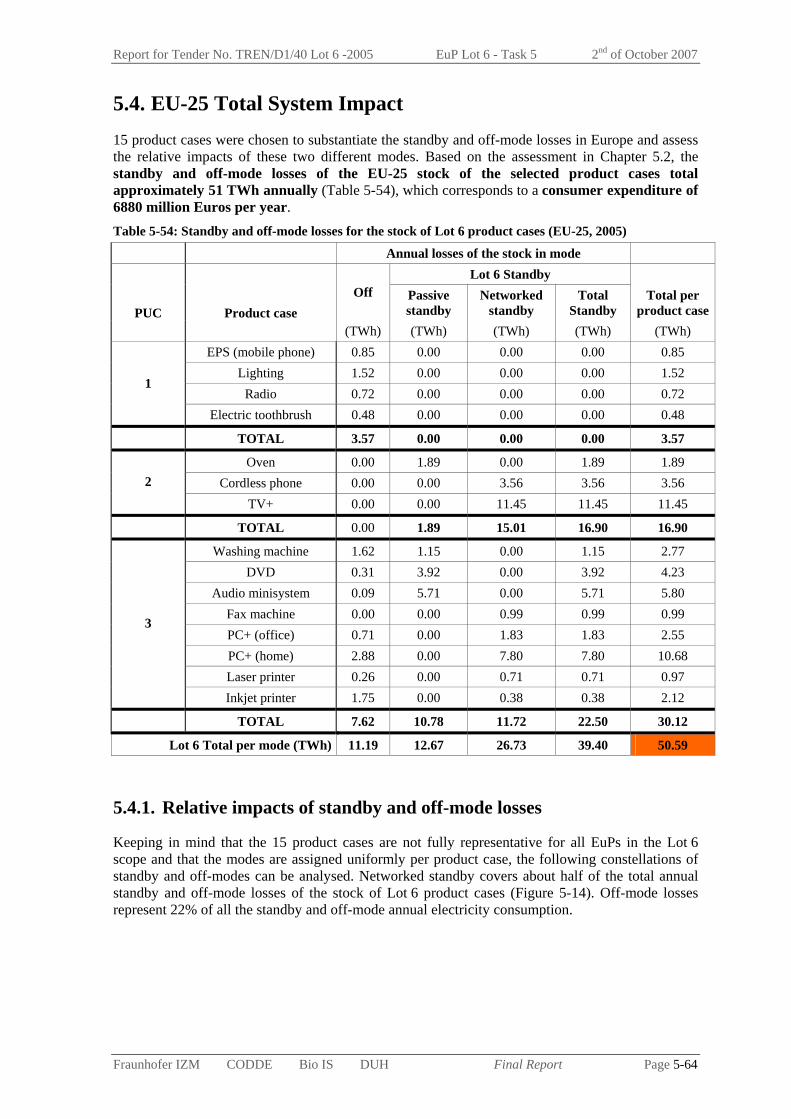
Report for Tender No. TREN/D1/40 Lot 6 -2005 EuP Lot 6 - Task 5 2nd of October 2007
Fraunhofer IZM CODDE Bio IS DUH Final Report Page 5-64
5.4. EU-25 Total System Impact 15 product cases were chosen to substantiate the standby and off-mode losses in Europe and assess the relative impacts of these two different modes. Based on the assessment in Chapter 5.2, the standby and off-mode losses of the EU-25 stock of the selected product cases total approximately 51 TWh annually (Table 5-54), which corresponds to a consumer expenditure of 6880 million Euros per year. Table 5-54: Standby and off-mode losses for the stock of Lot 6 product cases (EU-25, 2005)
Annual losses of the stock in mode Lot 6 Standby
Off Passive standby
Networked standby
Total Standby
Total per product casePUC Product case
(TWh) (TWh) (TWh) (TWh) (TWh) EPS (mobile phone) 0.85 0.00 0.00 0.00 0.85
Lighting 1.52 0.00 0.00 0.00 1.52 Radio 0.72 0.00 0.00 0.00 0.72
1
Electric toothbrush 0.48 0.00 0.00 0.00 0.48
TOTAL 3.57 0.00 0.00 0.00 3.57
Oven 0.00 1.89 0.00 1.89 1.89 Cordless phone 0.00 0.00 3.56 3.56 3.56 2
TV+ 0.00 0.00 11.45 11.45 11.45
TOTAL 0.00 1.89 15.01 16.90 16.90
Washing machine 1.62 1.15 0.00 1.15 2.77 DVD 0.31 3.92 0.00 3.92 4.23
Audio minisystem 0.09 5.71 0.00 5.71 5.80 Fax machine 0.00 0.00 0.99 0.99 0.99 PC+ (office) 0.71 0.00 1.83 1.83 2.55 PC+ (home) 2.88 0.00 7.80 7.80 10.68 Laser printer 0.26 0.00 0.71 0.71 0.97
3
Inkjet printer 1.75 0.00 0.38 0.38 2.12
TOTAL 7.62 10.78 11.72 22.50 30.12
Lot 6 Total per mode (TWh) 11.19 12.67 26.73 39.40 50.59
5.4.1. Relative impacts of standby and off-mode losses
Keeping in mind that the 15 product cases are not fully representative for all EuPs in the Lot 6 scope and that the modes are assigned uniformly per product case, the following constellations of standby and off-modes can be analysed. Networked standby covers about half of the total annual standby and off-mode losses of the stock of Lot 6 product cases (Figure 5-14). Off-mode losses represent 22% of all the standby and off-mode annual electricity consumption.

Report for Tender No. TREN/D1/40 Lot 6 -2005 EuP Lot 6 - Task 5 2nd of October 2007
Fraunhofer IZM CODDE Bio IS DUH Final Report Page 5-65
Off-mode22%
Passive standby mode
25%Networked
standby mode53%
Figure 5-14: Relative importance of the different modes under study of the total standby and off-mode losses (in TWh) of the Lot 6 stock (2005, EU-25)
5.4.2. Contribution of product cases to standby and off-mode losses
Figure 5-15 provides the annual electricity consumption of each of the 15 product cases (per 1000 product units) during the standby and off-mode phases. PC+(home) is clearly the product case with the highest annual standby and off-mode electricity consumption (without taking the stock into account), followed by Laser printers, Audio minisystems and Fax machines. Viewed on a per-product (or 1000 products) basis these are the most energy intensive cases in the Lot 6 investigations.
0 10000 20000 30000 40000 50000 60000 70000 80000 90000
EPS (mobile phone)Radio
LightingElectric toothbrushWashing machine
Cordless phoneInkjet printer
OvenDVD
PC+ (Office)TV+
Fax machineAudio minisystem
Laser printerPC+ (Home)
Electricity consumption (kWh)
PUC 2
PUC 1
PUC 3
Figure 5-15: Annual standby and off-mode losses per product case (per 1000 product units) in kWh
However, at the EU-25 level (that is to say, taking the stock into account) the magnitude of the contribution of each product case to the standby and off-mode electricity consumption is different (see Figure 5-16 below). TV+ is the largest contributor (24%), followed closely by PC+(home) (21%) to standby and off-mode losses among the 15 product cases. Audio minisystem, DVD player and Cordless phone are also relatively important product cases in terms of electricity consumption.

Report for Tender No. TREN/D1/40 Lot 6 -2005 EuP Lot 6 - Task 5 2nd of October 2007
Fraunhofer IZM CODDE Bio IS DUH Final Report Page 5-66
DVD8%
Audio minisystem11%
Oven4%
Electric toothbrush1%
PC+ (Home)21%
Laser printer2%
Inkjet printer4% Lighting
3%
EPS (mobile phone)
2%
TV+24%
Cordless phone7%
Washing machine5%
Fax machine2%
Radio1%
PC+ (Office)5%
Figure 5-16: Contribution of the product cases to annual standby and off-mode electricity consumption (EU-25 stock, 2005) in TWh
5.4.3. Standby and off-mode losses per household
Home appliances cause 46.1 TWh or 91.1% of the Lot 6 totals for standby and off-mode losses. This translates to 240 kWh or 33 Euros per average household per year. Further, Lot 6 standby and off-mode losses represent 6.5% of the annual electricity consumption of an average household (based on household electricity data in Section 2.1.1.).
The above is summarising the totals for the product cases investigated. There are additional energy uses in households, which can or should be included in the totals to give a fair representation of the situation.
46 TWh(6.5%)
?%?%
71 TWh(10%)
Lot 6 energy consumption
covered for households
(Task 5)
Energy consumptions for
product cases not included
in Lot 6 modes (idle, ready)
Energy consumption of
household products not
covered by Lot 6 cases
Cumulative estimate
for standby and off-mode
losses in households
(Task 2)
?
Year
ly L
ot 6
ele
ctric
al e
nerg
y(2
005,
EU
-25,
hou
seho
lds)
Figure 5-17: Principle for comparing Task 5 totals for households with top-down estimate introduced in Task 2 (percentages are share of annual household electricity consumption)
In addition to these 6.5 % covered by Lot 6, a certain part of households’ total electricity consumption could be attributable to “standby”, which is not covered by the current study due to a narrow standby definition (e.g. “idle” state of PCs and “ready” state of printers are intentionally not
Report for Tender No. TREN/D1/40 Lot 6 -2005 EuP Lot 6 - Task 5 2nd of October 2007
Fraunhofer IZM CODDE Bio IS DUH Final Report Page 5-67
covered by the Lot 6 definition). Furthermore, households have other products with standby and off-mode consumption in addition to the 15 product cases of the Lot 6 (Figure 5-17).
A top-down estimate for standby and off-mode losses in households (Task 2) arrived at 71 TWh (10 % of the household electricity consumption). This would indicate that approximately a quarter of all the standby and off-mode consumption in a wider sense are left out of the scope of this study. This would actually be quite good coverage, given all the uncertainties and necessary simplifications. Further analysis of estimates for totals (including beyond the 15 product cases) is now incorporated into the Task 5 conclusions (Page 5-70 of this report). At this stage it will not be assessed whether the top-down estimate in Task 2 and the bottom-up approach of Task 5 would in reality provide converging results.
As the electricity costs are alone responsible for all the consumer expenditure of Lot 6 standby and off-mode losses, the above discussion on TWh values is equally relevant regarding the consumer expenditure.
5.4.4. Standby and off-mode losses for office equipment
Office appliances cause 4.5 TWh or 8.9% of the Lot 6 totals for standby and off-mode losses. This corresponds to the lower end of the top-down estimate based on [Ellis 2006] introduced in Section 2.1.2. The upper end may have been reached, if further appliances (such as photocopiers) had been included in the analysis. Hence the Lot 6 value can be considered to be in line with values published in the literature. For a more detailed view of the office totals in comparison to existing studies see the Task 5 conclusions.
Higher standby and off-mode consumption would be observed, if further product types were included in the assessment: for example those that are considered as building infrastructure (some fixed lighting, air conditioning, smoke detectors) and network equipment installed outside of the actual offices (server rooms).

Report for Tender No. TREN/D1/40 Lot 6 -2005 EuP Lot 6 - Task 5 2nd of October 2007
Fraunhofer IZM CODDE Bio IS DUH Final Report Page 5-68
5.5. Task 5 Conclusions For standby and off-mode losses, the standard MEEuP methodology of defining few average EU products as Base Cases is not directly applicable, because the standby functionalities and the “non-functionality” of off-modes are not products themselves, but features shared by many different products. Hence, the methodology is adapted for Lot 6 calculations.
The aim of Task 5 has been to study three base cases:
Base Case 1: Off-mode Issues
Base Case 2: Lot 6 Standby Function Clusters
Base Case 3: Automated Transitioning
The analysis of and the discussions on these Lot 6 base cases are based on 15 example product cases, structured along the three product-use-clusters (PUCs) defined in Task 1. However, please note that the three PUCs are not identical to the three base cases. It is important that one product case may be relevant for more than one base case in this lot, and that power consumption resulting from Automated Transitioning (Base Case 3) has overlaps with Base Case 2, which is covering the standby function clusters. In this respect Base Case 3 is not additive to Base Case 2.
The standby and off-mode losses of the EU-25 stock of the 15 product cases amounts to approximately 51 TWh annually, which corresponds to a consumer expenditure of 6880 million Euros for electricity per year. Contribution of the product cases, grouped by main mode classes, to Lot 6 total is presented in Figure 5-18.
PC+ (Home)6%
Lighting3%
Rest (networked standby)
2%
Inkjet printer3%
Washing machine3%
PC+ (Office)1%
EPS (mobile phone)2%
Rest (off-mode)4%
Audio minisystem11%
TV+23%
Washing machine2%
Oven4%
DVD8%
Fax machine2%
PC+ (Office)4%
Cordless phone7%
PC+ (Home)15%
Off-mode
Passivestandby
Networkedstandby
Figure 5-18: Contribution of product cases to Lot 6 EU-25 total energy consumption (stock 2005)
Note that products contributing to more than one relevant mode appear more than once in this representation and that the smaller contributions are not shown individually to give a better overview.
Base Case 1 (covering the off-mode) makes up 22 % of the total or 11 TWh and 1522 million Euros. Base Case 2 (covering standby) makes up the remaining 78 % or 39 TWh and 5359 million Euros. In more detail, 25 % of the total is attributed to products in Lot 6 passive standby mode and the remaining 53 % are from networked standby mode, within Base Case 2.
Base Case 3 is not additive to the two other, but within the 2005 stock evaluation is rather a sub-set of Base Case 2. Base Case 3 covers the PUC 3 products with automated transitioning, which

Report for Tender No. TREN/D1/40 Lot 6 -2005 EuP Lot 6 - Task 5 2nd of October 2007
Fraunhofer IZM CODDE Bio IS DUH Final Report Page 5-69
contribute to Base Case 2 by 57 % or 23 TWh and 3060 million Euros. The further importance of Base Case 3 can be shown, when product trends and design options are analysed together in Task 8.
As the use phase is the only life cycle phase where standby and off-mode losses occur, the Base Case analysis was reduced to assessing the impacts and costs of electrical energy consumption in the use phase. However, the analysis of the improvement potential in Task 7 needs to be based on trade-offs between costs over the life cycle, as well as potential changes in the product design and the production. Effectively, cost changes and design changes (resulting in material changes and energy changes in the EcoReport) need to be quantified.
For the EcoReport assessments this would require determining the change in material composition between product generations and the achievable environmental improvements (to determine the point of Least Life Cycle Costs, LLCC). In addition to changes in electricity consumption and electricity costs, which have been analysed in Task 5, changes in the material composition or the product price from the previous product generation to the improved version can be taken into account in the improvement potential calculations.
In principle, the differential material bill and product costs can be prepared as an input for the EcoReport. As can be expected for the sensitive area of product costs very few inputs were received during the study. Within the Lot 6 reports the differential product costs are explained and used in Task 7, while differential materials are analysed in the Task 8 sensitivity analysis.

Report for Tender No. TREN/D1/40 Lot 6 -2005 EuP Lot 6 - Task 5 2nd of October 2007
Fraunhofer IZM CODDE Bio IS DUH Final Report Page 5-70
5.5.1. Estimation of Total Magnitude Standby and Off-mode Losses for EU-25 in 2005
Structure of Totals Estimation
Figure 5-19 shows the steps of the necessary extrapolations to arrive at a EU-25 total for standby and off-mode losses.
Building infrastructure extended scope totals:
103 TWh per year (lower estimate, infrastructure EuPs excl. HVAC),
122 TWh per year (upper estimate with all hidden devices)
These are possible totals for households and offices including EuPs in the building infrastructure.
Households:
46.1 TWh or 91.1 % attributed to 12 household product cases
Offices:
4.5 TWh or 8.9 % attributed to 3 office product cases
Extension to cover all mains connected household EuPs
Overhead for household products not covered by 9 of the 12 product cases: x 1.7
Total for intended household scope: 76 TWh p.a.
Extension to cover all mains connected office EuPs
Overhead for office EuPs not covered by 3 product cases: x 2
Total for intended office scope: 9 TWh p.a.
Total for mains connected household and office EuPs:
85 TWh per year This is the EU-25 total for 2005 for the defined Lot 6 investigation scope.
Adding infrastructural overheads in households and offices Min. household overhead (ICT related): 13 % ; broader assumption, still excluding HVAC: 20 % In Eureco 2002 between 33 % and 51 % of "total household standby" could not be attributed to
measurable/accessible products (average 43 % for 3 countries can be used ). Lower household estimate : 91 TWh p.a. Upper household estimate : 109 TWh p.a.
Assumption: same overheads for offices (20 % & 43 % ) Lower office estimate : 11 TWh p.a. Upper office estimate : 13 TWh p.a.
Calculated sum of standby and off-mode losses for 15 product cases, scope EU-25, year 2005
51 TWh per year
Figure 5-19: Estimation overview and results for EU-25 totals
Note: Most values on this page are rounded to integers for simplification.
Explanations for the values follow on the next pages.
Report for Tender No. TREN/D1/40 Lot 6 -2005 EuP Lot 6 - Task 5 2nd of October 2007
Fraunhofer IZM CODDE Bio IS DUH Final Report Page 5-71
Details of Current Lot 6 Results used above
The 15 product cases selected (mains connected household and office EuPs) represent standby and off-mode power consumption of 51 TWh per year (50.59 TWh as of 26.6.2007). This is based on the 2005 stock situation for the 15 product cases investigated. The biggest contributors are TV+ (at 11.45 TWh) and PC+(home) at 10.68 TWh. 22 % of the total are attributed to off-mode losses, the rest is powering Lot 6 standby functions. The 15 product cases were chosen to represent certain behavioural models (the user interaction possibilities, the mode combinations available, the degree of automation via power management). Although they were also chosen to cover a significant part of the magnitude of standby and off-mode, they are not representative of other products directly or as a model mix to extrapolate from.
46.1 TWh or 91.1 % are attributed to household products, and 4.5 TWh or 8.9 % are calculated for the office equipment. For the PC+ cases separate assumptions and calculations were done for offices and households, while for other "dual use" products a clear cut (simplified) allocation to either segment was done (all laser printers and fax machines are actually added to the office segment, while inkjet printers, DECT phones, mobile phones and lighting are fully allocated to household products).
The data situation to arrive at a totals estimate is quite different between the two segments. For household equipment a number of studies and publications are available, whereas for office equipment there are fewer sources, which are harder to adapt to be used in this study.
As a fundamental problem all studies and publications have different product scopes, different mode definitions, possibly different measurement procedures and are of course not covering the same time frame.
Details of Estimations
The factors to estimate totals from the calculated base cases in Task 5 derive from the German ISI study (published 2005) and the Eureco study (published 2002). The first is used to estimate, what percentage of products in households and offices have to be added to the 15 product cases (“mains connected products”). The latter is used to estimate what percentage needs to be added to cover all EuPs in households and offices, including building infrastructure.
Additionally, summary percentages related to either total household electricity consumption or office electricity consumption from other studies are compared.
The ISI standby data [Schlomann 2005] is basically an update of the earlier [Cremer 2003] data on ICT energy use in Germany, with additional household products covered. The data has been estimated for 2004 (or partially 2005 for the English version of the report).
By comparing, which product types are covered by the Lot 6 product cases and by the ISI study, we can define the percentage of energy use of the ISI data, which is covered by equivalent Lot 6 product cases. This amounts to 59 % covered and 41 % not covered regarding the household products (or their yearly energy use more precisely). The relation between these percentages gives the overhead (or missing products), which needs to be added to the Lot 6 product case energy. In the household case, 41 % missing EuPs, which should be in the intended scops, means multiplying by roughly 1.7. For office equipment the split between covered and not covered products is 49 % covered and 51 % not covered, resulting in a multiplier of approximately 2.04.
It is valid to use the German data this way, because the errors regarding different EuP penetrations in different countries, or differences from mode definitions between ISI and Lot 6 (most relevant would be ready modes for laser printers and copiers) roughly cancel each other out.
The result of this extrapolation step is the Lot 6 total for the investigated scope of mains connected household and office EuPs. The EU-25 standby and off-mode energy consumption for 2005 is therefore determined as 85 TWh. It does not cover what has been termed building infrastructural EuPs in these two application environments. Further extension of the scope via extrapolations is

Report for Tender No. TREN/D1/40 Lot 6 -2005 EuP Lot 6 - Task 5 2nd of October 2007
Fraunhofer IZM CODDE Bio IS DUH Final Report Page 5-72
possible, but has higher uncertainties. This is why these further assumptions and steps are shown, but are not communicated as the EU-25 total of the study.
For this next step, adding an estimate for standby and off-mode in building infrastructure, the ISI study has only sparse data on additional household infrastructure. ICT related EuPs such as antenna amplifiers, LNBs for satellites and intercoms add 13 % to the households total (marked in Figure 5-19). The office infrastructure devices (such as servers or routers) are considered to have no standby contributions within the study. Lighting, alarm or security systems or air conditioning were not considered with the “ICT” focus.
To accommodate further distributed products, but still excluding the whole HVAC segment, a 20 % overhead seems more realistic (marked in Figure 5-19).
As a separate approach data from the 2002 Eureco study of household measurements in Denmark, Italy, Portugal and Greece can be used to estimate standby and off-mode losses in households beyond the “mains connected EuPs”. The measurements were done for the complete households on the one hand (subtracting e.g. refrigerators as they were not considered standby) and for all accessible EuPs individually. The difference between the two measurements represents the building infrastructure or other “hidden” EuPs not identified, and even other losses such as wire and contact losses. As a result, the hidden products make up 33 % (Denmark, marked in Figure 5-19) up to 51 % (Italy, marked in Figure 5-19) of the total household standby energy (Greece with 56 % should be excluded, because no individual products were measured). On average 43 % of the energy can not be attributed to measured products (marked in Figure 5-19).
It should be noted, that the Eureco data is older, and that the distribution of countries is not representative, but that should not affect the applicability of the overhead percentages too much.
In absence of usable data the same percentages for infrastructural overheads (20 % as lower estimate and 43 % as higher estimate) are also applied for the office equipment.
Comparison to other studies (expressed as percentage of household electricity)
The results in Lot 6 Task 5 for household standby and off-mode power consumption (46.1 TWh) are equivalent to 240 kWh/a per household, which can also be expressed as 27.4 W per household (artificial average over the whole year or continuous power equivalent). This corresponds to 6.5 % of household electricity consumption.
The extrapolated value of 76 TWh/a (or 40 W per household), which includes all mains connected household EuPs, corresponds to 10.1 % of household electricity.
This roughly fits with the estimated 10 % of the ISI study, although some modes (notably ready modes for printers and copiers) are treated differently. As a percentage this also fits with the Australian figures of e.g. 10.7 % or 92.2 W per household [EES 2006a], where the total energy consumption per household is much higher, but likewise possible infrastructural standby overheads seem to be mostly excluded (some, like smoke detectors, are mentioned).
Older summaries such as [Mohanty 2001] cite more standby percentages in relation to household electricity consumption. The figures are mostly lower (e.g. France 7 %), with a spread from 5 % to 11 %. The measurement campaigns and study estimations go back as far as 1998. It can not be ascertained from this, whether the standby issue has grown in proportion (if we now assume 10.4 % for all of Europe, closer to the upper limit of older values), or if other changes in trends and in methodology are responsible.
When including the assumed infrastructural overheads for households the total rises to 109 TWh. This would equal a staggering 14.5 % of the total electricity consumption of European households, or 57 W when expressed as a distributed average over the year.

Report for Tender No. TREN/D1/40 Lot 6 -2005 EuP Lot 6 - Task 5 2nd of October 2007
Fraunhofer IZM CODDE Bio IS DUH Final Report Page 5-73
The Eureco measurement campaigns with a 13.5 % average are of course in a comparable magnitude, since this source was used for the extrapolation as described above. However, from that study it is not sure, whether all of what we have here termed “infrastructural overheads” should be considered as Lot 6 standby, when the devices consuming this energy can not be identified. The 4 country average of 13.5 % corresponds to 53 W average per household, but for the reference year 2001.
For offices such comparisons are more difficult. For the U.S. and for Australia 4-8 % of electricity consumption in offices has been estimated as standby [Kawamoto 2000] [Ellis 2005]. However, the electricity consumption for all European offices is only roughly available to make a useful comparison. Task 2 extrapolates a total of 120 TWh/a for office electricity. In relation, the covered Lot 6 product cases (4.5 TWh/a) would equal about 3.7 %, and the extrapolated Lot 6 scope of mains connected office equipment (9 TWh/a) accounts for 7.5 % of office electricity use. The further extrapolation to include infrastructural EuPs with standby in offices (11 to 13 TWh/a) would amount to 9.2 % and 10.8 %, respectively.
Considering that the sources for the 4-8 % estimates seem to have concentrated on the Lot 6 scope as well (only some infrastructure included) the order of magnitude would seem to be comparable.
Not included in any of the extrapolations are
Further infrastructure (information & communication networks, power networks)
Non-office professional areas and EuPs (industry, medical, education, point-of-sales)
Various always-on products, which could have power management
Reduction potentials are assumed to be lower in these areas, although individual product cases (such as banking machines) have potential.

Report for Tender No. TREN/D1/40 Lot 6 -2005 EuP Lot 6 - Task 6 2nd of October 2007
Fraunhofer IZM CODDE Bio IS DUH Final Report Page 6-i
EuP Preparatory Study Lot 6 Standby and Off-mode Losses
Task 6 Technical Analysis BAT Final Report
Compiled by Fraunhofer IZM
Contractor: Fraunhofer Institute for Reliability and Microintegration, IZM, Berlin
Department Environmental Engineering
Dr.-Ing. Nils F. Nissen
Gustav-Meyer-Allee 25, 13355 Berlin, Germany
Contact:
Tel.: +49-30-46403-132
Fax: +49-30-46403-131
Email: [email protected]
Berlin, 2nd of October 2007
Disclaimer
The findings presented in this report are results of the research conducted by the IZM consortium and the continuous feedback from a wide range of stakeholders. The statements and recommendations presented in the final report however are not to be perceived as the opinion of the European Commission.
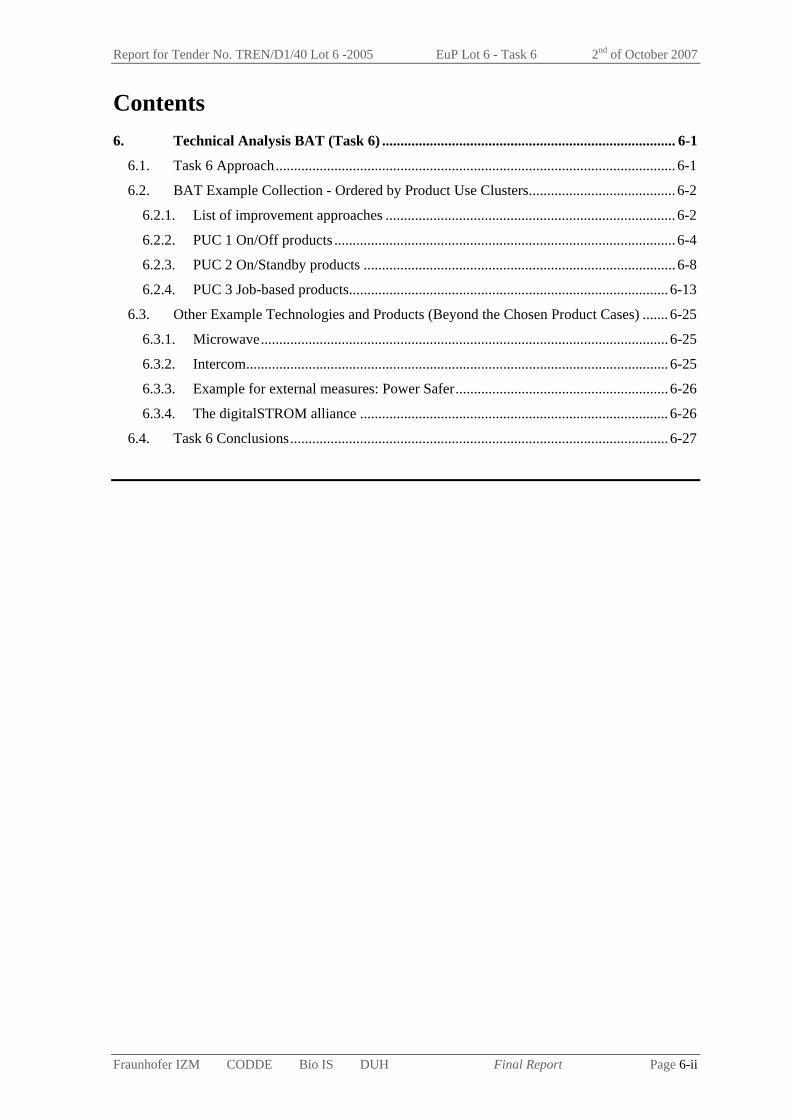
Report for Tender No. TREN/D1/40 Lot 6 -2005 EuP Lot 6 - Task 6 2nd of October 2007
Fraunhofer IZM CODDE Bio IS DUH Final Report Page 6-ii
Contents 6. Technical Analysis BAT (Task 6) ................................................................................ 6-1
6.1. Task 6 Approach............................................................................................................. 6-1 6.2. BAT Example Collection - Ordered by Product Use Clusters........................................ 6-2
6.2.1. List of improvement approaches ............................................................................... 6-2 6.2.2. PUC 1 On/Off products ............................................................................................. 6-4 6.2.3. PUC 2 On/Standby products ..................................................................................... 6-8 6.2.4. PUC 3 Job-based products....................................................................................... 6-13
6.3. Other Example Technologies and Products (Beyond the Chosen Product Cases) ....... 6-25 6.3.1. Microwave............................................................................................................... 6-25 6.3.2. Intercom................................................................................................................... 6-25 6.3.3. Example for external measures: Power Safer.......................................................... 6-26 6.3.4. The digitalSTROM alliance .................................................................................... 6-26
6.4. Task 6 Conclusions....................................................................................................... 6-27

Report for Tender No. TREN/D1/40 Lot 6 -2005 EuP Lot 6 - Task 6 2nd of October 2007
Fraunhofer IZM CODDE Bio IS DUH Final Report Page 6-1
6. Technical Analysis BAT (Task 6)
The objective of Task 6 is to identify best available technologies regarding standby and off-mode losses.
BAT (best available technology) is defined as the technology with lowest environmental impacts, which is available on the market. BNAT (best not yet available technology) is a technology with even further reduced environmental impacts than BAT, which is still in the stage of development and not yet introduced to the market.
Examples of both groups, BAT and BNAT, will be listed and analysed together in Task 6.
6.1. Task 6 Approach As indicated in Task 1 and Task 3 there are two main strategies to minimise standby energy consumption:
Minimising the power consumption level of a (given) standby mode and the associated set of standby functions
Faster transitioning from a higher standby level to a lower standby level (or to off-mode)
Transition improvements may require looking at modes otherwise outside the Lot 6 scope, i.e. levels of on-mode consumption and the "transition into standby" modes as defined in Task 1.
As additional options, it is principally also possible to change (i.e. limit) the standby functions offered or to use external measures to reduce the power consumption (usually, but not always, leading to a loss of all standby functionality). The first option is usually not considered a viable option (when the standby functions are considered useful to the user), while the latter is principally outside the Lot 6 scope, because it is not a design measure targeting the single EuP. Nevertheless, some examples in these directions will be covered in the collection of possibilities in Task 6.
Off-mode losses can either be eliminated by installing a primary side hard-off switch instead of a soft switch/no switch, or reduced by minimising the active circuitry and in particular increasing the efficiency of the power supply under the remaining off-mode load.
From an environmental point of view, off-mode power consumption according to the Lot 6 definition should always be avoidable. A device not delivering and not even offering a function should not consume energy. The reasons for designing EuPs with off-mode power consumption must be sought within the companies' interests, such as
Reducing the product costs (i.e. components) Design considerations and assumed user expectations (including design "fashion") Lowering the technical requirements on the product, for example lower flame redardancy
levels or lower voltages in the end product
Special borderline cases can be EMC or PFC1 circuits or components. If they cannot be placed behind a primary switch or if there is no primary side hard-off switch, then they contribute to off-mode losses. It can be argued that these are actually functions, which are invisible to the user, but are still needed for the proper function of the product. We propose nevertheless to classify such product configurations as contributing to off-mode. On the one hand they should usually be placed behind a primary side switch, in which case they do not contribute to any off-mode losses. On the other hand the EMC or PFC circuits are clearly not main functions, for which a product is intended.
Tasks 6 and 7 pose two fundamental problems, which should be explained before the BAT examples are presented. These are
Allocation or "disaggregation" of improvements related to standby
1 Electromagnetic Compatibility and Power Factor Correction

Report for Tender No. TREN/D1/40 Lot 6 -2005 EuP Lot 6 - Task 6 2nd of October 2007
Fraunhofer IZM CODDE Bio IS DUH Final Report Page 6-2
Matching the specific improvement of an example to the theoretical base case or product case configuration
Firstly, most standby improvements will be implemented during a product redesign, which will introduce other changes to the product at the same time. It is not possible from outside of a company to separate the changes due to improvements on standby (or off-mode) from all other design changes. Only for virtual examples or for reference designs is this partially possible.
Consequently, the cost changes due to the improvement in power consumption cannot be identified for complex product redesigns, and neither can the influence of these cost changes on the product price be quantified. However, such costs – either absolute product prices or expressed differentially as explained in Task 4.1 – are essential for determining the LLCC in Task 7. Here rough estimates per design option will have to be introduced.
Secondly, inferring from one improvement step between two specific and similar products to the improvement of a virtual, averaged product case is normally not possible. For the horizontal standby lot the features making up a base case are not even pinned down in detail. Without knowing the features of the original case, it is very hard to apply feature changes, to modify their realisation or to describe a feature shift from one generation to another.
6.2. BAT Example Collection - Ordered by Product Use Clusters
6.2.1. List of improvement approaches
There are a lot of generic improvement options, which are applicable for different product cases. Design options which will affect the off-mode (Off) or standby (St), external measures (Ext) and user behaviour (Use) are differentiated. Some options will affect more than one of these possibilities (O+S indicates off-mode and standby together).
The following is a list of possible improvement options, which will be used as a short notation with each product case.
Off1: hard-off switch on primary side A primary side hard off switch can be installed in almost every product to avoid off-mode losses, but a lot of products do not have hard-off switches in order to keep some functions available all the time.
O+S1: more efficient power supply (internal) O+S2: more efficient power supply (external)
More efficient power supplies would reduce the off-mode losses and the side “losses” as part of the standby energy consumption.
O+S3: auto-standby transitions, auto-off functions Auto standby functions can reduce the energy consumption by shortening the on-mode time of a product or by turning the device from a high standby mode into a low standby mode. This is especially applicable for job-based products.
St1a: power buffering to supply standby (batteries, supercaps) St1b: autarkic energy supply for standby functions (e.g. solar) St1c: secondary power supply for standby functions
There are different options to supply the standby circuit with power without keeping the main power supply activated. For options like batteries or supercaps it has to be checked, whether these options really lead to reduced energy consumption, or whether the energy consumption is only shifted from one mode to another or, in the worst case, the energy consumption actually increases due to additional losses. A secondary power supply with higher efficiency in the low power range can be used to reduce the losses in the power supply during standby.
St2a: improved circuit design of the standby function, possibly with more integrated ICs or microcontrollers

Report for Tender No. TREN/D1/40 Lot 6 -2005 EuP Lot 6 - Task 6 2nd of October 2007
Fraunhofer IZM CODDE Bio IS DUH Final Report Page 6-3
New and optimised microcontrollers with integrated power save functions can lead to less components and therefore to less “side losses” and a reduced energy consumption.
St2b: improved circuit design of the standby function, possibly with more dedicated microcontrollers By installing additional microcontrollers, which are more dedicated for the standby functions, the standby energy consumption can be reduced, because only the “small” microcontroller need to be powered.
St3: reduced circuits powered during standby functions (electronic switches/relays) Installing electronic switches or relays that isolate non-standby circuits from the power source leads to a reduced standby energy consumption. The ability to control the flow of power is an essential precondition for power management.
St4: enabling user settings to switch off circuit blocks not needed during standby It should be possible for the user to permanently disable a functionality which is not needed. This user setting should really switch that part off.
St5: not allowing the user to disable standby time-out completely This is an option to enforce the effect of options such as auto-standby transitions, but it may contradict the wishes of the user (or of administrators).
St6a: use of no or very low power display technologies (e.g. bi-stable displays to indicate status)
St6b: use of more efficient signal lamps (other than LEDs, efficient LED circuits or flashing LEDs)
St7: avoiding continuous preheating (not necessary for modern CRTs/printers etc.) Old CRT displays preheat continuously to enable a fast reactivation. This is not necessary anymore through new optimised components and a different circuit design.
St8: use of non-volatile memory to eliminate continuous power need for memory e.g. settings
St9: minimising the power level of necessary safety functions S+E1: adjusting network (device only wakes up when it's meant)
Lot 6 networked standby products often “wake up” via network, even when the incoming information is not related to them. As an external measure, this “bad traffic” can be avoided by adjusting the network so that the device does not unnecessarily reactivate from standby. As a product design measure, the wake-up mechanism could be more selective or have different levels of robustness.
Ext1: external improvements (power strips, master slave) To avoid off-mode losses or to switch off a device, which normally does not have an off-mode power strips with switches can be used. This option is similar to the option U1, but more practicable for the user and therefore likely to be used more often.
Ext2: communication between devices or phantom power supply to peripherals This is difficult to realise as a product option, because it involves more than one product, but it could lead to products going into standby simultaneously, or to peripherals needed no own power supply and being without power, when the main device is deactivated.
Use1: always unplug/disconnect The user has the option to always unplug a device when it is not needed, but this is not really practical for the user and therefore not a realistic scenario to follow.
Note: This numbering is only used within Task 6. The more representative quantifiable design options in Task 7 have a separate numbering system.
In the following discussion on the BAT for the different product cases it will be shown, which of these improvement options are generally applicable for each product and which options are actually used/installed in the BAT examples.

Report for Tender No. TREN/D1/40 Lot 6 -2005 EuP Lot 6 - Task 6 2nd of October 2007
Fraunhofer IZM CODDE Bio IS DUH Final Report Page 6-4
6.2.2. PUC 1 On/Off products
6.2.2.1. External Power Supply (EPS) for mobile phones
The Lot 7 no-load case for the external power supplies corresponds with the Lot 6 off-mode. Due to the fact that the main data and information for the EPS are extracted from the Lot 7 report the wording “no-load” instead of “off-mode” appears in this section. For this product only the Lot 6 off-mode is of interest.
Regarding the base case from [BIO 2007], the power consumption level could be reduced from 0.3 W down to under 0.1 W through improvements in the electronic circuitry. Thus, the potential for reducing off-mode power level is quite low (0.2 W) as an absolute number, but still quite high relatively. This is due to the switch to efficient power supplies for mobile phones, which has already taken place over the last years. Thus, the representative case for most low power EPS happens to be partially optimised already. Since this is the case with highest market figures in Lot 7 this study uses the same delineation and technical status.
Regarding the changes in costs and material, the examples were mainly extracted from the Lot 7 report. However, in most cases the changes in the bill of materials (BOM) cannot be allocated to the reduction of no-load losses, i.e. off-mode losses, alone because most of the new technologies also increase the on-mode efficiency of the EPS.
► Primary side integrated IC
“A 5 W EPS with voltage and current regulation on the primary side achieves less than 200 mW no-load losses and an average efficiency of 67 %. Such an external power supply has been on the market since 2000” [BIO 2007]. Friwo Group CEAG AG introduced a 3 W EPS with a newly developed ASIC, which reaches no-load losses less than 100 mW. Other manufacturers like iWatt and Power Integrations have also followed this concept.
“Primary side regulation results in significant reduction in the number of electronic components. […] Such a design can be realised with less than 30 electronic components and significantly reduced printed wiring board size.” [BIO 2007]. “Primary side regulation does not need an optocoupler, which usually provides the feedback from the secondary side to the primary side ensuring galvanic isolation.” [BIO 2007]
► Energy Star listed products
The Energy Star for AC-DC EPS lists additional BAT examples, as cited in the Lot 7 study [BIO 2007]. The lowest no-load values for 230 V operation are:
60 mW: Dong Yang E&P, TAD037 (3.5 W rated output) and AA-M2 (4.8 W rated output)
80 mW: Huizhou Skyfortune Electronics, S024EM0900120 (10.8 W rated output)
90 mW: Salcomp, AC-2E (2.65 W rated output)
These examples serve to show, that below 100 mW off-mode losses are already possible and available on the market – even up to the 10 W class of EPS.
► Fairchild Power switches
“Fairchild Power Switches (FPS) are highly integrated off-line power switches with a fully avalanche rated SenseFET and current mode PWM IC offering Advanced Burst Mode Operation to meet low standby power regulations and achieve improved efficiencies. EMI emissions are reduced through intelligent frequency modulation. According to the manufacturer, in comparison to discrete MOSFET and controller or RCC switching converter solutions, the FPS simplifies designs by reducing total component count, design size, and weight while at the same time improving system reliability and lowering costs in target applications.” [BIO 2007]
Report for Tender No. TREN/D1/40 Lot 6 -2005 EuP Lot 6 - Task 6 2nd of October 2007
Fraunhofer IZM CODDE Bio IS DUH Final Report Page 6-5
► Bias winding technology
Power Integrations declare that no-load losses less than 30 mW are achievable with what they call Bias Winding technology. In their assembly (specialised circuit and the Power Integrations ASIC) only three further components are needed to reduce the no-load losses from 300 mW to 30 mW (in this case two diodes and one capacitor are additionally needed). Component cost is 1 cent (about 5 cents assumed in retail) [Balakrishnan 2006].
► Product case: Emerson (Astec-Power) [Emerson 2006]
Emerson (Astec-Power) submitted a BAT product case for EPS for mobile phones. The power level in the off-mode after improvement is 150 mW for 230 Vac input (before 230 mW for 110 Vac input). The additional costs are negligible or even 0 € states Astec. “The technique in using the simple and yet inherently superior attributes of the Ringing Choke Converter circuit has been used and been taken advantage by Astec during the past few years in the mobile phone charger product range. The RCC flyback topology achieves less than 150 mW in the standby mode even at worst case 230 Vac line input voltage and can be less than 100 mW at 115 Vac. This functional attribute is achieved since there is an inherent burst condition when the circuit is operated at no load. An average of close to 70 % active efficiency (based on EPA efficiency measurement method) is also achieved for this 5 W external adapter due to its optimised switching performance.” [Emerson 2006]
► Emerson (Astec-Power) BNAT
“Investigation also show that a BNAT […] is possible in further reducing the off-mode losses to 20 mW by using a special controller that goes into sleep mode when no-load is present at the secondary output. There will be some tradeoff between having extremely low no-load losses vs output ripple when operating at sleep mode.” [Emerson 2006]
► Ultra low stand-by power charger for mobile phone (BNAT)
“This BNAT approach is based on the assumption that for applications, such as mobile phones, no-load power consumption is dominant. Consequently the product is optimised for no-load power; no effort has been put to maximise its efficiency. In fact, this BNAT has lower efficiencies than many products already on the market. However, the required maximum no-load power is only 0.01 W at 230 V AC input.” [BIO 2007]
“Ultra low no-load power is possible to achieve with relatively slight modification if the ripple voltage (due to burst mode operation) is allowed to increase. In the best case, only two additional SMD components are needed. Cost impact in this approach are minor, however, ripple specification in the mobile phone - EPS interface must be modified (EPS detection).” [BIO 2007]
► High efficient EPS (low power range) at prototype level (BNAT)
“Very high efficiencies for power supplies in the low power range are achievable with a combination of primary integrated IC and synchronous power rectification: FRIWO recently developed this power supply prototype, based on a prior product generation, with a relatively high output current […] The prototype achieves a high average efficiency. Although synchronous rectification requires additional power, the overall no-load losses of the prototype are well below 0.15 W. Compared to the prior product generation without synchronous rectification, the dimensions did not change and there were no significant BOM changes.” [BIO 2007]
In addition to improvements in the electronic circuitry, possible further options are limited to installing hard-off switches on the primary side to avoid the off-mode losses of small EPSs for mobile phones. The same effect could be reached by external measures through power strips or master / slave outlets. Especially for master / slave outlets, it should be remembered that these solutions also have permanent low power consumption so it is possible that the off-mode

Report for Tender No. TREN/D1/40 Lot 6 -2005 EuP Lot 6 - Task 6 2nd of October 2007
Fraunhofer IZM CODDE Bio IS DUH Final Report Page 6-6
consumption from the EPS is on a lower level than the external outlet. In both options the user behaviour is a key factor. The existence of a switch does not automatically imply that the customer will use it to switch off the device (especially when EPS are installed in harder to reach areas, such as below a desk).
6.2.2.2. Lighting (magnetic)
Hard-off switches on the primary side of the transformer would avoid the off-mode losses completely. To increase the energy efficiency while the halogen lamp is in use, the efficiency of the (internal or external) power supply could be improved. However, this would only minimally change the consumption in off-mode. The solution would be to replace the magnetic transformers by electric transformers with higher efficiency (see also Lot 7).
To reduce the standby consumption2 of magnetic transformers for halogen lighting, the Swedish engineering company Artektron has invented the Trans-OFF technology. It consists of a small IC with a simple external circuitry, which in connection with any type of magnetic power supply transformer reduces the standby energy consumption to less than one part per thousand [Röing 2001].
“A tiny pilot current is led through the transformers´ primary winding and it detects when the secondary winding is closed. By this detection the primary side is opened to the net according to a well-defined curve of about 10 periods of the AC. The pilot current [needs] less than 0.002 W, which is a true standby function.” [Röing 2001]
Figure 1: Artektron Trans-OFF [Röing 2001]
“The plug-in transformer will undoubtedly become more costly by the added electronic circuitry. Voluntary efforts by the distributors are not likely to take place. For the consumer the extra Euro would however soon prove profitable, as the pay-off time is less than two years.” [Röing 2001]
6.2.2.3. Lighting (electronic)
Hard-off switches on the primary side of the (electronic) transformer would avoid the off-mode losses completely. Another improvement option is to increase the efficiency of the (internal or external) power supply.
IR2161 by International Rectifier provides an example of an intelligent converter control IC specifically designed for electronic transformers of low voltage halogen lamps. The compact 8-pin device incorporates a 600 V half-bridge driver, advanced overload and short-circuit protection circuitry and adaptive control techniques. The integrated design reduces parts count by 20 %, simplifies circuits and increases reliability, according to the manufacturer [BIO 2007].
The IR2161 is based upon International Rectifier’s high-voltage junction-isolation (HVJI) IC technology. It can adapt to changing supply voltage, frequency and lamp conditions. Adaptive dead-time control is a key feature of this IC, which increases transformer reliability by continually
2 Röing uses the term of standby for lighting but within Lot 6 this is considered as off-mode with losses.
Report for Tender No. TREN/D1/40 Lot 6 -2005 EuP Lot 6 - Task 6 2nd of October 2007
Fraunhofer IZM CODDE Bio IS DUH Final Report Page 6-7
maintaining soft switching. Soft start limits inrush current to the lamp filament to boost lamp life. The chip also is compatible with external triac wall-switch light dimmers [BIO 2007].
Halogen lamps are not inherently energy efficient, so the motivation for using the intelligent ICs is space savings, reliability and improved lamp life. The technical specifications of IR2161 do not provide data on the energy efficiency implications of this new IC, which thus cannot be assessed.
6.2.2.4. Radio
Regarding the base cases the only improvement potential for the radio is to reduce or eliminate the off-mode losses. Taking into account the long time spent in off-mode (23 h per day assumed in Task 3), also a small reduction would be valuable.
Possible improvement options:
Off1: hard-off switch on primary side O+S1/2:more efficient power supply (internal/external) Ext1: external improvements, (power strips, master slave) Use1: always unplug/disconnect
The off-mode losses can be reduced by more efficient power supplies. Therefore the options analysed in section 6.2.2.1 are of interest. Options to eliminate the off-mode losses would be to install a primary side hard-off switch (on the designer side) and to use power strips or to unplug the radio after each use (on the user side).
To illustrate BAT for Radio, no real product cases have been identified, which would fit into the category (radio without any Lot 6 standby functions) and which could be evaluated. As the described radios have no remote control function and no clock, the hard-off switch is a realistic BAT option, however.
6.2.2.5. Electric toothbrush
Electric toothbrushes are considered to be used only 6 minutes per day (0.1 h/d) on average; the rest of the time (23.9 h/d), off-mode losses occur when the battery in the toothbrush is not charging. The time for charging has not been included in the use pattern for simplicity, but it would not change the results by much, even though this would be classified as slow charging.
The charger cradles for electric toothbrushes are continuously powered with constant power level of for example 1 W, regardless of the actual charging function3, and this is considered as energy losses when the product is in off-mode. Therefore the main improvement option is to increase the efficiency of the power supply in the charger cradle. Another possible improvement option is to let the charge cradle know when the internal battery of the toothbrush is fully loaded. In this case the charge cradle could reduce the power level down to a minimum. Further possible improvement option is to minimise the losses while the toothbrush is in use: during this time the charge cradle could reduce the power level down to a minimum. However, due to the extremely short use time of only 6 minutes per day, this option will not lead to significant energy savings. Yet another improvement option is of course to increase the efficiency of the inductive energy transfer from the charge cradle to the toothbrush.
In Task 6 the best available technologies for the product cases should be described but there is also room for negative examples. As mentioned in Task 3, there is a trend of integrating displays in small household appliances. Recently, even toothbrushes or toasters have become available equipped with a display, which is always on. Following the differentiation used in this study, such electric toothbrushes should be counted as PUC 2 products due to the standby function for the display. Nevertheless, toothbrushes are considered under PUC 1 – without display – because the display equipped brush is still the exception. Further additional energy consuming functions like monitoring the brushing time, the charge level or the brush head change time are also integrated in 3 Tested at Fraunhofer IZM.

Report for Tender No. TREN/D1/40 Lot 6 -2005 EuP Lot 6 - Task 6 2nd of October 2007
Fraunhofer IZM CODDE Bio IS DUH Final Report Page 6-8
the new generation of toothbrushes. Although a potential increase in energy consumption due to the integrated display cannot be quantified, the example should show that even simple products can exhibit a feature shift, which may move the product within the standby topic.
6.2.3. PUC 2 On/Standby products
6.2.3.1. Electric oven
For the electric oven only the Lot 6 passive standby mode is of interest. Possible improvement options comprise:
Off1: hard-off switch on primary side St1c: secondary power supply for standby functions St6a: using no or very low power display technologies (bi stable display to indicate
status) St6b: using more efficient signal lamps (other than LEDs, efficient LED circuits or
flashing LEDs) St4: deactivate clock or timer function via "setup" (reduced functionality)
Most ovens are assumed to have a clock, therefore they remain in standby rather than off-mode, when all heating is switched off. Additionally, timers are present in many models, which also fall under Lot 6 standby. The open question for ovens is whether the high power that needs to be switched – especially for unsupervised timer controlled cooking – necessitates a higher level of standby power consumption.
According to CECED, 2.5 W is the power level in Lot 6 passive standby associated with best available technology for ovens with a clock. However, a product example for microwave oven with comparable features and the same conditions of Lot 6 standby consumption comes with 1.7 W. This implies that for ovens with clock and timer features a standby consumption under 2 W could be possible.
In the Swiss measurement campaign by S.A.F.E. [Nipkow 2003] ovens were measured with 1 to a maximum of 2.6 W, averaging at 2.2 W for 6 products measured. Although no individual models with their feature range can be identified and the values are a bit older, 1 W ovens seem to have been on the market then (possibly without a timer).
6.2.3.2. Cordless phone
This product case is relevant for the networked standby. The base station waits for incoming signals from the telephone network even when the handset is off the cradle.
Possible improvement options:
O+S2: more efficient power supply (external) St6a: using no or very low power display technologies (bi-stable display to indicate
status) St6b: using more efficient signal lamps (other than LEDs, efficient LED circuits or
flashing LEDs) Ext1: external improvements (power strips, master slave) (with reservations)
According to the Australian survey and Lot 7 study, cordless units normally have an external power supply, which is still usually a linear mode power supply. Therefore the main improvement option is to increase the energy efficiency of the EPS (especially in low-load) [BIO 2007]).
The Energy Star Product list for cordless phones [Energy Star 2007a] identifies the following products with low standby energy consumption.

Report for Tender No. TREN/D1/40 Lot 6 -2005 EuP Lot 6 - Task 6 2nd of October 2007
Fraunhofer IZM CODDE Bio IS DUH Final Report Page 6-9
The EnergyStar list has two potential BAT products. The main difference between the Radioshack (43-5562) and (43-3576) is the used technology. The first appliance with 1.3 W is based on digital technology and the second with 2.44 W on analogue technology [Energy Star 2007a]. This seems to be also a reason for lower standby values in case of cordless phones. It should be noted that Energy Star includes in the cordless phone list “combination units” which have an answering machine, as well as additional handsets with their own chargers, which are not addressed by the Lot 6 product case.
As an example of a BAT product, Siemens provided information for the Gigaset A160 which is a standard cordless phone without an answering machine. This product is on a test level and should be available in 2007. Before any improvement options, the power level of a similar product was about 3 W for networked standby; after improvements the power level is at 1.2 W. The device was measured after 24 hours charging with the handset in the cradle. The main improvement was to replace the linear power supply with more efficient switched power supply. The above mentioned energy consumption of 1.2 W is only applicable for standard, not for ISDN or VoIP, phones.
With similar technical improvements, Siemens’ comfort model A165 with an answering machine achieves a standby power level of 2 W compared to 4 W prior to improvement. This model has, besides the answering machine, additional features such as a larger display in the handset and a larger memory for telephone numbers.
A general improvement option besides a more efficient power supply is the so called ECO DECT standard. ECO mode describes a reduced transmitting power for cordless phones with DECT standard. If the handset is placed in the base station the transmitting power is reduced by factor 250.000 or more [Virnich 2007]. This implies a reduction in the Lot 6 networked standby power consumption, at least for those users leaving the handset in the cradle for most of the time. The correct user behaviour, i.e. placing the handset back into the cradle after each call, is important to bring about the energy savings with this technology. The ECO DECT mode can also lead to higher standby energy consumption caused by charging the handset, when it is placed in the cradle. Only an intelligent charge controller can minimise this, so that overall this mode leads to reduced energy consumption in standby. However, a combined value for improved power supply, the reduction of transmission power while in the cradle and a possible adaptive transmission power level adjustment is not available.
6.2.3.3. TV+
Regarding the configuration of TV+, two contributing products are considered: the TVs and the set-top-boxes. TVs are subdivided in three main technologies: CRT, LCD and Plasma. Rear projection TVs are neglected, as in comparison to the other technologies they have a low market share in Europe which is currently not expected to increase.
In general, all TV sets have standby, and most remain in standby when not used. Only a few configurations (like using an EPS) would lead to off-mode losses, and even then the TV set would need to be switched off in such a way that it does not react to the remote control (and all other timers and receivers are deactivated). Older TVs in Europe had a primary side hard-off switch as a standard, but over the years this portion seems to have declined, with most flat screens and most CRTs now offering only a soft switch to activate the standby (same as the off/standby button on the remote control).
EPS are only relevant for smaller LCD TVs and might be a temporary occurrence, similar to the LCD monitor development where most products have shifted back to internal power supplies.
According to the Lot 5 preliminary findings, the shift to larger screen sizes, together with a growing household penetration, leads to a large increase in active mode power consumption. The standby power consumption per product does not necessarily rise with the critical screen size, but the total consumption will reflect the market or stock growth. So, standby relevance of TVs is generally increasing, despite many products reaching below 1 W in standby. So Lot 5 references current standby values of TV’s about 0.3 W and aims with standby power below 0.2 W for 2008.
Report for Tender No. TREN/D1/40 Lot 6 -2005 EuP Lot 6 - Task 6 2nd of October 2007
Fraunhofer IZM CODDE Bio IS DUH Final Report Page 6-10
Another cross-cutting issue is the relevance of potential program downloads over the broadcast channels, in particular electronic program guides (EPG). All devices with decoding of digital broadcasts and with recording capability have this feature or will have it in the nearest future. The EPG is becoming the main route for setting the timer for recording a program. Many "classic" TV sets without recording capability also offer EPG functionality as an alternative for buying printed TV program guides.
From discussions in Lot 5, three main possibilities for updating the EPG have become apparent:
checking for updates only while the device is active (never during standby),
setting a timer to activate the receiver unit to check for updates once during the night or early morning,
staying in listening mode all the time during standby, possibly with multiple update downloads per night.
The first two cases have no or very little relevance to the Lot 6 standby scope. The timer and the few minutes of waiting for potential download information require almost no energy additional to the standard functions (i.e. remote control still functional). The download itself can be estimated to use a maximum of ca. 20 W over a maximum of 10 minutes once in 24 h. Except for the check and the possible download, the device stays in passive standby (with the timer function) for most of the non-active time.
The third case, apparently mostly activated in set-top-boxes rather than in TVs with an EPG, is more relevant as the device stays in networked standby all the time. Recording devices with a timer programming – starting already with VCR technology – also stay in networked standby while they have a function to identify the actual start and end of the program to record, such as the video programming signal VPS.
6.2.3.4. TV+ (CRT TV)
The relevant mode for a standard CRT TV is Lot 6 passive standby, and potentially off-mode. These products may have further standby modes outside the Lot 6 scope, like active standby, based on different features. In reference to the Lot 6 standby, all TVs have the function of reactivation via remote control or possibly via soft switch and may display the current status via LEDs or with a small display. Regarding new or future products, the networked standby mode replaces passive standby with functions like automated updates or wake up on external signals. (e.g. TV with integrated hard disk recorder or DVD recorder, combination of TV and PC in one case)
Possible improvement options for CRT TV include:
Off1: hard-off switch on primary side O+S3: auto-off functions St1c: secondary power supply for standby functions St3: reduce circuits powered during standby functions (electronic switches/relays) St4: enable user settings to switch off circuit blocks not needed during standby St5: do not allow the user to disable standby time-out completely St6b: using more efficient signal lamps (other than LEDs, efficient LED circuits or
flashing LEDs) St8: use non-volatile memory to eliminate continuous power need for memory e.g.
settings Ext1: external improvements, not product specific (power strips, master slave) Use1: always unplug/disconnect
For the best available products on the market, appliances from the Australian store survey [EnergyConsult 2006] can be explored. The best available CRT TV (LG 32fs2rnb) on the Australian market comes with a passive standby of 0.5 W and with roughly no off-mode losses.

Report for Tender No. TREN/D1/40 Lot 6 -2005 EuP Lot 6 - Task 6 2nd of October 2007
Fraunhofer IZM CODDE Bio IS DUH Final Report Page 6-11
The most significant power reduction of the CRT television from LG compared to base case results from turning off the high voltage power supply in standby mode4.
The above mentioned LG product is close to the results from the Japanese “Top Runner Program”, which identifies an average standby power of 0.3 W for TV sets sold in 2005 [Ohkuni 2006]. The TV from LG is a high class application with a registered price of $1999. In the low price segment up to $600 the Panasonic (tx29fx50a) has the best standby value with 1 W.
In the LG (32fs2rnb) product, the LED illuminates brightly when it is set in standby mode. It is assumed that the passive standby function setting is identical for all different TV technologies. On the basis for acceptance, the achievable passive standby power level for CRT TVs must be in a range of under 0.3 W compared to the best plasma TV (Panasonic th42pa50) [EnergyConsult 2006].
Regarding off-mode, the LG (32fs2rnb) uses a primary side hard-off switch to avoid any off-mode losses. In off-mode the clock is reset and the timer function is deactivated. The timer to turn the device automatically into on-mode or standby only works when the hard-off power button is switched to the on-position.
In both cases the auto-off functions and external improvements like using power strips or master slave power strips are not considered. In case of an existent primary side hard-off switch, those external solutions are needless, unless other connected devices can be turned off at the same time.
The passive standby combined with an auto-off function or an off-switch can lead the device in a mode with losses under 0.1 W (this must be considered an off-mode, not a passive standby BAT).
6.2.3.5. TV+ (LCD TV)
The LCD TV contributing to the base case (Task 4) comes with networked standby, and potentially off-mode. As a possible BAT product on the market the Australian store survey lists the Sony (klw40a10) and for Europe a German consumer magazine “Stiftung Warentest” has identified comparable BAT product candidates. Both have a passive standby but no off-mode losses. The used function setting for LCD TVs is identical with CRT TVs.
The Sony (klw40a10) has a measured passive standby of 0.2 W. Under the same conditions, the BAT product from Stiftung Warentest reaches a standby power level of 0.5 W. According to the Lot 5 Task 6, Philips is introducing 0.2 W passive standby for all their new TVs over the next years.
In case of the Sony TV and further current Sony models, the EPG is only updated when the device is active, so the device does not have to listen to the network for new program updates. Another option is to turn off the status LED (like a model from JVC) when the device is in standby mode. Additional improvements come with new model series from Sony. An auto-standby function is implemented, whereby the device switches into standby mode automatically one hour after program ends and the power management for the PC port can also switch the TV into standby, if there is no signal input for 30 sec.
New functions like these reduce active times but lead to longer standby times. When looking only at the impacts on standby, such a shift might be interpreted as a negative development, while in total the energy consumption of a TV would be reduced.
In case of off-mode the TV from German benchmark has a primary side hard-off switch, which avoids any off-mode losses. So there are still TV sets available with this feature.
6.2.3.6. TV+ (Plasma TV)
The potential BAT product for the plasma TV segment was taken from the Australian store survey. The Panasonic (th42pa50) with a panel size of 42” and its standby relevant functions are displaying
4 In addition to the standby features of the base case (remote reactivation function and a fast reactivation function using a high voltage power supply [Schlomann 2005]), the LG 32” slim CRT TV has a timer function, a sleep function (to be activated by the user) and a LED to indicate the current power status of the TV.

Report for Tender No. TREN/D1/40 Lot 6 -2005 EuP Lot 6 - Task 6 2nd of October 2007
Fraunhofer IZM CODDE Bio IS DUH Final Report Page 6-12
status by LED, waiting for reactivation via remote control, and an auto-transition to standby. The power consumption in off-mode is not known. The standby value is given as 0.1 W, but the technical data of the product gives a standby power consumption of 0.3 W, which is also inline with the BAT input for plasma TVs in Lot 5 Task 6.
The plasma TV from Conia (cpdp4251), also measured in the Australian store survey [EnergyConsult 2006], presents with 0.1 W the lowest value in off-mode, but with 1.2 W a higher value for standby. Comparable with the LCD TV example (Sony klw40a10), the Conia plasma TV also has an auto-standby function, which switches the device into standby after the end of broadcast. This means the TV transfers automatically from on-mode to standby mode 1 hour after the broadcast on the current channel ends. Taking into account that this function is deactivated in default setting and that nearly all TV stations broadcast 24h per day, the relevance of such auto-standby feature is not as important as that of the LCD TV from Sony.
About 80 % of measured units in the Australian intrusive survey had a hard-off switch, so this feature is still pertinent in the current stock.
6.2.3.7. TV+ (Set-top-boxes)
Set-top-boxes could be further divided into more and less complex set-top-boxes. Simple criteria to classify the product as complex are integrated hard disks and/or modules for playback and recording. Set-top-box contributing to the TV+ base case is relevant for the Lot 6 network standby. Typical standby functions for set-top-boxes are reactivation by remote control, display status and time and waiting for network signal for automated updates, which contribute to Lot 6 standby. More complex set-top-boxes with additional functions are originally out of scope of this product case, but may in fact be partially covered in the power consumption levels.
In some cases, for BAT products, there is no reactivation via network signal. Therefore such devices only have a passive standby. In some cases set-top-boxes have an off-mode with losses caused by a soft switch.
Possible improvement options for Set-top-boxes:
Off1: hard-off switch on primary side O+S3: auto-off functions St1c: secondary power supply for standby functions St3: reduce circuits powered during standby functions (electronic switches/relais) St4: enable user settings to switch off circuit blocks not needed during standby St5: do not allow the user to disable standby time-out completely St6b: using more efficient signal lamps (other than LEDs, efficient LED circuits or
flashing LEDs) St8: use non-volatile memory to eliminate continuous power need for memory e.g.
settings Ext1: external improvements, not product specific (power strips, master slave)
The product with lowest power consumption in off-mode comes from Dgtec (dgt90sd) and in passive standby mode from Philips (FTR9964) [EnergyConsult 2006]. The device from Philips can be assumed as the product with the lowest power level in both modes.
Dgetec (dgt90sd) reaches 7.5 W in Lot 6 networked standby and no losses in off-mode. The Set-top-box from Philips needs only 1.72 W in standby mode and 0.17 W in off-mode – the appliance was measured in a store survey already in January 2003 [EnergyConsult 2006].
More recently, a comparable product from Kathrein (UFT571si) was measured with a passive standby value of 0.7 W and no off-mode losses [STIFWA 2006a] through primary side hard-off switch. The very low passive standby level of this appliance is reached through a reduced standby function setting. So the UFT 571si has limited timer function and only one tuner. The reactivation time from standby to active is with 5.6 sec in middle range compared to all other devices analysed by “Stiftung Warentest”. This indicates that optimised standby does not necessarily have negative impacts for the ease of use. The low standby level for Kathrein UFT571si could be reached through

Report for Tender No. TREN/D1/40 Lot 6 -2005 EuP Lot 6 - Task 6 2nd of October 2007
Fraunhofer IZM CODDE Bio IS DUH Final Report Page 6-13
an optimised circuit design and display status over one LCD segment in standby. Firmware updates are not automated. The EPG is only updated in active mode [Kathrein 2005]. A special case is the power consumption for a connected active aerial. Such a feature is sometimes also called phantom power supply. In the default setting the aerial power is switched off during standby. For a loop through to another set-top-box this option can be deactivated, so the aerial port is fully powered all the time and the second tuner can receive even when the set-top-box is in passive standby. This would lead to a higher standby power level [Kathrein 2005].
On Semiconductor has presented a redesigned power supply for a typical satellite receiver with 80 W load power. For the no-load (Lot 6 off-mode), an input power of 700 mW5 is achieved. The BOM cost for this redesigned power supply is 5.25 €. This has to be compared to a standard design for existing power supply with 2.5 W for off-mode, involving BOM costs of about 7.5 €.
Measurements of set-top-boxes in Switzerland [Bush 2007] show much lower values for standby than those indicated by the Australian measurements. The lowest standby was measured at 3.7 W and the average standby consumption across 33 products (simple and complex set-top-boxes) was 8.8 W. Even for on-mode the lowest measured value is only 5.9 W (below the BAT level for standby above!) and the average level was 12.3 W. These values have however not been integrated into the calculations for Task 7 and 8 (scenarios). One model offering passive standby additionally was measured at 1.1 W, or 2.8 W when the power supply for the LNB was activated.
6.2.4. PUC 3 Job-based products
6.2.4.1. Washing machine
Regarding the base cases for washing machines, off-mode, Lot 6 passive standby and automated transitioning are of interest. Typical standby functionalities for washing machines are display or signal lamp functions and a timer function, which enables the washing machine to be programmed to begin functioning at a later time. To reflect this, the Australian store survey 2005/2006 distinguishes between active standby, delay start mode and off-mode.
Possible improvement options include:
Off1: hard-off switch on primary side O+S3: auto-standby transitions, auto-off functions St1c: secondary power supply for standby functions St6a: using no or very low power display technologies (bi stable display to indicate
status) (with reservations, not all washing machines have displays) St6b: using more efficient signal lamps (other than LEDs, efficient LED circuits or
flashing LEDs) Ext1: external improvements Use1: always unplug/disconnect
Based on the Australian store survey 2005/2006 [EnergyConsult 2006], models from Bosch (wfl 2400), Fisher & Paykel (awf60md) and Whirlpool (wf665) are investigated as best available product candidates on the market.
The front loader from Bosch has an average standby energy consumption of 0.9 W, the top loader from Fisher & Paykel has an average energy consumption of 0.8 W in active standby and 0.9 W in delay start mode. Both washing machines have a primary side hard-off switch and no off-mode losses. The hard-off switch from the Bosch model is integrated in the programme selector. It uses LEDs to indicate the mode and the selected programmes. The Fisher & Paykel top loader has a delay start mode [EnergyConsult 2006]. The models from Bosch and Fisher & Paykel show that there is no generic difference in the standby energy consumption between front and top loaders.
The front loader from Whirlpool has an even further reduced standby energy consumption of 0.04 W, but consumes almost the same amount (0.037 W) in off-mode, although it seems to have a hard-off switch. This model does not have a delay start mode and uses LEDs to indicate the
5 OnSemiconductor exhibitor presentation Jenck

Report for Tender No. TREN/D1/40 Lot 6 -2005 EuP Lot 6 - Task 6 2nd of October 2007
Fraunhofer IZM CODDE Bio IS DUH Final Report Page 6-14
mode/status of the washing machine [EnergyConsult 2006]. With a primary side hard-off switch the off-mode losses could be avoided.
For the European market, CECED gives the following energy consumption levels for BAT products: 0.9 W in Lot 6 standby mode (end of cycle) and 0.1 W in off-mode. But CECED also states that the power consumption in delay start mode ranges from 1.9 to 4.4 W increasing with the number of functions available in that mode.
The delay start function causes longer standby times, if the washing machine would be switched off otherwise, and leads therefore to higher energy consumption. If the washing machine would stay in standby most of the time anyway, there is no clear-cut answer. The energy consumption in delay start mode changes with the models and the power consumption can be higher or lower than in passive standby.
Looking at the achievable standby energy consumption of the Whirlpool front loader, it should be possible for all washing machines to reduce the standby energy consumption to this level. Models with a display to indicate the mode probably have higher standby energy consumption. Therefore, the standby energy consumption can be reduced by omitting the displays or using very low power displays. Another improvement option would be to use a secondary power supply for standby functions, which is more efficient in the low voltage area. An auto-off function would bring about further reduction by switch off the washing machine once the programme has ended, but no example with this technology could be found. Auto-standby after the end of the wash cycle is the norm.
Washing machines with safety functions (e.g. water protection), which are always active, do not have an off-mode according to the Lot 6 definition. The standby energy consumption of the named BAT examples are probably not achievable for these models.
An option for the user is to use power strips to avoid off-mode losses, but, according to the manuals (Bosch, Whirlpool), multiple plugs and power strips should not be used for washing machines. Instead, Whirlpool advises the user to “turn power and water supply tap off once all the washing has been completed for the day” [Whirlpool 2007].
6.2.4.2. DVD
For this product case, DVD-players and DVD-recorders must be distinguished. Regarding the product case, power reduction potential in Lot 6 passive standby and off-mode with losses are relevant. However, a lot of DVD-players and -recorders do not have an off-mode switch and thereby the lowest power level is passive standby. Typical standby functions are reactivation via remote control, timer functions, display and signal lamps.
Possible improvement options:
Off1: hard-off switch on primary side O+S3: auto-standby transitions, auto-off functions St1c: secondary power supply for standby functions St5: do not allow the user to disable standby time-out completely St6a: using no or very low power display technologies (bi stable display to indicate
status) St6b: using more efficient signal lamps (other than LEDs, efficient LED circuits or
flashing LEDs) Ext1: external improvements Use1: always unplug/disconnect
One of the best products in the Australian store survey was a DVD-player from LG (dz9811p). This DVD-player has a value of 3.8 W for the “ready to play a disc” mode. The lowest achievable power level is 0.6 W, where the device can still be reactivated via remote control, making this a passive standby [EnergyConsult 2006]. This model has an auto-standby function (“auto power off”). If the DVD-player is left in “stop-mode”, a screensaver will appear after five minutes and after another five minutes the DVD-player turns into passive standby [LG 2007]. Although this model has no

Report for Tender No. TREN/D1/40 Lot 6 -2005 EuP Lot 6 - Task 6 2nd of October 2007
Fraunhofer IZM CODDE Bio IS DUH Final Report Page 6-15
off-mode at all, other examples in that survey show that a primary side hard-off switch to achieve a 0 W off-mode for DVD-players is possible.
In the same source the DVD Player dvpns50p from Sony was measured at 0.1 W standby, supposedly with the remote control still operational. If correct, this is the lowest value encountered for DVD players.
According to the input from Pioneer, the passive standby energy consumption for a DVD-recorder has been reduced from 0.93 W (DVR-530H) to 0.61 W (DVR-540H, the successor with a market entry in 2006) by improved circuit design. Similar improvements have been done for the models DVR-440H, DVR-545H, DVR640H and DVR-645H. With the improved circuit design also the on-mode energy consumption (outside Lot 6 scope) of these devices could be improved by 20 %. In case for the DVD-player the passive standby has been reduced from 0.61 W to certain 0.12 W [Pioneer 2007].
Compared to DVD-players, the DVD-recorders are characterised by higher energy consumption. A DVD-recorder from Liteon (lv5005) consumes 13.5 W when it is ready to play or record a disc. In the lowest standby mode it reaches a value of 5.8 W [EnergyConsult 2006]. This recorder has an auto-sleep function that switches the device into a lower standby after 30, 60, 90 or 120 min in a higher standby mode. This function is in default setting switched off and needs to be enabled by the user [Liteon 2007]. A DVD-recorder from LG (dr165) consumes a lot more energy in the "ready" mode (18.3 W), where it is ready to play or record a disc, but only 1.2 W in the lowest achievable standby mode [EnergyConsult 2006], in which the remote control is supposedly still operational. No example for a DVD-recorder with a primary side hard-off switch was found.
Measures to reduce the standby energy consumption would be to install no or very low power displays, more efficient signal lamps and/or to switch these off completely in passive standby. Auto-standby transitions and auto-off functions would also lead to reduced energy consumption. The impacts could be enforced by not allowing the user to disable these functions or at least setting them as default. Secondary power supplies which are more efficient at a low power consumption level could be used for standby functions.
An external measure for the user would be to use a power strip to switch off the device when it is not needed. A master/slave power strip could be used together with the TV, so that the DVD-player is switched off when the TV is off or in standby. This is not always applicable for a DVD-recorder, as it could also be used to record when the TV is off.
6.2.4.3. Audio minisystem
► Reduction in which mode(s), base case
According to the base case, Audio minisystem has a passive standby and off-mode; also automated transitioning is relevant to reduce the energy consumption. Typical standby functionalities for the audio minisystem are reactivation via remote control, display and signal lamp functions and timer functions. It has to be considered that some models do not have an off-switch. The mode with the lowest energy consumption is then passive standby.
Possible improvement options include:
Off1: hard-off switch on primary side O+S3: auto-standby transitions, auto-off functions St1c: secondary power supply for standby functions St6a: using no or very low power display technologies (bi stable display to indicate
status) St6b: using more efficient signal lamps (other than LEDs, efficient LED circuits or
flashing LEDs) Ext1: external improvements Use1: always unplug/disconnect

Report for Tender No. TREN/D1/40 Lot 6 -2005 EuP Lot 6 - Task 6 2nd of October 2007
Fraunhofer IZM CODDE Bio IS DUH Final Report Page 6-16
To identify the best products on the market, models tested in the Australian store survey are examined. The survey distinguishes between three modes for the audio minisystem: active standby (ready to play a disk), passive standby (device can be reactivated via remote control) and off-mode.
A CD&cassette player from Telefunken (tmh903) has an energy consumption of 3.5 W in the Australian active standby and 2.6 W in the Australian passive standby. It has a remote control to operate the CD player. The model from Aiwa (JAX-N1) uses more energy in the “ready to play a disk” mode (13.1 W), but has a further reduced passive standby energy consumption of 0.136 W. This model does not have a hard-off switch. It can be reactivated via remote control [EnergyConsult 2006]. Another model from Aiwa (JAX-N3) has an “ECO mode” in which the display blacks out when the device is turned into standby; instead a red signal lamps lights up. The energy consumption in that mode is 0.25 W, compared to 15 W when the “ECO mode” is turned off. The display can also be dimmed, but no information on the effect of that measure on the energy consumption could be found. This audio minisystem also has a “sleep function”. The device can be programmed to turn into a passive standby when the CD/tape ends (auto) or after a certain time (90 to 10 min) [Aiwa 2003].
The above mentioned models do not have an off-mode; with the switches on the devices they can only be turned into standby. A primary side hard-off switch could eliminate the standby energy consumption by turning the audio minisystem into an off-mode without losses. The ultra thin CD system from TDK (NX03CD), is an example of a device with a hard-off switch with a 0 W off-mode [EnergyConsult 2006].
Other options to reduce the energy consumption would be to install no or very low power displays and more efficient signal lamps. Another option is to include an auto-standby transition such as the sleep function from the Aiwa model. To enforce the effect, the feature (turn the device into a low standby mode when the CD/tape has ended) should be active as a default setting. An auto-off function would also be an option. The losses of the power supply in standby could also be reduced by installing a secondary power supply which is more efficient for the low power consumption.
6.2.4.4. Facsimiles
According to the Facsimile product case, only Lot 6 networked standby and automated transitioning are relevant. In most cases, the device is always in standby (similar to the cordless phone) but when the fax is not used very often (especially in home use), the device is likely to be in off-mode most of the time and only switched on when it is actually used. Therefore off-mode losses should not be disregarded completely.
Possible improvement options include:
Off1: hard-off switch on primary side (with limitations) O+S3: auto-standby transitions, auto-off functions St1c: secondary power supply for standby functions St3: reduce circuits powered during standby functions (electronic switches/relays) St4: enable user settings to switch off circuit blocks not needed during standby St5: do not allow the user to disable standby time-out completely St6a: using no or very low power display technologies (bi stable display to indicate
status) St6b: using more efficient signal lamps (other than LEDs, efficient LED circuits or
flashing LEDs) St7: avoid continuous preheating (not necessary for CRT/printers etc.)
The standby energy consumption of facsimiles differs according to different technologies and functions. Facsimiles with laser printing technology use more energy than facsimiles with inkjet and thermo transfer printing due to their heating elements. Currently, facsimile machines mostly have also additional functionalities like telephone, answering machine, copy and print functions and timer functionalities to send the fax at a later time. These multifunctional models are covered by the original product case as long as they are built around a fax function. Often these functions are associated with higher energy consumption, but this is not necessarily the case as shown by the
Report for Tender No. TREN/D1/40 Lot 6 -2005 EuP Lot 6 - Task 6 2nd of October 2007
Fraunhofer IZM CODDE Bio IS DUH Final Report Page 6-17
product example from Brother. The FAX-T104 model, which has a telephone included, has the same standby consumption (4.4 W) as the thermo transfer FAX-T102. A standby above 4 W is not a best value, but these two products show that at least a simple added phone does not add to standby.
One of the best products in the market is the facsimile machine from Sharp (UX-F41CL) with a standby energy consumption of 0.8 W. According to the manufacturer, this could be achieved with an efficient power supply circuit, an LSI for peripheral circuits, by switching off unnecessary circuits during standby and by reducing the number of required parts.
A facsimile from OKI (OKIFAX 4580) uses only 0.35 W in the energy saving mode. The facsimile turns into the energy saving mode automatically after 180 seconds. However, the energy saving mode cannot be used when the facsimile is connected to a PC. The user can disable the energy saving function, but it is set as default. The time to activate the energy saving mode cannot be changed. When the energy saving mode is deactivated, the device uses 6.5 W in standby [Oki 2002, IEE 2007].
According to [Energy Star 2007b] there are also facsimiles which use no energy (0 W) in standby (Kyocera Mita LDC 680, Panasonic KX-F1050 and KX-F1000). The model from Kyocera Mita is a laser facsimile. The lowest standby energy consumption is achieved in an “energy saver mode” (“auto shutoff function”). The device turns into this mode, when it is not used for more than 2 h. In that mode the internal heater shuts down, which causes a reactivation time of 60 s to print. This model also has a hard-off switch, but it is not known, if there are off-mode losses or how much energy is used in the higher standby modes (before turning into the “energy saver mode”). The thermal transfer facsimiles from Panasonic have, according to the manuals, a standby energy consumption of approximately 5 W (120 V input) [Panasonic 2001].
Further reduction of the energy consumption could be achieved by installing no or very low power displays and more efficient signal lamps. Another possibility would be to switch off displays and signal lamps completely during standby. Installing a hard-off switch is probably possible for all facsimiles, but would contribute only marginally to reduced energy consumption due to the long standby times and almost no time in off-mode. For home use, a hard-off switch might be applicable, but it contradicts the intention to potentially always receive a fax. A better approach would be to achieve shorter “high” standby times by faster auto-transitions into a lower standby mode with less energy consumption. For example, the model from Kyocera Mita has such an “energy saver mode”, but the time to activate the auto-transition is 2 h. This time could be shortened or the user could be enabled to choose a suitable time. The longer reactivation time from a standby mode can be a problem for some users and may lead the user to inactivate such modes. Continuous preheating causes energy consumption and should be avoided. Other improvement options include reducing the circuits powered during standby with electronic switches and relays, and installing a secondary power supply which is adjusted to the low power consumption in standby.
An external measure to reduce the standby energy consumption of an analogue facsimile would be the Power-Safer FX-20 (see also Section 6.3.3). The device can be installed between the facsimile and the plug and switches the facsimile on automatically when a fax is received or sent, or can be switched on manually. After ten minutes, the Power-Safer switches the facsimile off again and the standby energy consumption can be reduced to 0.3 W, which is the energy consumption of the Power-Safer [PowerSafer 2002].
6.2.4.5. PC+
In accordance with the PC+ product case, different products (monitor, speakers, etc.) with different energy consumption have to be distinguished. For the PC itself the difference is made between desktop PC and notebook. The monitor is further subdivided into CRT display and LCD display.
Concerning the Lot 6 standby definition, the PC+ case has many exceptions that bring a lot of difficulties to classify the correct mode for PCs and peripheral devices. For example, an internal power supply with additional functions to power peripheral devices when the PC is turned off and is not powered [c´t 2007] causes mode overlapping. From the point of view of the PC this is off-mode but for the power source this is part of its main function. A similar example, regarding the
Report for Tender No. TREN/D1/40 Lot 6 -2005 EuP Lot 6 - Task 6 2nd of October 2007
Fraunhofer IZM CODDE Bio IS DUH Final Report Page 6-18
USB port, is the trend of powering a variety of small devices (e.g. lamps, clocks, toys) over USB [DPA 2007]. These additional devices may need to be powered when the PC itself is turned off. So, for PC there is a lot of ambiguity regarding the mode definitions. A further cross cutting issue is the trend towards multimedia home networks with the PC as a central server for music, video and broadcast content. This generates a lot of new peripheral products like external multimedia player and server. All these trends create cross cutting issues for PCs and their peripheral devices.
6.2.4.6. PC+ (CRT display)
According to CRT displays contributing to the product case, Lot 6 networked standby and off-mode are relevant. Typically, in networked standby the display is connected to the PC and to the power source but nothing is displayed except its status via LED. This mode can be initiated by the display itself (no source detected) or by a message in the video signal from the PC. In standby, the display mainly has two functions: to indicate status via low power light and wait for a video signal from the PC for wake up. Additional functions, such as a power supply of an integrated USB-hub or active speakers, lead to higher standby power.
Possible improvement options include:
Off1: hard-off switch on primary side O+S3: auto-standby transitions, auto-off functions St1c: secondary power supply for standby functions St3: reduce circuits powered during standby functions (electronic switches/relais) St5: do not allow the user to disable standby time-out completely St6a: using no or very low power display technologies (bi stable display to indicate
status) St6b: using more efficient signal lamps (other than LEDs, efficient LED circuits or
flashing LEDs) Ext1: external improvements Use1: always unplug/disconnect
The CRT display from Lanix measured by Energy Star has an average energy consumption of 2 W in networked standby and 1 W in off-mode [Energy Star 2006], which both represent an improvement compared to the product case. The reduced energy levels were achieved by an improved circuit design and deactivation of cathode preheating. In addition, for the power save mode optimised firmware can lead to a lower standby consumption. A Samsung display (MB997) is representative for all current CRT displays from Samsung regarding standby, i.e. the standby power level is irrespective of the screen size. The averaged power level for Samsung (MB997) is ≤2 W in networked standby. The products from Lanix(LN995N) and Samsung (997MBR) do not support any integrated devices. A 17” display labeled by TCO 2005 with a resolution of 1024x768 is listed by Lot 3 as BAT product with 3.8 W in off-mode and 3.8 W in standby[IVF 2007]. The Energy Star list names models with even lower power consumption as LXB-F17069HB from Lenovo which uses 0.22 W in standby and the Color monitor E50 from IBM with 0.2 W in off-mode [Energy Star 2007c].
Installing a hard-off switch on the primary side instead of the usually used soft switch could avoid all the off-mode losses. Further improvement options include the use of more efficient signal lamps or turning off signal lamps in standby, integrated auto-off function as a default setting in combination with electronic switches like relays to automatically transition into 0 W off-mode.
6.2.4.7. PC+ (LCD display)
In case of LCD displays, the same modes as for the CRT displays are of interests, i.e. Lot 6 networked standby and off-mode. The functions for networked standby of LCD displays are identically with those of the CRT displays.

Report for Tender No. TREN/D1/40 Lot 6 -2005 EuP Lot 6 - Task 6 2nd of October 2007
Fraunhofer IZM CODDE Bio IS DUH Final Report Page 6-19
In Energy Star survey the BenQ Q7C3 is the best product with a low energy consumption in both modes, although some other models like the HP (LP2465) have a lower off-mode level but a much higher standby level.
According to Lot 3 study [IVF 2007], the average LCD display sold in 2005 had a consumption of 0.9 W in networked standby and 0.8 W in off-mode. Products from BenQ (Q7C3) and HP(LP2465) serve as exemplary devices. An appliance from BenQ (Q7C3) consumes 0.37 W in standby and 0.32 W in off-mode while the HP (LP2465) has an energy consumption of 1.02 W in standby and 0.01 W in off-mode. These results from EnergyStar show that a standby and off-mode under 0.5 W for LCD displays is no problem. For both products the standby energy consumption was achieved by improved circuit design (e.g. for BenQ Q7C3 from 2 W in previous product generation to 0.37 W).
A 17” display with a resolution of 1024x768 is listed by Lot 3 as BAT product with 0.67 W in off-mode and 0.67 W in standby [IVF 2007].
Taking into account that most current LCD displays have only a soft-off switch, a primary side hard-off switch would be an improvement option. Alternatively another solution could be implemented to transfer the device to a mode where it uses close to 0 W like the model from HP. Auto standby function depends in most cases on the control by the PC. However, the auto-off function is an option, which turns the device off after a defined time without any signal from the PC.
6.2.4.8. PC+ (desktop)
In case of desktop PC,s the relevant modes are the Lot 6 networked standby and off-mode. In accordance with Task 4, only the low power levels of PCs are of interest. For standby, this can be compared to “sleep mode” used in Lot 3 [IVF 2007] and EnergyStar version 4.0.
Typical standby functions for desktops are reactivation via power button, input devices like keyboard or mouse, and the network wake up. Following the Lot 6 off-mode definition desktop computers turn off by software or switch and can be activated either by a soft-off or a hard-off switch
Possible improvement options include:
Off1: hard-off switch on primary side O+S3: auto-standby transitions, auto-off functions St1a: power buffering to supply standby (batteries, supercaps) St1c: secondary power supply for standby functions St3: reduce circuits powered during standby functions (electronic switches/relais) St4: enable user settings to switch off circuit blocks not needed during standby St5: do not allow the user to disable standby time-out completely St6a: using no or very low power display technologies (bi stable display to indicate
status) St6b: using more efficient signal lamps (other than LEDs, efficient LED circuits or
flashing LEDs) Ext1: external improvements Use1: always unplug/disconnect
According to Energy Star [EnergyStar 2007c], the ThinkCentre (M55p 8792-xxx) from Lenovo consumes 0.8 W in the sleep mode; an off-mode value is not available. Another BAT product is provided by Lot 3 with 1.1 W in off-mode and 2.6 W in standby. This system is equipped with an Intel dual core processor of 1.67 GHz, 512 MB system memory and 80 GB hard disc [IVF 2007].
In this sleep state the desktop PC saves the memory and caches information. An intelligent power management turns off all internal devices except the power management control unit, bios, memory and possible assigned PCI ports and/or parts of the integrated network interface. This state allows the computer to wake up by timer, an external signal from network or serial interfaces like a signal from USB-port. Important for PCs is a power management that is perfectly aligned with the installed hardware. On the secondary side, the internal power supply has to be switched down in
Report for Tender No. TREN/D1/40 Lot 6 -2005 EuP Lot 6 - Task 6 2nd of October 2007
Fraunhofer IZM CODDE Bio IS DUH Final Report Page 6-20
networked standby to support only some internal electronic parts with 5 V (a separate 5 V standby output of PC power supplies).
A possible option for standby and off-mode is the integration of power buffering batteries or super caps. Those buffers will be charged in on-mode and discharged in standby and off-mode.
Concerning the power management it is necessary that the default setting is optimised for short transitional times that switch the appliance as fast as possible into networked standby and/or off-mode. In the context of power management, it is necessary to give the user a simple list of pre-settings. To avoid off-mode losses there should be a hard off-switch on the front side of a desktop PC (or easily reachable from the front). Otherwise the external solution to use a power strip could be preferred to turn off the PC, display, printer and additional peripheral devices off at the same time.
Another exemplary product is the Eco-PC by KERP and Micro Pro developed to:
Reduce energy consumption Minimise standby-loss Use hard drives with flash memory Use low power components Opt for modular structures which allow upgrades of individual components (e.g. RAM) Ensure easy access to components Reduce the number of components Substitute heavy metal-containing components
This PC is provided with Intel Core 2 Duo 6300, and a 400 W power supply. The measured standby energy consumption (equivalent to sleep in [IVF 2007]) is 3.54 W and off-mode consumption is 1.74 W [Stachura 2006].
6.2.4.9. PC+(notebook)
Relevant modes for notebooks are identical with modes of desktop PCs. Typical standby functions for notebooks are reactivation via power button, via input devices like keyboard or mouse, and the network wake up. Following the Lot 6 off-mode definition, desktop computers turn off by software or switch and can only be activated by switch. The assigned functions of power management are equal to desktop PCs.
Possible improvement options include:
Off1: hard-off switch on primary side O+S3: auto-standby transitions, auto-off functions St1a: power buffering to supply standby (batteries, supercaps) St1c: secondary power supply for standby functions St3: reduce circuits powered during standby functions (electronic switches/relais) St4: enable user settings to switch off circuit blocks not needed during standby St5: do not allow the user to disable standby time-out completely St6b: using more efficient signal lamps (other than LEDs, efficient LED circuits or
flashing LEDs) Ext1: external improvements
According to EnergyStar, a Notebook from Acer (TravelMate 3000) has a consumption of 0.4 W in sleep mode (the Travel Mate 8100 series from Acer goes even down to 0.34 W in standby) [EnergyStar 2007c], which conforms to Lot 6 networked standby. This notebook from Acer has only a soft switch that turns the device in off-mode. The sleep mode is reached by closing the monitor, by hot key or initiated from the operating system. As in the case for the desktop PC, the current power level of the notebook is controlled by a power management (ACPI). The optimised presets of power management allow a fast transition into standby or off-mode. This power management can be manually customised to suit the user’s preferences. Taking into account the

Report for Tender No. TREN/D1/40 Lot 6 -2005 EuP Lot 6 - Task 6 2nd of October 2007
Fraunhofer IZM CODDE Bio IS DUH Final Report Page 6-21
fact that a notebook is a mobile product, the power management presets are already optimised for a fast transitioning to standby and off-mode. The results are longer times for standby and off-mode, but therefore a reduced on-mode time.
A further BAT product is from Lot 3 has 0.38 W in off-mode and 0.82 W in standby. This system is equipped with 1024 MB system memory and 80 GB hard disc [IVF 2007].
Otherwise the limited power of power cells for notebooks makes it necessary to reduce the power consumption of notebooks in all modes. Power management which is optimised for the installed hardware combined with presetting that are well adapted for standby and off-mode offer the best improvement potential. The transition to standby depends not only on the notebook itself but also external devices like HDD or USB-hubs can influence the automated transition. If an external device that is connected by USB does not support the standby functions of the notebook, the notebook cannot change into this mode.
Note: For the LLCC calculation in Task 7 not the lowest values found in the Energy Star lists, but more robust values exhibited by more devices will be used as confirmed BAT for the calculation. The lowest value will be used as best BAT.
Desktops: standby: 2.2 W, off-mode: 0.8 W (best BAT: 1 W in standby, 0.4 W in off-mode)
Notebooks: standby: 0.5 W, off-mode: 0.38 W (best BAT: 0.34 W in standby)
CRT monitors: standby: 0.6 W, off-mode: 0.2 W (best BAT: 0.22 W in standby)
LCD monitors: standby: 0.4 W, off-mode: 0.3 W (best BAT: 0.38 W in standby) [EnergyStar 2007c]
6.2.4.10. PC+ (Hub)
For Hubs that contribute to the PC+(office) product case, the Lot 6 relevant mode is networked standby. Main function of ethernet hubs is to broadcast data over all ports. If there is no network traffic the appliance should switch into a low power standby mode and only wake up if there is traffic again on the network. The energy level data used for product case hubs, coming from the Australian Intrusive survey, include also switches and routers for home area [EES 2006a]. Most of the hubs, found in this survey, used an external power supply. However the off-mode is not relevant for the small hubs up to 6 Ports, because they do not have any switch to turn off the appliance. Only for larger hubs with 8 ports and an off-switch the off-mode may be relevant. However, such large hubs are out of scope of this study.
Possible improvement options:
Off1: hard-off switch on primary side O+S3: auto-standby transitions, auto-off functions St1a: power buffering to supply standby (batteries, supercaps) St1c: secondary power supply for standby functions St3: reduce circuits powered during standby functions (electronic switches/relais) St4: enable user settings to switch off circuit blocks not needed during standby St5: do not allow the user to disable standby time-out completely St6b: using more efficient signal lamps (other than LEDs, efficient LED circuits or
flashing LEDs) Ext1: external improvements
Regarding the high speed network switches, which were measured for a report in a computer magazine, the reduced energy consumption in networked standby was 0.5 W [c´t 2006]. This low power mode should also be possible for hubs, and therefore serves as the BAT.
6.2.4.11. PC+ (Computer speaker)
Based on the Australian fact sheets [NAEEEC 2004d], networked standby and off-mode are relevant to the computer speakers contributing to the PC+(home) product case. Typical standby functions of computer speakers are current status display, and reactivation via remote control or via signal from computer. Simpler versions may belong to passive standby only, or even on/off
Report for Tender No. TREN/D1/40 Lot 6 -2005 EuP Lot 6 - Task 6 2nd of October 2007
Fraunhofer IZM CODDE Bio IS DUH Final Report Page 6-22
products. Following from the trend of computer speakers being part of home entertainment unit and the development to a higher sound quality, more and more PC speakers are provided with a subwoofer and more than 2 speakers. While features of future products increase, an increase in standby consumption is also likely [EnergyConsult 2006].
Possible improvement options include:
Off1: hard-off switch on primary side O+S3: auto-standby transitions, auto-off functions St1a: power buffering to supply standby (batteries, supercaps) St1c: secondary power supply for standby functions St3: reduce circuits powered during standby functions (electronic switches/relais) St4: enable user settings to switch off circuit blocks not needed during standby St5: do not allow the user to disable standby time-out completely St6b: using more efficient signal lamps (other than LEDs, efficient LED circuits or
flashing LEDs) Ext1: external improvements
Yamaha 5.1 surround system (tss10) had the lowest off-mode with 1.5 W. This system consists of five speakers, one subwoofer and one amplifier unit. The speaker system includes an EPS and is controlled by the amplifier unit and can be switched into standby and back via remote control or soft switch on the amplifier. According to the Australian store survey, Auriga (293) had a energy consumption of 2.3 W in standby and 2.2 W in off-mode and Altec Lansing (series100) a standby level of 2.4 W and off-mode level of 2.0 W [EnergyConsult 2006]. Both are only 2 speaker systems without any subwoofer, and can therefore be considered classic PC speakers. A BAT product with subwoofer from Altec Lansing (atp3) provide a power level of 7.6 W in standby (2005/06) and it is equipped with hard off switch [EnergyConsult 2006]. It should be mentioned that in a previous measurement (2003/04) the standby is 6.8 W and the off-mode is 4.5 W.
A general improvement option is to integrate an auto-standby function and auto-off function to reduce the energy consumption and minimise the standby time. Only few computer speakers have the function of automatic transition into standby and no speaker has an auto-off function.
In case of products with subwoofer, the power supply unit should be integrated in the subwoofer or in the amplifier. In combination with a primary side hard-off switch this option would avoid the off-mode losses.
6.2.4.12. PC+ (modems)
In general modems are subdivided in dialup modems, broadband modems and broadband modems with wireless LAN.
6.2.4.13. Laser printer
Regarding the Laser printer product case, improvement potential for the energy consumption in Lot 6 networked standby and off-mode is relevant.
Laser printers in ready mode can use up to 250 W. Therefore fast transition into the lower power modes like sleep or standby modes is highly recommended. One of the major improvement potentials in this context is associated with the prevention of mistakable, short network signals that unnecessarily power the printer up. The device should only be powered up from low level mode (sleep or standby) to the ready mode when a real print job is received. Typical standby functionalities are displays and signal lamps, reactivation via network and possibly preheating, which is not considered a Lot 6 standby function.
Possible improvement options include:
Off1: hard-off switch on primary side O+S3: auto-standby transitions, auto-off functions

Report for Tender No. TREN/D1/40 Lot 6 -2005 EuP Lot 6 - Task 6 2nd of October 2007
Fraunhofer IZM CODDE Bio IS DUH Final Report Page 6-23
St1c: secondary power supply for standby functions St3: reduce circuits powered during standby functions (electronic switches/relais) St4: enable user settings to switch off circuit blocks not needed during standby St5: do not allow the user to disable standby time-out completely St6a: using no or very low power display technologies (bi stable display to indicate
status) St6b: using more efficient signal lamps (other than LEDs, efficient LED circuits or
flashing LEDs) St7: avoid continuous preheating (not necessary for CRT/printers etc.) S+E1: adjust network Ext1: external improvements
One of the best products found for laser printers is the Epson (epl-509) with an average standby energy consumption of 0.64 W and off-mode losses of 0.036 W, listed in the Australian store survey 2003/2004. However, no further information on this model could be found. Feedback from Epson indicates that the model number cited from the Australian data must be wrong. Therefore this value will be used only as an extreme BAT in Task 7, not as the confirmed BAT.
The next higher off-mode value with 0.4 W (Lexmark e230) from the Australian store survey will be used as confirmed BAT. In the survey 2005/2006 most laser printers had a primary side hard-off switch, which enables a 0 W off-mode. A model with low energy consumption in standby (2.0 W) and 0 W in off-mode due to a hard-off switch, is the laser printer from Canon (i-SENSYS LBP3000) [Canon 2007]. This model has an “On-Demand-Fixing Technology” (the fixing heater is only heated up momentarily during printing) which enables fast start up. It allows printing directly from standby without any delay, resulting in longer standby and shorter active time [Canon 2006].
General improvement options are auto-standby transitions and auto-off functions to reduce the energy consumption by shortening the active and standby times. Most printers already have an auto-standby transition, however hardly any printer has an auto-off function. The auto-standby transitions differ between different models: Some models stay in a high standby mode, where a lot of functions, such as preheating, are still powered. A lot of manufacturers do not enable low energy standby modes, because the longer reactivation time from these modes is seen to interfere with the usability. Also the time to activate the auto-standby functions varies.
An important issue for laser printer is the auto-standby transition into a low standby mode. The auto-standby transition into the energy saving mode is activated after a defined time (like 30 min with typical default setting) and it switches of the fixing unit (which is otherwise continuously heated in the higher standby mode). The time to activate the auto-standby transition should be adjusted by the user but not switched off completely. Yet, the model from Canon shows that reactivation from standby does not automatically need more time than printing directly from active mode. So an auto-standby transition does not necessarily affect the usability. It also shows that continuously preheating is not necessary. The effect from auto-standby and auto-off function could be enforced by not allowing the user to disable these functions completely.
As a direct input from Seiko Epson Corporation, the following example was received regarding the reduction of energy consumption in ready and standby modes: The standby energy consumption (“Ruhemodus”) could be reduced from 25 W (AL-C4200) to 17 W for the successor AL-C3800. This model uses 78 W in energy saving mode (according to the manual, for Lot 6 this is a ready mode) and no energy in off-mode. The transition time from ready mode to standby mode was shortened, which required the warming time of the fixing unit to be shortened as well. Controllers were installed, which enable the printer to reactivate from standby “soon” after it receives the instructions. Technologies, such as “quick fuser” and “On-Demand-Fixing”, could shorten the warming time. In the standby mode all electrical circuits except the external interface are not powered. The time the printer waits before changing into standby can be adjusted by the user between 5 and 300 min (default setting: 30 min) [Epson 2006]. According to the manufacturer, the improvement in the energy consumption did not cause changes in the manufacturing costs.
Another improvement option is to install a secondary power supply which is more effective in the low voltage area, to reduce the standby energy consumption caused by decreased efficiency of the

Report for Tender No. TREN/D1/40 Lot 6 -2005 EuP Lot 6 - Task 6 2nd of October 2007
Fraunhofer IZM CODDE Bio IS DUH Final Report Page 6-24
power supply. The power requirements in standby could also be reduced by using no or very low power displays, more efficient signal lamps and reducing circuits powered during standby with relays or electronic switches. External measure would be to use power strips to avoid off-mode losses if no off-mode without losses is available. The above named problem of “wrong traffic” which reactivates the printer from standby or keeps it in active mode all the time could be avoided by adjusting the network so that the device only reactivates when it should actually print.
6.2.4.14. Inkjet printer
For the inkjet printer, the same modes as for the laser printer are of interest, which are Lot 6 networked standby and off-mode. In reality, a lot of inkjet printers do not have a hard-off switch and therefore no off-mode. Standby functionalities from inkjet printers are display and signal lamp functionalities, reactivation via network and power button.
Possible improvement options include:
Off1: hard-off switch on primary side O+S3: auto-standby transitions, auto-off functions St1c: secondary power supply for standby functions St3: reduce circuits powered during standby functions (electronic switches/relays) St4: enable user settings to switch off circuit blocks not needed during standby St5: do not allow the user to disable standby time-out completely St6a: using no or very low power display technologies (bi stable display to indicate
status) St6b: using more efficient signal lamps (other than LEDs, efficient LED circuits or
flashing LEDs) St7: avoid continuous preheating (not necessary for CRT/printers etc.) S+E1: adjust network (with reservations, maybe for home use not so important) Ext1: external improvements
One BAT product is a Photo Printer from Canon (i560). It uses 0.2 W in standby according to [Energy Star 2007b] (less than 0.5 W according to the manufacturer [Canon 2003]). It has a soft-off switch which can be used to turn the device into standby; the printer will also turn into standby automatically after a certain time. A newer model from Canon (PIXMA iP2500) uses 0.7 W in standby and 0.5 W in off-mode [Canon 2007]. According to “Stiftung Warentest”, there are also inkjet printers which use no energy in standby or off-mode [STIFWA 2006e], but no further information to verifiy these values could be found. So, for current inkjet printers, a standby power level less than 1 W seems to be an achievable target.
The inkjet printer Canon i560 is not on the market anymore. Therefore a newer model (Canon PIXMA ip2500) was named. For the LLC calculation in Task 7 the higher values of the Canon PIXMA iP2500 are used as confirmed BAT and the older product i560 as best BAT.
Most printers already have an auto-standby transition function, but the time it takes for that transition differs. An auto-off function would be another option for models which have an off-mode. Installing a primary side hard-off switch would enable an off-mode without losses. The problem of “wrong traffic” which reactivates the printer from standby, although no printing should be done, does probably not occur very frequently in the assumed home use compared to the office use assumed for laser printers. Therefore to adjust the network is a possibility, but will not significantly reduce the overall energy consumption of inkjet printers.
The Seiko Epson Corporation has indicated that they will design inkjet printers with improvements to the standby energy consumption. They want to achieve a reduction of the energy consumption by the following measures:
Adoption of high-efficiency power supply, AC-DC and DC-DC converter Adoption of low power consumption ASIC for card slots and network devices Cut power supply to motors, sensors, etc. in standby

Report for Tender No. TREN/D1/40 Lot 6 -2005 EuP Lot 6 - Task 6 2nd of October 2007
Fraunhofer IZM CODDE Bio IS DUH Final Report Page 6-25
The often named possibility of installing a hard-off switch is met with doubts at Epson. Installing a hard-off switch would result in higher costs for the product not only for the hard-off switch itself, but also in costs for new electrical circuits to avoid quality problems. In their opinion the reduction of the energy consumption to 0.3 W in standby with a soft-off switch is already sufficient. Epson sees the potential in shortening the transition time from ready mode to standby, but also points out the limits of this measure to maintain the usability.
In general, no or low power display technologies and more efficient signal lamps could be used to reduce the standby energy consumption. The displays could also be switched off completely in standby. Other improvement options are reducing the circuits powered during standby and using secondary power supplies for standby functions. External measures are using power strips to switch off the printer completely when it is not needed or master/slave power strips, so that the printer is switched off automatically when the PC is not used.
A BNAT is to use ultra low power devices, such as installed in cellular phones, to reduce the standby energy consumption of inkjet printers.
6.3. Other Example Technologies and Products (Beyond the Chosen Product Cases)
This section very shortly introduces products with other comparable BAT features, products from outside the 15 product cases scope or examples outside of the product design scope (external measures).
6.3.1. Microwave
A lot of households have microwaves. A distinction is needed between models with manual programme selectors without displays and models with displays. Models with manual programme selectors have no standby functions, but an off-mode, often with losses. Due to the displays, which serve as clocks, these models are in Lot 6 passive standby most of the time.
Sharp has developed microwave ovens with display (e.g. model R-85ST-A), where the user can decide if he wants to use the display as a clock or reduce the energy consumption by using an energy save mode (default setting). This energy save mode switches off the display two minutes after the use and reactivates when the door is opened. According to the manufacturer, the device uses less than 0.1 W in standby when the energy save mode is activated [Sharp 2006].
When the user wants to use the display, e.g. for a clock, low power displays could be used to reduce the energy consumption in standby.
One exemplary product on the market with manual controls and no off-mode losses is a microwave from Tiffany (mw20) tested in the Australian store survey 2005/2006 [EnergyConsult 2006]. However, such models are presumably only produced for the low-end market segments.
6.3.2. Intercom
Intercoms are outside of Lot 6 scope. However, there is a big potential for standby reduction through optimisation of the sensor and transformer circuits in these systems. At present, most intercoms are all the time fully powered, even when nobody uses the system. If the sensor system is optimised, only the sensors for reactivation would be in low power state active when the intercom is not being used. Considering that nearly all apartment buildings in cities have a larger intercom, and most single houses have a smaller point-to-point intercom, there is a big potential for reducing the energy consumption in Lot 6 standby.
The German company Grothe GmbH managed to reduce the standby energy consumption of intercoms by 80 to 90 % with a special power supply. The energy consumption in the power supply during standby is reduced by a resistor, so that only a sensor is powered. This sensor detects when more power for the active mode is needed and the resistor is bridged with a relay, so that the full

Report for Tender No. TREN/D1/40 Lot 6 -2005 EuP Lot 6 - Task 6 2nd of October 2007
Fraunhofer IZM CODDE Bio IS DUH Final Report Page 6-26
rated current is available when needed. Afterwards the intercom switches automatically back into the energy saving standby mode [DBU 2003].
6.3.3. Example for external measures: Power Safer
An external measure to reduce off-mode losses or to switch off a product which normally does not have an off-mode is to use power strips. But often the function “reactivation via remote control” is appreciated and so the product causes standby energy consumption. These could be reduced with the Power Safer. The Power Safer will be installed between the power outlet and the device. If the device is switched into standby the Power Safer blocks the current entry.
The energy consumption is reduced to the own consumption of the Power Safer of less than 0.3 W. The Power Safer is applicable for e.g. analogue facsimiles, TVs, audio systems, VCR/DVD-players and recorders. The Power Safer FX 20 for analogue facsimiles switches the device off when it is left in standby for more than ten minutes and automatically reactivates when a fax will be received or sent and can be switched on manually. The Power Safer PS 1.1 (for TVs) and PS 3M (switching capacity 600 W, for audio/video systems, etc., up to five devices can be connected) turn off the device some seconds after it is switched into standby. They have to be reactivated via an infrared remote control. The remote control of the connected device can be used, so there is almost no difference in usage visible from the user side.
A similar product has been announced for the UK market under the name of “Savasocket”.
6.3.4. The digitalSTROM alliance
Quite recently, in July 2007, a new industry alliance has been started to promote a new type of home automation network [digitalSTROM 2007]. Built around an integrated electronic module, which combines chip card type processing with MOSFET switching capabilities, and a proprietory protocol for communication via the mains installation, all electric products can be digitally switched on or off and – where appropriate – dimmed or put into standby. The standby consumption of the circuit itself is given as 0.3 W. Additional functions like measuring the power consumption or unique identification for each chip within the network are already built in.
The alliance, initiated by the ETH Zürich who have developed the central chip called dSID, strives to integrate such circuits into mainstream products ("dSready") within the next 2 years and is now enlarging industry membership. The scope is on the European market first of all, but this includes international manufacturers by necessity. In parallel to developing a product base an open standard, external controls for existing products (some are already functional), specialised multi-function wall switches, a secure webserver package for connecting to PC (or PDA) networks make up the package.
Ease of installation from the professional to the DIY level, the multitude of predefined functions, minimal price and size per module and the seamless integration into the standard cabling are the main claims to support why this system could achieve wider penetration than previous home automation systems.
Many details are not published at this stage, but the concept is certainly appealing – even though the obstacles for making it an international standard incorporated into products is equally daunting.
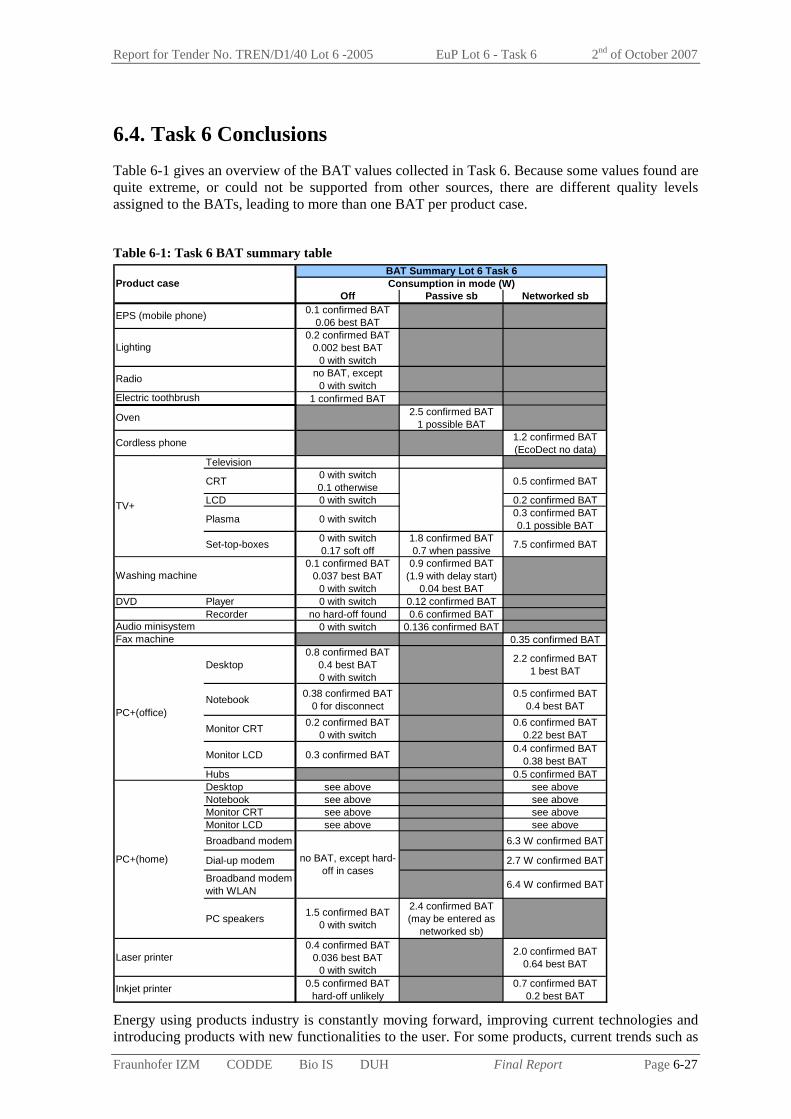
Report for Tender No. TREN/D1/40 Lot 6 -2005 EuP Lot 6 - Task 6 2nd of October 2007
Fraunhofer IZM CODDE Bio IS DUH Final Report Page 6-27
6.4. Task 6 Conclusions Table 6-1 gives an overview of the BAT values collected in Task 6. Because some values found are quite extreme, or could not be supported from other sources, there are different quality levels assigned to the BATs, leading to more than one BAT per product case.
Table 6-1: Task 6 BAT summary table
Off Passive sb Networked sb0.1 confirmed BAT
0.06 best BAT0.2 confirmed BAT
0.002 best BAT0 with switch
no BAT, except 0 with switch
1 confirmed BAT2.5 confirmed BAT
1 possible BAT1.2 confirmed BAT(EcoDect no data)
Television
CRT 0 with switch0.1 otherwise 0.5 confirmed BAT
LCD 0 with switch 0.2 confirmed BAT
Plasma 0 with switch 0.3 confirmed BAT0.1 possible BAT
Set-top-boxes 0 with switch0.17 soft off
1.8 confirmed BAT0.7 when passive 7.5 confirmed BAT
0.1 confirmed BAT0.037 best BAT
0 with switch
0.9 confirmed BAT(1.9 with delay start)
0.04 best BATDVD Player 0 with switch 0.12 confirmed BAT
Recorder no hard-off found 0.6 confirmed BAT0 with switch 0.136 confirmed BAT
0.35 confirmed BAT
Desktop0.8 confirmed BAT
0.4 best BAT0 with switch
2.2 confirmed BAT1 best BAT
Notebook 0.38 confirmed BAT0 for disconnect
0.5 confirmed BAT 0.4 best BAT
Monitor CRT 0.2 confirmed BAT0 with switch
0.6 confirmed BAT 0.22 best BAT
Monitor LCD 0.3 confirmed BAT 0.4 confirmed BAT 0.38 best BAT
Hubs 0.5 confirmed BATDesktop see above see aboveNotebook see above see aboveMonitor CRT see above see aboveMonitor LCD see above see aboveBroadband modem 6.3 W confirmed BAT
Dial-up modem 2.7 W confirmed BAT
Broadband modem with WLAN 6.4 W confirmed BAT
PC speakers 1.5 confirmed BAT0 with switch
2.4 confirmed BAT(may be entered as
networked sb)0.4 confirmed BAT
0.036 best BAT0 with switch
2.0 confirmed BAT 0.64 best BAT
0.5 confirmed BAT hard-off unlikely
0.7 confirmed BAT0.2 best BAT
no BAT, except hard-off in cases
Laser printer
Inkjet printer
Oven
Cordless phone
Washing machine
PC+(home)
Fax machine
EPS (mobile phone)
Lighting
Radio
Electric toothbrush
Audio minisystem
TV+
BAT Summary Lot 6 Task 6Consumption in mode (W)
PC+(office)
Product case
Energy using products industry is constantly moving forward, improving current technologies and introducing products with new functionalities to the user. For some products, current trends such as
Report for Tender No. TREN/D1/40 Lot 6 -2005 EuP Lot 6 - Task 6 2nd of October 2007
Fraunhofer IZM CODDE Bio IS DUH Final Report Page 6-28
portability, together with standby/off-mode and energy efficiency initiatives and legislation (e.g. in California and Australia) have been driving the standby/off-mode consumption down. For these products (e.g. EPS for mobile phones and notebook PCs) further technical improvement potential regarding standby consumption and off-mode losses may be limited in short term. Usually, the user behaviour still plays an important role in determining the total consumption in these modes.
On the other hand, some products have received limited attention up until now and such products (e.g. DECT phones and modems) offer important saving potentials in standby and/or off-mode. Yet, for other products, current trends are probably pushing the standby/off-mode consumption upwards as new features such as displays are added to previously simple products (e.g. toothbrush).
Often, the product developments aim at improving many parameters at the same time and the standby/off-mode improvements must be implemented during a planned product redesign. Even if energy issues are (in exceptional cases) at the heart of redesign process, the attention may be on the active mode efficiency or total energy consumption rather than on the standby/off-mode consumption. It is almost impossible from outside of a company to separate the changes due to improvements of standby (or off-mode) from all other design changes.
Often a trade-off can be observed, especially between the active mode and standby energy consumption: if an appliance turns faster into standby mode, for example, the time and consumption in active mode is reduced but the standby consumption is likely to increase. Regarding the total consumption, the change is likely to be beneficial, but from the narrower Lot 6 point of view, such a change could be considered negative. Further, there may be a trade-off between very low standby consumption and off-mode losses – optimising one may compromise the other. Consequently, it may be hard to compare the energy performance of two products based only on the Watt figures for standby and off-mode. A life cycle approach over all modes may be needed, and the variability of the user behaviour may have to be taken into account to determine the best approach.
Many of the state-of-the-art products and components rely on patented technologies. However, they are often based on common improvement approaches, such as improved controller ICs. Furthermore, innovative approaches and manufacturing processes are enabling the production of new, alternative components and products cost-effectively. Precise cost changes due to the improvement in power standby/off-mode power consumption cannot be identified for complex product redesigns, and neither can the influence of these cost changes on the product price be quantified. However, the available data suggests that the costs that could be allocated to standby/off-mode improvements can be rather small; if not positive (e.g. lower costs due to fewer components).

Report for Tender No. TREN/D1/40 Lot 6 -2005 EuP Lot 6 - Task 7 2nd of October 2007
Fraunhofer IZM CODDE Bio IS DUH Final Report Page 7-i
EuP Preparatory Study Lot 6 Standby and Off-mode Losses
Task 7 Improvement Potentials Final Report
Compiled by Fraunhofer IZM
Contractor: Fraunhofer Institute for Reliability and Microintegration, IZM, Berlin
Department Environmental Engineering
Dr.-Ing. Nils F. Nissen
Gustav-Meyer-Allee 25, 13355 Berlin, Germany
Contact:
Tel.: +49-30-46403-132
Fax: +49-30-46403-131
Email: [email protected]
Berlin, 2nd of October 2007
Disclaimer
The findings presented in this report are results of the research conducted by the IZM consortium and the continuous feedback from a wide range of stakeholders. The statements and recommendations presented in the final report however are not to be perceived as the opinion of the European Commission.
Report for Tender No. TREN/D1/40 Lot 6 -2005 EuP Lot 6 - Task 7 2nd of October 2007
Fraunhofer IZM CODDE Bio IS DUH Final Report Page 7-ii
Contents 7. Improvement Potential (Task 7).................................................................................. 7-1
7.1. Design Options ............................................................................................................... 7-2 7.1.1. Individual design options .......................................................................................... 7-2 7.1.2. Option combinations ............................................................................................... 7-14
7.2. Impacts.......................................................................................................................... 7-20 7.3. Costs ............................................................................................................................. 7-21 7.4. LLCC Calculations ....................................................................................................... 7-23 7.5. BNAT and System Analysis ......................................................................................... 7-40
Report for Tender No. TREN/D1/40 Lot 6 -2005 EuP Lot 6 - Task 7 2nd of October 2007
Fraunhofer IZM CODDE Bio IS DUH Final Report Page 7-1
7. Improvement Potential (Task 7)
As shown in Task 6 there are a lot of examples of improved products regarding standby and off-mode losses. In particular there is a wide range of new products in the product case categories, which exhibit significantly not only marginally improved standby values. In Task 7 the quantifiable improvement options have to be identified. The environmental impacts and (life cycle) costs of these options are then analysed. As a result the option(s) with the least life cycle costs (LLCC) and possible further options defining BAT or BNAT improvement levels are determined.
Because of the horizontal nature of Lot 6 we will generalize the design options and discuss them per Lot 6 mode. The relevant product cases and input from Task 6 will serve as the basis of assumptions, but to capture the broader picture, generalizations and simplifications are necessary. In a way the calculations are therefore scenarios, expressing the potential impacts of a wide-spread introduction of the chosen design options. The calculations are first of all performed for one year, then with the LLCC extended to the assumed lifetime per product. There are no describable products to represent the base cases defined and evaluated in Task 5. The temporal aspects of market diffusion and policy scenarios (under which conditions the market and stock are changing at which pace) will be explored in Task 8.
To achieve the necessary generalisation level, the investigations are ordered by the Lot 6 modes. This is “almost” the same as going by the Lot 6 base cases. For off-mode and Base Case 1 the scope is actually the same. For standby, it is more useful to differentiate passive and networked standby primarily (this covers all standby products same as Base Case 2). The discussion on the difficult possible transitional issues and shifts between modes (Base Case 3) follows, but can not yet lead to quantifications.
How the calculations are done
The generalised design options are applied to the Lot 6 product cases – including the individual sub-products, where applicable. From this the yearly energy saving potential is calculated for those products, where the design option is applicable.
The total yearly saving for each option can then be divided by the number of products included in the calculation and by the number of hours per year. The result is a "continuous power saving equivalent", which is used to show the average improvement through each option.
For the LCC and LLCC the calculations revert to the individual product cases, so that the energy assumptions fit with the product (the average improvement could otherwise be higher than the assumed power consumption in a mode). The cost assumptions however stay on the generalised level, with one product cost assumption per design option.

Report for Tender No. TREN/D1/40 Lot 6 -2005 EuP Lot 6 - Task 7 2nd of October 2007
Fraunhofer IZM CODDE Bio IS DUH Final Report Page 7-2
Table 7-1: Base values to calculate differential improvement options
stock 2005assumed on-mode passive standby off-mode
assumed 0 W off-mode
assumed disconnected
Mio h/day W h/day W h/day W h/day h/day h/dayEPS mobile phone 780,00
EPS mobile phone 780,00 1,4 0 0 0,3 10 0 12,6Lighting 179,00
Magnetic transformer 42,96 0,5 0 0 4,0 23,5 0 0Electronic transformer 28,64 0,5 0 0 0,2 23,5 0 0with hard off switch (correction factor) 89,50 0,5 0 0 0 23,5 0
Radio 114,40Radio with losses 57,20 1 0 0 1,5 23 0 0Radio without losses 57,20 1 0 0 0 23 0
Electric toothbrush 42,70Toothbrush 42,70 2,1 0 0 1,4 21,9 0 0
Electric oven 73,00Oven 73,00 0,3 0 3 23,7 0 0 0
Cordless phone 179,60Cordless phone 179,60 1,4 2,4 22,6 0 0 0 0
TV+ 275,92CRT TV 261,02 4 6 12 0 1,5 0 8 0LCD TV 11,04 4 3 12 0 2 0 8 0Plasma TV 2,76 4 3 12 0 1,5 0 8 0Rear projection 1,10 4 2 12 0 0,1 0 8 0Set-top-box 56,30 4 10,7 20 0 0 0 0
Washing machine 184,60Washing machine 184,60 1 0 5,7 3 1,2 20 0 0
DVD 143,30DVD player 128,97 0,6 0 4,8 15,6 1,5 4 3,8 0DVD recorder 14,33 0,6 0 4,8 15,6 1,5 4 3,8 0
Audio minisystem 114,40Audio minisystem 114,40 3,4 0 8 17,1 1,5 1,4 2,1 0
Fax 20,00Fax 20,00 0,9 5,9 23,1 0 0 0 0 0
PC+ (office) 80,50Desktop 44,00 6,2 4 8,8 0 2,7 9 0 0Notebook 36,50 7,2 3 8,2 0 1,5 8,6 0 0Monitor CRT 24,00 7,1 6,3 10,4 0 1,5 6,5 0 0Monitor LCD 20,50 7,1 2,3 10,4 0 1,35 6,5 0 0Hub 6,44 8 5 16 0 0 0 0 0
PC+ (home) 126,00Desktop 102,00 3,7 4 9,2 0 2,7 11,1 0 0Notebook 24,00 3,3 3 9 0 1,5 11,7 0,0 0Monitor CRT 57,00 2,8 6,3 9,6 0 1,5 11,6 0 0Monitor LCD 47,50 2,8 2,3 9,6 0 1,35 11,6 0 0PC speakers 64,26 1,8 0 0 3,6 2,4 2,5 13,4 6,4 0Broadband modem 31,00 4 8,2 20 0 7,5 0 0 0Dial-up modem 16,60 4 5,5 2,6 0 2,6 12 5,4 0Broadband modem with WLAN 25,40 4 13 20 0 13 0 0 0
Laser printer 16,60Laser printer (office) 16,60 0,4 20 5,9 0 3 14,2 3,5 0Laser printer (home) 0,00 0,1 20 1,9 0 3 13,1 8,9 0
Inkjet printer 90,20Inkjet printer (office) 0,00 0,3 6 6 0 3 14,2 3,5 0Inkjet printer (home) 90,20 0,1 6 1,9 0 3 17,7 4,3 0
networked standby
The assumptions for changes in power levels per mode are transferred into the table to calculate the difference in yearly standby and off-mode power consumption. The changed values will be indicated with each design option.
7.1. Design Options
7.1.1. Individual design options
7.1.1.1. Hard-off switch
Adding a primary side hard-off switch can be considered the ultimate measure against off-mode losses. There are three main obstacles to this simplification
the measure is dependent on user behaviour, and therefore the exact impacts are hard to assess,

Report for Tender No. TREN/D1/40 Lot 6 -2005 EuP Lot 6 - Task 7 2nd of October 2007
Fraunhofer IZM CODDE Bio IS DUH Final Report Page 7-3
design freedom and potential additional costs (the manufacturers' main arguments),
even with hard-off switches the power consumption is not always zero
Additionally, the discussion about primary side hard-off switches always has to be duplicated within the context of reducing Lot 6 standby, not "just" the off-mode losses. But in this section we will first look at off-mode issues only.
The most relevant constellations for off-mode losses are EPS no-load losses, secondary side switches and soft switches requiring continuous power for the switch itself, without powering any Lot 6 standby function.
On average the cases where the off-mode switch leads to "true" 0 W should far outweigh the cases where components placed before the switch lead to some remaining off-mode losses. Therefore a reduction to 0 W will be assumed when a primary side hard-off switch is installed. The high importance and variation of the user behaviour can only be captured by calculating with more than one assumption. If the hard–off switch replaces a soft-off switch, it is user independent, so there is a shift of 100 % from off-mode with losses to 0 W off-mode. If the hard-off switch is additionally, 25 % (for the low estimation, Option 1) or 75 % (for the high estimation, Option 2) of the users use the hard-off switch. Because the mode duration linearly influences the energy consumption per mode, 25 % of users using a hard-off switch means a reduction of off-mode losses by 25 %.
Added product cost estimate: On average 1 € of additional costs will be assumed. In reality, the variation is large, from 0 € when replacing a soft switch to a few Euros when the constructive overhead for the hard-off switch is bigger.
Energy reduction potential: The Task 5 off-mode losses among the product cases range from 1.2 W to 3.3 W, with the special role of the EPS case already reaching 0.3 W in no-load condition. For a number of product cases, 0 W can already be shown among the Task 6 BAT cases.
For the material side, the weight of the hard-off switch could be integrated into the differential EcoReport calculations, however, this improvement option does not necessarily lead to additional hardware but rather to a replacement of other switches. Internal mains voltage cabling may also contribute to the material related differences. A switch with cabling is investigated in the Task 8 sensitivity analysis.
For lighting, radios, washing machines, monitors, PC speakers, dial-up modems and printers a hard-off switch would replace a soft-off switch. Therefore the user behaviour does not change, there is a 100 % shift from off-mode with losses to 0 W off-mode.
For electric toothbrushes and desktops the hard-off switch would be new or additionally to a soft-off switch. The effect on energy saving would be user dependent and is calculated with 25 % to 75 % of the users using the hard-off switch.
For TVs, Set-top-boxes, DVD players and recorders and audio minisystems the basic use patterns describe the stock 2005, where some of the devices have a hard-off switch, which are used by some users, and other devices only have a soft-switch. The option of installing a hard-off switch can therefore not only shift the time in off-mode to 0 W off-mode. For the basic use pattern for TVs, already a lot of the users use the hard off switch, so the use pattern is not changed for the low estimation. For the high estimation 1 h in standby is assumed for all TVs and the rest of the standby time is divided 25 % in networked standby to 75 % in 0 W off-mode. For set-top-boxes the hard-off switch would be additionally. The use pattern is changed regarding the use pattern of TVs.
For the low estimation of DVD players and recorders the off-mode time does not change, but is now a 0 W off-mode. For the high estimation a differentiation between players and recorders was made. For the players the same assumptions as for the TV were done (1 h passive standby, rest divided 25 % to 75 %). For DVD recorders a longer standby time is assumed (24 h timer standby per week plus 1 h/d as for TVs and DVD players). For the audio minisystem 1 h in standby for all devices is assumed for Option 1 and 2.
For some products, such as EPS mobile phone, cordless phone, fax, hubs and notebooks, hard-off switches are not considered.

Report for Tender No. TREN/D1/40 Lot 6 -2005 EuP Lot 6 - Task 7 2nd of October 2007
Fraunhofer IZM CODDE Bio IS DUH Final Report Page 7-4
Table 7-2: Changed assumptions for Option 2 (high estimation)
stock 2005assumed on-mode passive standby off-mode
assumed 0 W off-mode
assumed disconnected
Mio h/day W h/day W h/day W h/day h/day h/dayLighting 179,00
Magnetic transformer 42,96 0,50 0 0 4 0 23,5 0Electronic transformer 28,64 0,50 0 0 0,2 0 23,5 0with hard off switch (correction factor) 89,50 0,50 0 0 0 0 23,5 0
Radio 114,40 0Radio with losses 57,20 1,00 0 0 1,5 0 23 0Radio without losses 57,20 1,00 0 0 0 0 23 0
Electric toothbrush 42,70 0Toothbrush 42,70 2,10 0 0 1,4 5,475 16,425 0
TV+ 275,92CRT TV 261,02 4,00 6 5,75 0 0 1,5 0 14,25 0LCD TV 11,04 4,00 3 5,75 0 0 2 0 14,25 0Plasma TV 2,76 4,00 3 5,75 0 0 1,5 0 14,25 0Rear projection 1,10 4,00 2 5,75 0 0 0,1 0 14,25 0Set-top-box 56,30 4,00 10,7 5,75 0 0 0 0 14,25 0
Washing machine 184,60Washing machine 184,60 1,00 0 0 5,7 3 1,2 0 20 0
DVD 143,30DVD player 128,97 0,60 0 0 4,8 6,6 1,5 0 16,8 0DVD recorder 14,33 0,60 0 0 4,8 9,06 1,5 0 14,34 0
Audio minisystem 114,40Audio minisystem 114,40 3,40 0 0 8 5,9 1,5 0 14,7 0
PC+ (office) 80,50Desktop 44,00 6,20 4 8,8 0 0 2,7 2,25 6,75 0Monitor CRT 24,00 7,10 6,3 10,4 0 0 1,5 0 6,5 0Monitor LCD 20,50 7,10 2,3 10,4 0 0 1,35 0 6,5 0
PC+ (home) 126,00Desktop 102,00 3,70 4 9,2 0 0 2,7 2,775 8,325 0Monitor CRT 57,00 2,80 6,3 9,6 0 0 1,5 0 11,6 0Monitor LCD 47,50 2,80 2,3 9,6 0 0 1,35 0 11,6 0PC speakers 64,26 1,80 0 0 3,6 2,4 2,5 0 19,8 0
Broadband modem 31,00 4,00 8,2 7,925 0 0 7,5 0 12,075 0Dial-up modem 16,60 4,00 5,5 2,6 0 0 2,6 0 17,4 0
Laser printer 16,60Laser printer (office) 16,60 0,40 20 5,9 0 0 3 0 17,7 0Laser printer (home) 0,00 0,10 20 1,9 0 0 3 0 22 0
Inkjet printer 90,20Inkjet printer (office) 0,00 0,30 6 6 0 0 3 0 17,7 0Inkjet printer (home) 90,20 0,10 6 1,9 0 0 3 0 22 0
networked standby
The yellow cells show the shift from off-mode with losses to 0 W off-mode, the orange cells show user dependent assumptions.
The lower Option 1 estimate, where 25 % of the users regularly use the hard-off switch, looks quite similar and is not shown here (Option 1).
7.1.1.2. No-load optimised PSU, incl. secondary PSU
If a hard-off switch is not employed to curb off-mode losses then lowering those losses is mainly a matter of changes in the power supply. Power supplies with minimised off-mode losses have been available for some time, and newer developments in power supply topology and controller ICs allow losses below 200 mW [Bio 2007].
For the products without a hard-off switch and for those, where the user chooses not to use the hard-off option, a reduction to 200 mW or below can be a substantial improvement, independent of the user behaviour. Of course, if users use the hard-off option or external measures to a larger extent, the real gains from lowering off-mode losses will be smaller.
Added product cost estimate: According to the Lot 7 results, efficient redesigns of a power supply can be considered cost neutral in many cases (neglecting the redesign effort because of the very high production volumes). As an average of all the different variants included here we assume additional costs of 0.2 €. The reduced losses in no-load condition are likely to lead to improved
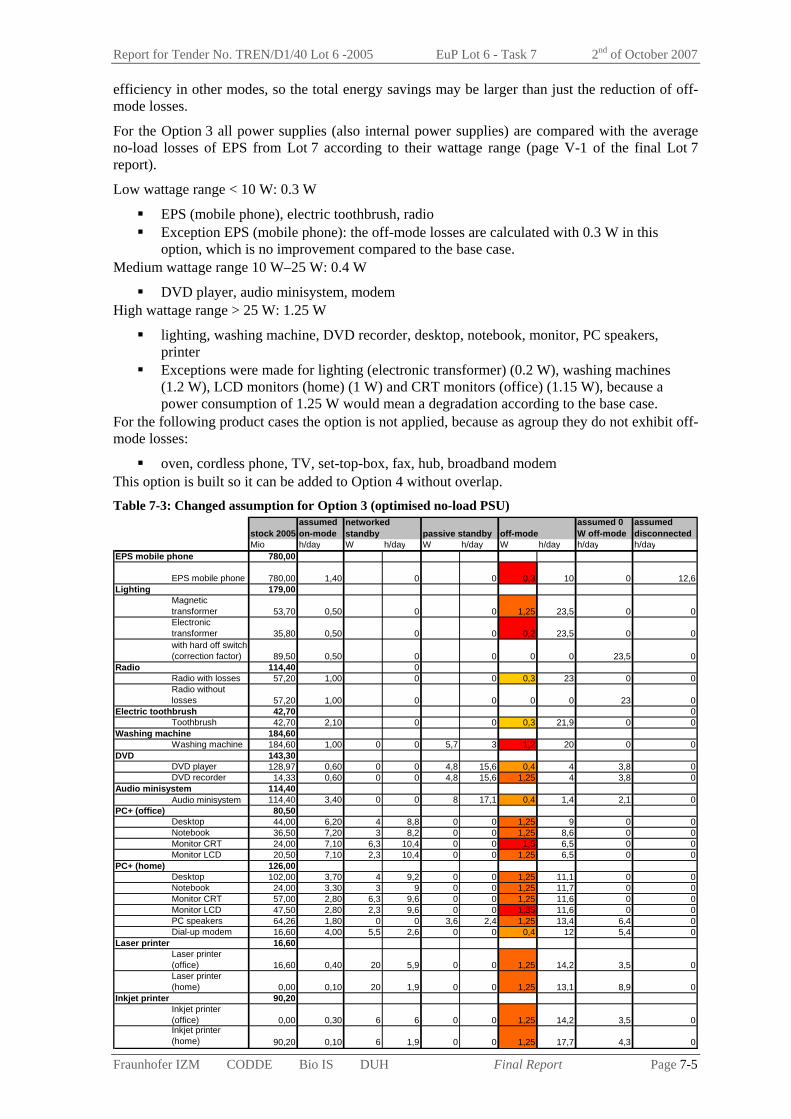
Report for Tender No. TREN/D1/40 Lot 6 -2005 EuP Lot 6 - Task 7 2nd of October 2007
Fraunhofer IZM CODDE Bio IS DUH Final Report Page 7-5
efficiency in other modes, so the total energy savings may be larger than just the reduction of off-mode losses.
For the Option 3 all power supplies (also internal power supplies) are compared with the average no-load losses of EPS from Lot 7 according to their wattage range (page V-1 of the final Lot 7 report).
Low wattage range < 10 W: 0.3 W
EPS (mobile phone), electric toothbrush, radio Exception EPS (mobile phone): the off-mode losses are calculated with 0.3 W in this
option, which is no improvement compared to the base case. Medium wattage range 10 W–25 W: 0.4 W
DVD player, audio minisystem, modem High wattage range > 25 W: 1.25 W
lighting, washing machine, DVD recorder, desktop, notebook, monitor, PC speakers, printer
Exceptions were made for lighting (electronic transformer) (0.2 W), washing machines (1.2 W), LCD monitors (home) (1 W) and CRT monitors (office) (1.15 W), because a power consumption of 1.25 W would mean a degradation according to the base case.
For the following product cases the option is not applied, because as agroup they do not exhibit off-mode losses:
oven, cordless phone, TV, set-top-box, fax, hub, broadband modem This option is built so it can be added to Option 4 without overlap. Table 7-3: Changed assumption for Option 3 (optimised no-load PSU)
stock 2005assumed on-mode passive standby off-mode
assumed 0 W off-mode
assumed disconnected
Mio h/day W h/day W h/day W h/day h/day h/dayEPS mobile phone 780,00
EPS mobile phone 780,00 1,40 0 0 0,3 10 0 12,6Lighting 179,00
Magnetic transformer 53,70 0,50 0 0 1,25 23,5 0 0Electronic transformer 35,80 0,50 0 0 0,2 23,5 0 0with hard off switch (correction factor) 89,50 0,50 0 0 0 0 23,5 0
Radio 114,40 0Radio with losses 57,20 1,00 0 0 0,3 23 0 0Radio without losses 57,20 1,00 0 0 0 0 23 0
Electric toothbrush 42,70 0Toothbrush 42,70 2,10 0 0 0,3 21,9 0 0
Washing machine 184,60Washing machine 184,60 1,00 0 0 5,7 3 1,2 20 0 0
DVD 143,30DVD player 128,97 0,60 0 0 4,8 15,6 0,4 4 3,8 0DVD recorder 14,33 0,60 0 0 4,8 15,6 1,25 4 3,8 0
Audio minisystem 114,40Audio minisystem 114,40 3,40 0 0 8 17,1 0,4 1,4 2,1 0
PC+ (office) 80,50Desktop 44,00 6,20 4 8,8 0 0 1,25 9 0 0Notebook 36,50 7,20 3 8,2 0 0 1,25 8,6 0 0Monitor CRT 24,00 7,10 6,3 10,4 0 0 1,5 6,5 0 0Monitor LCD 20,50 7,10 2,3 10,4 0 0 1,25 6,5 0 0
PC+ (home) 126,00Desktop 102,00 3,70 4 9,2 0 0 1,25 11,1 0 0Notebook 24,00 3,30 3 9 0 0 1,25 11,7 0 0Monitor CRT 57,00 2,80 6,3 9,6 0 0 1,25 11,6 0 0Monitor LCD 47,50 2,80 2,3 9,6 0 0 1,35 11,6 0 0PC speakers 64,26 1,80 0 0 3,6 2,4 1,25 13,4 6,4 0Dial-up modem 16,60 4,00 5,5 2,6 0 0 0,4 12 5,4 0
Laser printer 16,60Laser printer (office) 16,60 0,40 20 5,9 0 0 1,25 14,2 3,5 0Laser printer (home) 0,00 0,10 20 1,9 0 0 1,25 13,1 8,9 0
Inkjet printer 90,20Inkjet printer (office) 0,00 0,30 6 6 0 0 1,25 14,2 3,5 0Inkjet printer (home) 90,20 0,10 6 1,9 0 0 1,25 17,7 4,3 0
networked standby
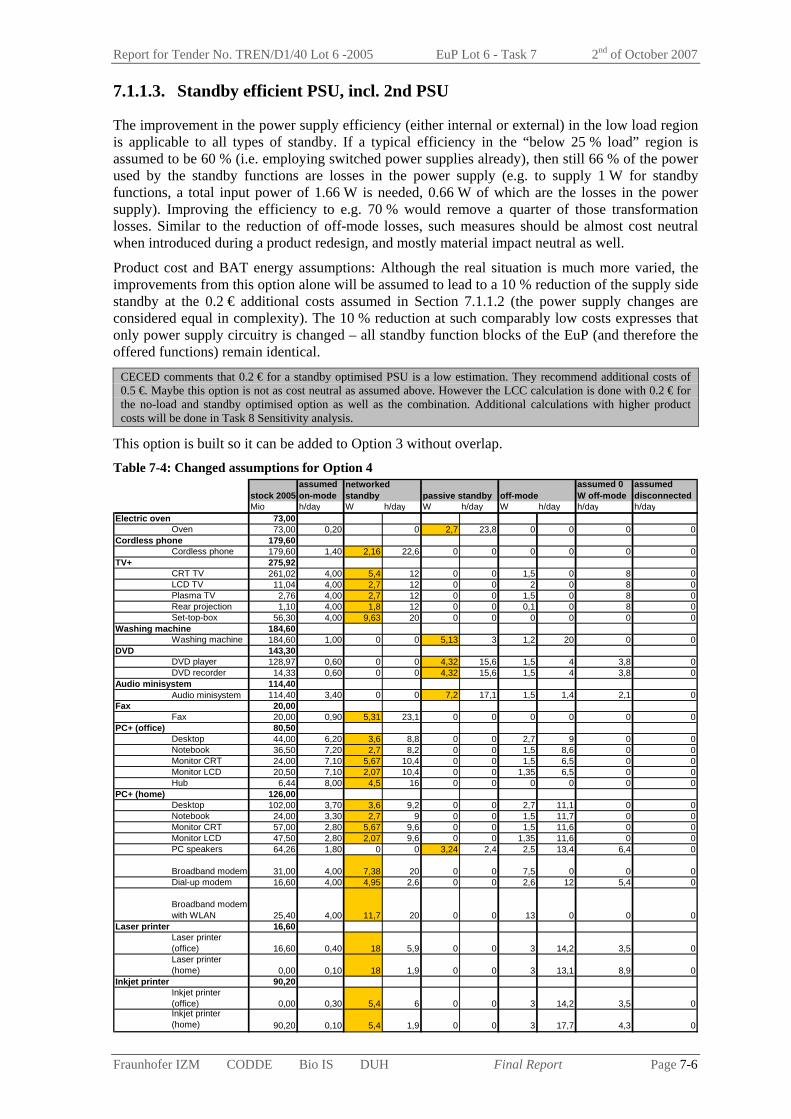
Report for Tender No. TREN/D1/40 Lot 6 -2005 EuP Lot 6 - Task 7 2nd of October 2007
Fraunhofer IZM CODDE Bio IS DUH Final Report Page 7-6
7.1.1.3. Standby efficient PSU, incl. 2nd PSU
The improvement in the power supply efficiency (either internal or external) in the low load region is applicable to all types of standby. If a typical efficiency in the “below 25 % load” region is assumed to be 60 % (i.e. employing switched power supplies already), then still 66 % of the power used by the standby functions are losses in the power supply (e.g. to supply 1 W for standby functions, a total input power of 1.66 W is needed, 0.66 W of which are the losses in the power supply). Improving the efficiency to e.g. 70 % would remove a quarter of those transformation losses. Similar to the reduction of off-mode losses, such measures should be almost cost neutral when introduced during a product redesign, and mostly material impact neutral as well.
Product cost and BAT energy assumptions: Although the real situation is much more varied, the improvements from this option alone will be assumed to lead to a 10 % reduction of the supply side standby at the 0.2 € additional costs assumed in Section 7.1.1.2 (the power supply changes are considered equal in complexity). The 10 % reduction at such comparably low costs expresses that only power supply circuitry is changed – all standby function blocks of the EuP (and therefore the offered functions) remain identical.
CECED comments that 0.2 € for a standby optimised PSU is a low estimation. They recommend additional costs of 0.5 €. Maybe this option is not as cost neutral as assumed above. However the LCC calculation is done with 0.2 € for the no-load and standby optimised option as well as the combination. Additional calculations with higher product costs will be done in Task 8 Sensitivity analysis.
This option is built so it can be added to Option 3 without overlap. Table 7-4: Changed assumptions for Option 4
stock 2005assumed on-mode passive standby off-mode
assumed 0 W off-mode
assumed disconnected
Mio h/day W h/day W h/day W h/day h/day h/dayElectric oven 73,00
Oven 73,00 0,20 0 2,7 23,8 0 0 0 0Cordless phone 179,60
Cordless phone 179,60 1,40 2,16 22,6 0 0 0 0 0 0TV+ 275,92
CRT TV 261,02 4,00 5,4 12 0 0 1,5 0 8 0LCD TV 11,04 4,00 2,7 12 0 0 2 0 8 0Plasma TV 2,76 4,00 2,7 12 0 0 1,5 0 8 0Rear projection 1,10 4,00 1,8 12 0 0 0,1 0 8 0Set-top-box 56,30 4,00 9,63 20 0 0 0 0 0 0
Washing machine 184,60Washing machine 184,60 1,00 0 0 5,13 3 1,2 20 0 0
DVD 143,30DVD player 128,97 0,60 0 0 4,32 15,6 1,5 4 3,8 0DVD recorder 14,33 0,60 0 0 4,32 15,6 1,5 4 3,8 0
Audio minisystem 114,40Audio minisystem 114,40 3,40 0 0 7,2 17,1 1,5 1,4 2,1 0
Fax 20,00Fax 20,00 0,90 5,31 23,1 0 0 0 0 0 0
PC+ (office) 80,50Desktop 44,00 6,20 3,6 8,8 0 0 2,7 9 0 0Notebook 36,50 7,20 2,7 8,2 0 0 1,5 8,6 0 0Monitor CRT 24,00 7,10 5,67 10,4 0 0 1,5 6,5 0 0Monitor LCD 20,50 7,10 2,07 10,4 0 0 1,35 6,5 0 0Hub 6,44 8,00 4,5 16 0 0 0 0 0 0
PC+ (home) 126,00Desktop 102,00 3,70 3,6 9,2 0 0 2,7 11,1 0 0Notebook 24,00 3,30 2,7 9 0 0 1,5 11,7 0 0Monitor CRT 57,00 2,80 5,67 9,6 0 0 1,5 11,6 0 0Monitor LCD 47,50 2,80 2,07 9,6 0 0 1,35 11,6 0 0PC speakers 64,26 1,80 0 0 3,24 2,4 2,5 13,4 6,4 0
Broadband modem 31,00 4,00 7,38 20 0 0 7,5 0 0 0Dial-up modem 16,60 4,00 4,95 2,6 0 0 2,6 12 5,4 0
Broadband modem with WLAN 25,40 4,00 11,7 20 0 0 13 0 0 0
Laser printer 16,60Laser printer (office) 16,60 0,40 18 5,9 0 0 3 14,2 3,5 0Laser printer (home) 0,00 0,10 18 1,9 0 0 3 13,1 8,9 0
Inkjet printer 90,20Inkjet printer (office) 0,00 0,30 5,4 6 0 0 3 14,2 3,5 0Inkjet printer (home) 90,20 0,10 5,4 1,9 0 0 3 17,7 4,3 0
networked standby

Report for Tender No. TREN/D1/40 Lot 6 -2005 EuP Lot 6 - Task 7 2nd of October 2007
Fraunhofer IZM CODDE Bio IS DUH Final Report Page 7-7
7.1.1.4. Confirmed BAT
The average energy consumption for each product case is reduced to the confirmed BAT value. The individual BAT values for off-mode, passive and networked standby do not necessarily come from the same example. For radios no BAT could be found. With the exception of Set-top-boxes, PC+ and Electric oven the BAT values for passive, and networked standby are in the range of 1 W. This option should describe the reduction in all modes that is currently possible. If there is no great change on side of function settings for future products those standby values could be an achievable target for the next product generation.
The additional costs are calculated to the improved mode. Off-mode losses are mostly caused by losses of the power supply so the costs for the improvement should be the same as for Option 3 and 4, which are 0.2 €. For passive standby additional costs of 1 € and for networked standby of 3 € are assumed. Table 7-5: Changed assumptions for Option 5 (confirmed BAT)
stock 2005assumed on-mode passive standby off-mode
assumed 0 W off-mode
assumed disconnected
Mio % h/day W h/day W h/day W h/day h/day h/dayEPS mobile phone 780,00
EPS mobile phone 780,00 1,00 1,40 0 0 0,1 10 0 12,6Lighting 179,00
Magnetic transformer 42,96 0,24 0,50 0 0 0,2 23,5 0 0Electronic transformer 28,64 0,16 0,50 0 0 0,2 23,5 0 0with hard off switch (correction factor) 89,50 0,50 0,50 0 0 0 0 23,5 0
Radio 114,40 0Radio with losses 57,20 0,50 1,00 0 0 1,5 23 0 0Radio without losses 57,20 0,50 1,00 0 0 0 0 23 0
Electric toothbrush 42,70 0Toothbrush 42,70 1,00 2,10 0 0 1 21,9 0 0
Electric oven 73,00Oven 73,00 1,00 0,30 0 2,5 23,7 0 0 0 0
Cordless phone 179,60Cordless phone 179,60 1,00 1,40 1,2 22,6 0 0 0 0 0 0
TV+ 275,92CRT TV 261,02 0,95 4,00 0,5 12 0 0 1,5 0 8 0LCD TV 11,04 0,04 4,00 0,2 12 0 0 2 0 8 0Plasma TV 2,76 0,01 4,00 0,3 12 0 0 1,5 0 8 0Rear projection 1,10 0,00 4,00 2 12 0 0 0,1 0 8 0Set-top-box 56,30 0,20 4,00 7,5 20 0 0 0 0 0 0
Washing machine 184,60Washing machine 184,60 1,00 1,00 0 0 0,9 3 0,1 20 0 0
DVD 143,30DVD player 128,97 0,90 0,60 0 0 0,12 15,6 0,12 4 3,8 0DVD recorder 14,33 0,10 0,60 0 0 0,6 15,6 0,6 4 3,8 0
Audio minisystem 114,40Audio minisystem 114,40 1,00 3,40 0 0 0,136 17,1 0,136 1,4 2,1 0
Fax 20,00Fax 20,00 1,00 0,90 0,35 23,1 0 0 0 0 0 0
PC+ (office) 80,50Desktop 44,00 0,55 6,20 2,2 8,8 0 0 0,8 9 0 0Notebook 36,50 0,45 7,20 0,5 8,2 0 0 0,38 8,6 0 0Monitor CRT 24,00 0,30 7,10 0,6 10,4 0 0 0,2 6,5 0 0Monitor LCD 20,50 0,25 7,10 0,4 10,4 0 0 0,3 6,5 0 0Hub 6,44 0,08 8,00 0,5 16 0 0 0 0 0 0
PC+ (home) 126,00Desktop 102,00 0,81 3,70 2,2 9,2 0 0 0,8 11,1 0 0Notebook 24,00 0,19 3,30 0,5 9 0 0 0,38 11,7 0 0Monitor CRT 57,00 0,45 2,80 0,6 9,6 0 0 0,2 11,6 0 0Monitor LCD 47,50 0,38 2,80 0,4 9,6 0 0 0,3 11,6 0 0PC speakers 64,26 0,51 1,80 0 0 2,4 2,4 1,5 13,4 6,4 0
Broadband modem 31,00 0,25 4,00 6,3 20 0 0 6,3 0 0 0Dial-up modem 16,60 0,13 4,00 2,7 2,6 0 0 2,6 12 5,4 0
Broadband modem with WLAN 25,40 0,20 4,00 6,4 20 0 0 6,4 0 0 0
Laser printer 16,60Laser printer (office) 16,60 1,00 0,40 2 5,9 0 0 0,4 14,2 3,5 0Laser printer (home) 0,00 0,00 0,10 2 1,9 0 0 0,4 13,1 8,9 0
Inkjet printer 90,20Inkjet printer (office) 0,00 0,00 0,30 0,7 6 0 0 0,5 14,2 3,5 0Inkjet printer (home) 90,20 1,00 0,10 0,7 1,9 0 0 0,5 17,7 4,3 0
networked standby

Report for Tender No. TREN/D1/40 Lot 6 -2005 EuP Lot 6 - Task 7 2nd of October 2007
Fraunhofer IZM CODDE Bio IS DUH Final Report Page 7-8
7.1.1.5. Simplified BAT calculation
Keeping in mind that the generalised option will not be applicable to all products, we propose to calculate a design option of “<1 W” passive standby, which includes a mix of improvements to the power supply, reducing the power level of the standby functions themselves, and switching off circuit parts not needed in passive standby.
The passive standby functions assumed to fit under this option are: reactivation by remote control, a clock including a low brightness display, further display area for status information or status LEDs alternatively, and the possibility to reactivate via timer.
All off-mode losses are on average set to 0.3 W, with lower values for the mobile phone EPS (and lighting with electronic transformer). The average passive standby values are set to 1 W, the networked standby values to 3 W, with a lower value for cordless phones.
For most products with passive standby, BAT examples below 1 W have been identified. 0.3 - 0.8 W examples cover the majority of products, and some examples go down as far as 0.04 W, although this could imply a reduction of the features still offered compared to other product lines. The notable exceptions are ovens, where the BAT cited from CECED is 2.5 W, and 1.5 W for larger PC speaker systems with remote control, which can be argued to operate in passive standby, although the PC+ cases in general are subsumed as networked standby. For the ovens, the slightly older S.A.F.E. measurement campaign in Switzerland reported measurement results down to 1 W for ovens, with an average of 2.2 W [Nipkow 2003], so possibly 1 W is not totally out of reach, or the features of the products are not comparable.
The simplified BAT is introduced to "equalise" the assumption values across more products, therefore some product assumptions are actually higher than the confirmed BAT, while for a few product cases the simplified BAT is below the confirmed BAT.
Product cost estimate: For the simplified BAT calculation the same additional costs as for the confirmed BAT calculation are used.
For some product cases the off-mode losses are reduced below the confirmed BAT level, because this is a simplified assumption.
The table below contains the values for the simplified BAT calculation. The values marked in red are exceptions. If the base case value is lower than the simplified BAT value, the base case is used for the calculation. The LCD and Plasma TV values are consistent with this option, but are in fact no improvement.

Report for Tender No. TREN/D1/40 Lot 6 -2005 EuP Lot 6 - Task 7 2nd of October 2007
Fraunhofer IZM CODDE Bio IS DUH Final Report Page 7-9
Table 7-6: Changed assumptions for Option 6 (simplified BAT calculation)
stock 2005assumed on-mode passive standby off-mode
assumed 0 W off-mode
assumed disconnected
Mio h/day W h/day W h/day W h/day h/day h/dayEPS mobile phone 780,00
EPS mobile phone 780,00 1,40 0 0 0,1 10 0 12,6Lighting 179,00
Magnetic transformer 42,96 0,50 0 0 0,2 23,5 0 0Electronic transformer 28,64 0,50 0 0 0,2 23,5 0 0with hard off switch (correction factor) 89,50 0,50 0 0 0 0 23,5 0
Radio 114,40 0Radio with losses 57,20 1,00 0 0 0,3 23 0 0Radio without losses 57,20 1,00 0 0 0 0 23 0
Electric toothbrush 42,70 0Toothbrush 42,70 2,10 0 0 0,3 21,9 0 0
Electric oven 73,00Oven 73,00 0,30 0 1 23,7 0 0 0 0
Cordless phone 179,60Cordless phone 179,60 1,40 1,2 22,6 0 0 0 0 0 0
TV+ 275,92CRT TV 261,02 4,00 3 12 0 0 1,5 0 8 0LCD TV 11,04 4,00 3 12 0 0 2 0 8 0Plasma TV 2,76 4,00 3 12 0 0 1,5 0 8 0Rear projection 1,10 4,00 2 12 0 0 0,1 0 8 0Set-top-box 56,30 4,00 3 20 0 0 0 0 0 0
Washing machine 184,60Washing machine 184,60 1,00 0 0 1 3 0,3 20 0 0
DVD 143,30DVD player 128,97 0,60 0 0 1 15,6 0,3 4 3,8 0DVD recorder 14,33 0,60 0 0 1 15,6 0,3 4 3,8 0
Audio minisystem 114,40Audio minisystem 114,40 3,40 0 0 1 17,1 0,3 1,4 2,1 0
Fax 20,00Fax 20,00 0,90 3 23,1 0 0 0 0 0 0
PC+ (office) 80,50Desktop 44,00 6,20 3 8,8 0 0 0,3 9 0 0Notebook 36,50 7,20 3 8,2 0 0 0,3 8,6 0 0Monitor CRT 24,00 7,10 3 10,4 0 0 0,3 6,5 0 0Monitor LCD 20,50 7,10 3 10,4 0 0 0,3 6,5 0 0Hub 6,44 8,00 3 16 0 0 0 0 0 0
PC+ (home) 126,00Desktop 102,00 3,70 3 9,2 0 0 0,3 11,1 0 0Notebook 24,00 3,30 3 9 0 0 0,3 11,7 0 0Monitor CRT 57,00 2,80 3 9,6 0 0 0,3 11,6 0 0Monitor LCD 47,50 2,80 3 9,6 0 0 0,3 11,6 0 0PC speakers 64,26 1,80 0 0 1 2,4 0,3 13,4 6,4 0
Broadband modem 31,00 4,00 3 20 0 0 7,5 0 0 0Dial-up modem 16,60 4,00 3 2,6 0 0 0,3 12 5,4 0
Broadband modem with WLAN 25,40 4,00 3 20 0 0 13 0 0 0
Laser printer 16,60Laser printer (office) 16,60 0,40 3 5,9 0 0 0,3 14,2 3,5 0Laser printer (home) 0,00 0,10 3 1,9 0 0 0,3 13,1 8,9 0
Inkjet printer 90,20Inkjet printer (office) 0,00 0,30 3 6 0 0 0,3 14,2 3,5 0Inkjet printer (home) 90,20 0,10 3 1,9 0 0 0,3 17,7 4,3 0
networked standby
7.1.1.6. Extreme BAT
The average is set to the best BAT, instead of the confirmed BAT, also when this value implies a change of functionality. The individual best BAT values for off-mode, passive and networked standby do not necessarily come from the same example.
For some product cases the "extreme" BAT values are the same as the confirmed BAT values (Option 5).
Product cost estimation: If the values are different from Option 5, the costs will be doubled, otherwise it is calculated with the same costs as in Option 5.

Report for Tender No. TREN/D1/40 Lot 6 -2005 EuP Lot 6 - Task 7 2nd of October 2007
Fraunhofer IZM CODDE Bio IS DUH Final Report Page 7-10
off-mode: 0.4 € passive standby: 2 € networked standby: 6 €
Table 7-7: Changed assumptions for Option 7 (extreme BAT)
stock 2005assumed on-mode passive standby off-mode
assumed 0 W off-mode
assumed disconnected
Mio h/day W h/day W h/day W h/day h/day h/dayEPS mobile phone 780,00
EPS mobile phone 780,00 1,40 0 0 0,06 10 0 12,6Lighting 179,00
Magnetic transformer 42,96 0,50 0 0 0,002 23,5 0 0Electronic transformer 28,64 0,50 0 0 0,002 23,5 0 0with hard off switch (correction factor) 107,40 0,50 0 0 0 0 23,5 0
Radio 114,40 0Radio with losses 57,20 1,00 0 0 1,5 23 0 0Radio without losses 57,20 1,00 0 0 0 0 23 0
Electric toothbrush 42,70 0Toothbrush 42,70 2,10 0 0 1 21,9 0 0
Electric oven 73,00Oven 73,00 0,30 0 1 23,7 0 0 0 0
Cordless phone 179,60Cordless phone 179,60 1,40 1,2 22,6 0 0 0 0 0 0
TV+ 275,92CRT TV 261,02 4,00 0,5 12 0 0 1,5 0 8 0LCD TV 11,04 4,00 0,2 12 0 0 2 0 8 0Plasma TV 2,76 4,00 0,1 12 0 0 1,5 0 8 0Rear projection 1,10 4,00 2 12 0 0 0,1 0 8 0Set-top-box 56,30 4,00 7,5 20 0 0 0 0 0 0
Washing machine 184,60Washing machine 184,60 1,00 0 0 0,04 3 0,037 20 0 0
DVD 143,30DVD player 128,97 0,60 0 0 0,12 15,6 0,12 4 3,8 0DVD recorder 14,33 0,60 0 0 0,6 15,6 0,6 4 3,8 0
Audio minisystem 114,40Audio minisystem 114,40 3,40 0 0 0,136 17,1 0,136 1,4 2,1 0
Fax 20,00Fax 20,00 0,90 0,35 23,1 0 0 0 0 0 0
PC+ (office) 80,50Desktop 44,00 6,20 1 8,8 0 0 0,4 9 0 0Notebook 36,50 7,20 0,34 8,2 0 0 0,34 8,6 0 0Monitor CRT 24,00 7,10 0,22 10,4 0 0 0,2 6,5 0 0Monitor LCD 20,50 7,10 0,38 10,4 0 0 0,3 6,5 0 0Hub 6,44 8,00 0,5 16 0 0 0 0 0 0
PC+ (home) 126,00Desktop 102,00 3,70 1 9,2 0 0 0,4 11,1 0 0Notebook 24,00 3,30 0,34 9 0 0 0,34 11,7 0 0Monitor CRT 57,00 2,80 0,22 9,6 0 0 0,2 11,6 0 0Monitor LCD 47,50 2,80 0,38 9,6 0 0 0,3 11,6 0 0PC speakers 64,26 1,80 0 0 2,4 2,4 1,5 13,4 6,4 0
Broadband modem 31,00 4,00 6,3 20 0 0 7,5 0 0 0Dial-up modem 16,60 4,00 2,7 2,6 0 0 2,6 12 5,4 0
Broadband modem with WLAN 25,40 4,00 6,4 20 0 0 13 0 0 0
Laser printer 16,60Laser printer (office) 16,60 0,40 0,64 5,9 0 0 0,036 14,2 3,5 0
Inkjet printer 90,20Inkjet printer (home) 90,20 0,10 0,2 1,9 0 0 0,2 17,7 4,3 0
networked standby
For some products no best BAT for off-mode was available, so the passive standby value was used (marked in orange).
7.1.1.7. Complex buffering
With more complex hardware configurations it is also possible to achieve zero or near zero Watt in off-mode while retaining the design freedom of the lower voltage soft switches. The technical design options are similar to those, which will be explored for powering standby functions without an external flow of power: buffering the energy internally, generating the necessary energy from
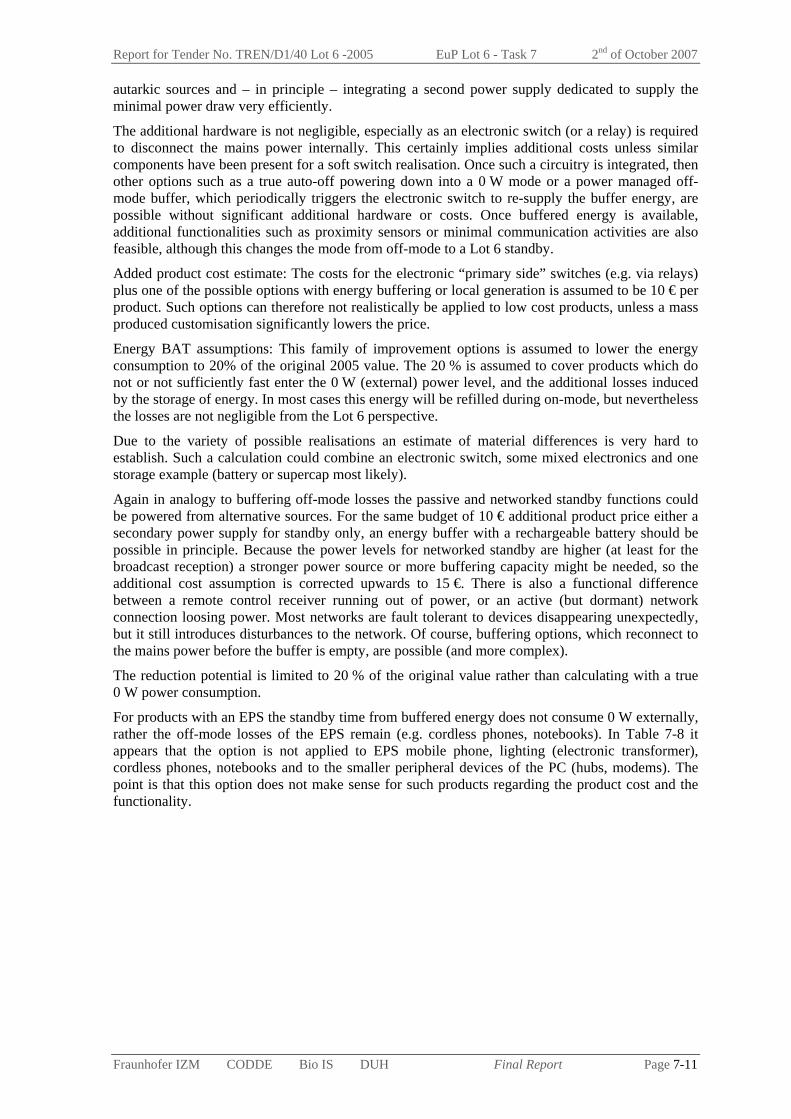
Report for Tender No. TREN/D1/40 Lot 6 -2005 EuP Lot 6 - Task 7 2nd of October 2007
Fraunhofer IZM CODDE Bio IS DUH Final Report Page 7-11
autarkic sources and – in principle – integrating a second power supply dedicated to supply the minimal power draw very efficiently.
The additional hardware is not negligible, especially as an electronic switch (or a relay) is required to disconnect the mains power internally. This certainly implies additional costs unless similar components have been present for a soft switch realisation. Once such a circuitry is integrated, then other options such as a true auto-off powering down into a 0 W mode or a power managed off-mode buffer, which periodically triggers the electronic switch to re-supply the buffer energy, are possible without significant additional hardware or costs. Once buffered energy is available, additional functionalities such as proximity sensors or minimal communication activities are also feasible, although this changes the mode from off-mode to a Lot 6 standby.
Added product cost estimate: The costs for the electronic “primary side” switches (e.g. via relays) plus one of the possible options with energy buffering or local generation is assumed to be 10 € per product. Such options can therefore not realistically be applied to low cost products, unless a mass produced customisation significantly lowers the price.
Energy BAT assumptions: This family of improvement options is assumed to lower the energy consumption to 20% of the original 2005 value. The 20 % is assumed to cover products which do not or not sufficiently fast enter the 0 W (external) power level, and the additional losses induced by the storage of energy. In most cases this energy will be refilled during on-mode, but nevertheless the losses are not negligible from the Lot 6 perspective.
Due to the variety of possible realisations an estimate of material differences is very hard to establish. Such a calculation could combine an electronic switch, some mixed electronics and one storage example (battery or supercap most likely).
Again in analogy to buffering off-mode losses the passive and networked standby functions could be powered from alternative sources. For the same budget of 10 € additional product price either a secondary power supply for standby only, an energy buffer with a rechargeable battery should be possible in principle. Because the power levels for networked standby are higher (at least for the broadcast reception) a stronger power source or more buffering capacity might be needed, so the additional cost assumption is corrected upwards to 15 €. There is also a functional difference between a remote control receiver running out of power, or an active (but dormant) network connection loosing power. Most networks are fault tolerant to devices disappearing unexpectedly, but it still introduces disturbances to the network. Of course, buffering options, which reconnect to the mains power before the buffer is empty, are possible (and more complex).
The reduction potential is limited to 20 % of the original value rather than calculating with a true 0 W power consumption.
For products with an EPS the standby time from buffered energy does not consume 0 W externally, rather the off-mode losses of the EPS remain (e.g. cordless phones, notebooks). In Table 7-8 it appears that the option is not applied to EPS mobile phone, lighting (electronic transformer), cordless phones, notebooks and to the smaller peripheral devices of the PC (hubs, modems). The point is that this option does not make sense for such products regarding the product cost and the functionality.
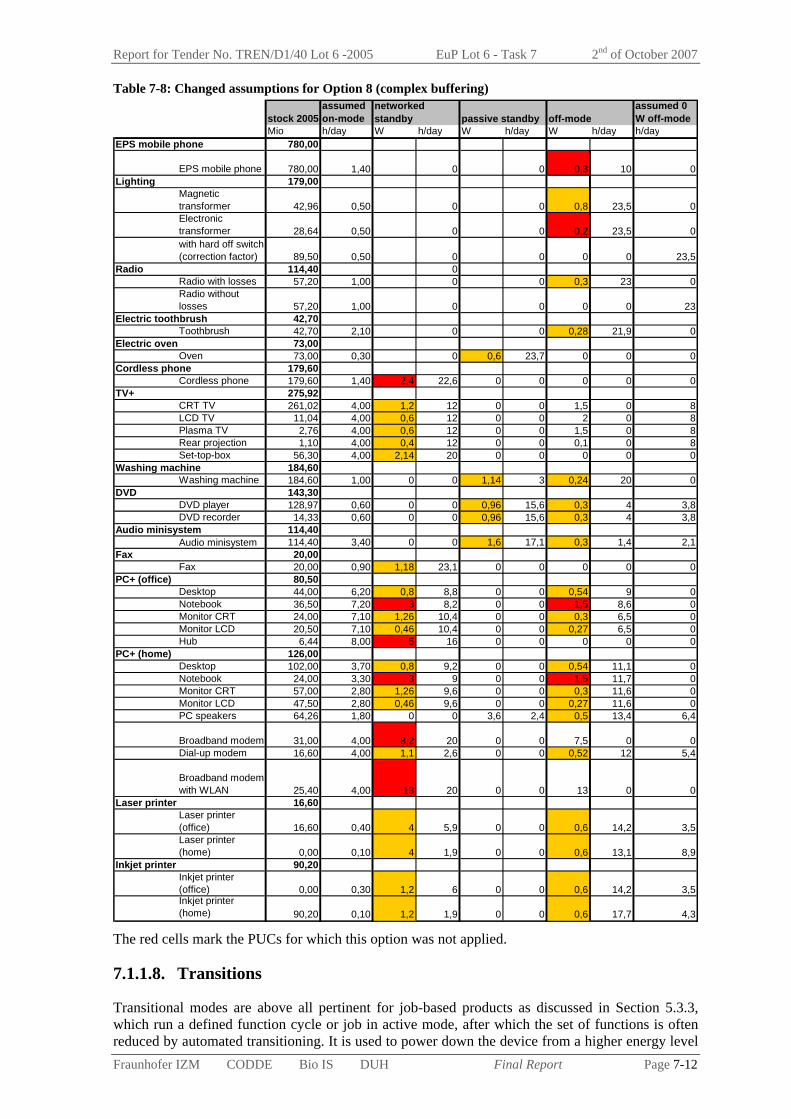
Report for Tender No. TREN/D1/40 Lot 6 -2005 EuP Lot 6 - Task 7 2nd of October 2007
Fraunhofer IZM CODDE Bio IS DUH Final Report Page 7-12
Table 7-8: Changed assumptions for Option 8 (complex buffering)
stock 2005assumed on-mode passive standby off-mode
assumed 0 W off-mode
Mio h/day W h/day W h/day W h/day h/dayEPS mobile phone 780,00
EPS mobile phone 780,00 1,40 0 0 0,3 10 0Lighting 179,00
Magnetic transformer 42,96 0,50 0 0 0,8 23,5 0Electronic transformer 28,64 0,50 0 0 0,2 23,5 0with hard off switch (correction factor) 89,50 0,50 0 0 0 0 23,5
Radio 114,40 0Radio with losses 57,20 1,00 0 0 0,3 23 0Radio without losses 57,20 1,00 0 0 0 0 23
Electric toothbrush 42,70Toothbrush 42,70 2,10 0 0 0,28 21,9 0
Electric oven 73,00Oven 73,00 0,30 0 0,6 23,7 0 0 0
Cordless phone 179,60Cordless phone 179,60 1,40 2,4 22,6 0 0 0 0 0
TV+ 275,92CRT TV 261,02 4,00 1,2 12 0 0 1,5 0 8LCD TV 11,04 4,00 0,6 12 0 0 2 0 8Plasma TV 2,76 4,00 0,6 12 0 0 1,5 0 8Rear projection 1,10 4,00 0,4 12 0 0 0,1 0 8Set-top-box 56,30 4,00 2,14 20 0 0 0 0 0
Washing machine 184,60Washing machine 184,60 1,00 0 0 1,14 3 0,24 20 0
DVD 143,30DVD player 128,97 0,60 0 0 0,96 15,6 0,3 4 3,8DVD recorder 14,33 0,60 0 0 0,96 15,6 0,3 4 3,8
Audio minisystem 114,40Audio minisystem 114,40 3,40 0 0 1,6 17,1 0,3 1,4 2,1
Fax 20,00Fax 20,00 0,90 1,18 23,1 0 0 0 0 0
PC+ (office) 80,50Desktop 44,00 6,20 0,8 8,8 0 0 0,54 9 0Notebook 36,50 7,20 3 8,2 0 0 1,5 8,6 0Monitor CRT 24,00 7,10 1,26 10,4 0 0 0,3 6,5 0Monitor LCD 20,50 7,10 0,46 10,4 0 0 0,27 6,5 0Hub 6,44 8,00 5 16 0 0 0 0 0
PC+ (home) 126,00Desktop 102,00 3,70 0,8 9,2 0 0 0,54 11,1 0Notebook 24,00 3,30 3 9 0 0 1,5 11,7 0Monitor CRT 57,00 2,80 1,26 9,6 0 0 0,3 11,6 0Monitor LCD 47,50 2,80 0,46 9,6 0 0 0,27 11,6 0PC speakers 64,26 1,80 0 0 3,6 2,4 0,5 13,4 6,4
Broadband modem 31,00 4,00 8,2 20 0 0 7,5 0 0Dial-up modem 16,60 4,00 1,1 2,6 0 0 0,52 12 5,4
Broadband modem with WLAN 25,40 4,00 13 20 0 0 13 0 0
Laser printer 16,60Laser printer (office) 16,60 0,40 4 5,9 0 0 0,6 14,2 3,5Laser printer (home) 0,00 0,10 4 1,9 0 0 0,6 13,1 8,9
Inkjet printer 90,20Inkjet printer (office) 0,00 0,30 1,2 6 0 0 0,6 14,2 3,5Inkjet printer (home) 90,20 0,10 1,2 1,9 0 0 0,6 17,7 4,3
networked standby
The red cells mark the PUCs for which this option was not applied.
7.1.1.8. Transitions
Transitional modes are above all pertinent for job-based products as discussed in Section 5.3.3, which run a defined function cycle or job in active mode, after which the set of functions is often reduced by automated transitioning. It is used to power down the device from a higher energy level

Report for Tender No. TREN/D1/40 Lot 6 -2005 EuP Lot 6 - Task 7 2nd of October 2007
Fraunhofer IZM CODDE Bio IS DUH Final Report Page 7-13
to a lower, the exact level depending on the functions that are still required. Automated transitioning/deactivation is a means to save energy without an active intervention of the user. However, the user may have influence on the transitioning via changing pre-defined product settings, possibly including the option to deactivate the transitioning or set the timeout to arbitrary high values.
Hence, improvement options could include:
faster transitioning to lower power mode transitioning to a lower power levels (e.g. to a Lot 6 standby mode instead of a higher level
“ready” mode; or to off-mode where possible) setting short transitioning times as products’ default options limiting the possibility of the user to deactivate the transitioning or the set unnecessarily
high timeout values Above, automated transitioning is considered as an existing product feature, which may be improved in order to lower energy consumption – over all modes including transitioning out of on mode or “ready” modes.
However, it may also be considered as an option itself: adding automated transitioning to a product as a new feature may help to reduce the energy consumption from the base line. “Always on”, “On/Off” and “On/Standby” products could be made to be “demand aware”, and automated transitioning implemented when they are not needed. For such an option, the impacts to the overall energy consummation would have to be estimated. On one hand automated transitioning adds “intelligence” and may help to lower energy consumption; on the other hand such smart functions require energy and circuitry themselves. Thus it is important to verify that the implementation of such an option does not have adversary effects on the energy consumption.
With auto-off and auto-standby functions shifts between modes are possible. Individual assumptions for changes of the use pattern were done. For auto-off functions only a transformation into off-mode with losses was considered. This excludes all off-mode product cases for this option except the electronic toothbrush that possible could switch from off-mode into off-mode without losses. A further exception is applied for products like hub’s and modems where an auto-off function is not acceptable from user scenario.
Transitions from on-mode to standby are not taken into account. This would appear as an increase of the standby energy consumption because the reduction in on-mode is out of scope.
For the costs it has to be considered if auto-transitions need different hardware or just adjustment of the setup. For changes in the hardware additional product costs of 2 € are assumed. Setup changes should not result in higher product costs, so no additional costs were taken into account.

Report for Tender No. TREN/D1/40 Lot 6 -2005 EuP Lot 6 - Task 7 2nd of October 2007
Fraunhofer IZM CODDE Bio IS DUH Final Report Page 7-14
Table 7-9: Changed assumptions for Option 9 (transitions)
stock 2005assumed on-mode passive standby off-mode
assumed 0 W off-mode
assumed disconnected
Mio h/day W h/day W h/day W h/day h/day h/dayElectric toothbrush 42,70 0
Toothbrush 42,70 2,10 0 0 1,4 1 20,9 0Cordless phone 179,60
Cordless phone 179,60 1,40 2,4 4 1 18,6 0 0 0 0TV+ 275,92
CRT TV 261,02 4,00 6 2 0 0 1,5 10 8 0LCD TV 11,04 4,00 3 2 0 0 2 10 8 0Plasma TV 2,76 4,00 3 2 0 0 1,5 10 8 0Rear projection 1,10 4,00 2 2 0 0 0,1 10 8 0Set-top-box 56,30 4,00 10,7 0,5 1 19,5 0 0 0 0
Washing machine 184,60Washing machine 184,60 1,00 0 0 5,7 0,2 1,2 22,8 0 0
DVD 143,30DVD player 128,97 0,60 0 0 4,8 1 1,5 18,6 3,8 0DVD recorder 14,33 0,60 0 0 4,8 4 1,5 15,6 3,8 0
Audio minisystem 114,40Audio minisystem 114,40 3,40 0 0 8 1 1,5 17,5 2,1 0
Fax 20,00Fax 20,00 0,90 5,9 1 1 22,1 0 0 0 0
PC+ (office) 80,50Desktop 44,00 6,20 4 1 0 0 2,7 16,8 0 0Notebook 36,50 7,20 3 1 0 0 1,5 15,8 0 0Monitor CRT 24,00 7,10 6,3 1 0 0 1,5 15,9 0 0Monitor LCD 20,50 7,10 2,3 1 0 0 1,35 15,9 0 0Hub 6,44 8,00 5 16 0 0 0 0 0 0
PC+ (home) 126,00Desktop 102,00 3,70 4 1 0 0 2,7 19,3 0 0Notebook 24,00 3,30 3 1 0 0 1,5 19,7 0 0Monitor CRT 57,00 2,80 6,3 1 0 0 1,5 20,2 0 0Monitor LCD 47,50 2,80 2,3 1 0 0 1,35 20,2 0 0
Laser printer 16,60Laser printer (office) 16,60 0,40 20 2,95 3 2,95 3 14,2 3,5 0Laser printer (home) 0,00 0,10 20 0,95 3 0,95 3 13,1 8,9 0
Inkjet printer 90,20Inkjet printer (office) 0,00 0,30 6 3 3 3 3 14,2 3,5 0Inkjet printer (home) 90,20 0,10 6 0,9 0 0 3 18,7 4,3 0
networked standby
The table does not contain the excluded PUC’s like EPS mobile phone or Lighting
7.1.2. Option combinations
Some option combinations have already been mentioned in the above explanation of the design options. The off-mode options can usually not just be added to the standby related options, because they may cover the same products, and the additional product costs are not always additive. There can be side effects to combining two options, such as a hard-off switch together with BAT for passive standby, because the lower standby levels are then only contributing for a shortened mode duration.
For options 3 and 4 (and 8), if they apply to the same product the additional product costs should only be added once to the life cycle costs. However, the energy saving again might not be simply additive.
7.1.2.1. Combination 3+4: more efficient PSU
Installing more efficient power supplies to reduce the power supply losses does not effect either the off-mode or standby, but all-modes (including on mode, but out of scope). Therefore the Options 3 and 4 can be added.
No additional hardware is needed, so the assumed 0.2 € cover also the option combination.
7.1.2.2. Combination 5+1: BAT plus hard-off switch (25 %)
The option should cover not only the improvements for standby also the greater improvement for the off-mode losses.

Report for Tender No. TREN/D1/40 Lot 6 -2005 EuP Lot 6 - Task 7 2nd of October 2007
Fraunhofer IZM CODDE Bio IS DUH Final Report Page 7-15
For the combination of Options 5 and 1 the average is set to the individual BAT values and additionally a hard-off switch is installed, which is used by 25 % of the users (if not replacing a soft-switch).
The additional products costs of Option 5 and 1 will be added, when both options are used for the product case:
off-mode: 0.2 € + 1 € passive standby: 1 € + 1 € networked standby: 3 € + 1 €
7-10: Combination 5+1 (BAT plus hard-off switch (25 %))
stock 2005assumed on-mode passive standby off-mode
assumed 0 W off-mode
assumed disconnected
Mio h/day W h/day W h/day W h/day h/day h/dayEPS mobile phone 780,00
EPS mobile phone 780,00 1,40 0 0 0,1 10 0 12,6Lighting 179,00
Magnetic transformer 42,96 0,50 0 0 0,2 0 23,5 0Electronic transformer 28,64 0,50 0 0 0,2 0 23,5 0with hard off switch (correction factor) 89,50 0,50 0 0 0 0 23,5 0
Radio 114,40 0Radio with losses 57,20 1,00 0 0 1,5 0 23 0Radio without losses 57,20 1,00 0 0 0 0 23 0
Electric toothbrush 42,70 0Toothbrush 42,70 2,10 0 0 1 16,425 5,475 0
Electric oven 73,00Oven 73,00 0,30 0 2,5 23,7 0 0 0 0
Cordless phone 179,60Cordless phone 179,60 1,40 1,2 22,6 0 0 0 0 0 0
TV+ 275,92CRT TV 261,02 4,00 0,5 12 0 0 1,5 0 8 0LCD TV 11,04 4,00 0,2 12 0 0 2 0 8 0Plasma TV 2,76 4,00 0,3 12 0 0 1,5 0 8 0Rear projection 1,10 4,00 2 12 0 0 0,1 0 8 0Set-top-box 56,30 4,00 7,5 12 0 0 0 0 8 0
Washing machine 184,60Washing machine 184,60 1,00 0 0 0,9 3 0,1 0 20 0
DVD 143,30DVD player 128,97 0,60 0 0 0,12 15,6 0,12 0 7,8 0DVD recorder 14,33 0,60 0 0 0,6 15,6 0,6 0 7,8 0
Audio minisystem 114,40Audio minisystem 114,40 3,40 0 0 0,136 15,7 0,136 0 4,90 0
Fax 20,00Fax 20,00 0,90 0,35 23,1 0 0 0 0 0 0
PC+ (office) 80,50Desktop 44,00 6,20 2,2 8,8 0 0 0,8 6,75 2,25 0Notebook 36,50 7,20 0,5 8,2 0 0 0,38 8,6 0 0Monitor CRT 24,00 7,10 0,6 10,4 0 0 0,2 0 6,5 0Monitor LCD 20,50 7,10 0,4 10,4 0 0 0,3 0 6,5 0Hub 6,44 8,00 0,5 16 0 0 0 0 0 0
PC+ (home) 126,00Desktop 102,00 3,70 2,2 9,2 0 0 0,8 8,325 2,775 0Notebook 24,00 3,30 0,5 9 0 0 0,38 11,7 0 0Monitor CRT 57,00 2,80 0,6 9,6 0 0 0,2 0 11,6 0Monitor LCD 47,50 2,80 0,4 9,6 0 0 0,3 0 11,6 0PC speakers 64,26 1,80 0 0 2,4 2,4 1,5 13,4 6,4 0
Broadband modem 31,00 4,00 6,3 20,75 0 0 7,5 0 5 0Dial-up modem 16,60 4,00 2,7 2,6 0 0 2,6 0 17,4 0
Broadband modem with WLAN 25,40 4,00 6,4 20 0 0 13 0 0 0
Laser printer 16,60Laser printer (office) 16,60 0,40 2 5,9 0 0 0,4 0 17,7 0Laser printer (home) 0,00 0,10 2 1,9 0 0 0,4 0 22 0
Inkjet printer 90,20Inkjet printer (office) 0,00 0,30 0,7 6 0 0 0,5 0 17,7 0Inkjet printer (home) 90,20 0,10 0,7 1,9 0 0 0,5 0 22 0
networked standby

Report for Tender No. TREN/D1/40 Lot 6 -2005 EuP Lot 6 - Task 7 2nd of October 2007
Fraunhofer IZM CODDE Bio IS DUH Final Report Page 7-16
7.1.2.3. Combination 5+8: BAT plus complex buffering
This combination represents a design optimisation with high cost impacts.
For product cases which have a BAT value of 0.5 W or more, an additional complex buffering is considered possible. The BAT value is decreased to 20 %.
The additional products costs of Option 5 and 8 can be added, when both options are used for the product case:
off-mode: 10 € + 0.2 € passive standby: 10 € + 1 € networked standby: 15 € + 3 €
Table 7-11: assumptions for combination 5+8 (BAT and complex buffering)
stock 2005assumed on-mode passive standby off-mode
assumed 0 W off-mode
assumed disconnected
Mio h/day W h/day W h/day W h/day h/day h/dayEPS mobile phone 780,00
EPS mobile phone 780,00 1,40 0 0 0,1 10 0 12,6Lighting 179,00
Magnetic transformer 42,96 0,50 0 0 0,2 23,5 0 0Electronic transformer 28,64 0,50 0 0 0,2 23,5 0 0with hard off switch (correction factor) 89,50 0,50 0 0 0 0 23,5 0
Radio 114,40 0Radio with losses 57,20 1,00 0 0 0,3 23 0 0Radio without losses 57,20 1,00 0 0 0 0 23 0
Electric toothbrush 42,70 0Toothbrush 42,70 2,10 0 0 0,2 21,9 0 0
Electric oven 73,00Oven 73,00 0,30 0 0,5 23,7 0 0 0 0
Cordless phone 179,60Cordless phone 179,60 1,40 1,2 22,6 0 0 0 0 0 0
TV+ 275,92CRT TV 261,02 4,00 0,1 12 0 0 1,5 0 8 0LCD TV 11,04 4,00 0,2 12 0 0 2 0 8 0Plasma TV 2,76 4,00 0,3 12 0 0 1,5 0 8 0Rear projection 1,10 4,00 0,4 12 0 0 0,1 0 8 0Set-top-box 56,30 4,00 1,5 20 0 0 0 0 0 0
Washing machine 184,60Washing machine 184,60 1,00 0 0 0,18 3 0,1 20 0 0
DVD 143,30DVD player 128,97 0,60 0 0 0,12 15,6 0,12 4 3,8 0DVD recorder 14,33 0,60 0 0 0,12 15,6 0,12 4 3,8 0
Audio minisystem 114,40Audio minisystem 114,40 3,40 0 0 0,136 17,1 0,136 1,4 2,1 0
Fax 20,00Fax 20,00 0,90 0,35 23,1 0 0 0 0 0 0
PC+ (office) 80,50Desktop 44,00 6,20 0,44 8,8 0 0 0,16 9 0 0Notebook 36,50 7,20 0,5 8,2 0 0 0,38 8,6 0 0Monitor CRT 24,00 7,10 0,12 10,4 0 0 0,2 6,5 0 0Monitor LCD 20,50 7,10 0,4 10,4 0 0 0,3 6,5 0 0Hub 6,44 8,00 0,1 16 0 0 0 0 0 0
PC+ (home) 126,00Desktop 102,00 3,70 0,44 9,2 0 0 0,16 11,1 0 0Notebook 24,00 3,30 0,5 9 0 0 0,38 11,7 0 0Monitor CRT 57,00 2,80 0,12 9,6 0 0 0,2 11,6 0 0Monitor LCD 47,50 2,80 0,4 9,6 0 0 0,3 11,6 0 0PC speakers 64,26 1,80 0 0 0,48 2,4 0,3 13,4 6,4 0
Broadband modem 31,00 4,00 6,3 20 0 0 7,5 0 0 0Dial-up modem 16,60 4,00 2,7 2,6 0 0 2,6 12 5,4 0
Broadband modem with WLAN 25,40 4,00 6,4 20 0 0 13 0 0 0
Laser printer 16,60Laser printer (office) 16,60 0,40 0,4 5,9 0 0 0,4 14,2 3,5 0Laser printer (home) 0,00 0,10 0,4 1,9 0 0 0,4 13,1 8,9 0
Inkjet printer 90,20Inkjet printer (office) 0,00 0,30 0,14 6 0 0 0,1 14,2 3,5 0Inkjet printer (home) 90,20 0,10 0,14 1,9 0 0 0,1 17,7 4,3 0
networked standby
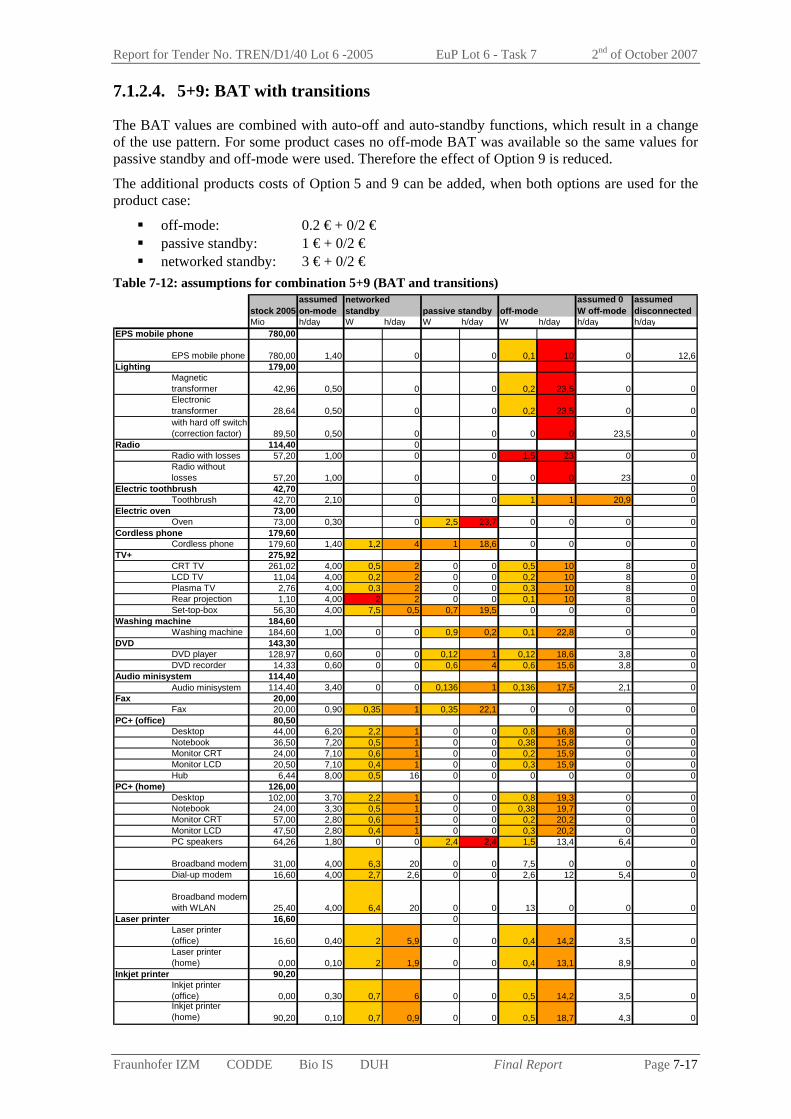
Report for Tender No. TREN/D1/40 Lot 6 -2005 EuP Lot 6 - Task 7 2nd of October 2007
Fraunhofer IZM CODDE Bio IS DUH Final Report Page 7-17
7.1.2.4. 5+9: BAT with transitions
The BAT values are combined with auto-off and auto-standby functions, which result in a change of the use pattern. For some product cases no off-mode BAT was available so the same values for passive standby and off-mode were used. Therefore the effect of Option 9 is reduced.
The additional products costs of Option 5 and 9 can be added, when both options are used for the product case:
off-mode: 0.2 € + 0/2 € passive standby: 1 € + 0/2 € networked standby: 3 € + 0/2 €
Table 7-12: assumptions for combination 5+9 (BAT and transitions)
stock 2005assumed on-mode passive standby off-mode
assumed 0 W off-mode
assumed disconnected
Mio h/day W h/day W h/day W h/day h/day h/dayEPS mobile phone 780,00
EPS mobile phone 780,00 1,40 0 0 0,1 10 0 12,6Lighting 179,00
Magnetic transformer 42,96 0,50 0 0 0,2 23,5 0 0Electronic transformer 28,64 0,50 0 0 0,2 23,5 0 0with hard off switch (correction factor) 89,50 0,50 0 0 0 0 23,5 0
Radio 114,40 0Radio with losses 57,20 1,00 0 0 1,5 23 0 0Radio without losses 57,20 1,00 0 0 0 0 23 0
Electric toothbrush 42,70 0Toothbrush 42,70 2,10 0 0 1 1 20,9 0
Electric oven 73,00Oven 73,00 0,30 0 2,5 23,7 0 0 0 0
Cordless phone 179,60Cordless phone 179,60 1,40 1,2 4 1 18,6 0 0 0 0
TV+ 275,92CRT TV 261,02 4,00 0,5 2 0 0 0,5 10 8 0LCD TV 11,04 4,00 0,2 2 0 0 0,2 10 8 0Plasma TV 2,76 4,00 0,3 2 0 0 0,3 10 8 0Rear projection 1,10 4,00 2 2 0 0 0,1 10 8 0Set-top-box 56,30 4,00 7,5 0,5 0,7 19,5 0 0 0 0
Washing machine 184,60Washing machine 184,60 1,00 0 0 0,9 0,2 0,1 22,8 0 0
DVD 143,30DVD player 128,97 0,60 0 0 0,12 1 0,12 18,6 3,8 0DVD recorder 14,33 0,60 0 0 0,6 4 0,6 15,6 3,8 0
Audio minisystem 114,40Audio minisystem 114,40 3,40 0 0 0,136 1 0,136 17,5 2,1 0
Fax 20,00Fax 20,00 0,90 0,35 1 0,35 22,1 0 0 0 0
PC+ (office) 80,50Desktop 44,00 6,20 2,2 1 0 0 0,8 16,8 0 0Notebook 36,50 7,20 0,5 1 0 0 0,38 15,8 0 0Monitor CRT 24,00 7,10 0,6 1 0 0 0,2 15,9 0 0Monitor LCD 20,50 7,10 0,4 1 0 0 0,3 15,9 0 0Hub 6,44 8,00 0,5 16 0 0 0 0 0 0
PC+ (home) 126,00Desktop 102,00 3,70 2,2 1 0 0 0,8 19,3 0 0Notebook 24,00 3,30 0,5 1 0 0 0,38 19,7 0 0Monitor CRT 57,00 2,80 0,6 1 0 0 0,2 20,2 0 0Monitor LCD 47,50 2,80 0,4 1 0 0 0,3 20,2 0 0PC speakers 64,26 1,80 0 0 2,4 2,4 1,5 13,4 6,4 0
Broadband modem 31,00 4,00 6,3 20 0 0 7,5 0 0 0Dial-up modem 16,60 4,00 2,7 2,6 0 0 2,6 12 5,4 0
Broadband modem with WLAN 25,40 4,00 6,4 20 0 0 13 0 0 0
Laser printer 16,60 0Laser printer (office) 16,60 0,40 2 5,9 0 0 0,4 14,2 3,5 0Laser printer (home) 0,00 0,10 2 1,9 0 0 0,4 13,1 8,9 0
Inkjet printer 90,20Inkjet printer (office) 0,00 0,30 0,7 6 0 0 0,5 14,2 3,5 0Inkjet printer (home) 90,20 0,10 0,7 0,9 0 0 0,5 18,7 4,3 0
networked standby
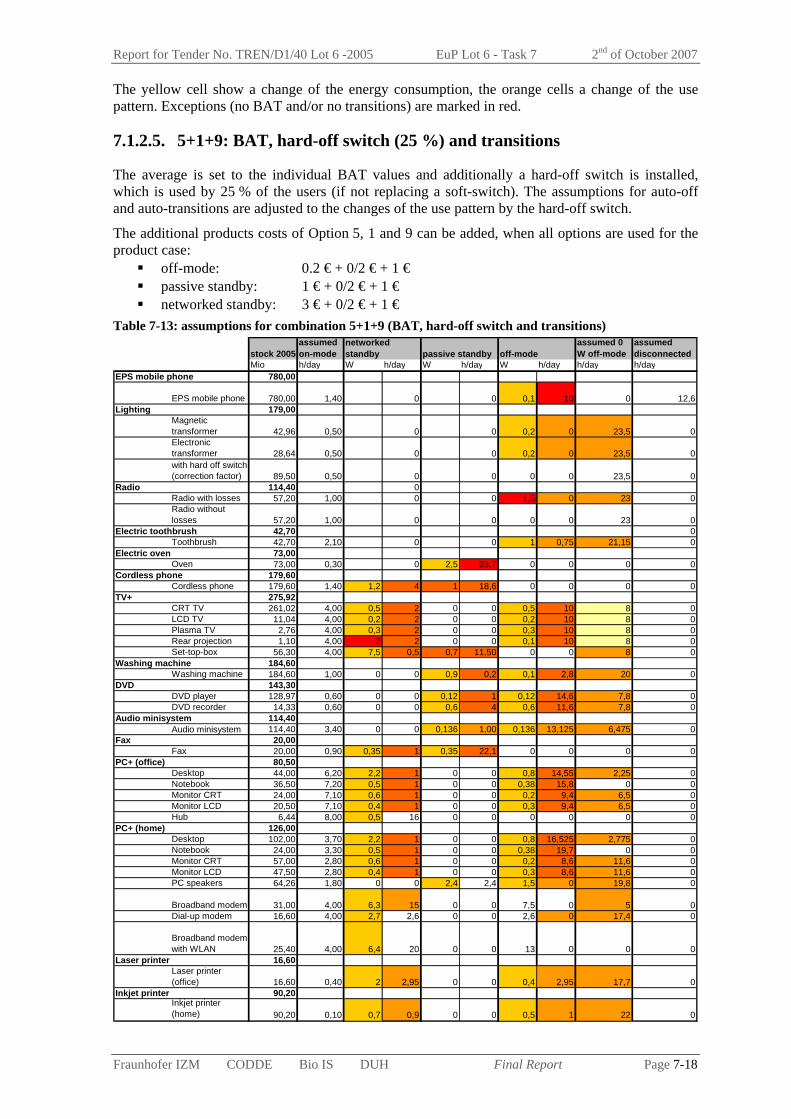
Report for Tender No. TREN/D1/40 Lot 6 -2005 EuP Lot 6 - Task 7 2nd of October 2007
Fraunhofer IZM CODDE Bio IS DUH Final Report Page 7-18
The yellow cell show a change of the energy consumption, the orange cells a change of the use pattern. Exceptions (no BAT and/or no transitions) are marked in red.
7.1.2.5. 5+1+9: BAT, hard-off switch (25 %) and transitions
The average is set to the individual BAT values and additionally a hard-off switch is installed, which is used by 25 % of the users (if not replacing a soft-switch). The assumptions for auto-off and auto-transitions are adjusted to the changes of the use pattern by the hard-off switch.
The additional products costs of Option 5, 1 and 9 can be added, when all options are used for the product case:
off-mode: 0.2 € + 0/2 € + 1 € passive standby: 1 € + 0/2 € + 1 € networked standby: 3 € + 0/2 € + 1 €
Table 7-13: assumptions for combination 5+1+9 (BAT, hard-off switch and transitions)
stock 2005assumed on-mode passive standby off-mode
assumed 0 W off-mode
assumed disconnected
Mio h/day W h/day W h/day W h/day h/day h/dayEPS mobile phone 780,00
EPS mobile phone 780,00 1,40 0 0 0,1 10 0 12,6Lighting 179,00
Magnetic transformer 42,96 0,50 0 0 0,2 0 23,5 0Electronic transformer 28,64 0,50 0 0 0,2 0 23,5 0with hard off switch (correction factor) 89,50 0,50 0 0 0 0 23,5 0
Radio 114,40 0Radio with losses 57,20 1,00 0 0 1,5 0 23 0Radio without losses 57,20 1,00 0 0 0 0 23 0
Electric toothbrush 42,70 0Toothbrush 42,70 2,10 0 0 1 0,75 21,15 0
Electric oven 73,00Oven 73,00 0,30 0 2,5 23,7 0 0 0 0
Cordless phone 179,60Cordless phone 179,60 1,40 1,2 4 1 18,6 0 0 0 0
TV+ 275,92CRT TV 261,02 4,00 0,5 2 0 0 0,5 10 8 0LCD TV 11,04 4,00 0,2 2 0 0 0,2 10 8 0Plasma TV 2,76 4,00 0,3 2 0 0 0,3 10 8 0Rear projection 1,10 4,00 2 2 0 0 0,1 10 8 0Set-top-box 56,30 4,00 7,5 0,5 0,7 11,50 0 0 8 0
Washing machine 184,60Washing machine 184,60 1,00 0 0 0,9 0,2 0,1 2,8 20 0
DVD 143,30DVD player 128,97 0,60 0 0 0,12 1 0,12 14,6 7,8 0DVD recorder 14,33 0,60 0 0 0,6 4 0,6 11,6 7,8 0
Audio minisystem 114,40Audio minisystem 114,40 3,40 0 0 0,136 1,00 0,136 13,125 6,475 0
Fax 20,00Fax 20,00 0,90 0,35 1 0,35 22,1 0 0 0 0
PC+ (office) 80,50Desktop 44,00 6,20 2,2 1 0 0 0,8 14,55 2,25 0Notebook 36,50 7,20 0,5 1 0 0 0,38 15,8 0 0Monitor CRT 24,00 7,10 0,6 1 0 0 0,2 9,4 6,5 0Monitor LCD 20,50 7,10 0,4 1 0 0 0,3 9,4 6,5 0Hub 6,44 8,00 0,5 16 0 0 0 0 0 0
PC+ (home) 126,00Desktop 102,00 3,70 2,2 1 0 0 0,8 16,525 2,775 0Notebook 24,00 3,30 0,5 1 0 0 0,38 19,7 0 0Monitor CRT 57,00 2,80 0,6 1 0 0 0,2 8,6 11,6 0Monitor LCD 47,50 2,80 0,4 1 0 0 0,3 8,6 11,6 0PC speakers 64,26 1,80 0 0 2,4 2,4 1,5 0 19,8 0
Broadband modem 31,00 4,00 6,3 15 0 0 7,5 0 5 0Dial-up modem 16,60 4,00 2,7 2,6 0 0 2,6 0 17,4 0
Broadband modem with WLAN 25,40 4,00 6,4 20 0 0 13 0 0 0
Laser printer 16,60Laser printer (office) 16,60 0,40 2 2,95 0 0 0,4 2,95 17,7 0
Inkjet printer 90,20Inkjet printer (home) 90,20 0,10 0,7 0,9 0 0 0,5 1 22 0
networked standby

Report for Tender No. TREN/D1/40 Lot 6 -2005 EuP Lot 6 - Task 7 2nd of October 2007
Fraunhofer IZM CODDE Bio IS DUH Final Report Page 7-19
7.1.2.6. 7+2: extreme BAT plus hard-off switch (75 %)
As an extreme point of reduction the combination of Option 7 and 2 could be added – more as an exploration towards the theoretical minimum. This combines "best BAT" values per mode with a high percentage of used hard-off switches.
The costs will be added, if the hard-off switch applies to the product case:
off-mode: 0.2/0.4 € + 1 € passive standby: 1/2 € + 1 € networked standby: 3/6 € + 1 €
Table 7-14: assumptions for combination 7+2 (best BAT and hard-switch 75%)
stock 2005assumed on-mode passive standby off-mode
assumed 0 W off-mode
assumed disconnected
Mio h/day W h/day W h/day W h/day h/day h/dayEPS mobile phone 780,00
EPS mobile phone 780,00 1,40 0 0 0,06 10 0 12,6Lighting 179,00
Magnetic transformer 42,96 0,50 0 0 0,002 0 23,5 0Electronic transformer 28,64 0,50 0 0 0,002 0 23,5 0with hard off switch (correction factor) 107,40 0,50 0 0 0 0 23,5 0
Radio 114,40 0Radio with losses 57,20 1,00 0 0 1,5 0 23 0Radio without losses 57,20 1,00 0 0 0 0 23 0
Electric toothbrush 42,70 0Toothbrush 42,70 2,10 0 0 1 5,475 16,425 0
Electric oven 73,00Oven 73,00 0,30 0 1 23,7 0 0 0 0
Cordless phone 179,60Cordless phone 179,60 1,40 1,2 22,6 0 0 0 0 0 0
TV+ 275,92CRT TV 261,02 4,00 0,5 5,75 0 0 1,5 0 14,25 0LCD TV 11,04 4,00 0,2 5,75 0 0 2 0 14,25 0Plasma TV 2,76 4,00 0,1 5,75 0 0 1,5 0 14,25 0Rear projection 1,10 4,00 2 5,75 0 0 0,1 0 14,25 0Set-top-box 56,30 4,00 7,5 5,75 0 0 0 0 14,25 0
Washing machine 184,60Washing machine 184,60 1,00 0 0 0,04 3 0,037 0 20 0
DVD 143,30DVD player 128,97 0,60 0 0 0,12 6,6 0,12 0 16,8 0DVD recorder 14,33 0,60 0 0 0,6 5,78 0,6 0 17,62 0
Audio minisystem 114,40Audio minisystem 114,40 3,40 0 0 0,136 5,9 0,136 0 14,7 0
Fax 20,00Fax 20,00 0,90 0,35 23,1 0 0 0 0 0 0
PC+ (office) 80,50Desktop 44,00 6,20 1 8,8 0 0 0,4 2,25 6,75 0Notebook 36,50 7,20 0,34 8,2 0 0 0,34 8,6 0 0Monitor CRT 24,00 7,10 0,22 10,4 0 0 0,2 0 6,5 0Monitor LCD 20,50 7,10 0,38 10,4 0 0 0,3 0 6,5 0Hub 6,44 8,00 0,5 16 0 0 0 0 0 0
PC+ (home) 126,00Desktop 102,00 3,70 1 9,2 0 0 0,4 2,78 8,33 0Notebook 24,00 3,30 0,34 9 0 0 0,34 11,7 0 0Monitor CRT 57,00 2,80 0,22 9,6 0 0 0,2 0 11,6 0Monitor LCD 47,50 2,80 0,38 9,6 0 0 0,3 0 11,6 0PC speakers 64,26 1,80 0 0 2,4 2,4 1,5 0 19,8 0
Broadband modem 31,00 4,00 6,3 7,93 0 0 7,5 0 12,08 0Dial-up modem 16,60 4,00 5,5 2,6 0 0 2,6 0 17,4 0
Broadband modem with WLAN 25,40 4,00 6,4 20 0 0 13 0 0 0
Laser printer 16,60Laser printer (office) 16,60 0,40 0,64 5,9 0 0 0,036 0 17,7 0
Inkjet printer 90,20Inkjet printer (home) 90,20 0,10 0,2 1,9 0 0 0,2 0 22 0
networked standby
In this table the changes of energy consumption are shown in yellow, the changes of the use pattern in orange.
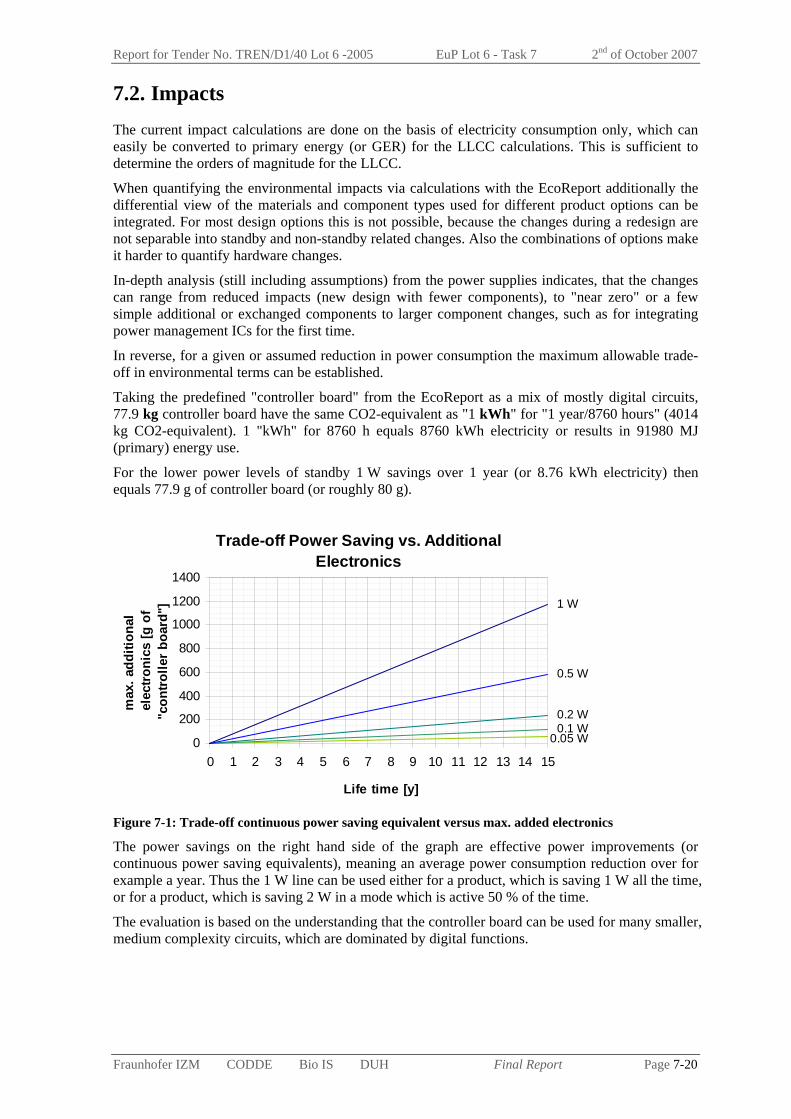
Report for Tender No. TREN/D1/40 Lot 6 -2005 EuP Lot 6 - Task 7 2nd of October 2007
Fraunhofer IZM CODDE Bio IS DUH Final Report Page 7-20
7.2. Impacts The current impact calculations are done on the basis of electricity consumption only, which can easily be converted to primary energy (or GER) for the LLCC calculations. This is sufficient to determine the orders of magnitude for the LLCC.
When quantifying the environmental impacts via calculations with the EcoReport additionally the differential view of the materials and component types used for different product options can be integrated. For most design options this is not possible, because the changes during a redesign are not separable into standby and non-standby related changes. Also the combinations of options make it harder to quantify hardware changes.
In-depth analysis (still including assumptions) from the power supplies indicates, that the changes can range from reduced impacts (new design with fewer components), to "near zero" or a few simple additional or exchanged components to larger component changes, such as for integrating power management ICs for the first time.
In reverse, for a given or assumed reduction in power consumption the maximum allowable trade-off in environmental terms can be established.
Taking the predefined "controller board" from the EcoReport as a mix of mostly digital circuits, 77.9 kg controller board have the same CO2-equivalent as "1 kWh" for "1 year/8760 hours" (4014 kg CO2-equivalent). 1 "kWh" for 8760 h equals 8760 kWh electricity or results in 91980 MJ (primary) energy use.
For the lower power levels of standby 1 W savings over 1 year (or 8.76 kWh electricity) then equals 77.9 g of controller board (or roughly 80 g).
Trade-off Power Saving vs. Additional Electronics
0.1 W0.2 W
0.5 W
1 W
0.05 W0
200
400
600
800
1000
1200
1400
0 1 2 3 4 5 6 7 8 9 10 11 12 13 14 15
Life time [y]
max
. add
ition
al
elec
tron
ics
[g o
f "c
ontro
ller b
oard
"]
Figure 7-1: Trade-off continuous power saving equivalent versus max. added electronics
The power savings on the right hand side of the graph are effective power improvements (or continuous power saving equivalents), meaning an average power consumption reduction over for example a year. Thus the 1 W line can be used either for a product, which is saving 1 W all the time, or for a product, which is saving 2 W in a mode which is active 50 % of the time.
The evaluation is based on the understanding that the controller board can be used for many smaller, medium complexity circuits, which are dominated by digital functions.
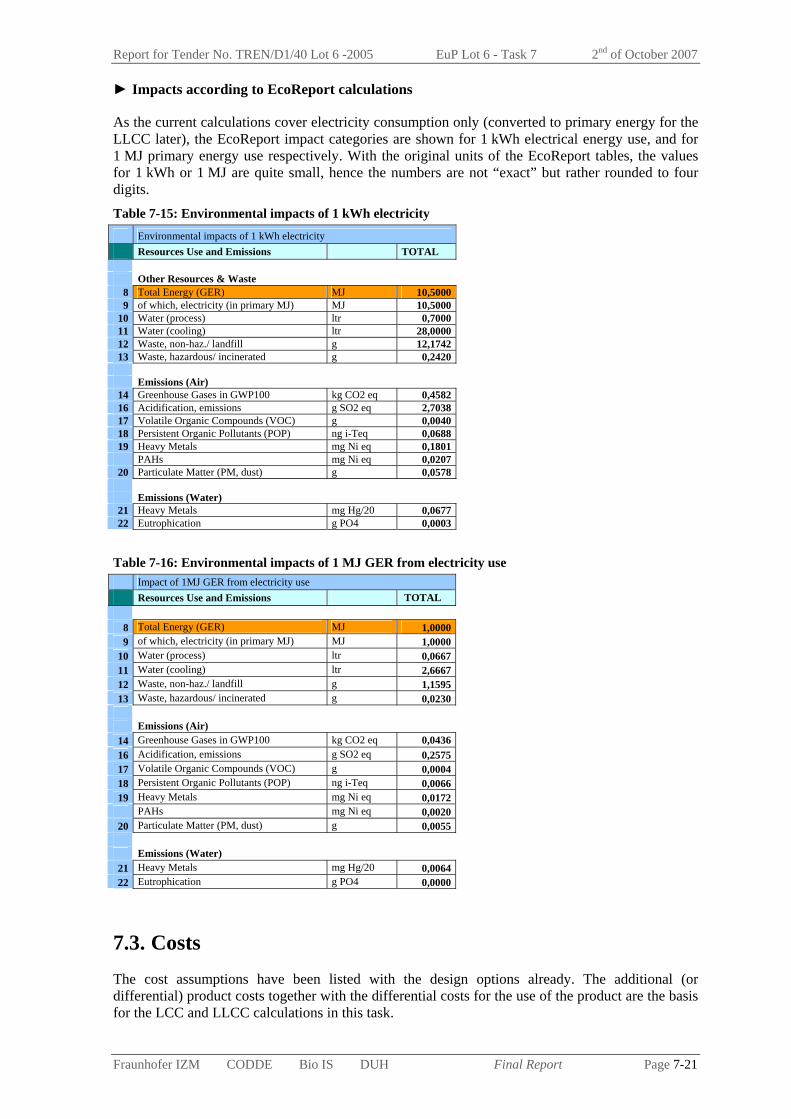
Report for Tender No. TREN/D1/40 Lot 6 -2005 EuP Lot 6 - Task 7 2nd of October 2007
Fraunhofer IZM CODDE Bio IS DUH Final Report Page 7-21
► Impacts according to EcoReport calculations
As the current calculations cover electricity consumption only (converted to primary energy for the LLCC later), the EcoReport impact categories are shown for 1 kWh electrical energy use, and for 1 MJ primary energy use respectively. With the original units of the EcoReport tables, the values for 1 kWh or 1 MJ are quite small, hence the numbers are not “exact” but rather rounded to four digits. Table 7-15: Environmental impacts of 1 kWh electricity Environmental impacts of 1 kWh electricity Resources Use and Emissions TOTAL Other Resources & Waste
8 Total Energy (GER) MJ 10,50009 of which, electricity (in primary MJ) MJ 10,5000
10 Water (process) ltr 0,700011 Water (cooling) ltr 28,000012 Waste, non-haz./ landfill g 12,174213 Waste, hazardous/ incinerated g 0,2420
Emissions (Air) 14 Greenhouse Gases in GWP100 kg CO2 eq 0,458216 Acidification, emissions g SO2 eq 2,703817 Volatile Organic Compounds (VOC) g 0,004018 Persistent Organic Pollutants (POP) ng i-Teq 0,068819 Heavy Metals mg Ni eq 0,1801
PAHs mg Ni eq 0,020720 Particulate Matter (PM, dust) g 0,0578
Emissions (Water) 21 Heavy Metals mg Hg/20 0,067722 Eutrophication g PO4 0,0003
Table 7-16: Environmental impacts of 1 MJ GER from electricity use Impact of 1MJ GER from electricity use Resources Use and Emissions TOTAL
8 Total Energy (GER) MJ 1,00009 of which, electricity (in primary MJ) MJ 1,0000
10 Water (process) ltr 0,066711 Water (cooling) ltr 2,666712 Waste, non-haz./ landfill g 1,159513 Waste, hazardous/ incinerated g 0,0230
Emissions (Air) 14 Greenhouse Gases in GWP100 kg CO2 eq 0,043616 Acidification, emissions g SO2 eq 0,257517 Volatile Organic Compounds (VOC) g 0,000418 Persistent Organic Pollutants (POP) ng i-Teq 0,006619 Heavy Metals mg Ni eq 0,0172
PAHs mg Ni eq 0,002020 Particulate Matter (PM, dust) g 0,0055
Emissions (Water) 21 Heavy Metals mg Hg/20 0,006422 Eutrophication g PO4 0,0000
7.3. Costs The cost assumptions have been listed with the design options already. The additional (or differential) product costs together with the differential costs for the use of the product are the basis for the LCC and LLCC calculations in this task.

Report for Tender No. TREN/D1/40 Lot 6 -2005 EuP Lot 6 - Task 7 2nd of October 2007
Fraunhofer IZM CODDE Bio IS DUH Final Report Page 7-22
In line with the EcoReport calculations the discounting rate has been taken into the calculation for the LCC. The discounting rate is set as 1.8 %, according to the assumptions given in Task 5.
► Technical lifetime of product cases
The average number of years for the product use is needed for the LCC calculations. The following data used in the calculations will be integrated in Task 3 in the final report. Table 7-17: Technical lifetime
Reference in source Lifetime in
years Source
PUC 1
EPS mobile phone 3 [Bio 2007]
Lighting 15 [CEN 2007]
Radio 8.7 [Schlomann 2004]
Electric toothbrush personal hygiene appliances EPS/BC 4 [Bio 2007]
PUC 2
Electric oven Elektroeinbauherd mit Backofen 15 [Mietrechtspraxis 2007]
Cordless phone Cordless phone base station 7.2 [Schlomann 2004]
TV+ TV (avg. 2006) 10 [IZM 2006b]
PUC 3 Washing machine Washing machine (avg.) 12 [CEN 2007] DVD DVD player/recorder 8.7 [Schlomann 2004] Audio minisystem Audio compact system 8.7 [Schlomann 2004] Fax Facsimile Machines 8 [IZM 2006a] PC+ (office+home) PC+ simplification 6 [IVF 2007]
Desktop PC 6 [IVF 2007] Laptop 5 [IVF 2007] CRT monitor 6 [IVF 2007] LCD monitor 6 [IVF 2007] Laser printer EP Printer 6 [IZM 2006a] Inkjet printer Inkjet Printer 4 [IZM 2006a]
Note that in the “+”-cases only one lifetime is used for the mix of products. Therefore e.g. set-top-boxes have a comparatively long use time with 10 years, and laptops are calculated with 6 years same as the other PC+ product parts.
► Other cost estimates for standby
Same as with the environmental gains or burdens of improving standby performance or reducing off-mode loses, costs are very hard to quantify, and companies are reluctant to hand out actual changes in the product cost calculations.
The German study [Biebeler 2006] estimated costs for LCD TVs, for TFT monitors and for electric shavers as part of an impact assessment of the EuP (financed by German industry associations, not by the commission). Based on manufacturer questionnaires and interviews they assumed
One-time costs between 4000 and 100 000 Euros (redesign of products)
Additional product costs between 0.2 and 5 Euros

Report for Tender No. TREN/D1/40 Lot 6 -2005 EuP Lot 6 - Task 7 2nd of October 2007
Fraunhofer IZM CODDE Bio IS DUH Final Report Page 7-23
Although the values are based on few industry answers, it is at least a recent attempt to quantify the costs. One underlying assumption was, however, that because of the EuP implementation the products would have to be redesigned. The Lot 6 study usually works under the assumption, that during a pending redesign the new requirements are fed into the design process. Whether this can be achieved for a horizontal measure will have to be discussed in Task 8.
The product costs in [Biebeler 2006] are then allocated to reduction of standby and off-mode losses as follows:
- LDC-TVs: 0.75 € for reducing Standby + 0.75 € for the reduction of the Off-mode losses
Assumed target value LCD-TV: 0.5 W Off-mode losses, 1.0 W standby
- TFT-monitors: 1 € for reducing Standby + 4 € for the reduction of the Off-mode losses
Assumed target value TFT-monitor: 0.3-0.5 W Off-mode losses, 1.0 W standby
- Electric shavers: 0.5 € to reduce the Off-mode losses
Assumed target value Electric shaver: 0.3 W Off-mode losses, no standby for electric shavers is assumed
In detail the reasons for these costs are not always clear, such as the quite large amount of 4 € for reducing the monitor off-mode losses. This could reflect replacing EPS with internal power supplies, or with power supplies very efficient under low load (soft-off on the monitor). Incidentally, EPS usage has been greatly reduced in LCD monitors over the last product generations.
► Trade-off chart for additional product costs
On a generalised level the potential trade-off between saving energy during use and investing more hardware with a higher product price can be examined similar to the hardware trade-off in Figure 7-1.
Trade-off Power Saving vs. Increased Product Costs
0.1 W0.2 W
0.5 W
1 W
0.05 W02468
101214161820
0 1 2 3 4 5 6 7 8 9 10 11 12 13 14 15
Life time [y]
max
. add
ition
al p
rodu
ct
pric
e [€
]
Figure 7-2: Trade-off continuous power saving equivalent versus max. added product costs
Again, the power values in Watt on the right hand side are continuous power saving equivalents, so the 1 W line also applies to 4 W saving in a mode, which covers 6 h/day on average.
7.4. LLCC Calculations Based on the assumption in Chapter 7.1 for each of the design options, the power saving over the lifetime of the product versus the LCC costs can be displayed per product case. For each product
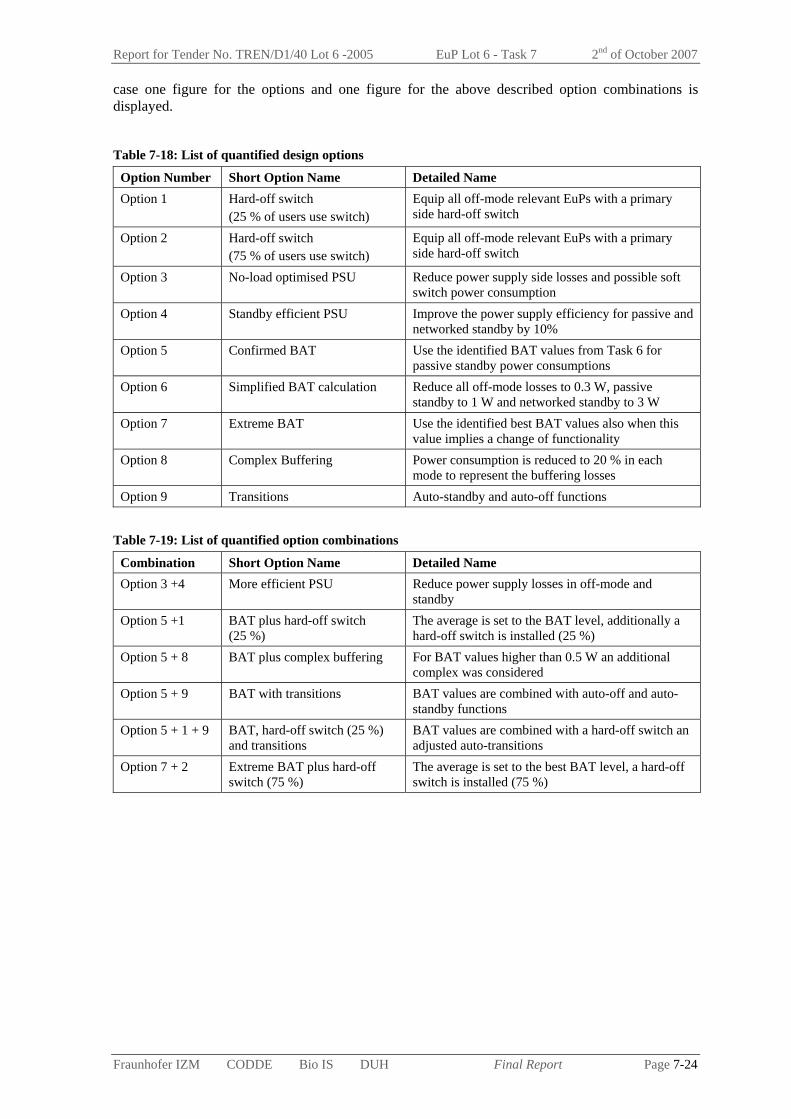
Report for Tender No. TREN/D1/40 Lot 6 -2005 EuP Lot 6 - Task 7 2nd of October 2007
Fraunhofer IZM CODDE Bio IS DUH Final Report Page 7-24
case one figure for the options and one figure for the above described option combinations is displayed.
Table 7-18: List of quantified design options
Option Number Short Option Name Detailed Name Option 1 Hard-off switch
(25 % of users use switch) Equip all off-mode relevant EuPs with a primary side hard-off switch
Option 2 Hard-off switch (75 % of users use switch)
Equip all off-mode relevant EuPs with a primary side hard-off switch
Option 3 No-load optimised PSU Reduce power supply side losses and possible soft switch power consumption
Option 4 Standby efficient PSU Improve the power supply efficiency for passive and networked standby by 10%
Option 5 Confirmed BAT Use the identified BAT values from Task 6 for passive standby power consumptions
Option 6 Simplified BAT calculation Reduce all off-mode losses to 0.3 W, passive standby to 1 W and networked standby to 3 W
Option 7 Extreme BAT Use the identified best BAT values also when this value implies a change of functionality
Option 8 Complex Buffering Power consumption is reduced to 20 % in each mode to represent the buffering losses
Option 9 Transitions Auto-standby and auto-off functions Table 7-19: List of quantified option combinations
Combination Short Option Name Detailed Name Option 3 +4 More efficient PSU Reduce power supply losses in off-mode and
standby Option 5 +1 BAT plus hard-off switch
(25 %) The average is set to the BAT level, additionally a hard-off switch is installed (25 %)
Option 5 + 8 BAT plus complex buffering For BAT values higher than 0.5 W an additional complex was considered
Option 5 + 9 BAT with transitions BAT values are combined with auto-off and auto-standby functions
Option 5 + 1 + 9 BAT, hard-off switch (25 %) and transitions
BAT values are combined with a hard-off switch an adjusted auto-transitions
Option 7 + 2 Extreme BAT plus hard-off switch (75 %)
The average is set to the best BAT level, a hard-off switch is installed (75 %)
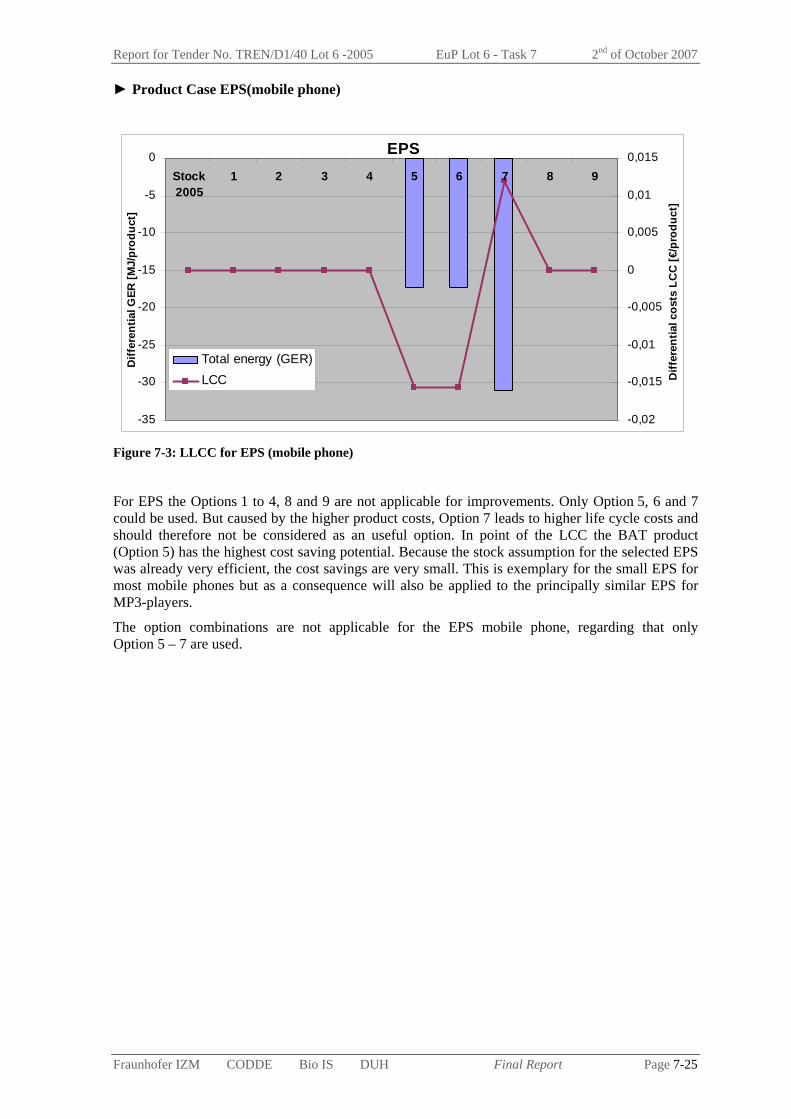
Report for Tender No. TREN/D1/40 Lot 6 -2005 EuP Lot 6 - Task 7 2nd of October 2007
Fraunhofer IZM CODDE Bio IS DUH Final Report Page 7-25
► Product Case EPS(mobile phone)
EPS
-35
-30
-25
-20
-15
-10
-5
0Stock2005
1 2 3 4 5 6 7 8 9
Diff
eren
tial G
ER [M
J/pr
oduc
t]
-0,02
-0,015
-0,01
-0,005
0
0,005
0,01
0,015
Diff
eren
tial c
osts
LC
C [€
/pro
duct
]
Total energy (GER)LCC
Figure 7-3: LLCC for EPS (mobile phone)
For EPS the Options 1 to 4, 8 and 9 are not applicable for improvements. Only Option 5, 6 and 7 could be used. But caused by the higher product costs, Option 7 leads to higher life cycle costs and should therefore not be considered as an useful option. In point of the LCC the BAT product (Option 5) has the highest cost saving potential. Because the stock assumption for the selected EPS was already very efficient, the cost savings are very small. This is exemplary for the small EPS for most mobile phones but as a consequence will also be applied to the principally similar EPS for MP3-players.
The option combinations are not applicable for the EPS mobile phone, regarding that only Option 5 – 7 are used.

Report for Tender No. TREN/D1/40 Lot 6 -2005 EuP Lot 6 - Task 7 2nd of October 2007
Fraunhofer IZM CODDE Bio IS DUH Final Report Page 7-26
► Product Case Lighting
Lighting
-1600
-1400
-1200
-1000
-800
-600
-400
-200
0
Stock2005
1 2 3 4 5 6 7 8 9
Diff
eren
tial G
ER [M
J/pr
oduc
t]
-16
-14
-12
-10
-8
-6
-4
-2
0
Diff
eren
tial c
osts
LC
C [€
/pro
duct
]
Total energy (GER)
LCC
Figure 7-4: LLCC for Lighting
Lighting
-1600
-1400
-1200
-1000
-800
-600
-400
-200
0
Stock2005
3+4 5 5+9 1 5+1 5+1+9 7+2 5+8
Diff
eren
tial G
ER [M
J/pr
oduc
t]
-16
-14
-12
-10
-8
-6
-4
-2
0
Diff
eren
tial c
osts
LC
C [€
/pro
duct
]
Total energy (GER)
LCC
Figure 7-5: LLCC for Lighting (option combination)
All options except Option 9 are in principle applicable for Lighting. Because Option 9 is not used the Combination 5+9 is the same as Option 5 and 5+1+9 the same as 5+1. The use of a hard-off switch is user independent for Lighting, so Option 1 and 2 are the same. The option combination 5+8 is excluded by grey line in point of, that buffered energy is no realistic scenario for Lighting. But for consistence and comparability this option combination is displayed in Figure 7-5.
As shown in this figure the point of LLCC for Lighting is within Option 1, hard-off switch (user independent).

Report for Tender No. TREN/D1/40 Lot 6 -2005 EuP Lot 6 - Task 7 2nd of October 2007
Fraunhofer IZM CODDE Bio IS DUH Final Report Page 7-27
► Product Case Radio
Radio
-700
-600
-500
-400
-300
-200
-100
0Stock2005
1 2 3 4 5 6 7 8 9
Diff
eren
tial G
ER [M
J/pr
oduc
t]
-8
-6
-4
-2
0
2
4
6
Diff
eren
tial c
osts
LC
C [€
/pro
duct
]
Total energy (GER)
LCC
Figure 7-6: LLCC for Radio
Radio
-700
-600
-500
-400
-300
-200
-100
0Stock2005
5 5+9 3+4 1 5+1 5+1+9 7+2 5+8
Diff
eren
tial G
ER [M
J/pr
oduc
t]
-8
-6
-4
-2
0
2
4
6
Diff
eren
tial c
osts
LC
C [€
/pro
duct
]
Total energy (GER)
LCC
Figure 7-7: LLCC for Radio (option combination)
For the radio Options 4 and 9 (no standby) and 5 and 7 (no BAT available) could not be applied. The hard-off switch option is user independent. Therefore the Options 1, 2, 5+1, 5+1+9 and 7+2 are the same. Because of the assumed high product costs, Option 8 would result in increased costs, but it would not be the option with highest energy saving, this would be Option 1, which is also the option with the lowest costs. The option combination 5+8 is excluded by grey line because of high additional product price and the also unrealistic combination for the radio case.

Report for Tender No. TREN/D1/40 Lot 6 -2005 EuP Lot 6 - Task 7 2nd of October 2007
Fraunhofer IZM CODDE Bio IS DUH Final Report Page 7-28
► Product Case Electric Toothbrush
Electric toothbrush
-500
-450
-400
-350
-300
-250
-200
-150
-100
-50
0Stock2005
1 2 3 4 5 6 7 8 9
Diff
eren
tial G
ER [M
J/pr
oduc
t]
-6
-4
-2
0
2
4
6
Diff
eren
tial c
osts
LC
C [€
/pro
duct
]
Total energy (GER)
LCC
Figure 7-8: LLCC for Electric Toothbrush
Electric toothbrush
-500
-450
-400
-350
-300
-250
-200
-150
-100
-50
0Stock2005
1 5 5+1 3+4 7+2 5+9 5+1+9 5+8
Diff
eren
tial G
ER [M
J/pr
oduc
t]
-6
-4
-2
0
2
4
6
Diff
eren
tial c
osts
LC
C [€
/pro
duct
]
Total energy (GER)
LCC
Figure 7-9: LLCC for Electric Toothbrush (option combination)
The electric toothbrush does not have a standby mode, therefore Option 4 could not be applied. Options 8 and option combination 5+8 lead to increasing costs, so they should not be considered as an option. The highest energy saving potential has option combination 5+1+9, but the point of LLCC is within Option 3 (same as Combination 3+4).
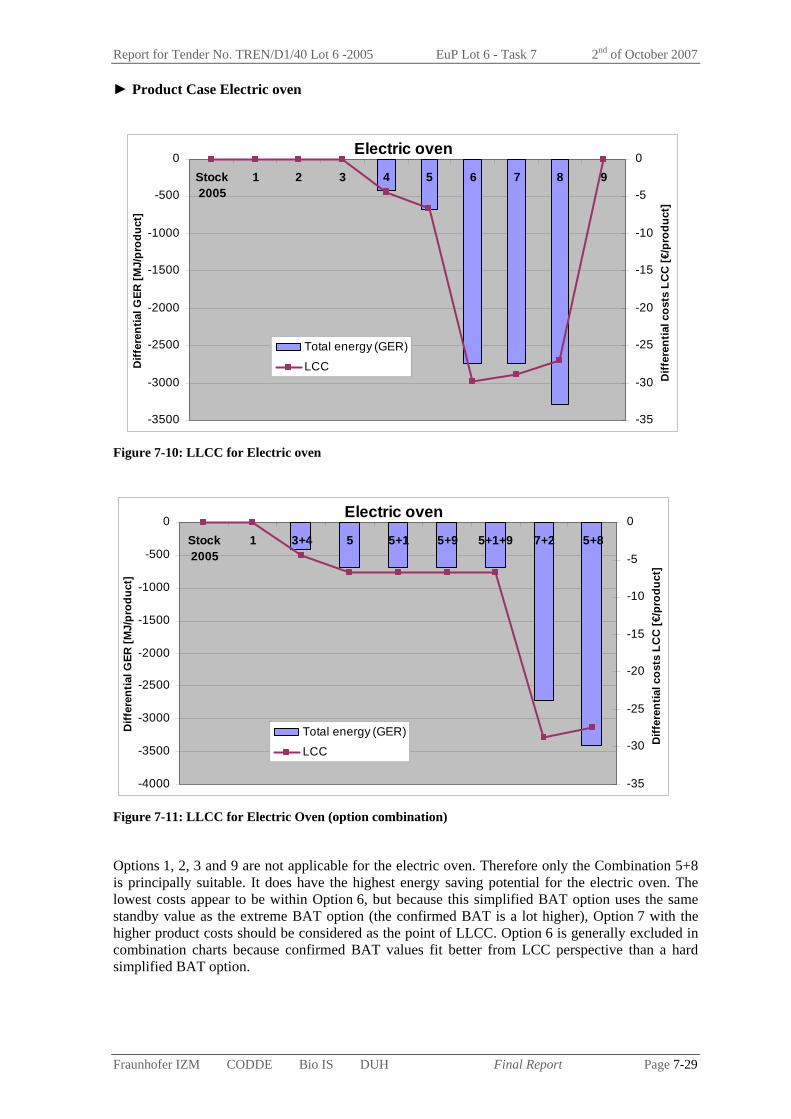
Report for Tender No. TREN/D1/40 Lot 6 -2005 EuP Lot 6 - Task 7 2nd of October 2007
Fraunhofer IZM CODDE Bio IS DUH Final Report Page 7-29
► Product Case Electric oven
Electric oven
-3500
-3000
-2500
-2000
-1500
-1000
-500
0Stock2005
1 2 3 4 5 6 7 8 9
Diff
eren
tial G
ER [M
J/pr
oduc
t]
-35
-30
-25
-20
-15
-10
-5
0
Diff
eren
tial c
osts
LC
C [€
/pro
duct
]
Total energy (GER)
LCC
Figure 7-10: LLCC for Electric oven
Electric oven
-4000
-3500
-3000
-2500
-2000
-1500
-1000
-500
0Stock2005
1 3+4 5 5+1 5+9 5+1+9 7+2 5+8
Diff
eren
tial G
ER [M
J/pr
oduc
t]
-35
-30
-25
-20
-15
-10
-5
0
Diff
eren
tial c
osts
LC
C [€
/pro
duct
]
Total energy (GER)
LCC
Figure 7-11: LLCC for Electric Oven (option combination)
Options 1, 2, 3 and 9 are not applicable for the electric oven. Therefore only the Combination 5+8 is principally suitable. It does have the highest energy saving potential for the electric oven. The lowest costs appear to be within Option 6, but because this simplified BAT option uses the same standby value as the extreme BAT option (the confirmed BAT is a lot higher), Option 7 with the higher product costs should be considered as the point of LLCC. Option 6 is generally excluded in combination charts because confirmed BAT values fit better from LCC perspective than a hard simplified BAT option.
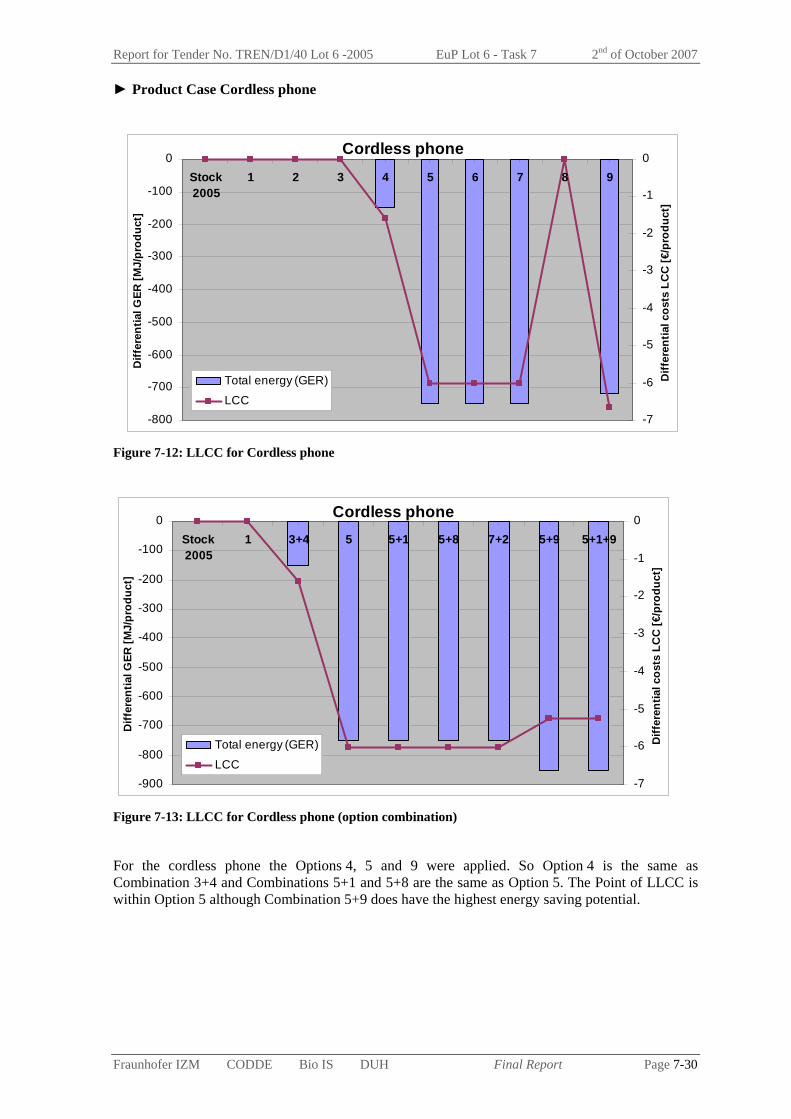
Report for Tender No. TREN/D1/40 Lot 6 -2005 EuP Lot 6 - Task 7 2nd of October 2007
Fraunhofer IZM CODDE Bio IS DUH Final Report Page 7-30
► Product Case Cordless phone
Cordless phone
-800
-700
-600
-500
-400
-300
-200
-100
0Stock2005
1 2 3 4 5 6 7 8 9
Diff
eren
tial G
ER [M
J/pr
oduc
t]
-7
-6
-5
-4
-3
-2
-1
0
Diff
eren
tial c
osts
LC
C [€
/pro
duct
]
Total energy (GER)
LCC
Figure 7-12: LLCC for Cordless phone
Cordless phone
-900
-800
-700
-600
-500
-400
-300
-200
-100
0Stock2005
1 3+4 5 5+1 5+8 7+2 5+9 5+1+9
Diff
eren
tial G
ER [M
J/pr
oduc
t]
-7
-6
-5
-4
-3
-2
-1
0
Diff
eren
tial c
osts
LC
C [€
/pro
duct
]
Total energy (GER)
LCC
Figure 7-13: LLCC for Cordless phone (option combination)
For the cordless phone the Options 4, 5 and 9 were applied. So Option 4 is the same as Combination 3+4 and Combinations 5+1 and 5+8 are the same as Option 5. The Point of LLCC is within Option 5 although Combination 5+9 does have the highest energy saving potential.
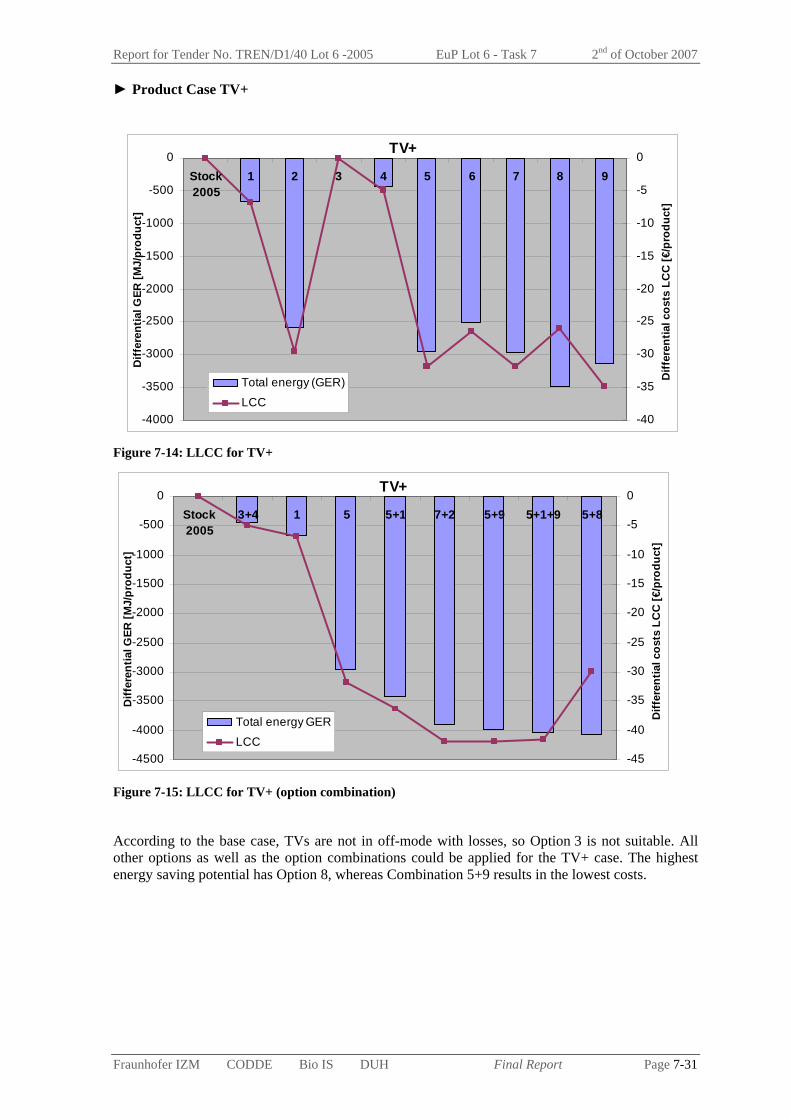
Report for Tender No. TREN/D1/40 Lot 6 -2005 EuP Lot 6 - Task 7 2nd of October 2007
Fraunhofer IZM CODDE Bio IS DUH Final Report Page 7-31
► Product Case TV+
TV+
-4000
-3500
-3000
-2500
-2000
-1500
-1000
-500
0Stock2005
1 2 3 4 5 6 7 8 9
Diff
eren
tial G
ER [M
J/pr
oduc
t]
-40
-35
-30
-25
-20
-15
-10
-5
0
Diff
eren
tial c
osts
LC
C [€
/pro
duct
]
Total energy (GER)
LCC
Figure 7-14: LLCC for TV+
TV+
-4500
-4000
-3500
-3000
-2500
-2000
-1500
-1000
-500
0Stock2005
3+4 1 5 5+1 7+2 5+9 5+1+9 5+8
Diff
eren
tial G
ER [M
J/pr
oduc
t]
-45
-40
-35
-30
-25
-20
-15
-10
-5
0
Diff
eren
tial c
osts
LC
C [€
/pro
duct
]
Total energy GER
LCC
Figure 7-15: LLCC for TV+ (option combination)
According to the base case, TVs are not in off-mode with losses, so Option 3 is not suitable. All other options as well as the option combinations could be applied for the TV+ case. The highest energy saving potential has Option 8, whereas Combination 5+9 results in the lowest costs.

Report for Tender No. TREN/D1/40 Lot 6 -2005 EuP Lot 6 - Task 7 2nd of October 2007
Fraunhofer IZM CODDE Bio IS DUH Final Report Page 7-32
► Product Case Washing machine
Washing machine
-2000
-1800
-1600
-1400
-1200
-1000
-800
-600
-400
-200
0Stock2005
1 2 3 4 5 6 7 8 9
Diff
eren
tial G
ER [M
J/pr
oduc
t]
-25
-20
-15
-10
-5
0
Diff
eren
tial c
osts
LC
C [€
/pro
duct
]
Total energy (GER)
LCC
Figure 7-16: LLCC for Washing machine
Washing machine
-2000
-1800
-1600
-1400
-1200
-1000
-800
-600
-400
-200
0Stock2005
3+4 1 5 5+1 5+9 5+1+9 7+2 5+8
Diff
eren
tial G
ER [M
J/pr
oduc
t]
-20
-18
-16
-14
-12
-10
-8
-6
-4
-2
0
Diff
eren
tial c
osts
LC
C [€
/pro
duct
]
Total energy (GER)
LCC
Figure 7-17: LLCC for Washing machine (option combination)
Option 3 (improving the PSU to reduce off-mode losses) is generally suitable for the washing machine, but the estimated value for Option 3 in off-mode is higher than the base case value. Therefore the option was not applied. The use of the hard-of switch was considered user independent, so Option 1 and 2 are the same.
The point of LLCC can be seen within Combination 5+1. Although Option 7 has an even lower value, it is not considered a realistic option in this case.

Report for Tender No. TREN/D1/40 Lot 6 -2005 EuP Lot 6 - Task 7 2nd of October 2007
Fraunhofer IZM CODDE Bio IS DUH Final Report Page 7-33
► Product Case DVD player/recorder
DVD
-3000
-2500
-2000
-1500
-1000
-500
0Stock2005
1 2 3 4 5 6 7 8 9
Diff
eren
tial G
ER [M
J/pr
oduc
t]
-35
-30
-25
-20
-15
-10
-5
0
Diff
eren
tial c
osts
LC
C [€
/pro
duct
]
Total energy (GER)
LCC
Figure 7-18: LLCC for DVD player/recorder
DVD
-3000
-2500
-2000
-1500
-1000
-500
0Stock2005
1 3+4 5+9 5 5+1 5+1+9 5+8 7+2
Diff
eren
tial G
ER [M
J/pr
oduc
t]
-35
-30
-25
-20
-15
-10
-5
0
Diff
eren
tial c
osts
LC
C [€
/pro
duct
]
Total energy (GER)
LCC
Figure 7-19: LLCC for DVD player/recorder (option combination)
The same values were used for best BAT and confirmed BAT, therefore Option 5 and 7 are the same. The BAT example achieves the lowest costs for the product case DVD player and recorder. The highest energy saving potential has option combination 7+2, but is not a realistic scenario with 75 % of all users using the hard-off switch.
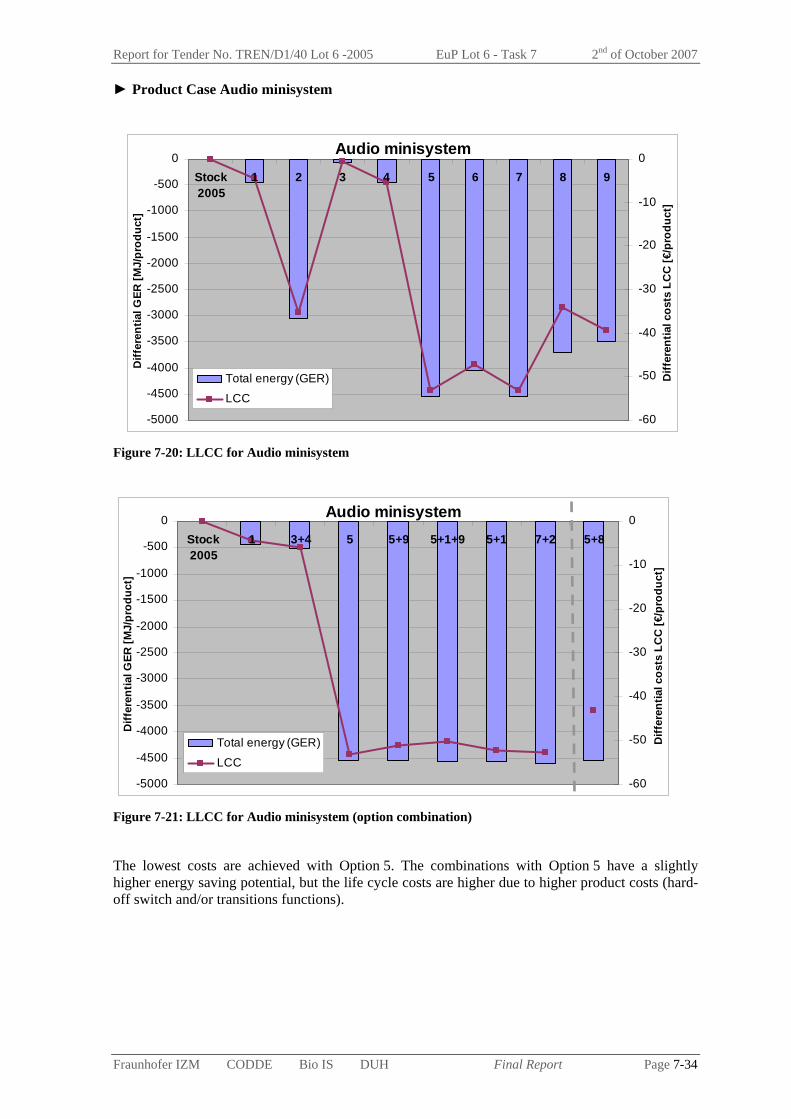
Report for Tender No. TREN/D1/40 Lot 6 -2005 EuP Lot 6 - Task 7 2nd of October 2007
Fraunhofer IZM CODDE Bio IS DUH Final Report Page 7-34
► Product Case Audio minisystem
Audio minisystem
-5000
-4500
-4000
-3500
-3000
-2500
-2000
-1500
-1000
-500
0Stock2005
1 2 3 4 5 6 7 8 9
Diff
eren
tial G
ER [M
J/pr
oduc
t]
-60
-50
-40
-30
-20
-10
0
Diff
eren
tial c
osts
LC
C [€
/pro
duct
]
Total energy (GER)
LCC
Figure 7-20: LLCC for Audio minisystem
Audio minisystem
-5000
-4500
-4000
-3500
-3000
-2500
-2000
-1500
-1000
-500
0Stock2005
1 3+4 5 5+9 5+1+9 5+1 7+2 5+8
Diff
eren
tial G
ER [M
J/pr
oduc
t]
-60
-50
-40
-30
-20
-10
0
Diff
eren
tial c
osts
LC
C [€
/pro
duct
]
Total energy (GER)
LCC
Figure 7-21: LLCC for Audio minisystem (option combination)
The lowest costs are achieved with Option 5. The combinations with Option 5 have a slightly higher energy saving potential, but the life cycle costs are higher due to higher product costs (hard-off switch and/or transitions functions).
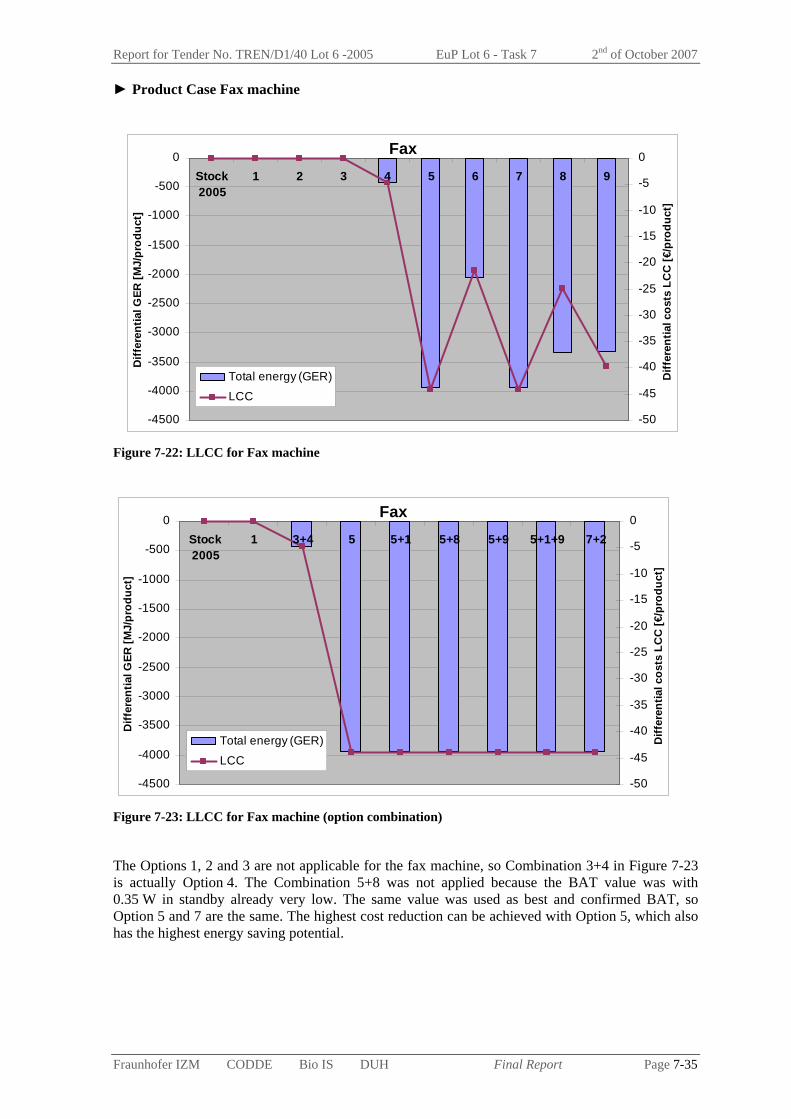
Report for Tender No. TREN/D1/40 Lot 6 -2005 EuP Lot 6 - Task 7 2nd of October 2007
Fraunhofer IZM CODDE Bio IS DUH Final Report Page 7-35
► Product Case Fax machine
Fax
-4500
-4000
-3500
-3000
-2500
-2000
-1500
-1000
-500
0Stock2005
1 2 3 4 5 6 7 8 9
Diff
eren
tial G
ER [M
J/pr
oduc
t]
-50
-45
-40
-35
-30
-25
-20
-15
-10
-5
0
Diff
eren
tial c
osts
LC
C [€
/pro
duct
]
Total energy (GER)
LCC
Figure 7-22: LLCC for Fax machine
Fax
-4500
-4000
-3500
-3000
-2500
-2000
-1500
-1000
-500
0Stock2005
1 3+4 5 5+1 5+8 5+9 5+1+9 7+2
Diff
eren
tial G
ER [M
J/pr
oduc
t]
-50
-45
-40
-35
-30
-25
-20
-15
-10
-5
0
Diff
eren
tial c
osts
LC
C [€
/pro
duct
]
Total energy (GER)
LCC
Figure 7-23: LLCC for Fax machine (option combination)
The Options 1, 2 and 3 are not applicable for the fax machine, so Combination 3+4 in Figure 7-23 is actually Option 4. The Combination 5+8 was not applied because the BAT value was with 0.35 W in standby already very low. The same value was used as best and confirmed BAT, so Option 5 and 7 are the same. The highest cost reduction can be achieved with Option 5, which also has the highest energy saving potential.
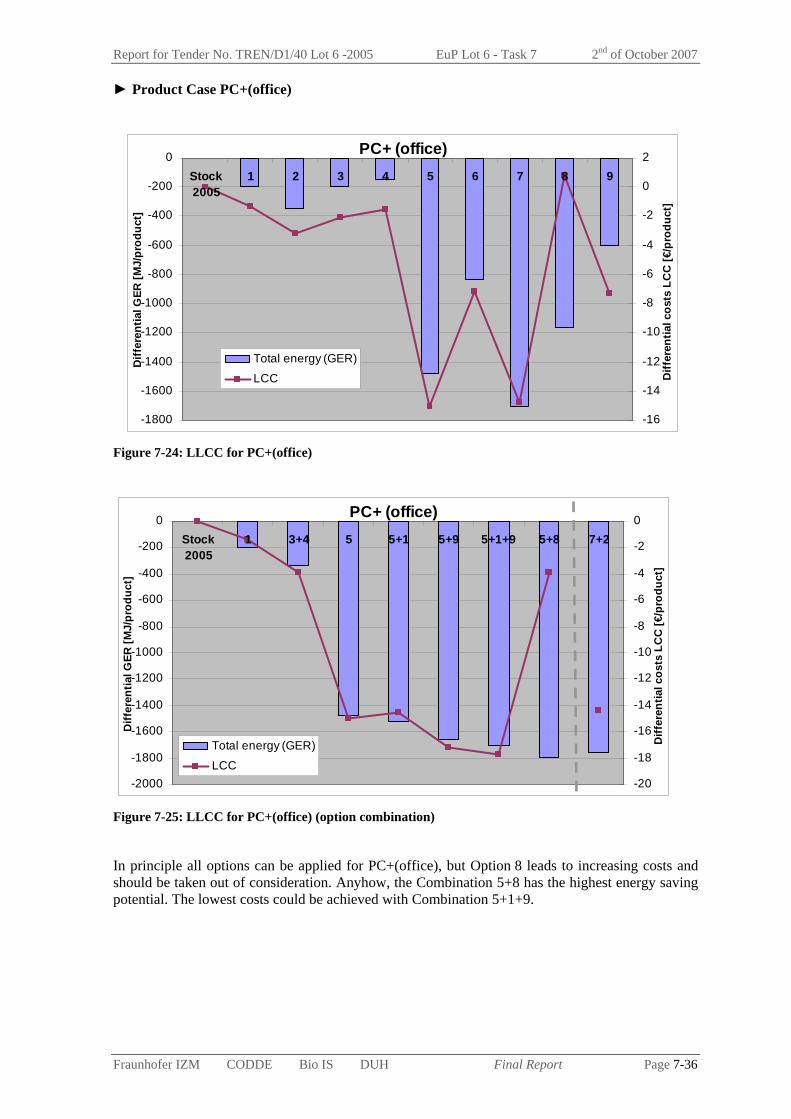
Report for Tender No. TREN/D1/40 Lot 6 -2005 EuP Lot 6 - Task 7 2nd of October 2007
Fraunhofer IZM CODDE Bio IS DUH Final Report Page 7-36
► Product Case PC+(office)
PC+ (office)
-1800
-1600
-1400
-1200
-1000
-800
-600
-400
-200
0Stock2005
1 2 3 4 5 6 7 8 9
Diff
eren
tial G
ER [M
J/pr
oduc
t]
-16
-14
-12
-10
-8
-6
-4
-2
0
2
Diff
eren
tial c
osts
LC
C [€
/pro
duct
]
Total energy (GER)
LCC
Figure 7-24: LLCC for PC+(office)
PC+ (office)
-2000
-1800
-1600
-1400
-1200
-1000
-800
-600
-400
-200
0Stock2005
1 3+4 5 5+1 5+9 5+1+9 5+8 7+2
Diff
eren
tial G
ER [M
J/pr
oduc
t]
-20
-18
-16
-14
-12
-10
-8
-6
-4
-2
0
Diff
eren
tial c
osts
LC
C [€
/pro
duct
]
Total energy (GER)
LCC
Figure 7-25: LLCC for PC+(office) (option combination)
In principle all options can be applied for PC+(office), but Option 8 leads to increasing costs and should be taken out of consideration. Anyhow, the Combination 5+8 has the highest energy saving potential. The lowest costs could be achieved with Combination 5+1+9.

Report for Tender No. TREN/D1/40 Lot 6 -2005 EuP Lot 6 - Task 7 2nd of October 2007
Fraunhofer IZM CODDE Bio IS DUH Final Report Page 7-37
► Product Case PC+(home)
PC+ (home)
-3500
-3000
-2500
-2000
-1500
-1000
-500
0Stock2005
1 2 3 4 5 6 7 8 9
Diff
eren
tial G
ER [M
J/pr
oduc
t]
-40
-35
-30
-25
-20
-15
-10
-5
0
Diff
eren
tial c
osts
LC
C [€
/pro
duct
]
Total energy (GER)
LCC
Figure 7-26: LLCC for PC+(home)
PC+ (home)
-4500
-4000
-3500
-3000
-2500
-2000
-1500
-1000
-500
0Stock2005
3+4 1 5 5+1 5+9 5+1+9 7+2 5+8
Diff
eren
tial G
ER [M
J/pr
oduc
t]
-45
-40
-35
-30
-25
-20
-15
-10
-5
0
Diff
eren
tial c
osts
LC
C [€
/pro
duct
]
Total energy (GER)
LCC
Figure 7-27: LLCC for PC+(home) (option combination)
Note that the PC speakers are classified as passive standby, while all other PC+(home) devices contribute to networked standby.
In contradiction to the office use, the Option 8 does not lead to increasing, but decreasing costs for the PC+(home) case and is therefore an option for this case. The lowest costs and the highest energy saving potential can be achieved with Combination 7+2. But as this is not considered a very realistic scenario the point of LLCC is set to Combination 5+1+9.

Report for Tender No. TREN/D1/40 Lot 6 -2005 EuP Lot 6 - Task 7 2nd of October 2007
Fraunhofer IZM CODDE Bio IS DUH Final Report Page 7-38
► Product Case Laser printer
Laser printer
-4000
-3500
-3000
-2500
-2000
-1500
-1000
-500
0Stock2005
1 2 3 4 5 6 7 8 9
Diff
eren
tial G
ER [M
J/pr
oduc
t]
-45
-40
-35
-30
-25
-20
-15
-10
-5
0
Diff
eren
tial c
osts
LC
C [€
/pro
duct
]
Total energy (GER)
LCC
Figure 7-28: LLCC for Laser printer
Laser printer
-4000
-3500
-3000
-2500
-2000
-1500
-1000
-500
0Stock2005
3+4 1 5 5+9 5+1 5+1+9 7+2 5+8
Diff
eren
tial G
ER [M
J/pr
oduc
t]
-45
-40
-35
-30
-25
-20
-15
-10
-5
0
Diff
eren
tial c
osts
LC
C [€
/pro
duct
]
Total energy (GER)
LCC
Figure 7-29: LLCC for Laser printer (option combination)
The use of the hard-off switch is considered user independent, because it replaces a soft-switch, so Option 1 and 2 are the same. The lowest costs can be achieved with the extreme BAT example with 75 % of the users using the hard-off switch (Option 7+2), but the point of LLCC is set to Option 5+1+9.
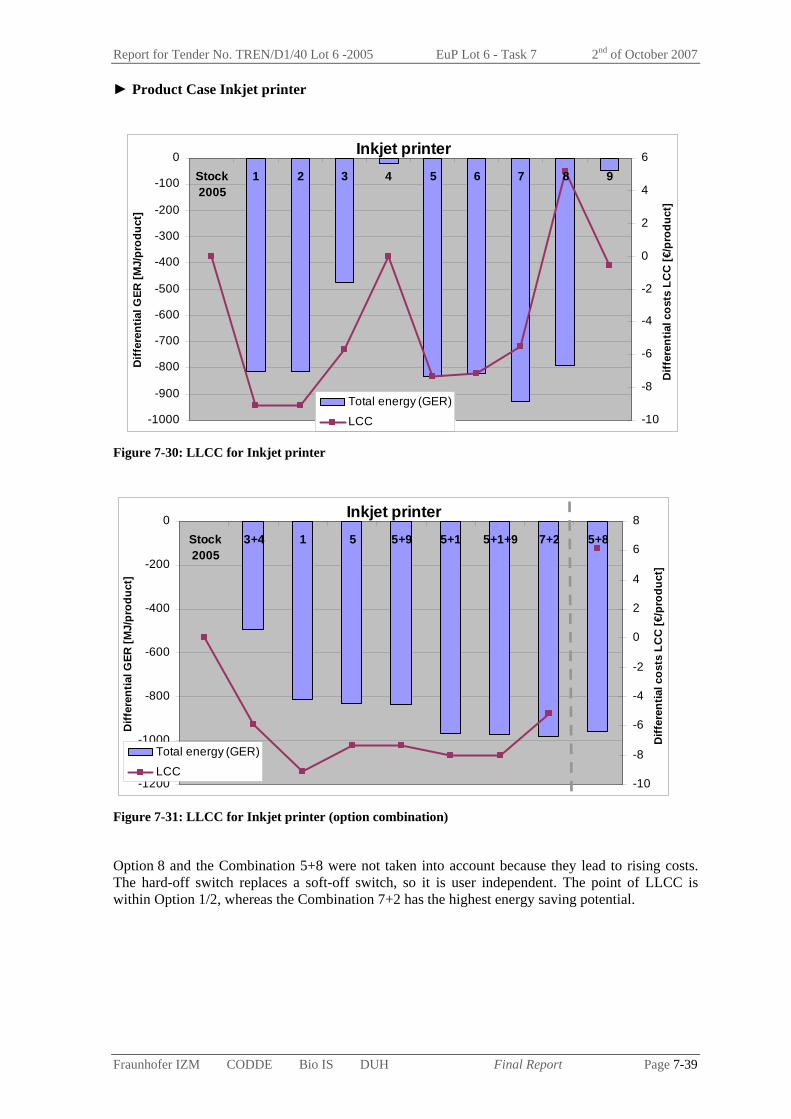
Report for Tender No. TREN/D1/40 Lot 6 -2005 EuP Lot 6 - Task 7 2nd of October 2007
Fraunhofer IZM CODDE Bio IS DUH Final Report Page 7-39
► Product Case Inkjet printer
Inkjet printer
-1000
-900
-800
-700
-600
-500
-400
-300
-200
-100
0Stock2005
1 2 3 4 5 6 7 8 9
Diff
eren
tial G
ER [M
J/pr
oduc
t]
-10
-8
-6
-4
-2
0
2
4
6
Diff
eren
tial c
osts
LC
C [€
/pro
duct
]
Total energy (GER)
LCC
Figure 7-30: LLCC for Inkjet printer
Inkjet printer
-1200
-1000
-800
-600
-400
-200
0Stock2005
3+4 1 5 5+9 5+1 5+1+9 7+2 5+8
Diff
eren
tial G
ER [M
J/pr
oduc
t]
-10
-8
-6
-4
-2
0
2
4
6
8
Diff
eren
tial c
osts
LC
C [€
/pro
duct
]
Total energy (GER)
LCC
Figure 7-31: LLCC for Inkjet printer (option combination)
Option 8 and the Combination 5+8 were not taken into account because they lead to rising costs. The hard-off switch replaces a soft-off switch, so it is user independent. The point of LLCC is within Option 1/2, whereas the Combination 7+2 has the highest energy saving potential.

Report for Tender No. TREN/D1/40 Lot 6 -2005 EuP Lot 6 - Task 7 2nd of October 2007
Fraunhofer IZM CODDE Bio IS DUH Final Report Page 7-40
7.5. BNAT and System Analysis For the specific product cases very few BNAT relevant values could be identified. Most developments are centred on power supply issues, because great improvements have been made in circuits for improved no-load and low-load conditions and are often integrated with distinguishing and selling higher efficiency power supplies on the market. No-load values of, for example, 20 or even 10 mW seem to be possible; not only for the low power range up to 5 W output, but also for higher ratings, such as the “simpler” supplies for lighting applications. At these power levels the question of investing in further reductions or of employing a hard-off switch will certainly fade into the background against optimisation potentials elsewhere in the life cycle.
When applying dedicated, power efficient microcontrollers for the standby functions (and the related power management running in the background) 10’s of mW levels of power consumption should also suffice for the basic passive standby functions and 100’s of mW could be enough for some, but certainly not all network connections. For broadcasting receptions (especially with the move to digital HDTV), and also for higher transmission rates in networks, the power requirements remain higher. However, future network protocols including the internet should and will increasingly support devices being able to switch back to lower transmission speeds when the traffic is low, or to communicate to the network to buffer incoming traffic, so that the device can go to sleep periodically and still be connected to the network.
All the features currently integrated into mobile phones and PDAs also tell a story about what is possible at very low consumption levels – both regarding computation/memory/display/camera and regarding high speed networking. However, the specialised components needed come at a price and the true product price is most often not transparent to the mobile phone buyer.
When talking about the 10’s and 100’s of mW as future levels for Lot 6 standby and for off-mode losses, the question is for which special components or functions (such as an indispensable sensor type, a very bright clock display or a special timer) these very low targets will never be feasible, or whether substitution technologies are possible in the future. Among the myriad of product types and product designs potentially covered by the horizontal measure there will always be justifiable exceptions.
From the systems view we a moving towards an environment of networked products. A substantial reduction of standby, while retaining essential functions, is therefore a logical and necessary step for the future. A restriction of continuous network activity or trying to slow down the diffusion of networked products would possibly be counterproductive. When more products are networked the potential time in off-mode and the possibility to switch off completely will diminish in relevance. The desire of users to have control over the power status of each product is continuously eroded by new features.
For the current situation and near future, the joint optimisation of connected products should be a hot topic. If more and more users decide to control “clusters” of connected products via external switches or master-slave configurations, then manufacturers could think about integrating similar measures into their products. This could either mean that the main product distributes the power to the connected products, or that the products communicate about their status and their interfacing needs. Since more and more products change into networked and “smart” products, a portion of that intelligence might be used for that end. Of course the biggest obstacle is the standardisation of such an inter-product communication to enable products from different manufacturers to be used together. The immense standardisation activities in the computer field and the remaining problems with fault-free power management in all products give an idea what this would require.
What should also be discussed as a systems aspect – because it goes beyond the design options for a single product – are user influences on the potential improvements. Apart from the off-switch options, the user behaviour has been largely excluded as an influencing factor from the options quantified in this study. Nevertheless user behaviour on the levels described in Task 3 – informed buying decision, informed use and upgrade and “correct” recycling and disposal – is a key factor for achieving any improvements in the market. This will be looked at with the policy scenarios in Task 8.

Report for Tender No. TREN/D1/40 Lot 6 -2005 EuP Lot 6 - Task 8 2nd of October 2007
Fraunhofer IZM CODDE Bio IS DUH Final Report Page 8-i
EuP Preparatory Study Lot 6 Standby and Off-mode Losses
Task 8 Scenario, Policy, Impact and Sensitivity Analysis
Final Report
Compiled by Fraunhofer IZM
Contractor: Fraunhofer Institute for Reliability and Microintegration, IZM, Berlin
Department Environmental Engineering
Dr.-Ing. Nils F. Nissen
Gustav-Meyer-Allee 25, 13355 Berlin, Germany
Contact:
Tel.: +49-30-46403-132
Fax: +49-30-46403-131
Email: [email protected]
Berlin, 2nd of October 2007
Disclaimer
The findings presented in this report are results of the research conducted by the IZM consortium and the continuous feedback from a wide range of stakeholders. The statements and recommendations presented in the final report however are not to be perceived as the opinion of the European Commission.

Report for Tender No. TREN/D1/40 Lot 6 -2005 EuP Lot 6 - Task 8 2nd of October 2007
Fraunhofer IZM CODDE Bio IS DUH Final Report Page 8-ii
Contents 8. Scenario, Policy, Impact and Sensitivity Analysis (Task 8) ...................................... 8-1
8.1. Policy and Scenario Analysis ......................................................................................... 8-2 8.1.1. Scenario development ............................................................................................... 8-3 8.1.2. Policy recommendations ........................................................................................... 8-9
8.2. Impact Analysis Industry and Consumers .................................................................... 8-26 8.2.1. Impacts on the manufacturer ................................................................................... 8-26 8.2.2. Impacts on the consumers ....................................................................................... 8-27
8.3. Sensitivity Analysis of Main Parameters...................................................................... 8-27

Report for Tender No. TREN/D1/40 Lot 6 -2005 EuP Lot 6 - Task 8 2nd of October 2007
Fraunhofer IZM CODDE Bio IS DUH Final Report Page 8-1
8. Scenario, Policy, Impact and Sensitivity Analysis (Task 8)
Introductory Remarks
Standby has been an important issue now for several years and manufacturers to some extent have absorbed the developments into mainstream products. But still not all products reach lower power consumption levels that are rather within easy reach. Supplier side solutions, notably power supplies and power management circuits, are available in broad variety, but of course any additional cost is critical to the adoption of these solutions.
It has become easier to develop with low standby consumption and off-mode losses, but this still does not mean that these topics are addressed in all product development processes. Major drivers for neglecting or even increasing the power consumption levels are assumptions about the consumer expectations – examples standby and network functionality available 24 hours, or soft switches as an "indispensable" design factor – as well as the need for saving a few cents of component costs in price competitive markets. For the more complex products, an optimised power management is also a considerable design effort, since mistakes in the power management appear only at the product integration level, not during the design of individual modules.
The separation of the product parts dealing with mains level voltages into one external part (the EPS) is still a practical solution for manufacturers, but often comes with a negative impact regarding environment and energy losses. With a broad change to switched power supplies with higher efficiencies and special optimisation also for the lowest load and no-load regions this appears to be less of a problem. Nevertheless those cases where the EPS is only needed at times but stays plugged in all the time are a clear case of energy waste. For some products, such as computer monitors, the trend has already reversed back to integrated power supplies, but for all mobile products, many small products and even for mid-size products such as inkjet printers EPS are widely employed.
For products, which are running in full operation or at a high standby level all the time, the no-load losses of the EPS are of no concern, and there is no practical difference in comparison to an internal power supply with the same full-load and low-load efficiencies. This shows that not all off-mode power consumptions have the same priority for reduction or regulation.
In the historic view it is also important to chart the neutral ground between environmentally driven crusaders against all “standby” and any perceived encroachment on freedom of design decisions and product development choices. Environmentalists have learned that industry is sometimes advancing on environmental issues, if it fits into their market perspective and does not lead to unfair situations with the competition. Industry has learned that environmental performance can be one distinguishing factor on the market (adding to the “quality” perception of a brand), and that legislation might in fact sometimes be beneficial to ensure the fairness of a market.
For standby and off-mode losses, any regulation should aim for the level of compromise that works with the market and not against it. Reducing product features, requiring "active thought" of the user for each operation of a product or expecting fundamental changes in user behaviour to achieve any improvements are unlikely to work for the majority of the market. The best settings should be "active by default".
Enabling conscious consumers or purchasers to select the best product is another, somewhat opposite issue. Although environmental behaviour should not be expected as a society wide norm, it should be supported at least by supplying the relevant information. This information should ideally be available and accessible before making the purchase decision.1
1 In today's internet culture putting performance values into the product manuals can of course suddenly make the information available worldwide – via official consumer and test organisations (a likely source for informed buyers), but also via individuals, blogs or non-official product databases.

Report for Tender No. TREN/D1/40 Lot 6 -2005 EuP Lot 6 - Task 8 2nd of October 2007
Fraunhofer IZM CODDE Bio IS DUH Final Report Page 8-2
Both points are valid: at the basic level the user should not be involved (else savings are not secure) and yet for further improvements the user must be involved and supported.
There are furthermore contradictory views on how much standby is "useful" and how much of it is operating invisible to the user. On the one hand manufacturers claim the "right" to deploy standby functions as they see fit. The market should determine, which features are required for a product to be successful. On the other hand users could claim a "right" to know what their products are doing and to have the possibility to make them to do nothing.
For the off-mode, there seems to be a wider consensus that power consumption without function (aka Lot 6 off-mode) can be limited more strictly. Nevertheless, for a number of products a reduction of off-mode losses below an ambitious limit value is argued to be unrealistic or the integration of a hard-off switch is assumed to be too costly and not in the interest of the average consumer.
Against the backdrop of all these developments and controversial standpoints, this task aims to draw common conclusions applicable for a horizontal approach. This is done by first describing scenarios of the standby and off-mode energy consumption development in Europe based on the findings of the previous tasks.
8.1. Policy and Scenario Analysis
► Scope Questions
The biggest challenge to a simple approach for standby and off-mode is the scope. If the scope is wide (as is intended by a horizontal measure) the boundary of the definition could lead to grey areas, where ambiguity and/or the possibility to evade the definition might exist.
With a narrower scope the delineation might be more successful, but the overall improvement potential is also lower. If the definition cannot capture new products appearing on the market, and the multifunctional derivations of previously individual products then a principal strength and appeal of the horizontal measure would be lost.
A third option would be to start with a narrower scope and then expand step by step, but again this might necessitate naming products or product classes individually, rather than capturing them by their energy use behaviour. A legislation, which needs to be adapted for all new product types appearing on the market, is always one step behind. Often this could still be in time to capture the majority of new market entries, but not for very fast developments.
The definition of what constitutes standby and off-mode losses is the other essential part of the scope question for this study. The mode definitions in this study are considered practical and flexible and are currently being considered for the revision of IEC 62301. Principally, products without standby or off-mode losses can also be addressed by future regulation, if the product could or should have such a mode to improve its environmental performance.
Following from the scope issue, another recurring discussion is on the coexistence of horizontal regulations with vertical limits or measures. There is no final decision on the interrelation of implementing measures targeting the same products (it is up to the Commission to define a mechanism). In short this will be referenced as the “horizontal vs. vertical measures” issue.
► Choice of requirements
Once the scope has been agreed on, the next issue regarding policy choices is the type of requirements that should be developed for the covered products and modes. This study will discuss the following principal approaches for setting specific requirements
"One horizontal limit": set one limit value regardless of mode or product features. Very simple and controllable, but might have to start with higher limit values.

Report for Tender No. TREN/D1/40 Lot 6 -2005 EuP Lot 6 - Task 8 2nd of October 2007
Fraunhofer IZM CODDE Bio IS DUH Final Report Page 8-3
"Multiple horizontal limits": set multiple limit values, potentially (a) to differentiate by the Lot 6 modes, (b) to differentiate by other technical features of the products, (c) to introduce tiered limit values, (d) to differentiate a selected number of exclusions, (e) to exclude products with vertical measures, until these are in operation. (a) to (e) can be implemented in any combination as well.
"Requirements to have low power states": possible requirement stipulating that all products in the eventual scope should have a low power state equivalent to Lot 6 standby or off-mode. This requirement could extend to always-on products and to transitional modes or functions, which would otherwise be out of scope. The most important function from the historic point of view would be the continuous preheating function of CRTs, which should not be allowed as a continuous standby function. Currently espresso machines are increasingly showing similar behaviour again, with 30 W and more of "ready mode heating". Compared with the separate issues with laser printer preheating (clearly considered a transitional ready mode, so outside the Lot 6 scope) it would be necessary to make sure that all EuPs with such high level transitional modes do have at least one lower mode. A possible requirement for a switch, for example for products otherwise staying in a high networked standby all the time, would also fall under this requirement type. Likewise, user friendly standby (or sleep) buttons could be addressed.
"Transitioning requirements": As a second part of the same argument, EuPs, which have (or should have according to the previous requirement) a low power state and are job-based (PUC 3) should actually transition into that mode as often, as fast and for as long as is reasonable. This automated power saving behaviour should not be possible to be disabled by the user. A requirement for an automated transition to zero Watt off-mode requirement does not seem necessary, if the standby or off-modes are low enough. Technically, auto-off circuits (transitioning from active or from standby into off-mode without further intervention of the user) might also be an option.
The first two are possibilities for limit values, the second two options are possible “mandatory product features” (must-have features), which might be harder to define in a horizontal manner.
A recurring difficult issue is the inclusion of technical solutions, which benefit connected products: a product, which incorporates technical features for the power management of connected products (either separating the connected product from mains voltage in standby/off-mode, or intentionally supplying power to a connected device while being in standby) should possibly be included in the differentiation regarding functional scope. So far this has not been included as a Lot 6 standby function, because of the scope limitation to single products. This topic is referenced as “connected products problem” in short.
Showing data in a more open and comparable manner (i.e. according to standards!) will lead to pressure from the market and is a valuable tool. Labelling schemes are using exactly this approach, which is why we consider as one option "mandatory data requirements".
Other accompanying non-technical or non-EuP-design related possibilities are
Educating the user by measures additional to the information available at point of sales / labels and product manual
External measures, including smart metering, master-slave switches
These options (data requirements, educational and external measures), which do not directly regulate the product performance, will be taken up again after the analysis of potential specific requirements and the scenarios.
8.1.1. Scenario development
“Scenarios” in the meaning of this chapter cover two variations: First, the development covering the years 2005 up to 2020, which would take place without any implementing measure on standby

Report for Tender No. TREN/D1/40 Lot 6 -2005 EuP Lot 6 - Task 8 2nd of October 2007
Fraunhofer IZM CODDE Bio IS DUH Final Report Page 8-4
and off-mode losses, is defined. Then the way an implementing measure could alter this situation is analysed.
The scenario without any implementing measure will be developed in three parts, which can be interpreted as “worst case”, “best case” and the most reasonable assumption entitled “business as usual”, or “b-a-u”.
From Task 2 the stock assumptions are available for the years 2005, 2010 and 2020. Years in-between will be interpolated (linearly, if not indicated otherwise), where necessary. The starting point for all scenarios is the EU-25 totals estimate for the Lot 6 investigation scope derived at the end of Task 5. This covers “mains connected household and office appliances” plus no-load conditions of chargers and EPS in these environments. Building infrastructure and other application fields are not covered in this total (see Task 5 conclusion).
Worst case scenario
The main influence on standby development is from the growing number of devices. The worst case calculation is based on the assumption that the individual devices continue with the average consumption of the appliances in the 2005 stock. Because in many product examples old technologies are being phased out and newer products already show lower standby levels, this does not seem a realistic scenario at first glance. There are some counterproductive trends however, which give some credence to including this trend:
more products exhibiting additional features, and especially more network functions, fewer new products offering hard-off switches at all, new, merged and multifunctional products not achieving optimal power management, growing market shares of no-name products potentially using cheap, non-optimised circuits.
The worst case is therefore already the net result of some products entering the market with lower standby and off-mode values and others aggravating the situation.
The stock development is however not changed in any of the scenarios, so the possibility of higher additional sales (not replacing old equipment) is not reflected in the worst case scenario.
Business as usual (b-a-u) scenario
The business as usual scenario is oriented on the perception that new products already have lower standby (and off-mode) values in many cases and that the worst of the older, power consuming products are being phased out of the market. Per product, this seems to be true for complex products, whose power management capabilities have been improved, and to a lesser degree for simpler products, where the components and technologies for at least not needlessly squandering energy are not really a prohibitive cost factor. Yet, some products with lowest cost power supply and switch topologies certainly still remain in and appear on the market.
Thus, the average of all standby consumptions and off-mode losses is assumed to decrease over time. The total energy consumption would however still increase, because the number of EuPs contributing to the consumption is rising faster than the standby and off-mode losses per average product are being reduced.
For this scenario, 1% improvement per year for the average sum of standby and off-mode losses per product is assumed and it is further assumed that this trend is already valid for 2005 (and before).
In the calculations, 2005 (the base case calculation) is taken as the reference year, and then per year 1 % incremental reduction is used. Thus the 2006 value for standby and off-mode together per product is 99 % of the 2005 value, and for 2007 99 % x 99 % is used, and so on. For simplification, especially below 10 years time frame, one percent per year could be used (i.e. 5 % after five years).
When looking at specific improvements over time – insofar as they can be ascertained at all – the 1 % reduction per year is considered moderate, as many product groups contributing heavily to the totals should show a faster rate of reduction. The counterproductive trends – more products equipped with remote controls, more network connectivity, fewer hard-off switches – are therefore also reflected in this "positive" trend to a reasonable degree.

Report for Tender No. TREN/D1/40 Lot 6 -2005 EuP Lot 6 - Task 8 2nd of October 2007
Fraunhofer IZM CODDE Bio IS DUH Final Report Page 8-5
Best case scenario (without an implementing measure)
As a more positive outlook (called best case in comparison among the b-a-u possibilities – although the further improvement scenarios will of course be even "better"), the situation in which other drivers lead to a reduction of the relevant consumption while no explicit implementing measure is imposed on standby and off-mode losses in Europe has to be considered.
For developments outside the EU, the Australian plans to reduce standby serve as the main example. If internationally acting manufacturers want to continue selling products in Australia (and New Zealand) then they will have to offer compliant products. The same products – or at least the same improvements implemented in those products – could then also be expected to appear on the European market.
Most of the Australian requirements covering standby are organised in two stages. The first stage is setting voluntary targets, which start already in 2007 and 2008. Stage 2 in 2012 is announced to introduce mandatory limits, if the industry average is not sufficiently improved. The products covered are shown in Table 8-1 and Table 8-2. Additionally, a horizontal requirement for "home entertainment" has been announced in October 2006, as shown in Table 8-3. The first stage will set limits for these appliances already in 2008, while the second stage is again announced for 2012. [EES 2006b, EEE 2007]
Table 8-1: List of Australian Standby Product Profiles and Summary of Requirements - Households
Table 8-2: List of Australian Standby Product Profiles and Summary of Requirements - IT

Report for Tender No. TREN/D1/40 Lot 6 -2005 EuP Lot 6 - Task 8 2nd of October 2007
Fraunhofer IZM CODDE Bio IS DUH Final Report Page 8-6
Table 8-3: Home entertainment horizontal measure announced (Announcement 10/2006):
2008 2012 Mode Passive standby Off Passive standby Off Without video recording capabilities
4 watts 0.3 1 watt* 0.3
With video recording capabilities
6 watts 0.3 1 watt 0.3
* and auto power down in 30 mins
Improvements in standby and off-mode losses can also occur within Europe even without horizontal implementing measures, for example if vertical implementing measures come into force and adequately address standby and off-mode losses. This way, a large portion of the more complex products would have to be improved after the start of each compliance phase.
Consequently, large product segments would reduce their standby and off-mode consumption more rapidly than in the b-a-u scenario. The expected increase in "miscellaneous" products (i.e. in numbers) and the use of networks (i.e. potentially more standby power usage per product) would be assumed to be smaller in comparison. This assumption applies to mains connected EuPs – for products disappearing into the building infrastructure the negative trend might again be stronger.
As a simplification, a 2 % reduction of the average per-product consumption will be assumed starting after 2010. If for example three large contributors like TV sets, desktop computers and audio minisystems (an arbitrary selection, not linked to the current vertical studies) were to be improved significantly, then after the stock turnover e.g. 12% could be reduced in addition to the b-a-u scenario.
The calculation with quite simple and not very demanding assumptions is as follows: reducing TV standby to a 2 W average for all technologies, reducing Desktop off-mode to 1 W average and reducing passive standby of Audio minisystems to 2 W on average results in savings of roughly 9.9 TWh per year, which is approximately 12 % of the extrapolated EU-25 total for 2005. If market replacement starts in 2010 then this saving is realised by 2020, thus an additional 1 % per year is certainly justified as a conservative assumption.
The resulting graphical scenarios are shown in Figure 8-1. The stock numbers for 2005, 2010 and 2020 are taken from Task 2 with yearly linear interpolations in-between. The yearly interpolations will be needed for the stock replacement models in the further scenarios. Showing only the values for 2005, 2010 and 2020 can lead to wrong interpretations of the trend in 2020.
0
20
40
60
80
100
120
140
2005 2010 2015 2020year
Year
ly L
ot 6
con
sum
ptio
n [T
Wh]
SC1 (worst case) [TWh/a]
SC2 (b-a-u scenario) [TWh/a]
SC3 (best case) [TWh/a]
Figure 8-1: The three basic scenarios without implementing measure

Report for Tender No. TREN/D1/40 Lot 6 -2005 EuP Lot 6 - Task 8 2nd of October 2007
Fraunhofer IZM CODDE Bio IS DUH Final Report Page 8-7
Before extending these scenarios to the influence of potential implementing measures, some basic assumptions and principles for the following scenarios have to be explained.
Start of EuP compliance
As a simplification, compatible with the MeEuP method, the starting date of the implementing measure is assumed in 2010. Realistically, more and more products compliant with the new targets would appear on the market before that, since not all products can be converted on the same date. However, for the scenarios, it is assumed that the 2010 stock – assumed as the stock at the start of the year – still contains only old (or b-a-u-level) products. All products entering the market in 2010 then have to be compliant, which will first affect the 2011 stock. Basing the calculations on start of compliance in 2010 does in no way reflect the expected implementation schedule for this lot. Actual start of compliance could be earlier or later. The duration between official publication of the implementing measure and enforcement on the market in relation to the "redesign cycle" is discussed in a later section under the recommendations.
Stock replacement model
For the transition from old (or b-a-u) models to products compliant with the implementing measure it is important to model the phase out of the products in the pre-compliance stock. For normal (vertical) product group studies it may be enough to assume one average product life time. In this horizontal lot the situation is much more complex. Regardless of the number of product groups, which need to be distinguished, the question of the interpretation of the average product life time is the critical point.
Certainly, the life times as defined in Task 3 are intended to represent the average number of years the product is typically used, not technical life times (limited by the long term reliability of products), nor actual use times (towards the end of the life time some products might be used less). A similar life time differentiation is proposed in the CEN Workshop Agreement CEN WS 27 [CEN 2007]. The life time of a product can be limited by the design life time (i.e. reliability), economical life time (i.e. when early replacement is economical), or the behavioural/social life time, which is due to product replacements by the user. Especially short lived products are often limited by the behavioural/social aspects rather than the design or economical life time.
When a market is stable and saturated (replacement sales only) the number of products reaching end of life are the inverse of the product life time (i.e. 1/8th of all products for 8 year life time). When the market is growing, this is not exactly true anymore, as the portion of younger products in the stock of one year is larger than for the older products. In principle the number of products leaving the stock rate would be lower than the inverse of the life time, but in most cases this is still good enough as an approximation.
When a market is declining – or actually disrupted when looking only at the pre-compliance stock – the percentage of products discarded can actually be more than the inverse of the life time. This would then slowly decline and then drop to zero, if no new products (of a certain category) entered the market at one point.
The drop to zero is another critical point: with a simple model, after the average life time all products of that type are completely discarded, which is clearly unrealistic. Rather a distribution of life times, which also extends beyond the average, is needed. This will for some scenarios be done with a "soft stock replacement model", while for most charts the linear stock model is used. For the linear model an average life time of 8 years is assumed, which is the rounded geometric average of the 15 product cases – without weighing by market volumes, as this would shift the average to even lower values2.
Assumptions and input for LLCC improvement scenarios
Apart from the starting date of the compliance and the model for stock replacement on the market assumptions have to be introduced for the improvement targets. The main options, which are more easily calculated, are the threshold values for power consumption.
2 The 8 year average product life time is validated in the sensitivity section of this report.
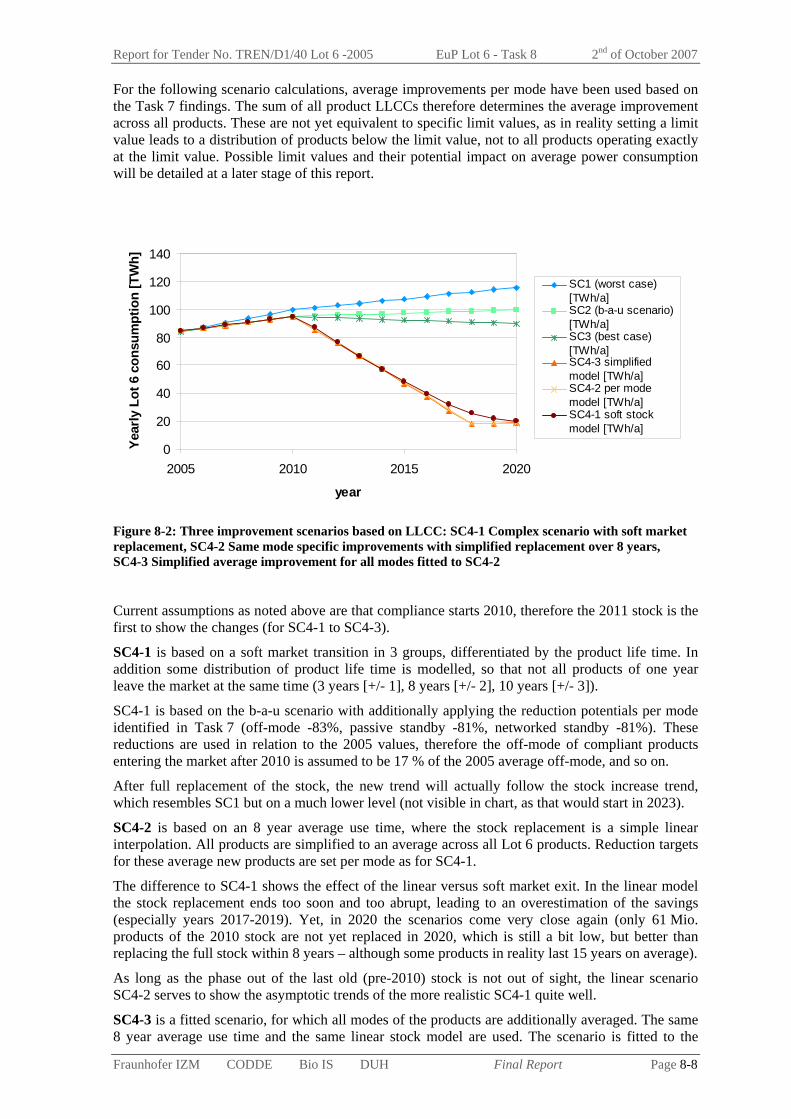
Report for Tender No. TREN/D1/40 Lot 6 -2005 EuP Lot 6 - Task 8 2nd of October 2007
Fraunhofer IZM CODDE Bio IS DUH Final Report Page 8-8
For the following scenario calculations, average improvements per mode have been used based on the Task 7 findings. The sum of all product LLCCs therefore determines the average improvement across all products. These are not yet equivalent to specific limit values, as in reality setting a limit value leads to a distribution of products below the limit value, not to all products operating exactly at the limit value. Possible limit values and their potential impact on average power consumption will be detailed at a later stage of this report.
0
20
40
60
80
100
120
140
2005 2010 2015 2020
year
Year
ly L
ot 6
con
sum
ptio
n [T
Wh]
SC1 (worst case) [TWh/a]SC2 (b-a-u scenario) [TWh/a]SC3 (best case) [TWh/a]SC4-3 simplifiedmodel [TWh/a]SC4-2 per modemodel [TWh/a]SC4-1 soft stockmodel [TWh/a]
Figure 8-2: Three improvement scenarios based on LLCC: SC4-1 Complex scenario with soft market replacement, SC4-2 Same mode specific improvements with simplified replacement over 8 years, SC4-3 Simplified average improvement for all modes fitted to SC4-2
Current assumptions as noted above are that compliance starts 2010, therefore the 2011 stock is the first to show the changes (for SC4-1 to SC4-3).
SC4-1 is based on a soft market transition in 3 groups, differentiated by the product life time. In addition some distribution of product life time is modelled, so that not all products of one year leave the market at the same time (3 years [+/- 1], 8 years [+/- 2], 10 years [+/- 3]).
SC4-1 is based on the b-a-u scenario with additionally applying the reduction potentials per mode identified in Task 7 (off-mode -83%, passive standby -81%, networked standby -81%). These reductions are used in relation to the 2005 values, therefore the off-mode of compliant products entering the market after 2010 is assumed to be 17 % of the 2005 average off-mode, and so on.
After full replacement of the stock, the new trend will actually follow the stock increase trend, which resembles SC1 but on a much lower level (not visible in chart, as that would start in 2023).
SC4-2 is based on an 8 year average use time, where the stock replacement is a simple linear interpolation. All products are simplified to an average across all Lot 6 products. Reduction targets for these average new products are set per mode as for SC4-1.
The difference to SC4-1 shows the effect of the linear versus soft market exit. In the linear model the stock replacement ends too soon and too abrupt, leading to an overestimation of the savings (especially years 2017-2019). Yet, in 2020 the scenarios come very close again (only 61 Mio. products of the 2010 stock are not yet replaced in 2020, which is still a bit low, but better than replacing the full stock within 8 years – although some products in reality last 15 years on average).
As long as the phase out of the last old (pre-2010) stock is not out of sight, the linear scenario SC4-2 serves to show the asymptotic trends of the more realistic SC4-1 quite well.
SC4-3 is a fitted scenario, for which all modes of the products are additionally averaged. The same 8 year average use time and the same linear stock model are used. The scenario is fitted to the

Report for Tender No. TREN/D1/40 Lot 6 -2005 EuP Lot 6 - Task 8 2nd of October 2007
Fraunhofer IZM CODDE Bio IS DUH Final Report Page 8-9
SC4-2 reductions, resulting in an average continuous power consumption of 0.33 W (standby consumptions and off-mode losses together). The 2005 initial situation for the same calculated value is at 2.09 W, or on average a 82% reduction of the total is achievable after complete market replacement. The average of 0.33 W for the "new" stock part is not further reduced in this calculation between 2010 and 2020. Again, the 2018-2020 trend shows a stronger increase (following the stock increase without further reductions assumed) than the b-a-u scenario.
8.1.2. Policy recommendations
Note: These recommendations are the views of the study contractors and should not be interpreted as views of the European Commission.
The "Lot 6 investigation scope" of mains connected household and office equipment is certainly the proposed scope. Specifying maximum operating voltages, such as the WEEE/RoHS scope (1000 V AC and 1500 V DC) or alternatively "below 400 V" (indicating the inclusion of three phase currents), should not be needed when addressing household and office environments, as it is more relevant for other professional / industrial uses. However, ovens are one example frequently connected with three phase voltage, so if mains is understood as 220 V only, they might suddenly be out of scope to a large extent – or their coverage might depend on the actual installation instead of the product type only. Products, which can alternatively be connected with a mains plug, or be hard-wired to either 220 V or three-phase 380 V, must therefore be considered specifically when describing the scope.
The short wording "mains connected household and office equipment" used throughout the Lot 6 reports should be understood to include such special cases. If a voltage range should be referenced for clarification, then "100 – 400 V AC" would be recommended to clarify what "mains" means.
The estimates resulting in Task 5 indicate that the household segment is the most relevant in total impact for Lot 6, and that this is the area where the highest improvements can be realised.

Report for Tender No. TREN/D1/40 Lot 6 -2005 EuP Lot 6 - Task 8 2nd of October 2007
Fraunhofer IZM CODDE Bio IS DUH Final Report Page 8-10
The Australian data [AGO 2005] indicates that 58% of energy efficiency gains can be implemented in the residential sector, compared to only 14% on "manufacturing and other" and 28 % for the commercial sector. Note that these values refer to all energy efficiency measures, not to standby explicitly. The "electronics and standby" category is estimated to make up 20 % of the predicted savings, but the split of standby between sectors is not possible from the published data.
To compare with the Lot 6 analysis the residential sector is covered in Lot 6 (except for the building infrastructure part), and of the commercial sector only the office products (again without infrastructure) would be covered. Manufacturing & other is not covered in the Lot 6 investigations.
The office equipment segment is of considerably smaller significance, according to the data in this preparatory study, but there are significant overlaps in equipment types and thus inclusion of office equipment seems justified. While in detail the types of computers, printers and certainly copiers differ between home use and office use, the similarities of standby features and the overlap of models supplied to both markets is large enough to justify the application of the same requirements. Of course the office equipment investigated here is almost fully covered by vertical studies, so the extrapolation to more horizontal office products (such as office telephones or document shredders, which do not appear in households) is not as secure as for the more elaborate mix of household products.
For end user equipment (office workplaces and copier/printer rooms) it is quite clear, which products have "dual use" characteristics and should be treated the same, but for additional equipment, like the small hubs included in the PC+ product case, the product type does not directly signify whether it will be used in the office space itself or for example in server rooms.
Building infrastructure
Building infrastructural EuPs have not been covered through the base cases. However, the functionalities are sufficiently covered that the same proposals apply. Many infrastructure products may have a main function running continuously, but still any standby and off-modes can be determined by following the Lot 6 definition.
Applications beyond households and offices
Infrastructural equipment outside of home/office use is another area of high concern. Even though the energy consumption in this area is assumed to be high and expected to rise significantly these products cannot be targeted with the same approach fitting for the smaller, consumer-oriented products. The sector needs to define efficiency measures for communications infrastructure first of all (W per day, W per MBit, W per subscriber line, W per average program, etc.) and this should of course include any potential standby (if the products are not "always-on" according to the proposed definition).
Report for Tender No. TREN/D1/40 Lot 6 -2005 EuP Lot 6 - Task 8 2nd of October 2007
Fraunhofer IZM CODDE Bio IS DUH Final Report Page 8-11
As has been noted in a feedback, the core network is of course never in standby, and even the "low traffic" (if ever) needs to be transmitted with minimum delays. The telecommunications infrastructure and also the broadcasting infrastructure equipment need to be targeted with other measures, not with a horizontal standby and off-mode limitation.
Flexibility for new product types
The scope should be defined so that new product types can be covered horizontally. As an example take a future stand-alone IP-TV (currently neither a TV according to Lot 5, nor a computer according to Lot 3), which would be covered by the horizontal rule, as intended.
► Recommendation on modes and definition
The definition of modes as developed and described in Task 1 serves as the basis for deciding, which operating states of products will be addressed by the implementing measure. Threshold limits (or other requirements) could apply to all Lot 6 modes at once, or be differentiated by those modes. For the networked standby further product attributes might need to be known for a proper differentiation, as will be shown later in this task.
Of course, if the same limit values would be applied to the different standby modes or for passive standby and off-mode, then the mode definition could in principle be simplified as well. One horizontal value covering all Lot 6 modes, or reducing the three relevant modes into two seems unlikely, however.
Separate limits for "Off-mode with losses" and "0 W off-mode" do not seem reasonable and both are to be regulated together. The definition makes the differentiation so that the calculations are transparent and to avoid misunderstandings when declaring hours in off-mode.
The differentiated segments of limit values would therefore be: upper limit(s) for all off-modes, limit(s) for Lot 6 passive standby and possibly more than one differentiated limit for the Lot 6 networked standby. To keep the communication and enforcement simple, the minimum differentiation to be considered would actually be to allow the same limit for off-mode as for passive standby, but to keep networked standby apart, so that the passive standby can be reasonably low.
The recommendation of this study is to have a minimum of three modes with distinct threshold values, namely networked standby, passive standby and (all) off-modes.
► Note on redesign cycle for horizontal measure
For putting the requirements of a horizontal implementing measure in force, the time between the official publication and the actual compliance should be sufficient to allow the redesign of the products in that period. There are two main aspects to consider as a redesign cycle: how long does it take to redesign a product according to new requirements and how often is a product generation being replaced by a successor. "Tiered entry", i.e. phasing in the limit values, should help for most cases, but for those products not reaching the initial limits the time frame for transition could still be short.
It is expected that the redesign cycles (development process duration) will vary from 0.5 years to at least 2 years in cases, and that the generational redesign time will be from 0.5 years (with overlapping development of the next generation) to over 4 years for products in a more mature market. However, the measure is addressed to only a limited set of functions (in case of passive standby: very simple functions) and does not cover the main function of the equipment in scope. Therefore the actual complexity of the necessary redesigns is much lower than for a standard product redesign.

Report for Tender No. TREN/D1/40 Lot 6 -2005 EuP Lot 6 - Task 8 2nd of October 2007
Fraunhofer IZM CODDE Bio IS DUH Final Report Page 8-12
Stakeholder comment:
Professional use equipment tends towards a generational redesign cycle of 6-7 years.
► Background summary/considerations for suggestions for threshold values
The central minimal requirements for standby and off-mode are of course threshold values. Possible threshold values are developed and checked based on three concepts:
the Task 7 LLCC analysis showing possible levels of improvement, which are suitable from a life-cycle-costing perspective (following the logic of the MEEuP method),
the environmentally driven reduction targets, possibly oriented on a fast and thorough reduction of perceived waste of energy, and
potentially higher threshold limits oriented on the higher confirmed BAT values for identified function clusters, so that product groups or additional features not captured in averages and in confirmed BATs are not barred from market entry.
The MeEuP method is oriented on the LLCC results as potential limit values, but at the same time the possibility of setting stricter or more relaxed limits has to be re-examined here, because the LLCC can be interpreted on a product-by-product case, or for the average of all products.
Turning the LLCC findings from Task 7 into limit values is indeed not straightforward. When aggregating the Task 7 results – to show how much improvement is possible – we are implicitly averaging across all products. This leads to a simple figure like a 82 % reduction of Lot 6 energy for each product that should cost-efficiently be feasible. A limit value oriented on that average alone would be unrealistic as for some of the products it might be much harder to reach that level in a given reasonable time frame.
Setting a high improvement potential according to the point of least life cycle costs as the limit value is potentially challenging even for the products closer to the "average", as even here a realistic new average across all products involved must always be lower than the limit value. For example, if the point of LLCC happens to be the confirmed BAT value of say 0.5 W, then setting 0.5 W as a limit value implies the future products achieve a distribution of values below 0.5 W. In other words all new products have to perform better than the current confirmed BAT, which would then lead to an average power consumption below 0.5 W. To achieve a new market average of 0.5 W the limit value might have to be set at 0.6 W, for example, but this cannot be determined exactly with some mathematical or statistical formula.
In Task 7 of this study it indeed turns out that for most product cases the point of LLCC is at or even beyond the "confirmed BAT" calculations (Option 5 in revised Task 7). In other words, if the costs for making the product changes are reasonable on average (the sensitivity section will look at higher product change costs), then even a strong and more costly reduction pays off over the life cycle. The following sections are therefore revisiting some of the BAT findings to check under what circumstances they are a suitable basis for horizontal limit values.
Where one product can supply standby functions (or off-mode options) for a given energy budget, other products with "comparable" feature sets should achieve the same after some time allowed for diffusion, adaptation and redesign. Thus, from this viewpoint the lowest realistic off-mode values are applicable for most other products: a generalisation on the lowest level.
For standby a few standby function clusters should be sufficient to determine appropriate levels. Although this study has not determined precise energy consumption budgets per individual standby function (the concept of so-called functional adders), a few rough estimates are possible to examine potential low limits.
Off-mode: Off-mode losses of 0.3 W and below seem to be feasible even up to 150 W power supplies with power factor correction (taken from EPS examples in Lot 7). For higher power ratings, the no-load losses are increasing slightly. Up to the 250 W of the EPS definition Lot 7 has shown (using the assumption that this is true for internal power supplies as well) that 0.7 W certainly seems possible across the examined range. In any case, for devices with off-mode losses

Report for Tender No. TREN/D1/40 Lot 6 -2005 EuP Lot 6 - Task 8 2nd of October 2007
Fraunhofer IZM CODDE Bio IS DUH Final Report Page 8-13
above 0.7 W – and certainly above 1 W – the question has to be asked, whether these levels should be allowed continuously at all, as they supply no function.
Passive standby power consumption well below 0.5 W are state of the art e.g. for TVs or audio amplifiers. So this should be possible for off-mode as well. The options to reduce off-mode losses include a galvanic or electronic switch at the mains input (even if this might introduce additional hardware) and if this hardware and the potentially needed soft switch do need some power (the only power consuming features in the Lot 6 off-mode) then this power requirement must be met by alternative means. Alternatives introduced in Task 7 – though not equally applicable for all product types – are e.g. solar cells, energy buffering or a secondary power supply optimised only for the small load. Secondary power supplies are in use in audio amplifiers, for example, where high peak power needs are often realised with large conventional (or toroidal) transformers [Yamaha 2007]. Most often secondary power supplies are applied to offer standby functions, but at a power level of e.g. 0.1 W passive standby the same low levels would also apply for a soft switch without the remote control. Generalising on the audio amplifier example, 0.1 W should be possible for any on/standby remote control even for products with hundreds of W rated power, and in extension a soft switch without any remote control should also be possible.
Confirmed BAT levels for off-mode below 0.3 W have also been identified among the 15 product cases – and additionally it should be reiterated that for many products the 0 W option of the hard-off switch is in fact also BAT.
Passive standby: For the defined passive standby function cluster (covering remote control functions, timers, status displays, memory refresh and sensor based safety functions) realisations below 1 W are certainly possible.
Without expanding this in the manner of true power budgets per function, for some of the passive standby functions (or combinations) explicit assumptions can be given.
- Remote control: A remote control receiver can be realised below 100 mW. An optional dedicated microcontroller (which could serve other purposes at the same time) would make realisations below 150 mW possible, which cover more than just the detection of wake-up over remote control.3
- Memory refresh: For setup storage etc. continuous power consumption should not be necessary as non-volatile memory is possible even in lower price segments. A product not loosing its settings during disconnect is always positive for the consumer, as well. The power consumption of the main or graphics memory (RAM) may be problematic, if it needs to be powered continuously during passive standby.
- Clock: If a microcontroller is present for other functions running (e.g. even a remote control receiver) a clock needs no additional power. A timer likewise is a function present in all energy optimised microcontrollers. The power circuitry or relay needed to directly switch larger function blocks on or off might add to the power needed for timers in comparison to clocks.
- Simple displays and low power LEDs are certainly available at below 100 mW for example4. Large, graphical displays need more power; also clock displays (i.e. when high brightness is continuously required) have larger variations.
- Sensor based safety functions: For functions falling under this category we have less specific data, but some should be included in the 0.9 W budget of the best washing machines.5
Thus the lowest realisations of all functions in the passive standby cluster should be possible below 1 W. The only uncertainty would be for the sensor based safety functions (higher power consumptions are not explicitly known, but could be necessary) and for more complex or very bright displays. However, a 3 W fully graphical display might not be appropriate as a continuous status display, or would need to be dimmed during standby.
Networked standby: The situation for networks is much more complex as the type of network and the actual or future detail of network protocols and network layers can make a difference. Certain values are available to estimate the minimal power requirements of selected combinations.
3 See [Yamaha 2007] for the 100 mW standby including remote control reactivation. 4 Low power SMD LEDs are available with 20-40 mW, see (arbitrary selection) Osram LS A679, LG A67K or LG M67K. 5 This references the CECED BAT value of 0.9 W for a washing machine without delay start (timer) activated.
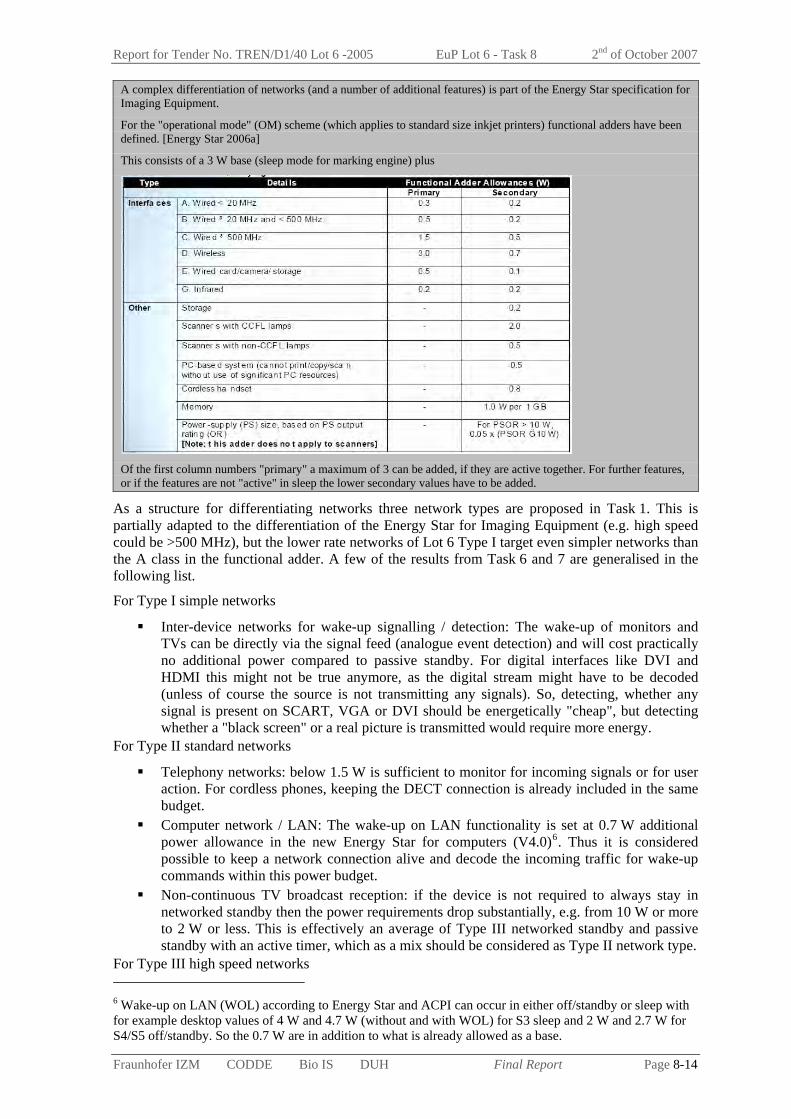
Report for Tender No. TREN/D1/40 Lot 6 -2005 EuP Lot 6 - Task 8 2nd of October 2007
Fraunhofer IZM CODDE Bio IS DUH Final Report Page 8-14
A complex differentiation of networks (and a number of additional features) is part of the Energy Star specification for Imaging Equipment.
For the "operational mode" (OM) scheme (which applies to standard size inkjet printers) functional adders have been defined. [Energy Star 2006a]
This consists of a 3 W base (sleep mode for marking engine) plus
Of the first column numbers "primary" a maximum of 3 can be added, if they are active together. For further features, or if the features are not "active" in sleep the lower secondary values have to be added.
As a structure for differentiating networks three network types are proposed in Task 1. This is partially adapted to the differentiation of the Energy Star for Imaging Equipment (e.g. high speed could be >500 MHz), but the lower rate networks of Lot 6 Type I target even simpler networks than the A class in the functional adder. A few of the results from Task 6 and 7 are generalised in the following list.
For Type I simple networks
Inter-device networks for wake-up signalling / detection: The wake-up of monitors and TVs can be directly via the signal feed (analogue event detection) and will cost practically no additional power compared to passive standby. For digital interfaces like DVI and HDMI this might not be true anymore, as the digital stream might have to be decoded (unless of course the source is not transmitting any signals). So, detecting, whether any signal is present on SCART, VGA or DVI should be energetically "cheap", but detecting whether a "black screen" or a real picture is transmitted would require more energy.
For Type II standard networks
Telephony networks: below 1.5 W is sufficient to monitor for incoming signals or for user action. For cordless phones, keeping the DECT connection is already included in the same budget.
Computer network / LAN: The wake-up on LAN functionality is set at 0.7 W additional power allowance in the new Energy Star for computers (V4.0)6. Thus it is considered possible to keep a network connection alive and decode the incoming traffic for wake-up commands within this power budget.
Non-continuous TV broadcast reception: if the device is not required to always stay in networked standby then the power requirements drop substantially, e.g. from 10 W or more to 2 W or less. This is effectively an average of Type III networked standby and passive standby with an active timer, which as a mix should be considered as Type II network type.
For Type III high speed networks 6 Wake-up on LAN (WOL) according to Energy Star and ACPI can occur in either off/standby or sleep with for example desktop values of 4 W and 4.7 W (without and with WOL) for S3 sleep and 2 W and 2.7 W for S4/S5 off/standby. So the 0.7 W are in addition to what is already allowed as a base.

Report for Tender No. TREN/D1/40 Lot 6 -2005 EuP Lot 6 - Task 8 2nd of October 2007
Fraunhofer IZM CODDE Bio IS DUH Final Report Page 8-15
Continuous broadcasting reception (at least tuner, decoder, processor active): The devices should keep only one tuner active. Currently 7.5 W "while listening" is definitively possible for the set-top-boxes. According to [Bush 2007] "active standby" is possible at 3.7 W, and even the lowest on-mode consumption for a simple set-top-box was 5.9 W. Set-top-boxes not listening all the time bring substantially lower averages. Networked standby for TV receivers with recording capability also covers waiting for the start signature for a programmed recording job. While this function is set (traditionally this was done via timers, then additionally via VPS, now shifting towards electronic program guides and Tivo) power consumption of TVs is for example 9.5 W (this is an example value from a stakeholder, not a lowest possible value). Although this would statistically not be activated all the time, it could easily be running continuously for a week or more, when programming series recordings or during holidays.
High speed wired and wireless networks potentially will also have higher power consumptions than the Type II class. In the future, network protocols and hardware should support switching down the transmission rates, when traffic is comparatively low or when all connected end devices are detected to be in standby (for example with IPv6).
Networked standby summary
Full network connections, such as wake-up over LAN for computers, seem to be possible at around 2 W. Telephony reception including DECT is also possible below 2 W. Non-continuous checking for an update over a network or broadcast is also possible at an average of below 2 W. The simpler signalling detection such as on SCART, VGA, DVI is only minimally higher than passive standby (i.e. 1 W would suffice). Only the higher speed networks (e.g. >500 MHz), continuous broadcasting reception, and possibly some wireless network types such as higher speed WLAN need more than 2 W averaged over time. For these fast changing areas 5 W might be a strict but possible target.
Aiming at one minimum requirement for all network types leads to two choices: setting a quite high limit in order to accommodate all the current configurations and technologies, or setting a lower, more ambitious limit possibly relegating many higher speed technologies to exemptions.
The use and activity of these network types must be justified, i.e. first of all, the product must be in a Lot 6 networked standby and the speed and duration of the network activity should be critically checked. For some networks, reducing the connection speed during standby might be possible (or will be in future versions), while for others – especially the broadcast receptions – the continuous reception and decoding might not have to be offered in the future.
The above discussions were based on the lowest values found in this study in each product category. There is a difference between "no better product could be found on the market" or if it is principally not possible to achieve a lower BAT. For some products with high confirmed BAT values, lower values are possible when comparing the offered combination of functions with other product cases. Transferring findings from one case to another with similar features should still be considered, even though it always entails the danger of oversimplification. In such a case, the transfer should not be based on the absolute lowest value found to allow for the higher uncertainty. In other cases, like the radio and lighting the hard-off switch is a factual BAT, even though in the Task 7 analysis we have aimed to integrate BATs for "off-mode with losses" rather than a BAT of 0 W.
The sections below describe the issue with some examples based on confirmed BAT values for off-mode, passive and networked standby to see, which would be the upper limits when discussing based on "higher" BATs, and which of the higher BATs would be dismissed by transferring findings from other products.
Off-mode: The highest cases of current off-mode BATs (without hard-off switches) are Electric Toothbrush (1 W), Desktop Computers (0.8 W new confirmed BAT) and PC speakers (1.5 W). For the simple radios there is no BAT currently, but effectively the audio minisystem BAT could be applied instead, or 0 W for a hard-off switch. In principle, electric toothbrushes and certainly PC speakers have further reduction potential even without a hard-off switch – the high values are
Report for Tender No. TREN/D1/40 Lot 6 -2005 EuP Lot 6 - Task 8 2nd of October 2007
Fraunhofer IZM CODDE Bio IS DUH Final Report Page 8-16
caused by the very small profit margins in these areas leading to the use of simplest circuit layouts. That leaves the desktop BAT as the highest off-mode among the product cases. Since we cannot know about other examples not investigated that value could be a representative "high" BAT value.
Thus, adding some safety, the conservative off-mode BAT to consider would be 1 W. It applies to a complex device with a large power supply, which is internally supplying a "standby" voltage during "off" to operate a soft switch. It would not include any functions like wake-up over LAN.
Consideration of Energy Star 4.0 requirements
Without wake-up on LAN the energy star for computers now specifies 2 W for desktops and 1 W for laptops. Lot 3 in their Task 8 review of the various values encountered during their study note that 76 % of desktop models listed in the Energy Star 2006 data collection consume less than 2 W in off/standby and 81 % of listed notebooks reach below the required levels [IVF 2007b]. Clearly, even for the selected 2006 models the requirements of 2 W and 1 W do not only cover the best 25 or 30 % percent of the sample. For the listed brand products (we acknowledge that this is not the whole market) the lowest values are 0.4 W for desktop off and 0.14 W for notebooks (both without wake-up on LAN).
Passive standby: Three confirmed BATs are higher than 1 W in the final Task 7: The electric oven at 2.5 W, the PC speaker at 2.4 W and the more complex situation of the washing machines. The BAT update for washing machines leads to 1.9 W BAT with delay start (water sensor, door lock and a status display are also active), and 0.9 W BAT without the timer function. The high value for the PC speakers is probably for a surround system, where actually lower values such as for receivers or the audio minisystem should also be possible. The high values for the two large household appliances are not yet fully understood, as according to other sources products with lower values have been on the market in the past. The circuitry of the timer for delay start seems to be the cause of high standby rather than the water stop safety function. It seems to be problematic here to differentiate the current typical feature set of the large household appliances included.
To leave room for "feature rich" products (passive features only!) and for example digital user interfaces with (dimmed) displays 2 W might be appropriate for most products. Yet the large household appliances would still not fit as they seem to require more than 2.5 W from the present situation. There is no specific information on power budgets for sensor-based safety functions, which would currently require more than that. This is an area with higher uncertainty.
Networked standby: Feature rich and multiple network products need additional room above the passive standby level, e.g. more than 3 W. For high-speed and continuous broadcast reception 10 – 15 W can still be "good products" depending on the offered feature range.
Energy Star for computers has settled on 4 W sleep (4.7 W sleep including WOL) for desktops and 1.7 W as a maximum for laptops (2.4 W with WOL). As evaluated by the Lot 3 study, 91 % of listed desktop products in the 2006 Energy Star base data consume less than 4 W in sleep, and 81 % of notebooks consume less than 1.7 W in sleep. Again, for the sleep mode alone, much more than 25 % of the representative sample for Energy Star definition are below the requirements in 2006 already.
Mid Term Targets
Because off-mode consumption is considered as an energy loss, a medium to long term target (also proposed in Lot 7) would be 0.3 W. This might not apply to all power ranges of products but is also a visible goal in the Australian standby proposals. For the horizontal measure achieving 0.5 W medium term across all products is considered realistic. For higher power range products7 the target might have to be slightly higher still (i.e. 0.7 – 0.8 W). Products not staying below those values might justifiably be forced to offer a hard-off switch, a more efficient soft switch or an auto-off circuitry.
For passive standby, 1 W is seen as a reasonable medium term target. While this is easily achievable in almost all examined product groups except the large household appliances providing
7 A typical lower border of the "higher power" versus "low power" range appearing in the Lot 7 recommendations and also in the functional adder for imaging equipment would be 10 W.

Report for Tender No. TREN/D1/40 Lot 6 -2005 EuP Lot 6 - Task 8 2nd of October 2007
Fraunhofer IZM CODDE Bio IS DUH Final Report Page 8-17
the whole set of passive standby functions, as a horizontal target this is demanding, yet realistic, feasible and in line with plans for legislation on standby in other parts of the world.
For networked standby the horizontal limit should aim at 2 W (including cyclic activity with timer controlled passive standby inbetween). For some network types and reception patterns this does not currently seem possible. Within a 2 W budget adding new network capability to existing products should continue to be possible – but not with limitless choices. Certainly Bluetooth and DECT show that this range is also allowing wireless communication (if the wireless network really needs to be active during standby all the time).
Low rate inter-product channels and detecting signal presence (e.g. on VGA, DVI, SCART, HDMI) are certainly not limited by this allowance. If such network configurations can be clearly differentiated then the target should be set below 2 W. This corresponds to Type I of the network differentiation introduced in Task 1.
Higher bandwidth networks and continuous broadcast reception during standby will need separate rules, as they currently need around 8 W and are decreasing only slowly (and possibly increasing again with each next higher speed specification). More research in that area has certainly been started during the course of this study, but no radically lower values are known from research (when continuously listening to the broadcast). According to the Swiss measurements [Bush 2007], simple set-top-boxes already on the market seem to be able to receive and decode digital broadcasts continuously at levels below 6 W – or to offer networked standby functionality at roughly 4 W. The potential to aim at less than 10 W for broadcast reception can certainly be shown.
If broadcast reception and high speed networks are covered horizontally, then the current 8-10 W class could still serve as the minimum requirement to at least exclude the largest energy users. Products needing more than 10 W continuously either would need to implement one lower power mode (possibly offering less functionality in that added mode), to reduce the network speed or time slot of network activities or integrate a hard-off switch after all – if there are potential applications where this would be used. A requirement to integrate a hard-off switch into a fast network device is certainly not beneficial, if it is never used. Mid- to long-term a further reduction to a level of 5 W should be aimed at. This corresponds to Type III of the network differentiation introduced in Task 1.
► Recommendation on minimal requirements (threshold values)
The recommendations for target minimal requirements are shown in Table 8-4.
Table 8-4: Recommended Lot 6 horizontal targets for minimum requirements
Lot 6 Mode Limit possible? Proposed Limit
Off-mode (any) Yes 0.5 W 0.75 W for >10 W rated PSU output (<0.3 W long term)
Passive Standby
Yes – large household appliances providing sensor based safety may be problematic
1 W
Networked Standby Difficult - subdivision by network types proposed
1 W for Type I "simple networks" 5 W for Type III "high speed networks" 2 W for other networks (Type II)
The subdivisions would make it necessary to document for all products, which Lot 6 mode(s) they are offering, and at what power levels. Some products would additionally have to declare technical parameters or features. These would be the rated power supply output, if the higher off-mode limit value is claimed, and the network type, if networked standby is available.
This could be a mandatory information requirement up front (e.g. in the product documentation) but could also be information, which must be delivered on request.

Report for Tender No. TREN/D1/40 Lot 6 -2005 EuP Lot 6 - Task 8 2nd of October 2007
Fraunhofer IZM CODDE Bio IS DUH Final Report Page 8-18
The Type I simple networks are considered to be energetically very close to passive standby. Having a separate limit value here – which could in our proposal coincide with the passive standby value – is needed, because else even the simplest signal detection on an input could be interpreted as a network according to the Lot 6 definition, which would give them a higher allowance.
Recommendation on phasing in the requirements
For implementing a horizontal measure, which aims at the targets listed in Table 8-4, a two-tiered introduction is proposed.
This approach is expected to resolve the time pressure for early redesigns (see section on redesign cycle) to a large degree. The Tier 1 period could also be used to gather "mandatory" data about the products then covered by the horizontal measure and to further develop the measure (in particular networked standby).
For a period of 2 years (Tier 1) we propose the following requirements:
Off-mode: 1 W horizontally (not differentiating power levels) Passive standby: 2 W Networked standby:
3 W for Type I (simple networks)
4 W for Type II (standard rate networks)
10 W for Type III (high speed networks and continuous broadcast reception)
After that Tier 2 should use the target requirements set out in Table 8-5. If the start of compliance for Tier 1 would be in 2010, then Tier 2 would start in 2012. However, such dates must be treated with extreme caution as has been noted above. This is just to illustrate one possible time scale, which is used as the basis for the scenario calculations.
Table 8-5: Lot 6 two-tiered implementation proposal
Tier 1 Tier 2 Off-mode for rated output <10 W 1 W 0.5 W Off-mode for rated output >10 W 1 W 0.75 W Passive standby 2 W 1 W Networked standby "Type I" 3 W 1 W Networked standby "Type II" 4 W 2 W Networked standby "Type III" 10 W 5 W
Figure 8-3 shows the proposed limit values in graphical form. Presented in this way, the comparatively large allowance of 10 W for Tier 1 networked standby Type III is even more apparent.
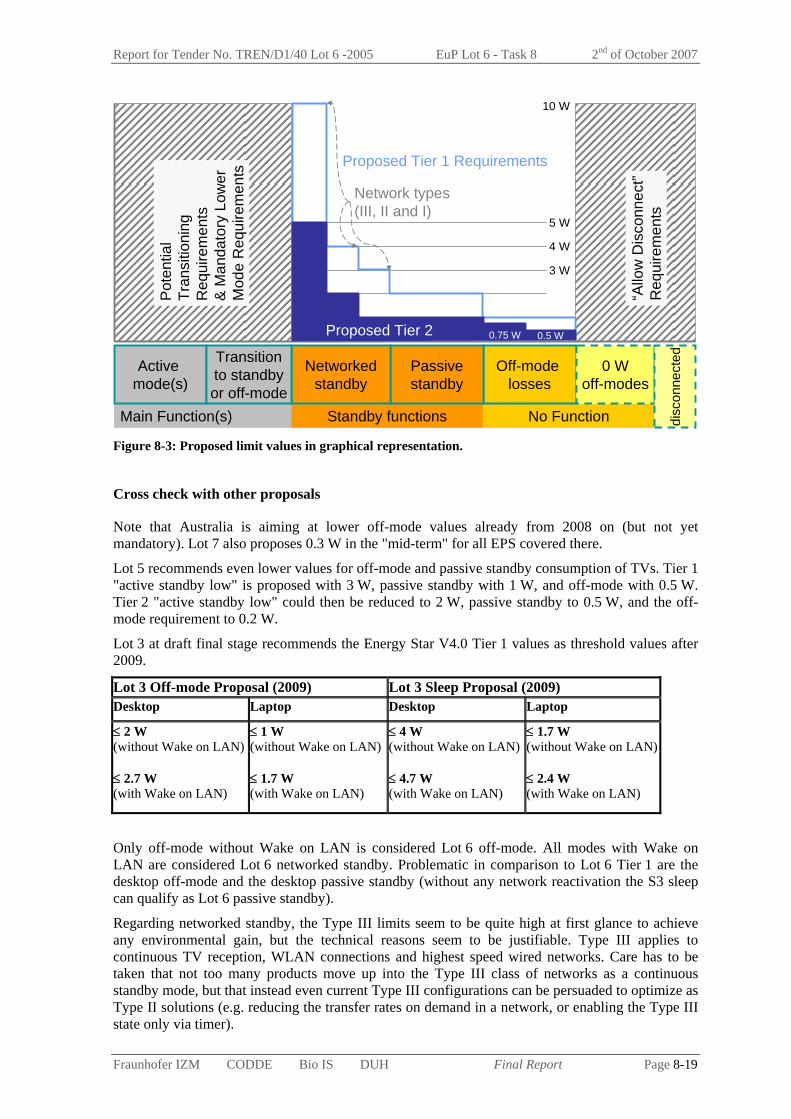
Report for Tender No. TREN/D1/40 Lot 6 -2005 EuP Lot 6 - Task 8 2nd of October 2007
Fraunhofer IZM CODDE Bio IS DUH Final Report Page 8-19
Main Function(s) Standby functions No Function
Active mode(s)
Off-mode losses
0 Woff-modes
Passivestandby
disc
onne
ctedNetworked
standby
Transitionto standbyor off-mode
Network types(III, II and I)
Proposed Tier 2
“Allo
w D
isco
nnec
t”R
equi
rem
ents
Pot
entia
l Tr
ansi
tioni
ngR
equi
rem
ents
& M
anda
tory
Low
er
Mod
e R
equi
rem
ents
Proposed Tier 1 Requirements
10 W
5 W
4 W
3 W
0.75 W 0.5 W
Figure 8-3: Proposed limit values in graphical representation.
Cross check with other proposals
Note that Australia is aiming at lower off-mode values already from 2008 on (but not yet mandatory). Lot 7 also proposes 0.3 W in the "mid-term" for all EPS covered there.
Lot 5 recommends even lower values for off-mode and passive standby consumption of TVs. Tier 1 "active standby low" is proposed with 3 W, passive standby with 1 W, and off-mode with 0.5 W. Tier 2 "active standby low" could then be reduced to 2 W, passive standby to 0.5 W, and the off-mode requirement to 0.2 W.
Lot 3 at draft final stage recommends the Energy Star V4.0 Tier 1 values as threshold values after 2009.
Lot 3 Off-mode Proposal (2009) Lot 3 Sleep Proposal (2009) Desktop Laptop Desktop Laptop
≤ 2 W (without Wake on LAN) ≤ 2.7 W (with Wake on LAN)
≤ 1 W (without Wake on LAN) ≤ 1.7 W (with Wake on LAN)
≤ 4 W (without Wake on LAN) ≤ 4.7 W (with Wake on LAN)
≤ 1.7 W (without Wake on LAN) ≤ 2.4 W (with Wake on LAN)
Only off-mode without Wake on LAN is considered Lot 6 off-mode. All modes with Wake on LAN are considered Lot 6 networked standby. Problematic in comparison to Lot 6 Tier 1 are the desktop off-mode and the desktop passive standby (without any network reactivation the S3 sleep can qualify as Lot 6 passive standby).
Regarding networked standby, the Type III limits seem to be quite high at first glance to achieve any environmental gain, but the technical reasons seem to be justifiable. Type III applies to continuous TV reception, WLAN connections and highest speed wired networks. Care has to be taken that not too many products move up into the Type III class of networks as a continuous standby mode, but that instead even current Type III configurations can be persuaded to optimize as Type II solutions (e.g. reducing the transfer rates on demand in a network, or enabling the Type III state only via timer).
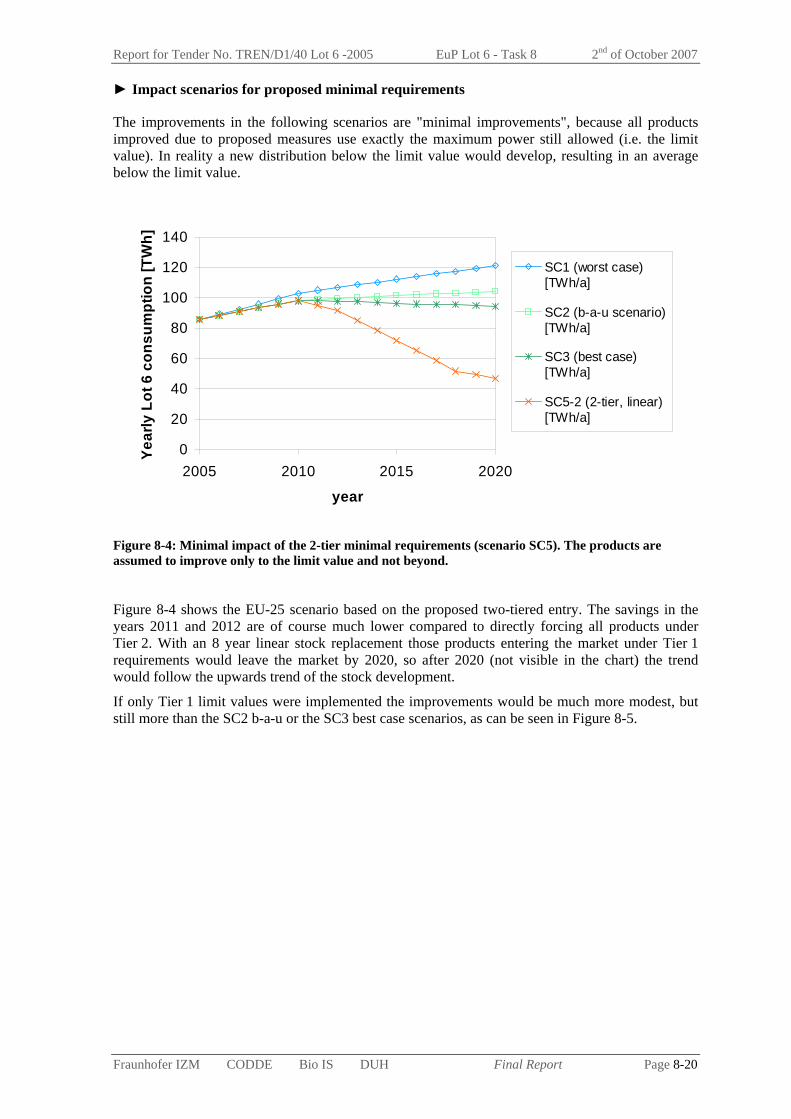
Report for Tender No. TREN/D1/40 Lot 6 -2005 EuP Lot 6 - Task 8 2nd of October 2007
Fraunhofer IZM CODDE Bio IS DUH Final Report Page 8-20
► Impact scenarios for proposed minimal requirements
The improvements in the following scenarios are "minimal improvements", because all products improved due to proposed measures use exactly the maximum power still allowed (i.e. the limit value). In reality a new distribution below the limit value would develop, resulting in an average below the limit value.
0
20
40
60
80
100
120
140
2005 2010 2015 2020
year
Year
ly L
ot 6
con
sum
ptio
n [T
Wh]
SC1 (worst case) [TWh/a]
SC2 (b-a-u scenario) [TWh/a]
SC3 (best case) [TWh/a]
SC5-2 (2-tier, linear)[TWh/a]
Figure 8-4: Minimal impact of the 2-tier minimal requirements (scenario SC5). The products are assumed to improve only to the limit value and not beyond.
Figure 8-4 shows the EU-25 scenario based on the proposed two-tiered entry. The savings in the years 2011 and 2012 are of course much lower compared to directly forcing all products under Tier 2. With an 8 year linear stock replacement those products entering the market under Tier 1 requirements would leave the market by 2020, so after 2020 (not visible in the chart) the trend would follow the upwards trend of the stock development.
If only Tier 1 limit values were implemented the improvements would be much more modest, but still more than the SC2 b-a-u or the SC3 best case scenarios, as can be seen in Figure 8-5.

Report for Tender No. TREN/D1/40 Lot 6 -2005 EuP Lot 6 - Task 8 2nd of October 2007
Fraunhofer IZM CODDE Bio IS DUH Final Report Page 8-21
0
20
40
60
80
100
120
140
2005 2010 2015 2020
year
Year
ly L
ot 6
con
sum
ptio
n [T
Wh]
SC1 (worst case) [TWh/a]
SC2 (b-a-u scenario) [TWh/a]
SC3 (best case) [TWh/a]
SC6-2 (Tier 1 only,linear) [TWh/a]
Figure 8-5: Minimal impact of implementing Tier 1 only (scenario SC6). The products are assumed to improve only to the limit value and not beyond, unless their average in 2005 is already below the limit values.
Figure 8-6 shows the development, if Tier 2 limit values are implemented directly from the start. The scenario would approach the SC5 trend (two-tiered) around 2020 at 47 TWh – i.e. even with a two year delay between SC5 and the harsher SC7 the difference is gone in 2020, when applying the 8 year linear stock model.
0
20
40
60
80
100
120
140
2005 2010 2015 2020
year
Year
ly L
ot 6
con
sum
ptio
n [T
Wh]
SC1 (worst case) [TWh/a]
SC2 (b-a-u scenario) [TWh/a]
SC3 (best case) [TWh/a]
SC7-2 (Tier 2 only,linear) [TWh/a]
Figure 8-6: Minimal impact of implementing only Tier 2 minimal requirements (scenario SC7). The products are assumed to improve only to the limit value and not beyond.
Figure 8-7 shows the linear scenarios in comparison. SC5-2 is the recommended implementation. Note once more that SC5 to SC7 are minimal improvement calculations, since the new compliant

Report for Tender No. TREN/D1/40 Lot 6 -2005 EuP Lot 6 - Task 8 2nd of October 2007
Fraunhofer IZM CODDE Bio IS DUH Final Report Page 8-22
stock is exactly fixed at the limit value. On the other hand, towards 2020 the real stock replacement containing some longer lived products is likely to slow down the improvement.
0
20
40
60
80
100
120
140
2005 2010 2015 2020
year
Year
ly L
ot 6
con
sum
ptio
n [T
Wh] SC1 (worst case)
SC2 (b-a-u scenario)
SC3 (best case)
SC4-2 (LLCC-based,linear)SC5-2 (2-tier, linear)
SC6-2 (Tier 1 only,linear)SC7-2 (Tier 2 only,linear)
Figure 8-7: Comparison of the scenarios. For SC5, SC6 and SC7 the products are assumed to improve only to the limit value and not beyond.
Table 8-6: Comparison of 2020 consumption values and improvements against business as usual.
Scenario TWh/a in 2020 Change compared to b-a-u SC2 (b-a-u) 104 SC1 (worst case) 121 +16 % SC3 (best case) 94 -10 % SC4 (LLCC) 19 -81 % SC5 (2-tier) and SC7 47 -55 % SC6 (Tier 1 only) 77 -26 % SC5-n (2-tier, new soft stock) 8 54 -48 %
The recommended 2-tier implementation represented in SC5 leads to at least a 55 % improvement against the business as usual in 2020. SC4 based on the LLCC of the individual product cases is not considered realistic for implementation. This scenario would correspond to a further reduction of the limit values (of Tier 2) by a factor of more than two across all modes. Nevertheless, according to the assumptions and calculations in Task 7 such strong reductions would on average pay off for the consumers.
The simplified scenarios do not differentiate by modes in full detail. For the b-a-u case the split between modes is assumed to continue with the percentages of the 2005 base case calculation (off-mode 22 %, passive standby 25 %, networked standby 53 %).
If the stock would be fully replaced with Tier 1 compliant products (scenario SC6 in 2020) the distribution between modes would be 19 % for off-mode, 15 % for passive standby and 66 % for
8 A further cross-checking scenario with a more detailed stock model is now included in the sensitivity section, see Page 8-40.

Report for Tender No. TREN/D1/40 Lot 6 -2005 EuP Lot 6 - Task 8 2nd of October 2007
Fraunhofer IZM CODDE Bio IS DUH Final Report Page 8-23
networked standby. The restrictions on networked standby are less stringent during Tier 1 than for off-mode and passive standby.
Of the remaining 47 TWh according to Tier 2 (scenario SC5 in 2020) the contributions are divided into 23 % for off-mode, 12 % for passive standby and 64 % for networked standby. From Tier 1 to Tier 2 all modes including networked standby are reduced by a similar factor.
► Recommendation on "Requirements to have low power states"
In order to achieve the maximum savings possible, products could be forced to offer at least one of the modes regulated by the horizontal implementing measure (including 0 W off-mode in this case). This should be possible for all products except the always-on (PUC 0) products, since the PUC differentiation for PUC 1-3 always includes one mode below active or transitional (i.e. ready mode).
Always-on products would need separate treatment, because it cannot be ensured that a lower power mode or off-mode is technically possible, makes sense and would be used in reality. Therefore only a generic requirement for PUC 0 is recommended, in the direction that designers should check, whether integrating power management or demand aware powering down is possible for each individual product design.
A related requirement could be that all products – regardless of the existence a hard-off switch – should allow a "disconnect" phase without
undue delays in startup or updating over the network, before the EuP can be used after reactivation,
loosing settings or timer programming.
This would emphasize that non-volatile memory rather than continuously refreshed memory should be preferred for setup storage. At the same time this would at least not prohibit external measures (external switches or master-slave power strips) from use. Such a requirement is certainly in the interests of the user, and only a minority of products on the market today would not comply.
One specific requirement should be set that EuPs with continuous preheating must have one lower mode conforming to the Lot 6 standby or off-mode definition.
► Recommendation on "Transitioning requirements"
For products, which are job-based (and have power management), setting a maximum transition time (before transitioning to a lower power mode) would be logical, but the Task 7 calculations cannot express this clearly (too many overlapping assumptions needed, and possible shifts between on-mode and standby). Based on existing requirements in labels a maximum timeout of 30 minutes before transitioning into Lot 6 standby or directly into off-mode could be recommended. Requests for exemptions are however likely even for this requirement. For professional equipment there might be considerable resistance against such requirements, if the quality of output could be negatively affected.
Generally the trade-off between faster transition into lower power modes and the extended wake-up times must be acceptable to the user.
For products, which do not yet have "auto-standby" in some way, it can probably not be prescribed as a specific requirement. In some cases – like the TV set – it just makes no sense that the device should decide, when to switch into standby.
Auto-off, likewise, can be a good energy saving solution, especially if the manufacturer already has integrated the hardware for a soft-off into the product - but again a product, which is not demand aware, cannot make the decision alone. An auto-off for a television set after e.g. 4 hours of inactivity (in standby) might actually be acceptable to many users, who would on the next day need to switch on the TV once on the appliance, i.e. without the remote control. In combination with increasing network capabilities of TVs, this is again not a very realistic development, and the efforts should be invested in minimising the standby of those new features, rather than teaching the user that his eco-television now behaves differently than a standard television.
Report for Tender No. TREN/D1/40 Lot 6 -2005 EuP Lot 6 - Task 8 2nd of October 2007
Fraunhofer IZM CODDE Bio IS DUH Final Report Page 8-24
Only for EuPs with preheating a maximum transitioning time should be explicitly set. A maximum presetting of 15 minutes is recommended, and the maximum setting allowed should not exceed 120 minutes.
For other products, the transitioning requirements discussed here are proposed only as generic requirements (preset timeout as short as possible, etc.) not as specific requirements (e.g. timeout must always be shorter than 15 minutes).
► Comments regarding standardisation
For measuring standby IEC62301 is certainly the best and most widely applied standard, as was concluded in Task 1. The only drawback (as with any precise measurement standard) is that for fast checks the procedure might be a bit complex (too many variables to monitor and document) and the accuracy requirements are quite high (which is logical, when measuring in the <1 W region). Currently IEC TC 59 (WG 9) considers integrating the set of Lot 6 standby definitions in the revision of the standard.
A standardised definition should also stay compatible with the IEC62087 as far as possible. As long as the division line between active standby low and high is maintained and the exclusion of active standby high in the Lot 6 scope is acceptable from an environmental and technical viewpoint, then the compatibility should work. Possibly in practice of the IEC62087, the Type I networks proposed in Lot 6 are energetically very close to passive standby, as well. Feedback has corrected the assumption that active standby (low and high) only covers reactivation via the broadcast reception. Reactivation via connected products is also considered active standby low in IEC 62087.
A better match with the details of energy star for computers is difficult (linked to the ACPI states S3 and S5 mainly), as the mode separation there is more linked to the user action (power down command) rather than the actual state and features after powering down. Thus the S5 "off/standby" state may include wake-up over LAN (or other network) functions, which can clearly not be an off-mode according to the Lot 6 distinctions.
A drawback of the current Lot 6 definition could be that from the outside the Lot 6 mode(s) of a product might not be easily ascertained. Therefore, measuring correctly could only be possible after reaffirming each mode present with the manufacturer, or by making a documentation on the available modes (according to the future applicable standard) mandatory.
► Discussion of information requirements
The recommended minimum information requirement addresses the product documentation. The documentation of a product should list the modes and the measured power consumptions. Where necessary to ascertain the correct usage of the minimum requirements, technical data on the power supply and/or the network type(s) incorporated must be supplied. The appropriate measuring standard used and the version of the standard should be provided.
Where time-outs for automated transitioning apply, the default, minimum and the maximum values should be given in minutes.
Although information requirements only affecting product documentation in general have to be considered inefficient and too late to inform the user before the purchasing decision, this requirement would enable compliance checks and help with documenting and analysing the development of standby / off-modes in Europe after the enforcement of the implementing measure.
After a short delay the information would most likely also be available to users before buying the product, if the users are actively searching for energy-saving products. Therefore mandatory product documentation can reach the informed buyer in the same way as consumer test magazines.
Direct point-of-sales information should be considered the domain of labels with their accompanying rules and standards. A separate label on standby is not considered necessary, if the limit values remain as recommended. Integrating standby values into existing or revised labels as a separate information might be appropriate, if the size of the label and the legibility of the contents allow that. Depending on the complexity of the product it must be checked whether the proposed

Report for Tender No. TREN/D1/40 Lot 6 -2005 EuP Lot 6 - Task 8 2nd of October 2007
Fraunhofer IZM CODDE Bio IS DUH Final Report Page 8-25
mode names used in this study should be directly used towards the consumers (in addition the localisation could lead to further problems, since not all countries would use the English terms). This especially refers to the direction user interfaces are taking, where "standby" as a term will not be used towards the consumer anymore.
Furthermore, standby and off-mode power consumptions can be integrated into energy efficiency indices, which are the base for labelling with energy efficiency classes, if a compromise for an average use pattern can be found for a product class.
► Discussion of trends and external measures potentially not covered
Improvements are also possible through other routes, which are not covered by an implementing measure. As an example, consider information on energy efficient product use directly provided by the product itself, rather than in a manual or on a label.
There are possibilities for educating the user additional to point of sales information and the product manual, which the manufacturer can implement. As one example, Nokia has supplied information, where the device tells the user about better energy saving behaviour (i.e. disconnecting the EPS when the mobile phone is fully charged). If such messages do not impede the normal handling of the device and in particular do not require the user to acknowledge with an action every time the message has come up, then this could be a helpful option costing only a few lines of code. Its potential saving effect cannot be quantified, however.
As an extension of that idea, consider future devices or an automated home making suggestions on how you could save more energy, or during which time of the day you could switch off more devices.
External measures, including smart metering, master-slave switches, or so-called power safer devices (see Task 6) are principally outside the scope of Lot 6. The reason is that EuP targets the design of single products. Nevertheless these are options applied by many users already. Some of these devices have their own standby power consumption, so for already efficient products this can be a step backwards. For older products and combinations of old and new products, external measures will continue to make sense for a number of years. A retrofit of old devices with external measures has not been included in the scenarios.
Possibly manufacturers should think about integrating similar functionality into their new products, rather than have their customers buy additional hardware elsewhere.

Report for Tender No. TREN/D1/40 Lot 6 -2005 EuP Lot 6 - Task 8 2nd of October 2007
Fraunhofer IZM CODDE Bio IS DUH Final Report Page 8-26
8.2. Impact Analysis Industry and Consumers
8.2.1. Impacts on the manufacturer
To achieve the improvements calculated in the LCC scenarios, the question is how the costs are distributed. Obviously, the customers save money (in a life cycle perspective), so do the manufacturers have to pay? For the calculations in Task 7 it is assumed that the additional product costs are passed on one-to-one to the costumer. It is also implicitly assumed that the additional costs are the same or similar for all manufacturers of the same product type. In principle, additional costs then affect all products in the same way, so competition is not disturbed. Since the additional product price includes overhead costs and margins similarly to any other part of the product, turnover and profits are actually increasing (provided the spending capacity of customers does not diminish sales).
In markets with very strong competition and where product prices are strategic rather than covering real costs, the manufacturer may not be able to pass on even small amounts to the costumer, because this would lead to a loss of market share. So increasing manufacturing costs to fulfil the requirements would in these cases lead to a smaller margin for the manufacturer (note that in such extreme cases the profit per product may already be below zero).
Although the additional costs are assumed to be similar for all manufacturer of the same product type, it can be seen that more “basic” products with only very few functions can probably maintain the requirements more easily than products with a lot of features. This could lead to a widening of the range of prices between basic and more complex products, which leads to more pressure on the top feature products.
Products may have to be redesigned to achieve the improvements. If the adjustments can be made during a regular redesign cycle the additional design costs are not very high, but early, unscheduled redesigns could lead to additional costs. As the status and regularity of redesigns varies a lot between companies, some manufacturers could be more affected than others. However, this applies to any other legal requirement as well. The costs of unscheduled redesigns cannot be passed on directly to the costumer, if the competitors manage the same transition with mostly scheduled redesigns. If all face the same situation, competition is not affected negatively, but rather those companies inserting new requirements most flexibly into the design procedures are rewarded.
Manufacturers, which already invested in energy saving technologies in the past, can adapt more easily when energy requirements/limits will be implemented and therefore will have a market advantage. On the other hand, manufacturers who modify and market their new products ahead of schedule could be disadvantaged during that time, if the product costs are indeed higher (see also impacts on the costumer).
Optimally, it should be possible for companies to integrate requirements into their internal procedures (down to PDM/CAD/documentation and procurement level). As with existing environmental requirements like RoHS and with quality management, the framework should exist in most companies. Adding to the requirements list does not take a lot of time in itself, but making sure the procedures work for all types of equipment or redesign projects in a company and gathering additional data (from suppliers, if necessary) for the first time is time consuming. Then the final step of integrating the data flows and requirements into the company software is the most expensive and time critical step. Solution providers have of course started working on "EuP compliance" modules, even though the implementing measures are not yet fixed and might differ widely between product types.

Report for Tender No. TREN/D1/40 Lot 6 -2005 EuP Lot 6 - Task 8 2nd of October 2007
Fraunhofer IZM CODDE Bio IS DUH Final Report Page 8-27
Another question is how authorities will check, if a product is conforming to an implementing measure and to limit values in particular.
Registering all products centrally with their standby related performance is not possible for a horizontal measure, because it covers too many products with too many market entries. The CE marking system operates on the assumption that putting the mark on the product means compliance with the relevant legal requirements. If manufacturers have to provide details about EuP compliance in the product documentation, this would be well within the CE approach.
Importers may have the problem that they cannot influence the supplying companies and their products. For some companies (more likely for specialised equipment), the European market means only a fraction of their business volume. So they may decide that changing their models according to the European requirements would cause too much costs compared to the sales. For the importer based within Europe, however, this “fraction” may represent the total volume of orders.
8.2.2. Impacts on the consumers
For the proposed limits the total product price is expected to increase on average due to higher manufacturing costs. In the Task 7 calculations this was compensated for all product cases by the reduced energy consumption and therefore resulted in total energy cost savings for the user. The life cycle costs from the consumers point of view are reduced, so there is no negative impact on the customer.
A temporary problem during the introduction of such measures is that not all consumers can oversee the life cycle costs of a product at the time of the purchase. A manufacturer modifying his products ahead of schedule could be disadvantaged during the transition period, if his product costs are indeed higher. Without additional information this could lead, especially in the low price segment where already small differences in the price are important, to a decision towards the less efficient products.
Unavailability of certain products due to strict EuP requirements could also affect the consumers, but this can only be a temporary occurrence. In the long run, more innovative and energy efficient products will be available and benefit the consumers. According to the scope and conclusions of this study, a reduction of features (or non-introduction for new features) would not take place.
8.3. Sensitivity Analysis of Main Parameters Main parameters to look at are variations of energy costs, the choice and representativeness of the product cases and a look at the influence of specific assumptions, which are not or not yet aligned with data in the vertical studies. A short analysis on the influence of energy impact factors in the EcoReport calculations has been done, although this has not proven so be a major factor. Finally, the stock replacement models of the scenario calculations are cross-checked once more.
► Assumptions on costs, especially energy costs
The calculations are all based on one average electricity price. There are two questions to discuss, which have also come up during the stakeholder meeting: would the electricity price differences across Europe make a difference regarding the conclusions and would an increase of the average electricity price make a difference?
The following calculations are done with highest and lowest electricity prices in Europe, which were for Denmark 0.232 €/kWh or 171 % of the EU-25 average, and for Greece 0.0694 €/kWh or 51 % of the average.
Basically, all consumer/user expenditure on electricity would scale with these values.

Report for Tender No. TREN/D1/40 Lot 6 -2005 EuP Lot 6 - Task 8 2nd of October 2007
Fraunhofer IZM CODDE Bio IS DUH Final Report Page 8-28
For the electricity costs linked with the TV+ case, the following calculations can be made.
Total Annual Consumer Expenditure in EU 25 using the EU 25 avg. Electricity Price (in
million Euro)
Total Annual Consumer Expenditure in EU 25 using the
Danish Electricity Price (in million Euro, rounded)
Total Annual Consumer Expenditure in EU 25 using the
Greek Electricity Price (in million Euro, rounded)
TV+ 1863 3178 951
In principle, higher electricity prices make the improvement options in Task 7 even more economic, and might even shift the point of LLCC to option combinations achieving higher energy savings. The current points of LLCC in Task 7 are already covering quite high reductions, so a major shift beyond the chosen improvement options is unlikely to push the proposed limit values even further down. Because the electricity prices are expected to increase across Europe, this direction is the only one, which needs to be discussed further as an influence.
For a country like Greece, the point of LLCC might shift in the other direction based on the current prices. Since the energy efficiency savings are nevertheless necessary in "low electricity price" countries and since there is some distance between the LLCC results and the proposed limits, the proposal is sufficiently robust regarding energy prices of the member states.
The methodological omission or simplification that the EcoReport does not consider an increase of electricity costs over a 15 year period is therefore more relevant. What is covered via the discounting rate in the LCC calculations are the inflation and interest rates, but any increase of the electricity price beyond those rates (which seems very likely) is not covered. Even incrementally higher electricity prices would only strengthen the arguments for even lower targets, however, as has been shown with the Danish electricity prices.
► Data in the EcoReports, such as energy generation
To check the robustness of energy data, which is almost exclusively determining all environmental impact calculations in this study, some impact classes from the EcoReport tool have been compared with impact data from a commercial life cycle assessment tool called EIME.
The comparison is done for 1 MJ of electrical energy.
Impact indicator EIME Unit
EIME results (for 1
European MJ)
Unit correction
factor Result after
unit correctionVHK Unit
VHK results
ratio EIME/VHK Comment
Energy Depletion MJ 3,06 1 3,06 MJ 2,919 105%
Water Depletion dm3 0,44 1 0,44 ltr 0,1946 226%
Global Warming (GWP100)
g ~CO2 144,55 0,001 0,14
kg CO2 eq.
0,1274 110%
Air Acidification g ~H+ 0,022878 32,0298977 0,73278 g SO2
eq. 0,751 98%
Water Eutrophication
g ~PO4 4,13E-04 1,00E+03 4,13E-01 mg N 0,08974 460% 1g of N ~
1g PO4
When using the comparable impact classes on the EPS (mobile phone) example, the following results are obtained.

Report for Tender No. TREN/D1/40 Lot 6 -2005 EuP Lot 6 - Task 8 2nd of October 2007
Fraunhofer IZM CODDE Bio IS DUH Final Report Page 8-29
Impact indicator
VHK Result (Annual Environmental Impacts per 1000 products), (only on 5
indicators)
Ratio EIME/VHK
EIME Result (for 1 European MJ),
(only on 5 indicators)
EPS Energy Depletion 11498 105% 12072,9
Water Depletion 767 226% 1733,42
Global Warming (GWP100) 502 110% 552,2
Air Acidification 2961 98% 2901,78
Water Eutrophication 0,353 460% 1,6238
In conclusion, for energy/CO2 the impact assessment is roughly the same, only for water the results differ more widely. This should not influence the main conclusions of the study.
► Simplifications in the product cases
One simplification in this study was, that some products (laser and inkjet printers, facsimiles) were assigned completely to either office or home use, although in reality these products are used in both environments. This was considered reasonable, because the numbers of appliances shifted between the application sectors considered is comparatively small (e.g. facsimiles in households). The total number of such EuPs is covered correctly, only the differentiation between offices and households is simplified.
Another simplification is the assumed average energy consumption of each product case. The energy consumption changes with the features, the manufacturer and with the age/generation of a product. For each product case an average product was “designed”, which does not exist in reality. Also hard-off switches, which only some models of the product cases have, were mostly “integrated” in the average energy consumption. This simplification to one representative per base case (or product case in this study) is a requirement of the MeEuP method.
This leads to the next simplification: the use pattern. For most product cases the use pattern is done according to the average use assumed for the majority within the product class. For some products (e.g. TVs), products with different performance or use pattern defining features (with and without hard-off switch) were used to construct one "merged" use pattern. For the simpler PUC 1 (lighting, radio) products the differentiation is even explicitly kept separated throughout the calculations. That the modelling of the different cases is done slightly differently in this study should not have adverse effects on the results, rather it adds details in some instances, which would otherwise not be covered or remain hidden.
The mode assignments also contain simplifications. Some product cases were completely assigned to either passive or networked standby although the stock in reality includes models with both modes (e.g. all TVs are counted as networked standby products). Sub-products were then assigned to the same mode as the higher-ranking product group (e.g. all PC speakers are "networked", because they are part of PC+). Adding reliable sub-divisions of which market share actually offers which modes (e.g. how many TVs have no network functions) for all product cases is not possible. This simplification is therefore a result of choosing representative products, as required by the method.
These average use patterns and energy consumptions lead to an artificial product, which is needed for the EcoReport calculations (Task 5) and the Task 7 improvement calculations. For the EcoReport, these simplifications are not a problem, because they should lead to a representative cross section of the stock 2005. It is more a problem for the Task 7 improvement calculation. It has to be understood that the improvement potential calculated for one product does not mean that each product of the same product class can be improved by the same amount. Nevertheless, the summary improvement of Task 7 is the starting point for Task 8 according to the MeEuP method.

Report for Tender No. TREN/D1/40 Lot 6 -2005 EuP Lot 6 - Task 8 2nd of October 2007
Fraunhofer IZM CODDE Bio IS DUH Final Report Page 8-30
► Products in “Lot 6 scope” but not covered by the product cases (extrapolation assumptions)
In Lot 6 only a relatively limited range of products were used as product cases. The selected products serve as examples for the real life implementation of the standby and off mode functions studied. They are used to produce the numerical estimates (aggregated standby power consumption in the EU etc) required by the MEEuP.
Note that on the other hand the number of individual EuPs supported with data ("assumption sets") is larger than for other studies. The selected cases cannot cover all possible products covered by an eventual horizontal implementing measure. This is not necessary since the functional approach with a well defined set of functions provided by a certain product ensures applicability to the whole range of relevant product categories.
► Products outside “Lot 6 investigation scope” (mains connected household and office EuPs), such as the building infrastructure products
Building infrastructure such as intercoms and fixed antenna amplifiers also have a high improvement potential as these devices have standby and off-mode losses as well. Most of the estimated improvement options can also be applied for built-in devices.
An example to improve also these products was named in Task 6 (reducing the standby energy consumption of intercoms).
More problematic than these communication and infotainment chain products are infrastructural devices related to heating such as warm water generation, pumps, etc. The full overheads presented in Task 5 are therefore viewed as cautious extensions, which are not the main numeric result of the study.
► General level of design options & cost assumptions in Task 7
Some feedback received regards the cost factors for the options used in Task 7 as too low. So the question is, if the LCC are only negative because of the assumed low product costs. Therefore the LCC were calculated again with the doubled costs for each option.
The calculation shows that the option of complex buffering becomes with 20/30 € (instead of 10/15 €) for more (but still not all) product cases too expensive as the LCC becomes positive.
For the small appliances EPS and electric toothbrush as well as inkjet printers, doubling the costs leads also for some other options to increased instead of decreased LCC (compared to the base case). For all other product cases the energy consumption is reduced so much that even with the higher product costs the Life cycle costs can be reduced, although it is understood that the LCC do not decrease as much as in Task 7. The point of LLCC does not change for most products.

Report for Tender No. TREN/D1/40 Lot 6 -2005 EuP Lot 6 - Task 8 2nd of October 2007
Fraunhofer IZM CODDE Bio IS DUH Final Report Page 8-31
TV+
-4500
-4000
-3500
-3000
-2500
-2000
-1500
-1000
-500
0Stock2005
3+4 1 5 5+1 7+2 5+9 5+1+9 5+8D
iffer
entia
l GER
[MJ/
prod
uct]
-40
-35
-30
-25
-20
-15
-10
-5
0
Diff
eren
tial c
osts
LC
C [€
/pro
duct
]
Total energy GER
LCC
Figure 8-8: LLCC for TV+ (doubled costs)
TV+
-4500
-4000
-3500
-3000
-2500
-2000
-1500
-1000
-500
0Stock2005
3+4 1 5 5+1 7+2 5+9 5+1+9 5+8
Diff
eren
tial G
ER [M
J/pr
oduc
t]
-45
-40
-35
-30
-25
-20
-15
-10
-5
0
Diff
eren
tial c
osts
LC
C [€
/pro
duct
]
Total energy GER
LCC
Figure 8-9: LLCC for TV+ (costs as estimated in Task 7)

Report for Tender No. TREN/D1/40 Lot 6 -2005 EuP Lot 6 - Task 8 2nd of October 2007
Fraunhofer IZM CODDE Bio IS DUH Final Report Page 8-32
Table 8-7: LCC with normal and doubled product cost assumptions EPS (mobile phone) Lighting Radio
Electric tooth-brush
Electric oven
Cordless phone TV+
Washing machine DVD
Audio mini-system Fax
PC+ (office)
PC+ (home)
Laser printer
Inkjet printer
Option 1 -14,09 -5,84 -0,46 -6,87 -11,76 -1,38 -4,27 -1,37 -12,76 -10,93 -9,09-13,09 -4,84 0,54 -5,87 -10,76 -0,38 -3,27 -0,37 -11,76 -9,93 -8,09
Option 2 -14,09 -5,84 -3,37 -29,45 -11,76 -18,04 -35,36 -3,23 -20,70 -10,93 -9,09-13,09 -4,84 -2,37 -28,45 -10,76 -17,04 -34,36 -2,23 -19,70 -9,93 -8,09
Option 3 -9,84 -5,27 -4,38 -1,41 -0,41 -2,12 -7,34 -6,76 -5,68-9,64 -5,07 -4,18 -1,21 -0,21 -1,92 -7,14 -6,56 -5,48
Option 4 -4,40 -1,60 -4,92 -0,71 -2,77 -5,22 -4,80 -1,55 -4,55 -3,10 -0,02-4,20 -1,40 -4,72 -0,51 -2,57 -5,02 -4,60 -1,35 -4,35 -2,90 0,18
Option 5 -0,09 -13,68 -1,46 -6,67 -6,02 -31,77 -18,35 -29,76 -53,07 -44,02 -15,02 -32,14 -37,07 -7,320,11 -13,48 -1,26 -5,67 -3,02 -28,77 -17,35 -28,76 -52,07 -41,02 -12,02 -29,14 -34,07 -4,32
Option 6 -0,09 -13,68 -5,27 -4,38 -29,69 -6,02 -26,50 -16,06 -24,41 -47,12 -21,57 -7,16 -37,03 -35,81 -7,160,11 -13,48 -5,07 -4,18 -28,69 -3,02 -23,50 -15,06 -23,41 -46,12 -18,57 -4,16 -34,03 -32,81 -4,16
Option 7 0,06 -14,68 -1,46 -28,69 -6,02 -31,78 -19,39 -29,76 -53,07 -44,02 -14,75 -33,23 -40,76 -5,510,46 -14,28 -1,26 -26,69 -3,02 -28,78 -17,39 -28,76 -52,07 -41,02 -8,75 -27,23 -37,76 0,49
Option 8 -1,69 4,53 5,34 -26,83 -25,98 -7,47 -15,65 -34,06 -24,99 0,83 -13,35 -20,97 5,208,31 14,53 15,34 -16,83 -10,98 2,53 -5,65 -24,06 -9,99 15,83 1,65 -5,97 20,20
Option 9 -3,56 -6,66 -34,85 -4,70 -16,71 -39,49 -39,72 -7,32 -9,15 -14,04 -0,57-1,56 -4,66 -32,85 -2,70 -14,71 -37,49 -39,72 -7,32 -9,15 -14,04 -0,57
-9,84 -5,27 -4,38 -4,40 -1,60 -4,92 -0,71 -4,38 -5,83 -4,80 -3,86 -12,09 -10,06 -5,90-9,64 -5,07 -4,18 -4,20 -1,40 -4,72 -0,51 -4,18 -5,63 -4,60 -3,66 -11,89 -9,86 -5,70
-0,09 -13,89 -5,84 -1,50 -6,67 -6,02 -36,29 -18,41 -29,03 -52,22 -44,02 -14,55 -33,13 -37,66 -8,000,11 -12,69 -4,84 -0,30 -5,67 -3,02 -32,29 -16,41 -27,03 -50,22 -41,02 -10,55 -29,13 -33,66 -4,00
-0,09 -3,68 4,53 5,21 -27,36 -6,02 -29,88 -8,49 -20,13 -43,07 -44,02 -3,84 -25,96 -24,71 6,140,11 6,52 14,53 15,41 -16,36 -3,02 -11,88 3,51 -9,13 -32,07 -41,02 14,16 -7,96 -6,71 24,14
-0,09 -13,68 -3,43 -6,67 -5,25 -42,00 -17,54 -27,76 -51,07 -44,02 -17,19 -35,32 -37,07 -7,360,11 -13,48 -1,23 -5,67 -0,25 -37,00 -14,54 -24,76 -48,07 -41,02 -14,19 -32,32 -34,07 -4,36
-0,09 -13,89 -5,84 -2,48 -6,67 -5,25 -41,51 -17,60 -27,03 -50,18 -44,02 -17,71 -41,67 -38,98 -8,040,11 -12,69 -4,84 0,72 -5,67 -0,25 -35,51 -13,60 -23,03 -46,18 -41,02 -14,71 -37,67 -34,98 -4,040,06 -13,69 -5,84 -3,58 -28,69 -6,02 -41,99 -18,78 -29,65 -52,75 -44,02 -14,41 -42,64 -39,90 -5,180,46 -12,29 -4,84 -2,38 -26,69 -3,02 -37,99 -15,78 -27,65 -50,75 -41,02 -7,41 -35,64 -35,90 1,82
Combination 5+1+9Combination 7+2
Combination 3+4Combination 5+1Combination 5+8Combination 5+9
Table 8-7 shows the different LCC calculated with the additional product costs used in Task 7 (first row) and with doubled costs (second row) for all product cases. Cells marked in yellow show where the differential LCC is positive in relation to the base case calculations. The point of LLCC per product case is marked in bold.
The point of LLCC would shift for the following products: For the EPS (mobile phone) no option would be cost-effective, if the assumed costs increase. For lighting and for the radio the point of LLCC would shift from the hard-off switch option to the BAT value (lighting) and the improved PSU (radio) respectively.
For the question how realistic it is to achieve these energy savings, not only the cost factors but the options themselves have to be reviewed.
The best/extreme BAT value (Option 7) is not a realistic scenario. Often these models come with a reduced functionality and therefore the values are not achievable for all other products.
It also has to be considered, that some values can only be achieved because of patent-registered technologies. This seems to be the case for laser printers, were some technologies enable a very fast reactivation from standby. For other manufacturers to achieve the same low energy consumption in standby could cause long reactivation times, which reduce the usability. Only values, which can be achieved by all manufacturers (e.g. by obtaining licences), should be required.
Option 8 (complex buffering) is also a “difficult” option. This option should be seen as an alternative for a technology that separates the device from the mains in off-mode or standby, which does not implicitly mean a battery buffer. Therefore the additional product costs were estimated a lot higher than for the other options. To install complex and expensive technologies can be useful for products with a high energy consumption, if the performance can be improved so much that it is cost-effective. For some product cases, for which it was applied in Task 7, it is unprofitable (which can be seen in the increasing LCC), but on the other hand it was profitable for some product cases, even with the doubled product costs. It also has to be seen that for some product cases it is technically no or just a very difficult option.
According to feedback, complex buffering with a battery is for example not a possibility for TVs. Rechargeable batteries can for example be limited to 500 charging cycles, which would cause

Report for Tender No. TREN/D1/40 Lot 6 -2005 EuP Lot 6 - Task 8 2nd of October 2007
Fraunhofer IZM CODDE Bio IS DUH Final Report Page 8-33
battery replacements every 500 days. For all products, it has to be considered that using batteries to buffer standby does not automatically lead to decreased power consumption but to a shift of the power consumption, from standby and off-mode to on mode. If the power supplies are more efficient in on mode than in the low power area of standby and off-mode, this option can reduce the overall energy consumption. Self-discharge of the battery may still diminish any energy savings and impose a limit on the maximum standby time.
The use pattern for Option 9 (transitions) can only be expressed and calculated via scenarios. A lot of different possibilities are imaginable. For some products, transitions from on mode to standby are already standard (e.g. printers), but on mode is out of the Lot 6 scope. Therefore transitions from on mode to standby and auto-off functions (from on-mode) were not considered. Such options do have a high energy saving potential, although the actual standby and off-mode losses would in these cases increase.
► The material side of improvement options
That impacts through additional hardware (for switches or buffering) are not exceeding the energy savings has been estimated via the trade-off charts in Task 7. An EcoReport calculation for the additional hardware for a switch was done exemplarily.
Figure 8-10: Switch used for the EcoReport calculation, plus a necessary cabling configuration
The calculation is based on the material composition of the switch shown in Table 8-8. Simplifications had to be done to implement the measured values into the EcoReport calculation. Only the input section for materials was filled in, the sections “use phase”, “distribution (including final assembly)” and “disposal and recycling” were left blank. An additional calculation was done for comparison with the trade-off charts. In this calculation the total weight of the switch (33.6 g) was taken as the predefined “controller board”, which should certainly overestimate the influence of the switch.

Report for Tender No. TREN/D1/40 Lot 6 -2005 EuP Lot 6 - Task 8 2nd of October 2007
Fraunhofer IZM CODDE Bio IS DUH Final Report Page 8-34
Table 8-8: Input for the EcoReport calculation Pos MATERIALS Extraction & Production Weight Category Material or Processnr Description of component in g
2 Housing3 Switch case 2,7 2-TecPlastics 12-PC4 Switch metal pins etc. 1,5 4-Non-ferro 31-CuZn38 cast7 Electronic assembly9 Big caps & coils (THT) 6-Electronics 44-big caps & coils
12 SMD /LED's average13 6-Electronics 48-SMD/ LED's avg.14 6-Electronics 48-SMD/ LED's avg.15 Solder 0,01 4-Non-ferro 52-Solder SnAg4Cu0.516 Miscellaneous17 6-Electronics 47-IC's avg., 1% Si18 Resistors (THT) 0,06 6-Electronics 48-SMD/ LED's avg.19 6-Electronics 48-SMD/ LED's avg.20 3-Ferro 24-Ferrite27 Cables28 Copper wire 7,72 4-Non-ferro 29-Cu wire29 Cable insulating 11,58 1-BlkPlastics 8-PVC30 Plug case 3,5 1-BlkPlastics 8-PVC31 Plug connector 4,9 4-Non-ferro 31-CuZn38 cast32 Connector on switch side 1,2 4-Non-ferro 31-CuZn38 cast33 Miscellaneous34 bulb 0,4 7-Misc. 54-Glass for lamps
Total weight 33,6
Table 8-9: Input for calculation with predefined mix "controller board" (worst case) Pos MATERIALS Extraction & Production Weight Category Material or Processnr Description of component in g
2 Housing67 Electronic assembly9 Switch (total weight) 33,6 6-Electronics 98-controller board
27 Cables2833 Miscellaneous
Total weight 33,6
Table 8-10: Environmental impacts of a hard-off switch Environmental impacts of a switch Resources Use and Emissions TOTAL Materials
1 BulkPlastics g 152 TecPlastics g 33 Non-ferro g 15
Total g 34 Other Resources & Waste
8 Total Energy (GER) MJ 49 of which, electricity (in primary MJ) MJ 1
10 Water (process) ltr 011 Water (cooling) ltr 112 Waste, non-haz./ landfill g 18513 Waste, hazardous/ incinerated g 16
Emissions (Air) 14 Greenhouse Gases in GWP100 kg CO2 eq 016 Acidification, emissions g SO2 eq 317 Volatile Organic Compounds (VOC) g 018 Persistent Organic Pollutants (POP) ng i-Teq 019 Heavy Metals mg Ni eq 2
PAHs mg Ni eq 020 Particulate Matter (PM, dust) g 1
Emissions (Water) 21 Heavy Metals mg Hg/20 122 Eutrophication g PO4 0
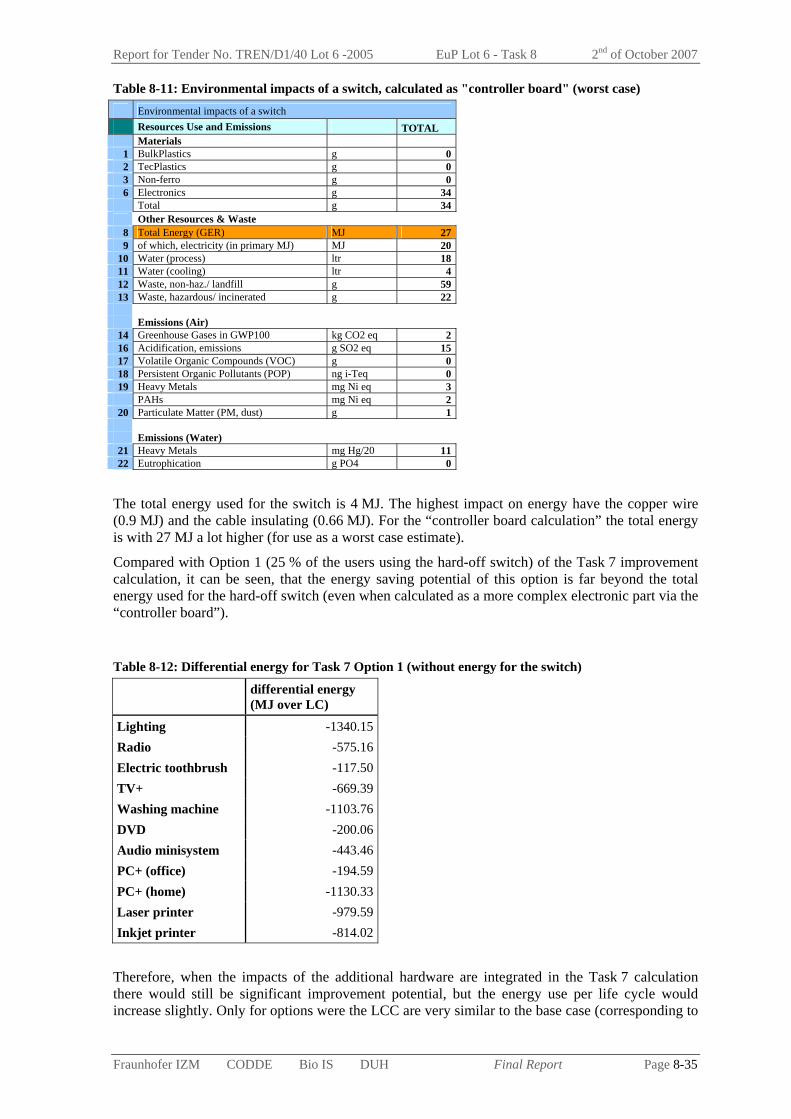
Report for Tender No. TREN/D1/40 Lot 6 -2005 EuP Lot 6 - Task 8 2nd of October 2007
Fraunhofer IZM CODDE Bio IS DUH Final Report Page 8-35
Table 8-11: Environmental impacts of a switch, calculated as "controller board" (worst case) Environmental impacts of a switch Resources Use and Emissions TOTAL Materials
1 BulkPlastics g 02 TecPlastics g 03 Non-ferro g 06 Electronics g 34
Total g 34 Other Resources & Waste
8 Total Energy (GER) MJ 279 of which, electricity (in primary MJ) MJ 20
10 Water (process) ltr 1811 Water (cooling) ltr 412 Waste, non-haz./ landfill g 5913 Waste, hazardous/ incinerated g 22
Emissions (Air) 14 Greenhouse Gases in GWP100 kg CO2 eq 216 Acidification, emissions g SO2 eq 1517 Volatile Organic Compounds (VOC) g 018 Persistent Organic Pollutants (POP) ng i-Teq 019 Heavy Metals mg Ni eq 3
PAHs mg Ni eq 220 Particulate Matter (PM, dust) g 1
Emissions (Water) 21 Heavy Metals mg Hg/20 1122 Eutrophication g PO4 0
The total energy used for the switch is 4 MJ. The highest impact on energy have the copper wire (0.9 MJ) and the cable insulating (0.66 MJ). For the “controller board calculation” the total energy is with 27 MJ a lot higher (for use as a worst case estimate).
Compared with Option 1 (25 % of the users using the hard-off switch) of the Task 7 improvement calculation, it can be seen, that the energy saving potential of this option is far beyond the total energy used for the hard-off switch (even when calculated as a more complex electronic part via the “controller board”).
Table 8-12: Differential energy for Task 7 Option 1 (without energy for the switch)
differential energy (MJ over LC)
Lighting -1340.15Radio -575.16Electric toothbrush -117.50TV+ -669.39Washing machine -1103.76DVD -200.06Audio minisystem -443.46PC+ (office) -194.59PC+ (home) -1130.33Laser printer -979.59Inkjet printer -814.02
Therefore, when the impacts of the additional hardware are integrated in the Task 7 calculation there would still be significant improvement potential, but the energy use per life cycle would increase slightly. Only for options were the LCC are very similar to the base case (corresponding to

Report for Tender No. TREN/D1/40 Lot 6 -2005 EuP Lot 6 - Task 8 2nd of October 2007
Fraunhofer IZM CODDE Bio IS DUH Final Report Page 8-36
a small differential energy gain), the small additional expenditure of 4 – 27 MJ could make this option environmentally unprofitable.
► Simplifications in the scenario calculations in Task 8
The change of product cases over time is not fully captured in the scenarios. Changes of the total number of models over time were estimated, but not always changes within one product group were taken into account. Feature shifts for the integration of set-top-boxes into TV sets and for the percentage between DVD players and recorders have been estimated. It can be assumed that DVD recorders gain market share compared to DVD players, so the percentage of DVD is estimated to increase from 10 % in 2005, over 12 % in 2010 to 15 % in 2020. Also for the PC+ cases estimations for the sub-products were done.
The estimated use pattern (with all the simplifications named above) are not changed for the scenarios in Task 8. The user behaviour should not change that much over time, but for use pattern defining features the deviation over time could be higher. For the Task 8 scenarios, the percentage of models with hard-off switches stays the same throughout 2020. Whether more or less switches are present is expressed through the Task 7 improvement potentials. In reality a trend towards soft switches instead of hard-off switches and even towards standby instead of off-mode can be seen. So there would be a shift in the use pattern from off-mode without losses towards off-mode with losses and standby over time. This is not covered in the methodological setup.
As another effect of the assumed “average product” also the stock 2005 in the scenarios is treated with one uniform power consumption. So all products that leave the stock are assumed to have the same energy consumption. A more realistic scenario would be that in the phasing out of old stock "worst performers" would leave the market before more recent models. But for such a scenario the average power consumption of the sales in 2005 compared to the stock 2005 would be needed, or a full breakdown of average power consumptions per year of market entry. For the broad scope of products covered, there is not sufficient data to support this analysis.
The potential exclusion of vertically covered product groups from the horizontally achievable improvements is not examined in detail. A “remaining reduction potential” could be calculated with the Task 7 assumptions, but this cannot statistically be supported, because the vertical products are such major contributors to the results
Finally, for the scenarios in Task 8 simplified linear stock models were used. Possible deviations to more realistic "soft stock models" have been examined and shown in that section. Realistic soft stock models increase the number of assumptions and the complexity of the calculations a lot.
Figure 8-11 shows the possible effects of some simplifications in these scenarios.

Report for Tender No. TREN/D1/40 Lot 6 -2005 EuP Lot 6 - Task 8 2nd of October 2007
Fraunhofer IZM CODDE Bio IS DUH Final Report Page 8-37
0
20
40
60
80
100
120
140
2005 2010 2015 2020
year
Year
ly L
ot 6
con
sum
ptio
n [T
Wh]
SC1 (worst case) [TWh/a]SC2 (b-a-u scenario) [TWh/a]SC3 (best case) [TWh/a]SC4-3 simplifiedmodel [TWh/a]SC4-2 per modemodel [TWh/a]SC4-1 soft stockmodel [TWh/a]
Effect of more compliant products already before start of compliance The mix of power consumptions must be below the limit valueStock replacement will take longer even than the soft stock model
Figure 8-11: Potential areas of uncertainty due to simplifications shown in comparison to the LLCC scenario SC4-1.
► Cross check with more detailed scenario calculations
To check the validity of the many simplifications in the Task 8 scenarios, a further cross check with a more detailed scenario type has been performed. The detailed model is based on a linear stock development per single EuP ("assumption set") for a 2-tiered implementing measure with Tier 1 in 2010 and Tier 2 starting in 2012. One remaining simplification is that the life times are rounded to the next full integer.
The stock developments are visualised in the following graphs (Table 8-13, Table 8-14, Figure 8-12).

Report for Tender No. TREN/D1/40 Lot 6 -2005 EuP Lot 6 - Task 8 2nd of October 2007
Fraunhofer IZM CODDE Bio IS DUH Final Report Page 8-38
Table 8-13: Stock development for simpler product cases.
0
200
400
600
800
1000
1200
2005 2010 2015 2020
Mio
. uni
ts o
n m
arke
t
EPS mobile phone (new )
EPS mobile phone (middle)
EPS mobile phone (old)
0
50
100
150
200
250
300
2005 2010 2015 2020
Mio
. uni
ts o
n m
arke
t
w ith hard off sw itch(correction factor) (new )
Electronic transformer (new )
Magnetic transformer (new )
w ith hard off sw itch(correction factor) (middle)
Electronic transformer (middle)
Magnetic transformer (middle)
w ith hard off sw itch
0
20
40
60
80
100
120
140
2005 2010 2015 2020
Mio
. uni
ts o
n m
arke
t
Radio w ithout losses (new )
Radio w ith losses (new )
Radio w ithout losses (middle)
Radio w ith losses (middle)
Radio w ithout losses (old)
Radio w ith losses (old)
0
10
20
30
40
50
60
2005 2010 2015 2020
Mio
. uni
ts o
n m
arke
t
Toothbrush (new )
Toothbrush (middle)
Toothbrush (old)
0
10
20
30
40
50
60
70
80
2005 2010 2015 2020
Mio
. uni
ts o
n m
arke
t
Oven (new )
Oven (middle)
Oven (old)
0
50
100
150
200
250
2005 2010 2015 2020
Mio
. uni
ts o
n m
arke
t
Cordless phone (new )
Cordless phone (middle)
Cordless phone (old)
0
50
100
150
200
250
2005 2010 2015 2020
Mio
. uni
ts o
n m
arke
t
Washing machine (new )
Washing machine (middle)
Washing machine (old)
0
50
100
150
200
250
300
2005 2010 2015 2020
Mio
. uni
ts o
n m
arke
t DVD recorder (new )
DVD player (new )
DVD recorder (middle)
DVD player (middle)
DVD recorder (old)
DVD player (old)
0
20
40
60
80
100
120
140
2005 2010 2015 2020
Mio
. uni
ts o
n m
arke
t
Audio minisystem (new)Audio minisystem (middle)Audio minisystem (old)
0
5
10
15
20
25
2005 2010 2015 2020
Mio
. uni
ts o
n m
arke
t
Fax (new)Fax (middle)Fax (old)
0
5
10
15
20
25
2005 2010 2015 2020
Mio
. uni
ts o
n m
arke
t
Laser printer (office) (new)Laser printer (office) (middle)Laser printer (office) (old)
0
20
40
60
80
100
120
140
160
2005 2010 2015 2020
Mio
. uni
ts o
n m
arke
t
Inkjet printer (home) (new)Inkjet printer (home) (middle)Inkjet printer (home) (old)

Report for Tender No. TREN/D1/40 Lot 6 -2005 EuP Lot 6 - Task 8 2nd of October 2007
Fraunhofer IZM CODDE Bio IS DUH Final Report Page 8-39
Table 8-14: Stock development for complex product cases.
TV+
0
100
200
300
400
500
600
2005 2010 2015 2020
Mio
. uni
ts o
n m
arke
tSet-top-box (new)Rear projection (new)Plasma TV (new)LCD TV (new)CRT TV (new)Set-top-box (middle)Rear projection (middle)Plasma TV (middle)LCD TV (middle)CRT TV (middle)Set-top-box (old)Rear projection (old)Plasma TV (old)LCD TV (old)CRT TV (old)
PC+(office)
0
50
100
150
200
250
300
350
2005 2010 2015 2020
Mio
. uni
ts o
n m
arke
t
Hub (new)Monitor LCD (new)Monitor CRT (new)Notebook (new)Desktop (new)Hub (middle)Monitor LCD (middle)Monitor CRT (middle)Notebook (middle)Desktop (middle)Hub (old)Monitor LCD (old)Monitor CRT (old)Notebook (old)Desktop (old)
PC+(home)
0
100
200
300
400
500
600
700
800
2005 2010 2015 2020
Mio
. uni
ts o
n m
arke
t
Broadband modem with WLAN (new)Dial- up modem (new)Broadband modem (new)PC speakers (new)Monitor LCD (new)Monitor CRT (new)Notebook (new)Desktop (new)Broadband modem with WLAN (middle)Dial- up modem (middle)Broadband modem (middle)PC speakers (middle)Monitor LCD (middle)Monitor CRT (middle)Notebook (middle)Desktop (middle)Broadband modem with WLAN (old)Dial- up modem (old)Broadband modem (old)PC speakers (old)Monitor LCD (old)Monitor CRT (old)Notebook (old)Desktop (old)
Stock Development for all Lot 6 Product Cases
0
500
1000
1500
2000
2500
3000
3500
4000
4500
2005 2010 2015 2020Year
Mio
uni
ts o
n m
arke
t
Stock (new)Stock (middle)Stock (old)
Figure 8-12: Summary stock development for old stock (pre 2010), middle stock (Tier 1 compliant EuPs) and new stock (Tier 2 compliant EuPs).
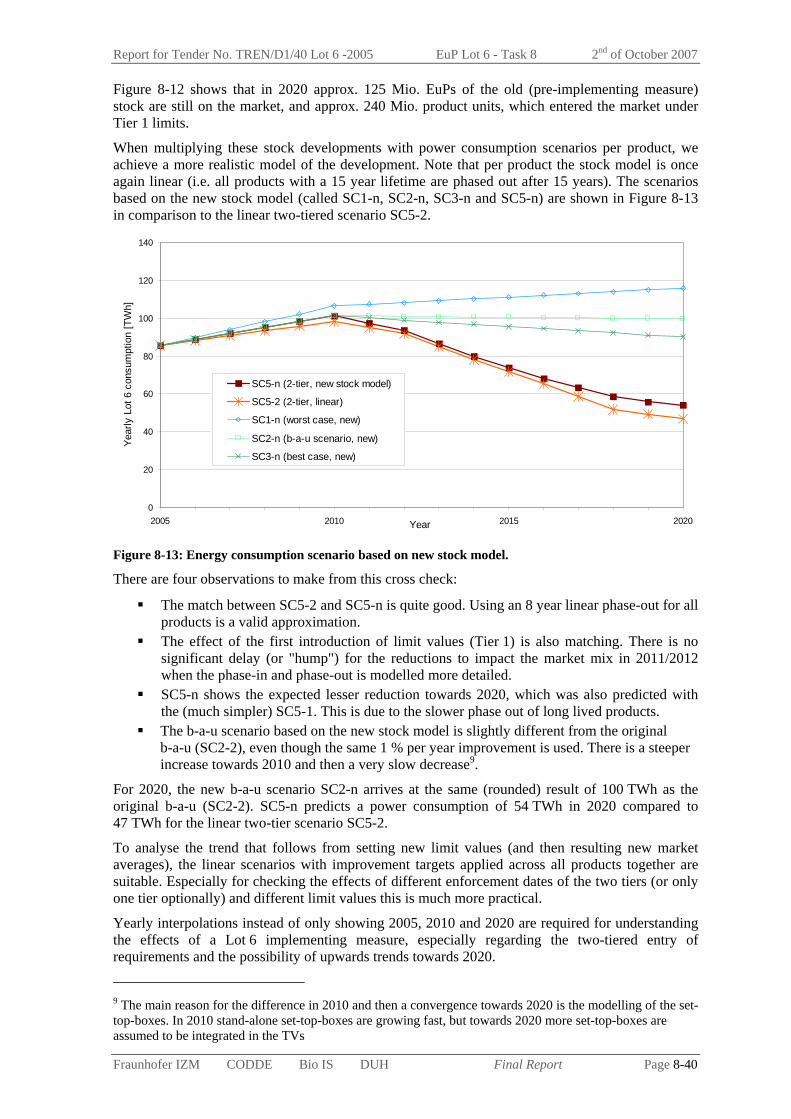
Report for Tender No. TREN/D1/40 Lot 6 -2005 EuP Lot 6 - Task 8 2nd of October 2007
Fraunhofer IZM CODDE Bio IS DUH Final Report Page 8-40
Figure 8-12 shows that in 2020 approx. 125 Mio. EuPs of the old (pre-implementing measure) stock are still on the market, and approx. 240 Mio. product units, which entered the market under Tier 1 limits.
When multiplying these stock developments with power consumption scenarios per product, we achieve a more realistic model of the development. Note that per product the stock model is once again linear (i.e. all products with a 15 year lifetime are phased out after 15 years). The scenarios based on the new stock model (called SC1-n, SC2-n, SC3-n and SC5-n) are shown in Figure 8-13 in comparison to the linear two-tiered scenario SC5-2.
0
20
40
60
80
100
120
140
2005 2010 2015 2020Year
Year
ly L
ot 6
con
sum
ptio
n [T
Wh]
SC5-n (2-tier, new stock model)
SC5-2 (2-tier, linear)
SC1-n (worst case, new)
SC2-n (b-a-u scenario, new)
SC3-n (best case, new)
Figure 8-13: Energy consumption scenario based on new stock model.
There are four observations to make from this cross check:
The match between SC5-2 and SC5-n is quite good. Using an 8 year linear phase-out for all products is a valid approximation.
The effect of the first introduction of limit values (Tier 1) is also matching. There is no significant delay (or "hump") for the reductions to impact the market mix in 2011/2012 when the phase-in and phase-out is modelled more detailed.
SC5-n shows the expected lesser reduction towards 2020, which was also predicted with the (much simpler) SC5-1. This is due to the slower phase out of long lived products.
The b-a-u scenario based on the new stock model is slightly different from the original b-a-u (SC2-2), even though the same 1 % per year improvement is used. There is a steeper increase towards 2010 and then a very slow decrease9.
For 2020, the new b-a-u scenario SC2-n arrives at the same (rounded) result of 100 TWh as the original b-a-u (SC2-2). SC5-n predicts a power consumption of 54 TWh in 2020 compared to 47 TWh for the linear two-tier scenario SC5-2.
To analyse the trend that follows from setting new limit values (and then resulting new market averages), the linear scenarios with improvement targets applied across all products together are suitable. Especially for checking the effects of different enforcement dates of the two tiers (or only one tier optionally) and different limit values this is much more practical.
Yearly interpolations instead of only showing 2005, 2010 and 2020 are required for understanding the effects of a Lot 6 implementing measure, especially regarding the two-tiered entry of requirements and the possibility of upwards trends towards 2020.
9 The main reason for the difference in 2010 and then a convergence towards 2020 is the modelling of the set-top-boxes. In 2010 stand-alone set-top-boxes are growing fast, but towards 2020 more set-top-boxes are assumed to be integrated in the TVs

Report for Tender No. TREN/D1/40 Lot 6 -2005 EuP Lot 6 - Annexes 2nd of October 2007
Fraunhofer IZM CODDE Bio IS DUH Final Report Page 9-1
EuP Preparatory Study Lot 6 Standby and Off-mode Losses
Literature and Annexes for Task Reports Final Report
Compiled by Fraunhofer IZM
Contractor: Fraunhofer Institute for Reliability and Microintegration, IZM, Berlin
Department Environmental Engineering
Dr.-Ing. Nils F. Nissen
Gustav-Meyer-Allee 25, 13355 Berlin, Germany
Contact:
Tel.: +49-30-46403-132
Fax: +49-30-46403-131
Email: [email protected]
Berlin, 2nd of October 2007
Disclaimer
The findings presented in this report are results of the research conducted by the IZM consortium and the continuous feedback from a wide range of stakeholders. The statements and recommendations presented in the final report however are not to be perceived as the opinion of the European Commission.

Report for Tender No. TREN/D1/40 Lot 6 -2005 EuP Lot 6 - Annexes 2nd of October 2007
Fraunhofer IZM CODDE Bio IS DUH Final Report Page 9-2
Intention and Status of Document
This is the literature & annexes part for the final report version of Lot 6, to accompany Tasks 1 to 8.
Contents 9. Literature....................................................................................................................... 9-1 10. Annexes ........................................................................................................................ 10-1
Annex 1-1: Product Naming and Classification........................................................................ 10-1 Annex 1-2: International and European test standards (Task 1.2) .......................................... 10-12 Annex 1-3: Other test procedures (Task 1.2) .......................................................................... 10-13 Annex 1-4: Detailed comparison of the parameters extracted from the main test standards.
(Task 1.2) .................................................................................................................... 10-15 Annex 1-5: Mandatory requirements on standby and off-modes power consumption. (Task 1.3)
10-18 Annex 1-6: Mandatory requirements on standby and off-modes losses labelling. (Task 1.3) 10-22 Annex 1-7: Voluntary programs related to standby and off-modes losses. (Task 1.3) ........... 10-23 Annex 1-8: Ecolabel and ecolabelling program related to standby and off-modes losses.
(Task 1.3) .................................................................................................................... 10-26 Annex 1-9: Legislation, voluntary program and ecolabel having an indirect impact on standby
and off mode losses reduction (Task 1.3) ................................................................... 10-29 Annex 2-1 (2-1 to 2-6 Tables for Task 2) ............................................................................... 10-32 Annex 3-1 (3-1 to 3-5 Using times of devices not covered by the product cases).................. 10-36

Report for Tender No. TREN/D1/40 Lot 6 -2005 EuP Lot 6 - Annexes 2nd of October 2007
Fraunhofer IZM CODDE Bio IS DUH Final Report Page 9-1
9. Literature
[AGO] Australian Green House Office; homepage: http://www.greenhouse.gov.au/appliances/ (22.8.2006).
[AGO 2005] Australian Greenhouse Office, When you keep measuring it you know even more about it!, Projects Impacts 2005-2020, National Appliance and Equipment Energy Efficiency Program, Australia, 2005.
[Aiwa 2003] Aiwa; Mini Hi-Fi Component System JAX-N operating instruction, 2003.
[Almeida 2006] Almeida, Anibal et al.; Residential Monitoring to Decrease Energy Use and Carbon Emissions in Europe; ISR, Fraunhofer-ISI, Sintef, 2006.
[Atanasiu 2006] Atanasiu, Bogdan et al.; Major Households Appliances in New Member States and Candidate Countries: looking for energy savings; Joint Research Centre, Institute for Environment Sustainability, 2006.
[Australia SPS] Australian Standby Power Strategy; http://www.energyrating.gov.au/library/details200212-standby.html, (29.11.2006).
[Balakrishnan 2006] Balakrishnan, Balu: Recent Technological Advancements in Reducing Standby Power; Standby Power Conference, Australia, November 2006.
[Bauknecht 2005] Bauknecht, D.: Energieeffizienz statt Steinkohlesubventionen; Kurzstudie in Auftrag von Greenpeace, Freiburg, March 2005 http://www.greenpeace.de/fileadmin/gpd/user_upload/themen/energie/greenpeace_studie_effizienz_statt_steinkohlesubventionen.pdf (22.03.2007)
[Bertoldi 2001] Bertoldi, Paolo et al.; Assessing the market transformation for domestic appliances resulting from European Union policies; European commission, PW consulting, International Energy Agency, 2001.
[Bertoldi 2002] Bertoldi, Paolo et al.; Standby power use: How big is the problem? What policies and technical solutions can address it?; Lawrence Berkeley National Laboratory, 2002.
[Biebeler 2006] Biebeler, Hendrik, Mahammadzadeh, Mahammad; Gesetzesfolgenabschätzung und Integrierte Produktpolitik; Forschungsberichte aus dem Institut der deutschen Wirtschaft Köln, Heft Nr.17, Köln, 2006.
[BIO 2006] BIO IS Consortium; EuP preparatory studies, Lot 7 – Battery chargers and external power supplies; http://www.ecocharger.org/ (2006).
[BIO 2007] BIO IS Consortium; EuP preparatory studies, Lot 7 – Battery chargers and external power supplies, final report, January 2007.
[Balakrishnan 2006] Balakrishnan, Balu: Recent Technological Advancements in Reducing Standby Power; Standby Power Conference, Australia, November 2006.
[Blue Angel] Blue angel (Blauer Engel); Homepage: http://www.blauer-engel.de/willkommen/willkommen.htm (22.8.2006).
[Bouwer 2006] Bouwer, M., et al.; Green Public Procurement in Europe 2006 – Conclusions and recommendations., Virage Milieu & Management bv, Korte Spaarne 31, 2011 AJ Haarlem, the Netherlands, 2006.
[Börkey 1998] Börkey, Peter, Lévêque, François; Voluntary approaches for environmental protection in the European Union; CERNA, Ecole des Mines de Paris in the context of the Organisation for Economic Co-opération and Development survey on the use of voluntary approaches in environmental policy, 1998.

Report for Tender No. TREN/D1/40 Lot 6 -2005 EuP Lot 6 - Annexes 2nd of October 2007
Fraunhofer IZM CODDE Bio IS DUH Final Report Page 9-2
[Bush 2006] Bush, Eric; Marktcheck: Elektronische Geräte; Swiss Alpine Laboratories for Testing of Energy Efficiency (S.A.L.T.), Hochschule für Technik und Wirtschaft, Chur, 2006.
[Bush 2007] Bush, Eric, et al.; Measurement of the power consumption of set-top boxes, Final Report; Swiss Alpine Laboratories for Testing of Energy Efficiency (S.A.L.T.), English version, May 2007.
[Canon 2006] Canon; LPB 3000 User's guide, 2006.
[Canon 2003] Canon; i560 series Desktop Photo Printer, Quick Start Guide, 2006.
[Canon 2007] Canon; Kentaro Niwano, Feedback on update slides from Task 2-7, 2007.
[CE 2006] Consumer Electronics Association; 5 Technologies to watch 2007, homepage: www.CE.org (16.11.2006).
[CECED] European Committee of Domestic Equipments Manufacturers, homepage: http://www.ceced.org/ (08.11.2006).
[CEN 2007] Comité Européen de Normalisation, Saving lifetimes of Energy Efficiency Improvement Measures in bottom-up calculations, Final CWA draft (CEN WS 27), CEN WORKSHOP AGREEMENT, Brussels, 2007.
[CODDE 1996] Conecption Developpement Durable Environnement, EIME Softwaretool, integrated information system for environmental conscious design, ADEME, 1996.
[Cremer 2003a] Cremer, C. et al.; Der Einfluss moderner Gerätegenerationen der Informations- und Kommunikationstechnik auf den Energieverbrauch in Deutschland bis zum Jahr 2010 – Möglichkeiten zur Erhöhung der Energieeffizienz und zur Energieeinsparung in diesen Bereichen; Fraunhofer Institut für Systemtechnik und Innovationsforschung (ISI), Karlsruhe, 2003.
[Cremer 2003b] Cremer, C. et al.; Energy Consumption of Information and Communication Technology (ICT) in Germany up to 2010, Project number 28/01, Summary of the final report to the German Federal Ministry of Economics and Labour, Fraunhofer Institute for Systems and Innovation Research (Fraunhofer ISI), Karlsruhe, 2003.
[c´t 2006] c’t Magazin für Computertechnik; Issue 6, 2006.
[c´t 2007] c’t Magazin für Computertechnik; Ladestation; Issue 7, 2007.
[Darnell 2005] Darnell Group Inc.; External AC-DC Power Supplies - Global Market Forecasts and Competitive Environment - Eighth Edition - Europe Market Forecasts, 2005.
[DPA 2007] DPA; Hamster, Mäuse, Staubsauger: Spielzeug für den USB-Anschluss, http://www.web.de (28.03.2007).
[DBU 2003] Deutsche Bundesstiftung Umwelt; Sprechanlage mit Stromsparschaltung, DBU Aktuell, Osnabrück, 2003.
[digitalSTROM 2007] digitalSTROM Alliance; homepage: www.digitalstrom.org (22.8.2007)
[EANR 2003] Energy Australia Network Region; Global electricity and customer number forecasts 2002-2009; 2003.
[EC 2006] Special Eurobarometer; E-Communications Household Survey, 2006 Homepage: http://ec.europa.eu (07.03.2007).
[Ecolabel Australia] Australian Ecolabel Association; Homepage: www.aela.org.au/homefront.htm (22.8.2006).

Report for Tender No. TREN/D1/40 Lot 6 -2005 EuP Lot 6 - Annexes 2nd of October 2007
Fraunhofer IZM CODDE Bio IS DUH Final Report Page 9-3
[Ecomark Japanese] Japan Environment Association – Eco Mark Office; homepage: www.ecomark.jp/english/ (22.8.2006).
[Ecomark Korean] Korean Eco Products Institute – Ecolabelling Program; homepage: http://www.koeco.or.kr/eng/business/business01_01.asp?search=1_1 (18.10.2006).
[ECP Canada] Environmental Choice Program – Canada; homepage: http://www.environmentalchoice.com/English/ECP%20Footer/About%20the%20Program (20.11.2006).
[EEE 2007] Equipment Energy Efficiency Programme; Achievements 2006; Ministerial Council on Energy, E3 Committee, Report No 2007/01, Australia, 2006
[EES 2006a] Energy Efficient Strategies; 2005 Intrusive Residential Standby Survey Report, Ministerial Council on Energy, E3 Committee, Australia, 2006.
[EES 2006b] Energy Efficient Strategies; Standby Power - Current Status, Ministerial Council on Energy, (E3) Committee, Report No 2006/10, Australia, 2006.
[Ellis 2005] Ellis, Mark; Standby Energy Consumption in Australian Local Government Buildings, Australian Greenhouse Office, International Council for Local Environmental Initiatives, Report No. 2005/22, Australia, 2005.
[Emerson 2006] Emerson; Lot 7 Task 6 Improvement Options Data Request, 2006.
[ENEA 2006] ENEA; EuP preparatory studies, Lot 13 Domestic Refrigerators & Freezers, LOT 14 Domestic Dishwashers & Washing Machines PART I – PRESENT SITUATION, A Portrait of the Household Appliance Industry and Market Worldwide, Version 2.0, 2006.
[EnergyConsult 2006] EnergyConsult; Appliance Standby Power Consumption: Store Survey 2005/06 - Final Report, Ministerial Council on Energy, Australia, 2006.
[Energy Star] Energy Star; Homepage: http://www.energystar.gov (22.8.2006).
[Energy Star 2006a] Energy Star; Program Requirements for Imaging Equipment (V1.0), 2006.
[Energy Star 2006b] Energy Star; Monitors Product List, Includes All ENERGY STAR Qualified Models, 2006.
[Energy Star 2007a] Energy Star; Phones Product List, Includes All ENERGY STAR Qualified Models,2007.
[Energy Star 2007b] Energy Star; Printers, Faxes, Printer/Faxes, and Mailing Machines Product List, Includes All ENERGY STAR Qualified Models, 2007.
[Energy Star 2007c] Energy Star; Computers Product List, Includes All ENERGY STAR Qualified Models, 2007.
[EPA-NR 2006] EPA-NR (Energy Performance Assessment of existing Non-Residential buildings); Survey: National context and need for instruments; www.epa-nr.org, November 2006
[Epson 2006] Epson, Epson AcuLaser C3800 Benutzerhandbuch, 2006.
[EST 2006] Energy Saving Trust; The rise of machines: A review of energy using products in the home from 1970 to today, 2006.
[EU Eco-label] European Eco-label; Product groups: http://ec.europa.eu/environment/ecolabel/product/index_en.htm (22.8.2006).

Report for Tender No. TREN/D1/40 Lot 6 -2005 EuP Lot 6 - Annexes 2nd of October 2007
Fraunhofer IZM CODDE Bio IS DUH Final Report Page 9-4
[EU Stand-by Init.] European Union Stand-by Initiative; Homepage: http://energyefficiency.jrc.cec.eu.int/html/standby_initiative.htm (19.5.2006).
[EURECO 2002] EURECO Project; Campagne de mesures par usage dans 400 logements de la Communauté Européenne; 2002.
[Eurostat audio 2003] Eurostat; Cinema, TV and radio in the EU – Statistics on audiovisual services – data 1980 – 2002; 2003.
[Eurostat CE 2005] Eurostat; Consumers in Europe – Facts and Figures – Data 1999-2004; 2005.
[Eurostat] Eurostat; Homepage: http://epp.eurostat.ec.europa.eu/ (21.11.2006).
[Floyd 1998] Floyd, David B.; Webber, Carrie; Leaking Electricity: Individual Field Measurement of Consumer Electronics*, Florida Solar Energy Center, Lawrence Berkeley National Laboratory, Presented at the American Council for an Energy-Efficient Economy, Asilomar Conference Center, Pacific Grove, California, August 23-28, 1998.
[forsa 2004] Gesellschaft für Sozialforschung und statistische Analyse mbH (forsa); Evaluierung der Effizienzkampagne der Initiative EnergieEffizient, Abschlussbericht; Berlin, 2004.
[GED 2002] Gemeinschaft Energielabel Deutschland; Standby – Der heimliche Stromverbrauch; 2002. http://www.energielabel.de/index.cfm?fact=sh_news_detail&id=111 (19.5.2006).
[GEEA] Group for Energy Efficiency Appliances; Homepage: http://www.efficient-appliances.org (22.8.2006)
[gfu 2006] Gesellschaft für Unterhaltungs- und Kommunikationselektronik (gfu); Consumer Electronics-Markt in Deutschland 2005; published, http://www.gfu.de/home/download.xhtml ( 22.2.2006).
[GIFAM] Groupement Interprofessionnel des Fabricants d’Appareils Ménagers, Homepage: http://www.gifam.fr (21.11.2006).
[GovTrack.us 2007] GovTrack.us (database of federal legislation); GovTrack.us H.R. 3221--110th Congress (2007): New Direction for Energy Independence, National Security, and Consumer Protection Act; http://www.govtrack.us/congress/bill.xpd?bill=h110-3221 (21.8.2007)
[Gudbjerg 2006] Gudbjerg, Erik, Gram-Hanssen, Kirsten; Standby consumption in private homes socio-economic studies, mapping and measuring reduction? What works: campaigns or hardware solutions?; EEDAL London 2006, ELokalEnergi A/S and Danish Building Research Institute, 2006.
[Hamilton 2006] Hamilton, Booz Allen; The Future Role of Cable in Shaping the Digital Home in Europe; Liberty Global Policy Series, 2006.
[Harrington 2006] Harrington, Lloyd et al.; Quantification of Standby in Australia and Trends in Standby for New Products; EEDAL London 2006, Energy Efficient Strategies, EnergyConsult Australia, 2006.
[Harris 2003] Harris, Jeffrey et al.; Using government purchasing power to reduce equipment standby power; Lawrence Berkeley National Laboratory, ECEEE Summer Study, 2003.
[Harris 2005] Harris, Jeffrey et al.; Using government purchasing power to reduce equipment standby power; Lawrence Berkeley National Laboratory, ECEEE Summer Study, 2003.
Report for Tender No. TREN/D1/40 Lot 6 -2005 EuP Lot 6 - Annexes 2nd of October 2007
Fraunhofer IZM CODDE Bio IS DUH Final Report Page 9-5
[Hershberg 2004] Hershberg, Craig; Presentation at Energy Star Conference, Frankfurt (United States – Energy Protection Agency); 2004.
[Hu 2006] Hu, Robert Yie-Zu; Regulating Standby Power Activities in Taiwan; Standby Power Conference 2006, Canberra, 2006.
[IBM 2006] IBM Business Consulting Services; The end of television as we know it – A future industry perspective, 2006.
[ICLEI 2003] ICLEI European Secretariat; Eco-Procurement Programme (2003) – Study contract to survey the state of play of green public procurement in the European Union – Final report; 2003.
[IEA 1999] International Energy Agency; Conclusion of Task Force 1: Definitions and Terminology of Standby Power; IEA Stand-by Power Initiative, Washington DC, 1999.
[IEA 2005] International Energy Agency; Standby power use and the IEA “1-watt plan” – Fact sheet; 2005.
[IEC 62018] IEC 62018; Power consumption of information technology equipment- Measurement methods; International Electrotechnical Commission, Geneva, 2003.
[IEC 62075] IEC 62075; Safety of electronic Equipment within the field of Audio/Video, Information Technology and Communication technology; International Electrotechnical Commission, Committee Draft, 2006.
[IEC 62087] IEC 62087; Methods of measurement for t he power consumption of audio, video and related equipment; International Electrotechnical Commission, Geneva, 2002.
[IEC 62301] IEC 62301; Household electrical appliances – Measurement of standby power; International Electrotechnical Commission, Geneva, 2005.
[IEE 2007] Initiative Energie Effizienz (IEE); TopTen der Bürogeräte, Faxgeräte, 2007, http://www.stromeffizienz.de (06.07.2007).
[INSEE] Institut National de la Statistique et des Etudes Economiques; France.
[ISO 14024] ISO; Environmental labels and declarations - Type I environmental labelling-Principles and procedures, ISO, 1999.
[Iosifidis 2006] Iosifidis, P.; DTT and the Role of PSBs in Driving Digital Switchover, 2006.
[IT Eco 2005] IT Eco Declaration; Criteria Comparison of ECO labels and self-declaration systems Information Technology Eco Declaration - Personal Computers: www.itecodeclaration.org (22.8.2006).
[ITU 2005] International Telecommunication Union; Europe & CIS’s telecommunication/ICT market and trends 2003/2004; 2005.
[IVF 2006] IVF Consortium; EuP preparatory studies, Lot 3 – Personal Computers (desktops & laptops) and computer monitors; http://www.ecocomputer.org/ (2006 and updates)
[IVF 2007] IVF Consortium; EuP preparatory studies, Lot 3 – Personal Computers (desktops & laptops) and computer monitors; Draft Final Report (Task 1-7), 2007.
[IVF 2007b] IVF Consortium; EuP preparatory studies, Lot 3 – Personal Computers (desktops & laptops) and computer monitors; Draft Final Report (Task 8), 2007.

Report for Tender No. TREN/D1/40 Lot 6 -2005 EuP Lot 6 - Annexes 2nd of October 2007
Fraunhofer IZM CODDE Bio IS DUH Final Report Page 9-6
[IZM 2006a] IZM Consortium; EuP Preparatory Studies, Lot 4 – Imaging equipment: copiers, faxes, printers, scanners, multifunctional devices; http://www.ecoimaging.org/ (updated in 2007).
[IZM 2006b] IZM Consortium; EuP Preparatory Studies, Lot 5 – Consumer electronics: televisions; http://www.ecotelevision.org/ (updated in 2007).
[Kathrein 2005] Kathrein; Operating Manual DVB-T-Receiver UFT 571 (silver/black), 2005.
[Kim 2006] Kim, Yungrae; Dynamic Korea 1W Policy, Standby Power Conference 2006, Canberra, 2006.
[Korean e-Standby] KEMCO (Korean Energy Management COrporation); the Korean e-Standby Program: www.kemco.or.kr/english/sub03_energyefficiency02.asp (22.03.2007).
[Kuckartz 2004] Kuckartz, U. et al.; Umweltbewusstsein in Deutschland 2004; Bundesministerium für Umwelt, Naturschutz und Reaktorsicherheit, Berlin, 2004.
[Legislation] Definition of legislation; homepage: www.canadianlawsite.com/Dictionary_L.htm (23.10.2006).
[LG 2007] LG; DVD Player OWNER’S MANUAL MODEL: DZ9811P, 2007.
[Liteon 2007] Liteon; DVD Recorder LVW 5005 LVW 5001 User Manual, 2007.
[MEEuP 2005a] Kemna, René et al.; Final Report MEEuP Methodology Report; VHK for European Commission, Delft, 2005.
[MEEuP 2005b] Kemna, René et al.; Final Report MEEuP Product Cases Report; VHK for European Commission, Delft, 2005.
[Meier 1997] Meier, Alan, Huber, Wolfgang; Results from the investigations on leaking electricity in the US; Berkeley, California, 1997.
[Mietrechtspraxis 2007] Mietrechtspraxis; “Lebensdauertabelle Kücheneinrichtungen”, available at http://www.mietrecht.ch/deutsch/mietrecht/lebensdauertabelle/lebensdauer-kuechen.html, 14.03.2007.
[Molinder 1997] Molinder, O. et al.; Study on miscellaneous standby power consumption of household equipment (light - audio - white goods). [Prepared for the European Union under contract 4.1031/E96-008 (EU-DG XVII, June 25)], Sweden, 1997.
[Mordziol 2006] Mordziol, C.; Erfahrungen mit der Entwicklung von Effizienzstandards für Elektrogeräte; Internal Presentation, Berlin, 2006.
[MTP 2006a] UK Market Transformation Program; Trends in the use of imaging equipments, 2006.
[MTP 2006b] UK Market Transformation Program; Assumptions for energy scenarios in the domestic lighting sector, 2006.
[MTP 2006c] UK Market Transformation Program; Sustainable Products 2006: Policy Analysis and Projections, 2006.
[NAEEEC 2003a] National Appliance and Equipment Energy Efficiency Committee; product profile: DVD players/recorders and DVD/VCR combos, Summary of resultes for 2001, 2002 and 2003 NAEEEC store suryveys, Canberra 2003.
Report for Tender No. TREN/D1/40 Lot 6 -2005 EuP Lot 6 - Annexes 2nd of October 2007
Fraunhofer IZM CODDE Bio IS DUH Final Report Page 9-7
[NAEEEC 2003b] National Appliance and Equipment Energy Efficiency Committee; product profile: computer printers, summary of results for 2001, 2003 NAEEEC intrusive household/ store survey and Lawrence Berkeley Laboratories 2001, Canberra 2004.
[NAEEEC 2004a] National Appliance and Equipment Energy Efficiency Committee; C75STANDBY PRODUCT PROFILE 2003/03, 2004.
[NAEEEC 2004b] National Appliance and Equipment Energy Efficiency Committee; product profile: integrated stereos, summary of results for 2001, 2002 and 2003 NAEEEC store surveys, Canberra 2004.
[NAEEEC 2004c] National Appliance and Equipment Energy Efficiency Committee; product profile: modems, summary of results for 2001, NAEEEC intrusive household survey, Canberra 2004.
[NAEEEC 2004d] National Appliance and Equipment Energy Efficiency Committee; product profile: computer speakers, Canberra 2004.
[NAEEEC 2005] National Appliance and Equipment Energy Efficiency Committee; Minimum Energy Performance Standards – Halogen Lighting Transformers; Australia, 2005.
[Nipkow 2003] Nipkow, J. and Bush, E.; Standby Consumption of household appliances, final report, Swiss Agency for Energy Efficiency, Zürich 2003.
[Nipkow 2004] Nipkow, J. and Bush, E.; Stand by Verbrauch von Haushaltgeräten, Bulletin SEV/AES 3/04, Zürich, 2004.
[Nordman 2006] Nordman, Bruce, McWhinney, Marla; Electronics Come of Age: A Taxonomy for Miscellaneous and LowPower Products; EEDAL London 2006, Lawrence Berkeley National Laboratory, 2006.
[NSwan] Nordic Swan; Homepage: www.svanen.nu/Eng/default.asp (22.8.2006).
[Ohkuni 2006] Ohkuni, Kotaro; Top Runner Program and Efforts to Reduce Standby Power Consumption in Japan, Standby Power Conference 2006, 2006.
[Oki 2002] Oki Systems (Deutschland) GmbH; Okifax 4580 Handbuch, 2002.
[Öko-Test 2003] Öko-Test; Das hat Format, Test Fernseher 32 Zoll, November 2003.
[Palmer 1998] Palmer, J. and Boardman, B.; Domestic Efficient Lighting, 1998.
[Panasonic 2001] Panasonic; Multifunction plain paper fax KX-F1050 KX-F1070 Operating Instruction, 2001.
[Pelosi 2007] Pelosi, Nancy, as current speaker of the U.S. House of Representatives; New Direction for Energy Independence, National Security, and Consumer Protection Act; http://www.speaker.gov/legislation?id=0076 (21.8.2007)
[Pioneer 2007] Pioneer; Lot 6 Product Fact Sheet on BAT/BNAT, 2007.
[Poll 2001] Poll, J. et al.; Revision of the EU ecolabel criteria for computers; Report number AEAT/ENV/R/0751, for the Department for the Environment, Food and Rural Affairs, 2001.
[PowerSafer 2002] PowerSafer, POWER SAFER® PS 3.x Der clevere Stromsparer für Mehrfachkombinationen, 2002.
[Rath 1997] Rath, Ursula et al.; UBA Texte Nr. 45/97, Klimaschutz durch Minderung von Leerlaufverlusten bei Elektrogeräten; Umweltbundesamt, Berlin, 1997.
Report for Tender No. TREN/D1/40 Lot 6 -2005 EuP Lot 6 - Annexes 2nd of October 2007
Fraunhofer IZM CODDE Bio IS DUH Final Report Page 9-8
[Roberson 2004] Roberson, Judy A. et al.; After-hours Power Status of Office Equipment and Energy Use of Miscellaneous Plug-Load Equipment; May 2004.
[Röing 2001] Röing, P., Avasoo, D.; Standby losses caused by low voltage lighting, http://195.178.164.205/library_links/proceedings/2001/pdf2001/panel4/01p4_4_204xa.pdf (09.03.2007).
[Rosen 2000a] Rosen, Karen et al.; National Energy Use of Consumer Electronics in 1999, Lawrence Berkeley National Laboratory 45988, Berkeley, 2000.
[Rosen 2000b ] Rosen, Karen B., Meier Alan K.; Energy Use of U.S. Consumer Electronics at the End of the 20th Century; In the Proceedings of “The Second International Conference on Energy Efficiency in Household Appliances” (27-29 September), Naples (Italy): Association of Italian Energy Economics (Rome), 2000.
[Rosenquist 2004] Rosenquist, Greg et al.; Energy Efficiency Standards for Residential and Commercial Equipment: Additional Opportunities; Lawrence Berkeley National Laboratory, Berkeley, 2004.
[Ross 2001] Ross, J. P., Meier, A.; Whole-House Measurements of Standby Power Consumption, The Second International Conference on Energy Efficiency in Household Appliances, Naples (Italy), September 2000, Lawrence Berkeley National Laboratory, 2001.
[Roth 2002] Roth, Kurt W. et al.; Energy Consumption by Office and Telecommunications Equipment in Commercial Buildings, Volume I: Energy Saving Potential; TIAX LCC, Cambridge, 2002.
[Roth 2004] Roth, Kurt W. et al.; Energy Consumption by Office and Telecommunications Equipment in Commercial Buildings, Volume II: Energy Consumption Baseline; Arthur D. Little, Inc., Cambridge, 2004.
[Roth 2006] Roth, Kurt W. et al.; U.S. Residential Information and Technology Energy Consumption in 2005 and 2010; Final Report by TiaxLlc for U.S. Department of Energy; Arthur D. Little, Inc., Cambridge, 2006.
[SAVE 1998] SAVE 1998; Study on water heating – labeling/standards – Task 3 – Appliance Market Study – Final Report; 2001.
[Schlomann 2005] Schlomann, Barbara et al.; Technische und rechtliche Anwendungsmöglichkeiten einer verpflichtenden Kennzeichnung des Leerlaufverbrauchs strombetriebener Haushalts- und Bürogeräte; Fraunhofer-Institut für Systemtechnik und Innovationsforschung (ISI), Karlsruhe, 2005.
[Schötz 2003] Schötz, D. et al.; Werbung für Energieeffizienz – Evaluierung einer Energieeffizienzkampagne am Beispiel der Stand-by-Kampagne „Au. Wirklich aus?; Berlin, 2003.
[Sharp 2006] Sharp; Sharp R-85ST-A user guide, 2006.
[Siderius 1998] Siderius, Hans-Paul; Standby Consumption in Households: Van Holsteijn en Kemma BV, Delft, The Netherlands, 1998.
[Siderius 2006] Siderius, Hans-Paul et al.; Standby: The Next Generation; EEDAL London 2006, SenterNovem, UK-MTP, Abakus, Danish Energy Authority, Denmark, 2006.
[Sidler 2002] Sidler, O.; End-use metering campaign in 400 households of the European Community, Assessment of the Potential Electricity Savings, EURECO, France, 2002.
[STIFWA 2001] Stiftung Warentest; Alles in einem, test 11/2001.
[STIFWA 2006a] Stiftung Warentest; Die besten Boxen, test 03/2006.

Report for Tender No. TREN/D1/40 Lot 6 -2005 EuP Lot 6 - Annexes 2nd of October 2007
Fraunhofer IZM CODDE Bio IS DUH Final Report Page 9-9
[STIFWA 2006b] Stiftung Warentest; Klein, aber nur zwei oho, test 08/2006.
[STIFWA 2006c] Stiftung Warentest; Tücken im Detail, test 11/2006.
[STIFWA 2006c] Stiftung Warentest; Süß, die Kleinen, Fotodrucker, test 07/2006.
[STIFWA 2006d] Stiftung Warentest; Druckfrisch, Tintenstrahldrucker, test 07/2006.
[STIFWA 2006e] Stiftung Warentest; Herr W. kauft ein Mufu, Multifunktionsdrucker, test 03/2006.
[STIFWA 2006f] Stiftung Warentest; Verlängerung, DVD-Rekorder mit Festplatte, test 07/2006.
[Stachura 2006] Stachura, Marek; Schiffleitner Andreas; Eco-PC Abstract of the Eco Design Report, KERP Research Electronis and Environment, MicroPro; Vienna, 2006.
[Strategy 2006] Strategy Analytics; IPTV and DTTV Boost Western European Digital TV to Record Growth; website: http://www.strategyanalytics.net/default.aspx?mod=ReportAbstractViewer&a0=3050 (2006).
[SVTC 2004] Silicon Valley Toxics Coalition: Desktop: http://www.svtc.org/cleancc/greendesign/ecodesktop.htm (22.8.2006) Laptop: http://www.svtc.org/cleancc/greendesign/ecolaptop.htm (22.8.2006).
[Take 2003] Take, Hiroshi; Market and Technological Trends in LCD TV, 2003.
[TCO] TCO Development; Homepage: www.tcodevelopment.com (22.8.2006).
[TRP] Top Runner Program; Homepage: http://www.eccj.or.jp/top_runner/index.html (22.8.2006).
[US DoE 2004] United States Department of Energy; Federal Purchasing: Leading the Market for Low Standby Products, 2004.
[US FEMP 2004a] United States Federal Energy Management Program; How to Buy Products with Low Standby Power, 2004.
[US FEMP 2004b] United States Federal Energy Management Program; Federal Purchasing: Leading the Market for Low Standby Products,2004.
[US FEMP 2006] United States Federal Energy Management Program: Fact Sheet; Washington 2006, homepage: http://www1.eere.energy.gov/femp/ (22.8.2006).
[UW 2006] University of Washington; Reliability definition; http://www.washington.edu/admin/hr/ocpsp/ps.research/comp.glossary.html (22.8.2006).
[Virnich 2007] Virnich, Martin; DECT »light« – Die ersten DECT-Schnurlostelefone mit Sendepause, VDB e.V., Ingenieurbüro für Baubiologie und Umweltmesstechnik, Mönchengladbach, 2007.
[Whirlpool 2007] Whirlpool; Whirlpool Automatic Washer WF665, instruction manual, Shanghai, 2007.
[Wortmann 2001] Wortmann, Klaus et al.; Wirklich aus? Die Standby-Kampagne der Energiestiftung Schleswig-Holstein; In: Energiewirtschaftliche Tagesfragen 51 (2001) 5, 2001.
[Wortmann 2002] Wortmann, Klaus et al.; Wirklich Aus? Ergebnisse der landesweiten Stromsparkampagne der Energiestiftung Schleswig-Holstein; In: Energiewirtschaftliche Tagesfragen 52 (2002) 1/2, 2002.

Report for Tender No. TREN/D1/40 Lot 6 -2005 EuP Lot 6 - Annexes 2nd of October 2007
Fraunhofer IZM CODDE Bio IS DUH Final Report Page 9-10
[Yamaha 2007] Yamaha Elektronik Europa GmbH; Product Specification and Manual for Receiver RX-797; http://www.yamaha-hifi.com (navigate to HiFi, Receiver, RX-797) (10.9.2007)

Report for Tender No. TREN/D1/40 Lot 6 -2005 EuP Lot 6 - Annexes 2nd of October 2007
Fraunhofer IZM CODDE Bio IS DUH Final Report Page 10-1
10. Annexes
Annex 1-1: Product Naming and Classification Product classification based on [Nordman 2006]. The classification has been extended with additional product classes, and for the use in this study larger “main categories” have been introduced. The classification covers domestic and office equipment, but also products considered “building installation” within the Lot 6 study.
The intention of this detailed (but still not exhaustive!) listing is primarily for introducing uniform product names (i.e. the product class names) and the allocation of these products to the main categories.
Lot 6 Main Categories Product Classification (Naming)
Categories by Nordman
Source (BN, ISI, IZM)
ICT&AV ICT&AV Amplifiers Audio Source Nordman ICT&AV Cassette Deck Audio Source Nordman ICT&AV CD Player Audio Source Nordman ICT&AV Equalizer (audio) Audio Source Nordman ICT&AV Pre-amplifier Audio Source IZM ICT&AV Receiver (audio) Audio Source Nordman ICT&AV Tuner Audio Source Nordman ICT&AV Turn table Audio Source Nordman ICT&AV Audio minisystem Audio Source Nordman ICT&AV Stereo, portable Audio Source Nordman ICT&AV Radio, table Audio Source Nordman ICT&AV CD Player, portable Audio Source Nordman ICT&AV other portable audio players Audio Source IZM ICT&AV other media Player Audio Source ISI ICT&AV Charger, digital music player Audio Source Nordman ICT&AV Musical keyboard Audio Source Nordman
ICT&AV Electrical piano / other el. instruments Audio Source IZM
ICT&AV Home theatre system Audio Source Nordman ICT&AV Karaoke machine Audio Source Nordman ICT&AV Subwoofer Audio Source Nordman ICT&AV Speakers, powered Audio Source Nordman ICT&AV speakers, wireless (base station) Audio Source Nordman ICT&AV speakers, wireless (speakers) Audio Source Nordman ICT&AV Desktop Computer Source Nordman ICT&AV Dock, notebook Computer Source Nordman ICT&AV Game console Computer Source Nordman
ICT&AV Game console with internet connectivity Computer Source Nordman
ICT&AV integrated-CRT Computer Source Nordman ICT&AV integrated-LCD Computer Source Nordman
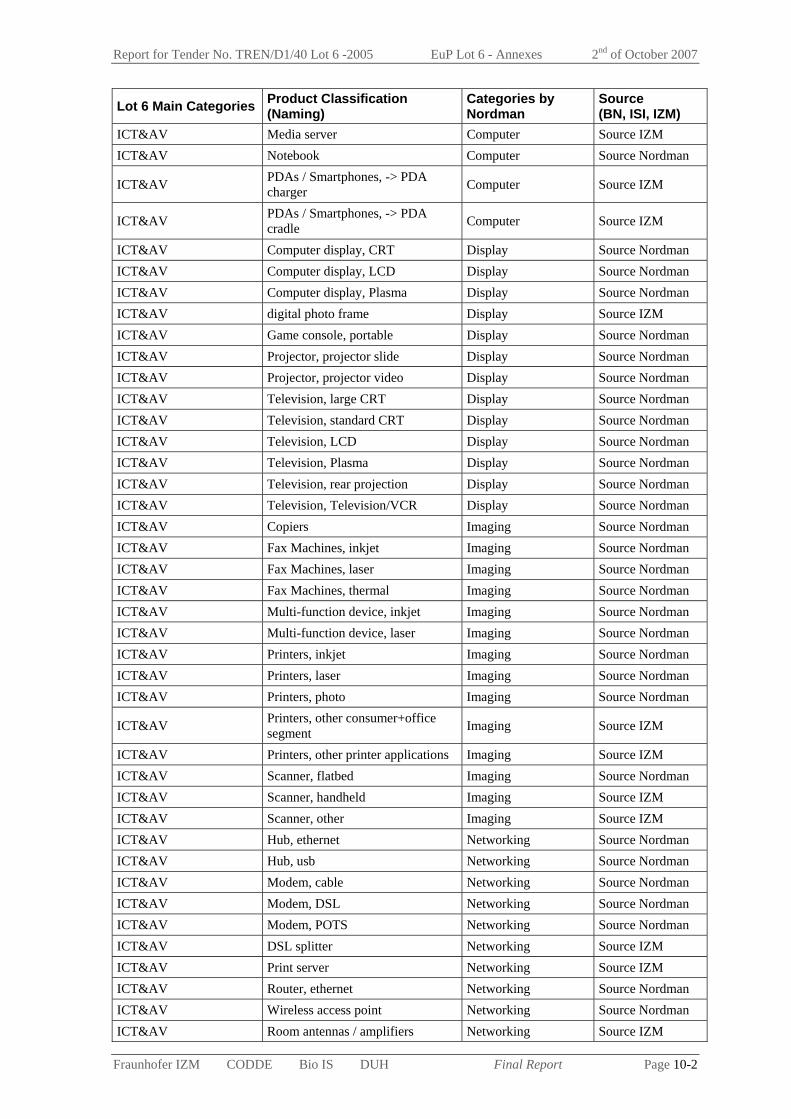
Report for Tender No. TREN/D1/40 Lot 6 -2005 EuP Lot 6 - Annexes 2nd of October 2007
Fraunhofer IZM CODDE Bio IS DUH Final Report Page 10-2
Lot 6 Main Categories Product Classification (Naming)
Categories by Nordman
Source (BN, ISI, IZM)
ICT&AV Media server Computer Source IZM ICT&AV Notebook Computer Source Nordman
ICT&AV PDAs / Smartphones, -> PDA charger Computer Source IZM
ICT&AV PDAs / Smartphones, -> PDA cradle Computer Source IZM
ICT&AV Computer display, CRT Display Source Nordman ICT&AV Computer display, LCD Display Source Nordman ICT&AV Computer display, Plasma Display Source Nordman ICT&AV digital photo frame Display Source IZM ICT&AV Game console, portable Display Source Nordman ICT&AV Projector, projector slide Display Source Nordman ICT&AV Projector, projector video Display Source Nordman ICT&AV Television, large CRT Display Source Nordman ICT&AV Television, standard CRT Display Source Nordman ICT&AV Television, LCD Display Source Nordman ICT&AV Television, Plasma Display Source Nordman ICT&AV Television, rear projection Display Source Nordman ICT&AV Television, Television/VCR Display Source Nordman ICT&AV Copiers Imaging Source Nordman ICT&AV Fax Machines, inkjet Imaging Source Nordman ICT&AV Fax Machines, laser Imaging Source Nordman ICT&AV Fax Machines, thermal Imaging Source Nordman ICT&AV Multi-function device, inkjet Imaging Source Nordman ICT&AV Multi-function device, laser Imaging Source Nordman ICT&AV Printers, inkjet Imaging Source Nordman ICT&AV Printers, laser Imaging Source Nordman ICT&AV Printers, photo Imaging Source Nordman
ICT&AV Printers, other consumer+office segment Imaging Source IZM
ICT&AV Printers, other printer applications Imaging Source IZM ICT&AV Scanner, flatbed Imaging Source Nordman ICT&AV Scanner, handheld Imaging Source IZM ICT&AV Scanner, other Imaging Source IZM ICT&AV Hub, ethernet Networking Source Nordman ICT&AV Hub, usb Networking Source Nordman ICT&AV Modem, cable Networking Source Nordman ICT&AV Modem, DSL Networking Source Nordman ICT&AV Modem, POTS Networking Source Nordman ICT&AV DSL splitter Networking Source IZM ICT&AV Print server Networking Source IZM ICT&AV Router, ethernet Networking Source Nordman ICT&AV Wireless access point Networking Source Nordman ICT&AV Room antennas / amplifiers Networking Source IZM

Report for Tender No. TREN/D1/40 Lot 6 -2005 EuP Lot 6 - Annexes 2nd of October 2007
Fraunhofer IZM CODDE Bio IS DUH Final Report Page 10-3
Lot 6 Main Categories Product Classification (Naming)
Categories by Nordman
Source (BN, ISI, IZM)
ICT&AV CD recorder Peripherals Source Nordman ICT&AV Dock, PDA Peripherals Source Nordman
ICT&AV External computer accessories, other Peripherals Source IZM
ICT&AV External drive Peripherals Source Nordman ICT&AV External sound interfaces Peripherals Source IZM ICT&AV Speakers, computer Peripherals Source Nordman ICT&AV Set-top-boxes, analog cable Set-top Source Nordman ICT&AV Set-top-boxes, digital cable Set-top Source Nordman
ICT&AV Set-top-boxes, digital cable with PVR Set-top Source Nordman
ICT&AV Set-top-boxes, internet Set-top Source Nordman ICT&AV Set-top-boxes, satellite Set-top Source Nordman ICT&AV Set-top-boxes, satellite with PVR Set-top Source Nordman ICT&AV Answering machine Telephony Source Nordman ICT&AV Caller ID unit Telephony Source Nordman ICT&AV Charger, mobile phone Telephony Source Nordman
ICT&AV Home and SoHo telephone systems Telephony Source IZM
ICT&AV Phone, Standard corded phone Telephony Source IZM
ICT&AV Phone, Comfort phone / Video phone Telephony Source IZM
ICT&AV Phone, cordless Telephony Source Nordman
ICT&AV Phone, cordless with answering machine Telephony Source Nordman
ICT&AV Phone, Additional charger cradle Telephony Source IZM
ICT&AV Phone, Base station with computing/network interface Telephony Source IZM
ICT&AV charger, still camera Video Source Nordman ICT&AV charger, video camera Video Source Nordman ICT&AV DVD, player Video Source Nordman ICT&AV DVD, recorder Video Source Nordman ICT&AV HD-Recorder Video Source IZM ICT&AV VCR Video Source Nordman ICT&AV VCR/DVD Video Source Nordman ICT&AV Videocassette rewinder Video Source Nordman
Small household appliances Small household appliances Automatic griddles Electronic housewares Source Nordman
Small household appliances Blanket Electronic housewares Source Nordman
Small household appliances Blender Electronic housewares Source Nordman
Small household appliances Bread makers Electronic housewares Source Nordman

Report for Tender No. TREN/D1/40 Lot 6 -2005 EuP Lot 6 - Annexes 2nd of October 2007
Fraunhofer IZM CODDE Bio IS DUH Final Report Page 10-4
Lot 6 Main Categories Product Classification (Naming)
Categories by Nordman
Source (BN, ISI, IZM)
Small household appliances Broiler Electronic housewares Source Nordman
Small household appliances Can opener Electronic housewares Source IZM
Small household appliances Clock Electronic housewares Source Nordman
Small household appliances Clock, radio Electronic housewares Source Nordman
Small household appliances Coffee grinder Electronic housewares Source IZM
Small household appliances Coffee makers, residential Electronic housewares Source Nordman
Small household appliances Corn popper, air Electronic housewares Source Nordman
Small household appliances Corn popper, hot oil Electronic housewares Source Nordman
Small household appliances Deep fryer, residential Electronic housewares Source Nordman
Small household appliances Egg cookers Electronic housewares Source Nordman
Small household appliances Espresso maker, residential Electronic housewares Source Nordman
Small household appliances Food processor Electronic housewares Source Nordman
Small household appliances Food slicer Electronic housewares Source Nordman
Small household appliances Frying pan Electronic housewares Source Nordman
Small household appliances Hand mixer Electronic housewares Source Nordman
Small household appliances Heating pad Electronic housewares Source Nordman
Small household appliances Hot plate (kitchen) Electronic housewares Source Nordman
Small household appliances Iron Electronic housewares Source Nordman
Small household appliances Juicer Electronic housewares Source Nordman
Small household appliances Kettle Electronic housewares Source Nordman
Small household appliances Kitchen machines / mixers Electronic housewares Source Nordman
Small household appliances Knife Electronic housewares Source Nordman
Small household appliances Mug warmer Electronic housewares Source Nordman
Small household appliances Oven, microwave Electronic housewares Source Nordman
Small household appliances Pasta maker Electronic housewares Source Nordman

Report for Tender No. TREN/D1/40 Lot 6 -2005 EuP Lot 6 - Annexes 2nd of October 2007
Fraunhofer IZM CODDE Bio IS DUH Final Report Page 10-5
Lot 6 Main Categories Product Classification (Naming)
Categories by Nordman
Source (BN, ISI, IZM)
Small household appliances Rice maker Electronic housewares Source Nordman
Small household appliances Sewing machine Electronic housewares Source Nordman
Small household appliances Slow cooker Electronic housewares Source Nordman
Small household appliances Stand mixer Electronic housewares Source Nordman
Small household appliances Tee maker Electronic housewares Source IZM
Small household appliances Toaster Electronic housewares Source Nordman
Small household appliances Toaster oven Electronic housewares Source Nordman
Small household appliances Vacuum, central Electronic housewares Source Nordman
Small household appliances Vacuum, rechargeable Electronic housewares Source Nordman
Small household appliances Vacuum, standard Electronic housewares Source Nordman
Small household appliances
Vacuum, automated vacuum cleaners Electronic housewares Source IZM
Small household appliances Waffle iron Electronic housewares Source Nordman
Small household appliances Air freshener Personal Care Source Nordman
Small household appliances Curling iron Personal Care Source Nordman
Small household appliances Hair dryer Personal Care Source Nordman
Small household appliances Heat lamp Personal Care Source Nordman
Small household appliances Home medical equipment Personal Care Source Nordman
Small household appliances Massager Personal Care Source Nordman
Small household appliances Shaver Personal Care Source Nordman
Small household appliances Epilator Personal Care Source IZM
Small household appliances Toothbrush Personal Care Source Nordman
Small household appliances Water softener Personal Care Source Nordman
Large household appliances Large household appliances Garbage disposal Major Appliance Source Nordman
Large household appliances Refrigerator, wine cooler Major Appliance Source Nordman
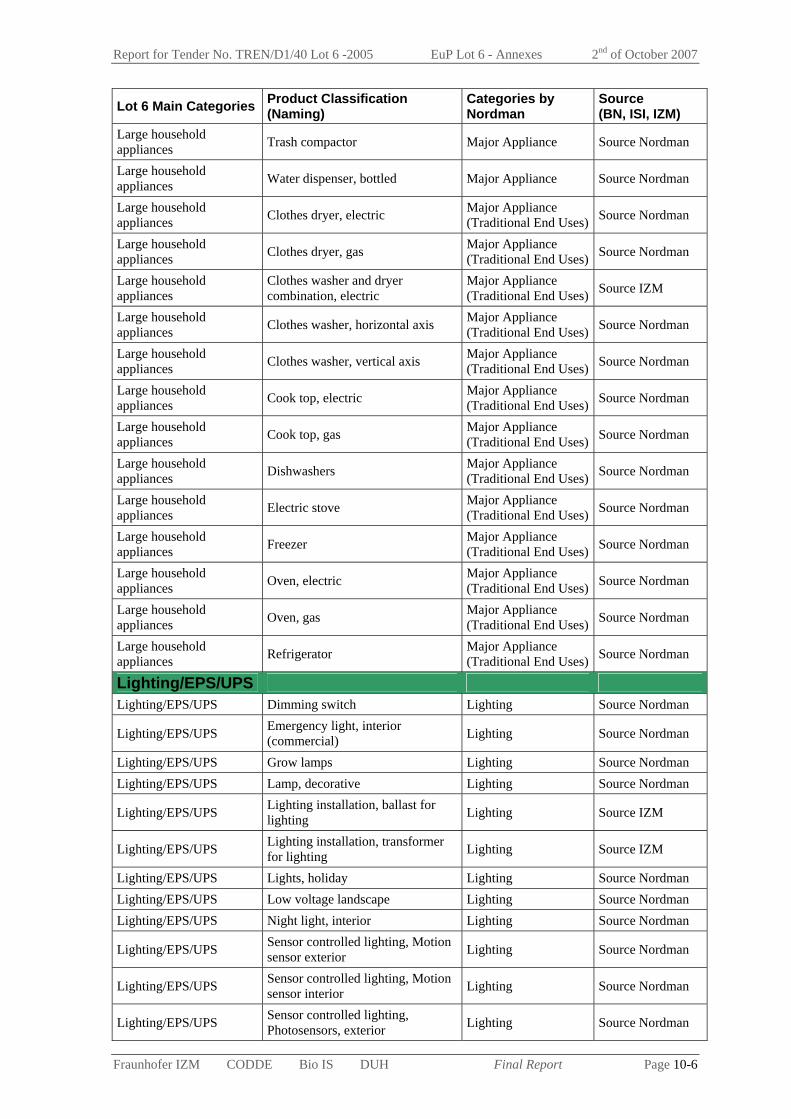
Report for Tender No. TREN/D1/40 Lot 6 -2005 EuP Lot 6 - Annexes 2nd of October 2007
Fraunhofer IZM CODDE Bio IS DUH Final Report Page 10-6
Lot 6 Main Categories Product Classification (Naming)
Categories by Nordman
Source (BN, ISI, IZM)
Large household appliances Trash compactor Major Appliance Source Nordman
Large household appliances Water dispenser, bottled Major Appliance Source Nordman
Large household appliances Clothes dryer, electric Major Appliance
(Traditional End Uses) Source Nordman
Large household appliances Clothes dryer, gas Major Appliance
(Traditional End Uses) Source Nordman
Large household appliances
Clothes washer and dryer combination, electric
Major Appliance (Traditional End Uses) Source IZM
Large household appliances Clothes washer, horizontal axis Major Appliance
(Traditional End Uses) Source Nordman
Large household appliances Clothes washer, vertical axis Major Appliance
(Traditional End Uses) Source Nordman
Large household appliances Cook top, electric Major Appliance
(Traditional End Uses) Source Nordman
Large household appliances Cook top, gas Major Appliance
(Traditional End Uses) Source Nordman
Large household appliances Dishwashers Major Appliance
(Traditional End Uses) Source Nordman
Large household appliances Electric stove Major Appliance
(Traditional End Uses) Source Nordman
Large household appliances Freezer Major Appliance
(Traditional End Uses) Source Nordman
Large household appliances Oven, electric Major Appliance
(Traditional End Uses) Source Nordman
Large household appliances Oven, gas Major Appliance
(Traditional End Uses) Source Nordman
Large household appliances Refrigerator Major Appliance
(Traditional End Uses) Source Nordman
Lighting/EPS/UPS Lighting/EPS/UPS Dimming switch Lighting Source Nordman
Lighting/EPS/UPS Emergency light, interior (commercial) Lighting Source Nordman
Lighting/EPS/UPS Grow lamps Lighting Source Nordman Lighting/EPS/UPS Lamp, decorative Lighting Source Nordman
Lighting/EPS/UPS Lighting installation, ballast for lighting Lighting Source IZM
Lighting/EPS/UPS Lighting installation, transformer for lighting Lighting Source IZM
Lighting/EPS/UPS Lights, holiday Lighting Source Nordman Lighting/EPS/UPS Low voltage landscape Lighting Source Nordman Lighting/EPS/UPS Night light, interior Lighting Source Nordman
Lighting/EPS/UPS Sensor controlled lighting, Motion sensor exterior Lighting Source Nordman
Lighting/EPS/UPS Sensor controlled lighting, Motion sensor interior Lighting Source Nordman
Lighting/EPS/UPS Sensor controlled lighting, Photosensors, exterior Lighting Source Nordman

Report for Tender No. TREN/D1/40 Lot 6 -2005 EuP Lot 6 - Annexes 2nd of October 2007
Fraunhofer IZM CODDE Bio IS DUH Final Report Page 10-7
Lot 6 Main Categories Product Classification (Naming)
Categories by Nordman
Source (BN, ISI, IZM)
Lighting/EPS/UPS Timer, exterior Lighting Source Nordman Lighting/EPS/UPS Timer, interior Lighting Source Nordman
Lighting/EPS/UPS Lighting, residential Lighting (Traditional End Uses) Source Nordman
Lighting/EPS/UPS Transformer, if not covered with appliance Power Source IZM
Lighting/EPS/UPS Linear external power supply, if not covered with appliance Power Source IZM
Lighting/EPS/UPS Switched external power supply, if not covered with appliance Power Source IZM
Lighting/EPS/UPS Power strip, Master / Slave Power Source IZM Lighting/EPS/UPS Power strip, illuminated switch Power Source IZM Lighting/EPS/UPS Surge protector Power Source Nordman Lighting/EPS/UPS Timer, general purpose Power Source Nordman
Lighting/EPS/UPS Uninterruptible power supply (UPS) Power Source Nordman
HVAC&water HVAC&water Air cleaner, mounted HVAC Source Nordman HVAC&water Air cleaner, portable HVAC Source Nordman
HVAC&water Air conditioning, evaporative cooler HVAC Source Nordman
HVAC&water Ceiling fan HVAC Source Nordman HVAC&water Dehumidifier HVAC Source Nordman HVAC&water Electric Towel Heaters HVAC Source IZM HVAC&water Exhaust fan HVAC Source Nordman HVAC&water Fan, portable HVAC Source Nordman HVAC&water Fan, rangehood HVAC Source Nordman HVAC&water Fan, whole house HVAC Source Nordman HVAC&water Fan, window HVAC Source Nordman HVAC&water Furnace fans HVAC Source Nordman HVAC&water Heating, fireplace electric HVAC Source Nordman HVAC&water Humidifier HVAC Source Nordman HVAC&water Space heater, non-portable HVAC Source IZM HVAC&water Space heater, portable (electric) HVAC Source Nordman
HVAC&water Space heater, portable (non-electric) HVAC Source Nordman
HVAC&water Air conditioning, central HVAC (Traditional End Uses) Source Nordman
HVAC&water Air conditioning, heat pump HVAC (Traditional End Uses) Source Nordman
HVAC&water Air conditioning, room/wall HVAC (Traditional End Uses) Source Nordman
HVAC&water Heating, boiler HVAC (Traditional End Uses) Source Nordman
HVAC&water Heating, furnace baseboard, floor or wall unit
HVAC (Traditional End Uses) Source Nordman

Report for Tender No. TREN/D1/40 Lot 6 -2005 EuP Lot 6 - Annexes 2nd of October 2007
Fraunhofer IZM CODDE Bio IS DUH Final Report Page 10-8
Lot 6 Main Categories Product Classification (Naming)
Categories by Nordman
Source (BN, ISI, IZM)
HVAC&water Heating, furnace central HVAC (Traditional End Uses) Source Nordman
HVAC&water Heating, heat pump HVAC (Traditional End Uses) Source Nordman
HVAC&water Heating, Electric Heating (convection, night storage)
HVAC (Traditional End Uses) Source IZM
HVAC&water Water heating, instantaneous single point of use Water heating Source Nordman
HVAC&water Water heating, point of use tank Water heating Source Nordman
HVAC&water Water heating, electric Water heating (Traditional End Uses) Source Nordman
HVAC&water Water heating, gas Water heating (Traditional End Uses) Source Nordman
HVAC&water Water heating, heat pump Water heating (Traditional End Uses) Source Nordman
HVAC&water Water heating, other Water heating (Traditional End Uses) Source Nordman
Building Infrastructure Building Infrastructure Breaker, AFI Infrastructure Source Nordman Building Infrastructure Breaker, GFCI Infrastructure Source Nordman Building Infrastructure Detector, carbon monoxide Infrastructure Source Nordman Building Infrastructure Detector, smoke Infrastructure Source Nordman Building Infrastructure Doorbell Infrastructure Source Nordman Building Infrastructure Fixed antenna amplifiers Infrastructure Source IZM Building Infrastructure Garage door opener Infrastructure Source Nordman Building Infrastructure GFCI outlet Infrastructure Source Nordman Building Infrastructure InterCom /Door opener Infrastructure Source ISI Building Infrastructure ISDN NTBA Infrastructure Source ISI Building Infrastructure LNB (low noise block converter) Infrastructure Source IZM Building Infrastructure Utility meter Infrastructure Source Nordman Building Infrastructure Wire losses Infrastructure Source Nordman Building Infrastructure CCTV Security Source IZM Building Infrastructure Security system Security Source Nordman
Other Other Aquarium Hobby / leisure Source Nordman Other Home trainer Hobby / leisure Source IZM Other Kiln Hobby / leisure Source Nordman Other Pool Hobby / leisure Source Nordman Other Reclining chair Hobby / leisure Source IZM Other Sauna, electric Hobby / leisure Source Nordman Other Spa/hot tub Hobby / leisure Source Nordman Other Charger, hedge trimmer Outdoor Appliances Source Nordman Other Charger, weed trimmer Outdoor Appliances Source Nordman Other Coil, snow melting Outdoor Appliances Source Nordman Other Grill, outdoor Outdoor Appliances Source Nordman

Report for Tender No. TREN/D1/40 Lot 6 -2005 EuP Lot 6 - Annexes 2nd of October 2007
Fraunhofer IZM CODDE Bio IS DUH Final Report Page 10-9
Lot 6 Main Categories Product Classification (Naming)
Categories by Nordman
Source (BN, ISI, IZM)
Other Lawn mower Outdoor Appliances Source Nordman Other Timer, irrigation Outdoor Appliances Source Nordman Other Electric toys, mains connected Toys Source IZM Other Electric toys, battery operated Toys Source IZM
Other Electric toys, std. rechargeable batteries Toys Source IZM
Other Electric toys, special batt. pack + charger Toys Source IZM
Other Electric toys, autarkic e.g. solar Toys Source IZM
Other Non electric toys - e.g. gas powered Toys Source IZM
Other Adding machine Business equipment Source Nordman Other Pencil sharpener Business equipment Source Nordman Other Shredder Business equipment Source Nordman Other Stapler Business equipment Source Nordman Other Typewriter Business equipment Source Nordman Other Auto engine heater Transportation Source Nordman Other Car, wheelchair or golf cart Transportation Source Nordman Other Bicycle light utility Source Nordman Other Charger, battery utility Source Nordman Other Floor polisher utility Source Nordman Other Infant monitor, receiver utility Source Nordman Other Infant monitor, transmitter utility Source Nordman Other Pet fence utility Source Nordman Other Power tool utility Source Nordman Other Power tool, cordless utility Source Nordman Other Pump, sump utility Source Nordman Other Pump, well utility Source Nordman Other Fountain, indoor Other Source Nordman Other adjustable bed Other Source IZM Other Waterbed Other Source Nordman

Report for Tender No. TREN/D1/40 Lot 6 -2005 EuP Lot 6 - Annexes 2nd of October 2007
Fraunhofer IZM CODDE Bio IS DUH Final Report Page 10-10
Australian proposal for product list
The following list of products was published in Australia for comments in January 2007. It is an attempt to define a basket of products (divided into core basket and secondary basket) for which the standby development could be tracked more reliably over the years. It might also internationally be used to analyse country differences – if national product data is available on a comparable basis.
This would necessitate tracking market data (or household penetration rates) together with the average power consumption per product entry.
Basket of Core Products (14) Major Appliances (2) • clothes washers • microwave ovens – electronic Home Entertainment Products (6) • televisions – CRT (conventional) • televisions – LCD • televisions – plasma • portable stereos • integrated stereos • Digital Video Disc players (DVDs) Office Equipment (5) • computer monitors – CRT • computer monitors – LCD • computer printers – laser black and white • computer printers – inkjet • multi-function devices (MFDs – combination scanner, printer and fax) Other Equipment (1) • external power supplies (no load in addition to equipment powered)
Basket of Secondary Products (another 29) Major Appliances (6) • clothes dryers • dishwashers • clothes washer/dryer combination units • air conditioners (any type with a single phase power plug – typically only window wall types) • instantaneous (non storage) gas water heaters (with electronic ignition) • microwave ovens – manual timer Home Entertainment Products (8) • televisions – rear projection • set top boxes (including variations – digital/analogue tuners, hard drive) • DVD recorders without hard drive (digital/analogue tuner) • DVD recorders with hard drive (digital/analogue tuner) • DVD/VCR combinations • Video Cassette Recorders • audio visual receivers (home theatre) • subwoofers Office Equipment (15) • computers (off mode only) • computer speakers • computer printers – laser colour • computer printers – inkjet

Report for Tender No. TREN/D1/40 Lot 6 -2005 EuP Lot 6 - Annexes 2nd of October 2007
Fraunhofer IZM CODDE Bio IS DUH Final Report Page 10-11
• network switches (including hubs) • routers • DSL or ADSL modems • scanners • facsimiles (fax machines) • photocopiers – black and white (categorise by copy speed) • photocopiers – colour (categorise by copy speed) • telephone answering machines • cordless phones – primary base station • cordless phones – secondary base station • cordless phones – with answering machine

Report for Tender No. TREN/D1/40 Lot 6 -2005 EuP Lot 6 - Annexes 2nd of October 2007
Fraunhofer IZM CODDE Bio IS DUH Final Report Page 10-12
Annex 1-2: International and European test standards (Task 1.2) This annex introduces the International and European test standards related to standby and off modes.
EN 62301: Household electrical appliances – Measurement of standby power
Adapted from IEC 62301 (2005) standard of the same name, it specifies methods of measurement of electrical power consumption in standby mode. It provides general conditions for measurements (configuration of the tested equipment, environment, power supply, supply-voltage waveform, power measurement accuracy, testing instrumentation, number of tests, and time of measurement) and the test procedure.
EN 62018: Power consumption of information technology equipment - Measurement methods (2004)
Adapted from IEC 62018 (2003) standard of the same name, it specifies methods of measurement of electrical power consumption in different modes during the use phase of information technology equipment (ITE). It also provides general conditions for measurement (configuration of the tested equipment, environment, power supply, supply-voltage waveform, power measurement accuracy, testing instrumentation, and time of measurement) and the test procedure.
EN 62087: Methods of measurement for the power consumption of audio video and related equipment (2005)
Adapted from IEC 62087 (2002) standard of the same name, it specifies methods of measurement of electrical power consumption of audio video and related equipment. It also provides general conditions for measurement (configuration of the tested equipment, environment, power supply, supply-voltage waveform, power measurement accuracy, number of relevant digits, testing instrumentation, and time of measurement) and the test procedure.
Report for Tender No. TREN/D1/40 Lot 6 -2005 EuP Lot 6 - Annexes 2nd of October 2007
Fraunhofer IZM CODDE Bio IS DUH Final Report Page 10-13
Annex 1-3: Other test procedures (Task 1.2)
This annex introduces the recognised test procedures which are not standards but test procedures established in the framework of an ecolabelling program or in the framework of manufacturer agreements for examples.
Energy Star test procedures
Energy Star is a joint program introduced in 1992 by the U.S. Environmental Protection Agency and the U.S. Department of Energy. It aims at saving money and protecting the environment through energy efficient products and practices. This American Energy Star Program was then extended to other countries [Energy Star].
Each Energy Star label provides or refers to a test procedure. The products covered by Energy Star are classified in more than forty product families grouped in 8 main categories. Three categories representing eleven product families, dealing with standby and off-mode losses are listed below:
Most of the Energy Star labels
give a standby definition related to energy consumption and functionality of products,
give limit values for each product family, and
define or refer to a test methodology for standby power consumption measurements.
Among the eleven Energy Star product families identified earlier, some refer to IEC standards:
IEC 62301 is used as reference directly or indirectly (through another document, which themselves refers to IEC 62301) for all or part of the test protocol and or for all or part of the test conditions, (six product families: Battery chargers – Room air cleaners – External power supplies – Computers – Computer monitors – Imaging equipments).
IEC 107- 1 (IEC 107- 1:1997, “Recommended methods of measurement on receivers for television broadcast transmissions, Part 1: General considerations - Electrical measurements other than those at audio-frequencies”) is used as reference for conditions of test of external speaker terminals, (three product families: Consumer audio and DVD products – Cordless phones – TVs, VCRs, DCR TVs with POD slots, combination units, television monitors, and component television units).
IEC 555 (“Disturbances in supply systems caused by household appliances and similar electrical equipment”) is used as reference for conditions related to testing equipment, (three product families: Consumer audio and DVD products – Cordless phones – TVs, VCRs, DCR TVs with POD slots, combination units, television monitors, and component television units).
No IEC standards are used as reference for two product families (Dishwashers – Water coolers).
In summary, IEC 62301 is used as a reference by a majority of the Energy Star test procedures for standby power consumption measurements, except the audio/video segment and cordless phones.
ECMA test procedures: Technical report / 70: Product-related environmental declaration (2004)
This technical report of the European Computer Manufacturer Association (ECMA) specifies standby and off-mode definitions. It does not specify a test procedure but it specifies that Energy

Report for Tender No. TREN/D1/40 Lot 6 -2005 EuP Lot 6 - Annexes 2nd of October 2007
Fraunhofer IZM CODDE Bio IS DUH Final Report Page 10-14
Star programme may be used as reference for all types of products (except TV sets where the IEC 62087:2002 should be used) and if suppliers do not follow the above mentioned protocols, they shall identified the applied test protocols in the designed section of the product declaration.
FEMP: Guidelines for measurement of standby power use (in response to executive order 13221) (2002)
The American Federal Energy Management Program (FEMP) is dedicated to help federal purchasers to identify efficient products, to provide model language for specifying efficient products in capital projects and service contracts, and to give buyers advice on everyday procurement decisions. This particular document of the FEMP specifies a standby definition and a test protocol for products non-covered by Energy Star specifications.
Report for Tender No. TREN/D1/40 Lot 6 -2005 EuP Lot 6 - Annexes 2nd of October 2007
Fraunhofer IZM CODDE Bio IS DUH Final Report Page 10-15
Annex 1-4: Detailed comparison of the parameters extracted from the main test standards. (Task 1.2) The parameters exposed in the following documents will be compared in this annex.
EN 62301: Household electrical appliances – Measurement of standby power,
EN 62018: Power consumption of information technology equipment - Measurement methods,
EN 62087: Methods of measurement for the power consumption of audio video and related equipment,
Energy Star Program Requirement (ESPR) for room air cleaners,
ESPR for water coolers,
ESPR for consumer audio and DVD products,
ESPR for cordless phones,
ESPR for TVs, VCRs, DCR TVs with POD slots, combination units, television monitors, and component television units,
ESPR for computer monitors,
ESPR for computers Final Draft that will be effective on 20th July 2007,
FEMP: Guidelines for measurement of standby power use.
► Configuration of the tested equipment
After analysing the documents listed above, with the exception of standard EN 62087, the configuration of the tested equipment imposed are the same: the equipment must be in a configuration representative of its typical utilisation.
Configuration refers to which hardware / software parts and versions are tested as a unit and which settings are “configured” before the test. ESPR for computers also add some system requirements, as in the configuration of the equipment that “the unit under test must be connected to an Ethernet network switch capable of the unit under test highest and lowest network speeds.”
► Environment
Ambient temperature
After analysing these documents, it seems that 23 ± 4 °C could be a good compromise. (Some of these documents also specified the case where a (range of) temperature is given by the manufacturer but do not include the temperature range specified by the test procedure.)
Air speed
For documents IEC 62301, ESPR for room air cleaners, air speed shall be ≤ 0.5 m/s. For document FEMP: Guidelines for measurements of standby power use, air speed shall be 0.5 m/s. For document ESPR for water coolers, air speed must be natural. For other documents air speed is not specified.
Humidity
The document ESPR for computer monitors requires a relative humidity between 30 and 80 % and the ESPR for computers requires a relative humidity from 10 to 80 %. For other documents humidity is not specified.

Report for Tender No. TREN/D1/40 Lot 6 -2005 EuP Lot 6 - Annexes 2nd of October 2007
Fraunhofer IZM CODDE Bio IS DUH Final Report Page 10-16
Network connection
The ESPR for computers adds this parameter: “The network connection must be live during all tests“.
Time allowed to the equipment to stabilise before measurement (equilibration time)
Most of the test procedures specify a time allowed to the equipment to stabilise before measurement, indeed in most cases the power consumption is not steady just after the equipment enter a mode (active, standby or off). The document IEC 62301 distinguishes two cases: where the value is steady (variation of less than 1 % over three minutes) or not steady. The time allocated to the equipment to stabilise should be at five minutes even for the steady case. For the non-steady case no minimum stabilizing time is given. In the ESPR document for room air cleaners, the equipment is allowed to stabilise for at least five minutes before the measurement. In ESPR documents for consumer audio and DVD products (TVs, VCRs, DCR TVs with POD slots, combination units, TV monitors, and component TV units), the measurement is performed after the unit reaches operating temperatures and the readings on the power meter stabilise (approximately 90 minutes). In ESPR document for cordless phones, the measurement is performed after the unit reaches operating temperatures and the readings on the power meter stabilise (this time may vary depending on the product). In ESPR document for computer monitors, the measurement is performed after a warm up time of at least 20 minutes. In IEC 62018, the measurement is performed for minimum one minute after the equipment enters standby mode. For IEC 62087, the measurement is performed 15 minutes after the equipment enters standby mode. In ESPR document for water coolers, FEMP guidelines, and ESPR for computers, for measurements of standby power use, no time of warm up is specified.
Duration of measurement
IEC 62301 distinguishes two cases: where the power consumption value is steady or not steady. The time of measurement is not specified in the first case and in the second case it must be at least three minutes or one or more full “standby operation cycles”. In ESPR document for room air cleaners, time of measurement is at least five minutes. In IEC 62087, ESPR for consumer audio and DVD products, ESPR for cordless phones, ESPR for TVs, VCRs, DCR TVs with POD slots, combination units, TV monitors, and component TV units, and ESPR for computer monitors, time of measurement shall be sufficiently long to measure correct average value. In FEMP document (Guidelines for measurements of standby power use), time of measurement shall be not less than five minutes, as long as needed to achieve a resolution of ± 0.1 W in the calculation of average power use and is calculated as following:
Minimum duration (in minutes) = [meter resolution (Wh) / required accuracy (W)] x 60 (min/h).
In ESPR document for water coolers, the energy consumed is measured in a 24 hour period. In ESPR document for computers, the time of measurement of standby mode is a five minutes period, (during that five minutes period true power values are recorded every second in order to get an average value). In IEC 62018, no measurement time is specified.
► Test instrumentation
Depending on the standard, the characteristics of test instrumentation that are required include accuracy, resolution, crest factor rating, bandwidth, period of calibration, and line impedance.
The most complete documents regarding these aspects are ESPR documents for consumer audio and DVD products, ESPR for cordless phones, and ESPR for TVs, VCRs, DCR TVs with POD slots, combination units, TV monitors, and component TV units. However, IEC 62018 and the ESPR document for computers are easier to understand.

Report for Tender No. TREN/D1/40 Lot 6 -2005 EuP Lot 6 - Annexes 2nd of October 2007
Fraunhofer IZM CODDE Bio IS DUH Final Report Page 10-17
► Number of relevant digits
In ESPR document for room air cleaners, test results must be rounded to the second decimal place. In ESPR documents for consumer audio and DVD products, ESPR for cordless phones, ESPR for TVs, VCRs, DCR TVs with POD slots, combination units, TV monitors, and component TV units, the percent of uncertainties tolerated is + 10 % / - 0%. In ESPR document for computer monitors, a steady value (variation of less than 1 % over three minutes) is required. In FEMP document, the average power consumption is rounded to the nearest 0.1 W. In IEC 62087, the number of relevant digits is related to the accuracy of the measurements. In IEC 62301, IEC 62018, and ESPR for computers and ESPR for water coolers, no number of relevant digits or percent of uncertainty is specified.
It seems that the most demanding document is the document ESPR for room air cleaners.
► Power supply
Depending on the document the characteristics of power supply that are required include voltage, total harmonic distortion, and frequency.
All documents unless the ESPR for room air cleaners are really complete regarding this aspect.
► Number of units required for test
Only the ESPR document for computer monitors specifies this point.
► Number of test per equipment
Only IEC 62301 and FEMP Guidelines for measurements of standby power use specify this point.
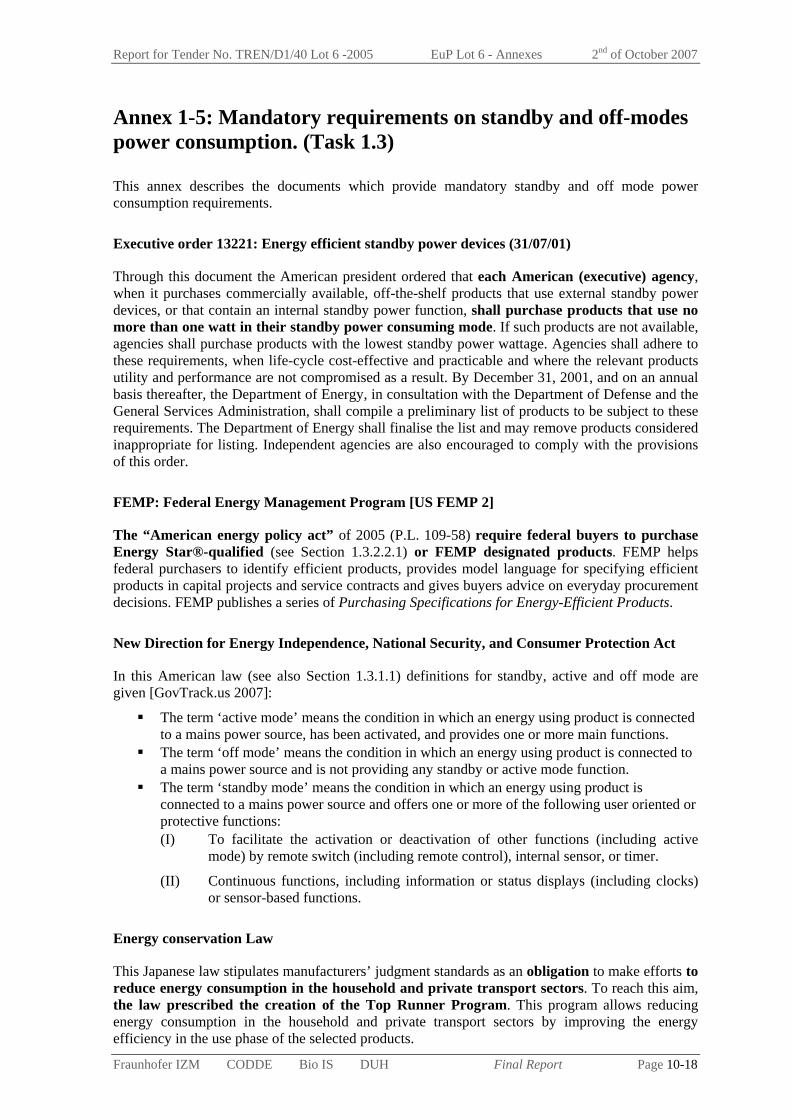
Report for Tender No. TREN/D1/40 Lot 6 -2005 EuP Lot 6 - Annexes 2nd of October 2007
Fraunhofer IZM CODDE Bio IS DUH Final Report Page 10-18
Annex 1-5: Mandatory requirements on standby and off-modes power consumption. (Task 1.3)
This annex describes the documents which provide mandatory standby and off mode power consumption requirements.
Executive order 13221: Energy efficient standby power devices (31/07/01)
Through this document the American president ordered that each American (executive) agency, when it purchases commercially available, off-the-shelf products that use external standby power devices, or that contain an internal standby power function, shall purchase products that use no more than one watt in their standby power consuming mode. If such products are not available, agencies shall purchase products with the lowest standby power wattage. Agencies shall adhere to these requirements, when life-cycle cost-effective and practicable and where the relevant products utility and performance are not compromised as a result. By December 31, 2001, and on an annual basis thereafter, the Department of Energy, in consultation with the Department of Defense and the General Services Administration, shall compile a preliminary list of products to be subject to these requirements. The Department of Energy shall finalise the list and may remove products considered inappropriate for listing. Independent agencies are also encouraged to comply with the provisions of this order.
FEMP: Federal Energy Management Program [US FEMP 2]
The “American energy policy act” of 2005 (P.L. 109-58) require federal buyers to purchase Energy Star®-qualified (see Section 1.3.2.2.1) or FEMP designated products. FEMP helps federal purchasers to identify efficient products, provides model language for specifying efficient products in capital projects and service contracts and gives buyers advice on everyday procurement decisions. FEMP publishes a series of Purchasing Specifications for Energy-Efficient Products.
New Direction for Energy Independence, National Security, and Consumer Protection Act
In this American law (see also Section 1.3.1.1) definitions for standby, active and off mode are given [GovTrack.us 2007]:
The term ‘active mode’ means the condition in which an energy using product is connected to a mains power source, has been activated, and provides one or more main functions.
The term ‘off mode’ means the condition in which an energy using product is connected to a mains power source and is not providing any standby or active mode function.
The term ‘standby mode’ means the condition in which an energy using product is connected to a mains power source and offers one or more of the following user oriented or protective functions: (I) To facilitate the activation or deactivation of other functions (including active
mode) by remote switch (including remote control), internal sensor, or timer.
(II) Continuous functions, including information or status displays (including clocks) or sensor-based functions.
Energy conservation Law
This Japanese law stipulates manufacturers’ judgment standards as an obligation to make efforts to reduce energy consumption in the household and private transport sectors. To reach this aim, the law prescribed the creation of the Top Runner Program. This program allows reducing energy consumption in the household and private transport sectors by improving the energy efficiency in the use phase of the selected products.

Report for Tender No. TREN/D1/40 Lot 6 -2005 EuP Lot 6 - Annexes 2nd of October 2007
Fraunhofer IZM CODDE Bio IS DUH Final Report Page 10-19
The “Energy conservation law” sets three criteria for these products, which determine when policy makers should consider the application of the Top Runner Program (Article 18 of the “Energy Conservation Law”). These criteria are:
products that are used in large quantities in Japan;
products that consume a considerable amount of energy in the use phase;
products, which have a high energy efficiency improvement potential.
Twenty one product groups are currently included in the Top Runner Program. These product groups include most of the electrical and electronic appliances and gasoline, diesel and LPG vehicles. For each product group, the top runner criteria have to be respected.
Act on the promotion of the purchase of Environment friendly products
This Korean Act stipulates that from July 2005 public agencies are obligated to purchase Eco label certified products. It makes reference to Korean ecolabelling program conducted from April 1992 and described in the following section.
Australia standby power strategy 2002-2012 [Australian SPS]
In August 2000, all Australian jurisdictions agreed to:
"...pursue efficiencies in standby power consumption of energy-consuming products, through support for the International Energy Agency's One -Watt program, and endorse its incorporation into the...program of work."
In the context of the IEA “One watt” initiative, the Equipment Energy Efficiency Committee (E3 Committee), on behalf of the Australian Ministerial Council on Energy, was looking for ideas and a response to a discussion paper consultation process in 2002. In a process throughout 2002, government agencies consulted with stakeholders about ideas to reduce standby. The standby strategy is a result of that dialogue with stakeholders.
The Ministerial Council on Energy published the national Standby Power Strategy - "Money Isn't All You're Saving" in late 2002 with the aim of minimising standby power losses. The strategy contained a wide range of possible policy measures to address unnecessary standby power losses and implemented some measures for particular product types. The strategy was a world-first and set a clear plan over ten years to ensure the standby power used by target products reached acceptable levels by 2012.
Within this timeframe, specific product types may be identified as "at risk" of using excessive standby and will therefore be targeted for specific action. Each product will then be dealt with in potentially a two stage action plan designed to reduce standby to levels that are acceptable for these product groups as quickly as economically viable. (Twenty seven standby "product profiles" (e.g. bread makers, burglar alarm, photocopiers) have been developed between 2002 and 2004 for each product type or product category.)
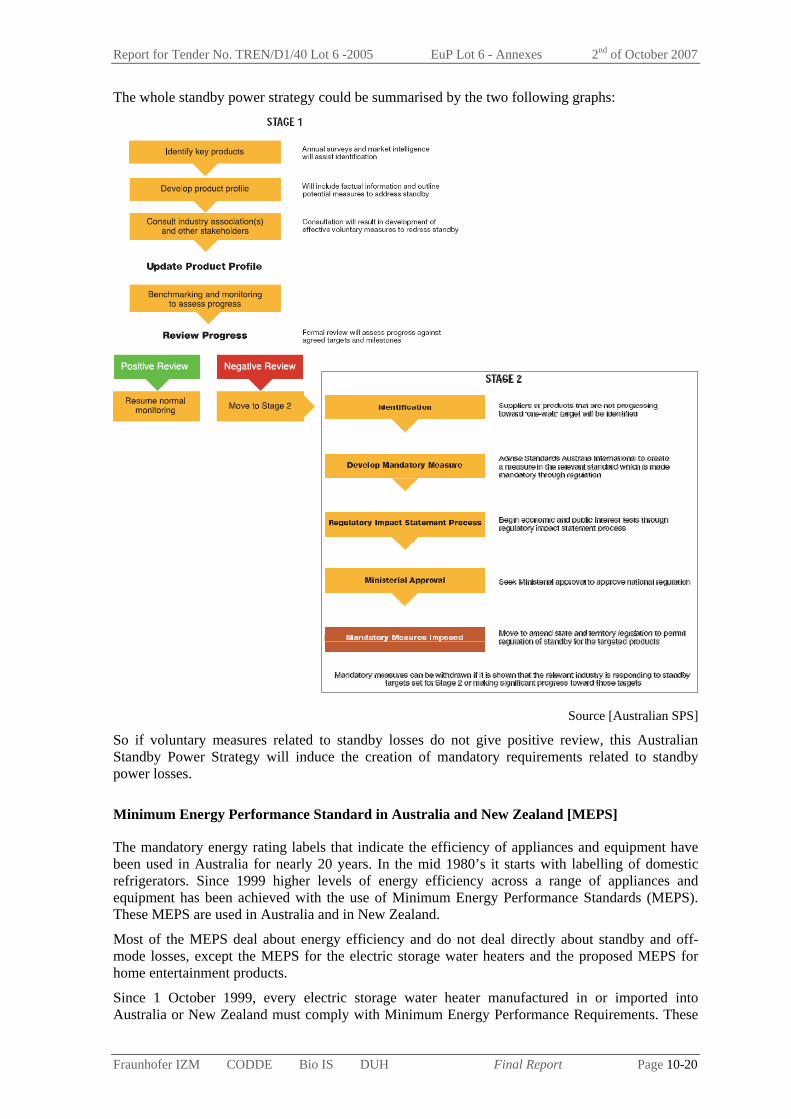
Report for Tender No. TREN/D1/40 Lot 6 -2005 EuP Lot 6 - Annexes 2nd of October 2007
Fraunhofer IZM CODDE Bio IS DUH Final Report Page 10-20
The whole standby power strategy could be summarised by the two following graphs:
Source [Australian SPS]
So if voluntary measures related to standby losses do not give positive review, this Australian Standby Power Strategy will induce the creation of mandatory requirements related to standby power losses.
Minimum Energy Performance Standard in Australia and New Zealand [MEPS]
The mandatory energy rating labels that indicate the efficiency of appliances and equipment have been used in Australia for nearly 20 years. In the mid 1980’s it starts with labelling of domestic refrigerators. Since 1999 higher levels of energy efficiency across a range of appliances and equipment has been achieved with the use of Minimum Energy Performance Standards (MEPS). These MEPS are used in Australia and in New Zealand.
Most of the MEPS deal about energy efficiency and do not deal directly about standby and off-mode losses, except the MEPS for the electric storage water heaters and the proposed MEPS for home entertainment products.
Since 1 October 1999, every electric storage water heater manufactured in or imported into Australia or New Zealand must comply with Minimum Energy Performance Requirements. These
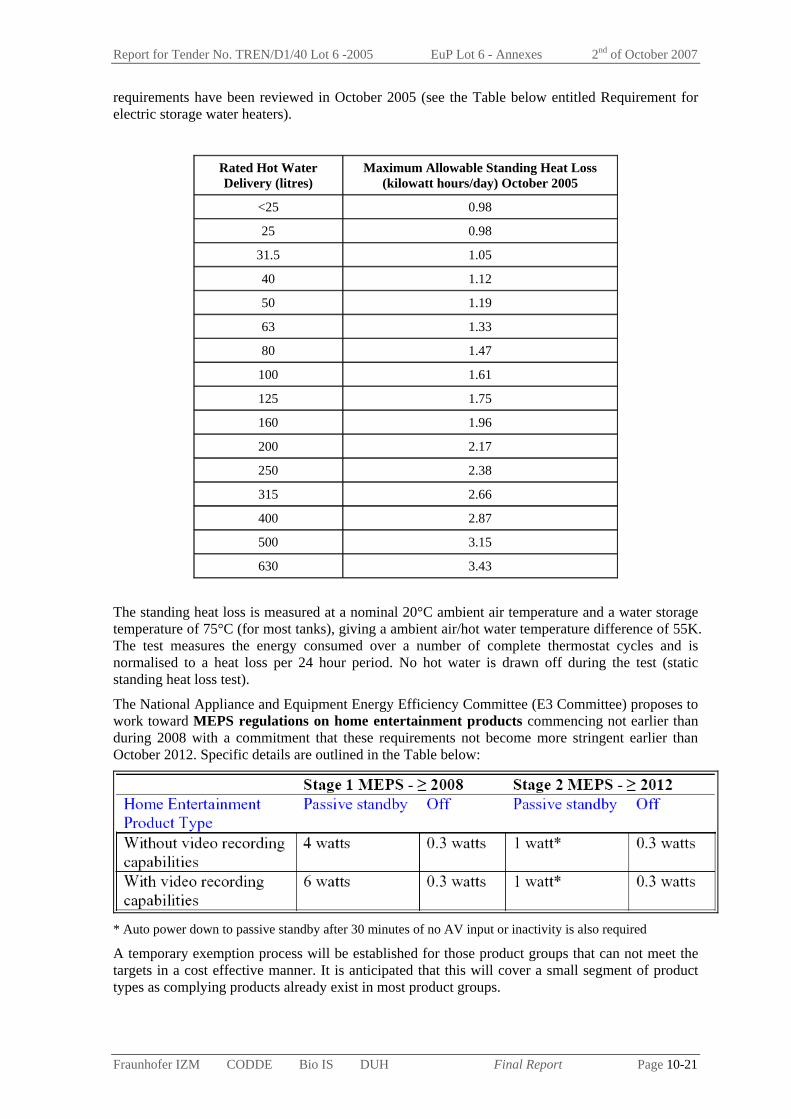
Report for Tender No. TREN/D1/40 Lot 6 -2005 EuP Lot 6 - Annexes 2nd of October 2007
Fraunhofer IZM CODDE Bio IS DUH Final Report Page 10-21
requirements have been reviewed in October 2005 (see the Table below entitled Requirement for electric storage water heaters).
Rated Hot Water Delivery (litres)
Maximum Allowable Standing Heat Loss (kilowatt hours/day) October 2005
<25 0.98
25 0.98
31.5 1.05
40 1.12
50 1.19
63 1.33
80 1.47
100 1.61
125 1.75
160 1.96
200 2.17
250 2.38
315 2.66
400 2.87
500 3.15
630 3.43
The standing heat loss is measured at a nominal 20°C ambient air temperature and a water storage temperature of 75°C (for most tanks), giving a ambient air/hot water temperature difference of 55K. The test measures the energy consumed over a number of complete thermostat cycles and is normalised to a heat loss per 24 hour period. No hot water is drawn off during the test (static standing heat loss test).
The National Appliance and Equipment Energy Efficiency Committee (E3 Committee) proposes to work toward MEPS regulations on home entertainment products commencing not earlier than during 2008 with a commitment that these requirements not become more stringent earlier than October 2012. Specific details are outlined in the Table below:
* Auto power down to passive standby after 30 minutes of no AV input or inactivity is also required
A temporary exemption process will be established for those product groups that can not meet the targets in a cost effective manner. It is anticipated that this will cover a small segment of product types as complying products already exist in most product groups.
Report for Tender No. TREN/D1/40 Lot 6 -2005 EuP Lot 6 - Annexes 2nd of October 2007
Fraunhofer IZM CODDE Bio IS DUH Final Report Page 10-22
Annex 1-6: Mandatory requirements on standby and off-modes losses labelling. (Task 1.3)
This annex describes the document which provide mandatory standby and off mode losses labelling.
Directive 2002/40/EC
This directive is entitled “Commission directive 2002/40/EC of 8 May 2002 implementing council directive 92/75/EEC with regard to energy labelling for household electric ovens”. This directive indicates that the providing of information about the equipment and have to contain the declaration of the power consumption when no heating function is performed and the oven is in the lowest power consuming mode.
Report for Tender No. TREN/D1/40 Lot 6 -2005 EuP Lot 6 - Annexes 2nd of October 2007
Fraunhofer IZM CODDE Bio IS DUH Final Report Page 10-23
Annex 1-7: Voluntary programs related to standby and off-modes losses. (Task 1.3)
This annex describes voluntary programs which provide recommendations related to standby and off mode power consumption.
International Energy Agency: “1-watt Plan” [IEA 2005]
In 1999, the IEA proposed that all countries harmonise energy policies to reduce standby power use to no more than one watt per device. The proposal contained 3 elements:
Participating countries would seek to lower standby to below 1 watt in all products by 2010
Each country would use measures and policies appropriate to its own circumstances
All countries would adopt the same definition and test procedure
Some actions have been initiated in some specific countries, following this plan. Australia and Korea have formally adopted the one-watt plan. President Bush signed the Executive Order n°13221 (see above in the Section 1.3.1.1). Energy Star and the European Code of Conduct have established voluntary programs to promote energy-efficient power supplies (necessary to achieve standby levels of one watt or less). Other countries, notably Japan and China, have undertaken strong measures to reduce standby power use.
European Union Stand-by Initiative [EU Stand-by Init.]
1997: As a first step the European Commission concluded a negotiated agreement with individual consumer electronic manufacturers and the EU trade association EACEM to reduce the stand-by losses of TVs and VCRs.
1999: A Commission Communication to the Council and the European Parliament on Policy Instruments to Reduce Stand-by Losses of Consumer Electronic Equipment set the political frame for further actions in this field. As a result two Codes of Conduct, for External Power Supplies and for Digital TV Services, were introduced. The requirements indicated in these codes of conduct are not mandatory.
2000: A second agreement with individual consumer electronic manufacturers and the EU trade association EACEM for reducing the stand-by losses of audio equipment was concluded. 2003: A new agreement for TVs and DVDs was concluded.
2000: Another important piece of the Commission and EU strategy is the Energy Star Agreement for office equipment between the EU and the USA. (see also Section 1.3.2.2.1). This agreement allows using Energy Star requirements for office equipments but these requirements are not mandatory.
2004: The Code of Conduct on energy efficiency of external power supplies – version 2 – was concluded the 24 November. It provides maximal no-load mode consumption as well as energy efficiency criteria for active mode, and a test method for measurements.
2005: The “European Climate Change Program” indicated the urgent need to take actions to reduce stand-by losses.
2006: The Code of Conduct on energy efficiency of digital TV service systems - version 4 - was concluded the 10th March. It provides in its annex B the maximum power consumption target and time schedule that the equipment must meet. It provides also its own standby passive mode definition as well as the standby active mode definition and the off-mode definition.
Report for Tender No. TREN/D1/40 Lot 6 -2005 EuP Lot 6 - Annexes 2nd of October 2007
Fraunhofer IZM CODDE Bio IS DUH Final Report Page 10-24
2006: The Code of Conduct on energy consumption of broadband equipment was concluded the 19th July 2006. It provides in its annex B the maximum power consumption target and time schedule that the equipment must meet. It provides also its own standby mode definition as well as the off-mode definition.
A Code of Conduct on energy consumption of Uninterruptible Power Supply (UPS) is also currently in progress.
European Committee of Domestic Equipment Manufacturers: Voluntary commitment on reducing standing losses of domestic electric storage water heaters [CECED]
This voluntary commitment on reducing standing losses of domestic Electric Storage Water Heaters (ESWH) was developed by the European Committee of Domestic Equipment Manufacturers (CECED). This final version was agreed on 19th November 1999 and was valid only until 31st December 2003, but no new version is available. This document presents the market, the market coverage (by manufacturers). It provides also maximum allowable standing loss values that should not be exceeded by the appliances sold by the manufacturers from the first January 2001. It explains the monitoring system, as well as the reporting system and the verification step. For the verification step, it refers to HD500/S1 also known as IEC 379 untitled “method for measuring the performance of ESWH for household purposes”. The purpose of this standard IEC 379 is to define the principal performance characteristics of ESWH and to describe the standard methods for measuring these characteristics (including energy performance characteristics).
E-Standby Program [e-Standby Program]
The e-Standby Program has been implemented by Ministry of Commerce, Industry and Energy (MOCIE) and Korea Energy Management Corporation (KEMCO) in Korea since April 1, 1999. It is based on the Article 13 of “Rational Energy Utilization Act”. The purpose of the program is to save standby power systematically by encouraging the manufacturers to produce and sell the energy-saving products that meet the energy- saving standards suggested voluntarily by MOCIE and KEMCO. It is a voluntary agreement program. 18 items (Computers, Monitors, Printers, Fax Machines, Copiers, Scanners, Multifunction Devices, Energy-Saving & Controlling Devices, External Power Supply, Televisions, VCRs, Home Audio Products, DVD Products, Microwaves, Battery Chargers, Set-top-boxes, Intercom, Cordless Phones) are subject to this program.
Australia [Australia AGO]
The 1998 National Greenhouse Strategy sets out Governments policy objectives in this area in the following terms:
“Improvements in the energy efficiency of domestic appliances and commercial and industrial equipment will be promoted by extending and enhancing the effectiveness of existing labelling and minimum energy performance standards”.
The Australian Greenhouse Office (AGO), within the Department of the Environment and Heritage, has given effect to this vision by adopting in particular the following strategy:
Voluntary programs: The AGO works in partnership with stakeholder groups to introduce programs that encourage market transformation by promoting highly efficient equipment or by identifying selected energy efficient products through appliance labelling. The AGO is currently working with its stakeholders to reduce standby power losses. An Energy Star agreement has been concluded between USA and Australia in 1996 (also see Section 1.3.2.1). This agreement allows using Energy Star requirements for office equipments and consumer electronics but these requirements are not mandatory.
In the framework of the Australian Standby Power Strategy, there will be also voluntary measures related to standby mode, see Section 1.3.1.1.

Report for Tender No. TREN/D1/40 Lot 6 -2005 EuP Lot 6 - Annexes 2nd of October 2007
Fraunhofer IZM CODDE Bio IS DUH Final Report Page 10-25
IEC 62075 at CDV stage
This standard (at the Committee Draft for Voting stage) applies to all “Audio/Video, Information and communication technology Equipment” marketed as final products. It specifies requirements and recommendations for the design of environmentally sound products regarding: life cycle thinking aspects, material efficiency, energy efficiency, consumables and batteries, chemical and noise emissions, extension of product lifetime, end of life, hazardous substances / preparations, product packaging and documentation. It does not provide any standby mode definition and it also does not provide limit values for standby or off-mode losses. It provides only general requirements on energy efficiency as well as off-modes and no load mode definitions. For off-mode it provides the following recommendations to the designer: consider design options to automatically switch from power save mode to an off-mode where practical, consider design options to reduce the power consumption in the soft off-modes to lowest values (zero watt if feasible), and consider a main power switch. If applicable, the main power switch should be placed on the product such that the user can easily reach and use it, inform the user through documentation or other means if zero watt in the state a user would consider hard off is not achievable. For the no load mode this standard specifies: “The designer shall consider design options that reduce power consumption of no load mode to the lowest value.”

Report for Tender No. TREN/D1/40 Lot 6 -2005 EuP Lot 6 - Annexes 2nd of October 2007
Fraunhofer IZM CODDE Bio IS DUH Final Report Page 10-26
Annex 1-8: Ecolabel and ecolabelling program related to standby and off-modes losses. (Task 1.3)
This annex describes the ecolabels and ecolabelling programs which provide recommendations related to standby and off mode losses.
European Eco-label [EU Eco-label]
A European Eco-label award scheme has been in operation since 1993, when the first product groups were established. Ecological criteria for a product group are normally established for a period of three years. Products covered by European Eco-label are classified in seven main categories.
Only two European Eco-labels deal with standby power consumption requirements. The Eco-label for computer and computer monitors refers to Energy Star for standby test procedure and requirements; and gives also additional requirements. And the Eco-label for TV provide its own requirements and refer for the test procedure to EN 50301 (“method of measurement on receivers for TV broadcast transmission”).
GEEA: Group for Energy Efficiency Appliances [GEEA]
This group of organizations aims at harmonizing the ongoing and/or planned voluntary informative activities in the field of home electronics and office equipment. Members are the Swiss federal office of energy (SFOE), the Danish energy authority (DEA), the Swedish national energy administration (STEM), the Austrian energy agency (E.V.A.), the German energy agency (DENA), the Netherlands agency for energy and the environment (Senter NOVEM), and the French agency for energy and the environment (ADEME).
Among the sixteen GEEA Ecolabels:
seven do not refer to Energy Star Requirements,
three refer for part of the definition of the modes and part of the test procedure to Energy Star,
five refers for definition of modes and test procedure to Energy Star,
four refer for test procedure and modes definitions to IEC 62087,
and one completely refers to Energy Star for definition test procedure and criteria.
Nordic Swan [NSwan]
The Swan is the official Nordic ecolabel, introduced by the Nordic council of ministers (Denmark, Finland, Iceland, Norway, and Sweden) in 1989. This label is available for around sixty product groups, from washing-up liquid to furniture. This label is usually valid for three years, then the criteria are revised and the company must reapply for a license.
Among the three Nordic Swan labels, which deal with standby power consumption requirements or with energy efficiency requirements:
One refers to GEEA test methodology and modes definitions (the Nordic Swan for audiovisual equipment),
One refers is harmonised with the Blue Angel but is going to be harmonised with Energy Star (the Nordic Swan for copying machines)
And one refers to Energy Star (the Nordic Swan for personal computers).
Report for Tender No. TREN/D1/40 Lot 6 -2005 EuP Lot 6 - Annexes 2nd of October 2007
Fraunhofer IZM CODDE Bio IS DUH Final Report Page 10-27
Energy Star label [Energy Star]
Energy Star is a joint program introduced in 1992 by the U.S. Environmental Protection Agency and the U.S. Department of Energy. It aims at saving money and protecting the environment through energy efficient products and practices. This American Energy Star Program was then extent to others countries [Hershberg]:
1995: Japan (only for office equipment),
1996: Australia (only for office equipment and consumer electronics),
1997: New Zealand (office equipment considering consumer electronics and other products),
1999: Taiwan (only for office equipment),
2000: European Union (only for office equipment),
2001: Canada (most products).
Energy Star labels have been created through this program. Products in more than 40 categories are eligible for the Energy Star. This label deals only with energy saving aspects. The Energy Star requirements, today, are not severe. Most of the equipments meet the Energy Star requirements. Today Energy Star requirement for computer but also for room air cleaner, for dishwasher, for telephony, and for TV VCR are under revision. The goal of these revisions is to have around 25 % of product per product category that comply at the moment of specification. EPA is considering new performance requirements for laptops, workstations, desktop computers, integrated computers, and desktop-derived servers under the new specification.
And since 2005, the “American energy policy act” requires federal buyers to purchase Energy Star®-qualified (or FEMP designated (see Section 1.3.1.1)) products.
Environmental Choice Program [Environmental Choice]
ECP was created as a voluntary ecolabelling program by Environment Canada (the environment department of the Government of Canada) in 1988. In 1995, TerraChoice Environmental Services Inc., a Canadian private sector company, assumed management of the ecolabelling program, though Environment Canada still retains ownership. ECP has generated more than 40 certification criteria documents (40 environmental choice ecolabels) for products like food container, household products or electricity generators. Among the four Environmental Choice ecolabels, which deal with standby power consumption requirements, two refer to Energy Star only for test procedure, one provides its own requirements but recognise Energy Star requirements as equivalent, and the last refers to current Energy Star requirements and test procedure.
Japanese Eco Mark [Japanese Ecomark]
In 1989, the Japanese Environment Association (JEA) developed “The Eco Mark”, ecolabel in cooperation with the Environment Ministry and a Japanese environmental association. The implementation and management of this ecolabel is in the hands of a Japanese environmental association.
The three Eco Marks, which deal with standby, power consumption requirements or with energy efficiency requirements (Eco mark for copiers, for personal computer and personal computer monitors, and for printers) refer for all or part of the requirements to Energy Star requirements and for test procedures to Energy Star procedures.

Report for Tender No. TREN/D1/40 Lot 6 -2005 EuP Lot 6 - Annexes 2nd of October 2007
Fraunhofer IZM CODDE Bio IS DUH Final Report Page 10-28
Korean Eco-Mark [Korean Ecomark]
Korea ecolabelling program has been conducted from April 1992. It is certification program executed by the ministry of Environment, in line with Article 20 of the “Act on Environmental Technology Development and Support”. Within this framework, the Korean label ecomark was launched the 1st June 1992 by the Korean ministry of the environment. The Korean Eco-Mark is administered by the Korean ministry of environment.
Among the seven Eco-Mark labels, which deal with standby power consumption, five considered that the current Energy Star requirements are equivalent the requirements of the Eco Mark. Two others provide their own requirements and test methodologies.
And from July 2005, in Korea, public agencies are obligated to purchase Eco-Mark certified products in accordance with the Korean Act (see Section 1.3.1.1).
Australian Ecolabel [Ecolabel Australia]
Australia developed the “Environmental Choice” ecolabel in 1991. In 2001, it launched a new attempt to label environmentally preferable products, this time with the “Environmental Choice Australia” ecolabel. The Australian Ecolabel Program has been developed for general compliance to ISO 14024 and is managed by a not-for-profit organization. Certification criteria exist for 20 product groups.
Among the four Australian ecolabels, which deal with standby power consumption requirements or with energy efficiency requirements, one does not refer to Energy Star requirements (Australian ecolabel for computer), one only refers to Energy Star for standby test procedure (Australian ecolabel for printers faxes and multifunctional devices), and two refer to Energy Star test procedure and requirements (Australian ecolabel for photocopiers, for TV and video media player).
TCO [TCO]
TCO is Swedish office equipment Eco label. It covered products like computers mobile phones, and office furniture. A private company supports it: TCO Development. This label is Swedish but it is valid globally over the world.
Among the four TCO labels, which deal with standby power consumption requirements or with energy efficiency requirements, two refer to Energy Star for criteria, definitions of modes, and test procedure, and one refers to Energy Star and Suisse Energy 2000 for criteria, definitions of modes, and test procedure.
Blue Angel [Blue Angel]
The Blue Angel is the German ecolabel. It was created in 1977 on the initiative of the Federal Minister of the Interior and approved by the Ministers of the Environment of the national government and the federal states. Today the Blue Angel is divided into eleven categories covering altogether more than 80 product groups. The Blue Angel applies to product groups such as office products, computers, wood, furniture or solar technology for example. The Federal Ministry of the Environment, Nature Protection and Nuclear Safety owns the label, but the criteria are specified jointly by the Federal Office for Environment Protection and the German Institute for quality assurance and marking (RAL). The RAL institute verifies and assigns the label-licenses for the manufacturers, which have to be renewed every three years.
Due to the longer history of the development and the stronger consideration of additional aspects within the label, which are not classical environmental protection, a summary of the goals and criteria of the Blue Angel is not as clear-cut as for other environmental labels.
The central aim of the Blue Angel is to facilitate the purchase decision for pollution free and efficient products.
Report for Tender No. TREN/D1/40 Lot 6 -2005 EuP Lot 6 - Annexes 2nd of October 2007
Fraunhofer IZM CODDE Bio IS DUH Final Report Page 10-29
Annex 1-9: Legislation, voluntary program and ecolabel having an indirect impact on standby and off mode losses reduction (Task 1.3) This annex provides examples of these legislations, voluntary programs or ecolabels, which contribute through energy efficiency or energy consumption requirements in reducing standby and off-mode losses.
For example, the European directives requiring indicating on a label the energy efficiency or the energy consumption of the appliances, contribute indirectly in reducing standby and off-mode losses. There are quoted below:
Commission Directive 2002/31/EC of 22 March 2002 implementing Council Directive 92/75/EEC with regard to energy labelling of household air-conditioners,
Commission Directive 97/17/EC of 16 April 1997 implementing Council Directive 92/75/EEC with regard to energy labelling of household dishwashers and amended by Commission Directive 1999/9/EC of 26 February 1999,
Council Directive 92/75/EEC of 22 September 1992 on the indication by labelling and standard product information of the consumption of energy and other resources by household appliances,
Commission Directive 2003/66/EC of 3 July 2003 amending Directive 94/2/EC implementing Council Directive 92/75/EEC with regard to energy labelling of household electric refrigerators, freezers and their combinations,
Commission Directive 98/11/EC of 27 January 1998 implementing Council Directive 92/75/EEC with regard to energy labelling of household lamps,
Commission Directive 95/13/EC of 23 May 1995 implementing Council Directive 92/75/EEC with regard to energy labelling of household electric tumble driers,
Commission Directive 96/60/EC of 19 September 1996 implementing Council Directive 92/75/EEC with regard to energy labelling of household combined washer-driers,
Commission Directive 95/12/EC of 23 May 1995 implementing Council Directive 92/75/EEC with regard to energy labelling of household washing machines and amended by Commission Directive 96/89/EC of 17 December 1996.
Another example are the requirements applicable to External Power Supplies (EPS) and linked to Energy efficiency or energy consumption that contribute indirectly in reducing standby and off-mode losses of equipments connected to EPS (as for example laptop computers). Below are quoted some of the documents pertaining EPS and providing energy efficiency or energy consumption requirements but not quoting directly standby or off-mode losses: (The list is not exhaustive and the purpose of these documents is not developed above, because this is already the object of the Lot 7 titled “battery chargers and external power supplies”.)
► California Standards for External Power Supplies
On December 15, 2004, the California Energy Commission (CEC) adopted new mandatory efficiency requirements for external power supplies sold in California. To determine the energy efficiency of external power supplies, these requirements are based on the Energy Star test method for calculating the energy efficiency of single voltage external ac/dc and ac/ac power supplies. These standards also require the international energy efficiency marking on the external power supplies.

Report for Tender No. TREN/D1/40 Lot 6 -2005 EuP Lot 6 - Annexes 2nd of October 2007
Fraunhofer IZM CODDE Bio IS DUH Final Report Page 10-30
► Australia and New Zealand: MEPS (Minimum Energy Performance Standards) for External Power Supplies
Based on the Minimum Energy Performance Standards (AS/NZS 4665-2 (2005)), from 1st October 2007 most EPS manufactured or imported for sale in Australia or New Zealand will be required to meet the specified requirements, which are technically identical to the Energy Star criteria. In addition to these mandatory requirements, the standards define voluntary requirements for high efficient products; they are identical to the phase 2 requirements of the Californian energy commission standards previously quoted.
Australian and New Zealand governments also strongly encourage manufacturers and suppliers to mark products in accordance with the International Marking Protocol, (which requires energy efficiency marking), however this is not yet mandatory.
► Code of conduct for External Power Supplies
Prepared by the European Commission in consultation with the stakeholders, the Code of Conduct concerns single voltage external ac-dc and ac-ac power supplies for electronic and electrical appliances. The Code of Conduct aims at minimizing energy consumption of EPS both under no-load and load conditions. It provides per range of rated output power a maximal no load power consumption. It provides also minimum efficiency criteria for active mode, as well as information about the monitoring system, and measurement method based on the Energy star test method.
Other miscellaneous examples of legislations voluntary programs or ecolabels not directly quoting the standby and off-modes losses but providing incentive measures on energy efficiency or on energy consumption and having an impact on the standby and off-modes losses.
► European Committee of Manufacturers of Domestic Equipments (CECED) voluntary commitments
This committee has been actively working in the pursuit of energy efficiency and the promotion of a rational use of energy at all levels. In this framework, it created several voluntary commitments on reducing energy consumption of household appliances. None of them directly use the term “standby mode” or “off-mode”. These voluntary commitments are quoted below:
Second voluntary commitment on reducing energy consumption of domestic washing machines (2002 – 2008)
Voluntary commitment on reducing energy consumption of household dishwashers (1999 – 2004) (No new version is available)
► Integrated product policy
The European Integrated Product Policy (IPP) seeks to minimise the environmental impact of the product by looking at all phases of a products' life-cycle -from extraction of natural resources until their disposal as waste - and taking action where it is most effective. This concern so many different products and actors, there can not be one simple policy measure for everything. Instead there is a whole variety of tools - both voluntary and mandatory - that can be used to achieve this objective. These include measures such as economic instruments, substance bans, voluntary agreements, environmental labelling and product design guidelines. This policy is in progress, it is probable that some of the measures used to achieve these policy objectives will deal about energy efficiency or energy consumption and maybe about standby and off-mode losses.

Report for Tender No. TREN/D1/40 Lot 6 -2005 EuP Lot 6 - Annexes 2nd of October 2007
Fraunhofer IZM CODDE Bio IS DUH Final Report Page 10-31
► Energy conservation law of China
This law has been formulated the first November 1997 with a view to facilitating energy savings throughout society, improving efficiency and economic benefits of energy use, protecting the environment, guaranteeing national economic and social development and meeting the needs of people’s livelihood. This law does not deal directly about standby and off-mode losses but in the long term, it may have a positive impact on energy consumption and energy efficiency and thus it may also reduce standby and off-mode losses.
► China Energy Conservation Project
CECP is a program aimed at saving energy (so indirectly aimed at reducing standby and off-mode losses) and reducing emissions by stimulating manufacturers to produce more efficient products and helping consumers to make more sustainable purchase decisions. It was initiated in 1998. Specifications for products are under development. Currently the program is voluntary, but the Chinese government will consider imposing mandatory standards if compliance is low.
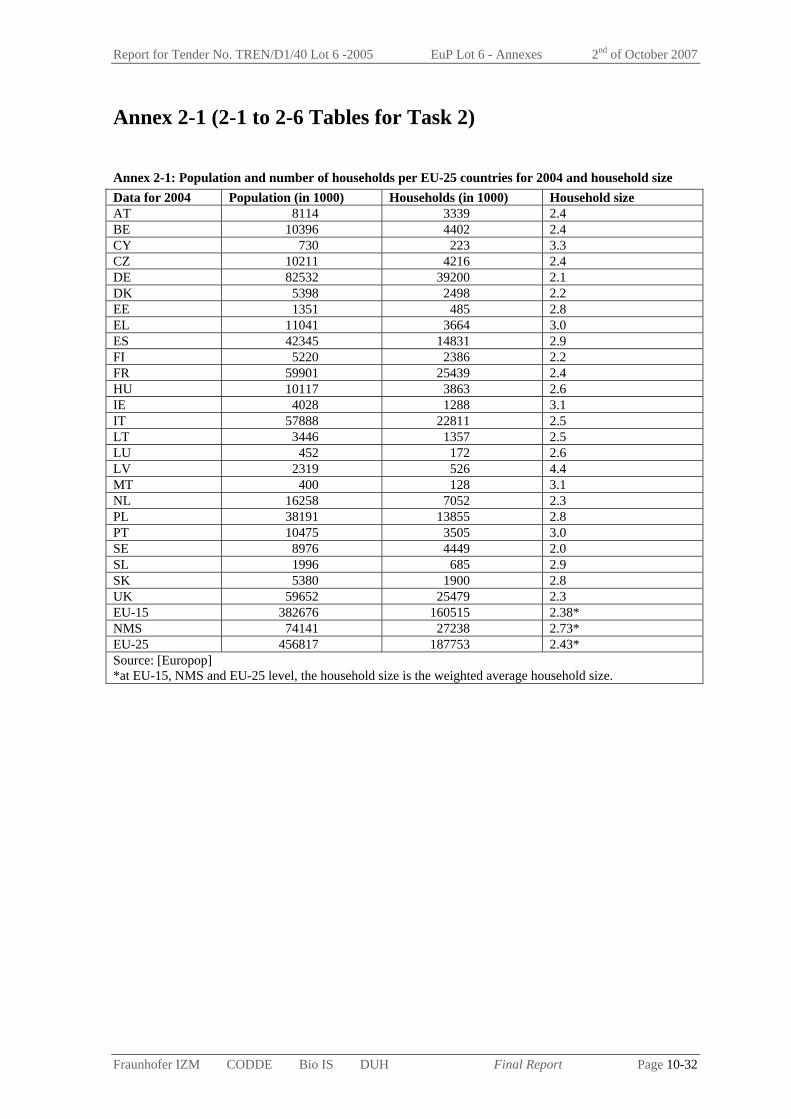
Report for Tender No. TREN/D1/40 Lot 6 -2005 EuP Lot 6 - Annexes 2nd of October 2007
Fraunhofer IZM CODDE Bio IS DUH Final Report Page 10-32
Annex 2-1 (2-1 to 2-6 Tables for Task 2) Annex 2-1: Population and number of households per EU-25 countries for 2004 and household size Data for 2004 Population (in 1000) Households (in 1000) Household size AT 8114 3339 2.4 BE 10396 4402 2.4 CY 730 223 3.3 CZ 10211 4216 2.4 DE 82532 39200 2.1 DK 5398 2498 2.2 EE 1351 485 2.8 EL 11041 3664 3.0 ES 42345 14831 2.9 FI 5220 2386 2.2 FR 59901 25439 2.4 HU 10117 3863 2.6 IE 4028 1288 3.1 IT 57888 22811 2.5 LT 3446 1357 2.5 LU 452 172 2.6 LV 2319 526 4.4 MT 400 128 3.1 NL 16258 7052 2.3 PL 38191 13855 2.8 PT 10475 3505 3.0 SE 8976 4449 2.0 SL 1996 685 2.9 SK 5380 1900 2.8 UK 59652 25479 2.3 EU-15 382676 160515 2.38* NMS 74141 27238 2.73* EU-25 456817 187753 2.43* Source: [Europop] *at EU-15, NMS and EU-25 level, the household size is the weighted average household size.

Report for Tender No. TREN/D1/40 Lot 6 -2005 EuP Lot 6 - Annexes 2nd of October 2007
Fraunhofer IZM CODDE Bio IS DUH Final Report Page 10-33
Annex 2-2: Population and derived number of households per EU-25 countries for 2000 to 2005 Country 2000 2001 2002 2003 2004 2005 BE 10239.1 10263.4 10309.7 10355.8 10396.4 10445.9 CZ 10278.1 10266.5 10206.4 10203.3 10211.5 10220.6 DK 5330 5349.2 5368.4 5383.5 5397.6 5411.4 DE 82163.5 82259.5 82440.3 82536.7 82531.7 82500.8 EE 1372.1 1367.0 1361.2 1356.0 1351.1 1347.0 EL 10903.8 10931.2 10968.7 11006.4 11040.7 11075.7 ES 40049.7 40476.7 40964.2 41663.7 42345.3 43038.0 FR 60481.6 60853.1 61235.9 61615.3 61984.0 62370.8 IE 3777.8 3833.0 3899.9 3963.7 4027.7 4109.2 IT 56929.5 56967.7 56993.7 57321.1 57888.2 58462.4 CY 690.5 697.5 705.5 715.1 730.4 749.2 LV 2381.7 2364.3 2345.8 2331.5 2319.2 2306.4 LT 3512.1 3487.0 3475.6 3462.6 3445.9 3425.3 LU 433.6 439.0 444.1 448.3 451.6 455.0 HU 10221.6 10200.3 10174.9 10142.4 10116.7 10097.5 MT 380.2 391.4 394.6 397.3 399.9 402.7 NL 15864 15987.1 16105.3 16192.6 16258.0 16305.5 AT 8002.2 8020.9 8065.1 8102.2 8140.1 8206.5 PL 38653.6 38254.0 38242.2 38218.5 38190.6 38173.8 PT 10195 10256.7 10329.3 10407.5 10474.7 10529.3 SI 1987.8 1990.1 1994.0 1995.0 1996.4 1997.6 SK 5398.7 5378.8 5379.0 5379.2 5380.1 5384.8 FI 5171.3 5181.1 5194.9 5206.3 5219.7 5236.6 SE 8861.4 8882.8 8909.1 8940.8 8975.7 9011.4 UK 58785.2 58999.8 59217.6 59437.7 59699.8 60034.5 EU-15 377187.1 378701.2 380446.2 382581.6 384831.2 387193.0 NMS 74877 74396.9 74279.2 74200.9 74141.8 74104.9 EU-25 452064.1 453098.1 454725.4 456782.5 458973.0 461297.9 EU-25 households = EU-25 population/2.4 188360.0 188790.9 189469.1 190326.2 191238.7 192207.6

Report for Tender No. TREN/D1/40 Lot 6 -2005 EuP Lot 6 - Annexes 2nd of October 2007
Fraunhofer IZM CODDE Bio IS DUH Final Report Page 10-34
Annex Tables 2-3 to 2-6 on halogen lighting
Annex 2-3: Share of halogen light bulbs in households (% of light bulbs)
Denmark Greece Portugal Italy
Kitchen 30 7.5 0 0
Bedroom 17.5 2.5 8.89 2.5
Living/dining room 20 5 5.56 12.5
Bathroom 32.5 5 10 0
Outside/garage 5 0 0 0
Entrance/hall 25 8.75 6.67 2.5
Annexes 5 0 0 0
Office 15 2.5 15.56 5
Annex 2-4: Number of halogen light bulbs per room and per household
Denmark Greece Portugal Italy
Kitchen 5.88 1.63 1.50 3.00
Bedroom 4.25 2.63 2.25 4.25
Living/dining room 4.00 6.13 5.50 5.50
Bathroom 3.13 2.63 2.25 2.50
Outside/garage 3.13 0.00 0.88 1.25
Entrance/hall 2.75 4.75 1.25 3.88
Annexes 2.25 2.75 1.00 2.75
Office 2.25 2.13 1.38 1.75
TOTAL 27.64 22.65 16.01 24.88
Annex 2-5: Average number of light bulbs per lamp and per room in households
Denmark Greece Portugal Italy
Kitchen 2.47 1.30 1.50 1.14
Bedroom 1.26 1.17 1.29 1.21
Living/dining room 1.6 2.04 2.20 1.83
Bathroom 2.5 1.31 1.50 1.25
Outside/garage 2.78 0.00 1.00 1.11
Entrance/hall 1.69 2.00 1.25 1.48
Annexes 1.8 1.38 1.00 2.20
Office 1.29 1.70 1.22 1.27

Report for Tender No. TREN/D1/40 Lot 6 -2005 EuP Lot 6 - Annexes 2nd of October 2007
Fraunhofer IZM CODDE Bio IS DUH Final Report Page 10-35
Annex 2-6: Share of halogen light bulbs per wattage in households (in % of existing halogen bulbs)
Denmark Greece Portugal Italy
<15 W 17.65 0.00 0.00 0.00
<25 W 58.82 9.50 18.46 0.00
<35 W 7.06 3.00 13.85 0.00
< 45W 8.82 16.50 4.62 0.00
<55W 2.35 23.00 26.92 0.00
<255W 4.71 13.00 36.15 28.75
<355W 0.59 19.50 0.00 58.75
<550 W 0 16.50 0.00 12.50
TOTAL low voltage (< 55W)
94.7 52 63.85 0.00

Report for Tender No. TREN/D1/40 Lot 6 -2005 EuP Lot 6 - Annexes 2nd of October 2007
Fraunhofer IZM CODDE Bio IS DUH Final Report Page 10-36
Annex 3-1 (3-1 to 3-5 Using times of devices not covered by the product cases) Annex 3-1. PUC 1 devices
On/ Off Products (PUC 1)
Category Device Active /On time [h/d]
Off time [h/d]
Hot plate 0.20 23.80
Kettle 0.20 23.80
Epilator 0.00 24.00
Shaver 0.05 23.95
Small household appliances
Hair dryer 0.05 23.95
Power tool 0.01 23.99 Others
Electric toys 0.10 23.90
Annex 3-2. PUC 2 households
On/ Standby products in households (PUC 2)
Category Devices Standby time [h/d]
Off-mode (losses) [h/d]
Off-mode time [h/d]
On-mode time" [h/d]
Speakers, powered 2.4 14.6 6.4 0.5 Subwoofer 16.1 3.2 0.0 4.7 Stereo, portable 9.4 9.4 4.7 0.6
ICT & AV
Phone, Comfort Phone 23.6 0.0 0.0 0.4 Annex 3-3. PUC 2 office
On/ standby products in offices (PUC 2) Category Devices Standby
time [h/d] Off-mode losses [h/d]
Off-mode time [h/d]
On-mode time [h/d]
Phone, Comfort phone 23.1 0.0 0.0 0.9 ICT & AV Answering machine 23.9 0.0 0.0 0.1

Report for Tender No. TREN/D1/40 Lot 6 -2005 EuP Lot 6 - Annexes 2nd of October 2007
Fraunhofer IZM CODDE Bio IS DUH Final Report Page 10-37
Annex 3-4. PUC 3 households
Job based products in households (PUC 3)
Category Devices Standby time [h/d]
Off-mode losses [h/d]
Off-mode time [h/d]
On-mode time [h/d]
Scanner 16.2 1.4 6.4 0.1 Copiers 0.1 12.0 12.0 0.1 VCR 15.2 3.8 3.8 1.3 DVD, recorder 15.2 0.0 7.6 1.3 HD-Recorder 15.2 0.0 7.6 1.3 Amplifier, CD Player etc. 10.3 3.4 6.8 3.4
Game console (net) 0.0 7.1 16.6 0.3
ICT & AV
Answering machine 23.9 0.0 0.0 0.1 Dishwasher 2.4 20.8 0.0 0.7 Washing machine and dryer combination 3.0 19.5 0.0 1.5
Large household appliances
Clothes dryer 3.0 20.6 0.0 0.4 Coffee maker 0.3 23.6 0.0 0.1 Espresso maker 3.0 21.0 0.0 0.0 Microwave 23.8 0.0 0.0 0.2
Small household appliances
Toaster 0.1 23.9 0.0 0.0 Charger, battery 0.5 23.5 0.0 0.0 Projector, video 12.1 3.6 3.6 4.7 Others
Charger 0.1 2.4 21.5 0.0 Annex 3-5. PUC 3 office
Job-based products in offices
Category Devices Standby time [h/d]
Off-mode losses [h/d]
Off-mode time [h/d]
On-mode time [h/d]
Scanner (flatbed, handheld) 15.8 3.6 4.4 0.3 Copiers 5.7 14.1 3.5 0.6 ICT & AV
Projector, video 4.7 4.7 14.1 0.5 Shredder 0.1 23.9 0.0 0.0
Others Charger (still camera, video camera) 0.3 6.2 17.3 0.2

Report for Tender No. TREN/D1/40 Lot 6 -2005 EuP Lot 6 – Feedback List 2nd of October 2007
Fraunhofer IZM CODDE Bio IS DUH Final Report Page 11-i
EuP Preparatory Study Lot 6 Standby and Off-mode Losses
Abridged and Commented Feedback List Final Report
Compiled by Fraunhofer IZM
Contractor: Fraunhofer Institute for Reliability and Microintegration, IZM, Berlin
Department Environmental Engineering
Dr.-Ing. Nils F. Nissen
Gustav-Meyer-Allee 25, 13355 Berlin, Germany
Contact:
Tel.: +49-30-46403-132
Fax: +49-30-46403-131
Email: [email protected]
Berlin, 2nd of October 2007
Disclaimer
The findings presented in this report are results of the research conducted by the IZM consortium and the continuous feedback from a wide range of stakeholders. The statements and recommendations presented in the final report however are not to be perceived as the opinion of the European Commission.

Report for Tender No. TREN/D1/40 Lot 6 -2005 EuP Lot 6 – Feedback List 2nd of October 2007
Fraunhofer IZM CODDE Bio IS DUH Final Report Page 11-ii
Contents 11. Commented Lot 6 Stakeholder Feedback List ......................................................... 11-1

Report for Tender No. TREN/D1/40 Lot 6 -2005 EuP Lot 6 – Feedback List 2nd of October 2007
Fraunhofer IZM CODDE Bio IS DUH Final Report Page 11-1
11. Commented Lot 6 Stakeholder Feedback List
The following two tables represent the stakeholder feedback received in written form for the Lot 6 study. Some feedback has been shortened, especially if it is considered outdated before the draft final versions already (May 2007) or if the feedback was very extensive. The feedback is also commented upon by the study consortium (though not each entry individually).
The first table lists the received input in reverse chronological order. The short name given to each feedback is then referenced in the feedback list. The short name makes reference to the document version, which is commented on (as far as that can be expressed in one date), not the date of the feedback. Feedback received through associations has sometimes been submitted by individual companies additionally, or an endorsement has been received.
Thanks once more to all stakeholders taking an active part in this study, be it by phone, by email or by personal contact and at the stakeholder meeting.
Short name in table Received on Origin, Version of document commented
EICTA on 20070619
16.07.2007 Ramon Launa Garces, EICTA Comments on Task Report 8 for EuP Study on Standby (Lot 6) (2007-07-16)
VMAS on 20070619
13.07.2007 Annette Gydesen, Viegand & Maagøe, Comments on EuP preparatory Study on Standby and off-mode losses (Lot 6) task 8 Report, (on behalf of the Danish Energy Authority) (2007-06-19).
Canon on 20070625
05.07.2007 Kentaro Niwano , Canon, Feedback on update slides from Task 2-7, (2007-06-25)
SHOC on 20070619
04.07.2007 Alfred Deinert , Siemens Home and Office Communication Devices GmbH & Co. KG, Kommentare zu Task 8 der EuP-Vorstudie, (2007-06-19)
CECED on 20070619
03.07.2007 CECED Comments on Task 7 and 8 of Lot 6 Preporatory Study; by Matteo Rambaldi (2007-06-19)
EPS on 20070420
03.07.2007 Eelco Smit, Epson, feedback lot 6, comments for task 1 report of Lot 6 (2007-04-20)
JBCE on 20070510
07.06.2007 Japan Business Council in Europe (JBCE), comments for Eup Preparatory Studies lot 6 "Stand-by and Off-mode Losses" (2007-05-10)
ERA on 20070510
31.05.2007 Chris Robertson, Reliability and Failure Analysis, ERA Technology Ltd Surrey, UK, comments on stakeholder meeting Lot 6 (2007-05-10)
INTEL on 20070510
30.05.2007 Todd Albertson, Intel Corporation, Intel comments on EuP study on Standby and Off-mode Losses (LOT 6) (2007-05-10).
TOS on 20070510
26.05.2007 Kenji Miura, Daijiro Ueyama, Toshiba, Global Environment Management Division Toshiba Corporation, EuP_Lot6_Toshiba_official_opinion (2007-05-10)
EICTA on 20070420
25.05.2007 Ramon Launa Garces, EICTA Comments on EuP study Standby and Off-mode Losses (LOT 6), on draft final version T1- T5 and T6+ T7 documents (2007-04-20-13)
VMAS on 20070504
24.05.2007 Annette Gydesen, Viegand & Maagøe, Comments on EuP preparatory Study on Standby and off-mode losses (Lot 6) Draft Final Report, (on behalf of the Danish Energy Authority) (2007-05-04)
TOPT on 20070504
17.05.2007 Eric Bush, Topten International Group, Comments on EuP-Study Lot 6, Standby and Off-mode losses (2007-05-04)
NOK on 20070504
17.05.2007 Nokia - Comments to LOT6 and 7 on Stakeholder Meeting (2007-05-04)
FSC on 20070504
14.05.2007 Hellmut Böttner, FSC, on Stakeholder Meeting Task 1-7 (2007-05-04)
ERA on 20070504
11.05.2007 Chris Robertson, Reliability and Failure Analysis, ERA Technology Ltd Surrey, UK, comments on stakeholder meeting Lot 6 (2007-05-04)
EPS on 20070413
03.05.2007 Eelco Smit, Epson, feedback lot 6, comments for task 6 and 7 report of Lot 6 (2007-05-03)
CECED on 20070413
03.05.2007 CECED Comments on Task 6 and 7 of Lot 6 Preparatory Study; by Matteo Rambaldi (2007-05-03)

Report for Tender No. TREN/D1/40 Lot 6 -2005 EuP Lot 6 – Feedback List 2nd of October 2007
Fraunhofer IZM CODDE Bio IS DUH Final Report Page 11-2
Short name in table Received on Origin, Version of document commented
GBO on 20070413
02.05.2007 Gunnar Boye Olesen, INFORSE-Europe / OVE, Comment to Stand-by and off-mode losses, lot 6, task 6 and 7. Preliminary version (2007-05-02)
POL on 20070413
30.04.2007 John Pearson, Polycom, Comment on EuP Lot 6 - Draft Final Reports Task 6 and 7 (2007-04-20)
SHOC on 20070427
30.04.2007 Alfred Deinert , Siemens Home and Office Communication Devices GmbH & Co. KG, Kommentare zu Task 6 und Task 7 der EuP-Vorstudie, (2007-04-13)
SHOC on 20070413
27.04.2007 Alfred Deinert , Siemens Home and Office Communication Devices GmbH & Co. KG, Bemerkungen und Vorschläge zur EuP-Vorstudie 6 (Standby losses), Task 6 (BAT) und Task 7(Improvement potential) (2007-04-13)
ORG on 20070420
27.04.2007 Sigrid Linher, Orgalime, ORGALIME COMMENTS FOR WORKSHOP ON EuP LOT 6 ON 4 MAY 2007 Brussels,26 April 2007, Draft final version Task 1-7 (2007-20-04)
TOS on 20070420
26.04.2007 Kenji Miura, Daijiro Ueyama, Toshiba, Global Environment Management Division Toshiba Corporation, EuP_Lot6_Toshiba_official_opinion (2007-04-20)
HPS on 20070420
26.04.2007 Hans-Paul Siderius, SenterNovem, Comments on the Task Report Lot 6: Standby and Off-mode Losses, Task 6 (Technical Analysis) and Task 7 (Improvement Potential)
BN on 20070420
26.04.2007 Bruce Nordman, LBNL, on Task 1-7 Draft Final Report (2007-04-20)
Loewe on 20070420
25.04.2007 Timo Och, Loewe, Lot 5 - Statements von LOEWE, (2007-04-20)
FSC on 20070420
25.04.2007 Hellmut Böttner, FSC, on Final Draft for Task 1-7 (2007-04-20)
Beko on 20070413
18.04.2007 Sebnem Tantan Akbas, Beko, on Tasks 6-7
POL on 20070413
16.04.2007 John Pearson, Polycom, Comment on EuP Lot 6 - Draft Final Reports Task 6 and 7 (2007-04-13)
GAR on 20070110
29.03.2007 Jamie Forrester, Garmin, Feedback for the Draft Definition Document for Standby and Off-mode Losses (Lot 6, task 1)
GBO on 20070216
12.03.2007 Gunnar Boye Olesen, INFORSE-Europe / OVE
NOK on 20070216
09.03.2007 Arja Mehtälä, Nokia, Comments to LOT6 Task 4-5 task reports
Intel on 20070413
06.03.2007 Julian Lageard, Intel, Intel feedback on EuP LOT 6 and LOT 6 (follow-up) (20070413)
HPS on 20070216 (1)
23.02.2007 Hans-Paul Siderius, SenterNovem, Interim Task Report Lot 6: Standby and Off-mode Losses, Task 5 (Definition of Base Case)
HPS on 20070216 (2)
23.02.2007 Hans-Paul Siderius, SenterNovem, Interim Task Report Lot 6: Standby and Off-mode Losses, Task 4 (Technical Analysis Existing Products)
CECED on 20070110
23.02.2007 CECED Statement on the Interim Report about “Standby and off-mode losses”; also supported by Gerhard Fuchs, BSH
NOK on 20070110
23.02.2007 NOKIA - Comments to LOT6 Task 1 - 3 documents
ELC on 20070210
16.02.2007 ELC European Lamp Companies Federation, Interim Report Standby and Off-mode Losses (Lot 6), Tasks 1-3 /Aspects for Lighting (2007-02-10)
GAR on 20060830
28.11.2006 Jamie Forrester, Garmin, Feedback for the Draft Definition Document for Standby and Off-mode Losses (Lot 6, task 1), on Version 1.0 (2006-08-30)
EICTA on 20060830
03.11.2006 Ramon Launa Garces, EICTA Comments on Standby and Off-mode Losses (LOT 6), on Version 1.0 (2006-08-30)
ORG on 20060830
06.10.2006 Sigrid Linher for Adrian Harris, ORGALIME POSITION PAPER ON C137 Draft Definition Document for Standby and Off-mode Losses (EuP study Lot 6, Task 1) Brussels, 6 October 2006, on Version 1.0 (2006-08-30)
CECED on 20060830
05.10.2006 Paolo Falcioni, CECED, on Version 1.0 (2006-08-30) also supported by Gerhard Fuchs (BSH), Heinz-Jürgen Büker (Miele), Bernhard Klee (ZVEI)
GBO on 20060830
02.10.2006 Gunnar Boye Olesen, INFORSE-Europe / OVE (version September 29, 2006) on Version 1.0 (2006-08-30)

Report for Tender No. TREN/D1/40 Lot 6 -2005 EuP Lot 6 – Feedback List 2nd of October 2007
Fraunhofer IZM CODDE Bio IS DUH Final Report Page 11-3
Short name in table Received on Origin, Version of document commented
TCO on 20060830
02.10.2006 Helena Nordin, TCO, on Version 1.0 (2006-08-30)
ZVEI on 20060830
28.09.2006 Bernhard Klee, ZVEI, on Version 1.0 (2006-08-30)
EES on 20060830
27.09.2006 Lloyd Harrington, Energy Efficient Strategies (EES) Australia, on Version 1.0 (2006-08-30)
IEA on 20060830
25.09.2006 Mark Ellis, IEA, on Version 1.0 (2006-08-30)
Intel on 20060830
25.09.2006 Julian Lageard, Intel, on Version 1.0 (2006-08-30)
BN on 20060830
24.09.2006 Bruce Nordman, LBNL, on Version 1.0 (2006-08-30)
FSC on 20060830
18.09.2006 Hellmut Böttner, FSC, on Version 1.0 (2006-08-30)
HPS on 20060830
12.09.2006 Hans-Paul Siderius, SenterNovem, on Version 1.0 (2006-08-30)

Report for Tender No. TREN/D1/40 Lot 6 -2005 EuP Lot 6 – Feedback List 2nd of October 2007
Fraunhofer IZM CODDE Bio IS DUH Final Report Page 11-4
Feedback Topic or No Text Actions / Comments
EICTA on 20070619
Basic problems for Imaging Equipment:
It is very unclear to EICTA which Lot 6 requirements (off, passive standby or networked standby) would be applied to imaging equipment products. Therefore, some of the following comments may not be applicable if the requirements are not applied to Imaging Equipment.
Potentially all modes, of course
EICTA on 20070619
1 Tables 8-1 and 8-2 on pages 8-5 and 8-6 list the Australian standby requirements. These requirements do not use the same definitions of standby and off. Rather than these requirements IZM should use the IEC 62310 definitions. IZM should not assume 100% compliance with passive and networked standby levels due to Australian requirements.
We know that the Australian definition is different from ours, the Australian requirements only serve as an example
EICTA on 20070619
2 2. ENERGY STAR levels and formula are used in the document (8-13 to 8-16) as assumed to be the common place technology. Indeed, they should represent the “best available technology”, not commonly available technology.
But shouldn't "best E*" of today (2007) be commonly available in >2010? Also E* as a level is not BAT as in the studies, where single best products and technologies are sought.
EICTA on 20070619
2a a. Specifically, Energy Star Imaging Equipment functional adders on page 8-14 represent the value needed by the most energy efficient (~25-30%) of Inkjet products with a base electronics adder of 3 W. So the actual networked standby power needed by today’s most efficient devices is at least 3.5 W for a USB2.0 or 100MB Ethernet connection. The 1 GB Ethernet connection (the future) requires at least 4.5 W. As a result the threshold values as suggested in Table 8-7 will lead to the elimination of the majority of imaging equipment products available on the market.
a. If 30% of inkjets operate at 3.5 W and less NOW, then 4W for >2010 is not possible? Tier 2 at 2W might be more problematic, but is supported by the best products found. For GB Ethernet higher values are proposed - in the future these should reduce the transfer rate when in standby (as soon as all protocols support this).
EICTA on 20070619
2b b. While it is helpful to look across industry for comparison, it is not technically reasonable to apply the energy needs of 1 product type to another product. This was done at the bottom of pg 8-15 when electric ovens and PC speakers were assumed to be the same as any other network connection. This is not a valid comparison. This fact is recognized by Energy Star and reflected in the TEC Tables and Base OM Tables for the different product types, technologies and speeds.
b. To some degree such comparisons and "transfers" of findings are valid. We did not transfer from ovens and PC speakers to "any other network connection", that must be a misunderstanding.
EICTA on 20070619
3 3. Off mode limits are set way too low for other considerations (mainly EMC filters, which are placed on the supply side of the off switch) and would require hard off switches on External power supply devices. Besides, hard off switches for printers could have a negative effect on consumer behaviour as explained in our letter on May 25th. Therefore, an impact assessment should closely analyse the impact on Safety/EMC issues and consumers before drafting any specific recommendations. When new components are required in order to achieve lower energy consumption in the use phase, the overall environmental impact over the entire life cycle should be carefully analyzed in order to make sure that the desired outcome i.e. lower environmental impact is really achieved.
Other input has suggested that EMC filters need not be placed before any switch. Potential negative impacts in active mode are addressed throughout the study, but have not been calculated.
EICTA on 20070619
4 4. Standby, as defined and required in this document is not a supported function in Imaging Equipment. Passive and networked standby modes are not common modes in imaging equipment. These modes are designed into PCs and consumer electronics, but not Imaging Equipment. To implement such modes would be a complete design shift as well as a major shift in the customer experience. Significantly longer wait times would be required by the customer. EICTA understand this definition is to be shutting all power off except for looking at the power switch or in the case of networked standby, monitoring the network for traffic. This definition is really a Wake On LAN functionality that would require 3-4 W in desktop PCs.
We do not yet understand, how networked standby should not apply to IE in total. Because networked standby includes passive standby functions, energy use for displays, buttons and the required microprocessors is also covered. We maintain, that waiting for a print command fits with waiting for a network command to reactivate the EuP.
EICTA on 20070619
5 It seems that printing industry would be required to meet off mode (< 1 W going to < 75 W, then to < 0.3 W) and either passive (3 W all products) or networked standby limits (4 W all products).
more or less
EICTA on 20070619
6 Passive and Networked Standby limits interfere with work being done on EUP Lot 4. The levels put forward in this document are significantly less than ESTAR levels, which are intended to represent the top 25% of products. To our understanding in case of overlaps, the outcome of the more specific Lot study would overrule the horizontal study. In your response from June12th you confirm that “coherence between the different studies will be ensured”. Please confirm.
For the relation to E* levels, see above.
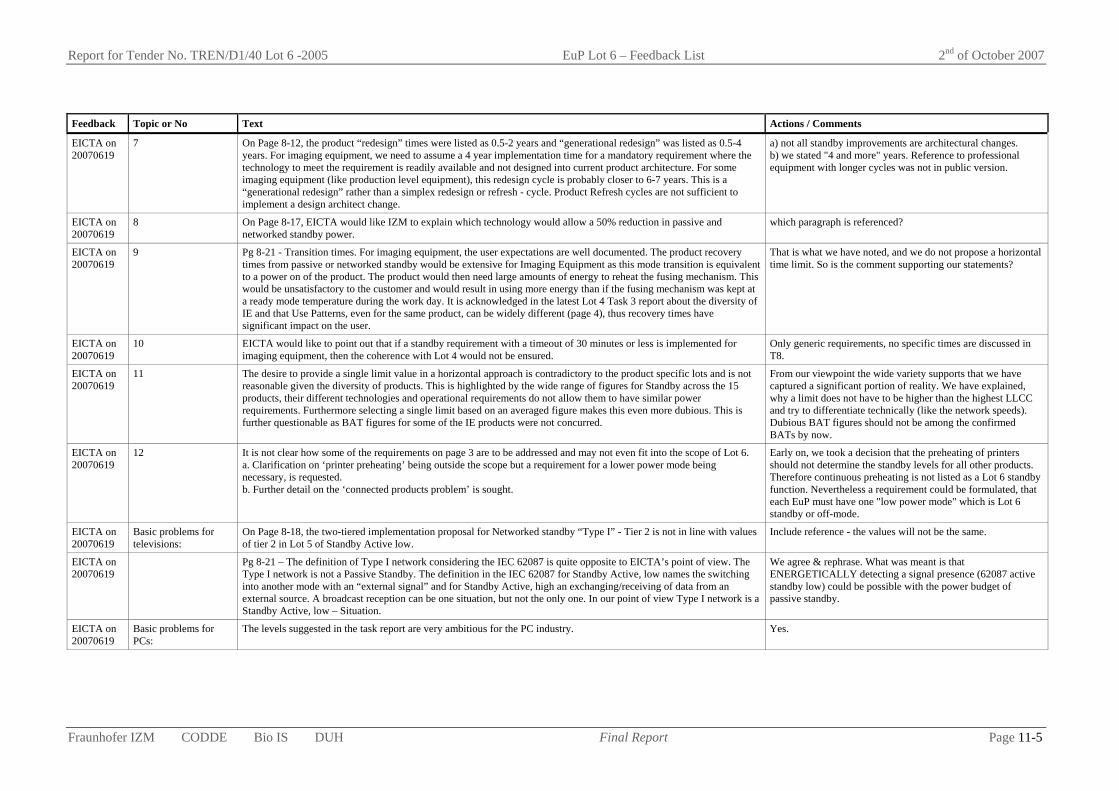
Report for Tender No. TREN/D1/40 Lot 6 -2005 EuP Lot 6 – Feedback List 2nd of October 2007
Fraunhofer IZM CODDE Bio IS DUH Final Report Page 11-5
Feedback Topic or No Text Actions / Comments
EICTA on 20070619
7 On Page 8-12, the product “redesign” times were listed as 0.5-2 years and “generational redesign” was listed as 0.5-4 years. For imaging equipment, we need to assume a 4 year implementation time for a mandatory requirement where the technology to meet the requirement is readily available and not designed into current product architecture. For some imaging equipment (like production level equipment), this redesign cycle is probably closer to 6-7 years. This is a “generational redesign” rather than a simplex redesign or refresh - cycle. Product Refresh cycles are not sufficient to implement a design architect change.
a) not all standby improvements are architectural changes. b) we stated "4 and more" years. Reference to professional equipment with longer cycles was not in public version.
EICTA on 20070619
8 On Page 8-17, EICTA would like IZM to explain which technology would allow a 50% reduction in passive and networked standby power.
which paragraph is referenced?
EICTA on 20070619
9 Pg 8-21 - Transition times. For imaging equipment, the user expectations are well documented. The product recovery times from passive or networked standby would be extensive for Imaging Equipment as this mode transition is equivalent to a power on of the product. The product would then need large amounts of energy to reheat the fusing mechanism. This would be unsatisfactory to the customer and would result in using more energy than if the fusing mechanism was kept at a ready mode temperature during the work day. It is acknowledged in the latest Lot 4 Task 3 report about the diversity of IE and that Use Patterns, even for the same product, can be widely different (page 4), thus recovery times have significant impact on the user.
That is what we have noted, and we do not propose a horizontal time limit. So is the comment supporting our statements?
EICTA on 20070619
10 EICTA would like to point out that if a standby requirement with a timeout of 30 minutes or less is implemented for imaging equipment, then the coherence with Lot 4 would not be ensured.
Only generic requirements, no specific times are discussed in T8.
EICTA on 20070619
11 The desire to provide a single limit value in a horizontal approach is contradictory to the product specific lots and is not reasonable given the diversity of products. This is highlighted by the wide range of figures for Standby across the 15 products, their different technologies and operational requirements do not allow them to have similar power requirements. Furthermore selecting a single limit based on an averaged figure makes this even more dubious. This is further questionable as BAT figures for some of the IE products were not concurred.
From our viewpoint the wide variety supports that we have captured a significant portion of reality. We have explained, why a limit does not have to be higher than the highest LLCC and try to differentiate technically (like the network speeds). Dubious BAT figures should not be among the confirmed BATs by now.
EICTA on 20070619
12 It is not clear how some of the requirements on page 3 are to be addressed and may not even fit into the scope of Lot 6. a. Clarification on ‘printer preheating’ being outside the scope but a requirement for a lower power mode being necessary, is requested. b. Further detail on the ‘connected products problem’ is sought.
Early on, we took a decision that the preheating of printers should not determine the standby levels for all other products. Therefore continuous preheating is not listed as a Lot 6 standby function. Nevertheless a requirement could be formulated, that each EuP must have one "low power mode" which is Lot 6 standby or off-mode.
EICTA on 20070619
Basic problems for televisions:
On Page 8-18, the two-tiered implementation proposal for Networked standby “Type I” - Tier 2 is not in line with values of tier 2 in Lot 5 of Standby Active low.
Include reference - the values will not be the same.
EICTA on 20070619
Pg 8-21 – The definition of Type I network considering the IEC 62087 is quite opposite to EICTA’s point of view. The Type I network is not a Passive Standby. The definition in the IEC 62087 for Standby Active, low names the switching into another mode with an “external signal” and for Standby Active, high an exchanging/receiving of data from an external source. A broadcast reception can be one situation, but not the only one. In our point of view Type I network is a Standby Active, low – Situation.
We agree & rephrase. What was meant is that ENERGETICALLY detecting a signal presence (62087 active standby low) could be possible with the power budget of passive standby.
EICTA on 20070619
Basic problems for PCs:
The levels suggested in the task report are very ambitious for the PC industry. Yes.

Report for Tender No. TREN/D1/40 Lot 6 -2005 EuP Lot 6 – Feedback List 2nd of October 2007
Fraunhofer IZM CODDE Bio IS DUH Final Report Page 11-6
Feedback Topic or No Text Actions / Comments
EICTA on 20070619
1 On page 8-12 you mention concerning Off-mode that “0.3 W seem to be feasible even up to 150 W”. Concerning Personal Computers, which are in that range of power supply, Energy Star 4.0 is targeting 0.5W in its Tier 2 applicable in 2009 only for the qualifying products that should represent less than 30% of the market at that date. Targetting 0.3 W for all products in 2010 seems rather unrealistic.
We do not target 0.3 W in tier 1 or 2, but beyond that.
EICTA on 20070619
2 1 W in off mode is less than the current Energy Star 4.0 limit (for desktops). Energy Star allows for 2 W for off mode. Remember that Energy Star is intended to target only the top 25% of the market, so making this even lower limit mandatory for all (desktop) computers would shut out many products from the market. Specifically high end gaming and multimedia PCs as well as workstations and other PC products (e.g. desktop derived servers) would be effectively banned from the market. We do not know if this is really the intention of the EU Commission.
Our target requirement is set for 2010 (or later) and not current products (see comment above). If, however, without any standby function up to 2 W are needed in >2010, there are only two routes: different product specific overruling the horizontal values or applying for exemptions. Specialised and niche products not visible in an average case are indeed of high concern. No specific data has been provided during the study.
EICTA on 20070619
Other products As this lot covers all product categories the limits proposed are very ambitious for a lot of them. It has to be questioned if the impact of all affected product groups have been assessed in enough detail. As an example projectors will be effectively shut out of the market if the standby limits would apply as suggested in the task report. We believe that this effect does not only impact projectors, but also other product groups. Shutting out complete product categories from the EU market is in stark contrast to the intention of the EuP.
It is not the aim of this study to ban complete product groups. If future limits cannot be achieved by some product groups there need to be exemptions, but too high limits would undermine the effect of such a measure. For projectors: without more detail we would argue, that a remote control + network interface wake-up should be possible. Preheating a lamp (?) or the cooling down fan are not Lot 6 standby. Any other problematic product states for projectors?
EICTA on 20070619
Customer information It is suggested to include information about power levels on the product, i.e. on a sticker. Putting yet another label on the product just for the European market containing this information will seriously impact the design of the product and will also ultimatively end up in having the product covered in stickers, as it is expected that other countries will in the mid to long term also mandate their version of an energy label on the product. For some products, an alternative could be that this information on power levels is provided on the Internet.
No, we explicitly do not propose additional stickers. And yes, the internet might be a better alternative than the product documentation only, but demanding this might lead to a mandatory central database, which we would rather not propose.
EICTA on 20070619
Other findings and comments
On page 8-3 you state about transitioning requirements for job-based products that “automated power saving behaviour should not be possible to be disabled by the user”. We agree on the idea of having automated power saving parameters set up by default in products when shipped to customers. We also agree on the fact that the eventual changes of these parameters by the user require an expert intervention. But we can’t agree on making the disabling impossible as for some applications these changes may be required. This would lead to reduced features of the products which you recognized as “unlikely to work for the majority of the market”.
That problem was brought up in T8 already, so we propose this as a generic recommendation for product designers.
EICTA on 20070619
We welcome the idea that network and telecom infrastructure equipments, as said on page 8-11 need to be targeted with other kind of measures than a horizontal one.
no action necessary
EICTA on 20070619
EICTA supports the proposal that different re-design cycles are needed for different product groups and that the information provided in the vertical studies will be taken into consideration.
no action necessary
EICTA on 20070619
All in all EICTA welcomes the approach taken in the study to compare data between the horizontal and vertical studies and put more emphasis on product category studies, when needed.
no action necessary
VMAS on 20070619
Minimum efficiency requirements
The recommended minimum efficiency requirements utilize only 70 % of the total cost effective potential for improvement of the energy efficiency in standby and off-mode. In our opinion the requirements should – in accordance with the eco-design-directive - utilize the total potential.
We think the LLCC results can not directly be transferred into requirements. Realising 70% of the savings by 2020 is still ambitious.

Report for Tender No. TREN/D1/40 Lot 6 -2005 EuP Lot 6 – Feedback List 2nd of October 2007
Fraunhofer IZM CODDE Bio IS DUH Final Report Page 11-7
Feedback Topic or No Text Actions / Comments
VMAS on 20070619
Minimum efficiency requirements
The DEA finds it very important to have ambitious requirements. If it is considered a problem for part of the European industry to comply such a requirement within 12 month from the decision of the implementing measure on standby The DEA prefers to have o longer period of phasing in the requirements in stead of having less ambitious requirements. Another possibility is to make exceptions for certain products, which pose special technical difficulties in meeting the requirements.
We agree and have reflected this in the 2 tier approach, we think. For the enforcement of tier 1 after its publication we do not make a proposal, but 12 months is certainly the minimum.
VMAS on 20070619
missing points in report
Which requirement levels correspond to the full utilization of the cost effective potential? there is no formula for this... some remarks added.
VMAS on 20070619
missing points in report
Which of the lot 6 standby modes have the largest potential for further savings? further compared to what?
VMAS on 20070619
missing points in report
For which products or product categories will it be most difficult to meet requirements corresponding to the least life cycle cost level and why is it so? Is it mostly due to lack of awareness etc. or is it due to technical problems?
The problematic cases (white goods and PCs among them) are mentioned in the text.
VMAS on 20070619
missing points in report
What will the additional savings be if: • The off-mode requirement is reduced to 0.3 W? • The passive standby mode requirement is reduced to 0.5 W? • The requirement for networked standby is reduced to respectively 0.5 W, 1 W and 5 W? • The requirements for all lot 6 standby modes are set at the levels mentioned above?
We can do some of these calculations across all products, but this does not capture the diversity of reality.
VMAS on 20070619
Requirement to have low power states
The DEA supports your proposal which requires that products should have at least one low power mode. The DEA also favours the related requirement i.e. that all products should allow a disconnect phase without loosing settings or timer programming etc.
VMAS on 20070619
Transitioning requirements
It is very important to have a short transitioning period and we are in favour of specific requirements. We think the possibilities to make specific requirements in this area should be assessed further.
VMAS on 20070619
Minimum information requirement /technical documentation
It is crucial that the technical documentation includes all information needed for compliance checks. You have listed the most important information to be included, but the information needed will have to be considered further when the final requirements in the implementing measure are known.
VMAS on 20070619
Point of sale information
The DEA agrees with you that a separate standby label is not necessary if the limit values are very low. Nor is there a reason for integrating standby values in existing or revised labels if the limit values are low.
VMAS on 20070619
Point of sale information
The DEA does not favour integrating standby consumption in energy efficiency indexes. We recommend that limit values are set for each mode. If you want to integrate all modes (on-mode, various standby modes) in energy efficiency index an average use pattern has to be defined. This is often very difficult and furthermore the average use pattern will vary from person to person, from household sector to public sector, from country to country etc.
VMAS on 20070619
Point of sale information
For products with high speed networks the proposed standby limit is 5 Watt. 5 Watt is a high limit value and we therefore recommend that networked standby Type III to be included in energy labels.
VMAS on 20070619
Information in product manuals
The DEA is of the opinion that information on standby power in all standby modes in any cases (also if the limit values are low) should be included in product manuals, brochures etc.
Canon on 20070625
T4 summary change networked standby value for facsimiles There is no reason for this change, the used values are realistic products.
Canon on 20070625
T4 Laser printer distinguish beside Laser printer between home and office For this survey with wide scope a further differentiation is considered too much effort for little gain. See sensitivity discussion (not in draft version).
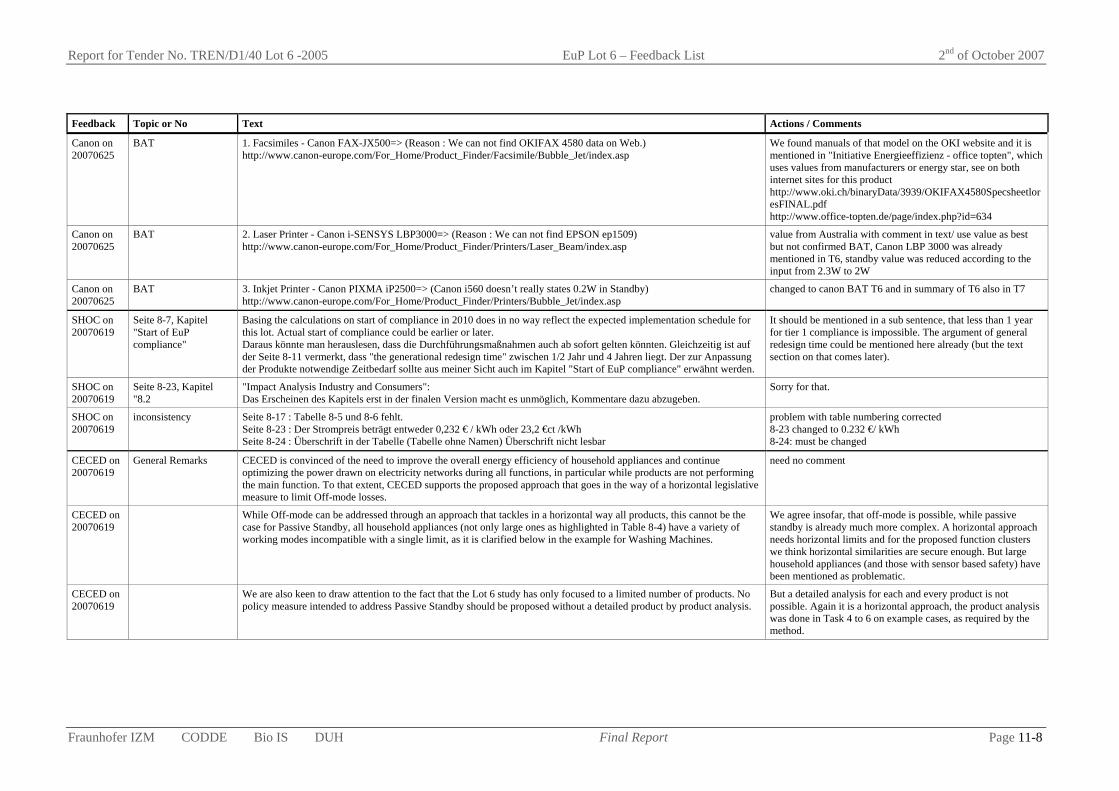
Report for Tender No. TREN/D1/40 Lot 6 -2005 EuP Lot 6 – Feedback List 2nd of October 2007
Fraunhofer IZM CODDE Bio IS DUH Final Report Page 11-8
Feedback Topic or No Text Actions / Comments
Canon on 20070625
BAT 1. Facsimiles - Canon FAX-JX500=> (Reason : We can not find OKIFAX 4580 data on Web.) http://www.canon-europe.com/For_Home/Product_Finder/Facsimile/Bubble_Jet/index.asp
We found manuals of that model on the OKI website and it is mentioned in "Initiative Energieeffizienz - office topten", which uses values from manufacturers or energy star, see on both internet sites for this product http://www.oki.ch/binaryData/3939/OKIFAX4580SpecsheetloresFINAL.pdf http://www.office-topten.de/page/index.php?id=634
Canon on 20070625
BAT 2. Laser Printer - Canon i-SENSYS LBP3000=> (Reason : We can not find EPSON ep1509) http://www.canon-europe.com/For_Home/Product_Finder/Printers/Laser_Beam/index.asp
value from Australia with comment in text/ use value as best but not confirmed BAT, Canon LBP 3000 was already mentioned in T6, standby value was reduced according to the input from 2.3W to 2W
Canon on 20070625
BAT 3. Inkjet Printer - Canon PIXMA iP2500=> (Canon i560 doesn’t really states 0.2W in Standby) http://www.canon-europe.com/For_Home/Product_Finder/Printers/Bubble_Jet/index.asp
changed to canon BAT T6 and in summary of T6 also in T7
SHOC on 20070619
Seite 8-7, Kapitel "Start of EuP compliance"
Basing the calculations on start of compliance in 2010 does in no way reflect the expected implementation schedule for this lot. Actual start of compliance could be earlier or later. Daraus könnte man herauslesen, dass die Durchführungsmaßnahmen auch ab sofort gelten könnten. Gleichzeitig ist auf der Seite 8-11 vermerkt, dass "the generational redesign time" zwischen 1/2 Jahr und 4 Jahren liegt. Der zur Anpassung der Produkte notwendige Zeitbedarf sollte aus meiner Sicht auch im Kapitel "Start of EuP compliance" erwähnt werden.
It should be mentioned in a sub sentence, that less than 1 year for tier 1 compliance is impossible. The argument of general redesign time could be mentioned here already (but the text section on that comes later).
SHOC on 20070619
Seite 8-23, Kapitel "8.2
"Impact Analysis Industry and Consumers": Das Erscheinen des Kapitels erst in der finalen Version macht es unmöglich, Kommentare dazu abzugeben.
Sorry for that.
SHOC on 20070619
inconsistency Seite 8-17 : Tabelle 8-5 und 8-6 fehlt. Seite 8-23 : Der Strompreis beträgt entweder 0,232 € / kWh oder 23,2 €ct /kWh Seite 8-24 : Überschrift in der Tabelle (Tabelle ohne Namen) Überschrift nicht lesbar
problem with table numbering corrected 8-23 changed to 0.232 €/ kWh 8-24: must be changed
CECED on 20070619
General Remarks CECED is convinced of the need to improve the overall energy efficiency of household appliances and continue optimizing the power drawn on electricity networks during all functions, in particular while products are not performing the main function. To that extent, CECED supports the proposed approach that goes in the way of a horizontal legislative measure to limit Off-mode losses.
need no comment
CECED on 20070619
While Off-mode can be addressed through an approach that tackles in a horizontal way all products, this cannot be the case for Passive Standby, all household appliances (not only large ones as highlighted in Table 8-4) have a variety of working modes incompatible with a single limit, as it is clarified below in the example for Washing Machines.
We agree insofar, that off-mode is possible, while passive standby is already much more complex. A horizontal approach needs horizontal limits and for the proposed function clusters we think horizontal similarities are secure enough. But large household appliances (and those with sensor based safety) have been mentioned as problematic.
CECED on 20070619
We are also keen to draw attention to the fact that the Lot 6 study has only focused to a limited number of products. No policy measure intended to address Passive Standby should be proposed without a detailed product by product analysis.
But a detailed analysis for each and every product is not possible. Again it is a horizontal approach, the product analysis was done in Task 4 to 6 on example cases, as required by the method.

Report for Tender No. TREN/D1/40 Lot 6 -2005 EuP Lot 6 – Feedback List 2nd of October 2007
Fraunhofer IZM CODDE Bio IS DUH Final Report Page 11-9
Feedback Topic or No Text Actions / Comments
CECED on 20070619
power consumption per mode single limit on "passive standby"
The collected data show that: • In the Delayed Start mode a number of features can be available: door lock, water protection, clock, and visualization through LEDs. Furthermore, if each user-selectable option is visualized through LEDs, the power consumption increases with the selected options, because more LEDs are lit. As a result, power consumption can vary from as low as 1.9W to as high as 4.4W • In the End of Cycle mode a number of features can be available: water protection, clock, and visualization through LEDs. In that case, power consumption can vary from as low as 0.9W to as high as 2W Those data support the statement in Table 8-4 of Lot6 study for Passive Standby that “it is problematic to implement a limit for large household appliances” due to the wide range of features offered. CECED believes it is not possible to propose a single limit for Passive Standby without jeopardizing the freedom of design and without the risk of being unfair toward appliances offering a variety of user oriented functions.
It would be helpful to have more differentiated values for water protection and timer. Less or more LEDs should be minor in comparison. A clock in itself needs very little energy. More in general, we still don't understand, whether the statement is that a limit would not be possible, or whether a limit would need to be at around 4W from the arguments and numbers provided. The "door lock" phase should not be considered as Lot 6 standby – it is considered part of the main function cycle.
CECED on 20070619
limit recommendation Being a single limit not a fair choice, CECED opinion is that the most convenient way to address Passive Standby for large household appliances is by including Passive Standby in the yearly energy consumption calculation as mentioned in “All-inclusive Energy Efficiency Index proposal” (see CECED document GS 07-68). A single all-inclusive energy efficiency rating, setting the basis for the calculation of the energy label classes, would enable the customer to make a purchasing decision depending on the yearly energy consumption of the appliance.
We welcome the discussion on inclusion in the labelling, although that is outside of the study scope. Also a label could exist together with a horizontal limit (but it is true that the limit value should not exclude a large portion from the market).
CECED on 20070619
Many products today on the market present room for further improving Passive Standby. Therefore, including it in the all-inclusive energy efficiency rating will allow differentiation also for appliances today grouped in the same efficiency cluster, with a label only based on the consumption in the active mode. Here the NEEI (New Energy Efficiency Index) would play a positive role in pushing toward a reduction of Passive Standby. As experienced in the past, market dynamics foster a natural evolution toward higher energy efficiency classes; therefore, CECED believes that being the scope for reducing consumption in active mode limited, the New Energy Efficiency Index will lead to reduction of Passive Standby consumption.
According to the proposal, good products will indeed need to improve standby when they are close to the boundary between NEEI classes. Products safely in the middle of a class and products with mid-range labels (C and above) might have less incentive.
CECED on 20070619
BAT From experiences in the past CECED knows very well that the consumers should be supported with the relevant information before their purchase decision. In this context and in order not to confuse consumers displaying values for several consumption modalities, a single grade should be supplied to gauge all energy consumption of the appliance. Separate information on Passive Standby and Off-mode losses in addition to information on active mode consumption would lead to confusion and possibly to choose on the basis of factors that are less relevant from the environmental and economic standpoint.
That is up to the label revision. We only point out that expressing standby performance on a label is a possibility. Clarity towards the consumer and the right amount of information is certainly most important.

Report for Tender No. TREN/D1/40 Lot 6 -2005 EuP Lot 6 – Feedback List 2nd of October 2007
Fraunhofer IZM CODDE Bio IS DUH Final Report Page 11-10
Feedback Topic or No Text Actions / Comments
CECED on 20070619
BAT Choice The example below shows how difficult it could become for consumers to make the best choice: Let’s assume, for the sake of an example to have two different washing machines: • Washing machine I: o Active mode: energy class A (0,18 kWh/cycle/kg) o Off-mode: 0,4W o Passive Standby: 2W • Washing machine II: o Active mode: energy class B (0,2 kWh/cycle/kg) o Off-mode: 0,2W o Passive Standby: 1W The first is better during the Active mode, while the second has a lower Off-mode and Passive Standby value. Which one should an energy conscious consumer select? Considering New Energy Efficiency Index proposed by CECED, we would have • Washing machine I => NEEI=0,185 (kWh/cycle/kg)3 • Washing machine II => NEEI=0,203 (kWh/cycle/kg) It is now easy to understand that Washing machine I has higher energy efficiency. A choice based on Off-mode and Passive Standby would mislead the consumer on the overall energy efficiency of the appliance.
Indeed from Lot 6 perspective only off-mode and passive standby are investigated. Nevertheless a cap on standby and off-mode consumption might be in order.
CECED on 20070619
Phasing in the requirements
CECED supports the introduction of a horizontal measure on off-mode. Although 0.75 W is a challenging target for some product categories, we believe that such value could be attained for new products. On the other hand it is fundamental that the inclusion of the Off-mode and Passive Standby values in the overall energy ranking are implemented as a package when the energy label is revised.
That is helpful support regarding off-mode. The phase in of the tier 2 limit is still debatable (in reference to the mention of "new products").
CECED on 20070619
T7 All-inclusive Energy Efficiency Index
CECED is convinced of the need to continue reducing the power drawn on electricity networks during all functions, in particular while products are not performing the main function. To that extent, CECED supports an approach that goes in the way of a horizontal legislative measure to limit off-mode losses. While off-mode can be easily addressed through an approach that tackles in a horizontal way all products, this cannot be the case for all other consumption modes. For properly addressing these modes, further in depth analysis would be necessary. Home appliance manufacturers have succeeded in improving the energy efficiency of appliances during the use phase. This has been successfully conveyed to the consumers via the Energy Label.
More details of the CECED NEEI proposal (not commented).
CECED on 20070619
T7 All-inclusive Energy Efficiency Index
However, this takes into account only the energy used to perform the main functions. For the products already covered by a label, CECED thinks that the most convenient way to address all energy modes of household appliances, is by including all of them into a single allinclusive energy efficiency rating that sets the basis for the calculation of the energy label classes. This would avoid confusing the consumers with complex technical differentiations and would provide the strongest incentive for an optimization of the overall product performances. Since standby can be in many cases better optimized, including it in the all-inclusive energy efficiency rating will allow further possible differentiation also for appliances where little differentiation is today possible with a label only based on the consumption in the active mode. In this document, terminology used follows EuP study Lot6 definitions [Ref 1: “Standby and Off-Mode Losses (Lot 6), Report for Tender No. TREN/D1/40 Lot 6 2005”].
More details of the CECED NEEI proposal (not commented).
CECED on 20070619
T7 All-inclusive Energy Efficiency Index
The main idea is to define a New Energy Efficiency Index (NEEI) evaluating overall Yearly Energy Consumption (YEC), where Active Mode, Standby and Off-Mode losses are taken into account. The definition of overall YEC has to be Product specific, so to take into account product peculiarities. In the following a proposal is made for Washing Machines and Ovens, subject of investigation in Lot 6 [Ref 1].
More details of the CECED NEEI proposal (not commented).

Report for Tender No. TREN/D1/40 Lot 6 -2005 EuP Lot 6 – Feedback List 2nd of October 2007
Fraunhofer IZM CODDE Bio IS DUH Final Report Page 11-11
Feedback Topic or No Text Actions / Comments
CECED on 20070619
T7 All-inclusive Energy Efficiency Index
New Energy Efficiency Index (NEEI) does depend on the selected usage pattern: Lot6 proposal of 73 usages/year seems not to be representative of the average European use. CECED would strongly support 110 usages/year to better represent an actual European average use of Ovens, as stated in the SAVE study [Ref 3: “Efficient Domestic ovens, Final Report, SAVE II Study, Contract number XVII/4.1031/D/97-047, TTS Institute, 2000”]
On-mode hours per year was changed to 109.5 (--> 0.3 h/d) in T7 calculation
CECED on 20070619
T7 option1,2 hard-off low, high: From a power consumption standpoint there is an advantage, even though it strongly depend on user behaviour. On the other hand, adding an hard-switch means going backward in the evolution path, deliberately giving up all the flexibility a soft switch offers
We see the restrictions and do not propose a mandatory hard-off. But we definitively have to investigate the options.
CECED on 20070619
T7 option 3,4 no-load optimised PSU, incl. secondary PSU / standby efficient PSU, incl. 2nd PSU It depends on the complexity of the PSU to be modified. 0,5€ is a better guess
No more data changes (but listed in grey comment boxes); see also Task 8 sensitivity to doubled costs
CECED on 20070619
T7 option 5 confirmed BAT It is impossible to have a consistent value of passive standby across all products
The confirmed BAT must only be one example product according to the method -- it should be a medium to full-featured product in our study.
CECED on 20070619
T7 option 6 simplified BAT It is impossible to have a consistent value of passive standby across all products
This might indeed not be fitting for all products within a group. The simplified BAT equalises too strongly between products on intention.
CECED on 20070619
T7 option 7 extreme BAT off-mode/passive standby : the relevant option costs strongly depends on the product
We have to operate with one (possibly higher?) value per product group. For the LLCC calculation this average value suffices.
CECED on 20070619
T7 option combination 3+4
more efficient PSU At least 0,5 € option costs
No more data changes (but listed in grey comment boxes) ; see also Task 8 sensitivity to doubled costs
EPS on 20070420
T1 Standby mode page 1-8
We understand that "Standby" is the lowest energy consumption mode including the following 4 functions. Is our understanding correct ? An EuP is considered to be in Lot 6 standby mode, when it is connected to a power source and offers a reactivation function (remote reactivation, self reactivation or switch reactivation). Additional functions, which may be active and consuming energy, are the following continuously running functions. (1) information or status display, such as displaying the time, (2) information storage needing continuous energy supply, (3) sensor-based safety functions, (4) network integrity communication. The above function types shall be termed Lot 6 standby functions. The associated energy consumption is the Lot 6 standby energy consumption. The same functions can be in use during active mode.
1) Contrary to IEC 62301 the standby definition of lot 6 does NOT refer to the "lowest energy consumption mode". See table 1-1 on p. 1-3. If the lowest power mode still provides any of the functions, then it is considered part of lot 6 standby, if the lowest power mode does not provide any function it is considered off-mode in lot 6 (with or without losses).
EPS on 20070420
T1 Networked Standby We understand that the equipment that has USB2.0 is corresponded to Networked Standby. Is our understanding correct? Yes it is correct for most appliances. However, the USB connection must offer the possibility for "remote network reactivation". For devices like Lighting via USB, there is only an On- or Off-mode and no standby. These become peripheral parts of the PC, if they use only power from the USB connection. This is exemplary for a lot of current USB-Toys.

Report for Tender No. TREN/D1/40 Lot 6 -2005 EuP Lot 6 – Feedback List 2nd of October 2007
Fraunhofer IZM CODDE Bio IS DUH Final Report Page 11-12
Feedback Topic or No Text Actions / Comments
JBCE on 20070510
Firstly, we are surprised to see that the horizontal lot 6 study is producing very different results from those that are emerging from vertical/product category specific lot studies, such as the ones on PCs and computer monitors, TVs, imaging equipment, and battery chargers and external power supplies
Some of the detailed differences are analysed below. There might be remaining mistakes on our side, which will be corrected as appropriate, but mostly there are reasons. We are aiming at using the same values (1) if they fit exactly for the Lot 6 purpose (2) if they are published and stable, when we need them.
JBCE on 20070510
Secondly, we would like to express our concern that not enough attention has been paid to the subject of varieties of functions during the stand-by period. The energy use of different products during their stand-by periods is different, because different functions are in use. Each product has its unique functions during its stand-by period. It is therefore inadequate - and this will create misunderstandings - if the stand-by impact of different products is compared in general.
For passive standby we have chosen the functions so that they allow the clustering and discussion as one group. For networked we aim to show the variety and draw more cautious conclusions. Industry was invited – via the BAT request in February 2007 – to provide example functions, which have higher power requirements, but practically no feedback was received on this. We reiterate our invitation to submit data until 4.7.2007 possibly allowing to differentiate more precisely in the reports.
JBCE on 20070510
Thirdly, JBCE would like raise and emphasise the point that ‘eco-design’ with the objective of reducing total energy consumption is a highly complicated process. Reducing total energy consumption requires, for example, dealing with trade-offs of energy uses between different processes (i.e. active/ready/sleep modes).
problem of increasing standby energy consumption due to shorter on mode time (automated transitions) named in T8
JBCE on 20070510
Fourthly, we also concerned to see that stand-by data from catalogues and manuals have been used. Catalogue and manual data do not necessarily represent useful data for the lot 6 study, because, for example, sometimes only representative data are given. We strongly request that only relevant and detailed data are used in the study. Indeed, we believe that the use of data provided directly by manufacturers is indispensable.
Consistency with data provided from the manufacturers in the framework of vertical lots will be ensured. However, only few Lot 6 specific data has been submitted. In general references to data sources are listed in the study and the rationale for data selection is given.
JBCE on 20070510
Finally, JBCE does understand that there is also the difficulty of limited time. We therefore propose to alter only the way of reporting the concept of standby, i.e. focusing on what stand-by energy consumption is composed of plus ideas of reducing consumption. We do not consider it necessary to mention/report on exact figures in relation to, for example, BAT as it is irrelevant to show the exact figures in the study report without studying the data provided by manufacturers.
This is not a possible avenue within the study. Uncertainties and sensitivities can be shown, but specific values (and assumptions) have to be used in the end.
ERA on 20070510
T1 How do you cover the network infrastructure (such as telecoms) in the study? specifically regarding "broadcast infrastructure equipment" as explained in my written question to you by email of 11 May (see below). While your answer in the minutes is helpful it does not clearly explain where BIE sits. Will you be addressing this when you amend the report and if so how?
BIE is considered out of scope.
ERA on 20070510
T1 The questions I raised was with regard to scope and the status of broadcast (e.g. TV) infrastructure equipment (I shall call this BIE for short). Section 1.1.6.3 talks about 5 application sectors: 1. Home - clearly BIE not in this category 2. Office - clearly BIE not in this category 3. Building Infrastructure - clearly BIE not in this category 4. Infrastructure (energy, com) 5. Public, commercial, industrial (excluding offices) Categories 3 to 5 you see as outside the scope of Lot 6. This implies that BIE is in one of the categories. To be clear, do you agree and if so which one do you think it is?
We have taken the liberty of putting this in the communication infrastructure (even though it is not a telecoms network).

Report for Tender No. TREN/D1/40 Lot 6 -2005 EuP Lot 6 – Feedback List 2nd of October 2007
Fraunhofer IZM CODDE Bio IS DUH Final Report Page 11-13
Feedback Topic or No Text Actions / Comments
ERA on 20070510
T1 Referring to your bullets on page 1-21: a) Building Infrastructure - no b) Energy and telecom infrastructure - seems the only option assuming you see BIE as telecom. Is this right in your view? c) Public and transportation infrastructure - no d) Industrial manufacturing equipment - no Might I propose that it if broadcast technology products are intended to be seen as Infrastructure Products within the meaning of this sub-section, it would be useful if this could be clarified by amending this section to explicitly cite broadcast in the words relating to data and telecom infrastructure.
INTEL on 20070510
used modes for Computer systems
1. Intel understands the desire to create a horizontal approach to defining standby and off-mode conditions in order to aggregate many different EuP’s into a common set of standby or off states. However, these definitions do not align well with PC industry standard definitions. The PC industry has been working with well defined ACPI definitions to describe machine state conditions for many years. Intel feels that there could be confusion over standby and off-state definitions as stated in Lot 6. For example, nearly all PC’s today, regardless of Office or Home application, can be configured in a networked mode in off (S5 Wake on LAN) <WOL and S5 is not a normal ACPI state. Since S5 is not a sleep state you can’t wake. It's a remote start. Maybe this is a nit.> and standby (S3 wake on LAN) making it difficult to align to the Lot 6 definitions. Intel would like to see further clarification of Passive Standby (Reactive and Continuous), Networked Standby, and Off-Mode, and 0 W Off-Mode as they related to industry standard PC ACPI states. Intel recommends a graphical representation of Lot 6 definitions.
INTEL on 20070510
T4 , T7 2. PC power consumption of 15W and 3.5W for Desktop and Mobile, respectively for networked standby and off-mode presented in Table 7-1 are about 3 times higher than the industry data collected for Tier I EPA Energy Star in 2006. Figure 1 is Mobile and DT power consumption data for the ACPI S3 state. For Laptops, the average S3 power consumption for the data submitted is 1.3W whereas for Desktops the average power consumption is approximately 3.4W. Clearly, there is a large discrepancy between the Lot 6 data and the data collected by the industry for Energy Star in 2006 if we assume that Networked Standby is S3 WOL. Further examination of older PC’s architectures does not indicate that S3 or S5 power consumption would be significantly larger than the data set provided to the EPA by the industry for previous generations of PC’s. In addition, Figure 2 shows the power consumption for Off (S5 WOL) power with similar results.
changed data for PC+ (home and office) according to Lot 3 and energy star data (sleep as networked standby with 4 W for desktop and 3 W for notebook)
INTEL on 20070510
T7 3. Assuming that Networked Standby and off-mode definitions align to S3 WOL and S5 respectively, then all total energy consumption for Office and Home PC’s and their respective LLCC analysis should be adjusted to reflect the reduction in Networked standby and off-mode power consumption.
new modes for task7 include off-mode reduction by primary side switch and networked standby reduction by option 4, 5 and option combination
INTEL on 20070510
T7 4. Aggregating hard-off switches or disconnects from the AC source with other options to reduce power consumption could be misleading. Hard-off switches require operator intervention. The use of a disconnect switch depends on a behavioural response that may or may not be consistently initiated. Analysis that shows total power consumption savings assuming 100% use of a disconnect switch could be communicating a larger potential benefit than what could be obtained when implemented. To fully understand the potential benefit, a consumer acceptance study needs to be undertaken. In addition, hard disconnect switches will prevent IT managers from repairing and managing Office PC’s during non-work hours reducing or eliminating the effectiveness of these new technologies.
a differentiation of hard-off switches is given in option 1and 2. only potentials where shown a discussion for every products case for exceptions is only short and not the main focus for T7
INTEL on 20070510
5. If it is the goal to reduce overall energy consumption then an energy buffering device, such as a rechargeable battery or capacitor, is inconsistent against these goals since energy is still required to sustain or recharge these devices.
in point of standby it make sense, buffering can also be supported by solar cells

Report for Tender No. TREN/D1/40 Lot 6 -2005 EuP Lot 6 – Feedback List 2nd of October 2007
Fraunhofer IZM CODDE Bio IS DUH Final Report Page 11-14
Feedback Topic or No Text Actions / Comments
TOS on 20070510
buffered standby energy
total power consumption would increase due to energy conversion loss - standby power consumption decrease, On-mode power consumption increase to charge the battery - total power consumption increase by the amount of conversion losses for the process of charge and discharge
problem named in T7, but can reduce energy consumption if e.g. power supply is a lot more efficient in on mode while charging the battery compared to the low voltage range in standby
TOS on 20070510
Waste of natural resources and increase of CO2 emissions at the production process (lithium ion battery and charging circuit)
buffered energy does not automatically mean "battery buffer", option 8 is "placeholder" for options that separate the device from the mains in standby and/or off-mode
TOS on 20070510
T7 application of option (7.1.3.5) TV and Set-Top-Boxes is not realistic as for TV and STB On- and Off would be repeated every day, rechargeable batteries would be more than one cycle of charge and discharge on one day, rechargeable batteries only have a max. of 500 charging cycles, this need a battery replacement every 500 days we request a description that a "Application of this option into TV and Set-Top-Boxes is not realistic" in this report
should be in T8 - sensitivity
TOS on 20070510
T7 expected value of 2.13 W in table 7.18 should be revised to larger one 2.13W of Set-Top-Box is expected value calculated from 20% of original one, due to this buffered standby option in point of unrealistic option this value has to be replaced with larger value
the option is calculated in the same for all products it is applied to, unrealistic T8 (see above)
TOS on 20070510
Network power consumption depending on each added feature standby power consumption also increase as the sample show considering the future development of features it is difficult to forecast how much both the standby active low and high increase. We think both should be "out of scope" or should be limited to what we clearly recognize today. There are two patterns depend on how big the circuit required to detect the reactivation signals( small scale detect circuit or large scale detect circuit)
EICTA on 20070420
General EICTA acknowledges the need to harmonize the basis for stand-by requirements between different product categories in order to ensure consistency and appreciates the work done by the consultants. However, when carrying out overlapping studies, it shall be carefully ensured that no conflicting data or requirements are developed in these studies.
Coherence between the different studies will be ensured, see above on comments for JBCE
EICTA on 20070420
It has been previously communicated that in case of overlaps, the outcome of the more specific lot studies would overrule the horizontal study. However, looking at the current studies this is not clear and this is the cause of a lot of concern in the industry. The concerns are more specifically listed below.
see above on comments for JBCE
EICTA on 20070420
overlapping Even as EICTA is aware that the standby study is a horizontal one, the merit of the lot is not fully clear. EICTA does not understand how the extremely scope limited results of the lot 6 study can be used to develop a horizontal measure, while even more than 60% of the evaluated products are already covered in product specific studies (such as PC, TV, EPS, printer).
The selection of product classes has been chosen according to the mode combinations they offer and the expected significance for total EU-25 standby, which is an essential result of the study.
EICTA on 20070420
scope It is not clear why products being evaluated by product specific lots are again separately and extensively discussed in lot 6. This is especially worrying as EICTA members have mainly provided input to the product specific lots only, as these were seen to be the most relevant for the industry. It should also be more clearly stated that the products covered in lot 6 study are examples only and the possible outcome will apply to all products in the same category, not just the ones covered by the study (for example EPS for all mobile products, not just mobile phones - as it has been done in e.g. lot 7 study). The representativeness of the chosen product examples shall also be studied, so that no undue requirements are developed because of unjustified generalizations.
Coherence between the different studies will be ensured, see above. The first part is repeatedly addressed in the texts. The product examples have been chosen to represent typical functional clusters and use patterns. Such an approach is requested by the MEEuP, also to ensure that a manageable workload results. Furthermore it can be disputed if a particular selection is representative – even a 90 product sample will not cover all other products representatively.

Report for Tender No. TREN/D1/40 Lot 6 -2005 EuP Lot 6 – Feedback List 2nd of October 2007
Fraunhofer IZM CODDE Bio IS DUH Final Report Page 11-15
Feedback Topic or No Text Actions / Comments
EICTA on 20070420
General In general the different lot studies do not seem to be very well coordinated. The applied assumptions shall be harmonized in the different studies. For instance, the TV use pattern applied in lot 6 (12 h standby, 8 h 0W off, 4 h on-mode) is different to this one used by lot 5 (4 h on-mode, 20 h standby). Where do the use patterns come from? And for mobile phone EPS no-load in lot 7 it is stated “few highly efficient EPS ... even below 0.1W” and in lot 6 “0.15W as confirmed BAT and as example 0.03W as best BAT”, and as BNAT as low as 0,01W. The figures should be aligned in the two studies.
Coherence between the different studies will be ensured, see above. Differences are indeed intentional: The difference was planned for examination in the Lot 6 sensitivity. Obviously TVs can only contribute more without the "0 W off". The reason for this difference is as follows: Lot 6 starts from the average 2005 stock, which still contains many TVs with hard-off switches. Lot 5 started from the new HD ready products of 2005/2006, where hard-off switches were mostly not present. As a simplification, Lot 5 decided to declare all non-active time as standby (in a sense of a "worst case"). This is then also used to describe the 2005 situation in Lot 5.
EICTA on 20070420
BASE Case T4 The applied standby passive value for TVs of 5,84 W seem to be too high and it is not clear where this value comes from. Lot 5 says that “over 30% of devices had 1 W standby power or less”. It seems not to be reasonable to assume that the other < 70% raise the average to 5.84 W. Again also these figures shall be harmonized with Lot 5.
As above, the high value in Lot 6 results from the 2005 stock average – dominated by CRTs with an assumed standby of 6 W. For "backcasting" to the 2005 situation, Lot 5 now uses a simplified 5 W average for 2005. The 2005 standby totals (stock) do not influence the conclusions regarding necessary improvements
EICTA on 20070420
T7 The proposed option 1a “Equip all off-mode relevant EuPs with a primary side hard-off switch” is too general. What are “all off-mode relevant EuPs”? In addition, the study does not comprehensively prove if the additional (or at least different) part such as partly to be flame-retardant wiring or switches, would improve the environmental performance of a product. Chapter 7.1.12 already raised some disadvantages of Option 1a but does not consider that it would also negatively impact product functionality as well as comfort. Finally, an increased “wake-up time” for some products such as PC or printer might motivate the consumer to leave the product switched on, which would waste manufacturers effort to reduce standby values. The approach taken by lot 5 (to require hard-off switch only for products having high standby power consumption) seems to be more reasonable. The applicability of such a switch for mobile products was studied also in the IPP pilot project on mobile phones and the results showed that it would not result in any reasonable environmental improvements, but that lower off-mode energy consumption and consumer behaviour are the key issues when dealing with energy consumption of EPS.
The option (also in the revised version) is indeed not applied to all products. The assumptions per product are in the tables (more explanations to be added in the revision). If the hard-off is only considered as an alternative to soft-off, then reduced functionality and increased wake-up time do not occur. From the user side, the two must be ex-changeable – the look&feel is the main difference. Alternatively, for a product without any off-mode (standby is then the lowest) a shift between Lot 6 modes would occur with the inclusion of a switch, and this may indeed change the functionality. However, not having for example a remote control continuously may be acceptable to many users. Depends on the product. The Lot 5 conclusion on hard-off does not mean we in Lot 6 should not examine the possible effect of broadly applying hard-off switches. Indeed we will not propose a requirement for a hard-off switch for all products in Task 8 – that is not the issue in Task 7, where potentials are explored.

Report for Tender No. TREN/D1/40 Lot 6 -2005 EuP Lot 6 – Feedback List 2nd of October 2007
Fraunhofer IZM CODDE Bio IS DUH Final Report Page 11-16
Feedback Topic or No Text Actions / Comments
EICTA on 20070420
used modes Lot 6 modes (Standby and Off) as defined do not, and can not, apply to continuously active products. Continuously active products may be constrained to be "active" due either to network activity (e.g., packet processing) or latency requirements (e.g., in switching, the time between when a packet is received to the time it is transmitted). For some networking products the network activity is never zero. In the area of Switching and Routing, the "probability of idle" approaches zero as you approach the core of the network. Due to the random activity, aggregation and varied applications through the core of the network, the probability of a core router ever seeing 0% activity is likely nil, therefore these products would never be able utilize a Standby Mode.
In principle we are following the same arguments. That is why we have "always-on" products (PUC 0). For some of those a reaction depending on the activity of the network is possible or will be possible in the future. As rightly said – towards the core of the network (which we are not covering) inactivity is probably "0" – so in reverse at the periphery of the network (which we are covering e.g. via modems and small hubs) there is a large potential for savings. In conclusion: A true "always-on" product has no Lot 6 standby and no Lot 6 off-mode. Therefore it can not fall under limit values defined per mode. It can be included in the scope nevertheless, and may fall under specific requirements without limit values ("you must offer a feature") or under generic requirements (like: if future network protocols have standby feature X then the products should implement it).
EICTA on 20070420
T1, Definition& products
The study on standby and off-mode losses is horizontal and it is intended to cover all relevant products which include the operation modes standby and off-mode. The used definition of standby and off modes seems to be useful and practical. The analyses in the study are carried out for 15 products as examples for the different product groups (PUC). The products are however due to the diversity of products not considered to be representatives for all products in the same group. It is at this stage difficult to evaluate how the selection of products would influence the conclusions of the study. We think it is important to realize that the results are intended to be used for horizontal requirements and we would recommend that a more horizontal approach is applied to the final analyses and discussions.
EICTA on 20070420
Test Standard The investigation of existing standards has shown that usable standards exist for the majority off relevant products. The lack of one single harmonized standard covering all products should not be used as argument for delaying eco-design requirements. The study propose to look at a number of aspects to improve the existing test standard IEC 62301 for instance the number of equipment required for tests, the number of test per equipment and to allow a percent of uncertainty to clarify misunderstanding. We think that the number of tests required should be limited as much as possible to reduce test costs for market control, etc. Regarding the need for a percent of uncertainty we would recommend that this problem is addressed in the coming implementing measure and not in the test standard.
EICTA on 20070420
Base case It is not very clear how the base case data are elaborated. The amount of product data on which the average values is based does not appear and it is not clear whether the data are market or stock data. On this background it is difficult to evaluate the quality of the data.
EICTA on 20070420
Improvement potential At this stage it is not clear how the result of the first 7 tasks will be or should be used in the elaboration of horizontal measures for off-mode and standby losses. If for instance cost effective solutions are on the market to reduce the off-mode losses to below 0.5 Watt for half of the product cases in the study is it then justified to go for a 0.5 Watt requirement for standby? We think it is difficult to evaluate the data and the importance of the data quality while it is not clear how the data will be used at a later stage.
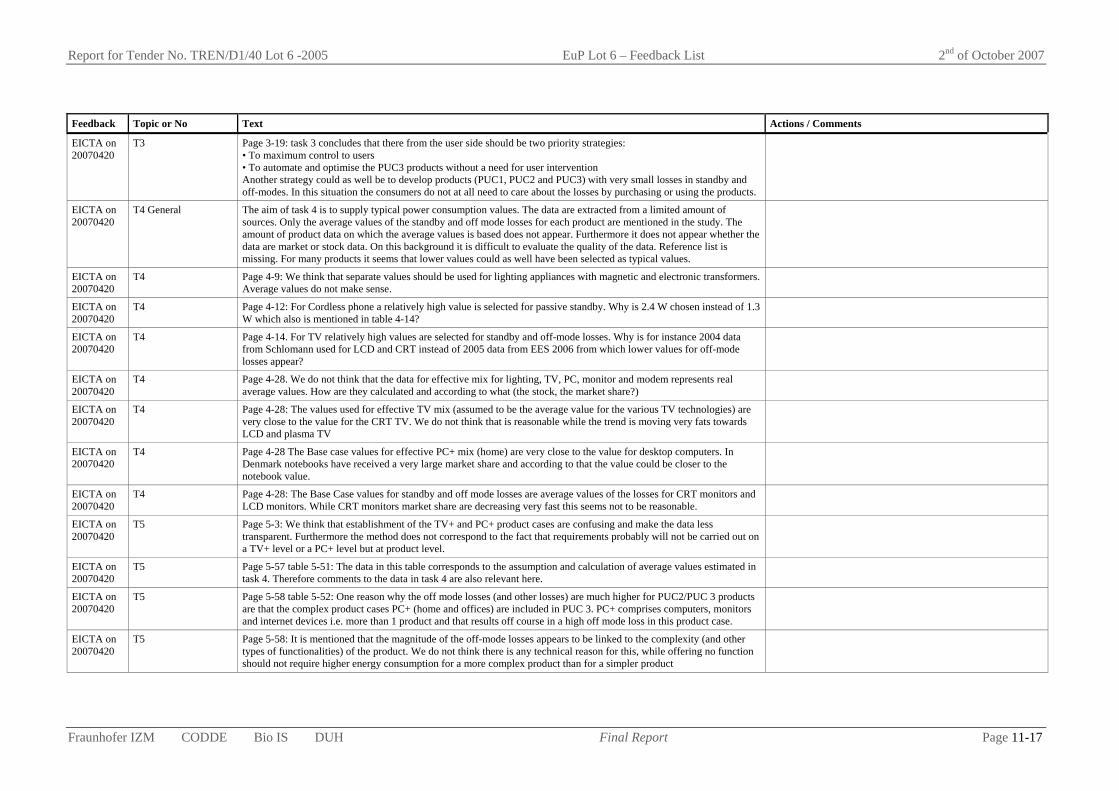
Report for Tender No. TREN/D1/40 Lot 6 -2005 EuP Lot 6 – Feedback List 2nd of October 2007
Fraunhofer IZM CODDE Bio IS DUH Final Report Page 11-17
Feedback Topic or No Text Actions / Comments
EICTA on 20070420
T3 Page 3-19: task 3 concludes that there from the user side should be two priority strategies: • To maximum control to users • To automate and optimise the PUC3 products without a need for user intervention Another strategy could as well be to develop products (PUC1, PUC2 and PUC3) with very small losses in standby and off-modes. In this situation the consumers do not at all need to care about the losses by purchasing or using the products.
EICTA on 20070420
T4 General The aim of task 4 is to supply typical power consumption values. The data are extracted from a limited amount of sources. Only the average values of the standby and off mode losses for each product are mentioned in the study. The amount of product data on which the average values is based does not appear. Furthermore it does not appear whether the data are market or stock data. On this background it is difficult to evaluate the quality of the data. Reference list is missing. For many products it seems that lower values could as well have been selected as typical values.
EICTA on 20070420
T4 Page 4-9: We think that separate values should be used for lighting appliances with magnetic and electronic transformers. Average values do not make sense.
EICTA on 20070420
T4 Page 4-12: For Cordless phone a relatively high value is selected for passive standby. Why is 2.4 W chosen instead of 1.3 W which also is mentioned in table 4-14?
EICTA on 20070420
T4 Page 4-14. For TV relatively high values are selected for standby and off-mode losses. Why is for instance 2004 data from Schlomann used for LCD and CRT instead of 2005 data from EES 2006 from which lower values for off-mode losses appear?
EICTA on 20070420
T4 Page 4-28. We do not think that the data for effective mix for lighting, TV, PC, monitor and modem represents real average values. How are they calculated and according to what (the stock, the market share?)
EICTA on 20070420
T4 Page 4-28: The values used for effective TV mix (assumed to be the average value for the various TV technologies) are very close to the value for the CRT TV. We do not think that is reasonable while the trend is moving very fats towards LCD and plasma TV
EICTA on 20070420
T4 Page 4-28 The Base case values for effective PC+ mix (home) are very close to the value for desktop computers. In Denmark notebooks have received a very large market share and according to that the value could be closer to the notebook value.
EICTA on 20070420
T4 Page 4-28: The Base Case values for standby and off mode losses are average values of the losses for CRT monitors and LCD monitors. While CRT monitors market share are decreasing very fast this seems not to be reasonable.
EICTA on 20070420
T5 Page 5-3: We think that establishment of the TV+ and PC+ product cases are confusing and make the data less transparent. Furthermore the method does not correspond to the fact that requirements probably will not be carried out on a TV+ level or a PC+ level but at product level.
EICTA on 20070420
T5 Page 5-57 table 5-51: The data in this table corresponds to the assumption and calculation of average values estimated in task 4. Therefore comments to the data in task 4 are also relevant here.
EICTA on 20070420
T5 Page 5-58 table 5-52: One reason why the off mode losses (and other losses) are much higher for PUC2/PUC 3 products are that the complex product cases PC+ (home and offices) are included in PUC 3. PC+ comprises computers, monitors and internet devices i.e. more than 1 product and that results off course in a high off mode loss in this product case.
EICTA on 20070420
T5 Page 5-58: It is mentioned that the magnitude of the off-mode losses appears to be linked to the complexity (and other types of functionalities) of the product. We do not think there is any technical reason for this, while offering no function should not require higher energy consumption for a more complex product than for a simpler product

Report for Tender No. TREN/D1/40 Lot 6 -2005 EuP Lot 6 – Feedback List 2nd of October 2007
Fraunhofer IZM CODDE Bio IS DUH Final Report Page 11-18
Feedback Topic or No Text Actions / Comments
EICTA on 20070420
T6 General The technical analysis in task 6 shows that technical solutions with very low electricity consumption in the standby and off-modes exist for almost all the product cases. Off mode consumptions as low as 0.1 Watt or even lower and standby passive consumption at 0.5 Watt are found in more cases. In our opinion products that still have high off-mode and standby consumption are more because of limited attention to the energy efficiency of the product than to lack of technical solutions to increase the energy efficiency.
EICTA on 20070420
T6 Page 6-3: Power strips are for more product cases mentioned as a possibility to reduce the energy consumption in the off-mode. It will reduce the electricity consumption in the off mode to zero and it is a good solution for existing products. However for new product it seems to be a more expensive solution for the consumers than the improvement of the energy efficiency of the products.
EICTA on 20070420
T6 Page 6-24: Microwave ovens are on this page mentioned as an example of a product, which is not covered by the product cases. It appears that microwave ovens which use less than 0.1 Watt in standby are on the market. According to the study the best available technology for ovens has a standby consumption of 2.5 Watt (and 1 Watt should be possible). We see no reason why it should not be possible to make normal ovens as efficient in the standby mode as microwave ovens.
EICTA on 20070420
T6 Page 6-24: The power safer is mention as and external measure to reduce the off mode losses. The extra costs for this solution are not mention. We think this solution is more expensive to the consumers than redesign of the products to improve the energy efficiency. However it is a good solution for existing products in the households
EICTA on 20070420
T7 Page 7-6: It should not be hard to reach the BAT level for desk top computers as indicated on table 7-5. The technology is well known from laptops.
EICTA on 20070420
T7 Page 7-10: We think it should be possible to improve the energy efficiency of the power supply side by more than 10 %.
EICTA on 20070420
T7 Page 7-13: From table 7-14 it appears that the best option is to reduce all passive standby loss to 1 Watt (design option 2d). The energy savings are relatively high to at a low extra product cost. However it is not clear how the improvements are obtained.
EICTA on 20070420
T7 Page 7-22: For some of the products the lifetime used are quit long (oven, PC, DVD).
EICTA on 20070420
T7 Page 7-24: The LLCC analysis shows that a hard switch is the design option with the lowest life cycle costs for external power supplies. However a hard switch on an external power supply is not a reasonable solution.
TOPT on 20070504
The design options should base on BAT (Best Available Technology) individually for each category (0.1 ... 1.0 Watts). However, in addition it would be reasonable to have a general limit for any EuP (e.g. 0.5 Watts or 1.0 Watts). It should be investigated
TOPT on 20070504
Data sources This analysis will be of importance for task 8 potential policy measures (e.g. mandatory energy declarations)
TOPT on 20070504
Data sources The reports should deal with this issue on a quantitative and qualitative level (e.g. percentage of models/brands with sufficient energy declarations for investigated categories. There might be considerable differences between categories depending on existing directives, labels or standards which should be discussed
TOPT on 20070504
Data sources Consumer information is an important issue in Ecodesign-Directive 2005/32/EC (article 14). Manufacturers should ensure energy declarations easy visible for buyers. Therefore a standard declaration format is absolutely crucial in order to inform the consumer and not to confuse him.

Report for Tender No. TREN/D1/40 Lot 6 -2005 EuP Lot 6 – Feedback List 2nd of October 2007
Fraunhofer IZM CODDE Bio IS DUH Final Report Page 11-19
Feedback Topic or No Text Actions / Comments
TOPT on 20070504
Data sources Obviously it was very difficult for the research team to find reliable data on energy consumption of products. This corresponds with the experiences of Topten International Group (TIG).
TOPT on 20070504
General First of all we would like to appreciate the high quality of the draft final reports for tasks 1 to 7. • Definition of standby should not be according to IEC 62301. Standby should express the power consumption of the lowest state which the product enters automatically according to the initial settings when products are shipped. • Products with enhanced standby including keeping warm of some components like imaging equipment or coffee/espresso-machines should be included in more detail as they may have 10 or 100 time higher standby losses than usual EuPs.
NOK on 20070504
General Studies made in LOT6 show somewhat stricter or different values e.g. in BAT and BNAT in comparison to LOT 7. Conclusions of studies for all related LOTs should be harmonised, priority should be on the conclusions made in the sector specific studies
NOK on 20070504
Lot 6 BAT (table 7-2) EPS (mobile phone) 0.15W as confirmed BAT, as example 0.03W as best BAT, 20mW or even 10mW as BNAT
changed in T7 and T6 with now BAT 0.1 W best BAT 0.06 W
NOK on 20070504
Lot 7 6.1: few highly efficient EPS ... even below 0.1W. Table 6-1: outstanding EPS: Salcomp(Shenzhen) 0.09W Dong Yang E&P 0.06W Hulzhou Skyfortune Electronics 0.06W
FSC on 20070504 General Please be aware that the data basis for lot 6 and lot 3 (PC and Monitors) should be the same.
FSC on 20070504 T6, BAT
According to the report of lot 3 task 6 page 157 and 158 the energy consumption for best available products (BAT) is: off/standby mode sleep mode Desktop 1.1 W 2.6 W Laptop 0.38 W 0.82 W LCD 0.67 W 0.67 W CRT 3.8 W 3.8W Can you please adapt your BAT-values or explain the differences?
FSC on 20070504 T5 The electricity use figures for base cases of 2005 are according to the report for lot 3 page 126:
FSC on 20070504 T7
The costs for a primary side hard-off switch for a PC should be replaced by values for the end-user price of the hard-off switch. In our opinion the end-user prices for hard-off switches are higher than the assumed costs in your report (material costs only are indeed approximately 1 €). An implementation requires additional EMI measures. A realistic end-user price for a hard-off switch is therefore approximately 2 € for a PC.
FSC on 20070504 T7 Networked standby and passive standby modes are both possible for PCs (Home and Office). So I would expect a
differentiation in Table 7-4 etc. of your report.
FSC on 20070504 General Generally I would like to propose using the same data basis for all relevant cases and options as used in the reports of lot
3 (PC and monitors).

Report for Tender No. TREN/D1/40 Lot 6 -2005 EuP Lot 6 – Feedback List 2nd of October 2007
Fraunhofer IZM CODDE Bio IS DUH Final Report Page 11-20
Feedback Topic or No Text Actions / Comments
ERA on 20070504
T1 The questions I raised was with regard to scope and the status of broadcast (e.g. TV) infrastructure equipment (I shall call this BIE for short). Section 1.1.6.3 talks about 5 application sectors: 1. Home - clearly BIE not in this category 2. Office - clearly BIE not in this category 3. Building Infrastructure - clearly BIE not in this category 4. Infrastructure (energy, com) 5. Public, commercial, industrial (excluding offices) Categories 3 to 5 you see as outside the scope of Lot 6. This implies that BIE is in one of the categories. To be clear, do you agree and if so which one do you think it is?
BIE is considered as communication network
ERA on 20070504
T1 Referring to your bullets on page 1-21: a) Building Infrastructure - no b) Energy and telecom infrastructure - seems the only option assuming you see BIE as telecom. Is this right in your view? c) Public and transportation infrastructure - no d) Industrial manufacturing equipment - no Might I propose that it if broadcast technology products are intended to be seen as Infrastructure Products within the meaning of this sub-section, it would be useful if this could be clarified by amending this section to explicitly cite broadcast in the words relating to data and telecom infrastructure.
see above
EPS on 20070413
Laser printer We haven’t sold the product “EP1509”. We would like you to check the product name and the power consumption values and, if possible, send the data source, Australian store survey 2005/2006 to us.
Should be epl509 not ep1509, maybe name problem in Australian data, source was used correctly
EPS on 20070413
Laser printer We didn’t use “quick fuser” or “ On demand-Fixing” to AL-C4200. “Quick fuser” or “ On demand Fixing” are the other company’s specific technical name. In Lot 6 product fact sheet on BAT/BNAT we have submitted, we wrote these technologies just in general for reducing the energy consumption.
has to be corrected in the report (done)
EPS on 20070413
Inkjet printer 0.3 W in BAT without a hard-off switch is not achievable power level for us. Recent years, there are many functions; such as LCD monitor and CD/DVD drive etc., in inkjet printers.
CD/DVD drive is clearly not standard for IJP, LCD displays (photo printers) should power off in standby -> are 0.3W not possible for standard IJP, or for all special IJP?
EPS on 20070413
Inkjet printer We would like you to consider the differences of product functions. In energy star, functional adder allowances are prepared. Are the multi function ink jet printers included the Lot.6 IJP scope? We want to know the definition of IJP.
MFC are included in Lot 6 scope, but not in the product case. Definitions given in Section 3.1.2.6.2 and Task 4, but it is still not clear enough
EPS on 20070413
General Furthermore we were surprised to see that the report included so many details on producer, products and specifications. I know that we did not specifically state that the data was covered by the confidentiality agreement but we would have expected that the data would be treated more careful.
We have only cited from public sources or from the BAT sheets supplied
CECED on 20070413
T6 General remark As a general remark about CECED data, it is important to note that CECED has provided an “average” of the Best Available Technologies. This data do not refer to the one absolute best possible performing appliance on the market, but represents the average of the different BATs provided by CECED manufacturers. According to CECED data, the best performing appliance on the European market today has off-mode losses equal to 0.1 W, and Lot6 Standby consumption equal to 1 W. CECED would prefer to see quoted European data only, to be sure that European products can be directly compared in terms of applicable basic legislative requirements and measuring methods.
If European data is available we prefer to use these. Often most coherent standby data for recent years are provided by Australian. Data for washing machines will be corrected.
Report for Tender No. TREN/D1/40 Lot 6 -2005 EuP Lot 6 – Feedback List 2nd of October 2007
Fraunhofer IZM CODDE Bio IS DUH Final Report Page 11-21
Feedback Topic or No Text Actions / Comments
CECED on 20070413
T6 As far as Washing Machines, it would be important to make explicit reference to the accuracy and precisions of the measurements done on the Whirlpool (wf665), named one of the best products on the market, and understand if the EN/IEC 62301 measurements method was used. All of the above should be clarified before that machine could be quoted as a reference. Furthermore, it seems fair to compare products with equal features, so inferring the same power consumption with different features seems a far-fetched hypothesis. For instance, we wonder how it can be assumed that all washing machines, also equipped with delay start function, can achieve a power consumption equivalent to the mentioned Whirlpool machine that, as it is written in the report (Task 6 page 13), is not equipped with such mode.
"Confirmed BAT" aims to capture products, which have typical, not reduced functionality.
CECED on 20070413
T6 A note on Delay Timer: the Delay Timer can be successfully used to shift the electrical load from a higher to a lower electricity demand peak (or electricity tariff zone) resulting in a much better use of the available energy. In order to promote the use of such feature, in Australia it was decided to leave the energy consumption during the delay start mode out of the Energy Efficiency Index for washing machines, so not to discourage manufacturers from equipping appliances with that feature.
delay start is part of standby functions, there is no reason to excluding this mode from standby (mode time has to be checked)
CECED on 20070413
T6 As far as Ovens are concerned, it is important to note that different features are offered for similar products. These different features have to be taken into account when comparing appliances among each others. Only appliances with the same features should be compared. The value that CECED has delivered regards an appliance with clock, which is the most relevant case for the Lot 6 investigation.
We intend to compare ovens with clock and timer functions. Industry input is needed, if the data are not fitting to this.
CECED on 20070413
T6 Finally, we would also like to point out that trends are now towards appliances equipped with more and more electronics as default features. While consolidating a BAT that is going to be taken as a reference point for future European policies, it is important to look at the best available technology in combination with the trends required today by the market. The chosen BAT should therefore incorporate the default features that are common in nowadays models, as this best represents the future trends in the market.
We agree with this view - so industry input on what is typical would be helpful
CECED on 20070413
T7 About lifetime, a recent CEN Workshop Agreement has been published where saving lifetimes of Energy Efficiency Improvements Measures in bottom-up calculation have been defined. For a Washing Machine a lifetime of 12 years has been specified. We would suggest using that value on the Table on page 7-22.
Will check for all products covered in CEN - however, the used value (11 years) is near the CEN Agreement, so major reason to change
CECED on 20070413
T7 Table 7-14 Option 2d is addressing a reduction to a level of less than 1 W with an increase of 1€ Product Costs for passive standby. We would like to see the logic behind this, since as in other options there is always a technological improvement mentioned with the possible savings in energy but not for this case.
It is a general test option to identify the effects if all devices change to <1 W with assumed additional product cost of 1,- € for horizontal approach
CECED on 20070413
T7 In addition, CECED would welcome a better involvement of Manufacturers in defining, in a shared way, how options can be combined per each product in order to come to a Life Cycle Cost curve for standby and off-mode losses. CECED believes that special care is needed in the exercise of combining design options, since often some options exclude each others and the benefits of combining different options can significantly vary from their simple arithmetic sum.
Industry input welcome - we are now creating the options combinations after the stakeholder meeting
CECED on 20070413
BAT CECED would like to see better justified the values around 10’s of mW for off-mode losses and 100’s of mW for basic passive standby function.
This is a rough generalisation of the BAT/BNATs for some products in Task 6
CECED on 20070413
BAT As far as standardization of inter-product communication to enable products to be used together, CECED has already announced the availability of AIS 1.0, namely Application Inter-working Specification, meant to enable household appliance connectivity and unlock promising energy management scenarios, able to offset higher Lot6 networked standby with a better overall energy usage.
Interesting development, will check but might not be integratable as a topic into the reports.
Report for Tender No. TREN/D1/40 Lot 6 -2005 EuP Lot 6 – Feedback List 2nd of October 2007
Fraunhofer IZM CODDE Bio IS DUH Final Report Page 11-22
Feedback Topic or No Text Actions / Comments
GBO on 20070413
T6 General A general comment is that in addition to the analysis of product groups it would be valuable to have an analysis of the BATs of the different stand-by functions (remote control activation, clocks, timers, readiness to charge batteries, computer network activation, phone network activation, TV network activation, power supply, etc.). These functions appear in a number of different product groups, but it is often the same basic stand-by functions that are used in the different product groups.
We have reduced this to differentiating the passive and networked standby clusters - where possible more detailed function allocations should be mentioned
GBO on 20070413
on 6.2.4.11 On computer speakers (6.2.4.11), it seems that stand-by and off-mode losses reflect that these apparatus are not equipped with any advanced power control, leading to the large stand-by and off-mode losses of this kind of equipment. If computer speakers were connected via an USB cable, their power consumption could be controlled from the computer and small speakers could be powered from the computer. Then the speakers could effectively be turned off when the computer is not in active mode, or if no sound display is active.
The common speaker is connected via analogue port, which has no possibility for power control. USB powered speakers would be included in the PC power consumption.
GBO on 20070413
T6 electric ovens On electric ovens it seems that the stand-by functions are the same as for washing machines (except maybe for a visible clock), so the stand-by losses should not necessarily be higher, even though current products might consume more.
Basic functions are the same, but sensors and newer functions (LCD display) develop in different directions
GBO on 20070413
T6 office PC On office PC's it seems that there is a large room for improvement of networked standby with confirmed BAT of 2.6 W compared with notebooks that have a confirmed BAT of 0.4 W for essentially the same functions.
Yes, it also depends on power supply
GBO on 20070413
T6 office PC Beside the chosen groups of technologies it could be interesting to have an analysis of the increasingly popular networked products including IP telephones, wireless networks, remote control functions of homes as the ”intelligent home concepts”. This would include BAT of power consumption of cabled and wireless LAN's, Bluetooth, and other popular communication technologies when no useful data is actually transmitted.
These products and trends are interesting, but can only be covered as additional Task 6 examples, not as full product cases
GBO on 20070413
T7 General In addition to the BAT example and the ”1W” example, it seems reasonable to introduce ”0.5W” and ”0.2W ”examples for passive standby, as many equipment classes have BAT's between 0.2W and 0.5W, and for the others types (such as computer speakers), it might be lack of power optimisation that results in higher stand-by including for the BAT.
The corresponding costs will be increasingly difficult to estimate.
GBO on 20070413
T7 General A general comments is that it seems that the BAT values used in task 7 are not always the same as those used in task 6. As an example: the passive standby of computer speakers is quoted to be 1.5W in 7.1.2.4 while it is 2.5 W as ”confirmed BAT in Table 6-1 in chapter 6.4.
Confirmed BATs must be the same, will recheck.
GBO on 20070413
T 7 7.1.2.3 Regarding 7.1.2.3, Potentials from power supply side, it seems that if the efficiency is 60% then only 40% of the power use is losses in power supply, not 66% as stated in the text. Maybe it would be more useful to work on an assumption of a no-load consumption and an efficiency factor for the consumption, so the consumption becomes no-load consumption + useful consumption divided by the efficiency factor. The efficiency factor could vary with consumption. It seems that the assumed efficiency gain of 10% is low. More documentation on this could maybe shed more light on the actual efficiencies and improvement potentials.
Rephrase section more clearly. 10% more from 60 to 70 is certainly easy; from 80 to 90 it would be difficult for many products.
GBO on 20070413
T7 conclusion Finally, the conclusions in 7.4 seems very interesting with LFCC saving potentials of hundreds of EUR's per piece of equipment, often higher than the purchase prices for the cheaper versions of the type of equipment.
Corrections have been published on 27.4.2007 on the Lot 6 web site (as PowerPoint, not as full report) Some savings (in terms of costs) are still considerable related to product purchasing prices

Report for Tender No. TREN/D1/40 Lot 6 -2005 EuP Lot 6 – Feedback List 2nd of October 2007
Fraunhofer IZM CODDE Bio IS DUH Final Report Page 11-23
Feedback Topic or No Text Actions / Comments
POL on 20070420
Taking this to the limit it could become quite a problem. Lets take one extreme example. For e.g. a PBX supporting ordinary telephones would be classed as outside any definition of standby when at least one telephone is in use but inside the networked standby definition when no call is being made or received. It seems that some products (videoconferencing systems, PBX's, routers etc.) don't have to change their functionality for the definition of being in standby or not to change. Also some manufacturers would be quite keen to blur this issue so they can get away with the need to comply so it seems that this could be quite an issue! Has this issue been considered and if so what is the plan/intent for products where the dividing line is difficult to determine?
Similar to "always-on" coverage, no definitive answer yet.
SHOC on 20070427
T6,7 Während der Gespräche mit Kollegen ist uns die etwas unklare Darstellung der Art der schnurlosen Telefone in der Standby-Studie aufgefallen. Heutzutage wird von vielen bei einem schnurlosen Telefon automatisch eine Anrufbeantworterfunktion erwartet. Diese Funktion ist aber bei der Betrachtung im Task 7 nicht berücksichtigt. Um sicherzustellen, dass die Leser der Studie Ihre Berechnungen korrekt interpretieren, schlage ich vor, die Bezeichnung "Cordless phone" auf "Simply cordless phone without AM" zu erweitern.
- Should be translated - clarify in product case definition, but leave name.
SHOC on 20070413
6.2.3.2 (Cordless phone)
Seit der Erfindung des Telefons ist der Benutzer immer erreichbar, das Gerät steht ihm unmittelbar zur Verfügung. Ein Hardwareschalter z.B. am schlecht zugänglichen externen Netzteil könnte zur kritischen Situationen führen, insbesondere wenn ein sofortiger Gebrauch (Notruf usw.) notwendig sein sollte. Deshalb ist die Nennung von „hard-off switch on primary side“ als „possible improvement options“ nicht unbedingt zielführend.
Should not be listed as an option for cordless – recheck.
SHOC on 20070413
6.2.3.2 (Cordless phone)
Voll zustimmen kann ich Ihnen zu der Aussage in der Tabelle 6-1 (Summary): “EcoDect not applicable“. Die dazu von Ihnen im Kapitel 6.2.3.2 genannte Begründung möchte ich hier noch weiter ergänzen: a) Es gibt keinen EcoDECT-Standard. b) Es gibt keine offizielle Festlegung zur Reduzierung der Sendeleistung um das 250 000-fache. c) Der von der „Stiftung Warentest“ im Oktober 2006 gemessene Energieverbrauch von „Orchid LR128 TAM“,vom Hersteller als ECO DECT-Gerät beschrieben, lag mit 4,6W deutlich über den Durchschnitt der untersuchten Geräte.
a) yes, no standard b) no _official_ values, but this is presumably possible c) needs to be followed and d) Siemens is also offering EcoDECT - do they have better details?
SHOC on 20070413
6.2.3.2 (Cordless phone)
Der Einfluss des Sendesignals auf den Standby-Energieverbrauch lässt sich relativ einfach grob abschätzen: Im Standby Modus wird gemäß dem DECT-Standard nur ein kurzer Synchronisationsimpuls von der Dauer 1/100 eines Rahmens ausgesendet. Bei 250 mW max. Sendeleistung und einem angenommenen extrem schlechten Wirkungsgrad von 10% verursacht das eine mittlere Leistungsaufnahme von ca. 25 mW. Da das ca. 1% der derzeit geschätzten Leistungsaufnahme von 2,4 W entspricht, würde eine Abschaltung (egal ob ganz, oder auf 1/100) nur eine 1%-ige Einsparung mit sich bringen. Zusammengefasst lässt sich eine Reduzierung des Energieverbrauches eines schnurlosen Telefons durch folgende Maßnahmen erreichen: 1. Benutzung eines effektiven Netzteils 2. Intelligenter Ladealgorithmus 3. Schaltungsoptimierung (evtl. auch Abschaltung des Senders) Deshalb möchte ich Sie bitten, die Studie entsprechend der oben genannten Argumente zu korrigieren und die unbegründeten Zahlen und Begriffe herauszunehmen.
good assumptions to use further on transmission power levels

Report for Tender No. TREN/D1/40 Lot 6 -2005 EuP Lot 6 – Feedback List 2nd of October 2007
Fraunhofer IZM CODDE Bio IS DUH Final Report Page 11-24
Feedback Topic or No Text Actions / Comments
SHOC on 20070413
7.1.3.2 Differentiation by network type
Hard-off switch bei Breitband-Modems ist kritisch für Verbraucher, die ausschließlich VoIP-Telefonie betreiben. Es ist nicht zwingend notwendig, den analogen/ISDN-Anschluss parallel zu ADSL zu nutzen. Im solchen Fall ist es unmöglich, nach Abschalten des Modems den Benutzer telefonisch zu erreichen, bzw. Anrufe (auch Notrufe) schnell zu tätigen. Auch bei Modems, die gleichzeitig als DECT- Basisstation dienen, ist der Telefonbetrieb nach dem Abschalten nicht mehr möglich. Deshalb schlage ich vor, den Satz: The other long networked standby modes of the cordless phone and the fax machine are not included, because the loss of functionality will prohibit use of the hard-off switch in most cases. Um das Wort Modem zu ergänzen und die Berechnung entsprechend anzupassen: The other long networked standby modes of the cordless phone, the modem and the fax machine are not included, because the loss of functionality will prohibit use of the hard-off switch in most cases.
Certainly not all DSL modems are used accordingly, so some modems could benefit from switches.
SHOC on 20070413
7.1.3.4. Efficiency gains from the power supplies
Wenn man eine Effizienzsteigerung von 10% über alle Produkte betrachtet, ist das wahrscheinlich erreichbar. Bei manchen Produktsegmenten, insbesondere bei solchen, die auf neuen Technologien basieren, werden allerdings schon jetzt sehr effiziente Netzteile verwendet. So sind die meisten Breitbandmodems derzeit mit Schaltnetzteilen ausgestattet. Eine weitere 10%-ige Verbesserung ist aus physikalischen Gründen nahezu nicht zu erreichen. Deshalb schlage ich vor, die Breitbandmodems aus der 3b-Option herauszunehmen.
Problem of generalisation - at least to be mentioned in the product section.
SHOC on 20070413
7.1.3.5. Energy buffering for supplying networked standby
In diesem Punkt werden Ideen untersucht, für die es noch keine praktische Realisierung auf dem Markt gibt. Derartige Vorschläge gehören aus meiner Sicht in die BNAT Betrachtungen. Unabhängig davon stimme ich dem folgenden Satz zu: The option is not applied to cordless phones, notebooks and to the smaller peripheral devices of the PC (hubs, modems).
The solutions have been around for some time, but are indeed sparsely implemented, if at all.
ORG on 20070420
General Orgalime recalls that a common understanding of a set of definitions is a precondition for proper implementation of EuP directive. Only a common understanding can help that definitions will be applied consistently in all sectoral studies. In that respect, Orgalime suggests that a dialogue between the consultants in charge of the different EuP preparatory studies is ensured so that this set of definitions prepared by IZM is consistently understood and applied by other consultants in their respective ongoing lots. It was indeed reported from other ongoing lots that there is some reluctance from consultants to rely on the IZM definition work.
The revised definition was sent to all other lots in January 2007 (too late for lots 7 and 8)
ORG on 20070420
Orgalime recognises that in general off mode losses, where no function is provided, should be minimised to limit “waste” consumption. Yet such a general statement cannot always be directly transposed for stand by without due consideration of the specific functions of each product in each mode. For instance, for the grey area “network background communication", Orgalime has concerns on the possible consequence of contractor’s proposal to base the definition of stand by on features (functionality approach), as opposed to the primary functions offered to the users. We propose to consider some background service functions (e.g. network, safety, energy demand management…) as being also essential functions for the product to perform its primary function at best. Such an approach is necessary to secure fields of user driven innovation and get the right balance between basic user needs and overall environmental impacts.
Some service functions regarded in Lot 6 passive standby and some of the mentioned functions as networked standby. Should not be defined as "primary=main" functions. The functions may be active outside the lot 6 modes, of course.
ORG on 20070420
T1 and T4 The IZM draft definitions paper mentions product areas, which are covered by other preparatory studies or lots: Those „vertical studies” are e.g.: PCs and computer monitors (Lot 3), Imaging equipment: Copiers, faxes, printers, scanners, multifunctional devices (Lot 4), Consumer electronics: Televisions (Lot 5) or Domestic dishwashers and washing machines (Lot 14).Orgalime expects that further investigations of products in the area of standby and off mode losses, which are already covered by such vertical studies, will take place there and not within lot 6.This is notably true: - for additional product specific functions, which may not have been listed by IZM in its lot 6 horizontal approach (as mentioned page 17). - for any ranking of relative importance of functions for each product.
Vertical lots will have precedence _if_ they consider standby and off-mode in suitable depth. The overlap of products to draw generalised conclusions is not considered a problem.

Report for Tender No. TREN/D1/40 Lot 6 -2005 EuP Lot 6 – Feedback List 2nd of October 2007
Fraunhofer IZM CODDE Bio IS DUH Final Report Page 11-25
Feedback Topic or No Text Actions / Comments
ORG on 20070420
T1 and T4 Last but not least, setting up detailed figures for each service function running in standby or off-mode phases can be properly discussed only with careful consideration of each product specific design and conditions of use: a given service function (e.g.: clock) may be the only one running (e.g.: oven) or be in addition to a basic function continuously running (e.g.: temperature controlling of a refrigerator). Power consumption may thus consequently greatly differ from one product to another for an equivalent function. As a result, Orgalime sees the necessity for a clear substantiation of the study’s respective content to avoid overlaps and inconsistencies. Orgalime calls Commission to consider any recommendation to be issued by consultant in careful manner to avoid risks of overlaps/inconsistencies in different implementing measures (horizontal vs sectoral) and for given products subject to horizontal study
Detailed definition of product features is given in task 4 and 5. we distinguish between safety function (as standby) and primary function for on-mode (like temperature controlling of a refrigerator).
ORG on 20070420
Scope The draft report focuses on mobile phones though the report shows that energy consumption does not matter and that there is a particular study that focuses on external power supplies (i.e.: lot 7); other appliances are not considered (e.g.: MP3 players or digital cameras).
Mobile phone is exemplary for small external power supplies (others are not excluded they are included via representation). They were taken in case of high number of items. The do not contribute a lot, because improvements have already been achieved.
TOS on 20070420
T4 In terms of TV used hours, wouldn't it be better to consider the consistency with Lot5? Lot 5 Lot 6 On 4 4.7 A Standby 0.5 0 P Standby 19.5 12.1 Off Mode Loss 0 5.3 0Watt 0 1.9
was already changed before (only 0 W off-mode still different)
TOS on 20070420
T6, 7 The idea of buffered energy supply is introduced in Option 1c, 2c and 3c. Is this considered as a BAT or BNAT? If this is defined in BAT in this report, Toshiba think it too immature to be a BAT. We think that this technology should be discussed deeper before making it BAT.
The technologies (and patents) are not new, but indeed current proof of application is largely missing
TOS on 20070420
T 7 Regarding LLCC explained at 7.4 of Task7, Toshiba would like to ask some more explanation on this.
HPS on 20070420
General comments The Task 6 report contains a lot of text which could be summarized in tables. In principle all information is in the summary table (page 26) and in many cases the text only elaborates in words what is in that table. And what is the use of quotations, e.g. on page 6-4. Of course it is useful to have some explanation regarding the figures, so the text should concentrate on that
HPS on 20070420
Secondly, I find the analysis very much fragmented. One of the good points of the first tasks of the study is the definition of functions related to standby. I would expect somewhere in the Task 6 analysis the improvement options for each function. This is important because in the end this part of Ecodesign should lead to a horizontal measure, so in principle independent – or as independent as possible – from specific products. The analysis of specific products could show that this is possible – to a large extent. Because, why should a remote control function for a TV have a different power consumption than a remote control for a audio set or a DVD player? Of course this differentiation in costs also influences the calculations in Task 7. But maybe this is a subject that belongs to Task 8.
Report for Tender No. TREN/D1/40 Lot 6 -2005 EuP Lot 6 – Feedback List 2nd of October 2007
Fraunhofer IZM CODDE Bio IS DUH Final Report Page 11-26
Feedback Topic or No Text Actions / Comments
HPS on 20070420
Connected to this is the feeling that the report makes things unneccesary complex. E.g. take table 7-23 (List of quantified design options). In essence this table boils down to 3 options: 1) use a hard-off switch, 2) lower (off mode/standby) losses by an improved power supply and 3) more complex solutions (e.g. energy buffer). Option 3 is too costly, for option 1 it is doubtful whether this is a ecodesign option (see below); so that leaves option 2) Furthermore in this table contains both design options and targets (<1 W passive standby scenario).
HPS on 20070420
It could be debated whether a (hard) off switch could count as a design option under Ecodesign. The reason is that for an off switch to be effective (in reducing energy consumption), it requires operation by the user (not once but every time the product is switched off). If an off switch is a design option then also the option to let the user decrease the brightness for TVs and monitors in the on-mode would be an Ecodesign option. In my opinion a (hard) off switch is only a design option if it adds the “hard off” functionality to an already existing (soft) switch on the product. Example: for a mobile phone EPS the hard off switch would not be a design option, for a TV a hard off switch (in stead of a soft off switch) would be a design option.
Offering a hard-off switch or not is a design option. Offering other settings (some of which are energy relevant) can also be design options.
HPS on 20070420
T6 Page 6-1 (EMC and PFC): These functions are accessory functions, i.e. when the product is providing a function and draws power the function of these circuits is to have the product compliant with EMC and power factor regulation. However, if the product provides no function and therefore should not draw any power there is also no need for these circuits and consequently these circuits should not draw power.
Clarify in text.
HPS on 20070420
T6 So, I would suggest to change the sentences from “We propose nevertheless ….” to the end of the section (please note that the last sentence is not finished) accordingly
Check
HPS on 20070420
T6 Page 6-6 (Pilot current): The pilot current is less than 0.002 W (? Currents are normally expressed in A). A comparable solution has be suggested/prototyped and won a Swiss innovation price some 10 years ago. In general it means that the off mode consumption of magnetic transformers could be as low (or lower) as the off mode consumption of electronic transformers.
The "W" was in the source, but should be changed.
HPS on 20070420
T6 Page 6-9 and following: Why are TVs treated in this Task according to their display technology? Has the display technology any correlation with the standby power consumption? I have not seen yet any technical reason for such a correlation. The same holds for CRT and LCD displays.
No technical reason, but nevertheless different BATs were identified.
HPS on 20070420
T6 Page 6-12 (Standby values STB): The low standby values for the Philips box refer to standby passive mode. Because the box is a Free-to-Air box it has no standby active mode (networked standby mode). For STB the problem is not with the standby passive mode; this can be as low as for TVs (although this requires some extra components and therefore costs). The problem for the STB is in the standby active mode (which is not part of this study).
Philips was identified as passive only; such boxes may have EPG network function, nevertheless.
HPS on 20070420
T6 Page 6-13 (Low standby power consumption Whirlpool): is this due to the use of an electronic control?
HPS on 20070420
T6 Page 6-17 (PC+): What you describe here is that the problem with the PC is that the status the user thinks the PC is in, is often not the status the PC is in as defined according to the modes in the report.
HPS on 20070420
T6 Page 6-22 (auto standby transition into a low standby mode): the default time to sleep specification for Energy Star compliant printers (which are measured according to the Operational Mode method) varies from 5 minutes to 60 minutes, depending on the speed of the printer.
HPS on 20070420
T7 Page 7-3 (Primary side hard-off switch): the third bullet (and Table 7-3) exactly indicate why it confusing to speak about a 0 W off mode or a hard-off switch (realising a 0 W off mode)
HPS on 20070420
T7 Page 7-10 (Losses in power supply): the example (1 W standby functions leads to 0.66 W losses in the power supply) is confusing because you suddenly use 1 W for the internal power consumption (DC) and not as usual at the AC side.
rephrase more clearly

Report for Tender No. TREN/D1/40 Lot 6 -2005 EuP Lot 6 – Feedback List 2nd of October 2007
Fraunhofer IZM CODDE Bio IS DUH Final Report Page 11-27
Feedback Topic or No Text Actions / Comments
HPS on 20070420
T7 Page 7-14 (EPG updates): the reason that (pay-TV) set top boxes are continuously in standby active mode is not (only) due to EPG updates, but mainly due to security issues. Service providers want to make sure that the box is not manipulated with.
increase mention of security features
HPS on 20070420
T7 Page 7-14 (BAT CRT monitors): 2 W seems quite high. Is there any technical reason for this value?
HPS on 20070420
T7 Page 7-32 (User behaviour): I disagree with the statement that user behaviour on the levels described in Task 3 is a key factor for achieving any improvements in the market. The aim of an Ecodesign implementing measure on standby is to make informed buying decisions regarding standby power consumption unnecessary. You don’t want any buyer to spend time on choosing the 0.3 W no load power supply in stead of the 1.5 W; they should spend time on deciding about e.g. efficient heating equipment, solar panels, etc. Also informed use is of very little value for standby in general, if levels are low enough. This leaves only correct recycling and disposal behaviour as an important user behaviour factor.
Rephrase: If the products have a wide range of energy levels, the user is important, if all products are good, the user is less important.
BN on 20070420
General remarks I glanced through the Lot 6 reports. You have done a tremendous amount of good work -- congratulations. I would like to provide detailed comments, but to digest all the reports would unfortunately take much more time than I could devote to the effort.
see attached LOT 3 comments
BN on 20070420
Task 6-7 An effort I am part of aims to put a power management capability into Ethernet by providing a way to quickly change the link rate to follow the actual data being transmitted. Most Ethernet links are very lightly utilized the great majority of the time so that significant savings are possible (hundreds of millions of $/year in the U.S. alone once fully deployed). This merits specific reference I believe.
Analyse sources.
BN on 20070420
Task 6-7 We also are working to add technology to PCs so that they could stay fully network present while asleep. To the extent that Sleep is outside of your scope, this would of course increase Standby consumption, while greatly reducing total consumption. We call this "proxying". Best source of information about this right now is at: http://www.csee.usf.edu/~christen/energy/main.html on the Publications page. We will eventually have more on this at: efficientnetworks.lbl.gov
Analyse sources.
Loewe on 20070420
L5 Operating modes On Mode Play - Display on – full function mode (Sound or Vision) On Mode Radio - Display off – appliance produces sound On Mode Record - Display off; Receiving data from tuner (DVB-C/T/S) or interconnection with external apparatus On Mode Record to Disc - Display off; Receiving data from tuner and record on integrated Hard Disk Recorder Download Acquisition Mode - EPG, Display off Standby-active-low - TV can be switched on with external signal or remote control Neben dem On-Mode „Play“ gibt es weitere On-Modes, allerdings mit abgeschaltetem Display. Warum wir hier von On-Mode sprechen und nicht von Standby erklärt sich durch die Funktion des TV-Gerät’s als „Radio“ oder als Schaltzentrale für die Timer-Aufnahme. Des Weiteren liegt aufgrund des Betriebs der integrierten Module, wie z.B. HDR oder Sat-Tuner nach unserer Einschätzung bei einer Programmaufnahme ein On-Mode vor. Dem Kunden werden diese Betriebsarten durch eine Anzeige an der Gerätefront sichtbar gemacht.
- Translation? - good listing of modes for Lot 5 / Lot 6.
Loewe on 20070420
Dieser Systemgedanke bedeutet für den Kunden die Einsparung separater Geräte, wie z.B. Sat-Receiver, DVB-Tuner oder Festplattenrekorder. Diese sind im TV-Gerät integriert und werden über eine gemeinsame Fernbedienung gesteuert. Der Nutzer profitiert neben der Bedienfreundlichkeit auch von einer erheblich reduzierten Leistungsaufnahme gegenüber dem Einzelbetrieb der Geräte sowohl im Standby als auch im On-Mode. Diese Integration sollte aus unserer Sicht, nicht zuletzt wegen des deutlichen Einsparpotentials (Leistungsverbrauch, Umweltgedanke, Ressourcenverbrauch, Materialverbrauch), in der Studie explizit aufgeführt sein.
Convergence problem - 3-in-1 allowed more power?

Report for Tender No. TREN/D1/40 Lot 6 -2005 EuP Lot 6 – Feedback List 2nd of October 2007
Fraunhofer IZM CODDE Bio IS DUH Final Report Page 11-28
Feedback Topic or No Text Actions / Comments
Loewe on 20070420
LOEWE. – Geräte bieten dem Kunden eine Vielzahl von Funktionen auch im Standby. Einen Standby-passive – Mode gibt es derzeit bei LOEWE. nicht. Vielmehr ist im Standby-activelow eine Aktivierung des Gerätes über die Scartbuchse durch den DVD-Player oder durch eine Audio-Anlage möglich. Diese „Überwachungsfunktion“ setzt den Einsatz zusätzlicher Komponenten im TV-Gerät gegenüber Standby-passive voraus.
Very good hint: Even without EPG/STB functions TVs can be networked. However, clarify that not all TV will have this wake-up over Scart functionality.
Loewe on 20070420
Die Leistungsaufnahme bei unseren Standby-active-low-Betrieb beträgt trotz der Zusatzfunktionen derzeit nur 1,8Watt und das mit integriertem Sat-Receiver, DVB-Tuner und Festplattenrekorder. Eine Berücksichtigung dieses Wertes für BAT im Task 6 unter Punkt 6.3.2 würden wir begrüßen. Im Task 7 der Studie werden unter Punkt 7.5.1.4 die BNAT-Werte für Standby-passive und Standby- active-low aufgeführt. Allerdings finden sich im Abschnitt zwei unterschiedliche Angaben für Standby-active-low : 0,7 & 1Watt ! Ein Wert von 0,7 Watt ist aus heutiger Sicht nur mit hohem Aufwand und Komforteinbußen für den Nutzer zu erreichen. Eine Reduzierung auf <1 Watt bedeutet zwar ebenfalls eine umfangreiche Konzeptüberarbeitung, wäre aber mit einem Zeithorizont von 2 Jahren als BNAT vertretbar.
Very good BAT - the tuner is apparently only activated intermittendly.
FSC on 20070420
T4 The values for Standby and off-mode power consumption (Table 4-24) are very different in comparison to the values in Lot 3 Table 97 for the base cases of Lot 3. This need to be explained or adapted.
based on stock for 2005 and not sales figures ours used source fitting better (one sentence has to be paste in Task 4)
FSC on 20070420
T4, T1 In the case of PC home I would expect passive standby values in table 4-24 and 6-1 instead of networked standby. Can you please explain the reason for having only networked standby values for PCs.
task4 already contain a sentence for this isue (maybe not clear enough?)
FSC on 20070420
T7 The description of the design option 3a (Hard-off switch for networked...) on page 7-24 is not clear. Can you please explain it.
a primary side hard off switch is not for every networked standby product reasonable
FSC on 20070420
T7 The average additional costs for a hard-off switch of 1 Euro per product is too low (see e.g. page 7-9) waiting for industry input !
Beko on 20070413
T6 off-mode options Off mode could add to 6.2.1 Generic improvement option, description of this mode as below. In this mode TV is switched off by using Power button, Remote Control or Auto-Off function. In this situation TV is Off mode and could not switch-On again by Remote Control or Auto-On function. Only way to switch-On TV, pressing Power button which is a touch switch, placed on TV. This feature easily adapted by using a relay in primary side.
POL on 20070413
What about a video-conferencing system supporting IP and ISDN functionality. In this instance I can see an argument that when not in a call it is "keeping network integrity". However in this mode it is providing so much more. Not only is it keeping network integrity for the LAN and ISDN (BRI x4 and PRI) ports functionality, it enables web access for provision of presentation downloads uploading new software, communication with the gateway, address provision, positioning of preset camera positions and so on and so and so forth. This seems to be to be main function even though its not in a call?
GAR on 20070110
Section 1.2.1 approaches that take a wide scope with respect to standby and off-mode losses too broad and go beyond standby power issues
GAR on 20070110
Section 1.2.2 approaches that take a narrow scope with respect to standby and off-mode losses are too narrow such that they would not include many EuPs that are significant energy consumers
Report for Tender No. TREN/D1/40 Lot 6 -2005 EuP Lot 6 – Feedback List 2nd of October 2007
Fraunhofer IZM CODDE Bio IS DUH Final Report Page 11-29
Feedback Topic or No Text Actions / Comments
GAR on 20070110
Section 1.3 Garmin supports excluding mobile devices, primary battery operated devices and secondary battery operated devices from the scope of standby and off-mode losses for the reasons mentioned in section 1.3 of the Document. Garmin believes the exclusion should be extended to include mobile devices used while connected to the power grid. As stated in the Document, the devices are already energy optimized because of the limited energy budget they usually operate under. Standby energy consumption is optimized for this reason as well, so mobile devices used while connected to the power grid would consume very little energy during active operation, in standby and in off mode. Mobile devices used while connected to the power grid would not be a significant source of energy consumption because they would rarely be connected to the power grid. Devices that are truly mobile may only connect to the power grid while performing special functions, e.g. to transfer data.
GAR on 20070110
Section 1.3 If a device is used for a considerable amount of time while connected to the power grid it may not actually be a mobile device. A laptop with a docking station would be an example of such a product. While the laptop can be undocked and used as a mobile device, it is designed and intended to be used when connected to the power grid for an extended amount of time. A digital camera, on the other hand, is a mobile device that is intended to be used while disconnected from the power grid, but may occasionally connect to the power grid to save battery power while downloading pictures. The camera would not be connected to the power grid for an extended amount of time, and would be consuming little energy while it is connected to the power grid since it is designed to operate from the limited energy available in the batteries. The market for mobile devices pushes them to be efficient in order to provide longer use and standby time. It is very common for estimated battery life to be part of a product’s specification sheet, which becomes part of the product’s marketing.
GAR on 20070110
Section 1.3 In order to be competitive, manufacturers have to consider the market and design products which will be desirable to the consumer. Products that are not energy efficient will not be desirable and will not succeed in the mobile market. Improving the energy efficiency of mobile devices which are already designed to be energy efficient could lead to high costs and little efficiency gain. This would cause the consumer to pay more for a product that would have minimally improved environmental impact. The implementation cost/environmental benefit ratio would not be favourable. Garmin believes excluding mobile devices used while connected to the power grid from the scope of the draft definition of standby and off-mode losses would be an environmentally friendly act. The energy spent testing the units, e.g. lighting, heating or cooling the test facility, using the test equipment, using computers and printers to generate test reports, creating reports that will eventually be discarded, transporting products and personnel to and from test facilities, etc., could have a greater negative impact on the environment than not testing mobile devices.
GBO on 20070216
-request for better discussion of boundaries of lot6 issues: who will treat "always-on" products that do not perform a function for longer periods, "ready" states, installed equipment with stand-by, power supply via USB/Ethernet connections?
GBO on 20070216
-the use of ovens seem too low (38% of households)
GBO on 20070216
General -we advocate stronger conclusions on the lack of and usefulness of consumer information on stand-by.
GBO on 20070216
General -we advocate a user-friendly "off" function to a state without power consumption.
GBO on 20070216
General -we propose that variations of stand-by and off-mode consumptions among products in each product group are included.

Report for Tender No. TREN/D1/40 Lot 6 -2005 EuP Lot 6 – Feedback List 2nd of October 2007
Fraunhofer IZM CODDE Bio IS DUH Final Report Page 11-30
Feedback Topic or No Text Actions / Comments
NOK on 20070216
Main message: T4,5 All mobile products should be covered in this lot and treated in a similar way.
NOK on 20070216
General comment to T4 and 5
EPS (mobile phones) is now the only example for mobile products in LOT6. EPS and battery charger for mobile products should be included in this study. E.g. EPS & BC for digital camera, power tools, MP3 or other music players are not included at all
NOK on 20070216
Questions to T4, 5 We have a concern that there’s not enough time to include all commented issues into remaining task studies if proposals involve additional work (e.g. comments mentioned above).
Intel on 20070413
follow-up question/ comment
Was there a reason not to mention idling or sleep conditions? We would recommend that for PC's and other multi-purpose devices, these conditions are acknowledged as these gradations of energy consumption attempt to associate the variable load opportunities of these multi-purpose devices. Ideally, turning on only the functions that are needed. Alternatively, the fact that resuming to service the activity directly influences how low of a power level these multipurpose devices can achieve, could be highlighted.
Intel on 20070413
feedback on LOT 6 from Intel business groups
It was considered that the drafts contain a purely historic view. Technology and use trends, especially as they affect standby conditions, appear not to look at offline tradeoffs e.g. PC use as PVR or to replace the VCR, or cell phone charging, VOIP replacement of voice recorders, music storage, or appliance updates. Several of my colleagues were surprised by comments to allow users more power management control. When the controls exist, they don’t use them. Our experience is that if there’s an automated policy and one is forced to turn it off, the features are less likely to be turned off…therefore these things actually go to sleep or standby. In addition, we would recommend more investigation on technology transition affects on standby, as the need to reuse things like the PC when not engaged by the user, has found an increasingly large number of items. It would be useful to have trends in usage given these advances and capabilities; and, recommendations or conclusions on net energy usage.
HPS on 20070216 (2)
General comment The focus in this task (and also in task 4) is very much on specific product groups. Although this approach gives you concrete material to work with (and you can use data from other sources regarding the product groups), two additional aspects need attention (at least in the following tasks). The first is that the goal of this study is – amongst others – to contribute to a horizontal solution/approach for a horizontal aspect (off-mode losses and standby consumption). So, it is important that solutions can be found that overarch specific product (groups). It might be even that some product groups can be left out of this solution because they will have their own specific solutions (e.g. PCs, set-top boxes). Second, when analysing trends for a horizontal approach it is also important that products that are not yet on the market are taking into account. When restricting the trends to the specific product groups, you might miss these new products.
HPS on 20070216 (2)
Section 5.2.1 (Inputs for the EcoReport)
Page 5-6: The situation however is not so unique for Lot 6 as it might seem, because also for other Lots electricity consumption – although not being the only – is often the main environmental parameter, so the use of a different energy mix will also significantly affect the environmental impacts.
HPS on 20070216 (2)
Section 5.3.1 (Base Case 1: Off-mode)
Page 5-52 (Hourly off-mode consumption): The product cases do not represent all products that may have off-mode losses but at least the values constitutes a minimum level. Page 5-53 (The magnitude of the off-mode losses appears to be linked to the complexity): Is there any technical reason for this? In theory it should not because offering no functionality should be independent from other functionalities, and an off-switch for a complex product should not be different from an off-switch for a simple product. The conclusion might also be influenced by the large role the PC plays in the off-mode, where it can be questioned whether this is really an off-mode (see my remark to page 4-20). Figure 5-2: You seem to want to draw the same conclusions from figure 5-2 as from table 5-49. However, figure 5-2 also includes the usage pattern. So, three variables play a role: the power consumption in off-mode, the usage in off-mode and the complexity of the product (PUC1 to PUC3). It seems that the usage pattern is a moderating variable.
Report for Tender No. TREN/D1/40 Lot 6 -2005 EuP Lot 6 – Feedback List 2nd of October 2007
Fraunhofer IZM CODDE Bio IS DUH Final Report Page 11-31
Feedback Topic or No Text Actions / Comments
HPS on 20070216 (2)
Section 5.3.2 (Base Case 2: Lot 6 standby)
Page 5-54 (Hourly off-mode consumption): what do you mean with a visible difference? Is the difference statistically significant? Furthermore, that figures show that networked standby consumes more energy than the passive standby is not saying that this should be so. Figure 5-4: also this figure shows that the usage pattern has – as could be expected – a large influence on the energy consumption.
HPS on 20070216 (2)
Section 5.3.3 (Base Case 3: Automated Transitioning)
A lot of the text in this section could be classified as design considerations, which would be more appropriate in Task 7 (Improvement options).
HPS on 20070216 (2)
Section 5.4 (EU-25 Total System Impact)
Table 5-51: Not all calculations in this table seem correct. The totals for PUC2 networked standby, total standby and total per product case should be: 16.32, 18.22 and 19.31. The grand total is 50.42 but this can be due to rounding. Furthermore this table seems to relax somewhat the statements about PUC3 because one single product group (TV+) has a far larger networked standby energy consumption than all of the PUC3 products together.
HPS on 20070216 (1)
General remark It is not always clear whether data refers to the market (products offered in shops etc. at a certain moment) or the stock (products present in households and offices at a certain moment).
HPS on 20070216 (1)
Section 4.1 (General Approach)
Page 4-1:There seems a contradiction between the statement here that standby consumption and off-mode losses only have environmental impacts during the use phase and the differential approach indicated in task 5 (as also expressed in the last sentence of the paragraph). Page 4-3 (Areas for investigating improvement options): The two off-mode issues are confusing. Either (requiring) an off-mode is an option or it is not. If an off-mode is an option, then the power consumption should be (near) zero (allowing for electronic switches) because the off-mode means no functionality. If an off-mode is not an option (because it will be never used, etc) then the question regarding the power consumption in the off-mode is not relevant because the product does not have an off-mode.
HPS on 20070216 (1)
Section 4.2 (Mode translation techniques)
Table 4-3 (see also remark on task 1): standby-active, high = transition to standby and off mode?
HPS on 20070216 (1)
Section 4.3 (Data per product case)
In several cases (see e.g. Low Voltage Halogen Lamps) a correction factor is used. While this is a practical way to fit the data into the model, attention must be paid that the savings options refer to the right value. An example: one might argue that the average off-mode losses for Low Voltage Halogen Lamps with 1.24 W are not very far from the magic goal of 1 W and therefore nothing need to be done. However, this 1.24 W is a result of 0.5*(0.6*4 W + 0.4*0.2 W); the 4 W (off-mode losses of magnetic transformers) is certainly worth targeting (unless it is assumed that the market percentage of magnetic transformers will decline to near zero anyhow). Page 4-20 (Soft switch PC): the text suggests that a soft switch results in a significant level of power consumption, which need not be the case. Furthermore, often what is called off-mode for PCs is not off-mode according to the definition of this report (no functionality) because the PC has still wake-on-lan capabilities.
CECED on 20070110
General remarks CECED agrees with the approach taken by the consultant, which makes a distinction between modes that do not perform any function and others where some functions are performed. We also positively notice that the report acknowledges that beyond the active mode, some other functions are also considered as relevant. CECED is convinced of the need to continue reducing the power draw on electricity networks during all functions, in particular while products are not performing the main function. To that extent, CECED supports an approach that goes in the way of a horizontal legislative measure to limit off-mode losses.
no action necessary

Report for Tender No. TREN/D1/40 Lot 6 -2005 EuP Lot 6 – Feedback List 2nd of October 2007
Fraunhofer IZM CODDE Bio IS DUH Final Report Page 11-32
Feedback Topic or No Text Actions / Comments
CECED on 20070110
General remarks - cont. -
While off mode can be easily addressed through an approach that tackles in a horizontal way all products, this cannot be the case for the other consumption modes covered by the scope of the Lot 6 study. For properly addressing these modes, further in depth analysis would be necessary. As far as CECED most relevant products are concerned, they are already covered by vertical studies, which will carry out a comprehensive assessment off all environmental impacts, including the consumption in the different modes covered by the Lot 6 study.
CECED on 20070110
General remarks - cont. -
Home appliance manufacturers have succeeded in improving the energy efficiency of appliances during the use phase. This has been successfully conveyed to the consumers via the Energy Label. However, this takes into account only the energy used to perform the main functions. For the products already covered by a label, we think that the most convenient way to address all energy modes is by including all of them into a single all-inclusive energy efficiency rating that sets the basis for the calculation of the energy label classes. This would avoid confusing the consumers with complex technical differentiations and would provide the strongest incentive for an optimization of the overall product performances.
CECED on 20070110
General remarks - cont. -
Finally, we would also like to point out that clocks for oven appliances are employed in the use phase to optimise the cooking process and contribute to an energy efficient usage of the appliances avoiding waste. Therefore, such additional features (e.g. clock) or functionalities (e.g. timer for start delay) incorporated in a product should be granted sufficient power, while their elimination through minimum levels should be carefully avoided.
CECED on 20070110
General remarks While off mode can be easily addressed through an approach that tackles in a horizontal way all products, this cannot be the case for the other consumption modes covered by the scope of the Lot 6 study. For properly addressing these modes, further in depth analysis would be necessary. As far as CECED most relevant products are concerned, they are already covered by vertical studies, which will carry out a comprehensive assessment off all environmental impacts, including the consumption in the different modes
CECED on 20070110
Aqua-stop feature: it is a good example of a function increasing the level of protection of the product or environment and convenience, as might be a function helping in a better overall energy management
CECED on 20070110
Relationship between Lot6 Horizontal study and other Vertical studies:
we support Lot6 statement that “an eventual implementing measure on standby and off-mode resulting from the findings of the lot 6 study can be superseded by implementing measures for specific products.” We also deem that coordination among lots is necessary to optimise time and resources and to seek for a better alignment of the conclusions.
CECED on 20070110
IEC/EN 62301: even though in this text we make reference to Lot6 definitions (such as Lot6 off-mode losses, Lot6 standby), we do support International Standards as the base for measurements.
CECED on 20070110
Although refrigerators are categorized as PUC1-appliances, for us it is clear that these appliances do not have any off-mode losses when they are switched on and performing their main function.
CECED on 20070110
Minimal settings on page 9, §1.1.2 “Main performance characteristics”, it is suggested that “best optimized” can only be reached under the condition that nobody can change the settings. According to us, it could lead to less design flexibility, ignoring the fact that customer do have convenience needs.
CECED on 20070110
On page 10, §1.1.3 “General terms definition”
, under the “Sensor-based safety function” the word “necessary” could lead to misinterpretation, since other means of protective device are possible. We propose to reword the sentence as follows: “Sensor-based safety function: a continuously running sensor circuitry to increase the level of protection of the product or the environment”
CECED on 20070110
On page 10, §1.1.3 “General terms definition”
, under the “Information or status display functions” it is stated: “A LED showing a soft switch is in the off position would not change the classification as off-mode”. According to us even a simple LED should be considered an information or status display and, therefore, it should be considered Lot6 Standby.
But not, if it only signals that the EuP is in off & still consuming energy.
Report for Tender No. TREN/D1/40 Lot 6 -2005 EuP Lot 6 – Feedback List 2nd of October 2007
Fraunhofer IZM CODDE Bio IS DUH Final Report Page 11-33
Feedback Topic or No Text Actions / Comments
CECED on 20070110
On page 11, §1.1.3 “Lot 6 Mode Definitions”, point iii
According to us a more consistent wording could be “lot 6 standby mode offers reactivation functions and/or at least one of the continuity functions, depending on the PUC”
CECED on 20070110
On page 11, §1.1.3 “Lot 6 Mode Definitions”, point v.
“Otherwise (lot 6 standby determined according to iii.) the mode shall be termed passive standby mode”. According to us, the definition needs to be improved. As it is written now it is not clear enough. We suggest avoiding that a definition is simply based on the negative of another one.
CECED on 20070110
On page 13, §1.1.3 “Lot 6 Mode Definitions”, figure 2
the color-coding is not sufficiently explained. It has to be clarified what it is meant with green and light blue. Check
CECED on 20070110
On page 13, §1.1.3 “Lot 6 Mode Definitions”, figure 3,
for clarification purposes, the third box should be “Does the EuP offer any function either [added] to the user or to a connected technical system”
CECED on 20070110
On page 26, §1.1.6.5 “Filtering criteria”.
Handheld products have to be disconnected after use due to safety reasons (as stated in the manual) and therefore should be considered as in "disconnected mode" according to lot 6 definition.
CECED on 20070110
Handheld prods, such as epilators, listed at page 28 in table 11 are stored in cupboard after usage and therefore, should be removed from the table 11
refers to products with charging cradles
CECED on 20070110
Literature and annexes for Task 1-3 / Appendix 3-4.
We suggest the following time usage: o Toaster: Standby time 0h; Off-mode losses time 23.5 h; On-mode time 0.5h o Espresso: Standby time 11.5h; Off-mode losses time 12 h; On-mode time 0.5h
check
NOK on 20070110
Main message All mobile products should be covered in this lot and treated in a similar way. Summary of all LOTs (and products’) standby should be done and calculated by following same principles (e.g. penetration & volumes defined for certain time slot – energy consumption according to best & worst cases /always on, on/off mode). Products which are not anymore in use (waste) should be included in calculations (in case penetration figures are used).
NOK on 20070110
Task 1 Definition products have been categorised into PUC (product-use-clusters) - EPS belonging to PUC1 is ok but should cover all EPS, not just for mobile phones terms 'mobile product', 'mobile device' are used and it is not clear what are these 'mobile' products or devices --> only 'mobile phone' has taken separately and studied further in Task 1-3 reports. Preferably use mobile product as definition (valid for Task 2-3 reports) coverage of 'mobile products or devices' should be wider: e.g. digital camera, power tools, MP3 or other music players etc - none of these are mentioned --> Leaves big part of mobile products out and focuses too much on mobile phones. Assumed relevance criteria for EPS is "high volume with significant 'no-load' – this is not ok as such because volume weighted power consumption comparison figures are not presented (calculations?)
We do not have suitable market data for all "mobile products", therefore mobile phones are chosen as primary example for the low power range -- the Lot 7 data includes mobile products with comparable EPS, but is still named "mobile phone EPS"
NOK on 20070110
Task 2 Market data penetration figures are presented only for EPS for mobile phone and not at all for other 'mobile product/device' EPS – should cover all mobile products.
see above
NOK on 20070110
Task 3 Consumer Behaviour and local infrastructure
"Transparency, easy to understand and comparative information at the point of sales or even better in marketing or sales conversation could help the consumers in their buying decision ...." Could this be linked to marking/labelling?
Yes.
Report for Tender No. TREN/D1/40 Lot 6 -2005 EuP Lot 6 – Feedback List 2nd of October 2007
Fraunhofer IZM CODDE Bio IS DUH Final Report Page 11-34
Feedback Topic or No Text Actions / Comments
ELC on 20070210
Page 68: 2.2.3 Results for Lighting Appliances. 2.2.3.1
These appliances always come with a transformer. In the case where the switch is behind the transformer, these lamps are responsible for significant energy losses. - We agree that low voltage halogen lamps have a transformer that results in significant energy losses. This occurs when, in the actual application when the switch is behind the transformer, the application is responsible for significant energy losses. We discourage these solutions to deliver a reduction in energy losses from standby. Placing switches behind the transformer, in the secondary circuit, is not a common practice. - We would like to note that low voltage halogen transformers are used in different technologies. • Electro Magnetic. These transformers in general have significant energy loss also in a condition where the lamps are switched off in the secondary circuit. • Electronic transformers. These kinds of transformers can have relative low energy loss in the condition where the lamps are switched off in the secondary circuit. This mainly depends on the topology of the electronic circuit applied and choice of components.
The estimate might be high (50% secondary switching). Magnetic & electronic are already covered and explained.
ELC on 20070210
Page 69 We disagree with the assumptions, as they are incorrect: - Since the survey date (Survey from 2000), a massive change to mains voltage halogen has taken place (spots GU10 and capsules G9 base). - The assumption that halogen lamps below 55W are all 12V. Currently a significant number of 25/35/40/50W mains voltage halogen lamps are available on the market. This category is also fast growing.
These are simplifications. Possibly lot 6 estimates should be lower. But to which values?
ELC on 20070210
Page 95: 2.3.1.3 Trends for Lighting: annual increase of 3% in halogen lamp stocks until 2020 forecasted for UK.
We disagree with the statements in this section. We are aware of an increasing number of light points per household. This is due to the installation of more sockets with lower wattages. We know currently the relative growth in Central Eastern Europe is even faster. - We would like to state that the for the domestic sector the mains voltage halogen lamp demand is growing at a greater rate as compared to low voltage halogen lamps. - The trend to miniaturisation is therefore more significant in the application of mains voltage halogen lamps than LV halogen lamps.
Try to adapt into forecasts/trends.
ELC on 20070210
Page 114: 3.1.2.4.4 Lighting.
Also here we would like to state that the for the domestic sector the MV halogen lamp demand is growing at a greater rate as compared to low voltage halogen lamps.
growth rate for low voltage now lower
GAR on 20060830
General We agree, as discussed in section 1.2.1 of the Document, that the approaches that take a wide scope with respect to standby and off-mode losses are too broad and go beyond standby power issues. We also agree, as discussed in section 1.2.2 of the Document, that the approaches that take a narrow scope with respect to standby and off-mode losses are too narrow such that they would not include many EuPs that are significant energy consumers.
no action necessary
GAR on 20060830
Comments Garmin supports excluding mobile devices, primary battery operated devices and secondary battery operated devices from the scope of standby and off-mode losses for the reasons mentioned in section 1.3 of the Document. We believe the exclusion should be extended to include mobile devices used while connected to the power grid. As stated in the Document, the devices are already energy optimized because of the limited energy budget they usually operate under. Standby energy consumption is optimized for this reason as well, so mobile devices used while connected to the power grid would consume very little energy during active operation, in standby and in off mode.
no action necessary - product scope in interest of stakeholder

Report for Tender No. TREN/D1/40 Lot 6 -2005 EuP Lot 6 – Feedback List 2nd of October 2007
Fraunhofer IZM CODDE Bio IS DUH Final Report Page 11-35
Feedback Topic or No Text Actions / Comments
GAR on 20060830
Comments Mobile devices used while connected to the power grid would not be a significant source of energy consumption because they would rarely be connected to the power grid. Devices that are truly mobile may only connect to the power grid while performing special functions, e.g. to transfer data. If a device is used for a considerable amount of time while connected to the power grid it may not actually be a mobile device. A laptop with a docking station would be an example of such a product. While the laptop can be undocked and used as a mobile device, it is designed and intended to be used when connected to the power grid for an extended amount of time. A digital camera, on the other hand, is a mobile device that is intended to be used while disconnected from the power grid, but may occasionally connect to the power grid to save battery power while downloading pictures. The camera would not be connected to the power grid for an extended amount of time, and would be consuming little energy while it is connected to the power grid since it is designed to operate from the limited energy available in the batteries.
no action necessary - however, docking stations could be in scope
GAR on 20060830
Comments The market for mobile devices pushes them to be efficient in order to provide longer use and standby time. It is very common for estimated battery life to be part of a product’s specification sheet, which becomes part of the product’s marketing. In order to be competitive, manufacturers have to consider the market and design products which will be desirable to the consumer. Products that are not energy efficient will not be desirable and will not succeed in the mobile market. Improving the energy efficiency of mobile devices which are already designed to be energy efficient could lead to high costs and little efficiency gain. This would cause the consumer to pay more for a product that would have minimally improved environmental impact. The implementation cost/environmental benefit ratio would not be favourable.
no action necessary
GAR on 20060830
Conclusion Garmin believes excluding mobile devices used while connected to the power grid from the scope of the draft definition of standby and off-mode losses would be an environmentally friendly act. The energy spent testing the units, e.g. lighting, heating or cooling the test facility, using the test equipment, using computers and printers to generate test reports, creating reports that will eventually be discarded, transporting products and personnel to and from test facilities, etc., could have a greater negative impact on the environment than not testing mobile devices.
no action necessary
EICTA on 20060830
General In general the document seems extensive with a good overview of the very many different ways "Standby" can be considered and Table 2 appears to be a useful comparison for reference purposes.
no action necessary
EICTA on 20060830
Definitions We do not support the continuous reference to "losses" or the inferences that our industry's products are all wasteful because they consume energy. For example in section 1.2.1 where the concept of "leaked or wasted energy" is raised as a possible extension of standby. Consumption is a fact of life and our products contribute enormously to social and economic progress. We suggest that the authors use the more accurate term "energy consumption". Energy loss is debatable, even emotional, as it depends on one's viewpoint whereas consumption is a real quantifiable amount. Of particular concern is the section covering "losses" caused by user behaviour that are outside our designers’ control. How can producers legislate for people leaving a product on without actually using it? It seems strange to even raise this topic and we recommend that this whole section be omitted.
(1.2.1) to (1.1.4.1) not changed (we do not define standby as losses); user behaviour has to be considered & is related to features offered
EICTA on 20060830
Definitions We are also concerned about variable terminology introduced in this document rather than using US/EU Energy Star definitions which are already widely used and recognised for IT products. In particular, complex multifunctional IT equipment has various operating states and we believe it is beneficial to have consistent terminology in all associated standards. For example, the consultation document uses "Main", "Standby" and "Off" terminology whereas the EPA Energy Star program for computers and monitors uses "On", "Idle", "Sleep" and "Standby". Since there is clear similarity between the definitions, EICTA asks why introduce new terms for IT products? The definitions of EuP Lot 6 task 1 document should be aligned with those in the Energy Star Computer V4.0 specification.
EnergyStar and IEC etc. also have conflicting terminology, so we do not follow EnergyStar for Computers

Report for Tender No. TREN/D1/40 Lot 6 -2005 EuP Lot 6 – Feedback List 2nd of October 2007
Fraunhofer IZM CODDE Bio IS DUH Final Report Page 11-36
Feedback Topic or No Text Actions / Comments
EICTA on 20060830
Comment Further guidance on power modes and energy consumption is provided in the most current eco design standard ISO 62075 CDV based on ECMA-341. In addition to using the generic modes, Energy Star modes should be used where available. Consistency at an international level is key to manufacturers’ ability to meet the various standards. There is also a need to recognize that low power states will continue to change as the focus on AC energy consumption increases.
ISO 62075 is considered only for computer (1.3.2.1)
EICTA on 20060830
Scope It seems that the Blue Angel and the ENERGY STAR requirements are mentioned together implying that these will or should be aligned perhaps even to form the basis for legislation. We would like to stress that ENERGY STAR, Blue Angel and other such initiatives are voluntary and whose intention is to provide customers with the means to distinguish the top-performers from the rest. Hence, we do not believe that they can be copied one on one to form the basis for mandatory measures.
Stress the differences between mandatory and non-mandatory (esp. 1.3.1)
EICTA on 20060830
Conclusion Finally, EICTA believes the section on inclusion of renewable energy is muddled. Since the purpose of the task is to focus on "energy consumption" that impacts the global demand for energy and thereby contributes to global warming, EICTA questions the need for this section.
The question is only raised, not answered.
ORG on 20060830
Definitions Paragraph 1 of the paper gives a comprehensive survey of existing definitions to Standby and explains the differences of the various approaches and standards based on. Finally, IZM determines an own definition to Standby und Off-mode Losses. We would like to propose to include the following expressions in the definitions:
ORG on 20060830
Page 9, 10: Definition of „Idle” and „Idle losses“ Page 17: Definition of „throttling“ Page 17: Implementing of ACPI-Stati S1, ..., S5 für Personal Computer
The computer specific terms have not been integrated in the revision.
ORG on 20060830
Concerning the definition of testing on open systems (e. g.: in the area of IT equipment) the basic configuration of the product delivered from manufacturer should be determined. For these products a wide range of configuration adjustments is possible. In connection with test standards for the “Energy Star”, IZM states that generally IEC 62301 (Household electrical appliances) is applied as reference for the majority of test standards for power consumption in Standby. In case of adapting this standard for testing of products, which are not covered by household electrical appliances, this should be substantiated.
Yes, IEC 62301 is used for non-household products already
ORG on 20060830
Functionality IZM proposes for definitions and further investigations to implement the "functionality approach" for the studies on standby. The different operating modes are determined as functions, whereby every mode, which would not be an “operating mode” or an “off-mode”, would be defined as “standby”. Apart from the core questions to the consequences of such a functionality approach, we have concerns e.g. with the grey area “network background communication". We further see the need for discussions in the field of base cases.
No action taken, but discussion to be continued

Report for Tender No. TREN/D1/40 Lot 6 -2005 EuP Lot 6 – Feedback List 2nd of October 2007
Fraunhofer IZM CODDE Bio IS DUH Final Report Page 11-37
Feedback Topic or No Text Actions / Comments
ORG on 20060830
Scope The IZM draft definitions paper mentions product areas, which are covered by other preparatory studies or lots: Those „vertical studies” are e.g.: - PCs and computer monitors (Lot 3) - Imaging equipment: Copiers, faxes, printers, scanners, multifunctional devices (Lot 4) - Consumer electronics: Televisions (Lot 5) - Domestic dishwashers and washing machines (Lot 14) Orgalime expects that further investigations of products in the area of standby and off-mode losses, which are already covered by such vertical studies, will take place there and not within lot 6. This is notably true for additional product specific functions, which may not have been listed by IZM in its lot 6 horizontal approach (as mentioned page 17). This is also valid for any ranking of relative importance of functions for each product. Last but not least, setting up detailed figures for each service function running in standby or off-mode phases can be properly discussed only with careful consideration of each product specific design and conditions of use: a given service function (e.g.: clock) may be the only one running (e.g.: oven) or be in addition to a basic function continuously running (e.g.: temperature controlling of a refrigerator). Power consumption may thus consequently greatly differ from one product to another for an equivalent function. As a result, Orgalime sees the necessity for a clear substantiation of the study’s respective content to avoid overlaps and inconsistencies.
Overlap intentional; clarification about vertical studies overruling horizontal ones added.
CECED on 20060830
General remarks CECED acknowledges the need of reducing the power drawn on electricity networks occurring when products are not performing their primary functions. European household equipment manufacturers have proactively achieved a significant decrease of their products energy consumption through Unilateral Industry Commitments that, in combination with the EU Energy Labelling scheme, have fostered the development of more efficient appliances. Throughout these innovations, from 1995 to 2005, CECED members have improved the energy efficiency of the most relevant products of about 40%.. As a result, it is estimated that about 17 Mt CO2 have been saved, equivalent to the amount of CO2 generated by 9 new thermo-electric generation plants of 500 MW each. CECED welcomes the recognition that standby energy consumption is understood as an important service offered to the user and not as an energy loss. In addition to that, we also welcome the proposal to study the background of all the functionalities, as an important step toward a balanced approach between power and performances.
no action necessary
CECED on 20060830
On Standby definition The Study performs a good survey of all existing standby definitions, either coming from International Standardisation bodies, conference papers and Voluntary Agreements. However, the Study is redefining the meaning of words already well established in the standardisation arena. Even though we understand the need to include in the Study all operating modes not pertaining to main functions, so to optimize the overall energy consumption, we stress the need to keep consistency with the EN62301 definitions. As an example, any future product specific standard (as IEC60456 for washing machines) will refer to IEC62301. Once preliminary studies have been completed, if European Commission mandates CENELEC to include Lot 6 Study definitions in the standards, we will face a very complex situation for EN60456 and other product standards, since the standby definition from Lot 6 Study is not in line with IEC/EN62301. Some open-ended questions arise: how can the new definitions coexist with already established concept in International Standardisation? What would be the measurement standard selected to check standby power consumption? CECED maintains that any new Standby definition should be coherent with already existing International Standards, so to minimise potential future problems.
no new standby definition can be in-line with all existing definitions. For the future of the mode definition in IEC 62301 see EES/Harrington.
CECED on 20060830
1 In the sub paragraph about “Classification of standby functions”, under §1.4. “Functionality Approach”, we would propose to investigate the very important Safety functions, as for instance water stop function in a washing machine. Furthermore we consider that oven clock displays represent a relevant feature of the product and that any oversimplification about this function must be avoided.
Yes, expressly included now.

Report for Tender No. TREN/D1/40 Lot 6 -2005 EuP Lot 6 – Feedback List 2nd of October 2007
Fraunhofer IZM CODDE Bio IS DUH Final Report Page 11-38
Feedback Topic or No Text Actions / Comments
CECED on 20060830
2 Under chapter “3. Existing Requirements on Standby and Off-mode Losses” we would add a reference to Commission Directive 2002/40/EC on Energy Labelling for Ovens of 8 May 2002, where Standby power consumption has been listed as one of the mandatory information in the product Fiche “…as soon as a suitable harmonised standard for stand-by-losses becomes available”. This is a concrete first approach and could probably have influence on other product categories.
Yes, included.
CECED on 20060830
3 As Standby functions are also investigated in the other EuP Lots, we consider that it is of the utmost relevance that the other Lots have an approach compatible with the one taken in Lot 6. We expect that the detailed investigation of standby functions of the products covered by other Lots is under the responsibility of the specific consultants, which evaluate the products under all the different facets. Lot 6 should refrain from getting in these details for the product covered by vertical studies. Therefore, there is no need for “distilling” standby functionalities at any type of EuP, outside the proposed scope of the study (as mentioned at page 17).
Discussed further, "overruling" now in the document. Otherwise "harmonisation" between lots and who has more "details" on standby is not resolved
CECED on 20060830
4 We agree with the fact that the list of products (page 17) is not a complete listing, but we would like to specify from the beginning that espresso makers should be considered as coffee maker, as far as the issue of keep warm/hot water is concerned, because of the common basic functionality performed.
table not continued. however, in the Nordman classification a similar distinction is still used.
CECED on 20060830
5 We would also propose to avoid using the term “optional” when defining the transition to standby (page 7), and replacing it with “any” to avoid misinterpretations and unnecessary reduction of the scope.
rephrased
CECED on 20060830
6 We welcome investigations on User behaviour before taking further steps although we know that user behaviour is very different across European countries. For instance, there are a number of functions that can be switched off by the User, therefore reducing voluntarily the needed power; or there might be products plugged off after use (e.g. irons and kitchen appliances) and thus they do not need any standby power.
Both behaviours are taken into account - but the differences across Europe are not detailed so far
GBO on 20060830
General The division of stand-by mode(s) (with some functionality) and off-mode (no functionality except a possible indicator of the status) seems to be a good definition, even though it does not conform with some existing definitions (that define stand-by as the mode with the lowest power consumption).
No action necessary
GBO on 20060830
Scope of definition 1 The basis for the work is to develop a basis for defining labels and standards that can inform consumers and regulate the market for energy using products that are used in larger numbers, e.g. consumer equipment. Therefore it seems reasonable to extend the scope beyond what is proposed in the draft: It would be reasonable to include: -equipment intended for use in households and that is intended to be supplied with network energy -equipment general professional use (products for general use in offices, shops, cafes/restaurants, general tools for workshops and in construction) and that is intended to be supplied with network energy -equipment in general use in public places and that is supplied with network energy
Extension of product scope: not possible, but check that such examples are mentioned, when the scope is determined
GBO on 20060830
2 This will, in addition to the products proposed by the draft, include: -gas equipment with stand-by flames -equipment for general professional use, possibly limited to equipment used more than a specified quantity in EU (specified by product category.) -equipment for use in public places, possibly limited to equipment used more than in a specified quantity in EU (specified by product category).
Comment on gas standby included (but not in product scope)

Report for Tender No. TREN/D1/40 Lot 6 -2005 EuP Lot 6 – Feedback List 2nd of October 2007
Fraunhofer IZM CODDE Bio IS DUH Final Report Page 11-39
Feedback Topic or No Text Actions / Comments
GBO on 20060830
3 The reason for inclusion of the gas equipment is that gas stand-by flames are still common in the market in a number of EU countries. The reason for inclusion of equipment for general professional use is that this equipment in many ways follows the same pattern as equipment for household use. (it is also covered the US 2005-order for public procurement mentioned in the draft). The reason for inclusion of equipment for use in public places is that this equipment in some cases have a large consumption in stand-by and that it is important to be able to evaluate this at the time of purchase, e.g. in public tenders.
Comment on gas standby included (but not in product scope)
GBO on 20060830
Connected Products Products that in their functionality are part of other (primary) products, should be considered in stand-by mode when the primary product is in stand-by mode, even if they are powered independently. Examples of such equipments are TV decoders and antenna amplifiers. The reason for this proposal is that seen from the consumers’ perspective such equipment has functionality that is entirely linked to the primary equipment and its energy consumption only has the purpose to assist the functionality of the primary equipment. The inclusion of such equipment in this lot will help to make energy consumption of such equipment visible for consumers.
In principle discussed, but from the method only EuPs are examined, not connected products
TCO on 20060830
Comment The TCO label is not geographically limited to Sweden as you write in the report. The label is well known and used in many countries over the world and the certificate is valid globally. The strongest markets where the TCO label are demanded for procurement are northern Europe and USA. Today about 50% of monitors produced world wide are TCO labelled.
Changed
ZVEI on 20060830
Definitionen Abschnitt 1 des Papiers gibt einen umfassenden Überblick über existierende Definitionen zu Standby und erläutert die Unterschiede der verschiedenen Ansätze, legt dann allerdings eigene Definitionen zu Standby und Off-mode Losses fest.Bei den Definitionen sollten noch folgende Begriffe berücksichtigt bzw. ergänzt werden: S. 9, 10: Definition der Begriffe „Idle“ und „Idle losses“ S. 17: Definition des Begriffes „throttling“ S. 17: Ergänzung der ACPI-Stati S1, ..., S5 für Personal Computer
already covered elsewhere
ZVEI on 20060830
Definitionen Bei der Definition von Messungen offener Systeme (z. B. im Bereich von IT-Geräten) sollte festgelegt werden, dass der Auslieferzustand ab Werk als Basiskonfiguration für derartige Messungen angewandt wird.
already covered elsewhere
ZVEI on 20060830
Im Zusammenhang mit Testverfahren zum “Energy Star” stellt IZM fest, dass für Messungen generell IEC 62301 (Household electrical appliances) als Referenz für die Mehrzahl von Testverfahren für den Stromverbrauch im standby angewandt wird. Falls dieser Standard für Messungen von Produkten herangezogen werden, die nicht unter den Anwendungsbereich der Elektrohausgeräte fallen, ist dies im Einzelnen zu begründen.
already covered elsewhere
ZVEI on 20060830
Funktionalität Das IZM schlägt vor, für die Definitionen und weiteren Analysen den "functionality approach" bei den Untersuchungen zu Standby zugrunde zu legen. Den unterschiedlichen Betriebszuständen werden damit Funktionen zugeordnet. Jeder Betriebszustand, der nicht unter "Normalbetrieb" bzw. "Aus-Zustand" zu sehen ist, wird demnach als Standby definiert. Neben der grundsätzlichen Frage nach den Konsequenzen dieses Funktionalitätsansatzes sehen wir u. a. beim Thema "Network background communication" sowie zu den Produktbeispielen weiteren Diskussionsbedarf.
already covered elsewhere
ZVEI on 20060830
Anwendungsbereich Das Definitionspapier erwähnt Produktbereiche, die bereits durch andere Vorbereitungsstudien bzw. Lose erfasst sind. Diese „vertikalen Studien“ betreffen z. B. - PCs and computer monitors (Lot 3) - Imaging equipment: Copiers, faxes, printers, scanners, multifunctional devices (Lot 4) - Consumer electronics: Televisions (Lot 5) - Domestic dishwashers and washing machines (Lot 14)
already covered elsewhere

Report for Tender No. TREN/D1/40 Lot 6 -2005 EuP Lot 6 – Feedback List 2nd of October 2007
Fraunhofer IZM CODDE Bio IS DUH Final Report Page 11-40
Feedback Topic or No Text Actions / Comments
ZVEI on 20060830
Anwendungsbereich Standby und Off-mode Losses, die durch eine derartige „vertikale Studie“ abgedeckt sind, die jeweiligen Anwendung auch dort untersucht und nicht in Lot 6 erfasst werden. Produktspezifische Untersuchungen sollen also im Umfang der Lots 3, 4, 5, 14 etc. erfolgen, wobei eine Harmonisierung der Definitionen bzw. Interpretation der einzelnen Modi anzustreben ist. Wir halten diese klare Abgrenzung des Untersuchungsrahmens für dringend erforderlich, um Überschneidungen mit anderen Untersuchun-gen und Inkonsistenzen bei den Ergebnissen zu vermeiden.
already covered elsewhere
EES on 20060830
General The report is an excellent examination of the issues associated with energy consumption of products in standby and other low power modes. It shows a thorough understanding of the main issues and provides a solid basis for moving forward on this issue.
no action necessary
EES on 20060830
General The approach to determine power requirements in terms of functionality is a good one. This is critical as we know that product functions and their combinations within products can change in time and a generic approach is likely to be the most robust. There perhaps needs to be a distinction between functions that are “essential” for consumer convenience and operation and those which may be considered optional.
in general the "passive" standby could "essential", or this has to be discussed for product cases
EES on 20060830
General Great care is required regarding the definition of primary function or on mode. If the primary function is always excluded from the scope of this study, many manufacturers will be encouraged to remove low power modes and power management from their products (meaning that they will always be on) to possible avoid future requirements. A better approach may be to specify functions that are included within the scope – then it will not matter whether these functions are the primary function or not.
That is the approach - but potential loopholes have to be watched (in this case escape via always on)
EES on 20060830
General Clearly, the use of IEC62301 will be important in the measurement of power levels in different modes. However, the definition of “standby mode” which included in this standard is of little value in your work as it defines a power level for a particular product, not a level of functionality. Even within one product type, the IEC62301 “standby mode” may include different levels of function for different individual products. So it is recommended that the definition in IEC62031 not be used in your study and that if you are using the term “standby” in your reports, maintain the current sense of the word, which is a general term which covers a range of possible low power modes for products. (refer to discussion on Page 9 and Section 1.2.2).
Agreed, also related to using "lot 6 standby" throughout
EES on 20060830
Your suggestions on ways to improve IEC62301 would be most welcome. While a product may have a wide range of possible modes, the ones of most interest are the ones in which the product will spend most of its time. Clearly, modes which consume the most energy are also of interest, although in many cases these will tend to be active modes. So some consideration needs to be given to whether a mode is likely to be activated during normal use. For example, a product may have an off mode or a power saving mode. However, if this mode is very complex to activate (or deactivate) or if a switch is difficult to access, then many consumers are unlikely to enter that mode.
Our suggestions are not concrete enough; should be revisited later in the study
EES on 20060830
There are many cases where power consumption in a particular mode is high because of poor product design or inappropriate configuration. The minimum power consumption possible through good design should set the relevant benchmark for a particular level of functionality.
Agreed, but not taken up in task 1 revision
EES on 20060830
One aspect that may be worthy of consideration is to restrict consideration to modes that will persist for an indefinite period without interruption from the user or external sources. This would essentially remove from consideration modes such as delay start or intermediate modes that may occur during power down or prior to load management activation. While these intermediate modes are of some interest, temporary modes should not be the main focus of concerns at this stage.
Have tried that approach (principally unlimited duration), but did not achieve the coverage and flexibility for a horizontal investigation

Report for Tender No. TREN/D1/40 Lot 6 -2005 EuP Lot 6 – Feedback List 2nd of October 2007
Fraunhofer IZM CODDE Bio IS DUH Final Report Page 11-41
Feedback Topic or No Text Actions / Comments
EES on 20060830
Networked appliances are becoming more common. What is critical for these products is to ensure that any residual or required communication functions that are active are at the lowest state possible for the relevant product. For example, there is little point in keeping a gigabit port active continuously on an appliance when it only has to check the network tariffs once per day. This comes back to the design of the network protocols to which products are attached to ensure that they are power management friendly. This is a key area of work that is yet to be advanced.
Agreed, similar aspects already appear in the documents & networked standby is looked at specifically
EES on 20060830
The other issue for all products is power management – all products should move to the lowest possible power state to maintain those functions that absolutely necessary for the acceptable operation of the product. While this is a common sense statement, it may be hard to apply on a case by case basis. See comments on Section 1.2.1 below. This is perhaps a future consideration, but it may be worth flagging early in the project as an item of future interest.
After revision covered through PUC 3 and Base Case 3
EES on 20060830
Preface Increasingly, there is concern about products that are continuous in nature such as monitoring and security equipment, clocks and timers and a wide range of other equipment that does not fall into the traditional basket of “standby” (these are often called base load). In these cases, the functions present may in fact be the main or primary function, so the study should not be restricted to modes that are not the main function. For many equipment types the distinction between active mode and “standby” modes is rather unclear. There are many examples where this is important so not including these functions or modes would be leave a large gap in the study scope. See comments on Table 6.
Yes, some exclusions (like radio alarm clocks) are not obvious, but logical.
EES on 20060830
Definition Proposal(i) While the 3 way split (on, standby, off)is notionally good for a simple product, there are many cases where only 2 or possibly only 1 of these modes will be present on a particular product. Also, there are many products which may multiple intermediate “standby” modes. So flexibility is required in interpretation.
We think the compromise between clarity and flexibility is workable - but some of the "multiple intermediate" modes will be out of scope
EES on 20060830
Definition Proposal(iii) The concept of off as being no function is a good base position. However, our experience is that many products use some power when in off mode. This may be due to poor design or it may be because some functions are in fact present and being performed without the knowledge of the user. For example, many products have some power consumption in “off” mode because they may have EMC filters which are on the mains side of an off switch. Of course EMC filters are required, but placing them so they are always energised results in unnecessary energy consumption. However a function for clothes washers such as monitoring valves for leakage and flood prevention may be a legitimate function which is operating in the background but it may not be obvious to the user. Power may also be consumed in off mode because of the use of low voltage operated soft touch switches (which require a DC rail to be alive at all times). This is perhaps an area that is unclear between off and a higher level of function. There are now a whole raft of products that have no off switch, so this needs to be considered. See also comments on Figure 3 below.
Yes, this is all covered as off-mode (or sensors as standby). The "may not be obvious to the user" part in Australian standby definition is also problematic
EES on 20060830
Definition Proposal (iv)
The definition for standby here is fine in a general sense. However, there needs to be judgement at some stage about what functions are essential for the ongoing usefulness of the machine and how this could be done in the least power consuming fashion. For example, maintaining program settings is desirable. However, this can be done without ongoing energy consumption through the use of EPROMs or other non-volatile memory chips. Similarly, many products have clock displays, but not all of these are necessarily essential.
Agreed, while we do not judge the usefulness of functions, alternatives which use less or no energy will be discussed (Task 6-7)
EES on 20060830
Definition Proposal (v) As noted above, there are many products that should be of interest that effectively only have one active type mode. It would be more useful to think of products as a collection of “functions” and in this way any product that has a designated function would have to meet the relevant requirements. We want to make sure that product designers do not have an incentive to add functions or modes to their products with the intent of gaining advantage or avoiding regulation. Conversely, we don’t want manufacturers to remove off or standby modes to avoid requirements.
Yes, loophole discussion will be difficult. Our approach seems to be "no worse" than other approaches.
Report for Tender No. TREN/D1/40 Lot 6 -2005 EuP Lot 6 – Feedback List 2nd of October 2007
Fraunhofer IZM CODDE Bio IS DUH Final Report Page 11-42
Feedback Topic or No Text Actions / Comments
EES on 20060830
Definition Proposal (vi)
Definition Proposal (vi): The definition as you have stated it here means that if there is a product such as a smoke alarm and its main function is to detect smoke, then this mode is the active function and therefore it is outside the scope of this study. I think that this is not a good position because it means that huge numbers of products will be automatically excluded. This may also mean that manufactures have an incentive to not provide an off switch or off mode on their products in some cases. The definition as you have stated is probably OK for a traditional appliance like a clothes washer, but may not work for other more complex products or for products where the main function is monitoring or display of time or temperature for example.
Yes, always on products are not covered even though some are "traditional" standby topics. Closing loopholes might require that also potential PUC 3 products have at least one standby or off-mode - but this might be very harsh on some products.
EES on 20060830
Page 8 – Table 1 The case of a network status event can be considered as steady state if the interactions are regular and result in a consistent power profile. IEC62301 envisages varying power levels with a consistent pattern over time and regards these as effectively steady state. The case of the timer causing a product to start at regular intervals (say at 7am every day) is a special case and the standby power should definitely be associated with the need for the timing function. A question of more interest is whether the timer function can be deactivated or disconnected during normal operation. Delay start functions should not really be considered in this category as these are one off events – a delay start can only initiate one program. Any additional delay start operations will require further delay start programming by the user.
That is exactly covered by networked standby. We do not differentiate "one off" or "repeated" timers.
EES on 20060830
Page 9 - Table 2: Australia has defined modes for a large number of product types and we would be happy to include some information for you table if you are interested. The Korean Standby 2010 program have also a wide range of definitions which may be of interest.
Not included in table, but taken into account (e.g. Australian definition will be in Task 4)
EES on 20060830
Page 10 – Figure 3 It is agreed that off mode with no power consumption is not of key interest for this study in terms of energy consumption. However, if a product uses no power in off mode, then this needs to be determined and verified and products who achieve this need to get credit for this achievement. There are also products that do no have any off or standby mode (or a function of interest to this study, to be more precise) – this needs to be clarified in the supporting text.
Out of scope discussion is included; "0 W credit" is not yet
EES on 20060830
Defining zero power consumption is sometimes difficult. Even when a power cable of a few metres length is plugged into a sensitive meter (which is required for IEC62301), a power consumption of up to 30 mW can result, purely from the magnetic resonance in the cables. At a power level of 50mW it is possible to design some circuits to performance functions that maybe desirable such as a remote control or monitoring function. So the breakpoint between no loss off modes and off modes with some losses is a little bit unclear in many cases. It is safest to include all possible off configurations within the scope but if they are measured as 0.0W, then this is fine. it is of little concern in any application and will not affect overall energy consumption as noted
Intended to switch to "near 0 W", but decided on the simpler term.
EES on 20060830
The problem with separating off mode and standby modes is that it is not always possible to know what functions are active in a product in any particular mode without asking the product designer to explain the design and operation. The safest approach is as set out in Table 1 – define products as either perceived off mode (when it looks like the product has no function – as far as the user is concerned) or as a mode with a particular function or set of functions which is (are) active.
But perceived off could include EPS no load... the "perception" part is also difficult.
EES on 20060830
The distinction of “hard off” is of little value as well. There are many products which are known to have a hard off switch but where there is some power consumption in off mode. These reasons for this can be many fold (or they can be a mystery). The only thing we can say for sure is that if a product appears to be off and uses virtually no power in this mode, then this fact needs to be noted and it will have little influence on total energy consumption while in this mode.
We also note that "hard off" is not 0 W. The other reasoning is good, but not yet taken up.
EES on 20060830
Page 10 – Section 1.2.1
This issue is really touching on the issue of power management. This is an important topic and has the potential to save a large amount of energy in the longer run. But it is agreed that this may be a little too ambitious to include in the first stage of this project. The issue is that the product needs to be able to work out when it is not required and then to shut down to a lower level of function wherever possible.
Yes, job-based products (PUC 3)

Report for Tender No. TREN/D1/40 Lot 6 -2005 EuP Lot 6 – Feedback List 2nd of October 2007
Fraunhofer IZM CODDE Bio IS DUH Final Report Page 11-43
Feedback Topic or No Text Actions / Comments
EES on 20060830
Page 11 – Section 1.2.2
As one of the primary authors of IEC62301 I fully support your discussion and conclusions with respect to the definition of “standby mode” in IEC62301. As noted above, I agree that the definition in this standard is of little value to you and it should be discarded. Note that IEC62301 also envisages that a range of other relevant low power modes may be present that these should be defined and measured in addition to “standby mode”. I would be happy to provide some additional background on the origin of the definition, but one aspect was that we knew that IEC62301 would be applied to a large number of possible products and we had no idea of the possible modes or their names for these products. The definition of “standby mode” was more or less concocted to give a sense of what the title of the standard was intended to cover (low power modes, not the main function). Most products would have at least one mode that would fit into that definition. The standard was always intended to be a measurement method rather than a way to define modes, the it should be considered in this context.
Agreement, and note the wording "discarded" - very clearly put.
EES on 20060830
Page 12 - Section 1.2.3 This is a very good discussion and makes a number of relevant points. One issue within IEC62301 which has recently been agreed is that standby mode should be amended to state that it is the “lowest power consumption mode attainable, using appliance controls or switches that are accessible and intended for operation by the user during normal use”. The concept of what consumer gets as a default setting and what they are most likely to use is an important consideration.
no action necessary
EES on 20060830
It should also be noted that some products do not have an off or power switch, yet will manage their own power consumption down to an effective off level. Other products have a power switch which does effectively nothing. So defining the level of function in each state is important.
to be taken up with switch discussions
EES on 20060830
In my view, a product that automatically reverts to off when not in use should only have this mode considered in any requirement for off and/or other low power modes. A product that requires user intervention to turn it off should have the off mode and other higher power modes considered.
to be considered later on
EES on 20060830
We believe that the case of products that charge batteries should be carefully considered and it may be necessary to break these into separate categories depending on the charger type and the battery type. There is a need to deal with all states of these products such as disconnected, charging battery and fully charged state. The device, the battery and the charger need to be considered as a package.
we are currently excluding these, unless the charger is a lot 7 EPS
EES on 20060830
It is imperative that for any scheme that the power consumption in each relevant mode is determined individually. As a separate exercise, the time in each mode can be estimated. This main issue here is that usage patterns vary widely by country and region. Keeping measurements specific for modes (function combinations) makes the approach widely applicable.
For measurements: yes, separate for each mode, for the study we need more aggregated levels
EES on 20060830
Page 13 – Section 1.3 In the case of washing machines, there are in fact a number of short duration events that occur around the main program. Some of these can be influenced by the user (e.g. anti-crease operation at the end of the program) and some cannot (pumping or electronic monitoring activity).
this more expressly addressed as a function cycle
EES on 20060830
No off products – the first example is an interesting one. If a product has no off switch and no power management then according to the definition at the start of the report, this product is not within the study scope. As soon as power management is included, it is within the scope. This is perhaps rather perverse and means that in some cases manufacturers will be encouraged to remove off switches and power management to avoid potential requirements. Two interesting questions arise: what are the main functions of such a device when it is on (are these functions that should be of interest within your study?) and what functions are still active when power management has been activated. This may help refine the scope somewhat.
no action necessary - the arguments are still in, but not fully resolved.
Report for Tender No. TREN/D1/40 Lot 6 -2005 EuP Lot 6 – Feedback List 2nd of October 2007
Fraunhofer IZM CODDE Bio IS DUH Final Report Page 11-44
Feedback Topic or No Text Actions / Comments
EES on 20060830
The second case (a toothbrush) is a battery charger (see comments above). In fact, these types of products typically use a magnetic resonance method of charging and the power consumed by the base station is not affected (within measurable limits) by whether the device is on the charge cradle or not. One could argue then that this product is always on and therefore excluded from the scope (which is clearly not desirable). So this is another point of interest for you to consider.
Toothbrush is now a product case, so in scope
EES on 20060830
needs to be a clear distinction between products that are not usually connected to the charger (e.g. mobile phones) and products that are usually connected to the charger when not in use (portable vacuum cleaners, cordless phones). Some products such as laptop computers are fairly complex and need to be carefully examined.
Yes, aware of these differentiations
EES on 20060830
The USA has done a lot of work on battery charging systems and it is worth examining the requirements of Energy Star (with which you will be familiar) and efficiency standards set by the California Energy Commission for further suggestions and insights.
Studies in California but be of interest, but chargers not chosen as product case
EES on 20060830
Table 6: General comments Mobile phone charger, not the phone itself, is of primary interest Audio/stereo – many of these products have additional intermediate modes where there is no sound, but where amplifiers and other components are active (e.g. CD player on but not playing). Computers – hard off switches are present on some products, but these are usually located on the back of the product and are very rarely used.
Yes, all cases to be covered
EES on 20060830
Networking components – there are in fact several states that these products could be in while operating – the most important issue is the network speed required and whether the data link has to remain alive for ongoing activity. The majority of energy requirements are to keep the pipe open rather than to transmit data. Network protocols needs to allow products that are not continuously required on the network to go to sleep to reduce power consumption – this is verging on power management issues and the network protocols are critical in this respect.
Will not go deeply into network protocols, but the issues are addressed
EES on 20060830
External power supplies – for some products these are permanently connected to a product (e.g. cordless phone base station), while for other products only to a product while it is charging (e.g. mobile phone).
see above
EES on 20060830
There are a raft of products which should be of interest but which will have trouble fitting into these categories. These include products like clocks (typically clock/radio/alarms, but they could be just clocks), smoke alarms (primary task is to monitor for smoke, but it could be argued that the main job is to sound an alarm when there is smoke, but this task occurs for typically zero or negligible time in the product life), security systems, door bells, fish tank equipment, timers, temperature gauges and displays, equipment that monitors temperatures for control purposes (e.g. solar controllers), insect killers, air fresheners, surge protectors, earth leakage circuit breakers, power boards (with LEDS), aerial boosters, energy meters and so forth. A lot of network equipment and broadband modems would also fall into this category, where this is effectively only an on mode, although there are varying levels of activity.
Yes, exclusions will occur, although some can be addressed via the "could be PUC 3 product" approach
EES on 20060830
Page 18 – Classification of off modes
As noted above, this is intellectually interesting, but in practice it is not possible to determine into which configuration a product may fall just by looking and performing measurements. More than one of these configurations may be relevant and they cannot be determined without detailed knowledge of the product design. At the end of the day, if a product appears to offer no function (or none is obvious) then is can be regarded as perceived off mode and the power consumption in that mode is determined and recorded. In most cases, any significant power consumption associated with this mode is almost always due to poor or sub-optimal design.
already covered above

Report for Tender No. TREN/D1/40 Lot 6 -2005 EuP Lot 6 – Feedback List 2nd of October 2007
Fraunhofer IZM CODDE Bio IS DUH Final Report Page 11-45
Feedback Topic or No Text Actions / Comments
EES on 20060830
Page 18 - Power management
as noted above, this is a critical requirement for minimising energy consumption during normal operation. The product should manage itself to provide the minimum function required at any time in order to save energy. In a network, this means that network protocols need to be formulated to allow products that are not always required to go to sleep for extended periods. However, while this aspect may not be in the initial phase of your study, you should perhaps flag it as an area of interest for later phases.
network issues are taken on board
EES on 20060830
Page 19 – Outlook We think that the additive functionality approach is an excellent methodology. Bruce Nordman and myself have been working on this concept for a short while and we felt that power requirements for one way communication functions (e.g. remote control) is fairly simple to define in most cases. Networked products (where digital signals are communicated in two directions) are a lot more complex and there are many different cases and levels to consider. We would be happy to share our thoughts on these issues as you progress.
More detailed exchange still to be arranged
EES on 20060830
Page 21 – Section 2.1.1
IEC62301 scope was limited to household appliances only because this was the scope of IEC TC59 who wrote the document. The standard itself envisages a very wide application and in fact it is already used for a huge range of products beyond that scope, so this should be no limitation. The standard is really only an equipment specification and measurement methodology so should be seen in this light. An amendment is proposed which will acknowledge the role of data logging equipment and to extend the stability time for measurements and clarifies a number of associated issues. I can provide more information if this is of interest. (see IEC 59/462/INF for details of the proposals). The definition of standby mode should be ignored for your study. IEC62018 is basically useless and we would discourage you from adapting anything in this document.
This also answers some feedback on "does IEC62301 apply for e.g. computers"
EES on 20060830
IEC62087 was in fact adopted from EN62087. The standard is moderately useful for the products within its scope (audio and video equipment – home entertainment) but it is fairly dated in a number of respects and has little of relevant to a whole raft of new digital equipment such as set top boxes and televisions (although this is of less importance for your study). It does not deal with on mode for new television technologies such as LCD or plasma. Note that IEC62087 has no specifications for accuracy or uncertainty of measurement for equipment used to perform measurements, which is not very satisfactory. I would recommend that the modes defined in this standard be considered if they useful but IEC62301 should be referenced as the preferred measurement method.
Agreed, the modes are good for reference (active standby high), but for measurements 62301 is best developed.
EES on 20060830
Page 25 – Section 2.2.1.
As noted above, the stabilisation time and the time for measurement under IEC62301 is likely to change with an amendment shortly.
not changed so far
EES on 20060830
Page 26 – Section 2.2.1.9
IEC62301 notes that some conditions such as temperature and illumination levels can affect standby readings. This is most obvious in products that brighten the display when the ambient illumination is bright and dim the display in low light or in darkness (e.g. clocks). The ambient temperature and air flow will affect the equilibrium temperature for products like external power supplies, but the effect in this case is usually extremely small. If these conditions are important for a particular product, then they need to be externally specified. IEC62301 is written in a way that provides default conditions, but if certain conditions are externally referenced, then these can be used as well.
no action necessary
EES on 20060830
Page 28 – Section 2.2.3
As stated previously, it is strongly recommended that the definition of “standby mode” in IEC62301 be ignored. The standard was always prepared as a test and measurement methodology and mode definitions and names should be externally defined.
Agreed, but others still reference that part.

Report for Tender No. TREN/D1/40 Lot 6 -2005 EuP Lot 6 – Feedback List 2nd of October 2007
Fraunhofer IZM CODDE Bio IS DUH Final Report Page 11-46
Feedback Topic or No Text Actions / Comments
EES on 20060830
Page 28 – Section 2.3: As noted above, there are a number of changes are proposed in a forthcoming amendment to IEC62301 in the near future which may address some of the issues raised. IEC TC59 WG9 would be happy to consider any additional changes to be included in such an amendment. Of course, anything to make the standard clearer and more applicable would be welcomed. Some of the items you have noted could be considered for inclusion in the amendment. However, it needs to be understood that the standard needs to be configured as a very general test methodology, and many procedures or specifications that reference the standard will themselves specify requirements like the number of units to be tested. Please bear in mind that an Energy Star representative (Andrew Fanara) was fully involved in the preparation of IEC62301 and we would like to consult Energy Star (US EPA) before transferring any requirements which are currently specified externally into IEC62301. Once requirements are moved into the IEC method, there is very little flexibility in their interpretation and it can take a long time to make any changes. It is critical that any requirements that may conflict with product or national/regional requirements be NOT included in the standard. Please contact me about making a detailed submission on possible changes to IEC62301. Note that TC59 meet on 20 October 2006, so a submission prior to that date would be very useful.
Currently, we do not see contradictions to a revised IEC62301 measurement part (without the mode definition).
EES on 20060830
Page 31 – Section 3.1 The Top Runner program only covers low power modes for a few product types such as televisions and VCRs. There are also voluntary targets for standby power gas products – The Japan Industrial Association of Gas and Kerosene Appliances (JGKA) announced its voluntary control of standby power for gas and kerosene fuelled appliances in early 2004.
no action necessary
IEA on 20060830
The IEA welcomes the objectives of the Eco-Design Directive and the opportunity to comment on the Draft Report on Standby and Off-Mode produced by the Fraunhofer Institute. The Report from the Fraunhofer Institute is timely in that it coincides with a growth in attention by governments and energy efficiency regulators on measures to increase energy efficiency. In particular, many of the products which would be covered by a Directive on Standby Power are also being scrutinised for standards or labelling programs in other countries. Since many of these products are international traded goods, there are considerable benefits for governments, manufacturers and consumers from harmonising approaches. This would include product definitions, test methods and performance requirements. The European Commission therefore has an important opportunity to play an active role in an international debate to further harmonisation objectives; one which the IEA would be pleased to support and assist.
no action necessary
IEA on 20060830
Unlike the other topics being considered under the Eco-Design Directive, this lot is concerned with a diverse and extremely large number of products, and this presents a particular set of issues. In this case, the question of how to practically implement a set of performance requirements under the Directive is paramount. For example, should the Directive apply to only a limited number of products, or to standby and off mode in all products? How will the Directive cope with products as they evolve or appear on the market, some of which we may not be able to envisage at the current time?
to be clarified later
IEA on 20060830
In accordance with our mandate from the G8, the IEA has promoted the concept of a 'horizontal' standard applying to Standby Power, as a practical means of capturing the wide range of products currently available and those which may emerge in the future. As envisaged, implementation of a 'horizontal standard' approach would also require an international forum to agree on categories of 'exceptions', such as for products which are captured by regulations applying to all modes, or for products where the Standby requirement may be different from the 'horizontal' standard. Such a forum could also provide the means to agree modal definitions on a product-by-product basis; which is still required for some products once the generic definitions for modes are agreed. We believe that this type of framework will provide a robust mechanism for implementing a directive on Standby Power while at the same time delivering international harmonisation. For these reasons we suggest that the Commission consider such an approach.
no action necessary
Report for Tender No. TREN/D1/40 Lot 6 -2005 EuP Lot 6 – Feedback List 2nd of October 2007
Fraunhofer IZM CODDE Bio IS DUH Final Report Page 11-47
Feedback Topic or No Text Actions / Comments
IEA on 20060830
I would be pleased to meet with the Commission to explore how the IEA could support international harmonisation and implementation of the Directive on Standby Power. The following comments are more specific and relate directly to the draft document produced by the Fraunhofer Institute.
no action necessary
IEA on 20060830
The draft report provides a useful and clear explanation of the issues involved in the definition of standby. I did note however that there was little discussion of the decision to exclude 'transition to on' and 'transition to off' within the proposed definition of standby. While I can understand why this may be a practical approach, if you accept the definition of active mode as being when a device is performing its primary function, and if the device is not doing so during these transitional periods, then it suggests that these periods should be part of standby. It would be useful to include some discussion of this potential inconsistency in further drafts.
mode scope has to be slightly limited
IEA on 20060830
In Section 2 regarding test standards, it may be useful to include the Australia/New Zealand standard for external power supplies (AS/NZS 4665.1 and 4665.2), as an example of an existing test method and performance requirement covering standby power consumption, albeit for a single product category.
more detail added
IEA on 20060830
Under section 3, I feel that the Standby Power strategies adopted by Australia and Korea warrant further detail, since both are rather more elaborate that the description provided, and in particular have a phased implementation approach which includes mandatory requirements. I hope that you may receive further comments from the individual countries on this issue, however I would be happy to provide further information.
more detail added
Intel on 20060830
Summary In summary, we are concerned about differences between the use terminology contained in this document and US EPA/Energy Star definitions that are already widely used and recognised. For more complicated machines like computers, various operating states exist and we believe it is beneficial to have consistent terminology across the different standards being developed. Intel recommends that an international body such as ECMA TC 108 studies both approaches with the goal of achieving an IEC standard. Consistency at an international level is key to manufacturers’ ability to meet the various standards.
But computer terminology does not apply to all products.
Intel on 20060830
Terms As the table below illustrates, the consultation document uses “ Main”, ”Standby” and “Off” as terms. The EPA Energy Start program for computers and monitors uses the terms “ON”, Idle, ” Sleep” and “standby”. There are definite similarities between the definitions - EPA’s “On” and EU’s “ Main” are similar, as are the EuP definition of “standby” and EPA definition of sleep, and the EU “off” and EPA “standby”. The table below compares the definitions.
Similarities yes, but for example lot 6 off is not EPA standby (as we understand it)
Intel on 20060830
Finally, there is a need to consider the fact that inactive states will continue to vary, evolve as the focus on AC power consumption increases.
no action necessary
BN on 20060830
Off mode I think if you want to have the idea of Off as having no functionality, the only functionality that can be allowed is use of a power switch that goes to and from zero W. In the definition of Off-mode (4), I am doubtful about defining a mode based on the user’s presumed intentions; I think modes need to be defined in terms of the product, not the user. Also, power failure is another way to get to Off for some products. It seems as though two cases are being combined (I think not to our advantage): the product is off, or the product should be off.
rephrased; user intention is only in explanation now
BN on 20060830
Overall Scheme I think you are right to focus on functionality, particularly for modes other than the minimum power mode. Fundamentally, providing functionality requires power so that a scheme which does not do this will provide too much to some products and too little to others.
no action necessary
BN on 20060830
Overall Scheme We need to also include a variety of other “horizontal” types of requirements to assume best energy efficiency. In addition to minimum power and other low-power modes, these likely cover power supplies (internal and external), battery charging, user interfaces, and (most importantly I believe) network requirements.
now more understandable (Canberra publication); fitting into an international "framework" is difficult, however

Report for Tender No. TREN/D1/40 Lot 6 -2005 EuP Lot 6 – Feedback List 2nd of October 2007
Fraunhofer IZM CODDE Bio IS DUH Final Report Page 11-48
Feedback Topic or No Text Actions / Comments
BN on 20060830
Mode Categories As noted in the middle of (4), modes are of three types: main, standby, and off. This division is similar to the On, Sleep, Off in IEEE 1621, though Off for user purposes probably includes some modes you classify as standby. In any case, a division of modes into a small number of basic categories seems essential for clarity. However, I would encourage you to rethink the terms.
IEEE1621 very helpful input, but essentially we keep our mode names
BN on 20060830
Terminology There are at least three relevant sources of terminology for modes: product industries, energy professionals, and ordinary people. IEEE 1621 is the only standard I know of that explicitly addresses power mode terms for ordinary people (the ISO/IEC symbol standards arguably do so indirectly, but not well as currently constructed). Product-specific terminology tends to be ad hoc and often lends more confusion to the topic (e.g. that “standby” on a copier is the ready mode, and your report (9:4) itself notes that the many different definitions of standby lead to confusion). We need to have clear correspondences among mode definitions in the three domains and work towards as much harmony as possible. More information on IEEE 1621 can be found at: http://eetd.LBL.gov/Controls/1621
as above
BN on 20060830
Terminology Energy Star “strongly recommends” use of 1621 in IT specifications, so far including displays (monitors), imaging equipment, and computers. Microsoft is shifting from “standby” to “sleep” for sleep modes in Vista.
Now mentioned in document
BN on 20060830
Terminology I like your suggestion on (9:4) to use the term “Lot 6 standby” to be unambiguous. Agreed and done
BN on 20060830
“Standby” mode The term “standby” should be reserved only for the minimum power mode of a product, and never used in user interfaces. Since the minimum power mode can vary from an off mode to a sleep mode to an on mode depending on the product (not the product type, but the individual product), It is best to think of it as a power level generally rather than a mode. The definition on (5) that “will not be needed” is again problematic as with Off in that it seems defined with respect to the user, not the product. A definition of either that referenced timers that caused an automatic shift to the mode could be included without bringing in the user’s intentions.
definition rephrased, but for us standby is NOT the lowest power mode
BN on 20060830
“Standby” mode Using the term “sleep” in lieu of standby as used in this document may be helpful (and used in (14:2)), or perhaps you might use “low power”. I would suggest using low power to cover any mode that is covered by the discussion (any non-active mode), possibly including ready and idle modes that are seen by the user as fully on. On (6) you note the closeness of standby and off – perhaps it is not necessary to separately name “off” and have it just the low power mode with no functionality other than responsiveness to power switches (either only hard switches or any power switch, though the latter could open the door to switches over the network). I think you would do well to use any term other than standby for the intermediate modes!
the "any term other than standby" is nicely phrased, but we continue to use "lot 6 standby"
BN on 20060830
Network awareness (6:6) notes that network awareness can be a continuous “background function”. I recommend review of how the Energy Star imaging specification (final in May) addresses this for “OM” products (like inkjets). Power allowances for different types of data and network interfaces are provided, which sometimes vary depending on whether the interface is active or not during the test. I noted that the imaging equipment specs were mentioned in Table 2 but not in the list on (24). I think the imaging spec is by far the most developed with respect to low power modes of any of the EStar specs so should be part of this analysis (imaging products are worth paying attention to as they have the longest history of any electronic product in assessments of energy efficiency). The computer spec is nearly final and should also be included.
References included and updated - but the "functional adders" for inkjets are not explored as an example yet
BN on 20060830
Network awareness I agree with your assessment (6:end) that network activities are associated with the most complex situations such a standard must address. We expect to begin a project on network-related energy consumption in January. I would be happy to add you to a list of people interested in the project.
Interesting.
BN on 20060830
Specific items

Report for Tender No. TREN/D1/40 Lot 6 -2005 EuP Lot 6 – Feedback List 2nd of October 2007
Fraunhofer IZM CODDE Bio IS DUH Final Report Page 11-49
Feedback Topic or No Text Actions / Comments
BN on 20060830
(6) Rather than use “reactivation”, easier to simply use “wake” and use the sleep metaphor. addressed, but not changed
BN on 20060830
(6:figure) Not sure the difference between “reactivation on the device” and “integrated sensor reactivation”.
BN on 20060830
(7:3) How about “Ready” instead of “Waiting”. That term is used on many products in the U.S. and I think clearly connotes that the product is immediately responsive to all operational controls (as opposed to Sleep where some intermediate action must usually be done to wake it).
changed where still in document
BN on 20060830
(10:1) Products with batteries can still be functionally on even while disconnected. I use “disconnected” to identify modes that result in no AC power consumption, but this is certainly different from specifying that all energy sources are disconnected.
consequences not fully explored, but we use "from all sources"
BN on 20060830
(10:Table 3) Defining non-productive losses wherein the functions are not used seems hard to be specific about. Clearly one can identify savings from having products power down when there is no activity, no presence, etc. for some period of time, but that doesn’t get into the question of whether the function is used or not. Some people have TVs on for their pets (at least in the U.S.). Many like to have TVs on for the sound, even if they don’t view the image for hours.
agreed, but no changes necessary
BN on 20060830
(11:end) The clear “appeal” of 62301 is that its definition is unambiguous; this is a big advantage. and that is mentioned
BN on 20060830
(12:1) I assume the reason that computers “would not normally be included” in 62301 is that it originated in an appliance committee. I think that Energy Star is the dominant user of 62301, and principally for electronics, so that this theoretical focus on appliances is not relevant in practice.
yes, covered in other discussions already
BN on 20060830
(12:4) The user perspective is where IEEE 1621 is focused. I have been trying to change the definition of the “standby” symbol to mean power as (at least in the U.S.) nearly all manuals refer to the “power” button and “power” indicator and surveys show that most people understand the symbol to mean power and virtually no one thinks it means standby.
reference to "power" button not yet included
BN on 20060830
(13:4) I’m not clear on the distinction being made. For many products there is a default time to go to sleep but the default can be changed; which category does this fall into? Does technically controlled mean that the time(s) are fixed?
if default time is not unlimited; will appear in PUC 3
BN on 20060830
(13:middle) Rather than refer to an “off” button, I’d refer to the power button (though I realize a few have on and off separate buttons).
reference to "power" button not yet included
BN on 20060830
(14:2) We have found it helpful to focus on AC power only, with tentative extensions to low-voltage DC (consider adding low-voltage DC to the figure on (16)). Battery power always comes from AC originally so to avoid double-counting, best to not count consumption from the battery, only into it.
yes, similar view
BN on 20060830
(14:end) I strongly encourage a limitation to just electricity for this discussion agreed
BN on 20060830
(15:3) For distinguishing products and systems, we use AC power cords as the defining characteristic; each item with its own AC cord is a separate product.
that is helpful but still doesn't solve all problems
BN on 20060830
(17:table) Not sure why throttling states of PCs is a function. “maintain network connection” seems like a function that could occur in any mode — on, sleep, or off — that is true of present day computers — so not a distinguishing item for this table. The boiler in my house has standby consumption – about 9 W as I recall. Hard for me to see how “sensing and regulating is part of main function” of an air conditioner; sensing when to turn back on seems like a standby function.
throttling is not standby; network connection can not be active in off-mode
BN on 20060830
(18:top) The taxonomy is focused on Misc and Electronics (not Other). OK

Report for Tender No. TREN/D1/40 Lot 6 -2005 EuP Lot 6 – Feedback List 2nd of October 2007
Fraunhofer IZM CODDE Bio IS DUH Final Report Page 11-50
Feedback Topic or No Text Actions / Comments
BN on 20060830
(18:bullets) I would add “data” interfaces in addition to “network”, though remote controls may be a special case of data interfaces. I well understand that network presence via wake-on-LAN only is quite different from maintaining network integrity, but I think it may be difficult to clearly delineate between the two network items (wake and background). Also, unclear toe how the unsupervised updates item is different from the general network integrity one.
text clarified
BN on 20060830
(18:classification of off)
I think you mean “soft power switch” not “soft switch”. sentence added, that switches are usually power switches in our documents
BN on 20060830
(18:end) On some systems it can take longer to come out of hibernate/suspend-to-disk than from the regular shutdown off mode. In most cases it is the reverse, but the point being that speed of wakeup is not a determining factor.
When restoring the current state of open programs is included even a slower suspend to disk will be used by users to save time
BN on 20060830
(20) I think that an explicit itemization of the “data/network” or “information” environment is needed for future test procedures. For example, some products may consume different power levels depending on whether an active WiFi network is present in the area, even if there is no physical connection to the product. The Energy Star computer test procedure specifies the speed of Ethernet connections as this has a marked effect on low power energy consumption. The specificity of this will only increase in future.
not yet addressed
BN on 20060830
(21) Isn’t 62018 COMPLETELY USELESS? You can be more polite, but if the standard contributes nothing to our purposes (or anyone’s), that should be noted somehow.
BN on 20060830
(21) If ASTM is considered international (I am not sure), then there are imaging product test procedures that are relevant. www.astm.org
checked, but not included
BN on 20060830
(25) I recommend reading the low power research report at http://www.energy.ca.gov/pier/final_project_reports/500-04-057.html I believe that this is where I reviewed various low-power test procedures (if not, let me know).
OK
BN on 20060830
(25) Some test procedures specify an equilibration time before the test begins at all (with the product unplugged) in addition to the times noted here.
tried to clarify
FSC on 20060830
Wir wünschen uns klare Definitionen, sodass keine „Schlupflöcher“ bleiben. no loopholes; covered elsewhere
FSC on 20060830
Bitte daher noch um Berücksichtigung folgender Hinweise:
FSC on 20060830
- S. 9, 10: Definition der Begriffe „Idle“ und „Idle losses“ bitte ergänzen - S. 17: Definition des Begriffes „throttling“ bitte ergänzen - S. 17: Ergänzung der ACPI-Stati S1, ..., S5 für Personal Computer
see English feedback elsewhere
FSC on 20060830
Warum wird generell IEC 62301 (Household electrical appliances) für Messungen empfohlen und nicht IEC 62018 (Power consumption of information technology equipment) und IEC 62087 (Methods of measurement for the power consumption of audio, video and related equipment)?
see Interim report and task1-3 on 1.1.4
FSC on 20060830
- S. 12, 29: Die Ergänzung von IEC 62301 um Parameter von Energy Star für Testprozeduren sollte erläutert werden (... note that a computer would not normally be included within the IEC62301). Was ist das Ergebnis?
S. 12 not relevant anymore, S.31-35
FSC on 20060830
Gerätedefinition für Messungen offener Systeme bitte ergänzen: Auslieferzustand ab Werk als Basiskonfiguration für Messungen nutzen
under 1.2.2. from page 36 a general definition

Report for Tender No. TREN/D1/40 Lot 6 -2005 EuP Lot 6 – Feedback List 2nd of October 2007
Fraunhofer IZM CODDE Bio IS DUH Final Report Page 11-51
Feedback Topic or No Text Actions / Comments
HPS on 20060830
1 I think it is necessary to distinguish between off and disconnected (not plugged into the mains). When the product is disconnected, it is certainly offering no functionality to the user, but it is also not possible as you indicate in definition iii to turn the EuP back on. I would consider the disconnected mode out of scope, because it is clear that in the disconnected mode no energy (from the mains) is used. Furthermore, all test methods specify that the product should be connected to a power source (mains). So, I do not share you view regarding disconnected being part of the off-mode (page 10). Furthermore, the term "hard-off" can be confusing, because if the EMC filter is on the 'wrong side' of the switch, power consumption can still occur.
changes made
HPS on 20060830
2 You distinguish between 'functionality' and 'functions' in definition ii, but in other parts of the report this distinction seems blurred: function seems to mean the same as functionality, i.e. providing a service to fulfil a user's need. In my opinion you only need either the term 'functionality' or the term 'function'; I have a preference for 'function'.
Agree, functionality is from the approach name
HPS on 20060830
3 The last sentence in definition iii (In the off-mode it is the intention of the user .... not be needed for some time.) is not needed. Further on in the document you argue that the intention of the user is not relevant, i.e. it would widen the scope too much (page 10). It is not necessary to introduce the intention of the user here; the user is already included in the concept by the definition of function.
Agree on contradiction; sentence in as explanation now
HPS on 20060830
4 Also the sentence 'All energy drawn from the energy supply ... off-mode losses' is not defining the off-mode, but the off-mode energy consumption (considered to be losses). Although I agree with the statement that off-mode energy consumption is - by definition - a loss, for the general approach in the report it may be more easy when you can write standby and off-mode energy consumption in stead of standby energy consumption and off-mode losses. On page 9 you write that "standby power consumption" plus "off-mode power consumption" equals "standby and off-mode losses"; this is not correct, since (not all) standby power consumption can be considered as a loss.
Wording still not 100%, obviously, but same understanding
HPS on 20060830
5 Definition iv does not start with a definition of standby mode, but with explaining a similarity (which you did already in the preface) between standby and the off mode (but in the first sentence you have not yet defined what standby mode is!). The word 'used' refers to the primary functions of the product. In my opinion you do not need (in a definition) the first two sentences. To be consistent with definition iii you could add (or better: make it a separate definition) the definition of standby energy consumption.
Duplication to preface intentional. Intro intentional. But old iv rephrased
HPS on 20060830
5a Furthermore, also strong arguments exist for saying that standby mode is different from off-mode, mainly because in the off-mode the product fulfils no function, whereas in standby (at least) some function is fulfilled. Also the addition 'for some duration' does not differentiate clearly between modes, because this can hold for all modes and is also determined by primary function of the product.
Yes, clarify “at the same time dissimilar, because..”; some duration: repeated from off-mode; not making use: Check
HPS on 20060830
Therefore, I do not share your view on page 6 ('in both cases the user is not making use of the product'), because this is a kind of "narrow view" regarding the user making use of the product. In definition ii you did not define "making use of" but functionality/function as the product delivering a service. And any standby function delivers a service to the user (whether the user uses this service is not relevant for the discussion as you state on page 10)
HPS on 20060830
6 In general I think you are too optimistic about making a clear distinction between (some) standby functions and primary functions. Increasingly, there will be a gray zone between the standby functions with "more functionality" and the primary functions.
As a trend, probably yes -> active standby high would catch some of those
HPS on 20060830
7 Definition v: what is a 'phase of operation', also related to the definition of a function in definition ii? Poss. Define: function can start other function, therefore …
HPS on 20060830
I+E1 I think the "subdefinitions" should be added to the definitions. Yes
Report for Tender No. TREN/D1/40 Lot 6 -2005 EuP Lot 6 – Feedback List 2nd of October 2007
Fraunhofer IZM CODDE Bio IS DUH Final Report Page 11-52
Feedback Topic or No Text Actions / Comments
HPS on 20060830
I+E2 What is the EuP itself? I assume that you mean that e.g. a remote control is not part of the "EuP itself". However, you might run into problems when you have to provide a definition of the EuP that is to be used in an implementing directive; because in this definition the remote control is clearly part of the EuP (as sold to the customer).
Check EuP and add explanation – tricky part
HPS on 20060830
I+E3 Subdefinition information display: feature = function? (you have not defined 'feature'); state = mode ? (you have not defined 'state').
Feature can be function, “indicate the state”=mode
HPS on 20060830
I+E4 Subdefinition background activities: internal (?) functions; EuP in total (?), see also point 2. Yes, critical
HPS on 20060830
Outlook Outlook on further steps (page 19) Warning appreciated
HPS on 20060830
In my opinion the two most difficult parts of your study are 1) the definition of standby and off mode and 2) the definition of the scope of the implementing measures (what products are covered). I think the definition part has been solved (almost) by your document, and also for the definition of the scope figure 4 provides a good first shot. However, I am worried about the approach you suggest in section 1.4.1, developing cases for specific functionalities and power budgets. In practice this will end up in a mess - I am afraid: products on the market have to be checked regarding the power budget they are allowed (what single functionalities they have) and then the power budget has to be assembled. This also will complicate market surveillance, because from the outside it will not be clear what functionalities (related to a power budget) a product has, so after having measured the product you do not immediately know whether the product is ok or not.
power budgets will now be for function clusters
HPS on 20060830
Furthermore, I think it will be very difficult to identify the power budget per functionality, especially because you do not want to be too generous for products with multiple functionalities. And also in this situation you will need a procedure to keep up with new functionalities.
as above
HPS on 20060830
All in all, this is not a solution that fits in a horizontal approach regarding standby and off mode. However, the functionality approach can give an indication of which products could be to complex to handle by a horizontal standby (and off mode) measure.
with clustering it can still be horizontal; and the indication of complex products is also included
HPS on 20060830
Figure 2, page 7: I do not understand why you mention 'principally unlimited duration' and 'constant power level' because in the text below the figure you already modify these statements. In practice 'unlimited duration' (in its literally sense) will never occur.
Make clearer, concepts to describe standby, not to define – or remove from figure
HPS on 20060830
Table 1, first figure: see comment 1 under Definition proposal. [inserted: disconnect should not be part of off] disconnected is not part of off
HPS on 20060830
Text under the table: why is standby not defined??
HPS on 20060830
Table 2, page 9: The headings of this table are a mix of categorization on functionality and power consumption (the latter especially regarding the off-mode). In my opinion this table shows the problems you run into when not distinguishing disconnected from off.
True, already indicated above table, but no elegant solution
HPS on 20060830
Page 11, 2nd paragraph under table 4: The product having a hard-off switch will have a standby mode under IEC62301, i.e. the standby mode is the mode where the switch is in the off position. So, the first row in table 4 (IEC62301 no standby case) is not correct. The same holds for table 5.
Agree, change wording – an even more brutal use of the word standby (hard-off=standby)
Report for Tender No. TREN/D1/40 Lot 6 -2005 EuP Lot 6 – Feedback List 2nd of October 2007
Fraunhofer IZM CODDE Bio IS DUH Final Report Page 11-53
Feedback Topic or No Text Actions / Comments
HPS on 20060830
Section 1.2.3: I do not understand the discussion regarding the approaches. In the definition you have defined off = no function (which you acknowledge on page 13). What could be relevant for the measurement method is how to put a product into the off-mode, or how to ascertain that a product is in the off-mode (because otherwise you can not measure the off-mode power consumption).
shifted to task 3
HPS on 20060830
The second paragraph on page 13 is confusing here, should be discussed earlier (section 1.1 Illustrations).
HPS on 20060830
User behaviour can be relevant in individual, specific cases. But it is not very helpful in a horizontal approach. One of the assumptions is that there are so many products with standby and off-mode consumption in today's home, that it is not realistic (or cost-effective) to achieve savings by changing user behaviour. The study you mention (Gudbjerg, 2006) in fact supports this view: providing households with written material did not change their behaviour (as to lower standby consumption), the visit of an energy advisor and technical devices did result in lower standby consumption. However, these instruments are not cost effective.
clarified and shifted to task 3
HPS on 20060830
Section 1.3, page 13, Washing machines: but once the door is unlocked, it is standby consumption. Can be added
HPS on 20060830
Section 1.3, page 15, Connected devices: if the product has a separate connection to the mains, then it would fall within the scope of the study.
Check, out of scope not the issue
HPS on 20060830
Section 1.3, page 15, Infrastructure: I would not classify vending machines and ATM under infrastructure. These products are certain interesting regarding standby, but might not fulfil the volume criterion of 200.000 pieces/year.
Principally yes -> seek clearer app areas
HPS on 20060830
Section 1.4.: What is the use of table 6? Furthermore, the table is wrong with regard to: - television off-mode: especially LCD TVs can have off-mode consumption, e.g. in case they have an external power supply, or only a "soft-off" switch. - PC: is a hard off switch present in most cases? - networking components, e.g. routers, wireless modems, can have an on-off switch (at least the wireless modem/router in my home has) and can have an off-mode. Whether this mode is used is another issue. - air conditioning: can have standby mode
Yes, still some mistakes -> table not in new version
HPS on 20060830
What is the use of differentiating the off-mode? Contrary to the standby mode, the off-mode is completely defined by off = no function. In the standby mode, it is useful to identify the standby functions, but in the off-mode there are no functions. Another question is, what is causing off-mode power consumption? But this need not be subject of a classification.
Yes, not classification but examples
HPS on 20060830
Section 2.1: As you indicate on page 20 it is important to distinguish between the test method and the limit values (in ecodesign terms 'specific requirements'); therefore regarding Energy Star I think it is useful to concentrate on the test procedures
Check
HPS on 20060830
I suggest that the items scope, standby definition, limit values, test definition (and may be others) are summarized in a table.
done
HPS on 20060830
Section 2.2.1: As far as I know the most recent developed standard is IEC62301. When developing this standard, other available measurement methods have been considered. To my knowledge the values for e.g. ambient temperature in IEC62301are (already) a good compromise. So, I don't think it is useful to start the discussion on these items again. Stick to IEC62301 - except for the definition! - wherever possible.
Yes, very helpful view, but still a modification of IEC necessary
HPS on 20060830
Please note that regarding items in section 2.2.1.3. changes in IEC62301 are proposed (to make measurements more consistent); please contact Lloyd Harrington ([email protected]).
in contact

Report for Tender No. TREN/D1/40 Lot 6 -2005 EuP Lot 6 – Feedback List 2nd of October 2007
Fraunhofer IZM CODDE Bio IS DUH Final Report Page 11-54
Feedback Topic or No Text Actions / Comments
HPS on 20060830
Although you write on page 26 that "An agreement on one general ... is therefore unlikely", this is exactly what is needed for a horizontal implementing measure on standby! Furthermore, I think that IEC62301 already fulfils this function to a large extent (improvements are always possible), especially considering that such a measurement method does not need to include definitions. The fact that IEC62301 contains a definition of standby does not limit the applicability to use the measurement method for measuring (other) low power modes (see the scope of IEC 62301).
Recheck “scope” within IEC, see other discussions of IEC62031
HPS on 20060830
Chapter 3: the readability of this chapter would greatly improve if the items per program were summarized in a table. done
HPS on 20060830
Page 33: "Today the Energy Star requirements ... efficient products". Not only computer specifications are under revision, but specifications for monitors and imaging equipment have been already revised. Goal of these revisions is to have around 25 % of the products comply at the moment of specification; however it is expected that after the specifications are in force a higher percentage of the market will comply.
Modify
HPS on 20060830
Section 3.3: Although I do not exactly know whether it is/should be part of your assignment, one of the goals of task 1.3 is to indicated whether the issue, i.e. standby and off-mode consumption, has already been dealt with by market force in a satisfactorily way. However, with the information you provide in this chapter, it is very hard to draw any conclusions on this subject. This would require an estimate of the percentage of products on the EU market that have standby and/or off-mode consumption covered by the programs you describe. Some indication can be given by the market coverage of the initiatives, e.g. the market coverage of the EU Eco-label is (almost) zero.
To our understanding not task 1.3
Related Documents