Welcome message from author
This document is posted to help you gain knowledge. Please leave a comment to let me know what you think about it! Share it to your friends and learn new things together.
Transcript

2004 ANNUAL VISITOR RESEARCH REPORT
This report has been cataloged as follows: Hawaii. Dept. of Business, Economic Development and Tourism. Research and Economic Analysis Division.
Annual visitor research report. Honolulu: 2000-
1. Tourist trade-Statistics-Hawaii G155.A1.H25.2004

TABLE OF CONTENTS
SUMMARY OF 2004 VISITORS TO HAWAII 1
OVERVIEW OF ALL VISITORS 2
Arrivals by Air 2
Cruise Passengers 5
AIR VISITOR CHARACTERISTICS BY MAJOR MARKET AREAS 13
U.S. West 14
U.S. East 15
Japan 16
Canada 16
Europe 17
Oceania 18
Other Asia 18
Latin America 19
AIR VISITOR CHARACTERISTICS BY PURPOSE OF TRIP 43
AIR VISITOR CHARACTERISTICS BY ACCOMMODATION 49
AIR VISITOR CHARACTERISTICS BY FIRST-TIME/
REPEAT STATUS 55
ISLAND SUPPLEMENT 59
AIR VISITOR EXPENDITURES BY CATEGORY 83
Daily Visitor Spending by Selected MMAs 85
CRUISE VISITORS 99
TOTAL AIR AND CRUISE VISITOR ARRIVALS BY ISLAND 105
HOTEL OCCUPANCY AND ROOM RATE 107
VISITOR PLANT INVENTORY 111
TOTAL AIR SEAT OPERATED TO HAWAII 115
APPENDIX 119
DEFINITIONS AND SOURCES OF DATA 120
i
LIST OF TABLES
Table 1 Summary of Visitor Statistics: 2004 vs. 2003 6
Table 2 Summary of Visitor Characteristics: 2004 vs. 2003 8
Table 3 Summary of Visitor Characteristics: 2004 vs. 2003 (% of Total) 9 Table 4 Visitor Days by Island: 2004 vs. 2003 10
Table 5 Visitor Days by Month: 2004 vs. 2003 10
Table 6 Average Daily Census by Island: 2004 vs. 2003 11
Table 7 Average Daily Census by Month: 2004 vs. 2003 11
Table 8 Visitors Staying Overnight or Longer: 1952-2004 12
Table 9 2004 Visitor Days by Month and MMA 20
Table 10 2004 Visitor Arrivals by Month and MMA 22
Table 11 U.S. West MMA Visitor Characteristics: 2004 vs. 2003 24
Table 12 2004 Domestic U.S. West MMA Visitor Arrivals by Month and State 25 Table 13 U.S. East MMA Visitor Characteristics: 2004 vs. 2003 26
Table 14 2004 Domestic U.S. East MMA Visitor Arrivals by Month and State 27 Table 15 Domestic U.S. Visitors by State: 1996 – 2004 29
Table 16 2004 Domestic U.S. Visitor Characteristics by State 30
Table 17 2004 Market Penetration for Top U.S. MSAs 31
Table 18 2004 Japan MMA Visitor Characteristics 32
Table 19 2004 International Japanese Visitor Characteristics by Region 33 Table 20 Canada MMA Visitor Characteristics: 2004 vs. 2003 34
Table 21 Europe MMA Visitor Characteristics: 2004 vs. 2003 35
Table 22 Oceania MMA Visitor Characteristics: 2004 vs. 2003 36
Table 23 Other Asia MMA Visitor Characteristics: 2004 vs. 2003 37
Table 24 Latin America MMA Visitor Characteristics: 2004 vs. 2003 38
ii
LIST OF TABLES (continued) Table 25 Other MMA Visitor Characteristics: 2004 vs. 2003 39
Table 26 2004 Visitor Age Distribution by MMA (% of MMA Total) 40
Table 27 Honeymoon/ Get Married Visitor Characteristics: 2004 vs. 2003 46
Table 28 Meeting, Convention and Incentive Visitor Characteristics: 2004 vs. 2003 47
Table 29 Visiting Friends and Relatives Visitor Characteristics: 2004 vs. 2003 48
Table 30 Hotel Only Visitor Characteristics: 2004 vs. 2003 52
Table 31 Condo Only Visitor Characteristics: 2004 vs. 2003 53
Table 32 Cruise Ship Visitor Characteristics: 2004 vs. 2003 54
Table 33 First-Time Visitor Characteristics: 2004 vs. 2003 57
Table 34 Repeat Visitor Characteristics: 2004 vs. 2003 58
Table 35 Visitor Arrivals by Island and Month: 2004 vs. 2003 62
Table 36 2004 Average Daily Census by Island and Month 65
Table 37 2004 Domestic U.S. Visitor Arrivals by Island from Top U.S. MSAs 66
Table 38 2004 Domestic U.S. Visitor Arrivals by Island and State of Residence 67
Table 39 2004 Domestic U.S. Visitor Arrivals by Island and State of Residence (% of Total) 68
Table 40 2004 Domestic U.S. Visitor Length of Stay by Island and State of Residence 69
Table 41 Oahu Visitor Characteristics: 2004 vs. 2003 70
Table 42 Maui County Visitor Characteristics: 2004 vs. 2003 71
Table 43 Maui Island Visitor Characteristics: 2004 vs. 2003 72
Table 44 Molokai Visitor Characteristics: 2004 vs. 2003 73
Table 45 Lanai Visitor Characteristics: 2004 vs. 2003 74
Table 46 Kauai Visitor Characteristics: 2004 vs. 2003 75
Table 47 Island of Hawaii (Big Island) Visitor Characteristics: 2004 vs. 2003 76
Table 48 Hilo Visitor Characteristics: 2004 vs. 2003 77
Table 49 Kona Visitor Characteristics: 2004 vs. 2003 78
iii
LIST OF TABLES (continued)
Table 50 2004 Visitor Days by Island and MMA 79
Table 51 2004 Visitor Arrivals by Island and MMA 81
Table 52 Visitor Expenditures by Category: 2004 vs. 2003 88
Table 53 U.S. West Visitor Personal Daily Spending by Category 2004 vs. 2003 89 Table 54 U.S. East Visitor Personal Daily Spending by Category 2004 vs. 2003 90 Table 55 Japanese Visitor Personal Daily Spending by Category 2004 vs. 2003 91 Table 56 Canadian Visitor Personal Daily Spending by Category 2004 vs. 2003 92 Table 57 European Visitor Personal Daily Spending by Category 2004 vs. 2003 93 Table 58 Oceanian Visitor Personal Daily Spending by Category 2004 vs. 2003 94 Table 59 Other Asian Visitor Personal Daily Spending by Category 2004 vs. 2003 95 Table 60 Latin American Visitor Personal Daily Spending by Category 2004 vs. 2003 96 Table 61 Other Visitor Personal Daily Spending by Category 2004 vs. 2003 97 Table 62 2004 Visitor Expenditures by Island by MMA 98
Table 63 2004 Visitor Expenditures by Island by MMA 98 (% share of State total) Table 64 2003 Cruise Ship Visitors 102 Table 65 2004 Cruise Ship Visitors 102 Table 66 2004 Total Cruise Ship Passengers by MMA 103
Table 67 2004 Per Person Per Day Cruise Passenger Spending by Category and by MMA 104 Table 68 Total Visitor Arrivals 2004 vs. 2003 106 Table 69 State Hotel Occupancy Rate: 2004 vs. 2003 108
iv
LIST OF TABLES (continued) Table 70 Oahu Hotel Occupancy Rate: 2004 vs. 2003 108
Table 71 Maui Hotel Occupancy Rate: 2004 vs. 2003 109
Table 72 Kauai Hotel Occupancy Rate: 2004 vs. 2003 109
Table 73 Hawaii (Big Island) Hotel Occupancy Rate: 2004 vs. 2003 110
Table 74 2004 Visitor Plant Inventory - Existing Inventory by Island and Type 112
Table 75 2004 Visitor Plant Inventory - Class of Units by County 113
Table 76 1965-2004 Visitor Plant Inventory–Available Units by County 114
Table 77 Total Air Seats Operated to Hawaii 116
Table 78 Domestic Air Seats Operated to Hawaii 116
Table 79 International Air Seats Operated to Hawaii 117
LIST OF FIGURES Figure 1 Air Visitor Days by Major Market Areas, Calendar Year 2004 3
Figure 2 Air Visitor Expenditures by Major Market Areas, Calendar Year 2004 3
Figure 3 2004 U.S. West Visitor Age Distribution 41
Figure 4 2004 U.S. East Visitor Age Distribution 41
Figure 5 2004 Japan Visitor Age Distribution 42
Figure 6 2004 Canada Visitor Age Distribution 42
Figure 7 2004 Visitor Arrivals by Purpose of Trip 45
Figure 8 2004 Visitor Arrivals by Accommodation 51
Figure 9 Visitor Length of Stay by Accommodation 2004 vs. 2003 51
Figure 10 Total Visitor Expenditures by Category: 2004 vs. 2003 84
Figure 11 2004 Visitor Per Person Per Day Spending by Category and Selected MMA 86
Figure 12 Visitor Per Person Per Day Spending by Selected MMA: 2004 vs. 2003 87 Figure 13 Air Seats Operated to Hawaii by Island 118
v
ABOUT THIS REPORT This report was produced by the staff of the Research and Economic Analysis Division of the Hawaii State Department of Business, Economic Development & Tourism (DBEDT). The department is headed by Mr. Theodore E. Liu. This report was prepared by Mr. Cy S.Y. Feng under the direction of the Division Administrator, Dr. Pearl Imada Iboshi, with the assistance of Dr. Eugene Tian, Ms. Minh-Chau T. Chun, Mr. Lawrence Liu and Ms. Danielle Lee. Ms. Marsha Wienert, State Tourism Liaison; Mr. Frank Haas, Director of Tourism Marketing, Hawaii Tourism Authority; and Mr. Christopher Kam, Director of the Market Trends, Hawaii Visitors and Convention Bureau, reviewed this report and provided valuable comments. The report is also available in Adobe Acrobat form on the DBEDT Web Site, http://www3.hawaii.gov/dbedt/tourism. For further information on the content of this report, contact the DBEDT Library at 586-2424, or e-mail [email protected]. If you would like copies of this report, contact the Research and Economic Analysis Division at (808) 586-2466.
vi
SUMMARY OF 2004 VISITORS TO HAWAII
OVERVIEW OF ALL VISITORS
VISITORS BY AIR:
VISITOR DAYS
TOTAL EXPENDITURES
PER PERSON PER DAY SPENDING
PER PERSON PER TRIP SPENDING
ISLAND VISITOR PATTERNS
MONTHLY VISITATION PATTERN
CRUISE PASSENGERS
1
OVERVIEW OF ALL VISITORS ALL VISITORS 2004 was a very good year for Hawaii’s visitor industry with increases in key areas such as visitor expenditures and visitor days due to record arrivals from the domestic visitor market and continuing growth from the international sector. Overall, total visitor days from those who came to the islands by air and by cruise ships rose 6.9 percent compared to 2003. The total number of air and cruise ship arrivals surpassed the previous year’s level by 8.5 percent to reach 6,991,927 visitors. Total expenditures by air and cruise ship visitors increased 8 percent to $10.9 billion. Of this amount, $10.8 billion in expenditures were by visitors who came by air, 8 percent higher than 2003. The average daily spending by air visitors was $172 per person, compared to $170 per person in 2003. Transpacific airfare costs to and from Hawaii are not included in these spending estimates. Expenditures by visitors who came to the islands aboard out-of-state cruise ships grew 21.2 percent to $54.3 million, while the average daily spending by these visitors was $94 per person. Spending by visitors who arrived by air to board Hawaii-home ported ships is included in expenditure estimates of visitors who arrived by air, rather than with those who arrived by cruise ship. It should be noted that in 2004 improvements were made to the methodologies used to collect visitor expenditure statistics. The visitor expenditure diary survey which collected statewide expenditure data were replaced by departure surveys of visitors on each island which yielded much larger samples and provided improved data for visitor expenditures by island. Due to these changes, 2004 visitor expenditure statistics may not be entirely comparable to data report in 2003 and in earlier years. See the Technical Notes, Definitions and Sources of Data for Visitor Statistics section (Page 122) for further information.
ARRIVALS BY AIR VISITOR DAYS AND ARRIVALS Total visitor days (visitor arrivals multiplied by the average length of stay) of those who came to the islands by air rose 6.8 percent in 2004. A total of 6,912,094 visitors arrived by air to the state, up 8.3 compared to 2003. International air visitor days grew 4.2 percent thanks to a 9.2 percent increase in arrivals to 2,019,134 visitors. Domestic visitor days rose 7.6 percent due to an 8 percent growth in arrivals by air. In fact, total domestic air arrivals of 4,892,960 visitors in 2004, was the best on record, even surpassing the previous high of 4,531,289 domestic visitors who came in 2003. Visitor days from the U.S. West, Hawaii’s primary market (41.7% of the state total visitor days), grew 5.4 percent due to a 6.1 percent increase in visitor arrivals compared to the previous year. The average length of stay by U.S. West visitors declined to 9.54 days from 9.60 days. U.S. East arrivals (+9.2%) also increased in 2004 and contributed to a 9 percent growth in visitor days. The average length of stay by U.S. East was relatively unchanged at 10.25 days. U.S. East visitors represent Hawaii’s second largest market, accounting for 29.2 percent of the state total visitor days.
2
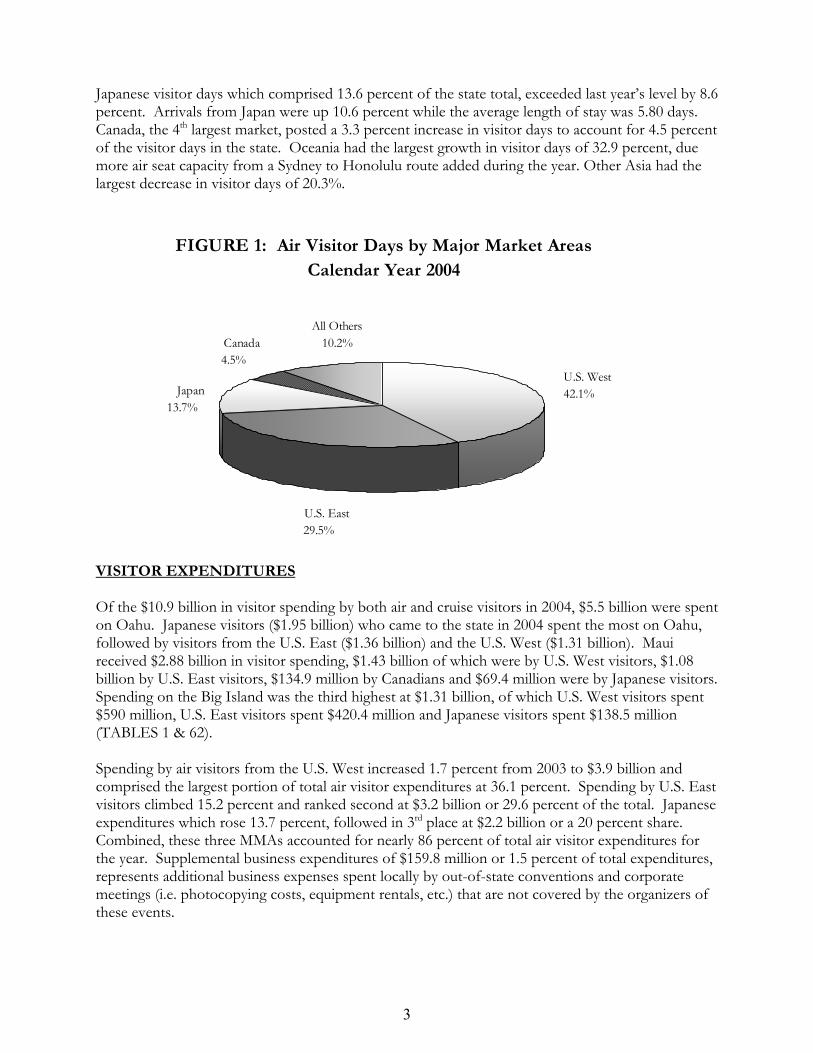
Japanese visitor days which comprised 13.6 percent of the state total, exceeded last year’s level by 8.6 percent. Arrivals from Japan were up 10.6 percent while the average length of stay was 5.80 days. Canada, the 4th largest market, posted a 3.3 percent increase in visitor days to account for 4.5 percent of the visitor days in the state. Oceania had the largest growth in visitor days of 32.9 percent, due more air seat capacity from a Sydney to Honolulu route added during the year. Other Asia had the largest decrease in visitor days of 20.3%.
FIGURE 1: Air Visitor Days by Major Market Areas Calendar Year 2004
U.S. East29.5%
Japan13.7%
Canada4.5%
All Others10.2%
U.S. West42.1%
VISITOR EXPENDITURES Of the $10.9 billion in visitor spending by both air and cruise visitors in 2004, $5.5 billion were spent on Oahu. Japanese visitors ($1.95 billion) who came to the state in 2004 spent the most on Oahu, followed by visitors from the U.S. East ($1.36 billion) and the U.S. West ($1.31 billion). Maui received $2.88 billion in visitor spending, $1.43 billion of which were by U.S. West visitors, $1.08 billion by U.S. East visitors, $134.9 million by Canadians and $69.4 million were by Japanese visitors. Spending on the Big Island was the third highest at $1.31 billion, of which U.S. West visitors spent $590 million, U.S. East visitors spent $420.4 million and Japanese visitors spent $138.5 million (TABLES 1 & 62). Spending by air visitors from the U.S. West increased 1.7 percent from 2003 to $3.9 billion and comprised the largest portion of total air visitor expenditures at 36.1 percent. Spending by U.S. East visitors climbed 15.2 percent and ranked second at $3.2 billion or 29.6 percent of the total. Japanese expenditures which rose 13.7 percent, followed in 3rd place at $2.2 billion or a 20 percent share. Combined, these three MMAs accounted for nearly 86 percent of total air visitor expenditures for the year. Supplemental business expenditures of $159.8 million or 1.5 percent of total expenditures, represents additional business expenses spent locally by out-of-state conventions and corporate meetings (i.e. photocopying costs, equipment rentals, etc.) that are not covered by the organizers of these events.
3
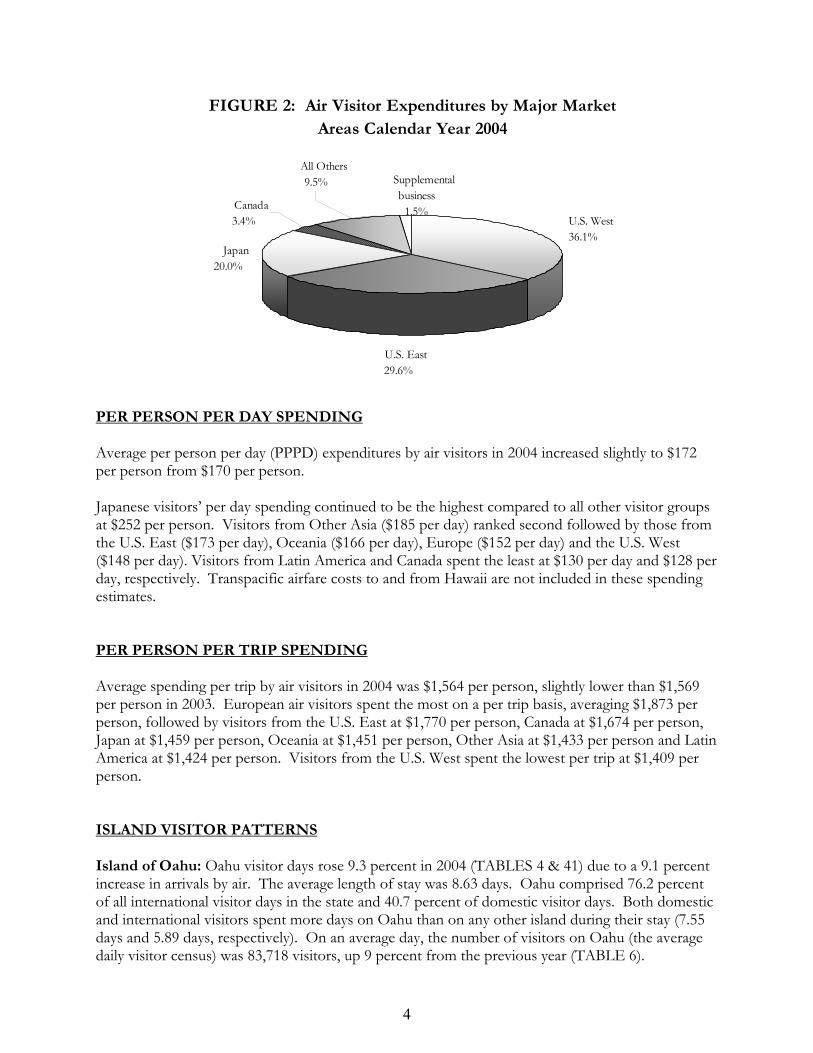
FIGURE 2: Air Visitor Expenditures by Major Market Areas Calendar Year 2004
U.S. West36.1%
Japan20.0%
Canada3.4%
All Others9.5% Supplemental
business 1.5%
U.S. East29.6%
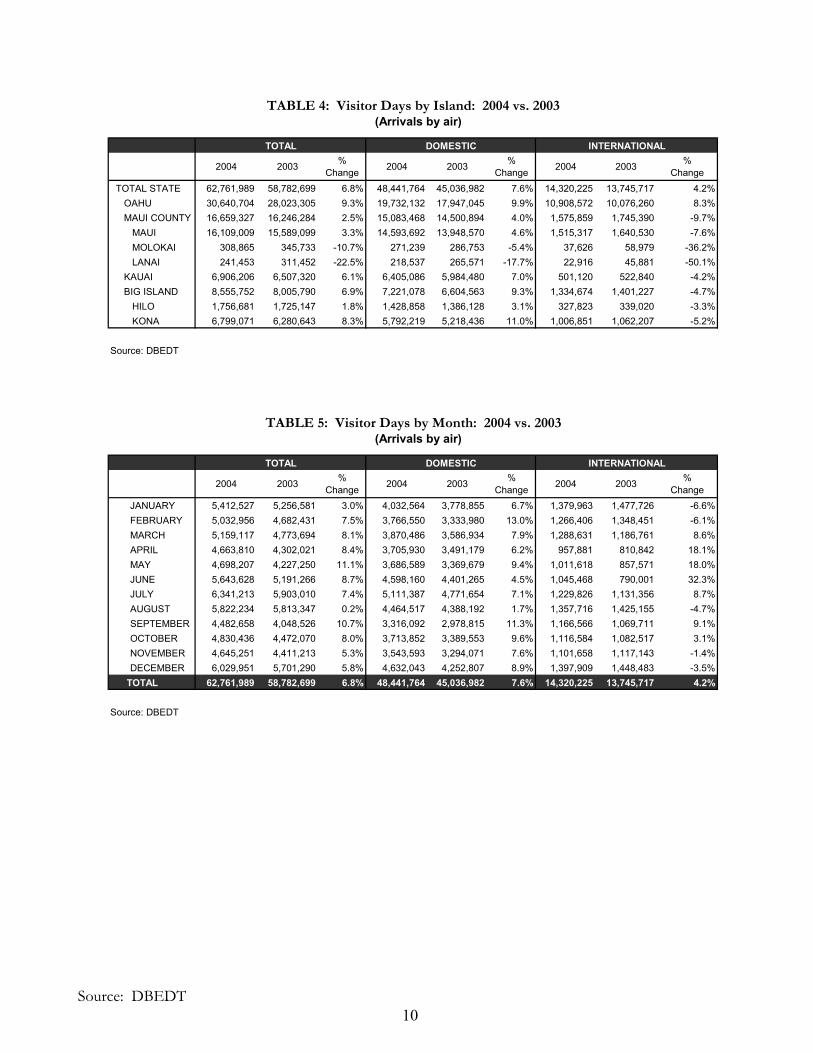
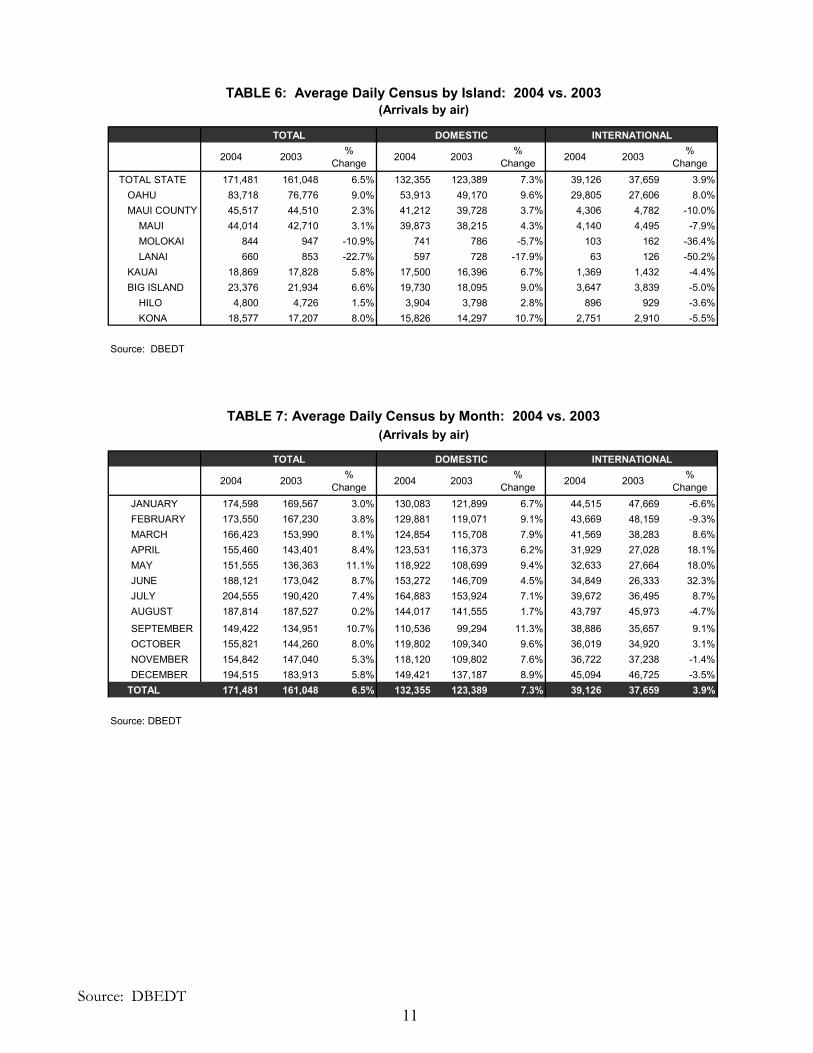
PER PERSON PER DAY SPENDING Average per person per day (PPPD) expenditures by air visitors in 2004 increased slightly to $172 per person from $170 per person. Japanese visitors’ per day spending continued to be the highest compared to all other visitor groups at $252 per person. Visitors from Other Asia ($185 per day) ranked second followed by those from the U.S. East ($173 per day), Oceania ($166 per day), Europe ($152 per day) and the U.S. West ($148 per day). Visitors from Latin America and Canada spent the least at $130 per day and $128 per day, respectively. Transpacific airfare costs to and from Hawaii are not included in these spending estimates. PER PERSON PER TRIP SPENDING Average spending per trip by air visitors in 2004 was $1,564 per person, slightly lower than $1,569 per person in 2003. European air visitors spent the most on a per trip basis, averaging $1,873 per person, followed by visitors from the U.S. East at $1,770 per person, Canada at $1,674 per person, Japan at $1,459 per person, Oceania at $1,451 per person, Other Asia at $1,433 per person and Latin America at $1,424 per person. Visitors from the U.S. West spent the lowest per trip at $1,409 per person. ISLAND VISITOR PATTERNS Island of Oahu: Oahu visitor days rose 9.3 percent in 2004 (TABLES 4 & 41) due to a 9.1 percent increase in arrivals by air. The average length of stay was 8.63 days. Oahu comprised 76.2 percent of all international visitor days in the state and 40.7 percent of domestic visitor days. Both domestic and international visitors spent more days on Oahu than on any other island during their stay (7.55 days and 5.89 days, respectively). On an average day, the number of visitors on Oahu (the average daily visitor census) was 83,718 visitors, up 9 percent from the previous year (TABLE 6).
4
Islands of Maui, Molokai and Lanai: Total visitor days for the island of Maui increased 3.3 percent thanks to a 1.4 percent growth in visitor arrivals (TABLES 4 & 43). This island accounted for 10.6 percent of all international visitor days spent in Hawaii and 30.1 percent of all domestic visitor days. Maui Island's average daily visitor census grew 3.1 percent to 44,014 air visitors. Total visitor days for Molokai (-10.7%) and Lanai (-22.5%) were lower compared to 2003 (TABLES 44 & 45). The average daily census on Molokai was off 10.9 percent to 844 visitors while the average daily census on Lanai declined 22.7 percent to 660 visitors (TABLE 6). Island of Kauai: Increased visitor arrivals (+4.6%) contributed to a 6.1 percent growth in total visitor days for Kauai in 2004. Kauai accounted for 13.2 percent of the State’s total domestic visitor days, but only 3.5 percent of international visitor days. The average daily census was 18,869 visitors, 5.8 percent higher than in the previous year. Island of Hawaii: Visitor days for the island of Hawaii grew 6.9 percent. Contributing to this increase was a 6.1 percent increase in arrivals compared to the previous year (TABLE 47). The average daily census rose 6.6 percent to 23,376 visitors in 2004. Hawaii comprised 9.3 percent of all international visitor days for the State and 14.9 percent of all domestic visitor days. MONTHLY VISITATION PATTERN July continues to be the most popular month for air visitors to Hawaii. In July 2004 an average of 204,555 visitors were present per day. December was second averaging 194,515 visitors per day. June and August ranked third and fourth with 188,121 and 187,814 visitors, respectively on a daily basis. Generally, the summer months (June through August) and the winter months (December, January and February) saw the most visitors to the islands.
CRUISE PASSENGERS A total of 244,377 passengers were aboard cruise ships touring the islands in 2004, of which 240,800 visitors were from out of state (up 4.5 percent from 2003) while 3,577 passengers were Hawaii residents (TABLE 66). Of those from out of state, 160,967 visitors came by air to board cruise ships while 79,833 visitors came by cruise ships to Hawaii (TABLE 65). It should be noted that characteristics and expenditures of cruise visitors who came by air are combined with other air visitors’ statistics (See Cruise Visitors, pages 99 to 104).
5
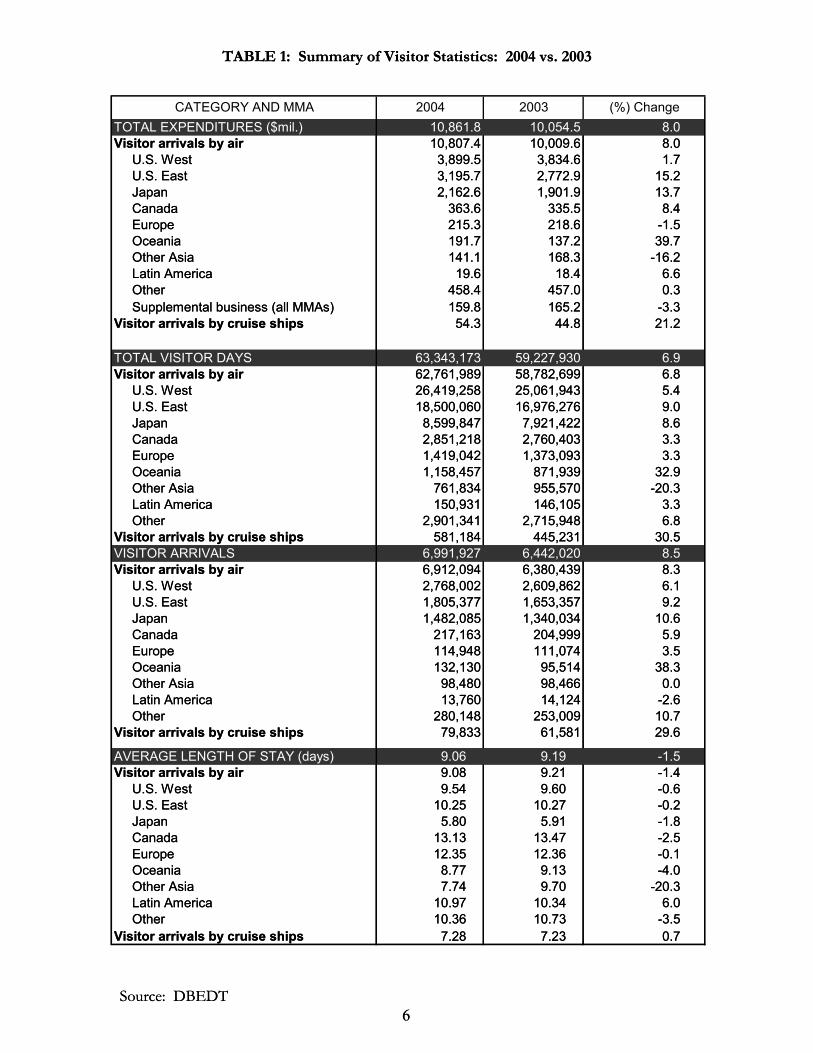
TABLE 1: Summary of Visitor Statistics: 2004 vs. 2003
TOTAL EXPENDITURES ($mil.) 10,861.8 10,054.5 8.0Visitor arrivals by air 10,807.4 10,009.6 8.0 U.S. West 3,899.5 3,834.6 1.7 U.S. East 3,195.7 2,772.9 15.2 Japan 2,162.6 1,901.9 13.7 Canada 363.6 335.5 8.4
Europe 215.3 218.6 -1.5 Oceania 191.7 137.2 39.7 Other Asia 141.1 168.3 -16.2 Latin America 19.6 18.4 6.6 Other 458.4 457.0 0.3
Supplemental business (all MMAs) 159.8 165.2 -3.3Visitor arrivals by cruise ships 54.3 44.8 21.2
TOTAL VISITOR DAYS 63,343,173 59,227,930 6.9Visitor arrivals by air 62,761,989 58,782,699 6.8 U.S. West 26,419,258 25,061,943 5.4 U.S. East 18,500,060 16,976,276 9.0 Japan 8,599,847 7,921,422 8.6 Canada 2,851,218 2,760,403 3.3 Europe 1,419,042 1,373,093 3.3 Oceania 1,158,457 871,939 32.9 Other Asia 761,834 955,570 -20.3 Latin America 150,931 146,105 3.3 Other 2,901,341 2,715,948 6.8Visitor arrivals by cruise ships 581,184 445,231 30.5VISITOR ARRIVALS 6,991,927 6,442,020 8.5Visitor arrivals by air 6,912,094 6,380,439 8.3 U.S. West 2,768,002 2,609,862 6.1 U.S. East 1,805,377 1,653,357 9.2 Japan 1,482,085 1,340,034 10.6 Canada 217,163 204,999 5.9 Europe 114,948 111,074 3.5 Oceania 132,130 95,514 38.3 Other Asia 98,480 98,466 0.0 Latin America 13,760 14,124 -2.6 Other 280,148 253,009 10.7Visitor arrivals by cruise ships 79,833 61,581 29.6
AVERAGE LENGTH OF STAY (days) 9.06 9.19 -1.5Visitor arrivals by air 9.08 9.21 -1.4 U.S. West 9.54 9.60 -0.6 U.S. East 10.25 10.27 -0.2 Japan 5.80 5.91 -1.8 Canada 13.13 13.47 -2.5 Europe 12.35 12.36 -0.1 Oceania 8.77 9.13 -4.0 Other Asia 7.74 9.70 -20.3 Latin America 10.97 10.34 6.0 Other 10.36 10.73 -3.5Visitor arrivals by cruise ships 7.28 7.23 0.7
CATEGORY AND MMA (%) Change20032004
TABLE 1: Summary of Visitor Statistics: 2004 vs. 2003
Source: DBEDT 6
TOTAL EXPENDITURES ($mil.) 10,861.8 10,054.5 8.0Visitor arrivals by air 10,807.4 10,009.6 8.0 U.S. West 3,899.5 3,834.6 1.7 U.S. East 3,195.7 2,772.9 15.2 Japan 2,162.6 1,901.9 13.7 Canada 363.6 335.5 8.4
Europe 215.3 218.6 -1.5 Oceania 191.7 137.2 39.7 Other Asia 141.1 168.3 -16.2 Latin America 19.6 18.4 6.6 Other 458.4 457.0 0.3
Supplemental business (all MMAs) 159.8 165.2 -3.3Visitor arrivals by cruise ships 54.3 44.8 21.2
TOTAL VISITOR DAYS 63,343,173 59,227,930 6.9Visitor arrivals by air 62,761,989 58,782,699 6.8 U.S. West 26,419,258 25,061,943 5.4 U.S. East 18,500,060 16,976,276 9.0 Japan 8,599,847 7,921,422 8.6 Canada 2,851,218 2,760,403 3.3 Europe 1,419,042 1,373,093 3.3 Oceania 1,158,457 871,939 32.9 Other Asia 761,834 955,570 -20.3 Latin America 150,931 146,105 3.3 Other 2,901,341 2,715,948 6.8Visitor arrivals by cruise ships 581,184 445,231 30.5VISITOR ARRIVALS 6,991,927 6,442,020 8.5Visitor arrivals by air 6,912,094 6,380,439 8.3 U.S. West 2,768,002 2,609,862 6.1 U.S. East 1,805,377 1,653,357 9.2 Japan 1,482,085 1,340,034 10.6 Canada 217,163 204,999 5.9 Europe 114,948 111,074 3.5 Oceania 132,130 95,514 38.3 Other Asia 98,480 98,466 0.0 Latin America 13,760 14,124 -2.6 Other 280,148 253,009 10.7Visitor arrivals by cruise ships 79,833 61,581 29.6
AVERAGE LENGTH OF STAY (days) 9.06 9.19 -1.5Visitor arrivals by air 9.08 9.21 -1.4 U.S. West 9.54 9.60 -0.6 U.S. East 10.25 10.27 -0.2 Japan 5.80 5.91 -1.8 Canada 13.13 13.47 -2.5 Europe 12.35 12.36 -0.1 Oceania 8.77 9.13 -4.0 Other Asia 7.74 9.70 -20.3 Latin America 10.97 10.34 6.0 Other 10.36 10.73 -3.5Visitor arrivals by cruise ships 7.28 7.23 0.7
CATEGORY AND MMA (%) Change20032004
Source: DBEDT 6
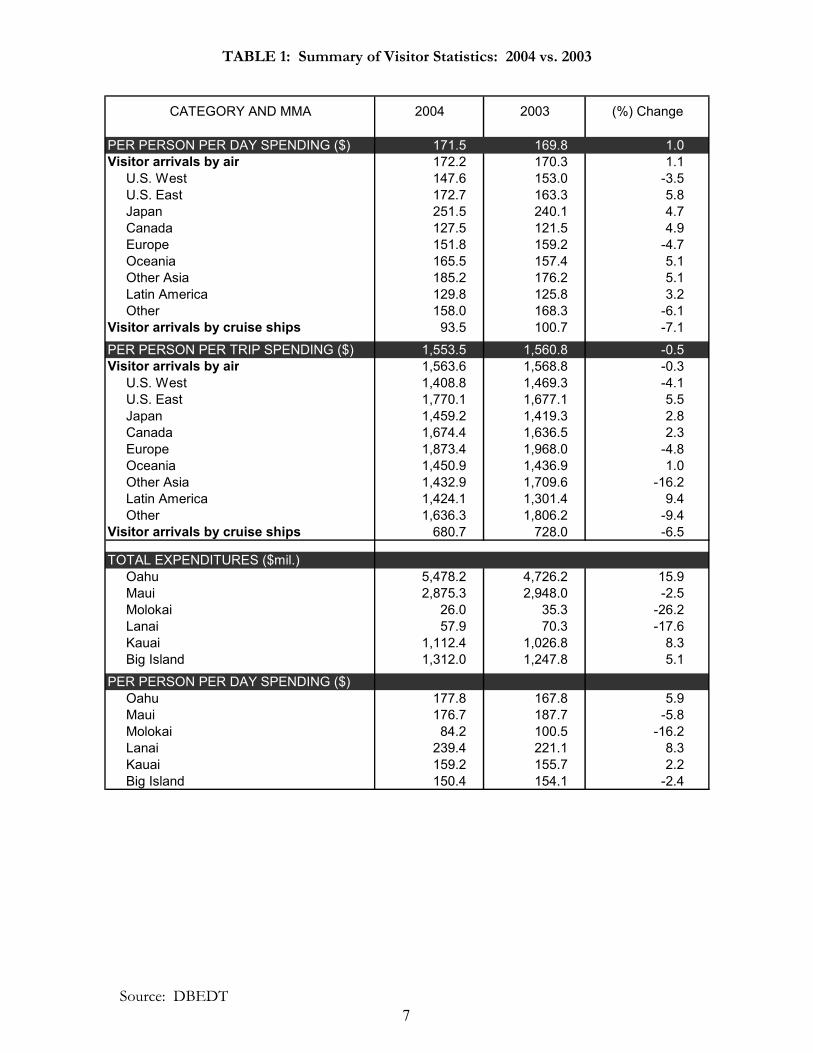
TABLE 1: Summary of Visitor Statistics: 2004 vs. 2003
PER PERSON PER DAY SPENDING ($) 171.5 169.8 1.0Visitor arrivals by air 172.2 170.3 1.1 U.S. West 147.6 153.0 -3.5 U.S. East 172.7 163.3 5.8 Japan 251.5 240.1 4.7 Canada 127.5 121.5 4.9 Europe 151.8 159.2 -4.7 Oceania 165.5 157.4 5.1 Other Asia 185.2 176.2 5.1 Latin America 129.8 125.8 3.2 Other 158.0 168.3 -6.1Visitor arrivals by cruise ships 93.5 100.7 -7.1
PER PERSON PER TRIP SPENDING ($) 1,553.5 1,560.8 -0.5Visitor arrivals by air 1,563.6 1,568.8 -0.3 U.S. West 1,408.8 1,469.3 -4.1 U.S. East 1,770.1 1,677.1 5.5 Japan 1,459.2 1,419.3 2.8 Canada 1,674.4 1,636.5 2.3 Europe 1,873.4 1,968.0 -4.8 Oceania 1,450.9 1,436.9 1.0 Other Asia 1,432.9 1,709.6 -16.2 Latin America 1,424.1 1,301.4 9.4 Other 1,636.3 1,806.2 -9.4Visitor arrivals by cruise ships 680.7 728.0 -6.5
TOTAL EXPENDITURES ($mil.) Oahu 5,478.2 4,726.2 15.9 Maui 2,875.3 2,948.0 -2.5 Molokai 26.0 35.3 -26.2 Lanai 57.9 70.3 -17.6 Kauai 1,112.4 1,026.8 8.3 Big Island 1,312.0 1,247.8 5.1
PER PERSON PER DAY SPENDING ($) Oahu 177.8 167.8 5.9 Maui 176.7 187.7 -5.8 Molokai 84.2 100.5 -16.2 Lanai 239.4 221.1 8.3 Kauai 159.2 155.7 2.2 Big Island 150.4 154.1 -2.4
CATEGORY AND MMA 2004 2003 (%) Change
Source: DBEDT 7
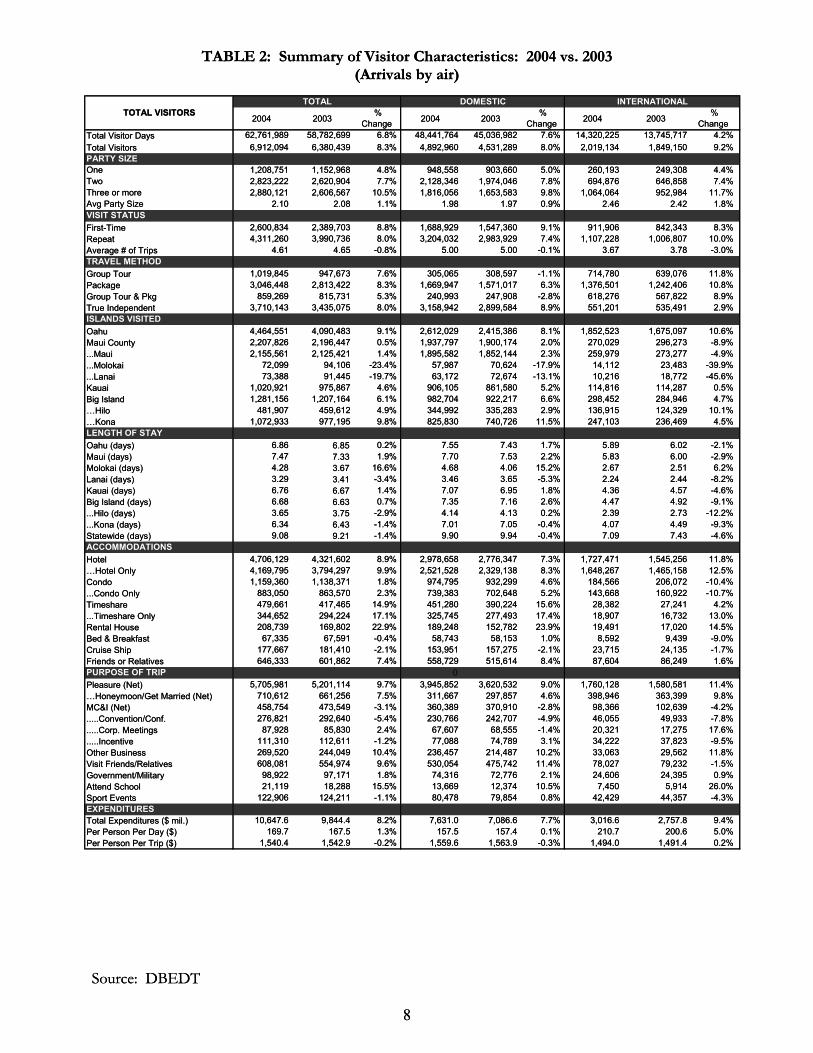
TABLE 2: Summary of Visitor Characteristics: 2004 vs. 2003 (Arrivals by air)
TOTAL DOMESTIC INTERNATIONAL
2004 2003%
Change 2004 2003%
Change 2004 2003%
ChangeTotal Visitor Days 62,761,989 58,782,699 6.8% 48,441,764 45,036,982 7.6% 14,320,225 13,745,717 4.2% Total Visitors 6,912,094 6,380,439 8.3% 4,892,960 4,531,289 8.0% 2,019,134 1,849,150 9.2% PARTY SIZEOne 1,208,751 1,152,968 4.8% 948,558 903,660 5.0% 260,193 249,308 4.4%Two 2,823,222 2,620,904 7.7% 2,128,346 1,974,046 7.8% 694,876 646,858 7.4% Three or more 2,880,121 2,606,567 10.5% 1,816,056 1,653,583 9.8% 1,064,064 952,984 11.7% Avg Party Size 2.10 2.08 1.1% 1.98 1.97 0.9% 2.46 2.42 1.8%
VISIT STATUSFirst-Time 2,600,834 2,389,703 8.8% 1,688,929 1,547,360 9.1% 911,906 842,343 8.3% Repeat 4,311,260 3,990,736 8.0% 3,204,032 2,983,929 7.4% 1,107,228 1,006,807 10.0% Average # of Trips 4.61 4.65 -0.8% 5.00 5.00 -0.1% 3.67 3.78 -3.0%TRAVEL METHODGroup Tour 1,019,845 947,673 7.6% 305,065 308,597 -1.1% 714,780 639,076 11.8%Package 3,046,448 2,813,422 8.3% 1,669,947 1,571,017 6.3% 1,376,501 1,242,406 10.8% Group Tour & Pkg 859,269 815,731 5.3% 240,993 247,908 -2.8% 618,276 567,822 8.9%True Independent 3,710,143 3,435,075 8.0% 3,158,942 2,899,584 8.9% 551,201 535,491 2.9% ISLANDS VISITEDOahu 4,464,551 4,090,483 9.1% 2,612,029 2,415,386 8.1% 1,852,523 1,675,097 10.6% Maui County 2,207,826 2,196,447 0.5% 1,937,797 1,900,174 2.0% 270,029 296,273 -8.9% ...Maui 2,155,561 2,125,421 1.4% 1,895,582 1,852,144 2.3% 259,979 273,277 -4.9% ...Molokai 72,099 94,106 -23.4% 57,987 70,624 -17.9% 14,112 23,483 -39.9%...Lanai 73,388 91,445 -19.7% 63,172 72,674 -13.1% 10,216 18,772 -45.6%Kauai 1,020,921 975,867 4.6% 906,105 861,580 5.2% 114,816 114,287 0.5%Big Island 1,281,156 1,207,164 6.1% 982,704 922,217 6.6% 298,452 284,946 4.7%…Hilo 481,907 459,612 4.9% 344,992 335,283 2.9% 136,915 124,329 10.1%…Kona 1,072,933 977,195 9.8% 825,830 740,726 11.5% 247,103 236,469 4.5%LENGTH OF STAY Oahu (days) 6.86 6.85 0.2% 7.55 7.43 1.7% 5.89 6.02 -2.1Maui (days) 7.47 7.33 1.9% 7.70 7.53 2.2% 5.83 6.00 -2.9Molokai (days) 4.28 3.67 16.6% 4.68 4.06 15.2% 2.67 2.51 6.2%Lanai (days) 3.29 3.41 -3.4% 3.46 3.65 -5.3% 2.24 2.44 -8.2%Kauai (days) 6.76 6.67 1.4% 7.07 6.95 1.8% 4.36 4.57 -4.6Big Island (days) 6.68 6.63 0.7% 7.35 7.16 2.6% 4.47 4.92 -9.1...Hilo (days) 3.65 3.75 -2.9% 4.14 4.13 0.2% 2.39 2.73 -12.2%...Kona (days) 6.34 6.43 -1.4% 7.01 7.05 -0.4% 4.07 4.49 -9.3%Statewide (days) 9.08 9.21 -1.4% 9.90 9.94 -0.4% 7.09 7.43 -4.6%ACCOMMODATIONSHotel 4,706,129 4,321,602 8.9% 2,978,658 2,776,347 7.3% 1,727,471 1,545,256 11.8% …Hotel Only 4,169,795 3,794,297 9.9% 2,521,528 2,329,138 8.3% 1,648,267 1,465,158 12.5% Condo 1,159,360 1,138,371 1.8% 974,795 932,299 4.6% 184,566 206,072 -10.4%...Condo Only 883,050 863,570 2.3% 739,383 702,648 5.2% 143,668 160,922 -10.7%Timeshare 479,661 417,465 14.9% 451,280 390,224 15.6% 28,382 27,241 4.2%...Timeshare Only 344,652 294,224 17.1% 325,745 277,493 17.4% 18,907 16,732 13.0% Rental House 208,739 169,802 22.9% 189,248 152,782 23.9% 19,491 17,020 14.5% Bed & Breakfast 67,335 67,591 -0.4% 58,743 58,153 1.0% 8,592 9,439 -9.0% Cruise Ship 177,667 181,410 -2.1% 153,951 157,275 -2.1% 23,715 24,135 -1.7% Friends or Relatives 646,333 601,862 7.4% 558,729 515,614 8.4% 87,604 86,249 1.6%PURPOSE OF TRIP 0Pleasure (Net) 5,705,981 5,201,114 9.7% 3,945,852 3,620,532 9.0% 1,760,128 1,580,581 11.4% …Honeymoon/Get Married (Net) 710,612 661,256 7.5% 311,667 297,857 4.6% 398,946 363,399 9.8%MC&I (Net) 458,754 473,549 -3.1% 360,389 370,910 -2.8% 98,366 102,639 -4.2% .....Convention/Conf. 276,821 292,640 -5.4% 230,766 242,707 -4.9% 46,055 49,933 -7.8% .....Corp. Meetings 87,928 85,830 2.4% 67,607 68,555 -1.4% 20,321 17,275 17.6% .....Incentive 111,310 112,611 -1.2% 77,088 74,789 3.1% 34,222 37,823 -9.5%Other Business 269,520 244,049 10.4% 236,457 214,487 10.2% 33,063 29,562 11.8% Visit Friends/Relatives 608,081 554,974 9.6% 530,054 475,742 11.4% 78,027 79,232 -1.5%Government/Military 98,922 97,171 1.8% 74,316 72,776 2.1% 24,606 24,395 0.9%Attend School 21,119 18,288 15.5% 13,669 12,374 10.5% 7,450 5,914 26.0Sport Events 122,906 124,211 -1.1% 80,478 79,854 0.8% 42,429 44,357 -4.3%EXPENDITURESTotal Expenditures ($ mil.) 10,647.6 9,844.4 8.2% 7,631.0 7,086.6 7.7% 3,016.6 2,757.8 9.4%Per Person Per Day ($) 169.7 167.5 1.3% 157.5 157.4 0.1% 210.7 200.6 5.0%Per Person Per Trip ($) 1,540.4 1,542.9 -0.2% 1,559.6 1,563.9 -0.3% 1,494.0 1,491.4 0.2%
TOTAL VISITORS
% %
% %
%
TABLE 2: Summary of Visitor Characteristics: 2004 vs. 2003 (Arrivals by air)
Source: DBEDT
8
TOTAL DOMESTIC INTERNATIONAL
2004 2003%
Change 2004 2003%
Change 2004 2003%
ChangeTotal Visitor Days 62,761,989 58,782,699 6.8% 48,441,764 45,036,982 7.6% 14,320,225 13,745,717 4.2% Total Visitors 6,912,094 6,380,439 8.3% 4,892,960 4,531,289 8.0% 2,019,134 1,849,150 9.2% PARTY SIZEOne 1,208,751 1,152,968 4.8% 948,558 903,660 5.0% 260,193 249,308 4.4%Two 2,823,222 2,620,904 7.7% 2,128,346 1,974,046 7.8% 694,876 646,858 7.4% Three or more 2,880,121 2,606,567 10.5% 1,816,056 1,653,583 9.8% 1,064,064 952,984 11.7% Avg Party Size 2.10 2.08 1.1% 1.98 1.97 0.9% 2.46 2.42 1.8%
VISIT STATUSFirst-Time 2,600,834 2,389,703 8.8% 1,688,929 1,547,360 9.1% 911,906 842,343 8.3% Repeat 4,311,260 3,990,736 8.0% 3,204,032 2,983,929 7.4% 1,107,228 1,006,807 10.0% Average # of Trips 4.61 4.65 -0.8% 5.00 5.00 -0.1% 3.67 3.78 -3.0%TRAVEL METHODGroup Tour 1,019,845 947,673 7.6% 305,065 308,597 -1.1% 714,780 639,076 11.8%Package 3,046,448 2,813,422 8.3% 1,669,947 1,571,017 6.3% 1,376,501 1,242,406 10.8% Group Tour & Pkg 859,269 815,731 5.3% 240,993 247,908 -2.8% 618,276 567,822 8.9%True Independent 3,710,143 3,435,075 8.0% 3,158,942 2,899,584 8.9% 551,201 535,491 2.9% ISLANDS VISITEDOahu 4,464,551 4,090,483 9.1% 2,612,029 2,415,386 8.1% 1,852,523 1,675,097 10.6% Maui County 2,207,826 2,196,447 0.5% 1,937,797 1,900,174 2.0% 270,029 296,273 -8.9% ...Maui 2,155,561 2,125,421 1.4% 1,895,582 1,852,144 2.3% 259,979 273,277 -4.9% ...Molokai 72,099 94,106 -23.4% 57,987 70,624 -17.9% 14,112 23,483 -39.9%...Lanai 73,388 91,445 -19.7% 63,172 72,674 -13.1% 10,216 18,772 -45.6%Kauai 1,020,921 975,867 4.6% 906,105 861,580 5.2% 114,816 114,287 0.5%Big Island 1,281,156 1,207,164 6.1% 982,704 922,217 6.6% 298,452 284,946 4.7%…Hilo 481,907 459,612 4.9% 344,992 335,283 2.9% 136,915 124,329 10.1%…Kona 1,072,933 977,195 9.8% 825,830 740,726 11.5% 247,103 236,469 4.5%LENGTH OF STAY Oahu (days) 6.86 6.85 0.2% 7.55 7.43 1.7% 5.89 6.02 -2.1Maui (days) 7.47 7.33 1.9% 7.70 7.53 2.2% 5.83 6.00 -2.9Molokai (days) 4.28 3.67 16.6% 4.68 4.06 15.2% 2.67 2.51 6.2%Lanai (days) 3.29 3.41 -3.4% 3.46 3.65 -5.3% 2.24 2.44 -8.2%Kauai (days) 6.76 6.67 1.4% 7.07 6.95 1.8% 4.36 4.57 -4.6Big Island (days) 6.68 6.63 0.7% 7.35 7.16 2.6% 4.47 4.92 -9.1...Hilo (days) 3.65 3.75 -2.9% 4.14 4.13 0.2% 2.39 2.73 -12.2%...Kona (days) 6.34 6.43 -1.4% 7.01 7.05 -0.4% 4.07 4.49 -9.3%Statewide (days) 9.08 9.21 -1.4% 9.90 9.94 -0.4% 7.09 7.43 -4.6%ACCOMMODATIONSHotel 4,706,129 4,321,602 8.9% 2,978,658 2,776,347 7.3% 1,727,471 1,545,256 11.8% …Hotel Only 4,169,795 3,794,297 9.9% 2,521,528 2,329,138 8.3% 1,648,267 1,465,158 12.5% Condo 1,159,360 1,138,371 1.8% 974,795 932,299 4.6% 184,566 206,072 -10.4%...Condo Only 883,050 863,570 2.3% 739,383 702,648 5.2% 143,668 160,922 -10.7%Timeshare 479,661 417,465 14.9% 451,280 390,224 15.6% 28,382 27,241 4.2%...Timeshare Only 344,652 294,224 17.1% 325,745 277,493 17.4% 18,907 16,732 13.0% Rental House 208,739 169,802 22.9% 189,248 152,782 23.9% 19,491 17,020 14.5% Bed & Breakfast 67,335 67,591 -0.4% 58,743 58,153 1.0% 8,592 9,439 -9.0% Cruise Ship 177,667 181,410 -2.1% 153,951 157,275 -2.1% 23,715 24,135 -1.7% Friends or Relatives 646,333 601,862 7.4% 558,729 515,614 8.4% 87,604 86,249 1.6%PURPOSE OF TRIP 0Pleasure (Net) 5,705,981 5,201,114 9.7% 3,945,852 3,620,532 9.0% 1,760,128 1,580,581 11.4% …Honeymoon/Get Married (Net) 710,612 661,256 7.5% 311,667 297,857 4.6% 398,946 363,399 9.8%MC&I (Net) 458,754 473,549 -3.1% 360,389 370,910 -2.8% 98,366 102,639 -4.2% .....Convention/Conf. 276,821 292,640 -5.4% 230,766 242,707 -4.9% 46,055 49,933 -7.8% .....Corp. Meetings 87,928 85,830 2.4% 67,607 68,555 -1.4% 20,321 17,275 17.6% .....Incentive 111,310 112,611 -1.2% 77,088 74,789 3.1% 34,222 37,823 -9.5%Other Business 269,520 244,049 10.4% 236,457 214,487 10.2% 33,063 29,562 11.8% Visit Friends/Relatives 608,081 554,974 9.6% 530,054 475,742 11.4% 78,027 79,232 -1.5%Government/Military 98,922 97,171 1.8% 74,316 72,776 2.1% 24,606 24,395 0.9%Attend School 21,119 18,288 15.5% 13,669 12,374 10.5% 7,450 5,914 26.0Sport Events 122,906 124,211 -1.1% 80,478 79,854 0.8% 42,429 44,357 -4.3%EXPENDITURESTotal Expenditures ($ mil.) 10,647.6 9,844.4 8.2% 7,631.0 7,086.6 7.7% 3,016.6 2,757.8 9.4%Per Person Per Day ($) 169.7 167.5 1.3% 157.5 157.4 0.1% 210.7 200.6 5.0%Per Person Per Trip ($) 1,540.4 1,542.9 -0.2% 1,559.6 1,563.9 -0.3% 1,494.0 1,491.4 0.2%
TOTAL VISITORS
% %
% %
%
Source: DBEDT
8
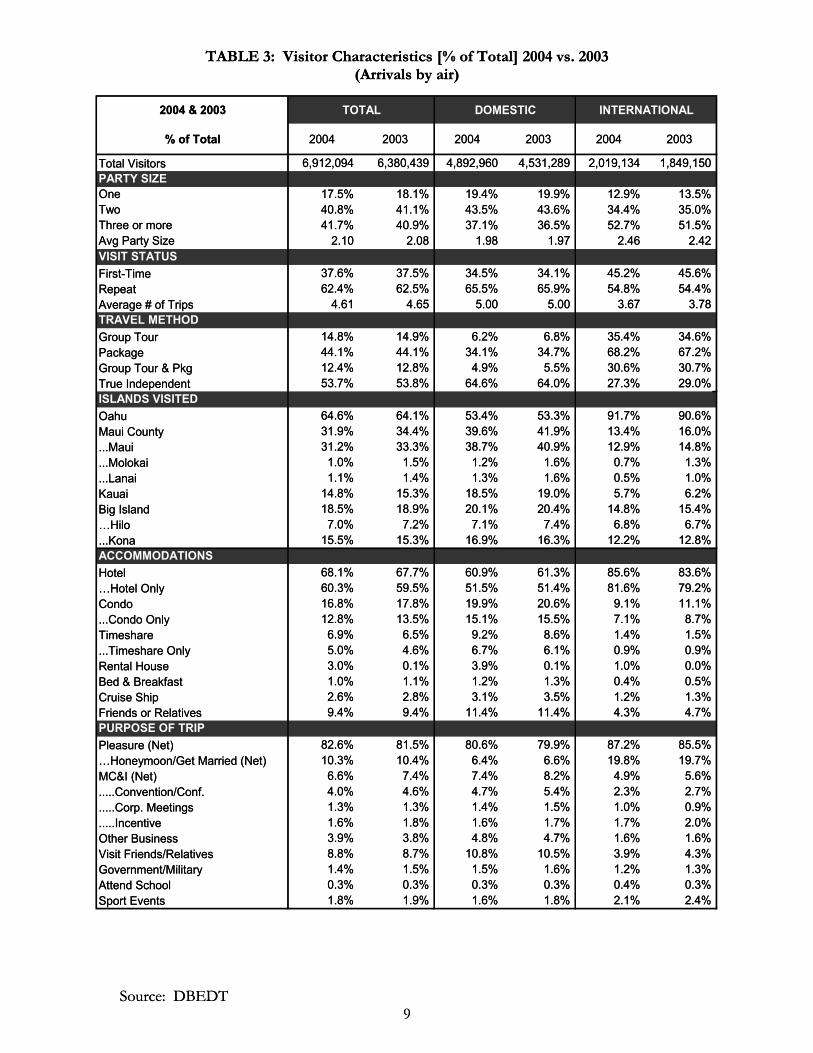
TABLE 3: Visitor Characteristics [% of Total] 2004 vs. 2003 (Arrivals by air)
2004 & 2003 TOTAL DOMESTIC INTERNATIONAL
% of Total 2004 2003 2004 2003 2004 2003
Total Visitors 6,912,094 6,380,439 4,892,960 4,531,289 2,019,134 1,849,150 PARTY SIZEOne 17.5% 18.1% 19.4% 19.9% 12.9% 13.5%Two 40.8% 41.1% 43.5% 43.6% 34.4% 35.0%Three or more 41.7% 40.9% 37.1% 36.5% 52.7% 51.5%Avg Party Size 2.10 2.08 1.98 1.97 2.46 2.42VISIT STATUSFirst-Time 37.6% 37.5% 34.5% 34.1% 45.2% 45.6%Repeat 62.4% 62.5% 65.5% 65.9% 54.8% 54.4%Average # of Trips 4.61 4.65 5.00 5.00 3.67 3.78TRAVEL METHODGroup Tour 14.8% 14.9% 6.2% 6.8% 35.4% 34.6%Package 44.1% 44.1% 34.1% 34.7% 68.2% 67.2%Group Tour & Pkg 12.4% 12.8% 4.9% 5.5% 30.6% 30.7%True Independent 53.7% 53.8% 64.6% 64.0% 27.3% 29.0%ISLANDS VISITEDOahu 64.6% 64.1% 53.4% 53.3% 91.7% 90.6%Maui County 31.9% 34.4% 39.6% 41.9% 13.4% 16.0%...Maui 31.2% 33.3% 38.7% 40.9% 12.9% 14.8%...Molokai 1.0% 1.5% 1.2% 1.6% 0.7% 1.3%...Lanai 1.1% 1.4% 1.3% 1.6% 0.5% 1.0%Kauai 14.8% 15.3% 18.5% 19.0% 5.7% 6.2%Big Island 18.5% 18.9% 20.1% 20.4% 14.8% 15.4%…Hilo 7.0% 7.2% 7.1% 7.4% 6.8% 6.7%...Kona 15.5% 15.3% 16.9% 16.3% 12.2% 12.8%ACCOMMODATIONSHotel 68.1% 67.7% 60.9% 61.3% 85.6% 83.6%…Hotel Only 60.3% 59.5% 51.5% 51.4% 81.6% 79.2%Condo 16.8% 17.8% 19.9% 20.6% 9.1% 11.1%...Condo Only 12.8% 13.5% 15.1% 15.5% 7.1% 8.7%Timeshare 6.9% 6.5% 9.2% 8.6% 1.4% 1.5%...Timeshare Only 5.0% 4.6% 6.7% 6.1% 0.9% 0.9%Rental House 3.0% 0.1% 3.9% 0.1% 1.0% 0.0%Bed & Breakfast 1.0% 1.1% 1.2% 1.3% 0.4% 0.5%Cruise Ship 2.6% 2.8% 3.1% 3.5% 1.2% 1.3%Friends or Relatives 9.4% 9.4% 11.4% 11.4% 4.3% 4.7%PURPOSE OF TRIPPleasure (Net) 82.6% 81.5% 80.6% 79.9% 87.2% 85.5%…Honeymoon/Get Married (Net) 10.3% 10.4% 6.4% 6.6% 19.8% 19.7%MC&I (Net) 6.6% 7.4% 7.4% 8.2% 4.9% 5.6%.....Convention/Conf. 4.0% 4.6% 4.7% 5.4% 2.3% 2.7%.....Corp. Meetings 1.3% 1.3% 1.4% 1.5% 1.0% 0.9%.....Incentive 1.6% 1.8% 1.6% 1.7% 1.7% 2.0%Other Business 3.9% 3.8% 4.8% 4.7% 1.6% 1.6%Visit Friends/Relatives 8.8% 8.7% 10.8% 10.5% 3.9% 4.3%Government/Military 1.4% 1.5% 1.5% 1.6% 1.2% 1.3%Attend School 0.3% 0.3% 0.3% 0.3% 0.4% 0.3%Sport Events 1.8% 1.9% 1.6% 1.8% 2.1% 2.4%
TABLE 3: Visitor Characteristics [% of Total] 2004 vs. 2003 (Arrivals by air)
Source: DBEDT
9
2004 & 2003 TOTAL DOMESTIC INTERNATIONAL
% of Total 2004 2003 2004 2003 2004 2003
Total Visitors 6,912,094 6,380,439 4,892,960 4,531,289 2,019,134 1,849,150 PARTY SIZEOne 17.5% 18.1% 19.4% 19.9% 12.9% 13.5%Two 40.8% 41.1% 43.5% 43.6% 34.4% 35.0%Three or more 41.7% 40.9% 37.1% 36.5% 52.7% 51.5%Avg Party Size 2.10 2.08 1.98 1.97 2.46 2.42VISIT STATUSFirst-Time 37.6% 37.5% 34.5% 34.1% 45.2% 45.6%Repeat 62.4% 62.5% 65.5% 65.9% 54.8% 54.4%Average # of Trips 4.61 4.65 5.00 5.00 3.67 3.78TRAVEL METHODGroup Tour 14.8% 14.9% 6.2% 6.8% 35.4% 34.6%Package 44.1% 44.1% 34.1% 34.7% 68.2% 67.2%Group Tour & Pkg 12.4% 12.8% 4.9% 5.5% 30.6% 30.7%True Independent 53.7% 53.8% 64.6% 64.0% 27.3% 29.0%ISLANDS VISITEDOahu 64.6% 64.1% 53.4% 53.3% 91.7% 90.6%Maui County 31.9% 34.4% 39.6% 41.9% 13.4% 16.0%...Maui 31.2% 33.3% 38.7% 40.9% 12.9% 14.8%...Molokai 1.0% 1.5% 1.2% 1.6% 0.7% 1.3%...Lanai 1.1% 1.4% 1.3% 1.6% 0.5% 1.0%Kauai 14.8% 15.3% 18.5% 19.0% 5.7% 6.2%Big Island 18.5% 18.9% 20.1% 20.4% 14.8% 15.4%…Hilo 7.0% 7.2% 7.1% 7.4% 6.8% 6.7%...Kona 15.5% 15.3% 16.9% 16.3% 12.2% 12.8%ACCOMMODATIONSHotel 68.1% 67.7% 60.9% 61.3% 85.6% 83.6%…Hotel Only 60.3% 59.5% 51.5% 51.4% 81.6% 79.2%Condo 16.8% 17.8% 19.9% 20.6% 9.1% 11.1%...Condo Only 12.8% 13.5% 15.1% 15.5% 7.1% 8.7%Timeshare 6.9% 6.5% 9.2% 8.6% 1.4% 1.5%...Timeshare Only 5.0% 4.6% 6.7% 6.1% 0.9% 0.9%Rental House 3.0% 0.1% 3.9% 0.1% 1.0% 0.0%Bed & Breakfast 1.0% 1.1% 1.2% 1.3% 0.4% 0.5%Cruise Ship 2.6% 2.8% 3.1% 3.5% 1.2% 1.3%Friends or Relatives 9.4% 9.4% 11.4% 11.4% 4.3% 4.7%PURPOSE OF TRIPPleasure (Net) 82.6% 81.5% 80.6% 79.9% 87.2% 85.5%…Honeymoon/Get Married (Net) 10.3% 10.4% 6.4% 6.6% 19.8% 19.7%MC&I (Net) 6.6% 7.4% 7.4% 8.2% 4.9% 5.6%.....Convention/Conf. 4.0% 4.6% 4.7% 5.4% 2.3% 2.7%.....Corp. Meetings 1.3% 1.3% 1.4% 1.5% 1.0% 0.9%.....Incentive 1.6% 1.8% 1.6% 1.7% 1.7% 2.0%Other Business 3.9% 3.8% 4.8% 4.7% 1.6% 1.6%Visit Friends/Relatives 8.8% 8.7% 10.8% 10.5% 3.9% 4.3%Government/Military 1.4% 1.5% 1.5% 1.6% 1.2% 1.3%Attend School 0.3% 0.3% 0.3% 0.3% 0.4% 0.3%Sport Events 1.8% 1.9% 1.6% 1.8% 2.1% 2.4%
Source: DBEDT
9
TOTAL DOMESTIC INTERNATIONAL
2004 2003 % Change 2004 2003 %
Change 2004 2003 % Change
TOTAL STATE 62,761,989 58,782,699 6.8% 48,441,764 45,036,982 7.6% 14,320,225 13,745,717 4.2% OAHU 30,640,704 28,023,305 9.3% 19,732,132 17,947,045 9.9% 10,908,572 10,076,260 8.3% MAUI COUNTY 16,659,327 16,246,284 2.5% 15,083,468 14,500,894 4.0% 1,575,859 1,745,390 -9.7% MAUI 16,109,009 15,589,099 3.3% 14,593,692 13,948,570 4.6% 1,515,317 1,640,530 -7.6% MOLOKAI 308,865 345,733 -10.7% 271,239 286,753 -5.4% 37,626 58,979 -36.2% LANAI 241,453 311,452 -22.5% 218,537 265,571 -17.7% 22,916 45,881 -50.1% KAUAI 6,906,206 6,507,320 6.1% 6,405,086 5,984,480 7.0% 501,120 522,840 -4.2% BIG ISLAND 8,555,752 8,005,790 6.9% 7,221,078 6,604,563 9.3% 1,334,674 1,401,227 -4.7% HILO 1,756,681 1,725,147 1.8% 1,428,858 1,386,128 3.1% 327,823 339,020 -3.3% KONA 6,799,071 6,280,643 8.3% 5,792,219 5,218,436 11.0% 1,006,851 1,062,207 -5.2%
Source: DBEDT
TABLE 4: Visitor Days by Island: 2004 vs. 2003 (Arrivals by air)
TOTAL DOMESTIC INTERNATIONAL
2004 2003 % Change 2004 2003 %
Change 2004 2003 % Change
JANUARY 5,412,527 5,256,581 3.0% 4,032,564 3,778,855 6.7% 1,379,963 1,477,726 -6.6%FEBRUARY 5,032,956 4,682,431 7.5% 3,766,550 3,333,980 13.0% 1,266,406 1,348,451 -6.1%MARCH 5,159,117 4,773,694 8.1% 3,870,486 3,586,934 7.9% 1,288,631 1,186,761 8.6%APRIL 4,663,810 4,302,021 8.4% 3,705,930 3,491,179 6.2% 957,881 810,842 18.1%MAY 4,698,207 4,227,250 11.1% 3,686,589 3,369,679 9.4% 1,011,618 857,571 18.0%JUNE 5,643,628 5,191,266 8.7% 4,598,160 4,401,265 4.5% 1,045,468 790,001 32.3%JULY 6,341,213 5,903,010 7.4% 5,111,387 4,771,654 7.1% 1,229,826 1,131,356 8.7%AUGUST 5,822,234 5,813,347 0.2% 4,464,517 4,388,192 1.7% 1,357,716 1,425,155 -4.7%SEPTEMBER 4,482,658 4,048,526 10.7% 3,316,092 2,978,815 11.3% 1,166,566 1,069,711 9.1%OCTOBER 4,830,436 4,472,070 8.0% 3,713,852 3,389,553 9.6% 1,116,584 1,082,517 3.1%NOVEMBER 4,645,251 4,411,213 5.3% 3,543,593 3,294,071 7.6% 1,101,658 1,117,143 -1.4%DECEMBER 6,029,951 5,701,290 5.8% 4,632,043 4,252,807 8.9% 1,397,909 1,448,483 -3.5%
TOTAL 62,761,989 58,782,699 6.8% 48,441,764 45,036,982 7.6% 14,320,225 13,745,717 4.2%
Source: DBEDT
TABLE 5: Visitor Days by Month: 2004 vs. 2003 (Arrivals by air)
Source: DBEDT 10
TOTAL DOMESTIC INTERNATIONAL
2004 2003 % Change 2004 2003 %
Change 2004 2003 % Change
TOTAL STATE 171,481 161,048 6.5% 132,355 123,389 7.3% 39,126 37,659 3.9% OAHU 83,718 76,776 9.0% 53,913 49,170 9.6% 29,805 27,606 8.0% MAUI COUNTY 45,517 44,510 2.3% 41,212 39,728 3.7% 4,306 4,782 -10.0% MAUI 44,014 42,710 3.1% 39,873 38,215 4.3% 4,140 4,495 -7.9% MOLOKAI 844 947 -10.9% 741 786 -5.7% 103 162 -36.4% LANAI 660 853 -22.7% 597 728 -17.9% 63 126 -50.2% KAUAI 18,869 17,828 5.8% 17,500 16,396 6.7% 1,369 1,432 -4.4% BIG ISLAND 23,376 21,934 6.6% 19,730 18,095 9.0% 3,647 3,839 -5.0% HILO 4,800 4,726 1.5% 3,904 3,798 2.8% 896 929 -3.6% KONA 18,577 17,207 8.0% 15,826 14,297 10.7% 2,751 2,910 -5.5%
Source: DBEDT
TABLE 6: Average Daily Census by Island: 2004 vs. 2003 (Arrivals by air)
TOTAL DOMESTIC INTERNATIONAL
2004 2003 % Change 2004 2003 %
Change 2004 2003 % Change
JANUARY 174,598 169,567 3.0% 130,083 121,899 6.7% 44,515 47,669 -6.6%FEBRUARY 173,550 167,230 3.8% 129,881 119,071 9.1% 43,669 48,159 -9.3%MARCH 166,423 153,990 8.1% 124,854 115,708 7.9% 41,569 38,283 8.6%APRIL 155,460 143,401 8.4% 123,531 116,373 6.2% 31,929 27,028 18.1%MAY 151,555 136,363 11.1% 118,922 108,699 9.4% 32,633 27,664 18.0%JUNE 188,121 173,042 8.7% 153,272 146,709 4.5% 34,849 26,333 32.3%JULY 204,555 190,420 7.4% 164,883 153,924 7.1% 39,672 36,495 8.7%AUGUST 187,814 187,527 0.2% 144,017 141,555 1.7% 43,797 45,973 -4.7%
SEPTEMBER 149,422 134,951 10.7% 110,536 99,294 11.3% 38,886 35,657 9.1%OCTOBER 155,821 144,260 8.0% 119,802 109,340 9.6% 36,019 34,920 3.1%NOVEMBER 154,842 147,040 5.3% 118,120 109,802 7.6% 36,722 37,238 -1.4%DECEMBER 194,515 183,913 5.8% 149,421 137,187 8.9% 45,094 46,725 -3.5%
TOTAL 171,481 161,048 6.5% 132,355 123,389 7.3% 39,126 37,659 3.9%
Source: DBEDT
TABLE 7: Average Daily Census by Month: 2004 vs. 2003 (Arrivals by air)
Source: DBEDT 11
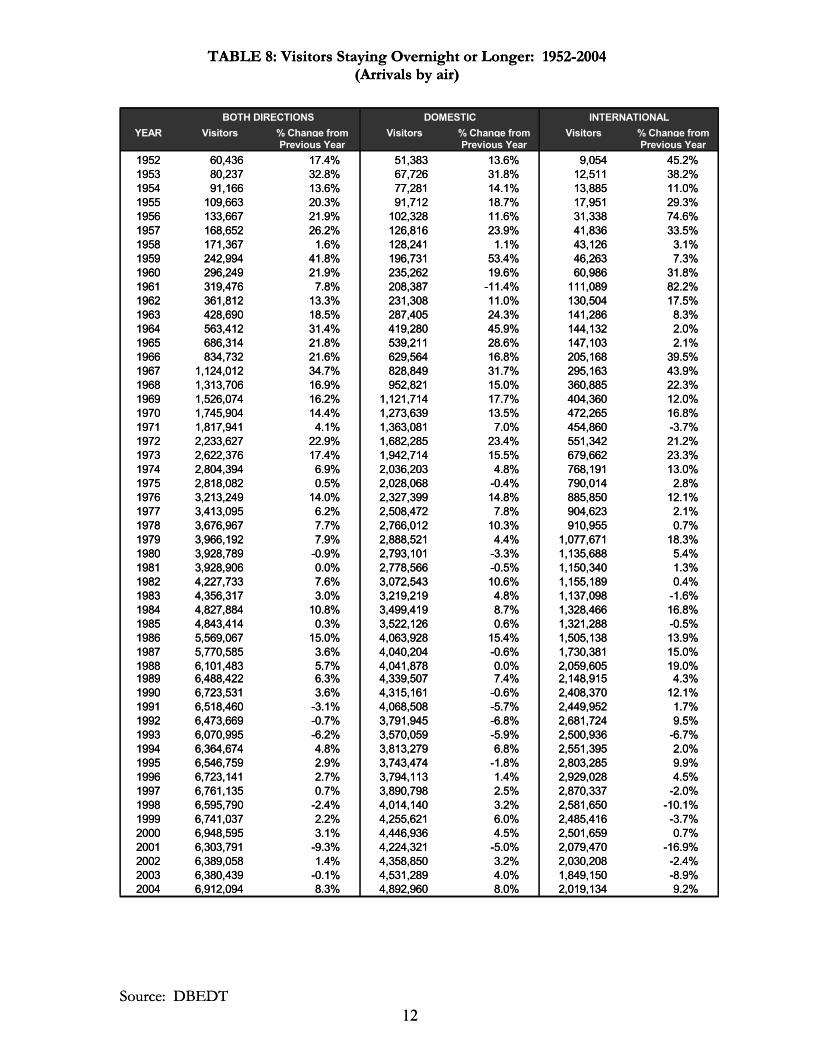
TABLE 8: Visitors Staying Overnight or Longer: 1952-2004 (Arrivals by air)
YEAR Visitors % Change from Visitors % Change from Visitors % Change fromPrevious Year Previous Year Previous Year, , ,
1952 60,436 17.4% 51,383 13.6% 9,054 45.2%1953 80,237 32.8% 67,726 31.8% 12,511 38.2%1954 91,166 13.6% 77,281 14.1% 13,885 11.0%1955 109,663 20.3% 91,712 18.7% 17,951 29.3%1956 133,667 21.9% 102,328 11.6% 31,338 74.6%1957 168,652 26.2% 126,816 23.9% 41,836 33.5%1958 171,367 1.6% 128,241 1.1% 43,126 3.1%1959 242,994 41.8% 196,731 53.4% 46,263 7.3%1960 296,249 21.9% 235,262 19.6% 60,986 31.8%1961 319,476 7.8% 208,387 -11.4% 111,089 82.2%1962 361,812 13.3% 231,308 11.0% 130,504 17.5%1963 428,690 18.5% 287,405 24.3% 141,286 8.3%1964 563,412 31.4% 419,280 45.9% 144,132 2.0%1965 686,314 21.8% 539,211 28.6% 147,103 2.1%1966 834,732 21.6% 629,564 16.8% 205,168 39.5%1967 1,124,012 34.7% 828,849 31.7% 295,163 43.9%1968 1,313,706 16.9% 952,821 15.0% 360,885 22.3%1969 1,526,074 16.2% 1,121,714 17.7% 404,360 12.0%1970 1,745,904 14.4% 1,273,639 13.5% 472,265 16.8%1971 1,817,941 4.1% 1,363,081 7.0% 454,860 -3.7%1972 2,233,627 22.9% 1,682,285 23.4% 551,342 21.2%1973 2,622,376 17.4% 1,942,714 15.5% 679,662 23.3%1974 2,804,394 6.9% 2,036,203 4.8% 768,191 13.0%1975 2,818,082 0.5% 2,028,068 -0.4% 790,014 2.8%1976 3,213,249 14.0% 2,327,399 14.8% 885,850 12.1%1977 3,413,095 6.2% 2,508,472 7.8% 904,623 2.1%1978 3,676,967 7.7% 2,766,012 10.3% 910,955 0.7%1979 3,966,192 7.9% 2,888,521 4.4% 1,077,671 18.3%1980 3,928,789 -0.9% 2,793,101 -3.3% 1,135,688 5.4%1981 3,928,906 0.0% 2,778,566 -0.5% 1,150,340 1.3%1982 4,227,733 7.6% 3,072,543 10.6% 1,155,189 0.4%1983 4,356,317 3.0% 3,219,219 4.8% 1,137,098 -1.6%1984 4,827,884 10.8% 3,499,419 8.7% 1,328,466 16.8%1985 4,843,414 0.3% 3,522,126 0.6% 1,321,288 -0.5%1986 5,569,067 15.0% 4,063,928 15.4% 1,505,138 13.9%1987 5,770,585 3.6% 4,040,204 -0.6% 1,730,381 15.0%1988 6,101,483 5.7% 4,041,878 0.0% 2,059,605 19.0%1989 6,488,422 6.3% 4,339,507 7.4% 2,148,915 4.3%1990 6,723,531 3.6% 4,315,161 -0.6% 2,408,370 12.1%1991 6,518,460 -3.1% 4,068,508 -5.7% 2,449,952 1.7%1992 6,473,669 -0.7% 3,791,945 -6.8% 2,681,724 9.5%1993 6,070,995 -6.2% 3,570,059 -5.9% 2,500,936 -6.7%1994 6,364,674 4.8% 3,813,279 6.8% 2,551,395 2.0%1995 6,546,759 2.9% 3,743,474 -1.8% 2,803,285 9.9%1996 6,723,141 2.7% 3,794,113 1.4% 2,929,028 4.5%1997 6,761,135 0.7% 3,890,798 2.5% 2,870,337 -2.0%1998 6,595,790 -2.4% 4,014,140 3.2% 2,581,650 -10.1%1999 6,741,037 2.2% 4,255,621 6.0% 2,485,416 -3.7%2000 6,948,595 3.1% 4,446,936 4.5% 2,501,659 0.7%2001 6,303,791 -9.3% 4,224,321 -5.0% 2,079,470 -16.9%2002 6,389,058 1.4% 4,358,850 3.2% 2,030,208 -2.4%2003 6,380,439 -0.1% 4,531,289 4.0% 1,849,150 -8.9%2004 6,912,094 8.3% 4,892,960 8.0% 2,019,134 9.2%
BOTH DIRECTIONS DOMESTIC INTERNATIONAL
TABLE 8: Visitors Staying Overnight or Longer: 1952-2004 (Arrivals by air)
Source: DBEDT 12
YEAR Visitors % Change from Visitors % Change from Visitors % Change fromPrevious Year Previous Year Previous Year, , ,
1952 60,436 17.4% 51,383 13.6% 9,054 45.2%1953 80,237 32.8% 67,726 31.8% 12,511 38.2%1954 91,166 13.6% 77,281 14.1% 13,885 11.0%1955 109,663 20.3% 91,712 18.7% 17,951 29.3%1956 133,667 21.9% 102,328 11.6% 31,338 74.6%1957 168,652 26.2% 126,816 23.9% 41,836 33.5%1958 171,367 1.6% 128,241 1.1% 43,126 3.1%1959 242,994 41.8% 196,731 53.4% 46,263 7.3%1960 296,249 21.9% 235,262 19.6% 60,986 31.8%1961 319,476 7.8% 208,387 -11.4% 111,089 82.2%1962 361,812 13.3% 231,308 11.0% 130,504 17.5%1963 428,690 18.5% 287,405 24.3% 141,286 8.3%1964 563,412 31.4% 419,280 45.9% 144,132 2.0%1965 686,314 21.8% 539,211 28.6% 147,103 2.1%1966 834,732 21.6% 629,564 16.8% 205,168 39.5%1967 1,124,012 34.7% 828,849 31.7% 295,163 43.9%1968 1,313,706 16.9% 952,821 15.0% 360,885 22.3%1969 1,526,074 16.2% 1,121,714 17.7% 404,360 12.0%1970 1,745,904 14.4% 1,273,639 13.5% 472,265 16.8%1971 1,817,941 4.1% 1,363,081 7.0% 454,860 -3.7%1972 2,233,627 22.9% 1,682,285 23.4% 551,342 21.2%1973 2,622,376 17.4% 1,942,714 15.5% 679,662 23.3%1974 2,804,394 6.9% 2,036,203 4.8% 768,191 13.0%1975 2,818,082 0.5% 2,028,068 -0.4% 790,014 2.8%1976 3,213,249 14.0% 2,327,399 14.8% 885,850 12.1%1977 3,413,095 6.2% 2,508,472 7.8% 904,623 2.1%1978 3,676,967 7.7% 2,766,012 10.3% 910,955 0.7%1979 3,966,192 7.9% 2,888,521 4.4% 1,077,671 18.3%1980 3,928,789 -0.9% 2,793,101 -3.3% 1,135,688 5.4%1981 3,928,906 0.0% 2,778,566 -0.5% 1,150,340 1.3%1982 4,227,733 7.6% 3,072,543 10.6% 1,155,189 0.4%1983 4,356,317 3.0% 3,219,219 4.8% 1,137,098 -1.6%1984 4,827,884 10.8% 3,499,419 8.7% 1,328,466 16.8%1985 4,843,414 0.3% 3,522,126 0.6% 1,321,288 -0.5%1986 5,569,067 15.0% 4,063,928 15.4% 1,505,138 13.9%1987 5,770,585 3.6% 4,040,204 -0.6% 1,730,381 15.0%1988 6,101,483 5.7% 4,041,878 0.0% 2,059,605 19.0%1989 6,488,422 6.3% 4,339,507 7.4% 2,148,915 4.3%1990 6,723,531 3.6% 4,315,161 -0.6% 2,408,370 12.1%1991 6,518,460 -3.1% 4,068,508 -5.7% 2,449,952 1.7%1992 6,473,669 -0.7% 3,791,945 -6.8% 2,681,724 9.5%1993 6,070,995 -6.2% 3,570,059 -5.9% 2,500,936 -6.7%1994 6,364,674 4.8% 3,813,279 6.8% 2,551,395 2.0%1995 6,546,759 2.9% 3,743,474 -1.8% 2,803,285 9.9%1996 6,723,141 2.7% 3,794,113 1.4% 2,929,028 4.5%1997 6,761,135 0.7% 3,890,798 2.5% 2,870,337 -2.0%1998 6,595,790 -2.4% 4,014,140 3.2% 2,581,650 -10.1%1999 6,741,037 2.2% 4,255,621 6.0% 2,485,416 -3.7%2000 6,948,595 3.1% 4,446,936 4.5% 2,501,659 0.7%2001 6,303,791 -9.3% 4,224,321 -5.0% 2,079,470 -16.9%2002 6,389,058 1.4% 4,358,850 3.2% 2,030,208 -2.4%2003 6,380,439 -0.1% 4,531,289 4.0% 1,849,150 -8.9%2004 6,912,094 8.3% 4,892,960 8.0% 2,019,134 9.2%
BOTH DIRECTIONS DOMESTIC INTERNATIONAL
Source: DBEDT 12
AIR VISITOR CHARACTERISTICS BY MAJOR MARKET AREAS
U.S. WEST
U.S. EAST
JAPAN
CANADA
EUROPE
OCEANIA
OTHER ASIA
LATIN AMERICA
13
AIR VISITOR CHARACTERISTICS BY MAJOR MARKET AREA (MMA)
U.S. West Visitors by Air: The U.S. West continued to be Hawaii’s primary visitor market and the largest of the MMAs in terms of total expenditures, visitor days and visitor arrivals. Visitor arrivals increased 6.1 percent compared to 2003 and contributed to a 5.4 percent growth in U.S. West visitor days. The average length of stay by these visitors was 9.54 days. Expenditures by U.S. West visitors rose 1.7 percent from the previous year to $3.9 billion. Daily spending by this group of visitors was $148 per person compared to $153 per person in 2003. (TABLES 1 & 11). Other facts about the U.S. West market: • Repeat visitors accounted for 77.3 percent of all visitors from the U.S. West, compared to 76.9
percent in the previous year. • Reflecting the fact that the majority of U.S. West visitors have been to the islands before, nearly
67 percent of the U.S. West visitors were true independent travelers while the remainder purchased group or package tours.
• About 46 percent of all U.S. West visitors went to Oahu, 37.6 percent went to Maui, 18.5 percent went to the Big Island and 17.7 percent went to Kauai.
• The Big Island (+6.3%), Oahu (+5.3%), Kauai (+4.4%) and Maui (+0.5%) experienced growth in visitations from the U.S. West.
• The average length of stay by U.S. West visitors increased on Oahu, Maui, Molokai, Kauai and the Big Island in 2004 compared to the previous year. U.S West visitors stayed the longest on the Big Island (8.23 days), followed by Maui (8.17 days), Kauai (7.90 days), Oahu (7.51 days), Molokai (5.28 days) and Lanai (3.73 days).
• More than 55 percent of the visitors stayed in hotels, 23.9 percent stayed in condominiums, 12.2 percent stayed with friends and relatives and 10.3 percent stayed in timeshare properties.
• The number of visitors who came for pleasure increased 6.7 percent from 2003. Those who came to get married/honeymooned in the islands also rose by 1 percent.
• More than half (52%) of visitors from this MMA were female and 48 percent were male. (TABLE 26). The largest age group was between 41 to 59 years (32.7%), followed by the 25 to 40 years age group (24.5%) and those 60 years and older (14.5%) (TABLE 26)
Most (98.3%) of the 2,768,002 U.S. West visitors to the islands arrived from domestic points of origin while the remainder came on international flights. California remains the largest contributor (63.9%) to total U.S. West arrivals. Arrivals from California increased 6.1 percent from 2003 to 1.77 million visitors. California was also the biggest single state market accounting for 36.1 percent of domestic visitors and 25.6 percent of total visitors in 2004 (TABLES 10 & 12). Washington (+10.6%) and Oregon (+4.9%), the second and third largest contributors to U.S. West arrivals, also rose to 293,786 and 135,943 visitors, respectively.
14

U.S. East Visitors by Air: Hawaii’s second largest visitor market is the U.S. East. In 2004 total visitor days from this group rose 9 percent due to a 9.2 percent growth in arrivals to the islands. The average length of stay by these visitors was 10.25 days. Total expenditures by U.S. East visitors climbed 15.2 percent to $3.2 billion. Daily spending rose to $173 per person from $163 per person in the previous year (TABLES 1 & 13). In addition: • Oahu hosted 62.9 percent of the U.S. East visitors who came in 2004. Close to 41 percent
visited Maui, 22.5 percent visited the Big Island and 20.3 percent visited Kauai. • More U.S. East visitors went to Oahu (+9.7%), the Big Island (+6.4%), Kauai (+4.9%) and Maui
(+3.3%) than in 2003. • Oahu, Maui, Molokai, Kauai and the Big Island experienced a longer average length of stay by
U.S. East visitors compared to the previous year. This group of visitors stayed the longest on Oahu (7.42 days), followed by Maui (6.95 days), the Big Island (6.20 days), Kauai (6 days), Molokai (3.80 days) and Lanai (3.08 days).
• Similar to their U.S. West counterpart, more U.S. East visitors came for pleasure (+10.9%) to honeymoon/get married (+6.3%) and to visit friends or relatives (+11.4%) in 2004.
• About half (51.2%) of the visitors have been to Hawaii at least once before. • Close to 63 percent of the U.S. East visitors were true independent travelers. • The majority (68.3%) of the visitors chose hotels for their lodging, 15 percent stayed in
condominiums, 10.7 percent stayed with friends or relatives and 8.2 percent stayed in timeshare properties.
• Over half (52.1%) of U.S. East visitors were female. Those between 41-59 years old were the largest age group (35.3%), followed by those between the ages 25-40 (25.5%) and those 60 years and older (16%) (TABLE 26).
Most (97.4%) of the 1,805,377 U.S. East visitors arrived in Hawaii from domestic flights while only 48,437 came from international points of origin. All seven regions of the U.S East market reported increased arrivals compared to 2003, led by the South Atlantic region (+12.1%), the East South Central region (+11.1%), the East North Central region (+9.3%), the Mid Atlantic region (+8.5%), the West North Central region (+8.2%), the New England region (+7.4%) and the West South Central region (+5.6%). The largest of all the sub-markets is the East-North-Central Region with 412,006 visitors. Ranked second in arrivals is the South Atlantic Region with 386,662 visitors (TABLE 14).
15
Japanese Visitors by Air: Ranked third in terms of total visitor expenditures, visitor days and arrivals is the Japanese market. A 10.6 percent increase in arrivals contributed to an 8.6 percent growth in Japanese visitor days in 2004. The average length of stay was 5.80 days. Total Japanese visitor expenditures rose 13.7 percent to $2.2 billion. Daily spending by Japanese visitors continued to be the highest among all visitors to Hawaii at $252 per person, up from $240 per person in the previous year (TABLES 1 & 18). In addition: • Nearly 96 percent of the Japanese visitors in 2004 came to Oahu, 14.4 percent visited the Big
Island, 8 percent visited the island of Maui and 3.7 percent visited Kauai. • Japanese visitors stayed the longest on Oahu (5.22 days), followed by the Big Island (3.26 days),
Maui (3.12 days), Lanai (2.47 days), Kauai (1.89 days) and Molokai (1.49 days). • In contrast to U.S. visitors, most Japanese visitors came on packaged tours, while only 13.7
percent were true independent travelers. • Over half (54.6%) of the arrivals were repeat visitors to the islands. • The most popular choice of lodging among Japanese visitors continues to be hotels,
accommodating 91.6 percent of those who came in 2004. • The number of Japanese visitors who came for pleasure (+11.1%), for corporate meetings
(+18.6%) or to honeymoon/get married (+10.4%) increased compared to the previous year. • Similar to their U.S. counterparts there were also more female (57.8%) visitors from Japan than
male. However, the largest age group were younger, between 25 to 40 years old (39.6%), followed by those between 41 to 59 years (24.7%) and those over 60 years old (13.2%) (TABLE 26).
Most (99.2%) of the 1,482,085 Japanese visitors came to Hawaii on international flights. Three central regions: Kanto (which includes Tokyo), Kinki (including Kyoto and Osaka) and Chubu (including Nagoya) together, contributed to 43.6 percent of total Japanese arrivals in 2004 (TABLES 18 & 19). Canadian Visitors by Air: Total visitor days from Canada, the State’s fourth largest visitor market, increased 3.3 percent due to 5.9 percent growth in arrivals compared to the previous year. The average length of stay by these visitors was 13.13 days, the longest among Hawaii’s visitor groups. Total expenditures by Canadian visitors rose 8.4 percent to $363.6 million in 2004. Daily visitor spending increased from $122 per person to $128 per person and was the lowest among the MMAs (TABLES 1 & 20). In addition: • Repeat visitors comprised 57.1 percent of the Canadian visitors in 2004. • Oahu and Maui were the two most popular islands, visited by 56.7 percent and 42.9 percent of
the Canadians, respectively. More Canadian visitors went to Oahu and Kauai than in 2003.
16

• Close to 66 percent of all Canadian visitors were true independent travelers. • Canadian visitors spent the most time on Maui (10.10 days), followed by Oahu (9.99 days), the
Big Island (8.20 days), Kauai (7.70 days), Molokai (5.62 days) and Lanai (3.58 days). • Nearly 57 percent of Canadians visitors stayed in hotels, 28.5 percent stayed in condominiums,
9.5 percent stayed in timeshare properties and 7.8 percent stayed with friends and relatives. • A greater number of Canadian visitors were in Hawaii for pleasure (+7.3%), for incentive travels
(+21.2%), for corporate meetings (+3.4%), to honeymoon/get married (+10.5%) and to visit friends or relatives (+6.4%) compared to the previous year.
• The largest age group for Canadian visitors was between 41 to 59 years (34.6%), followed by those 25 to 40 years (25%) and those over 60 years old (18.9%). Nearly 53 percent of the visitors were female (TABLE 26).
About 27 percent of the 217,163 total Canadian visitors arrived in Hawaii from the U.S. mainland while the majority flew direct from Canada or from other international destinations. European Visitors by Air: European total visitor days rose 3.3 percent due to increased arrivals (+3.5%) in 2004. The average length of stay by this group of visitors was virtually unchanged at 12.35 days. Total expenditures by European visitors of $215.3 million, were 1.5 percent lower than in 2003. (TABLES 1 & 21). In addition: • The United Kingdom (58.2%) and Germany (24.4%) comprised the majority of the total
114,948 European visitors in 2004 (TABLE 10). • Nearly 88 percent of Europeans arrived in the islands from U.S. cities. • Oahu was visited by 73.3 percent of the Europeans, followed by Maui (33.2%), the Big island
(22.6%) and Kauai (17.8%). • European visitors stayed the longest on Oahu (9.07 days), followed by Maui (7.94 days), the Big
Island (7.69 days), Molokai (6.62 days) Kauai (6.48 days) and Lanai (3.12 days). • Over half purchased packages for at least their air and hotel accommodations while about 45
percent of the European visitors made independent travel arrangements. • More European visitors came to Hawaii for pleasure (+3.9%) and to honeymoon/get married
(+3.7%) compared to 2003. • Hotels were the lodging choice for 76.6 percent of the European visitors. About 8 percent
stayed with friends and relatives, while 7.4 percent stayed in condominium properties. • Close to 71 percent were first time visitors to Hawaii. • Those between 41 to 59 years old comprised the largest age group (32.8%) of European visitors,
followed by those between 25 to 40 years (31.5%) and those over 60 years old (17.4%). There were slightly more male (50.4%) than female (49.6%) European visitors in 2004 (TABLE 26).
17
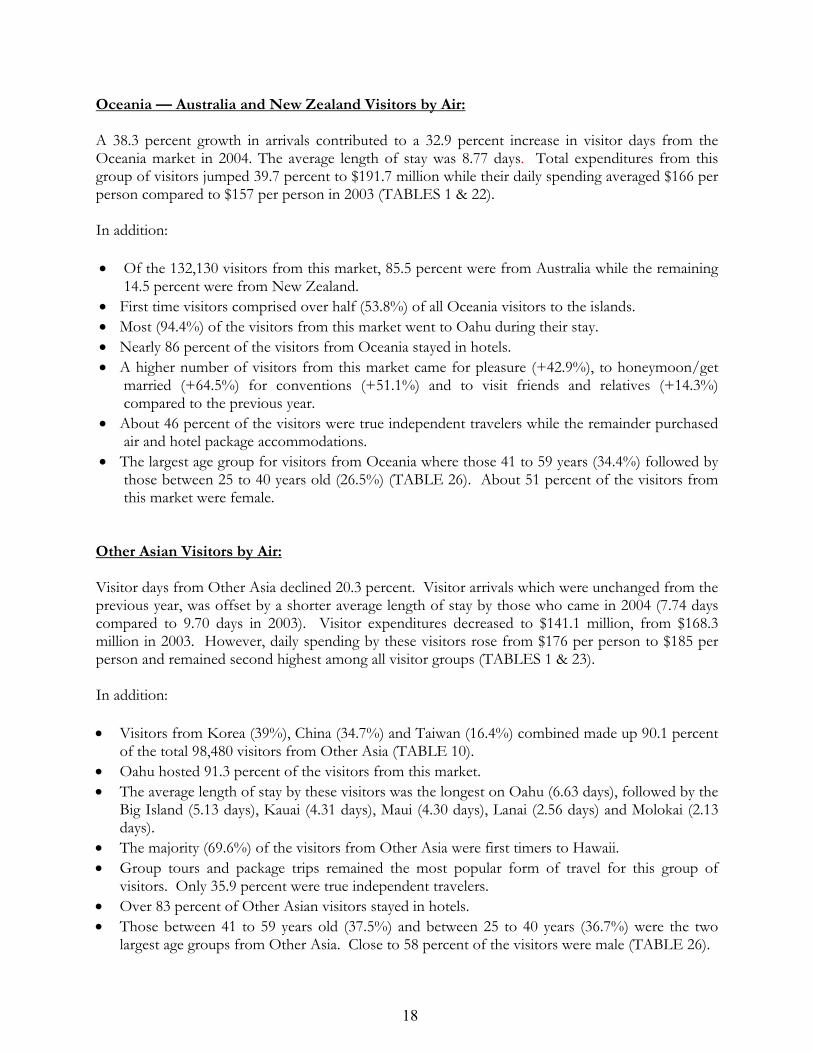
Oceania — Australia and New Zealand Visitors by Air: A 38.3 percent growth in arrivals contributed to a 32.9 percent increase in visitor days from the Oceania market in 2004. The average length of stay was 8.77 days. Total expenditures from this group of visitors jumped 39.7 percent to $191.7 million while their daily spending averaged $166 per person compared to $157 per person in 2003 (TABLES 1 & 22). In addition: • Of the 132,130 visitors from this market, 85.5 percent were from Australia while the remaining
14.5 percent were from New Zealand. • First time visitors comprised over half (53.8%) of all Oceania visitors to the islands. • Most (94.4%) of the visitors from this market went to Oahu during their stay. • Nearly 86 percent of the visitors from Oceania stayed in hotels. • A higher number of visitors from this market came for pleasure (+42.9%), to honeymoon/get
married (+64.5%) for conventions (+51.1%) and to visit friends and relatives (+14.3%) compared to the previous year.
• About 46 percent of the visitors were true independent travelers while the remainder purchased air and hotel package accommodations.
• The largest age group for visitors from Oceania where those 41 to 59 years (34.4%) followed by those between 25 to 40 years old (26.5%) (TABLE 26). About 51 percent of the visitors from this market were female.
Other Asian Visitors by Air: Visitor days from Other Asia declined 20.3 percent. Visitor arrivals which were unchanged from the previous year, was offset by a shorter average length of stay by those who came in 2004 (7.74 days compared to 9.70 days in 2003). Visitor expenditures decreased to $141.1 million, from $168.3 million in 2003. However, daily spending by these visitors rose from $176 per person to $185 per person and remained second highest among all visitor groups (TABLES 1 & 23). In addition: • Visitors from Korea (39%), China (34.7%) and Taiwan (16.4%) combined made up 90.1 percent
of the total 98,480 visitors from Other Asia (TABLE 10). • Oahu hosted 91.3 percent of the visitors from this market. • The average length of stay by these visitors was the longest on Oahu (6.63 days), followed by the
Big Island (5.13 days), Kauai (4.31 days), Maui (4.30 days), Lanai (2.56 days) and Molokai (2.13 days).
• The majority (69.6%) of the visitors from Other Asia were first timers to Hawaii. • Group tours and package trips remained the most popular form of travel for this group of
visitors. Only 35.9 percent were true independent travelers. • Over 83 percent of Other Asian visitors stayed in hotels. • Those between 41 to 59 years old (37.5%) and between 25 to 40 years (36.7%) were the two
largest age groups from Other Asia. Close to 58 percent of the visitors were male (TABLE 26).
18
19
• The majority of the visitors from Other Asia came from international points of origin while 36.6 percent arrived in Hawaii through the U.S. mainland.
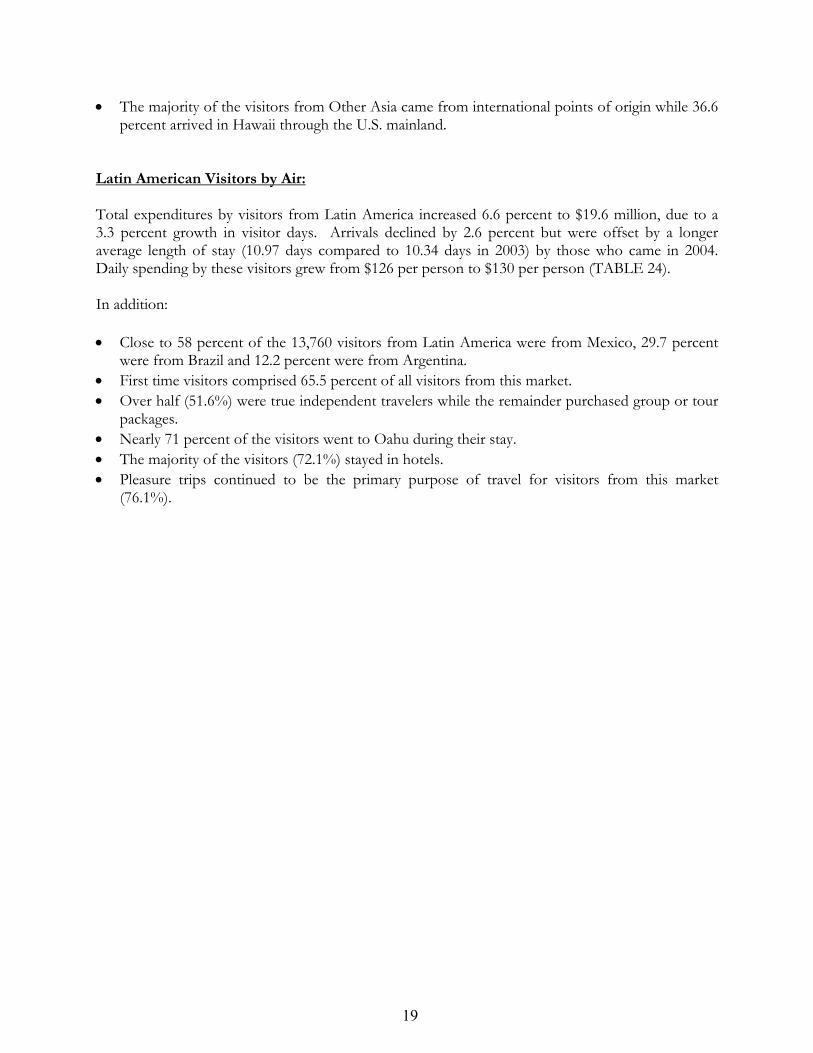
Latin American Visitors by Air: Total expenditures by visitors from Latin America increased 6.6 percent to $19.6 million, due to a 3.3 percent growth in visitor days. Arrivals declined by 2.6 percent but were offset by a longer average length of stay (10.97 days compared to 10.34 days in 2003) by those who came in 2004. Daily spending by these visitors grew from $126 per person to $130 per person (TABLE 24). In addition: • Close to 58 percent of the 13,760 visitors from Latin America were from Mexico, 29.7 percent
were from Brazil and 12.2 percent were from Argentina. • First time visitors comprised 65.5 percent of all visitors from this market. • Over half (51.6%) were true independent travelers while the remainder purchased group or tour
packages. • Nearly 71 percent of the visitors went to Oahu during their stay. • The majority of the visitors (72.1%) stayed in hotels. • Pleasure trips continued to be the primary purpose of travel for visitors from this market
(76.1%).
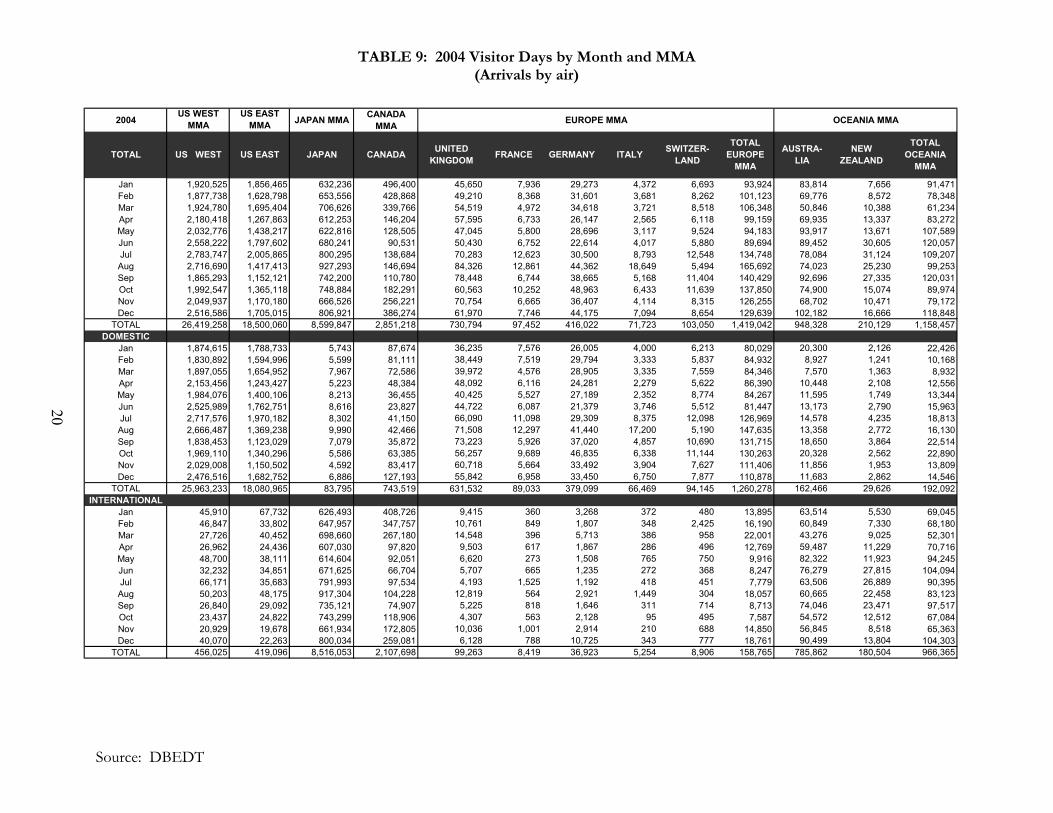
TABLE 9: 2004 Visitor Days by Month and MMA (Arrivals by air)
2004US WEST
MMAUS EAST
MMA JAPAN MMA CANADA MMA EUROPE MMA OCEANIA MMA
Jan 1,920,525 1,856,465 632,236 496,400 45,650 7,936 29,273 4,372 6,693 93,924 83,814 7,656 91,471Feb 1,877,738 1,628,798 653,556 428,868 49,210 8,368 31,601 3,681 8,262 101,123 69,776 8,572 78,348Mar 1,924,780 1,695,404 706,626 339,766 54,519 4,972 34,618 3,721 8,518 106,348 50,846 10,388 61,234Apr 2,180,418 1,267,863 612,253 146,204 57,595 6,733 26,147 2,565 6,118 99,159 69,935 13,337 83,272May 2,032,776 1,438,217 622,816 128,505 47,045 5,800 28,696 3,117 9,524 94,183 93,917 13,671 107,589Jun 2,558,222 1,797,602 680,241 90,531 50,430 6,752 22,614 4,017 5,880 89,694 89,452 30,605 120,057Jul 2,783,747 2,005,865 800,295 138,684 70,283 12,623 30,500 8,793 12,548 134,748 78,084 31,124 109,207Aug 2,716,690 1,417,413 927,293 146,694 84,326 12,861 44,362 18,649 5,494 165,692 74,023 25,230 99,253Sep 1,865,293 1,152,121 742,200 110,780 78,448 6,744 38,665 5,168 11,404 140,429 92,696 27,335 120,031Oct 1,992,547 1,365,118 748,884 182,291 60,563 10,252 48,963 6,433 11,639 137,850 74,900 15,074 89,974Nov 2,049,937 1,170,180 666,526 256,221 70,754 6,665 36,407 4,114 8,315 126,255 68,702 10,471 79,172Dec 2,516,586 1,705,015 806,921 386,274 61,970 7,746 44,175 7,094 8,654 129,639 102,182 16,666 118,848
TOTAL 26,419,258 18,500,060 8,599,847 2,851,218 730,794 97,452 416,022 71,723 103,050 1,419,042 948,328 210,129 1,158,457DOMESTIC
Jan 1,874,615 1,788,733 5,743 87,674 36,235 7,576 26,005 4,000 6,213 80,029 20,300 2,126 22,426Feb 1,830,892 1,594,996 5,599 81,111 38,449 7,519 29,794 3,333 5,837 84,932 8,927 1,241 10,168Mar 1,897,055 1,654,952 7,967 72,586 39,972 4,576 28,905 3,335 7,559 84,346 7,570 1,363 8,932Apr 2,153,456 1,243,427 5,223 48,384 48,092 6,116 24,281 2,279 5,622 86,390 10,448 2,108 12,556May 1,984,076 1,400,106 8,213 36,455 40,425 5,527 27,189 2,352 8,774 84,267 11,595 1,749 13,344Jun 2,525,989 1,762,751 8,616 23,827 44,722 6,087 21,379 3,746 5,512 81,447 13,173 2,790 15,963Jul 2,717,576 1,970,182 8,302 41,150 66,090 11,098 29,309 8,375 12,098 126,969 14,578 4,235 18,813Aug 2,666,487 1,369,238 9,990 42,466 71,508 12,297 41,440 17,200 5,190 147,635 13,358 2,772 16,130Sep 1,838,453 1,123,029 7,079 35,872 73,223 5,926 37,020 4,857 10,690 131,715 18,650 3,864 22,514Oct 1,969,110 1,340,296 5,586 63,385 56,257 9,689 46,835 6,338 11,144 130,263 20,328 2,562 22,890Nov 2,029,008 1,150,502 4,592 83,417 60,718 5,664 33,492 3,904 7,627 111,406 11,856 1,953 13,809Dec 2,476,516 1,682,752 6,886 127,193 55,842 6,958 33,450 6,750 7,877 110,878 11,683 2,862 14,546
TOTAL 25,963,233 18,080,965 83,795 743,519 631,532 89,033 379,099 66,469 94,145 1,260,278 162,466 29,626 192,092INTERNATIONAL
Jan 45,910 67,732 626,493 408,726 9,415 360 3,268 372 480 13,895 63,514 5,530 69,045Feb 46,847 33,802 647,957 347,757 10,761 849 1,807 348 2,425 16,190 60,849 7,330 68,180Mar 27,726 40,452 698,660 267,180 14,548 396 5,713 386 958 22,001 43,276 9,025 52,301Apr 26,962 24,436 607,030 97,820 9,503 617 1,867 286 496 12,769 59,487 11,229 70,716May 48,700 38,111 614,604 92,051 6,620 273 1,508 765 750 9,916 82,322 11,923 94,245Jun 32,232 34,851 671,625 66,704 5,707 665 1,235 272 368 8,247 76,279 27,815 104,094Jul 66,171 35,683 791,993 97,534 4,193 1,525 1,192 418 451 7,779 63,506 26,889 90,395Aug 50,203 48,175 917,304 104,228 12,819 564 2,921 1,449 304 18,057 60,665 22,458 83,123Sep 26,840 29,092 735,121 74,907 5,225 818 1,646 311 714 8,713 74,046 23,471 97,517Oct 23,437 24,822 743,299 118,906 4,307 563 2,128 95 495 7,587 54,572 12,512 67,084Nov 20,929 19,678 661,934 172,805 10,036 1,001 2,914 210 688 14,850 56,845 8,518 65,363Dec 40,070 22,263 800,034 259,081 6,128 788 10,725 343 777 18,761 90,499 13,804 104,303
TOTAL 456,025 419,096 8,516,053 2,107,698 99,263 8,419 36,923 5,254 8,906 158,765 785,862 180,504 966,365
TOTAL US WEST US EAST JAPAN CANADA UNITED KINGDOM GERMANYFRANCE ITALY SWITZER-
LAND
TOTAL EUROPE
MMA
TOTAL OCEANIA
MMA
AUSTRA-LIA
NEW ZEALAND
20
Source: DBEDT
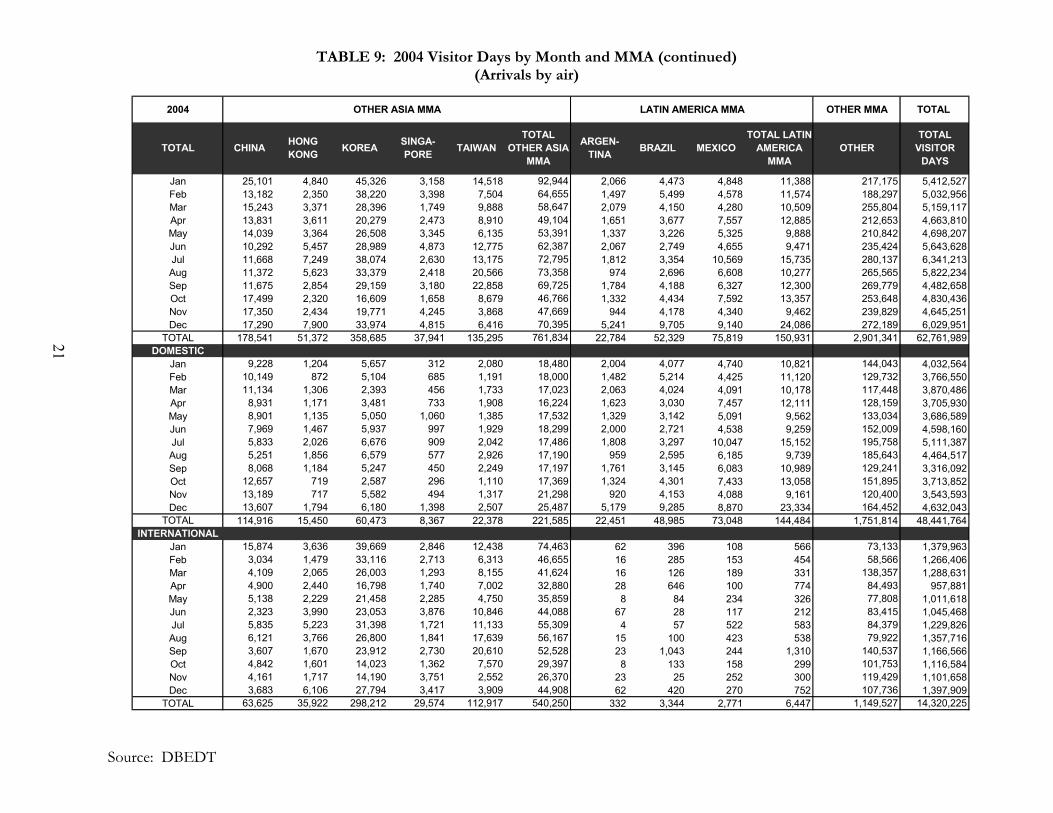
TABLE 9: 2004 Visitor Days by Month and MMA (continued) (Arrivals by air)
2004 OTHER ASIA MMA LATIN AMERICA MMA OTHER MMA TOTAL
Jan 25,101 4,840 45,326 3,158 14,518 92,944 2,066 4,473 4,848 11,388 217,175 5,412,527Feb 13,182 2,350 38,220 3,398 7,504 64,655 1,497 5,499 4,578 11,574 188,297 5,032,956Mar 15,243 3,371 28,396 1,749 9,888 58,647 2,079 4,150 4,280 10,509 255,804 5,159,117Apr 13,831 3,611 20,279 2,473 8,910 49,104 1,651 3,677 7,557 12,885 212,653 4,663,810May 14,039 3,364 26,508 3,345 6,135 53,391 1,337 3,226 5,325 9,888 210,842 4,698,207Jun 10,292 5,457 28,989 4,873 12,775 62,387 2,067 2,749 4,655 9,471 235,424 5,643,628Jul 11,668 7,249 38,074 2,630 13,175 72,795 1,812 3,354 10,569 15,735 280,137 6,341,213Aug 11,372 5,623 33,379 2,418 20,566 73,358 974 2,696 6,608 10,277 265,565 5,822,234Sep 11,675 2,854 29,159 3,180 22,858 69,725 1,784 4,188 6,327 12,300 269,779 4,482,658Oct 17,499 2,320 16,609 1,658 8,679 46,766 1,332 4,434 7,592 13,357 253,648 4,830,436Nov 17,350 2,434 19,771 4,245 3,868 47,669 944 4,178 4,340 9,462 239,829 4,645,251Dec 17,290 7,900 33,974 4,815 6,416 70,395 5,241 9,705 9,140 24,086 272,189 6,029,951
TOTAL 178,541 51,372 358,685 37,941 135,295 761,834 22,784 52,329 75,819 150,931 2,901,341 62,761,989DOMESTIC
Jan 9,228 1,204 5,657 312 2,080 18,480 2,004 4,077 4,740 10,821 144,043 4,032,564Feb 10,149 872 5,104 685 1,191 18,000 1,482 5,214 4,425 11,120 129,732 3,766,550Mar 11,134 1,306 2,393 456 1,733 17,023 2,063 4,024 4,091 10,178 117,448 3,870,486Apr 8,931 1,171 3,481 733 1,908 16,224 1,623 3,030 7,457 12,111 128,159 3,705,930May 8,901 1,135 5,050 1,060 1,385 17,532 1,329 3,142 5,091 9,562 133,034 3,686,589Jun 7,969 1,467 5,937 997 1,929 18,299 2,000 2,721 4,538 9,259 152,009 4,598,160Jul 5,833 2,026 6,676 909 2,042 17,486 1,808 3,297 10,047 15,152 195,758 5,111,387Aug 5,251 1,856 6,579 577 2,926 17,190 959 2,595 6,185 9,739 185,643 4,464,517Sep 8,068 1,184 5,247 450 2,249 17,197 1,761 3,145 6,083 10,989 129,241 3,316,092Oct 12,657 719 2,587 296 1,110 17,369 1,324 4,301 7,433 13,058 151,895 3,713,852Nov 13,189 717 5,582 494 1,317 21,298 920 4,153 4,088 9,161 120,400 3,543,593Dec 13,607 1,794 6,180 1,398 2,507 25,487 5,179 9,285 8,870 23,334 164,452 4,632,043
TOTAL 114,916 15,450 60,473 8,367 22,378 221,585 22,451 48,985 73,048 144,484 1,751,814 48,441,764INTERNATIONAL
Jan 15,874 3,636 39,669 2,846 12,438 74,463 62 396 108 566 73,133 1,379,963Feb 3,034 1,479 33,116 2,713 6,313 46,655 16 285 153 454 58,566 1,266,406Mar 4,109 2,065 26,003 1,293 8,155 41,624 16 126 189 331 138,357 1,288,631Apr 4,900 2,440 16,798 1,740 7,002 32,880 28 646 100 774 84,493 957,881May 5,138 2,229 21,458 2,285 4,750 35,859 8 84 234 326 77,808 1,011,618Jun 2,323 3,990 23,053 3,876 10,846 44,088 67 28 117 212 83,415 1,045,468Jul 5,835 5,223 31,398 1,721 11,133 55,309 4 57 522 583 84,379 1,229,826Aug 6,121 3,766 26,800 1,841 17,639 56,167 15 100 423 538 79,922 1,357,716Sep 3,607 1,670 23,912 2,730 20,610 52,528 23 1,043 244 1,310 140,537 1,166,566Oct 4,842 1,601 14,023 1,362 7,570 29,397 8 133 158 299 101,753 1,116,584Nov 4,161 1,717 14,190 3,751 2,552 26,370 23 25 252 300 119,429 1,101,658Dec 3,683 6,106 27,794 3,417 3,909 44,908 62 420 270 752 107,736 1,397,909
TOTAL 63,625 35,922 298,212 29,574 112,917 540,250 332 3,344 2,771 6,447 1,149,527 14,320,225
TOTAL VISITOR
DAYS
ARGEN-TINA BRAZILHONG
KONG KOREA SINGA-PORETOTAL MEXICO OTHER
TOTAL LATIN AMERICA
MMA
TOTAL OTHER ASIA
MMACHINA TAIWAN
21
Source: DBEDT
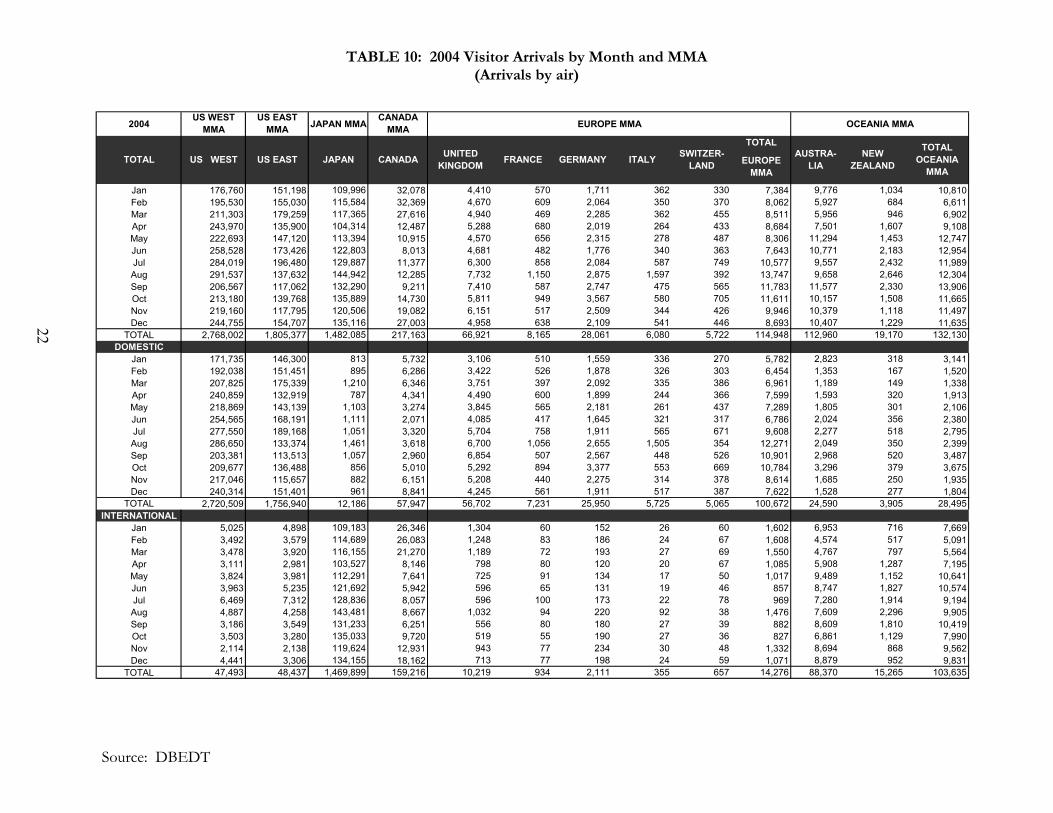
TABLE 10: 2004 Visitor Arrivals by Month and MMA (Arrivals by air)
2004US WEST
MMAUS EAST
MMA JAPAN MMACANADA
MMA EUROPE MMA OCEANIA MMA
TOTAL
EUROPE MMA
Jan 176,760 151,198 109,996 32,078 4,410 570 1,711 362 330 7,384 9,776 1,034 10,810Feb 195,530 155,030 115,584 32,369 4,670 609 2,064 350 370 8,062 5,927 684 6,611Mar 211,303 179,259 117,365 27,616 4,940 469 2,285 362 455 8,511 5,956 946 6,902Apr 243,970 135,900 104,314 12,487 5,288 680 2,019 264 433 8,684 7,501 1,607 9,108May 222,693 147,120 113,394 10,915 4,570 656 2,315 278 487 8,306 11,294 1,453 12,747Jun 258,528 173,426 122,803 8,013 4,681 482 1,776 340 363 7,643 10,771 2,183 12,954Jul 284,019 196,480 129,887 11,377 6,300 858 2,084 587 749 10,577 9,557 2,432 11,989Aug 291,537 137,632 144,942 12,285 7,732 1,150 2,875 1,597 392 13,747 9,658 2,646 12,304Sep 206,567 117,062 132,290 9,211 7,410 587 2,747 475 565 11,783 11,577 2,330 13,906Oct 213,180 139,768 135,889 14,730 5,811 949 3,567 580 705 11,611 10,157 1,508 11,665Nov 219,160 117,795 120,506 19,082 6,151 517 2,509 344 426 9,946 10,379 1,118 11,497Dec 244,755 154,707 135,116 27,003 4,958 638 2,109 541 446 8,693 10,407 1,229 11,635
TOTAL 2,768,002 1,805,377 1,482,085 217,163 66,921 8,165 28,061 6,080 5,722 114,948 112,960 19,170 132,130DOMESTIC
Jan 171,735 146,300 813 5,732 3,106 510 1,559 336 270 5,782 2,823 318 3,141Feb 192,038 151,451 895 6,286 3,422 526 1,878 326 303 6,454 1,353 167 1,520Mar 207,825 175,339 1,210 6,346 3,751 397 2,092 335 386 6,961 1,189 149 1,338Apr 240,859 132,919 787 4,341 4,490 600 1,899 244 366 7,599 1,593 320 1,913May 218,869 143,139 1,103 3,274 3,845 565 2,181 261 437 7,289 1,805 301 2,106Jun 254,565 168,191 1,111 2,071 4,085 417 1,645 321 317 6,786 2,024 356 2,380Jul 277,550 189,168 1,051 3,320 5,704 758 1,911 565 671 9,608 2,277 518 2,795Aug 286,650 133,374 1,461 3,618 6,700 1,056 2,655 1,505 354 12,271 2,049 350 2,399Sep 203,381 113,513 1,057 2,960 6,854 507 2,567 448 526 10,901 2,968 520 3,487Oct 209,677 136,488 856 5,010 5,292 894 3,377 553 669 10,784 3,296 379 3,675Nov 217,046 115,657 882 6,151 5,208 440 2,275 314 378 8,614 1,685 250 1,935Dec 240,314 151,401 961 8,841 4,245 561 1,911 517 387 7,622 1,528 277 1,804
TOTAL 2,720,509 1,756,940 12,186 57,947 56,702 7,231 25,950 5,725 5,065 100,672 24,590 3,905 28,495INTERNATIONAL
Jan 5,025 4,898 109,183 26,346 1,304 60 152 26 60 1,602 6,953 716 7,669Feb 3,492 3,579 114,689 26,083 1,248 83 186 24 67 1,608 4,574 517 5,091Mar 3,478 3,920 116,155 21,270 1,189 72 193 27 69 1,550 4,767 797 5,564Apr 3,111 2,981 103,527 8,146 798 80 120 20 67 1,085 5,908 1,287 7,195May 3,824 3,981 112,291 7,641 725 91 134 17 50 1,017 9,489 1,152 10,641Jun 3,963 5,235 121,692 5,942 596 65 131 19 46 857 8,747 1,827 10,574Jul 6,469 7,312 128,836 8,057 596 100 173 22 78 969 7,280 1,914 9,194Aug 4,887 4,258 143,481 8,667 1,032 94 220 92 38 1,476 7,609 2,296 9,905Sep 3,186 3,549 131,233 6,251 556 80 180 27 39 882 8,609 1,810 10,419Oct 3,503 3,280 135,033 9,720 519 55 190 27 36 827 6,861 1,129 7,990Nov 2,114 2,138 119,624 12,931 943 77 234 30 48 1,332 8,694 868 9,562Dec 4,441 3,306 134,155 18,162 713 77 198 24 59 1,071 8,879 952 9,831
TOTAL 47,493 48,437 1,469,899 159,216 10,219 934 2,111 355 657 14,276 88,370 15,265 103,635
SWITZER-LAND
AUSTRA-LIA
NEW ZEALAND
TOTAL OCEANIA
MMATOTAL US WEST US EAST JAPAN CANADA UNITED
KINGDOM GERMANYFRANCE ITALY
22
Source: DBEDT
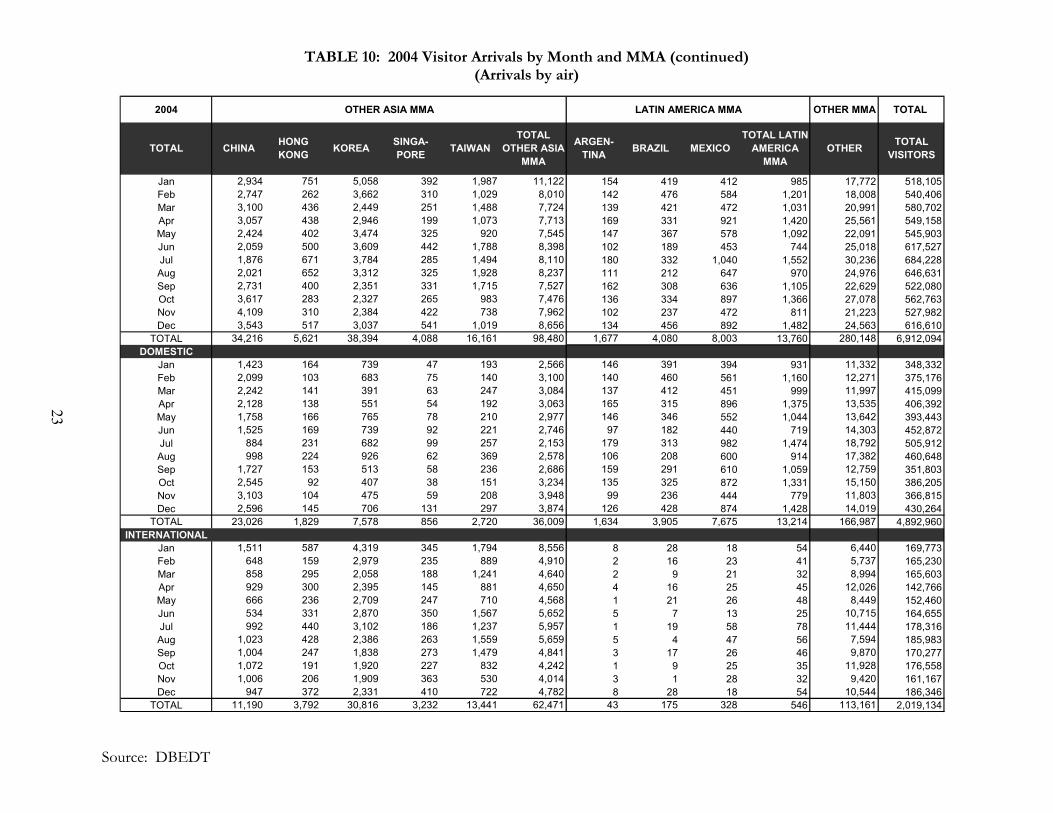
TABLE 10: 2004 Visitor Arrivals by Month and MMA (continued) (Arrivals by air)
Source: DBEDT
2004 OTHER ASIA MMA LATIN AMERICA MMA OTHER MMA TOTAL
Jan 2,934 751 5,058 392 1,987 11,122 154 419 412 985 17,772 518,105Feb 2,747 262 3,662 310 1,029 8,010 142 476 584 1,201 18,008 540,406Mar 3,100 436 2,449 251 1,488 7,724 139 421 472 1,031 20,991 580,702Apr 3,057 438 2,946 199 1,073 7,713 169 331 921 1,420 25,561 549,158May 2,424 402 3,474 325 920 7,545 147 367 578 1,092 22,091 545,903Jun 2,059 500 3,609 442 1,788 8,398 102 189 453 744 25,018 617,527Jul 1,876 671 3,784 285 1,494 8,110 180 332 1,040 1,552 30,236 684,228Aug 2,021 652 3,312 325 1,928 8,237 111 212 647 970 24,976 646,631Sep 2,731 400 2,351 331 1,715 7,527 162 308 636 1,105 22,629 522,080Oct 3,617 283 2,327 265 983 7,476 136 334 897 1,366 27,078 562,763Nov 4,109 310 2,384 422 738 7,962 102 237 472 811 21,223 527,982Dec 3,543 517 3,037 541 1,019 8,656 134 456 892 1,482 24,563 616,610
TOTAL 34,216 5,621 38,394 4,088 16,161 98,480 1,677 4,080 8,003 13,760 280,148 6,912,094DOMESTIC
Jan 1,423 164 739 47 193 2,566 146 391 394 931 11,332 348,332Feb 2,099 103 683 75 140 3,100 140 460 561 1,160 12,271 375,176Mar 2,242 141 391 63 247 3,084 137 412 451 999 11,997 415,099Apr 2,128 138 551 54 192 3,063 165 315 896 1,375 13,535 406,392May 1,758 166 765 78 210 2,977 146 346 552 1,044 13,642 393,443Jun 1,525 169 739 92 221 2,746 97 182 440 719 14,303 452,872Jul 884 231 682 99 257 2,153 179 313 982 1,474 18,792 505,912Aug 998 224 926 62 369 2,578 106 208 600 914 17,382 460,648Sep 1,727 153 513 58 236 2,686 159 291 610 1,059 12,759 351,803Oct 2,545 92 407 38 151 3,234 135 325 872 1,331 15,150 386,205Nov 3,103 104 475 59 208 3,948 99 236 444 779 11,803 366,815Dec 2,596 145 706 131 297 3,874 126 428 874 1,428 14,019 430,264
TOTAL 23,026 1,829 7,578 856 2,720 36,009 1,634 3,905 7,675 13,214 166,987 4,892,960INTERNATIONAL
Jan 1,511 587 4,319 345 1,794 8,556 8 28 18 54 6,440 169,773Feb 648 159 2,979 235 889 4,910 2 16 23 41 5,737 165,230Mar 858 295 2,058 188 1,241 4,640 2 9 21 32 8,994 165,603Apr 929 300 2,395 145 881 4,650 4 16 25 45 12,026 142,766May 666 236 2,709 247 710 4,568 1 21 26 48 8,449 152,460Jun 534 331 2,870 350 1,567 5,652 5 7 13 25 10,715 164,655Jul 992 440 3,102 186 1,237 5,957 1 19 58 78 11,444 178,316Aug 1,023 428 2,386 263 1,559 5,659 5 4 47 56 7,594 185,983Sep 1,004 247 1,838 273 1,479 4,841 3 17 26 46 9,870 170,277Oct 1,072 191 1,920 227 832 4,242 1 9 25 35 11,928 176,558Nov 1,006 206 1,909 363 530 4,014 3 1 28 32 9,420 161,167Dec 947 372 2,331 410 722 4,782 8 28 18 54 10,544 186,346
TOTAL 11,190 3,792 30,816 3,232 13,441 62,471 43 175 328 546 113,161 2,019,134
OTHERTOTAL LATIN
AMERICA MMA
TOTAL OTHER ASIA
MMACHINA TAIWAN MEXICOBRAZILKOREA SINGA-
PORETOTAL ARGEN-TINA
HONG KONG
TOTAL VISITORS
23
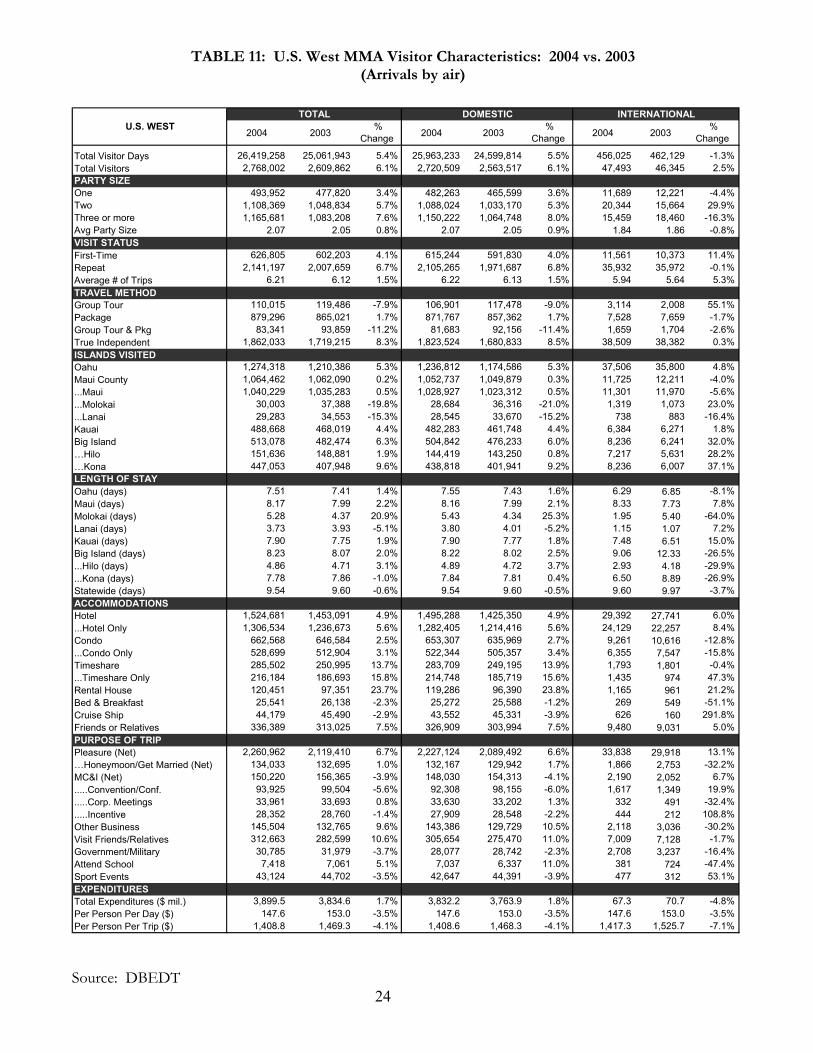
TABLE 11: U.S. West MMA Visitor Characteristics: 2004 vs. 2003 (Arrivals by air)
Source: DBEDT
24
TOTAL DOMESTIC INTERNATIONAL
2004 2003%
Change 2004 2003%
Change 2004 2003%
Change
Total Visitor Days 26,419,258 25,061,943 5.4% 25,963,233 24,599,814 5.5% 456,025 462,129 -1.3%Total Visitors 2,768,002 2,609,862 6.1% 2,720,509 2,563,517 6.1% 47,493 46,345 2.5%PARTY SIZEOne 493,952 477,820 3.4% 482,263 465,599 3.6% 11,689 12,221 -4.4%Two 1,108,369 1,048,834 5.7% 1,088,024 1,033,170 5.3% 20,344 15,664 29.9%Three or more 1,165,681 1,083,208 7.6% 1,150,222 1,064,748 8.0% 15,459 18,460 -16.3%Avg Party Size 2.07 2.05 0.8% 2.07 2.05 0.9% 1.84 1.86 -0.8%VISIT STATUSFirst-Time 626,805 602,203 4.1% 615,244 591,830 4.0% 11,561 10,373 11.4%Repeat 2,141,197 2,007,659 6.7% 2,105,265 1,971,687 6.8% 35,932 35,972 -0.1%Average # of Trips 6.21 6.12 1.5% 6.22 6.13 1.5% 5.94 5.64 5.3%TRAVEL METHODGroup Tour 110,015 119,486 -7.9% 106,901 117,478 -9.0% 3,114 2,008 55.1%PackaGroTrue ISLAOahuMaui...Ma...Mo...LanKauaBig I…Hil…KoLENOahuMauiMoloLanaiKauaBig I...Hil...KoStateACHotel...HotCond...ConTime...TimRentBedCruiFrienPURPlea…HMC.....C.....C.....InOtheVisiGoveAtteSporEXPENTotalPer Per
U.S. WEST
ge 879,296 865,021 1.7% 871,767 857,362 1.7% 7,528 7,659 -1.7%up Tour & Pkg 83,341 93,859 -11.2% 81,683 92,156 -11.4% 1,659 1,704 -2.6%
Independent 1,862,033 1,719,215 8.3% 1,823,524 1,680,833 8.5% 38,509 38,382 0.3%NDS VISITED
1,274,318 1,210,386 5.3% 1,236,812 1,174,586 5.3% 37,506 35,800 4.8% County 1,064,462 1,062,090 0.2% 1,052,737 1,049,879 0.3% 11,725 12,211 -4.0%ui 1,040,229 1,035,283 0.5% 1,028,927 1,023,312 0.5% 11,301 11,970 -5.6%lokai 30,003 37,388 -19.8% 28,684 36,316 -21.0% 1,319 1,073 23.0%ai 29,283 34,553 -15.3% 28,545 33,670 -15.2% 738 883 -16.4%i 488,668 468,019 4.4% 482,283 461,748 4.4% 6,384 6,271 1.8%
sland 513,078 482,474 6.3% 504,842 476,233 6.0% 8,236 6,241 32.0%o 151,636 148,881 1.9% 144,419 143,250 0.8% 7,217 5,631 28.2%na 447,053 407,948 9.6% 438,818 401,941 9.2% 8,236 6,007 37.1%GTH OF STAY (days) 7.51 7.41 1.4% 7.55 7.43 1.6% 6.29 6.85 -8.1% (days) 8.17 7.99 2.2% 8.16 7.99 2.1% 8.33 7.73 7.8%kai (days) 5.28 4.37 20.9% 5.43 4.34 25.3% 1.95 5.40 -64.0% (days) 3.73 3.93 -5.1% 3.80 4.01 -5.2% 1.15 1.07 7.2%i (days) 7.90 7.75 1.9% 7.90 7.77 1.8% 7.48 6.51 15.0%
sland (days) 8.23 8.07 2.0% 8.22 8.02 2.5% 9.06 12.33 -26.5%o (days) 4.86 4.71 3.1% 4.89 4.72 3.7% 2.93 4.18 -29.9%na (days) 7.78 7.86 -1.0% 7.84 7.81 0.4% 6.50 8.89 -26.9%wide (days) 9.54 9.60 -0.6% 9.54 9.60 -0.5% 9.60 9.97 -3.7%
COMMODATIONS1,524,681 1,453,091 4.9% 1,495,288 1,425,350 4.9% 29,392 27,741 6.0%
el Only 1,306,534 1,236,673 5.6% 1,282,405 1,214,416 5.6% 24,129 22,257 8.4%o 662,568 646,584 2.5% 653,307 635,969 2.7% 9,261 10,616 -12.8%do Only 528,699 512,904 3.1% 522,344 505,357 3.4% 6,355 7,547 -15.8%
share 285,502 250,995 13.7% 283,709 249,195 13.9% 1,793 1,801 -0.4%eshare Only 216,184 186,693 15.8% 214,748 185,719 15.6% 1,435 974 47.3%
al House 120,451 97,351 23.7% 119,286 96,390 23.8% 1,165 961 21.2% & Breakfast 25,541 26,138 -2.3% 25,272 25,588 -1.2% 269 549 -51.1%se Ship 44,179 45,490 -2.9% 43,552 45,331 -3.9% 626 160 291.8%ds or Relatives 336,389 313,025 7.5% 326,909 303,994 7.5% 9,480 9,031 5.0%POSE OF TRIPsure (Net) 2,260,962 2,119,410 6.7% 2,227,124 2,089,492 6.6% 33,838 29,918 13.1%oneymoon/Get Married (Net) 134,033 132,695 1.0% 132,167 129,942 1.7% 1,866 2,753 -32.2%&I (Net) 150,220 156,365 -3.9% 148,030 154,313 -4.1% 2,190 2,052 6.7%
onvention/Conf. 93,925 99,504 -5.6% 92,308 98,155 -6.0% 1,617 1,349 19.9%orp. Meetings 33,961 33,693 0.8% 33,630 33,202 1.3% 332 491 -32.4%centive 28,352 28,760 -1.4% 27,909 28,548 -2.2% 444 212 108.8%r Business 145,504 132,765 9.6% 143,386 129,729 10.5% 2,118 3,036 -30.2%
t Friends/Relatives 312,663 282,599 10.6% 305,654 275,470 11.0% 7,009 7,128 -1.7%rnment/Military 30,785 31,979 -3.7% 28,077 28,742 -2.3% 2,708 3,237 -16.4%
nd School 7,418 7,061 5.1% 7,037 6,337 11.0% 381 724 -47.4%t Events 43,124 44,702 -3.5% 42,647 44,391 -3.9% 477 312 53.1%
DITURES Expenditures ($ mil.) 3,899.5 3,834.6 1.7% 3,832.2 3,763.9 1.8% 67.3 70.7 -4.8%
Person Per Day ($) 147.6 153.0 -3.5% 147.6 153.0 -3.5% 147.6 153.0 -3.5%Person Per Trip ($) 1,408.8 1,469.3 -4.1% 1,408.6 1,468.3 -4.1% 1,417.3 1,525.7 -7.1%
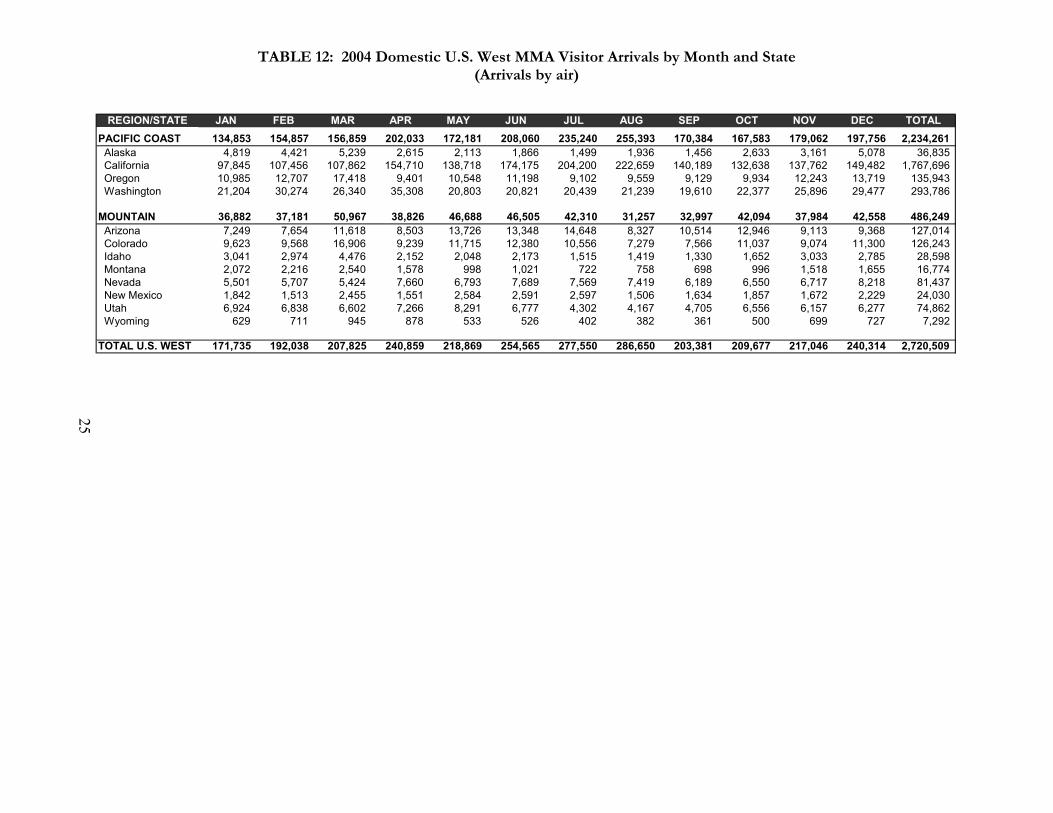
TABLE 12: 2004 Domestic U.S. West MMA Visitor Arrivals by Month and State (Arrivals by air)
REGION/STATE JAN FEB MAR APR MAY JUN JUL AUG SEP OCT NOV DEC TOTALPACIFIC COAST 134,853 154,857 156,859 202,033 172,181 208,060 235,240 255,393 170,384 167,583 179,062 197,756 2,234,261 Alaska 4,819 4,421 5,239 2,615 2,113 1,866 1,499 1,936 1,456 2,633 3,161 5,078 36,835 California 97,845 107,456 107,862 154,710 138,718 174,175 204,200 222,659 140,189 132,638 137,762 149,482 1,767,696 Oregon 10,985 12,707 17,418 9,401 10,548 11,198 9,102 9,559 9,129 9,934 12,243 13,719 135,943 Washington 21,204 30,274 26,340 35,308 20,803 20,821 20,439 21,239 19,610 22,377 25,896 29,477 293,786
MOUNTAIN 36,882 37,181 50,967 38,826 46,688 46,505 42,310 31,257 32,997 42,094 37,984 42,558 486,249 Arizona 7,249 7,654 11,618 8,503 13,726 13,348 14,648 8,327 10,514 12,946 9,113 9,368 127,014 Colorado 9,623 9,568 16,906 9,239 11,715 12,380 10,556 7,279 7,566 11,037 9,074 11,300 126,243 Idaho 3,041 2,974 4,476 2,152 2,048 2,173 1,515 1,419 1,330 1,652 3,033 2,785 28,598 Montana 2,072 2,216 2,540 1,578 998 1,021 722 758 698 996 1,518 1,655 16,774 Nevada 5,501 5,707 5,424 7,660 6,793 7,689 7,569 7,419 6,189 6,550 6,717 8,218 81,437 New Mexico 1,842 1,513 2,455 1,551 2,584 2,591 2,597 1,506 1,634 1,857 1,672 2,229 24,030 Utah 6,924 6,838 6,602 7,266 8,291 6,777 4,302 4,167 4,705 6,556 6,157 6,277 74,862 Wyoming 629 711 945 878 533 526 402 382 361 500 699 727 7,292
TOTAL U.S. WEST 171,735 192,038 207,825 240,859 218,869 254,565 277,550 286,650 203,381 209,677 217,046 240,314 2,720,509
25
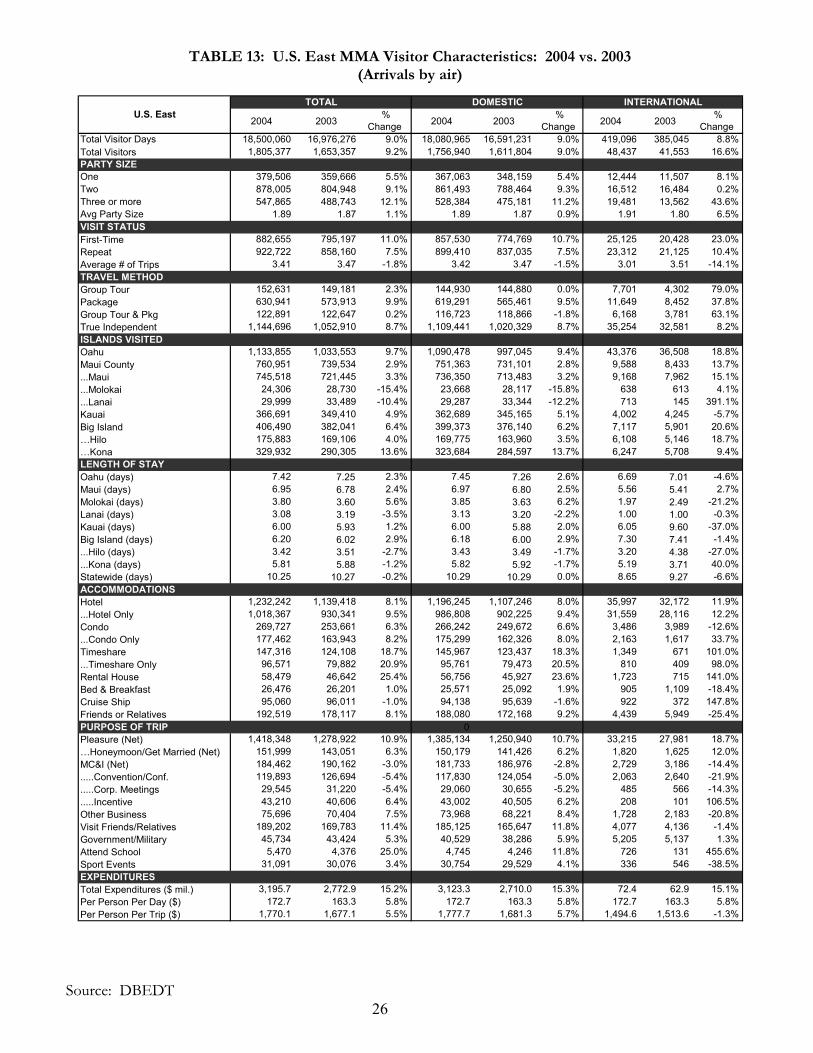
TABLE 13: U.S. East MMA Visitor Characteristics: 2004 vs. 2003 (Arrivals by air)
26 Source: DBEDT
TOTAL DOMESTIC INTERNATIONAL
2004 2003%
Change 2004 2003%
Change 2004 2003%
ChangeTotal Visitor Days 18,500,060 16,976,276 9.0% 18,080,965 16,591,231 9.0% 419,096 385,045 8.8%Total Visitors 1,805,377 1,653,357 9.2% 1,756,940 1,611,804 9.0% 48,437 41,553 16.6%PARTY SIZEOne 379,506 359,666 5.5% 367,063 348,159 5.4% 12,444 11,507 8.1%Two 878,005 804,948 9.1% 861,493 788,464 9.3% 16,512 16,484 0.2%Three or more 547,865 488,743 12.1% 528,384 475,181 11.2% 19,481 13,562 43.6%Avg Party Size 1.89 1.87 1.1% 1.89 1.87 0.9% 1.91 1.80 6.5%VISIT STATUSFirst-Time 882,655 795,197 11.0% 857,530 774,769 10.7% 25,125 20,428 23.0%Repeat 922,722 858,160 7.5% 899,410 837,035 7.5% 23,312 21,125 10.4%Average # of Trips 3.41 3.47 -1.8% 3.42 3.47 -1.5% 3.01 3.51 -14.1%TRAVEL METHODGroup Tour 152,631 149,181 2.3% 144,930 144,880 0.0% 7,701 4,302 79.0%Package 630,941 573,913 9.9% 619,291 565,461 9.5% 11,649 8,452 37.8%
TI
.
.
.
L
.
.
.
.
.
F
.
.
.
T
U.S. East
Group Tour & Pkg 122,891 122,647 0.2% 116,723 118,866 -1.8% 6,168 3,781 63.1%rue Independent 1,144,696 1,052,910 8.7% 1,109,441 1,020,329 8.7% 35,254 32,581 8.2%
SLANDS VISITEDOahu 1,133,855 1,033,553 9.7% 1,090,478 997,045 9.4% 43,376 36,508 18.8%Maui County 760,951 739,534 2.9% 751,363 731,101 2.8% 9,588 8,433 13.7%..Maui 745,518 721,445 3.3% 736,350 713,483 3.2% 9,168 7,962 15.1%..Molokai 24,306 28,730 -15.4% 23,668 28,117 -15.8% 638 613 4.1%..Lanai 29,999 33,489 -10.4% 29,287 33,344 -12.2% 713 145 391.1%Kauai 366,691 349,410 4.9% 362,689 345,165 5.1% 4,002 4,245 -5.7%Big Island 406,490 382,041 6.4% 399,373 376,140 6.2% 7,117 5,901 20.6%…Hilo 175,883 169,106 4.0% 169,775 163,960 3.5% 6,108 5,146 18.7%…Kona 329,932 290,305 13.6% 323,684 284,597 13.7% 6,247 5,708 9.4%LENGTH OF STAY Oahu (days) 7.42 7.25 2.3% 7.45 7.26 2.6% 6.69 7.01 -4.6%Maui (days) 6.95 6.78 2.4% 6.97 6.80 2.5% 5.56 5.41 2.7%Molokai (days) 3.80 3.60 5.6% 3.85 3.63 6.2% 1.97 2.49 -21.2%anai (days) 3.08 3.19 -3.5% 3.13 3.20 -2.2% 1.00 1.00 -0.3%
Kauai (days) 6.00 5.93 1.2% 6.00 5.88 2.0% 6.05 9.60 -37.0%Big Island (days) 6.20 6.02 2.9% 6.18 6.00 2.9% 7.30 7.41 -1.4%..Hilo (days) 3.42 3.51 -2.7% 3.43 3.49 -1.7% 3.20 4.38 -27.0%..Kona (days) 5.81 5.88 -1.2% 5.82 5.92 -1.7% 5.19 3.71 40.0%Statewide (days) 10.25 10.27 -0.2% 10.29 10.29 0.0% 8.65 9.27 -6.6%ACCOMMODATIONSHotel 1,232,242 1,139,418 8.1% 1,196,245 1,107,246 8.0% 35,997 32,172 11.9%..Hotel Only 1,018,367 930,341 9.5% 986,808 902,225 9.4% 31,559 28,116 12.2%Condo 269,727 253,661 6.3% 266,242 249,672 6.6% 3,486 3,989 -12.6%..Condo Only 177,462 163,943 8.2% 175,299 162,326 8.0% 2,163 1,617 33.7%Timeshare 147,316 124,108 18.7% 145,967 123,437 18.3% 1,349 671 101.0%..Timeshare Only 96,571 79,882 20.9% 95,761 79,473 20.5% 810 409 98.0%Rental House 58,479 46,642 25.4% 56,756 45,927 23.6% 1,723 715 141.0%Bed & Breakfast 26,476 26,201 1.0% 25,571 25,092 1.9% 905 1,109 -18.4%Cruise Ship 95,060 96,011 -1.0% 94,138 95,639 -1.6% 922 372 147.8%
riends or Relatives 192,519 178,117 8.1% 188,080 172,168 9.2% 4,439 5,949 -25.4%PURPOSE OF TRIP 0Pleasure (Net) 1,418,348 1,278,922 10.9% 1,385,134 1,250,940 10.7% 33,215 27,981 18.7%…Honeymoon/Get Married (Net) 151,999 143,051 6.3% 150,179 141,426 6.2% 1,820 1,625 12.0%MC&I (Net) 184,462 190,162 -3.0% 181,733 186,976 -2.8% 2,729 3,186 -14.4%....Convention/Conf. 119,893 126,694 -5.4% 117,830 124,054 -5.0% 2,063 2,640 -21.9%....Corp. Meetings 29,545 31,220 -5.4% 29,060 30,655 -5.2% 485 566 -14.3%....Incentive 43,210 40,606 6.4% 43,002 40,505 6.2% 208 101 106.5%Other Business 75,696 70,404 7.5% 73,968 68,221 8.4% 1,728 2,183 -20.8%Visit Friends/Relatives 189,202 169,783 11.4% 185,125 165,647 11.8% 4,077 4,136 -1.4%Government/Military 45,734 43,424 5.3% 40,529 38,286 5.9% 5,205 5,137 1.3%Attend School 5,470 4,376 25.0% 4,745 4,246 11.8% 726 131 455.6%Sport Events 31,091 30,076 3.4% 30,754 29,529 4.1% 336 546 -38.5%EXPENDITURES
otal Expenditures ($ mil.) 3,195.7 2,772.9 15.2% 3,123.3 2,710.0 15.3% 72.4 62.9 15.1%Per Person Per Day ($) 172.7 163.3 5.8% 172.7 163.3 5.8% 172.7 163.3 5.8%Per Person Per Trip ($) 1,770.1 1,677.1 5.5% 1,777.7 1,681.3 5.7% 1,494.6 1,513.6 -1.3%
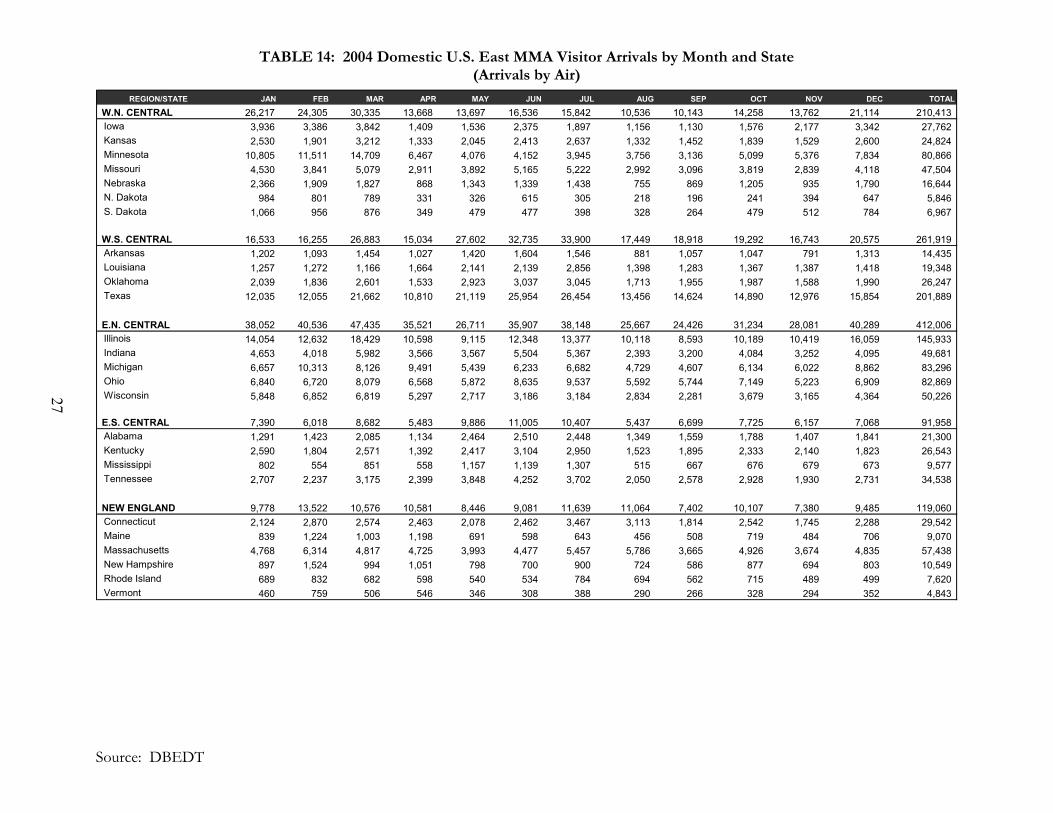
TABLE 14: 2004 Domestic U.S. East MMA Visitor Arrivals by Month and State (Arrivals by Air)
REGION/STATE JAN FEB MAR APR MAY JUN JUL AUG SEP OCT NOV DEC TOTAL
W.N. CENTRAL 26,217 24,305 30,335 13,668 13,697 16,536 15,842 10,536 10,143 14,258 13,762 21,114 210,413 Iowa 3,936 3,386 3,842 1,409 1,536 2,375 1,897 1,156 1,130 1,576 2,177 3,342 27,762 Kansas 2,530 1,901 3,212 1,333 2,045 2,413 2,637 1,332 1,452 1,839 1,529 2,600 24,824 Minnesota 10,805 11,511 14,709 6,467 4,076 4,152 3,945 3,756 3,136 5,099 5,376 7,834 80,866 Missouri 4,530 3,841 5,079 2,911 3,892 5,165 5,222 2,992 3,096 3,819 2,839 4,118 47,504 Nebraska 2,366 1,909 1,827 868 1,343 1,339 1,438 755 869 1,205 935 1,790 16,644 N. Dakota 984 801 789 331 326 615 305 218 196 241 394 647 5,846 S. Dakota 1,066 956 876 349 479 477 398 328 264 479 512 784 6,967
W.S. CENTRAL 16,533 16,255 26,883 15,034 27,602 32,735 33,900 17,449 18,918 19,292 16,743 20,575 261,919 Arkansas 1,202 1,093 1,454 1,027 1,420 1,604 1,546 881 1,057 1,047 791 1,313 14,435 Louisiana 1,257 1,272 1,166 1,664 2,141 2,139 2,856 1,398 1,283 1,367 1,387 1,418 19,348 Oklahoma 2,039 1,836 2,601 1,533 2,923 3,037 3,045 1,713 1,955 1,987 1,588 1,990 26,247 Texas 12,035 12,055 21,662 10,810 21,119 25,954 26,454 13,456 14,624 14,890 12,976 15,854 201,889
E.N. CENTRAL 38,052 40,536 47,435 35,521 26,711 35,907 38,148 25,667 24,426 31,234 28,081 40,289 412,006 Illinois 14,054 12,632 18,429 10,598 9,115 12,348 13,377 10,118 8,593 10,189 10,419 16,059 145,933 Indiana 4,653 4,018 5,982 3,566 3,567 5,504 5,367 2,393 3,200 4,084 3,252 4,095 49,681 Michigan 6,657 10,313 8,126 9,491 5,439 6,233 6,682 4,729 4,607 6,134 6,022 8,862 83,296 Ohio 6,840 6,720 8,079 6,568 5,872 8,635 9,537 5,592 5,744 7,149 5,223 6,909 82,869 Wisconsin 5,848 6,852 6,819 5,297 2,717 3,186 3,184 2,834 2,281 3,679 3,165 4,364 50,226
E.S. CENTRAL 7,390 6,018 8,682 5,483 9,886 11,005 10,407 5,437 6,699 7,725 6,157 7,068 91,958 Alabama 1,291 1,423 2,085 1,134 2,464 2,510 2,448 1,349 1,559 1,788 1,407 1,841 21,300 Kentucky 2,590 1,804 2,571 1,392 2,417 3,104 2,950 1,523 1,895 2,333 2,140 1,823 26,543 Mississippi 802 554 851 558 1,157 1,139 1,307 515 667 676 679 673 9,577 Tennessee 2,707 2,237 3,175 2,399 3,848 4,252 3,702 2,050 2,578 2,928 1,930 2,731 34,538
NEW ENGLAND 9,778 13,522 10,576 10,581 8,446 9,081 11,639 11,064 7,402 10,107 7,380 9,485 119,060 Connecticut 2,124 2,870 2,574 2,463 2,078 2,462 3,467 3,113 1,814 2,542 1,745 2,288 29,542 Maine 839 1,224 1,003 1,198 691 598 643 456 508 719 484 706 9,070 Massachusetts 4,768 6,314 4,817 4,725 3,993 4,477 5,457 5,786 3,665 4,926 3,674 4,835 57,438 New Hampshire 897 1,524 994 1,051 798 700 900 724 586 877 694 803 10,549 Rhode Island 689 832 682 598 540 534 784 694 562 715 489 499 7,620 Vermont 460 759 506 546 346 308 388 290 266 328 294 352 4,843
27
Source: DBEDT

TABLE 14: 2004 Domestic U.S. East MMA Visitor Arrivals by Month and State (continued) (Arrivals by air)
Source: DBEDT
REGION/SATE JAN FEB MAR APR MAY JUN JUL AUG SEP OCT NOV DEC TOTAL
MID ATLANTIC 20,858 22,982 20,909 22,595 20,098 21,922 32,571 33,417 18,400 22,357 17,471 21,342 274,922 New Jersey 5,619 5,449 5,065 6,180 5,607 6,191 9,595 9,986 4,952 6,218 4,747 5,528 75,139 New York 9,641 11,253 9,490 10,995 8,791 8,538 14,208 17,224 8,490 9,918 7,787 10,807 127,142 Pennsylvania 5,597 6,279 6,354 5,419 5,700 7,193 8,768 6,207 4,958 6,222 4,938 5,006 72,640
S. ATLANTIC 27,474 27,834 30,518 30,037 36,698 41,005 46,662 29,806 27,525 31,514 26,063 31,528 386,662 Delaware 572 523 482 488 390 463 597 393 344 397 402 372 5,422 Washington,D.C. 648 566 611 414 525 500 808 825 407 632 517 892 7,345 Florida 6,607 6,880 8,997 7,299 11,577 11,339 13,023 7,082 8,005 9,095 7,342 8,313 105,560 Georgia 3,736 4,246 4,461 5,062 7,285 6,845 7,220 3,413 4,842 4,844 3,967 4,857 60,780 Maryland 4,143 4,418 4,294 4,121 3,817 5,238 7,259 5,717 3,421 4,320 3,584 4,123 54,455 N. Carolina 3,358 3,093 3,496 3,729 4,120 5,943 5,078 2,517 3,250 3,622 2,993 3,787 44,986 S. Carolina 1,457 1,434 1,449 1,549 2,143 2,108 2,168 1,028 1,458 1,509 1,102 1,890 19,297 Virginia 6,453 6,128 6,216 6,769 6,287 7,778 9,678 8,368 5,411 6,533 5,765 6,929 82,316 West Virginia 500 545 512 604 552 791 829 461 387 564 391 365 6,502
TOTAL U.S. EAST 146,300 151,451 175,339 132,919 143,139 168,191 189,168 133,374 113,513 136,488 115,657 151,401 1,756,940
28
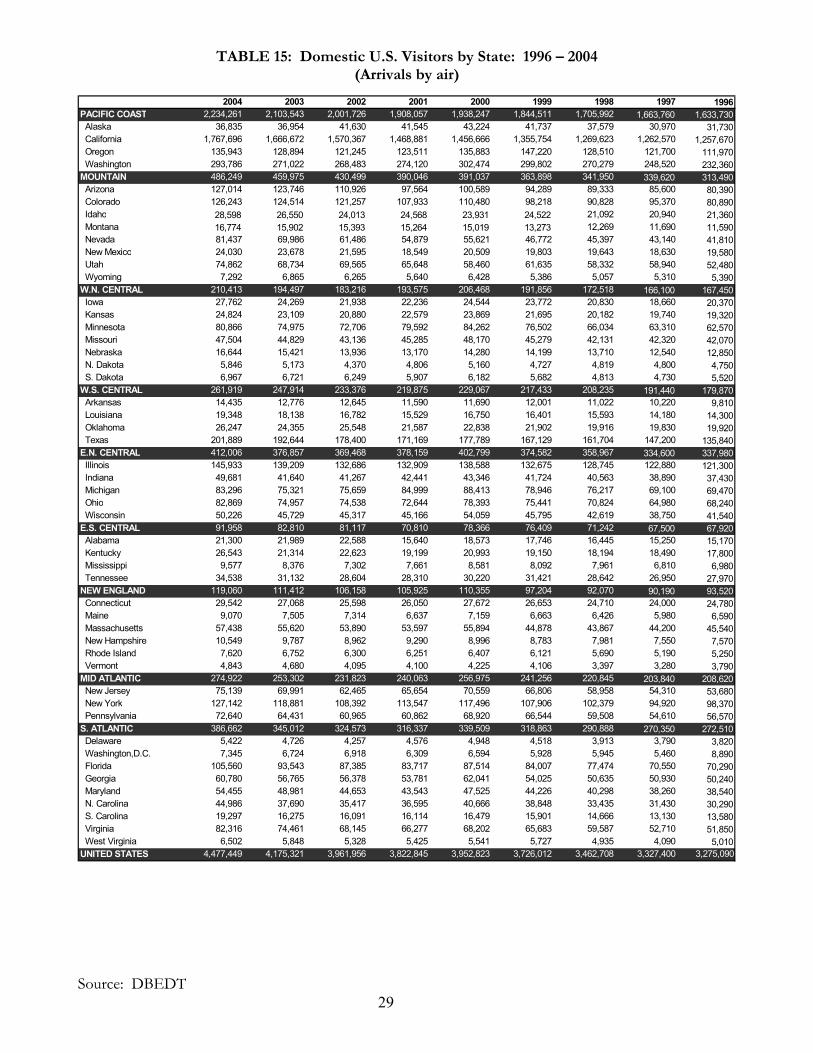
TABLE 15: Domestic U.S. Visitors by State: 1996 – 2004 (Arrivals by air)
2004 2003 2002 2001 2000 1999 1998 1997 1996PACIFIC COAST 2,234,261 2,103,543 2,001,726 1,908,057 1,938,247 1,844,511 1,705,992 1,663,760 1,633,730 Alaska 36,835 36,954 41,630 41,545 43,224 41,737 37,579 30,970 31,730 California 1,767,696 1,666,672 1,570,367 1,468,881 1,456,666 1,355,754 1,269,623 1,262,570 1,257,670 Oregon 135,943 128,894 121,245 123,511 135,883 147,220 128,510 121,700 111,970 Washington 293,786 271,022 268,483 274,120 302,474 299,802 270,279 248,520 232,360MOUNTAIN 486,249 459,975 430,499 390,046 391,037 363,898 341,950 339,620 313,490 Arizona 127,014 123,746 110,926 97,564 100,589 94,289 89,333 85,600 80,390 Colorado 126,243 124,514 121,257 107,933 110,480 98,218 90,828 95,370 80,890 Idaho 28,598 26,550 24,013 24,568 23,931 24,522 21,092 20,940 21,360 Montana 16,774 15,902 15,393 15,264 15,019 13,273 12,269 11,690 11,590 Nevada 81,437 69,986 61,486 54,879 55,621 46,772 45,397 43,140 41,810 New Mexico 24,030 23,678 21,595 18,549 20,509 19,803 19,643 18,630 19,580 Utah 74,862 68,734 69,565 65,648 58,460 61,635 58,332 58,940 52,480 Wyoming 7,292 6,865 6,265 5,640 6,428 5,386 5,057 5,310 5,390W.N. CENTRAL 210,413 194,497 183,216 193,575 206,468 191,856 172,518 166,100 167,450 Iowa 27,762 24,269 21,938 22,236 24,544 23,772 20,830 18,660 20,370 Kansas 24,824 23,109 20,880 22,579 23,869 21,695 20,182 19,740 19,320 Minnesota 80,866 74,975 72,706 79,592 84,262 76,502 66,034 63,310 62,570 Missouri 47,504 44,829 43,136 45,285 48,170 45,279 42,131 42,320 42,070 Nebraska 16,644 15,421 13,936 13,170 14,280 14,199 13,710 12,540 12,850 N. Dakota 5,846 5,173 4,370 4,806 5,160 4,727 4,819 4,800 4,750 S. Dakota 6,967 6,721 6,249 5,907 6,182 5,682 4,813 4,730 5,520W.S. CENTRAL 261,919 247,914 233,376 219,875 229,067 217,433 208,235 191,440 179,870 Arkansas 14,435 12,776 12,645 11,590 11,690 12,001 11,022 10,220 9,810 Louisiana 19,348 18,138 16,782 15,529 16,750 16,401 15,593 14,180 14,300 Oklahoma 26,247 24,355 25,548 21,587 22,838 21,902 19,916 19,830 19,920 Texas 201,889 192,644 178,400 171,169 177,789 167,129 161,704 147,200 135,840E.N. CENTRAL 412,006 376,857 369,468 378,159 402,799 374,582 358,967 334,600 337,980 Illinois 145,933 139,209 132,686 132,909 138,588 132,675 128,745 122,880 121,300 Indiana 49,681 41,640 41,267 42,441 43,346 41,724 40,563 38,890 37,430 Michigan 83,296 75,321 75,659 84,999 88,413 78,946 76,217 69,100 69,470 Ohio 82,869 74,957 74,538 72,644 78,393 75,441 70,824 64,980 68,240 Wisconsin 50,226 45,729 45,317 45,166 54,059 45,795 42,619 38,750 41,540E.S. CENTRAL 91,958 82,810 81,117 70,810 78,366 76,409 71,242 67,500 67,920 Alabama 21,300 21,989 22,588 15,640 18,573 17,746 16,445 15,250 15,170 Kentucky 26,543 21,314 22,623 19,199 20,993 19,150 18,194 18,490 17,800 Mississippi 9,577 8,376 7,302 7,661 8,581 8,092 7,961 6,810 6,980 Tennessee 34,538 31,132 28,604 28,310 30,220 31,421 28,642 26,950 27,970NEW ENGLAND 119,060 111,412 106,158 105,925 110,355 97,204 92,070 90,190 93,520 Connecticut 29,542 27,068 25,598 26,050 27,672 26,653 24,710 24,000 24,780 Maine 9,070 7,505 7,314 6,637 7,159 6,663 6,426 5,980 6,590 Massachusetts 57,438 55,620 53,890 53,597 55,894 44,878 43,867 44,200 45,540 New Hampshire 10,549 9,787 8,962 9,290 8,996 8,783 7,981 7,550 7,570 Rhode Island 7,620 6,752 6,300 6,251 6,407 6,121 5,690 5,190 5,250 Vermont 4,843 4,680 4,095 4,100 4,225 4,106 3,397 3,280 3,790MID ATLANTIC 274,922 253,302 231,823 240,063 256,975 241,256 220,845 203,840 208,620 New Jersey 75,139 69,991 62,465 65,654 70,559 66,806 58,958 54,310 53,680 New York 127,142 118,881 108,392 113,547 117,496 107,906 102,379 94,920 98,370 Pennsylvania 72,640 64,431 60,965 60,862 68,920 66,544 59,508 54,610 56,570S. ATLANTIC 386,662 345,012 324,573 316,337 339,509 318,863 290,888 270,350 272,510 Delaware 5,422 4,726 4,257 4,576 4,948 4,518 3,913 3,790 3,820 Washington,D.C. 7,345 6,724 6,918 6,309 6,594 5,928 5,945 5,460 8,890 Florida 105,560 93,543 87,385 83,717 87,514 84,007 77,474 70,550 70,290 Georgia 60,780 56,765 56,378 53,781 62,041 54,025 50,635 50,930 50,240 Maryland 54,455 48,981 44,653 43,543 47,525 44,226 40,298 38,260 38,540 N. Carolina 44,986 37,690 35,417 36,595 40,666 38,848 33,435 31,430 30,290 S. Carolina 19,297 16,275 16,091 16,114 16,479 15,901 14,666 13,130 13,580 Virginia 82,316 74,461 68,145 66,277 68,202 65,683 59,587 52,710 51,850 West Virginia 6,502 5,848 5,328 5,425 5,541 5,727 4,935 4,090 5,010UNITED STATES 4,477,449 4,175,321 3,961,956 3,822,845 3,952,823 3,726,012 3,462,708 3,327,400 3,275,090
Source: DBEDT 29
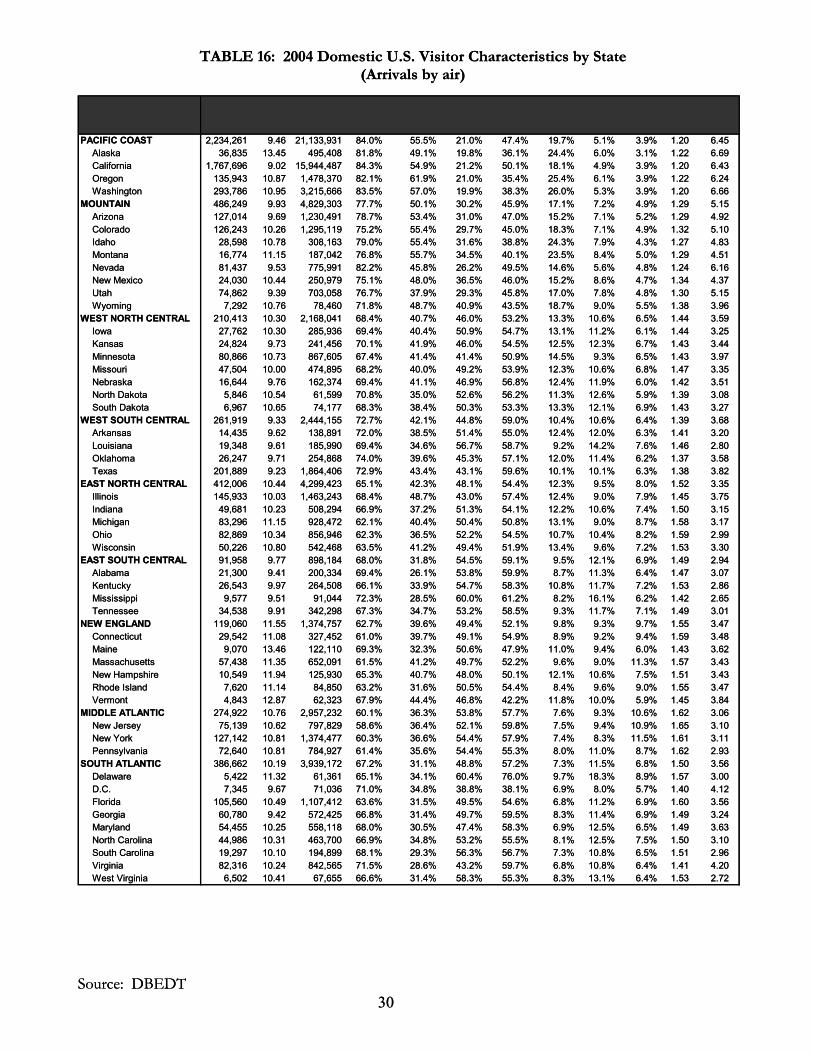
TABLE 16: 2004 Domestic U.S. Visitor Characteristics by State (Arrivals by air)
L.O.S. % ONE % % % % % AVERAGEVISITORS IN ISLAND N.I. FIRST- HOTEL CONDO HONEY- ISLES # OF
HAWAII ONLY ONLY TIME ONLY ONLY MOON VISITED TRIPSPACIFIC COAST 2,234,261 9.46 21,133,931 84.0% 55.5% 21.0% 47.4% 19.7% 5.1% 3.9% 1.20 6.45
Alaska 36,835 13.45 495,408 81.8% 49.1% 19.8% 36.1% 24.4% 6.0% 3.1% 1.22 6.69California 1,767,696 9.02 15,944,487 84.3% 54.9% 21.2% 50.1% 18.1% 4.9% 3.9% 1.20 6.43Oregon 135,943 10.87 1,478,370 82.1% 61.9% 21.0% 35.4% 25.4% 6.1% 3.9% 1.22 6.24Washington 293,786 10.95 3,215,666 83.5% 57.0% 19.9% 38.3% 26.0% 5.3% 3.9% 1.20 6.66
MOUNTAIN 486,249 9.93 4,829,303 77.7% 50.1% 30.2% 45.9% 17.1% 7.2% 4.9% 1.29 5.15Arizona 127,014 9.69 1,230,491 78.7% 53.4% 31.0% 47.0% 15.2% 7.1% 5.2% 1.29 4.92Colorado 126,243 10.26 1,295,119 75.2% 55.4% 29.7% 45.0% 18.3% 7.1% 4.9% 1.32 5.10Idaho 28,598 10.78 308,163 79.0% 55.4% 31.6% 38.8% 24.3% 7.9% 4.3% 1.27 4.83Montana 16,774 11.15 187,042 76.8% 55.7% 34.5% 40.1% 23.5% 8.4% 5.0% 1.29 4.51Nevada 81,437 9.53 775,991 82.2% 45.8% 26.2% 49.5% 14.6% 5.6% 4.8% 1.24 6.16New Mexico 24,030 10.44 250,979 75.1% 48.0% 36.5% 46.0% 15.2% 8.6% 4.7% 1.34 4.37Utah 74,862 9.39 703,058 76.7% 37.9% 29.3% 45.8% 17.0% 7.8% 4.8% 1.30 5.15Wyoming 7,292 10.76 78,460 71.8% 48.7% 40.9% 43.5% 18.7% 9.0% 5.5% 1.38 3.96
WEST NORTH CENTRAL 210,413 10.30 2,168,041 68.4% 40.7% 46.0% 53.2% 13.3% 10.6% 6.5% 1.44 3.59Iowa 27,762 10.30 285,936 69.4% 40.4% 50.9% 54.7% 13.1% 11.2% 6.1% 1.44 3.25Kansas 24,824 9.73 241,456 70.1% 41.9% 46.0% 54.5% 12.5% 12.3% 6.7% 1.43 3.44Minnesota 80,866 10.73 867,605 67.4% 41.4% 41.4% 50.9% 14.5% 9.3% 6.5% 1.43 3.97Missouri 47,504 10.00 474,895 68.2% 40.0% 49.2% 53.9% 12.3% 10.6% 6.8% 1.47 3.35Nebraska 16,644 9.76 162,374 69.4% 41.1% 46.9% 56.8% 12.4% 11.9% 6.0% 1.42 3.51North Dakota 5,846 10.54 61,599 70.8% 35.0% 52.6% 56.2% 11.3% 12.6% 5.9% 1.39 3.08South Dakota 6,967 10.65 74,177 68.3% 38.4% 50.3% 53.3% 13.3% 12.1% 6.9% 1.43 3.27
WEST SOUTH CENTRAL 261,919 9.33 2,444,155 72.7% 42.1% 44.8% 59.0% 10.4% 10.6% 6.4% 1.39 3.68Arkansas 14,435 9.62 138,891 72.0% 38.5% 51.4% 55.0% 12.4% 12.0% 6.3% 1.41 3.20Louisiana 19,348 9.61 185,990 69.4% 34.6% 56.7% 58.7% 9.2% 14.2% 7.6% 1.46 2.80Oklahoma 26,247 9.71 254,868 74.0% 39.6% 45.3% 57.1% 12.0% 11.4% 6.2% 1.37 3.58Texas 201,889 9.23 1,864,406 72.9% 43.4% 43.1% 59.6% 10.1% 10.1% 6.3% 1.38 3.82
EAST NORTH CENTRAL 412,006 10.44 4,299,423 65.1% 42.3% 48.1% 54.4% 12.3% 9.5% 8.0% 1.52 3.35Illinois 145,933 10.03 1,463,243 68.4% 48.7% 43.0% 57.4% 12.4% 9.0% 7.9% 1.45 3.75Indiana 49,681 10.23 508,294 66.9% 37.2% 51.3% 54.1% 12.2% 10.6% 7.4% 1.50 3.15Michigan 83,296 11.15 928,472 62.1% 40.4% 50.4% 50.8% 13.1% 9.0% 8.7% 1.58 3.17Ohio 82,869 10.34 856,946 62.3% 36.5% 52.2% 54.5% 10.7% 10.4% 8.2% 1.59 2.99Wisconsin 50,226 10.80 542,468 63.5% 41.2% 49.4% 51.9% 13.4% 9.6% 7.2% 1.53 3.30
EAST SOUTH CENTRAL 91,958 9.77 898,184 68.0% 31.8% 54.5% 59.1% 9.5% 12.1% 6.9% 1.49 2.94Alabama 21,300 9.41 200,334 69.4% 26.1% 53.8% 59.9% 8.7% 11.3% 6.4% 1.47 3.07Kentucky 26,543 9.97 264,508 66.1% 33.9% 54.7% 58.3% 10.8% 11.7% 7.2% 1.53 2.86Mississippi 9,577 9.51 91,044 72.3% 28.5% 60.0% 61.2% 8.2% 16.1% 6.2% 1.42 2.65Tennessee 34,538 9.91 342,298 67.3% 34.7% 53.2% 58.5% 9.3% 11.7% 7.1% 1.49 3.01
NEW ENGLAND 119,060 11.55 1,374,757 62.7% 39.6% 49.4% 52.1% 9.8% 9.3% 9.7% 1.55 3.47Connecticut 29,542 11.08 327,452 61.0% 39.7% 49.1% 54.9% 8.9% 9.2% 9.4% 1.59 3.48Maine 9,070 13.46 122,110 69.3% 32.3% 50.6% 47.9% 11.0% 9.4% 6.0% 1.43 3.62Massachusetts 57,438 11.35 652,091 61.5% 41.2% 49.7% 52.2% 9.6% 9.0% 11.3% 1.57 3.43New Hampshire 10,549 11.94 125,930 65.3% 40.7% 48.0% 50.1% 12.1% 10.6% 7.5% 1.51 3.43Rhode Island 7,620 11.14 84,850 63.2% 31.6% 50.5% 54.4% 8.4% 9.6% 9.0% 1.55 3.47Vermont 4,843 12.87 62,323 67.9% 44.4% 46.8% 42.2% 11.8% 10.0% 5.9% 1.45 3.84
MIDDLE ATLANTIC 274,922 10.76 2,957,232 60.1% 36.3% 53.8% 57.7% 7.6% 9.3% 10.6% 1.62 3.06New Jersey 75,139 10.62 797,829 58.6% 36.4% 52.1% 59.8% 7.5% 9.4% 10.9% 1.65 3.10New York 127,142 10.81 1,374,477 60.3% 36.6% 54.4% 57.9% 7.4% 8.3% 11.5% 1.61 3.11Pennsylvania 72,640 10.81 784,927 61.4% 35.6% 54.4% 55.3% 8.0% 11.0% 8.7% 1.62 2.93
SOUTH ATLANTIC 386,662 10.19 3,939,172 67.2% 31.1% 48.8% 57.2% 7.3% 11.5% 6.8% 1.50 3.56Delaware 5,422 11.32 61,361 65.1% 34.1% 60.4% 76.0% 9.7% 18.3% 8.9% 1.57 3.00D.C. 7,345 9.67 71,036 71.0% 34.8% 38.8% 38.1% 6.9% 8.0% 5.7% 1.40 4.12Florida 105,560 10.49 1,107,412 63.6% 31.5% 49.5% 54.6% 6.8% 11.2% 6.9% 1.60 3.56Georgia 60,780 9.42 572,425 66.8% 31.4% 49.7% 59.5% 8.3% 11.4% 6.9% 1.49 3.24Maryland 54,455 10.25 558,118 68.0% 30.5% 47.4% 58.3% 6.9% 12.5% 6.5% 1.49 3.63North Carolina 44,986 10.31 463,700 66.9% 34.8% 53.2% 55.5% 8.1% 12.5% 7.5% 1.50 3.10South Carolina 19,297 10.10 194,899 68.1% 29.3% 56.3% 56.7% 7.3% 10.8% 6.5% 1.51 2.96Virginia 82,316 10.24 842,565 71.5% 28.6% 43.2% 59.7% 6.8% 10.8% 6.4% 1.41 4.20West Virginia 6,502 10.41 67,655 66.6% 31.4% 58.3% 55.3% 8.3% 13.1% 6.4% 1.53 2.72
STATE & REGION VISITOR DAYS % MCI
TABLE 16: 2004 Domestic U.S. Visitor Characteristics by State (Arrivals by air)
Source: DBEDT 30
Source: DBEDT 30
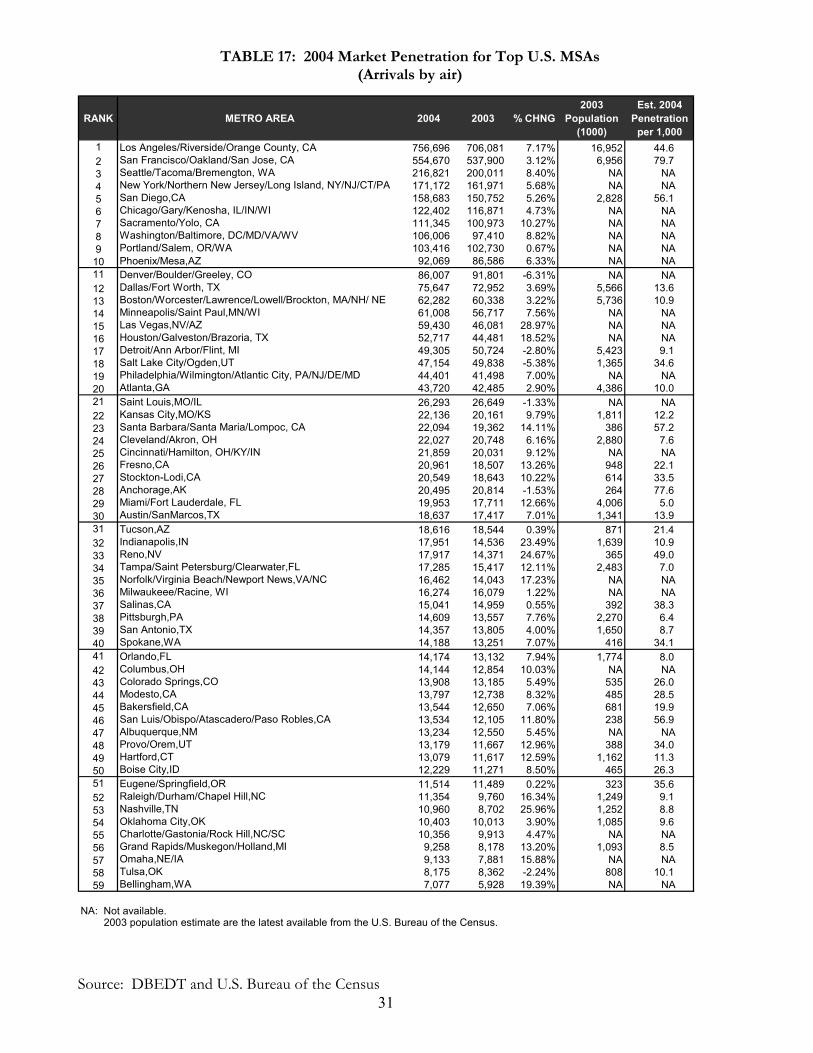
TABLE 17: 2004 Market Penetration for Top U.S. MSAs (Arrivals by air)
RANK METRO AREA 2004 2003 % CHNG2003
Population (1000)
Est. 2004 Penetration
per 1,0001 Los Angeles/Riverside/Orange County, CA 756,696 706,081 7.17% 16,952 44.62 San Francisco/Oakland/San Jose, CA 554,670 537,900 3.12% 6,956 79.73 Seattle/Tacoma/Bremengton, WA 216,821 200,011 8.40% NA NA4 New York/Northern New Jersey/Long Island, NY/NJ/CT/PA 171,172 161,971 5.68% NA NA5 San Diego,CA 158,683 150,752 5.26% 2,828 56.16 Chicago/Gary/Kenosha, IL/IN/WI 122,402 116,871 4.73% NA NA7 Sacramento/Yolo, CA 111,345 100,973 10.27% NA NA8 Washington/Baltimore, DC/MD/VA/WV 106,006 97,410 8.82% NA NA9 Portland/Salem, OR/WA 103,416 102,730 0.67% NA NA10 Phoenix/Mesa,AZ 92,069 86,586 6.33% NA NA11 Denver/Boulder/Greeley, CO 86,007 91,801 -6.31% NA NA12 Dallas/Fort Worth, TX 75,647 72,952 3.69% 5,566 13.613 Boston/Worcester/Lawrence/Lowell/Brockton, MA/NH/ NE 62,282 60,338 3.22% 5,736 10.914 Minneapolis/Saint Paul,MN/WI 61,008 56,717 7.56% NA NA15 Las Vegas,NV/AZ 59,430 46,081 28.97% NA NA16 Houston/Galveston/Brazoria, TX 52,717 44,481 18.52% NA NA17 Detroit/Ann Arbor/Flint, MI 49,305 50,724 -2.80% 5,423 9.118 Salt Lake City/Ogden,UT 47,154 49,838 -5.38% 1,365 34.619 Philadelphia/Wilmington/Atlantic City, PA/NJ/DE/MD 44,401 41,498 7.00% NA NA20 Atlanta,GA 43,720 42,485 2.90% 4,386 10.021 Saint Louis,MO/IL 26,293 26,649 -1.33% NA NA22 Kansas City,MO/KS 22,136 20,161 9.79% 1,811 12.223 Santa Barbara/Santa Maria/Lompoc, CA 22,094 19,362 14.11% 386 57.224 Cleveland/Akron, OH 22,027 20,748 6.16% 2,880 7.625 Cincinnati/Hamilton, OH/KY/IN 21,859 20,031 9.12% NA NA26 Fresno,CA 20,961 18,507 13.26% 948 22.127 Stockton-Lodi,CA 20,549 18,643 10.22% 614 33.528 Anchorage,AK 20,495 20,814 -1.53% 264 77.629 Miami/Fort Lauderdale, FL 19,953 17,711 12.66% 4,006 5.030 Austin/SanMarcos,TX 18,637 17,417 7.01% 1,341 13.931 Tucson,AZ 18,616 18,544 0.39% 871 21.432 Indianapolis,IN 17,951 14,536 23.49% 1,639 10.933 Reno,NV 17,917 14,371 24.67% 365 49.034 Tampa/Saint Petersburg/Clearwater,FL 17,285 15,417 12.11% 2,483 7.035 Norfolk/Virginia Beach/Newport News,VA/NC 16,462 14,043 17.23% NA NA36 Milwaukeee/Racine, WI 16,274 16,079 1.22% NA NA37 Salinas,CA 15,041 14,959 0.55% 392 38.338 Pittsburgh,PA 14,609 13,557 7.76% 2,270 6.439 San Antonio,TX 14,357 13,805 4.00% 1,650 8.740 Spokane,WA 14,188 13,251 7.07% 416 34.141 Orlando,FL 14,174 13,132 7.94% 1,774 8.042 Columbus,OH 14,144 12,854 10.03% NA NA43 Colorado Springs,CO 13,908 13,185 5.49% 535 26.044 Modesto,CA 13,797 12,738 8.32% 485 28.545 Bakersfield,CA 13,544 12,650 7.06% 681 19.946 San Luis/Obispo/Atascadero/Paso Robles,CA 13,534 12,105 11.80% 238 56.947 Albuquerque,NM 13,234 12,550 5.45% NA NA48 Provo/Orem,UT 13,179 11,667 12.96% 388 34.049 Hartford,CT 13,079 11,617 12.59% 1,162 11.350 Boise City,ID 12,229 11,271 8.50% 465 26.351 Eugene/Springfield,OR 11,514 11,489 0.22% 323 35.652 Raleigh/Durham/Chapel Hill,NC 11,354 9,760 16.34% 1,249 9.153 Nashville,TN 10,960 8,702 25.96% 1,252 8.854 Oklahoma City,OK 10,403 10,013 3.90% 1,085 9.655 Charlotte/Gastonia/Rock Hill,NC/SC 10,356 9,913 4.47% NA NA56 Grand Rapids/Muskegon/Holland,MI 9,258 8,178 13.20% 1,093 8.557 Omaha,NE/IA 9,133 7,881 15.88% NA NA58 Tulsa,OK 8,175 8,362 -2.24% 808 10.159 Bellingham,WA 7,077 5,928 19.39% NA NA
NA: Not available. 2003 population estimate are the latest available from the U.S. Bureau of the Census.
Source: DBEDT and U.S. Bureau of the Census 31

TABLE 18: Japan MMA Visitor Characteristics 2004 vs. 2003 (Arrivals by air)
Source: DBEDT
32
TOTAL DOMESTIC INTERNATIONAL
2004 2003%
Change 2004 2003%
Change 2004 2003%
ChangeTotal Visitor Days 8,599,847 7,921,422 8.6% 83,795 90,011 -6.9% 8,516,053 7,831,411 8.7%Total Visitors 1,482,085 1,340,034 10.6% 12,186 12,901 -5.5% 1,469,899 1,327,133 10.8%PARTY SIZEOne 134,989 126,612 6.6% 3,936 4,045 -2.7% 131,054 122,567 6.9%Two 467,295 434,942 7.4% 4,461 4,904 -9.0% 462,834 430,038 7.6%Three or more 879,801 778,480 13.0% 3,789 3,952 -4.1% 876,012 774,528 13.1%Avg Party Size 2.76 2.72 1.4% 1.72 1.73 -0.6% 2.77 2.73 1.4%VISIT STATUS First-Time 672,916 618,241 8.8% 4,265 4,235 0.7% 668,651 614,007 8.9%Repeat 809,169 721,792 12.1% 7,921 8,666 -8.6% 801,248 713,126 12.4%Average # of Trips 3.64 3.73 -2.3% 5.04 5.17 -2.6% 3.63 3.71 -2.3%TRAVEL METHODGroup Tour 652,035 577,198 13.0% 2,301 2,293 0.3% 649,735 574,906 13.0%Package 1,196,350 1,067,062 12.1% 4,935 4,743 4.0% 1,191,415 1,062,318 12.2%Group Tour & Pkg 568,809 514,005 10.7% 1,832 1,777 3.1% 566,976 512,228 10.7%True Independent 202,509 209,778 -3.5% 6,783 7,641 -11.2% 195,726 202,137 -3.2%ISLANDS VISITED Oahu 1,418,747 1,276,468 11.1% 10,835 11,576 -6.4% 1,407,912 1,264,892 11.3%Maui County 125,742 141,494 -11.1% 1,260 1,565 -19.5% 124,481 139,929 -11.0%...Maui 119,050 123,135 -3.3% 1,220 1,500 -18.7% 117,830 121,635 -3.1%...Molokai 6,512 13,189 -50.6% 47 76 -38.7% 6,466 13,113 -50.7%...Lanai 4,241 10,457 -59.4% 49 61 -19.2% 4,191 10,396 -59.7%Kauai 54,904 51,696 6.2% 535 636 -15.9% 54,370 51,060 6.5%Big Island 214,066 192,809 11.0% 1,079 1,184 -8.8% 212,986 191,625 11.1%…Hilo 77,520 63,498 22.1% 314 445 -29.6% 77,206 63,053 22.4%…Kona 170,511 155,097 9.9% 871 905 -3.8% 169,640 154,192 10.0%LENGTH OF STAY Oahu (days) 5.22 5.28 -1.1% 5.99 6.00 -0.3% 5.21 5.27 -1.1%Maui (days) 3.12 3.28 -4.8% 6.73 5.80 16.0% 3.09 3.25 -5.0%Molokai (days) 1.49 1.22 22.1% 3.95 2.92 35.3% 1.47 1.21 21.6%Lanai (days) 2.47 1.90 29.9% 3.03 2.45 23.6% 2.46 1.90 29.8%Kauai (days) 1.89 2.03 -6.8% 5.52 5.26 4.9% 1.86 1.99 -6.7%Big Island (days) 3.26 3.30 -1.4% 6.91 6.83 1.1% 3.24 3.28 -1.3%...Hilo (days) 1.89 1.80 4.9% 7.55 6.06 24.7% 1.86 1.77 5.4%...Kona (days) 3.23 3.37 -4.1% 5.83 5.95 -1.9% 3.22 3.36 -4.1%Statewide (days) 5.80 5.91 -1.8% 6.88 6.98 -1.4% 5.79 5.90 -1.8%ACCOMMODATIONSHotel 1,358,224 1,204,991 12.7% 9,504 10,130 -6.2% 1,348,720 1,194,861 12.9%...Hotel Only 1,333,917 1,179,575 13.1% 9,073 9,646 -5.9% 1,324,844 1,169,929 13.2%Condo 109,518 124,290 -11.9% 1,478 1,547 -4.4% 108,040 122,743 -12.0%...Condo Only 91,364 104,859 -12.9% 1,256 1,276 -1.6% 90,108 103,583 -13.0%Timeshare 6,031 5,898 2.2% 154 166 -7.1% 5,877 5,732 2.5%...Timeshare Only 4,238 3,946 7.4% 105 115 -8.3% 4,132 3,831 7.9%Rental House 3,748 3,745 0.1% 189 121 56.2% 3,559 3,624 -1.8%Bed & Breakfast 1,651 2,461 -32.9% 44 85 -48.8% 1,607 2,376 -32.4%Cruise Ship 911 1,334 -31.7% 89 71 25.9% 822 1,263 -34.9%Friends or Relatives 19,350 18,749 3.2% 991 1,043 -5.0% 18,359 17,707 3.7%PURPOSE OF TRIPPleasure (Net) 1,363,487 1,227,532 11.1% 10,052 10,573 -4.9% 1,353,435 1,216,959 11.2%…Honeymoon/Get Married (Net) 374,493 339,330 10.4% 1,629 1,725 -5.6% 372,864 337,606 10.4%MC&I (Net) 50,699 52,521 -3.5% 597 654 -8.7% 50,102 51,867 -3.4%.....Convention/Conf. 11,621 15,217 -23.6% 298 297 0.2% 11,323 14,920 -24.1%.....Corp. Meetings 13,308 11,224 18.6% 189 220 -14.4% 13,119 11,003 19.2%.....Incentive 26,750 27,219 -1.7% 134 146 -8.2% 26,616 27,073 -1.7%Other Business 10,938 9,207 18.8% 474 469 1.2% 10,464 8,738 19.8%Visit Friends/Relatives 25,267 25,422 -0.6% 1,101 1,237 -11.0% 24,166 24,185 -0.1%Government/Military 1,490 1,977 -24.7% 139 200 -30.5% 1,351 1,777 -24.0%Attend School 3,316 2,701 22.8% 106 98 8.3% 3,210 2,603 23.3%Sport Events 34,875 38,207 -8.7% 108 97 10.5% 34,767 38,110 -8.8%EXPENDITURESTotal Expenditures ($ mil.) 2,162.6 1,901.9 13.7% 21.1 21.6 -2.5% 2,141.6 1,880.3 13.9%Per Person Per Day ($) 251.5 240.1 4.7% 251.5 240.1 4.7% 251.5 240.1 4.7%Per Person Per Trip ($) 1,459.2 1,419.3 2.8% 1,729.2 1,675.2 3.2% 1,456.9 1,416.8 2.8%
JAPAN
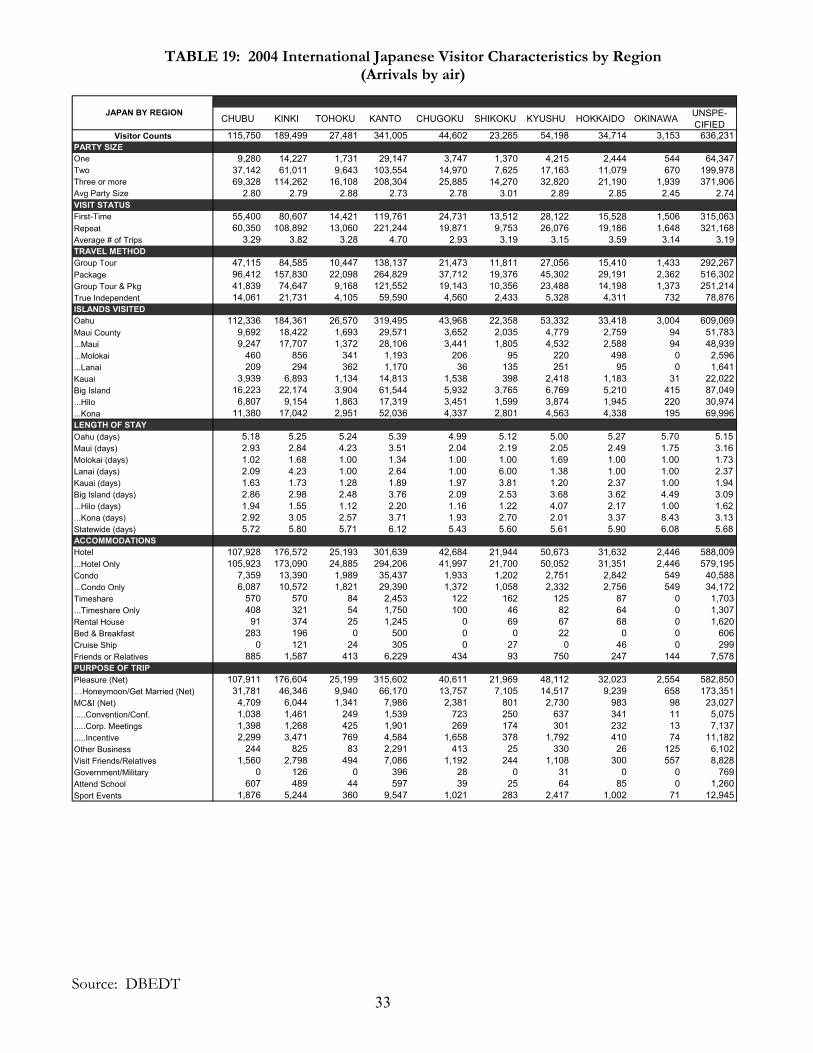
TABLE 19: 2004 International Japanese Visitor Characteristics by Region (Arrivals by air)
Source: DBEDT 33
CHUBU KINKI TOHOKU KANTO CHUGOKU SHIKOKU KYUSHU HOKKAIDO OKINAWA UNSPE-CIFIED
Visitor Counts 115,750 189,499 27,481 341,005 44,602 23,265 54,198 34,714 3,153 636,231 PARTY SIZEOne 9,280 14,227 1,731 29,147 3,747 1,370 4,215 2,444 544 64,347 Two 37,142 61,011 9,643 103,554 14,970 7,625 17,163 11,079 670 199,978 Three or more 69,328 114,262 16,108 208,304 25,885 14,270 32,820 21,190 1,939 371,906 Avg Party Size 2.80 2.79 2.88 2.73 2.78 3.01 2.89 2.85 2.45 2.74VISIT STATUSFirst-Time 55,400 80,607 14,421 119,761 24,731 13,512 28,122 15,528 1,506 315,063 Repeat 60,350 108,892 13,060 221,244 19,871 9,753 26,076 19,186 1,648 321,168 Average # of Trips 3.29 3.82 3.28 4.70 2.93 3.19 3.15 3.59 3.14 3.19TRAVEL METHODGroup Tour 47,115 84,585 10,447 138,137 21,473 11,811 27,056 15,410 1,433 292,267 Package 96,412 157,830 22,098 264,829 37,712 19,376 45,302 29,191 2,362 516,302 Group Tour & Pkg 41,839 74,647 9,168 121,552 19,143 10,356 23,488 14,198 1,373 251,214 True Independent 14,061 21,731 4,105 59,590 4,560 2,433 5,328 4,311 732 78,876 ISLANDS VISITEDOahu 112,336 184,361 26,570 319,495 43,968 22,358 53,332 33,418 3,004 609,069 Maui County 9,692 18,422 1,693 29,571 3,652 2,035 4,779 2,759 94 51,783 ...Maui 9,247 17,707 1,372 28,106 3,441 1,805 4,532 2,588 94 48,939 ...Molokai 460 856 341 1,193 206 95 220 498 0 2,596 ...Lanai 209 294 362 1,170 36 135 251 95 0 1,641 Kauai 3,939 6,893 1,134 14,813 1,538 398 2,418 1,183 31 22,022 Big Island 16,223 22,174 3,904 61,544 5,932 3,765 6,769 5,210 415 87,049 ...Hilo 6,807 9,154 1,863 17,319 3,451 1,599 3,874 1,945 220 30,974 ...Kona 11,380 17,042 2,951 52,036 4,337 2,801 4,563 4,338 195 69,996 LENGTH OF STAY Oahu (days) 5.18 5.25 5.24 5.39 4.99 5.12 5.00 5.27 5.70 5.15Maui (days) 2.93 2.84 4.23 3.51 2.04 2.19 2.05 2.49 1.75 3.16Molokai (days) 1.02 1.68 1.00 1.34 1.00 1.00 1.69 1.00 1.00 1.73Lanai (days) 2.09 4.23 1.00 2.64 1.00 6.00 1.38 1.00 1.00 2.37Kauai (days) 1.63 1.73 1.28 1.89 1.97 3.81 1.20 2.37 1.00 1.94Big Island (days) 2.86 2.98 2.48 3.76 2.09 2.53 3.68 3.62 4.49 3.09...Hilo (days) 1.94 1.55 1.12 2.20 1.16 1.22 4.07 2.17 1.00 1.62...Kona (days) 2.92 3.05 2.57 3.71 1.93 2.70 2.01 3.37 8.43 3.13Statewide (days) 5.72 5.80 5.71 6.12 5.43 5.60 5.61 5.90 6.08 5.68ACCOMMODATIONSHotel 107,928 176,572 25,193 301,639 42,684 21,944 50,673 31,632 2,446 588,009 ...Hotel Only 105,923 173,090 24,885 294,206 41,997 21,700 50,052 31,351 2,446 579,195 Condo 7,359 13,390 1,989 35,437 1,933 1,202 2,751 2,842 549 40,588 ...Condo Only 6,087 10,572 1,821 29,390 1,372 1,058 2,332 2,756 549 34,172 Timeshare 570 570 84 2,453 122 162 125 87 0 1,703 ...Timeshare Only 408 321 54 1,750 100 46 82 64 0 1,307 Rental House 91 374 25 1,245 0 69 67 68 0 1,620 Bed & Breakfast 283 196 0 500 0 0 22 0 0 606 Cruise Ship 0 121 24 305 0 27 0 46 0 299 Friends or Relatives 885 1,587 413 6,229 434 93 750 247 144 7,578 PURPOSE OF TRIPPleasure (Net) 107,911 176,604 25,199 315,602 40,611 21,969 48,112 32,023 2,554 582,850 …Honeymoon/Get Married (Net) 31,781 46,346 9,940 66,170 13,757 7,105 14,517 9,239 658 173,351 MC&I (Net) 4,709 6,044 1,341 7,986 2,381 801 2,730 983 98 23,027 .....Convention/Conf. 1,038 1,461 249 1,539 723 250 637 341 11 5,075 .....Corp. Meetings 1,398 1,268 425 1,901 269 174 301 232 13 7,137 .....Incentive 2,299 3,471 769 4,584 1,658 378 1,792 410 74 11,182 Other Business 244 825 83 2,291 413 25 330 26 125 6,102 Visit Friends/Relatives 1,560 2,798 494 7,086 1,192 244 1,108 300 557 8,828 Government/Military 0 126 0 396 28 0 31 0 0 769 Attend School 607 489 44 597 39 25 64 85 0 1,260 Sport Events 1,876 5,244 360 9,547 1,021 283 2,417 1,002 71 12,945
JAPAN BY REGION
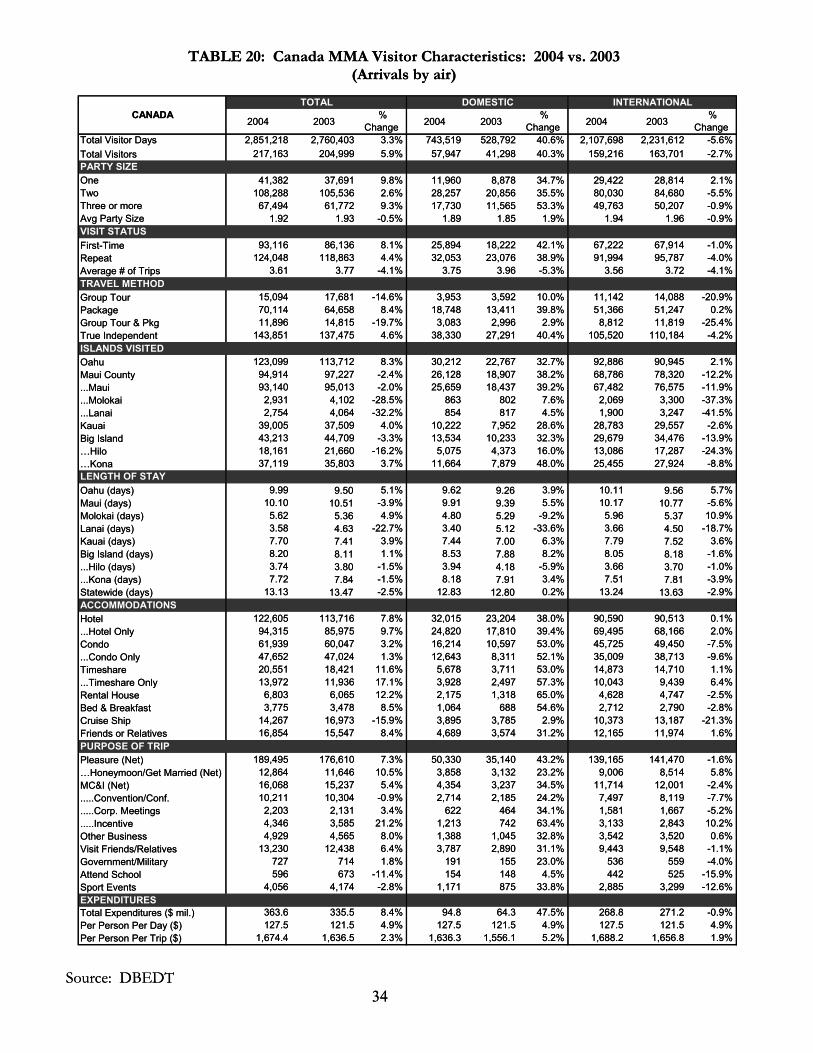
TABLE 20: Canada MMA Visitor Characteristics: 2004 vs. 2003 (Arrivals by air)
TABLE 20: Canada MMA Visitor Characteristics: 2004 vs. 2003 (Arrivals by air)
Source: DBEDT
34
TOTAL DOMESTIC INTERNATIONAL
2004 2003%
Change 2004 2003%
Change 2004 2003%
ChangeTotal Visitor Days 2,851,218 2,760,403 3.3% 743,519 528,792 40.6% 2,107,698 2,231,612 -5.6%Total Visitors 217,163 204,999 5.9% 57,947 41,298 40.3% 159,216 163,701 -2.7%PARTY SIZEOne 41,382 37,691 9.8% 11,960 8,878 34.7% 29,422 28,814 2.1%Two 108,288 105,536 2.6% 28,257 20,856 35.5% 80,030 84,680 -5.5%Three or more 67,494 61,772 9.3% 17,730 11,565 53.3% 49,763 50,207 -0.9%Avg Party Size 1.92 1.93 -0.5% 1.89 1.85 1.9% 1.94 1.96 -0.9%VISIT STATUSFirst-Time 93,116 86,136 8.1% 25,894 18,222 42.1% 67,222 67,914 -1.0%Repeat 124,048 118,863 4.4% 32,053 23,076 38.9% 91,994 95,787 -4.0%Average # of Trips 3.61 3.77 -4.1% 3.75 3.96 -5.3% 3.56 3.72 -4.1%TRAVEL METHODGroup Tour 15,094 17,681 -14.6% 3,953 3,592 10.0% 11,142 14,088 -20.9%Package 70,114 64,658 8.4% 18,748 13,411 39.8% 51,366 51,247 0.2%Group Tour & Pkg 11,896 14,815 -19.7% 3,083 2,996 2.9% 8,812 11,819 -25.4%True Independent 143,851 137,475 4.6% 38,330 27,291 40.4% 105,520 110,184 -4.2%ISLANDS VISITED Oahu 123,099 113,712 8.3% 30,212 22,767 32.7% 92,886 90,945 2.1%Maui County 94,914 97,227 -2.4% 26,128 18,907 38.2% 68,786 78,320 -12.2%...Maui 93,140 95,013 -2.0% 25,659 18,437 39.2% 67,482 76,575 -11.9%...Molokai 2,931 4,102 -28.5% 863 802 7.6% 2,069 3,300 -37.3%...Lanai 2,754 4,064 -32.2% 854 817 4.5% 1,900 3,247 -41.5%Kauai 39,005 37,509 4.0% 10,222 7,952 28.6% 28,783 29,557 -2.6%Big Island 43,213 44,709 -3.3% 13,534 10,233 32.3% 29,679 34,476 -13.9%…Hilo 18,161 21,660 -16.2% 5,075 4,373 16.0% 13,086 17,287 -24.3%…Kona 37,119 35,803 3.7% 11,664 7,879 48.0% 25,455 27,924 -8.8%LENGTH OF STAY Oahu (days) 9.99 9.50 5.1% 9.62 9.26 3.9% 10.11 9.56 5.7%Maui (days) 10.10 10.51 -3.9% 9.91 9.39 5.5% 10.17 10.77 -5.6%Molokai (days) 5.62 5.36 4.9% 4.80 5.29 -9.2% 5.96 5.37 10.9%Lanai (days) 3.58 4.63 -22.7% 3.40 5.12 -33.6% 3.66 4.50 -18.7%Kauai (days) 7.70 7.41 3.9% 7.44 7.00 6.3% 7.79 7.52 3.6%Big Island (days) 8.20 8.11 1.1% 8.53 7.88 8.2% 8.05 8.18 -1.6%...Hilo (days) 3.74 3.80 -1.5% 3.94 4.18 -5.9% 3.66 3.70 -1.0%...Kona (days) 7.72 7.84 -1.5% 8.18 7.91 3.4% 7.51 7.81 -3.9%Statewide (days) 13.13 13.47 -2.5% 12.83 12.80 0.2% 13.24 13.63 -2.9%ACCOMMODATIONSHotel 122,605 113,716 7.8% 32,015 23,204 38.0% 90,590 90,513 0.1%...Hotel Only 94,315 85,975 9.7% 24,820 17,810 39.4% 69,495 68,166 2.0%Condo 61,939 60,047 3.2% 16,214 10,597 53.0% 45,725 49,450 -7.5%...Condo Only 47,652 47,024 1.3% 12,643 8,311 52.1% 35,009 38,713 -9.6%Timeshare 20,551 18,421 11.6% 5,678 3,711 53.0% 14,873 14,710 1.1%...Timeshare Only 13,972 11,936 17.1% 3,928 2,497 57.3% 10,043 9,439 6.4%Rental House 6,803 6,065 12.2% 2,175 1,318 65.0% 4,628 4,747 -2.5%Bed & Breakfast 3,775 3,478 8.5% 1,064 688 54.6% 2,712 2,790 -2.8%Cruise Ship 14,267 16,973 -15.9% 3,895 3,785 2.9% 10,373 13,187 -21.3%Friends or Relatives 16,854 15,547 8.4% 4,689 3,574 31.2% 12,165 11,974 1.6%PURPOSE OF TRIPPleasure (Net) 189,495 176,610 7.3% 50,330 35,140 43.2% 139,165 141,470 -1.6%…Honeymoon/Get Married (Net) 12,864 11,646 10.5% 3,858 3,132 23.2% 9,006 8,514 5.8%MC&I (Net) 16,068 15,237 5.4% 4,354 3,237 34.5% 11,714 12,001 -2.4%.....Convention/Conf. 10,211 10,304 -0.9% 2,714 2,185 24.2% 7,497 8,119 -7.7%.....Corp. Meetings 2,203 2,131 3.4% 622 464 34.1% 1,581 1,667 -5.2%.....Incentive 4,346 3,585 21.2% 1,213 742 63.4% 3,133 2,843 10.2%Other Business 4,929 4,565 8.0% 1,388 1,045 32.8% 3,542 3,520 0.6%Visit Friends/Relatives 13,230 12,438 6.4% 3,787 2,890 31.1% 9,443 9,548 -1.1%Government/Military 727 714 1.8% 191 155 23.0% 536 559 -4.0%Attend School 596 673 -11.4% 154 148 4.5% 442 525 -15.9%Sport Events 4,056 4,174 -2.8% 1,171 875 33.8% 2,885 3,299 -12.6%EXPENDITURESTotal Expenditures ($ mil.) 363.6 335.5 8.4% 94.8 64.3 47.5% 268.8 271.2 -0.9%Per Person Per Day ($) 127.5 121.5 4.9% 127.5 121.5 4.9% 127.5 121.5 4.9%Per Person Per Trip ($) 1,674.4 1,636.5 2.3% 1,636.3 1,556.1 5.2% 1,688.2 1,656.8 1.9%
CANADATOTAL DOMESTIC INTERNATIONAL
2004 2003%
Change 2004 2003%
Change 2004 2003%
ChangeTotal Visitor Days 2,851,218 2,760,403 3.3% 743,519 528,792 40.6% 2,107,698 2,231,612 -5.6%Total Visitors 217,163 204,999 5.9% 57,947 41,298 40.3% 159,216 163,701 -2.7%PARTY SIZEOne 41,382 37,691 9.8% 11,960 8,878 34.7% 29,422 28,814 2.1%Two 108,288 105,536 2.6% 28,257 20,856 35.5% 80,030 84,680 -5.5%Three or more 67,494 61,772 9.3% 17,730 11,565 53.3% 49,763 50,207 -0.9%Avg Party Size 1.92 1.93 -0.5% 1.89 1.85 1.9% 1.94 1.96 -0.9%VISIT STATUSFirst-Time 93,116 86,136 8.1% 25,894 18,222 42.1% 67,222 67,914 -1.0%Repeat 124,048 118,863 4.4% 32,053 23,076 38.9% 91,994 95,787 -4.0%Average # of Trips 3.61 3.77 -4.1% 3.75 3.96 -5.3% 3.56 3.72 -4.1%TRAVEL METHODGroup Tour 15,094 17,681 -14.6% 3,953 3,592 10.0% 11,142 14,088 -20.9%Package 70,114 64,658 8.4% 18,748 13,411 39.8% 51,366 51,247 0.2%Group Tour & Pkg 11,896 14,815 -19.7% 3,083 2,996 2.9% 8,812 11,819 -25.4%True Independent 143,851 137,475 4.6% 38,330 27,291 40.4% 105,520 110,184 -4.2%ISLANDS VISITED Oahu 123,099 113,712 8.3% 30,212 22,767 32.7% 92,886 90,945 2.1%Maui County 94,914 97,227 -2.4% 26,128 18,907 38.2% 68,786 78,320 -12.2%...Maui 93,140 95,013 -2.0% 25,659 18,437 39.2% 67,482 76,575 -11.9%...Molokai 2,931 4,102 -28.5% 863 802 7.6% 2,069 3,300 -37.3%...Lanai 2,754 4,064 -32.2% 854 817 4.5% 1,900 3,247 -41.5%Kauai 39,005 37,509 4.0% 10,222 7,952 28.6% 28,783 29,557 -2.6%Big Island 43,213 44,709 -3.3% 13,534 10,233 32.3% 29,679 34,476 -13.9%…Hilo 18,161 21,660 -16.2% 5,075 4,373 16.0% 13,086 17,287 -24.3%…Kona 37,119 35,803 3.7% 11,664 7,879 48.0% 25,455 27,924 -8.8%LENGTH OF STAY Oahu (days) 9.99 9.50 5.1% 9.62 9.26 3.9% 10.11 9.56 5.7%Maui (days) 10.10 10.51 -3.9% 9.91 9.39 5.5% 10.17 10.77 -5.6%Molokai (days) 5.62 5.36 4.9% 4.80 5.29 -9.2% 5.96 5.37 10.9%Lanai (days) 3.58 4.63 -22.7% 3.40 5.12 -33.6% 3.66 4.50 -18.7%Kauai (days) 7.70 7.41 3.9% 7.44 7.00 6.3% 7.79 7.52 3.6%Big Island (days) 8.20 8.11 1.1% 8.53 7.88 8.2% 8.05 8.18 -1.6%...Hilo (days) 3.74 3.80 -1.5% 3.94 4.18 -5.9% 3.66 3.70 -1.0%...Kona (days) 7.72 7.84 -1.5% 8.18 7.91 3.4% 7.51 7.81 -3.9%Statewide (days) 13.13 13.47 -2.5% 12.83 12.80 0.2% 13.24 13.63 -2.9%ACCOMMODATIONSHotel 122,605 113,716 7.8% 32,015 23,204 38.0% 90,590 90,513 0.1%...Hotel Only 94,315 85,975 9.7% 24,820 17,810 39.4% 69,495 68,166 2.0%Condo 61,939 60,047 3.2% 16,214 10,597 53.0% 45,725 49,450 -7.5%...Condo Only 47,652 47,024 1.3% 12,643 8,311 52.1% 35,009 38,713 -9.6%Timeshare 20,551 18,421 11.6% 5,678 3,711 53.0% 14,873 14,710 1.1%...Timeshare Only 13,972 11,936 17.1% 3,928 2,497 57.3% 10,043 9,439 6.4%Rental House 6,803 6,065 12.2% 2,175 1,318 65.0% 4,628 4,747 -2.5%Bed & Breakfast 3,775 3,478 8.5% 1,064 688 54.6% 2,712 2,790 -2.8%Cruise Ship 14,267 16,973 -15.9% 3,895 3,785 2.9% 10,373 13,187 -21.3%Friends or Relatives 16,854 15,547 8.4% 4,689 3,574 31.2% 12,165 11,974 1.6%PURPOSE OF TRIPPleasure (Net) 189,495 176,610 7.3% 50,330 35,140 43.2% 139,165 141,470 -1.6%…Honeymoon/Get Married (Net) 12,864 11,646 10.5% 3,858 3,132 23.2% 9,006 8,514 5.8%MC&I (Net) 16,068 15,237 5.4% 4,354 3,237 34.5% 11,714 12,001 -2.4%.....Convention/Conf. 10,211 10,304 -0.9% 2,714 2,185 24.2% 7,497 8,119 -7.7%.....Corp. Meetings 2,203 2,131 3.4% 622 464 34.1% 1,581 1,667 -5.2%.....Incentive 4,346 3,585 21.2% 1,213 742 63.4% 3,133 2,843 10.2%Other Business 4,929 4,565 8.0% 1,388 1,045 32.8% 3,542 3,520 0.6%Visit Friends/Relatives 13,230 12,438 6.4% 3,787 2,890 31.1% 9,443 9,548 -1.1%Government/Military 727 714 1.8% 191 155 23.0% 536 559 -4.0%Attend School 596 673 -11.4% 154 148 4.5% 442 525 -15.9%Sport Events 4,056 4,174 -2.8% 1,171 875 33.8% 2,885 3,299 -12.6%EXPENDITURESTotal Expenditures ($ mil.) 363.6 335.5 8.4% 94.8 64.3 47.5% 268.8 271.2 -0.9%Per Person Per Day ($) 127.5 121.5 4.9% 127.5 121.5 4.9% 127.5 121.5 4.9%Per Person Per Trip ($) 1,674.4 1,636.5 2.3% 1,636.3 1,556.1 5.2% 1,688.2 1,656.8 1.9%
CANADA
Source: DBEDT 34
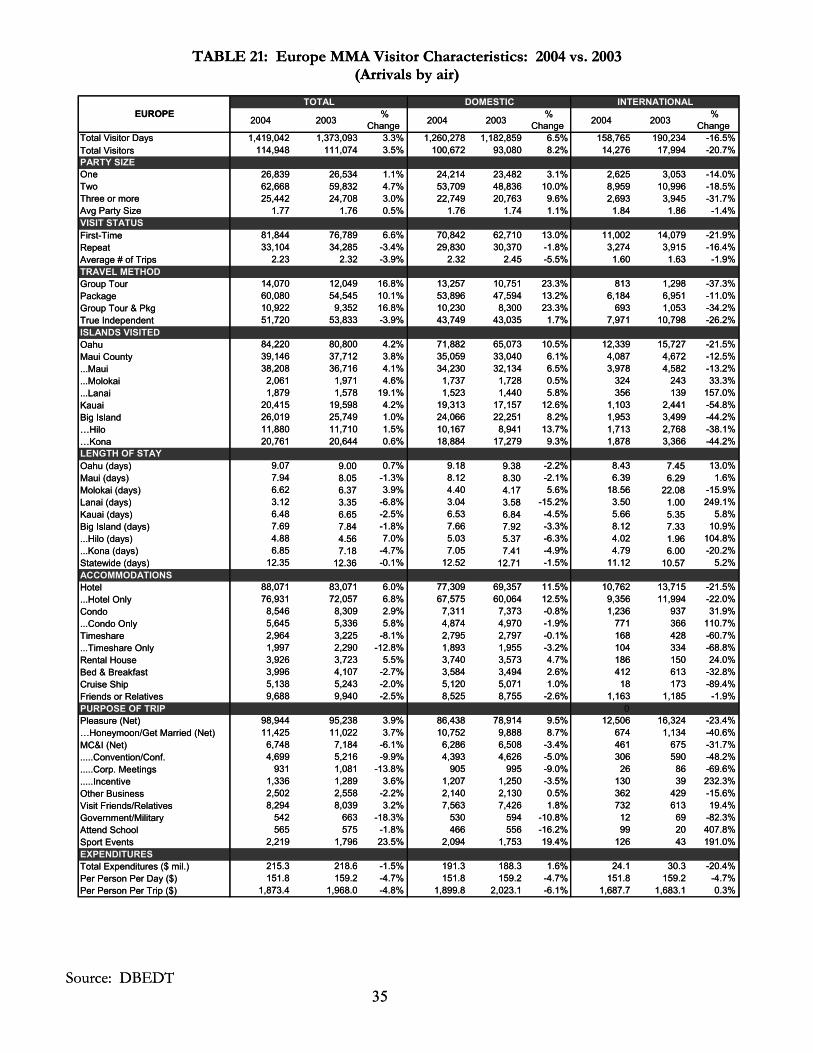
TABLE 21: Europe MMA Visitor Characteristics: 2004 vs. 2003 (Arrivals by air)
TABLE 21: Europe MMA Visitor Characteristics: 2004 vs. 2003 (Arrivals by air)
Source: DBEDT
35
TOTAL DOMESTIC INTERNATIONAL
2004 2003%
Change 2004 2003%
Change 2004 2003%
ChangeTotal Visitor Days 1,419,042 1,373,093 3.3% 1,260,278 1,182,859 6.5% 158,765 190,234 -16.5%Total Visitors 114,948 111,074 3.5% 100,672 93,080 8.2% 14,276 17,994 -20.7%PARTY SIZEOne 26,839 26,534 1.1% 24,214 23,482 3.1% 2,625 3,053 -14.0%Two 62,668 59,832 4.7% 53,709 48,836 10.0% 8,959 10,996 -18.5%Three or more 25,442 24,708 3.0% 22,749 20,763 9.6% 2,693 3,945 -31.7%Avg Party Size 1.77 1.76 0.5% 1.76 1.74 1.1% 1.84 1.86 -1.4%VISIT STATUSFirst-Time 81,844 76,789 6.6% 70,842 62,710 13.0% 11,002 14,079 -21.9%Repeat 33,104 34,285 -3.4% 29,830 30,370 -1.8% 3,274 3,915 -16.4%Average # of Trips 2.23 2.32 -3.9% 2.32 2.45 -5.5% 1.60 1.63 -1.9%TRAVEL METHODGroup Tour 14,070 12,049 16.8% 13,257 10,751 23.3% 813 1,298 -37.3%Package 60,080 54,545 10.1% 53,896 47,594 13.2% 6,184 6,951 -11.0%Group Tour & Pkg 10,922 9,352 16.8% 10,230 8,300 23.3% 693 1,053 -34.2%True Independent 51,720 53,833 -3.9% 43,749 43,035 1.7% 7,971 10,798 -26.2%ISLANDS VISITED Oahu 84,220 80,800 4.2% 71,882 65,073 10.5% 12,339 15,727 -21.5%Maui County 39,146 37,712 3.8% 35,059 33,040 6.1% 4,087 4,672 -12.5%...Maui 38,208 36,716 4.1% 34,230 32,134 6.5% 3,978 4,582 -13.2%...Molokai 2,061 1,971 4.6% 1,737 1,728 0.5% 324 243 33.3%...Lanai 1,879 1,578 19.1% 1,523 1,440 5.8% 356 139 157.0%Kauai 20,415 19,598 4.2% 19,313 17,157 12.6% 1,103 2,441 -54.8%Big Island 26,019 25,749 1.0% 24,066 22,251 8.2% 1,953 3,499 -44.2%…Hilo 11,880 11,710 1.5% 10,167 8,941 13.7% 1,713 2,768 -38.1%…Kona 20,761 20,644 0.6% 18,884 17,279 9.3% 1,878 3,366 -44.2%LENGTH OF STAY Oahu (days) 9.07 9.00 0.7% 9.18 9.38 -2.2% 8.43 7.45 13.0%Maui (days) 7.94 8.05 -1.3% 8.12 8.30 -2.1% 6.39 6.29 1.6%Molokai (days) 6.62 6.37 3.9% 4.40 4.17 5.6% 18.56 22.08 -15.9%Lanai (days) 3.12 3.35 -6.8% 3.04 3.58 -15.2% 3.50 1.00 249.1%Kauai (days) 6.48 6.65 -2.5% 6.53 6.84 -4.5% 5.66 5.35 5.8%Big Island (days) 7.69 7.84 -1.8% 7.66 7.92 -3.3% 8.12 7.33 10.9%...Hilo (days) 4.88 4.56 7.0% 5.03 5.37 -6.3% 4.02 1.96 104.8%...Kona (days) 6.85 7.18 -4.7% 7.05 7.41 -4.9% 4.79 6.00 -20.2%Statewide (days) 12.35 12.36 -0.1% 12.52 12.71 -1.5% 11.12 10.57 5.2%ACCOMMODATIONSHotel 88,071 83,071 6.0% 77,309 69,357 11.5% 10,762 13,715 -21.5%...Hotel Only 76,931 72,057 6.8% 67,575 60,064 12.5% 9,356 11,994 -22.0%Condo 8,546 8,309 2.9% 7,311 7,373 -0.8% 1,236 937 31.9%...Condo Only 5,645 5,336 5.8% 4,874 4,970 -1.9% 771 366 110.7%Timeshare 2,964 3,225 -8.1% 2,795 2,797 -0.1% 168 428 -60.7%...Timeshare Only 1,997 2,290 -12.8% 1,893 1,955 -3.2% 104 334 -68.8%Rental House 3,926 3,723 5.5% 3,740 3,573 4.7% 186 150 24.0%Bed & Breakfast 3,996 4,107 -2.7% 3,584 3,494 2.6% 412 613 -32.8%Cruise Ship 5,138 5,243 -2.0% 5,120 5,071 1.0% 18 173 -89.4%Friends or Relatives 9,688 9,940 -2.5% 8,525 8,755 -2.6% 1,163 1,185 -1.9%PURPOSE OF TRIP 0Pleasure (Net) 98,944 95,238 3.9% 86,438 78,914 9.5% 12,506 16,324 -23.4%…Honeymoon/Get Married (Net) 11,425 11,022 3.7% 10,752 9,888 8.7% 674 1,134 -40.6%MC&I (Net) 6,748 7,184 -6.1% 6,286 6,508 -3.4% 461 675 -31.7%.....Convention/Conf. 4,699 5,216 -9.9% 4,393 4,626 -5.0% 306 590 -48.2%.....Corp. Meetings 931 1,081 -13.8% 905 995 -9.0% 26 86 -69.6%.....Incentive 1,336 1,289 3.6% 1,207 1,250 -3.5% 130 39 232.3%Other Business 2,502 2,558 -2.2% 2,140 2,130 0.5% 362 429 -15.6%Visit Friends/Relatives 8,294 8,039 3.2% 7,563 7,426 1.8% 732 613 19.4%Government/Military 542 663 -18.3% 530 594 -10.8% 12 69 -82.3%Attend School 565 575 -1.8% 466 556 -16.2% 99 20 407.8%Sport Events 2,219 1,796 23.5% 2,094 1,753 19.4% 126 43 191.0%EXPENDITURESTotal Expenditures ($ mil.) 215.3 218.6 -1.5% 191.3 188.3 1.6% 24.1 30.3 -20.4%Per Person Per Day ($) 151.8 159.2 -4.7% 151.8 159.2 -4.7% 151.8 159.2 -4.7%Per Person Per Trip ($) 1,873.4 1,968.0 -4.8% 1,899.8 2,023.1 -6.1% 1,687.7 1,683.1 0.3%
EUROPETOTAL DOMESTIC INTERNATIONAL
2004 2003%
Change 2004 2003%
Change 2004 2003%
ChangeTotal Visitor Days 1,419,042 1,373,093 3.3% 1,260,278 1,182,859 6.5% 158,765 190,234 -16.5%Total Visitors 114,948 111,074 3.5% 100,672 93,080 8.2% 14,276 17,994 -20.7%PARTY SIZEOne 26,839 26,534 1.1% 24,214 23,482 3.1% 2,625 3,053 -14.0%Two 62,668 59,832 4.7% 53,709 48,836 10.0% 8,959 10,996 -18.5%Three or more 25,442 24,708 3.0% 22,749 20,763 9.6% 2,693 3,945 -31.7%Avg Party Size 1.77 1.76 0.5% 1.76 1.74 1.1% 1.84 1.86 -1.4%VISIT STATUSFirst-Time 81,844 76,789 6.6% 70,842 62,710 13.0% 11,002 14,079 -21.9%Repeat 33,104 34,285 -3.4% 29,830 30,370 -1.8% 3,274 3,915 -16.4%Average # of Trips 2.23 2.32 -3.9% 2.32 2.45 -5.5% 1.60 1.63 -1.9%TRAVEL METHODGroup Tour 14,070 12,049 16.8% 13,257 10,751 23.3% 813 1,298 -37.3%Package 60,080 54,545 10.1% 53,896 47,594 13.2% 6,184 6,951 -11.0%Group Tour & Pkg 10,922 9,352 16.8% 10,230 8,300 23.3% 693 1,053 -34.2%True Independent 51,720 53,833 -3.9% 43,749 43,035 1.7% 7,971 10,798 -26.2%ISLANDS VISITED Oahu 84,220 80,800 4.2% 71,882 65,073 10.5% 12,339 15,727 -21.5%Maui County 39,146 37,712 3.8% 35,059 33,040 6.1% 4,087 4,672 -12.5%...Maui 38,208 36,716 4.1% 34,230 32,134 6.5% 3,978 4,582 -13.2%...Molokai 2,061 1,971 4.6% 1,737 1,728 0.5% 324 243 33.3%...Lanai 1,879 1,578 19.1% 1,523 1,440 5.8% 356 139 157.0%Kauai 20,415 19,598 4.2% 19,313 17,157 12.6% 1,103 2,441 -54.8%Big Island 26,019 25,749 1.0% 24,066 22,251 8.2% 1,953 3,499 -44.2%…Hilo 11,880 11,710 1.5% 10,167 8,941 13.7% 1,713 2,768 -38.1%…Kona 20,761 20,644 0.6% 18,884 17,279 9.3% 1,878 3,366 -44.2%LENGTH OF STAY Oahu (days) 9.07 9.00 0.7% 9.18 9.38 -2.2% 8.43 7.45 13.0%Maui (days) 7.94 8.05 -1.3% 8.12 8.30 -2.1% 6.39 6.29 1.6%Molokai (days) 6.62 6.37 3.9% 4.40 4.17 5.6% 18.56 22.08 -15.9%Lanai (days) 3.12 3.35 -6.8% 3.04 3.58 -15.2% 3.50 1.00 249.1%Kauai (days) 6.48 6.65 -2.5% 6.53 6.84 -4.5% 5.66 5.35 5.8%Big Island (days) 7.69 7.84 -1.8% 7.66 7.92 -3.3% 8.12 7.33 10.9%...Hilo (days) 4.88 4.56 7.0% 5.03 5.37 -6.3% 4.02 1.96 104.8%...Kona (days) 6.85 7.18 -4.7% 7.05 7.41 -4.9% 4.79 6.00 -20.2%Statewide (days) 12.35 12.36 -0.1% 12.52 12.71 -1.5% 11.12 10.57 5.2%ACCOMMODATIONSHotel 88,071 83,071 6.0% 77,309 69,357 11.5% 10,762 13,715 -21.5%...Hotel Only 76,931 72,057 6.8% 67,575 60,064 12.5% 9,356 11,994 -22.0%Condo 8,546 8,309 2.9% 7,311 7,373 -0.8% 1,236 937 31.9%...Condo Only 5,645 5,336 5.8% 4,874 4,970 -1.9% 771 366 110.7%Timeshare 2,964 3,225 -8.1% 2,795 2,797 -0.1% 168 428 -60.7%...Timeshare Only 1,997 2,290 -12.8% 1,893 1,955 -3.2% 104 334 -68.8%Rental House 3,926 3,723 5.5% 3,740 3,573 4.7% 186 150 24.0%Bed & Breakfast 3,996 4,107 -2.7% 3,584 3,494 2.6% 412 613 -32.8%Cruise Ship 5,138 5,243 -2.0% 5,120 5,071 1.0% 18 173 -89.4%Friends or Relatives 9,688 9,940 -2.5% 8,525 8,755 -2.6% 1,163 1,185 -1.9%PURPOSE OF TRIP 0Pleasure (Net) 98,944 95,238 3.9% 86,438 78,914 9.5% 12,506 16,324 -23.4%…Honeymoon/Get Married (Net) 11,425 11,022 3.7% 10,752 9,888 8.7% 674 1,134 -40.6%MC&I (Net) 6,748 7,184 -6.1% 6,286 6,508 -3.4% 461 675 -31.7%.....Convention/Conf. 4,699 5,216 -9.9% 4,393 4,626 -5.0% 306 590 -48.2%.....Corp. Meetings 931 1,081 -13.8% 905 995 -9.0% 26 86 -69.6%.....Incentive 1,336 1,289 3.6% 1,207 1,250 -3.5% 130 39 232.3%Other Business 2,502 2,558 -2.2% 2,140 2,130 0.5% 362 429 -15.6%Visit Friends/Relatives 8,294 8,039 3.2% 7,563 7,426 1.8% 732 613 19.4%Government/Military 542 663 -18.3% 530 594 -10.8% 12 69 -82.3%Attend School 565 575 -1.8% 466 556 -16.2% 99 20 407.8%Sport Events 2,219 1,796 23.5% 2,094 1,753 19.4% 126 43 191.0%EXPENDITURESTotal Expenditures ($ mil.) 215.3 218.6 -1.5% 191.3 188.3 1.6% 24.1 30.3 -20.4%Per Person Per Day ($) 151.8 159.2 -4.7% 151.8 159.2 -4.7% 151.8 159.2 -4.7%Per Person Per Trip ($) 1,873.4 1,968.0 -4.8% 1,899.8 2,023.1 -6.1% 1,687.7 1,683.1 0.3%
EUROPE
Source: DBEDT 35

TABLE 22: Oceania MMA Visitor Characteristics: 2004 vs. 2003 (Arrivals by air)
TOTAL DOMESTIC INTERNATIONAL% % %
2004 2003 Change 2004 2003 Change 2004 2003 ChangeTotal Visitor Days 1,158,457 871,939 32.9% 192,092 136,590 40.6% 966,365 735,349 31.4%Total Visitors 132,130 95,514 38.3% 28,495 18,641 52.9% 103,635 76,873 34.8%PARTY SIZEOne 21,085 17,696 19.1% 6,678 4,991 33.8% 14,407 12,706 13.4%Two 64,160 49,926 28.5% 12,477 7,878 58.4% 51,683 42,048 22.9%Three or more 46,885 27,891 68.1% 9,340 5,772 61.8% 37,545 22,119 69.7%Avg Party Size 2.05 1.92 6.5% 1.87 1.79 4.1% 2.10 1.95 7.4%VISIT STATUSFirst-Time 71,048 50,897 39.6% 13,495 8,721 54.7% 57,553 42,177 36.5%Repeat 61,082 44,617 36.9% 15,000 9,920 51.2% 46,082 34,696 32.8%Average # of Trips 2.47 2.65 -6.8% 2.95 3.16 -6.7% 2.34 2.53 -7.5%TRAVEL METHODGroup Tour 8,731 5,253 66.2% 804 708 13.5% 7,928 4,544 74.5%Package 71,037 50,335 41.1% 14,633 8,789 66.5% 56,404 41,546 35.8%Group Tour & Pkg 7,743 4,634 67.1% 590 562 5.1% 7,153 4,072 75.6%True Independent 60,104 44,560 34.9% 13,648 9,706 40.6% 46,455 34,855 33.3%ISLANDS VISITED Oahu 124,754 87,193 43.1% 25,981 16,378 58.6% 98,773 70,815 39.5%Maui County 24,137 21,513 12.2% 3,293 2,688 22.5% 20,843 18,825 10.7%...Maui 23,666 20,851 13.5% 3,177 2,566 23.8% 20,489 18,285 12.1%...Molokai 1,599 1,422 12.5% 134 143 -6.7% 1,465 1,278 14.6%...Lanai 1,418 1,659 -14.5% 102 161 -36.6% 1,316 1,498 -12.2%Kauai 10,878 10,230 6.3% 1,228 1,244 -1.3% 9,650 8,986 7.4%Big Island 18,292 15,190 20.4% 2,193 1,772 23.8% 16,100 13,418 20.0%…Hilo 14,989 11,296 32.7% 812 767 5.9% 14,177 10,529 34.6%…Kona 16,900 13,826 22.2% 1,657 1,293 28.2% 15,243 12,533 21.6%LENGTH OF STAY Oahu (days) 6.98 7.03 -0.8% 5.85 6.13 -4.7% 7.28 7.24 0.5%Maui (days) 5.75 5.78 -0.7% 5.89 5.92 -0.4% 5.72 5.76 -0.7%Molokai (days) 1.96 2.43 -19.4% 2.99 4.95 -39.7% 1.86 2.14 -13.1%Lanai (days) 1.51 2.06 -27.0% 3.78 2.82 34.0% 1.33 1.98 -32.9%Kauai (days) 4.78 4.74 0.8% 6.10 6.48 -5.9% 4.62 4.50 2.5%Big Island (days) 5.17 5.46 -5.2% 6.00 6.61 -9.2% 5.06 5.31 -4.6%...Hilo (days) 1.86 1.86 0.1% 4.56 3.73 22.3% 1.71 1.73 -0.9%...Kona (days) 3.95 4.48 -11.8% 5.70 6.84 -16.7% 3.76 4.23 -11.2%Statewide (days) 8.77 9.13 -4.0% 6.74 7.33 -8.0% 9.32 9.57 -2.5%ACCOMMODATIONSHotel 113,201 80,707 40.3% 24,300 15,103 60.9% 88,902 65,604 35.5%...Hotel Only 101,120 71,022 42.4% 23,305 14,329 62.6% 77,815 56,693 37.3%Condo 9,231 6,792 35.9% 1,226 978 25.3% 8,004 5,814 37.7%...Condo Only 4,749 4,349 9.2% 923 730 26.5% 3,825 3,619 5.7%Timeshare 2,827 2,902 -2.6% 490 505 -2.9% 2,337 2,397 -2.5%...Timeshare Only 1,786 1,233 44.9% 333 379 -11.9% 1,453 855 70.0%Rental House 1,759 1,054 66.9% 341 336 1.5% 1,418 718 97.5%Bed & Breakfast 1,620 931 74.0% 254 182 39.3% 1,366 749 82.5%Cruise Ship 3,167 3,361 -5.8% 268 275 -2.7% 2,899 3,085 -6.0%Friends or Relatives 7,947 6,324 25.7% 1,738 1,402 24.0% 6,208 4,922 26.1%PURPOSE OF TRIP 0 0Pleasure (Net) 116,893 81,797 42.9% 25,768 16,255 58.5% 91,124 65,542 39.0%…Honeymoon/Get Married (Net) 6,039 3,671 64.5% 1,175 810 45.2% 4,864 2,862 70.0%MC&I (Net) 6,706 5,036 33.2% 691 702 -1.6% 6,016 4,335 38.8%.....Convention/Conf. 5,168 3,419 51.1% 441 465 -5.3% 4,727 2,954 60.0%.....Corp. Meetings 479 512 -6.4% 137 148 -7.3% 342 364 -6.0%.....Incentive 1,401 1,261 11.1% 134 130 2.9% 1,267 1,131 12.0%Other Business 1,340 1,873 -28.5% 631 573 10.1% 709 1,300 -45.5%Visit Friends/Relatives 7,236 6,330 14.3% 1,592 1,285 23.9% 5,644 5,045 11.9%Government/Military 403 873 -53.8% 190 221 -14.0% 214 652 -67.2%Attend School 276 139 99.0% 37 72 -48.0% 238 67 256.9%Sport Events 1,779 649 174.1% 185 167 10.9% 1,594 482 230.4%EXPENDITURESTotal Expenditures ($ mil.) 191.7 137.2 39.7% 31.8 21.5 47.9% 159.9 115.7 38.2%Per Person Per Day ($) 165.5 157.4 5.1% 165.5 157.4 5.1% 165.5 157.4 5.1%Per Person Per Trip ($) 1,450.9 1,436.9 1.0% 1,115.6 1,153.4 -3.3% 1,543.1 1,505.7 2.5%
OCEANIA
TABLE 22: Oceania MMA Visitor Characteristics: 2004 vs. 2003 (Arrivals by air)
Source: DBEDT
36
TOTAL DOMESTIC INTERNATIONAL% % %
2004 2003 Change 2004 2003 Change 2004 2003 ChangeTotal Visitor Days 1,158,457 871,939 32.9% 192,092 136,590 40.6% 966,365 735,349 31.4%Total Visitors 132,130 95,514 38.3% 28,495 18,641 52.9% 103,635 76,873 34.8%PARTY SIZEOne 21,085 17,696 19.1% 6,678 4,991 33.8% 14,407 12,706 13.4%Two 64,160 49,926 28.5% 12,477 7,878 58.4% 51,683 42,048 22.9%Three or more 46,885 27,891 68.1% 9,340 5,772 61.8% 37,545 22,119 69.7%Avg Party Size 2.05 1.92 6.5% 1.87 1.79 4.1% 2.10 1.95 7.4%VISIT STATUSFirst-Time 71,048 50,897 39.6% 13,495 8,721 54.7% 57,553 42,177 36.5%Repeat 61,082 44,617 36.9% 15,000 9,920 51.2% 46,082 34,696 32.8%Average # of Trips 2.47 2.65 -6.8% 2.95 3.16 -6.7% 2.34 2.53 -7.5%TRAVEL METHODGroup Tour 8,731 5,253 66.2% 804 708 13.5% 7,928 4,544 74.5%Package 71,037 50,335 41.1% 14,633 8,789 66.5% 56,404 41,546 35.8%Group Tour & Pkg 7,743 4,634 67.1% 590 562 5.1% 7,153 4,072 75.6%True Independent 60,104 44,560 34.9% 13,648 9,706 40.6% 46,455 34,855 33.3%ISLANDS VISITED Oahu 124,754 87,193 43.1% 25,981 16,378 58.6% 98,773 70,815 39.5%Maui County 24,137 21,513 12.2% 3,293 2,688 22.5% 20,843 18,825 10.7%...Maui 23,666 20,851 13.5% 3,177 2,566 23.8% 20,489 18,285 12.1%...Molokai 1,599 1,422 12.5% 134 143 -6.7% 1,465 1,278 14.6%...Lanai 1,418 1,659 -14.5% 102 161 -36.6% 1,316 1,498 -12.2%Kauai 10,878 10,230 6.3% 1,228 1,244 -1.3% 9,650 8,986 7.4%Big Island 18,292 15,190 20.4% 2,193 1,772 23.8% 16,100 13,418 20.0%…Hilo 14,989 11,296 32.7% 812 767 5.9% 14,177 10,529 34.6%…Kona 16,900 13,826 22.2% 1,657 1,293 28.2% 15,243 12,533 21.6%LENGTH OF STAY Oahu (days) 6.98 7.03 -0.8% 5.85 6.13 -4.7% 7.28 7.24 0.5%Maui (days) 5.75 5.78 -0.7% 5.89 5.92 -0.4% 5.72 5.76 -0.7%Molokai (days) 1.96 2.43 -19.4% 2.99 4.95 -39.7% 1.86 2.14 -13.1%Lanai (days) 1.51 2.06 -27.0% 3.78 2.82 34.0% 1.33 1.98 -32.9%Kauai (days) 4.78 4.74 0.8% 6.10 6.48 -5.9% 4.62 4.50 2.5%Big Island (days) 5.17 5.46 -5.2% 6.00 6.61 -9.2% 5.06 5.31 -4.6%...Hilo (days) 1.86 1.86 0.1% 4.56 3.73 22.3% 1.71 1.73 -0.9%...Kona (days) 3.95 4.48 -11.8% 5.70 6.84 -16.7% 3.76 4.23 -11.2%Statewide (days) 8.77 9.13 -4.0% 6.74 7.33 -8.0% 9.32 9.57 -2.5%ACCOMMODATIONSHotel 113,201 80,707 40.3% 24,300 15,103 60.9% 88,902 65,604 35.5%...Hotel Only 101,120 71,022 42.4% 23,305 14,329 62.6% 77,815 56,693 37.3%Condo 9,231 6,792 35.9% 1,226 978 25.3% 8,004 5,814 37.7%...Condo Only 4,749 4,349 9.2% 923 730 26.5% 3,825 3,619 5.7%Timeshare 2,827 2,902 -2.6% 490 505 -2.9% 2,337 2,397 -2.5%...Timeshare Only 1,786 1,233 44.9% 333 379 -11.9% 1,453 855 70.0%Rental House 1,759 1,054 66.9% 341 336 1.5% 1,418 718 97.5%Bed & Breakfast 1,620 931 74.0% 254 182 39.3% 1,366 749 82.5%Cruise Ship 3,167 3,361 -5.8% 268 275 -2.7% 2,899 3,085 -6.0%Friends or Relatives 7,947 6,324 25.7% 1,738 1,402 24.0% 6,208 4,922 26.1%PURPOSE OF TRIP 0 0Pleasure (Net) 116,893 81,797 42.9% 25,768 16,255 58.5% 91,124 65,542 39.0%…Honeymoon/Get Married (Net) 6,039 3,671 64.5% 1,175 810 45.2% 4,864 2,862 70.0%MC&I (Net) 6,706 5,036 33.2% 691 702 -1.6% 6,016 4,335 38.8%.....Convention/Conf. 5,168 3,419 51.1% 441 465 -5.3% 4,727 2,954 60.0%.....Corp. Meetings 479 512 -6.4% 137 148 -7.3% 342 364 -6.0%.....Incentive 1,401 1,261 11.1% 134 130 2.9% 1,267 1,131 12.0%Other Business 1,340 1,873 -28.5% 631 573 10.1% 709 1,300 -45.5%Visit Friends/Relatives 7,236 6,330 14.3% 1,592 1,285 23.9% 5,644 5,045 11.9%Government/Military 403 873 -53.8% 190 221 -14.0% 214 652 -67.2%Attend School 276 139 99.0% 37 72 -48.0% 238 67 256.9%Sport Events 1,779 649 174.1% 185 167 10.9% 1,594 482 230.4%EXPENDITURESTotal Expenditures ($ mil.) 191.7 137.2 39.7% 31.8 21.5 47.9% 159.9 115.7 38.2%Per Person Per Day ($) 165.5 157.4 5.1% 165.5 157.4 5.1% 165.5 157.4 5.1%Per Person Per Trip ($) 1,450.9 1,436.9 1.0% 1,115.6 1,153.4 -3.3% 1,543.1 1,505.7 2.5%
OCEANIA
Source: DBEDT 36
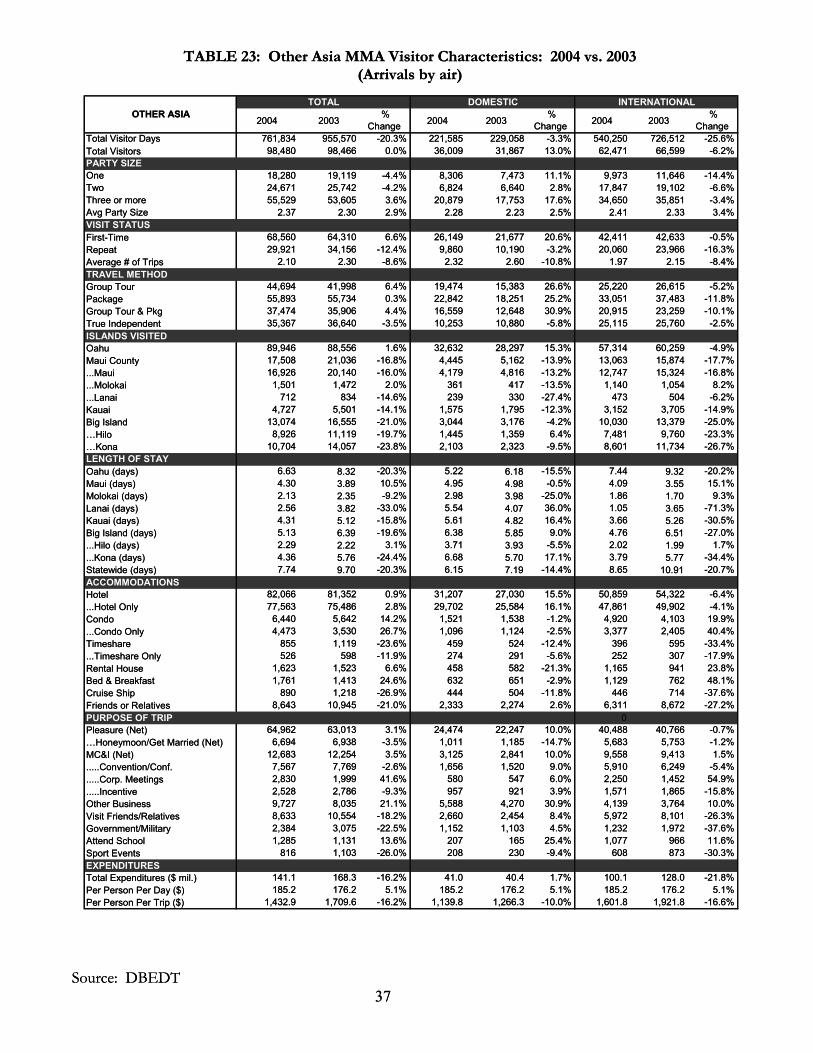
TABLE 23: Other Asia MMA Visitor Characteristics: 2004 vs. 2003 (Arrivals by air)
TOTAL DOMESTIC INTERNATIONAL% % %
2004 2003 Change 2004 2003 Change 2004 2003 ChangeTotal Visitor Days 761,834 955,570 -20.3% 221,585 229,058 -3.3% 540,250 726,512 -25.6%Total Visitors 98,480 98,466 0.0% 36,009 31,867 13.0% 62,471 66,599 -6.2%PARTY SIZEOne 18,280 19,119 -4.4% 8,306 7,473 11.1% 9,973 11,646 -14.4%Two 24,671 25,742 -4.2% 6,824 6,640 2.8% 17,847 19,102 -6.6%Three or more 55,529 53,605 3.6% 20,879 17,753 17.6% 34,650 35,851 -3.4%Avg Party Size 2.37 2.30 2.9% 2.28 2.23 2.5% 2.41 2.33 3.4%VISIT STATUS First-Time 68,560 64,310 6.6% 26,149 21,677 20.6% 42,411 42,633 -0.5%Repeat 29,921 34,156 -12.4% 9,860 10,190 -3.2% 20,060 23,966 -16.3%Average # of Trips 2.10 2.30 -8.6% 2.32 2.60 -10.8% 1.97 2.15 -8.4%TRAVEL METHODGroup Tour 44,694 41,998 6.4% 19,474 15,383 26.6% 25,220 26,615 -5.2%Package 55,893 55,734 0.3% 22,842 18,251 25.2% 33,051 37,483 -11.8%Group Tour & Pkg 37,474 35,906 4.4% 16,559 12,648 30.9% 20,915 23,259 -10.1%True Independent 35,367 36,640 -3.5% 10,253 10,880 -5.8% 25,115 25,760 -2.5%ISLANDS VISITED Oahu 89,946 88,556 1.6% 32,632 28,297 15.3% 57,314 60,259 -4.9%Maui County 17,508 21,036 -16.8% 4,445 5,162 -13.9% 13,063 15,874 -17.7%...Maui 16,926 20,140 -16.0% 4,179 4,816 -13.2% 12,747 15,324 -16.8%...Molokai 1,501 1,472 2.0% 361 417 -13.5% 1,140 1,054 8.2%...Lanai 712 834 -14.6% 239 330 -27.4% 473 504 -6.2%Kauai 4,727 5,501 -14.1% 1,575 1,795 -12.3% 3,152 3,705 -14.9%Big Island 13,074 16,555 -21.0% 3,044 3,176 -4.2% 10,030 13,379 -25.0%…Hilo 8,926 11,119 -19.7% 1,445 1,359 6.4% 7,481 9,760 -23.3%…Kona 10,704 14,057 -23.8% 2,103 2,323 -9.5% 8,601 11,734 -26.7%LENGTH OF STAY Oahu (days) 6.63 8.32 -20.3% 5.22 6.18 -15.5% 7.44 9.32 -20.2%Maui (days) 4.30 3.89 10.5% 4.95 4.98 -0.5% 4.09 3.55 15.1%Molokai (days) 2.13 2.35 -9.2% 2.98 3.98 -25.0% 1.86 1.70 9.3%Lanai (days) 2.56 3.82 -33.0% 5.54 4.07 36.0% 1.05 3.65 -71.3%Kauai (days) 4.31 5.12 -15.8% 5.61 4.82 16.4% 3.66 5.26 -30.5%Big Island (days) 5.13 6.39 -19.6% 6.38 5.85 9.0% 4.76 6.51 -27.0%...Hilo (days) 2.29 2.22 3.1% 3.71 3.93 -5.5% 2.02 1.99 1.7%...Kona (days) 4.36 5.76 -24.4% 6.68 5.70 17.1% 3.79 5.77 -34.4%Statewide (days) 7.74 9.70 -20.3% 6.15 7.19 -14.4% 8.65 10.91 -20.7%ACCOMMODATIONSHotel 82,066 81,352 0.9% 31,207 27,030 15.5% 50,859 54,322 -6.4%...Hotel Only 77,563 75,486 2.8% 29,702 25,584 16.1% 47,861 49,902 -4.1%Condo 6,440 5,642 14.2% 1,521 1,538 -1.2% 4,920 4,103 19.9%...Condo Only 4,473 3,530 26.7% 1,096 1,124 -2.5% 3,377 2,405 40.4%Timeshare 855 1,119 -23.6% 459 524 -12.4% 396 595 -33.4%...Timeshare Only 526 598 -11.9% 274 291 -5.6% 252 307 -17.9%Rental House 1,623 1,523 6.6% 458 582 -21.3% 1,165 941 23.8%Bed & Breakfast 1,761 1,413 24.6% 632 651 -2.9% 1,129 762 48.1%Cruise Ship 890 1,218 -26.9% 444 504 -11.8% 446 714 -37.6%Friends or Relatives 8,643 10,945 -21.0% 2,333 2,274 2.6% 6,311 8,672 -27.2%PURPOSE OF TRIP 0Pleasure (Net) 64,962 63,013 3.1% 24,474 22,247 10.0% 40,488 40,766 -0.7%…Honeymoon/Get Married (Net) 6,694 6,938 -3.5% 1,011 1,185 -14.7% 5,683 5,753 -1.2%MC&I (Net) 12,683 12,254 3.5% 3,125 2,841 10.0% 9,558 9,413 1.5%.....Convention/Conf. 7,567 7,769 -2.6% 1,656 1,520 9.0% 5,910 6,249 -5.4%.....Corp. Meetings 2,830 1,999 41.6% 580 547 6.0% 2,250 1,452 54.9%.....Incentive 2,528 2,786 -9.3% 957 921 3.9% 1,571 1,865 -15.8%Other Business 9,727 8,035 21.1% 5,588 4,270 30.9% 4,139 3,764 10.0%Visit Friends/Relatives 8,633 10,554 -18.2% 2,660 2,454 8.4% 5,972 8,101 -26.3%Government/Military 2,384 3,075 -22.5% 1,152 1,103 4.5% 1,232 1,972 -37.6%Attend School 1,285 1,131 13.6% 207 165 25.4% 1,077 966 11.6%Sport Events 816 1,103 -26.0% 208 230 -9.4% 608 873 -30.3%EXPENDITURESTotal Expenditures ($ mil.) 141.1 168.3 -16.2% 41.0 40.4 1.7% 100.1 128.0 -21.8%Per Person Per Day ($) 185.2 176.2 5.1% 185.2 176.2 5.1% 185.2 176.2 5.1%Per Person Per Trip ($) 1,432.9 1,709.6 -16.2% 1,139.8 1,266.3 -10.0% 1,601.8 1,921.8 -16.6%
OTHER ASIA
TABLE 23: Other Asia MMA Visitor Characteristics: 2004 vs. 2003 (Arrivals by air)
Source: DBEDT
37
TOTAL DOMESTIC INTERNATIONAL% % %
2004 2003 Change 2004 2003 Change 2004 2003 ChangeTotal Visitor Days 761,834 955,570 -20.3% 221,585 229,058 -3.3% 540,250 726,512 -25.6%Total Visitors 98,480 98,466 0.0% 36,009 31,867 13.0% 62,471 66,599 -6.2%PARTY SIZEOne 18,280 19,119 -4.4% 8,306 7,473 11.1% 9,973 11,646 -14.4%Two 24,671 25,742 -4.2% 6,824 6,640 2.8% 17,847 19,102 -6.6%Three or more 55,529 53,605 3.6% 20,879 17,753 17.6% 34,650 35,851 -3.4%Avg Party Size 2.37 2.30 2.9% 2.28 2.23 2.5% 2.41 2.33 3.4%VISIT STATUS First-Time 68,560 64,310 6.6% 26,149 21,677 20.6% 42,411 42,633 -0.5%Repeat 29,921 34,156 -12.4% 9,860 10,190 -3.2% 20,060 23,966 -16.3%Average # of Trips 2.10 2.30 -8.6% 2.32 2.60 -10.8% 1.97 2.15 -8.4%TRAVEL METHODGroup Tour 44,694 41,998 6.4% 19,474 15,383 26.6% 25,220 26,615 -5.2%Package 55,893 55,734 0.3% 22,842 18,251 25.2% 33,051 37,483 -11.8%Group Tour & Pkg 37,474 35,906 4.4% 16,559 12,648 30.9% 20,915 23,259 -10.1%True Independent 35,367 36,640 -3.5% 10,253 10,880 -5.8% 25,115 25,760 -2.5%ISLANDS VISITED Oahu 89,946 88,556 1.6% 32,632 28,297 15.3% 57,314 60,259 -4.9%Maui County 17,508 21,036 -16.8% 4,445 5,162 -13.9% 13,063 15,874 -17.7%...Maui 16,926 20,140 -16.0% 4,179 4,816 -13.2% 12,747 15,324 -16.8%...Molokai 1,501 1,472 2.0% 361 417 -13.5% 1,140 1,054 8.2%...Lanai 712 834 -14.6% 239 330 -27.4% 473 504 -6.2%Kauai 4,727 5,501 -14.1% 1,575 1,795 -12.3% 3,152 3,705 -14.9%Big Island 13,074 16,555 -21.0% 3,044 3,176 -4.2% 10,030 13,379 -25.0%…Hilo 8,926 11,119 -19.7% 1,445 1,359 6.4% 7,481 9,760 -23.3%…Kona 10,704 14,057 -23.8% 2,103 2,323 -9.5% 8,601 11,734 -26.7%LENGTH OF STAY Oahu (days) 6.63 8.32 -20.3% 5.22 6.18 -15.5% 7.44 9.32 -20.2%Maui (days) 4.30 3.89 10.5% 4.95 4.98 -0.5% 4.09 3.55 15.1%Molokai (days) 2.13 2.35 -9.2% 2.98 3.98 -25.0% 1.86 1.70 9.3%Lanai (days) 2.56 3.82 -33.0% 5.54 4.07 36.0% 1.05 3.65 -71.3%Kauai (days) 4.31 5.12 -15.8% 5.61 4.82 16.4% 3.66 5.26 -30.5%Big Island (days) 5.13 6.39 -19.6% 6.38 5.85 9.0% 4.76 6.51 -27.0%...Hilo (days) 2.29 2.22 3.1% 3.71 3.93 -5.5% 2.02 1.99 1.7%...Kona (days) 4.36 5.76 -24.4% 6.68 5.70 17.1% 3.79 5.77 -34.4%Statewide (days) 7.74 9.70 -20.3% 6.15 7.19 -14.4% 8.65 10.91 -20.7%ACCOMMODATIONSHotel 82,066 81,352 0.9% 31,207 27,030 15.5% 50,859 54,322 -6.4%...Hotel Only 77,563 75,486 2.8% 29,702 25,584 16.1% 47,861 49,902 -4.1%Condo 6,440 5,642 14.2% 1,521 1,538 -1.2% 4,920 4,103 19.9%...Condo Only 4,473 3,530 26.7% 1,096 1,124 -2.5% 3,377 2,405 40.4%Timeshare 855 1,119 -23.6% 459 524 -12.4% 396 595 -33.4%...Timeshare Only 526 598 -11.9% 274 291 -5.6% 252 307 -17.9%Rental House 1,623 1,523 6.6% 458 582 -21.3% 1,165 941 23.8%Bed & Breakfast 1,761 1,413 24.6% 632 651 -2.9% 1,129 762 48.1%Cruise Ship 890 1,218 -26.9% 444 504 -11.8% 446 714 -37.6%Friends or Relatives 8,643 10,945 -21.0% 2,333 2,274 2.6% 6,311 8,672 -27.2%PURPOSE OF TRIP 0Pleasure (Net) 64,962 63,013 3.1% 24,474 22,247 10.0% 40,488 40,766 -0.7%…Honeymoon/Get Married (Net) 6,694 6,938 -3.5% 1,011 1,185 -14.7% 5,683 5,753 -1.2%MC&I (Net) 12,683 12,254 3.5% 3,125 2,841 10.0% 9,558 9,413 1.5%.....Convention/Conf. 7,567 7,769 -2.6% 1,656 1,520 9.0% 5,910 6,249 -5.4%.....Corp. Meetings 2,830 1,999 41.6% 580 547 6.0% 2,250 1,452 54.9%.....Incentive 2,528 2,786 -9.3% 957 921 3.9% 1,571 1,865 -15.8%Other Business 9,727 8,035 21.1% 5,588 4,270 30.9% 4,139 3,764 10.0%Visit Friends/Relatives 8,633 10,554 -18.2% 2,660 2,454 8.4% 5,972 8,101 -26.3%Government/Military 2,384 3,075 -22.5% 1,152 1,103 4.5% 1,232 1,972 -37.6%Attend School 1,285 1,131 13.6% 207 165 25.4% 1,077 966 11.6%Sport Events 816 1,103 -26.0% 208 230 -9.4% 608 873 -30.3%EXPENDITURESTotal Expenditures ($ mil.) 141.1 168.3 -16.2% 41.0 40.4 1.7% 100.1 128.0 -21.8%Per Person Per Day ($) 185.2 176.2 5.1% 185.2 176.2 5.1% 185.2 176.2 5.1%Per Person Per Trip ($) 1,432.9 1,709.6 -16.2% 1,139.8 1,266.3 -10.0% 1,601.8 1,921.8 -16.6%
OTHER ASIA
Source: DBEDT 37

TABLE 24: Latin America MMA Visitor Characteristics: 2004 vs. 2003 (Arrivals by air)
Source: DBEDT
38
TOTAL DOMESTIC INTERNATIONAL% % %
2004 2003 Change 2004 2003 Change 2004 2003 ChangeTotal Visitor Days 150,931 146,105 3.3% 144,484 136,556 5.8% 6,447 9,549 -32.5%Total Visitors 13,760 14,124 -2.6% 13,214 12,782 3.4% 546 1,342 -59.3%PARTY SIZEOne 3,484 3,299 5.6% 3,407 3,179 7.2% 77 120 -35.9%Two 5,419 5,960 -9.1% 5,325 5,332 -0.1% 95 628 -84.9%Three or more 4,857 4,866 -0.2% 4,483 4,271 5.0% 374 594 -37.0%Avg Party Size 1.85 1.85 -0.3% 1.84 1.85 -0.8% 2.07 1.84 12.1%VISIT STATUS First-Time 9,019 9,023 0.0% 8,596 8,357 2.9% 423 665 -36.4%Repeat 4,741 5,102 -7.1% 4,619 4,425 4.4% 123 677 -81.9%Average # of Trips 2.56 2.57 -0.6% 2.57 2.61 -1.5% 2.10 2.15 -2.4%TRAVEL METHODGroup Tour 1,700 1,978 -14.0% 1,546 1,903 -18.8% 155 75 106.7%Package 6,244 6,833 -8.6% 6,004 6,018 -0.2% 240 815 -70.5%Group Tour & Pkg 1,286 1,605 -19.8% 1,162 1,530 -24.0% 124 75 66.1%True Independent 7,102 6,918 2.7% 6,827 6,391 6.8% 275 527 -47.7%ISLANDS VISITED Oahu 9,703 10,140 -4.3% 9,257 8,860 4.5% 447 1,280 -65.1%Maui County 5,311 5,791 -8.3% 5,082 5,265 -3.5% 230 526 -56.3%...Maui 5,194 5,511 -5.8% 4,964 5,061 -1.9% 230 450 -48.9%...Molokai 227 362 -37.2% 199 362 -45.1% 29 0 NA...Lanai 264 561 -52.9% 236 387 -39.1% 28 174 -83.8%Kauai 1,862 1,981 -6.0% 1,743 1,898 -8.2% 120 83 43.8%Big Island 2,870 3,358 -14.5% 2,682 3,117 -14.0% 189 241 -21.6%…Hilo 1,241 1,555 -20.2% 1,113 1,315 -15.4% 128 241 -46.9%…Kona 2,387 2,767 -13.8% 2,215 2,527 -12.3% 172 241 -28.7%LENGTH OF STAY Oahu (days) 8.34 7.87 6.0% 8.35 8.12 2.8% 8.29 6.16 34.4%Maui (days) 7.33 5.90 24.2% 7.46 6.29 18.6% 4.53 1.53 196.9%Molokai (days) 3.56 2.98 19.5% 4.07 2.98 36.7% 0.00 0.00 NALanai (days) 2.67 4.27 -37.4% 2.99 6.19 -51.7% 0.00 0.00 NAKauai (days) 6.34 5.42 17.0% 6.30 5.62 12.1% 6.89 0.83 733.6%Big Island (days) 6.39 5.78 10.6% 6.60 5.99 10.2% 3.40 3.02 12.5%...Hilo (days) 3.13 3.68 -15.2% 3.36 4.23 -20.6% 1.10 0.70 57.1%...Kona (days) 6.05 4.94 22.6% 6.30 5.19 21.4% 2.92 2.32 25.7%Statewide (days) 10.97 10.34 6.0% 10.93 10.68 2.3% 11.81 7.12 65.9%ACCOMMODATIONSHotel 9,923 10,214 -2.9% 9,529 9,068 5.1% 394 1,146 -65.6%...Hotel Only 8,922 8,796 1.4% 8,583 7,813 9.8% 339 983 -65.5%Condo 1,125 1,255 -10.3% 1,042 1,091 -4.5% 83 164 -49.3%...Condo Only 879 840 4.7% 826 840 -1.6% 53 0 NATimeshare 510 527 -3.2% 487 527 -7.6% 23 0 NA...Timeshare Only 347 398 -12.9% 347 398 -12.9% 0 0 NARental House 487 492 -1.0% 414 416 -0.5% 73 76 -3.9%Bed & Breakfast 161 152 5.7% 148 152 -2.5% 12 0 NACruise Ship 872 1,352 -35.5% 848 1,352 -37.3% 24 0 NAFriends or Relatives 1,461 1,404 4.1% 1,385 1,241 11.6% 76 163 -53.1%PURPOSE OF TRIPPleasure (Net) 10,469 10,711 -2.3% 10,025 9,574 4.7% 444 1,137 -60.9%…Honeymoon/Get Married (Net) 1,259 1,659 -24.1% 1,196 1,319 -9.3% 63 339 -81.4%MC&I (Net) 1,985 2,126 -6.6% 1,940 2,060 -5.8% 45 65 -31.5%.....Convention/Conf. 1,561 1,552 0.6% 1,516 1,508 0.5% 45 44 2.8%.....Corp. Meetings 265 316 -15.9% 253 294 -13.9% 12 22 -43.0%.....Incentive 296 386 -23.3% 284 386 -26.5% 12 0 NAOther Business 429 432 -0.6% 406 401 1.4% 23 31 -25.7%Visit Friends/Relatives 1,040 1,060 -1.9% 1,004 984 2.0% 36 76 -53.1%Government/Military 86 92 -7.0% 63 92 -31.9% 23 0 NAAttend School 82 80 3.3% 70 80 -12.3% 12 0 NASport Events 399 278 43.7% 324 247 31.5% 75 31 140.8%EXPENDITURESTotal Expenditures ($ mil.) 19.6 18.4 6.6% 18.8 17.2 9.2% 0.8 1.2 -30.3%Per Person Per Day ($) 129.8 125.8 3.2% 129.8 125.8 3.2% 129.8 125.8 3.2%Per Person Per Trip ($) 1,424.1 1,301.4 9.4% 1,419.6 1,344.1 5.6% 1,533.1 895.2 71.3%
LATIN AMERICA
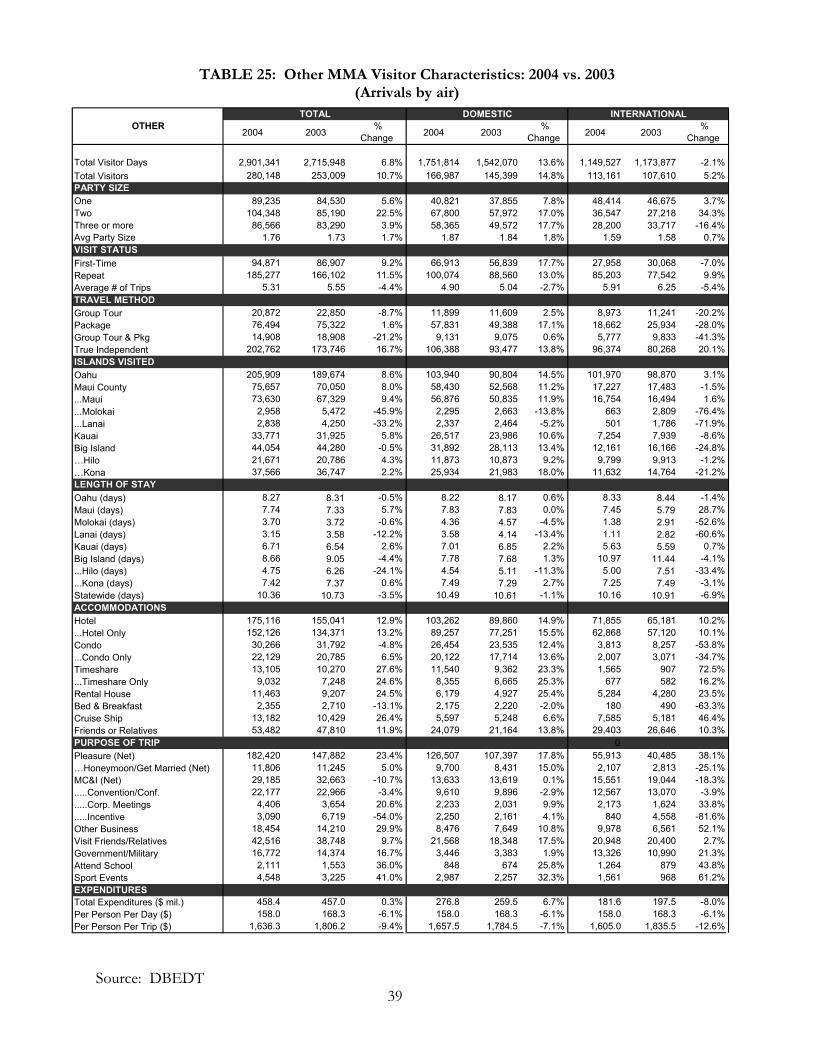
TABLE 25: Other MMA Visitor Characteristics: 2004 vs. 2003
(Arrivals by air)
Source: DBEDT 39
TOTAL DOMESTIC INTERNATIONAL
2004 2003 %
Change 2004 2003%
Change 2004 2003%
Change
Total Visitor Days 2,901,341 2,715,948 6.8% 1,751,814 1,542,070 13.6% 1,149,527 1,173,877 -2.1%Total Visitors 280,148 253,009 10.7% 166,987 145,399 14.8% 113,161 107,610 5.2%PARTY SIZEOne 89,235 84,530 5.6% 40,821 37,855 7.8% 48,414 46,675 3.7%Two 104,348 85,190 22.5% 67,800 57,972 17.0% 36,547 27,218 34.3%Three or more 86,566 83,290 3.9% 58,365 49,572 17.7% 28,200 33,717 -16.4%Avg Party Size 1.76 1.73 1.7% 1.87 1.84 1.8% 1.59 1.58 0.7%VISIT STATUS First-Time 94,871 86,907 9.2% 66,913 56,839 17.7% 27,958 30,068 -7.0%Repeat 185,277 166,102 11.5% 100,074 88,560 13.0% 85,203 77,542 9.9%Average # of Trips 5.31 5.55 -4.4% 4.90 5.04 -2.7% 5.91 6.25 -5.4%TRAVEL METHODGroup Tour 20,872 22,850 -8.7% 11,899 11,609 2.5% 8,973 11,241 -20.2%PackageGroup TTrue InISLANOahuMaui Co...Maui...Molo...Lanai KauaiBig Is…Hilo…Kona
Oahu (MauiMolokaLanKauai (dBig Is...Hilo...Kona (dStatewACCOHotel...HotelCondo...CondoTimesh...TimeRentBed & Cruise ShipFriendsPURPOSPleasu…HMC&I (Net).....Con.....Cor.....InceOtherVisit FrGovernAttend SSport E
Total EPer PePer Pe
OTHER
76,494 75,322 1.6% 57,831 49,388 17.1% 18,662 25,934 -28.0%our & Pkg 14,908 18,908 -21.2% 9,131 9,075 0.6% 5,777 9,833 -41.3%
dependent 202,762 173,746 16.7% 106,388 93,477 13.8% 96,374 80,268 20.1%DS VISITED
205,909 189,674 8.6% 103,940 90,804 14.5% 101,970 98,870 3.1%unty 75,657 70,050 8.0% 58,430 52,568 11.2% 17,227 17,483 -1.5%
73,630 67,329 9.4% 56,876 50,835 11.9% 16,754 16,494 1.6%kai 2,958 5,472 -45.9% 2,295 2,663 -13.8% 663 2,809 -76.4%
2,838 4,250 -33.2% 2,337 2,464 -5.2% 501 1,786 -71.9%33,771 31,925 5.8% 26,517 23,986 10.6% 7,254 7,939 -8.6%
land 44,054 44,280 -0.5% 31,892 28,113 13.4% 12,161 16,166 -24.8%21,671 20,786 4.3% 11,873 10,873 9.2% 9,799 9,913 -1.2%37,566 36,747 2.2% 25,934 21,983 18.0% 11,632 14,764 -21.2%
LENGTH OF STAY days) 8.27 8.31 -0.5% 8.22 8.17 0.6% 8.33 8.44 -1.4%
(days) 7.74 7.33 5.7% 7.83 7.83 0.0% 7.45 5.79 28.7%i (days) 3.70 3.72 -0.6% 4.36 4.57 -4.5% 1.38 2.91 -52.6%
ai (days) 3.15 3.58 -12.2% 3.58 4.14 -13.4% 1.11 2.82 -60.6%ays) 6.71 6.54 2.6% 7.01 6.85 2.2% 5.63 5.59 0.7%
land (days) 8.66 9.05 -4.4% 7.78 7.68 1.3% 10.97 11.44 -4.1% (days) 4.75 6.26 -24.1% 4.54 5.11 -11.3% 5.00 7.51 -33.4%
ays) 7.42 7.37 0.6% 7.49 7.29 2.7% 7.25 7.49 -3.1%ide (days) 10.36 10.73 -3.5% 10.49 10.61 -1.1% 10.16 10.91 -6.9%MMODATIONS
175,116 155,041 12.9% 103,262 89,860 14.9% 71,855 65,181 10.2% Only 152,126 134,371 13.2% 89,257 77,251 15.5% 62,868 57,120 10.1%
30,266 31,792 -4.8% 26,454 23,535 12.4% 3,813 8,257 -53.8% Only 22,129 20,785 6.5% 20,122 17,714 13.6% 2,007 3,071 -34.7%
are 13,105 10,270 27.6% 11,540 9,362 23.3% 1,565 907 72.5%share Only 9,032 7,248 24.6% 8,355 6,665 25.3% 677 582 16.2%
al House 11,463 9,207 24.5% 6,179 4,927 25.4% 5,284 4,280 23.5%Breakfast 2,355 2,710 -13.1% 2,175 2,220 -2.0% 180 490 -63.3%
13,182 10,429 26.4% 5,597 5,248 6.6% 7,585 5,181 46.4% or Relatives 53,482 47,810 11.9% 24,079 21,164 13.8% 29,403 26,646 10.3%
E OF TRIP 0re (Net) 182,420 147,882 23.4% 126,507 107,397 17.8% 55,913 40,485 38.1%
oneymoon/Get Married (Net) 11,806 11,245 5.0% 9,700 8,431 15.0% 2,107 2,813 -25.1%29,185 32,663 -10.7% 13,633 13,619 0.1% 15,551 19,044 -18.3%
vention/Conf. 22,177 22,966 -3.4% 9,610 9,896 -2.9% 12,567 13,070 -3.9%p. Meetings 4,406 3,654 20.6% 2,233 2,031 9.9% 2,173 1,624 33.8%ntive 3,090 6,719 -54.0% 2,250 2,161 4.1% 840 4,558 -81.6%
Business 18,454 14,210 29.9% 8,476 7,649 10.8% 9,978 6,561 52.1%iends/Relatives 42,516 38,748 9.7% 21,568 18,348 17.5% 20,948 20,400 2.7%ment/Military 16,772 14,374 16.7% 3,446 3,383 1.9% 13,326 10,990 21.3%
chool 2,111 1,553 36.0% 848 674 25.8% 1,264 879 43.8%vents 4,548 3,225 41.0% 2,987 2,257 32.3% 1,561 968 61.2%
EXPENDITURESxpenditures ($ mil.) 458.4 457.0 0.3% 276.8 259.5 6.7% 181.6 197.5 -8.0%rson Per Day ($) 158.0 168.3 -6.1% 158.0 168.3 -6.1% 158.0 168.3 -6.1%rson Per Trip ($) 1,636.3 1,806.2 -9.4% 1,657.5 1,784.5 -7.1% 1,605.0 1,835.5 -12.6%
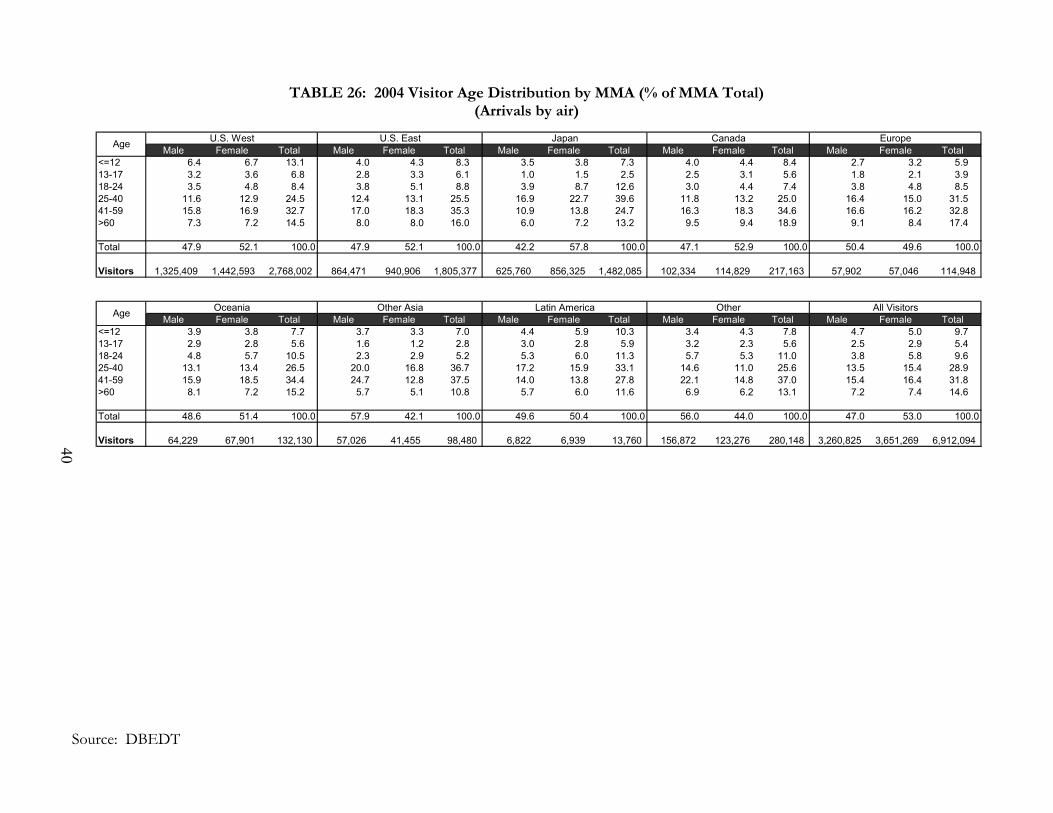
TABLE 26: 2004 Visitor Age Distribution by MMA (% of MMA Total) (Arrivals by air)
Source: DBEDT
Male Female Total Male Female Total Male Female Total Male Female Total Male Female Total<=12 6.4 6.7 13.1 4.0 4.3 8.3 3.5 3.8 7.3 4.0 4.4 8.4 2.7 3.2 5.913-17 3.2 3.6 6.8 2.8 3.3 6.1 1.0 1.5 2.5 2.5 3.1 5.6 1.8 2.1 3.918-24 3.5 4.8 8.4 3.8 5.1 8.8 3.9 8.7 12.6 3.0 4.4 7.4 3.8 4.8 8.525-40 11.6 12.9 24.5 12.4 13.1 25.5 16.9 22.7 39.6 11.8 13.2 25.0 16.4 15.0 31.541-59 15.8 16.9 32.7 17.0 18.3 35.3 10.9 13.8 24.7 16.3 18.3 34.6 16.6 16.2 32.8>60 7.3 7.2 14.5 8.0 8.0 16.0 6.0 7.2 13.2 9.5 9.4 18.9 9.1 8.4 17.4
Total 47.9 52.1 100.0 47.9 52.1 100.0 42.2 57.8 100.0 47.1 52.9 100.0 50.4 49.6 100.0
Visitors 1,325,409 1,442,593 2,768,002 864,471 940,906 1,805,377 625,760 856,325 1,482,085 102,334 114,829 217,163 57,902 57,046 114,948
Male Female Total Male Female Total Male Female Total Male Female Total Male Female Total<=12 3.9 3.8 7.7 3.7 3.3 7.0 4.4 5.9 10.3 3.4 4.3 7.8 4.7 5.0 9.713-17 2.9 2.8 5.6 1.6 1.2 2.8 3.0 2.8 5.9 3.2 2.3 5.6 2.5 2.9 5.418-24 4.8 5.7 10.5 2.3 2.9 5.2 5.3 6.0 11.3 5.7 5.3 11.0 3.8 5.8 9.625-40 13.1 13.4 26.5 20.0 16.8 36.7 17.2 15.9 33.1 14.6 11.0 25.6 13.5 15.4 28.941-59 15.9 18.5 34.4 24.7 12.8 37.5 14.0 13.8 27.8 22.1 14.8 37.0 15.4 16.4 31.8>60 8.1 7.2 15.2 5.7 5.1 10.8 5.7 6.0 11.6 6.9 6.2 13.1 7.2 7.4 14.6
Total 48.6 51.4 100.0 57.9 42.1 100.0 49.6 50.4 100.0 56.0 44.0 100.0 47.0 53.0 100.0
Visitors 64,229 67,901 132,130 57,026 41,455 98,480 6,822 6,939 13,760 156,872 123,276 280,148 3,260,825 3,651,269 6,912,094
Japan Canada
All Visitors
Age
Age
Europe
Oceania Other Asia Latin America Other
U.S. West U.S. East
40
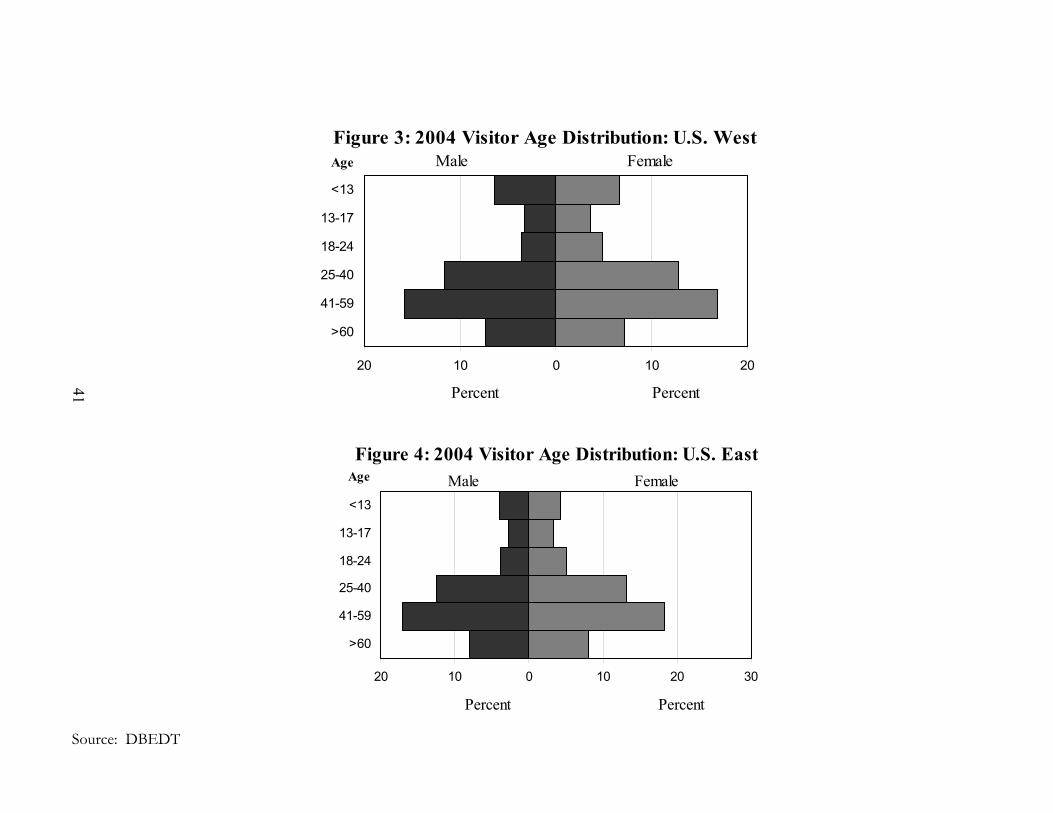
Source: DBEDT
Figure 3: 2004 Visitor Age Distribution: U.S. West
20 10 0 10 20
<13
13-17
18-24
25-40
41-59
>60
Male FemaleAge
PercentPercent41
Figure 4: 2004 Visitor Age Distribution: U.S. East
20 10 0 10 20 30
<13
13-17
18-24
25-40
41-59
>60
Male FemaleAge
PercentPercent
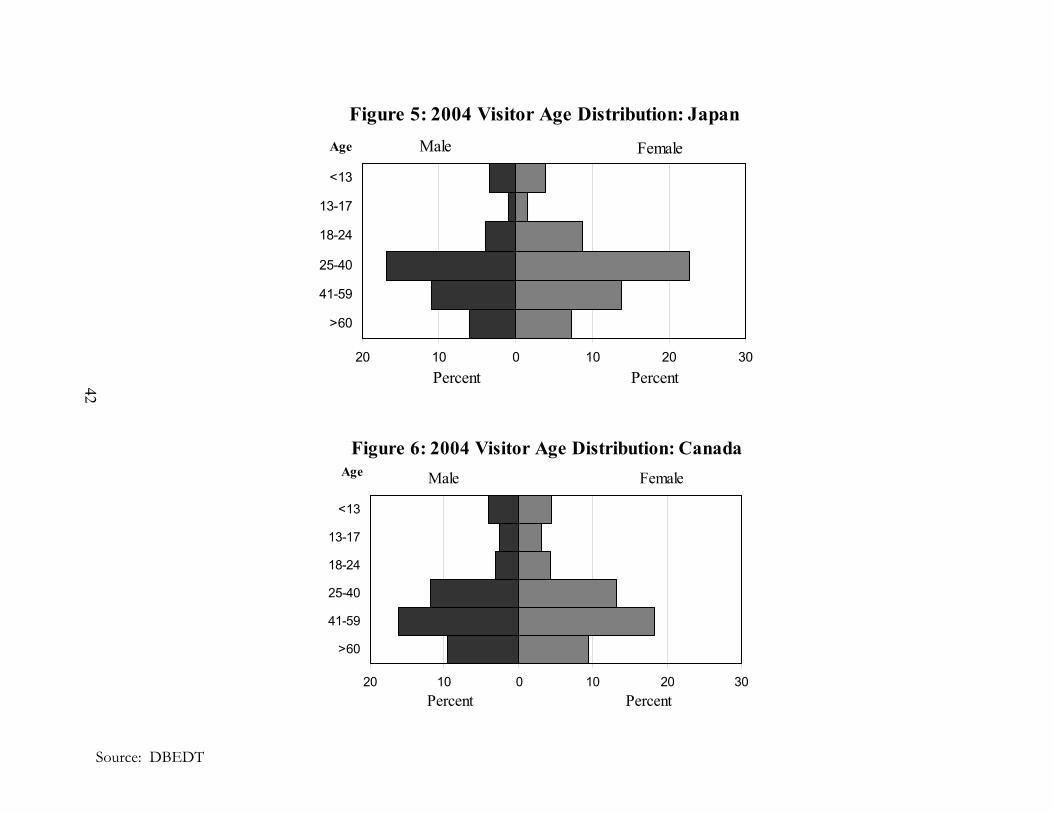
Figure 5: 2004 Visitor Age Distribution: Japan
20 10 0 10 20 30
<13
13-17
18-24
25-40
41-59
>60
Male FemaleAge
PercentPercent
Figure 6: 2004 Visitor Age Distribution: Canada
20 10 0 10 20 30
<13
13-17
18-24
25-40
41-59
>60
Male FemaleAge
PercentPercent
Source: DBEDT
42
AIR VISITOR CHARACTERISTICS BY PURPOSE OF TRIP
HONEYMOON AND GET MARRIED VISITOR
MEETINGS, CONVENTION AND INCENTIVE VISITOR
VISITING FRIENDS AND RELATIVES
43
44
AIR VISITOR CHARACTERISTICS BY PURPOSE OF TRIP
HONEYMOON/GET MARRIED: A total of 710,612 visitors arrived by air to honeymoon/get married in Hawaii in 2004, up 7.5 percent compared to the previous year. This group comprised 10.3 percent of total air visitors to the islands. Close to 56 percent arrived from international points of origin while the remainder came on domestic flights. Oahu and the Big Island experienced growth in the number of honeymooners and those who got married in the islands during the year. Nearly 64 percent were first-time visitors to the state. Only 26.4 percent travel as true independent while the majority purchased group or packaged tours (TABLE 27). Oahu was visited by 75.6 percent of all honeymoon/wedding visitors. Close to 29 percent visited Maui, 14.6 percent visited Kauai, 14.5 percent visited the Big Island, 1 percent went to Lanai and 0.8 percent went to Molokai. The average length of stay by this group in the state was 7.49 days. These visitors spent the most time on Maui (6.38 days), followed by Kauai (5.61 days), Oahu (5.39 days), the Big Island (4.33 days), Lanai (3.01 days) and Molokai (2.79 days). The majority (87.2%) stayed in hotels while 9.1 percent chose condominiums.
MEETINGS, CONVENTION AND INCENTIVE (MCI): A total of 458,754 visitors came to the islands by air for meetings, conventions and incentives, 3.1 percent lower compared to 2003. MCI visitors accounted for 6.6 percent of total air visitors in 2004. The majority arrived on domestic flights while 21.4 percent came from foreign destinations. About 61 percent were repeat visitors. Over half (53.9%) came as true independents, while the remainder purchased either group or package tour accommodations (TABLE 28). MCI visitors stayed an average of 8.06 days in Hawaii. They spent the most time on Maui (6.59 days), followed by the Big Island (6.47 days), Oahu (6.29 days), Kauai (6.09 days), Lanai (3.83 days) and Molokai (3.73 days). Hotels remained the most popular lodging choice for nearly 91% of all MCI travelers during their stay.
VISITING FRIENDS AND RELATIVES: Those in Hawaii to see friends or relatives increased 9.6 percent to 608,081 visitors and comprised 8.8 percent of all visitors who came by air in 2004. Nearly 87 percent arrived from the U.S. mainland while 12.8 percent came from foreign countries. The majority (76.7%) has been to Hawaii before and 83.3 percent were independent travelers. Close to 72.2 percent of this group of visitors went to Oahu, 19.3 percent visited the Big Island and 20.4 percent visited Maui (TABLE 29). The average length of stay for this group of visitors was 12.52 days, longer than the average 9.08 days for all air visitors to the state. Visitors here to see friends and family spent the most time on Oahu (9.96 days), followed by the Big Island (9.31 days), Maui (9.10 days), Kauai (8.64 days), Molokai (5.33 days) and Lanai (3.93 days). The majority (62.2%) of this group of visitors stayed with their friends and relatives, 32.7 percent stayed in hotels and 10.8 percent stayed in condominiums.
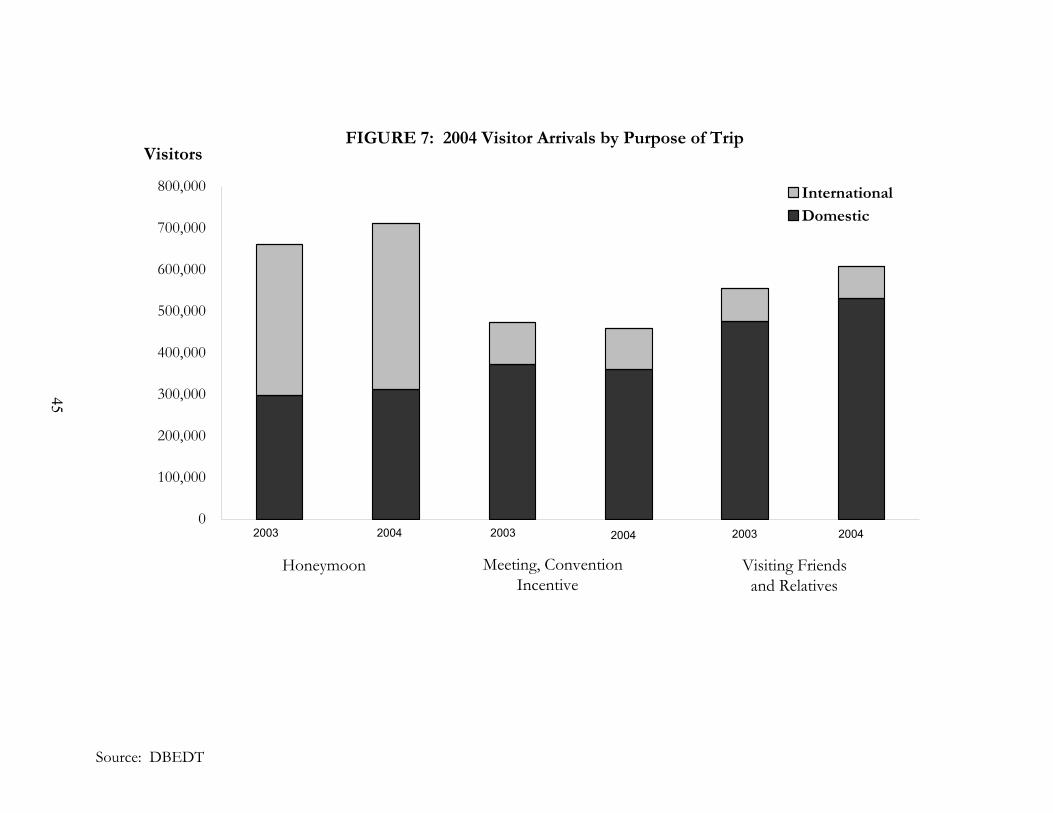
Source: DBEDT
FIGURE 7: 2004 Visitor Arrivals by Purpose of Trip
0
100,000
200,000
300,000
400,000
500,000
600,000
700,000
800,000 International
Domestic
2003
Visitors
2004 2003 2004 2003 2004
Honeymoon Meeting, Convention Incentive
Visiting Friends and Relatives
45
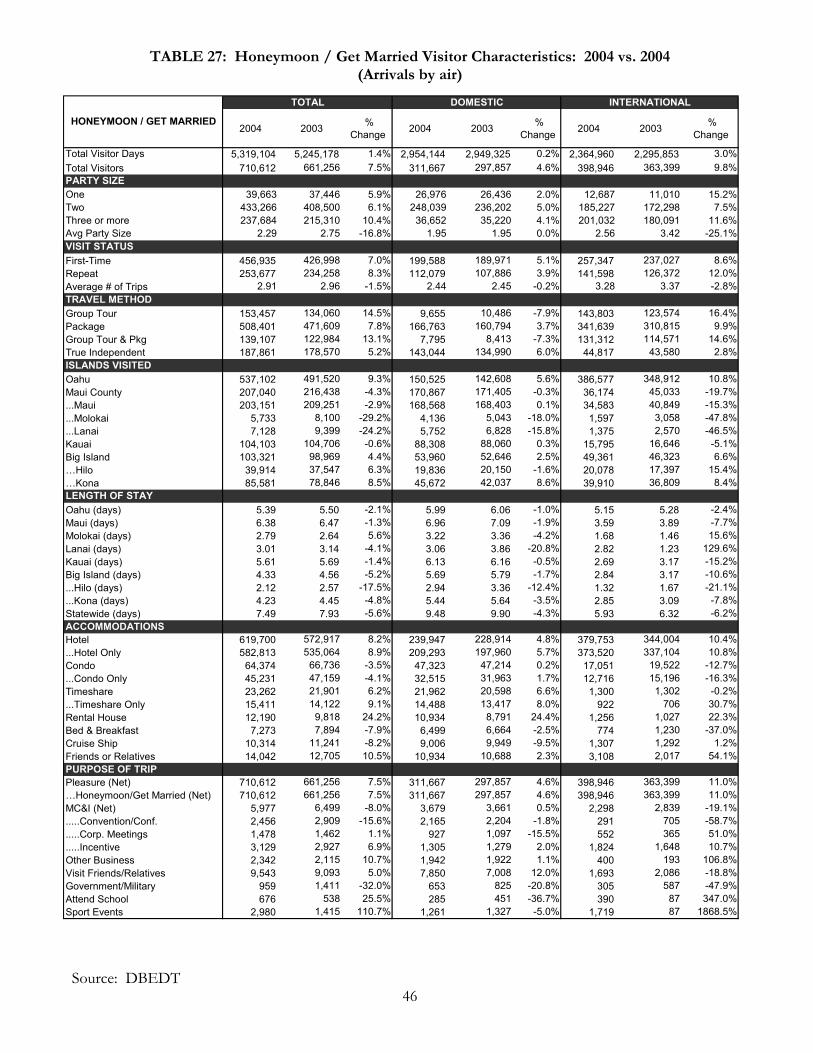
TABLE 27: Honeymoon / Get Married Visitor Characteristics: 2004 vs. 2004 (Arrivals by air)
TOTAL DOMESTIC INTERNATIONAL
2004 2003 % Change 2004 2003 %
Change 2004 2003 % Change
Total Visitor Days 5,319,104 5,245,178 1.4% 2,954,144 2,949,325 0.2% 2,364,960 2,295,853 3.0%Total Visitors 710,612 661,256 7.5% 311,667 297,857 4.6% 398,946 363,399 9.8%PARTY SIZEOne 39,663 37,446 5.9% 26,976 26,436 2.0% 12,687 11,010 15.2%Two 433,266 408,500 6.1% 248,039 236,202 5.0% 185,227 172,298 7.5%Three or more 237,684 215,310 10.4% 36,652 35,220 4.1% 201,032 180,091 11.6%Avg Party Size 2.29 2.75 -16.8% 1.95 1.95 0.0% 2.56 3.42 -25.1%VISIT STATUSFirst-Time 456,935 426,998 7.0% 199,588 189,971 5.1% 257,347 237,027 8.6%Repeat 253,677 234,258 8.3% 112,079 107,886 3.9% 141,598 126,372 12.0%Average # of Trips 2.91 2.96 -1.5% 2.44 2.45 -0.2% 3.28 3.37 -2.8%TRAVEL METHODGroup Tour 153,457 134,060 14.5% 9,655 10,486 -7.9% 143,803 123,574 16.4%Package 508,401 471,609 7.8% 166,763 160,794 3.7% 341,639 310,815 9.9%Group Tour & Pkg 139,107 122,984 13.1% 7,795 8,413 -7.3% 131,312 114,571 14.6%True Independent 187,861 178,570 5.2% 143,044 134,990 6.0% 44,817 43,580 2.8%ISLANDS VISITEDOahu 537,102 491,520 9.3% 150,525 142,608 5.6% 386,577 348,912 10.8%Maui County 207,040 216,438 -4.3% 170,867 171,405 -0.3% 36,174 45,033 -19.7%...Maui 203,151 209,251 -2.9% 168,568 168,403 0.1% 34,583 40,849 -15.3%...Molokai 5,733 8,100 -29.2% 4,136 5,043 -18.0% 1,597 3,058 -47.8%...Lanai 7,128 9,399 -24.2% 5,752 6,828 -15.8% 1,375 2,570 -46.5%Kauai 104,103 104,706 -0.6% 88,308 88,060 0.3% 15,795 16,646 -5.1%Big Island 103,321 98,969 4.4% 53,960 52,646 2.5% 49,361 46,323 6.6%…Hilo 39,914 37,547 6.3% 19,836 20,150 -1.6% 20,078 17,397 15.4%…Kona 85,581 78,846 8.5% 45,672 42,037 8.6% 39,910 36,809 8.4%LENGTH OF STAY Oahu (days) 5.39 5.50 -2.1% 5.99 6.06 -1.0% 5.15 5.28 -2.4%Maui (days) 6.38 6.47 -1.3% 6.96 7.09 -1.9% 3.59 3.89 -7.7%Molokai (days) 2.79 2.64 5.6% 3.22 3.36 -4.2% 1.68 1.46 15.6%Lanai (days) 3.01 3.14 -4.1% 3.06 3.86 -20.8% 2.82 1.23 129.6%Kauai (days) 5.61 5.69 -1.4% 6.13 6.16 -0.5% 2.69 3.17 -15.2%Big Island (days) 4.33 4.56 -5.2% 5.69 5.79 -1.7% 2.84 3.17 -10.6%...Hilo (days) 2.12 2.57 -17.5% 2.94 3.36 -12.4% 1.32 1.67 -21.1%...Kona (days) 4.23 4.45 -4.8% 5.44 5.64 -3.5% 2.85 3.09 -7.8%Statewide (days) 7.49 7.93 -5.6% 9.48 9.90 -4.3% 5.93 6.32 -6.2%ACCOMMODATIONSHotel 619,700 572,917 8.2% 239,947 228,914 4.8% 379,753 344,004 10.4%...Hotel Only 582,813 535,064 8.9% 209,293 197,960 5.7% 373,520 337,104 10.8%Condo 64,374 66,736 -3.5% 47,323 47,214 0.2% 17,051 19,522 -12.7%...Condo Only 45,231 47,159 -4.1% 32,515 31,963 1.7% 12,716 15,196 -16.3%Timeshare 23,262 21,901 6.2% 21,962 20,598 6.6% 1,300 1,302 -0.2%...Timeshare Only 15,411 14,122 9.1% 14,488 13,417 8.0% 922 706 30.7%Rental House 12,190 9,818 24.2% 10,934 8,791 24.4% 1,256 1,027 22.3%Bed & Breakfast 7,273 7,894 -7.9% 6,499 6,664 -2.5% 774 1,230 -37.0%Cruise Ship 10,314 11,241 -8.2% 9,006 9,949 -9.5% 1,307 1,292 1.2%Friends or Relatives 14,042 12,705 10.5% 10,934 10,688 2.3% 3,108 2,017 54.1%PURPOSE OF TRIPPleasure (Net) 710,612 661,256 7.5% 311,667 297,857 4.6% 398,946 363,399 11.0%…Honeymoon/Get Married (Net) 710,612 661,256 7.5% 311,667 297,857 4.6% 398,946 363,399 11.0%MC&I (Net) 5,977 6,499 -8.0% 3,679 3,661 0.5% 2,298 2,839 -19.1%.....Convention/Conf. 2,456 2,909 -15.6% 2,165 2,204 -1.8% 291 705 -58.7%.....Corp. Meetings 1,478 1,462 1.1% 927 1,097 -15.5% 552 365 51.0%.....Incentive 3,129 2,927 6.9% 1,305 1,279 2.0% 1,824 1,648 10.7%Other Business 2,342 2,115 10.7% 1,942 1,922 1.1% 400 193 106.8%Visit Friends/Relatives 9,543 9,093 5.0% 7,850 7,008 12.0% 1,693 2,086 -18.8%Government/Military 959 1,411 -32.0% 653 825 -20.8% 305 587 -47.9%Attend School 676 538 25.5% 285 451 -36.7% 390 87 347.0%Sport Events 2,980 1,415 110.7% 1,261 1,327 -5.0% 1,719 87 1868.5%
HONEYMOON / GET MARRIED
Source: DBEDT
46
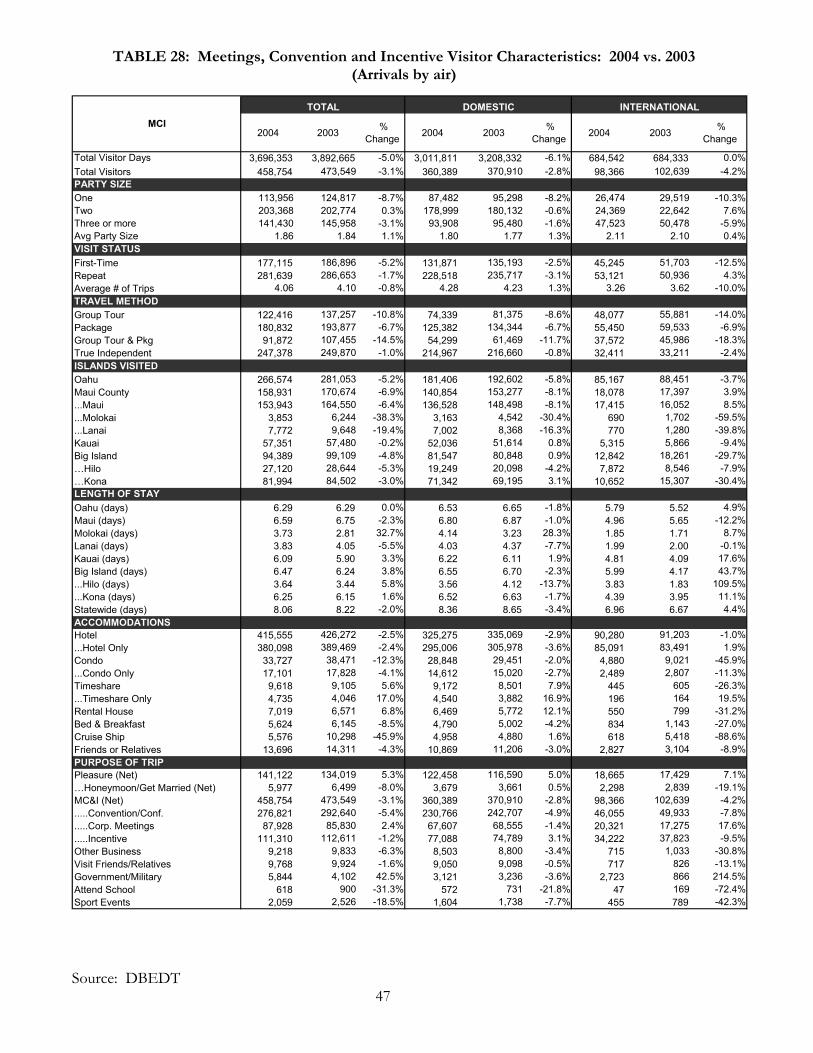
TABLE 28: Meetings, Convention and Incentive Visitor Characteristics: 2004 vs. 2003 (Arrivals by air)
Source: DBEDT
47
TOTAL DOMESTIC INTERNATIONAL
2004 2003 % Change 2004 2003 %
Change 2004 2003 % Change
Total Visitor Days 3,696,353 3,892,665 -5.0% 3,011,811 3,208,332 -6.1% 684,542 684,333 0.0%Total Visitors 458,754 473,549 -3.1% 360,389 370,910 -2.8% 98,366 102,639 -4.2%PARTY SIZEOne 113,956 124,817 -8.7% 87,482 95,298 -8.2% 26,474 29,519 -10.3%Two 203,368 202,774 0.3% 178,999 180,132 -0.6% 24,369 22,642 7.6%Three or more 141,430 145,958 -3.1% 93,908 95,480 -1.6% 47,523 50,478 -5.9%Avg Party Size 1.86 1.84 1.1% 1.80 1.77 1.3% 2.11 2.10 0.4%VISIT STATUSFirst-Time 177,115 186,896 -5.2% 131,871 135,193 -2.5% 45,245 51,703 -12.5%Repeat 281,639 286,653 -1.7% 228,518 235,717 -3.1% 53,121 50,936 4.3%Average # of Trips 4.06 4.10 -0.8% 4.28 4.23 1.3% 3.26 3.62 -10.0%TRAVEL METHODGroup Tour 122,416 137,257 -10.8% 74,339 81,375 -8.6% 48,077 55,881 -14.0%Package 180,832 193,877 -6.7% 125,382 134,344 -6.7% 55,450 59,533 -6.9%Group Tour & Pkg 91,872 107,455 -14.5% 54,299 61,469 -11.7% 37,572 45,986 -18.3%True Independent 247,378 249,870 -1.0% 214,967 216,660 -0.8% 32,411 33,211 -2.4%ISLANDS VISITED Oahu 266,574 281,053 -5.2% 181,406 192,602 -5.8% 85,167 88,451 -3.7%Maui County 158,931 170,674 -6.9% 140,854 153,277 -8.1% 18,078 17,397 3.9%...Maui 153,943 164,550 -6.4% 136,528 148,498 -8.1% 17,415 16,052 8.5%...Molokai 3,853 6,244 -38.3% 3,163 4,542 -30.4% 690 1,702 -59.5%...Lanai 7,772 9,648 -19.4% 7,002 8,368 -16.3% 770 1,280 -39.8%Kauai 57,351 57,480 -0.2% 52,036 51,614 0.8% 5,315 5,866 -9.4%Big Island 94,389 99,109 -4.8% 81,547 80,848 0.9% 12,842 18,261 -29.7%…Hilo 27,120 28,644 -5.3% 19,249 20,098 -4.2% 7,872 8,546 -7.9%…Kona 81,994 84,502 -3.0% 71,342 69,195 3.1% 10,652 15,307 -30.4%LENGTH OF STAY Oahu (days) 6.29 6.29 0.0% 6.53 6.65 -1.8% 5.79 5.52 4.9%Maui (days) 6.59 6.75 -2.3% 6.80 6.87 -1.0% 4.96 5.65 -12.2%Molokai (days) 3.73 2.81 32.7% 4.14 3.23 28.3% 1.85 1.71 8.7%Lanai (days) 3.83 4.05 -5.5% 4.03 4.37 -7.7% 1.99 2.00 -0.1%Kauai (days) 6.09 5.90 3.3% 6.22 6.11 1.9% 4.81 4.09 17.6%Big Island (days) 6.47 6.24 3.8% 6.55 6.70 -2.3% 5.99 4.17 43.7%...Hilo (days) 3.64 3.44 5.8% 3.56 4.12 -13.7% 3.83 1.83 109.5%...Kona (days) 6.25 6.15 1.6% 6.52 6.63 -1.7% 4.39 3.95 11.1%Statewide (days) 8.06 8.22 -2.0% 8.36 8.65 -3.4% 6.96 6.67 4.4%ACCOMMODATIONSHotel 415,555 426,272 -2.5% 325,275 335,069 -2.9% 90,280 91,203 -1.0%...Hotel Only 380,098 389,469 -2.4% 295,006 305,978 -3.6% 85,091 83,491 1.9%Condo 33,727 38,471 -12.3% 28,848 29,451 -2.0% 4,880 9,021 -45.9%...Condo Only 17,101 17,828 -4.1% 14,612 15,020 -2.7% 2,489 2,807 -11.3%Timeshare 9,618 9,105 5.6% 9,172 8,501 7.9% 445 605 -26.3%...Timeshare Only 4,735 4,046 17.0% 4,540 3,882 16.9% 196 164 19.5%Rental House 7,019 6,571 6.8% 6,469 5,772 12.1% 550 799 -31.2%Bed & Breakfast 5,624 6,145 -8.5% 4,790 5,002 -4.2% 834 1,143 -27.0%Cruise Ship 5,576 10,298 -45.9% 4,958 4,880 1.6% 618 5,418 -88.6%Friends or Relatives 13,696 14,311 -4.3% 10,869 11,206 -3.0% 2,827 3,104 -8.9%PURPOSE OF TRIP Pleasure (Net) 141,122 134,019 5.3% 122,458 116,590 5.0% 18,665 17,429 7.1%…Honeymoon/Get Married (Net) 5,977 6,499 -8.0% 3,679 3,661 0.5% 2,298 2,839 -19.1%MC&I (Net) 458,754 473,549 -3.1% 360,389 370,910 -2.8% 98,366 102,639 -4.2%.....Convention/Conf. 276,821 292,640 -5.4% 230,766 242,707 -4.9% 46,055 49,933 -7.8%.....Corp. Meetings 87,928 85,830 2.4% 67,607 68,555 -1.4% 20,321 17,275 17.6%.....Incentive 111,310 112,611 -1.2% 77,088 74,789 3.1% 34,222 37,823 -9.5%Other Business 9,218 9,833 -6.3% 8,503 8,800 -3.4% 715 1,033 -30.8%Visit Friends/Relatives 9,768 9,924 -1.6% 9,050 9,098 -0.5% 717 826 -13.1%Government/Military 5,844 4,102 42.5% 3,121 3,236 -3.6% 2,723 866 214.5%Attend School 618 900 -31.3% 572 731 -21.8% 47 169 -72.4%Sport Events 2,059 2,526 -18.5% 1,604 1,738 -7.7% 455 789 -42.3%
MCI
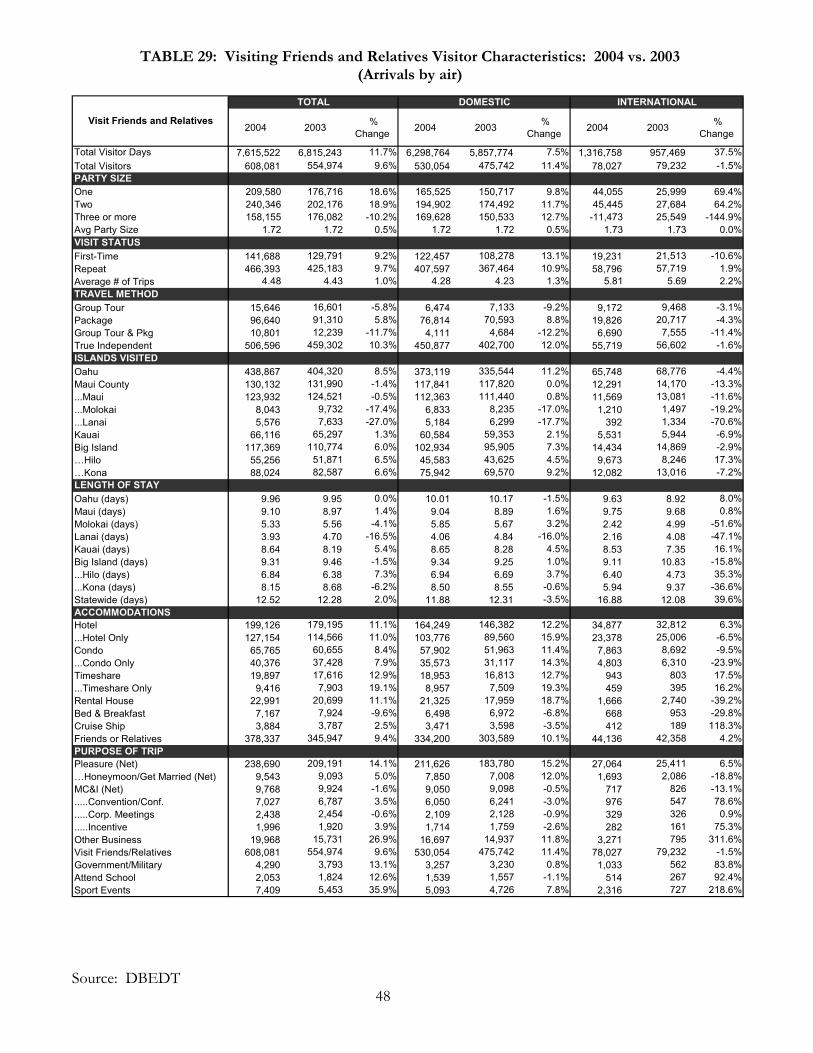
TABLE 29: Visiting Friends and Relatives Visitor Characteristics: 2004 vs. 2003 (Arrivals by air)
Source: DBEDT
48
TOTAL DOMESTIC INTERNATIONAL
2004 2003 % Change 2004 2003 %
Change 2004 2003 % Change
Total Visitor Days 7,615,522 6,815,243 11.7% 6,298,764 5,857,774 7.5% 1,316,758 957,469 37.5%Total Visitors 608,081 554,974 9.6% 530,054 475,742 11.4% 78,027 79,232 -1.5%PARTY SIZEOne 209,580 176,716 18.6% 165,525 150,717 9.8% 44,055 25,999 69.4%Two 240,346 202,176 18.9% 194,902 174,492 11.7% 45,445 27,684 64.2%Three or more 158,155 176,082 -10.2% 169,628 150,533 12.7% -11,473 25,549 -144.9%Avg Party Size 1.72 1.72 0.5% 1.72 1.72 0.5% 1.73 1.73 0.0%VISIT STATUS First-Time 141,688 129,791 9.2% 122,457 108,278 13.1% 19,231 21,513 -10.6%Repeat 466,393 425,183 9.7% 407,597 367,464 10.9% 58,796 57,719 1.9%Average # of Trips 4.48 4.43 1.0% 4.28 4.23 1.3% 5.81 5.69 2.2%TRAVEL METHODGroup Tour 15,646 16,601 -5.8% 6,474 7,133 -9.2% 9,172 9,468 -3.1%Package 96,640 91,310 5.8% 76,814 70,593 8.8% 19,826 20,717 -4.3%Group Tour & Pkg 10,801 12,239 -11.7% 4,111 4,684 -12.2% 6,690 7,555 -11.4%True Independent 506,596 459,302 10.3% 450,877 402,700 12.0% 55,719 56,602 -1.6%ISLANDS VISITED Oahu 438,867 404,320 8.5% 373,119 335,544 11.2% 65,748 68,776 -4.4%Maui County 130,132 131,990 -1.4% 117,841 117,820 0.0% 12,291 14,170 -13.3%...Maui 123,932 124,521 -0.5% 112,363 111,440 0.8% 11,569 13,081 -11.6%...Molokai 8,043 9,732 -17.4% 6,833 8,235 -17.0% 1,210 1,497 -19.2%...Lanai 5,576 7,633 -27.0% 5,184 6,299 -17.7% 392 1,334 -70.6%Kauai 66,116 65,297 1.3% 60,584 59,353 2.1% 5,531 5,944 -6.9%Big Island 117,369 110,774 6.0% 102,934 95,905 7.3% 14,434 14,869 -2.9%…Hilo 55,256 51,871 6.5% 45,583 43,625 4.5% 9,673 8,246 17.3%…Kona 88,024 82,587 6.6% 75,942 69,570 9.2% 12,082 13,016 -7.2%LENGTH OF STAY Oahu (days) 9.96 9.95 0.0% 10.01 10.17 -1.5% 9.63 8.92 8.0%Maui (days) 9.10 8.97 1.4% 9.04 8.89 1.6% 9.75 9.68 0.8%Molokai (days) 5.33 5.56 -4.1% 5.85 5.67 3.2% 2.42 4.99 -51.6%Lanai (days) 3.93 4.70 -16.5% 4.06 4.84 -16.0% 2.16 4.08 -47.1%Kauai (days) 8.64 8.19 5.4% 8.65 8.28 4.5% 8.53 7.35 16.1%Big Island (days) 9.31 9.46 -1.5% 9.34 9.25 1.0% 9.11 10.83 -15.8%...Hilo (days) 6.84 6.38 7.3% 6.94 6.69 3.7% 6.40 4.73 35.3%...Kona (days) 8.15 8.68 -6.2% 8.50 8.55 -0.6% 5.94 9.37 -36.6%Statewide (days) 12.52 12.28 2.0% 11.88 12.31 -3.5% 16.88 12.08 39.6%ACCOMMODATIONSHotel 199,126 179,195 11.1% 164,249 146,382 12.2% 34,877 32,812 6.3%...Hotel Only 127,154 114,566 11.0% 103,776 89,560 15.9% 23,378 25,006 -6.5%Condo 65,765 60,655 8.4% 57,902 51,963 11.4% 7,863 8,692 -9.5%...Condo Only 40,376 37,428 7.9% 35,573 31,117 14.3% 4,803 6,310 -23.9%Timeshare 19,897 17,616 12.9% 18,953 16,813 12.7% 943 803 17.5%...Timeshare Only 9,416 7,903 19.1% 8,957 7,509 19.3% 459 395 16.2%Rental House 22,991 20,699 11.1% 21,325 17,959 18.7% 1,666 2,740 -39.2%Bed & Breakfast 7,167 7,924 -9.6% 6,498 6,972 -6.8% 668 953 -29.8%Cruise Ship 3,884 3,787 2.5% 3,471 3,598 -3.5% 412 189 118.3%Friends or Relatives 378,337 345,947 9.4% 334,200 303,589 10.1% 44,136 42,358 4.2%PURPOSE OF TRIPPleasure (Net) 238,690 209,191 14.1% 211,626 183,780 15.2% 27,064 25,411 6.5%…Honeymoon/Get Married (Net) 9,543 9,093 5.0% 7,850 7,008 12.0% 1,693 2,086 -18.8%MC&I (Net) 9,768 9,924 -1.6% 9,050 9,098 -0.5% 717 826 -13.1%.....Convention/Conf. 7,027 6,787 3.5% 6,050 6,241 -3.0% 976 547 78.6%.....Corp. Meetings 2,438 2,454 -0.6% 2,109 2,128 -0.9% 329 326 0.9%.....Incentive 1,996 1,920 3.9% 1,714 1,759 -2.6% 282 161 75.3%Other Business 19,968 15,731 26.9% 16,697 14,937 11.8% 3,271 795 311.6%Visit Friends/Relatives 608,081 554,974 9.6% 530,054 475,742 11.4% 78,027 79,232 -1.5%Government/Military 4,290 3,793 13.1% 3,257 3,230 0.8% 1,033 562 83.8%Attend School 2,053 1,824 12.6% 1,539 1,557 -1.1% 514 267 92.4%Sport Events 7,409 5,453 35.9% 5,093 4,726 7.8% 2,316 727 218.6%
Visit Friends and Relatives
AIR VISITOR CHARACTERISTICS BY ACCOMMODATION
HOTEL ONLY VISITOR
CONDOMINIUM ONLY VISITOR
CRUISE SHIP VISITOR
49
AIR VISITOR CHARACTERISTICS BY ACCOMMODATION
HOTELS ONLY: The number of air visitors who chose hotels as their only accommodation rose 9.9 percent to 4,169,795 visitors or 60.3 percent of the total air visitors to Hawaii in 2004. More domestic visitors (60.5%) than international visitors (39.5%) stayed exclusively in hotels. Over half (56.5%) of hotel only visitors were repeat visitors to Hawaii. Nearly 39 percent were true independent travelers while the majority purchased group or package tours. The average length of stay by hotel only visitors was 7.31 days. This group spent the most time on Maui (6.18 days), followed by Oahu (5.91 days), Kauai (5.26 days), the Big Island (5.15 days), Lanai (3.43 days) and Molokai (2.63 days). Pleasure was the primary reason given by 83.1 percent of all hotel only visitors for their trip to Hawaii. Those who got married or honeymooned in the islands accounted for 14 percent of the total from this group while MCI travelers comprised 9.1 percent (TABLE 30). CONDOMINIUMS ONLY: About 13 percent of the total air visitors to the islands, or 883,050 visitors stayed exclusively in condominiums in 2004, 2.3 percent higher compared to the previous year. Close to 92 percent traveled to Hawaii for pleasure. The majority (83.7%) came from the domestic market while 69 percent were true independent travelers. More than half (52.8%) visited Maui, 28.8 percent visited Oahu, 17.2 percent visited Kauai while 14.4 percent visited the Big Island. This group of visitors stayed longer in Hawaii (11.24 days) than their hotel-only counterpart. Condominium-only visitors spent the most time on Maui (10.16 days), followed by the Big Island (9.68 days), Oahu (9.65 days), Kauai (9.18 days), Molokai (6.71 days) and Lanai (3.26 days) (TABLE 31).
CRUISE SHIPS: The number of air visitors who came to board cruise ships touring the islands decreased (-2.1%) to 177,667 visitors and comprised 2.6 percent of all visitors who came by air in 2004. Their average length of stay was 10.15 days. Nearly 87 percent of these visitors came from the domestic market while the remainder was from foreign countries. Over half (56.6%) were first-time visitors to Hawaii. In addition to cruise ships, 50.1 percent of the passengers also stayed in hotels (TABLE 32).
50

FIGURE 8: 2004 Visitor Arrivals by Accommodation
0
500,000
1,000,000
1,500,000
2,000,000
2,500,000
3,000,000
3,500,000
4,000,000
4,500,000
International
Domestic
Visitors
2003 2004 2003 2004 2003 2004
Hotel Only Condo Only Cruise Ship
FIGURE 9: Length of Stay by Accommodation: 2004 vs. 2003
7.71
11.36
9.86
7.31
11.24
10.15
0.00
2.00
4.00
6.00
8.00
10.00
12.002003
2004
Days
Hotel Only Condo Only Cruise Ship
Source: DBEDT 51
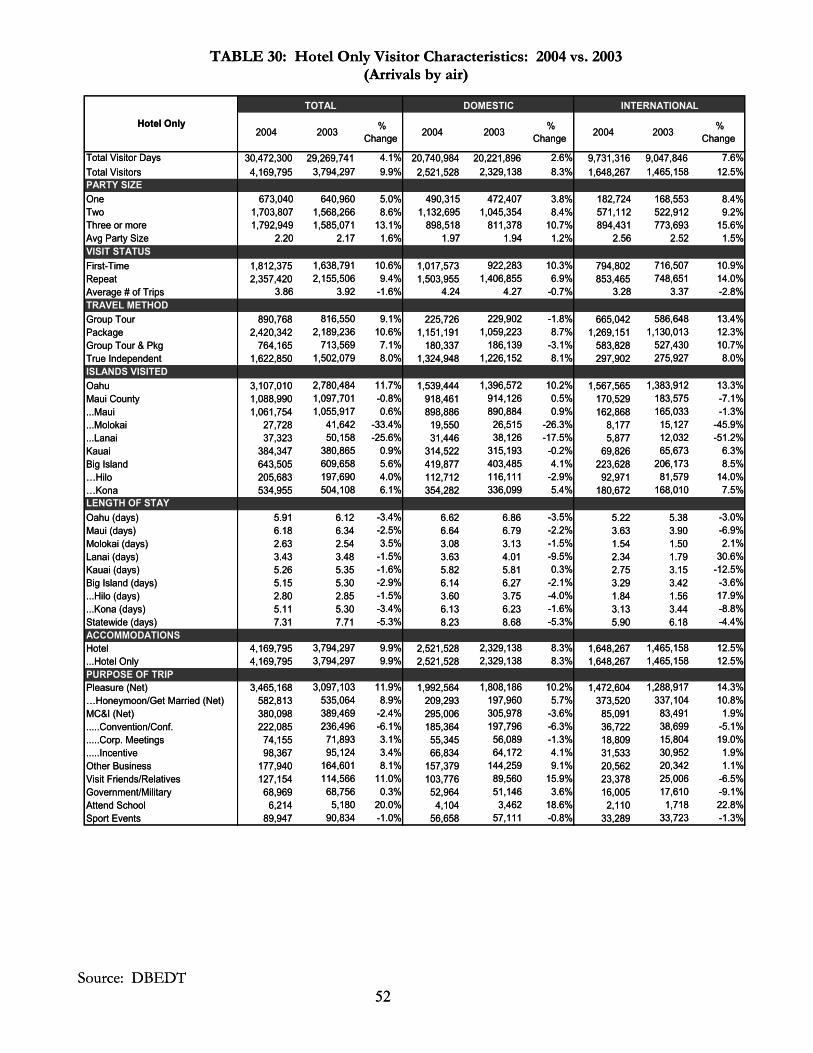
TABLE 30: Hotel Only Visitor Characteristics: 2004 vs. 2003 (Arrivals by air)
TOTAL DOMESTIC INTERNATIONAL
2004 2003 % Change 2004 2003 %
Change 2004 2003 % Change
Total Visitor Days 30,472,300 29,269,741 4.1% 20,740,984 20,221,896 2.6% 9,731,316 9,047,846 7.6%Total Visitors 4,169,795 3,794,297 9.9% 2,521,528 2,329,138 8.3% 1,648,267 1,465,158 12.5%PARTY SIZEOne 673,040 640,960 5.0% 490,315 472,407 3.8% 182,724 168,553 8.4%Two 1,703,807 1,568,266 8.6% 1,132,695 1,045,354 8.4% 571,112 522,912 9.2%Three or more 1,792,949 1,585,071 13.1% 898,518 811,378 10.7% 894,431 773,693 15.6%Avg Party Size 2.20 2.17 1.6% 1.97 1.94 1.2% 2.56 2.52 1.5%VISIT STATUS First-Time 1,812,375 1,638,791 10.6% 1,017,573 922,283 10.3% 794,802 716,507 10.9%Repeat 2,357,420 2,155,506 9.4% 1,503,955 1,406,855 6.9% 853,465 748,651 14.0%Average # of Trips 3.86 3.92 -1.6% 4.24 4.27 -0.7% 3.28 3.37 -2.8%TRAVEL METHODGroup Tour 890,768 816,550 9.1% 225,726 229,902 -1.8% 665,042 586,648 13.4%Package 2,420,342 2,189,236 10.6% 1,151,191 1,059,223 8.7% 1,269,151 1,130,013 12.3%Group Tour & Pkg 764,165 713,569 7.1% 180,337 186,139 -3.1% 583,828 527,430 10.7%True Independent 1,622,850 1,502,079 8.0% 1,324,948 1,226,152 8.1% 297,902 275,927 8.0%ISLANDS VISITED Oahu 3,107,010 2,780,484 11.7% 1,539,444 1,396,572 10.2% 1,567,565 1,383,912 13.3%Maui County 1,088,990 1,097,701 -0.8% 918,461 914,126 0.5% 170,529 183,575 -7.1%...Maui 1,061,754 1,055,917 0.6% 898,886 890,884 0.9% 162,868 165,033 -1.3%...Molokai 27,728 41,642 -33.4% 19,550 26,515 -26.3% 8,177 15,127 -45.9%...Lanai 37,323 50,158 -25.6% 31,446 38,126 -17.5% 5,877 12,032 -51.2%Kauai 384,347 380,865 0.9% 314,522 315,193 -0.2% 69,826 65,673 6.3%Big Island 643,505 609,658 5.6% 419,877 403,485 4.1% 223,628 206,173 8.5%…Hilo 205,683 197,690 4.0% 112,712 116,111 -2.9% 92,971 81,579 14.0%…Kona 534,955 504,108 6.1% 354,282 336,099 5.4% 180,672 168,010 7.5%LENGTH OF STAY Oahu (days) 5.91 6.12 -3.4% 6.62 6.86 -3.5% 5.22 5.38 -3.0%Maui (days) 6.18 6.34 -2.5% 6.64 6.79 -2.2% 3.63 3.90 -6.9%Molokai (days) 2.63 2.54 3.5% 3.08 3.13 -1.5% 1.54 1.50 2.1%Lanai (days) 3.43 3.48 -1.5% 3.63 4.01 -9.5% 2.34 1.79 30.6%Kauai (days) 5.26 5.35 -1.6% 5.82 5.81 0.3% 2.75 3.15 -12.5%Big Island (days) 5.15 5.30 -2.9% 6.14 6.27 -2.1% 3.29 3.42 -3.6%...Hilo (days) 2.80 2.85 -1.5% 3.60 3.75 -4.0% 1.84 1.56 17.9%...Kona (days) 5.11 5.30 -3.4% 6.13 6.23 -1.6% 3.13 3.44 -8.8%Statewide (days) 7.31 7.71 -5.3% 8.23 8.68 -5.3% 5.90 6.18 -4.4%ACCOMMODATIONSHotel 4,169,795 3,794,297 9.9% 2,521,528 2,329,138 8.3% 1,648,267 1,465,158 12.5%...Hotel Only 4,169,795 3,794,297 9.9% 2,521,528 2,329,138 8.3% 1,648,267 1,465,158 12.5%PURPOSE OF TRIPPleasure (Net) 3,465,168 3,097,103 11.9% 1,992,564 1,808,186 10.2% 1,472,604 1,288,917 14.3%…Honeymoon/Get Married (Net) 582,813 535,064 8.9% 209,293 197,960 5.7% 373,520 337,104 10.8%MC&I (Net) 380,098 389,469 -2.4% 295,006 305,978 -3.6% 85,091 83,491 1.9%.....Convention/Conf. 222,085 236,496 -6.1% 185,364 197,796 -6.3% 36,722 38,699 -5.1%.....Corp. Meetings 74,155 71,893 3.1% 55,345 56,089 -1.3% 18,809 15,804 19.0%.....Incentive 98,367 95,124 3.4% 66,834 64,172 4.1% 31,533 30,952 1.9%Other Business 177,940 164,601 8.1% 157,379 144,259 9.1% 20,562 20,342 1.1%Visit Friends/Relatives 127,154 114,566 11.0% 103,776 89,560 15.9% 23,378 25,006 -6.5%Government/Military 68,969 68,756 0.3% 52,964 51,146 3.6% 16,005 17,610 -9.1%Attend School 6,214 5,180 20.0% 4,104 3,462 18.6% 2,110 1,718 22.8%Sport Events 89,947 90,834 -1.0% 56,658 57,111 -0.8% 33,289 33,723 -1.3%
Hotel Only
TABLE 30: Hotel Only Visitor Characteristics: 2004 vs. 2003 (Arrivals by air)
Source: DBEDT 52
TOTAL DOMESTIC INTERNATIONAL
2004 2003 % Change 2004 2003 %
Change 2004 2003 % Change
Total Visitor Days 30,472,300 29,269,741 4.1% 20,740,984 20,221,896 2.6% 9,731,316 9,047,846 7.6%Total Visitors 4,169,795 3,794,297 9.9% 2,521,528 2,329,138 8.3% 1,648,267 1,465,158 12.5%PARTY SIZEOne 673,040 640,960 5.0% 490,315 472,407 3.8% 182,724 168,553 8.4%Two 1,703,807 1,568,266 8.6% 1,132,695 1,045,354 8.4% 571,112 522,912 9.2%Three or more 1,792,949 1,585,071 13.1% 898,518 811,378 10.7% 894,431 773,693 15.6%Avg Party Size 2.20 2.17 1.6% 1.97 1.94 1.2% 2.56 2.52 1.5%VISIT STATUS First-Time 1,812,375 1,638,791 10.6% 1,017,573 922,283 10.3% 794,802 716,507 10.9%Repeat 2,357,420 2,155,506 9.4% 1,503,955 1,406,855 6.9% 853,465 748,651 14.0%Average # of Trips 3.86 3.92 -1.6% 4.24 4.27 -0.7% 3.28 3.37 -2.8%TRAVEL METHODGroup Tour 890,768 816,550 9.1% 225,726 229,902 -1.8% 665,042 586,648 13.4%Package 2,420,342 2,189,236 10.6% 1,151,191 1,059,223 8.7% 1,269,151 1,130,013 12.3%Group Tour & Pkg 764,165 713,569 7.1% 180,337 186,139 -3.1% 583,828 527,430 10.7%True Independent 1,622,850 1,502,079 8.0% 1,324,948 1,226,152 8.1% 297,902 275,927 8.0%ISLANDS VISITED Oahu 3,107,010 2,780,484 11.7% 1,539,444 1,396,572 10.2% 1,567,565 1,383,912 13.3%Maui County 1,088,990 1,097,701 -0.8% 918,461 914,126 0.5% 170,529 183,575 -7.1%...Maui 1,061,754 1,055,917 0.6% 898,886 890,884 0.9% 162,868 165,033 -1.3%...Molokai 27,728 41,642 -33.4% 19,550 26,515 -26.3% 8,177 15,127 -45.9%...Lanai 37,323 50,158 -25.6% 31,446 38,126 -17.5% 5,877 12,032 -51.2%Kauai 384,347 380,865 0.9% 314,522 315,193 -0.2% 69,826 65,673 6.3%Big Island 643,505 609,658 5.6% 419,877 403,485 4.1% 223,628 206,173 8.5%…Hilo 205,683 197,690 4.0% 112,712 116,111 -2.9% 92,971 81,579 14.0%…Kona 534,955 504,108 6.1% 354,282 336,099 5.4% 180,672 168,010 7.5%LENGTH OF STAY Oahu (days) 5.91 6.12 -3.4% 6.62 6.86 -3.5% 5.22 5.38 -3.0%Maui (days) 6.18 6.34 -2.5% 6.64 6.79 -2.2% 3.63 3.90 -6.9%Molokai (days) 2.63 2.54 3.5% 3.08 3.13 -1.5% 1.54 1.50 2.1%Lanai (days) 3.43 3.48 -1.5% 3.63 4.01 -9.5% 2.34 1.79 30.6%Kauai (days) 5.26 5.35 -1.6% 5.82 5.81 0.3% 2.75 3.15 -12.5%Big Island (days) 5.15 5.30 -2.9% 6.14 6.27 -2.1% 3.29 3.42 -3.6%...Hilo (days) 2.80 2.85 -1.5% 3.60 3.75 -4.0% 1.84 1.56 17.9%...Kona (days) 5.11 5.30 -3.4% 6.13 6.23 -1.6% 3.13 3.44 -8.8%Statewide (days) 7.31 7.71 -5.3% 8.23 8.68 -5.3% 5.90 6.18 -4.4%ACCOMMODATIONSHotel 4,169,795 3,794,297 9.9% 2,521,528 2,329,138 8.3% 1,648,267 1,465,158 12.5%...Hotel Only 4,169,795 3,794,297 9.9% 2,521,528 2,329,138 8.3% 1,648,267 1,465,158 12.5%PURPOSE OF TRIPPleasure (Net) 3,465,168 3,097,103 11.9% 1,992,564 1,808,186 10.2% 1,472,604 1,288,917 14.3%…Honeymoon/Get Married (Net) 582,813 535,064 8.9% 209,293 197,960 5.7% 373,520 337,104 10.8%MC&I (Net) 380,098 389,469 -2.4% 295,006 305,978 -3.6% 85,091 83,491 1.9%.....Convention/Conf. 222,085 236,496 -6.1% 185,364 197,796 -6.3% 36,722 38,699 -5.1%.....Corp. Meetings 74,155 71,893 3.1% 55,345 56,089 -1.3% 18,809 15,804 19.0%.....Incentive 98,367 95,124 3.4% 66,834 64,172 4.1% 31,533 30,952 1.9%Other Business 177,940 164,601 8.1% 157,379 144,259 9.1% 20,562 20,342 1.1%Visit Friends/Relatives 127,154 114,566 11.0% 103,776 89,560 15.9% 23,378 25,006 -6.5%Government/Military 68,969 68,756 0.3% 52,964 51,146 3.6% 16,005 17,610 -9.1%Attend School 6,214 5,180 20.0% 4,104 3,462 18.6% 2,110 1,718 22.8%Sport Events 89,947 90,834 -1.0% 56,658 57,111 -0.8% 33,289 33,723 -1.3%
Hotel Only
Source: DBEDT 52
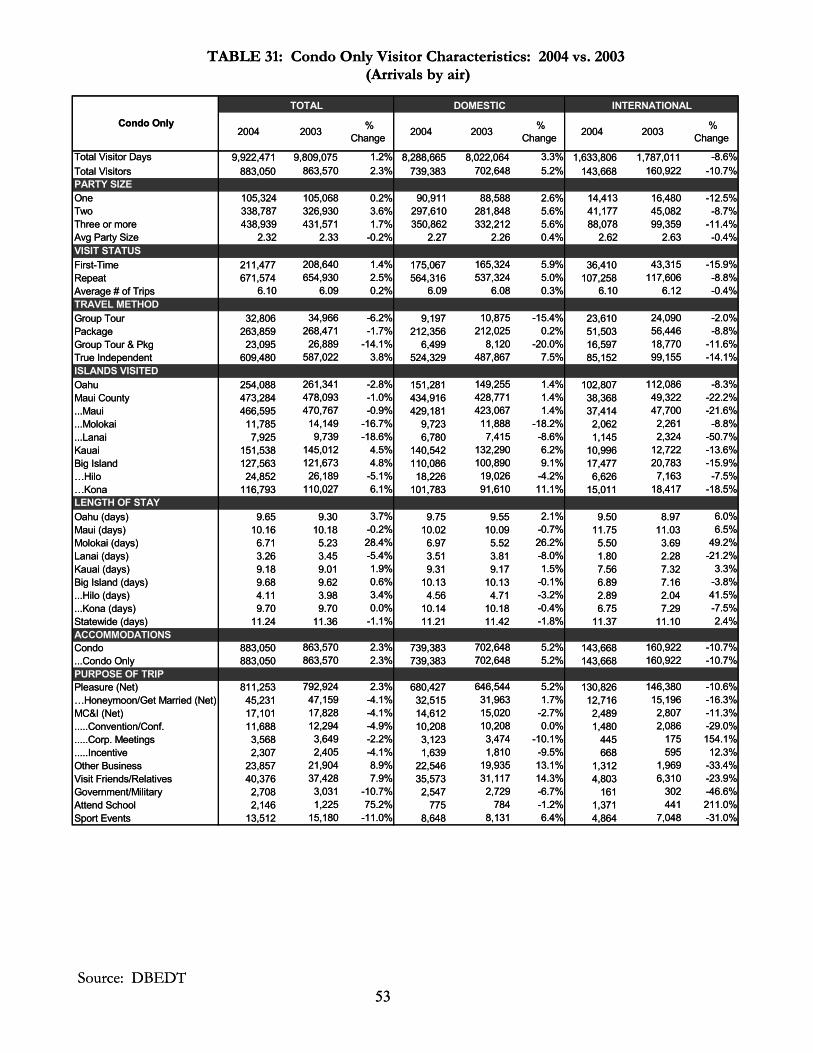
TABLE 31: Condo Only Visitor Characteristics: 2004 vs. 2003 (Arrivals by air)
TOTAL DOMESTIC INTERNATIONAL
2004 2003 % Change 2004 2003 %
Change 2004 2003 % Change
Total Visitor Days 9,922,471 9,809,075 1.2% 8,288,665 8,022,064 3.3% 1,633,806 1,787,011 -8.6%Total Visitors 883,050 863,570 2.3% 739,383 702,648 5.2% 143,668 160,922 -10.7%PARTY SIZEOne 105,324 105,068 0.2% 90,911 88,588 2.6% 14,413 16,480 -12.5%Two 338,787 326,930 3.6% 297,610 281,848 5.6% 41,177 45,082 -8.7%Three or more 438,939 431,571 1.7% 350,862 332,212 5.6% 88,078 99,359 -11.4%Avg Party Size 2.32 2.33 -0.2% 2.27 2.26 0.4% 2.62 2.63 -0.4%VISIT STATUS First-Time 211,477 208,640 1.4% 175,067 165,324 5.9% 36,410 43,315 -15.9%Repeat 671,574 654,930 2.5% 564,316 537,324 5.0% 107,258 117,606 -8.8%Average # of Trips 6.10 6.09 0.2% 6.09 6.08 0.3% 6.10 6.12 -0.4%TRAVEL METHODGroup Tour 32,806 34,966 -6.2% 9,197 10,875 -15.4% 23,610 24,090 -2.0%Package 263,859 268,471 -1.7% 212,356 212,025 0.2% 51,503 56,446 -8.8%Group Tour & Pkg 23,095 26,889 -14.1% 6,499 8,120 -20.0% 16,597 18,770 -11.6%True Independent 609,480 587,022 3.8% 524,329 487,867 7.5% 85,152 99,155 -14.1%ISLANDS VISITED Oahu 254,088 261,341 -2.8% 151,281 149,255 1.4% 102,807 112,086 -8.3%Maui County 473,284 478,093 -1.0% 434,916 428,771 1.4% 38,368 49,322 -22.2%...Maui 466,595 470,767 -0.9% 429,181 423,067 1.4% 37,414 47,700 -21.6%...Molokai 11,785 14,149 -16.7% 9,723 11,888 -18.2% 2,062 2,261 -8.8%...Lanai 7,925 9,739 -18.6% 6,780 7,415 -8.6% 1,145 2,324 -50.7%Kauai 151,538 145,012 4.5% 140,542 132,290 6.2% 10,996 12,722 -13.6%Big Island 127,563 121,673 4.8% 110,086 100,890 9.1% 17,477 20,783 -15.9%…Hilo 24,852 26,189 -5.1% 18,226 19,026 -4.2% 6,626 7,163 -7.5%…Kona 116,793 110,027 6.1% 101,783 91,610 11.1% 15,011 18,417 -18.5%LENGTH OF STAY Oahu (days) 9.65 9.30 3.7% 9.75 9.55 2.1% 9.50 8.97 6.0%Maui (days) 10.16 10.18 -0.2% 10.02 10.09 -0.7% 11.75 11.03 6.5%Molokai (days) 6.71 5.23 28.4% 6.97 5.52 26.2% 5.50 3.69 49.2%Lanai (days) 3.26 3.45 -5.4% 3.51 3.81 -8.0% 1.80 2.28 -21.2%Kauai (days) 9.18 9.01 1.9% 9.31 9.17 1.5% 7.56 7.32 3.3%Big Island (days) 9.68 9.62 0.6% 10.13 10.13 -0.1% 6.89 7.16 -3.8%...Hilo (days) 4.11 3.98 3.4% 4.56 4.71 -3.2% 2.89 2.04 41.5%...Kona (days) 9.70 9.70 0.0% 10.14 10.18 -0.4% 6.75 7.29 -7.5%Statewide (days) 11.24 11.36 -1.1% 11.21 11.42 -1.8% 11.37 11.10 2.4%ACCOMMODATIONSCondo 883,050 863,570 2.3% 739,383 702,648 5.2% 143,668 160,922 -10.7%...Condo Only 883,050 863,570 2.3% 739,383 702,648 5.2% 143,668 160,922 -10.7%PURPOSE OF TRIPPleasure (Net) 811,253 792,924 2.3% 680,427 646,544 5.2% 130,826 146,380 -10.6%…Honeymoon/Get Married (Net) 45,231 47,159 -4.1% 32,515 31,963 1.7% 12,716 15,196 -16.3%MC&I (Net) 17,101 17,828 -4.1% 14,612 15,020 -2.7% 2,489 2,807 -11.3%.....Convention/Conf. 11,688 12,294 -4.9% 10,208 10,208 0.0% 1,480 2,086 -29.0%.....Corp. Meetings 3,568 3,649 -2.2% 3,123 3,474 -10.1% 445 175 154.1%.....Incentive 2,307 2,405 -4.1% 1,639 1,810 -9.5% 668 595 12.3%Other Business 23,857 21,904 8.9% 22,546 19,935 13.1% 1,312 1,969 -33.4%Visit Friends/Relatives 40,376 37,428 7.9% 35,573 31,117 14.3% 4,803 6,310 -23.9%Government/Military 2,708 3,031 -10.7% 2,547 2,729 -6.7% 161 302 -46.6%Attend School 2,146 1,225 75.2% 775 784 -1.2% 1,371 441 211.0%Sport Events 13,512 15,180 -11.0% 8,648 8,131 6.4% 4,864 7,048 -31.0%
Condo Only
TABLE 31: Condo Only Visitor Characteristics: 2004 vs. 2003 (Arrivals by air)
Source: DBEDT 53
TOTAL DOMESTIC INTERNATIONAL
2004 2003 % Change 2004 2003 %
Change 2004 2003 % Change
Total Visitor Days 9,922,471 9,809,075 1.2% 8,288,665 8,022,064 3.3% 1,633,806 1,787,011 -8.6%Total Visitors 883,050 863,570 2.3% 739,383 702,648 5.2% 143,668 160,922 -10.7%PARTY SIZEOne 105,324 105,068 0.2% 90,911 88,588 2.6% 14,413 16,480 -12.5%Two 338,787 326,930 3.6% 297,610 281,848 5.6% 41,177 45,082 -8.7%Three or more 438,939 431,571 1.7% 350,862 332,212 5.6% 88,078 99,359 -11.4%Avg Party Size 2.32 2.33 -0.2% 2.27 2.26 0.4% 2.62 2.63 -0.4%VISIT STATUS First-Time 211,477 208,640 1.4% 175,067 165,324 5.9% 36,410 43,315 -15.9%Repeat 671,574 654,930 2.5% 564,316 537,324 5.0% 107,258 117,606 -8.8%Average # of Trips 6.10 6.09 0.2% 6.09 6.08 0.3% 6.10 6.12 -0.4%TRAVEL METHODGroup Tour 32,806 34,966 -6.2% 9,197 10,875 -15.4% 23,610 24,090 -2.0%Package 263,859 268,471 -1.7% 212,356 212,025 0.2% 51,503 56,446 -8.8%Group Tour & Pkg 23,095 26,889 -14.1% 6,499 8,120 -20.0% 16,597 18,770 -11.6%True Independent 609,480 587,022 3.8% 524,329 487,867 7.5% 85,152 99,155 -14.1%ISLANDS VISITED Oahu 254,088 261,341 -2.8% 151,281 149,255 1.4% 102,807 112,086 -8.3%Maui County 473,284 478,093 -1.0% 434,916 428,771 1.4% 38,368 49,322 -22.2%...Maui 466,595 470,767 -0.9% 429,181 423,067 1.4% 37,414 47,700 -21.6%...Molokai 11,785 14,149 -16.7% 9,723 11,888 -18.2% 2,062 2,261 -8.8%...Lanai 7,925 9,739 -18.6% 6,780 7,415 -8.6% 1,145 2,324 -50.7%Kauai 151,538 145,012 4.5% 140,542 132,290 6.2% 10,996 12,722 -13.6%Big Island 127,563 121,673 4.8% 110,086 100,890 9.1% 17,477 20,783 -15.9%…Hilo 24,852 26,189 -5.1% 18,226 19,026 -4.2% 6,626 7,163 -7.5%…Kona 116,793 110,027 6.1% 101,783 91,610 11.1% 15,011 18,417 -18.5%LENGTH OF STAY Oahu (days) 9.65 9.30 3.7% 9.75 9.55 2.1% 9.50 8.97 6.0%Maui (days) 10.16 10.18 -0.2% 10.02 10.09 -0.7% 11.75 11.03 6.5%Molokai (days) 6.71 5.23 28.4% 6.97 5.52 26.2% 5.50 3.69 49.2%Lanai (days) 3.26 3.45 -5.4% 3.51 3.81 -8.0% 1.80 2.28 -21.2%Kauai (days) 9.18 9.01 1.9% 9.31 9.17 1.5% 7.56 7.32 3.3%Big Island (days) 9.68 9.62 0.6% 10.13 10.13 -0.1% 6.89 7.16 -3.8%...Hilo (days) 4.11 3.98 3.4% 4.56 4.71 -3.2% 2.89 2.04 41.5%...Kona (days) 9.70 9.70 0.0% 10.14 10.18 -0.4% 6.75 7.29 -7.5%Statewide (days) 11.24 11.36 -1.1% 11.21 11.42 -1.8% 11.37 11.10 2.4%ACCOMMODATIONSCondo 883,050 863,570 2.3% 739,383 702,648 5.2% 143,668 160,922 -10.7%...Condo Only 883,050 863,570 2.3% 739,383 702,648 5.2% 143,668 160,922 -10.7%PURPOSE OF TRIPPleasure (Net) 811,253 792,924 2.3% 680,427 646,544 5.2% 130,826 146,380 -10.6%…Honeymoon/Get Married (Net) 45,231 47,159 -4.1% 32,515 31,963 1.7% 12,716 15,196 -16.3%MC&I (Net) 17,101 17,828 -4.1% 14,612 15,020 -2.7% 2,489 2,807 -11.3%.....Convention/Conf. 11,688 12,294 -4.9% 10,208 10,208 0.0% 1,480 2,086 -29.0%.....Corp. Meetings 3,568 3,649 -2.2% 3,123 3,474 -10.1% 445 175 154.1%.....Incentive 2,307 2,405 -4.1% 1,639 1,810 -9.5% 668 595 12.3%Other Business 23,857 21,904 8.9% 22,546 19,935 13.1% 1,312 1,969 -33.4%Visit Friends/Relatives 40,376 37,428 7.9% 35,573 31,117 14.3% 4,803 6,310 -23.9%Government/Military 2,708 3,031 -10.7% 2,547 2,729 -6.7% 161 302 -46.6%Attend School 2,146 1,225 75.2% 775 784 -1.2% 1,371 441 211.0%Sport Events 13,512 15,180 -11.0% 8,648 8,131 6.4% 4,864 7,048 -31.0%
Condo Only
Source: DBEDT 53
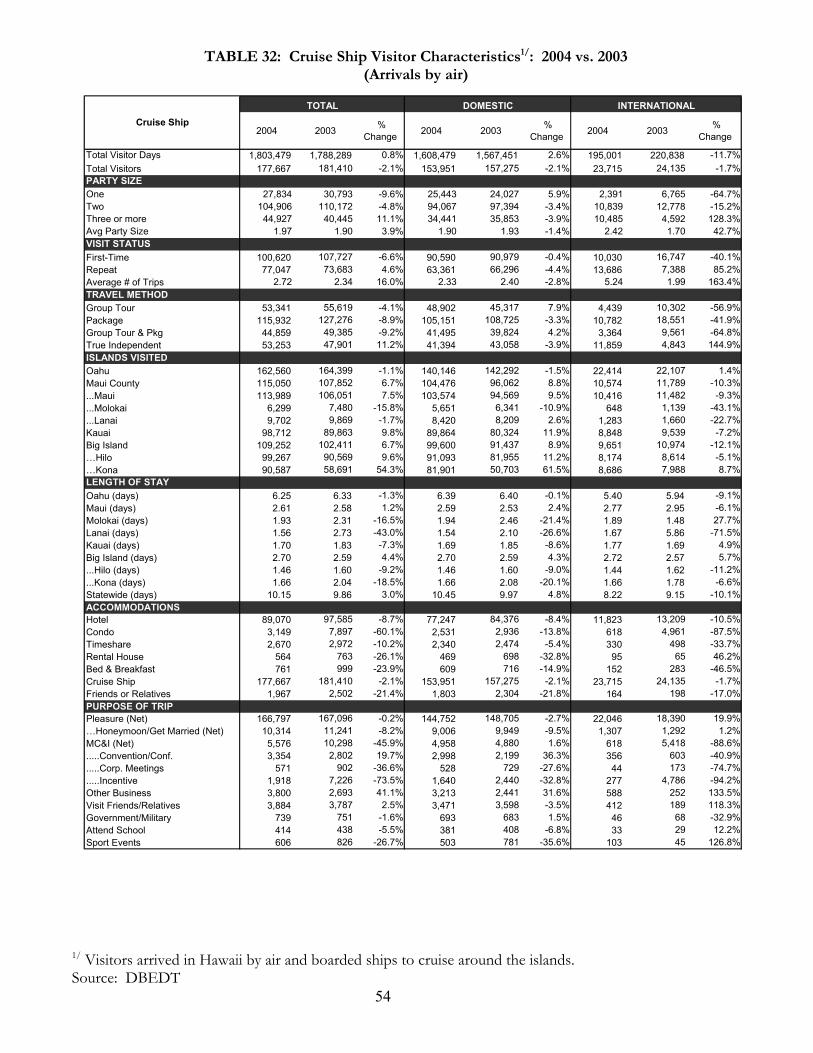
TABLE 32: Cruise Ship Visitor Characteristics1/: 2004 vs. 2003 (Arrivals by air)
TOTAL DOMESTIC INTERNATIONAL
2004 2003 % Change 2004 2003 %
Change 2004 2003 % Change
Total Visitor Days 1,803,479 1,788,289 0.8% 1,608,479 1,567,451 2.6% 195,001 220,838 -11.7%Total Visitors 177,667 181,410 -2.1% 153,951 157,275 -2.1% 23,715 24,135 -1.7%PARTY SIZEOne 27,834 30,793 -9.6% 25,443 24,027 5.9% 2,391 6,765 -64.7%Two 104,906 110,172 -4.8% 94,067 97,394 -3.4% 10,839 12,778 -15.2%Three or more 44,927 40,445 11.1% 34,441 35,853 -3.9% 10,485 4,592 128.3%Avg Party Size 1.97 1.90 3.9% 1.90 1.93 -1.4% 2.42 1.70 42.7%VISIT STATUS First-Time 100,620 107,727 -6.6% 90,590 90,979 -0.4% 10,030 16,747 -40.1%Repeat 77,047 73,683 4.6% 63,361 66,296 -4.4% 13,686 7,388 85.2%Average # of Trips 2.72 2.34 16.0% 2.33 2.40 -2.8% 5.24 1.99 163.4%TRAVEL METHODGroup Tour 53,341 55,619 -4.1% 48,902 45,317 7.9% 4,439 10,302 -56.9%Package 115,932 127,276 -8.9% 105,151 108,725 -3.3% 10,782 18,551 -41.9%Group Tour & Pkg 44,859 49,385 -9.2% 41,495 39,824 4.2% 3,364 9,561 -64.8%True Independent 53,253 47,901 11.2% 41,394 43,058 -3.9% 11,859 4,843 144.9%ISLANDS VISITED Oahu 162,560 164,399 -1.1% 140,146 142,292 -1.5% 22,414 22,107 1.4%Maui County 115,050 107,852 6.7% 104,476 96,062 8.8% 10,574 11,789 -10.3%...Maui 113,989 106,051 7.5% 103,574 94,569 9.5% 10,416 11,482 -9.3%...Molokai 6,299 7,480 -15.8% 5,651 6,341 -10.9% 648 1,139 -43.1%...Lanai 9,702 9,869 -1.7% 8,420 8,209 2.6% 1,283 1,660 -22.7%Kauai 98,712 89,863 9.8% 89,864 80,324 11.9% 8,848 9,539 -7.2%Big Island 109,252 102,411 6.7% 99,600 91,437 8.9% 9,651 10,974 -12.1%…Hilo 99,267 90,569 9.6% 91,093 81,955 11.2% 8,174 8,614 -5.1%…Kona 90,587 58,691 54.3% 81,901 50,703 61.5% 8,686 7,988 8.7%LENGTH OF STAY Oahu (days) 6.25 6.33 -1.3% 6.39 6.40 -0.1% 5.40 5.94 -9.1%Maui (days) 2.61 2.58 1.2% 2.59 2.53 2.4% 2.77 2.95 -6.1%Molokai (days) 1.93 2.31 -16.5% 1.94 2.46 -21.4% 1.89 1.48 27.7%Lanai (days) 1.56 2.73 -43.0% 1.54 2.10 -26.6% 1.67 5.86 -71.5%Kauai (days) 1.70 1.83 -7.3% 1.69 1.85 -8.6% 1.77 1.69 4.9%Big Island (days) 2.70 2.59 4.4% 2.70 2.59 4.3% 2.72 2.57 5.7%...Hilo (days) 1.46 1.60 -9.2% 1.46 1.60 -9.0% 1.44 1.62 -11.2%...Kona (days) 1.66 2.04 -18.5% 1.66 2.08 -20.1% 1.66 1.78 -6.6%Statewide (days) 10.15 9.86 3.0% 10.45 9.97 4.8% 8.22 9.15 -10.1%ACCOMMODATIONSHotel 89,070 97,585 -8.7% 77,247 84,376 -8.4% 11,823 13,209 -10.5%Condo 3,149 7,897 -60.1% 2,531 2,936 -13.8% 618 4,961 -87.5%Timeshare 2,670 2,972 -10.2% 2,340 2,474 -5.4% 330 498 -33.7%Rental House 564 763 -26.1% 469 698 -32.8% 95 65 46.2%Bed & Breakfast 761 999 -23.9% 609 716 -14.9% 152 283 -46.5%Cruise Ship 177,667 181,410 -2.1% 153,951 157,275 -2.1% 23,715 24,135 -1.7%Friends or Relatives 1,967 2,502 -21.4% 1,803 2,304 -21.8% 164 198 -17.0%PURPOSE OF TRIPPleasure (Net) 166,797 167,096 -0.2% 144,752 148,705 -2.7% 22,046 18,390 19.9%…Honeymoon/Get Married (Net) 10,314 11,241 -8.2% 9,006 9,949 -9.5% 1,307 1,292 1.2%MC&I (Net) 5,576 10,298 -45.9% 4,958 4,880 1.6% 618 5,418 -88.6%.....Convention/Conf. 3,354 2,802 19.7% 2,998 2,199 36.3% 356 603 -40.9%.....Corp. Meetings 571 902 -36.6% 528 729 -27.6% 44 173 -74.7%.....Incentive 1,918 7,226 -73.5% 1,640 2,440 -32.8% 277 4,786 -94.2%Other Business 3,800 2,693 41.1% 3,213 2,441 31.6% 588 252 133.5%Visit Friends/Relatives 3,884 3,787 2.5% 3,471 3,598 -3.5% 412 189 118.3%Government/Military 739 751 -1.6% 693 683 1.5% 46 68 -32.9%Attend School 414 438 -5.5% 381 408 -6.8% 33 29 12.2%Sport Events 606 826 -26.7% 503 781 -35.6% 103 45 126.8%
Cruise Ship
1/ Visitors arrived in Hawaii by air and boarded ships to cruise around the islands. Source: DBEDT
54

AIR VISITOR CHARACTERISTICS BY FIRST-TIME/REPEAT STATUS
FIRST-TIME VISITOR
REPEAT VISITOR
55
AIR VISITOR CHARACTERISTICS BY FIRST-TIME/REPEAT STATUS
FIRST-TIME VISITORS: Close to 38 percent of the visitors who arrived by air in 2004 were first-time visitors to the islands, an increase of 8.8 percent over the previous year. Nearly 65 percent of these visitors arrived on domestic flights while the remainder came from foreign destinations. First-time visitors comprised 22.6 percent of the U.S. West market, 48.9 percent of the U.S. East market, 45.4 percent of the Japanese market and 42.9 percent of the Canadian market but accounted for the majority of the smaller European (71.2%), Other Asia (69.6%) and Latin America (65.5%) and Oceania (53.8%) markets (TABLES 20-24). Only 39.7 percent traveled as true independent while most purchased either group or package tour accommodations. About 77 percent of all first time visitors stayed in hotels. Oahu was the most popular destination, visited by 74.4 percent of the first timers to the State, followed by Maui (30.2%), the Big Island (17.6%) and Kauai (13.8%). First time visitors stayed the longest on Oahu (6.22 days), followed by Maui (6.17 days), Kauai (5.32 days), the Big Island (5.22 days), Molokai (2.96 days) and Lanai (2.58 days). Most (85.7%) visited the islands for pleasure. REPEAT VISITORS: The number of repeat visitors rose 8 percent to comprise 62.4 percent of total arrivals by air in the state. (TABLE 2). About 62 percent were independent travelers. The majority of the repeat visitors were from the U.S West where 77.4 percent reported that they have been to the islands before. (TABLE 11). Repeat visitors accounted for 51.1 percent of U.S. East arrivals (TABLE 13), 54.6 percent of Japanese arrivals and 57.1 percent of Canadian arrivals in 2004. Nearly 59 of all repeat visitors went to Oahu, 31.8 percent visited Maui, 19.1 percent went to the Big Island and 15.3 percent went to Kauai. Repeat visitors stayed the longest on Maui (8.22 days), followed by the Big Island (7.49 days), Kauai (7.55 days), Oahu (7.36 days), Molokai (5.00 days) and Lanai (3.70 days). 62.5 percent of repeat visitors chose hotels for their accommodations, 20.1 percent stayed in condominiums, 11.4 percent stayed with friends and relatives and 8.2 percent stayed in timeshare properties. The majority (80.6%) returned to Hawaii for pleasure, 10.8 percent to visit friends or relatives and 6.5 percent for meetings, conventions and incentives.
56

TABLE 33: First-Time Visitor Characteristics: 2004 vs. 2003 (Arrivals by air)
TABLE 33: First-Time Visitor Characteristics: 2004 vs. 2003 (Arrivals by air)
Source: DBEDT
57
TOTAL DOMESTIC INTERNATIONAL
2004 2003 % Change 2004 2003 %
Change 2004 2003 % Change
Total Visitor Days 21,322,187 20,360,582 4.7% 15,558,250 14,927,140 4.2% 5,763,938 5,433,442 6.1%Total Visitors 2,600,834 2,389,703 8.8% 1,688,929 1,547,360 9.1% 911,906 842,343 8.3%PARTY SIZEOne 450,102 430,420 4.6% 338,016 320,595 5.4% 112,086 109,825 2.1%Two 1,149,631 1,060,922 8.4% 809,963 742,012 9.2% 339,668 318,910 6.5%Three or more 1,001,101 898,361 11.4% 540,950 484,753 11.6% 460,152 413,608 11.3%Avg Party Size 2.12 2.09 1.4% 1.92 1.90 1.0% 2.47 2.42 2.1%VISIT STATUS First-Time 2,600,834 2,389,703 8.8% 1,688,929 1,547,360 9.1% 911,906 842,343 8.3%Average # of Trips 1.00 1.00 0.0% 1.00 1.00 0.0% 1.00 1.00 0.0%TRAVEL METHODGroup Tour 535,774 500,222 7.1% 176,696 171,954 2.8% 359,078 328,268 9.4%Package 1,486,054 1,378,177 7.8% 804,208 740,868 8.5% 681,846 637,309 7.0%Group Tour & Pkg 452,524 435,064 4.0% 145,390 143,299 1.5% 307,134 291,766 5.3%True Independent 1,031,531 946,368 9.0% 853,415 777,837 9.7% 178,116 168,531 5.7%ISLANDS VISITED Oahu 1,934,324 1,757,240 10.1% 1,077,771 974,988 10.5% 856,553 782,252 9.5%Maui County 798,362 798,864 -0.1% 689,736 674,393 2.3% 108,627 124,471 -12.7%...Maui 784,913 775,993 1.1% 679,870 662,189 2.7% 105,043 113,805 -7.7%...Molokai 25,655 35,977 -28.7% 20,916 24,688 -15.3% 4,739 11,288 -58.0%...Lanai 26,860 33,682 -20.3% 23,084 26,394 -12.5% 3,777 7,288 -48.2%Kauai 360,183 350,772 2.7% 313,864 302,911 3.6% 46,320 47,861 -3.2%Big Island 456,484 432,059 5.7% 332,200 310,124 7.1% 124,284 121,936 1.9%…Hilo 214,197 202,231 5.9% 150,809 143,255 5.3% 63,388 58,976 7.5%…Kona 367,393 329,002 11.7% 266,935 231,763 15.2% 100,458 97,239 3.3%LENGTH OF STAY Oahu (days) 6.22 6.31 -1.4% 6.87 7.07 -2.9% 5.40 5.36 0.9%Maui (days) 6.17 6.30 -2.1% 6.40 6.57 -2.6% 4.70 4.77 -1.5%Molokai (days) 2.96 3.11 -4.8% 3.14 3.43 -8.6% 2.20 2.41 -9.0%Lanai (days) 2.58 3.08 -16.1% 2.63 3.18 -17.2% 2.30 2.73 -16.0%Kauai (days) 5.32 5.42 -1.7% 5.54 5.65 -1.9% 3.81 3.90 -2.5%Big Island (days) 5.22 5.25 -0.5% 5.83 5.81 0.4% 3.59 3.83 -6.3%...Hilo (days) 2.81 2.96 -5.1% 3.30 3.44 -4.1% 1.65 1.80 -8.4%...Kona (days) 4.85 5.07 -4.4% 5.40 5.65 -4.5% 3.40 3.71 -8.4%Statewide (days) 8.20 8.52 -3.8% 9.21 9.65 -4.5% 6.32 6.45 -2.0%ACCOMMODATIONSHotel 2,012,740 1,838,291 9.5% 1,186,095 1,089,190 8.9% 826,645 749,101 10.4%...Hotel Only 1,812,375 1,638,791 10.6% 1,017,573 922,283 10.3% 794,802 716,507 10.9%Condo 294,770 294,256 0.2% 245,409 233,549 5.1% 49,361 60,708 -18.7%...Condo Only 211,477 208,640 1.4% 175,067 165,324 5.9% 36,410 43,315 -15.9%Timeshare 127,711 111,582 14.5% 118,264 103,024 14.8% 9,447 8,558 10.4%...Timeshare Only 91,269 77,942 17.1% 84,635 72,645 16.5% 6,634 5,297 25.2%Rental House 57,161 45,384 25.9% 51,160 41,192 24.2% 6,001 4,192 43.2%Bed & Breakfast 30,036 29,191 2.9% 25,270 24,592 2.8% 4,765 4,599 3.6%Cruise Ship 100,620 107,727 -6.6% 90,590 90,979 -0.4% 10,030 16,747 -40.1%Friends or Relatives 156,594 146,424 6.9% 135,115 122,340 10.4% 21,479 24,084 -10.8%PURPOSE OF TRIPPleasure (Net) 2,229,701 2,016,643 10.6% 1,416,447 1,283,344 10.4% 813,253 733,299 10.9%…Honeymoon/Get Married (Net) 456,935 426,998 7.0% 199,588 189,971 5.1% 257,347 237,027 8.6%MC&I (Net) 177,115 186,896 -5.2% 131,871 135,193 -2.5% 45,245 51,703 -12.5%.....Convention/Conf. 108,380 114,312 -5.2% 87,206 91,295 -4.5% 21,174 23,017 -8.0%.....Corp. Meetings 27,580 27,005 2.1% 18,691 19,418 -3.7% 8,889 7,587 17.2%.....Incentive 47,278 51,976 -9.0% 31,073 29,707 4.6% 16,204 22,269 -27.2%Other Business 60,643 54,521 11.2% 50,061 43,968 13.9% 10,583 10,553 0.3%Visit Friends/Relatives 141,688 129,791 9.2% 122,457 108,278 13.1% 19,231 21,513 -10.6%Government/Military 27,123 29,307 -7.5% 20,166 20,021 0.7% 6,956 9,287 -25.1%Attend School 8,509 7,025 21.1% 5,206 4,932 5.5% 3,303 2,092 57.9%Sport Events 47,684 50,144 -4.9% 32,824 33,363 -1.6% 14,860 16,781 -11.4%
First-Time
Source: DBEDT 57
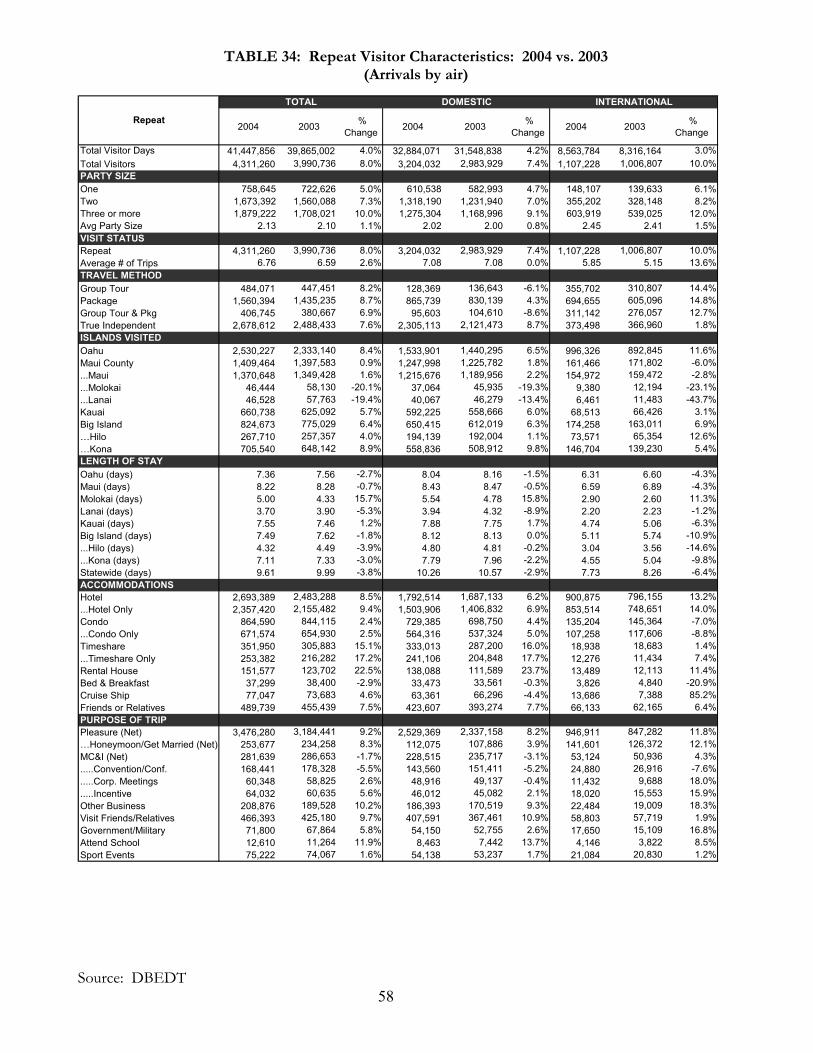
TABLE 34: Repeat Visitor Characteristics: 2004 vs. 2003 (Arrivals by air)
TOTAL DOMESTIC INTERNATIONAL
2004 2003 % Change 2004 2003 %
Change 2004 2003 % Change
Total Visitor Days 41,447,856 39,865,002 4.0% 32,884,071 31,548,838 4.2% 8,563,784 8,316,164 3.0%Total Visitors 4,311,260 3,990,736 8.0% 3,204,032 2,983,929 7.4% 1,107,228 1,006,807 10.0%PARTY SIZEOne 758,645 722,626 5.0% 610,538 582,993 4.7% 148,107 139,633 6.1%Two 1,673,392 1,560,088 7.3% 1,318,190 1,231,940 7.0% 355,202 328,148 8.2%Three or more 1,879,222 1,708,021 10.0% 1,275,304 1,168,996 9.1% 603,919 539,025 12.0%Avg Party Size 2.13 2.10 1.1% 2.02 2.00 0.8% 2.45 2.41 1.5%VISIT STATUS Repeat 4,311,260 3,990,736 8.0% 3,204,032 2,983,929 7.4% 1,107,228 1,006,807 10.0%Average # of Trips 6.76 6.59 2.6% 7.08 7.08 0.0% 5.85 5.15 13.6%TRAVEL METHODGroup Tour 484,071 447,451 8.2% 128,369 136,643 -6.1% 355,702 310,807 14.4%Package 1,560,394 1,435,235 8.7% 865,739 830,139 4.3% 694,655 605,096 14.8%Group Tour & Pkg 406,745 380,667 6.9% 95,603 104,610 -8.6% 311,142 276,057 12.7%True Independent 2,678,612 2,488,433 7.6% 2,305,113 2,121,473 8.7% 373,498 366,960 1.8%ISLANDS VISITED Oahu 2,530,227 2,333,140 8.4% 1,533,901 1,440,295 6.5% 996,326 892,845 11.6%Maui County 1,409,464 1,397,583 0.9% 1,247,998 1,225,782 1.8% 161,466 171,802 -6.0%...Maui 1,370,648 1,349,428 1.6% 1,215,676 1,189,956 2.2% 154,972 159,472 -2.8%...Molokai 46,444 58,130 -20.1% 37,064 45,935 -19.3% 9,380 12,194 -23.1%...Lanai 46,528 57,763 -19.4% 40,067 46,279 -13.4% 6,461 11,483 -43.7%Kauai 660,738 625,092 5.7% 592,225 558,666 6.0% 68,513 66,426 3.1%Big Island 824,673 775,029 6.4% 650,415 612,019 6.3% 174,258 163,011 6.9%…Hilo 267,710 257,357 4.0% 194,139 192,004 1.1% 73,571 65,354 12.6%…Kona 705,540 648,142 8.9% 558,836 508,912 9.8% 146,704 139,230 5.4%LENGTH OF STAY Oahu (days) 7.36 7.56 -2.7% 8.04 8.16 -1.5% 6.31 6.60 -4.3%Maui (days) 8.22 8.28 -0.7% 8.43 8.47 -0.5% 6.59 6.89 -4.3%Molokai (days) 5.00 4.33 15.7% 5.54 4.78 15.8% 2.90 2.60 11.3%Lanai (days) 3.70 3.90 -5.3% 3.94 4.32 -8.9% 2.20 2.23 -1.2%Kauai (days) 7.55 7.46 1.2% 7.88 7.75 1.7% 4.74 5.06 -6.3%Big Island (days) 7.49 7.62 -1.8% 8.12 8.13 0.0% 5.11 5.74 -10.9%...Hilo (days) 4.32 4.49 -3.9% 4.80 4.81 -0.2% 3.04 3.56 -14.6%...Kona (days) 7.11 7.33 -3.0% 7.79 7.96 -2.2% 4.55 5.04 -9.8%Statewide (days) 9.61 9.99 -3.8% 10.26 10.57 -2.9% 7.73 8.26 -6.4%ACCOMMODATIONSHotel 2,693,389 2,483,288 8.5% 1,792,514 1,687,133 6.2% 900,875 796,155 13.2%...Hotel Only 2,357,420 2,155,482 9.4% 1,503,906 1,406,832 6.9% 853,514 748,651 14.0%Condo 864,590 844,115 2.4% 729,385 698,750 4.4% 135,204 145,364 -7.0%...Condo Only 671,574 654,930 2.5% 564,316 537,324 5.0% 107,258 117,606 -8.8%Timeshare 351,950 305,883 15.1% 333,013 287,200 16.0% 18,938 18,683 1.4%...Timeshare Only 253,382 216,282 17.2% 241,106 204,848 17.7% 12,276 11,434 7.4%Rental House 151,577 123,702 22.5% 138,088 111,589 23.7% 13,489 12,113 11.4%Bed & Breakfast 37,299 38,400 -2.9% 33,473 33,561 -0.3% 3,826 4,840 -20.9%Cruise Ship 77,047 73,683 4.6% 63,361 66,296 -4.4% 13,686 7,388 85.2%Friends or Relatives 489,739 455,439 7.5% 423,607 393,274 7.7% 66,133 62,165 6.4%PURPOSE OF TRIPPleasure (Net) 3,476,280 3,184,441 9.2% 2,529,369 2,337,158 8.2% 946,911 847,282 11.8%…Honeymoon/Get Married (Net) 253,677 234,258 8.3% 112,075 107,886 3.9% 141,601 126,372 12.1%MC&I (Net) 281,639 286,653 -1.7% 228,515 235,717 -3.1% 53,124 50,936 4.3%.....Convention/Conf. 168,441 178,328 -5.5% 143,560 151,411 -5.2% 24,880 26,916 -7.6%.....Corp. Meetings 60,348 58,825 2.6% 48,916 49,137 -0.4% 11,432 9,688 18.0%.....Incentive 64,032 60,635 5.6% 46,012 45,082 2.1% 18,020 15,553 15.9%Other Business 208,876 189,528 10.2% 186,393 170,519 9.3% 22,484 19,009 18.3%Visit Friends/Relatives 466,393 425,180 9.7% 407,591 367,461 10.9% 58,803 57,719 1.9%Government/Military 71,800 67,864 5.8% 54,150 52,755 2.6% 17,650 15,109 16.8%Attend School 12,610 11,264 11.9% 8,463 7,442 13.7% 4,146 3,822 8.5%Sport Events 75,222 74,067 1.6% 54,138 53,237 1.7% 21,084 20,830 1.2%
Repeat
Source: DBEDT
58
ISLAND SUPPLEMENT
OAHU VISITORS BY AIR
MAUI COUNTY VISITORS BY AIR
Maui Island
Molokai
Lanai
KAUAI VISITORS BY AIR
HAWAII (BIG ISLAND) VISITORS BY AIR
Hilo
Kona
59

ISLAND SUPPLEMENT ISLAND OF OAHU: Total arrivals by air to Oahu increased 9.1 percent to 4,464,551 visitors in 2004. Close to 70 percent of these visitors stayed exclusively on Oahu while the remainder also visited the neighbor islands. (TABLE 41). Over half (58.5%) of the total Oahu visitors arrived on domestic flights while 41.5 percent came from foreign countries. Independent travelers accounted for 45.8 percent of all visitors to Oahu, while the remainder purchased group tours or package accommodations. There were more repeat visitors (56.7%) than first-time visitors (43.3%) to Oahu. The majority (78.4%) of all visitors to Oahu stayed in hotels, 10.2 percent stayed with friends or relatives, 9.4 percent stayed in condominium and 3.6 percent stayed in timeshare properties. Oahu had the largest share of honeymoon/wedding visitors at 12%, but the bulk of the visitors, nearly 81 percent who visited Oahu, traveled for pleasure.
ISLAND OF MAUI: A total of 2,155,561 visitors came by air to the island of Maui in 2004, 1.4 percent higher compared to the previous year. Close to 57 percent of these visitors spent all their time on Maui while 43.5 percent also visited other islands in addition to Maui (TABLE 43). Only 12.1 percent of the Maui visitors arrived on international flights while the majority came from the domestic markets. Repeat visitors comprised 63.6 percent of the total visitors to Maui compared to 36.4 percent of first-time visitors. There were more true independent travelers (58.2%) to Maui than those who purchased group tours or package accommodations. Maui had the largest share of visitors staying in condominiums (28.5% of total Maui visitors). In addition, close to 61 percent of all visitors to Maui stayed in hotels, 8.5 percent stayed in timeshare properties and 6.2 percent stayed with friends or relatives. About 88 percent visited the island of Maui for pleasure.
ISLAND OF MOLOKAI: Total arrivals by air to Molokai declined 23.4 percent to 72,099 visitors in 2004. Most of those who visited Molokai also visited other islands but only 11.9 percent stayed on Molokai exclusively (TABLE 44). The majority (80.4%) percent of all Molokai visitors arrived on domestic flights. About 64 percent were repeat visitors while 35.6 percent were first-timers to the state. Close to 61 percent of the visitors to Molokai were independent travelers. The remainder purchased group tour or package accommodations. Over half (57.6%) stayed in hotels, 26 percent stayed in condominiums, 13 percent stayed with friends or relatives and 6.2 percent stayed in timeshare properties. Pleasure was the primary purpose for visitations to this island given by 82.5 percent of all Molokai visitors.
60

ISLAND OF LANAI: A total of 73,388 visitors came to Lanai in 2004, down 19.7 percent compared to the previous year. About 12.5 percent of these visitors spent their entire time on this island (TABLE 45). About 86 percent of the Lanai visitors arrived on domestic flights while 13.9 percent came from foreign destinations. There were more repeat visitors (63%) than first timers (36.6%) on Lanai during the year. Similar to visitors on Maui and Molokai, there were more independent travelers to Lanai (59.9%) than those who purchased group tours or package accommodations. Hotels were the primary choice for lodging by 68.6 percent of the visitors to Lanai, 17.3 percent stayed in condominiums and 8.6 percent stayed with friends or relatives. The majority (83.5%) of Lanai’s visitors came for pleasure.
ISLAND OF KAUAI: Total arrivals to Kauai rose 4.6 percent to 1,020,920 visitors in 2004. Close to 44 percent of these visitors stayed on this island exclusively (TABLE 46). There were more visitors to Kauai from the domestic market (88.8%) than those from foreign countries (11.2%). There were also a larger number of repeat visitors (64.7%) compared to first-time visitors (35.3%) during the year. Close to 62 percent of the Kauai visitors were independent travelers. Of all the islands, Kauai had the largest share of visitors to stayed in timeshare properties (17.3% of total Kauai visitors). Over half (55.7%) of those who visited Kauai stayed in hotels, 23.2 percent stayed in condominium and 6.8 percent stayed with friends or relatives.
THE BIG ISLAND: Arrivals by air to the Big Island rose 6.1 percent from 2003 to 1,281,156 visitors. Those who stayed exclusively on this island comprised 39.9 percent of the total or 510,746 visitors (TABLE 47). Nearly 77 percent of all Big Island visitors were from the domestic U.S. mainland while 23.3 percent were from foreign countries. Repeat visitors (64.4%) accounted for a larger proportion than first-time visitors (35.6%) among this group. There were also more visitors traveling independently (57.3%) than those who purchased group tours or package accommodations. About 66.5 percent of all visitors to the Big Island stayed in hotels, 16.7 percent stayed in condominiums, 10.5 percent stayed with friends and relatives, 9.2 percent stayed in timeshare properties and 8.5 percent stayed on cruise ships. Compared to the other islands, the Big Island had the largest share of meetings, conventions and incentive visitors (7.4% of total visitors to the Big Island) while close to 85 percent of the visitors traveled to the Big Island for pleasure.
61
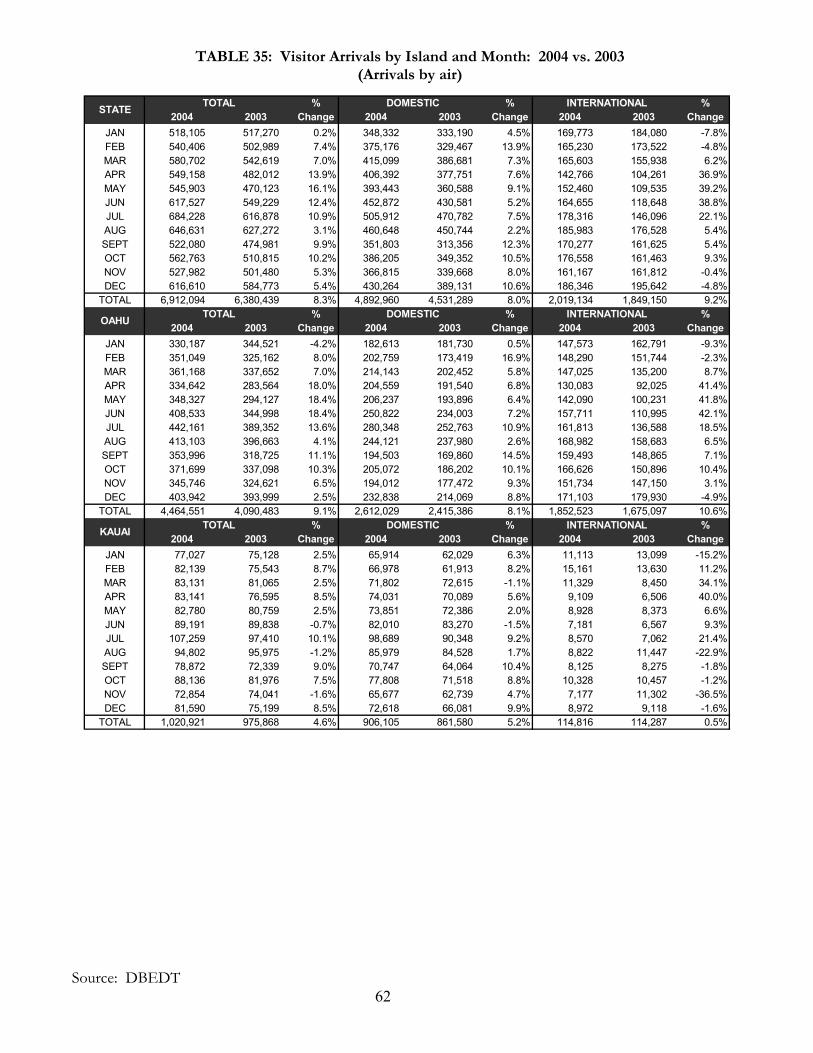
TABLE 35: Visitor Arrivals by Island and Month: 2004 vs. 2003 (Arrivals by air)
TOTAL % DOMESTIC % INTERNATIONAL %2004 2003 Change 2004 2003 Change 2004 2003 Change
JAN 518,105 517,270 0.2% 348,332 333,190 4.5% 169,773 184,080 -7.8%FEB 540,406 502,989 7.4% 375,176 329,467 13.9% 165,230 173,522 -4.8%MAR 580,702 542,619 7.0% 415,099 386,681 7.3% 165,603 155,938 6.2%APR 549,158 482,012 13.9% 406,392 377,751 7.6% 142,766 104,261 36.9%MAY 545,903 470,123 16.1% 393,443 360,588 9.1% 152,460 109,535 39.2%JUN 617,527 549,229 12.4% 452,872 430,581 5.2% 164,655 118,648 38.8%JUL 684,228 616,878 10.9% 505,912 470,782 7.5% 178,316 146,096 22.1%AUG 646,631 627,272 3.1% 460,648 450,744 2.2% 185,983 176,528 5.4%SEPT 522,080 474,981 9.9% 351,803 313,356 12.3% 170,277 161,625 5.4%OCT 562,763 510,815 10.2% 386,205 349,352 10.5% 176,558 161,463 9.3%NOV 527,982 501,480 5.3% 366,815 339,668 8.0% 161,167 161,812 -0.4%DEC 616,610 584,773 5.4% 430,264 389,131 10.6% 186,346 195,642 -4.8%
TOTAL 6,912,094 6,380,439 8.3% 4,892,960 4,531,289 8.0% 2,019,134 1,849,150 9.2%TOTAL % DOMESTIC % INTERNATIONAL %
2004 2003 Change 2004 2003 Change 2004 2003 ChangeJAN 330,187 344,521 -4.2% 182,613 181,730 0.5% 147,573 162,791 -9.3%FEB 351,049 325,162 8.0% 202,759 173,419 16.9% 148,290 151,744 -2.3%MAR 361,168 337,652 7.0% 214,143 202,452 5.8% 147,025 135,200 8.7%APR 334,642 283,564 18.0% 204,559 191,540 6.8% 130,083 92,025 41.4%MAY 348,327 294,127 18.4% 206,237 193,896 6.4% 142,090 100,231 41.8%JUN 408,533 344,998 18.4% 250,822 234,003 7.2% 157,711 110,995 42.1%JUL 442,161 389,352 13.6% 280,348 252,763 10.9% 161,813 136,588 18.5%AUG 413,103 396,663 4.1% 244,121 237,980 2.6% 168,982 158,683 6.5%SEPT 353,996 318,725 11.1% 194,503 169,860 14.5% 159,493 148,865 7.1%OCT 371,699 337,098 10.3% 205,072 186,202 10.1% 166,626 150,896 10.4%NOV 345,746 324,621 6.5% 194,012 177,472 9.3% 151,734 147,150 3.1%DEC 403,942 393,999 2.5% 232,838 214,069 8.8% 171,103 179,930 -4.9%
TOTAL 4,464,551 4,090,483 9.1% 2,612,029 2,415,386 8.1% 1,852,523 1,675,097 10.6%TOTAL % DOMESTIC % INTERNATIONAL %
2004 2003 Change 2004 2003 Change 2004 2003 ChangeJAN 77,027 75,128 2.5% 65,914 62,029 6.3% 11,113 13,099 -15.2%FEB 82,139 75,543 8.7% 66,978 61,913 8.2% 15,161 13,630 11.2%MAR 83,131 81,065 2.5% 71,802 72,615 -1.1% 11,329 8,450 34.1%APR 83,141 76,595 8.5% 74,031 70,089 5.6% 9,109 6,506 40.0%MAY 82,780 80,759 2.5% 73,851 72,386 2.0% 8,928 8,373 6.6%JUN 89,191 89,838 -0.7% 82,010 83,270 -1.5% 7,181 6,567 9.3%JUL 107,259 97,410 10.1% 98,689 90,348 9.2% 8,570 7,062 21.4%AUG 94,802 95,975 -1.2% 85,979 84,528 1.7% 8,822 11,447 -22.9%SEPT 78,872 72,339 9.0% 70,747 64,064 10.4% 8,125 8,275 -1.8%OCT 88,136 81,976 7.5% 77,808 71,518 8.8% 10,328 10,457 -1.2%NOV 72,854 74,041 -1.6% 65,677 62,739 4.7% 7,177 11,302 -36.5%DEC 81,590 75,199 8.5% 72,618 66,081 9.9% 8,972 9,118 -1.6%
TOTAL 1,020,921 975,868 4.6% 906,105 861,580 5.2% 114,816 114,287 0.5%
STATE
OAHU
KAUAI
Source: DBEDT 62
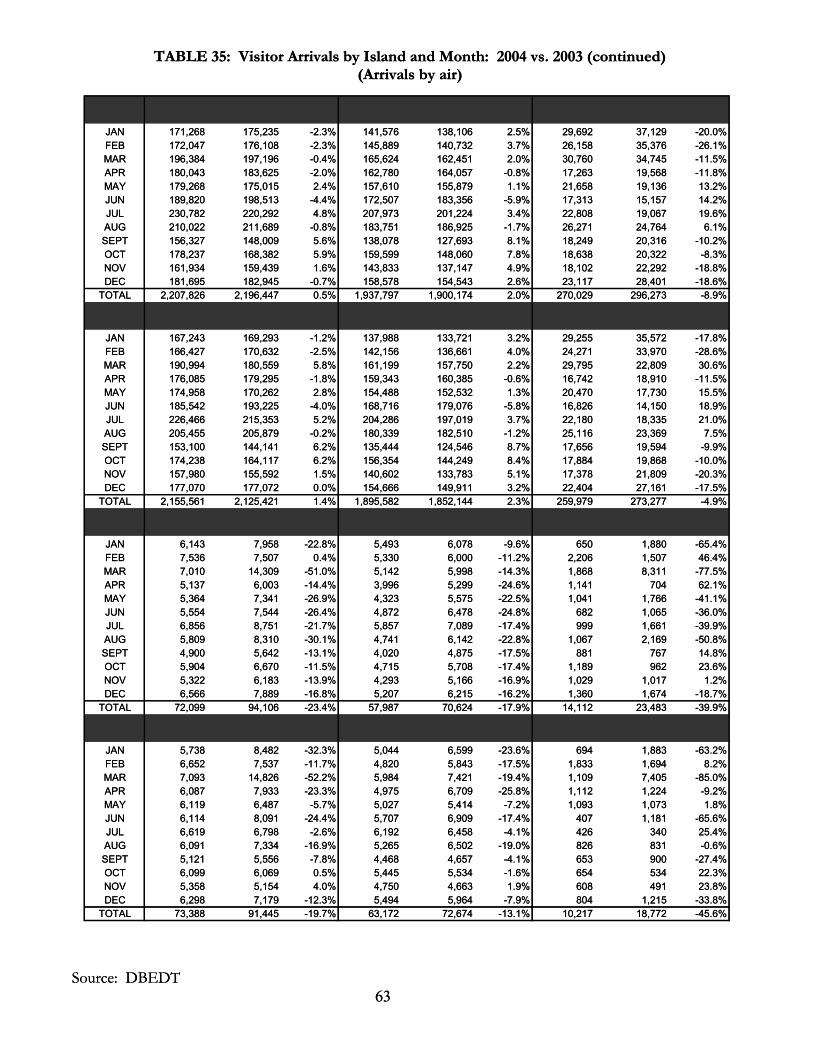
TABLE 35: Visitor Arrivals by Island and Month: 2004 vs. 2003 (continued) (Arrivals by air)
MAUI TOTAL % DOMESTIC % INTERNATIONAL %COUNTY 2004 2003 Change 2004 2003 Change 2004 2003 Change
JAN 171,268 175,235 -2.3% 141,576 138,106 2.5% 29,692 37,129 -20.0%FEB 172,047 176,108 -2.3% 145,889 140,732 3.7% 26,158 35,376 -26.1%MAR 196,384 197,196 -0.4% 165,624 162,451 2.0% 30,760 34,745 -11.5%APR 180,043 183,625 -2.0% 162,780 164,057 -0.8% 17,263 19,568 -11.8%MAY 179,268 175,015 2.4% 157,610 155,879 1.1% 21,658 19,136 13.2%JUN 189,820 198,513 -4.4% 172,507 183,356 -5.9% 17,313 15,157 14.2%JUL 230,782 220,292 4.8% 207,973 201,224 3.4% 22,808 19,067 19.6%AUG 210,022 211,689 -0.8% 183,751 186,925 -1.7% 26,271 24,764 6.1%SEPT 156,327 148,009 5.6% 138,078 127,693 8.1% 18,249 20,316 -10.2%OCT 178,237 168,382 5.9% 159,599 148,060 7.8% 18,638 20,322 -8.3%NOV 161,934 159,439 1.6% 143,833 137,147 4.9% 18,102 22,292 -18.8%DEC 181,695 182,945 -0.7% 158,578 154,543 2.6% 23,117 28,401 -18.6%
TOTAL 2,207,826 2,196,447 0.5% 1,937,797 1,900,174 2.0% 270,029 296,273 -8.9%TOTAL % DOMESTIC % INTERNATIONAL %
2004 2003 Change 2004 2003 Change 2004 2003 ChangeJAN 167,243 169,293 -1.2% 137,988 133,721 3.2% 29,255 35,572 -17.8%FEB 166,427 170,632 -2.5% 142,156 136,661 4.0% 24,271 33,970 -28.6%MAR 190,994 180,559 5.8% 161,199 157,750 2.2% 29,795 22,809 30.6%APR 176,085 179,295 -1.8% 159,343 160,385 -0.6% 16,742 18,910 -11.5%MAY 174,958 170,262 2.8% 154,488 152,532 1.3% 20,470 17,730 15.5%JUN 185,542 193,225 -4.0% 168,716 179,076 -5.8% 16,826 14,150 18.9%JUL 226,466 215,353 5.2% 204,286 197,019 3.7% 22,180 18,335 21.0%AUG 205,455 205,879 -0.2% 180,339 182,510 -1.2% 25,116 23,369 7.5%SEPT 153,100 144,141 6.2% 135,444 124,546 8.7% 17,656 19,594 -9.9%OCT 174,238 164,117 6.2% 156,354 144,249 8.4% 17,884 19,868 -10.0%NOV 157,980 155,592 1.5% 140,602 133,783 5.1% 17,378 21,809 -20.3%DEC 177,070 177,072 0.0% 154,666 149,911 3.2% 22,404 27,161 -17.5%
TOTAL 2,155,561 2,125,421 1.4% 1,895,582 1,852,144 2.3% 259,979 273,277 -4.9%MOLO- TOTAL % DOMESTIC DOMESTIC % INTERNATIONAL %
KAI 2004 2003 Change 2004 2003 Change 2004 2003 ChangeJAN 6,143 7,958 -22.8% 5,493 6,078 -9.6% 650 1,880 -65.4%FEB 7,536 7,507 0.4% 5,330 6,000 -11.2% 2,206 1,507 46.4%MAR 7,010 14,309 -51.0% 5,142 5,998 -14.3% 1,868 8,311 -77.5%APR 5,137 6,003 -14.4% 3,996 5,299 -24.6% 1,141 704 62.1%MAY 5,364 7,341 -26.9% 4,323 5,575 -22.5% 1,041 1,766 -41.1%JUN 5,554 7,544 -26.4% 4,872 6,478 -24.8% 682 1,065 -36.0%JUL 6,856 8,751 -21.7% 5,857 7,089 -17.4% 999 1,661 -39.9%AUG 5,809 8,310 -30.1% 4,741 6,142 -22.8% 1,067 2,169 -50.8%SEPT 4,900 5,642 -13.1% 4,020 4,875 -17.5% 881 767 14.8%OCT 5,904 6,670 -11.5% 4,715 5,708 -17.4% 1,189 962 23.6%NOV 5,322 6,183 -13.9% 4,293 5,166 -16.9% 1,029 1,017 1.2%DEC 6,566 7,889 -16.8% 5,207 6,215 -16.2% 1,360 1,674 -18.7%
TOTAL 72,099 94,106 -23.4% 57,987 70,624 -17.9% 14,112 23,483 -39.9%TOTAL % DOMESTIC DOMESTIC % INTERNATIONAL %
2004 2003 Change 2004 2003 Change 2004 2003 ChangeJAN 5,738 8,482 -32.3% 5,044 6,599 -23.6% 694 1,883 -63.2%FEB 6,652 7,537 -11.7% 4,820 5,843 -17.5% 1,833 1,694 8.2%MAR 7,093 14,826 -52.2% 5,984 7,421 -19.4% 1,109 7,405 -85.0%APR 6,087 7,933 -23.3% 4,975 6,709 -25.8% 1,112 1,224 -9.2%MAY 6,119 6,487 -5.7% 5,027 5,414 -7.2% 1,093 1,073 1.8%JUN 6,114 8,091 -24.4% 5,707 6,909 -17.4% 407 1,181 -65.6%JUL 6,619 6,798 -2.6% 6,192 6,458 -4.1% 426 340 25.4%AUG 6,091 7,334 -16.9% 5,265 6,502 -19.0% 826 831 -0.6%SEPT 5,121 5,556 -7.8% 4,468 4,657 -4.1% 653 900 -27.4%OCT 6,099 6,069 0.5% 5,445 5,534 -1.6% 654 534 22.3%NOV 5,358 5,154 4.0% 4,750 4,663 1.9% 608 491 23.8%DEC 6,298 7,179 -12.3% 5,494 5,964 -7.9% 804 1,215 -33.8%
TOTAL 73,388 91,445 -19.7% 63,172 72,674 -13.1% 10,217 18,772 -45.6%
LANAI
MAUI
TABLE 35: Visitor Arrivals by Island and Month: 2004 vs. 2003 (continued) (Arrivals by air)
Source: DBEDT 63
Source: DBEDT 63
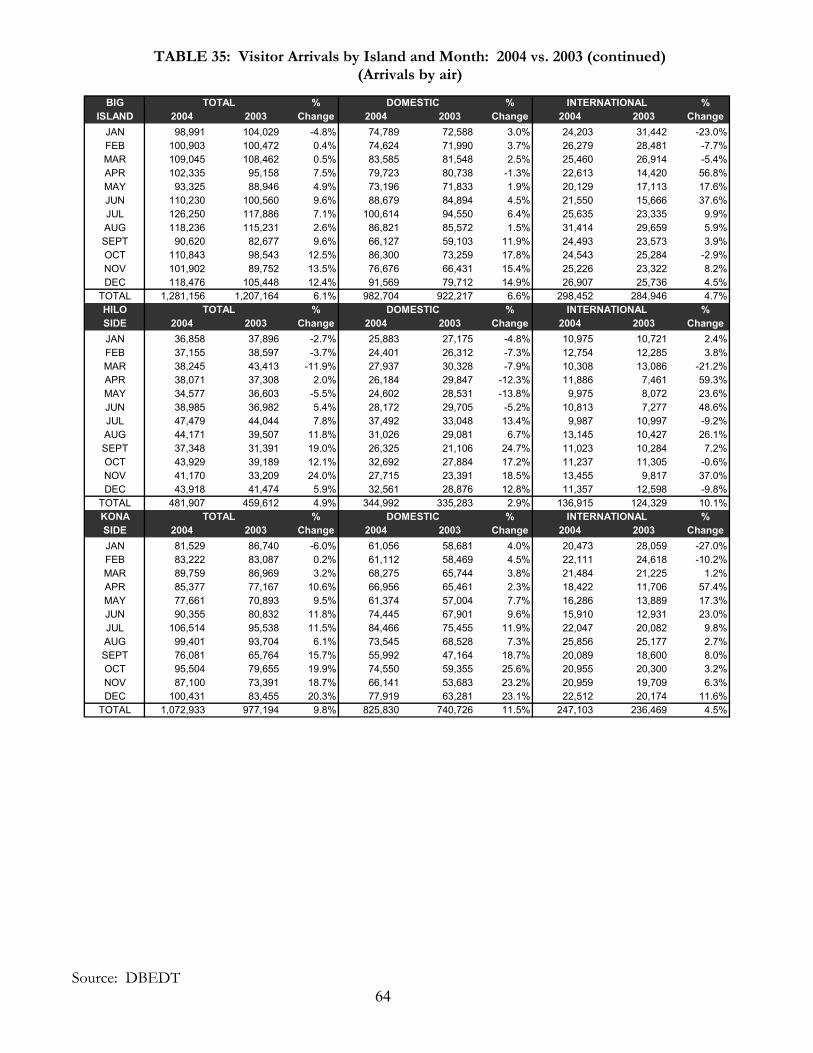
TABLE 35: Visitor Arrivals by Island and Month: 2004 vs. 2003 (continued) (Arrivals by air)
BIG TOTAL % DOMESTIC % INTERNATIONAL %ISLAND 2004 2003 Change 2004 2003 Change 2004 2003 Change
JAN 98,991 104,029 -4.8% 74,789 72,588 3.0% 24,203 31,442 -23.0%FEB 100,903 100,472 0.4% 74,624 71,990 3.7% 26,279 28,481 -7.7%MAR 109,045 108,462 0.5% 83,585 81,548 2.5% 25,460 26,914 -5.4%APR 102,335 95,158 7.5% 79,723 80,738 -1.3% 22,613 14,420 56.8%MAY 93,325 88,946 4.9% 73,196 71,833 1.9% 20,129 17,113 17.6%JUN 110,230 100,560 9.6% 88,679 84,894 4.5% 21,550 15,666 37.6%JUL 126,250 117,886 7.1% 100,614 94,550 6.4% 25,635 23,335 9.9%AUG 118,236 115,231 2.6% 86,821 85,572 1.5% 31,414 29,659 5.9%SEPT 90,620 82,677 9.6% 66,127 59,103 11.9% 24,493 23,573 3.9%OCT 110,843 98,543 12.5% 86,300 73,259 17.8% 24,543 25,284 -2.9%NOV 101,902 89,752 13.5% 76,676 66,431 15.4% 25,226 23,322 8.2%DEC 118,476 105,448 12.4% 91,569 79,712 14.9% 26,907 25,736 4.5%
TOTAL 1,281,156 1,207,164 6.1% 982,704 922,217 6.6% 298,452 284,946 4.7%HILO TOTAL % DOMESTIC % INTERNATIONAL %SIDE 2004 2003 Change 2004 2003 Change 2004 2003 ChangeJAN 36,858 37,896 -2.7% 25,883 27,175 -4.8% 10,975 10,721 2.4%FEB 37,155 38,597 -3.7% 24,401 26,312 -7.3% 12,754 12,285 3.8%MAR 38,245 43,413 -11.9% 27,937 30,328 -7.9% 10,308 13,086 -21.2%APR 38,071 37,308 2.0% 26,184 29,847 -12.3% 11,886 7,461 59.3%MAY 34,577 36,603 -5.5% 24,602 28,531 -13.8% 9,975 8,072 23.6%JUN 38,985 36,982 5.4% 28,172 29,705 -5.2% 10,813 7,277 48.6%JUL 47,479 44,044 7.8% 37,492 33,048 13.4% 9,987 10,997 -9.2%AUG 44,171 39,507 11.8% 31,026 29,081 6.7% 13,145 10,427 26.1%SEPT 37,348 31,391 19.0% 26,325 21,106 24.7% 11,023 10,284 7.2%OCT 43,929 39,189 12.1% 32,692 27,884 17.2% 11,237 11,305 -0.6%NOV 41,170 33,209 24.0% 27,715 23,391 18.5% 13,455 9,817 37.0%DEC 43,918 41,474 5.9% 32,561 28,876 12.8% 11,357 12,598 -9.8%
TOTAL 481,907 459,612 4.9% 344,992 335,283 2.9% 136,915 124,329 10.1%KONA TOTAL % DOMESTIC % INTERNATIONAL %SIDE 2004 2003 Change 2004 2003 Change 2004 2003 ChangeJAN 81,529 86,740 -6.0% 61,056 58,681 4.0% 20,473 28,059 -27.0%FEB 83,222 83,087 0.2% 61,112 58,469 4.5% 22,111 24,618 -10.2%MAR 89,759 86,969 3.2% 68,275 65,744 3.8% 21,484 21,225 1.2%APR 85,377 77,167 10.6% 66,956 65,461 2.3% 18,422 11,706 57.4%MAY 77,661 70,893 9.5% 61,374 57,004 7.7% 16,286 13,889 17.3%JUN 90,355 80,832 11.8% 74,445 67,901 9.6% 15,910 12,931 23.0%JUL 106,514 95,538 11.5% 84,466 75,455 11.9% 22,047 20,082 9.8%AUG 99,401 93,704 6.1% 73,545 68,528 7.3% 25,856 25,177 2.7%SEPT 76,081 65,764 15.7% 55,992 47,164 18.7% 20,089 18,600 8.0%OCT 95,504 79,655 19.9% 74,550 59,355 25.6% 20,955 20,300 3.2%NOV 87,100 73,391 18.7% 66,141 53,683 23.2% 20,959 19,709 6.3%DEC 100,431 83,455 20.3% 77,919 63,281 23.1% 22,512 20,174 11.6%
TOTAL 1,072,933 977,194 9.8% 825,830 740,726 11.5% 247,103 236,469 4.5%
Source: DBEDT 64
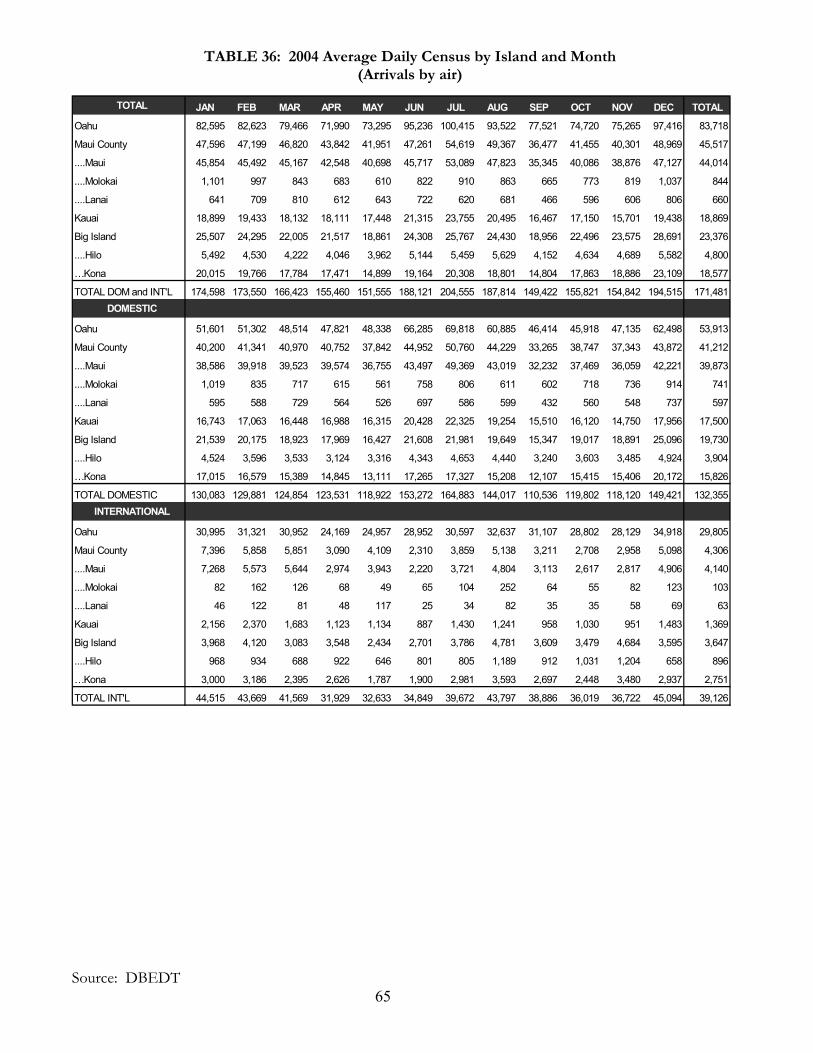
TABLE 36: 2004 Average Daily Census by Island and Month (Arrivals by air)
TOTAL JAN FEB MAR APR MAY JUN JUL AUG SEP OCT NOV DEC TOTAL
Oahu 82,595 82,623 79,466 71,990 73,295 95,236 100,415 93,522 77,521 74,720 75,265 97,416 83,718
Maui County 47,596 47,199 46,820 43,842 41,951 47,261 54,619 49,367 36,477 41,455 40,301 48,969 45,517
....Maui 45,854 45,492 45,167 42,548 40,698 45,717 53,089 47,823 35,345 40,086 38,876 47,127 44,014
....Molokai 1,101 997 843 683 610 822 910 863 665 773 819 1,037 844
....Lanai 641 709 810 612 643 722 620 681 466 596 606 806 660
Kauai 18,899 19,433 18,132 18,111 17,448 21,315 23,755 20,495 16,467 17,150 15,701 19,438 18,869
Big Island 25,507 24,295 22,005 21,517 18,861 24,308 25,767 24,430 18,956 22,496 23,575 28,691 23,376
....Hilo 5,492 4,530 4,222 4,046 3,962 5,144 5,459 5,629 4,152 4,634 4,689 5,582 4,800
…Kona 20,015 19,766 17,784 17,471 14,899 19,164 20,308 18,801 14,804 17,863 18,886 23,109 18,577
TOTAL DOM and INT'L 174,598 173,550 166,423 155,460 151,555 188,121 204,555 187,814 149,422 155,821 154,842 194,515 171,481 DOMESTIC
Oahu 51,601 51,302 48,514 47,821 48,338 66,285 69,818 60,885 46,414 45,918 47,135 62,498 53,913
Maui County 40,200 41,341 40,970 40,752 37,842 44,952 50,760 44,229 33,265 38,747 37,343 43,872 41,212
....Maui 38,586 39,918 39,523 39,574 36,755 43,497 49,369 43,019 32,232 37,469 36,059 42,221 39,873
....Molokai 1,019 835 717 615 561 758 806 611 602 718 736 914 741
....Lanai 595 588 729 564 526 697 586 599 432 560 548 737 597
Kauai 16,743 17,063 16,448 16,988 16,315 20,428 22,325 19,254 15,510 16,120 14,750 17,956 17,500
Big Island 21,539 20,175 18,923 17,969 16,427 21,608 21,981 19,649 15,347 19,017 18,891 25,096 19,730
....Hilo 4,524 3,596 3,533 3,124 3,316 4,343 4,653 4,440 3,240 3,603 3,485 4,924 3,904
…Kona 17,015 16,579 15,389 14,845 13,111 17,265 17,327 15,208 12,107 15,415 15,406 20,172 15,826
TOTAL DOMESTIC 130,083 129,881 124,854 123,531 118,922 153,272 164,883 144,017 110,536 119,802 118,120 149,421 132,355 INTERNATIONAL
Oahu 30,995 31,321 30,952 24,169 24,957 28,952 30,597 32,637 31,107 28,802 28,129 34,918 29,805
Maui County 7,396 5,858 5,851 3,090 4,109 2,310 3,859 5,138 3,211 2,708 2,958 5,098 4,306
....Maui 7,268 5,573 5,644 2,974 3,943 2,220 3,721 4,804 3,113 2,617 2,817 4,906 4,140
....Molokai 82 162 126 68 49 65 104 252 64 55 82 123 103
....Lanai 46 122 81 48 117 25 34 82 35 35 58 69 63
Kauai 2,156 2,370 1,683 1,123 1,134 887 1,430 1,241 958 1,030 951 1,483 1,369
Big Island 3,968 4,120 3,083 3,548 2,434 2,701 3,786 4,781 3,609 3,479 4,684 3,595 3,647
....Hilo 968 934 688 922 646 801 805 1,189 912 1,031 1,204 658 896
…Kona 3,000 3,186 2,395 2,626 1,787 1,900 2,981 3,593 2,697 2,448 3,480 2,937 2,751
TOTAL INT'L 44,515 43,669 41,569 31,929 32,633 34,849 39,672 43,797 38,886 36,019 36,722 45,094 39,126
Source: DBEDT 65

TABLE 37: 2004 Domestic U.S. Visitor Arrivals by Island from Top U.S. MSAs (Arrivals by air)
Domestic Flights TOTAL OAHU MAUI COUNTY MAUI MOLOKAI LANAI KAUAI BIG
ISLAND HILO KONA
Albuquerque 13,234 6,931 4,816 4,729 147 147 3,202 2,746 1,056 2,286Anchorage 20,495 10,842 6,779 6,481 390 163 2,476 4,409 1,311 3,747Atlanta 43,720 29,255 17,695 17,367 511 706 7,805 9,440 3,995 7,469Austin 18,637 9,409 7,735 7,556 238 307 4,137 4,089 1,543 3,400Bakersfield 13,544 6,994 5,043 4,942 145 145 2,208 2,295 731 1,931Bellingham 7,077 2,608 3,068 3,018 61 64 1,362 1,341 373 1,164Boise 12,229 4,896 5,539 5,427 176 137 2,255 2,326 726 2,047Boston 62,282 36,904 28,248 27,784 793 1,025 15,621 15,394 6,370 12,633Charlotte 10,356 6,376 4,400 4,320 87 205 2,004 2,540 985 2,141Chicago 122,402 60,082 61,928 60,846 1,523 2,047 25,327 26,459 9,501 22,593Cincinnati 21,859 14,882 10,247 10,047 381 390 4,848 5,371 2,620 4,354Cleveland 22,027 13,173 10,616 10,445 281 296 4,909 5,344 2,442 4,282Colorado Springs 13,908 7,962 4,577 4,463 169 151 2,743 2,847 1,103 2,295Columbus 14,144 8,663 6,400 6,295 152 212 2,998 3,326 1,455 2,675Dallas 75,647 38,609 34,278 33,690 783 1,274 14,159 13,955 4,996 11,614Denver 86,007 37,249 34,910 34,122 1,007 1,181 19,995 19,618 5,811 17,361Detroit 49,305 29,012 24,714 24,308 641 841 11,579 11,948 5,079 9,822Eugene 11,514 4,409 4,965 4,833 204 99 2,121 2,463 679 2,197Fresno 20,961 9,943 8,407 8,224 173 223 3,236 3,719 1,102 3,252Grand Rapids 9,258 5,333 4,597 4,519 106 169 2,174 2,144 874 1,766Hartford 13,079 8,446 5,768 5,574 255 236 3,109 3,298 1,365 2,700Houston 52,717 30,202 23,982 23,602 635 981 8,940 9,836 4,213 7,767Indianapolis 17,951 11,357 7,516 7,412 201 283 3,493 3,836 1,650 3,134Kansas City 22,136 12,493 9,527 9,371 232 323 4,509 4,688 1,870 3,821Las Vegas 59,430 35,258 19,962 19,576 555 605 8,530 9,574 3,482 7,855Los Angeles 756,696 361,766 288,174 282,183 6,410 8,238 123,251 131,065 35,618 114,044Miami 19,953 13,498 8,837 8,698 315 464 4,127 5,249 2,549 4,216Milwaukee 16,274 9,377 7,769 7,601 238 259 3,771 4,162 1,695 3,398Minneapolis 61,008 35,197 25,956 25,471 606 773 12,585 12,280 4,206 10,207Modesto 13,797 6,109 5,610 5,511 120 128 2,240 2,262 675 1,988Nashville 10,960 6,866 4,493 4,437 117 157 2,100 2,452 991 1,983New York 171,172 106,870 81,604 79,833 2,407 3,541 42,379 43,175 17,139 35,507Norfolk 16,462 13,309 3,906 3,766 169 242 2,148 2,856 1,382 2,148Oklahoma City 10,403 6,166 4,052 3,972 104 121 1,767 2,062 782 1,689Omaha 9,133 5,071 3,829 3,740 132 148 1,500 2,017 693 1,667Orlando 14,174 9,716 5,794 5,714 172 256 2,925 3,545 1,627 2,857Philadelphia 44,401 27,253 20,762 20,340 738 903 11,154 11,367 5,074 9,411Phoenix 92,069 42,336 38,221 37,525 987 1,204 19,209 17,408 5,576 15,137Pittsburgh 14,609 9,260 6,966 6,821 194 319 3,197 3,841 1,808 3,176Portland 103,416 40,757 45,177 44,089 1,339 1,149 17,912 20,493 5,659 17,862Provo 13,179 9,087 3,830 3,774 67 92 2,258 1,682 612 1,374Raleigh 11,354 7,027 4,726 4,604 178 196 2,385 3,010 1,287 2,394Reno 17,917 7,229 7,231 7,052 178 233 3,328 3,734 997 3,243Sacramento 111,345 46,034 46,691 45,796 1,234 983 20,597 19,200 5,807 16,475Saint Louis 26,293 15,700 12,107 11,890 420 434 5,461 5,885 2,416 4,974Salinas 15,041 6,559 5,625 5,441 186 172 2,662 2,961 814 2,580Salt Lake City 47,154 28,708 16,462 16,042 463 458 9,144 6,695 2,364 5,637San Antonio 14,357 9,676 4,682 4,546 167 252 2,282 2,709 1,313 2,044San Diego 158,683 77,088 55,561 54,294 1,512 1,602 31,511 27,998 8,417 24,192San Francisco 554,670 233,265 212,041 207,178 5,333 5,565 95,634 104,944 26,997 92,663San Luis/Obispo 13,534 4,796 5,162 4,978 229 129 3,166 3,143 1,058 2,716Santa Barbara 22,094 8,750 7,951 7,647 311 227 4,885 4,665 1,119 4,207Seattle 216,821 94,199 89,293 87,391 2,541 1,909 34,898 38,293 10,740 33,050Spokane 14,188 5,816 6,449 6,323 178 181 2,289 2,487 639 2,177Stockton 20,549 9,881 8,118 7,974 257 151 3,073 2,922 1,014 2,527Tampa 17,285 11,642 7,251 7,115 252 303 3,482 4,409 2,067 3,460Tucson 18,616 8,834 6,997 6,743 297 315 4,055 4,104 1,508 3,438Tulsa 8,175 4,751 3,444 3,355 94 131 1,425 1,500 588 1,206Washington 106,006 73,797 34,035 33,095 1,341 1,491 19,624 23,240 9,858 18,796
Source: DBEDT 66

TABLE 38: 2004 Domestic U.S. Visitor Arrivals by Island and State of Residence (Arrivals by air)
MAUI BIGCOUNTY ISLAND
Alabama 21,300 15,738 7,127 6,981 282 319 3,516 4,375 2,076 3,485Alaska 36,835 18,732 12,518 12,002 729 302 4,738 8,475 2,687 7,141Arizona 127,014 59,163 50,988 49,841 1,584 1,723 26,759 24,901 8,276 21,453Arkansas 14,435 8,881 5,751 5,640 176 216 2,600 2,866 1,203 2,298California 1,767,696 797,262 674,735 659,866 16,806 18,233 305,436 319,466 87,706 279,035Colorado 126,243 56,291 49,750 48,509 1,601 1,693 29,604 29,241 9,253 25,439Connecticut 29,542 17,805 13,659 13,272 517 579 7,141 7,693 2,843 6,460Delaware 5,422 3,571 2,209 2,165 90 83 1,189 1,427 591 1,192Florida 105,560 72,314 43,218 42,362 1,606 2,227 22,632 27,421 13,153 21,841Georgia 60,780 41,677 23,849 23,394 717 966 10,696 13,122 5,787 10,364Idaho 28,598 12,768 11,889 11,604 408 280 5,559 5,557 1,657 4,869Illinois 145,933 74,856 72,527 71,207 1,932 2,378 30,008 31,704 11,750 26,879Indiana 49,681 31,218 21,576 21,183 661 719 9,931 10,757 4,794 8,674Iowa 27,762 16,553 11,654 11,408 412 296 5,428 5,783 2,355 4,667Kansas 24,824 14,428 10,508 10,257 327 372 4,768 5,244 2,124 4,203Kentucky 26,543 17,541 11,646 11,454 415 413 4,991 5,813 2,703 4,741Louisiana 19,348 12,646 7,543 7,417 280 334 3,329 4,258 1,942 3,384Maine 9,070 6,141 3,019 2,916 150 132 1,692 1,973 933 1,512Maryland 54,455 37,867 18,800 18,313 759 823 10,580 12,723 5,690 10,294Massachusetts 57,438 33,791 26,319 25,845 777 968 14,542 14,333 5,992 11,704Michigan 83,296 49,665 40,292 39,591 1,143 1,433 19,495 19,995 8,618 16,346Minnesota 80,866 47,400 34,093 33,435 870 1,011 16,647 16,450 5,773 13,586Mississippi 9,577 6,851 3,278 3,200 132 178 1,436 1,843 823 1,451Missouri 47,504 28,524 20,480 20,129 644 720 9,503 10,195 4,207 8,466Montana 16,774 7,433 6,856 6,702 252 129 3,409 3,757 1,164 3,214Nebraska 16,644 9,805 6,835 6,682 229 211 2,853 3,778 1,415 3,020Nevada 81,437 44,148 28,660 28,023 795 916 12,743 14,124 4,679 11,826New Hampshire 10,549 6,259 4,253 4,185 129 182 2,498 2,668 1,064 2,180New Jersey 75,139 47,781 36,082 35,392 1,078 1,538 18,944 18,970 8,026 15,517New Mexico 24,030 12,505 8,460 8,262 315 303 5,663 5,244 2,012 4,328New York 127,142 80,608 58,819 57,547 1,862 2,487 30,578 31,911 13,335 25,839North Carolina 44,986 29,329 17,625 17,226 630 793 8,716 10,904 4,831 8,626North Dakota 5,846 3,802 2,180 2,132 67 48 1,022 1,029 377 835Ohio 82,869 52,612 38,230 37,555 1,153 1,390 18,299 20,454 9,484 16,514Oklahoma 26,247 15,862 10,093 9,867 295 349 4,438 5,070 2,069 4,058Oregon 135,943 51,834 58,873 57,409 1,951 1,401 24,839 28,319 7,852 24,857Pennsylvania 72,640 46,771 33,203 32,538 1,096 1,435 16,791 18,940 8,835 15,306Rhode Island 7,620 5,215 3,120 3,068 86 102 1,672 1,634 813 1,284South Carolina 19,297 13,637 7,042 6,882 303 331 3,630 4,273 2,107 3,357South Dakota 6,967 4,293 2,710 2,663 89 75 1,249 1,570 650 1,229Tennessee 34,538 22,556 14,030 13,790 464 531 6,168 8,098 3,563 6,462Texas 201,889 114,185 85,487 83,869 2,362 3,424 36,262 38,457 15,573 31,069Utah 74,862 46,520 25,135 24,520 656 710 14,134 10,826 3,790 9,140Vermont 4,843 2,692 1,776 1,738 87 64 1,150 1,275 558 991Virginia 82,316 58,797 24,976 24,305 894 1,203 14,277 16,821 7,176 13,417Washington 293,786 126,417 122,116 119,521 3,459 2,739 47,842 53,079 14,764 45,953Washington, D.C. 7,345 4,791 2,291 2,191 129 132 1,422 1,633 692 1,301West Virginia 6,502 4,459 2,426 2,371 130 107 1,197 1,667 730 1,343Wisconsin 50,226 29,558 22,637 22,180 697 720 11,399 12,245 5,121 9,788Wyoming 7,292 3,740 2,758 2,669 127 114 1,557 1,851 578 1,563
LANAI KAUAI HILO KONATOTAL OAHU MAUI MOLOKAIDomestic Flights
Source: DBEDT 67
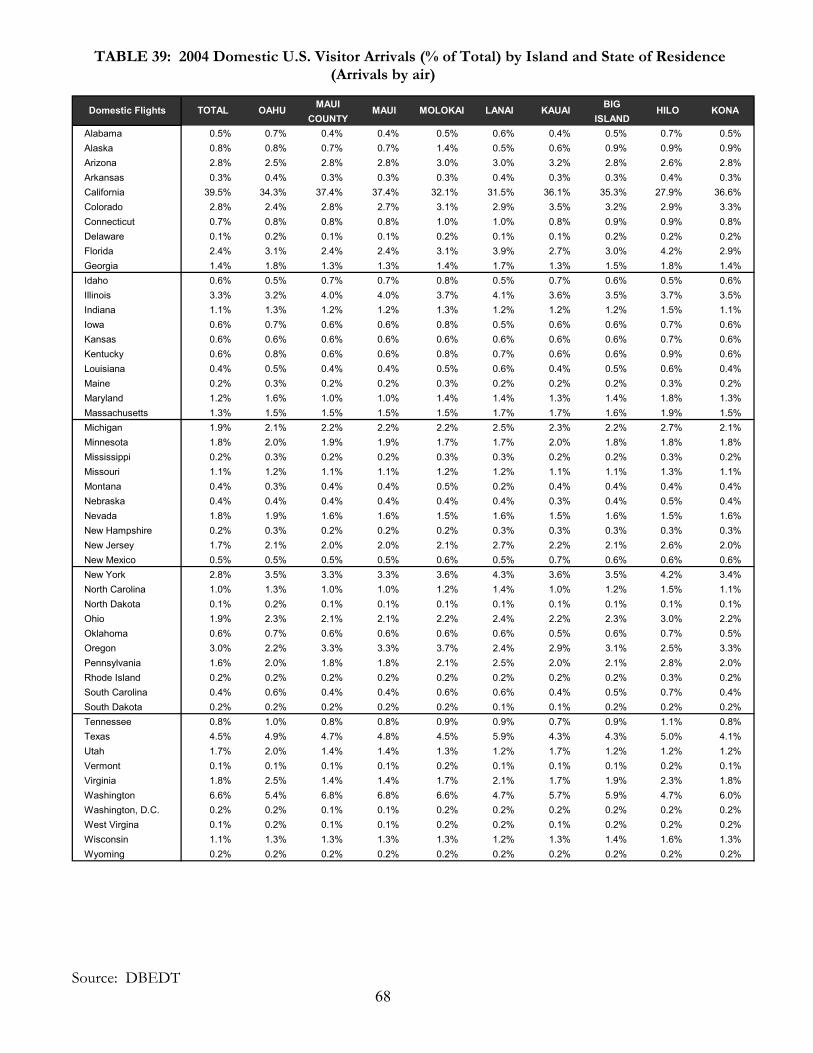
TABLE 39: 2004 Domestic U.S. Visitor Arrivals (% of Total) by Island and State of Residence (Arrivals by air)
MAUI BIGCOUNTY ISLAND
Alabama 0.5% 0.7% 0.4% 0.4% 0.5% 0.6% 0.4% 0.5% 0.7% 0.5%Alaska 0.8% 0.8% 0.7% 0.7% 1.4% 0.5% 0.6% 0.9% 0.9% 0.9%Arizona 2.8% 2.5% 2.8% 2.8% 3.0% 3.0% 3.2% 2.8% 2.6% 2.8%Arkansas 0.3% 0.4% 0.3% 0.3% 0.3% 0.4% 0.3% 0.3% 0.4% 0.3%California 39.5% 34.3% 37.4% 37.4% 32.1% 31.5% 36.1% 35.3% 27.9% 36.6%Colorado 2.8% 2.4% 2.8% 2.7% 3.1% 2.9% 3.5% 3.2% 2.9% 3.3%Connecticut 0.7% 0.8% 0.8% 0.8% 1.0% 1.0% 0.8% 0.9% 0.9% 0.8%Delaware 0.1% 0.2% 0.1% 0.1% 0.2% 0.1% 0.1% 0.2% 0.2% 0.2%Florida 2.4% 3.1% 2.4% 2.4% 3.1% 3.9% 2.7% 3.0% 4.2% 2.9%Georgia 1.4% 1.8% 1.3% 1.3% 1.4% 1.7% 1.3% 1.5% 1.8% 1.4%Idaho 0.6% 0.5% 0.7% 0.7% 0.8% 0.5% 0.7% 0.6% 0.5% 0.6%Illinois 3.3% 3.2% 4.0% 4.0% 3.7% 4.1% 3.6% 3.5% 3.7% 3.5%Indiana 1.1% 1.3% 1.2% 1.2% 1.3% 1.2% 1.2% 1.2% 1.5% 1.1%Iowa 0.6% 0.7% 0.6% 0.6% 0.8% 0.5% 0.6% 0.6% 0.7% 0.6%Kansas 0.6% 0.6% 0.6% 0.6% 0.6% 0.6% 0.6% 0.6% 0.7% 0.6%Kentucky 0.6% 0.8% 0.6% 0.6% 0.8% 0.7% 0.6% 0.6% 0.9% 0.6%Louisiana 0.4% 0.5% 0.4% 0.4% 0.5% 0.6% 0.4% 0.5% 0.6% 0.4%Maine 0.2% 0.3% 0.2% 0.2% 0.3% 0.2% 0.2% 0.2% 0.3% 0.2%Maryland 1.2% 1.6% 1.0% 1.0% 1.4% 1.4% 1.3% 1.4% 1.8% 1.3%Massachusetts 1.3% 1.5% 1.5% 1.5% 1.5% 1.7% 1.7% 1.6% 1.9% 1.5%Michigan 1.9% 2.1% 2.2% 2.2% 2.2% 2.5% 2.3% 2.2% 2.7% 2.1%Minnesota 1.8% 2.0% 1.9% 1.9% 1.7% 1.7% 2.0% 1.8% 1.8% 1.8%Mississippi 0.2% 0.3% 0.2% 0.2% 0.3% 0.3% 0.2% 0.2% 0.3% 0.2%Missouri 1.1% 1.2% 1.1% 1.1% 1.2% 1.2% 1.1% 1.1% 1.3% 1.1%Montana 0.4% 0.3% 0.4% 0.4% 0.5% 0.2% 0.4% 0.4% 0.4% 0.4%Nebraska 0.4% 0.4% 0.4% 0.4% 0.4% 0.4% 0.3% 0.4% 0.5% 0.4%Nevada 1.8% 1.9% 1.6% 1.6% 1.5% 1.6% 1.5% 1.6% 1.5% 1.6%New Hampshire 0.2% 0.3% 0.2% 0.2% 0.2% 0.3% 0.3% 0.3% 0.3% 0.3%New Jersey 1.7% 2.1% 2.0% 2.0% 2.1% 2.7% 2.2% 2.1% 2.6% 2.0%New Mexico 0.5% 0.5% 0.5% 0.5% 0.6% 0.5% 0.7% 0.6% 0.6% 0.6%New York 2.8% 3.5% 3.3% 3.3% 3.6% 4.3% 3.6% 3.5% 4.2% 3.4%North Carolina 1.0% 1.3% 1.0% 1.0% 1.2% 1.4% 1.0% 1.2% 1.5% 1.1%North Dakota 0.1% 0.2% 0.1% 0.1% 0.1% 0.1% 0.1% 0.1% 0.1% 0.1%Ohio 1.9% 2.3% 2.1% 2.1% 2.2% 2.4% 2.2% 2.3% 3.0% 2.2%Oklahoma 0.6% 0.7% 0.6% 0.6% 0.6% 0.6% 0.5% 0.6% 0.7% 0.5%Oregon 3.0% 2.2% 3.3% 3.3% 3.7% 2.4% 2.9% 3.1% 2.5% 3.3%Pennsylvania 1.6% 2.0% 1.8% 1.8% 2.1% 2.5% 2.0% 2.1% 2.8% 2.0%Rhode Island 0.2% 0.2% 0.2% 0.2% 0.2% 0.2% 0.2% 0.2% 0.3% 0.2%South Carolina 0.4% 0.6% 0.4% 0.4% 0.6% 0.6% 0.4% 0.5% 0.7% 0.4%South Dakota 0.2% 0.2% 0.2% 0.2% 0.2% 0.1% 0.1% 0.2% 0.2% 0.2%Tennessee 0.8% 1.0% 0.8% 0.8% 0.9% 0.9% 0.7% 0.9% 1.1% 0.8%Texas 4.5% 4.9% 4.7% 4.8% 4.5% 5.9% 4.3% 4.3% 5.0% 4.1%Utah 1.7% 2.0% 1.4% 1.4% 1.3% 1.2% 1.7% 1.2% 1.2% 1.2%Vermont 0.1% 0.1% 0.1% 0.1% 0.2% 0.1% 0.1% 0.1% 0.2% 0.1%Virginia 1.8% 2.5% 1.4% 1.4% 1.7% 2.1% 1.7% 1.9% 2.3% 1.8%Washington 6.6% 5.4% 6.8% 6.8% 6.6% 4.7% 5.7% 5.9% 4.7% 6.0%Washington, D.C. 0.2% 0.2% 0.1% 0.1% 0.2% 0.2% 0.2% 0.2% 0.2% 0.2%West Virgina 0.1% 0.2% 0.1% 0.1% 0.2% 0.2% 0.1% 0.2% 0.2% 0.2%Wisconsin 1.1% 1.3% 1.3% 1.3% 1.3% 1.2% 1.3% 1.4% 1.6% 1.3%Wyoming 0.2% 0.2% 0.2% 0.2% 0.2% 0.2% 0.2% 0.2% 0.2% 0.2%
LANAI KAUAI KONADomestic Flights TOTAL OAHU MAUI HILOMOLOKAI
Source: DBEDT 68
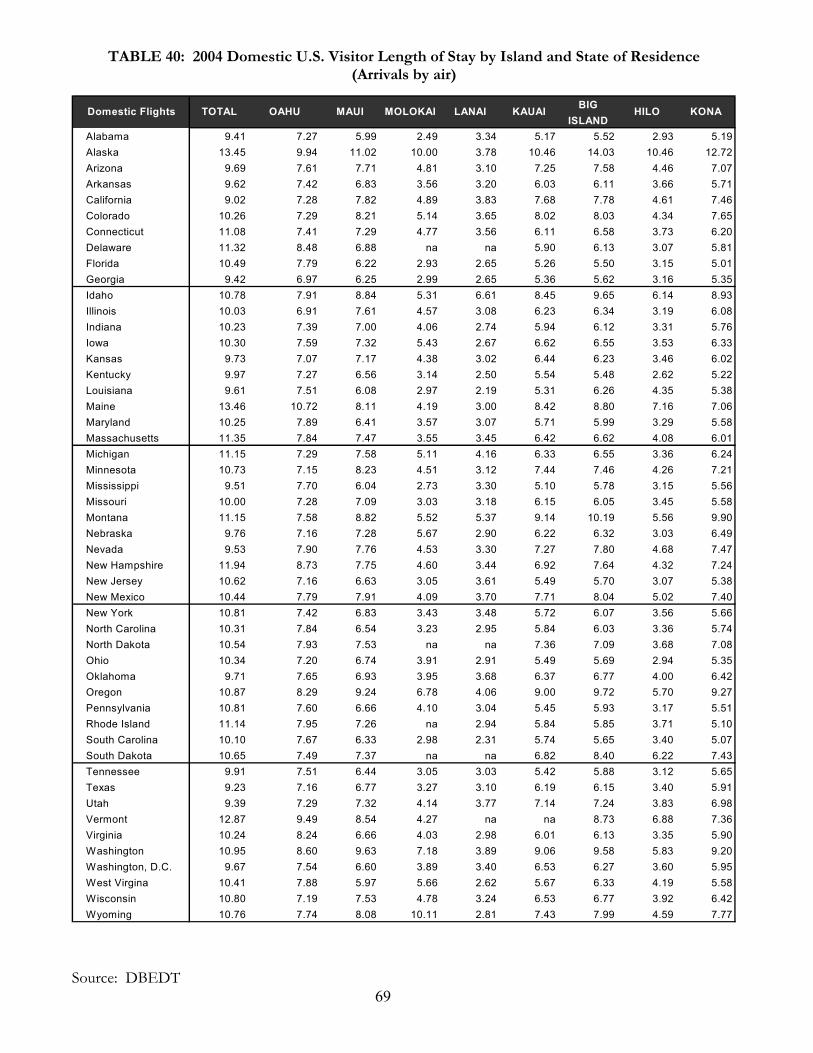
TABLE 40: 2004 Domestic U.S. Visitor Length of Stay by Island and State of Residence (Arrivals by air)
BIGISLAND
Alabama 9.41 7.27 5.99 2.49 3.34 5.17 5.52 2.93 5.19Alaska 13.45 9.94 11.02 10.00 3.78 10.46 14.03 10.46 12.72Arizona 9.69 7.61 7.71 4.81 3.10 7.25 7.58 4.46 7.07Arkansas 9.62 7.42 6.83 3.56 3.20 6.03 6.11 3.66 5.71California 9.02 7.28 7.82 4.89 3.83 7.68 7.78 4.61 7.46Colorado 10.26 7.29 8.21 5.14 3.65 8.02 8.03 4.34 7.65Connecticut 11.08 7.41 7.29 4.77 3.56 6.11 6.58 3.73 6.20Delaware 11.32 8.48 6.88 na na 5.90 6.13 3.07 5.81Florida 10.49 7.79 6.22 2.93 2.65 5.26 5.50 3.15 5.01Georgia 9.42 6.97 6.25 2.99 2.65 5.36 5.62 3.16 5.35Idaho 10.78 7.91 8.84 5.31 6.61 8.45 9.65 6.14 8.93Illinois 10.03 6.91 7.61 4.57 3.08 6.23 6.34 3.19 6.08Indiana 10.23 7.39 7.00 4.06 2.74 5.94 6.12 3.31 5.76Iowa 10.30 7.59 7.32 5.43 2.67 6.62 6.55 3.53 6.33Kansas 9.73 7.07 7.17 4.38 3.02 6.44 6.23 3.46 6.02Kentucky 9.97 7.27 6.56 3.14 2.50 5.54 5.48 2.62 5.22Louisiana 9.61 7.51 6.08 2.97 2.19 5.31 6.26 4.35 5.38Maine 13.46 10.72 8.11 4.19 3.00 8.42 8.80 7.16 7.06Maryland 10.25 7.89 6.41 3.57 3.07 5.71 5.99 3.29 5.58Massachusetts 11.35 7.84 7.47 3.55 3.45 6.42 6.62 4.08 6.01Michigan 11.15 7.29 7.58 5.11 4.16 6.33 6.55 3.36 6.24Minnesota 10.73 7.15 8.23 4.51 3.12 7.44 7.46 4.26 7.21Mississippi 9.51 7.70 6.04 2.73 3.30 5.10 5.78 3.15 5.56Missouri 10.00 7.28 7.09 3.03 3.18 6.15 6.05 3.45 5.58Montana 11.15 7.58 8.82 5.52 5.37 9.14 10.19 5.56 9.90Nebraska 9.76 7.16 7.28 5.67 2.90 6.22 6.32 3.03 6.49Nevada 9.53 7.90 7.76 4.53 3.30 7.27 7.80 4.68 7.47New Hampshire 11.94 8.73 7.75 4.60 3.44 6.92 7.64 4.32 7.24New Jersey 10.62 7.16 6.63 3.05 3.61 5.49 5.70 3.07 5.38New Mexico 10.44 7.79 7.91 4.09 3.70 7.71 8.04 5.02 7.40New York 10.81 7.42 6.83 3.43 3.48 5.72 6.07 3.56 5.66North Carolina 10.31 7.84 6.54 3.23 2.95 5.84 6.03 3.36 5.74North Dakota 10.54 7.93 7.53 na na 7.36 7.09 3.68 7.08Ohio 10.34 7.20 6.74 3.91 2.91 5.49 5.69 2.94 5.35Oklahoma 9.71 7.65 6.93 3.95 3.68 6.37 6.77 4.00 6.42Oregon 10.87 8.29 9.24 6.78 4.06 9.00 9.72 5.70 9.27Pennsylvania 10.81 7.60 6.66 4.10 3.04 5.45 5.93 3.17 5.51Rhode Island 11.14 7.95 7.26 na 2.94 5.84 5.85 3.71 5.10South Carolina 10.10 7.67 6.33 2.98 2.31 5.74 5.65 3.40 5.07South Dakota 10.65 7.49 7.37 na na 6.82 8.40 6.22 7.43Tennessee 9.91 7.51 6.44 3.05 3.03 5.42 5.88 3.12 5.65Texas 9.23 7.16 6.77 3.27 3.10 6.19 6.15 3.40 5.91Utah 9.39 7.29 7.32 4.14 3.77 7.14 7.24 3.83 6.98Vermont 12.87 9.49 8.54 4.27 na na 8.73 6.88 7.36Virginia 10.24 8.24 6.66 4.03 2.98 6.01 6.13 3.35 5.90Washington 10.95 8.60 9.63 7.18 3.89 9.06 9.58 5.83 9.20Washington, D.C. 9.67 7.54 6.60 3.89 3.40 6.53 6.27 3.60 5.95West Virgina 10.41 7.88 5.97 5.66 2.62 5.67 6.33 4.19 5.58Wisconsin 10.80 7.19 7.53 4.78 3.24 6.53 6.77 3.92 6.42Wyoming 10.76 7.74 8.08 10.11 2.81 7.43 7.99 4.59 7.77
LANAI KAUAI KONAHILODomestic Flights TOTAL OAHU MAUI MOLOKAI
Source: DBEDT 69
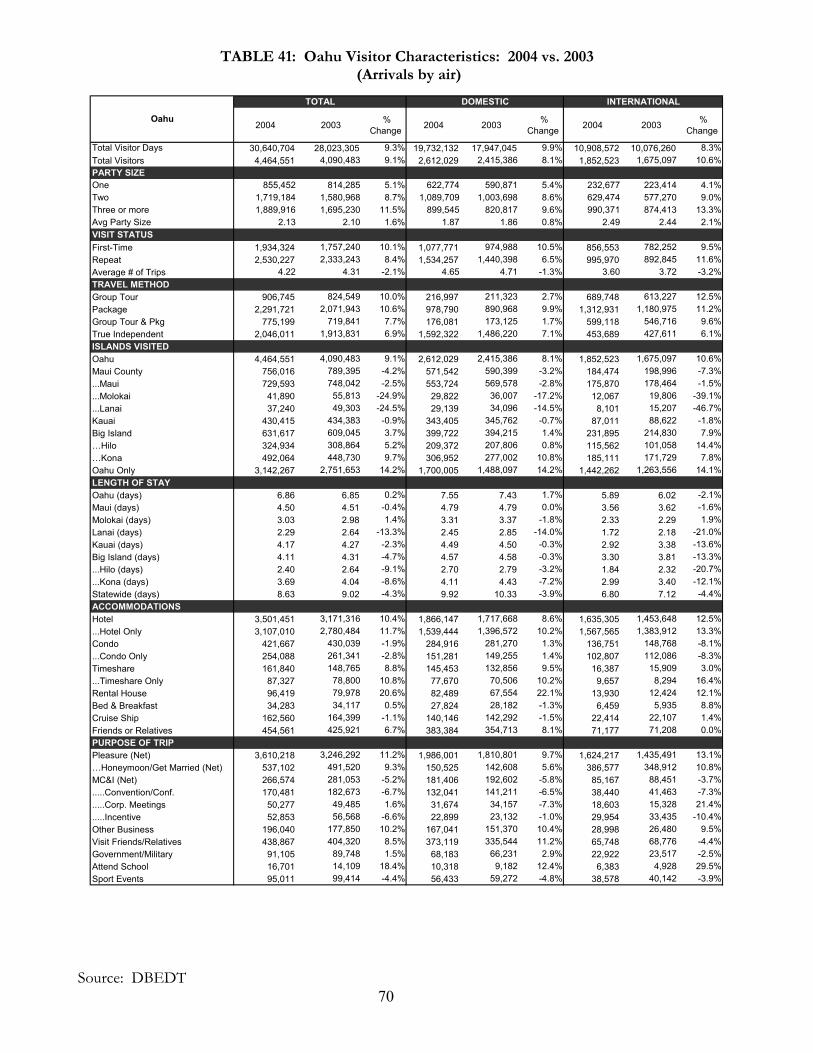
TABLE 41: Oahu Visitor Characteristics: 2004 vs. 2003 (Arrivals by air)
TOTAL DOMESTIC INTERNATIONAL
2004 2003 % Change 2004 2003 %
Change 2004 2003 % Change
Total Visitor Days 30,640,704 28,023,305 9.3% 19,732,132 17,947,045 9.9% 10,908,572 10,076,260 8.3%Total Visitors 4,464,551 4,090,483 9.1% 2,612,029 2,415,386 8.1% 1,852,523 1,675,097 10.6%PARTY SIZEOne 855,452 814,285 5.1% 622,774 590,871 5.4% 232,677 223,414 4.1%Two 1,719,184 1,580,968 8.7% 1,089,709 1,003,698 8.6% 629,474 577,270 9.0%Three or more 1,889,916 1,695,230 11.5% 899,545 820,817 9.6% 990,371 874,413 13.3%Avg Party Size 2.13 2.10 1.6% 1.87 1.86 0.8% 2.49 2.44 2.1%VISIT STATUS First-Time 1,934,324 1,757,240 10.1% 1,077,771 974,988 10.5% 856,553 782,252 9.5%Repeat 2,530,227 2,333,243 8.4% 1,534,257 1,440,398 6.5% 995,970 892,845 11.6%Average # of Trips 4.22 4.31 -2.1% 4.65 4.71 -1.3% 3.60 3.72 -3.2%TRAVEL METHODGroup Tour 906,745 824,549 10.0% 216,997 211,323 2.7% 689,748 613,227 12.5%Package 2,291,721 2,071,943 10.6% 978,790 890,968 9.9% 1,312,931 1,180,975 11.2%Group Tour & Pkg 775,199 719,841 7.7% 176,081 173,125 1.7% 599,118 546,716 9.6%True Independent 2,046,011 1,913,831 6.9% 1,592,322 1,486,220 7.1% 453,689 427,611 6.1%ISLANDS VISITEDOahu 4,464,551 4,090,483 9.1% 2,612,029 2,415,386 8.1% 1,852,523 1,675,097 10.6%Maui County 756,016 789,395 -4.2% 571,542 590,399 -3.2% 184,474 198,996 -7.3%...Maui 729,593 748,042 -2.5% 553,724 569,578 -2.8% 175,870 178,464 -1.5%...Molokai 41,890 55,813 -24.9% 29,822 36,007 -17.2% 12,067 19,806 -39.1%...Lanai 37,240 49,303 -24.5% 29,139 34,096 -14.5% 8,101 15,207 -46.7%Kauai 430,415 434,383 -0.9% 343,405 345,762 -0.7% 87,011 88,622 -1.8%Big Island 631,617 609,045 3.7% 399,722 394,215 1.4% 231,895 214,830 7.9%…Hilo 324,934 308,864 5.2% 209,372 207,806 0.8% 115,562 101,058 14.4%…Kona 492,064 448,730 9.7% 306,952 277,002 10.8% 185,111 171,729 7.8%Oahu Only 3,142,267 2,751,653 14.2% 1,700,005 1,488,097 14.2% 1,442,262 1,263,556 14.1%LENGTH OF STAY Oahu (days) 6.86 6.85 0.2% 7.55 7.43 1.7% 5.89 6.02 -2.1%Maui (days) 4.50 4.51 -0.4% 4.79 4.79 0.0% 3.56 3.62 -1.6%Molokai (days) 3.03 2.98 1.4% 3.31 3.37 -1.8% 2.33 2.29 1.9%Lanai (days) 2.29 2.64 -13.3% 2.45 2.85 -14.0% 1.72 2.18 -21.0%Kauai (days) 4.17 4.27 -2.3% 4.49 4.50 -0.3% 2.92 3.38 -13.6%Big Island (days) 4.11 4.31 -4.7% 4.57 4.58 -0.3% 3.30 3.81 -13.3%...Hilo (days) 2.40 2.64 -9.1% 2.70 2.79 -3.2% 1.84 2.32 -20.7%...Kona (days) 3.69 4.04 -8.6% 4.11 4.43 -7.2% 2.99 3.40 -12.1%Statewide (days) 8.63 9.02 -4.3% 9.92 10.33 -3.9% 6.80 7.12 -4.4%ACCOMMODATIONSHotel 3,501,451 3,171,316 10.4% 1,866,147 1,717,668 8.6% 1,635,305 1,453,648 12.5%...Hotel Only 3,107,010 2,780,484 11.7% 1,539,444 1,396,572 10.2% 1,567,565 1,383,912 13.3%Condo 421,667 430,039 -1.9% 284,916 281,270 1.3% 136,751 148,768 -8.1%...Condo Only 254,088 261,341 -2.8% 151,281 149,255 1.4% 102,807 112,086 -8.3%Timeshare 161,840 148,765 8.8% 145,453 132,856 9.5% 16,387 15,909 3.0%...Timeshare Only 87,327 78,800 10.8% 77,670 70,506 10.2% 9,657 8,294 16.4%Rental House 96,419 79,978 20.6% 82,489 67,554 22.1% 13,930 12,424 12.1%Bed & Breakfast 34,283 34,117 0.5% 27,824 28,182 -1.3% 6,459 5,935 8.8%Cruise Ship 162,560 164,399 -1.1% 140,146 142,292 -1.5% 22,414 22,107 1.4%Friends or Relatives 454,561 425,921 6.7% 383,384 354,713 8.1% 71,177 71,208 0.0%PURPOSE OF TRIPPleasure (Net) 3,610,218 3,246,292 11.2% 1,986,001 1,810,801 9.7% 1,624,217 1,435,491 13.1%…Honeymoon/Get Married (Net) 537,102 491,520 9.3% 150,525 142,608 5.6% 386,577 348,912 10.8%MC&I (Net) 266,574 281,053 -5.2% 181,406 192,602 -5.8% 85,167 88,451 -3.7%.....Convention/Conf. 170,481 182,673 -6.7% 132,041 141,211 -6.5% 38,440 41,463 -7.3%.....Corp. Meetings 50,277 49,485 1.6% 31,674 34,157 -7.3% 18,603 15,328 21.4%.....Incentive 52,853 56,568 -6.6% 22,899 23,132 -1.0% 29,954 33,435 -10.4%Other Business 196,040 177,850 10.2% 167,041 151,370 10.4% 28,998 26,480 9.5%Visit Friends/Relatives 438,867 404,320 8.5% 373,119 335,544 11.2% 65,748 68,776 -4.4%Government/Military 91,105 89,748 1.5% 68,183 66,231 2.9% 22,922 23,517 -2.5%Attend School 16,701 14,109 18.4% 10,318 9,182 12.4% 6,383 4,928 29.5%Sport Events 95,011 99,414 -4.4% 56,433 59,272 -4.8% 38,578 40,142 -3.9%
Oahu
Source: DBEDT 70
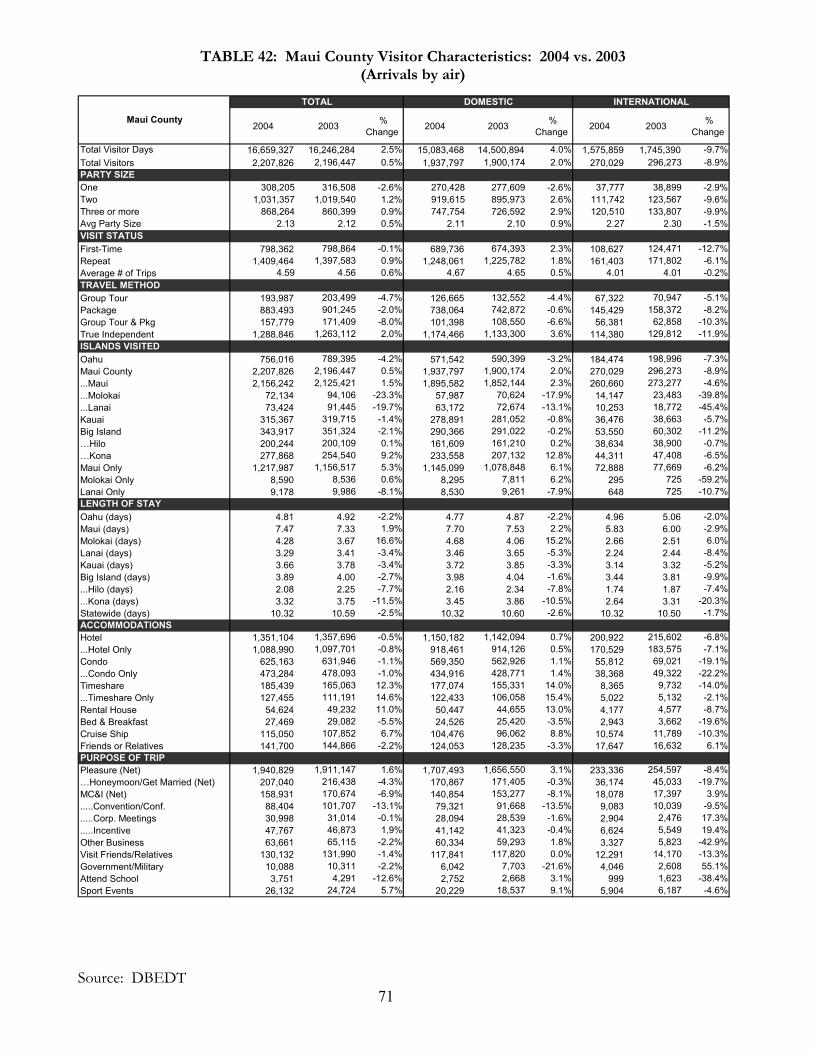
TABLE 42: Maui County Visitor Characteristics: 2004 vs. 2003 (Arrivals by air)
TOTAL DOMESTIC INTERNATIONAL
2004 2003 % Change 2004 2003 %
Change 2004 2003 % Change
Total Visitor Days 16,659,327 16,246,284 2.5% 15,083,468 14,500,894 4.0% 1,575,859 1,745,390 -9.7%Total Visitors 2,207,826 2,196,447 0.5% 1,937,797 1,900,174 2.0% 270,029 296,273 -8.9%PARTY SIZEOne 308,205 316,508 -2.6% 270,428 277,609 -2.6% 37,777 38,899 -2.9%Two 1,031,357 1,019,540 1.2% 919,615 895,973 2.6% 111,742 123,567 -9.6%Three or more 868,264 860,399 0.9% 747,754 726,592 2.9% 120,510 133,807 -9.9%Avg Party Size 2.13 2.12 0.5% 2.11 2.10 0.9% 2.27 2.30 -1.5%VISIT STATUSFirst-Time 798,362 798,864 -0.1% 689,736 674,393 2.3% 108,627 124,471 -12.7%Repeat 1,409,464 1,397,583 0.9% 1,248,061 1,225,782 1.8% 161,403 171,802 -6.1%Average # of Trips 4.59 4.56 0.6% 4.67 4.65 0.5% 4.01 4.01 -0.2%TRAVEL METHODGroup Tour 193,987 203,499 -4.7% 126,665 132,552 -4.4% 67,322 70,947 -5.1%Package 883,493 901,245 -2.0% 738,064 742,872 -0.6% 145,429 158,372 -8.2%Group Tour & Pkg 157,779 171,409 -8.0% 101,398 108,550 -6.6% 56,381 62,858 -10.3%True Independent 1,288,846 1,263,112 2.0% 1,174,466 1,133,300 3.6% 114,380 129,812 -11.9%ISLANDS VISITED Oahu 756,016 789,395 -4.2% 571,542 590,399 -3.2% 184,474 198,996 -7.3%Maui County 2,207,826 2,196,447 0.5% 1,937,797 1,900,174 2.0% 270,029 296,273 -8.9%...Maui 2,156,242 2,125,421 1.5% 1,895,582 1,852,144 2.3% 260,660 273,277 -4.6%...Molokai 72,134 94,106 -23.3% 57,987 70,624 -17.9% 14,147 23,483 -39.8%...Lanai 73,424 91,445 -19.7% 63,172 72,674 -13.1% 10,253 18,772 -45.4%Kauai 315,367 319,715 -1.4% 278,891 281,052 -0.8% 36,476 38,663 -5.7%Big Island 343,917 351,324 -2.1% 290,366 291,022 -0.2% 53,550 60,302 -11.2%…Hilo 200,244 200,109 0.1% 161,609 161,210 0.2% 38,634 38,900 -0.7%…Kona 277,868 254,540 9.2% 233,558 207,132 12.8% 44,311 47,408 -6.5%Maui Only 1,217,987 1,156,517 5.3% 1,145,099 1,078,848 6.1% 72,888 77,669 -6.2%Molokai Only 8,590 8,536 0.6% 8,295 7,811 6.2% 295 725 -59.2%Lanai Only 9,178 9,986 -8.1% 8,530 9,261 -7.9% 648 725 -10.7%LENGTH OF STAY Oahu (days) 4.81 4.92 -2.2% 4.77 4.87 -2.2% 4.96 5.06 -2.0%Maui (days) 7.47 7.33 1.9% 7.70 7.53 2.2% 5.83 6.00 -2.9%Molokai (days) 4.28 3.67 16.6% 4.68 4.06 15.2% 2.66 2.51 6.0%Lanai (days) 3.29 3.41 -3.4% 3.46 3.65 -5.3% 2.24 2.44 -8.4%Kauai (days) 3.66 3.78 -3.4% 3.72 3.85 -3.3% 3.14 3.32 -5.2%Big Island (days) 3.89 4.00 -2.7% 3.98 4.04 -1.6% 3.44 3.81 -9.9%...Hilo (days) 2.08 2.25 -7.7% 2.16 2.34 -7.8% 1.74 1.87 -7.4%...Kona (days) 3.32 3.75 -11.5% 3.45 3.86 -10.5% 2.64 3.31 -20.3%Statewide (days) 10.32 10.59 -2.5% 10.32 10.60 -2.6% 10.32 10.50 -1.7%ACCOMMODATIONSHotel 1,351,104 1,357,696 -0.5% 1,150,182 1,142,094 0.7% 200,922 215,602 -6.8%...Hotel Only 1,088,990 1,097,701 -0.8% 918,461 914,126 0.5% 170,529 183,575 -7.1%Condo 625,163 631,946 -1.1% 569,350 562,926 1.1% 55,812 69,021 -19.1%...Condo Only 473,284 478,093 -1.0% 434,916 428,771 1.4% 38,368 49,322 -22.2%Timeshare 185,439 165,063 12.3% 177,074 155,331 14.0% 8,365 9,732 -14.0%...Timeshare Only 127,455 111,191 14.6% 122,433 106,058 15.4% 5,022 5,132 -2.1%Rental House 54,624 49,232 11.0% 50,447 44,655 13.0% 4,177 4,577 -8.7%Bed & Breakfast 27,469 29,082 -5.5% 24,526 25,420 -3.5% 2,943 3,662 -19.6%Cruise Ship 115,050 107,852 6.7% 104,476 96,062 8.8% 10,574 11,789 -10.3%Friends or Relatives 141,700 144,866 -2.2% 124,053 128,235 -3.3% 17,647 16,632 6.1%PURPOSE OF TRIPPleasure (Net) 1,940,829 1,911,147 1.6% 1,707,493 1,656,550 3.1% 233,336 254,597 -8.4%…Honeymoon/Get Married (Net) 207,040 216,438 -4.3% 170,867 171,405 -0.3% 36,174 45,033 -19.7%MC&I (Net) 158,931 170,674 -6.9% 140,854 153,277 -8.1% 18,078 17,397 3.9%.....Convention/Conf. 88,404 101,707 -13.1% 79,321 91,668 -13.5% 9,083 10,039 -9.5%.....Corp. Meetings 30,998 31,014 -0.1% 28,094 28,539 -1.6% 2,904 2,476 17.3%.....Incentive 47,767 46,873 1.9% 41,142 41,323 -0.4% 6,624 5,549 19.4%Other Business 63,661 65,115 -2.2% 60,334 59,293 1.8% 3,327 5,823 -42.9%Visit Friends/Relatives 130,132 131,990 -1.4% 117,841 117,820 0.0% 12,291 14,170 -13.3%Government/Military 10,088 10,311 -2.2% 6,042 7,703 -21.6% 4,046 2,608 55.1%Attend School 3,751 4,291 -12.6% 2,752 2,668 3.1% 999 1,623 -38.4%Sport Events 26,132 24,724 5.7% 20,229 18,537 9.1% 5,904 6,187 -4.6%
Maui County
Source: DBEDT 71
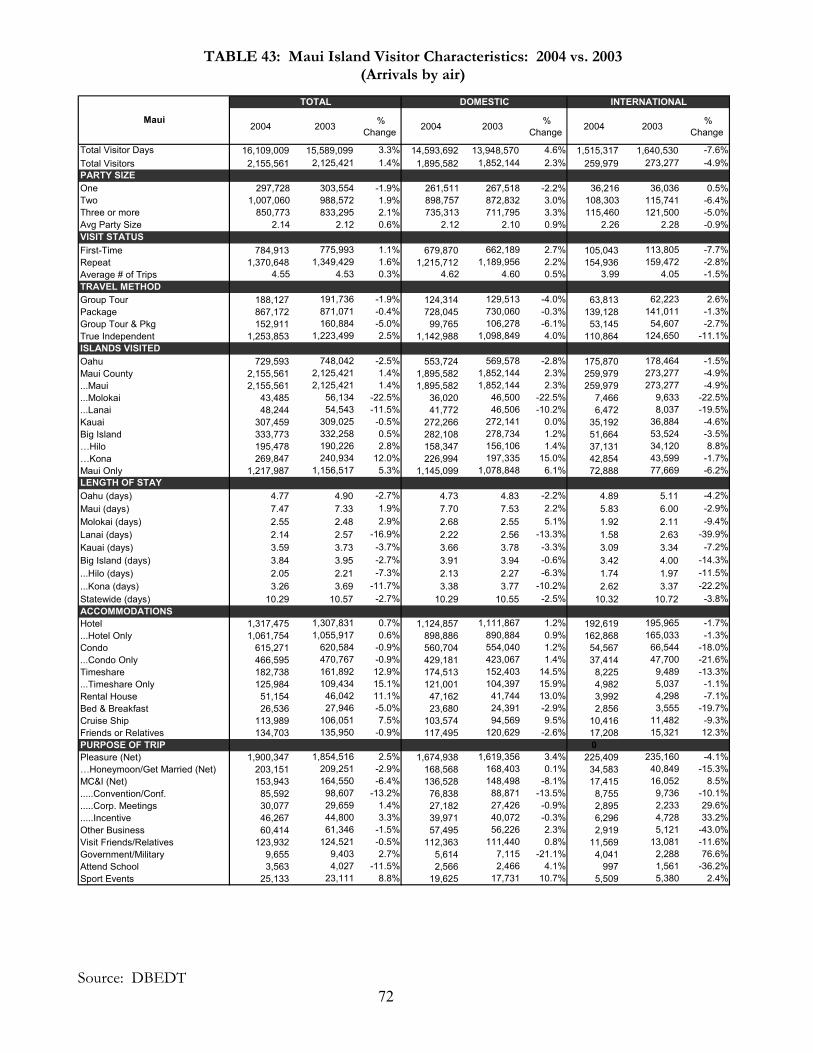
TABLE 43: Maui Island Visitor Characteristics: 2004 vs. 2003 (Arrivals by air)
TOTAL DOMESTIC INTERNATIONAL
2004 2003 % Change 2004 2003 %
Change 2004 2003 % Change
Total Visitor Days 16,109,009 15,589,099 3.3% 14,593,692 13,948,570 4.6% 1,515,317 1,640,530 -7.6%Total Visitors 2,155,561 2,125,421 1.4% 1,895,582 1,852,144 2.3% 259,979 273,277 -4.9%PARTY SIZEOne 297,728 303,554 -1.9% 261,511 267,518 -2.2% 36,216 36,036 0.5%Two 1,007,060 988,572 1.9% 898,757 872,832 3.0% 108,303 115,741 -6.4%Three or more 850,773 833,295 2.1% 735,313 711,795 3.3% 115,460 121,500 -5.0%Avg Party Size 2.14 2.12 0.6% 2.12 2.10 0.9% 2.26 2.28 -0.9%VISIT STATUS First-Time 784,913 775,993 1.1% 679,870 662,189 2.7% 105,043 113,805 -7.7%Repeat 1,370,648 1,349,429 1.6% 1,215,712 1,189,956 2.2% 154,936 159,472 -2.8%Average # of Trips 4.55 4.53 0.3% 4.62 4.60 0.5% 3.99 4.05 -1.5%TRAVEL METHODGroup Tour 188,127 191,736 -1.9% 124,314 129,513 -4.0% 63,813 62,223 2.6%Package 867,172 871,071 -0.4% 728,045 730,060 -0.3% 139,128 141,011 -1.3%Group Tour & Pkg 152,911 160,884 -5.0% 99,765 106,278 -6.1% 53,145 54,607 -2.7%True Independent 1,253,853 1,223,499 2.5% 1,142,988 1,098,849 4.0% 110,864 124,650 -11.1%ISLANDS VISITED Oahu 729,593 748,042 -2.5% 553,724 569,578 -2.8% 175,870 178,464 -1.5%Maui County 2,155,561 2,125,421 1.4% 1,895,582 1,852,144 2.3% 259,979 273,277 -4.9%...Maui 2,155,561 2,125,421 1.4% 1,895,582 1,852,144 2.3% 259,979 273,277 -4.9%...Molokai 43,485 56,134 -22.5% 36,020 46,500 -22.5% 7,466 9,633 -22.5%...Lanai 48,244 54,543 -11.5% 41,772 46,506 -10.2% 6,472 8,037 -19.5%Kauai 307,459 309,025 -0.5% 272,266 272,141 0.0% 35,192 36,884 -4.6%Big Island 333,773 332,258 0.5% 282,108 278,734 1.2% 51,664 53,524 -3.5%…Hilo 195,478 190,226 2.8% 158,347 156,106 1.4% 37,131 34,120 8.8%…Kona 269,847 240,934 12.0% 226,994 197,335 15.0% 42,854 43,599 -1.7%Maui Only 1,217,987 1,156,517 5.3% 1,145,099 1,078,848 6.1% 72,888 77,669 -6.2%LENGTH OF STAY Oahu (days) 4.77 4.90 -2.7% 4.73 4.83 -2.2% 4.89 5.11 -4.2%Maui (days) 7.47 7.33 1.9% 7.70 7.53 2.2% 5.83 6.00 -2.9%Molokai (days) 2.55 2.48 2.9% 2.68 2.55 5.1% 1.92 2.11 -9.4%Lanai (days) 2.14 2.57 -16.9% 2.22 2.56 -13.3% 1.58 2.63 -39.9%Kauai (days) 3.59 3.73 -3.7% 3.66 3.78 -3.3% 3.09 3.34 -7.2%Big Island (days) 3.84 3.95 -2.7% 3.91 3.94 -0.6% 3.42 4.00 -14.3%...Hilo (days) 2.05 2.21 -7.3% 2.13 2.27 -6.3% 1.74 1.97 -11.5%...Kona (days) 3.26 3.69 -11.7% 3.38 3.77 -10.2% 2.62 3.37 -22.2%Statewide (days) 10.29 10.57 -2.7% 10.29 10.55 -2.5% 10.32 10.72 -3.8%ACCOMMODATIONSHotel 1,317,475 1,307,831 0.7% 1,124,857 1,111,867 1.2% 192,619 195,965 -1.7%...Hotel Only 1,061,754 1,055,917 0.6% 898,886 890,884 0.9% 162,868 165,033 -1.3%Condo 615,271 620,584 -0.9% 560,704 554,040 1.2% 54,567 66,544 -18.0%...Condo Only 466,595 470,767 -0.9% 429,181 423,067 1.4% 37,414 47,700 -21.6%Timeshare 182,738 161,892 12.9% 174,513 152,403 14.5% 8,225 9,489 -13.3%...Timeshare Only 125,984 109,434 15.1% 121,001 104,397 15.9% 4,982 5,037 -1.1%Rental House 51,154 46,042 11.1% 47,162 41,744 13.0% 3,992 4,298 -7.1%Bed & Breakfast 26,536 27,946 -5.0% 23,680 24,391 -2.9% 2,856 3,555 -19.7%Cruise Ship 113,989 106,051 7.5% 103,574 94,569 9.5% 10,416 11,482 -9.3%Friends or Relatives 134,703 135,950 -0.9% 117,495 120,629 -2.6% 17,208 15,321 12.3%PURPOSE OF TRIP 0Pleasure (Net) 1,900,347 1,854,516 2.5% 1,674,938 1,619,356 3.4% 225,409 235,160 -4.1%…Honeymoon/Get Married (Net) 203,151 209,251 -2.9% 168,568 168,403 0.1% 34,583 40,849 -15.3%MC&I (Net) 153,943 164,550 -6.4% 136,528 148,498 -8.1% 17,415 16,052 8.5%.....Convention/Conf. 85,592 98,607 -13.2% 76,838 88,871 -13.5% 8,755 9,736 -10.1%.....Corp. Meetings 30,077 29,659 1.4% 27,182 27,426 -0.9% 2,895 2,233 29.6%.....Incentive 46,267 44,800 3.3% 39,971 40,072 -0.3% 6,296 4,728 33.2%Other Business 60,414 61,346 -1.5% 57,495 56,226 2.3% 2,919 5,121 -43.0%Visit Friends/Relatives 123,932 124,521 -0.5% 112,363 111,440 0.8% 11,569 13,081 -11.6%Government/Military 9,655 9,403 2.7% 5,614 7,115 -21.1% 4,041 2,288 76.6%Attend School 3,563 4,027 -11.5% 2,566 2,466 4.1% 997 1,561 -36.2%Sport Events 25,133 23,111 8.8% 19,625 17,731 10.7% 5,509 5,380 2.4%
Maui
Source: DBEDT 72

TABLE 44: Molokai Visitor Characteristics: 2004 vs. 2003 (Arrivals by air)
TOTAL DOMESTIC INTERNATIONAL
2004 2003 % Change 2004 2003 %
Change 2004 2003 % Change
Total Visitor Days 308,865 345,733 -10.7% 271,239 286,753 -5.4% 37,626 58,979 -36.2%Total Visitors 72,099 94,106 -23.4% 57,987 70,624 -17.9% 14,112 23,483 -39.9%PARTY SIZEOne 13,942 18,089 -22.9% 12,023 14,126 -14.9% 1,919 3,963 -51.6%Two 34,366 41,698 -17.6% 28,409 33,854 -16.1% 5,956 7,845 -24.1%Three or more 23,791 34,319 -30.7% 17,554 22,644 -22.5% 6,237 11,674 -46.6%Avg Party Size 1.97 2.02 -2.3% 1.89 1.92 -1.6% 2.30 2.31 -0.5%VISIT STATUS First-Time 25,655 35,977 -28.7% 20,916 24,688 -15.3% 4,739 11,288 -58.0%Repeat 46,444 58,130 -20.1% 37,071 45,935 -19.3% 9,373 12,194 -23.1%Average # of Trips 5.14 5.00 2.9% 5.17 5.30 -2.5% 5.05 4.11 22.9%TRAVEL METHODGroup Tour 9,071 12,604 -28.0% 5,220 6,125 -14.8% 3,851 6,478 -40.6%Package 26,250 38,576 -32.0% 18,830 24,306 -22.5% 7,421 14,271 -48.0%Group Tour & Pkg 7,450 11,075 -32.7% 4,004 4,940 -18.9% 3,445 6,135 -43.8%True Independent 44,263 54,001 -18.0% 37,942 45,133 -15.9% 6,321 8,869 -28.7%ISLANDS VISITEDOahu 41,890 55,813 -24.9% 29,822 36,007 -17.2% 12,067 19,806 -39.1%Maui County 72,099 94,106 -23.4% 57,987 70,624 -17.9% 14,112 23,483 -39.9%...Maui 43,485 56,134 -22.5% 36,020 46,500 -22.5% 7,466 9,633 -22.5%...Molokai 72,099 94,106 -23.4% 57,987 70,624 -17.9% 14,112 23,483 -39.9%...Lanai 16,226 21,422 -24.3% 13,072 16,915 -22.7% 3,154 4,507 -30.0%Kauai 19,855 26,216 -24.3% 16,014 21,046 -23.9% 3,841 5,171 -25.7%Big Island 22,999 32,681 -29.6% 18,718 24,873 -24.7% 4,281 7,808 -45.2%…Hilo 17,408 23,071 -24.5% 13,660 17,969 -24.0% 3,748 5,102 -26.5%…Kona 19,715 27,127 -27.3% 15,852 20,238 -21.7% 3,862 6,888 -43.9%Molokai Only 8,590 8,536 0.6% 8,295 7,811 6.2% 295 725 -59.2%LENGTH OF STAY Oahu (days) 6.17 5.27 17.2% 5.85 5.62 4.2% 6.96 4.63 50.4%Maui (days) 5.31 5.65 -6.1% 5.45 5.57 -2.2% 4.62 6.04 -23.5%Molokai (days) 4.28 3.67 16.6% 4.68 4.06 15.2% 2.67 2.51 6.2%Lanai (days) 1.70 2.05 -17.3% 1.76 2.09 -16.0% 1.45 1.90 -23.9%Kauai (days) 3.42 3.41 0.1% 3.56 3.65 -2.3% 2.81 2.45 14.6%Big Island (days) 4.57 4.67 -2.1% 4.55 4.99 -8.8% 4.65 3.64 27.8%...Hilo (days) 2.23 2.51 -11.1% 2.45 2.77 -11.7% 1.47 1.61 -8.9%...Kona (days) 3.36 3.48 -3.6% 3.27 3.67 -11.0% 3.73 2.93 27.2%Statewide (days) 13.85 13.39 3.4% 13.92 14.19 -1.9% 13.52 11.00 22.9%ACCOMMODATIONSHotel 41,546 57,533 -27.8% 31,329 39,805 -21.3% 10,217 17,728 -42.4%...Hotel Only 27,728 41,642 -33.4% 19,550 26,515 -26.3% 8,177 15,127 -45.9%Condo 18,748 21,815 -14.1% 15,471 18,153 -14.8% 3,277 3,661 -10.5%...Condo Only 11,785 14,149 -16.7% 9,723 11,888 -18.2% 2,062 2,261 -8.8%Timeshare 4,452 5,748 -22.5% 4,251 5,232 -18.8% 201 516 -61.0%...Timeshare Only 2,347 3,401 -31.0% 2,305 3,055 -24.6% 43 346 -87.6%Rental House 4,763 4,428 7.6% 4,384 4,012 9.3% 379 416 -8.9%Bed & Breakfast 2,000 2,476 -19.2% 1,823 2,107 -13.5% 177 369 -51.9%Cruise Ship 6,299 7,480 -15.8% 5,651 6,341 -10.9% 648 1,139 -43.1%Friends or Relatives 9,381 12,214 -23.2% 8,076 9,787 -17.5% 1,306 2,427 -46.2%PURPOSE OF TRIPPleasure (Net) 59,477 76,277 -22.0% 48,054 58,320 -17.6% 11,424 17,958 -36.4%…Honeymoon/Get Married (Net) 5,733 8,100 -29.2% 4,136 5,043 -18.0% 1,597 3,058 -47.8%MC&I (Net) 3,853 6,244 -38.3% 3,163 4,542 -30.4% 690 1,702 -59.5%.....Convention/Conf. 2,407 3,770 -36.2% 2,046 2,855 -28.3% 361 915 -60.6%.....Corp. Meetings 703 1,201 -41.4% 577 971 -40.6% 126 229 -45.2%.....Incentive 960 1,620 -40.8% 697 1,061 -34.3% 263 560 -53.1%Other Business 3,878 3,925 -1.2% 3,474 3,581 -3.0% 404 344 17.3%Visit Friends/Relatives 8,043 9,732 -17.4% 6,833 8,235 -17.0% 1,210 1,497 -19.2%Government/Military 719 1,930 -62.7% 522 840 -37.8% 197 1,090 -82.0%Attend School 430 473 -9.1% 310 359 -13.6% 120 114 5.0%Sport Events 1,186 1,735 -31.7% 895 1,045 -14.4% 291 690 -57.8%
Molokai
Source: DBEDT 73

TABLE 45: Lanai Visitor Characteristics: 2004 vs. 2003 (Arrivals by air)
TOTAL DOMESTIC INTERNATIONAL
2004 2003 % Change 2004 2003 %
Change 2004 2003 % Change
Total Visitor Days 241,453 311,452 -22.5% 218,537 265,571 -17.7% 22,916 45,881 -50.1%Total Visitors 73,388 91,445 -19.7% 63,172 72,674 -13.1% 10,216 18,772 -45.6%PARTY SIZEOne 11,954 14,378 -16.9% 10,184 12,164 -16.3% 1,770 2,214 -20.1%Two 38,123 45,664 -16.5% 33,929 38,088 -10.9% 4,195 7,576 -44.6%Three or more 23,311 31,402 -25.8% 19,059 22,422 -15.0% 4,252 8,981 -52.7%Avg Party Size 2.01 2.07 -2.8% 1.98 1.98 0.2% 2.19 2.42 -9.6%VISIT STATUS First-Time 26,860 33,683 -20.3% 23,084 26,394 -12.5% 3,777 7,288 -48.2%Repeat 46,528 57,763 -19.5% 40,088 46,279 -13.4% 6,440 11,483 -43.9%Average # of Trips 5.10 4.83 5.6% 5.10 4.93 3.5% 5.13 4.46 15.0%TRAVEL METHODGroup Tour 9,488 13,282 -28.6% 6,969 7,707 -9.6% 2,519 5,575 -54.8%Package 27,376 38,485 -28.9% 22,781 26,448 -13.9% 4,595 12,037 -61.8%Group Tour & Pkg 7,402 11,465 -35.4% 5,480 6,261 -12.5% 1,922 5,204 -63.1%True Independent 43,962 51,144 -14.0% 38,902 44,780 -13.1% 5,060 6,363 -20.5%ISLANDS VISITED Oahu 37,240 49,303 -24.5% 29,139 34,096 -14.5% 8,101 15,207 -46.7%Maui County 73,388 91,445 -19.7% 63,172 72,674 -13.1% 10,216 18,772 -45.6%...Maui 48,244 54,543 -11.5% 41,772 46,506 -10.2% 6,472 8,037 -19.5%...Molokai 16,226 21,422 -24.3% 13,072 16,915 -22.7% 3,154 4,507 -30.0%...Lanai 73,388 91,445 -19.7% 63,172 72,674 -13.1% 10,216 18,772 -45.6%Kauai 23,034 28,026 -17.8% 19,209 23,164 -17.1% 3,824 4,862 -21.3%Big Island 27,031 37,703 -28.3% 22,195 28,016 -20.8% 4,836 9,687 -50.1%…Hilo 19,845 26,864 -26.1% 15,502 19,227 -19.4% 4,343 7,637 -43.1%…Kona 23,840 29,497 -19.2% 19,397 23,146 -16.2% 4,443 6,351 -30.0%Lanai Only 9,178 9,986 -8.1% 8,530 9,261 -7.9% 648 725 -10.7%LENGTH OF STAY Oahu (days) 5.54 4.96 11.6% 5.30 5.16 2.7% 6.40 4.52 41.6%Maui (days) 5.30 5.35 -1.0% 5.37 5.28 1.8% 4.80 5.76 -16.7%Molokai (days) 1.79 2.31 -22.4% 1.86 2.31 -19.1% 1.49 2.34 -36.1%Lanai (days) 3.29 3.41 -3.4% 3.46 3.65 -5.3% 2.24 2.44 -8.2%Kauai (days) 3.15 3.26 -3.2% 3.18 3.43 -7.4% 3.02 2.42 24.5%Big Island (days) 4.04 4.39 -8.1% 4.13 4.62 -10.6% 3.58 3.72 -3.6%...Hilo (days) 1.85 2.17 -14.6% 2.02 2.48 -18.3% 1.23 1.39 -11.2%...Kona (days) 3.04 3.64 -16.6% 3.11 3.54 -12.1% 2.70 4.00 -32.6%Statewide (days) 12.45 12.82 -2.9% 12.26 13.12 -6.5% 13.60 11.66 16.6%ACCOMMODATIONSHotel 50,327 64,669 -22.2% 42,380 50,272 -15.7% 7,947 14,397 -44.8%...Hotel Only 37,323 50,158 -25.6% 31,446 38,126 -17.5% 5,877 12,032 -51.2%Condo 12,682 15,438 -17.8% 10,585 11,997 -11.8% 2,097 3,440 -39.1%...Condo Only 7,925 9,739 -18.6% 6,780 7,415 -8.6% 1,145 2,324 -50.7%Timeshare 4,512 4,816 -6.3% 4,150 4,519 -8.2% 362 297 22.0%...Timeshare Only 2,608 2,857 -8.7% 2,380 2,724 -12.6% 228 133 71.4%Rental House 2,186 2,157 1.3% 2,042 2,009 1.6% 144 148 -2.7%Bed & Breakfast 1,292 1,707 -24.3% 1,141 1,421 -19.7% 152 286 -46.9%Cruise Ship 9,702 9,869 -1.7% 8,420 8,209 2.6% 1,283 1,660 -22.7%Friends or Relatives 6,329 8,603 -26.4% 5,829 7,143 -18.4% 500 1,460 -65.8%PURPOSE OF TRIP 0Pleasure (Net) 61,269 75,919 -19.3% 53,034 59,932 -11.5% 8,234 15,987 -48.5%…Honeymoon/Get Married (Net) 7,128 9,399 -24.2% 5,752 6,828 -15.8% 1,375 2,570 -46.5%MC&I (Net) 7,772 9,648 -19.4% 7,002 8,368 -16.3% 770 1,280 -39.8%.....Convention/Conf. 4,020 4,955 -18.9% 3,703 4,629 -20.0% 317 326 -2.5%.....Corp. Meetings 1,591 2,133 -25.4% 1,532 1,853 -17.3% 60 280 -78.8%.....Incentive 2,734 3,388 -19.3% 2,272 2,692 -15.6% 462 696 -33.6%Other Business 3,030 3,832 -20.9% 2,678 3,177 -15.7% 352 655 -46.3%Visit Friends/Relatives 5,576 7,633 -27.0% 5,184 6,299 -17.7% 392 1,334 -70.6%Government/Military 449 884 -49.2% 421 662 -36.5% 28 222 -87.3%Attend School 262 344 -23.8% 216 324 -33.3% 46 20 132.0%Sport Events 965 1,157 -16.5% 551 755 -27.1% 415 402 3.3%
Lanai
Source: DBEDT 74
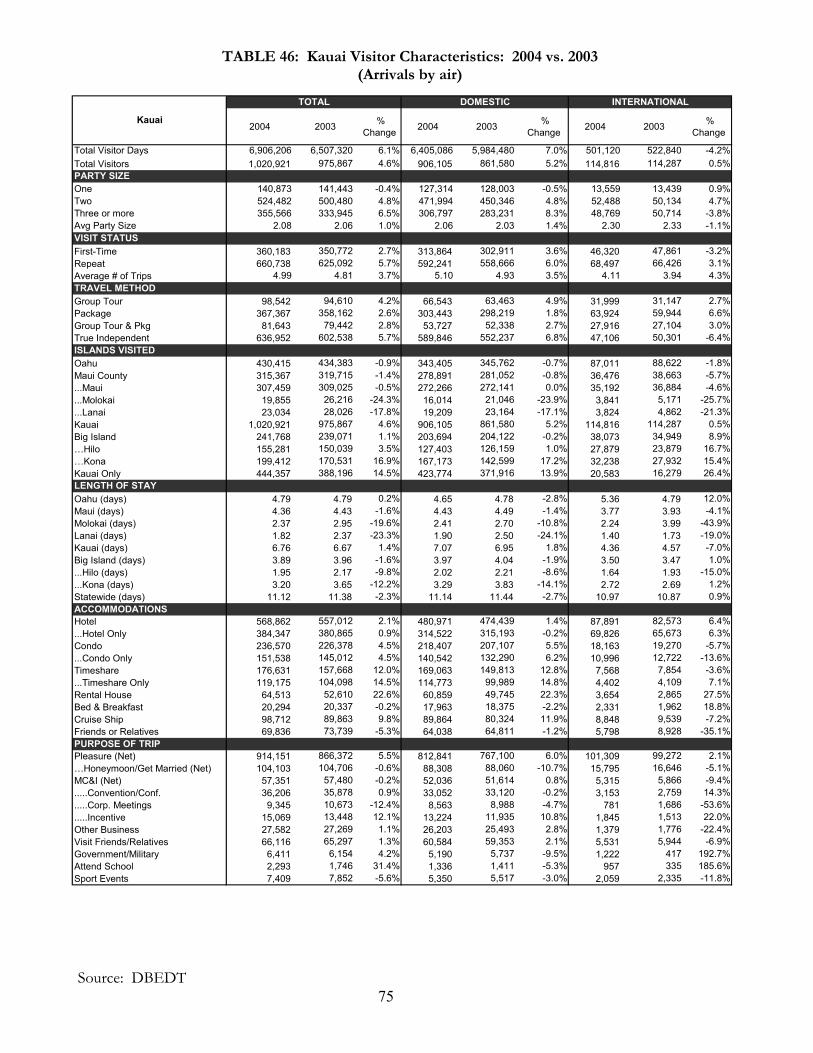
TABLE 46: Kauai Visitor Characteristics: 2004 vs. 2003 (Arrivals by air)
TOTAL DOMESTIC INTERNATIONAL
2004 2003 % Change 2004 2003 %
Change 2004 2003 % Change
Total Visitor Days 6,906,206 6,507,320 6.1% 6,405,086 5,984,480 7.0% 501,120 522,840 -4.2%Total Visitors 1,020,921 975,867 4.6% 906,105 861,580 5.2% 114,816 114,287 0.5%PARTY SIZEOne 140,873 141,443 -0.4% 127,314 128,003 -0.5% 13,559 13,439 0.9%Two 524,482 500,480 4.8% 471,994 450,346 4.8% 52,488 50,134 4.7%Three or more 355,566 333,945 6.5% 306,797 283,231 8.3% 48,769 50,714 -3.8%Avg Party Size 2.08 2.06 1.0% 2.06 2.03 1.4% 2.30 2.33 -1.1%VISIT STATUSFirst-Time 360,183 350,772 2.7% 313,864 302,911 3.6% 46,320 47,861 -3.2%Repeat 660,738 625,092 5.7% 592,241 558,666 6.0% 68,497 66,426 3.1%Average # of Trips 4.99 4.81 3.7% 5.10 4.93 3.5% 4.11 3.94 4.3%TRAVEL METHODGroup Tour 98,542 94,610 4.2% 66,543 63,463 4.9% 31,999 31,147 2.7%Package 367,367 358,162 2.6% 303,443 298,219 1.8% 63,924 59,944 6.6%Group Tour & Pkg 81,643 79,442 2.8% 53,727 52,338 2.7% 27,916 27,104 3.0%True Independent 636,952 602,538 5.7% 589,846 552,237 6.8% 47,106 50,301 -6.4%ISLANDS VISITEDOahu 430,415 434,383 -0.9% 343,405 345,762 -0.7% 87,011 88,622 -1.8%Maui County 315,367 319,715 -1.4% 278,891 281,052 -0.8% 36,476 38,663 -5.7%...Maui 307,459 309,025 -0.5% 272,266 272,141 0.0% 35,192 36,884 -4.6%...Molokai 19,855 26,216 -24.3% 16,014 21,046 -23.9% 3,841 5,171 -25.7%...Lanai 23,034 28,026 -17.8% 19,209 23,164 -17.1% 3,824 4,862 -21.3%Kauai 1,020,921 975,867 4.6% 906,105 861,580 5.2% 114,816 114,287 0.5%Big Island 241,768 239,071 1.1% 203,694 204,122 -0.2% 38,073 34,949 8.9%…Hilo 155,281 150,039 3.5% 127,403 126,159 1.0% 27,879 23,879 16.7%…Kona 199,412 170,531 16.9% 167,173 142,599 17.2% 32,238 27,932 15.4%Kauai Only 444,357 388,196 14.5% 423,774 371,916 13.9% 20,583 16,279 26.4%LENGTH OF STAY Oahu (days) 4.79 4.79 0.2% 4.65 4.78 -2.8% 5.36 4.79 12.0%Maui (days) 4.36 4.43 -1.6% 4.43 4.49 -1.4% 3.77 3.93 -4.1%Molokai (days) 2.37 2.95 -19.6% 2.41 2.70 -10.8% 2.24 3.99 -43.9%Lanai (days) 1.82 2.37 -23.3% 1.90 2.50 -24.1% 1.40 1.73 -19.0%Kauai (days) 6.76 6.67 1.4% 7.07 6.95 1.8% 4.36 4.57 -7.0%Big Island (days) 3.89 3.96 -1.6% 3.97 4.04 -1.9% 3.50 3.47 1.0%...Hilo (days) 1.95 2.17 -9.8% 2.02 2.21 -8.6% 1.64 1.93 -15.0%...Kona (days) 3.20 3.65 -12.2% 3.29 3.83 -14.1% 2.72 2.69 1.2%Statewide (days) 11.12 11.38 -2.3% 11.14 11.44 -2.7% 10.97 10.87 0.9%ACCOMMODATIONSHotel 568,862 557,012 2.1% 480,971 474,439 1.4% 87,891 82,573 6.4%...Hotel Only 384,347 380,865 0.9% 314,522 315,193 -0.2% 69,826 65,673 6.3%Condo 236,570 226,378 4.5% 218,407 207,107 5.5% 18,163 19,270 -5.7%...Condo Only 151,538 145,012 4.5% 140,542 132,290 6.2% 10,996 12,722 -13.6%Timeshare 176,631 157,668 12.0% 169,063 149,813 12.8% 7,568 7,854 -3.6%...Timeshare Only 119,175 104,098 14.5% 114,773 99,989 14.8% 4,402 4,109 7.1%Rental House 64,513 52,610 22.6% 60,859 49,745 22.3% 3,654 2,865 27.5%Bed & Breakfast 20,294 20,337 -0.2% 17,963 18,375 -2.2% 2,331 1,962 18.8%Cruise Ship 98,712 89,863 9.8% 89,864 80,324 11.9% 8,848 9,539 -7.2%Friends or Relatives 69,836 73,739 -5.3% 64,038 64,811 -1.2% 5,798 8,928 -35.1%PURPOSE OF TRIPPleasure (Net) 914,151 866,372 5.5% 812,841 767,100 6.0% 101,309 99,272 2.1%…Honeymoon/Get Married (Net) 104,103 104,706 -0.6% 88,308 88,060 -10.7% 15,795 16,646 -5.1%MC&I (Net) 57,351 57,480 -0.2% 52,036 51,614 0.8% 5,315 5,866 -9.4%.....Convention/Conf. 36,206 35,878 0.9% 33,052 33,120 -0.2% 3,153 2,759 14.3%.....Corp. Meetings 9,345 10,673 -12.4% 8,563 8,988 -4.7% 781 1,686 -53.6%.....Incentive 15,069 13,448 12.1% 13,224 11,935 10.8% 1,845 1,513 22.0%Other Business 27,582 27,269 1.1% 26,203 25,493 2.8% 1,379 1,776 -22.4%Visit Friends/Relatives 66,116 65,297 1.3% 60,584 59,353 2.1% 5,531 5,944 -6.9%Government/Military 6,411 6,154 4.2% 5,190 5,737 -9.5% 1,222 417 192.7%Attend School 2,293 1,746 31.4% 1,336 1,411 -5.3% 957 335 185.6%Sport Events 7,409 7,852 -5.6% 5,350 5,517 -3.0% 2,059 2,335 -11.8%
Kauai
Source: DBEDT 75
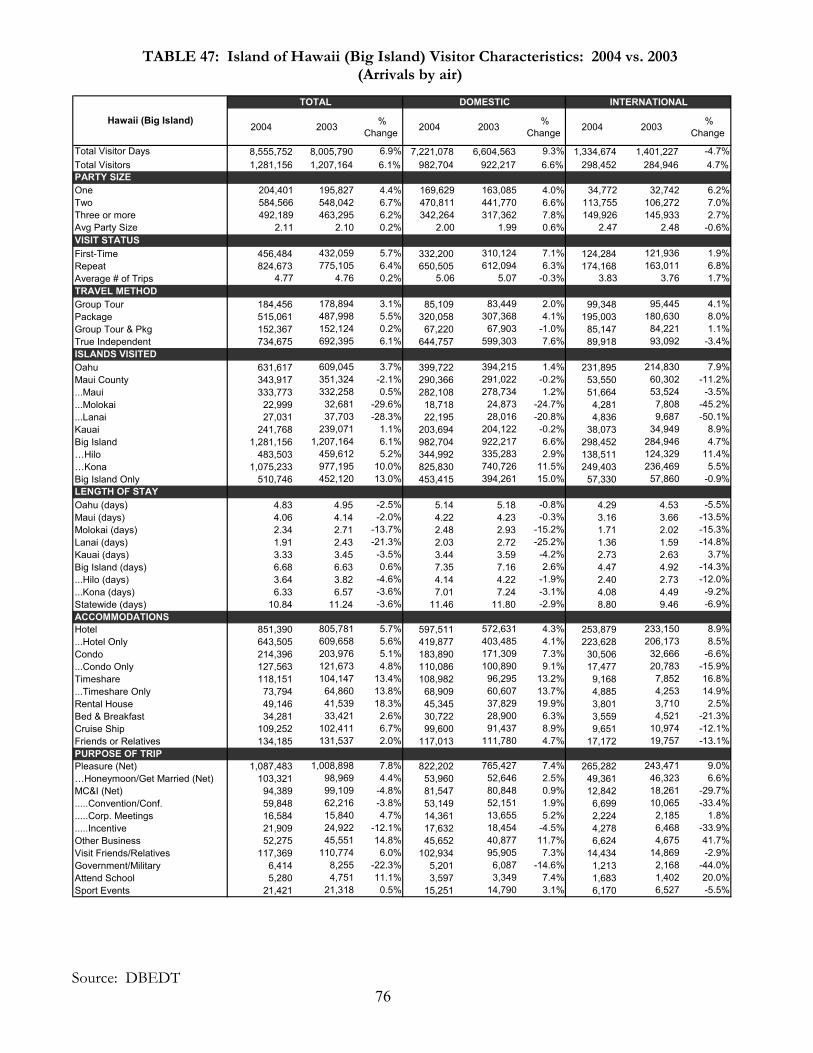
TABLE 47: Island of Hawaii (Big Island) Visitor Characteristics: 2004 vs. 2003 (Arrivals by air)
TOTAL DOMESTIC INTERNATIONAL
2004 2003 % Change 2004 2003 %
Change 2004 2003 % Change
Total Visitor Days 8,555,752 8,005,790 6.9% 7,221,078 6,604,563 9.3% 1,334,674 1,401,227 -4.7%Total Visitors 1,281,156 1,207,164 6.1% 982,704 922,217 6.6% 298,452 284,946 4.7%PARTY SIZEOne 204,401 195,827 4.4% 169,629 163,085 4.0% 34,772 32,742 6.2%Two 584,566 548,042 6.7% 470,811 441,770 6.6% 113,755 106,272 7.0%Three or more 492,189 463,295 6.2% 342,264 317,362 7.8% 149,926 145,933 2.7%Avg Party Size 2.11 2.10 0.2% 2.00 1.99 0.6% 2.47 2.48 -0.6%VISIT STATUS First-Time 456,484 432,059 5.7% 332,200 310,124 7.1% 124,284 121,936 1.9%Repeat 824,673 775,105 6.4% 650,505 612,094 6.3% 174,168 163,011 6.8%Average # of Trips 4.77 4.76 0.2% 5.06 5.07 -0.3% 3.83 3.76 1.7%TRAVEL METHODGroup Tour 184,456 178,894 3.1% 85,109 83,449 2.0% 99,348 95,445 4.1%Package 515,061 487,998 5.5% 320,058 307,368 4.1% 195,003 180,630 8.0%Group Tour & Pkg 152,367 152,124 0.2% 67,220 67,903 -1.0% 85,147 84,221 1.1%True Independent 734,675 692,395 6.1% 644,757 599,303 7.6% 89,918 93,092 -3.4%ISLANDS VISITEDOahu 631,617 609,045 3.7% 399,722 394,215 1.4% 231,895 214,830 7.9%Maui County 343,917 351,324 -2.1% 290,366 291,022 -0.2% 53,550 60,302 -11.2%...Maui 333,773 332,258 0.5% 282,108 278,734 1.2% 51,664 53,524 -3.5%...Molokai 22,999 32,681 -29.6% 18,718 24,873 -24.7% 4,281 7,808 -45.2%...Lanai 27,031 37,703 -28.3% 22,195 28,016 -20.8% 4,836 9,687 -50.1%Kauai 241,768 239,071 1.1% 203,694 204,122 -0.2% 38,073 34,949 8.9%Big Island 1,281,156 1,207,164 6.1% 982,704 922,217 6.6% 298,452 284,946 4.7%…Hilo 483,503 459,612 5.2% 344,992 335,283 2.9% 138,511 124,329 11.4%…Kona 1,075,233 977,195 10.0% 825,830 740,726 11.5% 249,403 236,469 5.5%Big Island Only 510,746 452,120 13.0% 453,415 394,261 15.0% 57,330 57,860 -0.9%LENGTH OF STAY Oahu (days) 4.83 4.95 -2.5% 5.14 5.18 -0.8% 4.29 4.53 -5.5%Maui (days) 4.06 4.14 -2.0% 4.22 4.23 -0.3% 3.16 3.66 -13.5%Molokai (days) 2.34 2.71 -13.7% 2.48 2.93 -15.2% 1.71 2.02 -15.3%Lanai (days) 1.91 2.43 -21.3% 2.03 2.72 -25.2% 1.36 1.59 -14.8%Kauai (days) 3.33 3.45 -3.5% 3.44 3.59 -4.2% 2.73 2.63 3.7%Big Island (days) 6.68 6.63 0.6% 7.35 7.16 2.6% 4.47 4.92 -14.3%...Hilo (days) 3.64 3.82 -4.6% 4.14 4.22 -1.9% 2.40 2.73 -12.0%...Kona (days) 6.33 6.57 -3.6% 7.01 7.24 -3.1% 4.08 4.49 -9.2%Statewide (days) 10.84 11.24 -3.6% 11.46 11.80 -2.9% 8.80 9.46 -6.9%ACCOMMODATIONSHotel 851,390 805,781 5.7% 597,511 572,631 4.3% 253,879 233,150 8.9%...Hotel Only 643,505 609,658 5.6% 419,877 403,485 4.1% 223,628 206,173 8.5%Condo 214,396 203,976 5.1% 183,890 171,309 7.3% 30,506 32,666 -6.6%...Condo Only 127,563 121,673 4.8% 110,086 100,890 9.1% 17,477 20,783 -15.9%Timeshare 118,151 104,147 13.4% 108,982 96,295 13.2% 9,168 7,852 16.8%...Timeshare Only 73,794 64,860 13.8% 68,909 60,607 13.7% 4,885 4,253 14.9%Rental House 49,146 41,539 18.3% 45,345 37,829 19.9% 3,801 3,710 2.5%Bed & Breakfast 34,281 33,421 2.6% 30,722 28,900 6.3% 3,559 4,521 -21.3%Cruise Ship 109,252 102,411 6.7% 99,600 91,437 8.9% 9,651 10,974 -12.1%Friends or Relatives 134,185 131,537 2.0% 117,013 111,780 4.7% 17,172 19,757 -13.1%PURPOSE OF TRIPPleasure (Net) 1,087,483 1,008,898 7.8% 822,202 765,427 7.4% 265,282 243,471 9.0%…Honeymoon/Get Married (Net) 103,321 98,969 4.4% 53,960 52,646 2.5% 49,361 46,323 6.6%MC&I (Net) 94,389 99,109 -4.8% 81,547 80,848 0.9% 12,842 18,261 -29.7%.....Convention/Conf. 59,848 62,216 -3.8% 53,149 52,151 1.9% 6,699 10,065 -33.4%.....Corp. Meetings 16,584 15,840 4.7% 14,361 13,655 5.2% 2,224 2,185 1.8%.....Incentive 21,909 24,922 -12.1% 17,632 18,454 -4.5% 4,278 6,468 -33.9%Other Business 52,275 45,551 14.8% 45,652 40,877 11.7% 6,624 4,675 41.7%Visit Friends/Relatives 117,369 110,774 6.0% 102,934 95,905 7.3% 14,434 14,869 -2.9%Government/Military 6,414 8,255 -22.3% 5,201 6,087 -14.6% 1,213 2,168 -44.0%Attend School 5,280 4,751 11.1% 3,597 3,349 7.4% 1,683 1,402 20.0%Sport Events 21,421 21,318 0.5% 15,251 14,790 3.1% 6,170 6,527 -5.5%
Hawaii (Big Island)
Source: DBEDT 76
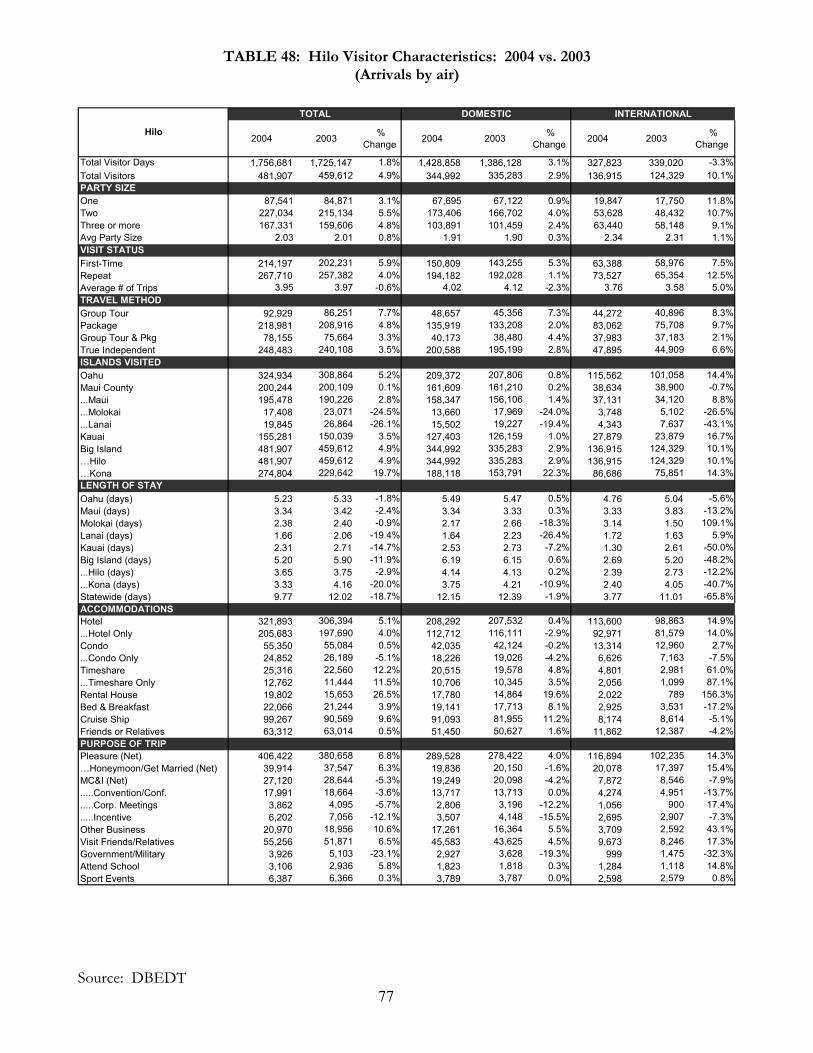
TABLE 48: Hilo Visitor Characteristics: 2004 vs. 2003 (Arrivals by air)
TOTAL DOMESTIC INTERNATIONAL
2004 2003 % Change 2004 2003 %
Change 2004 2003 % Change
Total Visitor Days 1,756,681 1,725,147 1.8% 1,428,858 1,386,128 3.1% 327,823 339,020 -3.3%Total Visitors 481,907 459,612 4.9% 344,992 335,283 2.9% 136,915 124,329 10.1%PARTY SIZEOne 87,541 84,871 3.1% 67,695 67,122 0.9% 19,847 17,750 11.8%Two 227,034 215,134 5.5% 173,406 166,702 4.0% 53,628 48,432 10.7%Three or more 167,331 159,606 4.8% 103,891 101,459 2.4% 63,440 58,148 9.1%Avg Party Size 2.03 2.01 0.8% 1.91 1.90 0.3% 2.34 2.31 1.1%VISIT STATUS First-Time 214,197 202,231 5.9% 150,809 143,255 5.3% 63,388 58,976 7.5%Repeat 267,710 257,382 4.0% 194,182 192,028 1.1% 73,527 65,354 12.5%Average # of Trips 3.95 3.97 -0.6% 4.02 4.12 -2.3% 3.76 3.58 5.0%TRAVEL METHODGroup Tour 92,929 86,251 7.7% 48,657 45,356 7.3% 44,272 40,896 8.3%Package 218,981 208,916 4.8% 135,919 133,208 2.0% 83,062 75,708 9.7%Group Tour & Pkg 78,155 75,664 3.3% 40,173 38,480 4.4% 37,983 37,183 2.1%True Independent 248,483 240,108 3.5% 200,588 195,199 2.8% 47,895 44,909 6.6%ISLANDS VISITEDOahu 324,934 308,864 5.2% 209,372 207,806 0.8% 115,562 101,058 14.4%Maui County 200,244 200,109 0.1% 161,609 161,210 0.2% 38,634 38,900 -0.7%...Maui 195,478 190,226 2.8% 158,347 156,106 1.4% 37,131 34,120 8.8%...Molokai 17,408 23,071 -24.5% 13,660 17,969 -24.0% 3,748 5,102 -26.5%...Lanai 19,845 26,864 -26.1% 15,502 19,227 -19.4% 4,343 7,637 -43.1%Kauai 155,281 150,039 3.5% 127,403 126,159 1.0% 27,879 23,879 16.7%Big Island 481,907 459,612 4.9% 344,992 335,283 2.9% 136,915 124,329 10.1%…Hilo 481,907 459,612 4.9% 344,992 335,283 2.9% 136,915 124,329 10.1%…Kona 274,804 229,642 19.7% 188,118 153,791 22.3% 86,686 75,851 14.3%LENGTH OF STAY Oahu (days) 5.23 5.33 -1.8% 5.49 5.47 0.5% 4.76 5.04 -5.6%Maui (days) 3.34 3.42 -2.4% 3.34 3.33 0.3% 3.33 3.83 -13.2%Molokai (days) 2.38 2.40 -0.9% 2.17 2.66 -18.3% 3.14 1.50 109.1%Lanai (days) 1.66 2.06 -19.4% 1.64 2.23 -26.4% 1.72 1.63 5.9%Kauai (days) 2.31 2.71 -14.7% 2.53 2.73 -7.2% 1.30 2.61 -50.0%Big Island (days) 5.20 5.90 -11.9% 6.19 6.15 0.6% 2.69 5.20 -48.2%...Hilo (days) 3.65 3.75 -2.9% 4.14 4.13 0.2% 2.39 2.73 -12.2%...Kona (days) 3.33 4.16 -20.0% 3.75 4.21 -10.9% 2.40 4.05 -40.7%Statewide (days) 9.77 12.02 -18.7% 12.15 12.39 -1.9% 3.77 11.01 -65.8%ACCOMMODATIONSHotel 321,893 306,394 5.1% 208,292 207,532 0.4% 113,600 98,863 14.9%...Hotel Only 205,683 197,690 4.0% 112,712 116,111 -2.9% 92,971 81,579 14.0%Condo 55,350 55,084 0.5% 42,035 42,124 -0.2% 13,314 12,960 2.7%...Condo Only 24,852 26,189 -5.1% 18,226 19,026 -4.2% 6,626 7,163 -7.5%Timeshare 25,316 22,560 12.2% 20,515 19,578 4.8% 4,801 2,981 61.0%...Timeshare Only 12,762 11,444 11.5% 10,706 10,345 3.5% 2,056 1,099 87.1%Rental House 19,802 15,653 26.5% 17,780 14,864 19.6% 2,022 789 156.3%Bed & Breakfast 22,066 21,244 3.9% 19,141 17,713 8.1% 2,925 3,531 -17.2%Cruise Ship 99,267 90,569 9.6% 91,093 81,955 11.2% 8,174 8,614 -5.1%Friends or Relatives 63,312 63,014 0.5% 51,450 50,627 1.6% 11,862 12,387 -4.2%PURPOSE OF TRIPPleasure (Net) 406,422 380,658 6.8% 289,528 278,422 4.0% 116,894 102,235 14.3%…Honeymoon/Get Married (Net) 39,914 37,547 6.3% 19,836 20,150 -1.6% 20,078 17,397 15.4%MC&I (Net) 27,120 28,644 -5.3% 19,249 20,098 -4.2% 7,872 8,546 -7.9%.....Convention/Conf. 17,991 18,664 -3.6% 13,717 13,713 0.0% 4,274 4,951 -13.7%.....Corp. Meetings 3,862 4,095 -5.7% 2,806 3,196 -12.2% 1,056 900 17.4%.....Incentive 6,202 7,056 -12.1% 3,507 4,148 -15.5% 2,695 2,907 -7.3%Other Business 20,970 18,956 10.6% 17,261 16,364 5.5% 3,709 2,592 43.1%Visit Friends/Relatives 55,256 51,871 6.5% 45,583 43,625 4.5% 9,673 8,246 17.3%Government/Military 3,926 5,103 -23.1% 2,927 3,628 -19.3% 999 1,475 -32.3%Attend School 3,106 2,936 5.8% 1,823 1,818 0.3% 1,284 1,118 14.8%Sport Events 6,387 6,366 0.3% 3,789 3,787 0.0% 2,598 2,579 0.8%
Hilo
Source: DBEDT 77
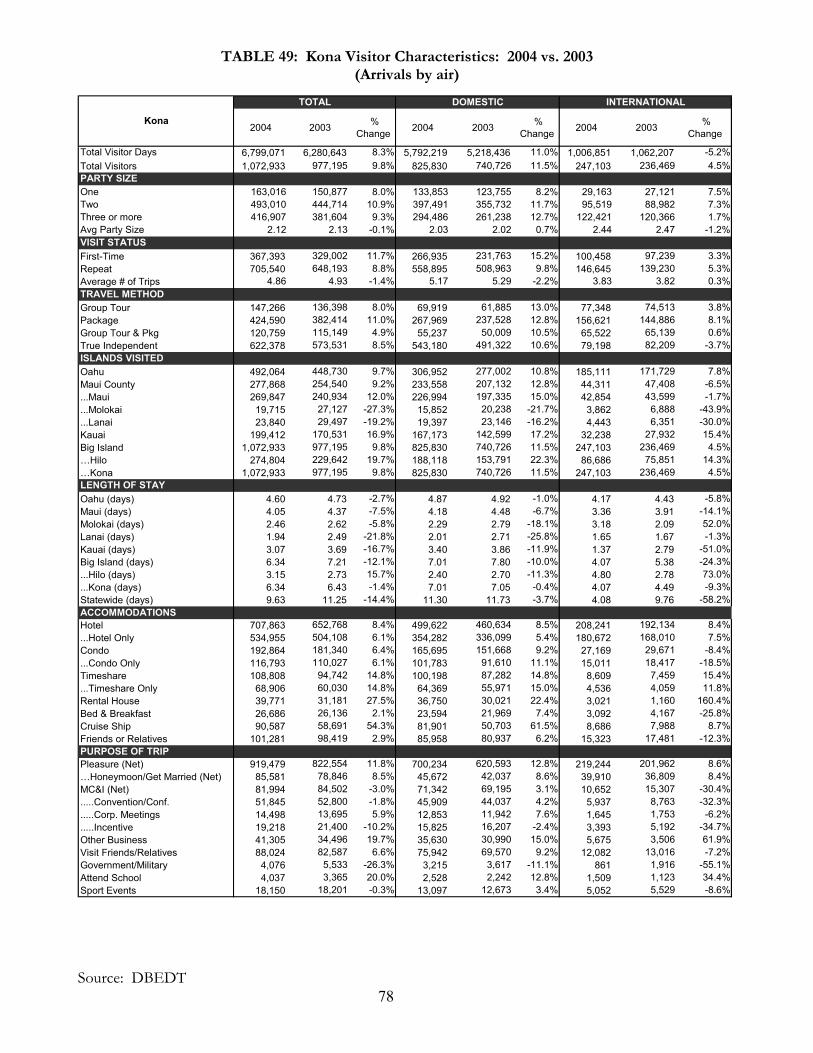
TABLE 49: Kona Visitor Characteristics: 2004 vs. 2003 (Arrivals by air)
78 Source: DBEDT
TOTAL DOMESTIC INTERNATIONAL
2004 2003 % Change 2004 2003 %
Change 2004 2003 % Change
Total Visitor Days 6,799,071 6,280,643 8.3% 5,792,219 5,218,436 11.0% 1,006,851 1,062,207 -5.2%Total Visitors 1,072,933 977,195 9.8% 825,830 740,726 11.5% 247,103 236,469 4.5%PARTY SIZEOne 163,016 150,877 8.0% 133,853 123,755 8.2% 29,163 27,121 7.5%Two 493,010 444,714 10.9% 397,491 355,732 11.7% 95,519 88,982 7.3%Three or more 416,907 381,604 9.3% 294,486 261,238 12.7% 122,421 120,366 1.7%Avg Party Size 2.12 2.13 -0.1% 2.03 2.02 0.7% 2.44 2.47 -1.2%VISIT STATUS First-Time 367,393 329,002 11.7% 266,935 231,763 15.2% 100,458 97,239 3.3%Repeat 705,540 648,193 8.8% 558,895 508,963 9.8% 146,645 139,230 5.3%Average # of Trips 4.86 4.93 -1.4% 5.17 5.29 -2.2% 3.83 3.82 0.3%TRAVEL METHODGroup Tour 147,266 136,398 8.0% 69,919 61,885 13.0% 77,348 74,513 3.8%Package 424,590 382,414 11.0% 267,969 237,528 12.8% 156,621 144,886 8.1%GrTrISLOM...M...M...LKaBi……LEOMMLaKaBi...Hi
StAH
C
Ti...T
BeCrFr
Pl
M............OtViGAttSp
Kona
oup Tour & Pkg 120,759 115,149 4.9% 55,237 50,009 10.5% 65,522 65,139 0.6%ue Independent 622,378 573,531 8.5% 543,180 491,322 10.6% 79,198 82,209 -3.7%
ANDS VISITEDahu 492,064 448,730 9.7% 306,952 277,002 10.8% 185,111 171,729 7.8%aui County 277,868 254,540 9.2% 233,558 207,132 12.8% 44,311 47,408 -6.5%
aui 269,847 240,934 12.0% 226,994 197,335 15.0% 42,854 43,599 -1.7%olokai 19,715 27,127 -27.3% 15,852 20,238 -21.7% 3,862 6,888 -43.9%anai 23,840 29,497 -19.2% 19,397 23,146 -16.2% 4,443 6,351 -30.0%uai 199,412 170,531 16.9% 167,173 142,599 17.2% 32,238 27,932 15.4%
g Island 1,072,933 977,195 9.8% 825,830 740,726 11.5% 247,103 236,469 4.5%Hilo 274,804 229,642 19.7% 188,118 153,791 22.3% 86,686 75,851 14.3%Kona 1,072,933 977,195 9.8% 825,830 740,726 11.5% 247,103 236,469 4.5%NGTH OF STAY
ahu (days) 4.60 4.73 -2.7% 4.87 4.92 -1.0% 4.17 4.43 -5.8%aui (days) 4.05 4.37 -7.5% 4.18 4.48 -6.7% 3.36 3.91 -14.1%olokai (days) 2.46 2.62 -5.8% 2.29 2.79 -18.1% 3.18 2.09 52.0%nai (days) 1.94 2.49 -21.8% 2.01 2.71 -25.8% 1.65 1.67 -1.3%uai (days) 3.07 3.69 -16.7% 3.40 3.86 -11.9% 1.37 2.79 -51.0%
g Island (days) 6.34 7.21 -12.1% 7.01 7.80 -10.0% 4.07 5.38 -24.3%lo (days) 3.15 2.73 15.7% 2.40 2.70 -11.3% 4.80 2.78 73.0%
...Kona (days) 6.34 6.43 -1.4% 7.01 7.05 -0.4% 4.07 4.49 -9.3%atewide (days) 9.63 11.25 -14.4% 11.30 11.73 -3.7% 4.08 9.76 -58.2%CCOMMODATIONSotel 707,863 652,768 8.4% 499,622 460,634 8.5% 208,241 192,134 8.4%
...Hotel Only 534,955 504,108 6.1% 354,282 336,099 5.4% 180,672 168,010 7.5%ondo 192,864 181,340 6.4% 165,695 151,668 9.2% 27,169 29,671 -8.4%
...Condo Only 116,793 110,027 6.1% 101,783 91,610 11.1% 15,011 18,417 -18.5%meshare 108,808 94,742 14.8% 100,198 87,282 14.8% 8,609 7,459 15.4%
imeshare Only 68,906 60,030 14.8% 64,369 55,971 15.0% 4,536 4,059 11.8%Rental House 39,771 31,181 27.5% 36,750 30,021 22.4% 3,021 1,160 160.4%
d & Breakfast 26,686 26,136 2.1% 23,594 21,969 7.4% 3,092 4,167 -25.8%uise Ship 90,587 58,691 54.3% 81,901 50,703 61.5% 8,686 7,988 8.7%iends or Relatives 101,281 98,419 2.9% 85,958 80,937 6.2% 15,323 17,481 -12.3%
PURPOSE OF TRIPeasure (Net) 919,479 822,554 11.8% 700,234 620,593 12.8% 219,244 201,962 8.6%
…Honeymoon/Get Married (Net) 85,581 78,846 8.5% 45,672 42,037 8.6% 39,910 36,809 8.4%C&I (Net) 81,994 84,502 -3.0% 71,342 69,195 3.1% 10,652 15,307 -30.4%.Convention/Conf. 51,845 52,800 -1.8% 45,909 44,037 4.2% 5,937 8,763 -32.3%.Corp. Meetings 14,498 13,695 5.9% 12,853 11,942 7.6% 1,645 1,753 -6.2%.Incentive 19,218 21,400 -10.2% 15,825 16,207 -2.4% 3,393 5,192 -34.7%her Business 41,305 34,496 19.7% 35,630 30,990 15.0% 5,675 3,506 61.9%sit Friends/Relatives 88,024 82,587 6.6% 75,942 69,570 9.2% 12,082 13,016 -7.2%overnment/Military 4,076 5,533 -26.3% 3,215 3,617 -11.1% 861 1,916 -55.1%end School 4,037 3,365 20.0% 2,528 2,242 12.8% 1,509 1,123 34.4%ort Events 18,150 18,201 -0.3% 13,097 12,673 3.4% 5,052 5,529 -8.6%
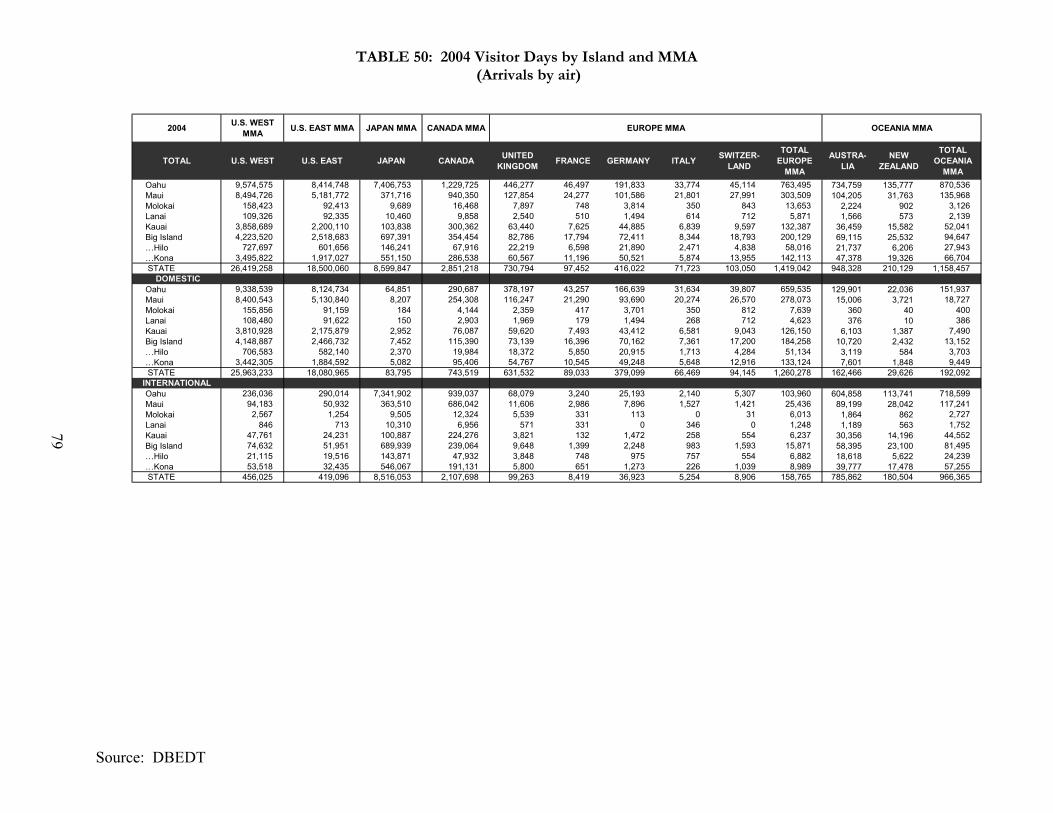
TABLE 50: 2004 Visitor Days by Island and MMA (Arrivals by air)
2004 U.S. WEST MMA U.S. EAST MMA JAPAN MMA CANADA MMA EUROPE MMA OCEANIA MMA
TOTAL U.S. WEST U.S. EAST JAPAN CANADA UNITED KINGDOM FRANCE GERMANY ITALY SWITZER-
LAND
TOTAL EUROPE
MMA
AUSTRA-LIA
NEW ZEALAND
TOTAL OCEANIA
MMA Oahu 9,574,575 8,414,748 7,406,753 1,229,725 446,277 46,497 191,833 33,774 45,114 763,495 734,759 135,777 870,536 Maui 8,494,726 5,181,772 371,716 940,350 127,854 24,277 101,586 21,801 27,991 303,509 104,205 31,763 135,968 Molokai 158,423 92,413 9,689 16,468 7,897 748 3,814 350 843 13,653 2,224 902 3,126 Lanai 109,326 92,335 10,460 9,858 2,540 510 1,494 614 712 5,871 1,566 573 2,139 Kauai 3,858,689 2,200,110 103,838 300,362 63,440 7,625 44,885 6,839 9,597 132,387 36,459 15,582 52,041 Big Island 4,223,520 2,518,683 697,391 354,454 82,786 17,794 72,411 8,344 18,793 200,129 69,115 25,532 94,647 …Hilo 727,697 601,656 146,241 67,916 22,219 6,598 21,890 2,471 4,838 58,016 21,737 6,206 27,943 …Kona 3,495,822 1,917,027 551,150 286,538 60,567 11,196 50,521 5,874 13,955 142,113 47,378 19,326 66,704
STATE 26,419,258 18,500,060 8,599,847 2,851,218 730,794 97,452 416,022 71,723 103,050 1,419,042 948,328 210,129 1,158,457 DOMESTIC
Oahu 9,338,539 8,124,734 64,851 290,687 378,197 43,257 166,639 31,634 39,807 659,535 129,901 22,036 151,937 Maui 8,400,543 5,130,840 8,207 254,308 116,247 21,290 93,690 20,274 26,570 278,073 15,006 3,721 18,727 Molokai 155,856 91,159 184 4,144 2,359 417 3,701 350 812 7,639 360 40 400 Lanai 108,480 91,622 150 2,903 1,969 179 1,494 268 712 4,623 376 10 386 Kauai 3,810,928 2,175,879 2,952 76,087 59,620 7,493 43,412 6,581 9,043 126,150 6,103 1,387 7,490 Big Island 4,148,887 2,466,732 7,452 115,390 73,139 16,396 70,162 7,361 17,200 184,258 10,720 2,432 13,152 …Hilo 706,583 582,140 2,370 19,984 18,372 5,850 20,915 1,713 4,284 51,134 3,119 584 3,703 …Kona 3,442,305 1,884,592 5,082 95,406 54,767 10,545 49,248 5,648 12,916 133,124 7,601 1,848 9,449
STATE 25,963,233 18,080,965 83,795 743,519 631,532 89,033 379,099 66,469 94,145 1,260,278 162,466 29,626 192,092INTERNATIONAL
Oahu 236,036 290,014 7,341,902 939,037 68,079 3,240 25,193 2,140 5,307 103,960 604,858 113,741 718,599 Maui 94,183 50,932 363,510 686,042 11,606 2,986 7,896 1,527 1,421 25,436 89,199 28,042 117,241 Molokai 2,567 1,254 9,505 12,324 5,539 331 113 0 31 6,013 1,864 862 2,727 Lanai 846 713 10,310 6,956 571 331 0 346 0 1,248 1,189 563 1,752 Kauai 47,761 24,231 100,887 224,276 3,821 132 1,472 258 554 6,237 30,356 14,196 44,552 Big Island 74,632 51,951 689,939 239,064 9,648 1,399 2,248 983 1,593 15,871 58,395 23,100 81,495 …Hilo 21,115 19,516 143,871 47,932 3,848 748 975 757 554 6,882 18,618 5,622 24,239 …Kona 53,518 32,435 546,067 191,131 5,800 651 1,273 226 1,039 8,989 39,777 17,478 57,255
STATE 456,025 419,096 8,516,053 2,107,698 99,263 8,419 36,923 5,254 8,906 158,765 785,862 180,504 966,365
79
Source: DBEDT
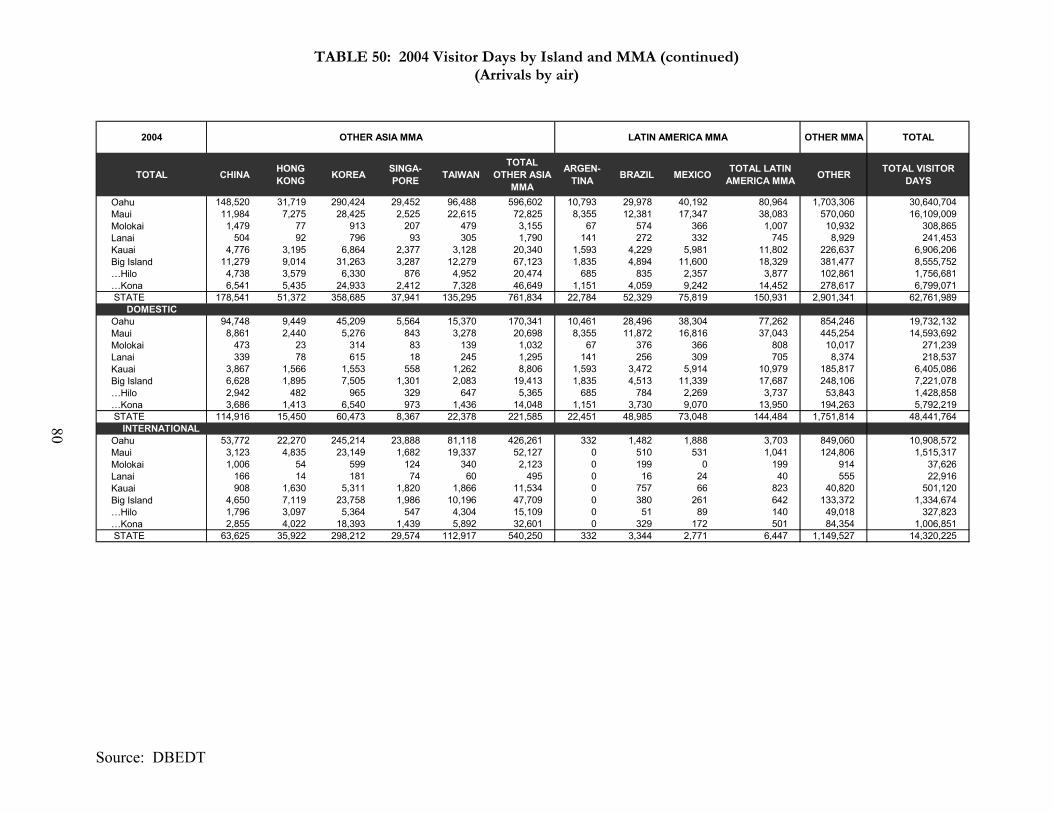
TABLE 50: 2004 Visitor Days by Island and MMA (continued) (Arrivals by air)
2004 OTHER ASIA MMA LATIN AMERICA MMA OTHER MMA TOTAL
TOTAL CHINA HONG KONG KOREA SINGA-
PORE TAIWANTOTAL
OTHER ASIA MMA
ARGEN-TINA BRAZIL MEXICO TOTAL LATIN
AMERICA MMA OTHER TOTAL VISITOR DAYS
Oahu 148,520 31,719 290,424 29,452 96,488 596,602 10,793 29,978 40,192 80,964 1,703,306 30,640,704 Maui 11,984 7,275 28,425 2,525 22,615 72,825 8,355 12,381 17,347 38,083 570,060 16,109,009 Molokai 1,479 77 913 207 479 3,155 67 574 366 1,007 10,932 308,865 Lanai 504 92 796 93 305 1,790 141 272 332 745 8,929 241,453 Kauai 4,776 3,195 6,864 2,377 3,128 20,340 1,593 4,229 5,981 11,802 226,637 6,906,206 Big Island 11,279 9,014 31,263 3,287 12,279 67,123 1,835 4,894 11,600 18,329 381,477 8,555,752 …Hilo 4,738 3,579 6,330 876 4,952 20,474 685 835 2,357 3,877 102,861 1,756,681 …Kona 6,541 5,435 24,933 2,412 7,328 46,649 1,151 4,059 9,242 14,452 278,617 6,799,071
STATE 178,541 51,372 358,685 37,941 135,295 761,834 22,784 52,329 75,819 150,931 2,901,341 62,761,989DOMESTIC
Oahu 94,748 9,449 45,209 5,564 15,370 170,341 10,461 28,496 38,304 77,262 854,246 19,732,132 Maui 8,861 2,440 5,276 843 3,278 20,698 8,355 11,872 16,816 37,043 445,254 14,593,692 Molokai 473 23 314 83 139 1,032 67 376 366 808 10,017 271,239 Lanai 339 78 615 18 245 1,295 141 256 309 705 8,374 218,537 Kauai 3,867 1,566 1,553 558 1,262 8,806 1,593 3,472 5,914 10,979 185,817 6,405,086 Big Island 6,628 1,895 7,505 1,301 2,083 19,413 1,835 4,513 11,339 17,687 248,106 7,221,078 …Hilo 2,942 482 965 329 647 5,365 685 784 2,269 3,737 53,843 1,428,858 …Kona 3,686 1,413 6,540 973 1,436 14,048 1,151 3,730 9,070 13,950 194,263 5,792,219
STATE 114,916 15,450 60,473 8,367 22,378 221,585 22,451 48,985 73,048 144,484 1,751,814 48,441,764 INTERNATIONAL
Oahu 53,772 22,270 245,214 23,888 81,118 426,261 332 1,482 1,888 3,703 849,060 10,908,572 Maui 3,123 4,835 23,149 1,682 19,337 52,127 0 510 531 1,041 124,806 1,515,317 Molokai 1,006 54 599 124 340 2,123 0 199 0 199 914 37,626 Lanai 166 14 181 74 60 495 0 16 24 40 555 22,916 Kauai 908 1,630 5,311 1,820 1,866 11,534 0 757 66 823 40,820 501,120 Big Island 4,650 7,119 23,758 1,986 10,196 47,709 0 380 261 642 133,372 1,334,674 …Hilo 1,796 3,097 5,364 547 4,304 15,109 0 51 89 140 49,018 327,823 …Kona 2,855 4,022 18,393 1,439 5,892 32,601 0 329 172 501 84,354 1,006,851
STATE 63,625 35,922 298,212 29,574 112,917 540,250 332 3,344 2,771 6,447 1,149,527 14,320,225
80
Source: DBEDT

TABLE 51: 2004 Visitor Arrivals by Island and MMA (Arrivals by air)
2004 U.S. WEST MMA
U.S. EAST MMA JAPAN MMA CANADA
MMA EUROPE MMA OCEANIA MMA
TOTAL U.S. WEST U.S. EAST JAPAN CANADA UNITED KINGDOM FRANCE GERMANY ITALY SWITZER-
LAND
TOTAL EUROPE
MMA
AUSTRA-LIA
NEW ZEALAND
TOTAL OCEANIA
MMA Oahu 1,274,318 1,133,855 1,418,747 123,099 51,401 5,382 20,001 3,751 3,686 84,220 106,832 17,922 124,754 Maui 1,040,229 745,518 119,050 93,140 17,893 2,754 12,173 2,688 2,701 38,208 19,896 3,770 23,666 Molokai 30,003 24,306 6,512 2,931 887 179 721 97 178 2,061 1,251 348 1,599 Lanai 29,283 29,999 4,241 2,754 963 147 454 171 144 1,879 1,159 259 1,418 Kauai 488,668 366,691 54,904 39,005 9,539 1,173 7,336 1,128 1,241 20,415 9,010 1,868 10,878 Big Island 513,078 406,490 214,066 43,213 11,315 2,247 9,335 1,173 1,950 26,019 15,508 2,784 18,292 …Hilo 151,636 175,883 77,520 18,161 5,287 1,106 4,146 436 905 11,880 12,712 2,277 14,989 …Kona 447,053 329,932 170,511 37,119 9,102 1,690 7,376 987 1,606 20,761 14,373 2,526 16,900
STATE 2,768,002 1,805,377 1,482,085 217,163 66,921 8,165 28,061 6,080 5,722 114,948 112,960 19,170 132,130DOMESTIC
Oahu 1,236,812 1,090,478 10,835 30,212 42,203 4,775 18,226 3,510 3,168 71,882 22,511 3,470 25,981 Maui 1,028,927 736,350 1,220 25,659 15,631 2,289 11,286 2,541 2,483 34,230 2,684 493 3,177 Molokai 28,684 23,668 47 863 672 113 688 97 168 1,737 115 19 134 Lanai 28,545 29,287 49 854 742 80 454 102 144 1,523 94 8 102 Kauai 482,283 362,689 535 10,222 9,092 1,107 6,921 1,068 1,125 19,313 1,018 210 1,228 Big Island 504,842 399,373 1,079 13,534 10,358 1,969 8,920 1,096 1,723 24,066 1,840 352 2,193 …Hilo 144,419 169,775 314 5,075 4,504 895 3,731 359 678 10,167 700 112 812 …Kona 438,818 323,684 871 11,664 8,211 1,413 6,960 910 1,389 18,884 1,385 272 1,657
STATE 2,720,509 1,756,940 12,186 57,947 56,702 7,231 25,950 5,725 5,065 100,672 24,590 3,905 28,495INTERNATIONAL
Oahu 37,506 43,376 1,407,912 92,886 9,197 607 1,775 241 518 12,339 84,321 14,452 98,773 Maui 11,301 9,168 117,830 67,482 2,262 465 887 147 218 3,978 17,212 3,277 20,489 Molokai 1,319 638 6,466 2,069 215 66 33 0 10 324 1,136 329 1,465 Lanai 738 713 4,191 1,900 221 66 0 69 0 356 1,064 252 1,316 Kauai 6,384 4,002 54,370 28,783 447 66 415 60 115 1,103 7,992 1,657 9,650 Big Island 8,236 7,117 212,986 29,679 957 277 416 77 227 1,953 13,668 2,432 16,100 …Hilo 7,217 6,108 77,206 13,086 783 211 416 77 227 1,713 12,012 2,165 14,177 …Kona 8,236 6,247 169,640 25,455 891 277 416 77 216 1,878 12,988 2,255 15,243
STATE 47,493 48,437 1,469,899 159,216 10,219 934 2,111 355 657 14,276 88,370 15,265 103,635
81
Source: DBEDT
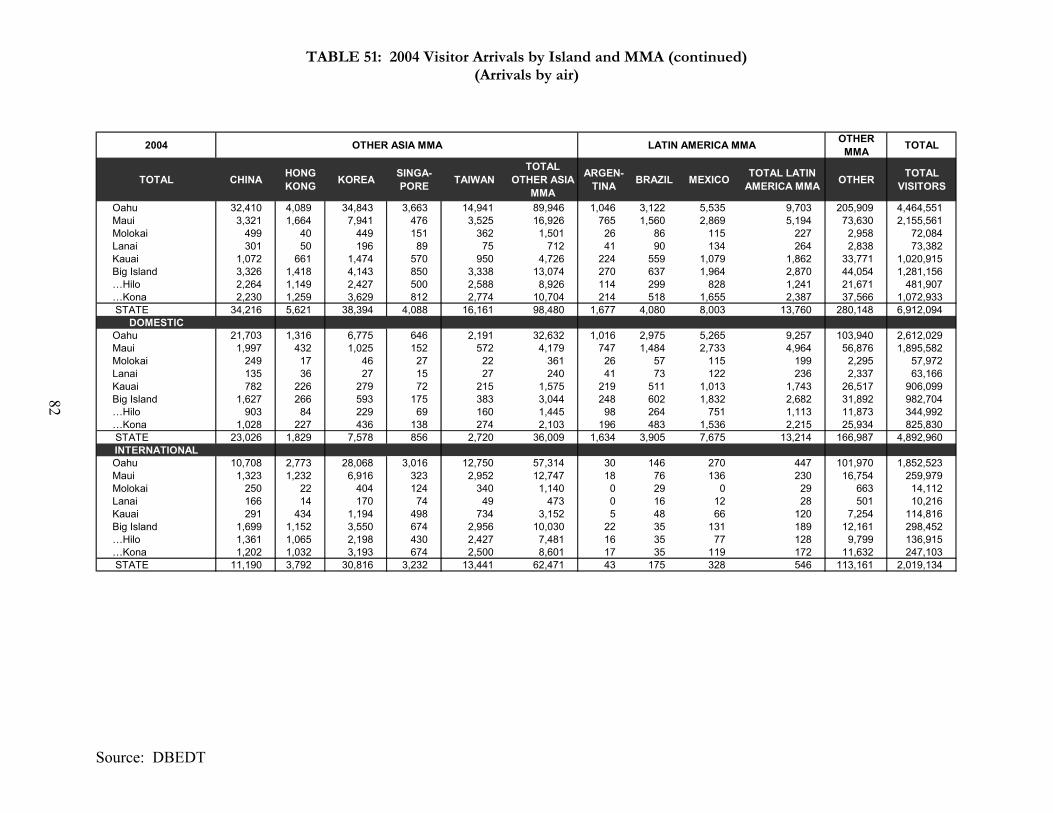
TABLE 51: 2004 Visitor Arrivals by Island and MMA (continued) (Arrivals by air)
Source: DBEDT
2004 OTHER ASIA MMA LATIN AMERICA MMA OTHER MMA TOTAL
TOTAL CHINA HONG KONG KOREA SINGA-
PORE TAIWANTOTAL
OTHER ASIA MMA
ARGEN-TINA BRAZIL MEXICO TOTAL LATIN
AMERICA MMA OTHER TOTAL VISITORS
Oahu 32,410 4,089 34,843 3,663 14,941 89,946 1,046 3,122 5,535 9,703 205,909 4,464,551 Maui 3,321 1,664 7,941 476 3,525 16,926 765 1,560 2,869 5,194 73,630 2,155,561 Molokai 499 40 449 151 362 1,501 26 86 115 227 2,958 72,084 Lanai 301 50 196 89 75 712 41 90 134 264 2,838 73,382 Kauai 1,072 661 1,474 570 950 4,726 224 559 1,079 1,862 33,771 1,020,915 Big Island 3,326 1,418 4,143 850 3,338 13,074 270 637 1,964 2,870 44,054 1,281,156 …Hilo 2,264 1,149 2,427 500 2,588 8,926 114 299 828 1,241 21,671 481,907 …Kona 2,230 1,259 3,629 812 2,774 10,704 214 518 1,655 2,387 37,566 1,072,933
STATE 34,216 5,621 38,394 4,088 16,161 98,480 1,677 4,080 8,003 13,760 280,148 6,912,094DOMESTIC
Oahu 21,703 1,316 6,775 646 2,191 32,632 1,016 2,975 5,265 9,257 103,940 2,612,029 Maui 1,997 432 1,025 152 572 4,179 747 1,484 2,733 4,964 56,876 1,895,582 Molokai 249 17 46 27 22 361 26 57 115 199 2,295 57,972 Lanai 135 36 27 15 27 240 41 73 122 236 2,337 63,166 Kauai 782 226 279 72 215 1,575 219 511 1,013 1,743 26,517 906,099 Big Island 1,627 266 593 175 383 3,044 248 602 1,832 2,682 31,892 982,704 …Hilo 903 84 229 69 160 1,445 98 264 751 1,113 11,873 344,992 …Kona 1,028 227 436 138 274 2,103 196 483 1,536 2,215 25,934 825,830
STATE 23,026 1,829 7,578 856 2,720 36,009 1,634 3,905 7,675 13,214 166,987 4,892,960INTERNATIONAL
Oahu 10,708 2,773 28,068 3,016 12,750 57,314 30 146 270 447 101,970 1,852,523 Maui 1,323 1,232 6,916 323 2,952 12,747 18 76 136 230 16,754 259,979 Molokai 250 22 404 124 340 1,140 0 29 0 29 663 14,112 Lanai 166 14 170 74 49 473 0 16 12 28 501 10,216 Kauai 291 434 1,194 498 734 3,152 5 48 66 120 7,254 114,816 Big Island 1,699 1,152 3,550 674 2,956 10,030 22 35 131 189 12,161 298,452 …Hilo 1,361 1,065 2,198 430 2,427 7,481 16 35 77 128 9,799 136,915 …Kona 1,202 1,032 3,193 674 2,500 8,601 17 35 119 172 11,632 247,103
STATE 11,190 3,792 30,816 3,232 13,441 62,471 43 175 328 546 113,161 2,019,134
82
AIR VISITOR EXPENDITURES BY CATEGORY
AIR VISITOR SPENDING PATTERNS BY SELECTED
MMA:
U.S. WEST
U.S. EAST
JAPAN
CANADA
EUROPE
OCEANIA
OTHER ASIA
LATIN AMERICA
OTHER
83
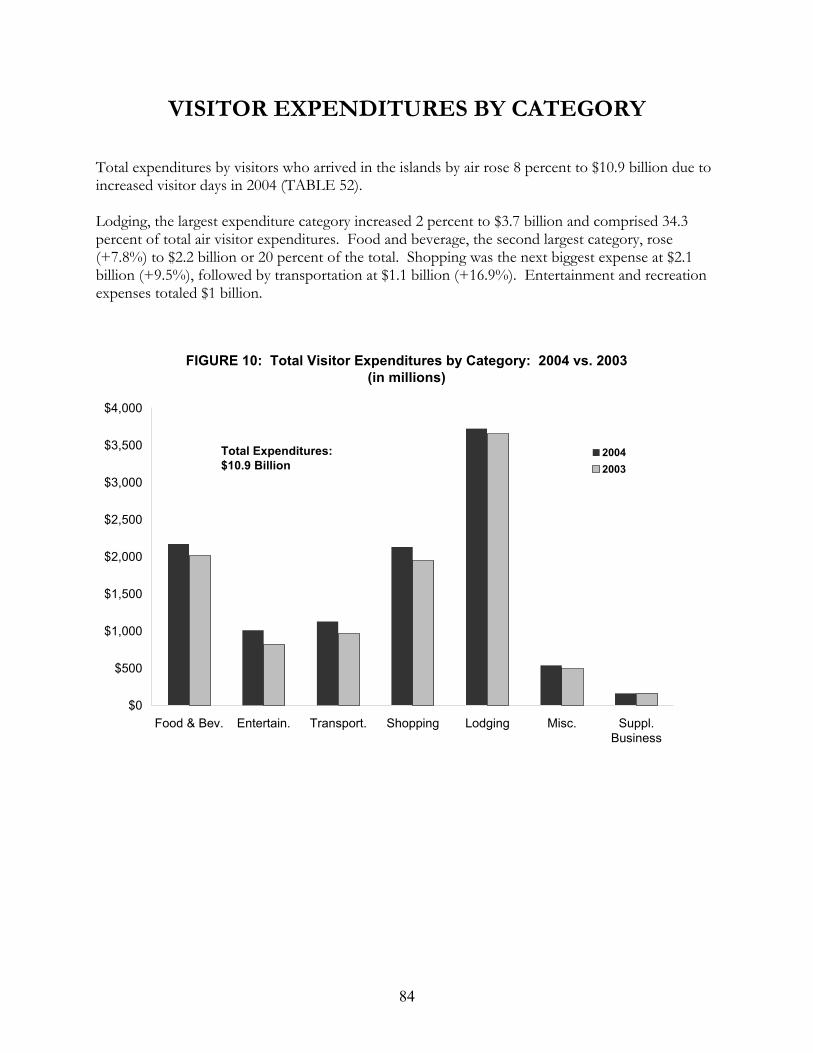
VISITOR EXPENDITURES BY CATEGORY
Total expenditures by visitors who arrived in the islands by air rose 8 percent to $10.9 billion due to increased visitor days in 2004 (TABLE 52). Lodging, the largest expenditure category increased 2 percent to $3.7 billion and comprised 34.3 percent of total air visitor expenditures. Food and beverage, the second largest category, rose (+7.8%) to $2.2 billion or 20 percent of the total. Shopping was the next biggest expense at $2.1 billion (+9.5%), followed by transportation at $1.1 billion (+16.9%). Entertainment and recreation expenses totaled $1 billion.
FIGURE 10: Total Visitor Expenditures by Category: 2004 vs. 2003(in millions)
$0
$500
$1,000
$1,500
$2,000
$2,500
$3,000
$3,500
$4,000
Food & Bev. Entertain. Transport. Shopping Lodging Misc. Suppl.Business
20042003
Total Expenditures:$10.9 Billion
84
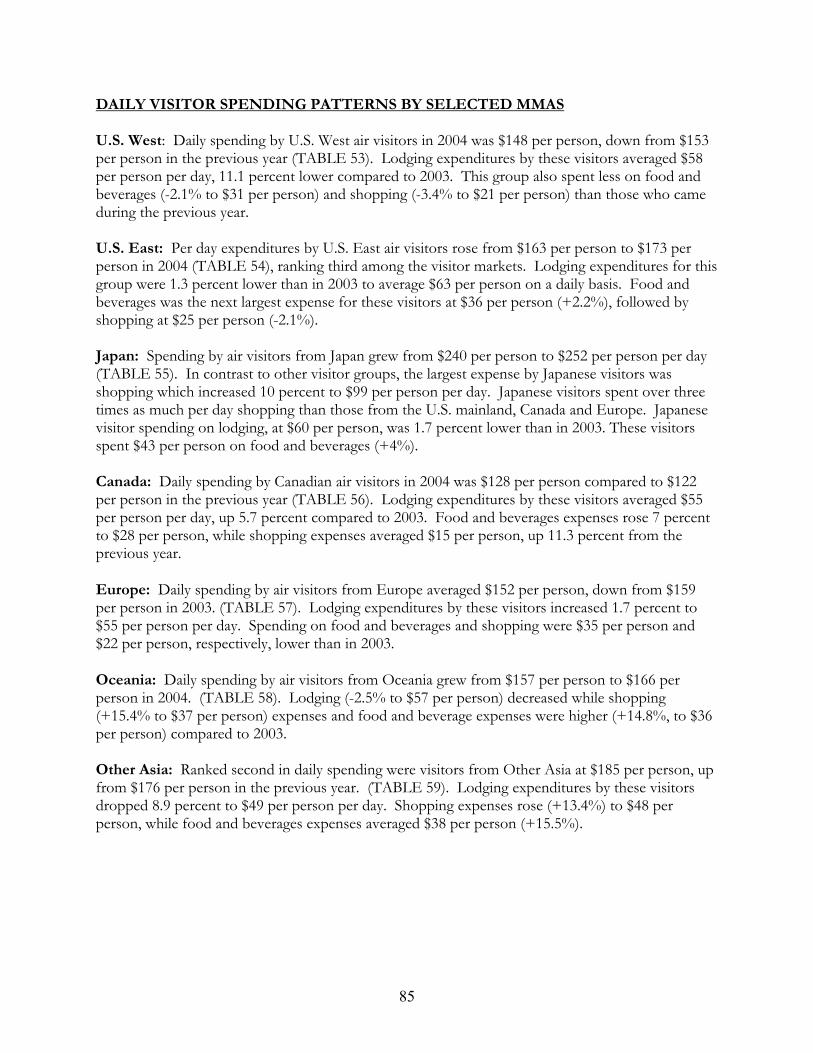
85
DAILY VISITOR SPENDING PATTERNS BY SELECTED MMAS U.S. West: Daily spending by U.S. West air visitors in 2004 was $148 per person, down from $153 per person in the previous year (TABLE 53). Lodging expenditures by these visitors averaged $58 per person per day, 11.1 percent lower compared to 2003. This group also spent less on food and beverages (-2.1% to $31 per person) and shopping (-3.4% to $21 per person) than those who came during the previous year. U.S. East: Per day expenditures by U.S. East air visitors rose from $163 per person to $173 per person in 2004 (TABLE 54), ranking third among the visitor markets. Lodging expenditures for this group were 1.3 percent lower than in 2003 to average $63 per person on a daily basis. Food and beverages was the next largest expense for these visitors at $36 per person (+2.2%), followed by shopping at $25 per person (-2.1%). Japan: Spending by air visitors from Japan grew from $240 per person to $252 per person per day (TABLE 55). In contrast to other visitor groups, the largest expense by Japanese visitors was shopping which increased 10 percent to $99 per person per day. Japanese visitors spent over three times as much per day shopping than those from the U.S. mainland, Canada and Europe. Japanese visitor spending on lodging, at $60 per person, was 1.7 percent lower than in 2003. These visitors spent $43 per person on food and beverages (+4%). Canada: Daily spending by Canadian air visitors in 2004 was $128 per person compared to $122 per person in the previous year (TABLE 56). Lodging expenditures by these visitors averaged $55 per person per day, up 5.7 percent compared to 2003. Food and beverages expenses rose 7 percent to $28 per person, while shopping expenses averaged $15 per person, up 11.3 percent from the previous year. Europe: Daily spending by air visitors from Europe averaged $152 per person, down from $159 per person in 2003. (TABLE 57). Lodging expenditures by these visitors increased 1.7 percent to $55 per person per day. Spending on food and beverages and shopping were $35 per person and $22 per person, respectively, lower than in 2003. Oceania: Daily spending by air visitors from Oceania grew from $157 per person to $166 per person in 2004. (TABLE 58). Lodging (-2.5% to $57 per person) decreased while shopping (+15.4% to $37 per person) expenses and food and beverage expenses were higher (+14.8%, to $36 per person) compared to 2003. Other Asia: Ranked second in daily spending were visitors from Other Asia at $185 per person, up from $176 per person in the previous year. (TABLE 59). Lodging expenditures by these visitors dropped 8.9 percent to $49 per person per day. Shopping expenses rose (+13.4%) to $48 per person, while food and beverages expenses averaged $38 per person (+15.5%).
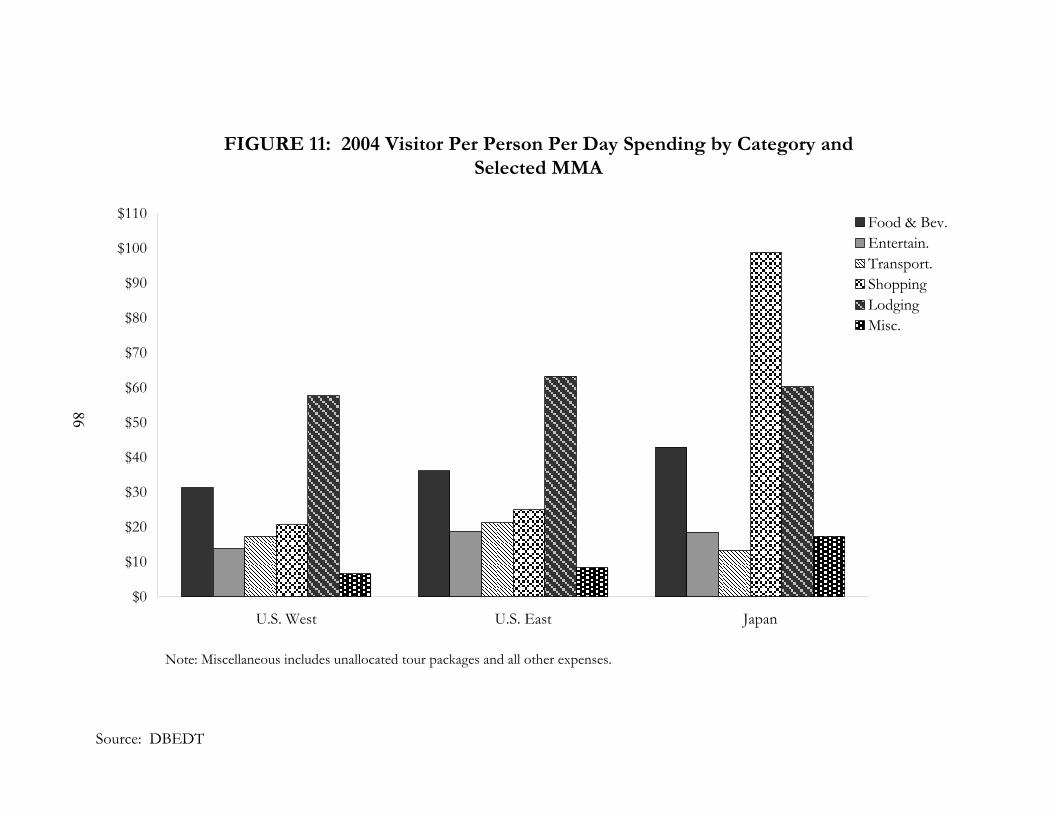
FIGURE 11: 2004 Visitor Per Person Per Day Spending by Category and Selected MMA
$0
$10
$20
$30
$40
$50
$60
$70
$80
$90
$100
$110
U.S. West U.S. East Japan
Food & Bev.Entertain.Transport.ShoppingLodgingMisc.
86
Note: Miscellaneous includes unallocated tour packages and all other expenses.
Source: DBEDT
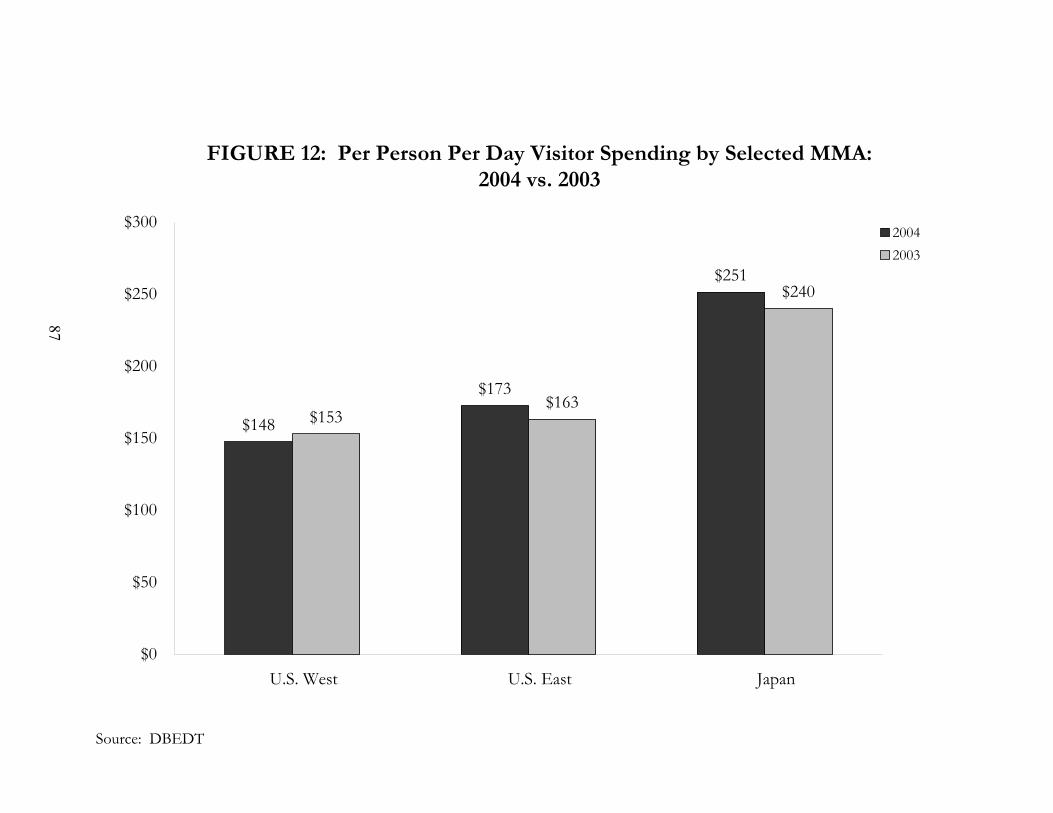
Source: DBEDT
FIGURE 12: Per Person Per Day Visitor Spending by Selected MMA: 2004 vs. 2003
$148
$173
$251
$153$163
$240
$0
$50
$100
$150
$200
$250
$300
U.S. West U.S. East Japan
20042003
87
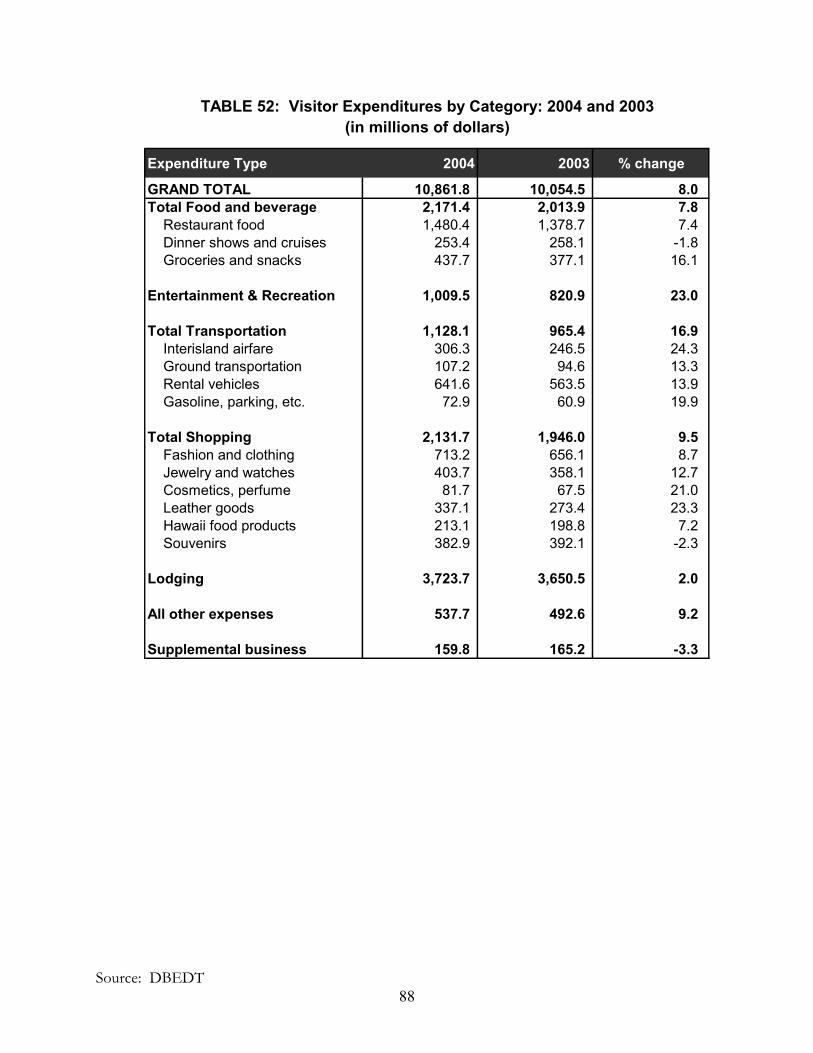
(in millions of dollars)
Expenditure Type 2004 2003 % change
GRAND TOTAL 10,861.8 10,054.5 8.0Total Food and beverage 2,171.4 2,013.9 7.8 Restaurant food 1,480.4 1,378.7 7.4 Dinner shows and cruises 253.4 258.1 -1.8 Groceries and snacks 437.7 377.1 16.1
Entertainment & Recreation 1,009.5 820.9 23.0
Total Transportation 1,128.1 965.4 16.9 Interisland airfare 306.3 246.5 24.3 Ground transportation 107.2 94.6 13.3 Rental vehicles 641.6 563.5 13.9 Gasoline, parking, etc. 72.9 60.9 19.9
Total Shopping 2,131.7 1,946.0 9.5 Fashion and clothing 713.2 656.1 8.7 Jewelry and watches 403.7 358.1 12.7 Cosmetics, perfume 81.7 67.5 21.0 Leather goods 337.1 273.4 23.3 Hawaii food products 213.1 198.8 7.2 Souvenirs 382.9 392.1 -2.3
Lodging 3,723.7 3,650.5 2.0
All other expenses 537.7 492.6 9.2
Supplemental business 159.8 165.2 -3.3
TABLE 52: Visitor Expenditures by Category: 2004 and 2003
Source: DBEDT
88
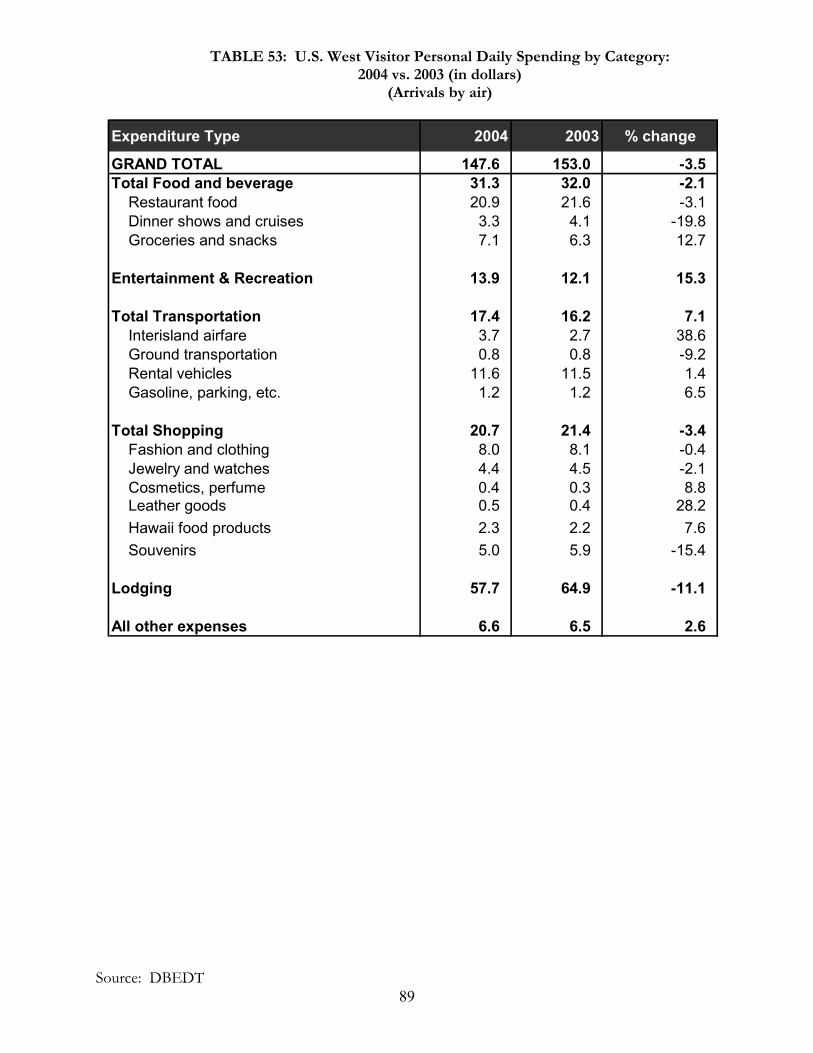
TABLE 53: U.S. West Visitor Personal Daily Spending by Category: 2004 vs. 2003 (in dollars)
(Arrivals by air)
Expenditure Type 2004 2003 % change
GRAND TOTAL 147.6 153.0 -3.5Total Food and beverage 31.3 32.0 -2.1 Restaurant food 20.9 21.6 -3.1 Dinner shows and cruises 3.3 4.1 -19.8 Groceries and snacks 7.1 6.3 12.7
Entertainment & Recreation 13.9 12.1 15.3
Total Transportation 17.4 16.2 7.1 Interisland airfare 3.7 2.7 38.6 Ground transportation 0.8 0.8 -9.2 Rental vehicles 11.6 11.5 1.4 Gasoline, parking, etc. 1.2 1.2 6.5
Total Shopping 20.7 21.4 -3.4 Fashion and clothing 8.0 8.1 -0.4 Jewelry and watches 4.4 4.5 -2.1 Cosmetics, perfume 0.4 0.3 8.8 Leather goods 0.5 0.4 28.2 Hawaii food products 2.3 2.2 7.6 Souvenirs 5.0 5.9 -15.4
Lodging 57.7 64.9 -11.1
All other expenses 6.6 6.5 2.6
Source: DBEDT 89
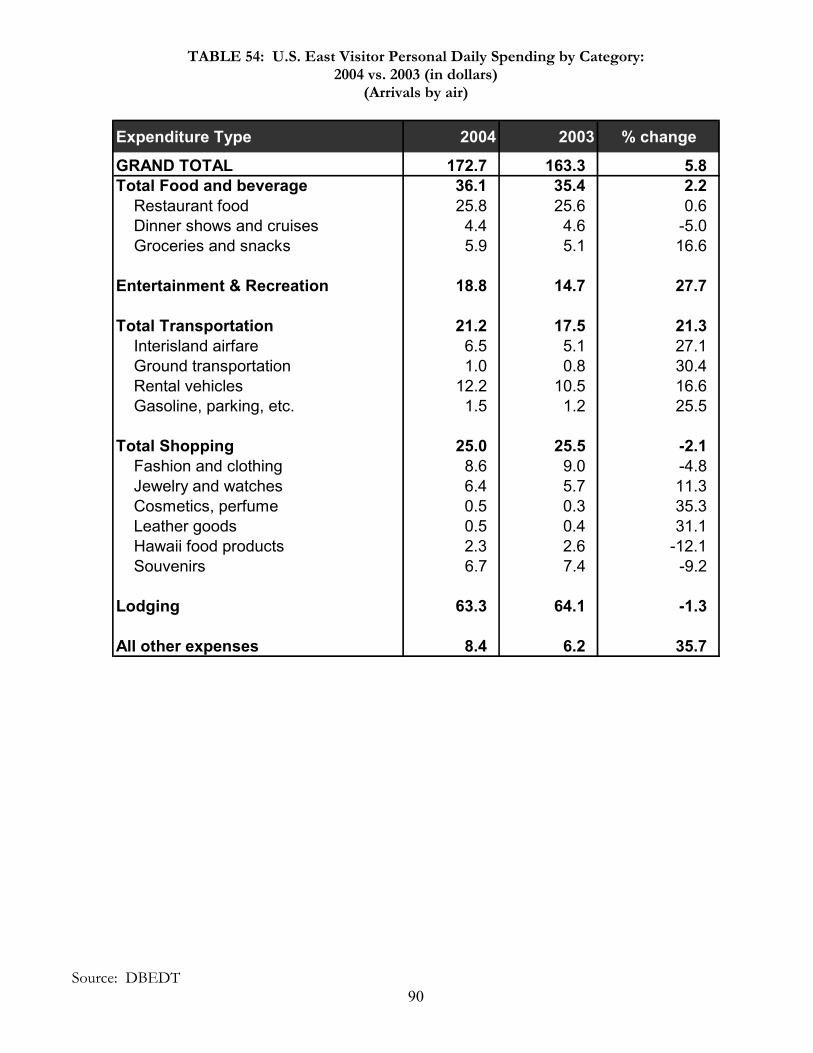
TABLE 54: U.S. East Visitor Personal Daily Spending by Category: 2004 vs. 2003 (in dollars)
(Arrivals by air)
Expenditure Type 2004 2003 % change
GRAND TOTAL 172.7 163.3 5.8Total Food and beverage 36.1 35.4 2.2 Restaurant food 25.8 25.6 0.6 Dinner shows and cruises 4.4 4.6 -5.0 Groceries and snacks 5.9 5.1 16.6
Entertainment & Recreation 18.8 14.7 27.7
Total Transportation 21.2 17.5 21.3 Interisland airfare 6.5 5.1 27.1 Ground transportation 1.0 0.8 30.4 Rental vehicles 12.2 10.5 16.6 Gasoline, parking, etc. 1.5 1.2 25.5
Total Shopping 25.0 25.5 -2.1 Fashion and clothing 8.6 9.0 -4.8 Jewelry and watches 6.4 5.7 11.3 Cosmetics, perfume 0.5 0.3 35.3 Leather goods 0.5 0.4 31.1 Hawaii food products 2.3 2.6 -12.1 Souvenirs 6.7 7.4 -9.2
Lodging 63.3 64.1 -1.3
All other expenses 8.4 6.2 35.7
Source: DBEDT 90
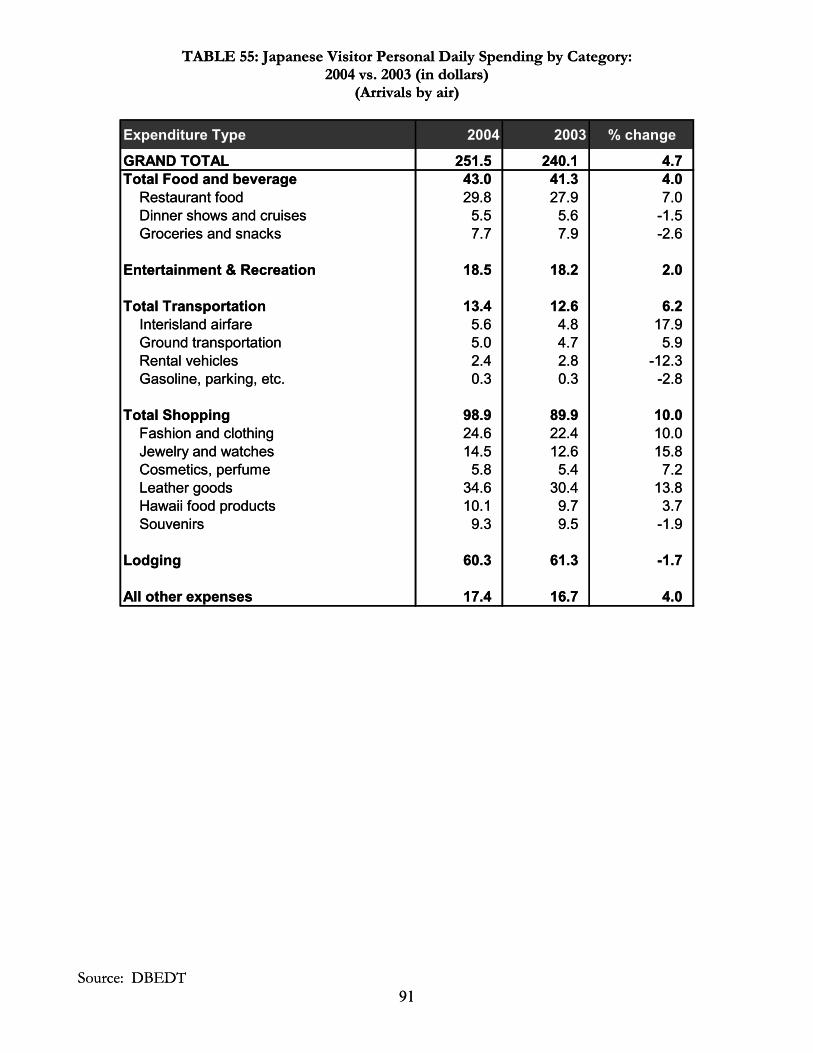
TABLE 55: Japanese Visitor Personal Daily Spending by Category: 2004 vs. 2003 (in dollars)
(Arrivals by air)
Expenditure Type 2004 2003 % change
GRAND TOTAL 251.5 240.1 4.7Total Food and beverage 43.0 41.3 4.0 Restaurant food 29.8 27.9 7.0 Dinner shows and cruises 5.5 5.6 -1.5 Groceries and snacks 7.7 7.9 -2.6
Entertainment & Recreation 18.5 18.2 2.0
Total Transportation 13.4 12.6 6.2 Interisland airfare 5.6 4.8 17.9 Ground transportation 5.0 4.7 5.9 Rental vehicles 2.4 2.8 -12.3 Gasoline, parking, etc. 0.3 0.3 -2.8
Total Shopping 98.9 89.9 10.0 Fashion and clothing 24.6 22.4 10.0 Jewelry and watches 14.5 12.6 15.8 Cosmetics, perfume 5.8 5.4 7.2 Leather goods 34.6 30.4 13.8 Hawaii food products 10.1 9.7 3.7 Souvenirs 9.3 9.5 -1.9
Lodging 60.3 61.3 -1.7
All other expenses 17.4 16.7 4.0
TABLE 55: Japanese Visitor Personal Daily Spending by Category: 2004 vs. 2003 (in dollars)
(Arrivals by air)
Source: DBEDT
91
Expenditure Type 2004 2003 % change
GRAND TOTAL 251.5 240.1 4.7Total Food and beverage 43.0 41.3 4.0 Restaurant food 29.8 27.9 7.0 Dinner shows and cruises 5.5 5.6 -1.5 Groceries and snacks 7.7 7.9 -2.6
Entertainment & Recreation 18.5 18.2 2.0
Total Transportation 13.4 12.6 6.2 Interisland airfare 5.6 4.8 17.9 Ground transportation 5.0 4.7 5.9 Rental vehicles 2.4 2.8 -12.3 Gasoline, parking, etc. 0.3 0.3 -2.8
Total Shopping 98.9 89.9 10.0 Fashion and clothing 24.6 22.4 10.0 Jewelry and watches 14.5 12.6 15.8 Cosmetics, perfume 5.8 5.4 7.2 Leather goods 34.6 30.4 13.8 Hawaii food products 10.1 9.7 3.7 Souvenirs 9.3 9.5 -1.9
Lodging 60.3 61.3 -1.7
All other expenses 17.4 16.7 4.0
Source: DBEDT 91
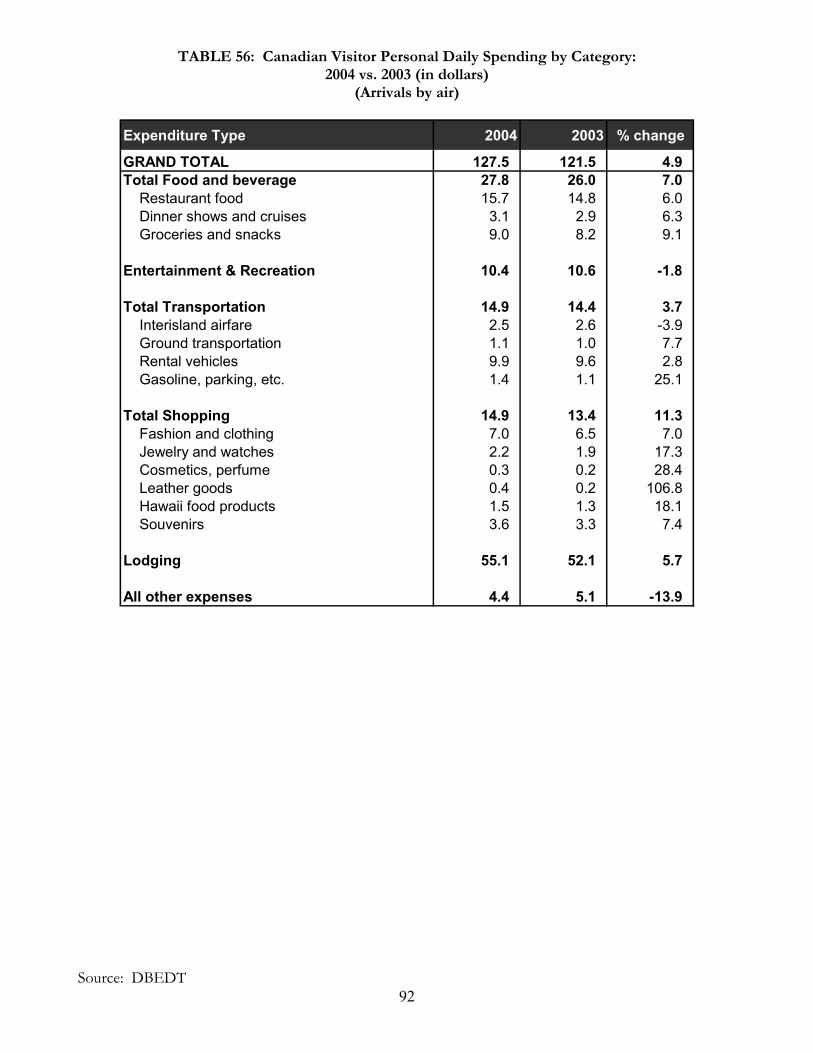
TABLE 56: Canadian Visitor Personal Daily Spending by Category: 2004 vs. 2003 (in dollars)
(Arrivals by air)
Expenditure Type 2004 2003 % change
GRAND TOTAL 127.5 121.5 4.9Total Food and beverage 27.8 26.0 7.0 Restaurant food 15.7 14.8 6.0 Dinner shows and cruises 3.1 2.9 6.3 Groceries and snacks 9.0 8.2 9.1
Entertainment & Recreation 10.4 10.6 -1.8
Total Transportation 14.9 14.4 3.7 Interisland airfare 2.5 2.6 -3.9 Ground transportation 1.1 1.0 7.7 Rental vehicles 9.9 9.6 2.8 Gasoline, parking, etc. 1.4 1.1 25.1
Total Shopping 14.9 13.4 11.3 Fashion and clothing 7.0 6.5 7.0 Jewelry and watches 2.2 1.9 17.3 Cosmetics, perfume 0.3 0.2 28.4 Leather goods 0.4 0.2 106.8 Hawaii food products 1.5 1.3 18.1 Souvenirs 3.6 3.3 7.4
Lodging 55.1 52.1 5.7
All other expenses 4.4 5.1 -13.9
Source: DBEDT 92
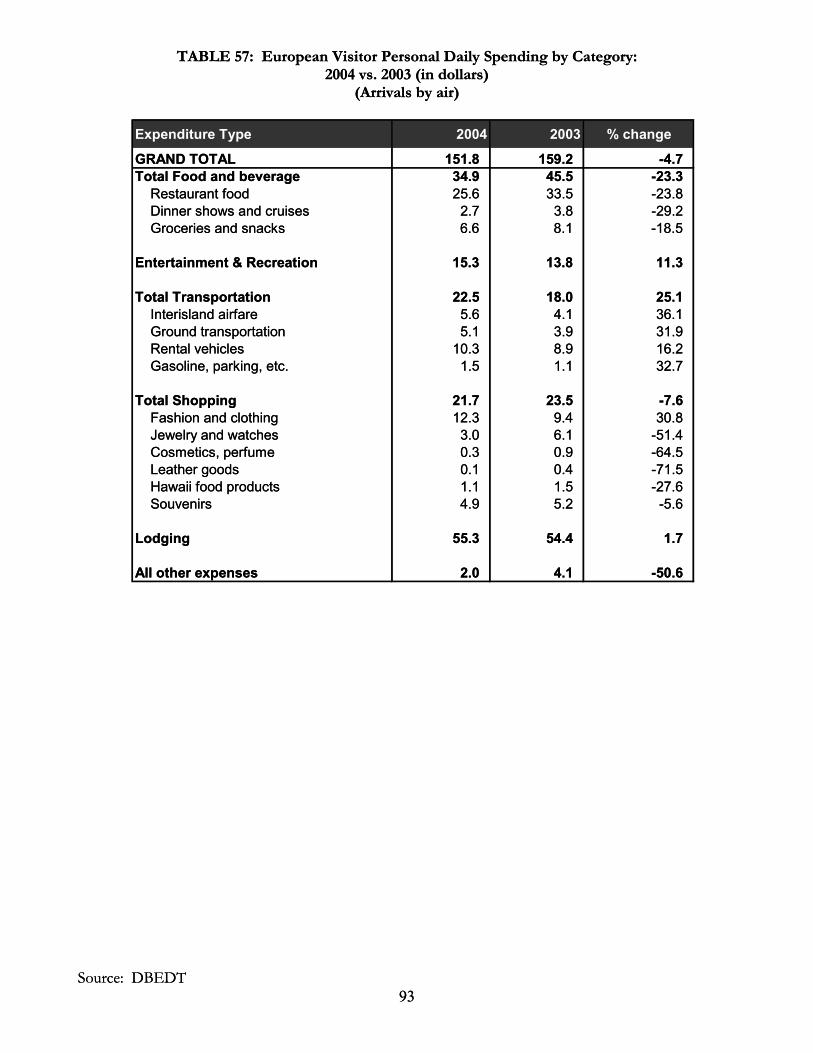
TABLE 57: European Visitor Personal Daily Spending by Category: 2004 vs. 2003 (in dollars)
(Arrivals by air)
Expenditure Type 2004 2003 % change
GRAND TOTAL 151.8 159.2 -4.7Total Food and beverage 34.9 45.5 -23.3 Restaurant food 25.6 33.5 -23.8 Dinner shows and cruises 2.7 3.8 -29.2 Groceries and snacks 6.6 8.1 -18.5
Entertainment & Recreation 15.3 13.8 11.3
Total Transportation 22.5 18.0 25.1 Interisland airfare 5.6 4.1 36.1 Ground transportation 5.1 3.9 31.9 Rental vehicles 10.3 8.9 16.2 Gasoline, parking, etc. 1.5 1.1 32.7
Total Shopping 21.7 23.5 -7.6 Fashion and clothing 12.3 9.4 30.8 Jewelry and watches 3.0 6.1 -51.4 Cosmetics, perfume 0.3 0.9 -64.5 Leather goods 0.1 0.4 -71.5 Hawaii food products 1.1 1.5 -27.6 Souvenirs 4.9 5.2 -5.6
Lodging 55.3 54.4 1.7
All other expenses 2.0 4.1 -50.6
TABLE 57: European Visitor Personal Daily Spending by Category: 2004 vs. 2003 (in dollars)
(Arrivals by air)
Source: DBEDT
93
Expenditure Type 2004 2003 % change
GRAND TOTAL 151.8 159.2 -4.7Total Food and beverage 34.9 45.5 -23.3 Restaurant food 25.6 33.5 -23.8 Dinner shows and cruises 2.7 3.8 -29.2 Groceries and snacks 6.6 8.1 -18.5
Entertainment & Recreation 15.3 13.8 11.3
Total Transportation 22.5 18.0 25.1 Interisland airfare 5.6 4.1 36.1 Ground transportation 5.1 3.9 31.9 Rental vehicles 10.3 8.9 16.2 Gasoline, parking, etc. 1.5 1.1 32.7
Total Shopping 21.7 23.5 -7.6 Fashion and clothing 12.3 9.4 30.8 Jewelry and watches 3.0 6.1 -51.4 Cosmetics, perfume 0.3 0.9 -64.5 Leather goods 0.1 0.4 -71.5 Hawaii food products 1.1 1.5 -27.6 Souvenirs 4.9 5.2 -5.6
Lodging 55.3 54.4 1.7
All other expenses 2.0 4.1 -50.6
Source: DBEDT 93
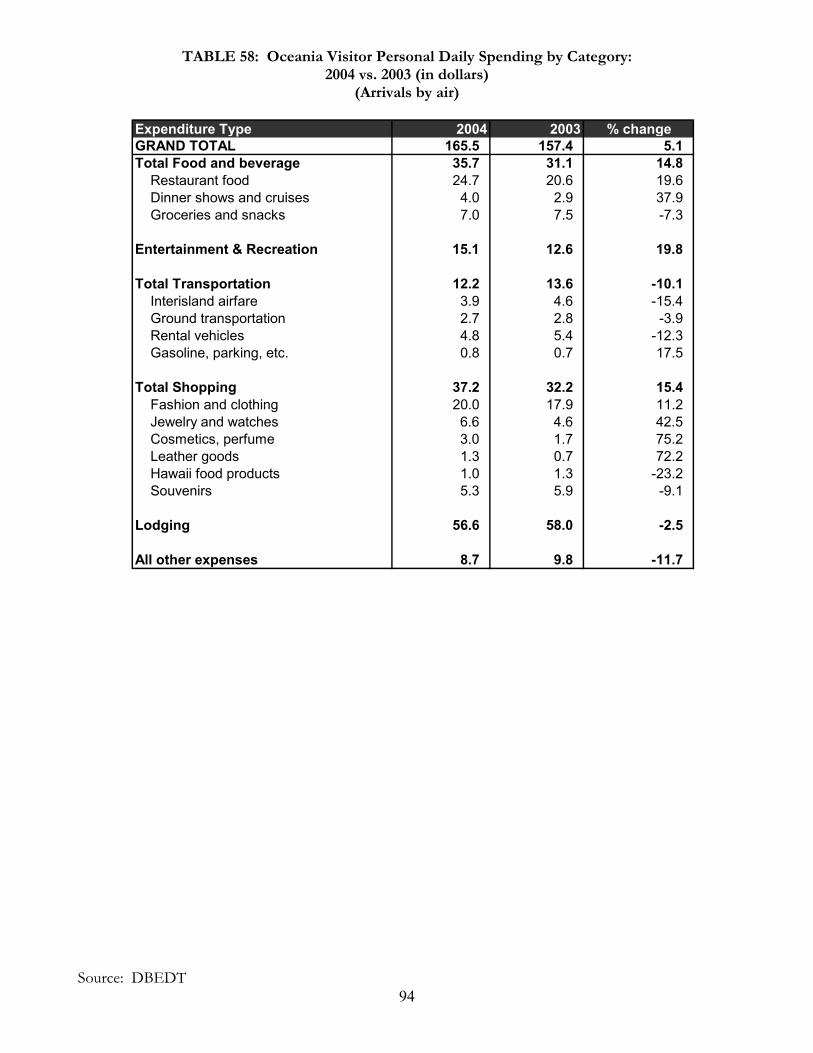
TABLE 58: Oceania Visitor Personal Daily Spending by Category: 2004 vs. 2003 (in dollars)
(Arrivals by air)
Expenditure Type 2004 2003 % changeGRAND TOTAL 165.5 157.4 5.1Total Food and beverage 35.7 31.1 14.8 Restaurant food 24.7 20.6 19.6 Dinner shows and cruises 4.0 2.9 37.9 Groceries and snacks 7.0 7.5 -7.3
Entertainment & Recreation 15.1 12.6 19.8
Total Transportation 12.2 13.6 -10.1 Interisland airfare 3.9 4.6 -15.4 Ground transportation 2.7 2.8 -3.9 Rental vehicles 4.8 5.4 -12.3 Gasoline, parking, etc. 0.8 0.7 17.5
Total Shopping 37.2 32.2 15.4 Fashion and clothing 20.0 17.9 11.2 Jewelry and watches 6.6 4.6 42.5 Cosmetics, perfume 3.0 1.7 75.2 Leather goods 1.3 0.7 72.2 Hawaii food products 1.0 1.3 -23.2 Souvenirs 5.3 5.9 -9.1
Lodging 56.6 58.0 -2.5
All other expenses 8.7 9.8 -11.7
Source: DBEDT 94
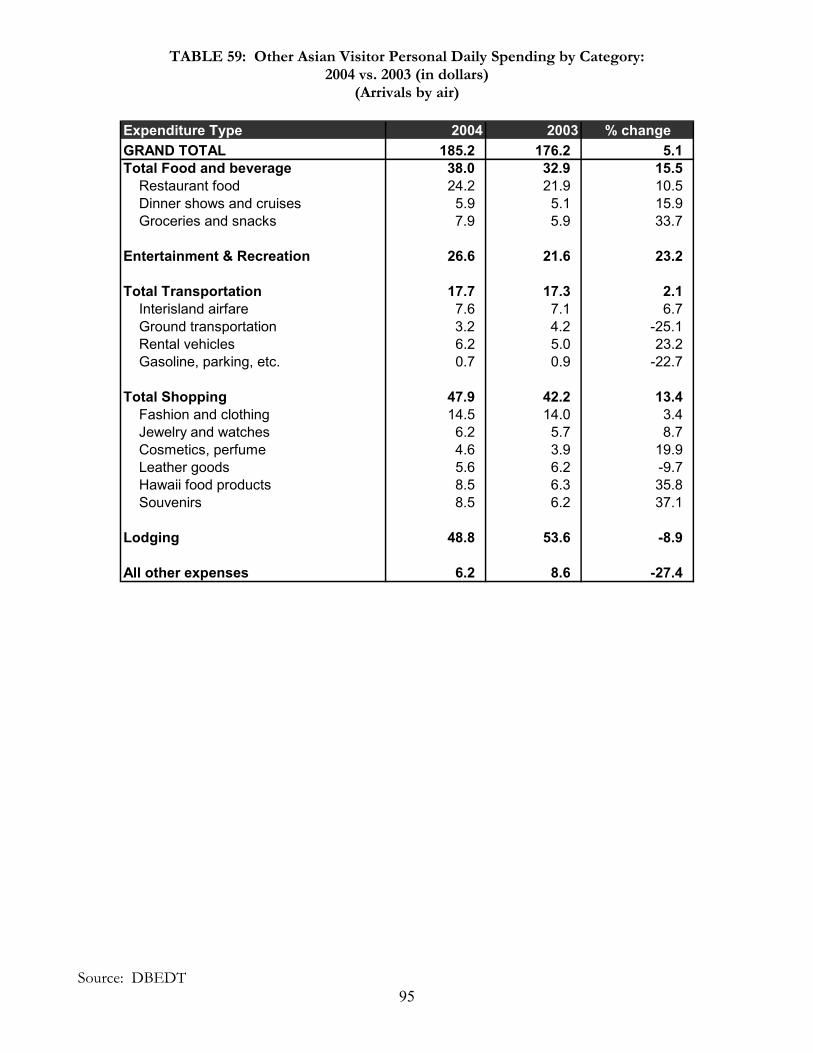
TABLE 59: Other Asian Visitor Personal Daily Spending by Category: 2004 vs. 2003 (in dollars)
(Arrivals by air)
Expenditure Type 2004 2003 % changeGRAND TOTAL 185.2 176.2 5.1Total Food and beverage 38.0 32.9 15.5 Restaurant food 24.2 21.9 10.5 Dinner shows and cruises 5.9 5.1 15.9 Groceries and snacks 7.9 5.9 33.7
Entertainment & Recreation 26.6 21.6 23.2
Total Transportation 17.7 17.3 2.1 Interisland airfare 7.6 7.1 6.7 Ground transportation 3.2 4.2 -25.1 Rental vehicles 6.2 5.0 23.2 Gasoline, parking, etc. 0.7 0.9 -22.7
Total Shopping 47.9 42.2 13.4 Fashion and clothing 14.5 14.0 3.4 Jewelry and watches 6.2 5.7 8.7 Cosmetics, perfume 4.6 3.9 19.9 Leather goods 5.6 6.2 -9.7 Hawaii food products 8.5 6.3 35.8 Souvenirs 8.5 6.2 37.1
Lodging 48.8 53.6 -8.9
All other expenses 6.2 8.6 -27.4
Source: DBEDT 95
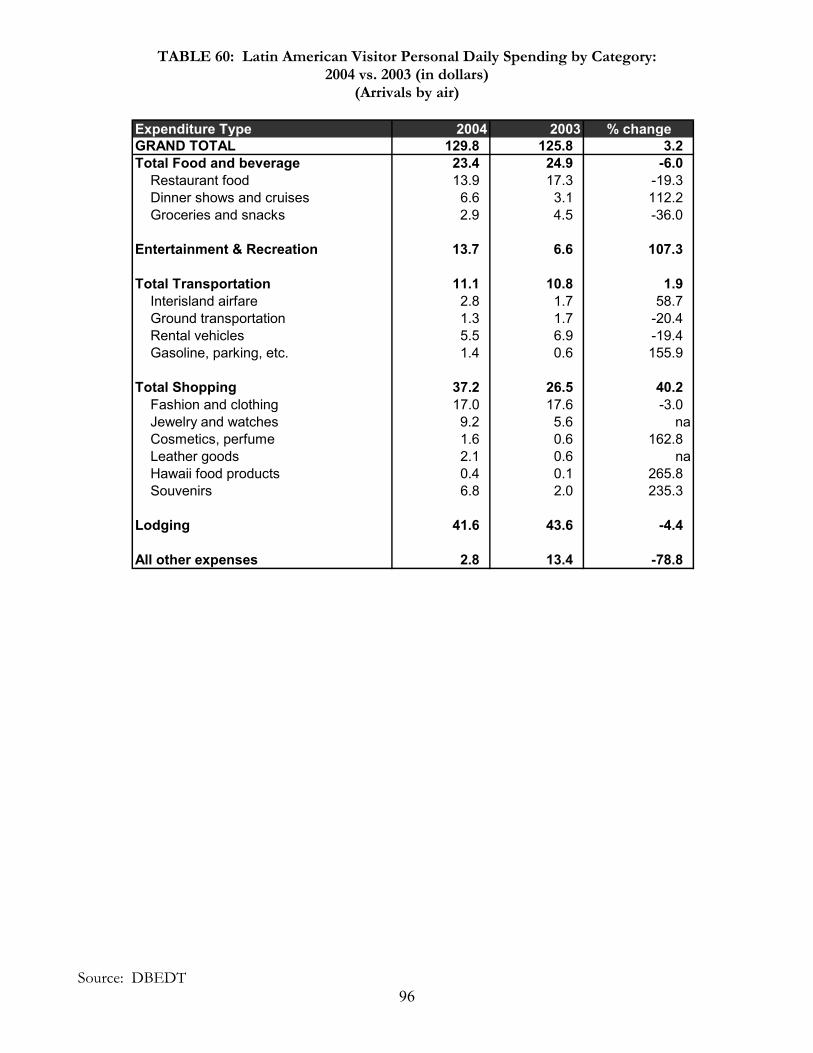
TABLE 60: Latin American Visitor Personal Daily Spending by Category: 2004 vs. 2003 (in dollars)
(Arrivals by air)
Expenditure Type 2004 2003 % changeGRAND TOTAL 129.8 125.8 3.2Total Food and beverage 23.4 24.9 -6.0 Restaurant food 13.9 17.3 -19.3 Dinner shows and cruises 6.6 3.1 112.2 Groceries and snacks 2.9 4.5 -36.0
Entertainment & Recreation 13.7 6.6 107.3
Total Transportation 11.1 10.8 1.9 Interisland airfare 2.8 1.7 58.7 Ground transportation 1.3 1.7 -20.4 Rental vehicles 5.5 6.9 -19.4 Gasoline, parking, etc. 1.4 0.6 155.9
Total Shopping 37.2 26.5 40.2 Fashion and clothing 17.0 17.6 -3.0 Jewelry and watches 9.2 5.6 na Cosmetics, perfume 1.6 0.6 162.8 Leather goods 2.1 0.6 na Hawaii food products 0.4 0.1 265.8 Souvenirs 6.8 2.0 235.3
Lodging 41.6 43.6 -4.4
All other expenses 2.8 13.4 -78.8
Source: DBEDT 96
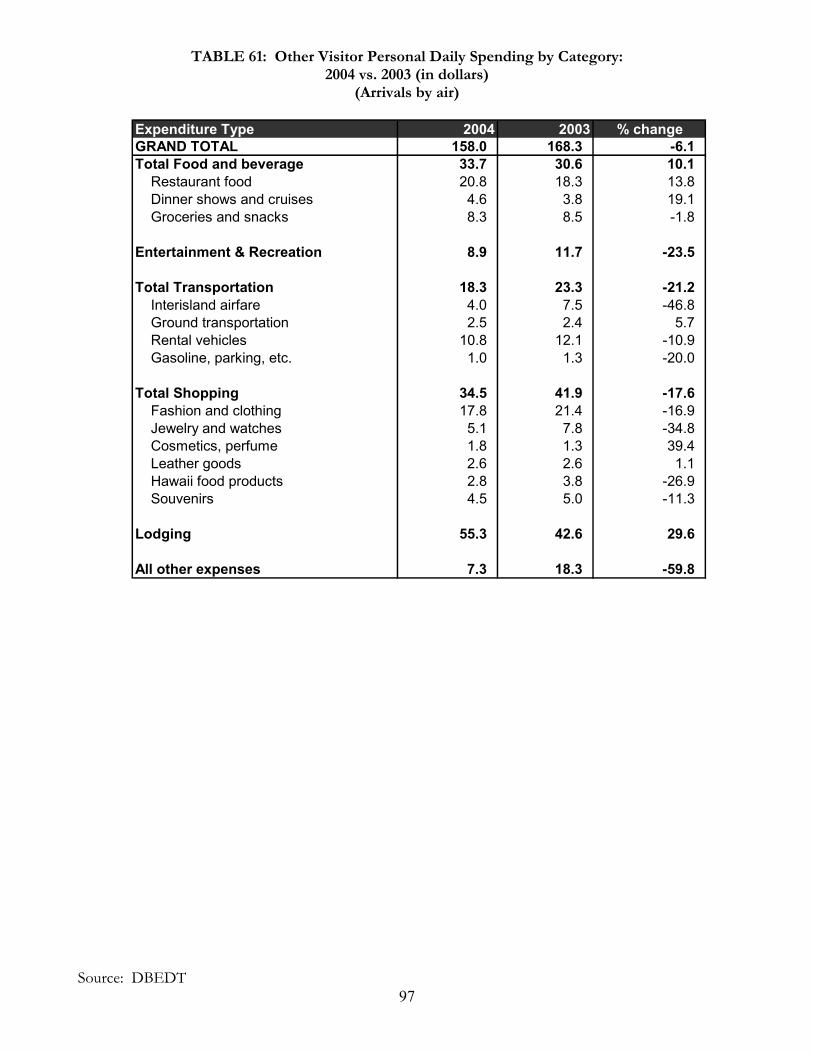
TABLE 61: Other Visitor Personal Daily Spending by Category: 2004 vs. 2003 (in dollars)
(Arrivals by air)
Source: DBEDT
97
Expenditure Type 2004 2003 % changeGRAND TOTAL 158.0 168.3 -6.1Total Food and beverage 33.7 30.6 10.1 Restaurant food 20.8 18.3 13.8 Dinner shows and cruises 4.6 3.8 19.1 Groceries and snacks 8.3 8.5 -1.8
Entertainment & Recreation 8.9 11.7 -23.5
Total Transportation 18.3 23.3 -21.2 Interisland airfare 4.0 7.5 -46.8 Ground transportation 2.5 2.4 5.7 Rental vehicles 10.8 12.1 -10.9
-20.0
-17.6-16.9-34.839.41.1
-26.9-11.3
29.6
-59.8
Gasoline, parking, etc. 1.0 1.3
Total Shopping 34.5 41.9 Fashion and clothing 17.8 21.4 Jewelry and watches 5.1 7.8 Cosmetics, perfume 1.8 1.3 Leather goods 2.6 2.6 Hawaii food products 2.8 3.8 Souvenirs 4.5 5.0
Lodging 55.3 42.6
All other expenses 7.3 18.3

Source: DBEDT
2004 U.S. WEST MMA
U.S. EAST MMA
JAPAN MMA
CANADA MMA
EUROPE MMA
OCEANIA MMA
OTHER ASIA MMA
LATIN AMERICA
MMA
OTHER MMA TOTAL
Oahu 1,312.7 1,364.0 1,945.9 150.9 105.9 152.4 113.5 12.9 320.0 5,478.2 Maui 1,428.8 1,078.3 69.7 135.3 61.4 18.9 10.4 4.0 68.5 2,875.3 Molokai 12.4 8.3 0.9 1.9 1.4 0.2 0.2 0.0 0.7 26.0 Lanai 26.0 20.9 3.7 2.8 1.2 0.4 0.5 0.2 2.3 57.9 Kauai 597.1 397.7 17.9 39.0 20.7 6.7 3.7 1.3 28.2 1,112.4 Big Island 591.0 422.5 138.9 43.9 29.4 16.4 17.0 2.1 50.8 1,312.0
STATE 3,968.0 3,291.7 2,177.0 373.8 219.9 195.0 145.3 20.5 470.5 10,861.8
Note: Visitor Expenditures by Island includes business supplement expenses and expenditures by cruise visitors in Hawaii.
2004 U.S. WEST MMA
U.S. EAST MMA
JAPAN MMA
CANADA MMA
EUROPE MMA
OCEANIA MMA
OTHER ASIA MMA
LATIN AMERICA
MMA
OTHER MMA TOTAL
Oahu 33.1% 41.4% 89.4% 40.4% 48.1% 78.1% 78.1% 62.9% 68.0% 50.4% Maui 36.0% 32.8% 3.2% 36.2% 27.9% 9.7% 7.2% 19.4% 14.6% 26.5% Molokai 0.3% 0.3% 0.0% 0.5% 0.6% 0.1% 0.2% 0.2% 0.1% 0.2% Lanai 0.7% 0.6% 0.2% 0.8% 0.5% 0.2% 0.3% 0.8% 0.5% 0.5% Kauai 15.0% 12.1% 0.8% 10.4% 9.4% 3.5% 2.5% 6.3% 6.0% 10.2% Big Island 14.9% 12.8% 6.4% 11.7% 13.4% 8.4% 11.7% 10.4% 10.8% 12.1%
STATE 100.0% 100.0% 100.0% 100.0% 100.0% 100.0% 100.0% 100.0% 100.0% 100.0%
TABLE 62: 2004 Visitor Expenditures by Island and MMA(in $millions)
TABLE 63: 2004 Visitor Expenditures by Island and MMA( % share of State Total)
98
CRUISE VISITORS
ARRIVALS BY AIR AND BY CRUISE SHIPS
LENGTH OF STAY
CRUISE VISITOR DAYS
TOTAL CRUISE PASSENGERS BY MMA
DAILY SPENDING BY CATEGORY AND BY
MMA
99
CRUISE SHIP PASSENGERS IN HAWAII In addition to the 79,833 out-of-state visitors who arrived by cruise ships, another 160,967 out-of-state visitors also came by air to board cruise ships touring the islands in 2004. Combined, there were 240,800 cruise visitors to the state, 4.5 percent higher compared to the previous year. There were 64 out-of-state cruise ships in the islands in 2004. These ships combined with the U.S. flagged, Hawaii home-ported ship Pride of Aloha, made 146 tours around the islands during the year. In 2003, there were 46 out-of-state cruise ships which made 125 tours carrying 230,495 out-of-state visitors. Several more U.S. flagged ships will be added to Hawaii’s inter-island cruise routes in 2005 and 2006, further expanding Hawaii’s cruise visitor industry. Point of Origin and Island Visitation In total there were 244,377 passengers aboard cruise ships in the islands during 2004, 99 percent were out-of-state visitors while 3,577 passengers were Hawaii residents. By the nature of the cruise routes, these passengers went to most of the neighbor islands. Mostly all (99.8%) of the cruise passengers visited Oahu, 97.6 percent visited the Big Island, 95.7 percent visited Maui, and 94.3 percent visited Kauai. In addition to their cruise itinerary, 8,988 passengers visited Lanai while 7,645 visited Molokai. Visitors from the U.S. East comprised the largest percentage of out-of-state passengers (53%), followed by visitors from U.S. West (27.9%), Canada (6.7%), Europe (3.2%) and others (9.2%). Close to 58 percent of the out-of-state passengers were repeat visitors to the islands, while 41.7 percent came to Hawaii for the first time. The majority (81.6%) of the out-of-state passengers cruised the islands for leisure, 8.5 percent visited friends and relatives, 4.5 percent were on their honeymoon while 4.7 percent played golf. Length of Stay and Type of Accommodation The total average length of stay by out-of-state cruise passengers in 2004 was 8.06 days. In addition to the average of 5.39 days these passengers spent aboard ship touring the islands and the 1.10 days they spent on shore after their cruise was over, visitors who arrived in Hawaii by air stayed an average of 1.57 days in Hawaii before their cruise.
100
Passengers from Canada spent the most time in the islands at 8.87 days. Their average length of cruise was 5.22 days and they also spent 2.17 days on shore after their cruise was over. The average length of stay by European visitors was 8.41 total days, of which 4.94 days were spent on ship and 1.50 days were spent post cruise. U.S West visitors spent an average of 8.13 total days in the islands, 5.28 days aboard ship and 1.26 days after cruise. The average length of stay by U.S. East visitors was 7.85 days, 5.50 days of which were spent on ship and 0.82 spent after the cruise was over. Of those out-of-state who spent extra nights in Hawaii either before or after their shipboard cruises, 57.9 percent chose to stay in hotels. Other types of lodging used by cruise visitors during their extra nights included condominiums (6.2%), timeshare properties (5.4%) and staying with friends and relatives (4.4%). Cruise Visitor Expenditures The average out-of-state cruise visitor in 2004 spent approximately $94 per person per day (PPPD) while on shore in Hawaii. This amount is comprised of tour costs and other on-land expenditures such as lodging, food and beverages, shopping, transportation and entertainment. U.S. East cruise visitors spent the most at $103 PPPD, followed by visitors from Europe ($91), Canada ($90), and the U.S. West ($82). In contrast, daily spending by Hawaii resident cruise passengers was only $65 per person. U.S. East, U.S. West, Canadian and European cruise visitors spent more on shore tours than on shopping and food and beverages. Of those cruise visitors who stayed extra nights in Hawaii before or after their cruise, Canadian visitors spent the most for lodging, followed by those from Europe, U.S. East and U.S. West. Expenditure data were not available for visitors from Japan, China, Latin America, or Australia due to their small sample size in the survey.
101
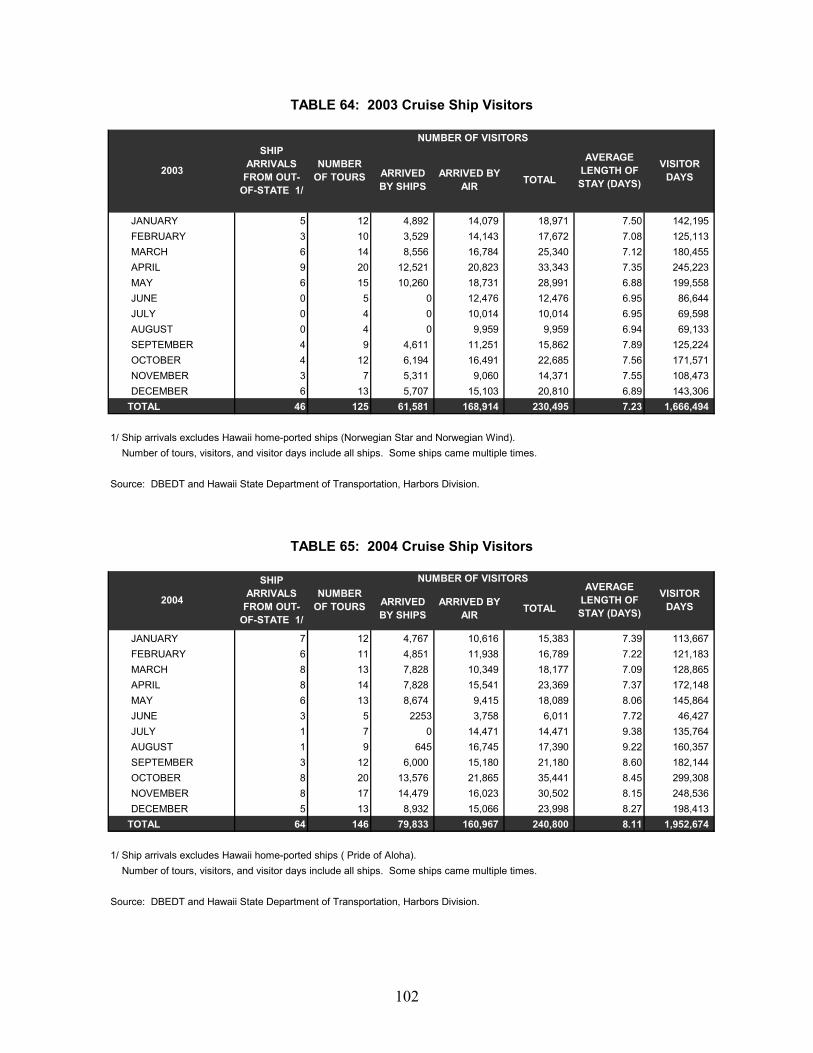
102
ARRIVED BY SHIPS
ARRIVED BY AIR TOTAL
5 12 4,892 14,079 18,971 7.50 142,195 3 10 3,529 14,143 17,672 7.08 125,113 6 14 8,556 16,784 25,340 7.12 180,455 9 20 12,521 20,823 33,343 7.35 245,223 6 15 10,260 18,731 28,991 6.88 199,558 0 5 0 12,476 12,476 6.95 86,644 0 4 0 10,014 10,014 6.95 69,598 0 4 0 9,959 9,959 6.94 69,133 4 9 4,611 11,251 15,862 7.89 125,224 4 12 6,194 16,491 22,685 7.56 171,571 3 7 5,311 9,060 14,371 7.55 108,473 6 13 5,707 15,103 20,810 6.89 143,306
46 125 61,581 168,914 230,495 7.23 1,666,494
1/ Ship arrivals excludes Hawaii home-ported ships (Norwegian Star and Norwegian Wind). Number of tours, visitors, and visitor days include all ships. Some ships came multiple times.
Source: DBEDT and Hawaii State Department of Transportation, Harbors Division.
ARRIVED BY SHIPS
ARRIVED BY AIR TOTAL
7 12 4,767 10,616 15,383 7.39 113,667 6 11 4,851 11,938 16,789 7.22 121,183 8 13 7,828 10,349 18,177 7.09 128,865 8 14 7,828 15,541 23,369 7.37 172,148 6 13 8,674 9,415 18,089 8.06 145,864 3 5 2253 3,758 6,011 7.72 46,427 1 7 0 14,471 14,471 9.38 135,764 1 9 645 16,745 17,390 9.22 160,357 3 12 6,000 15,180 21,180 8.60 182,144 8 20 13,576 21,865 35,441 8.45 299,308 8 17 14,479 16,023 30,502 8.15 248,536 5 13 8,932 15,066 23,998 8.27 198,413
64 146 79,833 160,967 240,800 8.11 1,952,674
1/ Ship arrivals excludes Hawaii home-ported ships ( Pride of Aloha). Number of tours, visitors, and visitor days include all ships. Some ships came multiple times.
Source: DBEDT and Hawaii State Department of Transportation, Harbors Division.
TOTAL
SEPTEMBEROCTOBERNOVEMBERDECEMBER
MAYJUNEJULYAUGUST
JANUARYFEBRUARYMARCHAPRIL
TABLE 65: 2004 Cruise Ship Visitors
2004
SHIP ARRIVALS
FROM OUT-OF-STATE 1/
NUMBER OF TOURS
NUMBER OF VISITORSAVERAGE
LENGTH OF STAY (DAYS)
VISITOR DAYS
TABLE 64: 2003 Cruise Ship Visitors
2003
SHIP ARRIVALS
FROM OUT-OF-STATE 1/
NUMBER OF TOURS
NUMBER OF VISITORS
AVERAGE LENGTH OF STAY (DAYS)
VISITOR DAYS
JANUARYFEBRUARYMARCHAPRILMAYJUNEJULYAUGUST
TOTAL
SEPTEMBEROCTOBERNOVEMBERDECEMBER

Table 66: 2004 Total Cruise Passengers by MMA
Total
Out-of-State
Visitors Hawaii
Residents US West US East Canada Europe OtherTotal Passengers 244,377 240,800 3,577 67,271 127,532 16,240 7,700 22,057
Island Visitation (Number of Passengers)
Oahu 243,920 240,343 3,577 67,143 127,290 16,209 7,685 22,016Kauai 230,558 226,981 3,577 63,410 120,213 15,308 7,258 20,792Maui County 233,971 230,394 3,577 64,364 122,021 15,538 7,367 21,104
Maui 233,971 230,394 3,577 64,364 122,021 15,538 7,367 21,104Molokai 7,645 7,573 72 2,733 3,850 520 134 335Lanai 8,988 8,971 17 3,215 4,639 536 188 393
Big Island 238,445 234,868 3,577 65,614 124,390 15,840 7,510 21,514
Purpose of Trip (Number of Passengers)
Honeymoon 10,852 10,717 135 3,017 5,780 623 331 966Wedding 3,756 3,756 0 1,105 1,655 315 299 383Convention / Conference 5,249 5,124 125 1,319 3,030 332 156 287Business 4,614 4,486 128 1,509 2,239 233 71 433Visit Friends or Relatives 21,356 20,521 834 8,548 9,051 1,359 245 1,318Play Golf 11,384 11,287 96 3,074 6,230 652 443 889Leisure 198,782 196,386 2,396 52,890 104,955 13,344 6,453 18,745
Type of Accomodation Before or After Cruise(Number of Passengers)
Hotel 139,814 139,522 292 32,502 77,019 10,548 5,090 14,364Hotel only 122,084 121,931 153 25,527 69,329 9,015 4,833 13,228Condo 15,133 14,841 292 6,004 6,296 1,450 83 1,007Condo only 3,026 2,754 271 933 1,083 413 0 325Timeshare 12,950 12,950 0 4,593 6,508 987 285 577Timeshare Only 2,513 2,513 0 896 1,279 195 66 78Bed & Breakfast 7,826 7,826 0 2,684 4,016 617 86 424Bed & Breakfast only 145 145 0 20 78 19 0 29Friends & relatives 10,894 10,637 258 3,992 5,029 744 93 779Friends only 1,993 1,799 194 619 851 47 0 282Other accomodation 12,998 11,897 1,101 4,044 6,117 771 119 847Other accomodation only 4,454 3,448 1,005 1,209 1,719 274 44 202
Average Length of Stay (days)
Total Length of Stay in Hawaii 8.02 8.06 4.84 8.13 7.85 8.87 8.41 10.66LOS in Hawaii Before Cruise 1.55 1.57 0.08 1.59 1.53 1.49 1.96 2.17LOS in Hawaii During Cruise 5.38 5.39 4.66 5.28 5.50 5.22 4.94 6.75LOS in Hawaii After Cruise 1.09 1.10 0.10 1.26 0.82 2.17 1.50 1.74Type of Visitors
First Timers 100,790 100,493 297 14,906 67,086 6,181 4,613 9,050Repeat Visitors 143,587 140,307 3,280 52,365 60,446 10,059 3,087 13,007
Visitors by MMAPassenger Type
Source: DBEDT
103
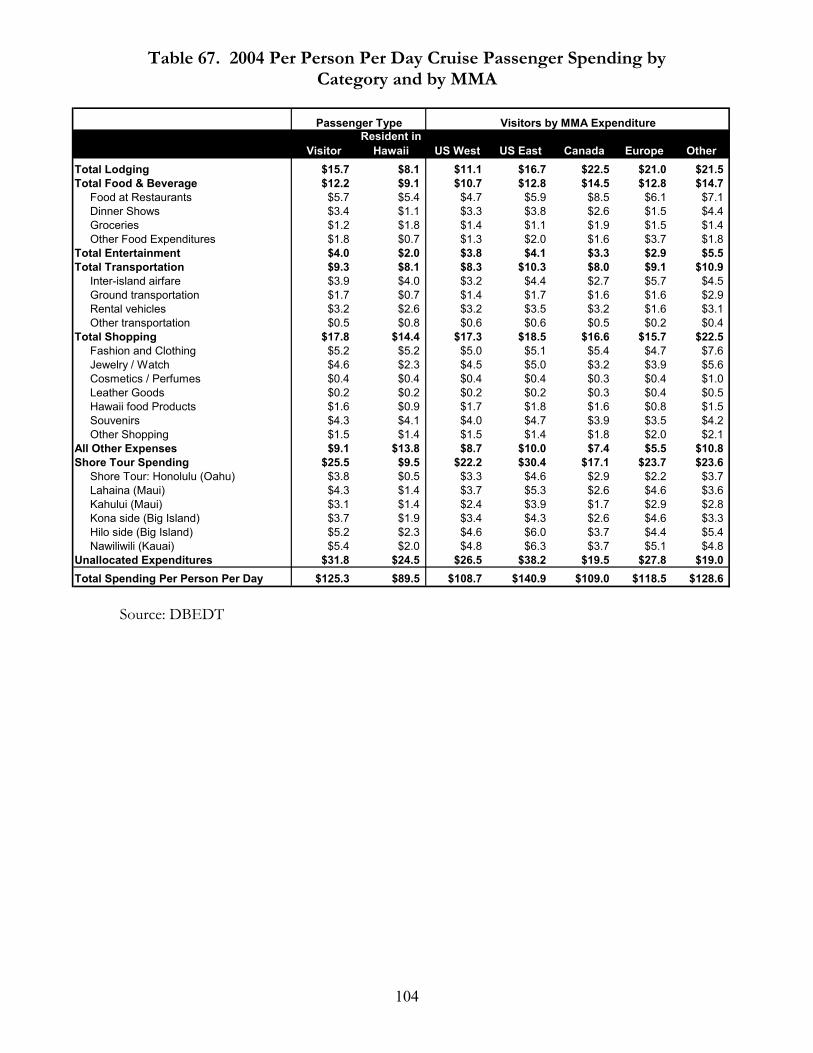
Table 67. 2004 Per Person Per Day Cruise Passenger Spending by Category and by MMA
VisitorResident in
Hawaii US West US East Canada Europe OtherTotal Lodging $15.7 $8.1 $11.1 $16.7 $22.5 $21.0 $21.5Total Food & Beverage $12.2 $9.1 $10.7 $12.8 $14.5 $12.8 $14.7
Food at Restaurants $5.7 $5.4 $4.7 $5.9 $8.5 $6.1 $7.1 Dinner Shows $3.4 $1.1 $3.3 $3.8 $2.6 $1.5 $4.4 Groceries $1.2 $1.8 $1.4 $1.1 $1.9 $1.5 $1.4 Other Food Expenditures $1.8 $0.7 $1.3 $2.0 $1.6 $3.7 $1.8
Total Entertainment $4.0 $2.0 $3.8 $4.1 $3.3 $2.9 $5.5Total Transportation $9.3 $8.1 $8.3 $10.3 $8.0 $9.1 $10.9
Inter-island airfare $3.9 $4.0 $3.2 $4.4 $2.7 $5.7 $4.5 Ground transportation $1.7 $0.7 $1.4 $1.7 $1.6 $1.6 $2.9 Rental vehicles $3.2 $2.6 $3.2 $3.5 $3.2 $1.6 $3.1 Other transportation $0.5 $0.8 $0.6 $0.6 $0.5 $0.2 $0.4
Total Shopping $17.8 $14.4 $17.3 $18.5 $16.6 $15.7 $22.5 Fashion and Clothing $5.2 $5.2 $5.0 $5.1 $5.4 $4.7 $7.6 Jewelry / Watch $4.6 $2.3 $4.5 $5.0 $3.2 $3.9 $5.6 Cosmetics / Perfumes $0.4 $0.4 $0.4 $0.4 $0.3 $0.4 $1.0 Leather Goods $0.2 $0.2 $0.2 $0.2 $0.3 $0.4 $0.5 Hawaii food Products $1.6 $0.9 $1.7 $1.8 $1.6 $0.8 $1.5 Souvenirs $4.3 $4.1 $4.0 $4.7 $3.9 $3.5 $4.2 Other Shopping $1.5 $1.4 $1.5 $1.4 $1.8 $2.0 $2.1
All Other Expenses $9.1 $13.8 $8.7 $10.0 $7.4 $5.5 $10.8Shore Tour Spending $25.5 $9.5 $22.2 $30.4 $17.1 $23.7 $23.6
Shore Tour: Honolulu (Oahu) $3.8 $0.5 $3.3 $4.6 $2.9 $2.2 $3.7 Lahaina (Maui) $4.3 $1.4 $3.7 $5.3 $2.6 $4.6 $3.6 Kahului (Maui) $3.1 $1.4 $2.4 $3.9 $1.7 $2.9 $2.8 Kona side (Big Island) $3.7 $1.9 $3.4 $4.3 $2.6 $4.6 $3.3 Hilo side (Big Island) $5.2 $2.3 $4.6 $6.0 $3.7 $4.4 $5.4 Nawiliwili (Kauai) $5.4 $2.0 $4.8 $6.3 $3.7 $5.1 $4.8
Unallocated Expenditures $31.8 $24.5 $26.5 $38.2 $19.5 $27.8 $19.0Total Spending Per Person Per Day $125.3 $89.5 $108.7 $140.9 $109.0 $118.5 $128.6
Passenger Type Visitors by MMA Expenditure
Source: DBEDT
104
TOTAL AIR AND CRUISE VISITOR ARRIVALS BY ISLAND
105
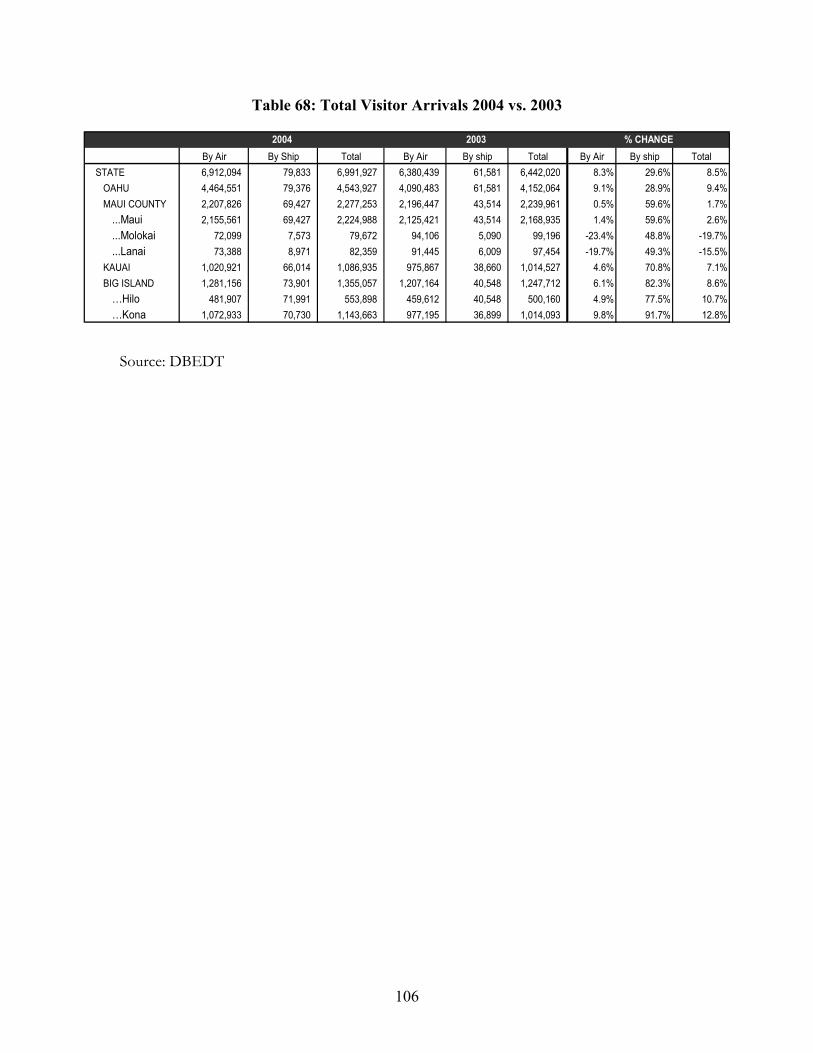
Table 68: Total Visitor Arrivals 2004 vs. 2003
By Air By Ship Total By Air By ship Total By Air By ship TotalSTATE 6,912,094 79,833 6,991,927 6,380,439 61,581 6,442,020 8.3% 29.6% 8.5% OAHU 4,464,551 79,376 4,543,927 4,090,483 61,581 4,152,064 9.1% 28.9% 9.4% MAUI COUNTY 2,207,826 69,427 2,277,253 2,196,447 43,514 2,239,961 0.5% 59.6% 1.7%
...Maui 2,155,561 69,427 2,224,988 2,125,421 43,514 2,168,935 1.4% 59.6% 2.6%
...Molokai 72,099 7,573 79,672 94,106 5,090 99,196 -23.4% 48.8% -19.7%
...Lanai 73,388 8,971 82,359 91,445 6,009 97,454 -19.7% 49.3% -15.5% KAUAI 1,020,921 66,014 1,086,935 975,867 38,660 1,014,527 4.6% 70.8% 7.1% BIG ISLAND 1,281,156 73,901 1,355,057 1,207,164 40,548 1,247,712 6.1% 82.3% 8.6%
…Hilo 481,907 71,991 553,898 459,612 40,548 500,160 4.9% 77.5% 10.7%…Kona 1,072,933 70,730 1,143,663 977,195 36,899 1,014,093 9.8% 91.7% 12.8%
% CHANGE20032004
Source: DBEDT
106

HOTEL OCCUPANCY AND ROOM RATE
HOTEL OCCUPANCY RATE, AVERAGE ROOM
RATE, AND REVENUE PER AVAILABLE ROOM
STATE
OAHU
MAUI
KAUAI
HAWAII (Big Island)
107
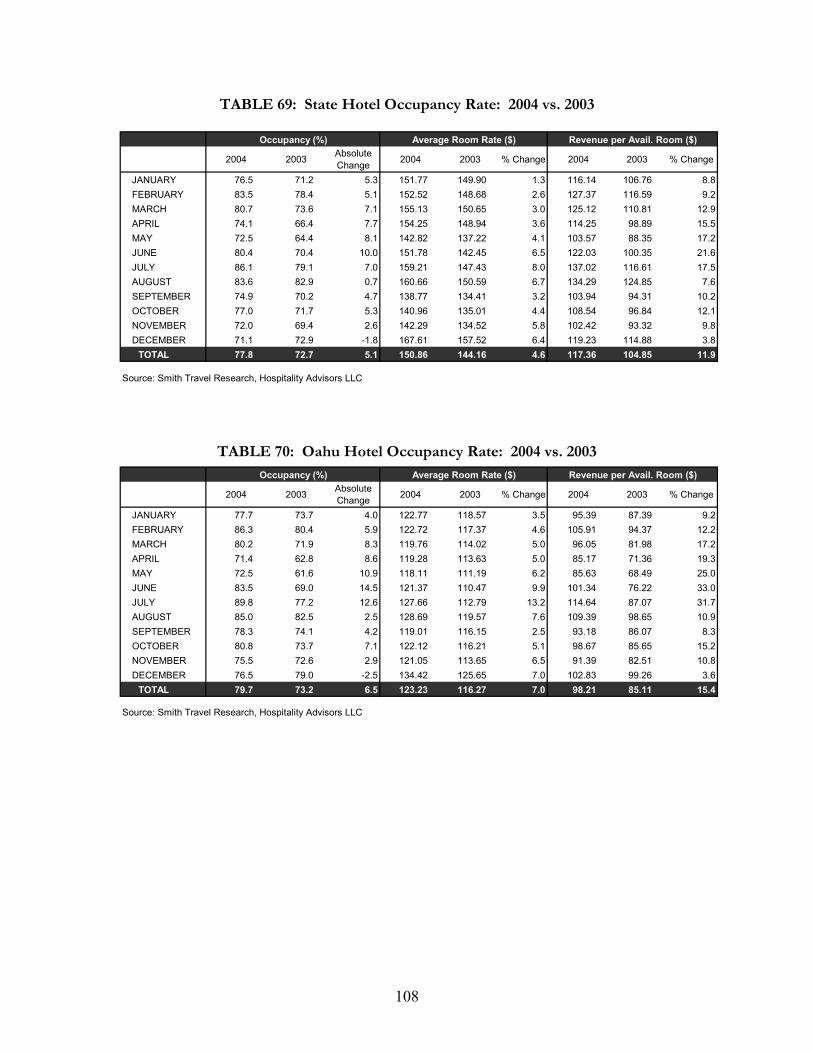
TABLE 69: State Hotel Occupancy Rate: 2004 vs. 2003
Occupancy (%) Average Room Rate ($) Revenue per Avail. Room ($)
2004 2003 Absolute Change 2004 2003 % Change 2004 2003 % Change
JANUARY 76.5 71.2 5.3 151.77 149.90 1.3 116.14 106.76 8.8FEBRUARY 83.5 78.4 5.1 152.52 148.68 2.6 127.37 116.59 9.2MARCH 80.7 73.6 7.1 155.13 150.65 3.0 125.12 110.81 12.9APRIL 74.1 66.4 7.7 154.25 148.94 3.6 114.25 98.89 15.5MAY 72.5 64.4 8.1 142.82 137.22 4.1 103.57 88.35 17.2JUNE 80.4 70.4 10.0 151.78 142.45 6.5 122.03 100.35 21.6JULY 86.1 79.1 7.0 159.21 147.43 8.0 137.02 116.61 17.5AUGUST 83.6 82.9 0.7 160.66 150.59 6.7 134.29 124.85 7.6SEPTEMBER 74.9 70.2 4.7 138.77 134.41 3.2 103.94 94.31 10.2OCTOBER 77.0 71.7 5.3 140.96 135.01 4.4 108.54 96.84 12.1NOVEMBER 72.0 69.4 2.6 142.29 134.52 5.8 102.42 93.32 9.8DECEMBER 71.1 72.9 -1.8 167.61 157.52 6.4 119.23 114.88 3.8
TOTAL 77.8 72.7 5.1 150.86 144.16 4.6 117.36 104.85 11.9
Source: Smith Travel Research, Hospitality Advisors LLC
TABLE 70: Oahu Hotel Occupancy Rate: 2004 vs. 2003
Occupancy (%) Average Room Rate ($) Revenue per Avail. Room ($)
2004 2003 Absolute Change 2004 2003 % Change 2004 2003 % Change
JANUARY 77.7 73.7 4.0 122.77 118.57 3.5 95.39 87.39 9.2FEBRUARY 86.3 80.4 5.9 122.72 117.37 4.6 105.91 94.37 12.2MARCH 80.2 71.9 8.3 119.76 114.02 5.0 96.05 81.98 17.2APRIL 71.4 62.8 8.6 119.28 113.63 5.0 85.17 71.36 19.3MAY 72.5 61.6 10.9 118.11 111.19 6.2 85.63 68.49 25.0JUNE 83.5 69.0 14.5 121.37 110.47 9.9 101.34 76.22 33.0JULY 89.8 77.2 12.6 127.66 112.79 13.2 114.64 87.07 31.7AUGUST 85.0 82.5 2.5 128.69 119.57 7.6 109.39 98.65 10.9SEPTEMBER 78.3 74.1 4.2 119.01 116.15 2.5 93.18 86.07 8.3OCTOBER 80.8 73.7 7.1 122.12 116.21 5.1 98.67 85.65 15.2NOVEMBER 75.5 72.6 2.9 121.05 113.65 6.5 91.39 82.51 10.8DECEMBER 76.5 79.0 -2.5 134.42 125.65 7.0 102.83 99.26 3.6
TOTAL 79.7 73.2 6.5 123.23 116.27 7.0 98.21 85.11 15.4
Source: Smith Travel Research, Hospitality Advisors LLC
108
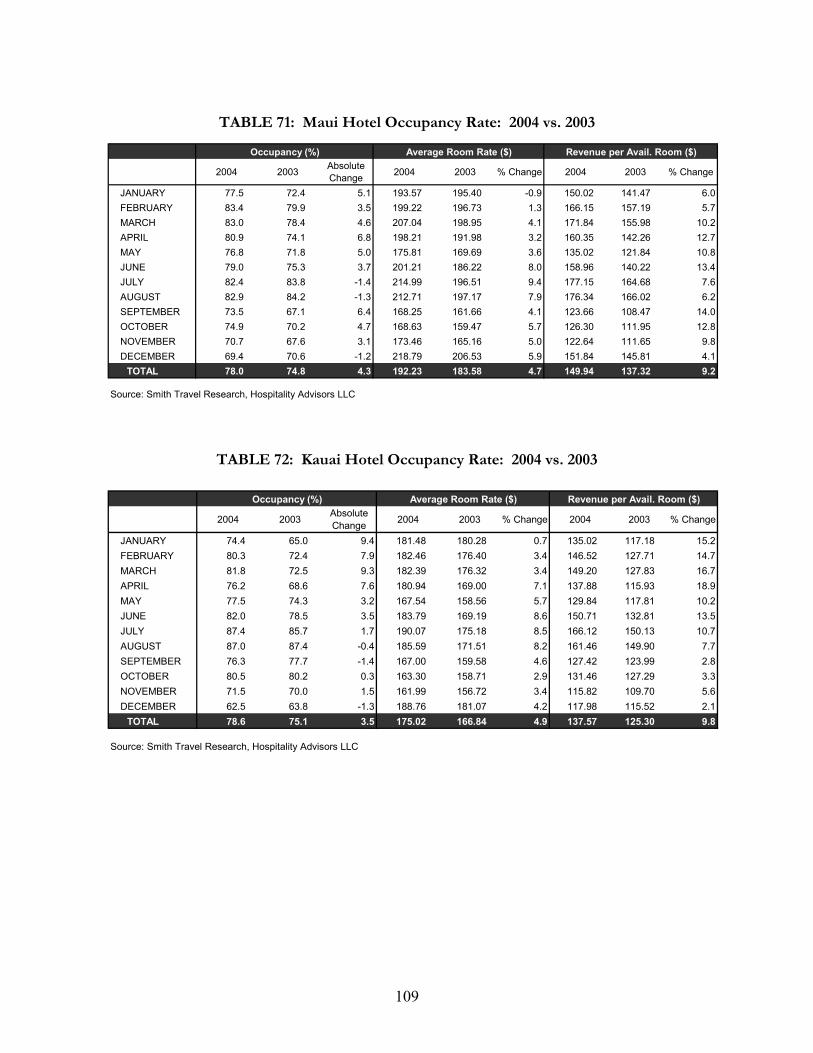
TABLE 71: Maui Hotel Occupancy Rate: 2004 vs. 2003
Occupancy (%) Average Room Rate ($) Revenue per Avail. Room ($)
2004 2003 Absolute Change 2004 2003 % Change 2004 2003 % Change
JANUARY 77.5 72.4 5.1 193.57 195.40 -0.9 150.02 141.47 6.0FEBRUARY 83.4 79.9 3.5 199.22 196.73 1.3 166.15 157.19 5.7MARCH 83.0 78.4 4.6 207.04 198.95 4.1 171.84 155.98 10.2APRIL 80.9 74.1 6.8 198.21 191.98 3.2 160.35 142.26 12.7MAY 76.8 71.8 5.0 175.81 169.69 3.6 135.02 121.84 10.8JUNE 79.0 75.3 3.7 201.21 186.22 8.0 158.96 140.22 13.4JULY 82.4 83.8 -1.4 214.99 196.51 9.4 177.15 164.68 7.6AUGUST 82.9 84.2 -1.3 212.71 197.17 7.9 176.34 166.02 6.2SEPTEMBER 73.5 67.1 6.4 168.25 161.66 4.1 123.66 108.47 14.0OCTOBER 74.9 70.2 4.7 168.63 159.47 5.7 126.30 111.95 12.8NOVEMBER 70.7 67.6 3.1 173.46 165.16 5.0 122.64 111.65 9.8DECEMBER 69.4 70.6 -1.2 218.79 206.53 5.9 151.84 145.81 4.1
TOTAL 78.0 74.8 4.3 192.23 183.58 4.7 149.94 137.32 9.2
Source: Smith Travel Research, Hospitality Advisors LLC
TABLE 72: Kauai Hotel Occupancy Rate: 2004 vs. 2003
Occupancy (%) Average Room Rate ($) Revenue per Avail. Room ($)
2004 2003 Absolute Change 2004 2003 % Change 2004 2003 % Change
JANUARY 74.4 65.0 9.4 181.48 180.28 0.7 135.02 117.18 15.2FEBRUARY 80.3 72.4 7.9 182.46 176.40 3.4 146.52 127.71 14.7MARCH 81.8 72.5 9.3 182.39 176.32 3.4 149.20 127.83 16.7APRIL 76.2 68.6 7.6 180.94 169.00 7.1 137.88 115.93 18.9MAY 77.5 74.3 3.2 167.54 158.56 5.7 129.84 117.81 10.2JUNE 82.0 78.5 3.5 183.79 169.19 8.6 150.71 132.81 13.5JULY 87.4 85.7 1.7 190.07 175.18 8.5 166.12 150.13 10.7AUGUST 87.0 87.4 -0.4 185.59 171.51 8.2 161.46 149.90 7.7SEPTEMBER 76.3 77.7 -1.4 167.00 159.58 4.6 127.42 123.99 2.8OCTOBER 80.5 80.2 0.3 163.30 158.71 2.9 131.46 127.29 3.3NOVEMBER 71.5 70.0 1.5 161.99 156.72 3.4 115.82 109.70 5.6DECEMBER 62.5 63.8 -1.3 188.76 181.07 4.2 117.98 115.52 2.1
TOTAL 78.6 75.1 3.5 175.02 166.84 4.9 137.57 125.30 9.8
Source: Smith Travel Research, Hospitality Advisors LLC
109
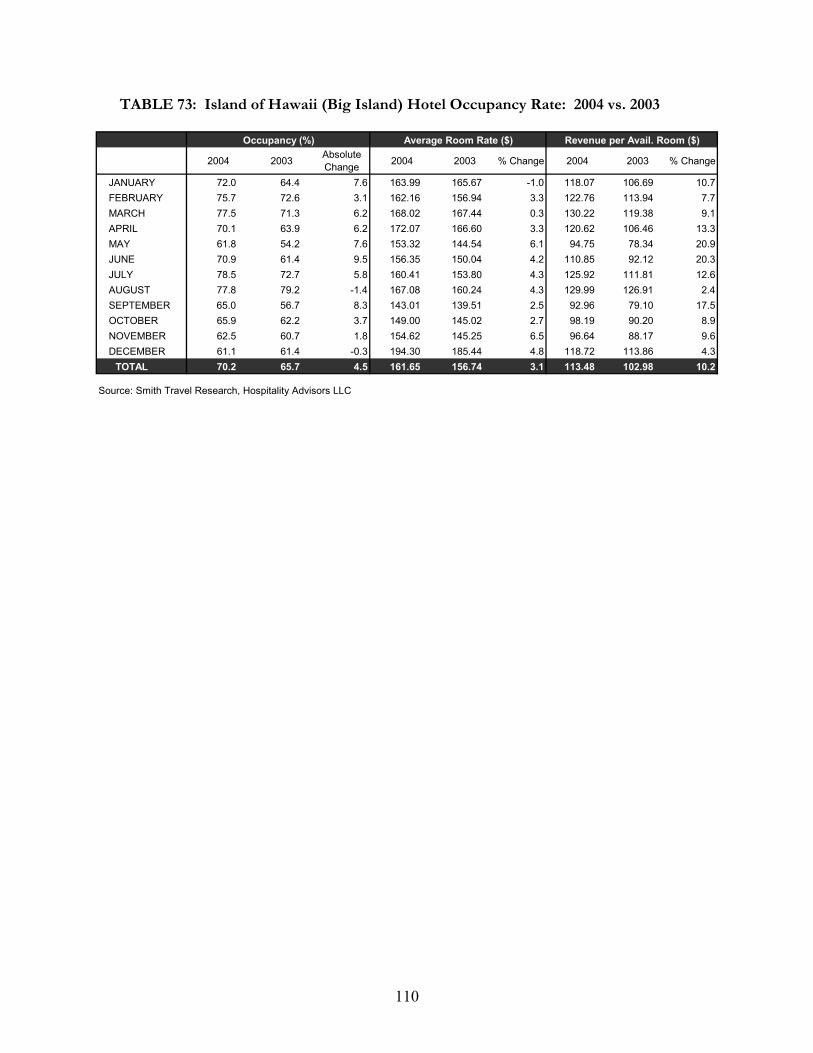
TABLE 73: Island of Hawaii (Big Island) Hotel Occupancy Rate: 2004 vs. 2003
Occupancy (%) Average Room Rate ($) Revenue per Avail. Room ($)
2004 2003 Absolute Change 2004 2003 % Change 2004 2003 % Change
JANUARY 72.0 64.4 7.6 163.99 165.67 -1.0 118.07 106.69 10.7FEBRUARY 75.7 72.6 3.1 162.16 156.94 3.3 122.76 113.94 7.7MARCH 77.5 71.3 6.2 168.02 167.44 0.3 130.22 119.38 9.1APRIL 70.1 63.9 6.2 172.07 166.60 3.3 120.62 106.46 13.3MAY 61.8 54.2 7.6 153.32 144.54 6.1 94.75 78.34 20.9JUNE 70.9 61.4 9.5 156.35 150.04 4.2 110.85 92.12 20.3JULY 78.5 72.7 5.8 160.41 153.80 4.3 125.92 111.81 12.6AUGUST 77.8 79.2 -1.4 167.08 160.24 4.3 129.99 126.91 2.4SEPTEMBER 65.0 56.7 8.3 143.01 139.51 2.5 92.96 79.10 17.5OCTOBER 65.9 62.2 3.7 149.00 145.02 2.7 98.19 90.20 8.9NOVEMBER 62.5 60.7 1.8 154.62 145.25 6.5 96.64 88.17 9.6DECEMBER 61.1 61.4 -0.3 194.30 185.44 4.8 118.72 113.86 4.3
TOTAL 70.2 65.7 4.5 161.65 156.74 3.1 113.48 102.98 10.2
Source: Smith Travel Research, Hospitality Advisors LLC
110

VISITOR PLANT INVENTORY
EXISTING INVENTORY
CLASS OF UNITS
AVAILABLE UNITS
111
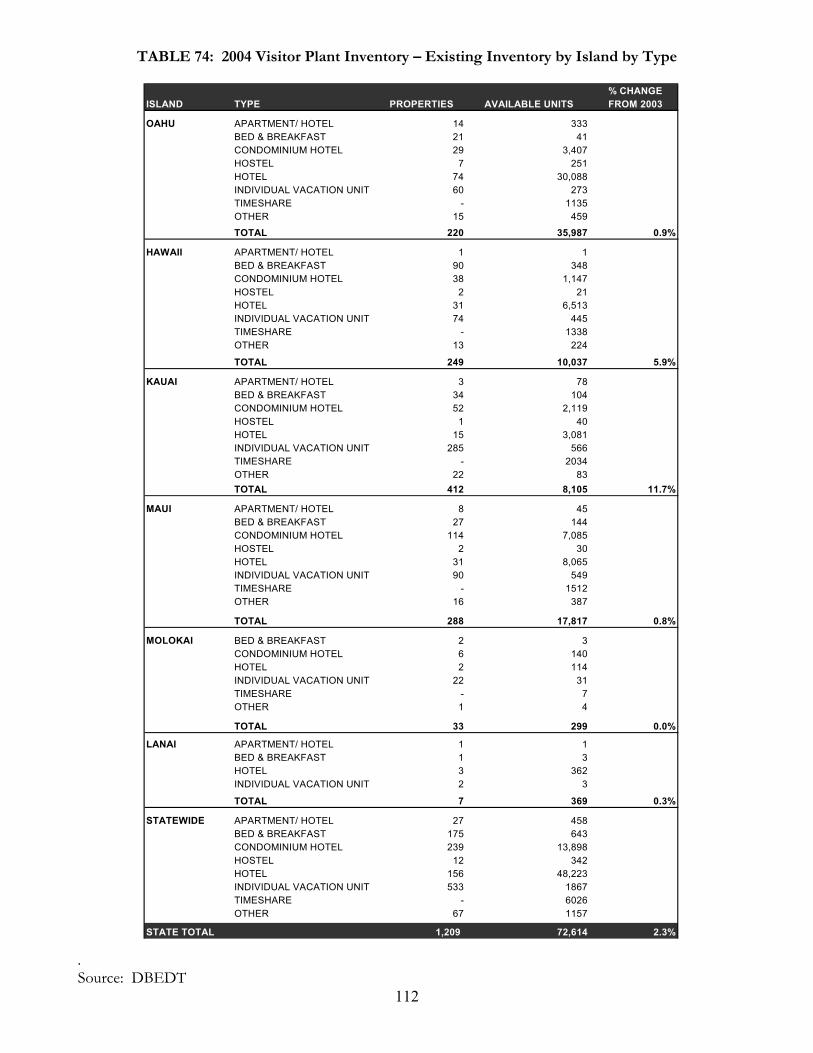
TABLE 74: 2004 Visitor Plant Inventory – Existing Inventory by Island by Type
. Source: DBEDT
112
% CHANGE ISLAND TYPE PROPERTIES AVAILABLE UNITS FROM 2003
OAHU APARTMENT/ HOTEL 14 333BED & BREAKFAST 21 41CONDOMINIUM HOTEL 29 3,407HOSTEL 7 251HOTEL 74 30,088INDIVIDUAL VACATION UNIT 60 273TIMESHARE - 1135OTHER 15 459
TOTAL 220 35,987 0.9%
HAWAII APARTMENT/ HOTEL 1 1BED & BREAKFAST 90 348CONDOMINIUM HOTEL 38 1,147HOSTEL 2 21HOTEL 31 6,513INDIVIDUAL VACATION UNIT 74 445TIMESHARE - 1338OTHER 13 224
TOTAL 249 10,037 5.9%
KAUAI APARTMENT/ HOTEL 3 78BED & BREAKFAST 34 104CONDOMINIUM HOTEL 52 2,119HOSTEL 1 40HOTEL 15 3,081INDIVIDUAL VACATION UNIT 285 566TIMESHARE - 2034OTHER 22 83TOTAL 412 8,105 11.7%
MAUI APARTMENT/ HOTEL 8 45BED & BREAKFAST 27 144CONDOMINIUM HOTEL 114 7,085HOSTEL 2 30HOTEL 31 8,065INDIVIDUAL VACATION UNIT 90 549TIMESHARE - 1512OTHER 16 387
TOTAL 288 17,817 0.8%
MOLOKAI BED & BREAKFAST 2 3CONDOMINIUM HOTEL 6 140HOTEL 2 114INDIVIDUAL VACATION UNIT 22 31TIMESHARE - 7OTHER 1 4
TOTAL 33 299 0.0%
LANAI APARTMENT/ HOTEL 1 1BED & BREAKFAST 1 3HOTEL 3 362INDIVIDUAL VACATION UNIT 2 3
TOTAL 7 369 0.3%
STATEWIDE APARTMENT/ HOTEL 27 458BED & BREAKFAST 175 643CONDOMINIUM HOTEL 239 13,898HOSTEL 12 342HOTEL 156 48,223INDIVIDUAL VACATION UNIT 533 1867TIMESHARE - 6026OTHER 67 1157
STATE TOTAL 1,209 72,614 2.3%
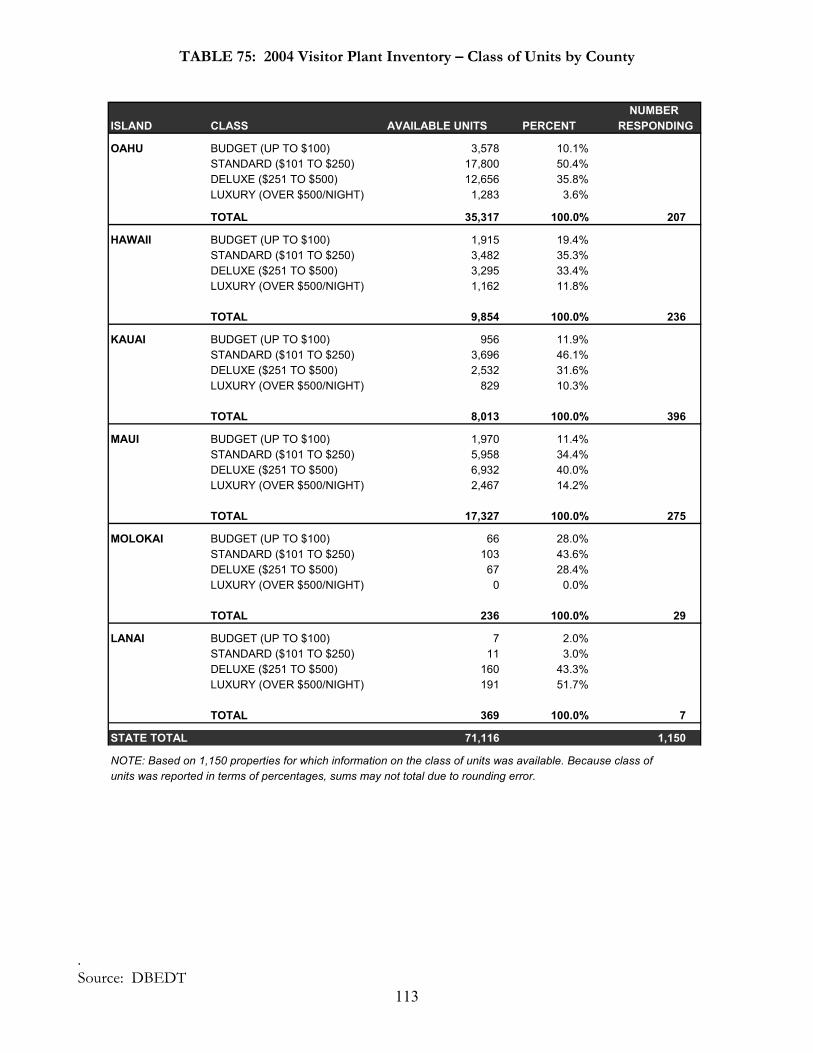
TABLE 75: 2004 Visitor Plant Inventory – Class of Units by County
NUMBER ISLAND CLASS AVAILABLE UNITS PERCENT RESPONDING
OAHU BUDGET (UP TO $100) 3,578 10.1%STANDARD ($101 TO $250) 17,800 50.4%DELUXE ($251 TO $500) 12,656 35.8%LUXURY (OVER $500/NIGHT) 1,283 3.6%
TOTAL 35,317 100.0% 207
HAWAII BUDGET (UP TO $100) 1,915 19.4%STANDARD ($101 TO $250) 3,482 35.3%DELUXE ($251 TO $500) 3,295 33.4%LUXURY (OVER $500/NIGHT) 1,162 11.8%
TOTAL 9,854 100.0% 236
KAUAI BUDGET (UP TO $100) 956 11.9%STANDARD ($101 TO $250) 3,696 46.1%DELUXE ($251 TO $500) 2,532 31.6%LUXURY (OVER $500/NIGHT) 829 10.3%
TOTAL 8,013 100.0% 396
MAUI BUDGET (UP TO $100) 1,970 11.4%STANDARD ($101 TO $250) 5,958 34.4%DELUXE ($251 TO $500) 6,932 40.0%LUXURY (OVER $500/NIGHT) 2,467 14.2%
TOTAL 17,327 100.0% 275
MOLOKAI BUDGET (UP TO $100) 66 28.0%STANDARD ($101 TO $250) 103 43.6%DELUXE ($251 TO $500) 67 28.4%LUXURY (OVER $500/NIGHT) 0 0.0%
TOTAL 236 100.0% 29
LANAI BUDGET (UP TO $100) 7 2.0%STANDARD ($101 TO $250) 11 3.0%DELUXE ($251 TO $500) 160 43.3%LUXURY (OVER $500/NIGHT) 191 51.7%
TOTAL 369 100.0% 7
STATE TOTAL 71,116 1,150
NOTE: Based on 1,150 properties for which information on the class of units was available. Because class of units was reported in terms of percentages, sums may not total due to rounding error.
. Source: DBEDT
113
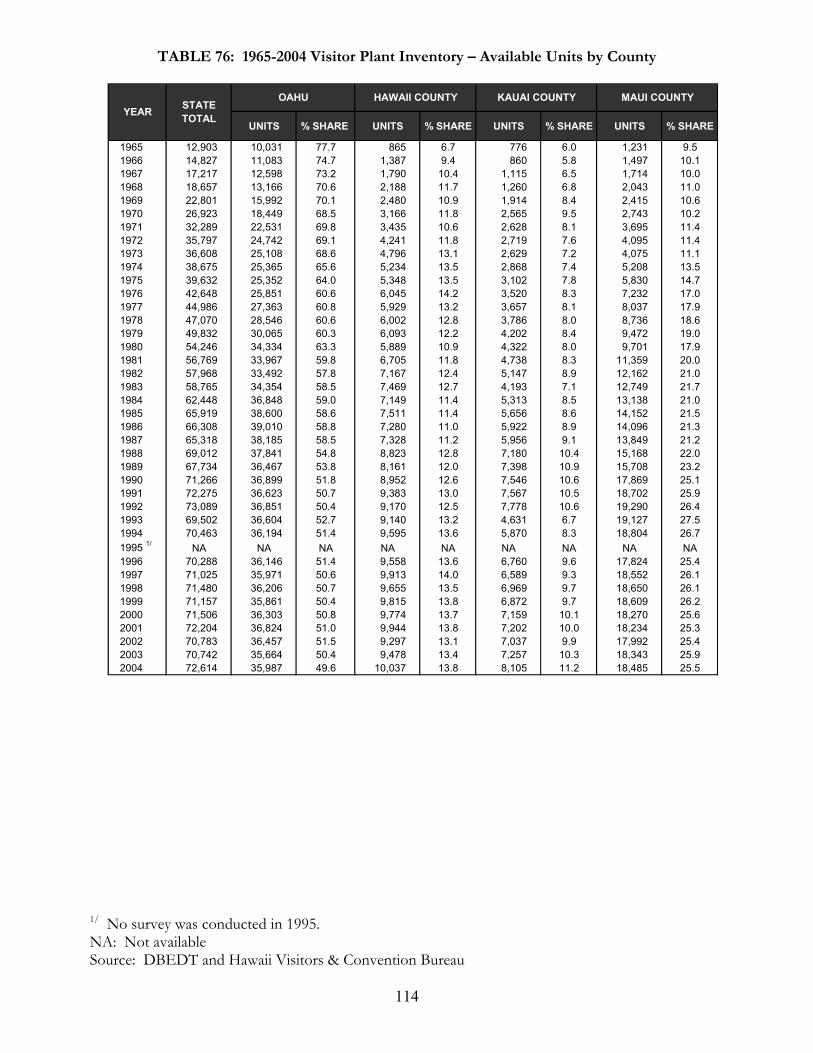
TABLE 76: 1965-2004 Visitor Plant Inventory – Available Units by County
UNITS % SHARE UNITS % SHARE UNITS % SHARE UNITS % SHARE
1965 12,903 10,031 77.7 865 6.7 776 6.0 1,231 9.51966 14,827 11,083 74.7 1,387 9.4 860 5.8 1,497 10.11967 17,217 12,598 73.2 1,790 10.4 1,115 6.5 1,714 10.01968 18,657 13,166 70.6 2,188 11.7 1,260 6.8 2,043 11.01969 22,801 15,992 70.1 2,480 10.9 1,914 8.4 2,415 10.61970 26,923 18,449 68.5 3,166 11.8 2,565 9.5 2,743 10.21971 32,289 22,531 69.8 3,435 10.6 2,628 8.1 3,695 11.41972 35,797 24,742 69.1 4,241 11.8 2,719 7.6 4,095 11.41973 36,608 25,108 68.6 4,796 13.1 2,629 7.2 4,075 11.11974 38,675 25,365 65.6 5,234 13.5 2,868 7.4 5,208 13.51975 39,632 25,352 64.0 5,348 13.5 3,102 7.8 5,830 14.71976 42,648 25,851 60.6 6,045 14.2 3,520 8.3 7,232 17.01977 44,986 27,363 60.8 5,929 13.2 3,657 8.1 8,037 17.91978 47,070 28,546 60.6 6,002 12.8 3,786 8.0 8,736 18.61979 49,832 30,065 60.3 6,093 12.2 4,202 8.4 9,472 19.01980 54,246 34,334 63.3 5,889 10.9 4,322 8.0 9,701 17.91981 56,769 33,967 59.8 6,705 11.8 4,738 8.3 11,359 20.01982 57,968 33,492 57.8 7,167 12.4 5,147 8.9 12,162 21.01983 58,765 34,354 58.5 7,469 12.7 4,193 7.1 12,749 21.71984 62,448 36,848 59.0 7,149 11.4 5,313 8.5 13,138 21.01985 65,919 38,600 58.6 7,511 11.4 5,656 8.6 14,152 21.51986 66,308 39,010 58.8 7,280 11.0 5,922 8.9 14,096 21.31987 65,318 38,185 58.5 7,328 11.2 5,956 9.1 13,849 21.21988 69,012 37,841 54.8 8,823 12.8 7,180 10.4 15,168 22.01989 67,734 36,467 53.8 8,161 12.0 7,398 10.9 15,708 23.21990 71,266 36,899 51.8 8,952 12.6 7,546 10.6 17,869 25.11991 72,275 36,623 50.7 9,383 13.0 7,567 10.5 18,702 25.91992 73,089 36,851 50.4 9,170 12.5 7,778 10.6 19,290 26.41993 69,502 36,604 52.7 9,140 13.2 4,631 6.7 19,127 27.51994 70,463 36,194 51.4 9,595 13.6 5,870 8.3 18,804 26.71995 1/ NA NA NA NA NA NA NA NA NA1996 70,288 36,146 51.4 9,558 13.6 6,760 9.6 17,824 25.41997 71,025 35,971 50.6 9,913 14.0 6,589 9.3 18,552 26.11998 71,480 36,206 50.7 9,655 13.5 6,969 9.7 18,650 26.11999 71,157 35,861 50.4 9,815 13.8 6,872 9.7 18,609 26.22000 71,506 36,303 50.8 9,774 13.7 7,159 10.1 18,270 25.62001 72,204 36,824 51.0 9,944 13.8 7,202 10.0 18,234 25.32002 70,783 36,457 51.5 9,297 13.1 7,037 9.9 17,992 25.42003 70,742 35,664 50.4 9,478 13.4 7,257 10.3 18,343 25.92004 72,614 35,987 49.6 10,037 13.8 8,105 11.2 18,485 25.5
KAUAI COUNTY MAUI COUNTYSTATE TOTALYEAR
OAHU HAWAII COUNTY
1/ No survey was conducted in 1995. NA: Not available Source: DBEDT and Hawaii Visitors & Convention Bureau
114
115
TOTAL AIR SEATS OPERATED TO HAWAII
TOTAL AIR SETS
DOMESTIC AIR SEATS
INTERNATIONAL AIR SEATS
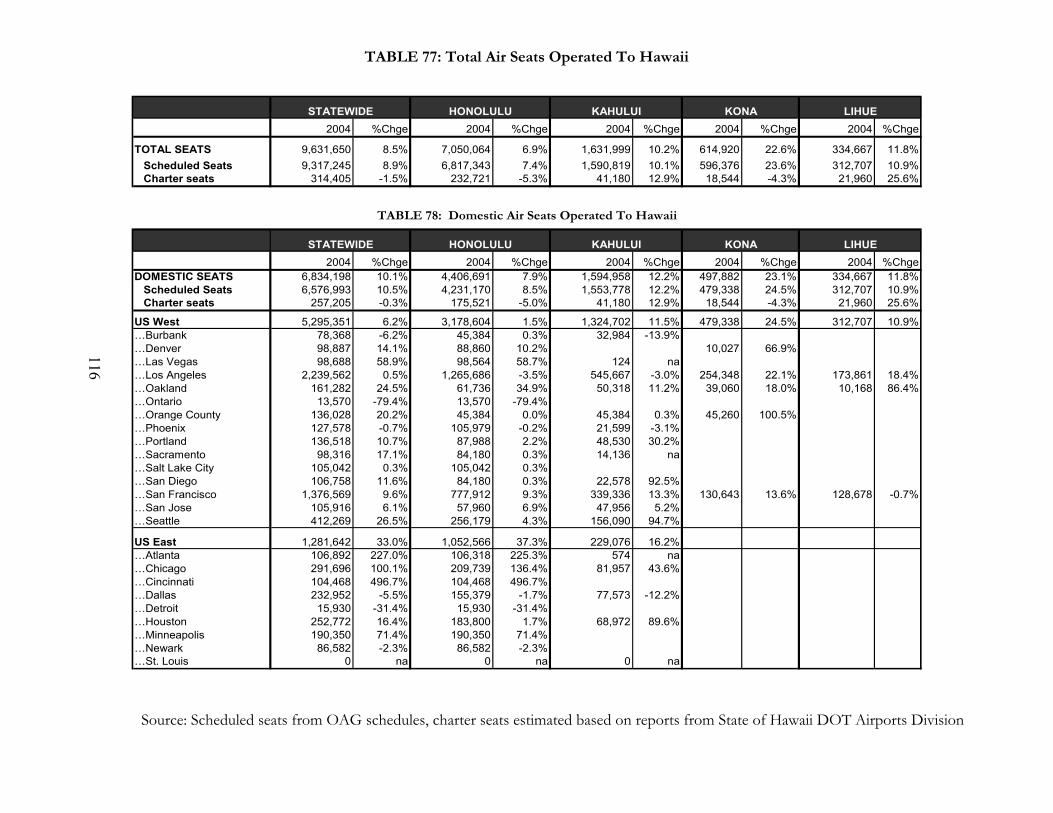
TABLE 77: Total Air Seats Operated To Hawaii
2004 %Chge 2004 %Chge 2004 %Chge 2004 %Chge 2004 %Chge
TOTAL SEATS 9,631,650 8.5% 7,050,064 6.9% 1,631,999 10.2% 614,920 22.6% 334,667 11.8% Scheduled Seats 9,317,245 8.9% 6,817,343 7.4% 1,590,819 10.1% 596,376 23.6% 312,707 10.9% Charter seats 314,405 -1.5% 232,721 -5.3% 41,180 12.9% 18,544 -4.3% 21,960 25.6%
2004 %Chge 2004 %Chge 2004 %Chge 2004 %Chge 2004 %ChgeDOMESTIC SEATS 6,834,198 10.1% 4,406,691 7.9% 1,594,958 12.2% 497,882 23.1% 334,667 11.8% Scheduled Seats 6,576,993 10.5% 4,231,170 8.5% 1,553,778 12.2% 479,338 24.5% 312,707 10.9% Charter seats 257,205 -0.3% 175,521 -5.0% 41,180 12.9% 18,544 -4.3% 21,960 25.6%
US West 5,295,351 6.2% 3,178,604 1.5% 1,324,702 11.5% 479,338 24.5% 312,707 10.9%…Burbank 78,368 -6.2% 45,384 0.3% 32,984 -13.9%…Denver 98,887 14.1% 88,860 10.2% 10,027 66.9%…Las Vegas 98,688 58.9% 98,564 58.7% 124 na…Los Angeles 2,239,562 0.5% 1,265,686 -3.5% 545,667 -3.0% 254,348 22.1% 173,861 18.4%…Oakland 161,282 24.5% 61,736 34.9% 50,318 11.2% 39,060 18.0% 10,168 86.4%…Ontario 13,570 -79.4% 13,570 -79.4%…Orange County 136,028 20.2% 45,384 0.0% 45,384 0.3% 45,260 100.5%…Phoenix 127,578 -0.7% 105,979 -0.2% 21,599 -3.1%…Portland 136,518 10.7% 87,988 2.2% 48,530 30.2%…Sacramento 98,316 17.1% 84,180 0.3% 14,136 na…Salt Lake City 105,042 0.3% 105,042 0.3%…San Diego 106,758 11.6% 84,180 0.3% 22,578 92.5%…San Francisco 1,376,569 9.6% 777,912 9.3% 339,336 13.3% 130,643 13.6% 128,678 -0.7%…San Jose 105,916 6.1% 57,960 6.9% 47,956 5.2%…Seattle 412,269 26.5% 256,179 4.3% 156,090 94.7%
US East 1,281,642 33.0% 1,052,566 37.3% 229,076 16.2%…Atlanta 106,892 227.0% 106,318 225.3% 574 na…Chicago 291,696 100.1% 209,739 136.4% 81,957 43.6%…Cincinnati 104,468 496.7% 104,468 496.7%…Dallas 232,952 -5.5% 155,379 -1.7% 77,573 -12.2%…Detroit 15,930 -31.4% 15,930 -31.4%…Houston 252,772 16.4% 183,800 1.7% 68,972 89.6%…Minneapolis 190,350 71.4% 190,350 71.4%…Newark 86,582 -2.3% 86,582 -2.3%…St. Louis 0 na 0 na 0 na
KAHULUI KONA LIHUE
STATEWIDE HONOLULU KAHULUI KONA
TABLE 78: Domestic Air Seats Operated To Hawaii
LIHUE
STATEWIDE HONOLULU
116
Source: Scheduled seats from OAG schedules, charter seats estimated based on reports from State of Hawaii DOT Airports Division
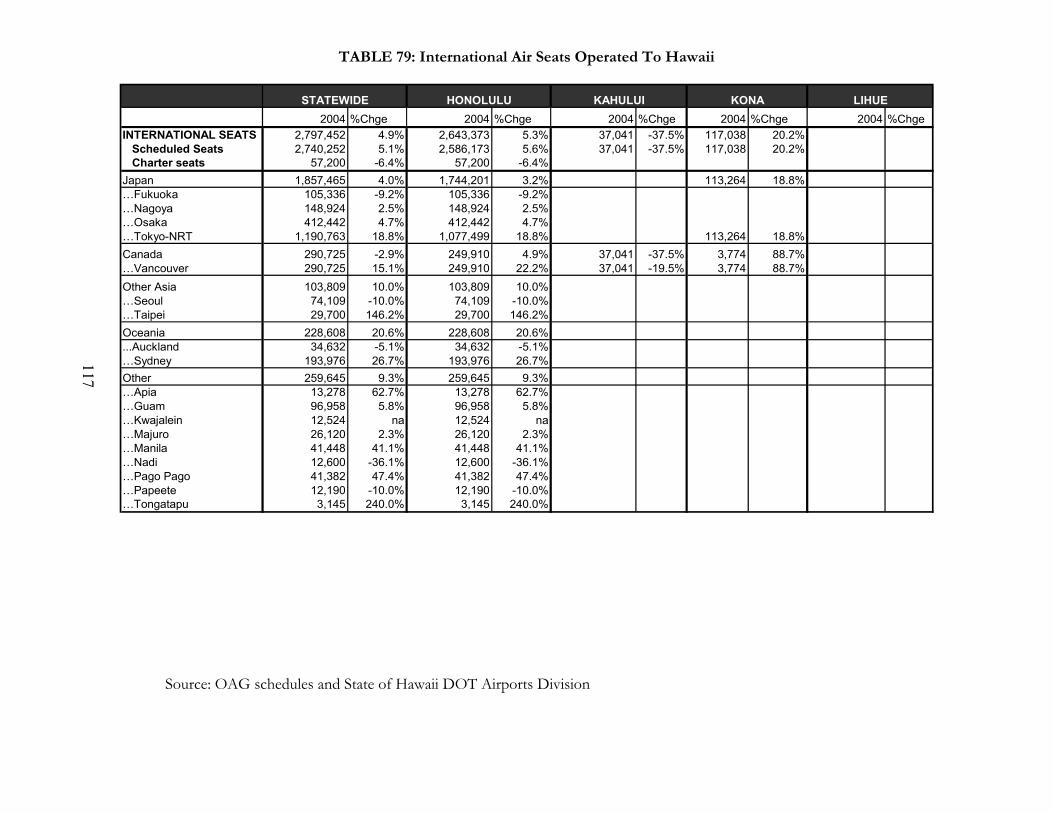
TABLE 79: International Air Seats Operated To Hawaii
Source: OAG schedules and State of Hawaii DOT Airports Division
2004 %Chge 2004 %Chge 2004 %Chge 2004 %Chge 2004 %ChgeINTERNATIONAL SEATS 2,797,452 4.9% 2,643,373 5.3% 37,041 -37.5% 117,038 20.2% Scheduled Seats 2,740,252 5.1% 2,586,173 5.6% 37,041 -37.5% 117,038 20.2% Charter seats 57,200 -6.4% 57,200 -6.4%Japan 1,857,465 4.0% 1,744,201 3.2% 113,264 18.8%…Fukuoka 105,336 -9.2% 105,336 -9.2%…Nagoya 148,924 2.5% 148,924 2.5%…Osaka 412,442 4.7% 412,442 4.7%…Tokyo-NRT 1,190,763 18.8% 1,077,499 18.8% 113,264 18.8%Canada 290,725 -2.9% 249,910 4.9% 37,041 -37.5% 3,774 88.7%…Vancouver 290,725 15.1% 249,910 22.2% 37,041 -19.5% 3,774 88.7%Other Asia 103,809 10.0% 103,809 10.0%…Seoul 74,109 -10.0% 74,109 -10.0%…Taipei 29,700 146.2% 29,700 146.2%Oceania 228,608 20.6% 228,608 20.6%...Auckland 34,632 -5.1% 34,632 -5.1%…Sydney 193,976 26.7% 193,976 26.7%Other 259,645 9.3% 259,645 9.3%…Apia 13,278 62.7% 13,278 62.7%…Guam 96,958 5.8% 96,958 5.8%…Kwajalein 12,524 na 12,524 na…Majuro 26,120 2.3% 26,120 2.3%…Manila 41,448 41.1% 41,448 41.1%…Nadi 12,600 -36.1% 12,600 -36.1%…Pago Pago 41,382 47.4% 41,382 47.4%…Papeete 12,190 -10.0% 12,190 -10.0%…Tongatapu 3,145 240.0% 3,145 240.0%
LIHUESTATEWIDE HONOLULU KAHULUI KONA
117
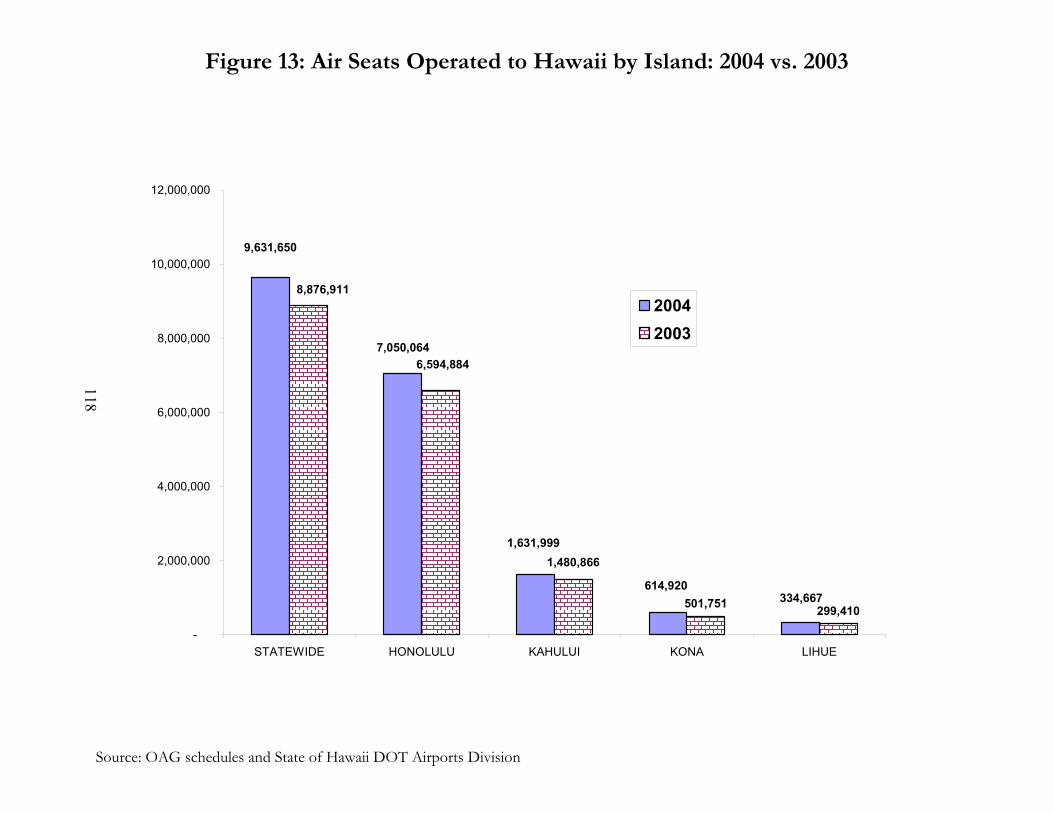
Figure 13: Air Seats Operated to Hawaii by Island: 2004 vs. 2003
Source: OAG schedules and State of Hawaii DOT Airports Division
501,751 299,410334,667
614,920
1,631,999
7,050,064
9,631,650
8,876,911
1,480,866
6,594,884
-
2,000,000
4,000,000
6,000,000
8,000,000
10,000,000
12,000,000
STATEWIDE HONOLULU KAHULUI KONA LIHUE
20042003
118
APPENDIX
DEFINITIONS AND SOURCES OF DATA
FOR VISITOR STATISTICS
119
TECHNICAL NOTES, DEFINITIONS AND SOURCES OF DATA FOR VISITOR STATISTICS
DEFINITIONS Average Daily Census: Average number of visitors present daily in the State. Average Length of Stay: Number of days visitors are in the State including the day of arrival and of departure. . Major Market Areas (MMAs): The following geographical areas are defined by the Hawaii Tourism Authority for marketing purposes to make the State more globally competitive: 1. U.S. West – Pacific and Mountain States 2. U.S. East – Other States in the Continental U.S. 3. Japan 4. Canada 5. Europe – United Kingdom, Germany, France, Italy, and Switzerland 6. Oceania – Australia and New Zealand 7. Other Asia – China, Hong Kong, Korea, Singapore and Taiwan 8. Latin America – Argentina, Brazil and Mexico 9. Other – All countries and districts not listed in MMA 1 to 8 above, including Guam,
Puerto Rico, U.S. Virgin Islands, and other U.S. territories 10. Hawaii Convention Center Visitor: Out-of-state traveler who stayed in Hawaii for a period of time between one night but less than one year.
Domestic Visitor: Visitor who stayed in Hawaii for at least one night but less than one year arriving on flights from the U.S. mainland. Total domestic arrivals include U.S. residents and international visitors who came to Hawaii on domestic flights. A foreign resident arriving from the U.S. mainland is counted as a domestic visitor.
International Visitor Visitor who stayed in Hawaii for at least one night but less than one year arriving on flights from U.S. territories and foreign countries. An U.S. resident arriving in Hawaii on a flight directly from a foreign country is counted as an international visitor.
Group TourVisitors who travel and participate in activities in a group with tour guide(s) much of the time during their visit. For Japanese visitor, company-paid incentive travels are included in this category.
Package Visitors who purchased a packaged trip which included at least air-tickets and accommodations.
120
True Independent Visitors who were not part of a tour group and did not purchase their air-tickets and accommodations as a package. Pleasure (Net) Visitors whose reason for traveling are either for vacation or for honeymoon (includes wedding) or both. If a visitor selects two or more sub-categories within the pleasure category, they are counted only once. Therefore, the sum of the sub-categories may be larger than the pleasure category. MC&I (Net) Visitors whose reason for traveling are for meetings, conventions, or incentives. If a visitor selects two or more sub-categories within the MC&I category, they are counted only once. Therefore, the sum of the sub-categories may be larger than the MC&I category.
SOURCES OF DATA The data in this report come from eleven sources:
1. Monthly passenger counts for each airline, 2. International visitors by country of residence from the Bureau of Customs & Border
Protection, U.S. Department of Homeland Security, 3. International visitor counts by visa type from the Bureau of Customs & Border Protection,
Honolulu office, 4. U.S. Customs declaration forms, 5. An International Intercept Survey at the Honolulu International Airport, 6. A Domestic in-flight survey of passengers on flights originating in the Mainland U.S., 7. Honolulu International Airport billing records, 8. A Visitor Expenditure Survey for domestic visitors, 9. Honolulu and Hilo Harbor cruise ship passenger counts, and 10. A Visitor Plant Inventory survey (refer to DBEDT's 2004 Visitor Plant Inventory Report). 11. Hospitality Advisors hotel report. Airline Passenger Counts: Every airline (both chartered and scheduled) reports passenger counts each month to DBEDT. Those passenger counts provide the total number of arriving passengers. Visitor counts are derived by subtracting the estimated in-transit passengers, returning Hawaii residents, and intended residents as measured by the U.S. Customs Declaration Forms and domestic in-flight surveys.
Office of Immigration Statistics, Washington, D.C.: Monthly reports from the Washington, D.C. Office of Immigration Statistics, U.S. Department of Homeland Security provide counts of international visitors to Hawaii by their country of residence. The reports also identify those simply passing through Hawaii. Canadian and U.S residents are not included in these counts. Bureau of Customs & Border Protection, Honolulu: Monthly reports from the Bureau of Customs & Border Protection Honolulu office provide counts of Canadian visitors, U.S. permanent residents and U.S. citizens coming on flights from international cities.
121
U.S. Customs Declaration Forms: All Customs Declaration Forms are systematically pulled for 10 days in each month to determine the number of returning Hawaii residents on international flights. The forms are also used to determine the state of residence of those living on the U.S. mainland, stopping over in Hawaii after their international trip. This survey does not collect names, addresses or other personally identifying information. International Intercept Survey: The international intercept survey provides information on international visitor characteristics such as length of stay, island visitation patterns, accommodations, etc. The survey also collects information on visitor expenditures. It is distributed to a systematic sample of passengers in the boarding area and walkways at the Honolulu International Airport and the Kahului Airport on Maui. In 2004, a total of 82,920 such surveys were completed and processed. Domestic Survey: The domestic survey form is on the reverse side of the Hawaii State Department of Agriculture’s mandatory Plants and Animals declaration form. The dual-sided form is distributed to passengers on all flights from the U.S. mainland to Hawaii every day of the year. Hawaii-bound air carriers from the U.S. mainland reported carrying 5,911,004 passengers in 2004, excluding in-transit passengers who are only in Hawaii for a few hours. In 2004, there were 2,273,194 usable forms collected and processed. Each form represented an average party of 1.98 visitors, for a total of 4,892,960 surveyed passengers, which accounted for 82.8 percent of total passengers. The characteristics of respondents were attributed to non-respondents as well. All usable forms were optically scanned and tabulated to produce the results presented here. Honolulu International Airport Billing Records: The billings records show the number of passengers on flights from Canada who were pre-cleared in Canada and not included in the INS, Honolulu reports. Honolulu, Hilo and Lahaina Harbor Cruise Passenger Counts: All cruise ships entering Honolulu, Hilo and Lahaina Harbor report passenger counts to the Department of Transportation, Harbors Division, and the Department of Land and Natural Resources. DBEDT obtains passenger counts from these harbors and estimates counts for Kauai based on this information. The DBEDT numbers specifically look at the number of passengers arriving in the state on cruise ships. Visitors flying to Hawaii and then boarding the cruise vessel are captured in the surveys of air passengers. TECHNICAL NOTES In a continuing effort to improve the accuracy and timeliness of our visitor research data series, DBEDT implemented changes to the methodology used to collect and process visitor expenditure statistics in 2004. Prior to 2004, statewide visitor expenditures were collected using a daily visitor expenditure diary survey. Based names and addresses provided on the completed Department of Agriculture Plants and Animal Declaration forms, a randomly selected group of 2,300 domestic visitors per month had diaries sent to their place of accommodations to obtain
122
daily expenditure patterns. Only visitors who stayed at least four days were selected. In 2003, there were 5,920 usable expenditure diaries were collected and processed. In 2004 the visitor diary surveys was discontinued. Visitor expenditure statistics were now calculated based on surveys of domestic and international visitor departing from airports on Oahu, Maui, Lanai, Molokai, Kauai and the Big Island which yielded a much larger sample size and provided improved data for visitor expenditures by island. In 2004 a total of 42,818 usable forms were collected and processed. Due to these changes, 2004 visitor expenditure statistics may not be entirely comparable to data report in 2003 and in earlier years.
123
Related Documents