DOE/RL-2019-23 Revision 0 200-ZP-1 OPERABLE UNIT RINGOLD FORMATION UNIT A CHARACTERIZATION SAMPLING AND ANALYSIS PLAN Prepared for the U.S. Department of Energy Assistant Secretary for Environmental Management P.O. Box 550 Richland, Washington 99352 Approved for Public Release; Further Dissemination Unlimited Richland Operations Office

Welcome message from author
This document is posted to help you gain knowledge. Please leave a comment to let me know what you think about it! Share it to your friends and learn new things together.
Transcript
DOE/RL-2019-23Revision 0
200-ZP-1 OPERABLE UNIT RINGOLDFORMATION UNIT A CHARACTERIZATIONSAMPLING AND ANALYSIS PLAN
Prepared for the U.S. Department of EnergyAssistant Secretary for Environmental Management
P.O. Box 550 Richland, Washington 99352
Approved for Public Release; Further Dissemination Unlimited
Richland Operations Office


DOE/RL-2019-23Revision 0
200-ZP-1 OPERABLE UNIT RINGOLD FORMATION UNIT ACHARACTERIZATION SAMPLING AND ANALYSIS PLAN
Date PublishedFebruary 2020
Prepared for the U.S. Department of Energy Assistant Secretary for Environmental Management
P.O. Box 550 Richland, Washington 99352
Release Approval Date
Approved for Public Release; Further Dissemination Unlimited
By Lynn M. Ayers at 10:13 am, Feb 20, 2020
Richland Operations Office
[APPROVED l

DOE/RL-2019-23Revision 0
TRADEMARK DISCLAIMER Reference herein to any specific commercial product, process, or service bytradename, trademark, manufacturer, or otherwise, does not necessarilyconstitute or imply its endorsement, recommendation, or favoring by theUnited States Government or any agency thereof or its contractors orsubcontractors.
This report has been reproduced from the best available copy.
Printed in the United States of America
DOE/RL-2019-2~. REV. 0
Concurrence Page
Title: 200-ZP-l Groundwater Operable Unit Ringold Formation Unit A Characterization Sampling and Analysis Plar,
Concurrence:
PrintNanie
U.S. Department ofEnergy, Richland Operations Office
Print Name
U.S. Environmental Protection Agency
Signature ~ZP
Date
2./rs /;oze, Signature Date
iii

DOE/RL-2019-23, REV. 0
iv
This page intentionally left blank.

DOE/RL-2019-23, REV. 0
v
Contents
1 Introduction ....................................................................................................................................... 1
1.1 Project Scope and Objectives .................................................................................................... 5
1.1.1 Remedy Implementation Documentation ................................................................... 5
1.2 Background ............................................................................................................................... 7
1.2.1 Site Geology/Hydrology ............................................................................................. 7
1.2.2 Groundwater Flow ...................................................................................................... 7
1.2.3 Sources of Groundwater Contamination................................................................... 11
1.3 Data Quality Objective Summary ........................................................................................... 11
1.3.1 Statement of the Problem .......................................................................................... 11
1.3.2 Decision Statements and Decision Rules .................................................................. 12
1.3.3 Sampling Designs ..................................................................................................... 14
1.4 Contaminants of Concern ........................................................................................................ 19
2 Quality Assurance Project Plan ..................................................................................................... 20
2.1 Project Management ................................................................................................................ 20
2.1.1 Project/Task Organization ........................................................................................ 20
2.1.2 Quality Objectives and Criteria ................................................................................ 24
2.1.3 Special Training Requirements and Certification ..................................................... 24
2.1.4 Documentation and Records ..................................................................................... 24
2.2 Data Generation and Acquisition ............................................................................................ 30
2.2.1 Sampling Methods Requirements ............................................................................. 30
2.2.2 Analytical Methods Requirements ........................................................................... 30
2.2.3 Field Screening Methods .......................................................................................... 34
2.2.4 Quality Control ......................................................................................................... 34
2.2.5 Measurement Equipment .......................................................................................... 43
2.2.6 Instrument/Equipment Testing, Inspection, and Maintenance ................................. 43
2.2.7 Data Management ..................................................................................................... 44
2.3 Assessment/Oversight ............................................................................................................. 44
2.3.1 Assessments and Response Action ........................................................................... 44
2.3.2 Reports to Management ............................................................................................ 45
2.4 Data Review and Usability ...................................................................................................... 45
2.4.1 Data Review and Verification .................................................................................. 45
2.4.2 Data Validation ......................................................................................................... 45
2.4.3 Reconciliation with User Requirements ................................................................... 46
3 Field Sampling Plan ........................................................................................................................ 46
3.1 Sampling Objectives ................................................................................................................ 47
3.2 Sampling Locations and Frequencies ...................................................................................... 47

DOE/RL-2019-23, REV. 0
vi
3.3 Well Drilling and Completion Procedures .............................................................................. 51
3.3.1 Monitoring Well Construction .................................................................................. 51
3.4 Field-Specific Collection Requirements .................................................................................. 55
3.4.1 Sample Location and Depth ...................................................................................... 55
3.4.2 Sample Identification ................................................................................................ 55
3.4.3 Field Sample Logbook .............................................................................................. 55
3.4.4 Corrective Actions and Deviations for Sampling Activities..................................... 56
3.4.5 Sampling Procedure .................................................................................................. 56
3.4.6 Slug Testing .............................................................................................................. 58
3.4.7 Radiological Field Data ............................................................................................ 59
3.5 Calibration of Field Equipment ............................................................................................... 59
3.6 Sampling Handling .................................................................................................................. 60
3.6.1 Containers ................................................................................................................. 60
3.6.2 Container Labeling ................................................................................................... 61
3.6.3 Sample Custody ........................................................................................................ 61
3.6.4 Sample Transportation .............................................................................................. 62
4 Management of Waste .................................................................................................................... 62
5 Health and Safety ............................................................................................................................ 63
6 References ........................................................................................................................................ 63
Appendices
A 200-ZP-1 Operable Unit Ringold Formation Unit A Data Quality Objectives ........................ A-i
B 200-ZP-1 Operable Unit Ringold Formation Unit A Proposed Monitoring Well Profiles ...... B-i
Figures
Figure 1. Location of Hanford Site and the 200-ZP-1 OU ....................................................................... 2
Figure 2. Approximate Location of Proposed Rwia Monitoring Wells .................................................... 3
Figure 3. 200-ZP-1 OU Remedy Implementation Documentation ........................................................... 6
Figure 4. Carbon Tetrachloride Plume with Proposed Wells and Location of HSGF Model
Cross Sections ........................................................................................................................... 8
Figure 5. HSGF Model Cross Section with Proposed Wells and Carbon Tetrachloride
Concentrations, West to East (A to A’) ..................................................................................... 9
Figure 6. HSGF Model Cross Section with Proposed Wells and Carbon Tetrachloride
Concentrations, South to North (B to B’) ................................................................................ 10
Figure 7. Project Organization ................................................................................................................ 21
Figure 8. Diagram Showing Configuration of Access Port in Protective Casing ................................... 52
Figure 9. Conceptual Illustration of Monitoring Well Design When the Rlm is Not Present ................ 53

DOE/RL-2019-23, REV. 0
vii
Figure 10. Conceptual Illustration of Monitoring Well Design When the Rlm is Present ....................... 54
Tables
Table 1. Proposed Rwia Monitoring Wells with Estimated Geologic Contacts ...................................... 4
Table 2. Decision Statements ................................................................................................................ 13
Table 3. Decision Rules ......................................................................................................................... 13
Table 4. Summary of Data Inputs to Resolve DSs ................................................................................ 14
Table 5. Constituents of Interest for Groundwater During Drilling and for Groundwater Post-
Development ........................................................................................................................... 15
Table 6. Constituents of Interest and Physical Properties for Sediments During Drilling .................... 17
Table 7. Document References for Constituents of Interest .................................................................. 19
Table 8. Data Quality Indicators ........................................................................................................... 25
Table 9. Change Control for Sampling Projects .................................................................................... 28
Table 10. Constituent Methods and Analytical Performance Requirements for
Groundwater Samples ............................................................................................................. 31
Table 11. Constituent Methods and Analytical Performance Requirements for
Sediment Samples ................................................................................................................... 32
Table 12. Physical Properties Methods for Sediment Samples ............................................................... 33
Table 13. QC Samples ............................................................................................................................. 33
Table 14. Field and Laboratory QC Elements and Acceptance Criteria ................................................. 35
Table 15. Groundwater Preservations and Holding Times ...................................................................... 41
Table 16. Soil and Sediment Preservations and Holding Times ............................................................. 42
Table 17. Summary of Rwia Characterization Well Sampling ............................................................... 48

DOE/RL-2019-23, REV. 0
viii
This page intentionally left blank.

DOE/RL-2019-23, REV. 0
ix
Terms
CERCLA Comprehensive Environmental Response, Compensation, and Liability
Act of 1980
COC contaminant of concern
DOE U.S. Department of Energy
DOE-RL U.S. Department of Energy, Richland Operations Office
DOT U.S. Department of Transportation
DQA data quality assessment
DQI data quality indicator
DQO data quality objective
DR decision rule
DS decision statement
DUP laboratory sample duplicate
EB equipment blank
Ecology Washington State Department of Ecology
EPA U.S. Environmental Protection Agency
F&T fate and transport
FS feasibility study
FSO Field Sampling Operations
FTB full trip blank
FWS field work supervisor
FXR field transfer blank
FY fiscal year
HASQARD Hanford Analytical Services Quality Assurance Requirements Document
HEIS Hanford Environmental Information System
HSGF Hanford South Geologic Framework
IATA International Air Transportation Association
IC institutional control
LCS laboratory control sample
MB method blank

DOE/RL-2019-23, REV. 0
x
MNA monitored natural attenuation
MS matrix spike
MSD matrix spike duplicate
O&M operations and maintenance
OU operable unit
P&T pump and treat
PMP performance monitoring plan
PNNL Pacific Northwest National Laboratory
PQL practical quantitation limit
QA quality assurance
QAPjP quality assurance project plan
QC quality control
RCT radiological control technician
RD/RAWP remedial design/remedial action work plan
Rlm Ringold Formation member of Wooded Island – lower mud unit
ROD Record of Decision
Rwia Ringold Formation member of Wooded Island – unit A
Rwie Ringold Formation member of Wooded Island – unit E
SAP sampling and analysis plan
SMR Sample Management and Reporting
SPLIT field split
SUR surrogate
TCE trichloroethene
TIC total inorganic carbon
TOC total organic carbon
Tri-Party Agreement Hanford Federal Facility Agreement and Consent Order
VOA volatile organic analysis
VOC volatile organic compound

DOE/RL-2019-23, REV. 0
1
1 Introduction
This sampling and analysis plan (SAP) addresses the phased installation of monitoring wells in and
around the 200-ZP-1 Groundwater Operable Unit (OU) to support characterization of the Ringold
Formation member of Wooded Island – unit A (Rwia). This SAP is separate and distinct from the
remediation well installation SAP provided in Appendix G of DOE/RL-2009-115, Performance
Monitoring Plan for the 200-ZP-1 Groundwater Operable Unit Remedial Action (hereinafter referred to
as the 200-ZP-1 OU performance monitoring plan [PMP]).
The 200-ZP-1 OU comprises groundwater contaminated by releases from facilities and waste sites
associated with former Hanford Site plutonium concentration and recovery operations at the Plutonium
Finishing Plant and plutonium separation operations at T Plant. The 200-ZP-1 OU underlies the northern
portion of the 200 West Area, located at the western end of the Central Plateau. The 200 West Area is
about 8 km (5 mi) south of the Columbia River and 11 km (7 mi) from the nearest Hanford Site boundary.
The 200-ZP-1 OU includes several groundwater contaminant plumes that span about 13 km2 (5 mi2)
beneath the 200 West Area. Figure 1 shows the location of the 200-ZP-1 OU at the Hanford Site.
The primary contaminant of concern (COC) in groundwater for the 200-ZP-1 OU is carbon tetrachloride.
Figure 2 shows the approximate mapped concentration distribution in 2017 of the carbon tetrachloride
plume within the Rwia, below the Ringold Formation member of Wooded Island – lower mud unit (Rlm)
(ECF-200W-16-0092, Calculation of Three-Dimensional Groundwater Concentration Plumes for
200-West for Calendar Year (CY) 2015).
This SAP supports implementation of the 200-ZP-1 OU selected remedy, as described in
EPA et al., 2008, Record of Decision Hanford 200 Area 200-ZP-1 Superfund Site, Benton County,
Washington (hereinafter referred to as the 200-ZP-1 OU Record of Decision [ROD]). The monitoring
wells proposed in this SAP are in addition to those proposed in the 200-ZP-1 OU PMP
(DOE/RL-2009-115) and previous SAPs. The additional wells have been identified to continue
fulfillment of requirements in accordance with the Comprehensive Environmental Response,
Compensation, and Liability Act of 1980 (CERCLA).
Under this SAP, 12 monitoring wells are proposed for installation from fiscal year (FY) 2020 through
FY 2022 at a planned installation rate of 4 monitoring wells per year. The actual schedule for installation,
construction, and operation of the monitoring wells will be determined based on priority of Hanford Site
work activities and available funding each FY. Table 1 lists the monitoring wells proposed for
installation, as well as the known key hydrogeologic units and anticipated depths for each well.
Figure 2 shows the identified approximate locations of the proposed monitoring wells. Locations for only
8 of the proposed 12 monitoring wells have currently been identified for the first phase. Table 1 provides
details for the eight monitoring wells (MW-A through MW-H) with identified locations. Using
information collected during and after the installation of the first eight monitoring wells, the other four
monitoring well locations (MW-I through MW-L) will be identified for the second phase through
probabilistic optimization analyses that includes fate and transport (F&T) modeling combined with
a continuation of the data gap analysis process, as initially documented in SGW-61350, Data Gaps
Evaluation in Groundwater Monitoring at the Hanford 200-ZP-1 Groundwater Operable Unit.
The remaining four monitoring well locations will be selected based on results of the initial data collected
under this SAP, as well as data collected under other SAPs. Once selected, the remaining four well
locations will be incorporated into this SAP by adhering to the document change control process
described in Section 2.1.4.

DOE/RL-2019-23, REV. 0
2
Figure 1. Location of Hanford Site and the 200-ZP-1 OU
Major Roads 0 I
- Columbia River
c:::J Site Boundary o
/ /
/ /
/
/
/ /
/
/ /
/ /
/ /
I I
I
I I
I
I I
I
' I
4 8 Km
4 8 Miles gwf09031
North Slope
-- \ \ __ ,,c-----Central Plateau (Outer Area)
200-BP-5
200-PO-1
\ \ \ \ \
200-UP-1
400 Area
Energy Northwest

DO
E/R
L-2
019-2
3, R
EV
. 0
3
Figure 2. Approximate Location of Proposed Rwia Monitoring Wells
• Proposed Rwia Monitoring Well
• Planned PMP Monitoring Well
• Planned Extraction Well
T Planned Injection Well
Current Extraction Well
T Current Injection Well
0 Wells Screened in the Rwia
• Volatile Organic Monitoring Well
• Piezometers
LJ RlmExtent
2017 Carbon Tetrachloride Plume Below Rim
<5 µg/L
~5 and <50 µg/L
~50 and <100 µg/L
Groundwater Interest Area Boundary
-- Roads
Data Gap Scores Below Rim - 3-5 • 5.1-10 • 10.1-12.5 • 12.6-14
0 14.1-15 • 15.1-16
- 16.1-18
- 1a.1-22.5
/ / , / / /
, / / / / /
/ / / / /
/ / / / /
/ / / / /
/ / / / / /
/ / / , / /
/ / / / /
/ / / / /
/ / / / /
/ / / / / /
/ / / / / /
, / / / / /
, / / / / /
/ / / / /
/ / / / /
/ / / / /
/ / / / / /
/ / / , / /
/ / / . / / / / /
/ / / / /
/ / / / /
/ / / / / /
/ / / , / / ~
T
/
/,{oo-1- .,. L / . oo·-u~ • • / / 1-,
/ / / / /
/ /
0 1,000 2,000 ft / / / / / / e / ' e
0 200 400 600 m I I
/ /
/
/
/
/ /
/ /
/ / /
/
/ /
T
/
/ . / /
/
/
•
/////// , v // / / / / / / / / / / / / / / / /..,...,_____ / / / / / / / / / / / / / / / / / / / / "'1 '-::""':a,i:;ii'.""7'""':'f"'7"'7""""""' .... .,;J. .... ____ /
//////////// ////////////////////////////////// (// / / / / / / / / / / ..,...,. ___ ,. _____ ~ / / / / / / / / / / / / / / / / / / / / / / / / / / / / / / / / / / / / / / / / / / / / / / / / / / / / / / / / / / / / / / / / / / / / / / / / / / / / / / / / / / / / / / / / / / / / / / / /
/ // / / / / / /// / / / / / / / / / / / /////// .. / / / / / / / / /// / / / / // / / / / // // /// / / / / ////////// / / / / / / / / / / / / / / / / / / / / / / / / / / / / / / / / / / / / / / / / / / / / / / / / / / / / / / / -~ / /.
/ / / / / / / / / / / / / / / / / / / / / / / / / / / / / / / / / / / / / / / / / / / / / / / / / / . / / / / / / / / / / / / / / / / / / / / / / / / / / / / / / / / / / / / / / / / / / / / / / / / / / / / / / / / / / / / / / / / / / / /
/ / / / / / '///////,'///// / ///////// ' ,'/////,'////,'////,'/,'/////////,' / / / / / / / / / / / / / / / / / / / / / / / / / / / / / / / / / / / / / / / / / / / , / / / / / / / / / / / / / / / / / / / / / / / / / / / / / / / / / / / / / / / / / / / / / / / / / / / / / / /
////// ,A ////// / / /

DO
E/R
L-2
019-2
3, R
EV
. 0
4
Table 1. Proposed Rwia Monitoring Wells with Estimated Geologic Contacts M
on
ito
rin
g
Wel
l
Well
Name
Well
ID
Easting
(m)
Northing
(m) Ele
va
tion
(m)
Ele
va
tion
(ft)
Est
ima
ted
To
tal
Dep
th (
ft b
gs)
Est
ima
ted
Dep
th
to W
ate
r (f
t b
gs)
Estimated Depth to Geologic Contacts* (ft bgs)
Hf1
Hf2
CC
U
CC
Uc
Rtf
Rw
ie
Rlm
Rw
ia
Ba
salt
MW-A 299-W13-4 D0080 568086 136340 225.6 740 536 322 14 68 140 157 167 189 NP 452 526
MW-B 299-W19-133 D0081 567849 135350 219.5 720 564 293 3 67 176 186 198 240 445 466 554
MW-C 699-46-70 D0082 568697 137656 217.0 712 431 287 1 33 105 146 158 185 340 361 421
MW-D 699-45-67C D0083 569433 137129 221.6 727 464 311 7 62 196 202 203 214 322 366 454
MW-E 299-W14-26 D0084 567285 135729 216.4 710 551 286 10 61 138 143 151 160 428 468 541
MW-F 699-40-70 D0085 568732 135703 224.9 738 559 315 6 40 157 173 242 261 419 430 549
MW-G 699-42-62 D0086 571106 136438 224.0 735 461 335 5 46 275 308 308 318 NP 360 451
MW-H 699-41-65 D0087 570029 136109 230.4 756 518 344 8 47 236 NP 273 283 369 416 508
MW-I TBD TBD TBD TBD TBD TBD TBD TBD TBD TBD TBD TBD TBD TBD TBD TBD TBD
MW-J TBD TBD TBD TBD TBD TBD TBD TBD TBD TBD TBD TBD TBD TBD TBD TBD TBD
MW-K TBD TBD TBD TBD TBD TBD TBD TBD TBD TBD TBD TBD TBD TBD TBD TBD TBD
MW-L TBD TBD TBD TBD TBD TBD TBD TBD TBD TBD TBD TBD TBD TBD TBD TBD TBD
*The estimated depths to geologic contacts are based on the Hanford South Geologic Framework Model, as documented in ECF-HANFORD-13-0029, Development of the Hanford South
Geologic Framework Model, Hanford Site, Washington; and CP-60925, Model Package Report: The Central Plateau Vadose Zone Geoframework Version 1.0.
bgs = below ground surface
CCU = Cold Creek unit
CCUc = Cold Creek unit caliche
Hf1 = Hanford formation unit 1
Hf2 = Hanford formation unit 2
ID = identification
NP = not present
Rtf = Ringold Formation member of Taylor Flat
Rlm = Ringold Formation member of Wooded Island – lower mud unit
Rwia = Ringold Formation member of Wooded Island – unit A
Rwie = Ringold Formation member of Wooded Island – unit E
TBD = to be determined

DOE/RL-2019-23, REV. 0
5
Collection of measurements and observations provides an opportunity for integration with other projects
and activities, including data collection performed for other OUs. Conversely, information and developed
knowledge may be shared with other projects through integration activities. Measurements and
observations collected and used through integration activities must be assessed to ensure that they meet
the data quality requirements of the current activity and that their uncertainty and limitations are
understood. Information should be clearly identified as based on either direct data (i.e., collected under
the auspices of this activity) or indirect data (i.e., collected through an integration activity).
In an effort to facilitate this integration process with other projects and activities, the project teams for
collocated and nearby source and groundwater OUs were consulted to determine if additional sampling
activities should be included in this SAP to support data needs for these other OUs. At the time of
this SAP issuance, no additional sampling activities or needs were identified for the initial eight proposed
well locations.
1.1 Project Scope and Objectives
The 200-ZP-1 OU ROD (EPA et al., 2008) presents the remedial actions for restoring the aquifer and the
cleanup levels to be achieved. The preferred alternative for the 200-ZP-1 OU consists of pump and treat
(P&T), monitored natural attenuation (MNA), flow-path control, and institutional controls (ICs).
DOE/RL-2008-78, 200 West Area 200-ZP-1 Pump-and-Treat Remedial Design/Remedial Action
Work Plan (hereinafter referred to as the 200-ZP-1 P&T remedial design/remedial action work plan
[RD/RAWP]) describes how the design and implementation of the remedial action process required by
the ROD will be executed.
This SAP addresses the drilling of monitoring wells within the Rwia to further characterize the nature
and extent of contaminants, to refine the geologic framework for the Rwia, and to provide hydraulic
properties for contaminant F&T modeling. This effort is supplemental to the 200-ZP-1 OU PMP
(DOE/RL-2009-115) and supports the performance evaluation of the selected remedy by improving
the understanding of the Rwia. The work will also support P&T optimization efforts focused on
the Rwia and associated contamination. The overall goal of this project is to obtain additional data
(with emphasis on the Rwia) to provide for reliable and predictive F&T modeling to support P&T and
MNA remedy optimization.
1.1.1 Remedy Implementation Documentation
As discussed in Section 5.5 of the 200-ZP-1 P&T RD/RAWP (DOE/RL-2008-78), remedy
implementation documents include the RD/RAWP; the 200-ZP-1 OU PMP; DOE/RL-2009-124,
200 West Pump and Treat Operations and Maintenance Plan (hereinafter referred to as the 200 West
P&T operations and maintenance [O&M] plan); DOE/RL-2019-38, 200-ZP-1 Operable Unit
Optimization Study Plan (hereinafter referred to as the 200-ZP- OU optimization study); and this SAP.
Figure 3 depicts the relationship between 200-ZP-1 OU remedy implementation documents and their
relation to remedy reporting, optimization, decisions, and management. As shown in the figure, the
200-ZP-1 P&T RD/RAWP (DOE/RL-2008-78) describes the remedy tasks and provides the overall
direction for remedy implementation to meet 200-ZP-1 OU ROD (EPA et al., 2008) requirements.

6
DO
E/R
L-2
019-2
3, R
EV
. 0
Figure 3. 200-ZP-1 OU Remedy Implementation Documentation
Other Operable Unit The Hanford Well Feed stream processing Requirements Maintenance Plan requirements
l l l 200-ZP-1 OU Remedial Design/Remedial • Action Work Plan (RD/RAWP) (Rev. 1) Performance Monitoring Plan (PMP) for . Actions to meet ROD requi rements the 200-ZP-1 OU Remedial Action (Rev. 3) 200 West P& T Operations and Maintenance . Facili ty and well network configuration . Groundwater mon itoring fo r remedy (O&M) Plan (Rev. 6) Actions to add ress data gaps, performance assessment 200-ZP-1
Configuration and operations of t he facility .
Requirements .
optim ization, and remedy modification . Optimization of well network and and injection/extract ion well network needs remedy approach . M onitoring of the facili ty and extraction wells . RAO performance prediction for operat ions, PMP, and other feed stream ,. 200-ZP-1 OU Optimization Study Plan
t-- . Data gap analysis Data needs . . Study of potentia l remedy
Transit ions to MNA and closure . I configu ration modifications t o
address remedy performance needs " Reporting
200-ZP-1 OU Ringold A Annual P&T Repart Yes Characterization SAP . Contaminant plume remedy performance Confirmation . Address Ri ngold A data gaps for . 200 West P&T Facil ity performance RAOs sampling/ remedy opt imizat ion/modification . Recommendat ions for opt imization Achieved? closeout
Annual P& T Remedy Progress Assessment Report documentation
. P&T remedy progress toward RAOs . Consolidated we ll network assessment No
Remedy Decision Modifications Updated OU Implementation Documents . Negotiate remedy modifications as . TPA change notices to update documents as needed --
needed t hrough CERCLA remedy . Periodic OU document revisions modification procedures

DOE/RL-2019-23, REV. 0
7
1.2 Background
The 200 Areas are located on a broad, relatively flat plain that constitutes a local topographic high
commonly referred to as the Central Plateau. The 200-ZP-1 OU underlies the northern portion of the
200 West Area, which is located at the western end of the Central Plateau.
The following sections summarize the hydrogeology, groundwater flow, contaminant plumes, and sources
of contamination for the 200-ZP-1 OU. An overview is also provided of the data quality objective (DQO)
process directing the sampling objectives, and the contaminants are identified.
1.2.1 Site Geology/Hydrology
The Hanford Site lies in a sediment-filled basin on the Columbia Plateau in southeastern Washington
State (Figure 1). The geology underlying the 200 West Area comprises (in descending order) the
Hanford formation, the Cold Creek unit, the Ringold Formation, and the Columbia River Basalt Group.
The suprabasalt sediments are about 169 m (555 ft) thick and primarily consist of the Ringold Formation,
Cold Creek unit, and Hanford formation, which are composed of sand and gravel, with some silt layers.
The uppermost aquifer in the 200-ZP-1 OU is unconfined and occurs in the Ringold Formation. In the
200 West Area, the Ringold Formation is primarily comprised of the Rwia at the base; the Rlm, an
aquitard present in part of the 200-ZP-1 interest area; and the Ringold Formation member of Wooded
Island – unit E (Rwie) overlying the Rlm and Rwia. Figure 2 shows the current modeled extent of
the Rlm in the 200-ZP-1 OU, and Table 1 provides details on the anticipated depths to geologic contacts
at each proposed well location based on the current Hanford South Geologic Framework (HSGF) Model,
as documented in ECF-HANFORD-13-0029, Development of the Hanford South Geologic Framework
Model, Hanford Site, Washington; and CP-60925, Model Package Report: The Central Plateau Vadose
Zone Geoframework Version 1.0. Figure 4 shows the modeled carbon tetrachloride plume with the
proposed Rwia monitoring wells and the location of HSGF Model cross sections depicted in Figures 5
and 6. The HSGF Model cross sections shown in Figures 5 and 6 were used to help select sampling
intervals for the proposed wells, as discussed in Chapter 3.
Groundwater in the unconfined aquifer flows from areas where the water table is higher (west of the
Hanford Site) to areas where the water table is lower (the Columbia River). The depth of the water table
in the 200 West Area varies from about 50 m (164 ft) in the southwest corner (near the former
216-U-10 Pond) to >100 m (328 ft) to the north. Table 1 also provides anticipated depths to water for
each proposed well location.
1.2.2 Groundwater Flow
Groundwater flows predominantly east-northeast beneath the Central Plateau from the 200 West Area to
the 200 East Area, with velocities typically ranging from 0.0001 to 0.5 m/d (0.00033 to 1.64 ft/d).
Historical effluent discharges in the 200 West Area altered the groundwater flow regime, especially
around the 216-U-10 Pond. Seepage from the 216-U-10 Pond raised the water table elevation, which in
turn temporarily deflected groundwater flow to the north. As the discharges ceased, the water table
declined and the eastward groundwater flow pattern was restored.

8
DO
E/R
L-2
019-2
3, R
EV
. 0
Figure 4. Carbon Tetrachloride Plume with Proposed Wells and Location of HSGF Model Cross Sections
8'
U-4'-H
A'
j PU!wla_G
••-•0-,1 A
9-J-<11 1- I tt .. 1•-•u.
~•le 1118!>1 ... ... 1411 uu

DOE/RL-2019-23, REV. 0
9
Figure 5. HSGF Model Cross Section with Proposed Wells and Carbon Tetrachloride Concentrations, West to East (A to A’)
Unit Name - Hanford-1
Hanford-2 Hanford-3
- Cold_Creek_Unit - CC_Caliche
Ringo ld-TF Ringold-E
- Ringo ld Lower Mud - Ringold-A - Basalt
CTET - 34
50.0 100.0 500.0
- 1000.0
)
ZPl_Rwia_F t,99~-09
ZPl_Rwi a _H
ZPl_Rwi a _G
Scal e 1:1869
46 7 93 4 14 0 1 1 869

DOE/RL-2019-23, REV. 0
10
Figure 6. HSGF Model Cross Section with Proposed Wells and Carbon Tetrachloride Concentrations, South to North (B to B’)
Unit Name - Hanford-1
Hanford-2 Hanford-3
- Cold_Creek_Unit - CC_Caliche
Ringold-TF [ Ringold-E - Ringold Lower Mud - Ringold-A - Basalt
CTET - 34
50.0 100.0 500.0
- 1000.0
699-38-70C Zfl,l~ll-i,a_B
ZP 1 Rwia _ A 699-4:}-09
299-Nll-1 299- N11-sk -w 11-43 299-W l l --88 699-45-69C
Scale 1:1661
415 830 124 6 1 66 1

DOE/RL-2019-23, REV. 0
11
1.2.3 Sources of Groundwater Contamination
The groundwater COCs identified in the 200-ZP-1 OU ROD (EPA et al., 2008) include carbon
tetrachloride, total chromium, hexavalent chromium, iodine-129, nitrate, technetium-99, trichloroethene
(TCE), and tritium. Carbon tetrachloride is the primary risk driver in groundwater, forming a plume area
of about 20 km2 (7.9 mi2) and primarily extending north, south, and east from the source areas.
The primary carbon tetrachloride and TCE sources were associated with liquid waste discharges from
plutonium separation processes at the Plutonium Finishing Plant to the 216-Z-1A, 216-Z-9, and
216-Z-18 Cribs and Trenches. These sources have been mitigated and there is no longer a continuing
carbon tetrachloride source that would contribute to a plume of concern (DOE/RL-2014-48, Response
Action Report for the 200-PW-1 Operable Unit Soil Vapor Extraction Remediation).
Sources of chromium, iodine-129, nitrate, TCE, technetium-99, and tritium contamination in the
200-ZP-1 OU include releases from past leaks in single-shell tanks and pipelines in Waste Management
Areas T and TX/TY, and liquid waste disposal from plutonium processing operations to cribs and
trenches adjacent to the waste management areas. Except for nitrate, the remaining contaminant plumes in
the 200-ZP-1 OU are predominately located within the boundaries of the carbon tetrachloride plume.
1.3 Data Quality Objective Summary
The DQO process is a strategic planning approach to define the criteria that a data collection design
should satisfy. This process is used to ensure that the type, quantity, and quality of environmental data
used in decision making will be appropriate for the intended application. The DQOs for this SAP were
developed in accordance with EPA/240/B-06/001, Guidance on Systematic Planning Using the Data
Quality Objectives Process (EPA QA/G-4). The DQO process involves a series of logical steps used to
plan for the resource-effective acquisition of environmental data. The performance and acceptance criteria
are determined through the DQO process, which serves as the basis for designing the plan to collect data
of sufficient quality and quantity to support project goals. The DQO process used to support the sample
design presented in this SAP is provided in Appendix A.
This SAP supports implementation of the 200-ZP-1 OU preferred cleanup alternative, as provided in the
200-ZP-1 OU ROD (EPA et al., 2008). Samples collected as part of this SAP will be used to support
decisions related to remedy performance and optimization in the Rwia. Sample analysis includes the
COCs in the 200-ZP-1 OU (as provided in the ROD), as well as chloroform, uranium, and other indicator
constituents of interest, to assist in monitoring and implementing the preferred cleanup alternative.
In addition, to update and improve groundwater modeling parameters, samples will be analyzed for
physical properties, and hydraulic tests will be performed during drilling and following installation of
the wells. This section presents the key outputs resulting from the DQO process.
1.3.1 Statement of the Problem
For the 200-ZP-1 OU, evaluation and optimization of the selected remedy (as specified in the
200-ZP-1 OU ROD [EPA et al., 2008]) is the ultimate purpose of data collection for the OU. To support
this purpose, the nature and extent of carbon tetrachloride and other 200-ZP-1 OU COCs (as defined by
the ROD) in the Rwia and Rlm must be better understood.
Since implementation of the 200-ZP-1 OU ROD (EPA et al., 2008), a greater proportion of carbon
tetrachloride has been found below the Rlm (in the Rwia) (ECF-200W-16-0092) than was originally
estimated in the remedial investigation (DOE/RL-2006-24, Remedial Investigation Report for the
200-ZP-1 Groundwater Operable Unit) and the 200-ZP-1 OU feasibility study (FS) (DOE/RL-2007-28,
Feasibility Study Report for the 200-ZP-1 Groundwater Operable Unit). The majority of the carbon
tetrachloride mass within the Rwia appears to be located further to the east (i.e., in the downgradient

DOE/RL-2019-23, REV. 0
12
direction) than was understood during the remedial investigation. As discussed in SGW-62137, 200 West
Pump-and-Treat Performance Against Remedial Action Objectives Specified in the 200-ZP-1 Operable
Unit Record of Decision, recent estimates indicate that approximately 25% of the remaining total carbon
tetrachloride mass is found deep within the unconfined aquifer below the Rlm. The more recently
modeled Rwia plume in 2015 is substantially larger than previously estimated in 2008, is located
farther to the northeast, and represents a greater fraction of the overall contaminant mass within the
200-ZP-1 OU. Currently, there are limited characterization data, hydrogeologic data, hydraulic data, and
transport parameter information for the Rwia and Rlm. A specific area where additional data are needed
is to the north and northeast of the 200 West Area, where a portion of the carbon tetrachloride plume
>100 µg/L is not currently being hydraulically contained by the P&T component of the selected remedy.
In addition, the region to the northeast where contaminants are transported and discharge into
groundwater from the 200 West Area toward the 200 East Area via a zone of higher transmissivity
needs to be better understood. Although this SAP addresses the primary data needs associated with the
Rwia and Rlm, some Rwie data are also needed in this area of potential contaminant migration.
Based on these needs, sufficient data must be collected within the defined study area to adequately define
the nature and extent of the 200-ZP-1 OU COC plumes and the hydrogeologic properties, hydraulic
properties, and transport parameters of the Rwia, the Rlm, and, to a limited extent, the Rwie. The data
will support F&T modeling, the well design process, facilitate performance evaluation of the
200-ZP-1 OU remedy, and assist in making recommendations for optimizing or modifying the remedy.
A determination regarding the adequacy of the information and knowledge obtained from these studies
will be made in the context of improving the ability to reasonably predict the likely future performance
of the remedy in attaining the remedial action objectives as specified in the 200-ZP-1 OU ROD
(EPA et al., 2008). Section A.6.2 in Appendix A discusses the approach for determining data adequacy.
1.3.2 Decision Statements and Decision Rules
The DQO process identifies the key decisions and goals that must be addressed to achieve the final
solution to the problem statement. As stated in the 200-ZP-1 OU ROD (EPA et al., 2008), the selected
remedy combines P&T, MNA, flow-path control, and ICs. This SAP addresses monitoring well
installation and associated data collection at depth to solve the problem statement. The key questions that
the data collection must address and the alternative actions that may result from the data analysis are
presented in decision statements (DSs).
The DSs consolidate potential questions and alternative actions. Decision rules (DRs) are generated from
the DSs. A DR is an “IF…THEN…” statement incorporating the parameter of interest, unit of decision
making, action level, and actions resulting from resolution of the decision. Tables 2 and 3 present the DSs
and DRs, respectively, as identified during the DQO process. Appendix A presents the principal study
questions and alternative actions used to develop the DSs and DRs.

DOE/RL-2019-23, REV. 0
13
Table 2. Decision Statements
DS # Decision Statement
1
Determine if the vertical and lateral spatial distribution of the aqueous and sorbed COC concentrations in
the major facies of the Rwia and Rlm are adequately defined to support remedy performance evaluation and
F&T modeling; otherwise, collect additional data to define the vertical and lateral distribution of COCs.
2
Determine if the hydrogeologic properties and erosional features/unconformities of the Rwia and Rlm and
contacts and transitions between the Rwie, Rlm, Rwia, and basalt are adequately defined to support F&T
modeling and the well design process; otherwise, collect additional data to define these properties.
3 Determine if the hydraulic properties of the Rwia and Rlm are adequately defined to support F&T
modeling; otherwise, collect additional data to define these properties.
4 Determine if the transport parameters for the 200-ZP-1 Operable Unit COCs are adequately defined within
the Rwia and Rlm to support F&T modeling; otherwise, collect additional data to define these properties.
COC = contaminant of concern
DS = decision statement
F&T = fate and transport
Rlm = Ringold Formation member of Wooded Island –
lower mud unit
Rwia = Ringold Formation member of Wooded Island –
unit A
Rwie = Ringold Formation member of Wooded Island –
unit E
Table 3. Decision Rules
DS # DR # Decision Rule
1 1
If the vertical and lateral spatial distribution of the aqueous and sorbed COC concentrations in the
major facies of the Rwia and Rlm are adequately defined to support remedy performance evaluation
and F&T modeling, then no further data collection is required. Otherwise, collect additional data to
define the vertical and lateral distribution of COCs.
2 2
If the hydrogeologic properties and erosional features/unconformities of the Rwia and Rlm and
contacts and transitions between the Rwia, Rwie, Rlm, and basalt are adequately defined to support
F&T modeling and the well design process, then no further data collection is required. Otherwise,
collect additional data to define these properties.
3 3
If the hydraulic properties of the Rwia and Rlm are adequately defined to support F&T modeling,
then no further data collection is required. Otherwise, collect additional data to define
these properties.
4 4
If the transport parameters for the 200-ZP-1 Operable Unit COCs are adequately defined within the
Rwia and Rlm to support F&T modeling, then no further data collection is required. Otherwise,
collect additional data to define these properties.
COC = contaminant of concern
DR = decision rule
DS = decision statement
F&T = fate and transport
Rlm = Ringold Formation member of Wooded Island –
lower mud unit
Rwia = Ringold Formation member of Wooded Island –
unit A
Rwie = Ringold Formation member of Wooded Island –
unit E

DOE/RL-2019-23, REV. 0
14
1.3.3 Sampling Designs
The supplemental data gathered from installing 12 Rwia monitoring wells in the 200-ZP-1 OU will
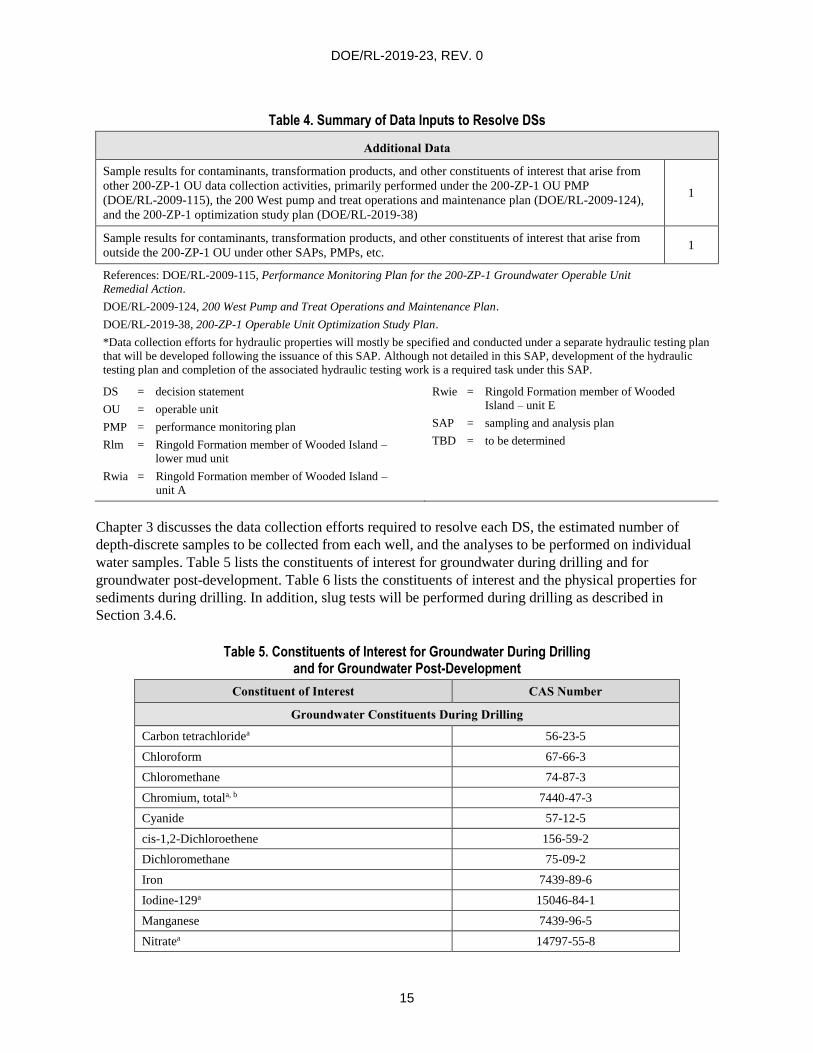
address the DSs identified in Table 2. Table 4 summarizes the primary data inputs needed to resolve
the DSs. Chapter 3 discusses the data collection efforts required to resolve each DS, the estimated number
of depth-discrete samples to be collected from each well boring, and the analyses to be performed on
individual water samples.
Table 4. Summary of Data Inputs to Resolve DSs
Data Inputs DS #
Data Collection Specified in this SAP
Groundwater (aqueous contaminants, transformation products, and other constituents of interest) sample
results from new monitoring wells to better define the lateral and vertical extent and distribution of
contaminant plumes to support remedy performance evaluation and F&T modeling
1
Sediment (sorbed contaminants, transformation products, and other constituents of interest) sample results
from new monitoring wells to better define the sorbed versus aqueous contaminant concentrations to support
remedy performance evaluation and F&T modeling
1
Geologic observations (during drilling, using visual observation and geophysical logging) of the contacts and
transitions between the Rwia, Rwie, Rlm, and basalt to better define the geologic framework to support
F&T modeling
2
Geologic observations (during drilling, using visual observation and geophysical logging) of the erosional
features and unconformities in the Rwia and Rlm to better define the geologic framework to support
F&T modeling
2
Sediment physical properties (bulk density, particle density, total porosity, particle-size distribution, and
saturated hydraulic conductivity) sample results from new monitoring wells used to better define
hydrogeologic and hydraulic properties and differences between the Rwia and Rwie to support
F&T modeling to support the well design process.
2 and 3
Hydraulic head distribution observations during drilling to better define hydraulic conditions to support
F&T modeling 3
Slug testing (during drilling) results to better define the vertical profile of hydraulic conductivity for the
Rwia associated with major zones of different transmissivity to support F&T modeling 3
Sediment transport-related (geochemical parameters and organic content) sample results from new
monitoring wells to better define the transport parameters to support F&T modeling 4
Results of supplemental laboratory contaminant mobility and transport studies performed at Pacific
Northwest National Laboratory will be used to better understand sediment/water partitioning and develop
distribution coefficients for carbon tetrachloride to support F&T modeling
4
Data Collection to be Specified in a Subsequent Testing Plan*
Hydraulic testing (TBD*) to better define large-scale transmissivity and storage properties to support
F&T modeling 3
Hydraulic testing (TBD*) to better define the vertical profile of hydraulic conductivity for the Rwia
associated with major zones of different transmissivity to support F&T modeling 3
Hydraulic testing (TBD*) to better define the vertical hydraulic conductivity (leakage factor) to support
F&T modeling 3
Hydraulic testing (TBD*) to better define the effective porosity of the Rwia within the observed/interpreted
plume migration pathways to support F&T modeling 3
DOE/RL-2019-23, REV. 0
15
Table 4. Summary of Data Inputs to Resolve DSs
Additional Data
Sample results for contaminants, transformation products, and other constituents of interest that arise from
other 200-ZP-1 OU data collection activities, primarily performed under the 200-ZP-1 OU PMP
(DOE/RL-2009-115), the 200 West pump and treat operations and maintenance plan (DOE/RL-2009-124),
and the 200-ZP-1 optimization study plan (DOE/RL-2019-38)
1
Sample results for contaminants, transformation products, and other constituents of interest that arise from
outside the 200-ZP-1 OU under other SAPs, PMPs, etc. 1
References: DOE/RL-2009-115, Performance Monitoring Plan for the 200-ZP-1 Groundwater Operable Unit
Remedial Action.
DOE/RL-2009-124, 200 West Pump and Treat Operations and Maintenance Plan.
DOE/RL-2019-38, 200-ZP-1 Operable Unit Optimization Study Plan.
*Data collection efforts for hydraulic properties will mostly be specified and conducted under a separate hydraulic testing plan
that will be developed following the issuance of this SAP. Although not detailed in this SAP, development of the hydraulic
testing plan and completion of the associated hydraulic testing work is a required task under this SAP.
DS = decision statement
OU = operable unit
PMP = performance monitoring plan
Rlm = Ringold Formation member of Wooded Island –
lower mud unit
Rwia = Ringold Formation member of Wooded Island –
unit A
Rwie = Ringold Formation member of Wooded
Island – unit E
SAP = sampling and analysis plan
TBD = to be determined
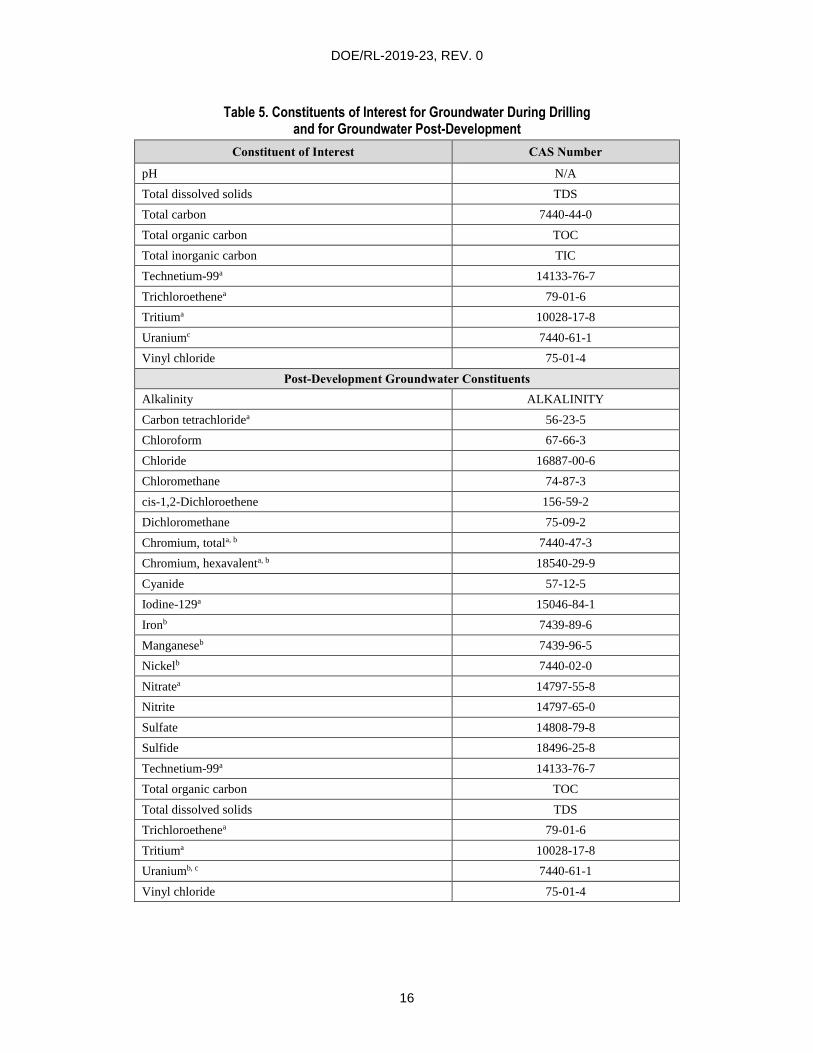
Chapter 3 discusses the data collection efforts required to resolve each DS, the estimated number of
depth-discrete samples to be collected from each well, and the analyses to be performed on individual
water samples. Table 5 lists the constituents of interest for groundwater during drilling and for
groundwater post-development. Table 6 lists the constituents of interest and the physical properties for
sediments during drilling. In addition, slug tests will be performed during drilling as described in
Section 3.4.6.
Table 5. Constituents of Interest for Groundwater During Drilling and for Groundwater Post-Development
Constituent of Interest CAS Number
Groundwater Constituents During Drilling
Carbon tetrachloridea 56-23-5
Chloroform 67-66-3
Chloromethane 74-87-3
Chromium, totala, b 7440-47-3
Cyanide 57-12-5
cis-1,2-Dichloroethene 156-59-2
Dichloromethane 75-09-2
Iron 7439-89-6
Iodine-129a 15046-84-1
Manganese 7439-96-5
Nitratea 14797-55-8
DOE/RL-2019-23, REV. 0
16
Table 5. Constituents of Interest for Groundwater During Drilling and for Groundwater Post-Development
Constituent of Interest CAS Number
pH N/A
Total dissolved solids TDS
Total carbon 7440-44-0
Total organic carbon TOC
Total inorganic carbon TIC
Technetium-99a 14133-76-7
Trichloroethenea 79-01-6
Tritiuma 10028-17-8
Uraniumc 7440-61-1
Vinyl chloride 75-01-4
Post-Development Groundwater Constituents
Alkalinity ALKALINITY
Carbon tetrachloridea 56-23-5
Chloroform 67-66-3
Chloride 16887-00-6
Chloromethane 74-87-3
cis-1,2-Dichloroethene 156-59-2
Dichloromethane 75-09-2
Chromium, totala, b 7440-47-3
Chromium, hexavalenta, b 18540-29-9
Cyanide 57-12-5
Iodine-129a 15046-84-1
Ironb 7439-89-6
Manganeseb 7439-96-5
Nickelb 7440-02-0
Nitratea 14797-55-8
Nitrite 14797-65-0
Sulfate 14808-79-8
Sulfide 18496-25-8
Technetium-99a 14133-76-7
Total organic carbon TOC
Total dissolved solids TDS
Trichloroethenea 79-01-6
Tritiuma 10028-17-8
Uraniumb, c 7440-61-1
Vinyl chloride 75-01-4

DOE/RL-2019-23, REV. 0
17
Table 5. Constituents of Interest for Groundwater During Drilling and for Groundwater Post-Development
Constituent of Interest CAS Number
Field Screening Parameters d
Dissolved oxygen N/A
Oxidation-reduction potential N/A
pH N/A
Specific conductance N/A
Temperature N/A
Turbidity N/A
a. The COCs are specified in EPA et al., 2008, Record of Decision Hanford 200 Area 200-ZP-1 Superfund
Site, Benton County, Washington.
b. Both filtered and unfiltered samples will be collected for all metal constituents except hexavalent
chromium. A filtered sample will be collected for hexavalent chromium.
c. Uranium (total) will also be analyzed as a target constituent. While not a COC specified in the
200-ZP-1 OU Record of Decision (EPA et al., 2008), it is a COC for the adjacent 200-UP-1 OU.
d. Field screening parameters to be collected in accordance with DOE/RL-96-68, Hanford Analytical Services
Quality Assurance Requirements Document, Vol. 3, Field Analytical Technical Requirements.
CAS = Chemical Abstracts Service
COC = contaminant of concern
N/A = not applicable
OU = operable unit
TDS = total dissolved solids
TIC = total inorganic carbon
TOC = total organic carbon
Table 6. Constituents of Interest and Physical Properties for Sediments During Drilling
Constituent of Interest CAS Number Purpose
Sediment Constituents
Carbon tetrachloridea, b 56-23-5 Used for comparison to aqueous concentrations
Chloroformb 67-66-3 Used for comparison to aqueous concentrations
Chloromethaneb 74-87-3 Used for comparison to aqueous concentrations
Chromium, totala 7440-47-3 Used for comparison to aqueous concentrations
Chromium, hexavalenta 18540-29-9 Used for comparison to aqueous concentrations
Cyanide 57-12-5 Used for comparison to aqueous concentrations
cis-1,2-Dichloroethaneb 156-59-2 Used for comparison to aqueous concentrations
Dichloromethaneb 75-09.2 Used for comparison to aqueous concentrations
Iron 7439-89-6 Used for comparison to aqueous concentrations, to establish baseline
geochemistry, and to evaluate reduction-oxidation minerals
Manganese 7439-96-5 Used for comparison to aqueous concentrations, to establish baseline
geochemistry, and to evaluate reduction-oxidation minerals
pH N/A Used for comparison to aqueous concentrations and to establish
baseline geochemistry
Total carbonb 7440-44-0 Used for comparison to aqueous concentrations and to establish
baseline geochemistry

DOE/RL-2019-23, REV. 0
18
Table 6. Constituents of Interest and Physical Properties for Sediments During Drilling
Constituent of Interest CAS Number Purpose
Total organic carbonb TOC Used for comparison to aqueous concentrations and to establish
baseline geochemistry
Total inorganic carbonb TIC Used for comparison to aqueous concentrations and to establish
baseline geochemistry
Technetium-99a 14133-76-7 Used for comparison to aqueous concentrations
Trichloroethenea, b 79-01-6 Used for comparison to aqueous concentrations
Uraniumc 7440-61-1 Used for comparison to aqueous concentrations
Vinyl chlorideb 75-01-4 Used for comparison to aqueous concentrations
Sediment Physical Properties
Bulk density, particle
density, and porosity N/A
Used in evaluating soil texture needed to support geologic interpretation,
interpretation of physical and chemical testing data, and provide
parameter inputs to fate and transport modeling
Particle-size distribution N/A
Used in evaluating soil texture needed to support geologic interpretation
and interpretation of physical and chemical testing data, as well as the
well design process
Saturated hydraulic
propertiesd N/A Used in geologic interpretation and provides parameter inputs to fate and
transport modeling
a. The COCs are specified in EPA et al., 2008, Record of Decision Hanford 200 Area 200-ZP-1 Superfund Site, Benton
County, Washington.
b. Analysis to be performed by Pacific Northwest National Laboratory to accommodate potential for supplemental studies
from full, intact liners C or D. If there is a question regarding the intact nature of the liners, the project scientist should be
contacted for direction.
c. Uranium (total) will also be analyzed as a target constituent. While not a COC specified in the 200-ZP-1 OU Record of
Decision (EPA et al., 2008), it is a COC for the 200-UP-1 OU to the south.
d. A full, intact liner is required for this analysis. If there is a question regarding the intact nature of the liner for this analysis,
the project scientist should be contacted for direction.
CAS = Chemical Abstracts Service
COC = contaminant of concern
N/A = not applicable
OU = operable unit
TIC = total inorganic carbon
TOC = total organic carbon
To support the need for collecting transport parameter data (identified in Appendix A and summarized in
Table 4), sediment samples will also be provided to Pacific Northwest National Laboratory (PNNL) for
laboratory contaminant mobility and transport studies to better understand sediment/water partitioning
and to develop distribution coefficients for carbon tetrachloride in the Rwia and Rlm. Split-spoon sample
liners C and D collected for each sample interval will be provided to PNNL. The full, intact liner C will
be designated for volatile organic compound (VOC), total carbon, total organic carbon (TOC), total
inorganic carbon (TIC) analyses. Liner D will be held in reserve at PNNL for use if reanalysis or
additional sample material is needed. Only sediment samples that correspond to groundwater samples
with higher carbon tetrachloride concentrations (based on quick-turnaround analytical results) will
undergo supplemental studies at PNNL.
To support the need for collecting the remaining hydraulic properties data (identified in Appendix A
and summarized in Table 4), a hydraulic testing plan will be developed following the issuance of
this SAP. The testing plan will focus on hydraulic testing activities to be performed for the completed

DOE/RL-2019-23, REV. 0
19
Rwia monitoring wells installed under this SAP. The development of the testing plan and completion of
the associated work is a requirement under this SAP.
1.4 Contaminants of Concern
Section 1.2.3 lists the COCs for the 200-ZP-1 OU, as identified the 200-ZP-1 OU ROD
(EPA et al., 2008). Table 5 lists the groundwater constituents of interest for samples collected during
drilling and after well development. Table 6 lists the sediment constituents of interest and physical
properties for samples collected during drilling. The constituents of interest that are not COCs were
derived from a review of the documents listed in Table 7. The additional constituents include anticipated
degradation products of COCs that can be used to assist in evaluating natural attenuation processes
and rates. Additional parameters for post-development sampling include the contaminants sampled
under the 200-ZP-1 OU performance monitoring SAP (Appendix B of the 200-ZP-1 OU PMP
[DOE/RL-2009-115]).
Table 7. Document References for Constituents of Interest
Reference Summary
DOE/RL-2006-24, Remedial
Investigation Report for 200-ZP-1
Groundwater Operable Unit
Includes a summary of data for the 200-ZP-1 OU, including individual
well information and a summary of the logic for screening contaminants
based on available data.
DOE/RL-2007-28, Feasibility Study
Report for the 200-ZP-1 Groundwater
Operable Unit
Establishes a basis for remedial action in the 200-ZP-1 OU, formulates
preliminary objectives for conducting the remedial action, and
develops and evaluates alternatives for remediating groundwater in
the 200-ZP-1 OU. A baseline risk assessment is also presented.
DOE/RL-2007-33, Proposed Plan for
Remediation of the 200-ZP-1
Groundwater Operable Unit
Issued by DOE and EPA for public and Tribal Nations comment, and
Ecology has concurred with the preferred alternative. The plan identifies
the preferred approach for remediating 200-ZP-1 OU groundwater and
explains the reasons for this preference. The proposed plan facilitates
public and Tribal Nations review by summarizing the findings of the
remedial investigation report, feasibility study report, and baseline risk
assessment contained in the feasibility study report.
DOE/RL-2008-78, 200 West Area
200-ZP-1 Pump-and-Treat Remedial
Design/Remedial Action Work Plan
Includes the plan and schedule for implementing all of the tasks to design,
install, and operate the remedy set forth in the 200-ZP-1 OU Record of
Decision (EPA et al., 2008).
DOE/RL-2009-115, Performance
Monitoring Plan for the 200-ZP-1
Groundwater Operable Unit
Remedial Action
Provides guidance for collecting and evaluating groundwater monitoring
data associated with implementing the 200-ZP-1 OU remedial action.
DOE/RL-2009-124, 200 West Pump and
Treat Operations and Maintenance Plan
Provides guidance for collecting extracted groundwater data from the
200-ZP-1 OU, 200-UP-1 OU, and 200-BP-5 OU P&T extraction wells
prior to treatment at the 200 West P&T. It also provides guidance for
collecting operational data associated with various treatment processes in
the P&T facility and for collecting treated groundwater data for the
facility effluent prior to injection into the aquifer.
EPA et al., 2008, Record of Decision
Hanford 200 Area 200-ZP-1 Superfund
Site, Benton County, Washington
Presents the selected remedy for the 200-ZP-1 OU, which is part of the
Hanford Site 200 Areas.
DOE = U.S. Department of Energy
Ecology = Washington State Department of Ecology
EPA = U.S. Environmental Protection Agency
OU = operable unit
P&T = pump and treat

DOE/RL-2019-23, REV. 0
20
The 200-ZP-1 OU FS (DOE/RL-2007-28) outlines the statistical measures used to determine the COCs.
In addition to the COCs presented in the 200-ZP-1 OU ROD (EPA et al., 2008), other parameters or
constituents may be analyzed (e.g., chloroform and other byproducts of COC degradation) to support
future MNA monitoring. The reporting requirements for certain broad-spectrum U.S. Environmental
Protection Agency (EPA) methods are provided in SW-846, Test Methods for Evaluating Solid Waste:
Physical/Chemical Methods, Third Edition; Final Update V, as amended; and Methods 6020, 8260,
and 300.0. If analyses indicate tentatively identified compounds beyond those listed in Tables 5 and 6,
these will also be reported in the Hanford Environmental Information System (HEIS) database and will
have a “J” qualifier (estimated value).
2 Quality Assurance Project Plan
The quality assurance project plan (QAPjP) establishes the quality requirements for environmental data
collection. It includes planning, implementing, and assessing sampling tasks, field measurements,
laboratory analysis, and data review. This chapter describes the applicable environmental data collection
requirements and controls based on the quality assurance (QA) elements provided in EPA/240/B-01/003,
EPA Requirements for Quality Assurance Project Plans (EPA QA/R-5); and DOE/RL-96-68, Hanford
Analytical Services Quality Assurance Requirements Document (HASQARD). DoD and DOE, 2017,
Department of Energy (DOD) / Department of Energy (DOE) Consolidated Quality Systems Manual
(QSM) for Environmental Laboratories, is also discussed. Section 7.8 of Ecology et al., 1989b, Hanford
Federal Facility Agreement and Consent Order Action Plan (hereinafter referred to as the Tri-Party
Agreement Action Plan), requires that QA/quality control (QC) and sampling and analysis activities
specify the QA requirements for past-practice processes. This QAPjP also describes applicable
requirements and controls based on guidance provided in Ecology Publication No. 04-03-030, Guidelines
for Preparing Quality Assurance Project Plans for Environmental Studies; and EPA/240/R-02/009,
Guidance for Quality Assurance Project Plans (EPA QA/G-5). This QAPjP supplements the contractor’s
environmental QA program plan.
The QAPjP includes the following sections that describe the quality requirements and controls applicable
to Hanford Site OU sampling activities:
Section 2.1, “Project Management”
Section 2.2, “Data Generation and Acquisition”
Section 2.3, “Assessment and Oversight”
Section 2.4, “Data Review and Usability”
2.1 Project Management
This section addresses planned project goals, management approaches, and output documentation.
2.1.1 Project/Task Organization
The contractor (or its approved subcontractor) is responsible for planning, coordinating, sampling, and
shipping samples to the appropriate laboratory. The contractor is also responsible for preparing and
maintaining configuration control of the SAP and assisting the U.S. Department of Energy (DOE),
Richland Operations Office (DOE-RL) project manager in obtaining approval of the SAP and future
proposed revisions. The project organization for soil and groundwater sampling is described in the
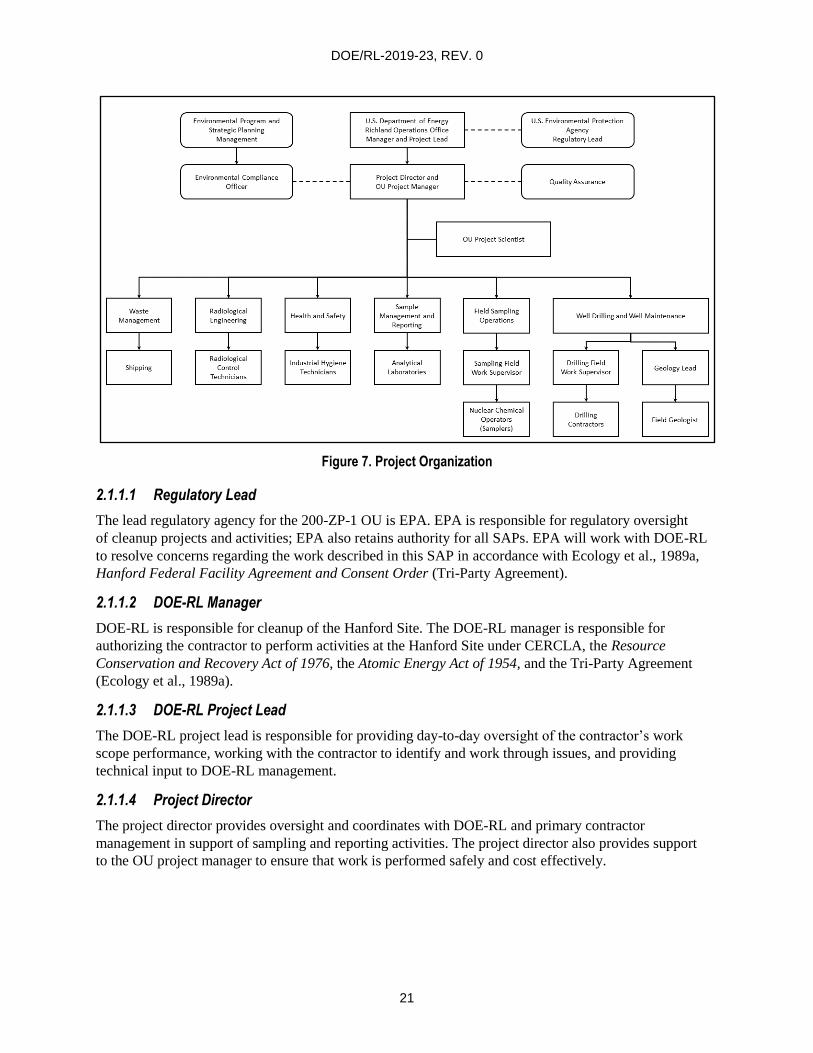
following sections and is shown in Figure 7.
DOE/RL-2019-23, REV. 0
21
Figure 7. Project Organization
2.1.1.1 Regulatory Lead
The lead regulatory agency for the 200-ZP-1 OU is EPA. EPA is responsible for regulatory oversight
of cleanup projects and activities; EPA also retains authority for all SAPs. EPA will work with DOE-RL
to resolve concerns regarding the work described in this SAP in accordance with Ecology et al., 1989a,
Hanford Federal Facility Agreement and Consent Order (Tri-Party Agreement).
2.1.1.2 DOE-RL Manager
DOE-RL is responsible for cleanup of the Hanford Site. The DOE-RL manager is responsible for
authorizing the contractor to perform activities at the Hanford Site under CERCLA, the Resource
Conservation and Recovery Act of 1976, the Atomic Energy Act of 1954, and the Tri-Party Agreement
(Ecology et al., 1989a).
2.1.1.3 DOE-RL Project Lead
The DOE-RL project lead is responsible for providing day-to-day oversight of the contractor’s work
scope performance, working with the contractor to identify and work through issues, and providing
technical input to DOE-RL management.
2.1.1.4 Project Director
The project director provides oversight and coordinates with DOE-RL and primary contractor
management in support of sampling and reporting activities. The project director also provides support
to the OU project manager to ensure that work is performed safely and cost effectively.
Shipping
Environmental Program and Strategic Planning
Management
Environmental Compliance Officer
Radiological Control
Technicians
Industrial Hygiene Technicians
U.S. Department of Energy Richland Operations Office Manager and Project lead
Project Director and OU Project Manager
Sample Management and
Reporting
Analytical Laboratories
OU Project Scientist
Field Sampling Operations
Sampling Field Work Supervisor
Nuclear Chemical Operators (Samplers)
U.S. Environmental Protection Agency
Regulatory Lead
Quality Assurance
Well Drilling and Well Maintenance
Drilling Field Work Supervisor
Drilling Contractors
Geology l ead
Field Geologist

DOE/RL-2019-23, REV. 0
22
2.1.1.5 Operable Unit Project Manager
The OU project manager (or designee) provides oversight for activities and coordinates with DOE-RL,
the regulatory agencies, and contractor management in support of sampling activities to ensure that work
is performed safely and cost effectively. The OU project manager (or designee) is also responsible for
managing sampling documents and requirements, field activities, and subcontracted tasks, and for
ensuring that the project file is properly maintained.
2.1.1.6 Operable Unit Project Scientist
The OU project scientist is responsible for developing specific sampling designs, analytical requirements,
and QC requirements, either independently or as defined through a systematic planning process.
The OU project scientist ensures that sampling and analysis activities (as delegated by OU project
manager) are carried out in accordance with the SAP. The OU project scientist works closely with the
environmental compliance officer, the QA and Health and Safety organizations, the field work supervisor
(FWS), and the Sample Management and Reporting (SMR) organization to integrate these and other
technical disciplines in planning and implementing the work scope.
2.1.1.7 Sample Management and Reporting
The SMR organization oversees offsite analytical laboratories, coordinates laboratory analytical work
to ensure that laboratories conform to SAP requirements, and verifies that laboratories are qualified to
perform Hanford Site analytical work. SMR generates field sampling documents, labels, and instructions
for field sampling personnel and develops the sample authorization form, which provides information and
instructions for the analytical laboratories. SMR ensures that field sampling documents are revised to
reflect approved changes. SMR receives analytical data from the laboratories, ensures that the data are
appropriately reviewed, performs data entry into the HEIS database, and arranges for data validation and
recordkeeping. SMR is responsible for resolving sample documentation deficiencies or issues associated
with Field Sampling Operations (FSO), laboratories, or other entities. SMR is responsible for informing
the OU project manager of any issues reported by the analytical laboratories.
2.1.1.8 Field Sampling Operations
FSO is responsible for planning and coordinating field sampling resources and provides the FWS for
sampling operations. The FWS directs the nuclear chemical operators (samplers), who collect samples
in accordance with this SAP and corresponding standard methods and procedures. The FWS ensures that
deviations from field sampling documents or issues encountered in the field are documented appropriately
(e.g., in the field logbook). The FWS ensures that samplers are appropriately trained and available.
Samplers collect samples in accordance with sampling documentation. Samplers also complete field
logbooks, data forms, and chain-of-custody forms (including any shipping paperwork) and enable
delivery of the samples to the analytical laboratory.
Pre-job briefings are conducted by FSO in accordance with work management and work release
requirements to evaluate activities and associated hazards by considering the following factors:
Objective of the activities
Individual tasks to be performed
Hazards associated with the planned tasks
Controls applied to mitigate the hazards
Environment in which the job will be performed

DOE/RL-2019-23, REV. 0
23
Facility where the job will be performed
Equipment and material required
2.1.1.9 Quality Assurance
The QA point of contact provides independent oversight and is responsible for addressing QA issues on
the project and overseeing implementation of the project QA requirements. Responsibilities include
reviewing project documents (including the QAPjP) and participating in QA assessments on sample
collection and analysis activities, as appropriate.
2.1.1.10 Environmental Compliance Officer
The environmental compliance officer provides technical oversight, direction, and acceptance of project
and subcontracted environmental work and also develops appropriate mitigation measures, with the goal
of minimizing adverse environmental impacts.
2.1.1.11 Health and Safety
The Health and Safety organization is responsible for coordinating industrial safety and health support
within the project as carried out through health and safety plans, job hazard analyses, and other pertinent
safety documents required by federal regulations or internal primary contractor work requirements.
2.1.1.12 Radiological Engineering
Radiological Engineering is responsible for radiological engineering and health physics support for the
project. Specific responsibilities include conducting as low as reasonably achievable reviews, exposure
and release modeling, and radiological controls optimization for work planning. In addition, radiological
hazards are identified, and appropriate controls are implemented to maintain worker exposures to hazards
at levels as low as reasonably achievable. Radiological Engineering interfaces with the project Health and
Safety representative and other appropriate personnel as needed to plan and direct radiological control
technician (RCT) support for activities.
2.1.1.13 Waste Management
Waste Management is responsible for identifying waste management sampling/characterization
requirements to ensure regulatory compliance and for interpreting data to determine waste designations
and profiles. Waste Management communicates policies and procedures and ensures project compliance
for storage, transportation, disposal, and waste tracking in a safe and cost-effective manner.
2.1.1.14 Analytical Laboratories
The analytical laboratories analyze samples in accordance with established procedures and their
subcontracts and provide necessary data packages containing analytical and QC results. The laboratories
provide explanations of results to support data review and in response to resolving analytical issues.
Statements of work flow down quality requirements consistent with HASQARD (DOE/RL-98-68).
The laboratories are evaluated under DoD and DOE (2017) requirements and must be accredited by
EPA and the Washington State Department of Ecology (Ecology) for the analyses performed for the DOE
prime contractor.

DOE/RL-2019-23, REV. 0
24
2.1.1.15 Well Drilling and Well Maintenance
The well drilling and maintenance and the well coordination and planning managers are responsible for
the following:
Planning, coordinating, and executing drilling construction
Performing well maintenance activities
Coordinating with the OU project scientist regarding field constraints that could affect
sampling design
Coordinating well decommissioning with DOE-RL and Ecology approval, as appropriate, in
accordance with the substantive standards of WAC 173-160, “Minimum Standards for Construction
and Maintenance of Wells”; and DOE/RL-2005-70, Hanford Site Well Decommissioning Plan
The well drilling and well maintenance organization will oversee, and may assist in, hydraulic testing
activities to be conducted under this SAP and under the subsequently developed hydraulic testing plan
(discussed in Section 1.3.3).
2.1.2 Quality Objectives and Criteria
The QA objective of this plan is to ensure that the generation of analytical data of known and appropriate
quality is acceptable and useful in order to meet the evaluation requirements stated in this SAP. Data
quality indicators (DQIs) are data descriptors that help determine the acceptability and usefulness of data
to the user. For the purposes of this SAP, the principal DQIs (precision, accuracy, representativeness,
comparability, completeness, bias, and sensitivity) are defined in Table 8.
2.1.3 Special Training Requirements and Certification
Workers receive a level of training that is commensurate with their responsibility for collecting and
transporting samples in compliance with applicable DOE orders and government regulations. The FWS,
in coordination with line management, will ensure that special training requirements for field personnel
are met.
Training has been instituted by the contractor management team to meet training and qualification
programs that satisfy multiple training drivers imposed by applicable DOE, Code of Federal Regulations,
and Washington Administrative Code requirements.
Training records are maintained for each employee in an electronic training record database, and
the contractor’s training organization maintains the database. Line management confirms that an
employee’s training is appropriate and up to date prior to the employee performing any field work.
2.1.4 Documentation and Records
The OU project manager (or designee) is responsible for ensuring that the current version of this SAP
is being used and for providing updates to field personnel. Version control is maintained by the
administrative document control process. Table 9 defines the types of changes that may impact sampling
and the associated approvals, notifications, and documentation requirements.
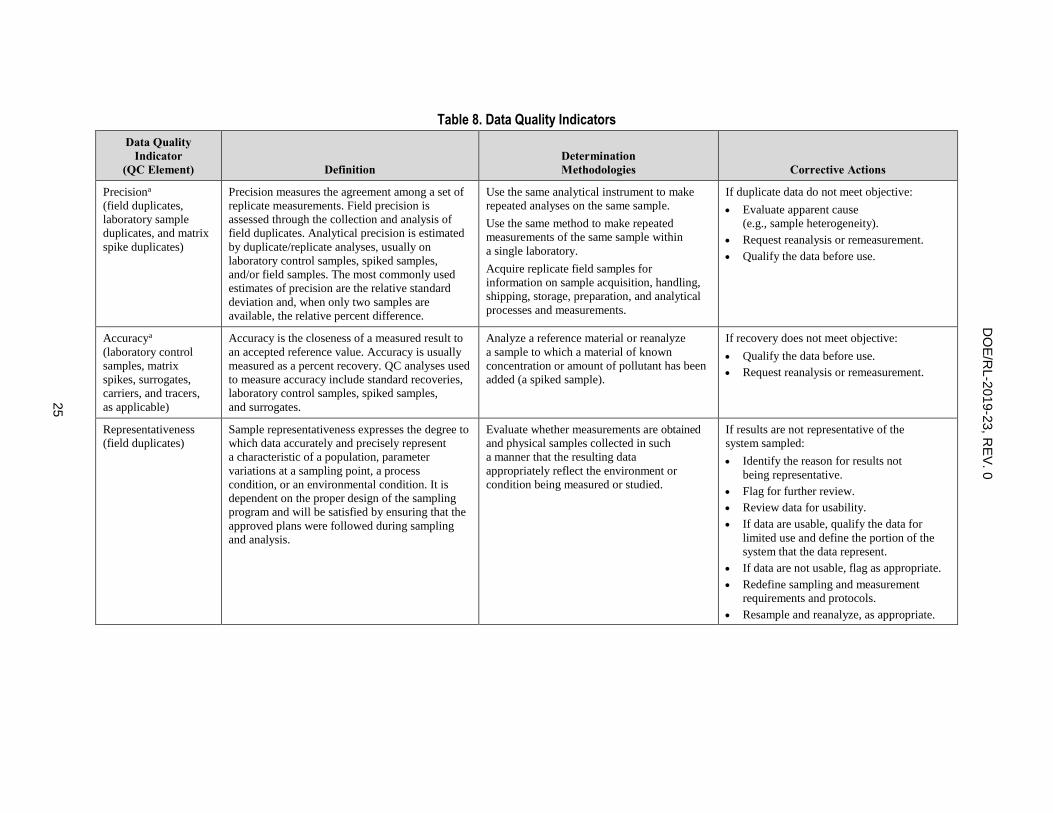
DO
E/R
L-2
019-2
3, R
EV
. 0
25
Table 8. Data Quality Indicators
Data Quality
Indicator
(QC Element) Definition
Determination
Methodologies Corrective Actions
Precisiona
(field duplicates,
laboratory sample
duplicates, and matrix
spike duplicates)
Precision measures the agreement among a set of
replicate measurements. Field precision is
assessed through the collection and analysis of
field duplicates. Analytical precision is estimated
by duplicate/replicate analyses, usually on
laboratory control samples, spiked samples,
and/or field samples. The most commonly used
estimates of precision are the relative standard
deviation and, when only two samples are
available, the relative percent difference.
Use the same analytical instrument to make
repeated analyses on the same sample.
Use the same method to make repeated
measurements of the same sample within
a single laboratory.
Acquire replicate field samples for
information on sample acquisition, handling,
shipping, storage, preparation, and analytical
processes and measurements.
If duplicate data do not meet objective:
Evaluate apparent cause
(e.g., sample heterogeneity).
Request reanalysis or remeasurement.
Qualify the data before use.
Accuracya
(laboratory control
samples, matrix
spikes, surrogates,
carriers, and tracers,
as applicable)
Accuracy is the closeness of a measured result to
an accepted reference value. Accuracy is usually
measured as a percent recovery. QC analyses used
to measure accuracy include standard recoveries,
laboratory control samples, spiked samples,
and surrogates.
Analyze a reference material or reanalyze
a sample to which a material of known
concentration or amount of pollutant has been
added (a spiked sample).
If recovery does not meet objective:
Qualify the data before use.
Request reanalysis or remeasurement.
Representativeness
(field duplicates)
Sample representativeness expresses the degree to
which data accurately and precisely represent
a characteristic of a population, parameter
variations at a sampling point, a process
condition, or an environmental condition. It is
dependent on the proper design of the sampling
program and will be satisfied by ensuring that the
approved plans were followed during sampling
and analysis.
Evaluate whether measurements are obtained
and physical samples collected in such
a manner that the resulting data
appropriately reflect the environment or
condition being measured or studied.
If results are not representative of the
system sampled:
Identify the reason for results not
being representative.
Flag for further review.
Review data for usability.
If data are usable, qualify the data for
limited use and define the portion of the
system that the data represent.
If data are not usable, flag as appropriate.
Redefine sampling and measurement
requirements and protocols.
Resample and reanalyze, as appropriate.

DO
E/R
L-2
019-2
3, R
EV
. 0
26
Table 8. Data Quality Indicators
Data Quality
Indicator
(QC Element) Definition
Determination
Methodologies Corrective Actions
Comparability
(field duplicate, field
splits, laboratory
control samples,
matrix spikes,
and matrix
spike duplicates)
Comparability expresses the degree of confidence
with which one data set can be compared to
another. It is dependent on the proper design of
the sampling program and will be satisfied by
ensuring that the approved plans are followed and
that proper sampling and analysis techniques
are applied.
Use identical or similar sample collection and
handling methods, sample preparation and
analytical methods, holding times, and quality
assurance protocols.
If data are not comparable to other data sets:
Identify appropriate changes to data
collection and/or analysis methods.
Identify quantifiable bias, if applicable.
Qualify the data as appropriate.
Resample and/or reanalyze if needed.
Revise sampling/analysis protocols to
ensure future comparability.
Completeness
(no QC element;
addressed in data
quality assessment)
Completeness is a measure of the amount of valid
data collected compared to the amount planned.
Measurements are considered to be valid if they
are unqualified or qualified as estimated data
during validation. Field completeness is a measure
of the number of samples collected versus the
number of samples planned. Laboratory
completeness is a measure of the number of valid
measurements compared to the total number of
measurements planned.
Compare the number of valid measurements
completed (samples collected or
samples analyzed) with those established
by the project’s quality criteria (data
quality objectives or performance/
acceptance criteria).
If data set does not meet the completeness
objective:
Identify appropriate changes to data
collection and/or analysis methods.
Identify quantifiable bias, if applicable.
Resample and/or reanalyze if needed.
Revise sampling/analysis protocols to
ensure future completeness.

DO
E/R
L-2
019-2
3, R
EV
. 0
27
Table 8. Data Quality Indicators
Data Quality
Indicator
(QC Element) Definition
Determination
Methodologies Corrective Actions
Bias
(equipment blanks,
field transfer blanks,
full trip blanks,
laboratory control
samples, matrix
spikes, and
method blanks)
Bias is the systematic or persistent distortion of
a measurement process that causes error in one
direction (e.g., the sample measurement is
consistently lower than the sample’s true value).
Bias can be introduced during sampling, analysis,
and data evaluation.
Analytical bias refers to deviation in one direction
(i.e., high, low, or unknown) of the measured
value from a known spiked amount.
Sampling bias may be revealed by analysis of
replicate samples.
Analytical bias may be assessed by
comparing a measured value in a sample of
known concentration to an accepted
reference value or by determining the
recovery of a known amount of contaminant
spiked into a sample (matrix spike).
For sampling bias:
Properly select and use sampling tools.
Institute correct sampling and subsampling
practices to limit preferential selection or
loss of sample media.
Use sample handling practices, including
proper sample preservation, that limit the
loss or gain of constituents to the
sample media.
Analytical data that are known to be
affected by either sampling or analytical
bias are flagged to indicate possible bias.
Laboratories that are known to generate
biased data for a specific analyte are asked
to correct their methods to remove the bias
as best as practicable. Otherwise, samples
are sent to other laboratories for analysis.
Sensitivity
(method detection
limit, practical
quantitation limit,
and relative
percent difference)
Sensitivity is an instrument’s or method’s
minimum concentration that can be reliably
measured (i.e., instrument detection limit or limit
of quantitation).
Determine the minimum concentration or
attribute to be measured by an instrument
(instrument detection limit) or by a laboratory
(limit of quantitation).
The lower limit of quantitationb is the lowest
level that can be routinely quantified and
reported by a laboratory.
If detection limits do not meet objective:
Request reanalysis or remeasurement using
methods or analytical conditions that
will meet required detection or limit
of quantitation.
Qualify/reject the data before use.
Source: SW-846, Test Methods for Evaluating Solid Waste: Physical/Chemical Methods, Third Edition; Final Update V, as amended.
a. Acceptance criteria for QC elements of precision and accuracy for groundwater and sediment analyses are provided in Tables 10 and 11, respectively.
b. For purposes of this sampling and analysis plan, the lower limit of quantitation is interchangeable with the practical quantitation limit as specified in Table 10 for groundwater samples
and Table 11 for sediment samples.
QC = quality control
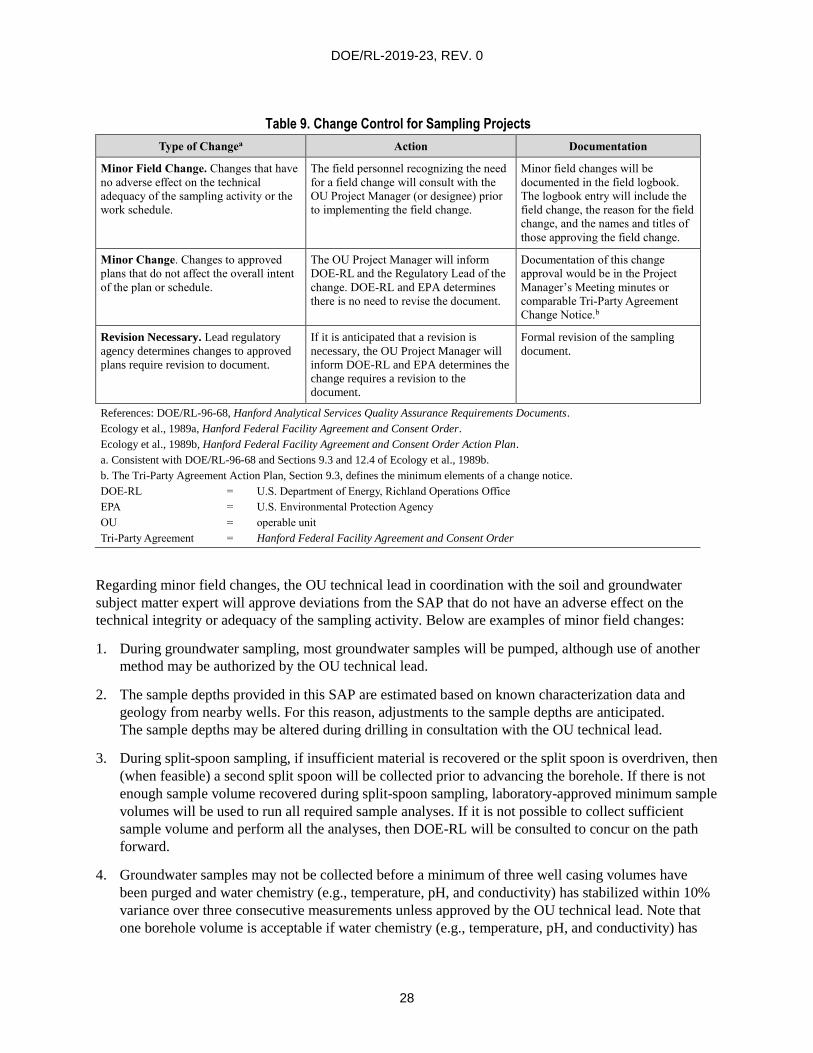
DOE/RL-2019-23, REV. 0
28
Table 9. Change Control for Sampling Projects
Type of Changea Action Documentation
Minor Field Change. Changes that have
no adverse effect on the technical
adequacy of the sampling activity or the
work schedule.
The field personnel recognizing the need
for a field change will consult with the
OU Project Manager (or designee) prior
to implementing the field change.
Minor field changes will be
documented in the field logbook.
The logbook entry will include the
field change, the reason for the field
change, and the names and titles of
those approving the field change.
Minor Change. Changes to approved
plans that do not affect the overall intent
of the plan or schedule.
The OU Project Manager will inform
DOE-RL and the Regulatory Lead of the
change. DOE-RL and EPA determines
there is no need to revise the document.
Documentation of this change
approval would be in the Project
Manager’s Meeting minutes or
comparable Tri-Party Agreement
Change Notice.b
Revision Necessary. Lead regulatory
agency determines changes to approved
plans require revision to document.
If it is anticipated that a revision is
necessary, the OU Project Manager will
inform DOE-RL and EPA determines the
change requires a revision to the
document.
Formal revision of the sampling
document.
References: DOE/RL-96-68, Hanford Analytical Services Quality Assurance Requirements Documents.
Ecology et al., 1989a, Hanford Federal Facility Agreement and Consent Order.
Ecology et al., 1989b, Hanford Federal Facility Agreement and Consent Order Action Plan.
a. Consistent with DOE/RL-96-68 and Sections 9.3 and 12.4 of Ecology et al., 1989b.
b. The Tri-Party Agreement Action Plan, Section 9.3, defines the minimum elements of a change notice.
DOE-RL = U.S. Department of Energy, Richland Operations Office
EPA = U.S. Environmental Protection Agency
OU = operable unit
Tri-Party Agreement = Hanford Federal Facility Agreement and Consent Order
Regarding minor field changes, the OU technical lead in coordination with the soil and groundwater
subject matter expert will approve deviations from the SAP that do not have an adverse effect on the
technical integrity or adequacy of the sampling activity. Below are examples of minor field changes:
1. During groundwater sampling, most groundwater samples will be pumped, although use of another
method may be authorized by the OU technical lead.
2. The sample depths provided in this SAP are estimated based on known characterization data and
geology from nearby wells. For this reason, adjustments to the sample depths are anticipated.
The sample depths may be altered during drilling in consultation with the OU technical lead.
3. During split-spoon sampling, if insufficient material is recovered or the split spoon is overdriven, then
(when feasible) a second split spoon will be collected prior to advancing the borehole. If there is not
enough sample volume recovered during split-spoon sampling, laboratory-approved minimum sample
volumes will be used to run all required sample analyses. If it is not possible to collect sufficient
sample volume and perform all the analyses, then DOE-RL will be consulted to concur on the path
forward.
4. Groundwater samples may not be collected before a minimum of three well casing volumes have
been purged and water chemistry (e.g., temperature, pH, and conductivity) has stabilized within 10%
variance over three consecutive measurements unless approved by the OU technical lead. Note that
one borehole volume is acceptable if water chemistry (e.g., temperature, pH, and conductivity) has
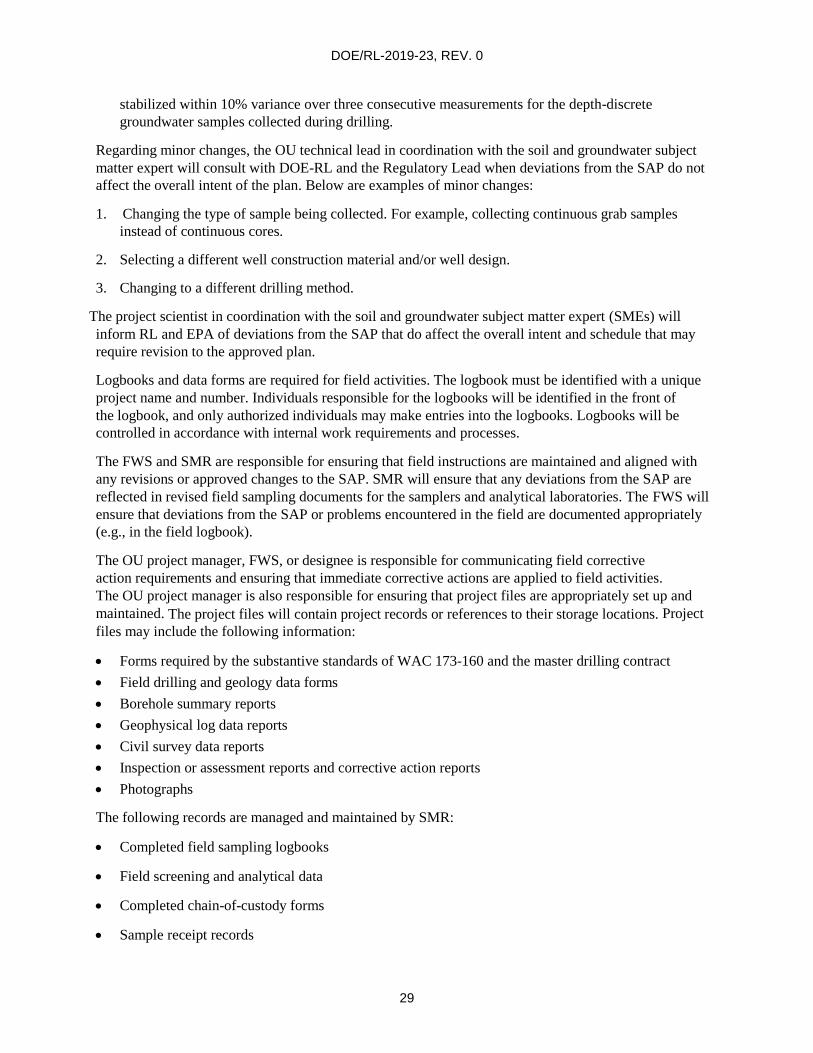
DOE/RL-2019-23, REV. 0
29
stabilized within 10% variance over three consecutive measurements for the depth-discrete
groundwater samples collected during drilling.
Regarding minor changes, the OU technical lead in coordination with the soil and groundwater subject
matter expert will consult with DOE-RL and the Regulatory Lead when deviations from the SAP do not
affect the overall intent of the plan. Below are examples of minor changes:
1. Changing the type of sample being collected. For example, collecting continuous grab samples
instead of continuous cores.
2. Selecting a different well construction material and/or well design.
3. Changing to a different drilling method.
The project scientist in coordination with the soil and groundwater subject matter expert (SMEs) will
inform RL and EPA of deviations from the SAP that do affect the overall intent and schedule that may
require revision to the approved plan.
Logbooks and data forms are required for field activities. The logbook must be identified with a unique
project name and number. Individuals responsible for the logbooks will be identified in the front of
the logbook, and only authorized individuals may make entries into the logbooks. Logbooks will be
controlled in accordance with internal work requirements and processes.
The FWS and SMR are responsible for ensuring that field instructions are maintained and aligned with
any revisions or approved changes to the SAP. SMR will ensure that any deviations from the SAP are
reflected in revised field sampling documents for the samplers and analytical laboratories. The FWS will
ensure that deviations from the SAP or problems encountered in the field are documented appropriately
(e.g., in the field logbook).
The OU project manager, FWS, or designee is responsible for communicating field corrective
action requirements and ensuring that immediate corrective actions are applied to field activities.
The OU project manager is also responsible for ensuring that project files are appropriately set up and
maintained. The project files will contain project records or references to their storage locations. Project
files may include the following information:
Forms required by the substantive standards of WAC 173-160 and the master drilling contract
Field drilling and geology data forms
Borehole summary reports
Geophysical log data reports
Civil survey data reports
Inspection or assessment reports and corrective action reports
Photographs
The following records are managed and maintained by SMR:
Completed field sampling logbooks
Field screening and analytical data
Completed chain-of-custody forms
Sample receipt records

DOE/RL-2019-23, REV. 0
30
Laboratory data packages
Analytical data verification and validation reports
Analytical data “case file purges” (i.e., raw data purged from laboratory files) provided by the offsite
analytical laboratories
The laboratory is responsible for maintaining, and having available upon request, the following:
Analytical logbooks
Raw data and QC sample records
Standard reference material and/or proficiency test sample data
Sample chain-of-custody and sample storage temperature logs
Instrument calibration information
Training records for employees (in regard to analytical methods)
Laboratory state accreditation records
Laboratory audit records
Convenience copies of laboratory analytical results are maintained in the HEIS database. Records may be
stored in either electronic (e.g., in the managed records area of the Integrated Document Management
System) or hardcopy format (e.g., DOE Records Holding Area). Documentation and records, regardless
of medium or format, are controlled in accordance with internal work requirements and processes that
ensure accuracy and retrievability of stored records. Records required by the Tri-Party Agreement
(Ecology et al., 1989a) will be managed in accordance with requirements listed therein.
2.2 Data Generation and Acquisition
This section addresses data generation and acquisition to ensure that the project’s methods for sampling
measurement and analysis, data collection or generation, data handling, and QC activities are appropriate
and documented. Requirements for instrument calibration and maintenance, supply inspections, and data
management are also addressed.
2.2.1 Sampling Methods Requirements
The procedures to be implemented in the field will be in accordance with those presented in Section 3.4
of this SAP. In the event that sampling activities cannot be performed in accordance with this SAP,
deviations will be communicated by the FWS to SMR and the OU project manager, documented in the
field logbook, and may result in field changes to the work instructions and/or the SAP.
2.2.2 Analytical Methods Requirements
Table 10 presents the selected analytical methods to meet the practical quantitation limits (PQLs) and the
analytical performance requirements for groundwater samples. Table 11 presents the selected analytical
methods to meet PQLs and analytical performance requirements for sediment samples. The PQLs will
meet the DQO requirements. Table 12 presents the selected methods for analyzing physical properties of
sediments, as specified in Table 6. Some of the analyses identified in Tables 11 and 12 are conducted
at PNNL. The analytical performance requirements for methods listed in Table 12 are identified and
defined in the method procedures or in the laboratory’s internal QA requirements and are not specified in
this SAP.

DOE/RL-2019-23, REV. 0
31
Updated EPA methods and nationally recognized standard methods may be substituted for the analytical
methods identified in Tables 10, 11, and 12 in order to follow any changed requirements in method
updates. The new method must achieve project DQOs as well as or better than the replaced method.
Table 10. Constituent Methods and Analytical Performance Requirements for Groundwater Samples
Survey/Analytical Methoda Required PQLb
SW-846, Method 8260, Carbon tetrachloride 3 µg/L
SW-846, Method 8260, Trichloroethene 2.1 µg/L
SW-846, Method 8260, Chloroform 5 µg/L
SW-846, Method 8260, Chloromethane 10 µg/L
SW-846, Method 8260, Dichloromethane 5.25 µg/L
SW-846, Method 8260, cis-1,2-Dichloroethene 5 µg/L
SW-846, Method 8260, Vinyl chloride 2.1 µg/L
SW-846 Method 6020, Chromium (total) 10.5 µg/L
SW-846, Method 7196, Chromium (hexavalent) 10.5 µg/L
SW-846, Method 6010, Iron 105 µg/L
SW-846, Method 6020, Manganese 5.25 µg/L
SW-846, Method 9056 or 300.0, Nitrate-N 250 µg/L
SW-846, Method 9056 or 300.0, Nitrite-N 250 µg/L
SW-846, Method 9045, pH N/A
SW-846, Method 9056 or 300.0, Chloride 400 µg/L
SW-846, Method 9056 or 300.0A, Sulfate 1,050 µg/L
EPA 4500-S, 376.1, Sulfide 2.1 mg/L
SW-846, Method 9012/9014, 335.4, or SM 4500, Cyanide (total) 10.5 µg/L
SW-846, Method 2320 or 310.1, Alkalinity 5.25 mg/L
SW-846, Method 2540 or 160.1, Total dissolved solids 21 mg/L
SW-846, Method 9060 or 415.1, Total carbon 1.05 mg/L
SW-846, Method 9060 or 415.1, Total inorganic carbon 1.05 mg/L
SW-846, Method 9060 or 415.1, Total organic carbon 1.05 mg/L
SW-846, Method 6020, Uranium (total) 1.05 µg/L
Low-energy photon spectroscopy, Iodine-129 1 pCi/L
Liquid scintillation, Tritium 700 pCi/L

DOE/RL-2019-23, REV. 0
32
Table 10. Constituent Methods and Analytical Performance Requirements for Groundwater Samples
Survey/Analytical Methoda Required PQLb
Liquid scintillation, Technetium-99 50 pCi/L
a. Equivalent methods may be substituted in future sampling and analysis instructions or other documents. For
EPA Method 300.0, see EPA/600/4-79/020, Methods for Chemical Analysis of Water and Wastes. For four-digit
EPA methods, see SW-846, Test Methods for Evaluating Solid Waste: Physical/Chemical Methods, Third Edition;
Final Update V, as amended.
b. PQLs are specified in contracts with analytical laboratories. Actual PQLs vary by laboratory and may be lower.
Method detection limits for chemical analyses are three to five times lower than quantitation limits.
EPA = U.S. Environmental Protection Agency
N/A = not applicable
PQL = practical quantitation limit
Table 11. Constituent Methods and Analytical Performance Requirements for Sediment Samples
Analytical Methoda Required PQLb
SW-846, Method 8260, Carbon tetrachloridec 5 µg/kg
SW-846, Method 8260, Trichloroethenec 5 µg/kg
SW-846, Method 8260, Chloroformc 5 µg/kg
SW-846, Method 8260, Chloromethanec 10 µg/kg
SW-846, Method 8260, Dichloromethanec 5 µg/kg
SW-846, Method 8260, cis-1,2-Dichloroethenec 5 µg/kg
SW-846, Method 8260, Vinyl chloridec 10 µg/kg
SW-846 Method 6020, Chromium (total) 1,000 µg/kg
SW-846, Method 7196, Chromium (hexavalent) 500 µg/kg
SW-846, Method 6010, Iron 25,000 µg/kg
SW-846, Method 6020, Manganese 1,000 µg/kg
SW-846, Method 9045, pH N/A
SW-846, Method 9012/9014, 335.4, or SM 4500, Cyanide (total) 1,000 µg/kg
SW-846, Method 9060 or 415.1, Total carbonc 100,000 µg/kg
SW-846, Method 9060 or 415.1, Total inorganic carbonc 100,000 µg/kg
SW-846, Method 9060 or 415.1, Total organic carbonc 100,000 µg/kg
SW-846, Method 6020, Uranium (total) 150 µg/kg
Liquid scintillation, Technetium-99 5 pCi/g
a. Equivalent methods may be substituted in future sampling and analysis instructions or other documents. For EPA
Method 300.0, see EPA/600/4-79/020, Methods for Chemical Analysis of Water and Wastes. For four-digit EPA
methods, see SW-846, Test Methods for Evaluating Solid Waste: Physical/Chemical Methods, Third Edition; Final
Update V, as amended.
b. PQLs are specified in contracts with analytical laboratories. Actual PQLs vary by laboratory and may be lower.
Method detection limits for chemical analyses are three to five times lower than quantitation limits.
c. Analysis to be performed by Pacific Northwest National Laboratory using full, intact liners C or D. If there is a
question about the intact nature of the liners, the project scientist should be contacted for direction.
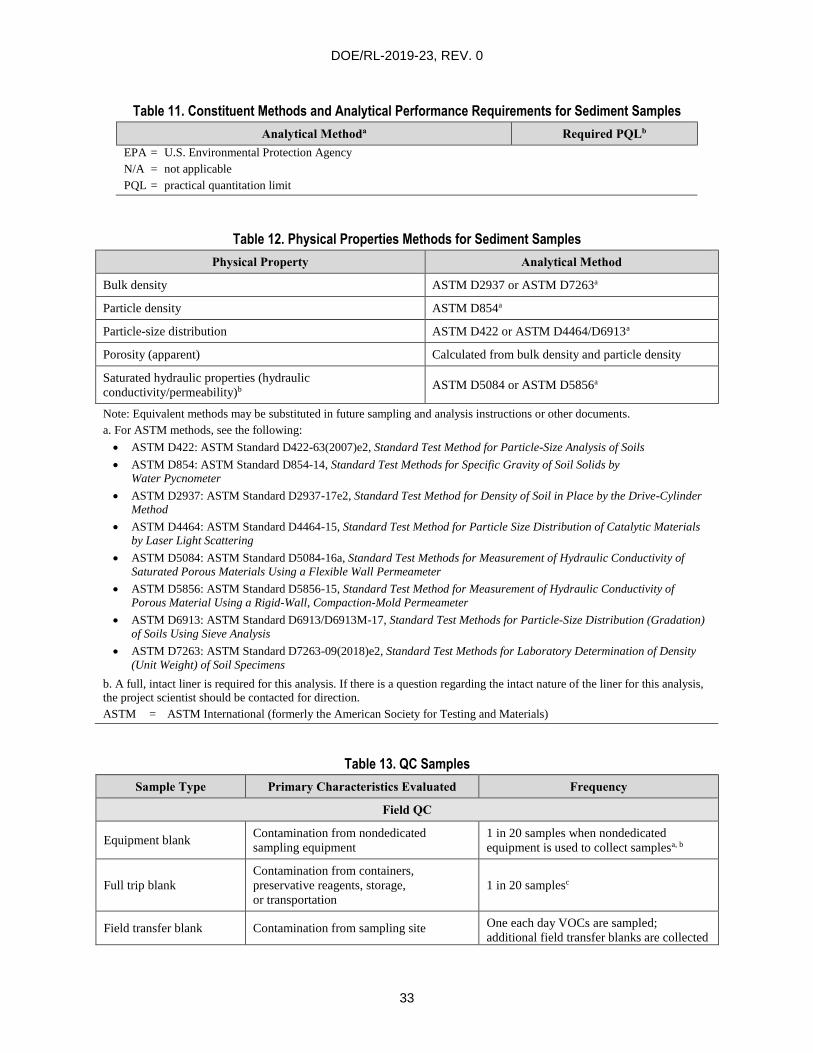
DOE/RL-2019-23, REV. 0
33
Table 11. Constituent Methods and Analytical Performance Requirements for Sediment Samples
Analytical Methoda Required PQLb
EPA = U.S. Environmental Protection Agency
N/A = not applicable
PQL = practical quantitation limit
Table 12. Physical Properties Methods for Sediment Samples
Physical Property Analytical Method
Bulk density ASTM D2937 or ASTM D7263a
Particle density ASTM D854a
Particle-size distribution ASTM D422 or ASTM D4464/D6913a
Porosity (apparent) Calculated from bulk density and particle density
Saturated hydraulic properties (hydraulic
conductivity/permeability)b ASTM D5084 or ASTM D5856a
Note: Equivalent methods may be substituted in future sampling and analysis instructions or other documents.
a. For ASTM methods, see the following:
ASTM D422: ASTM Standard D422-63(2007)e2, Standard Test Method for Particle-Size Analysis of Soils
ASTM D854: ASTM Standard D854-14, Standard Test Methods for Specific Gravity of Soil Solids by
Water Pycnometer
ASTM D2937: ASTM Standard D2937-17e2, Standard Test Method for Density of Soil in Place by the Drive-Cylinder
Method
ASTM D4464: ASTM Standard D4464-15, Standard Test Method for Particle Size Distribution of Catalytic Materials
by Laser Light Scattering
ASTM D5084: ASTM Standard D5084-16a, Standard Test Methods for Measurement of Hydraulic Conductivity of
Saturated Porous Materials Using a Flexible Wall Permeameter
ASTM D5856: ASTM Standard D5856-15, Standard Test Method for Measurement of Hydraulic Conductivity of
Porous Material Using a Rigid-Wall, Compaction-Mold Permeameter
ASTM D6913: ASTM Standard D6913/D6913M-17, Standard Test Methods for Particle-Size Distribution (Gradation)
of Soils Using Sieve Analysis
ASTM D7263: ASTM Standard D7263-09(2018)e2, Standard Test Methods for Laboratory Determination of Density
(Unit Weight) of Soil Specimens
b. A full, intact liner is required for this analysis. If there is a question regarding the intact nature of the liner for this analysis,
the project scientist should be contacted for direction.
ASTM = ASTM International (formerly the American Society for Testing and Materials)
Table 13. QC Samples
Sample Type Primary Characteristics Evaluated Frequency
Field QC
Equipment blank Contamination from nondedicated
sampling equipment
1 in 20 samples when nondedicated
equipment is used to collect samplesa, b
Full trip blank
Contamination from containers,
preservative reagents, storage,
or transportation
1 in 20 samplesc
Field transfer blank Contamination from sampling site One each day VOCs are sampled;
additional field transfer blanks are collected

DOE/RL-2019-23, REV. 0
34
Table 13. QC Samples
Sample Type Primary Characteristics Evaluated Frequency
if VOC samples are acquired on the same
day for multiple laboratories (wells or other
media samples)
Field duplicate samples Reproducibility/sampling precision 1 in 20 samplesc
Field split samples Interlaboratory comparability As needed, determined by Sample
Management and Reporting
Laboratory Batch QCd
Carrier Recovery/yield Added to each sample and QC samplee
Method blanks Laboratory contamination One per analytical batche
Laboratory sample
duplicate Laboratory reproducibility and precision One per analytical batche
Matrix spikes Matrix effect/laboratory accuracy One per analytical batche
Matrix spike duplicate Laboratory reproducibility, and method
accuracy and precision One per analytical batche
Surrogates Recovery/yield for organic compounds Added to each sample and QC
Tracers Recovery/yield Added to each sample and QC
Laboratory control Method accuracy One per analytical batche
Grundfos® is a registered trademark of Grundfos Corporation, Bjerringbro, Denmark.
a. For portable Grundfos® pumps, equipment blanks are collected 1 per 10 well trips. Whenever a new type of nondedicated
equipment is used, an equipment blank will be collected every time sampling occurs until it can be shown that less frequent
collection of equipment blanks is adequate to monitor the decontamination procedure for the nondedicated equipment.
b. Vendor-provided borehole equipment is considered dedicated equipment, and equipment blanks are not typically acquired
in this instance.
c. For groundwater, a sample is collected any time a well is accessed for sampling; this is also known as a well trip. Field
duplicates and full trip blanks are run at a frequency of 1 in 20 well trips (i.e., 5% of the well trips) for all groundwater
monitoring wells sampled within any given month (not just those restricted to a single treatment, storage, and disposal unit).
d. Batching across projects is allowed for similar matrices (e.g., Hanford Site groundwater).
e. Unless not required by, or a different frequency is called out, in laboratory analysis method.
DOE = U.S. Department of Energy
QC = quality control
VOC = volatile organic compound
The laboratory contaminant mobility and transport studies performed by PNNL will be conducted using
PNNL-developed methods and procedures that are not specified in this SAP.
2.2.3 Field Screening Methods
Field screening parameters used for site characterization will be measured in accordance with
HASQARD requirements (DOE/RL-96-68), as applicable. Field screening methods may also be
performed in accordance with manufacturers’ manuals. Table 5 provides the parameters identified
for field screening.
2.2.4 Quality Control
The QC requirements specified in this SAP must be followed in the field and analytical laboratory to
ensure that reliable data are obtained. Field QC samples will be collected to evaluate the potential for

DOE/RL-2019-23, REV. 0
35
cross-contamination and to provide information pertinent to sampling variability. Laboratory QC samples
estimate the precision, bias, and matrix effects of the analytical data. Table 13 summarizes the field
and laboratory QC sample requirements, and Table 14 lists the general field and laboratory QC elements
and acceptance criteria.
Table 14. Field and Laboratory QC Elements and Acceptance Criteria
Analyte QC Element
Acceptance Criteria
Corrective Action Water Soil
General Physical and Chemical Parameters
Alkalinity MB
< MDL
<5% sample concentration Flag with “C”
LCS 80%–120% recovery Flag with “o”a
DUPb or MS/MSDc ≤20% RPD ≤35% RPD Review datad
MS/MSDc 75%–125% recovery Flag with “N”
EB, FTB < MDL
<5% sample concentration Flag with “Q”
Field duplicateb ≤20% RPD Footnote e Review datad
Total dissolved
solids MB
< MDL
<5% sample
concentration
N/A Flag with “C”
LCS 80%–120% recovery N/A Flag with “o”a
DUPb ≤20% RPD N/A Review datad
EB, FTB
< MDL
<5% sample
concentration
N/A Flag with “Q”
Field duplicateb ≤20% RPD N/A Review datad
Total organic
carbon/total
inorganic carbon
MB < MDL
<5% sample concentration Flag with “C”
LCS 80%–120% recovery Flag with “o”a
DUPb or MS/MSDc ≤20% RPD ≤35% RPD Review datad
MS/MSDc 75%–125% recovery Flag with “N”
EB, FTB < MDL
<5% sample concentration Flag with “Q”
Field duplicateb ≤20% RPD Footnote e Review datad
Ammonia and Anions
Anions by IC MB
< MDL
<5% sample concentration Flag with “C”
LCS 80%–120% recovery Flag with “o”a
DUPb or MS/MSDc ≤20% RPD ≤35% RPD Review datad
MS/MSDc 75%–125% recovery Flag with “N”
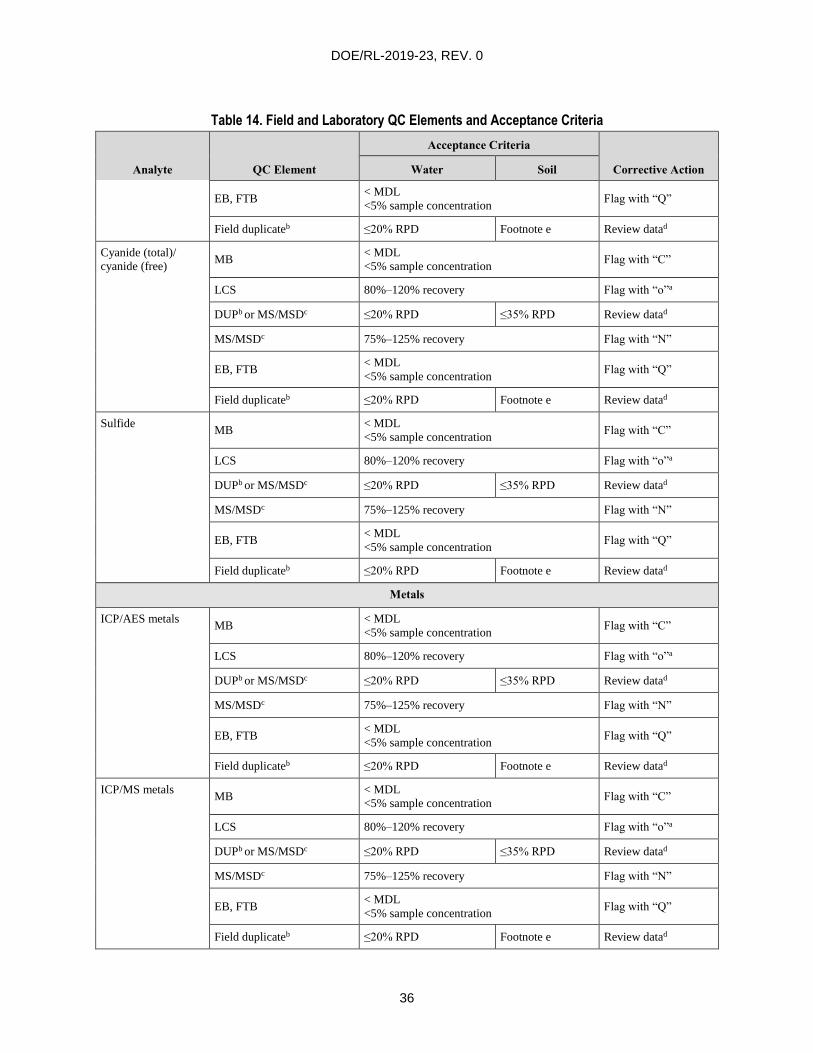
DOE/RL-2019-23, REV. 0
36
Table 14. Field and Laboratory QC Elements and Acceptance Criteria
Analyte QC Element
Acceptance Criteria
Corrective Action Water Soil
EB, FTB < MDL
<5% sample concentration Flag with “Q”
Field duplicateb ≤20% RPD Footnote e Review datad
Cyanide (total)/
cyanide (free) MB
< MDL
<5% sample concentration Flag with “C”
LCS 80%–120% recovery Flag with “o”a
DUPb or MS/MSDc ≤20% RPD ≤35% RPD Review datad
MS/MSDc 75%–125% recovery Flag with “N”
EB, FTB < MDL
<5% sample concentration Flag with “Q”
Field duplicateb ≤20% RPD Footnote e Review datad
Sulfide MB
< MDL
<5% sample concentration Flag with “C”
LCS 80%–120% recovery Flag with “o”a
DUPb or MS/MSDc ≤20% RPD ≤35% RPD Review datad
MS/MSDc 75%–125% recovery Flag with “N”
EB, FTB < MDL
<5% sample concentration Flag with “Q”
Field duplicateb ≤20% RPD Footnote e Review datad
Metals
ICP/AES metals MB
< MDL
<5% sample concentration Flag with “C”
LCS 80%–120% recovery Flag with “o”a
DUPb or MS/MSDc ≤20% RPD ≤35% RPD Review datad
MS/MSDc 75%–125% recovery Flag with “N”
EB, FTB < MDL
<5% sample concentration Flag with “Q”
Field duplicateb ≤20% RPD Footnote e Review datad
ICP/MS metals MB
< MDL
<5% sample concentration Flag with “C”
LCS 80%–120% recovery Flag with “o”a
DUPb or MS/MSDc ≤20% RPD ≤35% RPD Review datad
MS/MSDc 75%–125% recovery Flag with “N”
EB, FTB < MDL
<5% sample concentration Flag with “Q”
Field duplicateb ≤20% RPD Footnote e Review datad
I
I
I
I
I
I
I
I
I
I

DOE/RL-2019-23, REV. 0
37
Table 14. Field and Laboratory QC Elements and Acceptance Criteria
Analyte QC Element
Acceptance Criteria
Corrective Action Water Soil
Hexavalent
chromium MB
< MDL
<5% sample concentration Flag with “C”
LCS 80%–120% recovery Flag with “o”a
DUPb or MS/MSDc ≤20% RPD ≤35% RPD Review datad
MS/MSDc 75%–125% recovery Flag with “N”
EB, FTB < MDL
<5% sample concentration Flag with “Q”
Field duplicateb ≤20% RPD Footnote e Review datad
Uranium (total) by
ICP/MS MB
< MDL
<5% sample concentration Flag with “C”
LCS 80%–120% recovery Flag with “o”a
DUPb or MS/MSDc ≤20% RPD ≤35% RPD Review datad
MS/MSDc 75%–125% recovery Flag with “N”
EB, FTB < MDL
<5% sample concentration Flag with “Q”
Field duplicateb ≤20% RPD Footnote e Review datad
Volatile Organic Compounds
Volatile organics by
GC/MS MB
< MDLf
<5% sample concentration Flag with “B”
LCS 70%–130% recovery or % recovery
statistically derivedg Flag with “o”a
DUPb or MS/MSDc ≤ 20% RPD Review datad
MS/MSDc 70%–130% recovery Flag with “T”
SUR 70%–130% recovery
% recovery
statistically
derivedg
Review datad
EB, FTB, FXR < MDL f
<5% sample concentration Flag with “Q”
Field duplicateb ≤20% RPD Footnote e Review datad
Radiological Parameters
AEA (uranium,
isotopic) MB
< MDC
<5% sample activity concentration Flag with “B”
LCS
80%–120% recovery or statistically
derived limitsg Flag with “o”a
DUPb ≤20% RPD ≤30% RPD Review datad
Tracer 30%–105% recovery Review datad

DOE/RL-2019-23, REV. 0
38
Table 14. Field and Laboratory QC Elements and Acceptance Criteria
Analyte QC Element
Acceptance Criteria
Corrective Action Water Soil
EB, FTB
< MDC
<5% sample activity concentration Flag with “Q”
Field duplicateb ≤20% RPD Footnote e Review datad
Iodine-129 MB
< MDC
<5% sample activity concentration Flag with “B”
LCS 80%–120% recovery or statistically
derived limitsg Flag with “o”a
DUPb ≤20% RPD ≤30% RPD Review datad
Carrier 40%–110% recovery Review datad
EB, FTB < MDC
<5% sample activity concentration Flag with “Q”
Field duplicateb ≤20% RPD Footnote e Review datad
Technetium-99 MB
< MDC
<5% sample activity concentration Flag with “B”
LCS 80%-120% recovery or statistically
derived limitsg Flag with “o”a
DUPb ≤20% RPD ≤30% RPD Review datad
MS 75%–125% recovery Flag with “N”
EB, FTB < MDC
<5% sample activity concentration Flag with “Q”
Field duplicateb ≤20% RPD Footnote e Review datad
Tritium MB
< MDC
<5% sample activity concentration Flag with “B”
LCS 80%–120% recovery or statistically
derived limitsg Flag with “o”a
DUPb ≤20% RPD ≤30% RPD Review datad
MS 75%–125% recovery Flag with “N”
EB, FTB < MDC
<5% sample activity concentration Flag with “Q”
Field duplicateb ≤20% RPD Footnote e Review datad
Note: Specific analytes and methods for determination are available from SMR.
a. The reporting laboratory will apply the “o” flag with SMR concurrence.
b. Applies when at least one result is greater than the laboratory practical quantitation limit (chemical analyses) or greater than five
times the MDC (radiochemical analyses).
c. Either a sample duplicate or an MSD is to be analyzed to determine measurement precision (if insufficient sample volume, an LCS
duplicate is analyzed with the acceptance criteria defaulting to the DUP/MSD criteria).
d. After review, corrective actions are determined on a case-by-case basis. Corrective actions may include a laboratory recheck or
flagging the data.
e. A field duplicate RPD for soils is not recommended because of possible soil matrix heterogeneity effects.
f. For the common laboratory contaminants acetone, methylene chloride, 2-butanone, toluene, and phthalate esters, the acceptance
criterion is less than five times the MDL.
I
I
I
I
I
I
I
I

DOE/RL-2019-23, REV. 0
39
Table 14. Field and Laboratory QC Elements and Acceptance Criteria
Analyte QC Element
Acceptance Criteria
Corrective Action Water Soil
g. Laboratory-determined, statistically derived control limits based on historical data are used here. Control limits are reported with
the data.
AEA = alpha energy analysis
DUP = laboratory sample duplicate
EB = equipment blank
FTB = full trip blank
GC/MS = gas chromatography/mass spectrometry
IC = ion chromatography
ICP/AES = inductively coupled plasma/atomic
emission spectroscopy
ICP/MS = inductively coupled plasma/mass spectrometry
LCS = laboratory control sample
MB = method blank
MDC = minimum detectable concentration
MDL = method detection limit
MS = matrix spike
MSD = matrix spike duplicate
N/A = not applicable
QC = quality control
RPD = relative percent difference
SMR = Sample Management and Reporting
SUR = surrogate
Data flags:
B, C = Possible laboratory contamination; analyte was detected in the associated MB (laboratory applied). The “B” flag is used for
organic analytes and radioanalytes. The “C” flag is used for general chemical parameters and inorganic analytes.
o = Result may be biased; associated LCS result was outside the acceptance limits (laboratory applied).
N = Result may be biased; associated MS result was outside the acceptance limits (all methods except GC/MS)
(laboratory applied).
Q = Problem with associated field QC samples; results were out of limits (SMR review).
T = Result may be biased; associated MS result was outside the acceptance limits (GC/MS only) (laboratory applied).
For groundwater analytical methods, Table 10 summarizes the specific field and laboratory precision and
accuracy requirements for each groundwater analysis to be performed. Table 11 summarizes the specific
precision and accuracy requirements for each sediment analysis to be performed. Data will be qualified
and flagged in the HEIS database, as appropriate.
The QC requirements for the laboratory contaminant mobility and transport studies performed by PNNL
will be based on PNNL procedures and laboratory requirements that are not specified in this SAP.
2.2.4.1 Field Quality Control Samples
Field QC samples are collected to evaluate the potential for cross-contamination and provide information
pertinent to field sampling variability and laboratory performance to help ensure that reliable data are
obtained. Field QC samples include field duplicates, split samples, and three types of field blanks: full trip
blanks (FTBs), field transfer blanks (FXRs), and equipment blanks (EBs). Field blanks are typically
prepared using high-purity reagent water. The QC sample definitions and their required collection
frequencies are described below:
Field duplicates: Independent samples collected as close as possible to the same time and location as
the scheduled sample that are intended to be identical. Field duplicates are placed in separate sample
containers and are analyzed independently. Field duplicates are used to determine precision for both
sampling and laboratory measurements.
Field splits (SPLITs): Two samples are collected as close as possible to the same time and location
that are intended to be identical. The SPLITs will be stored in separate containers and analyzed by
different laboratories for the same analytes. The SPLITs are interlaboratory comparison samples used
to evaluate comparability between laboratories.

DOE/RL-2019-23, REV. 0
40
Equipment blanks (EBs): High-purity water is passed through or poured over the decontaminated
sampling equipment and collected in sample containers, as identified on the sample authorization
form. The EB sample bottles are placed in the same storage containers with the samples from the
associated sampling event. The EB samples are analyzed for the same constituents as the samples
from the associated sampling event and are used to evaluate the effectiveness of the decontamination
process. EBs are not required for disposable sampling equipment.
Field transfer blanks (FXRs): Preserved volatile organic analysis (VOA) sample vials are filled
with high-purity reagent water at the sample collection site where VOC samples are collected. FXRs
will be prepared during sampling to evaluate potential contamination attributable to field conditions.
After collection, FXR sample vials will be sealed and placed in the same storage containers with the
samples collected the same day for the associated sampling event. FXR samples will be analyzed for
VOCs only.
Full trip blanks (FTBs): Bottles are prepared by the sampling team prior to traveling to the sampling
site. The preserved bottle set is either for VOA only or identical to the set that will be collected in the
field. It is filled with high-purity water and the bottles are sealed and transported (unopened) to the
field in the same storage containers used for samples collected that day. Collected FTBs are typically
analyzed for the same constituents as the samples from the associated sampling event. FTBs are used
to evaluate potential contamination of the samples attributable to the sample bottles, preservative,
handling, storage, and transportation.
2.2.4.2 Laboratory Quality Control Samples
Internal QA/QC programs are maintained by the laboratories used by the project. Laboratory QA includes
a comprehensive QC program that includes the use of laboratory control samples (LCSs), laboratory
sample duplicates (DUPs), matrix spikes (MSs), matrix spike duplicates (MSDs), method blanks (MBs),
surrogates (SURs), tracers, and carriers. These QC analyses are required by EPA methods (e.g., methods
identified in SW-846) and will be run at the frequency specified in the respective references unless
superseded by agreement. QC checks outside of control limits are documented in analytical laboratory
reports during assessments of data quality. Table 13 lists the laboratory QC checks and their typical
frequencies, and Table 14 lists the acceptance criteria. Descriptions of the various types of laboratory QC
samples are as follows:
Carrier: A known quantity of nonradioactive isotope that is expected to behave similarly and is
added to a sample aliquot. Sample results are generally corrected based on carrier recovery.
Laboratory control sample (LCS): A control matrix (e.g., reagent water) spiked with analytes
representing the target analytes or certified reference material used to evaluate laboratory accuracy.
Laboratory sample duplicate (DUP): An intralaboratory replicate sample that is used to evaluate
the precision of a method in a given sample matrix.
Matrix spike (MS): A sample aliquot spiked with a known concentration of the target analyte(s).
The MS is used to assess the bias of a method in a given sample matrix. Spiking occurs prior to
sample preparation and analysis.
Matrix spike duplicate (MSD): A replicate spiked sample aliquot that is subjected to the entire
sample preparation and analytical process. MSD results are used to determine the bias and precision
of a method in a given sample matrix.

DOE/RL-2019-23, REV. 0
41
Method blank (MB): An analyte-free matrix to which the same reagents are added in the same
volumes or proportions as used in the sample processing. The MB is carried through sample
preparation and the analytical process and is used to quantify contamination resulting from the
analytical process.
Surrogate (SUR): A compound added to every sample in the analysis batch (field samples and QC
samples) prior to preparation. SURs are typically similar in chemical composition to the analyte being
determined but they are not normally encountered. SURs are expected to respond to the preparation
and measurement systems in a manner similar to the analytes of interest. Because SURs are added to
every standard, sample, and QC sample, they are used to evaluate overall method performance in
a given matrix. SURs are used only in organic analyses.
Tracer: A known quantity of a radioactive isotope that differs from the isotope of interest but is
expected to behave similarly and is added to a sample aliquot. Sample results are generally corrected
based on tracer recovery.
Laboratories are required to analyze samples within the holding times specified in Tables 15 and 16.
In some instances, constituents in the samples not analyzed within the specified holding times may be
compromised by volatilization, decomposition, or by other chemical changes. Data from samples
analyzed outside the holding times are flagged in the HEIS database with an “H.”
Table 15. Groundwater Preservations and Holding Times
Constituents Preservationsa Holding Timesb
General Chemical Parameters
Alkalinity Store ≤6C 14 days
pH None Analyze immediately
Specific conductance Store ≤6C 28 days
Total inorganic carbon Store ≤6C, adjust pH to <2 with H2SO4
or HCl 28 days
Total organic carbon Store ≤6C, adjust pH to <2 with H2SO4 28 days
Total dissolved solids Store ≤6C 7 days
Total suspended solids Store ≤6C 7 days
Ammonia, Anions, and Cyanide
Ammonia Store ≤6C, adjust pH to <2 with H2SO4 28 days
Cyanide (total and free) Store ≤6C, adjust pH to >12 with NaOH 14 days
Chloride, sulfate Store ≤6C 28 days
Nitrate, nitrite Store ≤6C 48 hours
Sulfide Store ≤6C, ZnAc + NaOH to pH >9 7 days
Metals
Hexavalent chromium Store ≤6C 24 hours
Metals (except mercury and hexavalent
chromium), including uranium Adjust pH to <2 with HNO3 6 months

DOE/RL-2019-23, REV. 0
42
Table 15. Groundwater Preservations and Holding Times
Constituents Preservationsa Holding Timesb
Dissolved metals (except mercury and
hexavalent chromium), including uranium Filter prior to adjust pH to <2 with HNO3 6 months
Volatile Organic Compounds
Volatile organics (by GC/MS) Store ≤6C, adjust pH to <2 with HCl or
H2SO4
7 days unpreserved
14 days preserved
Radiological Parameters
Uranium, isotopic, by alpha energy analysis Adjust pH to <2 with HNO3 6 months
Iodine-129 None 6 months
Technetium-99, by liquid scintillation Adjust pH to <2 with HNO3 6 months
Tritium None 6 months
a. For preservation identified as store at <6°C, the sample should be protected against freezing unless it is known that freezing
will not affect the sample integrity.
b. References for holding times are provided in CHPRC-00189, Environmental Quality Assurance Program Plan.
GC/MS = gas chromatography/mass spectrometry
Table 16. Soil and Sediment Preservations and Holding Times
Constituents Preservationsa Holding Timesb
General Chemical Parameters
pH None Analyze immediately
Total organic carbon Store ≤6C 28 days
Total inorganic carbon Store ≤6C 28 days
Anions
Cyanide (total and free) Store ≤6C 14 days before extraction
14 days after extraction
Metals
Hexavalent chromium Store ≤6C 30 days before extraction
24 hours after extraction
Metals (except mercury and hexavalent
chromium), including uranium None 6 months
Volatile Organic Compounds
Volatile organics (by GC/MS) Store ≤6C 14 days
Radiological Parameters
Uranium, isotopic, by alpha energy analysis None 6 months
Technetium-99, by liquid scintillation None 6 months

DOE/RL-2019-23, REV. 0
43
Table 16. Soil and Sediment Preservations and Holding Times
Constituents Preservationsa Holding Timesb
Physical Properties
Bulk density None None
Particle density None None
Particle-size distribution None None
Porosity None None
Saturated hydraulic properties None None
a. For preservation identified as store at <6°C, the sample should be protected against freezing unless it is
known that freezing will not affect the sample integrity.
b. References for holding times are provided in CHPRC-00189, Environmental Quality Assurance
Program Plan.
GC/MS = gas chromatography/mass spectrometry
2.2.5 Measurement Equipment
Each user of measuring equipment is responsible for ensuring that the equipment is functioning as
expected, properly handled, and properly calibrated at required frequencies in accordance with methods
governing control of the measuring equipment. Onsite environmental instrument testing, inspection,
calibration, and maintenance will be recorded in accordance with approved methods. Field screening
instruments will be used, maintained, and calibrated in accordance with the manufacturers’ specifications
and other approved methods.
2.2.6 Instrument/Equipment Testing, Inspection, and Maintenance
Collection, measurement, and testing equipment should meet applicable standards (e.g., ASTM
International [formerly the American Society for Testing and Materials]) or have been evaluated as
acceptable and valid in accordance with instrument-specific methods, requirements, and specifications.
Software applications will be acceptance tested prior to use in the field.
Measurement and testing equipment used in the field or the laboratory will be subject to preventive
maintenance measures to minimize downtime. Laboratories must maintain and calibrate their equipment.
Maintenance requirements (e.g., documentation of routine maintenance) will be included in the
individual laboratory and onsite organization’s QA plan or operating protocols, as appropriate.
Maintenance of laboratory instruments will be performed in a manner consistent with applicable
Hanford Site requirements.
2.2.6.1 Instrument/Equipment Calibration and Frequency
Section 3.5 discusses field equipment calibration. Analytical laboratory instruments are calibrated in
accordance with the laboratory’s QA plan and applicable Hanford Site requirements.
2.2.6.2 Inspection/Acceptance of Supplies and Consumables
Consumables, supplies, and reagents will be reviewed in accordance with SW-846 requirements and will
be appropriate for their use. Supplies and consumables used to support sampling and analysis activities
are procured in accordance with internal work requirements and processes. Responsibilities and interfaces
necessary to ensure that items procured/acquired for the contractor meet the specific technical and quality
requirements must be in place. The procurement system ensures that purchased items comply with

DOE/RL-2019-23, REV. 0
44
applicable procurement specifications. Supplies and consumables are checked and accepted by users
prior to use.
2.2.7 Data Management
SMR, in coordination with the OU project manager, is responsible for ensuring that analytical data are
appropriately reviewed, managed, and stored in accordance with applicable programmatic requirements
governing data management methods.
Electronic data access, when appropriate, will be through the HEIS database. Where electronic data are
not available, hardcopies will be provided in accordance with Section 9.6 of the Tri-Party Agreement
Action Plan (Ecology et al., 1989b).
Laboratory errors are reported to SMR through an established process. For reported laboratory errors,
a sample issue resolution form will be initiated in accordance with applicable procedures. This process is
used to document analytical errors and to establish their resolution with the OU project manager.
The sample issue resolution forms become a permanent part of the analytical data package for future
reference and for records management.
2.3 Assessment/Oversight
Assessment and oversight activities address the effectiveness of project implementation and associated
QA/QC activities. The purpose of assessment is to ensure that the QAPjP is implemented as prescribed.
Routine evaluation of data quality described for this project will be documented and filed with the data
in the project file. The OU project manager and/or the drilling and sampling FWS will monitor field
activities for this SAP. The OU project manager retains overall responsibility for sampling but may
delegate specific responsibilities to the drilling and sampling FWS or other appropriate DOE prime
contractor staff. SMR will select a laboratory to perform the soil and groundwater analyses for this SAP.
SMR will also assess and verify that analytical data are reported by the laboratory and will then enter the
verified data into the HEIS database.
2.3.1 Assessments and Response Action
Management assessments and/or independent assessments may be performed at the direction of the
OU project manager or QA organization to verify compliance with the requirements outlined in this SAP,
project field instructions, the QAPjP methods, and regulatory requirements. Deficiencies identified by
these assessments will be reported in accordance with existing programmatic requirements. The project
management chain coordinates the corrective actions/deficiency resolutions in accordance with the
QA program, the corrective action management program, and associated methods implementing these
programs. When appropriate, corrective actions will be taken by the OU project manager (or designee).
A data usability assessment will be performed for the identified SAP activities, and the data usability
assessment results will be provided to the OU project manager. No other planned assessments have been
identified. If circumstances arise in the field dictating the need for additional assessments, then additional
assessments will be performed.
Oversight activities in the analytical laboratories, including corrective action management, are conducted
in accordance with the laboratory’s QA plan. SMR oversees offsite analytical laboratories and verifies
that the laboratories are qualified to perform Hanford Site analytical work.

DOE/RL-2019-23, REV. 0
45
2.3.2 Reports to Management
Program and project management (as appropriate) will be made aware of deficiencies identified by
management assessments, corrective actions from the environmental compliance officer, and findings
from independent assessments and surveillances. Issues reported by the laboratories are communicated
to SMR, which then initiates a sample issue resolution form. The process is used to document analytical
or sample issues and to establish resolution with the OU project manager. If an assessment finding results
in sampling issues that affect a regulatory requirement, DOE will be informed, and the matter will be
discussed with the regulatory agencies.
2.4 Data Review and Usability
This section addresses QA activities that occur after data collection. Implementation of these activities
determines whether the data conform to the specified criteria, thus satisfying the project objectives.
2.4.1 Data Review and Verification
Data review and verification are performed to confirm that sampling and chain-of-custody documentation
are complete. This review includes linking sample numbers to specific sampling locations and reviewing
sample collection dates and sample preparation and analysis dates to assess whether holding times (if any)
have been met. Furthermore, review of QC data is used to determine whether analyses have met the data
quality requirements specified in this SAP.
The criteria for verification include, but are not limited to, review for contractual compliance
(i.e., samples were analyzed as requested), use of the correct analytical method, transcription errors,
correct application of dilution factors, appropriate reporting of dry weight versus wet weight, and correct
application of conversion factors. Field QA/QC results will be reviewed to ensure that they are usable.
The OU project scientist performs data reviews to help determine if observed changes reflect potential
data errors, which may result in submitting a request for data review for questionable data. The laboratory
may be asked to check calculations or reanalyze the sample. In extreme cases, another sample may be
collected. Results of the request for the data review process are used to flag the data appropriately in
the HEIS database and/or to add comments.
2.4.2 Data Validation
Data validation is an independent assessment to ensure reliability of the data. Analytical data validation
provides a level of assurance that an analyte is present or absent. Validation may also include
the following:
Verification of instrument calibrations
Evaluation of analytical results based on MBs
Recovery of various internal standards
Correctness of uncertainty calculations
Correctness of identification and quantification of analytes
Effect of quality deficiencies on data reliability
The contractor follows the data validation process described in EPA-540-R-2017-001, National
Functional Guidelines for Inorganic Superfund Methods Data Review; and EPA-540-R-2017-002,
National Functional Guidelines for Organic Superfund Methods Data Review, adjusted for use with
SW-846, HASQARD requirements (DOE/RL-96-68), and radiochemistry methods. The criteria for data
validation are based on a graded approach using five levels of validation (Levels A through E). Level A

DOE/RL-2019-23, REV. 0
46
is the lowest level and is the same as verification. Level E is a 100% review of all data (e.g., calibration
data and calculations of representative samples from the data set). Data validation may be performed to
Level C, which is a review of the QC data. Level C validation consists of a review of the QC data and
specifically requires verification of deliverables; requested versus MB blank results, MS/MSD results,
surrogate recoveries, and duplicate sample results. Level C data validation is generally equivalent to
Level 2A (EPA 540-R-08-005, Guidance for Labeling Externally Validated Laboratory Analytical Data
for Superfund Use). Level C data validation will be performed on at least 5% of the data by matrix and
analyte group under the direction of SMR. “Analyte group” refers to categories such as radionuclides,
volatile chemicals, semivolatiles, metals, and anions. The goal is to include each of the various analyte
groups and matrices during the data validation process. The DOE-RL project lead or OU project manager
may specify a higher percentage of data to be validated or that data validation be performed at
higher levels.
2.4.3 Reconciliation with User Requirements
The purpose of reconciliation with user requirements is to determine if quantitative data are of the correct
type and are of adequate quality and quantity to meet project data needs. The DQA process is the
scientific and statistical evaluation of previously verified and validated data to determine if information
obtained from environmental data are of the right type, quality, and quantity to support their intended use.
The DQA process uses the entirety of the collected data to determine usability for decision-making
purposes. If a statistical sampling design was used during field sampling activities, then the DQA will be
performed in accordance with EPA/240/B-06/003, Data Quality Assessment: Statistical Methods for
Practitioners (EPA QA/G-9S). When judgmental (focused) sampling designs are implemented in
the field, DQIs such as precision, accuracy, representativeness, comparability, completeness, and
sensitivity for the specific data sets (individual data packages) will be evaluated in accordance with
EPA/240/R-02/004, Guidance on Environmental Data Verification and Data Validation (EPA QA/G-8).
Data verification and data validation are integral to the statistical DQA evaluation process and the DQI
evaluation process. Results of the DQA or DQI processes generated by SMR will be used by the
OU project manager to interpret the data and determine if the DQOs for this activity have been met.
3 Field Sampling Plan
This SAP includes the 12 Rwia monitoring wells planned to be installed during FY 2020, FY 2021, and
FY 2022. The field sampling plan defines the sampling and analysis requirements for samples and the
field measurements to be collected from each well. Groundwater samples will be analyzed for the eight
COCs identified in the 200-ZP-1 OU ROD (EPA et al., 2008), as well as uranium and various other
constituents (including additional VOCs), as specified in Table 5. Sediment samples will be analyzed for
some of the 200-ZP-1 OU COCs, as well as uranium, various other constituents (including additional
VOCs), and physical properties, as specified in Table 6.
Additionally, selected sediment samples will undergo laboratory contaminant mobility and transport
studies at PNNL to better understand sediment/water partitioning and to develop distribution coefficients
for carbon tetrachloride in the Rwia and Rlm. Split-spoon sample liners C and D collected for each
sample interval will be provided to PNNL. The full, intact liner C will be designated for VOC, total
carbon, TOC, TIC analyses, and potential special studies. Liner D will be held in reserve at PNNL for use
if reanalysis or additional sample material is needed. These supplemental studies will only be conducted
on sediment samples that correspond to groundwater samples with higher carbon tetrachloride
concentrations (based on quick-turnaround analytical results).
DOE/RL-2019-23, REV. 0
47
The sampling data results from all sources except PNNL will be entered into the HEIS database.
PNNL will report results in laboratory reports, and the associated data will not be entered into the HEIS
database. All sampling data results will be used to support performance evaluation of the selected remedy
by improving the understanding of the Rwia. The data will also support P&T optimization efforts focused
on the Rwia.
Additional details regarding field-specific sample collection requirements are provided in the
following sections.
3.1 Sampling Objectives
The objective of the field sampling plan is to clearly identify project sampling and analysis activities.
The field sampling plan uses the sampling design identified during the DQO process and identifies
sampling locations, the total number of samples to be collected, the sampling procedures to be
implemented and analyses to be performed, and sample bottle requirements.
The proposed monitoring wells to be installed will support the 200-ZP-1 OU selected remedy.
The drilling schedule will be defined by the drilling manager.
3.2 Sampling Locations and Frequencies
This section identifies the locations of the proposed monitoring wells to be installed and defines the
sampling and analysis requirements for the samples and measurements to be collected from each well.
Figure 2 shows the approximate locations of the monitoring wells proposed in this SAP (listed in
Table 1). The actual locations will be determined based on field reconnaissance of current site conditions
to comply with the National Historic Preservation Act of 1966 and avoid restrictions, roads, waste sites,
and other obstructions. Additional samples may be collected at the discretion of the project manager if
unexpected conditions are encountered that indicate the need for additional data. Geophysical logging will
be conducted based on direction from the drilling manager. Table 17 lists the locations and depths to be
sampled at each well during drilling, and Table 13 lists the field QC requirements. After well acceptance,
the wells may be hydraulically tested as part of an aquifer testing plan, which is subsequent to and outside
the direct scope of this SAP.
The well locations proposed in this SAP were selected based on the following information regarding
contaminant distribution and migration, as well as the currently modeled geologic framework for the
200-ZP-1 OU:
Maps depicting the contamination extent of the primary COC (carbon tetrachloride), as presented
in DOE/RL-2017-68, Calendar Year 2017 Annual Summary Report for Pump-and-Treat Operations
in the Hanford Central Plateau Operable Units
Locations, thicknesses, and extents of the primary water-bearing geologic units in the 200-ZP-1 OU
(Rwia, Rwie, and Rlm), as modeled in HSGF Model and described in ECF-HANFORD-13-0029
The data gap analysis process documented in SGW-61350 and summarized further in Appendix A
of this SAP

DO
E/R
L-2
019-2
3, R
EV
. 0
48
Table 17. Summary of Rwia Characterization Well Sampling
Sampling
Location
Well
Name
Well
ID
Saturated Zone Sampling
During Drilling
Geologic Archive
Grab Samplinga
Sieve Analysis
Grab Samplinga
Post-Development
Groundwater
Samplinga, f
Split-Spoon Soil Samples,a,b, c
Groundwater Samples,a, d
and Slug Testsa, e
(ft bgs)
Targeted
Geologic
Formation
MW-A 299-W13-4 D0080
332, 358, 390, 420 Rwie Every 5 ft or where
lithologic changes
occur, from ground
surface to total depth.
Collect geologic
archive grab samples
in pint jar and a chip
tray from
drill cuttings.
Every 5 ft, from
water table to top of
basalt.
Collect sieve
analysis grab
samples from drill
cuttings for field
screening
sieve analysis.
Following well
construction and
final well
development.
Collect
groundwater
sample from the
screened interval.
454, 470, 485, 498, 510, 524 Rwia
MW-B 299-W19-133 D0081
303, 360, 420 Rwie
447, 460 Rlm
470, 485, 500, 515, 530, 541, 552 Rwia
MW-C 699-46-70 D0082
297, 310, 330 Rwie
345, 355 Rlm
365, 382, 400, 420 Rwia
MW-D 699-45-67C D0083
321 Rwie
330, 350 Rlm
366, 377, 387, 399, 410, 430, 442,
453 Rwia
MW-E 299-W14-26 D0084
296, 345, 395 Rwie
435, 455 Rlm
470, 483, 495, 515, 527, 539 Rwia

DO
E/R
L-2
019-2
3, R
EV
. 0
49
Table 17. Summary of Rwia Characterization Well Sampling
Sampling
Location
Well
Name
Well
ID
Saturated Zone Sampling
During Drilling
Geologic Archive
Grab Samplinga
Sieve Analysis
Grab Samplinga
Post-Development
Groundwater
Samplinga, f
Split-Spoon Soil Samples,a,b, c
Groundwater Samples,a, d
and Slug Testsa, e
(ft bgs)
Targeted
Geologic
Formation
MW-F 699-40-70 D0085
325, 360, 400 Rwie
422 Rlm
432, 446, 460, 475, 490, 505, 520,
534, 548 Rwia
MW-G 699-42-62 D0086 345, 355 Rwie
360, 365, 380, 400, 420, 435, 450 Rwia
MW-H 699-41-65 D0087
354, 362 Rwie
372, 392, 410 Rlm
420, 436, 450, 465, 480, 493, 506 Rwia
MW-Ig TBD TBD TBD TBD
MW-Jg TBD TBD TBD TBD
MW-Kg TBD TBD TBD TBD
MW-Lg TBD TBD TBD TBD
a. Samples will be collected in accordance with Section 3.4.5. The sample intervals listed are anticipated depths based on the estimated depths to groundwater and geologic
contacts listed in Table 1 for each well. The actual depths to groundwater and to geologic contacts may be different during drilling. During drilling, the field geologist, in
consultation with the geology subject matter expert, will identify the depth at which groundwater and the transition between target formations occurs and, in consultation with
the project scientist, may adjust the sample depth in response to these conditions, provided the target formation is sampled and the intent of the sample interval is achieved.
The following must be considered when adjusting sample intervals:
The first (shallowest) sample within the Rwie is intended to be collected approximately 3 m (10 ft) into the saturated zone. Only one sample is planned in the Rwie at
MW-D, so this sample is intended to be collected approximately 3 m (10 ft) into the saturated zone and above the anticipated contact with the Rlm.
The last (deepest) sample within the Rwie is intended to be collected within the Rwie at a depth approaching, but above, the transition to the next target geologic formation
(i.e., the Rlm when present, otherwise the Rwia). Only one sample is planned in the Rwie at MW-D, so this sample is intended to be collected approximately 3 m (10 ft)
into the saturated zone and above the anticipated contact with the Rlm.
The first (shallowest) Rlm sample is intended to be collected within the first few feet of the Rlm.
The last (deepest) Rlm sample is intended to be collected within the Rlm and a few feet above the Rwia.
The first (shallowest) Rwia sample is intended to be collected within the first few feet of the Rwia.
The last (deepest) Rwia sample is intended to be collected within the Rwia and a few feet above the anticipated contact with the basalt.

DO
E/R
L-2
019-2
3, R
EV
. 0
50
Table 17. Summary of Rwia Characterization Well Sampling
Sampling
Location
Well
Name
Well
ID
Saturated Zone Sampling
During Drilling
Geologic Archive
Grab Samplinga
Sieve Analysis
Grab Samplinga
Post-Development
Groundwater
Samplinga, f
Split-Spoon Soil Samples,a,b, c
Groundwater Samples,a, d
and Slug Testsa, e
(ft bgs)
Targeted
Geologic
Formation
Sample intervals within formations, and not above or below transition between target formations (i.e., other than first or last planned within the formation), may be adjusted by
the field geologist, in consultation with the project scientist, to accommodate field conditions that resulted in the adjustment of a prior sampling interval and/or the drilling
method (e.g., moved ±3 m [10 ft] to accommodate a 6.1 m [20 ft] length of drilling pipe), provided the targeted geologic formation is sampled and approximate even spacing
between sample intervals is maintained.
The field geologist will notify the drilling buyer’s technical representative and contact the project scientist (or designee) if unexpected conditions are encountered in the field
that may warrant collection of additional samples. Additional samples may be collected at the discretion of the project manager if unexpected conditions are encountered that
indicate the need for additional data.
b. Split-spoon soil samples collected and analyzed for all of the Table 6 sediment constituents and physical properties (at standard turnaround times). If field screening
instruments indicate radiological contamination above background at a given interval, two additional samples will be obtained. One sample will be sent for 24-hour turnaround
gamma energy analysis and one additional sample for testing based on the gamma energy analysis results (as determined by the project manager).
c. Material from split-spoon liner A will be sent to an offsite commercial laboratory for contaminant concentration analyses, with the exception of volatile organic compounds,
total carbon, total organic carbon, and total inorganic carbon. Liner B will be sent to an offsite commercial laboratory for saturated hydraulic properties testing. Liners C and D
will be sent to PNNL. Liner C will be used for volatile organic carbon, total carbon, total organic carbon, and total inorganic carbon analyses, as well as potential special
studies. Liner D will be held in reserve at PNNL for use in reanalysis or if additional sample material is needed.
d. Groundwater samples collected during drilling will be analyzed for all “groundwater constituents during drilling” listed in Table 5 (at standard turnaround times) and field
screening parameters. Groundwater samples collected during drilling will also be analyzed for carbon tetrachloride and nitrate at quick-turnaround times. If samples have
elevated organic concentrations, an “E” flag may be applied to the data due to a lack of time for dilutions and re-runs based on a quick-turnaround time. The standard
turnaround time sample will account for dilutions and re-runs, as applicable. Collect filtered and unfiltered samples for all metals. Samples will not be collected during drilling
for hexavalent chromium.
e. Slug tests will be performed during drilling at each identified interval in the Rwie and Rwia and at one of the identified intervals within the Rlm following the collection of
split-spoon sediment samples and groundwater samples. Slug tests will be conducted in accordance with the steps outlined in Section 3.4.6.
f. Following construction and final development of each well, one groundwater sample will be collected and analyzed for all “post-development groundwater constituents”
identified in Table 5 (at standard turnaround times) and field screening parameters to provide baseline concentrations for each constituent. Collect filtered and unfiltered
samples for all metals except hexavalent chromium. A filtered sample will be collected for hexavalent chromium.
g. Specific locations have not been identified for monitoring wells MW-I through MW-L. Once these four additional locations have been selected, additional information will
be provided in this table in accordance with the change control process discussed in Section 2.1.4.
bgs = below ground surface
ID = identification
PNNL = Pacific Northwest National Laboratory
Rlm = Ringold Formation member of Wooded Island – lower mud unit
Rwia = Ringold Formation member of Wooded Island – unit A
Rwie = Ringold Formation member of Wooded Island – unit E
TBD = to be determined

DOE/RL-2019-23, REV. 0
51
The eight proposed monitoring well locations initially identified were selected to collect data in the study
area to adequately define the nature and extent of the COC plumes and the hydrogeologic properties,
hydraulic properties, and transport parameters of the Rwia, the Rlm, and, to a limited extent, the Rwie.
This data will support F&T modeling, allow for performance evaluation of the 200-ZP-1 OU remedy,
and assist in making recommendations for optimizing or modifying the remedy.
Locations for the remaining four proposed monitoring wells will be identified through F&T modeling
combined with a continuation of the data gap analysis process, as documented in SGW-61350 and
summarized in Appendix A of this SAP. Newly identified monitoring well locations will be incorporated
into this SAP by adhering to the document change control process described in Section 2.1.4.
3.3 Well Drilling and Completion Procedures
Well drilling will be performed in accordance with the substantive standards of WAC 173-160 for
resource protection wells. The wells will be drilled approximately 3.0 m (10 ft) into basalt or to refusal.
The drilling method will likely use an air circulation technique; however, the final drilling method will be
determined during negotiation of the drilling contract.
The monitoring wells will be constructed as 4 in. diameter wells. The wells will be constructed with
a Type 304 or 316 stainless-steel, continuous wire-wrap screen (V-slot or other, depending on application
and sieve analysis results), on top of approximately a 0.9 to 3 m (3 to 10 ft) long, Schedule 10 Type 304
or 316 stainless-steel sump with end cap. A Schedule 10 Type 304 or 316 stainless-steel riser will be used
to extend the permanent well into the vadose zone, with Schedule 10 Type 304 or 316 stainless-steel
casing through the vadose zone to the ground surface. Screen slot size and sand pack grain size will be
determined after evaluating the sample data collected every 1.5 m (5 ft) from saturated zone drill cuttings
for field screening grain-size (sieve) analysis (Table 17). Colorado silica sand (or an equivalent quality
material) will be used for the sand pack. Sodium bentonite pellets and/or natural sodium bentonite chunks
or crumbles, or powdered bentonite, will be used for bentonite sealing material. Type I/II Portland cement
will be used for cement grout. A bentonite seal will be placed between the well screen sections (for wells
with multiple screen sections), as required by the design. Any portion of the borehole below the sand pack
will be sealed with bentonite or cement to prevent cross-communication between aquifers. Bentonite
slurry or cement will not be poured down the long annulus but will instead be placed by tremie tube.
Surface construction consisting of protective casing, protective guard posts, and cement pad must be in
place prior to well acceptance. The protective casing will be a minimum 2 in. larger in diameter than the
permanent casing. The protective casing will rise approximately 0.9 m (3 ft) above ground surface.
The permanent casing will rise to approximately 0.3 m (1 ft) below the top of the protective casing.
The protective casing will have a lockable well cap that extends approximately 38.1 cm (15 in.) above
the top of the protective casing. An access port will be provided on the protective casing and configured
as shown in Figure 8. If the completion differs from the WAC 173-160 minimum standards, then
a comparable alternative specification will be used that will provide equal or greater human health and
resource protection.
3.3.1 Monitoring Well Construction
Monitoring wells will typically have a minimum 6.1 m (20 ft) screen length as a single casing well.
Figures 9 and 10 provide conceptual illustrations of well designs for monitoring wells installed
in unconfined and confined aquifers, respectively. Monitoring wells will generally be constructed
with 4 in. diameter casing. Actual well designs, including screen lengths and locations, will be determined
by observations made and characterization data collected during drilling. Sieve analysis will be used to
size the filter pack and select well screen slot size.
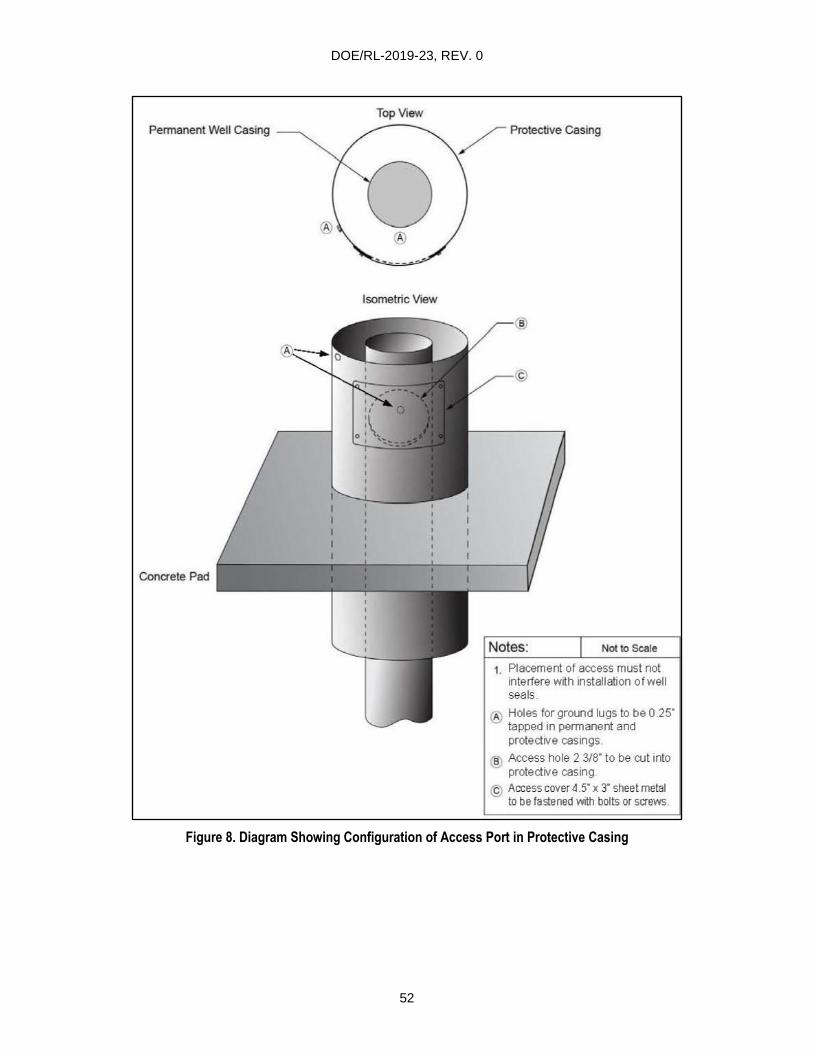
DOE/RL-2019-23, REV. 0
52
Figure 8. Diagram Showing Configuration of Access Port in Protective Casing
Top View
Permanent Well Casing
Isometric View
Concrete Pad
Protecbve Casing
Notes: Noto Scale
1. Placement of access must not interfere with 1nstallabon of well seals.
A Holes for ground lugs to be o.2s· tapped in permanent and protective casings
8 Access hole 2 3/8" to be cut into protective casing
.& Access cover 4 .s· x 3· sheet metal to be fastened with bolts or screws

DOE/RL-2019-23, REV. 0
53
Figure 9. Conceptual Illustration of Monitoring Well Design When the Rlm is Not Present
Ground Surface
Water Table
Tota l Depth
Notto Scale
Bolted Acces Panel -1 (stainless steel)... ... _
Survey Marker,
4ftx4ft
(brass)
Cement Grout - - - - - - - - - - -
Bentonite - - - - - - - - -- - - - - -
Filter Pack Sand - - - - - - - - - - - f
:_, \% Bentonite Backfill------ - ..,G•x xx x x1 xxxxx~
1xxxxx1
I I I I I _I
'Protective Casing (6-in. stainless steel)
- - - - - - - Permanent Casing (4-in. stainless steel)
Screen
TBD
3 ft
1-=h
TBD
Sump and End Capf Oft
TBD
Note: Actual well designs will be determined by observations made and characterization data collected during drilling.

DOE/RL-2019-23, REV. 0
54
Figure 10. Conceptual Illustration of Monitoring Well Design When the Rlm is Present
Ground Surface
Water Table
Tota l Depth
Notto Scale
Bolted Acces Panel -1 (stainless steel)... ... _
Survey Marker, (brass)
Cement Grout - - - - - - - - - - -
4ftx4ft
/
i:~: ' ✓:
I I I I I _I
'Protective Casing (6-in. stainless steel)
I,/, , , , , , ,'
>'.r -------Permanent Casing : , : ,, (4- in. stainless steel)
Bentonite - - - - - - - -- - - - - - el;,:
1::: /,
Benton ite Sea I - - - - - - - - - - - -f/ ---- - -- -------------------------------- X X
Ringold Lower Mud k xx
(
u Ii
Filter Pack Sand - - - - - - - - - - - f
//1
,:-1
::::i
:: :I , , , '1 , , , , , , , , //
:_, \% Bentonite Backfill--- - - - - -,G•x xx x x1 xxxxx~
1xxxxx1
Screen
TBD
TBD
Sump and End Capf Oft
TBD
Note: Actual well designs will be determined by observations made and characterization data collected during drilling.
DOE/RL-2019-23, REV. 0
55
3.4 Field-Specific Collection Requirements
The field-specific collection requirements for sampling are outlined in this section.
3.4.1 Sample Location and Depth
The sample number, well identification number, and depth will be documented. Each bottle/container and
chain-of-custody form must be identified by sample number and sample authorization form number.
3.4.2 Sample Identification
A sample data-tracking database will be used to track the samples from collection and through the
laboratory analysis process. The HEIS database is the Hanford Site repository for laboratory analytical
results. The HEIS sample numbers will be issued to the project sampling organization. The radiological
and physical properties of each sample will be identified and labeled with a unique HEIS sample number.
The sample location, depth, and corresponding HEIS number will be documented in the sampler’s field
logbook/data forms. Each sample container will be labeled with the following information, using
a waterproof marker on firmly affixed, water-resistant labels:
Sample authorization form number
HEIS number
Sample collection date and time
Analysis required
Preservation method (if applicable)
Collector’s name or initials
3.4.3 Field Sample Logbook
Logbooks or data forms are required for field activities and will be used in accordance with HASQARD
requirements (DOE/RL-96-68). A logbook must be identified with a unique project name and number.
The individual(s) responsible for logbooks will be identified in the front of the logbook, and only
authorized persons may make logbook entries. Logbook entries will be reviewed by the FWS, cognizant
scientist/engineer, or other responsible manager; the review will be documented by signature and date.
Logbooks will be permanently bound, waterproof, and ruled with sequentially numbered pages. Pages
will not be removed from logbooks for any reason. Entries will be made in indelible ink. Corrections will
be made by marking through the erroneous data with a single line, entering the correct data, and initialing
and dating the changes.
Data forms may be used to collect field information; however, information recorded on data forms must
follow the same requirements as those for logbooks. The data forms must be referenced in the logbooks.
A summary of information to be recorded in logbooks or on the data forms is as follows:
Day and date; time task started; weather conditions; and names, titles, and organizations of personnel
performing the task.
Purpose of visit to the task area.
Site activities in specific detail (e.g., maps and drawings) or the forms used to record such
information (e.g., soil boring log or well completion log). Also, details of any field tests that were

DOE/RL-2019-23, REV. 0
56
conducted; and reference to any forms that were used, other data records, and methods followed when
conducting the activity.
Details of any field calibrations and surveys that were conducted. Reference any forms that were
used, other data records, and the methods followed in conducting the calibrations and surveys.
Details of any samples collected and the preparation (if any) of SPLITs, DUPs, MSs, or MBs.
Reference the methods used for sample collection or preparation; list the locations of the samples
collected, sample type, each label or tag numbers, sample identification, sample containers and
volume, preservation method, packaging, chain-of-custody form number, and analytical request form
number pertinent to each sample or sample set; and note the time and the name of the individual to
whom sample custody was transferred.
Time, equipment type, serial or identification number, and methods followed for decontaminations
and equipment maintenance performed. Reference the page numbers of any logbook where detailed
information is recorded.
Any equipment failures or breakdowns that occurred, with a brief description of repairs
or replacements.
3.4.4 Corrective Actions and Deviations for Sampling Activities
The OU project manager, FWS, appropriate field crew supervisors, and SMR personnel must document
deviations from protocols, issues pertaining to sample collection, chain-of-custody forms, target analytes,
contaminants, sample transport, or noncompliant monitoring. An example of a deviation is samples not
collected due to field conditions.
As appropriate, such deviations or issues will be documented (e.g., in the field logbook) in accordance
with internal corrective action methods. The OU project manager, FWS, field crew supervisors, or SMR
will be responsible for communicating field corrective action requirements and for ensuring that
immediate corrective actions are applied to field activities.
Changes in sample activities that require notification, approval, and documentation will be performed as
specified in Table 9.
3.4.5 Sampling Procedure
Procedures from the DOE prime contractor (or its approved subcontractor) will be used for sampling.
Depth-discrete soil samples will be collected from the aquifer at the intervals identified in Table 17 using
split-spoon sampling equipment and methods. These split-spoon sediment samples will be used for the
analyses listed in Table 6. Additional depth-discrete grab soil samples will be collected from saturated
zone drill cuttings at 1.5 m (5 ft) intervals from the water table to basalt to enable sieve analyses to be
completed to design both the filter pack and the slot size for the well screens. Geologic archive grab soil
samples will be collected from the drill cuttings at 1.5 m (5 ft) intervals from ground surface to basalt.
DOE/RL-2019-23, REV. 0
57
The sample intervals listed in Table 17 are anticipated depths based on the estimated depths to
groundwater and geologic contacts listed in Table 1 for each well. The actual depths to groundwater and
to geologic contacts may be different during drilling. During drilling, the field geologist, in consultation
with the geology subject matter expert, will identify the depth at which groundwater and the transition
between target formations occurs and, in consultation with the project scientist, may adjust the sample
depth in response to these conditions, provided the target formation is sampled and the intent of the
sample interval is achieved. The following must be considered when adjusting sample intervals:
The first (shallowest) sample within the Rwie is intended to be collected approximately 3 m (10 ft)
into the saturated zone. Only one sample is planned in the Rwie at MW-D, so this sample is intended
to be collected approximately 3 m (10 ft) into the saturated zone and above the anticipated contact
with the Rlm.
The last (deepest) sample within the Rwie is intended to be collected within the Rwie at a depth
approaching, but above, the transition to the next target geologic formation (i.e., the Rlm when
present, otherwise the Rwia). Only one sample is planned in the Rwie at MW-D, so this sample is
intended to be collected approximately 3 m (10 ft) into the saturated zone and above the anticipated
contact with the Rlm.
The first (shallowest) Rlm sample is intended to be collected within the first few feet of the Rlm.
The last (deepest) Rlm sample is intended to be collected within the Rlm and a few feet above
the Rwia.
The first (shallowest) Rwia sample is intended to be collected within the first few feet of the Rwia.
The last (deepest) Rwia sample is intended to be collected within the Rwia and a few feet above the
anticipated contact with the basalt.
Sample intervals within formations, and not above or below transition between target formations
(i.e., other than first or last planned within the formation), may be adjusted by the field geologist, in
consultation with the project scientist, to accommodate field conditions that resulted in the adjustment of
a prior sampling interval and/or the drilling method (e.g., moved ±3 m [10 ft] to accommodate a 6.1 m
[20 ft] length of drilling pipe), provided the targeted geologic formation is sampled and approximate even
spacing between sample intervals is maintained.
The field geologist will notify the drilling buyer’s technical representative and contact the project scientist
(or designee) if unexpected conditions are encountered in the field that may warrant collection of
additional samples. Additional samples may be collected at the discretion of the project manager if
unexpected conditions are encountered that indicate the need for additional data.
The split-spoon liners collected from each sampling interval will be designated for laboratory analyses
as follows (designated from deepest to shallowest):
Liner A – contaminant concentration analyses, excluding VOC, total carbon, TOC, and TIC at offsite
analytical laboratory
Liner B – saturated hydraulic conductivity (full, intact liner) and other physical parameters at
offsite laboratory

DOE/RL-2019-23, REV. 0
58
Liner C – analyses for VOCs (full, intact liner), total carbon, TOC, and TIC to be performed on all
samples, and special studies on select samples at PNNL
Liner D – held in reserve at PNNL for use in reanalysis or if additional sample material is needed
If inadequate sample material is generated from the first attempt at collecting a sediment sample (due to
incomplete recovery), another sample will be collected immediately below the initially sampled interval.
Most groundwater samples will be collected from selected intervals using a submersible pump, although
collecting samples with a bailer is also acceptable (e.g., near the water table where insufficient head may
be available for pumping, or where groundwater turbidity is high enough to interfere with pumping).
Prior to sample capture, the pump will be operated for a sufficient period of time to provide stabilized
field readings. Groundwater samples will be used for the analyses listed in Table 5.
Split-spoon soil samples and groundwater samples collected during drilling as the boring is advanced will
support performance evaluation of the selected remedy by improving the understanding of the Rwia and
will also support P&T optimization efforts focused on the Rwia.
3.4.6 Slug Testing
Slug tests will be conducted at the frequencies and locations described in Table 17. For slug testing
performed during drilling, the water level in a borehole is quickly changed by inserting, removing, or
otherwise displacing a known volume of water inside the borehole. The subsequent water-level response
is then monitored, and hydraulic parameters are calculated using these data. The slug testing procedure
steps are as follows:
General slug testing steps for Rwia and Rwie sample depths for each borehole (with
temporary screen):
1. Advance the borehole to the targeted sample depth.
2. Remove drill stem and bit from borehole.
3. Lower tubing string (minimum 4 in. diameter) with short (2 to 3 ft) temporary screen and packer
to bottom of borehole.
4. Pull back drill casing a few feet to expose the entire screen to the formation.
5. Inflate packer to provide seal between tubing string and drill casing to isolate the sample depth.
6. Measure the depth to water inside the tubing string (needed to determine slug testing depth).
7. Lower sample pump to the depth of the screen.
8. Purge borehole until field parameters pH, temperature, conductivity, and turbidity stabilize
(effectively developing the borehole prior to slug testing).
9. Collect groundwater sample.
10. Remove sample pump from borehole.
11. Install pressure transducer inside tubing string to a depth of approximately 1 to 2 ft below the
expected depth of the slug rod at full immersion. Slug test will be conducted near the top of the
water column, as determined by the water-level measurement (from step 6 above).
12. Monitor baseline water level with the transducer and allow water levels to stabilize.

DOE/RL-2019-23, REV. 0
59
13. Perform slug injection and withdrawal test per slug test procedure using a slug rod (allow up to
1 to 2 hours to complete slug tests).
14. Following slug testing, remove slug rod and pressure transducer from borehole.
15. Deflate packer and remove tubing string and screen from borehole.
16. Continue drilling to the next sample depth.
General slug testing steps for Rlm sample depth for each borehole (with no temporary screen):
NOTE: These steps assume the drill cuttings/soil sample indicate silty or clayey materials (i.e., low
permeability), as determined by the field geologist. Because the Ringold lower mud unit is expected
to produce low water yield, stabilizing the field parameters for the groundwater sample and
developing the sample depth for the slug test may be limited. A slug test will be performed in only
one of the sample depths within the Rlm unit for each borehole.
1. Advance the borehole to the targeted sample depth.
2. Remove drill stem and bit from borehole.
3. Measure depth to water in the borehole.
4. Evacuate water column in the borehole with pump or bailer to collect groundwater sample and to
initiate the slug test.
5. Immediately following groundwater sample collection, measure the depth to water.
6. Install pressure transducer in borehole and begin logging the water level to monitor the slug test
recovery. The duration of the slug test will be determined by the field geologist, in consultation
with the project scientist. If the water level does not respond to the borehole evacuation
(e.g., water level does not change over a reasonable period following initiation of the test
[2 hours]), as determined by the field geologist in consultation with the project scientist, then
abandon the slug test.
Supplemental hydraulic testing will be performed after well acceptance and will be specified and
conducted under a separate hydraulic testing plan that will be developed following issuance of this SAP.
Although not detailed in this SAP, development of the hydraulic testing plan and completion of the
associated hydraulic testing work is a required task under this SAP.
3.4.7 Radiological Field Data
Alpha and beta/gamma data collection in the field will be used as needed to support sampling and
analysis efforts. Generally, cuttings from drilled boreholes (excluding slough) will be field screened for
evidence of radiological contamination. Screening will be conducted visually and with field instruments
in accordance with 10 CFR 835, “Occupational Radiation Protection.” Radiological screening will be
performed by the RCT or other qualified personnel in accordance with Hanford procedures. The RCT
will record field measurements, noting the depth of the sample and the instrument reading. Measurements
will be relayed to the field geologist for inclusion into the field logbook or operational records daily,
as applicable.
3.5 Calibration of Field Equipment
Onsite environmental instruments are calibrated in accordance with manufacturers’ operating instructions,
internal work requirements and processes, and/or field instructions that provide direction for equipment
DOE/RL-2019-23, REV. 0
60
calibration or verification of accuracy by analytical methods. Calibration records will include the raw
calibration data, identification of the standards used, associated reports, date of analysis, and analyst’s
name or initials. The results from all instrument calibration activities are recorded in accordance with
HASQARD requirements (DOE/RL-96-68).
Field instrumentation calibration and QA checks will be performed as follows:
Prior to initial use of a field analytical measurement system.
At the frequency recommended by the manufacturer or methods, or as required by regulations.
Upon failure to meet specified QC criteria.
Calibration of radiological field instruments at the Hanford Site is performed by the Mission Support
Alliance prime contractor, as specified by their calibration program.
Daily calibration checks will be performed and documented for each instrument used. These checks
will be made on standard materials sufficiently similar to the matrix under consideration for direct
comparison of data. Analysis times will be sufficient to establish detection efficiency and resolution.
Using standards for calibration that are traceable to a nationally recognized standard agency source or
measurement system. Manufacturers’ recommendations for storage and handling of standards (if any)
will be followed. Expired standards will not be used for calibration.
3.6 Sampling Handling
Sample handling and transfer will be in accordance with established methods to preclude loss of identity,
damage, deterioration, and loss of sample. Custody seals or custody tape will be used to verify that
sample integrity has been maintained during sample transport. The custody seal will be inscribed with the
sampler’s initials and date. If it is discovered during the chain-of-custody process that the custody tape
has been tampered with or broken on the sample bottle, SMR personnel will be notified. The sample will
be analyzed, but the results will include a flag to indicate that custody was broken. If the custody tape on
the cooler has been tampered with or broken, this condition will be documented in the data package.
If the sample data did not trend with the other data or were not as expected, the data from the sample
would be flagged accordingly.
A sampling and analytical database is used to track samples from the point of collection and through the
laboratory analysis process.
3.6.1 Containers
Samples will be collected, where and when appropriate, in break-resistant containers. The field sample
collection record will indicate the laboratory lot number of the bottles used in sample collection.
When commercially pre-cleaned containers are used in the field, the name of the manufacturer, lot
identification, and certification will be retained for documentation.
Containers will be capped and stored in an environment that minimizes the possibility of sample container
contamination. If contamination of the stored sample containers occurs, corrective actions will be
implemented to prevent reoccurrences. Contaminated sample containers cannot be used for a sampling
event. Container sizes may vary depending on laboratory-specific volumes/requirements for meeting
analytical detection limits. Container types and sample amounts/volumes are identified on the
chain-of-custody form.

DOE/RL-2019-23, REV. 0
61
The Radiological Engineering organization will measure the contamination levels and the dose rates
associated with the filled sample containers. This information and other data will be used to select proper
packaging, marking, labeling, and shipping paperwork and to verify that the sample can be received by
the analytical laboratory in accordance with the laboratory’s radioactivity acceptance criteria. If the dose
rate on the outside of a sample container or the curie content exceeds levels acceptable by an offsite
laboratory, the FWS (in consultation with SMR) can send smaller sample volumes to the laboratory.
3.6.2 Container Labeling
Each sample is identified by affixing a standardized label or tag to the container. This label or tag will
include the sample identification number. The label will also identify or provide reference to associate the
sample with the date and time of collection, preservative used (if applicable), analysis required, and
collector’s name or initials. Sample labels may be either pre-printed or handwritten in indelible or
waterproof ink.
3.6.3 Sample Custody
Sample custody will be maintained in accordance with existing protocols to ensure that sample integrity
is maintained throughout the analytical process. Chain-of-custody protocols will be followed throughout
sample collection, transfer, analysis, and disposal to ensure that sample integrity is maintained.
A chain-of-custody record will be initiated in the field at the time of sampling and will accompany
each sample or set of samples shipped to any laboratory.
Shipping requirements will determine how sample shipping containers are prepared for shipment.
The analyses requested for each sample will be indicated on the accompanying chain-of-custody form.
Each time the responsibility for sample custody changes, new and previous custodians will sign the record
and note the date and time. The field sampling team will make a copy of the signed record before sample
shipment and will transmit the copy to SMR.
The following minimum information is required on a completed chain-of-custody form:
Project name
Collectors’ names
Unique sample number
Date, time, and location (or traceable reference thereto) of sample collection
Matrix
Preservatives
Chain-of-possession information (i.e., signatures and printed names of each individual involved in the
transfer of sample custody and storage locations, and dates/times of receipt and relinquishment)
Requested analyses (or reference thereto)
Number of sample containers per unique sample identification number
Shipped-to information (i.e., analytical laboratory performing the analysis)
Samplers should note any sample anomalies. If anomalies are found, samplers should inform SMR so
special instructions for analysis can be provided to the laboratory if deemed necessary.

DOE/RL-2019-23, REV. 0
62
3.6.4 Sample Transportation
Packaging and transportation instructions will comply with applicable transportation regulations and
DOE requirements. Regulations for classifying, describing, packaging, marking, labeling, and
transporting hazardous materials, hazardous substances, and hazardous wastes are enforced by the
U.S. Department of Transportation (DOT) as described in 49 CFR 171, “Transportation,” “General
Information, Regulations, and Definitions,” through 177, “Carriage by Public Highway.”1 Carrier-specific
requirements defined in the current edition of the International Air Transportation Association (IATA)
Dangerous Goods Regulations will also be used when preparing sample shipments conveyed by air
freight providers.
Samples containing hazardous constituents above regulated amounts will be considered hazardous
material in transportation and will be transported according to DOT/IATA requirements. If the sample
material is known or can be identified, then the material will be packaged, marked, labeled, and shipped
according to the specific instructions for that material. Appropriate laboratory notifications will be made,
if necessary, through the SMR project coordinator.
Materials are classified by DOT/IATA as radioactive when the isotope-specific activity concentration and
the exempt consignment limits described in 49 CFR 173, “Shippers—General Requirements for
Shipments and Packagings,” are exceeded. Samples will be screened, or relevant historical data will be
used, to determine if these values are exceeded. When screening or historical data indicate that samples
are radioactive, the samples will be properly classified, described, packaged, marked, labeled, and
transported according to DOT/IATA requirements.
Prior to shipping radioactive samples to the laboratory, the organization responsible for shipping will
notify the laboratory of the approximate number and radiological levels of the samples. This notification
is conducted through the SMR project coordinator. The laboratory is responsible for ensuring that the
applicable license limits are not exceeded. Prior to sample receipt, the laboratory will provide SMR with
written acceptance for samples with elevated radioactive contamination or dose.
4 Management of Waste
Waste generated by drilling and sampling activities (e.g., personal protective clothing and equipment)
will be managed in accordance with the 200-ZP-1 OU waste management plan (Appendix B of the
200 West P&T O&M plan [DOE/RL-2009-124]). The waste management plan establishes the
requirements for managing and disposing waste associated with groundwater wells used to monitor
and remediate the 200-ZP-1 OU, as required by the 200-ZP-1 OU ROD (EPA et al., 2008).
Remediation-derived waste from well sampling and installation activities is handled in accordance
with CERCLA. The characterization of waste generated by drilling and the sampling of wells identified
in this SAP will vary by location, depth, and the time of each well’s installation.
Saturated zone soils and related miscellaneous solid waste will be designated for disposal on the
basis of an existing waste profile developed using data previously obtained from numerous other
200-ZP-1 OU wells in accordance with the 200-ZP-1 OU waste management plan (Appendix B of
DOE/RL-2009-124).
Offsite analytical laboratories are responsible for disposing unused sample quantities and wastes
generated during analytical processes. Pursuant to 40 CFR 300.440, “National Oil and Hazardous
1 Transportation regulations 49 CFR 174, “Carriage by Rail,” and 49 CFR 176, “Carriage by Vessel,” are not
applicable, as these two transportation methods are not used.
DOE/RL-2019-23, REV. 0
63
Substances Pollution Contingency Plan,” “Procedures for Planning and Implementing Off-Site Response
Actions,” approval from the DOE remedial project manager is required before returning any unused
samples or waste from offsite laboratories.
5 Health and Safety
DOE has established the hazardous waste operations safety and health program pursuant to the
Price-Anderson Amendments Act of 1988 to ensure the safety and health of workers involved in
mixed-waste site activities. The program was developed to comply with the requirements of 10 CFR 851,
“Worker Safety and Health Program,” which incorporates the standards of 29 CFR 1910.120,
“Occupational Safety and Health Standards,” “Hazardous Waste Operations and Emergency Response”;
10 CFR 830, “Nuclear Safety Management”; and 10 CFR 835. The health and safety program defines the
chemical, radiological, and physical hazards and specifies the controls and requirements for daily work
activities on the overall Hanford Site. Personnel training; control of industrial safety and radiological
hazards; personal protective equipment; site control and general emergency response to spills, fire,
accidents, injury, site visitors; and incident reporting are governed by the health and safety program.
Site-specific health and safety plans will be used to supplement the general health and safety program.
6 References
10 CFR 830, “Nuclear Safety Management,” Code of Federal Regulations. Available at:
http://www.gpo.gov/fdsys/pkg/CFR-2010-title10-vol4/xml/CFR-2010-title10-vol4-part830.xml.
10 CFR 835, “Occupational Radiation Protection,” Code of Federal Regulations. Available at:
http://www.gpo.gov/fdsys/pkg/CFR-2010-title10-vol4/xml/CFR-2010-title10-vol4-part835.xml.
10 CFR 851, “Worker Safety and Health Program,” Code of Federal Regulations. Available at:
http://www.ecfr.gov/cgi-bin/text-
idx?SID=47e3de0454360a17406cb89ade0c966d&mc=true&node=pt10.4.851&rgn=div5.
29 CFR 1910.120, “Occupational Safety and Health Standards,” “Hazardous Waste Operations and
Emergency Response,” Code of Federal Regulations. Available at: http://www.ecfr.gov/cgi-
bin/text-idx?c=ecfr&rgn=div8&view=text&node=29:5.1.1.1.8.8.33.14&idno=29.
40 CFR 300.440, “National Oil and Hazardous Substances Pollution Contingency Plan,” “Procedures
for Planning and Implementing Off-Site Response Actions,” Code of Federal Regulations.
Available at: http://www.ecfr.gov/cgi-bin/text-
idx?SID=19ced5634bd68b173b0730bd8e5472eb&mc=true&node=pt40.28.300&rgn=div5#se40.
28.300_1440.
49 CFR, “Transportation,” Code of Federal Regulations. Available at: http://www.ecfr.gov/cgi-bin/text-
idx?SID=670b98fcf27b2244917cfdf3293b16e4&tpl=/ecfrbrowse/Title49/49cfrv2_02.tpl#0.
ASTM D422-63(2007)e2, 2007, Standard Test Method for Particle-Size Analysis of Soils, ASTM
International, West Conshohocken, Pennsylvania.
ASTM D854-14, 2014, Standard Test Methods for Specific Gravity of Soil Solids by Water Pycnometer,
ASTM International, West Conshohocken, Pennsylvania.
ASTM D2937-17e2, 2017, Standard Test Method for Density of Soil in Place by the Drive-Cylinder
Method, ASTM International, West Conshohocken, Pennsylvania.

DOE/RL-2019-23, REV. 0
64
ASTM D4464-15, 2015, Standard Test Method for Particle Size Distribution of Catalytic Materials by
Laser Light Scattering, ASTM International, West Conshohocken, Pennsylvania.
ASTM D5084-16a, 2016, Standard Test Methods for Measurement of Hydraulic Conductivity of
Saturated Porous Materials Using a Flexible Wall Permeameter, ASTM International, West
Conshohocken, Pennsylvania.
ASTM D5856-15, 2015, Standard Test Method for Measurement of Hydraulic Conductivity of Porous
Material Using a Rigid-Wall, Compaction-Mold Permeameter, ASTM International, West
Conshohocken, Pennsylvania.
ASTM D6913/D6913M-17, 2017, Standard Test Methods for Particle-Size Distribution (Gradation) of
Soils Using Sieve Analysis, ASTM International, West Conshohocken, Pennsylvania.
ASTM D7263-09(2018)e2, 2018, Standard Test Methods for Laboratory Determination of Density (Unit
Weight) of Soil Specimens, ASTM International, West Conshohocken, Pennsylvania.
Atomic Energy Act of 1954, 42 USC 2011, Pub. L. 83-703, 68 Stat. 919, as amended. Available at:
https://legcounsel.house.gov/Comps/Atomic%20Energy%20Act%20Of%201954.pdf.
CHPRC-00189, 2019, Environmental Quality Assurance Program Plan, Rev. 15, CH2M HILL Plateau
Remediation Company, Richland, Washington. Available at:
https://pdw.hanford.gov/document/AR-01304.
Comprehensive Environmental Response, Compensation, and Liability Act of 1980, 42 USC 9601, et seq.,
Pub. L. 107-377, December 31, 2002. Available at:
https://www.csu.edu/cerc/researchreports/documents/CERCLASummary1980.pdf.
CP-60925, 2018, Model Package Report: The Central Plateau Vadose Zone Geoframework Version 1.0,
Rev. 0, CH2M HILL Plateau Remediation Company, Richland, Washington. Available at:
https://pdw.hanford.gov/document/0065500H.
DOD and DOE, 2017, Department of Energy (DOD) / Department of Energy (DOE) Consolidated
Quality Systems Manual (QSM) for Environmental Laboratories, U.S. Department of Defense
and U.S. Department of Energy, Washington, D.C. Available at:
http://www.denix.osd.mil/edqw/documents/documents/qsm-version-5-1-final/.
DOE/RL-96-68, 2014, Hanford Analytical Services Quality Assurance Requirements Document,
Volume 1, Administrative Requirements; Volume 2, Sampling Technical Requirements; Volume 3,
Field Analytical Technical Requirements; and Volume 4, Laboratory Technical Requirements,
Rev. 4, U.S. Department of Energy, Richland Operations Office, Richland, Washington.
Available at:
http://www.hanford.gov/files.cfm/DOE-RL-96-68-VOL1-04.pdf.
http://www.hanford.gov/files.cfm/DOE-RL-96-68-VOL2-04.pdf.
http://www.hanford.gov/files.cfm/DOE-RL-96-68-VOL3-04.pdf.
http://www.hanford.gov/files.cfm/DOE-RL-96-68-VOL4-04.pdf.
DOE/RL-2005-70, 2019, Hanford Site Well Decommissioning Plan, Rev. 4, U.S. Department of Energy,
Richland Operations Office, Richland, Washington. Available at:
https://pdw.hanford.gov/document/AR-02380.

DOE/RL-2019-23, REV. 0
65
DOE/RL-2006-24, 2006, Remedial Investigation Report for the 200-ZP-1 Groundwater Operable Unit,
Rev. 0, U.S. Department of Energy, Richland Operations Office, Richland, Washington.
Available at: https://pdw.hanford.gov/document/DA03997593.
DOE/RL-2007-28, 2008, Feasibility Study Report for the 200-ZP-1 Groundwater Operable Unit, Rev. 0,
U.S. Department of Energy, Richland Operations Office, Richland, Washington. Available at:
https://pdw.hanford.gov/document/0808050315.
https://pdw.hanford.gov/document/00098828.
DOE/RL-2007-33, 2008, Proposed Plan for Remediation of the 200-ZP-1 Groundwater Operable Unit,
Rev. 0, U.S. Department of Energy, Richland Operations Office, Richland, Washington.
Available at: https://pdw.hanford.gov/document/00098832.
DOE/RL-2008-78, 200 West Area 200-ZP-1 Pump-and-Treat Remedial Design/Remedial Action Work
Plan, current revision, U.S. Department of Energy, Richland Operations Office,
Richland, Washington.
DOE/RL-2009-115, Performance Monitoring Plan for the 200-ZP-1 Groundwater Operable Unit
Remedial Action, current revision, U.S. Department of Energy, Richland Operations Office,
Richland, Washington.
DOE/RL-2009-124, 200 West Pump and Treat Operations and Maintenance Plan, current revision,
U.S. Department of Energy, Richland Operations Office, Richland, Washington.
DOE/RL-2014-48, 2016, Response Action Report for the 200-PW-1 Operable Unit Soil Vapor Extraction
Remediation, Rev. 0, U.S. Department of Energy, Richland Operations Office, Richland,
Washington. Available at https://pdw.hanford.gov/document/0074963H.
DOE/RL-2017-68, 2018, Calendar Year 2017 Annual Summary Report for Pump-and-Treat Operations
in the Hanford Central Plateau Operable Units, Rev. 0, U.S. Department of Energy, Richland
Operations Office, Richland, Washington. Available at:
https://pdw.hanford.gov/document/0064707H.
DOE/RL-2019-38, 200-ZP-1 Operable Unit Optimization Study Plan, Rev. 0, U.S. Department of
Energy, Richland Operations Office, Richland, Washington. Available at:
https://pdw.hanford.gov/document/AR-03236.
ECF-200W-16-0092, 2019, Calculation of Three-Dimensional Groundwater Concentration Plumes for
200-West for Calendar Year (CY) 2015, Rev. 1, CH2M HILL Plateau Remediation Company,
Richland, Washington. Available at: https://pdw.hanford.gov/document/AR-01148.
ECF-HANFORD-13-0029, 2018, Development of the Hanford South Geologic Framework Model,
Hanford Site, Washington, Rev. 5, CH2M HILL Plateau Remediation Company, Richland,
Washington. Available at: https://pdw.hanford.gov/document/0064943H.
ECF-HANFORD-18-0058, 2019, Practical Quantitation Limits for Groundwater Environmental
Samples, Rev. 0, CH2M HILL Plateau Remediation Company, Richland, Washington.
Available at: https://pdw.hanford.gov/document/0063870H.
Ecology Publication No. 04-03-030, 2004, Guidelines for Preparing Quality Assurance Project Plans for
Environmental Studies, revised December 2016, Washington State Department of Ecology,
Olympia, Washington. Available at:
https://fortress.wa.gov/ecy/publications/documents/0403030.pdf.

DOE/RL-2019-23, REV. 0
66
Ecology, EPA, and DOE, 1989a, Hanford Federal Facility Agreement and Consent Order, 2 vols.,
as amended, Washington State Department of Ecology, U.S. Environmental Protection Agency,
and U.S. Department of Energy, Olympia, Washington. Available at:
http://www.hanford.gov/?page=81.
Ecology, EPA, and DOE, 1989b, Hanford Federal Facility Agreement and Consent Order Action Plan,
as amended, Washington State Department of Ecology, U.S. Environmental Protection Agency,
and U.S. Department of Energy, Olympia, Washington. Available at:
http://www.hanford.gov/?page=82.
EPA/240/B-01/003, 2001, EPA Requirements for Quality Assurance Project Plans, EPA QA/R-5, Office
of Environmental Information, U.S. Environmental Protection Agency, Washington, D.C.
Available at: https://www.epa.gov/sites/production/files/2016-06/documents/r5-final_0.pdf.
EPA/240/B-06/001, 2006, Guidance on Systematic Planning Using the Data Quality Objectives Process
(EPA QA/G-4), Office of Environmental Information, U.S. Environmental Protection Agency,
Washington, D.C. Available at:
https://www.epa.gov/sites/production/files/documents/guidance_systematic_planning_dqo_proce
ss.pdf.
EPA/240/B-06/003, 2006, Data Quality Assessment: Statistical Methods for Practitioners,
EPA QA/G-9S, Office of Environmental Information, U.S. Environmental Protection Agency,
Washington, D.C. Available at: https://www.epa.gov/sites/production/files/2015-
08/documents/g9s-final.pdf.
EPA/240/R-02/004, 2002, Guidance on Environmental Data Verification and Data Validation,
EPA QA/G-8, Office of Environmental Information, U.S. Environmental Protection Agency,
Washington, D.C. Available at: https://www.epa.gov/sites/production/files/2015-
06/documents/g8-final.pdf.
EPA/240/R-02/009, 2002, Guidance for Quality Assurance Project Plans, EPA QA/G-5, Office of
Environmental Information, U.S. Environmental Protection Agency, Washington, D.C.
Available at: https://www.epa.gov/sites/production/files/2015-06/documents/g5-final.pdf.
EPA 540-R-08-005, 2009, Guidance for Labeling Externally Validated Laboratory Analytical Data for
Superfund Use, OSWER No. 9200.1-85, Office of Solid Waste and Emergency Response,
U.S. Environmental Protection Agency, Washington, D.C. Available at:
https://nepis.epa.gov/Exe/ZyPURL.cgi?Dockey=P1002WWF.TXT.
EPA-540-R-2017-001, 2017, National Functional Guidelines for Inorganic Superfund Methods Data
Review, Office of Superfund Remediation and Technology Innovation, U.S. Environmental
Protection Agency, Washington, D.C. Available at:
https://www.epa.gov/sites/production/files/2017-
01/documents/national_functional_guidelines_for_inorganic_superfund_methods_data_review_0
1302017.pdf.
EPA-540-R-2017-002, 2017, National Functional Guidelines for Organic Superfund Methods Data
Review, Office of Superfund Remediation and Technology Innovation, U.S. Environmental
Protection Agency, Washington, D.C. Available at:
https://www.epa.gov/sites/production/files/2017-
01/documents/national_functional_guidelines_for_organic_superfund_methods_data_review_013
072017.pdf.

DOE/RL-2019-23, REV. 0
67
EPA/600/4-79/020, 1983, Methods for Chemical Analysis of Water and Wastes, Office of Research and
Development, U.S. Environmental Protection Agency, Washington, D.C. Available at:
http://nepis.epa.gov/Exe/ZyPURL.cgi?Dockey=30000Q10.TXT.
EPA, Ecology, and DOE, 2008, Record of Decision Hanford 200 Area 200-ZP-1 Superfund Site, Benton
County, Washington, U.S. Environmental Protection Agency, Washington State Department of
Ecology, and U.S. Department of Energy, Olympia, Washington. Available at:
https://pdw.hanford.gov/document/00098825.
IATA, 2019, Dangerous Goods Regulations, 60th Edition, International Air Transport Association,
Montreal, Quebec, Canada.
National Historic Preservation Act of 1966, Pub. L. 89-665, as amended, 16 USC 470, et seq.
Available at: https://www.nps.gov/history/local-law/nhpa1966.htm.
Price-Anderson Amendments Act of 1988, Pub. L. 100-408, Aug. 20, 1988, 102 Stat. 1066, 42 USC 2010,
et seq. Available at: http://www.gpo.gov/fdsys/pkg/STATUTE-102/pdf/STATUTE-102-
Pg1066.pdf.
Resource Conservation and Recovery Act of 1976, 42 USC 6901, et seq. Available at:
https://elr.info/sites/default/files/docs/statutes/full/rcra.pdf.
SGW-61350, Data Gaps Evaluation in Groundwater Monitoring at the Hanford 200-ZP-1 Groundwater
Operable Unit, Rev. 1, CH2M HILL Plateau Remediation Company, Richland, Washington.
Available at: https://pdw.hanford.gov/document/AR-03045.
SGW-62137, 2018, 200 West Pump-and-Treat Performance Against Remedial Action Objectives
Specified in the 200-ZP-1 Operable Unit Record of Decision, Rev. 0, CH2M HILL Plateau
Remediation Company, Richland, Washington. Available at:
https://pdw.hanford.gov/document/AR-01243.
SW-846, 2015, Test Methods for Evaluating Solid Waste: Physical/Chemical Methods, Third Edition;
Final Update V, as amended, Office of Solid Waste and Emergency Response,
U.S. Environmental Protection Agency, Washington, D.C. Available at: https://www.epa.gov/hw-
sw846/sw-846-compendium.
WAC 173-160, “Minimum Standards for Construction and Maintenance of Wells,” Washington
Administrative Code, Olympia, Washington. Available at:
http://apps.leg.wa.gov/WAC/default.aspx?cite=173-160.

DOE/RL-2019-23, REV. 0
68
This page intentionally left blank.

DOE/RL-2019-23, REV. 0
A-i
Appendix A
200-ZP-1 Operable Unit Ringold Formation Unit A
Data Quality Objectives

DOE/RL-2019-23, REV. 0
A-ii
This page intentionally left blank.

DOE/RL-2019-23, REV. 0
A-iii
Contents
A1 Data Quality Objectives ................................................................................................................ A-1
A2 State the Problem .......................................................................................................................... A-1
A3 Identify the Goals of the Study..................................................................................................... A-4
A4 Identify the Information Inputs ................................................................................................... A-7
A4.1 Data Inputs to Resolve Decision Statement #1 ................................................................ A-12
A4.2 Data Inputs to Resolve Decision Statement #2 ................................................................ A-12
A4.3 Data Inputs to Resolve Decision Statement #3 ................................................................ A-13
A4.4 Data Inputs to Resolve Decision Statement #4 ................................................................ A-13
A5 Define the Boundaries of the Study ........................................................................................... A-13
A6 Develop the Analytic Approach ................................................................................................. A-14
A6.1 Approach for Selecting Proposed Rwia Monitoring Well Locations ............................... A-14
A6.2 Approach for Determining Adequacy .............................................................................. A-16
A6.3 Decision Rules and Approaches to Resolve Decision Statements ................................... A-18
A6.3.1 Decision Rule and Approach to Resolve Decision Statement #1 ......................... A-18
A6.3.2 Decision Rule and Approach to Resolve Decision Statement #2 ......................... A-21
A6.3.3 Decision Rule and Approach to Resolve Decision Statement #3 ......................... A-23
A6.3.4 Decision Rule and Approach to Resolve Decision Statement #4 ......................... A-23
A7 Specify Performance or Acceptance Criteria ........................................................................... A-24
A7.1 Groundwater Levels ......................................................................................................... A-24
A7.2 Pumping Rates ................................................................................................................. A-25
A7.3 Contaminant Concentrations ............................................................................................ A-25
A7.4 Other Measured Parameters ............................................................................................. A-27
A7.5 Model Predictions ............................................................................................................ A-27
A8 Develop the Plan for Obtaining Data ........................................................................................ A-28
A9 References .................................................................................................................................... A-28

DOE/RL-2019-23, REV. 0
A-iv
Figures
Figure A-1. Hydrogeologic Three-Dimensional Model Cross Section of 2017 Carbon
Tetrachloride Plume, West to East (A to A’) ...................................................................... A-3
Figure A-2. Carbon Tetrachloride Plume Estimates Below the Rlm in the 2008 Feasibility
Study Versus 2015 .............................................................................................................. A-4
Figure A-3. Carbon Tetrachloride Plume Estimates Above the Rlm in the 2008 Feasibility
Study Versus 2015 .............................................................................................................. A-5
Figure A-4. Carbon Tetrachloride Plume >100 µg/L and Simulated Capture Zone, 2017 .................... A-6
Figure A-5. Data Gap Analysis Scores for Potential Monitoring Well Locations Below the Rlm ...... A-15
Figure A-6. Combined Map of Rlm Extent and the Carbon Tetrachloride Plume, Data Gap
Analysis Scores, and Existing Monitoring Wells Below the Rlm .................................... A-17
Tables
Table A-1. Constituents of Interest for Groundwater During Drilling and for Groundwater
Post-Development ............................................................................................................... A-8
Table A-2. Constituents of Interest and Physical Properties for Sediments During Drilling.............. A-10
Table A-3. Constituent Methods and Analytical Performance Requirements for
Groundwater Samples ....................................................................................................... A-19
Table A-4. Constituent Methods and Analytical Performance Requirements for
Sediment Samples ............................................................................................................. A-20
Table A-5. Physical Properties Methods for Sediment Samples ........................................................ A-22

DOE/RL-2019-23, REV. 0
A-v
Terms
AA alternative action
COC contaminant of concern
DQO data quality objective
DR decision rule
DS decision statement
F&T fate and transport
IC institutional control
MNA monitored natural attenuation
O&M operations and maintenance
OU operable unit
P&T pump and treat
PMP performance monitoring plan
PNNL Pacific Northwest National Laboratory
PSQ principal study question
PQL practical quantitation limit
RAO remedial action objective
RD/RAWP remedial design/remedial action work plan
Rlm Ringold Formation member of Wooded Island – lower mud unit
ROD Record of Decision
Rwia Ringold Formation member of Wooded Island – unit A
Rwie Ringold Formation member of Wooded Island – unit E
SAP sampling and analysis plan
TBD to be determined

DOE/RL-2019-23, REV. 0
A-vi
This page intentionally left blank.

DOE/RL-2019-23, REV. 0
A-1
A 200-ZP-1 Operable Unit Ringold Formation Unit A
Data Quality Objectives
The data quality objective (DQO) process used to support the sample design presented the main text of
this sampling and analysis plan (SAP) is provided in this appendix.
A1 Data Quality Objectives
The DQO process is a strategic planning approach to define the criteria that a data collection design
should satisfy. This process is used to ensure that the type, quantity, and quality of environmental data
used in decision making will be appropriate for the intended application. The DQOs for the
200-ZP-1 Groundwater Operable Unit (OU) Ringold Formation unit A SAP were developed in
accordance with EPA/240/B-06/001, Guidance on Systematic Planning Using the Data Quality
Objectives Process (EPA QA/G-4). The DQO process involves a series of logical steps used to plan for
the resource-effective acquisition of environmental data. The performance and acceptance criteria are
determined through the DQO process, which serves as the basis for designing the plan to collect data of
sufficient quality and quantity to support project goals. The DQO process consists of the following seven
iterative steps.
1. State the problem.
2. Identify the goal of the study.
3. Identify the information inputs.
4. Define the boundaries of the study.
5. Develop the analytic approach.
6. Specify performance or acceptance criteria.
7. Develop the plan for obtaining data.
Each of the DQO steps is further discussed in Sections A2 through A8.
As discussed in Section 5.5 of DOE/RL-2008-78, 200 West Area 200-ZP-1 Pump-and-Treat Remedial
Design/Remedial Action Work Plan (hereinafter referred to as the 200-ZP-1 pump and treat (P&T)
remedial design/remedial action work plan [RD/RAWP]), and in Section 1.1.1 in the main text of this
SAP, an optimization study will be conducted in accordance with DOE/RL-2019-38, 200-ZP-1 Operable
Unit Optimization Study Plan (hereinafter referred to as the 200-ZP-1 optimization study plan), which is
focused on evaluating the potential for accelerating carbon tetrachloride cleanup by increasing the
treatment capacity of the 200 West P&T. While many of the DQOs identified herein for this SAP may be
used to support the optimization study, additional DQOs may be developed. The potential additional
DQOs for the optimization study are not identified in this SAP and will be identified separately as part of
the optimization study plan and/or associated SAPs.
A2 State the Problem
The first step in the DQO process is to define the problem. For the 200-ZP-1 OU, evaluation and
optimization of the selected remedy, as specified in EPA et al., 2008, Record of Decision Hanford
200 Area 200-ZP-1 Superfund Site, Benton County, Washington (hereinafter referred to as the
200-ZP-1 OU Record of Decision [ROD]), is the ultimate purpose of data collection for the OU.
To support this purpose, the nature and extent of carbon tetrachloride and other 200-ZP-1 OU
contaminants of concern (COCs) (as defined in the 200-ZP-1 OU ROD) in the Ringold Formation

DOE/RL-2019-23, REV. 0
A-2
member of Wooded Island – unit A (Rwia) and the Ringold Formation member of Wooded Island –
lower mud unit (Rlm) must be better understood. Figure A-1 provides a cross-section map of the carbon
tetrachloride concentrations in the 200 West Area as approximated in 2017 through interpolation of
groundwater sample data.
Since implementation of the 200-ZP-1 OU ROD (EPA et al., 2008), a larger proportion of carbon
tetrachloride has been identified below the Rlm that is substantially larger than previously estimated
(located farther to the northeast) and represents a greater fraction of the overall contaminant mass within
the 200-ZP-1 OU (Figure A-2). For comparison, the 2015 carbon tetrachloride plume estimate above
the Rlm is only moderately larger in extent in the east-west direction than was estimated during the 2008
feasibility study (DOE/RL-2007-28, Feasibility Study Report for the 200-ZP-1 Groundwater Operable
Unit) but is more extensive in the north and south directions (Figure A-3). In both Figures A-2 and A-3
(below and above the Rlm, respectively), more recent data have identified a greater extent of
contamination in the northeast area.
Currently, there are limited characterization data, hydrogeologic data, hydraulic data, and information to
define transport parameters for the Rwia and Rlm. A specific area where additional data are needed is to
the north and northeast of the Hanford Site 200 West Area, where a portion of the carbon tetrachloride
plume >100 µg/L is not currently being hydraulically contained by the P&T component of the selected
remedy (Figure A-4). In addition, the region to the northeast (where contaminants are transported and
discharge in groundwater from the 200 West Area toward the 200 East Area via a zone of higher
transmissivity) needs to be better understood. Although the main text of this SAP addresses the primary
data needs associated with the Rwia and Rlm, some Ringold Formation member of Wooded Island –
unit E (Rwie) data will facilitate improving the understanding of groundwater and contaminant
movement in this area.
Based on these needs, data must be collected within the defined study area to adequately define the nature
and extent of the 200-ZP-1 OU COC plumes and the hydrogeologic properties, hydraulic properties, and
transport parameters of the Rwia, the Rlm, and, to a limited extent, the Rwie. The data will support fate
and transport (F&T) modeling, facilitate performance evaluation of the 200-ZP-1 OU remedy, and assist
in making recommendations for optimizing or modifying the remedy. The data will supplement data to be
collected as part of well installation, as defined in DOE/RL-2009-115, Performance Monitoring Plan for
the 200-ZP-1 Groundwater Operable Unit Remedial Action (hereinafter referred to as the 200-ZP-1 OU
performance monitoring plan [PMP]), which occur concurrently with the effort described in the main text
of this SAP. The 200-ZP-1 OU PMP effort is focused on monitoring for current remedy implementation
needs. This SAP focuses specifically on characterization in the Rwia, Rlm, and Rwie that is associated
with future remedy optimization efforts.
A determination regarding the adequacy of the information and knowledge obtained from these studies
will be made in the context of improving the ability to reasonably predict the likely future performance of
the remedy in attaining the remedial action objectives (RAOs) specified in the 200-ZP-1 OU ROD
(EPA et al., 2008). The process for determining what is meant by “adequately defined” is discussed in
Section A6 as part of the analytical approach development. The overall goal of this project is to obtain
additional data (with emphasis on the Rwia) to provide for reliable and predictive F&T modeling to
support P&T and monitored natural attenuation (MNA) remedy optimization.

DO
E/R
L-2
019-2
3, R
EV
. 0
A-3
Source: DOE/RL-2017-68, Calendar Year 2017 Annual Summary Report for Pump-and-Treat Operations in the Hanford Central Plateau Operable Units.
Figure A-1. Hydrogeologic Three-Dimensional Model Cross Section of 2017 Carbon Tetrachloride Plume, West to East (A to A’)
- Ringold Lower Mud
Well Type lnjectton Wells
Extraction Wells 699-43-678
299-W14-74 299-W12-4
Carbon Tetrachlortde (ug/ ll 299-Wl4•73 - 3.4 - 50 299-W15-227
50 - 100 299-W15-225
100-500
500 - 1000 - > 1000 Ringold E
+150
+100 ---------1
Ringold E
Ringold A
Scale 1:1500
375 750 1125 1500

DOE/RL-2019-23, REV. 0
A-4
Note: Comparison based on DOE/RL-2007-28, Feasibility Study Report for the 200-ZP-1
Groundwater Operable Unit; and 2015 modeling presented in ECF-200W-16-0092, Rev. 1,
Calculation of Three-Dimensional Groundwater Concentration Plumes for 200-West for
Calendar Year (CY) 2015.
Figure A-2. Carbon Tetrachloride Plume Estimates Below the Rlm in the 2008 Feasibility Study Versus 2015
A3 Identify the Goals of the Study
The second step of the DQO process identifies the key decisions and/or goals that must be addressed
to achieve the final solution. As stated in the 200-ZP-1 OU ROD (EPA et al., 2008), the selected remedy
combines the components of groundwater P&T, MNA, flow-path control, and institutional controls (ICs).
As specified in the 200-ZP-1 P&T RD/RAWP (DOE/RL-2008-78), monitoring will be conducted to
evaluate performance of the P&T system, flow-path control, and MNA. Performance monitoring for the
first three components is primarily addressed by the 200-ZP-1 OU PMP (DOE/RL-2009-115). The ICs
are specifically excluded from the 200-ZP-1 OU PMP and are monitored in accordance with
DOE/RL-2001-41, Sitewide Institutional Controls Plan for Hanford CERCLA Response Actions and
RCRA Corrective Actions. The data collected under this study will be supplemental to the data collected
under the 200-ZP-1 OU PMP, with a focus on obtaining characterization information for the Rwia and
Rlm to support future remedy optimization needs.
1 W'IS.227 _ ,,
W1$-21
wt$-44 .. : W1a.35 W1$.43 y Mt.:37
y y w,a.3& 'Ml•llil y
zone
20151 Estimate .a.ee ,,
,)
CTET (µg/L)
D < so - 51-100
c:::::::J 101-soo
c;;;;;;;;J so1-1.ooo - 1,001 -2.000
- >2,000
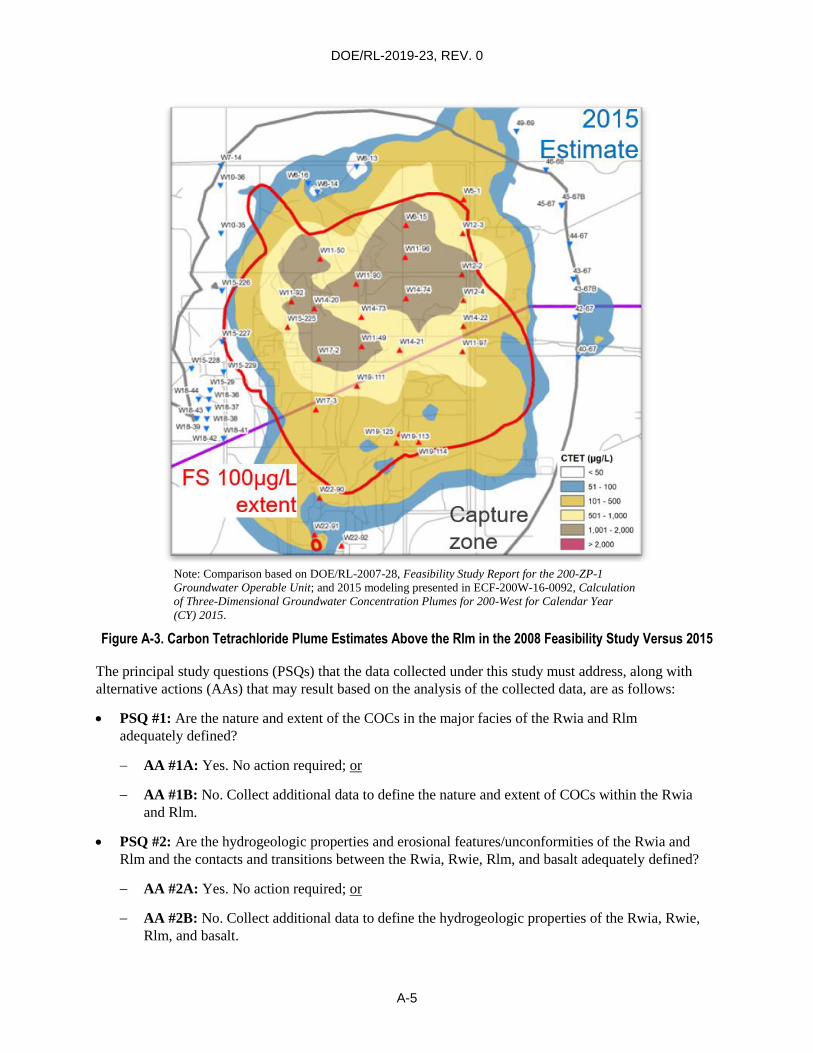
DOE/RL-2019-23, REV. 0
A-5
Note: Comparison based on DOE/RL-2007-28, Feasibility Study Report for the 200-ZP-1
Groundwater Operable Unit; and 2015 modeling presented in ECF-200W-16-0092, Calculation
of Three-Dimensional Groundwater Concentration Plumes for 200-West for Calendar Year
(CY) 2015.
Figure A-3. Carbon Tetrachloride Plume Estimates Above the Rlm in the 2008 Feasibility Study Versus 2015
The principal study questions (PSQs) that the data collected under this study must address, along with
alternative actions (AAs) that may result based on the analysis of the collected data, are as follows:
PSQ #1: Are the nature and extent of the COCs in the major facies of the Rwia and Rlm
adequately defined?
AA #1A: Yes. No action required; or
AA #1B: No. Collect additional data to define the nature and extent of COCs within the Rwia
and Rlm.
PSQ #2: Are the hydrogeologic properties and erosional features/unconformities of the Rwia and
Rlm and the contacts and transitions between the Rwia, Rwie, Rlm, and basalt adequately defined?
AA #2A: Yes. No action required; or
AA #2B: No. Collect additional data to define the hydrogeologic properties of the Rwia, Rwie,
Rlm, and basalt.
2015
101-500
[k) so1 - 1.ooo
- 1,001 - 2,000
- > 2,000

DO
E/R
L-2
019-2
3, R
EV
. 0
A-6
Source: DOE/RL-2017-68, Calendar Year 2017 Annual Summary Report for Pump-and-Treat Operations in the Hanford Central Plateau Operable Units.
Figure A-4. Carbon Tetrachloride Plume >100 µg/L and Simulated Capture Zone, 2017
\ \ \ \ \
\ I I
\ ', \
\ \
',
I I
I,
\ \,
P&T Wells 2017
Well "fype, OU
& ExttacilOn. UP- . IJ I n!CCUO<l, I-" 1 .6 E.ir11cion, ZP I
• I nju:clioo. ZP-1 , rtd "69Y--. 0to1'ifod ~ -•+,· ,xcfix "299· a 8P.-\•a:inr"! (m)
lii!!d Crr.un.1l\'9!P.r . - r,,ode . Ms;,kr Cor.~mir.ant '=m·~- CY ZQI 7 Cilrbon Ti!Ui1't,i:,:Jn......, ,
- 3• - \CO 2017 Sfmotalod Capturo froqucincw D•: CS
0,5-0.6
• C.6 - 0.7 o a.7 0.8
D o.e-o.9 . 0.9 - '
o~==:::;: 50=0;;;_---:~1 ,000 Me1ei, \
r 3.000 FHI 0 1,500

DOE/RL-2019-23, REV. 0
A-7
PSQ #3: Are the typical values and the variabilities of the hydraulic properties of the major facies of
the Rwia and Rlm adequately defined?
AA #3A: Yes. No action required; or
AA #3B: No. Collect additional data to define the hydraulic properties of the Rwia and Rlm.
PSQ #4: Are the transport parameters for the 200-ZP-1 OU COCs within the Rwia and Rlm
adequately defined?
AA #4A: Yes. No action required; or
AA #4B: No. Collect additional data to define the transport properties.
The resulting decision statements (DSs) are the basis for discussion in the subsequent DQO process steps:
DS #1: Determine if the vertical and lateral spatial distribution of the aqueous and sorbed COC
concentrations in the major facies of the Rwia and Rlm are adequately defined to support remedy
performance evaluation and F&T modeling; otherwise, collect additional data to define the vertical
and lateral distribution of COCs.
DS #2: Determine if the hydrogeologic properties and erosional features/unconformities of the Rwia
and Rlm and the contacts and transitions between the Rwia, Rwie, Rlm, and basalt are adequately
defined to support of F&T modeling; otherwise, collect additional data to define these properties.
DS #3: Determine if the hydraulic properties of the Rwia and Rlm are adequately defined to support
F&T modeling; otherwise, collect additional data to define these properties.
DS #4: Determine if the transport parameters for the 200-ZP-1 OU COCs are adequately defined
within the Rwia and Rlm to support F&T modeling; otherwise, collect additional data to define
these properties.
A4 Identify the Information Inputs
The third step of the DQO process identifies the data and information that may be needed to resolve
the DSs listed in Section A3. The types and specifications of primary data that are collected are
summarized below:
Contaminant sampling data collected during drilling and post-development: Groundwater
contaminant sampling during drilling and following development of the proposed Rwia monitoring
wells is needed to better define the horizontal and vertical extent and the distribution of aqueous
contamination above cleanup levels. Sediment contaminant sampling during drilling of the proposed
wells is needed to better define the sorbed versus aqueous partitioning of contamination in the
aquifer. The groundwater samples will be analyzed for the constituents listed in Table A-1, and the
sediment samples will be analyzed for the constituents listed in Table A-2. In addition to analysis
for 200-ZP-1 OU COCs, Tables A-1 and A-2 also summarize other constituents to be sampled for
various data uses. These other constituents include COC transformation and degradation products,
COCs from other OUs, and key geochemical and field parameters. The constituents of interest that
are not identified as COCs were derived from a review of the documents listed in Table 7 in the
main text of this SAP.

DOE/RL-2019-23, REV. 0
A-8
Table A-1. Constituents of Interest for Groundwater During Drilling and for Groundwater Post-Development
Constituent of Interest CAS Number
Groundwater Constituents During Drilling
Carbon tetrachloridea 56-23-5
Chloroform 67-66-3
Chloromethane 74-87-3
Chromium, totala, b 7440-47-3
Cyanide 57-12-5
cis-1,2-Dichloroethene 156-59-2
Dichloromethane 75-09-2
Iron 7439-89-6
Iodine-129a 15046-84-1
Manganese 7439-96-5
Nitratea 14797-55-8
pH N/A
Total dissolved solids TDS
Total carbon 7440-44-0
Total organic carbon TOC
Total inorganic carbon TIC
Technetium-99a 14133-76-7
Trichloroethenea 79-01-6
Tritiuma 10028-17-8
Uraniumc 7440-61-1
Vinyl chloride 75-01-4
Post-Development Groundwater Constituents
Alkalinity ALKALINITY
Carbon tetrachloridea 56-23-5
Chloroform 67-66-3
Chloride 16887-00-6
Chloromethane 74-87-3
cis-1,2-Dichloroethene 156-59-2
Dichloromethane 75-09-2
Chromium, totala, b 7440-47-3
Chromium, hexavalenta, b 18540-29-9
Cyanide 57-12-5
Iodine-129a 15046-84-1
Ironb 7439-89-6
Manganeseb 7439-96-5
Nickelb 7440-02-0
Nitratea 14797-55-8

DOE/RL-2019-23, REV. 0
A-9
Table A-1. Constituents of Interest for Groundwater During Drilling and for Groundwater Post-Development
Constituent of Interest CAS Number
Nitrite 14797-65-0
Sulfate 14808-79-8
Sulfide 18496-25-8
Technetium-99a 14133-76-7
Total organic carbon TOC
Total dissolved solids TDS
Trichloroethenea 79-01-6
Tritiuma 10028-17-8
Uraniumb, c 7440-61-1
Vinyl chloride 75-01-4
Field Screening Parameters d
Dissolved oxygen N/A
Oxidation-reduction potential N/A
pH N/A
Specific conductance N/A
Temperature N/A
Turbidity N/A
a. The COCs are specified in EPA et al., 2008, Record of Decision Hanford 200 Area 200-ZP-1
Superfund Site, Benton County, Washington.
b. Both filtered and unfiltered samples will be collected for all metal constituents except
hexavalent chromium. A filtered sample will be collected for hexavalent chromium.
c. Uranium (total) will also be analyzed as a target constituent. While not a COC specified in the
200-ZP-1 OU Record of Decision (EPA et al., 2008), it is a COC for the adjacent 200-UP-1 OU.
d. Field screening parameters to be collected in accordance with DOE/RL-96-68, Hanford
Analytical Services Quality Assurance Requirements Document, Vol. 3, Field Analytical
Technical Requirements.
CAS = Chemical Abstracts Service
COC = contaminant of concern
N/A = not applicable
OU = operable unit
TDS = total dissolved solids
TIC = total inorganic carbon
TOC = total organic carbon

DOE/RL-2019-23, REV. 0
A-10
Table A-2. Constituents of Interest and Physical Properties for Sediments During Drilling
Constituent of Interest CAS Number Purpose
Sediment Constituents
Carbon tetrachloridea 56-23-5 Used for comparison to aqueous concentrations
Chloroform 67-66-3 Used for comparison to aqueous concentrations
Chloromethane 74-87-3 Used for comparison to aqueous concentrations
Chromium, totala 7440-47-3 Used for comparison to aqueous concentrations
Chromium, hexavalenta 18540-29-9 Used for comparison to aqueous concentrations
Cyanide 57-12-5 Used for comparison to aqueous concentrations
cis-1,2-Dichloroethane 156-59-2 Used for comparison to aqueous concentrations
Dichloromethane 75-09.2 Used for comparison to aqueous concentrations
Iron 7439-89-6 Used for comparison to aqueous concentrations, to establish baseline
geochemistry, and to evaluate reduction-oxidation minerals
Manganese 7439-96-5 Used for comparison to aqueous concentrations, to establish baseline
geochemistry, and to evaluate reduction-oxidation minerals
pH N/A Used for comparison to aqueous concentrations and to establish
baseline geochemistry
Total carbon 7440-44-0 Used for comparison to aqueous concentrations and to establish
baseline geochemistry
Total organic carbon TOC Used for comparison to aqueous concentrations and to establish
baseline geochemistry
Total inorganic carbon TIC Used for comparison to aqueous concentrations and to establish
baseline geochemistry
Technetium-99a 14133-76-7 Used for comparison to aqueous concentrations
Trichloroethenea 79-01-6 Used for comparison to aqueous concentrations
Uraniumb 7440-61-1 Used for comparison to aqueous concentrations
Vinyl chloride 75-01-4 Used for comparison to aqueous concentrations
Sediment Physical Properties
Bulk density, particle
density, and porosity N/A
Used in evaluating soil texture needed to support geologic interpretation,
interpretation of physical and chemical testing data, and provide
parameter inputs to fate and transport modeling
Particle-size distribution N/A
Used in evaluating soil texture needed to support geologic interpretation
and interpretation of physical and chemical testing data and to support
well design process
Saturated hydraulic
properties N/A
Used in geologic interpretation and provides parameter inputs to fate and
transport modeling
a. The COCs are specified in EPA et al., 2008, Record of Decision Hanford 200 Area 200-ZP-1 Superfund Site, Benton
County, Washington.
b. Uranium (total) will also be analyzed as a target constituent. While not a COC specified in the 200-ZP-1 OU Record of
Decision (EPA et al., 2008), it is a COC for the 200-UP-1 OU to the south.
CAS = Chemical Abstracts Service
COC = contaminant of concern
N/A = not applicable
OU = operable unit
TIC = total inorganic carbon
TOC = total organic carbon

DOE/RL-2019-23, REV. 0
A-11
Hydrogeologic properties data collected during drilling: Geologic observations and geophysical
data collection during drilling are needed to better define the geologic framework of the
200-ZP-1 OU, with specific focus on the contacts and transitions between the Rwia, Rwie, Rlm,
and basalt and the erosional features and unconformities of the Rwia and Rlm. This need will
primarily be satisfied by producing geologic logs of the sediment and basalt encountered during
drilling of each new well and using geophysical logging (including spectral gamma and neutron
moisture logging) of each drilled borehole prior to well construction. Sediment physical property
sampling during drilling is also needed to better define hydrogeologic properties of and differences
between the Rwia and Rwie. Specifically, the sediment samples will be analyzed for bulk density,
particle density, total porosity, and particle-size distribution, as listed under the sediment physical
properties in Table A-2.
Hydraulic properties data collected during drilling and following well construction: Hydraulic
head distribution observations collected during drilling are needed to better define hydraulic
conditions in the 200-ZP-1 OU. This need will primarily be satisfied by recording hydraulic head
measurement in geologic logs during drilling of each new well. Hydraulic slug testing data collection
is also needed to better define the hydraulic conductivity vertical profile for the Rwia and Rlm
associated with the major zones of different transmissivity encountered during drilling of each well.
This need will be satisfied by conducting slug tests during drilling at each planned groundwater and
sediment sampling interval, except in the Rlm where only one interval will be tested. Sediment
physical property sampling during drilling is needed to better define Rwia hydraulic properties. The
sediment samples will be analyzed for saturated hydraulic conductivity, as listed under the sediment
physical properties in Table A-2. Following well acceptance of the new Rwia monitoring wells,
supplemental hydraulic testing is needed to further define the 200-ZP-1 OU hydraulic properties.
These additional tests will be conducted in accordance with a separately developed hydraulic testing
plan, with emphasis on data collection to support evaluating vertical conductivity, large-scale
transmissivity and storage properties, hydraulic conductivity vertical profiles associated with
principal zones of transmissivity, and effective porosity within and downgradient of observed and
interpreted plume migration pathways.
Transport parameter sampling data collected during drilling: Sediment sampling for transport
parameters during drilling of the proposed Rwia monitoring wells is needed to better define transport
parameters of the 200-ZP-1 OU for use in F&T model. The sediment samples will be analyzed
geochemical parameters and organic content as listed in Table A-2. Sediment samples will also be
provided to Pacific Northwest National Laboratory (PNNL) for laboratory contaminant mobility and
transport studies to better understand sediment/water partitioning and develop distribution
coefficients for carbon tetrachloride in the Rwia and Rlm. Only sediment samples that correspond to
groundwater samples with higher carbon tetrachloride concentrations (based on quick-turnaround
analytical results) will undergo the supplemental studies at PNNL. The supplemental studies
will be conducted using PNNL-developed methods and procedures that are not specified in
this DQO process.
Additional contaminant sampling data collected under other sampling plans: Where appropriate,
groundwater and sediment contaminant sampling data collected under other sampling plans will
be used to support this study if the data are of acceptable quality and meet the performance
requirements specified in the main text of this SAP. The data may include results for contaminants,
transformation products, and other constituents that arise from other 200-ZP-1 OU data collection
activities, including the 200-ZP-1 OU PMP (DOE/RL-2009-115); the 200-ZP-1 optimization study
plan (DOE/RL-2019-38); and DOE/RL-2009-124, 200 West Pump and Treat Operations and
DOE/RL-2019-23, REV. 0
A-12
Maintenance Plan (hereinafter referred to as the 200 West P&T operations and maintenance [O&M]
plan); or from other data collection activities outside of the 200-ZP-1 OU.
Collection of measurements and observations provides an opportunity for integration with other projects
and activities, including data collection performed for other OUs. Conversely, information and developed
knowledge may be shared with other projects through integration activities. Measurements and
observations collected and used through integration activities must be assessed to ensure that they meet
the data quality requirements of the current activity and that their uncertainty and limitations are
understood. Information should be clearly identified as based on either direct data (i.e., collected under
the auspices of this activity) or indirect data (i.e., collected through an integration activity).
The following sections identify the data inputs needed to resolve each DS presented in Section A3.
A4.1 Data Inputs to Resolve Decision Statement #1
The following data inputs are required to resolve DS #1, “Determine if the vertical and lateral spatial
distribution of the aqueous and sorbed COC concentrations in the major facies of the Rwia and Rlm are
adequately defined to support remedy performance evaluation and F&T modeling…”:
Groundwater (aqueous contaminants, transformation products, and other constituents of interest)
sample results from the new monitoring wells to better define the lateral and vertical extent and
distribution of contaminant plumes
Sediment (sorbed contaminants, transformation products, and other constituents of interest)
sample results from the new monitoring wells to better define the sorbed versus aqueous
contaminant concentrations
Sample results for contaminants, transformation products, and other constituents of interest that arise
from other 200-ZP-1 OU data collection activities, primarily performed under the 200-ZP-1 OU PMP
(DOE/RL-2009-115), the 200-ZP-1 optimization study plan (DOE/RL-2019-38), and the 200 West
P&T O&M plan (DOE/RL-2009-124)
Sample results for contaminants, transformation products, and other constituents of interest that arise
from outside the 200-ZP-1 OU under other SAPs, PMPs, etc.
These data are described in Section A6 and are discussed in further detail in Section A6.3.1.
A4.2 Data Inputs to Resolve Decision Statement #2
The following data inputs are required to resolve DS #2, “Determine if the hydrogeologic properties and
erosional features/unconformities of the Rwia and Rlm, and contacts and transitions between the Rwia,
Rwie, Rlm, and basalt adequately defined to support F&T modeling…”:
Geologic observations (during drilling, using visual observation and geophysical logging) of
the contacts, transitions, erosional features, and unconformities between the Rwia, Rwie, Rlm, and
basalt to better define the geologic framework
Sediment physical properties (bulk density, particle density, total porosity, particle-size distribution,
and saturated hydraulic conductivity) sample results from the new monitoring wells to better define
hydrogeologic and hydraulic properties and differences between the Rwia, Rwie, and Rlm
These data are described in Section A6 and are discussed in further detail in Section A6.3.2.

DOE/RL-2019-23, REV. 0
A-13
A4.3 Data Inputs to Resolve Decision Statement #3
The following data inputs are required to resolve DS #3, “Determine if the hydraulic properties of the
Rwia and Rlm are adequately defined to support F&T modeling…”:
Sediment physical properties (bulk density, particle density, total porosity, particle-size distribution,
and saturated hydraulic conductivity) sample results from the new monitoring wells to better define
hydrogeologic and hydraulic properties and differences between the Rwia, Rwie, and Rlm
Hydraulic head distribution observations during drilling to better define hydraulic conditions to
support F&T modeling
Slug testing (during drilling) results to better define the vertical profile of hydraulic conductivity
for the Rwia associated with major zone of different transmissivity to support F&T modeling
Hydraulic testing (to be determined [TBD]) to better define large-scale transmissivity and
storage properties
Hydraulic testing (TBD) to better define the vertical profile of hydraulic conductivity for the Rwia
associated with major zones of different transmissivity
Hydraulic testing (TBD) to better define the vertical hydraulic conductivity (leakage factor)
Hydraulic testing (TBD) to better define the effective porosity of the Rwia within the
observed/interpreted plume migration pathways
These data are described in Section A6 and are discussed in further detail in Section A6.3.3.
A4.4 Data Inputs to Resolve Decision Statement #4
The following data inputs are required to resolve DS #4, “Determine if the transport parameters for the
200-ZP-1 OU COCs are adequately defined within the Rwia and Rlm to support F&T modeling…”:
Sediment transport-related (geochemical parameters and organic content) sample results from the new
monitoring wells to better define the transport parameters
Results of supplemental laboratory contaminant mobility and transport studies performed by PNNL
will be used to better understand sediment/water partitioning and develop distribution coefficients for
carbon tetrachloride
These data are described in Section A6 and are discussed in further detail in Section A6.3.4.
A5 Define the Boundaries of the Study
The fourth step of the DQO process is used to identify the spatial and temporal features pertinent to the
decision-making process. The overall spatial study boundaries include the area of the current carbon
tetrachloride plume and the discharge zone of Rwia and Rlm groundwater into a zone of higher
transmissivity at the eastern margin of the Rwia. Specific study zones within the overall study boundaries
are as follows:
Carbon tetrachloride plume core, where carbon tetrachloride concentrations exceed or are
near 100 µg/L
Eastern margin of the Rlm, where the Rlm appears to be thinning or absent

DOE/RL-2019-23, REV. 0
A-14
Northeastern uncontained extent of the carbon tetrachloride plume >100 µg/L
The likely discharge zone into a zone of higher transmissivity, as identified in part through
groundwater F&T modeling
The temporal study boundaries are limited to fiscal years 2020 through 2023 in order to meet other
200-ZP-1 OU remedy evaluation schedule requirements.
A6 Develop the Analytic Approach
The fifth step of the DQO process involves developing an analytic approach and the associated decision
rules (DRs) that outline how data collected under this study will be used for decision-making purposes.
The DRs for each DS provide clear requirements that guide the decision-making process.
The 200-ZP-1 OU PMP (DOE/RL-2009-115) presents and supports a multi-stage decision-making
process that is tied to the remedy components (excluding ICs) stated in the 200-ZP-1 OU ROD
(EPA et al., 2008). The data collection activities developed in the main text of this SAP to resolve the
four DSs for this study ultimately support the multi-stage decision-making process identified in the
200-ZP-1 OU PMP by providing characterization information to support future remedy optimization.
A6.1 Approach for Selecting Proposed Rwia Monitoring Well Locations
Since this study ultimately supports the multi-stage decision-making process identified in the
200-ZP-1 OU PMP (DOE/RL-2009-115), consistency and integration with the PMP, where appropriate,
is a goal. The systematic data gap analysis process developed in 2017 (SGW-61350, Data Gaps
Evaluation in Groundwater Monitoring at the Hanford 200-ZP-1 Groundwater Operable Unit
[hereinafter referred to as the 200-ZP-1 OU data gap analysis]) for use in the PMP is one of the primary
methods in this study to evaluate the need for and locations of new monitoring wells below the Rlm
(in the Rwia).
The 200-ZP-1 OU data gap analysis (SGW-61350) followed the established and industry-standard
methods to combine spatial statistics with evaluations of hydraulics and modeling using the Central
Plateau Groundwater Model, as documented in CP-47631, Model Package Report: Central Plateau
Groundwater Model, Version 8.4.5. The existing monitoring network was evaluated based on four
primary factors:
Proximity to active monitoring wells
Kriging error variances (a factor that reflects the uncertainty associated with
concentration interpolations)
Hydraulic capture (containment) frequency predictions
Predicted concentrations over time
These primary factors are assessed independently, and the associated results are then combined to identify
and score potential monitoring well locations. The 200-ZP-1 OU data gap analysis (SGW-61350)
provides additional information on the systematic process used to score potential locations for new
monitoring wells below the Rlm (within the Rwia), and Figure A-5 shows a spatial representation of
the resulting scores. The higher score locations shown in the figure generally indicate areas having
a potential need for new Rwia monitoring wells based on the data gap study process.

A-1
5
DO
E/R
L-2
019-2
3, R
EV
. 0
Source: SGW-61350, Data Gaps Evaluation in Groundwater Monitoring at the Hanford 200-ZP-1 Groundwater Operable Unit.
Figure A-5. Data Gap Analysis Scores for Potential Monitoring Well Locations Below the Rlm
T W7-1 ~
T W10 -36
T W10-35
T W15-226
L W15 -227
W15-228 ~ T ~ T W15-229
W18-44 W15-29' Y T W18<& ..
W18-43 'Y W18-J7
w, 8-42 ; : W1 8-38
W18-39 T W18~1
.,
• ws-13 W6-16 ,. () W6-14
200-ZP-1 . .. w 6-1s
.& W11 -50 .& W11 -96
.& W11-90 W11-92
... t W14-20 .& W14-74
.& W14-73
• •"~ ,a W1 1-49 ... J,,. W14-21
.A. W19-111
.A. W17-J
~ ,19-125
.A. W22-90
.A. W22-91 ... W22-92
... ... .A. W19-114 W1 9-11 3
"'- W5-1
.& W12-3
.& W12-2
.& W12-4
.& W14-22
"'- W11 -97
200-UP-1
200-BP-5 ... EJJ-268 ,A. E33-360
-- I ~- -----------
Y E20-2
-------------'
• MonitoringWells Below RLM
P& T Wells 2017
Well Type , OU
.A. Extraction, BP-5
.& Extraction, UP-1
Y Injection , UP-1
.& Extraction, ZP-1
Y Injection . ZP-1
Well prefix '299- ' and "699-" omitted
-- CTET Below RLM (3.4 µg/L)
Scores Below RLM
<5
c:J 5.1 - 10
• 10.1-12.5
• 12.6 - 14 • , 4.1-15
o , s .1 - 16
. ,6.1 - 16
waste Site
Facility
TreatmentBuildings
1111 Basalt Above Water Table
300 600 900 Meters
1,500 3,000 Feet I

DOE/RL-2019-23, REV. 0
A-16
In addition to using the systematic process of the 200-ZP-1 OU data gap analysis (SGW-61350),
professional judgment and conventional methods are used to evaluate the need for and locations of new
Rwia monitoring wells. Figure A-6 provides a comparison of available monitoring wells that are screened
in the Rwia, as well as the estimated extent of the Rlm based on the current Hanford South Geologic
Framework Model, as documented in ECF-HANFORD-13-0029, Development of the Hanford South
Geologic Framework Model, Hanford Site, Washington. This comparison shows several areas that lack
Rwia monitoring well coverage in the study area. The locations of the proposed monitoring wells to be
installed in accordance with the 200-ZP-1 OU PMP (DOE/RL-2009-115) are also considered in relation
to the areas that lack Rwia monitoring well coverage. The monitoring wells proposed in the PMP are also
considered (as well as existing wells and piezometers) for potential use in post-installation hydraulic
testing. The resulting map of the first eight proposed Rwia monitoring wells is shown in Figure 2 in the
main text of this SAP, and a list of the proposed wells is provided in Table 1 in the main text.
The systematic data gap analysis process (SGW-61350) was developed so it could be updated as new data
are collected from existing monitoring wells and from new monitoring wells installed under the main text
of this SAP and the 200-ZP-1 OU PMP (DOE/RL-2009-115). The results of the updated data gap analysis
will be combined with professional judgment, conventional methods, and evaluations of uncertainties to
develop a new list of locations for the remaining four proposed Rwia monitoring wells to supplement the
initial eight proposed Rwia monitoring wells.
A6.2 Approach for Determining Adequacy
The overall goal of the analytical approach is to obtain additional data (with emphasis on the Rwia) to
provide for reliable and predictive F&T modeling to support P&T and MNA remedy optimization.
The general approach to resolve the four DSs in this study is to adopt and expand upon previous work
using methods similar to those used in past studies to complete integrated data analyses, set within
an uncertainty management framework that considers the value added by new data and information.
This uncertainty management framework will be developed to establish the process for determining what
is “adequately defined” for use in resolving the DSs. As discussed in Section A2, “adequately defined”
will be determined in the context of the ability to reasonably predict the likely future performance of the
remedy in attaining the RAOs specified in the 200-ZP-1 OU ROD (EPA et al., 2008), recognizing that
although data may be sufficient to make a prediction, the data may not necessarily be adequate to make
a reliable prediction.
Some uncertainties may not be meaningfully reduced by further data collection efforts and are, therefore,
irreducible uncertainties. These uncertainties have to be managed in the decision-making process.
To support the need for establishing what is considered to be adequately defined, the uncertainty
management framework will be developed to propose a strategy incorporating the following three
elements and associated specifications:
Data collection procedures and methods: Data collection will be guided by integrated analyses of
existing available data. The planning process will be founded on formalized and documented DQOs.
Peer review will be conducted of the planning stages. State-of-the-art field techniques will be
implemented. Data obtained will be subject to thorough quality assurance and quality
control procedures.
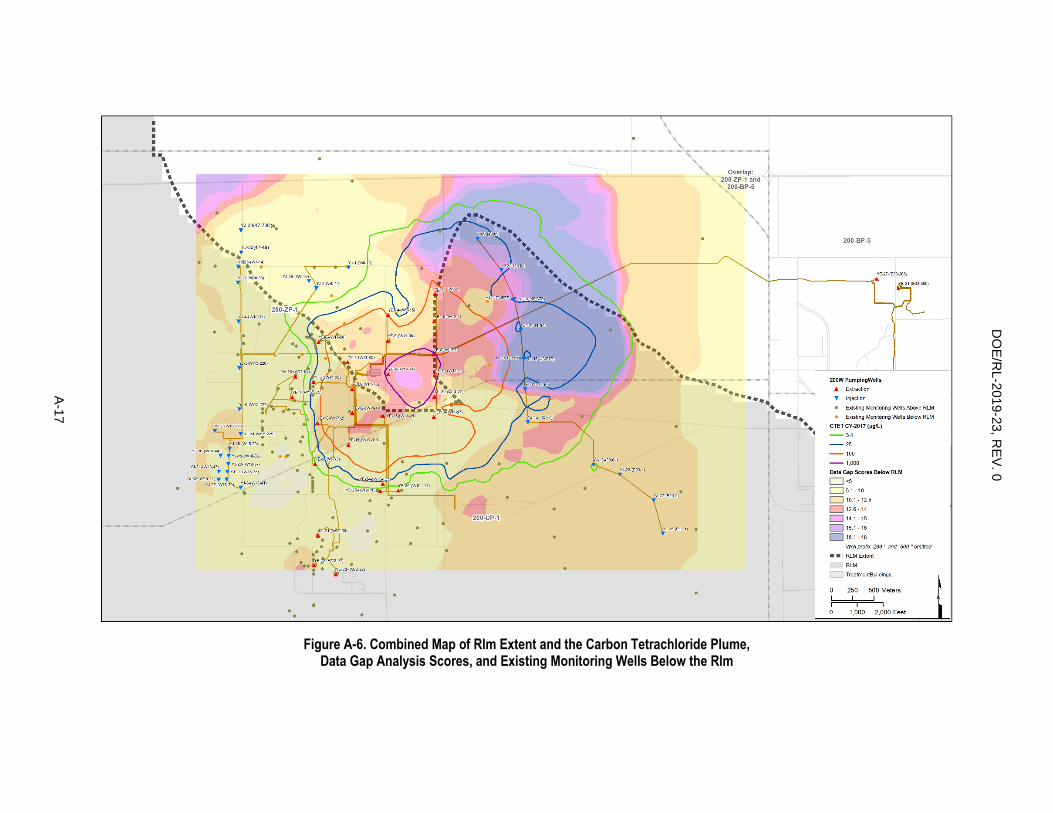
A-1
7
DO
E/R
L-2
019-2
3, R
EV
. 0
Figure A-6. Combined Map of Rlm Extent and the Carbon Tetrachloride Plume, Data Gap Analysis Scores, and Existing Monitoring Wells Below the Rlm
• • • • •--------• • •
• • • •• • • • • •• YJ-34{47-78C)I,•
• • .. ••
•• YJ-33(4 7-46 )
••tl(','n-~) ,J.)•(~0-36)
•• • • .... ~
200-ZP-~ • •
. .
• ...
200-UP-1
\ \
-~-----------------
....
Overlap: 200-ZP~1 and
200-BP-5
'
•• ••
• ... '"' - - - -1 ----... t - -
. YJ-27-[E20-2l
····-~. •••••
••
200-BP-5
200W PumpingWells
,. Extraction
T Injection
• Existing Monitoring 'Alells Mx:Ne RLM
• faisling Monitoring \o'iklts Below RLM
CTET CY-20 17 (µg/L)
- 3.4
- 25
- 100
- 1,000
Data Gap Scores Below RLM
c:] <5 o s.1-10 C] 10.1- 12.s • ,2.6-14
c::] 14 .1-15
o ,s.1-16 [:] 16.1 - 18
Well prEJnx '299-, and "699- . omitter:i
• • I RLM Extent
RLM
D TreatmentBuildir'l(ls
250 500 Meters
, ,ooo 2,000 Feet
DOE/RL-2019-23, REV. 0
A-18
Spatial distribution and variability: Sample data and geological characteristics will be
evaluated using geostatistical methods that facilitate evaluation of spatial (and temporal) variability
and uncertainty.
Statistical and modeling analysis methods: The sequential analysis process will be focused on
empirical data evaluations, historical modeling to calibrate flow fields and aspects of contaminant
transport, and predictive modeling. The data gap analysis combines geostatistical descriptions of
spatial variability with predictive modeling to estimate future migration to prioritize new data
acquisition and improve knowledge.
Data collection methods are implemented to provide representative data values over space and time.
Using these data, methods are available to characterize and quantify spatial and temporal variability.
In addition, some aspects of associated uncertainties can also be quantified, although this also relies
upon the judgment of subject matter experts.
Groundwater flow and contaminant F&T modeling have been used at the Hanford Site to guide remedy
decisions and make predictions of likely future performance. Although imperfect, F&T modeling is the
most suitable mechanism to combine available data and information to make predictions of future
behavior and performance. When available data are combined with F&T modeling, predictions can be
made, and some aspects of the uncertainty associated with those predictions can be quantified. For the
purpose of this study, the reduction in the uncertainty associated with model predictions of future
groundwater flow conditions, contaminant migration patterns and rates, and remedy performance will be
used to evaluate the adequacy of the available data and information.
The uncertainty management framework developed will be documented in an internal document.
The approach used and the outcome will be summarized and presented in the characterization report.
A6.3 Decision Rules and Approaches to Resolve Decision Statements
The inputs, analyses, and types of questions are described collectively as the analytical approach for
resolving each DS. Details of the analytical approach, as well as the associated DRs, are discussed in the
following sections. The considerations and planned procedure for determining what is adequately defined
is discussed (in principle) in Section A6.2. This process will be further developed following issuance of
this SAP and applies to all of the sections that follow.
A6.3.1 Decision Rule and Approach to Resolve Decision Statement #1
To determine if the vertical and lateral spatial distribution of the aqueous and sorbed COC concentrations
in the major facies of the Rwia and Rlm are adequately defined to support remedy performance evaluation
and F&T modeling, the following DR has been developed:
DR #1: If the vertical and lateral spatial distribution of the aqueous and sorbed COC concentrations
in the major facies of the Rwia and Rlm are adequately defined to support remedy performance
evaluation and F&T modeling, then no further data collection is required. Otherwise, collect
additional data to define the vertical and lateral distribution of COCs.
For each of the new Rwia monitoring wells installed, groundwater and sediment samples will be collected
during drilling at the planned sampling intervals specified in Table 17 in the main text of this SAP.
Additional groundwater samples will be collected from the constructed well following final well
development. The groundwater samples will be analyzed for COCs and other constituents of interest, as
specified in Tables A-1 and A-3. Sediment samples will be analyzed for COCs and other constituents of
interest in accordance with Table A-2 and Table A-4.
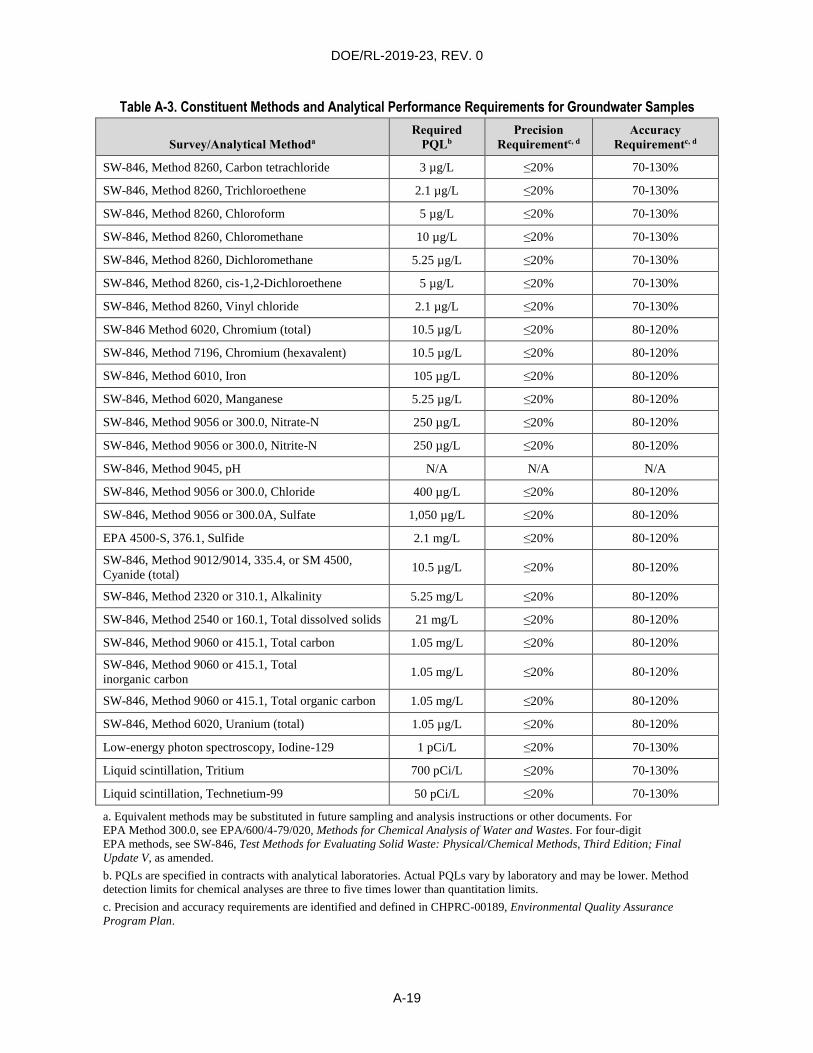
DOE/RL-2019-23, REV. 0
A-19
Table A-3. Constituent Methods and Analytical Performance Requirements for Groundwater Samples
Survey/Analytical Methoda
Required
PQLb
Precision
Requirementc, d
Accuracy
Requirementc, d
SW-846, Method 8260, Carbon tetrachloride 3 µg/L ≤20% 70-130%
SW-846, Method 8260, Trichloroethene 2.1 µg/L ≤20% 70-130%
SW-846, Method 8260, Chloroform 5 µg/L ≤20% 70-130%
SW-846, Method 8260, Chloromethane 10 µg/L ≤20% 70-130%
SW-846, Method 8260, Dichloromethane 5.25 µg/L ≤20% 70-130%
SW-846, Method 8260, cis-1,2-Dichloroethene 5 µg/L ≤20% 70-130%
SW-846, Method 8260, Vinyl chloride 2.1 µg/L ≤20% 70-130%
SW-846 Method 6020, Chromium (total) 10.5 µg/L ≤20% 80-120%
SW-846, Method 7196, Chromium (hexavalent) 10.5 µg/L ≤20% 80-120%
SW-846, Method 6010, Iron 105 µg/L ≤20% 80-120%
SW-846, Method 6020, Manganese 5.25 µg/L ≤20% 80-120%
SW-846, Method 9056 or 300.0, Nitrate-N 250 µg/L ≤20% 80-120%
SW-846, Method 9056 or 300.0, Nitrite-N 250 µg/L ≤20% 80-120%
SW-846, Method 9045, pH N/A N/A N/A
SW-846, Method 9056 or 300.0, Chloride 400 µg/L ≤20% 80-120%
SW-846, Method 9056 or 300.0A, Sulfate 1,050 µg/L ≤20% 80-120%
EPA 4500-S, 376.1, Sulfide 2.1 mg/L ≤20% 80-120%
SW-846, Method 9012/9014, 335.4, or SM 4500,
Cyanide (total) 10.5 µg/L ≤20% 80-120%
SW-846, Method 2320 or 310.1, Alkalinity 5.25 mg/L ≤20% 80-120%
SW-846, Method 2540 or 160.1, Total dissolved solids 21 mg/L ≤20% 80-120%
SW-846, Method 9060 or 415.1, Total carbon 1.05 mg/L ≤20% 80-120%
SW-846, Method 9060 or 415.1, Total
inorganic carbon 1.05 mg/L ≤20% 80-120%
SW-846, Method 9060 or 415.1, Total organic carbon 1.05 mg/L ≤20% 80-120%
SW-846, Method 6020, Uranium (total) 1.05 µg/L ≤20% 80-120%
Low-energy photon spectroscopy, Iodine-129 1 pCi/L ≤20% 70-130%
Liquid scintillation, Tritium 700 pCi/L ≤20% 70-130%
Liquid scintillation, Technetium-99 50 pCi/L ≤20% 70-130%
a. Equivalent methods may be substituted in future sampling and analysis instructions or other documents. For
EPA Method 300.0, see EPA/600/4-79/020, Methods for Chemical Analysis of Water and Wastes. For four-digit
EPA methods, see SW-846, Test Methods for Evaluating Solid Waste: Physical/Chemical Methods, Third Edition; Final
Update V, as amended.
b. PQLs are specified in contracts with analytical laboratories. Actual PQLs vary by laboratory and may be lower. Method
detection limits for chemical analyses are three to five times lower than quantitation limits.
c. Precision and accuracy requirements are identified and defined in CHPRC-00189, Environmental Quality Assurance
Program Plan.

DOE/RL-2019-23, REV. 0
A-20
Table A-3. Constituent Methods and Analytical Performance Requirements for Groundwater Samples
Survey/Analytical Methoda
Required
PQLb
Precision
Requirementc, d
Accuracy
Requirementc, d
d. Accuracy criteria are the minimum for associated batch laboratory control sample percent recoveries. Laboratories may use
statistically derived control limits. Additional analyte-specific evaluations are also performed for matrix spikes and surrogates
as appropriate to the method. Precision criteria are for batch laboratory replicate matrix spike analyses.
EPA = U.S. Environmental Protection Agency
N/A = not applicable
PQL = practical quantitation limit
Table A-4. Constituent Methods and Analytical Performance Requirements for Sediment Samples
Analytical Methoda
Required
PQLb
Precision
Requirementc, d
Accuracy
Requirementc, d
SW-846, Method 8260, Carbon tetrachloridee 5 µg/kg ≤20% 70-130%
SW-846, Method 8260, Trichloroethenee 5 µg/kg ≤20% 70-130%
SW-846, Method 8260, Chloroforme 5 µg/kg ≤20% 70-130%
SW-846, Method 8260, Chloromethanee 10 µg/kg ≤20% 70-130%
SW-846, Method 8260, Dichloromethanee 5 µg/kg ≤20% 70-130%
SW-846, Method 8260, cis-1,2-Dichloroethenee 5 µg/kg ≤20% 70-130%
SW-846, Method 8260, Vinyl chloridee 10 µg/kg ≤20% 70-130%
SW-846 Method 6020, Chromium (total) 1,000 µg/kg ≤35% 80-120%
SW-846, Method 7196, Chromium (hexavalent) 500 µg/kg ≤35% 80-120%
SW-846, Method 6010, Iron 25,000 µg/kg ≤35% 80-120%
SW-846, Method 6020, Manganese 1,000 µg/kg ≤35% 80-120%
SW-846, Method 9045, pH N/A N/A N/A
SW-846, Method 9012/9014, 335.4, or SM 4500,
Cyanide (total) 1,000 µg/kg ≤35% 80-120%
SW-846, Method 9060 or 415.1, Total carbone 100,000 µg/kg ≤35% 80-120%
SW-846, Method 9060 or 415.1, Total inorganic carbone 100,000 µg/kg ≤35% 80-120%
SW-846, Method 9060 or 415.1, Total organic carbone 100,000 µg/kg ≤35% 80-120%
SW-846, Method 6020, Uranium (total) 150 µg/kg ≤35% 80-120%
Liquid scintillation, Technetium-99 5 pCi/g ≤30% 80-120%
a. Equivalent methods may be substituted in future sampling and analysis instructions or other documents. For
EPA Method 300.0, see EPA/600/4-79/020, Methods for Chemical Analysis of Water and Wastes. For four-digit
EPA methods, see SW-846, Test Methods for Evaluating Solid Waste: Physical/Chemical Methods, Third Edition; Final
Update V, as amended.
b. PQLs are specified in contracts with analytical laboratories. Actual PQLs vary by laboratory and may be lower. Method
detection limits for chemical analyses are three to five times lower than quantitation limits.
c. Precision and accuracy requirements are identified and defined in CHPRC-00189, Environmental Quality Assurance
Program Plan.
d. Accuracy criteria are the minimum for associated batch laboratory control sample percent recoveries. Laboratories must
meet statistically based control if more stringent. Additional analyte-specific evaluations also performed for matrix spikes and
surrogates as appropriate to the method. Precision criteria are for batch laboratory replicate matrix spike analyses.

DOE/RL-2019-23, REV. 0
A-21
Table A-4. Constituent Methods and Analytical Performance Requirements for Sediment Samples
Analytical Methoda
Required
PQLb
Precision
Requirementc, d
Accuracy
Requirementc, d
e. Analysis to be performed by Pacific Northwest National Laboratory using full, intact liners C or D. If there is a question
regarding the intact nature of the liners, the project scientist should be contacted for direction.
EPA = U.S. Environmental Protection Agency
N/A = not applicable
PQL = practical quantitation limit
The following inputs and analyses support this evaluation:
Identify whether observed groundwater COC and other constituent concentration data collected
during drilling are deviating from predicted values, which may suggest that contaminant nature and
extent estimates used in the F&T model are not representative.
Identify whether observed groundwater COC and other constituent concentration data collected
post-development are deviating from predicted values, which may suggest that contaminant
concentration estimates used in the F&T model are not representative.
Identify whether observed sediment COC and other constituent concentration data collected during
drilling are deviating from predicted values, which may suggest that contaminant estimates used in
the conceptual site model are not representative.
Additional questions that should be answered include the following:
Are there other factors that could impact the representativeness of the COC and other constituent
concentration data collected?
What changes to the estimated contaminant concentrations used in the F&T model and/or the
conceptual site model would improve remedy evaluation and optimization efforts?
A6.3.2 Decision Rule and Approach to Resolve Decision Statement #2
To determine if the hydrogeologic properties and erosional features/unconformities of the Rwia and Rlm
and the contacts and transitions between the Rwia, Rwie, Rlm, and basalt are adequately defined to
support F&T modeling, the following DR has been developed:
DR #2: If the hydrogeologic properties and erosional features/unconformities of the Rwia and Rlm
and the contacts and transitions between the Rwia, Rwie, Rlm, and basalt are adequately defined to
support F&T modeling, then no further data collection is required. Otherwise, collect additional data
to define these properties.
For each of the new Rwia monitoring wells installed, geologic observations are recorded continuously
during drilling, and geophysical (spectral gamma and neutron moisture) logging data are collected in the
boreholes prior to well construction. Sediment physical property samples will also be collected during
drilling at the planned sampling intervals specified in Table 17 in the main text of this SAP. The sediment
samples will be analyzed for hydrogeologic properties in accordance with Tables A-2 and A-5.

DOE/RL-2019-23, REV. 0
A-22
Table A-5. Physical Properties Methods for Sediment Samples
Physical Property Analytical Method
Bulk density ASTM D2937 or ASTM D7263a
Particle density ASTM D854a
Particle-size distribution ASTM D422 or ASTM D4464/D6913a
Porosity (apparent) Calculated from bulk density and particle density
Saturated hydraulic properties (hydraulic
conductivity/permeability)b ASTM D5084 or ASTM D5856a
Note: Equivalent methods may be substituted in future sampling and analysis instructions or other documents.
a. For ASTM methods, see the following:
ASTM D422: ASTM Standard D422-63(2007)e2, Standard Test Method for Particle-Size Analysis of Soils
ASTM D854: ASTM Standard D854-14, Standard Test Methods for Specific Gravity of Soil Solids by
Water Pycnometer
ASTM D2937: ASTM Standard D2937-17e2, Standard Test Method for Density of Soil in Place by the Drive-Cylinder
Method
ASTM D4464: ASTM Standard D4464-15, Standard Test Method for Particle Size Distribution of Catalytic Materials
by Laser Light Scattering
ASTM D5084: ASTM Standard D5084-16a, Standard Test Methods for Measurement of Hydraulic Conductivity of
Saturated Porous Materials Using a Flexible Wall Permeameter
ASTM D5856: ASTM Standard D5856-15, Standard Test Method for Measurement of Hydraulic Conductivity of
Porous Material Using a Rigid-Wall, Compaction-Mold Permeameter
ASTM D6913: ASTM Standard D6913/D6913M-17, Standard Test Methods for Particle-Size Distribution (Gradation)
of Soils Using Sieve Analysis
ASTM D7263: ASTM Standard D7263-09(2018)e2, Standard Test Methods for Laboratory Determination of Density
(Unit Weight) of Soil Specimens
b. A full, intact liner is required for this analysis. If there is a question about the intact nature of the liner for this analysis, the
project scientist should be contacted for direction.
ASTM = ASTM International (formerly the American Society for Testing and Materials)
The following inputs and analyses support this evaluation:
Identify whether the geologic observations and geophysical data are deviating from the Hanford
South Geologic Framework Model, which may suggest that the geologic framework model is not
representative. Specific focus should be on the contacts and transitions between the Rwia, Rwie, Rlm,
and basalt and the erosional features and unconformities of the Rwia and Rlm.
Identify whether observed hydrogeologic properties are deviating from predicted values, which may
suggest that estimated hydrogeologic properties used in the F&T model are not representative.
Additional questions that should be answered include the following:
Are there other factors that could impact the representativeness of the geologic observations,
geophysical logging data collected, or hydrogeologic properties data?
What changes to the estimated geologic framework and hydrogeologic properties used in the F&T
model would improve remedy evaluation and optimization efforts?

DOE/RL-2019-23, REV. 0
A-23
A6.3.3 Decision Rule and Approach to Resolve Decision Statement #3
To determine if the hydraulic properties of the Rwia and Rlm are adequately defined to support F&T
modeling, the following DR has been developed:
DR #3: If the hydraulic properties of the Rwia and Rlm are adequately defined to support F&T
modeling, then no further data collection is required. Otherwise, collect additional data to define
these properties.
For each of the new Rwia monitoring wells installed, sediment physical property samples will be
collected during drilling at the planned sampling intervals specified in Table 17 in the main text of
this SAP. These sediment samples will be analyzed for hydraulic properties in accordance with
Tables A-2 and A-5. Hydraulic head distribution observations will be recorded regularly during drilling,
and slug tests will be performed during drilling at the planned sampling intervals specified in Table 17 in
the main text of this SAP. The slug tests will be conducted in accordance with procedures from the
U.S. Department of Energy prime contractor (or its approved subcontractor).
Following construction and development of the Rwia monitoring wells, supplemental hydraulic testing
will be specified and conducted under a separate hydraulic testing plan that will be developed following
issuance of this SAP. Although not detailed in this SAP, development of the hydraulic testing plan and
completion of the associated hydraulic testing work is a required task under this SAP. Possible
post-completion supplemental hydraulic testing may include the following:
Slug testing
Multi-well constant-rate drawdown and recovery testing
Single well constant-rate drawdown and recovery testing
Single well step testing
Barometric response function analysis (deconvolution)
Borehole flowmeter testing
Tracer testing
The following inputs and analyses support this evaluation:
Identify whether observed hydraulic properties are deviating from predicted values, which may
suggest that estimated hydraulic properties used in the F&T model are not representative.
Additional questions that should be answered include the following:
Are there other factors that could impact the representativeness of the hydraulic properties
data collected?
What changes to the estimated hydraulic properties used in the F&T model would improve remedy
evaluation and optimization efforts?
A6.3.4 Decision Rule and Approach to Resolve Decision Statement #4
To determine if the transport parameters for the 200-ZP-1 OU COCs are adequately defined within the
Rwia and Rlm to support F&T modeling, the following DR has been developed:
DR #4: If the transport parameters for the 200-ZP-1 OU COCs are adequately defined within the
Rwia and Rlm to support F&T modeling, then no further data collection is required. Otherwise,
collect additional data to define these properties.

DOE/RL-2019-23, REV. 0
A-24
For each of the new Rwia monitoring wells installed, sediment samples will be collected during drilling at
the planned sampling intervals specified in Table 17 in the main text of this SAP. These sediment samples
will be analyzed for transport parameters in accordance with Tables A-2 and A-4. Additionally, selected
sediment samples will undergo laboratory contaminant mobility and transport studies at PNNL to better
understand sediment/water partitioning and develop distribution coefficients for carbon tetrachloride in
the Rwia and Rlm. These supplemental studies will only be conducted on sediment samples that
correspond to groundwater samples with higher carbon tetrachloride concentrations (based on
quick-turnaround analytical results). The supplemental studies will be conducted using PNNL-developed
methods and procedures that are not specified in this DQO process.
The following inputs and analyses support this evaluation:
Identify whether observed transport parameters are not within reasonable bounds given the current
understanding of the system, which may suggest that estimated hydraulic properties used in the F&T
model are not representative.
Additional questions that should be answered include the following:
Are there other factors that could impact the representativeness of the transport parameter
data collected?
What changes to the estimated transport parameters used in the F&T model would improve remedy
evaluation and optimization efforts?
A7 Specify Performance or Acceptance Criteria
The sixth step of the DQO process involves deriving the performance or acceptance criteria that the
collected data need to achieve to minimize the possibility of either making erroneous conclusions or
failing to keep uncertainty in estimates within acceptable levels. Typically, the DR as a statistical
hypothesis test is specified in this section, and the consequences of making incorrect decisions from the
statistical hypothesis test are examined. However, the monitoring data statistical tests to support the
end of the 200-ZP-1 OU remedial action have not been developed as part of the 200-ZP-1 OU PMP
(DOE/RL-2009-115) and may not be applicable. Since this Rwia study supports the decision-making
process identified in the 200-ZP-1 OU PMP, the language and requirements of this section will be
generally consistent with the PMP, where appropriate.
More quantitative specifications of data quality are defined and presented as part of the quality assurance
project plan provided in Chapter 2 in the main text of this SAP. The following sections present the
potential uncertainties associated with the data to be collected and the potential impacts of
those uncertainties.
A7.1 Groundwater Levels
Groundwater-level data consist of several components:
Depth-to-water measurement from top of casing
Surveyed elevation of the top of casing
Surveyed northing and easting coordinates of the well
Elevation interval in the aquifer at which the depth to water is representative (well screen top and
bottom elevations)

DOE/RL-2019-23, REV. 0
A-25
The most critical components of groundwater-level data are the depth-to-water measurement and the
top-of-casing elevation. Elevations for the top of casing are typically specified to the nearest 0.3 cm
(0.01 ft), and depth-to-water measurements are typically specified to the nearest 0.61 cm (0.02 ft). Errors
on the order of a couple of hundredths of a foot can be significant in situations where small horizontal
hydraulic gradients are expected (e.g., in hydraulic stagnation zones between extraction wells) or when
calculating vertical hydraulic gradients. In such sensitive areas, capture zone analyses can be subject to
significant uncertainty, leading to less-than-expected plume capture or unnecessary overpumping to
compensate for the uncertainty.
Groundwater elevation errors can be detected by preparing a two-dimensional water table map and
looking for irregularities in the elevation contours or conducting more formal cross-validation analyses of
the groundwater elevation data incorporating suitable trending and regression-based methods. These
methods comprise spatial evaluations of data consistency. Newly obtained groundwater elevation data can
also be compared to previously collected data through visual hydrograph analysis and more formal
temporal cross-validation analyses. These methods comprise temporal evaluations of data consistency.
While sometimes difficult to detect, such errors can be managed by designing hydraulic capture zones
conservatively with an appropriate margin of safety so small irreducible errors in measured groundwater
elevations do not lead to less-than-expected plume capture or unnecessary overpumping.
Ground surface elevations are typically provided to the nearest 0.03 m (0.10 ft) and are used along with
the top and bottom screen depths to calculate the top and bottom screen elevations. Errors up to 1.5 m
(5 ft) in top and bottom screen elevations on many occasions throughout the 200-ZP-1 OU have relatively
little impact on the use of groundwater elevation data because hydraulic stresses are transmitted fairly
easily through the aquifer. Since much of the well construction data for the 200-ZP-1 OU monitoring
wells is historical, screened interval data from monitoring wells may have the potential for significant
uncertainty. However, well screen elevation errors are likely not a significant concern for groundwater
elevation data since the vertical spatial position of groundwater elevation measurement is typically
interpreted as the potentiometric groundwater elevation at the mid-screen elevation in the well. These
mid-screen elevation data points can be used in the groundwater flow model by comparing them to
simulated heads taken from model grid cell center elevations.
Surveyed northing and easting coordinates are typically provided to the nearest 0.03 m (0.10 ft).
However, errors of up to 1.5 m (5 ft) in well coordinates should have little impact on any processes or
significant decisions. Well coordinates are relatively easy to verify in the field; thus, well coordinate
errors are likely not a concern.
Groundwater-level data collected during hydraulic testing (following well construction) will be discussed
further in the subsequently developed hydraulic testing plan. Requirements for data collection during
hydraulic testing will be specified in that plan.
A7.2 Pumping Rates
Measured pumping-rate data collected during hydraulic testing (following well construction) will be
discussed further in the subsequently developed hydraulic testing plan. Requirements for data collection
during hydraulic testing will be specified in the testing plan.
A7.3 Contaminant Concentrations
Contaminant concentration data consist of several components, including the actual groundwater and
sediment samples, subsequent laboratory analysis, and the three-dimensional spatial location from which
the sample originated in the aquifer. Contaminant concentrations from analytical laboratory analyses are

DOE/RL-2019-23, REV. 0
A-26
needed to construct three-dimensional contaminant plume depictions. To meet this goal, the required
practical quantitation limits (PQLs) should be equal to, or ideally less than, required groundwater
cleanup levels. Tables A-3 and A-4 list the analytical methods, accuracy and performance requirements,
and required PQLs for COCs and other constituents.
Failure to set required PQLs equal to or less than the cleanup levels could result in groundwater
contaminant monitoring data of insufficient quality. Since three-dimensional contaminant plume
depictions are usually constructed with the lowest concentration isosurface depicting the estimated extent
at the cleanup level, using the required PQLs above the cleanup levels will result in a lack of data to
establish plume outer boundaries. This will result in errors in the reported mass and volume statistics,
errors in extraction well capture analyses, and errors in simulated contaminant transport.
Other types of errors (e.g., random nonrepresentative samples and/or laboratory analyses) should have
limited impact on any significant decisions regarding remedy performance. Typically, if a sample result
seems erroneous and the result is critical (i.e., the result significantly changes the conceptual site model,
indicates loss of capture, or falsely indicates plume cleanup), sampling is repeated at that location
to verify the result. Significant decisions are generally not based on one sample result. An erroneous
sample result could impact the kriged concentrations in a limited area of a contaminant plume. However,
the plume depictions are usually regenerated annually, so the impact of such an error should be
relatively short-lived.
Horizontal spatial position errors are usually of small magnitude and would have little impact on any
processes or significant decisions. Surveyed northing and easting coordinates are typically provided to the
nearest 0.03 m (0.10 ft). Errors of up to 1.5 m (5 ft) in well coordinates would usually have little impact.
In addition, well coordinates are relatively easy to verify in the field; thus, well coordinate errors are
likely not a concern.
Ground surface elevations are typically provided to the nearest 0.03 m (0.10 ft), which is usually used
along with the top and bottom screen depths to calculate the top and bottom screen elevations. Errors in
top and bottom screen elevations of a couple of feet would likely have little impact on the use of
concentration data. However, contaminant concentrations tend to be highly vertically heterogeneous,
and an error of 3.0 m (10 ft) or more in a screened interval could introduce significant errors in the
three-dimensional contaminant plume depictions. Since much of the well construction data are historical
for the older 200-ZP-1 OU monitoring wells, the potential exists for significant errors in the reported well
screened intervals. These errors could potentially lead to errors in the three-dimensional contaminant
plume depictions and less-than-expected plume capture.
Another aspect of the vertical spatial positioning of data obtained from the 200-ZP-1 OU monitoring
wells is that many of the wells have relatively long screened intervals. The screen length for more
recently installed groundwater monitoring wells typically ranges from 1.5 to 4.6 m (5 to 20 ft); however,
many of the older 200-ZP-1 OU monitoring wells have screen lengths in excess of 9.1 m (30 ft).
The screen length variations can lead to uncertainty in the vertical position from which groundwater
samples were obtained and can result in high contaminant concentration intervals being diluted by less
contaminated groundwater from surrounding aquifer intervals. Again, such errors could potentially lead
to errors in the three-dimensional contaminant plume depictions and less-than-expected plume capture.
Vertical spatial position errors in contaminant concentration sampling data are relatively difficult to
detect and manage. Well construction information for a particular monitoring well should be reviewed if
samples collected from the well are questionable in relation to other upgradient and downgradient
samples. However, the relatively low density of samples usually makes it difficult to detect these types
of errors. In general, the uncertainty in three-dimensional contaminant plume delineation caused by the

DOE/RL-2019-23, REV. 0
A-27
sparse sampling network is much greater than all of the other sources of contaminant concentration
uncertainty. This uncertainty is furthered by the relative coarseness of the contaminant transport model
grid and the uncertainty in the model transport parameters. These errors are most often managed by using
professional judgment when evaluating the three-dimensional plume depictions and resulting model
simulations for consistency with the conceptual site model and hydrologic principles, as well as by
questioning any discrepancies.
A7.4 Other Measured Parameters
Tables A-1 and A-2 list other constituent parameters that are included with laboratory analyses.
Evaluating these parameters may provide a better understanding of natural attenuation conditions and/or
reaction pathways within plume reactive zones. Measurement errors for these parameters would usually
have little impact on any significant decisions regarding natural attenuation processes.
Table A-1 also lists the groundwater parameters typically measured in the field at each sampled
monitoring well during each monitoring event. These parameters may be monitored continuously in
a flow-through cell apparatus during monitoring well sampling. Stable readings are an indication that
sufficient purgewater has been withdrawn from a well and that a representative sample of the
groundwater can be collected. These parameters are also important for monitoring natural attenuation
processes. Field measurement errors for these parameters would usually have little impact on any
significant decisions regarding natural attenuation processes.
A7.5 Model Predictions
The groundwater flow and transport model is an important tool for simulating hydraulic capture and
predicting whether the remedy target of 95% mass reduction within 25 years and the ultimate remedy
RAO of aquifer cleanup within 125 years will be achieved. However, there are uncertainties associated
with the use of groundwater flow and F&T modeling that can lead to misunderstanding of model
prediction reliability. The potential impact of such uncertainties on the decision process can be minimized
by using multiple lines of evidence to increase the confidence in model predictions by ensuring that all
available data are used. Examples of available methods are described below; however, the procedure
outlined in Section A6.2 for determining adequacy will ultimately be used to identify and incorporate
suitable methods in the workflow process.
One example method is hydraulic capture (containment). The ability of the groundwater flow model to
accurately simulate hydraulic capture can be evaluated by using a residual analysis method. The residual
analysis method compares the simulated head distribution from the model to the measured groundwater
elevations, displaying the difference in terms of the estimated extent of hydraulic capture. This technique
is useful for determining if the model calibration is adequate and ensures that available data are used to
support decisions regarding plume capture and remedy optimization. The residual analysis method for
analyzing hydraulic data in the context of hydraulic capture (containment) usually includes the
following steps.
1. Calculate the differences between groundwater elevations measured at the monitoring wells during
the synoptic monitoring event and the elevations simulated by the groundwater flow model using
remedy extraction and injection rates recorded during the synoptic monitoring event. These
differences constitute the residuals.
2. Combine the simulated elevations with the calculated residuals, producing an estimated groundwater
elevation distribution that closely approximates measured values while retaining the underlying trend
and structure provided by the groundwater flow model.

DOE/RL-2019-23, REV. 0
A-28
3. Implement particle tracking to calculate an estimated extent of hydraulic capture (containment) that
combines the measured and modeled information.
4. Compare the estimated extent of hydraulic capture that is obtained in steps 1 through 3 with that
estimated on the basis of the groundwater flow model outputs, absent the addition of the residuals.
Groundwater elevation data collected during the most recent water-level monitoring event would provide
the calibration targets for model recalibration if the procedure described above suggests that recalibration
is warranted.
Another example method is three-dimensional plume depictions. The ability of the groundwater
transport model to accurately simulate plume migration depends, in part, on the accuracy of the starting
concentration distribution (three-dimensional plume depiction) and the contaminant transport parameters
used in the model. Additionally, the processes and parameters represented in the model are
approximations of the “real” transport processes and parameters. The three-dimensional plume for each
contaminant will adequately represent the available sampling data at the sampling locations based on
the construction method (kriging). The uncertainty involves the areas in between the sampling locations
and the outer boundaries of the plume depictions. The accuracy of each three-dimensional plume
depiction can be increased by providing additional sampling locations. However, increasing the number
of monitoring wells is costly and over time suffers from reduced benefit (in terms of reduction
in uncertainty).
A third example method that can be used to reduce this uncertainty involves using measured extraction
well contaminant concentrations and mass recovery as targets or constraints for transport modeling,
and then adjusting the plume contaminant distribution until simulated extraction well concentrations
and mass recovery are in reasonable agreement with measured values. The use of such methods
ensures that multiple lines of evidence are being used to construct and refine the three-dimensional
contaminant distributions.
A fourth example method is predicted contaminant transport. Contaminant transport parameters used in
the model can be evaluated by simulating the forward (in time) migration of plume depictions prepared
using historical data and comparing the simulated contaminant concentrations to more recently measured
contaminant concentrations and concentration trends at monitoring wells. This evaluation can reduce the
uncertainty in the transport parameters controlling the physical, chemical, and biological processes that
influence contaminant F&T, and it may result in changes to the model parameters that control dispersion,
retardation, and biodegradation. The use of such methods ensures that multiple lines of evidence are used
to reduce the uncertainty associated with model predictions.
A8 Develop the Plan for Obtaining Data
The seventh step of the DQO process is to develop the sampling and analysis design to generate data
needed to address the DSs provided in Section A3. The design for collecting data for contaminant
concentration, physical properties, and initial limited hydraulic properties is discussed in Chapter 3 in
the main text of this SAP. More extensive hydraulic testing will be documented and performed under
a separate hydraulic testing plan that is a required task under this SAP.
A9 References
ASTM D422-63(2007)e2, 2007, Standard Test Method for Particle-Size Analysis of Soils, ASTM
International, West Conshohocken, Pennsylvania.

DOE/RL-2019-23, REV. 0
A-29
ASTM D854-14, 2014, Standard Test Methods for Specific Gravity of Soil Solids by Water Pycnometer,
ASTM International, West Conshohocken, Pennsylvania.
ASTM D2937-17e2, 2017, Standard Test Method for Density of Soil in Place by the Drive-Cylinder
Method, ASTM International, West Conshohocken, Pennsylvania.
ASTM D4464-15, 2015, Standard Test Method for Particle Size Distribution of Catalytic Materials by
Laser Light Scattering, ASTM International, West Conshohocken, Pennsylvania.
ASTM D5084-16a, 2016, Standard Test Methods for Measurement of Hydraulic Conductivity of
Saturated Porous Materials Using a Flexible Wall Permeameter, ASTM International, West
Conshohocken, Pennsylvania.
ASTM D5856-15, 2015, Standard Test Method for Measurement of Hydraulic Conductivity of Porous
Material Using a Rigid-Wall, Compaction-Mold Permeameter, ASTM International, West
Conshohocken, Pennsylvania.
ASTM D6913/D6913M-17, 2017, Standard Test Methods for Particle-Size Distribution (Gradation) of
Soils Using Sieve Analysis, ASTM International, West Conshohocken, Pennsylvania.
ASTM D7263-09(2018)e2, 2018, Standard Test Methods for Laboratory Determination of Density (Unit
Weight) of Soil Specimens, ASTM International, West Conshohocken, Pennsylvania.
CHPRC-00189, 2019, Environmental Quality Assurance Program Plan, Rev. 15, CH2M HILL Plateau
Remediation Company, Richland, Washington. Available at:
https://pdw.hanford.gov/document/AR-01304.
CP-47631, 2018, Model Package Report: Central Plateau Groundwater Model, Version 8.4.5, Rev. 4,
CH2M HILL Plateau Remediation Company, Richland, Washington. Available at:
https://pdw.hanford.gov/document/0066449H.
DOE/RL-96-68, 2014, Hanford Analytical Services Quality Assurance Requirements Document,
Volume 1, Administrative Requirements; Volume 2, Sampling Technical Requirements; Volume 3,
Field Analytical Technical Requirements; and Volume 4, Laboratory Technical Requirements,
Rev. 4, U.S. Department of Energy, Richland Operations Office, Richland, Washington.
Available at:
http://www.hanford.gov/files.cfm/DOE-RL-96-68-VOL1-04.pdf.
http://www.hanford.gov/files.cfm/DOE-RL-96-68-VOL2-04.pdf.
http://www.hanford.gov/files.cfm/DOE-RL-96-68-VOL3-04.pdf.
http://www.hanford.gov/files.cfm/DOE-RL-96-68-VOL4-04.pdf.
DOE/RL-2001-41, 2015, Sitewide Institutional Controls Plan for Hanford CERCLA Response Actions
and RCRA Corrective Actions, Rev. 8, U.S. Department of Energy, Richland Operations Office,
Richland, Washington. Available at: https://pdw.hanford.gov/document/0081640H.
DOE/RL-2007-28, 2008, Feasibility Study Report for the 200-ZP-1 Groundwater Operable Unit, Rev. 0,
U.S. Department of Energy, Richland Operations Office, Richland, Washington. Available at:
https://pdw.hanford.gov/document/0808050315.
https://pdw.hanford.gov/document/00098828.
DOE/RL-2008-78, 200 West Area 200-ZP-1 Pump-and-Treat Remedial Design/Remedial Action Work
Plan, current revision, U.S. Department of Energy, Richland Operations Office,
Richland, Washington.
DOE/RL-2019-23, REV. 0
A-30
DOE/RL-2009-115, Performance Monitoring Plan for the 200-ZP-1 Groundwater Operable Unit
Remedial Action, current revision, U.S. Department of Energy, Richland Operations Office,
Richland, Washington.
DOE/RL-2009-124, 200 West Pump and Treat Operations and Maintenance Plan, current revision,
U.S. Department of Energy, Richland Operations Office, Richland, Washington.
DOE/RL-2017-68, 2018, Calendar Year 2017 Annual Summary Report for Pump-and-Treat Operations
in the Hanford Central Plateau Operable Units, Rev. 0, U.S. Department of Energy, Richland
Operations Office, Richland, Washington. Available at:
https://pdw.hanford.gov/document/0064707H.
DOE/RL-2019-38, 2019, 200-ZP-1 Operable Unit Optimization Study Plan, Rev. 0, U.S. Department
of Energy, Richland Operations Office, Richland, Washington. Available at:
https://pdw.hanford.gov/document/AR-03236.
ECF-200W-16-0092, 2019, Calculation of Three-Dimensional Groundwater Concentration Plumes for
200-West for Calendar Year (CY) 2015, Rev. 1, CH2M HILL Plateau Remediation Company,
Richland, Washington. Available at: https://pdw.hanford.gov/document/AR-01148.
ECF-HANFORD-13-0029, 2018, Development of the Hanford South Geologic Framework Model,
Hanford Site, Washington, Rev. 5, CH2M HILL Plateau Remediation Company, Richland,
Washington. Available at: https://pdw.hanford.gov/document/0064943H.
ECF-HANFORD-18-0058, 2019, Practical Quantitation Limits for Groundwater Environmental
Samples, Rev. 0, CH2M HILL Plateau Remediation Company, Richland, Washington.
Available at: https://pdw.hanford.gov/document/0063870H.
EPA/240/B-06/001, 2006, Guidance on Systematic Planning Using the Data Quality Objectives Process,
EPA QA/G-4, Office of Environmental Information, U.S. Environmental Protection Agency,
Washington, D.C. Available at:
https://www.epa.gov/sites/production/files/documents/guidance_systematic_planning_dqo_proce
ss.pdf.
EPA/600/4-79/020, 1983, Methods for Chemical Analysis of Water and Wastes, Office of Research and
Development, U.S. Environmental Protection Agency, Washington, D.C. Available at:
http://nepis.epa.gov/Exe/ZyPURL.cgi?Dockey=30000Q10.TXT.
EPA, Ecology, and DOE, 2008, Record of Decision Hanford 200 Area 200-ZP-1 Superfund Site, Benton
County, Washington, U.S. Environmental Protection Agency, Washington State Department of
Ecology, and U.S. Department of Energy, Olympia, Washington. Available at:
https://pdw.hanford.gov/document/00098825.
SGW-61350, 2019, Data Gaps Evaluation in Groundwater Monitoring at the Hanford 200-ZP-1
Groundwater Operable Unit, Rev. 1, CH2M HILL Plateau Remediation Company,
Richland, Washington. Available at: https://pdw.hanford.gov/document/AR-03045.
SW-846, 2015, Test Methods for Evaluating Solid Waste: Physical/Chemical Methods, Third Edition;
Final Update V, as amended, Office of Solid Waste and Emergency Response,
U.S. Environmental Protection Agency, Washington, D.C. Available at: https://www.epa.gov/hw-
sw846/sw-846-compendium.
DOE/RL-2019-23, REV. 0
B-i
Appendix B
200-ZP-1 Operable Unit Ringold Formation Unit A
Proposed Monitoring Well Profiles

DOE/RL-2019-23, REV. 0
B-ii
This page intentionally left blank.

DOE/RL-2019-23, REV. 0
B-iii
Figures
Figure B-1. Proposed Monitoring Well MW-A Profile ......................................................................... B-2
Figure B-2. Proposed Monitoring Well MW-B Profile ......................................................................... B-3
Figure B-3. Proposed Monitoring Well MW-C Profile ......................................................................... B-4
Figure B-4. Proposed Monitoring Well MW-D Profile ......................................................................... B-5
Figure B-5. Proposed Monitoring Well MW-E Profile .......................................................................... B-6
Figure B-6. Proposed Monitoring Well MW-F Profile .......................................................................... B-7
Figure B-7. Proposed Monitoring Well MW-G Profile ......................................................................... B-8
Figure B-8. Proposed Monitoring Well MW-H Profile ......................................................................... B-9

DOE/RL-2019-23, REV. 0
B-iv
This page intentionally left blank.

DOE/RL-2019-23, REV. 0
B-1
B 200-ZP-1 Operable Unit Ringold Formation Unit A
Proposed Monitoring Well Profiles
Figures B-1 through B-8 in this appendix present well profiles for proposed monitoring wells to be
installed in and around the 200-ZP-1 Groundwater Operable Unit (OU) to support characterization of the
Ringold Formation member of Wooded Island – unit A. The well profiles are provided to summarize the
estimated depths to geologic contacts, anticipated sampling intervals, and potential well construction for
each proposed monitoring well.
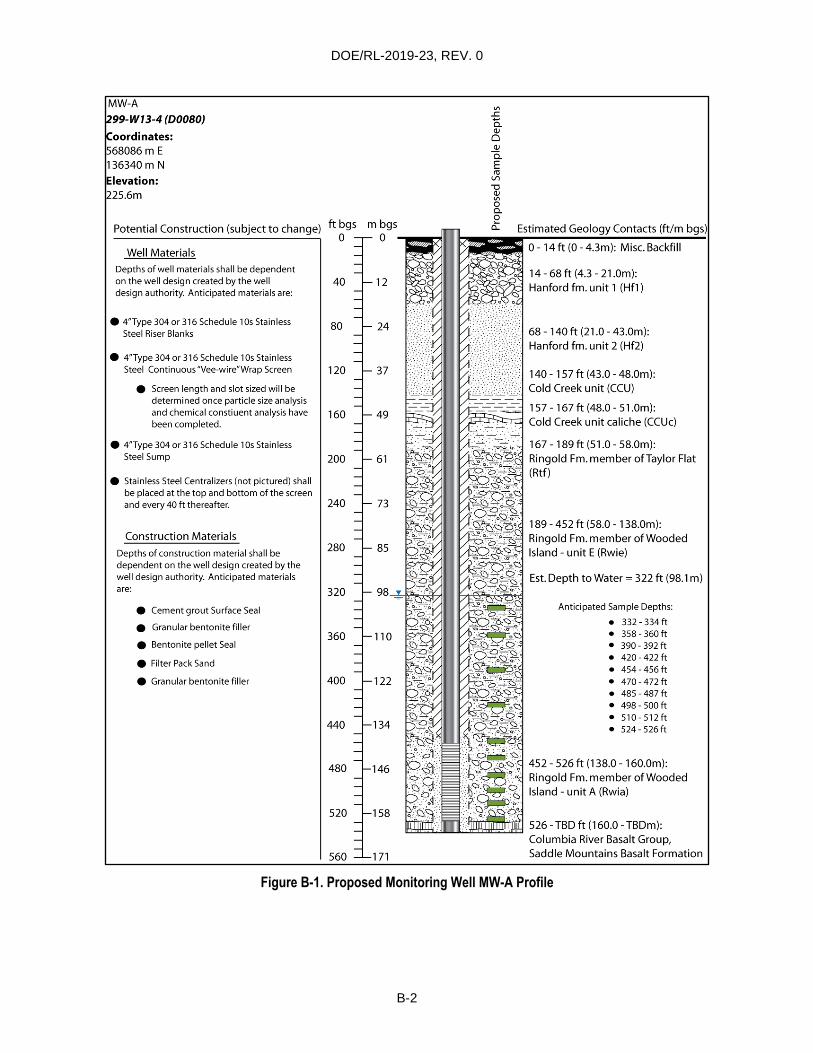
DOE/RL-2019-23, REV. 0
B-2
Figure B-1. Proposed Monitoring Well MW-A Profile
MW-A
99-W13-4 (D0080)
Coordinates: 568086 m E 136340 m N
Elevation: 225.6m
Potential Construction (subject to change) ft bgs m bgs 0 0
Well Materials
Depths of well materials shall be dependent on the wel I design created by the well 40 12 design authority. Anticipated materials are:
e 4"Type 304 or 316 Schedule 1 Os Stainless 80 24 Steel Riser Blanks
• 4"Type 304 or 316 Schedule 1 Os Sta in less Steel Continuous "Vee-wire"Wrap Screen 120 37
• Screen length and slot sized will be determined once particle size analysis and chemical constiuent analysis have 160 49 been completed.
• 4"Type 304 or 316 Schedule 1 Os Stainless Steel Sump 200 61
• Stain less Steel Centralizers (not pictured) shall be placed at the top and bottom of the screen and every 40 ft thereafter. 240 73
Construction Materials
Depths of construction material shall be 280 85
dependent on the well design created by the well desig n authority. Anticipated materials are: 320 98
• Cement grout Surface Seal
e Granular bentonite fi ller 360 110
• Bentonite pellet Seal
• Filter Pack Sand
• Granular bentonite filler 400 122
440 134
480 146
520 158
560 171
V,
..c Q. Q)
0 Q)
ci. E ro
Vl
"O Q) V,
0 0. 0
ct Estimated Geology Contacts (ft/m bgs)
O - 14 ft (0 - 4.3ml: Misc. Backfill
68 - 140 ft (21 .0 - 43.0m): Hanford fm. unit 2 (Hf2}
140 - 157 ft (43.0 - 48.0m): Cold Creek unit (CCU)
157-167ft (48.0-5 1.0m}: 1/-r:::r:':,'l::;:!-.---rl Cold Creek unit caliche (CCUc)
167 - 189 ft (51.0 - 58.0m): Ringold Fm. member of Taylor Flat (Rtf)
189 - 452 ft (58.0 - 138.0m}: Ringold Fm. member of Wooded Island - unit E (Rwie)
Est. Depth to Water= 322 ft (98.1 m)
Anticipated Sample Depths:
• 332 - 334 ft • 358- 360 ft • 390- 392 ft • 420-422 ft • 454-456 ft • 470-472ft • 485 -487 ft • 498 - 500 ft • 510 - 512ft • 524- 526 ft
452 - 526 ft (138.0 - 160.0m): Ringold Fm. member of Wooded Island - unit A (Rwia}
ll:i::!mf~:.:ILI..L.J~rn-:k,r,,!!o~~~l'ri'l~t.tc1 526 - TBD ft (160.0 - TBDm): Columbia River Basalt Group, Saddle Mountains Basalt Formation

DOE/RL-2019-23, REV. 0
B-3
Figure B-2. Proposed Monitoring Well MW-B Profile
MW-B
299-W19- 133 (D0081)
Coordinates: 567849 m E 135350 m N
Elevation: 219.5m
ft bgs m bgs Potential Construction (subject to change) 0 0
Well Materials
Depths of well materia ls sha ll be dependent 40 12 on the well design created by the well design authority. Anticipated materials are:
• 4"Type 304 or 316 Schedule 1 Os Stain less 80 24 Steel Riser Blanks
• 4"Type 304 or 316 Schedule 1 Os Stain less 120 37 Steel Continuous "Vee-wire"Wrap Screen
• Screen length and slot sized will be determined once pa rticle size analysis
160 49 and chemica l constiuent analysis have been completed.
• 4"Type 304 or 316 Schedule 1 Os Stain less 200 61 Steel Sump
• Stainless Steel Centralizers (not pictured) sha ll be placed at the top and bottom of the screen 240 73 and every 40 ft thereafter.
Construction Materials 280 85 Depths of construction materia l shall be dependent on the well desig n created by the wel l design authority. Anticipated materials
320 98 are:
• Cement grout Surface Seal
• Granular bentonite fi ller 360 110
• Bentonite pellet Seal
• Filter Pack Sand
• Granular bentonite filler 400 122
440 134
480 146
520 158
560 171
VI ..c:. +-' a. (]J
a (]J
a. E "' Vl
-0 (]J VI 0 a. 0
ct Estimated Geology Contacts (ft/m bgs)
0 - 3 ft (O - 0.9m): Misc. Backfill
3 - 67 ft (0.9 - 20.4ml: Hanford fm. unit 1 (Hfl)
67 - 176 ft (20.4 - 54.0m): Hanford fm. unit 2 (Hf2)
176 - 186 ft (54.0- 57.0m): Cold Creek unit (CCU)
186 - 198 ft (57.0 - 60.4ml: Cold Creek unit caliche (CCUc)
198 - 240 ft (60.4 - 73.2ml: Ringold Fm. member ofTaylor Flat (Rtf)
240 - 445 ft (73.2 - 136.0m): Ringold Fm. member of Wooded Island - unit E (Rwie)
Est . Depth to Water= 293 ft (89.3ml
Anticipated Sample Depths:
• 303-305 ft • 360- 362 ft • 420-422 ft • 447 -449ft • 460-462 ft • 470-472 ft • 485 -487 ft • 500- 502 ft • 515-517ft • 530- 532 ft • 541-543ft • 552- 554ft
445 - 466 ft (136.0 - 142.0m): Ringold Fm. member of Wooded Island - lower mud unit (Rim)
466 - 554 ft (142.0 - 169.0m): Ringold Fm. member of Wooded Island - unit A (Rwia)
554 - TBD ft (169.0 - TBDm): Columbia River Basalt Group,
"-'-"UJ..U1."--"-..... ......_\li"f:l11.trrl!:ttJ:Jfi:t:l Saddle Mountains Basalt Formation

DOE/RL-2019-23, REV. 0
B-4
Figure B-3. Proposed Monitoring Well MW-C Profile
MW-C
699-46-70 (D0082)
Coordinates: 568697 m E 137656 m N
Elevation: 217.0m
Potential Construction (subject to change) ft bgs m bgs 0 0 "'"P'!~~·
Well Materials
Depths of well materials sha ll be dependent on the well design created by t he well 40 12 design authority. Anticipated materials are:
• 4"Type 304 or 316 Schedule 1 Os Stainless 80 24 Steel Riser Blanks
• 4"Type 304 or 316 Schedule 1 Os Stainless Steel Cont inuous "Vee-wire"Wrap Screen 120 37
• Screen length and slot sized wi ll be determined once part icle size ana lysis and chemica l constiuent analysis have been completed.
160 49
• 4"Type304or316Schedule l OsStainless Steel Sump 200 61
• Stainless Steel Centra lizers (not pictured) shall be placed at the top and bottom of t he screen and every 40 f t t hereafter. 240 73
Construction Materials
Depths of construction material shall be 280 85 dependent on the well design created by t he well design authority. Anticipated materia ls are: 320 98
• Cement grout Surface Seal
e Granular benton ite fil ler
e Bentonite pellet Sea l 360 110
• Filter Pack Sand
• Granular bentonite filler 400 122
440 134
480 146
520 158
560 171
V\ .c a. Q)
0 Q)
0. E ro
V)
-0 Q) V\ 0 0. e c.. Estimated Geology Contacts (ft/m bgs)
0 - 1 ft (0 - 0.3m): Misc. Backfill /IM="---'l:--.rl / '¥",,.,..-""'l"r"',-M 1 - 33 ft (0.3 - 10.1 m):
Hanford fm. unit 1 (Hfl )
33 - 105 ft (10.1 - 32.0m): Hanford fm . unit 2 (Hf2)
105 - 146 ft (32.0 - 45.0m): Cold Creek unit (CCU)
146 - 158 ft (45.0 - 48.2m): Cold Creek unit caliche (CCUc)
)CI::'.:J:::i:t:=J:~ 158 - 185 ft (48.2 - 56.4m): Ringold Fm. member of Taylor Flat (Rtf)
185 - 340 ft (56.4 - 104m): Ringold Fm. member of Wooded Island - unit E (Rw ie)
Est. Depth to Water = 287 ft (87.5ml
340 - 361 ft (104.0 - 11 0.0m): Ringold Fm. member of Wooded Island - lower mud unit (Rim)
Anticipated Sample Depths:
• 297 - 299 ft
• 310-312ft
• 330 - 332 ft
• 345-347ft
• 355-357ft
• 365 - 367 ft
• 382 - 384 ft
• 400-402 ft
• 420 - 422 ft
361 - 421 ft (11 o.o - 128.3ml: Ringold Fm. member of Wooded Island - unit A (Rwia)
421 - TBD ft (1 28.3 - TBDm): Columbia River Basalt Group, Saddle Mountains Basalt Formation
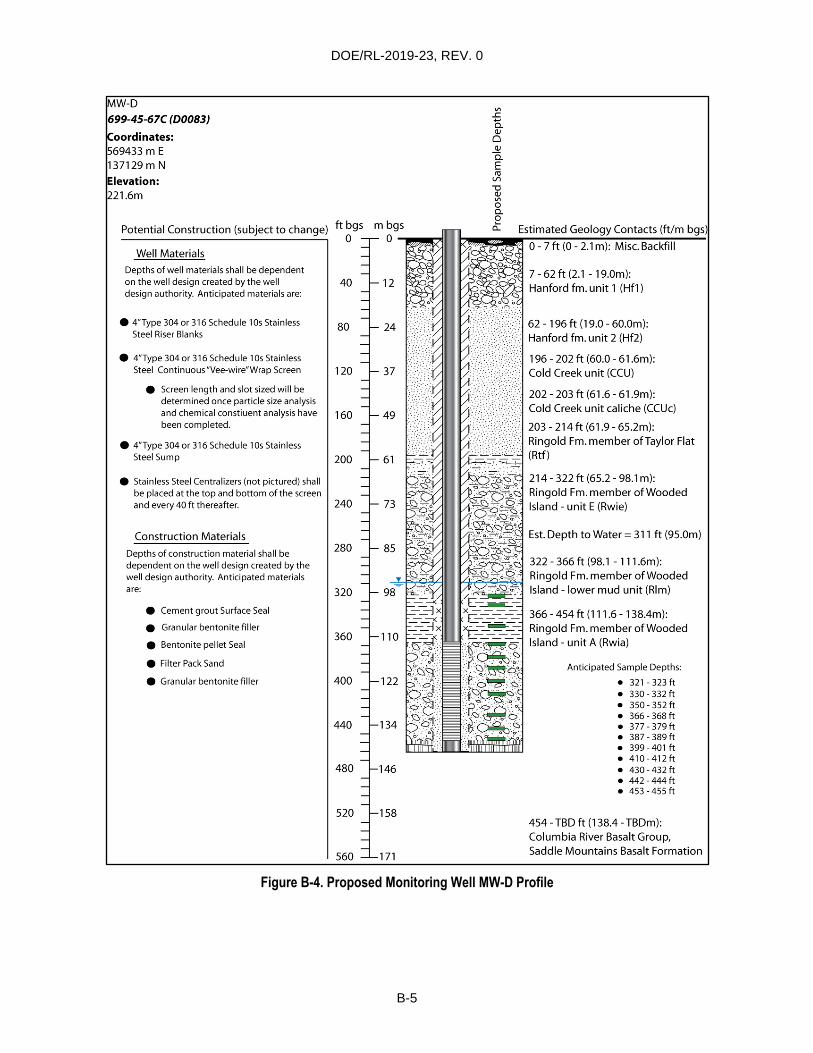
DOE/RL-2019-23, REV. 0
B-5
Figure B-4. Proposed Monitoring Well MW-D Profile
MW-D
699-45-67C (D0083)
Coordinates: 569433 m E 137129 m N
Elevation: 221.6m
Well Materials
Depths of well materials shall be dependent on the well design created by the well design authority. Anti cipated materials are:
• 4"Type 304 or 316 Schedule 1 Os Stainless Steel Riser Blanks
e 4"Type 304 or 316 Schedule 1 Os Stainless Steel Continuous"Vee-wire"Wrap Screen
• Screen length and slot sized will be determined once particle size analysis and chemical constiuent analysis have been completed.
e 4"Type 304 or 316 Schedule 1 Os Stainless Steel Sump
e Sta in less Steel Centralizers (not pictured) shall be placed at the top and bottom of the screen
40
80
120
160
200
and every 40 ft thereafter. 240
Construction Materials
Depths of construction material shall be 280
dependent on the well design created by the well design authority. Anticipated materials are: 320
e Cement grout Surface Seal
e Granular bentonite filler 360 e Bentonite pellet Sea l
• Filter Pack Sand
• Granular bentonite filler 400
440
480
520
560
12
24
37
49
61
73
85
98
146
158
171
V)
..c C. (].)
0 (].)
C. E ro
Vl
"C (].) V)
0 a. e
a... Estimated Geology Contacts (ft/m bgs)
0 - 7 ft (O - 2. 1 m): Misc. Backfill
o 7 - 62 ft (2.1 - 19.0m): Hanford fm. unit 1 (Hf1)
62 - 196 ft (19.0 - 60.0m): Hanford fm. unit 2 (Hf2)
196 - 202 ft (60.0 - 61.6ml: Cold Creek unit (CCU)
202 - 203 ft (61.6 - 61.9m): Cold Creek unit caliche (CCUc)
203 - 214 ft (6 1.9- 65.2ml: Ringold Fm. member ofTaylor Flat
"-'-"· '-'~•"-'-'· .:.i (Rtf)
214- 322 ft (65.2- 98.1 m): Ringold Fm. member of Wooded Island - unit E (Rwie)
Est. Depth to Water= 311 ft (95.0m)
322 - 366 ft (98.1 - 1 1 1 .6m): Ringold Fm. member of Wooded Island - lower mud unit (Rim)
366 - 454 ft (111 .6 - 138.4ml: Ringold Fm. member of Wooded Island - unit A (Rwia)
Anticipated Sample Depths:
• 321-323ft • 330 - 332 ft • 350-352 ft • 366- 36B ft • 377-379ft • 387 -389 ft • 399-401 ft • 410-412 ft • 430-432 ft • 442 -444 ft • 453-455 ft
454 - TBD ft (138.4 - TBDm): Columbia River Basalt Group, Saddle Mountains Basalt Formation

DOE/RL-2019-23, REV. 0
B-6
Figure B-5. Proposed Monitoring Well MW-E Profile
MW-E
299-W14-26 (D0084)
oordinates: 567285 m E 135729 m N
Elevation: 216.4m
Potential Construction (subject to change) ft bgs m bgs
(]J
a. E (U Vl
Vl .C -0 C. (]J (]J
cl Cl a. 0 a:
Well Materials o o ,_'111._m.,.•.,p,,~,.I
Estimated Geology Contacts (ft/m bgs)
0 - 10 ft (O - 3.0m): Misc. Backfill
10 - 61 ft (3 .0 - 19.0m): ,1',l'.,,✓,1,.lX;?-'"-21 Hanford fm. unit 1 (Hfl)
Depths of wel l materials sha ll be dependent on the well design created by the well design authori ty. Anticipated materials are:
• 4"Type 304 or 316 Schedule 10s Stainless Steel Riser Blan ks
• 4"Type304or316Schedule 10s5tainless Steel Continuous "Vee-wi re"Wrap Screen
• Screen length and slot sized w ill be determined once particle size analysis and chemica l const iuent analysis have been completed.
e 4"Type 304 or 316 Schedule 1 Os Stainless Steel Sump
• Sta inless Steel Cent ral izers (not pictu red) sha ll be placed at the top and bottom of the screen
40
80
120
160
200
and every 40 ft thereafter. 240
Construction Materials
Depths of construction material shal l be 280 dependent on the well design created by the well design authority. Anticipated materials are:
320
e Cement grout Surface Seal
e Granular bentonite fi ller
• Bentonite pellet Seal 360
• Filter Pack Sand
• Granular bentonite fi ller 400
440
480
520
560
12
24
37
49
61
73
85
98
110
122
134
146
158
171
61 -138ft (19.0-42.lm): Hanford fm. unit 2 (Hf2)
138 - 143 ft (42.1 - 44.0m): Cold Creek unit (CCU)
143 - 151 ft (44.0 - 46.0m): ,.U,-7"""i;l:'-r~ Cold Creek unit caliche (CCUc)
151 - 160 ft (46.0 - 49.0m): Ringold Fm. member ofTaylor Flat (Rtf )
160 - 428 ft (49.0 - 130.5m): Ringold Fm. member of Wooded Island - unit E (Rwie)
Est. Depth to Water= 286 ft (87.2ml
Anticipated Sample Depths:
• 296 - 298 ft • 345 - 347 ft • 395-397 ft • 435 - 437 ft • 455 - 457 ft • 470-472ft • 483 - 485 ft • 495- 497 ft • 515 - 517 ft • 527 - 529 ft • 539- 541 ft
428 - 468 ft (130.S - 143.0m): Ringold Fm. member of Wooded Island - lower mud unit (Rim)
468 - 541 ft (143.0 - 165.0m): Ringold Fm. member of Wooded Island - unit A (Rwia)
w..u..Lw.11. ...... ~ ww..J.JJ.U.LIWlllllU 541 - TBD ft (165.0 - TBDm): Columbia River Basalt Group, Saddle Mountains Basalt Formation

DOE/RL-2019-23, REV. 0
B-7
Figure B-6. Proposed Monitoring Well MW-F Profile
MW-F 699-40-70 (D0085) Coordinates: 568732 m E 135703 m N
Elevation: 224.9m
(]J
a. E "' V\ Vl ..C
-0 C. (]J (]J
cl Cl
Potential Construction (subject to change) ft bgs m bgs a. 0 a: Estimated Geology Contacts (ft/m bgs)
Well Materials
Depths of well materials shall be dependent on the well desig n created by the well design authority. Anticipated materials are:
• 4"Type 304 or 31 6 Schedule 1 Os Sta inless Steel Riser Blanks
• 4"Type 304 or 316 Schedule 10s Stainless Steel Contin uous "Vee-wire"Wrap Screen
• Screen length and slot sized wil l be determined once particle size ana lysis and chemica l constiuent analysis have been completed.
• 4"Type 304 or 316 Schedule 10s Stainless Steel Sump
• Stain less Steel Centralizers (not pictured) shall be placed at the top and bottom of the screen and every 40 ft thereafter.
Construct ion Materials
Dept hs of construction material shall be dependent on the well design created by the well design authority. Ant icipated materials are:
e Cement grout Surface Sea l
e Gran ular bentonite filler
• Bentonite pellet Seal
• Fi lter Pack Sand
• Granular bentonite fi ller
0 0 --.-.:i 0 - 6 ft (0 - 1 .8m): Misc. Backfil l
6 - 40 ft (1.8 - 12.2ml: 40 12
80 24
120 37
160 49
200 61
240 73
280 85
320
360 110
400 122
440 134
480 146
520 158
560 171
Hanford fm . unit 1 (Hfl )
40 - 157 ft (1 2.2 - 48.0m): Hanford fm . unit 2 (Hf2)
157 - 173 ft (48.0 - 53.0m): Cold Creek unit (CCU)
242- 261 ft (74.0 - 80.0m): Ringold Fm. member ofTaylor Flat (Rtf)
261 - 419 ft (80.0 - 1 28.0m): Ri ngold Fm. member of Wooded Island - un it E (Rwie)
Est. Depth to Water= 31 5 ft (96.0m) Anticipated Sample Depths:
• 325-327 ft • 360 -362 ft • 400 - 402ft • 422 - 424 ft • 432 - 434ft • 446- 448 ft • 460 -462 ft • 475 - 477ft • 490-492 ft • 505 - 507 ft • 520 -522 ft • 534 - 536 ft • 548-550ft
419-430ft (128.0 - 131 .1 m): Ri ngold Fm. member of Wooded Island - lower mud unit (Rim)
430 - 549 ft (131 .1 -167.3m): Ringold Fm. member of Wooded Island - unit A (Rwia)
......,.......,;.;..-....., ........ UJW..L.....,.w.u 549 - TBD ft (167.3 - TBDm): Colu mbia River Basalt Group, Saddle Mountains Basa lt Format ion
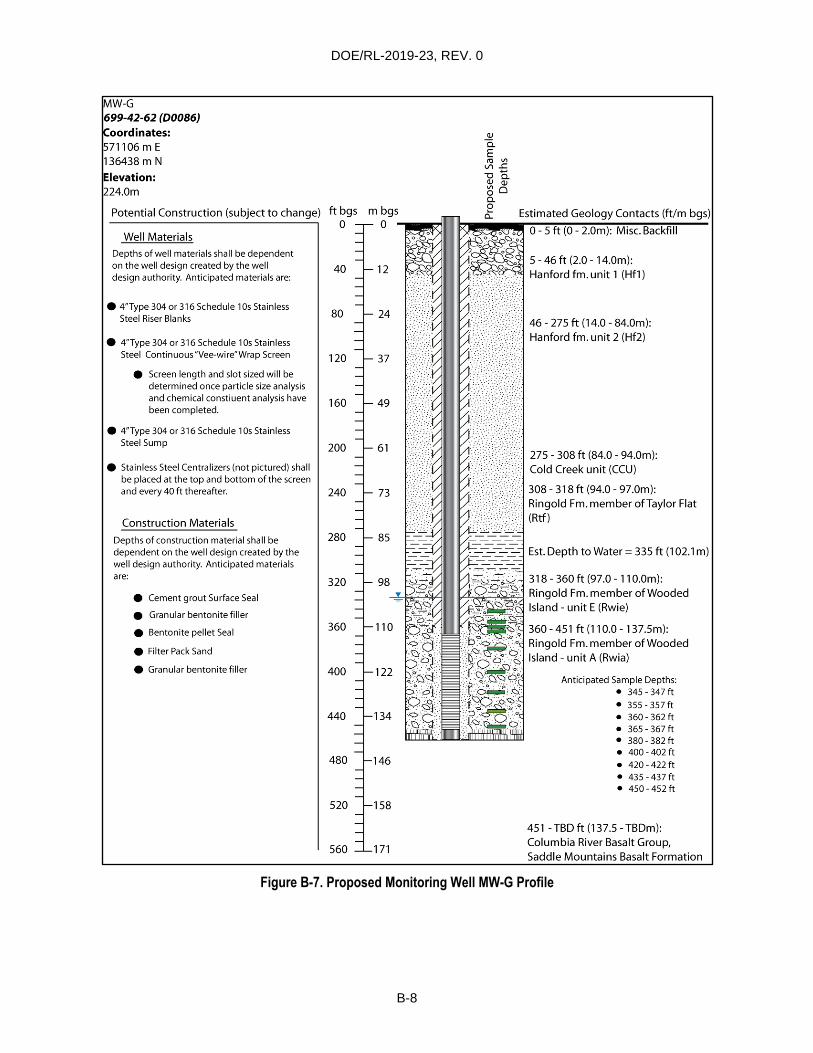
DOE/RL-2019-23, REV. 0
B-8
Figure B-7. Proposed Monitoring Well MW-G Profile
MW-G 699-42-62 (D0086) Coordinates: 571106 m E 136438 m N
Elevation: 224.0m
Potential Construct ion (subject to change) ft bgs m bgs 0 0
Well Materials
Depths of well materials shall be dependent on the well design created by t he well 40 12 design authority. Anticipated materia ls are:
e 4"Type 304 or 316 Schedule 1 Os Stai nless 80 24 Steel Riser Blanks
• 4"Type 304 or 316 Schedule 1 Os Stain less Steel Continuous "Vee-wi re"Wrap Screen 120 37
• Screen length and slot sized will be determined once particle size analysis and chemical constiuent analysis have 160 49 been completed.
e 4"Type 304 or 316 Schedule 1 Os Stai nless Steel Sump 200 61
e Stain less Steel Centralizers (not pictured) shall be placed at the top and bottom of t he screen and every 40 ft thereafter. 240 73
Construction Materials
Depths of construction material sha ll be 280 85 dependent on the well design created by the well design authority. Anticipated materia ls are:
320 98
• Cement grout Surface Seal
• Granular bentonite fil ler
e Bentonite pellet Sea l 360 110
e Fi lter Pack Sand
• Granular bentonite filler 400 122
440 134
480 146
520 158
560 171
QJ
0. E IO V>
V') .c "O 15. QJ QJ oO a. 0 ct Estimated Geology Contacts (ft/m bgs)
0 - 5 ft (0 - 2.0m): Misc. Backfill
/ 1..-.c:l.""'--""-•CI 5 - 46 ft (2,0 - 14,0m): Hanford fm . unit 1 (Hfl )
46 - 275 ft (14.0 - 84.0m): Hanford fm. unit 2 (Hf2)
275 - 308 ft (84.0 - 94.0m): Cold Creek unit (CCU)
308 - 318 ft (94.0 - 97.0m): Ringold Fm. member ofTaylor Flat (Rtf)
Est. Depth to Water = 335 ft (102.1 m)
318 - 360 ft (97.0 - 11 0.0m): ~;.,,;,;-,.o.;~O:J Ringold Fm. member of Wooded
Island - unit E (Rw ie)
360 - 451 ft (110.0 - 137.Sm): Ringold Fm. member of Wooded Island - unit A (Rwia)
Anticipated Sample Depths: • 345-347 ft
• 355-357 ft • 360 - 362 ft • 365 - 367 ft • 380 - 382 ft • 400 - 402 ft • 420- 422 ft • 435 - 437 ft • 450 - 452 ft
451 - TBD ft (137.5 - TBDm): Columbia River Basalt Group, Saddle Mountains Basalt Formation

DOE/RL-2019-23, REV. 0
B-9
Figure B-8. Proposed Monitoring Well MW-H Profile
MW-H
699-41 -65 (D0087)
Coordinates: 570029 m E 136109 m N
Elevation: 230.4m
Potential Construction (subject to change) ft bgs m bgs 0 0
Well Materials
Depths of well materials shall be dependent on the well design created by the well 40 12 design authority. Anticipated materials are:
• 4"Type 304 or 316 Schedule 1 Os Stainless 80 24 Steel Riser Blanks
• 4"Type 304 or 316 Schedule 10s Stain less Steel Continuous"Vee-wire"Wrap Screen 120 37
• Screen length and slot sized w ill be determined once part icle size analysis and chemica l const iuent analysis have 160 49 been completed.
• 4"Type 304 or 316 Schedule 10s Stainless Steel Sump 200 61
• Stai nless Steel Centralizers (not pictu red) shall be placed at the top and bottom of the screen and every 40 ft thereafter. 240 73
Construction Materials
Dept hs of construction material shall be 280 85
dependent on the well design created by the well design authority. Ant icipated materials are: 320 98
• Cement grout Surface Sea l
• Granular bentonite fi ller
• Benton ite pellet Sea l 360 110
• Filter Pack Sand
• Granular bentonite fi ller 400 122
440 134
480 146
520 158
560 171
<!/): ·.·.:.-_-.-_:,:• .J,
(ii\f .· ) ,
?;\:
}f'.:-:t, :'i j> :._.::::-: ,
WBt
"' .c 0. <I)
0 <I)
a. E Ill
V>
-0 <I)
"' 0 0. 0
ct Estimated Geology Contacts (ft/m bgs)
0 - 8 ft (0 - 2.4m): Misc. Backfill
8 - 47 ft (2.4 - 14.3m): 0 Hanford fm. unit 1 (Hf l )
47 - 236 ft (14.3 - 72.0m): Hanford fm. unit 2 (Hf2)
Ant icipated Sample Depths:
• 354 - 356 ft
• 362- 364ft • 372 - 374 ft • 392- 394ft • 410 - 41 2ft • 420-422 ft • 436- 438 ft • 450 - 452 ft • 465 - 467 ft • 480 - 482 ft • 493-495 ft • 506- 508 ft
283 - 369 ft (86.3 - 112.Sm): Ringold Fm. member of Wooded Island - unit E (Rwie)
- ~ · : ~~~~~ Est. Depth to Water= 344 ft (1 OS.Om) "!-.::::? ~ _..:.... xc=-~=-- 369 - 4 16 ft (112.5 - 127.0m): ~-------_ xe-::::-::::-::::- Ringold Fm. member of Wooded -~ ----=- Island - lower mud unit (Rim)
:'.f~%
ti t 416 - 508 ft (127.0 - 155.0m): Ringold Fm. member of Wooded Island - unit A (Rwia)
508 - TBD ft (155.0 - TBDm): Columbia River Basa lt Group, Saddle Mountains Basalt Formation

DOE/RL-2019-23, REV. 0
B-10
This page intentionally left blank.
Related Documents