53C10SW0008 2 16824 BUCKETT LAKE 010 REPORT ON INTERPRETATION OF MAGNETIC AND INDUCED POLARIZATION/RESISTIVITY SURVEYS NORTH SPIRIT PROJECT, NORTH SPIRIT LAKE DISTRICT OF KENORA RED LAKE MINING DIVISION, ONTARIO NTS 53 C/10 PROJECT 263 for PHELPS DODGE CORPORATION OF CANADA, LIMITED 2. 16824 Garth B. Burton, P.Geo. Geophysical Consultant Toronto, Ontario August, 1996

Welcome message from author
This document is posted to help you gain knowledge. Please leave a comment to let me know what you think about it! Share it to your friends and learn new things together.
Transcript

53C10SW0008 2 16824 BUCKETT LAKE
010
REPORT ON
INTERPRETATION OF MAGNETIC ANDINDUCED POLARIZATION/RESISTIVITY SURVEYS
NORTH SPIRIT PROJECT, NORTH SPIRIT LAKEDISTRICT OF KENORA
RED LAKE MINING DIVISION, ONTARIONTS 53 C/10
PROJECT 263
for
PHELPS DODGE CORPORATION OF CANADA, LIMITED
2. 16824
Garth B. Burton, P.Geo.Geophysical Consultant
Toronto, OntarioAugust, 1996

53C10SW0006 2.16824 BUCKETT LAKE
TABLE OF CONTENTS01OC
1. INTRODUCTION . . . . . . . . . . . . . . . . . . . . . . . . . l
2. LOCATION AND ACCESS . . . . . . . . . . . . . . . . . . . . . . l
3. CLAIMS INFORMATION . . . . . . . . . . . . . . . . . . . . . . l
4. HISTORY AND PREVIOUS WORK . . . . . . . . . . . . . . . . . . . . -s . . . . . l
5. GEOLOGY . . . . . . . . . . . .. . . . . . . . . . . . . . . . . . . . . . . . . . . . . . . . . . . . . . . . . . . . . 3
6. GEOPHYSICAL SURVEYS 3
6. l General Comments . . . . . . . . . . . . . . . . . . . . . . . . . . . . .. . . . . . . . . . . . . . . . . . 36.2 Discussion of Results . . . . . . . . . . . . . . . . . . . . . . . . . . . . . . . . . . . . . . . . . . . . . 4
7. CONCLUSIONS . . . . . . . . . . . . . . . . . . . . . . . . . . . . . . . . . . . . . . . . . . . . . . . . . . . . . 8
8. RECOMMENDATIONS 9
9. REFERENCES . . . . . . . . . . . . . . . . . . . . . . . . . . . . . . . . . . . . . . . . . . . . . . . . . . . . . 10
10. APPENDIX ........................................................11
LIST OF ACCOMPANYING MAPS
Plate Number
l
Drawing Number
E-1925-D1-263
E-1926-D1-263
Title Scale
Ground Magnetic Survey, 1:2500 Posting of Total Magnetic Field, North Spirit Lake Project, Red Lake District Ontario. Sheet 1.
Ground Magnetic Survey, 1:2500 Posting of Total Magnetic Field, North Spirit Lake Project, Red Lake District Ontario. Sheet 2.

E-1927-D1-263
E-1928-D1-263
E-1929-D1-263
E-1930-D1-263
E-1931-D8-263
E-1932-D8-263
Ground Magnetic Survey, 1:2500 Posting of Total Magnetic Field, North Spirit Lake Project, Red Lake District Ontario. Sheet 3.
Ground Magnetic Survey, 1:2500 Contours of Total Magnetic Field, North Spirit Lake Project, Red Lake District, Ontario. Sheet 1.
Ground Magnetic Survey, 1:2500 Contours of Total Magnetic Field, North Spirit Lake Project, Red Lake District, Ontario. Sheet 2
Ground Magnetic Survey, - . 1:2500 Contours of Total Magnetic Field, North Spirit Lake Project, Red Lake District, Ontario. Sheet 3.
Induced Polarization/ 1:2500Resistivity Survey,Contours of FilteredApparent Resistivity,North Spirit Lake Project,Red Lake District, Ontario.Sheet 1.
Induced Polarization/ 1:2500Resistivity Survey,Contours of FilteredApparent Resistivity,North Spirit Lake Project,Red Lake District, Ontario.Sheet 2.
Ill
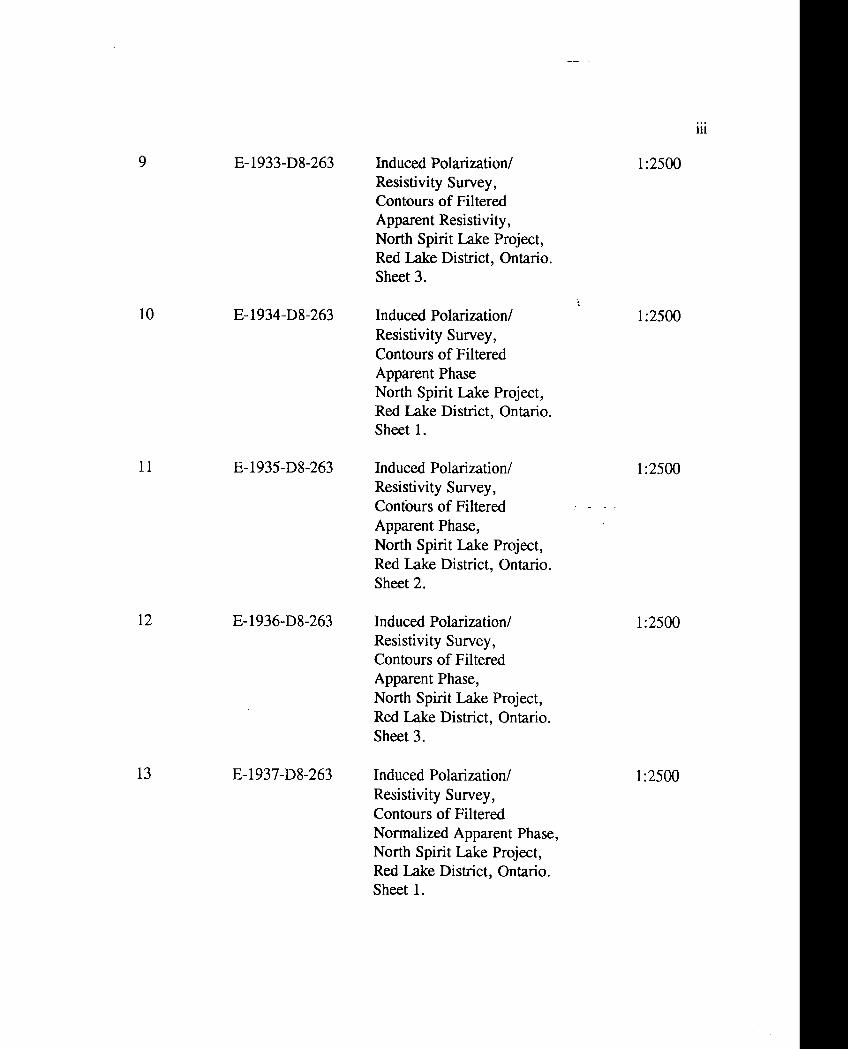
E-1933-D8-263
10 E-1934-D8-263
11 E-1935-D8-263
12 E-1936-D8-263
13 E-1937-D8-263
Induced Polarization/ Resistivity Survey, Contours of Filtered Apparent Resistivity, North Spirit Lake Project, Red Lake District, Ontario. Sheet 3.
Induced Polarization/ Resistivity Survey, Contours of Filtered Apparent Phase North Spirit Lake Project, Red Lake District, Ontario. Sheet 1.
Induced Polarization/ Resistivity Survey, Contours of Filtered Apparent Phase, North Spirit Lake Project, Red Lake District, Ontario. Sheet 2.
Induced Polarization/ Resistivity Survey, Contours of Filtered Apparent Phase, North Spirit Lake Project, Red Lake District, Ontario. Sheet 3.
Induced Polarization/ Resistivity Survey, Contours of Filtered Normalized Apparent Phase, North Spirit Lake Project, Red Lake District, Ontario. Sheet 1.
1:2500
1:2500
1:2500
1:2500
1:2500
IV
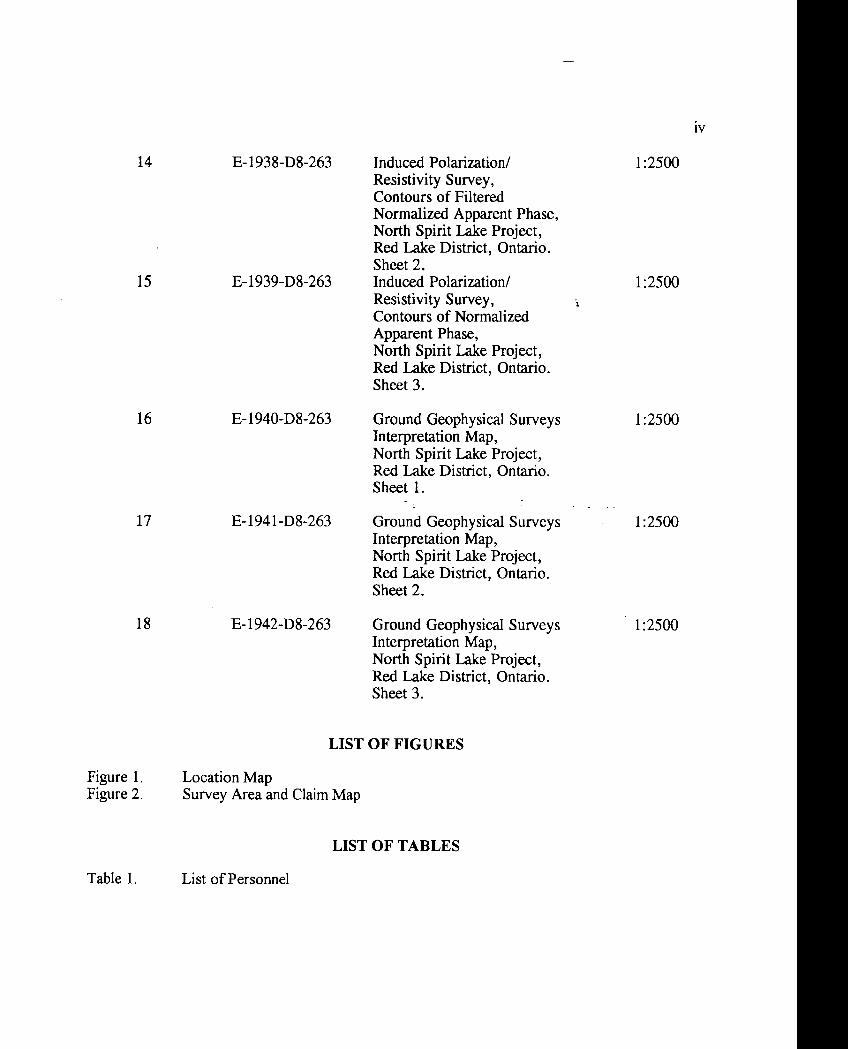
14
15
16
17
18
E-1938-D8-263
E-1939-D8-263
E-1940-D8-263
E-1941-D8-263
E-1942-D8-263
Induced Polarization/ Resistivity Survey, Contours of Filtered Normalized Apparent Phase, North Spirit Lake Project, Red Lake District, Ontario. Sheet 2.Induced Polarization/ Resistivity Survey, Contours of Normalized Apparent Phase, North Spirit Lake Project, Red Lake District, Ontario. Sheet 3.
Ground Geophysical Surveys Interpretation Map, North Spirit Lake Project, Red Lake District, Ontario. Sheet 1.
Ground Geophysical Surveys Interpretation Map, North Spirit Lake Project, Red Lake District, Ontario. Sheet 2.
Ground Geophysical Surveys Interpretation Map, North Spirit Lake Project, Red Lake District, Ontario. Sheet 3.
1:2500
1:2500
1:2500
1:2500
1:2500
LIST OF FIGURES
Figure l. Location MapFigure 2. Survey Area and Claim Map
LIST OF TABLES
Table 1. List of Personnel

INTRODUCTION
Following a regional compilation of airborne magnetics to determine the feasibility of exploring for GOLD in an area of heavy iron oxide formations in the NORTH SPIRIT LAKE AREA of Northwestern Ontario, a ground geophysical program was designed to follow-up recommendations from this internal study. The geophysical work was carried out during the winter of 1996. Magnetic survey was completed between 16th and 19th of February followed by induced polarization (IP)7resistivity surveying in March and April. Both surveys were performed on claims located in the Red Lake Mining Division of the Province of Ontariotowned by Phelps Dodge Corporation of Canada, Limited, referred to as NORTH SPIRIT LAKE project.
The purpose of these surveys was to map the geology of the area since more than 90 07o is covered by water and to identify potential anomalies that could be caused by sulphide-rich zones as favorable hosts for precious and/or base metal deposits.
LOCATION AND ACCESS
The property is located on North Spirit Lake about 170 km north-northeast of Red Lake and approximately 200 km northwest of Pickle Lake, in northwestern Ontario (Figure 1). Co-ordinates of the block of claims under study are: longitude 92 0 44'W fe 93 0 W and latitude 52 0 28'N b 52 G 38'N.
Access can be gained by driving via Secondary Highway No. 105 to Red Lake, then by aircraft equipped with skis or floats to North Spirit Lake a distance of 170 kilometers. Daily flights to Red Lake from Thunder Bay are an alternative to driving on Highway 105. A small native community is situated at the west end of the lake.
CLAIMS INFORMATION
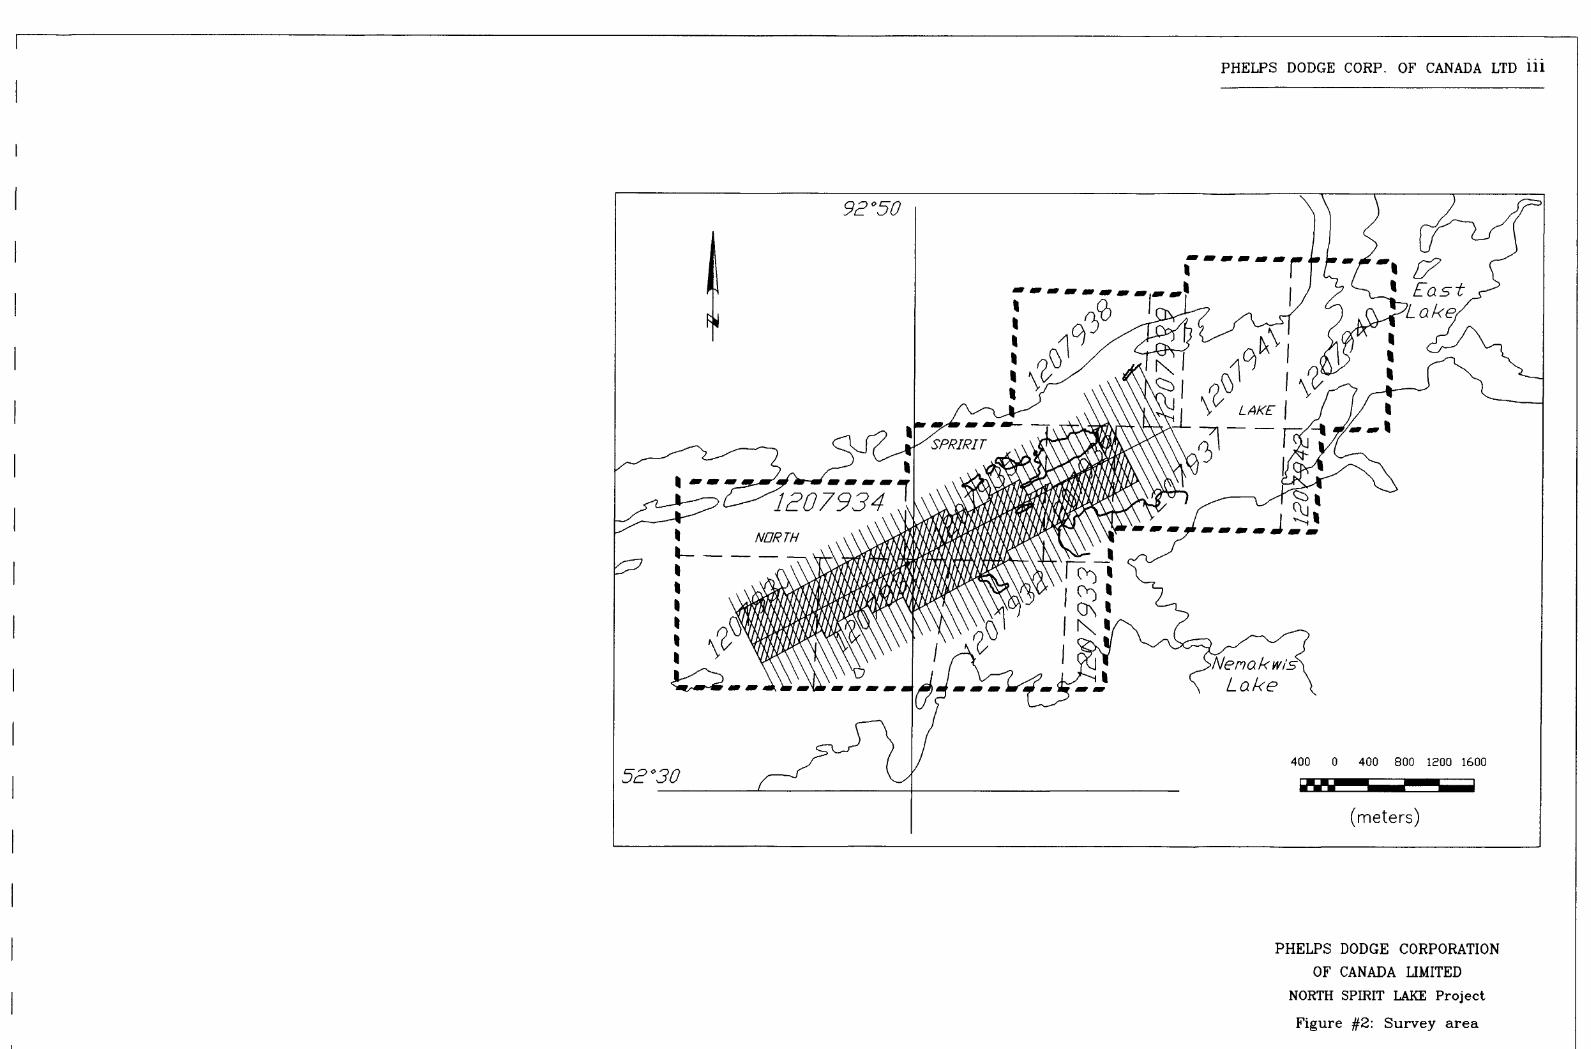
The grid covers parts of the following claims: 1207930 to 1207942 inclusive. They are located in the Red Lake Mining Division and are registered in the company's name, Phelps Dodge Corporation of Canada, Limited (Figure 2).
HISTORY AND PREVIOUS WORK
The past work focused mainly on the potential for iron ore deposits. Minor exploration was also carried out for base and precious metals associated with the ultramafic rocks. Prospecting for gold and iron ore began as early as 1936 and continued sporadically into the 1950's. During the early exploration phase, four main companies were involved:

PHELPS DODGE CORP. OF CANADA LTD 11
^_____l__
400 O 400 800 1200 1600
PHELPS DODGE CORPORATION
OF CANADA LIMITED
NORTH SPIRIT LAKE Project
Figure #1: Index of claims
PHELPS DODGE CORP. OF CANADA LTD 111
Ne ma k w is Lake
400 O 400 800 1200 1600
PHELPS DODGE CORPORATION
OF CANADA LIMITED
NORTH SPIRIT LAKE Project
Figure #2: Survey area

Derby Gold Syndicate Se Spirit Lake Gold Mines Ltd. a.k.a. Spirit Lake Mines:Au associated with Woods Intrusion at Pontoon Bay.
Crown Trust Ltd.
Prospectors Airways:
Iron ore on the main iron formation east of South Bay.
Au at Prospair Point.
Following this early work, additional companies became involved.
1938: Bateman's extensive geological report for the area was published. Newmont discovered base metals at MacDonald's Bay and worked it for several years.
1961:
1964 to 1971:
1969 to 1970:
1985 to 1986:
1986:
Upper Canada Mine investigated Iron Formations at East Bay
Silver Spirit Mines continued investigating the Newmont showing.
A spurt of activity as Dickenson Mines examined Iron Formations for Au.
McBean Investments Ltd. and Noranda explored the Peridotite Bay and Pontoon Bay areas for base metals.
BP Resources were searching for Au in an area of attractive alteration surrounding the major occurrences of Iron Formations north of South Bay. Magnetics and VLF EM surveys were conducted on 70 odd claims with no follow-up work.
Esso Minearals conducted a rock and chip sampling programme during the same period.
Rockspan Mines also explored the Newmont Showing.
Silver Spirit Mines continued exploration on their property conducting IP surveys over their Gold showings.

To date, no commercially viable mineral deposits have been located in the North Spirit Greenstone Belt.
GEOLOGY
Regionally, the area under study straddles the division between the Sachigo and Berens River Subprovinces of the Northwestern Superior Province ip the Archean Shield. The zone of greatest interest lies within a greenstone sequence in the Berens River Terrain.
The most recent geological work was compiled by John Wood during the late 1960's and early 1970's. The program was completed in 1971 and published in the Ontario Division of Mine's Geoscience Report 150, 1977.
The surrounding geology consists of metavolcanic and metasedimentary strata invaded by an extensive network of granitic intrusions. The volcanic sequences range from basaltic to rhyodacite. The original sediments consisted of conglomerate, sandstone, and mudstones, with some carbonates and cherts. The volcano-sedimentary formations are intruded by ultramafic to felsic bodies. The rocks trend anywhere between east-west to northerly. Major NW and NE faulting associated with the main structural break between the two subprovinces is prevalent. East-west directions are also evident.
Minor iron deposits have been outlined in the area. Showings of copper, lead, nickel, zinc, silver, and gold are also present.
GEOPHYSICAL SURVEYS
6. l General Comments
The surveys were executed along grid lines oriented in a Northwest - Southeast direction. Picket lines were laid out at 100 meter intervals and stations marked every 25m. Total line kilometers of the grid was 84.8 kms.
A ground magnetic survey was performed on the North Spirit Lake property between the 16th and the 19th of February 1996. Eighty kilometers of magnetic readings were taken. Two field units and a base station magnetometer were used to complete the survey. EDA Instruments and a GEM Systems GSM-19 Proton Magnetometer in station mode were used for taking field readings. However, the OMNI Plus broke down and the GSM-19 was used to complete the survey. For the base station unit, an EDA Instrument OMNI IV

proton magnetometer was used with a cycle time of 10 seconds. Several areas of the grid were not contoured on the final product due to the extreme gradient where accurate magnetic readings could not be obtained. A portion of the base line was read, but the data was lost during editing.
Phase domain IP/Resistivity surveying was carried out over the grid between March 21 and April 5, 1996. In total, 30 line kilometers of IP data were collected on the property. Initially, the survey was started using a set frequency of 1.0 Hz. Approximately 5 kilometers of lines were read with this arrangement. After realizing this setting was ineffective in this regional environment, a lower frequency of 0.25 Hz was used. The first set of readings were repeated and the remainder of the grid was surveyed with the new arrangement. Measurments were taken on lines spaced 100 meters apart in the central section of the grid, from Lines 16W to 8W, and from Lines 5W to 0. Lines 7W and 6W were not covered. Two hundred meter line spacing was used to complete the survey to the east, Lines 2E to 8E, and to the eest, Lines 18W to 40W.
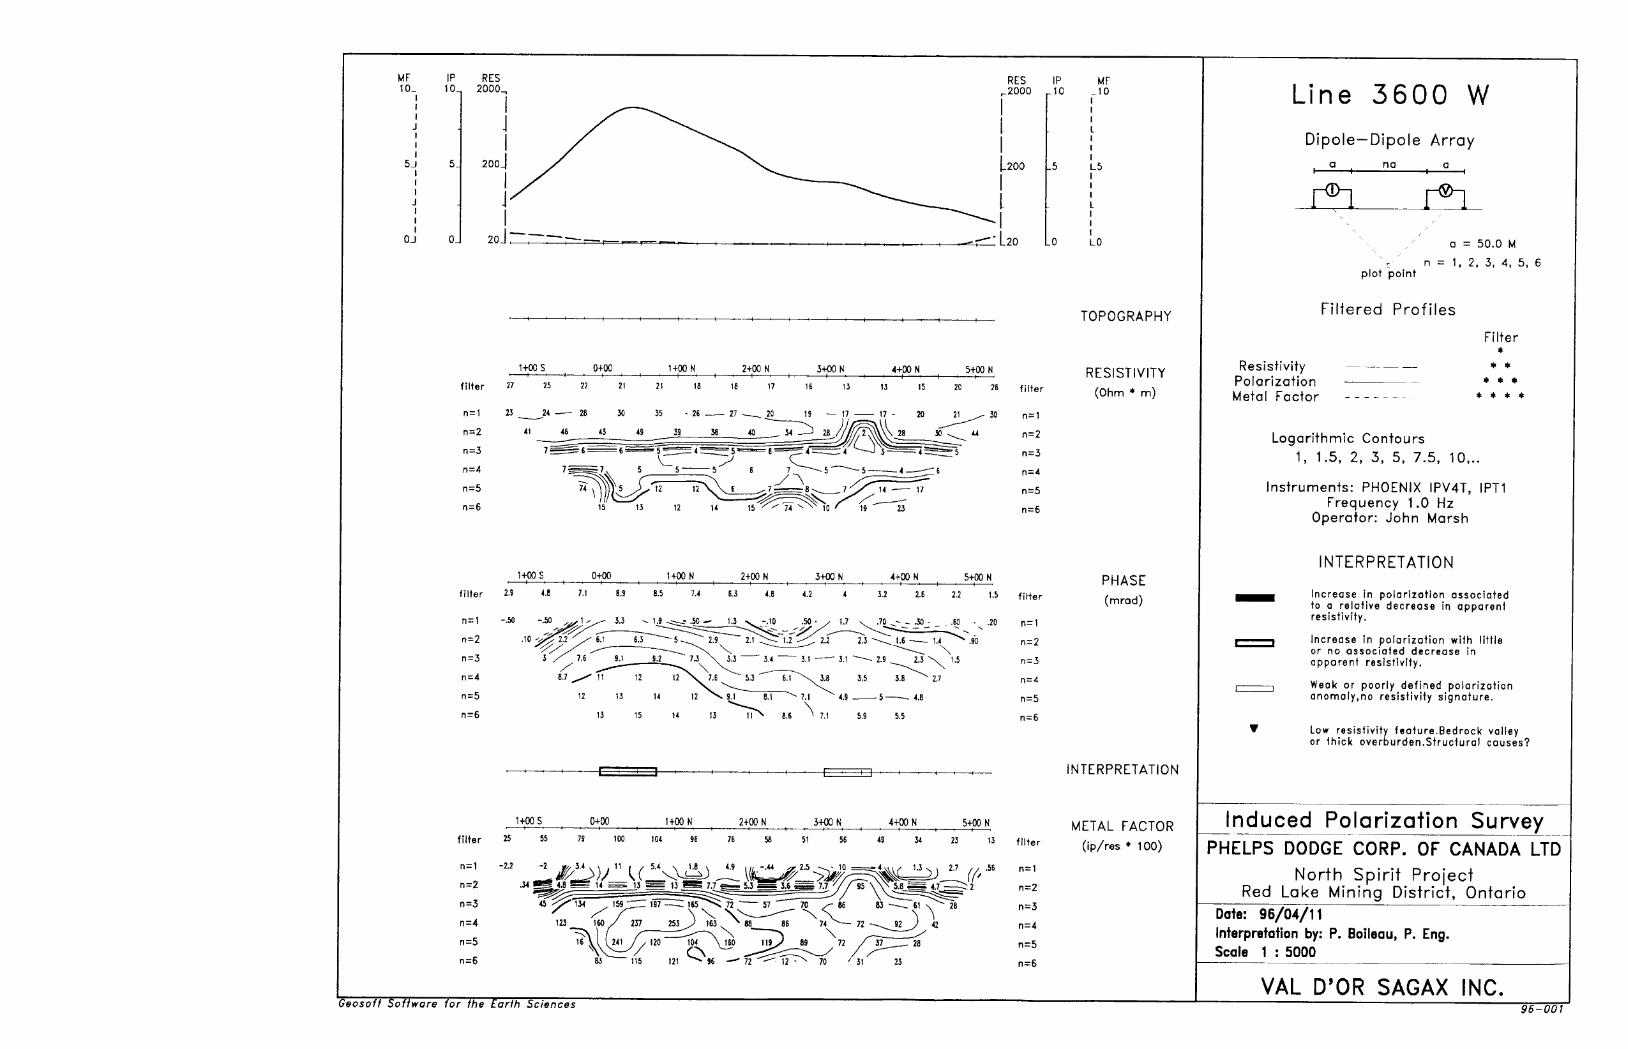
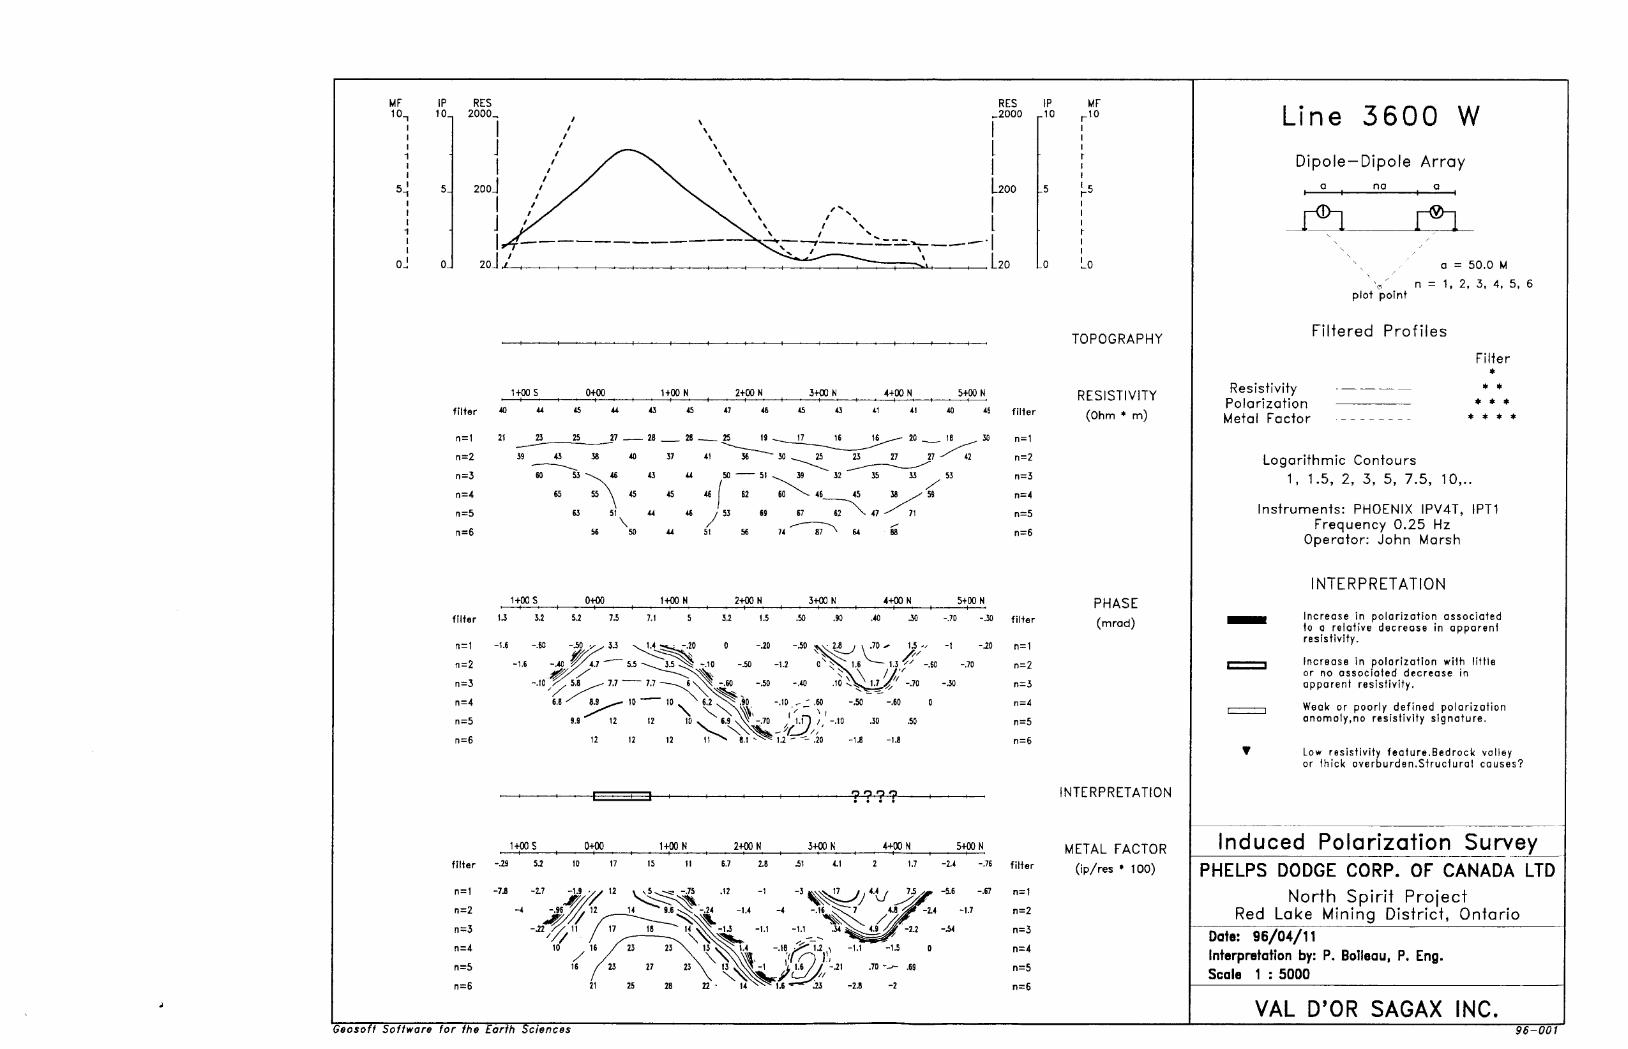
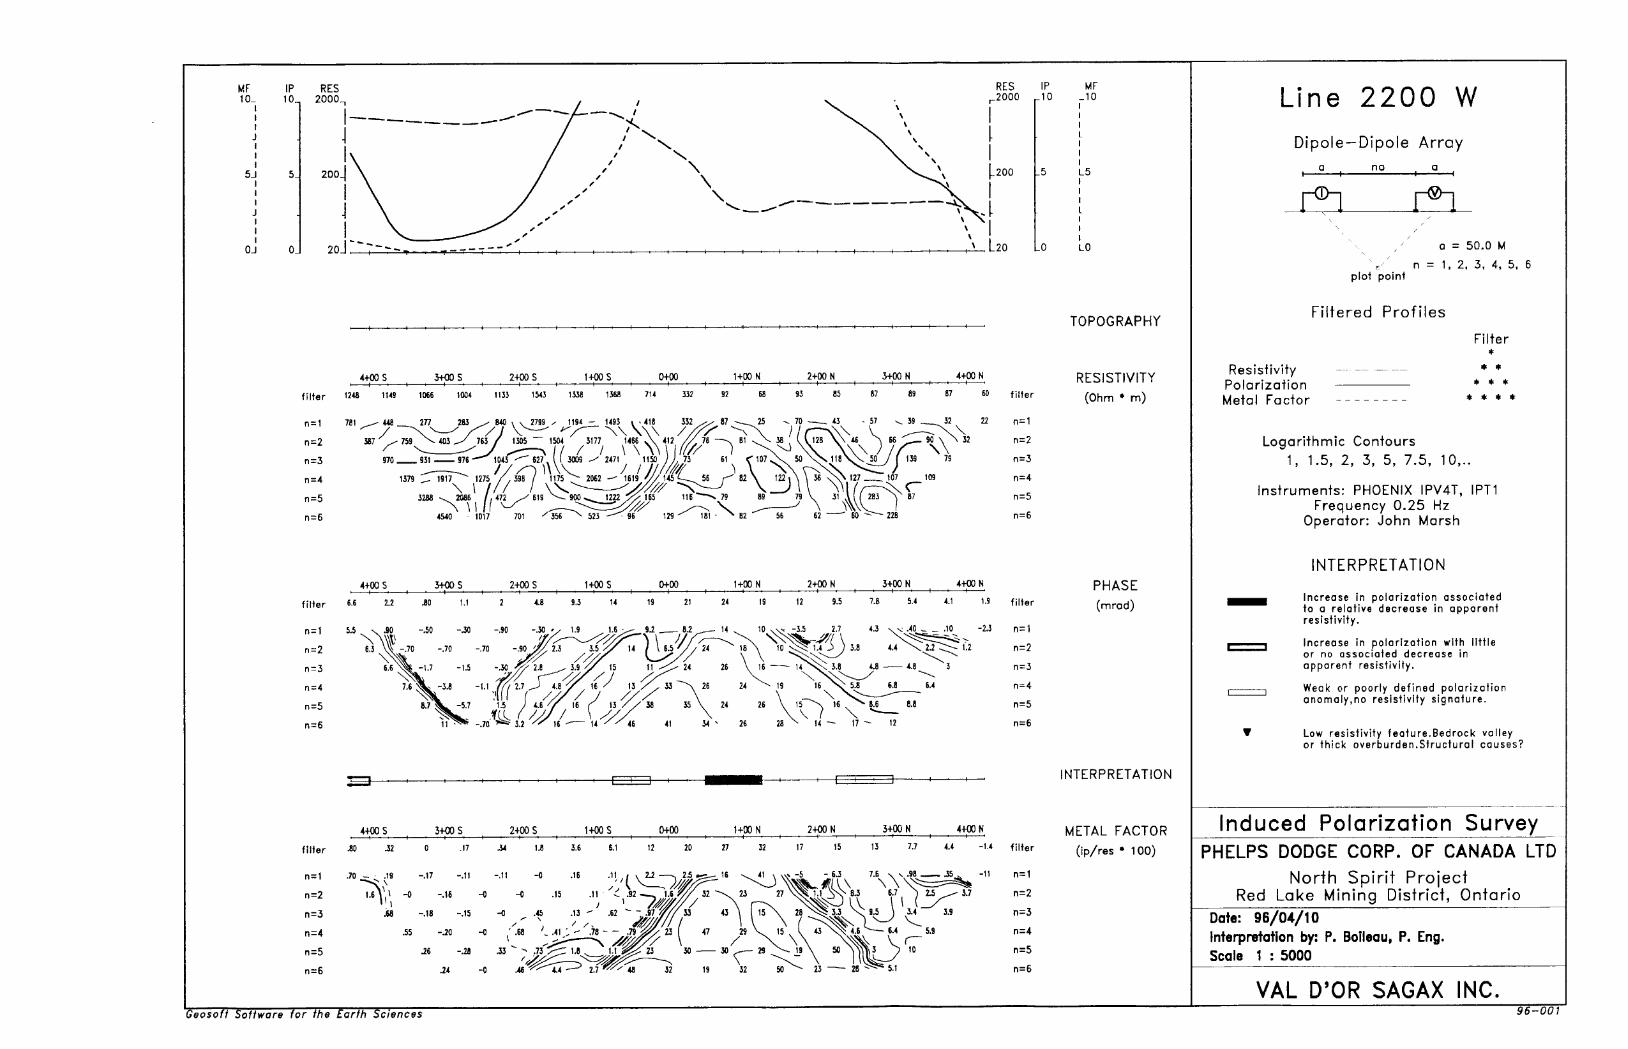
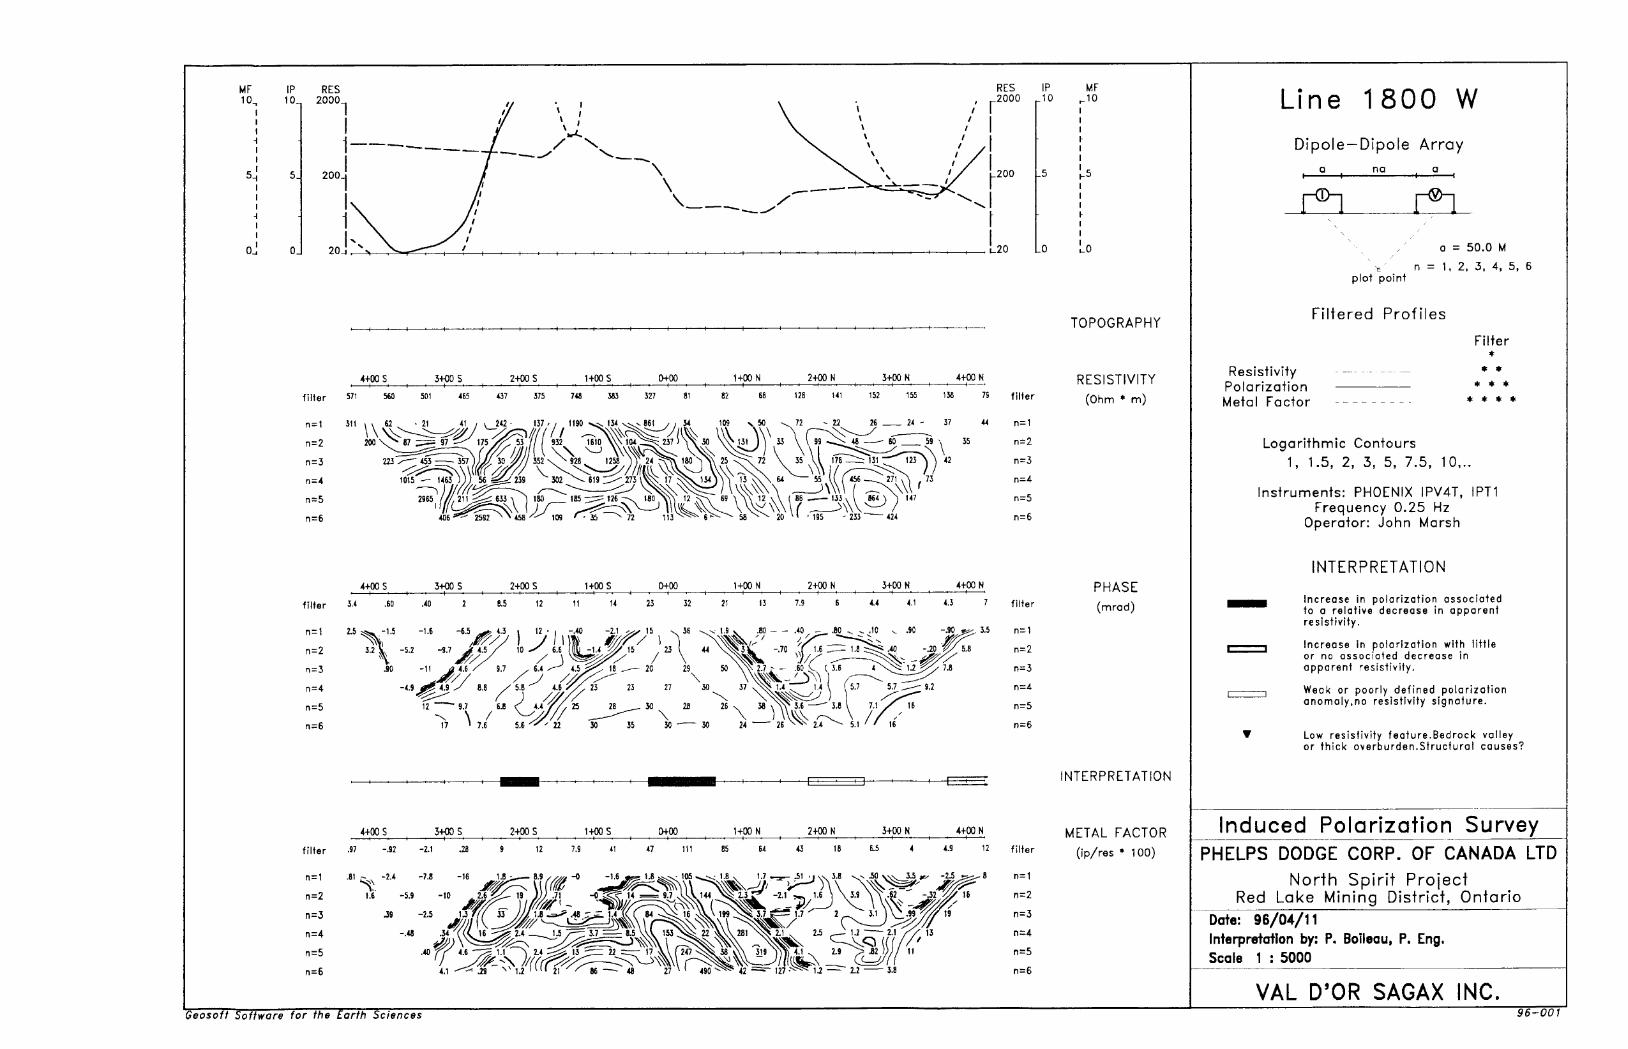
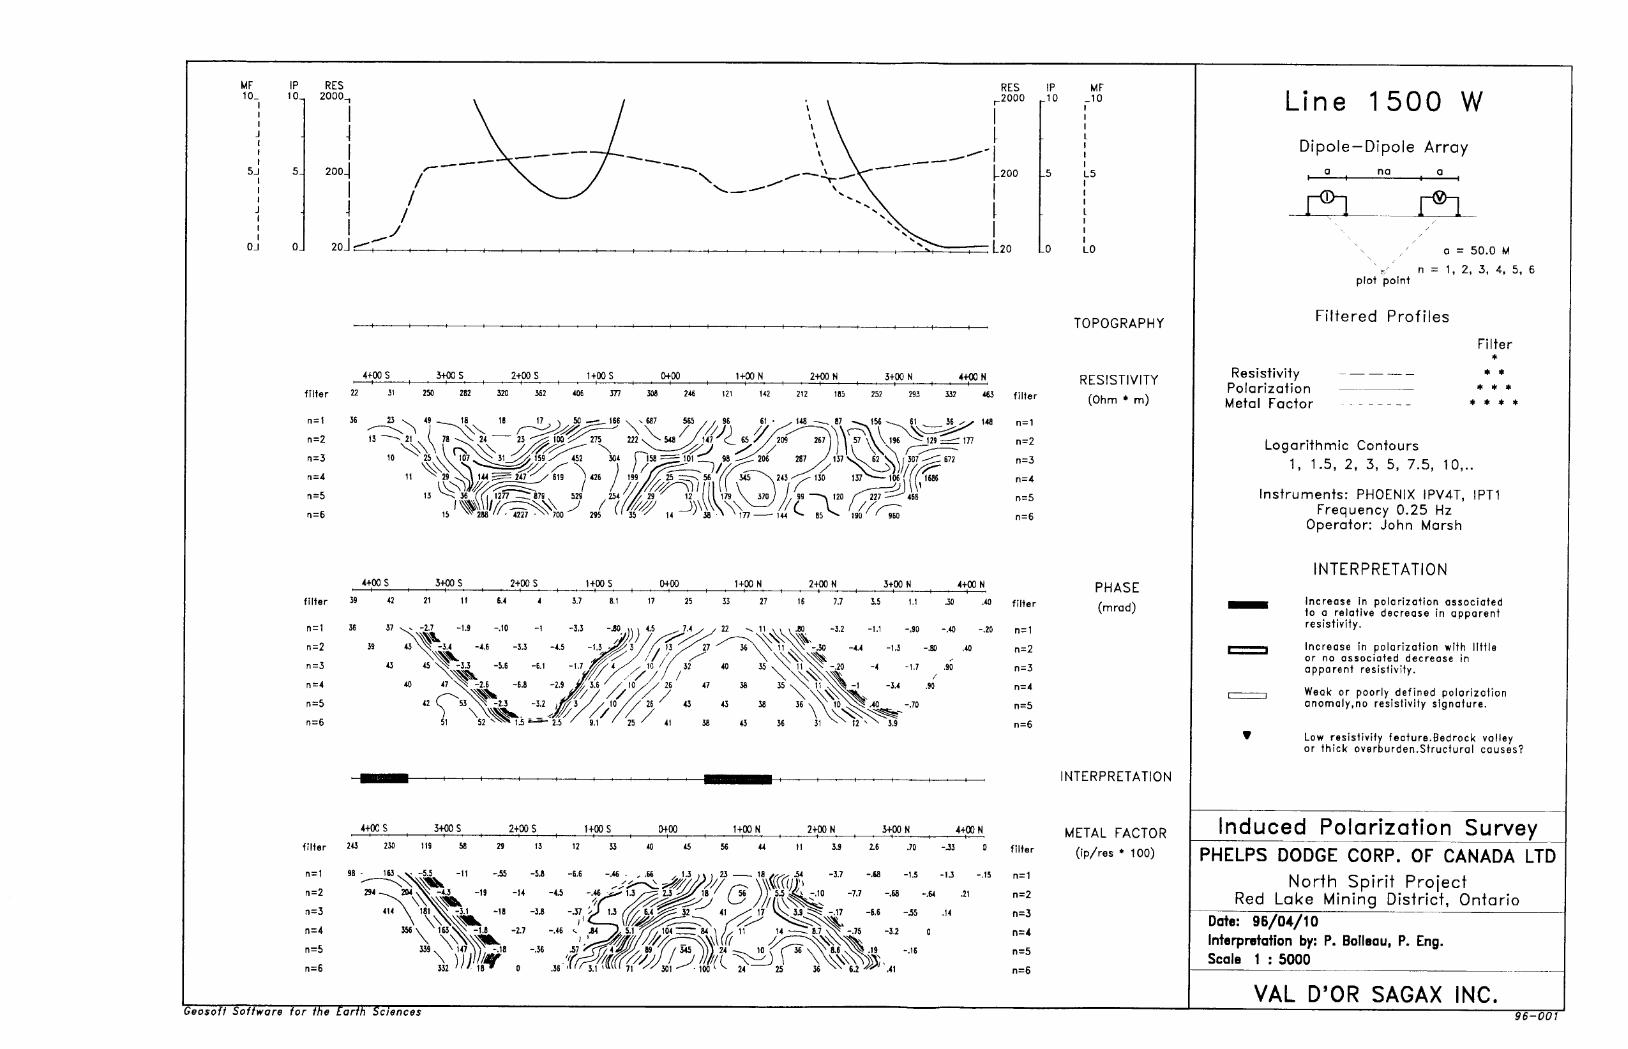
The IP/Resistivity surveys \vere conducted with an IPV--4T Turbo phase- domain receiver manufactured by Phoenix and with an IPT-1 transmitter using a l kW MG-1 motor generator. The dipole-dipole array was used with a 50m electrode separation (a). Primary voltages and phase values were measured every 50m for dipole separations (n) of l to 6 with a precision of 0. l mV and 0. l milliradian (mrad) respectively at an operating frequency of 0.25 Hz.
6.2 Discussion of Results
The quality of the magnetometer survey is generally good. However, there are some areas where unusual readings were encountered which do not fit into the normal scheme of things. Also, some "noisy" readings are evident. Both of these may be attributed to strong magnetic forces at or close to surface, i.e., magnetic iron formation. Fortunately, they were not severe enough to disturb the true significance of the magnetic images. The IP/resistivity data is also of good quality. Despite the fact all readings were taken over the ice on North Spirit Lake, very little discrepancies occur in the data. IP/resistivity readings could not be taken over the large island in the northeast corner of the grid because of high resistance over the land. This has affected an area of 125 meters or so, on nine lines south of the island.

The magnetic data has been presented as posted values on three independent sheets to cover the survey area as well as in contoured form both at scales of 1:2500. Contour interval for the magnetics is 25 nanoteslas (nT). The IP/resistivity information has also been presented in contour form on three sheets as well as in pseudosection for each individual line. The n^ readings of the apparent resistivity, apparent phase, and the normalized apparent phase are shown as color coded contours on maps at a scale of 1:2500. Contour interval varies according to parameter. The pseudosection s show resjsitivity in ohm- meters, phase in milliradians, and the normalized phase (metal factor) in ratio percentages plotted at a scale of 1:5000.
An interpretation has been made of the magnetic and IP/resistivity data and the results presented on three sheets comprising the INTERPRETATION
MAP at a scale of l :2500 which forms an integral part of this report. A discussion of the geophysical results follows.
The magnetics show a wide variation in intensities over the grid. Values over 100,000 nT are noted over the known oxide iron formations occurring in the south central and extreme western areas of the grid. This identifies an area of high concentrations of magnetite which relates to a complex mixture of ultramafic rocks and oxide iron formation. It is outlined on the accompanying INTERPRETATION MAP as a MAGNETIC ZONE and designated as an area of very strong magnetic activity. Other strong anomalies occur as narrow lineaments striking across the area generally perpendicular to the grid lines at an azimuth of 60 0 . These are scattered throughout the property and have values ranging from 300 to 4000 nT.
Broad magnetic anomalies appear in the eastern section of the grid which indicate a change in the geological composition for this part of the property. Several other broad magnetic horizons occur on the west side of the grid. These tend to be deep and may form the eastern extension of the small magnetite body identified by geological mapping and confirmed by the strong magnetic responses on the two most westerly lines of the grid.
The apparent resistivities measured on the property are quite variable with values ranging, often rapidly, from less than 100 ohm meters in deep water to the west, to more than 3000 ohm-meters in shallow water near the islands where the bedrock comes close to surface.
A conglomeration of IP and resistivity anomalies have been encountered on the North Spirit Grid which suggests the presence of considerable metallic

mineralization in the area. More than 20 "PHASE ANOMALY SYSTEMS" have been picked out of the maze of IP/resistivity responses obtained from the survey. SIXTEEN have been labeled A to P respectively. Some of these contain multiple zones.
The polarization effects collected during the survey present a weak background of less than 3 mrad inside which several strong anomalous responses were detected. The best responses were outlined in the central part of the survey between Lines 2200W and 900W near stations BL O and 400S where they constitute mainly two east-northeast, west-southwest trending anomalous zones. The anomalies are characterized by strong phase effects of 30 to more than 60 mrad generally associated with very strong resistivity decreases which represent massive to semi-massive, conductive mineralization. The survey also detected to the east and to the west several other anomalous responses which could constitute the extension of the two principal anomalous zones and particularly of the central one (BL 0).
Ten of the 16 IP anomaly systems identified, B, C, D, E, G, H, J, K, L and O, are associated with lithologies making up the general stratigraphic successions present on the grid. There is very little, or no ground control to support these observations. Of these ten, five IP anomalies, E, G, H, K & L, are associated with strong, extensive, linear magnetic anomalies. Consequently, they are considered to represent magnetite and/or magnetic pyrites within the stratigraphy. They dominate the geophysical characteristics of the area. In contrast, Anomaly B is weak and apparently short, but projects off to the west end of the grid. Anomaly D also displays a short strike length of less than 200 meters and is associated with a moderately strong magnetic anomaly of 300 nT. Two IP anomalies, C and O, coincide with resistivity highs. Anomaly O, on Lines 4W and 5W occurs on the south flank of a weak magnetic high which may be related to it. The resistivity high here may be the result of shallow water. Anomaly C is not fully defined but does show a strike length of over l kilometer. It may have some relation to the northeast striking group of IP anomalies that are postulated to be associated with potential gold deposits as discussed below.
Six of the 20 IP anomalies shown on the Interpretation Map appear to be related to structural features such as faults, and geological contacts oriented in an east-west direction. Only one of these, Anomaly P, has been labeled. It appears on the south end of Lines 2E, 4E, and 6E and is closely associated with the northern contact of a broad magnetic high possibly related to a mafic intrusion.

Four chargeability anomalies, A, I, M, and the set of anomalies labeled N, are considered to be the most important of the whole group because of their northeast-southwest attitude. It is postulated that these are fault controlled and that this structural orientation is the most favorable for the deposition of gold mineralization. The strong anomaly "G" with its associated magnetic responses may in part be related to this important group.
Anomaly A on the west side of the grid is over a kilometer long projecting off the grid to the west. The anomaly appears in fwo sections. On the first three lines, 40W, 39W, and 38W, the polarization responses are coincident with a strong magnetic feature both of which are close to surface. There seems to be a strong northwest fault displacing the anomalies between Lines 39W and 38W. East of Line 37W the phase anomalies and the magnetics separate and take on different characteristics. The magnetics continue on an east-northeasterly bearing, becomes deeper than the IP anomaly and eventually dies out after Line 35W suggesting a plunge to the formation towards the east. It may re-appear again in the form of the magnetic anomaly on Lines 29W to 24W. IP Anomaly A strikes off in a different direction trending more northeasterly. It becomes deeper,-in the 50 to 70 meter rangev which is much shallower than the magnetic anomaly. This part of the IP anomaly may be the most attractive for further exploration.
Anomaly I extending from 19 W to 14 W and striking in a northeast direction is situated among the strongly magnetic, highly conducting formational anomalies associated with stratigraphy. It has a strike length of approximately 600 meters and strong polarization coincident with a resistivity low. These features suggest disseminated sulphide concentrations in a fault zone.
Anomaly M, 750 meters to grid east, is very similar having roughly the same orientation but with lower phase readings along a fault zone. It is over 700 meters in length.
The last anomalies in the group involve IP Anomalies N and N-1. These have slightly different orientations than the others trending more northerly at 25 0 degrees and projecting off the survey area to the south. Anomaly N has moderate phase responses with corresponding resistivity highs which suggests silicification. Anomaly N-l is associated with a resistivity low. Cutting across the strike of these IP anomalies in an east-west direction is a combined resistivity low and chargeability low. The exact size of this anomaly is unknown since it trends off the area of IP coverage. The characteristics of this feature imply the source to be clay alteration products.

The part of Anomaly G that would be involved with these special anomalies is the section which shows the same strike direction following from Anomaly M. This observation is speculative at this point.
A different style of anomaly is displayed by conductor F which is identified by broad responses on two Lines, 22W and 20W, where the source appears to run parallel to the lines. The cause of this is unclear but it may havesomething to do with a mineralized intrusive felsic plug.
i
Another unlabelled anomaly on Lines 28W and 26W, appears to be the result of an underwater topographic high, i.e., a shoal.
7. CONCLUSIONS
The magnetometer and IP/resistivity survey performed on the North Spirit Lake claims detected numerous anomalous conditions which suggests the area should be explored further through a comprehensive drill program. The strongest magnetic expressions emanate from oxide iron formations (magnetite) the largest of which is located in the south central portion of th&grid. This is labeled "High Magnetic Area" on the Interpretation Map. Strong magnetic responses are evident on Lines 20W to 15 W with intensities decreasing towards the east where they connect with the ultramafic rocks and exposed iron formation on the small island located in the vicinity. The effect of the magnetic body spreads further to the east where it may be present at some depth below surface. The other intense magnetic anomalies are associated with the oxide iron formation on the west end of the grid. The magnetic expressions east of Line IE imply a different geological setting on this portion of the property.
Four variations in the anomaly patterns have been recognized. Type l includes 10 Anomaly Systems, B, C, D, E, G, H, J, K, L, and O, which appear to be related to stratigraphy. They dominate the entire grid from west to east. Most prominent within this group are Anomalies E, G, H, K and L which show very strong phase responses coincident with high magnetic values. These are reflecting magnetite and/or magnetic pyrites (pyrrhotite) mineralization which are considered to be defining lithologies making up the major rock types in this part of the belt. The sequences are broken up considerably by a predominant structural zone that cuts across the region in an easterly direction. Those parts of Anomaly C which coincide with resistivity highs, and, the central section of Anomaly G, may be favorable areas to search for gold mineralization.
The second type of anomaly styles are those which correlate with fault structures. These are exemplified by weak phase responses coupled with resistivity lows of which Anomaly P is a good illustration. Although there are a number of these shown on the Interpretation Map, they have not been labeled.
8.
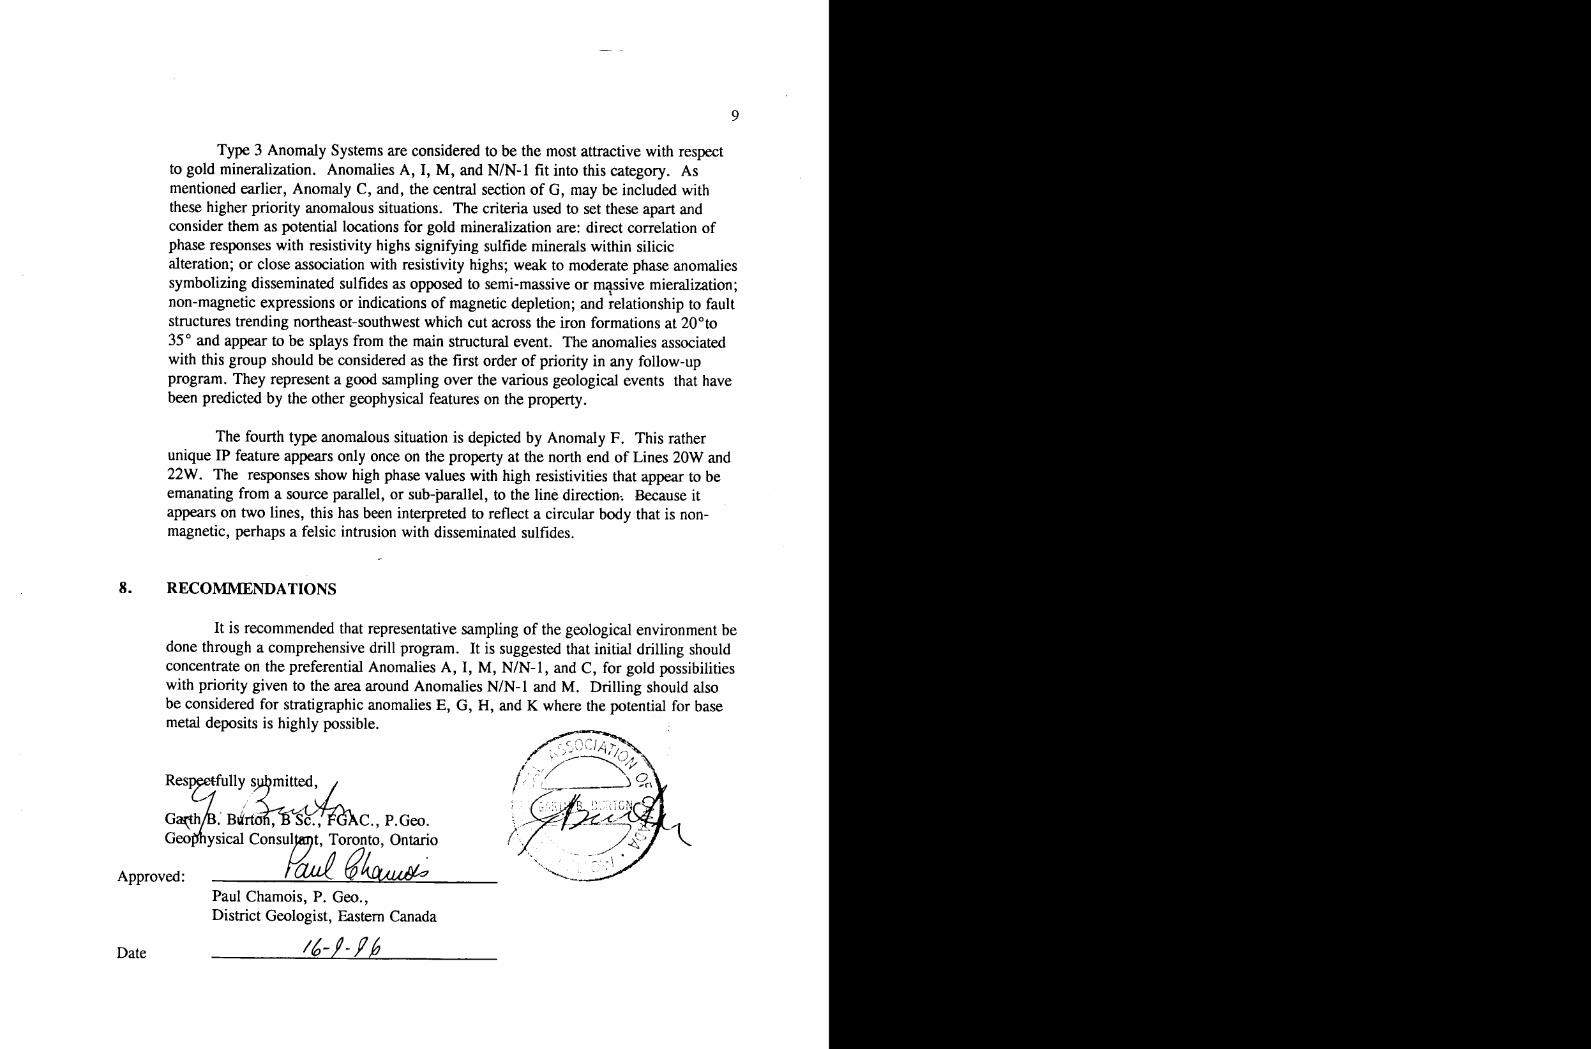
Type 3 Anomaly Systems are considered to be the most attractive with respect to gold mineralization. Anomalies A, I, M, and N/N-1 fit into this category. As mentioned earlier, Anomaly C, and, the central section of G, may be included with these higher priority anomalous situations. The criteria used to set these apart and consider them as potential locations for gold mineralization are: direct correlation of phase responses with resistivity highs signifying sulfide minerals within silicic alteration; or close association with resistivity highs; weak to moderate phase anomalies symbolizing disseminated sulfides as opposed to semi-massive or massive mieralization; non-magnetic expressions or indications of magnetic depletion; and relationship to fault structures trending northeast-southwest which cut across the iron formations at 20 0 to 35 0 and appear to be splays from the main structural event. The anomalies associated with this group should be considered as the first order of priority in any follow-up program. They represent a good sampling over the various geological events that have been predicted by the other geophysical features on the property.
The fourth type anomalous situation is depicted by Anomaly F. This rather unique IP feature appears only once on the property at the north end of Lines 20W and 22W. The responses show high phase values with high resistivities that appear to be emanating from a source parallel, or sub-parallel, to the line direction-. Because it appears on two lines, this has been interpreted to reflect a circular body that is non magnetic, perhaps a felsic intrusion with disseminated sulfides.
RECOMMENDATIONS
It is recommended that representative sampling of the geological environment be done through a comprehensive drill program. It is suggested that initial drilling should concentrate on the preferential Anomalies A, I, M, N/N-1, and C, for gold possibilities with priority given to the area around Anomalies N/N-1 and M. Drilling should also be considered for stratigraphic anomalies E, G, H, and K where the potential for base metal deposits is highly possible.
Respectfully submitted,
Ga^th/B. BtrfdnVTOc., P.Geo. Geophysical Consultant, Toronto, Ontario
Approved:
Date
Paul Chamois, P. Geo.,District Geologist, Eastern Canada
f (rf-t b

10
9. REFERENCES
Bateman, J.D., 1938. Geology of the North Spirit, Area. In Forty-Seventh AnnualReport of the Ontario Department of Mines being Vol. XLVII, Part VII, 1938.
Assessment File Index Reports. Earth Resources Si Land Information Systems (ERLIS). Ontario Ministry of Northern Development Si Mines.
Mineral Deposit Inventory (MDI) Reports. Ontario Ministry of Northern Development & Mines.
Aeromagnetic Data Set. Ontario Ministry of northern Development Se Mines.
Wood, John, 1977. Geology of North Spirit Lake Area, Geoscience Report 150. Ontario Division of Mines, Ministry of Natural Resources.
Burton, G.B., 1994. Report on Interpretation of Aeromagnetic Survey Data in the North Spirit Lake Area, Kenora District, Ontratio for Phelps Dodge Corporation of Canada, Limited. Internal Report. . . ,
Distribution
PDC Project File - Toronto - (2) Government of Ontario - (2)

11
10. APPENDIX
Table I- List of Personnel

12
TABLE I
List of Personnel
Name Address
Vytyl Exploration Services Thunder Bay, ON
Val d'Or-Sagax
R.T. Marcroft
H. Cook
G.B. Burton, P.Geo.,
F.L. Jagodits, P.Eng.,
Val d'Or, QU.
R.T. Marcroft and Associates, Mississauga, ON
Phelps Dodge Corporation of Canada, Limited, Toronto, ON
Geophysical Consultant Toronto, ON
Savaria Geophysics Inc., Toronto, ON
Activity
Grid preparation and ground magnetic survey.
i
IP/resistivity survey
Drafting
Word Processing
Interpretation and reporting
Geophysical consulting
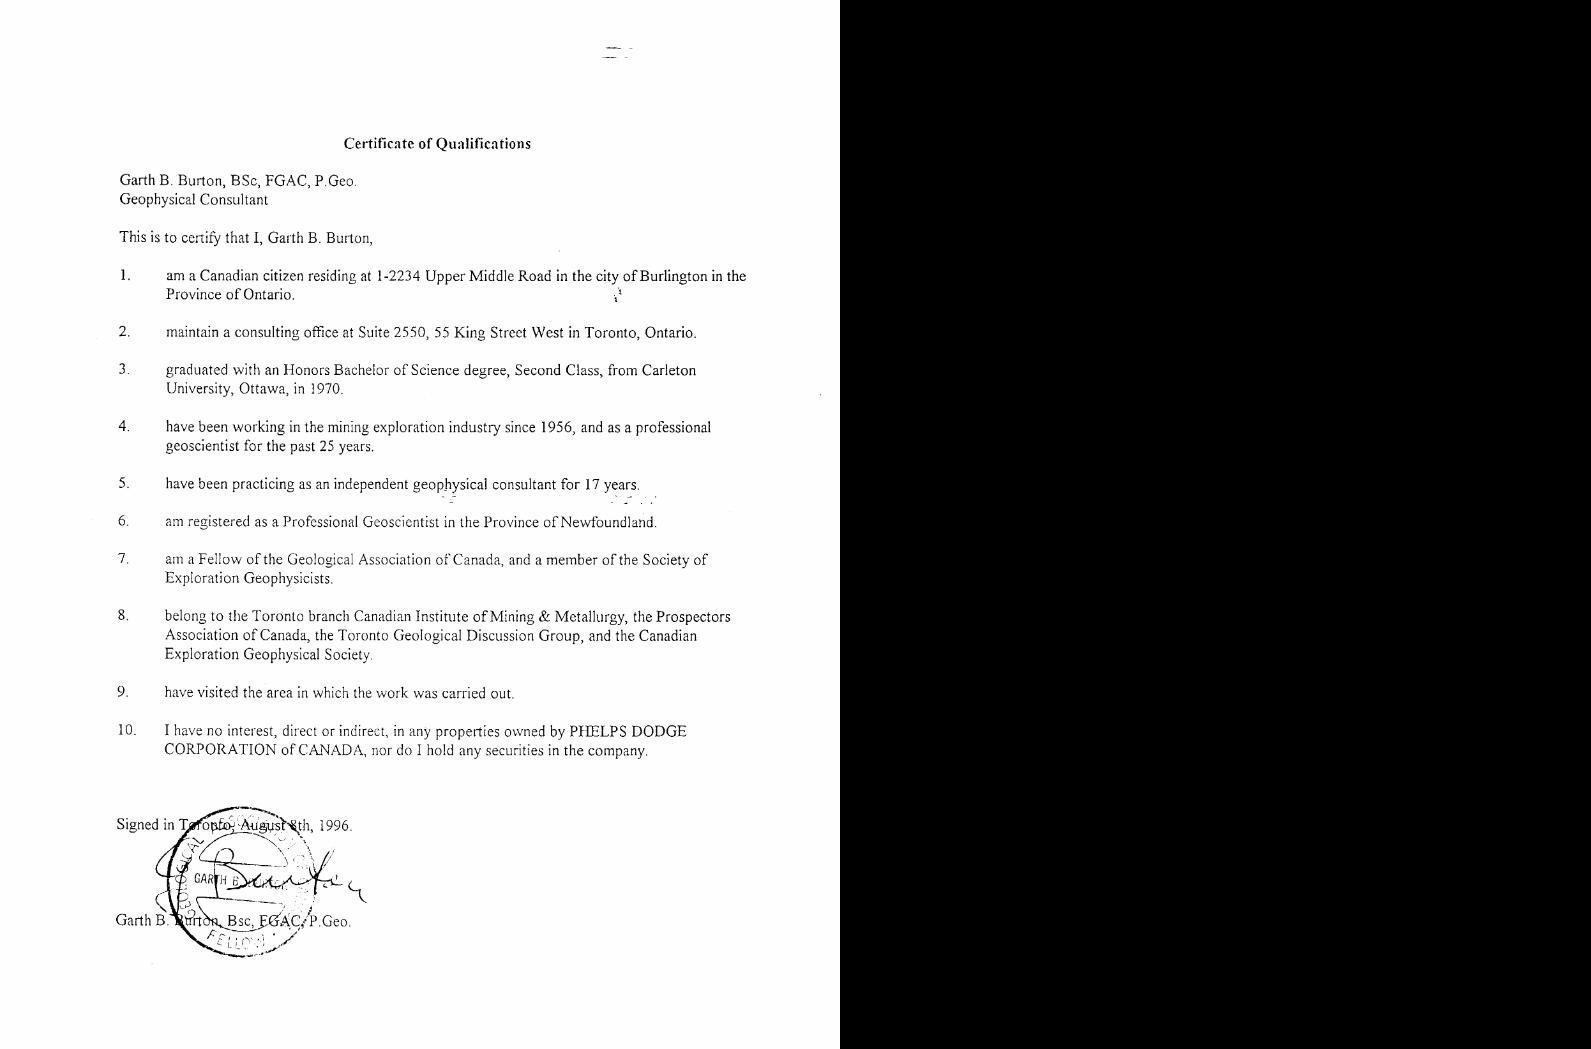
Certificate of Qualifications
Garth B. Burton, BSc, FGAC, P.Geo. Geophysical Consultant
This is to certify that I, Garth B. Burton,
1. am a Canadian citizen residing at 1-2234 Upper Middle Road in the city of Burlington in the Province of Ontario. i 5
2. maintain a consulting office at Suite 2550, 55 King Street West in Toronto, Ontario.
3. graduated with an Honors Bachelor of Science degree, Second Class, from Carleton University, Ottawa, in 1970.
4. have been working in the mining exploration industry since 1956, and as a professional geoscientist for the past 25 years.
5. have been practicing as an independent geophysical consultant for 17 years.
6. am registered as a Professional Geoscientist in the Province of Newfoundland.
7. am a Fellow of the Geological Association of Canada, and a member of the Society of Exploration Geophysicists.
8. belong to the Toronto branch Canadian Institute of Mining fc Metallurgy, the Prospectors Association of Canada, the Toronto Geological Discussion Group, and the Canadian Exploration Geophysical Society.
9. have visited the area in which the work was carried out.
10. I have no interest, direct or indirect, in any properties owned by PHELPS DODGE CORPORATION of CANADA, nor do I hold any securities in the company.
Signed Au'gus^th, 1996.
Garth B

MF 10.
IP 10.
5j 5,
OJ OJ
RES 2000
RES 2000
IP .10
MF
1+00 S 0+00 1+00 N 2+00 N 3+00 N 4+00 N 5+OONfilter 31 39 76 101 96 93 21 B4 91 89 91
n = ]
1^=2
r^3
n=4
11=5
11=6
1+00 S 0+00 1+00 N 2+00 N 3+00 N 4+00 N 5+OON
filter -70 1.7 2.6 2.8 2.7 3.1 2.8 2.2 .50 .30 .50 .60 .70 .40 filter
n = ^ - .70 -^- 1.9 ~ 2.5 v.:-M -1.1
1=2 2.2
11=5
11 = 6
4 x 1.6 ^ -2 -.60 O O - JO .20
_ 1.9 2.5 \ 1.5\x -2.7 -.30 .10 s ^ .9tT "~ - .60
-.50 -.70 ~\\\ ^t^-~ 5.3 \\ .70^S^1.5 1.8 1.?"^ -1.7
7.3 5.5 \^ 4C - ^ 1,2 1.5 C~^2-3
2,4 ' s 5 .6 6.8 5.7 \\\ .30 \ \ 1 .6 2 C 3 .3 ^ -.40 .20
. .'illl f
-.30 . 461 I^ l6.4
\\^-;(it o V-^ en \8.3 N 5.9 x^ .60 " N ' 2.5 4.6 -18* -.90
n=2
r^3
11=4
n=5
n=6
L5
-O LO
1+00 S 0+00
^ '" ^^ ^ 4fr^2^^^W*-19 -3.6 j)) U,-^ U ^ 19 f C 51 32 \W
^SAV.J ^
5+00 N
1.5 1.4 filter
TOPOGRAPHY
RESISTIVITY
(Ohm * m)
PHASE
(mrad)
INTERPRETATION
METAL FACTOR
(ip/res * 100)
Line 4000 W
Dipole-Dipole Array
[ L
plot point
Filtered Profiles
a = 50.0 M
n = 1, 2, 3, 4, 5, 6
Resistivity Polarization Metal Factor
Filter*
* * * * *
* * *
Logarithmic Contours1, 1.5, 2, 3, 5, 7.5, 10,..
Instruments: PHOENIX IPV4T, IPT1Frequency 1.0 Hz
Operator: John Marsh
INTERPRETATION
Increase in polarization associated to a relative decrease in apparent resistivity.
Increase in polarization with little or no associated decrease in apparent resistivity.
Weak or poorly defined polarization anomaly.no resistivity signature.
Low resistivity feature.Bedrock valley or thick overburden.Structural causes?
Induced Polarization SurveyPHELPS DODGE CORP. OF CANADA LTD
North Spirit Project Red Lake Mining District, Ontario
Date: 96/04/11Interpretation by: P. Boileau, P. Eng.Scale 1 : 5000
VAL D'OR SAGAX INC.Geosoff Software for the Earfh Sciences 96-001

MF IP 10.
5J 5.
OJ OJ
RES 2000^
200
IP .10
MF .10
.5 L5
1+00 S 0+00 1+00 N 2+00 N 3+00 N 4+00 N 5+OON
filter tO H 14 17 19 23 22 19 16 16 16 23 23 fj||e r
12 ^_- 19 18 26 35 36 30 -^ 21 22 22 27 29 -—— 25 n =
35 47 45 51
S' ' 18 19 *\ 6 ' ''
1+00 S 0+00 1+00 N 2+00 N 3+00 N 4+00 N 5+OON
filter '-B 2.2 2.6 3.5
n=3
11=4
r^5
n=6
filter5.5 4.1 3.1 2.7 15 2 .3 1.7 1.2
.30 -.40 -.40 1.5 s 3.2 ^ x. .60 .W .20 -.10 11=1
5.7 6.2 5.7 5.5 ^ \ 2.1 ^ 2 .7
6.3 X' 8.2 \ 6.2 6.9 6.6 6.4 ^x 3.9
7.4 - 7. 6.5 4.1 3,7 2.8
Lo LO
i+oo s o+oo 1+00 N 2+00 N 3+00 N 4+00 N 5+OON
filter 37 35 60 62 48 38 30 26 24 20 15 7.8 f;|{ e r
n^1 2.3 R. -3.1 -1.9 -4.6 m, 5.8 ^ 9.1 i i , 1.6 o- -O ^- .28 ,i i/ 2.9 4.5 f , 1 .4 v. -75 N -.48 n^1
' 9.7
' S^ -
27 /'S 94 N 72 ^ 107 96
94 ' 104 83 \116 105
99 ' to — 37^^ 117 ' ^*38 - 61
J
28 46 41 25
32 -^ 30 45 36
33 31
n=2
n=3
n=4
n^5
n=6
TOPOGRAPHY
RESISTIVITY
(Ohm * m)
PHASE
(mrad)
INTERPRETATION
METAL FACTOR
(ip/res * 100)
Line 3800 W
Dipole Dipole Array
a no a
plot point
Filtered Profiles
a = 50.0 M
0=1.2, 3, 4, 5, 6
Resistivity Polarization Metal Factor
Filter*
* 4* * *
* * * *
Logarithmic Contours
1, 1.5, 2 , 3 , 5, 7.5, 10,..
Instruments: PHOENIX IPV4T, IPT1Frequency 1.0 Hz
Operator: John Marsh
INTERPRETATION
Increase in polarization associated to a rejative decrease in apparent resistivity.
Increase in polarization with little or no associa-ted decrease in apparent resistivity.
Weak or poorly defined polarization anomaly,no resistivity signature.
Low resistivity feature.Bedrock valley or thick overburden.Structural causes?
Induced Polarization SurveyPHELPS DODGE CORP. OF CANADA LTD
North Spirit Project Red Lake Mining District, Ontario
Date: 96/04/11Interpretation by: P. Bolleau, P. Eng.Scale 1 : 50DO—————-—^———-
VAL D'OR SAGAX INC.Geosoft Software for the Earth Sciences 96-001
MF IP 10.
5J 5.
OJ 0.
RES 2000
200
IP 10
MF
.5
1+00 S 0+00 1+00 N 2+00 N 3+CON 4+00 NH————i————h-
5+00 Nfilter 27 25 22 21 21 IB 16 17 16
11=1 23 24 —— 28 30 35-26 —— 27 ——. 20 (9 — 17 —— 17 - 20 21 30
46 43 49 39____38 40 34 —J 28
n = 6
1+00 S
15 13
0+00
13 13 IS 20 26 filter
n=2
r^3
n=4
n^5
n=6
1+00 N 2+00 N 3+00 N 4+00 N 5+00 N7-1 8.9 8.5 7.4 E.3 4.6 4.2 3.2 2.6 2.2 1.5 fj|fer
11 = 1 -.50 -JO 3.3 -- 1.9 -jjO — 1.3 N -.10 .50 - 1 .7 -. .70
.10 -^ 2.2 ' s 6 .1 6.3 2.9 2.1 C-~- 1.2 -^ 2.2 2.3 ~-^ 1.6 -—— 1.4
3 X 7.6 9.1 9.2 7.3 \ J.3
8.7 ^-- 11 12 12 X 7.E 5.3 6.1 \ 3.8 3.5 3.8
12 13 14 12 ^ 9.1 8.1 "- 7.1 4.9
13 15 14 13 II v 8.6 v 7.1 5.9
L5
LO LO
1+00 S 0+00 1+00 N 2+00 N 3+00 N 4+00 N 5+00 Nfilter 25 55 79 100 104 96 76 58 51 56 49 34 23 13 fj|fer
n^1 -2.2 -2 g,, 3 .4
0=3
n=4
n^5
0=6
123 160 X 237 253
83 115 121 Q^*^?—^ \ /—~-
119^ 89 72 / B
70 ' 31 23
n=3
0=4
n=5
^=6
TOPOGRAPHY
RESISTIVITY (Ohm * m)
PHASE (mrod)
INTERPRETATION
METAL FACTOR (ip/res * 100)
Line 3600 WDipole—Dipole Array
a na a
plot point
Filtered Profiles
a - 50.0 M
n ^ 1, 2. 3, 4, 5, 6
Resistivity Polarization Metal Factor
Filter*
* *
Logarithmic Contours1, 1.5, 2 , 3 , 5, 7.5, 10,..
Instruments: PHOENIX IPV4T, IPT1Frequency 1.0 Hz
Operator: John Marsh
INTERPRETATION
Increase in polarization associated to a relative decrease in apparent resistivity.
Increase In polarization with little or no associated decrease in apparent resistivity.
Weak or poorly defined polarization anomaly,no resistivity signature.
Low resistivity feature.Bedrock valley or thick overburden.Structural causes?
Induced Polarization SurveyPHELPS DODGE CORP. OF CANADA LTD
North Spirit Project Red Lake Mining District, Ontario
Date: 96/04/11Interpretation by: P. Boileau, P. Eng.Scale 1 : 5000
VAL D'OR SAGAX INC.Geosoff Sof/vfcre for the Larfh Sc/ences 96-001

MF 10- 10-,
OJ
RES 2000
RES 2000
200 200
L20
IP 10
MF -10
Lo
2+00 S 1400 S 0+00 1+00 N 2+00 N 3+00 N 4+00 N 5+00 N
13 15 18 filterfilter 111 221 216 220 194 155 111 50 21
ie~u16* i 7
2+00 S 1+OOS 0+00 1+00 N 2+00 3+00 N 4+00 N 5+00 Nfilter 1-7 1-4 1.3 2.5 3.4 6.7 6.8 3.6 2.5 1.8 U .90 .60 fj|ter
.50 .20 s s . 1 , 2.9 - 2.2 ^\- -.10
U v 5.1 ' ' 12 11 N 9.9 II
O -.10 .20 .20 -.10 O n^1
.70 ; - .50 ^ .20 x .60" ^ -~ .40^ .40 ^ = 2
7.3 -—— 7.7 . 5.2 ~\ l7^\ .80 - " .60 ^- 1.1 ~i/ .70 p^3^\ \ \^o——~7.9 9 8.7 \ 6.1 \ x 2.1 -~— 1.5 ——- 1.4 1.4
--—————, 6.8 \ 2.8 2J \' 1.2 0=5
9.1 7.5 ^ 4.2 J.5 n=6
2+00 S 1+OOS 0+00 1+00 N 2+OON 5+00 N 4+00 N
\-' V\ /^- " 'T .72 - - .67 -- ^ 1.1 ' ' J9 x ^ .66 X U
TOPOGRAPHY
RESISTIVITY(Ohm * m)
PHASE
(mrad)
INTERPRETATION
METAL FACTOR
(ip/res * 100)
Ur\e 3 400 WDipole —Dipole Array
. a . na . a .
plot point
Filtered Profiles
a = 50.0 M
n = 1, 2, 3, 4, 5. 6
Resistivity Polarization Metal Factor
Filter*
* ** * *
* * * *
Logarithmic Contours1, 1.5, 2, 3, 5, 7.5, 10...
Instruments: PHOENIX IPV4T, IPT1Frequency 1.0 Hz
Operator: John Marsh
INTERPRETATION
Increase in polarization associated to a relative decrease in apparent resistivity.
Increase in polarization with little c r no associated decrease in apparent resistivity.
Weak or poorly defined polarization anomaly,no resistivity signature.
Low resistivity feature.Bedrock valley or thick overburden.Structural causes?
Induced Polarization SurveyPHELPS DODGE CORP. OF CANADA LTD
North Spirit Project Red Lake Mining District, Ontario
Date: 96/04/11Interpretation by: P. Boileau, P. Eng.Scale 1 : 5000
VAL D'OR SAGAX INC.Geosoft Software for fhe Earth Sciences 96-001

MF 10.
IP 10.
5.
OJ
RES 2000
200
IP MF .10 .10
Lo
filter
0 = 6
filter
n=2
0=5 0=6
2+00 S 1+00 S 0+00 1+00 N 2+00 N 5+00 N 4+00 N
2+00 S 1+OOS 0+00 1+00 N 2+00 N 3+00 N 4+00 Nfilter 5 3.2 2.J 2.5 1.E 1 .70 1.4 2.2 2.5 2.3 1.8 1.2 .70 filter
0=1 4.7 i i .90 —— .m, i 4.3 3.2 x 1.3 -v. -.30 - .50 ^ . .50 ~ , JO .10 -.10 -.20
3.5 / 2.5 5 1.7 V\ -.20 j , 1 .1
6.6 , U .60 -2.8 -2.1 -M ^\ 3.8
-.10 -3.3 -2.6 -2.5 ^x 4.7 5.6 6.6 4.6
0=2
0=3
0=4
0=5
0=6
2+00 S 1+OOS 0+00 1+00 N 2+00 N 3+00 N 4+00 N
15 filter
•^"/^^-"jm/ii ) \ ^.A .57 .-C u.99 ^ uffY, 49 \ 94 y 47 B
|/^ \-17 -21 J11 " 23 - 32
'
.0
TOPOGRAPHY
RESISTIVITY (Ohm * m)
PHASE (mrad)
INTERPRETATION
METAL FACTOR (ip/res * 100)
Line 3200 WDipole—Dipole Array
o no Q
plot point
Filtered Profiles
Resistivity — — — —Polarization ———————Metal Factor --------
a - 50.0 M n = 1. 2, 3, 4, 5, 6
Filter*
* ** * *
* * * *
Logarithmic Contours1, 1.5, 2 , 3 , 5, 7.5, 10,..
instruments: PHOENIX IPV4T, IPT1Frequency 1.0 Hz
Operator: John Marsh
INTERPRETATION
Increase in polarization associated to a relative decrease in apparent resistivity.
Increase in polarization with little or no associated decrease in apparent resistivity.
Weak or poorly defined polarization anomaly,no resistivity signature.
Low resistivity feature.Bedrock valley or thick overburden.Structural causes?
Induced Polarization SurveyPHELPS DODGE CORP. OF CANADA LTD
North Spirit Project Red Lake Mining District, Ontario
Date: 96/04/11Interpretation by: P. Boileau, P. Eng.Scale 1 : 5000
VAL D'OR SAGAX INC.GeosofV Sor/wore for the tarfh Sciences 96-001

MF 10-,
IP 10.
Oj
RES 2000
RES -2000
.200
-20
IP .10
MF .10
Lo
2+00 S 1+OOS 0+00 1+00 N 2+00 N 3+00 N 4+00 N
filter 691 77 65 H filter
29 Xo-S i-— 13 ~X. 8 , II 12 ~-i 9 9V^^^^ON C J r—
* 30 -^ 4 1 ^ 16 l 9^ 11 -*^ 7— 11
2+00 S 1+OOS 0+00 1+00 N 2+OC H 3+00 N 4+00 N
filter 12
0 = 1
0 = 2
n^3
0 = 4
0=5
0=6
-.90 -2.4 -2 -1.4 -1.1 -.40
-2.8 -3 -1.5 -.60 -.60 -.60 Ox f
-6.1 -4 -1.5 -.60 -.90 O r . 80l l
-4.5 -6.4 -4,6 -1.5 -.70 O .40 ,
.40 - ^ O
i T x ^
.50 filter
.30 .10 0=1
JO .30 i l 1y f
1.4 ^v^.60 - .70
1.5 -——2. "X" .90
12 sSJ '-JO -5.7 -47 -.10 ^ ;70-^ .40 . - .70 1/2.7 __ 2.2
-4.6 -4.1 .40 '^^U ~ ~~ .80 " ' 1.9 v 4.1
n=2
n=3
n^4
0=5
n=6
2+00 S 1+OOS 0+00 1+00 N 2+00 N 300 N 4+00 Nfilter 10 4.7 -17 -34 -26 -22 -13 -2.2 8.6 18 21 19 15 11 filter
-9.3 -II -18 -1.6 -M -3.7 .18 *-^ 2.4
-3.9 ~U - 1.9 O
-40 -129 -37 -13
0=6
12 ; \ -1.4 -49 -137 -37 -.91 f~*^±
6.5 V -.71 -20 -50 -.46 '^rlT^xjJJ^; Si "\^ 30 25
4.7 ™ -1.4 -15 -10 ^2.9\l 14^^-7.6^^29 37
TOPOGRAPHY
RESISTIVITY (Ohm * m)
PHASE
(mrad)
INTERPRETATION
METAL FACTOR (ip/res * 100)
Line 3000 WDipole-Dipole Array
i__i
plot point
Filtered Profiles
a = 50.0 M
n = 1. 2, 3, 4, 5, 6
Resistivity Polarization Metal Factor
Filter*
* ** * *
* * * *
Logarithmic Contours1, 1.5, 2, 3, 5, 7.5, 10,..
Instruments: PHOENIX IPV4T, IPT1Frequency 1.0 Hz
Operator: John Marsh
INTERPRETATION
Increase in polarization associated to a relative decrease in apparent resistivity.
Increase in polarization with little or no associated decrease in apparent resistivity.
Weak or poorly defined polarization anomaly.no resistivity signature.
Low resistivity feature.Bedrock valley or thick overburden.Structural causes?
Induced Polarization SurveyPHELPS DODGE CORP. OF CANADA LTD
North Spirit Project Red Lake Mining District, Ontario
Date: 96/04/11Interpretation by: P. Bolleau, P. Eng.Scale 1 : 5000
VAL D'OR SAGAX INC.Geosoft Software for the Earth Sciences 96-001

MF IP RES RES 10., 10 2000., ^2000
J L5. 5- 20oJ UoO
J ^ ___ l
0 0 20 l , , . , , , ^tif-^ l 7fl
2+00 S 1+00 S
filter 43 40 42 50 40 fi|
n-\ 1 3 - 24 —— - 33 - 55 - J4 n:
n=2 47 __ 44 C 6^ __ 77 n:
n ~3 72 \^0i~^'~ n;n-4 9 1 ^^t 6 n:
11=5 79 n:
2+00 S 1+00 S
filter --40 -.40 -.30 .10 .30 fm
n::1 -.50 -.70 -.60 .10 .30 n:
r^2 -.80 -.80 -.20 JO n -
n^3 -JO -.10 .10 n -
[1=4 .50 0 n=
n=5 .50 n=
2+00 S 1+00 Si —— i ———— i —— i —— i —— i —— i —— 'filter -2 -1.4 -.66 .23 .82 f||f
11=1 -3J -2.8 -1.7 70 x ^1 n:
n=2 -1.6 -1.7 -J9 - .42 n=''Sn-J -.71 -.76 ' 1^ n=
[1=4 .51 N 0 n:
nr5 ." n:
IP MF 10 ^10
.
.5 ^
-
.0 uO
TOPOGRAPHY
RESISTIVITY er (Ohm * m)
O
-2
-5
-A
-5
PHASEer (mrad)
:1
-2
-l
--4
--5
INTERPRETATION
METAL FACTOR er (ip/res * 100)
1 2 3 4 5
Line 2800 WDipole-Dipole Array
a na a
r^i r^ia = 50.0 M
' ? n ^ 1, 2, 3, 4 , 5 , 6 plot point
Filtered Profiles
Filter *
Resistivity — — — * *Polarization —————— * * *tufp-fnl Fnrtnr - * * * *
Logarithmic Contours 1, 1.5, 2, 3, 5, 7.5, 10,..
Instruments: PHOENIX IPV4T, IPT1 Frequency 1.0 Hz
Operator: John Marsh
INTERPRETATION
m^^ Increase in polarization associated to a relative decrease in apparent resistivity.
i i Increase in polarization with little or no associated decrease in apparent resistivity.
i , Weak or poorly defined polarization anomaly, no resistivity signature.
V Low resistivity feature. Bedrock valley or thick overburden. Structural causes?
Induced Polarization SurveyPHELPS DODGE CORP. OF CANADA LTD
North Spirit Project Red Lake Mining District, Ontario
Date: 96/04/10 Interpretation by: P. Boileau, P. Eng. Scale 1 : 5000
VAL D'OR SAGAX INC.Ceosoff Software for the tarfh Sciences 96-001

MF IP 10.
5.
Oj
RES 2000.
RES IP MF ^2000 ..10 ^10
.5 U5
.0 LO
1+OOS
filter W 50
11 = 1 0=2
0=3
0=4 0=5
0=6
0+00 1+00 N 2+00 N 3+00 N 4+00 N—i——i——i——t——i——i——i——i——i——i——i——i——i——i——i——i——i——t——.—97 126 120 121 60 109 105 107 109 99
5+00 H
109 86 filter
- w ,U Mi j i u s v^r zt ^ si M ; i i m \ v\ ^^^^//^\\ l /]\\\Vj X^162^160 N^VN^O W J N^V^f"
228 '^41 rv 114 102 \ 38 ' ' 8 6 ^ 105 ' -
1+OOS 0+00 1+00 N 2+00 N 3+OON 4+00 N 5+00 Nl——————l——————t——————l——————l——————l——————,——————l——————,——————l——————l——————l——————l——————j——————,——————l——————,——————l——————l——————l——————l——————l——————l——————l—————,——————j——————!
filter --M -40 .90 1.7 1.7 1.5 1J .60 -1.2 -1.1 -.70 -.60 -.20 -.40 filter
-.90 -.30 -1.4 -JO -JO 0=1
-4.1 -.90 -14 .20 -.10 0=2
4.8 "3J^\.1.4.;'y JO-~.70-~- O -3.8 -1 .40 .10 0=3
-1.3 -^ f.4 ^ 4.8 __ 3.4. Ul "-.M .10 -.40 < ~ .80 -3J JO -.40 0=4
0=5
33 3.5 ' ""O -M - .10 - 1.4 S 3"^ -3.2 0=6
0 = 1 -JO y 2^^-60 ^- "' ~-SO 1 1 1 2-l -—-^-Lj l '-"s
r^2 U ** -1 1?"^St4l^-''.90-x f ?IOV\2.1 \ .90W f—————-^^^X^XN ^ S'; \
-8.7 -1.8 f' ^0=3
0=4
0=5
0=6
3.8 —— 3.6\
2.2 ,/m\3.5 " '"2.2 , -3.5 -2.4 -JO \ C 1.8 C -2.9 -.60^)V^.
V - .40 -.10 - 1.4 S1*-* -3.2
1+OOS 0+00 1+00 N 2+00 N 3+OON 4+00 N 5+OONfilter -5-5 -2-6 -U .48 .81 2.1 J9 -4.3 -3.1 -1J -JO -J8 filter
-1J - 5.1 -^-. 1 .1 - . -3.1 -5.1 j. 2J 1.6 -13 -4.8 -1.1 -4J -J5 -JO 0=1
; K c*- -.19 *C\ 4.7 -14 -1.7 -4.1 J7 -.14
-5J -2.1 33-40 -8.8 t 3J
-3.1 .28 " -K, .22 -5J .26 -JX
6.9 s U ^ 4 .1 2.2 -13 -5.3 -.13 ^. .57 -2.2 -.46
TOPOGRAPHY
RESISTIVITY (Ohm * m)
PHASE (mrad)
INTERPRETATION
METAL FACTOR (ip/res * 100)
Line 4000 WDipole—Dipole Array
na
plot point
Filtered Profiles
a = 50.0 M n r: 1. 2. 3, 4. 5, 6
Resistivity Polarization Metal Factor
Filter*
* ** * *
* * * *
Logarithmic Contours1, 1.5, 2, 3, 5, 7.5, 10,..
Instruments: PHOENIX IPV4T, IPT1Frequency 0.25 Hz
Operator: John Marsh
INTERPRETATION
Increase in polarization associated to a relative decrease in apparent resistivity.
Increase in polarization with little or no associated decrease in apparent resistivity.
Weak or poorly defined polarization anomaly.no resistivity signature.
Low resistivity feature.Bedrock valley or thick overburden.Structural causes?
Induced Polarization SurveyPHELPS DODGE CORP. OF CANADA LTcT
North Spirit Project Red Lake Mining District, Ontario
Date: 96/04/10Interpretation by: P. Bolleau, P. Eng.Scale 1 : 5000
VAL D'OR SAGAX INC.Geosoft Software for the Earth Sciences 96-001

MF 10.,
1
0.
IP 10.
5.
Oj
RES 2000^
200,
RES ..2000
_200
20, -^v i 20
IP .10
MF .10
Lo
1+00 S 0+00 1+OON 2+00 N 3+00 N 4+00 N 5+OONfilter 32 37 45 47 52 58 W 63 62 61 M 54 47 44 f ilter
15 - —— 14 — 16 . —— 19 - 23 ^ 37
4t 47 48 43 S3 "~37 39 37
S3 —" ~ 53 45 52
54 54 69 58 57 63 77 92 ^~ 67 55 57
n=5 11=6
65 ^~ 76 66 61 63 78 S 1 10 108.
86/68 66 65 77 -110 123 10!
110 108. N 67 68
123 106 81
n=5
n=6
1+00 S 0+00 1+OON 2+OONH————'————h-
3+00 N 4+00 N 5+00 N
filter -M -.70 -M -JO -M
0=1 -2.3 -1.1 -1.1 -2.5 -1.9
r^2 -1.3 -2.4 -3.5 -.10
0=3 -1 -3.2
0=4 -2.1 /,i? 1.7 -^ 1
0=5 1".4
.90 -.10 -.10 .50 -.20 .20 -.70 filter
.50 -1.6 -.20 -^//\Ay - .40 \ U'^ -.70
S -4
11=6
'/ \1 — ).4 - —— U O* .90-/ 1.2
2.1^ U
2.2 V\ -M - 1.3 -.50 //f 1 .4 S;, - .40^^ l lL^.'2J V* -J)0 -JO .70,'' -.10 t
"' ~x1.6 c .60 O .30 ~ - .10
.90 -.70 -.60
-.90
. .
1.3 1.5 -^" 2.3 ' l'' -.9
n=2
n=3
0=6
1+00 S 0+00 1+OON 2+OON 5+OON 4+00 N 5+OON
filter -.38 -U
-5.5 -1.1 -5J...V, 7.9 -sx, -1J in-y.^ -2.6 r^1
-3 -li //T 3.9 ^ -1.1 -.If -2.1 n=2
-1.3 -1.6 - Us&'-M.&ZU^, -1J n=3
n=4
nr:5
0=6
TOPOGRAPHY
RESISTIVITY (Ohm * m)
PHASE (mrad)
INTERPRETATION
METAL FACTOR (ip/res * 100)
Line 3800 WDipole-Dipole Array
o noo
a = 50.0 M
n = 1, 2, 3, 4, 5, 6plot point
Tillered Profiles
Resistivity Polarization Metal Factor
Filter *
* ** * *
* * * *
Logarithmic Contours1, 1.5, 2 , 3 , 5, 7.5, 10,..
Instruments: PHOENIX IPV4T, IPT1Frequency 0.25 Hz
Operator: John Marsh
INTERPRETATION
Increase in polarization associated to a relative decrease in apparent resistivity.
Increase in polarization with little or no associated decrease in apparent resistivity.
Weak or poorly defined polarization anomaly.no resistivity signature.
Low resistivity feature.Bedrock valley or thick overburden.Structural causes?
Induced Polarization SurveyPHELPS DODGE CORP. OF CANADA LTD
North Spirit Project Red Lake Mining District, Ontario
Date: 96/04/11Interpretation by: P. Bolleau, P. Eng.Scale 1 : 5000
VAL D'OR SAGAX INC.Geosoft Software for the Earth Sciences 96-001
MF IP 10.
Oj
RES 2000^
200
RES ^2000
200
IP .10
MF .10
uO
1+00 S 0+00 1+00 N 2+00 N 3+00 N 4+00 N 5+00 N
filter 40
0=2
0=3
0=4
0=5
0=6
44 45 44 43 45 47 46 45 43 41 41 40 46 filter
28 __ 28 - __ 25 19
40 37 41 36~~~~~ 30 ~~^H 23 27 27 -- 42
44 50 —— 51 39 32 35 33 53
58
60 53 - 4S 43
65 55 45 45 K l 62 60 ^~ 46 45 38
44 46/53 69 67 62 47 - 7 1
56 74 87 64
1+00 S 0+00 1+00 N 2+00 N 3+00 N 4+00 N 5+00 Nfilter U 3.2 5.2 7.5 7.1 5 3.2 1.5 .50 .90 .40 JO -.70 -.30 fj|ter
0 = 1 -1.6 -.60 -JO x^ JJ -0.4 -*^-,20
-*#.0=2
0=3
0=4
0=5 0=6
-1.6
-.20 -M
4.7 ' 5.5 -- 3.5 C^ -.10 -.50 -1.2
-.10 'S. 5 .8 ^ 7 .7 —— 7.7
.70-- M,; -\ -M 0 = 1
1,6 ^U.f' -.60 -.70 0=2
0=3
6.8 s 8.9 ^- 10 ——— 10 ^ x 6.2 ON: .90 -.10 ^ - .60 -.50 -.60
9.9 12 12 10 v 6.9 xV'-.'i' "i
12 12
.70 . 1.1J ; -.10 .30 50'C^S'''11 "^ 8.1 -"^ 1.2 ' '- .20 -1.8 -1.8
0=4
0=5
0=6
filter
n=2 0=3 0=4 0=5 0=6
1+00 S 0+00 1+00 N 2+00 Ni——i————i————i——i——i——i——i——.——i——i——i——i—-.29 5.2 10 17 15 II 6.7 2.8
3+OON 1 4.1
4+00 N 2 1.7
5+00 N
-2.4 -.76 filter
TOPOGRAPHY
RESISTIVITY (Ohm * m)
PHASE
(mrad)
INTERPRETATION
METAL FACTOR (ip/res * 100)
Line 3600 WDipole-Dipole Array
no a
plot point
Filtered Profiles
a = 50.0 M
n = 1, 2, 3, 4, 5, 6
Resistivity Polarization Metal Factor
Filter*
* * * * *
* * *
Logarithmic Contours1, 1.5, 2 , 3 , 5, 7.5, 10,..
Instruments: PHOENIX IPV4T, IPT1Frequency 0.25 Hz
Operator: John Marsh
INTERPRETATION
Increase in polarization associated to a relative decrease in apparent resistivity.
Increase in polarization with little or no associated decrease in apparent resistivity.
Weak or poorly defined polarization anomaly,no resistivity signature.
Low resistivity feature.Bedrock volley or thick overburden.Structural causes?
Induced Polarization SurveyPHELPS DODGE CORP. OF CANADA LTD
North Spirit Project Red Lake Mining District, Ontario
Date: 96/04/11Interpretation by: P. Boileau, P. Eng.Scale 1 : 5000
VAL D'OR SAGAX INC.Geosoff Software for the Earth Sciences 96-001

MF 10,
IP 10.
Oj
RES 2000
200
20J
RES 2000
200
L20
IP .10
MF .10
Lo
H———i———h-
1+00 S 0+00 1+00 N 2+00 N 3+00 N 4+00 N 5+00 N
filter 286 256 215 177 125 72 53 43 39 36 31 32 34 filter
r\ = \ 1 38 - 79 -~_ 57 68 79 47 25 17 18 14 —— 15 ^-—13^" 18 - 20 0 = 1
n-2 1 94-__162——124 """'"^i* J 58 54 \38 \. 23 23 21 —— 19 _-21 31 n=2
n=3 S423350^66 f . 63 55 66 ^ 44 \ 26 x J2 "^ Z7____27^-^34 r^3
n-4 63T~"\ 413 ) j j 83 53 61 69 46 33 36 36 44 n^
n=5 714 | 1187 l \ 63 55 58 67 5i ,. J6 48 -~^~59 0=5
0 = 6 314 ^ 129- ^ 64 51 54 76 59 ^ 48 79 0 = 6
-.20 -.90 -1.2 -2 -1.3 filter
5.2 ___j.7 ^? U -3.1
6.6 5.1 "r -5.7 -3.f
1+00 S 0+00 1+00 N 2+00 N 3+00 K 4+00 N 5+OON
filter -61 .55 l J 6.6 8.9 9.7 -M -1J -3.4 -U -7.3 -3.4 fiHer
.97 , .10 -.28 -.19 , .85 x x 3.9 ___4.1 ,—, -9.6 -5.4 -.34
7.6 —— 7.6 N^S -3.4 -5J -3 -14 -12 -3.1
i i - -7/// l V 3jJlj'/Y 16 16 —— 14 \ 1.1^—1
-15 -2.9 0 = 1
n^6
-6.9 -7J -J6 " -4.6S*kv
6.6 ^^ 3J, -6.4 -4.8x^^ i /y8.6 8.6 •'•^ -12 -4J
0=2
n^3
n=4
nr5
n=6
TOPOGRAPHY
RESISTIVITY (Ohm * m)
PHASE(mrad)
INTERPRETATION
METAL FACTOR (ip/res * 100)
Line 3400 WDipole —Dipole Array
i—s—,
a ^ 50.0 M
n = 1, 2, 3, 4, 5, 6plot point
Filtered Profiles
Resistivity Polarization Metal Factor
Filter*
D- * * * *
Logarithmic Contours1, 1.5, 2, 3, 5, 7.5, 10,..
Instruments: PHOENIX IPV4T, IPT1Frequency 0.25 Hz
Operator: John Marsh
INTERPRETATION
Increase in polarization associated to a relative decrease in apparent resistivity.
Increase in polarization with little or no associated decrease in apparent resistivity.
Weak or poorly defined polarization anomaly.no resistivity signature.
Low resistivity feature.Bedrock valley or thick overburden.Structural causes?
Induced Polarization SurveyPHELPS DODGE CORP. OF CANADA LTD
North Spirit Project Red Lake Mining District, Ontario
Date: 96/04/10Interpretation by: P. Boileau, P. Eng.Scale 1 : 5000
VAL D'OR SAGAX INC.Geosoft Software for the Earth Sciences 96-001

MF 10.
IP 10.
5.
Oj
RES 2000
RES2000
200 200
IP.10
MF
Lo
2+00 S 1+00 S 0+00 1+00 N 2+00 N 3+00 N 4+00 N
23 filter
n^l
n^2
nr:3
n=4
n=5
n=6
2+00 S 1+00 S o+oo 1+00 N 2+00 N 3+00 4+00 N
filter 4.7 -.10 .50 1 1 l -30 .40 O filter
n=2
n=3 5.4—-..4.1 ' H/.--M " *M.4;
n^4 7.6 l [ -.10 -3.1 -1.2 .10 x N l 1" /^ 1 .8 __ 1.8 ^ 2.5 ~~^- 4 .2 ^ -1.6\ \* \\l ( f
n=5 5.8 ^k -3.4 -4.2 -2.9 -.80 -A 2.2 L7 \ 1.5 cC 1 ^ 5.6^St *ill l
n = 6 4^- -2.9 -3 -5.5 .40 ' 2.8 ^ 3.3 -~~~3.9 ^^ JO
.20 -1.4 JO -2.9 -.90 -.40 n^
n=2
n=3
n=4
2+00 S
filter 1-9 -SO
1+00 S 0+00 1+00 N 2+00 N 3+00 N 4+OCN
.13 -X f ilter
.90
TOPOGRAPHY
RESISTIVITY (Ohm * m)
PHASE (mrad)
INTERPRETATION
METAL FACTOR (ip/res * 100)
Line 3200 WDipole-Dipole Array
o noa
plot point
Filtered Profiles
a = 50.0 M
n :: 1. 2, 3, 4, 5, 6
Filter*
Resistivity Polarization Metal Factor
Logarithmic Contours1, 1.5, 2, 3, 5, 7.5, 10,..
Instruments: PHOENIX IPV4T, IPT1Frequency 0.25 Hz
Operator: John Marsh
INTERPRETATION
— Increase in polarization associated to a relative decrease in apparent resistivity.
—! Increase in polarization with little or no associated decrease in apparent resistivity.
—, Weak or poorly defined polarization onomaly.no resistivity signature.
Low resistivity feature.Bedrock valley or thick overburden.Structural causes?
Induced Polarization SurveyPHELPS DODGlfcORP. OF CANADA LTD
North Spirit Project Red Lake Mining District, Ontario
Date: 96/04/11Interpretation by: P. Boileau, P. Eng.Scale 1 : 5000
VAL D'OR SAGAX INC.Geosor/ iorrwore ror //ie tor/ri Sciences 96-001

MF IP 10.
Oj
RES 2000
RES .2000
(.200
1=120
IP .10
MF
Lo
2+00 S 1+00 S 0+00 1+00 N 2+00 N 3+00 N 4+00 N
filter "*60 *71 3*7 J?' 197 'O* 67 52 46 42 36 31 26 22 filter
1477
0=2
11=3
^=4
n=5 35 43 B5 IM 47 35
1006 "424- N 117 x N M 55 N 94 103 x 48
13 0=1
51 -^^ 28 25 24 24 25 22
32 W l 56 69^\ J9 J3~^\ 27 28 30
V /"~"\\ X^32 39 \ 68 94 \ 48 34 \ 29 30~30
36 0=6
2+00 S 1+00 S 0+00 1+00 N 2+00 N 3+00 N 4+00 N
filter 7.7 3.5 -1.5 -3.2 -2.B -13 -2 -1.6 -.90 -.40 -.60 -.40 -.60 -.20
[1 = 1 8.7 , 3 wi
5.9 \ V
-5.5 -3.6 -1.2 -.50 .10 -.40 -JO -JO -1.9 -.10 -JO -.40 0=1
-6.3 -6.1 -2 -1.5 -1.1 -JO -.40 , .90 N -.40 -M - .10\\
[1=4
[1=5
[1 = 6
7.2 \\ -.30 -7.4 -5.9 -1.9 -1.9 -1.3 -l .50 ~ " .60 -.20
7.7 sN -.10 -5.6 -6.4 -1.3 -JO -1.6 -.60 .6o' -1.4 -1.3V^ 7.9\V.10 -6.1 -6.B -14 -JO -U -.90 -1.2 1.4
7.7 ^ -.20 -7.9 -5.9 -2.5 -.70 -1.2 -2i .60
000
0=3
0=4
r^6
2+00 S 1+OOS 0+00 1+00 N 2+00 N 3+00 N 4+00 N
filter .99 -5.1 -11 -7.1 -5.5 -3.9 -3.4 -2 -.62 -2.2 -1.1 -2.4 -1.4 fjHer
.59 1.9 -16 -22 -15 -1.4 J2 -2.3 -2.1 -1.6 -11 -.73 -4.8 -2J 0=1
[1=2 1.6 x .63 -S.3 -17 -6.2 -3.5 -2.3 -2.9 -1.6 /SS; -'-' -2-1 --* 0=2
[1=3
[1=5
[1=6
1.6 x .63Ml1.6 V HS'\ -4.J -18 -5.6 -35 -1.9 -2.6 1 j '—— 2.3 S -JK - 1.5
\V\\ //' .76 \ -Q -4.7 -20 -3.2 -1.4 -1.7 -1.1 '^.9.? -4.9 -4.4
.44 O -5.4 -20 -3.4 -J3 -n -2 -3.3 4 4 .5' "x If .76 - -O -6.7 -16 -4.1 -.79 -1.1 -5.2 1.6
0=3
0=4
0=6
TOPOGRAPHY
RESISTIVITY (Ohm * m)
PHASE
(mrad)
INTERPRETATION
METAL FACTOR (ip/res * 100)
Line 3000 WDipole—Dipole Array
plot point
Filtered Profiles
a = 50.0 M
n = 1. 2, 3, 4, 5, 6
Resistivity Polarization Metal Factor
Filter*
* * * * *
Logarithmic Contours1, 1.5, 2, 3, 5, 7.5, 10,..
Instruments: PHOENIX IPV4T, IPT1Frequency 0.25 Hz
Operator: John Marsh
INTERPRETATION
Increase in polarization associated to a relative decrease in apparent resistivity.
Increase in polarization with little or no associated decrease in apparent resistivity.
Weak or poorly defined polarization anomaly,no resistivity signature.
Low resistivity feature.Bedrock valley or thick overburden.Structural causes?
Induced Polarization SurveyPHELPS DODGE CORP. OF CANADA LTD
North Spirit Project Red Lake Mining District, Ontario
Date: 96/04/11Interpretation by: P. Boileau, P. Eng.Scale 1 : 5000
VAL D'OR SAGAX INC.Geosoft Software for the L a rt h Sciences 96-001

MF 10.
IP 10.
CL, Oj
RES 2000,
200^
20J.
RES .2000
IP .10
MF
.5
Lo
1+00 s 0+00 1+00 N 2+00 N 3+00 N 4+00 N108 121 100 96 76 57 51 J7 33 31 30 filter
n=2 78 ——- 77 ——- 76 ^ 33 38 34
44 ^^ 110 176 141 72 62
1+00 S 0+00 1+00 N 2+00 N 3+00 N 4+00 N
filter -l- 7 -1.6 -L* -1.2 -1-1 --M --60 .40
-.90 -.50 -.40 -.40 -1.2
-1.4 -JO -.M -.80 -.50 -.10 40
-2.2 -1.3 -.80 -1.2 -1.8 -1.5
n=5 -2-9 -1.6 -1.3 -1.2 -3.5 -2.6 .20 (C( 2.4 V~~- 1.4 f 1.3^ A\ \ \ -—- ^n=6 -.90 -1.2 -1.6 -3.3 -1.3 - 1.2
1.2 1.4 .90 JO filter
.20 - -.10 -.50 -.60 0=1
0=2
0=3
0=4
0=5
0=62.1
1+00 S 0+00 1+00 N 2+00 N 3+00 N 4+00 Nfilter -2 -1-7 -U -1.5 -1.8 -1.7 -1.9 1.5 4.2 5.1 2.6 -.16 filter
n=1 -2.4 -1.4 -1.1 -1.4 -6.6 .43 - ,v U -^ -.42 -* -3.1 -3.4 0=1
n=2 -1.7 -1.1 -.86 -2.4 -1J
0=3 -3.1 -JO -.59 -2,4 -5.5 -2.6
0=4 -3J -.89 -.43 -1.6 -4.2 -3.3
11=5 -i.5 -1.5 -.71 -.83 -4.9 -4.2
0=6 -M - 1.6 -2.7 -1.3 "- 1.7 l -J7 *- 3
^=2
n=3
0=4
TOPOGRAPHY
RESISTIVITY (Ohm * m)
PHASE (mrad)
INTERPRETATION
METAL FACTOR (ip/res * 100)
Line 2800 WDipole-Dipole Array
a ___no___ Q
__[±L
plot point
Filtered Profiles
a = 50.0 M n ^ 1 , 2, 3, 4, 5, 6
Resistivity Polarization Metal Factor
Filter*
* ** * *
* * * *
Logarithmic Contours1, 1.5, 2, 3, 5, 7.5, 10,..
Instruments: PHOENIX IPV4T, IPT1Frequency 0.25 Hz
Operator: John Marsh
INTERPRETATION
— Increase in polarization associated to a relative decrease in apparent resistivity.
—! Increase in polarization with little or no associated decrease in apparent resistivity.
—j Weak or poorly defined polarization anomaly,no resistivity signature.
Low resistivity feature.Bedrock valley or thick overburden.Structural causes?
Induced Polarization Survey PHELPS DODGE CORP. OF CANADA LTD
North Spirit Project Red Lake Mining District, Ontario
Date: 96/04/10Interpretation by: P. Boileau, P. Eng.Scale 1 : 5000
VAL D'OR SAGAX INC.Software for the Earth Sciences 96-001

MF IP 10.
Oj 0.
RES 2000,
RES -2000
200 200
IP .10
MF -10
2+00 S 1+00 S 0+00 1+00 N 2+00 N 5+00 N
2+00 S 1+00 S 0+00 1+00 N 2+00 N
146
3+00 N
4+00 Ni —— i —— i38 37 filter
0=2
0=3
0=4
0=5
0=6
4+00 N
filter
2.3
6.3
2.6 1.9 1.4 1.9 2.2
-.30 -.90 .30 .10 s-s,. 2.5
-.20 -.10 -JO ', 1.4
3.1 .10 .60 .70 .30 .50 f;||er
-5.7 .10 v 50 . - O ^ 1.1 0 = 1
^ '~ 0 - " 0=2U t. 3.3^^ 2 ^t -4.1 .60. C ^ N O
5.5 5.4 \JS -.60 .70-^ - .80'(( 3.6 l 1.9 -x 2.5 2.8 \. -4.6 ^50 v IJ n = 3- - \ -o /'""sV "x^n=4 4.9-^ 5.1.N^.. r,60 . ii l ^r^ 1.6 v \.3.6j) 2.2 3 "\,"*' 1 ' 10 "^
^5 " N " v\ ( tx\P " —~ 3 X ^ "5'' "^n = 6 5 6.1 \ 1.8 - 5.4 ^~~ 2.9 ' 4.6 -5.3 -4.7 4.2 n = 6
L5
Lo LO
2+00 S
filter 1.6 2.1
1+00 S 0+00 1+00 N 2+00 N 3+00 N 4+00 N
.41 filter
0=1
r^2 0=3 0=4 0=5 0=6
TOPOGRAPHY
RESISTIVITY (Ohm * m)
PHASE
(mrad)
INTERPRETATION
METAL FACTOR (ip/res * 100)
Line 2600 WDipole—Dipole Array
a = 5 0.0 M
n = 1, 2. 3, 4, 5. 6
Filter
plot point
Filtered Profiles
Resistivity — — — —Polarization ——-———Metal Factor --------
Logarithmic Contours1, 1.5, 2, 3, 5, 7.5, 10,..
Instruments: PHOENIX IPV4T, IPT1Frequency 0.25 Hz
Operator: John Marsh
INTERPRETATION
Increase in polarization associated to a relative decrease in apparent resistivity.
Increase in polarization with little or no associated decrease in apparent resistivity.
Weak or poorly defined polarization anomaly,no resistivity signature.
Low resistivity feature.Bedrock valley or (hick overburden.Structural causes?
Induced Polarization SurveyPHELPS DODGE CORP. OF CANADA LTD
North Spirit Project Red Lake Mining District, Ontario
Date: 96/04/10Interpretation by: P. Boileau, P. Eng.Scale 1 : 5000
VAL D'OR SAGAX INC.Geosoft Software for the Earth Sciences 96-001

MF
1
O-
IP 10.
5.
OJ
RES 2000
200
20J
RES 2000
200
L 20
IP .10
MF .10
Lo
2+00 S 1+00 S 0+00 1+00 N 2+00 N 3+00 N 4+00 N
n-2 n=3
n=6
2+00 S 1+00 S 0+00 1+00 N 2+00 N 3+00 N 4+00 Hfilter 6.5 14 10 6.1 5.7 6.2 U 7 .5 4.8 1.8 .70 .20 -•30 filler
r^2
11=4
^ = 5
^=6
-.10 30 , ^M'^~ 2.9, \ .90 -2 -JO O .60 -.10 n^1
.10 -.20 - Y, 2 .2 x/ 6.2 ^-3.8^,-1J -2.3 -.40 -.10 JO 0 = 2
"Uj^r2.2"/ X8 8.1 \ 5.1 S^ -.40 -3 -.60 O 0 = 3A*-^-.70 -3.1 -.60 n^4
11 N 9.6__ M "~-^ H^v"--50 -3.1 n=5
8.2 "11 ' 20 "^ 13 13 13 11 ^•7 N-'^"30 0 = 6
2+00 S 1+00 S 0+00 1+00 N 2+00 N J+OON 4+00 N
filter -.38 filter
TOPOGRAPHY
RESISTIVITY (Ohm * m)
PHASE
(mrad)
INTERPRETATION
METAL FACTOR (ip/res ' 100)
Line 2400 WDipole—Dipole Array
l l
plot point
Filtered Profiles
a = 50.0 M n = 1, 2, 3 , 4, 5, 6
Filter*
Resistivity Polarization Metal Factor
Logarithmic Contours1, 1.5, 2, 3, 5, 7.5, 10,..
Instruments: PHOENIX IPV4T, IPT1Frequency 0.25 Hz
Operator: John Marsh
INTERPRETATION
Increase in polarization associated to o relative decrease in apparent resistivity.
Increase in polarization with little or no associated decrease in apparent resistivity.
Weak or poorly defined polarization anomaly.no resistivity signature.
Low resistivity feature.Bedrock valley or thick overburden.Structural causes?
Induced Polarization Survey PHELPS DODGE CORP. OF CANADA LTD
North Spirit Project Red Lake Mining District, Ontario
Date: 96/04/11Interpretation by: P. Bolleau, P. Eng.Scale 1 : 5000
VAL D'OR SAGAX INC.Geosol Software for the Earth Sciences 96-001
MF 10-
5J
OJ
IP 10.
RES 2000
RES 2000
IP .10
MF .10
4+00 S J+OOS 2+00 S 1+OOS 0+001 1+00 N 2+00 N 3+00 t 4+00 N
filter l?48 H* 1 Q66 1004 1133 1543 1338 1368 714 332 92 68 93 85 87 89 87 60 filter
0 = 1 781^-448_ 277 283 ^ 840 ^ v "'9 .' l19*^- !M? V.418 332/^87.--^25 ^70 —-43 -57 ^39 __^32 22
n=2 387 ^ 759
n=3 970___931 ——— 976 —' 1043" ^~~ 627\ II 3009 -^ 2471 1150 l J, n 6 1 f 1 07 Ov 50\Xll8\X"50 /f 139 "79 -^—— / //o u\V. J ill' ' —
0=4 1379 ^ n\r~~~~ 1 275. f , 398 f . 11.75 J~ 2062 -" 1 619.^.145"^-^ 56 r^ 82 \ 122"^ \ 36 \S^.127 __ 107 _109 0 = 4
0=5 3288 ^2086 /, 472 ^615 -^"900^^1222^-165 116——^79 89 —— 79 V 31i.A l f 283 V 87 0=5
13D5 ~" 1504 J177 1466 412 /X 76 —x 61 - 38
4540 1017 701 '356 x 523 -^ 96 129 - 181 - ^82 56 62
4+00 S filter 6.6 2.2
3+00 N 4+00 N—i——i——i——i——i——'7.B 5.4 4.1 1.9 filter
: .—— o.i ^,— 14 ^ lu ^v1 ~1J *-'\ f)fs~~^\ V^.-^( \ 16.5/7/24 ^18\ 10^1.43)370 -.70 -.70 -.90 '
L5
uO LO
4+00 S 3+OOS 2+00 Sfilter
.70
4+00 N
4.4 -1.4 fj|4.er
TOPOGRAPHY
RESISTIVITY (Ohm * m)
PHASE
(mrad)
INTERPRETATION
METAL FACTOR (ip/res * 100)
Line 2200 WDipole —Dipole Array
no a^-H——H
plot point
Filtered Profiles
a = 50.0 M
n = 1, 2. 3, 4, 5, 6
Filter
Resisfivity Polarization Metal Factor
Logarithmic Contours1, 1.5, 2 , 3 , 5, 7.5, 10...
Instruments: PHOENIX IPV4T, IPT1Frequency 0.25 Hz
Operator: John Marsh
INTERPRETATION
Increase in polarization associated to a relative decrease in apparent resistivity.
Increase in polarization with little or no associated decrease in apparent resistivity.
Weak or poorly defined polarization anomaly,no resistivity signature.
Low resistivity feature.Bedrock valley or thick overburden.Structural causes?
Induced Polarization SurveyPHELPS DODGE CORP. OF CANADA LTD
North Spirit Project Red Lake Mining District, Ontario
Date: 96/04/10Interpretation by: P. Boil ea u, P. Eng.Scale 1 : 5000
VAL D J OR SAGAX INC.Sof/H'ore for the Earfh Sc/enees 96-001

MF IP 10.
5J 5.
Oj Oj
RES 2000.
200
J f
J/
20.X
RES -2000
-H———i———t-
200
IP .10
MF .10
4+00 S 3+00 S
filler 28
0=1 0=2 0=3 0=4 0=5 0=6
2+00 S 1+00 S—i——i——i——i——1042 1043 675
2+00 N 3+00 N 4+00 N—i——i——i————i——i94 118 121 129 125 102 filter
4+00 S 3+OOS 2+00 S 1+00 S 0+00 1+00 N 2+00 N 3+00 N 4+00 N
filter
0 = 1
0=2
0=4
0=5
0=6
IB 11 8.4 B.I 7.6 6.6 5.3 4.1 filter35 26 22 13
-3.3 -3.2 -JO .SO -2.2 37 \ s 8.9 - __ 8.7 x x -1.5 - -1.1 JO ,- - .20 , - 1 .1
21 , 30 __ 33
35 ( 27 j 40 18 \ X 6.8 -^ 8.9 7.5
22 ' TN 47 42 53 —— TN x 24 25
L5
.0 LO
4+00 S
filter *S5 137
3+OOS
42 13
2+QQS
5.2 21
1+00 S 56 76
0+00
101 171
1+OON
110 65
2+00 N
41 14
3+00 N
5.1 5.1
4+00 N
4.1 4.3 filter
13 ^ 72 (f C 464 ) l) 38 — IS ^ ^\^^( ^
n=6
TOPOGRAPHY
RESISTIVITY (Ohm * m)
PHASE
(mrad)
INTERPRETATION
METAL FACTOR (ip/res * 100)
Line 2000 WDipole-Dipole Array
no a,——2——H-
plot point
Filtered Profiles
Resistivity — — — —Polarization ——————Metal Factor --------
a = 50.0 M
n ^ 1, 2, 3, 4, 5. 6
Filter*
* * * * *
Logarithmic Contours1, 1.5, 2, 3, 5, 7.5, 10,..
Instruments: PHOENIX IPV4T, IPT1Frequency 0.25 Hz
Operator: John Marsh
INTERPRETATION
Increase in polarization associated to a relative decrease in apparent resistivity.
Increase in polarization with little or no associated decrease in apparent resistivity.
Weak or poorly defined polarization anomaly.no resistivity signature.
Low resistivity feature.Bedrock valley or thick overburden.Structural causes?
Induced Polarization SurveyPHELPS DODGE CORP. OF CANADA LTD
North Spirit Project Red Lake Mining District, Ontario
Date: 96/04/11Interpretation by: P. Boileau, P. Eng.Scale 1 : 5000
VAL D'OR SAGAX INC.Geoso/7 Sor/ivare for the Earfn Sciences 96-001
MF 10,
IP 10.
0.
RES 2000
200\\____.
RES IP 2000 ..10
200
L20
MF .10
4+00 S 3+00 S 2+00 S 1+00 S 0+00 1+00 N 2+00 N 3+00 N 4+00 N
filter 571 560 501 465 437 375 748 383 327
242- 137/, 1190
128 141 152 155 136
24 - 37
4+00 S 3+00 S 2+00 S 1+00 S 0+00 1+00 N 2+00 N
424
3+00 N
75 filter
44 r^1 0=2
0=3
0=4
0=5
0=6
4+00 N
8.5 12 11 14filter 3.4 .60
r^ 2.5 ^ -1.5 -1.6 -63 .^4.3 -.40 -2.1 - cx 1 5 ^36 ^--. 1.9 v .80 - - .40
3.2 V -5.2 -9.7 .40 -.20 PS 5.8
O -II a 4 .6 9.7 2.7 r - .60 S. ( 3 .6. . .
27 30 37 - t'.4~r~"^ 1.4 l-4.9 4.9 8.8 X 5.8
12 ' 9.7 6.8 C 4.4 'f/, 25 28 ^ 30 26
7.6 5.6 ""22 JO 35 30 -—— 30 24
7 fi|ter
0 = 1
0=2
0=3
0=4
0=5
0=6
LO uO
4+00 S 3400 S 2+00 S 1+00 S 0+00 1+00 N 2+00 N 3+00 N 6.5 4
4+00
w]\\^m'^-^^^^mf (C)6j^ 2.4 ——J,-5/^"^: *-5
\T.?2 - -aT&tt
^jr
12 filter
0=1
0=2
2.1 'S/ 1 3
___^^" 12 —— 3.8
TOPOGRAPHY
RESISTIVITY (Ohm * m)
PHASE (mrad)
INTERPRETATION
METAL FACTOR (ip/res * 100)
Line 1800 WDipole-Dipole Array
a noQ
plot point
Filtered Profiles
a = 50.0 M
n = 1, 2. 3, 4, 5, 6
Resistivity Polarization Metal Factor
Filter*
* * **** * *
Logarithmic Contours1, 1.5, 2, 3, 5, 7.5, 10,..
Instruments: PHOENIX IPV4T, IPT1Frequency 0.25 Hz
Operator: John Marsh
INTERPRETATION
Increase in polarization associated to a relative decrease in apparent resistivity.
Increase in polarization with little or no associated decrease in apparent resistivity.
Weak or poorly defined polarization anomaly,no resistivity signature.
Low resistivity feature.Bedrock valley or thick overburden.Structural causes?
Induced Polarization SurveyPHELPS DODGE CORP. OF CANADA LTD
North Spirit Project Red Lake Mining District, Ontario
Date: 96/04/11Interpretation by: P. Bolleau, P. Eng.Scale 1 : 5000
VAL D'OR SAGAX INC.Geosof/ Software for the Earth Sc/ences 96-001

MF IP 10.
Oj
RES 2000
200
20J
RES 2000
200
L20
IP10
MF .-10
4+00 S 3+00 S 2+00 S 1+00 S 0+00
filter
11=1
n^2
n=3
11=4
[1=5
0=6
238 264 265 267 323 399 271 523 116
1+00 N
131
2+00 N172 194
3+00 N 4+00 N—i——i——i——i——i——i——i186 190 234 192 filter
43 — 56
4+00 S 3+00 S 2+00 S 1+00 S 0+00 1+00 N 2+00 N 3+00 N 4+00 N
filter 5-6 1.7 .30 .20 .40 14 5.3 10 17 27 27 21 12 5.5 2.7 1.6 3.4 1.9 filter
-2 . jet, 2 .4 , -.10 n^12.5 -.80 -3.1 -.60 -1.5 9.7 , , .40 -3.1 -.90.-3.3 -2.5 -2.9 -1.5 ' .K
-.90 -5.3 A 2.3 2.9
-O LO
4+00 S 3+OOS 2+00 S 1+00 S 0+00 1+00 N 2+00 N 5+00 H 4+OON
filter '6 5.4 -.81 -1.6 -2.2 1.1 6.4 20 23 39 37 28 14 2.8
27 \V -1,6 -4.9 -5.8 -10 -.47 .44 - - .48 1S^ 5 .5 VU 48
20 V -.41 -1.6 -12 -.48 .25 2 \ T 25
O - - .23 .24 S , 1 3 - VS \\\ -1.7 .77 1.1
13 —3S -- 18 ' '2.7
1 -.98 1.8 .85 filter
0=1
0=2
0=3
0=4
0=5
0=6
TOPOGRAPHY
RESISTIVITY (Ohm * m)
PHASE
(mrad)
INTERPRETATION
METAL FACTOR (ip/res * 100)
Line 1600 WDipole — Dipole Array
a
plot point
Filtered Profiles
a = 50.0 M
n :z 1, 2, 3, 4, 5, 6
Filter
Resistivity Polarization Metal Factor
Logarithmic Contours1, 1.5, 2, 3, 5, 7.5, 10,..
Instruments: PHOENIX IPV4T, IPT1Frequency 0.25 Hz
Operator: John Marsh
INTERPRETATION
Increase in polarization associated to a relative decrease in apparent resistivity.
Increase in polarization with little or no associated decrease in apparent resistivity.
Weak or poorly defined polarization anomaly,no resistivity signature.
Low resistivity feature.Bedrock valley or thick overburden.Structural causes?
Induced Polarization SurveyPHELPS DODGE CORP. OF CANADA LTD
North Spirit Project Red Lake Mining District, Ontario
Date: 96/04/10Interpretation by: P. Boileau, P. Eng.Scale 1 : 5000
VAL D'OR SAGAX INC.Geosoft Software for the Earth Sciences 96-001
MF 10.
5J
IP RES 2000.
5.
OJ 0.
200-|
20 J;
RES 2000
[20
IP.10
MF .10
4+00 S 3+00 S 2+00 S 1+00 S 0+00filter 22 31 250 282 320 362 406 377
1+00 N 2+00 N
142 212 185
36 23 s. 49 -^ 18 16 17 s 50 —~, 1 66 x -- 687-—-O^ l ^X\V r-^^^^ \ \13 —-^ 21 ( 78 -s^V 24 —— 23 -^ 100 t/ 275 222 s\
^^^j^^ If ^ li ^AW^^Ul/s 199 J/. 25 :r-x 56 ( f 345 \243Ol30 137^——106 f//////^^\l\\\\\ \ } 1^ ^——^\V Y/ 29 12 l 179 \ 370 y y. 99 —-\ 120 f 227-—^ 468f////// m\\\\x—'l t \ / //x—
3+00 N | | 4+00 N
252 293 332 463 filter
156 ^ 61 . 36 s/ 1 48 n=1
196 "^29 ^L 1 77 n=2
n^3
4+00 S J400S 2+00 S 1+00 S 0+00 1+00 N 2+00 N 3+00 N 4+00 N
filter 39
^2
n=3
^=4
n^5
0=6
21 11 6.4 3.7 8.1 17 25 33 27 16 7.7 3.5 1.1 JO .40 filter
n=2 n=3 n-t n=5 n=6
36 37 ^v -2.7 -1.9 -.10 -1 -3.3 -JO u , 4.5 ^ 1.4 s ,12 -^ 1 1 \ , , JO -3.2 -1.1 -.90 -.40 -.20
-.30 -4.4 -1.3 -XI . 40
43 45 V? -3.3 -5.6 -6.1 -1.7 40 35 v \ 11 C\v -.20 -4 -1.7 .80
-1 -3.4 .90
42 V. 51 V^ -2.3 -3.2 10 X x" 26 ' 4J 43
2.5 ' 9.1 ' 25 ' 41 38 43 36 31 12 - x 3.9
L5
.0 LO
filter
4+00 S 2W 2JO
f, 1 U1 ___. B4 l s 1 1 14 ——~. B./ \ V --n'////^r^,((( ^C1^^^19 Y f i45 Jjl 24 --10 {r^f \V " \^.-19N
^301 -^- 100 v ^ 24 25 36 ^ 6.2 ^ '
TOPOGRAPHY
RESISTIVITY (Ohm * m)
PHASE (mrad)
INTERPRETATION
METAL FACTOR (ip/res * 100)
Line 1500 WDipole-Dipole Array
a noa
plot point
Filtered Profiles
a = 50.0 M n ^ 1, 2, 3, 4. 5, 6
Filter
Resistivity Polarization Metal Factor
Logarithmic Contours1, 1.5, 2, 3, 5, 7.5, 10,..
Instruments: PHOENIX IPV4T, IPT1Frequency 0.25 Hz
Operator: John Marsh
INTERPRETATION
Increase in polarization associated to a relative decrease in apparent resistivity.
Increase in polarization with little or no associated decrease in apparent resistivity.
Weak or poorly defined polarization anomaly.no resistivity signature.
Low resistivity feature.Bedrock valley or thick overburden.Structural causes?
Induced Polarization SurveyPHELPS DODGE CORP. OF CANADA LTD
North Spirit Project Red Lake Mining District, Ontario
Date: 96/04/10Interpretation by: P. Bolleau, P. Eng.Scale 1 : 5000
VAL D'OR SAGAX INC.Software for the Earth Sciences 96-001

MF 10-
5J
IP 10.
OJ
RES 2000-
200
RES ^2000
20.
200
IP .10
MF .10
.5 L5
4+00 S 3+00 S 2+00 S 1+OOS-H————i————h-
0+00 1+00 N 2+00 N 3+00 N 4+00 Nfilter 294 137 165 239 278 317 332 343 195 76 145 162 190 169 162 221 193 181 filter
24
0=2 n=3
0=4
0=5 0=6
"^/rx 8- 29122 i 59 V^ 36 36
. 139 v x 734 539 , .123._ - 191 s l M i, 85 ^ 1 67 13S ^—165 v -65 67
l l f(i*A\\ *"- I//7 \^\\\ j/y W ^-^ 71 v\ \ iIff ^ \V\ 92 —— 73 ~~-— 81 .
718 1226.
58 J f 1 41 7 r 40 —— 37 __! 21 ^± 47 \ V ^ 895 J )
i/iii^si 5lTS^r^VJ1^^o ///Jy S *fVssfc^m\ (( ^ ^x026 l V 81 ' 21 " ' 3 ' 'I'' 43 V 125 A " 12 X '
'——•X269 X 161 124
295 —- 244 ^x 93
382 406
594\\Y
86 ^ 1 23
n=2
n=3
n^4
n=5
n=6
4+00 S 3+00 S 2+00 S 1+OOS 0+00H————'————h-
1+00 N 2+00 N 3+00 N 4+00 N
filter 14 21 16 9.2 7.8 11 22 53 40 32 23 13 6.7 2.4 .80 1.1 filter
0=1 .30 ^/J.
11=2 15
11=4
11=5
6.6 o*.-J.3 -1.3 -.20 -1.6 -1.5 -x 42 51
-2.9 -4.1 -2.6 y// 43 47 . 63W' c ^o 11 ^ 47 74
\-8.4 -t.6 V/ H 38 39 54 \ 85 x \ 24 ^-— 14 .
-tA W/ ' 44 34.-—— 30. 45 y 64 \ 88 \\ 26 -
31 N 25 ' ' 6.8 *^^ 43 33 22 ' TO ' 58 64 88 x 28 x 15 ^^ 5.8
4,5^——5.5__ ^.1.7 j. -.90 .20 -.60 -.80 .90 0 = 1
15 -^-^ 12 XX 2ll ^ -1.5 -.40 -.80 O 0 = 2
23 x 13 X\ 3.5^, -.10 O .^.70 0 = 3
-1.8 1.7 0=4
0=5
0=6
4+00 S 3+00 S 2+00 S 1+OOS 0+00 1+00 N 2+00 N 3+00 N 4+00 Nfilter 18 26 27 10 6 8.6 22 50 71 157 142 111
0=1
n=2 n=3
11=4 (1=5
30 25 1.4 .37 .93 filter
-.55 .16 -J9 -1.2 1.313 27 vv.K-11 -5.6 -.43 -1.1 -JO -~- 7.7 ,v x 41 .——: 2.4 -s , 1 6
~^ ///////|\\\ ' *W" l60 /, 1 2 J)) K, - .62 WlVl 58 226^ 458^/70=^1143814 12-,0i II l Li l M l Ut
' .63^^ 13 l l 40 ' l 1 07 —— TH 135 51 " ' 730^ N 10 - 9.4 ~~ 4.7
n=2
n=3
^=4
n=5
0=6
LO
TOPOGRAPHY
RESISTIVITY (Ohm * m)
PHASE
(mrad)
INTERPRETATION
METAL FACTOR (ip/res * 100)
Line 1400 WDipole-Dipole Array
g ___no___ a
r^i
plot point
Filtered Profiles
a = 50.0 M
n ^ 1, 2, 3, 4, 5, 6
Resistivity Polarization Metal Factor
Filter*
* ** * *
* * * *
Logarithmic Contours1, 1.5, 2 , 3 , 5, 7.5, 10,..
Instruments: PHOENIX IPV4T, IPT1Frequency 0.25 Hz
Operator: John Marsh
INTERPRETATION
Increase in polarization associated to a relative decrease in apparent resistivity.
Increase in polarization with little or no associated decrease in apparent resistivity.
Weak or poorly defined polarization anomaly.no resistivity signature.
Low resistivity feature.Bedrock valley or thick overburden.Structural causes?
Induced Polarization SurveyPHELPS DODGE CORP. OF CANADA LTD
North Spirit Project Red Lake Mining District, Ontario
Date: 96/04/11Interpretation by: P. Boileau, P. Eng.Scale 1 : 5000
VAL D'OR SAGAX INC.Geosoff Software for the Earth Sciences 96-001

MF 10-
IP 10.
OJ (L
RES2000.
RES 2000
20J
IP.10
MF
.5
4+00 S 3400 S 2+00 S 1+00 S 0+00 1+00 N 2+00 N 3+00 N 4+00 N
4+00 S 3+00 S 2+00 S 1+00 S 0+00 1+00 N 2+00 N 3+00 N 4+00 H
filter 16 28 u 25 15 It 12 21 35 51 36 25 22 IE 11 7.6 8.3 10 filter
n=2
^=4
-.40 m 6 .8 x 46 x 6.6 K -2.5 -t.t -1
.0 LO
4+00 S
filter 75 104
3+OOS481 18:
2+00 S 91 54
1+00 S
63 95
0+00
139 264
1+00 N
214 81
2+OON E5 42
3+00 N 24 4.1
4+00 N—'——i——i3.7 5.4 fi|)er
TOPOGRAPHY
RESISTIVITY(Ohm * m)
PHASE
(mrad)
INTERPRETATION
METAL FACTOR (ip/res * 100)
Line 1300 WDipole—Dipole Array
na
a ^ 50.0 M
n ^ 1, 2, 3, 4, 5, 6plot point
Filtered Profiles
Resistivity Polarization Metal Factor
Filter*
* ** * *
* * * *
Logarithmic Contours1, 1.5, 2, 3, 5, 7.5, 10,..
Instruments: PHOENIX IPV4T, IPT1Frequency 0.25 H z
Operator: John Marsh
INTERPRETATION
Increase in polarization associated to a relative decrease in apparent resistivity.
Increase in polarization with little or no associated decrease in apparent resistivity.
Weak or poorly defined polarization anomaly.no resistivity signature.
Low resistivity feature.Bedrock valley or thick overburden.Structural causes?
Induced Polarization SurveyPHELPS DODGE CORP. OF CANADA LTD
North Spirit Project Red Lake Mining District, Ontario
Date: 96/04/11Interpretation by: P. Boileau, P. Eng.Scale 1 : 5000
VAL D'OR SAGAX INC.Geosorr Software for the Earth Sciences 96-001

MF IP 10.
5.
Oj
RES 2000
RES .2000
20J
IP 10
MF -10
.5
4+00 S 3+00 S 2+00 S 1+00 S 0+00 1+00 N 2+00 N i+00 H
filler 257 filler
4+00 S 3+00 S 2+00 S 1+00 S 0+00 1+00 N 2+00 N 3+00 N
filter 15 25 32 21 12 8.1 4.8 6.5 -14 -14 5.7 3.7 1.4 -.20 -1.6 f||ter
0 = 3
0=4
0=5
0=6
12 TN TN
TN TN TN
37 32 X 23 v^N 10 s^ -2.5 J, 4 .1 ' x 8.1 TN TN TN TN
26 30 —— 30 } y 9 .6 -i: 5.3^_^ 7.8 TN TN TN 2.8
18 l 4 1 (u'-OJ 17 "^N 9.1 TN TN TN -16 -5.2 jg TN 19
41 12 ^^ 8.2 ^-20 TN TN TN TN -41 -18 TN
0=4
n=5
n=6
4+00 S 3+OOS 2+00 S 1+00 S 0+00 1+00 N 2+00 N 3+00 N
filter 153 253 376 169 108 39 4.3 1.4 -35 -179 -179 -44 -37 -35 -18 -.45 filter
0 = 1 U jn.tl -s 501 , r 8,7.
0=2 289
0=3
[1=4 (1=5 0=6
'f?
-U -.73 .12 -1 TN TN 21 y//, .72 -. ^ -.17 -.84 -2.5 11 = 1
-M - .42 .42"- J2 TN TN TN 6.5 ~P"l.6 i, -2 -.93 n=2
5J6 ^270 /562 \\v3J.. -.20 .21 ^.1.4 TN TN TN TN ' )) 8.9/ -3
271 53LX^ M ')))) -91 ----20 " ^ ™ ™ ™
359 292 //f. 25'^fe .88 - "- .49 TN TN TN -153 ^^7F TN
312 //TO ^ 21^^ 1.5 TN TN TN TN -417 -426 TN
^=3
nr4
n=5
n=6
TOPOGRAPHY
RESISTIVITY (Ohm * m)
PHASE (mrad)
INTERPRETATION
METAL FACTOR (ip/res * 100)
Line 1200 WDipole-Dipole Array
a noa
plot point
Filtered Profiles
a ^ 50.0 M
n = 1, 2, 3, 4, 5, 6
Resistivity Polarization Metal Factor
Filter*
* ** * *
* * * *
Logarithmic Contours1, 1.5, 2, 3, 5, 7.5, 10,..
Instruments: PHOENIX IPV4T, IPT1Frequency 0.25 Hz
Operator: John Marsh
INTERPRETATION
Increase in polarization associated to a relative decrease in apparent resistivity.
Increase in polarization with little or no associated decrease in apparent resistivity.
Weak or poorly defined polarization anomaly.no resistivity signature.
Low resistivity feature.Bedrock valley or thick overburden.Structural causes?
Induced Polarization SurveyPHELPS DODGE CORP. OF CANADA LTD
North Spirit Project Red Lake Mining District, Ontario
Date: 96/04/10Interpretation by: P. Bolleau, P. Eng.Scale 1 ; 5000________________
VAL D'OR SAGAX INC.Geosoff Software for the Earth Sciences 96-001
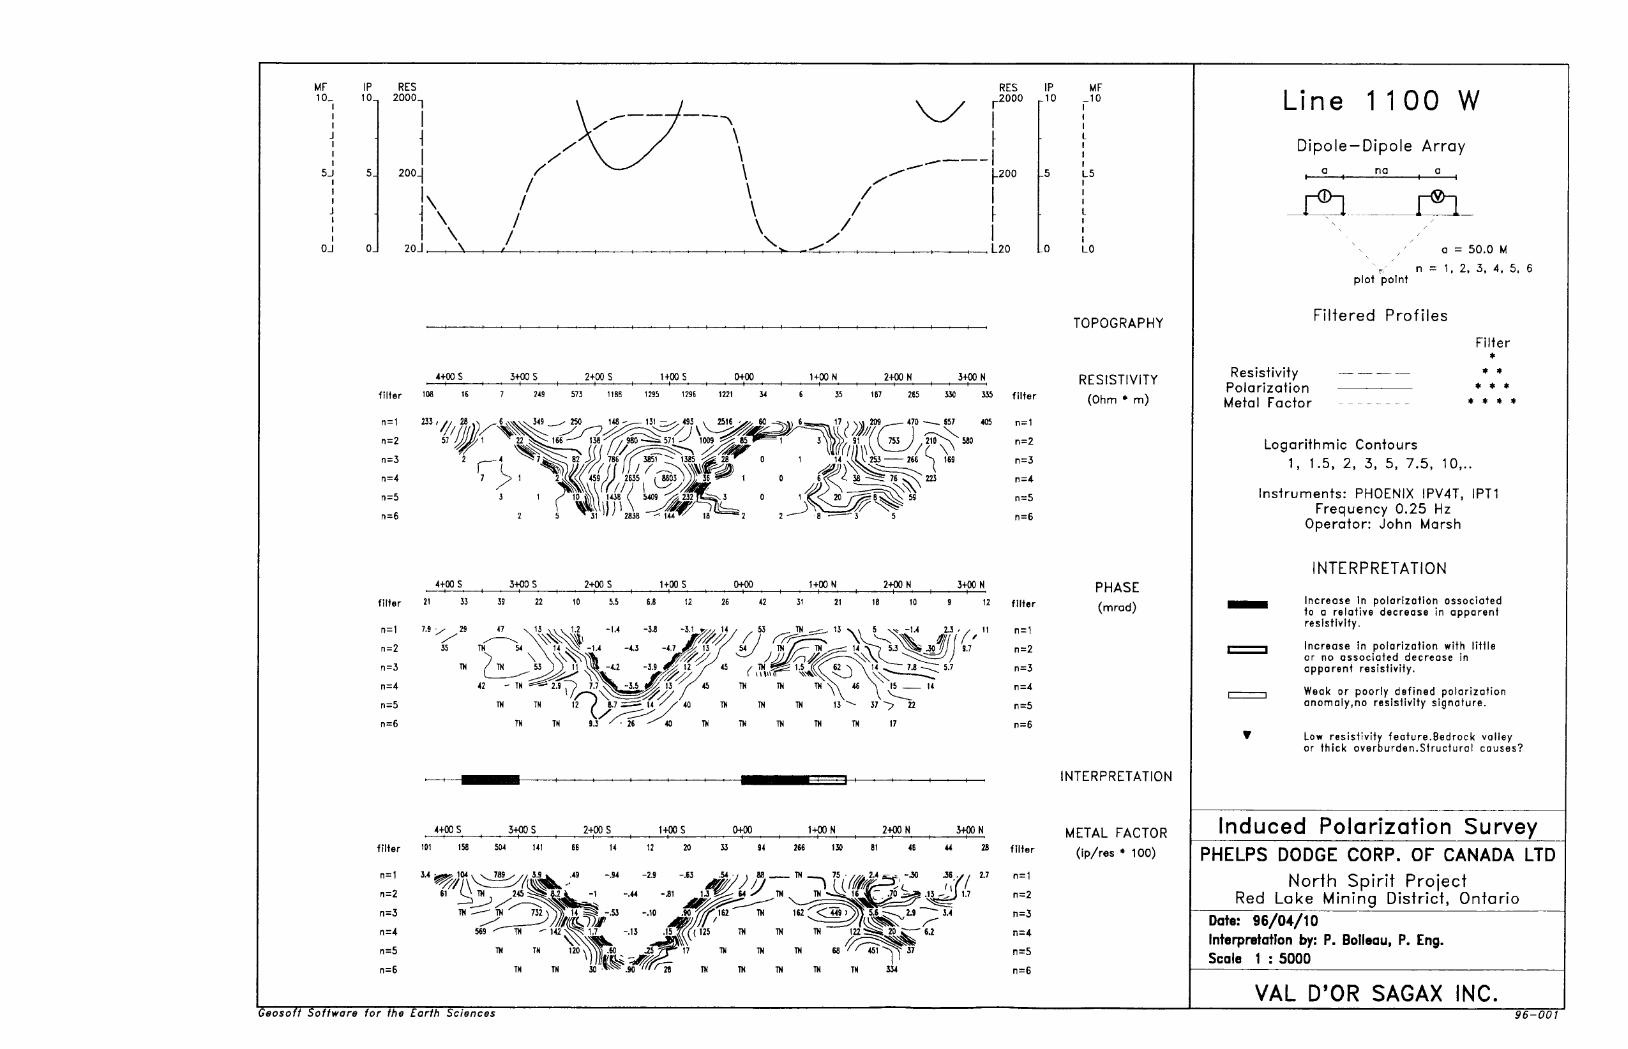
MF
5J
OJ
IP 10.
Oj
RES 2000-
200.|
i\70 l , \
RES .2000
IP^10
MF
\/
.200
, L20
3+OONfilter filter
n^1
^=2
n^3
n^4
^=5
n=6
4+00 S 3+00 S 2+00 S
M 7 TN A-- TN ^ 1 4 V^^ JM^^^~^
4+00 S—i——filter '01 158 504
3+00 S 2+00 S 1+00 S 0+00 1+00 N 2+00 N 3+OONfilter
L5
LO
TOPOGRAPHY
RESISTIVITY (Ohm * m)
PHASE (mrad)
INTERPRETATION
METAL FACTOR (ip/res * 100)
Line 1 1 00 WDipole-Dipole Array
a na a H————i
a = 50.0 M
n = 1. 2, 3, 4, 5. 6plot point
Filtered Profiles
Resistivity Polarization Metal Factor
Filter*
* ** * *
* * * *
Logarithmic Contours1, 1.5, 2, 3, 5, 7.5, 10,..
Instruments: PHOENIX IPV4T, IPT1Frequency 0.25 Hz
Operator: John Marsh
INTERPRETATION
Increase In polarization associated to a relative decrease in apparent resistivity.
Increase in polarization with little or no associated decrease in apparent resistivity.
Weak or poorly defined polarization anomaly.no resistivity signature.
Low resistivity feature.Bedrock valley or thick overburden.Structural causes?
Induced Polarization SurveyPHELPS DODGE CORP. OF CANADA LTD
North Spirit Project Red Lake Mining District, Ontario
Date: 96/04/10Interpretation by: P. Boileau, P. Eng.Scale 1 : 5000
VAL D'OR SAGAX INC.Geosoff Software for fhe Earfh Sciences 96-001

MF IP 10.
5j 5.
OJ OJ
RES 2000-
200-)
20 J./
/\ y
RES ^2000
[.200
L20
IP .10
MF -10
4+00 S 3400 S 2+00 S 1+00 S 0+00 1+00 2+00 N
0=6
4+00 S 3+00 S 2+00 S 1+00 S 0+00 1+00 N 2+00 N23 58 46 16 14 14
26 v^-9.3 v v 4.4 3.8 yf; -1.6 -2.5 A 4' 1 // 72 ™ f H ~ 2C ""j!*^ U//
^2 58 62 \ 39 \\ 11 \\ J.2 ^* -.30 -1.5 ,- 3.4 •T/ 60 TN \ TN ^^ -1-*JK 6 .2 /X 20\\\\vi/^ ^^x/ JJ^ ^^^y/72 x 41 \ V 8.1 W - 2 .70 5^?6.5 ^?X 51 TN ^"^ TN C~ K \N 9.5 -S 20\\vvW ' 'df^^y ' ' ^^"^^^^ = 4 69 72 \ 36 VA 3J t -.20 1^ 8.7 /X 50 TN TN 32 ^ 55 ^- 20\ \\^!S*
n=5 62 K \ 32\SN5.5——^.8 f/// 49 TN TN TN TH TN
^=3
filter
n=3
n=5
0=6 45 51 35 x^ 14 TN TN TN TH
Lo LO
4+00 S 3+00 S 2+00 S 1+00 S 0+00 1+00 N 2+00 Nfilterfilter 1709 1291 750 286 203 166 27 55 100 206 124 37
1J .49 J9 -39 -1.7 .to -^ 141 TN , i -.24 -.78 .44
555 TH. TH;——J1
819 -^ 1479 W 43 k^ J4 .15 tf^- 45 TN TN TN TH
3126 ' ' 539 "VN 14 X "' ' m TN TN
TOPOGRAPHY
RESISTIVITY (Ohm * m)
PHASE
(mrad)
INTERPRETATION
METAL FACTOR (ip/res * 100)
Line 1000 WDipole-Dipole Array
a no a
plot point
Filtered Profiles
a = 50.0 M
n = 1, 2, 3, 4, 5, 6
Filter
Resistivity Polarization Metal Factor
Logarithmic Contours1, 1.5, 2, 3, 5, 7.5, 10,..
Instruments: PHOENIX IPV4T, IPT1Frequency 0.25 Hz
Operator: John Marsh
INTERPRETATION
Increase in polarization associated to a relative decrease in apparent resistivity.
Increase in polarization with little or no associated decrease in apparent resistivity.
Weak or poorly defined polarization anomaly,no resistivity signature.
Low resistivity feature.Bedrock valley or thick overburden.Structural causes?
Induced Polarization SurveyPHELPS DODGE CORP. OF CANADA LTD
North Spirit Project Red Lake Mining District, Ontario
Date: 96/04/10Interpretation by: P. Bolleau, P. Eng.Scale 1 : 5000
VAL D'OR SAGAX INC.Geosoft Software for the Earth Sciences 96-001

MF 10-,
IP 10
Oj
RES 2000,
RES -2000
20o \ \
20.\/\s
—f———'———l-
\ fM
200
.20
IP .10
MF -10
.5
Lo
4+00 S 3+00 S 2+00 S 1+00 S 0+00 1+00 N 2+00 N
filter '55 244 443 856 1041 1525 1294 1237 680 25 94 275 304 638
73 j 1 26 x j 331 i . 1140 1224 v 1843 y ( 268 ^ 438 529 xxssr. J2 \ 78 , i 280 —174 __- 204 jSia-r 846
n=2
n=3
130 J 2 61 l 835 V 1468 1235 — 1071 ^ 1407 ——852
194 f y/3 819 x^. 1085 -^~Wi (fi 4766 ^ 2094
r^4 366 457 ^__618 ^— 5 12 y 2470 \ 5906
^=5 274-—— 326 —~ 267 ' (f 1 873 2747 . ^.H7~*li~ 12 ——— 15
n=6
^00 ^^
filter 21 U
11 ^—6.1
192 1J3 ' ' 948 v 1917 • •f "K '' 28 21
filter
n^
n=2
n^3
n^4
0=5
n^6
3+00 S 2+00 S HOOS 0+00 1+00 N 2+00 N
19 14 13 11 10 13 46 22 14 12
1-5
4+00 S 3+00 S 2+00 S HOOS 0+00 1+00 N 2+00 N
3.4 2.7 9.1 21 55 75 276 157 80 54 8.7
.47 J3 .34 .65 ^ -SI
iv^i^^--^ mz^s^.6 ^V- 1.6 ^ .91 ——— M , -.M *J*Tf(CH ^
'•5 filter
n=2
n=3
n=4
TOPOGRAPHY
RESISTIVITY (Ohm * m)
PHASE(mrad)
INTERPRETATION
METAL FACTOR (ip/res * 100)
Line 900 WDipole — Dipole Array
a na a i————i————————i————i
J±l
plot point
Filtered Profiles
a = 50.0 M
n = 1. 2. 3, 4. 5, 6
Resistivity Polarization Metal Factor
Filter*
* ** * ** * *
Logarithmic Contours1, 1.5, 2, 3, 5, 7.5, 10,..
Instruments: PHOENIX IPV4T, IPT1Frequency 0.25 Hz
Operator: John Marsh
INTERPRETATION
Increase in polarization associated to o relative decrease in apparent resistivity.
Increase in polarization with liitle or no associated decrease in apparent resistivity.
Weak or poorly defined polarization anomaly.no resistivity signature.
Low resistivity feature.Bedrock valley or thick overburden.Structural causes?
lnduced Polarization SurveyPHELPS DODGE CORP. OF CANADA LTD
North Spirit Project Red Lake Mining District, Ontario
Date: 96/04/10Interpretation by: P. Bolleau, P. Eng.Scale 1 : 5000
VAL D'OR SAGAX INC.Sof/ware for //ie for//] Se/ences 96-001
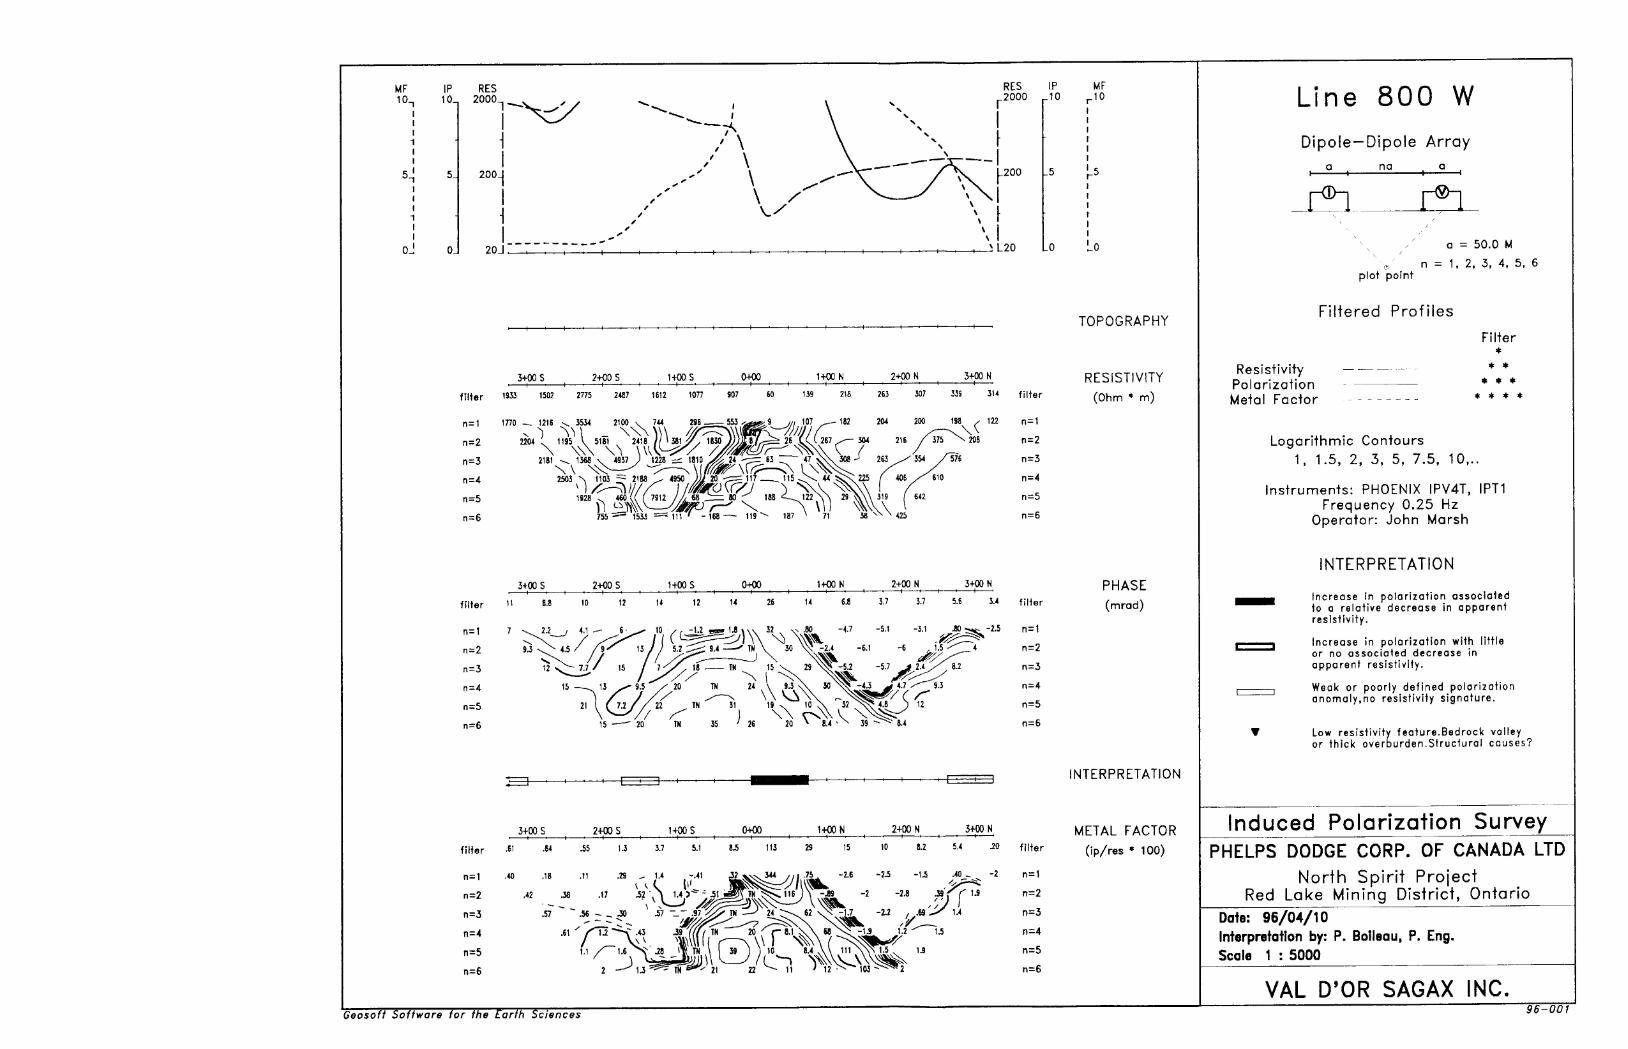
MF 10.
IP 10.
RES 2000,
2001
20J.
RES2000
IPr-10
200
L20
MF -10
3+00 S 2+00 S 1+00 S 0+00
filter 1S33 1502 2775 2487 1612 1077
0 = 1 1770 — 1216 -x. 3534 2100 v 744 291X s) Vi l . V\\Y)\ ///r -s
0=2 220* ' 1195 V 5181 2418 //I381i/, 1830\ \v\ M \ \\^y/ /^...0=3 2181 -v. 1M8 x 4937 ) 1 228 ^ 1810 ^ 2*
N \ X^C——-^ s*——~~ 0=4 2503 -s 1103 ~ 2188 ^ 4950
0=5 1S28 ^ 460 (( f 7912 l/tW^^- M' ^ 188
0=6 755 '^ 'i5J3 ^ in"7 ~- fee—- 119"^ 187
139
1+00 M | 2+00 N [ 3+00 N
218 263 307 339 3U filter
122 0=1
3+00 S 2+00 S 1+00 S 0+00 1+00 2+00 N 3+00 N
filler
x .J \\ rV\ V V^; 26 20 x 8.4 - x 39 •-^^ 8.4
3+00 S 2+00 S
11=2 0=3 0=4
3+00 N
5.* .20 fjHer
ns!
n^2
n=3
n=4
ns5
n=6
TOPOGRAPHY
RESISTIVITY (Ohm * m)
PHASE (mrad)
INTERPRETATION
METAL FACTOR (ip/res * 100)
Line 800 WDipole-Dipole Array
na a
plot point
Filtered Profiles
a = 50.0 M
n = 1, 2, 3, 4, 5, 6
Resistivity Polarization Metal Factor
Filter*
* ** * *
* * * *
Logarithmic Contours1, 1.5, 2, 3, 5, 7.5, 10...
Instruments: PHOENIX IPV4T, IPT1Frequency 0.25 Hz
Operator: John Marsh
INTERPRETATION
Increase in polarization associated to a relative decrease in apparent resistivity.
Increase in polarization with little or oo associated decrease in apparent resistivity.
Weak or poorly defined polarization anomaly.no resistivity signature.
Low resistivity feature.Bedrock valley or thick overburden.Structural causes?
Induced Polarization SurveyPHELPS DODGE CORP. OF CANADA LTD
North Spirit Project Red Lake Mining District, Ontario
Date: 96/04/10Interpretation by: P. Boileau, P. Eng.Scale 1 : 5000
VAL D'OR SAGAX INC.Geosor/ Software for the Earrh Sciences 96-001
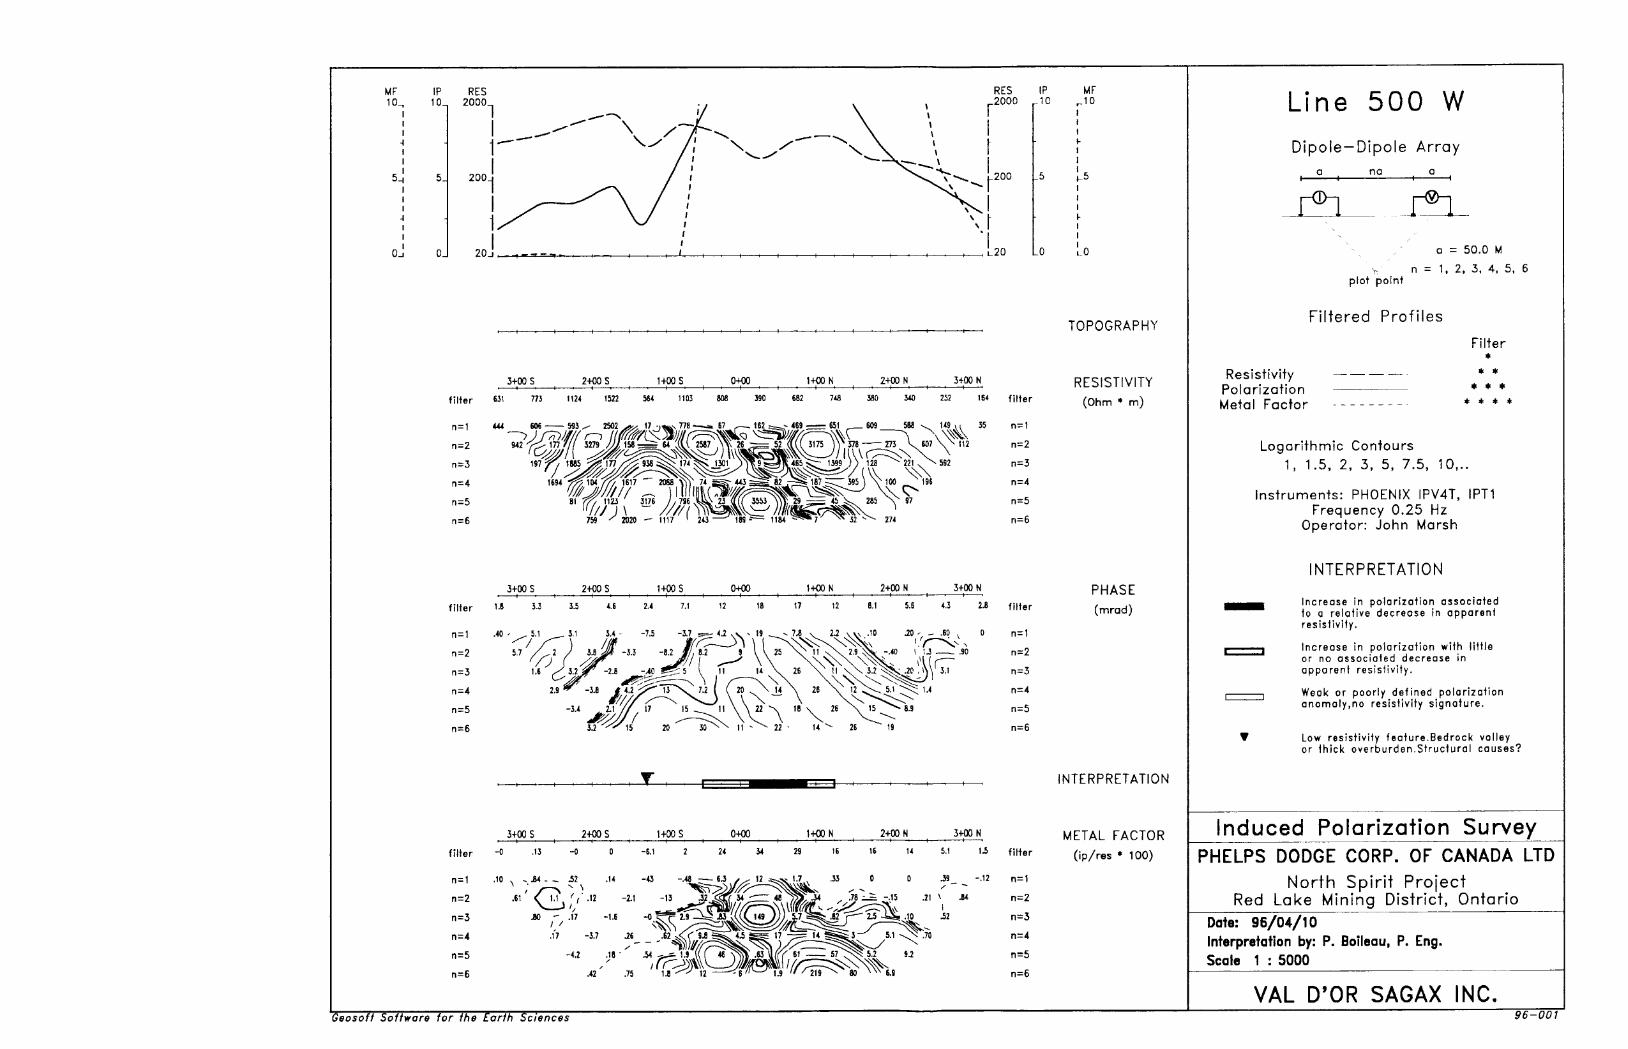
MF 10.
IP 10.
5., 5.
0.
RES 2000
200
20j
RES 2000
IP
200
u20
filter
filter
filter
n^
n=2
n=3
n=4
n=5
0=6
3+00 S 2-fOOS HOPS 0+00 1+00 N 2+00 N J+OON
773 1124 1522 564 1103 808 390 682 748 380 J40 252 164 fjjfer
11=3
11=4
r^5
n=6
n = \ 444 606——-593^ 2502 .~x, 17 -mus 778——a 67 ,—. \VL ^~. K&——V,\ .__ 609 588 ^ 149 u 35
942 "f^r 1 77 l J279 JJI. 1 58-^ 64 IU 2587 AY 26 ^ 52 ( 3175 M' 378 —— 273 V M7
82 r^* 187 C^ 395 V 100 195
759 ' 2020 — 1117 s 243
3+00 S 2+00 S 1+00 S 0+00 1+00 N 2+00 N 3+00 N
4.3
26 19
filter
r^l
n=2
n=3
0=4
0=5
0=6
3+00 S 2+00 S 1+00 S 0+00 1+00 N 2+00 N 3+ON-O -6.1 2 24 34 29 16 16 14 5.1 filter
.10 N - M - .61 '
JO
^2 .14 -43 -.48 ——6J j - 1 2 ^^S^I-7 x .33 O O JS - -.12 0=1
f l M -2.1 -13 *2 M Ms^:L W tii!'''** ' •'8 ^-^ "'.15 -2I V M n ^2
,42 .75 U 12 't 1.9 219 w 6.3 H—D
MF JO
TOPOGRAPHY
RESISTIVITY (Ohm * m)
PHASE (mrad)
INTERPRETATION
METAL FACTOR (ip/res * 100)
Line 500 WDipole —Dipole Array
J±L
plot point
Filtered Profiles
o = 5 0.0 M
n = 1, 2, 3, 4. 5, 6
Resistivity — — — Polarization ————— Metal Factor
Filter*
* * * * *
* * *
Logarithmic Contours1, 1.5, 2, 3, 5, 7.5, 10,..
instruments: PHOENIX IPV4T, IPT1Frequency 0.25 Hz
Operator: John Marsh
INTERPRETATION
Increase in polarization associated to a relative decrease io apparent resistivity.
Increase in polarization with little or no associated decrease in apparent resistivity.
Weak or poorly defined polarization anomaly,no resistivity signature.
Low resistivity feature.Bedrock valley or thick overburden.Structural causes?
Induced Polarization SurveyPHELPS DODGE CORP. OF CANADA LTD
North Spirit Project Red Lake Mining District, Ontario
Date: 96/04/10Interpretation by: P. Boileau, P. Eng.Scale 1 : 5000
VAL D'OR SAGAX INC.Ceosor/ Software for the Earth Sciences 96-001

MF 1CL 10^
Oj
RES 2000
RES2000
20J
IP.10
MF
Lo
filter 393
11 = 1
3+00 S 2+00 S 1+00 S 0+00 1+00 N——t——i——t——i——i——t——i——i——i——i——i——i——i——i——i——'——t——i—522 8JO 947 871 904 575 396 381 606
2+00 N | 3+00 N
330 392 266 280 filter
314 340 - 287 278 ,' "^ . I f———~\\ ^-
n=2 293 /-s 1 83 [ 782 ) 293 ^— 453
3+00 S 2+00 S-H———i———h- 1+00 S 0+00 1+00 N
W
2+00 N 3+00filter --SO -1-3 2-3 2.7 4.5 8.1 15 24 25 15 9.5 *.3 2.1 filter
2.9 , i,. .40 sast 4.1 ^-2J -3.4 -4.1 x* .4.41 .v s .22 l?vv"x "-M - - l :5 ^.-.60 -JO n = 1
36 \ 19 ,\X 3.1 u -1.8 *\ 2.6
2.4 ^ -.90 "S 2.5
19 , 25 19 v"S; 4 .5-3.6 -2.4 fc\ 5.{ -—— 5.1 y 12
JO '"' 1.7- ^- M - V ' 23 22
3+00 S 2+00 S 1+OOS 0+00 1+00 N 2+00 N 3+00 Nfilter -3B -.74 filter
TOPOGRAPHY
RESISTIVITY (Ohm * m)
PHASE
(mrad)
INTERPRETATION
METAL FACTOR (ip/res * 100)
Line 400 WDipole —Dipole Array
a no
plot point
Filtered Profiles
a = 50.0 M
n = l, 2, 3, 4, 5, 6
Resistivity —Polarization ——Metal Factor --
Filter
* * * * * * *
Logarithmic Contours1, 1.5, 2, 3, 5, 7.5, 10,..
Instruments: PHOENIX IPV4T, IPT1Frequency 0.25 Hz
Operator: John Marsh
INTERPRETATION
Increase in polarization associated to o relative decrease in apparent resistivity.
Increase in polarization with little or no associated decrease in apparent resistivity.
Weak or poorly defined polarization anomaly,no resistivity signature.
Low resistivity feature.Bedrock valley or thick overburden.Structural causes?
Induced Polarization SurveyPHELPS DODGE CORP. OF CANADA LTD
North Spirit Project Red Lake Mining District, Ontario
Date: 96/04/11Interpretation by: P. Boileau, P. Eng.Scale 1 : 5000
VAL D'OR SAGAX INC.Geosoff Software for the tarfn Sciences 96-001
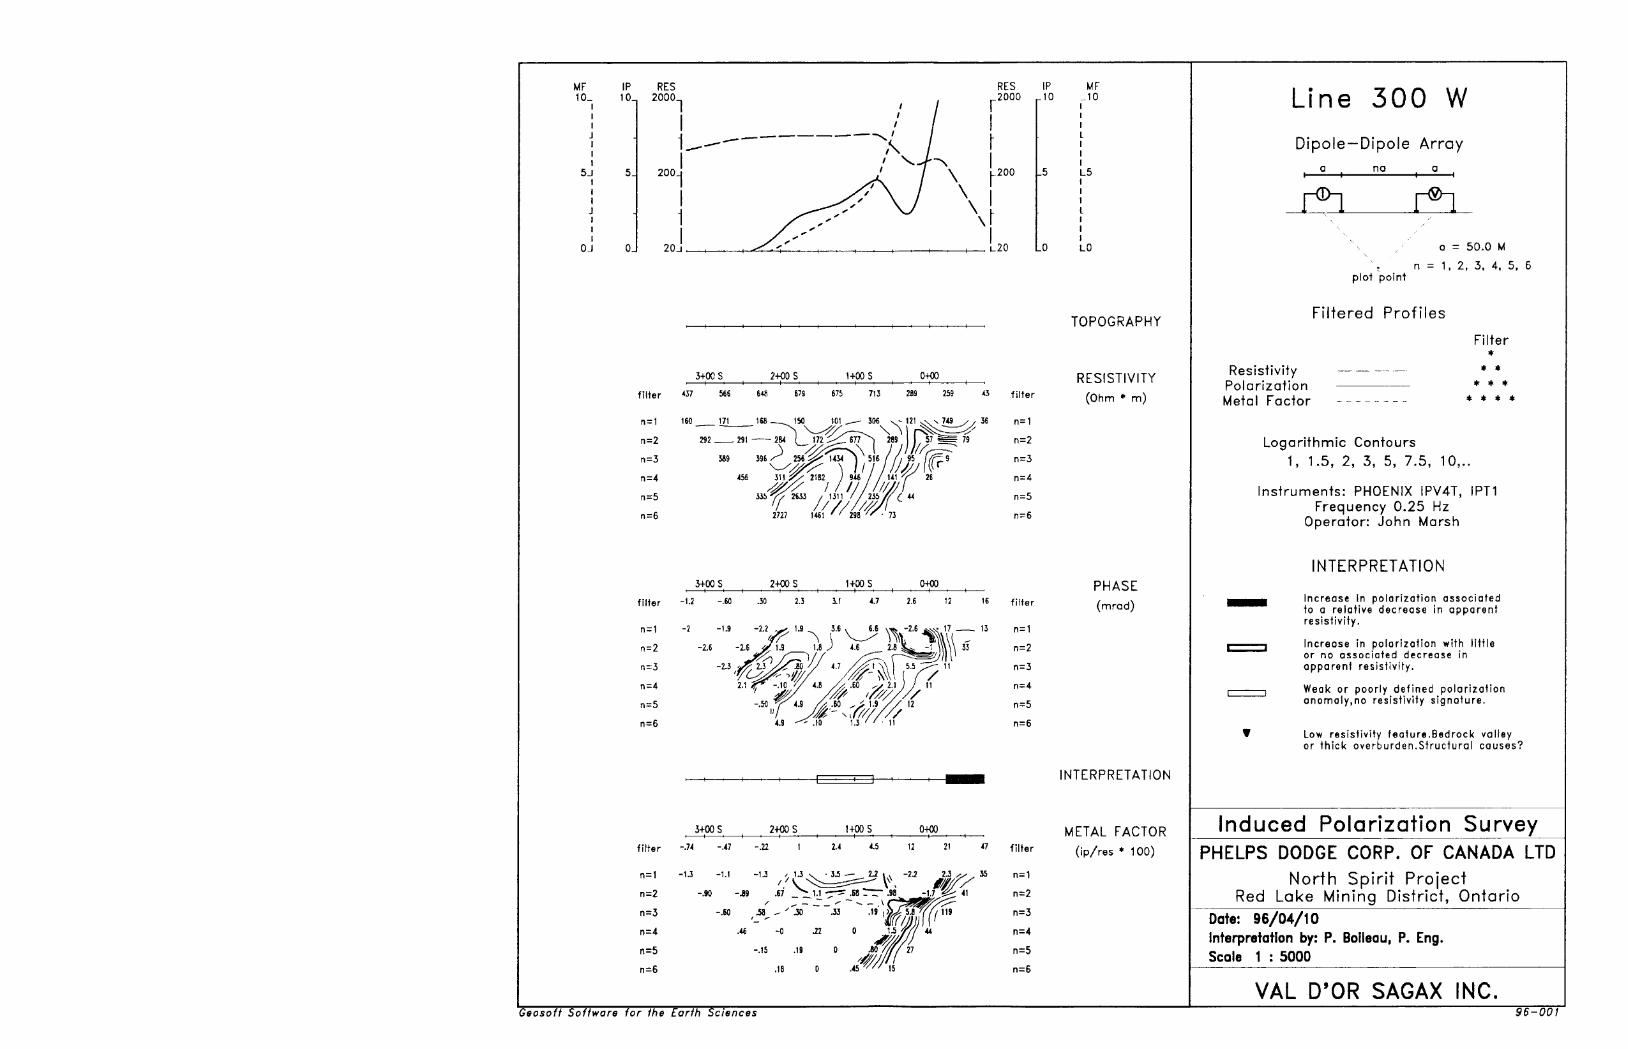
MF 10.
5J
OJ
IP 10.
5.
RES 2000
RES 2000
200
20j
IP .10
.5
3+00 S 2+00 S 1+00 S 0+00
filter
r\-\
n=2
n=3
n=4
n=5
3+00 S 2+00 S 1+00 S 0+00
filter
MF .10
3+00 S 2+00 S 1+00 S 0+00
filter
n^1
n=2
n=3
[1=4
L5
LO
TOPOGRAPHY
RESISTIVITY (Ohm * m)
PHASE
(mrad)
INTERPRETATION
METAL FACTOR (ip/res * 100)
Line 300 WDipole —Dipole Array
o noa
plot point
Filtered Profiles
a = 50.0 M
n = 1, 2, 3. 4. 5, 6
Resistivity Polarization Metal Factor
Filter*
* ** * *
* * * *
Logarithmic Contours1, 1.5, 2, 3, 5, 7.5, 10,..
Instruments: PHOENIX IPV4T, IPT1Frequency 0.25 Hz
Operator: John Marsh
INTERPRETATION
Increase In polarization associated to a relative decrease in apparent resistivity.
Increase in polarization with little or no associated decrease in apparent resistivity.
Weak or poorly defined polarization anomaly.no resistivity signature.
Low resistivity feature.Bedrock valley or thick overburden.Structural causes?
Induced Polarization SurveyPHELPS DODGE CORP. OF CANADA LTD
North Spirit Project Red Lake Mining District, Ontario
Date: 96/04/10Interpretation by: P. Boileau, P. Eng.Scale 1 : 5000
VAL D'OR SAGAX INC.Geosoft Software for the Earth Sciences 96-001

MF IP
5.
RES 2000-
200.
20J
RES IP 2000 10
L200
MF 10
.5
—l———'——h-
3+00 Sfilter 196 374
11=2n^4
n=5
n=6
2+00 S 1+00 S 0+00
3+00 S 2+OOS 1+00 S 0+00
filter -2-6 -1-4 --80 -JO 1.7 -2.3 4.4 fj|te r
-2J 16 r^1nrl -li -2.2 -.80 -.80 -U, J
^=2 -6 -2.3 -.80 -1.3 v 4J ^- 1.9 , -6
0=3 -6.2 -1.1 ~ \* ?/ ^ S0- " 10 " "-40
^=4 -3.9 -1.7 !4.5^-1.B -3.1
n=5
n=6 18 •'-4.1 -4.1
^ = 4
3+00 S 2+00 S 1+00 S 0+00
filter -2-5 -1.3 -1.1 -.85 -1.1 -.53 -6.9 -6.2 fj|fer
11 = 1 -2.6 -.86 -.45 -.17 -.92 , . .97... -2J ^9.6 n^1
n=2 -2J -.77 -.39 -J6 j) ' .45 -41 n=2
n =:3
n=5
r^6
-3.2 -J1 -1.1 JO -0 -.66
-1.8 -.79 .48 -.13 -6.4
-3.1 K - .73 -3.5
.31 -JX -8.9
n=3
0=4
n^5
n=6
TOPOGRAPHY
RFRIRTIVITY
PHASE (mrad)
INTERPRETATION
FACTOR i * 100)
Line 200 WDipole-Dipole Array
a na . a
plot point
Filtered Profiles
a = 50.0 M
n - 1, 2, 3, 4, 5, 6
Resistivity Polarization Metal Factor
Filter
* ** * *
* * * *
Logarithmic Contours1, 1.5, 2, 3, 5, 7.5, 10,..
Instruments: PHOENIX IPV4T, IPT1Frequency 0.25 Hz
Operator: John Marsh
INTERPRETATION
Increase in polarization associated to a relative decrease in apparent resistivity.
Increase in polarization with little or no associated decrease in apparent resistivity.
Weak or poorly defined polarization anomaly, no resistivity signature.
Low resistivity feature. Bedrock volley or thick overburden. Structural causes?
Induced Polarization SurveyPHELPS DODGE CORP. OF CANADA LTD
North Spirit Project Red Lake Mining District, Ontario
Date: 96/04/10Interpretation by: P. Boileau, P. Eng.Scale 1 : 5000
VAL D'OR SAGAX INC.Geosoft Soffware for the tarfh Sciences 96-001

MF 10-
5J
Oj
IP 10.
Oj
RES 2000
20J
RES 2000
200J ^-——— 200
L20
IP .10
.5
3+00 S 2+00 S 1+OOS 0+00 1+00 N
filter "9 i" filter
3+00 S 2+OOS 1+OOS 0+00 1+OON
filter -2
0 = 1 -1.2 -1.4
0=2
n^3
0=4
0=5
0=6
filter
MF .10
\-5
3+00 S 2+OOS 1+OOS 0+00 1+OON
filter -1.6 -1.1 -.20 filter
LO
TOPOGRAPHY
RESISTIVITY (Ohm * m)
PHASE
(mrad)
INTERPRETATION
METAL FACTOR (ip/res * 100)
Line 100Dipole-DIpole Array
a no g
plot point
Filtered Profiles
a = 50.0 M
n = 1, 2, 3, 4, 5, 6
Resistivity Polarization Metal Factor
Filter*
* * * * *
* * *
Logarithmic Contours1, 1.5, 2, 3, 5, 7.5, 10,..
Instruments: PHOENIX IPV4T, IPT1Frequency 0.25 Hz
Operator: John Marsh
INTERPRETATION
Increase in polarization associated to a relative decrease in apparent resistivity.
Increase in polarization with little or no associated decrease in apparent resistivity.
Weak or poorly defined polarization anomaly.no resistivity signature.
Low resistivity feature.Bedrock valley or thick overburden.Structural causes?
Induced Polarization SurveyPHELPS DODGE CORP. OF CANADA LTD
North Spirit Project Red Lake Mining District, Ontario
Date: 96/04/11Interpretation by: P. Bolleau, P. Eng.Scale 1 : 5000
VAL D'OR SAGAX INC.Geosoft Software for the Earth Sciences 96-001
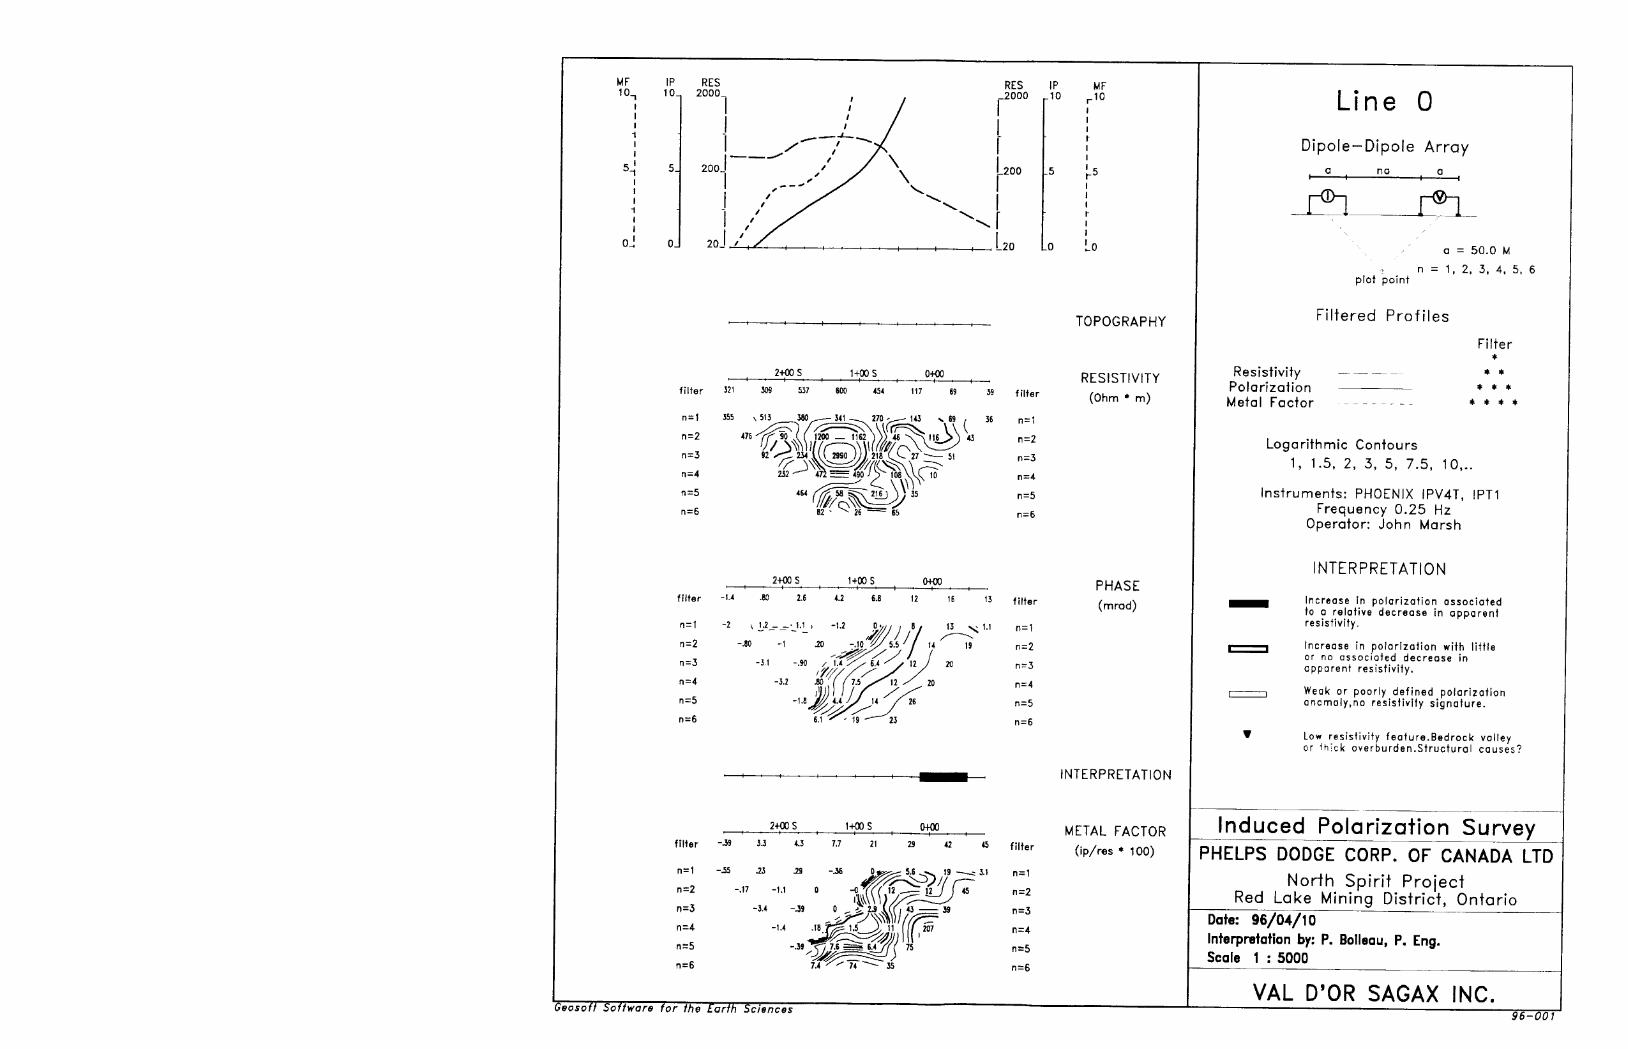
MF IP RES RES IP MF 10n 10 2000- ( .2000 10 r10
; l_ x"""7~~7\5^ 5- 200. /' y \ .200 .5 h5
f S \/"V^ "\,,-x \ '
n n 90 ,/ , X\ , , , , , . , , , , , 7n n n
TOPOGRAPHY
2+00 S ( 1+00 S | 0+00 ; RFSI5TIVITYfilter "1 JM 5" 600 454 117 69 J9 fj|ter ^Qhm t ^
n = 1 355 \513 MO ^--r 541 -^ 270 - — 1 43 x 69 , 36 n = 1
0=2 m -^^wlf 1 200 — 1162 \y) tt N^iite^V) 43 0=292^S^)^\7c^ 5 1
n=4 232 -~~^ 472 ^ 490 J y~ 1 08 Vsk 10 0=4
" ^^)'35
n = 6 82 - ^ 26 —— 65 0 = 6
2+00 S 1+00 S 0+00 PHA^Ffilter -1-4 -BO 2.6 4.2 6.6 (2 16 13 filter (mrod)
n^ -2 v K2^^.-J.1 , -1.2 Ov/y j t, U -^ ' -l 0=1
r^2 -.80 -1 .20 -.n'z/te'/ 1 4 19 0 = 2
r^3 -3.1 -.90 x M /x 6.4 ^x 12 7 20 o^3tw////'./ y~" 30 f //'//x"n=5 -1.8 /^ 4.4 J J 1 4 7 26 0=5'^Xjrs^s0=6 6.1 -^' 19 -^^23 0=6
. , . , , , , ^^0 IWTFPPPrTATinW
2+00 S , 1+00 S ( 0+00 ( kXFTAI FAriORfilter -J* 3J *J " 21 29 42 45 filter ( ipyres * , QQ)
0 = 1 -J5 J3 J9 -J6 IS^S^" 5'6 ~^1 l9 ~^ 3'' n :z 1
0=2 -.17 -1.1 0 ~^\\( i12 - Q-J ) K ^ =2
n-3 -3.4 -J9 0 ^ y^a^H/V^^ M "^ 0=4 -1.4 .18.|^1.5^A 11 l (f 207 nz4 0=5 -.39;^^^^ 75 0=5 n=6 7.4 -x^ 74 ^~ 35 0=6
Line 0Dipole-Dipole Array
a no a
a - 50.0 M
n ^ 1, 2, 3, 4. 5, 6 plot point
Filtered Profiles
Filter
Resistivity — — — * *Polarization —————— * * *Metal Factor . ------ -- ****
Logarithmic Contours 1, 1.5, 2, 3, 5, 7.5, 10,..
Instruments: PHOENIX IPV4T, IPT1 Frequency 0.25 Hz
Operator: John Marsh
INTERPRETATION
^^^^ Increase in polarization associated to a relative decrease in apparent resistivity.
i i Increase in polarization with little or no associated decrease in apparent resistivity.
i | Weak or poorly defined polarization anomaly, no resistivity signature.
V Low resistivity feature. Bedrock valley or Ihick overburden. Structural causes?
Induced Polarization SurveyPHELPS DODGE CORP. OF CANADA LTD
North Spirit Project Red Lake Mining District, Ontario
Date: 96/04/10 Interpretation by: P. Bolleau, P. Eng. Scale 1 : 5000
VAL D'OR SAGAX INC.Geosofr Software for the Earth Sciences 96-001

MF
1
0.
IP 10.
5.
OJ
RES 2000
RES 2000
\ ,
IP .10
MF .10
3+00 S 2+00 S 1+00 S 0+00filter "6 237 219 256 216 252
0=6
3+00 S 2+00 S 1+00 S 0+00
filter filter
filter
0=1
0=2 0=3 0=4 0=5 0=6
TOPOGRAPHY
RESISTIVITY (Ohm * m)
PHASE (mrad)
INTERPRETATION
METAL FACTOR (ip/res * 100)
Line 200 EDipole—Dipole Array
na
plot point
Filtered Profiles
a = 50.0 M
n = 1, 2, 3, 4, 5, 6
Resistivity Polarization Metal Factor
Filter*
* ** * *
* * * *
Logarithmic Contours1, 1.5, 2 , 3 , 5, 7.5, 10,..
Instruments: PHOENIX IPV4T, IPT1Frequency 0.25 Hz
Operator: John Marsh
INTERPRETATION
Increase in polarization associated to a relative decrease in apparent resistivity.
Increase in polarization with little or no associated decrease in apparent resistivity.
Weak or poorly defined polarization anomaly,no resistivity signature.
Low resistivity feature.Bedrock valley or thick overburden.Structural causes?
Induced Polarization SurveyPHELPS DODGE CORP. OF CANADA LTD
North Spirit Project Red Lake Mining District, Ontario
Date: 96/04/10Interpretation by: P. Bolleau, P. Eng.Scale 1 : 5000
VAL D'OR SAGAX INC.GeosofV Sdtware for the Earth Sc/ences 96-001
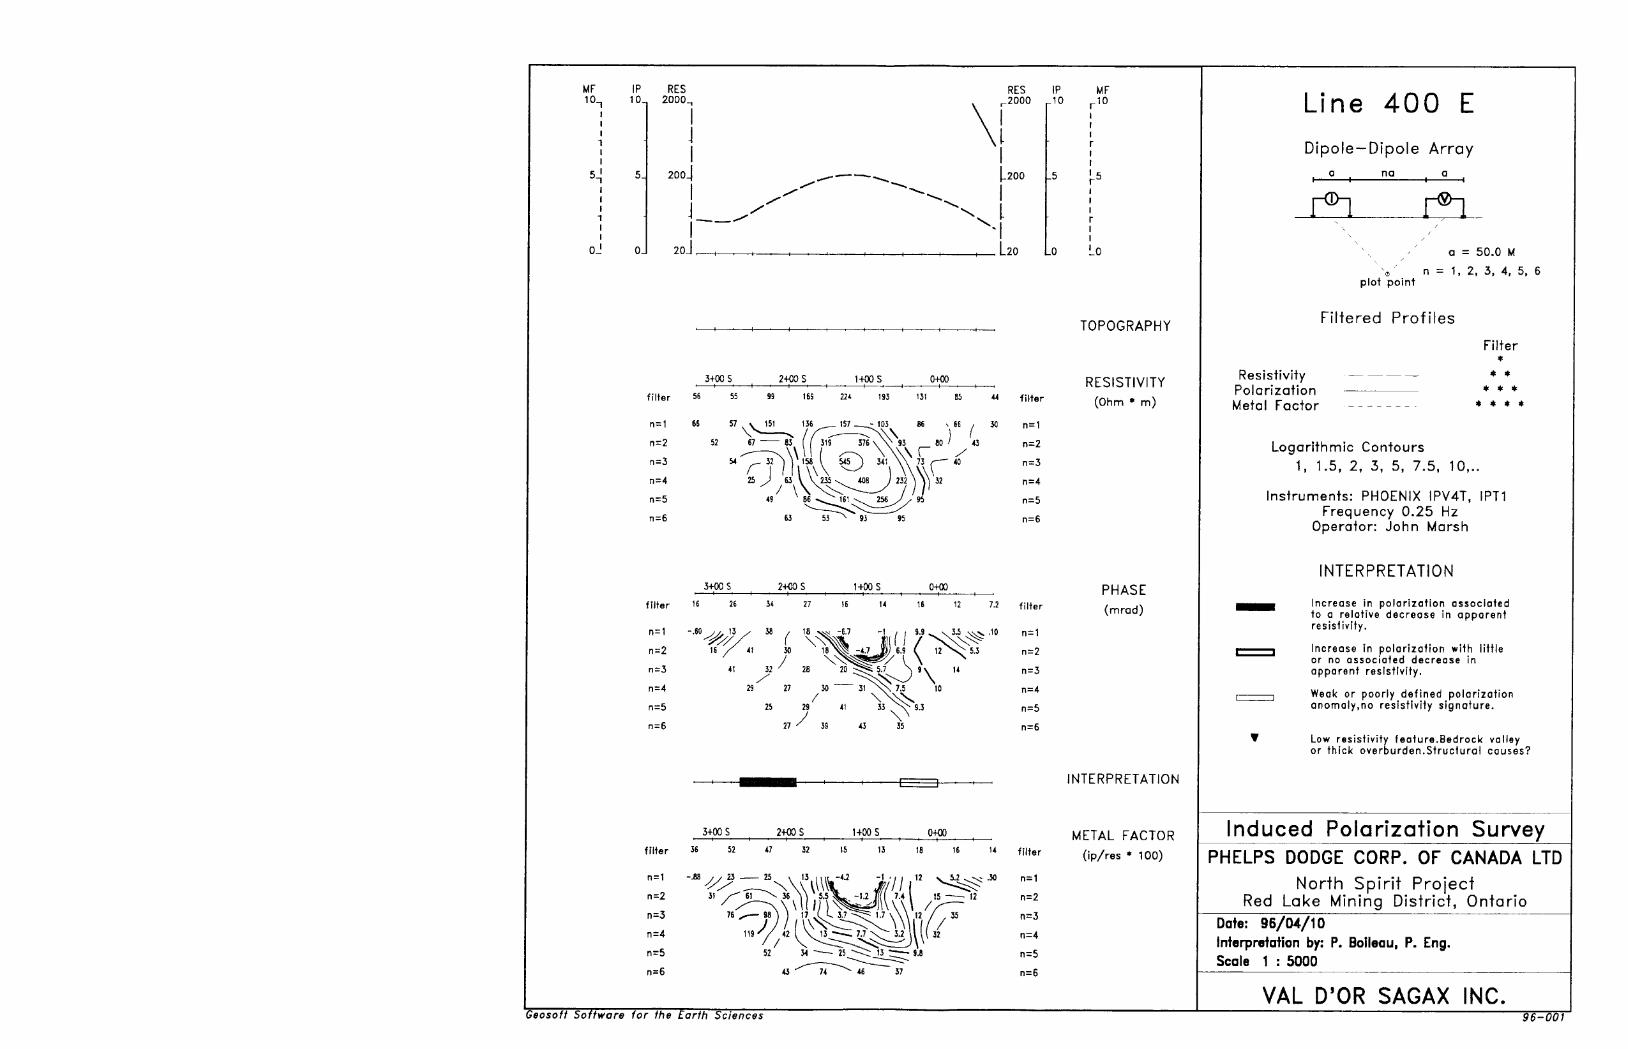
MF 10.
IP 10.
5.
OJ
RES 2000-
200-
20-
RES -2000
[-200
,l-20
IP .10
-5
3+00 S 2400 S 1+00 S
131
0+00
86 s 66 , 30
JO l 43^ - S
filter
0=2
0=3
0=4
0=6
1+00 S 0+00
filter
MF -10
3+00 S 2+00 S HOOS 0+00
filter
0 = 1
0=2 0=30=4 0=5 0=6
filter
TOPOGRAPHY
RESISTIVITY (Ohm * m)
PHASE (mrad)
INTERPRETATION
METAL FACTOR
(ip/res * 100)
Line 400 EDipole-Dipole Array
ploi point
Filtered Profiles
a :: 50.0 M n = 1, 2, 3, 4. 5, 6
Resistivity Polarization Metal Factor
Filter*
4 *
* * *
* * *
Logarithmic Contours1, 1.5, 2, 3, 5, 7.5, 10,..
Instruments: PHOENIX IPV4T, IPT1Frequency 0.25 Hz
Operator: John Marsh
INTERPRETATION
Increase in polarization associated to a relative decrease in apparent resistivity.
Increase in polarization with little or no associated decrease in apparent resistivity.
Weak or poorly defined polarizatioo anomaly.no resistivity signature.
Low resistivity feature.Bedrock valley or thick overburden.Structural causes?
Induced Polarization SurveyPHELPS DODGE CORP. OF CANADA LTD
North Spirit Project Red Lake Mining District, Ontario
Date: 96/04/10Interpretation by: P. Boileau, P. Eng.Scale 1 : 5000
VAL D'OR SAGAX INC.Geosoft Software for the Earth Sciences 96-001
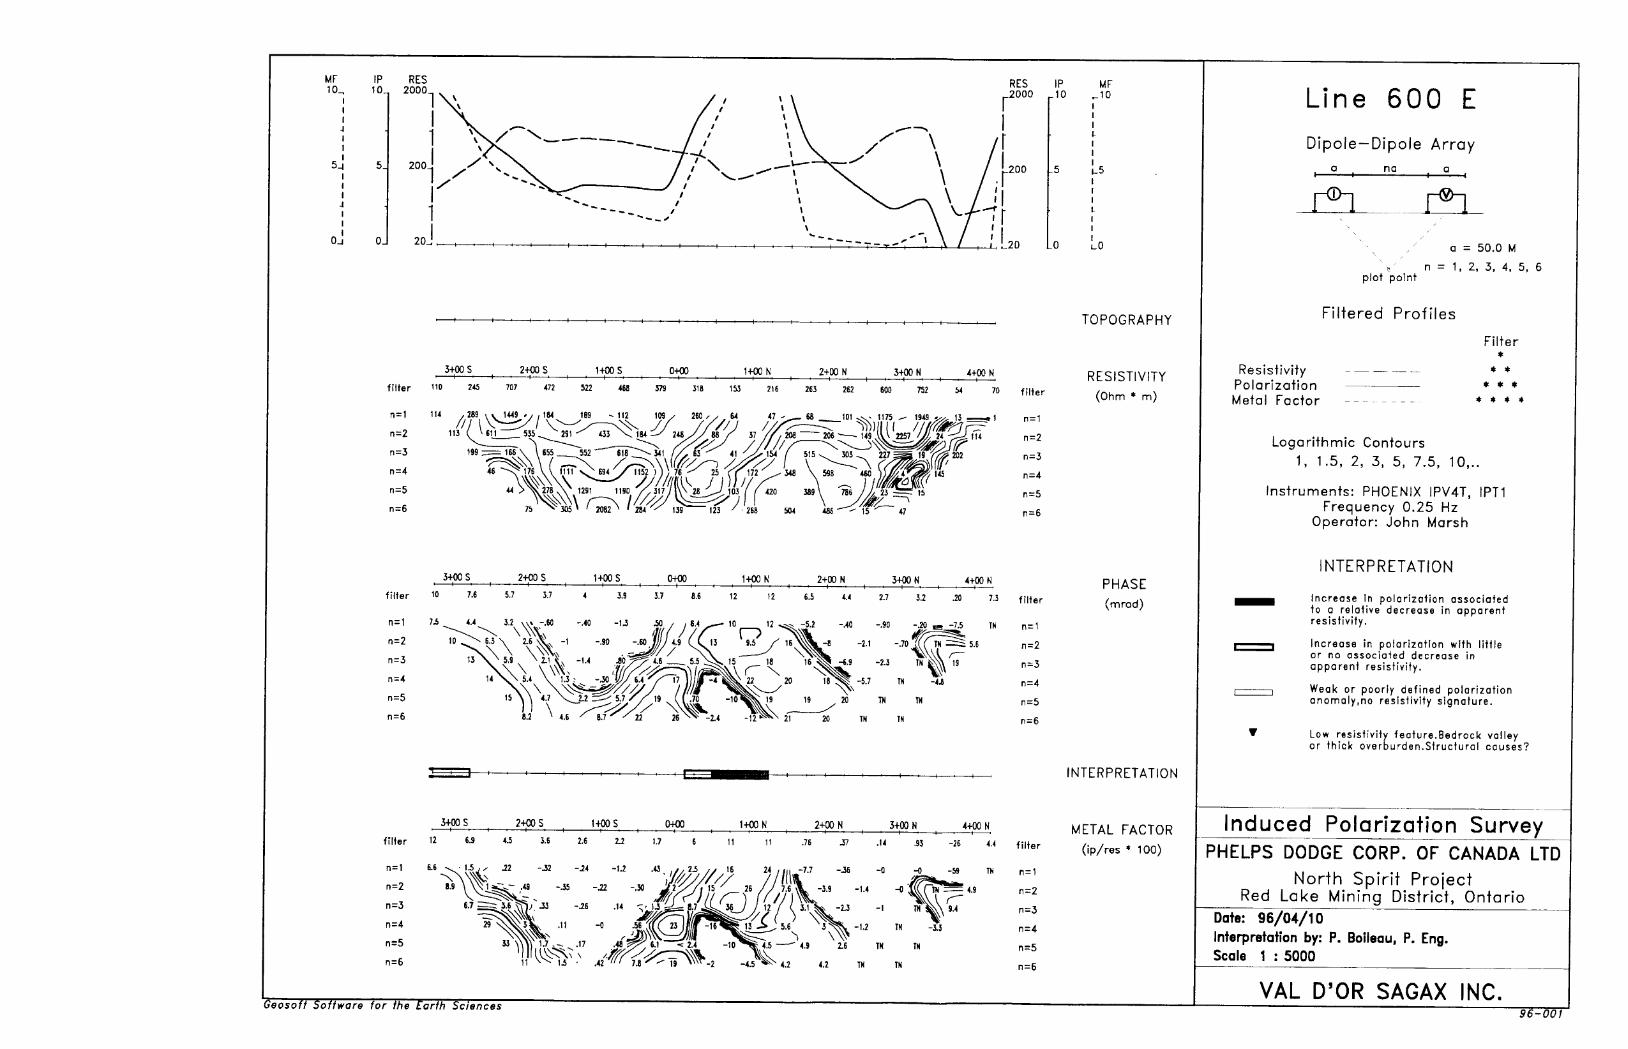
MF
5-1
IP 10.
5.
OJ
RES 2000 RES
2000
.200
IP .10
MF
3+00 S 2+00 S 0+00 1+00 N 2+00 N 3+00 N 4+00 Nfilter '10 245 707 472
5+00 S 2+00 S 1+OOS 0+00 1+00 K 2+00 N 3+00 N 4+00 Nfilter 10 7.6
n=6 8.2
Lo Lo
5+00 S 2+00 S 1+OOS 0+00 1+00 N 2+00 N 5+00 N 4+00 N
-26 4 .4 f i|ter
^=3
n=5
n^6
TOPOGRAPHY
RESISTIVITY (Ohm * m)
PHASE (mrod)
INTERPRETATION
METAL FACTOR (ip/res * 100)
Line 600 EDipole-Dipole Array
no a
plot point
Filtered Profiles
a = 50.0 M n = 1. 2, 3, 4, 5, 6
Resistivity Polarization Metal Factor
Filter*
* *
Logarithmic Contours1, 1.5, 2, 3, 5, 7.5, 10,..
Instruments: PHOENIX IPV4T, IPT1Frequency 0.25 Hz
Operator: John Marsh
INTERPRETATION
Increase in polarization associated to a relative decrease in apparent resistivity.
Increase in polarization with little or no associated decrease in apparent resistivity.
Weak or poorly defined polarization anomaly,no resistivity signature.
Low resistivity feature.Bedrock valley or thick overburden.Structural causes?
Induced Polarization SurveyPHELPS DODGE CORP. OF CANADA LTD
North Spirit Project Red Lake Mining District, Ontario
Date: 96/04/10Interpretation by: P. Boileau, P. Eng.Scale 1 : 5000
VAL D'OR SAGAX INC.Geosoff Software for the Earth Sciences 96-001

MF IP 10.
Oj
RES 2000.
200.
20j.
RES 2000
IP^10
MF
l L200
3+00 S 2+00 S 1+00 S 0+00 1+00 N 2+00 N 3+00 N 4+00 N
filter 264 372 463 496 459 419 374 261 178 174 162 159 126 124 92 68 filter
[1=2 310 270 271 198 ^~- 125 —-^ 165 -^ 2361 1125 113 60 (r^55 -— 48 r^1
" 70 [1=2
n=3' ^v *___ " \ V
n=3 245 f 335 448___400^——295 244 X 156 125 134 ^- 217 ^\ 87 .fss"*1' 71 0s- 110
260 469 769^BtJ O^ m f 1 40 141 131 f 317~^\ 240^^141 "100 ^ 61 [1=4
[1=5 331 j 726 f 1 520 - 1053 \ 204 126 139 S 287 333 367 \\ 135 f 77 n=5
' 1137 IS7fi l HW ' N 171 117 /' 901 1KH 171 326 ^^ 97 f^60 = 6 473 ' 1327 1676 ' 552 ' v 171 117' x 291 288 471
3+00 S 2+00 S 1+00 S 0+00 1+00 N 2+00 N 3+00 N 4+00 N
filter -2.1 -1.8 -1.6 -1.5 -1.2 -M - .60 -.50 -JO .30 JO .70 .70 .10 .80 4.5 fj|t e r
-1.6 -1.1 -.90 -1.4 -1 -.70 -.20 -.20 -.10 -.70 -.70 -1.1 .50 -1.7 -2.3*2.4 [1 =
0 = 2
0 = 3
0 = 4
0=5
0=6
-2 -1.5 -1.9 -.10 -M - .50 -.20 -JO -.70 JO - - .40 -.60 -1.6 -3 Jl/, 4.7/'/^r:^--Z.I -2 -1.4 -1.3 -.50 -.50 -.60 -.60 -1.1 , /J 1 .8 —— 1.3 * -2.7 -4.2
-3.1 -2 -1.1 -K - .90 -1.3 -.40 -1.6 - 1.4
-2.9 -1.5 -.70 -1.2 -1.3 -.50 -JO /x 1.2 ' 1 .9 18 ^_^.
-2.2 -1.5 -1.2 -1.5 -2.3 -.30 ^ 1.3 ' 1 .B ^ 1^ 3.5 " 7J
0=2
0=3
0=4
0=5
0=6
3+00 S 2+00 S 1+00 S 0+00 1+00 N 2+00 N 3+00 N 4+00 N
filter -.M -.56 -.52 -.57 -.60 -.45 -.25 -.28 -JO -.19 .10 .57 -.16 .78 6.5 fj|ter
n = t
n=2
n=3
0=4
n=5
^=6
-.39 -.35 -1.5 -1.9 -.97 -.17 -.14 -.13 -1J -2.7 -2.3 - \J." -2.1 -3.7:^x5 ^ 1
-.66 -.54 -.70 -O -.66 -.19 -O -21 - .63 J5. - - . .WU . -1 -2.7 -2.7^6.8 n=2-31 - .63 J5 . - .60 ;. -1 -2.7 1 "-V""^-SI -SK - .31 -.32 -.17 -.20 -.40 -.50 -.84 J2
-1J -.43 -.15 -O''t ^ v
-.25 -JO -J6 -1J .45 A 1.5 J3 -4.1\
-2.9 -6
-.88 -.20
-.46 -.12
-.12 -.66 -.43 -22 .40 ' 56 ' - - .76 C - Os
-.23 -1.3 -.25 .43 ' .62
0=3
0=4
0=5
0=6
TOPOGRAPHY
RESISTIVITY (Ohm * m)
PHASE
(mrad)
INTERPRETATION
METAL FACTOR (ip/res * 100)
Line 800 EDipole — Dipole Array
no aa
a ^ 50.0 M
n = 1, 2, 3, 4, 5, 6
Filter *
plot point
Filtered Profiles
Resistivity — — — — Polarization —————— Metal Factor
Logarithmic Contours1, 1.5, 2, 3, 5, 7.5, 10...
Instruments: PHOENIX IPV4T, IPT1Frequency 0.25 Hz
Operator: John Marsh
INTERPRETATION
Increase in polarization associated to a relative decrease in apparent resistivity.
Increase in polarization with little or no associated decrease in apparent resistivity.
Weak or poorly defined polarization anomaly,no resistivity signature.
Low resistivity feature.Bedrock valley or thick overburden.Structural causes?
Induced Polarization SurveyPHELPS DODGE CORP. OF CANADA LTD
North Spirit Project Red Lake Mining District, Ontario
Date: 96/04/10Interpretation by: P. Boileau, P. Eng.Scale 1 : 5000
VAL D'OR SAGAX INC.Geosol Sor/tfore for the Earth Sc/ences 96-001

Ministry ofNorthern Developmentand Mines
Ontario
Report of Work Conducted After Recording Claim
Mining Act
Transaction Number
oo //rPersonal information collected on this form is obtained under the authority of the Mining Act. This information will be used for correspondence. Questions about this collection should be directed to the Provincial Manager, Mining Lands, Ministry of Northern Development and Mines, Fourth Floor, 1 59 Cedar Street, Sudbury, Ontario, P3E 6A5, telephone (705) 670-7264. ^ ^
^ o l g g ?; AInstructions: - Please type or print and submit ir- -i -—'-~~'- v
- Refer to the Mining Act and Ree Recorder.
- A separate copy of this form mi- Technical reports and maps mu- A sketch, showing the claims tt
900
consult the Mining
Recorded Holder(s)
Address . . ^
Mm ng Division ^ Township/Area t . i. /~/" j i
fieO Ihk'i- fa r fi ^f.f La&lKurMDates ^ l i x? 7 ^ Work From: i L t/ , O,?/ T o: /Z, 1 i Performed /^i?X6,///^ tfffi ( ''y
Work Performed (Check One Work Group Only)Work Group
Geotechnical Survey
Physical Work, Including Drilling
Rehabilitation
Other Authorized r Work ^
Assays
Assignment from Reserve
Type
Client No.
Telephone No. - ^~ t
^j^S-viWD'^ofcl i l 1996 ——
MINING LANDS BHAINuH |
h'w. Cd-fji'tif GurflwKdl (tWCL if) tofutll]d' f y J } \J
• ECU O M 18 ONLY
•7/ ix/-/ Total Assessment Work Claimed on the Attached Statement of Costs S r v. J l l
Note: The Minister may reject for assessment work credit all or part of the assessment work submitted if the recorded holder cannot verify expenditures claimed in the statement of costs within 30 days of a request for verification.
Persons and Survey Company Who Performed the Work (Give Name and Address of Author of Report)
/"i j f 0 d
i
ji-w)*/ UwtfMMd (\cl.. @jfliMfal ^ Ufaj / / ,j. ;
(attach a schedule if necessary)
Certification of Beneficial Interest * See Note No. 1 on reverse side
1 certify that at the time the work was performed, the claims covered in this work report were recorded in the current holder's name or held under a beneficial interest by the current recorded holder.
Date Recortied Holder or Agent (Signature)
Certification of Work Reportl certify that ! have a personal knowledge of the facts set forth in this Work report, having performed the work or witnessed same during and/or after its completion and annexed report is true.
Name and Address of Person Certifying
"J Certified By (Sigrfaulre)Telepone No. Date
For Office Use OnlyTotal Value Cr. Recorded
00
? f,
/Jjtc
g Recorder/rV
Date Approved
f, ^~^—^/.A /t x (.*r~7Z**rr*c
Date Notice for Amendndents Sentdnde
G DIV.

1(583 I
e. c33 w tr
C~v r- r- o o
X}
oJO
N'w J
50 O
-•JQ.
m 3
ID 3 "^2"* — ' CD
COD B) O 3'""
o St3 C 9 to
O-
'o
-f vi
f?yr ET
CN.
Bo.
C* ooo O
\ -O o-
O S o- o O o
Oo-a g:
i s g S
o w 32.
1Q
o O'ill5 3 m O3 Q.
iJT
"O .5!
M Ox
^o•o
m.--e*
fi a o
Credits you are claiming in this report may be cut back. In order to minimize the adverse effects of such deletions, please indicate from which claims you wish to priorize the deletion of credits. Please mark ( s) one of the following:
1. D .Credits are to be cut back starting with the claim listed last, working backwards.
2. 0 Credits are to be cut back equally over all claims contained in this report of work.
3. CD Credits are to be cut back as priorized on the attached appendix.
In the event that you have not specified your choice of priority, option one will be implemented.
Note 1: Examples of beneficial interest are unrecorded transfers, option a greements, memorandum of agreements, etc., with respect
to the mining claims.
Note 2: If work has been performed on patented or leased land, please complete the following:
l certify thai the recorded holder had a beneficial interest in the patented ig
or leased land at the time the work was performed. ,M^Date

Ontario
Ministry ofNorthern Developmentand Mines
Ministere du Developpement du Nord et des mines
Statement of Costs for Assessment Credit
Etat des couts aux fins du credit devaluation
Mining Act/Loi sur les mines
Transaction NoVN e da transaction
. oo /s ?
Personal information collected on this form is obtained under the authority
of the Mining Act. This information will be used to maintain a record and
ongoing status of the mining claim(s). Questions about this collection should
be directed to the Provincial Manager, Minings Lands, Ministry of Northern
Development and Mines, 4th Floor, 159 Cedar Street. Sudbury, Ontario
P3E 6A5, telephone (705) 670-7264.
Les renseignements personnels contenus dans la presente (ormule sont
recueillis en verlu de la Loi sur les mines et serviront a tenir a jour un registre
des concessions minieres. Adresser toute quesiton sur la collece de ces
renseignements au chef provincial des terrains miniers, ministere du
Developpement du Nord et des Mines, 159, rue Cedar, 4e etage, Sudbury
(Ontario) P3E 6A5, telephone (705) 670-7264.
1. Direct Costs/Couts directs
Type
Wages Salaires
Contractor's and Consultant's Fees Droits de ('entrepreneur et de I'expert- consell
Supplies Used Fournitures utilisees
Equipment Rental Location de materiel
Description
Labour Main-d'oeuvreField Supervision Supervision sur le terrain
TypeAU CuttyG-wp^/d^tifclhafkrtType (7 (j g
Type
Amount Montant
/i, mmrfMl
Total Direct Costs Total des couts directs
Totals Total global
7&W
fttfl
2. Indirect Costs/Couts indirectsNote: When claiming Rehabilitation work Indirect costs are not
allowable as assessment work.Pour le remboursement des travaux de rehabilitation, les
couts indirects ne sont pas admissibles en tant que travaux
d'evaluation.
Type
Transportation Transport
e f
Food and Lodging Nourrlture et h6bergementMobilization and Demobilization Mobilisation et demobilisation
Description
Type
' g O J--' ?
Amount Montant
1 4
Sub Total of Indirect Costs Total partiel des couts indirects
Amount Allowable (not greater than 2044 of Direct Costs)
Montant admissible (n'excedant pas 20 Va des couts directs)
Total Value of Assessment Credit Valeur totale du credit (Total of Direct and Allowable devaluation Indirect costs* (Total des eoOti direct!
Totals Total global
et Indirect! admissible*
Note: The recorded holder will be required to verify expenditures claimed in
this statement of costs within 30 days of a request for verification, If
verification is not made, the Minister may reject for assessment work
all or part of the assessment work submitted.
Note : Le titulaire enregistre sera tenu de verifier les depenses demandees dans
le present etat des couts dans les 30 jours suivant une demande a eel
effet. Si la verification n'est pas effectuee, le ministre peut rejeter tout
ou une partie des travaux devaluation presentes.
Filing Discounts
1. Work filed within two years of completion is claimed at 10007o of
the above Total Value of Assessment Credit.
Remises pour depot
1. Les travaux deposes dans les deux ans suivant leur achievement sont
rembourses a 100 07o de la valeur totale susmentionnee du credit d'evaluation.
2. Work filed three, four or five years after completion is claimed at
5007o of the above Total Value of Assessment Credit. See
calculations below:
Total Value of Assessment Credit Total Assessment Claimed
x 0.50 = RECE
2 . Les travaux deposes trois, quatre ou cinq ans apres leur achievement
sont rembourses a 50 "/o de la valeur totale du credit d'evaluation
susmentionne\ Voir les calculs ci-dessous.
Valeur totale du credit d'evaluation Evaluation totale demandee
x 0,50 =
Certification Verifying Statement of CostajLn n * IQQ/ Attestation de I'etat des couts
l hprpbv certifv ^ f^'atteste par la presente :i i it;i euy we i in y* (*y *P f\ in tt f-% "fl 4y c\ 4 p* * -
that the amounts shown are as accurate as*rJoys^rwalAb'tfte^^e^Vs-:yi*-que les montants indiques sont le plus exact possible et que ces
were incurred while conducting assessment work on the lands shown depenses ont ete engagees pour effectuer les travaux d'evaluation
on the accompanying Report of Work form. t sur les terrains indiques dans la formule de rapport de travail ci-joint.
that as(Recorded Holder, Agent, Position irt-Company)
am authorized Et qu'a litre de . je suis autorise(titulaire enregistre, representanl. poste occupe dans la compagme)
to make this certificationa faire cette attestation.
Signature /"7
/CUtif SwAltft^
Date
/7WNota : Dans cede formule, lorsqu'il designs des personnes, le masculin est utilisfi au sens neutre.

Ministry ofNorthern Developmentand Mines
December 2, 1996
Scott A. RivettMining RecorderOntario Government Building227 Howey Street, Box 324Red Lake, ONPOV 2MO
Ministere du Developpement du Nord et des Mines Ontario
Geoscience Assessment Office 933 Ramsey Lake Road 6th Floor Sudbury, Ontario P3E 6B5
Telephone: Fax:
(705) 670-5853 (705) 670-5863
Dear Sir or Madam: Submission Number: 2.16824
Subject: Transaction Number(s): W 9620.00118
After reviewing the Work Report(s) we have prepared this letter and the attached summary, which lists the results of our review. Requirements of the Assessment Work Regulation may not have been fully met. Please examine the summary to determine the next course of action concerning the identified Work Report(s).
NOTE: The 90 day deemed approval provision, subsection 6(7) of the Assessment Work Regulation, is no longer in effect for this submission.
PLEASE NOTE ANY REQUESTED REVISIONS MUST BE SUBMITTED IN DUPLICATE.
If the anniversary dates for the mining claims affected by this correspondence have not passed, a number of options are available. Please contact the Mining Recorder to discuss these options.
If you have any questions regarding this correspondence, please contact Lucille Jerome at (705)670-5858.
Yours sincerely,
ORIGINAL SIGNED BYRon C. GashinskiSenior Manager, Mining Lands SectionMines and Minerals Division
Correspondence ID: 10393
Copy for: Assessment Library
Work Report Assessment Results
Submission Number: 2 .16824
Date Correspondence Sent: December 02, 1996 Assessor: Lucille Jerome
Transaction Number
W9620.00118
Section:
First Claim Number
1207930
Township(s) l A rea(s)
BUCKETT LAKE
14 Geophysical IP 14 Geophysical MAG
Status
Approval
Approval Date
November 26, 1996
Correspondence to:Mining Recorder Red Lake, ON
Resident Geologist Red Lake, ON
Assessment Files Library Sudbury, ON
Recorded Holder(s) and/or Agent(s):
Paul Chamois OSHAWA, ONTARIO
PHELPS DODGE CORPORATION OF CANADA, LIMITED PHOENIX, ARIZONA
Page: l
Correspondence ID: 10393

TRIM LINEOl
4- 4-
•?' V
JQCV)
LU
HH LU^OC OD
l?
* ~CL)
"
** SB'o"*-i
•OS
)
OAK'93045'
37'
36
35'
34'
.H A f, 2 P- l
.....- ...3* S*b (38379 j 38371 159900* ! * ! t ^ a
2*09 ffi J786 \ 2750 8768 2777 KT rJt* ^ T ^__-T
n-52 0 37'30"
10goi o
LU
Q
52o 30'J
53030'93000* 59 58
46 92 0 45'
HEWITT LAKE ,G-I794
•' i
REFERENCESAREAS^ WITHDRAWN FROM DISPOSITION
M.R.O. - MINING RIGHTS ONLY
S.R.O. - SURFACE RIGHTS ONLYM.+ S. - MINING AND SURFACE RIGHTS
Description Order No O*t* Ditpotition PiltT
IS09BI A 160583 VOL. l
LEGENDHIGHWAY AND ROUTE No. OTHER ROADS TRAILS SURVEYED LINES
TOWNSHIPS. BASE LINES, ETCLOTS, MINING CLAIMS, PARCELS, f TC
UNSURVEYED LINESLOT LINESPARCEL BOUNDARYMINING CLAIMS ETC
RAILWAY AND RIGHT OF WAY -* UTILITY LINES -" NON-PERENNIAL STREAM - FLOODING OR FLOODING RIGHTS i SUBDIVISION OR COMPOSITE PLAN RESERVATIONS ORIGINAL SHORELINE MARSH OR MUSKEG MINES TRAVERSE MONUMENT
DISPOSITION OF CROWN LANDS
TYPE OF DOCUMENT
PATENT, SURFACE 81 MINING RIGHTS
SYMBOL
ACE RIGHTSONLY "... 6 MINING RIGHTS ONLY . . .... . O
LEASE. SURFACE 4 MINING RIGHTS...... - ........ . B" .SURFACE RIGHTSONLY,_.... . ..,............. H" .MINING RIGHTS ONLY........,................... B
LICENCE OF OCCUPATION ..........................__. TORDER IN COUNCIL ,.............................. ...... OC
i RESERVATION .... ..... .................... ......0CANCELLED ../....................................... ®SAND A GRAVEL ._......._ ........................... ©
NOTE: MINING MIGHTS IN PARCELS PATENTED PRIOR TO MAY 6. 1913, VESTED IN ORIGINAL PATENTEE BY THE PUBLIC LANDS ACT. RS.O 1970. CHAP 3BO. SEC. 63. SUBSEC 1.
SCALE: 1 INCH = 40 CHAINS
FEETO -- 1OOO 2OOO 4000 6OOO 8000
O 700 METRES
TOWNSHIP
1OOO
"WEKT720OO
SEP 3 O 1S96RED LAKt. ONIARIO
AREA
BUG -AK
M.N.R. ADMINISTRATIVE
RED LAKMINING DIVISION
RED LALAND TITLES/ REGISTRY
KENORA
DIVISION
Ministry of LandNatural M*nagam*ntResources Branch
Ontario
Oil*JANUARY, 1983
•••••f
G-1744
THE INFORMATION THAT APPEARS ON THIS MAP HAS BEEN COMPILED FROM VARIOUS SOURCES, AND ACCURACY IS NOT GUARANTEED. THOSE WISHING TO STAKE MIN ING CLAIMS SHOULD CON SULT WITH THE MINING RECORDER, MINISTRY OF NORTHERN DEVELOP MENT AND MINES, FOR AD DITIONAL INFORMATION ON THE STATUS OF THE LANDS SHOWN HEREON.
A A
* 53C10SW0008 2.16824 BUCKETT LAKE 200
gc rx*
C 1-f
T
1
1
TRIM LINE

i i l^ x x f 11 i53C10SW0008 2.16824 BUCKETT LAKE
LOCATIOH MAP
Instruments:EDA OMNI Phis and GSM-19
EDA OMNI IV bate station magnetometer system
Contour interval - SOnT, 200nT, 2500nT
\
x,
Survey byVytyl Exploration S*rv
. Thunder Bay, Ontarto
To acfcompany report by Qafth B. Burton. ^. Geo, Consulting geophysicist 16*824
SHEET INDEX
-i -- 't .'"l
1cm - 26metres

LOCATION
Instruments:EDA OMNI PJus and QSM-19
EDA OMNI IV base station magnetometer system
Contour Interval - son T, 200nT, 2500* T
Survey by Vytyl ExptormtJon Serv
Bay, Ontario
Tfe accompany report by Qarth B. Burton. P. Geo., Consulting geophysicist 16*824
SHEET INDEX
tem - 26metres

LOCATION MAP
Instruments;EDA OMNt PkJt andEDA OMNI W base stationmagnetometer system -t* ' p .. ~
Contour Interval - 50nT, 200nT, 2500ftT
Survey byVyty4 Exploration Services
Thunder Bay, Ontario
To accompany report 0arth B. Burton, P. Consulting geophysicist
l 6 O 2 4
MEET INDEX
RECEIVED
OCT 11 1996
MINING LANDS BRANCH
'. t; ^ rif±RtxZ'~^'X
Scale 1cm - 25metres

F H
53C
10S
W00
08 2
168
24 B
UC
KE
TT L
AK
E24
0
—i-—
K.s
s s
-l*
ro
toro
to
Sen
en
en
-s t
i2
2S
S
S
S
——
l
O
-P*
-*
-**-
en
-P-
M
e*
c-j
en
-^j
OD
t l
—4—
CD
O
* CT
1 O
T CJ
* Q
J O
^ O
^ O
OO
OO
&O
O
-O
lO
S
S
.4—
——
(. -
- 4.
- -
sOD
jZ
. en
o*
-f-
-fS
en
CO^
(j,
-,
a s
s s
S
S S
S—
. \]
-^-
en
So
—*
-~tJ
1 en
Ln
en
CO
CO
OD
OO
2fo
-p
.
QO
O
O
OO
O
D
O!)
—
—
to
--1—
en
en
en
erO
D
OD
CD
O
O
— f-
--—
l—i
s
en
en
tn
en
en
en
en
en
-j--vj^
j-oooooC
oao
ij'
c.i
oocx
en
Ln
i,n
en
er
en
en
enO
O(5
oa
oa
oT
PO
DQ
DQ
O
O
a
O
O
—
-*
~.
—*
to
to
to
to
- ro
fe.
O)
en
c^
en
v/1
y
u1
OD
,T
C G
O
'TO
OO
D
O
od
31g
—4 -
CD
—
* -*
O
O
CJ"
Ms
sO
O
OO
O
D
OD
*.
*
O
t -
H——
— -
^
- f--
-
ro w o
^—j—
- CJ1
(^
gco Cx
iac O
en en
e/
1 en
oo oo
OD
oo
en en
ey
^
00
O"
--
Oden
en
--
j on
— i
~ -
00 S en
-—-i —
-
g g-"t t/l
Co -i*.
-IV
en
-4-
00 s ro
-H — S on
t —
Ln OD e-*
NJ
— -
i..n OO
T--J
—
1 — Cn
r-T
- -*
'
U--
oo ro en
e*
--t— en ao CJ g
. . ^™
. a Oo
-1~~ S 8
~ -*-
—
en CD en
— -
t- '/'
u?
NJ
NJ
- .
- X, CI J*.
e-i
-t-
t/1
OD o
o r-o
--H
——
en j to S
-4--
CJ1
--J
CO e- -f^
•--t
— 'n -~j
(ft
g
-t- {/i
-*j
OD -r-.
- -i— en 00
ro
- --
t- -
'7i 1 3 e-4
•*--
i.y -j
Oo
-C
- - 1
— —
-t— .
en
tjr^
en
e^j
en
en
—t-
-
'Ji
-^i
O
-- t
--en g
-n- en -j g t.j-i
- -*
~ er Cfi
-(S
.en
— t-
--
en en
— -t-
-'_
n i
4 -
Ln --j
U1 -~j
--4
—
-en
-j en
m
- 4— 'T
1 --
J en 0^
-~*~ en en
— ,
'/i
er o
-t — en s
-~i-~
tn -t*
en
— h-
— -i- -
in
en
en
e*j
0
-^J
-*-
-en (s
i O
en
t4*
J1
(
CT)
SJ5
Ol
Cft
——
l- -
t-H
——
^
——
—,
- -i—
——
^—
——
I-
ab
o
a a
a 2
g i
en
en
en
c*1
ener
en
en
en
e*
o
•e s
en
uio
m
L*
os
gS g
goj
en
S S
--*
oS
2
en
en
en
er
en
en
e^i
Ln
en
enO
D
CT5
OO
O
D
QO
O
C
OD
Q
Q
OD
O
Uen
en
en
if
-
s—s—
s—s
.cj-c^i—
• —-
*O
QO
t/'c
ji
O
Ot*
-*
o*
- -H—
—t-
H—
——
4.—
—.
^ S
—-
CxJ
.OJ
O
i
en
enoo
OD
o
—a
en
en
eri
en
en
g ^
- Cr OD
e*j
en
ooo,
W ST .^
o 3 u 10 01 3 3 10*. 8' 3"
10 05 00
im
x m
ff *
o -* II
\
11 S

"iS
wW
OB
2.1
6824
BU
CK
ET
T L
AK
E25
0
r10
003
r-.'
Of
l i
o O' •Si-
SS
os
en
en
en—
* —
* —
* C
D-s
i e*
~*
"-J
**J
Oho
O
en
en(O
(O
DO
-^
-*
tp
en
en
01OD
aa
oo
OD
—*
to
to
ot
C*j
hoOD
to
e-*
en
as
a—
" (O
-^
^en
--j
en
en
en
en
en-*
rx
j en
-J
en
y,
—
ro
~*
o*en
oa
-*
OD
—
'
en
en
en
en
en
ene
-i
C*J
ro
C
~i
Se
n
W
'-J
O
J -^
ea
-t*-
—-
*o
*-j
SOD
to
—*
—*
o
oS
o
—
oo
en
e-i
Cn
en
O
J--
* -*
O
ut
en
on
Goen
en
—'-^
0
0
en2
S
--4-—
t-—s
j (0
—*
-j
CO
tO
OO
—*
tn o o
en
NJ
to—*
ro
en
ro
OD
t*
c*t
ro
4*
-r*.
S i
iOD
en
en
oo
—*
enCT
) L~
J O
D
en
CT
icn
cn
en
tne
ne
ntn
en
-^
en
—-
OD
4^
e**
—*
to—
- *.
ej
en
o
o
o
-*
eno—
'-ocn'-pc-jtocn
—*
ene
ne
ne
ne
ne
ne
ne
ntn
etitn
en
en
OD
So
OD
oo
OD
oo
OD
OD
OD
OD
OD
oo
oo—
~~
'
~ '
- IS
J (*
0 —
* -*
-*
OC
T)C
5--
-
- o
if,
—
-*
r-j
NJ
to
to
fe
S
en
en
e
n
en
e
ns
en
en
en
-~
--
toS
on
—
e-
oo—
N
J
a
en
en^
.r
o
NO
-o
na
-t-u
o
eno
-*
-*S
K
S
S
S
S
--j
en
CD
(7
* ro
o
O
OD
*
o
to
-J
en
er
e^
en
en
en
enO
to
O
D e
n
en
*.
-p.
en
e-f
Ki
co
—
OD
j*.—
' e*
j ^
to
o*
—*
en
bs a
s a
er-
en
er
enen
en
en
tJ
-
sl
^ e;
*i
*-
on—
—
01
o
*o8
—*
ro
to-
-st
3Oo
^
en
enS
o
o
ooCD
ro
—
*e-
j co
—
4*
-
O
01 s? s?2
S
i i
s 2
s s
i en
c/
j -J
-~-
j CD
^:
) to
e-
s^
^
en
o
o
-*
-*
oS
^ S
^ g!
51 S
5! S
Sen
en
en
eh
S —
*-
—
jO
D
04
^
O
O^
l?S
8 8
gen
en
--
jm
4*
en
- —
— -
f—
—4-
-——
-(—
——
-^—
——
—(~
-——
—l—
——
——
-f.
je^-f^
en
cT
-cn
CT
icn
vO
DC
TitD
—
C
DO
Qen
en
o"
1 en
en
en
en
en
en
tO
*O
tO
tO
CC
OO
ClO
CoC
S3
-en
en
l^en
en
ro
S&S
8! *2
2rv
j ro
ew
oo
en
—
'en
~-
e-
itc
O
o J^
ty
O
KJ
-t*
—*
e-j
—*tn
en
en
Oo
oo
oo--
j e-4
—
'en
en
en
en
s s
tn
ef
en
en
en
en
enOD
oo
OD
OD
oo
OD
oo•t*
PO
en
-*-
e-i
CD a
^sl
^
O*
OD
-t*-
*-
tO
----H————h"
'
en
en
tn
tn
en
eri
en
en
en
c/i
er
ui
tji
t^i
enS
SS
SS
SS
Sg
gg
gen
00
oo
enro
-—
^. -^
Q
en
—
3
4k
3 S
*O
-*
CD
S S
fi
—
-*
ro
ro
e*-*
en
O
ho
Cd
-*
tn
c/*
o*
en
en
en(O
(O
CO
tO
*O
tp
en
en
en
en
4*-
f*
P-j
-*
o
in
-J8
s s
en
en
en
entn
en
en
ene
ne
ne
ne
ne
ne
ntn
tne
nsO
sO
^C
oO
OO
DO
DC
DG
Dfo
—
o
UD
to
OD
oo
-sj
enOO
OD
00
CO
—* ^ o o
en
en
en
en
en
en
en
en
en
en
Co
OU
OD
CD
tO
OD
OD
Ca
ao
Cc
S--*
Lft
to
en
(O
jfc
en
t^
r-o
o
to
cT
i o
en
en
*--
j en
en
en
en
io-^
—* o
8 S
S s
se s
to
-j
to
e^
tp
—*(s
* ro
—
o*
CD o
tn
en
en
en
(O o
en,
ooen
at
enentn
enenenenenenenen
OO
gO
OO
tO
UatjO
t^O
DO
DO
DO
O
OD
O
D tO
^
roro^lO
tO
CO
Co
—
OJ
to
--t
s
en
en
en
en
en
tn
en
in
Oo
on
co
cn
--j-^J-~
j--j

53C
1 OS
WO
ODS
2.1
6824
BU
CK
ETT
LA
KE
s a
g s
s a
-*
~---N
3h
oo
!
S
S
K B
(ji
y? w vi
NJ
t*0 ^
S S 2
t/i
tji
en
tn
e"
cr
--J
-J
-J
CTl
L
Ti
01
-j
o
co
OD
en
i/i
tfi
(/i
tJi
cr
g l
5 S
s ~
t^i
en
cji
LJi
Cf*
Cr
LTI
en
cj'*
DO
OO
OD
Oa
OO
CU
OO
CD
OO
y
C/i
en
e/*
Oi
en
u^
e^1
OD
OO
OD
CT
iaD
OO
uO
CO
04e^04-ifcj*
-ejK
)
—
en
i/i
en
en
e"
Lnen
OD
OD
aa
DO
OD
e^
en
enro
en
Oo0^
--
NJ

BASELINE AZMUTH eo*r
; ;, ,' -o.^-' /' i r
92-50
52-307 400 O 40080012001600
(meters)
LEGEND
CONTOUR INTERVALS (mllliradians)Linear contours:-.--. 2_____ 5_____ 10Electrode array: Dipole-dipole
a - 50 m n = 1,2,3,4,5,6Instruments: PHOENIX IPV4T, IPT1 Frequency: 0.25 Hz
RECEIVED
; OCT 111996
MM!! i'"- LANDS
50
SCALE 1 : 2 500
50 100 150 200
(meters)
phelps Qodfe
Corporation of Canada Limited
Province: OntarioTwp. /Area: Red Lake Dist.N.T.S.: 53 C 7 10Compiled by:Drawn by:REVISION DATE
DATE FILE No.05/96 96-001-4.3
BY
PROJ. No.263
NORTH SPIRIT Red Lake Dis
SHEEINDUCED POLARIZATIO
CONTOURS OF APPAR
LAKE PROJECT trict, Ontario H" 1M RESISTIVITY SURVEYENT PHASE (n = 1)
VAL D'OR SAGAX INC.Interpreted by:
SCALE1 : 2 500
PLATE No.E-1934-D8-263
53C10SW0008 2.16824 BUCKETT LAKE 270
.

LEGEND
CONTOUR INTERVALS (milliradicms)Linear contours:--.-- 2_____ 5————— 10 ,Electrode array: Dipole-dipole *r
a - 50 m n = 1,2,3,4,5,6Instruments: PHOENIX IPV4T, IPT1 Frequency: 0.25 Hz
If"
"• ! D? BRANCH
50
SCALE 1 : 2 500
50 100 150 200
(meters)
Phelps dodge
Corporation of Canada Limited
Province: OntarioTwp. /Area: Red Lake Dist.N.T.S.: 53 C 7 10Compiled by:Drawn by:REVISION DATE
DATE FILE No.05/96 96-001-4-3
BY
PROJ. No.263
NORTH SPIRIT Red Lake Dis
SHEEINDUCED POLARIZATIO
CONTOURS OF APPAR
LAKE PROJECT trict, Ontario:T 2M RESISTIVITY SURVEYENT PHASE (11 = 1)
VAL D'OR SAGAX INC.Interpreted by:
SCALE1 : 2 500
PLATE No.E-1935-D8-263-.-.- - — ..... mn mn mn H
53C10SW0008 2.16824 BUCKETT LAKE
280
l

BASELINEAnnum ao*T LEGEND
CONTOUR INTERVALS (milliradians)Linear contours:
Electrode array: Dipole-dipolea = 50 m n = 1 ,2,3,4,5,6
Instruments: PHOENIX IPV4T, IPT1 Frequency: 0.25 Hz
K \
LANDSBRANCH
400S - - A. 1 68
SCALE: 1 : 2 BOO50 100
BOOS - -L
150 200
phelps dodge
Corporation of Canada Limited
Province: OntarioTwp. /Area: Red Lake Dist.N.T.S.: 53 C 7 10Compiled by:Drawn by:REVISION DATE
DATE FILE No.05/96 96-001-4-3
BY
PROJ. No.263
NORTH SPIRIT Red Lake Dis
SHEEINDUCED POLARIZATIO
CONTOURS OF APPAR
LAKE PROJECT trict, Ontario IT 3M RESISTIVITY SURVEY ,ENT PHASE (0 = 1)
VAL D'OR SAGAX INC.Interpreted by:
SCALE1 : 2 500
PLATE No.E-1936-D8-263
53C10SW0008 2.16824 BUCKETT LAKE

53C10SW0008 2.16824 BUCKETT LAKE
LEGEND
CONTOUR INTERVALS (Phase/Resist. * 100)Linear contours:
.---- 10 between O and 100 Phase/Resist. * 100_____ 50_____ 200Electrode array: Dipole-dipole
a - 5 0 m n - 1 ,2,3,4,5,6
Instruments: PHOENIX IPV4T, IPT1
Frequency: 0.25 Hz
; ~ E l v B•JO l H 1996
LANDS BRA1
16824
50
SCALE 1 : 2 500
50 100 150 200
(meters)
phelps dodge
Corporation of Canada Limited
Province: OntarioTwp./Area:N.T.S.:
Red Lake Dist. 53 C 7TO"
Compiled by:Drawn by:REVISION
DATE05/96
DATE
FILE No.96-001-4.9
BY
PROJ. No,263
NORTH SPIRIT LAKE PROJECTRed Lake District, Ontario
SHEET 1INDUCED POLARIZATION RESISTIVITY SURVEYCONTOURS OF NORMALIZED APPARENT PHASE (n ^ 1)
VAL D'OR SAGAX INC.Interpreted by:
SCALE1 : 2 500
PLATE No.E-1937-D8-263
;H

————————-01
LEGEND
CONTOUR INTERVALS (Phase/Resist. * 100)Linear contours:-..--- 10 between O and 100 Phase/Resist. * 100_____ 50_____ 200Electrode array: Dipole-dipole
a = 50 m r\ = 1 ,2,3,4,5,6Instruments: PHOENIX IPV4T, IPT1 Frequency: 0.25 Hz
,HEGEIYE;C
! "!-T-LANDS BRAMCH [
53C10SW0008 2.16824 BUCKETT LAKE 310
50
SCALE 1 ; 2 5OO
50 100 150 200
(meters)
Phelps dodge
Corporation of Canada Limited
Province: OntarioTwp./Area: Red Lake Dist.N.T.S.:Compiled by:
53 C 710
Drawn by:REVISION
DATE05/96
DATE
FILE No.96-001-4.9
BY
'ROJ. No263
NORTH SPIRIT LAKE PROJECTRed Lake District, Ontario
SHEET 2INDUCED POLARIZATION RESISTIVITY SURVEYCONTOURS OF NORMALIZED APPARENT PHASE (0 = 1)
VAL D'OR SAGAX INC.Interpreted by:
SCALE1 : 2 500
PLATE No.E-1938-D8-263
t
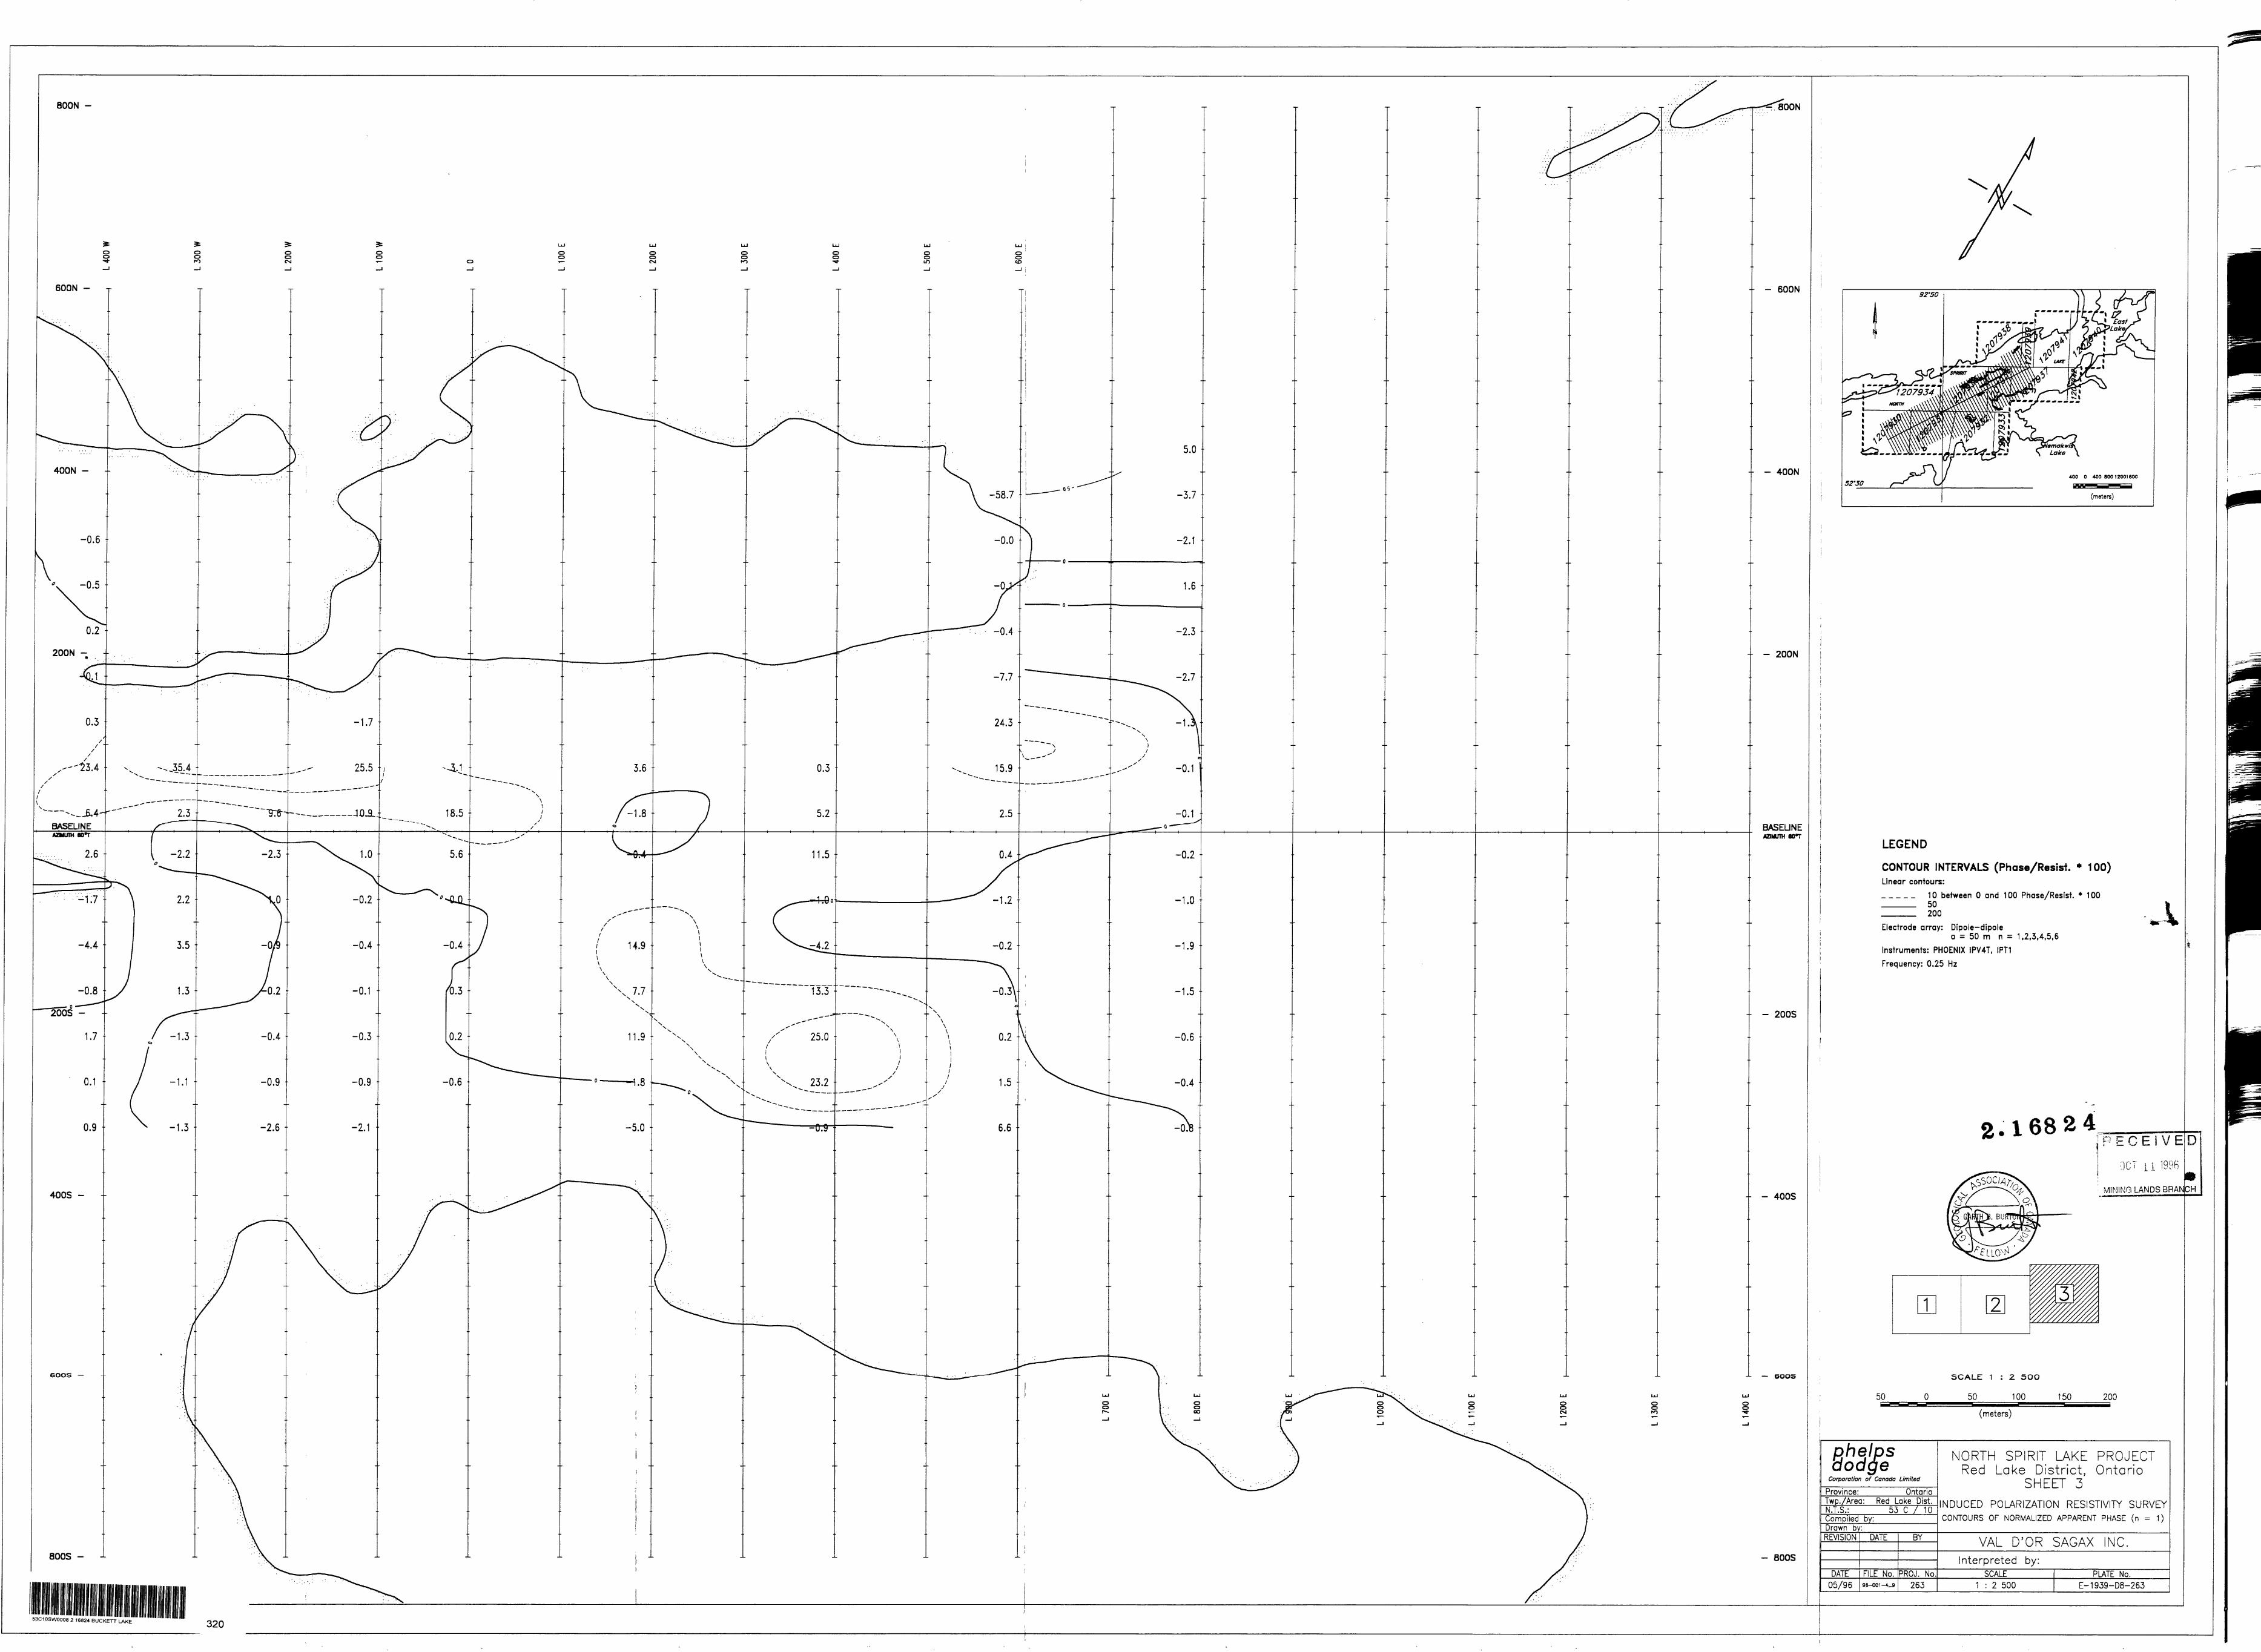
-- - 200N
BASELINE AZIMUTH eon
-- - 200S
-- - 400S
— 6OO5
- BOOS
92'50
52-307 400 O 400 80012001600
(meters)
LEGEND
CONTOUR INTERVALS (Phase/Resist. * 100)Linear contours:----. 10 between O and 100 Phase/Resist. * 100_____ 50_____ 200Electrode array: Dipole-dipole
a = 50 m n s 1,2,3,4,5,6Instruments: PHOENIX IPV4T, IPT1 Frequency: 0.25 Hz
\
2.16824.RECEIVED
OCT a 1998
MINING LANDS BRANCH
50
SCALE 1 : Z 5 OO
50 100 150 200
(meters)
53C10SW0008 2 16824 BUCKETT LAKE 320
Phelps dodge
Corporation of Canada Limited
Province: OntarioTwp./Area: Red Lake Dist N.T.S.: 53 C 7~UTCompiled by:Drown by:REVISION DATE
DATE05/96
FILE No.96-001-4-9
BY
'ROJ. No263
NORTH SPIRIT LAKE PROJECTRed Lake District, Ontario
SHEET 3INDUCED POLARIZATION RESISTIVITY SURVEYCONTOURS OF NORMALIZED APPARENT PHASE (0 = 1)
VAL D'OR SAGAX NO.Interpreted by:
SCALE1 : 2 500
PLATE No.E-1939-D8-263

BASELINE AZMUTH ao*r
53C10SW0008 2 16824 BUCKETT LAKE 330
LEGEND
CONTOUR INTERVALS (Ohm * metre)Logarithmic contours:-.--- 0.1 10,11.2,12.5,14.1,16,18,20,22_____ 0.2 10, 12.5, 16, 20, 25, 32, 40 ._____ 0.5 10, 32, 100, 320, 1000 ..Electrode array: Dipole-dipole
a s 50 m n = 1,2,3,4,5,6Instruments: PHOENIX IPV4T, I PT1 Frequency: 0.25 Hz
RECEIVED
JU! i! i9^
VIINIIMG LANDS BRAMPM
-68 2 4
50
SCALE 1 : 2 500
50 100 150 200
(meters)
Phelps dodge
Corporation of Canada Limited
Province: OntarioTwp./Area: Red Lake Dist.
53 C 7 UTCompiled by:Drawn by:REVISION
DATE05/96
DATE
FILE No.96-001-4-2
BY
PROJ. No263
NORTH SPIRIT LAKE PROJECTRed Lake District, Ontario
SHEET 1INDUCED POLARIZATION RESISTIVITY SURVEY CONTOURS OF APPARENT RESISTIVITf 0 = 1
VAL D'OR SAGAX INC.Interpreted by:
SCALE1 : 2 500
PLATE No.E-1931-D8-263

4——————.12.42
92'50
52'JOf 400 O 400 BOO 12001 BOO
(meters)
LEGEND
CONTOUR INTERVALS (Ohm * metre)Logarithmic contours:---.- 0.1 10,11.2,12.5,14.1,16,18,20,22_____ 0.2 10, 12.5, 16, 20, 25, 32, 40 ._____ 0.5 10, 32, 100, 320, 1000 ..Electrode array: Dipole-dipole
a = 50 m n = 1,2,3,4,5,6Instruments: PHOENIX IPV4T, IPT1 Frequency: 0.25 Hz
16824
50
SCALE 1 : 2 500
50 100 150 200
(meters)
Phelps dodge
Corporation of Canada Limited
Province: OntarioTwp. /Area: Red Lake Dist.N.T.S.: 53 C 7 10Compiled by:Drawn by:REVISION DATE
DATE FILE No.05/96 96-001-4-2
BY
PROJ. No.263
NORTH SPIRIT Red Lake Dis
SHEEINDUCED POLARIZATION CONTOURS OF APPAREf*
LAKE PROJECT trict, Ontario:T 2sj RESISTIVITY SURVEY JT RESISTIVITY (11=1)
VAL D'OR SAGAX INC.Interpreted by:
SCALE1 : 2 500
PLATE No.E-1932-D8-263
53C10SW0008 2 16824 BUCKETT LAKE

BASELINEAZIMUTH 60T LEGEND
CONTOUR INTERVALS (Ohm * metre)Logarithmic contours:
10,11.2,12.5,14.1,16,18,20,2210, 12.5, 16, 20, 25, 32, 4010, 32, 100, 320, 1000 ,.
Electrode array: Dipole-dipolea = 50 m n ~ 1 ,2,3,4,5,6
Instruments: PHOENIX IPV4T, IPT1 Frequency: 0.25 Hz
l 68 S 4jRECEIVf]
00 T H TO
MINING LANDS BRANCH
53C10SW0008 2 16824 BUCKETT LAKE
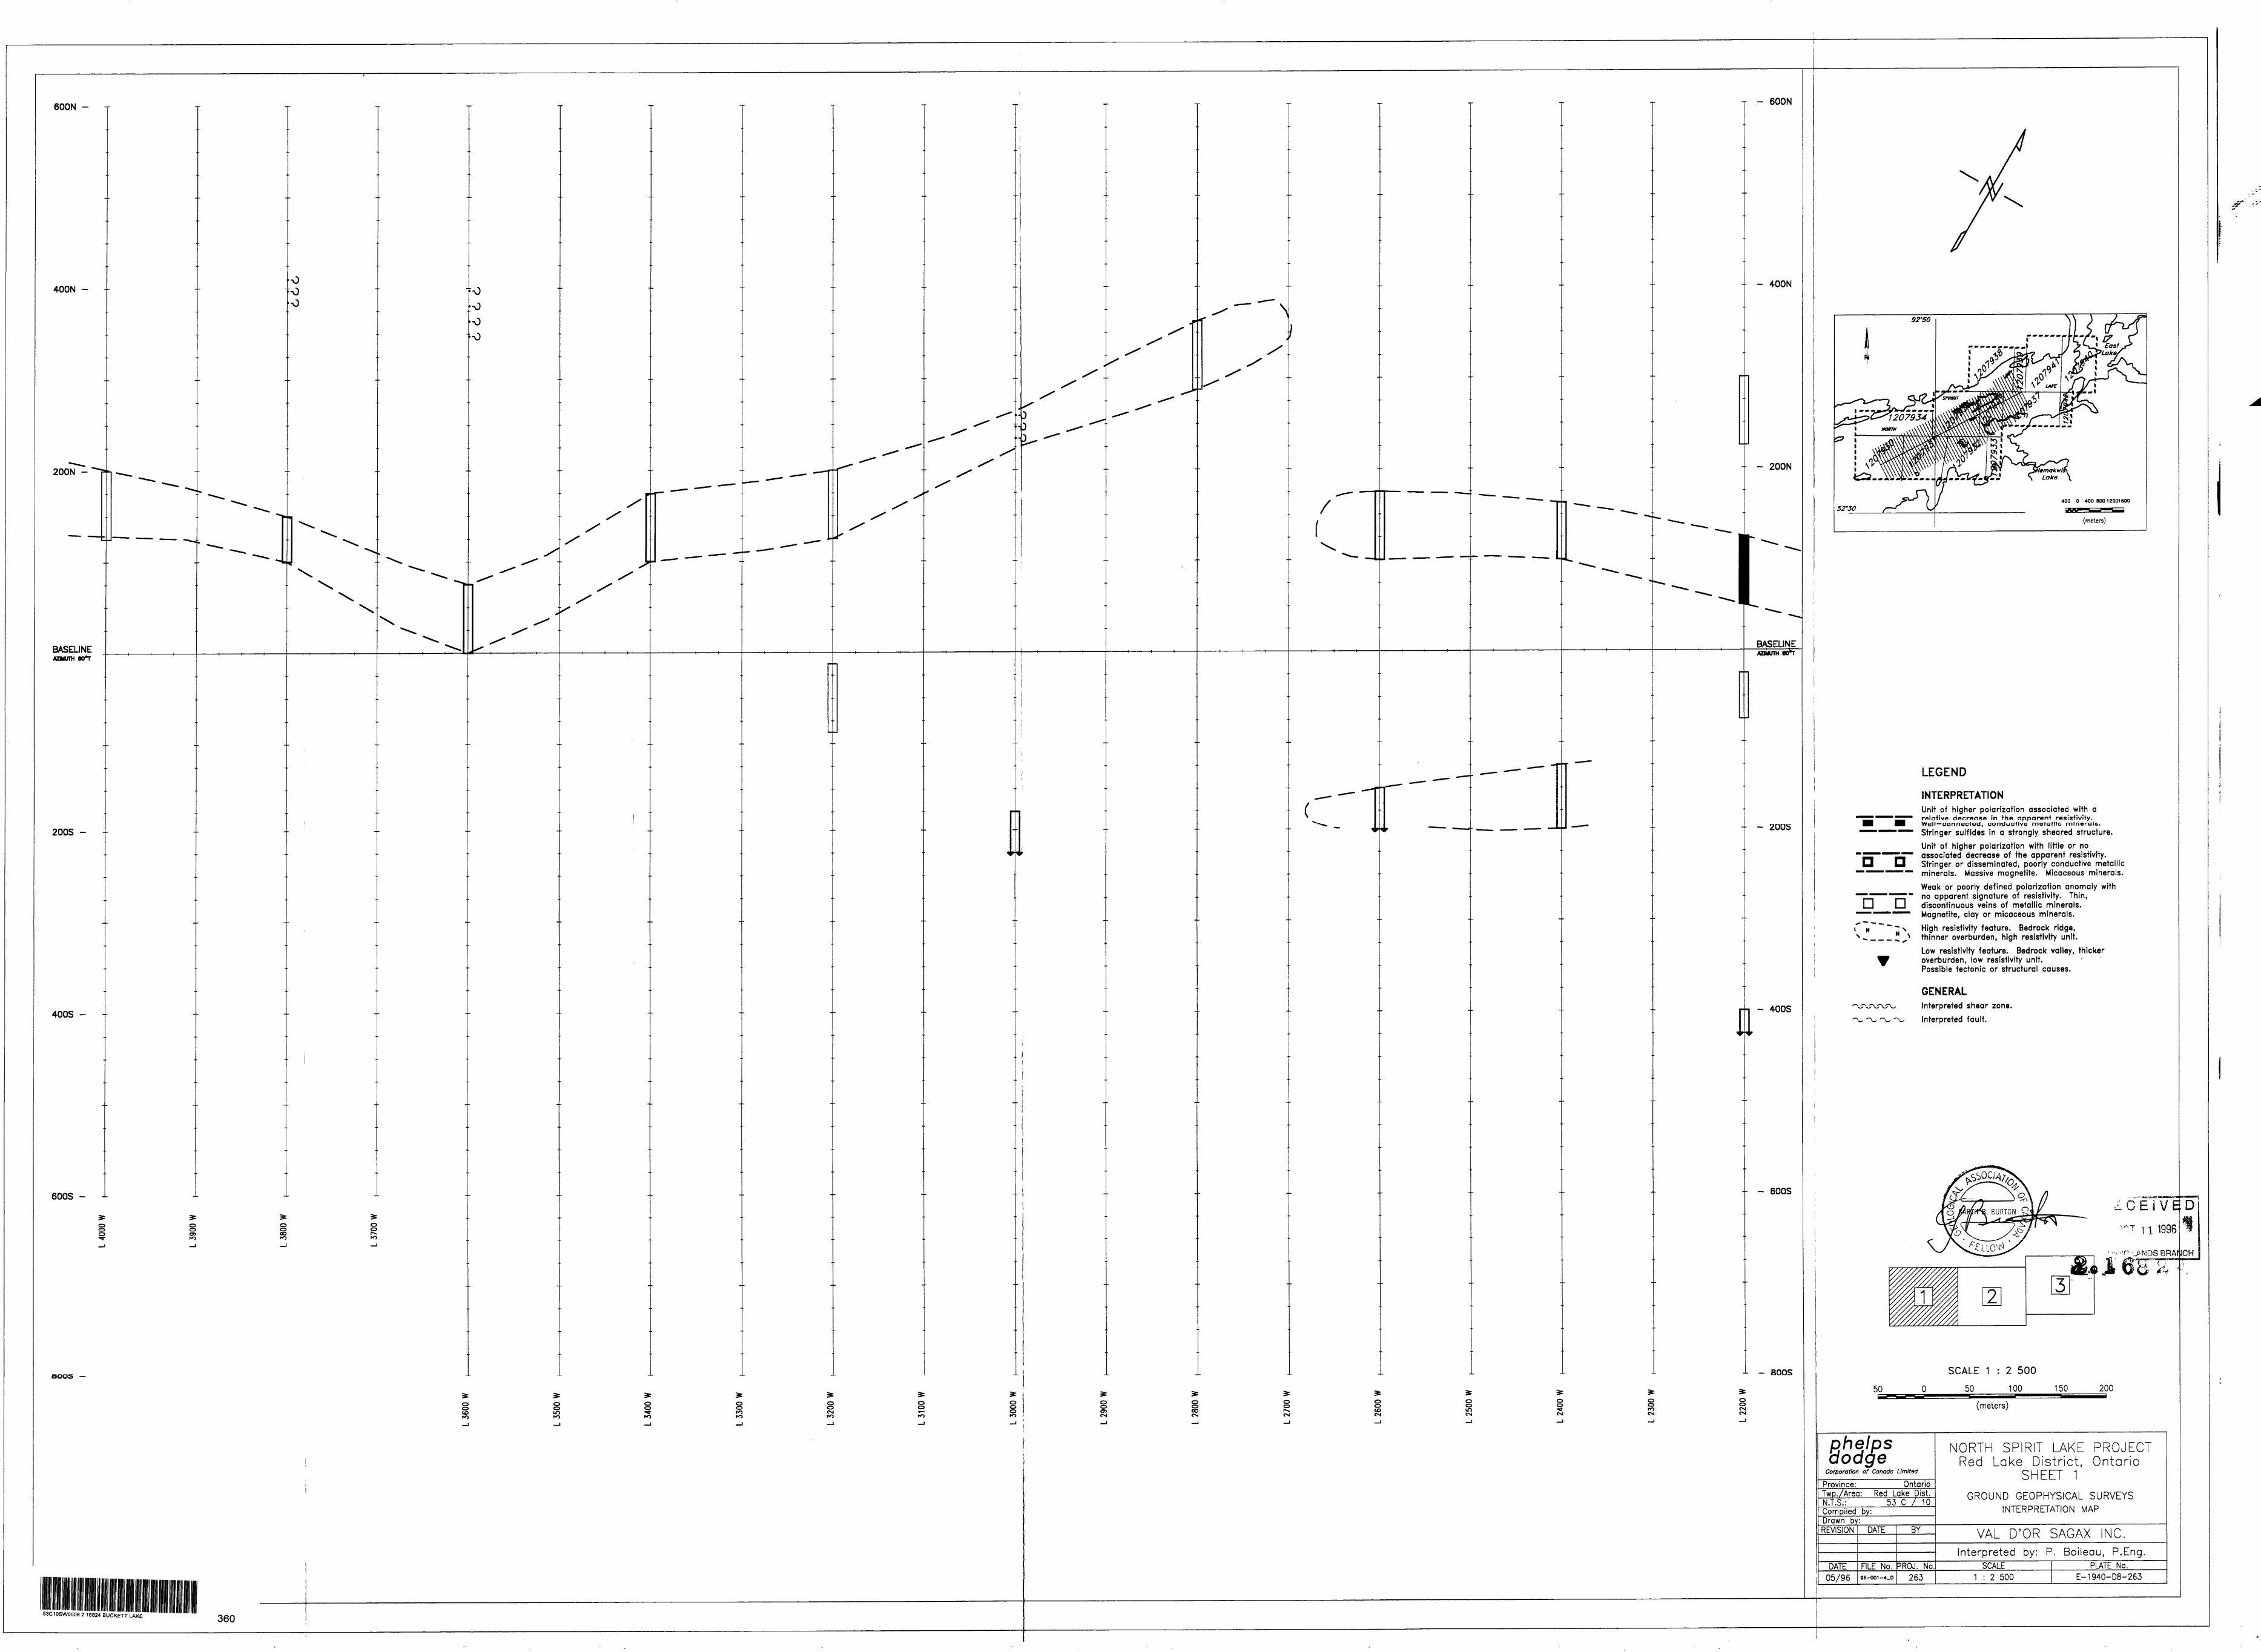
600N -
400N -
200N -
BASELINEAZNUTH SOT
200S -
400S - -
600S - -L
O •O O
O O
K)
o o ooro
OOi-o
aoos —
o o o
\
;
/
(
T - BOON
400N
-- - 200N
•- - ZOOS
BASELINEOMStH
JNEeo^T
II - 400S
-- - 600S
J- - BOOS
ooI-O
IDoo oo
OO CM
OO
Oo oro
O O O) CM
o o ooCM
ooO O
OoinCM
o oCM
OoCM CM
53C10SW0008 2 16824 BUCKETT LAKE360
LJ
LEGEND
INTERPRETATIONUnit of higher polarization associated with arelative decrease in the apparent resistivity. Well— connected, conductive metallic minerals.Stringer sulfides in a strongly sheared structure.
Unit of higher polarization with little or no associated decrease of the apparent resistivity. Stringer or disseminated, poorly conductive metallic minerals. Massive magnetite. Micaceous minerals.
Weak or poorly defined polarization anomaly with no apparent signature of resistivity. Thin, discontinuous veins of metallic minerals. Magnetite, clay or micaceous minerals.
High resistivity feature. Bedrock ridge, thinner overburden, high resistivity unit.
Low resistivity feature. Bedrock valley, thicker overburden, low resistivity unit. Possible tectonic or structural causes.
GENERALInterpreted shear zone.
Interpreted fault.
50
SCALE 1 : 2 500
50 100 150 200
(meters)
phelps dodge
Corporation of Canada Limited
Province: OntarioTwp./Area: Red Lake Dist.N.T.S.: 53 C /TOCompiled by:Drawn by:REVISION
DATE05/96
DATE
FILE No.96-001-4.0
BY
PROJ. No263
NORTH SPRIT LAKE PROJECTRed Lake District, Ontario
SHEET 1GROUND GEOPHYSICAL SURVEYS
INTERPRETATION MAP
VAL D'OR SAGAX INC.Interpreted by: P. Boileau, P.Eng.
SCALE1 : 2 500
PLATE No.E-1940-D8-263

600N - T
400N - --
200N - --
BASELINEAZMUIH eo*r
200S - --
400S -
600S -
aoos
CM 01
O O
1000S -
o04
Oo ato oCO
oo
53C10SW0008 2 16824 BUCKETT LAKE 370
D a
D D
LEGEND
INTERPRETATIONUnit of higher polariyn+lon associated with arelative decrease in the apparent resistivity. Well-connected, conductive metallic minerals. Stringer sulfides in a strongly sheared structure.Unit of higher polarization with little or no associated decrease of the apparent resistivity. Stringer or disseminated, poorly conductive metallic minerals. Massive magnetite. Micaceous minerals.Weak or poorly defined polarization anomaly with no apparent signature of resistivity. Thin, discontinuous veins of metallic minerals. Magnetite, clay or micaceous minerals.High resistivity feature. Bedrock ridge, thinner overburden, high resistivity unit.Low resistivity feature. Bedrock valley, thicker overburden, low resistivity unit. Possible tectonic or structural causes.
GENERAL^Interpreted shear zone. Interpreted fault.
.168
50
SCALE 1 : 2 500
50 100 150 200
(meters)
Phelps dodge
Corporation of Canada Limited
Province: OntarioTwp./Area:N.T.S.:
Red Lake Dist. 53 C /~W
Compiled by:Drawn by:REVISION
DATE05/96
DATE
FILE No.96-001-4-0
BY
'ROJ. No263
NORTH SPIRIT LAKE PROJECTRed Lake District, Ontario
SHEET 2GROUND GEOPHYSICAL SURVEYS
INTERPRETATION MAP
VAL D'OR SAGAX INC.Interpreted by: P. Boilegu, P.Eng.
SCALE1 : 2 500
PLATE No.E-1941-D8-263

-- - 200N
BASELINE AZIMUTH eon
-- - 200S
-- - 400S
-1- - 6005
- BOOS
p— - D P
LJ
LEGEND
INTERPRETATIONUnit of higher polarization associated with a relative decrease in the apparent resistivity.Well-connected, conductive metallic minerals. Stringer sulfides in a strongly sheared structure.
Unit of higher polarization with little or no associated decrease of the apparent resistivity. Stringer or disseminated, poorly conductive metallic minerals. Massive magnetite. Micaceous minerals.Weak or poorly defined polarization anomaly with no apparent signature of resistivity. Thin, discontinuous veins of metallic minerals. Magnetite, clay or micaceous minerals.High resistivity feature. Bedrock ridge, thinner overburden, high resistivity unit.Low resistivity feature. Bedrock valley, thicker overburden, low resistivity unit. Possible tectonic or structural causes.
GENERALInterpreted shear zone.
Interpreted fault.
2*16824 RECEIVED
OCT i \ 1
MINING LANDSBRANCH
50
SCALE 1 : 2 500
50 100 150 200
(meters)
Phelps dodge
Corporation of Canada Limited
Province: OntarioTwp./Area: Red Lake Dist. N.T.S.: 53 C 7"lQ"Compiled by:Drown by:REVISION DATE
DATE05/96 96-001-4-0 263
BY
FILE No. PROJ. No
NORTH SPIRIT LAKE PROJECTRed Lake District, Ontario
SHEET 3GROUND GEOPHYSICAL SURVEYS
INTERPRETATION MAP
VAL D'OR SAGAX INC.Interpreted by: P. Boileau, P.Eng.
SCALE1 : 2 500
PLATE No.E-1942-D8-263
53C10SW0008 2 16824 BUCKETT LAKE 380

LOCATION MAP
BASE LINEAZIMUTH 60 0 T
LEGEND
Extent of IP coverage
IP anomaly with identification strong, moderate, weak
R - resistivity highM — magnetic association
Magnetic anomaly
Broad magnetic anomaly
Magnetic zone with identification
Interpreted fault
To accompany report Garth B. Burton, P. Get., Consulting geophysicis
SHEET INDEX
Scale 1cm - 25metres
53C10SW0008 2 16824 BUCKETT LAKE
L

-.K""'*" ' 7 x —,Iiz6*l i/ X. '—
LOCATION MAP
BASELINE
LEGEND
Extent of IP coverage
S IP anomaly with Identification—ll Q {i strong, moderate, weak_B—^
R - resistivity highM - magnetic association
^s s ^ Magnetic anomaly
Broad magnetic anomaly
Magnetic zone with Identification
Interpreted fault
RECEIVE
2.16821*ccompany report by Garth B. Burton, P. Geo., Consulting geophysicist
SHEET INDEX
AREA OF VERY STRONG MAGNETIC ACTIVITY
HtGH MAGNETITE CONCENTRATIONS
IRON FORMATION Scale 1cm ~ 25metres
53C10SW0008 2 16824 B UCKETT LAKE
L

, BASELINE
'AZ. 60 0 T
LOCATION MAP
LEGEND
*1 Extent of IP coverage
I—j—j ,FX jILs Stl
M
anomaly with identification strong, moderate, weak
R - resistivity highM - magnetic association
y
>
Magnetic anomaly
Broad magnetic anomaly,
Magnetic zone with identification
Plunge
-w* Interpreted fault
i ,
O l 68 S ^pn
To accompany report by
Garth B. Burton, P. Geo.,
sulting geophysicistRECEIVED
OCT 11 1996
MINING LANDS BRANCH
SHEET INDEX
50 100 200m
Scale 1cm ~ 2 5 metre s
nht*ln*s
CorpontionUof Ctttdtb LuntodProvince: OntarioTwpVArea: Red Loke Dist.N.T.S.: 53C/10Compiled by: G. B. B.Drawn by: R. T. M.REVISION DATE
DATE RLE No.
AUG. 96
BY
PROJ.NO.263
NORTH SPIRIT LAKE PROJECT Red Lake District, Ontario
SHEE
. Ground Qeoph
:T 3
ystcal Surveys
INTERPRETATION MAPSCALE
l: 25OO
* .
DWG. NO. PLATE NaE-I942-D8-263 18
Related Documents