https://theses.gla.ac.uk/ Theses Digitisation: https://www.gla.ac.uk/myglasgow/research/enlighten/theses/digitisation/ This is a digitised version of the original print thesis. Copyright and moral rights for this work are retained by the author A copy can be downloaded for personal non-commercial research or study, without prior permission or charge This work cannot be reproduced or quoted extensively from without first obtaining permission in writing from the author The content must not be changed in any way or sold commercially in any format or medium without the formal permission of the author When referring to this work, full bibliographic details including the author, title, awarding institution and date of the thesis must be given Enlighten: Theses https://theses.gla.ac.uk/ [email protected]

Welcome message from author
This document is posted to help you gain knowledge. Please leave a comment to let me know what you think about it! Share it to your friends and learn new things together.
Transcript

https://theses.gla.ac.uk/
Theses Digitisation:
https://www.gla.ac.uk/myglasgow/research/enlighten/theses/digitisation/
This is a digitised version of the original print thesis.
Copyright and moral rights for this work are retained by the author
A copy can be downloaded for personal non-commercial research or study,
without prior permission or charge
This work cannot be reproduced or quoted extensively from without first
obtaining permission in writing from the author
The content must not be changed in any way or sold commercially in any
format or medium without the formal permission of the author
When referring to this work, full bibliographic details including the author,
title, awarding institution and date of the thesis must be given
Enlighten: Theses
https://theses.gla.ac.uk/

THE EVALUATION OF EARLY PREGNANCY AND
ITS COMPLICATIONS BY DIAGNOSTIC ULTRASOUND
A THESIS
presented to
THE UNIVERSITY OF GLASGOW
for the Degree of
DOCTOR OF MEDICINE
by
HUGH PETER ROBINSON, M.B. Ch.B., M.R.C.O.G.
DEPARTMENT OF MIDWIFERY, UNIVERSITY OF GLASGOW
MAY, 1978.

ProQuest Number: 10984443
All rights reserved
INFORMATION TO ALL USERS The quality of this reproduction is dependent upon the quality of the copy submitted.
In the unlikely event that the author did not send a com p le te manuscript and there are missing pages, these will be noted. Also, if material had to be removed,
a note will indicate the deletion.
uestProQuest 10984443
Published by ProQuest LLC(2018). Copyright of the Dissertation is held by the Author.
All rights reserved.This work is protected against unauthorized copying under Title 17, United States C ode
Microform Edition © ProQuest LLC.
ProQuest LLC.789 East Eisenhower Parkway
P.O. Box 1346 Ann Arbor, Ml 48106- 1346

l^i r • omU
V M ’ T : ” ' " r " V T '
’f ■ «-•« *■ 7 r '
. .
/ lines <s4 s s ^
Cop3 I ■

2
C O N T E N T S

3
PAGE
TITLE PAGE 1
CONTENTS 2
TABLES - LEGENDS 7
ILLUSTRATIONS - LEGENDS 10
ACKNOWLEDGEMENTS 18
SUMMARY 21
PREFACE 25
I. INTRODUCTION 27
II. ULTRASOUND PHYSICS AND INSTRUMENTATION 30
1. PHYSICS 31
2. INSTRUMENTATION 38:1. Pulsed ultrasound systems 38:2. Doppler ultrasound systems 43
III. HISTORICAL REVIEW OF THE LITERATURE 44
1. SAFETY OF DIAGNOSTIC ULTRASOUND 45:1. Biophysical mechanisms 46:2. Animal studies 47:3. Human studies 50:4. Chromosome studies 51:5. Enzyme activity 51:6. Summary 52
2. DEVELOPMENT OF ULTRASOUND AS A DIAGNOSTIC TECHNIQUE 53
3. DETECTION OF EARLY FETAL LIFE 55
:1. Electrocardiography 55:2. Ultrasonic methods 55:3. Fetal heart rates 57
4. DIAGNOSIS OF "EARLY PREGNANCY FAILURE" 58
:1. Clinical methods 59:2. Hormonal and biochemical methods 59:3. Vaginal cytology 61:4. Diagnostic ultrasound 62

4PAGE
5. ESTIMATION OF GESTATIONAL AGE 66
:1. Clinical methods 66:2. Diagnostic ultrasound 67:3. Radiological methods 71:4. Methods based on examination of the
amniotic fluid 72
IV. METHODS 74
1. DESCRIPTION OF EQUIPMENT 76
:1. Scanning gantry 76:2. Patient trolley 77:3. Electronic console 77:4. Camera 79
2. EXAMINATION TECHNIQUE 80
:1. Preparation of patient 80:2. Scanning technique 80:3. Preliminary examination 81
3. CLINICAL INFORMATION 82
:1. Clinical history 82:2. Outcome of the pregnancy 82
V. RESULTS 84
1. DETECTION OF FETAL HEART MOVEMENTS 85
:1. Description of the technique 85:2. Accuracy of detection 88:3. Fetal heart rate 88
2. DIAGNOSIS OF EARLY PREGNANCY FAILURE 90
:1. Indication for initial examinationand outcome 91
:2. Blighted ova 92:3. Missed abortions 95:4. Hydatidiform moles 97:5. Live abortions 98:6. Miscellaneous 99:7. Threatened abortion 99:8. Early pregnancy failure in twin
conceptions 100
3. ESTIMATION OF GESTATIONAL AGE 101
:1. Description of crown-rump lengthmeasurement technique 101
:2. Reproducibility of the crown-rumplength measurement technique (random errors) 103
:3. Systematic errors of the crown-rumplength measurement technique 106

5
PAGE
:4. "In vivo" comparison of ultrasonic and "actual" crown-rump length measurements 109
:5. Normal crown-rump length growth curve 109 :6. "Absolute" crown-rump length values 110:7. Estimation of gestational age using
crown-rump length measurements 111:8. "Crown-rump length" age and date of
onset of spontaneous labour 113:9. Serial crown-rump length measurements
and outcome of pregnancy 114:10. Description of gestation sac volume
measurement technique 114:11. Sources of error in the measurement
of gestation sac volume 117:12. "In vivo" comparison of ultrasonic
and "actual" gestation sac volume measurements 118
:13. Normal gestation sac volume growthcurve 120
:14. Estimation of gestational age usinggestation sac volume measurements 121
VI. DISCUSSION 122
1. CONFIRMATION OF FETAL LIFE 123
2. FETAL HEART RATE 126
:1. Bleeding in early pregnancy 127
3. DIAGNOSIS OF EARLY PREGNANCY FAILURE 128
:1. Blighted ova 129:2. Missed abortions 129:3. Hydatidiform moles 131:4. Management of "established" early
pregnancy failure 131:5. Live abortions 133:6. Relative incidences of the sub-groups
of early pregnancy failure 133:7. Aetiologies of early pregnancy failure
and their implications for clinical management 134
:8. Threatened abortion 136:9. Twin conceptions 137
4. ESTIMATION OF GESTATIONAL AGE 139
:1. Fetal crown-rump length 140:2. Bimanual examination of the uterus 143:3. Biparietal diameter measurement 143:4. Recommendations for the estimation of
gestation age 443:5. Correlation of "crown-rump length
estimated date of delivery and outcome 144:6. Absolute crown-rump length values 145:7. Gestation sac volumes 447

PAGE
:8. Comparison of gestation sac fluidvolumes and direct values 149
:9. Clinical application of gestationsac volumes 150
VII. CONCLUSIONS 151
VIII. REFERENCES 155

TABLES - LEGENDS

Table
1
2
3
4
5
6
7
8
Facing Page
Fetal heart rates (FHR), mean - 1SD, at three day intervals from 6 to 15 weeks (401 normal pregnancies).
Fetal heart rates, mean - 1SD, at three day intervals from 6 to 14 weeks (136 patients with threatened abortion).
Indication for initial ultrasound examination and outcome in 1059 pregnancies.
Classification of "Early Pregnancy Failure" and the number of patients in each category.
Indication for the first ultrasound examination in each category of "Early Pregnancy Failure".
Ultrasound findings in 30 patients shown to have twin conceptions in the first trimester of pregnancy.
Reproducibility of CRL technique (blind trial). Results obtained from three independent (coded) measurements in 30 unselected patients.
Change in fetal CRL from a maximum measurement as a result of a progressive reduction in ultrasonic power output level.
Indications for the first ultrasonic examination in the 424 pregnancies from which a normal CRL growth curve was derived.
88
89
91
91
91
100
104
105
110

9
Table
10a
10b
11a
lib
12
13
14
15
The basic mean and 2SD values of CRL for each day of menstrual age from 6 weeks and 2 days to 10 weeks and3 days, together with the mean and 2SD values derived from the regression analysis.
The basic mean and 2SD values of CRL for each day of menstrual age from 10 weeks and 4 days to 14 weeks and4 days, together with the mean and 2SD values derived from the regression analysis.
Mean CRL values derived from the regression analysis, from 6 weeks and 2 days to 10 weeks and 3 days, together with these values after correction for the systematic errors (1 mm + 3.7 per cent) of the technique.
Mean CRL values derived from the regression analysis, from 10 weeks and 4 days to 14 weeks and 4 days, together with these values after correction for the systematic errors (1 mm + 3.7 per cent) of the technique.
Comparison of ultrasonic estimates of gestation sac fluid volumes and the volumes measured directly from intact aborted sacs.
Mean and 2SD values of "gestation sac" volumes in intervals of three days.
Analysis of the menstrual and clinical factors of 506 consecutive patients.
Comparison of ultrasound "gestation sac" fluid volumes and direct values of amniotic fluid volumes derived from specimens obtained at hysterotomy.
Facing Page
110
110
110
110
119
120
144
149

ILLUSTRATIONS - LEGENDS

1
2
3
4
5
6
7
8
9
10
11
11
Facing Page
Diasonograph NE 4102 (Nuclear Enterprises Ltd., Sighthill, Edinburgh). 38
A simplified block diagram of a typical ultrasonic scanning system. 39
A diagrammatic representation of the three basic ultrasound modes, A, B and time position (TP), and their relationship to each other. 39
A pregnancy at 5 weeks and 1 day of menstrual age. 67
A pregnancy at 8 weeks. 67
A pregnancy at 10 weeks of menstrual age. 67
Least-squares regression line and standard error of the estimate of the relation between the length, and antero-posterior diameter of the uterus, and the duration of pregnancy.(Heilman et al, 1969) 68
Least-squares regression line and standard error of the estimate of the relation between the mean diameter of the gestation sac and the duration of pregnancy. (Heilman et al, 1969) 68
Mean fetal biparietal diameter growth curve in the second and third trimesters of pregnancy together with the 5th and 95th confidence limits. (Campbell and Newman, 1971) 70
Electronic console of the DiasonographNE 4102. 77
"Contour following" technique employed in scanning an early pregnancy. 80

12
Figure
12-16
17
18
19
20
21
22
23
24
Facing Page
Combined B, A, and TP scan techniqueemployed for the detection of fetalheart movements in the first trimesterof pregnancy. 85 & 86
A time position recording from an11 week fetus in which the early (lower)part of the trace shows evidence of fetalheart movements, but which is thereafterlost due to continued and vigorous fetalbody movements. 87
A time position recording of the fetal heart movements of a fetus at 10 weeks of menstrual age. During the examination the fetus made a small but rapid movement upwards towards the transducer. 87
A time position recording of fetal heart movements in which all the echoes have been subjected to a slow vertical movement pattern induced by maternal respiratory movements. 87
The effect of strong maternal arterialpulsations on a time position recordingof fetal heart movements. 87
Mean and 1SD limits of fetal heart ratefrom 6 to 14 weeks of menstrual age. 88
A blighted ovum at 9 weeks of menstrualage. 90
A blighted ovum at 12 weeks of menstrualage. 90
A pregnancy at 11 weeks in which the only identifiable structure within the gestation sac (GS) was a very small group of echoes on the posterior wall. 90
A missed abortion at 11 weeks of menstrual age. 91

26
27
:&2<
30
31
32
33
34
35
36
37
38
39
13
Facing Page
A missed abortion at 20 weeks. 91
A live pregnancy at 7 weeks and 2 dayswhich aborted spontaneously 36 hourslater and was thus classified as an"early live abortion". 91
A hydatidiform mole at normal andreduced ultrasound power output levels. 91
Gestation sac volumes in 96 of the 103 patients with a blighted ovum. 92
Pulsus trigeminus pattern in a fetalheart tracing obtained in the week priorto intrauterine death of an 8 week fetus. 96
Gestation sac volumes of the 24 patientswith missed abortions who were examined*on more than one occasion. 96
Estimated time of fetal death in 92 cases of missed abortion. 97
Interval between the estimated time offetal death and spontaneous abortion. 97
A hydatidiform mole with a number of"clear" areas within its substanceprobably representing areas of blood clot. 97
The ultrasound findings of the 9 patients with "early live abortions". 98
Outcome of 367 pregnancies complicated by vaginal bleeding. 99
Outcome of 367 pregnancies complicated by vaginal bleeding in relation to the presence or absence of fetal heart movements at the first examination. 99
A normal continuing twin pregnancy at 9 weeks of menstrual age. 100

14
Figure
40 A twin pregnancy at 8 weeks consistingof a normal pregnancy in which a fetus and fetal heart movements were identified, and a smaller blighted sac in which no fetus could be located.
41 Twin blighted sacs at 8 weeks.
42 A diagram of the technique employedto determine the longitudinal axisof the fetus in the technique of crown- rump length measurement.
43 A pregnancy at 6 weeks and 5 days in which the fetal echoes measure 9 mm.
44 A fetus at 10 weeks with a crown-rump length (CRL) of 30 mm.
45 A pregnancy at 10 weeks and 5 days in which the echoes at the fetal ends merge with the adjacent sac wall echoes.
46 A section of a 14 weeks fetus taken toone side of the midline to demonstrate the flexed position of the leg (L).
47 A fetus at 14 weeks and 1 day with a crown-rump length of 93 mm.
48 Standard deviations of 3 ’’blind” CRL measurements in each of 30 patients, in relation to the mean of the three measurements.
49a Four pictures of the same fetus takenat decreasing levels of ultrasound power output.
49b Change in the fetal CRL image, from amaximum measurement, with decreasing levels of ultrasound power output; mean values obtained from 9 experiments.
Facing Page
100100
102
102
103
103
103
103
104
105
105

15
Figure
50
51
52
53&54
55
56
57
Facing Page
Diagram illustrating the hypothesis thatthe echoes forming the extreme ends ofthe fetal image are derived not from theskin surface but from deeper structures. 108
A comparison of ultrasonic fetal CRL measurements and post-abortion direct measurements in a series of 41 missed abortions. 109
Mean growth curve of the fetal CRL from6^ to 14 weeks of menstrual age,together with the 2SD limits, derivedfrom a non-linear regression analysis of424 measurements. 110
Comparisons of the ages of pregnancies determined by "blind” CRL measurements and the ages based on calculations from "impeccable" menstrual histories in 94 patients. Ill
The differences (weeks) between the ages of pregnancies determined by bimanual examination of the uterus and the"menstrual" ages. 112
The differences (days) between the "CRL"ages and the menstrual ages in the samegroup of 40 patients shown in Figure 55. 112
The differences (weeks) between the ages of pregnancies determined by bimanual examination of the uterus and the "CRL" ages. 113
The differences (days) between the fetal"biparietal diameter (BPD)" ages and the"CRL" ages in 52 patients. The CRLmeasurements were obtained in the firsttrimester and the BPD measurements between18 and 22 weeks; all were performed "blind". 113

16
Figure » Facing Page
59 The differences (weeks) between the fetal "biparietal diameter” ages and the "CRL" ages in 41 patients. The CRL measurements were obtained in the first trimester and the BPD measurements between 34 and 38 weeks; all wereperformed blind. 113
60 Discrepancy (days) between the date ofdelivery predicted from a CRL measurementin the first trimester and the actual dateof delivery in 252 patients with "impeccable" menstrual histories. 113
61 Discrepancy (days) between the date ofdelivery predicted from a CRL measurementin the first trimester and the actual date of delivery in 165 patients with "doubtful" menstrual histories. 113
62 A diagrammatic representation of thetechnique employed in the ultrasonic estimation of "gestation sac" volume. 114
63 Haffplanimeter No. 315 used to measurethe gestation sac areas. 115
64 Gestation sac with artefact echoesobscuring a segment of the sac wall. 115
65 The line followed during planimetricmeasurement of gestation sac area. 116
66 The skeleton of a model constructed aspart of an experiment to determine the accuracy of the mathematical method of calculating gestation sac volume. 117
67 Standard deviations of 3 "blind" gestation sac volume measurements in each of 30 patients, and 5 blind measurements in each of 5 patients, in relation to the mean gestationsac volume in the 35 individual trials. 118

17
Figure
68 The smoothed mean and 2SD values(continuous lines),319 gestation sac volume estimations from 5 to 14 weeks of amenorrhoea.
69 A regression analysis of menstrualage against gestation sac volume.
70 Comparison between the mean crown- rump length values between 6 and 14 weeks of menstrual age derived in this study, and those published by Kurjak et al (1976) and Drumm et al (1976).
71 A comparison of the mean ultrasoniccrown-rump length values derived from the regression analysis and corrected for the systematic errors of the technique, with anatomical values reported in the literature.
Facing Page
120
121
142
145
I

18
A C K N O W L E D G E M E N T S

I am greatly indebted to Professor Ian Donald, now Emeritus Professor of Midwifery, University of Glasgow, for the privilege of working with him and his Department during the years 1971 to 1976 when the great bulk of the work described in this thesis was performed, and for the invaluable advice, and encouragement which he gave so willingly at its various stages of development.
My thanks go also to Professor C.R. Whitfield, Professor of Midwifery, University of Glasgow, for his support during the preparation of this manuscript, and for his detailed and helpful criticism of its various drafts.
I wish to acknowledge the Medical Research Council under whose auspices this work was conducted (Programme Grant No. G690/684/C, "Sonar, its application to diagnosis in obstetrics and gynaecology, and related fields"; Programme Leader, Professor Ian Donald).
I am extremely grateful to the consultant and other medical staff of the Queen Mother’s Hospital, Glasgow, whose unstinting co-operation made this study possible.
Without the constant interest and help of Dr. M. Pont and Mrs. I. Miller, the midwifery and auxilliary nursing staff connected with the ultrasonic department, and Mrs. M. Smith and Mrs. McKee the secretaries, the organisation and conduct of this investigation could not have progressed satisfactorily. To them I extend my sincere thanks.
I am grateful to the technical staff of the Department of Midwifery, and in particular to Mr. J.E.E. Fleming and Mr. A. Hall, who, over the years, have so willingly given of their time in advising and co-operating in many of the more technical aspects of this study, and in assisting in the statistical analysis of the results. I gratefully acknowledge also, Mr. T. Aitchison of the Department of Statistics, University of Glasgow, for his statistical advice and help.
I wish to thank Dr. J. Shaw-Dunn, Department of Anatomy, University of Glasgow, for his advice and comments on the embryological background to this work. Dr. Judy Caines for her

collaborative help in the study of twin conceptions,Dr. Manfred Hansmann and Dr. Jochen Hackeloer of Germany who translated the several German papers quoted in this thesis, and the librarians of the Glasgow University Library.
In recording my thanks to Mr. J. Devlin and his Department of Medical Illustration of the Yorkhill hospitals, I wish to make special mention of Miss Jean Hyslop the medical artist, and Mr. A. Herd.
My sincere thanks go to Miss Margaret Davidson for her skilful and experienced preparation of the manuscript, a task demanding much forbearance, and one which was carried out with unfailing good humour and patience.
To the patients themselves, I offer appreciation of their co-operation, and admiration for their fortitude and resilience when the outcome was unsuccessful.
Finally I wish to thank my wife Isabelle, and my family, for their unfailing support and understanding during the conduct of this study and during the preparation of the manuscript.
For its final form however, I accept full responsibility.


22
In the two decades since the use of ultrasound was first applied to the problems of obstetrics, its role has expanded dramatically, and, in good hands it may now be considered to be one of the most important diagnostic aids available to the obstetrician. In 1972 however, when the work described in this thesis was initiated, the ultrasonic techniques employed in early pregnancy were either subjective, or their limits of accuracy, in such areas as fetal heart movement detection and the estimation of gestational age, were less than optimal.
Thus, the objectives of this study were: to develop a reliable method of detecting fetal life earlier in the first trimester of pregnancy; to devise objective criteria for the early diagnosis of unsuccessful pregnancies; and to develop a more accurate means of estimating the gestational age of a pregnancy in the first trimester.
In pursuit of these objectives a "second generation" ultrasound equipment was used, the Diasonograph NE4102*, an equipment which is more sophisticated electronically than earlier models, and which has many novel and useful facilities. Using this equipment three new ultrasonic techniques were developed: a combined B-, A-scan method for detecting small movements of the fetal heart; a system for estimating the volume of the gestation sac; and a technique for the measurement of the fetal crown-rump length (CRL).
The technique devised to detect early fetal heart movements was based on the principle of first locating the fetus on a two-dimensional B-scan image, then examining the fetal echoes closely on an expanded uni-dimensional A-scan display. In this way it proved possible to detect movements of the fetal heart structures with reliability from seven weeks of amenorrhoea, and on occasion from as early as six weeks. Conversely, absence of such movements proved reliable as a means of diagnosing early fetal death, and with increasing confidence in the technique, patients were offered an elective termination of pregnancy, at times, on the sole evidence of the ultrasound examination.
* Nuclear Enterprises Ltd., Sighthill, Edinburgh.

23
A normal curve was derived for fetal heart rate from six and a half to 15 weeks of pregnancy, and the changes noted correlated with embryological and animal data recorded in the literature.
While fetal heart rate itself was not found to be useful as a means of anticipating intrauterine fetal death or impending abortion in individual cases, the presence or absence of demonstrable fetal life in patients with threatened abortion, gave prognostic information about the ultimate outcome in 92 per cent of them.
Analysis of the 282 pregnancies in this series which eventually aborted, allowed a simple and practical classification of ’’early pregnancy failure" into blighted ova (no fetus present within the gestation sac); missed abortions (a fetus present, but no fetal heart movements detectable); early and late live abortions (evidence of continuing fetal life until spontaneous abortion, before and after 12 weeks); and hydatidiform moles. The first two were found to constitute 80 per cent of these pregnancies, and early live abortions only three per cent.
Criteria independent of any knowledge of the menstrual and clinical histories were formulated for their diagnoses. On this basis all missed abortions and hydatidiform moles, and almost half of the blighted ova, can be diagnosed with confidence at a single examination. However, the remaining blighted ova require further examinations and measurements before a clear statement of abnormality can be given. The possible aetiologies of these sub-groups are discussed together with the doubtful merits of any form of treatment, at least for patients with blighted ova and those destined to have missed abortions.
It did not prove possible to predict reliably impending "live abortions" by any of the techniques used, although a finding of a low "sac volume/fetal CRL ratio" is considered to be a possible warning sign in the early live abortion group.
In a small sub-section of this study the outcome of 30 patients, diagnosed as having twin conceptions in the first trimester, was considered separately. Only 14 gave birth to twins, the remainder aborting or delivering eventually a

24
single baby. These results suggest that the incidence of twin conceptions is higher than the commonly accepted figure of 1 in 80.
Two techniques were developed with a view to obtaining objective, and more accurate estimates of gestational age in the first trimester. These were gestation sac volume, and CRL measurements, of which the latter has proven to be relatively simple in its application, to be reproducable, and to give an accuracy of + 4.7 days in 95 per cent of cases. This figure was confirmed in a large clinical "blind" trial. After correction for the systematic errors of the technique (1 mm plus 3.7%), the mean CRL growth curve, derived from 424 measurements, correlated well with the data published by some embryologists, but not with those by others. The possible reasons for these discrepancies are discussed.
Using CRL measurements as a baseline, the accuracy of clinical bimanual estimation of uterine size in the first trimester, and of biparietal diameter measurements at approximately 20 and 36 weeks, was assessed in a further "blind" trial. The 2SD limits of each of these estimations were found to be + 25.5 days, + 11 days, and + 30.4 days respectively. In view of this, and the desirability of having a reliable estimate of the gestational age in the modern management of pregnancy, it is recommended that at least all patients with "at risk" pregnancies, together with those whose menstrual histories are in any way unreliable, should be referred for an ultrasound examination at the time of their first antenatal clinic visits.
The technique described for gestation sac volume measurement is time-consuming, and the values obtained, when used as a means of estimating gestational age, have a range of error twice that achieved by CRL measurements. This technique is not therefore recommended for this purpose, although it is extremely useful in the early diagnosis of blighted ova.
It is concluded that the application of these three techniques allows a more objective and more reliable evaluation of early pregnancy and of its complications than was hitherto possible.

25
P R E F A C E
The early stimulus to the work described in this thesis dates from a retrospective analysis, conducted by the author in 1970, of the clinical value of an ultrasound examination in patients with a history of bleeding in early pregnancy. The series comprised 264 patients admitted to the gynaecology wards of the Western Infirmary, Glasgow, during the year 1969 (Robinson, 1972). During the course of this study it became clear that while the use of the information obtained from an ultrasound examination could be shown to influence clinical decisions, to shorten the length of stay of patients in hospital, and to provide a measure of reassurance when an Mintact” pregnancy was visualised, the information was by no means diagnostic in all situations. In particular no clear statement could be given that the fetus was actually alive, and no warning given of impending abortion in the significant group of patients in whom an ”intact" pregnancy was demonstrated but who subsequently aborted.
In view of this the author determined to take a particular interest in the problems of the first trimester of pregnancy when he took up post as a research assistant in 1971 in the Queen Mother's Hospital, under the terms of a Medical Research Council Programme Grant entitled, "Sonar, its application to diagnosis in obstetrics and gynaecology, and related fields", awarded to Professor Ian Donald, then Regius Professor of Midwifery at Glasgow University.

27
I
I N T R O D U C T I O N

28
Objective information about almost all aspects of the early developing pregnancy has always been extremely difficult to obtain due to the protected position of the gravid uterus within the confines of the pelvis. In view of this and the naturally high pregnancy wastage rate in the first trimester, it is not surprising that this period of pregnancy came to be associated with a greater degree of uncertainty and with more ill-founded beliefs and convictions than the latter two trimesters.
To help dispel these associations and to allow him to manage an individual in a more enlightened manner the obstetrician would ideally like to know if the fetus is alive or dead, or indeed if there is even a fetus present within the gestation sac; whether the pregnancy is single or multiple; if there is any evidence of fetal malformation; and, of major importance in modern obstetric practice, the age of the pregnancy. However, until the development in recent years of sophisticated investigative techniques, there were no ancilliary methods which would provide the answers to any of these questions, the obstetrician having to rely solely on the patient's history, his own clinical acumen, and the passage of time to resolve his diagnostic problems. As a result of this situation patients, quite empirically, were often confined to bed for many weeks in the event of complications such as bleeding, a course of action which is clearly inappropriate for those whose pregnancies are already destined to abort.
Of the techniques which have become available, diagnostic ultrasound is generally recognised as having the greatest potential for providing information of immediate and practical value to the clinician by allowing him to "see" inside the uterus and to measure and study the developing fetus.* When the work to be described in this thesis was initiated in 1972 considerable strides had been taken towards the realisation of this potential, principally as a result of the pioneering work of Professor Donald and his colleagues in Glasgow. At that time studies had been made of the changing appearances of the normal developing pregnancy, growth curves of uterine and gestation sac diameters had been compiled, and the features commonly associated with impending abortion had been documented. Apart from the growth data relating to uterine and gestation sac size however, the information to be derived from an

29
ultrasonic examination was largely subjective in nature being very much dependent on the experience of the observer.In terms of estimating gestation age the latter subjective approach was unsatisfactory due to the considerable variation in the ultrasonic features at any given age, while the use of uterine and gestation sac diameters was equally limited by the large biological variations of these parameters. Furthermore, in 1972, there was no method of reliably detecting the presence or absence of fetal life at a single examination early in the first trimester of pregnancy, although Doppler instrumentation had become established as a means of detecting fetal heart movements from the fourteenth week onwards.**
It was against this background therefore that the author began his investigations into the use of ultrasound in the evaluation of the early pregnancy and of its complications.
The specific aims of this work were threefold:A. To develop a reliable method of detecting fetal life
early in the first trimester of pregnancy.B. To devise objective criteria for the early diagnosis
of pregnancies destined to abort.C. To develop a more accurate means of estimating the
gestational age of a pregnancy in the first trimester.
* For convenience the term "fetus" is used irrespective of whether it is in the embryonal or fetal period of development.
* * In this thesis all references to the age of a pregnancy relate to menstrual age (weeks elapsed since the first day of the lastmenstrual period).

30
II
ULTRASOUND PHYSICS
AND
INSTRUMENTATION
31
II, 1. PHYSICS
Ultrasound may be defined as sound which lies above the range of hearing, the upper limit of which in the human seldom exceeds 20,000 cycles per second, that is 20 kilohertz (KHz).In the medical field the frequencies of ultrasound employed vary from 1 to 20 megahertz (MHz) depending on the particular application, with 2.5 MHz being the most common in obstetrical scanning. When used as a diagnostic technique in medicine the term "sonar” has been used as an alternative to "ultrasound" in order to distinguish it from the high power, low frequency ultrasound which is used in industry in a number of destructive processes, and in physiotherapy as a means of generating heat in deep tissues. The power levels employed in diagnostic ultrasound are only a small fraction of those used in industry and the frequencies are very much higher. These aspects of the physical properties of ultrasound will be considered in greater detail in the section on the safety of diagnostic ultrasound.
In common with audible sound, ultrasound is basically mechanical energy in the form of pressure waves and in most respects their properties are similar. From a practical standpoint the most important differences are: firstly, that ultrasound is only very poorly propagated through a gas; and secondly, unlike audible sound, it can be easily focussed into a narrow beam. In this latter form it behaves in many ways like a beam of light.
Transducers and propagation of ultrasound
Ultrasound in the high frequency range is both generated and detected by means of electrically charged crystals known as piezoelectric crystals. Such substances have the capability of converting mechanical energy in the form of sound to electrical energy, the two processes being termed the "piezoelectric (pressure/electricity) effect", and the "reverse piezoelectric effect", respectively. A device, whether naturally occurring or artificially produced, which can convert energy from one form to another is known as a "transducer". There are many naturally occurring piezoelectric crystals, the most common
32
being quartz. These, however, are now seldom if ever used for the generation of ultrasound in the medical field, having been replaced by synthetic materials such as lead zirconate titanate because of their better sensitivity. The shape and size of piezoelectric crystals can be tailored for specific purposes such that a given crystal will vibrate or ’’ring" at a predetermined frequency, be capable of focussing the ultrasound beam at a chosen depth, and have a clearly defined sensitivity range.
In practical terms ultrasound is generated by the external application of an electrical voltage to one axis of the crystal which results in a mechanical distortion of its shape along that axis. In the process of recovery from this distortion the crystal vibrates or oscillates according to its natural resonance frequency (the reverse piezoelectric effect) in a similar way to a coiled spring on the release of a stretching force. The mechanical energy in the form of ultrasonic waves produced by these oscillations is then transmitted through the adjoining medium by inducing vitrations in the particles or molecules in that medium. During the phase of forward motion in the vibration cycle the particle imparts energy to its distal neighbour and so on in a sequential manner thereby propagating the ultrasonic wave away from the crystal.
Conversely an ultrasonic wave impinging on the piezoelectric crystal causes a corresponding distortion of the crystal and as a result its surface electric charge changes (the piezoelectric effect). In this way a single crystal may act both as a transmitter and receiver of ultrasonic energy.
Power and Intensity
Ultrasonic power is usually expressed in watts, and its intensity in watts per square centimetre. In practice it is convenient to measure the ratios between pairs of intensities, particularly if the level of one is used as a reference for the comparison of all others. This sytem therefore obviates the need to make absolute measurements. In most diagnostic machines the reference point is usually the maximum intensity output of the machine. As ultrasonic waves are usually generated and received electrically the differences in intensity may be

33
expressed as a ratio of the relative voltages. In order to simplify this comparison of numbers which may span several orders of magnitude, a logarithmic unit, the decibel (db) is used, i.e. a reduction of 10 dB is equivalent to a drop in power output by a factor of 100 to 1.
Ultrasound velocity
The velocity (c) at which ultrasound travels through a medium is related to the elasticity (k) and the density (p) of the medium, according to the equation : c = k/p
In water the velocity of ultrasound is 1480 m/sec, in muscle 1590 m/sec, and skull-bone 4080 m/sec (Wells, 1972).For practical purposes a velocity of 1540 m/sec is assumed for the calibration of most diagnostic machines, this being the average velocity of ultrasound in human soft tissues.
Wavelength
With the passage of successive waves of ultrasound into a medium, there will be a corresponding series of equally spaced particles along the line of propagation which are all at exactly the same stage of displacement at any given instant.The distance between these points, the wavelength ( , is a function of the velocity of the ultrasound (c) and its frequency (f). Their relationship is given by the equation:
Hence, if the velocity is 1540 m/sec, and the frequency is1.5 MHz, then the wavelength is 1 mm. When the frequency is2.5 MHz, the wavelength in the same medium will be 0.6 mm. Therefore the higher the frequency of ultrasound used, the shorter is the wavelength. This fact is an important one when making a choice of which frequency to use for diagnostic purposes, as the shorter the wavelength the greater is the ability of an ultrasonic system to distinguish two points positioned in series along the line of the beam.
Attenuation of ultrasound
As ultrasound passes through a complex structure such as the body, its intensity is attenuated by reflection and refraction at interfaces between different tissues, by losses due to
34
conversion of some of the ultrasonic energy to heat (absorption), and by divergence of the beam.
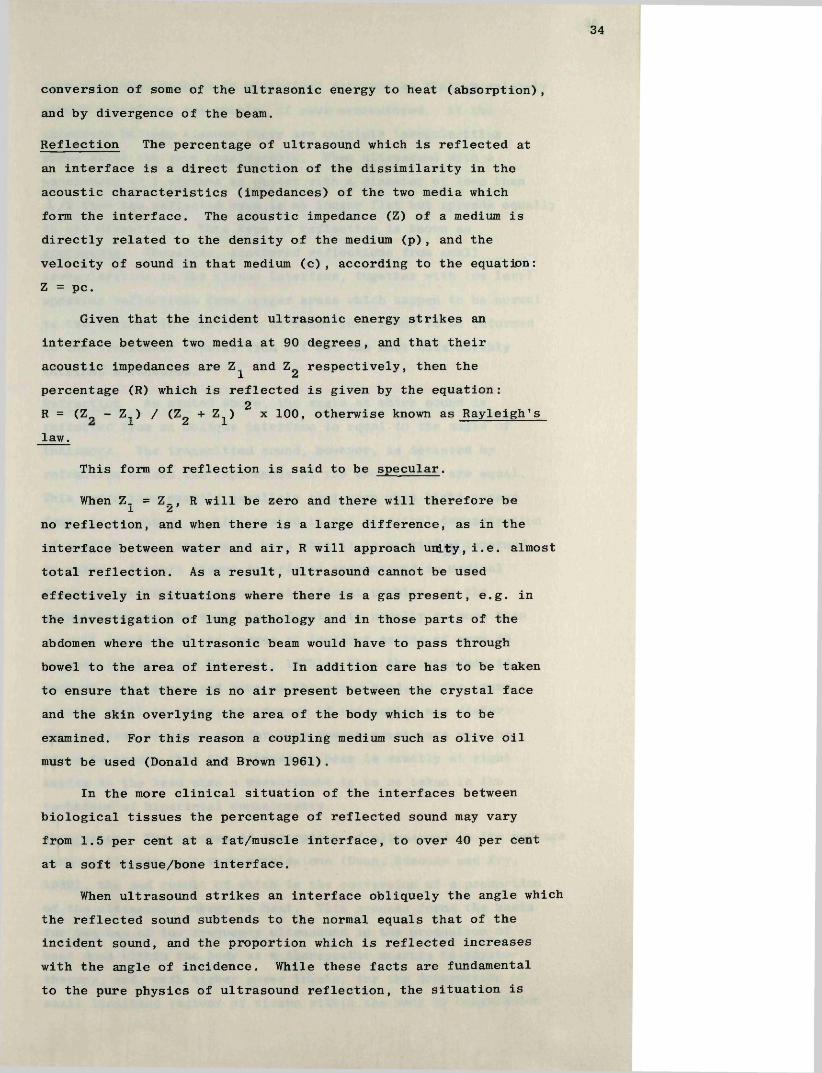
Reflection The percentage of ultrasound which is reflected at an interface is a direct function of the dissimilarity in the acoustic characteristics (impedances) of the two media which form the interface. The acoustic impedance (Z) of a medium is directly related to the density of the medium (p), and the velocity of sound in that medium (c), according to the equation:Z = pc.
Given that the incident ultrasonic energy strikes aninterface between two media at 90 degrees, and that theiracoustic impedances are Z and Z respectively, then the1 &percentage (R) which is reflected is given by the equation:
2R = (Z„ - Z„) / (Z„ + Z,) x 100, otherwise known as Rayleigh’sJL Z I
law.
This form of reflection is said to be specular.
When Z = Z , R will be zero and there will therefore be X zno reflection, and when there is a large difference, as in theinterface between water and air, R will approach unity, i.e. almosttotal reflection. As a result, ultrasound cannot be used effectively in situations where there is a gas present, e.g. in the investigation of lung pathology and in those parts of the abdomen where the ultrasonic beam would have to pass through bowel to the area of interest. In addition care has to be taken to ensure that there is no air present between the crystal face and the skin overlying the area of the body which is to be examined. For this reason a coupling medium such as olive oil must be used (Donald and Brown 1961).
In the more clinical situation of the interfaces between biological tissues the percentage of reflected sound may vary from 1.5 per cent at a fat/muscle interface, to over 40 per cent at a soft tissue/bone interface.
When ultrasound strikes an interface obliquely the angle which the reflected sound subtends to the normal equals that of the incident sound, and the proportion which is reflected increases with the angle of incidence. While these facts are fundamental to the pure physics of ultrasound reflection, the situation is

35
very much more complex in biological systems, as flat, completely smooth interfaces are rarely, if ever encountered. At the interface between tissues there are multiple irregularities whose sizes may vary considerably. When ultrasound with a wavelength (\ ) strikes an object with a diameter of less than \ / 2 then the reflected wave is no longer flat but spreads equally in all directions. This type of reflection is known as scattering. Therefore, scattered reflections from small irregularities in the tissue interface, together with low level specular reflections from larger areas which happen to be normal to the ultrasonic beam allow at least some sound to be returned to the transducer crystal from all but the most unfavourably inclined structures.
Refraction As stated above, the angle at which sound is reflected from an oblique interface is equal to the angle of incidence. The transmitted sound, however, is deviated by refraction unless the impedances of the two tissues are equal.This refraction exactly parallels that seen when light passes from air to water, as illustrated in the classical demonstration of a stick which appears to bend when it is partially immersed in water. At soft tissue interfaces encountered in medical diagnosis refraction is not a significant problem, as the amount by which the sound is refracted is usually no more than a small fraction of one degree at incident angles of even 45 degrees (Talbert and Campbell, 1972). When the interface is between soft tissue and bone on the other hand, as for example a fetal skull in utero, the degree of refraction may distort the eventual picture, and for this reason great care must be taken to ensure that the ultrasonic beam is exactly at right angles to the head when a measurement is to be taken in the technique of biparietal cephalometry.
Absorption The process of absorption of ultrasound in its passage through tissues is a very complex one (Dunn, Edmonds and Fry,1969), the end result of which is the conversion of a proportion of the ultrasonic energy to heat. This process forms the basis for the use of low frequency ultrasound in the production of heat deep within the body as a therapeutic measure in physiotherapy, and, with higher power levels, for the destruction of small localised regions of tissue within the body by coagulation

36
(Fry, 1958). At the frequencies and power levels used in medical diagnosis the level of heat production is so small as to be undetectable.
The proportion of ultrasound absorbed by different tissues varies, bone for example absorbs at a rate some 15 times that of soft tissues and several thousand times that of water. In addition, the rate of absorption of ultrasound rises with an increase in frequency, thereby limiting the use of the higher frequencies 0 5 MHz) in diagnosis to such specialised fields as ophthalmology, where only a short penetration distance is required.
There are therefore two factors which have to be considered in the choice of transducer frequency for any given purpose, namely depth resolution, which is directly related to wavelength as discussed earlier, and penetration. In obstetrical scanning a frequency of around 2.5 MHz has been found to provide a good compromise, with reasonable resolution of intrauterine structures, and good penetration of the pregnant abdomen in all save the very obese. In this latter situation recourse to the lower frequency of 1.5 MHz allows adequate penetration but suffers the penalty of poorer depth resolution.
Beam Width
The beam of ultrasound on leaving the transducer is initiallycylindrical in shape forming the so-called near field (Fresnelzone). The length of this field is given by the formula:
2I = 0.25 x D /X , where D is the diameter of the crystal, and X the wavelength of the ultrasound. Given a 2.5 MHz crystal with a diameter of 1.5 cm. the near field in soft tissues will be just over 6 cm. At the end of the near field the beam diverges to form the far field (Frauenhofer zone).
Ideally it is desirable to have as narrow a beam as possible to optimise lateral resolution, and with this as the only consideration, a very small diameter crystal would give the desired effect. Unfortunately, however, the length of the near field decreases with decreasing crystal diameter as determined by the above equation. In addition, the divergent angle in the far field can be shown to increase with decreasing crystal
37
diameter.
From the above equation it can also be seen that the near zone is lengthened if the frequency is increased (because wavelength is an inverse function of frequency), and therefore a smaller diameter, higher frequency crystal may be used to achieve a similar length of near field. It can also be shown that the angle of divergence in the far field decreases with an increase in frequency. These obvious advantages however are limited as before by the faster rate of sound absorption in the higher frequency range.
A more applicable improvement in resolution capability may be obtained through the use of a concave crystal, or by placing an appropriate lens in front of the crystal to achieve a focussing effect on the beam. This effect is limited to the near field, after which the ultrasonic beam diverges more rapidly. The advantage of this system in clinical practice has been found to outweigh the disadvantages, and most commercially available transducers are now constructed to give some degree of focussing.
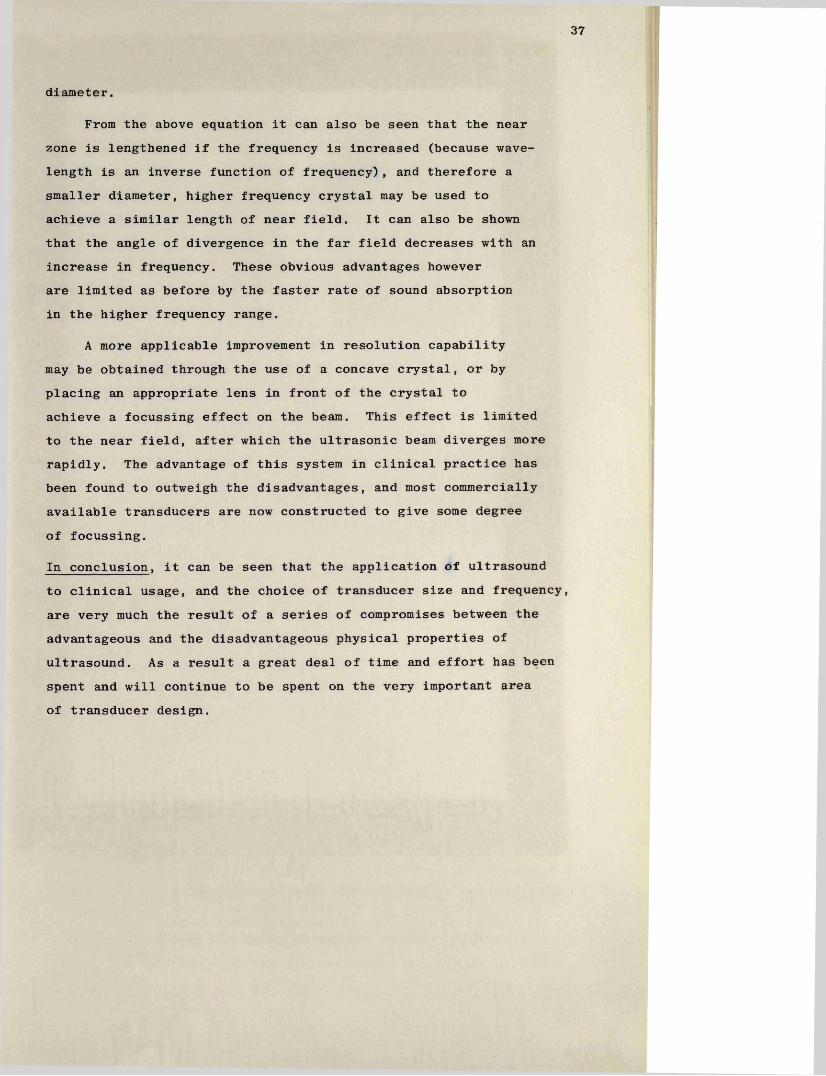
In conclusion, it can be seen that the application of ultrasound to clinical usage, and the choice of transducer size and frequency, are very much the result of a series of compromises between the advantageous and the disadvantageous physical properties of ultrasound. As a result a great deal of time and effort has been spent and will continue to be spent on the very important area of transducer design.
„ fit,
Figure 1. Diasonograph NE 4102 (Nuclear Enterprises Ltd., Sighthill, Edinburgh); the ultrasound equipment used in this study. The scanning gantry and the patient trolley are to the right, and the electronic console is to the left.
38
II, 2. INSTRUMENTATION
The diagnostic ultrasound systems in general use can be divided into two broad groups, the A, and B scan machines which employ pulsed ultrasound, and the simpler Doppler or motion- sensing machines which use continuous wave ultrasound.
II, 2:1 Pulsed Ultrasound Systems
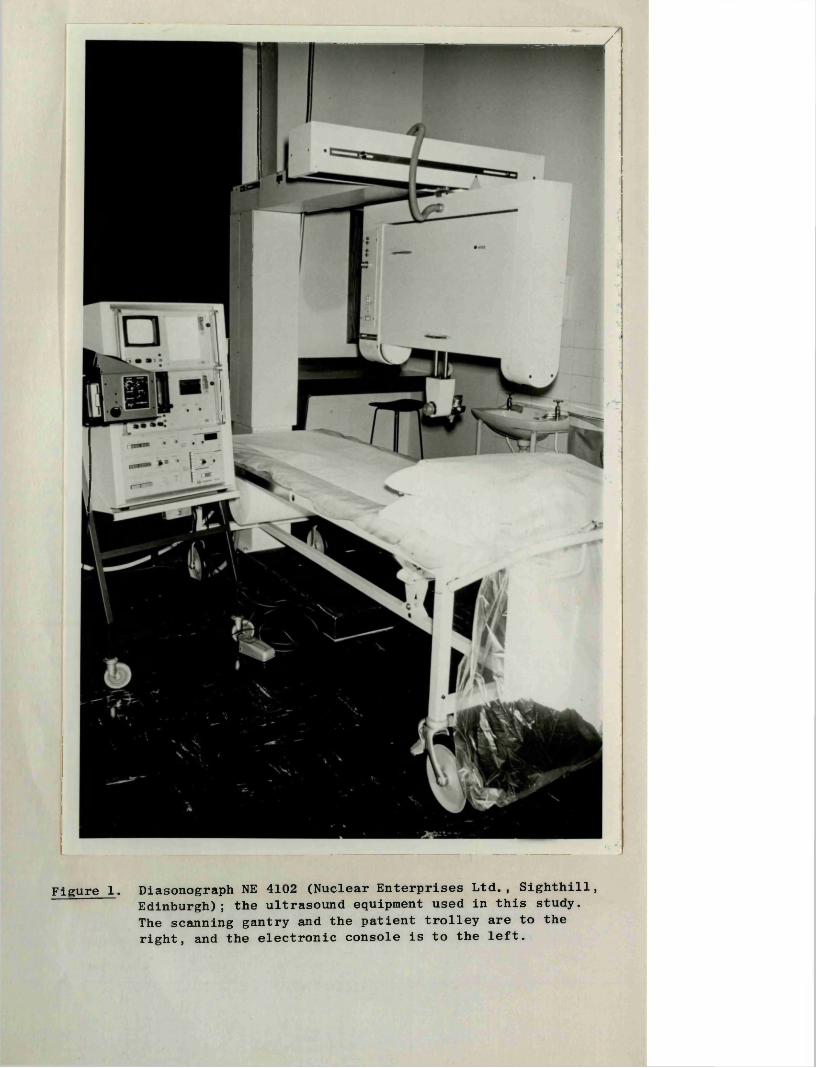
A pulsed ultrasound system when reduced to its most fundamental level may be described as a device which can detect an object, and measure its distance from the transducer, by means of sound reflection. Figure 1 shows a photograph of a Diasonograph NE 4102, the type of apparatus which was used in this study. In this type of system the piezoelectric crystal functions both as a generator and receiver of ultrasonic energy.The crystal is made to produce very short bursts of ultrasound lasting only a few cycles (approximately 1.5 microseconds), each burst of pulse being separated from the next by a "listening" or receiver phase when returning reflected ultrasound (echoes) may be detected. The length of the receiving phase is determined by the frequency with which the emitted pulses of ultrasound are produced, that is, the pulse repetition frequency (P.R.F.).In the Diasonograph the PRF is 600 per second. From this figure it can be calculated that the receiving phase between each pulse of ultrasound lasts approximately 1600 microseconds. The relationship and timing of these two phases are under the overall control of a very accurate timing generator, but thereafter, the electronic circuitry is quite separate. A block diagram of a typical ultrasonic scanning system is shown in Figure 2.
When the pulse of ultrasonic energy leaves the crystal (which is mounted in the ultrasonic transducer assembly) it travels down through the patient and is reflected and attenuated as described in the previous chapter, according to the characteristics of the various tissues and interfaces through which it passes.Sound reflected back along the beam path from an interface is subjected to the same processes of attenuation and reflection as the emitted sound, thereby increasing the energy loss of the returning sound even further. On reaching the crystal, which is
transm issionpulse
Timevaried
gaincontroller
SlowSweep
G enerator
TimingG enerator
A ttenuator T ran sm itte r
amplifiedechosignalsecho signals Video
P ro cesso rReceiver
Scanning F ram e
x position
Tim e-baseGeneration
Display Mode Switchingy position
Section- Scan
A-Scan
PositioningC ircuits
angle
T im e-position
Scan[tr a sonic T ran s-
ducer
Cathode-ray tube display
patient im age- \ forming as sound beam
explores patient
Figure 2. A simplified block diagram of a typical ultrasonic scanning system.
TRANSDUCER
| R eturning echo
Direction of U ltrasound Beam
A MODE
B-MODE(1)
T.R MODE(1) 1 a 3 4 M 7 *
(2)
(2)
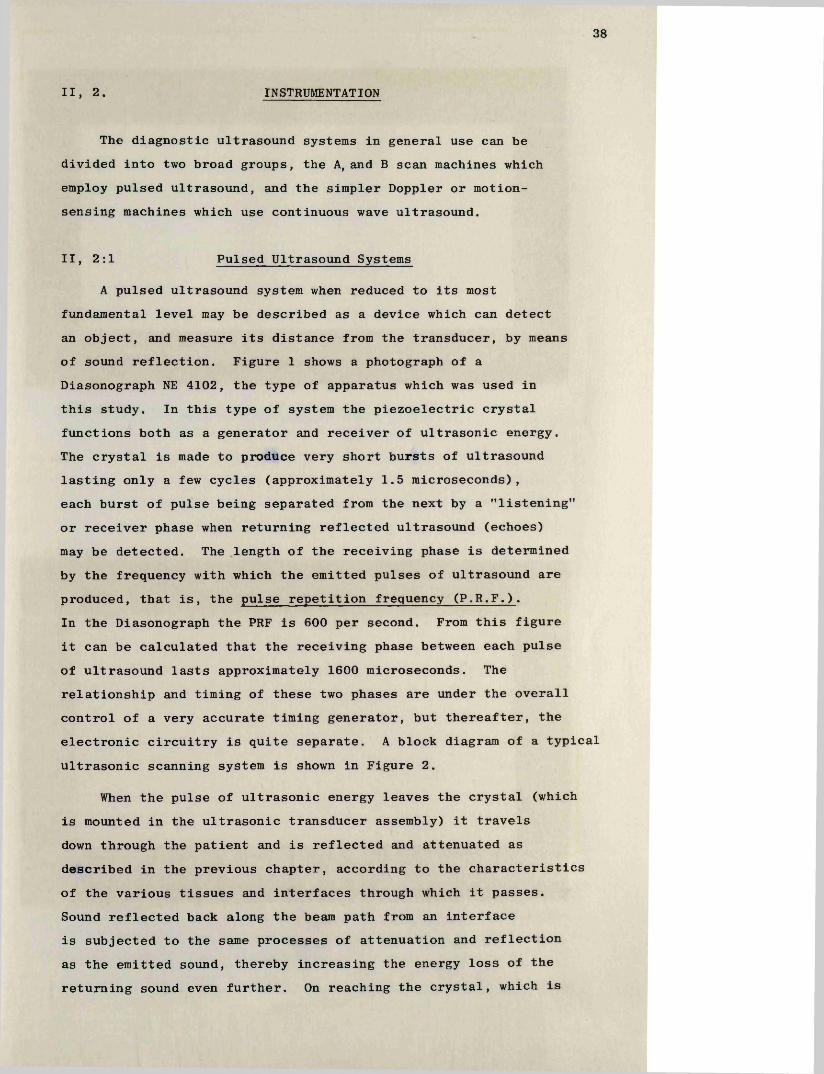
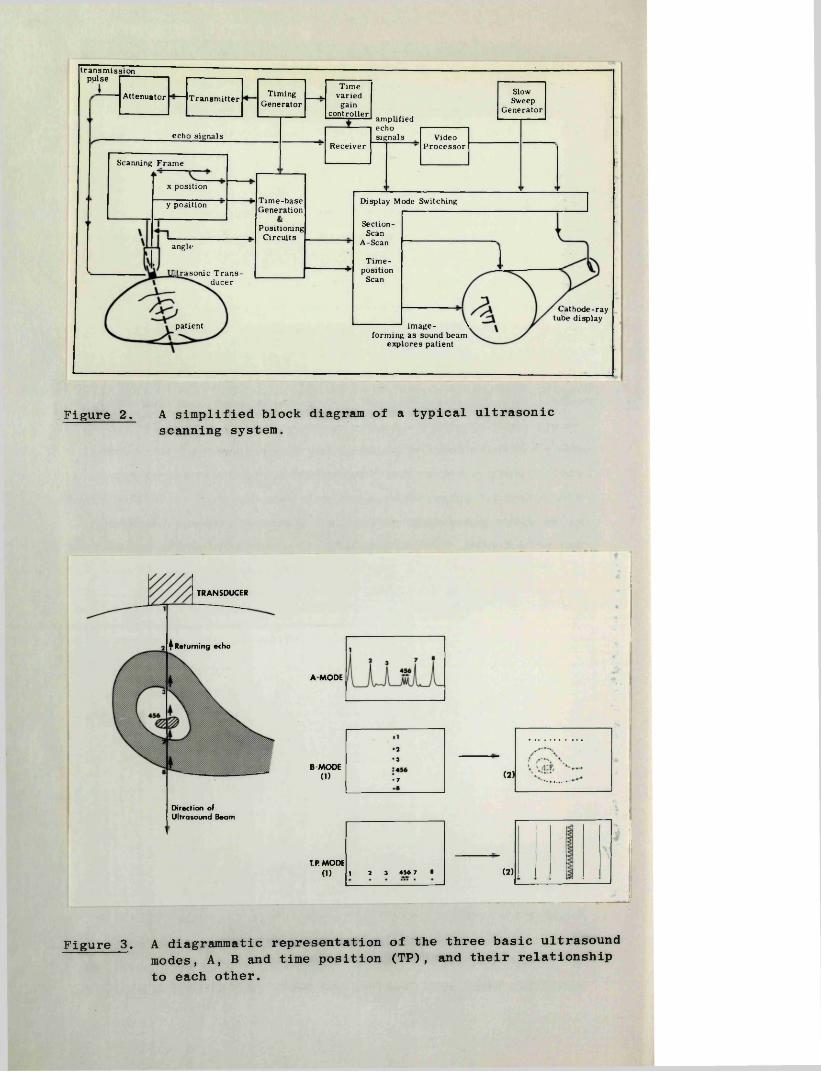
Figure 3. A diagrammatic representation of the three basic ultrasound modes, A, B and time position (TP), and their relationship to each other.

39
now in the receiving phase, the reflected ultrasound induces a small voltage charge across the transducer terminals as a result of the piezoelectric effect. These charges are detected by the electronic receiver system, amplified and processed in various ways and applied to the deflection plates of a cathode ray tube (CRT).
Given a knowledge of the speed of ultrasound in soft tissues (approximately 1540 m/sec) and the capability of measuring the time taken for the ultrasound to leave the crystal, strike an interface and return to the crystal, then the distance of that interface can be readily calculated. This information may then be displayed on the CRT screen in one of the three basic ultrasound modes, A. B. or time position (T.P.) as shown in Figure 3. Before describing each of these modes, some mention should be made of 'swept receiver gain* (time varied gain). As mentioned above, the ultrasound power levels of the returning echoes are considerably attenuated by their double passage through tissues, and, as might be expected, the level of attentuation is related to the depth of the particular interface. In the clinical situation echoes from interfaces very close to the surface may be three or four orders of magnitude greater in ratio to those from similar but distant interfaces. Therefore, without some form of selective processing, the receiver amplifier would either be completely overloaded by the 'near’ echoes, or, the 'distant' echoes would be lost. A swept receiver gain amplifier system resolves this problem by providing zero or minimal amplification to the near echoes, and thereafter by increasing the level at a predetermined rate until the more distal echoes are being maximally amplified. Ideally, echoes from similar interfaces should be equalised. In practice this is impossible to achieve due to the complexity of tissues and the effect of varying acoustic impedances. The resulting effect, however, is at least very much more balanced than would otherwise have been the case.
A-Mode The A-mode is by far the simplest of the three ultrasound modes providing information from one dimension only, that is, from the structures along the path of the sound beam. The returning echoes are here displayed as vertical deflections or blips on the horizontal time-base of the oscilloscope screen, the position of each being directly related to the depth from which the echo

40
originated (the nearer to the surface, the closer the deflection to the left side of the screen), and its amplitude to the strength of the echo.
For most applications the oscilloscope C.R.T. used is of the non-persistance variety, that is, the echo information is automatically erased immediately after each line has been presented. If this process is repeated more than 20 times per second the human eye will see the resulting effect as a steady trace. In the Diasonograph, 600 lines per second are produced.It follows from the above that a structure such as the fetal heart wall lying within the path of the beam will change its position relative to the transducer over a period of time, and therefore the corresponding echo derived from that structure will move similarly and will be recorded on the screen as a continuously moving deflection (Figure 3, echo number 5).
A major use of the A-mode in obstetrical practice is in the technique of biparietal cephalometry, where measurements of the distance between the echoes from the parietal eminences are made. The actual measurements are facilitated and made more accurate by the use of electronic distance markers (cursors) which can be superimposed on the appropriate echoes, and their separation presented on a digital read-out device. The application of the A-mode as a measurement technique is also of great importance in neurology where very small shifts in the position of the midline structures can be identified in various pathological conditions.
The second important use of the A-mode is in the detection of moving structures such as the demonstration of fetal heart movements in the first trimester of pregnancy (this application will be described in detail in Chapter V), and in the recognition and evaluation of valvular and other cardiac abnormalities in later life.
B-Mode This form of display is designed to produce information from two dimensions and thus the apparatus required to achieve this objective is more complex than A-scan equipment. (Most B-scan machines incorporate facilities for all three ultrasound modes.) In many ways a B-mode picture is analogous to an X-ray tomogram and for this reason the technique is sometimes known as echotomography.

41
The basic feature of a B-mode display is that instead of being fixed along the bottom of the CRT screen, the position of the time-base varies in direct relation to the spatial orientation of the transducer, and therefore the "line of sight" of the ultrasound beam. This is accomplished by means of electronic position sensing devices known as potentiometers which in the Diasonograph are housed in the scanning frame (Figure 1).
Returning echoes in a B-mode display are recorded as bright dots along the time-base, each dot corresponding to an individual A-scan deflection (Figure 3). With movement of the transducer over the surface of the patient further lines of echoes are added at the appropriate positions and angles. In this way a two-dimensional echogram, or picture of the structures and organs in the plane of the scan is gradually formed, any one picture comprising several thousand individual lines.
As stated above, B-scan pictures contain only two- dimensional information, no information being received from structures on either side of the plane of scan. It therefore follows that if information from the third dimension is to be obtained, it is necessary to undertake serial parallel scans at small intervals across the surface of the volume being studied, and to integrate mentally the resulting pictures. It is only by strict adherence to such a procedure that one can be certain that for example, a twin pregnancy has not been missed.
The information obtained by these scans may be presented either on a non-persistence oscilloscope, in which case time- exposure photography is used to store the echo information directly onto photographic film, or alternatively, the information may be stored electronically on the screen of a storage oscilloscope and photographed when the scan has been completed. Each system has its advantages and disadvantages. For technical reasons the former gives pictures with a smaller spot size, and it has the capacity to show the echoes with a range of brightness proportional to the amplitudes of the returning echoes providing a form of grey-scale. These factors result in a potential for better resolution of organ structure than is possible with storage oscillography. With the latter form of display the spot size is larger, the echo brightness is constant for all echoes which exceed a threshold level, and the pictures which are produced

42
have a characteristic black and white appearance with no gradations of grey. A distinct advantage of the storage oscilloscope however, is that the picture may be studied at leisure and photographed only if it portrays the desired features. In contrast, when a non-persistence oscilloscope is used, one is committed to taking a picture at the start of the scan. Thus a great deal of film may be wasted unless the scanning technique is of a high standard.
Recently a device known as a scan-converter has been introduced which has the capability of producing high resolution grey-scale pictures which can be stored on a television screen.This highly sophisticated apparatus therefore combines the advantages of the two systems described above with little of their disadvantages. Further comment on scan conversion is not applicable however, as this work was completed before its introduction to routine practice in our unit.
For most purposes Polaroid film (type 107) is used because of the immediacy of results, but 35 mm film is preferred by some as it is less expensive and in some situations it allows a more accurate record of the ultrasonic display.
T .P . Mode This mode is used to record movement patterns and is usually operated in conjunction with an A-mode. As in the A-mode, the information is obtained from a single dimension only and is displayed on a horizontal time-base, but in contrast the echoes are represented as bright dots rather than vertical blips. When activated, each successive sweep of the time-base is made to occur slightly above the previous one with the result that an echo from a moving or pulsating structure is graphed out as a regular waveform from the bottom to the top of the oscilloscope screen. In the same way an echo from a stationary structure will be recorded as a straight line (Figure 3). Given a knowledge of the rate at which the time-base is moved up the screen, such simple parameters as heart rate may be determined, and if the orientation of the ultrasonic beam is accurately known, it is possible to derive more complex information such as the speeds of the various phases of valvular opening and closure.

43
II, 2:2 Doppler Ultrasound Systems
Equipment employing the Doppler principle in ultrasound are used solely as motion sensing devices and are very much less complex than pulsed-echo systems. The probe in a Doppler system contains two piezoelectric crystals one of which produces a continuous beam of ultrasound, and the other acts solely as a receiver.
When sound strikes a moving structure its frequency is either increased or decreased depending on whether the direction of movement of the structure is towards or away from the sound source, that is the sound is "Doppler shifted". In a Doppler ultrasound system the frequency spectrum of the reflected sound is compared electronically with the emitted sound and the difference between the two is presented after suitable amplification to the observer. Using 2 MHz ultrasound the Doppler shift produced by most pulsating structures in the body is within the audible frequency range and can therefore be heard directly without further signal processing.
In this simple form Doppler systems are widely used for the detection of fetal heart movements in the second trimester of pregnancy, and for the detection of venous blood flow in patients with suspected venous thrombosis. The signals can also be used after suitable filtering as a trigger for fetal heart rate monitors and in other types of pulse and flow rate meters.

44
III
HISTORICAL REVIEW
OF THE
LITERATURE

45
III, 1. SAFETY OF DIAGNOSTIC ULTRASOUND
When a diagnostic system used in medical practice involves the interaction between some form of energy and the organs and tissues of the body, consideration must be given to the possibility of adverse or deleterious effects. This injunction is especially relevant when the organ being investigated is the pregnant uterus since it is well recognised that the developing fetus is particularly susceptible to such effects. The now classical example of this susceptibility was the finding of an increased incidence of malignancy in children who had been exposed to X-radiation while "in utero" (Stewart et al 1956). As the work to be described in this thesis involved the use of energy, in the form of ultrasound, and the stage of pregnancy studied was the first trimester when the fetus would be expected to be most vulnerable, it was considered appropriate to review the literature relating to the question of safety.
Since the first report that small creatures such as fish and frogs could be injured by continuous low frequency ultrasound (Wood and Loomis, 1927) a considerable volume of literature has accumulated on the safety and potential dangers of this form of energy. The present state of knowledge may be summarised by the statement that high intensity, low frequency ultrasound can cause damage to tissues and cells, but that the low intensity high frequency ultrasound used in medical diagnosis has not been shown to have any such adverse effects.
As a basis for discussion it is relevant at this point tooutline the acoustic characteristics of the ultrasound employedin diagnostic equipment. The peak power output has been shownto vary with different models (Hill, 1971; Hall, 1975), and inpulsed instruments it is usually in the region of 10 to 20
_2watts cm , with a time-averaged power output of 10 milliwatts _2cm or less. The pulse repetition frequency is again variable
but a common figure is 600 per second, each pulse lasting onlya few micro-seconds. The power output of instruments based onthe use of continuous wave ultrasound is of the order of
-210 milliwatts cm

46
III, 1:1 Biophysical Mechanisms
In the interaction between ultrasound and a medium there are four recognised potential mechanisms which, at least on a theoretical basis, could result in damage to a biological system (Hill, 1968; Taylor and Pond, 1972). These are -
1. Heating effects due to the absorption of ultrasonic wave energy.
2. Cavitation disturbances, resulting from enhanced movement around any cavities which are caused to vibrate strongly or to collapse.
3. Time-averaged disturbances due to non-linearities in the response of the target giving rise to displacement or "micro-streaming” .
4. Oscillatory disturbances. These are cyclic variations of pressure, temperature and forces on inhomogeneities which oscillate about their ambient values, but with their time-averaged displacements being zero.
Of these machanisms the first two are almost certainly inapplicable to the diagnostic situation. Connolly and Pond (1967) state that equipment used for diagnosis could only raise tissue temperature by a small fraction of a degree, while the temperature rise required to produce observable structural damage is in the order of 10°C. Similarly, cavitation does not occur in ultrasonic irradiations which involve widely separated pulses of only a few microseconds, since this effect requires a much longer time interval for its development (Hill, 1972 a and b). Furthermore the power levels required to produce this effect are several orders of magnitude higher than those used in clinical diagnosis.
On the other hand, microstreaming of nucleoplasm and cytoplasm has been induced in plant and marine egg cells (Wilson et al 1966). However the ultrasonic conditions employed were totally divorced from the clinical situation. No such effect has been demonstrated with ultrasound at diagnostic levels.
Oscillatory disturbances may well be the underlying cause of many of the diverse phenomena listed by Hill (1968) under the general heading of "direct mechanisms of action". These phenomena

47
include degradation of D.N.A. molecules in solution (Hawley et al 1963), and acceleration of wound healing (Dyson et al 1970).In each instance, however, the levels used were far in excess of those employed in diagnosis.
While the foregoing suggests that each of the major biophysical effects of ultrasound do not occur at diagnostic levels, or do so to only a negligible degree, the possibility of some, as yet unidentified, "direct" mechanism by which damage may be produced must still be considered. It is this possibility which has led researchers to formulate and conduct animal and other experiments on an empirical basis with little in the way of positive guidance as to what type of damage to expect. Attention has been principally directed towards the detection of teratogenic or mutagenic effects, functional disorders, chromosome damage and alterations in enzyme activity.
Ill, 1:2 Animal Studies
Teratogenesis and MutagenesisIn studies relating to these possible effects the experimental
models most commonly used have been laboratory strains of small mammals, principally because of their rapid rates of reproduction, large litter size and, most important, their well defined characteristics and pedigrees. One of the first reported studies was that of Holmes and Howry (1963) in which pregnant rabbits were insonated at various intervals in pregnancy using ultrasound with a similar frequency and pulse length to those employed in diagnostic machines. The intensity levels used however, were very much higher. No developmental abnormalities were noted in the resultant offspring. Using the spawn of fish and frogs as his models, Andrew (1964) failed to produce any developmental abnormalities following insonation for periods of 24 hours during the first 11 days of development. In his experiments pulsed ultrasound at diagnostic power levels was employed. Kirsten and his co-workers (1963) in their study subjected new-born mice to whole body insonation for five minutes with the purpose ofproducing maximal gonadal damage. One MHz continuous wave ultra-
-2sound was used with intensities of up to four watts cm . borne deaths resulted from these exposure but were attributed to the
48
inability of the mice to re-radiate the absorbed power in theform of heat. The mice which survived were then mated and nodevelopmental abnormalities found in their offspring throughoutthe next five generations. Similar negative findings wereobtained using pulsed ultrasound with a peak intensity of 10 watts
-2cm and pulse lengths of 50 and 100 microseconds. In acomprehensive study reported by Smyth (1966), mice were insonatedwith a pulsed ultrasound machine, giving an average power output
-2of 10 milliwatts cm , during the pre-mating and mating periods, and throughout pregnancy. No abnormalities were found in the subsequent two generations.
Further experimental studies on rodents, using a wide range of frequency and power levels with both pulsed and continuous wave ultrasound, have all failed to produce any observable teratogenic effects (Sunden, 1964; Warrick et al, 1970; McClean et al, 1972).
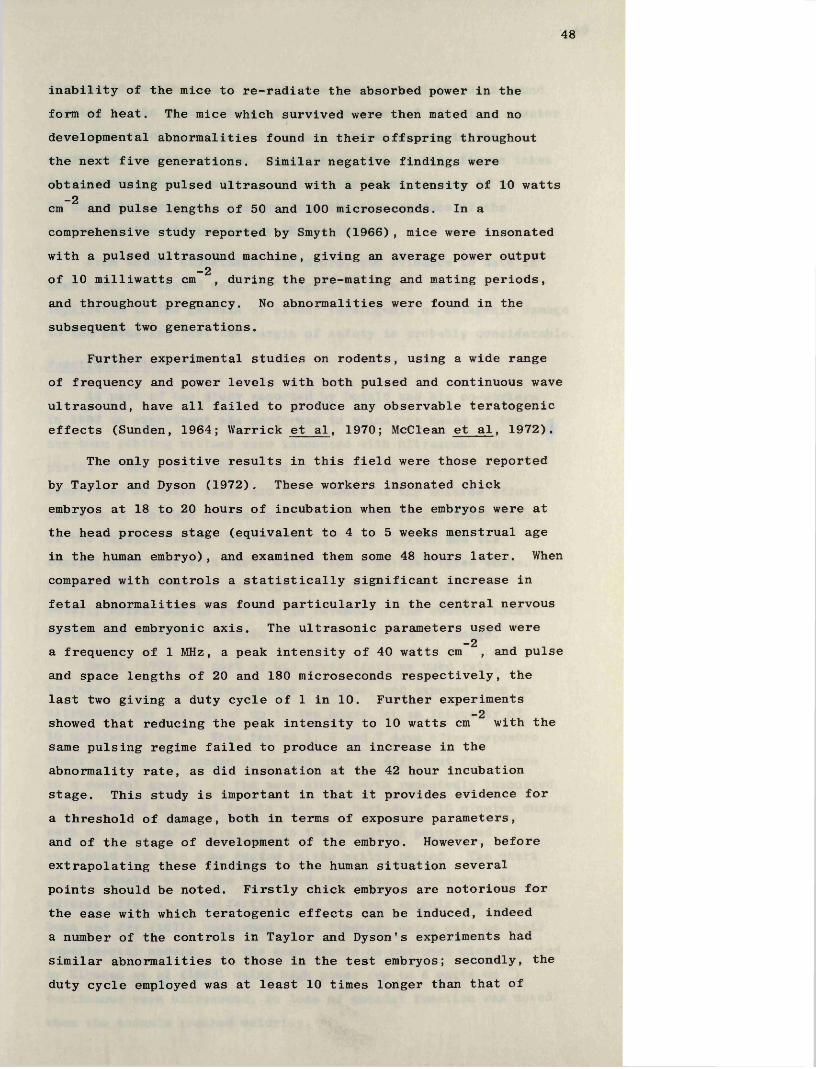
The only positive results in this field were those reportedby Taylor and Dyson (1972). These workers insonated chickembryos at 18 to 20 hours of incubation when the embryos were atthe head process stage (equivalent to 4 to 5 weeks menstrual agein the human embryo), and examined them some 48 hours later. Whencompared with controls a statistically significant increase infetal abnormalities was found particularly in the central nervoussystem and embryonic axis. The ultrasonic parameters used were
-2a frequency of 1 MHz, a peak intensity of 40 watts cm , and pulseand space lengths of 20 and 180 microseconds respectively, thelast two giving a duty cycle of 1 in 10. Further experiments
-2showed that reducing the peak intensity to 10 watts cm with the same pulsing regime failed to produce an increase in the abnormality rate, as did insonation at the 42 hour incubation stage. This study is important in that it provides evidence for a threshold of damage, both in terms of exposure parameters, and of the stage of development of the embryo. However, before extrapolating these findings to the human situation several points should be noted. Firstly chick embryos are notorious for the ease with which teratogenic effects can be induced, indeed a number of the controls in Taylor and Dyson's experiments had similar abnormalities to those in the test embryos; secondly, the duty cycle employed was at least 10 times longer than that of

49
diagnostic machines; and finally the intensity of the ultrasound applied to the chick embryos was in the order of 100 times greater than that which would normally reach a human embryo in the course of a routine B-scan examination. This latter figure takes into account the attenuation of the ultrasound by some 10 to 20 decibels during its passage from the skin surface of the patient to the uterine cavity (Hall, 1975).
From animal experiments therefore, the evidence to date is such that ultrasound used at "diagnostic levels" cannot be implicated in the genesis of either teratogenic or mutagenic damage to the fetus and that the margin of safety is probably considerable.
Functional Disorders
As part of the study reported by Donald and his co-workers in 1958 an experiment was performed in which the heads of two new-born sibling kittens were insonated with ultrasound for a period of one hour. One kitten and a sibling control were sacrificed 24 hours later and no evidence of any adverse effect found on a thorough macroscopical and microscopical examination of the excised brain. The remaining "test" kitten and its control were left with their mother for a further three weeks. During this period the development of the test animal was totally normal and in fact was in advance of the control animal. Postmortem examination again showed no evidence of damage.
Smyth (1966) as part of his investigations used rats,trained for a conditioned escape response, and exposed them toultrasound for periods of up to two hours, at an intensity of
-210 milliwatts cm . When tested 1, 2 and 7 days after exposuretheir conditioned escape responses were no different from thosein a control group. In the same study Smyth repeatedly insonatedthe gonads of male and female mice for periods of 10 minutes duringeach of five consecutive days in the premating period andcontinued with the same regime in the mating period. The uteriof the females were also insonated throughout pregnancy. Noadverse effects on the fertility of the test animals was observed.Dunn and Fry (1971) confirmed these findings using cats as theirexperimental models. In the experiments on new-born mice reported
-2by Kirsten et al (1963) using high power (up to 4 watts cm ) continuous wave ultrasound, no loss of gonadal function was noted when the animals reached maturity.

50
III, 1:3 Human Studies
Teratogenic Effects
The most important study yet performed which has been directly related to the safety of ultrasound in the human context was that undertaken in New York, Glasgow and Lund by Heilman and his colleagues (1970). In this collaborative study the case records of 1114 apparently normal pregnant women in whom diagnostic ultrasound examinations had been performed were subjected to computer analysis and it was found that the incidence of fetal abnormality was lower than might have been expected in the general population. This finding was independent of the gestational age at which the ultrasound examination was carried out, and of the number of examinations performed. To date this has been the only sizeable epidemiological investigation reported.A British Medical Research Council multicentre controlled study, designed to resolve the question of safety of diagnostic ultrasound in human pregnancies, was recently cancelled but other, less ambitious projects are being conducted currently in North America.
In a more experimental investigation Kamocsay (1958) insonated150 pregnant women in the first trimester prior to legal terminationof pregnancy. The equipment used was a physiotherapy machine employingcontinuous wave ultrasound at 0.8 MHz, with a time-averaged power
-2output of 0.5 to 1 watt cm , that is, almost two orders of magnitude greater than that used in diagnostic machines. None of his patients threatened to abort and apart from slight hyperaemia of the embryos removed within 48 hours, no adverse effects were found.
Functional Disorders
K o hom and his co-workers (1967) reported no change in the electroencephalogram of 20 newborn babies exposed to ultrasound at levels equivalent to those used in routine ultrasonic cephalometry, while Garg and Taylor (1967) in a more extensive study on the brains of six terminal patients using conventional A-scan techniques for periods of one hour each, showed no significant changes on clinical, E.E.G., and subsequent cerebral tissue enzyme and histological examinations. More recently Donald (1975) conducted a retrospective study of all children born in Glasgow from 1966
51
onwards who had been registered as having hearing defects.Two hundred and sixteen were found, and of these only seven had had an ultrasonic examination before delivery in either the Queen Mother's Hospital or any other hospital in the city.On reviewing the relevant obstetrical histories Donald considered that there were ample clinical reasons for these disabilities in all but one instance.
Ill, 1:4 Chromosome Studies
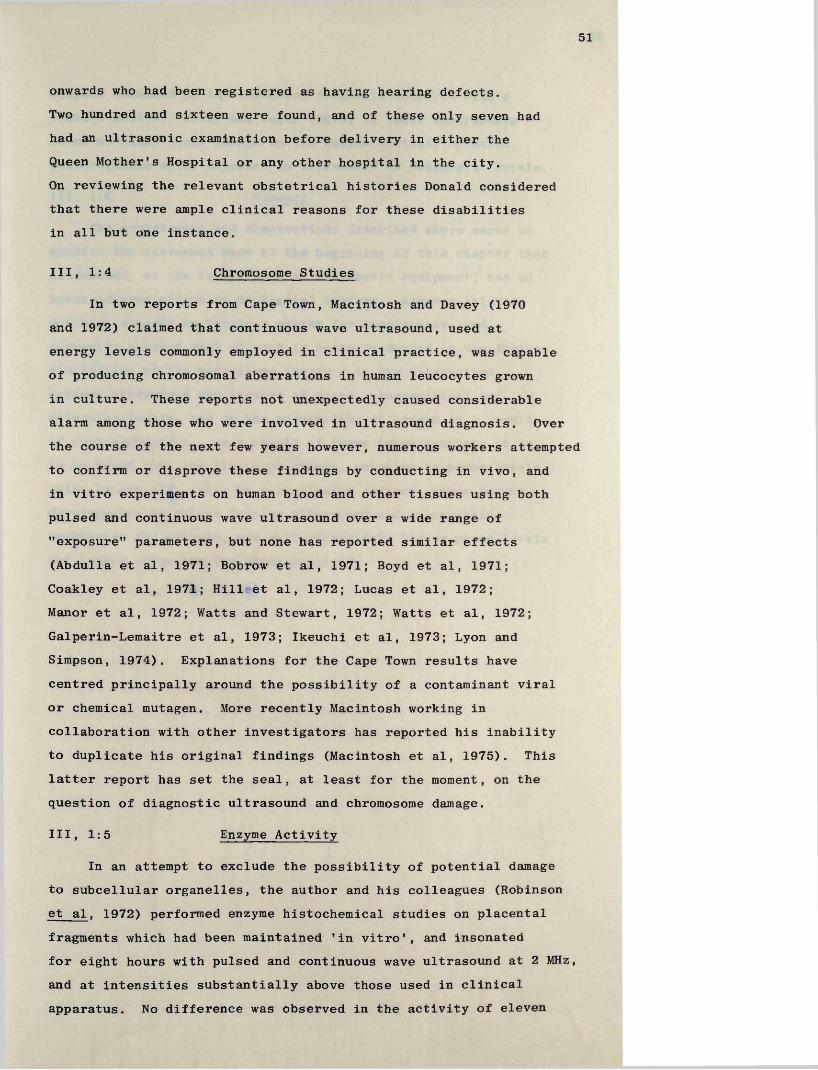
In two reports from Cape Town, Macintosh and Davey (1970 and 1972) claimed that continuous wave ultrasound, used at energy levels commonly employed in clinical practice, was capable of producing chromosomal aberrations in human leucocytes grown in culture. These reports not unexpectedly caused considerable alarm among those who were involved in ultrasound diagnosis. Over the course of the next few years however, numerous workers attempted to confirm or disprove these findings by conducting in vivo, and in vitro experiments on human blood and other tissues using both pulsed and continuous wave ultrasound over a wide range of "exposure" parameters, but none has reported similar effects (Abdulla et al, 1971; Bobrow et al, 1971; Boyd et al, 1971;Coakley et al, 1971; Hill et al, 1972; Lucas et al, 1972;Manor et al, 1972; Watts and Stewart, 1972; Watts et al, 1972; Galperin-Lemaitre et al, 1973; Ikeuchi et al, 1973; Lyon and Simpson, 1974). Explanations for the Cape Town results have centred principally around the possibility of a contaminant viral or chemical mutagen. More recently Macintosh working in collaboration with other investigators has reported his inability to duplicate his original findings (Macintosh et al, 1975). This latter report has set the seal, at least for the moment, on the question of diagnostic ultrasound and chromosome damage.
Ill, 1:5 Enzyme Activity
In an attempt to exclude the possibility of potential damage to subcellular organelles, the author and his colleagues (Robinson et al, 1972) performed enzyme histochemical studies on placental fragments which had been maintained 'in vitro', and insonated for eight hours with pulsed and continuous wave ultrasound at 2 MHz, and at intensities substantially above those used in clinical apparatus. No difference was observed in the activity of eleven

52
enzymes examined in the insonated fragments compared with a control series. Eitel and Geyer (1970) in their experiments found no significant change in the enzyme activity of malic dehydrogenase after exposure to ultrasound at diagnostic levels.
Ill, 1:6 Summary
The experiments and observations described above serve to confirm the statement made at the beginning of this chapter that ultrasound, at the levels used in diagnostic equipment, has no known adverse effect on biological systems. However this has not been allowed to become a matter for complacency, and currently a great deal of work is being conducted on the further elucidation of the mechanisms involved in the interaction between ultrasound and tissues at gross, microscopical and molecular levels, and on the possibility of hazard as a result of such mechanisms. As a result of these investigations it is to be hoped that the limits of safety, relative to power levels, pulse length etc., will be more clearly defined, since future developments in pulsed Doppler ultrasound and holographic techniques for example, may well necessitate higher power levels and longer pulse lengths being employed.

53
III, 2 DEVELOPMENT OF ULTRASOUND AS A DIAGNOSTIC TECHNIQUE
The development of ultrasound may be said to have originated from the work of Lord Rayleigh on the "Theory of Sound", published in 1887, and the discovery three years later of the phenomenon of piezoelectricity by P.J. Curie (Hill 1973). It was not until the First World War however, when the Anti-Submarine Detection and Investigations Committee (ASDIC) commissioned Langevin in Paris to develop a method for the underwater detection of German U-boats, that equipment was eventually constructed for the generation of ultrasound (Langevin, 1928). In the years that followed, its principal applications continued to be in the field of underwater detection and oceanography, although its heating effects at high power were applied in medicine, particularly in Germany, as a general and quite empirical therapeutic measure (Hill, 1973).
The next major breakthrough came again as the result of a "war stimulus" in the early 1940's with the application of echo-pulsing techniques for the localisation of flaws in metal (Firestone 1945, 1946). By this stage considerable advances had been made in the miniaturisation of ultrasound equipment and within a few years experimental studies were instituted in the field of medicine to explore the potential of ultrasound as a possible diagnostic tool.
The first report on its use in clinical diagnosis was that of Dussik (1942), where the author attempted to obtain information on intracranial structures by a "through-transmission" technique. However, this method proved to have little value as the differences in absorption of ultrasound by the variable thicknesses of the skull bones far exceeded the relatively slight absorption which occurred during its passage through the brain substance and ventricles. A more rewarding approach, and the one used most widely today, was the pulse-echo system. This system developed in two principal directions, the A-scan or amplitude-depth technique and the two-dimensional B-scan. The former, in which a single or unidimensional line of echoes is obtained has been found to be of most value in the fields of neurology, for the detection of mid-line echoes and their possible displacement in pathological conditions (Leksell, 1955, 1958; De Vlieger and Ridder, 1959), and in cardiology for the study of moving heart structures (Edler,

54
1955, 1961). In addition, the use of the A-mode has become an integral part of the techniques of fetal biparietal cephalometry, and for the early detection of fetal heart movements, as will be described later.
The development of the two-dimensional B-scan was pioneered by Wild and Reid and by Howry and his co-workers in the United States of America (Wild and Reid, 1952, 1954 and 1956; Howry and Bliss, 1952; Howry et al, 1954 and 1955; Holmes and Howry, 1963).The organs examined by these investigators were mainly the breast and, to a lesser extent, the neck and limbs, the liver, gallbladder and other abdominal organs. Even in these early years, and with the relatively crude apparatus then available, remarkably good results were achieved. A major inconvenience in all of these early B-mode studies however, was the necessity of having to immerse the region of interest in a water tank, or at best to make use of a cumbersome water-delay technique.
It was at this stage that Donald and Brown in Glasgow effected the next major advance in equipment design, namely the development of a contact scanning instrument which eliminated the need for "stand-off” techniques (Donald et al, 1958, Donald and Brown, 1961). With this new impetus, the use of ultrasound as a diagnostic technique changed from being a semi-academic laboratory pursuit in which only relatively fit people could be scanned, to become a much more acceptable ancilliary aid, and one which was capable of use in a practical clinical situation. As an obstetrician and gynaecologist it was not surprising therefore that Donald directed his researches to the problems of pregnancy and the differential diagnosis of gynaecological tumours. This was indeed fortunate, for here in these areas, almost more than in any others, ultrasound diagnoses could be quickly confirmed or refuted, thereby allowing the investigator to learn both from his mistakes and successes.
In this way the clinical efficacy and credibility of thetechnique was established, and the way opened for its more widespread use; during the ensuing years it has been shown to be anextremely useful diagnostic aid not only in the fields ofobstetrics and gynaecology but in virtually every other branch of medicine.

55
III, 3. DETECTION OF EARLY FETAL LIFE
Before the advent of modern technology it was impossible to discriminate accurately on a clinical basis between a continuing and a non-continuing pregnancy at a single examination up to the eighteenth or twentieth week. It was only with the passage of several weeks and by repeated assessments of uterine size that one could say with any certainty that growth had occurred and therefore infer that the fetus was probably alive. Similarly the diagnosis of a missed abortion was largely dependent on the absence of uterine growth over a period of at least two to four weeks.
The two products of modern technology with the greatest potential for providing instant and accurate information regarding the viability of a fetus were the electrocardiogram and diagnostic ultrasound.
Ill, 3:1 Electrocardiography
The application of electrocardiographic techniques to the fetus 'in utero' in the first half of pregnancy have been met with considerable technical difficulties due to the extremely small signal amplitude from the fetus and, according to mostauthors, its detection before the sixteenth week is extremelydifficult and only rarely achieved (Smyth, 1953; Bergman and Hall, 1958). However, recordings have been obtained as earlyas 11 weeks (Lamkee et al, 1962).
Ill, 3:2 Ultrasonic Methods
An ultrasonic diagnosis that a given fetus is alive may be inferred by demonstrating growth of the pregnancy over a period of weeks using conventional B-scan techniques, or be determined absolutely if movements of the fetal heart structures can be demonstrated. The former approach, which is analogous to clinical examination, relies on the indirect and somewhat subjective appreciation that the uterus and gestation sac have increased in size over a period of one to two weeks, and that the "milestones of development" described by Donald (1967 and 1969a) and Abdulla(1971) are reached at the appropriate times. The ultrasonic features of these "milestones" will be discussed in more detail under the heading "Estimation of Gestational Age". This method,
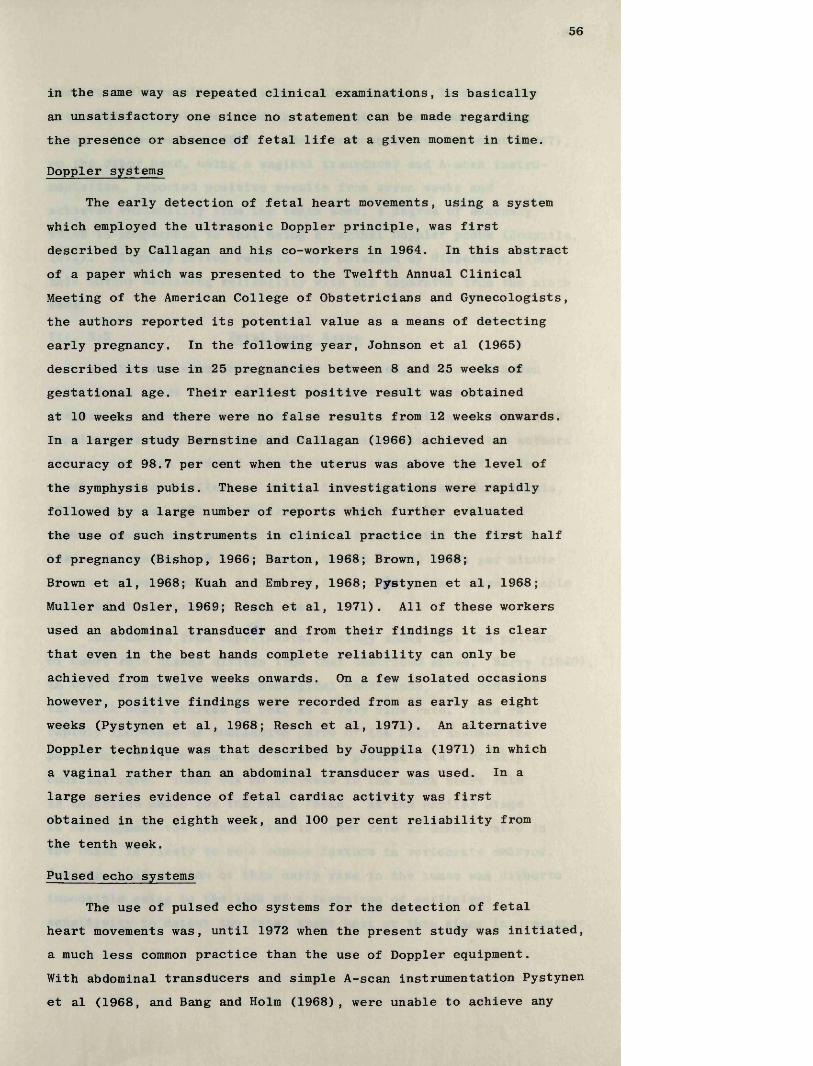
56
in the same way as repeated clinical examinations, is basically an unsatisfactory one since no statement can be made regarding the presence or absence df fetal life at a given moment in time.
Doppler systems
The early detection of fetal heart movements, using a system which employed the ultrasonic Doppler principle, was first described by Callagan and his co-workers in 1964. In this abstract of a paper which was presented to the Twelfth Annual Clinical Meeting of the American College of Obstetricians and Gynecologists, the authors reported its potential value as a means of detecting early pregnancy. In the following year, Johnson et al (1965) described its use in 25 pregnancies between 8 and 25 weeks of gestational age. Their earliest positive result was obtained at 10 weeks and there were no false results from 12 weeks onwards.In a larger study Bernstine and Callagan (1966) achieved an accuracy of 98.7 per cent when the uterus was above the level of the symphysis pubis. These initial investigations were rapidly followed by a large number of reports which further evaluated the use of such instruments in clinical practice in the first half of pregnancy (Bishop, 1966; Barton, 1968; Brown, 1968;Brown et al, 1968; Kuah and Embrey, 1968; Pystynen et al, 1968; Muller and Osier, 1969; Resch et al, 1971). All of these workers used an abdominal transducer and from their findings it is clear that even in the best hands complete reliability can only be achieved from twelve weeks onwards. On a few isolated occasions however, positive findings were recorded from as early as eight weeks (Pystynen et al, 1968; Resch et al, 1971). An alternative Doppler technique was that described by Jouppila (1971) in which a vaginal rather than an abdominal transducer was used. In a large series evidence of fetal cardiac activity was first obtained in the eighth week, and 100 per cent reliability from the tenth week.
Pulsed echo systems
The use of pulsed echo systems for the detection of fetal heart movements was, until 1972 when the present study was initiated, a much less common practice than the use of Doppler equipment.With abdominal transducers and simple A-scan instrumentation Pystynen et al (1968, and Bang and Holm (1968), were unable to achieve any

57
more reliable results than those outlined above. In the latter study Bank and Holm recorded the movement of the A-scan echoes using a time-position (T.P.) mode. Kratochwil and Eisenhut (1967), on the other hand, using a vaginal transducer and A-scan instrumentation, reported positive results from seven weeks and achieved reliability from the tenth week, a degree of accuracy which is comparable to that using a vaginal Doppler probe (Jouppila, 1971). Slightly better results were obtained by Hinselmann (1969), this author obtaining reliability with his apparatus from the ninth week.
Ill, 3:3 Fetal Heart Rates
At the time when this work was initiated, little was known about fetal heart rate values in the early weeks of human pregnancy. However, in a number of reports relating to the use of Doppler ultrasound as a method of detecting fetal life, the authors did provide data on fetal heart rates in the latter half of the first trimester (Muller and Osier, 1969; Tenhaeff and Karajiannis, 1970; Jouppila, 1971; Wladimiroff and Seelen, 1972). These workers found that the heart rate fell from a level of 170-180 beats per minute at 9 to 10 weeks, to 140 to 150 beats per minute at the sixteenth week. In none of these reports was there reliable measurements before the ninth week.
Information from experimental biology shows that the pattern of heart rate change differs from that described above. Barry (1940), in what he describes as physiological conditions, reported that the chick heart started to beat at a very slow rate. This rate rapidly increased as successive parts of the heart assumed the pacemaker function, and then reached a plateau at a virtually constant rate. There was no decrease in the chick heart rate as described above for the human fetus. At the earlier stage in development the initial rise in heart rate as demonstrated in the chick is likely to be a common feature in vertebrate embryos. However, confirmation of this early rise in the human was hitherto impossible owing to the lack of a technique of sufficient sensitivity to detect the fetal heart beat at this stage in pregnancy.

58
III, 4 DIAGNOSIS OF "EARLY PREGNANCY FAILURE"
Spontaneous abortion (early pregnancy failure) is a very common event, with most authorities quoting rates in the order of 10 to 15 per cent. These figures, however, relate to the number of abortions occurring in patients in whom pregnancy had been previously confirmed by urine pregnancy testing, or suspected on clinical grounds. Very much higher rates on the other hand have been calculated for the total loss of conceptuses from the stage of fertilisation onwards. Hertig and his co-workers (1959, 1967), in their now classic series of investigations, estimate that only 42 per cent of pregnancies are of such "viability" to cause the patient to miss her expected menstrual period; of these almost 30 per cent abort with or without preceding clinical signs of pregnancy, giving an overall wastage rate in the order of 60 per cent. From some "speculative arithmetic" Roberts and Lowe (1975), in a paper entitled "Where have all the conceptions gone?", conclude that at least 78 per cent of conceptions are aborted. Clearly therefore the obstetrician, in his management of the 10 to 15 per cent of patients who have clinical evidence of spontaneous abortion, is really only dealing with the 'tip of the iceberg', that is, those pregnancies which are sufficiently "normal" to have escaped abortion long enough to produce clinical signs and symptoms of pregnancy. It is to the diagnosis of this "relatively" small group of patients that the author will address himself in this review, and even more specifically to those patients who present before the cervical os starts to open.
Before discussing the available techniques it is relevant first to outline the pathological features of spontaneously aborted pregnancies. Fujikura and his co-workers (1966) in a detailed study of 327 abortuses found that 50 per cent of the specimens had an accompanying fetus or evidence of a cord stump, but of these only 31 (9.5 per cent of total) showed no evidence of maceration. The remaining specimens comprised empty intact sacs, ruptured but complete sacs with no evidence of a fetus or cord stump, and finally, a group of 72 (22 per cent) specimens considered to be incomplete. On the basis of this simple anatomical classification it may be surmised that there are at

59
least three pathophysiological entities: "missed abortions',* that is, pregnancies in which the fetus dies some time before spontaneous abortion occurs (possibly several weeks); "live abortions" , being pregnancies where the fetus is probably alive until shortly before spontaneous abortion, as evinced by the lack of maceration; "blighted ova", or pregnancies in which there is an absence of recognisable fetal tissue, and which must therefore have been abnormal from a very early stage in development.
How then might a diagnosis be made in each, or any, of these groups of early pregnancy failures prior to the onset of spontaneous abortion? At the time when this work commenced no author using any technique then available had been able to predict with accuracy and reliability that a given pregnancy would be aborted on the basis of a single examination or test.
Ill, 4:1 Clinical Methods
Until the cervix starts to dilate, and the abortion becomes inevitable, the mainstay of the clinical diagnosis of a non- continuing pregnancy depends, for the most part, on the detection of a discrepancy between uterine size on bimanual examination and the expected size according to the estimated gestational age. Such an approach is clearly subject to observer error, and even more important a patient’s menstrual history is frequently unreliable. In view of this, it is rare indeed for a clinician to take definitive action on the basis of a single examination when the cervix is still closed, preferring to delay a decision until he is convinced that repeated examinations over at least two to four weeks have failed to demonstrate growth of the uterus. An added clinical pointer is a history that the symptoms of pregnancy have decreased or disappeared.
Ill, 4:2 Hormonal and Biochemical Methods
Human Chorionic Gonadotrophin (H.C.G.) Assays
The most widely applied of these assays, and indeed the most widely used of all the hormonal and biochemical methods employed in early pregnancy, is the urine "pregnancy test", a test which over the years has evolved into a simple sideroom procedure. While useful in the routine confirmation of pregnancy in the earlier
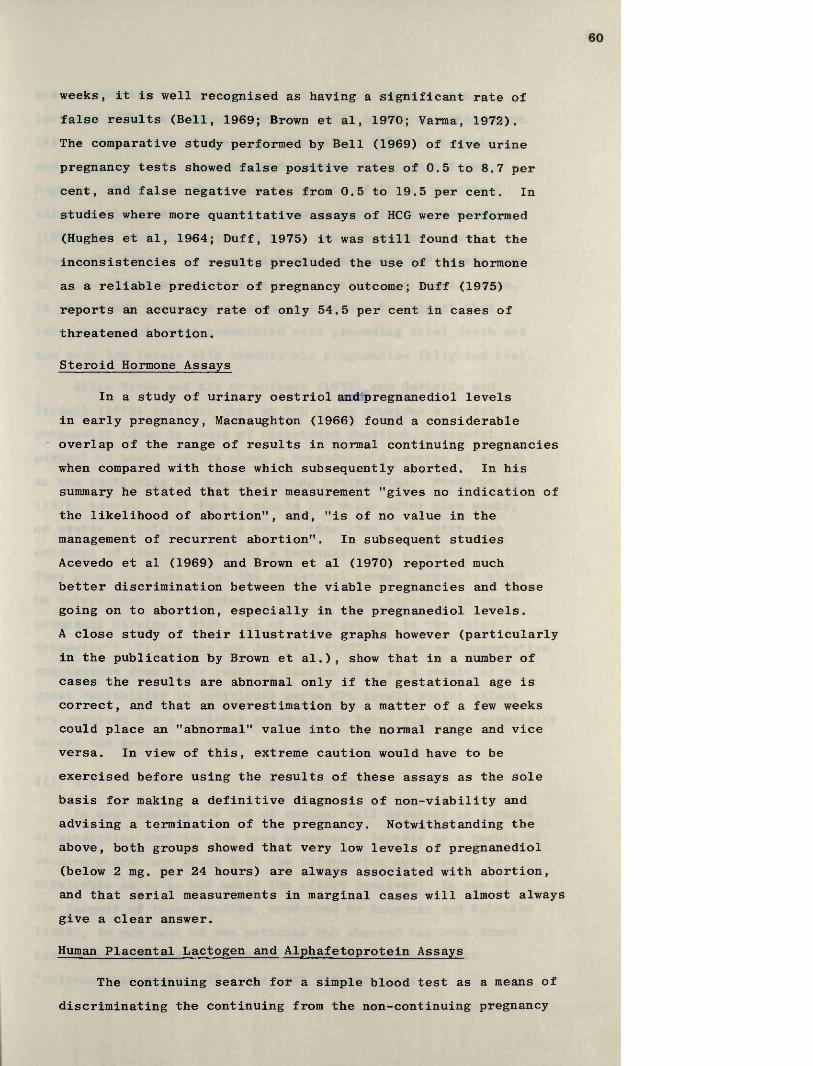
weeks, it is well recognised as having a significant rate of false results (Bell, 1969; Brown et al, 1970; Varma, 1972).The comparative study performed by Bell (1969) of five urine pregnancy tests showed false positive rates of 0.5 to 8.7 per cent, and false negative rates from 0.5 to 19.5 per cent. In studies where more quantitative assays of HCG were performed (Hughes et al, 1964; Duff, 1975) it was still found that the inconsistencies of results precluded the use of this hormone as a reliable predictor of pregnancy outcome; Duff (1975) reports an accuracy rate of only 54.5 per cent in cases of threatened abortion.
Steroid Hormone Assays
In a study of urinary oestriol and pregnanediol levels in early pregnancy, Macnaughton (1966) found a considerable overlap of the range of results in normal continuing pregnancies when compared with those which subsequently aborted. In his summary he stated that their measurement "gives no indication of the likelihood of abortion", and, "is of no value in the management of recurrent abortion". In subsequent studies Acevedo et al (1969) and Brown et al (1970) reported much better discrimination between the viable pregnancies and those going on to abortion, especially in the pregnanediol levels.A close study of their illustrative graphs however (particularly in the publication by Brown et al.), show that in a number of cases the results are abnormal only if the gestational age is correct, and that an overestimation by a matter of a few weeks could place an "abnormal" value into the normal range and vice versa. In view of this, extreme caution would have to be exercised before using the results of these assays as the sole basis for making a definitive diagnosis of non-viability and advising a termination of the pregnancy. Notwithstanding the above, both groups showed that very low levels of pregnanediol (below 2 mg. per 24 hours) are always associated with abortion, and that serial measurements in marginal cases will almost always give a clear answer.
Human Placental Lactogen and Alphafetoprotein Assays
The continuing search for a simple blood test as a means of discriminating the continuing from the non-continuing pregnancy

61
has led workers to evaluate the efficacy of human placental lactogen (HPL) and alphafetoprotein (AFP) in the maternal serum (Niven et al, 1972; Seppala and Ruoslahti, 1972; Ylikorkala and Jouppila, 1973; Gartside and Tindall, 1975; Garoff and Seppala, 1975). Of these, the latter is of little practical value in the first trimester, although Seppala and Ruoslahti (1972) did find that after 13 weeks abortion occurred more frequently (10/12) in women with abnormal serum AFP levels than in those (2/12) whose AFP levels were within the normal range.In this study there was reasonable evidence to suggest that very high levels were associated with preceding fetal death and the very low levels with anembryonic pregnancies (blighted ova).
While Niven and his co-workers (1972) and Gartside and Tindall (1975) consider that an HPL assay provides a useful prognostic index in cases of threatened abortion, a careful perusal of their results shows a considerable overlap of values in the continuing and non-continuing pregnancies. Niven et al(1972) however, feel that a single low value after nine weeks, or static or falling values before this time, are sufficient evidence of itself to justify a termination of pregnancy.They go on to state ’’that the occasional normal pregnancy might be interrupted is mitigated by the fact that bleeding in early pregnancy carries a high risk of complications in the third trimester”! Ylikorkala and Jouppila (1973) draw more conservative conclusions from their results, feeling that as a result of the great variability in individual serum HPL levels serial values are required for a reliable prognosis of fetal viability especially before the fourteenth week.
Ill, 4:3 Vaginal Cytology
In most centres the use of vaginal wall cytology as a means of predicting abortion has been abandoned, largely as a result of studies which have shown that the information obtained is so unreliable as to be not worth the effort involved. In one of the largest of these studies, conducted by McLennan and McLennan (1969), 44 per cent of the patients who aborted had been found earlier to have had "favourable smears" and of those with "unfavourable smears" 83.3 per cent did not abort.

62
III, 4:4 Diagnostic Ultrasound
The first report of the use of ultrasound in the diagnosis of non-continuing pregnancies was that of McVicar and Donald in 1963. In a series of 65 patients referred with ’’threatened abortions", three were identified as having missed abortions. The basis for diagnosis was the absence of strong fetal echoes and failure of the uterus to increase in size over a period of at least two weeks.
With the introduction of the full-bladder technique later that year (Donald, 1963) it then became possible to observe the growth of the uterus from an earlier stage in pregnancy, and more important, to monitor the growth of the gestation sac itself. In a number of subsequent publications, Donald and Abdulla suggested that "blighted ova" could be diagnosed by demonstrating lack of growth of the gestation sac, and by the disappearance of its normal "healthy ring pattern" (Donald and Abdulla, 1967; Donald 1969 a and b; Abdulla, 1971). It was also suggested that a pregnancy sited low in the uterus was an unfavourable sign and one which was commonly assaciated with subsequent spontaneous abortion. It was not until 1972 however, that Donald and his colleagues first published a systematic study of the ultrasonic findings in unsuccessful pregnancies (Donald et al, 1972). In a series of 141 patients referred with bleeding in the first trimester, "abnormal ultrasonic appearances" were noted in 57 of the 66 patients who subsequently aborted, and in 10 of the 75 patients whose pregnancies continued. The false positive and false negative rates were therefore 13.3 per cent and 13.6 per cent respectively. The ultrasonic features considered abnormal included loss of definition of the gestation sac, a "small for dates" gestation sac, failure of growth of the sac over a period of one or two weeks, a low position of the sac, and absence of fetal echoes. Of these, the first two were by far the most commonly noted abnormalities. Heilman and his co-workers (1973) in New York, in a series of 140 patients and using almost identical criteria of abnormality, reported very similar false positive and false negative rates of 10.5 per cent and 13.6 per cent respectively. While these results represented a considerable advance in the identification of pregnancies destined to abort, the significant false positive rate precluded the use of the above criteria as a reliable means
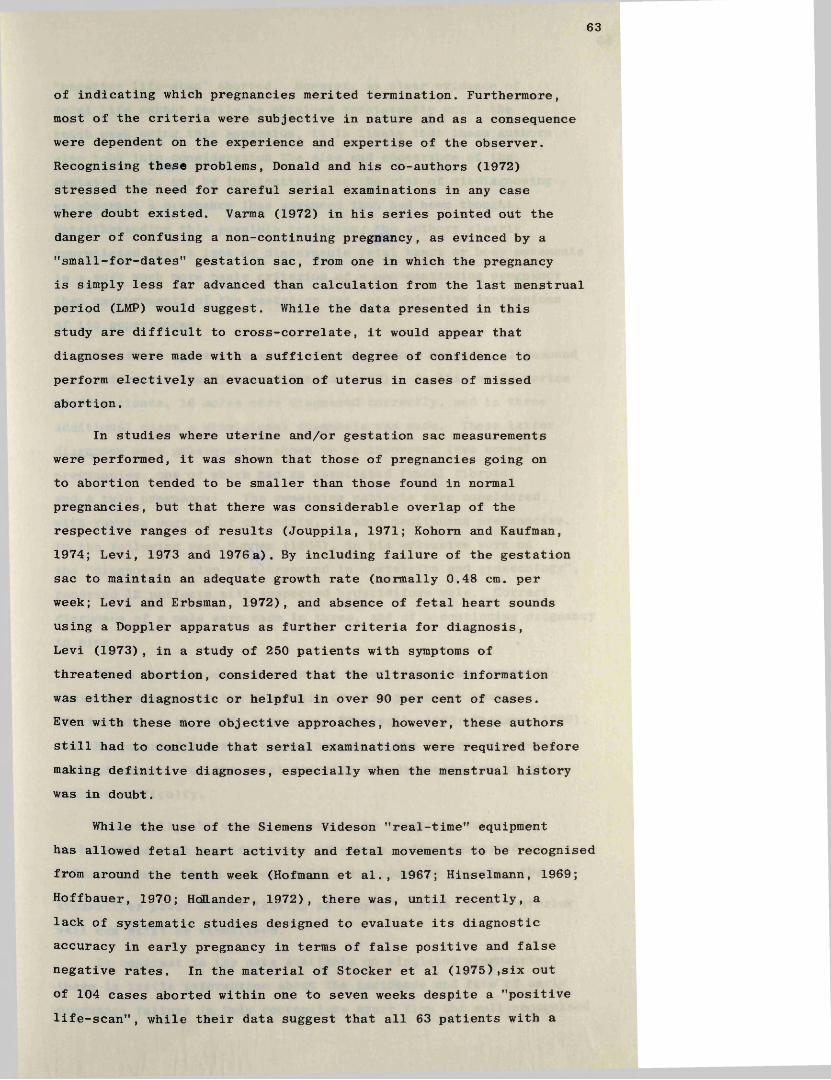
63
of indicating which pregnancies merited termination. Furthermore, most of the criteria were subjective in nature and as a consequence were dependent on the experience and expertise of the observer. Recognising these problems, Donald and his co-authors (1972) stressed the need for careful serial examinations in any case where doubt existed. Varma (1972) in his series pointed out the danger of confusing a non-continuing pregnancy, as evinced by a "small-for-dates" gestation sac, from one in which the pregnancy is simply less far advanced than calculation from the last menstrual period (LMP) would suggest. While the data presented in this study are difficult to cross-correlate, it would appear that diagnoses were made with a sufficient degree of confidence to perform electively an evacuation of uterus in cases of missed abortion.
In studies where uterine and/or gestation sac measurements were performed, it was shown that those of pregnancies going on to abortion tended to be smaller than those found in normal pregnancies, but that there was considerable overlap of the respective ranges of results (Jouppila, 1971; Kohorn and Kaufman, 1974; Levi, 1973 and 1976a). By including failure of the gestation sac to maintain an adequate growth rate (normally 0.48 cm. per week; Levi and Erbsman, 1972), and absence of fetal heart sounds using a Doppler apparatus as further criteria for diagnosis,Levi (1973), in a study of 250 patients with symptoms of threatened abortion, considered that the ultrasonic information was either diagnostic or helpful in over 90 per cent of cases.Even with these more objective approaches, however, these authors still had to conclude that serial examinations were required before making definitive diagnoses, especially when the menstrual history was in doubt.
While the use of the Siemens Videson "real-time" equipment has allowed fetal heart activity and fetal movements to be recognised from around the tenth week (Hofmann et al., 1967; Hinselmann, 1969; Hoffbauer, 1970; HdLander, 1972), there was, until recently, a lack of systematic studies designed to evaluate its diagnostic accuracy in early pregnancy in terms of false positive and false negative rates. In the material of Stocker et al (1975),six out of 104 cases aborted within one to seven weeks despite a "positive life-scan", while their data suggest that all 63 patients with a
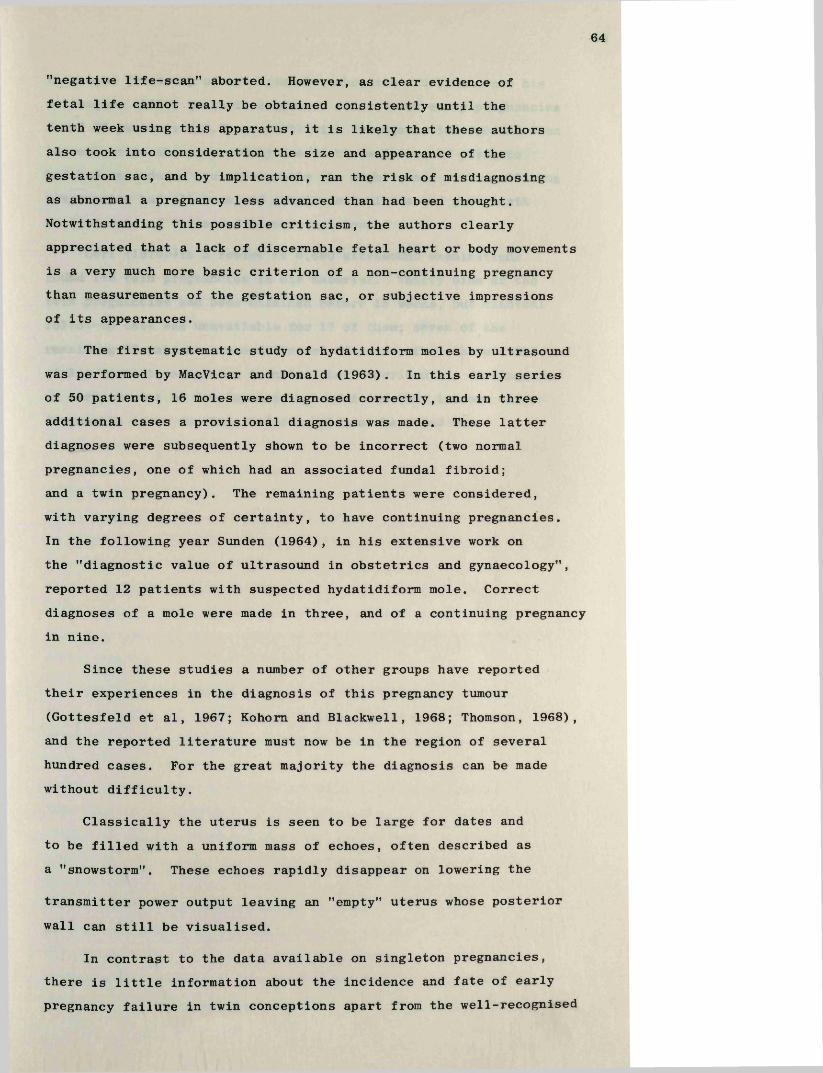
64
"negative life-scan" aborted. However, as clear evidence of fetal life cannot really be obtained consistently until the tenth week using this apparatus, it is likely that these authors also took into consideration the size and appearance of the gestation sac, and by implication, ran the risk of misdiagnosing as abnormal a pregnancy less advanced than had been thought. Notwithstanding this possible criticism, the authors clearly appreciated that a lack of discernable fetal heart or body movements is a very much more basic criterion of a non-continuing pregnancy than measurements of the gestation sac, or subjective impressions of its appearances.
The first systematic study of hydatidiform moles by ultrasound was performed by MacVicar and Donald (1963). In this early series of 50 patients, 16 moles were diagnosed correctly, and in three additional cases a provisional diagnosis was made. These latter diagnoses were subsequently shown to be incorrect (two normal pregnancies, one of which had an associated fundal fibroid; and a twin pregnancy). The remaining patients were considered, with varying degrees of certainty, to have continuing pregnancies.In the following year Sunden (1964), in his extensive work on the "diagnostic value of ultrasound in obstetrics and gynaecology", reported 12 patients with suspected hydatidiform mole. Correct diagnoses of a mole were made in three, and of a continuing pregnancy in nine.
Since these studies a number of other groups have reported their experiences in the diagnosis of this pregnancy tumour (Gottesfeld et al, 1967; K o h o m and Blackwell, 1968; Thomson, 1968), and the reported literature must now be in the region of several hundred cases. For the great majority the diagnosis can be made without difficulty.
Classically the uterus is seen to be large for dates and to be filled with a uniform mass of echoes, often described as a "snowstorm". These echoes rapidly disappear on lowering the
transmitter power output leaving an "empty" uterus whose posterior wall can still be visualised.
In contrast to the data available on singleton pregnancies, there is little information about the incidence and fate of early pregnancy failure in twin conceptions apart from the well-recognised

65
increased frequency of mid-trimester abortion. Hellmann and his colleagues (1973) in their series of 140 at-risk early pregnancies found 22 patients (15.7 per cent) with twin-gestation sacs of whom 14 went on to abortion. Only one of these latter 14 patients had had an induced ovulation while the eight women with continuing pregnancies had all received ovarian stimulants and gave birth to five sets of twins and three singletons.
Levi (1976b)in a review of 6,690 ultrasound examinations found 118 twin pregnancies in his material. Thirty nine of the twin pregnancies had been examined before 15 weeks, but clinical follow-up data was unavailable for 17 of them; seven of the remaining 22 patients were delivered of twins, the others (68%) giving birth to singleton infants. Levi ascribed his findings to an early arrest of development, but admitted that in some cases diagnostic error due to artefact could not be ruled out.
66
III, 5 THE ESTIMATION OF GESTATIONAL AGE
III, 5:1 Clinical Methods
The time-honoured method of estimating the gestational age of a pregnancy is by simple calculation from the date of the first day of a patient's last menstrual period (LMP) with confirmation by abdominal or bimanual palpation of the uterus.
If, as is now generally accepted, ovulation and conception takes place on or about the fourteenth day in a patient with a 28 day menstrual cycle, then this method of estimating gestational age will be a very accurate one given that the patient has an accurate record of the date of her LMP. Unfortunately, in situations where the patient is uncertain of her "dates" or has had "implantation bleeding" at the time of her next expected period, reliance on the menstrual history could lead to a considerable error. In addition those patients who have irregular and/or long menstrual cycles and those who have only recently stopped taking an oral contraceptive agent frequently do not ovulate 14 days after their LMP's, the interval being usually in excess of two weeks. In such circumstances, therefore, calculation of the gestational age of a pregnancy from the menstrual datum could also result in a significant error.Twenty two per cent of the patients attending a London hospital gave a history of one or other of the above sources of potential error (Beazley and Underhill, 1971).
Clinical assessment of uterine size at the time of the first antenatal visit on the other hand, especially in the first trimester, has long been held to be an accurate method of estimating gestational age. In 1970 however, Beazley and Underhill published, under the somewhat provocative title "The Fallacy of the Fundal Height", the results of a large series of simple measurements of the fundal height throughout pregnancy. From these measurements they concluded that it was not possible to predict the gestational age of a pregnancy in the latter two trimesters with an accuracy of any greater than plus or minus four weeks. In a smaller sub-section of this study they found that of 21 patients whose menstrual and ultrasound estimates of gestational age were in agreement, the estimate based on a clinical bimanual examination of the uterus was at
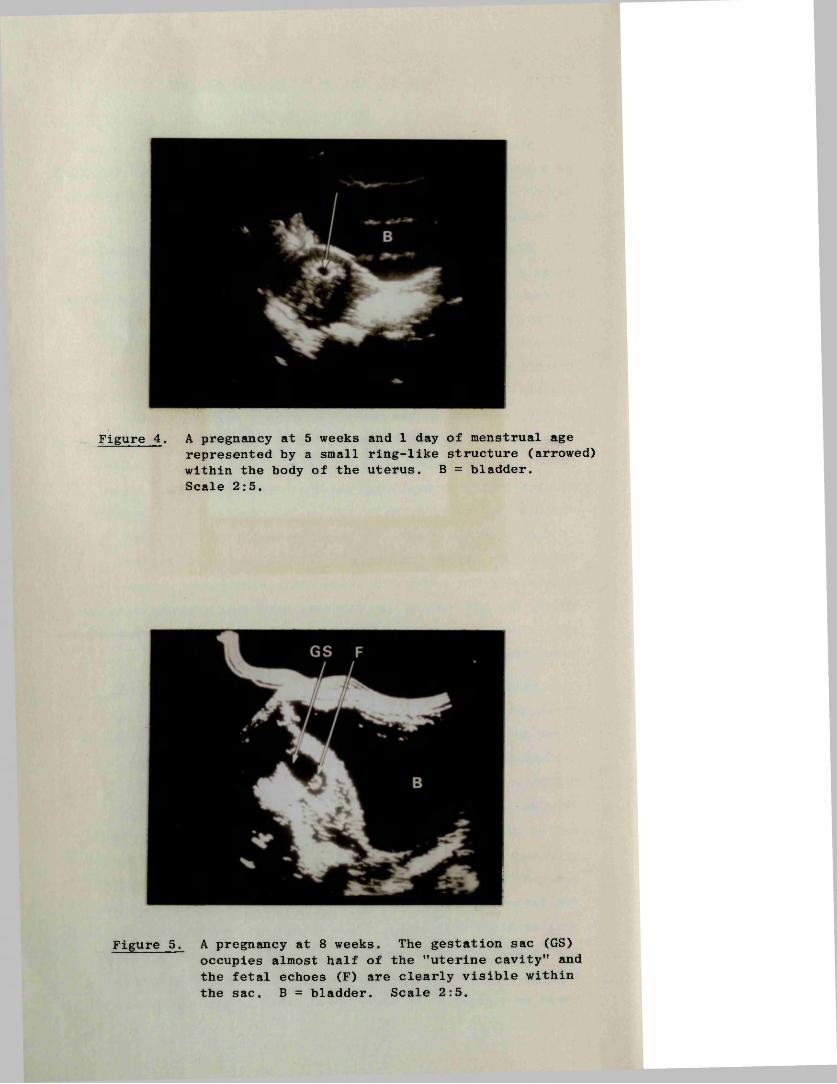
Figure 4 . A pregnancy at 5 weeks and 1 day of menstrual agerepresented by a small ring-like structure (arrowed) within the body of the uterus. B = bladder.Scale 2:5.
Figure 5. A pregnancy at 8 weeks. The gestation sac (GS) occupies almost half of the ’’uterine cavity” and the fetal echoes (F) are clearly visible within the sac. B = bladder. Scale 2:5.
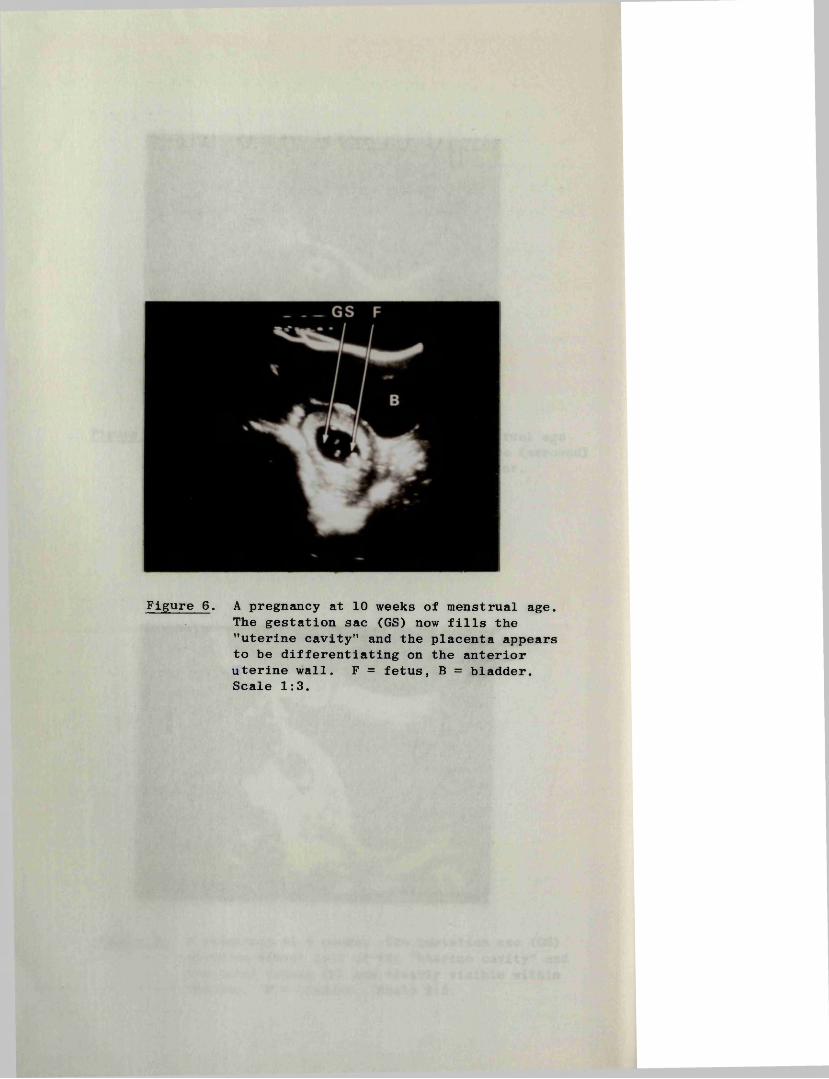
Figure 6 . A pregnancy at 10 weeks of menstrual age. The gestation sac (GS) now fills the "uterine cavity" and the placenta appears to be differentiating on the anterior uterine wall. F = fetus, B = bladder. Scale 1:3.

67
variance by two or more weeks in no less than eight patients (38%).
From the above, it is clear that there is considerable room for error in the clinical estimation of gestational age, and perforce it is not surprising that many and varied ancillary techniques have been applied in an attempt to obtain a more reliable and more accurate method of obtaining this information.
Ill, 5:2 Diagnostic Ultrasound
Early Pregnancy
Since the earliest reports from this Department of the recognition of fetal echoes by sonar in the first trimester (Donald et al., 1958; Donald and Brown, 1961; MacVicar and Donald,1963), two principal methods have been employed for the evaluation of gestation age during this period of pregnancy. There are:
1) the descriptive/subjective method2) mensuration of the uterus and gestation sac.
The descriptive method This, the first approach to the problem of assessing gestational age by ultrasound in the first trimester of pregnancy, was the outcome of several years of experience in observing the characteristic and changing appearances of normal pregnancies during each stage of their early development (Donald and Abdulla, 1967; Donald, 1969a; Abdulla, 1971). The features employed to predict the gestational age of a pregnancy using this approach were principally those of the overall gestation sac size, its size relative to that of the uterus, and the presence or absence of fetal echoes within the sac. (Figures 4 - 6 ) In details, it was considered that at five weeks of amenorrhoea the gestation sac should be discernable within the uterus (Figure 4), and that over the course of the next two weeks it should virtually double and redouble in size. At eight weeks the sac should occupy half of the "uterine cavity” and that around this time the fetal echoes themselves should first become 'visible* (Figure 5). At nine weeks the sac should be found to occupy two-thirds of the 'cavity', and one week later the 'cavity' should be completely filled. (Figure 6) In the eleven and twelve week period difficulty was experienced due to the echoes from the gestation sac appearing to break up resulting in a very 'confused' picture with no recognisable structures within the uterus. At this stage therefore, reliance was placed on the size of the uterus alone as the only remaining
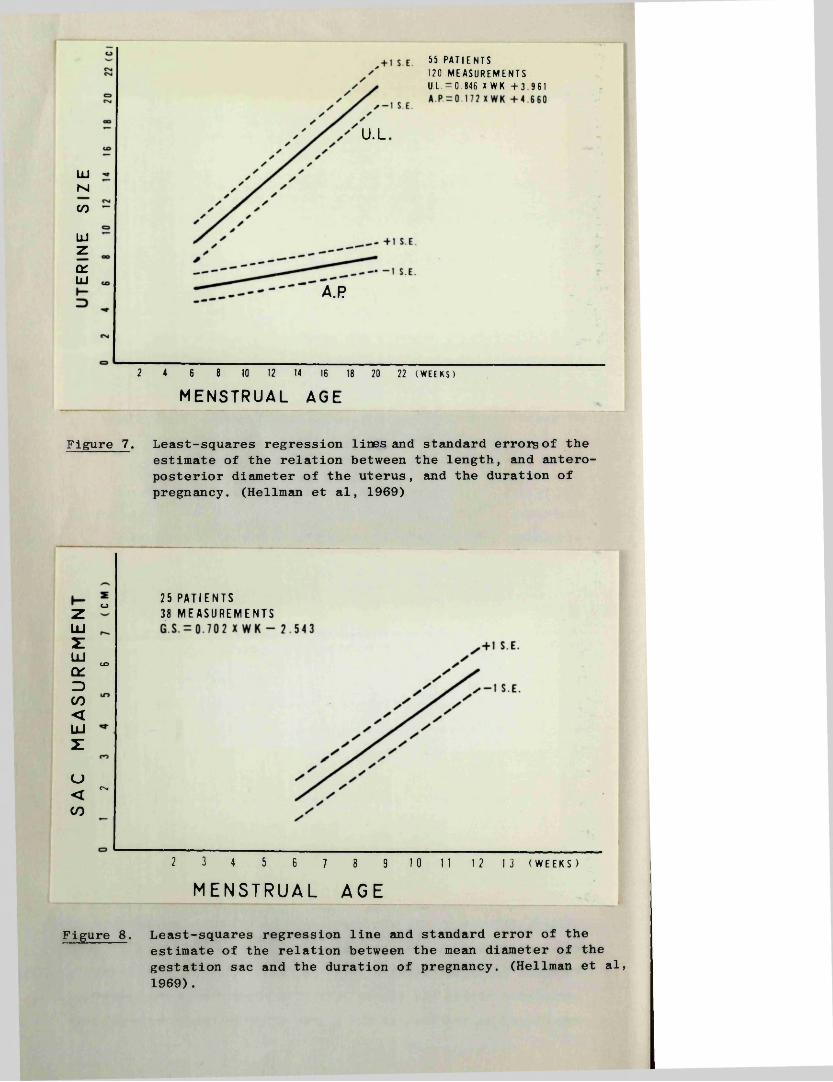
55 P A T I E N T S1 20 M E A S U R E M E N T SU.L. - 0 . 8 4 6 X W K + 3 9 6 1
U.L
LUMCOLUzonLU
A.P
2 4 6 8 10 12 14 IE 18 20 22 (WEEKS)MENSTRUAL AGE
Figure 7. Least-squares regression lines and standard errors of the estimate of the relation between the length, and anteroposterior diameter of the uterus, and the duration of pregnancy. (Heilman et al, 1969)
ZLUZLUO'3CO<LUZ
o<CO
25 PATIENTS 38 MEASUREMENTSU
CO
CM
32 5 64 9 10 11 1 2 1 3 ( W E E K S )87
M E N S T R U A L A G E
Figure 8 . Least-squares regression line and standard error of theestimate of the relation between the mean diameter of the gestation sac and the duration of pregnancy. (Heilman et al, 1969).

68
guide to the assessment of gestational age. By the thirteenth and fourteenth weeks it should be possible to identify and measure the fetal head, and from this period onwards the technique of biparietal cephalometry (Campbell, 1968, 1970) became the method of choice for assessing the age of a pregnancy.
It is clear that this approach to the evaluation of gestational age in the first 12 weeks of pregnancy is a very subjective one and is dependent to a large extent on the experience of the observer. Nevertheless, the degree of accuracy which can be achieved in the majority of patients is adequate for most practical purposes since the growth of a pregnancy during the first trimester is so rapid that the differences in the sonar appearances between pregnancies which are two or more weeks apart are usually obvious. This statement however, does not gainsay the fact that real doubt and uncertainty can and does arise using a subjective approach.For this reason, together with a natural inclination on the part of clinicians to have objective criteria on which to base their calculations of gestational age, it was to be expected that researchers in this field of diagnosis would seek alternative and more objective methods of assessing this important parameter in the first trimester of pregnancy.
Mensuration of the uterus and gestation sac Heilman and his co-workers in New York (1969) were the first group to perform ultrasonic measurements of the uterus and gestation sac in the early weeks of pregnancy. The uterine measurements recorded were those of the greatest length and the greatest antero-posterior diameter, while that of the gestation sac was the mean of its antero-posterior, longitudinal and transverse diameters. From a small series of 38 measurements on 25 patients whose pregnancies were between the fifth and tenth weeks, least squares regression lines for the growth of each of these parameters were computed, together with 'their standard errors of the estimates' (Figures 7 and 8). Unfortunately, the way in which the data was presented does not allow a precise estimate to be made of the limits within which a prediction of gestation age would be possible from an individual measurement. However, extrapolation from the available information suggests that it is unlikely that these limits are less than plus or minus two weeks. A similar appraisal of their uterine measurements showed that they would be even less accurate

69
as indices of gestational age.
Jouppila (1971) in a larger series derived his growth curve of the gestation sac from an average of the greatest and smallest diameters of the sac as depicted on a longitudinal scan. While the measurements employed differ from those of Heilman et al (1969), the resulting growth curves are very similar, and the approximate spread of results is comparable.
In 1972 Troostwijk found that the area of the largest cross-section of the gestation sac, measured by a planimeter, showed a higher correlation with gestational age than did simple measurement of its diameters. Once again, however, the published data did not afford a ready appreciation of the scatter of results. Nevertheless approximations suggest that this approach should be superior to those described above, but that the range within which the gestational age of a pregnancy could be predicted would still be well in excess of plus or minus one week. Levi and Erbsman (1972), on the other hand, derived measurements of the perimeter and area of the largest longitudinal section of the gestation sac, using a complicated method involving the division of the sac section into a large number of triangles. Analysis of the growth curves obtained with this technique show that an estimate of gestational age can be made to within plus or minus 10 days.
From the foregoing it is evident that until 1972 researchers in this field had directed their attention in early pregnancy to the uterus and gestation sac, little comment being made, and certainly no measurements being performed of the fetus itself. As a means of estimating the gestational age of a pregnancy, the use of gestation sac growth curves proved to be an important advance as it then became possible for the first time, at least theoretically, to give a measure of the accuracy with which such estimates could be given. It is unfortunate however that the scatter of results using these techniques were such that they did not allow estimates of gestational age to be given with an accuracy of any greater than plus or minus 10 to 14 days, since their basic simplicity made them easy techniques for practical use. A further problem, mentioned earlier, was that of the apparent dissolution of the gestation sac at around the eleventh week. This feature, which was confirmed by a number of other workers (Heilman et al, 1969; Kohorn et al, 1969; Jouppila, 1971; Troostwijk, 1972) using a variety of different
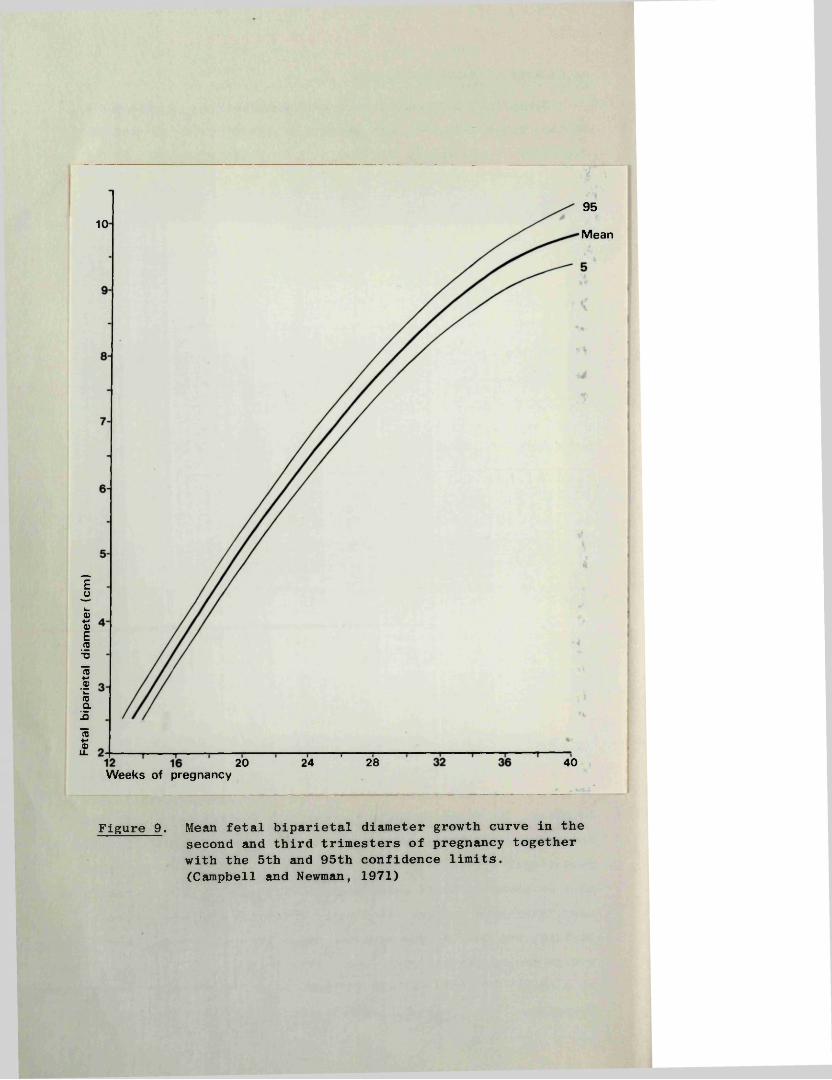
Feta
l bi
parie
tal
diam
eter
(c
m)
9510
Mean
28 4020 24Weeks of pregnancy
Figure 9 . Mean fetal biparietal diameter growth curve in the second and third trimesters of pregnancy together with the 5th and 95th confidence limits.(Campbell and Newman, 1971)

70
equipment, posed an additional limitation on the use of gestation sac dimensions for the objective estimation of gestational age.
Second and Third Trimester
The principal ultrasound technique used in the assessment of gestational age in the second and third trimesters is that of fetal biparietal cephalometry.
The possibility of visualising the fetal head in utero was first recognised by Donald and his co-workers in 1958. Dr. James Willocks, alone (1962 and 1963) and in collaboration with others of this department (Willocks et al., 1964) then devised a simple A-scan method of measuring the biparietal diameter (BPD) and proceeded to apply the results to clinical problems. However, it was not until 1968 when Campbell published his improved method of cephalometry using both B- and A-scans, that this technique became more widely used as a means of estimating gestational age.In a study designed to evaluate the accuracy of his technique, Campbell (1969) concluded that an estimate of gestational age could be made to within plus or minus nine days in 95% of cases "providing the measurement was taken during the period from the twentieth to the thirtieth weeks of pregnancy". While no comparable figures are available for the 13 to 20 week period, the rate of growth and biological variation of the BPD (Campbell and Newman, 1971) are such that an equal, if not superior accuracy of prediction is possible. (Figure 9) In the latter 10 weeks of pregnancy on the other hand, the rate of growth falls off sharply and the scatter of results at each week of gestational age becomes steadily greater. As a result of this the value of a single BPD measurement in the prediction of the age of a pregnancy, logically must be very much less. From extrapolation of the figures published by Campbell and Newman and from their graph, it seems that the accuracy would be no more than plus or minus three to four weeks. In this context, Hansmann (1974) in a computer analysis of his own data, found that a determination of the prospective birth date on the basis of a BPD measurement of 3 cm. (equivalent to 15 weeks of gestational age) could be given to within plus or minus 10 days, while a measurement of 9.2 cm. (equivalent to 35 weeks) gives an estimate to within plus or minus 24 days. Fleming (1968), examined the data published by the other workers in this field who have given methods of estimating gestational

71
age from BPD measurements (Brown, 1971; Willocks and Dunsmore,1971; Sabbagha et al, 1974), and found that the 95% confidence limits within which such an estimate could be given agrees very closely with the figures quoted by Hansmann (1974).
From the foregoing it is evident that the accuracy of prediction of gestational age from a BPD measurement becomes very much less reliable in the latter weeks of pregnancy. In clinical practice and given a normally growing fetus, the information would still have some clinical value were it not for the possibility that the fetal head could be small due to unsuspected intrauterine growth retardation, thereby incurring the additional possibility of a falsely low estimate being placed on the age of the fetus. Such an error could prove to be dangerous if taken at face value, in that it might encourage the clinician to prolong the pregnancy beyond the optimum time for delivery. In an attempt to resolve the problem of discriminating between a growth retarded fetus and a less mature but normally growing fetus, Campbell and Newman (1971) suggested taking a further measurement one or preferably two weeks later to determine the absolute increase in the BPD. This figure could then be compared with the range of expected growth increments at the appropriate head diameter. An increase within the normal range then suggests that the problem is one of mistaken "dates" and that the fetus is immature, while a smaller (or no) increase would favour a diagnosis of intrauterine fetal growth retardation in a more mature fetus.
Ill, 5:3 Radiological Methods
Prior to the introduction of diagnostic ultrasound, radiography was the most widely used ancillary method of assessing the gestational age of a pregnancy. For the most part this technique depends for its accuracy on the presence or absence of such features as the fetal fat line and the ossification centres in the fetal leg. Owing to the considerable biological variation of these features, both in terms of the time of their appearance and their relative sizes, Dee and his co-workers (1966) considered that the radiological assessment of gestational age was of dubious value. Furthermore, Schreiber and his co-workers (1963) found that in a significant proportion of babies,
72
ossification centres which are actually present cannot be recognised on an antenatal radiograph. In a semi-quantitative review Hartley (1957) found that 50.4 per cent of patients delivered within plus or minus seven days of a date based on the radiological findings, and to within 14 days in 76.8 per cent. Five point five per cent of patients in his series however delivered more than 21 days outside the estimated date of delivery. Russell (1969), from the same department in a more detailed study of 3606 pregnancies, showed that the potential error in the estimation of gestational age decreased as pregnancy approached term. The two standard deviation limits of the error of the radiological prediction fell from plus or minus 54 days when the pregnancy was less than 31 weeks to plus or minus 20 days between the 38th week and term. In both of these studies the criterion used in judging the accuracy of the radiographical estimate was the date of spontaneous onset of labour. In view of this it is likely that the estimates of potential error quoted above probably exaggerate the actual error as "any group of radiographed patients", to quote Russell (1973), "contains an excess of premature births, because often the fetus is radiographed by reason of the presence of an ’abnormality' which predisposes to a premature labour".
A final and important factor which may contribute to an error in the radiological estimation of gestational age is the possibility that the fetal bone age may be retarded due to intrauterine growth retardation (Scott and Usher, 1964; Murphy,1969; Croall and Grech, 1970). This possibility raises particular problems when trying to distinguish the pregnancy which is small because of growth retardation from that which is small simply because of erroneous dates.
Ill, 5:4 Methods Based on Examination of the Amniotic Fluid
These methods fall naturally into two groups: the examination of desquamated fetal cells in the liquor amnii (Brosens and Gordon, 1969); and the measurement of a number of its constituent biochemical substances such as creatinine and urea. Whitfield (1974), has recently reviewed the accuracy of both methods when used as indices of gestational age and found that neither was sufficiently reliable to be of any practical value in routine clinical practice. Lind and Billewicz (1971), employing a point scoring system based on cytology, the amniotic fluid creatinine level, and the difference

between the urea levels in the amniotic fluid and the maternal serum, were only able to predict gestational age to within a three weeks range with a certainty of 90 per cent.
In addition, the fact that these methods are invasive in nature and therefore carry a potential risk to the mother and fetus, has made this approach to the problem of estimating gestational age one which is rarely used in routine practice as a primary procedure.

74
IV
M E T H O D S

76
IV, 1 DESCRIPTION OF EQUIPMENT
The ultrasonic equipment used in this study was a Nuclear Enterprises Diasonograph NE4102. While capable of operating with transducers of varying frequencies, the 2.5 MHz transducer was employed to the exclusion of others apart from the occasional use of a 5.0 MHz transducer in cases of hydatidiform mole.
Basically the system comprises three parts, the electronic console shown on the left of the photograph (Figure 1), and the scanning gantry and patient trolley on the right.
IV, 1:1 Scanning Gantry
The scanning frame and its housing are suspended from the transverse arm of the gantry and may be positioned in any desired vertical plane by means of a system of brake release controls located in the housing. In addition the angular position of the scanning frame within the housing may be adjusted by means of a simple mechanical locking device which, on release, allows the frame to be tilted.
When the desired plane has been located, the whole scanning assembly may be locked in position to allow that particular section to be scanned and re-scanned at leisure. The position and angle of the scanning plane is readily ascertained by reference to two centimetre rules on the gantry, and to angle indicators on the housing of the scanning frame and on the upper transverse arm of the gantry. These positioning and measuring facilities make it possible to perform serial parallel section scans at predetermined intervals across the area of interest, or at a predetermined angle one to another, and make it possible to return to the exact position of a previous scan.
The transducer probe assembly, suspended from the scanning frame, is free to move both horizontally and vertically by means of a system of rails and pulleys within the scanning frame. The probe itself can be rotated through + 130 degrees and the angle measured by means of an additional indicator on the probe assembly. All movements of the transducer and therefore "line of sight" of the ultrasound beam are recorded electronically by linear and sine/cosine potentiometers housed in the scanning frame as described in Chapter II, 2:1.
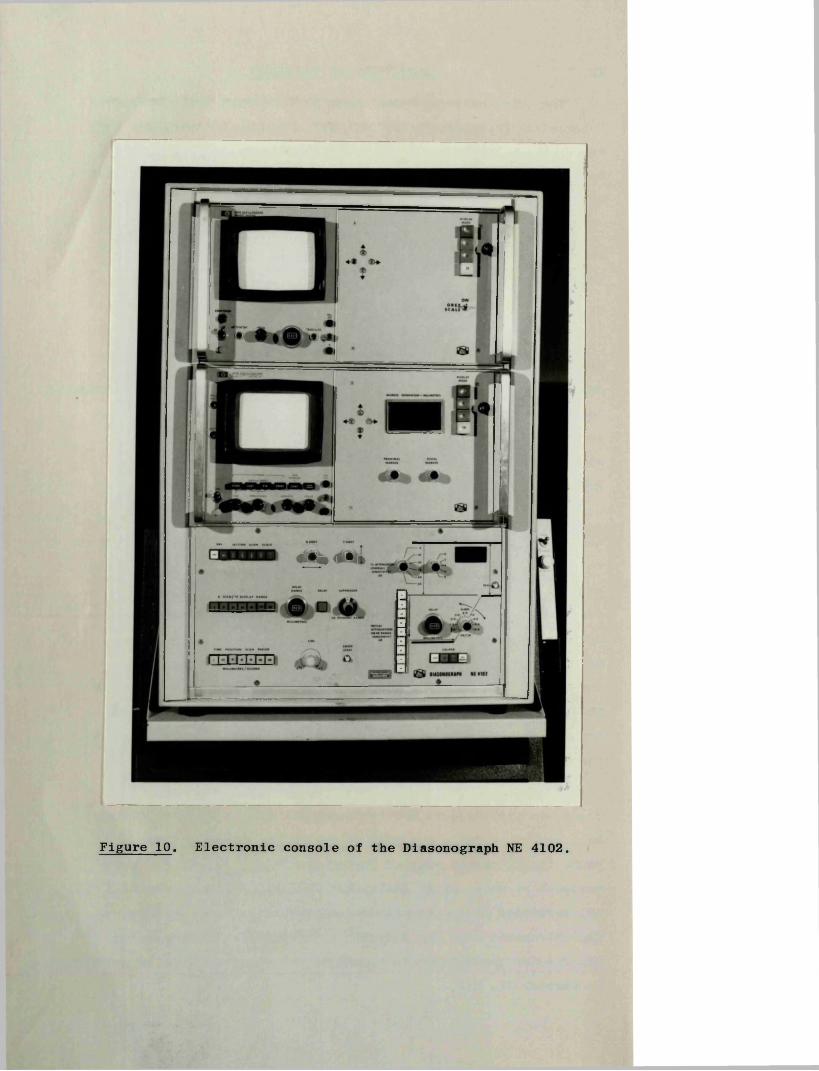
#•<,« *1*
Figure 10. Electronic console of the Diasonograph NE 4102.

77
IV, 1:2 Patient Trolley
With this equipment the trolley remains in a fixed position.It is our practice to have the patient lie on the trolley with her feet towards the vertical beam of the gantry.
IV, 1:3 Electronic Console
For descriptive purposes the console (Figure 10) may bedivided into upper middle and lower sections. The most obvious features of the upper two are the oscilloscopes. In the top section the oscilloscope has a short persistence cathode ray tube while that in the middle section is of the variable persistence/ storage type. The surfaces of both are divided by a graticule into squares of 0.94 cm, with 10 divisions on the horizontal axis and eight on the vertical. Each major division on the centre lines is further divided to give five sub-divisions of approximately 2 mm. Each oscilloscope has focussing and brightness controls. In addition the storage oscilloscope has controls which govern the persistence time of the ultrasound image. Both can display all three ultrasonic modes and are quite independent of each other. The display mode may be changed by simple press button switches. These switches are located on the far right of the two upper sections.
In the middle section is also located the adjustment controls for the electronic markers, and a digital display giving the marker separation in millimetres. Their "on/off” switches are placed in the extreme bottom right of the lower section. When activated the electronic markers appear as bright dots on the A-mode and as continuous lines on the B and TP-modes. The "proximal marker control" moves both dots synchronously while the "distal control" causes the distal marker to move independently. When positioned, the distance of the markers relative to the transducer face remains constant irrespective of the display mode or magnification factor in use. Thus, the markers can be placed above and below an area of interest, and thereafter that section may be examined in any of the three modes in the knowledge that the echoes between the markers in one mode are derived from the same structures as those in another mode.
The B-mode picture display scale switches are positioned in the upper left corner of the lower section. These allow B-mode scans to be displayed in a choice of picture scales (1/3, 2/5,3/5, 4/5, 5/5) of which the 2/5 and 5/5 were the most frequently

78
used in this series of investigations. These figures are approximations, the manufacturers specifying an actual scale factor on the 5/5 magnification of 0.94 to 1. On this scale, however, the echoes from one centimetre of tissue depth are recorded on 0.94 cm of screen, that is, the depth of one graticule square. As a result measurements can be made directly from the screen using the graticule itself as the ruler.
The x and Y-shift controls, adjacent to the display scale controls, govern the position of the B-mode display on the oscilloscope screen.
A-mode/TP display range controls. The depth of tissue displayed in the A and TP modes may be varied from 5 to 500 mm.Should one wish to examine the echoes from a 20 mm section of the body positioned well below the skin surface, activation of the delay switch and rotation of the "delay range" control will bring the appropriate section into view.
The effect of the suppression control is to raise or lower the "threshold", i.e. the amplitude level which echoes must attain before they are recorded on the screen. Thus, increasing the suppression results in the disappearance of the smaller amplitude echoes. For the purposes of this investigation, little or no suppression was used since the echoes from the early fetus are of small amplitude and suppression would therefore result in loss of information.
Time position scan period. These controls, sited in the lower left part of the bottom section, determine the speed of the TP mode time-base sweep. By selection of the appropriate switch and the use of the adjacent fine control, the rate of sweep may be adjusted accurately to any desired speed. The system is activated by the sweep start button.
Transmitter (Tx) attenuation. When set at zero this equipment is working at its maximum power output, and any numerical increase in the settings represents a reduction of the emitted ultrasonic energy. The controls are calibrated in decibels (dB) (see Chapter II, 1). In practice 20 to 30 dB of transmitter attenuation is commonly used.
The three controls which comprise the swept receiver gain are positioned in the lower right portion of the bottom section. Their

79
function has already been outlined in Chapter II, 2:1. In the typical examination of an early pregnancy an initial attenuation of 30 dB, operative for 10 mm is used, with a fast slope in the order of 10 dB per cm. These settings effect the desired reduction in the amplification of the large echoes from the abdominal wall, with no reduction of the echoes from the area of interest, i.e. the uterus and its contents. The digital display in the upper right corner of this section gives the sum of the transmitter attenuation and the initial receiver attenuation from the swept gain system.
IV, 1:4 Camera
The camera used was a Hewlett Packard HP 197A, designed to utilise standard Polaroid packs. This model has an electronically operated shutter with a wide range of apertures and exposure times. It has also an ultraviolet flash lamp which helps illuminate the screen graticule.
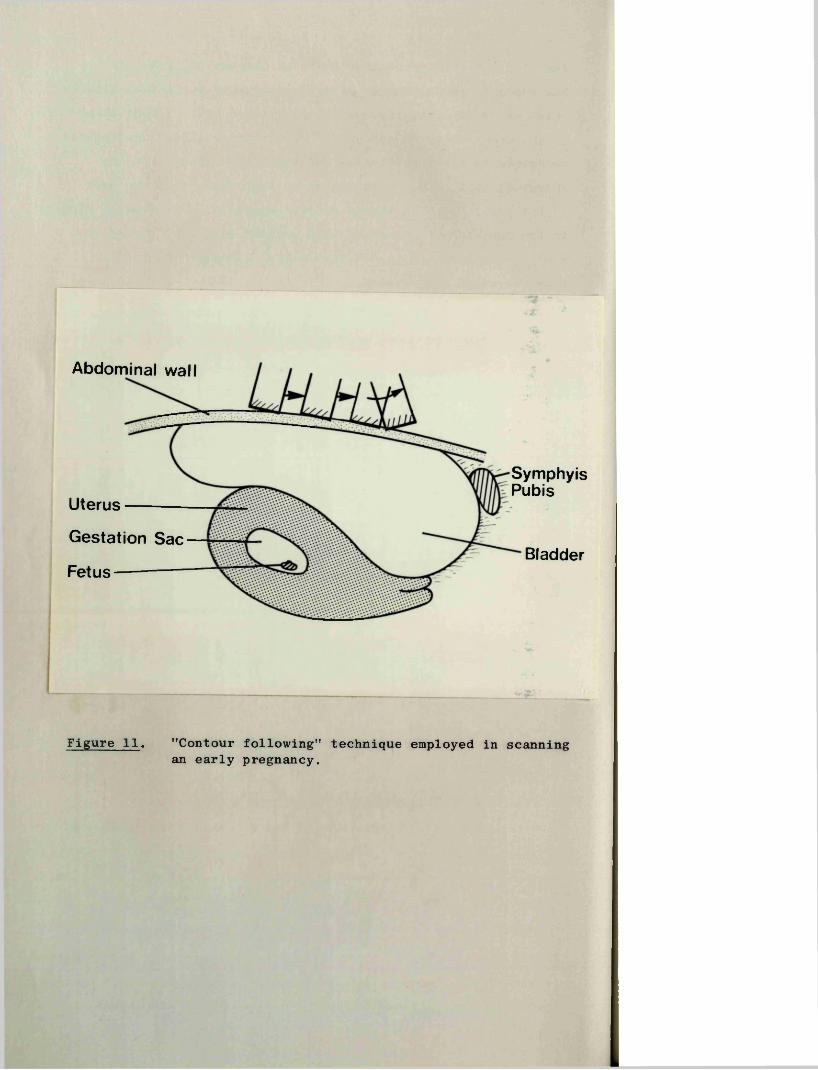
Abdominal wall
SymphyisPubisUterusGestation Sac BladderFetus
Figure 11. "Contour following" technique employed in scanning an early pregnancy.
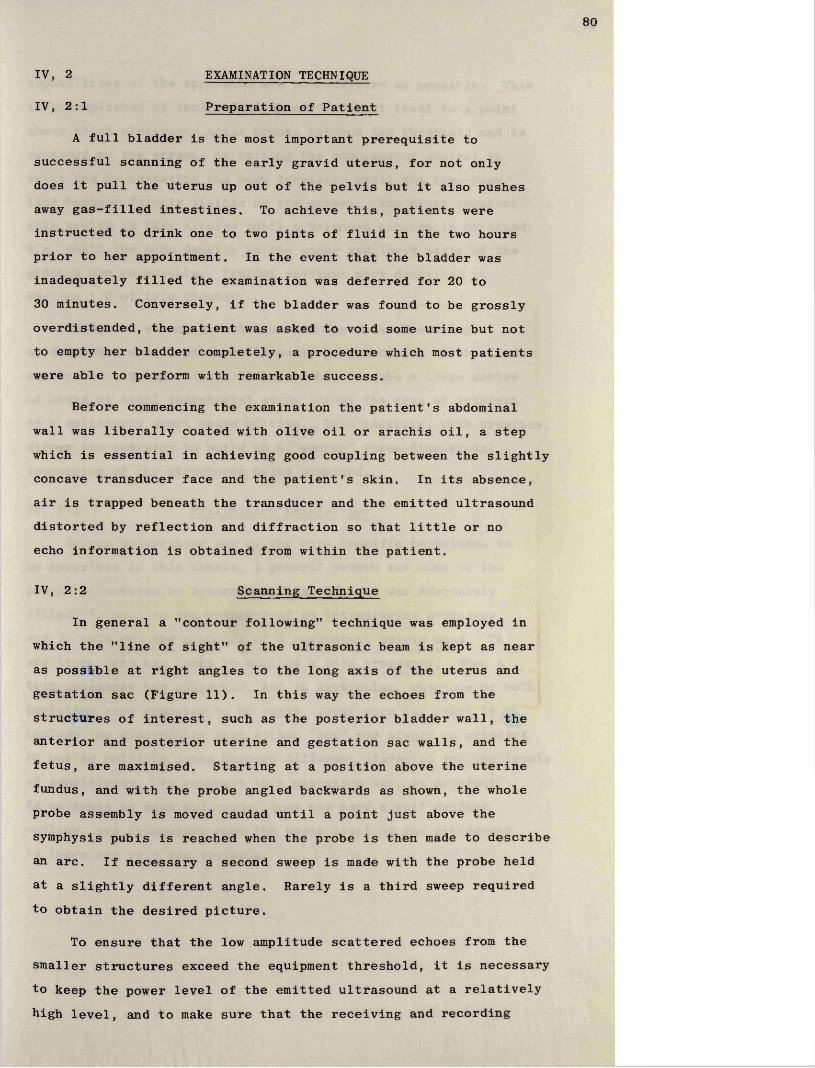
80
IV, 2 EXAMINATION TECHNIQUE
IV, 2:1 Preparation of Patient
A full bladder is the most important prerequisite to successful scanning of the early gravid uterus, for not only does it pull the uterus up out of the pelvis but it also pushes away gas-filled intestines. To achieve this, patients were instructed to drink one to two pints of fluid in the two hours prior to her appointment. In the event that the bladder was inadequately filled the examination was deferred for 20 to 30 minutes. Conversely, if the bladder was found to be grossly overdistended, the patient was asked to void some urine but not to empty her bladder completely, a procedure which most patients were able to perform with remarkable success.
Before commencing the examination the patient's abdominal wall was liberally coated with olive oil or arachis oil, a step which is essential in achieving good coupling between the slightly concave transducer face and the patient's skin. In its absence, air is trapped beneath the transducer and the emitted ultrasound distorted by reflection and diffraction so that little or no echo information is obtained from within the patient.
IV, 2:2 Scanning Technique
In general a "contour following" technique was employed in which the "line of sight" of the ultrasonic beam is kept as near as possible at right angles to the long axis of the uterus and gestation sac (Figure 11). In this way the echoes from the structures of interest, such as the posterior bladder wall, the anterior and posterior uterine and gestation sac walls, and the fetus, are maximised. Starting at a position above the uterine fundus, and with the probe angled backwards as shown, the whole probe assembly is moved caudad until a point just above the symphysis pubis is reached when the probe is then made to describe an arc. If necessary a second sweep is made with the probe heldat a slightly different angle. Rarely is a third sweep requiredto obtain the desired picture.
To ensure that the low amplitude scattered echoes from the smaller structures exceed the equipment threshold, it is necessary to keep the power level of the emitted ultrasound at a relativelyhigh level, and to make sure that the receiving and recording

81
capabilities of the apparatus are as sensitive as possible. This is accomplished by increasing the power output level to a point above which electronic noise breaks through the threshold and is recorded on the screen; by setting the suppression control to zero; and by adjusting the beam intensity until the time-base line becomes faintly visible on the screen. The swept receiver gain system is then altered until a balanced picture is obtained, i.e. until the echo density in the upper and lower parts of the picture are comparable. Typical settings were described in section 1:3 of this Chapter.
Using the scanning technique and the control settings as described above, pictures in early pregnancy can be obtained easily and quickly. It is thus possible to make a large series of scans at small incremental steps across the area of interest in a relatively short space of time. This facility, with practice, allows the operator to build up a "mental" three-dimensional impression of the structures being examined.
IV, 2:3 Preliminary Examination
Before undertaking any of the more specific techniques to be described in this thesis, a general search was made of the pelvic structures to determine if the bladder was adequately filled, to confirm the presence of an intrauterine pregnancy, and to rule out the presence of a coexistent pelvic mass. In addition, care was taken to exclude a twin pregnancy. When a twin pregnancy was suspected, and in particular, when one or both gestation sacs appeared to be empty, great care was taken to exclude the possibility that either "sac" was simply an artefact by making multiple scans through different planes at varying levels of sensitivity. In contrast to a gestation sac, an artefact is variable in size and shape, does not have a well defined outline, and disappears when the power level of the ultrasound is increased by a few decibels.
82
IV, 3 CLINICAL INFORMATION
IV, 3:1 Clinical History
A careful menstrual and clinical history was obtained from all patients, usually on completion of the ultrasonic examination. The menstrual data included the date and normality (or otherwise) of the last period, the length and regularity of the cycle, and any recent history of the use of an oral contraceptive agent.An attempt was also made to gauge the reliability of the patient as a historian. Note was taken of any history of vaginal bleeding, the dates and results of urine pregnancy tests, change in the symptoms of pregnancy, and the findings at any recent vaginal examination. Finally, relevant details were recorded of the patient’s past obstetrical and medical history.
IV, 3:2 Outcome of the Pregnancy
The clinical records of the patients examined during this investigation were carefully perused after abortion or delivery.
AbortionIn the event of a spontaneous abortion, the author endeavoured
to examine the products of conception before they were sent to the Pathology Department. Failing this, the other members of the staff co-operated in this task. In particular, note was taken of the presence or absence of a fetus and the degree of maceration.The fetus, if present, was placed in what was considered to be a normal degree of flexion and its length measured to the nearest millimetre. The sac wall and trophoblast were then inspected for gross evidence of degenerative changes.
When a diagnosis of an "early pregnancy failure" was made by ultrasound examination and a decision made to terminate the pregnancy, the author, when available, offered to undertake the procedure. In all cases two units of cross-matched blood were available at the time of operation. The cervix was slowly dilated to Hegar 10 and the uterus carefully evacuated with sponge forceps and sharp curettage. On no occasion was it possible to remove the gestation sac intact, but care was taken to identify the fetus when the sac ruptured. The products of conception were then examined as described above by the operator, and subsequently by an experienced pathologist.

83
Viable Delivery
Details of the course of each pregnancy and any significant complication were noted. Note was also taken of the date of delivery (and thus the menstrual age), whether the labour was spontaneous or induced, the mode of delivery, and the baby’s weight, sex and Apgar score.

84
V
R E S U L T S
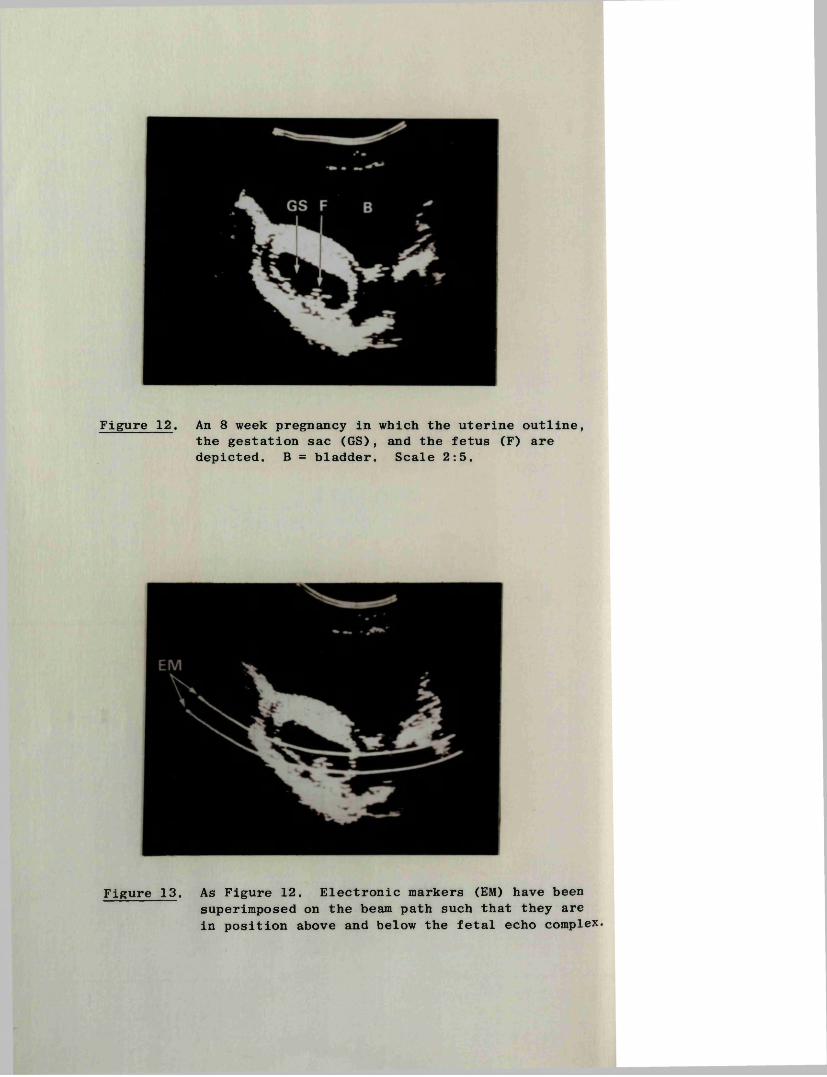
Figure 12. An 8 week pregnancy in which the uterine outline, the gestation sac (GS), and the fetus (F) are depicted. B = bladder. Scale 2:5.
Figure 13. As Figure 12. Electronic markers (EM) have been superimposed on the beam path such that they are in position above and below the fetal echo complex.
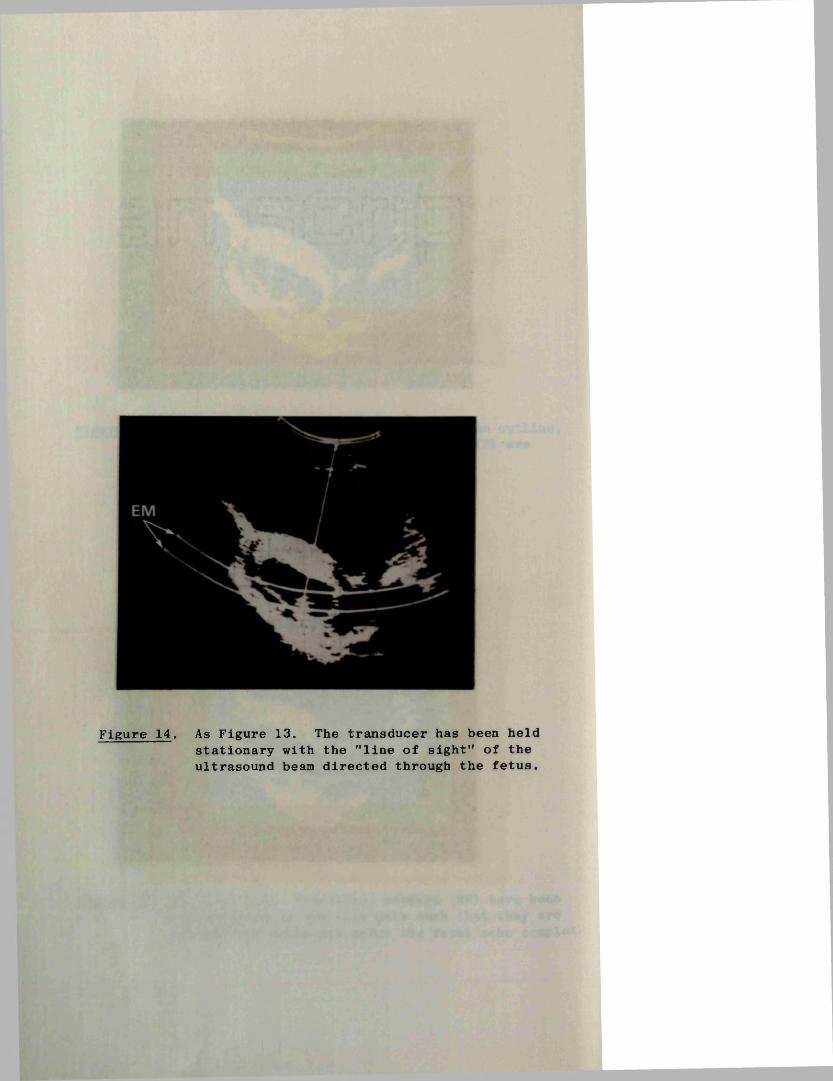
Figure 14. As Figure 13. The transducer has been held stationary with the ’’line of sight” of the ultrasound beam directed through the fetus.

85
V, 1 DETECTION OF FETAL HEART MOVEMENTS
V, 1:1 Description of the Technique
A description of this technique was originally reported by the author in the British Medical Journal (1972). (A reprint is enclosed.)
The first step in the procedure is to examine the pregnancy thoroughly by means of serial longitudinal section scans performed at small intervals from one side of the uterus to the other.The picture scale most commonly employed in this preliminary search is the 2:5 magnification since this allows the whole of the uterus and its contents to be displayed on the screen. During the course of these scans the gestation sac and fetus are identified (Figure 12). The section of the uterus which includes the largest area of fetal echoes is located, and by means of the X and Y shift controls this latter area is moved to the centre of the screen. At this point, especially when the fetus is small, i.e. less than eight weeks size, a useful step is to enlarge the picture scale to the 1:1 magnification as this allows the fetal echoes to be more clearly defined. The electronic markers are then placed "along the beam" in positions above and below the fetal echo complex as shown in Figure 13. With the transducer held firmly in position such that the ultrasonic beam traverses the fetus (Figure 14) attention is next directed to a simultaneous A-mode display on the upper short-persistence oscilloscope screen.The section of A-mode echoes between the electronic markers is then brought onto the screen by means of the delay control. These echoes, as they are positioned between the markers, must have originated from the fetus, and therefore any echoes moving independently in this area must be derived from the fetal heart.In the first trimester of pregnancy, the 20 millimetre display range, i.e. the range which depicts two centimetres of tissue depth on the 10 centrimetre wide screen, has been found to be the most suitable. This magnification is large enough to allow the small excursion of movement of the heart structures to be readily identified while still allowing, in most instances, the complete depth of the fetus to be portrayed. In those pregnancies of seven weeks or under, recourse to the 10:1 magnification may be necessary due to the extremely small amplitude of movement of the heart wall at this time.
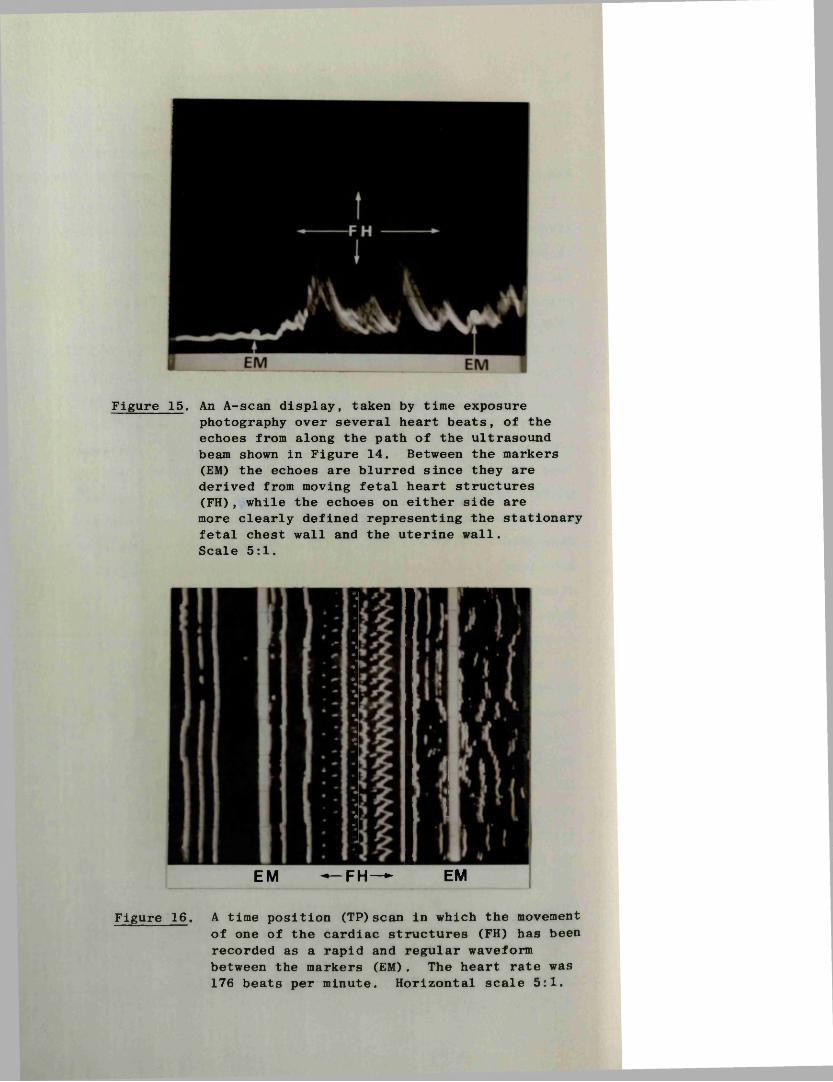
Figure 15. An A-scan display, taken by time exposurephotography over several heart beats, of the echoes from along the path of the ultrasound beam shown in Figure 14. Between the markers (EM) the echoes are blurred since they are derived from moving fetal heart structures (FH), while the echoes on either side are more clearly defined representing the stationary fetal chest wall and the uterine wall.Scale 5:1.
EM — FH— EM
Figure 16. A time position (TP)scan in which the movement of one of the cardiac structures (FH) has been recorded as a rapid and regular waveform between the markers (EM). The heart rate was 176 beats per minute. Horizontal scale 5:1.

86
The actual movements of the fetal cardiac structures are recognised by rapid positional and/or amplitude changes of a section of the fetal echoes. That these moving A-scan deflections are fetal in origin is further confirmed by finding that the echoes on either side are relatively stationary (Figure 15). In the event that this typical movement pattern is not immediately evident the ultrasonic beam is moved very slowly through the fetal echo complex until it is located. Failure to detect movements at this stage usually means that the particular two-dimensional section being examined does not include the fetal heart, and it is then necessary to move the scanning frame a few millimetres laterally and to repeat the process. This procedure is followed as often as is required.
The identification of moving echoes between the markers is, of itself, absolute evidence that the fetus is alive, and no further steps need be employed. However, in order to obtain a permanent record a TP-mode recording of the movement patterns may be made.This is achieved by maintaining the transducer in a stationary position with the beam directed through the fetal heart as described above, switching the lower storage oscilloscope from the B- to the TP-mode, and then activating the time position scan sweep. The resultant tracing is then photographed.
In most cases it is expedient to increase the transmitter output level by ten decibels as this increases the amplitude of the echoes so that a more satisfactory recording is obtained (Figure 16). The time position sweep period employed in this study was adjusted to give a rate of sweep of one major graticule square per second. This predetermined speed makes it possible to estimate the approximate heart rate by counting the number of beats recorded over an eight second period. For the purposes of this study at least two such recordings were made and a heart rate calculated from each. The mean was then taken for the purposes of statistical analysis.
The total procedure when the fetus is alive often takes less than 30 seconds but, on occasion, several minutes may be required. Confirmation that the fetus is dead on the other hand usually takes very much longer as it is mandatory that an extremely meticulous search is made of every cubic millimetre of
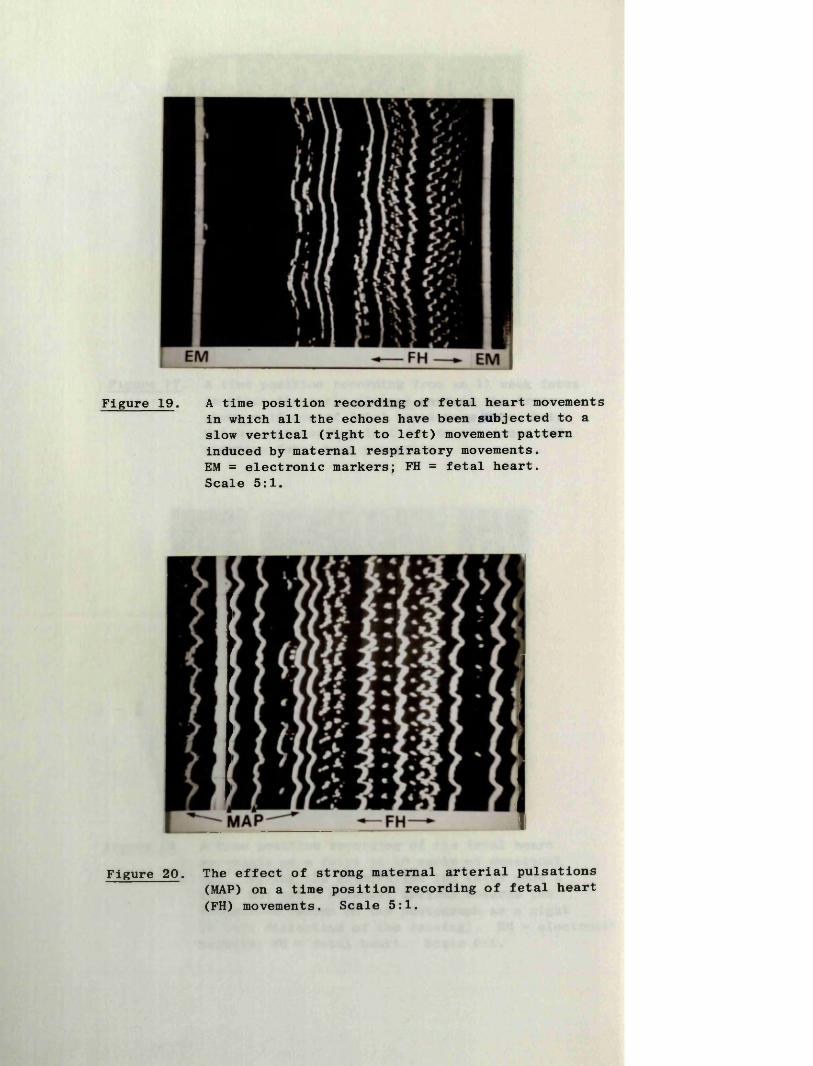
Figure 19. A time position recording of fetal heart movements in which all the echoes have been subjected to a slow vertical (right to left) movement pattern induced by maternal respiratory movements.EM = electronic markers; FH = fetal heart.Scale 5:1.
Figure 20 . The effect of strong maternal arterial pulsations (MAP) on a time position recording of fetal heart (FH) movements. Scale 5:1.
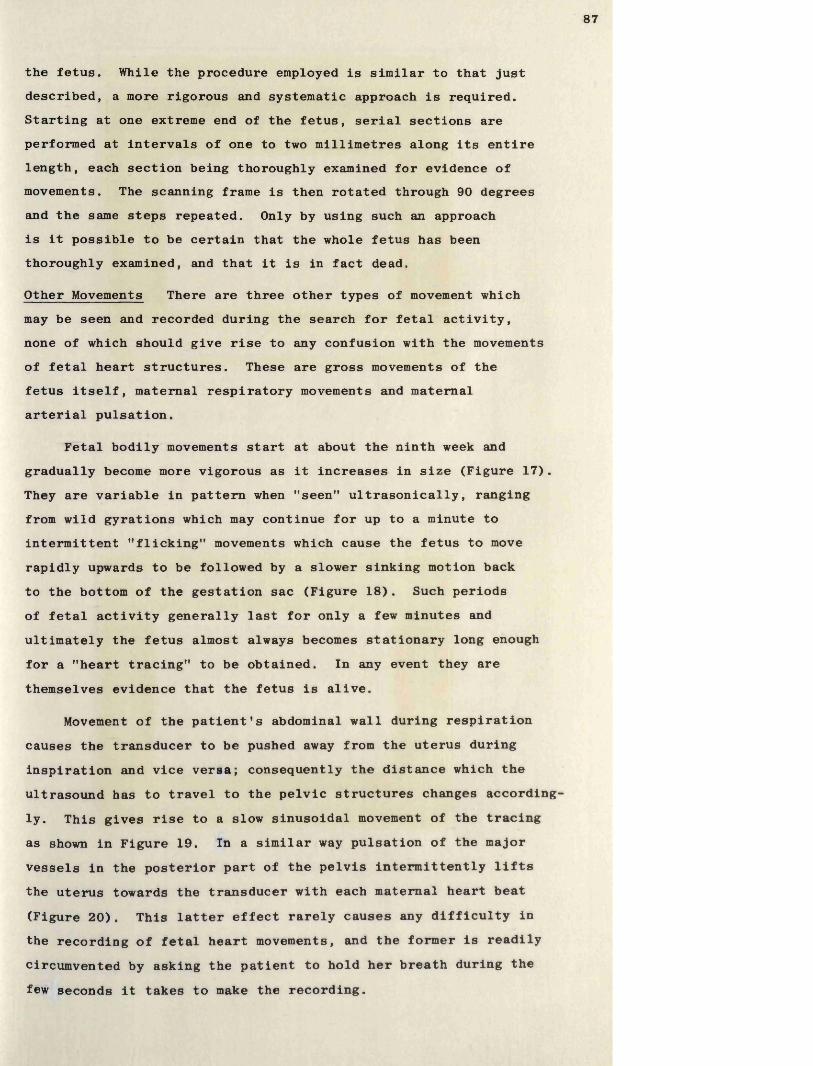
87
the fetus. While the procedure employed is similar to that just described, a more rigorous and systematic approach is required. Starting at one extreme end of the fetus, serial sections are performed at intervals of one to two millimetres along its entire length, each section being thoroughly examined for evidence of movements. The scanning frame is then rotated through 90 degrees and the same steps repeated. Only by using such an approach is it possible to be certain that the whole fetus has been thoroughly examined, and that it is in fact dead.
Other Movements There are three other types of movement which may be seen and recorded during the search for fetal activity, none of which should give rise to any confusion with the movements of fetal heart structures. These are gross movements of the fetus itself, maternal respiratory movements and maternal arterial pulsation.
Fetal bodily movements start at about the ninth week and gradually become more vigorous as it increases in size (Figure 17). They are variable in pattern when "seen” ultrasonically, ranging from wild gyrations which may continue for up to a minute to intermittent "flicking" movements which cause the fetus to move rapidly upwards to be followed by a slower sinking motion back to the bottom of the gestation sac (Figure 18). Such periods of fetal activity generally last for only a few minutes and ultimately the fetus almost always becomes stationary long enough for a "heart tracing" to be obtained. In any event they are themselves evidence that the fetus is alive.
Movement of the patient’s abdominal wall during respiration causes the transducer to be pushed away from the uterus during inspiration and vice versa; consequently the distance which the ultrasound has to travel to the pelvic structures changes accordingly. This gives rise to a slow sinusoidal movement of the tracing as shown in Figure 19. In a similar way pulsation of the major vessels in the posterior part of the pelvis intermittently lifts the uterus towards the transducer with each maternal heart beat (Figure 20). This latter effect rarely causes any difficulty in the recording of fetal heart movements, and the former is readily circumvented by asking the patient to hold her breath during the few seconds it takes to make the recording.
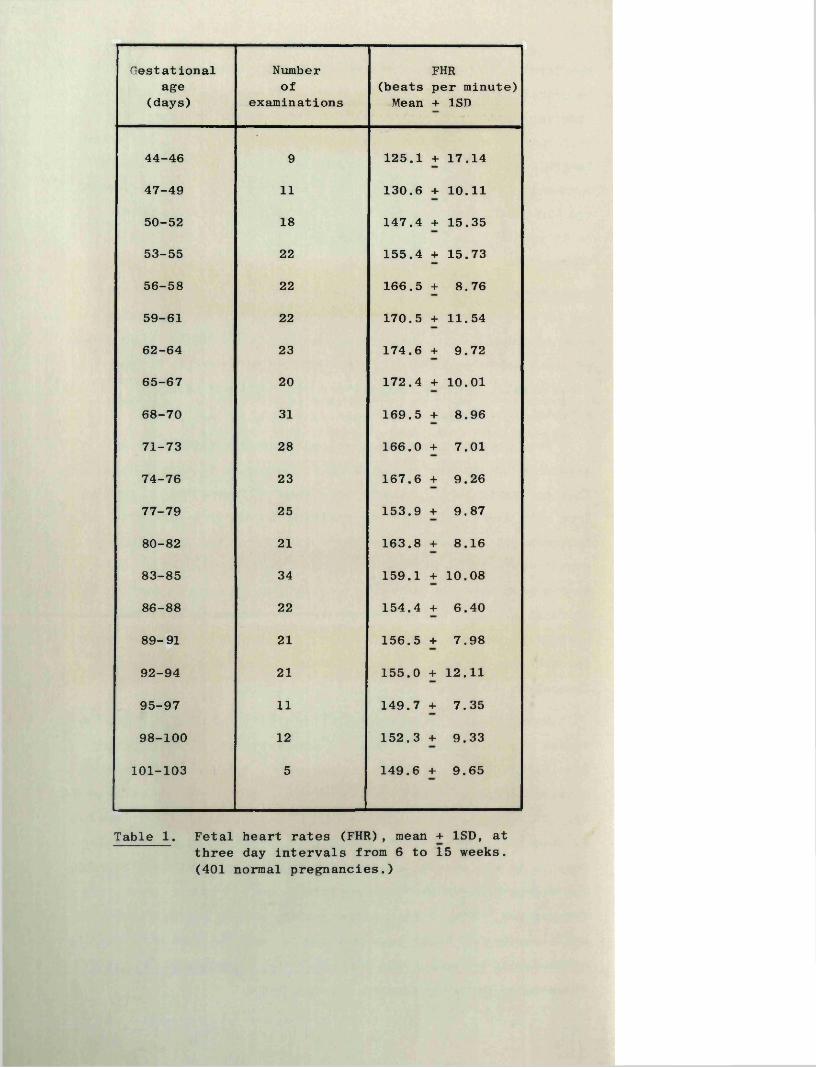
Gestationalage
(days)
Numberof
examinations(beatsMean
FHRper minute) + 1SD
44-46 9 125.1 + 17.14
47-49 11 130.6 + 10.11
50-52 18 147.4 + 15.35
53-55 22 155.4 + 15.73
56-58 22 166.5 + 8.76
59-61 22 170.5 + 11.54
62-64 23 174.6 + 9.72
65-67 20 172.4 + 10.01
68-70 31 169.5 + 8.96
71-73 28 166.0 + 7.01
74-76 23 167.6 + 9.26
77-79 25 153.9 + 9.87
80-82 21 163.8 + 8.16
83-85 34 159.1 + 10.08
86-88 22 154.4 + 6.40
89-91 21 156.5 + 7.98
92-94 21 155.0 + 12.11
95-97 11 149.7 + 7.35
98-100 12 152.3 + 9.33
101-103 5 149.6 + 9.65
Table 1. Fetal heart rates (FHR), mean + 1SD, at three day intervals from 6 to 15 weeks. (401 normal pregnancies.)
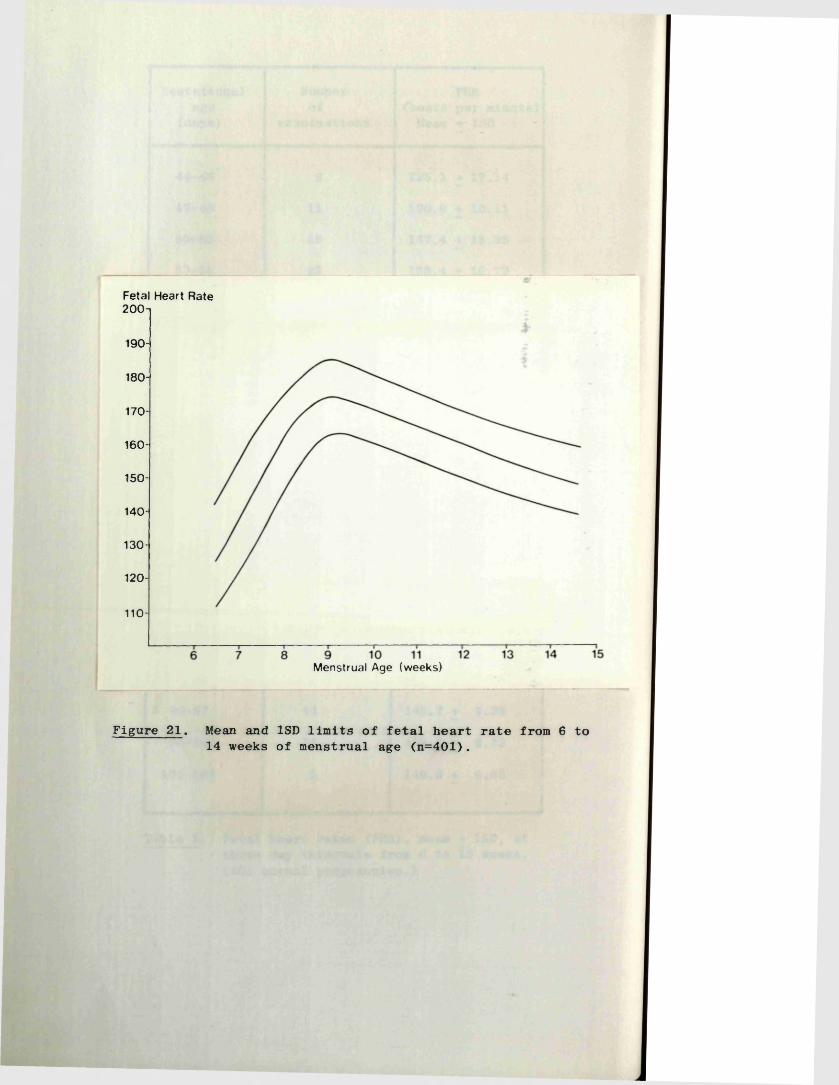
Fetal Heart Rate200-i
190-
180-
170-
160-
150-
140-
130-
120-
110-
M e n s t r u a l A g e ( w e e k s )
Figure 21. Mean and 1SD limits of fetal heart rate from 6 to 14 weeks of menstrual age (n=401).

88
V, 1:2 Accuracy of Detection of Fetal Heart Movements
In the total series of over 1000 patients included in this thesis, and using the technique described in the previous section, fetal heart movements were always detected in pregnancies unequivocably at seven weeks of menstrual age or over, and which were shown subsequently to be normal continuing pregnancies. There were no false positive or false negative results after seven weeks (see Chapter V, 2 relating to the ’’Diagnosis of Early Pregnancy Failure”). In 38 pregnancies between 6 and 7 weeks, fetal heart movements were detected in 22 (58%); there was one positive finding as early as 6 weeks and 0 days, and in 14 patients at 6 weeks and 6 days the examination in 13 was positive.
V, 1:3 Fetal Heart Rate
Normal rangeA total of 401 fetal heart rate (FHR) measurements from
individual patients were analysed. Strict criteria were observed for inclusion of patients in the study, namely certainty about the date of the LMP, a regular menstrual cycle (28 + 2 days), no vaginal bleeding since the last period, and no oral contraception for at least three months prior to the LMP; as far as possible only those patients were included who were well motivated towards being pregnant. Patients fulfilling these criteria will hereafter be termed as having ’’impeccable dates".
The FHR's were grouped in class intervals of three days and the individual mean and SD values for each calculated (Table 1). The results are also shown in the form of a smoothed graph in Figure 21. From this data it can be seen that the mean FHR rose rapidly from a level of 125 beats per minute at 6 weeks and 3 days of amenorrhoea, to a peak of 175 beats per minute at 9 weeks, and fell progressively to a value of 150 beats per minute at 15 weeks. The difference between the peak FHR and the early and late values were both highly significant using Student’s "t" test (p < 0.001), and the difference at 6 and 15 weeks to be significant at the 0.01 level.
FHR and threatened abortionOf the 165 patients in this series whose pregnancies continued
despite a "threat to abort", usable recordings were obtained in
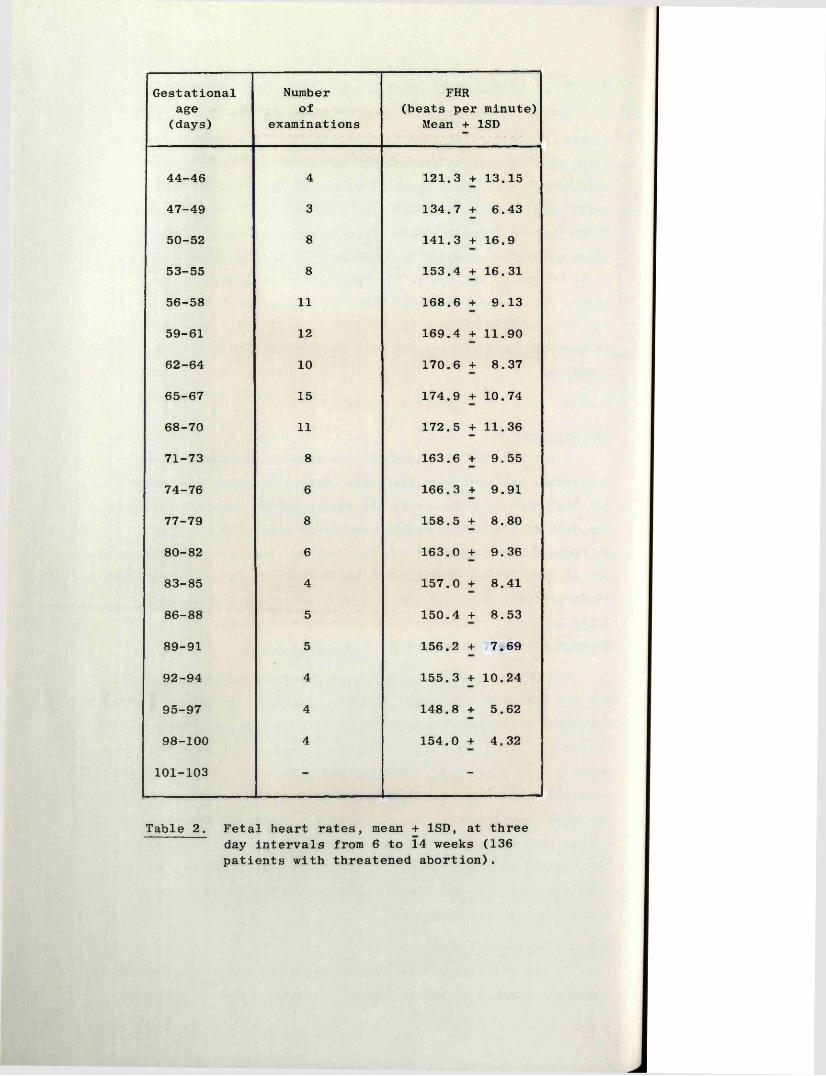
Gestationalage(days)
Numberof
examinations
FHR(beats per minute)
Mean + 1SD
44-46 4 121.3 + 13.15
47-49 3 134.7 + 6.43
50-52 8 141.3 + 16.9
53-55 8 153.4 + 16.31
56-58 11 168.6 + 9.13
59-61 12 169.4 + 11.90
62-64 10 170.6 + 8.37
65-67 15 174.9 + 10.74
68-70 11 172.5 + 11.36
71-73 8 163.6 + 9.55
74-76 6 166.3 + 9.91
77-79 8 158.5 + 8.80
80-82 6 163.0 + 9.36
83-85 4 157.0 + 8.41
86-88 5 150.4 + 8.53
89-91 5 156.2 + 7.69
92-94 4 155.3 + 10.24
95-97 4 148.8 + 5.62
98-100 4 154.0 + 4.32
101-103 - -
Table 2. Fetal heart rates, mean + 1SD, at three day intervals from 6 to 14 weeks (136 patients with threatened abortion).

89
136 during the period of active bleeding or within the ensuing three days. Mean and SD values were again calculated for three day intervals and the results tabulated as shown in Table 2.Using Student's "t" test no significant difference was found between the results obtained in the normal and "threatened abortion" groups at equivalent gestational ages.
In those patients with threatened abortions who had repeated FHR measurements performed, no consistent deviation from the normal trend of change was noted.
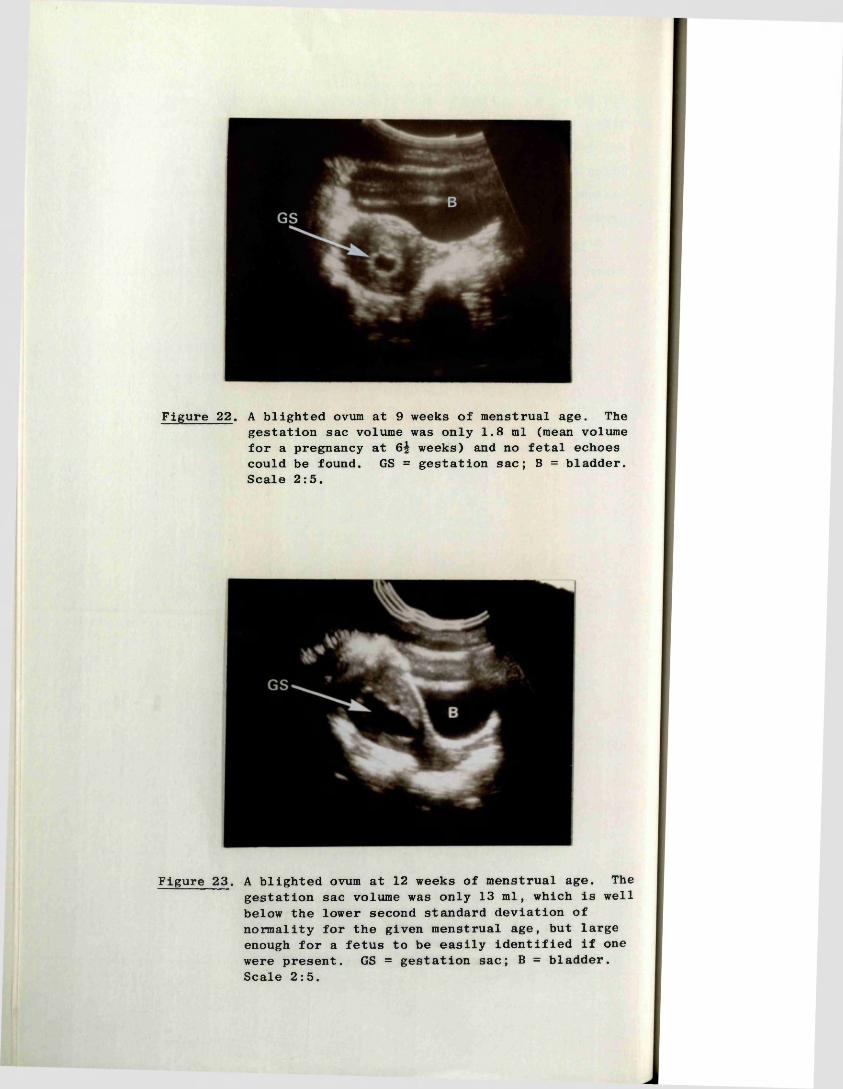
Figure 22. A blighted ovum at 9 weeks of menstrual age. The gestation sac volume was only 1.8 ml (mean volume for a pregnancy at 6^ weeks) and no fetal echoes could be found. GS = gestation sac; B = bladder. Scale 2:5.
Figure 23. A blighted ovum at 12 weeks of menstrual age. The gestation sac volume was only 13 ml, which is well below the lower second standard deviation of normality for the given menstrual age, but large enough for a fetus to be easily identified if one were present. GS = gestation sac; B = bladder. Scale 2:5.
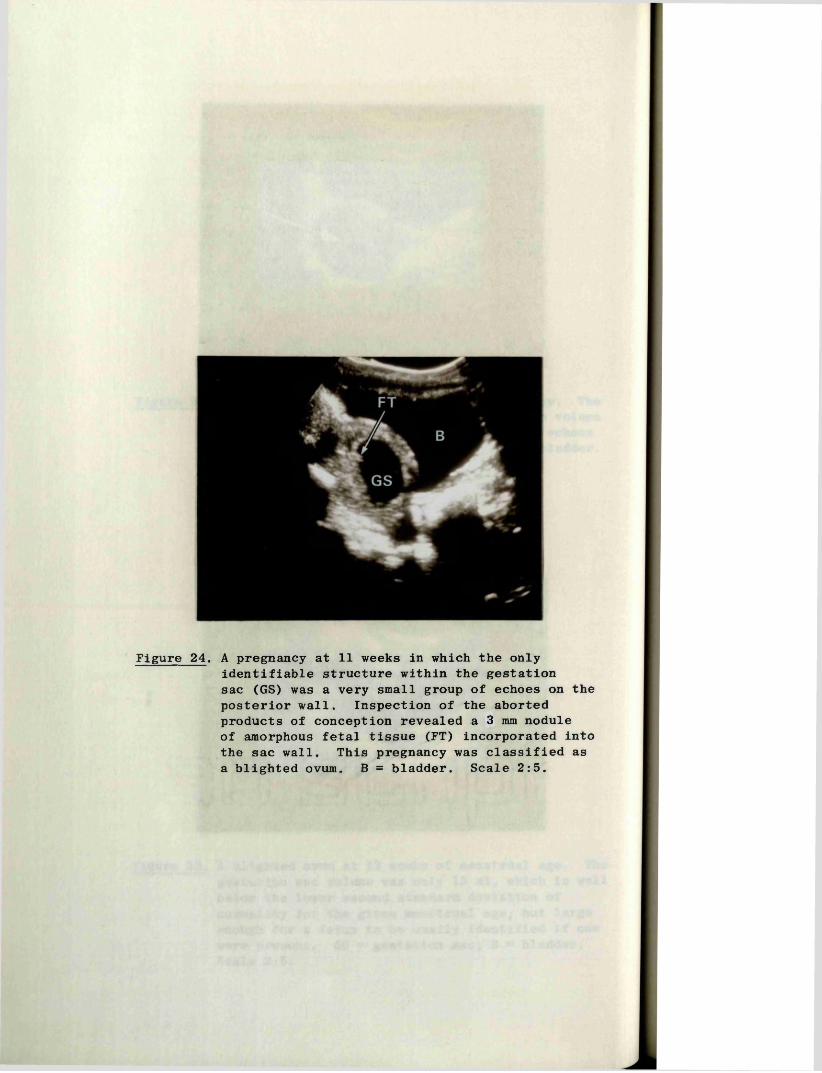
Figure 24. A pregnancy at 11 weeks in which the onlyidentifiable structure within the gestation sac (GS) was a very small group of echoes on the posterior wall. Inspection of the aborted products of conception revealed a 3 mm nodule of amorphous fetal tissue (FT) incorporated into the sac wall. This pregnancy was classified as a blighted ovum. B = bladder. Scale 2:5.
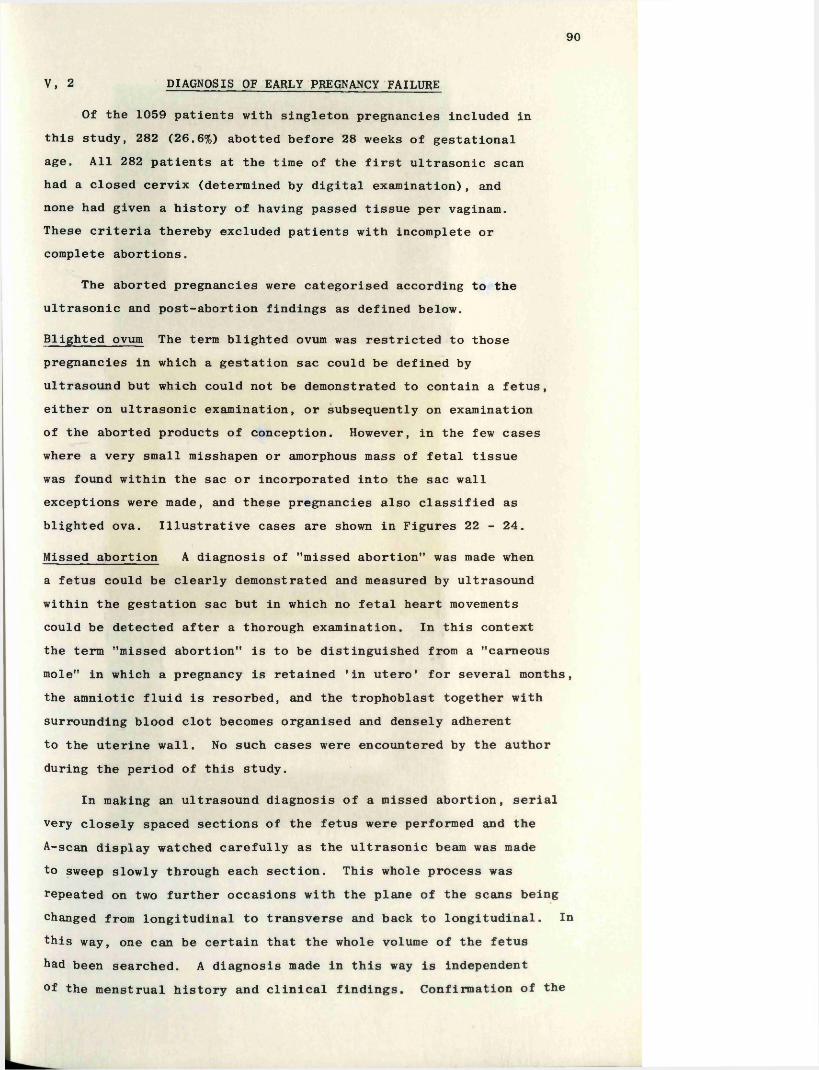
90
V, 2 DIAGNOSIS OF EARLY PREGNANCY FAILURE
Of the 1059 patients with singleton pregnancies included in this study, 282 (26.6%) abotted before 28 weeks of gestational age. All 282 patients at the time of the first ultrasonic scan had a closed cervix (determined by digital examination), and none had given a history of having passed tissue per vaginam.These criteria thereby excluded patients with incomplete or complete abortions.
The aborted pregnancies were categorised according to the ultrasonic and post-abortion findings as defined below.
Blighted ovum The term blighted ovum was restricted to those pregnancies in which a gestation sac could be defined by ultrasound but which could not be demonstrated to contain a fetus, either on ultrasonic examination, or subsequently on examination of the aborted products of conception. However, in the few cases where a very small misshapen or amorphous mass of fetal tissue was found within the sac or incorporated into the sac wall exceptions were made, and these pregnancies also classified as blighted ova. Illustrative cases are shown in Figures 22 - 24.
Missed abortion A diagnosis of "missed abortion" was made when a fetus could be clearly demonstrated and measured by ultrasound within the gestation sac but in which no fetal heart movements could be detected after a thorough examination. In this context the term "missed abortion" is to be distinguished from a "carneous mole" in which a pregnancy is retained 'in utero' for several months, the amniotic fluid is resorbed, and the trophoblast together with surrounding blood clot becomes organised and densely adherent to the uterine wall. No such cases were encountered by the author during the period of this study.
In making an ultrasound diagnosis of a missed abortion, serialvery closely spaced sections of the fetus were performed and theA-scan display watched carefully as the ultrasonic beam was made to sweep slowly through each section. This whole process was repeated on two further occasions with the plane of the scans being changed from longitudinal to transverse and back to longitudinal. Inthis way, one can be certain that the whole volume of the fetushad been searched. A diagnosis made in this way is independent °f the menstrual history and clinical findings. Confirmation of the
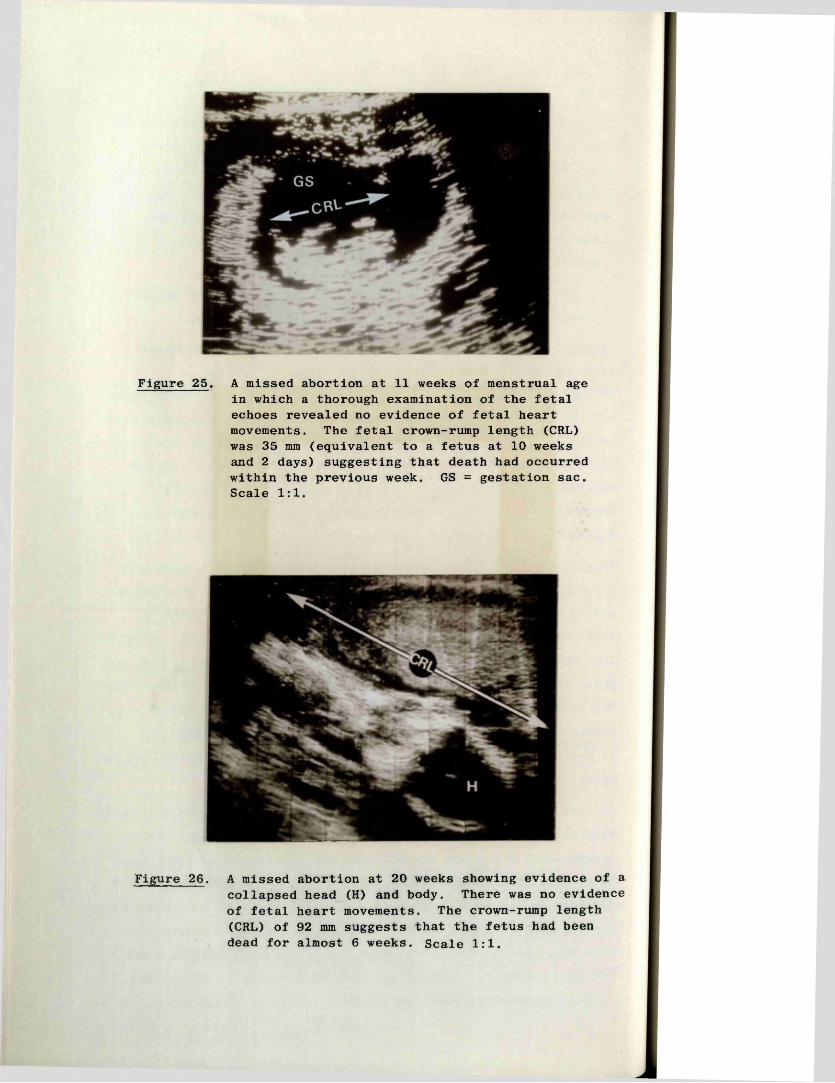
Figure 25. A missed abortion at 11 weeks of menstrual age in which a thorough examination of the fetal echoes revealed no evidence of fetal heart movements. The fetal crown-rump length (CRL) was 35 mm (equivalent to a fetus at 10 weeks and 2 days) suggesting that death had occurred within the previous week. GS = gestation sac. Scale 1:1.
Figure 26. A missed abortion at 20 weeks showing evidence of a collapsed head (H) and body. There was no evidence of fetal heart movements. The crown-rump length (CRL) of 92 mm suggests that the fetus had been dead for almost 6 weeks. Scale 1:1.
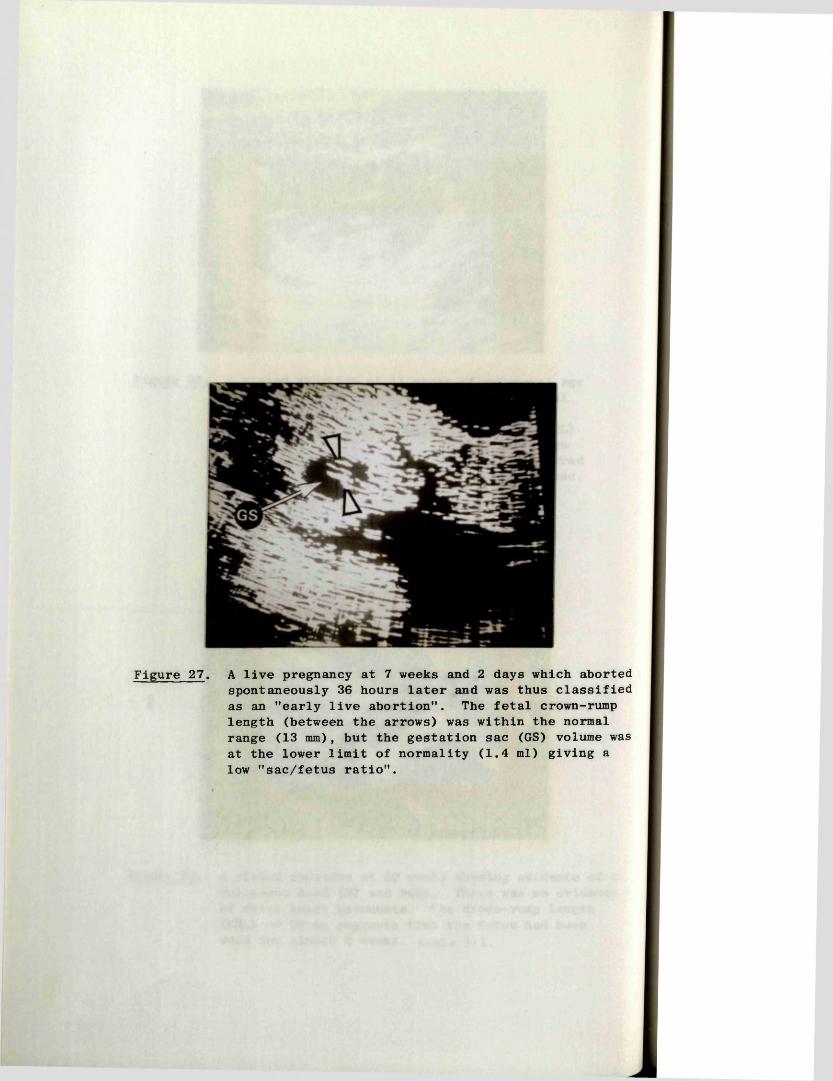
Figure 27. A live pregnancy at 7 weeks and 2 days which aborted spontaneously 36 hours later and was thus classified as an "early live abortion". The fetal crown-rump length (between the arrows) was within the normal range (13 mm), but the gestation sac (GS) volume was at the lower limit of normality (1.4 ml) giving a low "sac/fetus ratio".
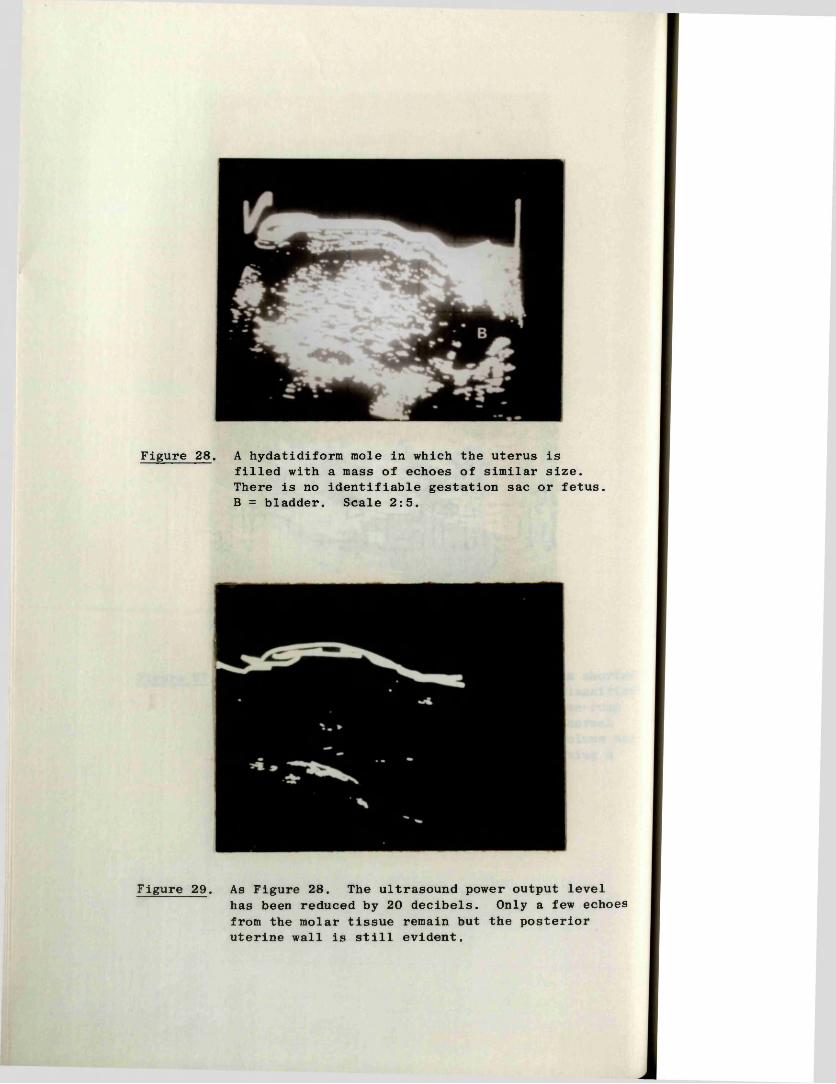
Figure 28. A hydatidiform mole in which the uterus isfilled with a mass of echoes of similar size. There is no identifiable gestation sac or fetus. B = bladder. Scale 2:5.
Figure 29. As Figure 28. The ultrasound power output levelhas been reduced by 20 decibels. Only a few echoes from the molar tissue remain but the posterior uterine wall is still evident.
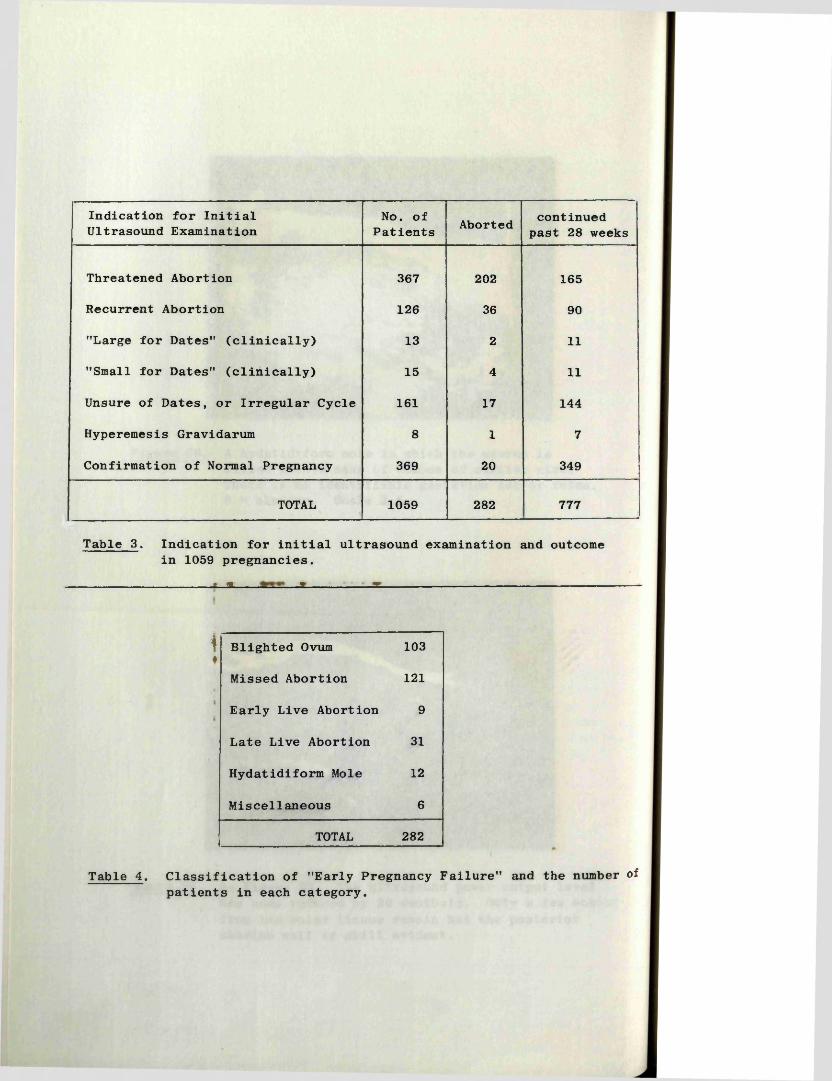
Indication for Initial Ultrasound Examination
No. of Patients Aborted continued
past 28 weeks
Threatened Abortion 367 202 165
Recurrent Abortion 126 36 90
"Large for Dates" (clinically) 13 2 11
"Small for Dates" (clinically) 15 4 11
Unsure of Dates, or Irregular Cycle 161 17 144
Hyperemesis Gravidarum 8 1 7
Confirmation of Normal Pregnancy 369 20 349
TOTAL 1059 282 777
Table 3. Indication for initial ultrasound examination and outcome in 1059 pregnancies.
-------------------------------------------------------t _ a _______ __________ * __________________ir. , -------------------------------------------------------------------------------------
\♦
Blighted Ovum 103
Missed Abortion 121
Early Live Abortion 9
Late Live Abortion 31
Hydatidiform Mole 12
Miscellaneous 6
TOTAL 282
Table 4. Classification of "Early Pregnancy Failure" and the number of patients in each category.
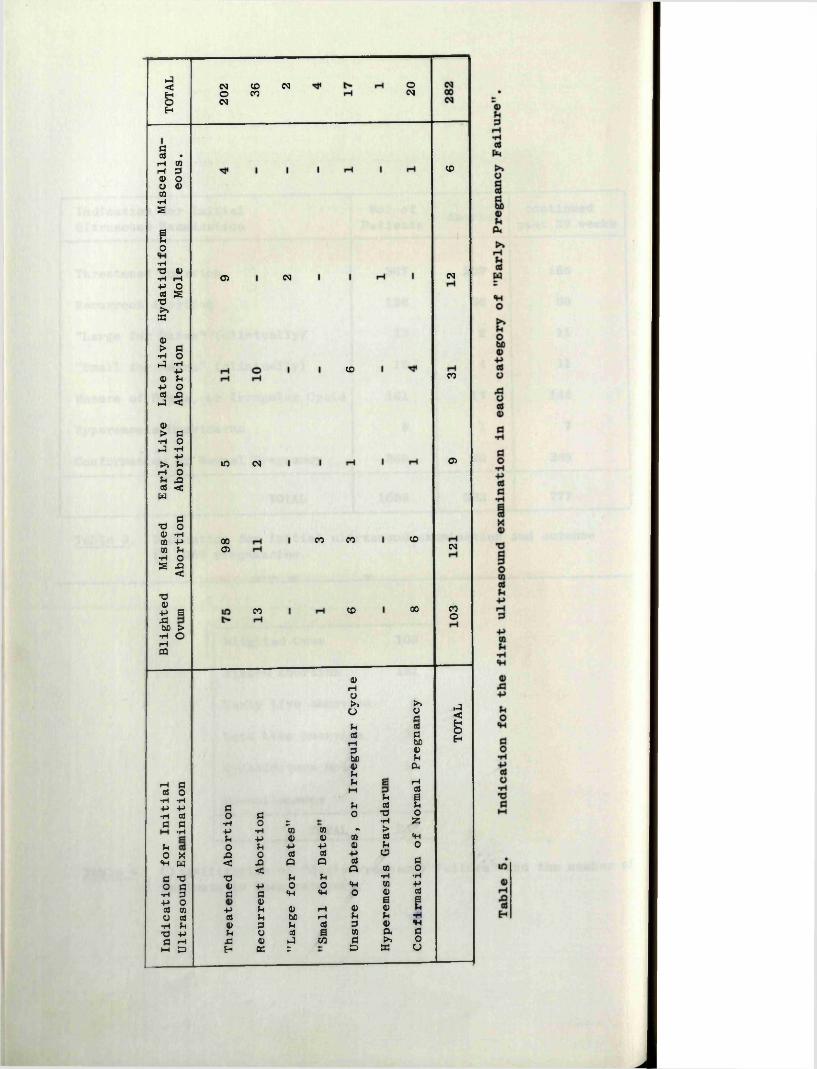
P5<gEh
dos •r—1 COi—1 305 OO 05CO•Hs
Bo
•HT3 <0•H rHP oOS sTS>»EC
45> d•H oJ •H
-p05 pP oCIS £}PI <0)> d•H oPI •H
P►> PrH oP .£2OS <W
aTS o45 •HCO Pn P•H O& X I<7345p sjd(50 >•H OrHPQ
CMOCMCOCO
<N O(M
05 <M
CO
in CM
0005
CO
CO
CO
CO
CO
00
CO
CM
CO
05
CM
COo
rH doS o•H •H-P P•H aJa d•Hpo X«H wc T3o d•H 3P oas COo as•H Pxs -Pa rHHH £3
do d
•H O 2-P •H (0P • P 05o P -P
X5 0 CIS< A Q
<T3 P1) p Od d «H
0)- p p a>d p (50<0 3 pp i aS
£3 4) P IEh EC S
(0rHO►» ►>
o orjp aSa$ d
rH (503 45(50 P4) P*PP jq rH
M aSp a
P aS po 73 0
•H 55*00 m >45 01 cd *H
- p <u P 0aS p a
Q ciS dQ CO o
P •H ■Ho «H CO p
«H O 4) as| I
rH 4) 45 PrH P P ■H08 3 4) Pa 00 a dCO d K 0
£3 sc u
.J<gEh

91
presence of a fetus by examination of the aborted products of conception was not considered essential in establishing the diagnosis as it was found that a small and very macerated fetus often disintegrated during the abortion process, especially when an elective evacuation of the uterus was performed. Illustrative cases are shown in Figures 25 and 26.
Live abortion An abortion was considered to be "live” if fetal heart movements had been clearly demonstrated by ultrasound within the few days prior to spontaneous abortion, and/or, if the fetus at the time of abortion showed no evidence of maceration and had a crown-rump length compatible with the period of amenorrhoea. Patients were designated as having had an early or late "live abortion" depending on whether abortion occurred before or after the twelfth week. An example of an early live abortion is shown in Figure 27.
Hydatidiform mole An ultrasound diagnosis of hydatidiform mole was made in those pregnancies where the uterus was seen to be filled with echoes of similar size and amplitude, and within which no gestation sac or fetus could be seen on a thorough examination.A further ultrasonic feature taken into consideration was the ease with which the intrauterine echoes disappeared with decrease in the transmitter power output as first described by MacVicar and Donald (1963). Echograms illustrating these features are shown in Figures 28 and 29.
Miscellaneous Patients in whom an ultrasonic diagnosis of a non-continuing pregnancy was made, but who were subsequently lost to follow-up, were classified as miscellaneous.
V, 2:1 Indication for initial examination and outcome
The indications for the initial ultrasound examination in all 1059 patients together with the outcome of the pregnancies (abortion or continued past 28 weeks gestation) is shown in Table 3. While many of the patients had two or more reasons for examination the one considered most important has been used for the purposes of this analysis, those at the top of the list taking precedence over the lower ones. In Table 4 the 282 pregnancies which aborted have been subdivided according to the categories outlines above, and in Table 5 they have been further analysed in relation to the indications for the first ultrasound examination.
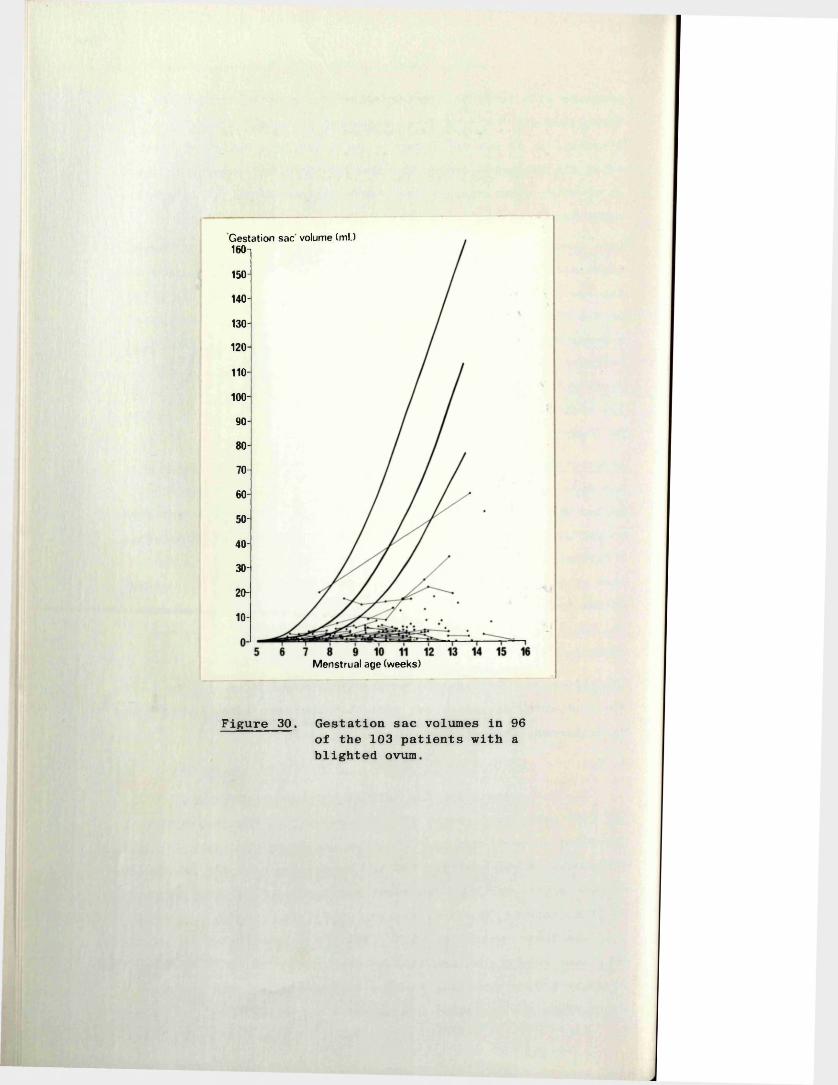
Gestation sac volume (ml.)160-i
150-
140-
130-
120
110-
100-
90-
80-
70-
60-
50-
40-
30-
20-
10-
Menstrual age (weeks)
Figure 30. Gestation sac volumes in 96 of the 103 patients with a blighted ovum.

92
V, 2:2 Blighted Ova
Of the three techniques described in this thesis (detection of fetal heart movements, and measurement of gestation sac volume and fetal crown-rump length - sections 1:1, 3:1 and 3:10 respectively of this Chapter) only measurements of the gestation sac volume (GSV) was directly applicable to the diagnosis of blighted ova, as the principal abnormality in these unsuccessful pregnancies was the absence of a fetus.
The GSV's (including serial measurements) of 96 of the 103 blighted ova are shown in Figure 30. The remaining seven patients with blighted ova were beyond 16 weeks of pregnancy and in each case the gestation sac had a volume of between 15 and 90 ml (i.e. well below the extrapolated lower 2SD line for normal GSV's). Examination of the data (see Figure 30) revealed that in all but 13 of the pregnancies the GSV's fell below the lower 2SD of normality at the time of the first examination. Of these 13 pregnancies, five were beyond seven weeks of amenorrhoea and in the normal course of events a fetus, and fetal heart movements, should have been identifiable without difficulty (section 1:2 of this Chapter). Therefore, absence of a fetus in these cases provided good circumstantial evidence that the pregnancies were non-cont inuing.
Comments 1) On the basis of the above (a "small for dates" gestation sac, and/or failure to find a fetus after seven weeks of amenorrhoea), a diagnosis of blighted ovum was possible at the first examination in all but a very few (8 cases) of this type of early pregnancy failure.
2) In this investigation, however, there were many patients with "uncertain" dates, or irregular cycles etc., and as a result the criterion of "small for dates" could not be used in making a definitive diagnosis in such patients. Furthermore, there were four patients in the series with purportedly "certain dates", whose gestation sacs at the first examination, were found to be considerably smaller than would have been expected on the basis of the given menstrual history. These patients were later shown to have normal, but less advanced, pregnancies.
In view of these observations it was considered to be of the utmost importance to devise ultrasonic criteria which wouldeliminate the possibility of the gestation sac being small simply

93
because of mistaken dates, and the fetus being absent simply because it is too small to be seen. To achieve this objective it became clear that the clinical and menstrual history should beignored and the state of the pregnancy assessed on the ultrasonicfindings alone.
The first step in evolving criteria of abnormality was to define normality in purely ultrasonic terms. On an initial analysis of 249 pregnancies which progressed beyond 28 weeks it was found that the fetus and fetal heart movements had been detected in all those in which the gestation sac had a volume of 2.0 ml or more. (In this group there were a total of 63 pregnancies with GSV's of between 2 and 5 ml.). However, on reviewing an additional 50 patients with continuing pregnancies between 5 and 8 weeks of menstrual age, it was noted that thefetus was not located in two with GSV's of 2.2 and 2.5 mis.respectively. In addition to the above, it was also found that all pregnancies with a GSV of less than 5 ml. increased in volume over a period of one week by more than 100 per cent.
Failure to meet these criteria could now be considered as objective evidence of abnormality, evidence which was independent of any clinical or menstrual history. However, before applying this scheme prospectively a further allowance of 0.5 ml. and 25 per cent respectively was made to obviate the possibility of underestimating the sac volume in a normal pregnancy through an error in the measurement technique. (This was assessed as - 10 per cent; see section 3:11 of this Chapter). In ultrasonic terms, a blighted ovum was therefore defined as a pregnancy which had a GSV of 3.0 ml. or over at any single examination but in which no fetus could be identified, or, if the sac was less than 3.0 ml. in volume, one which failed to increase in size by at least 75 per cent over a period of one week.
Applying these strict criteria to the 103 blighted ova in this series it was found that a definitive diagnosis could be made at the first ultrasonic examination in 49 (47.5 per cent). Of the 54 remaining patients, 31 had spontaneous or therapeutic abortions during the following seven days, and 23 re-examined one week later. At this second examination a definitive diagnosis was made in 15, with five requiring a third examination. The last three Patients had their pregnancies terminated after the second

94
examination on the basis of the probable ultrasonic diagnosis, together with supportive clinical evidence of a non-continuing pregnancy.
On only one occasion was a firm diagnosis of a blighted ovum made in a pregnancy which was subsequently shown to be normal. This patient who was examined early in the series, had an apparently empty gestation sac with a volume of 2.5 ml. Fortunately the pregnancy was allowed to continue and a subsequent scan revealed the presence of a living fetus. In the light of this experience the cut-off point for the diagnosis of a blighted ovum was raised from 2.5 to 3 ml. approximately halfway through the present series.
Of the 103 patients with blighted ova, 43 aborted spontaneously and 60 had their pregnancies terminated electively. In no case did a careful macroscopic or microscopic examination of the aborted products of conception reveal the presence of a formed fetus.In six instances an amorphorous nodule of fetal tissue of less than 3 mm. in size was found close to or incorporated into the sac wall (Figure 24).
There were 28 patients with no antecedent history of vaginal bleeding in whom a diagnosis of blighted ovum was made at either the first or second examination. Eighteen of these patients subsequently had elective terminations of their "pregnancies" performed within a few days of diagnosis, solely on the basis of the ultrasound findings. A further three pregnancies, found incidentally at a routine scan to be blighted ova, were allowed to continue for a further few weeks until symptoms of threatened abortion ensued, at which time an evacuation of the uterus was performed. Earlier surgery in these patients had been deferred because the finding of a long tightly closed cervix suggested that trauma during dilatation would be a distinct possibility. The remaining seven patients aborted spontaneously.
Associated Findings The products of conception from the spontaneous abortions, were, almost without exception, obviously necrotic.In comparison the majority of those from the elective terminations were at least partly "fresh".

95
V, 2:3 Missed Abortions
A positive diagnosis of missed abortion was made in all 121 patients in this series, at either the first examination (102 patients) or, at the first examination after fetal death had occurred (19 patients). On no occasion was there any evidence to believe that either false positive or false negative diagnoses had been made.
Outcome of the Pregnancies
Early in the series the credibility of the diagnoses was established by allowing pregnancies to continue without medical intervention until spontaneous abortion occurred (15 patients) , or, were terminated only after several confirmatory examinations at weekly intervals (23 patients). While 10 of the patients in the former group aborted within one week, spontaneous abortion did not take place until at least two weeks after the ultrasound diagnosis in the remaining five. One of these patients aborted six weeks later. Two of this group of 10 patients were readmitted via the "Flying Squad" having been allowed home to await spontaneous abortion. In each case the patient had bled suddenly and profusely during the abortion process, and both ultimately required blood transfusion and emergency evacuation of the uterus to combat shock and to control the bleeding.
Following this initial experience, most patients were offered an elective evacuation of the uterus whenever the diagnosis was made. In all, 89 such procedures were performed and in only two was a blood transfusion required because of excessive blood loss.
Of the 121 patients with "missed abortion", 23 gave no prior history of vaginal bleeding, including six who had been referred solely for the purpose of accumulating data for the crown-rump length (CRL) measurement series. All but three of these pregnancies were terminated electively. In two patients, elective termination of the missed abortion was deferred because of the finding of a long closed cervix. The procedures were eventually performed two and four weeks later respectively, when slight vaginal bleeding ensued and the cervix found to be more favourable.
Ultrasonic Findings Prior to Fetal Death
There were 19 patients who had had fetal heart movements
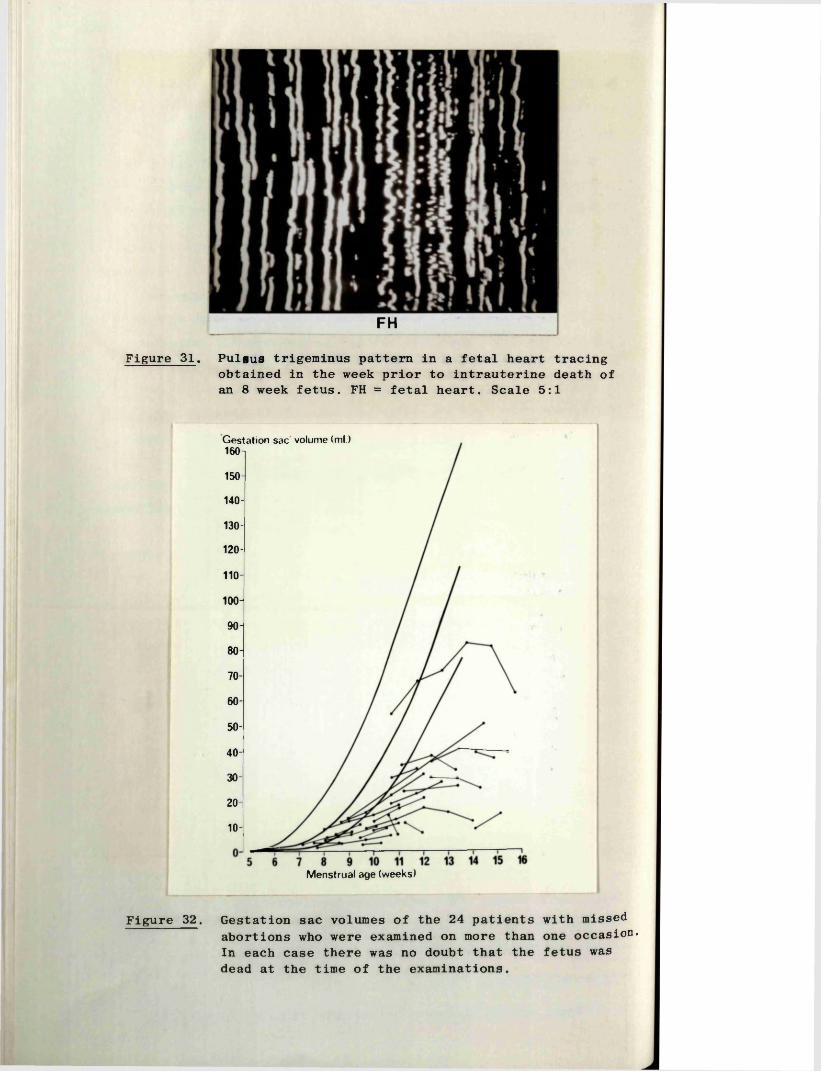
FHFigure 31. Pulius trigeminus pattern in a fetal heart tracing
obtained in the week prior to intrauterine death of an 8 week fetus. FH = fetal heart. Scale 5:1
Gestation sac volume (ml.) 160 ~|
150-
140-
130-
120-
110-
100-
90-
80-
70-60-
50-
40-
30-
20-
10-
Menstrual age (weeks)
Figure 32. Gestation sac volumes of the 24 patients with missed abortions who were examined on more than one occasion* In each case there was no doubt that the fetus was dead at the time of the examinations.

96
clearly demonstrated on at least one occasion earlier in the pregnancy, but who were subsequently shown to have a missed abortion. The interval between the last "normal" examination and the one in which the fetus was found to be dead, ranged from 4 days to 8 weeks. On reviewing the fetal heart rates in these pregnancies no significant deviation from the normal range was demonstrated at any gestational age although there was a tendency for the heart rates to lie above the mean values. The heart rate of one fetus was noted to be irregular, having a "pulsus trigeminus" pattern (Figure 31). Examination the following week revealed that the fetus had died. However, as this was the only arrhythmia found in the total series, its significance is uncertain.
Analysis of the fetal CRL's and GSV’s in these cases also showed no significant deviation from normality, and in particular seven fetuses who died between successive weekly scans had normal CRL’s and sac volumes at the time when the fetus was last confirmed to be alive.
Associated Findings
(a) Of the 89 patients who had an elective evacuation performed, a macerated fetus was positively identified in all but 17. Itis probable that the fetus had been broken up beyond recognition by the instrumentation at the time of the uterine evacuation in these cases. It is of further note that when the author performed the procedure (48 cases), i.e., when particular care was taken to identify the fetus, fetal material was found in the products of conception in all but three. In only four of the 32 patients who aborted spontaneously was a fetus not seen in the products of conception.
(b) While the fetus was invariably found to be in an advancedstate of maceration it was frequently noted that areas of thetrophoblast were macroscopically fresh, thereby accounting for the common finding of a positive urine pregnancy test despite the fetus being unequivocably dead. At the time of ultrasonic diagnosis, 78 of the 97 pregnancy tests performed were recorded as beingpositive. However, by the time spontaneous abortion ensuedall but six of 32 tests performed had become negative.
(c) That the trophoblast continued to function after fetal death is further demonstrated in Figure 32 which shows the GSV's of
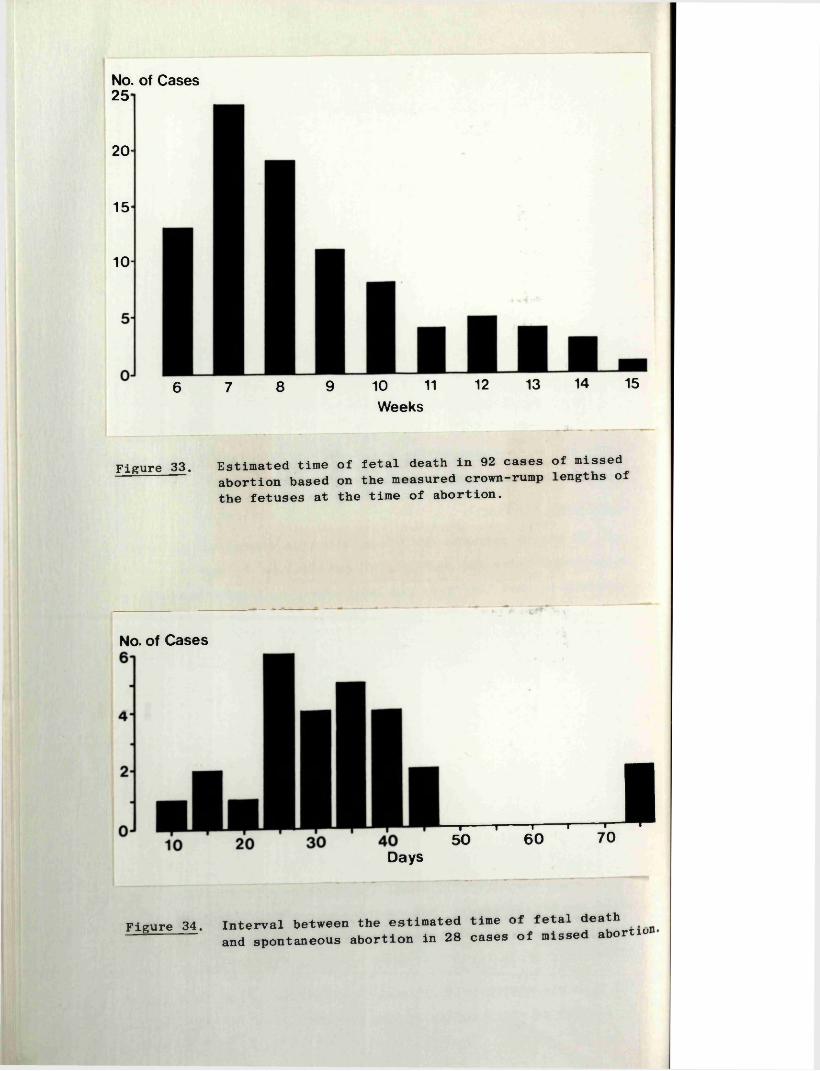
No. of Cases 25 -
20
15*
10-
6 7 8 9 10 11 12 13 14 15Weeks
Figure 33. Estimated time of fetal death in 92 cases of missed^— abortion based on the measured crown-rump lengths of
the fetuses at the time of abortion.
No. of Cases
— *---------- 1 1 1 150 60 70I
Days
Figure 34. Interval between the estimated time of fetal death------ and spontaneous abortion in 28 cases of missed abortio
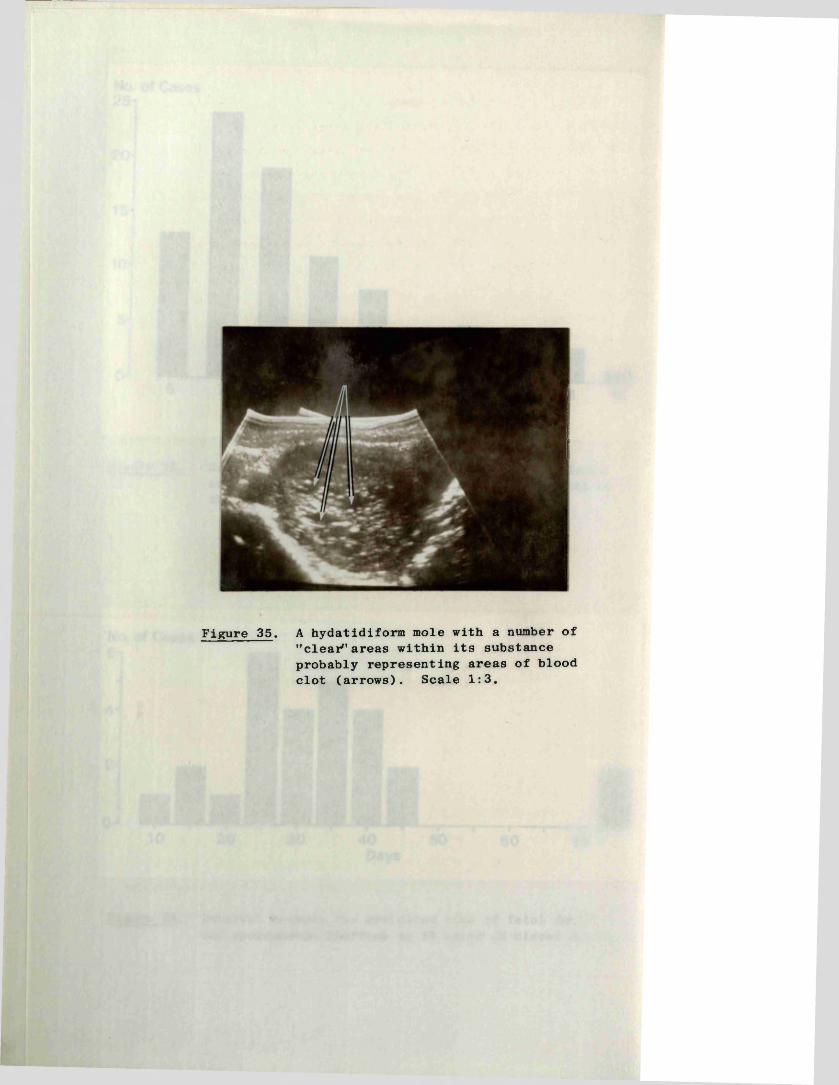
Figure 35. A hydatidiform mole with a number of "clear''areas within its substance probably representing areas of blood clot (arrows). Scale 1:3.

97
24 patients in whom measurements had been made on more than one occasion. In all but five of these pregnancies the gestation sac continued to increase in volume, albeit at a slower than normal rate, and in several instances spontaneous abortion was preceded by a reduction in sac volume. This latter observation may well be the result of complete trophoblastic death, for in the four cases observed the reduction in volume coincided with the urine pregnancy tests changing from positive to negative.
(d) If it is assumed, as the evidence suggests, that there is no significant slowing of fetal growth prior to its demise, then the fetal CRL could be used to estimate the gestational age at which it died. In this way the mean time of estimated fetal death was found to be just over eight weeks (8 weeks and 4 days), with 67 of the 92 fetuses (73 per cent) dying between six and nine weeks of menstrual age (Figure 33). (A measurable fetus was present in the products of conception in only 92 of the 100 cases in which fetal material was identified.) All but one fetus has a CRL compatible with an age of 14 weeks or less, the exception being estimated to have died at around 15 weeks. In the group of 28 patients who aborted spontaneously, and in whom a measurable fetus was found, the mean interval between the estimated time of fetal death and the eventual abortion was 32 days, with a range of 10 to 73 days (Figure 34).
Finally, perusal of the available clinical data pertaining to the estimated time of fetal death revealed that in very few cases (4 patients) was there a history of vaginal bleeding, or of other significant symptoms, within a period of one week before or after the time of death.
V, 2:4 Hydatidiform Moles
An immediate diagnosis was made at the first examination in all 12 patients in this group, although in three an alternative diagnosis of a long-standing missed abortion with resorption of the liquor could not be excluded on the ultrasonic evidence alone. The ultrasonic findings in these latter patients were atypical in that there were clear areas within the uterus, which in retospect was probably attributable to blood clot, both patients having had considerable vaginal bleeding (Figure 35). On no occasion however, was there any doubt that the pregnancy was a
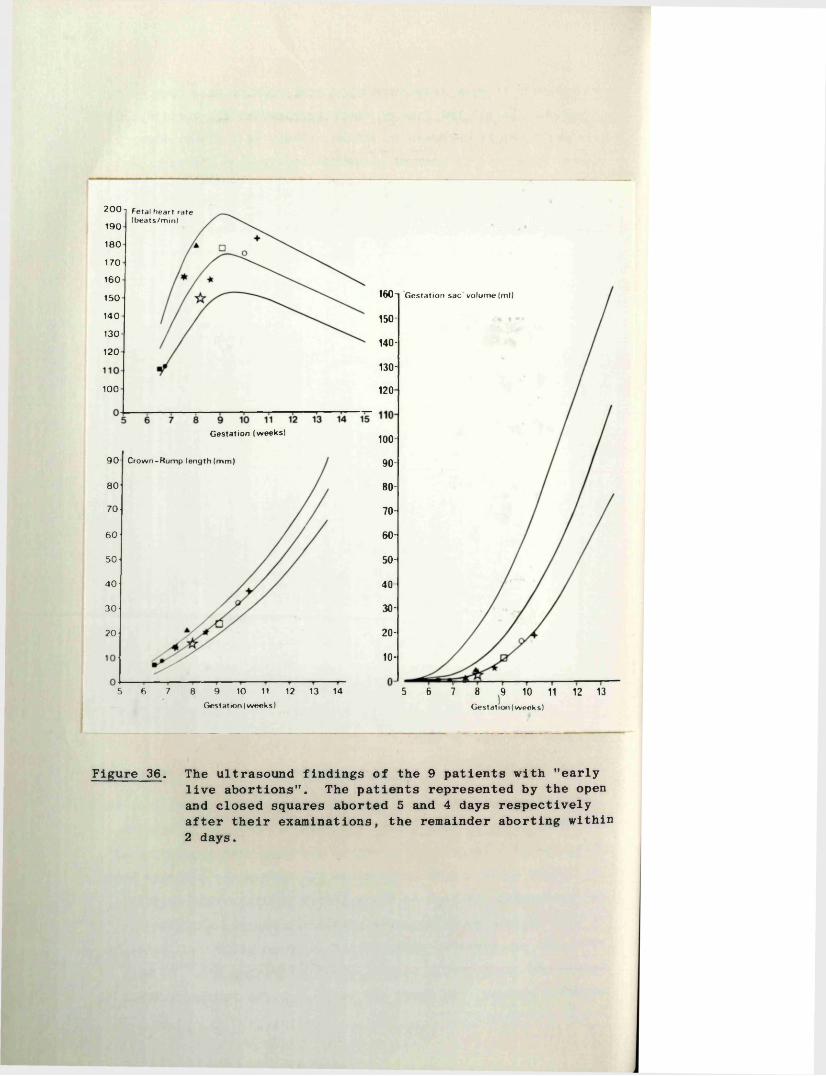
2 0 0 i Fetal heart rate (beats/m in)
1 9 0
1 8 0
1 7 0
1 6 0
160-t G estation sac volume (ml)15 0
1 4 0 150-130
140-120
130-
100 120
G estation (w eeks)100-
9 0 - C row n-R um p length (m m ) 90-
8 0 80-
7 0 70-
60-6 0
50-5 0
4 0 40-
30-3 0
20-20
10-
5 6 7 8 9̂ 10 11 12 13Gestation (w eeks)
5 6 8 9 10 11 12 13 14
Gest at ion (w eek s)
7
Figure 36. The ultrasound findings of the 9 patients with "early live abortions". The patients represented by the open and closed squares aborted 5 and 4 days respectively after their examinations, the remainder aborting within 2 days.
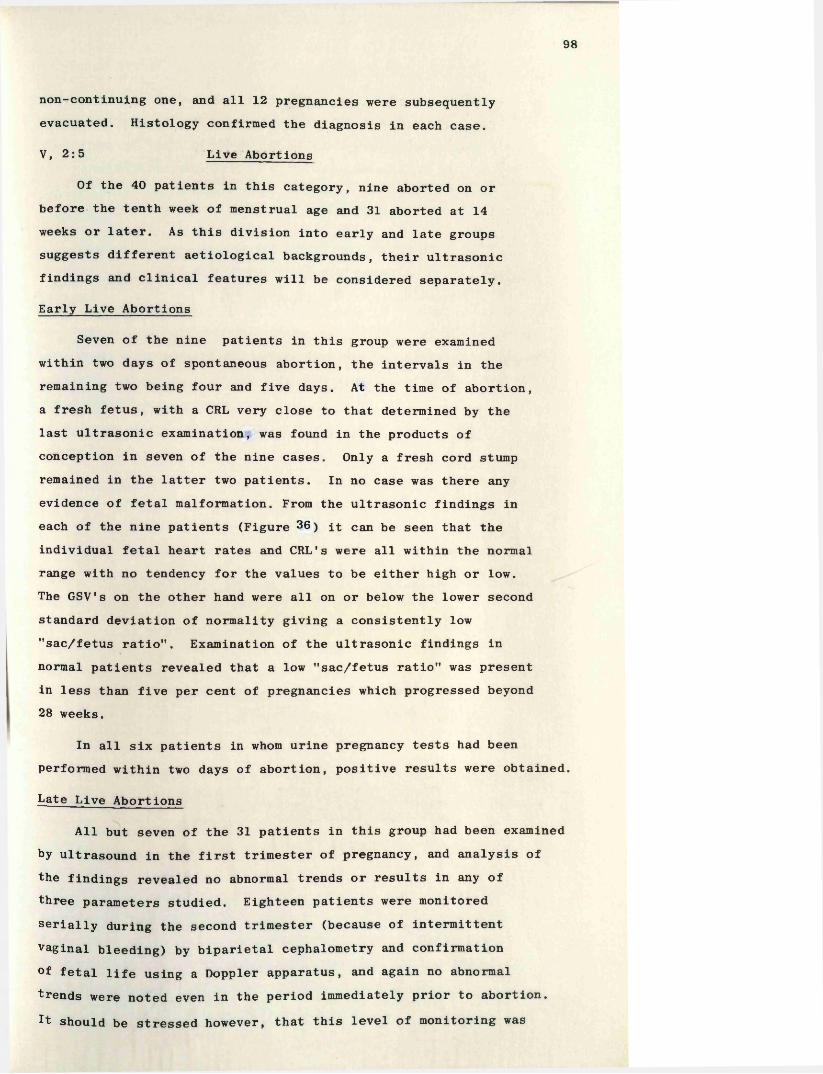
98
non-continuing one, and all 12 pregnancies were subsequently evacuated. Histology confirmed the diagnosis in each case.
V, 2:5 Live Abortions
Of the 40 patients in this category, nine aborted on or before the tenth week of menstrual age and 31 aborted at 14 weeks or later. As this division into early and late groups suggests different aetiological backgrounds, their ultrasonic findings and clinical features will be considered separately.
Early Live Abortions
Seven of the nine patients in this group were examined within two days of spontaneous abortion, the intervals in the remaining two being four and five days. At the time of abortion, a fresh fetus, with a CRL very close to that determined by the last ultrasonic examination, was found in the products of conception in seven of the nine cases. Only a fresh cord stump remained in the latter two patients. In no case was there any evidence of fetal malformation. From the ultrasonic findings in each of the nine patients (Figure 36) it can be seen that the individual fetal heart rates and CRL's were all within the normal range with no tendency for the values to be either high or low.The GSV's on the other hand were all on or below the lower second standard deviation of normality giving a consistently low Msac/fetus ratio”. Examination of the ultrasonic findings in normal patients revealed that a low ”sac/fetus ratio" was present in less than five per cent of pregnancies which progressed beyond 28 weeks.
In all six patients in whom urine pregnancy tests had been performed within two days of abortion, positive results were obtained.
Late Live Abortions
All but seven of the 31 patients in this group had been examined by ultrasound in the first trimester of pregnancy, and analysis of the findings revealed no abnormal trends or results in any of three parameters studied. Eighteen patients were monitored serially during the second trimester (because of intermittent vaginal bleeding) by biparietal cephalometry and confirmation °f fetal life using a Doppler apparatus, and again no abnormal trends were noted even in the period immediately prior to abortion.It should be stressed however, that this level of monitoring was
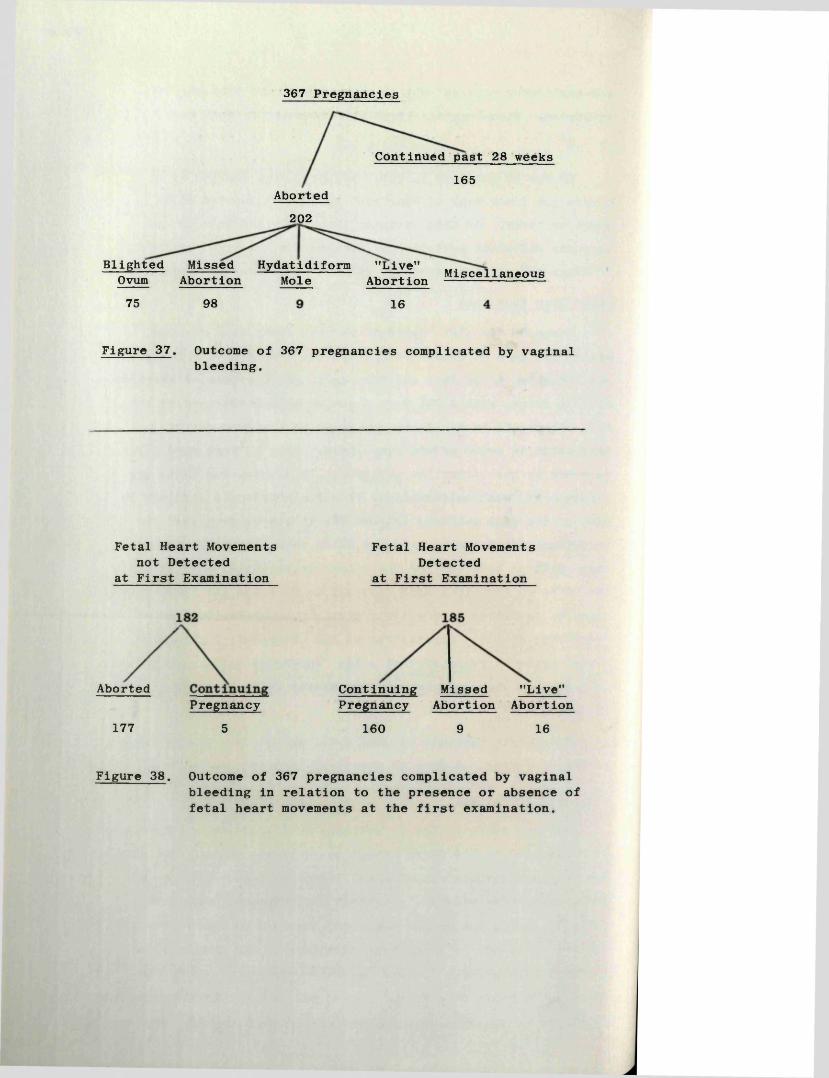
367 Pregnancies
Continued past 28 weeks165
Aborted202
Blighted Missed Hydatidiform "Live*'Ovum75
Abortion98
Mole Abortion16
Miscellaneous
Figure 37. Outcome of 367 pregnancies complicated by vaginal bleeding.
Fetal Heart Movements not Detected
at First Examination
Fetal Heart Movements Detected
at First Examination
AbortedPregnancy
177 5 160 9 16
Continuing Missed "Live" Pregnancy Abortion Abortion
Figure 38. Outcome of 367 pregnancies complicated by vaginal bleeding in relation to the presence or absence of fetal heart movements at the first examination.
99
not as intensive or detailed as that employed in the first trimester. In all cases the fetus showed no evidence of maceration at the time of abortion and its size was compatible with the given menstrual age, or the gestational age as determined by an earlier CRL measurement (see section 3:7 of this chapter).
Of the 31 patients, 22 had histories, and/or clinical features which were suggestive of an incompetent cervix.
V, 2:6 Miscellaneous
The six patients in this group were either lost to follow-up, or aborted at home and were not admitted to hospital. In five a provisional diagnosis of a blighted ovum had been made, and in one a missed abortion.
V, 2:7 Threatened Abortion
Of 367 patients referred for ultrasonic examination because of a threatened abortion, 202 (55%) aborted subsequently (Figure 37). In 129 (64%) of these pregnancies a definite diagnosis was made at the first examination (89 of the 98 missed abortions, all hydatidiform moles, 30 of the 75 blighted ova, and one case in the miscellaneous group). Furthermore, a provisional diagnosis was forwarded in all but three of the remaining cases in the blighted ovum and miscellaneous groups. These additional 45 patients gave an overall total of 86 per cent in whom the diagnosis was either certain or suspected at the time of the first examination. Twenty five patients were found initially to have living pregnancies of whom 16 subsequently had "live abortions", and nine went on to become missed abortions.
Of the 367 patients, fetal heart movements were detected at the first examination in 185 (50.4%). The outcome analysed according to this criterion is shown in Figure 38. The five patients whose pregnancies continued, despite absence of fetal heart movements at the first examination, were all at less than six and a half weeks of gestational age. As their sac volumes were well within the normal range for their ages, it was felt that the pregnancies were probably continuing. Nine pregnancies in which fetal heart movements were detected, died subsequently,&nd the diagnosis confirmed at a later examination.
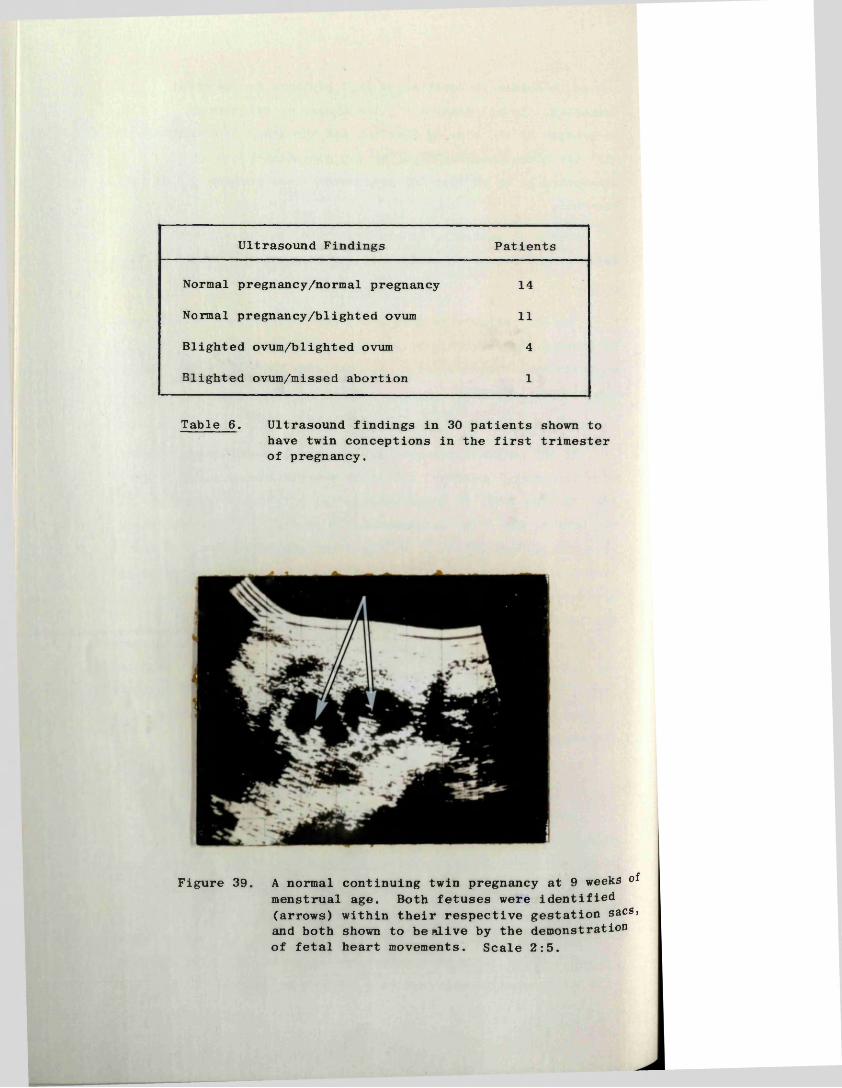
Ultrasound Findings Patients
Normal pregnancy/normal pregnancy 14
Normal pregnancy/blighted ovum 11
Blighted ovum/blighted ovum 4
Blighted ovum/missed abortion 1
Table 6. Ultrasound findings in 30 patients shown to have twin conceptions in the first trimester of pregnancy.
Figure 39. A normal continuing twin pregnancy at 9 weeks of menstrual age. Both fetuses were identified (arrows) within their respective gestation sacs, and both shown to be alive by the demonstrationof fetal heart movements. Scale 2:5.
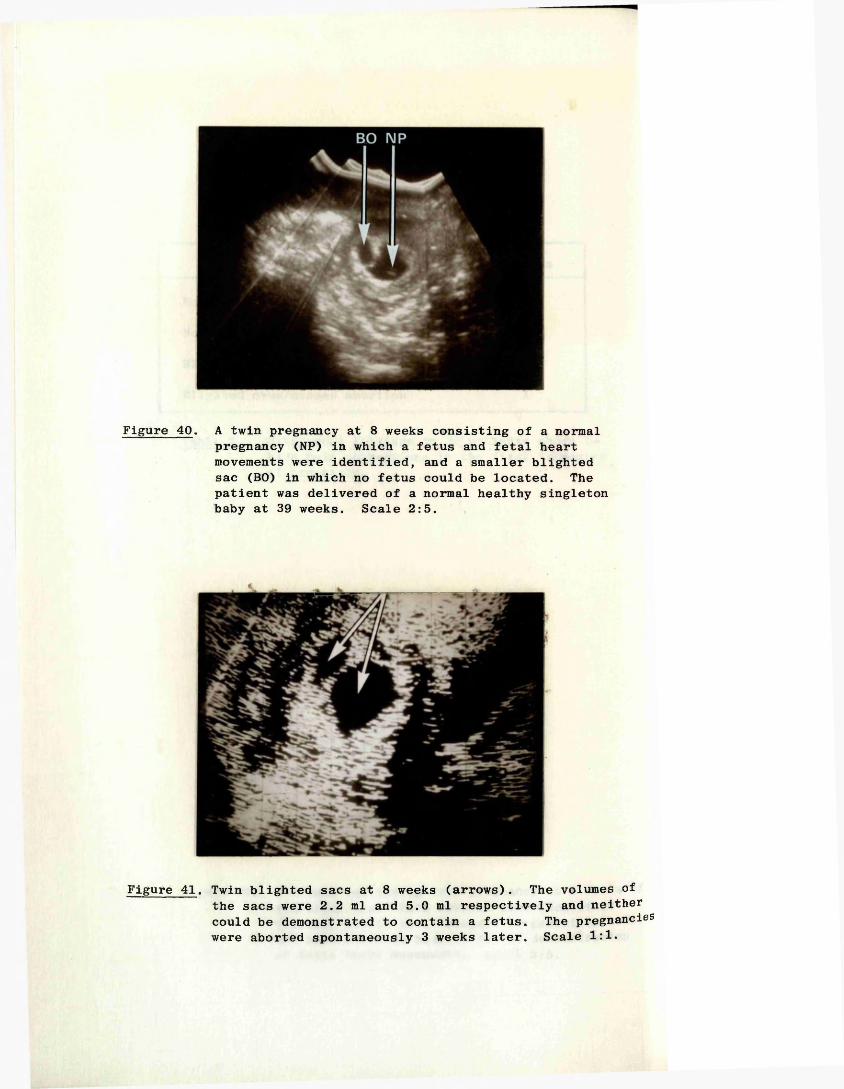
Figure 40. A twin pregnancy at 8 weeks consisting of a normal pregnancy (NP) in which a fetus and fetal heart movements were identified, and a smaller blighted sac (BO) in which no fetus could be located. The patient was delivered of a normal healthy singleton baby at 39 weeks. Scale 2:5.
Figure 41. Twin blighted sacs at 8 weeks (arrows). The volumes of the sacs were 2.2 ml and 5.0 ml respectively and neither could be demonstrated to contain a fetus. The pregnancies were aborted spontaneously 3 weeks later. Scale 1:1.
100
V, 2:8 Early Pregnancy Failure in Twin Conceptions
The results obtained in this group of patients were published by the author in collaboration with Dr. Judy S. Caines (1977) in the British Journal of Obstetrics and Gynaecology. (Reprint enclosed.)
In the years 1972 to 1975 in the Queen Mother’s Hospital, there were approximately 10,000 delivieries, including 109 sets of twins (1:91). During the same period an ultrasound diagnosis of a twin ’’conception" was made in the first trimester in 30 patients, and the findings in this group are shown in Table 6.The 14 patients in whom ultrasound demonstrated twin normal pregnancies were all delivered of two normal babies (Figure 39). Ten of the 11 patients in the second group (one normal pregnancy plus a blighted ovum) gave birth to singelton infants (the eleventh had a singleton late live abortion at 25 weeks)(Figure 40) .The remaining five patients all aborted (Figure 41) .Jive of the patients with twin viable pregnancies, together with the patient whose pregnancy culminated in a late live abortion had conceived following the use of ovarian stimulants.
(These cases are described in more detail in the enclosed reprint of the paper, to which reference was made at the beginning of this sub-section.)
In those patients with one normal pregnancy together with a blighted ovum, the abnormal sac was consistently the smaller of the two, and in nine its volume never exceeded that of a normal seven week pregnancy (2.5 ml.). In all of these cases it had disappeared before the end of the first trimester. The second sac in five patients was not identified until several weeks after the normal pregnancy had been recognised, probably as a result of the slower growth rate of blighted ova already described for singleton pregnancies. In two patients the sac volumes reached 10 ml., and in one, was "visible" until the early part of the second trimester.
The serial fetal heart rates, and the growth rates of the fetal CRL’s and GSV's during the first trimester, in the 10 patients delivered of a singleton infant, were all within normal limits. Nine of these patients experienced some vaginal bleeding in the first trimester, in contrast to only five of the 14 patients who had viable twins.

101
V, 3 ESTIMATION of ge stational age
V, 3:1 Description of Crown-Rump Length Measurement Technique
A description of this technique and some preliminary results were first reported by the author in the British Medical Journal (1973). (Reprint enclosed.)
The basic steps of the technique entail the determination of the "lie" or spatial orientation of the fetus within the gestation sac, and the performance of a series of scans along its long axis until the longest length of fetal echoes is located.
A preliminary scan of the pregnancy is first performed as described in Chapter IV, 2:3, and the presence of a fetus confirmed At this point the oscilloscope scale factor is switched to the 5:5 magnification. The scanning frame is then moved laterally to one side of the gestation sac and a series of more closely spaced longitudinal section scans performed across the sac and fetus. During the course of these scans it is possible to build up a three-dimensional impression of the approximate orientation of the fetus within the gestation sac. This is achieved by integrating mentally the distances between successive sections and the dimensions of the fetal echo complexes produced in each section. For example, when the lie of the fetus is a transverse one, the shape of each group of fetal echoes is usually circular and each is of a similar size. Furthermore the distance between the two sections which show the extreme ends of the fetus is proportionately very much greater. Conversely, serial longitudinal scans of a fetus whose lie is longitudinal, show a length of fetal echoes which is initially small, becomes very much bigger and more elongated, and then decreases in size, all over a relatively short distance between the first to the last section scan. These features are reversed when the scanning frame is turned through 90° and the examination performed by serial transverse scans. In practice these steps are usually incorporated into the initial preliminary scan of the pregnancy and can be performed very rapidly.
Having determined the approximate lie of the fetus within the gestation sac, the next stop is to identify its orientation with greater certainty. Those fetuses which are thought to lie
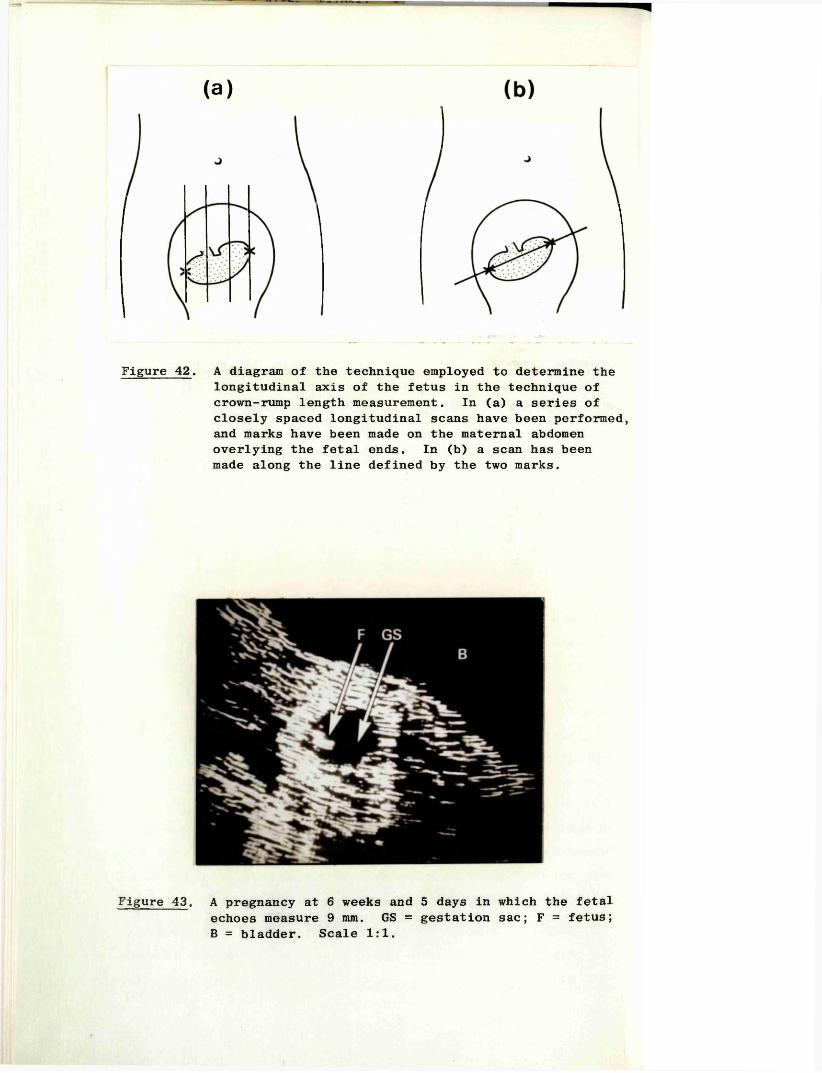
(a)
Figure 42. A diagram of the technique employed to determine the longitudinal axis of the fetus in the technique of crown-rump length measurement. In (a) a series of closely spaced longitudinal scans have been performed, and marks have been made on the maternal abdomen overlying the fetal ends. In (b) a scan has been made along the line defined by the two marks.
Figure 43. A pregnancy at 6 weeks and 5 days in which the fetal echoes measure 9 mm. GS = gestation sac; F = fetus; B = bladder. Scale 1:1.

102
transversely are re-examined by means of further longitudinal section scans, during the course of which each end of the fetus is located accurately and marks made with a Chinagraph pencil on the patient's abdominal wall at points overlying the fetal ends as shown diagrammatically in Figure 42(a). It is then a simple matter to rotate the scanning gantry to a position such that the line of scan will pass through both of these points and will therefore be aligned along the long axis of the fetus (Figure 42(b) ). Next, a series of very closely spaced parallel scans are performed until the section showing the longest length of fetal echoes is located. This is taken to be the crown-rump length (CRL) of the fetus.
If the orientation of the fetus is closer to a longitudinal than a transverse lie, the procedure is reversed; the ends of the fetus are identified during a series of transverse scans, and the fetal CRL is then identified on an appropriate longitudinal scan.
A vertical component to the lie of the fetus is unimportant, and it complicates neither the alignment of the scanning frame nor the scanning of the long axis of the fetus provided both fetal poles have been clearly defined.
In the early stages from 6^ to weeks, when the fetus is still very small, its length (6 to 15 mm) is not much greater than its breadth. In view of this the CRL is simply taken to be the larger of the two maximum measurements obtained on longitudinal and transverse scans (Figure 43). An additional reason for this alteration in the usual procedure is that the standard technique for defining the fetal ends and for marking their position on the maternal abdomen cannot be applied due to the relative size of the transducer face.
As a general rule measurements are only taken from pictures which have been obtained using a standardised scanning technique, that is, one in which a single or, at the most, two arc scans of the fetus have been required to cover its entire length. In addition the beam intensity of the oscilloscope screen and the machine sensitivity levels are set as high as possible commensurate with a minimum of artefactual lines or echoes within the sac. Optimally, this should result in a clearly defined gestation sac
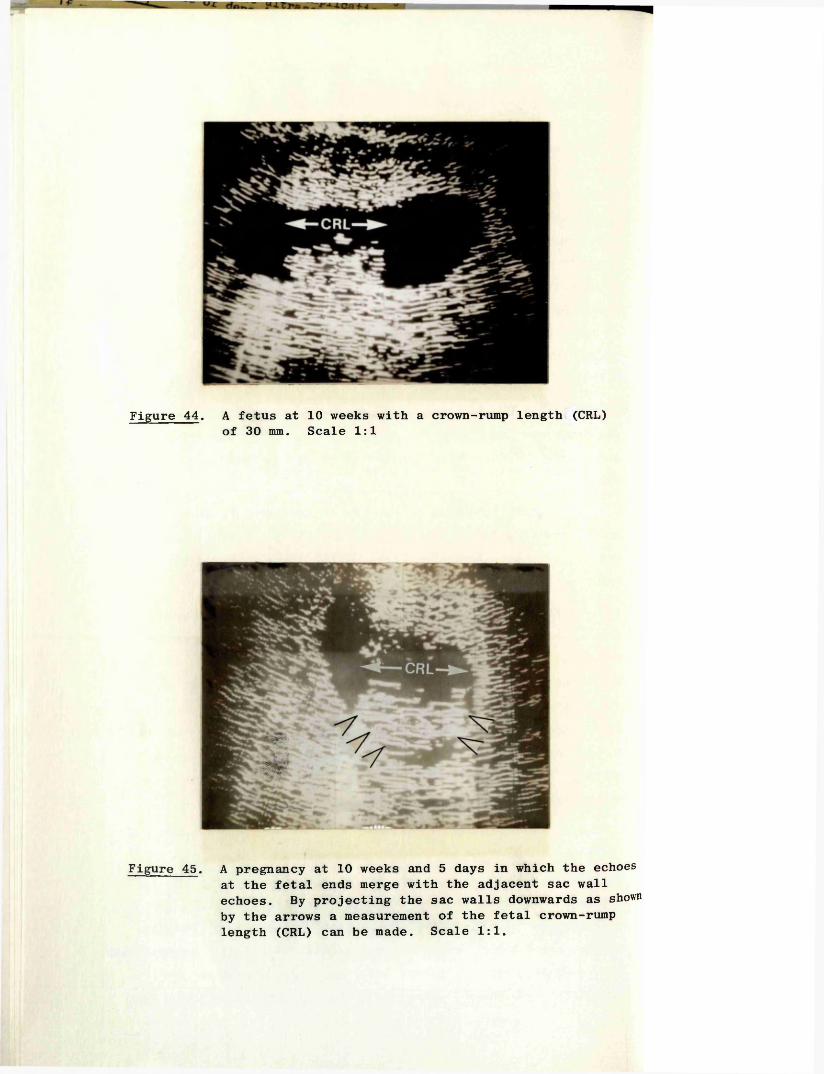
Figure 44. A fetus at 10 weeks with a crown-rump length (CRL) of 30 mm. Scale 1:1
Figure 45. A pregnancy at 10 weeks and 5 days in which the echoes at the fetal ends merge with the adjacent sac wall echoes. By projecting the sac walls downwards as shown by the arrows a measurement of the fetal crown-rump length (CRL) can be made. Scale 1:1.
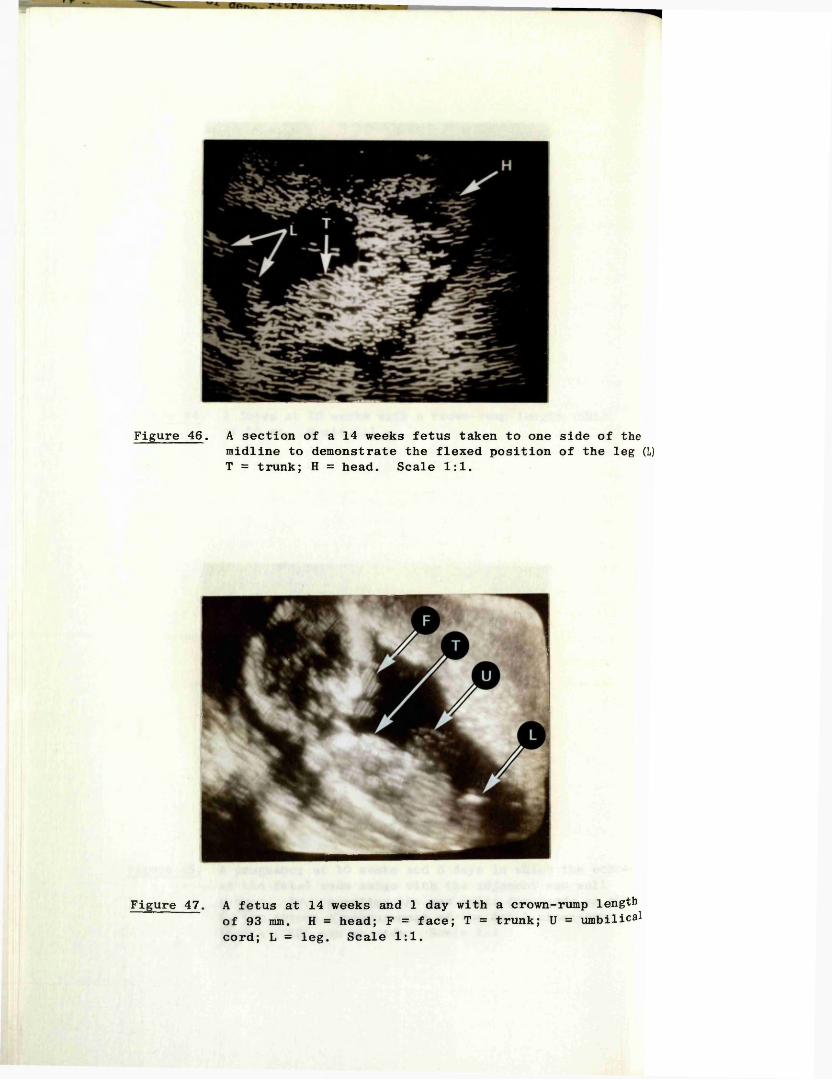
Figure 46. A section of a 14 weeks fetus taken to one side of themidline to demonstrate the flexed position of the leg (L) T = trunk; H = head. Scale 1:1.
Figure 47. A fetus at 14 weeks and 1 day with a crown-rump length of 93 mm. H = head; F = face; T = trunk; U = umbilical cord; L = leg. Scale 1:1.

103
outline and clear, well demarcated echoes at each end of the fetus (Figure 44). Not infrequently however, one end of the fetus is in close proximity to the sac wall and as a result differentiation of sac wall and fetal echoes may prove difficult.In such cases a "value judgement" is made using the projected line of the sac wall as a guide (Figure 45).
The fetal legs on the other hand rarely constitute a problem in defining the "rump" end of the fetus as their natural position of flexion, especially at the hip, keeps them well away from the area of interest (Figure 46).
Before an actual measurement is performed it is important that the gross shape and proportions of the fetal echo-complex correspond to those which would be expected from a first trimester fetus, that is the depth of echoes at each end of the fetus should be approximately equal (Figure 44), and after the eleventh week the length of the "head" in relation to that of the "trunk" should be approximately 1:1.5 (Figure 47). Failure to satisfy these criteria means that a skewed section of the fetus has been taken rather than a true longitudinal one, the reasons for which being either an initial error in the assessment of the fetal lie, or movement of the fetus during the scanning procedure. Where the error or movement has not been excessive, the fetal ends may be redefined with the scanning frame still in the transverse position. On the other hand, if the fetus has taken up a completely new orientation then the procedure is repeated from the beginning.
Having located and recorded the maximum length of fetal echoes on the oscilloscope screen, a measurement is made either directly from the oscilloscope screen, or, from a Polaroid photograph. In either event the screen graticule is used as a ruler as this obviates the necessity to correct for the scale factor of 0.94 to 1.
V, 3:2 Reproducibility of the Crown-Rump Length MeasurementTechnique (Random Errors)
The information and results reported in this and the following sub-section were first published by the author together with Mr. J.E.E. Fleming in the British Journal of Obstetrics and Gynaecology in 1975. (Reprint enclosed.)
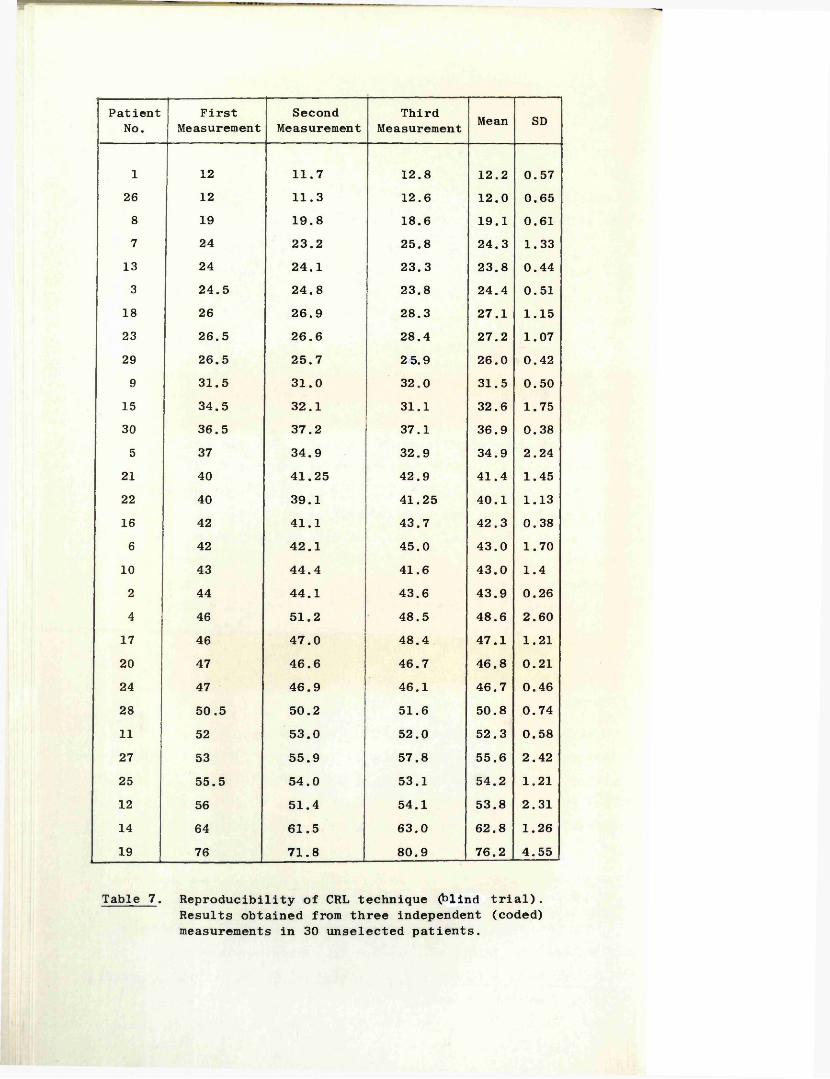
PatientNo.
FirstMeasurement
SecondMeasurement
ThirdMeasurement Mean SD
1 12 11.7 12.8 12.2 0.5726 12 11.3 12.6 12.0 0.658 19 19.8 18.6 19.1 0.617 24 23.2 25.8 24.3 1.33
13 24 24.1 23.3 23.8 0.443 24.5 24.8 23.8 24.4 0.51
18 26 26.9 28.3 27.1 1.1523 26.5 26.6 28.4 27.2 1.0729 26.5 25.7 2 5.9 26.0 0.429 31.5 31.0 32.0 31.5 0.50
15 34.5 32.1 31.1 32.6 1.7530 36.5 37.2 37.1 36.9 0.385 37 34.9 32.9 34.9 2.24
21 40 41.25 42.9 41.4 1.4522 40 39.1 41.25 40.1 1.1316 42 41.1 43.7 42.3 0.386 42 42.1 45.0 43.0 1.70
10 43 44.4 41.6 43.0 1.42 44 44.1 43.6 43.9 0.264 46 51.2 48.5 48.6 2.60
17 46 47.0 48.4 47.1 1.2120 47 46.6 46.7 46.8 0.2124 47 46.9 46.1 46.7 0.4628 50.5 50.2 51.6 50.8 0.7411 52 53.0 52.0 52.3 0.5827 53 55.9 57.8 55.6 2.4225 55.5 54.0 53.1 54.2 1.2112 56 51.4 54.1 53.8 2.3114 64 61.5 63.0 62.8 1.2619 76 71.8 80.9 76.2 4.55
Table 7 . Reproducibility of CRL technique (blind trial).Results obtained from three independent (coded) measurements in 30 unselected patients.
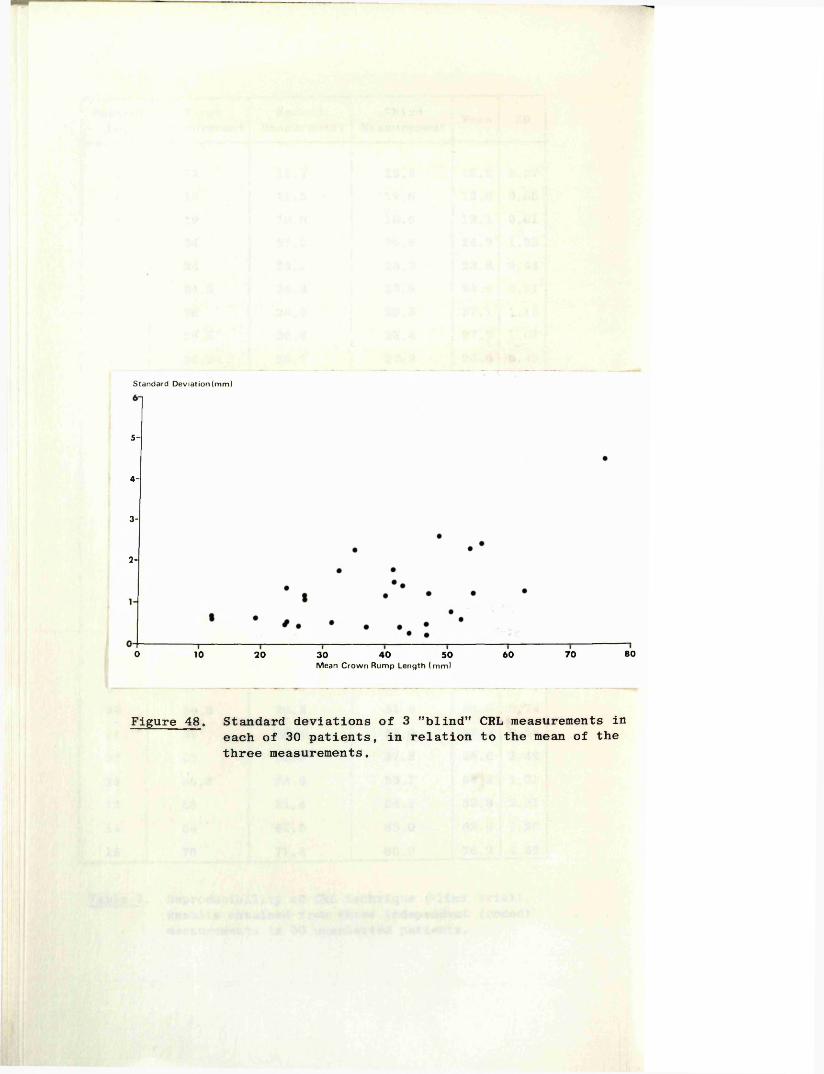
Standard Deviation (mm)
5-
4-
3-
2-
800 40 7010 20 6030 50Mean Crow n Rump Length (m m )
Figure 48. Standard deviations of 3 "blind” CRL measurements in each of 30 patients, in relation to the mean of the three measurements.

104
The reproducibility of the CRL measurement technique is directly related to the random errors which may be incurred during the procedure, that is errors whose magnitude may vary from measurement to measurement. The potential sources of such random errors include: operator judgement as to the correct lie of the fetus and the longest length of echoes; small movements of the fetus or mother resulting in a change in alignment of the fetus in relation to the scanning frame; variation in machine sensitivity settings causing a change in echo length as a result of change in the effective beam width; and errors in measurement from the photograph itself. While it is possible that in some cases these errors could be cumulative, it is more probable that there would be a tendency towards one error reducing or cancelling another.
Blind Clinical Trial to Evaluate the Overall Effect of the Random Errors
In this trial a series of 30 unselected patients whose menstrual histories were unknown to the author were examined, and in each case three independent measurements made of the fetal CRL. The ability to make such independent measurements was made possible by an electronic modification to the Diasonograph designed and constructed by Mr. Fleming of the Glasgow University Department of Ultrasonic Technology. This modification allowed the oscilloscope display scale to be changed to any one of 15 different coded scale factors ranging from 82 per cent to 126 per cent of live size.
Between each of the three individual measurements, the scanning frame was returned to a neutral position and, after an interval varying from two to ten minutes, the whole procedure was repeated using a different scale factor. The measurements were later decoded by Mr. Fleming and the results obtained are shown in Table 7.
From an analysis of these results it was found that the average standard deviation (SD) of the three measurements in the 30 trials was 1.2 millimetres. Apart from a single SD result of 4.55 millimetres in a patient whose fetus had a CRL of over 75 mm, all the SD's were less than 2.6 mm. It was also found that there was a tendency for the SD's to increase with an increase in the CRL (Figure 48), a finding which was probably due to the effect of random fetal movements which start at about nine weeks of menstrual age and which become more frequent and more vigorous
L
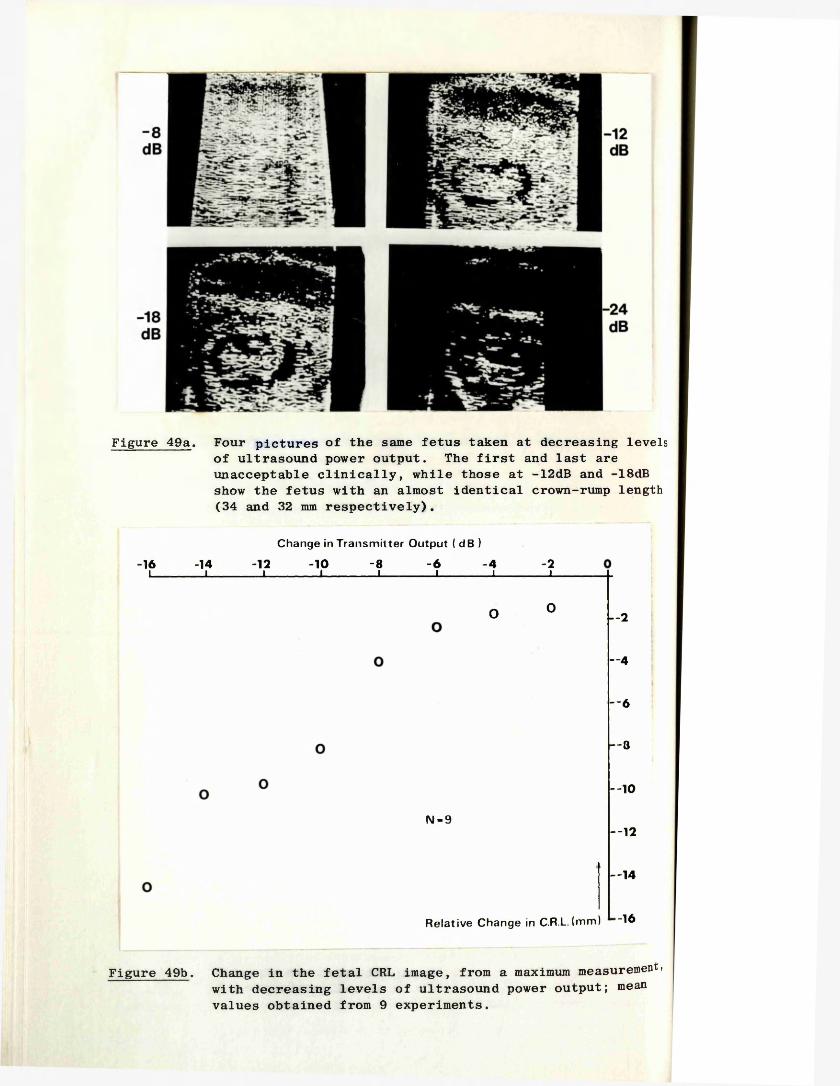
Figure 49a. Four pictures of the same fetus taken at decreasing levels of ultrasound power output. The first and last are unacceptable clinically, while those at -12dB and -18dB show the fetus with an almost identical crown-rump length (34 and 32 mm respectively).
Change in Transm itter Output ( dB )
-16 -14 -12 -10 -8 -6 -4 -2I____________ I____________ I____________ I____________ I____________ I____________ I____________ L
O 0 — 2
— 4
— 6
— 8
— 10
N - 9--12
— 14
Relative Change in C.R.L.(mm) "16
Figure 49b. Change in the fetal CRL image, from a maximum measurement) with decreasing levels of ultrasound power output; mean values obtained from 9 experiments.
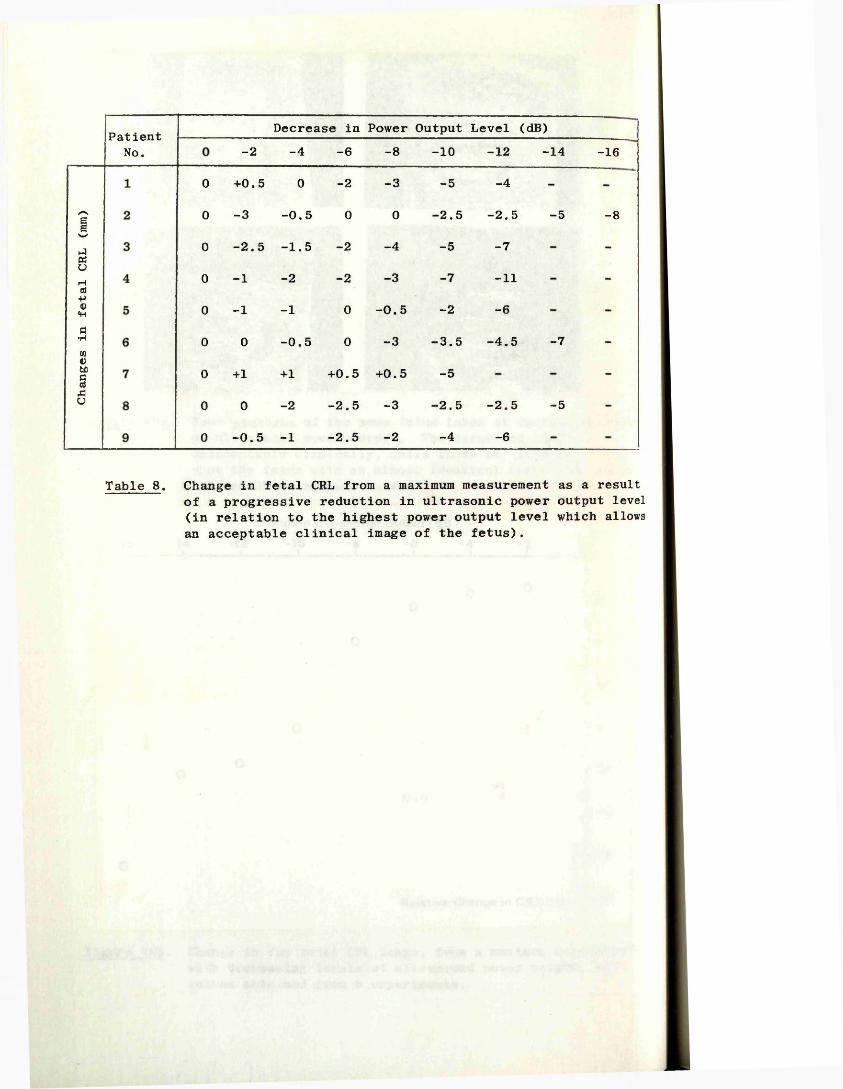
Changes
in fetal
CRL
(mm)
Patient No.
Decrease in Power Output Level (dB)-2 -4 -6 -8 - 1 0 -1 2 -14 -16
0 +0.5 0 -2
0 -3 -0.5 0
0 -2.5 -1.5 -2
0 -1 -2 -20 - 1 - 1 0
0 0 -0.5 0
0 +1 +1 +0.5 +0.50 0 -2 - 2 . 5 - 3
0 -0.5 -1 -2.5 -2
-3
0
-4
-3
-0.5
-3
-5
-2.5
-5
-7
-2-3.5
-5
-2.5
-4
-4
-2.5
-7
-11
-6-4.5
-2.5
-6
-5
-7
-5
-8
Table 8 . Change in fetal CRL from a maximum measurement as a result of a progressive reduction in ultrasonic power output level (in relation to the highest power output level which allows an acceptable clinical image of the fetus).

with increasing fetal size.
Evaluation of Individual Random Errors
Measurement from the photograph Of the four individual potential sources of random error itemised earlier, that of measurement of the length of the fetal echo complex from the photograph is the most easily quantified. A consecutive nonselected series of 50 photographs were extracted from the files and three independent measurements made of the fetal CRL's in each case. The average SD obtained in the 50 "trials" was found to be 0.26 mm.
Machine sensitivity This is a more complex factor involving both transmitter power output levels and receiver sensitivity characteristics. In the clinical situation however, it has been found that in any given individual, acceptable pictures are only obtained from a very limited range of machine settings and that within this range the length of fetal echoes varies only marginally. From a practical standpoint the receiver sensitivity is kept constant and the transmitter power output increased as high as possible commensurate with good definition of the ends of the fetus and with a minimum of "background noise" echoes within the confines of the gestation sac.
In order to quantify the change in length of the fetal echoes with change in transmitter power output the following experiment was performed on a series of nine patients.
The long axis of the fetus and its maximum length were located as previously described and the scanning gantry locked in position. The receiver attenuation system was left constant and the power output level increased to a level beyond which the picture became unacceptable, that is when the gestation sac became filled with "background noise" echoes. A series of scans of the fetus was then performed along exactly the same plane and with an identical scanning action, each at a power output level of 2 dB below the previous one. Polaroid photographs were taken of the resulting pictures and the length of the fetal echo complexes measured (Figure 49a).
The results obtained from the nine experiments are shown in Table 8, and are summarised, in graphical form, in Figure 49b.

106
On perusal of the original photographs it was considered that acceptable pictures had only been obtained over a small range of power output at the upper end of the scale, and that with decreasing power output, the fetal echo complex and gestation sac outline had become "fragmented" due to an insufficient number of echoes. The "maximum range" within which acceptable pictures was obtained, and therefore acceptable fetal measurements, was 6 dB. In this range the variation in fetal length was just over plus or minus 0.5 mm.
Operator judgement of the fetal lie and the effect of fetal and maternal movements
The random errors incurred in the technique as a result of these factors could not be quantified accurately on an individual basis. However, given that the overall reproducibility of the technique is plus or minus 1.2 mm. and that the two areas ofpotential error just described account for over half this value,then the average error due to operator judgement and fetal or maternal movement must be small. It is appreciated, on the other hand, that in an individual case the error may be very much larger, especially when the fetus is particularly active, and on occasions may be as much as 3 to 4 mm.
V, 3:3 Systematic Errors of the Crown-Rump Length MeasurementTechnique
In this section those errors which are incurred in all CRL measurements will be considered. In broad terms such errors are due to inaccuracies in the measurement system itself, they are usually constant, and in contrast to the random errors described in the previous section, they are not related to the human element. This group of errors, which may be conveniently grouped under the heading 'systematic errors', give a measure of the difference between the observed measurement and the real or absolute measurement .
In the CRL measurement technique the following were considered to be areas where systematic errors might be present.
Oscilloscope Scale Factor It is recognised that there are small but definite variations in the accuracy with which the ultrasonic transducer position may be represented on the display screen, even between machines of the same type. Such variations are the result

107
of the practical limits within, which the individual components may be manufactured and made to function.
The magnitude of this potential error was assessed by scanning in a linear manner a simple wire target in a water bath, the distances between adjacent wires having been measured accurately with a Vernier gauge. The distances between the resulting echoes on the oscilloscope screen were then measured with dividers and the difference calculated in terms of a percentage. In this way, the "scale factor (registration) error" of the Diasonograph used in this study was found to be +3 per cent in respect to the basic oscilloscope scale factor of 0.94 to 1. Similar experiments were conducted on four other ultrasound machines of the same type in the Glasgow area and revealed registration errors ranging from -0.8 per cent to +3 per cent.
Beam Width Effect (Lateral resolution) As discussed in Chapter II, 1, an ultrasonic "beam" has a measurable width, the dimension of which is directly related to the design of the transducer and the distance from the transducer face. In practice it is also related to the transmitter power output and receiver sensitivity levels in use at a given time. As a result of the beam having a measurable width, a short line rather than a single discrete dot is produced on the oscilloscope screen when a single point reflector is being scanned. This is due to the fact that as the beam sweeps across the point reflector a returning echo will be produced throughout the time that the point remains within the beam.
In order to evaluate the magnitude of the systematic error produced by this effect, a series of in vitro experiments was devised using dead but fresh animal fetuses. In each case, the fetus was measured very accurately using calipers and a Vernier gauge, then suspended in a water bath at 37 C and its length rechecked.The scanning frame was next aligned along the long axis of the fetus and ultrasonic pictures similar in echo density to those obtained from in vivo human fetuses were produced. The ultrasonic image of the fetus was photographed and measured in the usual way. Confirmation that the longest length of echoes has been located was achieved by repeating the measurement at very closely spaced intervals. Eight such experiments were performed using six mouse fetuses and one cow and one pig fetus. Their
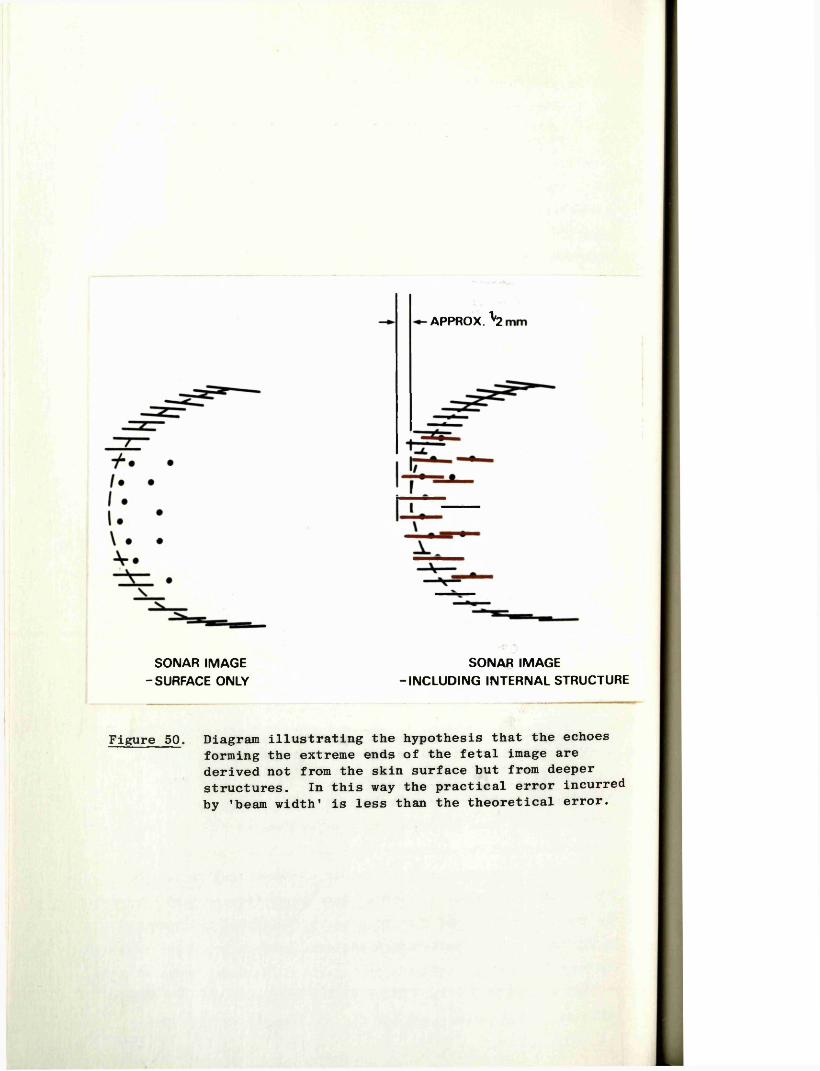
APPROX. \
SONAR IMAGE SONAR IMAGE- SURFACE ONLY -INCLUDING INTERNAL STRUCTURE
Figure 50. Diagram illustrating the hypothesis that the echoes forming the extreme ends of the fetal image are derived not from the skin surface but from deeper structures. In this way the practical error incurred by 'beam width' is less than the theoretical error.

108
lengths ranged from 22 to 87 mm. After correction for the scale factor error of +3 per cent described above, the mean difference between the actual fetal measurements and the measurements from the ultrasonic images was found to be 1.04 mm (SD 0.18 mm) with an absolute range of 0.6 mm to 1.9 mm.
The magnitude of the error produced by this effect is considerably smaller than that which would be expected from theoretical calculations. For example, a single wire scanned by a 2.5 MHz transducer at a power output level commensurate with that which reaches a fetus in utero, gives an echo approximately 5 mm long.If this error were applicable in CRL measurements, an overestimate of 5 mm would be anticipated, half of the "line" from the outer skin surface extending beyond the actual boundary of the fetus at each of its lateral ends. A possible explanation for this discrepancy between the experimental and the theoretical errors lies in the fact that since the ultrasound beam is tangential to the rounded surfaces of the crown and the rump of the fetus during the scan, little or no echoes would arise from the extremes of these areas. Thus the echoes which form the boundaries of the ultrasonic image have probably arisen from structures within the fetus itself. This concept is illustrated in Figure 50. If this hypothesis is correct then it is fortuitous that the length of the echoes derived from these structures close to the ends of the fetus are of such a length that a very close approximation to the true boundary is obtained. This approximation, as shown by the experiments with the machine sensitivity settings described in the previous section, seems to hold over a range of six decibels of transmitter power output.
Calibration Velocity There is a potential error which may be incurred in the CRL measurements if the "calibration velocity" of the apparatus differs from the actual average velocity in the tissues between the transducer and the fetus. For example, if the actual velocity is slower than the calibration velocity, then the ultrasonic image of the structure being examined will be magnified in direct proportion to the difference between the two.
Based on the known velocity of ultrasound in fat, muscle, and urine, and the estimated thicknesses and depths of these structures in the lower abdomen between the skin surface and the uterine cavity, Hall (1975) calculated that the true average
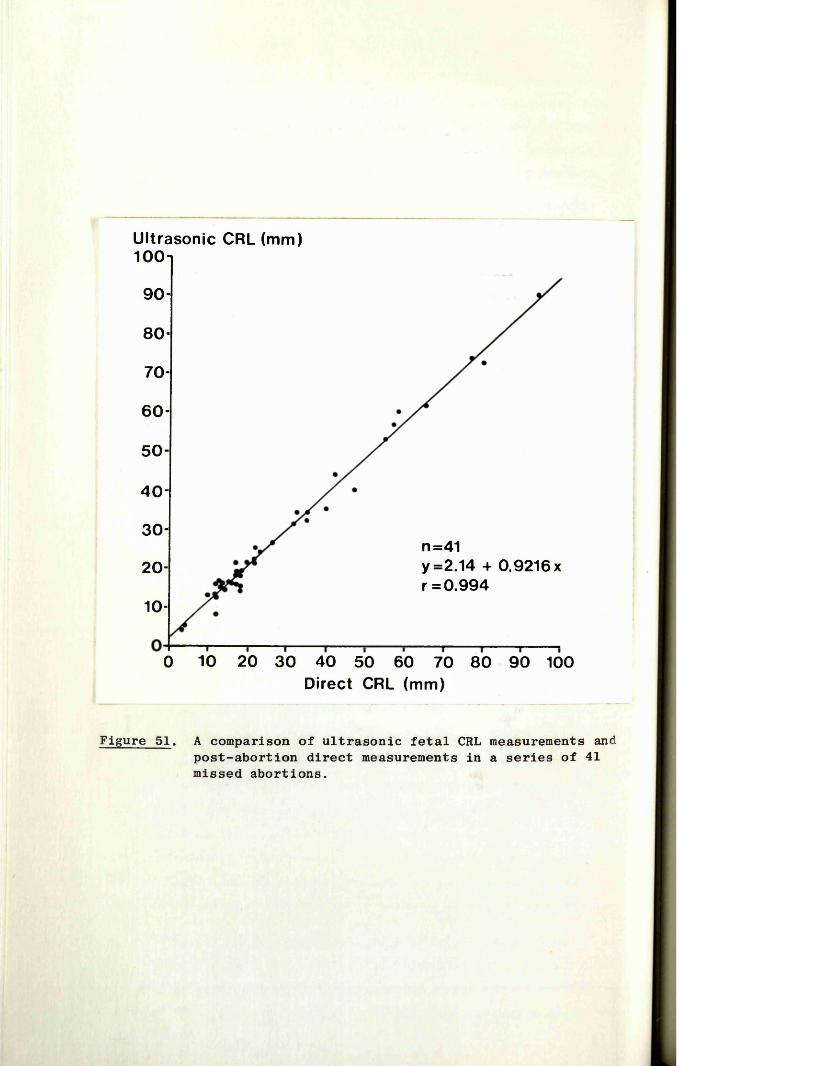
Ultrasonic CRL (mm)100i
90-
80-
70-
6 0 -
50 -
40 -
30-n=41y =2.14 + 0,9216 x r =0.994
20-
10-
0 10 20 30 40 50 60 70 80 90 100Direct CRL (mm)
Figure 51. A comparison of ultrasonic fetal CRL measurements and post-abortion direct measurements in a series of 41 missed abortions.

109
velocity of ultrasound in this part of the body is 1530 metres per second. As the apparatus used in this study was calibrated to 1540 metres per second, an overestimate of 0.7 per cent in the measurements had been incurred.
Summary
The systematic errors incurred in the CRL measurement technique, and with the apparatus which was used in this study, summate to an average overestimate of the actual length of a fetus by one millimetre plus 3.7 per cent.
V, 3:4 "In Vivo'* Comparison of Ultrasonic and "Actual"Crown-Rump Length Measurements
In order to obtain some measure of the accuracy of the technique in the practical situation, "in vivo" measurements were made of fetuses in a series of 41 cases of missed abortion (i.e. where the fetus was shown to be dead by the absence of fetal heart movements) . When the fetus was eventually aborted a direct measurement of the CRL was performed with the fetus placed in what was considered to be a normal degreee of flexion. At the time of this measurement, the corresponding ultrasonic value was not known to the observer. The "in vivo" and direct measurements were compared and the results plotted as shown in Figure 51. In 32 cases (78%) the difference between the measurements was 3 mm or less, and the maximum difference was 7 mm (2 cases). A least squares regression analysis of the data showed a highly positive correlation between the measurements (r = 0.994).
While it is appreciated that a fetus might not necessarily maintain an attitude of flexion after death the correlations are sufficiently close to allow an assumption that the ultrasonic measurements are indeed those of the crown-rump length.
V, 3:5 Normal Crown-Rump Length Growth Curve
The series analysed in this thesis comprises 424 fetal CRL measurements derived from pregnancies with menstrual ages ranging from 6 weeks and 2 days to 14 weeks and 4 days. In all cases the viability of the fetus was confirmed by the demonstration of fetal heart movements. Only patients considered to have "impeccable dates" were included in this part of the study (see section 1:3 of this chapter). Where a patient had had more than one CRL measurement performed only the first was used for the
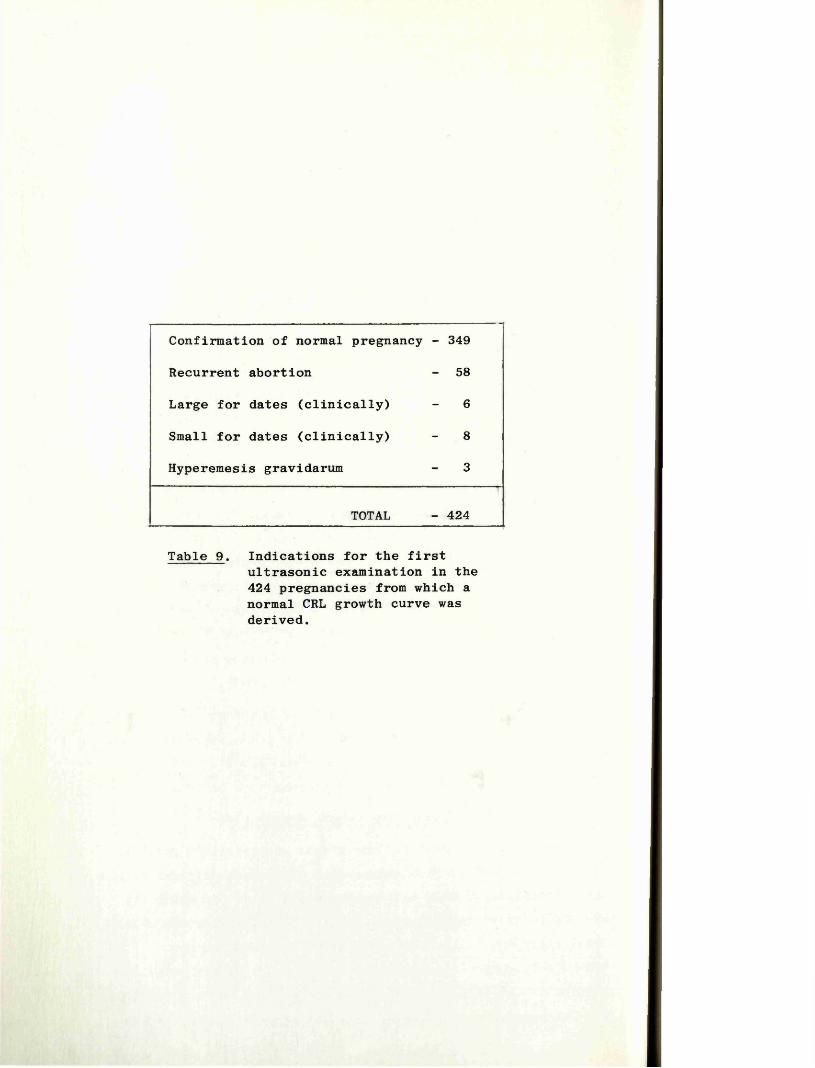
Confirmation of normal pregnancy - 349
Recurrent abortion - 58
Large for dates (clinically) - 6
Small for dates (clinically) - 8
Hyperemesis gravidarum - 3
TOTAL - 424
Table 9 . Indications for the firstultrasonic examination in the 424 pregnancies from which a normal CRL growth curve was derived.
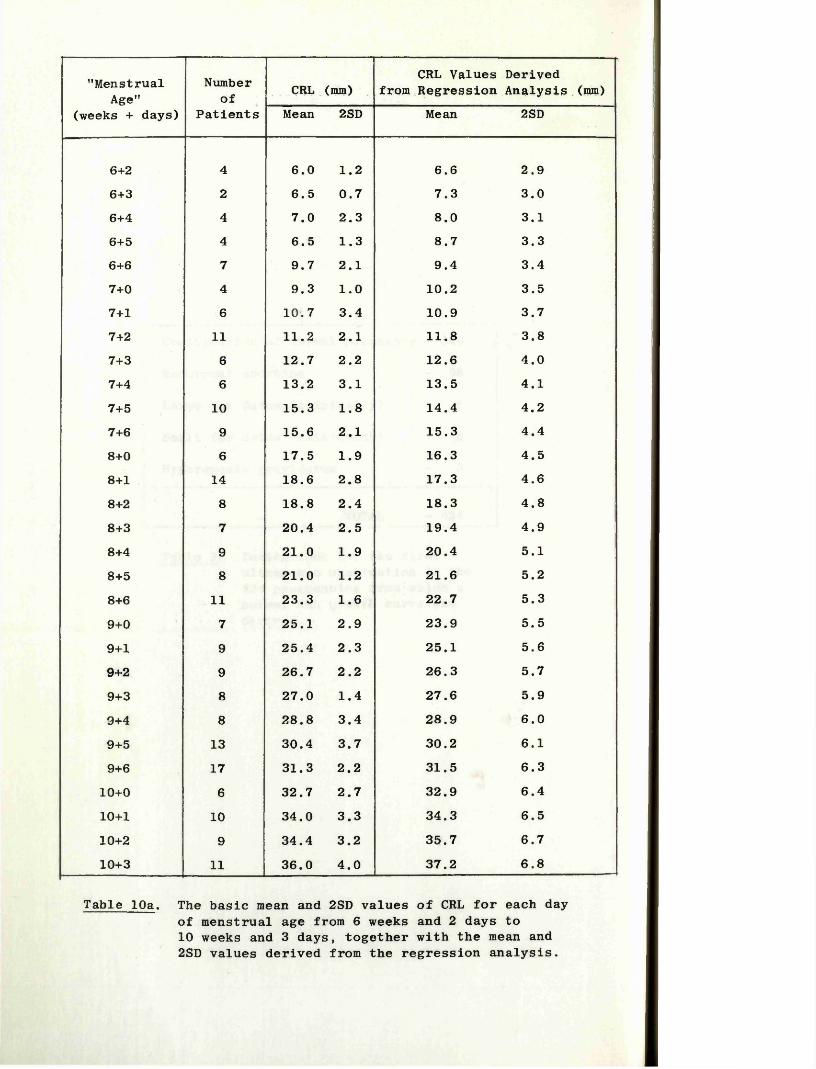
"Menstrual Age"
(weeks + days)
Numberof
PatientsCRL (mm)
CRL Values Derived from Regression Analysis (mm)
Mean 2SD Mean 2SD
6+2 4 6.0 1.2 6.6 2.96+3 2 6.5 0.7 7.3 3.06+4 4 7.0 2.3 8.0 3.16+5 4 6.5 1.3 8.7 3.36+6 7 9.7 2.1 9.4 3.47+0 4 9.3 1.0 10.2 3.57+1 6 10.7 3.4 10.9 3.77+2 11 11.2 2.1 11.8 3.87+3 6 12.7 2.2 12.6 4.07+4 6 13.2 3.1 13.5 4.17+5 10 15.3 1.8 14.4 4.27+6 9 15.6 2.1 15.3 4.48+0 6 17.5 1.9 16.3 4.58+1 14 18.6 2.8 17.3 4.68+2 8 18.8 2.4 18.3 4.88+3 7 20.4 2.5 19.4 4.98+4 9 21.0 1.9 20.4 5.18+5 8 21.0 1.2 21.6 5.28+6 11 23.3 1.6 22.7 5.39+0 7 25.1 2.9 23.9 5.59+1 9 25.4 2.3 25.1 5.69+2 9 26.7 2.2 26.3 5.79+3 8 27.0 1.4 27.6 5.99+4 8 28.8 3.4 28.9 6.09+5 13 30.4 3.7 30.2 6.19+6 17 31.3 2.2 31.5 6.3
10+0 6 32.7 2.7 32.9 6.410+1 10 34.0 3.3 34.3 6.510+2 9 34.4 3.2 35.7 6.710+3 11 36.0 4.0 37.2 6.8
Table 10a. The basic mean and 2SD values of CRL for each day of menstrual age from 6 weeks and 2 days to 10 weeks and 3 days, together with the mean and 2SD values derived from the regression analysis.
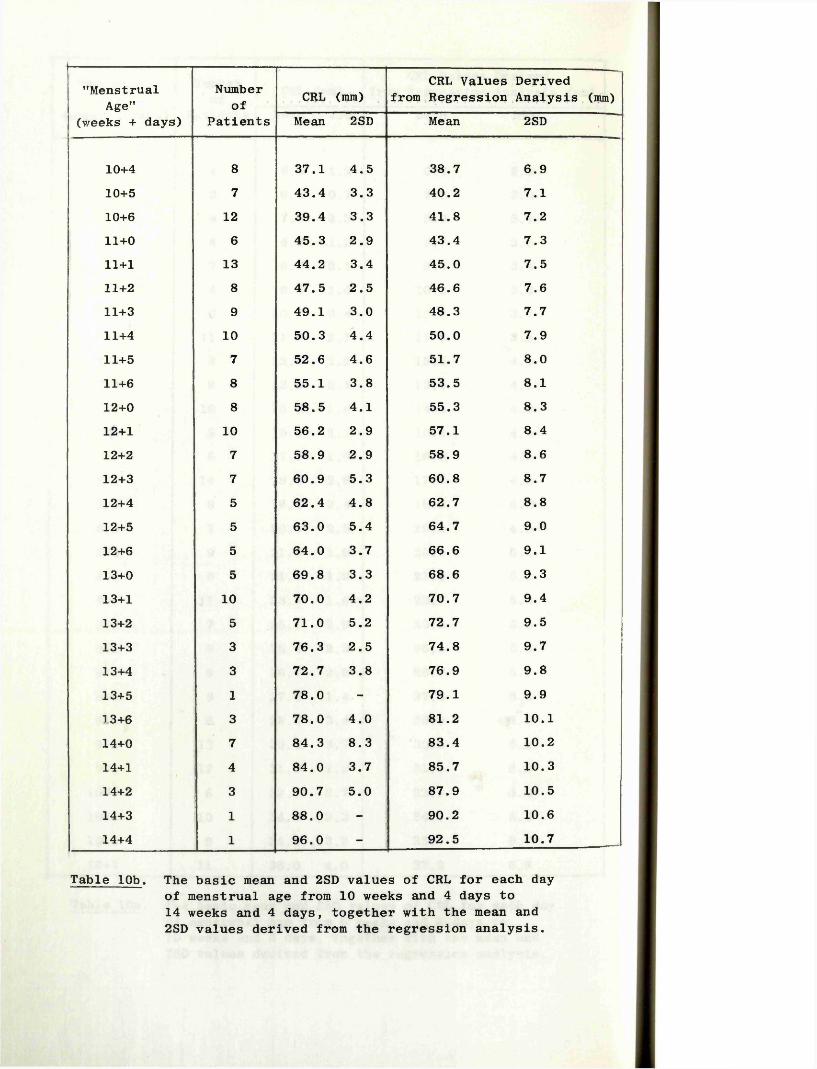
’’MenstrualAge"
(weeks + days)
Numberof
PatientsCRL (mm)
CRL Values Derived from Regression Analysis (mm)
Mean 2SD Mean 2SD
10+4 8 37.1 4.5 38.7 6.910+5 7 43.4 3.3 40.2 7.110+6 12 39.4 3.3 41.8 7.211+0 6 45.3 2.9 43.4 7.311+1 13 44.2 3.4 45.0 7.511+2 8 47.5 2.5 46.6 7.611+3 9 49.1 3.0 48.3 7.711+4 10 50.3 4.4 50.0 7.911+5 7 52.6 4.6 51.7 8.011+6 8 55.1 3.8 53.5 8.112+0 8 58.5 4.1 55.3 8.312+1 10 56.2 2.9 57.1 8.412+2 7 58.9 2.9 58.9 8.612+3 7 60.9 5.3 60.8 8.712+4 5 62.4 4.8 62.7 8.812+5 5 63.0 5.4 64.7 9.012+6 5 64.0 3.7 66.6 9.113+0 5 69.8 3.3 68.6 9.313+1 10 70.0 4.2 70.7 9.413+2 5 71.0 5.2 72.7 9.513+3 3 76.3 2.5 74.8 9.713+4 3 72.7 3.8 76.9 9.813+5 1 78.0 - 79.1 9.93 3+6 3 78.0 4.0 81.2 10.114+0 7 84.3 8.3 83.4 10.214+1 4 84.0 3.7 85.7 10.314+2 3 90.7 5.0 87.9 10.514+3 1 88.0 - 90.2 10.614+4 1 96.0 - 92.5 10.7
Table 10b. The basic mean and 2SD values of CRL for each day of menstrual age from 10 weeks and 4 days to 14 weeks and 4 days, together with the mean and 2SD values derived from the regression analysis.
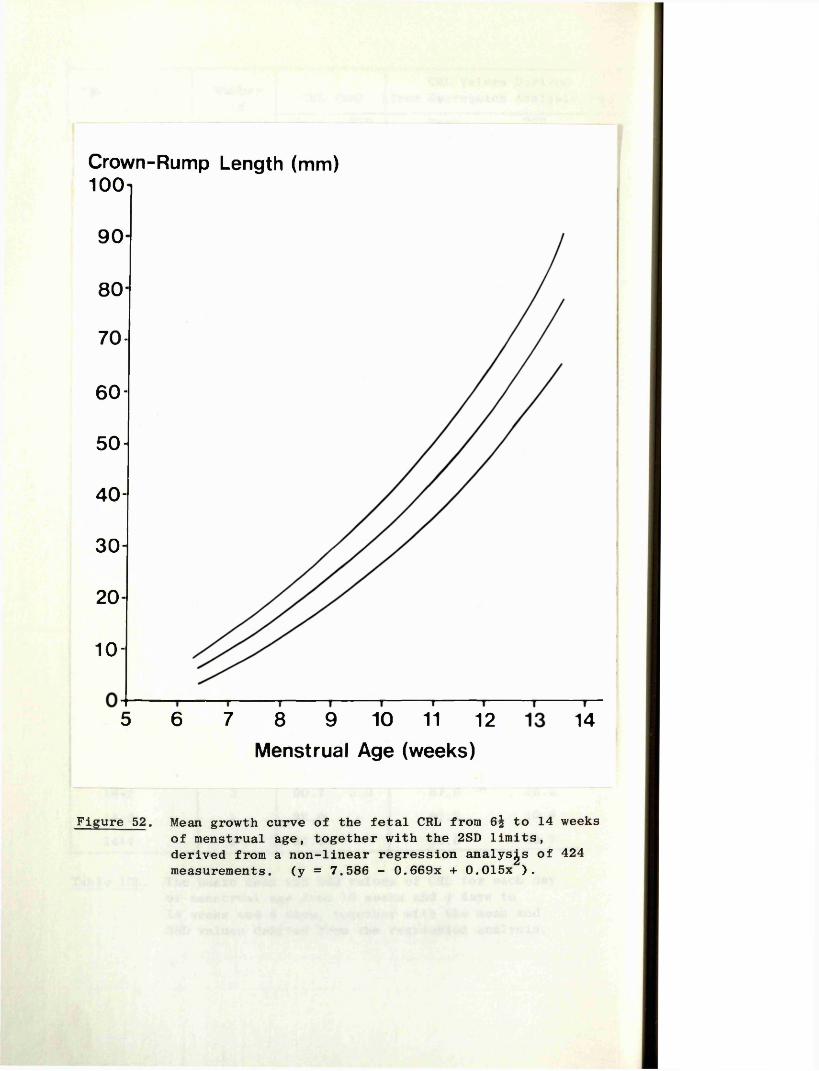
Crown-Rump Length (mm)100
90
80
70 -
60 -
50 -
40 -
30 -
20-
1 0 -
5 6 8 9 10 11 127 14Menstrual Age (weeks)
Figure 52. Mean growth curve of the fetal CRL from 6^ to 14 weeks of menstrual age, together with the 2SD limits, derived from a non-linear regression analyses of 424 measurements. (y = 7.586 - 0.669x + 0.015x ).
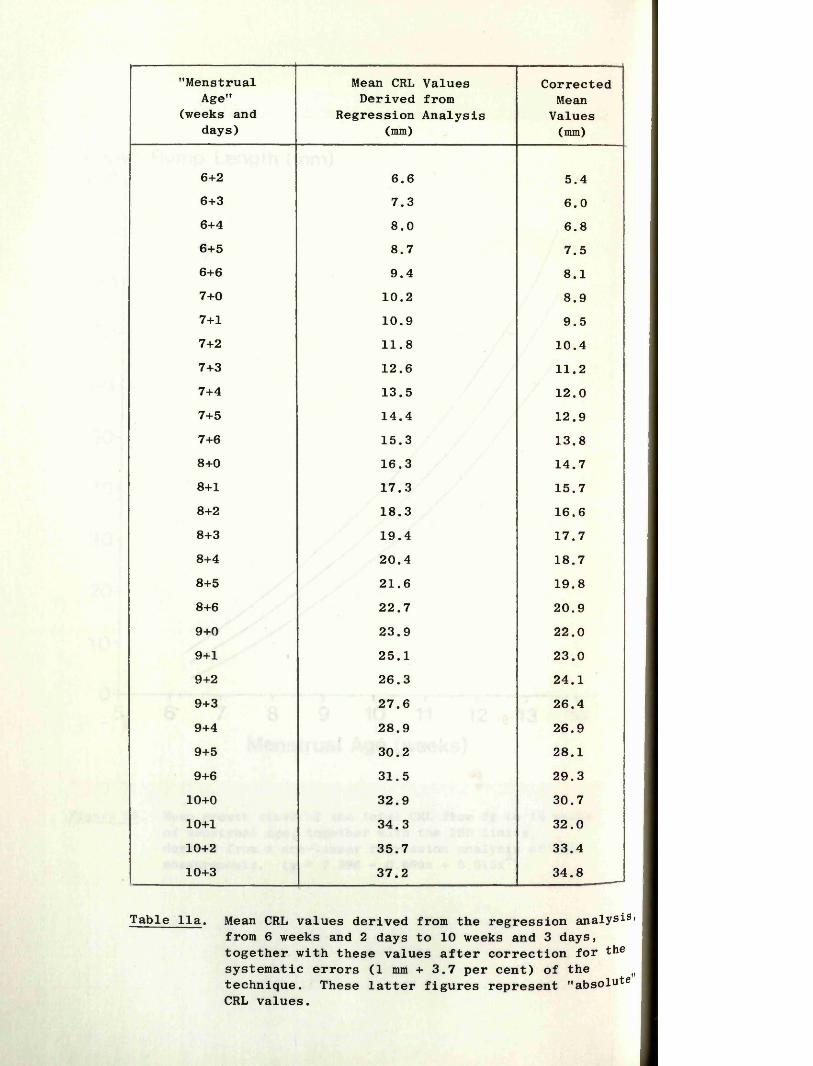
"Menstrual Age"
(weeks and days)
Mean CRL Values Derived from
Regression Analysis (mm)
CorrectedMean
Values(mm)
6+2 6.6 5.46+3 7.3 6.06+4 8.0 6.86+5 8.7 7.56+6 9.4 8.17+0 10.2 8.97+1 10.9 9.57+2 11.8 10.47+3 12.6 11.27+4 13.5 12.07+5 14.4 12.97+6 15.3 13.88+0 16.3 14.78+1 17.3 15.78+2 18.3 16.68+3 19.4 17.78+4 20.4 18.78+5 21.6 19.88+6 22.7 20.99+0 23.9 22.09+1 25.1 23.09+2 26.3 24.19+3 27.6 26.49+4 28.9 26.99+5 30.2 28.19+6 31.5 29.3
10+0 32.9 30.710+1 34.3 32.010+2 35.7 33.410+3 37.2 34.8
Table 11a. Mean CRL values derived from the regression analysis from 6 weeks and 2 days to 10 weeks and 3 days, together with these values after correction for the systematic errors (1 mm + 3.7 per cent) of the (| technique. These latter figures represent "absolute CRL values.
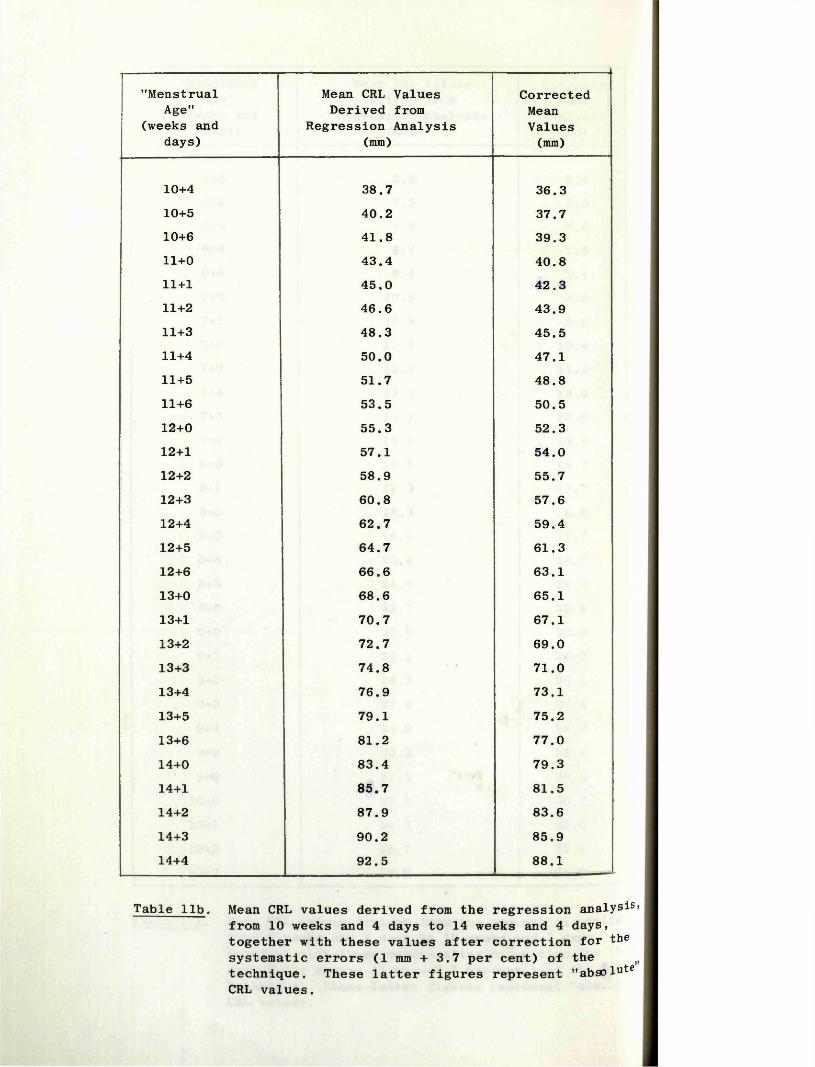
"Menstrual Age"
(weeks and days)
Mean CRL Values Derived from
Regression Analysis (mm)
CorrectedMeanValues(mm)
10+4 38.7 36.310+5 40.2 37.710+6 41.8 39.311+0 43.4 40.811+1 45.0 42.311+2 46.6 43.911+3 48.3 45.511+4 50.0 47.111+5 51.7 48.811+6 53.5 50.512+0 55.3 52.312+1 57.1 54.012+2 58.9 55.712+3 60.8 57.612+4 62.7 59.412+5 64.7 61.312+6 66.6 63.113+0 68.6 65.113+1 70.7 67.113+2 72.7 69.013+3 74.8 71.013+4 76.9 73.113+5 79.1 75.213+6 81.2 77.014+0 83.4 79.314+1 85.7 81.514+2 87.9 83.614+3 90.2 85.914+4 92.5 88.1
Table lib. Mean CRL values derived from the regression analysis from 10 weeks and 4 days to 14 weeks and 4 days, together with these values after correction for the systematic errors (1 mm + 3.7 per cent) of the technique. These latter figures represent "absolute CRL values.
110
purposes of compiling a normal growth curve in order that the data would be truly cross-sectional.
The indications for the initial examinations are shown in Table 9. The great majority (349/424) of patients were referred simply to allow normal data to be collected and to confirm that the pregnancy was a continuing one. Fifty eight patients gave a history of two or more previous abortions, and in all cases the pregnancies progressed normally to beyond 28 weeks. Of the remaining 19 patients six were thought on clinical grounds to be large for dates, and eight thought to be small for dates.These patients all fulfilled the criteria detailed above and were therefore included. A later review of the results showed that in each of these cases the CRL measurement fell within the normal range. The last three patients presented with excessive vomiting and were examined to exclude the presence of a hydatidiform mole.
The number of patients, the mean values and the 2SD limits were calculated for each day of the period under study, and the results are shown in Tables 10a and b. A non-linear regression analysis of the data was then performed to obtain the mean "line of best fit" together with its 2SD limits (Figure 52). The equation describing the "mean" line was :-
y = 7.586 - 0.669x + 0.015x2 with 2SD = - (0.136x - 3.07)
where y = CRL; and x = gestational age (menstrual age in days). The mean and 2SD values derived from this regression analysis are also shown in Tables 10a and b.
The equation was solved for y = 0, (i.e. CRL = 0 mm), and x found to equal 25 days.
V, 3:6 "Absolute" Crown-Rump Length Values
In order to obtain CRL values which are closer to the "real" mean growth curve, the mean values derived from the regression analysis (Tables 10a and b) were corrected for the systematic errors detailed earlier, i.e. the figures were reduced by 1 mm for the "beam width effect", and 3.7 per cent for the scale factor and velocity calibration errors. Both sets of figures are shown in Tables 11a and b.
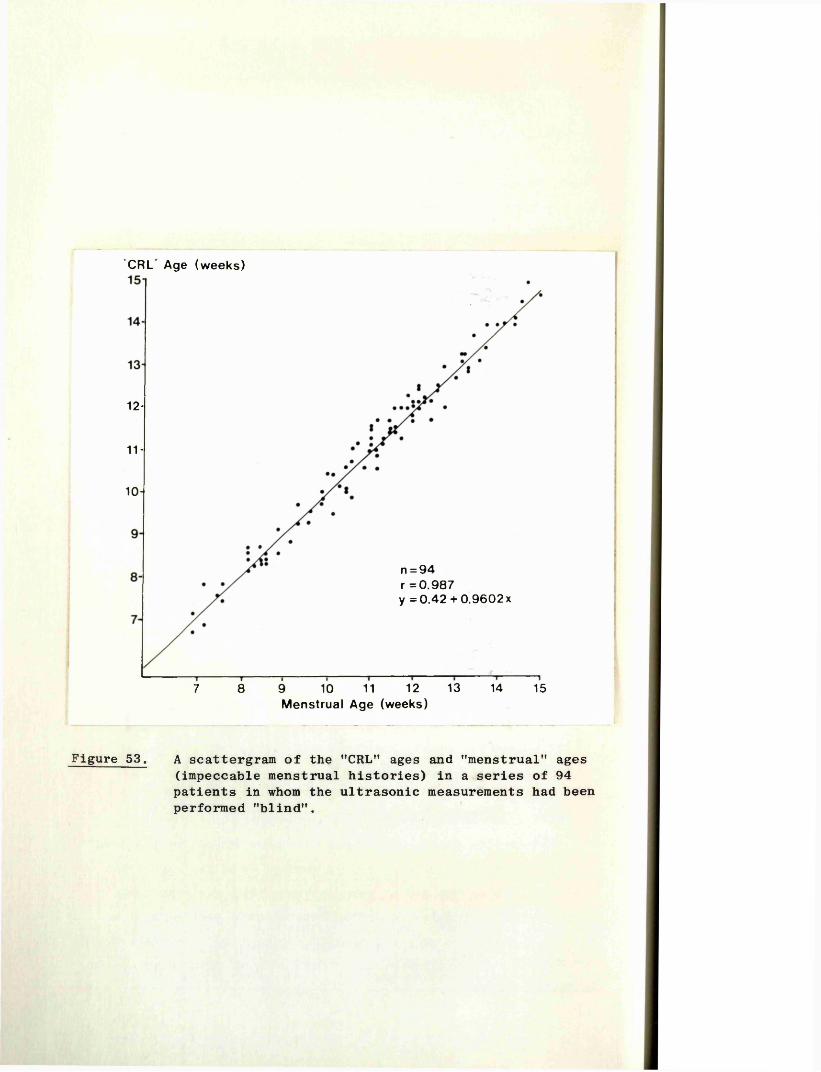
"CRL Age (weeks)
12-
11 -
10-
n = 94 r = 0 .9 87y = 0 .4 2 + 0 .9 6 0 2 x
1312 148 9 10 11 157Menstrual Age (weeks)
Figure 53. A scattergram of the "CRL” ages and "menstrual*' ages (impeccable menstrual histories) in a series of 94 patients in whom the ultrasonic measurements had been performed "blind".
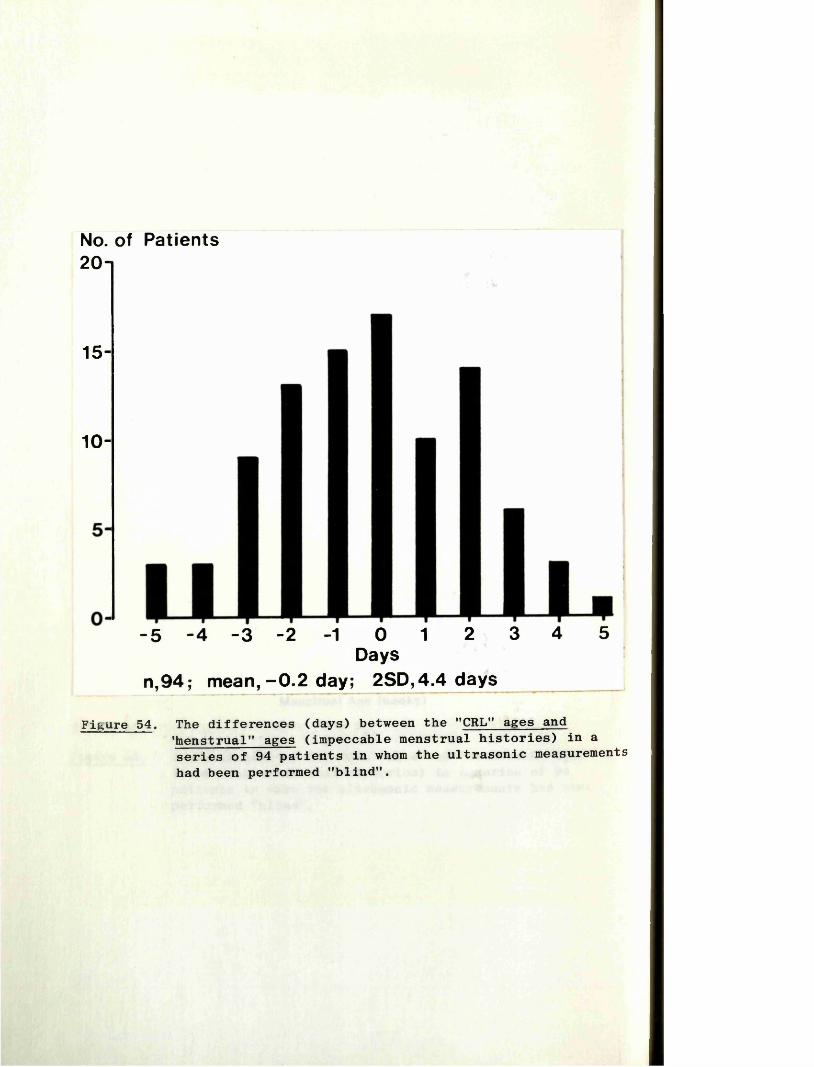
No. of Patients2 0 - i
15-
10-
-5 -4 -3 -2 -1 0 1 2 3 4 5Days
n,94; m ean,-0 .2 day; 2SD,4.4 days
Figure 54. The differences (days) between the "CRL" ages and'tnenstrual" ages (impeccable menstrual histories) in a series of 94 patients in whom the ultrasonic measurements had been performed "blind".
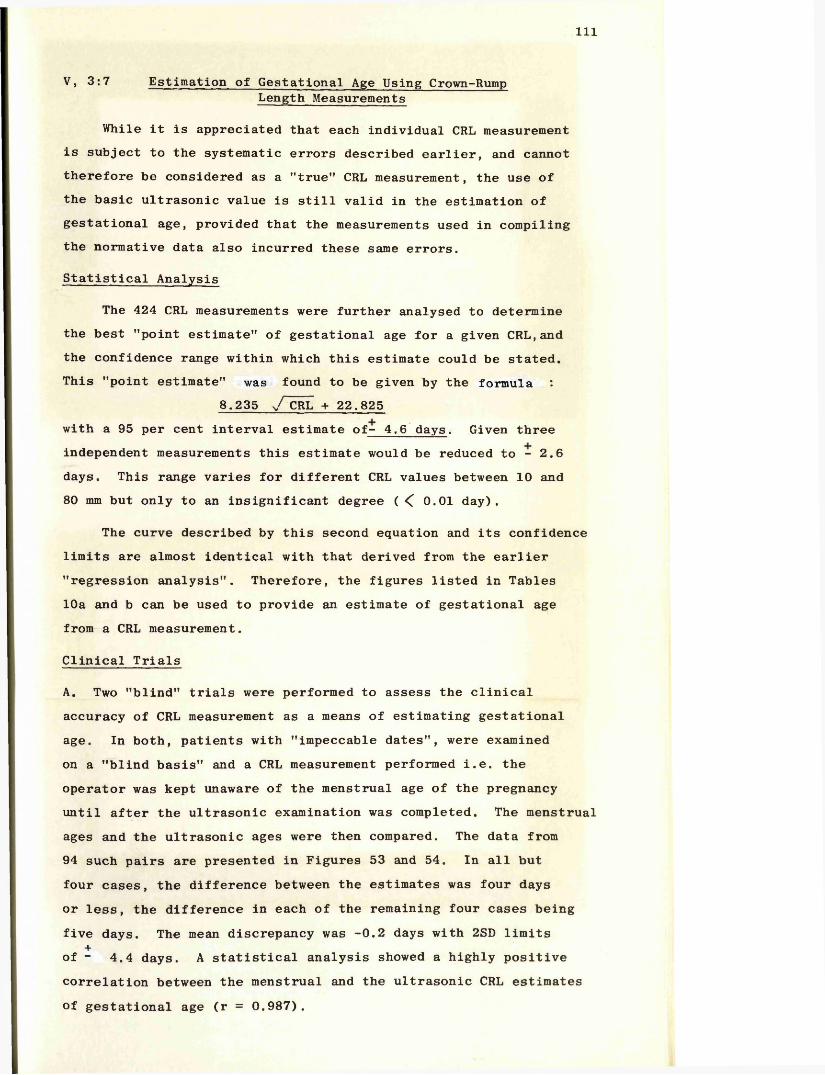
Ill
V, 3:7 Estimation of Gestational Age Using Crown-RumpLength Measurements
While it is appreciated that each individual CRL measurement is subject to the systematic errors described earlier, and cannot therefore be considered as a "true” CRL measurement, the use of the basic ultrasonic value is still valid in the estimation of gestational age, provided that the measurements used in compiling the normative data also incurred these same errors.
Statistical Analysis
The 424 CRL measurements were further analysed to determine the best "point estimate" of gestational age for a given CRL,and the confidence range within which this estimate could be stated.This "point estimate" was found to be given by the formula :
8.235 y^CRL + 22.825 with a 95 per cent interval estimate of- 4.6 days. Given three independent measurements this estimate would be reduced to - 2.6 days. This range varies for different CRL values between 10 and 80 mm but only to an insignificant degree ( < 0.01 day).
The curve described by this second equation and its confidence limits are almost identical with that derived from the earlier "regression analysis". Therefore, the figures listed in Tables 10a and b can be used to provide an estimate of gestational age from a CRL measurement.
Clinical Trials
A. Two "blind" trials were performed to assess the clinicalaccuracy of CRL measurement as a means of estimating gestationalage. In both, patients with "impeccable dates", were examinedon a "blind basis" and a CRL measurement performed i.e. theoperator was kept unaware of the menstrual age of the pregnancyuntil after the ultrasonic examination was completed. The menstrualages and the ultrasonic ages were then compared. The data from94 such pairs are presented in Figures 53 and 54. In all butfour cases, the difference between the estimates was four daysor less, the difference in each of the remaining four cases beingfive days. The mean discrepancy was -0.2 days with 2SD limits
+of - 4.4 days. A statistical analysis showed a highly positivecorrelation between the menstrual and the ultrasonic CRL estimates of gestational age (r = 0.987).
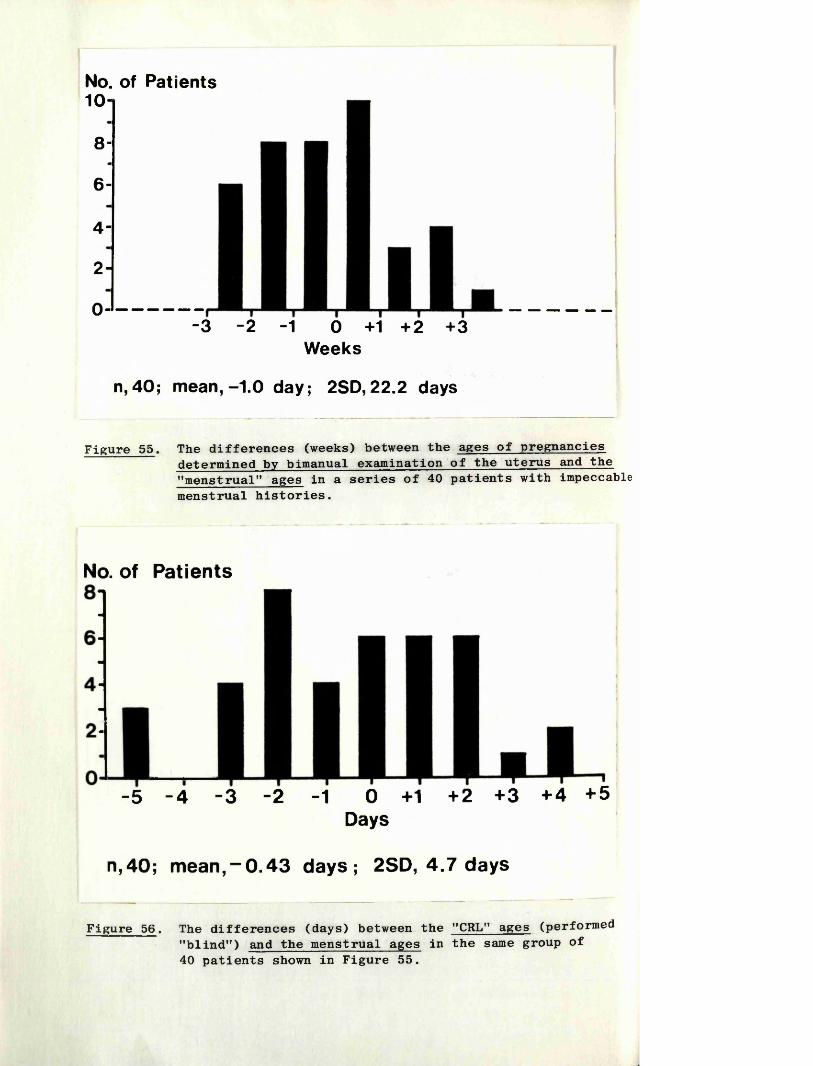
No. of Patients10
8-
6-
4-
2-
0--3 -2 -1 0 +1 +2 +3
Weeks
n,40; mean,-1.0 day; 2SD,22.2 days
Figure 55. The differences (weeks) between the ages of pregnancies determined by bimanual examination of the uterus and the "menstrual" ages in a series of 40 patients with impeccable menstrual histories.
No. of Patients
-5 -4 -3 -2 -1 0 +1 +2 +3 +4 +5Days
n,40; mean,-0 .4 3 days; 2SD, 4.7 days
Figure 5 6 . The differences (days) between the " C R L " ages ( p e r f o r m e d "blind") and the menstrual ages in the same group of 40 patients shown in Figure 55.
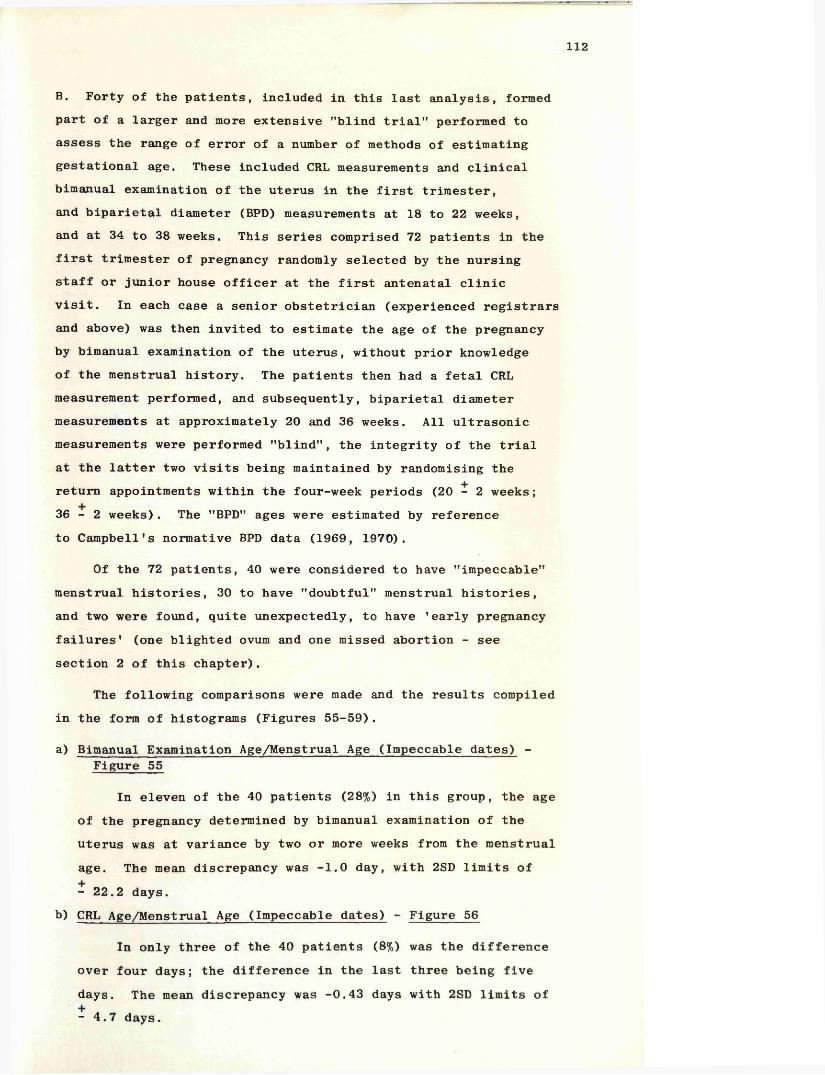
112
B. Forty of the patients, included in this last analysis, formed part of a larger and more extensive "blind trial" performed to assess the range of error of a number of methods of estimating gestational age. These included CRL measurements and clinical bimanual examination of the uterus in the first trimester, and biparietal diameter (BPD) measurements at 18 to 22 weeks, and at 34 to 38 weeks. This series comprised 72 patients in the first trimester of pregnancy randomly selected by the nursing staff or junior house officer at the first antenatal clinic visit. In each case a senior obstetrician (experienced registrars and above) was then invited to estimate the age of the pregnancy by bimanual examination of the uterus, without prior knowledge of the menstrual history. The patients then had a fetal CRL measurement performed, and subsequently, biparietal diameter measurements at approximately 20 and 36 weeks. All ultrasonic measurements were performed "blind", the integrity of the trial at the latter two visits being maintained by randomising the return appointments within the four-week periods (20 - 2 weeks; 3 6 - 2 weeks). The "BPD" ages were estimated by reference to Campbell’s normative BPD data (1969, 1970).
Of the 72 patients, 40 were considered to have "impeccable" menstrual histories, 30 to have "doubtful" menstrual histories, and two were found, quite unexpectedly, to have 'early pregnancy failures' (one blighted ovum and one missed abortion - see section 2 of this chapter).
The following comparisons were made and the results compiled in the form of histograms (Figures 55-59).
a) Bimanual Examination Age/Menstrual Age (Impeccable dates) -Figure 55
In eleven of the 40 patients (28%) in this group, the age of the pregnancy determined by bimanual examination of the uterus was at variance by two or more weeks from the menstrual age. The mean discrepancy was -1.0 day, with 2SD limits of- 22.2 days.
b) CRL Age/Menstrual Age (Impeccable dates) - Figure 56
In only three of the 40 patients (8%) was the difference over four days; the difference in the last three being five days. The mean discrepancy was -0.43 days with 2SD limits of- 4.7 days.
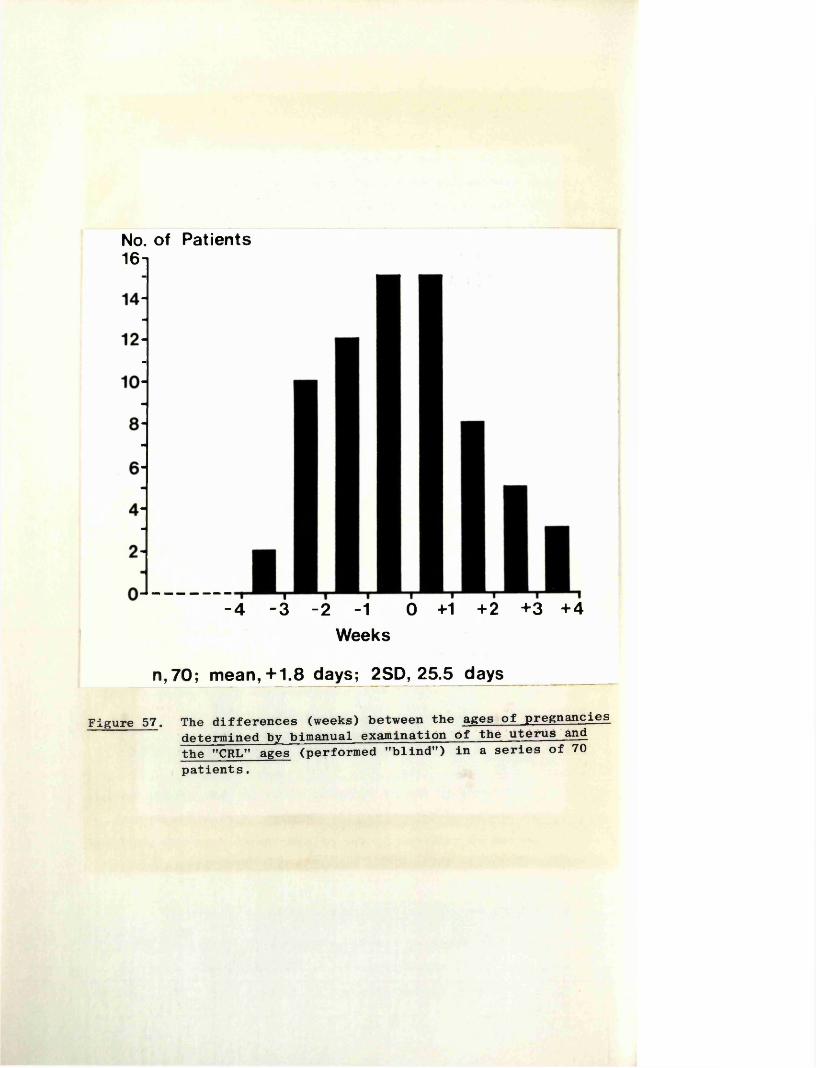
No. of Patients16t
-4 -3 -2 -1 0 +1 +2 +3 +4Weeks
n,70; mean,+1.8 days; 2SD, 25.5 days
Figure 57. The differences (weeks) between the ages of pregnancies determined by bimanual examination of the uterus and the "CRL” ages (performed "blind”) in a series of 70 patients.
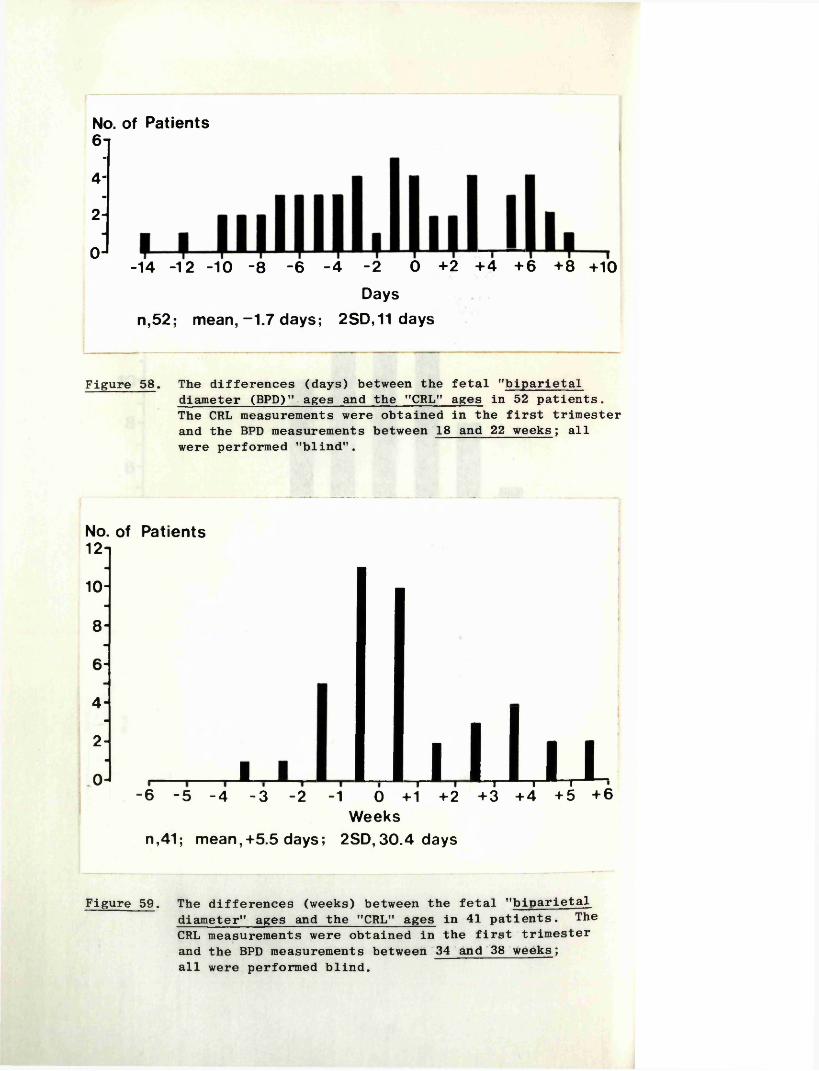
No. of Patients6 i
4
2
0-14 -12 -10 -8 -6 -4 -2 0 +2 +4 +6 +8 +10
Days n,52; mean,-1.7 days; 2SD,11 days
Figure 58. The differences (days) between the fetal "biparietaldiameter (BPD)" ages and the "CRL" ages in 52 patients. The CRL measurements were obtained in the first trimester and the BPD measurements between 18 and 22 weeks; all were performed "blind".
No. of Patients 12-
10
864
2
0 1 jllu-6 -5 -4 -3 -2 -1 0 +1 +2 +3 +4 +5 +6
Weeksn,41; mean,+5.5 days; 2SD,30.4 days
Figure 59. The differences (weeks) between the fetal "biparietal diameter" ages and the "CRL" ages in 41 patients. The CRL measurements were obtained in the first trimester and the BPD measurements between 34 and 38 weeks; all were performed blind.
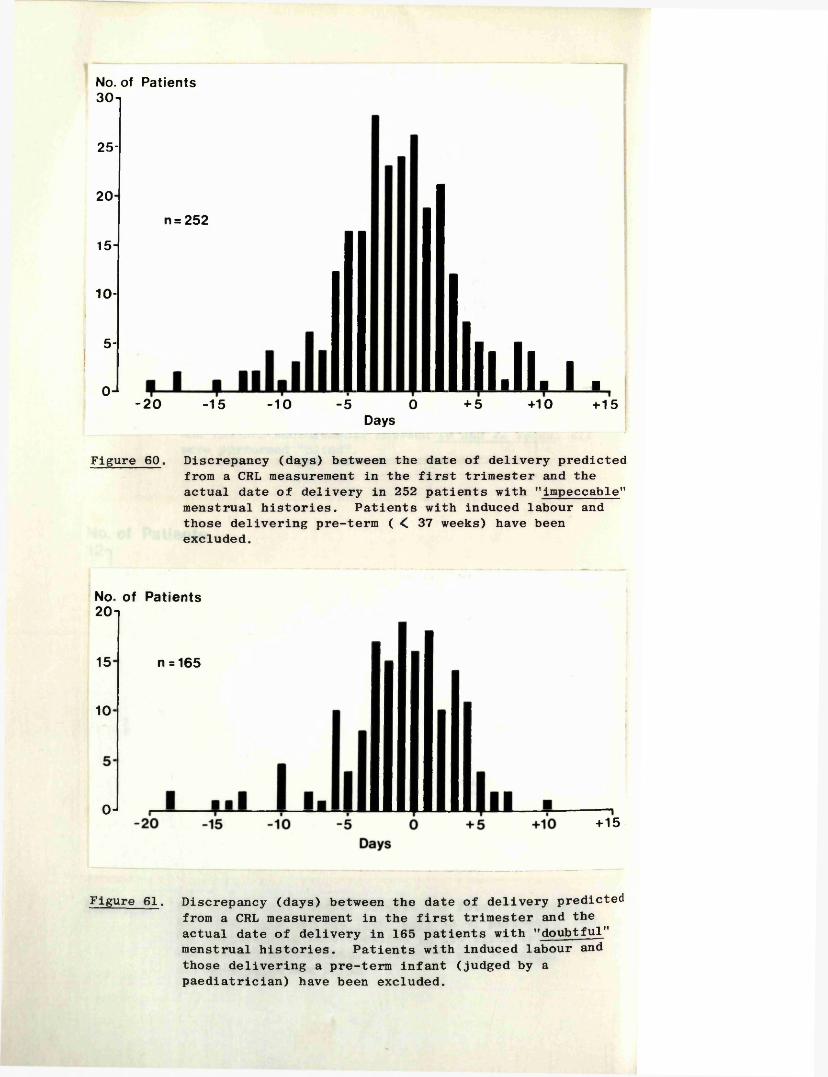
No. of Patients30-i
25-
20
15 -
10-
5-
0 J
n = 252
-20 -15 -10 5 0Days
lll.ll. i ■+ 5 +10 +15
Figure 60. Discrepancy (days) between the date of delivery predicted from a CRL measurement in the first trimester and the actual date of delivery in 252 patients with "impeccable'* menstrual histories. Patients with induced labour and those delivering pre-term ( < 37 weeks) have been excluded.
No. of Patients20i
15
10
0 J
n = 165
+15
Figure 61. Discrepancy (days) between the date of delivery predicted from a CRL measurement in the first trimester and the actual date of delivery in 165 patients with "doubtful" menstrual histories. Patients with induced labour and those delivering a pre-term infant (judged by a paediatrician) have been excluded.
3
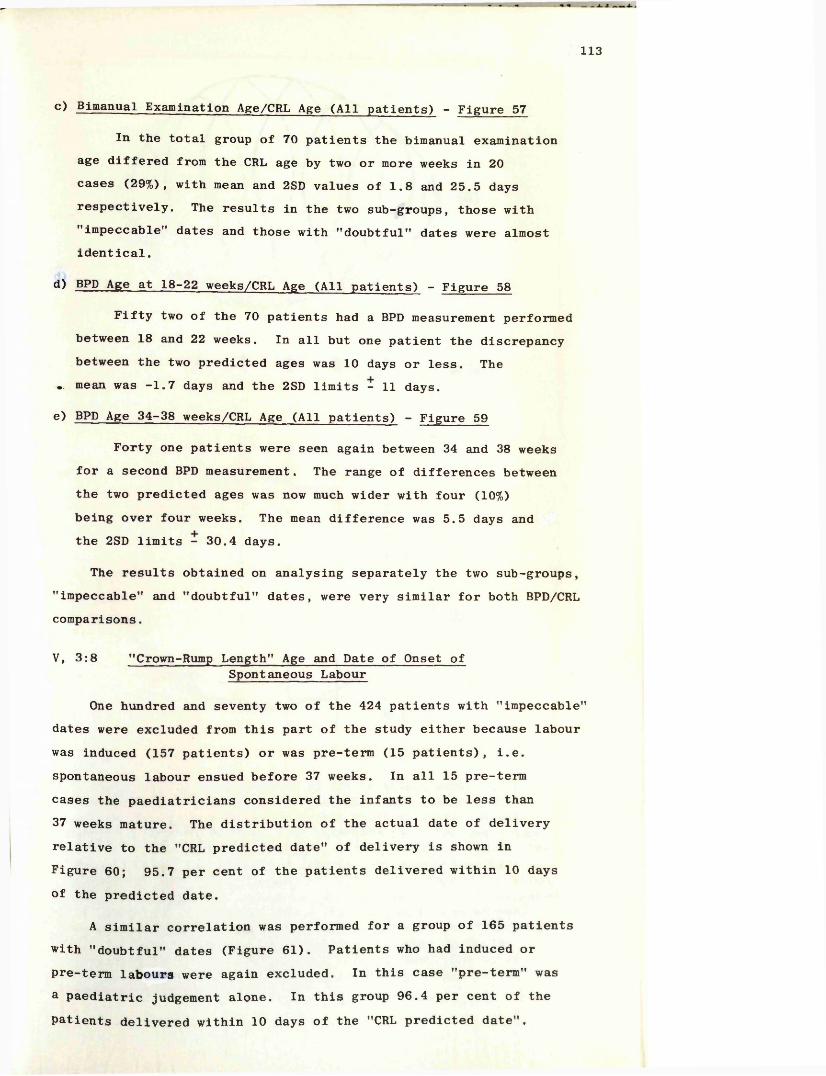
113
c> Bimanual Examination Age/CRL Age (All patients) - Figure 57
In the total group of 70 patients the bimanual examination age differed from the CRL age by two or more weeks in 20 cases (29%), with mean and 2SD values of 1.8 and 25.5 days respectively. The results in the two sub-groups, those with "impeccable” dates and those with "doubtful" dates were almost identical.
d) BPD Age at 18-22 weeks/CRL Age (All patients) - Figure 58
Fifty two of the 70 patients had a BPD measurement performed between 18 and 22 weeks. In all but one patient the discrepancy between the two predicted ages was 10 days or less. The
.. mean was -1.7 days and the 2SD limits - 11 days.
e) BPD Age 34-38 weeks/CRL Age (All patients) - Figure 59
Forty one patients were seen again between 34 and 38 weeks for a second BPD measurement. The range of differences between the two predicted ages was now much wider with four (10%) being over four weeks. The mean difference was 5.5 days and the 2SD limits - 30.4 days.
The results obtained on analysing separately the two sub-groups, "impeccable" and "doubtful" dates, were very similar for both BPD/CRL comparisons.
V, 3:8 "Crown-Rump Length" Age and Date of Onset ofSpontaneous Labour
One hundred and seventy two of the 424 patients with "impeccable" dates were excluded from this part of the study either because labour was induced (157 patients) or was pre-term (15 patients), i.e. spontaneous labour ensued before 37 weeks. In all 15 pre-term cases the paediatricians considered the infants to be less than 37 weeks mature. The distribution of the actual date of delivery relative to the "CRL predicted date" of delivery is shown in Figure 60; 95.7 per cent of the patients delivered within 10 daysof the predicted date.
A similar correlation was performed for a group of 165 patients with "doubtful" dates (Figure 61). Patients who had induced or pre-term labours were again excluded. In this case "pre-term" was a paediatric judgement alone. In this group 96.4 per cent of the patients delivered within 10 days of the "CRL predicted date".
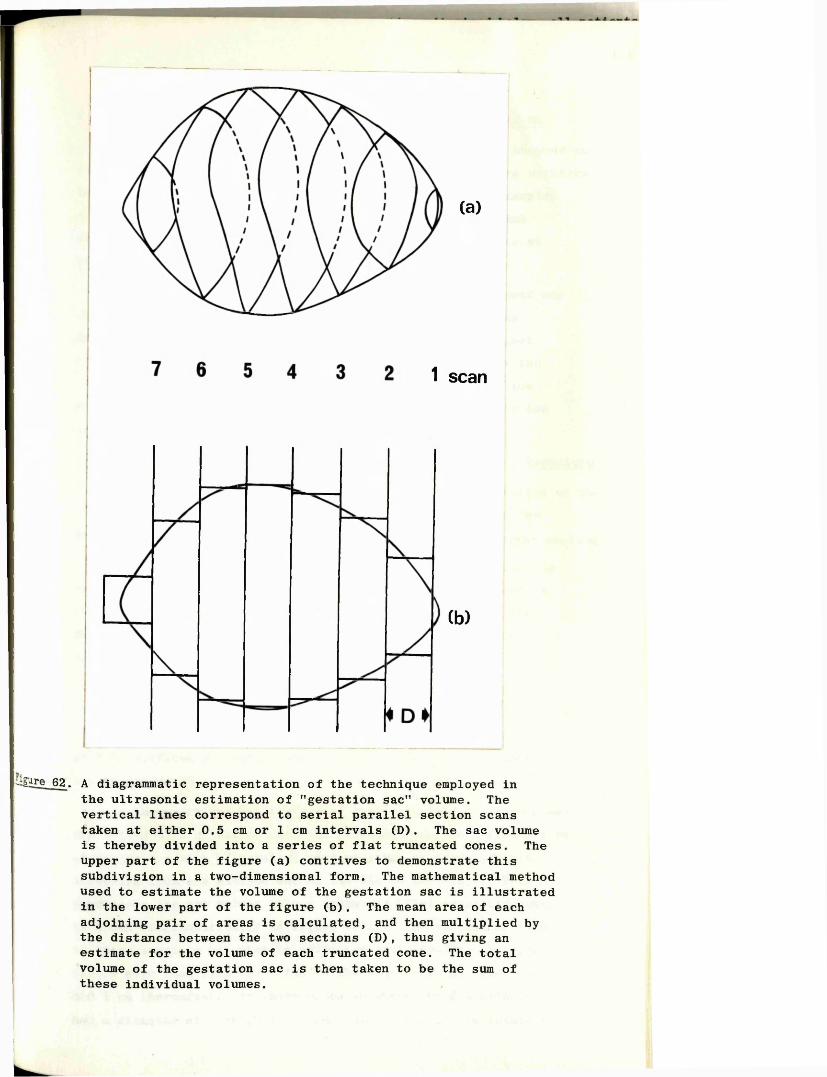
(a)
1 scan
Cb)
-igure 62. A diagrammatic representation of the technique employed in the ultrasonic estimation of "gestation sac" volume. The vertical lines correspond to serial parallel section scans taken at either 0.5 cm or 1 cm intervals (D). The sac volume is thereby divided into a series of flat truncated cones. The upper part of the figure (a) contrives to demonstrate this subdivision in a two-dimensional form. The mathematical method used to estimate the volume of the gestation sac is illustrated in the lower part of the figure (b). The mean area of each adjoining pair of areas is calculated, and then multiplied by the distance between the two sections (D), thus giving an estimate for the volume of each truncated cone. The total volume of the gestation sac is then taken to be the sum of these individual volumes.

114
V, 3:9 Serial Crown-Rump Length Measurements and Outcome
Three or more CRL measurements were performed in one hundred and thirty eight patients. In general the level of the results relative to the mean and 2SD lines remained fairly constant, for example, a fetus with a CRL measurement below the mean at the initial examination almost always had similarly placed measurements at the subsequent examinations.
The overall level of the first trimester CRL measurement was compared with eventual fetal weight, but no correlation was demonstrable. In particular there was no evidence to suggest that those fetuses with serial CRL measurements at or near the lower second SD line had a greater chance of being in the low weight range at birth than those fetuses with CRL values in the upper range.
V, 3:10 Description of Gestation Sac Volume Measurement Technique
A description of this technique together with a discussion of the results obtained was originally published by the author in the British Journal of Obstetrics and Gynaecology (1975). (Reprint enclosed.)
Throughout this section and the remainder of the thesis the term "gestation sac" will be used rather than "amniotic sac" as the volume measured was the total fluid-filled portion of the developing pregnancy which, until at least the eleventh week, comprises both the amniotic sac and the extraembryonic coelom (Arey, 1965).
The technique employed to measure the volume of the gestation sac was based on the principle that if two flat surfaces are placed in parallel at a known distance from each other, and if the areas of both surfaces are known, then the volume of the intervening space may be estimated.
In the practical application of this principle to measurement of the volume of a gestation sac, the procedure adopted was simply that of making a series of parallel section scans at predetermined intervals from one extreme end of the sac to the other. This subdivides the sac volume into a number of "flat truncated cones" as shown diagrammatically in Figure 62(a). The volumes of each of these sections may then be estimated individually. Intervals of 0.5 cm were used from the fifth to the tenth week of menstrual age and 1 cm thereafter. In those cases in which the gestation sac had a diameter of less than 1.5 cm, calculation of its volume was
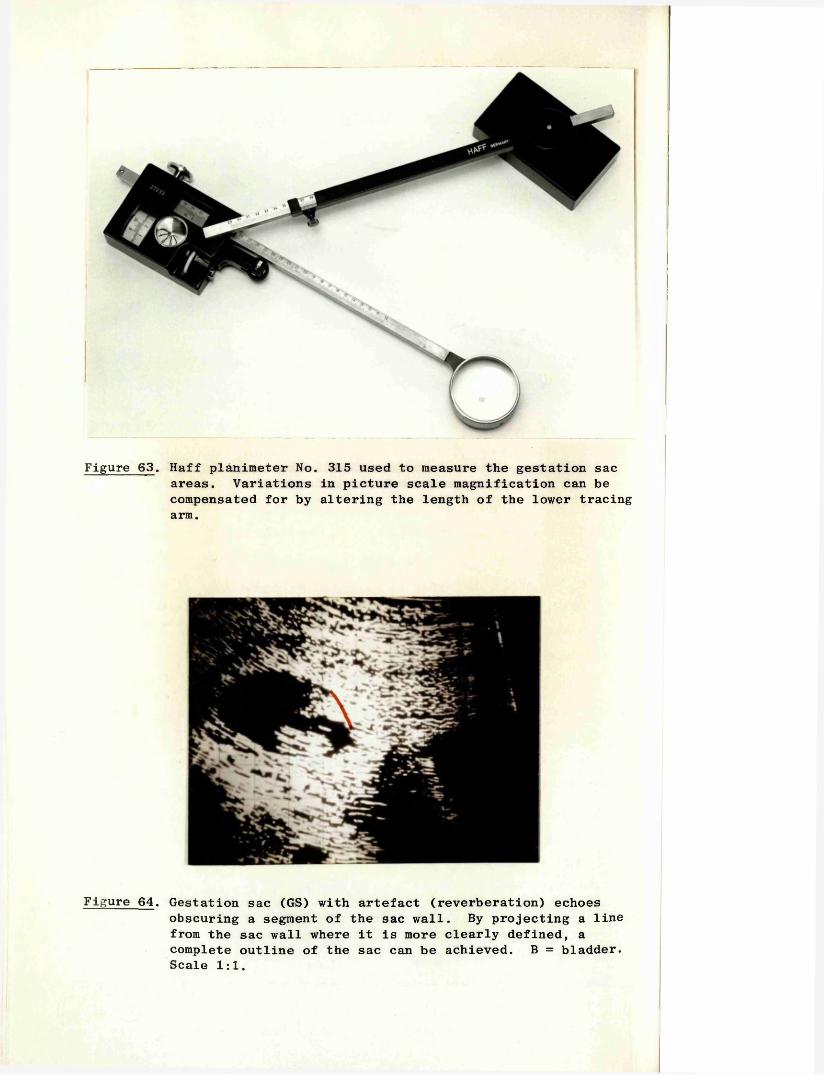
Figure 63. Haff planimeter No. 315 used to measure the gestation sac areas. Variations in picture scale magnification can be compensated for by altering the length of the lower tracing arm.
Figure 64. Gestation sac (GS) with artefact (reverberation) echoesobscuring a segment of the sac wall. By projecting a line from the sac wall where it is more clearly defined, a complete outline of the sac can be achieved. B = bladder. Scale 1:1.

115
made from a measurement of its maximum diameter, as in such cases the sac was almost invariably circular in cross-section. All scans were displayed on the 0.94 to 1 display scale and photographed with the Polaroid camera. The area of the gestation sac shown on each section was measured using a HaffPlanimeter No. 315 (Figure 63), appropriate corrections having been made for the scale factor of 0.94 to 1 and the additional 3.7 per cent due to scale registration and velocity calibration errors described in sub-section 3:3 of this Chapter. Corrections such as these are easily made by adjusting the length of the planimeter tracing arm thereby allowing a direct measurement to be made.
Practical Considerations
During the scanning process, attempts were made to satisfy certain criteria, namely that the outline of the gestation sac should be as complete as possible and that there should be no (or very few) artefact echoes within the sac. In a proportion of patients, especially those who are obese, or very slim, and those in whom the uterus is retroverted, a balance had to be made between these two criteria, and the best possible compromise was often achieved only by careful adjustment of the power output level and receiver sensitivity settings. From the above, it is evident that the judgement of the operator may be important in assessing when the picture is at its optimum, and thereafter, in extrapolating the line of the sac outline when a segment is obscured by artefact echoes (Figure 64). Notwithstanding the above, it has been found that a clear and complete gestation sac outline can be obtained in each of the serial sac sections in the majority of patients, and that the criteria required for an optimum picture can be satisfied over a relatively wide range of control settings.
The second practical point which merits consideration is the routine adopted in making allowances for the effect of beam width on the lateral walls of the sac, that is those walls which are parallel to the "line of sight” of the ultrasonic beam. The effect of "beam width” in these areas is that the sac wall echoes extend inwards beyond the true boundary of the sac, thereby reducing the inner transverse diameter of the gestation sac image. This problem does not apply to the antero-posterior diameter of the sac as the ultrasonic system is capable of recording accurately
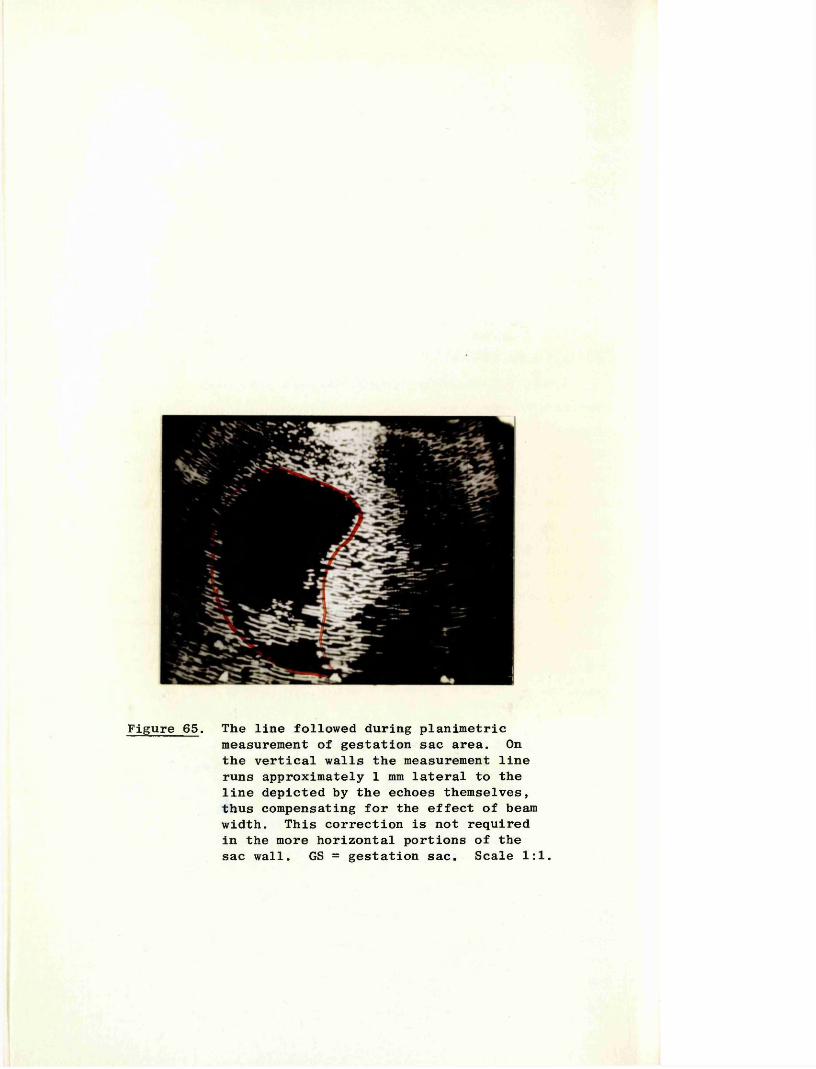
Figure 65. The line followed during planimetricmeasurement of gestation sac area. On the vertical walls the measurement line runs approximately 1 mm lateral to the line depicted by the echoes themselves, thus compensating for the effect of beam width. This correction is not required in the more horizontal portions of the sac wall. GS = gestation sac. Scale 1:1.

116
the position of a structure whose plane is perpendicular to that of the ultrasonic beam. During the planimetric measurement of the individual sac areas therefore, the line followed in the "vertical” portions of the sac section was one drawn 1 mm. lateral to that depicted by the echoes themselves. In the more horizontal parts of the sac wall however, this correction was not required and the sac outline followed more exactly (Figure 65).
Calculation of Gestation Sac Volume
Given the variable outline of gestation sacs, it was expedient to use an approximate method of estimating their volumes, the simplest and most appropriate being a modification of the "trapezoidal rule". This rule, which is normally used for the estimation of the area under a curve, requires a knowledge of the height of a series of points on the curve from a baseline, together with the horizontal distances of each point from the next. The product of the average of two adjacent height measurements and their distance apart gives a measure of the enclosed area. The total area under the curve is then the arithmetical total of the individual areas so calculated. In applying this rule to a three dimensional structure such as a gestation sac, the values for height are replaced by those for the equivalent area as shown diagrammatically in Figure 62(b). The volume of the last segment was estimated on an arbitrary basis by halving the area of the last sac section (An) and multiplying the result by distance, D.
The equation is thus :-
where V = volume of the sacD = distance between the scans
and A = area of the sac as depicted on the two-dimensional scan. In its reduced form the equation becomes :-
On consideration of the solid geometry of this method it can be shown that there is likely to be a small overestimation in the calculation of the volumes from the central "slices" and an
/A1+A2 j + r |A2+A3j + An-l+An
+ A2 +
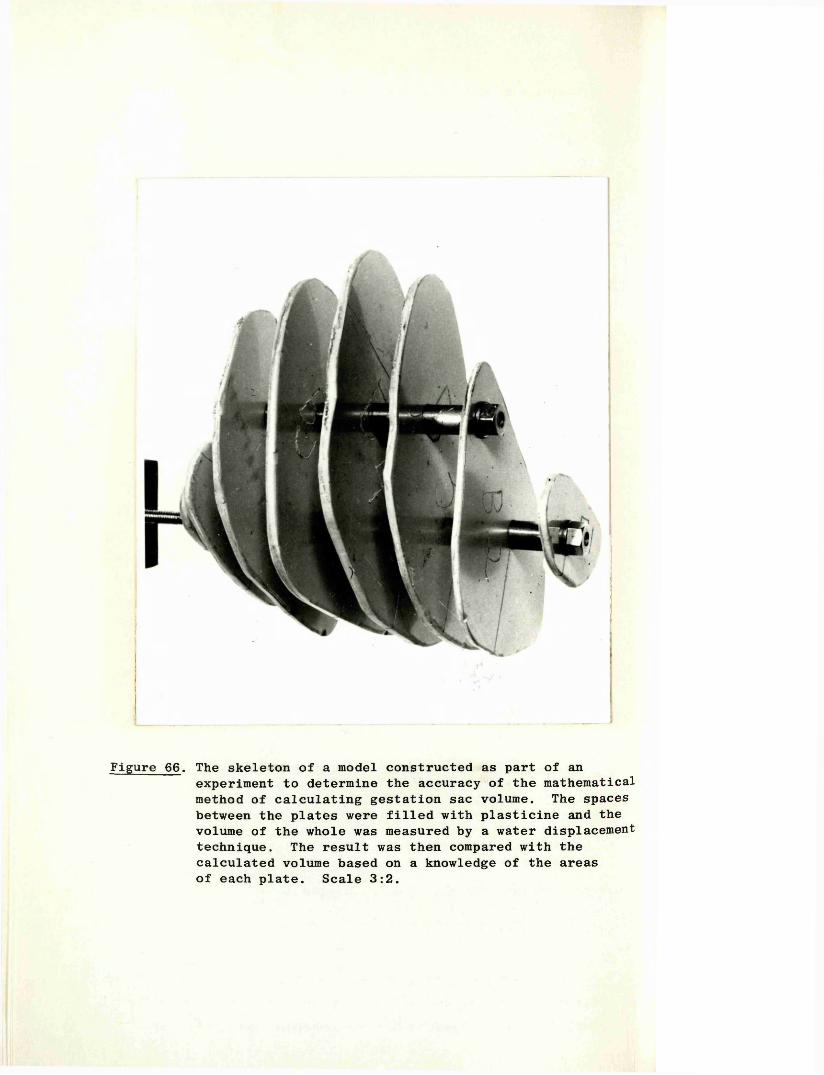
Figure 66. The skeleton of a model constructed as part of anexperiment to determine the accuracy of the mathematical method of calculating gestation sac volume. The spaces between the plates were filled with plasticine and the volume of the whole was measured by a water displacement technique. The result was then compared with the calculated volume based on a knowledge of the areas of each plate. Scale 3:2.

117
underestimation in the outer "slices".
To obtain an approximation of the potential error which might be incurred by the calculation method per se, three models of gestation sacs were constructed. For each model, a series of shaped metal plates corresponding to the individual "slices" of a representative gestation sac were constructed. The surface areas of these plates were measured very accurately using squared paper and fixed to a metal rod at predetermined intervals (Figure 66). The spaces between the plates were then filled with plasticine and the volume of the whole model measured by a simple water displacement technique. The value obtained was then compared with the volume calculated by the mathematical method described above. The percentage difference in each of the three models was found to be 5.3, 4.7 and 1.4 respectively for models of 3.2 ml,14.3 ml and 95.6 ml. In each case the calculated value was the smaller of the two.
While these experiments were limited in terms of numbers, they suggest that the mathematical method used is unlikely to result in a large error in the estimation of gestation sac volume (GSV).
V, 3:11 Sources of Error in the Measurement of GestationSac Volumes
These may be divided into random and systematic errors, in the same way as that described for the errors incurred in CRL measurements.
Systematic errors
The individual sources of systematic error were considered to be identical to those already evaluated for the CRL measurement technique, namely the oscilloscope scale factor error of 3 per cent, a beam width effect of 0.5 to 1 mm, and a 0.7 per cent error in calibration velocity. Steps were taken to compensate for these sources of error, as described earlier in this section.
Random errors
The potential sources of random error in this technique are less easily defined, but must include such inter-related factors as operator judgement when selecting the control settings to obtain the best possible picture of the gestation sac section, and errors which may be incurred when deciding the line of the sac wall to be followed during the planimetric measurement.
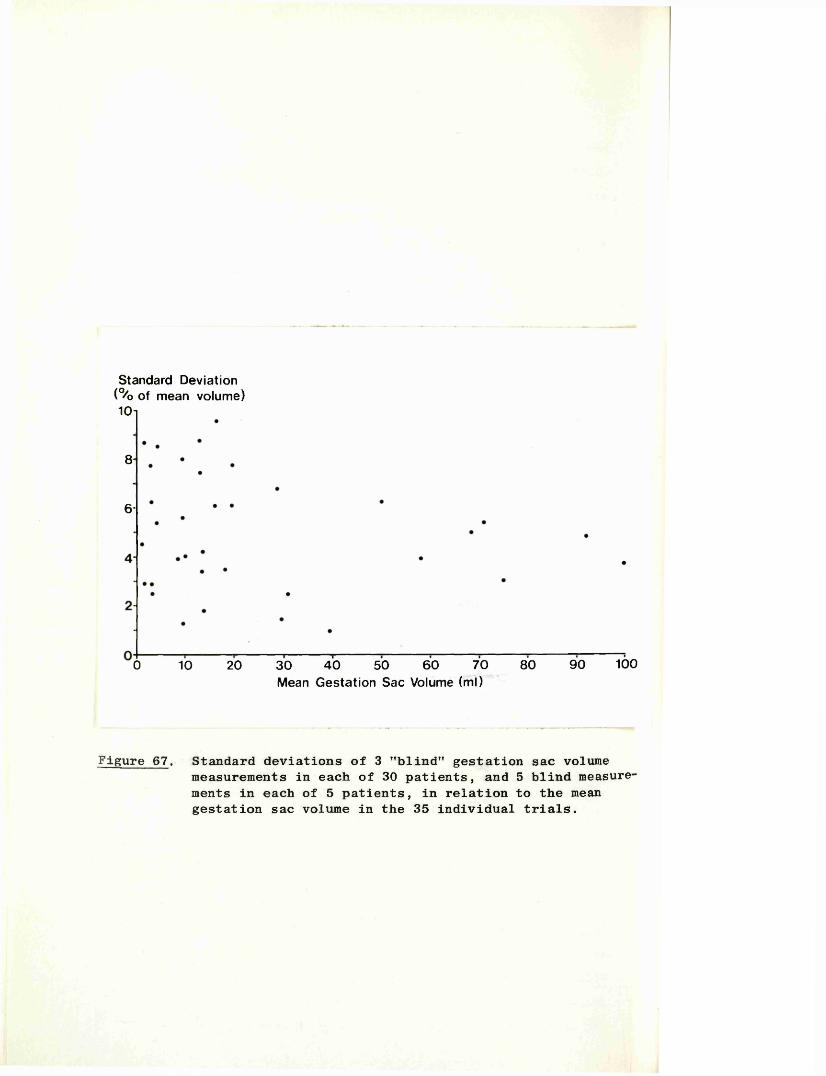
Standard Deviation (% of mean volume) 1Ch
8
6-
0 10 20 30 40 50 60 70 80 90 100Mean Gestation Sac Volume (ml)
Figure 67. Standard deviations of 3 "blind" gestation sac volumemeasurements in each of 30 patients, and 5 blind measure ments in each of 5 patients, in relation to the mean gestation sac volume in the 35 individual trials.

118
Reproducibility of the Gestation Sac Volume Measurement Technique
The practical effect of these potential sources of random error on the reproducibility of the technique was assessed in a similar way to that described for the CRL measurement technique.
Three independent GSV measurements were made in each of 30 patients, and five measurements made in a further five patients. Each set of scans was obtained at an interval of at least 5 minutes and more usually 10 to 15 minutes, to allow bladder filling or emptying. As a result of the alteration in bladder size the pressure exerted on the uterus changes, and as a direct consequence the shape of the gestation sac often also changes. In this way the relative independence of each volume measurement was assured, for while the shape of the gestation sac may change, its volume must remain constant. Tie results obtained in the 35 experiments are shown in graphical form in Figure 67.It was calculated that the average standard deviation of each set of sac volume measurements was 5.9 per cent for the triple volume measurement group, and 5.4 per cent for the group in which five sets of measurements had been performed. The values from which these two figures were obtained ranged from one per cent to 9.6 per cent, with a tendency for the SD to decrease with increasing sac volume.
Errors incurred during measurement from the photographs The potential error incurred during the process of measuring the sac areas from the photographs, was the only factor contributing to the overall random error which it was considered possible to quantify on an individual basis.
In order to evaluate the magnitude of this error a consecutive non-selected series of 50 sets of photographs were extracted from the files and three independent measurements made of the GSV1s in each case. The average standard deviation obtained in the 50 "trials" was 3.2 per cent with a range from zero to seven per cent.
The patients in this series included groups from each week of the first trimester, and whose GSV's ranged from 1 to 100 ml.
V, 3:12 "In VivoM Comparison of Ultrasonic and "Actual"Gestation Sac Volume Measurements
A comparison between ultrasonic measurements of GSV’s and

013COCO•H ft a . S5 d d S3• • • ft • • • •ft ft ft ft ft ft ft ft
0 0bD Oa d+J Q)d0 0O P P 0 Pft O
CO 03 o in O) CM 03 CO o• • • • • • • • •rH CO CD o CM CO 00 o COpH P rH
-p i do 0 o 0 /-*0 S co a •p 3 c« d ih•rl rH h ri SQ O P O ̂> P >£>
in CD o p 00 03 m in ino o d o o o CM CO* p
p 00 Tf a0 P 3 * 00 CO CM inp d p p • • • ••rl rH 0 a o m in 00 00 00 00Q ft > %»/ p CM p CM CM CM
COCO
inoin
i 0 aO 03 3•H o Ha -a 0 w oo p s >co 3 d(J r l H • i—IP ft O h dP > S PH ^ 0to P
00 00 00 o CO CM 03 m m• • • • • • • • •o in p 00 c* 00 o CO
p CM p CM CM CO CO 03
-o0P rH 0 r-vd 0 i •6 p 3 iH
•h 0 ih gP ft o ^CO > ft
d J P ft 0 O ft
CM©
00o
ino
CMCO o
coo*
oo oo coco co 03r—I CMCM
inm
co
o•rldO /TVw > .d 03 PfH O aP
o 00 CO m 00 03 in in CO m• • • • • • • • • •
rH CO rH rH 03 rHp CM CM CM N CO CO m
P d 0 . •H O
ftCM CO r}< in co oo 03
0>» pi—i pp oo u0 0u 0p dX3 043 >»TJ p p0 pU p dd o p0 pd 0 U0 u da d fto0 X II0a 00 •d S3po d ft> p430 P • «43 P 0p ■* d0•d T3 0d 0 pd U pU0 d 430 o 0a o 0d o 5hp fto d> o II
p•c p ftp Shd orH 43 •P d d0O 0 ad d p0 o 00 0d d ftO d 0p pp d >>d o ap ft o0 0 p0 obO 03 0i uP p 0o p0 00 0 f»0 0 43p dd o dap d 0p p d0 £0 • oO 0 pP 0d d 0o 0 00 dd T3 Ou 0p PrH U •d o d
•o dp d 0o 0pd o 00 d Pco -Pp d p p dft a a o o u o p
do •03 0 d d p ra p mrH P d p
CM

119
direct measurements immediately thereafter at termination of pregnancy by hysterotomy would be the ideal direct method of evaluating the error of this ultrasonic technique. Such a comparison, however, was almost impossible to organise because, in accordance with hospital policy, all but one first trimester terminations were carried out by the vaginal route, in which process the gestation sac was invariably ruptured. The information from the one exception is recorded in Table 12 (Patient no. 10), a patient at 10 weeks of menstrual age in whom a hysterectomy had been performed.
In the absence of data from normal pregnancies, consideration was given to a correlation between the ultrasonic and direct measurements of GSV’s in pregnancies which aborted spontaneously. Unfortunately, in most cases of spontaneous abortion in the first trimester, the sac wall is partially or completely devitalised making clear definition of its outline more difficult, thereby incurring a greater potential for error than in normal pregnancies.In addition to this, there was the simple logistical problem of accumulating aborted specimens with intact gestation sacs from patients who had been scanned within the preceding 48 hours. Despite these problems it was considered that such a correlative study would be of value. Table 12 shows the results obtained in nine patients who aborted spontaneously within two days of the last ultrasonic examination, and the one patient whose pregnancy was terminated by hysterectomy on the day following an ultrasonic examination. The estimates of fetal volume used in this table were derived from the figures given by Streeter (1921) for weight against crown-rump length, and assumed a specific gravity for the fetus of 1.0 (Harrison and Malpas 1953). The maximum error was found in Patient No. 4 where the difference was 4.0 ml., or 16 per cent. The average difference was 6.4 per cent.The closest correlations were to be found in the three patients in whom the tissues of the sac were noted to be fresh. Excluding these three patients, examination of the data obtained from those pregnancies in which the tissues were found to be partially necrotic shows that there was a tendency for the ultrasonic estimation of GSV to be greater than the corresponding direct post abortion measurements. No judgement can be made as to whether this overestimation was due to measurement error (bearing in mind the poor nature of the tissues), or to loss of fluid from the sac
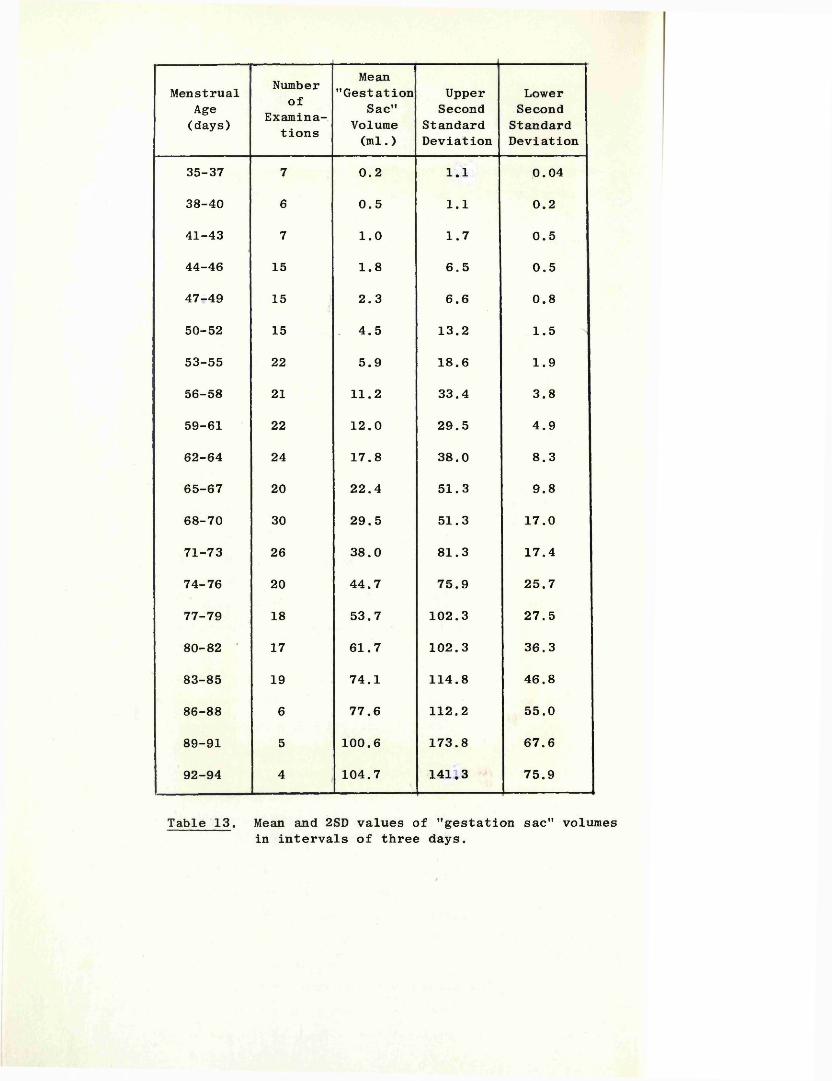
MenstrualAge(days)
Numberof
Examinations
Mean"Gestation
Sac"Volume(ml.)
UpperSecond
StandardDeviation
LowerSecond
StandardDeviation
35-37 7 0.2 1.1 0.04
38-40 6 0.5 1.1 0.2
41-43 7 1.0 1.7 0.5
44-46 15 1.8 6.5 0.5
47-49 15 2.3 6.6 0.8
50-52 15 . 4.5 13.2 1.5
53-55 22 5.9 18.6 1.9
56-58 21 11.2 33.4 3.8
59-61 22 12.0 29.5 4.9
62-64 24 17.8 38.0 8.3
65-67 20 22.4 51.3 9.8
68-70 30 29.5 51.3 17.0
71-73 26 38.0 81.3 17.4
74-76 20 44.7 75.9 25.7
77-79 18 53.7 102.3 27.5
80-82 ' 17 61.7 102.3 36.3
83-85 19 74.1 114.8 46.8
86-88 6 77.6 112.2 55.0
89-91 5 100.6 173.8 67.6
92-94 4 104.7 141.3 75.9
Table 13. Mean and 2SD values of "gestation sac" volumes in intervals of three days.
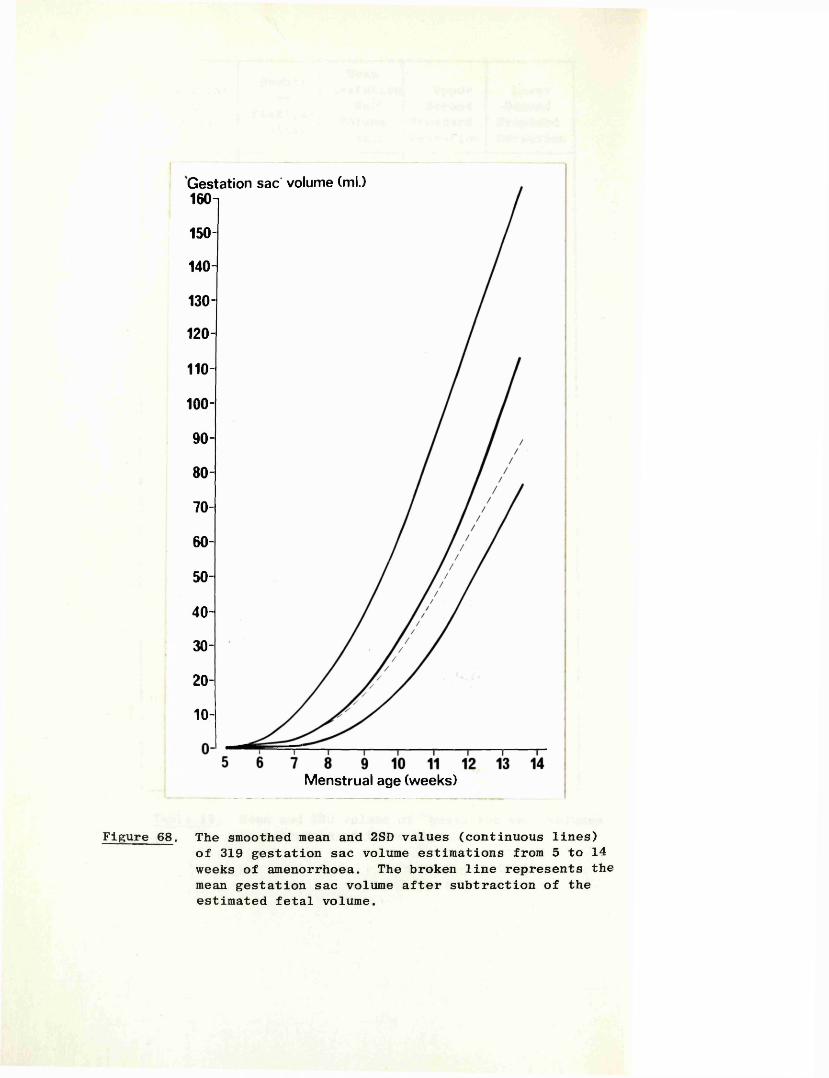
Gestation sac' volume (ml.)160-i
150-
140-
130-
120-
110-
100-
90-
80-
70-
60-
50-
40-
30-
20-
10-
Menstrual age (weeks)
Figure 68. The smoothed mean and 2SD values (continuous lines) of 319 gestation sac volume estimations from 5 to 14 weeks of amenorrhoea. The broken line represents the mean gestation sac volume after subtraction of the estimated fetal volume.
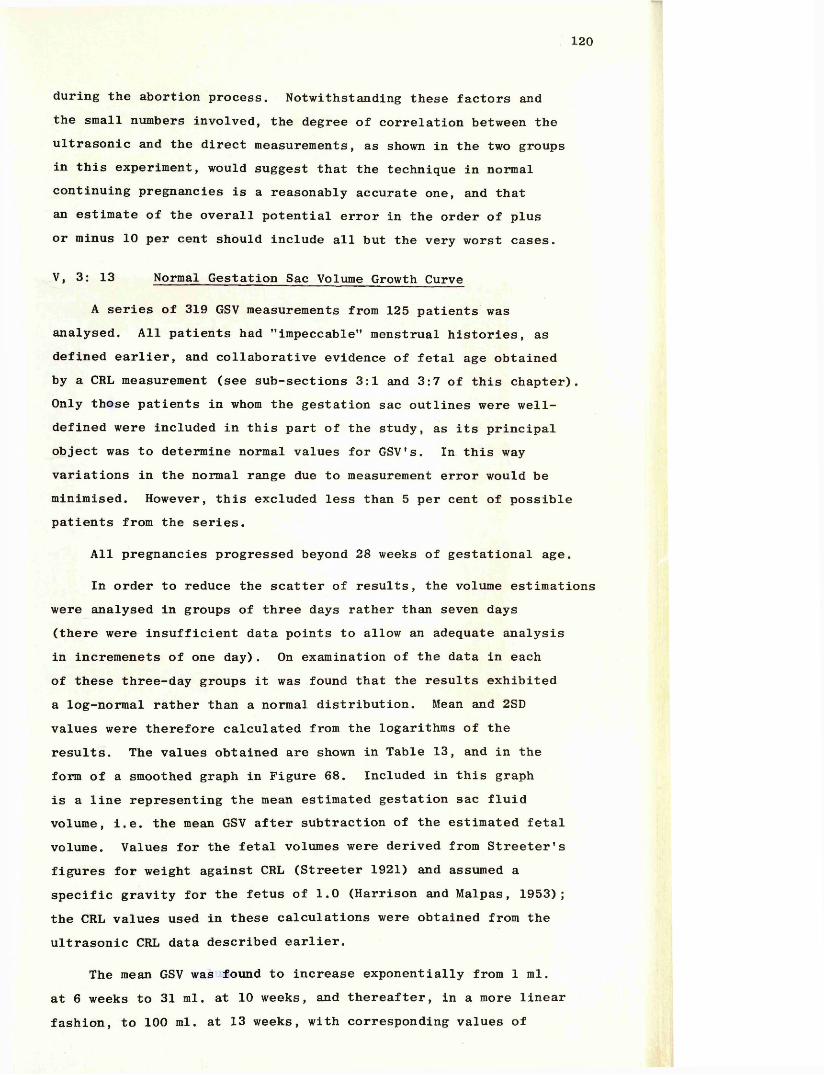
120
during the abortion process. Notwithstanding these factors and the small numbers involved, the degree of correlation between the ultrasonic and the direct measurements, as shown in the two groups in this experiment, would suggest that the technique in normal continuing pregnancies is a reasonably accurate one, and that an estimate of the overall potential error in the order of plus or minus 10 per cent should include all but the very worst cases.
V, 3: 13 Normal Gestation Sac Volume Growth Curve
A series of 319 GSV measurements from 125 patients was analysed. All patients had "impeccable'’ menstrual histories, as defined earlier, and collaborative evidence of fetal age obtained by a CRL measurement (see sub-sections 3:1 and 3:7 of this chapter). Only those patients in whom the gestation sac outlines were well- defined were included in this part of the study, as its principal object was to determine normal values for GSV’s. In this wayvariations in the normal range due to measurement error would beminimised. However, this excluded less than 5 per cent of possible patients from the series.
All pregnancies progressed beyond 28 weeks of gestational age.
In order to reduce the scatter of results, the volume estimationswere analysed in groups of three days rather than seven days(there were insufficient data points to allow an adequate analysis in incremenets of one day). On examination of the data in eachof these three-day groups it was found that the results exhibiteda log-normal rather than a normal distribution. Mean and 2SD values were therefore calculated from the logarithms of the results. The values obtained are shown in Table 13, and in the form of a smoothed graph in Figure 68. Included in this graph is a line representing the mean estimated gestation sac fluid volume, i.e. the mean GSV after subtraction of the estimated fetal volume. Values for the fetal volumes were derived from Streeter’s figures for weight against CRL (Streeter 1921) and assumed a specific gravity for the fetus of 1.0 (Harrison and Malpas, 1953); the CRL values used in these calculations were obtained from theultrasonic CRL data described earlier.
The mean GSV was found to increase exponentially from 1 ml. at 6 weeks to 31 ml. at 10 weeks, and thereafter, in a more linear fashion, to 100 ml. at 13 weeks, with corresponding values of
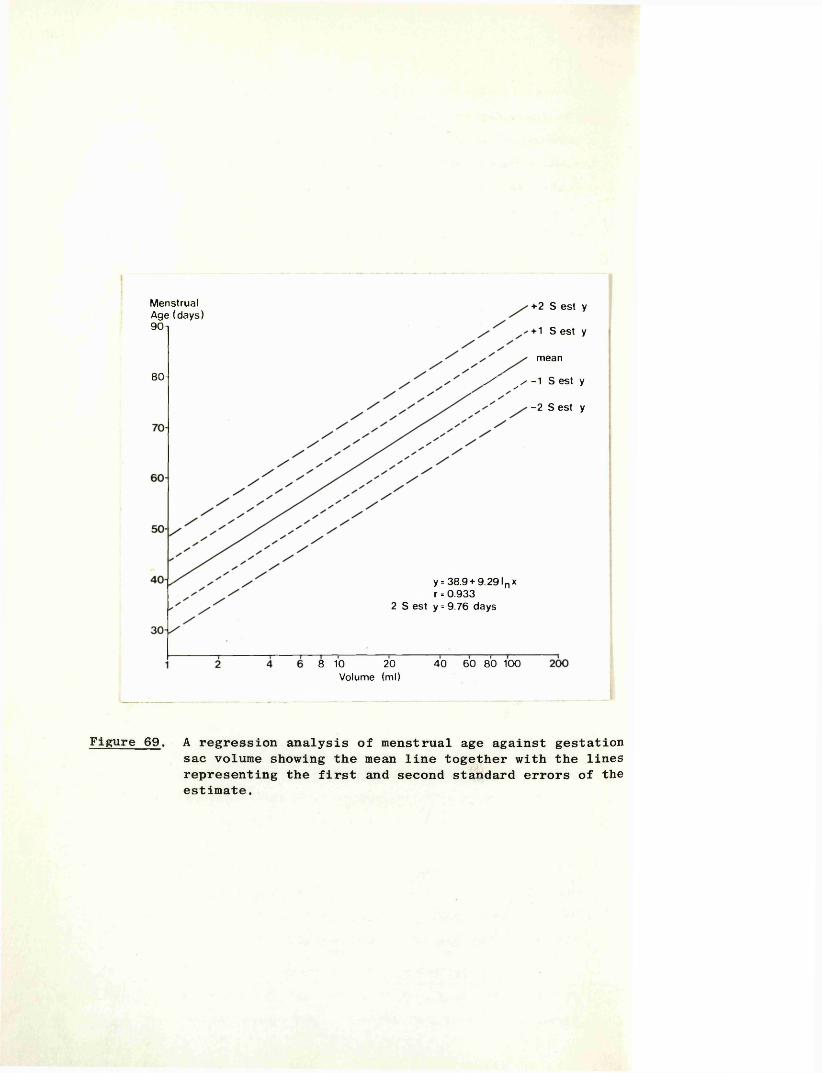
Menstrual Age (days) 90 n
80-
+2 S est y+ 1 S est ymean
s ' / -1 S est y-2 S est y
y = 38.9 + 9.291 n x r = 0.933
2 S est y= 9.76 days
8 10 20 Volume (ml)
40 60 80 100
Figure 69. A regression analysis of menstrual age against gestation sac volume showing the mean line together with the lines representing the first and second standard errors of the estimate.

121
1 ml, 28 ml. and 80 ml for the fluid volume alone. While the rapid increase in volume of the gestation sac is paralleled by a scatter of results which increases in absolute terms with advancing gestation, the scatter, as a percentage of the mean, actually decreases as the pregnancy advances.
V, 3:14 Estimation of Gestational Age Using Gestation Sac Volume Measurements
A regression analysis of the 319 gestation sac volume measurements was performed to determine statistically the limits of error incurred in using such measurements as a means of estimating gestational age. The curve fitted to the data is given by the equation
y = 38.9 + 9.29 log ̂ x
where y = menstrual age (days), and x = gestation sac volume.The correlation coefficient of this curve is 0.932, and two standard errors of the estimate found to be - 9.8 days (Figure 69).

122
VI
D I S C U S S I 0 N

123
Objective evaluation of the early pregnancy and of its complications has long been a problem, principally because of the relative inaccessibility of the gravid uterus at this stage to direct methods of investigation. With the introduction and refinement of sophisticated diagnostic ultrasound equipments in the last ten years, this situation has changed drmatically; using such equipment, it has become possible to "see", study and measure the early developing conceptus in a way which was hitherto impossible.
In this thesis, three new ultrasonic techniques devised by the author for the objective assessment of various aspects of early pregnancy have been described, together with the results of their application to some of the more commonly encountered problems of this critical period of life.
VI, 1 CONFIRMATION OF FETAL LIFE
From the results of human morphological, and comparative embryological studies, it has been estimated that the human heart starts to function approximately 21 days after conception, that is at around five weeks of menstrual age (De Haan, 1965;Corliss, 1976). Using the equipment, and the combined B and A-mode technique described in this thesis, it has been found possible to detect the presence of fetal heart movements with complete reliability from seven weeks of amenorrhoea, and on occasions from as early as 6 weeks and 0 days. This latter observation, if we are to accept the patient's menstrual history, and the opening statement of this section, was made some seven days after the initiation of fetal heart activity. No other technique has allowed the positive diagnosis of fetal life as early as this, and with such a degree of reliability. The question might therefore be posed of why should other techniques not achieve similar results. In general terms those previously described, including Doppler techniques with either abdominal (Callagan et al, 1964) or vaginal (Jouppila, 1971) transducers, and simple A mode systems (Kratochiwil and Eisenhut, 1967), all have the problems of the operator having to search blindly the whole volume of the pelvis or lower abdomen for the fetal heart, an organ which at this stage has proportionately a tiny volume. Furthermore, because of the extremely small amplitude of movement of the cardiac structures, the fetal heart "sounds" (or movements)

124
are easily obliterated by the higher amplitude of the "sounds"(or movements) from the maternal pelvic blood vessels. The improved accuracy of diagnosis reported by those who have employed a vaginal transducer (Kratochwil and Eisenhut, 1967; Jouppila, 1971) may be attributed, both to the closer approximation of the probe to the gravid uterus, and therefore to the reduction in the volume to be searched, and to the fact that here the ultrasonic beam is generally directed away from the maternal vessels. For reasons of patient acceptance however, especially those who have been admitted with vaginal bleeding, this latter technique has never been widely used. Therefore, in devising the present method the author was conscious of the desirability of using a transabdominal rather than a vaginal approach.
The problems of the above techniques were resolved by first visualising the early fetus with the B-mode thereby allowing the ultrasonic beam to be directed accurately at the fetus. By "labelling" the fetal echo complex as described in Chapter V, 1:1, it was then possible to scrutinise the corresponding A-mode echoes for evidence of movements in the certain knowledge that they were derived from the fetus and not from surrounding structures. The facility of expanding the A-mode up to a tenfold magnification was also of great importance, because only by this means was it possible to detect the extremely small excursion of the moving heart structures (< 1 mm) in many of the six and seven week fetuses. While this combined technique may be considered as a development of the A and TP mode approach described by Kratochwil and Eisenhut (1967), the addition of the preliminary B-mode location of the fetus makes it a very much faster and more reliable technique. Given a reasonable degree of experience, confirmation that the fetus is alive, in all but the earliest cases rarely takes longer than a few minutes. However, a negative report, with its possible clinical implications, should always be the result of a much more prolonged search. In this study, which included 121 patients with missed abortions, it was considered that there were no false results when a fetus had been positively identified within the gestation sac. Drumm and Clinch (1975) using this technique reported two misdiagnoses in their series of 69 patients in whom a missed abortion was diagnosed.They ascribed their failures to inexperience in one patient (a very early patient in the series), and to an underfilled bladder

125
resulting in an unsatisfactory examination in the other. It should be stressed again however, that a diagnosis of a missed abortion in the current investigation was made only after a systematic and meticulous search of the whole volume of the fetus.
Diagnoses of fetal death using other techniques cannot be made with such a degree of reliability, especially in the earlier weeks (7-10 weeks), due to uncertainty as to whether the fetus has been thoroughly and completely examined.
In a more recent report Piiroinen (1974) described a transabdominal technique, similar in concept to the present one, in which a conventional B-mode examination is first used to locate the fetus. At this point Piiroinen substitutes a 5 MHz Doppler transducer for the pulsed-echo probe at its exact position and angle, and then, by making small changes in its direction, a search is made over the limited field containing the fetus until the characteristic fetal heart tones are heard.From a series of 99 examinations, he reported that accuracy of diagnosis for both positive and negative results can be achieved in pregnancies of eight weeks of amenorrhoea and beyond. There were however only four patients with missed abortions during this period. In the author's limited and somewhat anecdotal experience of this approach, a positive result was usually easy to obtain, but a negative report could not be given with confidence.
In view of the validated reliability of the technique described in this study, its application to routine clinical practice is self-evident. In particular, the management of patients with a threatened or recurrent abortion is placed on a very much more objective basis when the presence or absence of fetal life can be determined with certainty, and patients may be reassured, or appraised of the inevitability of abortion, as appropriate. Furthermore, when the size of the uterus does not correspond clinically to the stated menstrual dates, a less advanced but continuing pregnancy is readily distinguished from a missed abortion. Finally, before undertaking operations such as cervical cerclage to prevent abortion due to incompetence of the cervix, it is reassuring to have prior confirmation of the viability of the fetus.
126
VI, 2 FETAL HEART RATE
This study confirms earlier reports that the fetal heart rate falls from a level of 175 beats per minute at nine weeks of gestational age to 150 beats per minute at 15 weeks (Muller and Osier, 1969; Tenhaeff and Karajiannis, 1970; Jouppila, 1971; Wladimiroff and Seelen, 1972). The improved sensitivity allowed by the combined B, A-mode technique described here has allowed, for the first time, human fetal heart rates to be documented for the period 6 weeks and 3 days to 9 weeks. While there is a considerable scatter of results it has been shown that the mean rate increases from 125 beats per minute to 175 beats per minute over this period. This change is highly significant, as is the difference between the mean rates at 9 weeks and 15 weeks (p < 0.001). In a subsequent investigation conducted by Piiroinen (1975), in which a combined B mode/Doppler technique was employed, an almost identical pattern of mean heart rate change was found. While there were many fewer observations than in this current study, it is interesting to note that the standard deviation limits were smaller.
This early rapid increase in heart rate may be related to the anatomical differentiation of the heart itself. Barry (1940) has described an increase in rate which accompanies differentiation of the atrium in the embryonic chick. This is probably associated with the faster inherent rate of contraction in atrial muscle, and with the gradual assumption of the pacemaker role by the developing atrium (Barry, 1942). In the present study the period of rising heart rate (6 to 9 weeks menstrual age) parallels the period of separation and rapid morphological development of the atria, and may reflect a similar sequence of structural and functional differentiation. While specific pacemaker and conducting tissue also appear in the heart during this same stage (Walls 1947) , their influence on heart rate is probably small as they are as yet poorly differentiated.
By nine weeks, when the heart rate begins to fall, the heart form is well established. In an unpublished electron microscopy study, Shaw Dunn (1973) noted that at nine weeks the cardiac muscles cells were relatively undeveloped, but that during the subsequent few weeks myofibrils, which form the contractile apparatus of the cell, appear in large numbers for

127
the first time. The development of myofibrils may be determined by changes in the haemodynamic load (Carey 1921), and the presence of these myofibrils may then affect the response of the heart wall to the load, resulting in slower, more efficient contractions.
Histological studies have shown that vagal fibres approach the fetal heart at the ninth week, but absence of the enzyme cholinesterase (Navaratnam, 1964) suggests that this system is not functional at this stage and plays no part in the decrease in heart rate. This supposition is further supported by the electron microscopic studies of Gamble (1966) who showed that myelinisation of the peripheral nerves, important for conduction velocity, does not occur until the 12-22 week period.
VI, 2:1 Bleeding in Early Pregnancy
In this study no difference was found, in either the mean heart rates or the spread of results, when a comparison was made between the values obtained from normal pregnancies and those from pregnancies complicated by a "threat to abort" but which continued past 28 weeks. In addition, the heart rates in a group of 19 pregnancies examined prior to intrauterine fetal death showed no significant deviation from the normal range; similarly, normal rates were found in the nine patients with "early live abortions" who aborted within one to five days of the last ultrasound examination. These observations suggest that for practical purposes, the rate of the fetal heart is of no prognostic value in patients whose pregnancies are complicated by vaginal bleeding. While it is probable that there is a change in the fetal heart rate, or rhythm, prior to fetal death the findings of this investigation infer that such a change must be a late, or even terminal, event.
128
VI, 3 DIAGNOSIS OF EARLY PREGNANCY FAILURE
The emphasis in this part of the study was to define criteria by which a non-continuing pregnancy might be diagnosed by ultrasound, and for such diagnoses to be independent of any knowledge of the clinical or menstrual history. This latter caveat was considered important if clinical action is to be taken on the basis of the ultrasound findings, for the potential unreliability of menstrual data in many patients leaves open the possibility of ascribing a "small for dates" gestation sac to a non-continuing pregnancy, rather than to a less advanced but viable pregnancy. Clearly an error such as this would destroy the credibility of the technique, and would militate against the option of offering a patient an elective termination of what was considered to be an abnormal pregnancy.
In earlier studies, notably those reported by Donald et al (1972) and Heilman et al (1973), somewhat subjective criteria of abnormality were used, of which a "poor", or small gestation sac were the most frequent. Not surprisingly there were significant false positive and false negative results (10-14%) in both series.By introducing gestation sac measurements to the problem (Jouppila, 1971; Kohom and Kaufman, 1974; Levi, 1973, 1976a) a more objective assessment of a non-continuing pregnancy could be made. However, as measurements were related by these authors to gestational age, and as even then there was still an overlap of normal and abnormal results, an absolute diagnosis on the basis of a single examination remained untenable. In view of this, Donaldand his colleagues (1972), Varma (1972), and Kohorn and Kaufman(1974), stressed the advisability of performing serial examinations to confirm a suspected diagnosis.
In this investigation, early pregnancy failures were divided into sub-groups, namely blighted ova, missed abortions, early andlate live abortions, and hydatidiform moles (Chapter V, 2).Thus, it has been possible to formulate individual and more precise diagnostic criteria for each. On this basis, it has been shown that almost half of the cases of blighted ovum, all missed abortions, and also (for practical purposes) all hydatidiform moles, could be diagnosed with confidence at the first examination.

129
VI, 3:1 Blighted Ova
Patients with a blighted ovum not diagnosed at the first examination (52.5%) required a second, and occasionally a third, examination before a definitive statement of abnormality was possible. The diagnoses were then based on either an abnormally slow growth rate of the sac (< 75% increase in volume per week), or absence of fetal echoes in a sac which has achieved a volume of > 3 ml. While the exclusion of the menstrual data, as an additional factor in helping to reach a diagnosis, reduces the detection rate at the first examination in this sub-group, those pregnancies which are diagnosed positively as blighted can then be managed or terminated without fear of error.
Given that it is not possible to make a definitive diagnosis at the first visit in half of the patients, a warning can at least be given that all might not be well if the gestation sac is seen to be "small for dates".
The single known misdiagnosis of blighted ovum was disconcerting, and indeed was the reason for raising the criterion of abnormality from 2.5 ml to 3.0 ml mid-way through the series. It is believed that no other errors of this type were made, and that no continuing pregnancies were terminated. While this supposition cannot be proven beyond all doubt the pathological findings that the products of conception were at least partially necrotic in all cases, is supportive. Less significant was the absence of a fetus (apart from a small disorganised nodule in six cases), as frequently fetal tissue is not identified even at therapeutic termination of normal very early pregnancies.
On a more academic note the small group of patients (Figure 30) with gestation sac volumes (GSV) of over 10 ml would seem to be atypical, the great majority of blighted ova never attaining this size. It is possible that these pregnancies were in fact missed abortions in which the fetus had become so macerated as to have disintegrated. In either event, there was no practical diagnostic problem as a sac of this volume, containing no recognisable fetus, is unequivocably abnormal.
VI, 3:2 Missed Abortions
The diagnosis of a missed abortion is very much more simple, being based on the single premise that if a fetus can be seen
130
within the gestation sac, yet no heart movements can be detected on a thorough examination, then the fetus is dead. As stated earlier, there were no false positive or false negative diagnoses. Of the 120 patients in this group, supportive evidence for the diagnosis was obtained in 100 by the finding of a macerated fetus in the aborted products of conception, and in all by the histological demonstration that the membranes and trophoblast were at least partially degenerated.
The demonstration in many of these cases of areas of apparently normal placental tissue, serves to explain the 80 per cent of the urine pregnancy tests which were positive when the diagnosis of missed abortion was first made. However, immediately prior to spontaneous abortion, only 12 per cent of pregnancy tests were positive.
A hypothesis for the natural history of events in missed abortions could thus be that the fetus first dies and that the placental tissue remains viable for a variable period. This is reflected in the finding of a continued increase in volume of the gestation sac and the persistance of significant levels of urinary human chorionic gonadotrophin. In the ensuing four weeks the trophoblast and decidua then die progressively, causing intermittent vaginal bleeding and eventually a decrease in the GSV. In parallel, the placental progesterone production will fall and, with a reduction in the inhibitory influence of this hormone on the uterus, contractions and ultimately spontaneous abortion ensue. In this context, it is perhaps relevant that a history of vaginal bleeding or abdominal pain was rarely elicited for the period of one week before or after the estimated time of fetal death. The typical story was that pregnancy symptoms (breast fullness and tenderness, nausea, etc.) diminished and disappeared some two to three weeks before abortion (approximately 2 weeks after the estimated time of fetal death), to be followed later by vaginal bleeding, an occurrence which often preceded spontaneous abortion by only a few days. In support of this hypothesis, Nesbitt (1967) states "Regardless of the primary cause, the precipitating cause of abortion is the regressive decidual change, necrosis, and haemorrhage, and separation of the placenta. In most instances the pathologic changes are secondary to fetal death which invariably occurs for an average of six weeks before
131
the abortus is expelled."
There were no cases of "cameous mole" in this series. This was probably the result of abnormal pregnancies having been terminated electively long before this pathological state was reached.
The ultrasound data in the 19 patients examined prior to fetal death showed no significant deviation from the normal ranges or trends. Thus, impending intrauterine fetal death could not be anticipated. Using the crown-rump length (CRL) as a marker of when the fetus died, it was shown that in 73 per cent of cases death had occurred by nine weeks of menstrual age, and by 14 weeks in all but one. Applying this information prospectively, a patient 10 weeks advanced in pregnancy with a history of recurrent abortion can be reassured that intrauterine death is unlikely if fetal heart movements are still present. By the time she reaches 14 weeks, she may then be told that, unless she has a late live abortion (a less common occurrence), the chances of her pregnancy progressing beyond 28 weeks are excellent.
VI, 3:3 Hydatidiform Moles
The diagnostic problem in these patients is a more academic one, in that it can on occasion be difficult to differentiate a hydatidiform mole from a long-standing missed abortion, and vice versa. This is particularly true when the placenta of the missed abortion has undergone hydropic degeneration, or, in the case of a hydatidiform mole, when there has been bleeding into the molar tissue. In either event, however, the pregnancy can be confidently labelled as non-continuing. Donald (1965) warned of the additional danger of confusing a mole and a degenerated uterine fibromyoma. There were no such cases in this series.
VI, 3:4 Management of "Established" Early Pregnancy Failure
As stated earlier, the primary object of this part of the study was to formulate criteria for the ultrasound diagnosis of abnormal pregnancies, such that these diagnoses could be applied prospectively and with complete reliability in the active management of established early pregnancy failures. Before applying these criteria as a basis for intervention, clinical confidence in their accuracy had to be established. Thus, in the earlier part of the series most pregnancies were allowed to take their natural course and be
132
aborted spontaneously, or they were only terminated following several confirmatory examinations at weekly intervals. However, with increasing confidence, and an appreciation that no false positive results were being obtained, it was felt that patients could be offered elective termination of their pregnancies whenever a firm diagnosis had been made. One hundred and sixty one (68%) of the 236 patients in the three sub-groups - blighted ovum, missed abortion and hydatidiform mole - had their pregnancies terminated. While there were incidental clinical grounds to support the ultrasound diagnosis in the majority, termination of pregnancy was performed on the ultrasound evidence alone in 38 patients. None of these patients gave a history of vaginal bleeding, and when performed, the urine pregnancy tests were positive.
It may be argued that given time, all of these pregnancies would have aborted spontaneously and that surgical intervention was needless interference, indeed interference which might result in trauma to the cervix. However, the great majority of patients with spontaneous abortions will ultimately come to operation and the early diagnosis by ultrasound allows what may have been an emergency procedure to be carried out electively with at least increased short-term safety for the patient. In this context, two patients allowed home to await spontaneous abortion were readmitted by Flying Squad in a shocked state, having bled suddenly and profusely at home. Emergency resuscitation of the patient and evacuation of the uterus was required. Conversely, only two of the 161 patients treated electively required a blood transfusion because of excessive blood loss, one of these postoperatively to correct anaemia. However, because of awareness of potential damage to the cervix during dilatation it has become the practice to assess clinically the state of the cervix before embarking on elective surgery. In this series five patients found to have long, tightly closed cervices were allowed home, to be seen at weekly intervals until the cervix had become more favourable.
Additional considerations supporting an aggressive line of management, are the avoidance of the psychological stress of awaiting a spontaneous abortion, and the reduced costs of hospitalisation if the problem is resolved expeditiously.

133
VI, 3:5 Live Abortions
These pregnancies are to be distinguished from those in which the fetus dies some weeks before spontaneous abortion.
In neither the early nor the late groups was it possible to anticipate with certainty, a live abortion. However, the ultrasound findings in the series of nine early live abortions consistently showed the GSV to be abnormally small in relation to the CRL of the fetus, a feature which was uncommon ( < 5%) in pregnancies which progressed normally. While this low "sac-fetus ratio" in the first 10 weeks of pregnancy is not diagnostic of impending abortion it may serve as a warning that all may not be well.
Reinold (1976), in a study of patients in early pregnancy using a real-time ultrasonic scanner, observed that the number of fetal movements decreased prior to spontaneous abortion, and that almost without exception there was complete absence of body movements when spontaneous abortion took place within the ensuing few days. Furthermore, he found a good correlation of outcome with the "quality" of the movements, these being judged as strong and brisk, slow and sluggish, or absent. The latter two were shown to have a much poorer prognosis for the fetus than the first. This approach may well provide a useful additional warning of impending abortion in this group, but unfortunately will not be applicable before the ninth week since fetal movements are not normally present until after this time. Nevertheless, it is a line of investigation which merits further study in those pregnancies of over 9-10 weeks.
In the late live abortion group ultrasound examinations would appear to offer even less in the way of predicting impending abortion. It is worth commenting however, that examinations after 14 weeks were less detailed and were usually performed much less frequently.
VI, 3:6 Relative Incidences of the Sub-Groups of EarlyPregnancy Failure
The blighted ovum and missed abortion groups form the major portion of the abnormal pregnancies in this series. If the miscellaneous group and the hydatidiform moles are excluded (most of the latter having been referred from other hospitals), then

134
the incidence of each is seen to be 39 per cent and 46 per cent respectively. The equivalent figure for the early live abortion group is 3.5 per cent, and for the late live abortions, 11.7 per cent. These figures are similar to those derived by Fujikura and his co-workers (1966) from a pathological study of 327 aborted specimens. In detail, they found 5.5 per cent to be comprised of totally empty intact sacs, and 23.5 per cent ruptured but complete sacs with no evidence of a fetus or cord. Of their 72 (22%) incomplete specimens it is probable that a proportion were anembryonic, and if half of this group were added to those above then the incidences of blighted ovum in the two studies would be remarkably close. The remaining 51 per cent all had an accompanying fetus or evidence of a cord stump, and of these 31 (9.5%) showed no evidence of maceration and might therefore be considered as "live" abortions. It is of note that in this "live" group there were no fetuses whose CRL's were equivalent to an age of between 10 and 14 weeks, a finding which exactly parallels that in this investigation. All of the remaining fetuses were macerated to a variable degree and might therefore be classified as "missed abortions". Thus, it is clear from these studies that "missed abortions" are a common occurrence and should not be confused with the more uncommon pathological entity of "carneous mole".
In 210 aborted specimens Stratford (1970) found an associated fetus in 146 (70%), of which a significant proportion were no more than disorganised nodular or cylindrical embryos. Hertig and Rock (1949) estimate that absence or gross deficiency of the embryo occurs in some 50 per cent of all recognised pregnancies ending in abortion by the tenth week of gestation.
This current study has also shown that early live abortions occur infrequently and that their natural history, as illustrated by ultrasound, is very different from that of missed abortions and blighted ova.
VI, 3:7 Aetiologies of Early Pregnancy Failure and The Implications for Clinical Management
A defect at the embryonal or fetal level, such as a chromosomal abnormality (Carr 1963 and 1965) has been shown to 'account* for, or be associated with, up to 50 per cent of spontaneous abortions, especially those which occur in the earlier part of the first trimester. On a more speculative note, it is

135
possible that smaller chromosomal abnormalities not yet detectable by current techniques, or even deletion of genes responsible for critical phases of development, might be causative factors in many of the remaining cases. The correlation of ultrasonic and genetic findings in spontaneous abortion is an area of investigation which is being explored currently by the author in collaboration with the Glasgow University Department of Medical Genetics at Yorkhill.Preliminary observations have shown that while 37 per cent of missed abortions and blighted ova had abnormal karyotypes, the incidence in the live abortions (11 cases) was nil. While the numbers are small, these results suggest that a genetic reason is less likely to be a major causative factor in early live abortion than is the case in the missed abortion and blighted ovum groups. As an alternative, an abnormality at the trophoblastic level might be implicated, for the formation of amniotic fluid (largely a function of the trophoblast at this stage) has been shown to be consistently reduced.
The aetiological background to late live abortions, apart from those associated with probable cervical incompetence, is likely to be more diverse. No attempt has been made here to investigate this particular problem.
It should be noted that a pregnancy which aborts after 14 weeks is not necessarily a second trimester problem, as many patients, shown in the first trimester to have a missed abortion or blighted ovum, do not abort their pregnancies until well after the fourteenth week. This information may well be important when planning the management of a future pregnancy in a patient with a history of recurrent abortion.
Accepting that a blighted ovum is grossly abnormal, and that in up to 50 per cent of missed abortions there is a major chromosomal abnormality, then any form of treatment in either group is most unlikely to be productive and would be difficult to justify. Pursuing this line of reasoning, it may be argued that the normality or otherwise of the majority of pregnancies is determined from a very early stage, and that there is little in the way of specific therapy that could possibly influence the outcome. Therefore, in the prospective management of a patient shown to have a living pregnancy after a number of blighted ova and/or missed abortions,
136
psychological support (and this may include bed rest) is about all that the clinician has to offer. In this context, the weekly demonstration of fetal heart movements from seven weeks onwards has been found to be extremely useful. Patients with early live abortions on the other hand, with their patently different natural history, may possibly be a group in whom appropriate hormonal treatment might be effective. The problem however, is that such cases are uncommon, and a properly constituted trial would be difficult to organise.
VI, 3:8 Threatened Abortion
The abortion rate in the 367 patients referred initially because of a ’'threat to abort" was 55 per cent, a figure which lies well within the range of 28 to 81 per cent in previously reported series (Colvin et al, 1950; Johannsen, 1970; Evans and Beischer, 1970). From the results of this investigation it is clear that a prognosis, either certain or provisional, can be given on the basis of a single ultrasound examination in the great majority. Of the 185 patients in whom fetal heart movements were detected at the first examination, 160 (87%) had pregnancies which continued normally, the remainder going on to become missed or live abortions. Conversely, of the 182 patients in whom fetal heart movements were not detected,177 (97%) aborted. The last five patients, who had normal pregnancies, were all seen before six and a half weeks when fetal heart movements would not normally be detectable.
Thus, the great majority of patients who present with a so-called "threat to abort" fall into two fairly well-defined categories: those in whom an ultrasound examination shows definite or very suspicious evidence of an early pregnancy failure; and those in whom the pregnancy is clearly alive. The bleeding in the former group is then simply the early stages of the spontaneous abortion process itself, while in the latter it would appear to have little prognostic significance, at least for the majority (Evans and Beischer, 1970). The actual cause of the bleeding in this second group is obscure. However, in view of the very rapid, and probably marginally different growth rates of the developing placenta and the underlying uterine wall, it is possible that small areas of separation, due to shearing effects, will occur from time to time. Bleeding of varying
137
amounts might then result.
As outlined in Chapter III, 4, biochemical and other ancillary aids, while useful in predicting outcome, do not provide the same quality or reliability of information. The hormonal assays in particular merely reflect the functional state of the trophoblast, and as has been shown in this study, viable placental tissue is still present long after the fetus has died, and even when no fetus is present. Their use in early live abortions on the other hand might well be more informative.
VI, 3:9 Twin Conceptions
While the number of patients in this part of the study is small, the data suggests that twin conceptions are more common than is generally appreciated, and that it is probable the incidence is in the region of 1 in 60 or even higher, rather than 1 in 80. It is appreciated however, that patients with twin pregnancies where one or both sacs are abnormal, are more likely to be referred for ultrasound examination because of their higher incidence of a "threat to abort". Conversely the blighted sac in a number of twin pregnancies comprising a normal sac and fetus together with an associated blighted ovum may be missed during routine ultrasound examinations since the abnormal sacs often appear only transiently during the first trimester. Therefore such patients might not be examined at the appropriate time for the blighted sac to be visualised.
Levi (1976b) as a result of his study, also considered that more multiple pregnancies are conceived than ultimately come to delivery. As support, he quoted the following from a German textbook by Stoeckel (1945), "It appears that twins are more often conceived than born; not only in addition to the evidence of foeti papyracei, it may be that twin material is reabsorbed due to early death, without leaving any trace."
The results of Heilman and his co-workers (1973) add little to this problem, due to the highly selected nature of their material.
Clearly this whole question could only be satisfactorily resolved if a large and unselected group of patients were to be scanned serially, and with care, from the early weeks of pregnancy.

138
Two practical points have emerged from this investigation. Firstly, the clinician should be circumspect about communicating a diagnosis of a twin pregnancy until two fetuses, each with evidence of fetal heart movements, are demonstrable. Secondly, it would seem that the presence of a blighted ovum does not adversely affect the development of a coexisting normal pregnancy, and its presence is not generally associated with any complication apart from bleeding in the first trimester of pregnancy.The one possible exception was the patient who aborted at 25 weeks. A cause and effect relationship is unlikely however, as the abnormal sac had disappeared by the twelfth week.

139
VI, 4 ESTIMATION OF GESTATIONAL AGE
A reliable estimate of the gestational age of a pregnancy is one of the more important pieces of information which an obstetrician requires in his optimal management of a pregnant patient. Given this information he is free to assess the complications of pregnancy, and to decide upon the ultimate timing of delivery, without fear that his actions might result in the birth of an unexpectedly premature infant. This latter possibility is particularly acute in the recurring and very difficult situation in which the uterus feels small for the calculated menstrual age, but where the date of the last period itself is in doubt. One is then faced with the problem of trying to establish whether the uterus is small because of mistaken dates, or small because of intrauterine growth retardation. Here, early delivery would be indicated to forestall possible intrauterine death if growth retardation were the problem, while such a course of action could prove disastrous if the reason were mistaken dates, and a very immature baby delivered. Similarly, a knowledge of the gestational age of the fetus is of great value in the management of pregnancies complicated by diabetes mellitus, hypertension, renal disease and rhesus isoimmunisation. In addition to "at risk” patients, the practice of elective induction of labour now encompasses patients with relatively minor indications for delivery, and indeed, is often performed for purely social convenience. For such a practice to be acceptable, it is important that errors are not made in the timing of delivery, and that no babies are delivered with "pseudodysmaturity due to iatrogenic immaturity" (Bonham, 1969). In view of these and other reasons it is clear that accurate ancillary methods of assessing this important parameter are required.
From a biological standpoint the first trimester is the period of pregnancy when it should be possible to make the most accurate estimate of gestational age. This statement is based on the premise that biological variation should be at its smallest during this time. Since all pregnancies must start at the same size, that is, a fertilised ovum, it will take some time before genetic and environmental factors begin to exert their influences, and to result in a significant variation in the size of the gravid uterus and its contents. As pregnancy advances this variation increases, as
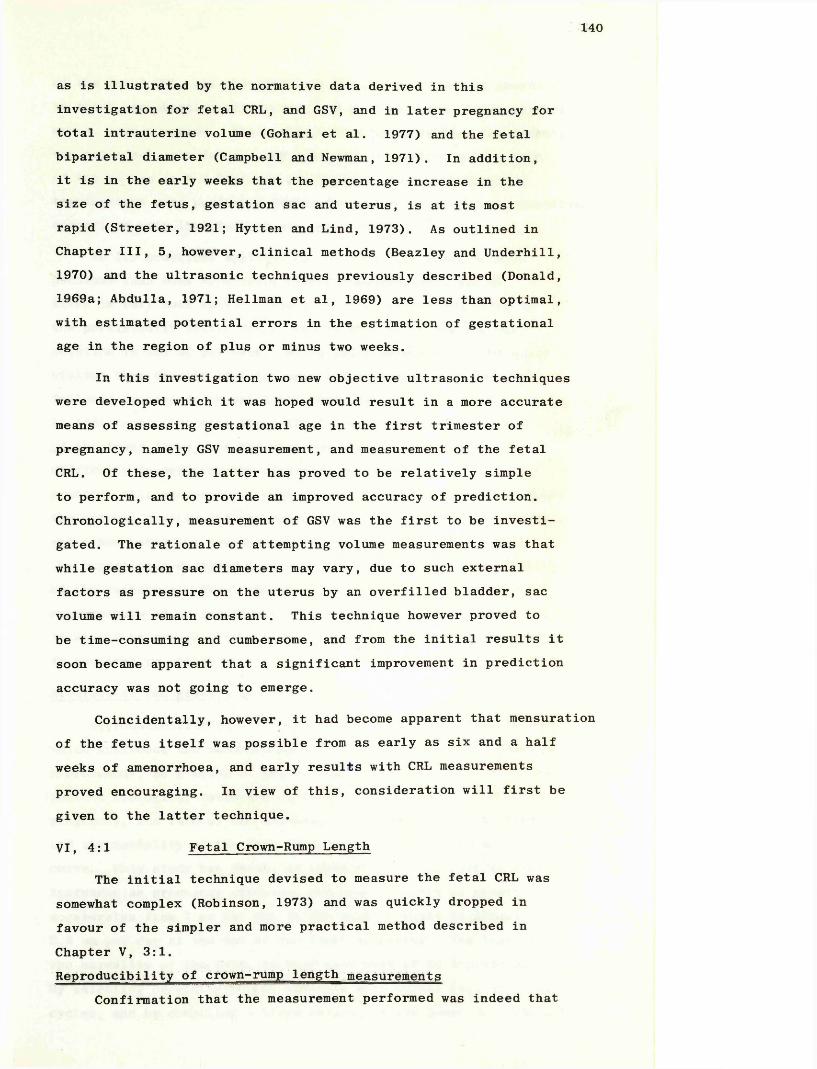
140
as is illustrated by the normative data derived in this investigation for fetal CRL, and GSV, and in later pregnancy for total intrauterine volume (Gohari et al. 1977) and the fetalbiparietal diameter (Campbell and Newman, 1971). In addition, it is in the early weeks that the percentage increase in the size of the fetus, gestation sac and uterus, is at its most rapid (Streeter, 1921; Hytten and Lind, 1973). As outlined in Chapter III, 5, however, clinical methods (Beazley and Underhill, 1970) and the ultrasonic techniques previously described (Donald, 1969a; Abdulla, 1971; Heilman et al, 1969) are less than optimal, with estimated potential errors in the estimation of gestational age in the region of plus or minus two weeks.
In this investigation two new objective ultrasonic techniques were developed which it was hoped would result in a more accurate means of assessing gestational age in the first trimester of pregnancy, namely GSV measurement, and measurement of the fetal CRL. Of these, the latter has proved to be relatively simple to perform, and to provide an improved accuracy of prediction. Chronologically, measurement of GSV was the first to be investigated. The rationale of attempting volume measurements was that while gestation sac diameters may vary, due to such external factors as pressure on the uterus by an overfilled bladder, sac volume will remain constant. This technique however proved to be time-consuming and cumbersome, and from the initial results it soon became apparent that a significant improvement in prediction accuracy was not going to emerge.
Coincidentally, however, it had become apparent that mensuration of the fetus itself was possible from as early as six and a half weeks of amenorrhoea, and early results with CRL measurements proved encouraging. In view of this, consideration will first be given to the latter technique.
VI, 4:1 Fetal Crown-Rump Length
The initial technique devised to measure the fetal CRL was somewhat complex (Robinson, 1973) and was quickly dropped in favour of the simpler and more practical method described in Chapter V, 3:1.R e p r o d u c ib i l i ty o f cit>wn-njumB_jLength measurements
Confirmation that the measurement performed was indeed that

141
of the fetal CRL, was obtained from the series of missed abortions in which pre-abortion ultrasound, and post-abortion direct measurements, were compared. While this method of validating the technique was not ideal, the fetus being dead, the very close correlation of the values (r = 0.994) was gratifying. As few therapeutic terminations were performed during the period of study, an equivalent comparison with live fetuses was not possible.
In its practical application the technique poses no more problems than does biparietal diameter measurement, and at times is very much easier. The main difficulty encountered is the persistently active fetus, and in this situation the only solution is one of patience. While fetal movements may be quite violent they usually last for only a few minutes, and are often followed by periods in which the fetus is completely stationary.An additional, but more theoretical, problem is the incursion of the lower limbs into the plane of measurement causing difficulty in defining the limits of the fetal "rump". In practice this was rarely a significant problem, presumably because the natural position of the fetal legs is one of flexion. These and other potential sources of random error were evaluated in the experiments designed to determine the overall reproducibility of the technique. While the variation in repeated "blind” measurements of an individual fetus was found to be small (- 1-2 mm) it should be stressed that a reasonable degree of care and patience is required to obtain optimal results.
Accuracy of CRL gestational age estimates
Reproducibility of the technique is only one of four factors which influence the accuracy of a CRL measurement, and indeed any measurement, as a means of estimating gestational age. The others include biological variation of fetal CRL's at a given point in pregnancy, the rate of CRL increase throughout the first trimester, and the normality of the data used to derive the reference growth curve. This study has shown, as expected, that biological variation increases as pregnancy advances, and that the rate of growth accelerates from 1 mm per day in the earlier weeks to almost 2.5 mm per day at the end of the first trimester. The last factor, the normality of the data, is very much more of an imponderable.By selecting carefully normal patients with normal regular menstrual cycles, and by compiling a large series, it was hoped that the effect
Crown-Rump Length (mm)90-1
80-
70-
60-
50-
40-
30-
- Present study o Kurjak et al (1976)■ Drumm et al (1976)
20-
10-
Menstrual Age (weeks)
Figure 70. Comparison between the mean crown-rump length valuesbetween 6 and 14 weeks of menstrual age derived in this study, and those published by Kurjak et al (1976) and Drumm et al (1976).
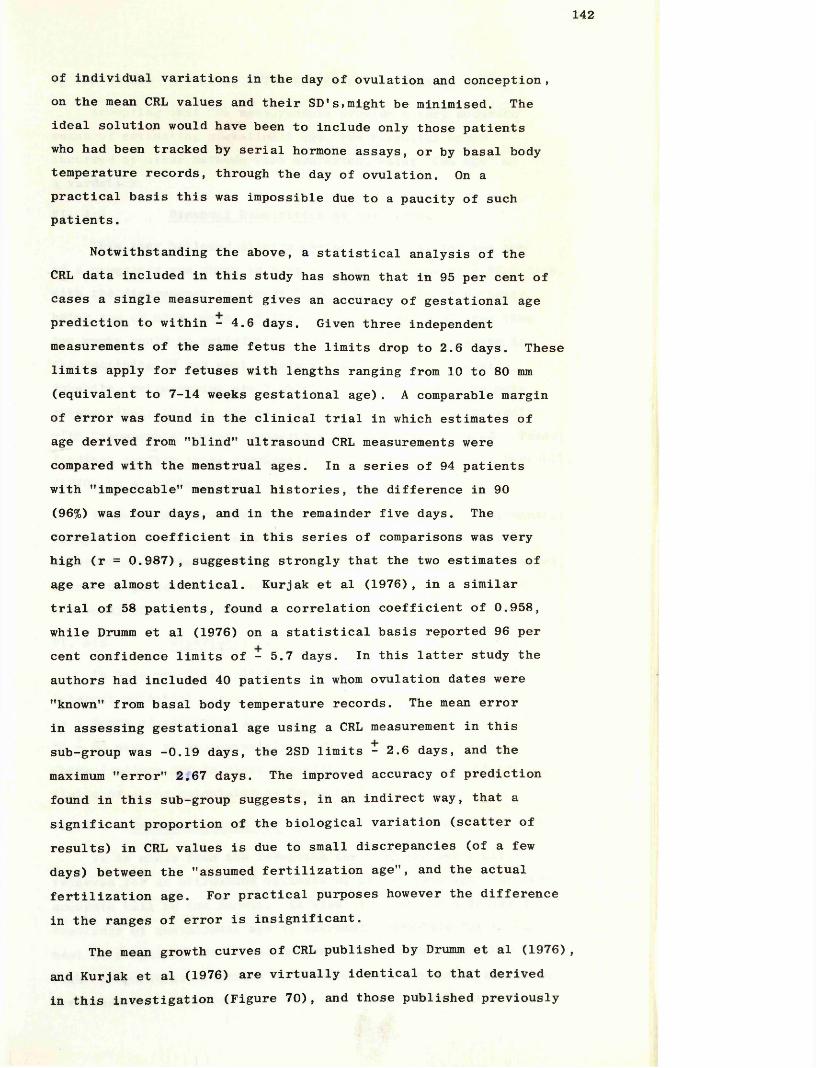
142
of Individual variations in the day of ovulation and conception , on the mean CRL values and their SD’s>might be minimised. The ideal solution would have been to include only those patients who had been tracked by serial hormone assays, or by basal body temperature records, through the day of ovulation. On a practical basis this was impossible due to a paucity of such patients.
Notwithstanding the above, a statistical analysis of the CRL data included in this study has shown that in 95 per cent of cases a single measurement gives an accuracy of gestational age prediction to within - 4.6 days. Given three independent measurements of the same fetus the limits drop to 2.6 days. These limits apply for fetuses with lengths ranging from 10 to 80 mm (equivalent to 7-14 weeks gestational age). A comparable margin of error was found in the clinical trial in which estimates of age derived from "blind” ultrasound CRL measurements were compared with the menstrual ages. In a series of 94 patients with "impeccable" menstrual histories, the difference in 90 (96%) was four days, and in the remainder five days. The correlation coefficient in this series of comparisons was very high (r = 0.987), suggesting strongly that the two estimates of age are almost identical. Kurjak et al (1976), in a similar trial of 58 patients, found a correlation coefficient of 0.958, while Drumm et al (1976) on a statistical basis reported 96 per cent confidence limits of - 5.7 days. In this latter study the authors had included 40 patients in whom ovulation dates were "known" from basal body temperature records. The mean error in assessing gestational age using a CRL measurement in this sub-group was -0.19 days, the 2SD limits - 2.6 days, and the maximum "error" 2.67 days. The improved accuracy of prediction found in this sub-group suggests, in an indirect way, that a significant proportion of the biological variation (scatter of results) in CRL values is due to small discrepancies (of a few days) between the "assumed fertilization age", and the actual fertilization age. For practical purposes however the difference in the ranges of error is insignificant.
The mean growth curves of CRL published by Drumm et al (1976), and Kurjak et al (1976) are virtually identical to that derived in this investigation (Figure 70), and those published previously
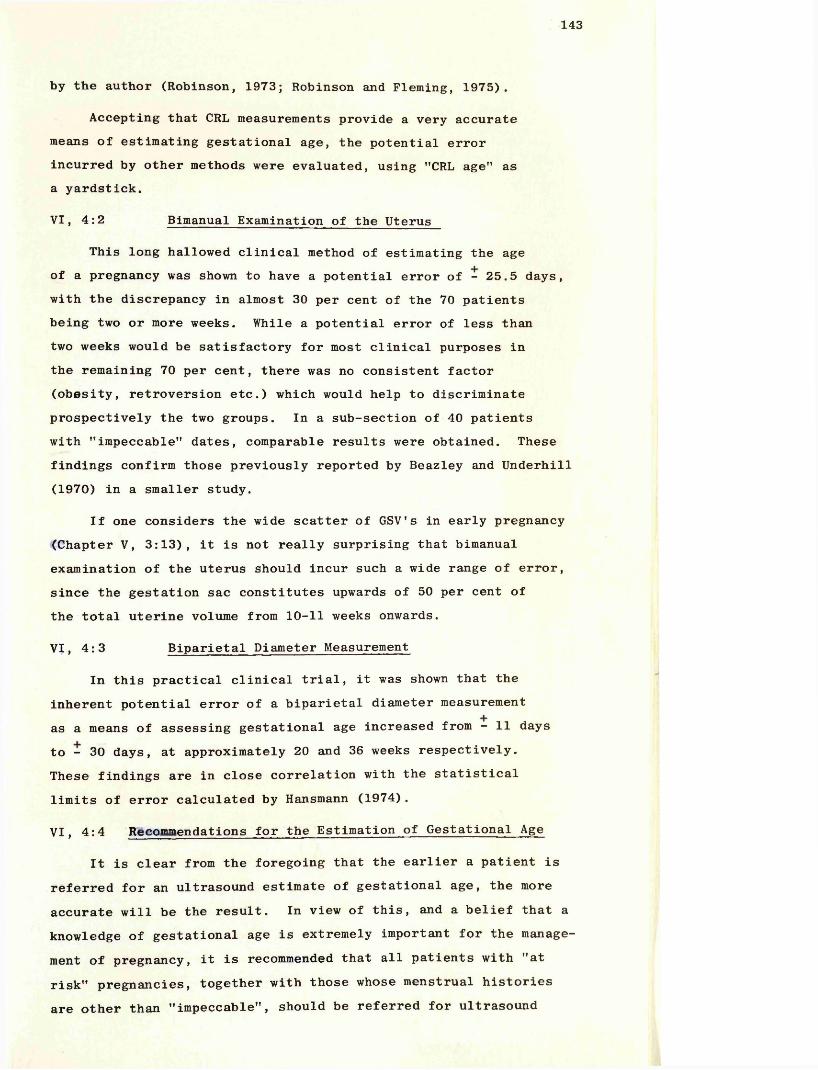
143
by the author (Robinson, 1973; Robinson and Fleming, 1975).
Accepting that CRL measurements provide a very accurate means of estimating gestational age, the potential error incurred by other methods were evaluated, using "CRL age" as a yardstick.
VI, 4:2 Bimanual Examination of the Uterus
This long hallowed clinical method of estimating the age of a pregnancy was shown to have a potential error of - 25.5 days, with the discrepancy in almost 30 per cent of the 70 patients being two or more weeks. While a potential error of less than two weeks would be satisfactory for most clinical purposes in the remaining 70 per cent, there was no consistent factor (obesity, retroversion etc.) which would help to discriminate prospectively the two groups. In a sub-section of 40 patients with "impeccable" dates, comparable results were obtained. These findings confirm those previously reported by Beazley and Underhill(1970) in a smaller study.
If one considers the wide scatter of GSV's in early pregnancy (Chapter V, 3:13), it is not really surprising that bimanual examination of the uterus should incur such a wide range of error, since the gestation sac constitutes upwards of 50 per cent of the total uterine volume from 10-11 weeks onwards.
VI, 4:3 Biparietal Diameter Measurement
In this practical clinical trial, it was shown that the inherent potential error of a biparietal diameter measurement as a means of assessing gestational age increased from - 11 days to - 30 days, at approximately 20 and 36 weeks respectively.These findings are in close correlation with the statistical limits of error calculated by Hansmann (1974).
V I t 4:4 Recommendations for the Estimation of Gestational Age
It is clear from the foregoing that the earlier a patient is referred for an ultrasound estimate of gestational age, the more accurate will be the result. In view of this, and a belief that a knowledge of gestational age is extremely important for the management of pregnancy, it is recommended that all patients with "at risk" pregnancies, together with those whose menstrual histories are other than "impeccable", should be referred for ultrasound
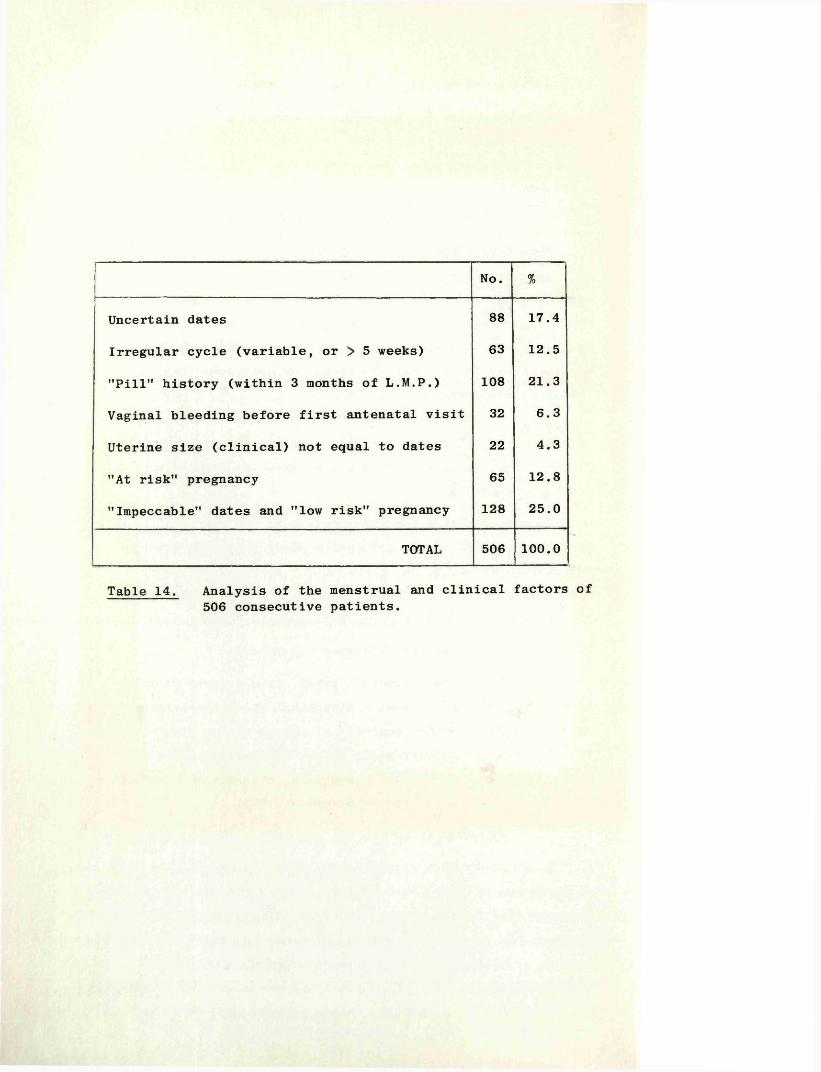
No. %
Uncertain dates 88 17.4
Irregular cycle (variable, or > 5 weeks) 63 12.5
"Pill" history (within 3 months of L.M.P.) 108 21.3
Vaginal bleeding before first antenatal visit 32 6.3
Uterine size (clinical) not equal to dates 22 4.3
"At risk" pregnancy 65 12.8
"Impeccable" dates and "low risk" pregnancy 128 25.0
TOTAL 506 100.0
Table 14. Analysis of the menstrual and clinical factors of 506 consecutive patients.
144
examination at the time of the first antenatal visit. In a review of 506 consecutive patients attending the Queen Mother’s Hospital it was found that no fewer than 75 per cent of patients had what was considered to be a valid indication for examination (Table 14).
As a result of these findings, and to afford a comprehensive service, ALL patients attending the Queen Mother's Hospital for antenatal care are now referred for a routine ultrasonic scan at the time of their first clinic visits.
VI, 4:5 Correlation of "CRL Estimated Date of Delivery"and Outcome
In the past, the accuracy of ancillary methods of estimating gestational age were judged by how close was the estimated date of delivery to the actual date. On this basis Campbell (1974) considered that a biparietal diameter measurement was accurate to within - 14 days in 93 per cent of "mature" deliveries, while Varma (1973) using two measurements at an interval of three weeks, and excluding growth-retarded babies, found 91.2 per cent of her patients went into spontaneous labour within nine days of the estimated date of delivery. In a comparative study between ultrasonic biparietal cephalometry, radiology and liquor studies in the prediction of the ultimate date of delivery, Underhill and her colleagues (1971) showed that the ultrasound method was significantly superior.
While this exercise was performed for CRL measurements (Figures 60 and 61, its relevance for this technique is somewhat doubtful for a number of reasons: firstly, it is accepted that the date of delivery in normal patients may itself vary widely (Treloar et al, 1967); secondly, owing to the induction policy of this hospital pregnancies were rarely allowed to continue past 41 weeks and thus the histograms shown in Figures 60 and 61, are skewed to the left; finally, to allow comparison with other studies, babies delivered before 37 weeks and considered pre-term by the paediatrician were excluded. The results demonstrated that over 95 per cent of patients, whose labours were neither pre-term or induced, began labour spontaneously within 10 days of the date predicted by the CRL measurements. There was no difference in outcome whether the dates were reliable or unreliable. Very similar results were reported by Drumm (1977).
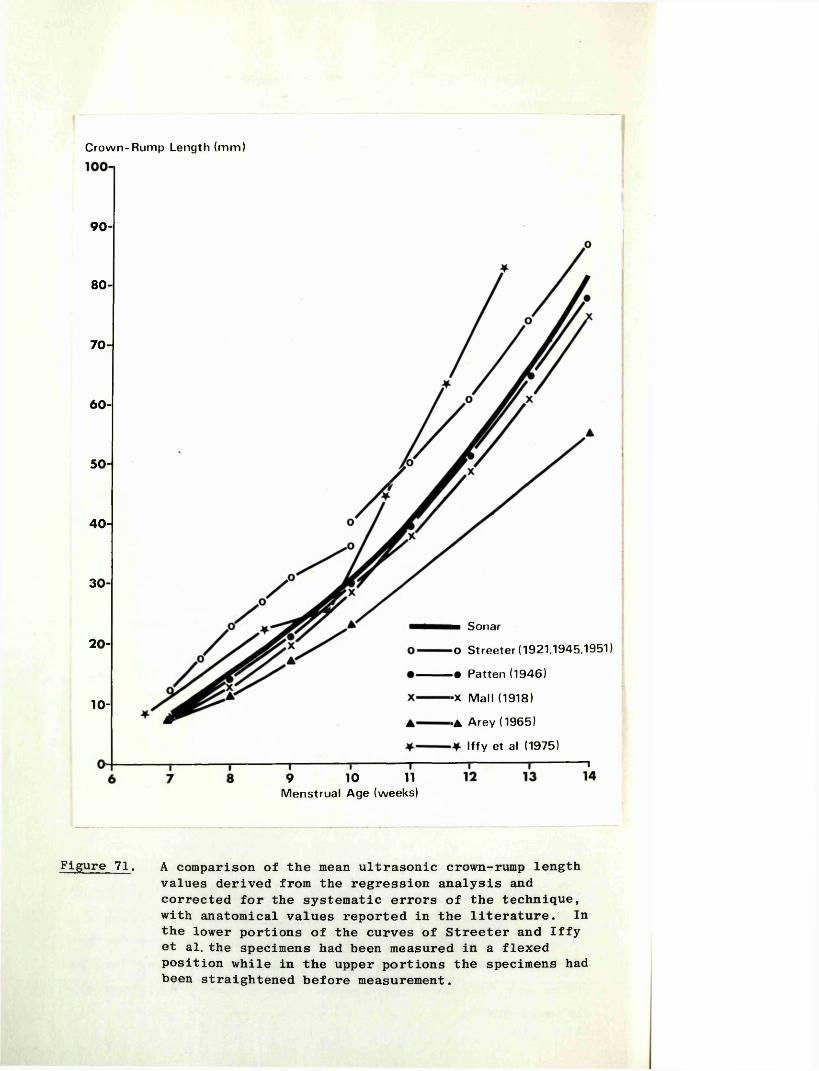
Crown-Rum p Length (m m )
90-
80-
70-
60-
50-
40-
30-
■ Sonar
0 Streeter (1921,1945,1951)
• Patten (1946)
20-
-x M all (1918)
•A Arey (1965)
Iffy et al (1975)
10-
9 10 11M enstrual Age (weeks)
Figure 71. A comparison of the mean ultrasonic crown-rump length values derived from the regression analysis and corrected for the systematic errors of the technique, with anatomical values reported in the literature. In the lower portions of the curves of Streeter and Iffy et al. the specimens had been measured in a flexed position while in the upper portions the specimens had been straightened before measurement.

145
VI> 4:6 Absolute Crown-Rump Length Values
In an earlier section of this discussion the influence of random errors in the technique was considered in relation to the reproducibility of the measurements, and, as one of a number of factors in relation to the accuracy of gestational age estimations. However, it was not until corrections had been made for the systematic errors incurred that any statement could be given regarding the accuracy of CRL measurements in terms of real or absolute values, or the accuracy of the growth curve when compared with those compiled by embryologists (Figure 71).
The compilation of CRL growth curves by embryologists has always been fraught with the problems of obtaining fresh, undamaged specimens with no abnormalities, accompanied by a reliable menstrual or conceptual history. It is not surprising therefore, that there is such a wide scatter of values when the growth curves of workers in this field are compared. On the other hand, because of its non-invasive nature, ultrasound is in a unique position to study and measure the developing fetus "in vivo". In addition, when compiling an ultrasonic growth curve, only those patients need be included who have "impeccable" menstrual histories, and whose infants can be shown to be normal at the time of delivery.
The accuracy of a growth curve is further dependent on there being a sufficient number of observations in the series such that random errors will tend to be self-eliminating. In this context, random errors include those of the measurement technique described earlier (Chapter V, 3:2), biological differences in fetal size, and errors in fetal age due to variation in the timing of ovulation and fertilization, even in a normal 28-day menstrual cycle. As the number of observations used to compile the growth curve totalled 424, and as the data was cross-sectional (one observation per patient), it may be contended that the mean ultrasound values derived by "regression analysis" and corrected for the systematic errors of the measurement technique, should approximate closely to the real or absolute mean values as found in nature.
Of the anatomical values reported in the literature and shown in Figure 71, those published by Streeter (1921, 19<© and 1951) and Iffey et al (1975) differ most consistently from the ultrasound values. The discrepancy of Streeter’s curves is of particular
146
importance as it is these values which are most widely quoted as reference points in studies of other aspects of early pregnancy development. In an attempt to explain this discrepancy a careful study was made of his published data. Firstly, the age of his specimens up to at least the eighth week of menstrual age was determined by a direct correlation with the fetuses of macaque or rhesus monkeys of known ovulation age at corresponding developmental levels. He considered that this method "appears to give more reliable age data than the clinical histories obtained from patients". As the monkey fetus develops faster, this approach must be open to serious question. Secondly, fetuses of 35 mm or over (equivalent to approximately 10 or more weeks of menstrual age) were straightened from their natural flexed positions before measurement, thereby adding several millimetres to their CRL's. As a result of this, Streeter’s CRL curve shown in Figure 71 is "broken" at 10 weeks. Finally, in just over 50 per cent of those specimens in which a stated menstrual age was given, there was a difference of at least seven days from the "estimated age", and in many cases the difference was two or more weeks. This, together with the fact that a number of the specimens were damaged, poorly fixed, or showed evidence of maceration, not unexpectedly resulted in a wide scatter of results when the CRL values were plotted against the given menstrual age. This latter point again highlights the problem of the very variable and at times poor material with which the embryologist has to work. In view of the foregoing there must be considerable doubt about the accuracy of Streeter's growth curves.
Iffy and his co-workers (1975) however, in a much more recent study, compiled their curve from apparently normal patients who had undergone legal termination of pregnancy. In view of this background, it was surprising to find that their data differed so widely from the ultrasonically derived values. While no clear explanation can be given, it is suggested that the accompanying menstrual information may have been inaccurate in many cases. This is a tenable explanation, as it is recognised that a patient may falsify her menstrual history in order to obtain a termination.

147
These workers followed closely the methods of Streeter (1920) in the collection and measurement of their specimens. This serves to explain the biphasic shape of their CRL growth curve.
With regard to the data of Arey (1965), little informed comment can be made as no correlative or background information is given with his figures.
The two remaining curves, those of Mall (1918) and Patten (1946), are remarkably close to the ultrasonic curve determined in this investigation. Of these, Patten’s values never differ by more than 2.5 mm from the ultrasound values. It is of particular note that this author compiled his curve "using the measurements from the best preserved embryos with the most complete and seemingly most dependable clinical histories". As the emphasis of Patten’s and Mall's work was primarily directed at the correlation of CRL to menstrual age, unlike that of Streeter, it would be reasonable to expect that their results would be the more accurate. Furthermore, the care with which Patten’s specimens would appear to have been selected is paralleled, to a large extent, by the selection of patients for the ultrasound study.The resulting very close similarity of the two curves would therefore support the contention that actual mean "in vivo" CRL values for human fetuses lie very close to the ultrasound values derived in this investigation.
As a final point it is interesting to note that when the equation describing the ultrasound CRL growth curve is solved for a CRL value of nil, the equivalent menstrual age is 25 days (11 days of conceptual age). Embryologically, at this age, the embryo has a length of no more than 0.1 - 0.2 mm (Corliss, 1976).
VI, 4:7 Gestation Sac Volumes
"Dissolution" of the Gestation Sac OutlineMost early workers in the field of early pregnancy diagnosis
by ultrasound made reference to an apparent "breaking up" or dissolution of the gestation sac wall at around the eleventh week of pregnancy. Donald (1967) who first described this feature attributed it to the differentiation of the chorion frondosum and the chorion laeve, while Heilman and his colleagues (1969) presumed that it represented the fusion of the decidua parietalis,

148
thereby eliminating an interface for reflection of the ultrasonic waves. Troostwijk (1972) gave as his explanation the complete filling of the uterine cavity by the gestation sac. Of these theories, the first would seem to have the best embryological basis, and, from an ultrasound standpoint, the loss of the trophoblastic shell from the greater part of the surface of the sac would, in effect, result in the elimination of a band of good sound-reflecting surfaces, making it more difficult to obtain good echoes from the sac wall. If this is indeed the explanation then there would be no reason to suppose that fusion of the decidua capsularis (or chorion laeve) and the decidua parietalis occurs any earlier than the normally accepted time of 14 to 16 weeks (Arey, 1965; Hamilton and Mossman, 1972).
Whatever the reason for this MdissolutionM , the ultrasonic appearances seem to be a feature of the older equipment and scanning techniques in use at the time of these studies, for, in the course of this current investigation and using more versatile and more sensitive equipment, it was often found possible to delineate completely the margins of the gestation sac up to and beyond the thirteenth and fourteenth weeks of pregnancy.
Growth of the gestation sac
Heilman et al (1969), Jouppila (1971), Troostwijk (1972),Levi and Erbsman (1972) and others, have demonstrated by ultrasound the rapid growth of the "gestation sac" in the first eleven weeks of pregnancy by means of growth curves of gestation sac diameters, circumferencesand areas. These observations went a long way towards quantifying the more subjective descriptions of Donald (1967 and 1969a). While their results infer an increase in the volume of the gestation sac with advancing pregnancy, such data cannot be used to provide more direct information. Furthermore, depending on the degree of bladder filling, the shape of the sac may vary from that of a sphere to almost pancake dimensions. Thus, simple measurements of a gestation sac section would be unreliable if used as a basis for calculating volume. However, the technique described in this investigation does provide absolute values for volume (within the limits of the experimental errors described in Chapter V, 3:11). As the technique can be applied to gestation sacs of varying shape, direct comparisons can be
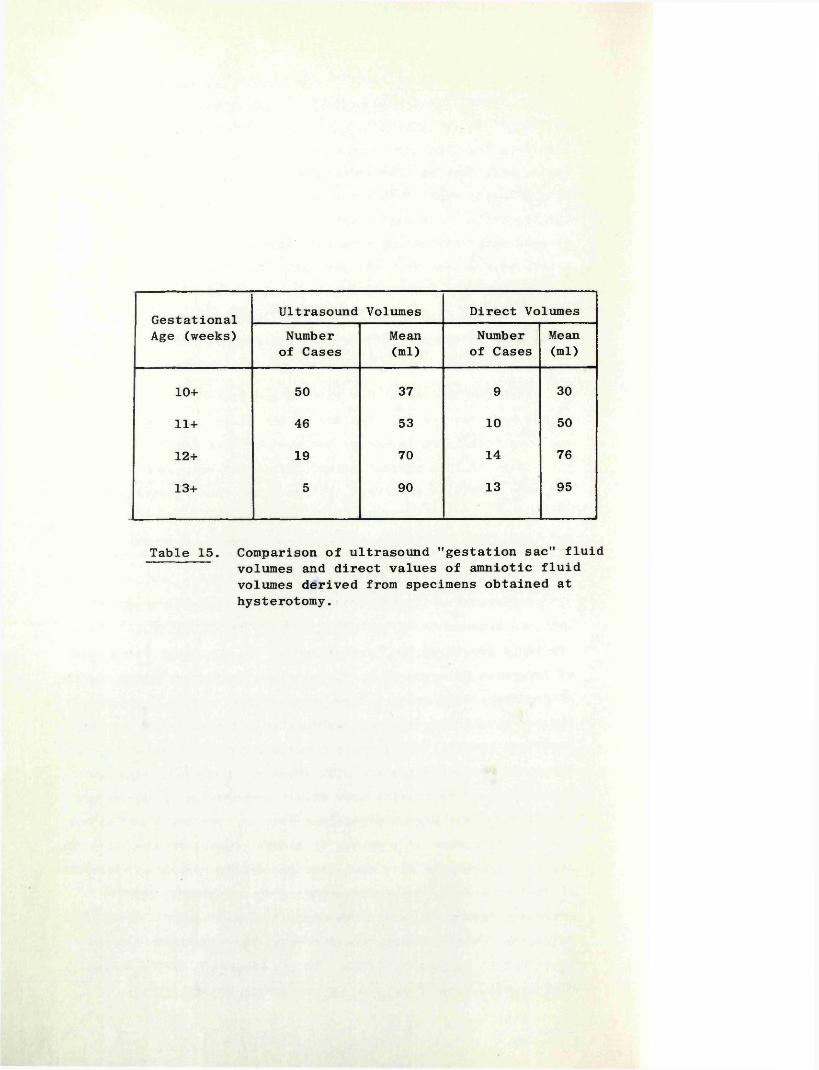
Gestational Age (weeks)
Ultrasound Volumes Direct VolumesNumber
of CasesMean(ml)
Number of Cases
Mean(ml)
10+ 50 37 9 30
11+ 46 53 10 50
12+ 19 70 14 76
13+ 5 90 13 95
Table 15. Comparison of ultrasound "gestation sac" fluid volumes and direct values of amniotic fluid volumes derived from specimens obtained at hysterotomy.

149
made between the sac volumes of different pregnancies, and in the same pregnancy at different gestational ages. Experiments designed to evaluate the reproducibility of the technique showed that the potential range of error was in the region of - 10 per cent. A similar figure was obtained when pre-abortion ultrasound measurements and post-abortion direct measurements were compared.
In compiling a mean growth curve, it is assumed that the effect of these random errors, together with those discussed in the context of CRL measurements, will be self-eliminating.
VI, 4:8 Comparison of Gestation Sac Fluid Volumesand Direct Values
The mean values for GSV’s as determined in this study, after correction for estimated fetal volume, are close to the values obtained by direct measurement in the 10 to 13 weeks range (Table 15). The direct values used in this table are the means of the results reported by Wagner and Fuchs (1962),Rhodes (1966), Abramovitch (1968), and Gillibrand (1969) for amniotic fluid volumes. While the ultrasound and direct measurements are not absolutely comparable, because of the inclusion of the extraembryonic coelom with the former technique, the results obtained are very close. Arey (1965) states that the amniotic cavity fills the chorionic sac at the end of the second month (10 weeks of menstrual age), and that loose fusion of the amnion and chorion then occurs. There is evidence however, from those workers who have undertaken fetoscopy in human pregnancies, that secure fusion may not be complete even at the fourteenth week Scrimgeour (1974). Furthermore Wagner and Fuchs (1962) in their study of amniotic fluid volumes reported small but measurable quantities of fluid in this space. If it is accepted that the extraembryonic coelom does not contribute a significant proportion of the ultrasonically determined volumes in the latter part of the first trimester, then the close correlation with the direct volumes at this stage offers indirect evidence for the validity of the ultrasonic measurements earlier in pregnancy where no direct comparative figures are available.
It is of interest in this context that at no time was any structure observed within the gestation sac which could be

150
confidently recognized as the amniotic membrane itself. The probable explanation is that the acoustic impedance of the very thin amnion is insufficient to reflect an echo which is strong enough to be recorded by the equipment.
VI, 4:9 Clinical Application of Gestation Sac Volumes
Used as a routine method for estimating the age of pregnancies, GSV measurement is time-consuming and somewhat cumbersome. Of more importance however, was the finding that the potential error incurred was in the order of - 10 days, a figure twice that when a CRL measurement is employed. In addition, the latter measurement can be obtained more quickly and more easily. For these reasons measurement of GSV’s in this context, was not continued beyond the initial series (Robinson, 1975), and no attempt made to obtain a wholly cross-sectional group of data for analysis. Despite this, it is likely that the growth curves and regression analysis curves (Figures 68 and 69) are reasonably close to the true values.
Despite their limited role in estimating gestational age, gestation sac volume measurements (as discussed earlier) have been found to be of considerable value in the early and positive diagnosis of blighted ova.

151
VII
C O N C L U S I O N S

152
1) Using an ultrasound technique devised by the author, (a development of a technique previously described), it is possible to detect with certainty the presence or absence of fetal heart movements from seven weeks of amenorrhoea and on occasions from as early as six weeks.
2) The human fetal heart rate increases from a mean of 125 beats per minute at six and a half weeks of amenorrhoea, to a peak of 175 beats per minute at nine weeks, and falls more slowly to a value of 150 beats per minute at 15 weeks.
3) It is suggested that the rise in heart rate is related to the structural and functional differentiation of the heart itself, while the fall may be a function of more efficient cardiac action and the development of myofibrils in the hitherto relatively undeveloped cardiac muscle cells.
4) The fetal heart rate does not appear to be prognostic of impending intrauterine death or abortion in the first trimester of pregnancy. However, the presence or absence of fetal heart movements at the first examination in patients with threatened abortion predicted the eventual outcome (abortion or continuing pregnancy) in 92 per cent of patients.
5) "Early pregnancy failures" may be conveniently subdivided into missed abortions, blighted ova, hydatidiform moles, and early and late live abortions. Missed abortions and blighted ova together comprise almost 80 per cent of "early pregnancy failures".
6) Given a meticulous examination, absence of fetal heart movements in an otherwise well defined fetus may be taken as clear evidence of death and the patient offered an elective termination of her pregnancy.It seems that the average age at which fetal death occurs in missed abortion is eight and a half weeks; that very few die 'in utero' after 14 weeks; that the average interval between fetal death and spontaneous abortion is 32 days; and that death of the trophoblast and decidua,

153
which had continued functioning after fetal demise, is the ultimate precipitating cause of spontaneous abortion.
7) Ignoring the menstrual and clinical history, a definite diagnosis of blighted ovum can be made in 47.5 per cent of cases, and the patient offered an elective termination of her pregnancy; the remainder require serial examinations and measurements before a clear statement can be given.
8) On the basis of a small gestation sac volume in relation to fetal size, impending abortion of a "live" fetus in the first trimester of pregnancy may be anticipated. This observation is not grounds for a definite diagnosis as similar findings were noted in a small percentage of continuing pregnancies.
9) It is suggested that the majority of "late live abortions" may be due to cervical incompetence. While the data is far from complete, it is unlikely that ultrasound will offer information of prognostic value.
10) Hydatidiform moles offer little problem for ultrasonic diagnosis.
11) In contrast to missed abortions and blighted ova, a genetic abnormality is less likely to be a major aetiological factor in early live abortions.
12) It is suggested that treatment directed at the preventionof first trimester abortions is, in the majority of patients, unlikely to influence the eventual outcome. A trial, strictly controlled by ultrasonic and genetic studies, would be required to clarify the problem.
13) On the basis of a small study it would appear that twin conceptions are more common than is generally appreciated, but that a significant proportion of the individual conceptions are blighted ova.

154
14) It is suggested that estimates of gestational age by ultrasound, early in pregnancy, provide information important for the later management of pregnancies, particularly when elective delivery is deemed necessary.
15) Ultrasonic fetal crown-rump length measurements in the first trimester of pregnancy provide an estimate of gestational age to within - 4 to 5 days. No other ancillary technique allows such a degree of accuracy at this or any other stage of pregnancy.
16) Clinical examination and (later) biparietal diameter measurement both incur a significant degree of error in the estimation of gestational age, and this error increases as pregnancy advances.
17) Ultrasound crown-rump length measurements correlate well with some embryological data but not with others.
18) Gestation sac volume measurements are not recommended as a routine means of assessing gestational age in the first trimester as they are less accurate than crown-rump length measurements, and as the technique itself is more time- consuming and awkward.
19) Gestation sac volume measurements find a useful place in the early diagnosis of blighted ova.
20) The three techniques described in this thesis allow a more objective and more reliable evaluation of early pregnancy and of its complications than was hitherto possible.

155
VIII
R E F E R E N C E S

156
Abdulla, U. (1971) Sonar in very early pregnancy. InUltrasonographia Medica, ed. Bock, J. and Ossoinig, K.Vol. Ill, 185-192. Wien: Verlag der Weiner Medzinischen Akademie.
Abdulla, U., Campbell, S., Dewhurst, C.J., Talbert, D.,Lucas, M. & Mallarkey, M. (1971) Effect of diagnostic ultrasound on maternal and fetal chromosomes. Lancet,2, 829-831.
Abramovitch, D.R. (1968) The volume of amniotic fluid inearly pregnancy. Journal of Obstetrics and Gynaecology of the British Commonwealth, 75, 728-731.
Acevedo, H.F., Vela, B.A., Campbell, E.A., Strickler, H.S., Gilmore, J., Moraca, J.I. & Arras, B.J. (1969) Urinary steroid profile in threatened abortion. American Journal of Obstetrics and Gynecology, 104, 964-972.
Andrew, D.S. (1964) Ultrasonography in pregnancy - an enquiryinto its safety. British Journal of Radiology, 37, 185-186.
Arey, L.B. (1965) Developmental Anatomy, a Textbook andLaboratory Manual of Embryology. 7th edition. Philadelphia and London: Saunders.
Bang, J. & Holm, H.H. (1968) Ultrasonics in the demonstration of fetal heart movements. American Journal of Obstetrics and Gynecology, 102, 956-960.
Barry, A. (1940) Age changes in the pulsation frequency of theembryonic chick heart. Journal of Experimental Zoology,85, 157-170.
Barry, A. (1942) Intrinsic pulsation rates of fragments ofembryonic chick heart. Journal of Experimental Zoology,91, 119-130.
Barton, J.J. (1968) Evaluation of the Doppler shift principle as a diagnostic aid in obstetrics. American Journal of Obstetrics and Gynecology, 102, 563-568.
Beazley, J.M. & Underhill, R.A. (1970) Fallacy of the fundal height. British Medical Journal, 4, 404-406.

157
Beazley, J.M. & Underhill, R.A. (1971) Confinement date unknown. Nursing Times, 67, 1414-1417.
Bell, J.L. (1969) Comparative study of immunological testsfor pregnancy diagnosis. Journal of Clinical Pathology,22, 79-83.
Bergman, P. & Hall, P. (1958) Prenatal fetal electrocardiography. Acta Obstetricia et Gynaecologica Scandinavica, 37, 348-357.
Bemstine, R.L. & Callagan, D.A. (1966) Ultrasonic Dopper inspection of the fetal heart. American Journal of Obstetrics and Gynecology, 95, 1001-1004.
Bishop, E.H. (1966) Obstetric uses of the ultrasonic motion sensor. American Journal of Obstetrics and Gynecology,96, 863-867.
Borrow, M., Blackwell, N., Unrau, A.E. & Bleaney, B. (1971)Absence of any observed effect of ultrasonic irradiation on human chromosomes. Journal of Obstetrics and Gynaecology of the British Commonwealth, 78, 730-736.
Bonham, D.G. (1969) In Perinatal Problems. The Second Report of the 1958 British Perinatal Mortality Survey, ed.Butler, N.R. & Alberman, E.D. Ch. 6, pp. 85-121.Edinburgh: Livingstone.
Boyd, E., Abdulla, U., Donald, I., Fleming, J.E.E., Hall, A.J.& Ferguson-Smith, M.A. (1971) Chromosome breakage and ultrasound. British Medical Journal, 2, 501-502.
Brosens, I. & Gordon, H. (1966) The estimation of maturityby cytological examination of the liquor amnii. Journal of Obstetrics and Gynaecology of the British Commonwealth, 73, 88-90.
Brown, A.D.G. & Robertson, J.G. (1968) The ultrasonic Doppler cardioscope in obstetrics. Journal of Obstetrics and Gynaecology of the British Commonwealth, 75, 92-96.
Brown, J.B., Evans, J.H., Beischer, N.A., Campbell, D.G. & Fortune, D.W. (1970) Hormone levels in threatened abortion. Journal of Obstetrics and Gynaecology of the British Commonwealth, 77, 690-700.

158
Brown, R.E. (1968) Detection of intrauterine death. American Journal of Obstetrics and Gynecology, 102, 965-968.
Brown, R.E. (1971) Ultrasonic fetal cephalometry. InUltrasonographia Medica, ed. Bock, J. and Ossoinig, K.Vol. Ill, 193-198. Wien: Verlag der Weiner Medizinischen Akademie.
Callagan, D.A., Rowland, T.C. & Goldman, D.E. (1964)Ultrasonic Doppler observation of the fetal heart.Obstetrics and Gynecology, 23, 637.
Campbell, S. (1968) An improved method of fetal cephalometryby ultrasound. Journal of Obstetrics and Gynaecology ofthe British Commonwealth, 75, 568-576.
Campbell, S. (1969) The prediction of fetal maturity byultrasonic measurement of the biparietal diameter.Journal of Obstetrics and Gynaecology of the British Commonwealth, 76, 603-609.
Campbell, S. (1970) Ultrasonic fetal cephalometry during thesecond trimester of pregnancy. Journal of Obstetrics and Gynaecology of the British Commonwealth, 77, 1057-1063.
Campbell, S. (1974) The assessment of fetal development bydiagnostic ultrasound. Clinics in Perinatology, 1, 507-525.
Campbell, S. & Newman, G.B. (1971) The growth of the fetalbiparietal diameter during normal pregnancy. Journal of Obstetrics and Gynaecology of the British Commonwealth,78, 513-519.
Carey, E.J. (1921) Studies in the dynamics of histogenesis.Tension of differential growth as a stimulus to myogenesis. American Journal of Anatomy, 29, 341-377.
Carr, D.H. (1963) Chromosome studies in abortuses and stillborn infants. Lancet, 2, 603-606.
Carr, D.H. (1965) Chromosome studies in spontaneous abortions. Obstetrics and Gynecology, 26, 308-326.
Coakley, W.T., Hughes, D.E., Slade, J.S. & Laurence, K.M.(1971) Chromosome aberrations after exposure to ultrasound. British Medical Journal, 1, 109-110.

159
Colvin, E.D., Bartholomew, R.A., Grimes, W.A. & Fish, J.S. (1950) Salvage possibilities in threatened abortion. American Journal of Obstetrics and Gynecology. 59, 1208-1222.
Connolly, C. & Pond, J. (1967) The possibility of harmful effects in using ultrasound for medical diagnosis.Biomedical Engineering. 2, 112-115.
Corliss, C.E. (1976) Patten's Human Embryology. New York: McGraw-Hill.
Croall, J. & Grech, P. (1970) Radiological maturity of the small-for-dates fetus. Journal of Obstetrics and Gynaecology of the British Commonwealth, 77, 802-807.
Dee, P.M., Parkin, J.M. & Simpson, W. (1966) A study of some radiological criteria used in assessing the gestational age of the human infant. Clinical Radiology, 17, 125-131.
Donald, I. (1963) The use of ultrasonics in the diagnosis of abdominal swellings. British Medical Journal, 2,1154-1155.
Donald, I. (1965) Diagnostic uses of sonar in obstetricsand gynaecology. Journal of Obstetrics and Gynaecology of the British Commonwealth, 72, 907-919.
Donald, I. (1967) Diagnostic ultrasonic echo sounding inobstetrics and gynaecology. Transactions of the Royal College of Physicians, Surgeons and Gynaecologists of South Africa, 11, 61-79.
Donald, I. (1969a) Sonar as a method of studying prenatal development. Journal of Pediatrics, 75, 326-333.
Donald, I. (1969b) Ultrasonics in diagnosis (sonar). Proceedings of the Royal Society of Medicine, 62, 442-446.
Donald, I. (1975) The biological effects of ultrasound. InPresent and Future of Diagnostic Ultrasound, ed. Donald, I.& Levi, S. Ch. 2, pp. 20-32. Rotterdam: Kooyker.
Donald, I. & Abdulla, U. (1967) Ultrasonics in obstetrics and gynaecology. British Journal of Radiology, 40, 604-611.
Donald, I. & Brown, T.G. (1961) Demonstration of tissue interfaces within the body by ultrasonic echo sounding. British Journal of Radiology, 34, 539-546.

160
Donald, I., MacVicar, J. & Brown, T.G. (1958) Investigation of abdominal masses by pulsed ultrasound. Lancet, I, 1188-1195.
Donald, I., Morley, P. & Barnett, E. (1972) The diagnosis of blighted ovum by sonar. Journal of Obstetrics and Gynaecology of the British Commonwealth, 79, 304-310.
Drumm, J.E. (1977) The prediction of delivery date by ultrasonic measurement of fetal crown-rump length.British Journal of Obstetrics and Gynaecology, 84, 1-5.
Drumm, J.E. & Clinch, J. (1975) Ultrasound in the management of clinically diagnosed threatened abortion. British Medical Journal, 1, 424.
Drumm, J.E., Clinch, J. & MacKenzie, G. (1976) The ultrasonic measurement of fetal crown-rump length as a method of assessing gestational age. British Journal of Obstetrics and Gynaecology, 83, 417-421.
Duff, G.B. (1975) Prognosis in threatened abortion: Acomparison between predictions made by sonar, urinary hormone assays and clinical judgement. British Journal of Obstetrics and Gynaecology, 82, 858-862.
Dunn, F., Edmonds, P.D. & Fray, W.J. (1969) Absorption and dispersion of ultrasound in biological media. In Biological Engineering, ed. Schwann, H.P. Ch. 3, pp. 205-332. New York: McGraw Hill.
Dunn, F. & Fry, F.J. (1971) Ultrasonic threshold dosages forthe mammalian central nervous system. I.E.E.E. Transactions on Biomedical Engineering, BME-18, 253-256.
Dussik, K.T. (1942) Uber die Moglichkeit hochfrequentemechanische Schwingungen als diagnostisches Hilfsmittel zu verwerten. Zentralblatt fur die Gesante Neurologie und Psychiatrie 174, 153-168.
Dyson, M . , Pond, J.B. Joseph, J. & Warwick, R. (1970) Stimulation of tissue regeneration by pulsed plane-wave ultrasound. I . E . E . E . Transactions on Sonics and Ultrasonics. SU-17, 133-140.

161
Edler, I. (1955) Diagnostic use of ultrasound in heart disease. Acta Medica Scandinavica, 152, Supplement no. 308, 32-35.
Edler, I. (1961) Ultrasound cardiography. Acta Medica Scandinavica. 170, Supplement no. 370, 1-123.
Eitel, V.L. & Geyer, H. (1970) Wirkung diagnostischer ultra-schall-dosen auf biochemische parameter. Zeitschrift fur Geburtshilfe und Gynakologie. 173, 116-120.
Evans, J.H. & Beischer, N.A. (1970) The prognosis of threatened abortion. Medical Journal of Australia, 2, 165-168.
Firestone, F.A. (1945) The supersonic reflectoscope for interiorinspection. Metal Progress, 48, 505-512.
Firestone, F.A. (1946) Supersonic reflectoscope, an instrumentfor inspecting the interior of solid parts by means of sound waves. Journal of the Acoustical Society of America, 17, 287-299.
Fleming, J.E.E. (1978) M.Sc. Thesis. University of Glasgow(In preparation)
Fry, W.J. (1958) Intense ultrasound in investigations of the central nervous system. In Advances in Biological and Medical Physics, ed. Lawrence, J.H. & Tobias, C.A.Vol. 8, pp 281-348. New York:Academic.
Fujikura, T., Froehlich, L.A. & Driscoll, S.G. (1966) Asimplified anatomic classification of abortions. American Journal of Obstetrics and Gynecology, 95, 902-905.
Galperin-Lemaitre, H., Gustot, P. & Levi, S. (1973) Ultrasound and marrow-cell chromosomes. Lancet, 2, 505-506.
Gamble, H.J. (1966) Further electron microscope studies of human fetal peripheral nerves. Journal of Anatomy, 100, 487-502.
Garg, A.G. & Taylor, A.R. (1967) An investigation into the effect of pulsed ultrasound on the brain. Ultrasonics, 5, 208-212.
Garoff, L. & Seppala, M. (1975) Prediction of fetal outcome in threatened abortion by maternal serum placental lactogen and alphafetoprotein. American Journal of Obstetrics and Gynecology, 121, 257-261.

162
Gartside, M.W. & Tindall, V.R. (1975) The prognostic value of human placental lactogen (HPL) levels in threatened abortion. British Journal of Obstetrics and Gynaecology,82, 303-309.
Gillibrand, P.N. (1969) Changes in amniotic fluid volume withadvancing pregnancy. Journal of Obstetrics and Gynaecology of the British Commonwealth, 76, 527-529.
Gohari, P., Berkowitz, R.L. & Hobbins, J.C. (1977) Prediction of intrauterine growth retardation by determination of total intrauterine volume. American Journal of Obstetrics and Gynecology, 127, 255-260.
Gottesfeld, K.R., Taylor, E.S., Thomson, H.E. & Holmes, J.H. (1967) Diagnosis of hydatidiform mole by ultrasound. Obstetrics and Gynecology, 30, 163-171.
Hall, A.J. (1975) An investigation into certain aspects of the safety of diagnostic ultrasound. M.Sc. Thesis.University of Glasgow.
Haan, R.L. de (1965) Organogenesis, ed. Haan, R.L. de &Ursprung, H. New York and London: Holt, Reinhart and Winston.
Hamilton, W.J. & Mossman, H.W. (1972) Human Embryology 4th edition. Cambridge: Heffer & Sons.
Hansmann, M. (1974) A critical evaluation of the performance of ultrasonic diagnosis in present-day obstetrics.Gynacologie, 7, 26-35.
Harrison, R.G. & Malpas, P. (1953) The volume of humanamniotic fluid. Journal of Obstetrics and Gynaecology of the British Empire, 60, 632-639.
Hartley, J.B. (1957) Radiological estimation of foetal maturity. British Journal of Radiology, 30, 561-576.
Hawley, S.A., Macleod, R.M. & Dunn, F. (1963) Degradation ofDNA by intense, non-cavitating ultrasound. Journal of the Acoustical Society of America, 35, 1285-1287.
Heilman, L.M., Duffus, G.M.,Donald, I. & Sunden, B. (1970)Safety of diagnostic ultrasound in obstetrics. Lancet,I, 1133-1135.

163
Heilman, L.M., Kobayashi, M., Fillisti, L., Lavenhar, M. &Cromb, E. (1969) Growth and development of the human fetus prior to the twentieth week of gestation. American Journal of Obstetrics and Gynecology, 103, 789-798.
Heilman, L.M., Kobayashi, M. & Cromb, E. (1973) Ultrasonic diagnosis of embryonic malformations. American Journal of Obstetrics and Gynecology, 115, 615-623.
Hertig, A.T. (1967) The overall problem in man. In Comparative Aspects of Reproductive Failure, ed.Benirschke, K. Ch. 1, pp 11-41. Berlin, Heidelberg and New York: Springer-Veriag.
Hertig, A.T. & Rock, J. (1949) A series of potentially abortive ova recovered from fertile women prior to the first missed menstrual period. American Journal of Obstetrics and Gynecology, 58, 968-993.
Hertig, A.T., Rock, J., Adams, E.C. & Menkin, M.C. (1959)Thirty-four fertilised human ova, good, bad and indifferent, recovered from 210 women of known fertility. Pediatrics,23, 202-211.
Hill, C.R. (1968) The possibility of hazard in medical and industrial applications of ultrasound. British Journal of Radiology, 41, 561-569.
Hill, C.R. (1971) Acoustic intensity measurements on ultrasonic diagnostic devices. In Ultrasonographia Medica, ed.Bock, J. & Ossoinig, K. Vol. II, pp 21-27. Wien:Verlag der Weiner Medizinschen Akamedie.
Hill, C.R. (1972a) Ultrasonic exposure threshold changes in cells and tissue. Journal of the Acoustical Society of America, 52, 667-672.
Hill, C.R. (1972b) Biological effects of ultrasound. In Ultrasonics in Clinical Diagnosis, ed. Wells, P.N.T.Ch. 9, pp 165-176. Edinburgh and London: Churchill Livingstone.
Hill, C.R. (1973) Medical ultrasonics - an historical review. British Journal of Radiology, 46, 899-905.

164
Hill, C.R., Joshi, G.P. & Revell, S.H. (1972) A search for chromosome damage following exposure of Chinese hamster cells to high intensity, pulsed ultrasound. British Journal of Radiology. 45, 333-334.
Hinselmann, M. (1969) Ultraschalldiagnostik in der Geburtshilfe. Deutsche Medzinische Wochenschrift, 94, 955-959.
Hoffbauer, H. (1970) Die bedeutung der ultraschalldiagnostik in der fruhschwangerschaft. Electromedica, 3, 227-231.
Hofmann, D., Hollander, H.J. & Weiser, P. (1967) Uber die geburtschilfliche bedeutung der ultraschalldiagnostik. Gynaecologia. 164, 24-36.
Hollander, H.J. (1972) Die ultraschalldiagnostik in der schwanger- schaft. Munchen: Urban and Schwarzenberg.
Holmes, J.H. & Howry, D.H. (1963) Ultrasonic diagnosis ofabdominal disease. American Journal of Digestive Diseases,8, 12-32.
Howry, D.H. & Bliss, W.R. (1952) Ultrasonic visualization ofsoft tissue structures of the body. Journal of Laboratory and Clinical Medicine, 40, 579-592.
Howry, D.H., Stott, D.A. & Bliss, W.R. (1954) The ultrasonic visualization of carcinoma of the breast and other soft tissue structures. Cancer, 7, 354-358.
Howry, D.H., Holmes, J.H., Cushman, C.R. & Posakony, G.J. (1955) Ultrasonic visualization of living organs and tissues, with observations on some disease processes. Geriatrics, 10, 123-128.
Hughes, H.E., Loraine, J.A., Bell, E.T. & Layton, R. (1964) Cytological observations, cervical mucus ferning and hormonal assays in early pregnancy. American Journal of Obstetrics and Gynecology, 90, 1297-1303.
Hytten, F.E. & Lind, T. (1973) Diagnostic indices in pregnancy, p. 85. Basle:Ciba-Geigy.
Iffy, L., Jakobovits, A., Westlake, W. , Wingate, M., Caterini, H., Kanofsky, P. & Menduke, H. (1975) Early intrauterine development: 1. The rate of growth of Caucasian embryos and fetuses between the 6th and 20th weeks of gestation. Pediatrics, 56, 173-186.

165
Ikeuchi, T. , Sasaki, M., Oshimura, M., Azumi, J., Tsuji, K. & Shimizu, T. (1973) Ultrasound and embryonic chromosomes. British Medical Journal, 1, 112.
Johannsen, A. (1970) The prognosis of threatened abortion.Acta Obstetricia et Gynecologica Scandinavica, 49, 89-93.
Johnson, W.L., Stegall, H.F., Lein, J.N. & Rushmer, R.F. (1965).Detection of fetal life in early pregnancy with an ultrasonic Doppler flowmeter. Obstetrics and Gynecology, 26, 305-307.
Jouppila, P. (1971) Ultrasound in the diagnosis of earlypregnancy and its complications. A comparative study of the A-, B-, and Doppler methods. Acta Obstetricia et Gynecologica Scandinavica, 50, Supplement no. 15.
Kamocsay, D.E. (1958) Ultrasound in gynecology. American Journal of Physical Medicine, 37, 196-198.
Kirsten, E.B., Zinsser, H.H. & Reid, J.M. (1963) Effect of1 megacycle ultrasound on the genetics of mice. I.E.E.E. Transactions on Ultrasonics and Engineering, 22, 112-116.
Kohorn, E.I. & Blackwell, R.J. (1968) The diagnosis ofhydatidiform mole by ultrasonic B-scanning. Journal of Obstetrics and Gynaecology of the British Commonwealth,75, 1014-1018.
Kohorn, E.I. & Kaufman, M. (1974) Sonar in the first trimester of pregnancy. Journal of Obstetrics and Gynecology, 44, 473-483.
Kohorn, E.I., Pritchard, J.W. & Hobbins, J.C. (1967) The safety of clinical ultrasonic examination. Electro- encephalographic examination of the neonate subjected to pulsed ultrasound. Obstetrics and Gynecology, 29, 272-274.
Kohorn, E.I., Morrison, J., Ashford, C. & Blackwell, R.J. (1969) Ultrasonic scanning in obstetrics and gynecology.Obstetrics and Gynecology, 34, 515-522.
Kratochwil, A. & Eisenhut, L. (1967) Der Frueste nachweis der fetalen hertzaktion durch ultraschall. Geburtshilfe und Frauenheilkunde, 27, 176-180.
Kuah, K.B. & Embrey, M.P. (1968) Experience with an ultrasonicfoetal pulse detector. British Medical Journal, 1, 438-440.

166
Kurjak, A., Cecuk, S. & Breyer, B. (1976) Prediction of maturity in the first trimester of pregnancy by ultrasonic measurement of fetal crown-rump length. Journal of Clinical Ultrasound,4, 83-84.
Lamkee, M.J., Huntington, H.W. & de Alvarez, R.R. (1962) Fetal electrocardiography, a study of the normal recording.American Journal of Obstetrics and Gynecology, 83,1622-1628.
Langevin, M.P. (1928) Les ondes ultrasonores. Revue Generale de L'Electricitie, 23, 626-634.
Leksell, L. (1955) Echo-encephalography. I. Detection of intracranial complications following head injury.Acta Chirurgica Scandinavica, 110, 301-315.
Leksell, L. (1958) Echo-encephalography. II. Midline echo from the pineal body as an index of pineal displacement.Acta Chirurgica Scandinavica, 115, 255-259.
Levi, S. (1973) Diagnostic use of ultrasonics in abortion.International Journal of Gynaecology and Obstetrics, 11, 195-200.
Levi, S. (1976a) Mensurations par ultrasons des dimensions du sac gestationnel dans les menaces d'avortement. Journal of Gynaecology, Obstetrics and Reproductive Biology, 5, 359-365.
Levi, S. (1976b) Ultrasonic assessment of the high rate ofhuman multiple pregnancy in the first trimester. Journal of Clinical Ultrasound, 4 , 3-5.
Levi, S. & Erbsman, F. (1972) Croissance du sac ovulaire humain au cours des premieres semaines de la gestation. Journal de Radiologie, d'Electrologie et de Medicine Nucleaire,53, 687-689.
Lind, T. & Billiwicz, W.Z. (1971) A point-scoring system forestimating gestational age from examination of amniotic fluid. British Journal of Hospital Medicine, 4, 681-685.
Lucas, M., Mullarkey, M. & Abdulla, U. (1972) The study of chromosomes in the newborn after ultrasonic fetal heart monitoring in labour. British Medical Journal, 3, 795 - 796.

167
Lyon, M.F. & Simpson, G.M. (1974) An investigation into the possible genetic hazards of ultrasound. British Journal of Radiology. 47, 712-722.
McClain, R.M., Hoar, R.M. & Saltzman, M.B. (1972) Teratologic study of rats exposed to ultrasound. American Journal of Obstetrics and Gynecology, 114, 39-42.
Macintosh, I.J.C. & Davey, D.A. (1970) Chromosome aberrationsinduced by an ultrasonic fetal pulse detector. British Medical Journal, 4, 92-93.
Macintosh, I.J.C. & Davey, D.A. (1972) Relationship betweenintensity of ultrasound and induction of chromosome aberrations. British Journal of Radiology, 45, 320-327.
Macintosh, I.J.C., Brown, R.C. & Coakley, W.T. (1975) Ultrasound and in vitro chromosome aberrations. British Journal of Radiology, 48, 230-232.
McLennan, M.T. & McLennan, C.E. (1969) Failure of vaginal wallcytologic smears to predict abortion. American Journal of Obstetrics and Gynecology, 103, 228-231.
Macnaughton, M.C. (1966) Urinary oestriol and pregnanediollevels in early pregnancy with special reference to abortion. Journal of Obstetrics and Gynaecology of the British Commonwealth, 73, 290-295.
MacVicar, J. & Donald, I. (1963) Sonar in the diagnosis ofearly pregnancy and its complications. Journal of Obstetrics and Gynaecology of the British Commonwealth, 70, 387-395.
Mall, F.P. (1918) On the age of human embryos. American Journal of Anatomy, 23, 397-422.
Manor, S.M., Serr, D.M., Tamari, I. Mashorer, A. & Frei, E.H.(1972) The safety of ultrasound in fetal monitoring. American Journal of Obstetrics and Gynecology, 113, 653-661.
Muller, K. & Osier, M. (1969) Early detection of foetal life by"Dopplerophonia". Acta Obstetricia Gynaecologica Scandinavica, 48, Supplement no. 3, 130-131.

168
Murphy, P.J. (1969) The estimation of fetal maturity withretarded intrauterine growth. Journal of Obstetrics and Gynaecology of the British Commonwealth, 76, 1070-1074.
Navaratnam, V. (1965) The ontogenesis of cholinesterase activity within the heart and cardiac ganglia in man, rat, rabbit and guinea pig. Journal of Anatomy, 99, 459-467.
Nesbitt, R.E.L. (1967) Pathology of abortion. In Novak1s Gynecologic and Obstetric Pathology, ed. Novak, E.R. & Woodruff, J.D. Ch. 33 pp. 523-540. Philadelphia & London: Saunders.
Niven, P.A.R., Landon, J. & Chard, T. (1972) Placental lactogen levels as a guide to the outcome of threatened abortion. British Medical Journal, 3, 799-801.
Patten, B.M. (1946) Human Embryology. 1st edition.Philadelphia & Toronto: Blakiston.
Piiroinen, 0. (1974) Detection of fetal heart activity duringearly pregnancy by combined B-scan and Doppler examination:A new application. Acta Obstetricia et Gynecologica Scandinavica, 53, 231-233.
Piiroinen, 0. (1975) Studies in diagnostic ultrasound. Size of the non-pregnant uterus in women of child-bearing age, and uterine growth and foetal development in the first half of normal pregnancy. Acta Obstetricia et Gynecologica Scandinavica, Supplement no. 46.
Psytynen, P., Ylostalo, P. & Ojala, A. (1968) Detection offoetal heart action by ultrasound transformed into audible signals. A comparative study with a visual method. Annales Chirurgia et Gynaecologiae Fenniae 57, 607-610.
Reinold, E. (1976) Ultrasonics in early pregnancy; diagnostic scanning and fetal motor activity. Basel: S. Karger.
Resch, B., Herczeg, J . , Altmayer, P. & Szatano, P. (1971)The efficiency of Doppler-technique in the first trimester of pregnancy. Annales Chirurgiae et Gynaecologiae Fenniae, 60, 85-88.

169
Rhodes, P. (1966) The volume of liquor amnii in early pregnancy. Journal of Obstetrics and Gynaecology of the British Commonwealth, 73, 23-26.
Roberts, C.J. & Lowe, C.R. (1975) Where have all the conceptions gone? Lancet, 1, 498-499.
Robinson, H.P. (1969) Sonar in the management of abortion.Journal of Obstetrics and Gynaecology of the British Commonwealth, 79, 90-94.
Robinson, H.P. (1972) Detection of fetal heart movements in the first trimester of pregnancy using pulsed ultrasound.British Medical Journal, 4, 466-468.
Robinson, H.P. (1973) Sonar measurement of the fetal crown-rumplength as a means of assessing maturity in the first trimester of pregnancy. British Medical Journal, 4, 28-31.
Robinson, H.P. (1975) Gestation sac volumes as determined bysonar in the first trimester of pregnancy. British Journal of Obstetrics and Gynaecology, 82, 100-107.
Robinson, H.P. & Fleming, J.E.E. (1975) A critical evaluation of sonar Mcrown-rump length” measurements. British Journal of Obstetrics and Gynaecology, 82, 702-710.
Robinson, H.P. & Caines, J.S. (1977) Sonar evidence of early pregnancy failure in patients with twin conceptions.British Journal of Obstetrics and Gynaecology, 84, 22-25.
Robinson, H.P., Sharp, F., Donald, I., Young, H. & Hall, A.J.(1972) The effect of pulsed and continuous wave ultrasound on the enzyme histochemistry of placental tissue in vitro. Journal of Obstetrics and Gynaecology of the British Commonwealth, 79, 821-827.
Russell, J.G.B. (1969) Radiological assessment of fetal maturity. Journal of Obstetrics and Gynaecology of the British Commonwealth, 76, 208-219.
Russell, J.G.B. (1973) Radiology in Obstetrics and Antenatal Paediatrics. London:Butterworths.
Sabbagha, R.E., Turner, H. Rockette, H . , Mazer, J. & Orgill, J.(1974) Sonar BPD and fetal age. Obstetrics and Gynecology, 43, 7-14.

170
Schreiber, M.H., Nichols, M.M. & McGarity, W.J. (1963) Epiphyseal ossification centre visualisation. Journal of the American Medical Association, 184, 504-507.
Scott, K.E. & Usher, R. (1964) Epiphyseal development in fetal malnutrition syndrome. New England Journal of Medicine,270, 822-824.
Scrimgeour, J. (1974) Personal communication.
Seppala, M. & Ruoslahti, E. (1972) Alphafetoprotein in abortion. British Medical Journal, 4, 769-771.
Shaw-Dunn, J. (1973) Personal communication.
Smyth, C.N. (1953) Experimental electrocardiography of the foetus. Lancet, I, 1124-1126.
Smyth, M.G. (1966) Animal toxicity studies with ultrasound at diagnostic power levels. In Proceedings of the First International Conference on Diagnostic Ultrasound, ed. Grossman, C.C., Holmes, J.H., Joyner, C. & Purnell, E.W. pp. 296-299. New York:Plenum.
Stewart, A., Webb, J., Giles, D. & Hewitt, D. (1956) Malignant disease in childhood and diagnostic irradiation in utero.Lancet, 2, 447.
Stocker, J. , Desjardins, P. & Deleon, A. (1975) Ultrasonography, its usefulness and reliability in early pregnancy. American Journal of Obstetrics and Gynecology, 121, 1084-1088.
Stoekel, W. (1945) Lehrbuch der Geburtschilfe. JenarGustav Fischer. Cited by Levi, S. (1976b) Journal of Clinical Ultrasound, 4, 3-5.
Stratford, B.F. (1970) Abnormalities of early human development.American Journal of Obstetrics and Gynecology, 107, 1223-1232.
Streeter, G.L. (1921) Weight, sitting height, head size, footlength and menstrual age of the human embryo. Contributions to Embryology No. 55. Carnegie Institution Publications,274, 143-170.

171
Streeter, G.L. (1949) Developmental horizons in human embryos. Contributions to Embryology No. 211. Carnegie Institution Publications, 575, 133-137.
Streeter, G.L. (1951) Developmental horizons in human embryos. Contributions to Embryology No. 230. Carnegie Institution Publications, 592, 165-196.
Sunden,B. (1964)0n the diagnostic value of ultrasound in obstetrics and gynaecology. Acta Obstetricia et Gynecologica Scandinavica, 43, Supplement no. 6, pp 66-80, 96-101.
Talbert, D.G. & Campbell, S. (1972) Physical aspects of diagnostic ultrasound. British Journal of Hospital Medicine, 8, 501-516.
Taylor, K.J.W. & Dyson,M. (1972) Possible hazards of diagnosticultrasound. British Journal of Hospital Medicine, 8, 571-577.
Taylor, K.J.W. & Pond, J.B. (1972) A study of the production of haemorrhagic injury and paraplegia in rat spinal cord by pulsed ultrasound of low megaHertz frequencies in the context of the safety for clinical usage. British Journal of Radiology, 45, 343-353.
Tenhaeff, D. & Karajiannis, G. (1970) Fruhnachweis fetalerHertztone im ersten Schwangerschaftsdrittel. Zentralblatt fur Gynakologie, 92, 736-740.
Thomson, H.E. (1968) The clinical use of pulsed echo ultrasound in obstetrics and gynecology. Obstetrical and Gynecological Survey, 23, 903-932.
Treloar, A.E., Borghild, B.G. & Cowan, D.W. (1967) Analysis of gestational interval. American Journal of Obstetrics and Gynecology, 99, 34-45.
Troostwijk, A. (1972) Echoscopie in de jonge zwangerschap. M.D. Thesis. Free University of Amsterdam.
Underhill, R.A. , Beazley, J.M. & Campbell, S. (1971) Comparison of ultrasound cephalometry, radiology, and liquor studies in patients with unknown confinement dates. British Medical Journal, 3, 736-738.

172
Varma, T.R. (1972) The value of ultrasonic B-scanning in diagnosis when bleeding is present in early pregnancy. American Journal of Obstetrics and Gynecology, 114, 607-612.
Varma, T.R. (1973) Prediction of delivery date by ultrasoniccephalometry. Journal of Obstetrics and Gynaecology of the British Commonwealth, 80, 316-319.
Vlieger, M. de, & Ridder, H.J. (1959) Use of echoencephalography. Neurology, 9, 216-223.
Wagner, G. & Fuchs, F. (1962) The volume of amniotic fluid in the first half of human pregnancy. Journal of Obstetrics and Gynaecology of the British Commonwealth, 69, 131-136.
Walls, E.W. (1947) The development of the specialized conducting tissue of the human heart. Journal of Anatomy, 81, 93-110.
Warwick, R., Pond, J.B., Woodward, B. & Connolly, C.C. (1970).Hazards of diagnostic ultrasonography - a study with mice. I.E.E.E. Transactions on Sonics and Ultrasonics, SU-17, 158-164.
Watts, P.L., Hall, A.J. & Fleming, J.E.E. (1972) Ultrasound andchromosome damage. British Journal of Radiology, 45, 335- 339.
Watts, P.L. & Stewart, C.R. (1972) The effect of fetal heart monitoring on maternal and fetal chromosomes. Journal of Obstetrics and Gynaecology of the British Commonwealth,79, 715-716.
Wells, P.N.T. (1972) Ultrasonics in Clinical Diagnosis. Edinburgh and London: Churchill, Livingstone.
Whitfield, C.R. (1974) The diagnostic value of amniocentesis. Clinics in Obstetrics and Gynaecology, 1, 67-84.
Wild, J.J. & Reid, J.M. (1952) Application of echo-rangingtechniques to the determination of structure of biological tissues. Science, 115, 226-230.
Wild, J.J. & Reid, J.M. (1954) Echographic visualisation oflesions of the living intact human breast. Cancer Research,14, 277-283.
Wild, J.J. & Reid, J.M. (1956) Diagnostic use of ultrasound.British Journal of Physical Medicine, 19, 248-257.

173
Willocks, J. (1962) The use of ultrasonic cephalometry.Proceedings of the Royal Society of Medicine, 55, 640-641.
Willocks, J. (1963) Fetal cephalometry by ultrasound and its place in clinical obstetrics. M.D. Thesis. University of Glasgow.
Willocks, J. & Dunsmore, I.R. (1971) Assessment of gestational age and prediction of dysmaturity by ultrasonic fetal cephalometry. Journal of Obstetrics and Gynaecology of the British Commonwealth, 78, 804-808.
Willocks, J., Donald, I., Duggan, T.C. & Day, N. (1964) Fetal cephalometry by ultrasound. Journal of Obstetrics and Gynaecology of the British Commonwealth, 71, 11-20.
Wilson, W.L., Wiercinski, F.J., Nyborg, W.L., Schnitzler, R.M.& Sichel, F.J. (1966) Deformation and motion produced in isolated single cells by localized ultrasonic vibration. Journal of the Acoustical Society of America, 40,1363-1370.
Wladimiroff, J.W. & Seelen, J.C. (1972) Fetal heart actionin early pregnancy. Development of fetal vagal function. European Journal of Obstetrics and Gynecology, 2, 55-63.
Wood, R.W. & Loomis, A.L. (1927) Physical and biological effects of high frequency sound waves of great intensity. Philosophical Magazine and Journal of Science, Series 7, 4, 417-436.
Ylikorkala, 0. & Jouppila, P. (1973) Human placental lactogen (HPL) in serum in complicated early pregnancy. Journal of Obstetrics and Gynaecology of the British Commonwealth,80, 1040-1045.
Related Documents