18th AlVC Conference Ventilation and Cooling held at Astir Palace, Vouliagmeni Complex, Athens, Greece 23rd-26th September 1997 Proceedings Volume 1

Welcome message from author
This document is posted to help you gain knowledge. Please leave a comment to let me know what you think about it! Share it to your friends and learn new things together.
Transcript
18th AlVC Conference Ventilation and Cooling
held at Astir Palace, Vouliagmeni Complex, Athens, Greece 23rd-26th September 1997
Proceedings Volume 1
bpic
Rectangle

O Copyright Oscar Faber Group Ltd 1997 All property rights, including copyright are vested in the Operating Agent (Oscar Faber Group) on behalf of the International Energy Agency.
In particular, no part of this publication may be reproduced, stored in a retrieval system or transmitted in any form or by any means, electronic, mechanical, photocopying, recording or otherwise, without the prior written permission of the Operating Agent.

PREFACE
International Energy Agency The international Energy Agency (IEA) was established in 1974 within the framework of the Organisation for Economic Co-operation and Development (OECD) to implement an International Energy Programme. A basic aim of the IEA is to foster co-operation among the twenty one IEA Participating Countries to increase energy security through energy conservation, development of alternative energy sources and energy research development and demonstration (RD&D). This is achieved in part through a Programme of collaborative RD&D consisting of forty-two Implementing Agreements, containing a total of over eighty separate energy RD&D projects. This publication forms one element of this Programme.
Energy Conservation in Buildings and Community Systems The IEA sponsors research and development in a number of areas related to energy. In one of these areas, energy conservation in buildings, the IEA is sponsoring various exercises to predict more accurately the energy use of buildings, including comparison of existing computer programs, building monitoring, comparison of calculation methods, as well as air quality and studies of occupancy.
The Executive Committee Overall control of the Programme is maintained by an Executive Committee, which not only monitors existing projects but identifies new areas where collaborative effort may be beneficial.
To date the following have been initiated by the Executive Committee (completed projects are identified by *): Annex 1 Load Energy Determination of Buildings* Annex 2 Ekistics and Advanced Community Energy Systems* Annex 3 Energy Conservation in Residential Buildings* Annex 4 Glasgow Commercial Building Monitoring* Annex 5 Air Infiltration and Ventilation Centre Annex 6 Energy Systems and Design of Communities* Annex 7 Local Government Energy Planning* Annex 8 Inhabitant Behaviour with Regard to Ventilation* Annex 9 Minimum Ventilation Rates* Annex 10 Building HVAC Systems Simulation* Annex 1 1 Energy Auditing* Annex 12 Windows and Fenestration* Annex 13 Energy Management in Hospitals* Annex 14 Condensation* Annex 15 Energy Efficiency in Schools* Annex 16 BEMS - 1: Energy Management Procedures* Annex 17 BEMS - 2: Evaluation and Emulation Techniques Annex 18 Demand Controlled Ventilating Systems* Annex 19 Low Slope Roof Systems Annex 20 Air Flow Patterns within Buildings* Annex 21 Thermal Modelling* Annex 22 Energy Efficient Communities* Annex 23 Multizone Air Flow Modelling (COME)* Annex 24 Heat Air and Moisture Transfer in Envelopes* Annex 25 Real Time HEVAC Simulation* Annex 26 Energy Efficient Ventilation of Large Enclosures*
Annex 27 Annex 28 Annex 29 Annex 30 Annex 31 Annex 32 Annex 33 Annex 34
Evaluation and Demonstration of Domestic Ventilation Systems* Low Energy Cooling Systems Energy Efficiency in Educational Buildings Bringing Simulation to Application Energy Related Environmental Impacts of Buildings Integral Building Envelope Performance Assessment. Advanced Local Energy Planning Computer-aided Evaluation of HVAC System Performance
Annex V Air Infiltration and Ventilation Centre The Air Infiltration and Ventilation Centre was established by the Executive Committee following unanimous agreement that more needed to be understood about the impact of air change on energy use and indoor air quality. The aim of the Centre is to promote an understanding of the complex behaviour of air flow in buildings and to advance the effective application of associated energy saving measures in both the design of new buildings and the improvement of the existing building stock.
The Participants in this task are Belgium, Canada, Denmark, Germany, Finland, France, Netherlands, New Zealand, Norway, Sweden, United Kingdom and the United States of America.
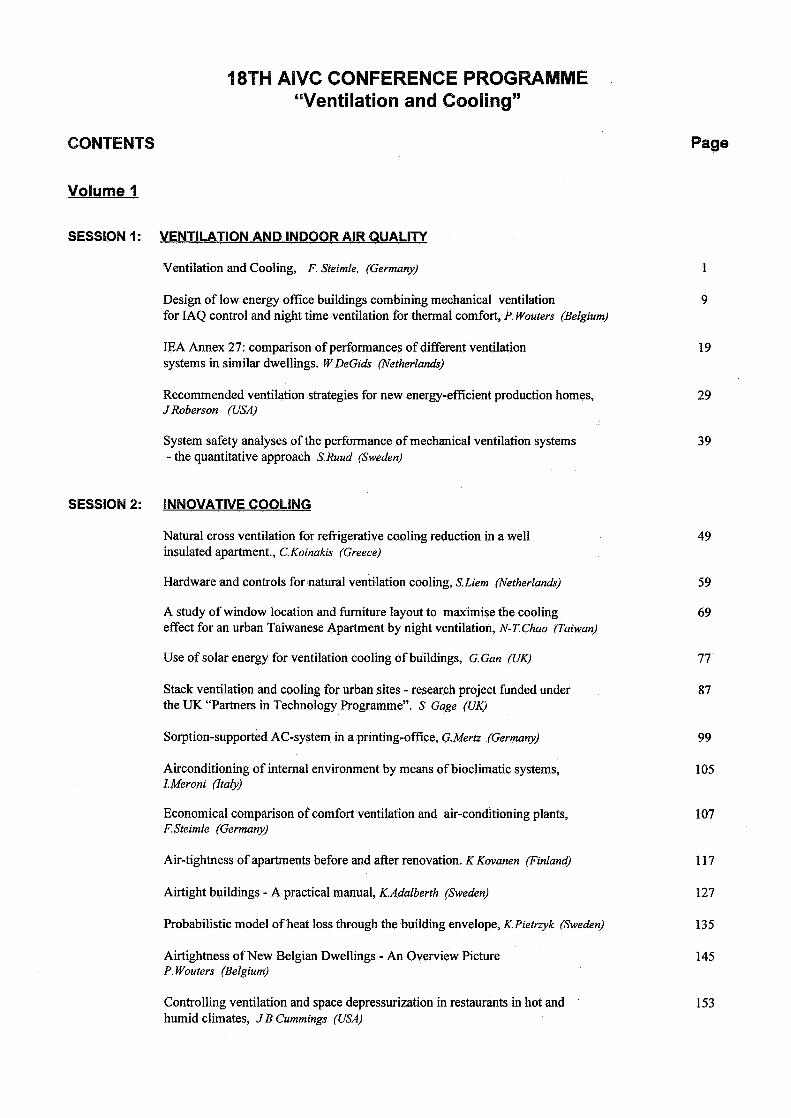
18TH AlVC CONFERENCE PROGRAMME "Ventilation and Cooling"
CONTENTS
Volume 1
SESSION I: VENTILATION AND INDOOR AIR QUALITY
Ventilation and Cooling, F. Steimle, (Germany)
Design of low energy office buildings combining mechanical ventilation for IAQ control and night time ventilation for thermal comfort, P. Wouters (Belgium)
IEA Annex 27: comparison of performances of different ventilation systems in similar dwellings. W DeGids (Netherlands)
Recommended ventilation strategies for new energy-efficient production homes, J Roberson (USA)
System safety analyses of the performance of mechanical ventilation systems - the quantitative approach S.Ruud (Sweden)
SESSION 2: INNOVATIVE COOLING
Natural cross ventilation for refiigerative cooling reduction in a well insulated apartment., C. Koinakis (Greece)
Hardware and controls for natural ventilation cooling, S.Liem (Netherlands)
A study of window location and furniture layout to maximise the cooling effect for an urban Taiwanese Apartment by night ventilation, N-T.Chao (Taiwan)
Use of solar energy for ventilation cooling of buildings, G.Gan (UK)
Stack ventilation and cooling for urban sites - research project funded under the UK "Partners in Technology Programme". S Gage (UK)
Sorption-supported AC-system in a printing-office, G.Mertz (Germany)
Airconditioning of internal environment by means of bioclimatic systems, I. Meroni (Italy)
Economical comparison of comfort ventilation and air-conditioning plants, F.Steimle (Germany)
Air-tightness of apartments before and after renovation. K Kovanen (Finland)
Airtight buildings - A practical manual, K.Adalberth (Sweden)
Probabilistic model of heat loss through the building envelope, K.Pietrzyk (Sweden)
Airtightness of New Belgian Dwellings - An Overview Picture P. Wouters (Belgium)
Controlling ventilation and space depressurization in restaurants in hot and humid climates, J B Cummings (USA)
Page
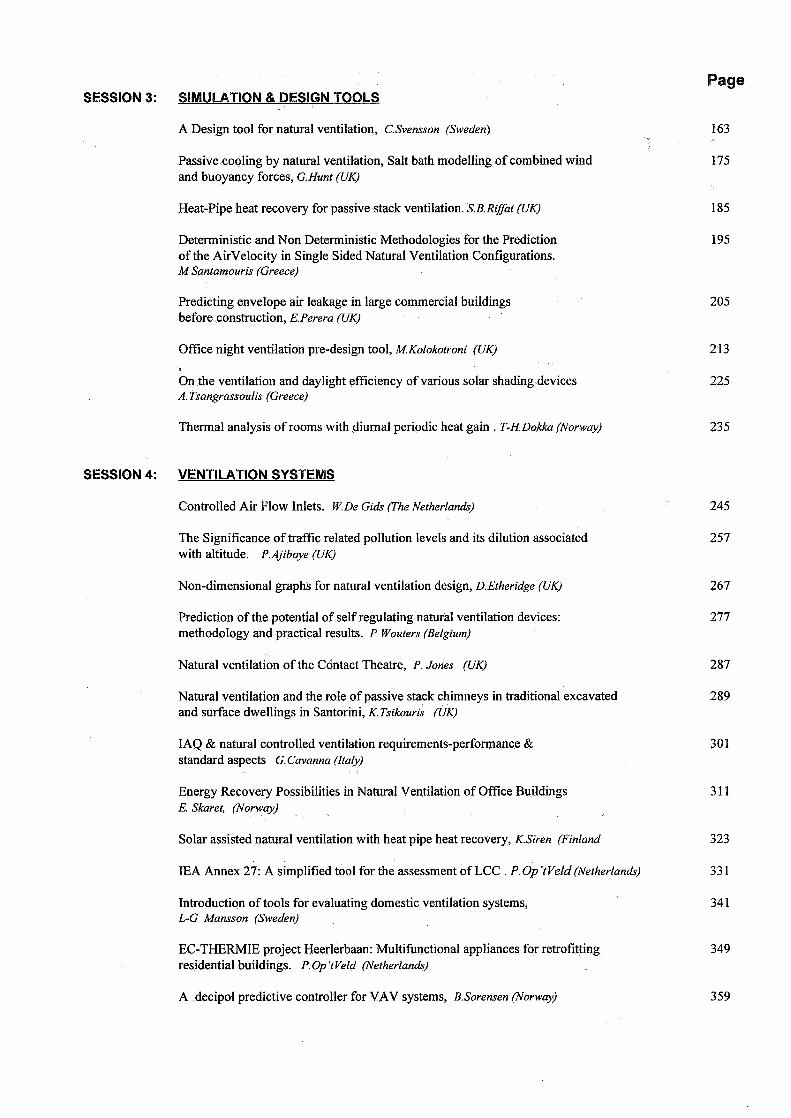
SESSION 3: SIMULATION & DESIGN TOOLS
A Design tool for natural ventilation, C.Svensson (Sweden)
Passive cooling by natural ventilation, Salt bath modelling of combined wind and buoyancy forces, G.Hunt (UK)
Heat-Pipe heat recovery for passive stack ventilation. S.B. R@at (UK)
Deterministic and Non Deterministic Methodologies for the Prediction of the Airvelocity in Single Sided Natural Ventilation Configurations. M Santamouris (Greece)
Predicting envelope air leakage in large commercial buildings before construction, E.Perera (UK)
Office night ventilation pre-design tool, M. Kolokotroni (UK)
9
On the ventilation and daylight efficiency of various solar shading devices A. Tsangrassoulis (Greece)
Thermal analysis of rooms with diurnal periodic heat gain . T-H.Dokka (Norway)
SESSION 4: VENTILATION SYSTEMS
Controlled Air Flow Inlets. W.De Gids (The Netherlands)
The Significance of traffic related pollution levels and its dilution associated with altitude. P.Ajiboye (UK)
Non-dimensional graphs for natural ventilation design, D.Etheridge (UK)
Prediction of the potential of self regulating natural ventilation devices: methodology and practical results. P Wouters (Belgium)
Natural ventilation of the Contact Theatre, P. Jones (UK)
Natural ventilation and the role of passive stack chimneys in traditional excavated and surface dwellings in Santorini, K. Tsikouris (UK)
IAQ & natural controlled ventilation requirements-performance & standard aspects G. Cavanna (Italy)
Energy Recovery Possibilities in Natural Ventilation of Office Buildings E. Skaret, (Norway)
Solar assisted natural ventilation with heat pipe heat recovery, K.Siren (Finland
IEA Annex 27: A simplified tool for the assessment of LCC . P. Op 't Veld (Netherlands)
Introduction of tools for evaluating domestic ventilation systems, L-G Mansson (Sweden)
EC-THERMIE project Heerlerbaan: Multifunctional appliances for retrofitting residential buildings. P.Op 'tVeld (Netherlands)
A decipol predictive controller for VAV systems, B.Sorensen (Norway)
Page
Introduction of air infiltration and ventilation in a simple modelling for energy consumption estimation in air conditioned buildings,O.Morisot (France)
Air distribution in an office building as measured with a passive tracer gas technique, H.Styrnne (Sweden)
Measured air exchange rates at workplace having different types of ventilation. P.Korhonen (Finland)
Adaption of a fan coil unit to operating conditions for optimum thermal comfort. D.Marcha1 (France)
Study of the ventilation on an ancient building located in the centre of Rome and now used as auniversity office. G. Fasano (Italy)
Evaluation of thermal comfort impact of direct fresh air supply in Winter part 2, comparison of different ways of air supply to exhaust only ventilation. T.Sawachi (Japan)
Measurements and control of air motions within a building. C Blomqvist (Sweden)
Volume 2
SESSION 5: VENTILATION SYSTEMS
A method for the economical optimisation of the design temperatures and the connecting flows of a cooling system PSarkomaa (Finland)
Guidance and tools for night and evaporative cooling in office buildings, J. Millet (France)
Increased ventilation airflow rate: Night and Day Cooling of an office building C. Martin (France)
Page
369
Dehumidification by alternative cooling systems. F.Steimle (Germany) 465
Applying night ventilation techniques in office buildings . KGeros (Greece) 467
Reducing cooling loads with under roof air cavities. G.Fracastoro (Italy) 477
Possibilities and limitations for evaporative and desiccant cooling technologies. T. Lindholm (Sweden)
Macroscopic Formulation and Solution of Ventilation Design Problems", J.Axley (USA) 497
SESSION 6: COMPUTER SIMULATION
Airflow through horizontal openings. A. Peppes (Greece)
Simulation of the cooling effect of the night time natural ventilation: A 3D numerical application to the Maison Ronde of Botta. D.Groleau (France)
Numerical simulation of IAQ and energy need by COMIS model: (outcome of Annex 27: Evaluation and demonstration of domestic ventilation systems) H. Yoshino (Japan)
Performance of series connected heat exchangers with liquid circuit on loop. E. Marttila (Finland)
Zonal models: presentation and proposal of a new expression of balance. equations applied to the study of air flow and heat transfer in buildings. M.Musy (France)
A modification of the power-law equation to account for large scale wind turbulence. K.Siren. (Finland)
Simulation of Non-passive particle dispersion in ventilated rooms. S. Holmberg (Sweden)
Qualification of ventilation systems. M.Baumann (France)
Checking of simulation models in a ventilation test room. A. Weber (Sweden)
Experimental Approach of air flow through a door connecting rooms with different temperature. N. Papamanolis (Greece)
Identification and validation of a model to predict the 3-D distribution of temperature in a ventilated test room, K.Janssens (Belgium)
Use of Computational Fluid Dynamics for Modelling Passive Downdraught Evaporative Cooling, M Cook (UK)
SESSION 7 - INNOVATIVE COOLING
Characteristics values of natural ventilation and air conditioning. A.van Paassen (Netherlands,,
Barriers to natural ventilation design of office buildings. S.Aggerholm (Denmark)
Feedback on the design of low energy buildings D.Azzi (UK)
Ventilation effectiveness measurements in real time using uniform tracer emission continuous M. Bassett (New Zealand)
Impacts of air distribution system leakage in Europe: the SAVE DUCT European programme continuous F.R. Carrie (France)
Page
535
VENTILATION AND COOLING 18TW AIVC CONFERENCE, ATHENS, GREECE
23-26 SEPTE
Title: Ventilation and Cooling
Author(s): Prof.Dr.-Ing. F. Steimle
Affiliation: Institut fur Angewandte Thermodynamik und Klirnatechnik, Universitat Essen, Universistatsstr.l5,45141 Essen, Federal Republic of Germany

The main source of humidity in office buildings are the human occupant in the offices. Moisture is therefore a result of heat transmission from the person to the room air.
1. Heat transmission of the human body
The human heat transmission is done by convection, radiation and by evaporation of water t o the environment. This physical transmissions cause the following six parameters of thermal comfort:
activity level clothing air temperature
s air humidity air velocity wall temperature
The different heat transmission mechanism take over different parts of the total heat load. The ratio are depending on various parameters. With rising air-temperature the convection is decreasing meanwhile the latent heat by evaporation is increasing. In fig. 1 the influence of the activity level on the different ratios is shown. The total heat losses wi th an activity level related to 120 W (left part of Fig. 1) is fairly constant over a wide range of temperature. But the ratio between the latent heat and the sensible heat is very different at various air temperatures.
Fig. 1 : Heat-transmission of persons in normal clothing 11 I

Higher activity level related to 250 W (middle part of Fig. 1) or t o 350 W (right part of Fig. 1) shows the same tendency. The sensible heat is always the sum of convection and radiation.
A t higher temperatures the evaporation must take over sometimes incomming radiation. i n cars e.g. the incoming solar radiation must be considered already at lower room-temperatures because this incoming energy must be bilanced by additional evaporaton. That is the reason why a large amount of water vapour ist transported t o the air.
Main standards and regulations are done for offices wi th fairly the same activity level for all persons in the room. But also in these rooms a different heat transmission t o the room can be seen in comparing the different individuals. /2/
Because the parameters of the heat convection are fairly stable, and because of the constant body temperature and a fixed clothing the control mechanism of the body temperature by changing the heat losses can only be done in the latent heat range. The rise of the temperature of the body surface can only be shifted in very small limits and the room air temperature and the air-velocity can not be ajusted individually. A change in the radiation is also not possible at a fixed wall temperature and given room configuration.
Fairly often different activity levels can be found in the same room. Some examples are shown wi th the following values (Tab. 1).
Tab. 1 : Activity levels
These activity levels are very different but w e can find them in the same room at the same time and wi th the same clothing. The distribution of the heat transmission t o radiation, convection and evaporation therefore depends also on the room temperature. Calculated values on the bases on some measurements are shown in the next table (Tab. 2).
2. Humidity and comfort
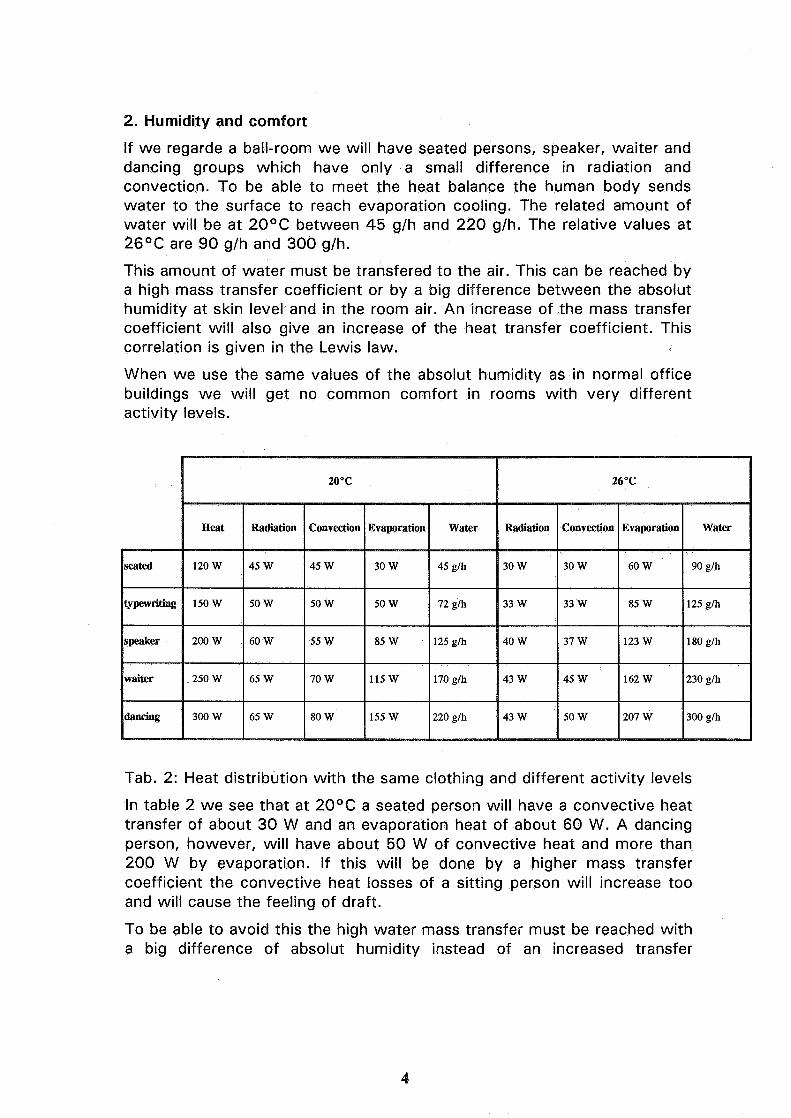
If we regarde a ball-room we will have seated persons, speaker, waiter and dancing groups which have only a small difference in radiation and convection. To be able to meet the heat balance the human body sends water to the surface to reach evaporation cooling. The related amount of water will be at 20°C between 45 glh and 220 glh. The relative values at 26OC are 90 glh and 300 glh.
This amount of water must be transfered to the air. This can be reached by a high mass transfer coefficient or by a big difference between the absolut humidity at skin level and in the room air. An increase of the mass transfer coefficient will also give an increase of the heat transfer coefficient. This correlation is given in the Lewis law.
When we use the same values of the absolut humidity as in normal office buildings we will get no common comfort in rooms with very different activity levels.
Tab. 2: Heat distribution with the same clothing and different activity levels
In table 2 we see that at 20°C a seated person will have a convective heat transfer of about 30 W and an evaporation heat of about 60 W. A dancing person, however, will have about 50 W of convective heat and more than 200 W by evaporation. If this will be done by a higher mass transfer coefficient the convective heat losses of a sitting person will increase too and will cause the feeling of draft.
To be able to avoid this the high water mass transfer must be reached with a big difference of absolut humidity instead of an increased transfer

coefficient. This means a temperature of 20°C and a low absolut humidity in the air with the standard air velocity will meet the comfort conditions for both groups of the population in the same room. The small temperature difference and a normal heat transfer coefficient will not give any draft for sitting persons and- also give enough evaporation potential for people with higher activity level like speakers, waiters and dancers.
The relative humidity in the rooms should not be lower than 30 %. Below this level the nose and the throat can dry out and this must be avoided. In a lot of different materials which are used in buildings a low humidity can also give a high electrostatic load which also cause discomfort. 141
s H20 kg dry air
Fig. 2: Comfort zone DIN 1946 pt 2
The investigations of 0. Fanger I51 about the thermal comfort shows a much smaller influence of the humidity, but these values are only valuable for office buildings. The reason of these results is the very small change of activity level, a very simular clothing and a fairly stable air temperature. As shown the activity level is of great influence. It. is not possible, therefore, to use the values for office buildings in a much broader scale. In figure 2 the optimal conditions are shown compared with the comfort zone of DIN 1946 part 2. These results can also be shown by experiments.
In air conditioned testrooms a group of about 30 people had to find out which rooms seems to be colder compared with the other one.
Unanimously they stated that a room with 26OC and 30% humidity is definetly cooler than a room with 24OC and 60 % humidity. These tests give the line of optimum conditions for summer (see figure 2).
3. Dehumidification load
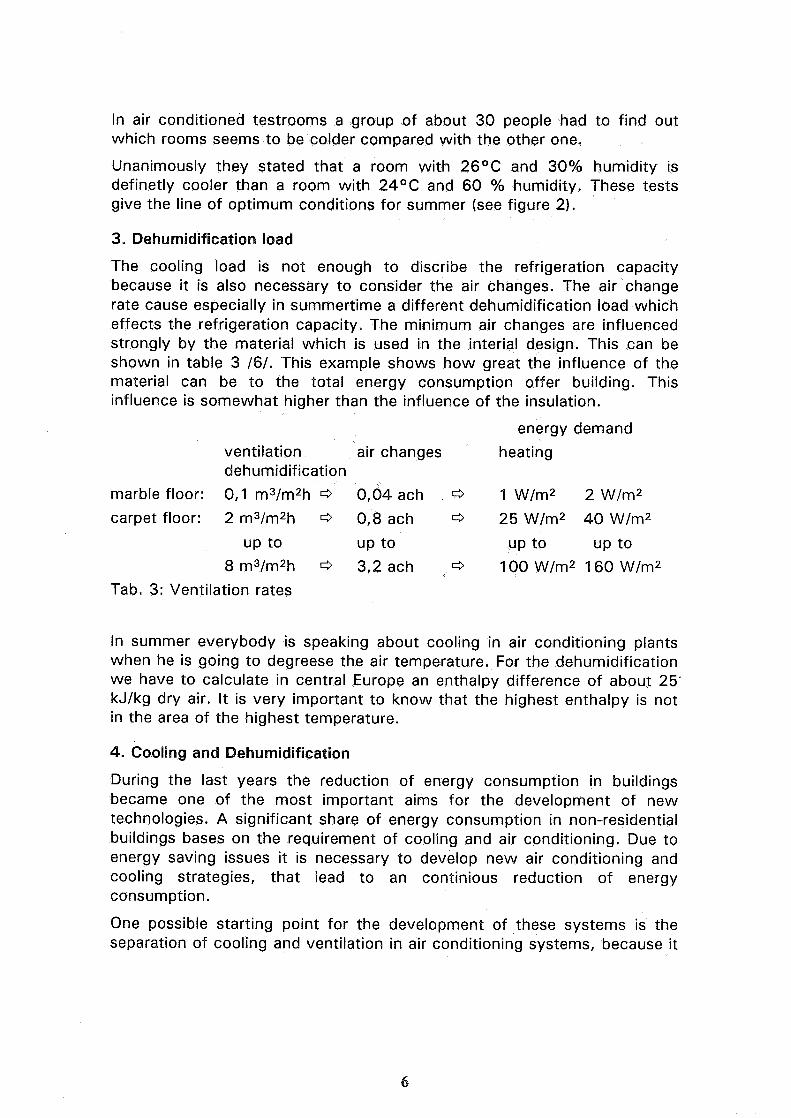
The cooling load is not enough to discribe the refrigeration capacity because it is also necessary to consider the air changes. The air change rate cause especially in summertime a different dehumidification load which effects the refrigeration capacity. The minimum air changes are influenced strongly by the material which is used in the interial design. This can be shown in table 3 161. This example shows how great the influence of the material can be to the total energy consumption offer building. This influence is somewhat higher than the influence of the insulation.
energy demand
ventilation air changes heating dehumidification
marble floor: 0,l m3/m2h @ 0,04 ach 0 1 W/m2 2 W/m2
carpet floor: 2 m3/m2h @ 0,8 ach @ 25W/m2 40W/m2
up to up to up to up to
8 m3/m2h @ 3,2 ach @ 100 W/m2 160 W/m2 Tab. 3: Ventilation rates
In summer everybody is speaking about cooling in air conditioning plants when he is going to degreese the air temperature. For the dehumidification we have to calculate in central Europe an enthalpy difference of about 25. kJ/kg dry air. It is very important to know that the highest enthalpy is not in the area of the highest temperature.
4. Cooling and Dehumidification
During the last years the reduction of energy consumption in buildings became one of the most important aims for the development of new technologies. A significant share of energy consumption in non-residential buildings bases on the requirement of cooling and air conditioning. Due to energy saving issues it is necessary to develop new air conditioning and cooling strategies, that lead to an continious reduction of energy consumption.
One possible starting point for the development of these systems is the separation of cooling and ventilation in air conditioning systems, because it

is more effective t o transport energy by using water systems than t o use only air t o deliver the cooling energy to the rooms. This strategy was the basis for the development of hybrid systems. By using these systems, it is possible to reduce the ventilation rates to a minimum, which ensures dehumidification and guarantees a satisfying air exchange due t o hygienic aspects. The main part of sensible cooling can be delivered t o the room by induction-coils, heat exchangers wi th free convection or chilled structural elements in the room like chilled ceilings.
During the last f e w years many chilled ceiling systems and free convective cooling systems were developed and they are nowadays often installed in combination wi th ventilation systems, which guarantees the necessary ventilation rate. These systems can be installed as well in new as in retrofit commercial buildings. A t the beginning of this period, there was no guide- line or technical standard available, which regulated or standardized the measurement of the cooling performance. So sometimes the given characteristic data for the design of these systems were related t o different operating parameters like room temperature or mean temperature of the cold water, which is mainly used as transport medium to distribute the cooling energy within the building. Also i t was possilble, that given data of cooling performance varied within a wide range for systems wi th nearly the same structure and design.
An accurate planning of these systems during the design period and an objective comparison of different systems is only possible, if the characteristic data for the description of heat transfer and cooling performance were investigated under comparable and clearly defined boundary conditions.
5. Refrigeration capacity
Mainly refrigeration systems for air conditioning are running with a temperature range of 6OC up to 12OC. Nearly all water chillers are designed for this temperature. The 6OC as supply temperature is necessary t o reach the dehumidification of the outdoor air used for air renewal.
Normally the same system temperature is used to transport heat from inner heat gains to the central system. In chilled ceiling systems the temperature a the surface must be about 20°C in summertime to avoid condensing water at the surface.
If there is used the same water chiller either for the dehumiditation and for the cooled ceilings the 5OC or 6OC chiller water will be mixed wi th return water to read the higher supply temperature of about 15OC. If the water chiller will be devided in t w o parts working on a different temperature level a lot of energy can be saved. In table 4 the C.O.P. for different chiller temperatures are shown. They are measured in a water cooled condenser wi th 30°C/350C. Compared wi th the supply temperature of 5OC the chiller
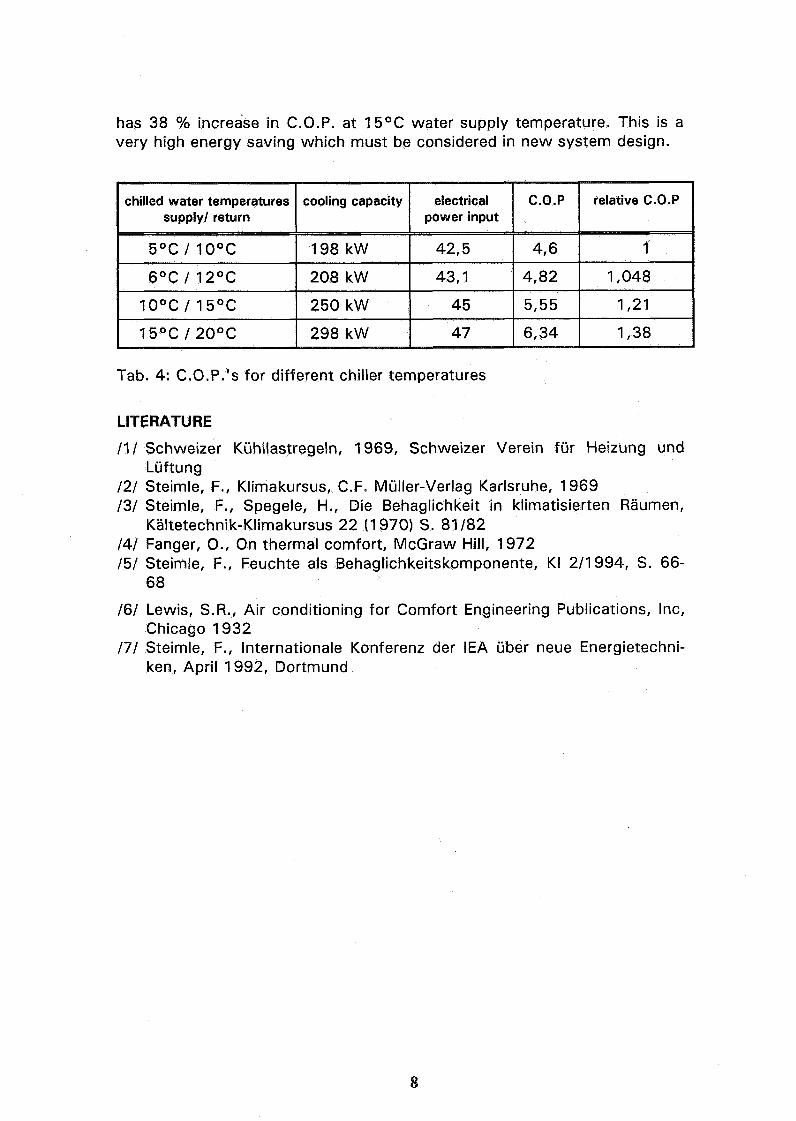
has 38 % increase in C.O.P. at 15OC water supply temperature. This is a very high energy saving which must be considered in new system design.
Tab. 4: C.O.P.'s for different chiller temperatures
LITERATURE
11 I Schweizer Kuhllastregeln, 1969, Schweizer Verein fur Heizung und Liiftung
I21 Steimle, F., Klimakursus, C.F. Muller-Verlag Karlsruhe, 1969 131 Steimle, F., Spegele, H., Die Behaglichkeit in klimatisierten Raumen,
Kaltetechnik-Klimakursus 2 2 (1 970) S. 81 182 I41 Fanger, O., On thermal comfort, McGraw Hill, 1972 151 Steimle, F., Feuchte als Behaglichkeitskomponente, KI 211 994, S. 66-
6 8
161 Lewis, S.R., Air conditioning for Comfort Engineering Publications, Inc, Chicago 1932
171 Steimle, F., Internationale Konferenz der IEA uber neue Energietechni- ken, April 1992, Dortmund
VENTILATION WND COOLING 18TH AIVC CONFERENCE, ATHENS, GREECE
23-26 SEPTENIBER, 11997
Title: Design of Low Energy Office Buildings Combining Mechanical Ventilation for IAQ Control and Night-Time Ventilation for Thermal Comfort
Author(s): P Wouters, D Duearme, S Martin, J Demeester, J Schietecat, S Sehouwenaars
Affiliation: Belgian Building Research Institute (CSTC-WTCB) Brussels, Belgium
AIVC Conference Athens . September 1997
Design of low energy office buildings combining mechanical ventilation for IAQ control and night time ventilation for thermal comfort
P . Wouters. D . Ducarme. S . Martin. J . Demeester. J . Schietecat. S . Schouwenaars Division of Building Physics and indoor Climate
Belgian Building Research Institute WTCB - CSTC
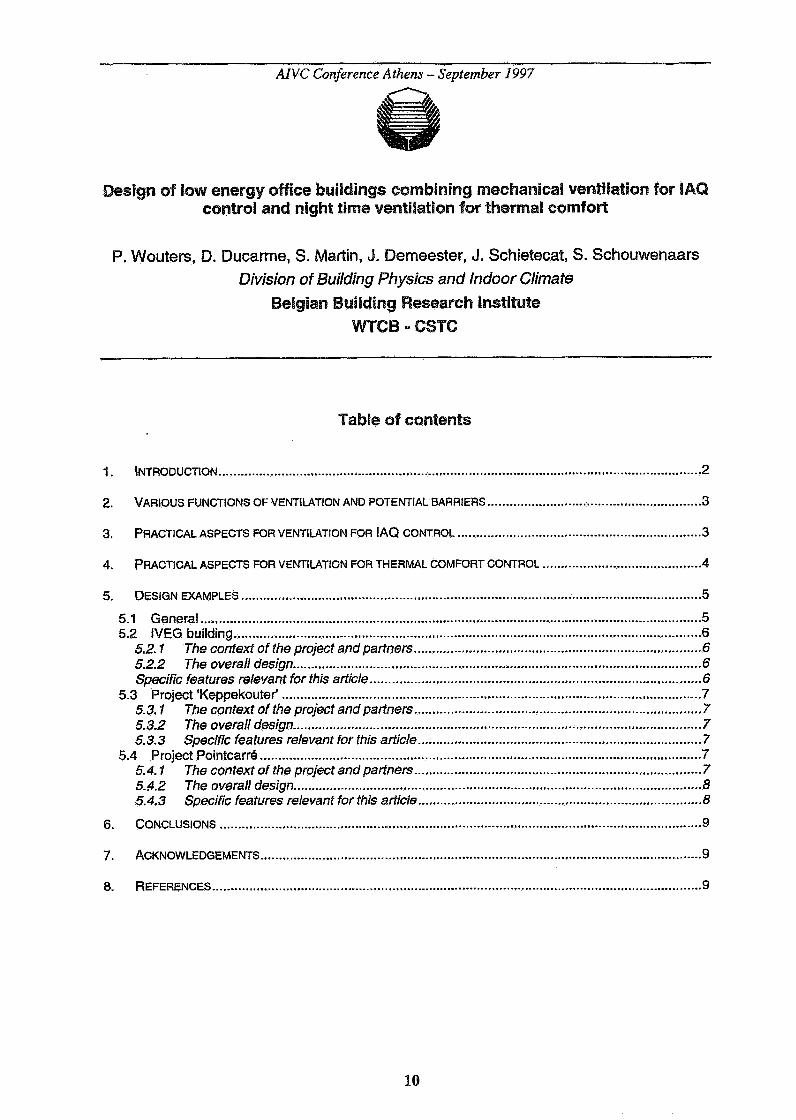
Table of contents
................................ 2 . VARIOUS FUNCTIONS OF VENTILATION AND POTENTIAL BARRIERS .. .................... 3 3 . PRACTICAL ASPECTS FOR VENTILATION FOR IAQ CONTROL .................................................................. 3
4 . PRACTICAL ASPECTS FOR VENTILATION FOR THERMAL COMFORT CONTROL ......................................... 4
........................................................................................................................... 5 . DESIGN EXAMPLES 5
5.1 General ........................................................................................................................................ 5 5.2 IVEG building ............................................................................................................................... 6
.............................................................................. 5.2.1 The context of the project and partners 6 ............................................................................... 5.2.2 The overall design ......................... ..... 6
.......................................................................................... Specific features relevant for this arficle 6 .................................................................................................................. 5.3 Project 'Keppekouter' 7
.............................................................................. 5.3.1 The context of the project and partners 7 .............................................................................................................. 5.3.2 The overall design -7
...................................................... 5.3.3 Specific features relevant for this article -7 ........................................................................................................................ 5.4 Project Pointcarre 7
.............................................................................. 5.4.1 The context of the project and partners 7 ............................................................................................................... 5.4.2 The overall design 8
5.4.3 Specific features relevant for fhis article ............................................................................ 8

Summary
The design of low-energy ofJEce buildings requires specific attention to an energy eficient concept forprovidutg good iredoor air quality conditions. With this respect, mechanical ventilation shows undeniable advantages: it can be optimally controtted (infrared detection, C02 control,. ..), heat recovev is applicable, outdoor noise and
pollution penetration can be minimised.
Another crucial challenge in low-enel-gy ofice buildings is the avoidance or, if impossible, the minimisation of active cooling needs. Nighttin~e natural ventilation can play an essential pan in an overheating prevention
straregy.
This paper iiiustrares these concepts through several consuIting projects:
* new office building to be occupied by the owner;
* new ofice building by promoter to be rented by several conrpanies;
advanced double facade building in polluted area downtown;
1. Introduction
The use of natural ventilation in non-domestic buildings is in principle an attractive option. h practice, one observes that there is often confusion with respect to the purpose of natural ventilation and the possible advantages and disadvantages. The Belgian Building Research Institute has been involved during the last few years in several consultancy studies for new buildings as well as for retrofitting projects and was also involved in several national and European projects in which the issue of natural ventiIation was studied. This paper aims to give an overview of these experiences and it also gives some critical remarks with respect to natural ventilation in general and with the challenges for the design process.
2. Various functions of natural ventilation
When people speak about a 'naturally ventilated office building', it is often not evident to have a good understanding of what they really mean : - in a number of countries and/or for a number of people, the meaning of natural ventilation
is that the air supply and exhaust is assumed to happen through cracks and leakages in the facades as well as by opening the windows and doors. It is clear that such an approach may work for not too airtight buildings in very mild climates with good outdoor conditions (no noise problems and good outdoor air quality) but it is clear that in most circumstances such a strategy can not guarantee good indoor air quality conditions;
- others understand by 'natural ventilation design' that the required supply air for indoor air quality (IAQ) control is guaranteed by specifically designed supply and exhaust openings allowing to meet the IAQ needs and at the same time to keep the energy demand within reasonable limits. This strategy can be described as 'natural velzrilation for IAQ control'.
- others understand by 'natural ventilation design' that ventilation plays a crucial role for keeping thermal comfort conditions in summer. In general, night ventilation is used for cooling down the building structure at night in order to limit the indoor temperatures at daytime. This strategy can be described as "natural ventihtion for thermal cornfort control'.
It is essential that the designers fully understand the different purposes for 'natural ventilation for IAQ control' and 'naturdl ventilation for thermal comfort control'. As described in the paper presented at the AIVC conference in ~o thenbur~ ' , the energy context for both strategies is completely different and therefore also the need for optimum control. In this paper, some practical aspects of both types of natural ventilation are discussed and illustrated with a number of practical examples.
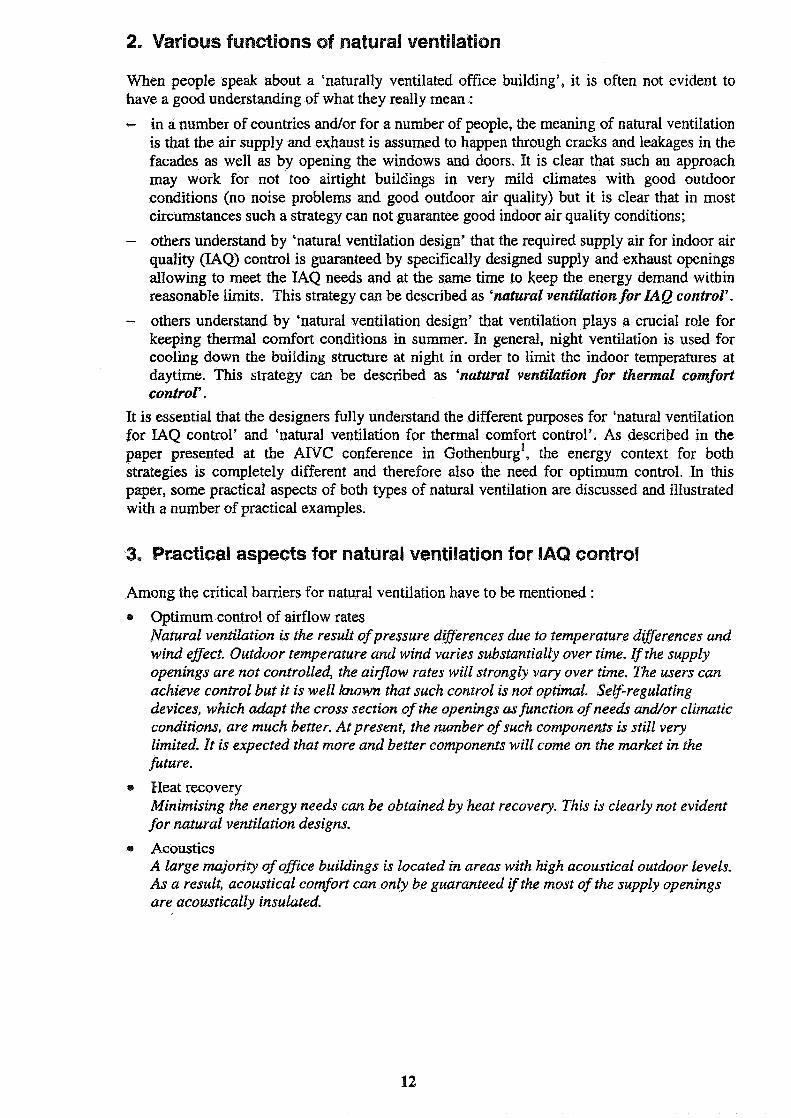
3. Practical aspects for natural ventilation for IAQ control
Among the critical barriers for natural ventilation have to be mentioned : r Optimum control of airflow rates
Natural ventilation is the result of pressure digerences due to temperature differences and wind egect. Outdoor temperature and wind varies substantially over time. I f the supply openings are not controlledy the airfEaw rates will strongly vary over time. Tlte users can achieve control but it is well kzown that such control is not optimal. Self-regulating devices, which adapt the cross section of the openings as function of needs &or climatic conditions, are much better. At present, the number of such components is still very limited. It is expected that more and better components will come on the market in the fiatre.
* Neat recovery Minimising the energy needs can be obtained by heat recovery. This is clearly not evident for natural ventilation designs.
Acoustics A large majority of oJEce buiMings is located in areas with high acoustical outdoor levels. As a result, acoustical comfort can only be guaranteed if the mast of the supply openings are acollstically insulated.

4. Practical aspects for natural ventilation for thermal comfort control
Natui-al ventilation for thermal comfort in summer is a very attractive option. The cooling potential is in principle very large, especially at night, but very large air quantities are needed since the thermal capacity of the air is very small (an outdoor air flow rate of 100 m3/h gives only 30 W/K cooling power).
Among the critical aspects have to be mentioned :
Acoustics Intensive ventilation during working hours through open windows is not evident in urban areas for buildings in the vicinity of traffic roads, airports,. . . Night time ventilation is often not a problem since there will be no or only a very limited occupation and since the outdoor noise levels are in general lower than during the working hours.
Outdoor pollution Traffic can create outdoor pollution problems due to which intensive ventilation through open windows at the streetside is not evident. At nighttime, pollution levels are in general lower and moreover no occupants.
e Burglary and insects At daytime and even more at nighttime, ventilation through open windows may not substantially increase the risk of burglary and the entrance of insects. Use of appropriate protection systems can guarantee this.
Thermal mass Night ventilation can be an attractive option but a requirement is a minimum amount of thennal mass.
Minimisation of thennal load (solar and internal) Even in buildings with a high thermal. mass, thermal comfort without active cooling can only be guaranteed if the thermal load is reasonable. In practice, this often means good control of solar gains (by appropriate shading devices) and reasonable internal gains (efficient lighting, energy efficient computers and controls,. . .)
5. Design examples
5.1 General
Delivery I End 1998 1 Summer 1997 1 1 Summer 1997 1 Summer 1997
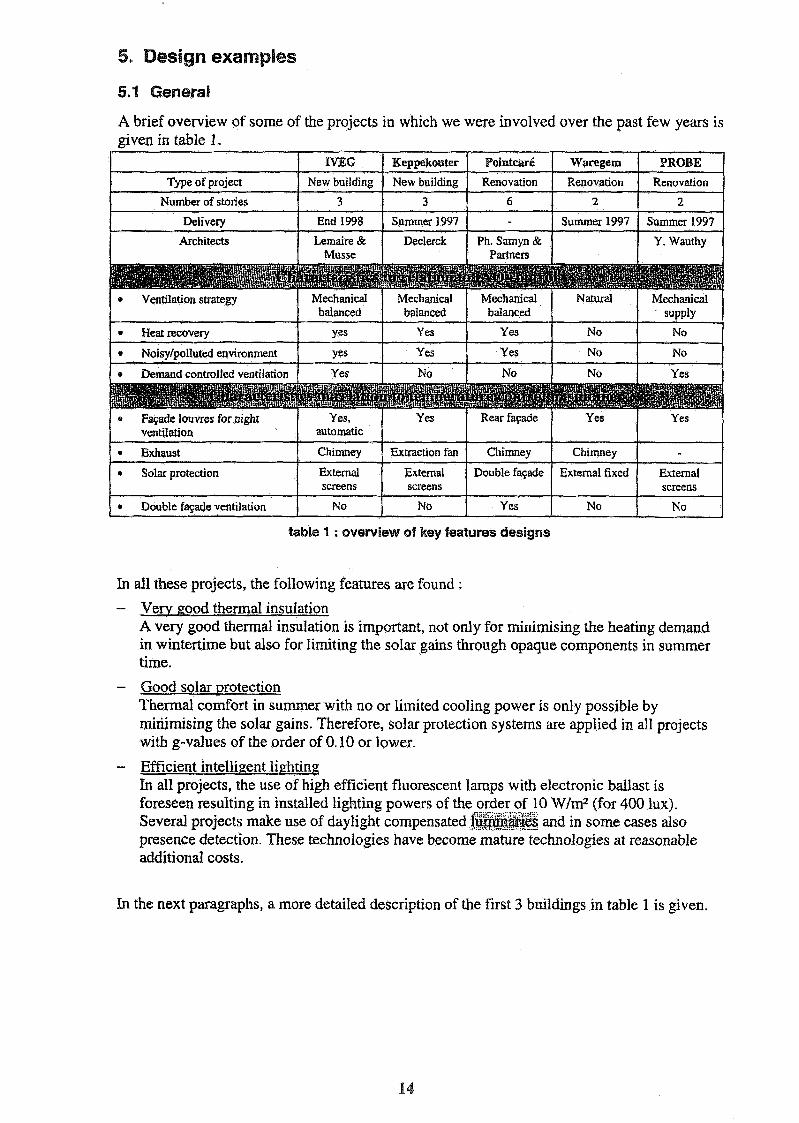
A brief overview of some of the projects in which we were involved over the past few years is given in table 1.
Architects I Y-wauthy I
Type. of project
Number of stories
balanced balanced balanced 1 1 supply
Heat recovery Yes Yes Yes I No No
1 ventilation I automatic
NJEG
New building
3
* Noisyipolluted environment
Demand controlled ventilation
I * Exhaust
Pointcar6
Renovation
6
Keppekouter
New building
3
1 Chimney
I Solar protection screens I
Waregern
Renovation
2
Yes
Yes
- -- - - - - - - -
* Double fac;ade ventilation No
PROBE
Renovation I
2 I
- - No
No
7 -
Yes I Y e i No No
Extraction fan
External screens
No
No
Yes
Chimney Chimney
Double fac;ade External fixed External screens
table 1 : overview of key features designs
In all these projects, the following features are found :
- Very pood thermal insulation A very good thermal insulation is important, not only for minimising the heating demand in wintertime but also for limiting the solar gains through opaque components in summer time.
- Good solar ~rotection Thermal comfort in summer with no or limited cooling power is only possible by minimising the solar gains. Therefore, solar protection systems are applied in all projects with g-values of the order of 0.10 or lower.
- Eff~cient intelligent lighting In all projects, the use of high efficient fluorescent lamps with electronic ballast is foreseen resulting in installed lighting powers of the order of 10 WfmZ (for 400 lux). Several projects make use of daylight compensated K@:$%& and in some cases also presence detection. These technologies have become mature technologies at reasonable additional costs.
In the next paragraphs, a more detailed description of the first 3 buildings in table 1 is given.
5.2 lVEG building
5.2.1 The context of the project and partners
This building will be the new head office of TVEG, which is public company for gas and distribution, which has some 70.000 clients in a number of villages in the region of Antwerp. A relatively long preparation period was possible (about 18 months) and the owner was very strongly motivated for realising a low energy building with good indoor climate conditions. Therefore, for a number of design decisions they were ready to take full responsibility and this of course simplifies certain decisions.
5.2.2 The overall design
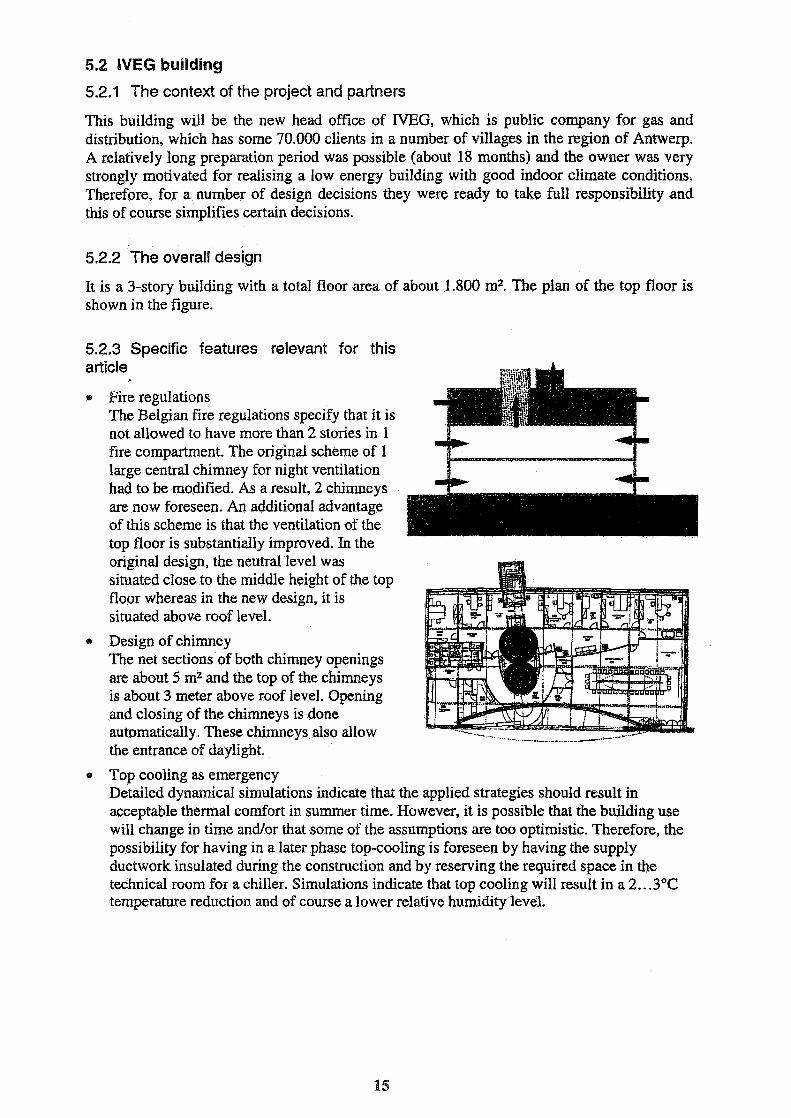
It is a 3-story building with a total floor area of about 1.800 m2. The plan of the top floor is shown in the figure.
5.2.3 Specific features relevant for this
Fire regulations The Belgian fire regulations specify that it is not allowed to have more than 2 stories in 1 fire compartment. The original scheme of 1 large central chimney for night ventilation had to be modified. As a result, 2 chimneys are now foreseen. An additional advantage of this scheme is that the ventilation of the top floor is substantially improved. In the original design, the neutral level was situated close to the middle height of the top floor whereas in the new design, it is situated above roof level.
Design of chimney The net sections of both chimney openings are about 5 m2 and the top of the chimneys is about 3 meter above roof level. Opening and closing of the chimneys is done aut~matically. These chimneys also allow the entrance of daylight.
Top cooling as emergency Detailed dynamical simulations indicate that the applied strategies should result in acceptable thermal comfort in summer time. However, it is possible that the building use will change in time and/or that some of the assumptions are too optimistic. Therefore, the possibility for having in a later phase top-cooling is foreseen by having the supply ductwork insulated during the construction and by reserving the required space in the technical room for a chiller. Simulations indicate that top cooling will result in a 2.. .3"C temperature reduction and of course a lower relative humidity level.
5.3.1 The context of the project and partners
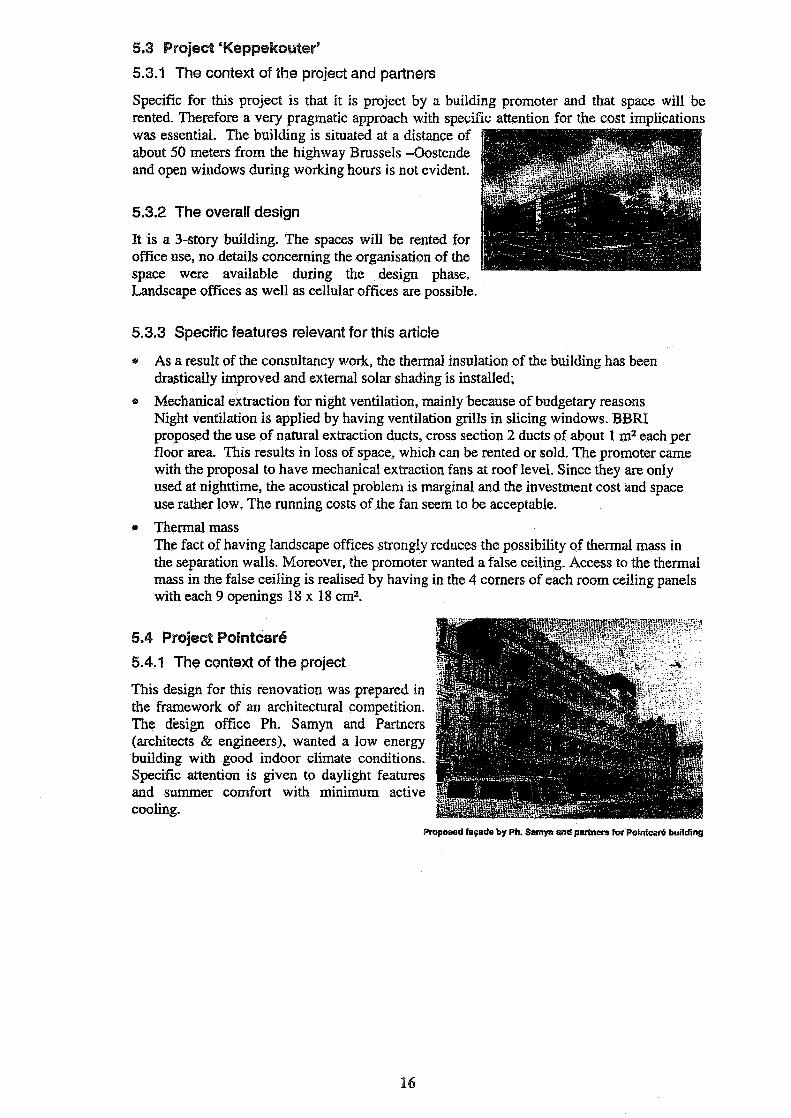
Specific for this project is that it is project by a building promoter and that space will be rented. Therefore a very pragmatic approach with specific attention for the cost imalications - - - was essential. The building is situaG at a distancd of about 50 meters from the highway Brussels -0ostende and open windows during working hours is not evident.
5.3.2 The overall design
It is a 3-story building. The spaces will be rented for office use, no details concerning the organisation of the space were available during the design phase. Landscape off~ces as well as cellular offices are possible.
5.3.3 Specific features relevant For this article
* As a result of the consultancy work, the thermal insulation of the building has been drastically improved and external solar shading is installed;
e Mechanical extraction for night ventilation, mainly because of budgetary reasons Night ventilation is applied by having ventilation grills in slicing windows. BBRI proposed the use of natural extraction ducts, cross section 2 ducts of about 1 m2 each per floor area. This results in loss of space, which can be rented or sold. The promoter came with the proposal to have mechanical extraction fans at roof level. Since they are only used at nighttime, the acoustical problem is marginal and the investment cost and space use rather low. The running costs of the fan seem to be acceptable.
e Thermal mass The fact of having landscape offices strongiy reduces the possibility of thermal mass in the separation walls. Moreover, the promoter wanted a false ceiling. Access to the thermal mass in the false ceiling is realised by having in the 4 corners of each room ceiling panels with each 9 openings 18 x 18 cm2.
5.4 Project Pointcar6
5.4.1 'The context of the project
This design for this renovation was prepared in the framework of an architectural competition. The design office Ph. Samyn and Partners (architects & engineers), wanted a low energy building with good indoor climate conditions. Specific attention is given to daylight features and summer comfort with minimum active cooling.
hopased faqade by Ph, Samyn and partners for Pointcere building

5.4.2 The overall design
The building is situated in Brussels along a road with very intensive traffic. The TGV station is at a distance of a few hundred meters. A complete renovation of the Qstory building is required.
5.4.3 Specific features relevant for this article
Double facade with various functions The acoustical outdoor levels and the outdoor air quality do not allow the opening of the windows at street side. On the contrary, the noi'se and air quality levels are quite satisfactory at the garden side. A double faqade concept has been adopted in order to combine various functions : - efficient solar shading without specific maintenance problem - very good acoustical insulation of the street faqade; - preheating of ventilation air during the heating season; - evacuation of room air during intensive night ventilation The operation mode in summer at night-time is shown in the figure above.
Avoidance of false ceilings in order to maximise thermal mass and use of daylight The high floor to ceiling height and the concrete floors are attractive conditions for use of thermal mass and daylight.
Balanced ventilation with heat recovery for LAO In order to combine good IAQ with low energy demand, a balanced ventilation system with heat recovery was proposed. The supply can only be used for top cooling if needed.
6. Conclusions
1. Natural ventilation for LAQ control requires completely different provisions than natural ventilation for thermal cornfoa control in summer.
2. The use of natural ventilation for IAQ control in low-energy offices is of course possible but it is not necessarily the best choice in all circumstances.
3. Achieving an optimum bal'vlce between ZAQ and energy use is for not evident with the natural ventilation devices on the market today. This situation may change in the future if self regulating devices become more widely available.
4. It is especially for summer ventilation very important that the issue of night ventilation is seriously considered from the beginning of the design process.
5. It is very important to have in the design process the appropriate knowledge, which allows quick decisions. Detailed simulations can be done afterwards for optimisation purposes and/of for checking if the proposed designs are feasible.
6. Optimising the airfIow rate for thermal comfort in summer is in general from a numerical pornt of view not a real challenge. The higher the ventilation rate, the better the performances (unless draught problems occur). The red challenge for summer comfort is a combined design and analysis of solar and internal gains, thermal mass, thermal insulation, solar protection, ventilation,. . . .
7. Further research is needed which focusses on the deIivery of very practical design guidesiruies to be used by designers in daily practice. The CIBSE guide on Natural ventilation in non-domestic buildings. Applications Manual AM 10 : 1997.
The experiences reported in this report have been carried out in the framework of various research projects : The Flemish Impulse Programme for Energy Technology (VLIET), the EC JOULE project NATVENT and the EC Altener project AIOLOS. Also the support received in the framework of the Belgian Technical Advisory service was very helpful. The authors wish to thank the other project partners for their contributions in these projects. Moreover, specific thanks goes to the owners, users and designers of the buildings reported in this paper.
8. References
1. Ventilation requirements in non-domestic buildings and energy efficiency, 1 7 ' ~ ATVC Conference Gothenburg 1996.
2. NATVENT brochure : A better way to work. Overcoming barriers to natural ventilation, 1977.
3. The CIBSE guide on Natural ventilation in non-domestic buildings. Applications Manuill AM10 : 1997

VENTILATION COOLING 118TH AIVC CONFERENCE, ATHENS, GREECE
23-26 SEPTEMBER, 11997
Title: Indoor Air Quality in Dwellings - A Comparison of the Performance of Different Ventilation Systems. IEA Annex 27 Evaluation of Ventilation Systems
Author(s): P J M Op't Veld*, W F De Gids**
Affiliation: * Cauberg Huygen Consulting Engineers, The Netherlands ** TNO Building and Construction Research, Dept Indoor Environment, Building Physics and Systems, Netherlands

INTRODUCTION
The main goal of IEA Annex 27 "Evaluation of ventilation systems" is to develop tools to evaluate ventilation systems in an objective way in terms of indoor air quality, energy, comfort, noise, life cycle costs, reliability and other building related parameters. To check the developed tools some measurements in real dwellings are necessary. The development of the tools is in its final stage. During the AIVC conference some of these tools will be presented. The indoor air quality tool is not yet ready. The results reported in this paper are investigations carried out in three groups of 10 dwellings with practically the same floor plan. Each group had a different ventilation system. The ventilation systems are:
Natural supply and passive stacks (natural) Natural supply with mechanical exhaust (mech. exhaust) Mechanical supply and exhaust (balanced)
This paper is the first analysis of the results. In a later stage the measurement results will be compared with the results of the tools developed within IEA Annex 27.
The measurements took place during the heating season 95/96 in Roermond, in the South East of the Netherlands. The measurements carried out are:
temperature and relative humidity PFT measurements to determine the total flow constant concentration tracer gas measurements to determine flow rates at room level IAQ measurements, C02, CO and TVOC's Air leakage tests system flow
During the measurements the occupants of the dwellings were asked to fill out a questionnaire form to determine their use of the ventilation provisions, such as the use of grids and vents and the switching of the mechanical system. An overview of all measurements is given in figure 1.
number of
dwellings
M templRH
Cl const.con
Elsystem flow
question.
natural mech.exh balanced
Figure 1 Overview of all measurements

DWELLING DATA
The dwellings are two storey single family houses with warm water heating systems. The dwellings have a flat roof. All windows are double glazed. The ground floor has an entrance hall, toilet and living with open kitchen. The first floor has three bedrooms and a bathroom.
Ventilation systems
Due to building regulations a ventilation system in the Netherlands consists of:
Natural ventilation: grids and openable windows in all habitable rooms, passive stacks in toilet, bathroom and kitchen.
Mechanical exhaust: vents and openable windows in all habitable rooms, mechanical exhaust in toilet, bathroom and kitchen
Balanced system: mechanical supply to all habitable rooms openable windows in all habitable rooms mechanical exhaust in toilet, bathroom and kitchen
Not all these provisions were found in the dwelling which were investigated. In case of natural ventilation the grids were not in the bedrooms and living, but only in the kitchen. In the dwellings with balanced systems the grids were in living room and kitchen. According to the building regulations they are not required there.
Air leakage data
The measured air leakage of the dwellings can be seen in figure 2.
natural mech.exh balanced
Figure 2 Results from pressurisation measurements
The air tightness of these dwellings can be considered as quite good. The differences between the three systems are however considerable.

Number of occupanh per dwelling
The average number of occupants in the dwelling may be important for the intensity of the use of the dwelling. Data can be found in figure 3.
number of occupants
natural mech.exh balanced
Figure 3 Average number of occupants grouped per ventilation system
The average number of occupants for all dwellings is about 2,9, which is a quite normal level. However the differences between the three groups are big. The natural ventilation system dwellings have about half of the occupancy than the two others.
MEASUREMENTS RESULTS
Figure 4 shows the measured data.
temperature in oc
natural mech.exh balanced
Figure 4 Telnperatures in the dwellings
The following remarks can be made.
The temperature in the living is almost the same in the dwellings with mechanical exhaust and the balanced systems. The naturally ventilated dwellings have the lowest temperature in the living as well as in the bedrooms. In the dwellings with balanced ventilation the difference between living and bedroom temperatures is as expected very low.
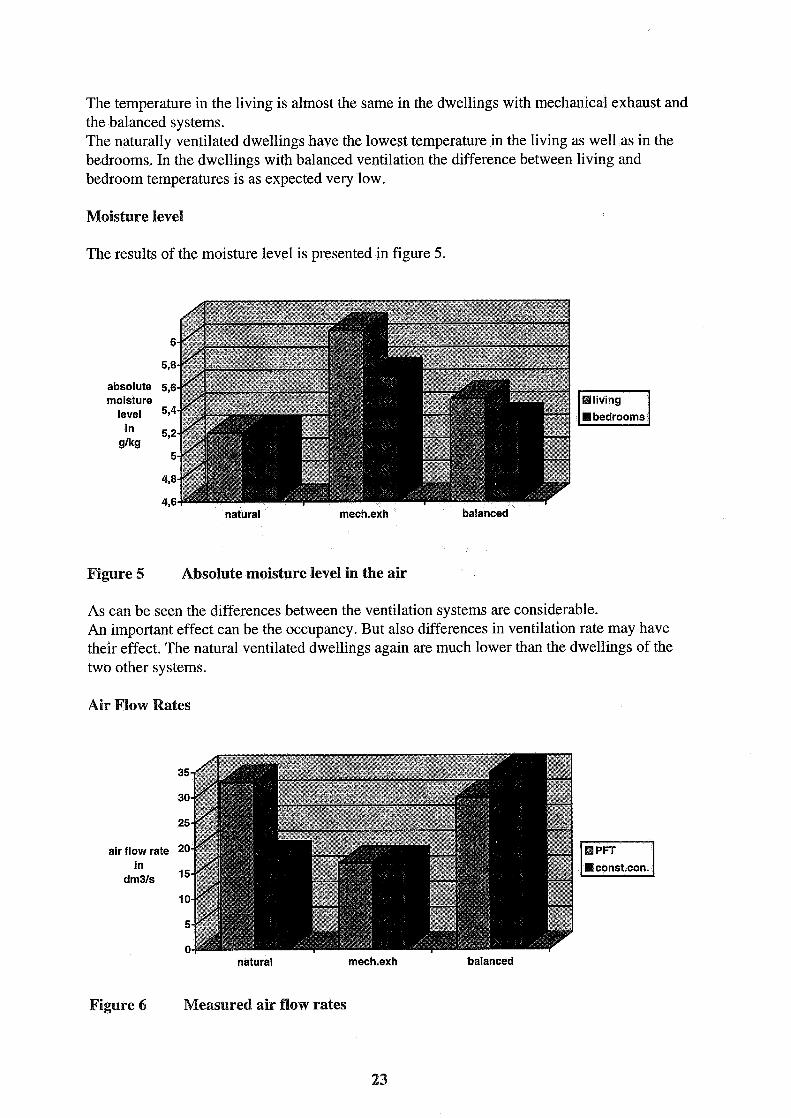
Moisture level
The results of the moisture level is presented in figure 5.
absolute moisture
level in
slks
natural mech.exh balanced
Figure 5 Absolute moisture level in the air
As can be seen the differences between the ventilation systems are considerable. An important effect can be the occupancy. But also differences in ventilation rate may have their effect. The natural ventilated dwellings again are much lower than the dwellings of the two other systems.
Air Flow Rates
air flow rate in
dm3Is
natural mech.exh balanced
Figure 6 Measured air flow rates
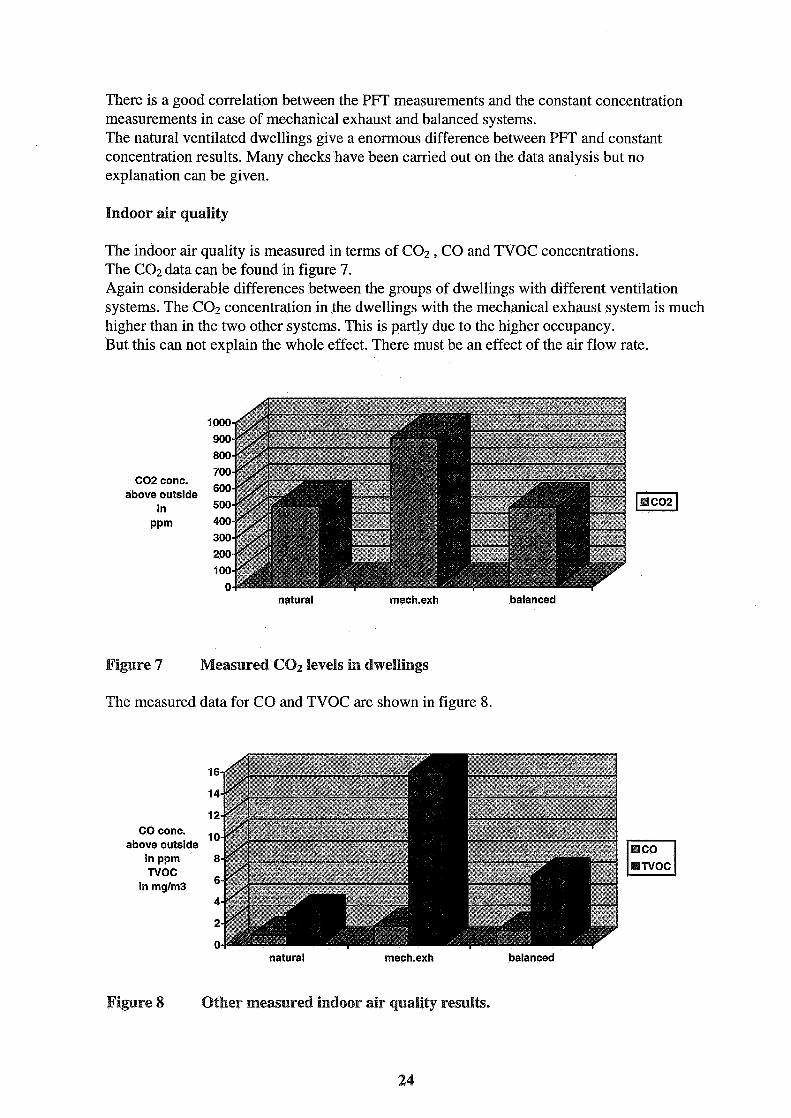
There is a good correlation between the PFT measurements and the constant concentration measurements in case of mechanical exhaust and balanced systems. The natural ventilated dwellings give a enormous difference between PFT and constant concentration results. Many checks have been carried out on the data analysis but no explanation can be given.
Indoor d r quality
The indoor air quality is measured in terms of C02 , CO and TVOC concentrations. The C02 data can be found in figure 7. Again considerable differences between the groups of dwellings with different ventilation systems. The C02 concentration in the dwellings with the mechanical exhaust system is much higher than in the two other systems. This is partly due to the higher occupancy. But this can not explain the whole effect. There must be an effect of the air flow rate.
C02 conc. above outside
in PPm
natural mech.exh balanced
Figure 7 Measured C 0 2 levels in dwellings
The measured data for CO and TVOC are shown in figure 8.
CO conc. above outside
in pprn TVOC
in mglm3
natural rnech.exh balanced
Figure 8 Other measured indoor air quality results.

The differences can't be explained on the bases of number of occupants. The habits of the occupants must be the risen for it.
Use of ventilation provisions
Grids
use of grids in
hlday bedrooms
kitchen
natural mech.exh balanced
Figure 9 The use of grids by the occupants in hours per day.
Some remarks are necessary to understand these figures. In the dwellings with natural ventilation system the grids are only present in the kitchen. In the dwellings with balanced systems the grids, which are not a necessity at all, are only present in living room and kitchen. The frequent use of these grids at average about 18 hours a day is remarkable. There effect on the flow rates are not very big. The sizing of the grids have to be checked.
Airing
use of windows in
hlday bedrooms
kitchen
natural mech.exh balanced
Figure 10 Use of windows for airing
The use of openable windows for airing give a more coherent picture. The result are shown in figure 10. In the living the use is at minimal level. The use of openable windows in the kitchen is limited to less than two hours, which can be explained by the cooking periods. In the bedrooms the lowest use is in the dwellings with mechanical exhaust which have the maximum use of the grids. (see figure 9) The results are in agreement with earlier research of IEA annex 8 "Inhabitants behaviour with regard to ventilation".
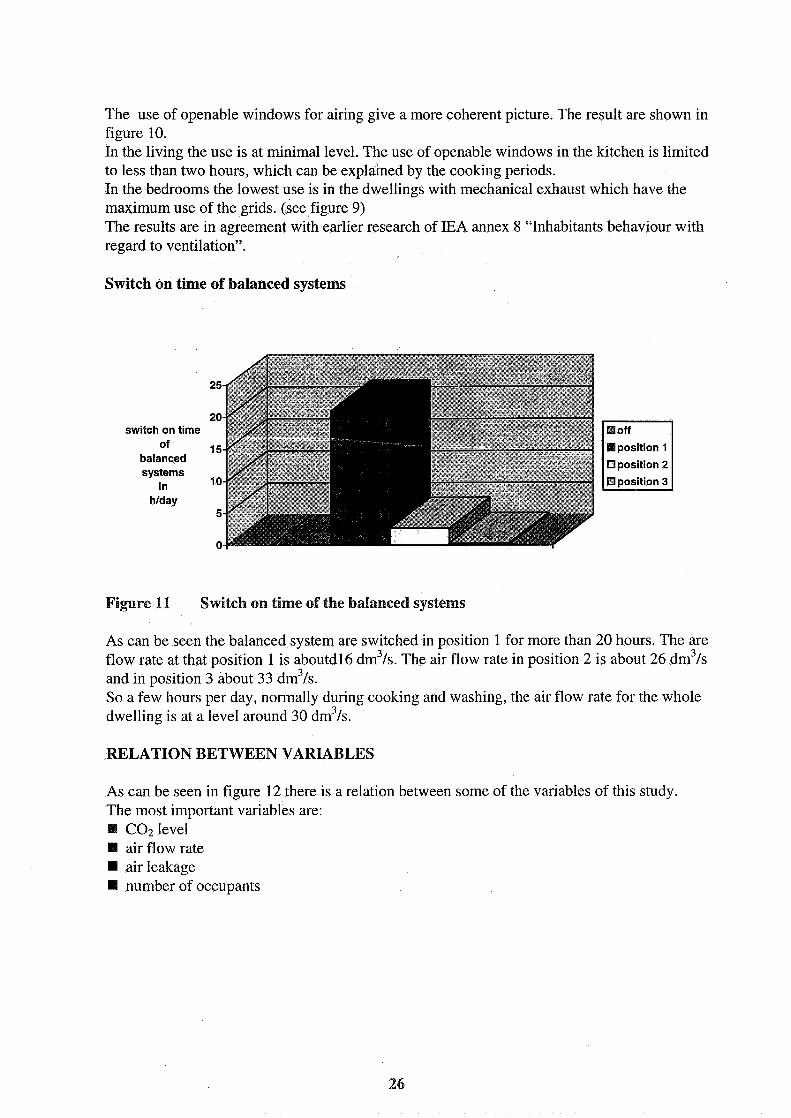
Switch on time of balanced systems
switch on time of
balanced systems
in hlday
position 1
(3 position 2
Figure 111 Switch on time of the balanced systems
As can be seen the balanced system are switched in position 1 for more than 20 hours. The are flow rate at that position 1 is aboutdl6 dm31s. The air flow rate in position 2 is about 26 dm3/s and in position 3 about 33 dm3/s. So a few hours per day, normally during cooking and washing, the air flow rate for the whole dwelling is at a level around 30 dm3/s.
RELATION BETWEEN VARIABLES
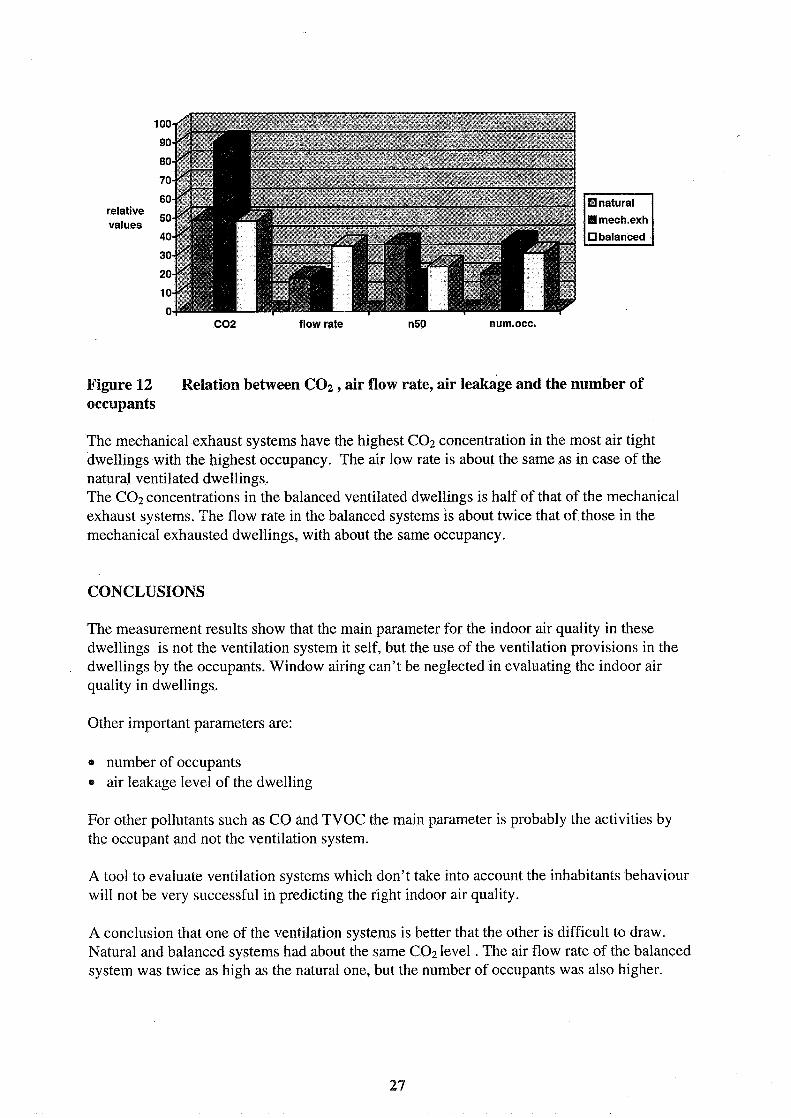
As can be seen in figure 12 there is a relation between some of the variables of this study. The most important variables are:
C02 level air flow rate air leakage number of occupants
relative values
C02 flow rate n50 nurn.occ.
Wmech.exh I3 balanced rnatural I
Figure 12 Relation between GOz, air flow rate, air leakage and the number of occupants
The mechanical exhaust systems have the highest C02 concentration in the most air tight dwellings with the highest occupancy. The air low rate is about the same as in case of the natural ventilated dwellings. The C 0 2 concentrations in the balanced ventilated dwellings is half of that of the mechanical exhaust systems. The flow rate in the balanced systems is about twice that of those in the mechanical exhausted dwellings, with about the same occupancy.
CONCLUSIONS
The measurement results show that the main parameter for the indoor air quality in these dwellings is not the ventilation system it self, but the use of the ventilation provisions in the dwellings by the occupants. Window airing can't be neglected in evaluating the indoor air quality in dwellings.
Other important parameters are:
e number of occupants e air leakage level of the dwelling
For other pollutants such as CO And TVOC the main parameter is probably the activities by the occupant and not the ventilation system.
A tool to evaluate ventilation systems which don't take into account the inhabitants behaviour will not be very successful in predicting the right indoor air quality.
A conclusion that one of the ventilation systems is better that the other is difficult to draw. Natural and balanced systems had about the same C 0 2 level . The air flow rate of the balanced system was twice as high as the natural one, but the number of occupants was also higher.

VENTILATION AND COOLING 18TH AIVC CONFERENCE, ATHENS, GREECE
23-26 SEPTEMBER, 1997
Title: Recommended Ventilatioan Strategies for New Energy-Efficient Production Homes
Author(§): , Judy A Roberson*, Nance E. Matson*", Richard E. Brown*, Jonathan 6. Koomey*
Affiliation: * Energy Analysis Program, **Indoor Environment Program Environmental Energy Technologies Division E.O. Lawrence Berkeley National Laboratory University of California, Berkeley, CA 94720, USA

VENTILATION AND COOLING
18TH ANNUAL AIVC CONFERENCE
ATHENS, GREECE, 23-26 SEPTEMBER, 1997
- ------ RECOMMENDED VENTILATION S ES
FOR NEW ENERGY-EFFICIENT PRODUCT .--. -""-
by Judy A ~oberson t , Nance E. ~ a t s o n f ,
Richard E. Brown$, and Jonathan 6. ~ o o m e y t
-- t ~ n e r g ~ Analysis Program,
S~ndoor Environment Program
Environmental Energy Technologies Division
E. 0. Lawrence Berkeley National Laboratory
University of California, Berkeley CA 94720, USA
SYNOPSIS
The U.S. Environmental Protection Agency is seeking to improve the thermal quality of new
homes, most of which are being built in the sunbelt by large building development companies.
Low-infiltration production (tract) homes need ventilation systems that satisfy the low-cost
priority of the builders as well as the safety, health and low operating cost expectations of
homeowners. We evaluated ten ventilation strategies in order to recommend the most suitable
systems for four climates: cold, mixed, hot-humid, and hot-arid.
We recommend that builders in mixed (cold and hot), hot-humid and hot-arid climates use supply
ventilation, which provides the safety and health benefits of positive indoor pressure and the
ability to filter and dehumidify ventilation air. When ventilation is integrated with forced-air
conditioning, we recommend that ductwork be installed within conditioned space and buyers be
offered the option of an efficient, variable-speed fan. In cold climates we recommend that
builders offer buyers the option of balanced heat recovery units, which significantly reduce
operating costs. In hot-humid climates, we recommend that builders offer buyers the option of
dehumidifying supply ventilation to control indoor humidity and improve occupant comfort.
1. INTRODUCTION The majority of new homes in the U.S. are built by large production building companies in fast-growing
sunbelt cities from Florida to California. The Environmental Protection Agency (EPA), in its efforts to
reduce greenhouse gas emissions, has introduced the Energy Star Homes program to encourage
production homebuilders to voluntarily improve the energy-efficiency of their construction to beyond
the levels required by the Model Energy Code. To achieve this, infiltration must be reduced to less than
0.20 (average annual) air changes per hour (ACH). This is below the level suggested to maintain indoor
air quality (according to ASHRAE, the American Society of Heating, Refrigerating and Air
Conditioning Engineers). These homes will need supplemental (active, mechanical) ventilation systems
to provide fresh air and remove moisture and indoor pollutants.
Our task was to recommend the most affordable and effective ventilation systems in four climates.
Suitable systems must meet or exceed ASHRAE ventilation and indoor air quality guidelines and be
easy to implement by production residential builders and subcontractors. This is a challenging task
because production builders' decisions are driven by cost, and though the Energy Star Homes program
goal is to build efficient production homes at no additional cost, ventilation systems add to first-cost.
Also, home ventilation systems currently available in the U.S. were developed for very cold climates,
and even experienced HVAC contractors are unfamiliar with residential ventilation, and finally, unlike
new custom homes, production home buyers have no input to the selection of their ventilation system.
2. SYSTEM DESCRIPTIONS
We determined that, at a minimum, ventilation systems must be able to deliver at least 0.35 ACH (daily
average) ventilation and not cause or contribute to indoor depressurization. In order to account for the
variation in effective ventilation rates, we normalized operating hours (operating costs) of all strategies
to an effective rate of 0.50 ACH. Table 1 provides the name and description of the ventilation strategies
evaluated.
Avoiding depressurization is a safety and health consideration. Negative indoor pressure can pull
smoke from a fireplace, radon gas (if present) from the soil, auto exhaust from an attached garage, and
pathogens from an attic, duct or building cavity into the home. It can also cause backdrafting (flue gas
reversal) of combustion appliances that interact with indoor air. The Energy Star Homes program
recommends that combustion appliances be direct-vent (sealed from indoor air), but it is reasonable to
assume that most of these homes will have an attached garage, fireplace, andlor radon gas. Temporary
depressurization can occur in any home (e.g., when a clothes dryer operates) but exhaust ventilation in a
tight home without provision of supply air could intensify, prolong, or even sustain depressurization.
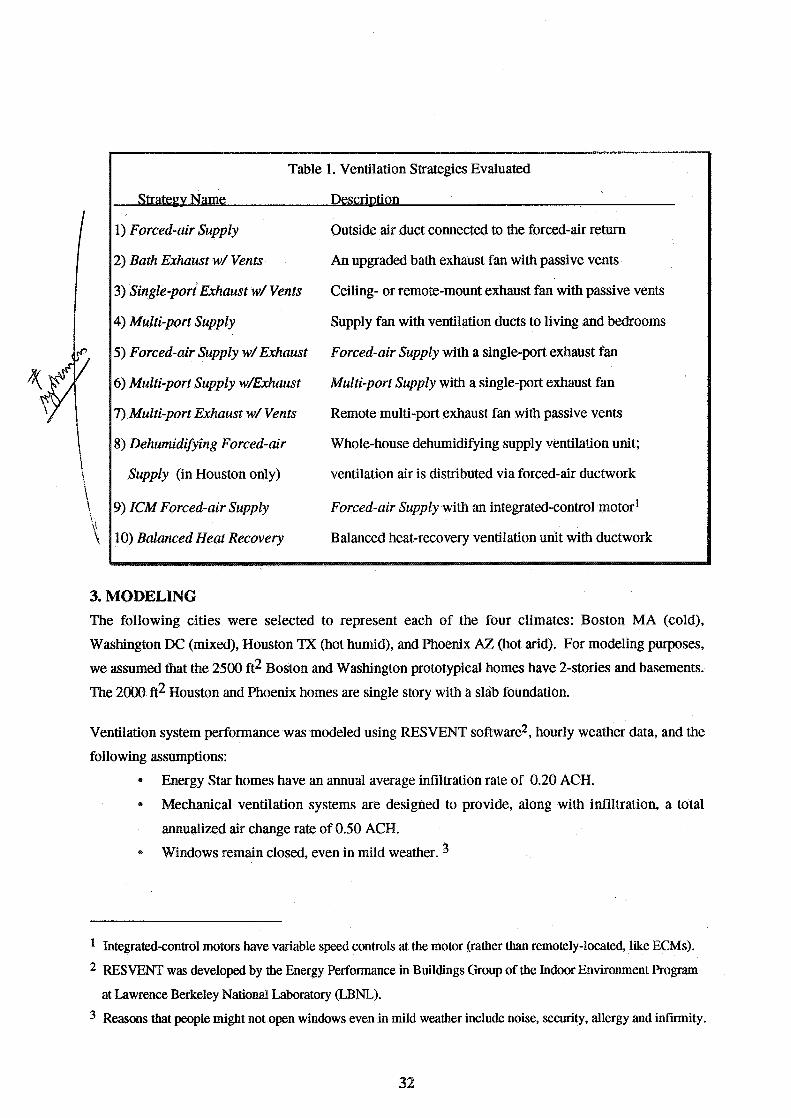
) Forced-air Supply Outside air duct connected to the forced-air return
) Bath Exhaust w/ Vents An upgraded bath exhaust fan with passive vents
) Single-port Exhaust w/ Vents Ceiling- or remote-mount exhaust fan with passive vents
) Multi-port Supply Supply fan with ventilation ducts to living and bedrooms
) Forced-air Supply w/Exhaust Forced-air Supply with a single-port exhaust fan
) Multi-port Supply wfixhaust Multi-port Supply with a single-port exhaust fan
) Multi-port Exhaust w/ Vents Remote multi-port exhaust fan with passive vents
) Dehumidifying Forced-air Whole-house dehumidifying supply ventilation unit;
Supply (in Houston only) ventilation air is distributed via forced-air ductwork
) ZCM Forced-air Supply Forced-air Supply with an integrated-control motor1
3. MODELING
The following cities were selected to represent each of the four climates: Boston MA (cold),
Washington DG (mixed), Houston TX (hot humid), and Phoenix AZ (hot arid). For modeling purposes,
we assumed that the 2500 ft2 Boston and Washington prototypical homes have Zstories and basements.
The 2 0 0 ft2 Houston and Phoenix homes are single story with a slab foundation.
Ventilation system performance was modeled using RESVENT software2, hourly weather data, and the
following assumptions:
Energy Star homes have an annual average infiltration rate of 0.20 ACH. * Mechanical ventilation systems are designed to provide, along with infiltration, a total
annualized air change rate of 0.50 ACH. * Windows remain closed, even in mild weather.
Integrated-control motors have variable speed controls at the motor (rather than remotely-located, like ECMs).
RESVENT was developed by the Energy Performance in Buildings Group of the Indoor Environment Program
at Lawrence Berkeley National Laboratory (LBNL).
Reasons that people might not open windows even in mild weather include noise, security, allergy and infirmity.

We used the ASHRAE 136 method to determine normalized leakage values corresponding to an
annualized average infiltration rate of 0.20 ACH. We used DOE-2 to determine the hours of heating
and cooling operation for forced-air integrated systems. Ventilation strategies were modeled with
continual (24 hour) operation.
Modeling results show that, to provide an effective ventilation rate of 0.50 ACH, mechanical system
design flow rates vary according to the climate, number of ventilation fans used, and whether the home
is pressurized. The corresponding mechanical ventilation system design rates are given in Table 2.
These results support the fact that ventilation contractors should take into account the climate, proposed
ventilation system type and operating schedule when designing a residential ventilation system.
(For 0.50 ACH Annualized Average Effective Ventilation Rate)
Ventilation Systems with: two fans one fan and vents one fan, no vents
Strate~ies (from Table I): #5, #6. #10 #2. #3, #7 #l. #4. #8. #9
WASHINGTON
HOUSTON
4. COSTS Our installation (first) cost estimates include materials, labor and 25% overhead and profit. Costs were
compiled from ventilation equipment manufacturers, distributors, contractors and consultants. Costs of
all systems include a programmable timer with an odoff switch. For systems with passive vents, we
assumed that one-story homes have five passive vents, and two-story homes have six passive vents.
The heat recovery (HRV) system modeled has a 70% heat recovery efficiency. We assumed that
installation costs are the same in each city (i.e., any variation is within the limits of our accuracy).
Annualized installation costs assume a 7% real discount rate. Installation costs were amortized
assuming a 20-year lifetime for all ventilation systems, replacement after ten years of standard air-
handler fans used intermittently for ventilation , and a 20-year lifetime for HRVs and other fans
designed for continuous operation.
Table 3 lists the installation, operating and total annualized costs of ventilation systems in homes with
two types of heating and cooling equipment - a furnace and air conditioner, and an electric heat pump.

Table 3. Ventilation System Costs
Installatic or First
2) Upgraded Bath Exhaust with Vent 3) Single-port Exhaust with Vents 4) Multi-port Supply 5) Forced-air Supply with Exhaust 6) Multi-port Supply with Exhaust 7) Multi-port Exhaust with Vents 8) ICM Forced-air Supply 9) Balanced Heat Recovery
BOSTON - cold climate 1) Forced-air Supply
Installatio
23 3 1 33 43 38 53 78
92
Cost ($)
300
Operating I Annualized
HOUSTON - hot humid climate 1) Forced-air Supply
WASHINGTON - mixed climate
2) Upgraded Bath Exhaust with Vent 3) Single-port Exhaust with Vents 4) Multi-port Supply 5) Forced-air Supply with Exhaust 6) Multi-port Supply with Exhaust 7) Multi-port Exhaust with Vents 8) Dehumidifying Forced-air Supply 9) ICM Forced-air Supply
1) Forced-air Supply 2) Upgraded Bath Exhaust with Vents 3) Single-port Exhaust with Vents 4) Multi-port Supply 5) Forced-air Supply with Exhaust 6) Multi-port Supply with Exhaust 7) Multi-port Exhaust with Vents 8) ICM Forced-air Supply 9) Balanced Heat Recovery
I 10) Balanced Heat Recovery 1
Operating
Cost ($)
435 346 346
342 499 370 346 325 289
300 463 613 650 663 763 1063 1550 1838
Annualized
Cost ($)
460 369 377 375 542 408 399 403
381
25 23 31 33 43 38 53
78 92
PHOENIX - hot arid climate
323 290 290 287 364 303
290 282
237
1) Forced-air Supply 2) Upgraded Bath Exhaust with Vents 3) Single-port Exhaust with Vents 4) Multi-port Supply 5) Forced-air Supply with Exhaust 6) Multi-port Supply with Exhaust 7) Multi-port Exhaust with Vents 8) ICM Forced-air Supply 9) Balanced Heat Recovery
348 313 321 320 407 341 343 360 329
Note: Total annualized cost is the sum of annualized installation cost and annual operating cost.
300 463 613 650
663 763 1063 1550
1838
25 23 3 1
33
43 38 53 78
92
308 255 255
249 363
283 255
252 206
333 278 286
282 406
321 308
330 298
354 246 246 240
409 274
246 244
201
379 269 277 273
452
312 299 322
293

5. EVALUATION
Strategies were compared to
5 c2LkLcq
& each other according to five "priority" criteria: 1) installation cost, 2)
operating cost, 3) indoor pressure, 4) effective distribution of ventilation air within the home, and 5) the
potential for ventilation-related condensation in exterior walls. For each of our five evaluation
criteria, we quantified the cost and effectiveness of ventilation strategies by assigning each a
score ( from -3 to 3) for each climate. Installation costs, indoor pressure and distribution
scores are based on system types, and therefore, the same for each climate. Total score (overall
cost and effectiveness) is the sum of the five scores. Finally, in each climate, we ranked
strategies (with 1 as best), based on the total scores. Scores and ranking results are provided in
Table 4. The scoring criteria is described below.
5.1. Installation Cost:
5.2. Annual Operating Cost Average of the annual ventilation system operating costs for furnace/AC and electric heat pump:.
5.3. Indoor Pressure, from a safety and health perspective:
%QE Indoor Pressure Strategies
3 positive #1,4, 8,9
0 neutral, balanced #2, 3,5,6,7, 10
-3 negative none evaluated
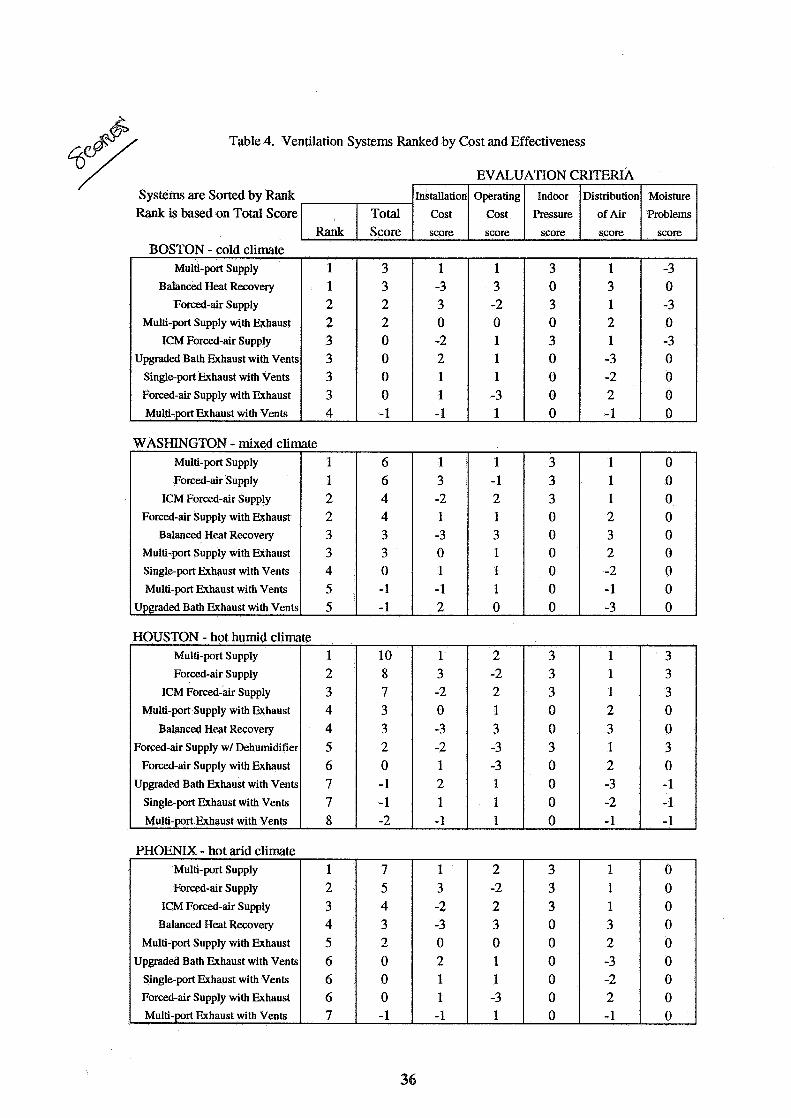
Table 4. Ventilation Systems Ranked by Cost and Effectiveness
EVALUATION CRITERIA
WASHINGTON - mixed climate
PHOENIX - hot arid climate
Forced-air Supply
ICM Forced-air Supply
Systems are Sorted by Rank
Multi-port Supply
Forced-air Supply
ICM Forced-air Supply
Forced-air Supply with Exhaust
Balanced Heat Recovery
Multi-port Supply with Exhaust
Singleport Exhaust with Vents
Multi-port Exhaust with Vents
Upgraded Bath Exhaust with Vents
HOUSTON - hot humid climate
I Balanced Heat Recovery 1 4 1
Installation
Cost
score
Rank is based on Total Score
Multi-port Supply
Forced-air Supply
ICM Forced-air Supply
Multi-port Supply with Exhaust
Balanced Heat Recovery
Forced-air Supply wl Dehumidifier
Forced-air Supply with Exhaust
Upgraded Bath Exhaust with Vents
Singleport Fxhaust with Vents
Multi-port Exhaust with Vents
Multi-port Supply with Exhaust
Upgraded Bath Exhaust with Vents
Single-port Exhaust with Vents
Forced-air Supply withExhaust 1 Multi-port Exhaust with Vents
BOSTON - cold climate
1 1 2 2 3 3 4 5 5
Operating
Cost
score Rank
Multi-port Supply
Balanced Heat Recovery
Forced-air Supply
Multi-port Supply with Exhaust
ICM Forced-air Supply
Upgraded Bath Exhaust with Vents
Singleport Exhaust with Vents
Forced-air Supply with Exhaust
Multi-port Exhaust with Vents
1 2 3 4 4 5 6 7 7 8
Total Score
6 6 4 4 3 3 0 - 1 -1
Indoor
Pressure
score
1 1 2 2 3 3 3 3 4
10 8 7 3 3 2 0 - 1 -1 -2
1 3 -2 1 -3 0 1 - 1 2
1 3 -2 0 -3 -2 1 2 1 - 1
Distribution
of Air
score
3 3 2 2 0 0 0 0 - 1
1 - 1 2 1 3 1 1 1 0
Moisture
Problems
score
1 -3 3 0 -2 2 1 1 - 1
1 3 -2 0 1 1 1 -3 1
3 0 3 0 3 0 0 0 0
1 3 1 2 1
-3 -2 2 - 1
-3 0 -3 0 -3 0 0 0 0
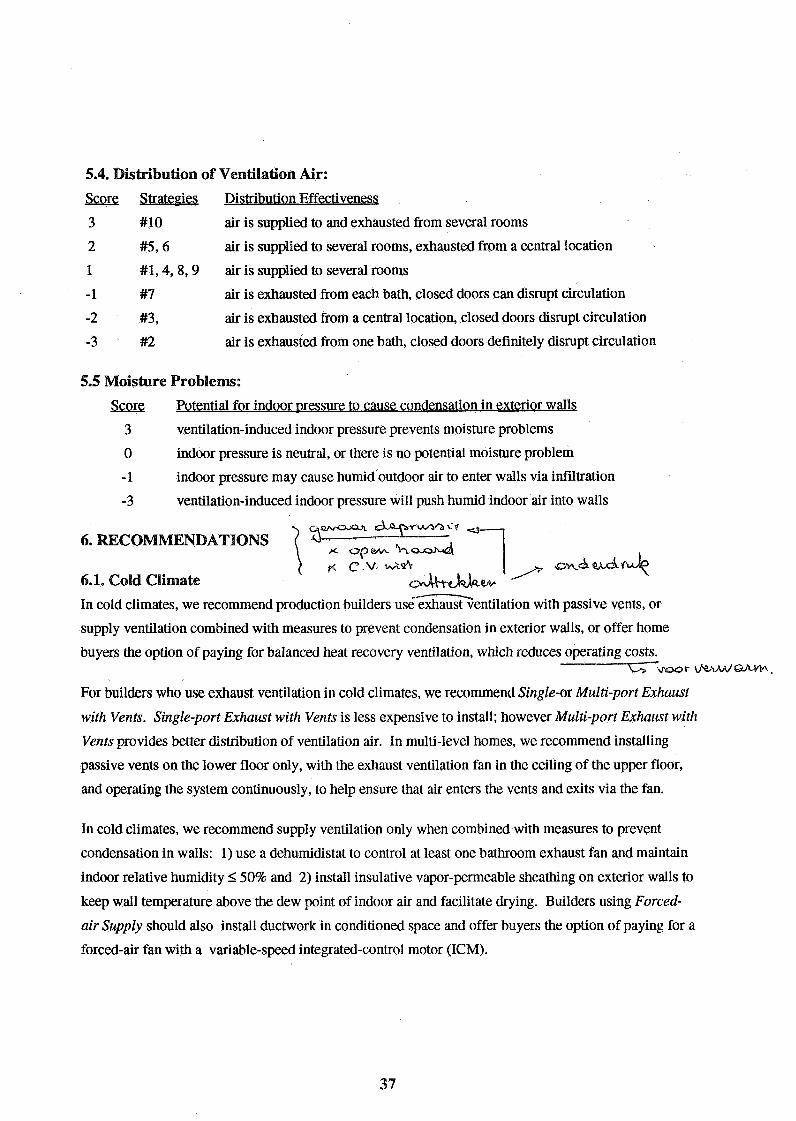
5.4. Distribution of Ventilation Air: Score Strategies Distribution Effectiveness
3 #10 air is supplied to and exhausted from several rooms
2 #5,6 air is supplied to several rooms, exhausted from a central location
1 #I, 4,8,9 air is supplied to several rooms
- 1 #7 air is exhausted from each bath, closed doors can disrupt circulation
-2 #3, air is exhausted from a central location, closed doors disrupt circulation
-3 #2 air is exhausted from one bath, closed doors definitely disrupt circulation
5.5 Moisture Problems:
Score Potential for indoor pressure to cause condensation in exterior walls
3 ventilation-induced indoor pressure prevents moisture problems
0 indoor pressure is neutral, or there is no potential moisture problem
- 1 indoor pressure may cause humid outdoor air to enter walls via infiltration
-3 ventilation-induced indoor pressure will push humid indoor air into walls
6. RECOMMENDATIONS
/ . c 3 ' d d * 6.1. Cold Climate In cold climates, we recommend production builders us~&haust~entilation with passive vents, or
supply ventilation combined with measures to prevent condensation in exterior walls, or offer home
buyers the option of paying for balanced heat recovery ventilation, which reduces operating costs. L., .voortrebWQhVM,
For builders who use exhaust ventilation in cold climates, we recommend Single-or Multi-port Exhaust
with Vents. Single-port Exhaust with Vents is less expensive to install; however Multi-port Exhaust with
Vents provides better distribution of ventilation air. In multi-level homes, we recommend installing
passive vents on the lower floor only, with the exhaust ventilation fan in the ceiling of the upper floor,
and operating the system continuously, to help ensure that air enters the vents and exits via the fan.
In cold climates, we recommend supply ventilation only when combined with measures to prevent
condensation in walls: 1) use a dehumidistat to control at least one bathroom exhaust fan and maintain
indoor relative humidity < 50% and 2) install insulative vapor-permeable sheathing on exterior walls to
keep wall temperature above the dew point of indoor air and facilitate drying. Builders using Forced-
air Supply should also install ductwork in conditioned space and offer buyers the option of paying for a
forced-air fan with a variable-speed integrated-control motor (ICM).
6.2. Hot Humid Climate In hot humid climates, we recommend production builders install Multi-port Supply We recommend
that builders using Forced-air Supply ventilation install ducts within conditioned space and offer buyers
the option of paying for a dehumidifying supply ventilation unit to improve comfort.
6.3. Mixed and Hot Arid Climates In these climates, we recommend production builders use Multi-port Supply ventilation. For builders
using Forced-air Supply ventilation, we recommend installing ducts in conditioned space and offering
buyers the option of paying for a forced-air fan with a variable-speed integrated-control motor (ICM).
7. CONCLUSION Incorporating energy-efficient construction in U.S. production homebuilding is a task that requires the
development of affordable and effective residential ventilation systems. Our investigation estimates the
costs of residential ventilation systems in the U.S, offers a method to evaluate ventilation systems and
their impact on the indoor environment, and provides usable information to the building community.
8. ACKNOWLEDGMENTS We appreciate the support of Jeanne Briskin, Sam Rashkin and Glenn Chinery of the US EPA Energy
Star Residential programs and the cooperation of colleagues at LBNL. Special thanks to Don Stevens
and Associates for sharing their valuable time and experience.
9. REFERENCES
ASHRAE Standard 119, "Air Leakage Performance for Detached Single-Family Residential Buildings", American Society of Heating, Refrigerating and Air-Conditioning Engineers, 1988.
ASHRAE Standard 136, "A Method of Determining Air Change Rates in Detached Dwellings," American Society of Heating, Refrigerating and Air-Conditioning Engineers, 1993.
ASHRAE Standard 62, "Ventilation for Acceptable Indoor Air Quality", American Society of Heating, Refrigerating and Air-Conditioning Engineers, 1989.
VENTILATION AND COOLING
lgTH ANNUAL AIVC CONFERENCE ATHENS, GREECE, 23-26 SEPTEMBER, 1997
System Safety Analyses of the Performance of Mechanical Ventilatio Systems - the quantitative approach
Svein H. Ruud
Swedish National Testing and Research Institute P.O.Box 857 S-501 15 B O ~ S Sweden
Johnny Kronvall
AB Jacobson & Widmark (J&W) Slagthuset S-21 1 20 MALMO Sweden
1 Synopsis
A method for estimating the reliability of mechanical ventilation systems in dwellings has been developed. The analysis is based on component level reliability models interconnected by so called fault-tree schemes. A simplified model for maintenance is included. The analysis procedure is applied on an central exhaust ventilation system and on a central supply and exhaust ventilation system with heat recovery. For each system, three different quality standards have been defined and combined with three levels of maintenance. Work has also been done on collecting relevant input data, e.g. expected life-time values for ventilation components. The result of an analysis can be presented as a figure showing the reliability of the total system as a function of time. The result can also be presented in a compressed form giving the mean and minimum reliability values for a certain time period. Finally, a classification routine is proposed. This will transform the resulting mean and minimum values into a five graded classification scale.
2 Introduction
At the 1996 AIVC Conference, the basic principles of a method for estimating the reliability of mechanical ventilation systems was outlined (Kronvall, 1996). The concept of the analysis was based on general methods for system safety analysis, e.g. Rau, 1992 and Salem et al., 1976. However, no qualitative data were presented and the principles were shown only for a simple mechanical exhaust ventilation system. During the last year, extensive work has been done, not least in order to come up with quantitative data and an evaluation procedure for assessing the performance of different mechanical ventilation systems in terms of reliability.
The paper forms part of the Swedish contribution to the work of IEA-Annex 27 "Evaluation and Demonstration of Domestic Ventilation Systems".
Model for Reliability
3.1 Reliability on Component Level
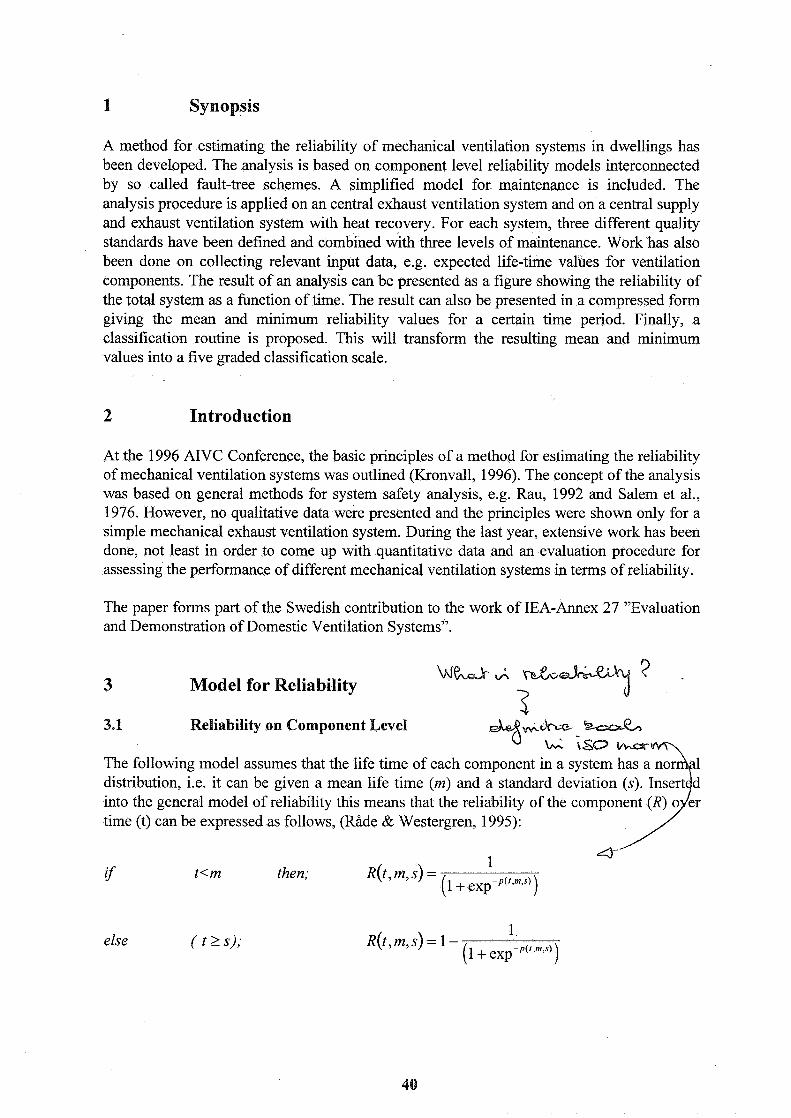
The following model assumes that the life time of each component in a system has a no distribution, i.e. it can be given a mean life time (m) and into the general model of reliability this means that the reliability of time (t) can be expressed as follows, (Riide & Westergren, 1995):
4- if
1 t<m then; ~ ( ~ 7 m, 4 = (l + e x p - P ( t ~ , s ' )
else ( t r s ) ; R(t,m,s) = 1 - 1
(l + exp-~''.".")
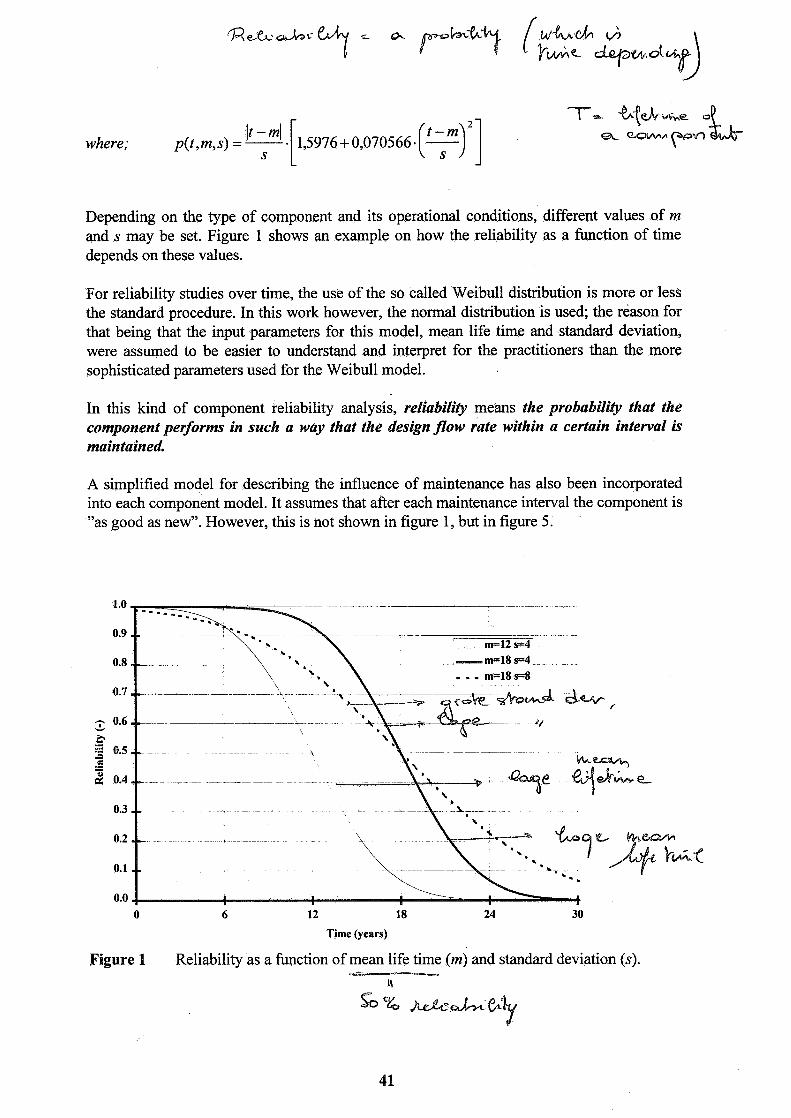
Depending on the type of component and its operational conditions, different values of m and s may be set. Figure 1 shows an example on how the reliability as a function of time depends on these values.
For reliability studies over time, the use of the so called Weibull distribution is more or less the standard procedure. In this work however, the normal distribution is used; the reason for that being that the input parameters for this model, mean life time and standard deviation, were assumed to be easier to understand and interpret for the practitioners than the more sophisticated parameters used for the Weibull model.
In this kind of component reliability analysis, reliability means the probability that the component perform in such a way that the design flow rate within a certain interval is maintained.
A simplified model for describing the influence of maintenance has also been incorporated into each component model. It assumes that after each maintenance interval the component is "as good as new". However, this is not shown in figure 1, but in figure 5.
Time (years)
Figure 1 Reliability as a function of mean life time (m) and standard deviation (s). UF -
9
G Cg e
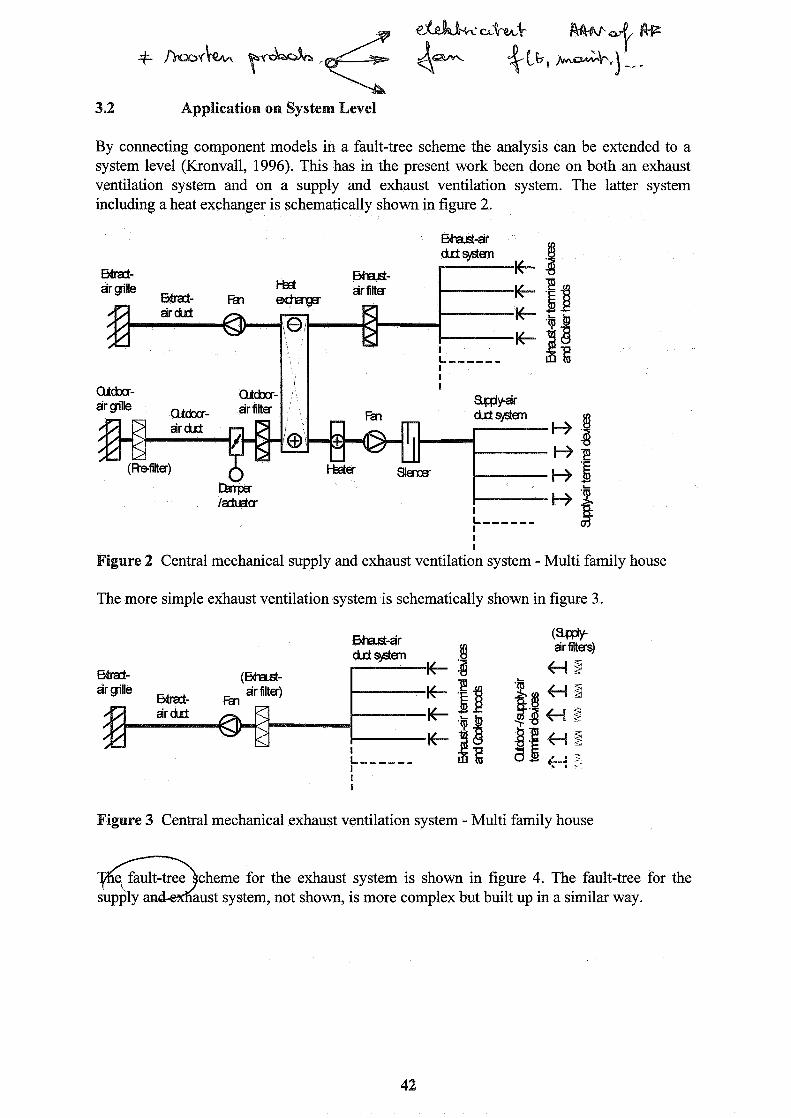
ckht
=k t 3.2 Application on System Level
By connecting component models in a fault-tree scheme the analysis can be extended to a system level (Kronvall, 1996). This has in the present work been done on both an exhaust ventilation system and on a supply and exhaust ventilation system. The latter system including a heat exchanger is schematically shown in figure 2.
The more simple exhaust ventilation system is schematically shown in figure 3.
(WY air filters)
4-42
Figure 3 Central mechanical exhaust ventilation system - Multi family house
house
heme for the exhaust system is shown in figure 4. The fault-tree for the ust system, not shown, is more complex but built up in a similar way.
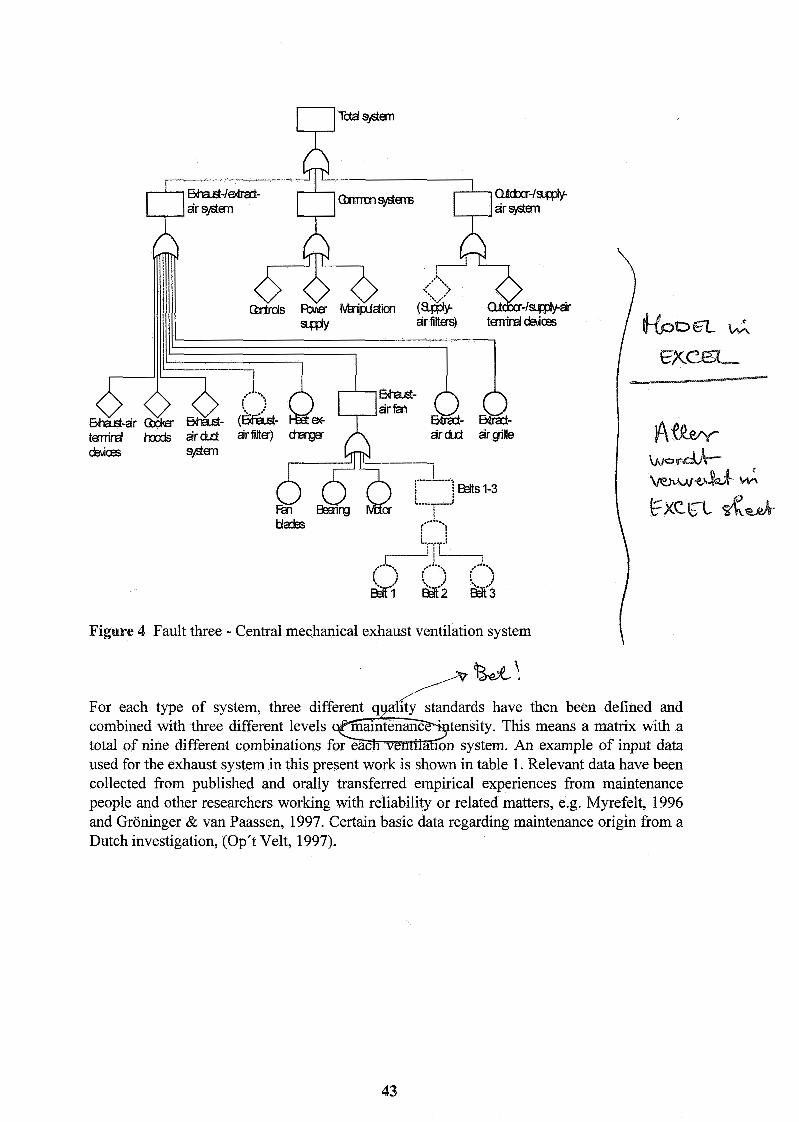
Figure 4 Fault three - Central mechanical exhaust ventilation system \ For each type of system, three di dads have then been defined and combined with three different levels ensity. This means a matrix with a total of nine different combinations system. An example of input data used for the exhaust system in this present work is shown in table 1. Relevant data have been collected from published and orally transferred empirical experiences from maintenance people and other researchers working with reliability or related matters, e.g. Myrefelt, 1996 and Groninger & van Paassen, 1997. Certain basic data regarding maintenance origin from a Dutch investigation, (Op't Velt, 1997).
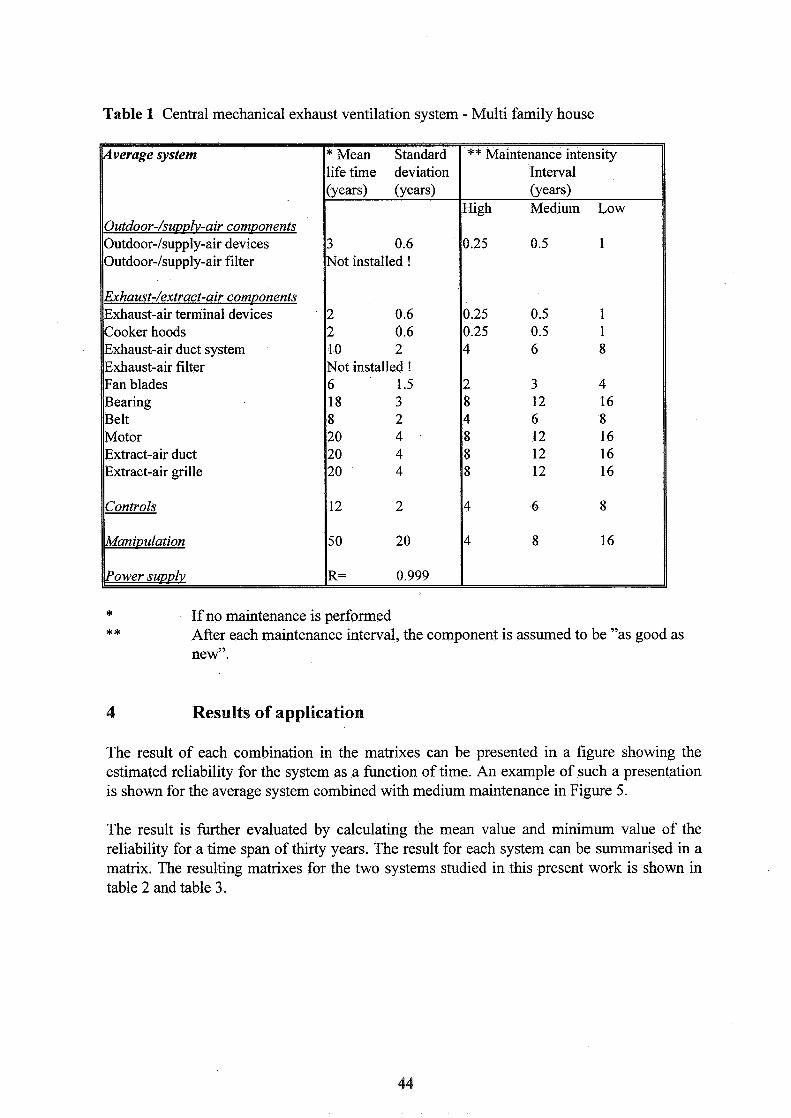
Table 1 Central mechanical exhaust ventilation system - Multi family house
Outdoor-/supply-air components Outdoor-/supply-air devices Outdoor-/supply-air filter
Exhaust-air duct system
* If no maintenance is performed ** After each maintenance interval, the component is assumed to be "as good as
new".
4 Results of application
The result of each combination in the matrixes can be presented in a figure showing the estimated reliability for the system as a function of time. An example of such a presentation is shown for the average system combined with medium maintenance in Figure 5.
The result is firther evaluated by calculating the mean value and minimum value of the reliability for a time span of thirty years. The result for each system can be surnrnarised in a matrix. The resulting matrixes for the two systems studied in this present work is shown in table 2 and table 3.
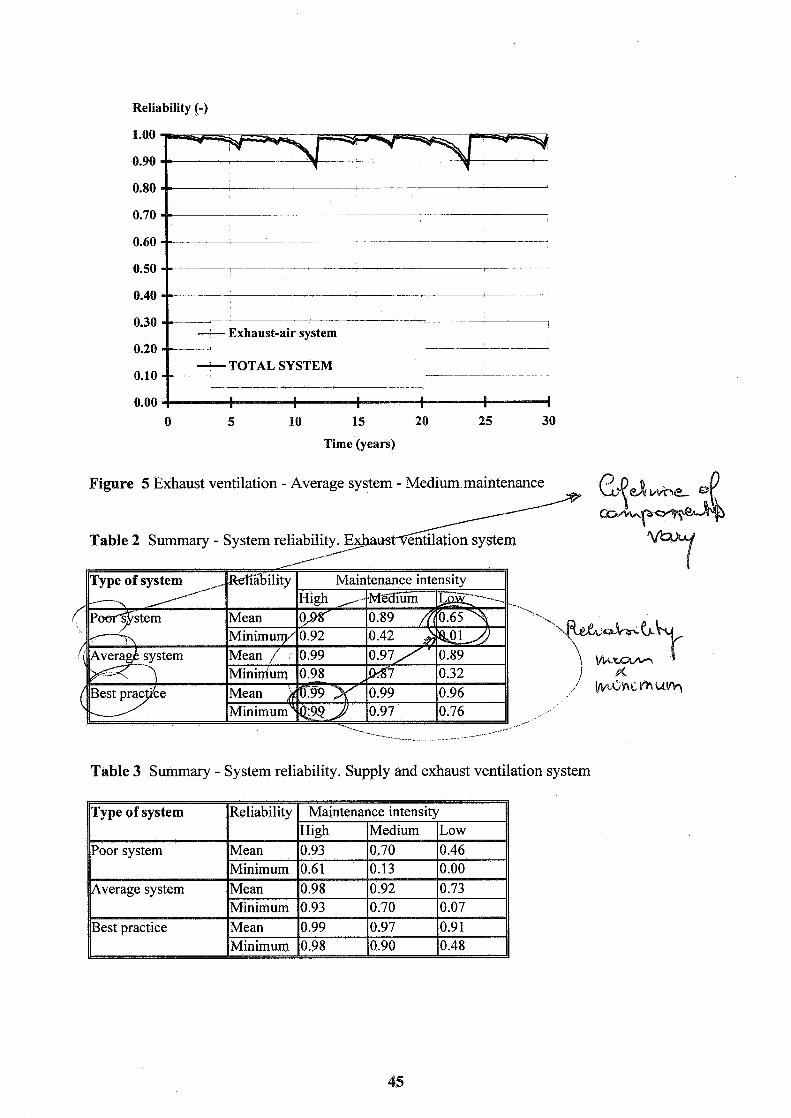
Reliability (-)
0.30 - -
- Exhaust-air system 0.20 - .- . - -- - - --
--TOTAL SYSTEM 0.10 - - - -- - - . . -- -- - -
Time (years)
Figure 5 Exhaust ventilation - Average system - Medium maintenance
Table 2 Summary - System reliabilit ion system
Table 3 Summary - System reliability. Supply and exhaust ventilation system
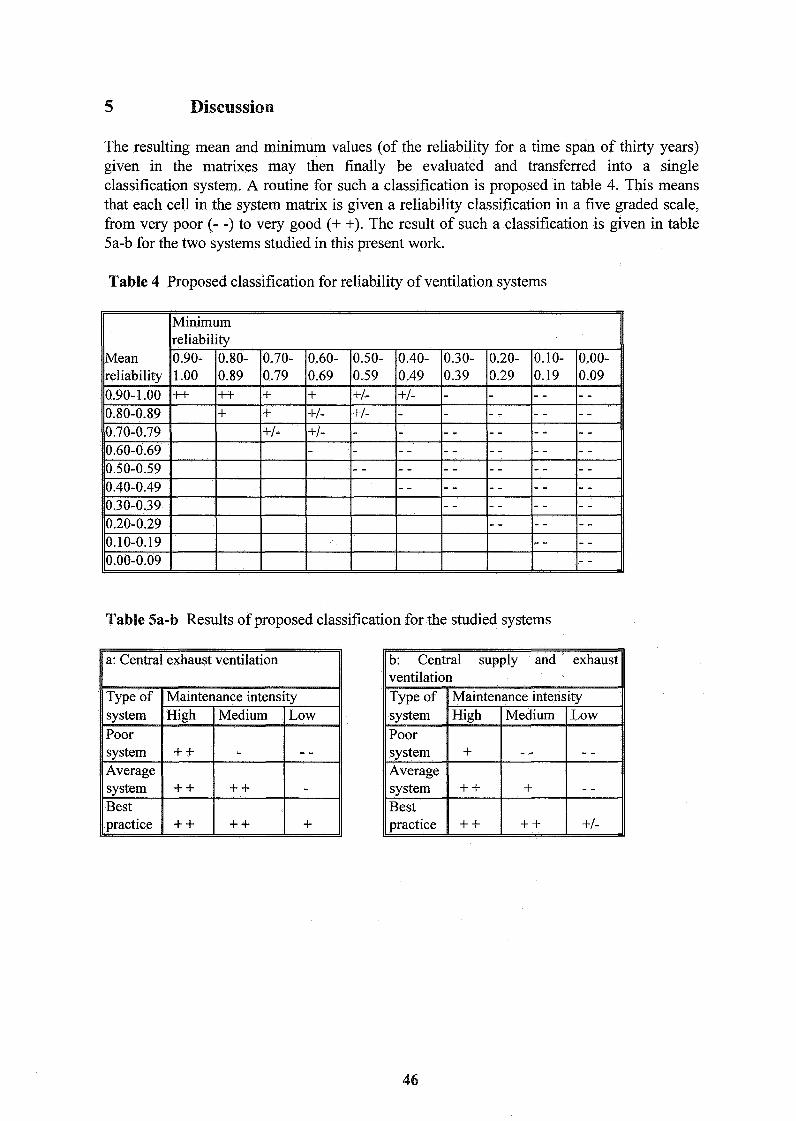
Discussion
The resulting mean and minimum values (of the reliability for a time span of thirty years) given in the matrixes may then finally be evaluated and transferred into a single classification system. A routine for such a classification is proposed in table 4. This means that each cell in the system matrix is given a reliability classification in a five graded scale, from very poor (- -) to very good (+ +). The result of such a classification is given in table 5a-b for the two systems studied in this present work.
Table 4 Proposed classification for reliability of ventilation systems
Table 5a-b Results of proposed classification for the studied systems

6 Conclusions
From the work performed hitherto, the following conclusi
This work was sponsored by the Swedish Council for Building Research under research contract no. 940309-6. The support is gratefully acknowledged.
8 References
Groninger, B.P. and van Paasen, A.H.C, Characteristics Values of Natural Ventilation and Air Conditioning, Proceedingsfiom the 18th AIVC Conference in Greece, AIVC, Coventry, UK, 1997.
Kronvall, J, System Safety Analysis on the Performance of Mechanical Ventilation Systems, Proceedingsfiom the 17th AIVC Conference in Sweden, AIVC, Coventry, UK, 1996.
Myrefelt, S, A Model for Feed-back of Experience on Operational Reliability in Indoor- climate and Ventilation systems (In Swedish) Div. of Building Services Engineering, Royal Institute of Technology, Sweden, 1996
Op't Velt, P, Field Research Maintenance Costs of Ventilation Systems and a SimpliJied Tool for Estimating LCC for Planned and Complaint/failure Maintenance, Internal paper for IEA-Annex 27, Maastricht, The Netherlands, 1997.
Rau, S.S., Reliability Based Design, McGraw-Hill, 1992.
Riide, L. and Westergren, B., BETA Mathematics Handbook for Science and Engineering, Chartwell-Bratt, 1995.
Salem, S.L. et al., A Computer-Oriented Approach to Fault-Tree Construction, Report No. UCLA-ENG-7635 and NSF/RA-760320, UCLA, Los Angeles, California, USA, April 1976.

Ventilation and Cooling 18th AlVC Conference, Athens, GREECE
23-26 September, 1997
Natural Cross Ventilation for Refrigerative Cooling Reduction in a Well Insulated Apartment
C Koinakis*, N Paparnanolis**
* Laboratory of Building Construction and Building Physics, Dept. of Civil Engineering, Aristotle University of Thessaloniki, P.O.Box 429, 54006 Thessaloni ki, Greece ** Dept. of Civil Engineering, University of Thessaly, Pedion Areos, 38334 Volos, Greece

In this paper the energy impact of natural cross ventilation is examined conducting a set of cross ventilation experiments in a well insulated apartment of a 5-storey building. The experimental results compared with simulation results derived from the combined use of the multizone air flow model COMIS and the thermal model Suncode. A 24-hour lasting natural cross ventilation experiment was conducted, to monitor thermal comfort ventilation mainly during the day and night time cooling ventilation. A short lasting cross ventilation experiment was also conducted to monitor the impact of ventilation in midday hours. Both experi- ments compared with a 24-hour lasting single-sided ventilation experiment. Surface and air tempela- ture, heat flux in building elements, ambient wind and solar conditions were monitored. The ventilation and infiltration phenomena in the above experiments were modelled in detail using 30min / lh time-step, taking into account landscape, wind environment, the building's shape as well as the leakage characteristics of the building's envelope.
1 INTRODUCTION
The knowledge of ventilation flow rates for all the ventilation phenomena in a building is necessary to estimate space heating and cooling loads, to determine IAQ and to make sizing calculations of air conditioning equipment (Liddament 1996). The study of cross ventilation and single-sided ventilation cooling potentials is aiming at the parallel use these techniques within the frames of ventilation strategies in order to reduce refrigerative cooling loads, and to simulate the energy impact of the user's behaviour. The ventilation phenomena and the thermal phenomena are very close related and strongly interacting and it is therefore essential to combine ventilation and thermal modelling to achieve adequate simulation of building energy performance.
The main scope of these experiments is to monitor and analyse natural cross ventilation potentials for refrigerative cooling reduction of common building types, which found to be a matter of great impa- tance especially in the Mediterranean climates. The use of air conditioning in Greece has dramatically increased during the last decade.
2 EXPE NTS
2.1 Description
The natural cross ventilation experiments presented in this paper are:
a 24-hour lasting, in order to combine the two aspects of passive cooling ventilation: thermal com- fort ventilation mainly during the day and night time cooling ventilation.
o a short (4-hour lasting) in order to monitor the impact of midday hours ventilation on building' s thermal charge, in other words a ((bad)) example of summer ventilation.
A 24 hour lasting single sided ventilation experiment was also conducted to be compared with the above mentioned experiments and to examine the potentials of these two passive cooling methods for refrigerative cooling reduction.
All the experiments are focusing on the same room (bedroom) of a 60 m2 well insulated apartment, although all the apartment rooms as well the adjacent apartments and the staircase were closely monitored.
The apartment where the experiments conducted is a reference one (not a passive solar one) and is located at the 4th (top) floor of a residential building of the Solar Village, a housing project of Greek Workers' Housing Organisation completed in the early 90's in Pefki-Attica, consisting of 435 apart- ments distributed in 30 buildings, an energy center, a solar information center and a commercial and community center, (figures 1,2).
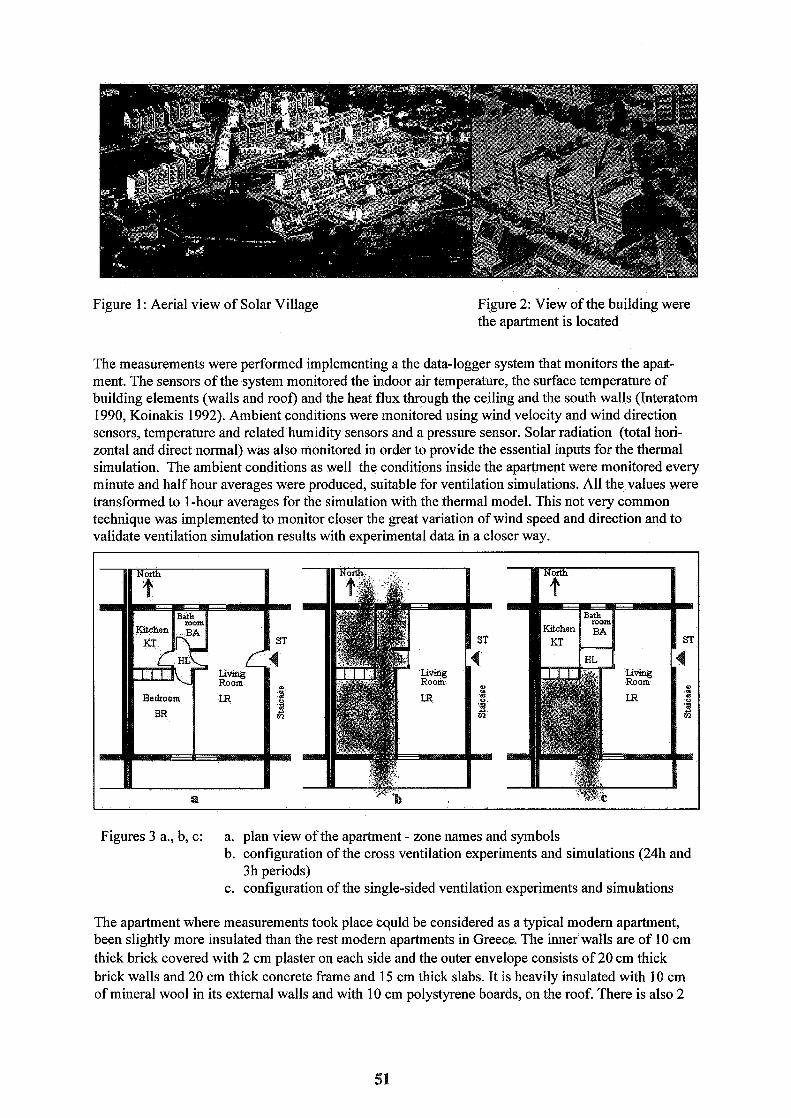
Figure 1 : Aerial view of Solar Village Figure 2: View of the building were the apartment is located
The measurements were performed implementing a the data-logger system that monitors the apart- ment. The sensors of the system monitored the indoor air temperature, the surface temperature of building elements (walls and roof) and the heat flux through the ceiling and the south walls (Interatom 1990, Koinakis 1992). Ambient conditions were monitored using wind velocity and wind direction sensors, temperature and related humidity sensors and a pressure sensor. Solar radiation (total hori- zontal and direct normal) was also monitored in order to provide the essential inputs for the thermal simulation. The ambient conditions as well the conditions inside the apartment were monitored every minute and half hour averages were produced, suitable for ventilation simulations. All the values were transformed to 1-hour averages for the simulation with the thermal model. This not very common technique was implemented to monitor closer the great variation of wind speed and direction and to validate ventilation simulation results with experimental data in a closer way.
Figures 3 a., b, c: a. plan view of the apartment - zone names and symbols b. configuration of the cross ventilation experiments and simulations (24h and
3 h periods) c. configuration of the single-sided ventilation experiments and simuhtions
The apartment where measurements took place cquld be considered as a typical modem apartment, been slightly more insulated than the rest modem apartments in Greece. The inner walls are of 10 cm thick brick covered with 2 cm plaster on each side and the outer envelope consists of 20 cm thick brick walls and 20 cm thick concrete frame and 15 cm thick slabs. It is heavily insulated with 10 cm of mineral wool in its external walls and with 10 cm polystyrene boards, on the roof. There is also 2
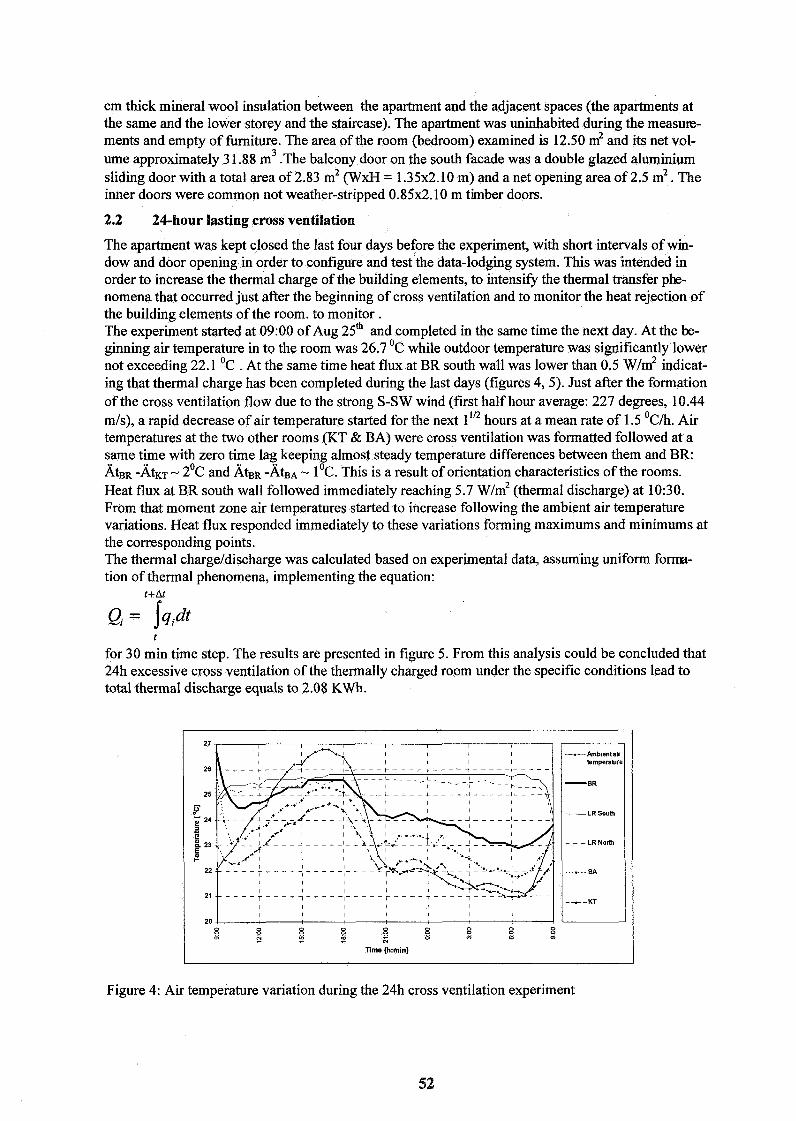
cm thick mineral wool insulation between the apartment and the adjacent spaces (the apartments at the same and the lower storey and the staircase). The apartment was uninhabited during the measuE- ments and empty of furniture. The area of the room (bedroom) examined is 12.50 m2 and its net vol- ume approximately 3 1.88 rn3 .The balcony door on the south facade was a double glazed aluminium sliding door with a total area of 2.83 m2 (WxH = 1.35x2.10 m) and a net opening area of 2.5 m2. The inner doors were common not weather-stripped 0.85x2.10 m timber doors.
2.2 24-hour lasting cross ventilation
The apartment was kept closed the last four days before the experiment, with short intervals of win- dow and door opening in order to configure and test the data-lodging system. This was intended in order to increase the thermal charge of the building elements, to intensify the thermal transfer phe- nomena that occurred just after the beginning of cross ventilation and to monitor the heat rejection of the building elements of the room. to monitor. The experiment started at 09:OO of Aug 25' and completed in the same time the next day. At the be- ginning air temperature in to the room was 26.7 OC while outdoor temperature was significantly lower not exceeding 22.1 OC . At the same time heat flux at BR south wall was lower than 0.5 w/m2 indicat- ing that thermal charge has been completed during the last days (figures 4, 5). Just after the formation of the cross ventilation flow due to the strong S-SW wind (first half hour average: 227 degrees, 10.44 m/s), a rapid decrease of air temperature started for the next lIn hours at a mean rate of 1.5 Oc/h. Air temperatures at the two other rooms (KT & BA) were cross ventilation was formatted followed at a same time with zero time lag keeping almost steady temperature differences between them and BR: iitBR -WtKT - 2 ' ~ and iitBR -iitBA - 1°c. This is a result of orientation characteristics of the rooms. Heat flux at BR south wall followed immediately reaching 5.7 w/m2 (thermal discharge) at 10:30. From that moment zone air temperatures started-to increase following the ambient airtemperature variations. Heat flux responded immediately to these variations forming maximums and minimums at the corresponding points. The thermal chargeldischarge was calculated based on experimental data, assuming uniform forma- tion of thermal phenomena,~implementing the equation:
t
for 30 min time step. The results are presented in figure 5. From this analysis could be concluded that 24h excessive cross ventilation of the thermally charged room under the specific conditions lead to total thermal discharge equals to 2.08 Kwh.
temperaUre
LR sourn
LR N o h
....... BA
T - - - - I - ---KT
0 8 0 0 0 0 g z ; .- rn X (D 8 Time (h:min)
Figure 4: Air temperature variation during the 24h cross ventilation experiment
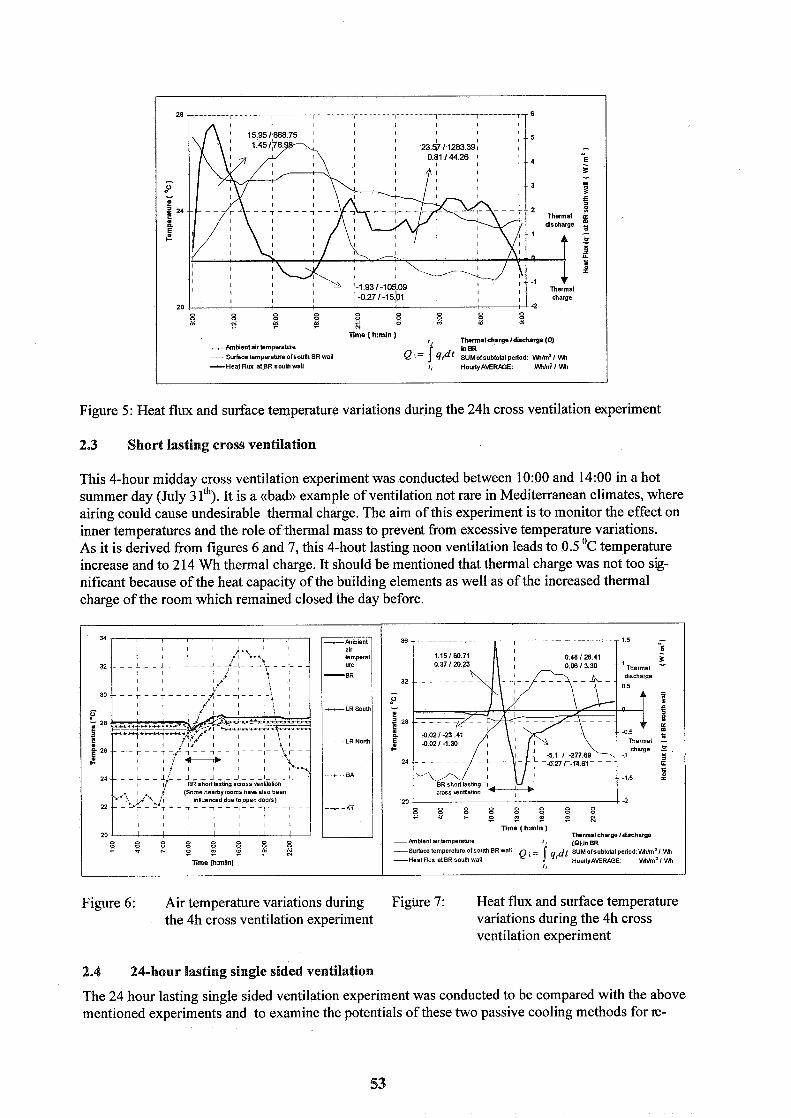
J : L-2 0 0 0 0 0 0
0 0 0, 5? '2 rn 0 0 .- is 5 W
l ime ( h:min ) ', Thennal charge ldtrcharge (Q - Amblentalr temperahlre -Surface temperature ofsouth 8R wall Q I = l q,dt : ~ D f s u b b b , pe,od Ylhlm2 / M -Heatflux at8R south wall 1, HaudyAMRffiE WI Ylh
Figure 5: Heat flux and surface temperature variations during the 24h cross ventilation experiment
2.3 Short lasting cross ventilation
This 4-hour midday cross ventilation experiment was conducted between 10:OO and 14:OO in a hot summer day (July 3 lfh). It is a ((bad)) example of ventilation not rare in Mediterranean climates, where airing could cause undesirable thermal charge. The aim of this experiment is to monitor the effect on inner temperatures and the role of thermal mass to prevent from excessive temperature variations. As it is derived from figures 6 and 7, this 4-hout lasting noon ventilation leads to 0.5 OC temperature increase and to 2 14 Wh thermal charge. It should be mentioned that thermal charge was not too sig- nificant because of the heat capacity of the building elements as well as of the increased thermal charge of the room which remained closed the day before.
Figure 6: Air temperature variations during Figure 7: Heat flux and surface temperature the 4h cross ventilation experiment variations during the 4h cross
ventilation experiment
annueoced due fo open doon)
. - * c p z p z g Time ( h:min )
Thermal shslgo 1 disch-
2.4 24-hour lasting single sided ventilation
8 8 8 8 8 8 8 8 . - * , - o , O Z L D R
Time (hmln)
The 24 hour lasting single sided ventilation experiment was conducted to be compared with the above mentioned experiments and to examine the potentials of these two passive cooling methods for E-
-hbtentalrtemperature ' (Q)inBR -Surface temperature ofsouth BR wall Q l = Jq ,d t SUMofrubtotalpenod Wh21 W -HeatRux atBR soum wall HoudyAMRffiE Wh' l W
1,

frigerative cooling reduction. An extra reason is to evaluate the single-sided ventilation modelling (presented in paragraph 3), as the other two ventilation experiments.
In figures 8 and 9 the variations of air and surface temperatures and the heat flux at BR south wall are presented for a 3 days period, including the preceding day and the next day of the 24-hour single- sided ventilation, in order to monitor the disturbance caused to the thermal figures of the room. It can be seen that heat flux is significantly lower than cross ventilation heat flux, having maximum value 2 times smaller than the corresponding cross ventilation value. As a result room air temperature de- creased about 1 OC after being almost steady for more than a day.
22 i - - - - - - . - - . * t - - L :+, -t--!------ .. * I I "4 I ' bd I
j 1st Day (all knestrai~on closed) 2nd Day 3rd Day 20 , X ~ ~ X X X X X X X 8 8 8 8 X X X X X X X X X X ...
Z P ' O $ M ' P h O . - , ' O E g " h ~ " $ M Time (h:min)
Figure 8: Air temperature variation during the 24h single-sided ventilation experiment
Figure 9: Heat flux and surface temperature variations during the 24-hour single-sided ventilation. experiment
3.1 Integration of ventilation and thermal simulations
Energy flow due to infiltration and natural (cross and single-sided) ventilation is calculated separately for each zone of the apartment following the configuration of the experiments mentioned in paragraph 2 and only the values for the room tested above are presented. Energy flow is calculated in two ways:
for incoming air flow from the ambient, due to infiltration and cross and single-sided ventilation for total incoming air flow (ambient and interzonal), due to infiltration and ventilation
Both air flows resulted from simulations implementing the air flow nodal model COMIS and the thermal nodal model Suncode (Feustel 1990 & 1995, Grosso 1992 and Weeling 1985).
The variation of meteorological parameters, especially wind speed and direction and ambient tempem- ture cause systematic variation in infiltration and ventilation rates in building (ASHRAE 1985 & 1993, Blomsterberg 1990, Grosso 1992, Roulet 199 1). Moreover the interaction of these parameters with user's behaviour expressed as the opening and closing of windows and doors using any possible combination, adds considerably on the complexity of the phenomena. From the one moment to the other completely different phenomena could take place in a common room starting for example with infiltration in a room closed for hours or days and overheated -as the one at the experiments- and then suddenly experiences massive air flow due to cross ventilation under strong 8-12 m/s wind. Soon after this would be followed by lower ventilation rates as a result of single-sided ventilation, possibly as a result of user's need for privacy or rest. It is therefore essential to examine in situ the ventilation phe- nomena and conditions in order to monitor every day's complexity and validate the capabilities of ventilation and thermal modelling.
For the purpose of ventilation and thermal simulations the apartment has been divided in five zones as presented in figure 3. An extra zone has been used for the staircase because it has found that signifi- cant interzonal air flow could occur between the living room (LR-zone) of the apartment and the staircase (Koinakis 1992). Although only the bedroom is examined in detail in this paper, it is prefer- able to produce a detailed ventilation model because the combination of the closed and opened doors and windows, could lead to various kinds of interzonal flows. On the contrary thermal modelling is a matter of less importance in this case study, because of the prevailing importance of the thermal ph - nomena. Air change rates in cross ventilation under strong wind often found to reach or exceed 100 ach and air flow velocity in selected points inside the apartment reached 1.8-2m/s making papers to blow. Although this seems excessive at first sight, it is a very common phenomenon in mild summer Mediterranean climate, where people find excessive air flow desirable and refreshing even at hot noon hours. The adjacent spaces (the two adjacent apartment on the same and the lower storey were modelled as an extra zone using the temperature data of the data logger system. The building is assumed to be non conditioned and uninhabited as it was at the time of the measurements.
Assuming specific values for zone air temperature, the air change rate is calculated for each zone for the specific door and window configuration. This is used as an input for thermal simulation where new zone air temperature values are calculated. The air change rate is then recalculated using these new temperatures. This iterative procedure is repeated till convergence is less than the desired threshold (preferably from 0.01 to 0.05 OC). The results derived from simulations were detailed including complete interzonal air flows, but only the results related to the examined room (bedroom) are presented in this paper. The contribution of a special ventilation model as the COMIS model proved to be essential in model- ling summer conditions where excessive ventilation is the main cause of heat transfer phenomena and adds considerably on the dynamic character of the phenomena. Therefore it is strongly recommended to implement an integrated calculation method for thermal simulation incorporated the estimation of ventilation and infiltration providing the essential wind and leakage data.
3.2 Simulation results compared with experimental data
The simulation results (figures 10, 11 and 12) were modified in order to show the energy flow per m2 inner BR surface, following the guidelines mentioned in the previous paragraph. It derives that energy flow due to ventilation follows almost exactly the heat flux variation, proving that ventilation is by far the main cause of heat transfer phenomena.

0 8 8 8 8 5 N B Z S ? o U)
O
Time ( kmin )
- Energy flow due to amblent incomlng a r [mnfiitralton and venblatlon) -.- Energy flaw due to total lncomlng a r (ambient and Interzonal lnfiltratlon and vent~lalton) -Heat Flux at BR south wall
Figure 10: 24-hour lasting cross ventilation experiment: energy flow due to ambient air and total in- coming air derived from simulation, versus heat flux experimental data in south BR wall.
. - - - - - - - - - - - 0 . - - - - - - - L - - - - - - - - -4 I I cross venblaboa I I I
I 1 I I I I I
0 0 8 8 8 0 .- 5 h 0 c 'D m : Time ( kmin )
- Energy flow due to am blent lncomlng a r (lnfiltratlon and ventilation) -.-Energy flow due to total Incoming a r (amblent and interzonal infiltrabon and ventllatlon) -Heat F l u at BR south wall
Figure 11: Short lasting cross ventilation: energy flow due to ambient air and total incoming air de- rived from simulation, versus heat flux experimental data in south BR wall.
1 5
0 5
0
65
1
~ ~ ~ ~ ~ $ ~ ~ ~ 5 " " " " ~ $ ~ ~ 8 8 8 ~ C 8 ? ' D m , ? ' D L ,
Time ( h:min )
- Energy flow due to amblent lncomlng alr (infiltration and ventllatlon) -.- Energy flow due to total incomlng air (am blent and Interzonal lnfiltratlon and ventllatlon) -Heat Flux at BR south wall
Figure 12: 24-hour lasting single-sided ventilation: energy flow due to ambient air and total incoming air derived from simulation, versus heat flux experimental data in south BR wall.
4 CONCLUSIONS
As it derived from the three experiments and the corresponding simulations, air flow inside buildings is strongly influenced by (in order of importance):
the configuration and the combination of opened and closed external and internal windows and doors and the time of the day they occurred, the outdoor wind conditions, mainly wind speed and direction,
e the thermal charge of the building elements and the ventilation period.
Air infiltration and leakage of the building's envelope tend to be negligible for buildings like the one examined in this paper in cases of summertime ventilation, because: e increased ventilation combined with increased thermal mass placed in the inner building's surfaces
proved to keep almost steady surface temperatures and heat flux. Only excessive air flow for more than a Chour period results significant temperature and heat flux change.
e the way that common Mediterranean buildings where built restricts infiltration flow paths only through the cracks of the external windows. The rest of the external building envelope is rather solid and airtight (Papamanolis 1996).
Heat flux in external building elements appear to form a sinus-like curve which was kept almost m- disturbed by infiltration flow rates regardless the wind magnitude. As soon as ventilation begins, heat flux follows step by step and in zero time lag the ventilation heat flow which resulted from the simu- lations.
Taking into consideration the total incoming flows (ambient and interzonal) proved to be quite impor- tant in cases of excessive ventilation rates . Ventilation heat flow due to total incoming air (ambient and interzonal) follows heat flux in building's envelope more accurate than ventilation heat flow due to ambient incoming flow only.
References
ASHRAE, Fundamentals, Volumes 1985 & 1993, Atlanta GA, (USA) .
Blomsterberg A. 1990. Ventilation and Airtightness in Low-rise Residential Buildings. Analyses and Full Scale Measurements, Swedish Counsil of Building Research, D 10, (Sweden).
Feustel. H.E, Raynor-Hoosen A. 199 1. Fundamentals of multizone airflow model COMIS, Report no TN 29, IEA Air Infiltration and Ventilation Center (UK)
Feustel. H.E, Smith B.V. 1995. COMIS 2.1- User's Guide, LBL, Berkeley CA (USA).
Grosso M. 1992. Wind Pressure Distribution Around Buildings: A Parametrical Model, Energy and Buildings, Vol. 18, Number 2, pp 101- 132 Elsevier Sequoia, (Netherlands).
Interatom Inc. 1990. Installations Manual for the project of Solar Village, (Germany & Greece).
Koinakis C. Loukas A. 1992. Field tests of airflow within an apartment. Wind tunnel simulation. Field test of airflow impact on the thermal balance of an apartment during the summer period, Laboratory of Building Construction and Building Physics, Aristotle University of Thessaloniki , Thessaloniki (Greece).
Liddament M.W. 1996. A guide to energy efJient ventilation, IEA Air Infiltration and Ventilation Center (UK)
Papamanolis N., Koinakis C. 1996. Air Change Rates in Buildings in Greece, International Confer- ence protection and Restoration of the Environment 111, 28-30 August 1996, Chania, Crete (Greece).
Roulet C.A., Vandaele L. 1991. Air Flow Patterns Within Buildings. Measurement Techniques, TN 34, IEA Air Infiltration and Ventilation Center (UK)
Weeling, T., Palmiter L. 1985. Suncode - PC A program user's manual, Ecotope Inc, Seattle, WA (USA).

VENTILATION AND COOLING
18 ANNUAL AIVC CONFE ATHENS, GREECE, 23-26 SEPTEMBER 1997
Hardware and controls for natural ventilation cooling
S.H. Liem, A.H.C. van Paassen
Delft university of Technology Faculty of Mechanical Engineering and Marine Technology
Process and Energy Department Laboratory of Refrigeration and Indoor Climate Technology
The Netherlands
Hardware and controls for natural ventilation cooling
S.H. Liem, A.H.C. van Paassen
Delft University of Technology The Netherlands
Summary
This research is part of project NATVENT~, a concerted action of nine institutions of seven European countries under the Joule-3 program. It aims to open the barriers that blocks the use of natural ventilation systems in office buildings in cold and moderate climate zones.
Natural night-time ventilation cooling is a very effective means to remove the heat, accumulated in the building fabrics during office hours. Moreover, it requires no energy at all. Cooling with natural ventilation has it limits; more than 6 air changes per hour have no more cooling effect. So precautions have to be taken to reduce the heat gain during the day by limiting the glass area to approximately 40% and using effective sun shading devices. The internal heat load is also limited to 25 ~ . m - ~ . Hardware for night cooling are the traditional types of windows and trickle ventilators. To obtain the most benefit of night cooling, automatic control is essential. For this the control strategies is of utmost importance. Specially for night-time ventilation cooling developed control strategies are incorporated in the predictive control, cooling day control, setpoint control, slab temperature control, degree hour control.
I. Introduction For cooling, much higher air flow rates are required than for only refreshing the indoor
atmosphere. These flow rates are not always available during the daily office hours, because, for reasons of comfort, the air velocity is limited. At night, without any occupation, these restrictions do not apply and much higher air velocities are allowed. To obtain the most benefits of natural night-time ventilation cooling, automatic control is essential. Automatically the windows or vent openings are closed, when the temperature has reached its setpoint, or when danger of ingress occurs or when wind speed exceed a given speed limit. In well designed office buildings with internal loads not exceeding 25 ~ . m - ~ , automatic controlled natural ventilation with night cooling control will satisfy [1,2]
First a review of components applicable for natural night-time ventilation cooling, that are available in the market or under development will be given. This will be followed by a discussion of complete systems. Because the importance of automatic control with night-time ventilation, also an overview is given of strategies that can be applied for an optimal use of natural night-time ventilation cooling.
Natural ventilation is a free source of cooling at our disposal. The wind and the temperature difference between the outdoor and the indoor are the main driving forces for the transport of this free cooling medium. Unfortunately, during office hours, for comfort reasons,

the indoor air velocity is limited to 0.15 m.s-I. At night, this constraint is not there and the windows can be more opened, but precautions have to be taken to prevent burglary. Cooling with natural ventilation has its limits. More than 6 air changes per hour (ach) have no more cooling effect [2]. So during the day the heat gain must be as small as possible. It can be stated that in buildings with maximum heat accumulation, 40% window area and with an effective automatic outside sun shaa-.-g device, night-time ventilation cooling can keep indoor temperatures at an acceptable level with an internal load not exceeding 25 ~ . m - ~ [1,2,6,7]. So only with automatic control the full benefits of natural cooling can be obtained.
3. The basic ventilation patterns Three basic ventilation patterns cooling can be distinguished: a. single sided ventilation,
b. cross ventilation and c. natural or fan assisted cross ventilation with an atrium or shaft.
3.1 Single sided ventilation Single sided ventilation occurs, when the inlet and the outlet windows are placed
in the same wall, see figure 1. The inlet and the outlet openings can be at different heights (left), or form one opening (right). The available air movement on the windward side is about 10% of the outdoor wind velocity at points up to a distance one sixth of the room depth from the window. Beyond this, the velocity decreases rapidly [3]. On the leeward side less air movement is produced. The ventilation is induced by the turbulence of the outside air
Figure I Single sided ventilation that increases with higher wind speeds [2].
3.2. Cross ventilation Cross ventilation has a much higher ventilation rate than single sided ventilation.
One configuration is shown in figure 2 (top); the air flow goes via the windows of the windward sided rooms and through vents near the ceiling via the corridor to the leeward sided rooms. Another configuration is shown in figure 2 (bottom): the air flow enters the windward sided rooms near the ceiling. There it sticks to the ceiling due to the Coanda effect and deep inside the room it drops to the floor where it goes to the corridor via the crack under the door. The first configuration is more comfortable for a summer situation because
Figure 2 Cross ventilation the fresh air passes the living zone, but for the winter situation the second configuration is better,
because it prevents draught from entering the living zone. The disadvantage however is the transportation of the polluted air to the leeward sided rooms. However, this does not apply for night ventilation.
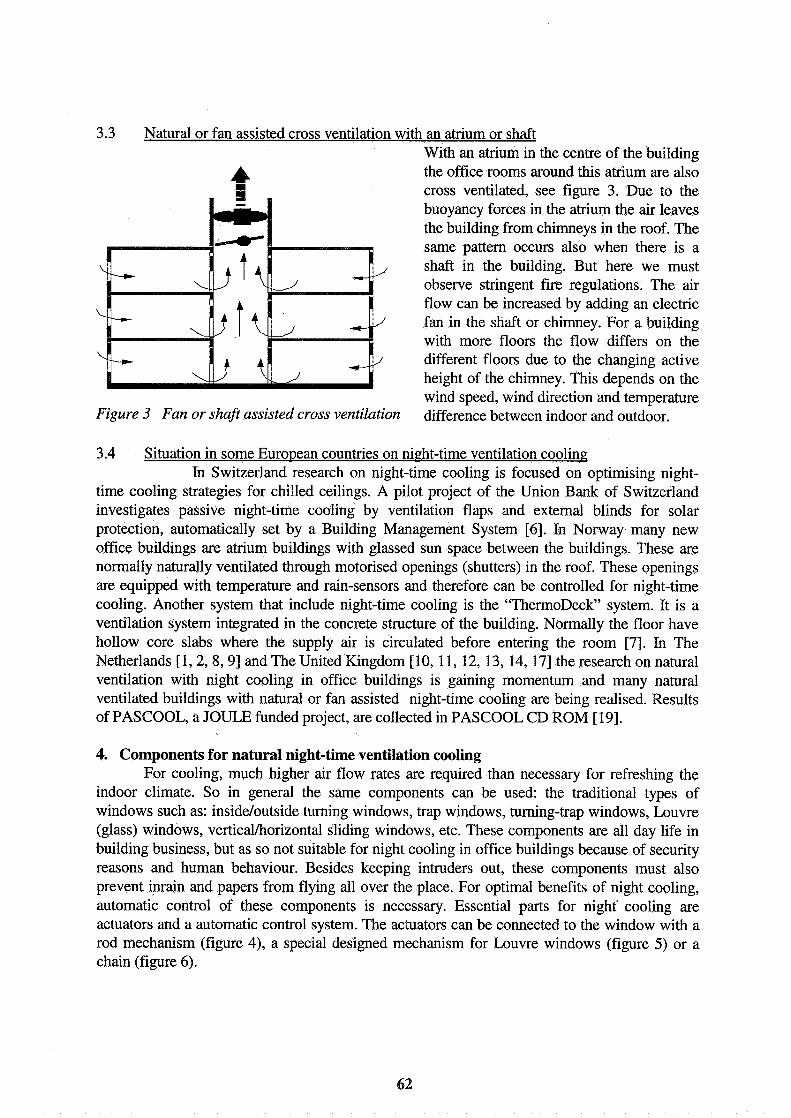
3.3 Natural or fan assisted cross ventilation with an atrium or shaft With an atrium in the centre of the building
A the office rooms around this atrium are also m cross ventilated, see figure 3. Due to the
buoyancy forces in the atrium the air leaves the building from chimneys in the roof. The same pattern occurs also when there is a shaft in the building. But here we must observe stringent fire regulations. The air flow can be increased by adding an electric fan in the shaft or chimney. For a building with more floors the flow differs on the different floors due to the changing active height of the chimney. This depends on the wind speed, wind direction and temperature
Figure 3 Fan or shaJi- assisted cross ventilation difference between indoor and outdoor.
3.4 Situation in some European countries on night-time ventilation cooling In Switzerland research on night-time cooling is focused on optimising night-
time cooling strategies for chilled ceilings. A pilot project of the Union Bank of Switzerland investigates passive night-time cooling by ventilation flaps and external blinds for solar protection, automatically set by a Building Management System [6]. In Norway many new office buildings are atrium buildings with glassed sun space between the buildings. These are normally naturally ventilated through motorised openings (shutters) in the roof. These openings are equipped with temperature and rain-sensors and therefore can be controlled for night-time cooling. Another system that include night-time cooling is the "ThermoDeck" system. It is a ventilation system integrated in the concrete structure of the building. Normally the floor have hollow core slabs where the supply air is circulated before entering the room [7]. In The Netherlands [I, 2,8,9] and The United Kingdom [lo, 1 1, 12, 13, 14, 171 the research on natural ventilation with night cooling in office buildings is gaining momentum and many natural ventilated buildings with natural or fan assisted night-time cooling are being realised. Results of PASCOOL, a JOULE funded project, are collected in PASCOOL CD ROM [19].
4. Components for natural night-time ventilation cooling For cooling, much higher air flow rates are required than necessary for refreshing the
indoor climate. So in general the same components can be used: the traditional types of windows such as: insideloutside turning windows, trap windows, turning-trap windows, Louvre (glass) windows, verticaVhorizonta1 sliding windows, etc. These components are all day life in building business, but as so not suitable for night cooling in office buildings because of security reasons and human behaviour. Besides keeping intruders out, these components must also prevent inrain and papers from flying all over the place. For optimal benefits of night cooling, automatic control of these components is necessary. Essential parts for night' cooling are actuators and a automatic control system. The actuators can be connected to the window with a rod mechanism (figure 4), a special designed mechanism for Louvre windows (figure 5) or a chain (figure 6).

Figure 4 An actuator Figure 5 An actuator connected Figure 6 A chain connects the with a rod mechanism to a Louvre window the actuator with the window
At present, electronic controlled trickle ventilators, see figure 7, are already available on the market. Each ventilator is equipped with a print board, a duct, a sensor and a servo motor to
control the moving sleeve. The air speed in the duct is measured based on the cooling time of a heated metal wire. The output of the sensor is converted into an electronic signal. This is passed to the controller which steers the servo motor to adjust the sleeves in the right position, such, that the air flow is constant, nominal 10- 18 [m-'.s-l per m length]. This ventilator is very suitable for night cooling because it is easy to
Figure 7 The electronic trickle connect it to a building management system.
ventilator The capacity can be increased by adding a mechanical exhaust fan. No exact figures are
available regarding the energy consumption and the life span of the servo motor. The price is comparable to a mechanical ventilation system.
A newly developed natural ventilation system, as applied in a new domestic housing project, called Urban Villa 1151, is worth mentioning here, because this system is also applicable for office buildings. Cooling is provided by a combination of an opening in the parapet and an outside turning trap window above the vision window, see figure 8. The dimensions of the opening under the parapet is approximately 1 * 0.5 m. At the outside this is covered by an aluminium grill with fine small- mesh wire netting for insects. At the inside this can be closed by a well isolated hatch that can be manually opened with a spindle and positioned in any desired position. The air flow enters the room via the external louvres and leaves the room via the two upper trap windows, each also measuring Figure 8 Vent openings in the approximately 1*0.5 m. A ventilation rate of 6 ach can be parapetand above the vision obtained in a summer night. windows
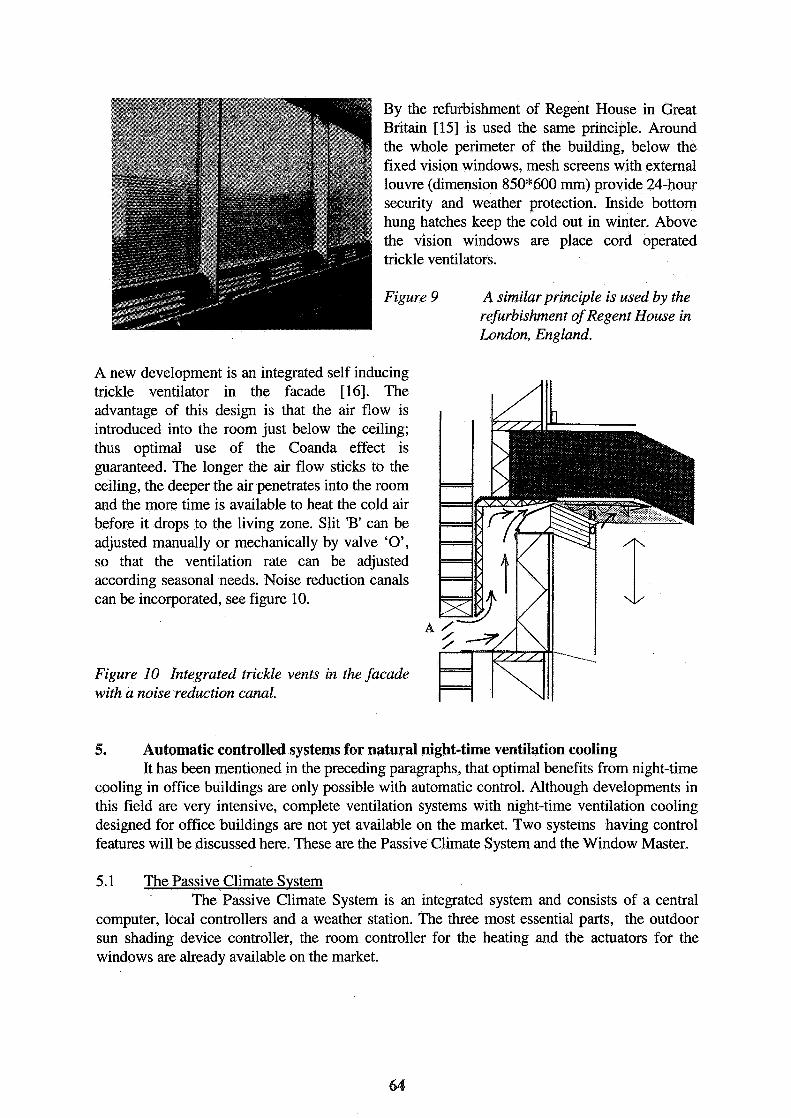
By the refurbishment of Regent House in Great Britain [15] is used the same principle. Around the whole perimeter of the building, below the fixed vision windows, mesh screens with external louvre (dimension 850*600 mrn) provide 24-hour security and weather protection. Inside bottom hung hatches keep the cold out in winter. Above the vision windows are place cord operated trickle ventilators.
Figure 9 A similar principle is used by the refurbishment of Regent House in London, England.
A new development is an integrated self inducing trickle ventilator in the facade [16]. The advantage of this design is that the air flow is introduced into the room just below the ceiling; thus optimal use of the Coanda effect is guaranteed. The longer the air flow sticks to the ceiling, the deeper the air penetrates into the room and the more time is available to heat the cold air before it drops to the living zone. Slit 'B' can be adjusted manually or mechanically by valve 'O', so that the ventilation rate can be adjusted according seasonal needs. Noise reduction canals can be incorporated, see figure 10.
A
Figure 10 Integrated trickle vents in the facade with a noise reduction canal.
5. Automatic controlled systems for natural night-time ventilation cooling It has been mentioned in the preceding paragraphs, that optimal benefits from night-time
cooling in office buildings are only possible with automatic control. Although developments in this field are very intensive, complete ventilation systems with night-time ventilation cooling designed for office buildings are not yet available on the market. Two systems having control features will be discussed here. These are the Passive Climate System and the Window Master.
5.1 The Passive Climate System The Passive Climate System is an integrated system and consists of a central
computer, local controllers and a weather station. The three most essential parts, the outdoor sun shading device controller, the room controller for the heating and the actuators for the windows are already available on the market.
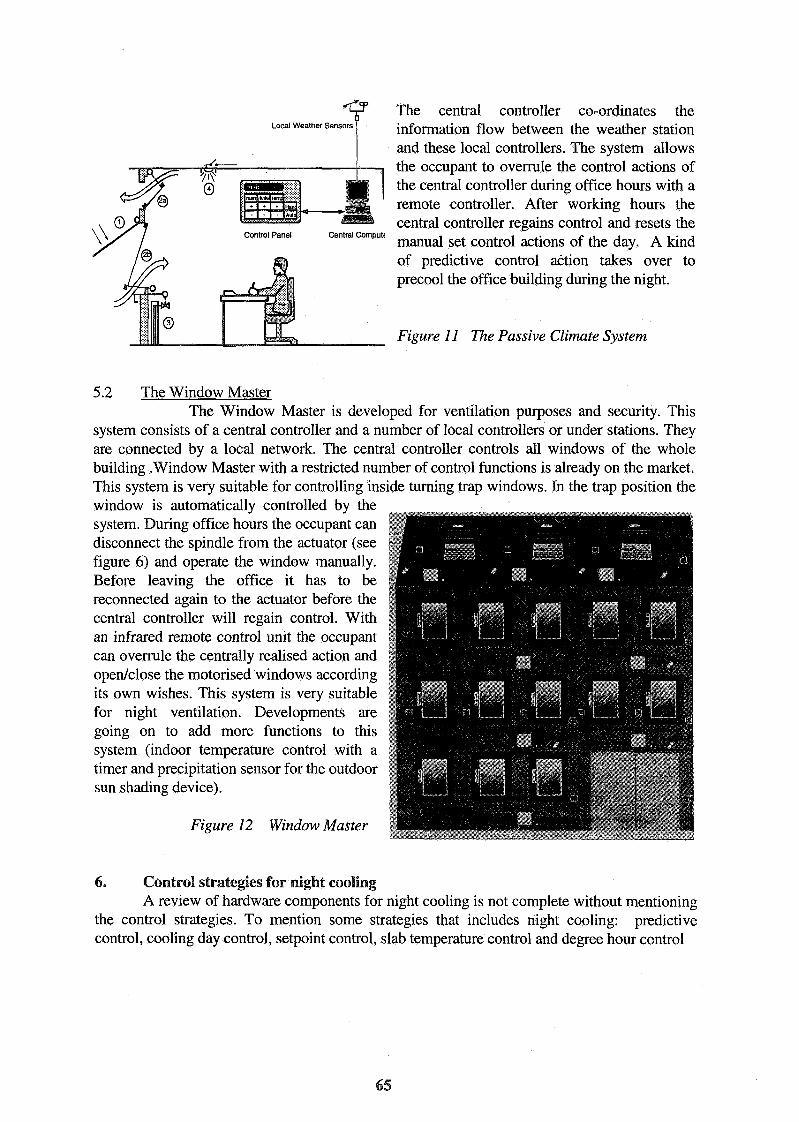
The central controller coordinates the Local Weather Sensors
I I
information flow between the weather station I I and these local controllers. The system allows
the occupant to overrule the control actions of the central controller during office hours with a remote controller. After working hours the central controller regains control and resets the manual set control actions of the day. A kind of predictive control action takes over to precool the office building during the night.
Figure 11 The Passive Climate System
5.2 The Window Master The Window Master is developed for ventilation purposes and security. This
system consists of a central controller and a number of local controllers or under stations. They are connected by a local network. The central controller controls all windows of the whole building .Window Master with a restricted number of control functions is already on the market. This system is very suitable for controlling inside turning trap windows. In the trap position the window is automatically controlled by the system. During office hours the occupant can disconnect the spindle from the actuator (see figure 6) and operate the window manually. Before leaving the office it has to be reconnected again to the actuator before the central controller will regain control. With an infrared remote control unit the occupant can overrule the centrally realised action and openlclose the motorised windows according its own wishes. This system is very suitable for night ventilation. Developments are going on to add more functions to this system (indoor temperature control with a timer and precipitation sensor for the outdoor sun shading device).
Figure 12 Window Master
6. Control strategies for night cooling A review of hardware components for night cooling is not complete without mentioning
the control strategies. To mention some strategies that includes night cooling: predictive control, cooling day control, setpoint control, slab temperature control and degree hour control
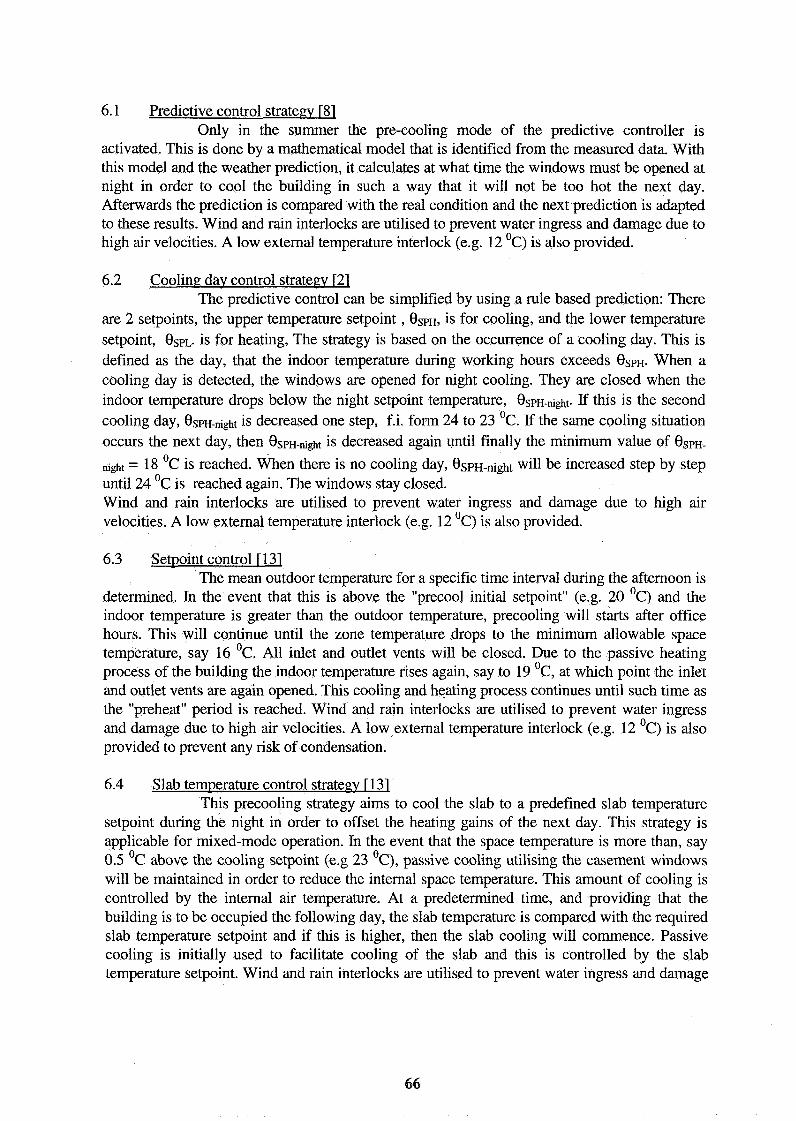
6.1 Predictive control strategy r81 Only in the summer the pre-cooling mode of the predictive controller is
activated. This is done by a mathematical model that is identified from the measured data. With this model and the weather prediction, it calculates at what time the windows must be opened at night in order to cool the building in such a way that it will not be too hot the next day. Afterwards the prediction is compared with the real condition and the next prediction is adapted to these results. Wind and rain interlocks are utilised to prevent water ingress and damage due to high air velocities. A low external temperature interlock (e.g. 12 OC) is also provided.
6.2 Cooling day control strategy r21 The predictive control can be simplified by using a rule based prediction: There
are 2 setpoints, the upper temperature setpoint , €ISPH, is for cooling, and the lower temperature setpoint, €ISPL. is for heating, The strategy is based on the occurrence of a cooling day. This is defined as the day, that the indoor temperature during working hours exceeds eSPH. When a cooling day is detected, the windows are opened for night cooling. They are closed when the indoor temperature drops below the night setpoint temperature, eSpH-night. If this is the second cooling day, OSPH-fight is decreased one step, t i . form 24 to 23 OC. If the same cooling situation occurs the next day, then eSPH-night is decreased again until finally the minimum value of eSPH- fight = 18 OC is reached. When there is no cooling day, eSPH-night will be increased step by step until 24 OC is reached again. The windows stay closed. Wind and rain interlocks are utilised to prevent water ingress and damage due to high air velocities. A low external temperature interlock (e.g. 12 OC) is also provided.
6.3 Setpoint control r131 The mean outdoor temperature for a specific time interval during the afternoon is
determined. In the event that this is above the "precool initial setpoint" (e.g. 20 OC) and the indoor temperature is greater than the outdoor temperature, precooling will starts after office hours. This will continue until the zone temperature drops to the minimum allowable space temperature, say 16 OC. All inlet and outlet vents will be closed. Due to the passive heating process of the building the indoor temperature rises again, say to 19 OC, at which point the inlet and outlet vents are again opened. This cooling and heating process continues until such time as the "preheat" period is reached. Wind and rain interlocks are utilised to prevent water ingress and damage due to high air velocities. A low external temperature interlock (e.g. 12 OC) is also provided to prevent any risk of condensation.
6.4 Slab temperature control strategy r131 This precooling strategy aims to cool the slab to a predefined slab temperature
setpoint during the night in order to offset the heating gains of the next day. This strategy is applicable for mixed-mode operation. In the event that the space temperature is more than, say 0.5 OC above the cooling setpoint (e.g 23 OC), passive cooling utilising the casement windows will be maintained in order to reduce the internal space temperature. This amount of cooling is controlled by the internal air temperature. At a predetermined time, and providing that the building is to be occupied the following day, the slab temperature is compared with the required slab temperature setpoint and if this is higher, then the slab cooling will commence. Passive cooling is initially used to facilitate cooling of the slab and this is controlled by the slab temperature setpoint. Wind and rain interlocks are utilised to prevent water ingress and damage
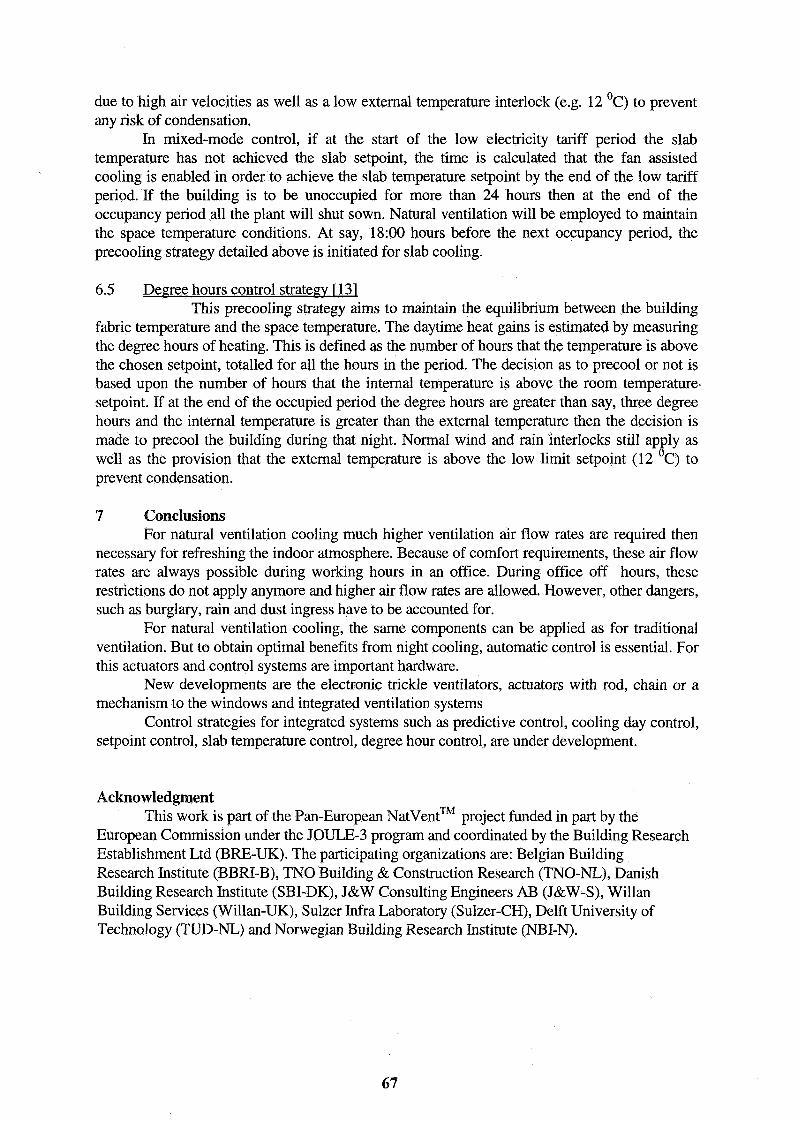
due to high air velocities as well as a low external temperature interlock (e.g. 12 OC) to prevent any risk of condensation.
In mixed-mode control, if at the start of the low electricity tariff period the slab temperature has not achieved the slab setpoint, the time is calculated that the fan assisted cooling is enabled in order to achieve the slab temperature setpoint by the end of the low tariff period. If the building is to be unoccupied for more than 24 hours then at the end of the occupancy period all the plant will shut sown. Natural ventilation will be employed to maintain the space temperature conditions. At say, 18:00 hours before the next occupancy period, the precooling strategy detailed above is initiated for slab cooling.
6.5 Degree hours control strategy r131 This precooling strategy aims to maintain the equilibrium between the building
fabric temperature and the space temperature. The daytime heat gains is estimated by measuring the degree hours of heating. This is defined as the number of hours that the temperature is above the chosen setpoint, totalled for all the hours in the period. The decision as to precool or not is based upon the number of hours that the internal temperature is above the room temperature. setpoint. If at the end of the occupied period the degree hours are greater than say, three degree hours and the internal temperature is greater than the external temperature then the decision is made to precool the building during that night. Normal wind and rain interlocks still apply as well as the provision that the external temperature is above the low limit setpoint (12 OC) to prevent condensation.
7 Conclusions For natural ventilation cooling much higher ventilation air flow rates are required then
necessary for refreshing the indoor atmosphere. Because of comfort requirements, these air flow rates are always possible during working hours in an office. During office off hours, these restrictions do not apply anymore and higher air flow rates are allowed. However, other dangers, such as burglary, rain and dust ingress have to be accounted for.
For natural ventilation cooling, the same components can be applied as for traditional ventilation. But to obtain optimal benefits from night cooling, automatic control is essential. For this actuators and control systems are important hardware.
New developments are the electronic trickle ventilators, actuators with rod, chain or a mechanism to the windows and integrated ventilation systems
Control strategies for integrated systems such as predictive control, cooling day control, setpoint control, slab temperature control, degree hour control, are under development.
Acknowledgment This work is part of the Pan-European ~ a t ~ e n t ~ ~ project funded in part by the
European Commission under the JOULE-3 program and coordinated by the Building Research Establishment Ltd (BRE-UK). The participating organizations are: Belgian Building Research Institute (BBRI-B), TNO Building & Construction Research (TNO-NL), Danish Building Research Institute (SBI-DK), J&W Consulting Engineers AB (J&W-S), Willan Building Services (Willan-UK), Sulzer Infra Laboratory (Sulzer-CH), Delft University of Technology (TUD-NL) and Norwegian Building Research Institute (NBI-N).
Reference
Paassen, A.H.C. van, P.J. Lute, Performance and feasibility of Passive Climate Systems, Proceedings Clima 2000, November 1-3, 1993, London, Great Britain Paassen, A.H.C. van, P.J.M. van Galen, Rules for Cooling through Motorized Vent Windows, Proceedings of the 19th International Congress of Refrigeration, August 20- 25,1995, The Hague, The Netherlands, volume IVb, page 1089 -1096 Bansal, N.K., G. Hauser, G. Minke, Passive Building Design, Elsevier Science B.V., The Netherlands, 1994 Paassen, dr. ir. A.H.C. van, ir. S.H. Liem, ir. P.J.M. van Galen, Veldtest Passief Klimaatsysteem, report K-207, TU Delft, Maart 1995 Galen, P.J.M. van, Automatische raarnopeningen als bruikbaar onderdeel van de klimaatbeheersing, report KK- 1070, TU Delft, Juli 1994 Cotting, RenC, Night Cooling, the Swiss report, Smart components and Intelligent Control Systems for Night Cooling, Sulzer Infra, Winterthur, April 18, 1996 Brunsell, Jldrn, Trygve Hestad, Report Natvent, Activity 3.4, Night cooling, report from Norway, Norwegian Building Research Institute, Oslo, June 16, 1996 Lute, P.J. The Use of Prediction in Temperature Control in Buildings, a Passive Climate Application, PhD thesis, TU Delft, WbMT, Koudetechniek en Klimaatregeling, 1992. Liem, S.H., A.H.C. van Paassen and R.J.W. Kouffeld, Digital control system for Extreme Low Energy Apartments, Proceedings of the 19th International Congress of Refrigeration, The Hague, NL, August 20-25,1995 Martin, A.J., Control of Natural Ventilation, TN 11/95, BSRIA, June 1995, ISBN 0 86022 406 6 Fletcher, J., Martin A.J., Night Cooling Control Strategies, Technical Appraisal 14/96, BSRIA, UK, September 1996 Kolokotroni, Maria and Steve Hayes, Detailed Design Tools Night Cooling for Commercial Buildings Control Strategy, IEA Annex 28, Subtask 2 Kolokotroni, Maria, contribution of BRE for Natvent WP 3.4, Building Research Establishment, London, June 12, 1996 Kolokotroni, M, Webb B.C. and Hayes S.D. , Summer cooling for Office-Type Buildings by Night Ventilation, 17th AIVC Conference, Gothenburg, Sweden, 17-20 September 1996. Zutphen, R.A.J.M., Een regelsysteem voor de Urban Villa, report KK-1017, Laboratory of Refrigeration and Indoor Climate Control, TU Delft, June 1992 Engel, Peter van den, Thennisch Comfort en ventilatie-efficientie door inducerende ventilatie via de gevel, thesis, TU Delft, 1995, ISBN 90-5269- 188-6 Webb, B. and Kolokotroni M., Night Cooling a 1950s office, the architects' journal, 13 June 1996. Van Paassen, A.H.C. and S.H. Liem, The Availability of Hardware suitable for Night- time Cooling and it's Control, Technical Report, Contract JOR3-CT95-0022 (DG 12 - WSME), Joule ID, period 1 February - 30 June 1996, Delft, July 1996 Santamouris, Prof. M., PASCOOL CD ROM, University of Athene, Greece
VENTILATION AND COOLING
18TH ANNUAL AIVC CONFERENCE ATHENS, GREECE, 23-26 SEPTEMBER, 1997
(Title) A STUDY OF WINDOW LOCATION AND FURNITURE LAYOUT TO XIMIZE THE COOLING EFFECT FOR AN URBAN TAIWANESE APARTMENT BY NIGHT VENTILATION
(Authors) Nien-Tzu chaol, Wen-An Wang2, and Che-Ming Chiang2
l ~ e ~ a r t m e n t of Architecture and Urban Planning, Chung-Hua Polytechnic Institute, 30 Tung-shiang, Hsin-Chu, Taiwan
2Department of Architecture, National Cheng-Kung University, Tainan, Taiwan.
A STUDY OF WINDOW LOCATION AND FURNITURE LAYOUT TO XIMIZE THE COOLING EFFECT FOR AN URBAN TAIWANESE
APARTMENT BY NIGHT VENTILATION
SYNOPSIS
The year-round climate of Taiwan is warm and humid. Apart from the hottest months in summer, there are four months suitable for nocturnal ventilation to acquire indoor cooling. The urban Taiwanese apartments are small due the limited usable land. To maximize the spatial use, a relative large occupant-defined space is developed. This space can be divided into two to three sub-spaces with wall units or smaller pieces of furniture when needed. Based on a previous study in a typical occupant-defined space, some wintertime design principles of furniture layout to achieve high indoor air quality were obtained. To provide an overall picture of the natural ventilation design for such a space, this study investigates the impacts of window location and furniture layout on the summertime indoor thermal comfort and air quality by night ventilation. Different furniture layouts have neglected effects on indoor thermal comfort when the layout does not obstruct the primary supply air stream. More spatial divisions by wall units can help to removal CO2 effectively by minimizing mixture among stratified thermal layers. Lower window location makes the penetration of supply air stream deeper into the room, which results in a cooler region away from the window. Lower window location achieves lower indoor C 0 2 concentration level than higher window location.
INTRODUCTION
The subtropical climate of Taiwan is warm and humid. Apart from the hottest two months (July and August) of which the monthly average temperatures are over 280C, there are four months the monthly average temperature are between 240C and 28OC. During these months the daily temperature difference between the highest and lowest is around 60C. For energy conservation, nocturnal ventilation could be a potential straiegy for acquiring indoor cooling.
Due to limited usable land, the urban Taiwanese apartments are small. To maximize the utilization, a relative large space, called occupant-defined space, is developed. The occupant- defined space can be divided into two to three sub-spaces with wall units or smaller pieces of furniture when needed. It is important for designers to know how to arrange furniture in accordance with window locations to maximize the cooling effect and obtain high indoor air quality from night ventilation.
From a previous study [Chao et al. 19971 some design principles to sub-divide an occupant- defined space by wall units were obtained to achieve high indoor air quality in winter. High indoor air quality can be obtained if wall units can be arranged to be kept away from the primary air flow path. By studying the air flow pattern of a typical occupant-defined space two suggestions were made. To make the air circulate freely in a space, a gap should be left at the bottom of each wall unit. The height of a wall unit should be restricted when the wall unit is beside a headpollutant source, simulating a person. The headpollutant source can hardly be reached by the supply air stream if the wall unit is too high.
To provide an overall picture of the natural ventilation design for a typical occupant-defined space, this study examines the summer indoor thermal comfort and air quality when night ventilation is applied The goal of this study is to maximize the nocturnal cooling effect by
investigating the impacts from both of window location and furniture layout on indoor thermal comfort and air quality.
RESEARCH METHODS
CFD simulations This study was carried out by computational fluid dynamics simulations. Since thermal buoyancy effect is prominent in this study, the applied turbulence model is the renormalization group k-E model [Yakhot et al. 19921. It has been found that the
renormalization group k-E model is more advanced in predicting the thermal buoyancy effect than the standard k-E model and the modified k-E model [Chen and Chao 19961. The
renormalization group k-E model has the same form as the standard k-E model, except for the model coefficients. The model coefficients in the renormalization group k-E model are:
In addition, the dissipation-rate transport equation has an additional source term R:
where q0 = 4.8, P = 0.012 and the dimensionless parameter, q , is defined by:
The computations are conducted by PHOENICS [Spalding 19941, a commercially available CFD code, which is popular among ventilation engineers. The governing equations are solved in the finite-volume method with a staggered grid system. A hybrid scheme is used for the numerical solution. The algorithm employed is SIMPLEST [Spalding 19941. As a convergence criterion, the sum of the normalized absolute residuals in each control volume for all calculated variables should be maintained at less than 10-3. To prevent the numerical solution process from oscillating or diverging, three methods are used. They are under- relaxation for the continuity equation, false time-steps for the other dependent variables, and source-term manipulation which treats positive source terms explicitly and negative source terms implicitly. A non-uniform mesh system is used with the finer mesh located in the near- wall region or the place with a large gradient of variables.
Apartment unit A typical occupant-defined space was chosen from an apartment unit (Fig. 1) located in an apartment complex in Taipei. The left side of this apartment unit, denoted by dash line, is the occupant-defined space (Fig. 1). Three kinds of window locations and three types of spatial division were investigated (Fig. 2). Case B and C were chosen because of their good performance in obtaining high indoor air quality by the effective removal of C 0 2 [Chao et al. 19971. Three lying persons, each generating 75 w of heat and 4 x 10⁻⁶ m31s of carbon dioxide (CO2), were simulated. The room and wall temperatures are 300C which are considered to be 40C higher than the outdoor temperature (260C). The simulation cases and the corresponding dimensions are shown in Table 1 and Table 2. All simulations were conducted in three dimensions in 39 x 20 x 23 cells.

Evaluation models To assess the performance of each design option, the average indoor thermal comfort and the average indoor concentration of CO2 are evaluated. Indoor thermal comfort is evaluated on both Fanger's Predicted Mean Vote [Fanger 19821 and his draft risk model [Fanger et al. 19881. The Predicted Mean Vote is determined by three personal parameters and four environmental parameters. The three personal parameters are metabolism, external work, and clothing insulation. The four environmental parameters are air temperature, mean radiant temperature, mean air velocity, and partial water vapor pressure. The draft risk model is a function of mean air velocity, turbulence intensity, and air temperature. To obtain a 90% level of satisfaction in thermal comfort, the value of the PMV should be kept between -0.5 and +0.5. A 15% or lower level of dissatisfaction in draft risk is desirable. Indoor air quality is evaluated on the average pollutant concentrations in three zones. A lower pollutant concentration in the evaluated region indicate an effective removal of C02. Six regions, two regions in each zone, are chosen for evaluating indoor thermal comfort and air quality. The location for each region is shown in Fig. 2.
RESULTS AND DISCUSSION
From Table 3, 4 and 5 one can find that thermal comfort level around each headpollutant source (zone 1) for all 9 cases is similar. The thermal comfort levels in region 1 of three zones for all cases are higher than 0.5, the comfort level, which means warm in the space. The percentages of dissatisfaction due to drafts in six regions for all cases are well below 15%, a desirable criterion.
Furniture layout In this study different ways of spatial division by wall units have neglected effects on indoor thermal comfort level. The possible explanation is that the arrangement of wall units in case B and case C does not obstruct the air circulation in the whole space [Chao et al. 19971. For each wall unit there is a gap left at the bottom to make the supply air stream go deeper into the space. In addition, the wall unit #1 and #3 are made shorter to make air circulation easier.
Different layouts of wall units have prominent influences on the ease in removing C02. Case C, the case with three wall units, obtains the lowest indoor C02 concentration level comparing with case A and B. The same situation has been found in the previous study in which less supply air volume was considered [Chao et al. 19971. The possible exp1anation.i~ that wall units are help to prevent mixture among different stratified thermal layers. The stratified thermal layers are generated by thermal buoyancy effect. More mixture among different thermal layers makes the removal of CO:! difficult and consequently, results in a high indoor CO2 concentration level.
Window location Type 1 window location (case A-1, B-1 and C-1) can make the supply air stream penetrate deeper into the room comparing with higher window locations. This situation can be observed from all three cases in Table 3 in which the PMV value is relatively lower in zone 3 than in other zones. The higher the window the shorter the penetration depth is. Therefore, type 3 window location (case A-3, B-3 and C-3) has the lowest PMV value in zone 1 than in other zones.
The higher the window location, the higher the indoor C02 concentration level will be. Type 1 window location obtains the lowest CO2 concentration level than the other types. The reason is that the position of type 1 window is lower the headpollutant sources. Type 2 window location is at the same level of the headpollutant sources while type 3 window location is higher than the heatlpollutant sources. Since the thermal buoyancy effect is
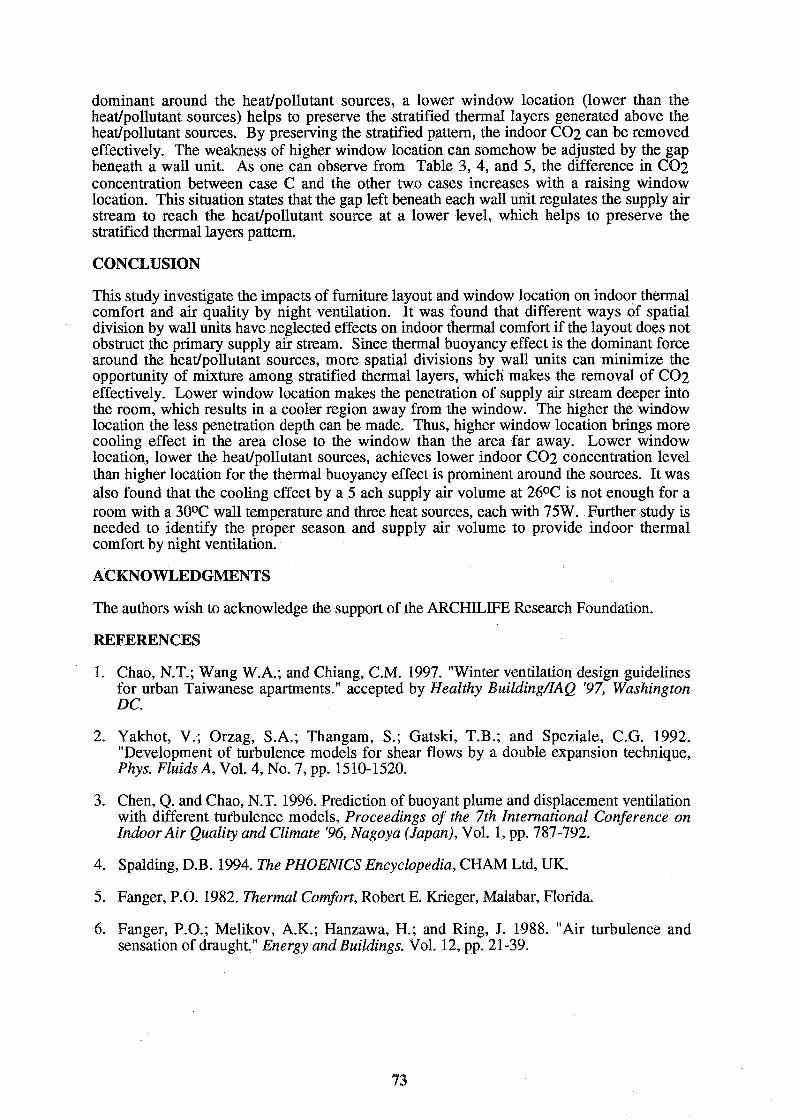
dominant around the headpollutant sources, a lower window location (lower than the headpollutant sources) helps to preserve the stratified thermal layers generated above the headpollutant sources. By preserving the stratified pattern, the indoor C02 can be removed effectively. The weakness of higher window location can somehow be adjusted by the gap beneath a wall unit. As one can observe from Table 3, 4, and 5, the difference in CO2 concentration between case C and the other two cases increases with a raising window location. This situation states that the gap left beneath each wall unit regulates the supply air stream to reach the headpollutant source at a lower level, which helps to preserve the stratified thermal layers pattern.
CONCLUSION
This study investigate the impacts of furniture layout and window location on indoor thermal comfort and air quality by night ventilation. It was found that different ways of spatial division by wall units have neglected effects on indoor thermal comfort if the layout does not obstruct the primary supply air stream. Since thermal buoyancy effect is the dominant force around the headpollutant sources, more spatial divisions by wall units can minimize the opportunity of mixture among stratified thermal layers, which makes the removal of C02 effectively. Lower window location makes the penetration of supply air stream deeper into the room, which results in a cooler region away from the window. The higher the window location the less penetration depth can be made. Thus, higher window location brings more cooling effect in the area close to the window than the area far away. Lower window location, lower the headpollutant sources, achieves lower indoor CO2 concentration level than higher location for the thermal buoyancy effect is prominent around the sources. It was also found that the cooling effect by a 5 ach supply air volume at 260C is not enough for a room with a 300C wall temperature and three heat sources, each with 75W. Further study is needed to identify the proper season and supply air volume to provide indoor thermal comfort by night ventilation.
The authors wish to acknowledge the support of the ARCHILIFE Research Foundation.
REFERENCES
1. Chao, N.T.; Wang W.A.; and Chiang, C.M. 1997. "Winter ventilation design guidelines for urban Taiwanese apartments." accepted by Healthy BuildingLIAQ '97, Washington DC.
2. Yakhot, V.; Orzag, S.A.; Thangam, S.; Gatski, T.B.; and Speziale, C.G. 1992. "Development of turbulence models for shear flows by a double expansion technique, Phys. Fluids A, Vol. 4, No. 7, pp. 15 10- 1520.
3. Chen, Q. and Chao, N.T. 1996. Prediction of buoyant plume and displacement ventilation with different turbulence models, Proceedings of the 7th International Conference on Indoor Air Quality and Climate '96, Nagoya (Japan), Vol. 1, pp. 787-792.
4. Spalding, D.B. 1994. The PHOENICS Encyclopedia, CHAM Ltd, UK.
5. Fanger, P.O. 1982. Thermal Comfort, Robert E. Krieger, Malabar, Florida.
6. Fanger, P.O.; Melikov, A.K.; Hanzawa, H.; and Ring, J. 1988. "Air turbulence and sensation of draught." Energy and Buildings. Vol. 12, pp. 2 1-39.
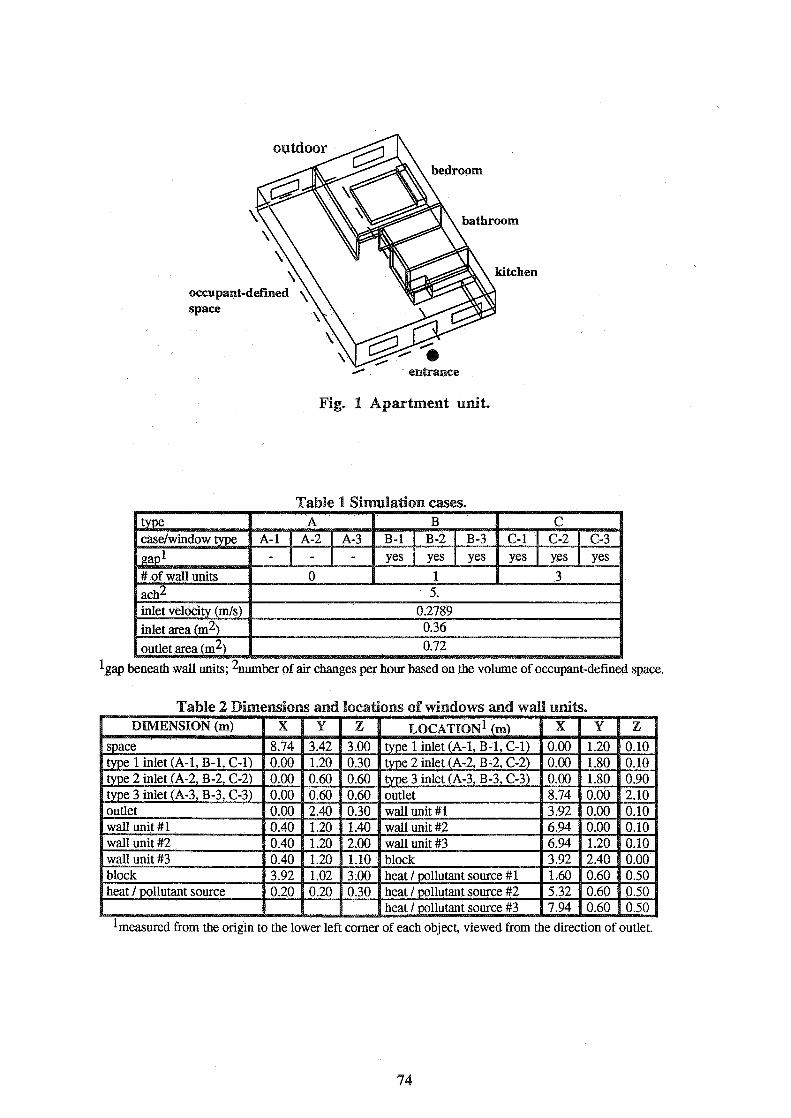
" entrance
Fig. 1 Apartment unit.
Table 1 Simula6on eases.
beneath wall units; %umber of air changes per hour based on the volume of occupant-defined space.
lmeaswd from the origin to the lower left corner of each object, viewed from the direction of outlet.

1. inlet 3. wall unit #1 6. heat/pollutant source #1 9. zone 1, region 1 12. zone 1, region 2 2. outlet 4. wall unit #2 7. heat/poMutant source #2 10. zone 2, region 1 13. zone 2, region 2
5. wall unit #3 8. heatlpollutant source #3 11. zone 3, region 1 14. zone 3, region 2
. (9) 01) (i) Fig. 2 Nine eases, (a) A-I, (b) A-2, (c) A-3, (d) B-1, (e) B-2, (f) B-3, (g) C-1, (h) C-2, and
(i) C-3.
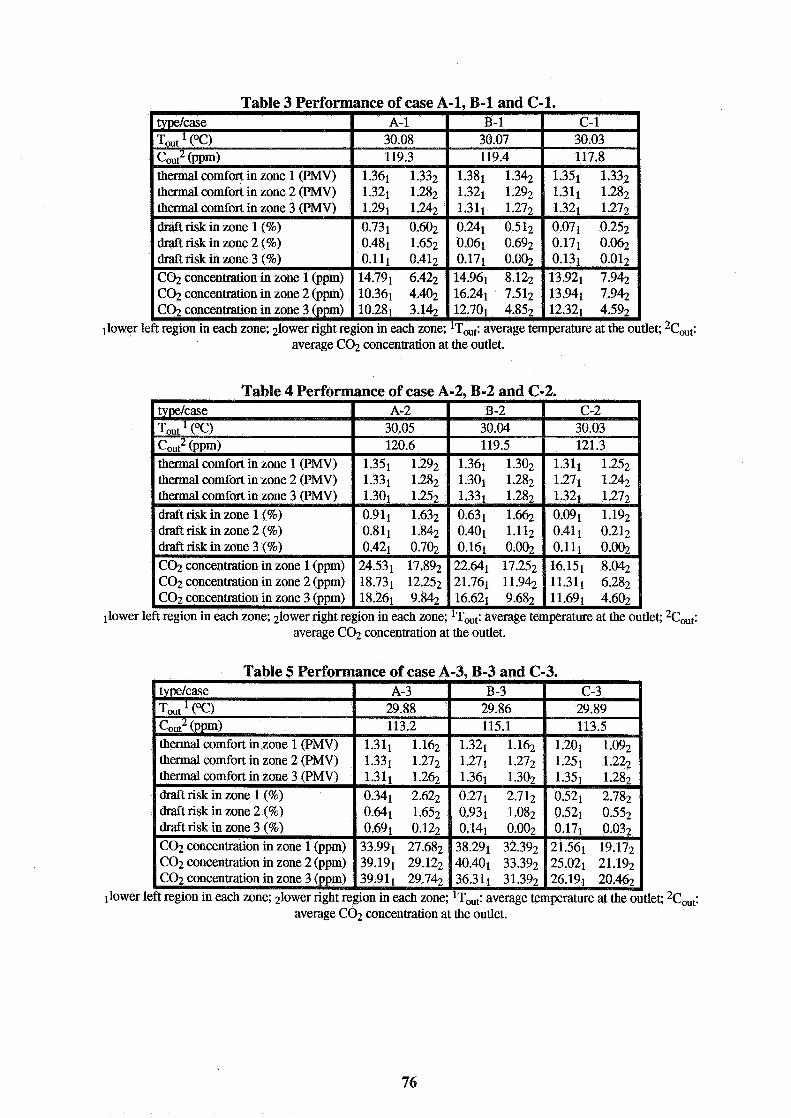
Table 3 Performance of case A-1, B-1 and C-1.
concentration in zone
llower left region in each zone; 2lower right region in each zone; IT,,,: average temperature at the ou tlet; 2C,,: average C02 concentration at the outlet.
Table 4 Performance of case A-2, B-2 and C-2.
llower left region in each zone; 2lower right region in each zone; ITou,: average temperature at the outlet; 2Cou,: average C02 concentration at the outlet.
Table 5 Performance of case A-3, B-3 and C-3.
tlet; 2C,: average GO2 concentration at the outlet.
VENTIlATlON AND COOLING
18TH ANNUAL AIVC CONFERENCE NS, GREECE, 23-26 SEPTEMBER, 1997
USE OF SOLAR ENERGY FOR VENTILATION COOLING OF BUILDINGS
Guohui Gan
Institute of Building Technology Department of Architecture and Building Technology
University of Nottingham Nottingham NG7 2RD, UK
USE OF SOLAR ENERGU FOR VEN TION COOLING OF BUILDINGS
SYNOPSIS
This paper discusses summer cooling of buildings by means of natural ventilation. Computational fluid dynamics is used to predict the ventilation rate in a room with a Trombe wall. The effect of Trombe wall insulation on the room thermal environment is investigated. It is shown that to maximise the effect of ventilation cooling, the interior surface of a Trombe wall should be insulated.
A Trombe wall system consists of a massive storage wall and glazing. The massive storage wall serves to collect and store solar energy. The stored energy is transferred to the inside building for winter heating or enhances room air movement for summer cooling. Fig. 1 shows a Trombe wall for summer cooling of a room. During the operation, the buoyancy effect of air in the channel between the solar heated storage wall and glazing draws room air to the bottom vent. The air in the channel exits to the ambient through the top vent while cool outdoor air is drawn into the room through an open window in the opposite wall. Depending on the ambient temperature, this operation can be either for daytime ventilation or night cooling. If the summer temperature of outdoor air is not very high such that indoor air is warmer than outdoor air due to high heat loads through lighting and other sources, the Trombe wall can be used for ventilation cooling during daytime to reduce or eliminate the need for energy intensive refrigerative cooling. If the outdoor air is hot during the day, the Trombe wall can be used for night cooling by drawing the cool ambient air into the space and so removing heat from the interior of the building.
In this work computational fluid dynamics (CFD) is used to investigate the potential of a Trombe wall for summer ventilation of a room with solar heat gains and conduction heat transfer. The effect of insulation of Trombe wall on the indoor thermal comfort is assessed.
The CFD model consists of a set of governing equations representing the mean and turbulent velocities and enthalpy. The time-averaged steady-state air flow equations can be written in the following form
where 4 is the flow variable, U, is the mean velocity component in x, direction, p is the air density, r$ is the diffusion coefficient and S$ is the source term.
The solution of the flow equations is based on the finite-volume TEAM code [ I ] and is validated against the experimental data for enclosures with Trombe wall geometries [ 2 ] .
The CFD technique is applied to simulating ventilation cooling of an occupied room with a
Trombe wall system (see the schematic of the room in Fig. 1). The room is a test chamber at the University of Nottingham which has dimensions of 5 m long, 3 m wide and 2.4 high. The simulated Trombe wall is assumed to include a double glazing unit and a 0.3 m thick concrete wall with thermal conductivity of 1.4 Wlm-K and insulated on the interior surface. It has the same width and height as the room and is situated at the south end of the room. The distance between the glazing and wall is 0.1 m. There are five 0.4 m X 0.1 m slots near the bottom of the storage wall and one single 3 m X 0.1 m slot at the top of glazing. Other room walls are insulated. In the north wall there is an openable window. In the summer ventilation mode, the outdoor air at a temperature of 20°C is assumed to enter the room through the window with an opening level of 1 m high and 0.5 m wide. It is further assumed that stack effect [3] is the sole driving force for air exchange between indoors and outdoors.
The storage wall solar heat gain is calculated from the daily mean total solar irradiance and mean solar gain factor on July 23. The daily mean solar irradiance on south wall is 165 W/m2 [3] and mean solar gain factor for double glazing is 0.64. The room is occupied by two people with heat generation. The occupants' metabolic rate is taken to be 1.2 met and clothing level 0.6 clo. The heat gain due to lighting is 20 W/m2 of floor area and uniformly distributed on the floor. The room is symmetrical and so only half of the room is used for simulation.
Solution of the flow field is considered to have converged when the sum of normalized residuals is less than for enthalpy and less than for other flow equations. Convergence is achieved after 10000 iterations. For a grid size of 68 x 40 x 27 for room length, height and half width, the CPU time for computation is 25 seconds per iteration on a Sun ULTRA server (Enterprise E3000 with three 250 MHz processors of 1 GB memory).
3 ULTS AND DISaSSION
Figures 2 and 3 show the predicted thermal environment on two vertical planes - symmetry plane and the plane through one of the occupant. It is seen from Fig. 2a that the outdoor air is drawn into the room through the window. The cool incoming air drops down to the floor due to the negative buoyancy effect and spreads over the floor. The buoyancy forces of air in the Trombe wall channel induce room air towards the bottom openings in the storage wall and eject the heated air in the channel through the outlet opening at the top of glazing. Because there is no strong air movement in the upper region of the room, the thermal plume created by the occupant reaches the ceiling (Fig. 3a and Fig. 3b). The predicted ventilation rate for the room is 103 11s. This is well above the minimum fresh air requirement for two persons [3]. The predicted mean air velocity in the occupied zone (from floor to 1.8 high and 0.15 from walls) is 0.08 d s . There exists a temperature gradient in the room but the mean gradient between 1.1 m and 0.1 m above the floor is only 1.1 K. The predicted mean air temperature in the occupied zone is 24.2"C. The mean radiant temperature varies from floor to ceiling due to heat gain from the floor but the variation is small (25.4"G on average) because of wall insulation (Fig. 2c and Fig. 3c). The predicted mean vote (PMV) [4] for the occupied zone is close to zero and the predicted percentage of dissatisfied (PPD) is 6.5%, within the comfort limit of 10% [ 5 ] . Thus, the average room environment is acceptable. Along the incoming air stream, air is slightly cool (PMV < -0.5) (Fig. 2d). This can be alleviated by adjusting the window opening level since the predicted ventilation rate is very high under the simulated conditions. However, since the air in the area where the occupant is situated is close
to a neutral temperature (i.e. PMV = 0) (Fig. 3d), such an operation may not be needed.
When the insulation on the interior surface of the storage wall is removed, part of the solar heat gain on the wall is transferred to the room through conduction and so less heat is utilised for generating the buoyancy forces in the channel of Trombe wall. The predicted mean air temperature in the occupied zone is increased to over 30°C due to the reduced ventilation rate and heat transfer from the storage wall by convection and radiation. The room is consequently far too hot for thermal comfort. However, the room thermal environment can be improved by opening extra vents in the north or other walls. Fig. 4 and Fig. 5 show the prelcted room air conditions with the non-insulated Trombe wall and a slot vent near the top of the north wall whose size is the same as the outlet vent for the Trombe wall. The non-insulated warm storage wall induces an upward thermal plume inside the room (Fig. 4a) and when air flows towards the vent in the north wall it distorts the thermal plume created by the occupant (Fig. 5a). The predicted ventilation rate is increased to 167 lls, of which 54% is induced by the Trombe wall. The mean air velocity in the occupied zone is also increased slightly to 0.09 mls. The mean air temperature in the occupied zone is 23.6"C, which is slightly lower than that under the original room and Trombe wall conditions due to the increased ventilation heat loss over heat gain from the storage wall. Also, the vertical temperature gradient is increased, however it is still within the comfort limit of 3 K [5]. The average value of mean radiant temperature for the occupied zone remains the same as for the room with insulated storage wall but the distribution is not so uniform. The mean radiant temperature near the Trombe wall is higher than that near the north wall, resulting in the variation of mean radiant temperature principally along the horizontal rather than vertical direction. This is due to the increased temperature of the interior surface of storage wall. The mean temperature of the interior surface is 3 1.4"C compared with 24.6"C when the surface is insulated. The PPD value for the occupied zone is 7.1%. The room as a whole is also comfortable but the cool incoming air stream disperses to a larger area due to the higher air flow rate.
The above predictions are based on the occupants' clothing level of 0.6 clo. The clothing level could be reduced to 0.5 clo or lower for summer conditions. Hence the occupants could tolerate slightly higher outdoor air temperatures (e.g. 21°C) or internal heat gains (say 25 w/m2) than used for the predictions without causing thermal discomfort provided that the interior surface of storage wall is insulated. In addition, opening more air vents can induce higher air exchange rates and thus allows the system to operate at even higher outdoor air temperatures. For example, with the storage wall insulated, when a vent is opened in the north wall in the same way as for the case with the non-insulated storage wall, the occupants with clothing level 0.4 clo will feel comfortable at outdoor air temperatures as high as 24°C. The predicted ventilation rate at the outdoor air temperature of 24°C is 160 11s. The predicted mean air and radiant temperatures in the occupied zone become 26.4" and 27.5"C, respectively. The mean value of PPD for the occupied zone is 11.9% for the clothing level of 0.5 clo and decreases to 9.2% when the clothing level is taken to be 0.4 clo. If the clothing level has to be fixed at 0.5 clo, the maximum outdoor air temperature for acceptable indoor thermal comfort is 23°C (with the predicted mean air and radiant temperatures and PPD in the occupied zone of 25.5", 26.7"C and 7.9%, respectively).
To demonstrate the effectiveness of the insulated Trombe wall for ventilation cooling, further predictions are made with the Trombe wall system removed but with the same amount of heat

gain imposed in the south wall as that from the non-insulated storage wall and with the slot vent opened at the top of both south and north walls. At an outdoor air temperature of 24"C, the predicted ventilation rate is reduced to 105 11s (compared with 160 11s for the room with insulated Trombe wall). The predicted mean air and radiant temperatures in the occupied zone reach 27.7"C and 28.7"C, respectively, and PPD is over 23% for clothing level 0.5 clo. However, when the outdoor air temperature is reduced by 4°C to 20°C, the predicted room thermal environment is acceptable with mean air and radiant temperatures reduced to 23.8"C and 24.9"C, respectively, and PPD for the occupied zone of 7.4%. Therefore, insulating the storage wall can provide ventilation cooling at higher outdoor air temperatures than without insulation (23 "C compared with 20°C for instance).
4 CONCLUSIONS
In moderate sunny days, Trombe walls can be used for ventilation cooling. To maximise ventilation cooling, the interior surface of storage wall should be insulated. Additional vents should be provided to increase ventilation rates for high outdoor temperatures.
Trombe walls are however designed principally for winter heating. If ventilation cooling is the main purpose, it would be more effective to enhance and control the ventilation rate by using a solar chimney than a Trombe wall [2].
REFERENCES
1 . HUANG, P.G. and LESCHZINER, M.A. "An introduction and guide to the computer code TEAM", Report TFD/83/9, UMIST, 1983.
2. GAN, 6 . "A parametric study of Trombe walls for passive cooling of buildings", to appear in Energy and Buildings.
3. CIBSE Guide Volume A, London, 1986. 4. FANGER, P.O. "Thermal Comfort", Robert E. Krieger Publishing Co., Florida, 1982. 5 . I S 0 7730: "Moderate thermal environments - determination of PMV and PPD indices
and specification of the conditions for thermal comfort", Geneva, 1984.
Fig. 1 Schematic diagram of a Trolnbe wall for ventilation cooling of a room
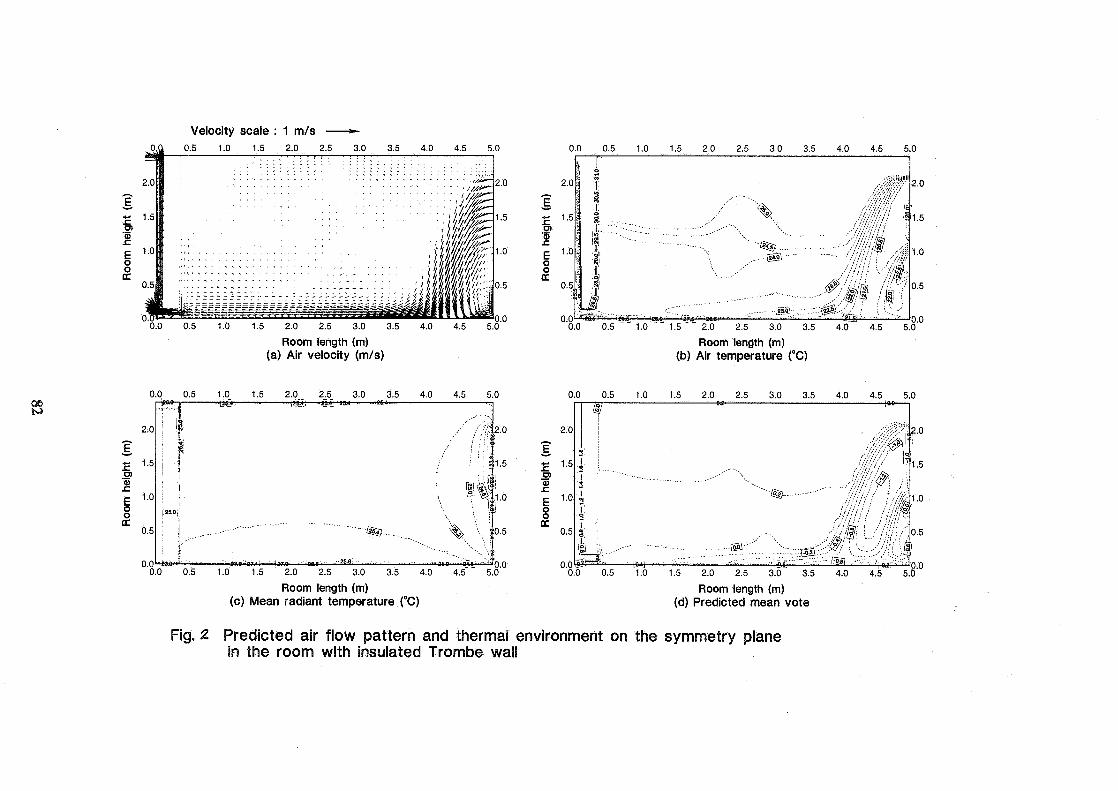
Velocity scale : 1 mls -
Room length (m) (b) Air temperature (OC)
Room length (m) (a) Air velocity (mls )
Room length (m) (c) Mean radiant temperature (OC)
Room length (m) (d) Predicted mean vote
Fig. 2 Predicted air flow pattern and thermal environment on the symmetry plane in the room with insulated Trombe wall

Velocitv scale : 1 mls -
Room length (m) (a) Air velocity (mls)
Room length (m) (c) Mean radiant temperature ("C)
Room length (m) (b) Air temperature ("C)
Room length (m) (d) Predicted mean vote
Fig. 3 Predicted air flow pattern and thermal environment on the plane through occupant in the room with insulated Trombe wall
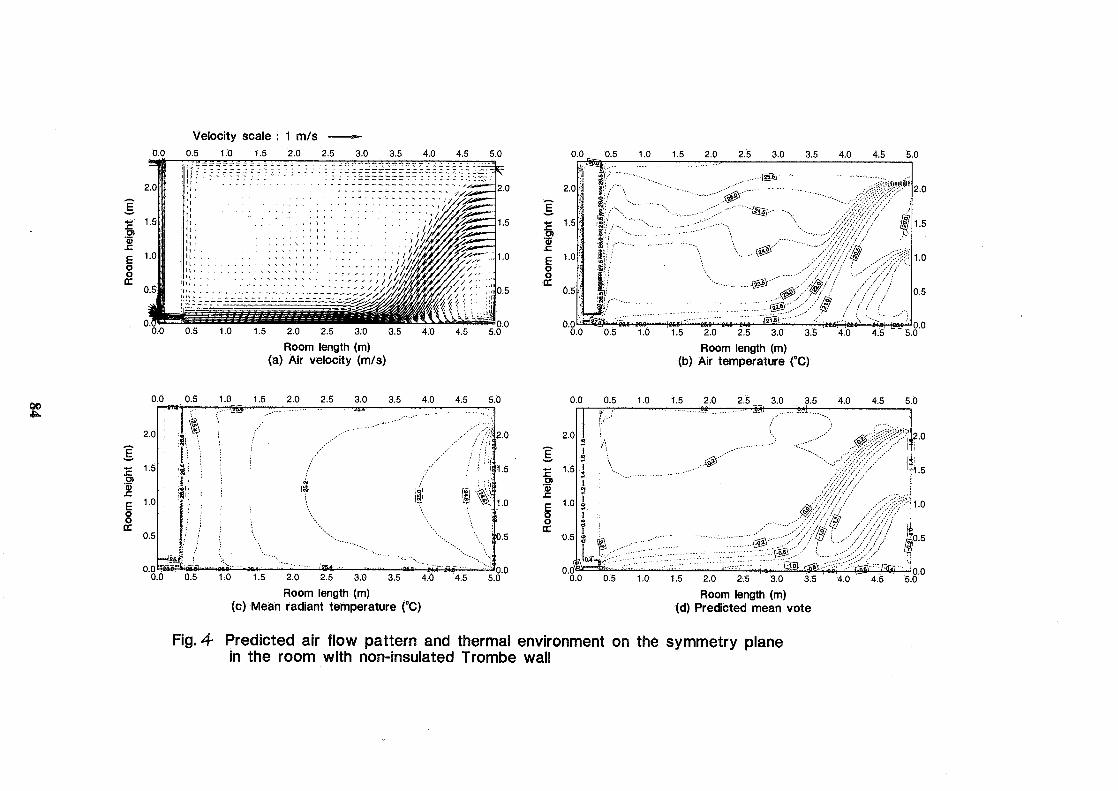
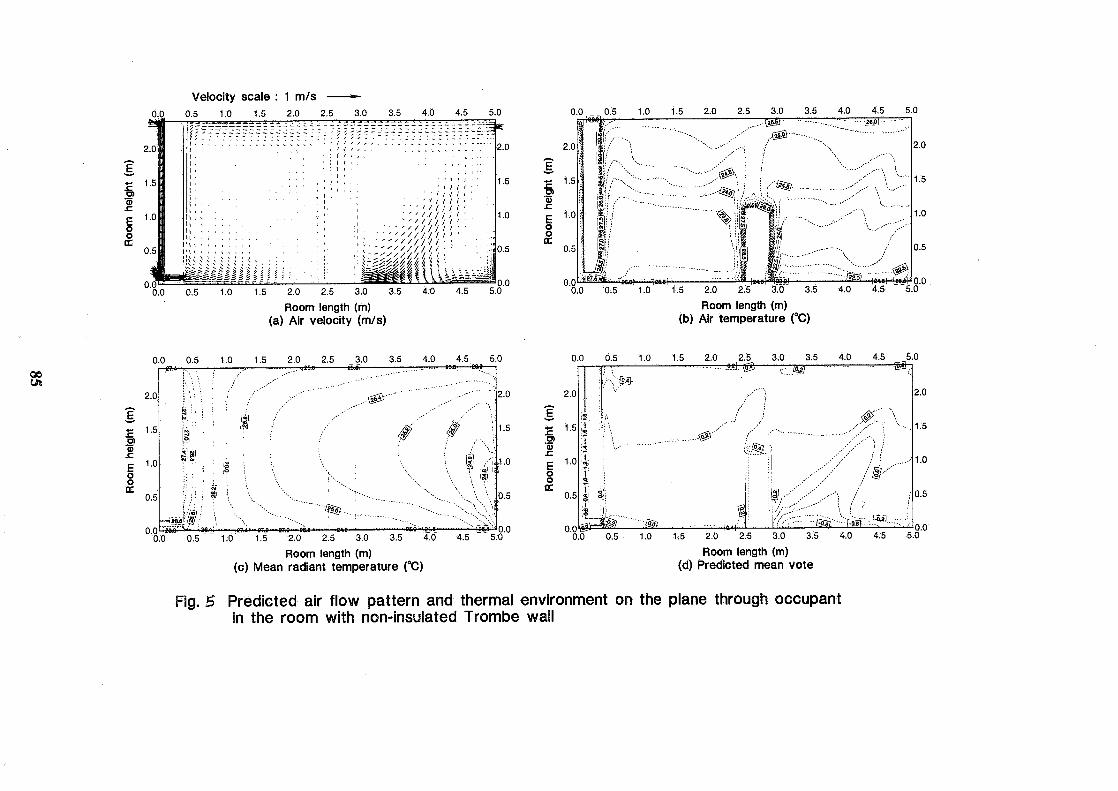

VENTILATION AND COOLING 18TH ANNUAL AIVC CONFERENCE
ATHENS, GREECE, 23-26 SEPTEMBER, 1997
STACK VENTILATION AND COOLING FOR URBAN SITES: Natural ventilation with roof intake for improved air quality
Stephen A Gage, AADipl, RIBA
The Bartlett, University College London
1
STACK .VENTILATION AND COOLING FOR URBAN SITES: Natural ventilation with roof intake for improved air quality
Stephen A Gage, AADipl, RIBA
Synopsis
The paper outlines the value of roof intake air ducts to serve largely passively ventilated and cooled buildings in urban areas. This approach improves air quality, reduces noise pollution and enhances security.
A diagrammatic representation of night cooling using this approach is given followed by a description of experimental work at the Bartlett. This work is directed at establishing methods of starting the ventilation process by overcoming buoyancy, and enhancing the cooling process by providing "mixed mode" cooling.
The author reports on "full size" experiments to establish wind driven ventilation techniques and experiments to establish whether roof planting could provide locally cooled air. Further experimental work on the latter is suggested.
The paper concludes by describing future work aimed at introducing refrigeration as a "mixed mode" ventilation and cooling strategy where passive night ventilation replaces the bulk of the cooling load, and discusses the architectural implications of the research. Further research to establish client attitudes to area loss in buildings as a result of installing large vertical passive stacks is recommended.
List of symbols
t(int) internal temperature t(ext) external temperature mlsec metres per second Pa pressure in pascals
Introduction
Air conditioned commercial buildings have twice the fuel cost and CO2 emissions when compared to non-air conditioned buildings. In addition, they are often perceived as uncomfortable and unhealthy. As a result there is a growing trend to avoid active cooling and mechanical ventilation, relying more on a passive control strategy. A new generation of naturally ventilated buildings has recently been constructed. As a result of their form and internal heat gains such buildings would have overheated if they had relied on conventional techniques. These naturally ventilated buildings are currently being monitored under the Sustainable Cities programme and research is currently being undertaken in this area as part of the NATVENT project. 1
This new generation of naturally ventilated, deep-plan building often encourages natural ventilation by the use of stacks, and cools the building by night venting i.e. drawing cool night air into the warmer building. These techniques are however limited for the following reasons.
1 . Stack ventilation normally utilises air drawn in from the perimeter of the building at a low level. Therefore, in urban locations the air inlet is normally located at street level; this results in gaseous, particulate and noise pollution entering the building. This is currently a major drawback in utilising passive ventilation in urban sites as a result of the impact that such pollutants can have on the health and comfort of occupants. Filtration is
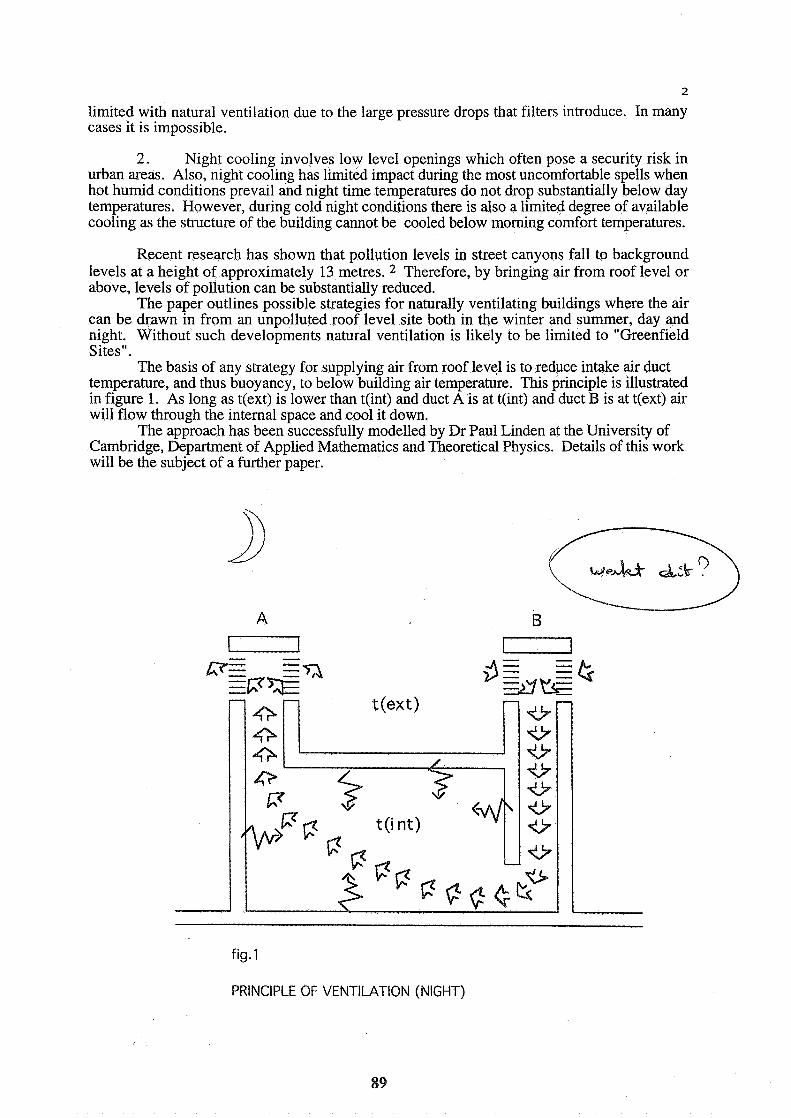
limited with natural ventilation due to the large pressure drops that filters introduce. In many cases it is impossible.
2 . Night cooling involves low level openings which often pose a security risk in urban areas. Also, night cooling has limited impact during the most uncomfortable spells when hot humid conditions prevail and night time temperatures do not drop substantially below day temperatures. However, during cold night conditions there is also a limited degree of available cooling as the structure of the building cannot be cooled below morning comfort temperatures.
Recent research has shown that pollution levels in street canyons fall to background levels at a height of approximately 13 metres. 2 Therefore, by bringing air from roof level or above, levels of pollution can be substantially reduced.
The paper outlines possible strategies for naturally ventilating buildings where the air can be drawn in from an unpolluted roof level site both in the winter and summer, day and night. Without such developments natural ventilation is likely to be limited to "Greenfield Sites".
The basis of any strategy for supplying air from roof level is to reduce intake air duct temperature, and thus buoyancy, to below building air temperature. This principle is illustrated in figure 1. As long as t(ext) is lower than t(int) and duct A is at t(int) and duct B is at t(ext) air will flow through the internal space and cool it down.
The approach has been successfully modelled by Dr Paul Linden at the University of Cambridge, Department of Applied Mathematics and Theoretical Physics. Details of this work will be the subject of a further paper.
fig. 1
PRINCIPLE OF VENTILATION (NIGHT)
3 Experimental work at the Bartlett
The experimental work at the Bartlett is focused on seeking ways to "kick start" and enhance this approach to passive cooling.
We are fortunate to have guidance from a number of industry partners. These include Monodraught Ltd., Trox UK Ltd and Max Fordham and Partners, Consulting Engineers. We are examining two different approaches:
to use pressure differences created by the wind to drive air into the intake duct, so that it is cooled down to external air temperature
* to provide a source of cool air on top of or in the intake duct
The former approach will only provide cooling when the external shade air temperature is lower than the internal temperature. The latter offers the possibly of mixed mode cooling where daytime ventilation air can be-cooled to comfort levels at times of excessive heat gain. We hope to examine the possibility of combining these approaches at a later stage in our work.
Wind driven ventilation
An obvious model for a wind driven intake stack is the traditional static Middle Eastern "wind catcher". 3 This is simple to build, but has the disadvantage that it will fail to work if the wind is in the wrong direction.
A substantial research project has been conducted jointly by Sir Michael Hopkins and Partners, Ove A m p and Partners and CSTB in Nantes under the Joule 2 Programme. This examines the feasibility of rotating wind catchers which combine intake and extract ventilation.
The basis of this work is to develop these devices to recover heat from outgoing air through a low resistance heat exchanger and to heat incoming air to a building. The same type of device has potential in passive cooling applications.
The Hopkins research was undertaken using CFD modelling and wind tunnel model tests. Conclusions are:
* hood type intakes are most efficient; the intake must be at least 2 metres above an adjoining flat roof to place it above
boundary turbulence; inlets and outlets should be vertically separated to allow close spacing between
ventilators; there is doubt that a wind vane will tum a large ventilator in light wind conditions.
We have taken the Hopkins research as a basis for further work. We are addressing the following issues:
the design of an intake hood which can be shaded; * strategies to drain rain water entry;
the use of wind driven servos to turn this type of ventilator.
All our work is being undertaken using "full size" experimental devices. A full size device in this context is a device with airways not less than 200 rnm diameter. This allows us to present experimental results giving absolute rather than relative air speeds and pressures.
The first experiment is the corrugated cardboard mock up shown in fig. 2. It has a long shaded intake hood and an intake drum which can be drained. There are seven right angle turns in the airflow through the experiment. The intake is 250% larger than the intake and extract ducts. The device was tested in a wind tunnel at the Building Research Establishment, Garston. Typical experimental results are shown in Table 1.
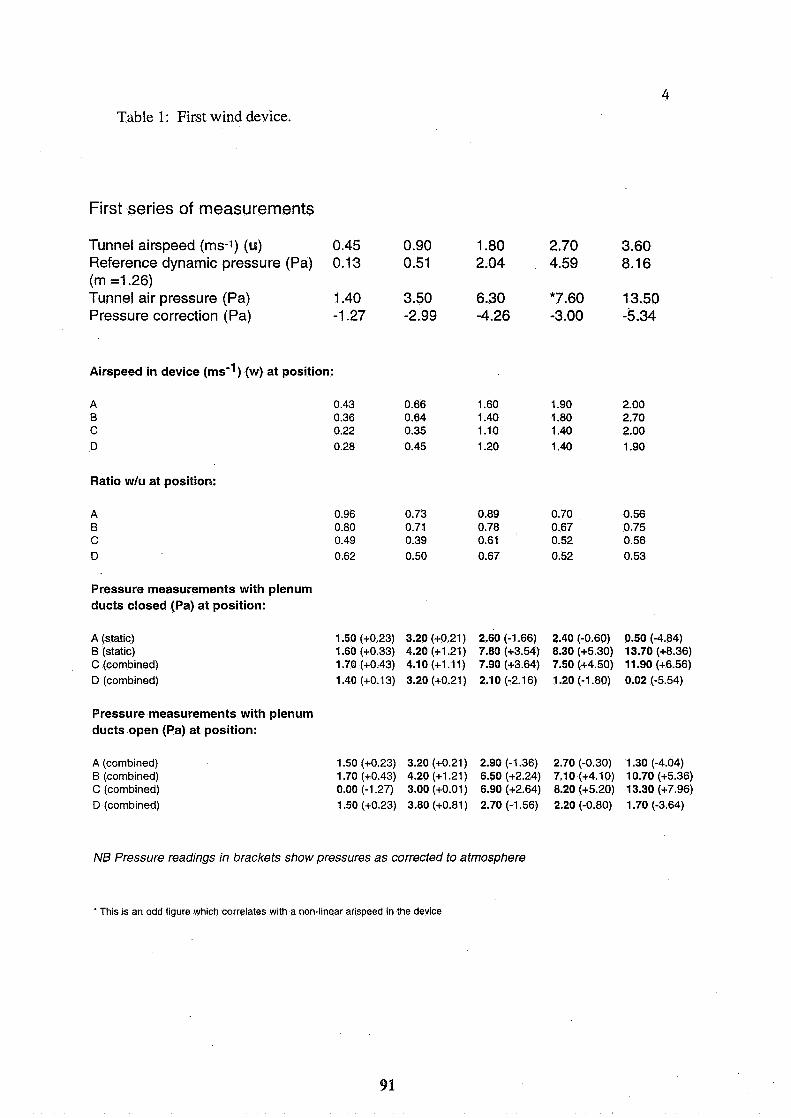
Table 1: First wind device.
First series of measurements
Tunnel airspeed (ms-1) (u) 0.45 0.90 1.80 2.70 3.60 Reference dynamic pressure (Pa) 0.13 0.51 2.04 4.59 8.16 (m =1.26) Tunnel air pressure (Pa) 1.40 3.50 6.30 *7.60 13.50 Pressure correction (Pa) -1.27 -2.99 -4.26 -3.00 -5.34
Airspeed in device (ms-l) (w) at position:
Ratio wlu at position:
Pressure measurements with plenum ducts closed (Pa) at position:
A (static) B (static) C (combined) D (combined)
Pressure measurements with plenum ducts open (Pa) at position:
A (combined) B (combined) C (combined) D (combined)
NB Pressure readings in brackets show pressures as corrected to atmosphere
' This 1s an odd figure which correlates w~th a non-hear arlspeed in the device

5 Air speeds in the device are between 60% and 70% of wind tunnel speeds. We are
currently constructing second experimental device to be tested in field conditions (see fig. 3). In this device intake and extract positions are vertically separated. The device will use a wind driven servo to turn it head to wind. The servo is derived from the tail fan wheels used to turn 19th century windmills in the UK.
fig.2
FIRST WlND DRIVEN EXPERIMENT
fig.3
SECOND WlND DRIVEN EXPERIMENT
01 plenum box 02 drain off positions 03 base drum 01 base drum 02 revolve 03 intake hood 04 outlet vane 04 rainshield 05 intake hood 06 outlet vent 05 outlet vent 06 fanwheel
Refer to table.1
The initial results of our investigations into wind assisted ventilation and passive cooling systems are encouraging. We believe that intakes can be roof mounted in urban conditions with considerable improvement in indoor air quality and acoustic environment.
Two questions remain unanswered in this approach. What happens when the wind does not blow and what happens when the external shade air temperature is such that a fully passive cooling strategy will not succeed?
A response to the first question is the introduction of large low energy fans into the intake ducts. These are ideally suited to take them. The second question is much more difficult to resolve. We see two possible responses which could lead to mixed mode cooling systems.
Roof garden experiments
Evaporative cooling techniques were used in Middle Eastern wind catchers; water filled unglazed earthenware pots and damp materials were introduced into the intake shafts. This approach has been further explored by Cook et a1 where sprayed water is used both to cool and drive the air. 5 We are concerned that Legionella risks and the problems involved introducing a substantial amount of water into a building will limit the application of this concept.
The undoubted effectiveness of the phase change in water to assist in cooling has also been explored by Giabaklou and Ballinger. 6 We have looked at the possibility of using evapo- transpiration in plants to locally reduce the shade air temperature above intake shafts. The idea that roof gardens could be used to temper the air entering the buildings below them is very attractive because it combines indoor and outdoor amenity for building users.
It is difficult to find the empirical data that would enable a designer to establish the efficacy of this approach. Various researchers have investigated the thermal effects of planting in the built environment. Papers by Parker, 7 Kimura, 8 Euorfopoulou and Arauantinos, Barrosso-Krause '0 and Onomina, Matsumoto and Hokoi l1 all indicate that evapo- transpiration will provide effective cooling. Parker's comments about the role of evapo- transpiration in cooling air are unquantified and all the other authors, with the exception of Kimura, concentrate on the role of vegetation to cool down the fabric of the building below usual (non vegetative covered) temperature levels. Kimura refers to experimental work undertaken at Yamashi where shade air temperatures are shown to be 1 - 2 "C lower in a densely planted garden that than the equivalent shade air temperatures outside the garden.
The subject of evapo-transpiration is also extensively studied by geographers and biologists. Oke, quoting experimental work by Long et al, l2 shows how; at 02.00 hours the temperature inside a field crop under an open sky is in excess of 2°C lower than the external air temperature; that at 06.00 hours the temperature is approximately 1 "C lower; that at 12.00 hours the temperature is over 1 "C higher and that at 18.00 hours the temperature was approximately 1 "C lower. He suggests that this process points to an active surface just below the surface of the crop. It should be noted that these experiments took place in the UK, in summer and that the 06.00 measurement can be assumed to be 1.5 hours after dawn.
Forests show different characteristics. Oke refers to work by Jarvis to show that at midday the increase in temperature is lifted to the centre of the canopy layer, and that the forest floor temperature is that of the shade air temperature above the canopy.
We constructed an experimental "roof garden" 1.2 metres square and 600 mm deep at the Bartlett, planted with garden shade tolerant plants, placed in pots in a water tray. The high surround was provided to reduce wind effects. In order to mimic the effects of a forest canopy we shaded the garden with an artificial canopy consisting of two layer of white perforated profiled metal decking with an air cavity between them. This is shown in fig. 4.
Typical experimental results are shown in Table 2, which compare two days, 4th and 5th August 1996. Both were sunny but the 5th was a day of exceptionally high humidity. It can be seen that this experiment was only partially successful in that the "artificial canopy" did not stop radiant heat gain. Nevertheless in conditions of low external RH this approach appears to provide an extended morning period where the garden temperature is lower than the external temperature.
Relative humidity is very high when cooling effects are most apparent. This is probably a result both of stomata1 evapo-transpiration and of evaporation from the water tray and the growing medium surface. The experiment also shows that, with this configuration heat once gained by the roof garden is trapped in it and that the early evening effects noted by Long do not occur.

Table 2: Experimental "garden".
0 garden temp
.-s- garden rh .>.. ... ' \,. ,...., met temp
~ e t r h
In hot, dry climates it is probably advantageous to consider enclosed shaded roof gardens under-planted with shade tolerant plants as sources of air for night cooling.
Experimental work should be undertaken to establish temperature profiles in a walled shaded and under-planted roof garden over Spring, Summer and Autumn in a hot, dry climate to establish actual temperature differences in field conditions.
We show a possible experiment in fig. 5. This shows a roof garden approximately 6 metres square surrounded by externally insulated walls 3 metres high. Alternative modes of shading are indicated. A trellis and vine cover may be more advantageous than opening
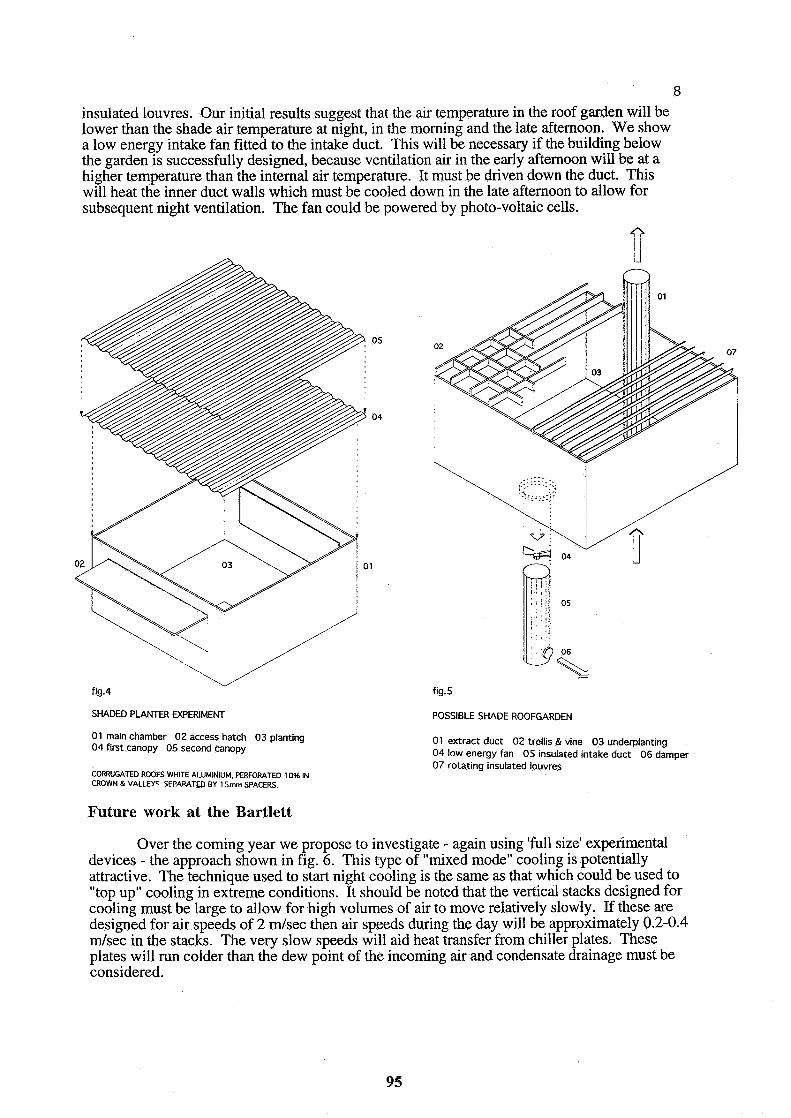
insulated louvres. Our initial results suggest that the air temperature in the roof garden will be lower than the shade air temperature at night, in the morning and the late afternoon. We show a low energy intake fan fitted to the intake duct. This will be necessary if the building below the garden is successfully designed, because ventilation air in the early afternoon will be at a higher temperature than the internal air temperature. It must be driven down the duct. This will heat the inner duct walls which must be cooled down in the late afternoon to allow for subsequent night ventilation. The fan could be powered by photo-voltaic cells.
SHADED PLANTER EXPERIMENT POSSIBLE SHADE ROOFGARDEN
01 main chamber 0 2 access hatch 03 planting 0 4 first canopy 05 second canopy
CORRUGATED ROOFS WHITE ALUMINIUM. PERFORATED 10% IN CROWN & VALLEF SFPMTED BY 1 Smm SPACERS.
01 extract duct 0 2 trellis & vine 0 3 underplant~ng 0 4 low energy fan 0 5 insulated intake duct 0 6 damper 0 7 rotating insulated louvres
Future work at the Bartlett
Over the coming year we propose to investigate - again using 'full size' experimental devices - the approach shown in fig. 6. This type of "mixed mode" cooling is potentially attractive. The technique used to start night cooling is the same as that which could be used to "top up" cooling in extreme conditions. It should be noted that the vertical stacks designed for cooling must be large to allow for high volumes of air to move relatively slowly. If these are designed for air speeds of 2 mlsec then air speeds during the day will be approximately 0.2-0.4 mlsec in the stacks. The very slow speeds will aid heat transfer from chiller plates. These plates will run colder than the dew point of the incoming air and condensate drainage must be considered.

PRINCIPLE OF ASSISTED COOLING (DAY)
Architectural consequences of vertical stack ventilation and cooling.
The architectural consequences of this approach to ventilation and cooling are such that it is unlikely to be applicable to buildings exceeding four stories in height. If we assume 10 air changes an hour, a duct speed of 2 mlsec and a floor to floor height of 3.6 metres the combined supply and extract stack area for any floor of a building is approximately 1 %. A four storey building will have 4% of its top floor area occupied by stacks. This subject deserves further research. The judgement that no developer will contemplate more than 4% loss of building area is based on the author's experience as a practising architect. It may be that the current commercial climate is more enlightened and a survey of potential clients should be undertaken.
Report under the NATVENT - European project on overcoming technical barriers to low energy natural ventilation, Kolotroni, Kukudia and Perera, Building Research Establishment, Garston.
LAXEN and NOORDALLY, 1987, "NO2 Distribution in Street Canyons", Atmospheric Environment, Vol. 21, NO 9, pp. 1899 - 1903.
RUDOFSKI B, 1964, Architecture without architects, Doubleday. DUNSTER B and PRINGLE J, 1997, "Research into sustainable architecture", Architectural Design, Vol67,
no 112. BOWMAN, LOMAS, COOK et al, "Application of passive down draught evaporative cooling to non
domestic buildings", Renewable Energy, Vol 10, no 213, pps 191 - 196.

GIABAKOU Z and BALLINGER A, 1996, "A passive cooling system by natural ventilation", Building and Environment, Vol 3 1, pp 503 - 507, .
PARKER J, "The impact of vegetation on air conditioning consumption." Proceedings workshop on controlling summer heat islamis, Berkley CA, 1989. * KTMURA K, "Evaporation in hot and humid urban spaces", Architecture and Urban Space, Dover Academic Publishers, pp 631-636.
EUI'AORFOPOULOU E, and ARAUANTINOS D, Numerical approach to the contribution of the planted roof to the cooling of buildings. lo BARROSSO-KRAUSE C , 1993, "Vegetal shelter: is it a good option as a passive cooling strategy?", 3rd European Conference on Architecture, 17-21 May, pp 395-398.
ONMURA S, MATSUMO M, HOKOI S, A study on evaporative cooling effect by roof lawn gardens. l 2 OKE T R, 1978, Boundary layer climates, Methuen & Co. pp 110-157.

VENTllATlON AND COOLING
18TH ANNUAL AIVC CONFERENCE ATHENS, GREECE, 23-26 SEPTEMBER, 1997
(Title) SORPTION-SUPPORTED AC-SYSTEM IN A PRINTING OFFICE
(Authors)
(Affiliation)
Giinther Mertz
Fachinstitut Gebaude-Klima e. V. Danziger Str. 20
D-7432 1 Bietigheim-Bissingen
SORPTION-SUPPORTED AIR-CONDITIONING IN A PRINTING OFFICE
Synopsis
One of the first sorption-supported air-conditioning systems ("Desiccative Evaporative Cool-
ing Systems") in an industrial building in Germany was installed in a printing office in Waiblin-
gen, a town in southern Germany. The circumstances for such a system showed to be optimal,
as the printing office is equipped with its own co-generation system delivering a considerable
amount of waste heat. The experiences made with the system in the hot and humid summer of
1995 were very positive. Even when the outdoor-temperature reached about 32 "C, the tem-
perature and humidity set points of 20 "C and 80 % relative humidity could be realized.
1. Sorption-supported Air-conditioning - Innovative Ventilation Technology in the In- dustrial Environment
The main feature of sorption-supported air-conditioning is the separation of the cooling and
dehumidification processes. When so far the water was removed from the air by cooling the
air below the dew point, now the water vapour is linked to solid or liquid hygroscopical sub-
stances. The so-called "sorption regenerator" is widely known. It is different from the tradi-
tional regenerator only in so far as it uses another kind of storage medium for heat recovery
purposes. The hygroscopical features are caused by impregnation with saline solutions or by
deposition of solid adsorbents. This way of air dehumidification combined with other compo-
nents leads to a completely new generation of air-conditioning systems. The integration of
sorption-supported dehumidification with both heat recovery and air moisturisation by evapo-
rative cooling is well advanced in Germany.
The most important progress in developing sorption-supported air-conditioning systems was
to replace the driving forces of the refrigeration process. While classical chillers need electric
current, sorption-supported air-conditioning uses heat as driving force.
2. An example from real life - the "Druckhaus Waiblingen", DWW (Waiblingen Printing
Office) In the meantime, the sorption-supported air-conditioning technology has finished the labora-
tory-stadium. The following report describes a printing-office in Waiblingen, Germany, which
was equipped with sorption-supported air-conditioning. Two central preconditions had to be
realized: on the one hand the surplus waste heat of the company co-generation system
occuring during the summer season ought to be reintegrated into the energy-circuit. On the
other hand the capacity of the co-generation system was not to be weakened by the chillers'
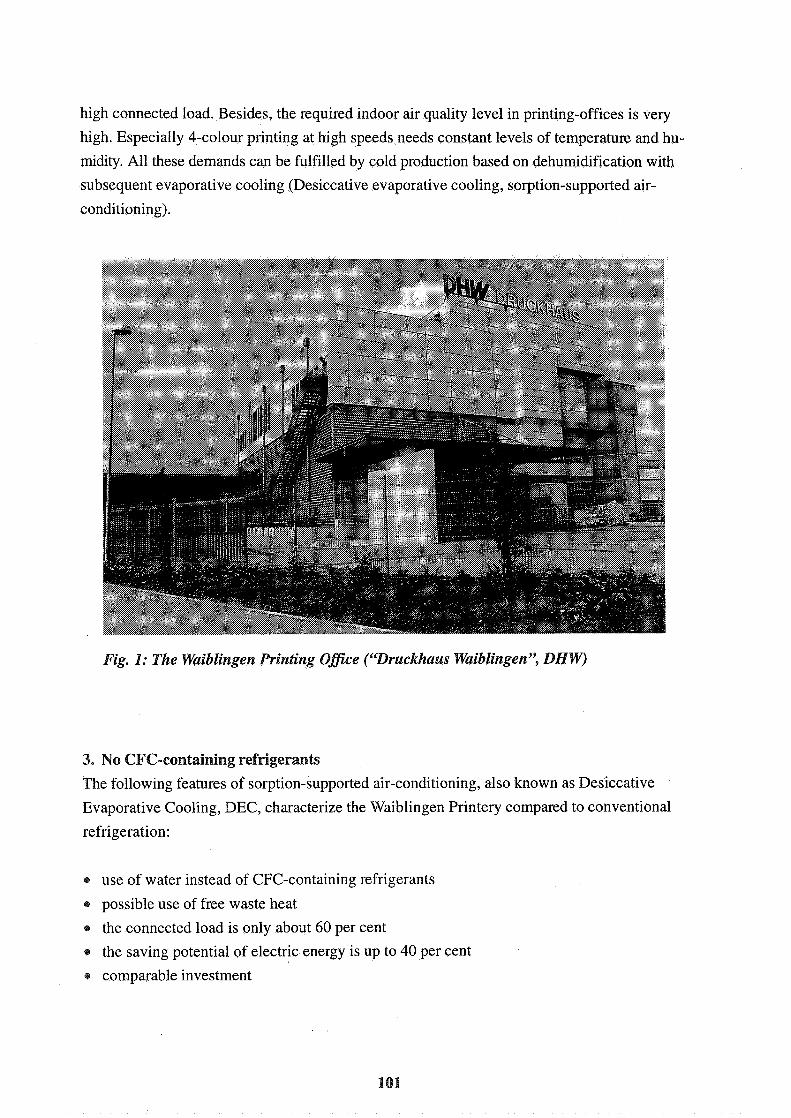
high connected load. Besides, the required indoor air quality level in printing-offices is very
high. Especially 4-colour printing at high speeds needs constant levels of temperature and hu-
midity. All these demands can be fulfilled by cold production based on dehumidification with
subsequent evaporative cooling (Desiccative evaporative cooling, sorption-supported air-
conditioning).
Fig. I : The Waiblingen Printing OfJiGe (""Druckhaus Waiblingen'; DHW)
3. No CFC-containing refrigerants
The following features of sorption-supported air-conditioning, also known as Desiccative
Evaporative Cooling, DEC, characterize the Waiblingen Printery compared to conventional
refrigeration:
a use of water instead of CFC-containing refrigerants
possible use of free waste heat
the connected load is only about 60 per cent
the saving potential of electric energy is up to 40 per cent
comparable investment
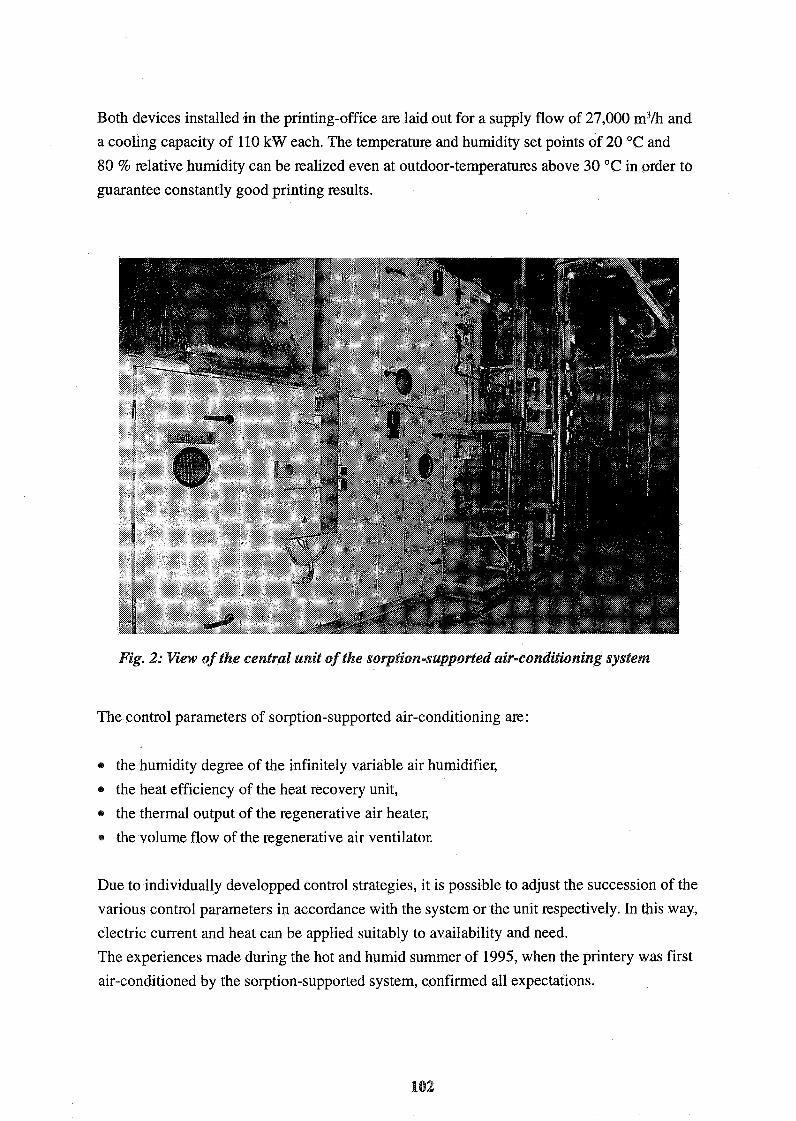
Both devices installed in the printing-office are laid out for a supply flow of 27,000 m3/h and
a cooling capacity of 110 kW each. The temperature and humidity set points of 20 "C and
80 % relative humidity can be realized even at outdoor-temperatures above 30 "C in order to
guarantee constantly good printing results.
Fig. 2: View ofthe central anit ofthe sorp~on-sapported air-condilioniq system
The control parameters of sorption-supported air-conditioning are:
a the humidity degree of the infinitely variable air humidifier,
the heat efficiency of the heat recovery unit,
the thermal output of the regenerative air heater,
the volume flow of the regenerative air ventilator.
Due to individually developped control strategies, it is possible to adjust the succession of the
various control parameters in accordance with the system or the unit respectively. In this way,
electric current and heat can be applied suitably to availability and need.
The experiences made during the hot and humid summer of 1995, when the printery was first
air-conditioned by the sorption-supported system, confirmed all expectations.
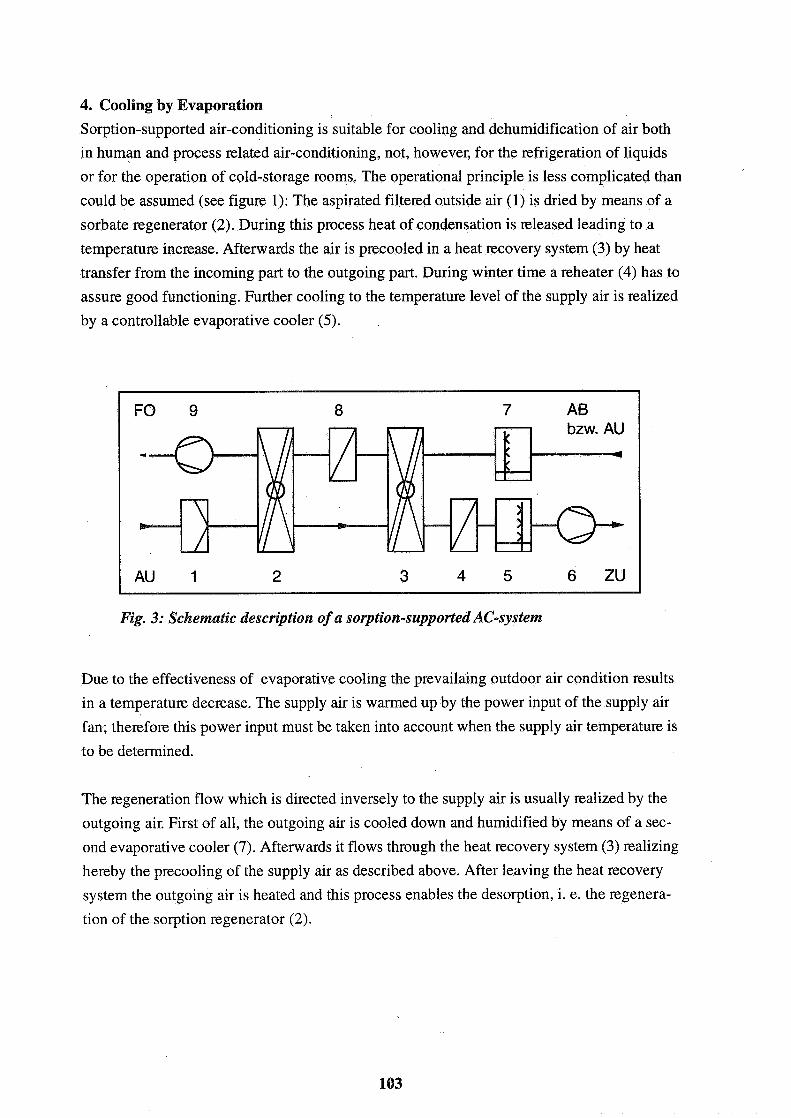
4. Cooling by Evaporation Sorption-supported air-conditioning is suitable for cooling and dehumidification of air both
in human and process related air-conditioning, not, however, for the refrigeration of liquids
or for the operation of cold-storage rooms. The operational principle is less complicated than
could be assumed (see figure 1): The aspirated filtered outside air (1) is dried by means of a
sorbate regenerator (2). During this process heat of condensation is released leading to a
temperature increase. Afterwards the air is precooled in a heat recovery system (3) by heat
transfer from the incoming part to the outgoing part. During winter time a reheater (4) has to
assure good functioning. Further cooling to the temperature level of the supply air is realized
by a controllable evaporative cooler (5).
Fig. 3: Schematic description of a sorption-supported AC-system
Due to the effectiveness of evaporative cooling the prevailaing outdoor air condition results
in a temperature decrease. The supply air is warmed up by the power input of the supply air
fan; therefore this power input must be taken into account when the supply air temperature is
to be determined.
The regeneration flow which is directed inversely to the supply air is usually realized by the
outgoing air. First of all, the outgoing air is cooled down and humidified by means of a sec-
ond evaporative cooler (7). Afterwards it flows through the heat recovery system (3) realizing
hereby the precooling of the supply air as described above. After leaving the heat recovery
system the outgoing air is heated and this process enables the desorption, i. e. the regenera-
tion of the sorption regenerator (2).
5. Reduced Operating Expenses Allow Economical Operation Wth regard to cost of production and investment the technologies of sorption-supported air-
conditioning and of classical cold production have to be compared in relation to the project
and in view of the specific basic conditions. In principle, these costs can be considered as be-
ing on the same level as conventional units for the fact that, in every respect, soprtion-sup-
ported air-conditioning is based on customary and reliable ventilation components. Whenever
the use of sorption-supported air-conditioning brings in economic advantages, in most cases
this is due to savings on the part of the operating expenses. Compared to air-conditioning
units with electrically driven refrigerating machines, the consumption of the individual de-
vices and unit components is differing, possibly leading to reduced costs of water, electric
power and work. In addition, the heat recovery units guarantee that the year-round heat con-
sumption corresponds roughly to the consumption of an air-conditioning system with refriger-
ating machine and standard heat recovery. The use of utility-supplied heating, solar heating
and anyway available waste heat shows to be particularly advantageous.
6. Conclusion The experiences made at the Waiblingen printing office (DHW) prove that ecologically desir-
able ways of cold production can definitely turn out economical. It ought to be mentioned yet
that the exact comparison of costs as well as the determination of a possible saving potential
must be carried out in relation to the project.
Further information Further information on behalf of this subject is available from the Fachinstitut Gebaude-Klima
e. V., Danziger Str. 20, D-74321 Bietigheim-Bissingen. Tel. +49-7142-54498, Fax -61298, as
well as from Robatherm Warme- und Klimatechnik GmbH, Industriestr. 21-27, D-8933 1
Burgau, Tel. +49-8222-999-0, Fax -999-222, and from the Znstitut fiir Luft- und Kaltetechnik
gGmbH, Bertolt-Brecht-Allee 20, D-01309 Dresden, Tel. +49-35 1-408 1-650, Fax -408 1-655.
VENTILATION AND COOLING 18TH AIVC CONFERENCE, ATHENS, GREECE
23-26 SEPTEMBER, 1997
Title: Air Conditioning of Internal Environment By Means of BioClimatic Systems
Author(s): I Meroni, M Fossi, M Vozzolo, F Seamoni, C Pollastro
Affiliation: National Council of Research, ICITE-Institute for Building Industrialization and Technology, Via Lombardia, 49,20098 San Giuliano, Milan, Italy
11 APR '97 15:20 CNR ICITE
AIR CONDITIONING OF INTERNAL ENVIRONMENT BY MEANS OF BIOCLIWATIG' SUSTZMS
I. Meroni, M. Foss? , Vozzolo, IF. Scarnoni, C. Pollastrw rational Council of Research
IGITE - Institute fbr B Industrialization and Tmhnology Via Lombardia, 49 - - San Giuliano - Milano - Italy
ICITE is canying out a research program with the aim of studying and qtimidng the energy performances of two prototypes of building components which an based on the utilization of hybrid solar system. The first one consists of a sun-operated pre-fabricat& modular systcm composed of a multi-layet element integrated with a module for energy management which causes a bidircctionat air flow between the intend and external envimment and tf.imugh the air space of the element. The second one consisrs of a ventilated double glaz~d window with varying transpmncy that under particular conditions causes diffnnnt air flows in order to heat or cool the intanal aviroment a c e d - to the season. The two systems contain solar photovoltaic cells which are intended to provide energy supply and thus allow the components eomplete autonomy as regards energy. Funhermore their working systems arre fully automatic so that the proposed technology does not interfere with the laying operations and helps manage the positive thermal contribution the external envimnment can provide. Besides we thought it advisable to resort to a practical tool suitable for testing the performances of the two systems under different working and climatic conditions. This is the reason why a mathematical model was studied, optimized and validated on the basis of data obtained from exp ation carried out in real working conditions on thc two systems. In the paper the outcome is presented and discussed.
Author comspondence: I. Meroni, CNR- Via Lmbardia, 49,20098, San Giuliano Mil., Milano, Italy fax ++39 2 98280088
VENTILATION AND COOLING
18TH ANNUAL AIVC CONFERENCE ATHENS, GREECE, 23-26 SEPTEMBER, 1997
(Title)
Economical comparison of comfort ventilation and air-conditioning plants.
(Authors)
Fritz Steimle, Sonke Biel, Jiirgen Roben
(Affiliation)
Universitat Essen
Institut f i r Angewandte Thermodynamik und Klimatechnik
Universitatsstr. 15
45 14 1 Essen, Germany

Synopsis
Continuously rising energy costs, the demand for reduction of CO2-emission and the
prohibition of CFC-containing refrigerants create a base for new concepts of air-conditioning
(A/C) systems. A primary action must be the prevention of heat consumption and cooling load
by improvement of the building architecture. Additional the efficiency of the A/C process must
be improved, in order to reduce the energy input.
In most cases the target is to replace the dehumidification process, which normally is realized
by refrigerating cycles, by alternative systems. The air dehumidification by cooling the air
below the dew point involves a high energy consumption.
The paper treats three different A/C systems for non industrial buildings. The task has been the
economic evaluation of the air-conditioning plants and the demonstration of the different
energy demand. Referring to the expected costs of the A/C systems the price of a new
dehumidification unit, which is developed at the university of Essen (see figure 3), has been
determinated. The results show that a higher price of the new system can be equalized by
lower energy costs.
1. Introduction
The calculation bases on a model which describes the A/C of ofice buildings. In order to
simulate the operation of the A/C-systems, four buildings with different air flow rates are
designed. The design of the systems is carried out so that comfort room air condition will be
reached for every outdoor air condition. he capital costs of the installed components are
determinated with price lists of manufacturers. The operating costs for heat, electricity and
water are calculated for a continuous plant operation over the year. The calculations are
carried out referring to the German VDI-Standard 2067 by using a statistical procedure.
2. List of symbols
OA Outdoor Air S A Supply Air RA Return Air EA Exhaust Air P Preheater R Reheater C Cooler
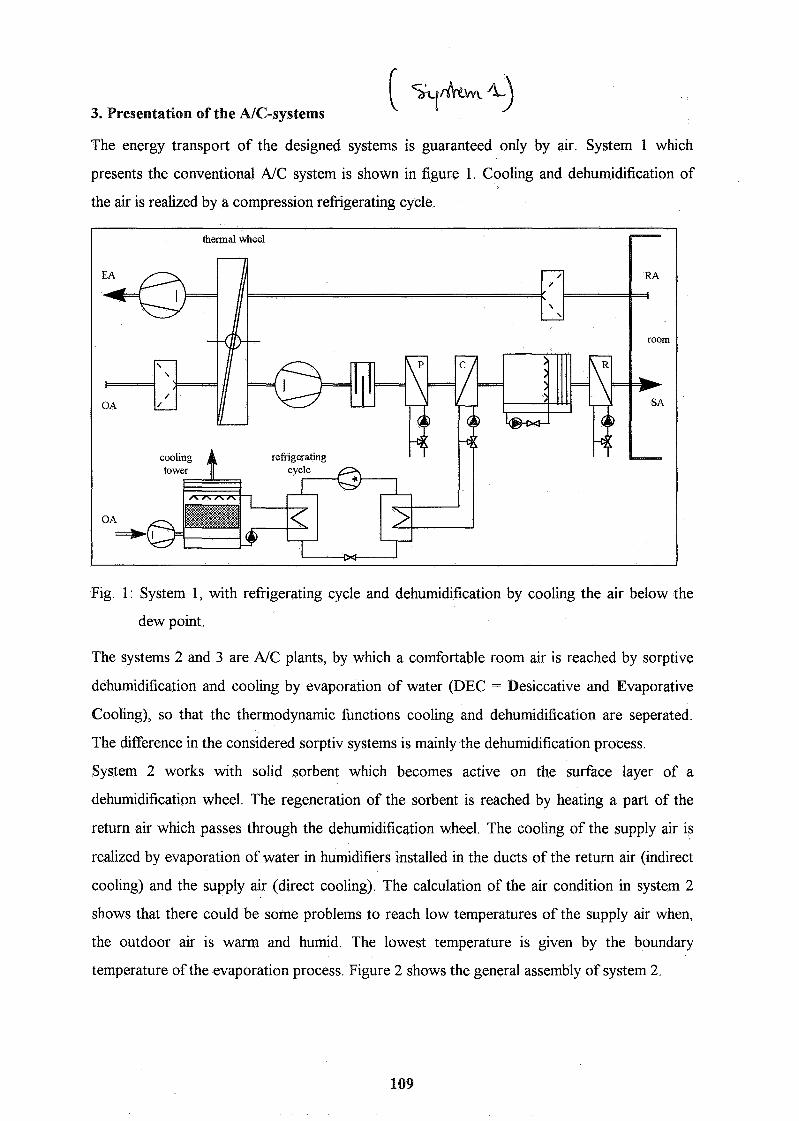
3. Presentation of the AIC-systems
The energy transport of the designed systems is guaranteed only by air. System 1 which
presents the conventional A/C system is shown in figure 1. Cooling and dehumidification of
the air is realized by a compression refrigerating cycle.
Fig. 1: System 1, with refrigerating cycle and dehumidification by cooling the air below the
dew point.
The systems 2 and 3 are A/C plants, by which a comfortable room air is reached by sorptive
dehumidification and cooling by evaporation of water (DEC = Desiccative and Evaporative
Cooling), so that the thermodynamic functions cooling and dehumidification are seperated.
The difference in the considered sorptiv systems is mainly the dehumidification process.
System 2 works with solid sorbent which becomes active on the surface layer of a
dehumidification wheel. The regeneration of the sorbent is reached by heating a part of the
return air which passes through the dehumidification wheel. The cooling of the supply air is
realized by evaporation of water in humidifiers installed in the ducts of the return air (indirect
cooling) and the supply air (direct cooling). The calculation of the air condition in system 2
shows that there could be some problems to reach low temperatures of the supply air when,
the outdoor air is warm and humid. The lowest temperature is given by the boundary
temperature of the evaporation process. Figure 2 shows the general assembly of system 2.
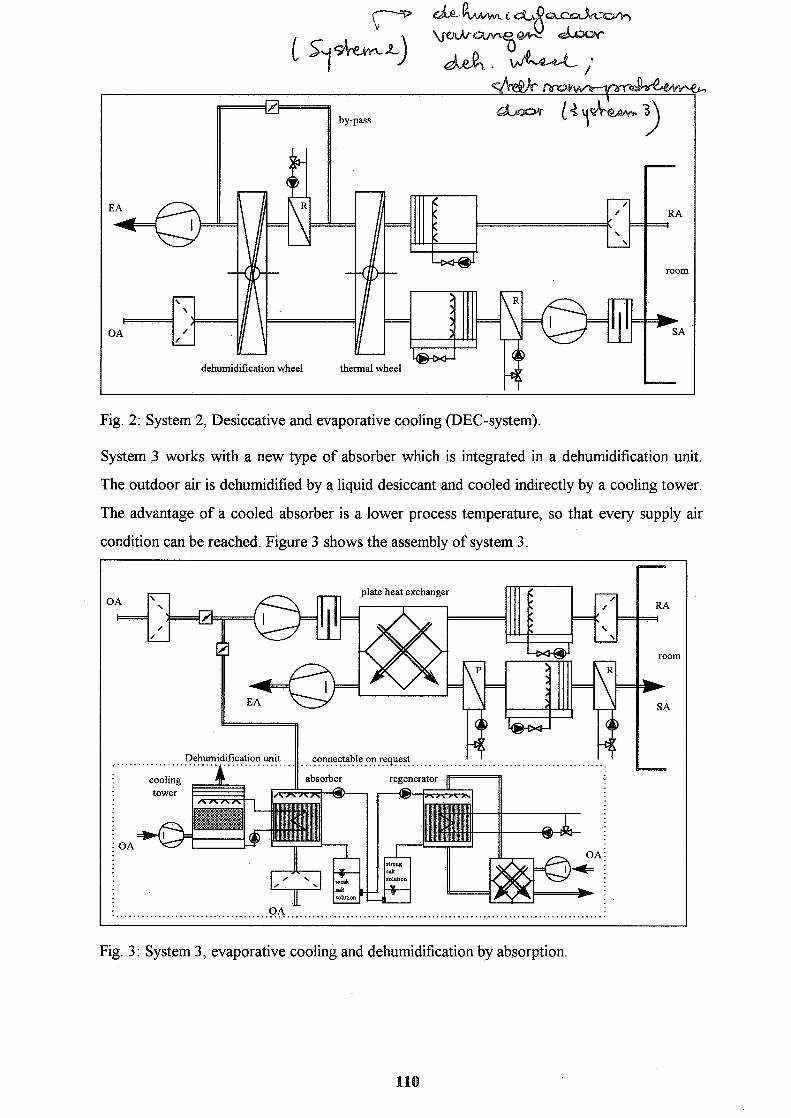
Fig. 2: System 2, Desiccative and evaporative cooling @EC-system).
System 3 works with a new type of absorber which is integrated in a dehumidification unit.
The outdoor air is dehumidified by a liquid desiccant and cooled indirectly by a cooling tower.
The advantage of a cooled absorber is a lower process temperature, so that every supply air
condition can be reached. Figure 3 shows the assembly of system 3.
Fig. 3: System 3, evaporative cooling and dehumidification by absorption.
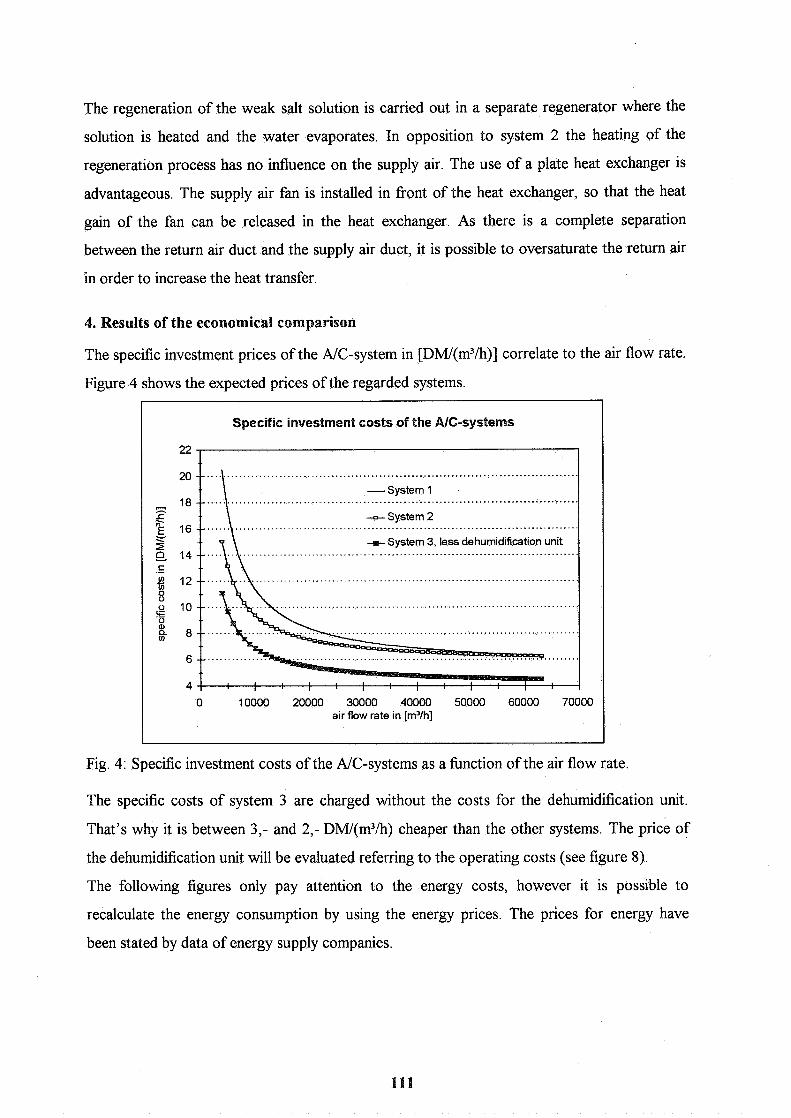
The regeneration of the weak salt solution is carried out in a separate regenerator where the
solution is heated and the water evaporates. In opposition to system 2 the heating of the
regeneration process has no influence on the supply air. The use of a plate heat exchanger is
advantageous. The supply air fan is installed in front of the heat exchanger, so that the heat
gain of the fan can be released in the heat exchanger. As there is a complete separation
between the return air duct and the supply air duct, it is possible to oversaturate the return air
in order to increase the heat transfer.
4. Results of the economical comparison
The specific investment prices of the NC-system in [DM/(m3/h)] correlate to the air flow rate.
Figure 4 shows the expected prices of the regarded systems.
Specific investment costs of the Ale-systems
...................................................................................
0 10000 20000 30000 40000 50000 60000 70000 air flow rate in [m3/h]
Fig. 4: Specific investment costs of the NC-systems as a fbnction of the air flow rate.
The specific costs of system 3 are charged without the costs for the dehumidification unit.
That's why it is between 3,- and 2,- DMl(m3/h) cheaper than the other systems. The price of
the dehumidification unit will be evaluated referring to the operating costs (see figure 8).
The following figures only pay attention to the energy costs, however it is possible to
recalculate the energy consumption by using the energy prices. The prices for energy have
been stated by data of energy supply companies.
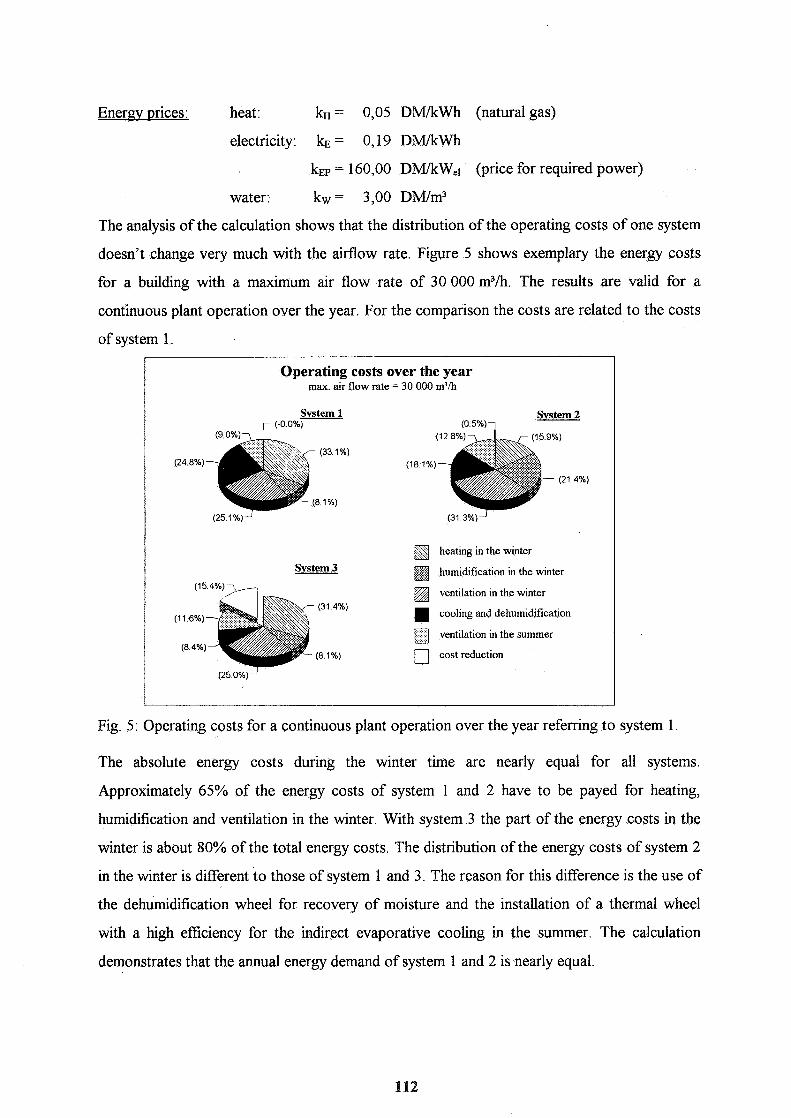
Enerq prices: heat: kH = 0,05 DM/kWh (natural gas)
electricity: k~ = 0,19 DM/kWh
kEP = 160,OO DM/kWel (price for required power)
water: kw = 3,00 DM/m3
The analysis of the calculation shows that the distribution of the operating costs of one system
doesn't change very much with the airflow rate. Figure 5 shows exemplary the energy costs
for a building with a maximum air flow rate of 30 000 m3/h. The results are valid for a
continuous plant operation over the year. For the comparison the costs are related to the costs
of system 1.
Operating costs over the year max. air flow rate = 30 000 m3/h
System 1 Svstem 2
(24.8%) (18 1%)
heating in the winter
System 3 humidification in the winter A,..
ventilation in the winter (31.4%) 1 cooling and dehumidification
ventilation in the summer
(8.1 %) [I] cost reduction
Fig. 5: Operating costs for a continuous plant operation over the year referring to system 1
The absolute energy costs during the winter time are nearly equal for all systems.
Approximately 65% of the energy costs of system 1 and 2 have to be payed for heating,
humidification and ventilation in the winter. With system 3 the part of the energy costs in the
winter is about 80% of the total energy costs. The distribution of the energy costs of system 2
in the winter is different to those of system 1 and 3. The reason for this difference is the use of
the dehumidification wheel for recovery of moisture and the installation of a thermal wheel
with a high efficiency for the indirect evaporative cooling in the summer. The calculation
demonstrates that the annual energy demand of system 1 and 2 is nearly equal.

It becomes obvious that the 15% cost reduction of system 3 is a result of the replacement of
the cooling and dehumidification process. For a better explanation the operating costs
expected in the summer time are exactly described in figure 6.
max. alr flow rate = 30 000 m3
ventilation in the summer
refrigerating cycle
pumps and heat recovery
Fig. 6: Operating costs for a plant operation in the summer time referring to system 1 .
The results of figure 6 show clearly that there are great differences between the regarded
systems concerning the energy demand. The NC-system with the refrigerating cycle causes
the highest operating costs in the summer. By using system 2 it is possible to reach a cost
reduction of about 8% and with system 3 it is possible to reduce the energy costs in the
summer around 40%.
As there are more components in the NC-plant which causes higher pressure differences, the
ventilation costs of the sorptive systems are 30% higher than those of system 1. The input of
heat in system 1 is necessary to reheat the air coming from the cooler up to a comfortable
supply air condition. It is obvious that the highest heat demand is given in system 2. In the
sorptive systems the heat is necessary for the regeneration of the sorbent. System 2 needs a
three times higher energy input for the regeneration then system 3. The difference is given by
the way of heating the sorbent. In system 2 the regeneration air flow must be heated which
causes great heating loss over the exhaust air. Whereas in system 3 the heating of the sorbent
is done directly by water and the process-heat is recovered in a heat exchanger. The need of
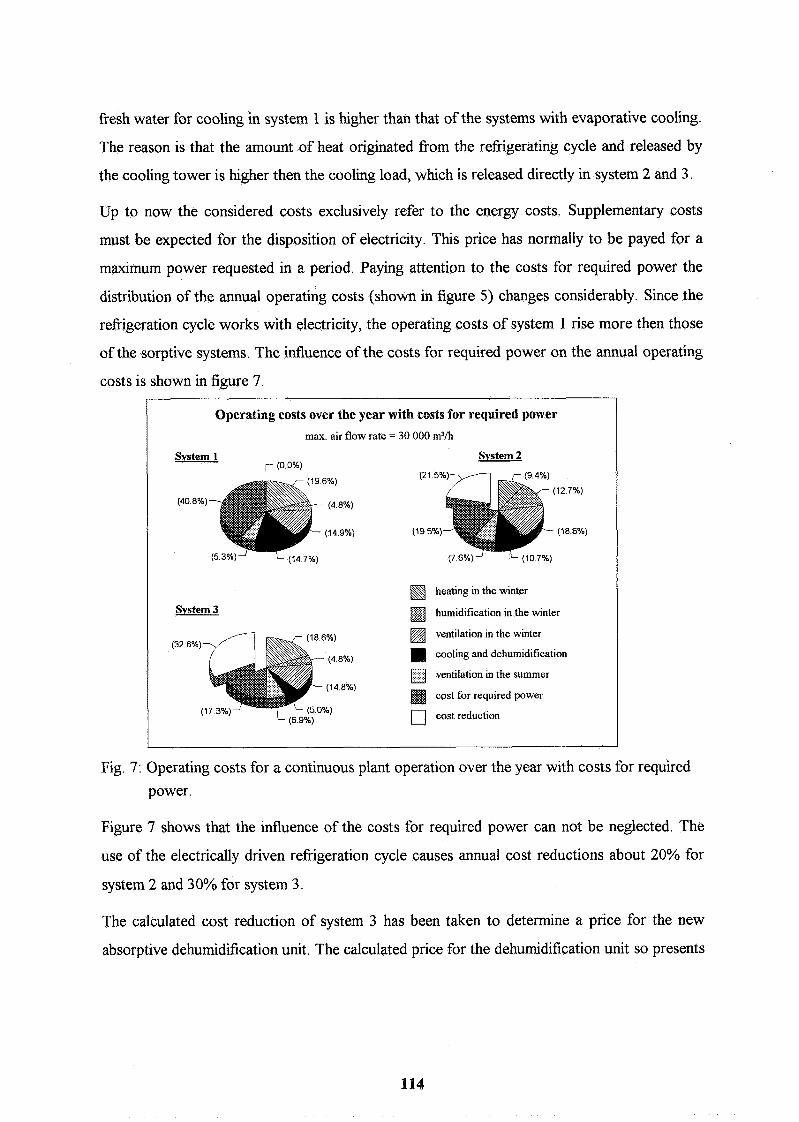
fresh water for cooling in system 1 is higher than that of the systems with evaporative cooling.
The reason is that the amount of heat originated from the refrigerating cycle and released by
the cooling tower is higher then the cooling load, which is released directly in system 2 and 3.
Up to now the considered costs exclusively refer to the energy costs. Supplementary costs
must be expected for the disposition of electricity. This price has normally to be payed for a
maximum power requested in a period. Paying attention to the costs for required power the
distribution of the annual operating costs (shown in figure 5) changes considerably. Since the
refrigeration cycle works with electricity, the operating costs of system 1 rise more then those
of the sorptive systems. The influence of the costs for required power on the annual operating
costs is shown in figure 7.
Operating costs over the year with costs for required power
max. air flow rate = 30 000 m3/h
Svstem 1 Svstem 2 r (0.0%)
(40.8%)
heating in the winter
System 3 humidification in the winter
ventilation in the winter (32.6%) 1 cooling and dehumidification
ventilation in the summer
cost for required power
cost reduction
Fig. 7: Operating costs for a continuous plant operation over the year with costs for required
power.
Figure 7 shows that the influence of the costs for required power can not be neglected. The
use of the electrically driven refrigeration cycle causes annual cost reductions about 20% for
system 2 and 30% for system 3.
The calculated cost reduction of system 3 has been taken to determine a price for the new
absorptive dehumidification unit. The calculated price for the dehumidification unit so presents
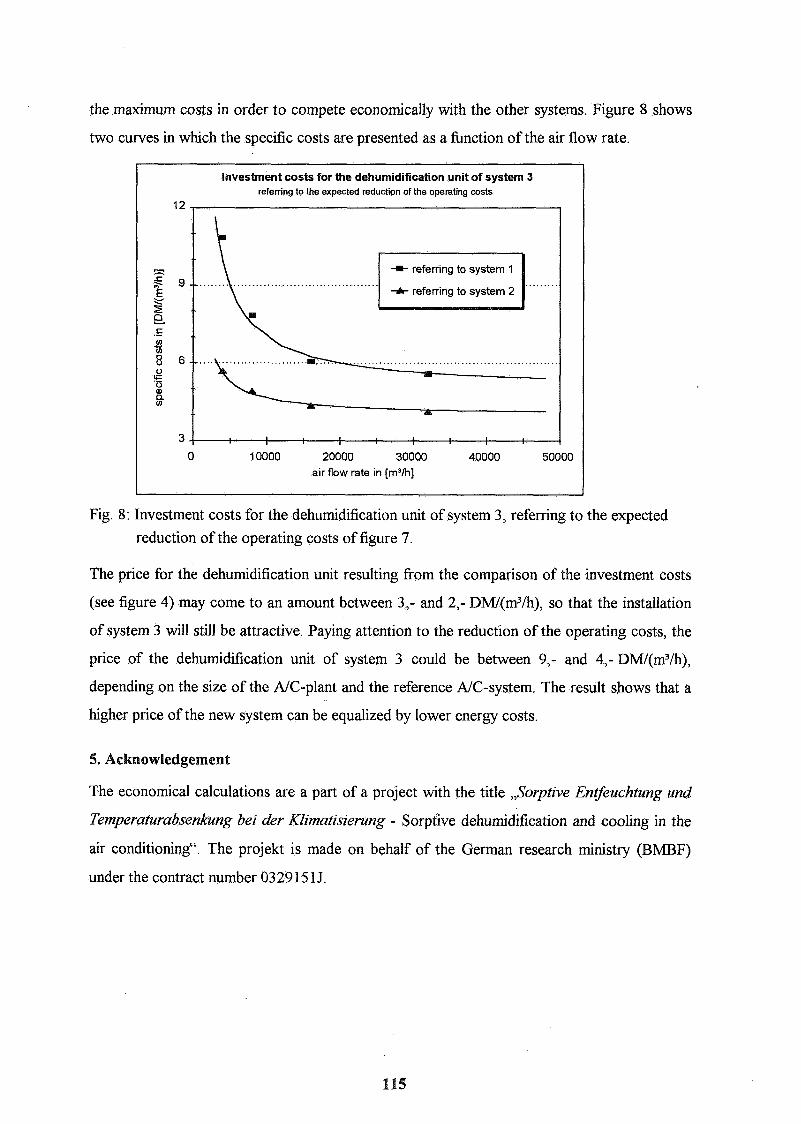
the maximum costs in order to compete economically with the other systems. Figure 8 shows
two curves in which the specific costs are presented as a fbnction of the air flow rate.
Investment costs for the dehumidification unit of system 3 referring to the expected reduction of the operating costs
0 10000 20000 30000 40000 50000 air flow rate In [rn3/h]
Fig. 8: Investment costs for the dehumidification unit of system 3, referring to the expected
reduction of the operating costs of figure 7.
The price for the dehumidification unit resulting from the comparison of the investment costs
(see figure 4) may come to an amount between 3,- and 2,- DM/(m3/h), so that the installation
of system 3 will still be attractive. Paying attention to the reduction of the operating costs, the
price of the dehumidification unit of system 3 could be between 9,- and 4,- DM/(m3/h),
depending on the size of the NC-plant and the reference NC-system. The result shows that a
higher price of the new system can be equalized by lower energy costs.
5. Acknowledgement
The economical calculations are a part of a project with the title ,,Sorptive Entfeuchtung und
Terperaturabsenkung bei der KIimatisierung - Sorptive dehumidification and cooling in the
air conditioning". The projekt is made on behalf of the German research ministry (BMBF)
under the contract number 0329 15 1 J.

VENTILATION AND COOLING
18TH ANNUAL AIVC CONFERENCE ATHENS, GREECE, 23-26 SEPTEMBER, 1997
(Title) AIRTIGHTNESS OF APARTMENTS
BEFORE AND AFTER RENOVATION
(Authors) Keijo Kovanen and Jorma Sateri
(Affiliation) VTT Building Technology, P.O. Box 1804, FIN-02044 VTT, Finland
1. Synopsis
This study aimed to research the airtightness of the building envelope in apartments before and after renovation. Measurements were carried out in three apartment buildings. One to four apartments were examined in each building. Typical renovation measures included changing the windows and refurbishing the interior surfaces. In some cases the ventilation system was renovated as well. No special emphasis was placed on the sealing of the envelope. The airtightness of the apartments increased in most of the cases. There were, however, apartments that became leakier during the renovation. Poor workmanship was usually evident in these cases. The main leakage route in the measured apartments seemed to be the balcony door.
2. List of symbols
coefficient coefficient air leakage rate at a 50 Pa pressure difference [l/h] air flow rate through the measured element [m3/h] air flow rate through the measuring device [m3/h] infiltration flow at a 50 Pa pressure difference [m3/h] temperature of air going through the measured element [K] temperature of air going through the measuring device [K] volume of the apartment [m3] pressure difference across the measured element [Pa]
3. Introduction
The airtightness of the building has a significant effect on the energy use and thermal comfort in apartments. The successful use of air-to-air heat recovery requires good airtightness to reduce the bypass of exhaust air due to exfiltration. On the other hand, sealing the envelope may lead to underventilation if the ventilation system is not renovated accordingly. This study aimed to research the airtightness of the building envelope in apartments before and after . renovation. Measurements were carried out in three apartment buildings. The air change rate, pressure distribution and airtightness were measured in 8 apartments.
4. Methods
4.1 Buildings
Measurements were carried out in three apartment buildings that have a mechanical exhaust ventilation system. Building A is situated in the middle part of Finland. One apartment was examined in that building. Buildings B and C are situated in southern part of Finland. Four apartments were examined in building B and three apartments were examined in building C.
Building A, which is three storeys high, was built in the 1960s. The ventilation did not function properly before the renovation. The ductwork was leaky and the mechanical exhaust ventilation system was centrally controlled without external air intakes. After the renovation,

each apartment had its own mechanical exhaust ventilation system with new ductwork. Furthermore, new air intakes were installed below the new windows. Measurements were carried out before the renovation in January 1996 and after the renovation in February 1996. In both cases the wind velocity was below 5 m/s.
Buildings B and C , which are both eight storeys high, were built in the 1970s. The ventilation was inadequate in both buildings before the renovation. The mechanical exhaust ventilation system was centrally controlled without air intakes. Some of the top floor apartments were found to be overpressurized. This caused humid indoor air to penetrate the wall structures and led to problems with dampness. Some occupants even got symptoms from fungi. Furthermore, some ground floor apartments had a positive air pressure compared to the hallway. Odours from these apartments penetrated into the hallway and from there into the top floor apartments, which were underpressurized as compared with the hallway. The ventilation was adequate in each apartment after the renovation. New air intakes were installed above the new windows. Each apartment now also has a sauna and balcony. Measurements were carried out before the renovation during January - February 1995 and after the renovation in October '96. In both cases the wind velocity was below 5 mls.
4.2 Airtightness of the whole apartment
A fan-pressurization test was used to get information on the airtightness of the whole apartment envelope Ill. A fan was mounted in a duct that pierced the window panel, creating excess underpressure inside the'apartment (Figure 1).
Figure 1. The principle of the fan-pressurization test. 1) adjustable fan 2) pressure difference meter 3) orifice plate for volume flow.
Both exhaust vents and external air intakes as well as the hallway door were sealed. The water seals of the floor drains and sinks were filled with water. All internal doors were left open. This caused air to enter the apartment via the cracks in the apartment envelope. The air flow rate of the incoming air was calculated from the air flow rate displaced by the fan and the density correction (equation 1).
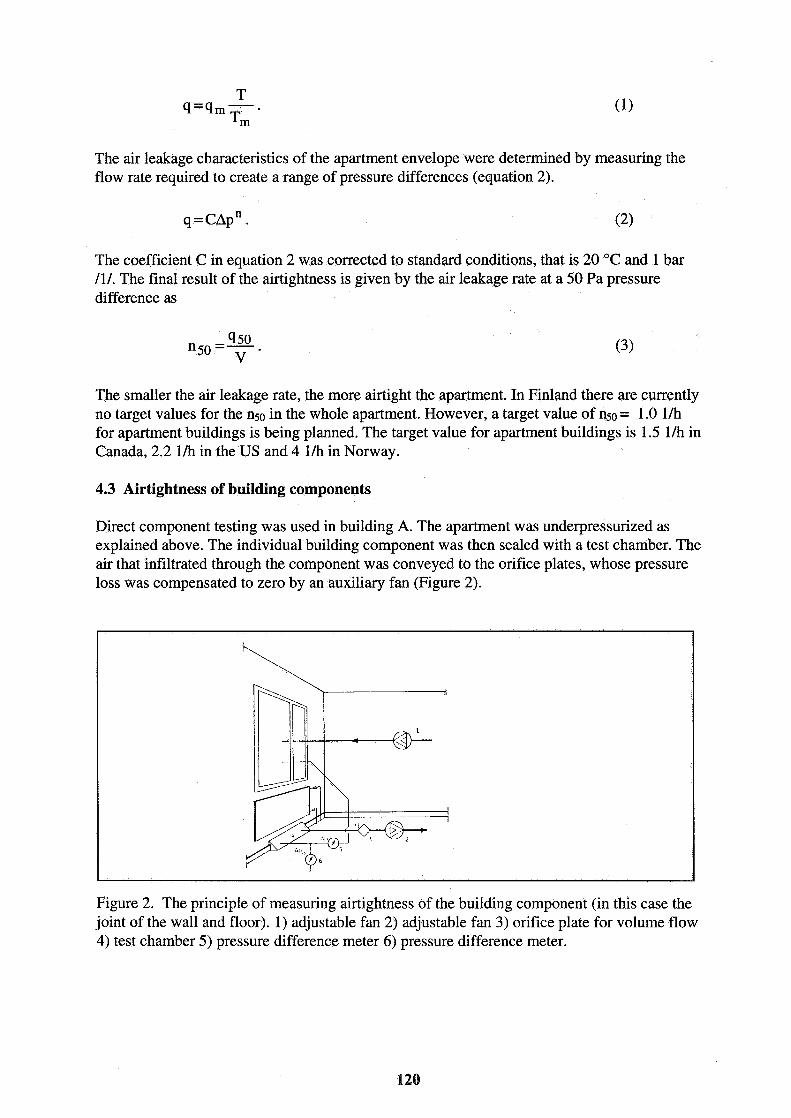
The air leakage characteristics of the apartment envelope were determined by measuring the flow rate required to create a range of pressure differences (equation 2).
The coefficient C in equation 2 was corrected to standard conditions, that is 20 "C and 1 bar 111. The final result of the airtightness is given by the air leakage rate at a 50 Pa pressure difference as
The smaller the air leakage rate, the more airtight the apartment. In Finland there are currently no target values for the 1150 in the whole apartment. However, a target value of 1150 = 1.0 l/h for apartment buildings is being planned. The target value for apartment buildings is 1.5 l/h in Canada, 2.2 l/h in the US and 4 l/h in Norway.
4.3 Airtightness of building components
Direct component testing was used in building A. The apartment was underpressurized as explained above. The individual building component was then sealed with a test chamber. The air that infiltrated through the component was conveyed to the orifice plates, whose pressure loss was compensated to zero by an auxiliary fan (Figure 2).
Figure 2. The principle of measuring airtightness of the building component (in this case the joint of the wall and floor). 1) adjustable fan 2) adjustable fan 3) orifice plate for volume flow 4) test chamber 5) pressure difference meter 6) pressure difference meter.
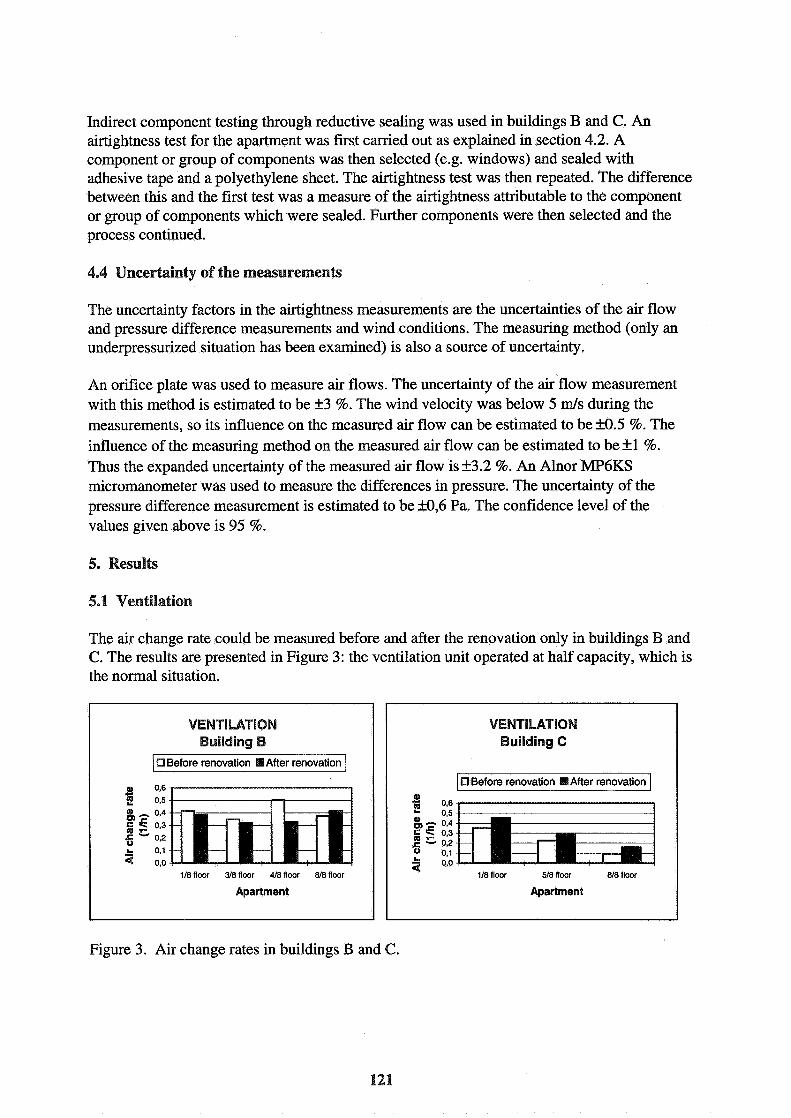
Indirect component testing through reductive sealing was used in buildings B and C. An airtightness test for the apartment was first carried out as explained in section 4.2. A component or group of components was then selected (e.g. windows) and sealed with adhesive tape and a polyethylene sheet. The airtightness test was then repeated. The difference between this and the first test was a measure of the airtightness attributable to the component or group of components which were sealed. Further components were then selected and the process continued.
4.4 Uncertainty of the measurements
The uncertainty factors in the airtightness measurements are the uncertainties of the air flow and pressure difference measurements and wind conditions. The measuring method (only an underpressurized situation has been examined) is also a source of uncertainty.
An orifice plate was used to measure air flows. The uncertainty of the air flow measurement with this method is estimated to be +3 %. The wind velocity was below 5 m/s during the measurements, so its influence on the measured air flow can be estimated to be kO.5 %. The influence of the measuring method on the measured air flow can be estimated to be +1 %. Thus the expanded uncertainty of the measured air flow is k3.2 %. An Alnor MP6KS micromanometer was used to measure the differences in pressure. The uncertainty of the pressure difference measurement is estimated to be M,6 Pa. The confidence level of the values given above is 95 %.
5. Results
5.1 Ventilation
The air change rate could be measured before and after the renovation only in buildings B and C. The results are presented in Figure 3: the ventilation unit operated at half capacity, which is the normal situation.
VENTlLATlON Building B
Before renovation After renovation
3 2 0,s
, 0,4 c + 0,3 2 = " 0 2
L 0,1 .- 4 0.0
118 floor 318 floor 418 floor 818 floor
Apartment
VENTILATION Building C
10 Before renovation .After renovation I e! 0.6
0.5 n 0.4 f 0,3
C - 0,2 0 0,1 L 0,o
118 floor 518 floor 8/8 floor
Apartment
Figure 3. Air change rates in buildings B and C.
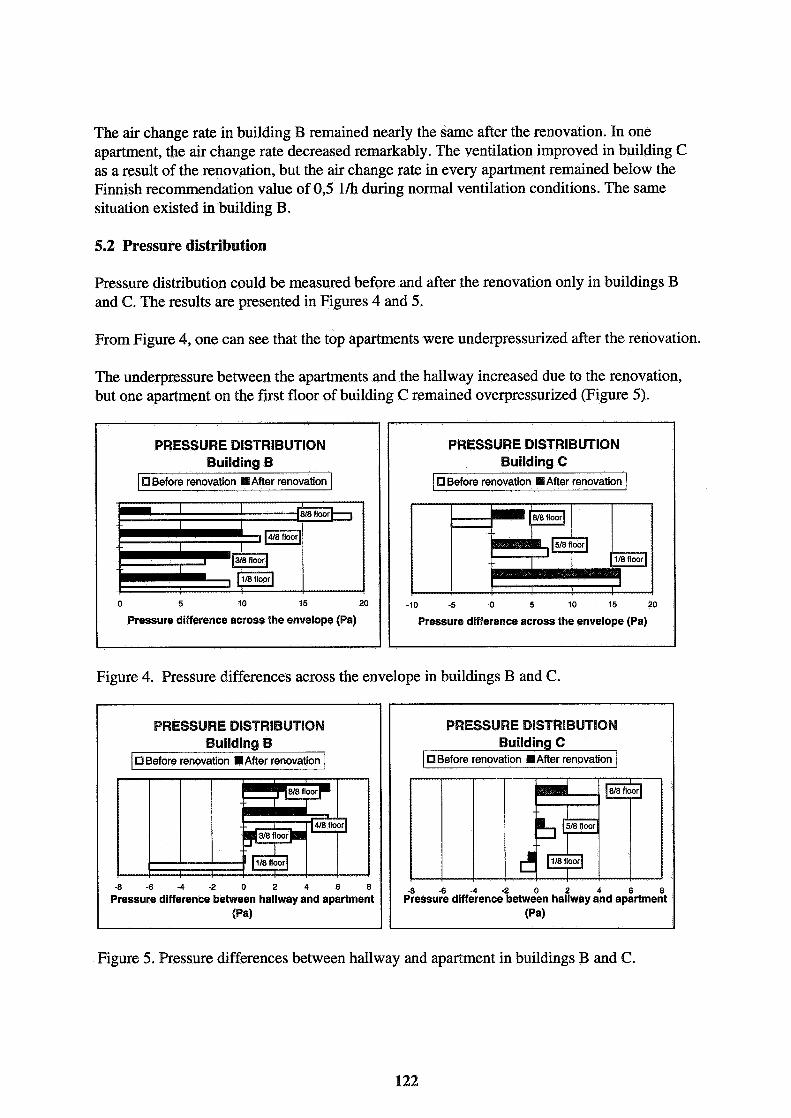
The air change rate in building B remained nearly the same after the renovation. In one apartment, the air change rate decreased remarkably. The ventilation improved in building C as a result of the renovation, but the air change rate in every apartment remained below the Finnish recommendation value of 0,5 l/h during normal ventilation conditions. The same situation existed in building B.
5.2 Pressure distribution
Pressure distribution could be measured before and after the renovation only in buildings B and C. The results are presented in Figures 4 and 5.
From Figure 4, one can see that the top apartments were underpressurized after the renovation.
The underpressure between the apartments and the hallway increased due to the renovation, but one apartment on the first floor of building C remained overpressurized (Figure 5).
Figure 4. Pressure differences across the envelope in buildings B and C.
PRESSURE DISTRIBUTION Building B
1 Before renovation .After renovation
0 5 10 15 20
Pressure difference across the envelope (Pa)
PRESSURE DISTRIBUTION Building C
Before renovation I# After renovation
-10 -5 0 5 10 15 20
Pressure difference across the envelope (Pa)
Figure 5. Pressure differences between hallway and apartment in buildings B and C.
PRESSURE DISTRIBUTION Building B
Before renovation .After renovation
-8 -8 -4 -2 0 2 4 6 8
Pressure difference between hallway and apartment (Pa)
PRESSURE DISTRIBUTION Building C
U Before renovation After renovation
-8 -6 -4 -2 0 2 4 6 8 Pressure difference between hallway and apartment
(Pa)
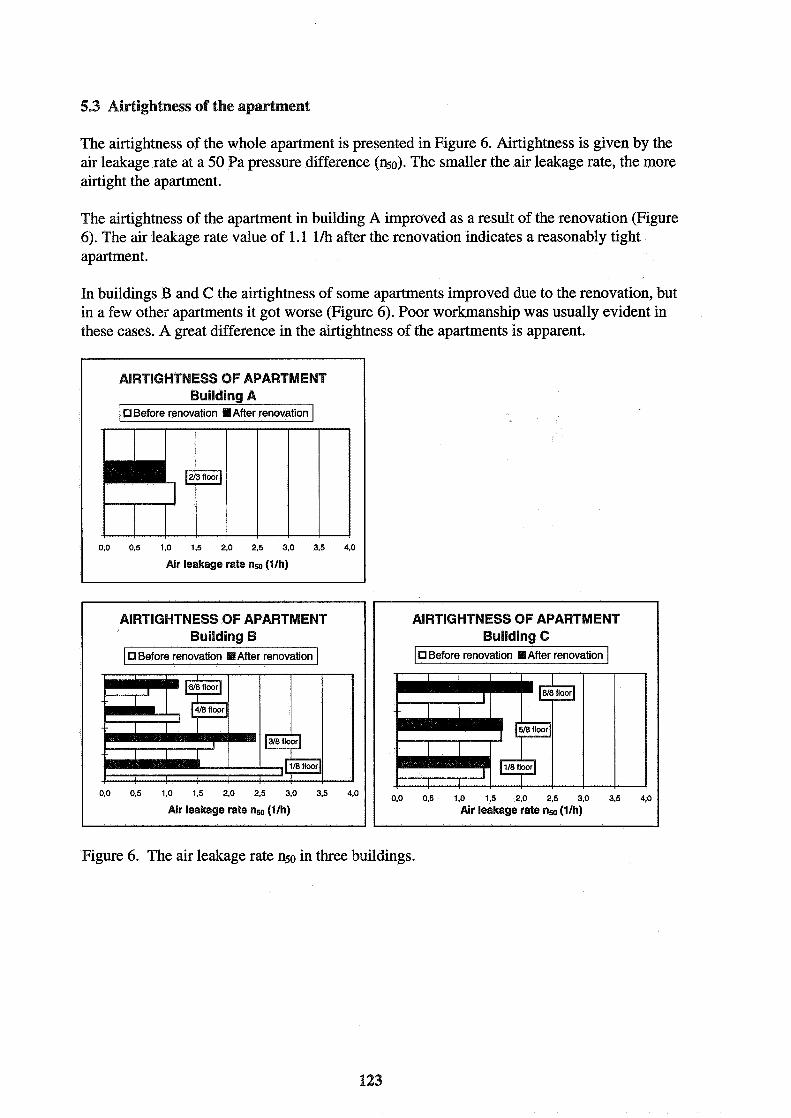
5.3 Airtightness of the apartment
The airtightness of the whole apartment is presented in Figure 6. Airtightness is given by the air leakage rate at a 50 Pa pressure difference (nso). The smaller the air leakage rate, the more airtight the apartment.
The airtightness of the apartment in building A improved as a result of the renovation (Figure 6). The air leakage rate value of 1.1 l/h after the renovation indicates a reasonably tight apartment.
In buildings B and C the airtightness of some apartments improved due to the renovation, but in a few other apartments it got worse (Figure 6). Poor workmanship was usually evident in these cases. A great difference in the airtightness of the apartments is apparent.
AIRTIGHTNESS OF APARTMENT Building A
Cl Before renovation Eil After renovation
0,O 0.5 1.0 1.5 2,O 2,5 3,O 3,s 4,O
Air leakage rate nso (Ih)
Figure 6. The air leakage rate n50 in three buildings.
AIRTIGHTNESS OF APARTMENT Building B
Before renovation .After renovation
OS0 OS5 l s5 2'0 2'5 3'0 3'5 4s0
Air leakage rate nm (lh)
AlRTlGHTNESS OF APARTMENT Building C
Cl Before renovation .After renovation
0,O 0 ,s 1.0 1,s 2,O 2,5 3,O 3.5 4,O Air leakage rate nso (lh)
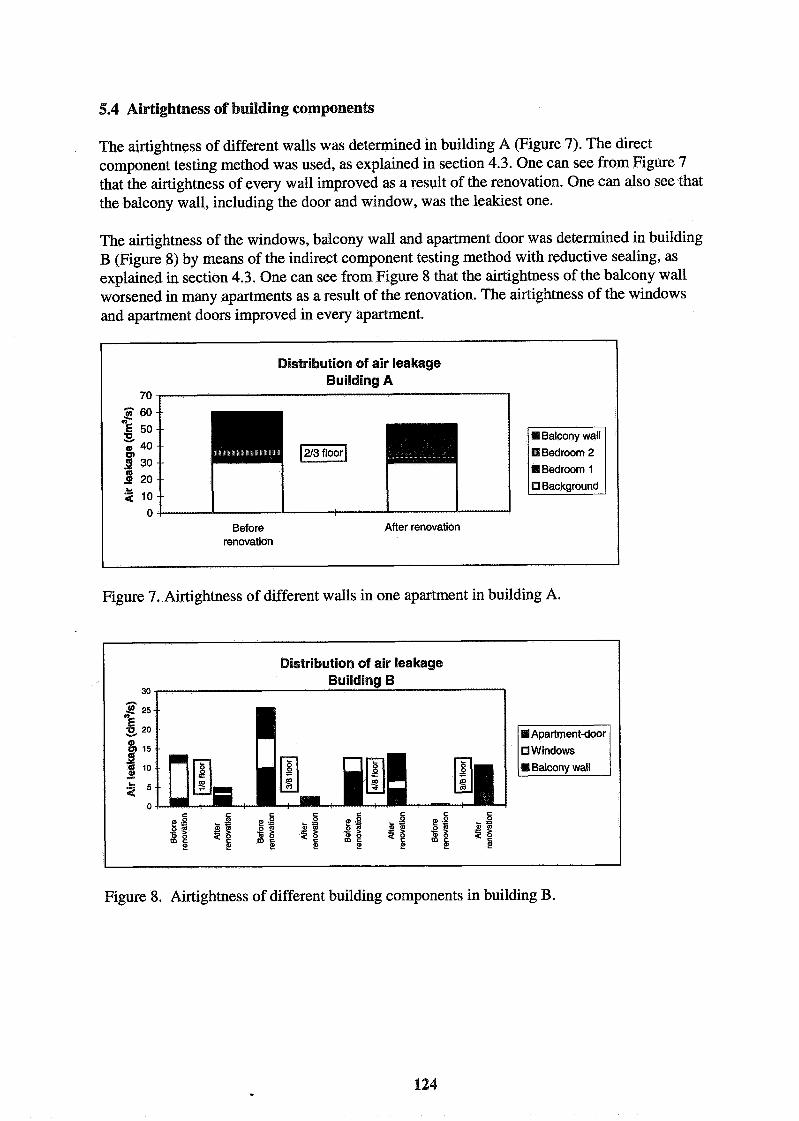
5.4 Airtightness of building components
The airtightness of different walls was determined in building A (Figure 7). The direct component testing method was used, as explained in section 4.3. One can see from Figure 7 that the airtightness of every wall improved as a result of the renovation. One can also see that the balcony wall, including the door and window, was the leakiest one.
The airtightness of the windows, balcony wall and apartment door was determined in building B (Figure 8) by means of the indirect component testing method with reductive sealing, as explained in section 4.3. One can see from Figure 8 that the airtightness of the balcony wall worsened in many apartments as a result of the renovation. The airtightness of the windows and apartment doors improved in every apartment.
Distribution of air leakage Building A
70
'iii 60 E 50 3
40 IOI Bedroom 2 # 30 H Bedroom 1
2 20
$ 10
0 Before After renovation
renovation
Figure 7. Airtightness of different walls in one apartment in building A.
Distribution of air leakage Building B
30 n $? 25 E 3 20
0)
3 l5 Cl Windows
61 10 0) - L .a 5
0
,I, .z "2 $ 1 a" ' 5 e g - g 5 3 $ 1 5 B $ 9 o m 2 9 f ,, a f $ a e $ $ a e e e e e e e e e
Figure 8. Airtightness of different building components in building B.
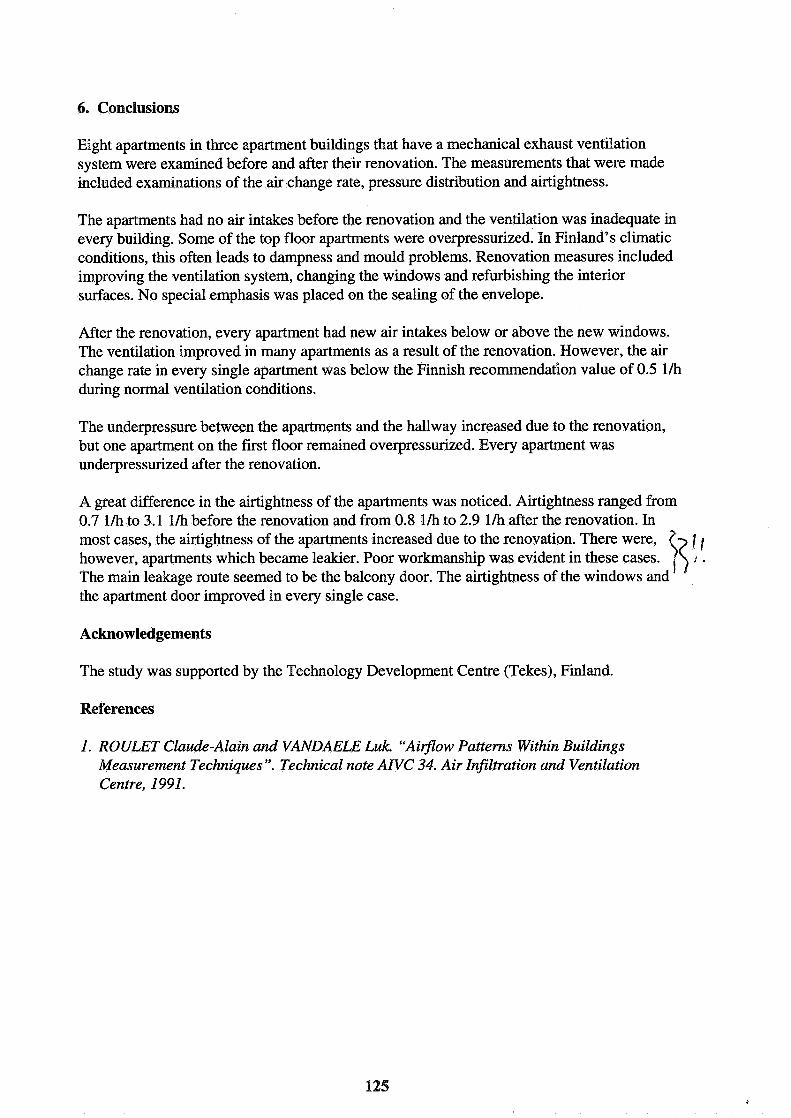
6. Conclusions
Eight apartments in three apartment buildings that have a mechanical exhaust ventilation system were examined before and after their renovation. The measurements that were made included examinations of the air change rate, pressure distribution and airtightness.
The apartments had no air intakes before the renovation and the ventilation was inadequate in every building. Some of the top floor apartments were overpressurized. In Finland's climatic conditions, this often leads to dampness and mould problems. Renovation measures included improving the ventilation system, changing the windows and refurbishing the interior surfaces. No special emphasis was placed on the sealing of the envelope.
After the renovation, every apartment had new air intakes below or above the new windows. The ventilation improved in many apartments as a result of the renovation. However, the air change rate in every single apartment was below the Finnish recommendation value of 0.5 l/h during normal ventilation conditions.
The underpressure between the apartments and the hallway increased due to the renovation, but one apartment on the first floor remained overpressurized. Every apartment was underpressurized after the renovation.
A great difference in the airtightness of the apartments was noticed. Airtightness ranged from 0.7 l/h to 3.1 l/h before the renovation and from 0.8 l/h to 2.9 l/h after the renovation. In most cases, the airtightness of the apartments increased due to the renovation. There were, however, apartments which became leakier. Poor workmanship was evident in these cases. The main leakage route seemed to be the balcony door. The airtightness of the windows and the apartment door improved in every single case.
Acknowledgements
The study was supported by the Technology Development Centre (Tekes), Finland.
References
1. ROULET Claude-Alain and VANDAELE Luk. "Airflow Patterns Within Buildings Measurement Techniques". Technical note ANC 34. Air Infiltration and Ventilation Centre, 1991.

VENTILATION AND COOLING 18TH AIVC CONFERENCE, ATHENS, GREECE
23-26 SEPTEMBER, 1997
Title: Airtight Buildings - A Practical Guide
Author(s): Karin Adalberth, MSc.
Affiliation: A B Jacobson & Widmark, Slagthuset, SE-21120 Malmo, Sweden Tel: +46 40 10 8200, Fax: +46 40 10 8201
Airtight Buildings - A Practical Guide
Although several investigations on how to design airtight buildings have been performed and the results firthermore have been published, many designers and contractors are still unaware of this knowledge. Therefore, the aim of this work is to collect existing knowledge andput it together to a practical guide. The target groups are architects, designers, con- tractors and building services engineers.
This paper is a summary of the report "Good Airtightness - guidelines to architects, build- ing designers and contractors "published in Sweden during the autumn of 1997 [I]. The guide contains six dzflerent chapters: 1) motives for air-, dzflusion- and windtightness; 2) materials that may be used for the purpose; 3) 70 drawings and speciJications on how to make air , dzflusion- and windtight constructions; 4) theory; 5) measurements; and, 6) quality assurance system for gaining air-, dzflusion and windtight buildings.
The content of chapter 1, 3 and 6 are emphasised in this conference paper.
Almost all of us trust in the positive effect of having a wind barrier in a building. The wind barrier will prevent the wind from blowing into the building envelope, e g the external wall, and reduce the function of the thermal insulation. The wind barrier will also prevent rain, which has penetrated through the facade from finding its way into the building envelope.
In the same manner there are a number of motives why a building should be airtight (preventing air to leak through the envelope of the building): thermal comfort for the users, rational use of energy, control of ventilation and reducing the risk for moisture problems.

2 Objectives
Although several investigations on how to design airtight buildings have been performed and the results furthermore have been published, many designers and contractors are still unaware of this knowledge. Therefore, the aim of this work is to collect existing knowledge and put it together to a practical guide. The target groups are architects, designers, contrac- tors and building services engineers.
3 Results
This paper is a summary of the report "Good Airtightness - guidelines to architects, build- ing designers and contractors" published in Sweden during the autumn of 1997 [I]. The guide contains six different chapters: 1) motives for air-, diffusion- and windtightness; 2) materials that may be used for the purpose; 3) 70 drawings and specifications on how to make air-, diffusion- and windtight constructions; 4) theory; 5) measurements; and, 6) quality assurance system for gaining air-, diffusion and windtight buildings.
The content of chapter 1,3 and 6 are emphasised in this conference paper.
3.1 Motives for making air-, diffusion- and windtightness
There are four major motives for making a building airtight. The first one is to save energy. In a building with poor airtightness the air will flow in and out through the envelope of the building. These air movements cause an extra energy flow. The size of the extra energy flow depends however on the ventilation system used. In natural ventilation systems and mechanical supply and exhaust ventilation air, the energy flow increases linearly with the air leakage through the envelope of the building. In mechanical exhaust ventilation the air leakage through the envelope is of minor importance for the extra energy flow, since the exhaust ventilation creates a negative pressure in the building, which prevents the exfiltra- tion. In a building with a heat exchanger or heat pump in the ventilation system, the air tightness is of greater importance. In these systems the heat exchangerlheat pump will not perform to its fully extent, since all the air will not pass the exchanger.
The second motive is thermal comfort. When cold outdoor air is leaking through the enve- lope of the building, the indoor surfaces will be cooled. These surfaces will cause cold down draught. The consequence is unpleasancy for the user. Also direct draught is unpleas- ant. In order to solve this problem, the user might want to increase the indoor temperature, which means an increasing energy use.
The third motive is to prevent moisture problems. In a building with poor airtightness the air flows through the envelope. When air is flowing from indoor to outdoor, the air brings moisture since the indoor air contains more vapour than outdoor air. When indoor air flows through the envelope, humidity will increase when temperature decreases. If the envelope has a poor airtightness there might be moisture problems in the envelope.

The fourth motive is that if the airtightness of the envelope is poor, the wind and outdoor temperature will affect the ventilation flows in the building. A ventilation system that works properly in one outdoor climate may work poorly in another extreme situation. The consequence is that the air change rate sometimes is too high or too low, depending on the outdoor conditions. An increased air change rate will cause an extra energy use.
The motive for making a building difision tight is to prevent indoor air containing mois- ture to diffuse out in the envelope of the building. The moisture content in indoor air is normally larger than in outdoor air. The moisture flow caused by diffusion, is however smaller than the moisture flow due to poor airtightness (convection).
The motive of having a wind barrier in a building is to prevent the wind in getting into the envelope of the building and reduce the function of the thermal insulation. The second mo- tive is to prevent rain, which has penetrated through the facade from getting into the build- ing envelope.
3.2 Drawings and specifications
The hardest part in getting an air-, diffusion- and windtight building are the connections between different constructions and around services penetrations, Figure 1, and it's actually these parts that have the largest influence on the air- and diffusiontightness.
The original report "Good Airtightness" contains over 70 drawings and specifications on different connections. Figure 2 is an example of a connection between a crawl space, an intermediate floor and an external wall. Figure 3 is an example of a connection between an external wall, an intermediate floor and a roof.
Figure 4 is an example on how to make an airtight construction around a service penetra- tion.
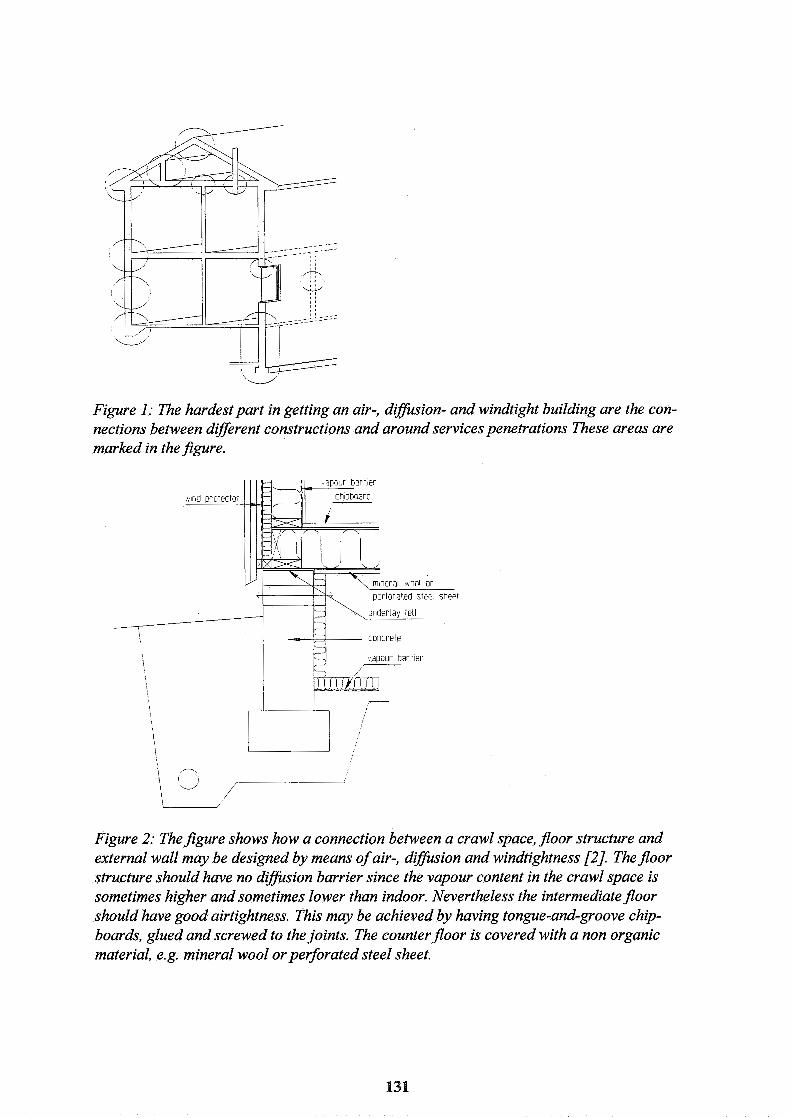
Figure I : The hardestpart in getting an air-, dzflusion- and windtight building are the con- nections between dzflerent constructions and around services penetrations These areas are marked in the Jigure.
apour barrler
Figure 2: TheJigure shows how a connection between a crawl space, floor structure and external wall may be designed by means of air-, dzflusion and windtightness [2]. The floor structure should have no diflusion barrier since the vapour content in the crawl space is sometimes higher and sometimes lower than indoor. Nevertheless the intermediate floor should have good airtightness. This may be achieved by having tongue-and-groove chip- boards, glued and screwed to the joints. The counter floor is covered with a non organic material, e.g. mineral wool or perforated steel sheet.

Figure 3: T h e m r e shows a connection between an external wall, an intermediate floor and a roo$ Mortar is placed in-between the external wall and the intermediate floor to achieve airtightness. Polyethelene foil with rubber strips are placed under the extra wooden sill between the roof trusses in order to achieve airtightness. The overlap joint of the polyethylene foil in the ceiling is clamped between two battens and to the sill.
Figure 4: T h e m r e shows how to achieve airtightness around a service penetration [3]. A rubber sheet is surrounded the pipe. The hole in the rubber sheet should be smaller than the dimension of the pipe. In this way the rubber sheet will surround the pipe airtight. The va- pour barrier in the ceiling is clamped with the rubber sheet andpressed with a sheet mate- rial to the extra "batten-cross".
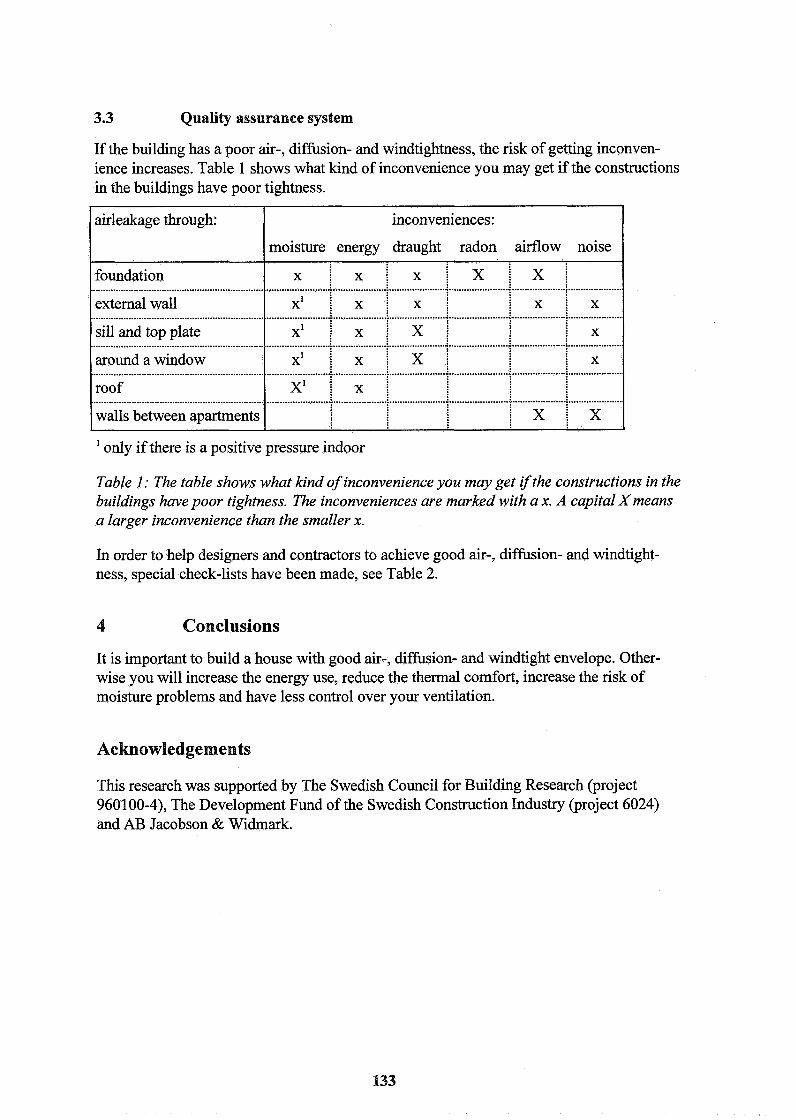
3.3 Quality assurance system
If the building has a poor air-, diffusion- and windtightness, the risk of getting inconven- ience increases. Table 1 shows what kind of inconvenience you may get if the constructions in the buildings have poor tightness.
1 only if there is a positive pressure indoor
airleakage through:
foundation
external wall .................................................................... sill and top plate .................................................................... around a window
roof ......................................................................................... walls between apartments
Table I : The table shows what kind of inconvenience you may get ifthe constructions in the buildings have poor tightness. The inconveniences are marked with a x. A capital X means a larger inconvenience than the smaller x.
inconveniences:
moisture energy draught radon airflow noise
x ; x ~ x i x ; x i ..............................................................................................................................................................................................................
x l ; x i x i i x : 'i x .............................................. ...........................................................................................
x l / x : ! x i I x ............................................... : ..........................................................................................
x l j x ; x i f x ...............................................................................................................................................................................................................
x l i x / ..................... : .......................................................................................... i x i x
In order to help designers and contractors to achieve good air-, diffusion- and windtight- ness, special check-lists have been made, see Table 2.
4 Conclusions
It is important to build a house with good air-, diffusion- and windtight envelope. Other- wise you will increase the energy use, reduce the thermal comfort, increase the risk of moisture problems and have less control over your ventilation.
Acknowledgements
This research was supported by The Swedish Council for Building Research (project 960 100-4), The Development Fund of the Swedish Construction Industry (project 6024) and A33 Jacobson & Widrnark.
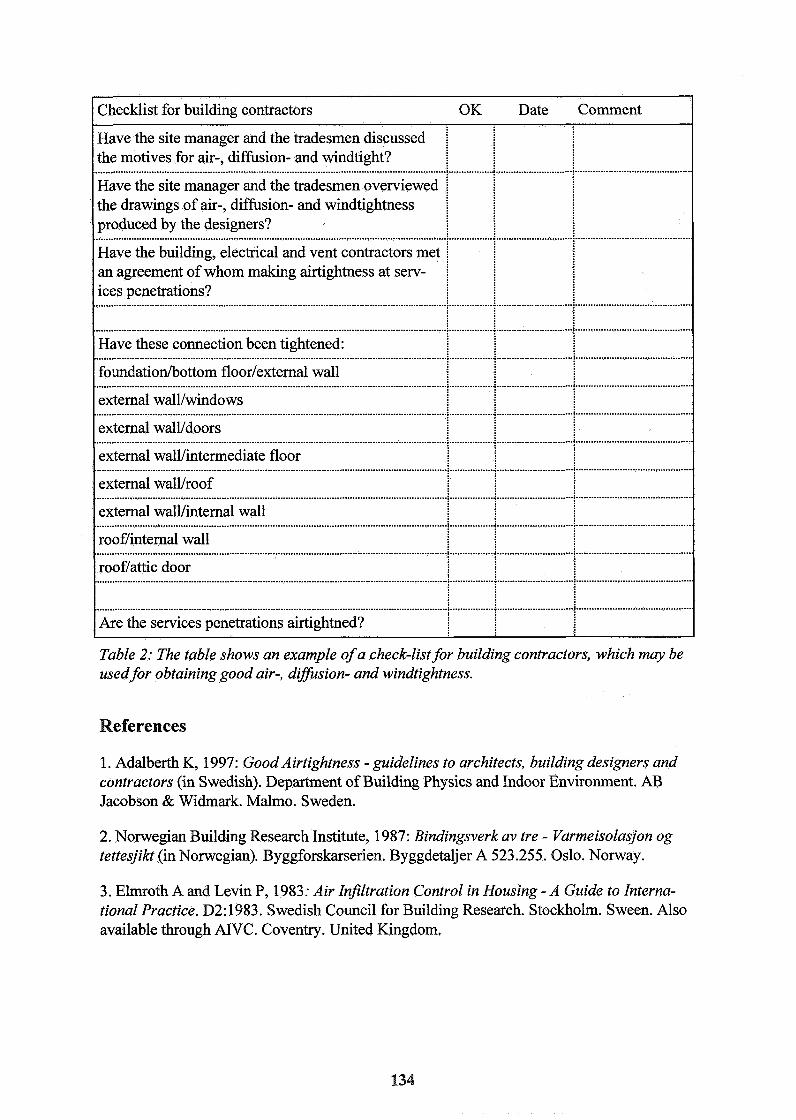
Checklist for building contractors OK Date Comment
Have the site manager and the tradesmen discussed I the motives for air-, diffusion- and windtight? ............................................................................................................................................................ a .............................. , .............................................. Have the site manager and the tradesmen overviewed 1 the drawings of air-, diffusion- and windtightness I produced by the designers? .......................................................................................................................................................................................................................................... Have the building, electrical and vent contractors met I an agreement of whom making airtightness at serv- I ices penetrations? ..........................................................................................................................................................................................................................................
.............................. ................. .............................................. ................................................................................................................................... ; 4 ;
Have these connection been tightened: .............................. ................. .............................................. .................................................................................................................................. ; 4 ;
foundation/bottom floorlexternal wall .......................................................................................................................................... ; ................. 4 ............................................................................. external walllwindows
.............................. .......................................................................................................................................... ; ................. 4 ; .............................................. external wallldoors .......................................................................................................................................... ; ................. 4 ............................................................................. external wall/intermediate floor
.............................. .......................................................................................................................................... ; ................. 6 ; .............................................. external walllroof
.............................. .......................................................................................................................................... ; ................. 4 ; .............................................. external walllinternal wall
.............................. .......................................................................................................................................... ; ................. 4 ; .............................................. rooflinternal wall .......................................................................................................................................................................................................................................... rooflattic door
.............................. .......................................................................................................................................... ; ................. 4 ; ..............................................
.............................. .......................................................................................................................................... ; ................. 4 ; .............................................. Are the services penetrations airtightned?
Table 2: The table shows an example of a check-list for building contractors, which may be used for obtaining good air , diflusion- and windtightness.
References
1. Adalberth K, 1997: Good Airtightness - guidelines to architects, building designers and contractors (in Swedish). Department of Building Physics and Indoor Environment. AB Jacobson & Widmark. Malmo. Sweden.
2. Norwegian Building Research Institute, 1987: Bindingsverk av tre - Varmeisolasjon og tettesjikt (in Norwegian). Byggforskarserien. Byggdetaljer A 523.255. Oslo. Norway.
3. Elrnroth A and Levin I?, 1983: Air Injiltration Control in Housing - A Guide to Interna- tional Practice. D2: 1983. Swedish Council for Building Research. Stockholm. Sween. Also available through AIVC. Coventry. United Kingdom.
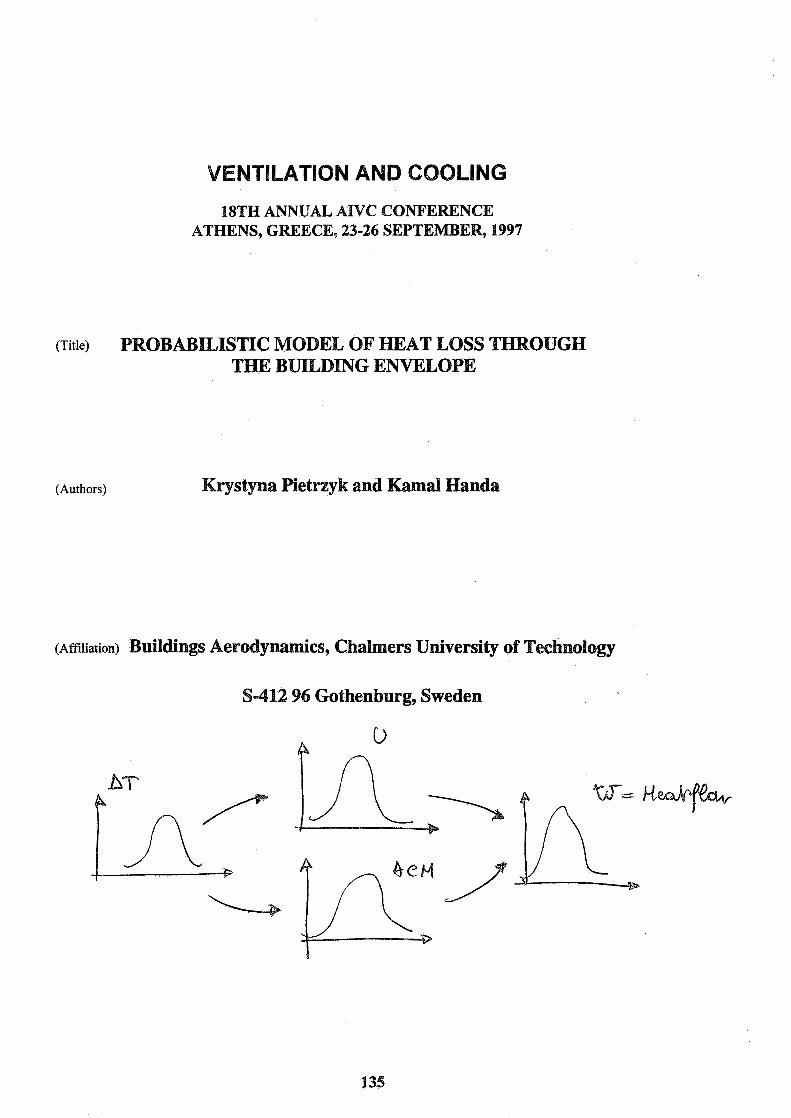
VENTILATION AND COOLING
18TH ANNUAL AIVC CONFERENCE ATHENS, GREECE, 23-26 SEPTEMBER, 1997
(Title) PROBABILISnC MODEL OF HEAT LOSS THROUGH THE BUILDING E LOPE
(Authors) Krystyna Pietrzyk and Kamal Handa
(Affiliation) Buildins Aerodynamics, Chalmers University of Technology
S-412 96 Gothenburg, Sweden
SYNOPSIS
A model for the application of probabilistic methods in the estimation of heat loss caused by convection and heat conduction through the material is developed. Temperature difference (AT) between inside and outside of a building, air change rate (ACH) and coefficient of thermal transmittance (U-value) of the building structure are treated as random variables. The mean value and the standard deviation of heat loss are estimated for different parameters of distributions for temperature difference, air change rate and thermal transmittance. The interaction between the above three quantities is described for different cases of tight and leaky envelopes by assuming certain degree of correlation between the random variables.
1. INTRODUCTION
The total heat loss in a building is generally calculated by adding the contributions from the heat loss due to natural ventilation and transmission through the materials, where the material properties, thermal transmittance and convection are treated as deterministic quantities. Influence of variation of leakage properties of the building, climatic conditions and the material properties is not catered for in the assessment of heat loss. Thermal performance of a building is associated with two main quantities selected from several parameters of interest, which can be defined as:
heat loss due to airflow through the construction heat loss due to transmission
The heat loss due to natural ventilation and transmission through the building structure is determined in a complex interaction, by local climatic conditions and the factors related to the building and their surroundings. The heat loss due to transmission is governed by the temperature difference across the envelope, properties of material and the type and quality of construction. Air infiltration is governed by the pressure difference due to wind and temperature and the leakage characteristics of the house. Examination of the effects of air infiltration and heat transmission on the thermal performance of the building indicates that these are interdependent and climate is the common parameter, which is random in space and time.
2. DETE DEL FOR HEAT LOSSES IN A BUILDING
2.1 Heat loss
Heat loss caused by ventilation or infiltration (called later ventilation heat loss) foms a significant part of the energy consumption in buildings. To keep the internal temperature at a constant level, fresh air supplied to the house must be heated. The common measure of the amount of exchange of air is air change rate (ACH). The energy needed for heating of the supplied air can be described by following equation:
ACH Wv = ATpcV-
3600 where
Wv - heat loss (kW)
AT - temperature difference between inside (Tint) and outside (Text) the building (K)
V - volume of the house (m3)
P - air density (kg/m3) c - specific thermal capacity (kJ/kgK)
2.2 Heat loss d
Transmission loss through the building envelope is the sum of heat losses through the building components and can be described by the following equation [3]:
where: w c - transmission heat loss (kW)
AT - temperature difference between inside and outside the building (K) m - number of building components
u i - overall average thermal transmittance of i:th component ( w I ~ ~ K )
A i - area of the i:th component (m2)
NU^ - Nusselt's number for the i:th component describing the effect of convection flows (leakage and interstitial convection) on the thermal performance of a structure
In order to include the changes in the average thermal transmittance of the components caused by the influence of the convective flow on conduction heat losses, one can define the overall average thermal transmittance of a building envelope Um as:
1 rn Urn = - C N U ~ U ~ A ~
Am i=l
where: A,- Area of the building envelope (m2)
Equation 2.2 can be rewritten by including equation 2.3 as: Wc = AT Um Am/lOOO (2.46
3. PROBABILISTIC MODEL OF HEAT LOSSES THROUGH THE BUILDING ENVELOPE
A probabilistic model for the estimation of heat loss is developed by including the variations in the temperature difference AT, air change rate ACH and average heat transfer coefficient

U. Influence of variation in the climatic parameters and the material properties on the heat loss is studied for two types of buildings with tight and leaky envelope. It is assumed in the analysis that description of permeability of an envelope is related to the outer surface of the building. Total heat loss in a building at a time t can be described as a sum of ventilation and transmission heat losses:
W(t> = WV(t> + WC(t) (3.1) where:
W(t) - total heat loss in a building (kW) Wv(t) - component due to ventilation heat loss (kW)
Wc(t) - component due to transmission heat loss (kW)
Substituting expressions 2.1 and 2.4 into 3.1 gives:
The main assumption is to include the randomness of the thermal transmittance and the climate in the model. The model should enable the estimation of the mean value and the standard deviation of the heat loss for the assumed statistical parameters of distributions of particular random variables. Four parameters from equation 3.2 are considered to vary with time. Define
AT(t) = X(t) inside-outside temperature difference ACH(t)= Y(t) air change rate U,(t) = Z(t) average overall thermal transmittance
W(t) ventilation and transmission heat loss in a building
For a constant value of internal temperature of 20°C the air density becomes also constant. Equation 3.2 can now be written as:
W(t) = g(X,Y,Z) = a X(t) Y(t) + b X(t) Z(t) where a = V c p / 3 6 0 0
b = Am / 1000
It is important to emphasis that the temperature difference across the building envelope is a common parameter for both air change rate and the thermal transmittance. Air infiltration is governed by the pressure difference due to wind and temperature while thermal transmittance depends on the temperature of the material and the leakage paths through the insulation Approximate mean and variance of the function W may be obtained by expanding g(X,Y,Z) in a Taylor series about the mean values of the variables X, Y and Z. For practical reasons - the first-order approximations for mean pw as well as for variance < of the function W have been used.

+2(aPy + b ~ z ) b P x P x z ~ x ~ z + 2 a b P x 2 ~ y z ~ y ~ z where:
P - mean value o - standard deviation
P - correlation coefficient
Assume that the mean values of X, Y, Z are the design values and the variations from the mean are caused by the influence of random parameters (climate etc.). It has been found [4] that for a naturally ventilated house with the uniformly distributed leakage over the building envelope, the distribution of air change rate can be defined by Normal probability density function. Temperature difference [4] and thermal transmittance are also assumed as normally distributed. A joint normal distribution function for the variables X,Y and Z has been applied in the model. The assumption of Normal probability density function for the heat losses has been verified for all cases of tight and leaky envelopes by comparing the statistical moments obtained by two different methods [2]. Normal distribution is found to be reasonable for a tight building with balanced or exhaust ventilation. However , for a leaky building, a slightly skewed distribution function gives a better fit.
Correlation coefficients among variables X, U, Z show linear dependence between them and they are specific for individual case (tight envelope, infiltration, exfiltration). The coefficient of partial correlation of air change rate and thermal transmittance, if the influence of temperature difference is eliminated, is of the form [I]]:
For a tight building the coefficient of partial correlation pyZmX is equal to zero. It is negative for the case of infiltration of the cold air entering the building and positive for the case of exfiltration of the warm air out of the building. The range of values of the correlation coefficient p,, can be estimated from the knowledge of pxy, pxz, and p,,,. Limits for p,, are presented in table 1.
Table 1: The range of values assumedfor-the correlation coeficients among random variables Xs Y and Z
pxy>O. PXZ<~. pyz<o-
Pyz'Pxy Pxz
pxy>O. pxz<O. pyz<O.
pxypxz - J(l- p~;)(l- ~ x z ' ) 5 PYZ < ~ X Y ~ X Z
pxy>O. pxz>o. pyz>o p x y p x z I puz 5 p x y p x z + J(1- px; )(I - pxz2)
P yz.x = 0
pyZex < 0
pyz., >O
1
2
3
Tight Envelop
Leaky Envelope Infiltration
Leaky Envelope Exfiltration

4. SENSITIVITY ANALYSIS OF HEAT LOSS IN A BUILDING
Sensitivity analysis of coefficient of variation of heat losses is carried out by considering certain ranges of values of the parameters pXy, pxzy pyz, I,, Iy I, and are estimated for the five cases shown in table 2 The coefficient of variation of heat loss is given by:
where s=~a,f ~ y . 2 2 A = (a + b s) I,
B = 2 (a + b s) 1, [a I, p,, + b s I, p,,] 2 2 2 2 2 C = ( a I, +2absI , I ,p , ,+b s I,)
Table 2: Cases considered in the Analysis
Case No. 1
2
3
4
Building Type
Tight building
Tight building
Tight building
Leaky building
Design Conditions
ACH=O, Only transmission heat losses are considered and is a purely theoretical case. ACH=const, Balanced ventilation is provided by mechanically operated inlets and outlets. ACH#const , Exhaust ventilation is provided by mechanically operated outlets. The air inlets are specified openings through ducts. (a) Infiltration is provided through the building
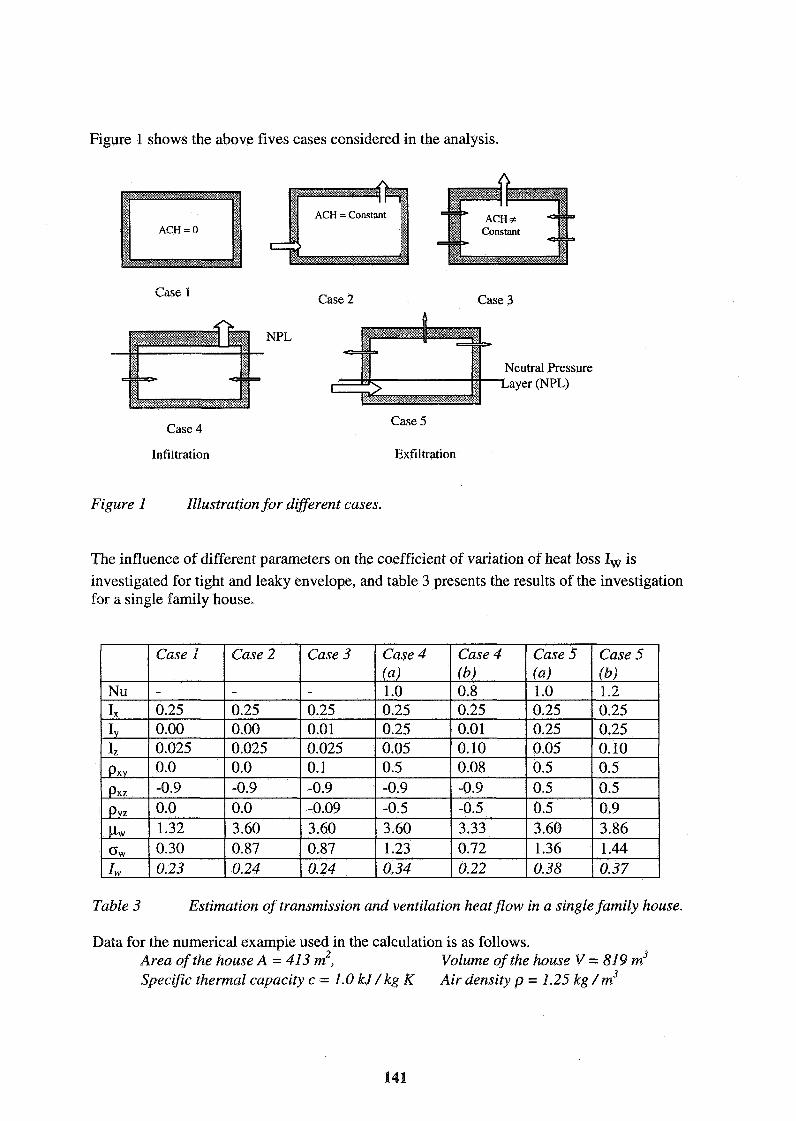
Figure 1 shows the above fives cases considered in the analysis.
ACH = Constant
Case 1 Case 2 Case 3
Case 4
Infiltration
Case 5
Exfiltration
Figure 1 Illustration for dzperent cases.
The influence of different parameters on the coefficient of variation of heat loss Iw is investigated for tight and leaky envelope, and table 3 presents the results of the investigation for a single family house.
Table 3 Estimation of transmission and ventilation heat flow in a single family house.
Data for the numerical example used in the calculation is as follows. Area of the house A = 413 m2, Volume of the house V = 819 m3 Specific thermal capacity c = l.0 k J / kg K Air density p = 1.25 kg /m3
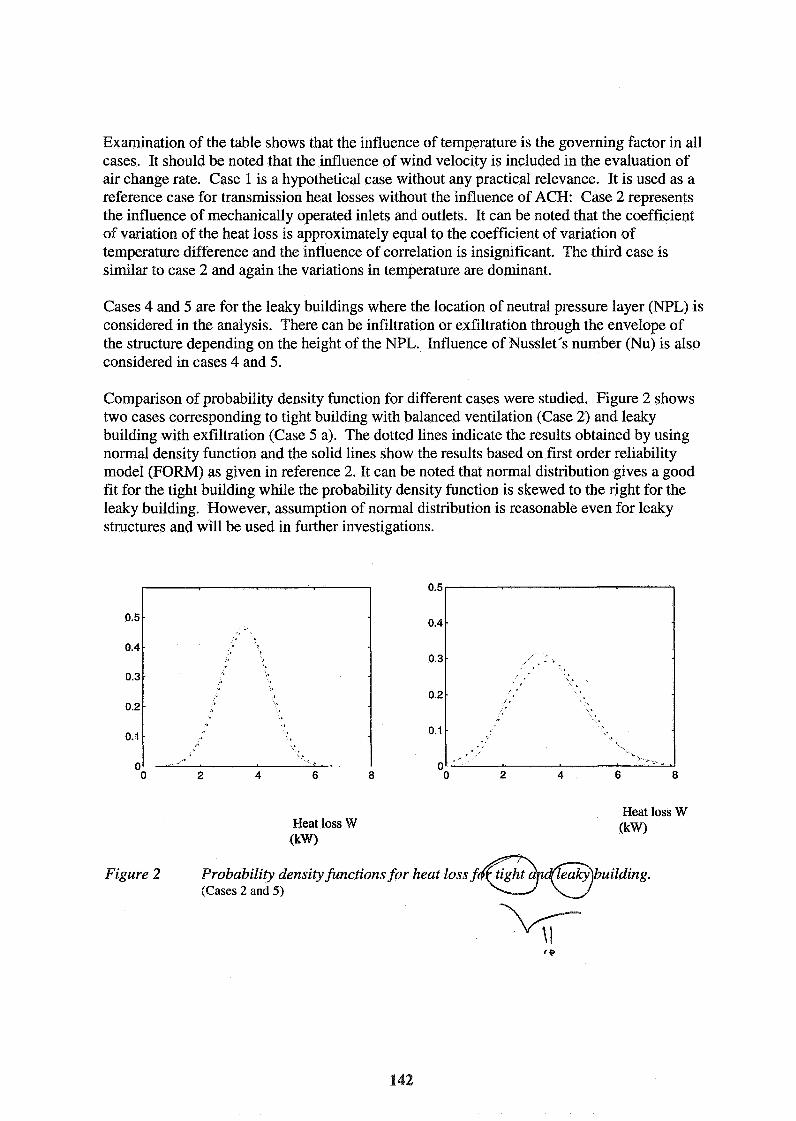
Examination of the table shows that the influence of temperature is the governing factor in all cases. It should be noted that the influence of wind velocity is included in the evaluation of air change rate. Case 1 is a hypothetical case without any practical relevance. It is used as a reference case for transmission heat losses without the influence of ACH: Case 2 represents the influence of mechanically operated inlets and outlets. It can be noted that the coefficient of variation of the heat loss is approximately equal to the coefficient of variation sf temperature difference and the influence of correlation is insignificant. The third case is similar to case 2 and again the variations in temperature are dominant.
Cases 4 and 5 are for the leaky buildings where the location of neutral pressure layer (NPL) is considered in the analysis. There can be infiltration or exfiltration through the envelope of the structure depending on the height of the NPL. Influence of Nusslet's number (Nu) is also considered in cases 4 and 5.
Comparison of probability density function for different cases were studied. Figure 2 shows two cases corresponding to tight building with balanced ventilation (Case 2) and leaky building with exfiltration (Case 5 a). The dotted lines indicate the results obtained by using normal density function and the solid lines show the results based on first order reliability model (FORM) as given in reference 2. It can be noted that normal distribution gives a good fit for the tight building while the probability density function is skewed to the right for the leaky building. However, assumption of normal distribution is reasonable even for leaky structures and will be used in further investigations.
Heat loss W Heat loss W (kW)
(kW)
Figure 2 Probability density functions for heat loss (Cases 2 and 5)

5. CONCLUSIONS
Application of probabilistic model for estimation the heat losses in a building gives us the possibility of taking into account the interactions between ventilation and transmission heat losses. The main conclusions from the work are:
1. The model calculates the first two moments (mean value, standard deviation and correlation) for the heat transmittance coefficient, air change rate and the temperature variations over a specified period of time. It is found that Normal density function is reasonably representative of the heat loss caused by conduction and ventilation.
2, Influence of variations in temperature and air change rate is important for calculating the coefficient of variation of heat loss.
3. Influence of variations in the transmittance properties of the material is not significant for this particular example. This may be due to the fact that small variations in U are assumed in the model.
4. Influence of Nusselt's number on the total variation in the heat loss is also non- significant due to small mean temperature differences and quasi static heat transmittance coefficient.
5. The analysis have shown that correlation between temperature and thermal transmittance does not have any significant influence, while correlation between temperature difference and air change rate is important and should be considered in the caPculations.
6. Further work is needed to develop a model which considers the non-linearities inherent in the analytical model and examine their influence on the total heat loss.
6. ACKNOWLEDGEMENTS
Financial support of the Swedish Council for Building Research (BFR) is gratefully acknowledged.
1. Cramer H, Mathematical methods in statistics. Princeton University Press, N.J. 1946
2. Ditlevsen O., Madsen H.,O., Structural reliability methods, John Wiley & Sons, England, 1996
3. Kohonen R., Kokko E., Ojanen T., Virtanen M., Thermal effects of air flows in building structures, Technical Research Centre of Finland, Laboratory of Heating and Ventilating, Espoo, Finland 1985
4. Pietrzyk K., Risk Analysis of Air Infiltration in a Single Family House (based on full- scale pressure measurements), Thesis for the Degree of Licentiate in Engineering, Building aerodynamics, Chalmers University of Technology, Gothenburg, Sweden, 1995

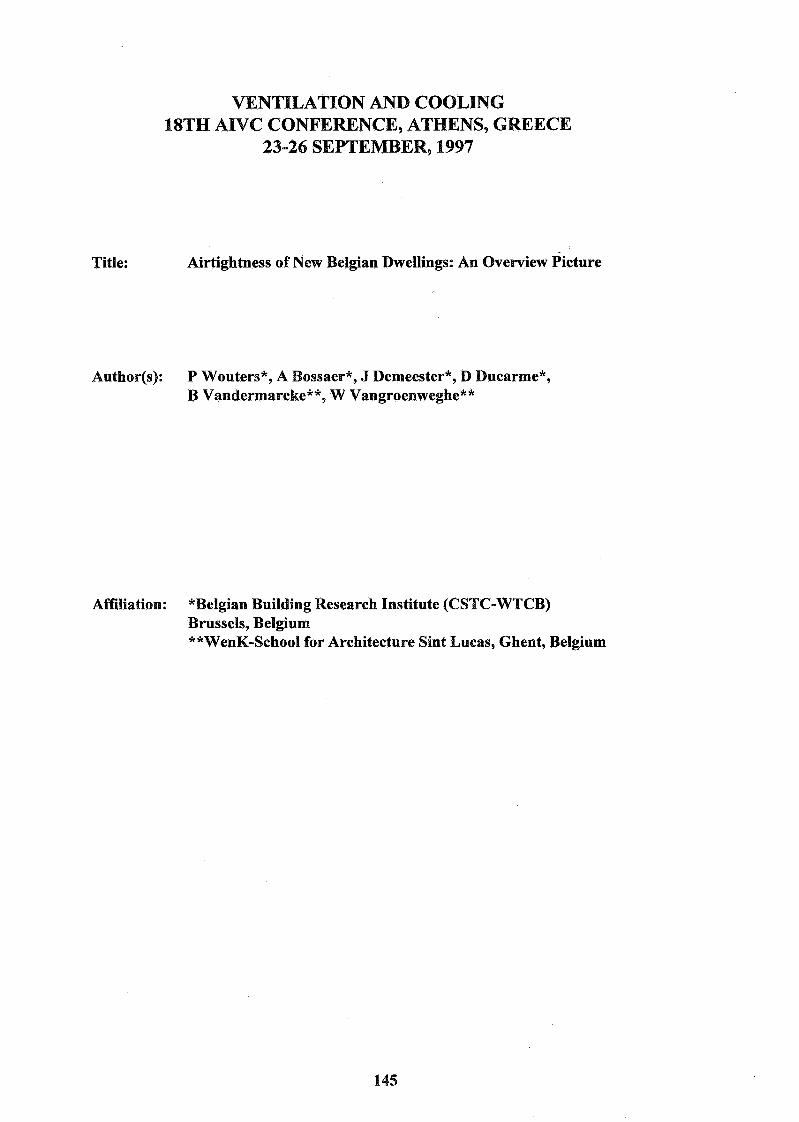
VENTILATION COOLING 18TH AIVC CONFEWNCE, ATHENS, GREECE
23-26 SEPTEMBER, 1997
Title: Airtightness of New Belgian Dwellings: An Overview picture
Author(s): P Wouters*, A Bossaer*, J Demeester*, D Ducarme*, B Vandermarcke*", W Vangroenweghe*"
Affiliation: "Belgian Building Research Institute (CSTC-WTCB) Brussels, Belgium **WenK-School for Architecture Sint Lucas, Ghent, Belgium

AIVC Conference Athens- September 1997
Aidghtness of new Belgian dwellings : an owenriew picture
P. Wouters, A. Bossaer, J. Remeester, D. Ducarnle
Belgian Building Research Institute
B. Vandermarcke, W. Vangroenweghe
WenK - School for Architecture Sint Lucas Gent
July 1997
Table of contents
2. RESULTS OF PRESSURlSATlOiV MEASUREMENTS ................................................................................. 3 ....................................................................................... ....................... 2.1 Global airtightness ..... 3
2.2 Airtightness of the different leakages ......................................................................................... 4
3. VISUAL ESTIMATION OF THE AIRTIGHTNESS ......................................................................................... 6
3.1 Approach ..................................................................................................................................... 6 3.2 Results ....................................................................................................................................... 7
4. CONCLUSIOMS ................................................................................................................................... 8
In the framework of the Flemish Impulse Programme on Energy Technology ( W T ) , the project- called SENVTVV is running from January 1995 till September 1997. The major objective is to obtain a detailed picture of various characteristics of dwellings constructed during the period 1990 - 1995. To achieve this, a representative sample of 200 dwellings is analysed in detail. The final report of this project is expected to be available at the end of 1997. This report gives an overview of detailed measurements carried out in 20 more or less representative recently constructed dwellings in Belgium.
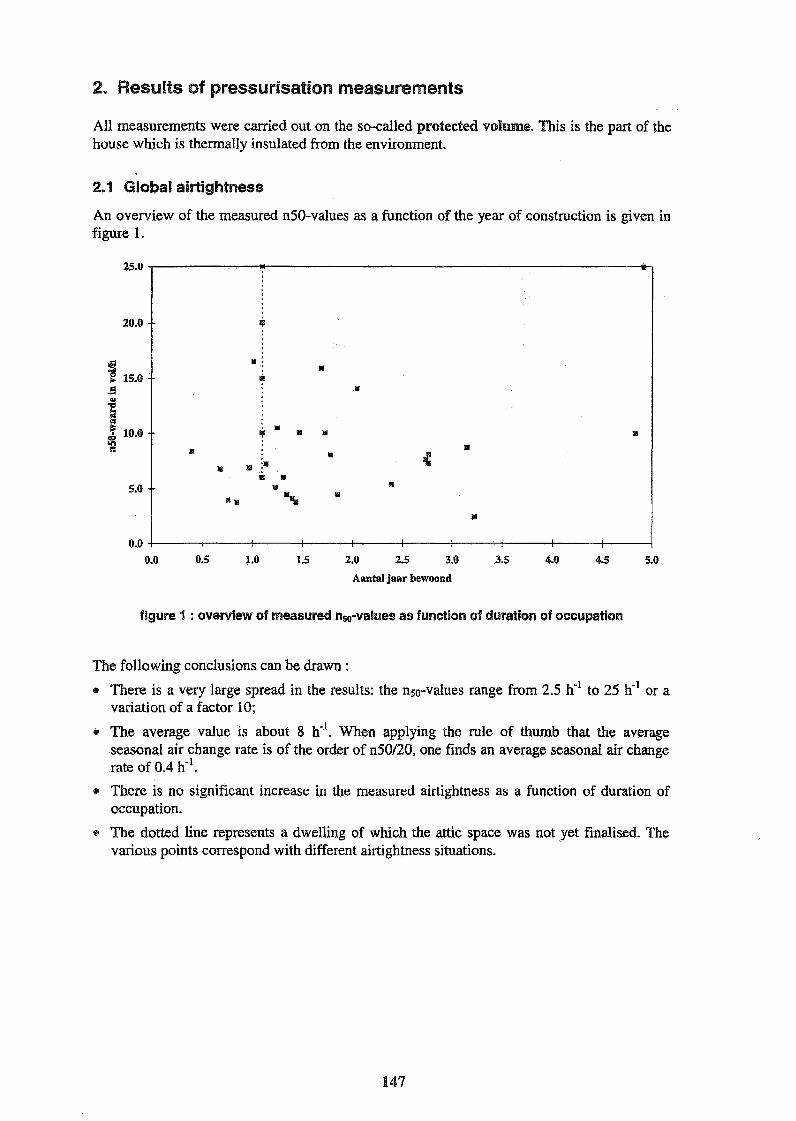
2. Results of presslariisation measurements
All measurements were carried out on the so-called protected volume. This is the part of the house which is thermally insulated from the environment.
2-1 Global airtightness
An overview of the measured n50-values as a function of the year of construction is given in figure 1.
Aantal jaar bewoond
figure 1 : overview of measured nw-values as function of duration of occupation
The following conclusions can be drawn :
1, There is a very large spread in the results: the nso-values range from 2.5 h-' to 25 h-' or a variation of a factor 10;
The average value is about 8 K'. When applying the rule of thumb that the average seasonal air change rate is of the order of n50/20, one finds an average seasonal air change rate of 0.4 h".
e There is no significant increase in the measured airtightness as a function of duration of occupation.
r The dotted line represents a dwelling of which the attic space was not yet finalised. The various points correspond with different airtightness situations.

figure 2 gives the when comparing following :
histogram of the measured n50-values. A substantial difference is found individual dwellings and apartments. The average n50-values are the
@ apartments : n5o = 4.8 h-'
individuaI rowhouses : nso = 6.4 h-'
individual free-standing individual dwellings : n50 = 9.6 h"
Gesloten bebouwing
PBI Appartementen
Open en half-open bebouwing I
figure 2 : histogram of n50-values with splitting up as function of building type
An important information is the location of the leakages. This is discussed in the next paragraph.
2.2 Airtightness of the different leakages
A first important observation is the fact that the most important leakages are situated in the non-occupied spaces : garage, insulated attics,. . .
@ In case a garage exists, it represents about 1 /3 of the total leakage.
e In case of an insulated attic, it represents on the average 50% of the total leakage.
a For a number of dwellings, the n50-value would drop down to less than 30% if the above mentioned spaces would be outside the protected volume.
Besides these very leaky spaces, there are also very airtiat spaces. In most cases, the bedrooms are often very airtight. An overview of the measured QSO-values is presented in figure 3.

figure 3 : measured air flow rates (QW) in the bedrooms
One can observe that 70% of the bedrooms have a QSO-value which is lower than 100 m3/h. On the other hand, 15% of the bedrooms have a Q5O-value which is higher than 500 m3/h. Most of the latter group are bedrooms situated below inclined roofs.
As far as the very airtight bedrooms is concerned, it is clear that the air infiltration through the leakages is insufficient for allowing a good IAQ. Also the bathrooms are often very airtight. This is illustrated in figure 4.
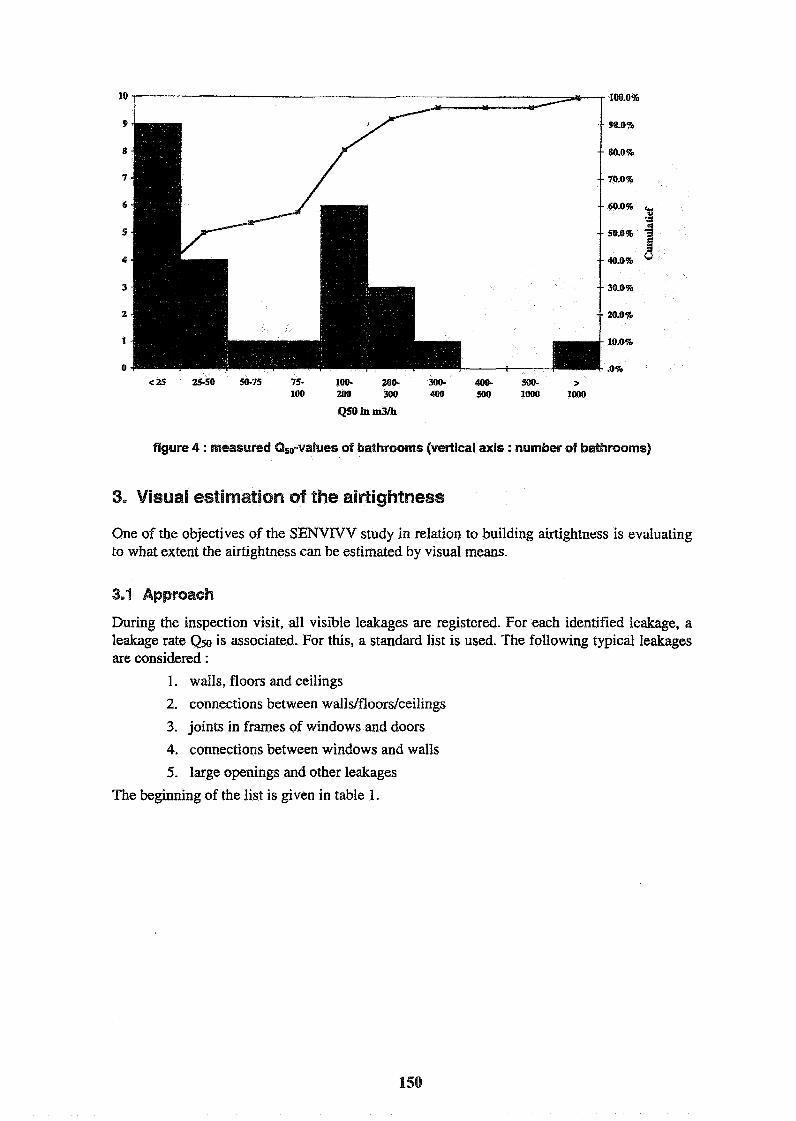
figure 4 : measured Q,p-values of bathrooms {vertical axis : number of bathrooms)
3, Visual estimation of the airtightness
One of the objectives of the SBNVTVV study in relation to building airtightness is evaluating to what extent the airtightness can be estimated by visual means.
3.1 Approach
During the inspection visit, all visible leakages are registered. For each identified leakage, a leakage rate Qso is associated. For this, a standard list is used. The following typical leakages are considered :
1. walls, floors and ceilings
2. connections between walls/floors/ceilings
3. joints in frames of windows and doors
4. connections between windows and walls
5. large openings and other leakages
The beginning of the list is given in table 1.
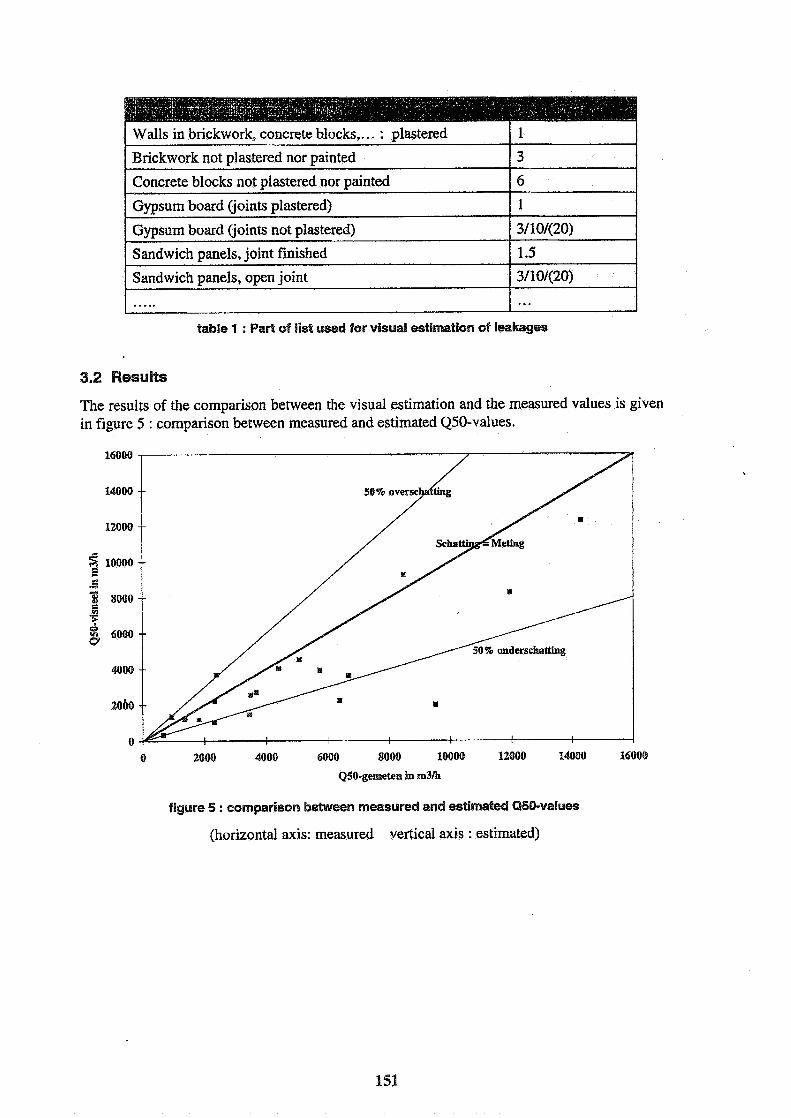
Brickwork not plastered nor painted 1 3 I 1
Walls in brickwork, concrete blocks,. . . : plastered 1
table 1 : Part of list used for visual estimation of leakages
Concrete blocks not plastered nor painted
Gypsum board (joints plastered)
Gypsum board (joints not plastered)
3.2 Results
The results of the comparison between the visual estimation and the measured values is given in figure 5 : comparison between measured and estimated QSO-values.
6
1
3/10/(20)
figure 5 : comparison between measured and estimated QSO-values
(horizontal axis: measured vertical axis : estimated)
Sandwich panels, joint finished
Sandwich panels, open joint
1.5
3/10/(20) I
The following observations can be made :
The estimated Q501value by the visual method is rarely above the measured value (only 3 times), in most cases is there an underestimation.
9 In only 1 case is the estimation more than 50% above the measured value;
In 4 cases is the estimation less than 50% of the measured value.
The results seem to indicate that the visual method allows a quite reafistic estimation of the minimum leakage level.
4. Conclusions
1. The airtightness of recent Belgian dwellings is not at all very good. One explanation is the fact that the owners of many dwellings take care of the finishing of certain parts of the dwelling.
2. For the Belgian context, the visual estimation of the leakage rate seems to allow a first order estimation of the minimum leakage rate of the dwelling.
3. Even in new dwellings constructed after 1990, the presence of purpose provided ventilation supply and exhaust devices is seldom. This is mainly due to the fact that there is not yet a legislation in the Flemish Region imposing such provisions.
5. Acknowledgements
This study is carried out in the framework of the VLIET-SENVTVV project, sponsored by the Flemish Government and by the following companies : Mineral Wool Association (hoglass, Isover, Owens-Coming, Rockwool Lapinus), Glaceries de Saint-Roch, Glaverbel, Air Trade Centre, Alcoa, Aldes, Aralco, Bemal, Duco, Renson, Sobinco, Stork, Ubbink.
The authors would like to thank all the sponsors as well as the occupants of the investigated dwellings for their collaboration.

VENTILATION AND COOLING
Athens, Greece, 23-26 September, 1997
Controlling Ventilation and Space Depressurization in Restaurants in Hot and Humid Climates
James B. Cummings Charles R. Withers
Don B. Shirey
Florida Solar Energy Center 1679 Clearlake Road Cocoa, Florida 32922
USA (407) 638- 1000
Synopsis
Testing was performed in 9 restaurants to identify uncontrolled air flows and pressure imbalances, building and duct system airtightness, building air barrier location, pressure differentials, building air flow balance, and ventilation rates. All restaurants are depressurized under normal operating conditions, ranging from -1.0 to -43 pascals. Space depressurization is a function of exhaust fan flow rates, missing or undersized make-up air, intermittent outdoor air caused by the cycling of air handlers, dirty outdoor air and make-up air filters, and building airtightness. Ventilation rates were found to be high, generally exceeding AS 62-1989 minimum recommended levels. Pressure imbalances and excessive ventilation rates impact energy use, heating/cooling system sizing, indoor comfort and humidity, building moisture damage, mold growth, combustion - equipment problems, and indoor air quality.
The objectives of good restaurant air flow management (in hot and humid climates) are to: 1) achieve positive pressure in the building under a majority of operating conditions, 2) avoid excessive ventilation, and 3) maintain air flow from dining area to kitchen, all while minimizing heatingkooling energy use and achieving acceptable dehumidification ( ~ 6 0 % I3.H most of the time). Recommendations are presented to achieve these objectives.
Symbols and definitions'
ACH50 - a measure of building airtightness, expressed as air changes per hour when the building is depressurized to 50 pascals (with respect to outdoors) by a calibrated fan.
air handler (AH) - in a forced air heating or cooling system, the cabinet which contains the distribution blower and may contain heat exchangers and filters.
d r dhtribution system (ADS) - includes all building elements (ducts, plenums, cavities of the building structure, and mechanical closets) through which air is transferred between the conditioned space and the space conditioning equipment.
backdrafting - a condition where flow in a combustion vent pipe is reversed so that air moves down the vent and into the building. Combustion gases therefore discharge into the space.
Vs @ 50 - a measure of building airtightness, expressed as air flow rate (11s) through leaks in the building envelope when the building is depressurized to 50 pascals by a calibrated fan.
exhaust air @A) - air drawn from a building, typically to remove unwanted elements such as heat, humidity, odors, and combustion fumes.
WAC - heating and air conditioning
W A C - heating, ventilating, and air conditioning.
infiltratiola - air flow across the building envelope, from outdoors to indoor, that is largely unintended. It may be driven by wind, temperature difference, duct leakage, return air imbalance, exhaust fans, clothes dryers, etc. Infiltration may act as a source of ventilation.
) - air pushed into a building to replace EA drawn from the building, is typically unconditioned, delivered in proximity to the EA intake, and is normally operated simultaneously with the EA (both EA and MA controlled by the same odoff switch).
make-up air capture rate - fraction of MA captured by EA before mixing into the building air volume. If 90% of MA is directly captured by the EA, then the MA capture rate is 0.90.
outdoor air (OA) - air moved from outdoors to the return side of the ADS, by the suction of the ADS blower or by a dedicated blower, to provide ventilation to the conditioned space.
uncontrolled air flow - air moving across the building envelope or between zones or compartments of a building, where the pathways of flow, the direction of flow, and the origin of the air are unknown, unspecified, or unintended.
ventilation- the intentional transport of air from outdoors to indoors or the transport of indoor air to outdoors, generally to remove or dilute pollutants and improve indoor air quality.
wrt - = "with respect to". Pressures are expressed as pressure in one location with respect to another location (e.g. "restaurant pressure was -8.4 pascals wrt outdoors").
1. Introduction
Restaurants generally have large exhaust fans, and therefore have the potential to experience space depressurization and high ventilation rates. In hot and humid climates, this combination of space depressurization and a high ventilation rate can produce undesirable consequences related to energy waste, moisture problems, combustion safety, and poor indoor air quality. To avert these problems, MA may be added to offset EA. When properly applied, MA can greatly reduce space depressurization and ventilation rates. When properly controlled, OA can produce positive pressure while achieving acceptable thermal and humidity conditions.
Space depressurization is a function of building airtightness and net exhaust air (EA,, = EA - MA - OA; calculated based on the absolute value of air flows). By use of a chart, building pressure may be determined if airtightness and EA,,, are known (Figure 1; based on chart by John Tooley and Neil Moyer of Natural Florida Retrofit, Inc.). This figure assumes n=0.65 for the equation Q = C(dP)", where Q is EA,, (Us), C is an air flow coefficient, dP is the indoor pressure wrt outdoors (pascals), and n is an air flow exponent. To the extent that n deviates from 0.65, the predicted pressures will be in error. Example; building airtightness is 2000 Us @ 50 and EA,, is 1000 Us. From Figure 1, find the intersection of 2000 Us @ 50 and EA,,, of 1000 Us. The indicated pressure is -17.5 pascals. From the same figure, one can predict approximate building airtightness knowing EA,,, and building pressure. Example; EA,, is 3500 Us and building pressure is -10 pascals. From Figure 1, find the intersection of EA,, of 3500 and building pressure of 10 pascals. Indicated building airtightness is 10,000 Us @ 50.
Building ventilation is a function of exhaust air, make-up air capture rate, and outdoor air, as defined by the following formulas.
Formula 1) If OA > (EA-MA), then ventilation (Us) = OA Dlus non-captured MA (MA that escapes into the room and finds its way into the ADS).
Formula 2) If OA 5 (EA-MA), then ventilation (Us) = (EA-MA) plus non-captured MA.

0
009
000 1
00s l
OOOZ
0092
0006
0096
0009
009P
0009
(99.0 = u sawnsss us43 is~s3ssd u! a~nssa~d aJe sau!l leuo6s!p)
)Jay 3 aJnssaJ6 ssan)y8!jn!v sn MOI~ JJV
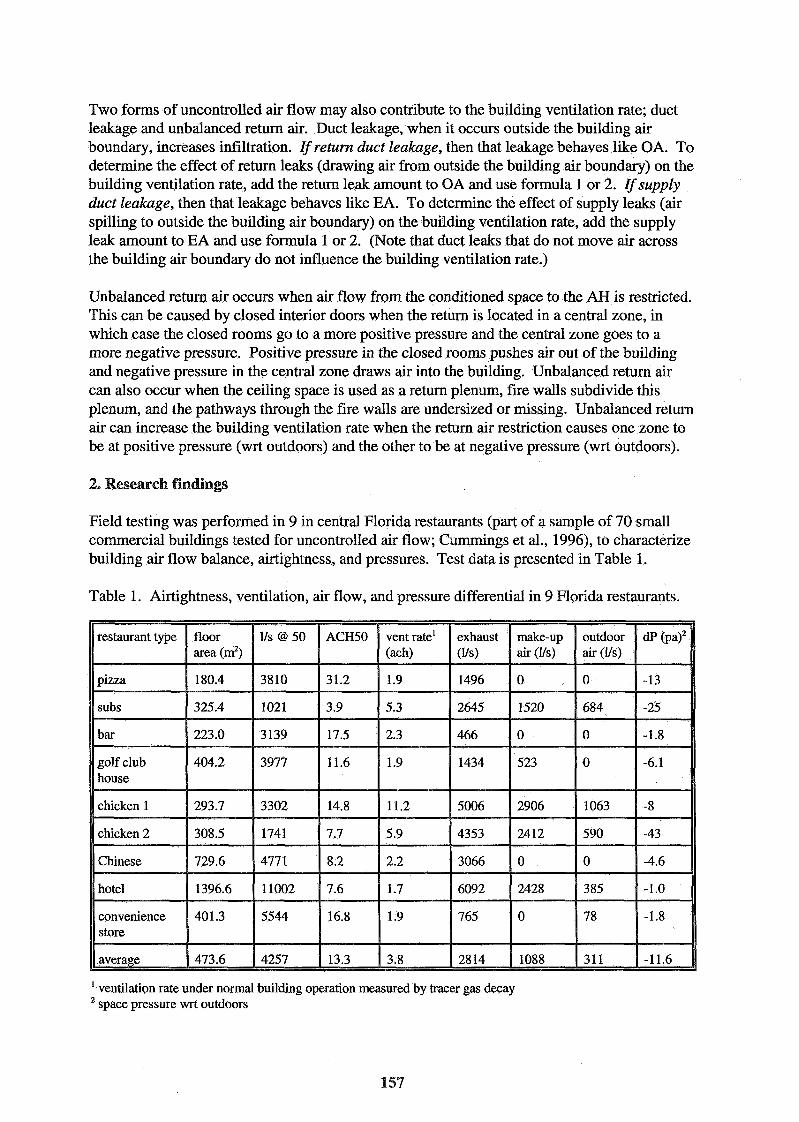
Two forms of uncontrolled air flow may also contribute to the building ventilation rate; duct leakage and unbalanced return air. Duct leakage, when it occurs outside the building air boundary, increases infiltration. lf return duct leakage, then that leakage behaves like OA. To determine the effect of return leaks (drawing air from outside the building air boundary) on the building ventilation rate, add the return leak amount to OA and use formula 1 or 2. ifsupply duct leakage, then that leakage behaves like EA. To determine the effect of supply leaks (air spilling to outside the building air boundary) on the building ventilation rate, add the supply leak amount to EA and use formula 1 or 2. (Note that duct leaks that do not move air across the building air boundary do not influence the building ventilation rate.)
Unbalanced return air occurs when air flow from the conditioned space to the AH is restricted. This can be caused by closed interior doors when the return is located in a central zone, in which case the closed rooms go to a more positive pressure and the central zone goes to a more negative pressure. Positive pressure in the closed rooms pushes air out of the building and negative pressure in the central zone draws air into the building. Unbalanced return air can also occur when the ceiling space is used as a return plenum, fire walls subdivide this plenum, and the pathways through the fire walls are undersized or missing. Unbalanced return air can increase the building ventilation rate when the return air restriction causes one zone to be at positive pressure (wrt outdoors) and the other to be at negative pressure (wrt outdoors).
2. Research findings
Field testing was performed in 9 in central Florida restaurants (part of a sample of 70 small commercial buildings tested for uncontrolled air flow; Cummings et al., 1996), to characterize building air flow balance, airtightness, and pressures. Test data is presented in Table 1.
Table 1. Airtightness, ventilation, air flow, and pressure differential in 9 Florida restaurants.
' ventilation rate under normal building operation measured by tracer gas decay space pressure wrt outdoors
2.1 Ventilation rates
Ventilation rates averaged 3.8 ach under normal operation, ranging from 1.7 to 11.2 ach. Ventilation averaged 25.5 l/s per person in these 9 restaurants and ranged from 6.1 l/s per person to 82.1 l/s per person. ASHRAE Standard 62-1989 (ASHRAE 1989) calls for 10 l/s per person in restaurant dining areas, 15 l/s per person in bars and cocktail lounges, and 8 Us per person in kitchen areas. Four of the 9 restaurants have bars or cocktail lounges. In 3 of these buildings, ventilation falls slightly below the recommended minimum during maximum occupancy. In most of the others, ventilation rates are excessive.
2.2 Depressurization caused by lack of make-up air
Four of the 9 restaurhts have no MA, and 3 of the 4 have no OA. Consequently, these 4 restaurants experience negative pressure whenever the EA operates.
2.3 Depressurization caused by undersized make-up air
MA was provided in 5 of the 9 restaurants, but on average MA was only 51 % of EA and OA was only 17% of EA (with all AHs operating and less if some were not operating). As a result, all 9 restaurants operated at negative pressures which ranged from -1.0 pascal to -43 pascals. The degree of depressurization is a function of the net exhaust air flow rate (Eh,, = EA - MA - OA) and the airtightness of the building. The greater EA,,, and the tighter the building envelope, the greater the building depressurization.
In all of these restaurants, the AHs do not run continuously. Rather they cycle on and off depending upon whether the thermostat calls for cooling or heating. Consequently OA is intermittent, turning on and off depending upon whether the AH is operating. Building pressure, therefore, varies as a function of which heatinglcooling systems are operating.
In chicken restaurant 1, for example, each of the 4 AHs had OA and operated in onloff control depending upon whether the thermostat called for heating or cooling. When all AHs were operating, building pressure was -3 pascals. When AHs were turned off, incrementally one at time, pressure decreased to -6, -9, -13, and -18 pascals. Three consequences of this space depressurization were observed. First, mold growth was occurring behind vinyl wallpaper on exterior walls in this 9 month old building. The mold growth was occurring as humid outside air was drawn into wall cavities, accumulated on cool gypsum board surfaces inside the walls, and was prevented from drying to indoors by the vinyl wallpaper. Second, the gas water heater was backdrafting when building pressure was -9 pascals or greater causing combustion gases to spill into the occupied space. Third, on two occasions, the store owner reported water heater "flame rollout". These events occurred at closing time when the thermostats were changed to higher settings to reduce cooling energy use overnight. Flame roll-out occurs under the following conditions: room pressure is -18 pascals, the water heater is off, the vent pipe is backdrafting, air flow down the vent pipe pushes into the top of the flue (the flue is the vent stack inside the water heater), and then the water heater turns on. Since air is pushing down the flue, gas is pushed out of the burn chamber and combustion occurs partly outside the bottom portion of the water heater. On these two occasions, smoke poured from the water heater closet and staff had to extinguish the fire.
In chicken restaurant 2, two of the 4 ANs had OA. With both AHs operating, building pressure was -43 pascals. With both ANs off, building pressure was -63 pascals. In spite of the strong depressurization, combustion safety and mold problems were not identified. Backdrafting and flame roll-out from the water heater did not occur because it was located in an exterior closet, which was well connected to outdoors and isolated from indoors. When the building was at -63 pascals, the water heater closet was at neutral pressure wrt outdoors. The reason for no mold is uncertain, except that there is considerably less vinyl wallpaper compared to the other chicken restaurant, thereby allowing greater moisture migration through the building envelope.
In both of these restaurants, depressurization was exacerbated by the intermittency of OA. The reader may conclude, therefore, that the controls should be changed so that the AHs operate continuously when the EA operates. This would allow the OA to operate as a reliable form of MA. The problem with this strategy, however, is that continuous AH operation causes poor dehumidification performance, particularly with fixed-capacity cooling systems. This poor performance results from evaporation of moisture from the coil and drain pan during the periods when the compressor turns off (Khattar et al., 1987; Henderson et al., 1992). Depending upon the length of the compressor on-cycle, moisture collecting on the cooling coil may not have time to exit the pan before the compressor turns off and evaporation begins. Indoor relative humidity levels often increase by 10 percentage points or more as a result of continuous blower operation. In addition, moisture-laden outdoor air is supplied to the space when the compressors cycle off but the AHs continue to operate, further increasing indoor relative humidity during hot and humid weather conditions.
2.4 Depressurization due lo dirty oubide air and make-up air filters
In the sub sandwich restaurant, building air flow imbalance occurred as a result of dirty filters. These filters had not been cleaned or replaced in the 8 months since the building was constructed. At start-up, the HVAC contractor had demonstrated that the building was operating at positive pressure by showing smoke flowing out through a window. However, in the intervening months, building pressure had become progressively more negative (the authors surmise) as the filters became progressively more dirty. The building was operating at -25 pascals at the time it was tested. When the filters were cleaned or replaced, building pressure rose to -2 pascals. Two major consequences of depressurization were observed. First, the pilot light of the instantaneous gas water heater was repeatedly blown out by severe backdrafting in the water heater vent pipe resulting in unavailability of hot water. Restaurant staff had identified that opening an exterior door would allow lighting the pilot light and operation of the heater long enough to do washing. Second, sewer gas was entering the men's bathroom because of the -25 pascal pressure and a toilet that was improperly sealed to the sewer line.
In the convenience store, 765 Vs kitchen EA operated with no MA and limited OA. Intakes grills for the OA were located under an exterior eave unknown to store staff, and behind the grills were OA filters which had not been cleaned in years. The filters were clogged so total OA was only 77.9 Vs for combined cooling capacity of 61.5 kW (17.5 tons).

3. Solutions
There are several objectives of good restaurant air flow management; 1) achieve positive pressure in the building under a majority of operating conditions, 2) maintain flow of air from the dining area to the food preparation area, 3) avoid excessive ventilation, 4) minimize heating and cooling energy use, and 5) control the cooling system so that it achieves acceptable dehumidification ( ~ 6 0 % RH most of the time). Achieving all of these objectives simultaneously is complicated. Following is one set of strategies to meet these objectives.
Positive pressure can be achieved by providing combined MA and OA greater than EA. As a first step, EA should be as small as possible while still meeting exhaust and ventilation requirements. As a second step, MA should be sized as large as possible, but normally not sized greater than 80% of EA. MA is sized at 80% or less of EA so that the food preparation area will be depressurized wrt to the dining area, air will flow from the dining area to the kitchen, and a large majority of the MA will be captured by the EA. To complete the building air flow balance, OA equal to 21 % to 25% of EA should be provided to the dining area, thus enhancing air flow toward the kitchen.
Excessive ventilation is avoided by providing MA to a location proximate to both the cooking appliances and EA intake so that a large proportion of the MA is captured by the EA. Optimal design would indicate that the cooking appliances be located between the MA discharge and EA intake. MA discharge should be located as close as possible to the EA intake while still permitting capture of the vast majority of the heat, humidity, odors, grease, and combustion fumes associated with cooking, but not discharging onto restaurant staff or affecting pilot lights or burners. In hot and humid climates, care must be taken to avoid condensation of moisture contained in MA on interior surfaces.
HAC loads are minimized by minimizing ventilation (no more ventilation than is necessary), not conditioning MA, and optimizing design so that a maximum proportion of MA is captured by EA. [Note that modulation of EA flow in response to cooking intensity by means of fan speed controllers in conjunction with temperature and smoke density sensors is also an option.]
Finally, the cooling system control must meet two performance criteria: 1) provide OA to the space when the EA is operating and 2) control indoor temperature and relative humidity within acceptable limits. It is possible to have the AH blowers operate continuously whenever the EA is operating. In fact, it is not uncommon for commercial building AHs to operate continuously. However, this approach can seriously compromise the dehumidification performance of the cooling system as a result of evaporation of moisture from the coil and drain pan (see Section 2.3). One solution is to separate (to a large extent) space conditioning from ventilation, as follows.
Designate one heatinglcooling system to treat OA. Its task is to provide conditioned OA to the dining area, and it will be controlled to operate simultaneously with EA and MA. While the AH blower will operate continuously in step with EA, the cooling compressor will cycle according to the requirements of the dining room thermostat. In order for the compressor to operate a large fraction of the time so that the OA will be cooled and dehumidified during hot and humid summer months, this designated OA unit can be controlled on the first stage of the thermostat. For example, if the thermostat setting for the dining area is 23.3"C, then the first
stage operation could control the compressor for the designated OA unit to operate at say 22.2"C. On most warm and hot days of the year, the compressor for this OA unit would then operate most of the time, thereby providing good dehumidification. The other cooling systems serving the dining area would not have OA and they would be controlled on the second stage at a 23.3"C setting. [Note that this control is best achieved by use of a two-stage thermostat. Use of individual thermostats with each set at different temperatures may be ineffective because the thermostat settings may differ or change over time, causing the compressor of the designated OA system to not operate a large proportion of the time and therefore not effectively dehumidify the OA.]
4. Wrap up
Field research has identified problems in restaurants associated with air flow balance, space depressurization, and HVAC system control. These problems can be characterized as primary or secondary consequences. Primary consequences are space depressurization and excessive ventilation rates. These primary consequences, in turn, cause secondary consequences including moisture accumulation in building cavities, combustion safety problems associated with backdrafting and flame roll-out, drawing sewer gases into the building, high relative humidity, moisture damage to building materials, and moldmildew growth.
A strategy has been presented for avoiding space depressurization and excessive ventilation. This involves providing unconditioned MA in proximity to the EA at about 80% of the EA flow rate and providing OA equal to about 21% to 25% of EA into the dining space, thus creating positive pressure in the building and enhancing air flow from dining area to kitchen. OA is provided by means of a dedicated OA heatinglcooling system. The AH blower for this unit would operate continuously during EA operation. The compressor or heating source for this unit would cycle in response to the first stage of the thermostat so that the system would effectively dehumidify the OA during most hours of the year.
5. Acknowledgments
Funding for this research was provided by the State of Florida Energy Office.
6. References
American Society of Heating, Refrigerating and Air-Conditioning Engineers (ASHRAE) Standard 62-1989. "Ventilation for Acceptable Indoor Air Quality", Atlanta, Georgia, USA, March, 1989.
Cummings, J.B., Withers, C.R., Moyer, N., Fairey, P., and McKendry, B. "Uncontrolled Air Flow in Non-Residential Buildings; Final Report", FSEC-CR-878-96, Florida Solar Energy Center, Cocoa, Florida, USA, April, 1996.
Henderson, H.I., Rengarajan, K., and Shirey, D.B. "The Impact of Comfort Control on Air Conditioner Energy Use in Humid Climates", ASH Transactions 1992, Vol. 98, Part 2.
Khattar, M.K., Swami, M.V., and Ramanan, N. "Another Aspect of Duty Cycling: Effects on Indoor Humidity", ASH Transactions 1987, Vol. 93, Part 1.

VENTILATION AND COOLING
18TH ANNUAL AIVC CONFERENCE ATHENS, GREECE, 23-26 SEPTEmER 1997
A Design Tool for Natural Ventilation
Charlotte Svensson Ssrren Aggerhoh
J&W Consulting Engineers Slagthuset S-2 1 1 20 Malmo Sweden
Danish Building Research Institute, SBI Dr Neergaards Vej 15 DK-2970 Hiarshoh Denmark
A DESIGN TOOL FOR NATU VENTILA~ON
Synopsis A ditKculty when designing natural ventilation in office buildings is the lack of simple design tools.
In order to be able to predict natural ventilation air flow rates and indoor air temperatures at the design stage, a computer model has been developed within the EU-JOULE project NatwentTM. The program is an integrated model with a thermal and an air flow model coupled together. It can be used early in the design process to determine possibilities and restrictions in the use of natural ventilation in an office building.
The most important objectives while developing the program have been to create a robust underlying theoretical model and an easy-to-use interface. Set in the Windows environment, the required input data are easily overviewed at all times. A key issue has been to use indata which are easy to quante, even at an early stage in the design process.
The paper discusses briefly the theoretical model as well as the NatventTM computer program.
The program will be subject to extensive user tests during the autumn of 1997 and will be released in the spring of 1998.
1 Introduction In many countries there is a turn towards natural ventilation as an alternative to sometimes energy and cost demanding mechanical ventilation systems. The objective is to save money and energy while maintaining an acceptable indoor air quality and thermal climate, or even to improve the indoor environment by reducing noise levels and giving the user more control over the indoor climate etc.
The aim of the EC-JOULE project ~ a t ~ e n t ~ ~ is to overcome technical barriers to low- energy natural ventilation in office-type buildings in moderate and cold climates. To identify the perceived barriers, a number of structured interviews among leading designers and decision makers, in each of the seven participating countries, have been made (Aggerholm, 1997). Many of the interviewees have given the development of a simple design tool, such as an easy-to-use computer program, as a key issue.
In order to meet this need and to be able to predict natural ventilation air flow rates and indoor air temperatures at the design stage of the process, this computer model was developed within the NatventTM project. The program is an integrated model with a thermal and an air flow model coupled together.
The design tool was developed at J&W Consulting Engineers in Sweden in co-operation with the Danish Building Research Institute, SBI.
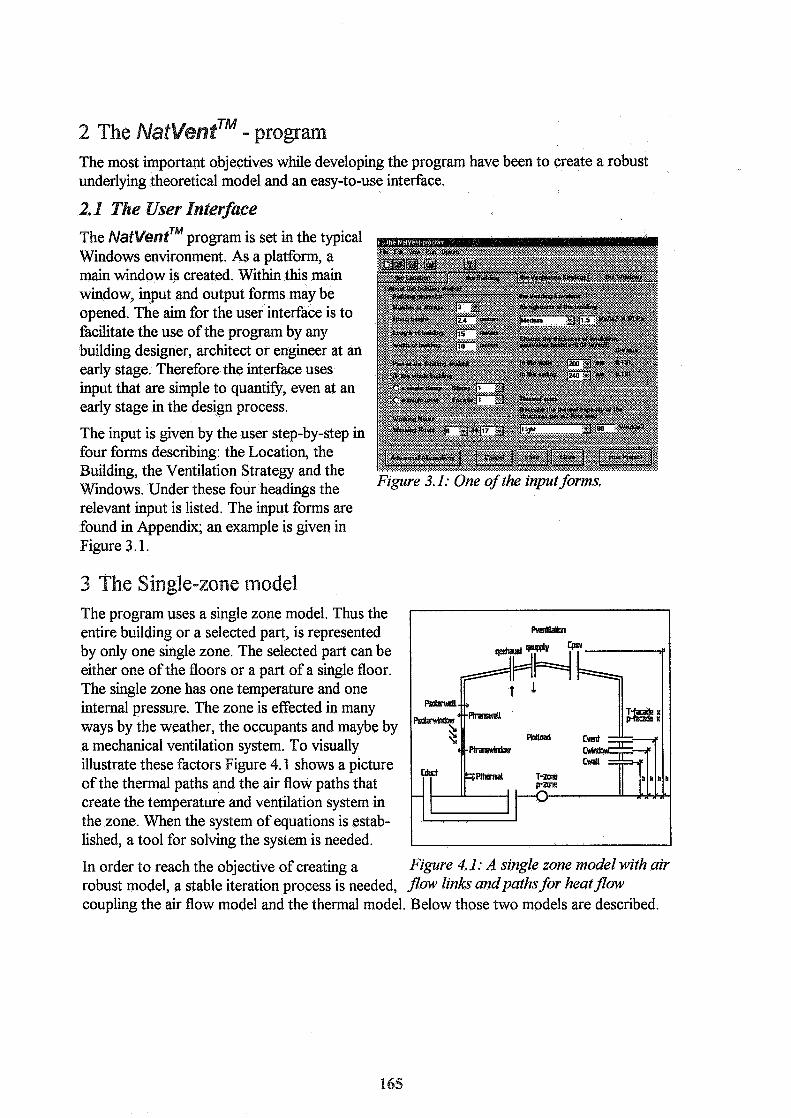
2 The mtventTM - program The most important objectives while developing the program have been to create a robust underlying theoretical model and an easy-to-use interface.
2.1 The User Interface The ~ a t ~ e n t ~ ~ program is set in the typical Windows environment. As a platform, a main window is created. Within this main window, input and output forms may be opened. The aim for the user interface is to facilitate the use of the program by any building designer, architect or engineer at an early stage. Therefore the interface uses input that are simple to quantifl, even at an early stage in the design process.
The input is given by the user step-by-step in four forms describing: the Location, the Building, the Ventilation Strategy and the Windows. Under these four headings the relevant input is listed. The input firms are found in Appendix; an example is given in Figure 3.1.
3 The Single-zone model The program uses a single zone model. Thus the entire building or a selected part, is represented by only one single zone. The selected part can be either one of the floors or a part of a single floor. The single zone has one temperature and one internal pressure. The zone is effected in many ways by the weather, the occupants and maybe by a mechanical ventilation system. To visually illustrate these factors Figure 4.1 shows a picture of the thermal paths and the air flow paths that create the temperature and ventilation system in the zone. When the system of equations is estab- lished, a tool for solving the system is needed.
Figure 3.1: One of the input forms.
In order to reach the objective of creating a Figure 4.1: A single zone model with air robust model, a stable iteration process is needed, flow links andpathsfor heatflow coupling the air flow model and the thermal model. Below those two models are described.
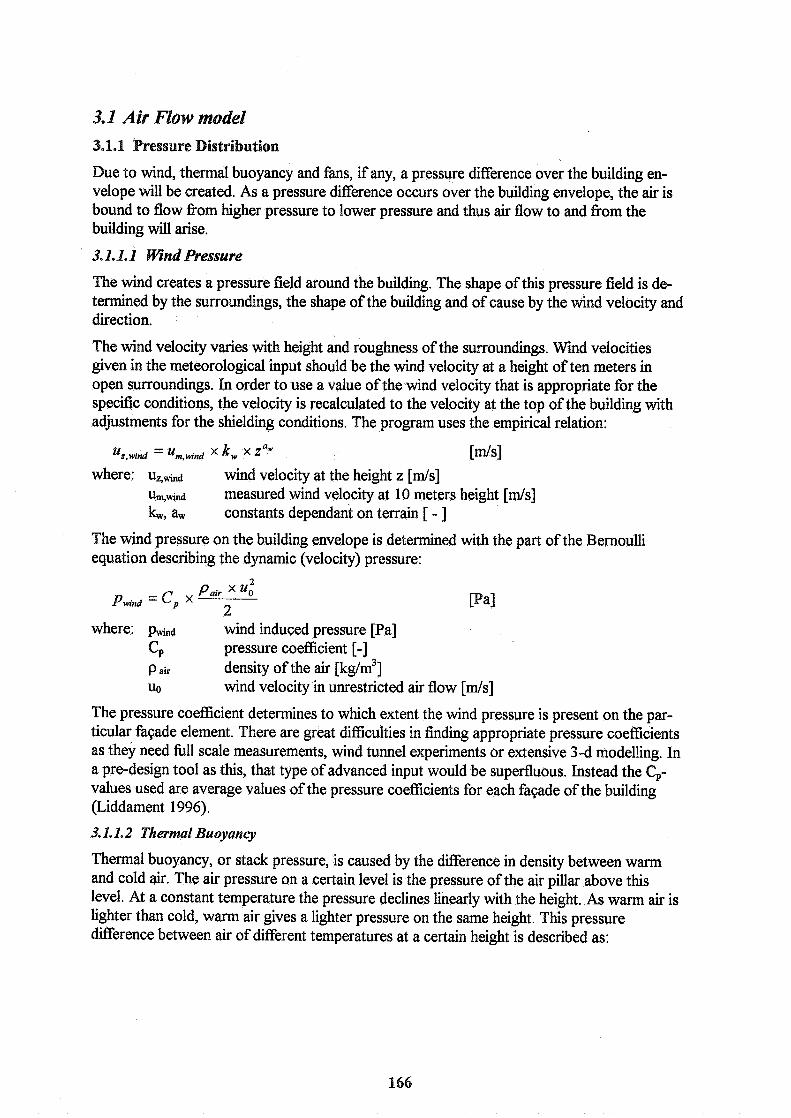
3.1 Air Flow model 3.1.1 Pressure Distribution
Due to wind, thermal buoyancy and fans, if any, a pressure difference over the building en- velope will be created. As a pressure difference occurs over the building envelope, the air is bound to flow from higher pressure to lower pressure and thus air flow to and from the building will arise.
3.1.1.1 Wind Pressure
The wind creates a pressure field around the building. The shape of this pressure field is de- termined by the surroundings, the shape of the building and of cause by the wind velocity and direction.
The wind velocity varies with height and roughness of the surroundings. Wind velocities given in the meteorological input should be the wind velocity at a height of ten meters in open surroundings. In order to use a value of the wind velocity that is appropriate for the specific conditions, the velocity is recalculated to the velocity at the top of the building with adjustments for the shielding conditions. The program uses the empirical relation:
'z,wind = 'rn,wind x k , x zaW Eds1 where: u 5 ~ wind velocity at the height z [ d s ]
u measured wind velocity at 10 meters height [ d s ] kw, a, constants dependant on terrain [ - ]
The wind pressure on the building envelope is determined with the part of the Bernoulli equation describing the dynamic (velocity) pressure:
where: pwind wind induced pressure pa ] CP pressure coefficient [-I P air density of the air [kg/m3] uo wind velocity in unrestricted air flow [rnls]
The pressure coefficient determines to which extent the wind pressure is present on the par- ticular faeade element. There are great difficulties in finding appropriate pressure coefficients as they need kll scale measurements, wind tunnel experiments or extensive 3-d modelling. In a pre-design tool as this, that type of advanced input would be superfluous. Instead the Cp- values used are average values of the pressure coefficients for each faqade of the building (Liddament 1 996).
Thermal buoyancy, or stack pressure, is caused by the difference in density between warm and cold air. The air pressure on a certain level is the pressure of the air pillar above this level. At a constant temperature the pressure declines linearly with the height. As warm air is lighter than cold, warm air gives a lighter pressure on the same height. This pressure difference between air of different temperatures at a certain height is described as:
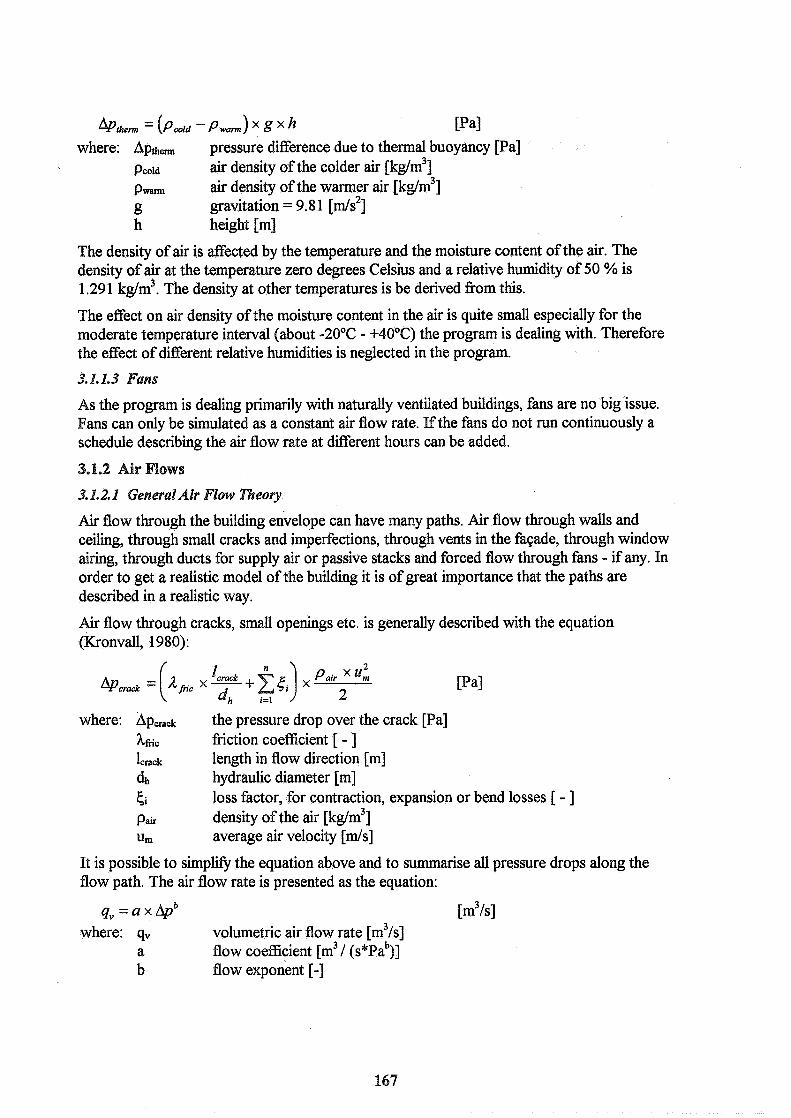
P a l where: Aph pressure difference due to thermal buoyancy [Pa]
P C O ~ ~ air density of the colder air [kg/m3] Pwann air density of the warmer air [kg/m3] g gravitation = 9.8 1 [m/s2] h height [m]
The density of air is affected by the temperature and the moisture content of the air. The density of air at the temperature zero degrees Celsius and a relative humidity of 50 % is 1.291 kg/m3. The density at other temperatures is be derived fi-om this.
The effect on air density of the moisture content in the air is quite small especially for the moderate temperature interval (about -20°C - +40°C) the program is dealing with. Therefore the effect of different relative humidities is neglected in the program.
3.1.1.3 Fans
As the program is dealing primarily with naturally ventilated buildings, fans are no big issue. Fans can only be simulated as a constant air flow rate. If the fans do not run continuously a schedule describing the air flow rate at different hours can be added.
3.1.2 Air Flows
3.1.2.1 General Air Flow Theory
Air flow through the building envelope can have many paths. Air flow through walls and ceiling, through small cracks and imperfections, through vents in the fagade, through window airing, through ducts for supply air or passive stacks and forced flow through fans - if any. In order to get a realistic model of the building it is of great importance that the paths are described in a realistic way.
Air flow through cracks, small openings etc. is generally described with the equation (Kronvall, 1980):
2
&crack = ('fk P a i r ' n
2 Pa l
where: Apcrack the pressure drop over the crack [Pa] kc friction coefficient [ - 1 ]crack length in flow direction [m] dh hydraulic diameter [m] 5i loss factor, for contraction, expansion or bend losses [ - ] Pair density of the air [kg/m3] Urn average air velocity [rn/s]
It is possible to simplifl the equation above and to summarise all pressure drops along the flow path. The air flow rate is presented as the equation:
q,, =axApb [m3/s] where: q,, volumetric air flow rate [m3/s]
a flow coefficient [m3 / ( s * ~ a ~ ) ] b flow exponent [-I

3.1.22 Air Flow throirgh the Building Envelope
The air leakage is specified, by the user, by choosing a low, medium or high air tightness. The program suggest an area related air leakage (l/s/m2), which is typical for the specific country. The flow coefficient is calculated fiom the air leakage data available with:
qleak %uild a = Pcrack 1000 x 50'3~~
where: Pcrack mean of outdoor and indoor densities [kg/m3] qleak air leakage expressed as leakage per square meter and second [l/s/m2] Abuild envelope area [m2]
The air leakage is distributed evenly over the walls and the ceiling. The floor is assumed to be an airtight construction. A flow exponent of 0.67 is empirically chosen, since many measurements on building envelopes show that this is a good estimation.
3.1.2.3 Air Flaw through Vents
The pressure drop through a sharp edged hole in a thin wall can be described as pick's equation):
- &crack 4, - Pcrack ' d
P crack Ekg/sl
where: q, mass air flow rate through the crack [kg/s] Ahole equivalent area of the hole [m2] c d coefficient of discharge = 0.6 [ - ] pcrack mean value air density of the internal and the external air
The equation is assumed to be applicable to the vents in the building. For the vents an equivalent area is given. These equivalent areas can normally be found in the manufacturers' specifications. The vents are by default placed at a height of two meters above the floor.
3.1.2.4 Air Flow through CVindavs and Skylight
The same principle as for the vents is applicable also for the windows. The difference is, as. the window can be opened or closed, a schedule is needed. As a default the openable win- dows are open (ajar) during working hours and closed during the night. To describe a win- dow ajar, it is assumed that 10 % of the open window area is actually open.
A large opening such as a window may have air flow that differs in direction top to bottom. To enable the option of a two way flow through the window, it is simulated as two links, one bottom half and one top half. The height of these links are on '/4 respectively % of the height of the window.
3.1.2.5 Air Flow through Ducts
There are two kind of ducts: supply air ducts and passive stacks. They both include air flow through ducts and they are treated in a similar way. In the ducts the friction losses are not neglectable, but a considerable part of the total pressure drop.
where: Apduct total pressure loss for the duct [Pa]

Apwd, pressure loss for a sharp edged hole, calculated as before [Pa] Apfiictim pressure loss due to fiction [Pa]
In order to use a realistic pressure drop over the ducts the friction part is studied. When cal- culating the fiction losses the air velocity of the previous time step is used. The friction losses are calculated separately for each ductlstack.
3.1.3 System of Equations
The criteria for solving the infiltration part of the equation system is that at all times there should be mass balance in the zone. The criteria for mass balance in the calculation is set to a maximum difference for Eq, of 0.0001 kg/s. This can be illustrated with:
where: qms*(t) mass flow for a certain link at time = t [kg/s]
The mass flow for each different link is calculated, as established earlier, with a non-linear equation written on the form:
where: &link = PO - P,nd + &them, [Pal where: po unknown internal pressure at ground level [Pa]
The solution of the system must be found iteratively, where the internal pressure is the un- known parameter that are to be found. This is done by using the Newton-Raphson method. By setting a starting value of the po, new approximations are made with:
where: f (Po) = i [a &L ] link=l
For each time step the calculated internal pressure for the previous time step is used as a start value. As for the first time step the internal pressure = -1 Pa is used.
3.2 Weath er data Three types of weather data files are used in the program:
- Summer design weather data for estimation of maximum room temperatures in hot summer design periods.
- Winter design weather data for estimation of minimum ventilation rates in calm temperate winter design periods.
- Actual weather data measured or from test or design reference years. These weather data could be used either for design purpose (duration graph) or for estimating the average ventilation rates or room temperatures for a period.
The weather data files includes hourly values of external air temperature, direct beam solar radiation, difise solar radiation on the horizontal, wind speed and wind direction.

The design weather data files can be generated by the program assuming period stationary weather with the same weather conditions each day in the period. The external air tempera- ture is described by a sinusoidal curve where the average temperature, the daily maximum temperature and the peak hour are specified by the user of the program. The direct beam solar radiation and the d i i s e solar radiation on the horizontal are calculated for clear sky conditions from the solar constant dependent on the latitude of the location, the time of the day and year and the turbidity of the atmosphere. The solar radiation data are only necessary for summer design. The wind speed and direction are assumed to be constant for the period and are specified by the user.
3.3 Solar radiah'on modd The solar radiation on external wall; and the roof and the insolation through windows and skylight is calculated either from actual weather data e.g. in a test or design reference year or from summer design weather data generated for a stationary hot, calm, clear sky period. Solar radiation are not calculated in case of winter design of the ventilation system.
The solar radiation is calculated from the direct beam solar radiation and from the d i i s e solar radiation on the horizontal, included in the weather data file. In calculating the diffuse radiation on the building clear sky conditions are assumed to simpld$ the calculation and avoiding the need for shadow conditions data. The solar radiation on the building also includes radiation reflected from the ground assuming a reflectance factor of 0.2. The direct beam solar radiation is neglected if the solar altitude is less than the horizon angle using 10" horizon angle in case of surrounding buildings and trees with half the height of the actual building and 25" in case of surrounding buildings and trees with the same height as the actual building.
The calculation of insolation through the windows and the skylight takes into account the type of glazing, the shading from overhangs and the effect of solar shading e.g. curtains, venetian blinds or protective glazing as specified by the user of the program.
3.4 Thermal model The thermal model is a one zone, one time constant model. In the model it is assumed that all internal structures and surfaces have the same temperature and that the internal air temperature can be averaged to one air temperature representing the hole building or zone.
The heat exchange between the internal surfaces and the air is calculated assuming a heat transfer coefficient of 3 wlm2 K and a total surface area of 4 times the floor area. The active heat capacity can be selected in a table by the user from the possibilities: very light, light, heavy and very heavy, or filled in directly by the user in TWm2 K.
The internal heat gains and the insolation is assumed to be supplied half to the surfaces and half to the room air. The heat loss through the windows, through the skylight and by ventilation is assumed to be from the room air. The heat loss through external walls and roof and the transmission of solar radiation through the same constructions are assumed to be coupled to the internal surface temperature. The calculation takes into account the U-value of the constructions and the absorption of solar radiation on the external surfkces.
4 Future Development During the autumn of 1997 extensive user tests will be performed by another member of the NatventTM consortium. These tests will aim to validate the results fiom the program and to give parametric studies of different office types. The program will also be available to the other NatventTM members during the autumn, to make evaluation of the user interface possible. The stability of the iteration process will also be evaluated. The final version of the program will be released in the spring of 1998.
5 Acknowledgements This paper is an output from the atv vent^^ project which is part fbnded by the European Commission DGXI within the JOULE programme 1994-1998 and under contract JON- GT95-0022. The work is also partly fbnded by the Swedish Council for Building Research under contract 950442-9.
6 References Aggerholm S, 1997, Barriers to Natural Ventilation Design of OfJice Buildings, Proceedings of the 18th NVC conference, Greece
CEN TC 156/WG2/AHG4/N6 and N4, 1995, Calculation Methods for the Determination of Air Flow Rates in Dwellings (Drafo, European Committee for Standardisation, Brussels, Belgium
Kronvall J, 1980, Air Flows in Building Components, Div. of Building Technology, Lund Institute of Technology, Lund, Sweden
Liddament M, 1996, A Guide to Energy Efficient Ventilation, AIVC
Orme M, Liddament My Wilson A, 1994, An Analysis and Data Summary of the AlVC 's Numerical Database, Technical Note 44, AIVC
Svensson C, i%e NatventTMprogram -Fundamentals, AB Jacobson & Widmark, Malmo, Sweden. To be published in the spring of 1998.
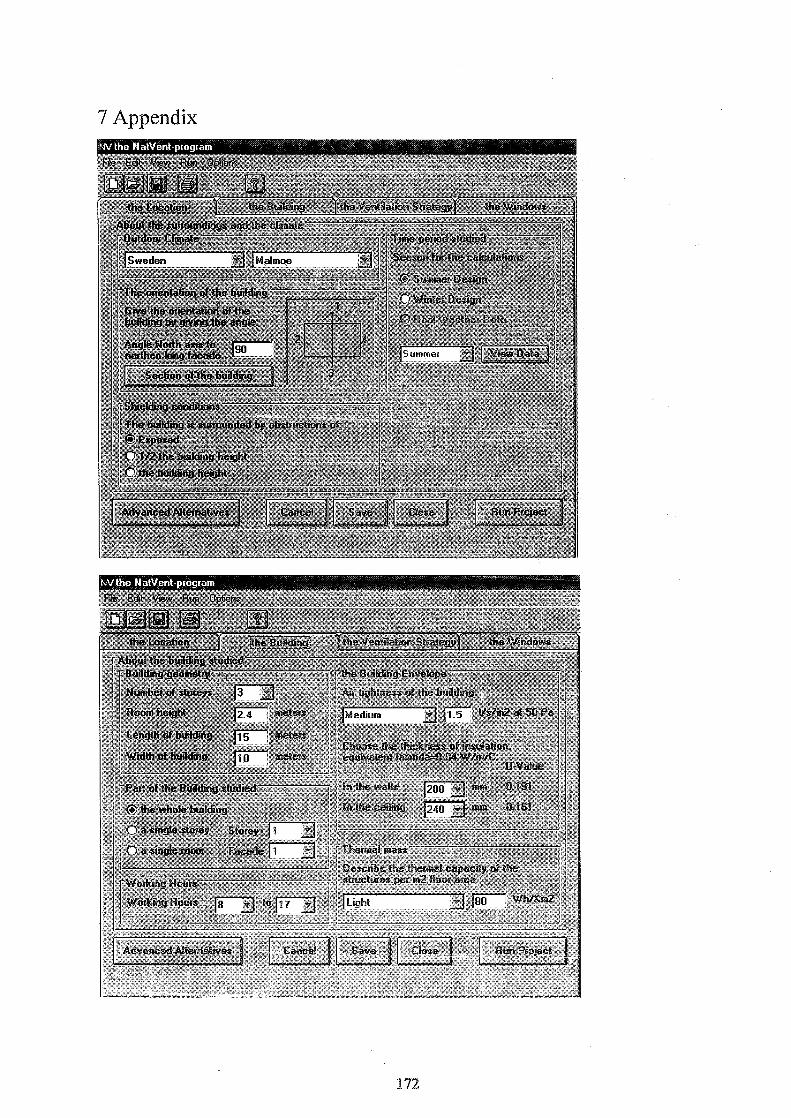
7 Appendix
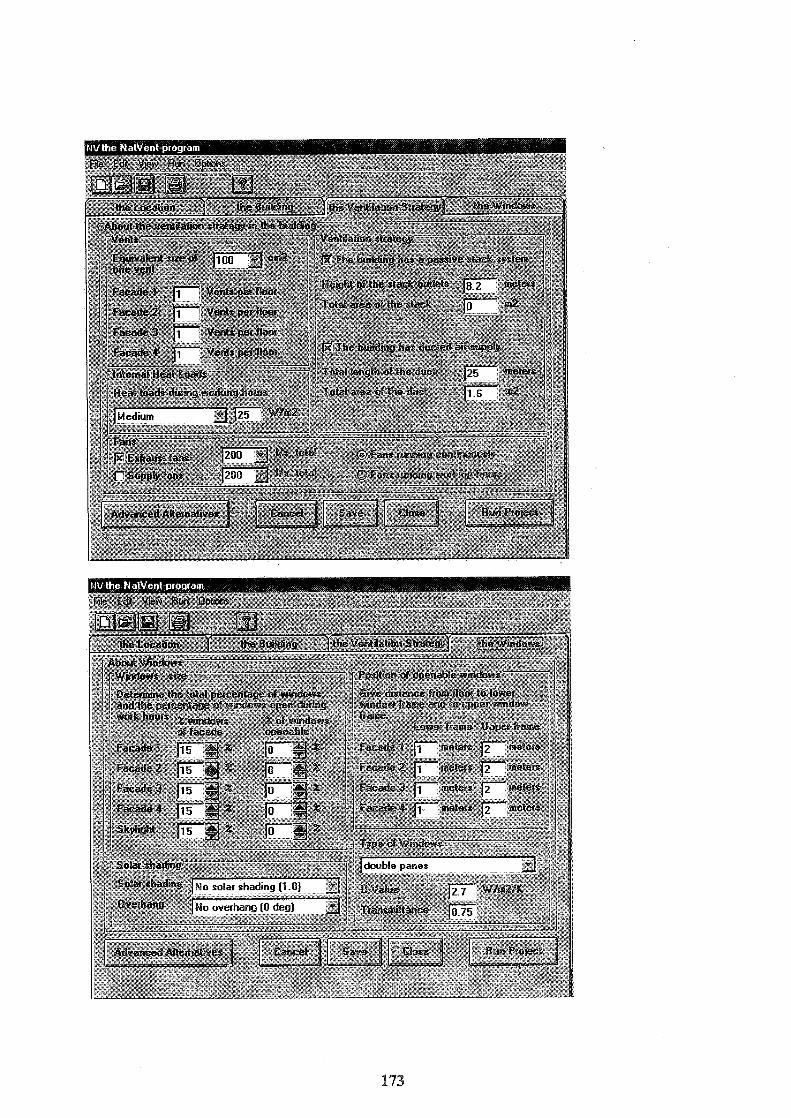

(Title)
(Authors)
I VENTILATION AND COOLING
18TH ANNUAL AIVC CONFERENCE ATHENS, GREE
Passive cooling by natural ventilati buoyancy forces
G.R. Hunt & P.F. Linden
(Affiliation) Department of Applied Mathematics and Theoretical Physics The University of Cambridge Silver Street Cambridge CB3 9EW
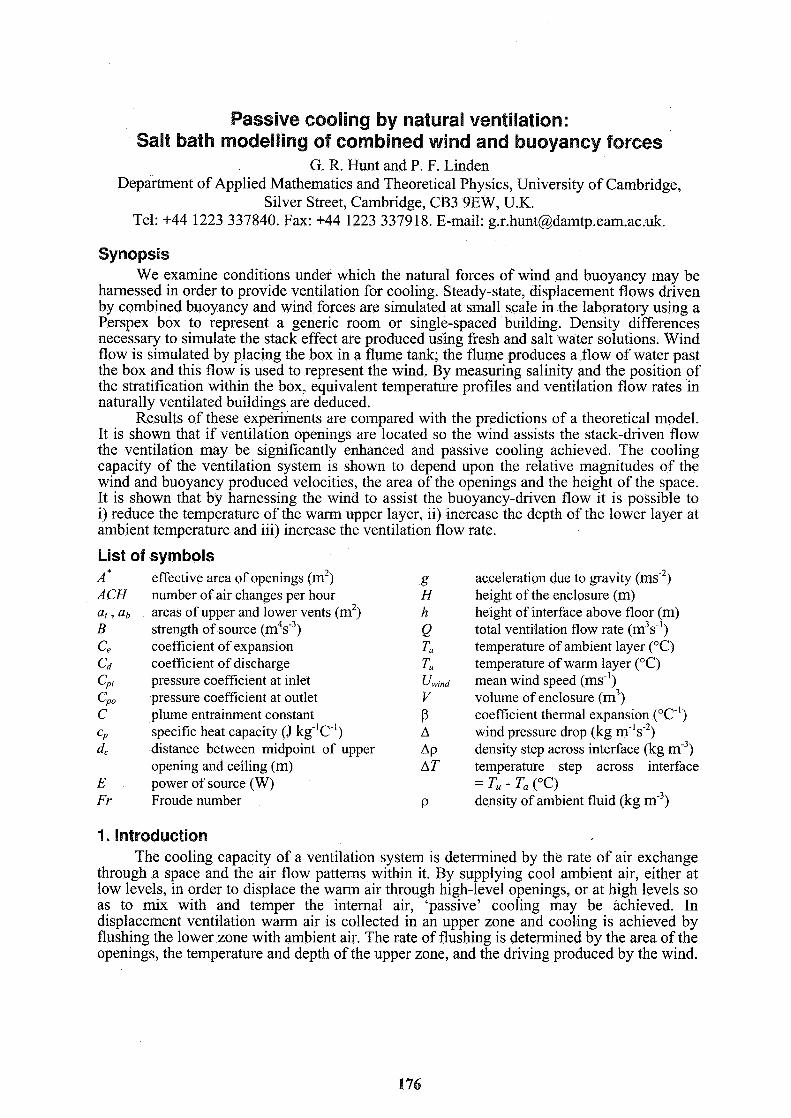
Passive cooling by natural ventilation: Salt bath modelling of combined wind and buoyancy forces
G. R. Hunt and P. F. Linden Department of Applied Mathematics and Theoretical Physics, University of Cambridge,
Silver Street, Cambridge, CB3 9EW, U.K. Tel: +44 1223 337840. Fax: +44 1223 337918. E-mail: [email protected].
Synopsis We examine conditions under which the natural forces of wind and buoyancy may be
harnessed in order to provide ventilation for cooling. Steady-state, displacement flows driven by combined buoyancy and wind forces are simulated at small scale in the laboratory using a Perspex box to represent a generic room or single-spaced building. Density differences necessary to simulate the stack effect are produced using fresh and salt water solutions. Wind flow is simulated by placing the box in a flume tank; the flume produces a flow of water past the box and this flow is used to represent the wind. By measuring salinity and the position of the stratification within the box, equivalent temperature profiles and ventilation flow rates in naturally ventilated buildings are deduced.
Results of these experiments are compared with the predictions of a theoretical model. It is shown that if ventilation openings are located so the wind assists the stack-driven flow the ventilation may be significantly enhanced and passive cooling achieved. The cooling capacity of the ventilation system is shown to depend upon the relative magnitudes of the wind and buoyancy produced velocities, the area of the openings and the height of the space. It is shown that by harnessing the wind to assist the buoyancy-driven flow it is possible to i) reduce the temperature of the warm upper layer, ii) increase the depth of the lower layer at ambient temperature and iii) increase the ventilation flow rate.
List of symbols A* effective area of openings (m2) ACH number of air changes per hour a, , ab areas of upper and lower vents (m2) B strength of source (m4s-3) ce coefficient of expansion c d coefficient of discharge C,, pressure coefficient at inlet C,,, pressure coefficient at outlet C plume entrainment constant
c~ specific heat capacity (J kg-'C-') dc distance between midpoint of upper
opening and ceiling (m) E power of source (W) Fr Froude number
acceleration due to gravity ( m ~ - ~ ) height of the enclosure (m) height of interface above floor (m) total ventilation flow rate (m3s-I) temperature of ambient layer ("C) temperature of warm layer ("C) mean wind speed (ms-I) volume of enclosure (m3) coefficient thermal expansion ("C") wind pressure drop (kg m-Isw2) density step across interface (kg m-3) temperature step across interface = Tu - To ("C) density of ambient fluid (kg m")
The cooling capacity of a ventilation system is determined by the rate of air exchange through a space and the air flow patterns within it. By supplying cool ambient air, either at low levels, in order to displace the warm air through high-level openings, or at high levels so as to mix with and temper the internal air, 'passive' cooling may be achieved. In displacement ventilation warm air is collected in an upper zone and cooling is achieved by flushing the lower zone with ambient air. The rate of flushing is determined by the area of the openings, the temperature and depth of the upper zone, and the driving produced by the wind.

If the system is designed to take advantage of the prevailing driving forces then energy may be saved as the periods in which mechanical cooling is needed may be reduced.
For stack-driven flows to be effective, the upper zone must be maintained at a depth and temperature sufficient to drive a ventilating flow at the required rate. The ventilation rate may be enhanced by increasing the depth and temperature of the upper layer, however, careful design is needed to ensure that occupants are not exposed to the high air temperatures and pollutant levels carried in this layer. If the area of the openings is too small or if their location is not carefully chosen the upper layer can descend to the occupied levels of the building which can have a dramatic effect on indoor air quality. The size and location of the ventilation openings and their effect on the depth and temperature of the upper zone must therefore be considered at the design stage of a naturally ventilated building to ensure the required ventilation will be provided. This task is further complicated as, over the majority of the year, the additional driving produced by the wind must also be taken into account.
In order to develop an understanding of temperature distribution and air movement within naturally ventilated enclosures a laboratory technique has been developed, see for example [1], which accurately reproduces stack-driven ventilation flows in small-scale models of buildings in water tanks. This technique, which is often referred to as the 'salt- bath' technique, has now been extended to include flows driven by the combined forces of. wind and buoyancy, see for example [2]. In parallel with the development of these laboratory techniques, simple theoretical models have been developed which provide further insight into the parameters controlling these flows.
A theoretical model for natural ventilation flows in an enclosure containing a localised source of heat on the floor of the space is presented by [l] who show that a steady-state displacement flow is established when openings are made at high and low levels. The stratification developed consists of two homogeneous fluid layers, a warm upper layer and a lower layer at ambient temperature, separated by a horizontal interface. A key result of [I] is that the depth h of the layer at ambient temperature is determined by entrainment intoihe rising thermal plume and can be increased only by increasing the dimensionless area A lH of the openings :
where the 'effective' area of the openings A* is given by
H is the total height of the space, C, and Cd denote the coefficients of expansion and discharge, respectively, C (= 0.14) is a constant dependent upon the entrainment into the plume, and a, and at, denote the respective areas of the upper and lower openings. Their results show that increasing the strength B of the source increases the temperature step across the interface but it does not alter the position of the interface. It has been shown by [3] that this latter result holds for any number of buoyant sources.
In this paper, we extend the work of [I] by considering the effect of a flow of wind past an enclosure containing a point source of heat. We focus our attention on steady-state displacement flows driven by buoyancy forces assisted by wind and present the results of laboratory experiments. These results are compared with the predictions of a theoretical model.
2. Laboratory Experiments Laboratory experiments to simulate steady-state air flow patterns and temperature
profiles in naturally ventilated buildings were conducted in a Perspex box (29.5 cm long, 25 cm high and 15 cm wide) which was suspended in a flume tank (length 2.65 m x width

0.30 m x depth 0.57 m) filled with fresh water. The box was used to represent a generic building or room and the large volume of water contained in the flume represented the external environment. The box had a number of circular holes in both windward and leeward faces and the total area of these ventilation openings could be varied by removing plastic plugs from the holes.
To simulate stack-driven flows, brine and fresh water were used to create density differences; brine is denser than fiesh water and therefore the buoyancy forces act downwards. In order to model a localised source of heat in a building, brine was injected continuously, and at a constant rate, through a circular nozzle in the top of the box. This fluid descended as a turbulent plume and is the analogue of a thermal plume rising in air from a source of heat.
Wind flow past the box was simulated by a flow of water in the flume tank. The flow of water generated by the flume flowed around the box and resulted in a 'wind' pressure drop A between the windward and leeward openings which was measured using a manometer tube; details of this procedure are given in [4].
Flows were visualised by adding dye to the brine injected into the box and using a shadowgraph. The dye colours only the salty fluid so that regions of dense fluid (coloured) and regions of fluid at ambient density (uncoloured) can be clearly distinguished. The shadowgraph enhances the contrast between regions of different density and allows fine scale structures in the flow to be seen.
An experiment was started by removing a number of plugs from openings in the box, at high-level on the windward face and at low-level on the leeward face, and supplying dense salt solution to the plume. After some time a steady-state flow was established. The height of the interface and the density difference between the ambient fluid and the salty layer of fluid inside the box were then measured. Ventilation rates and equivalent temperature differences for air flows in buildings were then deduced from these measurements, see $4.
Using the techniques described to create wind and buoyancy forces it was possible to simulate natural ventilation flows for a wide range of conditions. The effect of the wind speed on the ventilation rate and stratification was examined by varying the mean flow speed in the flume; the effect of the strength of the heat source was examined by increasing the density and volume of salt solution injected into the box, and the effect of the area of the openings was investigated by varying the number of openings in the box.
3. Theoretical model In order to determine the steady-state height h of the interface and the temperature of
the warm zone when a displacement mode of ventilation is assisted by wind we make use of the theory of transient, wind-assisted displacement flows developed by [5] and apply the method described by [I]. By matching the flow in.a turbulent plume with the flow driven through an enclosure by a warm upper layer, taking into account the additional driving produced by the wind, it is possible to show that the steady-state density step across the interface may be expressed as
and the height of the interface may be deduced from
where Fr denotes the Froude number

The derivation of expressions (3)-(5) is given in [6]. The Fry~de number is a measure of the relative magnitudes of the wind-produced velocity (Alp) and the buoyancy-produced velocity (B/H)"~: for Fr << 1 buoyancy provides the dominant driving force and for Fr >> 1 wind forces dominate the ventilation flow.
The theoretical model (3)-(5) predicts that when a displacement flow is assisted by wind, the height of the interface h/H is dependent upon entrainmen; into the rising plume, the wind pressure drop A, the dimensionless area of the openings A lH and the strength B of the heat source. This is in contrast to flows driven by buoyancy forces alone where the position of the interface is independent of the strength of the source and depends only upon entrainment into the plume and the dimensionless area of the openings, see equation (1).
4. Application to building ventilation The steady-state temperature distribution in a naturally ventilated enclosure may be
determined from the model as follows. First, the power E (Watts) of the heat source in the space must be converted into an equivalent source strength B using
where the physical properties of \he ambient air at 15 OC are P = 3 . 4 8 ~ 1 0 ~ ~ "c-' , c p = 1012 J kg-'C1 and p = 1.225 kg m . The wind pressure drop is related to the square of the wind speed, and hence, the Froude number (5) may be expressed as
where Uwind denotes the mean wind speed, and Cpi and Cp, denote the pressure coefficients at the inlet and outlet openings, respectively. By specifying the area of the openings and the height of the space, the height h of the interface separating the warm and cool layers of air can now be predicted from (4). Alternatively, a minimum acceptable interface height, e.g. h = H/2, may be specified by the designer and the area of openings required to achieve this height predicted from (4).
The density step Ap across the interface (3) can be converted into an equivalent temperature difference using the equation of state, namely, Aplp = - P(T,-T,), where T, and T, denote the respective temperatures of the warm upper layer and the cool lower layer. Substituting for (6) into (3) yields the temperature of the warm layer of air, namely
/ ' 2 1 3
Thus, by raising the height of the interface and/or reducing the power output of the heat source it is possible to decrease the temperature of the upper layer, and hence, passively cool the space.
Ventilation rates in buildings are normally expressed in terms of the number of air changes per hour ACH, and hence, if V is the total volume of the enclosure we have
5. Results and Discussion Results of the laboratory experiments are now described and compared with the
theoretical predictions. In order to avoid confusion, these results will be described assuming the direction of motion in the plume is upwards as it is for the case of a thermal plume rising from a heat source in a building.

In the absence of wind, the plume ascends entraining ambient fluid as it rises. Due to entrainment, the volume of fluid carried in the plume increases with height and its temperature decreases. On reaching the ceiling of the space the plume spreads horizontally creating a layer of warm air that gradually increases in depth and temperature and drives a flow through the enclosure. Inflow of cool ambient air is through the low-level openings and outflow of warm air is through the upper openings and thus a displacement flow is set-up. A steady state is eventually established when the ventilation flow rate through the space is equal to the flow rate in the plume at the height of the interface which separates the warm and cool layers of air. The upper layer is then well-mixed and its temperature is identical to the temperature in the plume at the height of the interface.
a) Effect of wind speed. If the low-level openings are located in regions of positive wind pressure and the leeward openings in regions of negative wind pressure then the effect of a flow of wind around the building is to raise the height of the interface toward the ceiling. The interface continues to rise until a new steady-state flow is established. Both the depth and temperature of the warm upper layer are then less than for the no-wind case and the ventilation flow rate through the enclosure is increased. These effects are illustrated schematically in figure 1. Increasing the wind speed is equivalent to increasing the Froude
Wind 1
B B ( 4 (b)
Figure 1. Schematic diagram showing the effect of wind on the interface height, temperature and flow rate established by displacement ventilation in an enclosure, a) stack-driven flow, and b) stack-driven flow assisted by wind.
14.00 14.50 15.00 15.50 16.00 16.50 17.00 17.50 18.00
Temperature (OC)
Figure 2. Typical temperature profiles for displacement flows driven by a) buoyancy forces alone (Fr = 0), note the interface at approximately hlH= 0.25, and b) buoyancy forces assisted by wind (Fr = 9), note the interface at approximately hlH = 0.4. The temperature step between the upper and lower layers is significantly reduced in b). In both a) and b) A*/H~ = 4.3x10-~, B = 2.3x10-~ m4s-3.

number and it has been demonstrated during the experiments that the displacement mode of ventilation is maintained for a wide range of Froude numbers. Typical temperature profiles, deduced from measurements of salinity, are illustrated in figure 2, where it can be seen that the wind has increased the depth of the ambient layer and decreased the temperature step across the interface.
b) Effect of opening area. Passive cooling may also be achieved by increasing the dimensionless area of the openings. The effect of an increase in the dimensionless area of the openings on the steady-state interface height and upper layer temperature is shown in figure 3. The experimental measurements are shown by symbols and the theoretical predictions by the continuous line. For a fixed wind speed and source strength, the interface height rises as the dimensionless area of the openings is increased (figure 3a). As a consequence of the rise in the interface height, the temperature (figure 3b) of the warm upper layer decreases and the ventilatiop rate increases. A factor of two increase in the dimensionles. area of the openings A / H ~ represents the equivalent of a factor of two increase in the area A of the openings or a factor of 2-'" decrease in the height of the space.
Figure 3. Effect of opening area: a) dimensionless interface height hlH vs. dimensionless area of the openings A * / H ~ ; b) dimensionless temperature step across the interface ATIAT,,, vs. dimensionless area of openings A*lk12. AT,,,,, is the difference in temperature between the ambient air and the air in the plume at ceiling height.
c) Effect of source strength. An increase in the source strength B results in a decrease in the Froude number, see (5), and hence, buoyancy forces become more significant and the depth of the ambient layer decreases (figure 4a). Furthermore, as B increases the temperature of the upper layer increases (figure 4b) thereby enhancing the buoyancy-driven flow and the overall ventilation flow rate. In this case cooling may be achieved only by decreasing the source strength. If, for example, we consider a wind speed of 2 ms-' incident with a building 5m in height then, in figure 4b, a non-dimensional source strength of 0.5~10- corresponds to a temperature step across the interface of approximately 12°C in air (assumins T, = 15°C and C,, - Cpo=l). Increasing the non-dimensional source strength to 1x10- results in a temperature step of approximately 20°C.
The interface height depends weakly upon the source strength as a large increase in B produces only a relatively small decrease in the interface height. However, the temperature step across the interface, and hence, the temperature of the upper layer, is strongly dependent upon the source strength.
Paradoxically, the effect of reducing the Froude number by increasing the strength of the source is to increase the ventilation flow rate through the enclosure. Recall that a reduction in the Froude number which results from a decrease in the wind speed decreases the ventilation flow rate (see fj5b). These results are described in greater detail in [6].

0.00 ! 0.00 0.50 1.00 1.50 2.00 2.50
Non-dimensional source strength (x lo-*) 0.00 0.50 1.00 1.50 2.00 2.50
Non-dimensional source strength (x 1 0-')
Figure 4. Effect of source strength: a) dimensionless interface height hlH vs. dimensionless source strength and b) dimensionless temperature step across the interface ATgpHl(A1p) vs. dimensionless source strength B/(H(A~~)~'').
6. Conclusions Displacement flows driven by buoyancy forces assisted by wind have been simulated at
small scale in the laboratory and the results of these experiments compared with the predictions of a theoretical model. The theoretical predictions are in good quantitative agreement with experimental measurements and the model may be used to estimate temperature profiles and ventilation flow rates within naturally ventilated buildings. Air flow and temperature conditions within an enclosure have been found to be dependent upon the relative magnitudes of the wind and buoyancy produced velocities (i.e. the Froude number), the area of the openings and the height of the space. Displacement flows established by a point source of buoyancy on the floor of the space are maintained for a wide range of Froude numbers when low-level openings are located in regions of positive wind pressure and high- level openings are located in regions of negative wind pressure. In this case, wind flow has a three-fold effect on the buoyancy-driven flow in the space: an increase in the wind speed i) raises the height of the interface above the floor of the space, thereby increasing the depth of the layer at ambient temperature; ii) results in a decrease in the temperature of the buoyant upper layer and iii) increases the ventilation flow rate through the enclosure. An increase in the strength of the heat source: i) decreases the depth of the layer at ambient temperature, ii) increases the temperature of the upper layer and iii) increases the ventilation flow rate. The height of the stratification is one of the main design parameters for displacement ventilat?on and by raising the height of the interface the reduced temperature of the upper layer may be used to provide additional cooling of the building fabric. In addition a greater area of the fabric is exposed to the ambient air thereby increasing the potential for cooling.
Acknowledgements The authors would like to thank the Building Research Establishment for their financial
support of this project through the Department of the Environment's Energy Related Environmental Issues (EnREI) in Buildings programme.
References 1. LINDEN, P.F., LANE-SERFF, G.F. and SMEED, D.A. "Emptying filling boxes: the fluid mechanics of natural ventilation" J. Fluid Mech., 212, 1990,300-335.
2. HUNT, G.R., LINDEN, P.F., KOLOKOTRONI, M. and PERERA, M.D.A.E.S. "Salt bath modelling of air flows" Building Sewices Journal, CIBSE, January 1997,43-44.

3. LINDEN, P.F. and COOPER, P. "Multiple sources of buoyancy in a naturally ventilated enclosure" J. Fluid Mech., 311, 1996, 177-192.
4. HUNT, G.R. and LINDEN, P.F. "Laboratory modelling of natural ventilation flows driven by the combined forces of buoyancy and wind" To be published as proceedings of the CIBSE National Conference 1997.
5. HUNT, G.R. and LINDEN, P.F. "The fluid mechanics of natural ventilation - displacement ventilation by buoyancy-driven flows assisted by wind" Building & Environment (in press).
6. HUNT, G.R. and LINDEN, P.F. "Steady-state flows in an enclosure ventilated by buoyancy forces assisted by wind" J. Fluid Mech. (submitted).
bpic
Rectangle


VENTILATION AND COOLING
18TH ANNUAL AIVC CONFlERENCE NS, GRIEECE, 23-26 SEPTEMBER, 1997
OR PASSIVE STACK VENTlLATlOlrl
.-- 0
S.B. Riffaf, 6. Gan*, L. Shao*, K. Siren*., A. Oliveira**^, C. Afonso*** and P. Kofoed****
* institute of Building Technology, Department of Architecture and Building Technology, University of Notlingham, UK
* * Laboratory of Heating, Ventilation and Air-conditioning, Helsinki University of Technology, Espoo, Finland
*** Department of Mechanical Engineering and Industrial Management,
University of Porto, Portugal
**** Sulzer lnfra Lab Ltd, Zurcherstrasse 46,CH-8401 Winterthur, Switzerland
HEAT-PIPE HEAT REeOVERY FOR PASSWE STACK VENTIMTION
SYNOPSIS
Four types of heat-pipe heat recovery systems were tested for application in passive stack ventilation. The effects of fin shape, pipe arrangement and air velocity on the heat recovery effectiveness were investigated. The air velocity was found to have a significant effect on the effectiveness of heat recovery; the effectiveness decreasing with increasing air velocity.
The pressure loss coefficient for heat pipe units was also determined. It was found that at low velocities for natural ventilation the pressure loss coefficient decreased with increasing air velocity but the total pressure loss increased with the velocity. It is recommended that in naturally-ventilated low-rise buildings, without the wind effect or solar energy, the design duct mean velocity should be less than 1 m/s in order for a heat recovery system to function properly. The use of a solar chimney and/or wind turbine could increase the range of air velocity and so the amount of heat recovery.
Ventilation accounts for 30% or more of space conditioning energy demand but as much as 70% of this energy can be recovered by the use of ventilation heat recovery systems [I]. Until now, effort has mainly been devoted to the design and development of heat recovery systems for mechanically-ventilated buildings. However, most domestic buildings are naturally ventilated and little consideration has been given to heat recovery from these buildings. A crucial parameter that limits the use of heat recovery with natural ventilation is pressure loss. The total pressure loss through a natural ventilation system should be much lower than in a mechanical ventilation system so that sufficient air flow can be achieved in the building. A system employing heat pipes would have the potential to provide substantial heat recovery without significant pressure loss.
A heat-pipe heat recovery unit is a heat exchanger consisting of externally-finned sealed pipes using a working fluid such as methanol or water. The unit is divided into two sections, i.e., the evaporator and the condenser, for heat exchange between exhaust and supply air (see Fig. 1). In addition to low flow resistance, a heat-pipe heat exchanger has a number of other advantages over conventional heat exchangers such as high reliability, no cross-contamination, compactness and suitability for both heating and cooling.
The objective of this study is to assess the performance of heat-pipe heat recovery units for naturally-ventilated buildings. The effectiveness of four heat-pipe units was measured in a two-zone chamber. The pressure loss characteristics of the units were determined by CFD modelling as well as measurement.
EFFEGFWENESS OF HEAT RECOVERY
The effectiveness of a heat-pipe heat recovery unit for sensible heat exchange between supply and exhaust air of the same flow rate, E (%), is defined as:
where T, and T, are the temperatures of inlet air before and supply air after the condenser section of heat exchanger in the supply duct (OC) respectively, and T, is the temperature of return air before the evaporator section of heat exchanger in the exhaust duct ( O C ) .
Measurements of the effectiveness were carried out in a vertical two-zone test chamber with a heat-pipe heat recovery unit. The two-zone chamber was designed to allow good mixing of supply air with room air in the lower zone and maintain a uniform temperature and concentration of return air in the upper zone. This ensured the reliability of temperature and air flow measurements.
Temperatures up and downstream of the heat recovery unit in both supply and exhaust ducts were measured using thermocouples (type T). The temperatures were recorded by a data logger. The air flow rate was measured using the constant-injection tracer-gas method [2].
Test chmber
Fig. 2 shows the schematic diagram of the test chamber. The chamber was made of plywood insulated with a layer of polyurethane. The chamber had a net interior base area of 1.169 X 1.133 m and a total height of 2.335 m. It was divided into two zones with a horizontal partition. There was an opening (0.215 X 0.215 m) in the middle of the partition to allow air to flow from one zone to another. Supply and exhaust ducts were connected to the chamber on one of the vertical walls. The air ducts were also made of plywood. When in operation, air entered the lower zone of the chamber via the supply duct and return air was extracted from the upper zone through the exhaust duct. A heat-pipe heat recovery unit was housed in the supply and exhaust ducts for heat exchange between return and supply air. An axial flow fan with adjustable speed was used to generate air flow through the chamber.
Heat pipes
Four types of heat-pipe heat recovery units were constructed and tested. Fig. 3 shows the cross-section of the heat pipes. The working fluid in the pipes was methanol with an operating temperature range from -40" to 100°C.
The first heat recovery unit (Type I) consisted of a bank of seven externally finned heat pipes. Each pipe was 0.0127 m in outside diameter and 0.45 m in length with 72 continuous plain fins on both the condenser and evaporator sections. The dimensions of each fin were 0.215 m long, 0.048 m high and 0.45 mm thick. There was a 0.02 m divider at the middle of the bank to prevent cross-contamination of return and supply air. The cross-sectional area of both the condenser and evaporator sections was 0.215 X 0.215 m. The total surface area of each finned pipe including fins and exposed pipe was 0.196 m2. The whole unit was made of copper.
The second type heat pipe had cylindrical spine fins. The fins were made of copper wire. The
unit with this type of fin consisted of three heat pipes of the same size and material as for Type I. There were eight continuous rows of fins on each of these pipes. Each row had about 300 spine fins and each spine fin was 0.7 mm in diameter and 30 mm long. The fins were soldered on the pipes and the tips of fins were fixed in such a way that they were uniformly distributed circumferentially. The estimated total surface area of the spine fins of each heat pipe was 0.158 m2, which is about 19% less than that of the continuous plain fins.
The third type of heat recovery unit was made of two rows of staggered heat pipes. Each row consisted of three heat pipes. Each pipe was 18 mm in diameter and 365 mm in length with 70 continuous louvred aluminium fins on both the condenser and evaporator sections. The dimensions of each fin were 180 mm long and 60 mm high. Each fin had 96 louvres with 2 mm spacing and 0.65 mm gap. The length of the louvres varied from 5.5 mm at the centreline of each pipe row to 8.5 mm near the edge of pipes. The cross-sectional areas of the condenser and evaporator sections were 180 X 180 mm and 175 X 180 mm, respectively. The total surface area for heat transfer of the evaporator section was 1.541 8 m2; this is about 8% more than that for Type I heat pipes.
The fourth type of heat recovery unit was made of five in-line heat pipes with wire fins. Each pipe was 19.05 mm in diameter and 450 mm long with 34.5 turns of copper wire fins on both the condenser and evaporator sections. Each turn of fins had 65 loops of wire 0.65 mm in diameter. The height of fins was about 12 mm. The cross-sectional area of the unit is the same as that of the first type of heat pipe. The total surface area for heat transfer of the evaporator or condenser section was 0.6035 m2; this is less than half of the first type.
Results. and discussion
Fig. 4 shows a comparison of the effectiveness for the four types of heat pipes. It can be seen that the rate of heat recovery increases with decreasing air velocity. However, for a given heat recovery unit this does not necessarily increase the total amount of heat recovery (proportional to velocity). To achieve a required quantity of heat recovery at a lower velocity, the size of a heat exchanger needs to be increased but this will result in a higher initial cost. The main benefit of a lower velocity is the lower pressure loss through the ventilation system since the flow resistance is proportional to the square of velocity.
The effectiveness for the spine-fin heat pipes presented in Fig. 4 was for seven equivalent heat pipes. The effectiveness for this type heat recovery unit was much lower than that of plain-fin heat pipes. The main reason for the ineffectiveness of spine-fin heat pipes is the poor thermal contact between fins and pipes, resulting in a high contact resistance.
For the same cross-sectional area, the staggered heat pipes with louvred fins were more effective than plain fins, particularly at lower velocities. This may be attributed mainly to the increased external surface area available for heat transfer per unit cross section (55% more).
The effectiveness of the unit with wire fins was lower than that with plain fins. This is due to the lower external surface area for the wire-fin heat pipes. If the surface area was increased by say 50%, which would still be less than that of the plain-fin heat pipes, the effectiveness would be higher than that of the plain-fin heat pipe unit.

The effectiveness of heat pipes could be increased by employing more than one bank. For example, for Type I heat pipes, the measured heat recovery was between 16% and 17% more efficient using two banks than using one bank. It may be postulated that the effectiveness could be further increased by employing more banks of heat pipes but this would increase flow resistance and cost of installation. For natural ventilation the resulting pressure loss must be smaller than the driving force so that adequate air flow rates can still be achieved.
P R E S S U R E L O S S A C R O S S HEAT PIPES
The pressure loss across a heat-pipe unit is represented by the pressure loss coefficient (k) as follows:
where AP, is the static pressure loss across the unit (Pa), V is the mean velocity of air flowing over the unit (mls) and p is the air density (kg/m3).
The pressure loss coefficient for Type I and 111 heat-pipe units was predicted by means of CFD modelling. The predictions were carried out using the CFD package FLUENT [3]. The CFD technique was validated for predicting the pressure loss coefficients for a number of duct fittings [ 2 ] . In the predictions, each row of heat pipes was modelled as one bank of rectangular cylinders such that it had the same free-area ratio and thickness as the real heat pipes. The fins were modelled as uniformly distributed rectangular studs on both sides of heat pipes such that the total cross-sectional area of the studs was the same as the sum of that of fins.
To determine the effect of fin shape on the pressure loss characteristics, flow resistance was also measured for two types of heat pipes - Type I and Type IV with pressure taps fitted on the up and downstream ducts of 0.15 m in diameter. Since the pressure loss at low values was difficult to determine, measurements were made at velocities higher than 2 rn/s such that the resulting pressure loss was higher than the precision of instrumentation (1 Pa).
The pressure loss coefficient was found to decrease with increasing mean air velocity. The pressure loss coefficient for Type I heat pipes can be correlated to velocity between 0.25 and 10 mls as follows:
where n is the number of heat-pipe banks.
The pressure loss at a given velocity can be obtained from the pressure loss coefficient (=%kpV2). For example, at a velocity of 0.5 mls, the pressure loss through a section of one bank of heat pipes is about 0.57 Pa and total pressure loss through the whole unit (both condenser and evaporator sections) is just over 1 Pa. Thus, if the driving pressure available for ventilation is, say, 1 Pa, the mean velocity through the heat-pipe unit should not be more
than 0.5 m/s. At a velocity of 1 m/s, the pressure loss through both sections of the unit is 4.5 Pa. Without the wind effect, this would require a stack height of about 10 m at a temperature difference between inlet and exhaust openings of 10 K, or 4 m height at 25 K temperature difference. In naturally-ventilated low-rise buildings, the average driving pressures are unlikely to exceed this value. Therefore, in designing ventilation ducts for housing this type heat recovery unit, the mean air velocity should be less than 1 mls.
Fig. 5 shows a comparison of pressure loss coefficient for Type I and Type 111 heat pipes. The predicted loss coefficient for the six staggered 18 mm heat pipes was higher than that for one bank of seven heat pipes of 12.7 mm in diameter despite the porosity (free-area ratio) of the former being higher than that of the latter. When the six pipes were arranged as a two-row in-line bank, the predicted loss coefficient became lower than that of one bank of seven smaller heat pipes. For example, at a velocity 1 rnls, the predicted loss coefficient for the two- row in-line six pipes was 3.3, compared with 4.2 for the staggered pipes and 3.7 for the in- line seven smaller heat pipes.
In Fig. 6 the measured pressure loss coefficient for Type I and Type IV heat pipes is compared. At air velocities higher than 2 mls, the pressure loss through the wire-fin heat pipe unit was higher than that for the plain-fin heat pipes particularly at high velocities. This may be explained by the opposite effect of the two types of fins on flow turbulence. The plain fins could act as a flow straightener whereas wire fins as a turbulence generator. The former decreased flow resistance whereas the latter increased flow resistance as velocity increased.
CONCLUSIONS
The experimental measurements show that air velocity has a significant effect on the effectiveness of heat-pipe heat recovery. The effectiveness decreases with increasing air velocity. For heat pipes with plain fins, at the same velocity the heat recovery is between 16% and 17% more efficient using two banks than using one bank. Poor thermal contact between fins and pipes can drastically reduce the effectiveness of heat pipes.
The numerical modelling indicates that at low velocities the pressure loss coefficient decreases with increasing air velocity but the total pressure loss still increases with the velocity. It is recommended that in naturally-ventilated low-rise buildings, without the wind effect or solar energy, the design mean air velocity should be less than 1 m/s in order for a heat recovery system to function properly. The use of a solar chimney andlor wind turbine could increase the range of air velocity and so the amount of heat recovery. For use in a natural ventilation system where low pressure losses are required, a staggered heat-pipe unit does not provide better overall performance than the in-line counterpart.
ACKNOWLEDGEMENT
This project is partly funded by the EU under "JOULE 111" Programme.
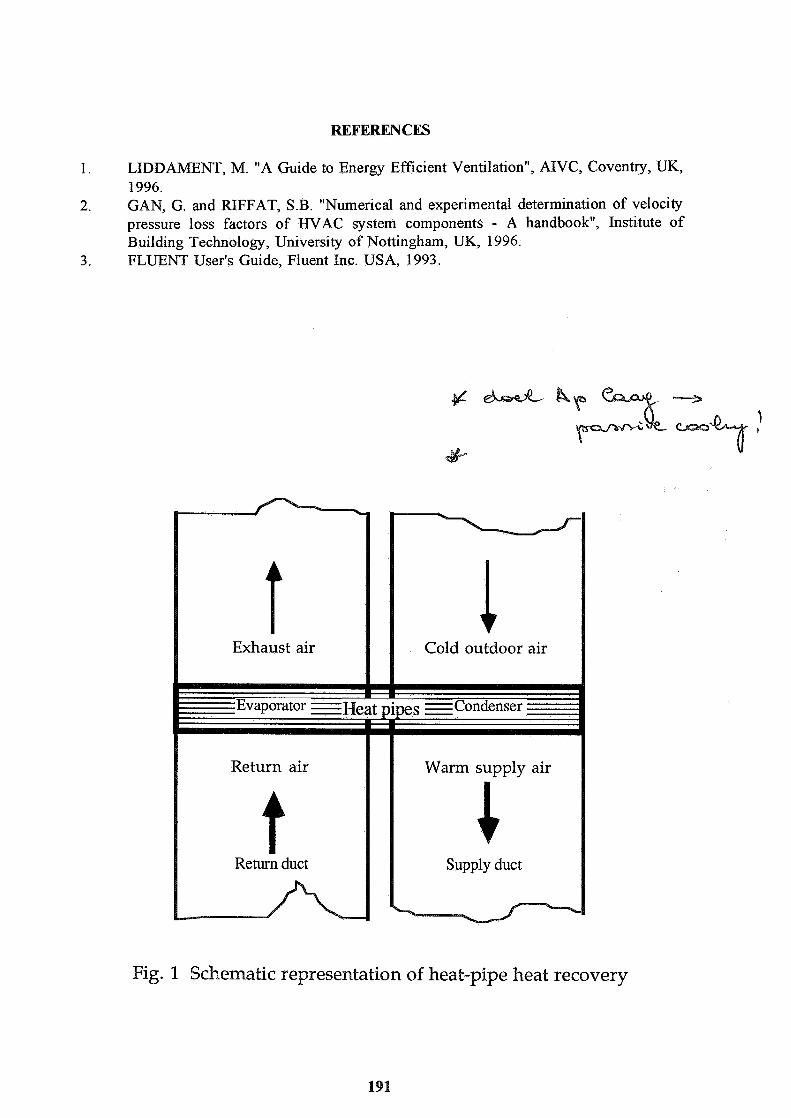
1. LIDDAMENT, M. "A Guide to Energy Efficient Ventilation", AIVC, Coventry, UK, 1996.
2. GAN, G. and RIFFAT, S.B. "Numerical and experimental determination of velocity pressure loss factors of HVAC system components - A handbook", Institute of Building Technology, University of Nottingham, UK, 1996.
3. FLUENT User's Guide, Fluent Inc. USA, 1993.
Fig. 1 Schematic representation of heat-pipe heat recovery
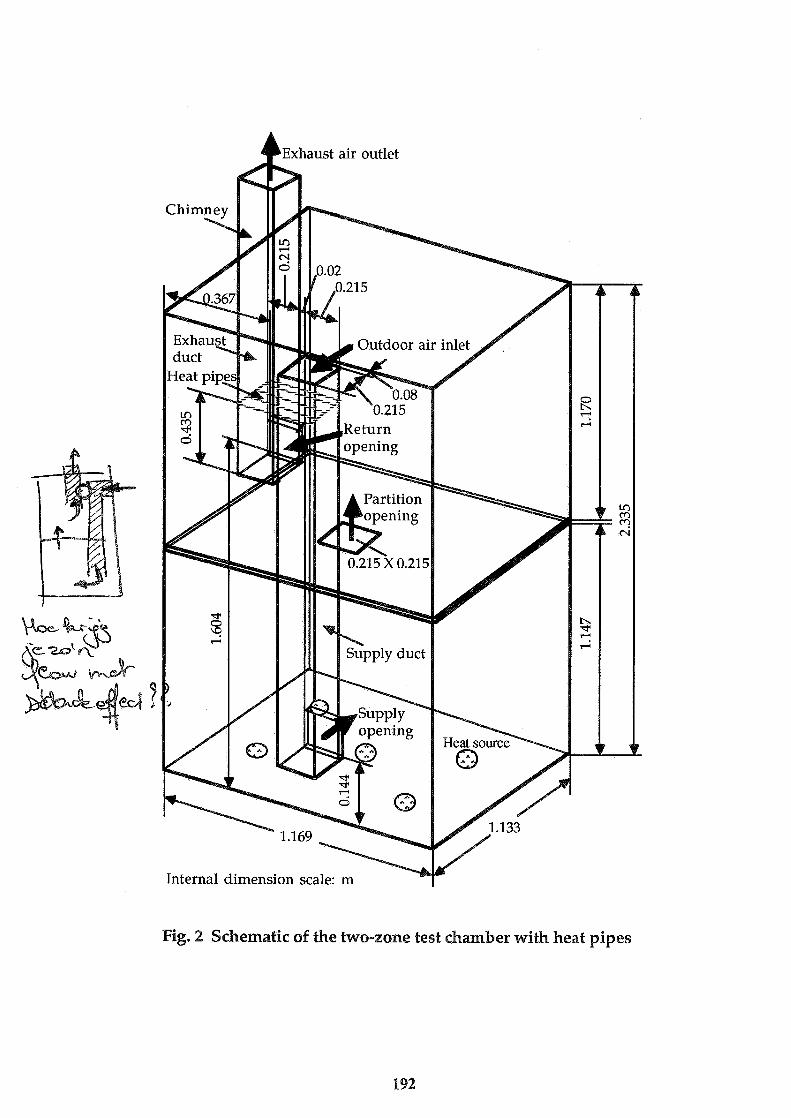
4Exhaus t air outlet
Fig. 2 Schematic of the tvvo-zone test chmber with heat pipes
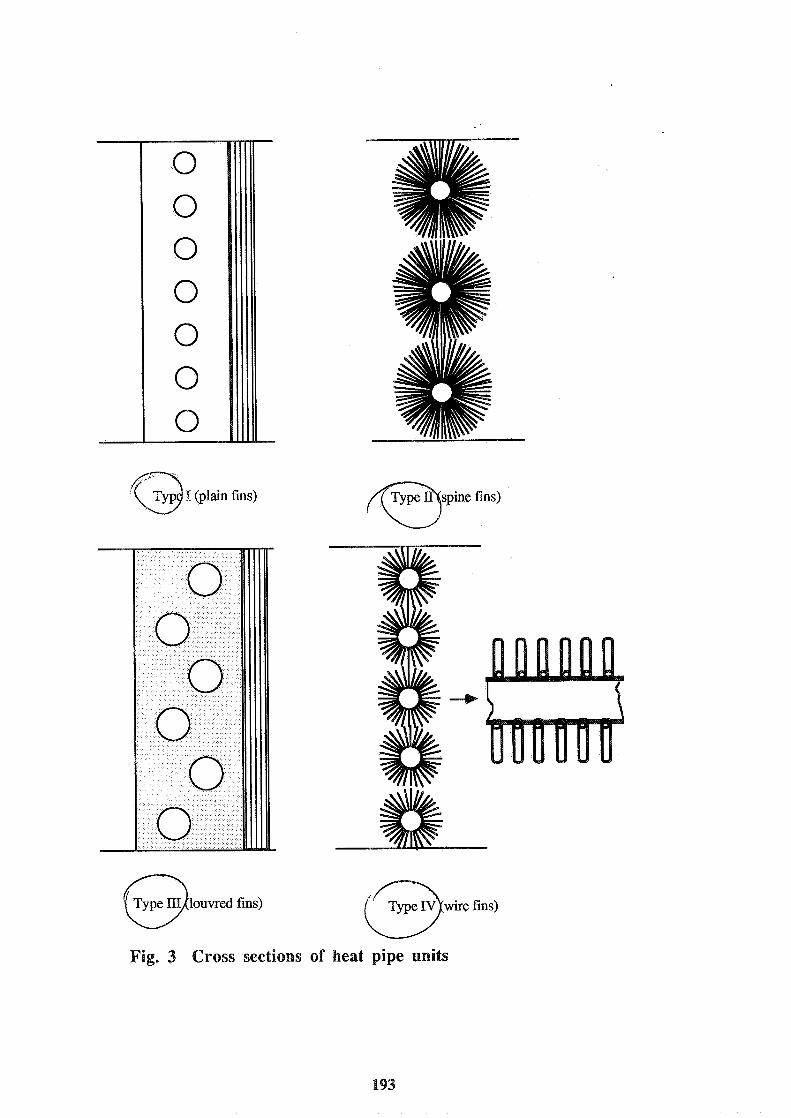
Q I blain fins)
U U U U U U
Type III louvred fins) 0 Fig. 3 Cross sections of heat pipe units

Mean air velocity (mls)
Fig. 4 Comparison of effectiveness for four types of heat pipes
2.5 0 2 4 6 8 10
Mean air velocity (m/s)
Fig. 5 Effect of pipe arrangement on the pressure loss coefficient
2 4 6 8 10 1 2
Mean air velocity (mls)
Fig. 6 Effect of fin shape on the pressure loss through heat pipes
VENTILATION AND COOLING 18TH ANNUAL AWC CONFERENCE
ATHENS, GREECE, 23-26 SEPTEMBER 1997
Title: Predicting Natural Ventilation Air Velocity Using Deterministic and Non-Deterministic Methodologies
1 Autho Santamouris I Affilitation: Group Building Environment Studies, Physics Dept., University of Athens, University Campus 7 84, Athens, Greece.

VELOCITY USING METHODOLOGIES u
Elena Dascalaki, Mat Santamouris GR-BES, University of Athens, Dept. of Applied Physics, Division of Meteorology, University
Campus, Build. Phys.-V, Athens, GR157 84, Greece.
SYNOPSIS
An extensive experimental program on single sided natural ventilation was carried out within the frame of PASCOOL EC research project. Within the frame of these activities, four single sided natural ventilation experiments were carried out in a test cell, a full scale outdoor facility. Experimental data were used as input for numerical simulations that were carried out using air flow calculation tools based on network modeling as well as computational fluid dynamics (CFD). Finally, fbzzy logic techniques were used to predict the air velocity profile in the middle of the opening. This paper presents the simulation results using the above approaches as well as a comparison with measurements.
INTRODUCTION
Natural ventilation has proved to be an energy saving way to reduce indoor cooling load, achieve thermal comfort and also maintain a healthy indoor environment, in the case where the outdoor air conditions allow for its use. The physical processes involved in both cases are very complex and the interpretation of their role in ventilation effectiveness is a difficult task. When the building communicates with the outdoor environment through only one or more openings located at the same exterior wall, ventilation is single sided.
In order to study the physical phenomena related to single sided natural ventilation and their impact on the air velocity field at the opening level, four experiments were performed in a Test Cell, which is a fbll scale facility, during October 1993 in Athens, Greece. The tracer gas decay technique was used in order to measure the bulk air flow rate. Although tracer gas techniques provide an estimate of the bulk air flow rate in the investigated room(s), they do not give any information on the air flow/velocity field. This information is very important when treating problems of comfort or indoor air pollutant transport. Air velocity measurements were taken at various heights in the middle of the opening, to provide some insight of the air velocity field at the level of the opening. However, in the case of single sided natural ventilation, the uncontrollable nature of the wind, produces constantly changing air flow patterns through an exterior opening. Therefore, a lot of simultaneous multiple velocity measurements of high accuracy are required in order to predict the air flow rate successfully. This requirement implies that such an experiment is difficult and very expensive to perform.
Three modeling approaches were used in order to predict the air velocity profile in the middle of the opening: a) Bernoulli theory, b) CFD and c) fbzzy logic techniques. In the following sections, a brief description of the experimental procedure is given and the results from three modeling approaches are compared with measurements.

The PASSYS Test Cell is a fully equipped, two room, outdoor facility for thermal and solar monitoring [I]. Ventilation experiments were carried out in the "service room", while the door connecting it to the "test room" was kept closed and sealed. The service room has a floor area of 8.6 m2 with a length of 2.4 m and a height of 3.29 m. It has an exterior door opening of 2.02 m2 with a width equal to 1.0 1 m.
During the experiments indoor air temperature was measured by PTlOO sensors (accuracy: f 0.1 OC). A mast holding four PTlOO sensors was used to monitor the vertical stratification. Their heights from the floor were: 0.42m, 1.76m, 2.37 m and 3.20m. Temperature stratification at the opening was monitored by an array of five T-fast sensors (accuracy f 0.1 OC). The T-fast sensor is a 12.58-6 m platinum wire, wired around an open Plexiglas base. The heights of these sensors from the floor were: 0.36m, 0.65m, 1.05m, 1.35m and 1.69m. Measurements of wind speed and direction were provided by a hot wire anemometer and a vane (accuracy: f 5 deg) at a height of 1.5 m, lm away from the Service room entrance door. At the same distance and at a height of 2 m, a T-fast sensor was placed to measure ambient temperature. Data on the wind at a 10 m height were also available. These measurements included lmin data, while the ones at 1.5 m were lsec data. Data in front of the door were chosen for this analysis as more appropriate for studying the physical processes at the door level. The air exchange rates were derived using the single tracer gas decay technique. N20 was used as tracer gas. Injection and sampling points were carefully chosen and distributed at various heights inside the studied rooms in order to supply the tracer gas homogeneously and also to monitor its spatial variation with time. The sampling period was set at 30 sec. Tracer gas concentration was measured by an infra-red gas analyser.
Comparison between indoor and outdoor average air temperature measurements shows that the average air temperature was higher indoors than outdoors. During the four experiments, this difference ranged between 0.5-30C. No significant temperature stratification was observed. Table 1 summarizes the mean characteristics of the Test Cell experiments.
Table 1 : Characteristics of the Test Cell Experiments.
The air velocity at various heights in the middle of the opening was measured by an array of five triple hot wire anemometers (lower threshold: 0.2 m/s, accuracy: k0.02mls) developed in the Laboratory of Meteorology of the University of Athens [2] and two commercial sensors manufactured by DANTEC (accuracy: +0.4%). The heights of the hot wires from the floor were 0.33 m, 0.63 m, 0.93 m, 1.43m and 1.73m. The heights of the commercial sensors from
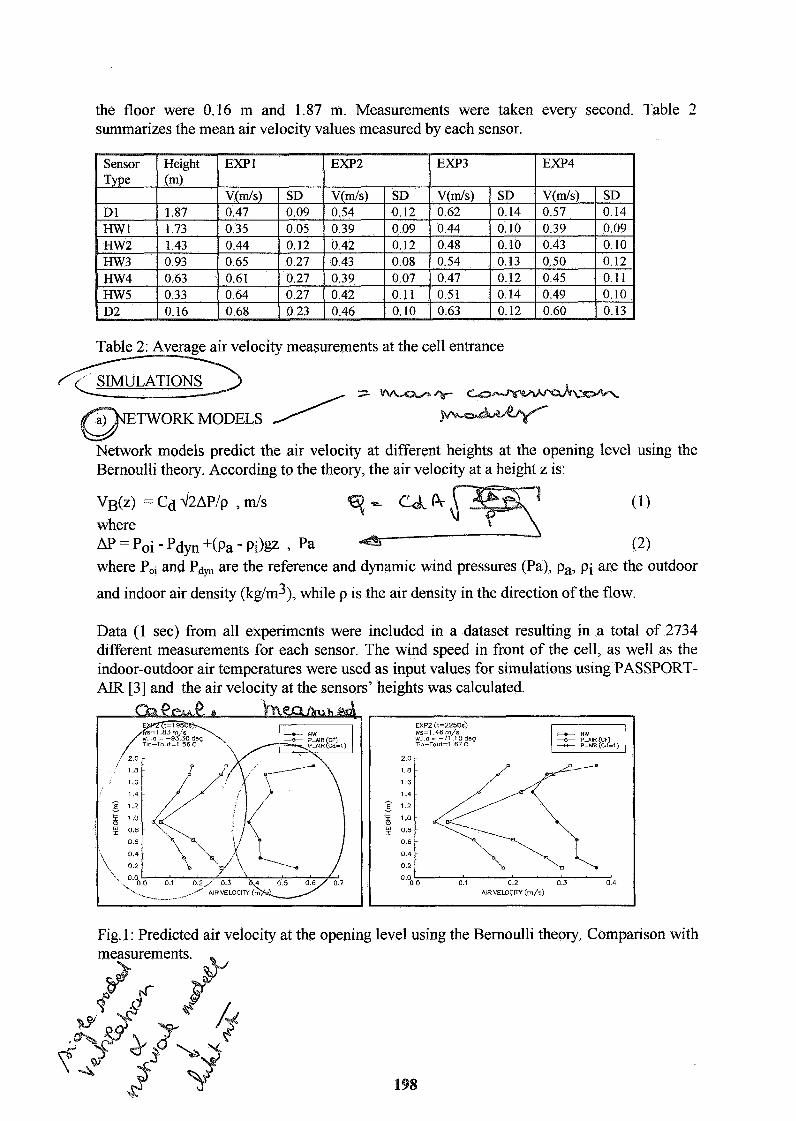
the floor were 0.16 m and 1.87 m. Measurements were taken every second. Table 2 summarizes the mean air velocity values measured by each sensor.
locity measurements at the cell entrance
-- / -
TWORK MODELS / Network models predict the air velocity at different heights at the opening level using the Bernoulli theory. According to the theory, the air velocity at a height z is:
VB(Z) = Cd 4 2 ~ ~ 1 ~ , m/s $- (1) where AP = Poi - Pdyn +(pa - ~ i ) g z , Pa (2) where Poi and PdW are the reference and dynamic wind pressures (Pa), pa, pi are the outdoor
and indoor air density (kg/m3), while p is the air density in the direction of the flow.
Data (1 sec) from all experiments were included in a dataset resulting in a total of 2734 different measurements for each sensor. The wind speed in front of the cell, as well as the indoor-outdoor air temperatures were used as input values for simulations using PASSPORT- AIR [3] and the air velocity at the sensors' heights was calculated.
Fig. 1 : Predicted air velocity at the opening level using the Bernoulli theory. Comparison with

Figure 1 gives a comparison between measured and predicted values. Predicted and measured values were not found to be in good agreement. The observed difference is attributed to the fact that network modeling considers homogenous pressure difference distribution along the opening surface. Simple observations of the flow characteristics near the openings in single sided naturally ventilated configurations reveal that the air velocity filed at the opening level is not homogenous. This absence of homogeneity introduces local turbulence, which is a very important driving force in the case of single sided ventilation. Network modeling practically neglects the effect of turbulence in the calculation of the air velocity. In reality, however, the air velocity field at the opening must be strongly affected by this factor, which is introduced by the constantly changing nature of the wind. Thus, despite its accuracy in predicting the air - -
exchange rates, the Bernoulli theory does not provide much information on the flow field at the opening.
COMPUTATION^ FLUID DYNAMICS (CFD) %
CFD modeling is based on the solution of the Navier-Stokes system of equations for mass, 3-;" momentum and energy conservation. This modeling type provides a detailed set of output on w&*-g Ch the air flow patterns and velocity fields. A very comprehensive set of input data is required,
w
the accuracy of which determines the accuracy of the obtained results. The domain size and grid discretization also plays an important role towards achieving convergence. A computational fluid dynamics model, PHOENICS [4] was used in order to simulate single sided natural ventilation when the wind impinges normally on the opening (incidence angle r O degrees).
The domain size that was chosen for the simulation was 20m x 32.4m (height x width). The adopted grid discretization had 36 x 35 points and was finer in the viscinity of the opening and inside the cell. The upper and lower boundaries of the solution domain were defined as adiabatic walls while the right and left edges were defined as inlet and outlet respectively. The inlet was located at 10m in front of the cell entrance while the outlet was located at 20m behind the cell. These distances were found to ensure the formation of a logarithmic profile of the wind in the windward area as well as a total recovery of the flow after the formation of the wake in the leeward area. The temperature at the inlet was set equal to 24 "C. The wind speed at the inlet was taken uniform with height. As the wind speed components were not available at 1Om away from the opening, various scenarios were tried by using different boundary conditions at the inlet. Figure 2 shows the results obtained using two scenarios. In the first scenario the horizontal and vertical component were taken equal to 2 rnls and 0.001 m/s respectively. In the second scenario the horizontal component was taken equal to 4 m/s. In both cases the solution domain and grid sizes are the same.
As shown, the derived air flow patterns are very different, though both scenarios give air velocity values that are close to the measured ones. Thus, the uncertainty of the boundary conditions at the inlet results in an uncertain flow pattern which implies that no unique solution can be derived. However, it is difficult to know in advance the exact values of the wind speed and its variation with height at any distance from the opening where this may be required according to the chosen simulation domain.
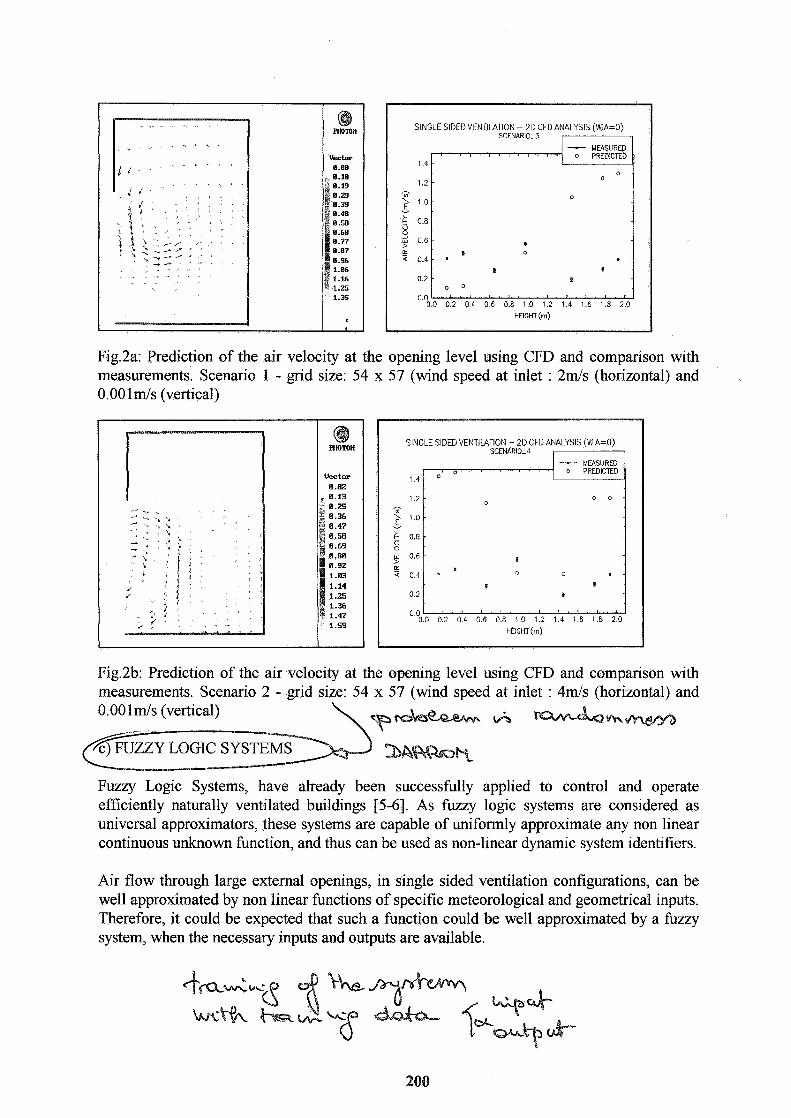
SINGLE SlDEDVENTllATlON - 2D CFD
Fig.2a: Prediction of the air velocity at the opening level using CFD and comparison with measurements. Scenario 1 - grid size: 54 x 57 (wind speed at inlet : 2mls (horizontal) and 0.00 1 m/s (vertical)
PHOTON
Vector 8.82 , 8.13
, 0.25
1.59
SCENARIO-4 - MEASURED 0 PREDICTED
1 4 - ' 0 " O ' " ~ " ' " '
4 0 4 *
0 0 . " ' . ' . ' ' . ' . " ' " ' 0 0 0 2 0 4 0 6 0 8 1 0 1 2 1 4 1 6 1.8 2 0
Fig.2b: Prediction of the air velocity at the opening level using CFD and comparison with measurements. Scenario 2 - grid size: 54 x 57 (wind speed at inlet : 4mls (horizontal) and 0.00 1 m/s (vertical) A v h
Fuzzy Logic Systems, have already been successfully applied to control and operate efficiently naturally ventilated buildings [5-61. As fuzzy logic systems are considered as universal approximators, these systems are capable of uniformly approximate any non linear continuous unknown function, and thus can be used as non-linear dynamic system identifiers.
Air flow through large external openings, in single sided ventilation configurations, can be well approximated by non linear functions of specific meteorological and geometrical inputs. Therefore, it could be expected that such a function could be well approximated by a fuzzy system, when the necessary inputs and outputs are available.
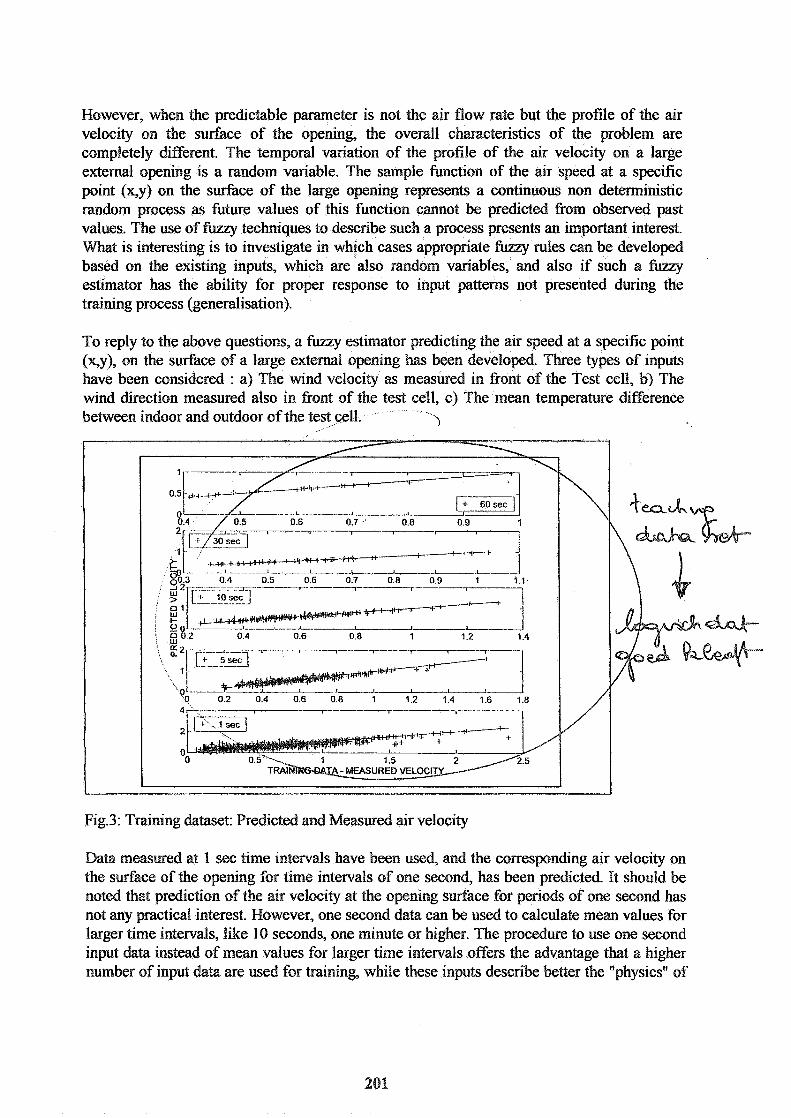
However, when the predictable parmeter is not the air flow rate but the profile of the air velocity on the surface of the opening, the overall charactenstics of the problem are completely different. The temporal variation of the profile of the air velocity on a large external opening is a random variable. The sample function of the air speed at a specific point (x,y) on the surface of the large opening represents a continuous non deterministic random process as future values of this function cannot be predicted from observed past values. The use of techniques to desclnibe such a proces s an important interest. What is interestin investigate in which cases appropiat mles can be developed based on the existing inputs, which are also random variables, and also if such a k z y estimator bas the ability for proper response to input patterns not presented dwing the training process (generalisation).
To reply to the above questions, a fuzzy estimator predicting the air speed at a specific point (x,y), on the surface of a large external olpening has been developd. Three types of inputs have been considered : a) The wind velociq as measured in front of the Test cell, b) The wind direc6on measured also in front of the test cell, c) The mean temperature difference bemeen indsor and outdoor of the test d l . -\
Fig.3: Training dataset: Predicted and Measured air velocity
Data measured at 1 sec time intervals have been used, and the corresponding air velocity on the surface of the opening for time intervals of one second, has been predicted. It should be noted that prediction of the air velocity at the opening sudace for pelniods of one second has not any practical interest. However, one second data can be used to calculate mean values for larger time intervds, like 10 seconds, one minute or higher. The pro~edure to use one second input data instead of mean values for larger time inkrvals of6ers the advantage that a higher number of input data are used for training, while these inputs describe better the "physics" of
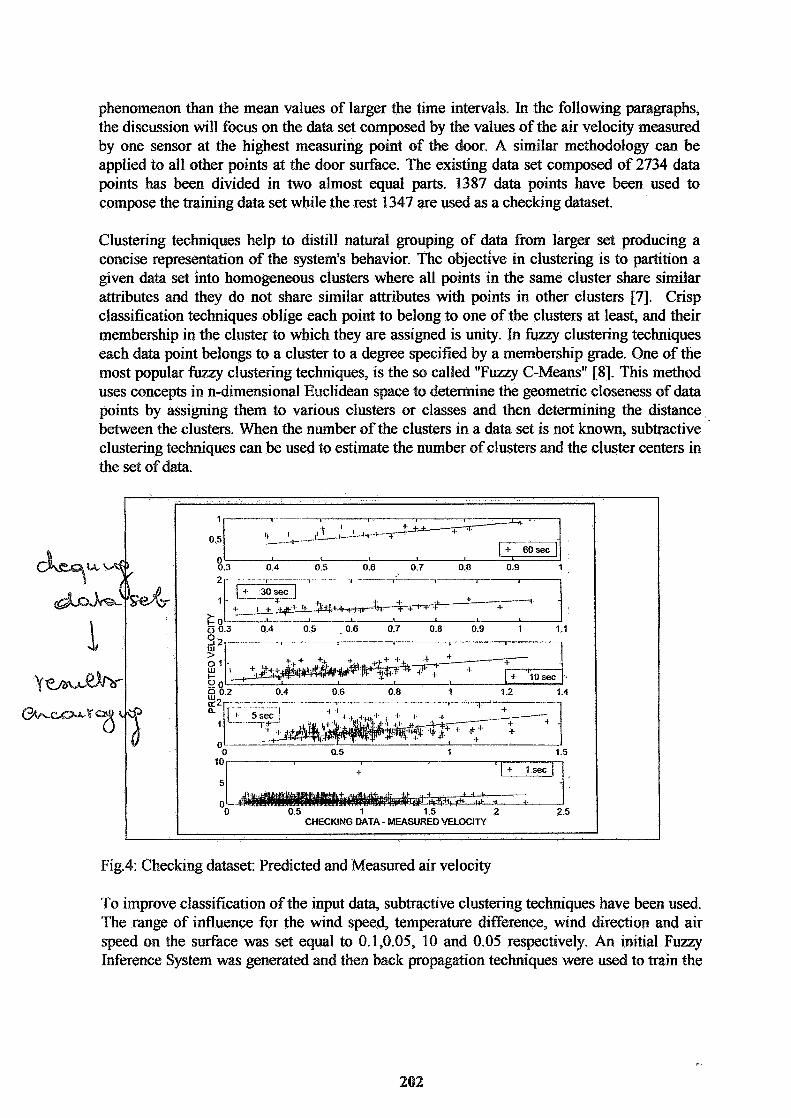
phenomenon than the mean values of larger the time intervals. In the following paragraphs, the discussion will focus on the data set composed by the values of the air velocity measured by one sensor at the highest measuring point of the door. A similar methodology can be applied to all other points at the door surface. The existing data set composed of 2734 data points has been divided in two almost equal parts. 1387 data points have been used to compose the training data set while the rest 1347 are used as a checking dataset.
Clustering techniques help to distill natural grouping of data from larger set producing a concise representation of the system's behavior. The objective in clustering is to partition a given data set into homogeneous clusters where all points in the same cluster share similar attributes and they do not share similar attributes with points in other clusters [7]. Crisp classification techniques oblige each point to belong to one of the clusters at least, and their membership in the cluster to which they are assigned is unity. In f k a y clustering techniques each data point belongs to a cluster to a degree specified by a membership grade. One of the most popular fuzzy clustering techniques, is the so called "Fuzzy C-Means" [8]. This method uses concepts in n-dimensional Euclidean space to determine the geometric closeness of data points by assigning them to various clusters or classes and then determining the distance between the clusters. When the number of the clusters in a data set is not known, subtractive clustering techniques can be used to estimate the number of clusters and the cluster centers in the set of data.
0 L 0
CHECKING DATA - MEASURED VELOClN
Fig.4: Checking dataset: Predicted and Measured air velocity
To improve classikation of the input data, subtractive clustering techniques have been used. The range of influence for the wind speed, temperature difference, wind direction and air speed on the surface was set equal to 0.1,0.05, 10 and 0.05 respectively. An initial Fuzzy Inference System was generated and then back propagation techniques were used to train the

system. The ANFIS - Adaptive Network based Fuzzy Inference System routine, operating in the frame of the MATLAB Fuzzy Logic Toolbox has also been used, for training.
The obtained results for both the training and checking data sets for one, five, ten, thirty and sixty seconds intervals are shown in figures 3 and 4 respectively. It is found that the present FIS predicts satisfactory the air velocity on the opening's surface for both the training and checking data while the trend of the predicted data is also satisfactory.
The present study was carried out partly within the frame of PASCOOL EC Research Programme. The authors would like to thank the Commission of the European Union, DG XI1 for Science, Research and Development, for their financial support.
CONCLUSIONS
Deterministic methodologies were used in order to predict the air velocity in the case of single sided ventilation. Comparison with experimental values has proved their inability to give accurate information on the air velocity at the opening level. This is attributed to the fact that the air velocity at the opening is strongly influenced by ever changing parameters such as the wind speed and the temperature difference across the opening. The stochastic nature of the wind was found to be better approached by non-deterministic modeling procedures, based on the principles of fuzzy logic systems.
REFERENCES
I . VANIIAELE I,. and WOIJTERS Y. , "The PASSYS Servicesf: Summary Report of the I'ASLSYS Projects, Belgian Building Researc/z Institute, EC DG XII, Brussels, 1994.
2. PAYADOPOIJ1,OX K.H, A. 2: LSOIIJEME:S, (I. HELMS, D. N. ASIMAKOPOULOS, M. SANTAMOlJRIS, A. ARC;IRIOI/, E. LIASCALAKI, "A triple Hot Wire System for Indoor Air Flow Measurements ", J. of Solar Energy Engineering, Vol. 11 8, No 3, pp168- 176, 1996.
3. IIASC X A K I E. AND SANTAMOIJRIS M , "PASSPORT-Azr, Description and Valzdution ", PA,S(TOOIJ Research Project, MDSWTL Final Report, Chapter 9, EC DG XII, Brussels, 1995.
4. ('HAM Concentration Heat & Momentum Ltd, PHOENII,'S version 2.1.3, Bakery House 40 High Street, Wimbledon Village, London SWI 9 5A UI UK.
5. BRIJANT M, A.I. DOINIS, (;. GIJARRAC'INO, P. MICHEL and M SANTAMOUHS, "Indoor Air-Quality by a Fuzzy Reasoning Machine in Naturally Ventilated Buildings", J. Applied Energy, In Press, 1996.
6. DO[Jh!IS A.I., SANTAMOUKIS M , I,EFAS C.C. AND MANOLAKIS D.E, "Thermal Comfort degradation by a visual comfort fuzzy reasoning machine under natural vent ilation ", J. Applied Energy, 48, 1994, 1 15- 130.
7. ROSS T.J., "Fuzzy Logic with Engineering Applications", Mc (;raw-Hill, Inc. 1995. 8. BEZDEK, J.C, "Pattern Recognition with Fuzzy Objective Function Algorithms", Plenum
Press, New York, 198 I .
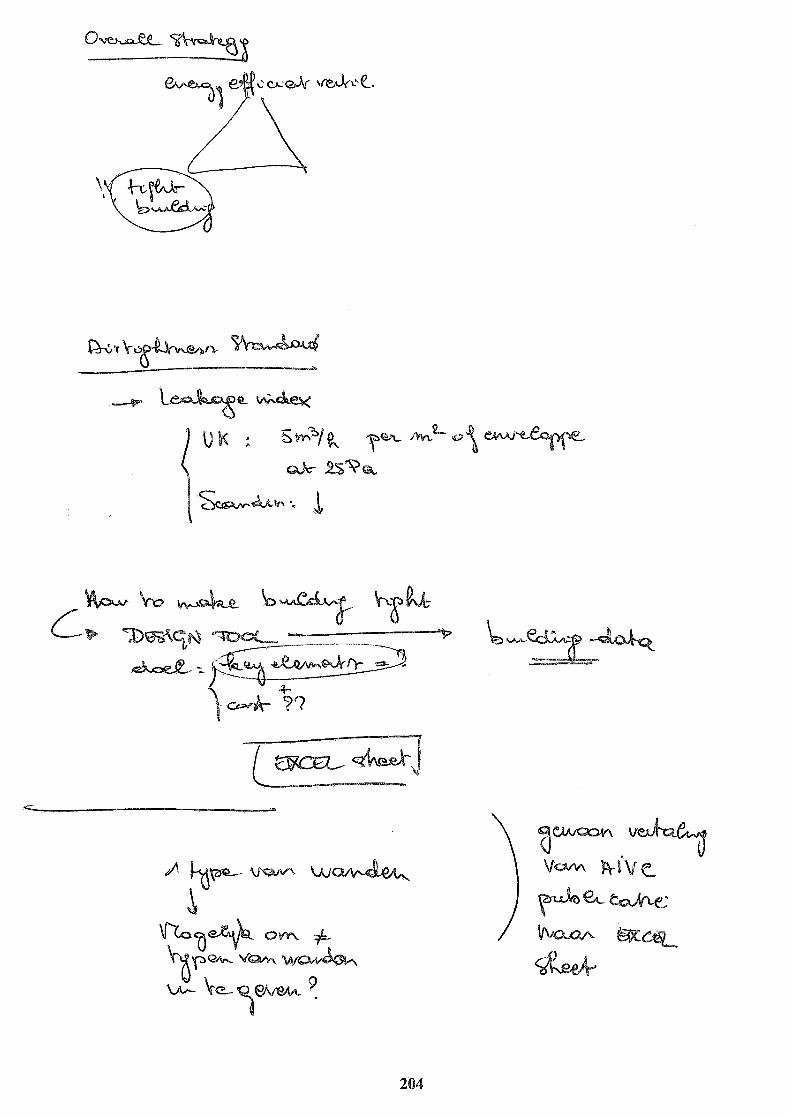
VENTILATION AND COOLING
18TH ANNUAL AIVC CONFERENCE ATHENS, GREECE, 23-26 SEPTEMBER, 1997
+-a Predicting Envelope Air Leakage in Large Co ercial Buildings Before Construction
M D , J Henderson2 and B C Webb1
1. Building Research Establishment Lt Garston, Watford, Herts., WD2 7JR United Kingdom
2. Department of Physics The University of Reading Whiteknights P 0 Box 220 Reading, RG6 6AF United Kingdom
@Copyright 1997 - Building Research Establishment Ltd, BRE
This paper will also be presented at the CIBSE National Conference 1997
Predicting Envelope Air Leakage in Large, Commercial Building Before Construction
by
M D A E S Perera, J Henderson and B C Webb
SYNOPSIS The concept of 'build tight - ventilate right' requires minimising air infiltration through the envelope of a building and then providing adequate ventilation in a controlled manner to satisfy the fresh air requirements of occupants. This paper describes a simple-to-use design tool (PC based and in spreadsheet format) for predicting the airtightness of office building envelopes either at the design stage or before a major refurbishment. The predicted value can be used as an indicator for post-completion air leakage testing to confirm the design assumptions and check on build quality.
Input of data is kept to a minimum. The simple design tool provides an overall leakage rate by considering the building size, glazed area, construction type and whether or not various tightness measures have been incorporated. The paper concludes with good comparisons between measured and predicted leakage rates in 10 office buildings. The paper also provides an example of how the tool can be used to assess the individual effectiveness of various key airtightness measures.
1. INTRODUCTION This paper describes a prototype version of a 'simple to use' design tool (PC based and in spreadsheet format) to predict the airtightness of office building envelopes; either at the design stage or before a major refurbishment. This is a significant development since hitherto the only means available to quantify this leakage was through a fan pressurisation test [I] once the building was constructed.
1.1. Air infiltration in office buildings Adequate ventilation is essential for the health, safety and comfort of building occupants, but excessive ventilation leads to energy waste and sometimes to discomfort. A building needs to be ventilated by design through controlled openings (e.g. openable windows) rather than by adventitious infiltration of air through the building envelope.
Air infiltration is the uncontrolled flow of air through cracks and gaps in the building envelope. It is driven by pressure and air temperature differences between the inside and outside of the building and is highly variable in response to changes in the weather. It cannot be designed for, and may therefore be considered as an overhead or penalty. Infiltration is not a reliable substitute for properly designed ventilation.
Good office design should therefore separate the mechanisms, which provide a good supply of fresh air to occupants, from the adverse and unpredictable effects of air infiltration. This demands good ventilation design and coupled to a clear and workable specification for an effective and maintainable airtightness layer. That is, the concept of 'build tight - ventilate

right'. It has to be emphasised that a building cannot be too tight - but it can be underventilated.
A building with an airtight envelope provides identifiable benefits to those who own, maintain and occupy it through the following:
e Energy savings since energy costs for space heating may be up to 20% less than for an equivalent but leaky building. Additionally, sophisticated energy- saving heating control systems and heat recovery systems can be economically viable options in tight buildings. . Enhanced comfort since draughts and localised cold spots are minimised in a tight building. Providing controlled ventilation, e.g. at high levels, ensures adequate fresh air for occupants with a minimum of draughts around people.
e Reduced risk of deterioration in a properly ventilated but tightly constructed building; since otherwise air leaking out of the building will tend to pull warm and moist internal air through the fabric of the walls and roof.
1.2. Current requirements and guidance Requirement L l of the England and Wales Building Regulations requires that 'reasonable provision shall be made for the conservation of fuel and power in buildings by: limiting the heat loss through the fabric of the building ...'. Supporting this is Approved Document (AD) Part L [2] which provides guidance on some sealing measures for the more common building situations. For methods of reducing infiltration in larger and more complex buildings, the AD refers to the Building Research Establishment (BRE) Report on 'Minimising air infiltration in office buildings' [3].
This BRE Report is an outline guide setting out the principles of providing an effective airtightness layer through the design of a tight envelope and the sealing of air leakage paths. In addition to air leakage through the fabric of the walls and ceilings, infiltration can occur through the junctions between building elements such as:
e doors and windows and their frames, @ window and door frames and the walls, 5 wall to ceiling joints, and 5 wall to floor joints.
1.3. Ensuring compliance and performance specification Using 'fan pressurisation' [I], the airtightness (or the leakiness) of the building envelope can be quantified. At present, however, this can only be done once the whole building has been constructed or, as an interim measure, when various stand-alone phases (of a multiphase project) are completed. This testing involves sealing a portable fan, such as the BREFAN system [I], into an outside doorway and measuring the air flow rates from the fans required to maintain a series of pressure differentials across the building envelope.
A suitable measure used to quantify the overall air leakiness of a building envelope is the 'leakage index', Q,,/S, where Q2, is the air flow rate at the imposed pressure differential of 25 Pa and S is the total permeable external envelope area. Airtightness target for a 'tight' UK building is set at [4] a value less than 5 m3/h per m2, while an 'average' building should be less than 10 m3/h per m2 and with a 'leaky' buildings in the region of 20 m3/h per m2 or more i l l .

2. "AIRTIGHTNESS PREDICTOR' DESIGN TOOL The objective was to produce a simple design tool which could be used at the design stage to predict the airtightness of office buildings. It was considered that this 'predictor' should have the following characteristics: . Easy to use and requiring the minimum amount of data input.
+a This input data should be readily available to the designer and should be at the gross building level rather than at any detailed component level.
e The output should be the predicted whole building leakage index. a The tool should provide a clear indication of the contribution of each
individual tightness measure to the overall building airtightness. a In so doing, the tool should be flexible for the designer to consider 'what-if'
scenarios of which tightness measures, when put together, will provide better return on investment while satisfying required tightness criteria.
2.1. Key parameters affecting airtightness Extensive development work was carried out to determine the key parameters which affected the overall air leakage of office-type UK buildings. Key emphasis was placed on identifying the required gross characteristics of these parameters (rather than at any detailed component level) to ensure compliance with the design tool's requirements as set out above. The following is the final list of key parameters:
Building form Users' input of actual or design values: . Volume . Surface permeable envelope area; i.e. the envelope area (usually walls and
roof) separating the 'conditioned' space (i.e. heated and cooled) of the building from the unconditioned space or the outside
e3 Number of storeys a Percentage of glazed wall area . Number of single and double external doors
With these overall building characteristics and using an (unpublished) internal BRE database of UK office building characteristics, the total lengths of joints of the following possible leakage paths were derived:
a Between window glazing and frames @ Between window frames and walls +a Between walls and ceiling and between walls and floors
General component information User input is through yeslno 'check' boxes for the following:
@ Composition of walls, i.e. whether brick (bare, plastered or with wall board panelling), concrete block (bare or plastered), concrete panels (with or without gaskets), metal panels or curtain walling
a Whether windows and doors were weather-stripped or not @ Whether joints between walls and windows/doors, and between walls and
floorslceilings were caulked or not. @ Joints between walls and floorlceiling (whether caulked or not)
2.2. Air leakage through componenb Within the design tool, the air leakage Q induced through any porous surface areas or a leaky joint (at a pressure differential Ap across them) was determined using empirical equations of the form,
Q = k. Apn where k is a flow coefficient expressed in terms of leakage per m2 of porous surface area or for each metre length of crack. The flow exponent n characterises the type of flow and varies in value between 0.5 (fully turbulent) to 1.0 (completely laminar).
The values for k and n were obtained from compiled [5] measured data. In all instances, median values were used (to represent 'average' components) rather than the extremes (representing either high-performance or poor quality components). For example, for a caulked wall to wall timber joint, a k-value of 1.6 x 10" dm3.s-'.m".Pa'" was used (rather than the quartiles 67 x 10" or 3.4 x 10") with a common exponent 'n' of 0.6.
2.3. The prototype design tool The prototype design tool is in spreadsheet form. The front worksheet receives input from the user and provides the leakage index and the percentage contribution made by each component and sealing measure. All calculations together with the database necessary to provide these results are contained in separate worksheets not obvious or accessible to the user.
The design tool works on the principle that leakage only occurs through the fabric or between building components. No specific calculations can be made if the building envelope is not designed from the outset for airtightness or this concept is not appreciated and significant large gaps are left in the building envelope. To ensure that the user is aware of the penalty for having large gaps, there is an additional check box which asks the users whether they are aware of these gaps in their building. If the answer is 'yes', then an empirical leakage (using previous in-house BRE measurements) of 10 m3/hr per m2 (at 25 Pa) is added to the overall calculated value.
The results are presented as both leakage indices (utilising permeable areas) and whole building leakage rates (using total building volume) at the standard pressure differential of 25 Pa for large buildings. However, corresponding values for a 50 Pa differential are also given even though it is difficult to establish this pressure in large UK office buildings with current pressurisation hardware [I].

3. RESULTS
3.1. Comparison of predictions with measurements The design tool was evaluated using measured leakage rates in the following 10 UK office buildings held in an internal BRE database
3 - ~(aulked), uc (uncaulked); 4 - M(easured), P(redicted)
The comparison between measured and predicted is encouraging given the generalised characteristics of UK buildings used in this prototype simplified tool. However, there are sizeable variations on some of the cases. Our view is that this could be improved by the following measures:
@ Take account of the quality of the components used, i.e. whether good, average or poor, and use the appropriate component characteristic from the built-in database.
@ Similarly, take account of infiltration through paths which are not obvious (and not component based) but is elsewhere on the building envelope and dependant on the care taken to minimise infiltration at both the design and construction stages.
a Extend the comparison study to encompass other buildings contained within the more extensive BRE database and determine whether other aspects (e.g. roof form) contribute to building tightness.

3.2. Identifying key tightness measures The design tool can be used to identify cost-effective key tightness measures by determining the impact they have on the overall airtightness and their percentage contribution to this overall value. The following example in Building #1 (the BRE Low-energy office of 1980) shows the effectiveness of weather-stripped windows in contributing to the overall airtightness of the building.
Weather-stripped Windows without windows weather-stripping
Leakage index (m3/h per m2 3.5 8.9 at 25 Pa)
Percentage contribution: through walls 15 6 ..................................................................... - ....................................................................................................
through ceiling 36 15 through window glazing and 34 73
frame ..................................................................... - .................................................................................................... through door and frame 6 2 ..................................................................... -...* ................................................................................................ joints between wall and 1 1
windowsldoors ..................................................................... - .................................................................................................... joints between walls and 8 3
4. CONCLUSIONS A prototype design tool to estimate the airtightness of large UK office buildings at the design stage is described here. This tool takes as input gross characteristics of the building such as volume and envelope area and converts these into possible leakage paths. A simple checklist then requests information about the methods used to seal these paths. The tool then uses this information and combines it with published leakage characteristics of individual components to provide an estimate of the leakiness of the building.
Comparison with full-scale results shows good agreement between measured and predicted. While the prototype design tool does require further refinement, it can be used to not only supply an airtightness estimate at the design stage but also a means by which the effectiveness of various airtightness measures can be considered.
However, it must be emphasised that the design tool is not a substitute for post-completion leakage measurement testing. Such testing is necessary to confirm design assumptions and provide a check on build quality. Data obtained through such testing could also be added to the growing database at BRE to refine this design tool as well as enhancing the derived practical guidance that could be provided to the UK construction industry.
ACKNOWLEDGEMENTS This research was supported by the Department of the Environment (DOE) and carried out under the DOE Building Regulations programme. The authors would like to express their thanks to Malcolm Orme of the Air Infiltration and Ventilation Centre for useful discussions and help.
REFERENCES 1. Perera, M D A E S, and Webb, B C, Minimising air leakage in commercial premises,
Building Services Journal, pp. 45-46, (February 1997). 2. Department of the Environment and The Welsh Office, Approved Document L
(Conservation of Fuel and Power) 1995 Edition, HMSO, (1994). 3. Perera, M D A E S, Turner, C H C and Scivyer, C R, Minimising air infiltration in
office buildings, BRE Report BR265, Building Research Establishment, Watford, (1994).
4. CIBSE, Natural ventilation in non-domestic buildings, CIBSE Applications Manual AM10, (1997).
5 . Orme, M S, Liddament, M W and Wilson, A, An analysis and data summary of the ANC7s numerical database, Technical Note 44, Air Infiltration and Ventilation Centre, (1994).

VENTILATION AND COOLING
18TH ANNUAL MVC CONFERENCE ATHENS, GREECE, 23-26 SEPTEMBER, 1997
ffice Night Ventilation Pre-Design Tool
r LX&
\ M Kolokotroni*, A Tindale? and S J Irving?
nt Ltd t Oscar Faber Applied Research Marlborough House
Herts., WD2 7JR, Upper Marlborough Road United Kingdom St. Albans, Herts AL1 3UT
United Kingdom
Tel: +44 1923 86 4000 Fax: +44 1923 66 4095
Tel: +44 181 784 5784 Fax: +44 181 784 5700
NiteCool: Office Night Ventilation Pre-Design Tool
M Kolokotroni, A Tindale and S J Irving
Abstract NiteCool was developed under the Energy Related Environmental Issues in Buildings (EnREI) DOE Programme and is designed especially for the assessment of a range of night cooling ventilation strategies. The program is based on a single zone ventilation model and is configured to analyse a 10m x 6m x3m cell of an office building. It is intended to be used at the early stages in the design process to help the designer to make informed decisions on the construction, opening configuration and operation of the building. The user input is restricted to a few parameters fiom which a weekly intemal temperature profile is predicted together with the energy consumption and the peak cooling capacity requirement relative to a reference system (with no night cooling). In this way, various building and system designs can be investigated by manually adjusting parameters until the comfortlenergy consumption design criteria are met. The program can also be used to calculate the size of openings required to achieve a certain flow rate under given design conditions. This is a very quick and easy way to investigate the feasibility of using natural ventilation to improve comfort levels in buildings.
introduction It has been established over recent years through research work and built examples that night ventilation is an effective low energy cooling technique for appropriately designed modem buildings, especially in climates with relatively low peak summer temperatures during the day and medium to large diurnal temperature differences such as those of the UK. Such weather combination allows the thermal mass of the building to use the cool night air to discard the heat absorbed during the day. Therefore, cooling using night ventilation is particularly suited to office buildings which are usually unoccupied during the night so that relatively high air flows can be used to provide maximum cooling effect. Buildings using night ventilation for cooling in the UK have been evaluated and reported with encouraging results [I-31.
Low energy techniques to avoid overheating have also been central to research efforts across Europe, especially in southern European countries. Night ventilation is one of the main techniques being investigated. In order to help designers to explore its application, a number of easy-to-use pre-design computer tools have been developed. Examples include LESOCOOL [4] which deals with natural ventilation systems that can be used to passively cool a building and it is based on one design day and SUMMER -Building [5] which uses the admittance method for the thermal simulations with real weather data and includes natural ventilation as one of the four low energy cooling techniques. In both tools, the user can define the building details and predictions include hourly internal temperatures, air flow rates, and in the case of SUMMER, energy savings.
The design tool described in this paper has been developed especially for UK office buildings and climate with the aim to facilitate comparisons with energy consumption and comfort benchmarks and provide the opportunity to explore quickly variations in internal heat gains, ventilation rates, occupancy patterns and external temperatures. External temperatures are user defined so that the user can investigate various scenarios such as a few warm days followed by cool weather and vice versa. In developing the model, it was critical that user input parameters are kept to the minimum and simulation time is fast.
Building configuration and calculation algorithms The building model is based on a typical cellular office with dimensions 10m width, 6m depth and 3m floor-to-ceiling height and therefore it is a single zone model. It is positioned in the middle of a row of offices on the middle floor of a 3-storey office. This module has been derived as a suitable office for night cooling through previous research work [6]. Three variations of thermal mass are included: LIGHT, MEDIUM and HEAVY. The definition of the types is based on the materials used (concrete) and area of exposed thermal mass which is provided by the ceiling. LIGHT construction includes a lightweight exposed concrete ceiling (specific heat 1 kJ/kgK, density 1200 kg/m3 and thickness 0.1 5m, heat capacity 1 80k~l'km~) MEDIUM construction includes a heavy weight exposed concrete ceiling (specific heat 0.85kJ/kgK, density 2 100 kg/m3 and thickness 0.15m, heat capacity 270k~lkm~). HEAVY construction includes a heavy weight waffle exposed concrete ceiling, thus offering an increased area of exposed thermal mass. The external wall is a granite clad wall in the case of MEDIUM and HEAVY types and a metal clad wall for LIGHT type, both insulated with 10cm mineral fibre. External windows are all assumed to be clear float double glazing, internal partitions are lightweight plasterboard and the floor is carpeted.
The 3TC (3 Time Constant) [7] lumped parameter simulation method is used for the thermal simulations. In this method, the thermal response of each room has three time constants and rooms are modelled as networks of thermal conductance and capacitance. The 3TC algorithms are implemented within the design tool and allow the modelling of long term storage of heat in the building fabric.
There are four natural ventilation modes incorporated in the model; single sided single opening single sided double opening cross ventilation stack ventilation (buoyancy and wind)
The ventilation algorithms for the first mode are based on the work by Warren and Parkins [8] and the algorithms for the last three modes are based on those described in the CIBSE Applications Manual on Natural Ventilation [9]. The tool also uses a methodology developed under an ETSU sponsored project [lo] which automatically sizes openings in order to achieve a user specific flow. This facility is available for all the four modes of natural ventilation.
The structure of the tool The data describing the current state of the buildings design is contained on five tabs on the main form of the program. These are;
e Building, Weather,
e Day Ventilation, e Night Ventilation and
Control Strategies.
Bujidjmg input parameters There are only eight main variables which describe the building and are controlled by the user:
s Internal Gains Infiltration airflow
s Orientation s Glazing ratio e Building weight e Occupied period s Solar protection and shading coefficient
Site location for the calculation of solar position.
Weather Calculations can be carried out either over a month or over the entire cooling season (assumed to be May to September). Each month is assessed by simulating the building for 7 days and energy data is multiplied up using appropriate factors. Data for each day can be set separately in terms of the risk that a certain weather combination will be exceeded. By defining a risk of (say) 5%, the weather data is selected such that the weather will only be hotter than the calculated weather data for 5% of days in the particular month. This defines the maximum and minimum daily temperatures. Hourly data is generated from this by assuming a daily sinusoidal temperature series. Each month has a fixed temperature lag from noon.
The weather data is calculated using the banded weather data in the CIBSE Guide [l 11. This is used because it provides coincident data for external dry bulb temperature, solar radiation data and mean daily windspeed, all of which are important in assessing room heat gain and ventilation cooling potential. More specifically, the weather data banded on temperature rather than that banded on solar radiation has been used. This is because periods of high temperature rather than high radiation are likely to present a greater design risk in buildings which are using ventilation cooling, since by their nature, they are likely to be well shaded.
A different risk factor can be selected for each day in the week. This enables the user to vary the sequence of weather to which the building is subject. This could be a sustained period of very hot weather or a cooler period followed by a warming-up period (Figure 1).

9 * 9 * 9 h
* h
9 m m CC) CC) oC)
Time and Day
15 2 z (D 2 Lo
Time and Day
Figure 1: Shows the last three days of one week simulation to demonstrate the effect of external air temperature sequence on predicted internal dry resultant temperatures. A warming up period was chosen for the first graph. A risk factor of 20% was chosen for Saturday to Tuesday, 10% for Wednesday, 5% for Thursday and 2.5% for Friday. Internal temperature was predicted to be 26.6"C on Friday (last day). A risk factor of 2.5 % was selected for all week for the second graph. This resulted in a temperature of 27.5OC during the last day. Note that the peak temperature for the building exposed to gradually increasing external temperature (first graph) is almost 1K lower than that for a constant 2.5% risk.
Cooling sysfems and reference NVAC sysfem Two different systems may be used to cool the design building; one for day time and the other for night. Data for these is independent, and is contained on separate tabs but day occupied period cannot overlap with the night cooling period. There are nine different cooling systems incorporated in the program: three mechanical ventilation, four natural ventilation and two active cooling systems as follows:

Mechanical Svstems Mechanical ventilation by supply fan Mechanical ventilation by extract fan Balanced mechanical ventilation by supply and extract fans
Natural Ventilation Systems o Single Sided single opening e Single Sided double opening e Cross ventilation 0 Stack ventilation
Active Cooling Systems Fan coil system Displacement ventilation system
It should be noted that mechanical systems are characterised by their Specific Fan Power and Coefficient of System Performance. The four natural ventilation systems have a design feature which allows the user to size and position openings to achieve a desired flow rate under design conditions.
Design Mode for Natural Ventilation Sys fems Design mode can be used to size and position openings to achieve a design flow under design internal and external conditions. Outside temperature and wind speed are required along with the corresponding design inside air temperature. The program picks up as default, the inlet and outlet pressure coefficients from the Wind Pressure form. These defaults can be edited if required. The program then sizes the ventilation openings based on a methodology developed under an ETSU sponsored project [lo] which is surnrnarised in the CIBSE Applications Manual on Natural Ventilation [9].
A test mode is also available if the user knows the sizes of the openings; these can be specified and the flowrates calculated based on the design weather and internal air temperature. Other parameters (e.g. vertical separation of openings) can also be varied whlst keeping the opening sizes fixed in order to assess the impact on the flowrate through the room. Once the opening sizes have been finalised, these sizes can be copied to the system tab on the main form and the system is evaluated in the normal way.
Energy Savings Comparisons One of the important features of the tool is the facility to compare the fuel used for the chosen design system to a reference HVAC system. The reference HVAC system is considered to be a standard solution to the design problem. No night ventilation is applied and the day cooling system defined on the main form is replaced with the system on the Reference HVAC form. Apart form the ventilation system, all other building and environmental parameters remain as for the design building. Two reference HVAC systems are available: (A) Displacement

ventilation system and (B) Fan coil system. There are two ways of defining the set point temperature of the reference HVAC system. The default option is to allow the program to automatically choose the set point such that the reference system provides a similar level of comfort to that maintained in the design building. The set point temperature is taken as the average temperature an hour either side of the peak temperature found in the design building. The second option is to enter a constant set point temperature.
As an example Tables 1-3 are provided tabulating the results of three different day systems using a range of night systems. The day ventilation rates are 4ACH for the fan coil system and natural ventilation systems and 3ACH for the displacement system. Night ventilation rates are 6ACH for all systems. Fan specific power is 0.75 for supply and 0.5 for extract. External temperatures are as specified for Figure 1A. Tables 1-3 show a range of potential energy savings or energy penalties when using mechanical ventilation at night. These values were predicted by specifying single values for delivered ventilation rates and fan specific power. In order to help the user to optimise the selection of the system parameters, the tool includes a parametric analysis facility. This is available for most of the user specified parameters in relation to the building, day and night ventilation systems. In the example demonstrated in Tables 1-3 the parametric analysis facility can be used to optimise the mechanical ventilation system by choosing appropriate ventilation rates and specific fan power values. Figure 2 shows four graphs as an example of such a parametric analysis.
Peak Internal Temperature vs Ventilation Rate Peak Internal Temperature vs Internal Gains
Peak Temp.
P e g C)
Ventilation Rate (ach)
Cooling Energy vs Ventilation Rate
Peak Temp.
P e a c)
Internal Gains pNlm2)
Cooling Energy vs Specific Fan Power
1100- - - ---- - - - - 20007- - - 7
I I I I
July Enargl Conrumpban
(MJI 700- - I
4- & L + -, & 4 I - L
I
+ . - L C ! i 4 O L 1 4 L 300 0 2 4 6 8 10 12 14 16 16 20 0 0 5 1 1 5 2 2 5 3
VdlsLon ible(ph) S m f r Fan Pwnt
Figure 2: The effect of the delivered ventilation rate and the internal gains are shown in the first two graphs against the peak internal temperatures. The required cooling energy in relation to the delivered ventilation rate and specific fan power is shown in the next graphs.
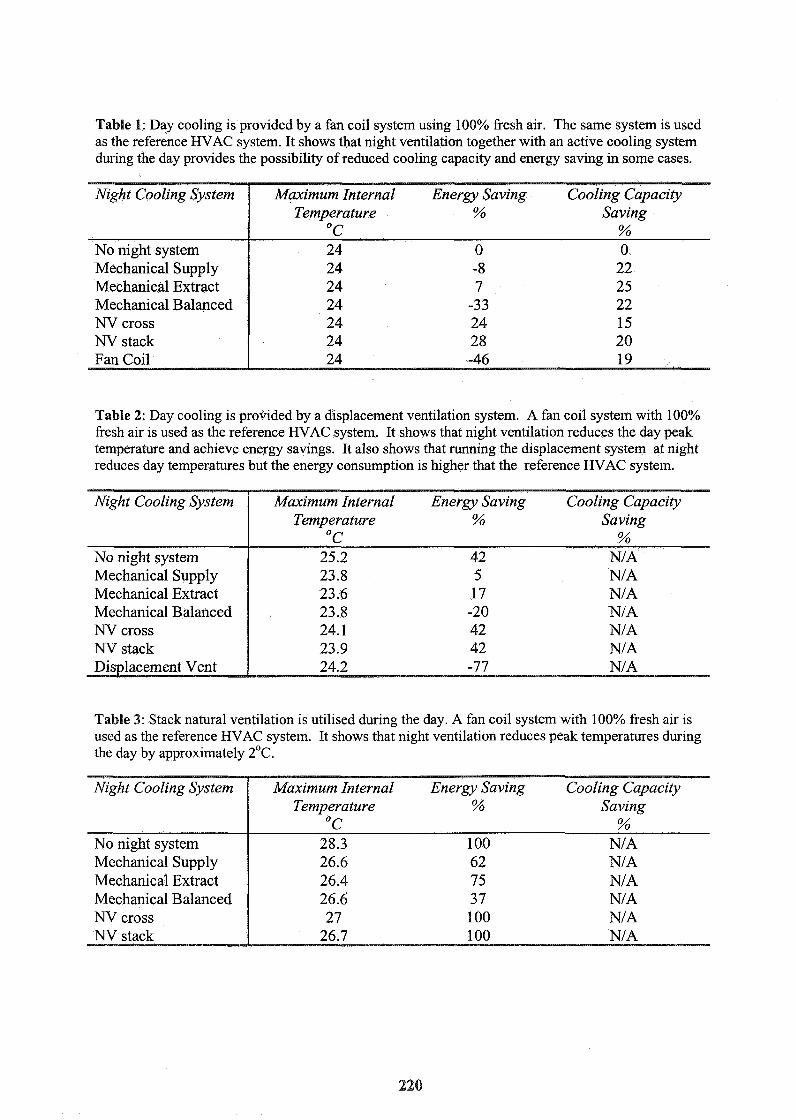
Table 1: Day cooling is provided by a fan coil system using 100% fresh air. The same system is used as the reference HVAC system. It shows that night ventilation together with an active cooling system during the day provides the possibility of reduced cooling capacity and energy saving in some cases.
"C % No night system 24 0 0 Mechanical Supply Mechanical Extract Mechanical Balanced NV cross NV stack
Table 2: Day cooling is provided by a displacement ventilation system. A fan coil system with 100% fresh air is used as the reference HVAC system. It shows that night ventilation reduces the day peak temperature and achieve energy savings. It also shows that running the displacement system at night reduces day temperatures but the energy consumption is higher that the reference HVAC system.
Mechanical Supply N/ A Mechanical Extract N/ A Mechanical Balanced NV cross NV stack
Table 3: Stack natural ventilation is utilised during the day. A fan coil system with 100% fresh air is used as the reference HVAC system. It shows that night ventilation reduces peak temperatures during the day by approximately 2OC.
No night system Mechanical Supply Mechanical Extract Mechanical Balanced
Control Strategies Effective control of night cooling systems is important if the system is to operate in an energy efficient way and provide optimum comfort to the occupants. The Controls tab on the main form allows the user to customise the operation of the night cooling system, by controlling three aspects of the operation:
1) Operation times; ie the time to start and end the operation of night cooling system. 2) System initiation, i.e. the decision as to whether or not to initiate the night cooling each
night. There are 4 control laws which can be selected for night cooling initiation: 9 Peak inside temperature during the previous occupied period must be greater than
23°C. 0 Average inside temperature during the previous day must be greater than 22°C. a Average outside air temperature during the previous afternoon (occupied period
only) must be greater than 20°C. a Slab temperature at time of night cooling initiation must be greater than 23°C.
3) System continuation, i.e. if the system has been initiated, how long it should be on. Three control laws can be selected:
a The current inside temperature is greater than the current outside temperature plus an offset of 2 degrees. This offset may be less for natural ventilation systems. The current inside temperature is greater than the heating set point temperature (18°C). This is to avoid overcooling the space and having to heat in the morning to bring it up to acceptable comfort levels. The current outside air temperature is greater than 12°C. Again this is to avoid overcooling the space.
All the above rules have been the result of an extensive study which included modelling and practical experience from monitored buildings [12].
Results and Parametric analysis The following summary results are displayed in the main form of the tool: 1. Maximum and minimum dry resultant temperatures; which occur while the building is
occupied over the analysis period. 2. Energy Saving; which is calculated as the percentage saving in cooling energy provided by
the design system over the reference system. 3. Cooling Capacity Saving; which is calculated as the percentage saving in installed cooling
capacity in the design building over that required for the building fitted with the reference system.
4. A graph button shows the variation of the dry resultant temperature with time over the last three days of the analysis.
In addition, the following graphical results can be obtained: 1. Parametric analysis graphs are available for all the important input variables (as
demonstrated in Figure 2). These show the variation of internal comfort temperature, cooling energy or peak cooling capacity with the selected parameter.
2. Graph of dry resultant temperature and outside air temperature with time (Figure 1).

3. Solar with time shows the incident and transmitted radiation on the glazing plane in w/m2. 4. Graph of cooling power and fuel use with time (Figure 3). 5. Graph of ventilation with time (Figure 4) 6 . Temperature frequency distribution graphs.
As an example Figures 3 and 4 are presented where stack natural ventilation is used at night and mechanical extract at 2ACH during the day. The external temperatures are as specified for Figure 1A. The building characteristic are 20w/m2 internal heat gains, 0.5 ACH infiltration, south orientation, heavy construction, 0.4 glazing ratio, 8.00-1 8.00 occupancy hours and solar protection with 0.2 shading coefficient.
Time and Day
Figure 3: Cooling power and fuel use with time. The performance of the cooling systems can be assessed by observing the relationship between the two lines.
-
9 Ln 9 CD b-
* b
9 CD a3
Time and Day
Figure 4: Graph of ventilation with time shows both the ventilation due to the cooling systems and that due to infiltration. This data may be useful in ensuring that sufficient fresh air is being provided.
Conclusions This paper describes a pre-design tool developed especially for the UK office building and climate for assessing a range of night cooling ventilation strategies. The program is based on a single zone ventilation model, a given office configuration and the 3TC thermal simulation model. It is an easy to use pre-design tool with very fast simulation time which allows quick comparisons between three mechanical ventilation systems, four natural ventilation systems and two active cooling systems in terms of temperature, fuel consumption and cooling power. In the case of natural ventilation systems, the program has the facility of automatically sizing openings in order to achieve a user specified flow. The program also allows the user to investigate very quickly the effect of different external temperature sequences on the internal dry resultant temperature. It also includes a parametric analysis facility which can be used for design optimisation. Written in Visual Basic, the program has a user friendly interface, with a minimum number of input parameters and fast simulation time, all of which will allow its use by designers at the initial design stage.
Acknowledgments This work is funded by the DOE Energy Related Environmental Issues in Buildings (EnREI) Programme, Department of the Environment, UK.
References 1. Willis S, Fordham M and Bordass B, 'Avoiding and minimising the use of air-conditioned
- A research report from the EnREI Programme' BRESCU, Report 3 1, October 1995 2. Martin A and Fletcher J, 'Night time is the right time' Building Services Journal, August
1996. 3. Webb B and Kolokotroni M, 'Night Cooling a 1950s Office', the Architects' Journal, 13
June 1996. 4. Florentzou F, van der Maas J and Roulet C-A, LESOCOOL v1 .O, EPFL, March 1996. 5. Santamouris M and Asimakopoulos D (Ed) SUMMER v2.0, 'A tool for Passive Cooling of
Buildings', CIENE, Department of Applied Physics, University of Athens, 1996. 6. Tindale A W, Irving S J, Concannon P J and Kolokotroni M, 'Simplified method for Night
Cooling', CIBSE National Conference 1995, Vol I, p8- 13, Eastbourne, 1-3 October 1995. 7. Tindale A., Third Order Lumped-parameter Simulation Method, BSER&T, 14(3), 87-97,
(1 993) 8. Warren P R and Parkins L M, Window Opening Behaviour in Office Buildings, BSER&T,
5 (3), 89-1 01, 1984. 9. CIBSE, Natural Ventilation in Non-domestic buildings, CIBSE Application Manual
AMlO: 1996. 10.Irving S J, Concannon PJ and Dhargalker H S, Sizing and location of passive ventilation
openings, ETSU report S/N5/00142, ETSU, 1995. 11 .CIBSE Guide, Volume A2, Weather & Solar Data, CIBSE 1982. 12. Martin A and Fletcher J, Night Cooling Strategies, BSRIA Technical Appraisal 14/96,
BSRIA 1996.

VENTILATION AND COOLING 18TH ANNUAL AIVC CONFERENCE
ATHENS, GREECE, 23-26 SEPTEMBER 1997
Title: On the ventilation and daylight efficiency of variou devices
Authors: A. Tsangrassoulis, M. Santamouris, D. Asimakopoulos
Affilitation: Group Building Environmental Studies, Physics Dept., University of Athens, University Campus 15784, Athens, Greece.

ON THE VENTXLATION AND DAYLIGHT EFFICIENCY OF VARlOUS SOLAR SHADING DEVICES
A. Tsangrassoulis, M. Santamouris and D.N. Asimakopoulos
Group Building Environmental Studies Physics Department, University of Athens, Panepistimioupolis, 157 84, Athens,
Greece.
Synopsis Solar control devices placed in front of large building openings disturb air flow and the radiation transfer. Although solar radiation transfer through obstructed openings is a relatively well researched area, very little information is available regarding the air flow perturbations and daylighting alterations created by external solar control devices. The present paper reports a series of experiments aiming at investigating natural ventilation and daylight phenomena associated with the use of specific shading devices. Experiments have been carried out in outdoor test cells and twenty eight different configurations have been tested for several window characteristics under various climatic and radiation characteristics. Based on the experimental results, specific modeling activities have been undertaken and theoretical methods of calculating air flow and daylight through openings equipped with specific solar control devices have been developed and are now presented. Theoretical predictions are compared with the corresponding experimental data and a very satisfactory agreement has bzen founJ for both air flow and daylight processes.
List of symbols C(t) gas concentration at time t (ppm) h air changes per time unit Lk is the luminance of the kth sky patch (cdfm') ak is the solid angle of the kth sky patch (sterad) dk is daylight coefficient of the kth sky patch () p density (kgr/m3) Q air flow rate (m3/sec) Cd discharge coefficient
A area of the opening (m2) ArD Archimedes nuinber Gr Grashof number Re Reynolds nuinber g acceleration of gravity (m/sec2) H opening's height (m) D depth of the test room (m) T temperature (OK) U air speed (inlsec)
1. Introduction Buildings are one of the most important energy consuming sectors. In Europe, buildings represent almost forty percent of its global energy consumption. A very high percentage of the consumed energy is used to cover both the cooling and the lighting needs oT buildings as well. The shading effects of fixed and movable shading devices have been extensively studied, and very accurate models for their performance have been developed under dynamic or steady state conditions 111. However, the impact of solar control devices on the airflow through obstructed openings is relatively poorly researched, while the existing knowledge on the air flow regime as well as on the

combined air flow and radiation transfer through openings equipped with solar control devices, is very limited [2]. In reality, phenomena of air flow through large openings are of a random nature and this because of the wind characteristics. Thus the proposed models should be designed to allow calculation of the air flow through the obstructed openings when the main climatic and geometrical characteristics are known. Modelling of the performance of the louvers, as it concerns daylighting, can be performed by using empirical or flux transfer methods, [3], radiosity based methods, [4], or ray tracing techniques, [5]. Radiosity based models can treat only diffuse surfaces and present problems with highly reflected materials. Furtherinore due to the need of accurate calculation of the form factors a high memory capacity is required in order to take into account detailed scenes such as an aperture equipped with blinds. Ray tracing techniques solve the rendering equation, [6], under most conditions including specular and diffuse reflection and transmittance in complicated curved geometries. However, as internal illumination has to be calculated in a dynamic way to take into account sky variability, these models require a very high computational effort and this because intereflection calculations have to be performed for each time step. Thus, there is a need for models that can calculate, in an accurate way, illuminance levels in complicated geotnetrical environments without to repeat time consuming intereflection calculations at every time step. This paper presents the results of a series of 28 different experimental configurations where various shading devices have been tested in a real scale outdoor facility. It also presents appropriate theoretical models to evaluate air flow and daylight transfer through the studied solar control devices.
2. The Experimental Set Up In order to expand existing knowledge on the physical phenomena related to the impact of movable solar control devices associated with large building openings a series of experiments have been carried out in a PASSYS test cell, [7]. Particularly, the experiments aimed to evaluate processes related to the air flow and daylight transfer through the openings under single side ventilation configurations. The PASSYS test cell is a fully equipped, two zones, outdoor facility for thermal and solar monitoring. Wall temperature, internal and external air temperature, internal and external (diffuse and global) illuminance, wind speed and direction were measured continuously in 2 min intervals. During the experiments and in order to estimate the luminance distribution of the sky, a luminance camera (Minolta LS-101) has been used to perform sky scanning. This procedure was based on the pattern recommended by the CIE [8], on 145 patches in 12 degree bands of altitude, centered in azimuth on the solar azimuth. The south facade of the cell is removable and allows installation and testing of specific building components. Experiments were carried out in the "test room" while the door connecting it to the "service room" was kept closed and sealed. The test room has a height of 2.72 m and a volume of 35 cubic meters. To study the impact of the opening surface especially on the air flow through the obstructed window, a specific component has been constructed and attached to the removable south facade of the cell. The component covers the whole facade of the cell and has a transparent surface - opening of 4 m2 located at the center of the facade. The maximum height and the width of the opening are equal to two meters. The opened area

of the component is adjustable in order to perform experiments under various opening surfaces. Two type of shading devices have been tested and in particular, movable vertical and horizontal louvers. The louvers are made from metallic sheets having a mat white finish of 0.1 m in width and 2 m in length. Experiments have been performed for various tilt angles of the louvers and various opening areas. Table 1 present the main characteristics of the experiments.
Vertical louvers
Table 1. Main geometrical characteristics of the experiments.
Ventilation experiments were perfonned using a single tracer gas decay method. N 2 0 was used as tracer gas. Injection and sampling points were carefully chosen in order to achieve the necessary homogeneity. The sainpling period was set to 30 sec. Tracer gas concentration was measured by an i.r. gas analyzer. During the experiments N 2 0 was injected in the room, while the exterior opening was sealed. Small fans were used to enhance good mixing of the gas during the injection period. When the gas concentration reached the required levels and mixing was satisfactory, fans were turned off, the injection stopped and the window opened. According to the decay method the decrease of the tracer gas concentration is given by the following equation:
C(t)=C(tO) exp(-kt) (1 )
where C(t) and C(t0) are the tracer gas concentrations at time t and at t=O, respectively. The air changes per hour have been calculated for each sampling point and then the mean value for the whole room was calculated as the mean of all sampling points.
3. Daylight Results and Modeling The developed method uses the Monte Carlo approach, a kind in order to calculate the daylight coefficients. Daylight coefficient tio between the luminance of a patch of shy and the illuminance in the building due to light from that patch. The sky can be divided into zones of altitude and azimuth and the daylight coefficient can be found at each zone. Then total illuminance, at one point in a room, can be calculated using the following equation:
number of sky patches
Illuminance = Lk ak dk k=l
(2)
where Lk is sky luminance, ak is the subtended size of a sky patch and dk is the daylight coefficient. Following the daylight coefficients approach, the intereflection calculation is carried out once for each zone, and it doesn't have to be repeated if the sky luminance distribution changes. The advantage of this approach is that hourly calculations of interior lighting in a building, for a whole year, can be performed faster without repeating intereflection calculations. Additionally, because the sky is treated as a number of point sources, the contribution of direct and reflected sunlight in the interior lighting could easily be assessed by adding, to the sky zone where the sun is located, an additional luminance equal to the nonnal solar iiluminance divided by the solid angle of the zone. Each emitted ray has an initial weight equal to 1. After each reflection or transinission the ray weight is inultiplied by the corresponding reflectance or transmitan~e of the surface. If the resulting value is larger than a predefined threshold value the whole procedure is repeated; in the opposite case, the ray is considered to be absorbed. This developed method can deal with a large variety of reflection models. Particularly, the method considers specular, diffuse, specular and diffuse, reflective and diffusing glass. The model considers the ground as a separate surface with reflectance equal to 0.2. For all rays that do intersect with the ground a single ground reflected daylight coefficient is calculated. The accuracy of the developed simulation method is affected by : a) the number of initial emitted rays, where the standard error regarding the estimation of the illuminance is inversely proportional to the number of emitted rays, and b) the limit value of ray-weight. This last variable affects the intereflection component of illuminance. Lower value contributes to higher intereflection values. Twenty five thousand initial rays have been used by the present model, while the threshold ray weight has been considered equal to 0.1 The ratio of this threshold value to the average reflectance of the area is equal to the mean number of light bounces. For our esperiments, the area weighted reflectance of the test cell was approximately equal to 0.4 thus, four light bounces have to be expected in average. After the quality control tests twenty one data sets ~neasured during June 1996 and September 1996 have been considered. Then for each specific experiment, simulations have been perfonned using the developed model. Finally, the calculated and measured data have been compared for both indoor measurement points. Mean differences between predicted and measured values are close to 13 % for the first measuring point and to 18 % for the second one. Higher differences are observed for
point two because the local illuminance is reduced as louvers reduce the area of visible sky. Consequently, intereflections have a much higher contribution to the horizontal illuminance at points away from the window, and this is a source of computational error. Differences are smaller when no shading devices are used. In this case there is no redirection of light by the shading devices and thus intereflections are not important. Maximum errors are observed in configurations combining small surface openings and shading devices. The error of internal and external illuminance measurements is estimated close to 10%. The main source of error is the procedure of estimating the sky luminance distribution. As already mentioned, the time period for a complete sky scanning was 15 minutes. In order to reduce the error, two measurements of zenith luminance have been performed one at the beginning and the other one at the end of a scanning session. When the variance between both values was higher than 25% the data set was rejected. The scanner's acceptance angle was lo so each point measurement is assigned practically to a sky patch, offering a small sky coverage. Errors associated with the model are of a random nature. The initial number of emitted rays is used to sample a continuous environment, resulting in an underestimation of the predicted illuminance. Furthermore, the number of the used light bounces is limited in comparison to infinite light bounces of real world. Increasing the number of rays and decreasing the threshold ray weight, predictions are improved, but the computational time increases.
4. Ventilation Results and Air Flow Modeling Calculation of the air flow through large building openings can be achieved either by using empirical, network or computeri~ed fluid dynamic models, [IC]. Empirical models are in general of local validity, while do not take into account effects related to solar control devices. Computerized fluid dynamic, CFD, models are powerful tools, but are not so suitable for natural ventilation configurations, [ l l ] . CFD tools are extremely sensitive to the initial and boundary conditions, which in natural ventilation studies are of a random nature and not well known. Network prediction models are based on the mass flow balance of a space
im
C P , - a, = 0 (3) ',=I
and combine the effect of wind and buoyancy to calculate pressure differences. Network models have been proved to provide very reasonable predictions of the air flow levels in natural ventilation configurations, [12]. In equation (3), Q,, is the volumetric flow rate through the ith flow path of the ]nth node and pi, is the density of air flow through the ith flow path of the mth node (kglm3). The air flow through an opening is calculated by using the standard orifice equation : -
where Cd is the discharge coefficient of the opening, A is the flow area, AP is the pressure difference across the opening and p is the air density. For large non obstructed openings, discharge coefficient varies between 0.6 and 1. An extensive review of the existing methodologies to calculate the discharge coefficient of large non obstructed internal openings is given by Santamouris et al. [13]. However,
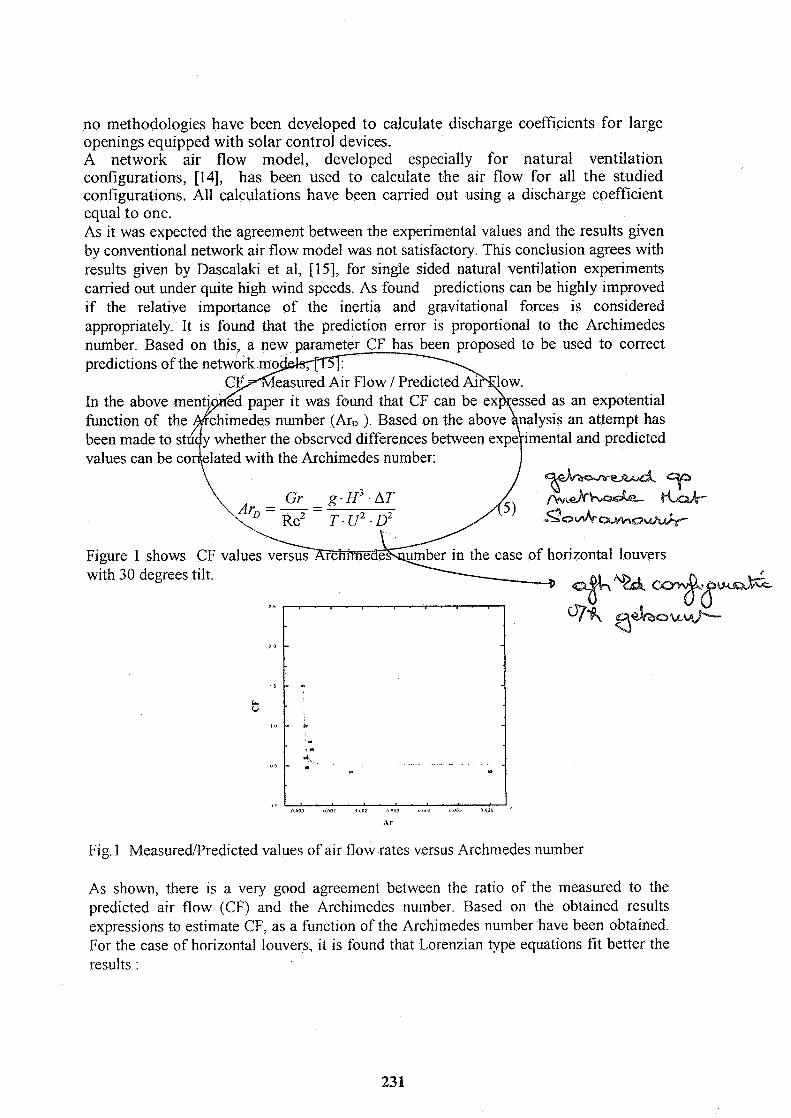
no methodologies have been developed to calculate discharge coefficients for large openings equipped with solar control devices. A network air flow model, developed especially for natural ventilation configurations, [14], has been used to calculate the air flow for all the studied configurations. All calculations have been carried out using a discharge coefficient equal to one. As it was expected the agreement between the experimental values and the results given by conventional network air flow model was not satisfactory. This conclusion agrees with results given by Dascalaki et al, [15], for single sided natural ventilation experiments carried out under quite high wind speeds. As found predictions can be highly improved if the relative importance of the inertia and gravitational forces is considered appropriately. It is found that the prediction error is proportional to the Archimedes
Figure 1 shows CF values the case of horizontal louvers with 30 degrees tilt.
Fig. 1 Measuredpredicted values of air flow rates versus Archinedes number
As shown, there is a very good agreeinent between the ratio of the measured to the predicted air flow (CF) and the Archimedes number. Based on the obtained results expressions to estimate CF, as a function of the Archimedes number have been obtained. For the case of horizontal louvers, it is found that Lorenzian type equations fit better the results :
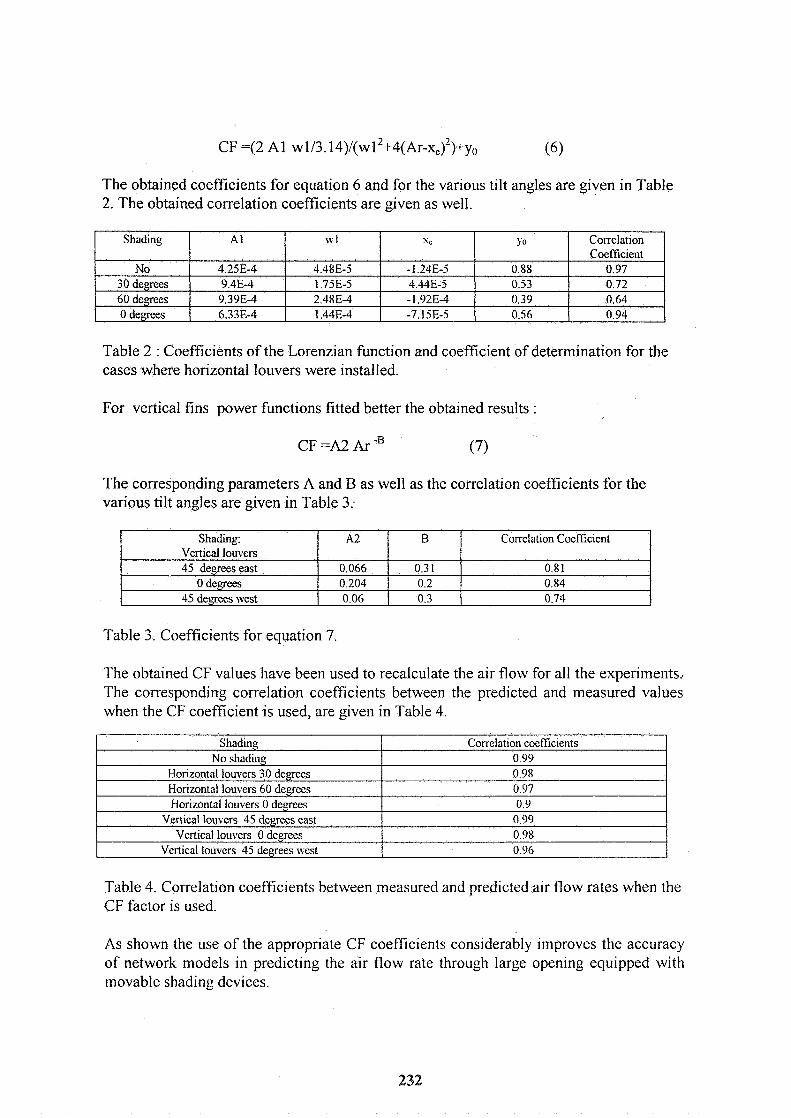
The obtained coefficients for equation 6 and for the various tilt angles are given in Table 2. The obtained correlation coefficients are given as well.
Table 2 : Coefficients of the Lorenzian function and coefficient of determination for the cases where horizontal louvers were installed.
For vertical fins power functions fitted better the obtained results :
The corresponding parameters A and B as well as the correlation coefficients for the various tilt angles are given in Table 3.
Table 3. Coefficients for equation 7.
Shading: Vertical louvers 45 degrees east
0 dcgrees 45 degrees west
The obtained CF values have been used to recalculate the air flow for all the experiments.. The corresponding correlation coefficients between the predicted and measured values when the CF coefficient is used, are given in Table 4.
A2
0.066 0.204 0.06
Table 4. Correlation coefficients between measured and predicted air flow rates when the CF factor is used.
Shading No sl~ading
Horizontal lowers 30 degrees Hon~ontal louvers 60 dcgrces Hori~oiital louvers 0 dcgrees
Vertrcal lou\.ers 45 degrees cast Vcrttcal louvcrs 0 dcgrees
Vertical louvcrs 45 degrees west
As shown the use of the appropriate CF coefficients considerably improves the accuracy of network models in predicting the air flow rate through large opening equipped with movable shading devices.
B
0.3 1 0.2 0.3
Correlation cocfficrents 0 99 0 98 0 97 0 9 0.99 0 98 0.96
Correlation CocEcicnt
0.8 1 0.84 0.74

The developed algorithms are valid for the specific solar control devices and for the range of climatic parameters under which the experiments have been carried out.
5. References 1. Sciuto S : 'Final Report of the Solar Contro Task', PASCOOL Research program, Coininission of the European Commission, Directorate General for Science, Resaerch and Development, 1 996. 2. Yakubu and Sharples : 'Airflow through modulated louvre systems', Building Serv. Eng. Res. Technol. 12(4), 151-155, 1991. 3. Matsura M : 'General calculation method of illuminance from verical louver blind system7. Proc. of the International daylighting conference, 1983. 4. Goral et. al. Modelling the interaction of light between diffuse surfaces, Computer Graphics, Vol. l8,No 3, 1984. 5. Ward G.: ' RADIANCE Lighting Simulation System ', SIGGRAPH 1994. 6. Kajiya J. :'The rendering equation'. Computer Graphics ,Vo1.20, No4, 1986. 7. Wouters P. and Wandaele L. : 'The PASSYS Services'. Final Report of the PASSYS Research project. European Commission, Directorate General for Science, Research and Development, 1995. 8. Perez R. and Kendirck J (eds) : 'Guide to recommended practice of daylight measurements', CIE TC 3-07, 199 1. 9. Tregenza P. R. : 'Daylight Coefficients', Lighting Research and Technology, Vol. 15, No 2,1983. 10. Santamouris M and D.N. Asimsrkopoulos, (Edsj : 'Passive Cooling of Buildings', James and James Science Publishers, London, 1996. 11. Regard M. : 'Contribution a 1' etude des mouvements d'air dans le batiment a I' aide d' un code de champ : Application a la ventilation naturelle d' un local par une ou deux grandes ouvertures'. Ph. Thesis presented to the Institut National des Sciences Appliques de Lyon. 1996. 12. Feustel H., Allard F., Dorer V., Garcia Rodrigez E., Herrlin M., Mingsheng L., Phaff H., Utsurni Y., Yoshibo H. Fundamendals of the multizone air flow model -COME, International Energy Agency- Air Infiltration and Ventilation Centre, Technical Note AIVC 29, Coventry, U.K. 1990 13. Santamouris, A. Argiriou, D. Asimakopoulos, N. Klitsikas and A. Dounis : 'Heat and Mass Transfer through Large Openings by Natural Convection. ' Journal Energy and Buildings, 23,p.p. 1-8, 1995. 14. Dascalaki E., F. Allard and Santainouris M. : 'Natural Ventilation Studies in the framework of the PASCOOL Project'. Proc. Int. Symposium Passive. Cooling of Buildings, M. Santamouris and D.N. Asimakopoulos, (Editors), Athens, Greece, June 1995. 15. Dascalaki E., M. Santarnouris, A. Argiriou, C. Helmis,, D.N. Asimakopoulos, K.Papadopoulos and A. Soileines : 'Predicting Single Sized Natural Ventilation Rates in Buildings7, Solar Energy, 55, p.p. 327-341, 1995.


VENTILATION AND COOLING lgTa ANNUAL AIVC CONFERENCE
ATHENS GREECE, 23 - 26 SEPTEMBER, 1997
Title
Thermal analysis of rooms with diurnal periodic heat gain, ThermSim. Practical use and comparison
I
Authors 1
M.Sc. Tor Helge Dokka17' and B.Se. Hanne Dokkal
Affilation
ebergv. 36,7045 Trondheim, No nce and Technology, 7034 Tron

P
Thermal analysis of rooms ~ t h diurnal periodic heat gain, ThermSim. Part 2 : Prac~eal use and comparison
Synopsis
Temperature and cooling demand in a room summertime are influenced by numerous factors, like internal gains, ventilation, solar gain, behaviour of occupants, thermal inertia of the room and outdoor conditions (climate).
The thermal environment and cooling demand summertime are often analysed using detailed computer programs, which take into account the factors mentioned above (among others). Often the overview, transparency and some of the physical insight is lost using these advanced computer programs.
In a predesign phase of a project it is preferable to do simple calculations of the thermal behaviour of a room. These simple calculations often gives more physical insight and overview than using computer programs. Simple calculations also gives a quality assurance of later computer analysis of the room.
This is part 2 of two related papers concerning a simplified method for thermal design of rooms, called ThermSim. Part 1 (the accompanying paper) is concerned with derivation and interpretation of the model.
This paper is concerned with practical guidance in choosing appropriate input to the model. Comparison to the advanced simulation program BRIS is also presented.
The model shows good agreement with computer analysis when the model assumptions is fulfilled.
List of symbols Symbol Description Ahc Facade area
Floor area A,, Area for whole window construction (including frame) Car Heat capacity of air (can be set to 0.34 Wh/m3K) Fsh Effective total shading factor I.," Normalized mechanical or natural air flow rate n Air infiltration in ACH n,,, Occupation time for persons
Operation time for lighting and appliances qper Heat gain from persons q ~ ~ a Heat gain from lighting and appliances q'7S01 Solar intensity through a vertical pane Q)'so~ - Daily sum of solar gain through a vertical pane T, Mean daily external temperature
Unit m2 m2 m2 Wh!m3K

' f e Daily amplitude external temperature AT[, Temperature rise over the supply fan Uf, U-value facade construction urn U-value window construction V Air volume
1 Introduction
This is part 2 of two related papers concerning a simplified method for thermal design of rooms. Part 1 (the accompanying paper) presents a methodlmodel, called ThermSim, that can be used in the thermal design of rooms.
This paper is concerned with practical guidance in choosing appropriate input to the model. In addition this paper gives examples in the use of the model, and comparison to advanced computer simulation.
2 Guidance in choosing appropriate input data
This sections gives guidance in selecting appropriate input to the model. Most of the input can be "normalized" by dividing the value with the floor area. E.g. internal loads in Watt can be normalized into Watt per m2 floor area (W/m2), which gives a much smaller range for the value. With this approach it is possible to make tables where normalized input values can be picked from, making the calculation process quick, and reducing the chance for calculation errors.
Values presented in the tables below are related to "Scandinavian" building standards, and may not be representative for other countries and other climates. It should however be easy to modify the tables to other standards and climates.
To exemplifi how values in the tables have been determined, an office room is used as a case study throughout the section.
2.1 Normalhed specific external loss The specific loss to the external is comprised of window losses, facade losses and loss due to infiltration. In modern (Scandinavian) buildings the external walls are well insulated, and heat loss through windows are dominating. In less airtight buildings (older buildings) might infiltration have some impact on the external loss.
Given an office 3 x 4 m (12 m2) large, with a facade area of 9 m2 (incl. window) and a window area of 2 m2. U-value for the facade construction is 0.25 W/m2K (15 cm mineral wool) and the U-value for the window is 2 W/m2K. Infiltration is estimated to 0.3 ACH (Ceiling height is 3 m). Normalized specific external loss is then given by :
UfacAfgc +U,,A,, +Ca,,nV (9-2).0.25+2.2+0.34.0.3.36 H" = - -
ext = 0.785 w I m2K Agoor 12

This figure is quite typical in office rooms, it normally lies between 0.4 W/m2K and 1.2 W/m2K. Table 1 presents typical values of normalized specific external loss, as a fbnction of normalized windows- and facade loss, and infiltration (in ACH).
Wind&Facad/ None 0.2W/m2K 0.5 W/m2K 1.0 W/m2K 3.0 W/m2K
n = 0.1 ACH (Low) 0.1 0.3 0.6 1.1 3.1 n = 0.2 ACH 0.2 0.4 0.7 1.2 3.2 n=0.3ACH(Med) 0.3 0.5 0.8 1.3 3.3 n = 0.5 ACH 0.5 0.7 1 .O 1.5 3.5 n = 0.7 ACH 0.7 0.9 1.2 1.7 3.7 n=l.OACH(High) 1.0 1.2 1.5 3 4.0 n = 1.3 ACH 1.3 1.5 1.8 2.3 - 4.3
2.2 Normalized total specific loss The total specific loss is the sum of the specific external loss and the ventilation loss. Air flow rate is often given in m3/h per m2 floor area (normalized air flow), which is convenient here.
The room in subsection 2.1 is ventilated (balanced mechanical vent.) with 10 m3/hmz (120 m3/h). The total specific loss is the given by :
Table 2 gives normalized total specific loss as a hnction of ventilation rate and normalized specific external loss.
External loss/ None 0.5W/m2K 1.0 W/m2K 2.0 W/m2K 4.0 W/m2K Ventilation rate -- Low Medium High_ - 0 m 3 / W 0 0.5 1 .O 2.0 4.0 3 m3/hm2 (Low) 1 .O 1.5 2.0 3 .O 5.0 5 m 3 / W 1.7 2.2 2.7 3.7 5.7 8 m3/hm2 (Medium) 2.7 3.2 3.7 4.7 6.7 11 m3/hm2 3.7 4.2 4.7 5.7 7.7
-- , 15 m3/hm2 (High) 5.0 5.5 6.0 7.0 9.0
2.3 Normalized specific heat capacity, timeconstant and time-lag The effective heat capacity of the room can be treated in the same manner as the specific losses. The effective heat capacity of a building construction exposed to a 24 hours cycle temperature variation, can be limited to the inside 10 cm of the construction, or inside the insulating layer. If heavy material as concrete or brick is covered with insulating materials (i.e. carpet or lowered ceiling), the accumulating layer is reduced considerably. These "des" gives specific (per m2) heat capacity of : - 50 W m 2 K for a massive concrete wall, - 35 W m K for a massive brick wall, - 4 W m 2 K for a insulated composite wall with gypsum board or wood panelling, -1 5- 25 Wh/mzK for a concrete slab covered with carpet or lowered ceiling.
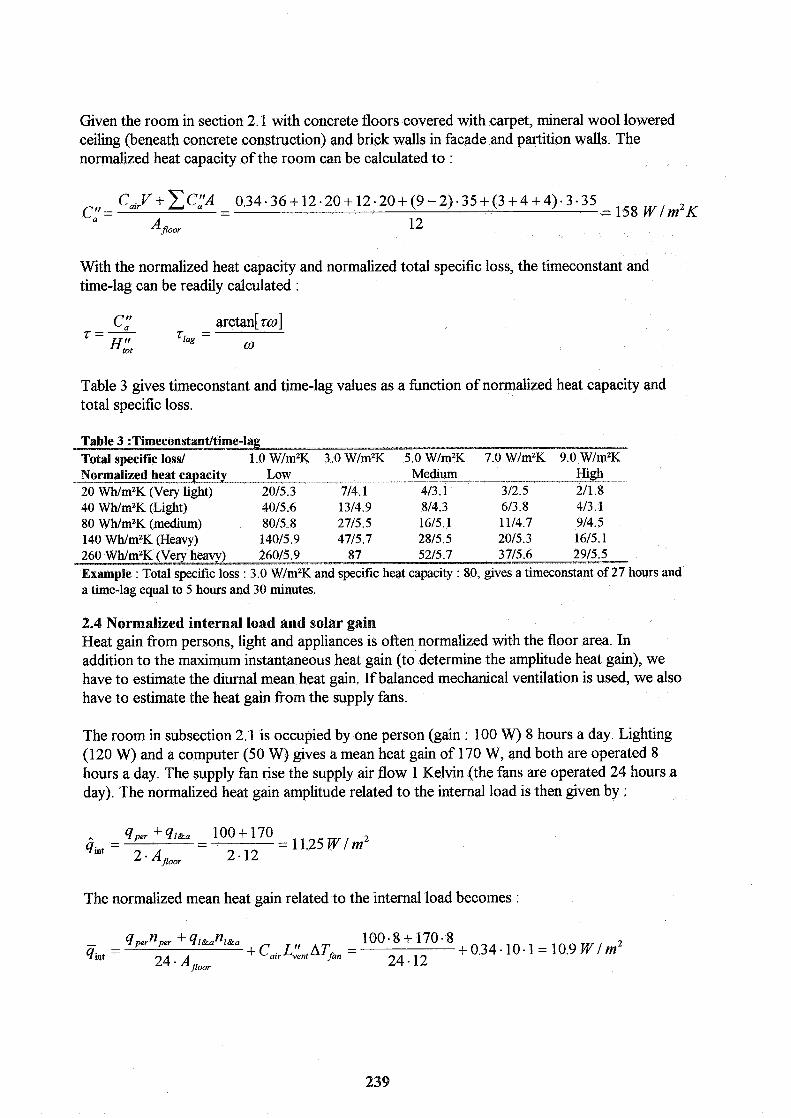
Given the room in section 2.1 with concrete floors covered with carpet, mineral wool lowered ceiling (beneath concrete construction) and brick walls in facade and partition walls. The normalized heat capacity of the room can be calculated to :
With the normalized heat capacity and normalized total specific loss, the timeconstant and time-lag can be readily calculated :
Table 3 gives timeconstant and time-lag values as a hnction of normalized heat capacity and total specific loss.
Table 3 :Timeconstant/tiee-1 --- -- Total soecific loss/ 1.0 W/m2K 3.0 WlmZK 5.0 W/mZK 7.0 WlmZK 9.0 W/m2K Normalized heat capacity --- Low - --. Medium - - ---- High 20 Wh/m2K (Very light) 2015.3 714.1 413.1 312.5 211.8 40 Wh/mzK (Light) 4015.6 1314.9 814.3 613.8 413.1 80 Wh/mZK (medium) 8015.8 2715.5 1615.1 1114.7 914.5 140 Wh/mZK (Heavy) 14015.9 4715.7 2815.5 2015.3 1615.1
Example : Total specific loss : 3.0 Wlm2K and specific heat capacity : 80, gives a timeconstant of 27 hours and a time-lag equal to 5 hours and 30 minutes.
2.4 Normalized internal load and solar gain Heat gain from persons, light and appliances is often normalized with the floor area. In addition to the maximum instantaneous heat gain (to determine the amplitude heat gain), we have to estimate the diurnal mean heat gain. If balanced mechanical ventilation is used, we also have to estimate the heat gain from the supply fans.
The room in subsection 2.1 is occupied by one person (gain : 100 W) 8 hours a day. Lighting (120 W) and a computer (50 W) gives a mean heat gain of 170 W, and both are operated 8 hours a day. The supply fan rise the supply air flow 1 Kelvin (the fans are operated 24 hours a day). The normalized heat gain amplitude related to the internal load is then given by :
The normalized mean heat gain related to the internal load becomes :

Table 4 gives normalized amplitude heat gain and mean heat gain related to internal loads. It is given as a fbnction of persons per 10 m2 floor area (a normal office room) and the normalized gain from lighting and.appliances. Heat gain from supply fan is included in the figures (air flow 10 m 3 / W and temperature rise 1 K). Operation of lighting and appliances is assumed to be 10 hours, and effective occupation time is set to 6 hours.
0.5 perdl0 m2 (low) 517 819 1011 1 15/15 1 perdl0 m2 (office) 818 919 10110 13/12 18/16 1.5 persIl0 mZ 1019 11/10 1311 1 15/13 20118 2 perdl0 m2 13/10 1411 1 15/13 18/15 23/19 3 perdl0 m2 (meet.room) 1811 3 19/14 20115 23/17 2812 1 5 perdl0 m2 (high) 28/18 29/19 30120 33/22 38/26
~ ~ o ~ ~ P 1 i t u d e heat gain df 15 W/m2 and a mean heat gain of 13 W/m2
2.5 Specific solar gain According to ,\I\, the maximum solar intensity through a vertical pane on a clear day can be approximated to 700 W/mZ. This figure can be used for facades facing East through South to West. Daily sum for the same facades can be approximated to 4700 Wh/mz.
Solar shading in form of venetian blinds, curtains and building extensions can reduce the solar gain considerably. The shading effect for these shading devices is often taken as a constant shading factor. Typical values are 0.1 - 0.25 for external venetian blinds, 0.3 - 0.7 for inside venetian blinds and 0.5 - 0.8 for curtains. These values are for two pane windows with no coating, and has to be adjusted if low emessivity coating, reflective coating, absorbing glass or more panes are used. Shading from building extensions and nearby vegetation or buildings has to be estimated from case to case.
In the room from subsection 2.1, the facade is facing south, and there is inside venetian blinds with a shading factor of 0.5. The normalized amplitude gain can be estimated to :
A q::, A,, Fsh 700 - 2 0.5 - - 4so l - - =29 W/m2
2 . ',or 2-12
The normalized mean solar gain can be estimated to :
- Q,:, A,, Fsh 4700.2 0.5 - qs01 - - = 16 W/m2
24 ',or 24. 12
Table 5 gives normalized solar gain (amplitude and mean) as a hnction of window area per m2 floor area and total shading factor. Values are valid for facades facing east to west.

Window area pr m2 1 0.05 m2/m2 0.10 m21m2 0.2 m2/m2 0.3 m2/m2 0.5 m2/m2 Total shading factor Low Normal High 0.85 1518 30116 6013 3 89/48 149180 0.75 1317 26/14 52/29 79/42 13 1/70 0.55 1015 19/10 3 9/22 5 813 0 96/50 0.40 714 1418 28/16 42/24 70140 0.25 412 915 18/10 26/15 44/25 0.10 211 412 714 1116 - 18/10 - .Example : With normal window area (0.2 m2/m2) and a total shading factor of 0.25, gives amplitude solar gain of 18 W/m2 and a mean heat gain of 10 W/m2
Total heat gain (daily mean and amplitude) is the sum of the internal gain and solar gain.
2.6 Climatic data In addition to the maximum solar intensity and daily solar gain treated in the previous subsection, we need to estimate the mean external temperature and its daily variation (amplitude). We also have to estimate the time for maximum heat gain (and external temperature).
The mean external temperature is normally found in meteorological journals. E.g. the highest five day mean temperature for the location in question could be used. This has to be evaluated against the use of the room from case to case.
The external temperature amplitude in Scandinavian climate varies between 5 - 7°C. If accurate information is not available a value of 6 "C can be used. If maximum external temperature isn't corresponding with the maximum heat gain, the temperature amplitude can be reduced a bit (0.5 - 2 "C).
If solar gain is dominating (compared to internal gains), which is one of the main assumptions in the model, the time for maximum heat gain is determined by the facadelwindow orientation. With daylight saving time (in Oslo) maximum solar gain is occurring : between 12.00 and 13.00 for south facades, between 9.00 and 10.00 for east facades, and between 17.00 and 18.00 for west facades. For other countries adjustment for time zone, longitude and daylight saving time has to be done.
3 Case study; comparison
A room which has been used in validation analysis of a computer program (TeknoSim), will be used as case study here, and compared to results fiom the widely used simulation program BRIS ,\I. The room has width, depth and height equal to : 3.6 m x 4.2 m x 2.7 m (An,,, = 15.12 m2, V = 40.82 m3) . The room has one facade, facing west, with one window (A,h = 1.92 m2, U,i, = 2.0 W/m2K). Infiltration is 0.2 ACH, and the room is ventilated continuously with 72 m3/h (4.8 m3/hd). The room is occupied with one person (9 hours a day), and heat gain fiom lighting and computer is 270 W (9 hours a day). The supply fan rises the supply temperature 1 "C.

Two different building constructions has been simulated : one heavy room with concrete floor, ceiling and external wall; and one light room with insulated composite construction covered with gypsum boards or particle boards. Partition walls are insulated composite walls with gypsum board in both cases.
Calculation Normalized total specific loss is calculated to : H"t,t = 2.18 W/mK (both cases). Normalized heat capacity for the two cases are calculated to : C)'&h = 3 1.2 W m 2 K (light room) and C)'%h = 140.6 Wh/m2K (heavy room). Timeconstant and time-lag for the light- and heavy room then become : zl&t = 14.3 hours, zl,l&t = 5 hours (light) and zheavy = 64.6 hours, T ~ , ~ ~ ~ ~ = 5.8 hours (heavy). Normalized mean heat gain and heat gain amplitude is respectively -
: q = 20.4 W/m2 and ij = 3 1.0 W/m2. Mean external temperature and temperature amplitude
are respectively : = 22 OC and ?e = 6.5 OC . This gives a stationary temperature of : T, = 3 1.7 OC (both cases), and a temperature amplitude for the light and heavy room of
respectively : te = 1.2 OC (light) and fe = 5.3 OC (heavy). Transient temperature differences are calculated to : = -10.8 OC (light) and ATh,,= -9.9 "C (heavy). Both cases are
simulated for a period of five days.
Simulated operative temperature the fifth simulation day in BRIS is shown in figure 1 (light room) and figure 2 (heavy room), and is compared to calculation with ThermSim (fifth day). The operative temperature in BRTS is used for the comparison, since the calculated temperature in ThermSim is a "merged" room-, surface- and structure temperature.
Comparison betwe nd TherrnSim; light room
I I
Figure 1 : Comparison between simulation in the advanced computer program BRIS and calculation with ThemSim, light room
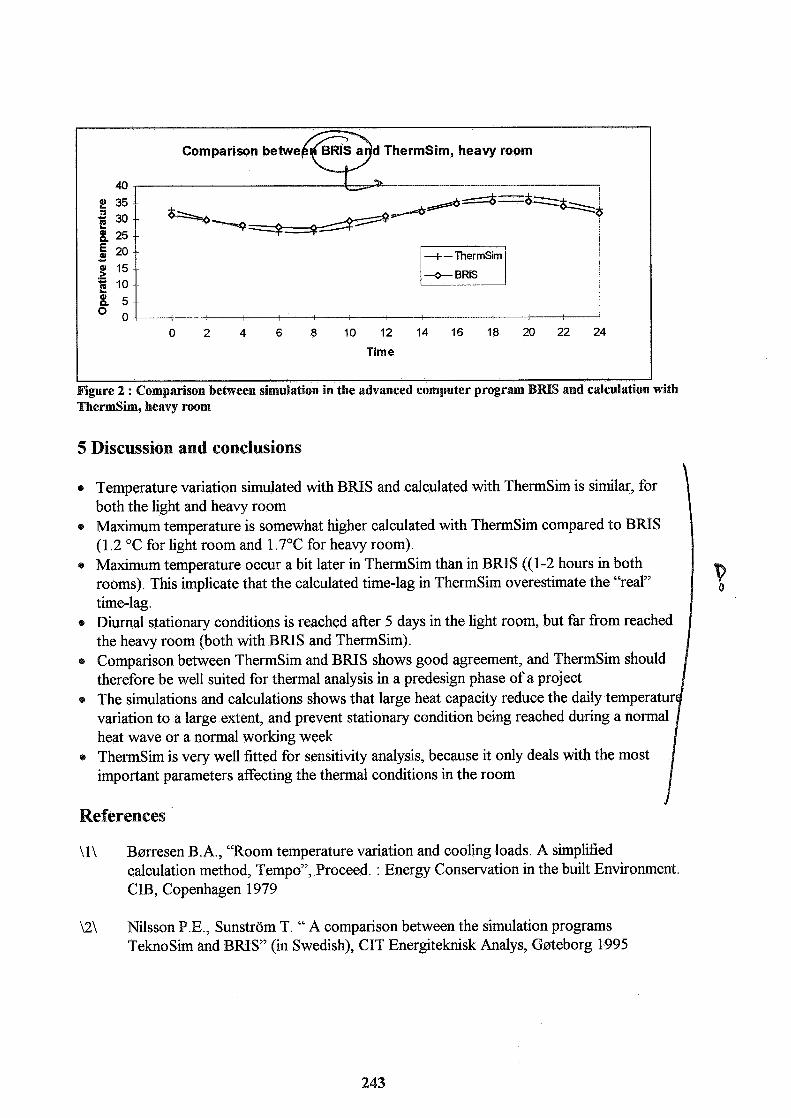
Comparison betwe d ThermSim, heavy room
-+ - ThermSim
Time I I I
Figure 2 : Comparison between simulation in the advanced computer program BRIS and calculation with ThemSim, heavy room
5 Discussion and conclusions
Q Temperature variation simulated with BRIS and calculated with ThermSim is similar, for both the light and heavy room
e Maximum temperature is somewhat higher calculated with ThermSim compared to BRIS (1.2 "C for light room and 1.7"C for heavy room). Maximum temperature occur a bit later in ThermSim than in BRIS ((1-2 hours in both rooms). This implicate that the calculated time-lag in ThermSim overestimate the "real" D
0 time-lag . Diurnal stationary conditions is reached after 5 days in the light room, but far from reached the heavy room (both with B N S and ThermSim).
Q Comparison between ThermSim and BRIS shows good agreement, and ThermSim should therefore be well suited for thermal analysis in a predesign phase of a project
Q The simulations and calculations shows that large heat capacity reduce the daily temperatur variation to a large extent, and prevent stationary condition being reached during a normal heat wave or a normal working week
Q ThermSim is very well fitted for sensitivity analysis, because it only deals with the most important parameters affecting the thermal conditions in the room
References
\ l \ Barresen B. A., 'Room temperature variation and cooling loads. A simplified calculation method, Tempo", Proceed. : Energy Conservation in the built Environment. CIB, Copenhagen 1979
\2\ Nilsson P.E., Sunstrom T. " A comparison between the simulation programs TeknoSim and BRIS" (in Swedish), CIT Energiteknisk Analys, Gateborg 1995

VENTILATION COOLING 18TH AIVC CONFERENCE, ATHENS, GREECE
23-26 SEPTEMBER, 11997
Title: Controlled Air Flow Inlets
Author(s): W F De Gids
Affiliation: TNO Building And construction Research, Department of Indoor Environment, Building Physics and Systems, The Netherlands

INTRODUCTION
Within the EU project NATVENT, which deals with the application of natural ventilation in office type buildings, one of the items to be studied was controlled air flow inlets. Natural air supply is a key part in the design of natural ventilation in offices. In case these air supplies are designed in the wrong way one may expect complaints in terms of draft and stuffiness. Size and controls on inlets are vital elements in design. Controlled air inlets may help to overcome the problems of draft and stuffiness, and may contribute to an energy efficient design of the building.
Several types of control can be considered such as: pressure control, humidity control, pollutant control and temperature control.
AVAILABILITY
Just a few of these innovative developments are available on the European market. Especially France have produced this type of inlets already for many years. One may say that France is really on the fore front in designing as well as in the application of these product. Because of the climate the Scandinavian countries have focused on control by outside temperature. Over the last few years in the Netherlands and France a number of new developments are going on.
The difference in philosophy of the countries involved on ventilation and the way the requirements are described in the building regulations in these countries have a large influence on the design and performance of the available controlled air inlets.
Some examples may explain the situation:
in France air inlets may not be fully closed, while in The Netherlands they must be completely closable. in The Netherlands the controllability of these inlets are must be between 1 and 25 Pa, where in France the control may be at about 20 Pa.
These conflicting requirements don't miss their effect on the design of the controlled inlets.
PERFORMANCES
Pressure controlled inlets
The objective of these inlets can be expressed as a constant natural supply air flow independent of wind pressure and pressure differences due to buoyancy
Big differences are found in the capacity or sizes of the inlets available on the European market. As mentioned earlier the reason for this is mainly the difference in the requirements in the building regulations. As an example for the same size of room the difference in the capacity of air inlets expressed in cm2 is in:
France 20 cm2 UK 40 cm2 Belgium 70 cm2 the Netherlands 100 cm2
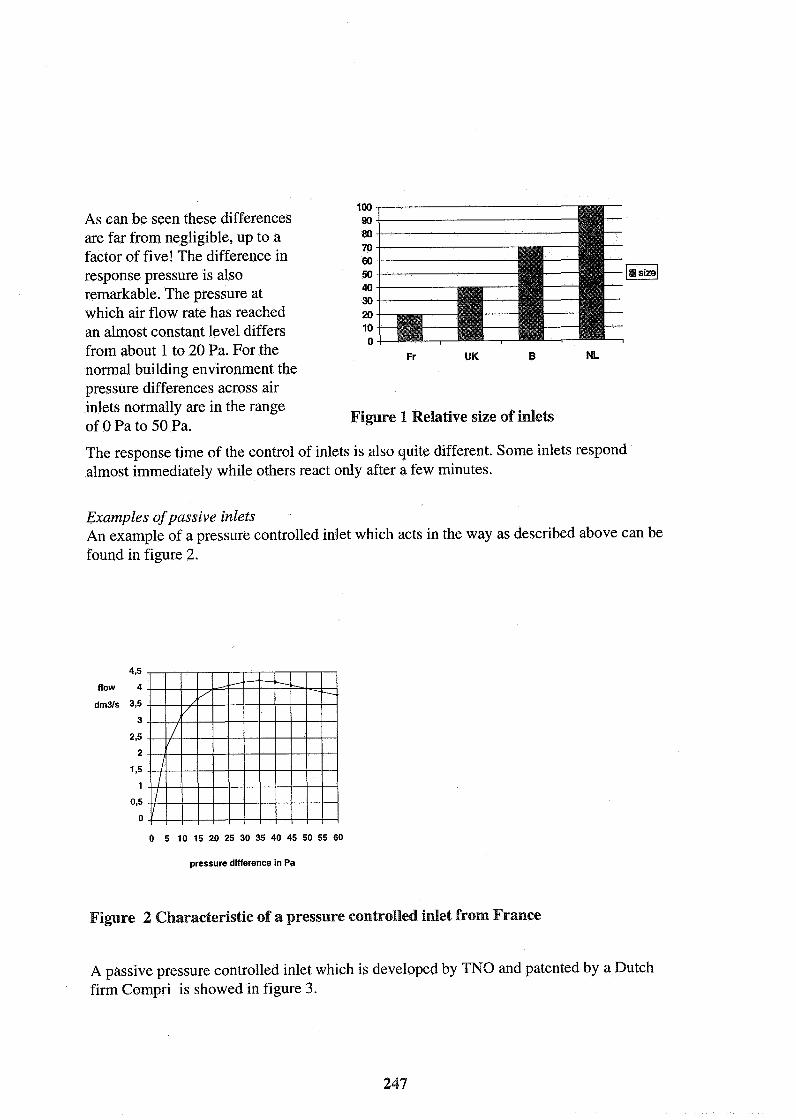
As can be seen these differences are far from negligible, up to a factor of five! The difference in response pressure is also remarkable. The pressure at which air flow rate has reached an almost constant level differs from about 1 to 20 Pa. For the normal building environment the pressure differences across air inlets normally are in the range of 0 Pa to 50 Pa. Figure 1 Relative size of inlets
The response time of the control of inlets is also quite different. Some inlets respond almost immediately while others react only after a few minutes.
Examples of passive inlets An example of a pressure controlled inlet which acts in the way as described above can be found in figure 2.
4,5 - flow 4 -
dm3Is 3,s - 3 .
2,s -
2 -
1,s .
1 .
0,s .
0 .
0 5 10 15 20 25 30 35 40 45 50 55 60
pressure difference in Pa
Figure 2 Characteristic of a pressure controlled inlet from France
A passive pressure controlled inlet which is developed by TNO and patented by a Dutch firm Gompri is showed in figure 3.

Figure 3 Cross section a passive pressure controlled inlet COMPRI IAQ
A performance curve of a pressure controlled inlet at 1 Pa can be seen in figure 7.
90% of time
0 ch aracteristie
const ant fluw
10
characteristic
3
0.4 1 10 100
pressure difference [Pa]
Figure 4 An example of the performance of a passive pressure controlled inlet from the Netherlands
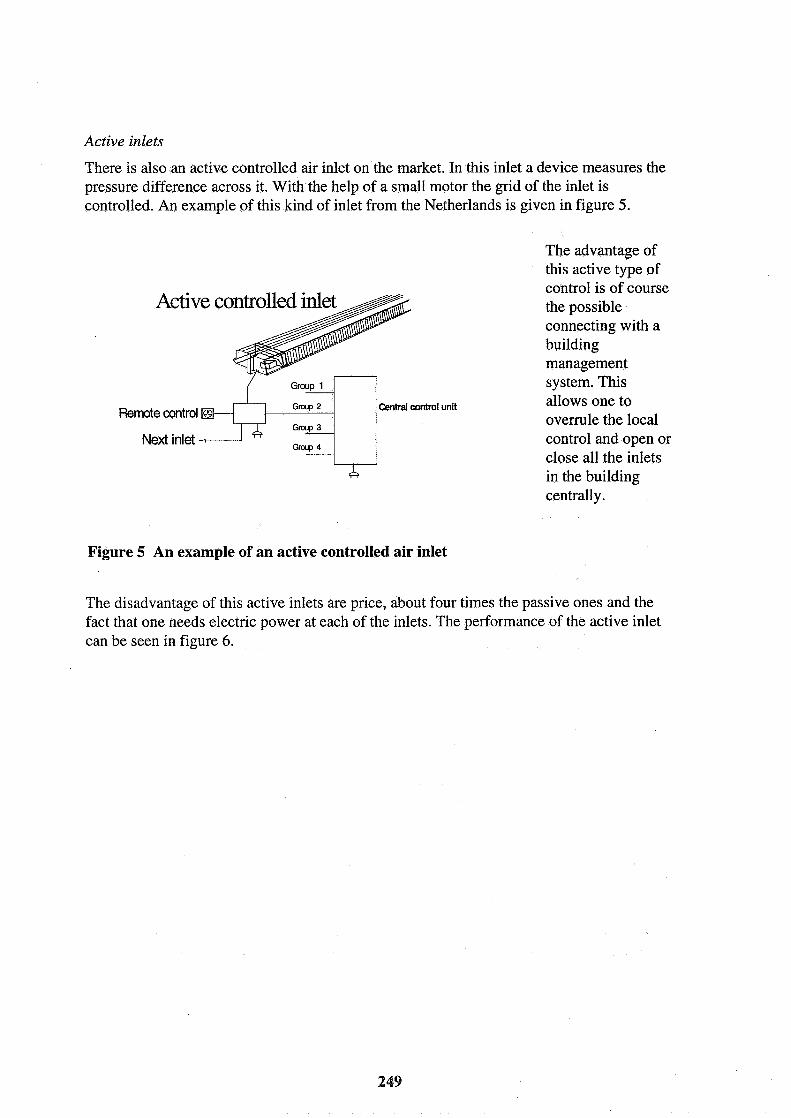
Active inlets
There is also an active controlled air inlet on the market. In this inlet a device measures the pressure difference across it. With the help of a small motor the grid of the inlet is controlled. An example of this kind of inlet from the Netherlands is given in figure 5.
The advantage of this active type of
Active controlled inl
-
control is of course the possible. connecting with a building management system. This allows one to overrule the local control and open or close all the inlets in the building centrally.
Figure 5 An example of an active controlled air inlet
I -a1 cantmi unit I
The disadvantage of this active inlets are price, about four times the passive ones and the fact that one needs electric power at each of the inlets. The performance of the active inlet can be seen in figure 6.
Remote control & - 2
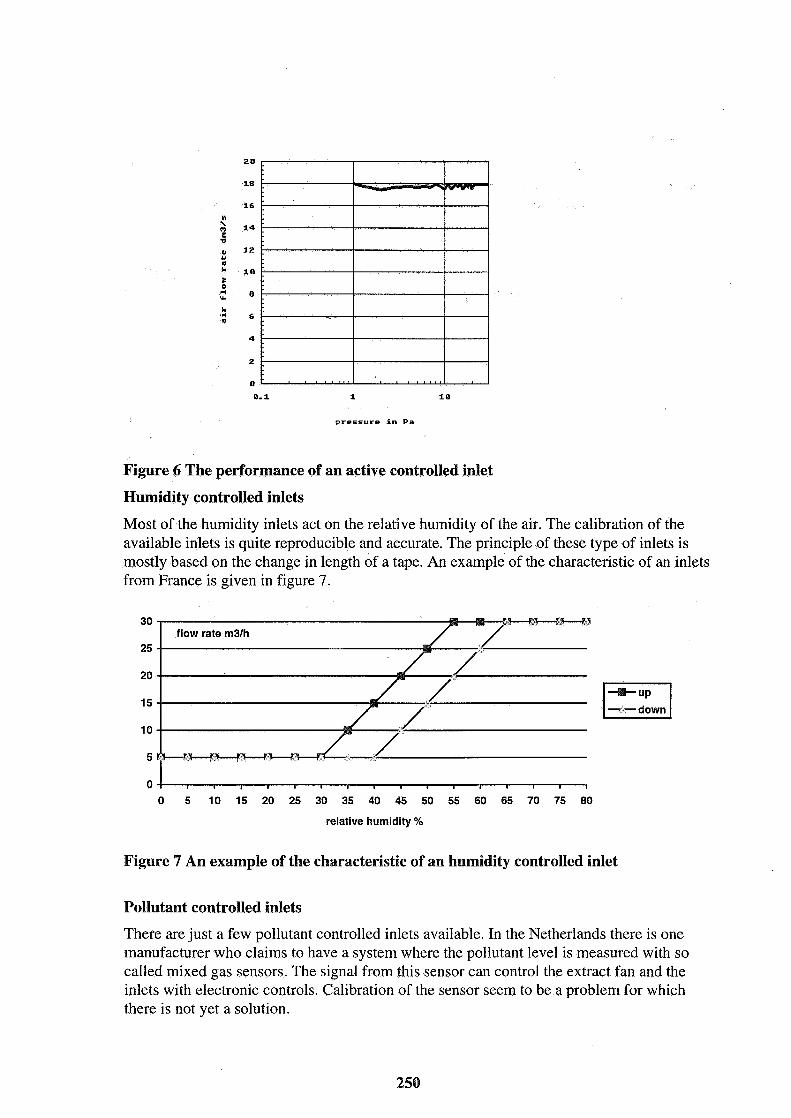
pressure in Pa
Figure 6 The performance of an active controlled inlet
Humidity controlled inlets
Most of the humidity inlets act on the relative humidity of the air. The calibration of the available inlets is quite reproducible and accurate. The principle of these type of inlets is mostly based on the change in length of a tape. An example of the characteristic of an inlets from France is given in figure 7.
0 I I I I I I I I I I I
0 5 10 15 20 25 30 35 40 45 50 55 60 65 70 75 80
relative humidity %
Figure 7 An example of the characteristic of an humidity controlled inlet
Pollutant controlled inlets
There are just a few pollutant controlled inlets available. In the Netherlands there is one manufacturer who claims to have a system where the pollutant level is measured with so called mixed gas sensors. The signal from this sensor can control the extract fan and the inlets with electronic controls. Calibration of the sensor seem to be a problem for which there is not yet a solution.
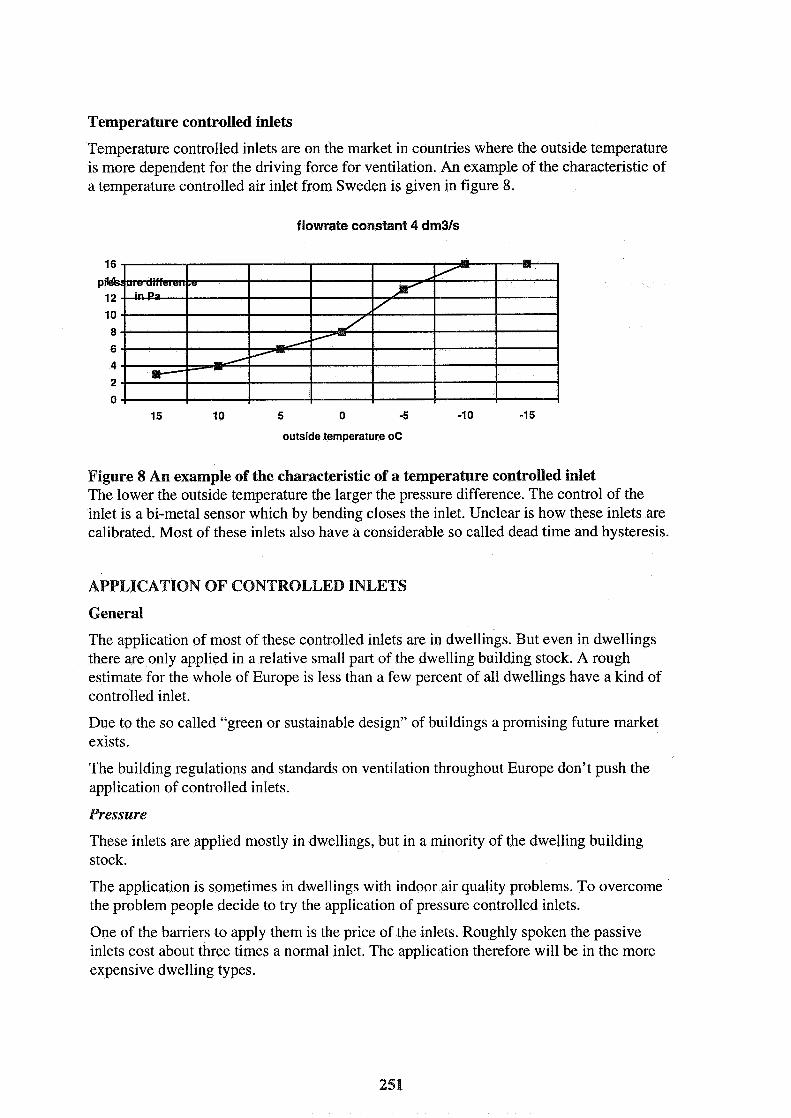
Temperature controlled inlets
Temperature controlled inlets are on the market in countries where the outside temperature is more dependent for the driving force for ventilation. An example of the characteristic of a temperature controlled air inlet from Sweden is given in figure 8.
flowrate constant 4 dm3ls
outside temperature oC
Figure 8 An example of the characteristic of a temperature controlled inlet The lower the outside temperature the larger the pressure difference. The control of the inlet is a bi-metal sensor which by bending closes the inlet. Unclear is how these inlets are calibrated. Most of these inlets also have a considerable so called dead time and hysteresis.
APPLICATION OF CONTROLLED INLETS
General
The application of most of these controlled inlets are in dwellings. But even in dwellings there are only applied in a relative small part of the dwelling building stock. A rough estimate for the whole of Europe is less than a few percent of all dwellings have a kind of controlled inlet.
Due to the so called "green or sustainable design" of buildings a promising future market exists.
The building regulations and standards on ventilation throughout Europe don't push the application of controlled inlets.
Pressure
These inlets are applied mostly in dwellings, but in a minority of the dwelling building stock.
The application is sometimes in dwellings with indoor air quality problems. To overcome the problem people decide to try the application of pressure controlled inlets.
One of the barriers to apply them is the price of the inlets. Roughly spoken the passive inlets cost about three times a normal inlet. The application therefore will be in the more expensive dwelling types.
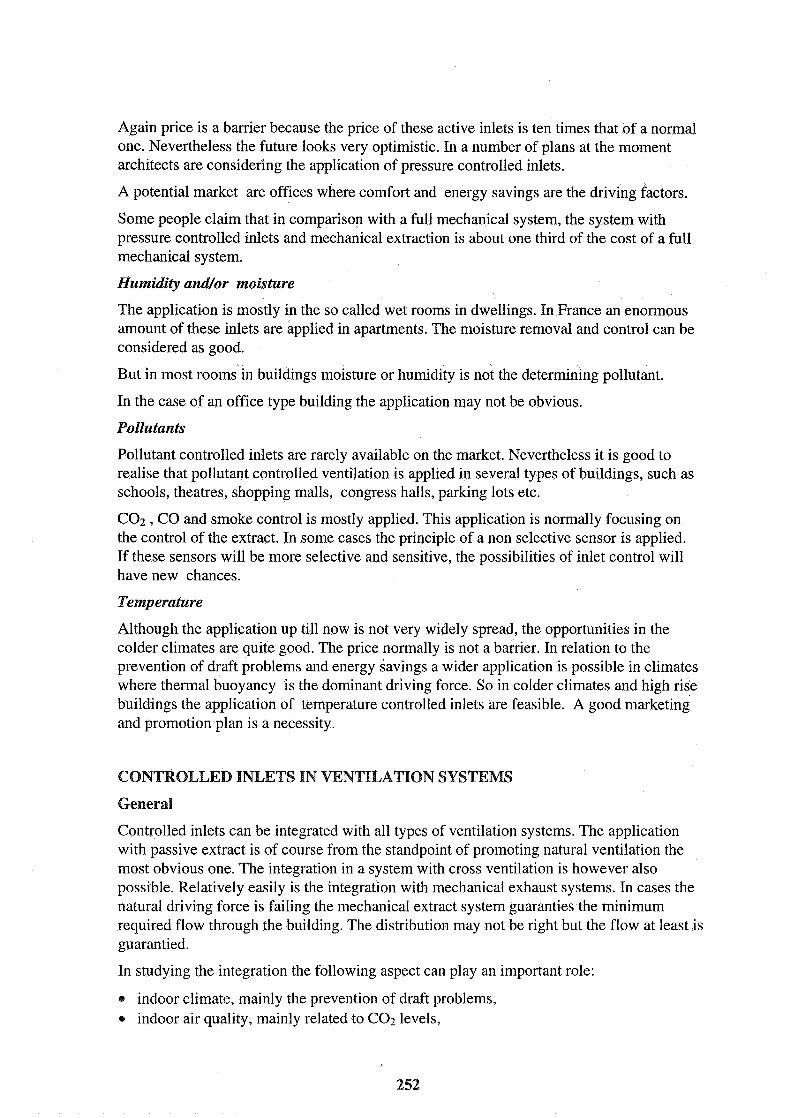
Again price is a barrier because the price of these active inlets is ten times that of a normal one. Nevertheless the future looks very optimistic. In a number of plans at the moment architects are considering the application of pressure controlled inlets.
A potential market are offices where comfort and energy savings are the driving factors.
Some people claim that in comparison with a full mechanical system, the system with pressure controlled inlets and mechanical extraction is about one third of the cost of a full mechanical system.
Humidity and/or moisture
The application is mostly in the so called wet rooms in dwellings. In France an enormous amount of these inlets are applied in apartments. The moisture removal and control can be considered as good.
But in most rooms in buildings moisture or humidity is not the determining pollutant.
In the case of an office type building the application may not be obvious.
Pollutants
Pollutant controlled inlets are rarely available on the market. Nevertheless it is good to realise that pollutant controlled ventilation is applied in several types of buildings, such as schools, theatres, shopping malls, congress halls, parking lots etc.
C02 , CO and smoke control is mostly applied. This application is normally focusing on the control of the extract. In some cases the principle of a non selective sensor is applied. If these sensors will be more selective and sensitive, the possibilities of inlet control will have new chances.
Temperature
Although the application up till now is not very widely spread, the opportunities in the colder climates are quite good. The price normally is not a barrier. In relation to the prevention of draft problems and energy savings a wider application is possible in climates where thermal buoyancy is the dominant driving force. So in colder climates and high rise buildings the application of temperature controlled inlets are feasible. A good marketing and promotion plan is a necessity.
CONTROLLED INLETS IN VENTILATION SYSTEMS
General
Controlled inlets can be integrated with all types of ventilation systems. The application with passive extract is of course from the standpoint of promoting natural ventilation the most obvious one. The integration in a system with cross ventilation is however also possible. Relatively easily is the integration with mechanical exhaust systems. In cases the natural driving force is failing the mechanical extract system guaranties the minimum required flow through the building. The distribution may not be right but the flow at least is guarantied.
In studying the integration the following aspect can play an important role:
indoor climate, mainly the prevention of draft problems, indoor air quality, mainly related to C02 levels,
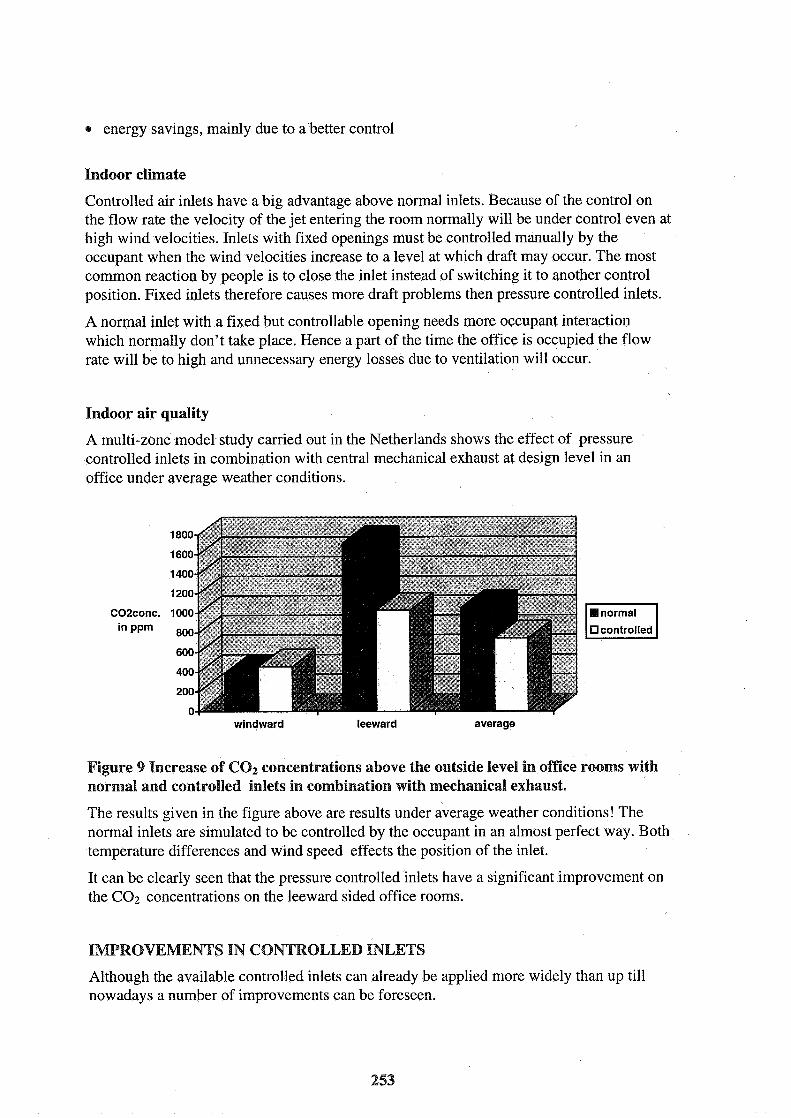
e energy savings, mainly due to a better control
Indoor climate
Controlled air inlets have a big advantage above normal inlets. Because of the control on the flow rate the velocity of the jet entering the room normally will be under control even at high wind velocities. Inlets with fixed openings must be controlled manually by the occupant when the wind velocities increase to a level at which draft may occur. The most common reaction by people is to close the inlet instead of switching it to another control position. Fixed inlets therefore causes more draft problems then pressure controlled inlets.
A normal inlet with a fixed but controllable opening needs more occupant interaction which normally don't take place. Hence a part of the time the office is occupied the flow rate will be to high and unnecessary energy losses due to ventilation will occur.
Indoor air quality
A multi-zone model study carried out in the Netherlands shows the effect of pressure controlled inlets in combination with central mechanical exhaust at design level in an office under average weather conditions.
CO2conc. in ppm
windward leeward average
controlled
Figure 9 Increase of C02 concentrations above the outside level in office rooms with normal and controlled inlets in combination with mechanical exhaust.
The results given in the figure above are results under average weather conditions! The normal inlets are simulated to be controlled by the occupant in an almost perfect way. Both temperature differences and wind speed effects the position of the inlet.
It can be clearly seen that the pressure controlled inlets have a significant improvement on the C02 concentrations on the leeward sided office rooms.
IMPROVEMENTS IN CONTROLLED INLETS
Although the available controlled inlets can already be applied more widely than up till nowadays a number of improvements can be foreseen.
The most important ones are listed below:
presence control interaction with building energy management systems sound attenuation air cleaning or filtering development of controlled inlets for ducted systems better integration in ventilation systems.
With regard to presence control simple technical solutions like infra red sensors can be easily applied to the already existing inlets. This option is important to decrease the ventilation heat. Interaction with building energy management systems is important because these systems can overrule local control if necessary. This can be of importance for energy as well as for safety for instance in case of fire or other hazard.
Natural inlets are is sometimes not applied because of high outdoor traffic noise levels. The barrier of noise can be taken in most situations with sound attenuation. Sound attenuated air inlets air widely available. It may be a good improvement on controlled inlets. Special attention is needed for ideas on controlled inlets for ducted systems.
In case of heat recovery a ducted system is necessary. A combination of the two leads to very energy efficient ventilation systems.
The last item is integration with ventilation systems. This report describes a number of solutions which are still not common practice but only applied in the special cases. More attention is needed to integrate controlled air inlets in total ventilation system design. A number of possibilities are not yet explored.
CONCLUSIONS
Controlled air inlets are available on the market but mainly applied up till now on dwelling type buildings.
The size and dimensions vary enormous because of local requirements throughout Europe.
Several types of control are available : pressure control, humidity control, pollutant control and temperature control.
As it stands now pressure controlled and temperature controlled inlets seems to have the most practical chances to be applied more in office type of buildings.
The performance of the controlled inlets are not always of that level that application in offices is obvious.
Some of the pressure controlled inlets are however very promising in terms of indoor air quality, comfort and energy.
Price is still a barrier to the wide application of these inlets.
Pressure controlled inlets improve the ventilation of offices. Controlled inlets can give significant better indoor air quality, better comfort and at the same time a lower energy use for ventilation.
A number of possible features as improvements on the existing ones can be easily foreseen.
The most important however is a better promotion of the lately developed controlled inlets. The products are there, the market is there, but the application still is far behind.
Demonstration project to show the real world that these inlets are vital parts of natural ventilation systems are necessary.
References
[I] B. Knoll AIVC Technote 35, Advanced ventilation systems AIVC Warwick March 1992
121 W.F. de Gids Controlled air flow inlets NATVENT report Workpackage 3, activity 2 Delft August 1997

VENTILATION AND COOLING
1 8TH AIVC CONFERENCE ATHENS, GREECE, 23-26 SEPTEMBER, 1997
The Signseance of Urban Pollution and its dilution associated with height
( I ) Willan Building Services Ltd, Unit 6 Tonbridge Chambers, Pembury Rd, Kent, UK, TN9 2HZ.
t2) Willan Building Services Ltd, 2 Brooklands Rd, Sale, Cheshire, UK, M33 3SS.

The significance of urban pollution and its dilution associated with h e m t
Willan Building Services Ltd., Unit 6 Tonbridge chambers, Pembury Road, Tonbridge, Kent, United Kingdom, TN9 2HZ. Willan Building Services Ltd., 2 Brooklands Road, Sale, Cheshire, United Kingdom, M33 3SS.
This paper identifies the significance of pollution at five sites amongst the worst on the British mainland, hence indicative of other polluted areas within Europe. Three sites are located in London and one each in Birmingham and Cardiff. The pollutants examined are NOz, SOz, O3 and PMlo. Newly proposed DOE figures defining poor air quality have been used to re-examine the fkequency of excess pollution episodes between 1992 - 1995. The results identifl the most appropriate periods for natural ventilation of offices in urban areas in terms of the hour in a day and time of year. Preliminary in-situ experiments also demonstrate that both PMlo and NOz concentrations decrease with increasing height from a busy road, and that this could be a useful strategy for reducing the impact of contaminants derived from vehicle emissions.
1. INTRODUCTION
The aim of this paper is to suggest ways in which barriers to natural ventilation may be overcome. The study forms part of the Pan-European project titled NatVent involving seven countries; the UK Building Research Establishment (BRE) are the co-ordinators. A widely perceived barrier to effective natural ventilation in urban areas is the ingress of external pollutants. Filtration of air supply is an option but may unacceptably restrict the flow of air into buildings. A possible solution is to vary ventilation periods to avoid 'polluted' occasions.
A general perception exists that pollution at roof level is likely to be less than by the road side, but there appears to be little quantitative evidence for this. Since the siting of ofices varies substantially in height it is useful to examine how height influences the concentration of mainly traffrc generated pollutants. If a dilution effect is evident it may be possible to recommend a suitable height for positioning air inlets in buildings to avoid or reduce the need for filtration. In section 3 of this paper the concentrations of PMlo, and NO2 are examined at varying heights fiom a busy road.
2. THE EXTENT OF URBAN POLLUTION IN CITIES
2.1 Selection Of sample sites
A recent European report examined the urban pollution problem across Europe, using seven cities sited as representative "of their air quality, geographical location and characteristics of their vehicle fleet", (1). The locations chosen were, London, The Hague, Cologne, Lyon, Milan, Athens and Madrid. Of these cities London, The Hague and Cologne are located within an area of Europe covered by the NatVent
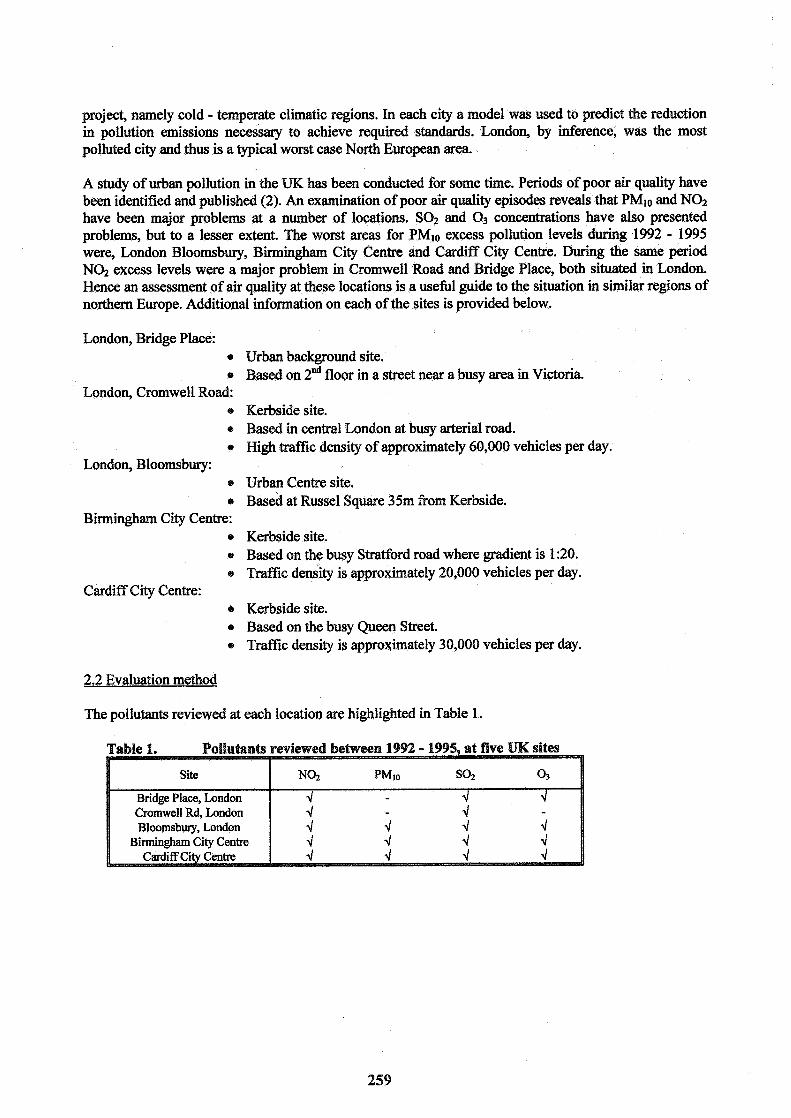
project, namely cold - temperate climatic regions. In each city a model was used to predict the reduction in pollution emissions necessary to achieve required standards. London, by inference, was the most polluted city and thus is a typical worst case North European area.
A study of urban pollution in the UK has been conducted for some time. Periods of poor air quality have been identified and published (2). An examination of poor air quality episodes reveals that PMlo and NO2 have been major problems at a number of locations. SO2 and O3 concentrations have also presented problems, but to a lesser extent. The worst areas for PMlo excess pollution levels during 1992 - 1995 were, London Bloomsbury, Birmingham City Centre and Cardiff City Centre. During the same period NOz excess levels were a major problem in Cromwell Road and Bridge Place, both situated in London. Hence an assessment of air quality at these locations is a usefil guide to the situation in similar regions of northern Europe. Additional information on each of the sites is provided below.
London, Bridge Place: 0
0
London, Cromwell Road: e
0
0
London, Bloomsbury: 9
0
Birmingham City Centre: 0
0
e
Cardiff City Centre: e
Urban background site. Based on 2nd floor in a street near a busy area in Victoria.
Kerbside site. Based in central London at busy arterial road. High traffic density of approximately 60,000 vehicles per day.
Urban Centre site. Based at Russel Square 35m from Kerbside.
Kerbside site. Based on the busy Stratford road where gradient is 1:20. Traffic density is approximately 20,000 vehicles p a day.
Kerbside site. Based on the busy Queen Street. Traffic density is approximately 30,000 vehicles per day.
2.2 Evaluation method
The pollutants reviewed at each location are highlighted in Table 1.
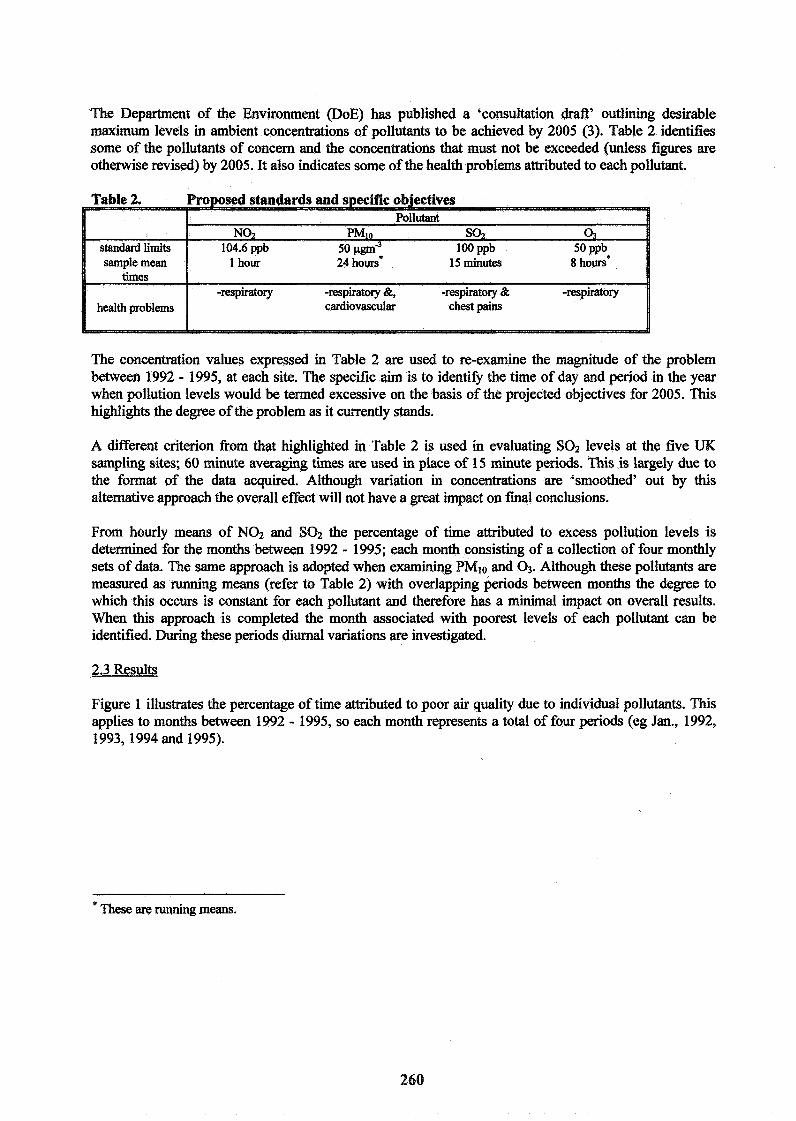
The Department of the Environment (DOE) has published a 'consultation draft' outlining desirable maximum levels in ambient concentrations of pollutants to be achieved by 2005 (3). Table 2 identifies some of the pollutants of concern and the concentrations that must not be exceeded (unless figures are otherwise revised) by 2005. It also indicates some of the health problems attributed to each pollutant.
The concentration values expressed in Table 2 are used to re-examine the magnitude of the problem between 1992 - 1995, at each site. The specific aim is to identifl the time of day and period in the year when pollution levels would be termed excessive on the basis of the projected objectives for 2005. This highlights the degree of the problem as it currently stands.
F times
health problems
A different criterion from that highlighted in Table 2 is used in evaluating SO2 levels at the five UK sampling sites; 60 minute averaging times are used in place of 15 minute periods. This is largely due to the format of the data acquired. Although variation in concentrations are 'smoothed' out by this alternative approach the overall effect will not have a great impact on final conclusions.
-respiratory -respiratory &, -respiratory & -respiratory cardiovascular chest pains
From hourly means of NO2 and SO2 the percentage of time attributed to excess pollution levels is determined for the months between 1992 - 1995; each month consisting of a collection of four monthly sets of data. The same approach is adopted when examining PMlo and 03. Although these pollutants are measured as running means (refer to Table 2) with overlapping periods between months the degree to which this occurs is constant for each pollutant and therefore has a minimal impact on overall results. When this approach is completed the month associated with poorest levels of each pollutant can be identified. During these periods diurnal variations are investigated.
2.3 Results
Figure 1 illustrates the percentage of time attributed to poor air quality due to individual pollutants. This applies to months between 1992 - 1995, so each month represents a total of four periods (eg Jan., 1992, 1993, 1994 and 1995).
* These are running means.

. Bloomsbury Cromwell Rd NO2
Bridge Place 1 Birmingham
Cardiff
F M A M J J A S O N D I J F M A M J J A S O N D
month month I
5 20
I. 3 16
I 12 53 &'
I 3
' 5 s 8 f 2
1' 4 P, C .a *
11 1 1 ' 0
bt 0 s 0 J F M A M J J A S O N D J F M A M J J A S O N D
For each pollutant in Figure 1 the maximum period of time attributed to poor air quality can be identified during each month. The values are provided in table 3, and the figwe typed in bold if it exceeds 5%.
month
Kev * These values do not include the Cardiff results because during 1994 the site was found to be 'contaminated' by building works. This had affected the normal distribution of particles at the site.
month
Figure 1 Amount of time associated with poor air quality during months between the years 1992 - 1995. The bench mark concentrations are those outlined in Table 2.
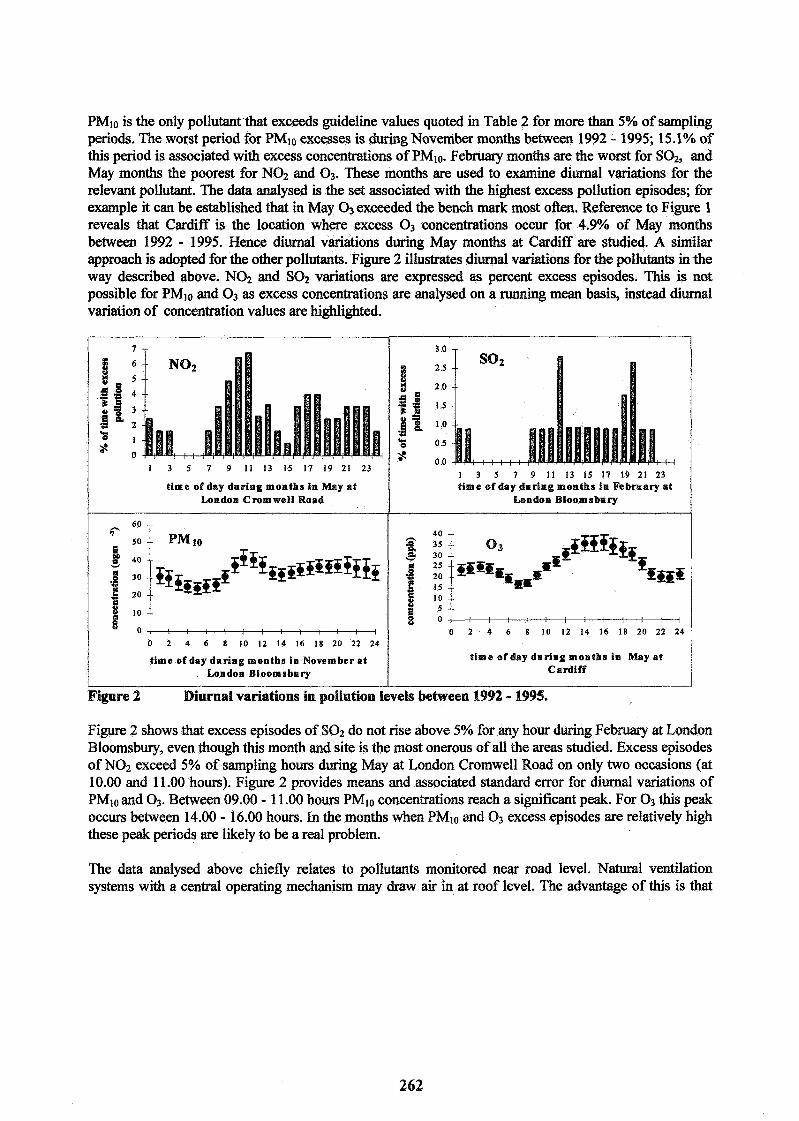
PMlo is the only pollutant'that exceeds guideline values quoted in Table 2 for more than 5% of sampling periods. The worst period for PMlo excesses is during November months between 1992 - 1995; 15.1% of this period is associated with excess concentrations of PMlo. February months are the worst for SO2, and May months the poorest for NO2 and 0 3 . These months are used to examine diurnal variations for the relevant pollutant. The data analysed is the set associated with the highest excess pollution episodes; for example it can be established that in May O3 exceeded the bench mark most often. Reference to Figure 1 reveals that Cardiff is the location where excess O3 concentrations occur for 4.9% of May months between 1992 - 1995. Hence diurnal variations during May months at Cardiff are studied. A similar approach is adopted for the other pollutants. Figure 2 illustrates diurnal variations for the pollutants in the way described above. NO2 and SOz variations are expressed as percent excess episodes. This is not possible for PMlo and O3 as excess concentrations are analysed on a running mean basis, instead diurnal variation of concentration values are highlighted.
time of day daring months in May at London Cromwell Road
1 I I
Figure 2 Diurnal variations in pollution levels between 1992 - 1995.
time of day during months tn February at London Bloomsbury
60 1̂
so --
1 40 -- V
8 30
4 20 1 0 -
Figure 2 shows that excess episodes of SO2 do not rise above 5% for any hour during February at London Bloomsbury, even though this month and site is the most onerous of all the areas studied. Excess episodes of NO2 exceed 5% of sampling hours during May at London Cromwell Road on only two occasions (at 10.00 and 1 1 .OO hours). Figure 2 provides means and associated standard error for diurnal variations of PMlo and 03. Between 09.00 - 11 .OO hours PMlo concentrations reach a significant peak. For O3 this peak occurs between 14.00 - 16.00 hours. In the months when PMlo and O3 excess episodes are relatively high these peak periods are likely to be a real problem.
I
-
PMIO
--
-- e l o
P g o , i ; : i : : : : ; ; ; ,
S 0 0 2 4 6 8 10 12 14 16 18 20 22 24
The data analysed above chiefly relates to pollutants monitored near road level. Natural ventilation systems with a central operating mechanism may draw air in at roof level. The advantage of this is that
0 2 4 6 8 10 12 14 16 18 20 22 24
time of day daring months in November at London Bloomsbury
time o f day during months in May at Cardiff
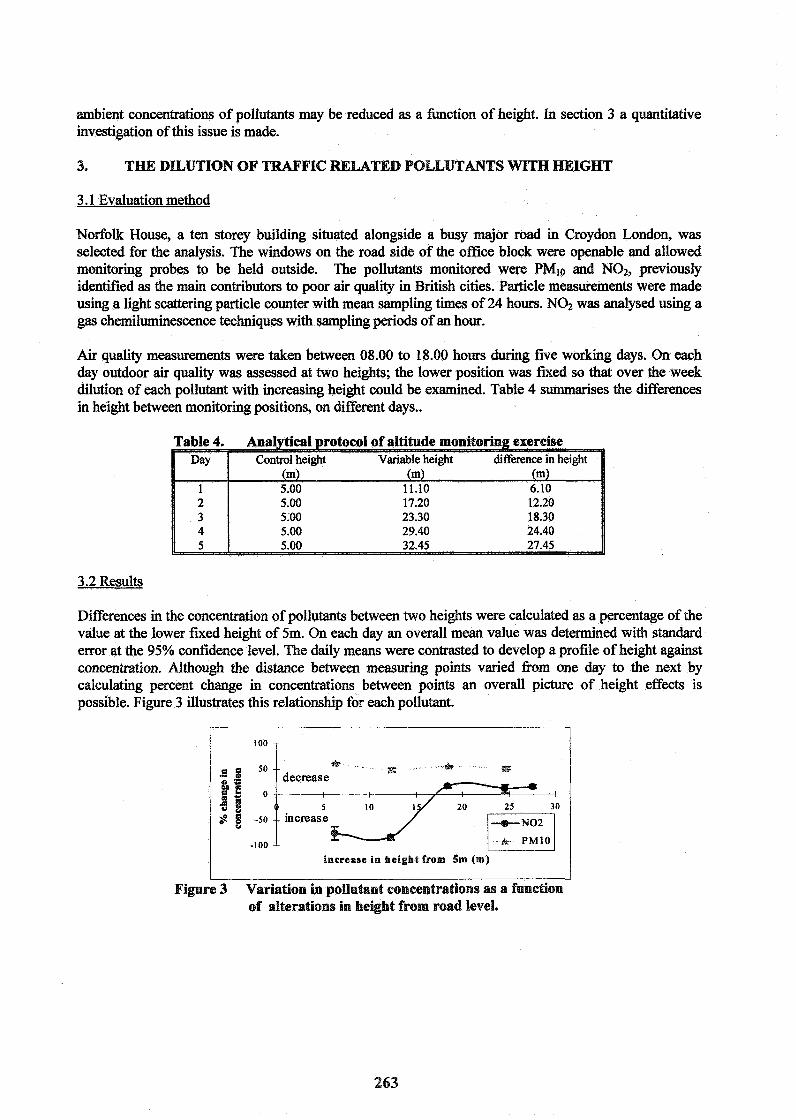
ambient concentrations of pollutants may be reduced as a function of height. In section 3 a quantitative investigation of this issue is made.
3. T33E DLLUTION OF IC RELATED POLLUT
3.1 Evaluation method
Norfolk House, a ten storey building situated alongside a busy major road in Croydon London, was selected for the analysis. The windows on the road side of the office block were openable and allowed monitoring probes to be held outside. The pollutants monitored were PMlo and NOz, previously identified as the main contributors to poor air quality in British cities. Particle measurements were made using a light scattering particle counter with mean sampling times of 24 hours. NO2 was analysed using a gas chemiluminescence techniques with sampling periods of an hour.
Air quality measurements were taken between 08.00 to 18.00 hours during five working days. On each day outdoor air quality was assessed at two heights; the lower position was fixed so that over the week dilution of each pollutant with increasing height could be examined. Table 4 summarises the differences in height between monitoring positions, on different days..
Table 4. An tocol of altitude monitori
I (m) (m) (m) 1 5.00 11.10 6.10 I
3.2 Results
Differences in the concentration of pollutants between two heights were calculated as a percentage of the value at the lower fixed height of 5m. On each day an overall mean value was determined with standard error at the 95% confidence level. The daily means were contrasted to develop a profile of height against concentration. Although the distance between measuring points varied &om one day to the next by calculating percent change in concentrations between points an overall picture of height effects is possible. Figure 3 illustrates this relationship for each pollutant.
increase in height from §an (m) I I d
Figure 3 Variation in pollutant concentrations as a function of alterations in height from road level.

PMlo concentrations are diluted with height in all circumstances accordii to Figure 3; particle concentrations diminish by between 48 - 61%' between 6.1 - 24.4 m above 5 m. The relationship between PMlo concentrations and height is not linear. NO2 behaves differently in that between 6.1 - 12.2 m above 5 m its concentration increases. Beyond 18.4 m above 5 m NOz levels fall by between 10 - 16.
The significance of variations in meteorological conditions in a vertical plane has not been assessed in this exercise which imposes a limitation on the results obtained from this approach.. However this preliminary exercise is of use as it indicates potential improvements in the quality of air provided to buildings when supply is at a sufficient height fiom busy roads.
4. DISCUSSION
A potential strategy for natural ventilation of non domestic buildings in cities is to avoid periods when pollution loads fiom trafEc may be high. The exercise in section 1 allows a decision to be made about the frequency of 'acceptable' excess pollution episodes in the outdoor environment. This is a possible design strategy for natural ventilation of non domestic buildings. An example of this approach is shown in Table 5 for the pollutants reviewed in section 1 of this paper. The assumption made in Table 5 is that excess outdoor pollution for up to 5% of sampling times is an acceptable fiequency of episodes.
Table 5 Suitable and unsuitable periods for natural ventilation due to pollutants in urban

The assumption behind Table 5 that 5% is a suitable upper bench mark for an acceptable fkequency of excess pollution episodes is an important one as a different value may produce a dissimilar distribution of appropriate periods for natural ventilation. However 5% is a reasonable value given the additional dilution effect of pollutants with increased height fiom road traffic emissions. There is also evidence of much lower indoor concentrations of pollutants compared to outdoor levels, (4); up to 60% lower indoor concentrations in a naturally ventilated building compared to outdoor values at street level.
Table 5 demonstrates likely occasions when PMlo and O3 ambient concentrations may be too high. Since this is based on calculations of percent excess episodes on monthly time scales it is possible that there are other periods in the day when the problem may also be consistent. Over the long term O3 may become more significant in urban areas where other pollutants diminish; NO reacts with O3 producing NO2. If traffic emissions of NO decrease Q3 concentrations will rise. This is most likely to occur during peak hours of traffic intensity. However there is evidence that building materials such as masonry, are effective at breaking up O3 molecules, hence overall the pollutant is not a severe problem (5).
Using the criteria set out in Table 5 5 4 does not appear to be a significant urban pollutant. There were no periods when excess SO2 concentrations prevailed for up to 5% of sampling periods. Although the sites examined were not the worst in Britain for this pollutant, they still represented areas where the problem was comparatively significant. Table 5 indicates that N@ concentrations can be persistently high, however these are very infrequent and the locations studied were the poorest for NO2 levels in the UK. Further more tougher legislation to control vehicle emissions are likely to be enforced given ongoing concerns about air quality. This will assist in maintaining NO2 concentrations below critical values. Section 3 also clearly demonstrated that height fiom roadsides is an important issue and can result in substantial reductions in pollutant concentrations, although fbrther work is required to quantify the effects of meteorological considerations.
5. CONCLUSION
Table 2 indicates the adverse health effects associated with high concentrations of urban pollutants. It emphasises the need for unpolluted air when supplying non domestic buildings adequate ventilation. When natural ventilation is the favoured option the quality of the supply air is even more critical, given that low driving forces attributed to natural ventilation prohibits the inclusion of extensive air filtration mechanisms. Whilst air conditioning generates larger pressures that will cope with air cleaning processes it is not an ideal solution for strategies geared to reducing energy consumption. Thus an alternative approach is necessary.
A potential low energy solution is to supply air to buildings for ventilation purposes in a way that avoids the most onerous pollution periods. Either air inlets can be shut off during these occasions, or fan assisted ventilation utilised, with polluted air drawn in through a system of cleaning filters. Deciding when to switch to a fan assisted scheme is possible from the approach made in Table 5. Table 5 indicates the periods during a year when natural ventilation is a possible low energy option, and also indicates the occasions when a fan assisted scheme would need to be operated to allow for air cleaning via filters.
The analysis of pollution data from the British mainland examined areas where the problem appeared most evident. London is a good representative of high polluting areas of northern Europe, where the climate is cold to moderate. Thus measures identified in this paper geared to reducing the demand for energy due to ventilation can be adopted in similar regions of Europe. Whilst it is not possible to account

for all circumstances that may occur the approach described in this paper is a wefbl step towards the promotion of natural ventilation. It is also note worthy that section 3 ofthis paper suggests that intelligent location of air inlets may greatly reduce the need for costly air filtration systems.
6. ACKNOWLEDGEMENTS
The authors wish to thank AEA technology, especially Paul Willis and Geoff Broughton, for their valuable help in locating data on the Internet and providing otherwise unattainable information; the Department of the Environment, for providing essential documentation upon which the originality of this paper is based; Stanger Science, especially Dr Sally Uren and Stuart Smith, for efficiently handling the altitude monitoring exercise at Norfolk house. This work is part of the Pan-European d at vent^ project co-ordhakd by BRE with the participation of Belgian Building Resemh Institute (Belgium), TNO Building & Construction Research (The Netherlands), Danish Building Research Institute SBI (Denmark), J&W Consulting Engineers AB (Sweden), Willan Building Services (UK), Sulzer Infirr Lab (Switzerland), Deflt University of Technology (The Netherlands) and Norwegian Building Research Institute (Norway). The UK participation in the project is funded in part by the European Commission under the JOULE-3 pro and the Dep of the Environment under the Partners in Technology (PiT) pm
1. Commission of the European Communities (1996); ~ommmicationfiom the Commission to the European Parliament and the Council on afiture strategy for the control of atmospheric emissions @om road transport taking into account the results of the Auto/Oil Program', COM(96) 248 final, Brussels.
2. National Environment Technology Centre (1995); 'Air Pollution in the UK:1995',
3. DOE, (1996); 'The United Kingdom National Air Quality Strategy: Consultation drafi', The Dep of the Environment.
4. Kuksdia, V., (1996); me dects of external amospheric pollution on indoor air quality9, pro of the 17* AnrC conference, L pp 4 1 - 49.
5. Gano-Ruiz, J.A et al., (1992); Vmtilation for energy eficien~y and optimum indoor air quality9, proceedings of the 13* AIVC conference, pp 217 - 232.
VENTILATION AND COOLING
18TH ANNUAL AIVC CONFERENCE ATHENS, GREECE, 23-26 SEPTEMBER, 1997
NON-DIMENSIONAL G U P H S FOR NATURAL VENTILATION DESIGN
Institute of Building Technology, Dent. of Architecture & Building Technology,
University of Nottingham, University Park, Nottingham, N 6 7 2RD, United Kingdom
Non-dimensional Graphs for Natural Ventilation Design
Synopsis There are certain conditions which are of interest when designing for natural ventilation of commercial buildings. These are:-
- summer cooling - indoor air quality in winter - night-time cooling.
For the first two conditions it is necessary to determine the distribution of open areas to give the desired distribution of flow rates. Since one is dealing with openings whose position and basic geometry are Itnown, the problem is relatively simple compared to general ventilation problems. When buoyancy acts alone the position of the neutral layer can be specified and the size of the openings can be determined explicitly, as described by other authors. The paper taltes this explicit approach further. First it is shown how, for the summer and winter design conditions, one non-dimensional graph covers the buoyancy alone case with a uni f~rm temperature and then how non-uniform temperatures can be covered by a few extra graphs. The approach is also extended to include the sizing of stacks as distinct from sharp-edged openings. For the winter design condition where the openings are small it is important to estimate the effects of adventitious openings. It may also be desirable to determine the effects of wind. Suitable procedures and graphs for doing this are described. Finally the possibility of using similar graphs in the evaluation of night-time cooling is briefl} discussed.
List of symbols a leakage coefficient [Pa.s/m6 ] b lealtage coefficient [Pa.s/m3 ] A area of opening [m']
A,, area of outlet opening [m'] Ar Archimedes number, U,,/U [-I c,) wind pressure coefficient [-I C, discharge coefficient of opening [-I d diameter of stack [in] 11 height of outlet, see Fig, A1 [m] H height of occupied space [m] I> length of staclt [m] 0 flow rate through opening [mils] Re stack Reynolds number [-1 I' temperature [K] t i wind speed [mls]
I?!, = dbp. y~ I p [mls] J height [m]
AC, pressure coefficient difference [-I Ap pressure difference across
envelope [Pa] AT temperature difference between
interior and exterior [K] Ap density difference between interior
and exterior [1tg/m7]
P density [kg/mi] v kinematic viscosity [m2/s ] Subscripts 1 opening number E exterior I interior H a t z = H 0 a t z = O L lealtage measurement
I . Introduction Although sophisticated numerical methods such as CFD and envelope flow models are available to the designer (e.g. Refs. 1 and 2), in the early stages of a design it may be helpful to use simple manual calculations. Such calculations are facilitated by non-dimensional graphs. which present the results of numerical predictions in a general and easily used form (Ref. 3). Examples of this approach for natural ventilation design, using results from envelope flow models, form the subject of this paper.
2. Summer cooling The usual aim of summer design is to provide sufficient fresh air entry to each space to prevent overheating of the occupants. The basic procedure is:- (i) decide an acceptable temperature rise above ambient e.g. AT = 3 K, (ii) calculate the flow rates required for each space. Q,, and ( i i i ) calculate the area of openings required for each space when the wind speed is zero i.e. buoyancy alone. The third part of the procedure is of concern here. 'The openings will be windows or air vents and they can be treated as sl~arp-edged with a sauare-law flow characteristic
(1)
Since the posit own (for buoyancy alone it is only the height z, which is relevant), the determination of the values of A, for the required Q, can be found by a relatively simple calculation for open-plan buildings with negligible internal flow resistance. This has been referred to as an explicit calculation (e.g. Ref. 2).
A typical problem is illustrated in Figure A1 in the Appendix. The height of the occupied part of the building is H and the height of the uppermost opening is (H + h). The values of Q, and z, are ltnown and it is required to calculate the A, such that fresh air enters each opening at the required rate, with the exception of the uppermost outlet opening where the air leaves the building (for convenience only a single outlet opening is considered here). This means that the neutral level, i.e. the height, z,,, at which the pressure difference across the envelope is zero, must lie somewhere close to H. By choosing a reasonable value for z,,, z,, =
H say, the pressure difference across each opening is ltnown, because the relation between Ap and I. is determined by the variation of AT with z and the height at which Ap = 0 is z,,. IJsing this relation. Ap, for each opening can be found and substituted with Q, in Equn. (1) to determine A, (C, can be talten as 0.6). The area of the outlet opening is found in the same way. since the flow rate through it is given by the sum of the other flow rates.
The explicit procedure has been described in Ref. 2 for the case of uniform internal temperature. In the following the explicit procedure is expressed in non-dimensional form and is extended to include the case of non-uniform temperature and the use of a stack in place of a square-law outlet opening.
2.1 Buoyancy alone, uniform temperature With a uniform internal temperature (AT,/ AT,, = I ) , the expression for the non-dimensional envelope pressure difference taltes a very simple form
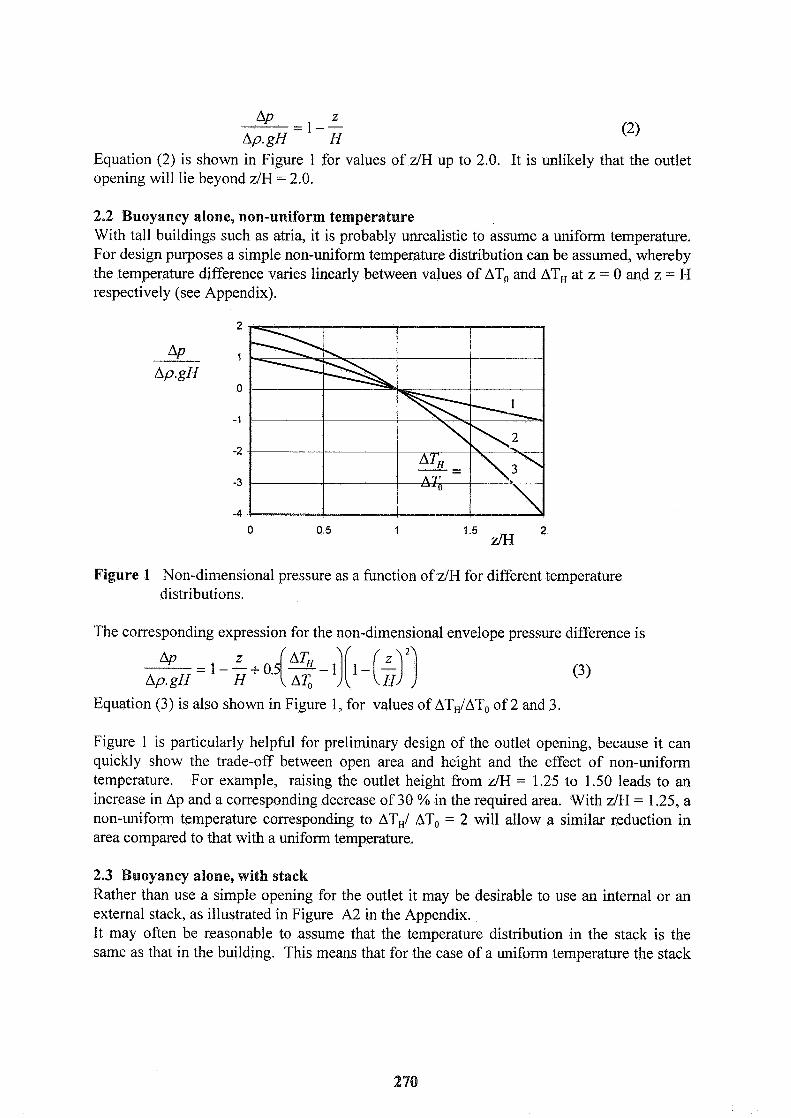
Equation (2) is shown in Figure 1 for values of dH up to 2.0. It is unlikely that the outlet opening will lie beyond dH = 2.0.
2.2 Buoyancy alone, non-uniform temperature With tall buildings such as atria, it is probably unrealistic to assume a uniform temperature. For design purposes a simple non-uniform temperature distribution can be assumed, whereby the temperature difference varies linearly between values of AT, and ATH at z = 0 and z = H respectively (see Appendix).
Figure 1 Non-dimensional pressure as a function of dH for different temperature distributions.
The corresponding expression for the non-dimensional envelope pressure difference is
Equation (3) is also shown in Figure 1, for values of ATHIAT, of 2 and 3.
Figure 1 is particularly helpful for preliminary design of the outlet opening, because it can quickly show the trade-off between open area and height and the effect of non-uniform temperature. For example, raising the outlet height from z/H = 1.25 to 1.50 leads to an increase in Ap and a corresponding decrease of 30 % in the required area. With z/H = 1.25, a non-uniform temperature corresponding to ATH/ AT, = 2 will allow a similar reduction in area compared to that with a uniform temperature.
2.3 Buoyancy alone, with stack Rather than use a simple opening for the outlet it may be desirable to use an internal or an external stack, as illustrated in Figure A2 in the Appendix. It may often be reasonable to assume that the temperature distribution in the stack is the same as that in the building. This means that for the case of a uniform temperature the stack
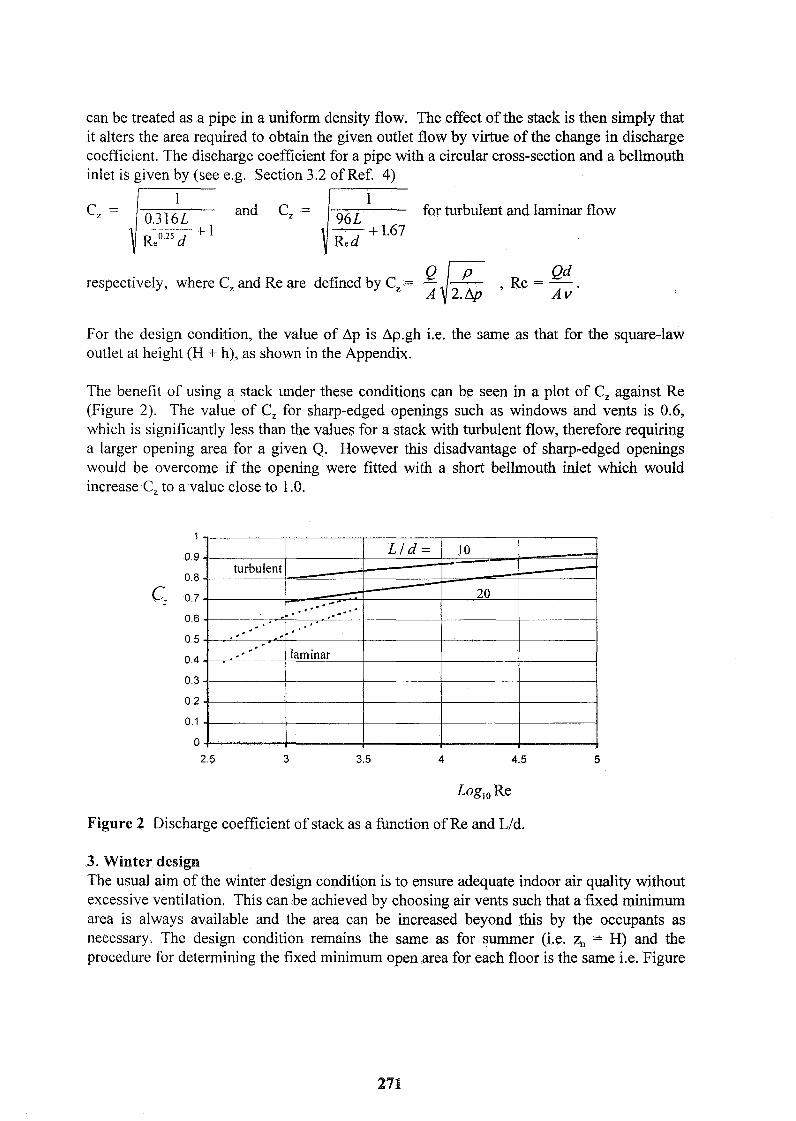
can be treated as a pipe in a uniform density flow. The effect of the stack is then simply that it alters the area required to obtain the given outlet flow by virtue of the change in discharge coefficient. The discharge coefficient for a pipe with a circular cross-section and a bellmouth inlet is given by (see e.g. Section 3.2 of Ref. 4)
cZ = ,I'x and C, = ,I'c for turbulent and laminar flow
R ~ O 2 5 d
Qd Q,/T , R e = x . respectively, where C, and Re are defined by C, = - - A 2.Ap
For the design condition, the value of Ap is Ap.gh i.e, the same as that for the square-law outlet at height (H + h), as shown in the Appendix.
The benefit of using a stack under these conditions can be seen in a plot of C, against Re (Figure 2). The value of C, for sharp-edged openings such as windows and vents is 0.6, which is significantly less than the values for a stack with turbulent flow, therefore requiring a larger opening area for a given Q. However this disadvantage of sharp-edged openings would be overcome if the opening were fitted with a short bellmouth inlet which would increase C, to a value close to 1 .O.
Figure 2 Discharge coefficient of stack as a function of Re and Lld.
3. Winter design The usual aim of the winter design condition is to ensure adequate indoor air quality without excessive ventilation. This can be achieved by choosing air vents such that a fixed minimum area is always available and the area can be increased beyond this by the occupants as necessary. The design condition remains the same as for summer (i.e. z,, = H) and the procedure for determining the fixed minimum open area for each floor is the same i.e. Figure
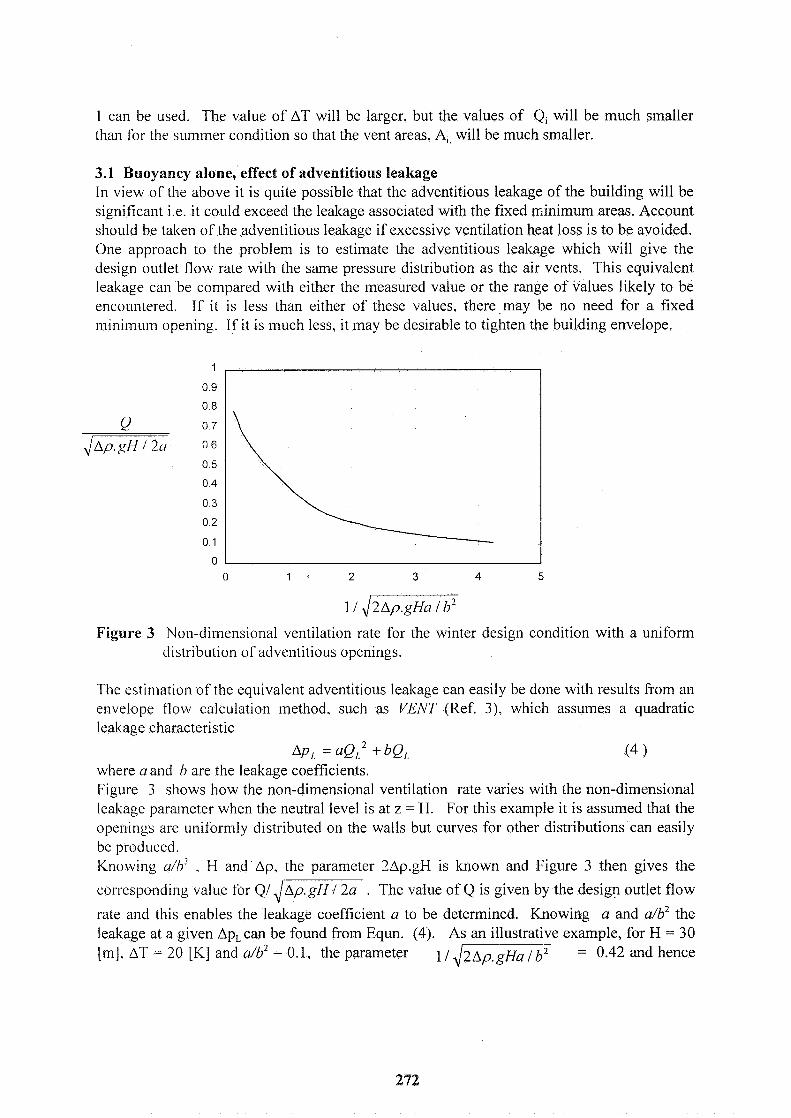
1 can be used. The value of AT will be larger, but the values of Q, will be much smaller than for the summer condition so that the vent areas, A, will be much smaller.
3.1 Buoyancy alone, effect of adventitious leakage I11 view of the above it is quite possible that the adventitious leakage of the building will be significant i.e. it could exceed the leakage associated with the fixed ~ i n i m u m areas. Account should be taken of the adventitious leakage if excessive ventilation heat loss is to be avoided. One approach to the problem is to estimate the adventitious leakage which will give the design outlet flow rate with the same pressure distribution as the air vents. This equivalent lealtage can be compared with either the measured value or the range of values likely to be encountered. If it is less than either of these values, there may be no need for a fixed rninirnuln opening. If it is much less, it may be desirable to tighten the building envelope.
Figure 3 Non-dimensional ventilation rate for the winter design condition with a uniform distribution of adventitious opeiiings.
The estimation of the equivalent adventitious leakage can easily be done with results from an envelope f-low calculation method, such as VENT (Ref. 3), which assumes a quadratic leakage characteristic
where u and 17 are the leakage coefficients. Figure 3 shows how the non-dimensional ventilation rate varies with the non-dimensional leakage parameter when the neutral level is at z = H. For this example it is assumed that the openings are uniformly distributed on the walls but curves for other distributions can easily be produced. Knowing u/h' . H and Ap, the parameter 2Ap.gH is known and Figure 3 then gives the
corresponding value for Q/ d m . The value of Q is given by the design outlet flow
rate and this enables the leakage coefficient a to be determined. Knowing a and a/b2 the leakage at a given Ap, can be found from Equn. (4). As an illustrative example, for H = 30 [m]. AT = 20 [K] and a/b2 = 0.1, the parameter 4- = 0.42 and hence
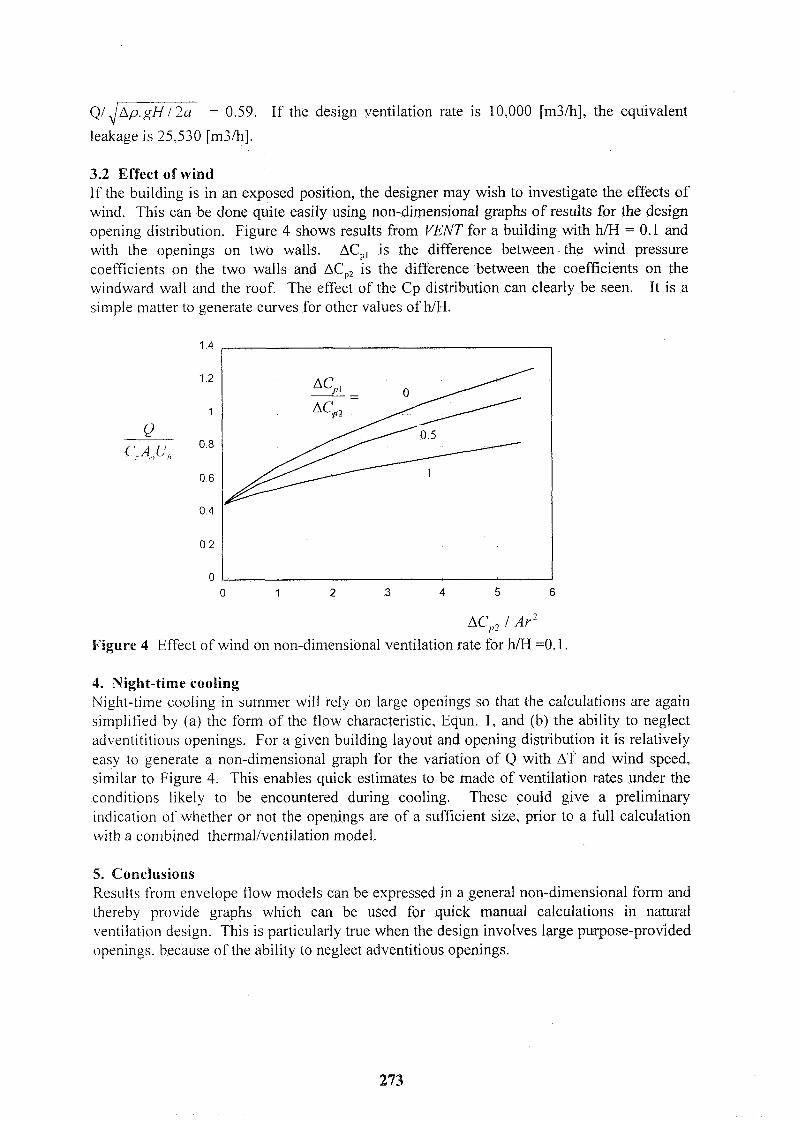
Q/,/- = 0.59. If the design ventilation rate is 10,000 [m3ih], the equivalent
leakage is 25,530 [m3/h].
3.2 Effect of wind If the building is in an exposed position, the designer may wish to investigate the effects of wind. This can be done quite easily using non-dimensional graphs of results for the design opening distribution. Figure 4 shows results from VENT for a building with hlH = 0.1 and with the openings on two walls. AC is the difference between- the wind pressure
'1 ' coefficients on the two walls and ACp2 is the difference between the coefficients on the windward wall and the roof. The effect of the Cp distribution can clearly be seen. It is a s i~~lple matter to generate curves for other values of WH.
AC,,, i ~r Figure 4 Effect of wind on non-dimensional ventilation rate for WH =O. 1.
4. Night-time cooling Night-time cooling in summer will rely on large openings so that the calculations are again simplified by (a) the form of the flow characteristic, Equn. 1, and (b) the ability to neglect adventititious openings. For a given building layout and opening distribution it is relatively easy to generate a non-dimensional graph for the variation of Q with AT and wind speed, similar to Figure 4. This enables quick estimates to be made of ventilation rates under the conditiotls liltely to be encountered during cooling. These could give a preliminary indication of whether or not the openings are of a sufficient size, prior to a full calculation with a combined thermal/ventilation model.
5. Conclusions Results i'rom envelope flow models can be expressed in a general non-dimensional form and thereby provide graphs which can be used for quick manual calculations in natural ventilation design. This is particularly true when the design involves large purpose-provided openings, because of the ability to neglect adventitious openings.

References 1. Clifford, M.J., Everitt, P.J., Clarke, R. and Riffat, S.B. Using computational fluid
dynamics as a design tool for naturally ventilated buildings. Building and Environment, 32(4), 305-3 12 (1997)
2. Liddament, M.W. A guide to energy eflcient ventilation. AIVC, Coventry, U K (1996). 3. Etheridge, D.W. and Stanway, R.J. A parametric study of ventilation as a basis for
design. Building and Environment, 23(2), 8 1-93 (1 988). 4. Etheridge, D.W. and Sandberg, M. Building Ventilation - Theory ancf Measurement,
John Wiley & Sons, Chichester, UK (1 996).
APPENDIX. Equations for buoyancy alone.
Figure A l
The absolute pressures at points outside and inside the building at height z are respectively
P,{z)=P,,-pEgz and P,{z)=P,,- [p,{z)g.dz
and the pressure difference across the envelope is given by
AP{z) = PFU - PI, - ~ [ P E Z - 1 P~{z).dz] A. 1
The design condition is Ap{z) = 0 at z = H, so H
PEO - = gbEH - 1 P l{z)'dzl and substituting in Equn. A.l gives
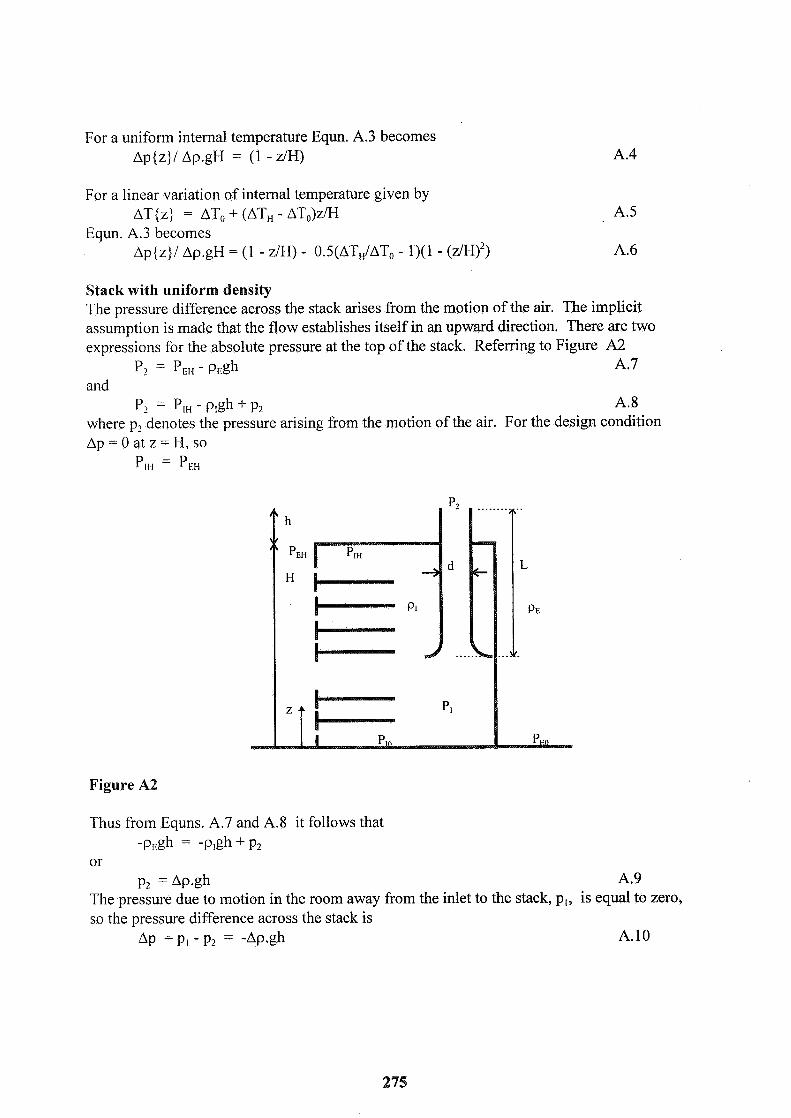
For a uniform internal temperature Equn. A.3 becomes Ap(z) / Ap.gH = (1 - AH)
For a linear variation of internal temperature given by AT { z J = ATo + (ATH - AT0)z/H
Equn. A.3 becomes Ap(z)l Ap.gH = (1 - z/H) - 0.5(ATHlAT0 - 1)(1 -
Stack with uniform density The pressure difference across the stack arises from the motion of the air. The implicit assumption is made that the flow establishes itself in an upward direction. There are two expressions for the absolute pressure at the top of the stack. Referring to Figure A2
P2 = PEH - pEgh A.7 and
P, = PIH - + P2 A.8 where p2 denotes the pressure arising from the motion of the air. For the design condition Ap = 0 at z = H, so
PI11 = PFH
Figure A2
Thus from Equns. A.7 and A.8 it follows that -P& = -p,gh + P2
or P2 = A.9
The pressure due to motion in the room away from the inlet to the stack, p,, is equal to zero, so the pressure difference across the stack is
Ap = pi - p2 = -Ap.gh A.10

VENTILATION AND COOLING 18TH AIVG CONFEltaENCE, ATHENS, GREECE
23-26 SEPTEMBER, 1997
Title: Prediction of the Potential of Self-Regulating Natural Ventilation Devices: Methodology and Practical Results
Author(s): P Wouters*, D Ducarme*, P Renson*", W Lernoutk*
Affiliation: * Belgian Building Research Institute (CSTC-WTCB) Brussels, Belgium **Renson nv, Waregem, Belgium
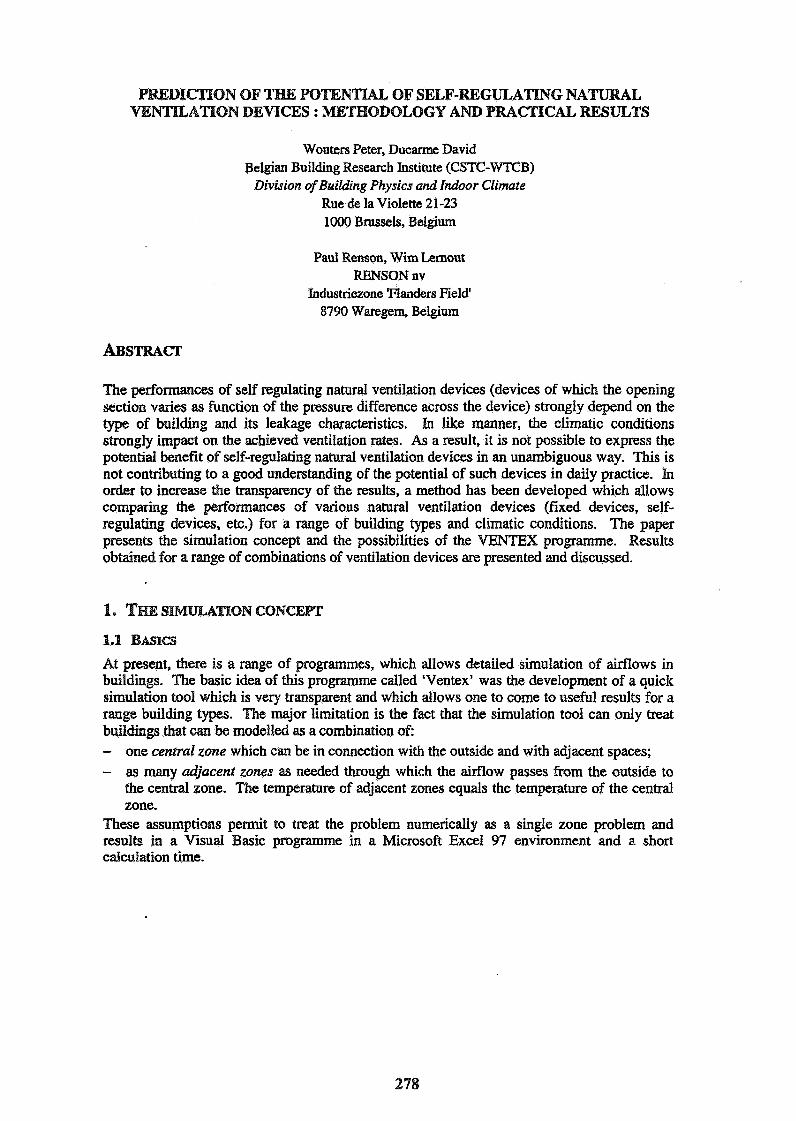
PREDIaON OF THE POTE OF SELF-REGUILGTING ATION DEWCES : MIETHODOLOG'ZI AND PRACTlCAL RESULTS
Wouters Peter, Ducarme David Belgian Building Research Institute (CSTC-WTCB)
Division of Building Physics and Indoor Climate Rue de la Violem 21-23 100 Brussels, Belgium
Paul Renson, Wim Lemout RENSON nv
Industriezone 'Flanders Field' 8790 Waregem, Belgium
The performances of self regulating natural ventilation devices (devices of which the opening section varies as function of the pressure difference across the device) strongly depend on the type of building and its leakage characteristics. In like manner, the climatic conditions strongly impact on the achieved ventilation rates. As a result, it is not possible to express the potential benefit of self-regulating natural ventilation devices in an unambiguous way. This is not contributing to a good understanding of the potential of such devices in daily practice. In order to increase the transparency of the results, a method has been developed which allows comparing the performances of various natural ventilation devices (fixed devices, self- regulating devices, etc.) for a range of building types and cIimatic conditions. The paper presents the simulation concept and the possibilities of the VENTEX programme. Results obtained for a range of combinations of ventilation devices are presented and discussed.
At present, there is a range of programmes, which allows detailed simulation of airflows in buildings. The basic idea of this programme called 'Ventex' was the development of a quick simulation tool which is very transparent and which allows one to come to useful results for a range building types. The major limitation is the fact that the simulation tool can only treat buildings that can be modelled as a combination of: - one central zone which can be in connection with the outside and with adjacent spaces; - as many adjacent zones as needed through which the airflow passes from the outside to
the central zone. The temperature of adjacent zones equals the temperature of the central zone.
These assumptions permit to treat the problem numerically as a single zone problem and results in a Visual Basic programme in a Microsoft Excel 97 environment and a short calculation time.
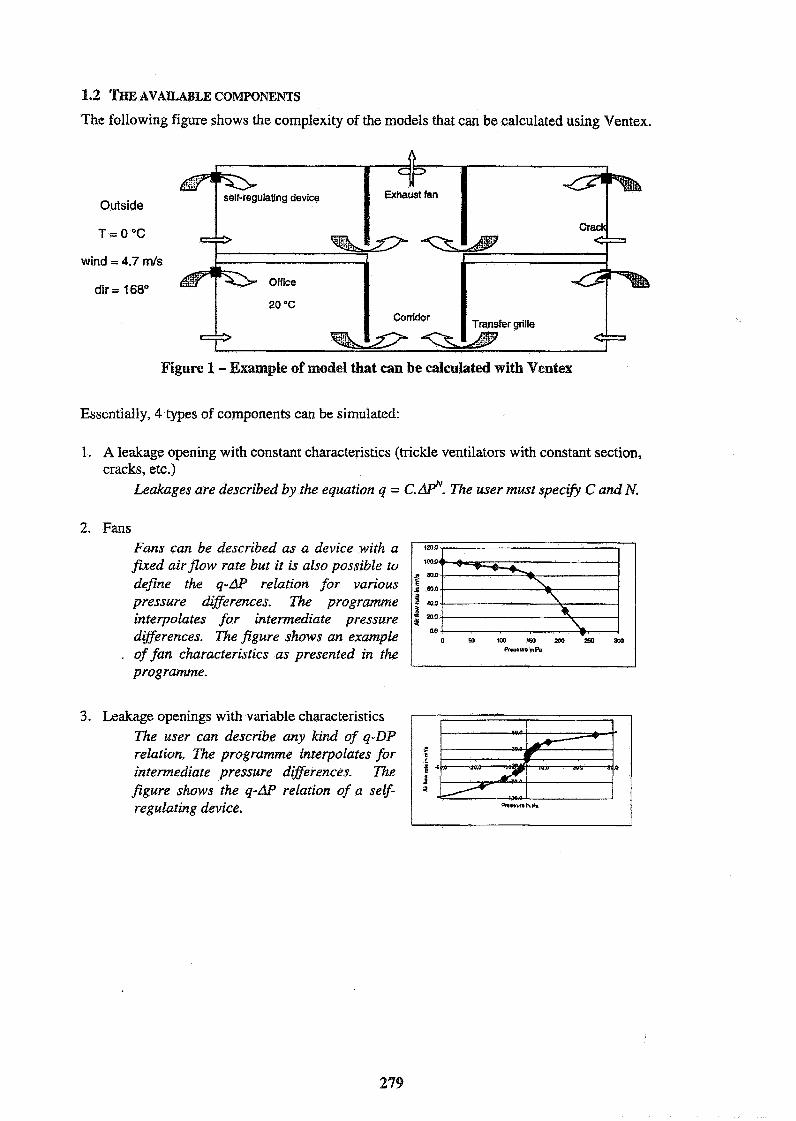
1.2 TI.1[F, AVAILABLE COWONENTS
The following figure shows the complexity of the models that can be calculated using Ventex.
Outside
T=O°C
wind = 4.7 mfs
dir = 168"
Figure 1 - Exmple of model that can be calcuIated with Ventex
Essentially, 4 types of components can be simulated:
1. A leakage opening with constant characteristics (trickle ventilators with constant section, cracks, etc.)
Leakages are described by the equation q = c.@. The user must spec& C and N.
2. Fans Fans can be described as a device with a f i e d airflow rate but it is also possible to define the q-AP relation for various pressure differences. The programme interpolates for intermediate pressure diflerences. The figure shows an exampte
. of fan characteristics as presented in the programme.
3. Leakage openings with variable characteristics The user can describe any kind of q-DP relation. The programme interpolates for intermediate pressure diugerences. The figure shows the q-AP relation of a self- regulating device.
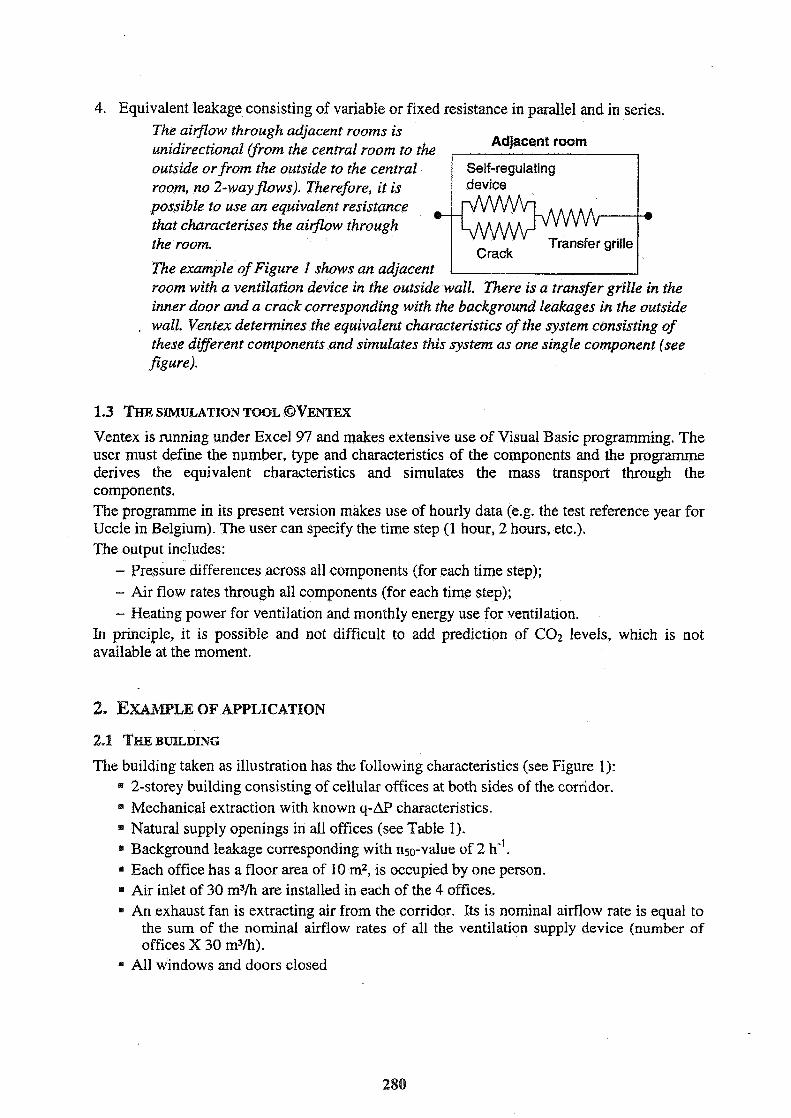
4. Equivalent leakage, consisting of variable or fixed resistance in parallel and in series. The airflow through adjacent rooms is unidirectional Cfrorn the central rootn to the ,
Adjacent room
outside or from the outside to the central room, no 2-wayflows). Therefore, it is possible to use an equivalent resistance that churacterises the aiflow through the room.
The example of Figure I shows an adjacent room with a ventilation device in the outside wall. There is a transfer grille in the inner door and a crack corresponding with the background leakages in the outside
. wall. Ventex determines the equivalent characteristics of the system consisting of these different components and simulates this system as one single component (see flgure).
1.3 TXON TOOL @VENTEX Ventex is running under Excel 97 and makes extensive use of Visual Basic programming. The user must define the number, type and characteristics of the components and the programme derives the equivalent characteristics and simulates the mass transport through the components. The programme in its present version makes use of hourly data (e.g. the test reference year for Uccle in Belgium). The user can specify the time step (1 hour, 2 hours, etc.). The output includes:
- Pressure differences across all cornponents (for each time step); - Air flow rates through all components (for each time step); - Heating power for ventilation and monthly energy use for ventilation.
In principle, it is possible and not difficult to add prediction of C 0 2 levels, which is not available at the moment.
2. E ~ M P L E OF APPLICATION
2.1 THE BUILDING
The building taken as illustration has the following characteristics (see Figure 1): = 2-storey building consisting of ceI1ula.r offices at both sides of the corridor.
Mechanical extraction with known q-AP characteristics. Natural supply openings in all offices (see Table 1). Background leakage corresponding with nso-value of 2 h". Each office has a floor area of I0 rnZ, is occupied by one person. Air inlet of 30 m3/h are installed in each of the 4 offices. An exhaust fan is extracting air from the corridor. Its is nominal airflow rate is equal to
the sum of the nominal airflow rates of all the ventilation supply device (number of offices X 30 m3/h).
All windows and doors closed
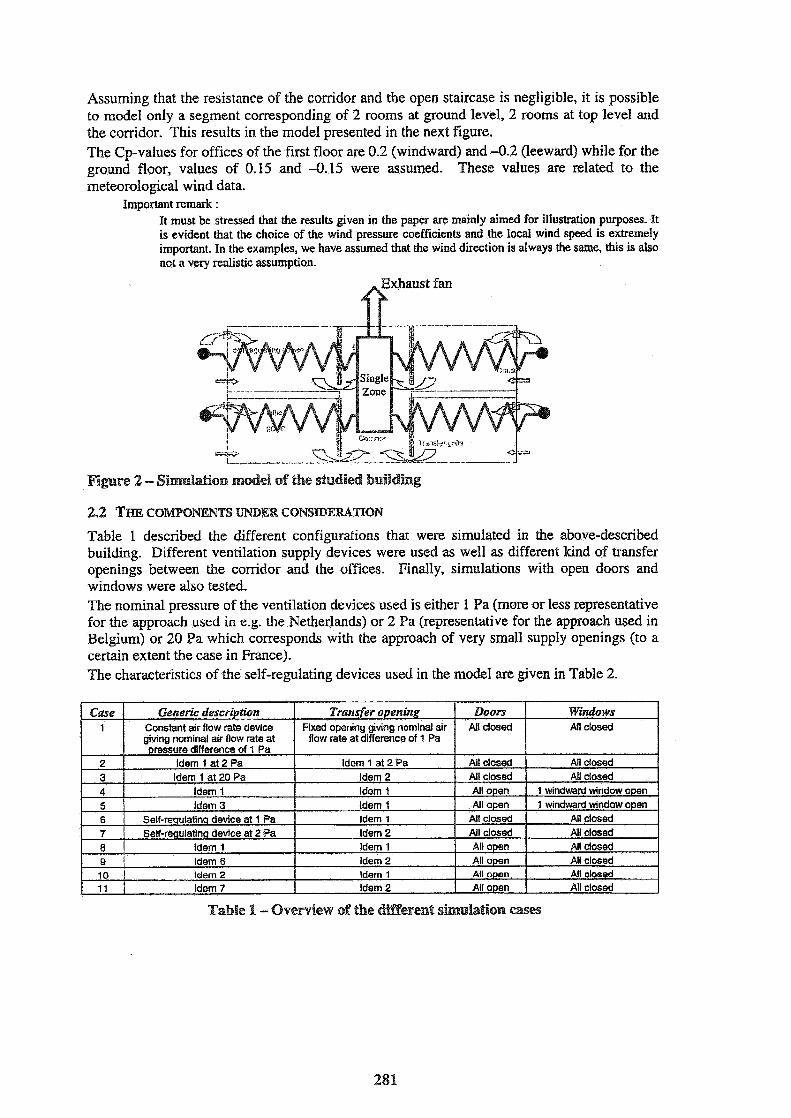
Assuming that the resistance of the corridor and the open staircase is negligible, it is possible to model only a segment corresponding of 2 rooms at ground level, 2 rooms at top level a d the corridor. This results in the model presented in the next figure. The Cp-values for offices of the first floor are 0.2 (windward) and -0.2 (leeward) while for the ground floor, values of 0.15 and -0.15 were assumed. These values are related to the meteorological wind data.
Important remark : It must be stressed that the results given in the paper are mainly aimed for illustration purposes. It is evident that the choice of the wind pressure coefficients and the local wind speed is exbremely important. In the examples, we have assumed that the wind direction is dways the same, this is also not a very realistic assumption.
Exhaust fan
fi
Kgure 2 - Sirnula~on m d e l of the studid buildlmg
2.2 THE COmBNENTS UNDER COPJS1IDERATLQN
Table 1 described the different configurations that were simulated in the above-described building. Different ventilation supply devices were used as well as different kind of transfer openings between the corridor and the offices. Finally, simulations with open doors and windows were also tested. The nominal pressure of the ventilation devices used is either 1 Pa (more or less representative for the approach used in e.g. the Netherlands) or 2 Pa (representative for the approach used in Belgium) or 20 Pa which corresponds with the approach of very small supply openings (to a certain extent the case in France). The characteristics of the self-regulating devices used in the model are given in Table 2.
Table B - Overview of the $Berent shda- cases
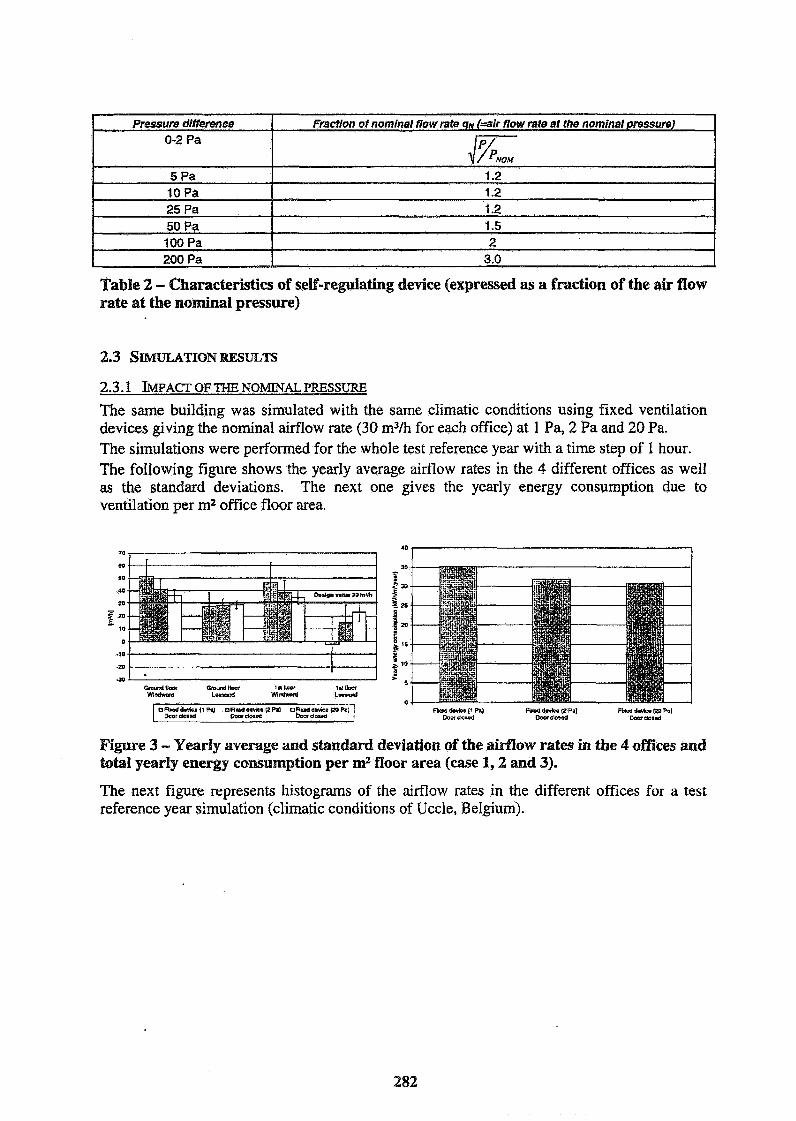
Table 2 - Characteristics of self-regulating device (expressed as a fraction of the air flow rate at the n o ~ n a l pressure)
2.3 SI TION RESULTS
2.3.1 IMPACT OF THE NOMD\TAL PRESSURE
The same building was simulated with the same climatic conditions using fixed ventilation devices giving the nominal airflow rate (30 m3/h for each office) at 1 Pa, 2 Pa and 20 Pa. The siinulations were performed for the whole test reference year with a time step of I hour. The foIIowing figure shows the yearly average airflow rates in the 4 different offices as well as the standard deviations. The next one gives the yearly energy consumption due to ventilation per mZ office floor area.
Figure 3 - Yearly average and standard deviation of the airfllow rates in the 4 affices and total yearly energy consumption per m2 floor area (case 1,2 and 3).
The next figure represents histograms of the airflow rates in the different offices for a test reference year simulation (climatic conditions of Uccle, Belgium).
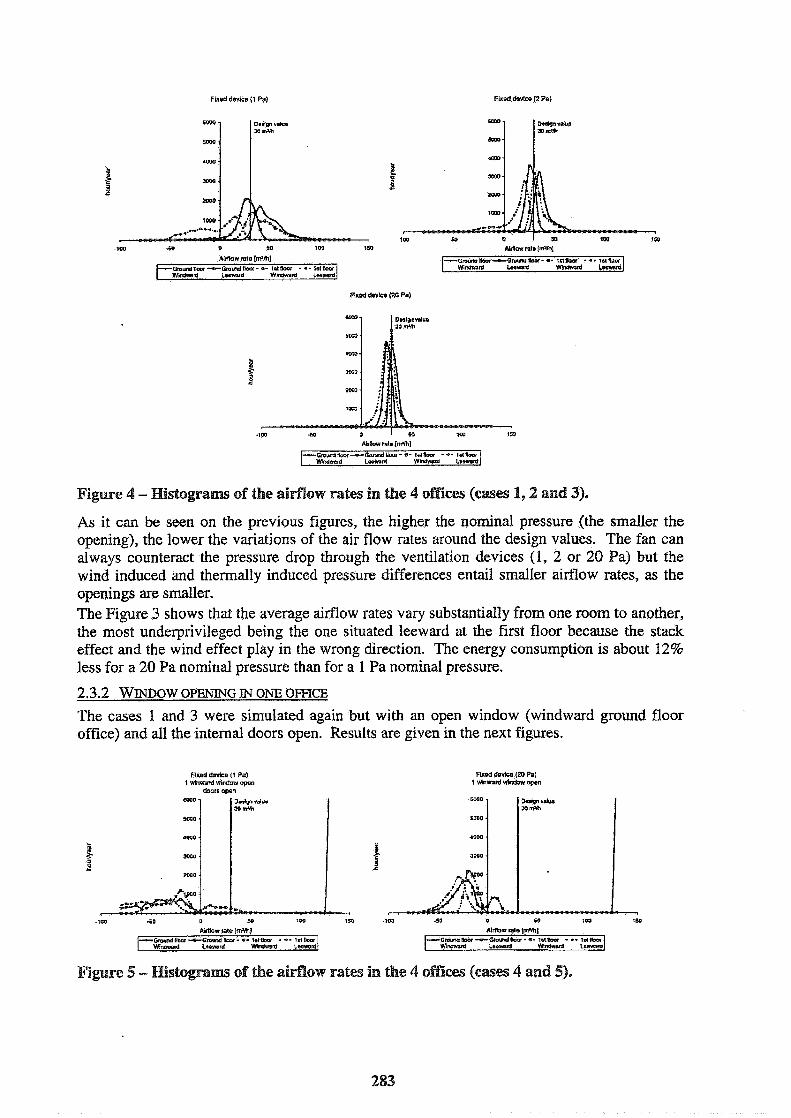
Fuod WEB (1 Pa) Fwd d w b (2 Pa)
mGd dovro (2C Pa)
Figure 4 - Histograms of the airflow rates in the 4 ofices (cases I, 2 and 3).
As it can be seen on the previous figures, the higher the nominal pressure (the smaller the opening), the lower the variations of the air flow rates around the design values. The fan can always counteract the pressure drop through the ventilation devices (1, 2 or 20 Pa) but the wind induced and thermally induced pressure differences entail smaller airflow rates, as the openings are smaller. The Figure 3 shows that the average airflow rates vary substantially from one room to another, the most underprivileged being the one situated leeward at the first floor because the stack effect and the wind effect play in the wrong direction. The energy consumption is about 12% less for a 20 Pa nominal pressure than for a 1 Pa nominal pressure.
2.3.2 WINDOW OPENING IN ohi OFFICE
The cases I and 3 were simulated again but with an open window (windward ground floor office) and all the internal doors open. Results are given in the next figures.
ArPd dmh (1 Pa) I winward window open
dwrr w a n
Figure 5 - Ifistogam of the airflow rates in the 4 offices (cases 4 and 5).

2.3 -3 IMPACT OF SELF-REGULATING DEVICES
The next figures show the simulation results when using self-regulating devices instead of fixed ventilation devices. The doors are kept closed.
Fimre 6 - Histogram of the &flow rates in the 4 oEees (cases 6 and 7).
When comparing these results with the two first ones of Figure 4, one can see that the impact of the self-regulation is small. This is due to the relatively resistant m s f e r grilles that increase the pressure drop through the adjacent room and therefore Iirnit the effect of the self- regulation. The next 4 figures compare self-regulating and fixed devices for a situation where all the internal door between the corridor and the offices are open.
mlrl WKO 11 pa) ss#-rew$l~w densa (1 Pa) Door open D i m own
I P
100 .50 0 W 0 so 1w 160 150 .lW
nufias rec. [m?q A i i nts lm'hl -Qmvdraor--Wovrl~-r-l6Idopr - - - 1 a h r
Wdwd Lmward W W w d L-mrd -Groundlh---QmminDOr - .I- l a c k - -- l l h
WndVIrd Llnrvd W M L w u d
R.ed m c o (2 Pa) Sel.raguWmg d m (2 Pa) Ooer o p n Door open
1W 40 0 . 50 101 150 .1W 50 0 60 100 150
Almor4 me pli'lill Airllow me [mVh] -C*omnoor-~Oatmdmm- -- I e b o - - - 1UMw
Wrhnrd Lorvrtd WfMnnl L n w d - Q ~ u d 4 w - - - ~ k c " . ~ . ?.I(tW --- 1.ln-
W1ndm.d Lnwald W d v m d Lnnud
Fiigure 7 - astograms of the drflow rates b the 4 omces (cases 8,9,10 and 11).
As it can be seen, the impact of the self-regulation is much bigger.
1. This paper presents the concept of the Ventex programme, allowing to predict in a straightforward way air flows in a multizone building
2. Results of the impact of the nominal pressure for natural supply openings on the aifflow rates are presented for an office building with mechanical extraction. The impact of use of internal doors is presented as well as the contribution of self-regulating devices.
3. Further work is needed before clear conclusions can be drawn on the impact of nominal pressure on aifflow rates, indoor air quality and energy use.
1. Microsoft Excel 97 2. A Guide to Energy Efficient Ventilation, March 1996. 3. BBRI Technical Note 203, Ventilatie van woningen - Dee1 II - Prestaties van
veritilatiesystemen, BBRI 1997.
The Ventex programme has been developed in the framework of the Flemish Impulse Programme for Energy Technology VLIET, contract VLIET/930.245/RENSON. The authors wish to thank VZJET for the financial support.


VENTILATION AND COOLING 18TH AIVC CONFERENCE, ATHENS, GREECE
23-26 SEPTE
Title: Natural Ventilation of the Contact Theatre
Author(s): P J Jones*, D K Alexander*, H G Jenkins*, A Short*"
Affiliation: *Welsh School of Architecture, Cardiff, UK ** Short Ford Associates, London, UK

Extended Abstract This paper will describe the design and development of the natural ventilation system of the new Contact Theatre Complex designed by A.Coldrick of Short Ford Associates, now beginning construction in Manchester,UK.
The ventilation design is based on a stack dominant system using an 'H-Pot' chimney configuration. The paper describes the development of the design of both the studio theatre and main auditorium ventilation systems. These have been developed with feedback from wind tunnel and CFD testing so as to produce a strategy and design relatively insensitive to wind direction, yet providing sufficient ventilation to overcome the high heat gains expected from an audience and stage lighting. The potential for conflicts between wind and buoyancy forces have been reduced through the location and positioning of inlets and through the sizing and termination design of the stack.
Rehearsal Foyer Foyer Studio ~ntrance Stacks Stacks Stack Inlet Stack
Figure 1 Wind Tunnel model of Contact Theatre initial design.
Grid Scale - 1.0m
Figure 2 CFD analysis of airflows within mixing chamber beneath Studio theatre.
OF PASSrVE STACK ACE DWEUINGS IN
K. TSK S and A. YOhTNG
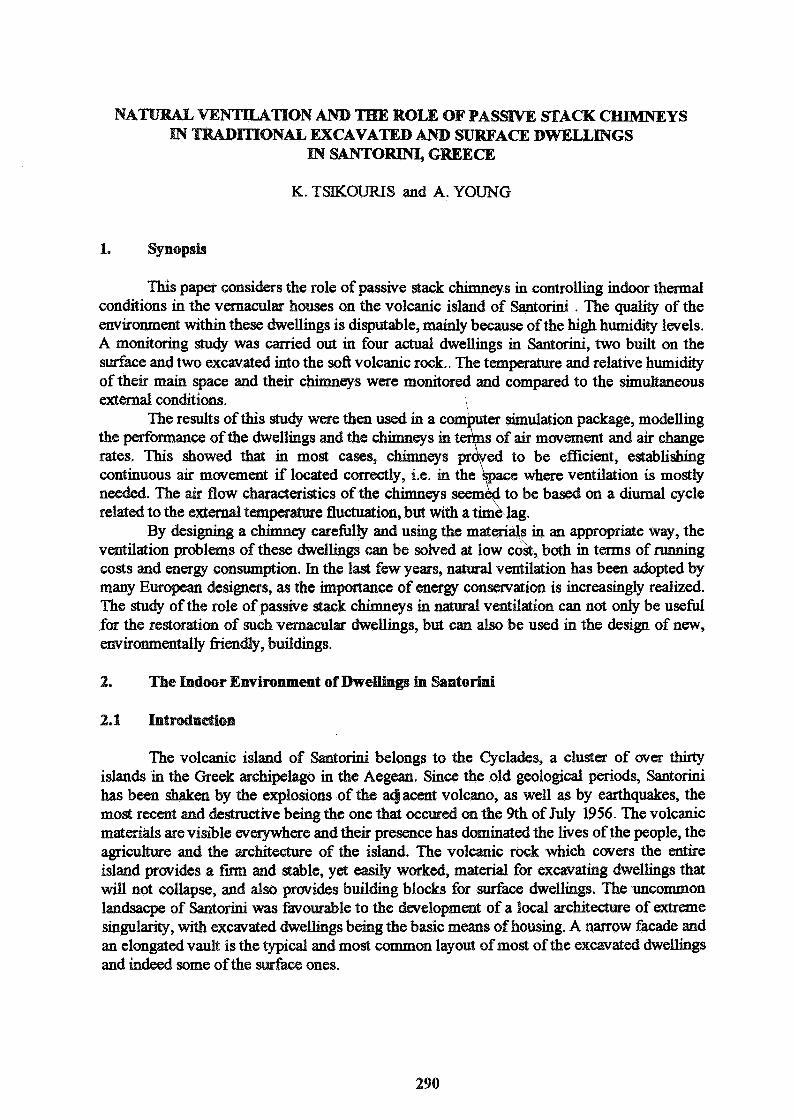
NA ROLE OF PAS STACK U S
K. TSIKOURIS and A. YOUNG
1. Synopsis
s in controlling indoor thermal conditions in the v the volcanic island of Santorini . The qualdy of the
because of the high humidity levels. lings in Santorini, two built on the
surface and two excavated into ft volcanic rock.. The temperature and relative humidrty were monitored and compared to the simultaneous
external conditions. I
The results of this study were then sirnulation package, modelling the performance of the dwellings and the fair movement and air change rates. This showed that in m to be efficient, establishing
ventilation is mostly needed. The air on a dimal cycle related to the ext
carefully and using the materials in an appropriate way, the ventilation problems of these &ellings can be solved at low costk both in terms of miming costs and energy consumption. In the last few years, natural ventilation has been adopted by
designers, as the im of energy conservation is increasingly realized. role of passive st ventilation can not only be useful
for the restoration of such vernacular dwellings, but can also be used in the design of new, ly fiendty, buildings.
2, The Indoor Environment of DweIlin~ in Santorini
2.1 Introduction
islmd of Santorini belongs to the Cyclades, a cluster of over eek archipelago in the Aegean. Since the old geological periods, Santorini by the explosions of the acJ volcano, as well as by earthquakes, the
most recent and destmctive being the one that occured on the 9th of July 1956. The volcanic materials are visible ev and their presence has dominated the lives of the people, the adculture and the arc e of the island. The volcanic rock which covers the entire island provides a f m and stable, yet easily worked, material for excavating dwellings that will not collapse, and also building blocks for s u h ~ e dwellings. The uncommon land of Santorini was le to the developent of a local archit singularity, with excavated dwellings bein ic means of housing. A narrow facade and an elongated vault is the typical and most layout of most of the excavated dwellings and indeed some of the surface ones.

2.2 The Potentlial of Natural Venmatian and the Role of Gh
An excmated dwelling is substantially a cave. It is surroun&d by ground, whiGh provides a huge ith an astonis$ing capacity. Therefme this heavy construction has a aviour which is favourable to the dwelling temperature. Heat is night-the, maintaining a stable temperature inside, pl winter, too. But the main dishantage of an excav and lighting indoors. Since the building is surrounded by ground on all sides but the front, the later is the only way through to the outside air. gs can only be situated at this front, normally narrow, facade. Daylibt penetrates the first room of the house. Any
situated at the back of the house is hardly ever reached by any daylight at all. Things get even worse when it comes to natural ventilation. Singlesided ventilation
would only be adequate for a depth of up to 5 or 6 m. But excmatd dwellings are usually much than this and only the fiont room has proper ventilation. Since the is d e e ~ ss-vmtilaion is impossible, the spaces at the rear of the house do lY have any ventilation at all. The air in these spaces changes rarely. Excess moisture remains in the room and, con ly, extremely high relative humidities occur, as the tmperature is most of the time at low levels. As a remk, darnmess, odours, mould grouth and cmdensatim on the
the (cold) outside air,
mcwmmt. In hot climates like the one of Santorini, where the ertirne, the flow of the air within the
wind pressure at the top o
stwk effect whiGh may want to shape and the orientation of the
A decisive factor for the efficien~y of a c &ion to the natural
isolated rooms are not likeb to play the rest of the house is obstmcted. C
more effective and contribute to the cwerall ventilation, because they vviU introduce an dtennative to cross ventilation and creafe air draughts at the rear.

3. The Moni tow %ndy
In order to Wonstrate the effedheness of c s as a m a s of a1 ventilation an ental mity was ~ m i e d out. Four buildings were seleded for monitoring in t eir environoowtal conditions. "Smart Reader"' data loggers were used, together with the "Trend Readei" [9] sohare pxkage to record and download readings for temperature and relake hunaidity. g took plae for one week. F of the four buildings a data logger was positi iddle of the height of the and another was hung in the k t space, at head height. Another logger for external conditions, was ps i t that it was alwqs in shade. The locadion of in each building is & o m on tbe floor plms (fig. 1-4).
The es dbthed sed as input values to the computer s Po&rm, (Produced by the Establishnoat) [2] which was used to pedict air flow rates in the rates for the vatious spaces in the dwelhgs. The results were used exp lh the operation of the ine the overall effectheness of the
a9 venti;rlion in these
Four buildings were selded for stucty &om the many traditional buildings on the island, see figures I to 4, and were representative of the basic ltypes to be found. They have all mhtaked the& ofiginal layoa with almost no ge or alteration to the o r i ~ a l mathals and arGhite elenrents. An ofiginal ey exists in every one of the selected buildings, wlithout any significant c h g e to its ~ t i d shape and materids. Bugdings 1 and 2 are excavated bto the ground whereas*3 and 4 arre SUffw b u i l h p .
Fig. 1 Buildkg 1: Flm~Plarr Fig. 2 Building 2 : Floor Plan
Reader and Trend Reader are ngi
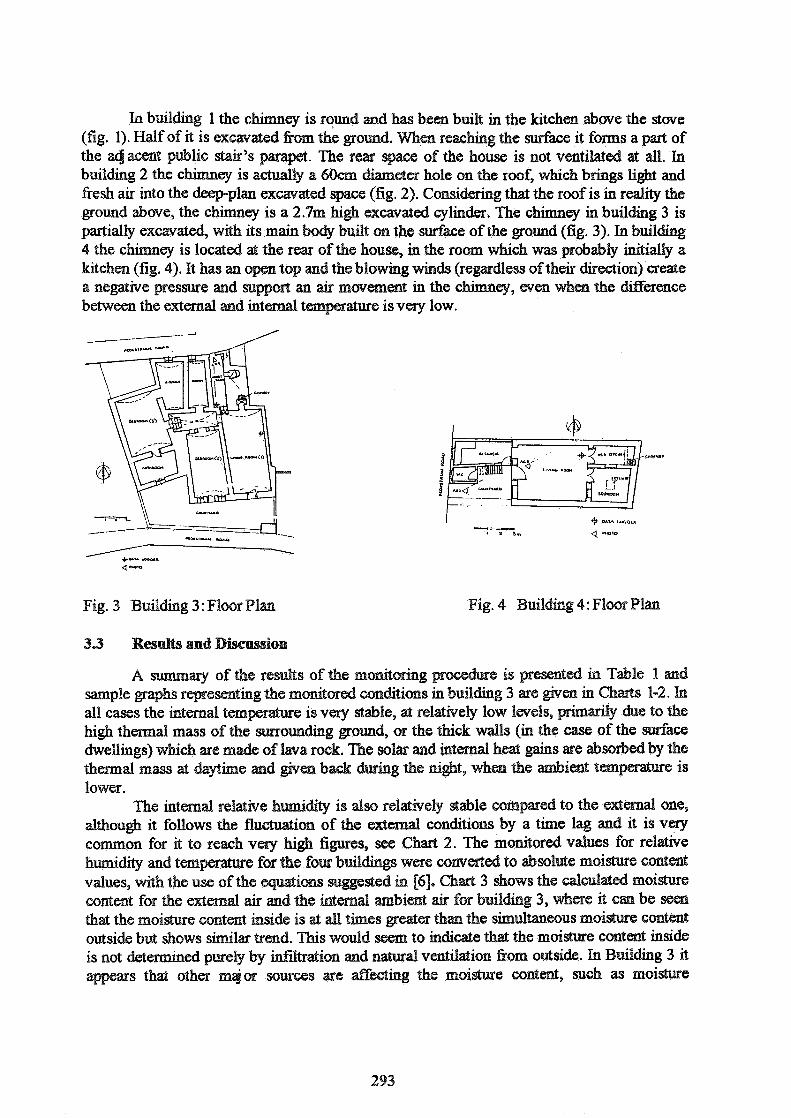
round and has been built in the kitchen &me the stove the ground. When reaching the d a c e it foms a part of The rear space of the house is not ventilated at all. In
a 6 0 m dimeta hole roof, which brings light and d space (fig. 2). Con that the roof is in reality the
fii& exmated cylinder. The c in building 3 is bugt m the &me of the ground (fig. 3). In building the house, in tbe room wfiich was prob&@ initially a
kitchen (fig, 4). It has an open t less of their direction) create a nemke pressure and , even when the differme between the external and i n t a d tmlperature is very low.
Fig. 3 Bui lag 3 : Floor Plan Fig. 4 Buildkg 4 : Floor Plan
33 Ra&s and Dknssliaa
A ary of the resuhs of the m g pro~edure is premted in Table 1 and g the m ~ t d canaims in bu i lhg 3 are
m e is very Sable, at relative@ low lwels, oundliog g o d , or the tEck wdls (in th
w ~ c h are made of lawa r solas and &ma1 heat gains are absorbd by the ass at w h e and w e n g the ~ g h t , when the ambient taperame is
lower. The internal relatke is dm relake@ stable coaopard to the
although follows rhe conaions by a t h e lag and it is very for it to r e d very art 2. The monitored vdws for relaive md temperature for fie fow bugdings wr=re (;om&& to absolute moishve coptent
values, whh the use of the equations suggested in 161. marl 3 shows the 6ak~ulded m i m e coat- for the external & and the internal ambient & for building 3, where it can be seen that the m i m e conlent inside is at d l tlimes greater than the sianultsaneous moisture content outside but shows shilar trend. m s would to indim that the moistuse cmtent inside
i n 4 pufely by Sdtr&iora and n a d ventilation from outside. In Bui lhg 3 it s that other mdor sources a e affecting the moisture content, such as moisture

absorption and rel from the walls, w h h could be significant due to the high porosity of the volcanic material of whi building is constructed. However, the plot of moisture content values for building 4 4) shows that the moisture content of the external and
air are not very different. In this case the moisture content inside is governed by de. Natural ventilation is pr&abb more effective in Building 4, which
could be an'buted to the position oft (at the rear space of the house).
Table 1: Monttorad for the roar B d b g
2: Mdlng 3 - Rela*@ ad-

sr srroyppuo3 amp!dmt pa3oponr. aqt 303 MOD v pappad 7 %ql!ng q -pap&= SEM w
lpmno aqt 03 no~tnqfJ~nos
azam8 vqa ass oo 3-m~ ST 11 .Ia~plmq arow aqa 303 moq md sa%ar!q~ la SE saw MQXJ .p 3y.x.anlo~ aql sassa 103 am^ au. '%wIF~~ a~ q MOD JF~ ~pm aqa 03 ST c~m~-~~n ST
aqt @no* MOD aql am oqs oslv .s%uplfnq aqa jo sa~eds upnr aql pm s aqo ~oj satel ~o~mo aql nr pm s8Tplrnq
03 amp '2 alqq na@ am s3psaJ ao!pIntnfs asau '&mp1!nq aqt 30 ao!@ptwa
'(5 w3 ass) 31astl sp*1 sp 03 saw03 a-Jadarat ap!splo aqt aooa~al@ Alma aqt q
~qt '4p3lta~oaql 'ompq sm JV .pbs arnomq samJadmat 9;splo pm apfs~ atit amos te poe sassa.~o~d i(ep arg se smq ~1
ar~, .spmdn Bqmw "!WJF~ asmm aqt aqt xq SMO~
s+q q3w p=sa aqt mq~ ~=@g J aq %gdaaq aql nrog par! asnoq aqr jo 3003
aqt pne slpm aqa llq paqrosqe am .xp Bqmmxq aq UIO~ paq pne ans aqt1~10.g sup3 mna 3 aqt q mmallorn q-e pz~wop e af c?prs+ apr u-eqo mqg ~~(lqer?p!sOO~
9 al3h pump E no atedo s aq, wqt va%%ms plnoM paravca aqo pme Aa

as was e x w e d . In Bui lhg 2, predicted air flow for the monitored tern e conditions is always $ownwar&. One psshle explanation is that, because building 2 is deep& excavated, it stays cooler than the outside air at a91 tbes, thus matkg a constant downward flow.
s the perfomme of Building 4, in
difference. The efiernal and room t es were those re~orded over me day in the building during the monitored es are those prediad by using these tmperatures. It can be seen how the direction of flow changes when
less t h the external temperature. Table 2 shows that the lation rates. Although these fairly high ventilation rates
in those roms which experience the ventilation,
e rear of an open-plan ctwe1lhg were shorn to operate much more the h t , like the c
roorns mia t hprwe &e and its cmwibut ventilation. In the case of a
can be used as a means of b p r w h g moss vmtilation, wherever the later is &ficult to acEe?ve.
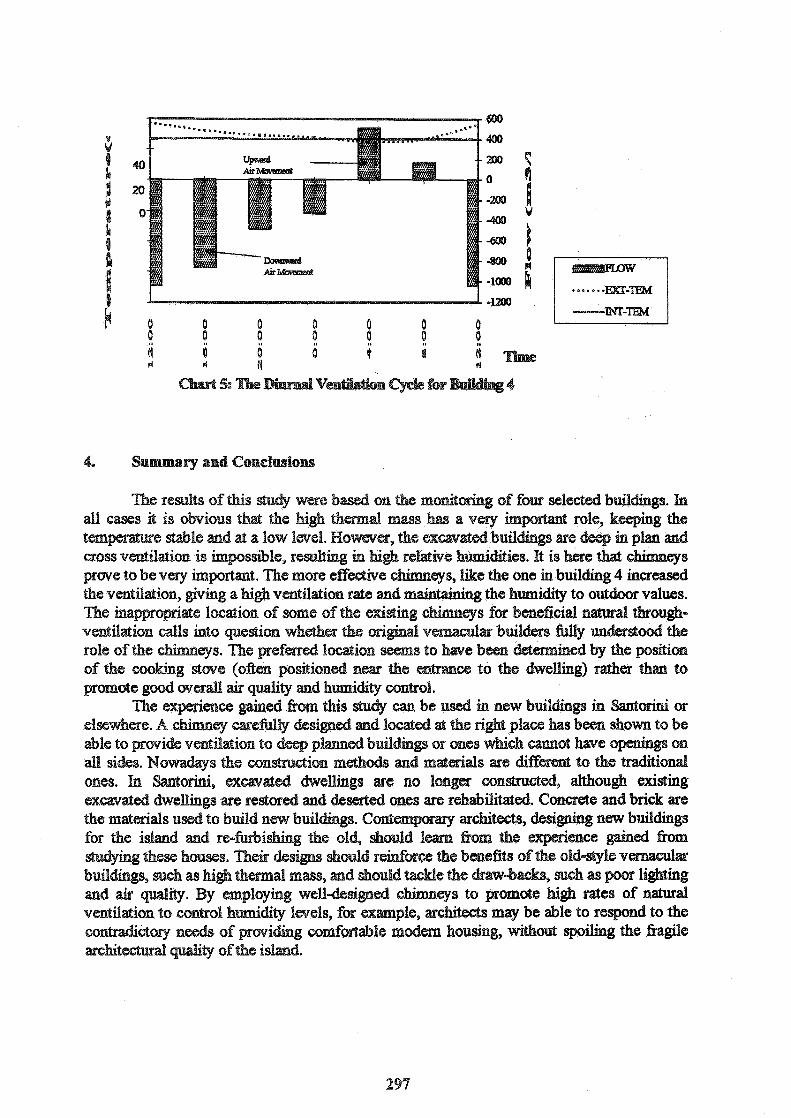
Air I
4. Surnmv and Goaaislesi~ers
The results of ~s all C S S it is h i o u s t a p m e slcal>le md a low lwel. cfoss v d a a i o n is hpss&le, remk grave to be very hpr tant . The more eE&ke
of the m h g starve (ofim ps&ioned I I ~ dhe to the dvvellhg) rather than to
t ~ s study can be used k n w b u i l h p k Santofi or wefrrlb deigned md l o c a d at fhe figbr place has been show to be
able to p i & ventilation to deep planned buahgs or ones *eh all sides. Now-s the c o n s t ~ i o n meahods and mat&ds are djifi'ermt to ones. Santofi, excanrated Bwellhgs we no longer conmcted, altth excznrated &elh@ are reamed and & w e d ones anre rehaba&ated. Cancr&e and brick a e the msllt&ds used to build n m bug&@. C@ for (he i s l d d re-fiarbihg the old, should stucjtyhg these houses. signs should r e ~ ~ c e the buddkgs, SUS:~ as mass, and should ~ f d e and &E qualiv. By mployhg well-dedped ventildian to conbol lami&* levels, for
of p i h g eomfonable ofthe islaad.
1. AWBI, HB. "Ventilation of Buildings" E 8t FN Spon, London 199 1 2. BUILDING RESEARCH ESTABLI a t of the E m i r m a t , "'BREEZE 6.3 : User Manual", Crown, London 1995 3. EUROPEAN COMMISION, Directorie General for Energy @G , Pro e "SAVE" "Passive Cooling in Hotels; Cycaldes" CRES, Athens 1995, 4. FANCiER, P.O. "Thermal Comfort: Anesis and Appli~ations in Enviromental En g" Mc Draw-Hill Book Company, New Yo& 1972 5. GrVOM,B. "Passive and Low Energy Cooling of Buil-s' Van Nostrand Reinhold, New Uork 1994 6. JONES, W.P. "Air Conditioning En g", 3rd Edition, er2
ar houses and churches of 209-2 13 (in Greek)
firolCqh Buildhg Desktqrr,
Reference Guide", Data Logger sis Software, Version 1.56 for DO§,

the chimney in Building 3


VENTILATION AND COOLING
lgTH ANNUAL AIVC CONFERENCE ATHENS, GREECE, 23,26 SEPTEPMBER, 1997
INDOOR AIR QUALITY AND NATURAL CONTROLLED VENTILATION - EWGENCE, PERFOMANCE AND STANDARD ASPECTS
Giovanni Cavanna, Adriano Fantucci, Vittorio Galitnberti, Giuseppina Varone
Central Institute for Industrialization and Technology in Building (ICITE) - National Research Center
Via Lombardia 49 Sesto Ulteriano S. Giuliano Milanese (MI) - ITALY

INDOOR AIR QUALITY AND NAT L CONTROLLED VENTILATION - EXIGENCE, PERFO NCE AND STANDARD ASPECTS
Synopsis As everybody knows, today the air quality of an indoor environment may have several effects on our health; the beginning of serious breathing pathologies and of some forms of cancer, are with no doubt due to the presence of polluting and extremely noxious agents in the places we most fkequently use. That's the reason why it is very important that indoor rooms are correctly aired also in our homes where, due to several incidental factors, the healthiness of the environment is still guaranteed by the mere and discretionary operation of users of opening the windows. In considering the growing attention drawn to these problems and in agreement with the provisions of the 3rd essential requirement laid down in Common Directive 8911 06, 'Hygiene, Health and the Environment', ICITE has undertaken to develop a research and experimentation study aimed at establishing a device for the controlled natural ventilation of residential environments. The main objectives have focused on the technical and performance-oriented characteristics of the devices that are already available on the Community markets and on the regulative aspects for what concerns air healthiness in domestic environments, while the final phase of the work, still in progress, will give new developping guidelines, both in regulative and productive terms.
1. Historical outline The indoor ventilation problem is not related to modern history, but it concerns the human civilization fkom its origin. Cooling needs or simply smells removing, have beeen solved in different way over the centuries, according to the technological evolution and climatic conditions. In any case, natural ventilation is based on the difference between indoor and outdoor pressure: when the indoor temperature exceeds the outdoor one, a continous air cycle is created throught the wall openings. Early solutions were based on this very simple approach such as, for instance, wind towers, studied and realized during the Pre-Christian era fiom the Middle-East. These towers maintained their technical validity for many years. The Roman age also considered ventilation as an health important factor. In fact they studied wind direction in order to improve building orientation. With regard to the Mitilene inhabitants, Vitruvio wrote: "When the Auster wind blows Mitilene's inhabitants fall ill, when the Mistral wind blows they have a cough, when the North wind blows they became healthy again". The typical Roman house solved ventilation needs by creating open spaces inside: all rooms faced the impluvium and perystilium. During the Middle Age new techniques were developed, based on the double air flow (drawing and ejection), and other passive techniques were developed to ventilate houses and castles. The ecclesiastical construction continued to apply Roman principles. During the Renaissance the techniques based on wind studies were improved by introducing mechanical systems to stimulate air, and passive ventilation was left in part. Also in Italy, mechanical ventilation was adopted, improving the performaces of early ventilators and using valves that, controlled by wires, sent air into those rooms only used fkom time to time.
Occasionally, wind towers were again adopted, which in Italy where known as "ventiere". In the eighteenth century and during the Industrial Revolution, scientific progress led to the first forms of calculus for determining the unitary air flow to guarantee hygiene and health indoors. England produced the most important resultus of this study at that time, where prisons were provided with heating and ventilation systems. The employment of prisoners to set their own ventilators was unique. Elsewhere, heating systems were steam-driven. The systems set up at Westminster in London, in the first half of the nintheenth, re-adopted the concept of the wind towers (Victoria and Clock towers), by conducting air to the cellars, from where it reached the rooms and was then conveyed through the combustion systems which exploited the induction effect. Other examples of the survival of the wind towers were in Great Britain and America. Nevertheless the principle of ventilation linked to conditioning systems was maintained for a long time. This principle is valid and operative even today, but the indoor ventilation problem for building without conditioning systems is still open.
2. Indoor air quality The Common Directive on building products 891106, relative to the proximaty of legislative, regulatory and administrative provisions of the Member States, adopted in Italy on 21 april 1993, with D.P.R. n. 246, specifies, among other things, the following essential requirements, to which every structure has to answer: - Health, safety and environment In order to satis- this requirement, each structure has to be conceived and built so that it does not constitute a threat 30 the health and safety of the occupants or neighbours. This threat is caused in particular by noxious gas, particles or dangerous gas present in the air, dangerous radiation emission, polluted or contaminated water or soil, evacuation defects of water, smoke and solid or liquid residuals and formation of humidity in some parts or within the interior surface of the structure. In particular, the interpretative documents of the Product Directive, in underlining the principles to verify the respect of essential requirements, (re- point above-mentioned) indicate ventilation (natural or artificial) as one of the most important aspects in order to pursue healthy and safe environment in buildings. In this way, the technical specifications require that the presence of polluting agents are brought back to safety levels, applying evalutation criteria of air quality, calculus methods to forecast the renovl rate, starting from climatic conditions and ventilation systems. Further measures referred to the calculus rate of the ventilation in building, determining its effectiveness, indentifying the kind of pollution and its concentration indoors. In general, the complete characteristics of ventilation systems have to be verified in terms of their speed and air flow and differences of pressure. The Directive 891106 also highlights, through its nouvelle approche to building products, that past cares about indoor aeration have continued to increase during last few years and the absence of ventilation has been shown as a great threat to human health. On the basis of a statistics study, carried out in the United States on a sample of 350 buildings, demonstrated that the effects due to the absence of ventilation (SO%), the wrong air distribution, inadequate conditions of temperature and humidity, on top of tobacco smoke and endogenous pollution, are responsible for bodily discomfort known as 'sick building syndrome'. This syndrome causes various symptoms, such as headaches, fatigue, nose and throat irritation, etc.

The incidence of endogenous pollution is responsible for a smaller part of this temporary bodily discomfort, but they have a biggest responsibility to long term, in supporting great pathologies, not always curable with the up-to-date medicine. This is the case, for instance, of some adhesives and sealants delivering carcinogent and toxic substances, such as formaldhehyde, radon, etc., in the environment. The absence of ventilation also allows the increase of relative humidity, which causes condensing phenomena and, as a consequence, mould formation accountable of respiratory pathologies.
3. The research proposal These further elements of knowledge, point out very clearly that the termal and hygrometric performances of a building and its components, have to satisfy environmental safety and healty needs, with optimum energetic consumptions. In fact, after superseding the economic restrictive worries, which imposed "hermetic sealing", the attention is today turned on indoor microclimate as an essential factor for the comfort of the occupants. In this way, the fiequence of air changes, especially in winter, is the crucial point of the problem, in considering that the energetic consumption has to be compared with air safety. External windows have always met the primary need of air change allowing, with easy operations, the opening of one or more of its components, but living to frequency and the amount of air to be recycled to the discretionality of the occupants. The increased attention drawn the objectives of safety and healthiness of domestic rooms has to be beyond the occupants' discretion, imposing on to external window additional performances able to guarantee permanent safety conditions. The window, also known as 'the intelligence of walls', is still able to fulfil new expectations, as simply as in the past, but it needs receive new inputs in the technical and standard fields. The modern construction sector in Italy, having to face several problems, doesn't seem to relying a satisfactory way on ventilation, and also the route of natural ventilation systems seems,to have still a long way to go. In such a situation, indoor natural ventilation is affected by multidisciplinary factors, having to interact with technical, normative, sanitary and economic variables. So, in order to give some acceptable answers to the up-to-date needs and to give useful orientation to the industry of the sector, and on the occasion of a specific demand coming from production world, the Systems and Components Department of Icite deemed it necessary to undertake a research study on the subject of natural controlled ventilation. The work programme has prelimanarily, outlined the necessity to follow two directions:
laboratory characterization and performance evaluation of a window filled with a ventilation unit; analysis and evaluation of national lows and standards, with reference to indoor ventilation criteria; analysis and evaluation of the effectiveness of operational instruments currently adopted.
In this field, the analytical phase of the study under way, aims at defining a reference frameworkin order to investigate and outline the existing gaps, concerning both need and performance aspects and legislative and normative aspects, all contributing to make a correct evaluation.
3-1 Laboratory charac1erization of the veatilatiopt system aad prqaragoa of test methodology
The investigated ventilation system is of the self-adjusting type, it is conceived to be fitted in the upper part of the window, breadthwise, between the transom and the glazing unit, reducing this way the glazed surface. Inside the system works a ventilation grid that with faint or no wind, allows for a satisfactory level of natural ventilation of the indoor environment, while it automatically stops working due to the action of the external pressure as soon as the atmospheric conditions change. The system is conceived in a way that it allows to keep acceptable conditions of indoor ventilation even when there is a strong wind outside. The system works thanks to the internal grid with self-adjusting air intake consisting of punched thin plates oscillating perpendicularly to the ventilator and of two baffles, the former being placed on the outside for the natural collection of air, the latter inside, turned upwards, to convey the air flow indoors avoiding air draughts and rain water seepage. According to the characteristics declared and checked in the laboratory, it is envisaged that with external air pressures greater that 20 Pa, the internal thin plates, by automatically placing themselves against the internal face of the system, manage to prevent a certain amount of air from seeping inside, by limiting the flow just to the air passing through the holes of the thin plates and throught the little gaps between them. With pressures less than 20 Pa, the system must ensure a constant air flow lying between 15 m3/h and 30 m3/h, according to the size of the system. In order to characterize the system, an "ad hoc" test chamber for the measurement of low pressures was used; the chamber was built according to the provisions contained in the Belgian standard NBN D 50-001. The 3m3 test chamber was built with bolted and silicone-bonded sandwich panels and provided with vertical walls allowing to apply (see fig ...) a constant air pressure in the inside. The opposite closing walls were prepared to contain the test device and the air intake, with negative pressure, generated by a fan. A pressure gauge was used to measure the pressure difference between the test chamber and the laboratory, while inside the duct placed between the fan and the chamber, the air flow rate was measured by means of a Pitot tube. The device was installed with the internal face turned towards the laboratory and the external one towards the test chamber, in order to simulate, inside the chamber, the actual external atmospheric conditions.
3.2 Laboratory characterization ofthe window frame fitted with the ventila~on system
The performance evaluation of the window system was carried out by means of official testing equipment for windows and structural glazings belonging to the "Components" service laboratory of ICITE, and thanks to the experience made over many years of activity in the field of compulsory and voluntary certification. In this connection, it must be remembered that ICITE is an active member of UEAtc and EOTA, the European organizations in charge of the harmonization of standards for granting technical agrdments. The whole system, consisting of an aluminium window fi-ame with a horizontal bascule opening and provided with a ventilation system, was then fitted into the test wall and tested according to the methodologies envisaged by standards UNI EN 42-77. Air permeability was measured by constantly increasing pressure at 50 Pa steps, from 50 to 500 Pa. The test was at first executed by sealing the system in order to assess the extent of the losses caused by the window frame, then, after removing the seal, the total losses were
recorded; the difference between the two values provided the amount of air passing through the system. Permeability values (table ....) resulted to be quite high, thus contradicting the limits suggested by the official standards. The watertightness test was not judged to be meaningfbl since it is not possible to make a comparison with the criteria suggested by the standards establishing that the nozzles used to spray water on the sample are to be fvred few centimeters below the upper transom of the window frame in the same place of the test set-up in which the ventilation system is to be installed.
The wind resistance tests previously carried out on the window frame not including the ventilation system, allowed to assign the highest resistance class. The same window frame, including the system and submitted again to the previous test, did not resist the 1800 Pa pressure due to the disjuntion of the lateral glazing beads.
4. National legislations and standards and assessment of the effectiveness of currently used working instruments
A1 Indoor ventilation The present national legislative situation on the subject of ventilation refers to Law No. 10 of 199 1 "Standards for the accomplishment of the national energy Programme concerning the rational use of energy, energy saving and development of renewable energy sources" which somehow introduces the problem regarding the change of indoor air. This law is very important since it goes beyond the restrictions imposed by Law 373176, issued following the serious energy crisis which took place during the 70ts, and it introduces important innovations about how to plan and realize living comfort and hygiene; moreover, it is structured on three levels of enforcement and this shows that the CPD has been satisfactorily adopted. While the first level of the legislative apparatus provides the general directives, the intermediate level, consisting of the compulsory D.P.R. (Decree of the President of the Republic) No. 412, precisely defines and reaffirms the basic role of thermal insulation in view of energy saving and environmental welfare, delegating the application procedures to the technical standards drawn up by UNI.
In particular, D.P.R. No. 412 of 26 August 1993 "Regulations containing standards for the planning, installation, operation and maintenance of thermal plants of buildings in order to restrict energy consumption, in accordance with article 4, sub-section 4, of Law 10/'91 and following amendments" defines, among other things, the climatic areas, subdivides the buildings according to their intended use and provides the specifications of the plants. As regards dwelling buildings and buildings with similar intended uses, the D.P.R. assumes a room temperature, during the winter working period of the air-conditioning unit and a maximum value determined on the basis of the arithmetical mean of air temperatures of all the individual premises of the buildings, defined and measured according to the specifications contained in the technical standard UNI 5364. Article 8 of the Decree also indicates the daily mean over 24 hours of the minimum number of air volumes that can be recycled in one hour, fixing it conventionally to 0,5 for dwelling buildings, if no controlled mechanical air changes are envisaged.
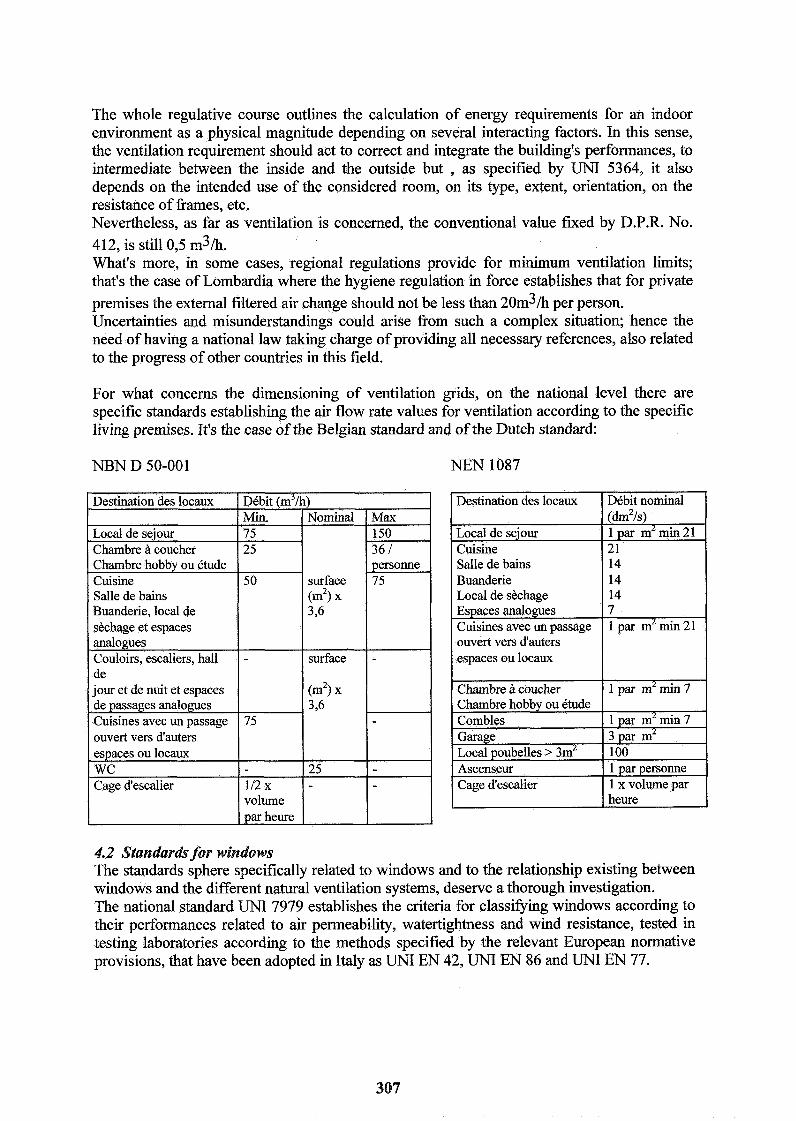
The whole regulative course outlines the calculation of energy requirements for an indoor environment as a physical magnitude depending on several interacting factors. In this sense, the ventilation requirement should act to correct and integrate the building's performances, to intermediate between the inside and the outside but , as specified by UNI 5364, it also depends on the intended use of the considered room, on its type, extent, orientation, on the resistance of frames, etc. Nevertheless, as far as ventilation is concerned, the conventional value fured by D.P.R. No. 412, is still 0,5 m31h. What's more, in some cases, regional regulations provide for minimum ventilation limits; that's the case of Lombardia where the hygiene regulation in force establishes that for private premises the external filtered air change should not be less than 20m3h per person. Uncertainties and misunderstandings could arise from such a complex situation; hence the need of having a national law taking charge of providing all necessary references, also related to the progress of other countries in this field.
For what concerns the dimensioning of ventilation grids, on the national level there are specific standards establishing the air flow rate values for ventilation according to the specific living premises. It's the case of the Belgian standard and of the Dutch standard:
NBN D 50-001 NEN 1087
4.2 Standardsfor windows The standards sphere specifically related to windows and to the relationship existing between windows and the different natural ventilation systems, deserve a thorough investigation. The national standard UNI 7979 establishes the criteria for classifying windows according to their performances related to air permeability, watertightness and wind resistance, tested in testing laboratories according to the methods specified by the relevant European normative provisions, that have been adopted in Italy as UNI EN 42, UNI EN 86 and UNI EN 77.
Air permeability can be defmed as the air amount, expressed in m3A-1, managing to pass through the close window system, due to the pressure difference between the external and the internal surfaces. The value measured in the laboratory, by submitting the window to an air mass under static pressure, is the indication used to assign one of the three classes of performance. The results of this test refer to the ratio between the square metres of opening surface (m3/h.m2) and the linear metres of the opening joint (m3k.m). Class A3 represents the most favourable case and therefore indicates that only a very small amount of air manages to seep through the joints. Such an appraisal can not obviously be extended to a window including the natural ventilation unit which, beside the assessment referring to the unit itself, is an integral part of a system with which it interacts, deserving this way a global appraisal. A great care should also be taken over the tests for the classification of wind resistance as far as this system is concerned. Such a test is used to assess the ability of the window to withstand a certain wind pressure which should engender neither functional degradations of the window frame nor failures of the mechanical parts representing a possible danger for the users. Some experiments executed at ICITE's laboratories on bottom hinged windows with the ventilation unit inserted breadthwise in their top part, produced resistance values much below the minimum class provided for by the standard. This shows a weakening of the whole system that therefore needs the application of additional safety measures in case of wind.
5. International methodologies for the calculation o f ventilation requirements in the indoor environment
The main objective of ventilation is to ensure the necessary air quality in an indoor environment. On the basis of this fundamental assumption, the first factor to be known is the air volume to be recycled, according to the pollution rate. Polluting agents adding to endogenous noxious substances depend on how many people are in the room and on the type of activity that is carried out in it. In this connection, there are no official reference standards defining in fbll detail the overall pollution and relevant admitted levels, being the nature of the problem made more complex by the poor knowledge about the exact number of agents contained in the air and about the ensuing effects and the actions that can be synergically derived from them. The knowledge so far acquired is collected in the OSHA (Occupational Health and Safety Administration) Recommendations (see table...). The presence of carbon dioxide, released by man in variable amounts, according to the activity he carries out in the indoor environment and to his metabolism, is a good indicator of air quality. ASHRAE standard 62-1989 "Ventilation for Acceptable Indoor Air Quality" assumes that the ventilation demand is acceptable whenever the concentration of carbon dioxide is not greater than 1000 ppm, as specified by the OSHA recommendations. The revision of ASHRAE standard 62-89, which besides has not yet been adopted, has kept the assessment criterion based on the concentration of carbon dioxide; however, it has specified that the criterion is not based on sanitary principles but that it is just a parameter for the control of human smells, since it is mainly based on the individual input represented by crowding. The American revised draR standard confirms the two previous methodological approaches; the compulsory approach and the performance-oriented approach, the former being used to calculate the minimum external air flow rate as the addition of two terms proportional to the index of indoor crowding and to the indoor area respectively, proposing proportional values that in the former case are of 3LIs per person and, in the latter case, are of 0735~/sm2.
The performance-oriented method needs a basic knowledge, namely: - the nature of pollutants present indoors; - the possible production of pollutants over a specific period of time; - the admitted concentration in terms of health and comfort. For the time being, it is extremely difficult to adopt this method since not all of the countless calculation inputs are known.
Another method used to dimension indoor ventilation was elaborated during the 80's in Northern Europe by a team of experts led by Prof. Fanger. The theory in question was criticized by many but appears in the IAQ chapter of CENITC pre-standard 156 "Ventilation for Buildings: design criteria for the indoor environment" and suggests to dimension the air change requirements on the basis of the air quality that can be sensed by man himself. To this end, two units of measurement have been introduced: the olf after the Latin word"olfactus", that senses the polluting molecules dispersed in the air through the olfactory sensorial activity, taking place at the end of the nasal cavity; the decipol, after the Latin word "pollutio", turns the actions that irritate to a lesser or greater extent the mucous membranes of the upper tract of the respiratory system and of the eye, into different levels of pollution present in the area. In other words, decipol represents the air quality that can be sensed as a result of the interaction between pollutants and ventilation. This means that with a polluting source of one olf, detected in an indoor environment in which 10 Vs clean air are let in, the qualitative value expressed in decipols will amount to one and will prove that air and pollution have perfectly blended. The equations proposed by Fanger are based on sensorial evaluations and, even if many people consider them rather superficial, still represent an effective and easy assessment instrument.
6. F u t u ~ developments The situation so far described clearly shows that fuhue developments will mainly follow two ways: the technical/performance-oriented way and the legislative way. The proposition of optimum ventilation values for indoor environments to be included in the Italian legislative and normative body becomes more and more meaningful also with reference to the present stage of the study which is trying to define, through a number of corrective actions to be applied to the studied prototype, performance-oriented criteria to be effectively applied to any atmospheric situation. To sum up, instead of completely closing the window when atmospheric conditions are bad, the application of a highly sensible mechanical regulator will ensure an air flow as an inverse funtion of the external pressure. Present difficulties concern the possibility of managing the air flow with pressures greater than 50 Pa, although even the most advanced standards ruling this subject do not envisage such a possibility.
References
1. A. Briganti "Ventilazione civile industriale" I QUADERNI di RCI, 1995.pp12,25

VENTILATION AND COOLING 18TH AIVC CONFERENCE, ATHENS, GREECE
23-26 SEPTE
Title: Energy Recovery Possibilities in Natural Ventilation of Office Buildings
Author(s): Eimund Skaret, Peter Blom, Jorn T Brunsell
Affiliation: Norwegian Building Research Institute, P O Box 123 Blindern, 0314 Oslo, Norway

E ~ R G U IWE;COVERU POSSIBILITIES 1[N NAT VENTILATION OF OFFICE
3 BUILDHGS
@.I,/-.
&*(..
Eimund Skhet Peter Blom and Jam T. Brunsell ylvr
1. S u m m y
The paper deals with energy consumption and heat recovery in ventilation. Net energy consumption for ventilation is calculate The calculations are done with various air flow rates and occupancy. The calculations shows differences between the seven countries, but the net ventilation heat loss is substantial for all. Norway and Sweden will benefit most fi-om heat recovery. Several heat recovery concepts for natural ventilation are presented. Advantages and disadvantages with the various systems are discussed, also with respect to requirements as thermal comfort, air flow control, air cleaning and operation/maintenance. The paper also analyses the distribution of natural driving forces for ventilation both in various countries and in different parts of the heating season. The calculations indicate a need for assisting fans.
A consortium of 7 countries conducts a project aiming at overcoming barriers to low-energy natural ventilation in office-type buildings in moderate and cold climates. The project, which is called NATVENT, is partly funded by the Commission of the European Union under the JOULE Program of the Fourth Framework.
Natural ventilation is the process of supplying outdoor air into a building and extracting the same amount of used or contaminated air &om the premises utilising wind and thermal buoyancy as the driving forces. Natural ventilation systems can attain much more interest in the future in moderate and cold climate countries if heat recovery is included. Such systems use very little energy for air transport, they generate very little noise and a good air quality can be obtained. As a basis for fwther work on developing solutions for natural ventilation with heat recovery the paper focus on practical concepts:
e Controlling the air flow in accordance with what is demanded Preventing pollution in urban and industrial areas from entering a building
3 Supplying the outdoor air without creating thermal discomfort 3 Ensuring low energy consumption
Ensuring user-friendliness in operation, service and maintenance a Energy- and cost effectiveness as a total (installation and running costs)
Preventing outdoor noise (traffic) fkom entering the building through ventilation openings
Sustainable development in the building sector requires energy efficient building design and operation. Ths paper shows that heat recovery cannot be neglected in natural ventilated office buildings. As a basis for further work on developing solutions for natural ventilation with heat recovery the paper focus on practical concepts. These concepts also pay attention to thermal comfort, air flow control, air cleaning and operatiodmaintenance.
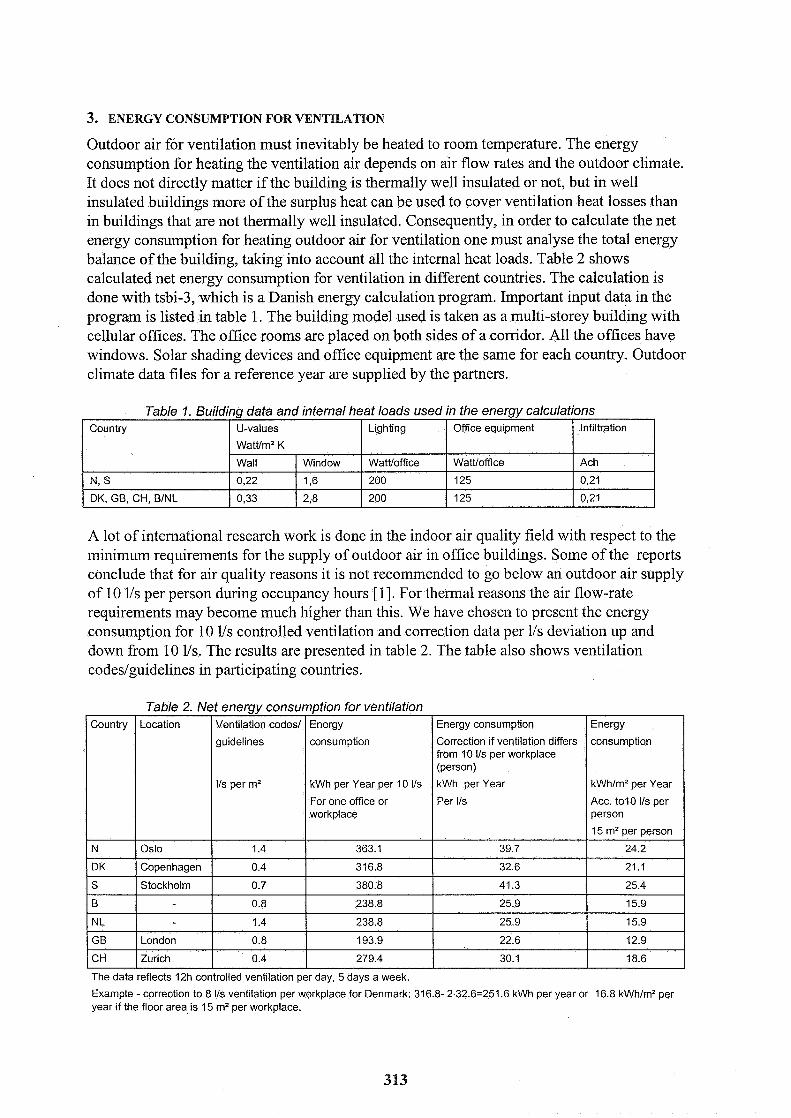
3. ENERGY CONSUMPTION FOR VENTILATION
Outdoor air for ventilation must inevitably be heated to room temperature. The energy consumption for heating the ventilation air depends on air flow rates and the outdoor climate. It does not directly matter if the building is thermally well insulated or not, but in well insulated buildings more of the surplus heat can be used to cover ventilation heat losses than in buildings that are not thermally well insulated. Consequently, in order to calculate the net energy consumption for heating outdoor air for ventilation one must analyse the total energy balance of the building, talung into account all the internal heat loads. Table 2 shows calculated net energy consumption for ventilation in different countries. The calculation is done with tsbi-3, which is a Danish energy calculation program. Important input data in the program is listed in table 1. The building model used is taken as a multi-storey building with cellular offices. The office rooms are placed on both sides of a corridor. All the offices have windows. Solar shading devices and office equipment are the same for each country. Outdoor climate data files for a reference year are supplied by the partners.
A lot of international research work is done in the indoor air quality field with respect to the minimum requirements for the supply of outdoor air in office buildings. Some of the reports conclude that for air quality reasons it is not recommended to go below an outdoor air supply of 10 11s per person during occupancy hours [I]. For thermal reasons the air flow-rate requirements may become much higher than this. We have chosen to present the energy consumption for 10 11s controlled ventilation and correction data per 11s deviation up and down from 10 11s. The results are presented in table 2. The table also shows ventilation codeslguidelines in participating countries.
Table 1. Building data and internal heat loads used in the energy calculations Infiltration
Ach
0,21
0,21
Table 2. Net energy consumption for ventilation
Office equipment
Watffoffice
125
125
Lighting
WatWoffice
200
200
Country
N, S
DK, GB. CH, BlNL
Energy
consumption
kWhlm2 per Year
Acc. to10 Ils per person
15 m2 per person
24.2
21 . I
25.4
15.9
15.9
12.9
18.6
Country
N
DK
S
B
NL
GB
CH
The data reflects 12h controlled ventilation per day, 5 days a week.
Example - correction to 8 11s ventilation per workplace for Denmark: 316.8- 2 32.6=251.6 kwh per year or 16.8 kWhlm2 per year if the floor area is 15 m2 per workplace.
U-values
Watffm2 K
Wall
0.22
0,33
Energy consumption
Correction lf vent~lation differs from 10 Ils per workplace (person)
kwh per Year
Per 11s
39.7
32.6
41.3
25.9
25.9
22.6
30.1
Location
Oslo
Copenhagen
Stockholm
London
Zurich
Window
1,6
2 8
Ventilation codes1
guidelines
11s per m2
1.4
0.4
0.7
0.8
1.4
0.8
0.4
Energy
consumption
kwh per Year per 10 11s
For one office or workplace
363.1
316.8
380.8
238.8
238.8
193.9
279.4
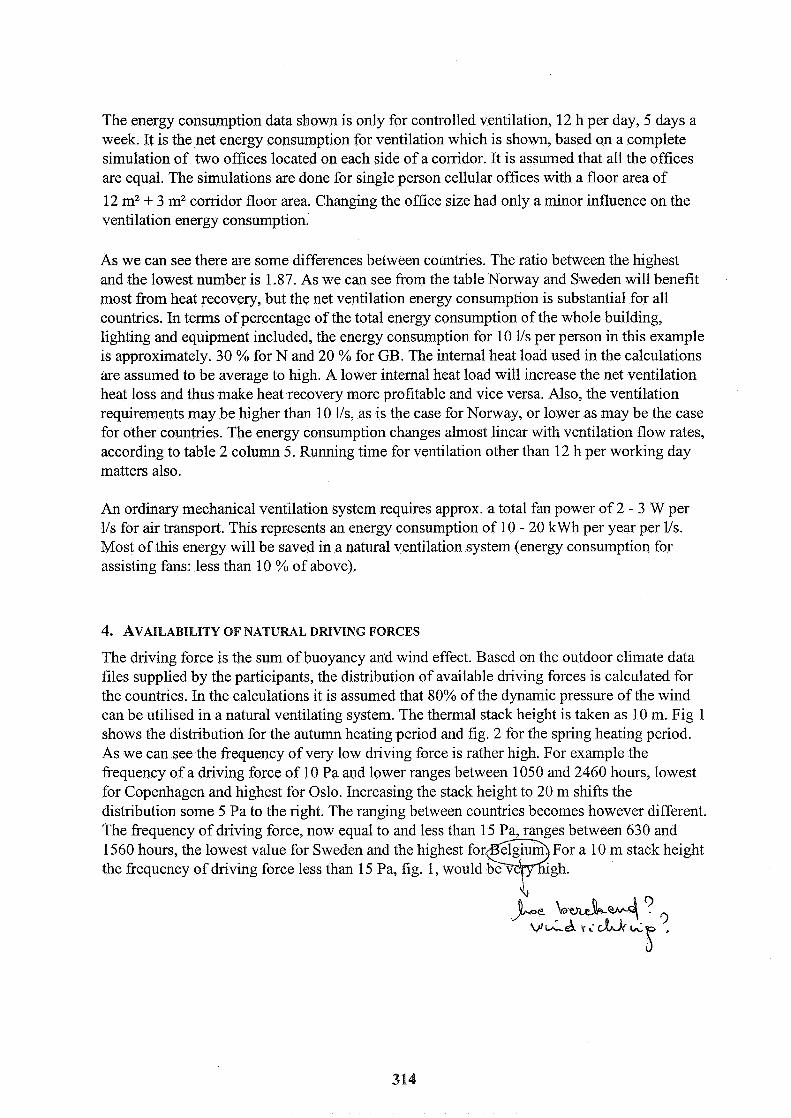
The energy consumption data shown is only for controlled ventilation, 12 h per day, 5 days a week. It is the net energy consumption for ventilation which is shown, based on a complete simulation of two offices located on each side of a corridor. It is assumed that all the offices are equal. The simulations are done for single person cellular offices with a floor area of
12 m2 + 3 m2 corridor floor area. Changing the office size had only a minor influence on the ventilation energy consumption.
As we can see there are some differences between countries. The ratio between the highest and the lowest number is 1.87. As we can see from the table Norway and Sweden will benefit most from heat recovery, but the net ventilation energy consumption is substantial for all countries. In terms of percentage of the total energy consumption of the whole building, lighting and equipment included, the energy consumption for 10 11s per person in this example is approximately. 30 % for N and 20 % for GB. The internal heat load used in the calculations are assumed to be average to high. A lower internal heat load will increase the net ventilation heat loss and thus make heat recovery more profitable and vice versa. Also, the ventilation requirements may be higher than 10 lls, as is the case for Norway, or lower as may be the case for other countries. The energy consumption changes almost linear with ventilatior, flow rates, according to table 2 column 5. Running time for ventilation other than 12 h per working day matters also.
An ordinary mechanical ventilation system requires approx. a total fan power of 2 - 3 W per 11s for air transport. This represents an energy consumption of 10 - 20 kwh per year per 11s. Most of this energy will be saved in a natural ventilation system (energy consumption for assisting fans: less than 10 % of above).
4. AVAILABILITY OF NATURAL DRIVING FORCES
The driving force is the sum of buoyancy arid wind effect. Based on the outdoor climate data files supplied by the participants, the distribution of available driving forces is calculated for the countries. In the calculations it is assumed that 80% of the dynamic pressure of the wind can be utilised in a natural ventilating system. The thermal stack height is taken as 10 m. Fig 1 shows the distribution for the autumn heating period and fig. 2 for the spring heating period. As we can see the frequency of very low driving force is rather high. For example the frequency of a driving force of 10 Pa and lower ranges between 1050 and 2460 hours, lowest for Copenhagen and highest for Oslo. Increasing the stack height to 20 m shifts the distribution some 5 Pa to the right. The ranging between countries becomes however different. The frequency of driving force, now equal to and less than 15 Pa, ranges between 630 and 1560 hours, the lowest value for Sweden and the highest fo For a 10 m stack height the frequency of driving force less than 15 Pa, fig. 1, would gh.
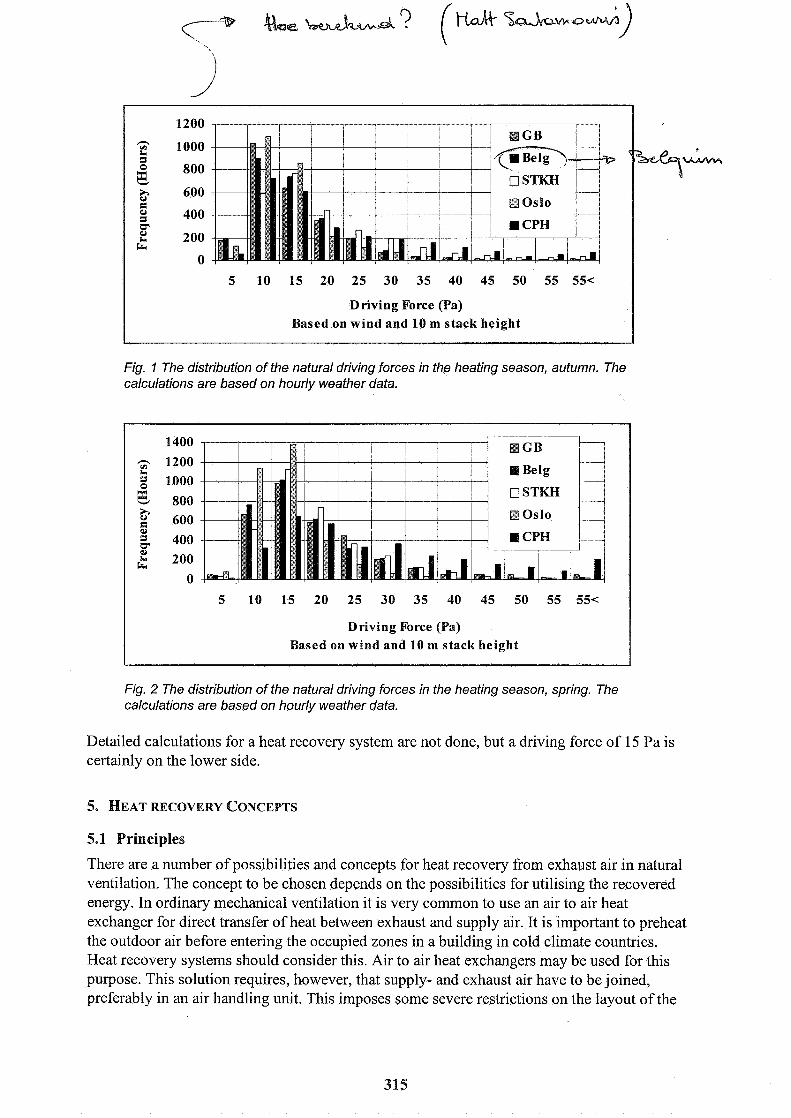
5 10 15 20 25 30 35 40 45 50 55 55<
Driving Force (Pa)
Fig. 1 The distribution of the natural driving forces in the heating season, autumn. The calculations are based on hourly weather data.
1400
1200 L g 1000
+?i 800 2 600 a4 7 400 u'
200
0
5 10 15 20 25 30 35 40 45 50 55 55<
Driving Force (Pa) Based on wind and 10 m stack height
I
-- - - -- - -- -- J
Fig. 2 The distribution of the natural driving forces in the heating season, spring. The calculations are based on hourly weather data.
Detailed calculations for a heat recovery system are not done, but a driving force of 15 Pa is certainly on the lower side.
5. HEAT RECOVERY CONCEPTS
5.1 Principles
There are a number of possibilities and concepts for heat recovery from exhaust air in natural ventilation. The concept to be chosen depends on the possibilities for utilising the recovered energy. In ordinary mechanical ventilation it is very common to use an air to air heat exchanger for direct transfer of heat between exhaust and supply air. It is important to preheat the outdoor air before entering the occupied zones in a building in cold climate countries. Heat recovery systems should consider this. Air to air heat exchangers may be used for this purpose. This solution requires, however, that supply- and exhaust air have to be joined, preferably in an air handling unit. This imposes some severe restrictions on the layout of the
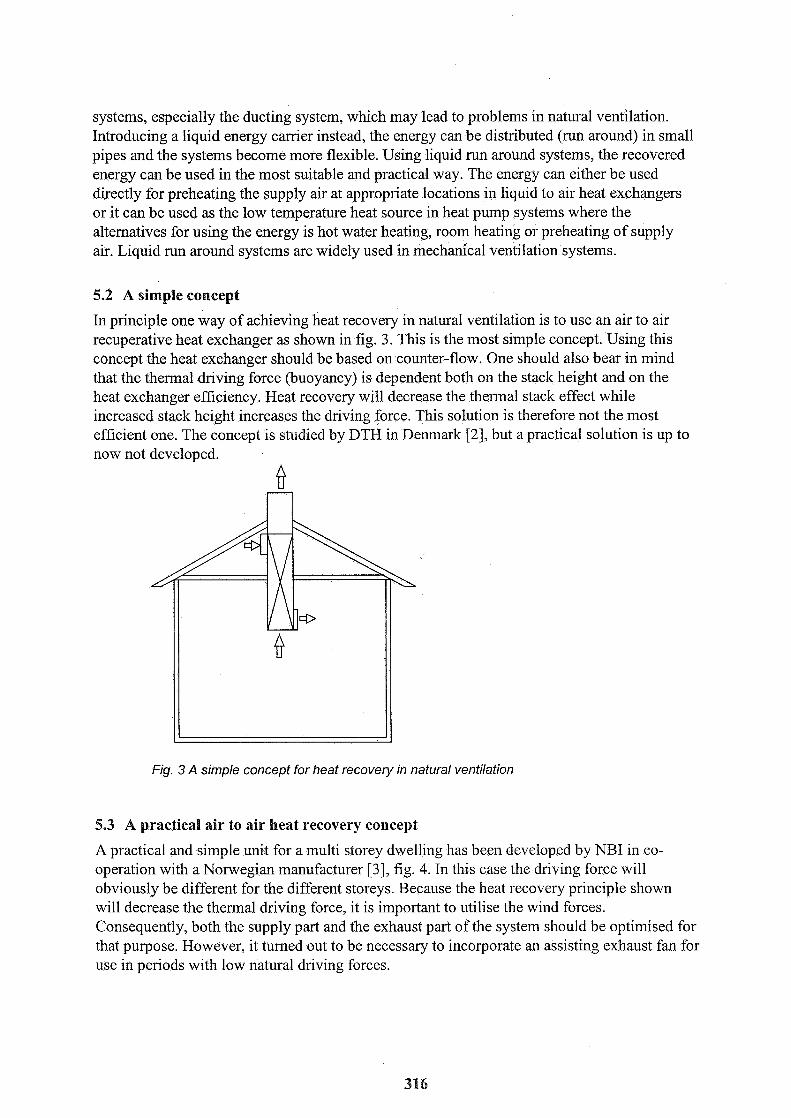
systems, especially the ducting system, which may lead to problems in natural ventilation. Introducing a liquid energy carrier instead, the energy can be distributed (run around) in small pipes and the systems become more flexible. Using liquid run around systems, the recovered energy can be used in the most suitable and practical way. The energy can either be used directly for preheating the supply air at appropriate locations in liquid to air heat exchangers or it can be used as the low temperature heat source in heat pump systems where the alternatives for using the energy is hot water heating, room heating or preheating of supply air. Liquid run around systems are widely used in mechanical ventilation systems.
5.2 A simple concept
In principle one way of achieving heat recovery in natural ventilation is to use an air to air recuperative heat exchanger as shown in fig. 3. This is the most simple concept. Using this concept the heat exchanger should be based on counter-flow. One should also bear in mind that the thermal driving force (buoyancy) is dependent both on the stack height and on the heat exchanger efficiency. Heat recovery will decrease the thermal stack effect while increased stack height increases the driving force. This solution is therefore not the most efficient one. The concept is studied by DTH in Denmark [2], but a practical solution is up to now not developed.
Fig. 3 A simple concepf for heat recovery in natural ventilation
5.3 A practical air to air heat recovery concept
A practical and simple unit for a multi storey dwelling has been developed by NBI in co- operation with a Norwegian manufacturer [3], fig. 4. In this case the driving force will obviously be different for the different storeys. Because the heat recovery principle shown will decrease the thermal driving force, it is important to utilise the wind forces. Consequently, both the supply part and the exhaust part of the system should be optimised for that purpose. However, it turned out to be necessary to incorporate an assisting exhaust fan for use in periods with low natural driving forces.

Fig.4. A practical simple unit for a dwelling for natural ventilation with heat recovery using an air to air heat exchanger.
5.4 Separated systems
A more rational approach in developing heat recovery concepts in natural ventilation is to separate exhaust air systems and supply air systems. However, in cold climate countries it is not acceptable, in the cold season, to supply outdoor air which is not preheated. Consequently, we are at the same time looking for air supply systems where the air can be preheated. The functional requirements for a good air supply system is the following:
9 The air shall be distributed to where it is needed. The distribution should be independent on the wind conditions. It should be possible to clean the supplied outdoor air.
5.4.1 Separated heat recovery systems with outdoor air supply through the outer walls
A concept for separated systems is shown in fig. 6. The exhaust air heat is recovered in an air to liquid heat exchanger in the exhaust stack. A practical solution for multifamily houses is developed in Sweden [4]. Both wind- and thermal driving forces are utilised. The recovered heat can be utilised directly by pumping the liquid energy carrier through heat exchangers in the supply openings in the facades. Due to the small temperature difference the efficiency seldom becomes more than 50 %, which means that the air will be too little preheated. The
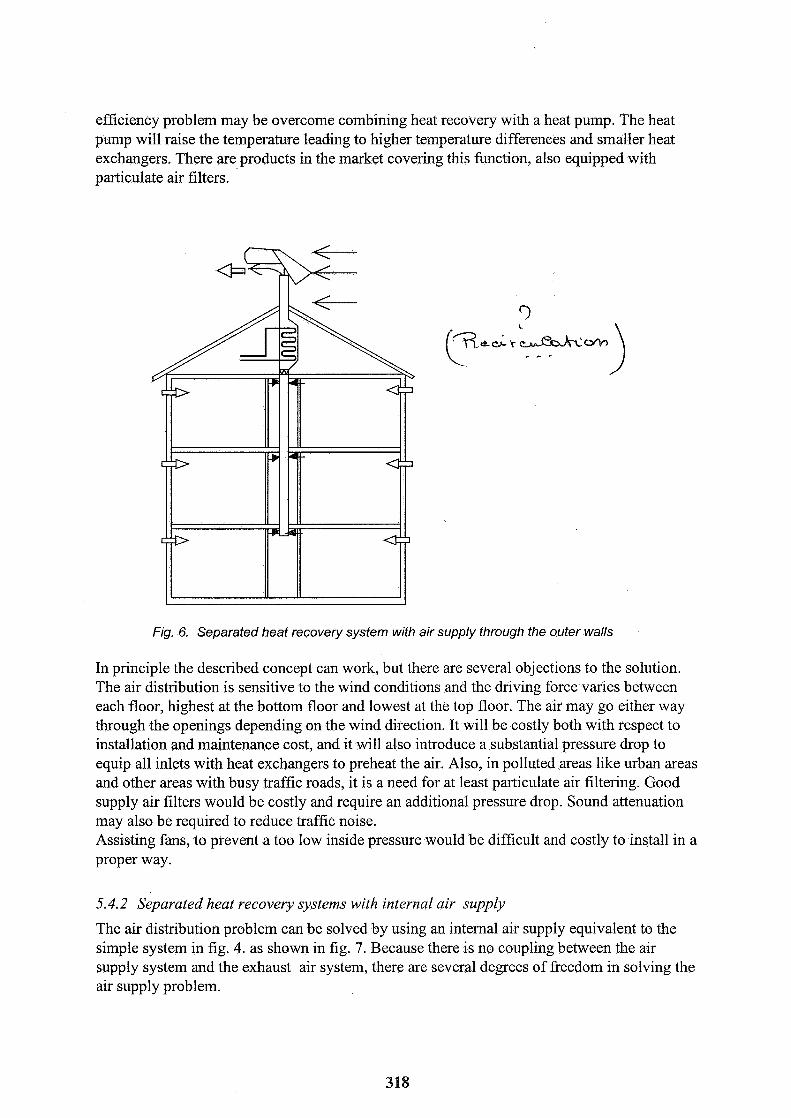
efficiency problem may be overcome combining heat recovery with a heat pump. The heat pump will raise the temperature leading to higher temperature differences and smaller heat exchangers. There are products in the market covering this function, also equipped with particulate air filters.
Fig. 6. Separated heat recovery system with air supply through the outer walls
In principle the described concept can work, but there are several objections to the solution. The air distribution is sensitive to the wind conditions and the driving force varies between each floor, highest at the bottom floor and lowest at the top floor. The air may go either way through the openings depending on the wind direction. It will be costly both with respect to installation and maintenance cost, and it will also introduce a substantial pressure drop to equip all inlets with heat exchangers to preheat the air. Also, in polluted areas like urban areas and other areas with busy traffic roads, it is a need for at least particulate air filtering. Good supply air filters would be costly and require an additional pressure drop. Sound attenuation may also be required to reduce traffic noise. Assisting fans, to prevent a too low inside pressure would be difficult and costly to install in a proper way.
5.4.2 Separated heat recovery systems with internal air supply
The air distribution problem can be solved by using an internal air supply equivalent to the simple system in fig. 4. as shown in fig. 7. Because there is no coupling between the air supply system and the exhaust air system, there are several degrees of freedom in solving the air supply problem.
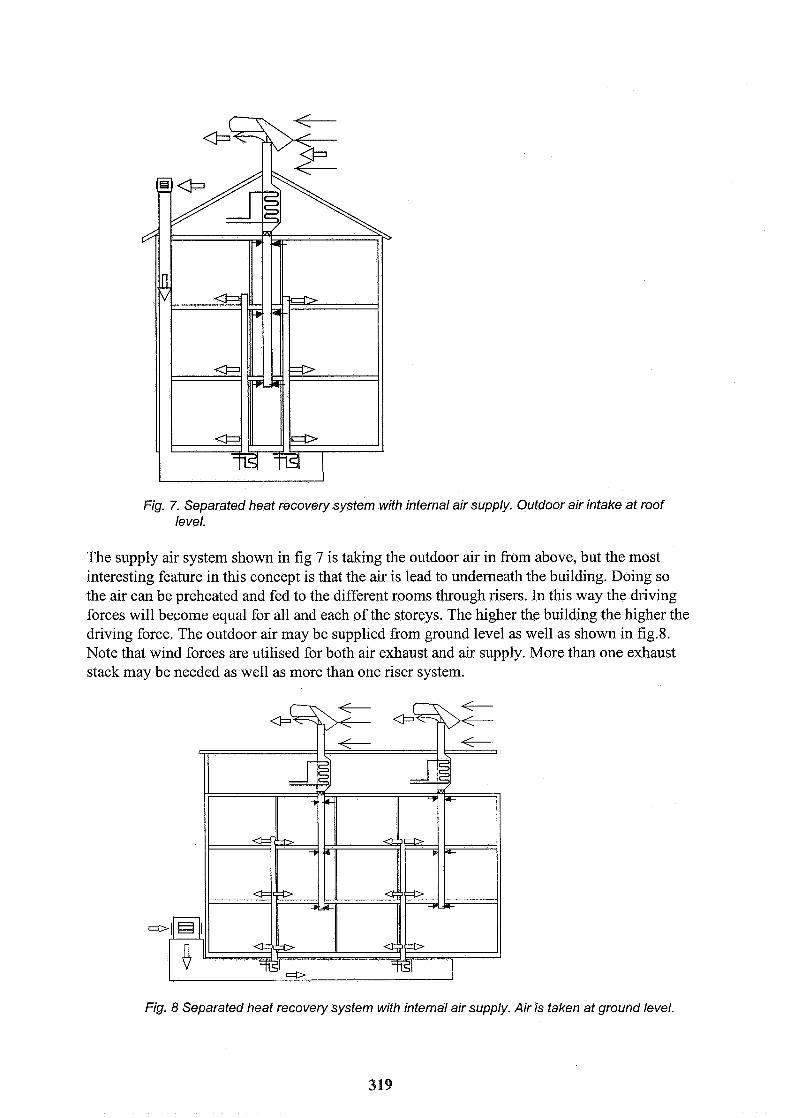
Fig. 7. Separated heat recovery system with internal air supply. Outdoor air intake at roof level.
The supply air system shown in fig 7 is taking the outdoor air in from above, but the most interesting feature in this concept is that the air is lead to underneath the building. Doing so the air can be preheated and fed to the different rooms through risers. In this way the driving forces will become equal for all and each of the storeys. The higher the building the higher the driving force. The outdoor air may be supplied from ground level as well as shown in fig.8. Note that wind forces are utilised for both air exhaust and air supply. More than one exhaust stack may be needed as well as more than one riser system.
Fig, 8 Separated heat recovery system with infernal air supply. Air is taken at ground level.

6. CHARACTERISTICS OF SYSTEMS AND COMPONENTS
6.1 The internal supply air system - characteristics
An internal air supply means to close the facades and supply the air from inside the building. This requires a ducted supply system. In principle there are two main solutions to this:
Outdoor air is taken in through a vertical stack from the roof top of the building down to a tunnel under the building. From the tunnel the supply air is lead through risers and distributed to where it is needed. In open plan lay-outs, simple distribution systems, like supplying air only to corridors and atriums, may be used. The heat exchanger for the preheating should be located at the bottom of the risers. In this way the full thermal stack effect is utilised as driving force, fig 7. The driving force will further be equal for each floor. Outdoor air is taken from an air intake at ground level to a tunnel underneath the building. The solution for the risers and the preheating is the same.
The solutions offer a good possibility for central cleaning (filtering of the supplied outdoor air. Electrostatic filters offers especially high efficient particulate filtering with very low flow resistance (pressure drop). Also traffic noise can easily be reduced by this solution. Depending on the strategy the air intake may be designed to utilise or neutralise the wind forces. Utilising the wind forces is recommended because this will maximise the driving forces. Generally, utilising the wind forces results in periodically rapid changes in driving force which the control system must counteract in order to prevent rapid changing air flow rates. Changing air flow rates may cause both thermal discomfort and excessive energy use if not counteracted. Fortunately, constant air flow devices both exists and new and better ones may be developed and be used.
The concepts shown only show the principle. Practical solutions must involve a close integration with the building design, to reduce the need for ordinary ducting. The building design may be more open, simplifying the exhaust air stack. There are numerous architectural possibilities here. Other interesting features are the horizontal tunnels which opens possibilities for pre-heating and pre-cooling of the supplied outdoor air, by exchanging heat with the surrounding ground. This may specifically increase the efficiency of night-cooling.
6.2 The heat recovery system - characteristics
The exhaust air heat recovery system is the easiest part of the problem solving and the solutions are rather straight forward. In the market there are different types of both air to liquid and air to air heat exchangers to choose between. However, a basic consideration to take is that the pressure drop should be low. This means that the face velocity will be lower than in ordinary systems. This in turn means larger heat exchanging surfaces, and somewhat more expensive components. A benefit from this is possibilities for higher heat recovery efficiencies. An important thing is to keep the heat exchanger surfaces clean by placing a filter in front of the heat exchanger. Because of the larger face area and lower face velocity compared to common practice, cheap plane filters may be used for the exhaust air, which means that the combination heat exchangerlfilter may not be more expensive than in ordinary systems. The ducting part of the system may also be rather simple since air can be extracted from a few locations.
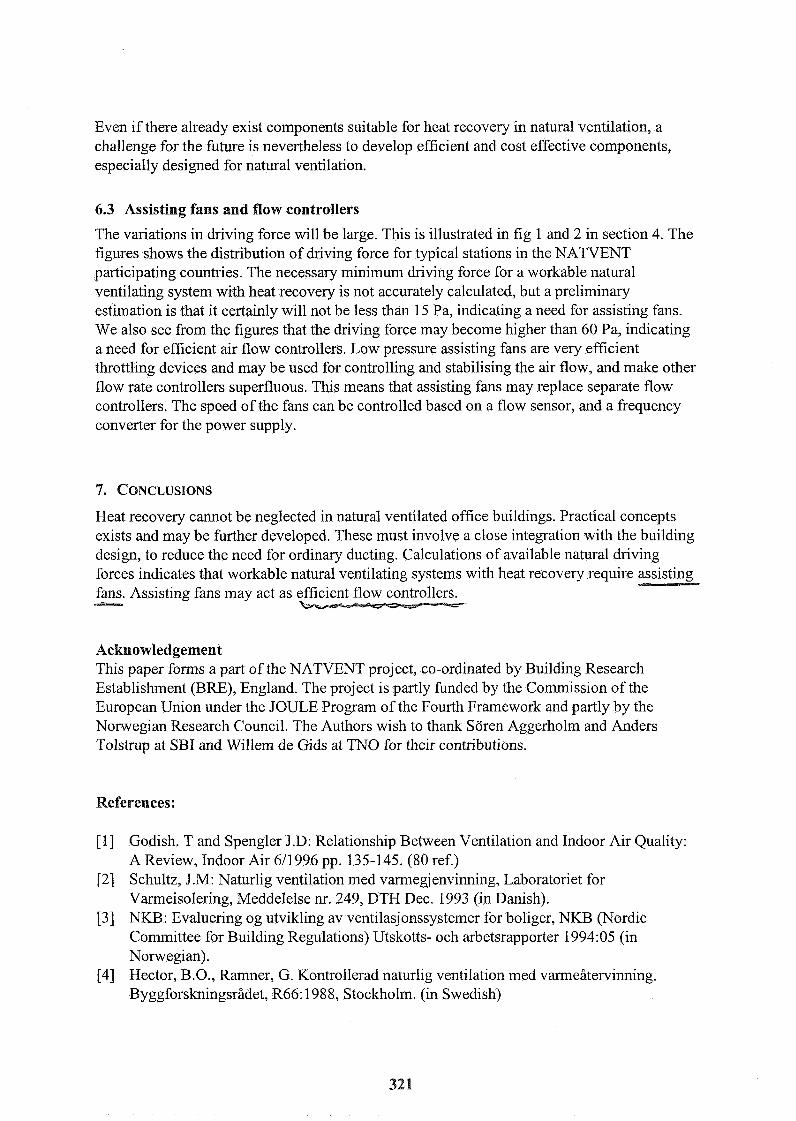
Even if there already exist components suitable for heat recovery in natural ventilation, a challenge for the future is nevertheless to develop efficient and cost effective components, especially designed for natural ventilation.
6.3 Assisting fans and flow controllers
The variations in driving force will be large. This is illustrated in fig 1 and 2 in section 4. The figures shows the distribution of driving force for typical stations in the MATVENT participating countries. The necessary minimum driving force for a workable natural ventilating system with heat recovery is not accurately calculated, but a preliminary estimation is that it certainly will not be less than 15 Pa, indicating a need for assisting fans. We also see from the figures that the driving force may become higher than 60 Pa, indicating a need for efficient air flow controllers. Low pressure assisting fans are very efficient throttling devices and may be used for controlling and stabilising the air flow, and make other flow rate controllers superfluous. This means that assisting fans may replace separate flow controllers. The speed of the fans can be controlled based on a flow sensor, and a frequency converter for the power supply.
Heat recovery cannot be neglected in natural ventilated office buildings. Practical concepts exists and may be further developed. These must involve a close integration with the building design, to reduce the need for ordinary ducting. Calculations of available natural driving forces indicates that workable natural ventilating systems with heat recovery require assisting fans. Assisting fans may act as efficient flow controllers.
Acknowledgement This paper forms a part of the NATVENT project, co-ordinated by Building Research Establishment (BRE), England. The project is partly funded by the Commission of the European Union under the JOULE Program of the Fourth Framework and partly by the Norwegian Research Council. The Authors wish to thank Soren Aggerholm and Anders Tolstrup at SBI and Willem de Gids at TNO for their contributions.
References:
[I] Godish. T and Spengler J.D: Relationship Between Ventilation and Indoor Air Quality: A Review, Indoor Air 611996 pp. 135-145. (80 ref.)
[2] Schultz, J.M: Naturlig ventilation med varmegjenvinning, Laboratoriet for Varmeisolering, Meddelelse nr. 249, DTH Dec. 1993 (in Danish).
[3] NKB: Evaluering og utvikling av ventilasjonssystemer for boliger, NKB (Nordic Committee for Building Regulations) Utskotts- och arbetsrapporter 1994:05 (in Norwegian).
[4] Hector, B.O., Ramner, G. Kontrollerad naturlig ventilation med varmeiitervinning. Byggforskningsriidet, R66: 1988, Stockholm. (in Swedish)

VENTILATION AND COOLING
18TH ANNUAL AIVC CONFERENCE 7' 1 ATHENS, GREECE, 23-26 SEPTEMBER, 1997
%eo, c R " . L
LAR ASSISTED N L VENTILATION W I - _. .. -.....--1 RECOVERY
e
K. sir6n1, S. iffa at^, C. ~ f o n s o ~ , A 01iveira3 and P. ~ o f o e d ~
1 Helsinki University of Technology, Espoo, Finland 2 University of Nottingham, Nottingham, UK 3 University of Porto, Porto, Portugal 4 Sulzer Infra Lab Ltd, Winterthur, Switzerland
SOLAR ASSISTED NATURAL VENTILATION WITH HEAT PIPE HEAT RECOVERY
SYNOPSIS Natural passive stack ventilation (PSV) consumes no power and so produces no harmful emissions, has no running cost, no noise of operation, requires little maintenance and because it involves no moving parts, operation is reliable. However, virtually all PSV systems are designed and constructed without incorporating heat recovery, leading to wasteful heat loss. The goal of the research reported here, is to develop a passive stack ventilation system with heat recovery for use in naturally ventilated buildings.
The heat recovery unit is based on the heat-pipe principle. A recovery unit having a sufficiently high efficiency and a very low pressure drop is aimed at. The drawback of an efficient heat recovery is, that it reduces the stack pressure by reducing the temperature difference between the supply and exhaust air flows, which can cause the ventilation system to fail. To avoid this problem, a solar chimney and a wind generator driven fan are integrated into the system to assist the air flows and to maintain them on a sufficient level from the viewpoint of indoor air quality. On the other hand, for the air flows not to be too high, a control unit is added to the system. A pilot plant shall be constructed, where all above mentioned features are included and thjs plant shall be monitored for six months to find out its performance.
Until now several versions of the heat recovery effectiveness has been around 55% with two banks of With the same velocity the pressure loss through a two chimney has been studied both theoretically and exp the performance of the chimney is not very sensitive to small changes in direction on both sides of the south. Measurements indicate a 47 % increase in air flow compared to a conventional stack. The air flow control unit has been developed and tested. It works well according to a control strategy specified for the PSV system. The work continues by designing and optimisation of the pilot plant.
ZNTRODUCTION Natural ventilation is being applied to an increasing number of new buildings across Europe to minimise reliance on mechanical ventilation and so reduce emission of greenhouse gases. The stack pressure created by the temperature difference between the indoor and outdoor air provides a driving force for natural ventilation and stack-driven ventilation has been applied to a wide range of modern buildings, including offices, schools and houses [ I , 21. Natural passive stack ventilation (PSV) consumes no power and so produces no harmful emissions, has no running cost, no noise of operation, requires little maintenance and because it involves no moving parts, operation is reliable. However, virtually all PSV systems are designed and constructed without incorporating heat recovery, leading to wasteful heat loss. It has been estimated that this heat loss amounts, depending of the location in Europe, to 3 - 15 GJ per
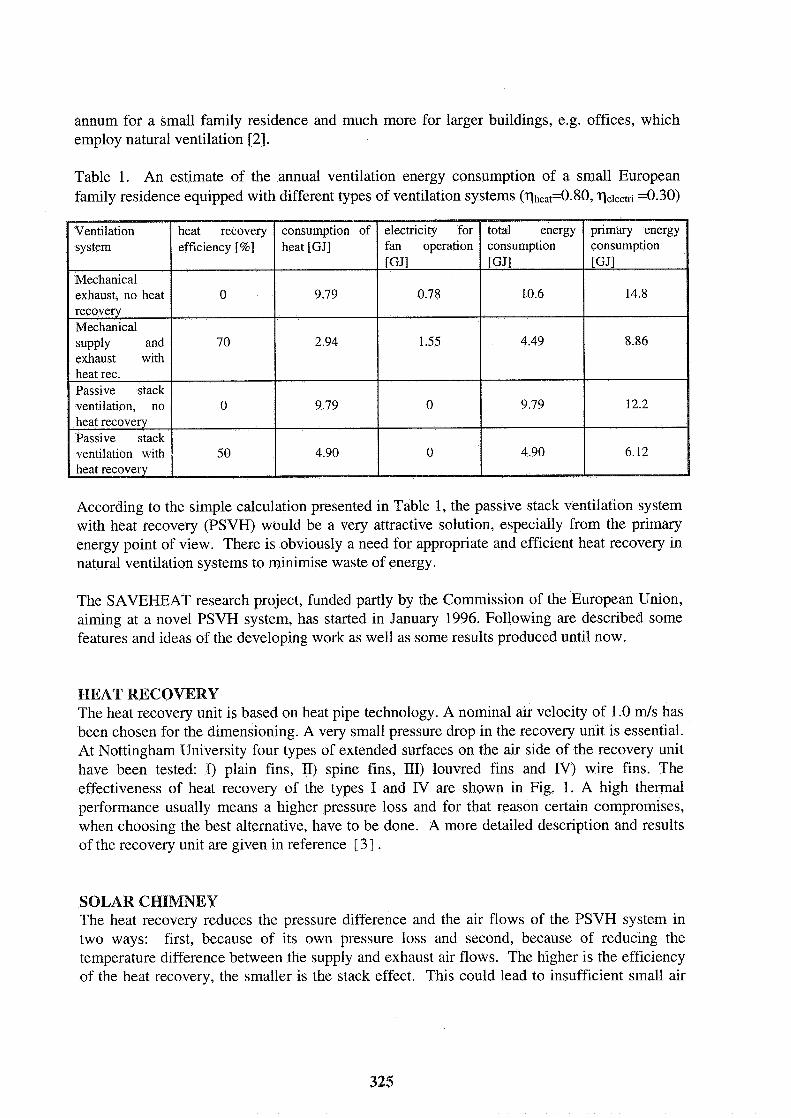
annum for a small family residence and much more for larger buildings, e.g. offices, which employ natural ventilation [ 2 ] .
Table 1. An estimate of the annual ventilation energy consumption of a small European family residence equipped with different types of ventilation systems (qheat=0.80, qelectri =0.30)
According to the simple calculation presented in Table 1, the passive stack ventilation system with heat recovery (PSVH) would be a very attractive solution, especially from the primary energy point of view. There is obviously a need for appropriate and efficient heat recovery in natural ventilation systems to minimise waste of energy.
The SAVEHEAT research project, funded partly by the Commission of the European Union, aiming at a novel PSVH system, has started in January 1996. Following are described some features and ideas of the developing work as well as some results produced until now.
HEAT RECOVERY The heat recovery unit is based on heat pipe technology. A nominal air velocity of 1.0 rnls has been chosen for the dimensioning. A very small pressure drop in the recovery unit is essential. At Nottingham University four types of extended surfaces on the air side of the recovery unit have been tested: I) plain fins, II) spine fins, m) louvred fins and IV) wire fins. The effectiveness of heat recovery of the types I and N are shown in Fig. 1. A high thermal performance usually means a higher pressure loss and for that reason certain compromises, when choosing the best alternative, have to be done. A more detailed description and results of the recovery unit are given in reference [3 ] .
SOLAR CHIMNEY The heat recovery reduces the pressure difference and the air flows of the PSVH system in two ways: first, because of its own pressure loss and second, because of reducing the temperature difference between the supply and exhaust air flows. The higher is the efficiency of the heat recovery, the smaller is the stack effect. This could lead to insufficient small air
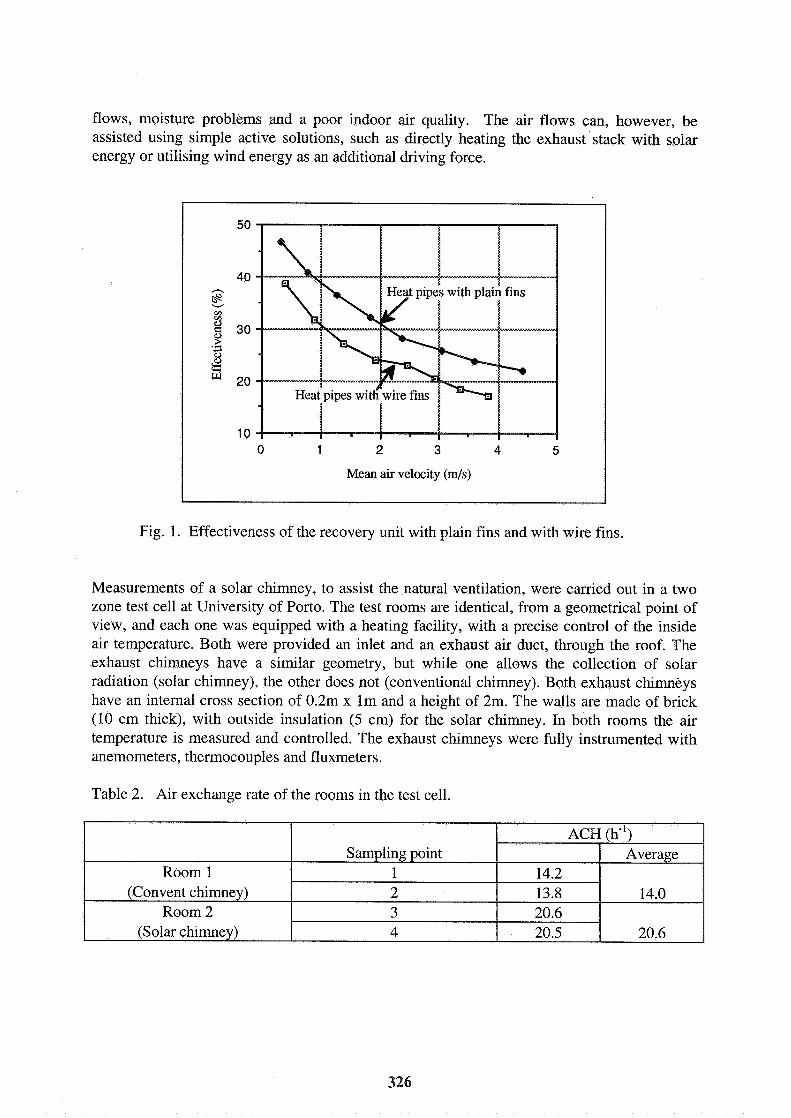
flows, moisture problems and a poor indoor air quality. The air flows can, however, be assisted using simple active solutions, such as directly heating the exhaust stack with solar energy or utilising wind energy as an additional driving force.
50
40 h
E V1
3 g 30
2i 8 a * 20
10 0 1 2 3 4 5
Mean air velocity (m/s)
Fig. 1. Effectiveness of the recovery unit with plain fins and with wire fins.
Measurements of a solar chimney, to assist the natural ventilation, were carried out in a two zone test cell at University of Porto. The test rooms are identical, from a geometrical point of view, and each one was equipped with a heating facility, with a precise control of the inside air temperature. Both were provided an inlet and an exhaust air duct, through the roof. The exhaust chimneys have a similar geometry, but while one allows the collection of solar radiation (solar chimney), the other does not (conventional chimney). Both exhaust chimneys have an internal cross section of 0.2m x l m and a height of 2m. The walls are made of brick (10 cm thick), with outside insulation (5 cm) for the solar chimney. In both rooms the air temperature is measured and controlled. The exhaust chimneys were fully instrumented with anemometers, thermocouples and fluxmeters.
Table 2. Air exchange rate of the rooms in the test cell.
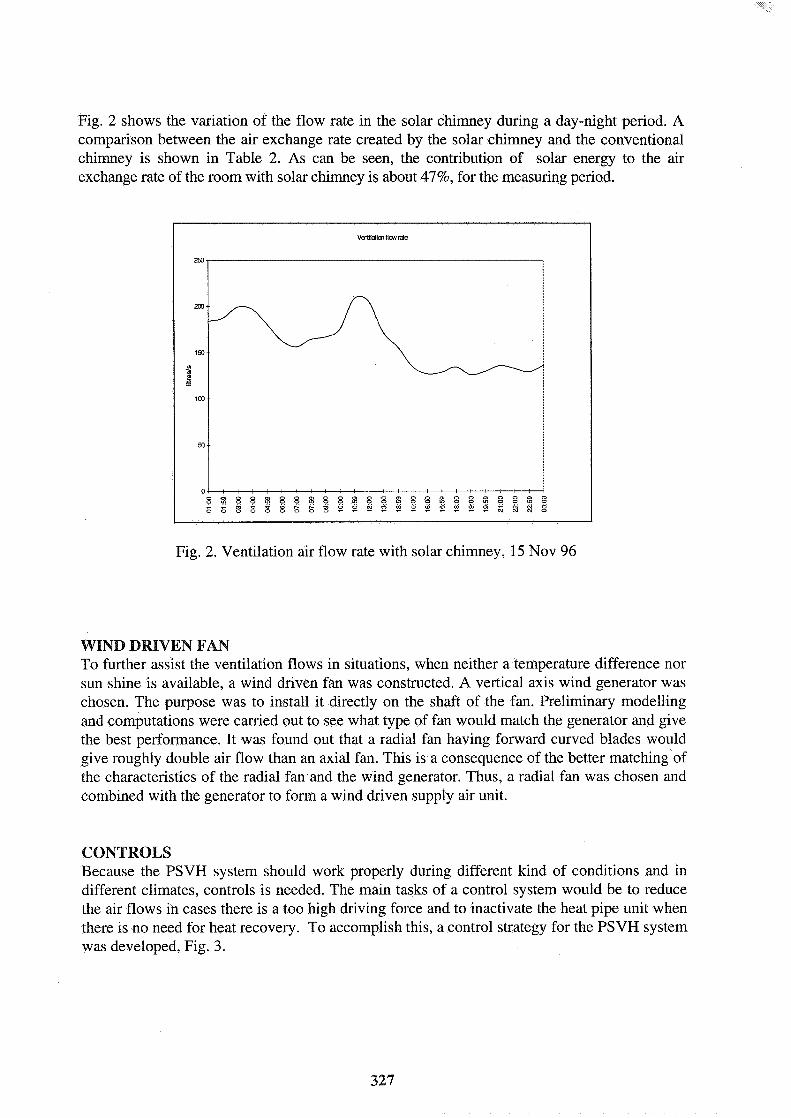
Fig. 2 shows the variation of the flow rate in the solar chimney during a day-night period. A comparison between the air exchange rate created by the solar chimney and the conventional chimney is shown in Table 2. As can be seen, the contribution of solar energy to the air exchange rate of the room with solar chimney is about 47%, for the measuring period.
Fig. 2. Ventilation air flow rate with solar chimney, 15 Nov 96
WIND DRIVEN FAN To further assist the ventilation flows in situations, when neither a temperature difference nor sun shine is available, a wind driven fan was constructed. A vertical axis wind generator was chosen. The purpose was to install it directly on the shaft of the fan. Preliminary modelling and computations were carried out to see what type of fan would match the generator and give the best performance. It was found out that a radial fan having forward curved blades would give roughly double air flow than an axial fan. This is a consequence of the better matching of the characteristics of the radial fan and the wind generator. Thus, a radial fan was chosen and combined with the generator to form a wind driven supply air unit.
CONTROLS Because the PSVH system should work properly during different kind of conditions and in different climates, controls is needed. The main tasks of a control system would be to reduce the air flows in cases there is a too high driving force and to inactivate the heat pipe unit when there is no need for heat recovery. To accomplish this, a control strategy for the PSVH system was developed, Fig. 3.
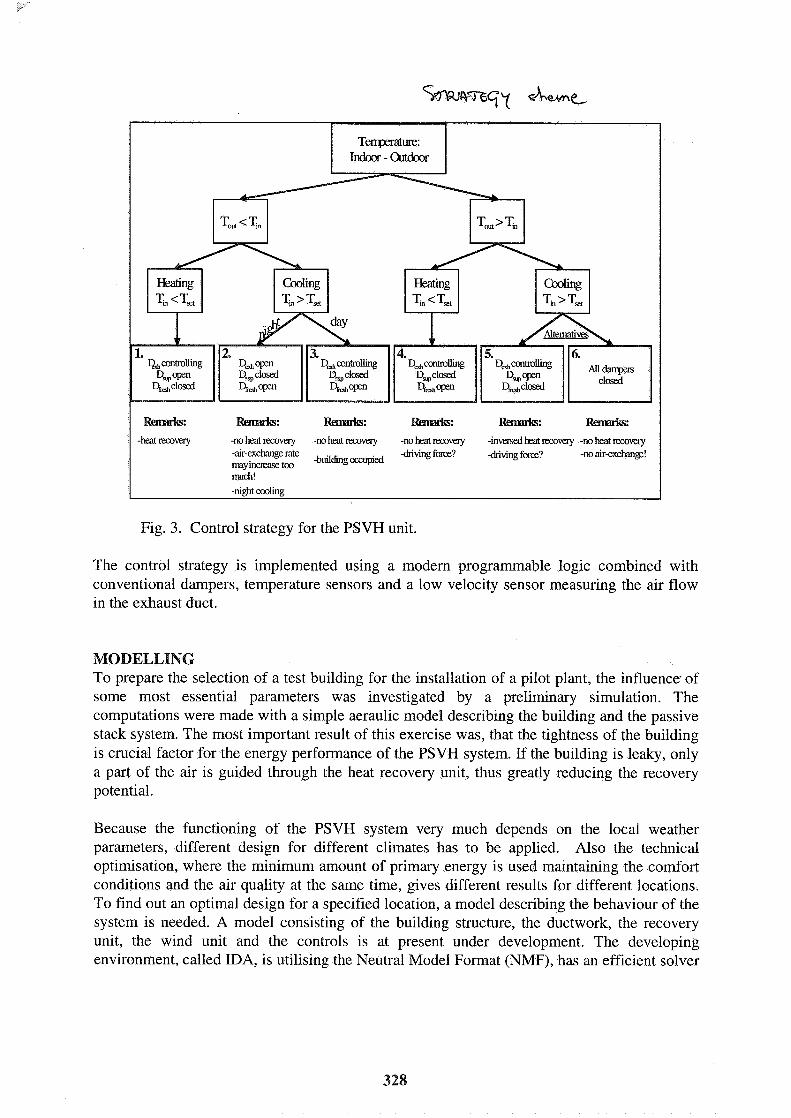
-no heat recovery -no heat recovery -no heat recovery -inversed heat recovery -no heat recovery -airexchange mte -building occupied driving force? driving force? m y increase too
Fig. 3. Control strategy for the PSVH unit.
The control strategy is implemented using a modern programmable logic combined with conventional dampers, temperature sensors and a low velocity sensor measuring the air flow in the exhaust duct.
MODELLING To prepare the selection of a test building for the installation of a pilot plant, the influence of some most essential parameters was investigated by a preliminary simulation. The computations were made with a simple aeraulic model describing the building and the passive stack system. The most important result of this exercise was, that the tightness of the building is crucial factor for the energy performance of the PSVH system. If the building is leaky, only a part of the air is guided through the heat recovery unit, thus greatly reducing the recovery potential.
Because the functioning of the PSVH system very much depends on the local weather parameters, different design for different climates has to be applied. Also the technical optimisation, where the minimum amount of primary energy is used maintaining the comfort conditions and the air quality at the same time, gives different results for different locations. To find out an optimal design for a specified location, a model describing the behaviour of the system is needed. A model consisting of the building structure, the ductwork, the recovery unit, the wind unit and the controls is at present under development. The developing environment, called IDA, is utilising the Neutral Model Format (NMF), has an efficient solver

and is one of the most advanced simulation tools in the building1HVAC sector at present[4]. This model combination shall first be validated against measurement results from a pilot PSVH plant and after that used to look at the optimal design and performance in different European climates.
PILOT PLANT A pilot plant of the PSVH system shall be built in an office building in Winterthur, Switzerland during the year 1997. The building, called SLM Building, is a five storey office with additional two basements and a technical level on the roof. It was completed in 1991 and is situated in a heavily urbanised part of Winterthur, with the main road to Ziirich just in front of it. The area of the ground floor is 396 m2. The remaining four upper floors have the measures 37,8* 19,8 m, giving 741 m2 to each of them. The building is planned for commerce and has approximately 180 workplaces.
An open office space in the building is prepared to serve as a test environment for the PSVH pilot plant. The space is isolated from the rest of the building to prevent the effect of the mechanical ventilation. The solar chimney will be built on the roof and the ductwork is guided in through one of the large windows. The plant will be equipped with a comprehensive monitoring equipment and monitored for a six months period to find out the performance of the pilot system.
CONCLUSIONS A passive stack ventilation system including heat recovery, flow assistance and controls (PSVH) is under development and seems to have potential to be an alternative for the conventional ventilation systems.
The heat pipe based recovery unit has shown an efficiency of 55% and a pressure loss of 4.5 Pa at the same time.
The tests of a solar chimney indicate 47% increase in air flow compared to a conventional stack.
Preliminary modelling of the PSVH system show, that a good tightness of the building is essential for the energy performance of the system.
The work continues by the construction and monitoring of a pilot scale PSVH system.

REFERENCES 1. Bunn, R. "Learning Curve, Will natural ventilation work" Building Service, October, 1993.
2. Woolliscroj?, M. "The relative energy use of passive stack ventilators and extract fans" Proceedings of the 15th AIVC Conference, Buxton, UK, pp 245-256, 1994
3. Riflat S.B., Gun G., Shao L., Sir& K., Oliveira A., Afonso C. and Kofoed P. "Heat-Pipe Heat Recovery for Passive Stack Ventilation" Proceedings of the 18th AIVC ~onfirence, Athens, Greece, 1997.
4. Sahlin P., Bring A. and Kolsaker K. "Future Trends of the Neutral Model Format" Proceedings of Building Simulation '95, Madison, Wisconsin, USA, pp 537-544, 1995.
VENTILATION AND COOLING
18TH ANNUAL AIVC CONFERENCE ATHENS, GREECE, 23-26 SEPTEMBER, 1997
IEA ANNEX 27: Evaluation and Demonstra estic Ventilation Systems. A simplified tool for the assessme
Peter Op 't Veld', Martien Liebregts2, Jelle Persoon2
'Cauberg-Huygen Consulting Eng., PO box 480,6200 AL Maastricht, the Netherlands 'Bouwhulp Group, PO box 2133,5600 CC Eindhoven, the Netherlands

Costs are one of the main decision factors for the selection of domestic ventilation systems. This often leads to a ventilation system that just meets the requirements of building regulations at the lowest initial costs. Decision makers are often not aware of the impact of the quality of the ventilation system on life cycle costs, not only for the ventilation system itself but also for the building, as a result of complaints or even damage due to a poor functioning ventilation system. In Annex 27 a simplified tool is developed to compare costs of ventilation systems, not only regarding the initial costs of the system, but also costs of maintenance and costs of complaints and failures related to ventilation and ventilation systems. Little is known about these costs, specially costs of maintenance and complaints. To collect some data a survey was carried out amongst 19 housing corporations, owning about 100,000 homes, and representatives of the Dutch ventilation industry (VLA). The first step was to put up a framework for the tool. With data and information of the Dutch ventilation industry and four housing corporations, owning buildings and homes with different types of ventilation systems (ME and MVHR), types of maintenance activities as well as maintenance cycles were defined. The second step was to estimate a relation between the user frequency, basic quality and the expected maintenance level, depending on the type of ventilation system. As a prerequisite it was assumed that a certain maintenance is necessary to maintain the performances (IAQ) of the ventilation system. The third step was to collect data on costs for maintenance and complaints amongst the other 15 housing corporations. It appeared from this part of the research that very few corporations were aware of the necessity of planned maintenance and the costs for maintenance as well as the costs for complaints related to the quality of the ventilation system. Despite this it was possible to "fill" the tool with data on costs by comparing these data with more common data on total maintenance. The simplified tool can be used for estimating the expected maintenance and maintenance activity cycles as well as the total life cycle costs for the system, the maintenance of the system, the expected complaints and the ventilation related maintenance of the building. The last step that is to make is linking this tool with the reliability tool of Annex 27. Svein Ruuds (1) and Johnny Kronvalls (2) work on reliability and system safety analyses is used as a basis for this.
INTRODUCTION
The objective of a tool for life cycle costs is to compare the total costs of ventilation systems and to make selections based on a cost comparison. The costs have to include:
initial costs (investments) costs for maintenance of the system costs of maintenance of the building as a result of the ventilation system and its use. costs for energy.
One of the ideas was that investing more in the quality of the installation and selecting the right kind of ventilation system in relation to building properties and user characteristics could finally lead to lower maintenance costs, specially for complaint maintenance. This paper mainly focuses on the costs for maintenance of the ventilation system and ventilation related complaints in the building. Costs for energy is an output of the energy tool of Annex 27. The tool is mainly developed to be used by housing corporations and associations. The development of the first idea for this tool was coached by chiefs of the technical department of four housing corporations in the Netherlands and representatives of the Dutch
ventilation industry (VLA). The first version of this tool was tested and applied by these housing corporations. In order to get more data and to veri@ the first results a larger survey on maintenance costs was carried out amongst 15 other housing corporations. These corporations have stipulated the maintenance activities and the maintenance cycles for the ventilation system and the building itself. The first remark is that in practice there appears not to be any consensus about the required maintenance activities. Most of the corporations have their own way of planning maintenance and assessing the necessity of maintenance. There is a lack of knowledge about maintenance and its impact. Only 40 to 50 % of the required maintenance activities, as described by the Dutch ventilation industry is really carried out. More over, only 50 % of the corporations could turn over detailed data about maintenance and complaint maintenance (= maintenance that is carried out if complaints occur and are reported to the corporation), concerning ventilation and ventilation systems. For the total maintenance activities and complaint maintenance much more data are available. However, it was possible to draw some conclusions from this survey. One of the facts is that maintenance of ventilation systems and its costs show a relation with the total costs of maintenance.
DEFINITIONS IN RELATION TO MAINTENANCE
The following aspects in relation with maintenance are considered and definitions are used:
a. Type of maintenance in relation with the organisation. The type of maintenance is determined by the way the maintenance is organised and managed. There is a difference in systematic maintenance (according to plan) and non-systematic maintenance. Systematic maintenance is based on the desired quality and need for maintenance of the building. Non-systematic maintenance is steered by signals like complaints and mutations.
b. Maintenance activity in relation to a technical property of a building or construction part. Maintenance activities are the activities that are necessary during the life span of a building to maintain a certain level of quality. Each activity has its own cycle: maintaining, partial repairing, replacing.
c. User frequency Building and construction parts are loaded by the environment and by daily use. This is an important factor to determine the need for maintenance. The design of the ventilation system in relation to the building must provide an optimal "load bearing" by a good selection of materials , construction and capacity. The users frequency is the load, in relation to the extent of use. This includes operating the ventilation provisions and cleaning.
d. Basic quality There is a distinction between the basic quality of mechanical ventilation or balanced ventilation in quality of the building and quality of the ventilation system. The basic quality of the building includes air tightness of the building envelope, location and type of supply devices in facade, ventilation windows etc. For the ventilation system the type of ventilation unit, fans, supply and exhaust air grilles and lay out and design of ducts.
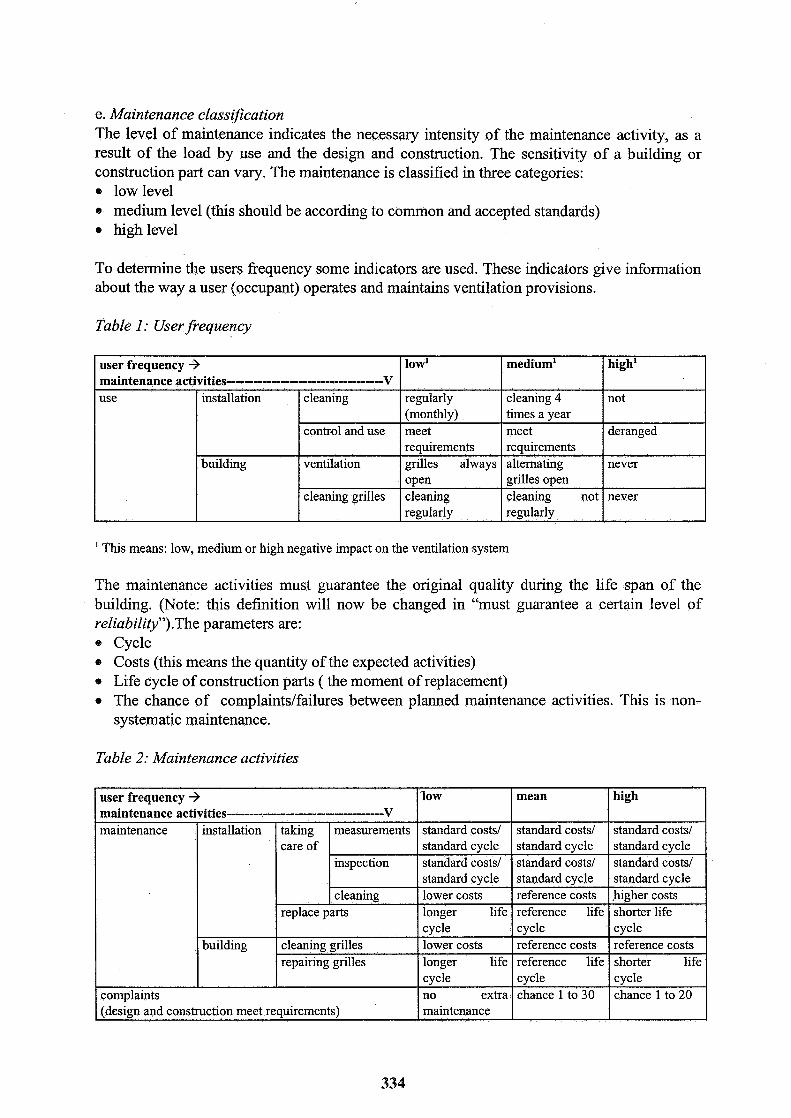
e. Maintenance classz>cation The level of maintenance indicates the necessary intensity of the maintenance activity, as a result of the load by use and the design and construction. The sensitivity of a building or construction part can vary. The maintenance is classified in three categories:
low level medium level (this should be according to common and accepted standards) high level
To determine the users frequency some indicators are used. These indicators give information about the way a user (occupant) operates and maintains ventilation provisions.
Table 1: User frequency
' This means: low, medium or high negative impact on the ventilation system
The maintenance activities must guarantee the original quality during the life span of the building. (Note: this definition will now be changed in "must guarantee a certain level of reliability7').The parameters are:
Cycle Costs (this means the quantity of the expected activities) Life cycle of construction parts ( the moment of replacement) The chance of complaints/failures between planned maintenance activities. This is non- systematic maintenance.
user frequency + maintenance activities .......................... v
Table 2: Maintenance activities
low'
regularly (monthly) meet requirements grilles always open cleaning regularly
cleaning
control and use
ventilation
cleaning grilles
use
medium1
cleaning 4 times a year meet requirements alternating grilles open cleaning not regularly
installation
building
high1
not
deranged
never
never
mean
standard costs1 standard cycle standard costs/ standard cycle reference costs reference life cycle reference costs reference life cycle chance 1 to 30
low
standard costs/ standard cycle standard costs/ standard cycle lower costs longer life cycle lower costs longer life cycle no extra maintenance
user frequency + maintenance activities --------------------------------- v
high
standard costs1 standard cycle standard costs/ standard cycle bigher costs shorter life cycle reference costs shorter life cycle chance 1 to 20
maintenance
complaints (design and construction meet requirements)
installation
building
taking care of
measurements
inspection
cleaning replace parts
cleaning grilles repairing grilles
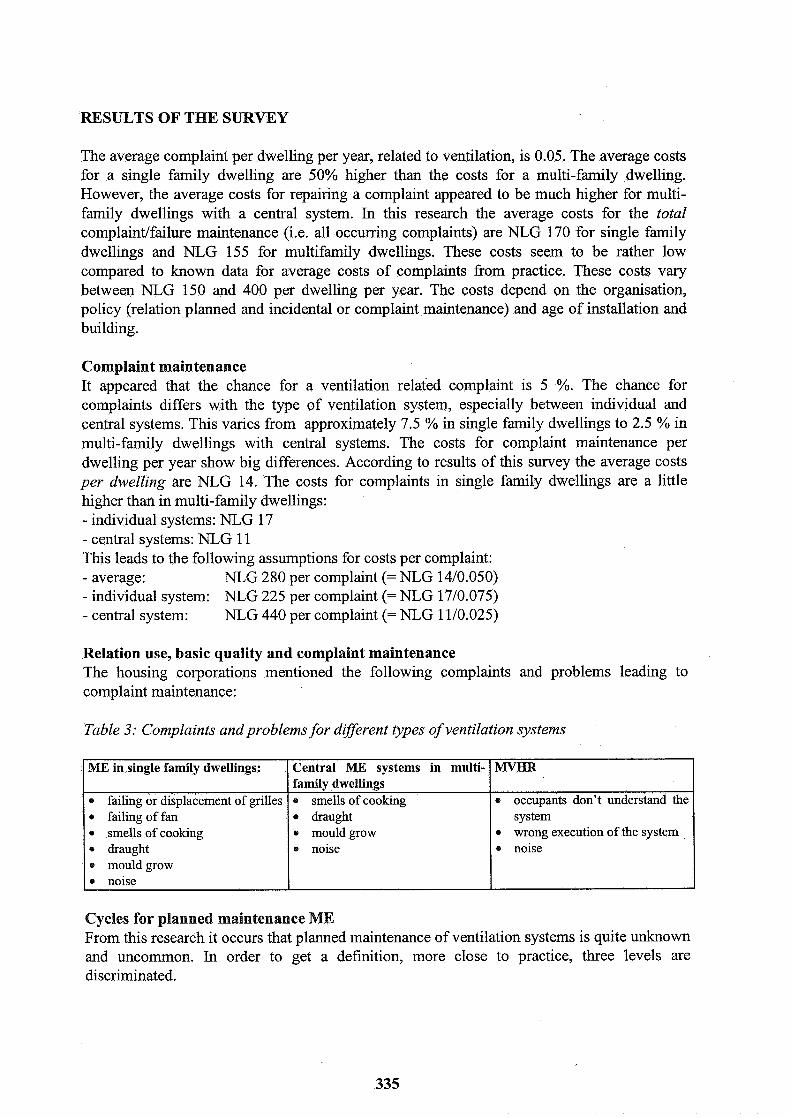
RESULTS OF THE SURVEY
The average complaint per dwelling per year, related to ventilation, is 0.05. The average costs for a single family dwelling are 50% higher than the costs for a multi-family dwelling. However, the average costs for repairing a complaint appeared to be much higher for multi- family dwellings with a central system. In this research the average costs for the total complaint/failue maintenance (i.e. all occurring complaints) are NLG 170 for single family dwellings and NLG 155 for multifamily dwellings. These costs seem to be rather low compared to known data for average costs of complaints from practice. These costs vary between NLG 150 and 400 per dwelling per year. The costs depend on the organisation, policy (relation planned and incidental or complaint maintenance) and age of installation and building.
Complaint maintenance It appeared that the chance for a ventilation related complaint is 5 %. The chance for complaints differs with the type of ventilation system, especially between individual and central systems. This varies from approximately 7.5 % in single family dwellings to 2.5 % in multi-family dwellings with central systems. The costs for complaint maintenance per dwelling per year show big differences. According to results of this survey the average costs per dwelling are NLG 14. The costs for complaints in single family dwellings are a little higher than in multi-family dwellings: - individual systems: NLG 17 - central systems: NLG 1 1 This leads to the following assumptions for costs per complaint: - average: NLG 280 per complaint (= NLG 1410.050) - individual system: NLG 225 per complaint (= NLG 1710.075) - central system: NLG 440 per complaint (= NLG 1110.025)
Relation use, basic quality and complaint maintenance The housing corporations mentioned the following complaints and problems leading to complaint maintenance:
Table 3: Complaints and problems for different types of ventilation systems
Cycles for planned maintenance ME From this research it occurs that planned maintenance of ventilation systems is quite unknown and uncommon. In order to get a definition, more close to practice, three levels are discriminated.
MVHR
occupants don't understand the system
e wrong execution of the system e noise
ME in single family dwellings:
* failing or displacement of grilles failing of fan
* smells of cooking 0 draught e mould grow e noise
Central ME systems in multi- family dwellings * smells of cooking e draught e mould grow e noise
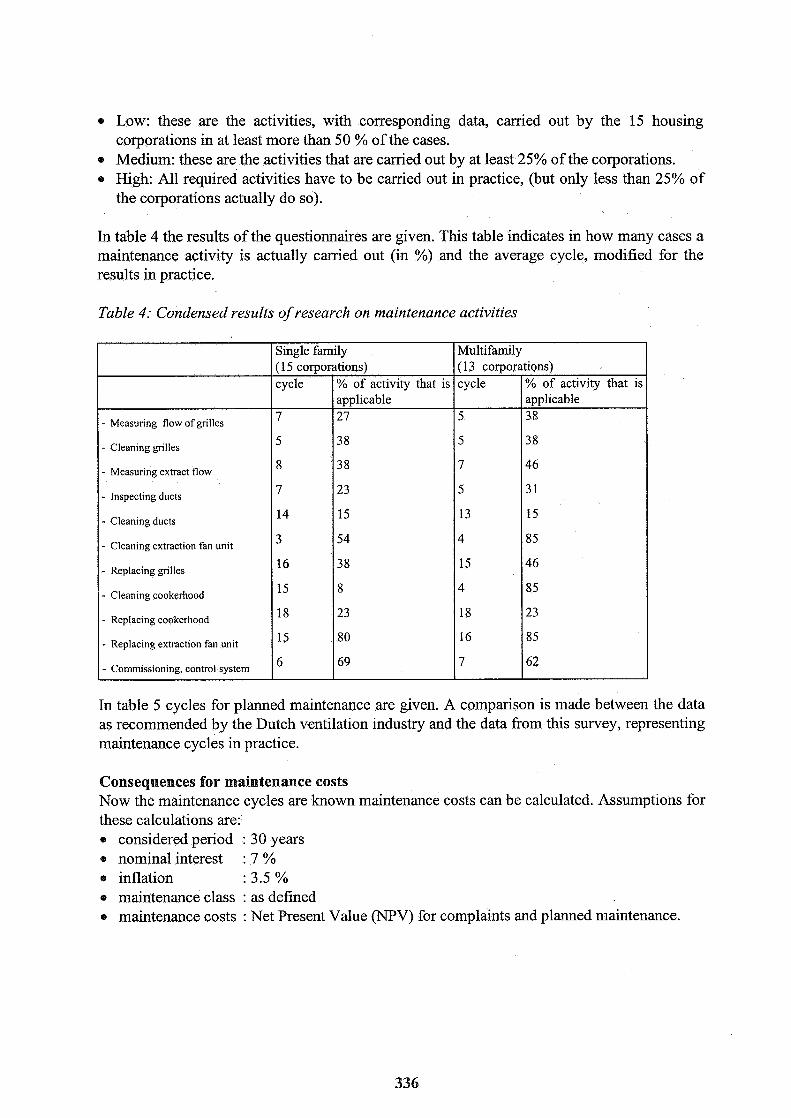
Low: these are the activities, with corresponding data, carried out by the 15 housing corporations in at least more than 50 % of the cases. Medium: these are the activities that are carried out by at least 25% of the corporations. High: All required activities have to be carried out in practice, (but only less than 25% of the corporations actually do so).
In table 4 the results of the questionnaires are given. This table indicates in how many cases a maintenance activity is actually carried out (in %) and the average cycle, modified for the results in practice.
Table 4: Condensed results of research on maintenance activities
In table 5 cycles for planned maintenance are given. A comparison is made between the data as recommended by the Dutch ventilation industry and the data from this survey, representing maintenance cycles in practice.
Consequences for maintenance costs Now the maintenance cycles are known maintenance costs can be calculated. Assumptions for these calculations are:
considered period : 30 years nominal interest : 7 % inflation : 3.5 %
9 maintenance class : as defined maintenance costs : Net Present Value (NPV) for complaints and planned maintenance.
- Measur~ng flow of grtlles
- Cleantng grtlles
- Measur~ng extract flow
- lnspecttng ducts
- Cleantng ducts
- Cleaning extractton fan unrt
- Replacing gnlles
- Clean~ng cookerhood
- Replacing cookerhood
- Replactng extraction fan unit
- Commissioning, control system
Multifamily (1 3 corporations) cycle
5
5
7
5
13
4
15
4
18
16
7
Single family
% of activity that is applicable 38
38
46
3 1
15
85
46
85
23
85
62
(1 5 corporations) cycle
7
5
8
7
14
3
16
15
18
15
6
% of activity that is applicable 27
38
38
23
15
54
38
8
23
80
69
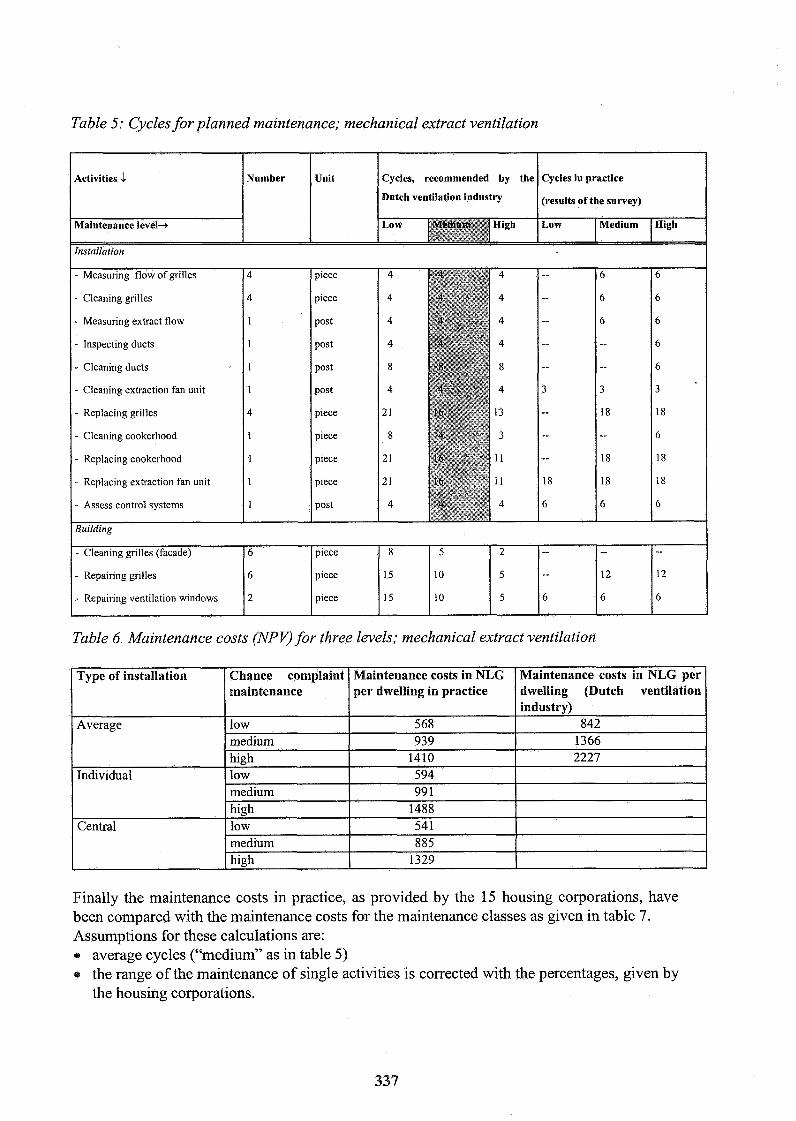
Table 5: Cycles for planned maintenance; mechanical extract ventilation
Table 6. Maintenance costs (NPV) for three levels; mechanical extract ventilation
es, recommen
tch ventilation industry results of the survey)
- Measuring extract flow
- Inspecting ducts
- Cleaning extraction fan unit
- Replacing grilles
- Cleaning cookerhood
- Replacing cookerhood
- Replacing extraction fan unit
Finally the maintenance costs in practice, as provided by the 15 housing corporations, have been compared with the maintenance costs for the maintenance classes as given in table 7. Assumptions for these calculations are:
average cycles ("'medium" as in table 5) the range of the maintenance of single activities is corrected with the percentages, given by the housing corporations.
2
5
5
Maintenance costs in NLG per dwelling (Dutch ventilation industry)
842 1366 2227
8
15
15
piece
piece
piece
- Cleaning grilles (facade)
- Repairing grilles
- Repairing ventilation windows
Maintenance costs in NLG per dwelling in practice
568 939
1410 594 99 1
1488 54 1 885
1329
Type of installation
Average
Individual
Central
--
--
6
5
10
10
6
6
2
Chance complaint maintenance
low medium high low medium high low medium high
--
12
6
--
12
6
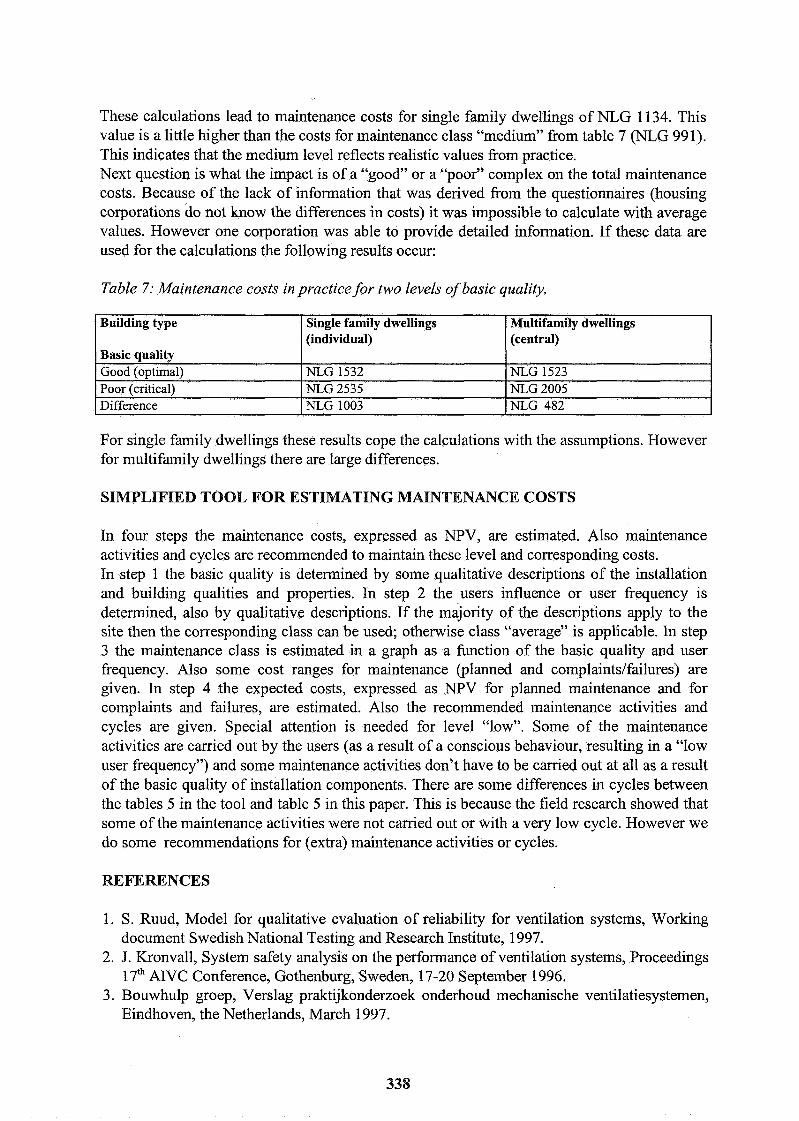
These calculations lead to maintenance costs for single family dwellings of NLG 1134. This value is a little higher than the costs for maintenance class "medium" from table 7 (NLG 991). This indicates that the medium level reflects realistic values fi-om practice. Next question is what the impact is of a "good" or a "poor" complex on the total maintenance costs. Because of the lack of information that was derived fi-om the questionnaires (housing corporations do not know the differences in costs) it was impossible to calculate with average values. However one corporation was able to provide detailed information. If these data are used for the calculations the following results occur:
Table 7: Maintenance costs in practice for two levels of basic quality.
For single family dwellings these results cope the calculations with the assumptions. However for multifamily dwellings there are large differences.
Building type
Basic quality Good (optimal) Poor (critical) Difference
SIMPLIFIED TOOL FOR ESTIMATING MAINTENANCE COSTS
In four steps the maintenance costs, expressed as NPV, are estimated. Also maintenance activities and cycles are recommended to maintain these level and corresponding costs. In step 1 the basic quality is determined by some qualitative descriptions of the installation and building qualities and properties. In step 2 the users influence or user frequency is determined, also by qualitative descriptions. If the majority of the descriptions apply to the site then the corresponding class can be used; otherwise class "average" is applicable. In step 3 the maintenance class is estimated in a graph as a function of the basic quality and user fi-equency. Also some cost ranges for maintenance (planned and complaints/failures) are given. In step 4 the expected costs, expressed as NPV for planned maintenance and for complaints and failures, are estimated. Also the recommended maintenance activities and cycles are given. Special attention is needed for level "low". Some of the maintenance activities are carried out by the users (as a result of a conscious behaviour, resulting in a "low user frequency") and some maintenance activities don't have to be carried out at all as a result of the basic quality of installation components. There are some differences in cycles between the tables 5 in the tool and table 5 in this paper. This is because the field research showed that some of the maintenance activities were not carried out or with a very low cycle. However we do some recommendations for (extra) maintenance activities or cycles.
Single family dwellings (individual)
NLG 1532 NLG 2535 NLG 1003
REFERENCES
Multifamily dwellings (central)
NLG 1523 NLG 2005 NLG 482
1. S. Ruud, Model for qualitative evaluation of reliability for ventilation systems, Working document Swedish National Testing and Research Institute, 1997.
2. J. Kronvall, System safety analysis on the performance of ventilation systems, Proceedings 1 7 ~ ~ AIVC Conference, Gothenburg, Sweden, 17-20 September 1996.
3. Bouwhulp groep, Verslag praktijkonderzoek onderhoud mechanische ventilatiesystemen, Eindhoven, the Netherlands, March 1997.

M P L I F I E D TOOL FOR E S T I M A T I N G C O M P L A I N T S AND MAI?YTENANCE
ISTS
rpe o f building: Single family
rpe o f vent i la t ion system: Mechanical extract, natural supply
~ e c i f i c qual i t ies that are o f concern f o r assessment:
!ntilation system, installation: Burlding:
~ t : Purpose provided openings:
location
accessibility
devises
uct a n d duct plan:
lay o u c o f the system
devise;
quality o f design
quality o f execution
#rilles:
control possibilities
cleaning possibilities
- presence - d e s ~ g n , according to b u l l d ~ n g regulations - a c c e s s ~ b ~ l ~ t y - control p o s s ~ b ~ l i t ~ e s
- cleamng p o s s ~ b l h t ~ e s
Butldlng envelope
- alr t ~ g h t n e s s
STEP 1: Estimate the basic aualitv bv table 1 I
r a b l e 1: B A S I C Q U A L I T Y
Explonolron Classtficatlon m category "aptunal" or "cnttcal" lf most of the aspects arc appl~cable for rint spcc~fic category. othenvtre category "average"
STEP 2: Estimate user frequency by table 2 I
crltlcal
C~Ificuil acccrs~blc - m sound proofing povlr8onr for mavntlng
. acrrr~vcduct lcngthr many bcndr . fkrlblc tuber - M y ducts . m round proofing pvtrsonr
. m mcaruremcnlr andlor rrmple~~or~ rcportr requgrcd noclean~ng poss~btl~rier a clcan~ng porr~btlitter *?rh chance of d~rordcr adjusmcnt
no rcqunrcmcntr
ln~ta113tton: ant1
duets
grilles and adjustment
BuBding: ntr tightness
T a b l e 2: U S E R F R E Q U E N C Y
Table 3: M A I N T E N A N C E CLASSES
optlmat
. easily acccstblc . mauntcd on conrMnlon wtth r p d sound pmofing pmvtsmnr
. ruanghtduct layout . rhon duct lengths no sharp bcndr, flexcblc lubes . alr tnghl realtngafduclr and mnncctronr round proofing proYlsl0"l as SIIC"C"S
and flcirble mourang on ""ll adjuslmcnl and cnm~n~rs~un~ng III cvcry dwellang compla~onrrpons of commlrnontng m q u m d slsanrng pourb~l~lrer wathout d~rordcr thc adjurrrnent (markmg or xcunng)
"50- 3 5
STEP 4: After estimating the most suitable maintenance class the expected maintenance costs can be estimated by table 4 and the planned maintenance activities by table 5
average
. acccrstblc . flerlble mounlrng on consmcl~on
. bmstcd flerrblc bcndr . no rpnal wal~ng of duds, connccltanr wried wtlh tape
- adjurtmcnl~n ltmltcd n~t~nher of lcst dwcll~ngq
* eamplet~on rcpon oflrrl dwelllngr rcquwed . eleantng pon$b1l8t8cr wllh l8rrnted chanccof dnrordcr L e adjurtmcnt
" 5 0 - 5 6
T a b l e 4: E X P E C T E D COSTS OF M A I N T E N A N C E
expressed as LCC over 30 y e a r s @CU)
T a b l e 5: P L A N N E D M A I N T E N A N C E A C T I V I T I E S
.replacing grilles
.cleaning cookerhood
replacing cookerhood
replacing ertrnction fan unit
Total 372 667 808
Maintenance costs Low Medium l l~gl l
'' Acttvtty camcd out by occupant
Planned maintenance 300 522 590
Complaints 72 145 218


Ventilation and Cooling 18th AlVC Conference, Athens, Greece
23 - 26 September, 1997
Introduction of Tools for Evaluating Domestic Ventilation Systems
L-G Mhnsson
LGM Consult AB, Tullinge, Sweden.
Synopsis
The IEA project Annex 27, Evaluation and Demonstration of Domestic Ventilation Systems, have come to the stage that simplified tools can be presented in a total scheme. At earlier AIVC conferences some of the tools have been presented in separate papers and still the tools are under development. In this paper a more general approach of the usage of the tools is to be presented.
The work is based on the joint work of participants from both AIVC countries (CAN, F, NL, S, UK, USA) and non-AIVC countries (I, J). The tools that are to be used are for indoor air quality, energy, noise, thermal comfort, life cycle cost, reliability, and building and user influences. A flow chart has been developed and is the procedure for the usage of the tools. The simplified evaluation tools are giving results both in a qualitatively and a quantitatively way. It has been applied on the four basic ventilation systems: adventitious, ~assive stack, mechanical exhaust, and mechanical supply and exhaust.
Background
The rate of outdoor air supply as well as comfort aspects associated with air distribution and the ability of the systems to remove pollutants are important factors to be considered at all stages in the building lifecycle. As distinct from a work place, residents can vary across a wide span from an allergic infant to a well trained sportsman, from active outgoing people to elderly confined to a life indoors. During the lifetime of a building the resident's pattern vary. This results in a varying need for supply air to obtain acceptable indoor climate and to avoid degradation of the fabric. Emis-sions from building materials are also time dependent. When the building is new or recently refurbished it may be necessary to dilute the emissions by extra outdoor air. In standards and codes the outdoor air needed in a dwelling is generally based on the maximum number of persons living in the dwelling, defined by the possible number of beds contained therein.
Dwellings represent about 25 - 30 % of all energy used in the OECD countries. In the near future domestic ventilation will represent 10 % of the total energy use. Thus even relatively. small reductions in overall ventilation levels could represent significant savings in total energy use. Improvement of residential ventilation is of concern in both existing and future buildings. The functioning of the ventilation system may deteriorate at all stages of the building process and during the lifetime of the building. Research in the recent years and in particular the IEA annexes now makes it possible to formulate methods to evaluate domestic ventilation systems.
Objectives
The objectives of the IEA Annex 27 are: to develop tools to evaluate domestic ventilation systems; to validate the methods and tools with data obtained from measurements; to demonstrate and evaluate ventilation systems for different climates, building types, and use of the dwellings. The methods, tools, and systems are intended for existing and future residential buildings, that require heating. The target group is composed of standard and policy makers, developers in industry, and ventilation system designers. With this general objectives the Annex is divided in three Subtasks: 1. State of the Art, 2. Development and Validation of Evaluation Methods, and 3. Evaluation, Demonstration, and Application Ventilation Systems.
Introduction
With the above objectives and scopes of the three Subtasks the Annex started in April 1993 and has today eight participants: Canada, France, Italy, Japan, Netherlands, Sweden, UK, and USA. Based on the subtask "State of the Art" assumptions have been set up to develop simplified tools for:
1. Indoor Air quality 2. Energy 3. Noise 4. Thermal Comfort 5. Life Cycle Cost 6. Reliability 7. Building and User aspects.
With the State of the Art Review, ref. 1, it is possible to give realistic assumptions of the most frequently used ventilation systems, the design of the dwellings, how many residents there usually are and when at home, the behaviour and which person in which room at what time. With these assumptions we can cover about 90 % of all possible cases, that are influencing the need of outdoor air supply. The usual levels of different pollutants in the dwellings are also given based on the review. The review report is based on and giving references to about 400 reports.
The OECD countries (14 of them) have 700 million inhabitants, 280 million dwellings with a floor space of 32 000 million m2. The habitable space varies greatly and goes from 65 m2ldwelling (Italy) to 152 m2/dwelling (USA). There is also a great variation between the countries weather the dwelling is in a single family house or in a multi family building.
The number of persons/dwelling goes from 2.1 (Sweden) to 3.2 (Japan, Italy). Combined with the dwelling area it gives a floor space from 27 m21person (UK) to 61 m2/person (USA). The crowdiness is defined by the number of persons/bedroom. From data can be seen that in 35 % - 50 % of all dwellings, there is less than 1 personJbedroom and in nearly all (90 - 95 %) less than 2 persons/bedroom.
A very important trend is that the number of one-person household is increasing. Today it goes from 20 % (Japan) to 40 % (Sweden). This trend has been observed during the last 45 years in all countries. A majority of the households have only two persons, except Japan (40 %). In the future it can be expected that we will have even more 1- and 2-person households as the number of persons older than 60 years during the next 40 years is growing from about 20 % today to 30 % of the population.
A survey amongst the AIVC countries gave that the most frequent ventilation system is either stack or simply window opening. However, in new constructions in most countries a fan is installed either for central exhaust or for local extraction in bath andlor kitchen.
Method
A complete computer simulation for various assumptions for the different parameters is never possible to be done for dwellings in the normal designing process. It is too expensive. With this in mind we are aiming at developing a set of tools that are easy enough to understand and use so that practitioner are able to use it even though not practised very frequent. The tools are

to be used in the design of new buildings or renovating existing. With the tools it may also be possible to give guidance to explain problems.
With this in mind the development of the tools aimed at having simplified tools based on the most sophisticated computer simulation codes that could solve our purposes. The tools had to be a mixture of qualitative and quantitative tools. All tools will have at least a qualitative way to make a judgement between the various systems, see table 1. By this we are covering most of the systems existing and possible as it can be combined.
For some of the tools we need to rely on laboratory tests and with more general assumption.. By giving a tool that the user can feed his on data sets or experiences a workable and always up-to-date tool can be at hand.
Table 1. Combination of variables
The procedure how to use the different tools is shown by a flow chart, see figure 1. All the tools are very briefly introduced. Some are given a more detailed introduction at this conference, IAQ was introduced at the 17th conference 1996. A more lengthy and detailed description is planned to be given at the AIVC conference 1998. Here after follows a brief introduction of the tools to be given.
Parameter
Local bath fan Kitchen fan Window airing pattern climate
Number of residents Houses, flats
Exhaust flow rate [lls] Air tightness IN501 Supply flow rate [l/sl Supply area
&m21
Thermal Comfort Different supply air devices, for location in external walls and windows, have been tested in laboratory. The thermal comfort in different points in the room have been measured at various external temperatures: Based on this a qualitatively based judgement table in 5 steps is set up for different outdoor temperatures device types as well as background leakage.
Noise If the dwelling is situated in a noisy area like close to roads, rail - ways, airports also the choice of the ventilation system affects the noise reduction. A leaky house, windows with bad weather-stripping, or a device in the window or wall can ruin the good intentions. As the noise
Window airing
Yesfno
Yes/no
3 cases
Ottawa, London, Nice 2,4, 5 persons
Detached. Ground & top floor. 4 storeys
House 2.5,5, 10 Flat 1, 2.5,5
-
0, 101,410
Mech. supply & exhaust Yesfno
Yesfno
3 cases
Ottawa, London, Nice 2 ,4 ,5 persons
Detached. Ground & top floor. 4 storeys 15, 30,45
House 1,2.5,5 Flat 1, 2.5,5
15,30,45
Stack
Yesfno
Yesfno
3 cases
Ottawa, London, Nice 2 ,4 ,5 persons
Detached. Ground & top floor. 4 storeys
House 2.5,5, 10 Flat 1,2.5, 5
0, 100,400
Mech. exhaust
Yes/no
Yesfno
3 cases
Ottawa, London, Nice 2,4, 5 persons
Detached. Ground & top floor. 4 storeys 15, 30,45
House 2.5,5, 10 Flat 1, 2.5, 5
0,100,400
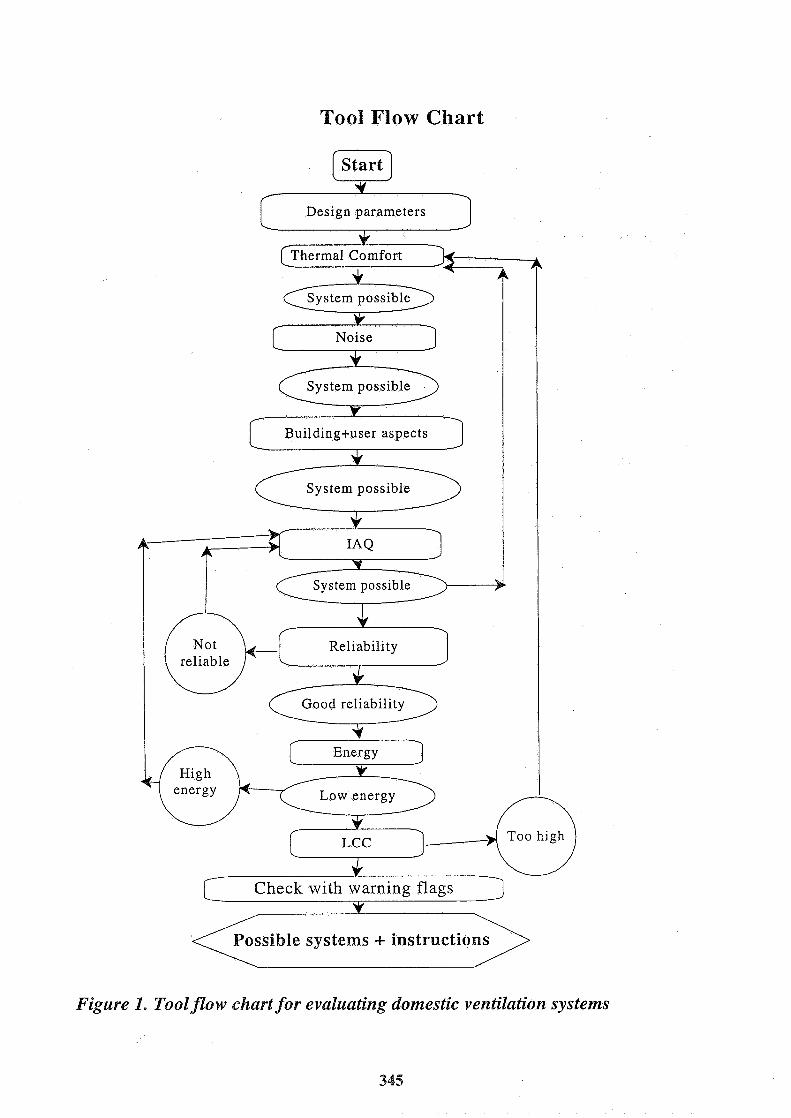
Tool Flow Chart
Figure I . TooEfklw chart for evaluating domestic ventilation systems
reduction is depending on many factors a set of cases have been calculated for the four main ventilation systems. Also the devices for outdoor air in stack and mechanical exhaust systems can be designed in many different ways giving more or less noise reduction. Tables are set up with the 5 step judgement to meet different required noise reductions taking into account the opening area for the devices with different noise reduction design. Ref 3.
Building and user aspects The building aspects are listed and discussed how they might influence the various systems. The dwelling lay-out and height of the rooms are of more concern the more the ventilation is relaying on window openings. The system selection might also affect the architectural design for the room design, facades and roofs. Construction and services design are also depending on the ventilation system chosen.
Even though many assumptions are made also other aspects may influence the choice of the ventilation system. A check list or a qualitatively way of judgement is to be set up. The various aspects discussed are:
User influence on how to use the system, obstruct the system, change the preadjustment 9 Maintenance: Systems are more or less sensitive for cleaning the devices and filters or
changing the filters. Furniture and decoration can make obstacles for the air flow. Most problems are caused by the curtains around the windows. User tendency to react on system failure either it is instant failure and slow degradation Cooking habit varies from country to country and over the long time. It is also affected by the family life stile. If a kitchen hood is used the sensitivity is less.
0 Hygiene: There is a tendency to use more water giving a higher water vapour content in the dwelling. The use of chemical products are under the development to be less harmful. Redecoration interval. Usually it includes more or less extra water vapour to the dwelling in addition with extra VOCs. Usually it is linked to changing tenants or ownership.
0 Other equipment installed or used: Here a lot of creativity is put in by quite another industries than the ventilation. Here can be foreseen many new machines that might affect the indoor environment more or less e.g. steam cleaners of floors, coffee machines, ovens not connected to the kitchen hood or gas fired grills not under a hood. Pets, the size and number varies a lot as well as the fur length and shedding Pot plants are giving some addition to the indoor water vapour content. Interest
0 Knowledge how to handle the situation for improving the effectiveness of ventilation Manual capability Life style is affecting the family's attitudes towards all the behaviour. Some of the relationships are investigated. The life style can be divided into 10 styles. These are: Work geared, Nature-love, Family - attached, Well-informed, Consumption geared, AgrarianIReligious, Moralist, Collective bent, Climber, Economiser
IAQ The intention is here to give both qualitative and quantitative tools. Calculations are made for the following parameters: Constant emission, C02, cooking products (incl. NOx), tobacco smoke, pressure difference (positive and negative), relative humidity (mould growth & house dust mite growing risks), outdoor air change rate. The combination of all parameters and values gives 17 500 cases and are dealt with by multi-variat parametric study using COMIS and SIREN computer programs. Ref 2.
Reliability Here assumptions have to be made on the lifetime of each component in the system selected. Also other the probability of a system to give the ventilation rate is here to be given. Sets of tables can be established for the probability and a computer code for the decrease of the flow rate at different replacement and maintenance intervals.
Energy Fan and air heating energy is calculated taking into account flow rate, heat recovery efficiency, air leakage (n50), window airing habits, climate. A computer nomogram is to be the final tool for easy handling.
LCC Mostly ventilation systems lack good maintenance. Some property owner have realised that each complaint cost money to deal with. In dwellings it is also a combination of maintenance made by the residents and by the professional organisations. A general trend is that it pays to do planned maintenance. The qualitatively approach is to combine the basic quality of the system for units, ducts, devices and possibilities to clean and adjust. After that the user's interest of the systems is estimated in three levels. By combining the two we will have three fields low, medium and high maintenance classes. The cost is estimated for the low and high for the various systems and building types. Planned maintenance costs is added with the cost for complaints.
Discussion The tools are to be developed to a paper tool. Of course it is of great concern to go on to develop the tools to computer versions so that it can be easier to use and to include more climates and having a self - educating instruction for each tool. Our goal have been to give designers tools that they can bring with them at meetings giving answers on various questions that are arising in meetings concerning the choice of systems. There are still a few months of work before the final tools are fully developed. The tools are to be checked on the measurements made during the annex running.
References
1. Msnsson L-G (ed.). Evaluation and Demonstration of Domestic Ventilation Systems. State of the Art. A12: 1996 Swedish Council for Building Research.
2. Minsson L-G, Millet J-R, Villenave J-G, Kronvall J. A tool for evaluating domestic ventilation systems' ability to provide an acceptable indoor air quality. 17th AIVC conference, 1996
3. Op't Veld P, Passlack-Zwaans C. IEA A27: Evaluation and demonstration of domestic ventilation systems. 17th AIVC conference, 1996


VENTILATION AND COOLING
18TH ANNUAL AIVC CONFERENCE ATHENS, GREECE, 23-26 SEPTEMBER, 1997
project Heerlerbaan: Multi-functional appliances for ldential buildings
Peter Op 't Veld
Cauberg-Hu box 480,6200 AL, Maastricht, the Netherlands
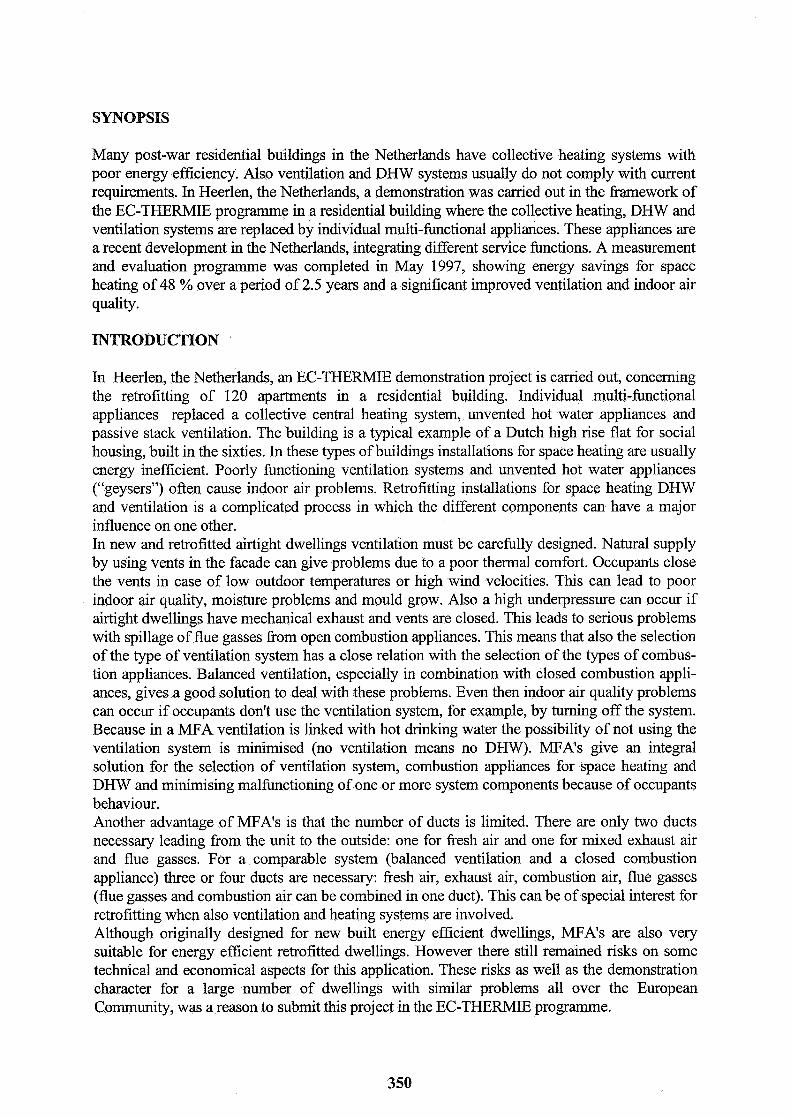
SYNOPSIS
Many post-war residential buildings in the Netherlands have collective heating systems with poor energy efficiency. Also ventilation and DHW systems usually do not comply with current requirements. In Heerlen, the Netherlands, a demonstration was carried out in the framework of the EC-THERMIE programme in a residential building where the collective heating, DHW and ventilation systems are replaced by individual multi-functional appliances. These appliances are a recent development in the Netherlands, integrating different service functions. A measurement and evaluation programme was completed in May 1997, showing energy savings for space heating of 48 % over a period of 2.5 years and a significant improved ventilation and indoor air quality.
INTRODUCTION
In Heerlen, the Netherlands, an EC-THERMIE demonstration project is carried out, concerning the retrofitting of 120 apartments in a residential building. Individual multi-functional appliances replaced a collective central heating system, unvented hot water appliances and passive stack ventilation. The building is a typical example of a Dutch high rise flat for social housing, built in the sixties. In these types of buildings installations for space heating are usually energy inefficient. Poorly functioning ventilation systems and unvented hot water appliances ("geysers") often cause indoor air problems. Retrofitting installations for space heating DHW and ventilation is a complicated process in which the different components can have a major influence on one other. In new and retrofitted airtight dwellings ventilation must be carefully designed. Natural supply by using vents in the facade can give problems due to a poor thermal comfort. Occupants close the vents in case of low outdoor temperatures or high wind velocities. This can lead to poor indoor air quality, moisture problems and mould grow. Also a high underpressure can occur if airtight dwellings have mechanical exhaust and vents are closed. This leads to serious problems with spillage of flue gasses from open combustion appliances. This means that also the selection of the type of ventilation system has a close relation with the selection of the types of combus- tion appliances. Balanced ventilation, especially in combination with closed combustion appli- ances, gives a good solution to deal with these problems. Even then indoor air quality problems can occur if occupants don't use the ventilation system, for example, by turning off the system. Because in a MFA ventilation is linked with hot drinking water the possibility of not using the ventilation system is minimised (no ventilation means no D m . MFA's give an integral solution for the selection of ventilation system, combustion appliances for space heating and DHW and minimising malfiulctioning of one or more system components because of occupants behaviour. Another advantage of MFA's is that the number of ducts is limited. There are only two ducts necessary leading from the unit to the outside: one for fresh air and one for mixed exhaust air and flue gasses. For a comparable system (balanced ventilation and a closed combustion appliance) three or four ducts are necessary: fresh air, exhaust air, combustion air, flue gasses (flue gasses and combustion air can be combined in one duct). This can be of special interest for retrofitting when also ventilation and heating systems are involved. Although originally designed for new built energy efficient dwellings, MFA's are also very suitable for energy efficient retrofitted dwellings. However there still remained risks on some technical and economical aspects for this application. These risks as well as the demonstration character for a large number of dwellings with similar problems all over the European Community, was a reason to submit this project in the EC-THERMIE programme.
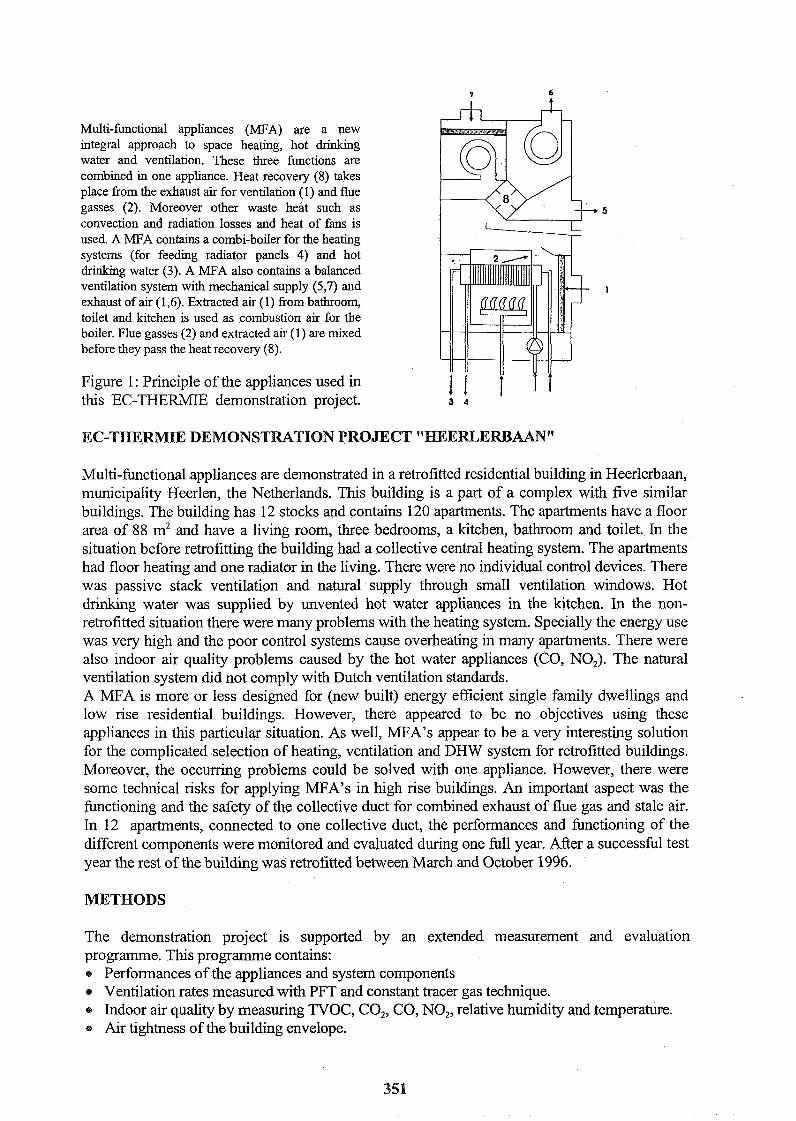
7 6
Multi-hctional appliances (MFA) are a new integral approach to space heating, hot drinking water and ventilation. These three functions are combined in one appliance. Heat recovery (8) takes place from the exhaust air for ventilation (1) and flue gasses (2). Moreover other waste heat such as 5
convection and radiation losses and heat of fans is used. A MFA contains a combi-boiler for the heating systems (for feeding radiator panels 4) and hot drinking water (3). A MFA also contains a balanced vendation system with mechanical supply (5,7) and 1 exhaust of air (1,6). Extracted air (1) from bathroom, toilet and kitchen is used as combustion air for the boiler. Flue gasses (2) and extracted air (1) are mixed before they pass the heat recovery (8).
Figure 1 : Principle of the appliances used in this EC-THERMIE demonstration project. 3 4
EC-THERIMIE DEMONSTRATION PROJECT "HEERLERB
Multi-fimctional appliances are demonstrated in a retrofitted residential building in Heerlerbaan, municipality Heerlen, the Netherlands. This building is a part of a complex with five similar buildings. The building has 12 stocks and contains 120 apartments. The apartments have a floor area of 88 m2 and have a living room, three bedrooms, a kitchen, bathroom and toilet. In the situation before retrofitting the building had a collective central heating system. The apartments had floor heating and one radiator in the living. There were no individual control devices. There was passive stack ventilation and natural supply through small ventilation windows. Hot drinking water was supplied by unvented hot water appliances in the kitchen. In the non- retrofitted situation there were many problems with the heating system. Specially the energy use was very high and the poor control systems cause overheating in many apartments. There were also indoor air quality problems caused by the hot water appliances (COY NO,). The natural ventilation system did not comply with Dutch ventilation standards. A MFA is more or less designed for (new built) energy efficient single family dwellings and low rise residential buildings. However, there appeared to be no objectives using these appliances in this particular situation. As well, MFA7s appear to be a very interesting solution for the complicated selection of heating, ventilation and DHW system for retrofitted buildings. Moreover, the occurring problems could be solved with one appliance. However, there were some technical risks for applying MFAYs in high rise buildings. An important aspect was the hctioning and the safety of the collective duct for combined exhaust of flue gas and stale air. In 12 apartments, connected to one collective duct, the performances and fimctioning of the different components were monitored and evaluated during one full year. After a successful test year the rest of the building was retrofitted between March and October 1996.
METHODS
The demonstration project is supported by an extended measurement and evaluation programme. This programme contains: e Performances of the appliances and system components e Ventilation rates measured with PFT and constant tracer gas technique.
Indoor air quality by measuring TVOC, CO,, CO, NO,, relative humidity and temperature. Air tightness of the building envelope.
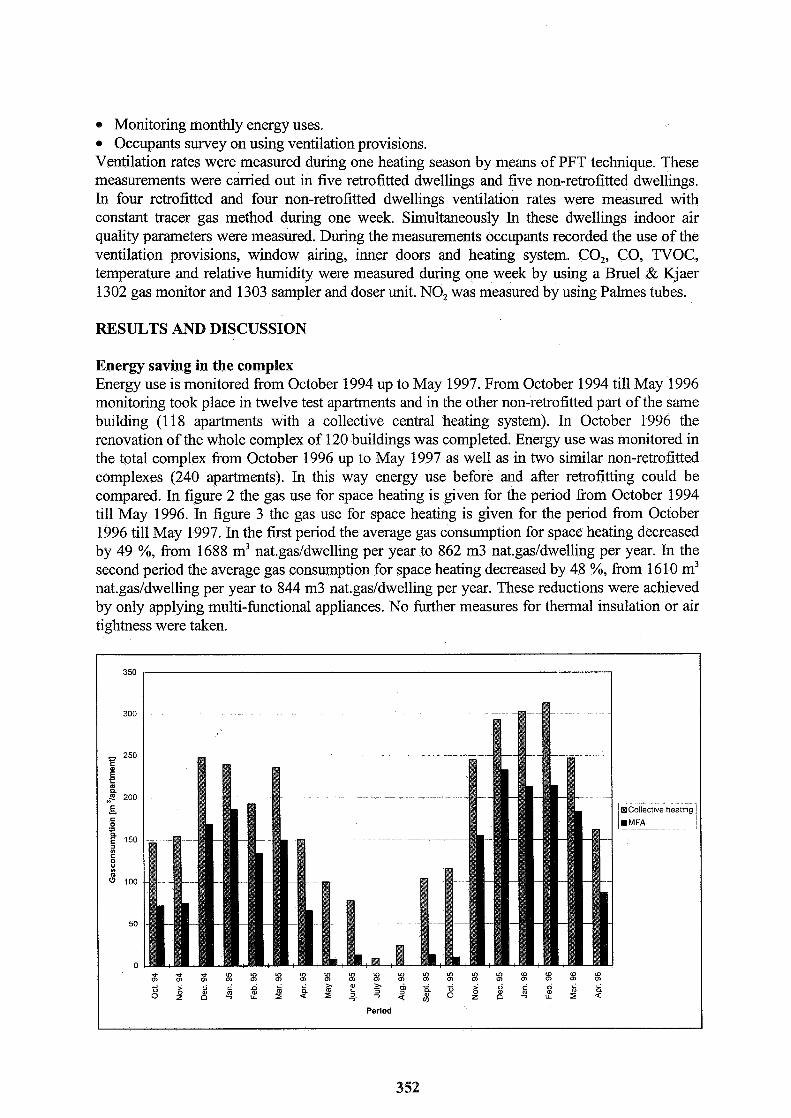
Monitoring monthly energy uses. Occupants survey on using ventilation provisions.
Ventilation rates were measured during one heating season by means of PFT technique. These measurements were carried out in five retrofitted dwellings and five non-retrofitted dwellings. In four retrofitted and four non-retrofitted dwellings ventilation rates were measured with constant tracer gas method during one week. Simultaneously In these dwellings indoor air quality parameters were measured. During the measurements occupants recorded the use of the ventilation provisions, window airing, inner doors and heating system. CO,, CO, TVOC, temperature and relative humidity were measured during one week by using a Bruel & Kjaer 1302 gas monitor and 1303 sampler and doser unit. NO, was measured by using Palrnes tubes.
RESULTS AND DISCUSSION
Energy saving in the complex Energy use is monitored from October 1994 up to May 1997. From October 1994 till May 1996 monitoring took place in twelve test apartments and in the other non-retrofitted part of the same building (1 18 apartments with a collective central heating system). In October 1996 the renovation of the whole complex of 120 buildings was completed. Energy use was monitored in the total complex f7om October 1996 up to May 1997 as well as in two similar non-retrofitted complexes (240 apartments). In this way energy use before and aRer retrofitting could be compared. In figure 2 the gas use for space heating is given for the period from October 1994 till May 1996. In figure 3 the gas use for space heating is given for the period from October 1996 till May 1997. In the first period the average gas consumption for space heating decreased by 49 %, from 1688 m3 nat.gas/dwelling per year to 862 m3 nat.gas/dwelling per year. In the second period the average gas consumption for space heating decreased by 48 %, from 16 10 m3 nat.gas/dwelling per year to 844 m3 nat.gas/dwelling per year. These reductions were achieved by only applying multi-functional appliances. No further measures for thermal insulation or air tightness were taken.
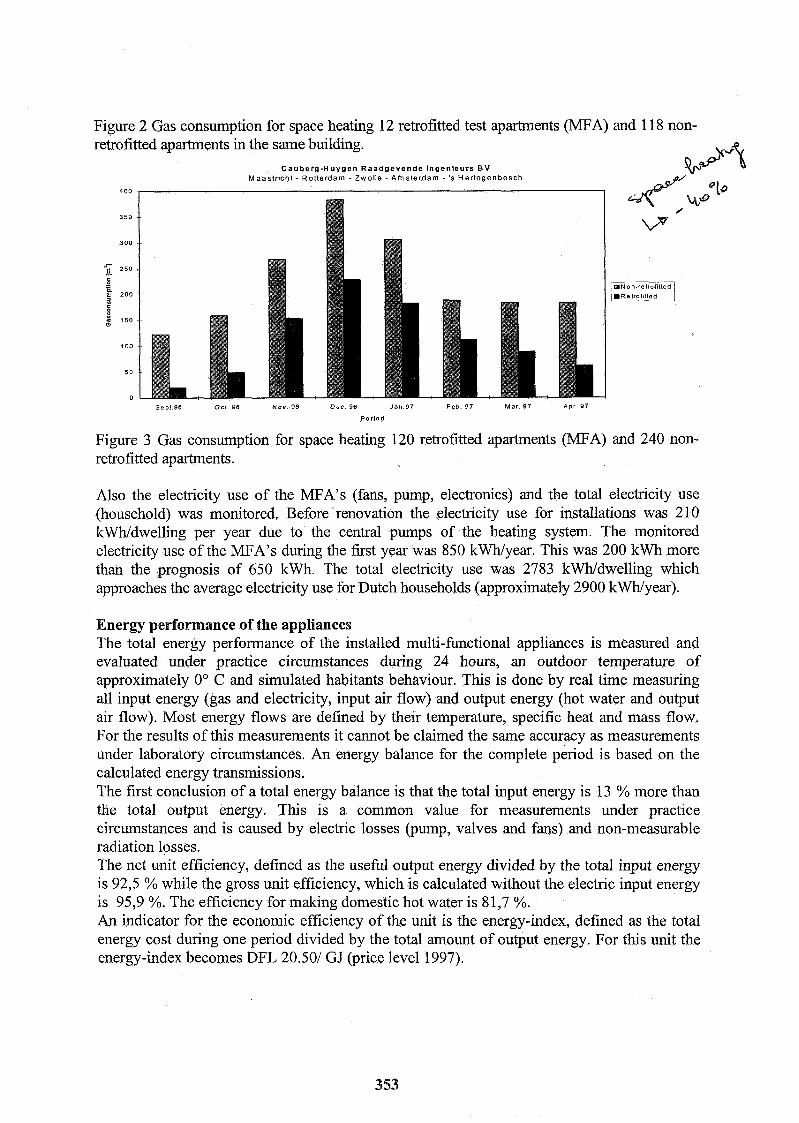
Figure 2 Gas consumption for space heating 12 retrofitted test apartments (MFA) and 11 8 non- retrofitted apartments in the same building. LyEe
Cauberg-Huygen Raadgevende lngenieurs B V Maastricht - Rotterdam - Zwolle - Amsterdam - 's Hertogenbosch
Sep! 96 Ocl 86 N O W 96 Dec 96 Jan 97 Feb 97 Mar 97 Apr 97
Period
Figure 3 Gas consumption for space heating 120 retrofitted apartments (MFA) and 240 non- retrofitted apartments.
Also the electricity use of the MFA's (fans, pump, electronics) and the total electricity use (household) was monitored. Before renovation the electricity use for installations was 210 kwdwelling per year due to the central pumps of the heating system. The monitored electricity use of the MFA's during the first year was 850 kWyear . This was 200 kwh more than the prognosis of 650 kWh. The total electricity use was 2783 kwdwelling which approaches the average electricity use for Dutch households (approximately 2900 kWyear).
Energy performance of the appliances The total energy performance of the installed multi-functional appliances is measured and evaluated under practice circumstances during 24 hours, an outdoor temperature of approximately 0" C and simulated habitants behaviour. This is done by real time measuring all input energy (gas and electricity, input air flow) and output energy (hot water and output air flow). Most energy flows are defined by their temperature, specific heat and mass flow. For the results of this measurements it cannot be claimed the same accuracy as measurements under laboratory circumstances. An energy balance for the complete period is based on the calculated energy transmissions. The first conclusion of a total energy balance is that the total input energy is 13 % more than the total output energy. This is a common value for measurements under practice circumstances and is caused by electric losses (pump, valves and fans) and non-measurable radiation losses. The net unit efficiency, defined as the useful output energy divided by the total input energy is 92,5 % while the gross unit efficiency, which is calculated without the electric input energy is 95,9 %. The efficiency for making domestic hot water is 81,7 %. An indicator for the economic efficiency of the unit is the energy-index, defined as the total energy cost during one period divided by the total amount of output energy. For this unit the energy-index becomes DFL 20.501 GJ (price level 1997).
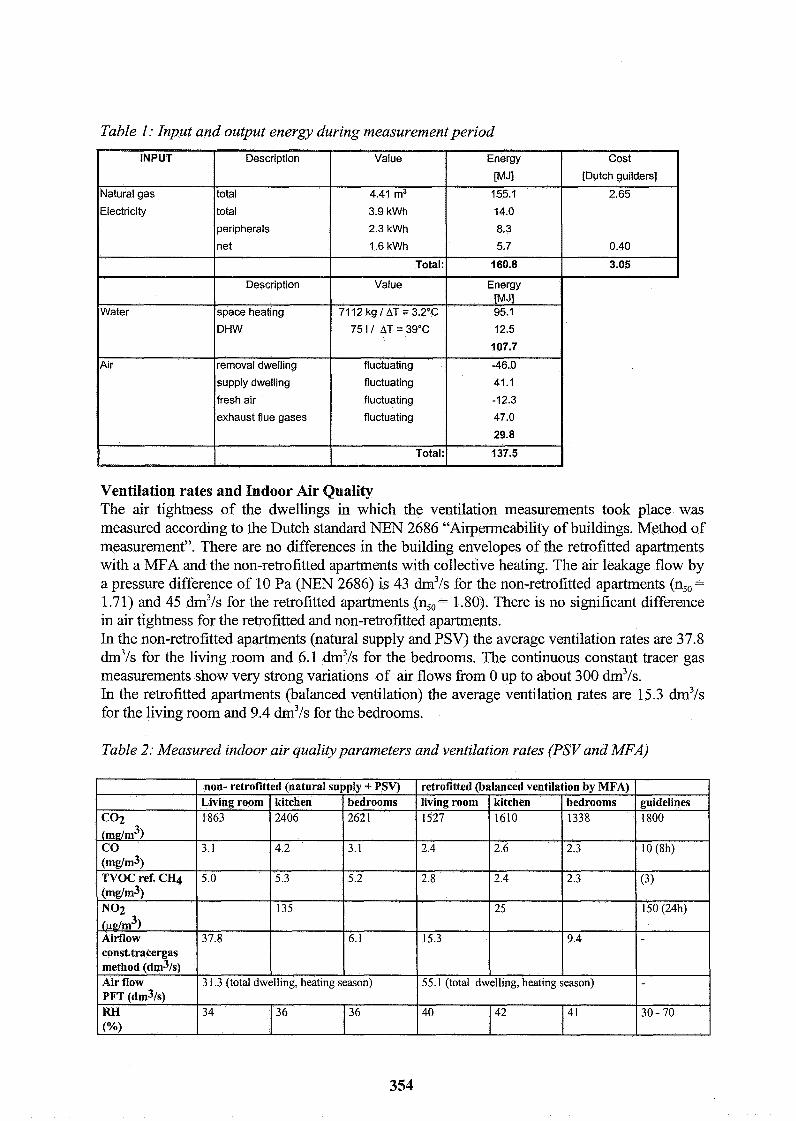
Table 1: Input and output energy during measurement period
Ventilation rates and Indoor Air Quality The air tightness of the dwellings in which the ventilation measurements took place was measured according to the Dutch standard NEN 2686 "Airpermeability of buildings. Method of measurement". There are no differences in the building envelopes of the retrofitted apartments with a MFA and the non-retrofitted apartments with collective heating. The air leakage flow by a pressure difference of 10 Pa (NEN 2686) is 43 dm3/s for the non-retrofitted apartments (n,, =
1.71) and 45 dm3/s for the retrofitted apartments (n,, = 1.80). There is no significant difference in air tightness for the retrofitted and non-retrofitted apartments. In the non-retrofitted apartments (natural supply and PSV) the average ventilation rates are 37.8 dm3/s for the living room and 6.1 dm3/s for the bedrooms. The continuous constant tracer gas measurements show very strong variations of air flows from 0 up to about 300 dm3/s. In the retrofitted apartments (balanced ventilation) the average ventilation rates are 15.3 dm3/s for the living room and 9.4 dm3/s for the bedrooms.
Table 2: Measured indoor air quality parameters and ventilation rates (PSV and MFA)
Co2 (mdm3) CO (mg/m3) TVOC ref. CHq (mg/m3) NO2 {r*p/m3) Airflow const.tracergas method (dm31s) Air flow PFT (dm31s) RH (%I
non- retrofitted (natural supply + PSV) Living room 1863
3.1
5.0
37.8
guidelines 1800
I0 (8h)
(3)
I50 (24h)
30 - 70
retrofitted (balanced ventilation by MFA) kitchen 2406
4.2
5.3
135
living room 1527
2.4
2.8
15.3
bedrooms 262 1
3.1
5.2
6.1
3 1.3 (total dwelling, heatlng season)
kitchen I610
2.6
2.4
25
34
bedrooms 1338
2.3
2.3 1
9.4
55.1 (total dwelling, heating season)
36 40 36
I I 42 4 1
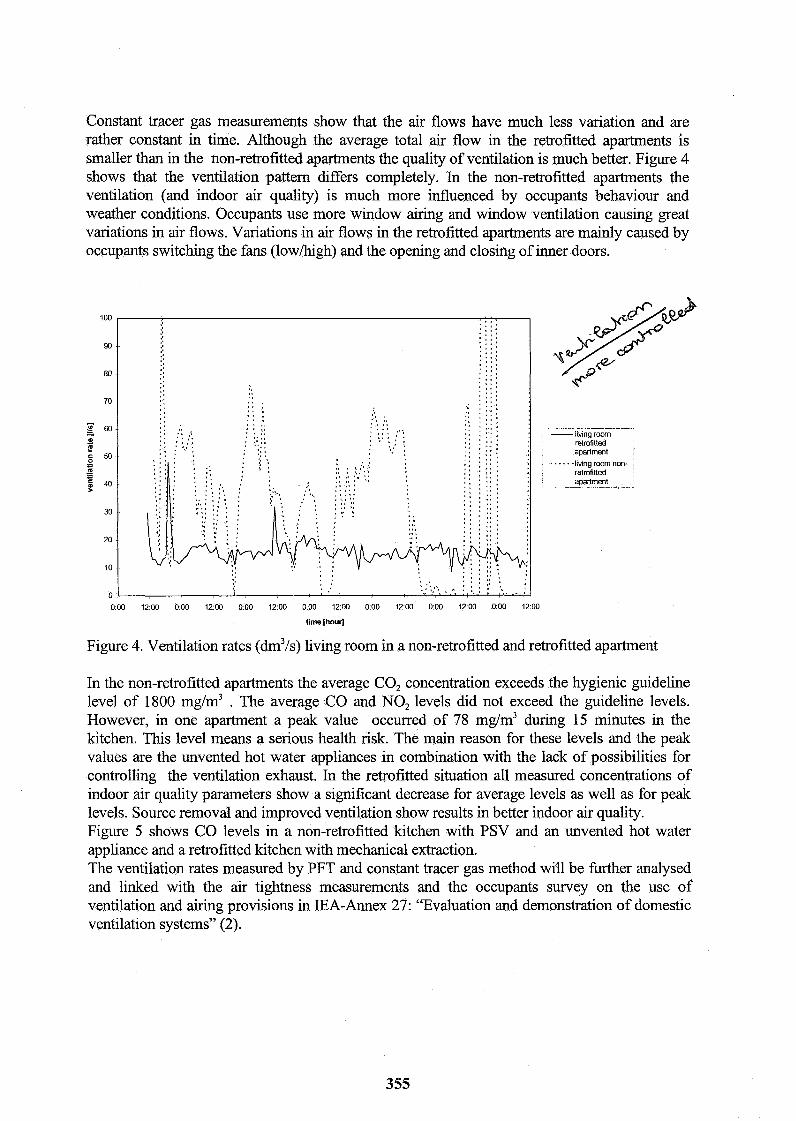
Constant tracer gas measurements show that the air flows have much less variation and are rather constant in time. Although the average total air flow in the retrofitted apartments is smaller than in the non-retrofitted apartments the quality of ventilation is much better. Figure 4 shows that the ventilation pattern differs completely. In the non-retrofitted apartments the ventilation (and indoor air quality) is much more influenced by occupants behaviour and weather conditions. Occupants use more window airing and window ventilation causing great variations in air flows. Variations in air flows in the retrofitted apartments are mainly caused by occupants switching the fans (lowlhigh) and the opening and closing of inner doors.
- - lhvtng mom
retrofitted apartment I
...... bwng mom non- I retmfitted i apartment .
000 1200 000 1200 000 1200 000 1200 000 1200 000 1200 000 1200
time [hour]
Figure 4. Ventilation rates (dm3/s) living room in a non-retrofitted and retrofitted apartment
In the non-retrofitted apartments the average CO, concentration exceeds the hygienic guideline level of 1800 mg/m3 . The average CO and NO, levels did not exceed the guideline levels. However, in one apartment a peak value occurred of 78 mg/m3 during 15 minutes in the kitchen. This level means a serious health risk. The main reason for these levels and the peak values are the unvented hot water appliances in combination with the lack of possibilities for controlling the ventilation exhaust. In the retrofitted situation all measured concentrations of indoor air quality parameters show a significant decrease for average levels as well as for peak levels. Source removal and improved ventilation show results in better indoor air quality. Figure 5 shows CO levels in a non-retrofitted kitchen with PSV and an unvented hot water appliance and a retrofitted kitchen with mechanical extraction. The ventilation rates measured by PFT and constant tracer gas method will be further analysed and linked with the air tightness measurements and the occupants survey on the use of ventilation and airing provisions in IEA-Annex 27: "Evaluation and demonstration of domestic ventilation systems" (2).

- - - - - -kitchen non-retrofitted/ 1 apartment I kitchen retrofitted 1 I -aDartment
O:oo 12:oo O:oo 12:oo 0:oo 12:oo 0:oo 12:oo 0:oo 12:oo 0:oo 12:oo 0:oo 12:oo time [hour]
Figure 5. CO levels (mg/m3) in a retrofitted and non-retrofitted kitchen
Occupants survey The objective of the survey is to get general insight in the retrofitting as a process and the functioning and acceptance of the multi-functional appliances (MFA). For several reasons an oral survey was chosen. The response was 75 % out of 72 addresses. Information and arguments provided by the housing corporation: The housing corporation Heerlerbaan provided clear and understandable information. The arguments used such as individual temperature control, energy saving and improved ventilation were accepted by 75% of the occupants. Appointments and realisation of the retrofitting: Most appointments were carried out correctly. 20% Felt tied at home during the activities. Noise and dust caused inconvenience to 30 % of the occupants. A few damages due to the activities were reported; they were mostly repaired by the housing corporation. In some apartments earlier improvements made by the occupants, like an additional cooker hood in the kitchen, were removed with permission of the occupants. Distribution of the costs: There is no raise in rent or in service costs calculated for heating and ventilation investments done by the housing corporation. A small raise in rent, equal to the rent calculated by the local utilities (MEGA) for a similar DHW appliance, is made for the DHW system. This raise is accepted by 65%. After retrofitting occupants are now individual financial responsible for their energy consumption. The general opinion is that this is a more fair system than before. Functioning and acceptance of the multi-functional appliances: Based on the first the occupants appreciate the individual space heating system, the temperature control in different rooms and the increased fresh air rate in the bedroom. All occupants with more experience (a full winter season included) are very positive. A minority of the occupants has problems with the control of the MFA and low temperature level in the bathroom. The location and size of the radiators installed is judged positively. The MFA is installed in a cupboard in the hall. This solution means that this space is not available anymore for storage. This solution is reported as negative but necessary by most of the
occupants. For this reason, additional storage capacity is installed by the housing corporation. The DHW system before retrofitting caused smell and very poor indoor air quality (NO,, TVOC, CO). All occupants appreciate the comfort of the DHW system but the waiting time to get hot water is too long (a common problem with these kind of so called "combi-boilers"). Complaints of natural ventilation system before retrofitting concerned cooking smells and condensation. After retrofitting these complaints are far less and occupants report a significant increase of fiesh air and improved indoor air quality. There is no univocal information on occupants with allergic sensitivities and their experiences. There are few negative reactions on the location of installed ducts. The size and finish of the ducts are reported positively. The fan is judged positively by most occupants. A few occupants report a great or, in contradiction, others a too small air capacity. Noise caused by the fan is reported by most occupants, especially at night. Half of the occupants wonder if the ventilator can be turned off for certain periods of time, for example at night and during the period of vacation or other absence. The general opinion is that the amount of draught has not changed; 15% of the occupants notice an increase in the amount of draught. This minority names several different rooms with draught, it is not clear where this draught is located exactly.
CONCLUSIONS
6 During the demonstration between October 1996 and May 1997 no major occurred concerning the functioning and performance of the multi-functional appliances. Gas use for space heating decreased by 48 % compared to the adjacent similar blocks, only by retrofitting the heating system.
@ Gas use for DHW increased. Tlvs problem is not inherent to MFA's but due to an increase in comfort of hot water supply in relation to small water heaters like unvented "geysers". As a result of tlvs conclusion further experiments are going on in this project on measures to limit the hot water use without influencing the comfort.
6 Although in retrofitted apartments average ventilation rates decreased, due to better control, the quality of the ventilation improved, resulting in better indoor air quality. Measurements of indoor air quality parameters show a significant decrease of concentrations CO, CO,, NO, and TVOC.
6 Electricity use of MFA's was about 130 kwh (20 %) higher than expected. In the next generation MFA's DC fans will be applied, decreasing electricity use with 50 %, and high efficiency heat recovery (laminar cross-flow heat exchangers) with an efficiency > 90 %.
ACKNOWLEDGEMENTS
This demonstration project was supported by the Commission of the European Communities in the framework of the THERMIE Programme, Directorate General for Energy (DG XVII). The authors would like to thank the housing corporation Heerlerbaan for their co-operation and support in the measurement and evaluation programme.
REFERENCES
1. P.J.M. Op 't Veld, H.G. Slijpen, "The Dutch E'novation program", Proceedings 16"' AIVC conference, Palm Springs, USA, 1995.
2. W. de Gids, "IEA Annex 27: Comparison of performances of different ventilation systems in similar dwellings", Proceedings 1 8t'' AIVC conference, Athens, Greece, 1997

VENTILATION AND COOLING 18TH ANNUAL AIVC CONFERENCE
ATHENS, GREECE, 23-26 SEPTEMBER, 1997
A decipol Predictive Controller for VAV Systems
Narvik Institute of Technology Building Science
P.O. Box 385 N-8501 Narvik, Norway
Synopsis
Due to the lack of proper sensors for odours, the odour concept, involving the units olf and decipol, is of very little practical use with respect to automatic control of VAV systems. However, the decipol level in a room may be predicted from the concentration of C 0 2 and the amount of fresh air supplied. By using the C 0 2 level as a decisive variable of the occupant load within the room, the actual air quality (decipol level) can be predicted. Once the decipol level is known, it is compared to a given set point, thus enabling the controller to alter the air flow rate accordingly. Eventually the room air quality should become equal to the specified set point. In this study, such a demand controlled ventilation algorithm is presented. The performance of the controller is visualized by simulation, and the results show that the approach to control the decipol level based on measurements of the C 0 2 level could be advantageous compared to commercial COa control.
1 Introduction
The olf and decipol units were introduced by Fanger in 1988 [2]. The basic idea was to find a method that related a quantitative measure of odours (olf) to a quality measure of odours (decipol), exactly the same way as any contaminant mass flow is related to a concentration within a space. A consequence of the lack of odour sensors, was that the results (the olf and decipol units) were based on the subjective perception of trained odour panels. One olf is defined as the emission rate of odours (bioeffluents) from a standard person and one decipol is the perceived air quality in a room hosting a standard person, ventilated with 10 litres/sec of fresh air. Olf emissions from other sources, such as building materials, are expressed in terms of the emission from one standard person (a one-olf source). The work by Fanger (see [2] and [3]) and the general acceptance of the units have led to new regulations and standards for determining minimum air flow rates for ventilation in many countries, for instance the new building regulations in Norway. Odour emission sources can roughly be categorized as follows:
1. From human occupancy
2. From non human occupancy, such as building materials and indoor processes
3. From external sources, such as the outdoor environment and depositions in the ven- tilation system.
The odour emission due to human occupancy depends mainly on the number of persons present and their physical activity levels. The emission rates from non human occupancy and external sources can in many cases be considered to be constant over time. Theoreti- cally, the decipol level in a room can be used as the decisive control variable in a demand controlled ventilation (DCV) system. By measuring the actual decipol level and comparing it to a given set-point level, the required amount of fresh air to the room can be computed by the flow controller. The obvious obstacle for enabling such a control system in practice is that no reliable odour sensors exist. In efforts to overcome this problem, mixed-gas sensor arrays and VOC sensors in combination with C 0 2 sensors have been introduced (e.g. as discussed in [4] and [5]), showing quite promising results. The intension of such sensors is to provide an overall measure of the air quality in a room. Unfortunately, there are practical limitations with respect to the number of substances which can be detected.
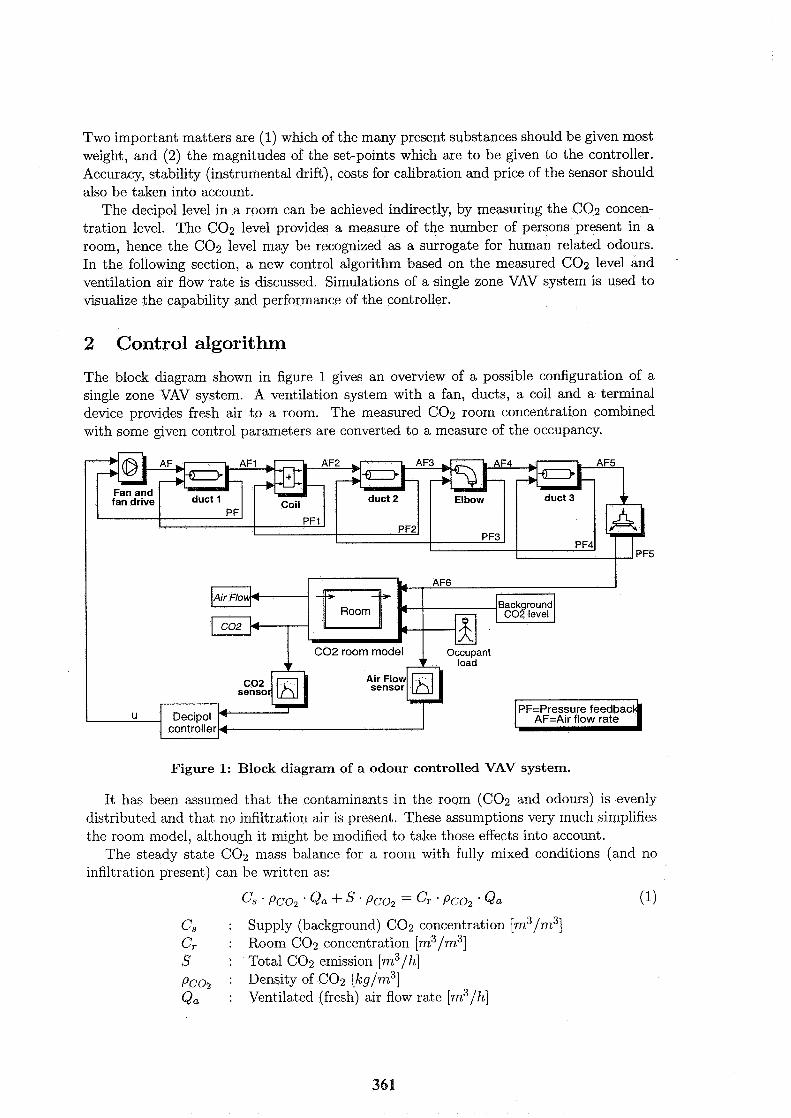
Two important matters are (1) which of the many present substances should be given most weight, and (2) the magnitudes of the set-points which are to be given to the controller. Accuracy, stability (instrumental drift), costs for calibration and price of the sensor should also be taken into account.
The decipol level in a room can be achieved indirectly, by measuring the C02 concen- tration level. The C02 level provides a measure of the number of persons present in a room, hence the C02 level may be recognized as a surrogate for human related odours. In the following section, a new control algorithm based on the measured 6 0 2 level and ventilation air flow rate is discussed. Simulations of a single zone VAV system is used to visualize the capability and performance of the controller.
2 Control algorithm
The block diagram shown in figure 1 gives an overview of a possible configuration of a single zone VAV system. A ventilation system with a fan, ducts, a coil and a terminal device provides fresh air to a room. The measured C02 room concentration combined with some given control parameters are converted to a measure of the occupancy.
AF=Air flow rate
Figure 1: Block diagram of a odour controlled VAV system.
It has been assumed that the contaminants in the room (C02 and odours) is evenly distributed and that no infiltration air is present. These assumptions very much simplifies the room model, although it might be modified to take those effects into account.
The steady state C02 mass balance for a room with fully mixed conditions (and no infiltration present) can be written as:
CS : Supply (background) C02 concentration [m3/m3] Cr : Room C02 concentration [m3/m3] S : Total C02 emission [m3/h] pco2 : Density of C02 [kg/m3] Q, : Ventilated (fresh) air flow rate [m3/h]

The C 0 2 emission from n persons can be expressed as a function of their mean activity level M as follows:
S = k . M . n [m3/h] (2)
The magnitude of the proportional factor k is determined by the respiratory quotient (RQ) times the amount of oxygen consumed by respiration. Hence, RQ is defined as the volumetric ratio of metabolic produced C 0 2 to consumed O2 [I]. RQ is found to be constant, independent of the level of physical activity, thus k must be a constant too. For a person having a normal diet mix of fat, carbohydrate and protein, RQ is equal to 0.83 [I]. At an activity level of 1.2 met, the 0 2 consumption is about 0.0216 m3/hour [I], and hence the value of k becomes 0.83:;0216 = 0.015 m3/hour per person and met.
A combination of the equations 1 knd 2, reveals the following expression for the occupant load:
If the supply concentration varies significant over time, for instance due to heavily traffic outdoor or due to recirculation of air, this concentration should be measured as well. However, it has been assumed that no recirculation of air is present and that variations to the background level is negligible. Thus C, is constant.
Now, establishing a similar balance for odours in the room:
G, : Supply (background) decipol level GT : Room decipol level F : Total olf emission to the room
The background decipol level is in the range 0 (clean air) to 0.5 decipol (low AQ in cities). The scaling of the olf emission term (36. F) of equation 4 comes from the definition of the decipol unit (1 olf ventilated with 10 litreslsec or 36 m3/h of fresh air). The total olf production in the room (F ) is the sum of occupant related odours (F,) and building related odours (Fb). Fb emits from materials'and processes within the room.
Fo will of course vary by the occupant load, and the contribution to Fo from a single person is very much dependent on the level of activity. Also, a major influence is caused by tobacco smoking, if smoking is present. Fo can be written as:
where fo is the olf emission from one person in the room. The magnitude of fo as a function of the activity level can be found in various literature, for instance from Fanger [3]. A standard person conducting sedentary work , i.e. having an activity level of 1-1.2 met, emits 1.0 olf to the room air. fo increases dramatically with the percentage number of occupants smoking.
The emission from non occupant sources (Fb) can be written as:
where fb is the olf emission from building materials per. square meter floor area A, and where Fp represents the emissions from processes within the room. The first term of
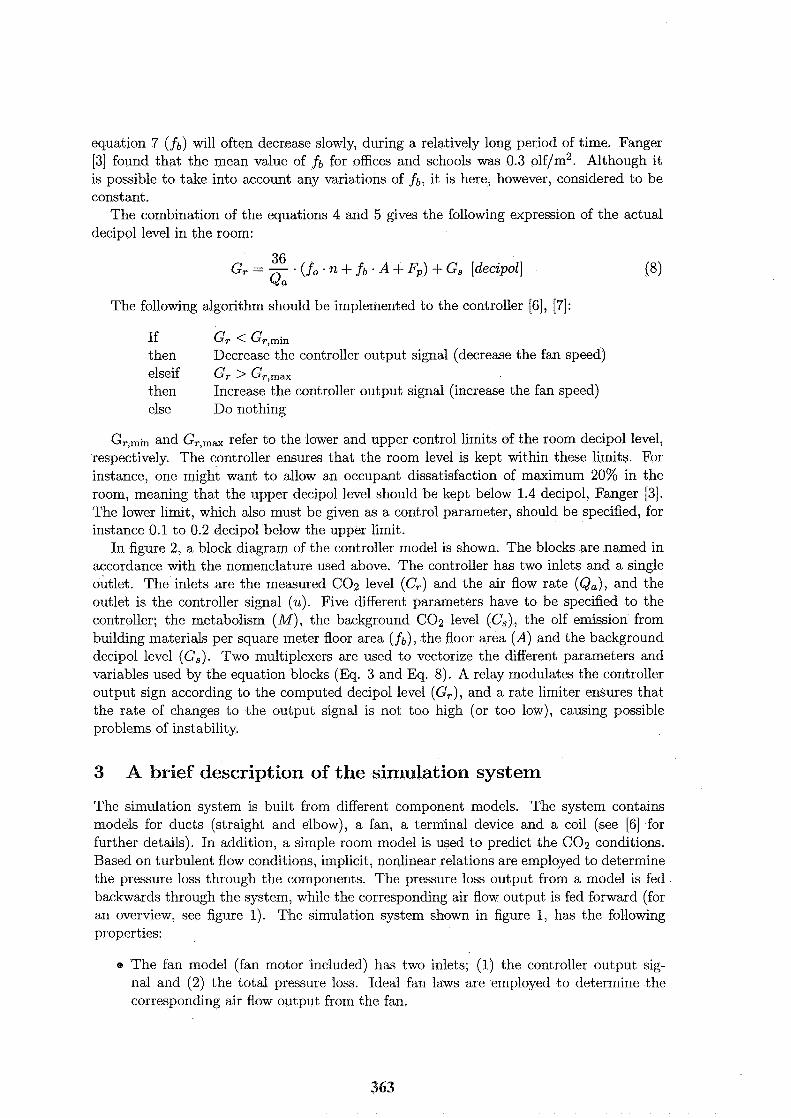
equation 7 (fb) will often decrease slowly, during a relatively long period of time. Fanger [3] found that the mean value of fb for offices and schools was 0.3 olf/m2. Although it is possible to take into account any variations of fb, it is here, however, considered to be const ant.
The combination of the equations 4 and 5 gives the following expression of the actual decipol level in the room:
36 GT = - . (fo .n + f b . A + Fp) + Gs [decipol]
Qa
The following algorithm should be implemented to the controller [6], [7]:
If GT < Gr,min then Decrease the controller output signal (decrease the fan speed) elseif GT > G,,, then Increase the controller output signal (increase the fan speed) else Do nothing
Gr,min and GT,rnax refer to the lower and upper control limits of the room decipol level, respectively. The controller ensures that the room level is kept within these limits. For instance, one might want to allow an occupant dissatisfaction of maximum 20% in the room, meaning that the upper decipol level should be kept below 1.4 decipol, Fanger [3]. The lower limit, which also must be given as a control parameter, should be specified, for instance 0.1 to 0.2 decipol below the upper limit.
In figure 2, a block diagram of the controller model is shown. The blocks are named in accordance with the nomenclature used above. The controller has two inlets and a single outlet. The inlets are the measured COa level (C,) and the air flow rate (Q,), and the outlet is the controller signal (u). Five different parameters have to be specified to the controller; the metabolism (Ad), the background 6 0 2 level (C,), the olf emission from building materials per square meter floor area (fb), the floor area (A) and the background decipol level (G,). Two multiplexers are used to vectorize the different parameters and variables used by the equation blocks (Eq. 3 and Eq. 8). A relay modulates the controller output sign according to the computed decipol level (G,), and a rate limiter ensures that the rate of changes to the output signal is not too high (or too low), causing possible problems of instability.
3 A brief description of the simulation system
The simulation system is built from different component models. The system contains models for ducts (straight and elbow), a fan, a terminal device and a coil (see [6] for further details). In addition, a simple room model is used to predict the C02 conditions. Based on turbulent flow conditions, implicit, nonlinear relations are employed to determine the pressure loss through the components. The pressure loss output from a model is fed backwards through the system, while the corresponding air flow output is fed forward (for an overview, see figure 1). The simulation system shown in figure 1, has the following properties:
e The fan model (fan motor included) has two inlets; (1) the controller output sig- nal and (2) the total pressure loss. Ideal fan laws are employed to determine the corresponding air flow output from the fan.

Figure 2: Block diagram of the controller.
e Both the duct and the elbow model account for pressure loss by friction. In addition, the elbow model has a table look up for single losses.
e The pressure losses in the coil and the terminal device are considered to be quadrat- ically proportional to the air flow (i.e. fully turbulent flow).
4 Sirnulation case
In most cases a dynamic simulation system has a large number of parameters which must be specified, hence the number of possible simulation cases are almost infinite. In this study, only influences of the major load of the system have been investigated, i.e. the room occupancy.
The chosen room for the simulation case was typically a meeting room where the occu- pant density was expected to be high. The Boor area was 40 m2 and the ceiling height 2.5 m, giving a room volume of 100 m3. Olf emission from building materials was expected to be 0.15 olf/m2. The supply air quality was assumed to be around 0.05 decipol, constant over time, and no internal odour emitting processes were present. The ventilation system was able to keep the room decipol level below 1.4 with occupant loads up to 29 persons. Maximum air flow to the room was 925 m3/h. Based on the olf emission from building materials, the flow controller determined a minimum air flow rate of 160 m3/h.
5 Simulation results
The system was simulated for different occupant loads over a time period of six hours, using the RK45 numerical integration method with a simulation time step of 2 seconds. Figure 3 shows the occupant loads during the simulation. The actual load present in the room is represented by the dashed, stairs shaped line. The other line shown is the estimated number of occupants. As one might notice, the size of the inertia of the room model is important for the estimation to become accurate. If the occupant load was varying rapidly over time, the estimated load wouid probably not reach its steady state value, hence giving an inaccurate estimate of the actual load. In such cases, however, the actual decipol level
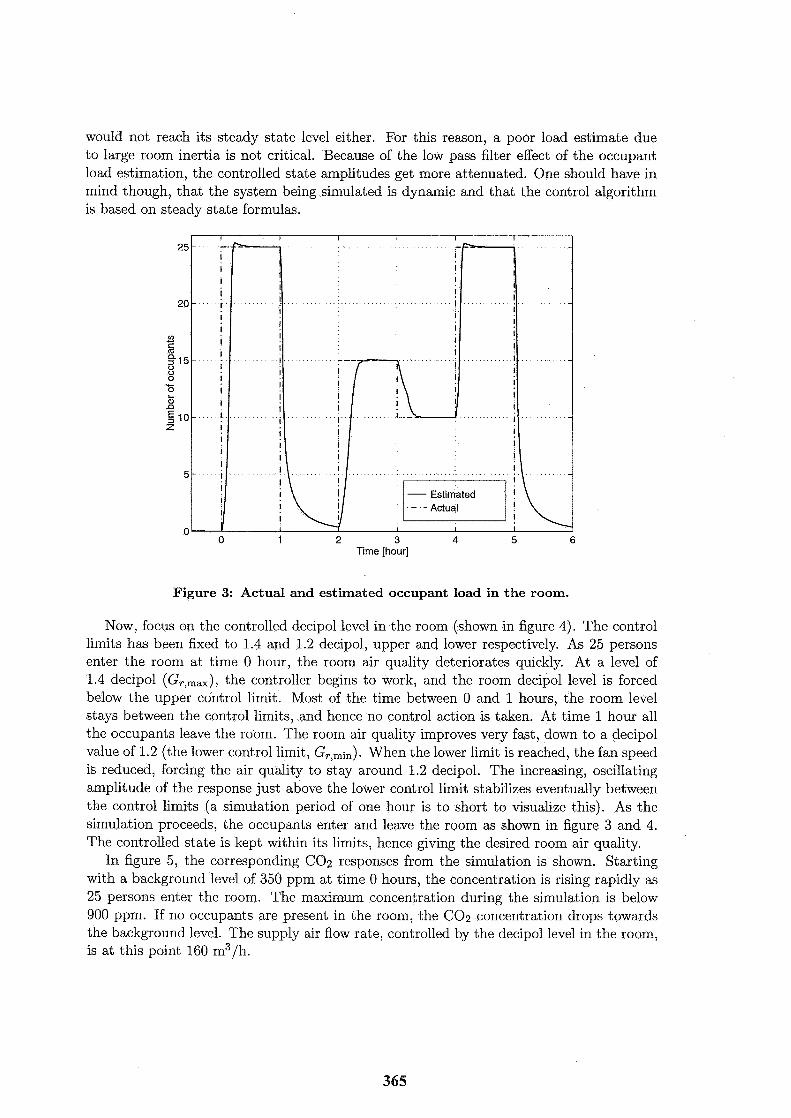
would not reach its steady state level either. For this reason, a poor load estimate due to large room inertia is not critical. Because of the low pass filter effect of the occupant load estimation, the controlled state amplitudes get more attenuated. One should have in mind though, that the system being simulated is dynamic and that the control algorithm is based on steady state formulas.
Figure 3: Actual and estimated occupant load in the room.
Now, focus on the controlled decipol level in the room (shown in figure 4). The control limits has been fixed to 1.4 and 1.2 decipol, upper and lower respectively. As 25 persons enter the room at time 0 hour, the room air quality deteriorates quickly. At a level of 1.4 decipol (G,,,), the controller begins to work, and the room decipol level is forced below the upper control limit. Most of the time between 0 and 1 hours, the room level stays between the control limits, and hence no control action is taken. At time 1 hour all the occupants leave the room. The room air quality improves very fast, down to a decipol value of 1.2 (the lower control limit, Gr,mi,). When the lower limit is reached, the fan speed is reduced, forcing the air quality to stay around 1.2 decipol. The increasing, oscillating amplitude of the response just above the lower control limit stabilizes eventually between the control limits (a simulation period of one hour is to short to visualize this). As the simulation proceeds, the occupants enter and leave the room as shown in figure 3 and 4. The controlled state is kept within its limits, hence giving the desired room air quality.
In figure 5, the corresponding C 0 2 responses from the simulation is shown. Starting with a background level of 350 ppm at time 0 hours, the concentration is rising rapidly as 25 persons enter the room. The maximum concentration during the simulation is below 900 ppm. If no occupants are present in the room, the C 0 2 concentration drops towards the background level. The supply air flow rate, controlled by the decipol level in the room, is at this point 160 m3/h.
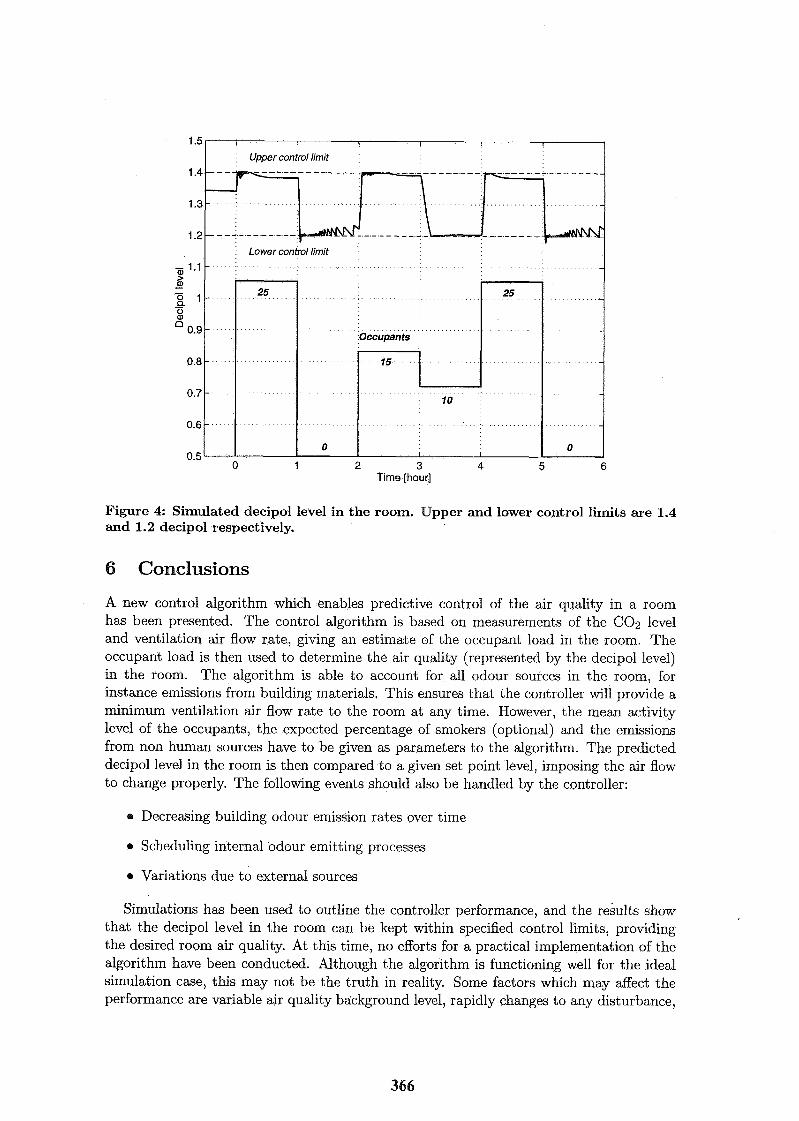
0 1 2 3 4 5 6 Time [hour]
Figure 4: Simulated decipol level in the room. Upper and lower control limits are 1.4 and 1.2 decipol respectively.
6 Conclusions
A new control algorithm which enables predictive control of the air quality in a room has been presented. The control algorithm is based on measurements of the CO2 level and ventilation air flow rate, giving an estimate of the occupant load in the room. The occupant load is then used to determine the air quality (represented by the decipol level) in the room. The algorithm is able to account for all odour sources in the room, for instance emissions from building materials. This ensures that the controller will provide a minimum ventilation air flow rate to the room at any time. However, the mean activity level of the occupants, the expected percentage of smokers (optional) and the emissions from non human sources have to be given as parameters to the algorithm. The predicted decipol level in the room is then compared to a given set point level, imposing the air flow to change properly. The following events should also be handled by the controller:
e Decreasing building odour emission rates over time
e Scheduling internal odour emitting processes
e Variations due to external sources
Simulations has been used to outline the controller performance, and the results show that the decipol level in the room can be kept within specified control limits, providing the desired room air quality. At this time, no efforts for a practical implementation of the algorithm have been conducted. Although the algorithm is functioning well for the ideal simulation case, this may not be the truth in reality. Some factors which may affect the performance are variable air quality background level, rapidly changes to any disturbance,
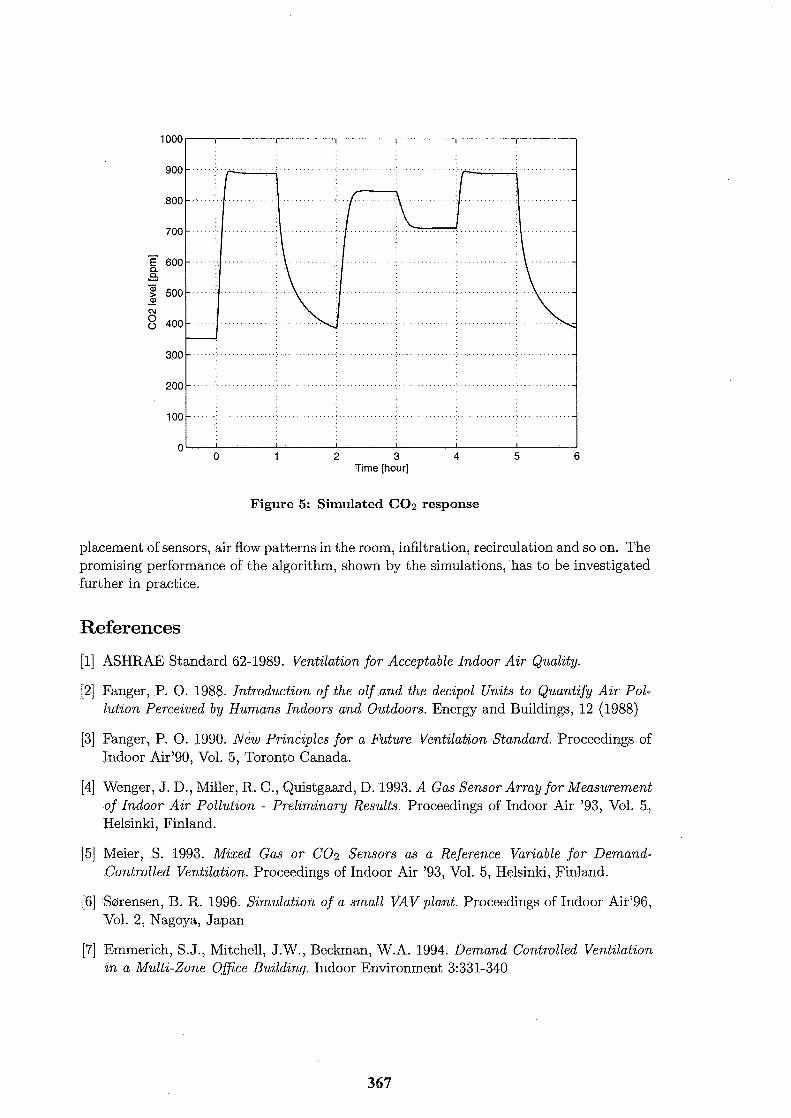
0 I I I I I I
0 1 2 3 4 5 6 Time [hour]
Figure 5: Simulated COz response
placement of sensors, air flow patterns in the room, infiltration, recirculation and so on. The promising performance of the algorithm, shown by the simulations, has to be investigated further in practice.
References
[I] ASHRAE Standard 62-1989. Ventilation for Acceptable Indoor Air Quality.
[2] Fanger, P. 0. 1988. Introduction of the olf and the decipol Units to Quantify Air Pol- lution Perceived by Humans Indoors and Outdoors. Energy and Buildings, 12 (1988)
[3] Fanger, P. 0. 1990. New Principles for a Future Ventilation Standard. Proceedings of Indoor Air790, Vol. 5, Toronto Canada.
[4] Wenger, J . D., Miller, R. C., Quistgaard, D. 1993. A Gas Sensor Array for Measurement of Indoor Air Pollution - Preliminary Results. Proceedings of Indoor Air '93, Vol. 5, Helsinki, Finland.
[5] Meier, S. 1993. Mixed Gas or COa Sensors as a Reference Variable for Demand- Controlled Ventilation. Proceedings of Indoor Air '93, Vol. 5, Helsinki, Finland.
[6] Seirensen, B. R. 1996. Simulation of a small VAV plant. Proceedings of Indoor Air'96, Vol. 2, Nagoya, Japan
[7] Emmerich, S. J., Mitchell, J.W., Beckman, W.A. 1994. Demand Controlled Ventilation in a Multi-Zone Ofice Building. Indoor Environment 3:331-340


VENTILATION AND COOLING
18TH ANNUAL AIVC CONFERENCE ATHENS, GREECE, 23-26 SEPTEMBER, 1997
Introduction of Air Infiltration and Ventilation in a Simple Modelling for Energy Consumption Estimation in Air Conditionned Buildings
Olivier MORISOT Dominique MARCH10 Matthieu ORPHELIN
Ecole des Mines de Paris- Centre 60, boulevard Saint Michel 75272 Paris Cedex 06 FRANCE tel33 01 40 51 90 80 fax 33 01 46 34 24 91 e-mail [email protected]

INTRODUCTION OF AIR INFILTRATION AND VENTILATION IN A SIMPLE MODELLING FOR ENERGY CONSUMPTION ESTIMATION IN AIR CONDITIONNED BUILDINGS
Olivier MORISOT' , Dominique MARCWIO', Matthieu ORPHELIN'
Synopsis- This study reports on the introduction of air infiltration and mechanical ventilation in a model for energy consumption estimation. The model applies to air conditionned non residential building and is developped to need few inputs. Existing air infiltration models are compared and three equivalent leakage area (ELA) databases are tested on the same case study. Calculations of air input throught opened-doors are made to compare flows due to air infiltration and due to natural ventilation. Simulations are made considering mean air infiltration value and hourly values. It appears that impact of air infiltration variation is no negligible in winter (+I1 % compared with mean air infiltration value).
Then concerning mechanical ventilation, this study reports on taking into consideration <<fresh air flow >> in the model. The first solution is to introduce mechanical outdoor air flow rate in building loads. The second solution is to calculate building loads without outdoor air flow rate and to introduce it in mixing box calculation. Both solutions are not equivalent concerning energy consumption (difference +16% for particular system used).
Keywords- air infiltration, mechanical ventilation, energy consumption, modelling
subscripts: a : ambient o : outside area : unit per m2
A area mZ B permeability coefficient m3
s.m2.pan C flow coefficient m3
S. Pan c~ head loss coefficient c, wind pressure coefficient
e exposure coefficient to wind Pa-" and stack effect
ELA equivalent leakage area m2 Ki empirical coefficient n air change rate due to volfh
infiltration
Fresh air introduced in building is partly controlled (mechanical and natural ventilation) and partly uncontrolled (air infiltration). Natural ventilation comes through opened windows, doors and other intentional apertures. Mechanical ventilation uses fan and intake andlor exhaust vents specifically designed and installed for ventilation. Infiltration is uncontrolled air flow through cracks, interstices, etc [ASHRAE, 19931.
n flow exponent Np number of openings per h-'
hour
P pressure Pa
Q air flow m3/s Q energy rate W
T temperature K
W wind speed m/s z, opening door mean time s p density kg/m3
Ecole des Mines de Paris- Centre d'Energ6tique 60, boulevard Saint Michel- 75272 Paris Cedex 06, France tel33 01 40 51 90 80 fax 33 01 46 34 24 91 e-mail: [email protected]
Knowing and mastering air fresh flows rates are important for two main reasons: - fresh air is used to improve indoor air quality and to dilute indoor air contaminants, - energy used to handle fresh air is a significant load.
The magnitude of these air flow rates should be known at maximum load to properly size the plant. Minimum air exchange rates should be known to assure proper control of indoor contaminant levels. How to simply evaluate energy consumption due to air exchanges ? A simple model for estimating air inflitration in a building has been introduced into a model for estimating energy consumption of air conditionned buildings. Main aspect of this model is to need few inputs in such a way that it could be used very soon in the design process, when materials and building caracteristics are not fixed in details. Existing models of air infiltration are compared and tested on the same simplified case study, a simple model is chosen. Then, two mechanical ventilation model are compared, first with mechanical air flow rate introduced in building load, second in system calculation level.
2. EXISTING MODELS IN AIR INFILTRATION
Infiltration is driven by wind, temperature difference creating stack effect and/or appliance- induced pressures across the building. Several methods detailed or simplified models are found in the literature.
2.1 AICVF's Guideline
AICVF' Guideline for heating [AICVF, 19891 considers contribution of wind and stack effect for winter. The pressure differences due to driving forces are considered in combination by adding them together and determining the aifflow rate through each opening due to this total pressure difference. The flow equation is simplified choosing a sizing approach in: Q = A . B . o , ~ ~ . A P ~ / ~ considering e = o , ~ ~ . A P ~ ' ~ , exposure coefficient to wind and stack effect. On the one hand, those formulas give data calculated with em (maximal value of exposure coefficient in winter) considering different types of buildings. On the other, the guideline gives permeability coefficient values established from CSTB~ in situ experiments for different types of windows, doors, walls, etc.
2.2 AIVC Methods
AIVC guideline [AIVC, 19961 and technical note [AIVC, 19941 notice that it is very difficult to identify and quantify all airflows, driving forces , size and location of each opening. Simplifications lead to different models.
2.2.1 empirical model: Few models establish correlation to determine air change rate due to infiltration. The simplest correlation is a linear formula [Etheridge and Sandberg, 19961: n = K, + K, IT, - T, ( + K, W
Type 19 of TRNSYS 14.2 gives values of coefficients depending on quality of building envelope construction. [TRNSYS, 19961
2.2.2 estimation from building air-tightness From sets of measurements, Kronvall suggests an approximate estimate of air infiltration which could be inferred from building air-tightness data. [AIVC, 19961. This method concerns energy analysis and air infiltration impact estimation. This method is based on building air-
-- - --
1 Association des IngCnieurs Chauffage Ventilation Froid: Refrigerating Ventilation Heating Engineers Ass. 2 Centre Scientifique et Technique du Bstiment: Technical and Scientific Center for Building
tightness mesure determined for a reference pressure of 50 Pa. This value is divided by an empirical coefficient representing forces influence. Simplified tables [AIVC, 19941 propose for six characteristical types of construction a basical value of ACH(5OPa).
2.2.3 simplified theorical model This model incorporates the effects of air-tighness and natural and mechanical driving forces. The model has been developed at the Lawrence and Berkeley Laboratory [Sherman, 19801. Equation are based on Equivalent Leakeage Area under 4 Pa (EL&). Flows due to the wind and stack effect are calculated independently. Equivalent leakeage area under 4 Pa can be extracted from tables building components as proposed in [ASHRAE, 19931.
2.2.4 zonal method AIVC Guideline suggest a method in 5 steps [AIVC, 19961:
1- calculation of flow throught the opening using detailed tables [AIVC, 19941 for several components; 2- development of a flow network identifying each source of air in building envelope (monozone model) or between each zone. Infiltration and natural ventilation are separated before combining the two networks. 3- pressure forces evaluation. [AIVC, 19941 suggests values for an evaluation of C, (wind pressure coefficient depending on the building shape and wind direction) 4- mechanical ventilation determination (fixed at a constant rate) 5- air mass flow balance (volumic balance). Equation of the balance between inflow and outflow of air is solved.
2.3 Choice for the method o f energy consumption
Main models evaluation criterias are summed up in the following chart:
The field of energy consumption model development is non-residential buildings, in which air exchange depends more on mechanical ventilation than it does on envelope performance. So a medium precision to evaluate air infiltration is enough. Considering our aim, it is excluded to incorporate a detailed calculation of airflows. Consequently empirical model, easier to introduce in the existing method, is chosen. The method must split airflows into different zones for a multizone building, and the chosen empirical model can not do that. Three configurations exist: - Outlet-flow is fixed by mechanical ventilation: it is suggested to characterize each zone by a pseudo-ELA (sum of artificial and unvolontary openings). Inlet flows are shared proportionnaly to ELAs. - Inlet flow is fixed by mechanical ventilation: outlet flows are shared proportionnaly to ELAs.
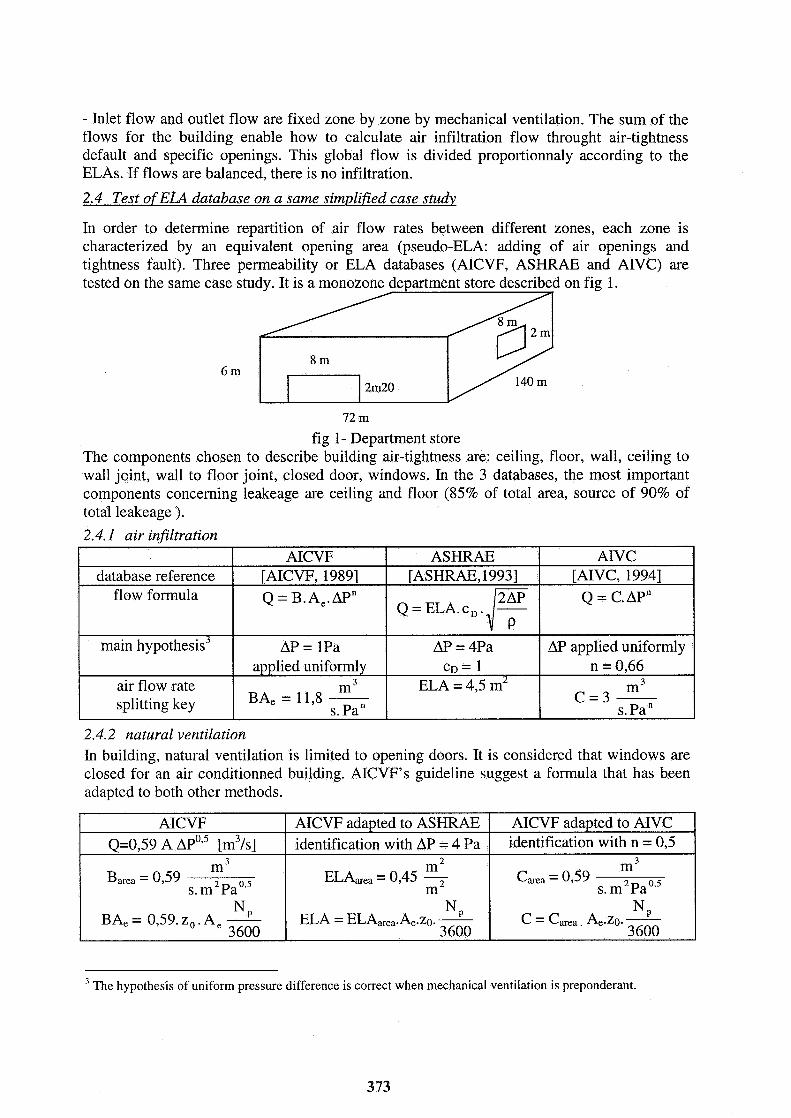
- Inlet flow and outlet flow are fixed zone by zone by mechanical ventilation. The sum of the flows for the building enable how to calculate air infiltration flow throught air-tightness default and specific openings. This global flow is divided proportionnaly according to the ELAs. If flows are balanced, there is no infiltration.
2.4 Test o f ELA database on a same simplified case study
fig 1- Department store The components chosen to describe building air-tightness are: ceiling, floor, wall, ceiling to wall joint, wall to floor joint, closed door, windows. In the 3 databases, the most important components concerning leakeage are ceiling and floor (85% of total area, source of 90% of total leakeage ).
In order to determine repartition of air flow rates between different zones, each zone is characterized by an equivalent opening area (pseudo-ELA: adding of air openings and tightness fault). Three permeability or ELA databases (AICVF, ASHRAE and AIVC) are tested on the same case study. It is a monozone department store described on fig 1.
2.4.1 air irlfiltration
6 m 8 m
2m20
2.4.2 natural ventilation
AIVC [AIVC, 19941
Q = C. APn database reference
flow formula
main hypothesis3
air flow rate splitting key
In building, natural ventilation is limited to opening doors. It is considered that windows are closed for an air conditionned building. AICVF's guideline suggest a formula that has been adapted to both other methods.
AICVF [AICVF, 19891 Q = B.A,.APn
AP = 1Pa applied uniformly
m3 BAe = 11,s S. Pan
ASHRAE [ASHRAE, 19931
The hypothesis of uniform pressure difference is correct when mechanical ventilation is preponderant.
AP = 4Pa C D = 1
ELA = 4,5 mL
AICVF adapted to AIVC identification with n = 0,5
AICVF Q=0,59 A AP'.~ [m3/s]
N P BA, = 0,59. Z, . A, - 3600
AP applied uniformly n = 0,66
m3
S. Pan C = 3 -
AICVF adapted to ASHRAE identification with AP = 4 Pa
N P ELA = ELAa,,.&.z0. - 3600
N P C = Cares, 4 . ~ 0 . - 3600
For the department store, two scenarios are considered: - 750 customers per hour by group of 6 persons, Np = 125 openings per hour. - 1500 customers per hour by group of 6 persons. Np : 250 openings per hour. Opening door mean time is fixed zo = 8 s.
2.4.3 Comparaison of results Airflow due to a 4 Pa pressure difference have been calculated with the 3 methods in order to homogenize results. So the three methods could be compared.
m3 AIVCF BA, [-
s. ~ a ~ , ~ I
ASHRAE ELA [mZ] m3
AIVC C [ S. pa 0.5
I
For infiltrations, AICVF method gives value 4 times more important than AIVC method, but AICVF database is used to size installation. It is probably not adapted to a energy consumption model. Considering the simplicity of case of study, ASHRAE and AIVC results have the same range of values. The two databases are equivalent. We choose to extract from one of those two databases a simplified components database.
scenario low 2,83
2 2 2,88
2.5 Estimation of air infiltration on HVAC energy consumption
scenario high 5,70
4 4 5,77
AIVC 26510 m3/h 0,44 vol/h 20740 mJ/h 0,34 vol/h 41540 m3/h 0,623 vol/h
mJ/h Qinfiltration
QnatUrd min max
2.5.1 Building, system and models The store HVAC system is composed of 12 roof-top units described in the following table:
Air flow rate in HVAC system are the same in cooling and heating modes: 216 000 m3/h. Rooftop units operate with constant air flow. Schedule of occupancy is the following:
AICVF 105730 m3/h 1,7 vol/h 20 400 m3/h 0,34 vol/h 4 1 060 m3/h 0.67 vollh
ASHRAE 41 830 m3/h 0,7 vol/h 20 450 mJ/h 0,34 vol/h 40 900 m3/h 0,68 volh
4 The natural ventilation flow rates are same for the 3 methods because the 3 methods use the same expression.
Sathurday 1909 perhour
Friday 1636 perhour occupation 9- 19h
Sunday 0
Mon-Tue-Thu 1309 perhour
Wednesday 1527 perhour

Mechanical ventilation is calculated from mean number of customers with 30 m3/h per person in the store and fixed to 0,75 volh. Meteorological datas are extracted from SRY file (2 caracteristic weeks per season) [Lund, 19851. The simulations are made for first week of winter and first week of summer. The chosen location is Carpentras in the South of France.
Supply-air-conditions are a result of supply-air-flow-rate and thermal and hydric loads of the building, which are calculated using COMFIE as a building simulation model [Peuportier, 19921. As roof-top air conditionners are running with a constant air flow, the cooling energy rate and the compressor electrical power are calculated, taking into consideration the fresh air flow rate, the return air flow rate, the supplied conditions at each calculation step. Air handling cycles in psychrometric chart, and finally energy consumption of roof-tops including auxiliaries (fans) are calculated, as described in [Morisot et al, 19971.
Zone loads calculation by COMFIE simulation nOl: mean value of air infiltration rate
simulation n02: hourly value of air infiltration using linear correlation Usefull Energy rates
Plant
Air Handling Cycles Energy Consumption
fig 2-flow chart of calculation
2.5.2 Simulations Fresh air is introduced in the roof-top units. In simulation nOl, average value of air infiltration is used and in simulation n02 hourly values are used (calculated using TRNSYS linear expression depending on temperature difference and wind). Air infiltrations are added to the loads of the building. Figure 3 shows evolution of air infiltration for the first week of summer and winter. Air infiltration rate is expressed in volume of the store per hour. Average value of air infiltration is calculated considering the 2 weeks of datas and its value is 0,44 vol/h.
o o o l : : : : : : ' : ' : : : I I2 25 I7 .B 1 S 97 iOP $21 111 1.3 I S 7
week in hour
fig 3- Air Infiltration Rate for two week of SRY files
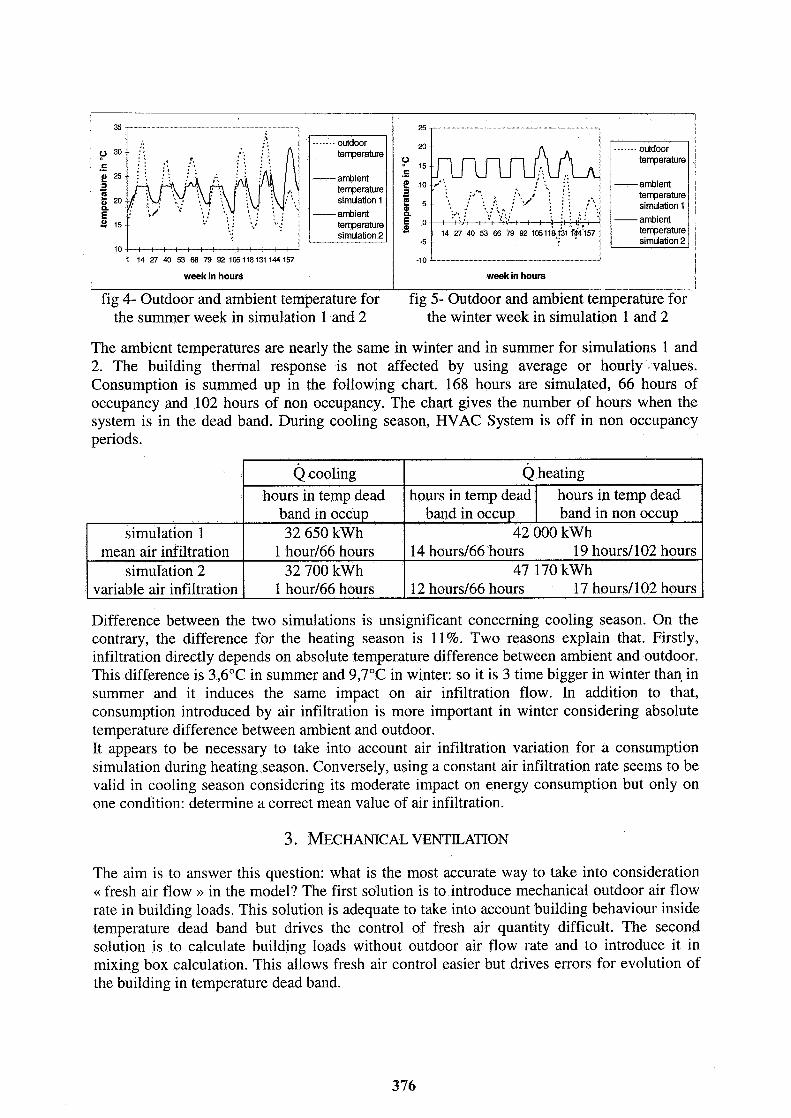
. . . . . . . outdoor temperature
ambient temperature simulation 1 ambient temperature
1 o J l : ; : l : : l : : : : : . ,
I 1 14 27 40 53 66 79 92 105118131 144157
week in hours
. . . . . . . outdoor
simulation1 ambient temperature
week in hours I I
fig 4- Outdoor and ambient temperature for fig 5- Outdoor and ambient temperature for the summer week in simulation 1 and 2 the winter week in simulation 1 and 2
The ambient temperatures are nearly the same in winter and in summer for simulations 1 and 2. The building thermal response is not affected by using average or hourly values. Consumption is summed up in the following chart. 168 hours are simulated, 66 hours of occupancy and 102 hours of non occupancy. The chart gives the number of hours when the system is in the dead band. During cooling season, HVAC System is off in non occupancy periods.
Difference between the two simulations is unsignificant concerning cooling season. On the contrary, the difference for the heating season is 11%. Two reasons explain that. Firstly, infiltration directly depends on absolute temperature difference between ambient and outdoor. This difference is 3,6"C in summer and 9,7"C in winter: so it is 3 time bigger in winter than in summer and it induces the same impact on air infiltration flow. In addition to that, consumption introduced by air infiltration is more important in winter considering absolute temperature difference between ambient and outdoor. It appears to be necessary to take into account air infiltration variation for a consumption simulation during heating season. Conversely, using a constant air infiltration rate seems to be valid in cooling season considering its moderate impact on energy consumption but only on one condition: determine a correct mean value of air infiltration.
simulation 1 mean air infiltration
simulation 2 variable air infiltration
3. MECHANICAL VENTILATION
The aim is to answer this question: what is the most accurate way to take into consideration << fresh air flow >> in the model? The first solution is to introduce mechanical outdoor air flow rate in building loads. This solution is adequate to take into account building behaviour inside temperature dead band but drives the control of fresh air quantity difficult. The second solution is to calculate building loads without outdoor air flow rate and to introduce it in mixing box calculation. This allows fresh air control easier but drives errors for evolution of the building in temperature dead band.
Q cooling hours in temp dead
band in occup 32 650 kwh
1 hour166 hours 32 700 kwh
1 hour166 hours
Q heating hours in temp dead
band in occup hours in temp dead band in non occup
42 000 kwh 14 hours166 hours 19 hours1102 hours
47 170 kwh 12 hours166 hours 17 hours/ 102 hours

Simulations are made on the store already described for the two weeks of SRY files.
3.1 Simulation
Introducing mechanical ventilation in the mixing box is compared to introduce it in building loads.
simulation n04 mechanical ventilation
Zone loads calculatio
simulation n03 mechanical ventilation
Plant
Energy Consumption
fig 6- Two possible models for mechanical ventilation
3.2 Results
temperature
-ambient ten-perature simulation 3
-ambient temperature simulation 4
/ ------. o ~ r I temperature
-ambient ten-perature simulation 3
- ambient tenperature simulation 4
week in hours I week in hours I
fig 7- Outdoor and ambiant temperature for fig 8- Outdoor and ambiant temperature for the summer week in simulation 3 and 4 the winter week in simulation 3 and 4.
The building thermal response are nearly the same for the two models. On the other hand, consumption between simulation n03 and 4 decreases significantly in winter (-16%) and decreases less in summer (-3%). The difference appears during the period when building temperature is in the temperature dead band. When ventilation is introduced in roof-top units, fresh air is supplied at ambient conditions as a << neutral air >>. Indeed, constant air flow roof- top units chosen do not include a fresh air control. In our particular case, system never uses outdoor air as a cooling or heating source. That explains the artificial consumption increase when fresh air is introduced in the mixing box. Differences are clearly evident on figure 8. They correspond to three sequences of overheating (2 in occupancy and 1 in unoccupancy).
simulation 3 ventilation in system
simulation 4 ventilation in load
Q cooling , . . . . . . . . . . . . . . . . . . . . . . . . . . . . . . . . . . . . . . . . . . . . . . . . . . . . . . . . . . . . . .
hours in temp dead band in occup 32 700 kwh
1 hour166 hours 3 1 870 kwh
0 hour166 hours
Q heating . . . . . . . . . . . . . . . . . . . . . . . . . . . -. . . . . . . . . . . . . . . . . . . . . . , . . . . . . . . . . . . . . . . . . - . . . . . . . . . . . . . . . . . . . . . . . . . . . . . . . . . . . .- . . . . . . . hours in temp dead f hours in temp dead
band in occup I band in non occup 47 170 k w h
12 hours166 hours 17 hours1 102 hours 39 650 k w h
10 hours166 hours 17 hours1102 hours
One can check that fresh air needs around 300 kW to become neutral (near 10000 kwh during the period). However, considering fresh air as a building load prevents from simulating a fresh air control. In the particular case (no fresh air control and overheating in summer), model of simulation 4 must be used.
This study relates to the introduction of air infiltration and mechanical ventilation in a model for energy consumption estimation. A simplified tool of air infiltration evaluation is chosen because of its facilty to use and its medium precision. Two ELA or equivalent databases can be used to determine an air flow rate splitting key. Simulations have shown it is necessary to use hourly value of infiltration instead of mean value. Models of mechanical ventilation have been compared. A simulation with particular system shows that both solutions are not equivalent for energy consumption (16% difference).
[AICVF, 19891 Roger CASARI (( Guide nOl de L'AICVF, chauffage: calculs des de'perditions et charges thermiques d'hiver w
1989, Pyc Ed., chapitre 12 les dkperditions par renouvellement d'air, p.131-142, p.186-189 [AIVC, 19941 Malcom ORME, Martin LIDDAMENT, Andrew WILSON (( Technical Note AIVC 44, An Analysis and Data Summary of the AIVC's Numerical Database , mars 1994, IEA energy conservation in buildings and community systems programme, 100 pages [AIVC, 19961 Martin LIDDAMENT (( a Guide to Energy Eficient Ventilation, Air Infiltration and Ventilation Centre ,, University of Wanvick Science Park, Coventry, Great Britain, mars 1996, 254 pages [ASHRAE, 19931 (( ASHRAE Handbooks, Fundamentals * 1993, chapter 23 Infiltration and Ventilation, p 23.1-23.23 [Etheridge and Sandberg, 19961 David ETHERIDGE, Mats SANDBERG (< Building Ventilation Theory and Measurement u 1996, pages 153-156 [Lund, 19851 Hans LUND
<< Short Reference Years and Test Reference Years for EEC Countries ,> Thermal Insulation Laboratory, Technical University of Denmark. Final report, contract ESF-029-DK 1985 [Morisot et al, 19971 Dominique MARCHIO, Jean-Robert MILLET, Olivier MORISOT (( Simple Modelling for Energy Consumption Estimation in Air Conditionned Buildings u, Clima 2000 proceedings Brussels 1997 [Peuportier, 19921 Bruno PEUPORTIER (( COMFIE- Passive Solar Design Tool for Multizone Buildings ,> User guide, Centre d'Energe'tique, Ecole des Mines de Paris, January 1992 [Sherman, 19801 M.H. SHERMAN, D. T. GRIMSRUD (( Measurement of Infiltration using Fan Pressurization and Weather Data First Symposium of the Air Infiltration Centre on Instrumentation and Measurement Techniques, Windsor, England, October 6-8, 1980, 60 pages [TRNSYS, 19961 (( TRNSYS a Transient System Simulation Program ,, Solar Energy Laboratory- University of Wisconsin- Madison, juillet 1996, chapter 4.8 Building Loads and Structures, 4.8.3 type 19: detailled zone

VENTILATION AND COOLING
18TH ANNUAL AIVC CONFERENCE, ATHENS, GREECE, 23-26 SEPTEMBER, 1997
as measured ue
Hans Stymne(*) and CarlAxel oma an(^)
( 1 ) ~ o ~ a l Institute of Technology @)Pentiaq AB Department of Built Environment P. 0. Box 7 P. 0. Box 88 S-80102 Gavle, Sweden S-80102 Gavle, Sweden

Synopsis
A passive tracer gas technique - the homogenous emission technique was utilised for measuring the air distribution in a part of an office building with displacement ventilation. Measurements were made during one winter period and one summer period. During the winter period the ventilation was run continuously, while odoff regulation was used during the summer period. The result from the winter measurement shows that the displacement effect was satisfactory but less pronounced close to the window-side of the office.
The paper discusses the effect of odoff ventilation strategy on the requirement of the measurement technique and the implications of such strategy on air quality. It is shown that the homogeneous emission tracer gas technique yields the true average mean age of air, also during transient conditions, but that special precautions must be taken when using intermittent sampling of the air.
1. Introduction
In most mechanically ventilated commercial buildings, the ventilation is varied depending on the occupancy. Usually ventilation is run in only two modes - on and off. During occupancy the ventilation is on, while it is off during nights and weekends. This type of operation has certain consequences on how to perform and interpret a ventilation measurement experiment and also affects the air quality during occupancy hours.
In the present paper, we present the result of ventilation measurements during two periods in the same office building. During the first measurement period, the ventilation was run continuously, while during the second period, ventilation was running only from 5 a.m. to 6 p.m. at weekdays.
In the first part of this paper, we discuss some general implication of varying flow rate on the measurement technique. In the second part we present the measurement and discuss the result in view of this general implications. Lastly, we discuss the effect of varying ventilation flow rate from an air quality and health aspect.
1.1 Measurement technique and varying flow rate.
The technique used in this work is a variant of a passive tracer gas technique called the homogeneous emission technique. This technique has been discussed in several recent papers (Stymne et al. 1992, Stymne 1994, Stymne and Boman 1994,1996). In essence, small passive tracer gas sources emitting a perfluorocarbon tracer (PFT) at a constant rate are distributed in a building in such a way that the emission is approximately homogeneous, which means that the emission rate per volume unit (S) is constant throughout the building space.
If the tracer emission is homogeneous, it has been shown (Sandberg and Sjoberg 1994, Stymne et al. 1994) that the local steady state concentration of tracer gas (C,) will be directly proportional to the local mean age of air (T,), and that a measurement of local concentrations
thus will yield estimates of the local mean ages of air and their distribution in space according to equation 1.
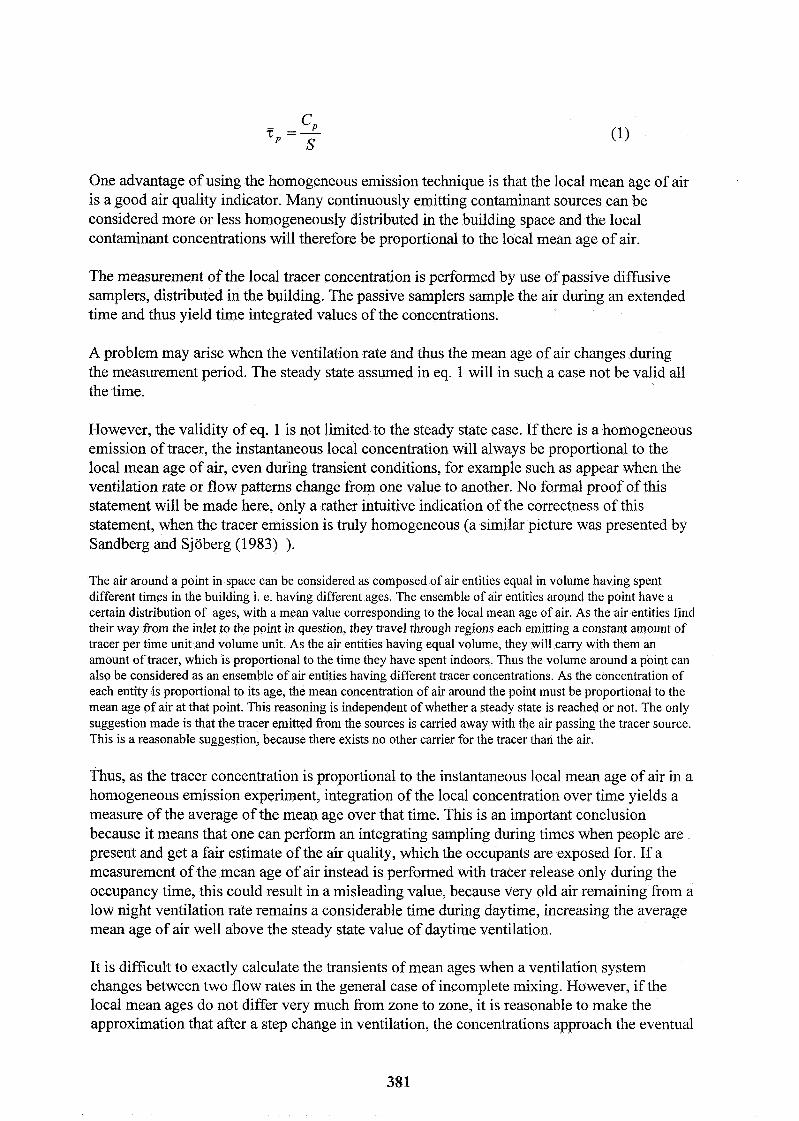
One advantage of using the homogeneous emission technique is that the local mean age of air is a good air quality indicator. Many continuously emitting contaminant sources can be considered more or less homogeneously distributed in the building space and the local contaminant concentrations will therefore be proportional to the local mean age of air.
The measurement of the local tracer concentration is performed by use of passive diffusive samplers, distributed in the building. The passive samplers sample the air during an extended time and thus yield time integrated values of the concentrations.
A problem may arise when the ventilation rate and thus the mean age of air changes during the measurement period. The steady state assumed in eq. 1 will in such a case not be valid all the time.
However, the validity of eq. 1 is not limited to the steady state case. If there is a homogeneous emission of tracer, the instantaneous local concentration will always be proportional to the local mean age of air, even during transient conditions, for example such as appear when the ventilation rate or flow patterns change from one value to another. No formal proof of this statement will be made here, only a rather intuitive indication of the correctness of this statement, when the tracer emission is truly homogeneous (a similar picture was presented by Sandberg and Sjoberg (1983) ).
The air around a point in space can be considered as composed of air entities equal in volume having spent different times in the building i. e. having different ages. The ensemble of air entities around the point have a certain distribution of ages, with a mean value corresponding to the local mean age of air. As the air entities find their way from the inlet to the point in question, they travel through regions each emitting a constant amount of tracer per time unit and volume unit. As the air entities having equal volume, they will cany with them an amount of tracer, which is proportional to the time they have spent indoors. Thus the volume around a point can also be considered as an ensemble of air entities having different tracer concentrations. As the concentration of each entity is proportional to its age, the mean concentration of air around the point must be proportional to the mean age of air at that point. This reasoning is independent of whether a steady state is reached or not. The only suggestion made is that the tracer emitted from the sources is carried away with the air passing the tracer source. This is a reasonable suggestion, because there exists no other carrier for the tracer than the air.
Thus, as the tracer concentration is proportional to the instantaneous local mean age of air in a homogeneous emission experiment, integration of the local concentration over time yields a measure of the average of the mean age over that time. This is an important conclusion because it means that one can perform an integrating sampling during times when people are present and get a fair estimate of the air quality, which the occupants are exposed for. If a measurement of the mean age of air instead is performed with tracer release only during the occupancy time, this could result in a misleading value, because very old air remaining from a low night ventilation rate remains a considerable time during daytime, increasing the average mean age of air well above the steady state value of daytime ventilation.
It is difficult to exactly calculate the transients of mean ages when a ventilation system changes between two flow rates in the general case of incomplete mixing. However, if the local mean ages do not differ very much from zone to zone, it is reasonable to make the approximation that after a step change in ventilation, the concentrations approach the eventual
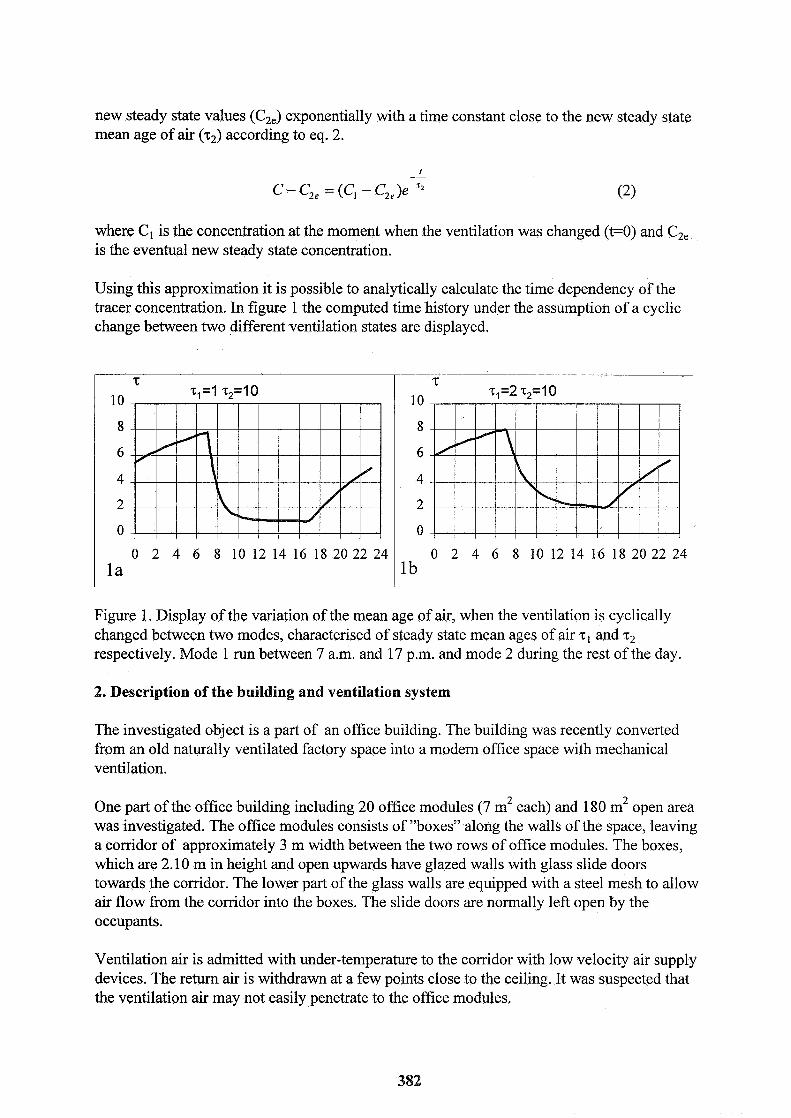
new steady state values (C,,) exponentially with a time constant close to the new steady state mean age of air (72) according to eq. 2.
C - C,, = (C, - C,,)e ''
where C1 is the concentration at the moment when the ventilation was changed (t=O) and C2, is the eventual new steady state concentration.
Using this approximation it is possible to analytically calculate the time dependency of the tracer concentration. In figure 1 the computed time history under the assumption of a cyclic change between two different ventilation states are displayed.
Figure 1. Display of the variation of the mean age of air, when the ventilation is cyclically changed between two modes, characterised of steady state mean ages of air T, and z2 respectively. Mode 1 run between 7 a.m. and 17 p.m. and mode 2 during the rest of the day.
2. Description of the building and ventilation system
The investigated object is a part of an office building. The building was recently converted from an old naturally ventilated factory space into a modern office space with mechanical ventilation.
One part of the office building including 20 office modules (7 m2 each) and 180 m2 open area was investigated. The office modules consists of "boxes" along the walls of the space, leaving a corridor of approximately 3 m width between the two rows of office modules. The boxes, which are 2.10 m in height and open upwards have glazed walls with glass slide doors towards the corridor. The lower part of the glass walls are equipped with a steel mesh to allow air flow from the corridor into the boxes. The slide doors are normally left open by the occupants.
Ventilation air is admitted with under-temperature to the corridor with low velocity air supply devices. The return air is withdrawn at a few points close lo the ceiling. It was suspected that the ventilation air may not easily penetrate to the office modules.

The ventilation is normally run only between 5 a.m. to 6 p.m. on weekdays. All other times the ventilation is off.
3. Experimental layout
3.1 Experiment 1
This experiment was performed during one week of cold winter conditions. During this experiment, the ventilation was run continuously at the same rate, day and night and weekend. This was made in order to be able to use integrating sampling during an extended period at approximately the same conditions which is valid during work hours.
Approximately 70 passive tracer gas sources were evenly distributed in the space to approximate a homogeneous emission. Approximately 50 samplers were distributed along the corridor and in some of the office modules at different heights in order to measure the local mean ages of air at different points. Samplers were also positioned close to air extract points.
3.2 Experiment 2
The second experiment was performed in the same object during summer conditions. The ventilation was run in its normal mode, which means that the ventilation is operating only on 1 3 hours each weekday.
The tracer gas sources were distributed in approximately the same patterns as in the first experiment. FIowever, the number of sources were tripled to yield a higher emission rate in the space.
Approximately the same numbers and positions of passive samplers were also distributed in the space as in experiment 1. These samplers were left to sample the air continuously during 2 weeks i. e. also during hours with no mechanical ventilation.
However, a few additional difisive samplers, which were electronically opened and closed were also positioned in the space. The latter samplers were meant to sample air only during 8 work hours during 5 days. As can be seen in the result and discussion sections of this paper, this part of the experiment was not entirely successful. However, the conclusions are valuable and worthwhile to report here.
4. Result
4.1 First experiment
In figure 2 the result from the first experiment is displayed in graphical form on a schematic plan of the office. The bars displayed in the plan, represent the local air change indices, i. e. the ratio between the mean age of the extract air and the local mean age of air. The lower lighter parts of the bars represent a unit air change index, that is the air change rate, which would have been expected if the ventilation had been of fully mixing type. The mean age of air at the extract point was determined to be 0.95 hours, which corresponds to an air change rate of 1.1 ACH.
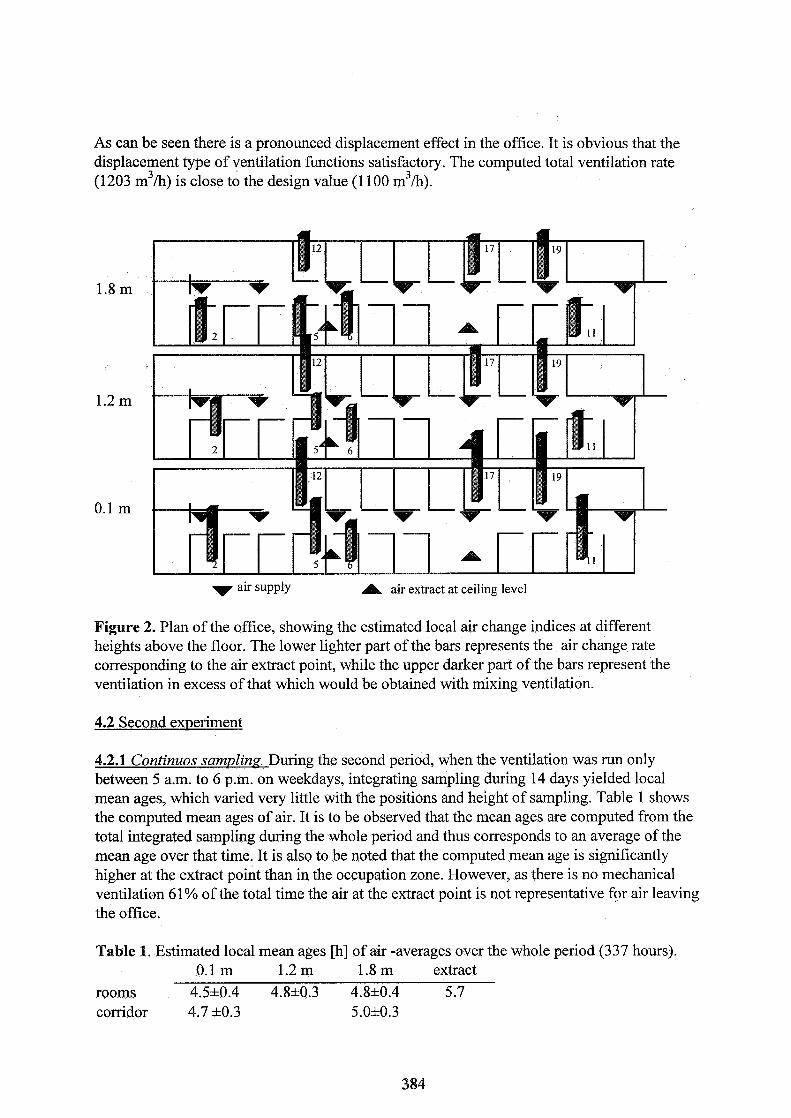
As can be seen there is a pronounced displacement effect in the office. It is obvious that the displacement type of ventilation functions satisfactory. The computed total ventilation rate (1203 m3/h) is close to the design value (1 100 m3/h).
air supply A air extract at ceiling level
Figure 2. Plan of the office, showing the estimated local air change indices at different heights above the floor. The lower lighter part of the bars represents the air change rate corresponding to the air extract point, while the upper darker part of the bars represent the ventilation in excess of that which would be obtained with mixing ventilation.
4.2 Second experiment
4.2.1 Continuos samplina. During the second period, when the ventilation was run only between 5 a.m. to 6 p.m. on weekdays, integrating sampling during 14 days yielded local mean ages, which varied very little with the positions and height of sampling. Table 1 shows the computed mean ages of air. It is to be observed that the mean ages are computed from the total integrated sampling during the whole period and thus corresponds to an average of the mean age over that time. It is also to be noted that the computed mean age is significantly higher at the extract point than in the occupation zone. However, as there is no mechanical ventilation 61% of the total time the air at the extract point is not representative for air leaving the office.
Table 1. Estimated local mean ages [h] of air -averages over the whole period (337 hours). 0.1 m 1.2 m 1.8 m extract
rooms 4.5*0.4 4.8*0.3 4.8*0.4 5.7 corridor 4.7 k0.3 5.0k0.3

As can be seen from the small difference between different heights, there is no tendency of air stratification typical for displacement ventilation.
4.2.2 Prowammed sumding. Programmed sampling was also performed at a few points in the office. The microprocessor controlled closing device was programmed to open the sampling tube at 8 a.m. and close it at 4 p.m. during 5 workdays. The result from the programmed sampler showed an average mean age of 1.5 hours.
5. Discussion.
5.1 First experiment.
The result (figure 2) shows that there is a marked tendency of stratified flow, typical for displacement type of ventilation. However, the different rooms are not equally well ventilated. Rooms no. 12, 17 and 19 on one side of the corridor are considerably better ventilated at breathing height (1.2 m) than rooms on the other side of the corridor (rooms no. 2, 5 ,6 and 11). The latter rooms show mean ages close to that which can be expected with mixing ventilation. A plausible explanation is that these latter rooms are located along the window wall, while the former rooms are arranged along an internal wall. The cold window surfaces will create a mixing convection on that side of the office.
The total air change rate (total volume divided with the mean age of air at the extract point) is 1.1 ACH, which is close to the design value, but must be considered to be rather low for an office.
5.2 Second experiment
5.2.1 Continuous sarnvlinn. As discussed in the introductory section integrating sampling in a homogeneous emission tracer gas experiment will yield an average of the local mean age of air during the sampling time. In the present case the ventilation was operating at its design flow rate 13 hours each weekday (totally 130 hours) and was off rest of the time (207 hours). In figure 3 the computed variation of mean age of air during the exposure time is displayed, assuming 1 ACH during the operation hours and 0.1 ACH during the non-operation hours. A further assumption is the exponential approach towards steady state conditions as discussed in the introduction.
mean age of alr [h] 1 I
12 12 12 12 12 12 12 12 12 12 12 12 12 12 12 ' t~me of day i_
Figure 3. Computed time variation of the mean age of air assuming 1 ACH during operation (5 a.m. to 6 p.m. weekdays) and 0.1 ACH during off periods.
The average of the mean ages displayed in figure 3 is 4.7 hours, close to the value estimated from the integrating samplers in experiment 2. The value 1 ACH for the work hour ventilation rate was chosen from the result of experiment 1. However, the same result for the average mean age can be obtained for other combinations of onloff ACHs. Figure 4 displays the possible combinations of onloff ACHs yielding the same average
Figure 4. Relationship between ACHs with mechanically ventilation off and on respectively, in order to achieve an average mean age of air of 4.7 hours during a fortnight (1 3 hours on-mode each weekday).
It is noted from figure 4 that the result is very insensitive to variations in ACH(on), but very sensitive to variations in ACH(off). Whatever value for ACH(on) we choose in the interval 0.6 to 2 the ACH(on) must be around 0.1 in order to yield the measured integrated value. Thus we can conclude from this experiment that the air change rate during operation-offhours is approximately 0.1 [h"] corresponding to a steady state mean age of air of 10 [h]. However, we can not even guess the ventilation during operation hours from continuous integration data. It is necessary to have other supplementary information. Such supplementary data can for example be obtained from integrated sampling only during work-hours.
The aim of this experiment was also to test such sampling, the result of which is discussed under next heading.
5.2.2 Programmed samplin~. The device for the electronic opedclose mechanism for the passive sampler was programmed to open the sampler tube from 8 a.m. to 4 p.m. during 5 workdays (totally 40 hours). The result showed an average age of air during this time of 1.5 hours.
Assuming the air change rates 0.1 [h-'1 and 1 [h-'1 for non-operation and operation hours respectively, we can calculate the theoretical average of the mean age of air during the opening time of the device. This amounts to 1.02 hours. Thus the result is not very encouraging. The discrepancy could of course be explained if the ventilation rate is lower during daytime, than we assumed (0.67 ACH instead of 1 ACH). However, such a low ventilation rate is not very likely. Instead, we suspect a leakage through the sampler sealing during the closed periods. The concentration is high during these periods, and time in closed conditions is long compared to that in opened conditions.
A simple calculation (figure 5) shows the effect which a small leakage may have on the computed mean age. The leakage is defined as the air sampling rate of a closed tube in relation to that of an open tube.
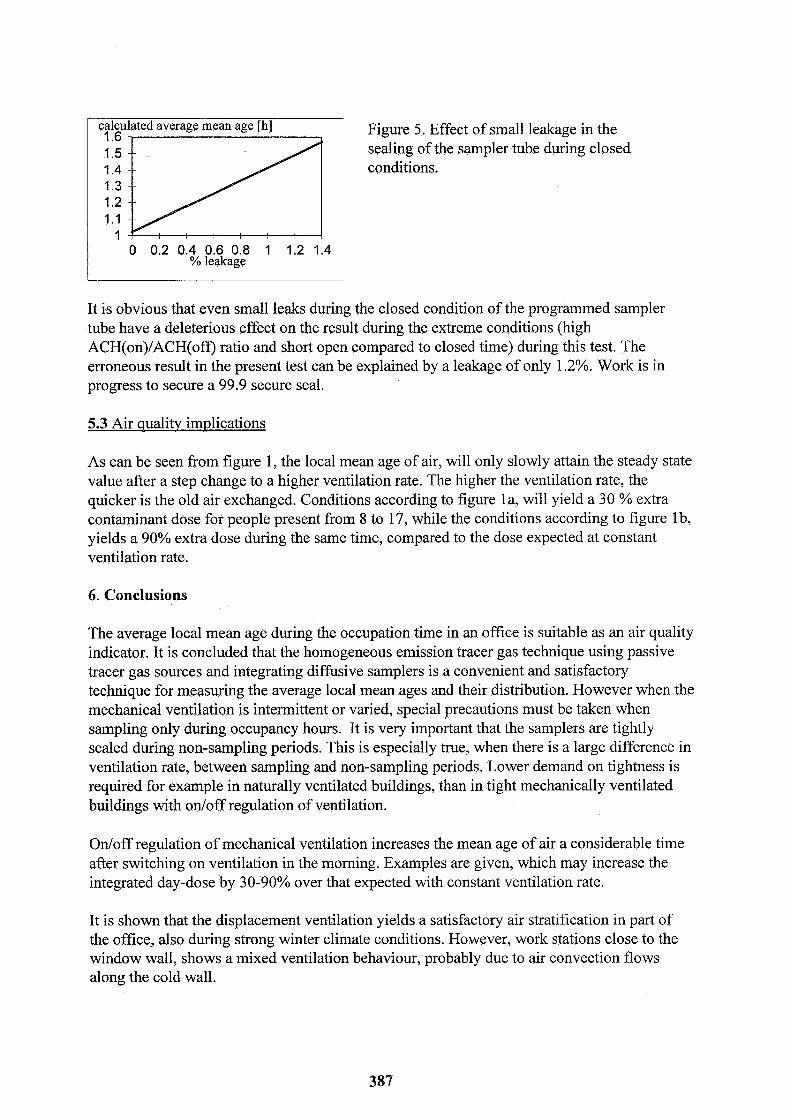
calculated average mean age [h] 1.6 1.5 1.4 1.3 1.2 1.1
1 0 0.2 0.4 0.6 0.8 1 1.2 1.4
% leakage
Figure 5. Effect of small leakage in the sealing of the sampler tube during closed conditions.
It is obvious that even small leaks during the closed condition of the programmed sampler tube have a deleterious effect on the result during the extreme conditions (high ACH(on)/ACH(off) ratio and short open compared to closed time) during this test. The erroneous result in the present test can be explained by a leakage of only 1.2%. Work is in progress to secure a 99.9 secure seal.
5.3 Air quality implications
As can be seen fiom figure 1, the local mean age of air, will only slowly attain the steady state value after a step change to a higher ventilation rate. The higher the ventilation rate, the quicker is the old air exchanged. Conditions according to figure 1 a, will yield a 30 % extra contaminant dose for people present from 8 to 17, while the conditions according to figure lb, yields a 90% extra dose during the same time, compared to the dose expected at constant ventilation rate.
6. Conclusions
The average local mean age during the occupation time in an office is suitable as an air quality indicator. It is concluded that the homogeneous emission tracer gas technique using passive tracer gas sources and integrating difhsive samplers is a convenient and satisfactory technique for measuring the average local mean ages and their distribution. However when the mechanical ventilation is intermittent or varied, special precautions must be taken when sampling only during occupancy hours. It is very important that the samplers are tightly sealed during non-sampling periods. This is especially true, when there is a large difference in ventilation rate, between sampling and non-sampling periods. Lower demand on tightness is required for example in naturally ventilated buildings, than in tight mechanically ventilated buildings with ordoff regulation of ventilation.
Ordoff regulation of mechanical ventilation increases the mean age of air a considerable time after switching on ventilation in the morning. Examples are given, which may increase the integrated day-dose by 30-90% over that expected with constant ventilation rate.
It is shown that the displacement ventilation yields a satisfactory air stratification in part of the office, also during strong winter climate conditions. However, work stations close to the window wall, shows a mixed ventilation behaviour, probably due to air convection flows along the cold wall.
6. Acknowledgement
Financial support for this work was supplied fiom the National Swedish Building Research Council, which is gratefully acknowledged. The authors also wish to thank Mrs Anita Eliasson and Mr Jorgen Sundberg for laboratory and field assistance and prof. Mats Sandberg for valuable discussions.
7. References
Sandberg, M., Sjoberg M. 1983. The use of moments for assessing air quality in ventilated rooms. Building; and Environment 18, 18 1 [1983].
Stymne H, Sandberg M, Holmgren 0 . 1992. "Ventilation measurements in large premises". Roomvent '92. Proceedings of the Third International Conference on Air Distribution in Rooms, Aalborg, Denmark Vol. 2, p 33-47
Stymne H. 1994. "Method to determine local mean ages of air and air exchange efficiency in large buildings and buildings with many rooms". NT Technical Report 321 NORDTEST, Finland
Stymne H, Boman CA. 1994. "Measurement of ventilation and air distribution using the homogeneous emission technique - A validation". Healthy Buildings '94, Proceedings of the 3rd International Conference, Budapest, Hungary, Vol. 2, pp 539-544
Stymne H, Boman CA. 1996. "Application of a passive tracer gas technique in naturally and mechanically ventilated school buildings". Proceedings of the 17th AIVG-conference - Optimum ventilation and Air Control within Buildings Gothenburg, Sweden September 1966 Vol 1, pp 283-492
Stymne H, Boman CA. 1996. Determination of air distribution patterns in large premises - application examples of the homogeneous emission technique. Proceedings of ROOMVENT"96 - 5th International Conference on air distribution in Rooms Yokohama, Japan, July 1996 Vol 1, pp 485-492

VENTILATION AND COOLING
18TH ANNUAL AIVC CONFERENCE ATHENS, GREECE, 23-26 SEPTEMBER, 1997
(Title)
Measured Air Exchange Rates at Workplaces Having Different Types of Ventilation
(Authors)
Pirjo Korhonen, Helmi K o k o ~ and Pentti Kalliokoski
(Affiliation)
Department of Environmental Sciences, University of Kuopio, P.O. BOX 1627, FIN-70211 FINLAND
1 SYNOPSIS
The aim of the study was to investigate the operation of different types of ventilation in places
constructed underground and ground level; the effect of ventilation on indoor radon levels was
also examined. Air exchange rates and radon concentrations were measured in underground
(n=73) and ground level (n=64) workplaces. Air exchange rates, designed exhaust ventilation
flows, ventilation rates per person and area were sigmficantly higher in underground places
than places constructed on the ground level. Mean of air exchange rate was significantly higher
in places having only mechanical exhaust ventilation in the underground places than in the
ground level places and indoor radon concentration was slightly higher in ground level,
whereas in the places having mechanical exhaust and supply ventilation the mean radon
concentration was almost twice higher in underground places. In general, all measures of
ventilation were higher in underground places, except the ventilation rate per area against soil.
This explains the radon concentration situation. The highest mean radon concentrations were
found when air exchange rates were below 3 6'. Ventilation was mainly effective altough, only
30 % of originally designed ventilation flows were achieved.
2 INTRODUCTION
Finnish guidelines for ventilation are currently under reform. Old guide value for air exchange
rate is 0.5 h-' in dwellings Ill. The new proposal includes a range from 0.4 to 0.8 h" (table 1).
These new values are mainly for dwellings, but they can also be used for offices, schools and
day-care centers 121. Good ventilation is a prerequisite for good indoor climate. When
ventilation fbnctions well and is in balance, it also prevents radon entry. In the study of
Denman 131, the improvement of the ventilation and sealing the constructions reduced the
radon level up to 95 % in British hospital premises. In Belgian schools, effective ventilation
together with pressurization and sealing the constructions decreased radon levels significantly
(14-98 %) 141. According to Nazaroff et al. 151, the indoor radon concentration is expected to
increase with ventilation rate if the entry mode is active and the ventilation is unbalanced.
Similar findings were discovered by our group 161 in Finnish homes, where the increase
became significant when the pressure difference exceeded 5 Pa. Kim et al. 171 have studied
radon levels in 74 subway stations. They found the radon levels to vary within a wide range up -3
to 677 Bq m and they suggested that increasing ventilation may increase negative pressure in
subway stations with mechanical ventilation. In any case, the relationship between indoor
radon level and ventilation is a complex that varies considerably with the particular
circumstances of a house 151.
Table 1. The guide values for dwellings, office buildings, schools, and factories.
Air exchange rate, Airflow
h-I 1 2 1.s-', person 1.s , m
~ w e l l i n ~ s ' ~ >0.4->O. 8 5-8 0.5-1
Office buildings"
Offices >0.4->0.8 8-16 1-2
Training rooms 6-12 3 -6
Schools, classrooms(21 >0.4->O. 8 6-12 3 -6
Light or middle light work 10 1.5
Garages 4 7
LS AND METHODS
3.1 Workplaces
Totally 137 workrooms were measured in 32 different workplaces. Radon concntrations were
measured continuously in 1 15 workrooms and air exchange rates in 97 workrooms. The places
included offices, servicing rooms, schools, and telecommunication centers. The total number of
employees in these rooms was almost 400. The room volumes varied from small office rooms
of 20 m3 to large research laboratories of 17 200 m3. Slightly more than half of workplaces
(n=73) were located underground. This also includes some places which were only partly
underground. For comparison the study also included workrooms in the ground level, 47 % of
the places. The most common type of ventilation was mechanical exhaust and supply (n=94).
3.2 Methods
Air exchange rates (h'l) were measured during working hours by the tracer gas technique and
the dilution method using freon-12, or later during the study, difluorodichloromethane as the
tracer gas and an infrared spectrophotometer W r a n 1A) as the analyzer. Calculated air
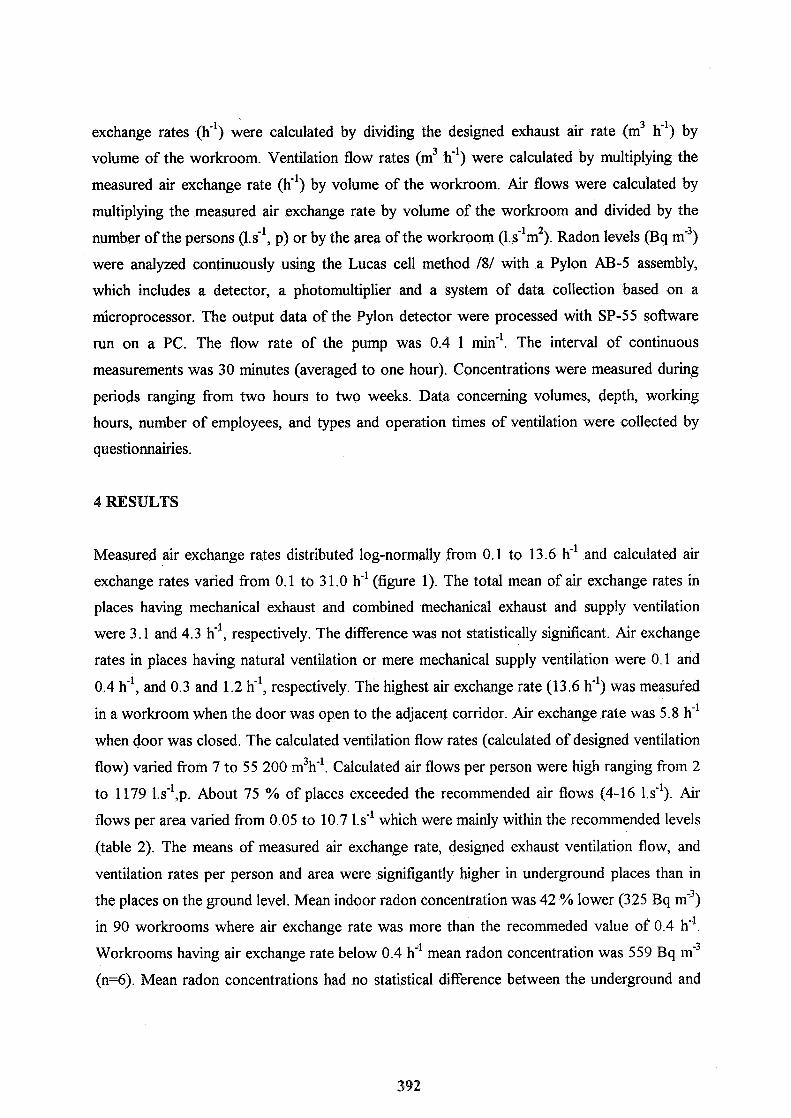
exchange rates (h-') were calculated by dividing the designed exhaust air rate (m3 h-') by
volume of the workroom. Ventilation flow rates (m3 h-') were calculated by multiplying the
measured air exchange rate (h") by volume of the workroom. Air flows were calculated by
multiplying the measured air exchange rate by volume of the workroom and divided by the -1 2 number of the persons (1.s-l, p) or by the area of the workroom (1.s m ). Radon levels (Bq m-3)
were analyzed continuously using the Lucas cell method 181 with a Pylon AB-5 assembly,
which includes a detector, a photomultiplier and a system of data collection based on a
microprocessor. The output data of the Pylon detector were processed with SP-55 software
run on a PC. The flow rate of the pump was 0.4 1 min-'. The interval of continuous
measurements was 30 minutes (averaged to one hour). Concentrations were measured during
periods ranging from two hours to two weeks. Data concerning volumes, depth, working
hours, number of employees, and types and operation times of ventilation were collected by
questionnairies.
4 RESULTS
Measured air exchange rates distributed log-normally from 0.1 to 13.6 h-' and calculated air
exchange rates varied from 0.1 to 3 1.0 h-' (figure 1). The total mean of air exchange rates in
places having mechanical exhaust and combined mechanical exhaust and supply ventilation
were 3.1 and 4.3 h-', respectively. The difference was not statistically significant. Air exchange
rates in places having natural ventilation or mere mechanical supply ventilation were 0.1 and
0.4 h-', and 0.3 and 1.2 h-l, respectively. The highest air exchange rate (13.6 h-') was measured
in a workroom when the door was open to the adjacent corridor. Air exchange rate was 5.8 h-'
when door was closed. The calculated ventilation flow rates (calculated of designed ventilation
flow) varied from 7 to 55 200 m3h-'. Calculated air flows per person were high ranging from 2
to 1179 l . ~ " , ~ . About 75 % of places exceeded the recommended air flows (4-16 1.s-I). Air
flows per area varied from 0.05 to 10.7 1 . i ' which were mainly within the recommended levels
(table 2). The means of measured air exchange rate, designed exhaust ventilation flow, and
ventilation rates per person and area were signifigantly higher in underground places than in
the places on the ground level. Mean indoor radon concentration was 42 % lower (325 Bq m")
in 90 workrooms where air exchange rate was more than the recommeded value of 0.4 h-'.
Workrooms having air exchange rate below 0.4 h-' mean radon concentration was 559 Bq m"
(n=6). Mean radon concentrations had no statistical difference between the underground and
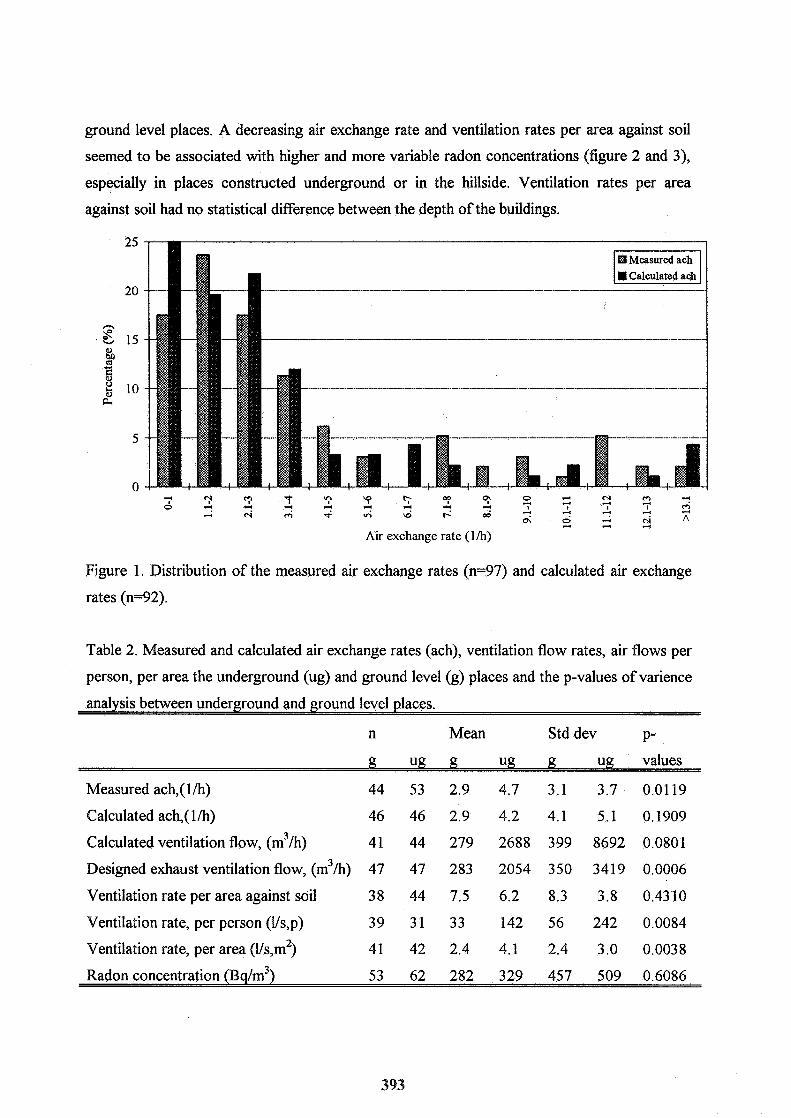
ground level places. A decreasing air exchange rate and ventilation rates per area against soil
seemed to be associated with higher and more variable radon concentrations (figure 2 and 3),
especially in places constructed underground or in the hillside. Ventilation rates per area
against soil had no statistical difference between the depth of the buildings.
4 9 3 "? 9 ' 2 - 2 2 4 4
4 4 2 2 ; 2 4 4 d 4 4
4 hi 6 + IA \d t-: od -! 4 2
4 C K g - A
Air exchange rate (1 /h)
Figure 1. Distribution of the measured air exchange rates (n=97) and calculated air exchange
rates (n=92).
Table 2. Measured and calculated air exchange rates (ach), ventilation flow rates, air flows per
person, per area the underground (ug) and ground level (g) places and the p-values of varience
analysis between underground and ground level places.
n Mean Std dev P-
a ug g ug !4 ug values
Measured ach,(l /h) 44 53 2.9 4.7 3.1 3.7 0.0119
Calculated ach,(l/h) 46 46 2.9 4.2 4.1 5.1 0.1909
Calculated ventilation flow, (m3/h) 41 44 279 2688 399 8692 0.0801
Designed exhaust ventilation flow, (m3/h) 47 47 283 2054 350 3419 0.0006
Ventilation rate per area against soil 38 44 7.5 6.2 8.3 3.8 0.4310
Ventilation rate, per person (l/s,p) 39 31 33 142 56 242 0.0084
Ventilation rate, per area (l/s,m2) 41 42 2.4 4.1 2.4 3.0 0.0038
Radon concentration ( ~ ~ l m ~ ) 53 62 282 329 457 509 0.6086

0 0 1 2 3 4 5 6 7 8 9 1 0 1 1 1 2 1 3 1 4
Air exchange rate ( l h )
Figure 2. Radon concentrations (Bq m'3) versus measured air exchange rates (h") during
working hours (n=9 1).
Ventilation rate (m3/h) /area (m2) against soil
3 -1 Figure 3. Radon concentretions (Bq k 3 ) during working hours versus ventilation rate (m h )
per area (m2) against soil (n=8 1).
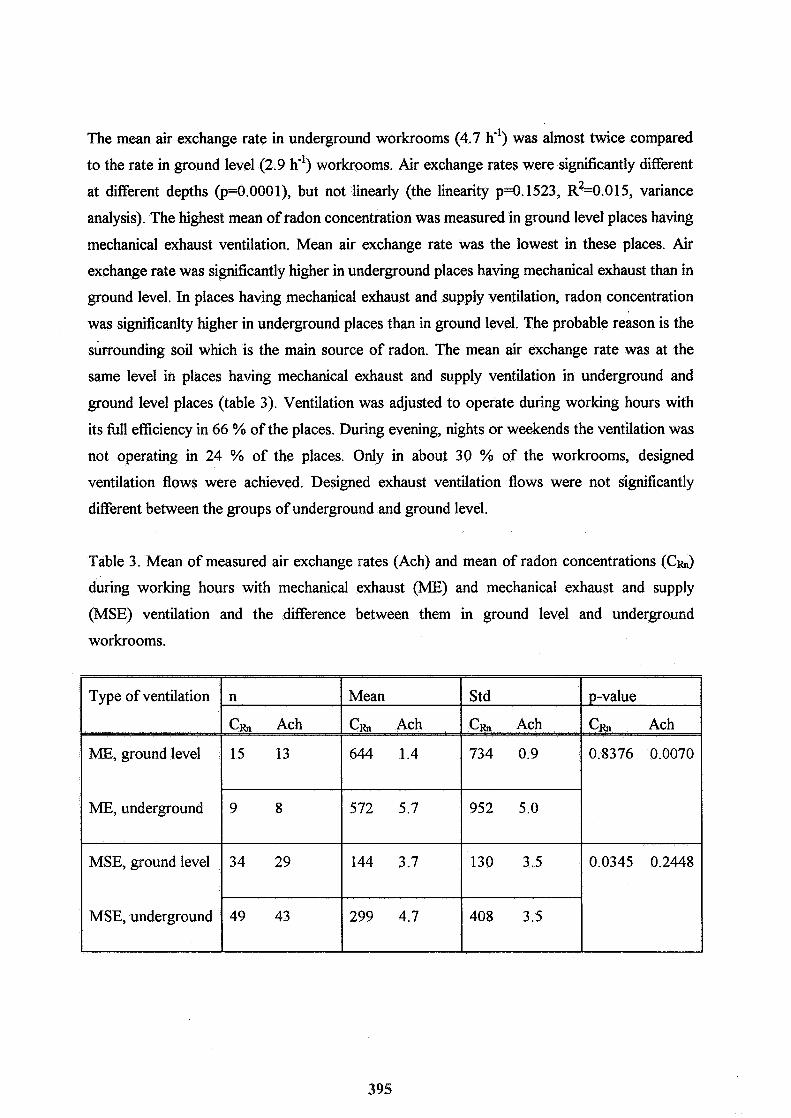
The mean air exchange rate in underground workrooms (4.7 h-') was almost twice compared
to the rate in ground level (2.9 h-') workrooms. Air exchange rates were significantly different
at different depths @=0.0001), but not linearly (the linearity p=0.1523, ~ ~ = 0 . 0 1 5 , variance
analysis). The highest mean of radon concentration was measured in ground level places having
mechanical exhaust ventilation. Mean air exchange rate was the lowest in these places. Air
exchange rate was significantly higher in underground places having mechanical exhaust than in
ground level. In places having mechanical exhaust and supply ventilation, radon concentration
was significanlty higher in underground places than in ground level. The probable reason is the
surrounding soil which is the main source of radon. The mean air exchange rate was at the
same level in places having mechanical exhaust and supply ventilation in underground and
ground level places (table 3). Ventilation was adjusted to operate during working hours with
its full efficiency in 66 % of the places. During evening, nights or weekends the ventilation was
not operating in 24 % of the places. Only in about 30 % of the workrooms, designed
ventilation flows were achieved. Designed exhaust ventilation flows were not significantly
different between the groups of underground and ground level.
Table 3. Mean of measured air exchange rates (Ach) and mean of radon concentrations (Ch)
during working hours with mechanical exhaust (ME) and mechanical exhaust and supply
(MSE) ventilation and the difference between them in ground level and underground
workrooms.
p-value
CRn Ach
0.8376 0.0070
0.0345 0.2448
Type of ventilation
ME, ground level
ME, underground
MSE, ground level
MSE, underground
n
CRn Ach
15 13
9 8
34 29
49 43
Mean
CRn Ach
644 1.4
572 5.7
144 3.7
299 4.7
Std
Ch A c ~
734 0.9
952 5.0
130 3.5
408 3.5

5 DISCUSSION
Mechanical ventilation is generally used in workplaces. Air exchange rates observed for
mechanical exhaust and combined mechanical exhaust and supply ventilation were not
significantly different. Measured air exchange rates varied largely during working hours. The
highest air exchange rates were due to opened doors which was typical situation during
workdays. Ventilation was generally in the recommended level in the underground places.
More non-compliance was found in the ground level places. Ventilation rates per person were
high.
Indoor radon concentrations were considerable high in some places. The highest
concentrations were measured in places having only mechanical exhaust ventilation and
constructed on the ground level. Some of these places were construced in the hillside, and part
of their walls was against to ground. There were also places constructed in the hillside which
were mainly underground and also grouped as an underground place. High radon levels were
observed when the ventilation rate per area against soil was low. Effective ventilation seems to
decreace indoor radon concentrations particularly in underground places and places
constructed in the hillside.
Acknowledgement
This research is supported by the Foundation of Occupational Health of Finnish Ministry of
Finance
REFERENCES
1. YM (ymparistorninisterio), ME, the Ministry of the Environment).
"National building code of Finland, D2. Indoor climate and ventilation in buildings,
Regulations and guidelines 1987" (Suomen rakentamismaarayskokoelma, Rakennusten
sisailmasto ja ilmanvaihto, maaraykset ja ohjeet) Helsinki, Finland: 1987 (In Finnish).
2. SIY (Sisailmayhdistys), Finnish Society of Indoor Air Quality and Climat, RAKLI (Suomen
Rakennuttajaliitto), Union of the Finnish Builder, SAFA (Suomen Arkkitehtiliitto) Union of the
Finnish Architects and SKOL (Suomen Konsulttitoimistojen Liitto) Union of the Finnish
Consultants."Classification of Indoor Air, Building Action and Surface Materials"
(Sisailmaston, rakennustijiden ja pintamateriaalien luokitus),Helsinki, Finland, 15.6.1995
3. DENMAN A.R.
"The significance of raised radon levels in NHS properities in Northamptonshire"
Radiation Protection Dosimetry, Vol54, Nol, 1994, pp65-68.
4. COHILIS, P., WOUTERS, P. and VOORDECKER, P.
"Radon reduction in buildings: The case of two Belgian schools, In Building Design,
Technology and Occupant Well-Being in Temperate Climates"
Eds.Sterling E., Bieva C., Collet C. Atlanta. ASHRAE, 1993, pp265-273.
5. NAZAROFF W.W., MOED B. A. and SEXTRO R.G. "
Relationship between indoor radon concentration and ventilation rate. In Radon and Its Decay
Products in Indoor air"
Edited by Nazaroff, W. W. and Nero, A. V. New York, Wiley-Interscience, 1988, pp98- 1 12.
6. KOKOTTI H., KALLIOKOSKI P. and JANTUNEN M. "
Dependency of radon entry on pressure difference"
Atmospheric Environment, Vol26A, No 12, 1992, pp2247-2250.
7. KIM, D-S. and KIM, Y-S.
"Distributions of Airborne Radon Concentrations in Seoul Metropolitan Subway Stations"
Health Physics,Vol65,No 1, 1993, pp 12-1 6.
8. LUCAS, H. "
Improved Low Level Alpha Scintillation Counter for Radon"
Rev. Sci. Instr, Vol28, 1957, pp680-683.


VENTILATION AND COOLING
18TH ANNUAL AIVC CONFERENCE ATHENS, GREECE, 23-26 SEPTEMBER, 1997
ADAPTATION OF A FAN COIL UNIT TO OPEMTING CONDITIONS FOR OPTMUM COMFORT
DANIEL MARCHAL, PIERRE BARLES
CENTRE TECHNIQUE DES INDUSTRIES AERAULIQUES ET THERMIQUES CETIAT 27 - 29, Boulevard du 1 1 Novembre 19 18 BP No 2042 69603 VILLEURBANNE CEDEX FRANCE

ADAPTATION OF A FAN COIL UNIT TO OPERATING CONDITIONS FOR OPTIMUM COMFORT
D. MARCHAL, P. BARLES
Centre Technique des Industries Aerauliques et Thermiques (CETIAT) 27 - 29, Boulevard du 1 1 Novembre 19 18 - BP No 2042 - 69603 Villeurbanne (France)
The work discussed here concerns the conditions of comfort obtained in a room cooled by a fan coil in relation to the form of air flow obtained. It is based both on practical experiment and on numerical simulation using CFD code. Combining these methods allowed a large number of configurations to be studied, in association with different operating conditions for the appliance.
Using the results in combination enabled a relation to be established between the problem data, the device characteristics and the comfort conditions obtained. A simple rule was derived from this, which can be used in practice in air-conditioned premises, in order to make the right choice or scaling of the air-conditioning appliance depending upon its conditions of use.
LIST OF SYMBOLS
: width of the fan-coil unit supply grille (m) : gravity acceleration (m/s2) : vertical distance between blowing plane and ceiling (m)
I' : air blowing velocity ( d s ) p : air volume coefficient of thermal expansion (K-l) At : temperature difference between intake and blowing (K) v : cinematic viscosity of air (m2/s) Re : Reynolds number Fr : Froude number
To cool inhabited premises that are subject to heat loads, cold-air ventilation is generally used. Cold air is denser than the ambient air, and tends to fall, making it difficult to distribute to places where it is needed. To remedy this difficulty, the property of air jets to adhere to the walls, termed the Coanda effect, is resorted-to. Thus, for a fan coil unit like the one shown in the diagram in figure 1, the cold-air jet from the blower is directed towards the ceiling, to which it adheres right up to the end of the room, which is thus enveloped with cooled air, ensuring a satisfactory degree of comfort.
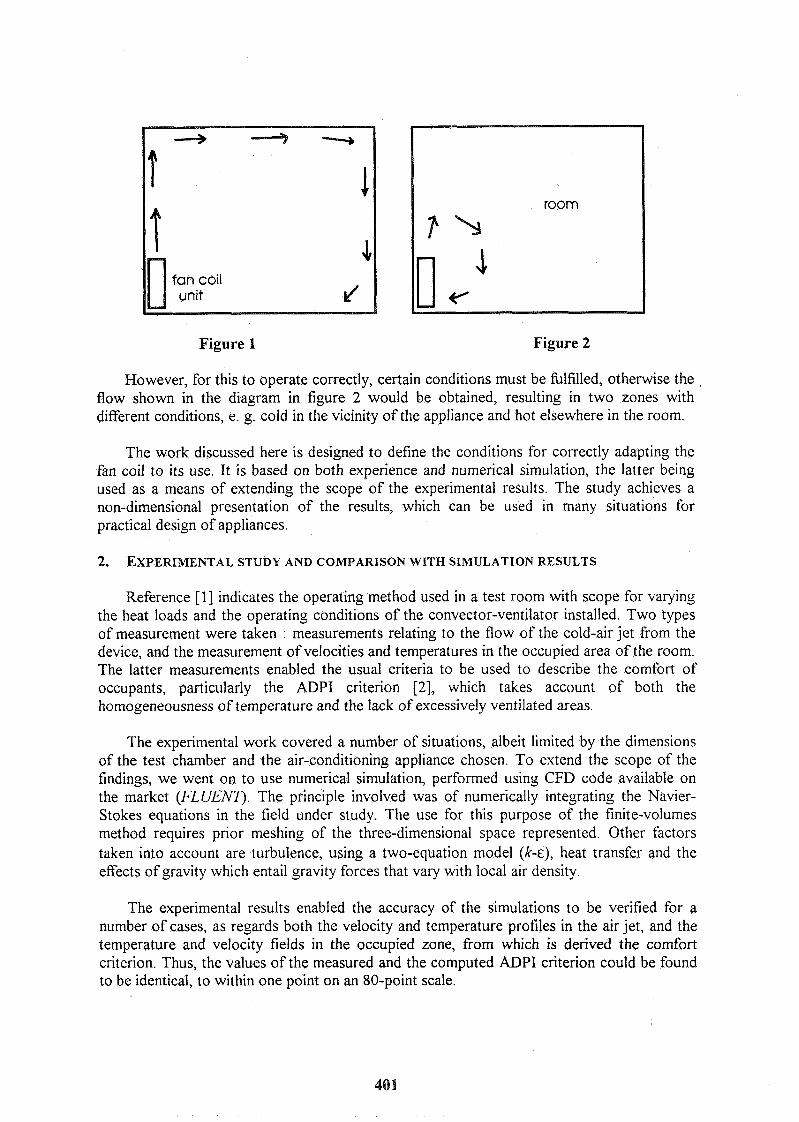
Figure 1 Figure 2
However, for this to operate correctly, certain conditions must be fulfilled, otherwise the flow shown in the diagram in figure 2 would be obtained, resulting in two zones with different conditions, e. g. cold in the vicinity of the appliance and hot elsewhere in the room.
The work discussed here is designed to define the conditions for correctly adapting the fan coil to its use. It is based on both experience and numerical simulation, the latter being used as a means of extending the scope of the experimental results. The study achieves a non-dimensional presentation of the results, which can be used in many situations for practical design of appliances.
Reference [I] indicates the operating method used in a test room with scope for varying the heat loads and the operating conditions of the convector-ventilator installed. Two types of measurement were taken : measurements relating to the flow of the cold-air jet from the device, and the measurement of velocities and temperatures in the occupied area of the room. The latter measurements enabled the usual criteria to be used to describe the comfort of occupants, particularly the ADPI criterion [2], which takes account of both the homogeneousness of temperature and the lack of excessively ventilated areas.
The experimental work covered a number of situations, albeit limited by the dimensions of the test chamber and the air-conditioning appliance chosen. To extend the scope of the findings, we went on to use numerical simulation, performed using CFD code available on the market (FLUENT). The principle involved was of numerically integrating the Navier- Stokes equations in the field under study. The use for this purpose of the finite-volumes method requires prior meshing of the three-dimensional space represented. Other factors taken into account are turbulence, using a two-equation model (k-E), heat transfer and the effects of gravity which entail gravity forces that vary with local air density.
The experimental results enabled the accuracy of the simulations to be verified for a number of cases, as regards both the velocity and temperature profiles in the air jet, and the temperature and velocity fields in the occupied zone, from which is derived the comfort criterion. Thus, the values of the measured and the computed ADPI criterion could be found to be identical, to within one point on an 80-point scale.
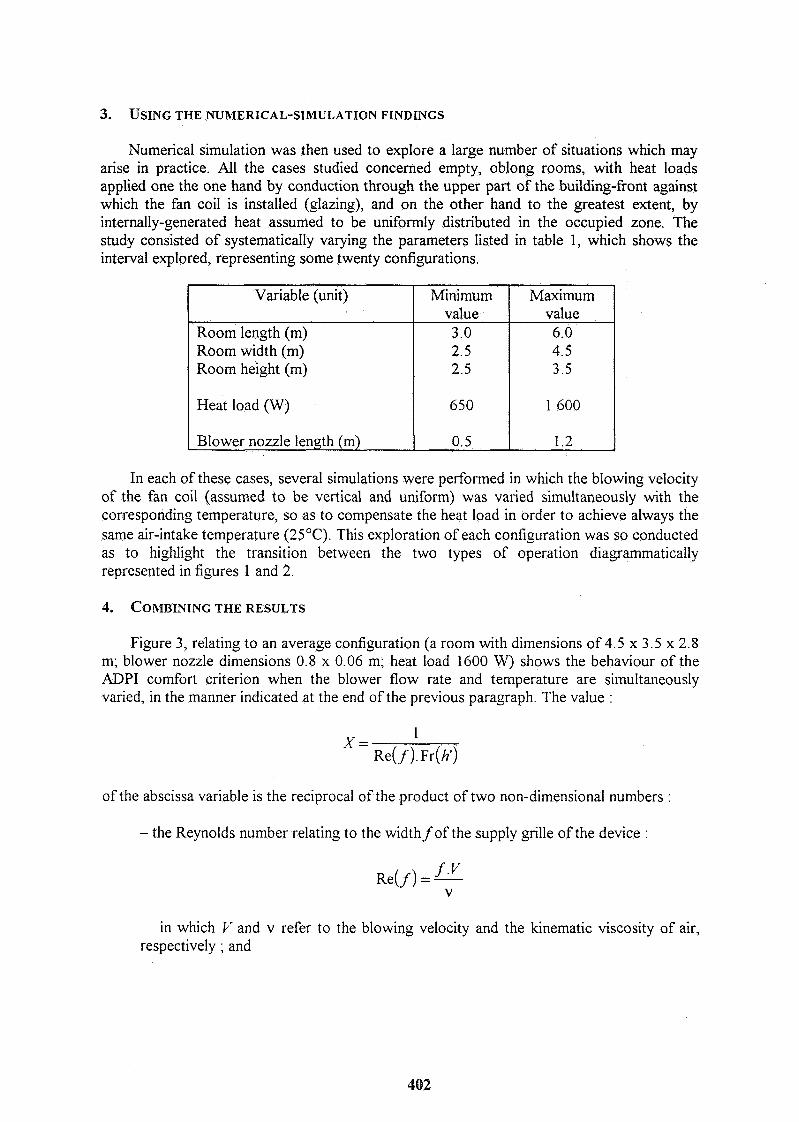
3. USING THE NURIERICAL-SIMULATION FINDINGS
Numerical simulation was then used to explore a large number of situations which may arise in practice. All the cases studied concerned empty, oblong rooms, with heat loads applied one the one hand by conduction through the upper part of the building-front against which the fan coil is installed (glazing), and on the other hand to the greatest extent, by internally-generated heat assumed to be uniformly distributed in the occupied zone. The study consisted of systematically varying the parameters listed in table 1, which shows the interval explored, representing some twenty configurations.
In each of these cases, several simulations were performed in which the blowing velocity of the fan coil (assumed to be vertical and uniform) was varied simultaneously with the corresponding temperature, so as to compensate the heat load in order to achieve always the same air-intake temperature (25°C). This exploration of each configuration was so conducted as to highlight the transition between the two types of operation diagrammatically represented in figures 1 and 2.
Figure 3, relating to an average configuration (a room with dimensions of 4.5 x 3.5 x 2.8 m; blower nozzle dimensions 0.8 x 0.06 m; heat load 1600 W) shows the behaviour of the ADPI comfort criterion when the blower flow rate and temperature are simultaneously varied, in the manner indicated at the end of the previous paragraph. The value :
Maximum value 6.0 4.5 3.5
1 600
1.2
Variable (unit)
Room length (m) Room width (m) Room height (m)
Heat load (W)
Blower nozzle length (m)
of the abscissa variable is the reciprocal of the product of two non-dimensional numbers :
Minimum value 3.0 2.5 2.5
650
0.5
- the Reynolds number relating to the width f of the supply grille of the device :
in which L' and v refer to the blowing velocity and the kinematic viscosity of air, respectively ; and
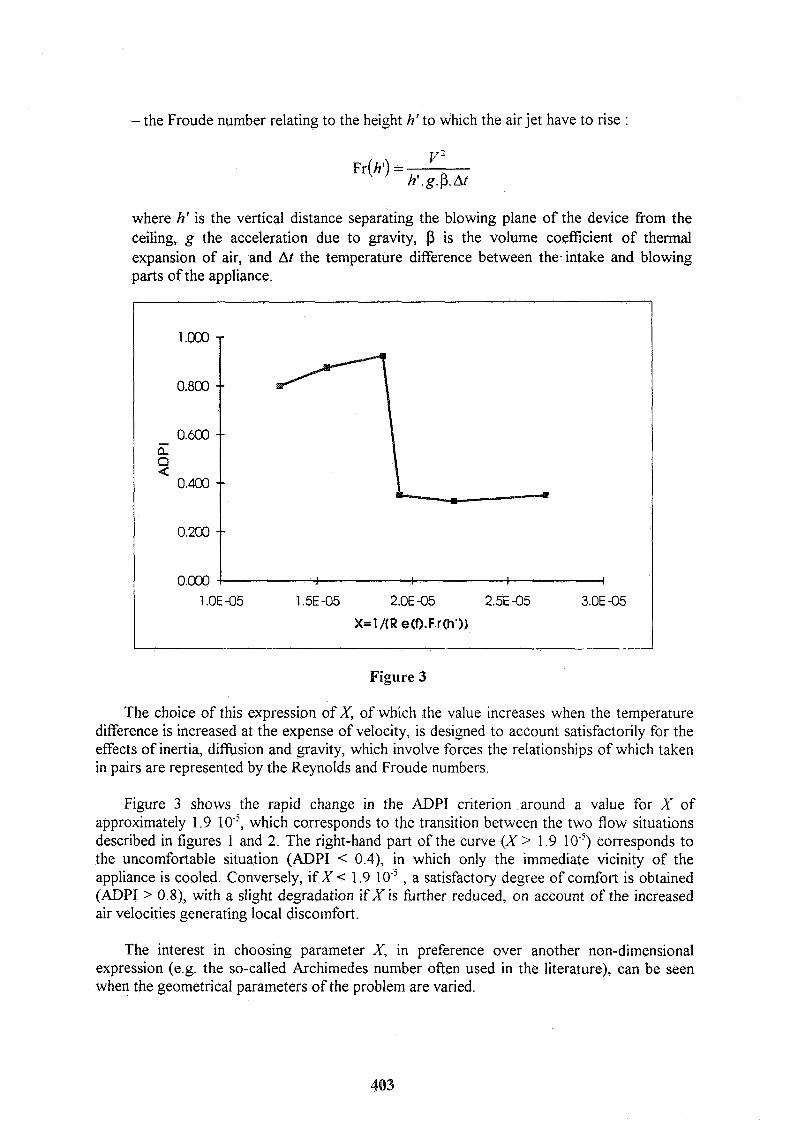
- the Froude number relating to the height h' to which the air jet have to rise :
where h' is the vertical distance separating the blowing plane of the device from the ceiling, g the acceleration due to gravity, fi is the volume coefficient of thermal expansion of air, and At the temperature difference between the- intake and blowing parts of the appliance.
Figure 3
The choice of this expression of X, of which the value increases when the temperature difference is increased at the expense of velocity, is designed to account satisfactorily for the effects of inertia, diffusion and gravity, which involve forces the relationships of which taken in pairs are represented by the Reynolds and Froude numbers.
Figure 3 shows the rapid change in the ADPI criterion around a value for X of approximately 1.9 which corresponds to the transition between the two flow situations described in figures 1 and 2. The right-hand part of the curve (X > 1.9 lo-') corresponds to the uncomfortable situation (ADPI < 0.4), in which only the immediate vicinity of the appliance is cooled. Conversely, if X < 1.9 10-' , a satisfactory degree of comfort is obtained (ADPI > 0.8), with a slight degradation if X is fbrther reduced, on account of the increased air velocities generating local discomfort.
The interest in choosing parameter X, in preference over another non-dimensional expression (e.g. the so-called Archimedes number often used in the literature), can be seen when the geometrical parameters of the problem are varied.
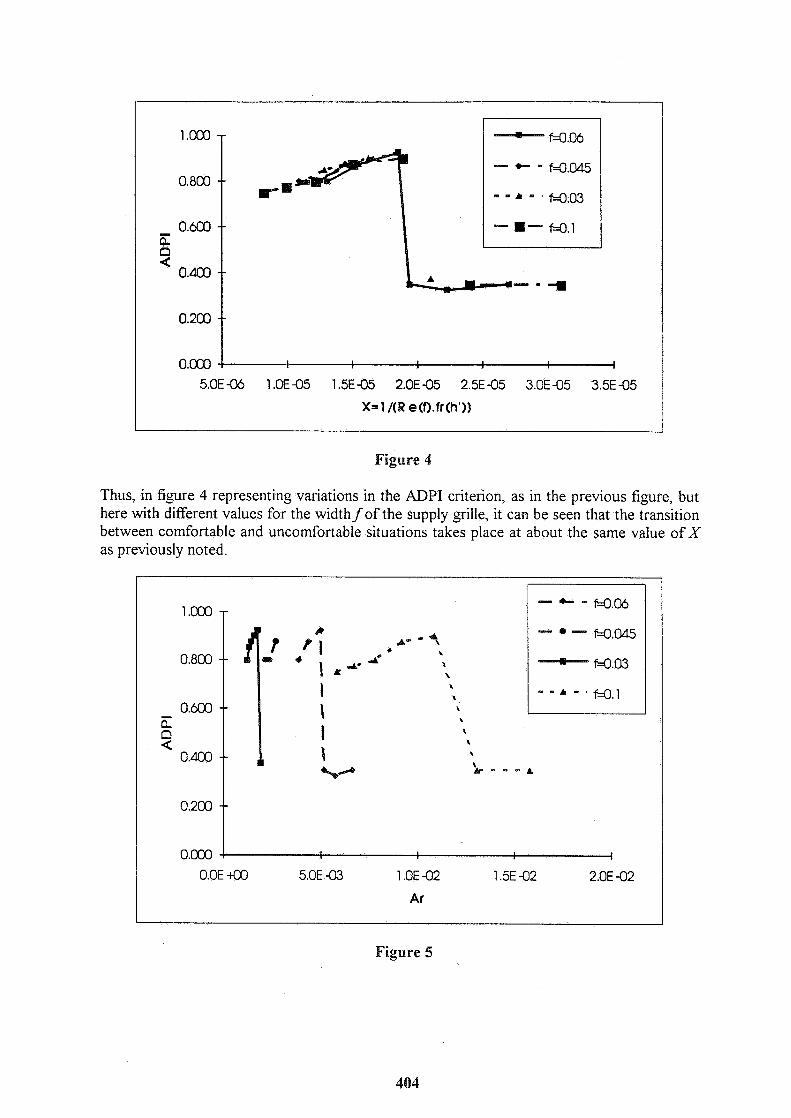
Figure 4
Thus, in figure 4 representing variations in the ADPI criterion, as in the previous figure, but here with different values for the width f of the supply grille, it can be seen that the transition between comfortable and uncomfortable situations takes place at about the same value of X as previously noted.
Figure 5
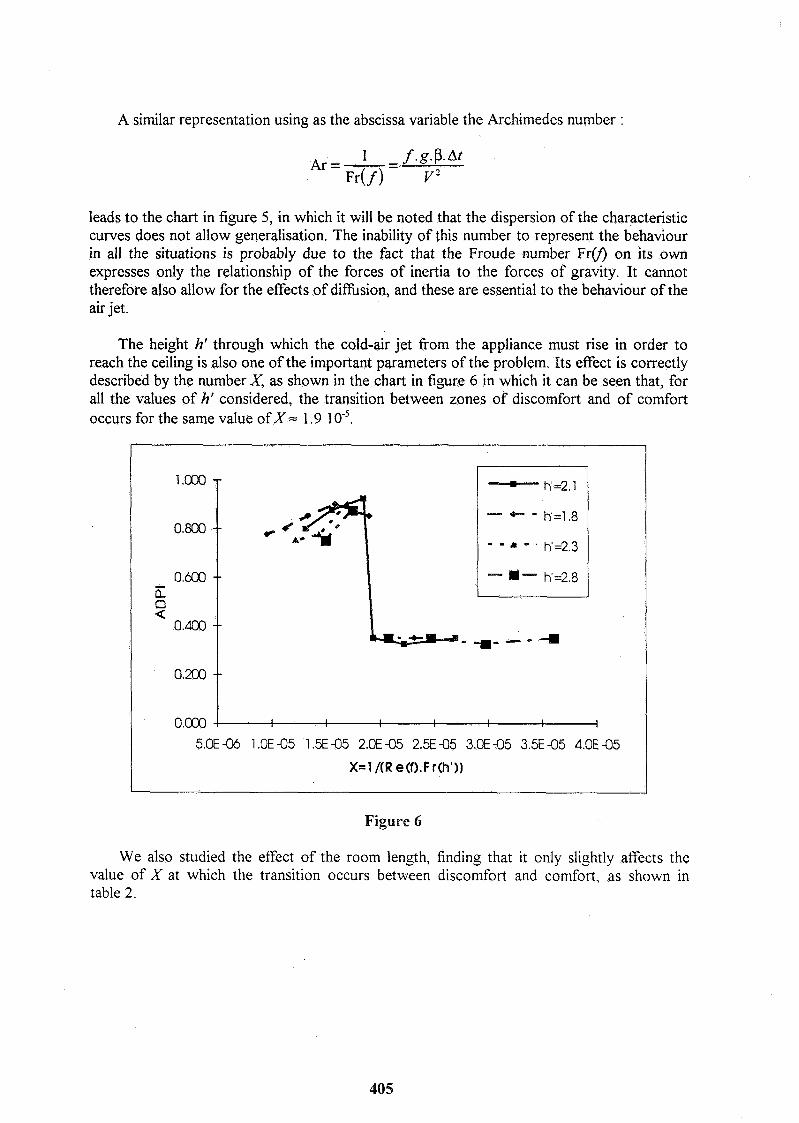
A similar representation using as the abscissa variable the Archimedes number :
leads to the chart in figure 5, in which it will be noted that the dispersion of the characteristic curves does not allow generalisation. The inability of this number to represent the behaviour in all the situations is probably due to the fact that the Froude number FrV) on its own expresses only the relationship of the forces of inertia to the forces of gravity. It cannot therefore also allow for the effects of diffision, and these are essential to the behaviour of the air jet.
The height h' through which the cold-air jet from the appliance must rise in order to reach the ceiling is also one of the important parameters of the problem. Its effect is correctly described by the number X, as shown in the chart in figure 6 in which it can be seen that, for all the values of h' considered, the transition between zones of discomfort and of comfort occurs for the same value of X = 1.9 lo-'.
Figure 6
We also studied the effect of the room length, finding that it only slightly affects the value of X at which the transition occurs between discomfort and comfort, as shown in table 2.

Table 2
The results obtained show that the other parameters listed in table 1 also only exert secondary effects on the change in flow conditions. Accordingly, as the single condition for a satisfactory degree of comfort in terms of the ADPI, the following can be adopted :
Room lenLgth (m) 3
For shorter rooms (3 m or less), a lower value (= 4.5 103 can be acceptable for this product.
Transition value of X 2.4 .
The study presented leads to a non-dimensional relationship which allows foreknowledge of the flow behaviour caused by a fan coil unit used for air-conditioning an inhabited room, and the resulting comfort rating. This law derived from combining the results can be used in practice for the purposes of real-life projects for air-conditioned premises, in order to make the correct choice or scaling of the air-conditioning appliance, allowing for the conditions of its use.
The reliability of the formulation presented here obviously depends on the assumptions followed, basically regarding the homogeneousness of the air flow from the appliance blower nozzle, and that of the heat loads in the occupied area of the room. Although many ordinary situations do not meet these conditions, these assumptions are necessary for purposes of a general study, otherwise the diversity of cases to be studied would negate any attempt at generalisation. For these reasons, the results presented must nevertheless be applied with caution.
[ I ] A. Meslem, C. Inard, P. Barles. Experimental studies on the air flow characteristics of air-conditioned ofice rooms ROOMVENT 96, 17th - 19th July 1996, Nagoya, Japan.
[ 2 ] Method of testing for room air diffusion. ANSIIASHRAE 1 13-1 990, American National Standards Institute, 1990.
VENTILATION AND COOLING 18TH AIVC CONFERENCE, ATHENS, GREECE
23-26 SEPTEMBER, 1997
Title: Study of the Ventilation in an Ancient Building Located in the Centre of Rome and Now Used as a University Office
Author(s): 6. Fasano, 6. Giorgiantoni, F. Raponi, V. Leonelli
Affiliation: Department of Energy, Div.Energy Rational Uses ENEA (The Italian Committee for the New Technologies, Energy and the Environment
lgth AIVC Conference,Athens,Greece 23-26 Sept 1997
Study of the ventilation in an Ancient Building Located on the Centre of Rome and now Used as Universitary Office
1 -2-3 -4 Department of Energy, Div.Energy Rational Uses ENEA (The Italian Committee for the New Technologies, Energy and the Environment
SYNOPSIS
An investigation of some Indoor Air Quality (IAQ) parameters in a significant office of the State in the area of Rome was undertaken.The aim, in future, will be to cover a wide range of situations in vaiious buildings and organizations, to achieve data to improve the working conditions, to have a more healthy working environment, to optimize energy consumption and energy management.Analisys of IAQ parameters was performed by field measurements; conditions of the ventilation system were checked by local inspections, code simulations by the multizone model CONTAM96 by NIST (National Insttute of Standard and Technologies USA) were undertaken and compared with the field measures, reproducing the local conditions with data extracted from the technical literature.
LIST OF SYMBOLS
Pa = Pressure (1 N/m2) ppm = Concentration (parts per million)
METHODS
The considered office is located in the City of Rome downtown. It is an hystorical building (1 6th century) and the activity of the organization is devoted to the scientific technical and administrative services of the Institute for Applied Physics of Nuclear Engineering.It is a multistorey building near a heavy all day traffic road and the office is a typical technical office with three employees located in the ground floor of the building.One of the threee smokes regularly and furthermore two personal computers are turned on.The duration of working activity is about eight hours (8-1 7) with one hour interval during 1unchtime.Air handling system (AHU) is not provided in this room.The office door, to comply with office regulations is constantly kept opened.The investigation period is febmary 1997. Therefore the main characteristics of the room can be summarized as follows:
Room dimensions:4.30*6.50 h 3.80 door: 1.24*2.10 kept opened window:class A1,permeability 12.5 m3/h/m ofjoint @ 100 Pa (from UNCSAAL Italian Windows Manufacturers Associations )
Outdoor conditions Since the period is from Feb 3 to 8 the outside temperature varies from 0 to 14 OC.Usua1 metheorological conditions in this period for this climate lead to clear sky and weak wind velocity (max 5 knots).
ISth AIVC Conference,Athens,Greece 23-26 Sept 1997
These outdoor conditions which include the values for the pressure are available from the metheorological station of Urbe Airport located in the North of Rome approximately 10 krn from the related building. These data are important because they allow to assess the fluidodynamic behaviour of the building, in case of remarkable wind velocities leading to local variations of the pressure, this resulting in changes of the internal-external pressure differences and consequently in different trends of the contaminant migrations.Al1 these data have been used to compile the metheorological .wth files used to make the simulations with the model.
Field measurements
The procedure includes two actions : information collection on the occupancy behaviour during working time measurement of the concentration of CO,CO,,moisture, VOC.
The sampling points were chosen near the positions of the three employees at a height from the floor which is the most probable during work i.e. 1.10 m. The adopted istrumentation is a BRUEL & KJEAR analyzer which includes : 0 Multi Gas Monitor 1302
Multipoint Sampler and Doser 1303 Personal Computer
This instrumentation is based on the principle of photoacustic absorbtion using a photoacustic measurement chamber.The system sensibility is 0.16 ppm for carbon monoxide, 3.2 ppm for carbon dioxide and 50 ppm for water vapour ;the answering time,which includes the suction lines is about 10 s .Before the sampling, the following calibration tests were performed :
zero calibration,through nitrogen N50 humidity calibration, through humidified N50 nitrogen span calibration through gas mixtures having known concentration filters calibration to avoid the humidity interference
The ciclic sampling system operates round the clock alternatively in the selected points.The analyzed concentrations are stored in an ASCII file.The sampling time is from 11 :30 of Dec 4 1996, up to 10 :30 of Dec 6 1996.
Computer simulations
It was decided to undertake code runs to have much confidence with the related phenomena, to achieve a flexible and reproducible procedure to be used in other places and in other circumstances, because it may happen that the possibility of the measuring interval is shorter than the planned one. It is not easy to have a continuous operating analyzer during working time. The instrument produces a repetitive noise during the suction phase and the room is heavily crossed by the sampling pipes.These inconvenients in a productive structure have to be minimized and also occupancy may have obstacles to the normal activity.Then the field measurements might not be so abundant as required. Furthermore, multiple simulations can enlarge the investigation cases, different climatic conditions, different occupancy can be studied and evaluated. It was realized that Computational Fluid Dynamic (CFD) codes such PHOENICS which is available in our division were too critical and particular to investigate such cases. To calculate air flows and contaminant dispersal in multizone buildings CONTAM 96 by NIST (National Institute of Standard and Technology) was used(l).This code uses the multizone network
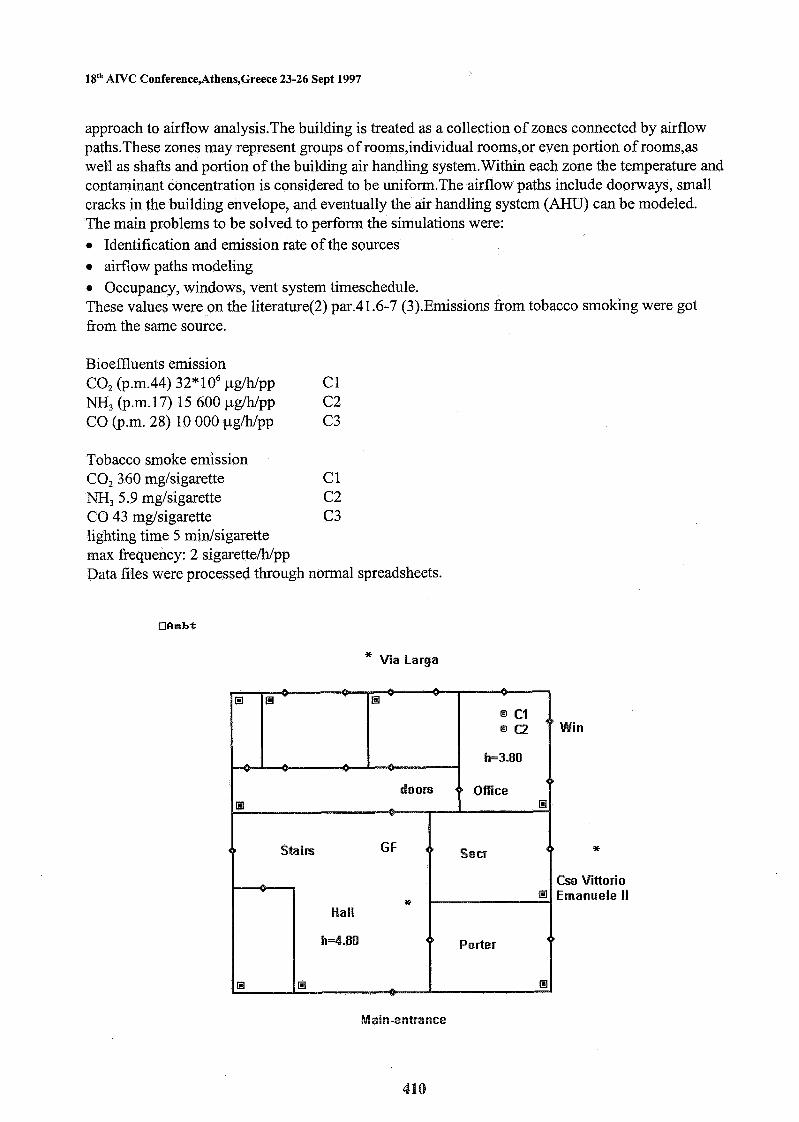
181h AIVC Conference,Athens,Greece 23-26 Sept 1997
approach to airflow analysis.The building is treated as a collection of zones connected by airflow paths.These zones may represent groups of rooms,individual rooms,or even portion of rooms,as well as shafts and portion of the building air handling system.Within each zone the temperature and contaminant concentration is considered to be uniform.The airflow paths include doorways, small cracks in the building envelope, and eventually the air handling system (AHU) can be modeled. The main problems to be solved to perform the simulations were: a Identification and emission rate of the sources a airflow paths modeling
Occupancy, windows, vent system timeschedule. These values were on the literature(2) par.41.6-7 (3).Emissions from tobacco smoking were got from the same source.
Bioeffluents emission CO, (p.m.44) 32" lo6 pg/h/pp C1 NH, (p.m. 17) 15 600 pglhlpp C2 CO (p.m. 28) 10 000 pgklpp C3
Tobacco smoke emission CO, 360 mgkigarette 6 1 NH, 5.9 mglsigarette C2 CO 43 mglsigarette C3 lighting time 5 minlsigarette max frequency: 2 sigaretteklpp Data files were processed through normal spreadsheets.
* Via Larga
Win
Cso Vittorio Emanuele I1

lgth AIVC Conference,Athens,Greece 23-26 Sept 1997
Figure 1 Office scheme for simulations
RESULTS
The field measurements in the technical office gave the following average readings:
Table 1 Contaminants Concentrations in technical office, field readings
The average concentrations attributed to Dr.Fargione, the smoker are therefore (CO, 607 ppm=1099 mg/m3, CO 5.58 ppm= 6.42 mg/m3 at 23.2 OC int.temp and 101 325 Pa int.press). External readings (CO, 536 ppm=1045 mg/m3, CO 4.72 ppm= 5.9 mg/m3 at 0 OC ext.temp and 101325 Pa ext.press).
The readings in the technical office were taken from 9:00 Feb 3 up to 24:OO Feb 9 1997. As far as the office is concerned, the simulations with the code gave the following results:
table 3 Simulations results for contaminants concentrations
Regarding the mass exchange, the simulations produced the following output :
Alr flows k g h
Figure 2 Mass exchange
18" AIVC Conference,Athens,Greece 23-26 Sept 1997
DISCUSSION
The first point to be recognized is that all the concentration readings are well below the limits recommended by ACGIH (Industrial Hygienist Association) (TWA CO, 5000 ppm, CO 25 ppm). The smoker was only one and the sampling point was located near the employee. As far as the simulations are concerned we can focus our attention to the following points : e The code calculates the concentrations in the zones as perfectly mixed ones. 0 All the main characteristics of the sources, of the windows, such as capacities and air
permeability were taken from the technical literature or from the manufacturers. Air permeability of windows is hard to be assessed because they were installed in the nineteenth century, probably infiltrations are greater than the assumed values. The lacking of mechanical ventilation results in a very low air mass exchange between the various flow paths.The underestimated air permeability may lead to the excessive growth of the internal pollutants concentration.This case of natural ventilation is stack effect driven by the wide stairwell at the centre of the building.The pressure differences driving the air masses are very low, 1-2 Pa. Being an Universitary Institute, the crossing of the main entrance is continuous, the entr-door is continuously opened and closed, i.e. op-close schedule should be completely assessed.
It is understood that the bad agreement between the code and the field measurements needs further comparisons. Different results have been observed between the various codes of IAQ (Indoor Air Quality) and the field measurements, underestimation or overestimation of the final figures is commonly accepted. Many codes are able to handle better some situations than others in the same study. A further step is to build up an airtightness measure matrix, to be implemented in parallel to these evaluations.These measures would generate the necessary link between the field and the computer codes. The evaluation of the air permeability would produce the test point which would refine the code input to achieve a better comprehension of the trend of the mass exchanges.
REFERENCES
1. G.N. Walton Contam '93 User manual 1994 NIST USA 2. 1995 ASHRAE Applications Handbook 3. UNCASAAL Serramenti Metallici, raccomandazioni per la progettazione AEDILMEDIA 4. M.Maroni, B.Seifert, T.Lindval1 Indoor Air Quality ELSEVIER
1 8'h AIVC Conference,Athens,Greece 23-26 Sept 1997
Study of the Ventilation in an Ancient Building Located on the Centre of Rome and now Used as Universitary Office
1-2-3-4 Department of Energy, Div.Energy Rational Uses ENEA (The Italian Committee for the New Technologies, Energy and the Environment
SYNOPSIS
An investigation of some Indoor Air Quality (IAQ) parameters in a significant office of the State in the area of Rome was undertaken.The aim, in future, will be to cover a wide range of situations in various buildings and organizations, to achieve data to improve the working conditions, to have a more healthy working environment, to optimize energy consumption and energy management.Analisys of IAQ parameters was performed by field measurements; conditions of the ventilation system were checked by local inspections, code simulations by the multizone model CONTAM96 by NIST (National Insttute of Standard and Technologies USA) were undertaken and compared with the field measures, reproducing the local conditions with data extracted from the technical literature.
LIST OF SYMBOLS
Pa = Pressure (1 N/m2) ppm = Concentration (parts per million)
METHODS
The considered office is located in the City of Rome downtown. It is an hystorical building (1 6" century) and the activity of the organization is devoted to the scientific technical and administrative services of the Institute for Applied Physics of Nuclear Engineering.It is a multistorey building near a heavy all day traffic road and the office is a typical technical office with three employees located in the ground floor of the building.One of the threee smokes regularly and furthermore two personal computers are turned on.The duration of working activity is about eight hours (8-17) with one hour interval during 1unchtime.Air handling system (AHU) is not provided in this room.The office door, to comply with office regulations is constantly kept opened.The investigation period is february 1997. Therefore the main characteristics of the room can be summarized as follows:
Room dimensions:4.30*6.50 h 3.80 door: 1.24*2.10 kept opened window:class A1,permeability 12.5 m3/h/m ofjoint @ 100 Pa (from UNCSAAL Italian Windows Manufacturers Associations )
Outdoor conditions Since the period is from Feb 3 to 8 the outside temperature varies from 0 to 14 OC.Usua1 metheorological conditions in this period for this climate lead to clear sky and weak wind velocity (max 5 knots).

18th AIVC Conference,Athens,Greece 23-26 Sept 1997
These outdoor conditions which include the values for the pressure are available from the metheorological station of Urbe Airport located in the North of Rome approximately 10 km from the related building. These data are important because they allow to assess the fluidodynamic behaviour of the building, in case of remarkable wind velocities leading to local variations of the pressure, this resulting in changes of the internal-external pressure differences and consequently in different trends of the contaminant migrations.Al1 these data have been used to compile the metheorological . wth files used to make the simulations with the model.
Field measurements
The procedure includes two actions : a information collection on the occupancy behaviour during working time e measurement of the concentration of CO,CO,,moistwe, VOC.
The sampling points were chosen near the positions of the three employees at a height from the floor which is the most probable during work i.e. 1.10 m. The adopted istrumentation is a BRUEL & KJEAR analyzer which includes :
Multi Gas Monitor 1302 Multipoint Sampler and Doser 1303 Personal Computer
This instrumentation is based on the principle of photoacustic absorbtion using a photoacustic measurement chamber.The system sensibility is 0.16 ppm for carbon monoxide, 3.2 ppm for carbon dioxide and 50 ppm for water vapour ;the answering time,which includes the suction lines is about 10 s .Before the sampling, the following calibration tests were performed :
zero calibration,through nitrogen N50 e humidity calibration, through humidified N50 nitrogen
span calibration through gas mixtures having known concentration filters calibration to avoid the humidity interference
The ciclic sampling system operates round the clock alternatively in the selected points.The analyzed concentrations are stored in an ASCII file.The sampling time is from 11 :30 of Dec 4 1996, up to 10 :30 ofDec 6 1996.
Computer simulations
It was decided to undertake code runs to have much confidence with the related phenomena, to achieve a flexible and reproducible procedure to be used in other places and in other circumstances, because it may happen that the possibility of the measuring interval is shorter than the planned one. It is not easy to have a continuous operating analyzer during working time. The instrument produces a repetitive noise during the suction phase and the room is heavily crossed by the sampling pipes.These inconvenients in a productive structure have to be minimized and also occupancy may have obstacles to the normal activity.Then the field measurements might not be so abundant as required. Furthermore, multiple simulations can enlarge the investigation cases, different climatic conditions, different occupancy can be studied and evaluated. It was realized that Computational Fluid Dynamic (CFD) codes such PHOENICS which is available in our division were too critical and particular to investigate such cases. To calculate air flows and contaminant dispersal in multizone buildings CONTAM 96 by NIST (National Institute of Standard and Technology) was used(l).This code uses the multizone network

lgth AIVC Conference,Athens,Greece 23-26 Sept 1997
approach to airflow analysis.The building is treated as a collection of zones connected by airflow paths.These zones may represent groups of rooms,individual rooms,or even portion of rooms,as well as shafts and portion of the building air handling system. Within each zone the temperature and contaminant concentration is considered to be uniform.The airflow paths include doorways, small cracks in the building envelope, and eventually the air handling system (AHU) can be modeled. The main problems to be solved to perform the simulations were:
Identification and emission rate of the sources airflow paths modeling Occupancy, windows, vent system timeschedule.
These values were on the literature(2) par.41.6-7 (3).Emissions from tobacco smoking were got fi-om the same source.
Bioeffluents emission CO, (p.m.44) 32*106 pghlpp C1 NH, (p.m. 17) 15 600 pglWpp C2 CO (p.m. 28) 10 000 pg/h/pp C3
Tobacco smoke emission CO, 360 mglsigarette C1 NH, 5.9 mglsigarette C2 CO 43 mglsigarette C3 lighting time 5 minlsigarette max frequency: 2 sigarettehlpp Data files were processed through normal spreadsheets.
* Via Larga
Cso Vittorio Emanuele II
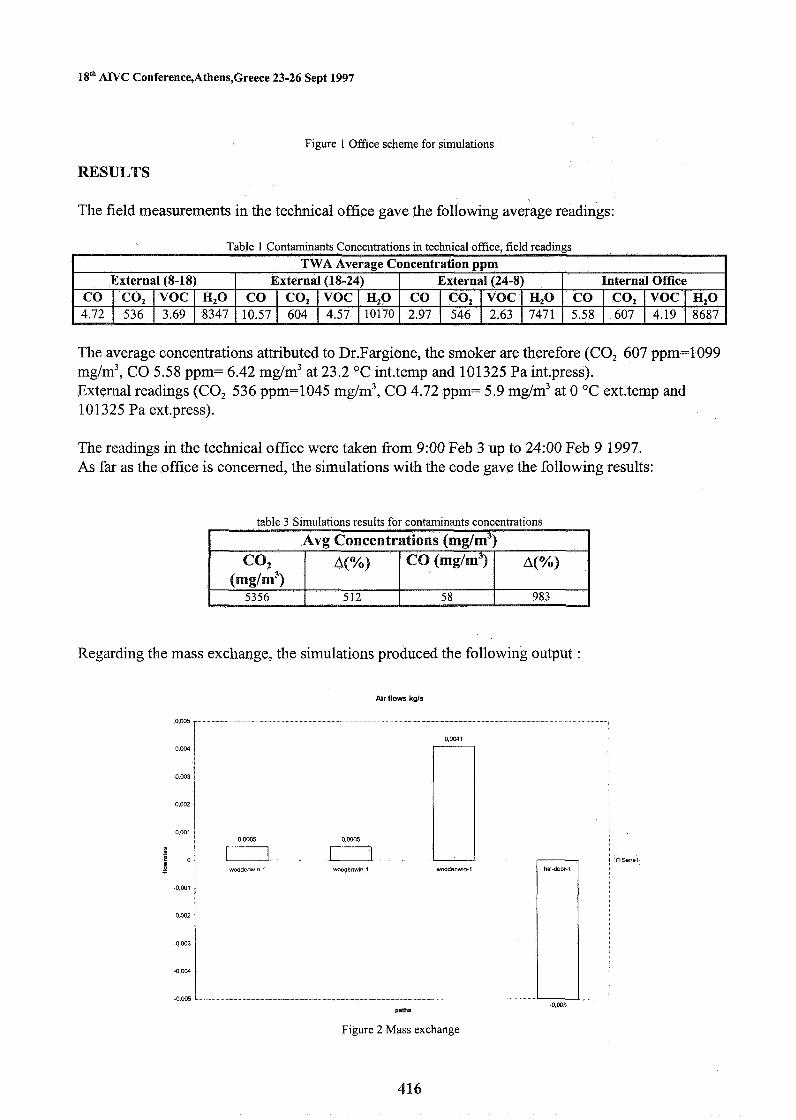
ISth A N C Conference,Athens,Greece 23-26 Sept 1997
Figure 1 Office scheme for simulations
RESULTS
The field measurements in the technical office gave the following average readings:
Table 1 Contaminants Concentrations in technical office. field readings
The average concentrations attributed to Dr.Fargione, the smoker are therefore (CO, 607 ppm=1099 mg/m3, CO 5.58 ppm= 6.42 mg/m3 at 23.2 OC int.temp and 101325 Pa int.press). External readings (CO, 536 ppm=1045 mg/m3, CO 4.72 ppm= 5.9 mg/m3 at 0 OC ext.temp and 101325 Pa ext.press).
-- --
TWA Average concentration ppm
The readings in the technical office were taken from 9:00 Feb 3 up to 24100 Feb 9 1997. As far as the office is concerned, the simulations with the code gave the following results:
table 3 Simulations results for contaminants concentrations
Internal Office CO I CO, 1 VOC I H,O 5.58 1 607 1 4.19 1 8687
External (8-18) CO ] CO, 1 VOC I H,O 4.72 1 536 1 3.69 1 8347
Regarding the mass exchange, the simulations produced the following output :
Airflows kgls
Serlel
wodenwm-l woodenwm-i
path*
External (18-24) CO I CO, I VOC I H,O
10.57 1 604 1 4.57 110170
Figure 2 Mass exchange
External (24-8) CO I CO, I VOC I H,O 2.97 1 546 1 2.63 1 7471
1 8 I h AWC Conference,Athens,Greece 23-26 Sept 1997
DISCUSSION
The first point to be recognized is that all the concentration readings are well below the limits recommended by ACGIH (Industrial Hygienist Association) (TWA CO, 5000 ppm, CO 25 ppm). The smoker was only one and the sampling point was located near the employee. As far as the simulations are concerned we can focus our attention to the following points :
The code calculates the concentrations in the zones as perfectly mixed ones. All the main characteristics of the sources, of the windows, such as capacities and air permeability were taken from the technical literature or from the manufacturers. Air permeability of windows is hard to be assessed because they were installed in the nineteenth century, probably infiltrations are greater than the assumed values. The lacking of mechanical ventilation results in a very low air mass exchange between the various flow paths.The underestimated air permeability may lead to the excessive growth of the internal pollutants concentration.This case of natural ventilation is stack effect driven by the wide stairwell at the centre of the building.The pressure differences driving the air masses are very low, 1-2 Pa. Being an Universitary Institute, the crossing of the main entrance is continuous, the entr-door is continuously opened and closed, i.e. op-close schedule should be completely assessed.
It is understood that the bad agreement between the code and the field measurements needs further comparisons. Different results have been observed between the various codes of IAQ (Indoor Air Quality) and the field measurements, underestimation or overestimation of the final figures is commonly accepted. Many codes are able to handle better some situations than others in the same study. A further step is to build up an airtightness measure matrix, to be implemented in parallel to these evaluations.These measures would generate the necessary link between the field and the computer codes. The evaluation of the air permeability would produce the test point which would refine the code input to achieve a better comprehension of the trend of the mass exchanges.
REFERENCES
1. G.N.Walton Contam '93 User manual 1994 NIST USA 2. 1995 ASHRAE Applications Handbook 3. UNCASAAL Serramenti Metallici, raccomandazioni per la progettazione AEDILMEDIA 4. M.Maroni, B. Seifert, T.Lindval1 Indoor Air Quality ELSEVIER


VENTILATION AND COOLING
18TH ANNUAL AIVC CONFERENCE ATHENS, GREECE, 23-26 SEPTEMBER, 1997
Evaluation of thermal coinfort impact of direct fresh air sr~pply in Winter Part 2, Comparison of different ways of air supply to exhaust only ventilation
Takao Sawachi and Seto Hironao
Building Research Instit~lte, Japan
1. SYNOPSIS IEA Annex 27 "Evaluation and Demonstration of Domestic Ventilation Systems" has been engaged in developing the evaluation tools for various aspects of their performance. This paper describes the evaluation tool for thermal comfort impact by ventilation systems. The tool is based on the experiment by using a room inside artificial climate chamber, focusing upon the temperature difference and cold air supply rate into the room. As the evaluation index, the percentage of living space volume where a specified thermal comfort condition is satisfied is used. Grouping of supply air inlets is made and the score for each group can be obtained by referring tables. This tool is unique and helps practitioners very much knowing how serious or mild thermal comfort impact the ventilation system helshe is examining has. 2. INTRODUCTION The improvement of the air tightness of building envelope in houses has made it indispensable to design rational ventilation system for houses, regardless of natural or mechanical. Although the technology for building ventilation has its long history and experiences in non residential buildings, it does not look easy to reach a solution which has satisfactory performance validated for residential building. Since man power and money available for maintaining domestic ventilation performance is limited, carehl consideration for various aspects of ventilation system performance is necessary in development and design process. Thermal comfort impact of the ventilation systems is one of such aspects which sometimes determines the total performance of the ventilation system. Thermal comfort condition can be sensed sometimes much easier than quality of indoor air, and occupant's complaint about coldness due to the ventilation could make hidher to stop the system in the worst case. Designers of the domestic ventilation systems need to know what type of ventilation system has milder impact on winter indoor thermal condition, and how to minimize thermal discomfort risk for a certain type of system 3. GROUPING OF AIR INLETS Outdoor fresh air can be taken into rooms through various types of inlet from the view point of thermal comfort indoors. In heating season, indoor vertical temperature gradient is grown up by cold outdoor air coming into lower part of the room without being sufficiently mixed with room air, as well as by down air stream along indoor surface of outside walls caused by heat exchange. In addition, the air coming into lower part of the room contributes to make air velocity near the floor higher. For the ventilation systems of higher quality, preheating of supplied air is available in order to prevent outdoor air from disturbing indoor thermal condition in winter. In the previous paper (Sawachi T. et al. 1996), it was found that dry bulb temperature and air velocity in the lower part of the room are the critical factors when the thermal comfort impact of the ventilation systems are evaluated. Under the same air supply rate and temperature difference between indoors and outdoors, milder thermal comfort impact can be obtained by the air inlet whose shape and position contributes to better mixing of supplied fresh air and room air before its reaching the lower part of the room. There are four factors characterizing air inlets. The first one is whether air flow path is concentrated or distributed. Generally, the air inlet is a specially installed air flow path and has larger opening area than background leakage area. However, especially in exhaust only ventilation systems for houses more than two stories, additional air supply paths to the background leakage have
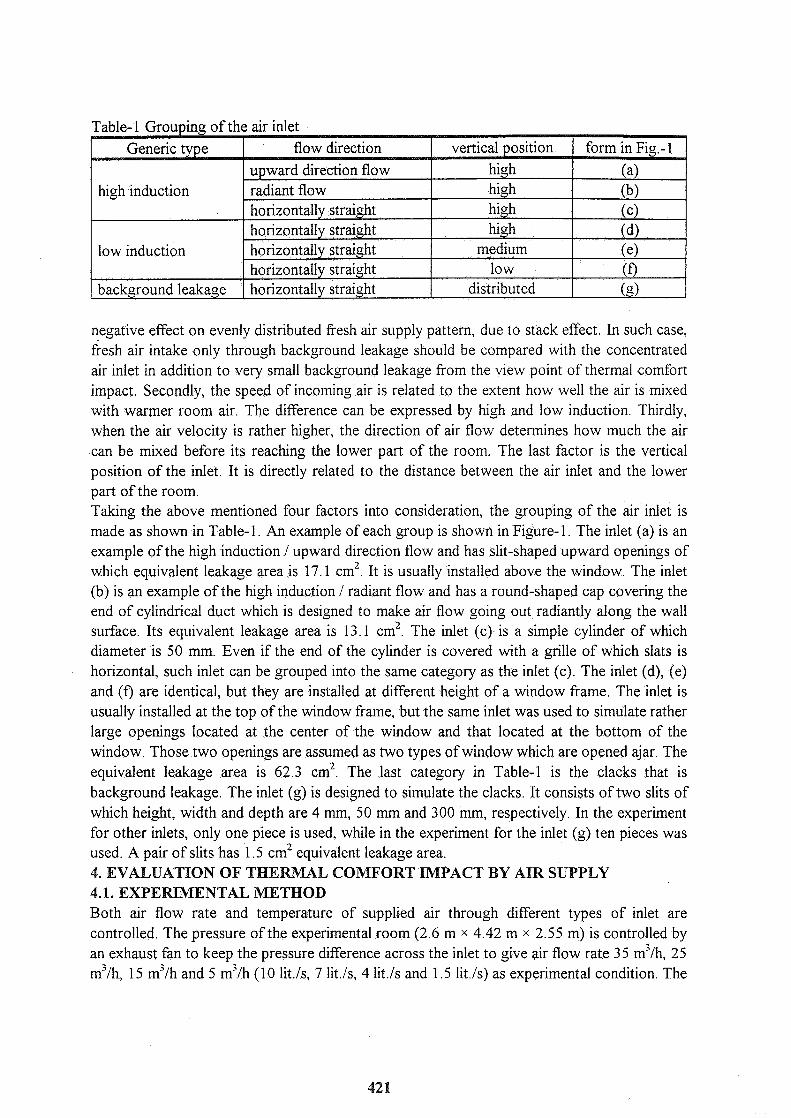
negative effect on evenly distributed fresh air supply pattern, due to stack effect. In such case, fresh air intake only through background leakage should be compared with the concentrated air inlet in addition to very small background leakage from the view point of thermal comfort impact. Secondly, the speed of incoming air is related to the extent how well the air is mixed with warmer room air. The difference can be expressed by high and low induction. Thirdly, when the air velocity is rather higher, the direction of air flow determines how much the air can be mixed before its reaching the lower part of the room. The last factor is the vertical position of the inlet. It is directly related to the distance between the air inlet and the lower part of the room. Taking the above mentioned four factors into consideration, the grouping of the air inlet is made as shown in Table-1. An example of each group is shown in Figure-1 . The inlet (a) is an example of the high induction / upward direction flow and has slit-shaped upward openings of which equivalent leakage area is 17.1 cm2. It is usually installed above the window. The inlet (b) is an example of the high induction / radiant flow and has a round-shaped cap covering the end of cylindrical duct which is designed to make air flow going out radiantly along the wall surface. Its equivalent leakage area is 13.1 cm2. The inlet (c) is a simple cylinder of which diameter is 50 mm. Even if the end of the cylinder is covered with a grille of which slats is horizontal, such inlet can be grouped into the same category as the inlet (c). The inlet (d), (e) and (f) are identical, but they are installed at different height of a window frame. The inlet is usually installed at the top of the window frame, but the same inlet was used to simulate rather large openings located at the center of the window and that located at the bottom of the window. Those two openings are assumed as two types of window which are opened ajar. The equivalent leakage area is 62.3 cm2. The last category in Table-1 is the clacks that is background leakage. The inlet (g) is designed to simulate the clacks. It consists of two slits of which height, width and depth are 4 mm, 50 mm and 300 mm, respectively. In the experiment for other inlets, only one piece is used, while in the experiment for the inlet (2) ten pieces was used. A pair of slits has 1.5 cm2 equivalent leakage area. 4. EVALUATION OF T H E W A L COMFORT IMPACT BY AIR SUPPLY 4.1. EXPERIMENTAL METHOD Both air flow rate and temperature of supplied air through different types of inlet are controlled. The pressure of the experimental room (2.6 m x 4.42 m x 2.55 m) is controlled by an exhaust fan to keep the pressure difference across the inlet to give air flow rate 35 m5/h, 25 mvh, 15 mvh and 5 m3/h (10 lit./s, 7 lit./s, 4 lit./s and 1.5 lit./s) as experimental condition. The
low induction
background leakage
horizontally straight horizontally straight horizontally straight
medium low
distributed
(el ( f )
(9)

(a) high induction I upward direction flow
H=1,900 mm E.L.A.=17.1 cm'
(b) high induction I radiant flow
H=1,900 mm E.L.A.=13.1 cm2
(c) high induction / horizontally straight flow H=1,900 mm E.L.A.=15.5 cm2
(d) H=1,900 mm
(e) H=1,425 mm
(d)(e)(f) common low induction inlet
(g) background leakage simulated by deep slits installed at different height
H=255 mm - 2,295 mm E.L.A.=1.5 cm2 x 10 E.L.A.=62.3 cm2
H: height above the floor E.L.A.: equivalent leakage area
Figure-1 Forms of the inlets used in the experiment
temperature outside the experimental room is controlled -lO°C, O°C, 10°C, and that inside the room is controlled to keep PMV (Fanger P.O. 1970) equal to zero at the center of the room by using two electric radiant heaters put below windows. Even though thermal comfort condition at the center of the room is kept nearly constant throughout whole series of experiment for different inlets, the distribution of thermal factors varies widely depending upon the route of cold air supplied through the inlets. Dry bulb temperature, globe temperature, air velocity and turbulence intensity are measured at one hundred and twelve points (7 x 4 x 4 = 112). The lowest position of the measurement is 10 cm above the floor. 4.2. EVALUATION INDEX Thermal comfort impact by cold air supply can be evaluated by the number of points where the relatively large deviation from comfort condition is observed. As the criteria of the comfort condition, PMV and PD (Fanger P.O. et al. 1988) are used. The PD is a predicted percentage of occupants who feel uncomfortable due to draught, and is expressed as a fbnction of air velocity, turbulence intensity and dry bulb temperature. Among one hundred and twelve points, the points where both conditions for PMV and PD expressed by inequalities (1) and (2) are satisfied are counted, and the percentage of the points is used as an index to evaluate the thermal comfort impact by the ventilation systems. -0.2<PMV<+0.2(PPD<7%) ..-..- (1) P D < 1 5 % ...... (2) 4.3. BASIC DATA FOR THE EVALUATION AND ITS EXTENTION The percentage of the points where both conditions (1) and (2) are satisfied is calculated for each combination of the air supply rate and the indoor-outdoor temperature difference. One hundred percent means the least impact of ventilation system and that at all of the one hundred and twelve points in the experimental room the deviations of PMV from the center and PD values are in the range of inequalities (1) and (2), respectively. On the other hand, smaller percentage means larger impact and extension of the space with difficulty to keep thermal comfort condition. In Figure-2, the contour lines of the percentage are drawn on air supply rate and temperature difference plane for each group of inlet. For the high induction / radiant flow inlet (b), the percentage becomes lower in higher air supply rate and larger temperature difference area. On the contrary, for the high induction / upper flow inlet, higher air supply rate does not necessary make the percentage lower, while larger temperature difference steadily makes the percentage lower. Higher air supply rate can contribute to mix supply air with room air and to weaken the cold air impact. It is general that the temperature difference is more influential on the percentage than the air supply rate. Among three directions of high induction inlets, thermal comfort impact by straight air flow is the largest one. For example, at 25 mvh and 20 K, the percentage for high induction / straight flow inlet is approximately 55%, while the percentage for high induction / upper flow inlet is more than 90%. Comparing three positions of low induction inlet, the highest position (d) gives the least thermal comfort impact. It confirms the rule that the inlet of cold fresh air should be installed at higher position to avoid serious thermal comfort impact. Even when the same amount of air is supplied through distributed small clacks, the percentage is not higher than that for general types of inlet (a), (b) and (d). The rather high impact on thermal comfort by clacks seems to come from air supply through clack at lower position of the wall. In the
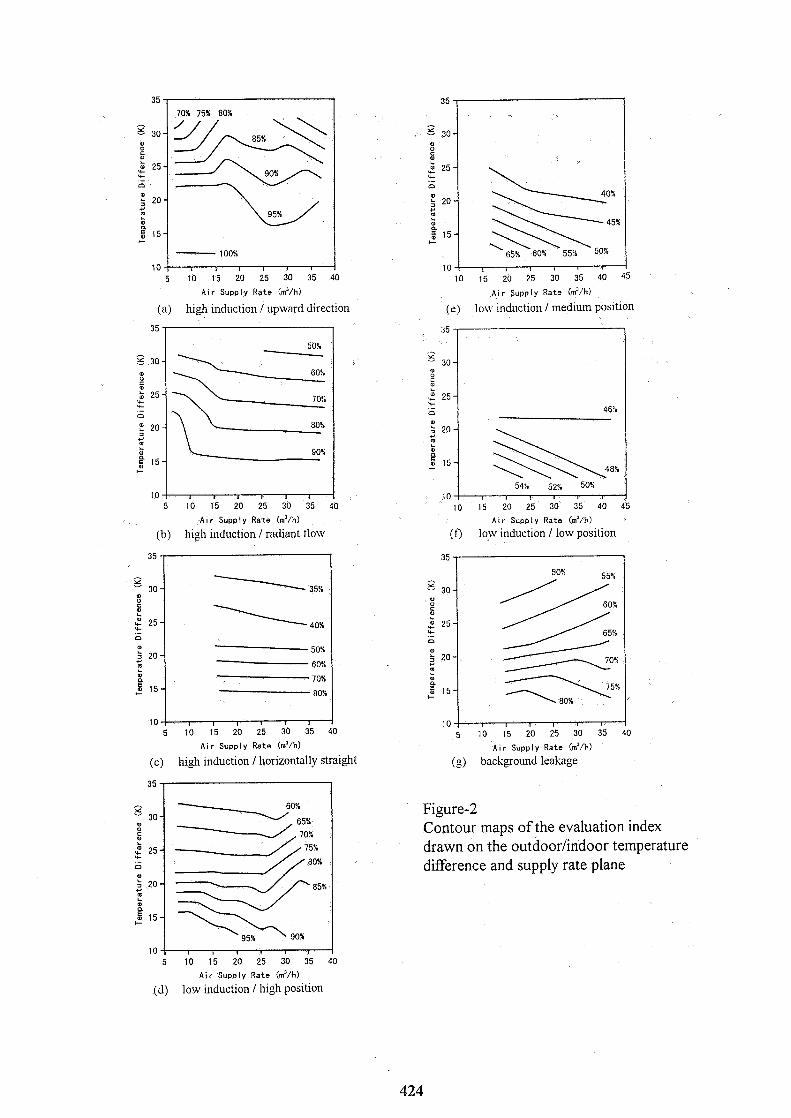
- 100%
10 1 I I f I I
5 10 15 20 25 30 35 40
Air Supply Rate (m3/h)
(a) 111gl1 induction / upxvard direction
1 0 1 r , r I , I I 5 10 15 20 25 30 35 40
A , r Supply Rate (m3/h)
(b) high induction / radiant tlow
5 10 15 20 25 30 35 40
Air Supply Rate (m3/h)
(c) high induction I horizontally straight
A ! r Supply Rate (m3/h)
(e) 10x1 ~nduction / medium position
54% 52% 50% 1 0 , , # , r r I
10 15 20 25 30 35 40 45
Atr Supply Rate (m3/h)
(0 low induction I low position
5 10 15 20 25 30 35 40
Air Supply Rate (m3/h)
(g) background leakage
Figure-2 Contour maps of the evaluation index drawn on the outdoor/indoor temperature difference and supply rate plane
5 10 15 20 25 30 35 40
Air Supply Rate (m3/h)
(d) low induction I high posltloi~

experiment, ten clack-simulating slits were evenly distributed at different height. It means that a concentrated inlet in place of distributed clacks relieves the cold air impact on thermal comfort condition. 5. A SIMPLIFIED TOOL FOR THE THERMAL COMFORT IMPACT EVALUATION IN IEA ANNEX 27 In Annex 27 "Evaluation and Demonstration of Domestic Ventilation System", a set of simplified tools to evaluate domestic ventilation systems are being developed. Among the tools, a thermal comfort impact evaluation tool is included. As input information, type of ventilation system, outdoor temperature and air supply rate are requested. Indoor temperature is assumed to be 22 "C. The Score is expressed with five ranks from "- -" to "+ +", and is given by Table-2 and Table-3. In the tables, scores for different types of inlet and temperature have been obtained from contour maps of Figure-2.
Criteria for Scoring the percentage of lattice points satisfying thermal comfort conditions (1) and (2): 100-95% +* 95-85% + 8575% 0 75-50% - 50-0% --
Table-3 Thermal Comfort Impact of Fresh Air Supply ~ = 1 5 m ~ / h ( 4 Ils )
Criteria for Scoring the percentage of lattice points satisfying thermal comfort conditions (1) and (2): 100-95% ++ 95-85% + 85-75% 0 75-50% - 50-0% --
(Example 1) If a natural ventilation with a window open ajar as air supply at 1.9 m above floor is used, the air supply rate is 15 m5/h and outdoor temperature is 10 "C, the score is "+-+". The opening is considered as a low induction type inlet. If the change of supply rate due to wind is not negligible, the increase of turbulence intensity of indoor air flow can make draft risk higher than the evaluation. Therefore, in such case, the score should be careklly interpreted.
(Example 2) When an exhaust only ventilation system with high induction / radiant flow natural supply vent is used, outdoor temperature is 0 "C and air supply rate is 3 5 m3/h, the score is "-", which means the percentage of lattice point without difficult to keep thermal comfort is 50-75%. Though thermal comfort situation depends not only upon ventilation system but also upon insulation, heating system etc., the percentage can be considered as an index for relative evaluation. The score, "-" means that there is still possibility for improvement. 6. SUMMARY For domestic ventilation systems, appropriate air supply technique to avoid thermal comfort impact should be selected. The basic data from the experiment shows a wide variation of the impact by different types of inlet, even if the ventilation system is fixed. The selection of ventilation system also make the difference of thermal comfort impact. The impact can be evaluated to know the type of inlet, supply air rate and outdoor temperature by referring the tables 2 and 3. 7. ACKNOWLEDGEMENTS This research has been done for IEA ANNEX 27 "Evaluation and Demonstration of Domestic Ventilation Systems". The fruitfil discussion in the ANNEX is reflected upon the theoretical framework. The author expresses gratitude to all members of the ANNEX, especially Mr. Peter Op't Veld. 8. REFERENCES I. SA WAC7HI, T., OSA WA, H., SETO, H., TANIGIJCHI, 1 ar~u' OHNISHI, S. "Elmlilation of thermal comfort inipact of direct fresh air slrpply in tvinter "
Proceedings of INDOOR AIR 96 Yo/. 3, 1996, pp1087- 1092 2. FANGER, P. 0. 'Thermal Comfort " Darlish Technical Press, 19 70 3. FANGER, P. O., MELIKOK A. K., HANZAWA, H and RING, J. '2ir Ti~rbrilerlcc! cmci Ser~satiorl of Draft" Energy and Buildings, 12, 1988, pp2 1-39
VENTILATION AND COOLING
18TH ANNUAL AIVC CONFERENCE ATHENS, GREECE 23-26 SEPTEMBER, 1997
Measurements and control of the air motions within a building
C. Blomqvist, M. Sandberg Royal Institute of Technology (KTH)
Centre for Built Environment Box 88, S-80102 Gavle, Sweden
Phone+4626147800 Faxi-4626147803 E-mail: [email protected]
Measurements and Control of the Air Motions within a Building
C. Blomqvist, M. Sandberg
1. SYNOPSIS There are a number of methods available concerning wit
buildings. Within control research, one can find new control algo t yet been used in practice. These new algorithms open the of developing and implementing of new demand controlled ventilation systems.
In a building tEnternal alr motions are due both to differences in temperature and pressure differences caused by the ventilation system. Therefore, one fundamental question is
control the air motions within a building using fan powered temperature control.
--
to report on measurements done to examine the influence of temperature differences between rooks on the air exchange through open doors in a building and to explore the use of modern control technique to minimise the temperature difference.
The result of the measurements shows that even very small (0.1-0.2"C) temperature differences between rooms cause bi-directional air flows in the doorways of a magnitude that exceed the flow rates caused by the mechanical ventilation system. Therefore it is necessary to control the temperatures in the rooms to make it possible for the ventilation system to distribute the air to those parts of the building where it is needed.
2. LIST OF SYMBOLS
C(AT) Coefficient g' [rn/s2] = gATIT Reduced gravitation constant ?Z [m/s21 Gravitation constant Gr [-I = g'h3/v2 Densiometric Grashof number v [m2/s] Kinematic viscosity Tc [Kl Temperature in cold room Tw [Kl Temperature in warm room AT [Kl Tw-Tc W [ml Width of door way h [ml Height of door way A=hw Area of door way
3. INTRODUCTION 3.1 Theory The flow in a door way can be caused by several mechanisms of which the two most important are:
@ Density difference caused by temperature differences, AT 0 Pressure differences caused by mechanical ventilation
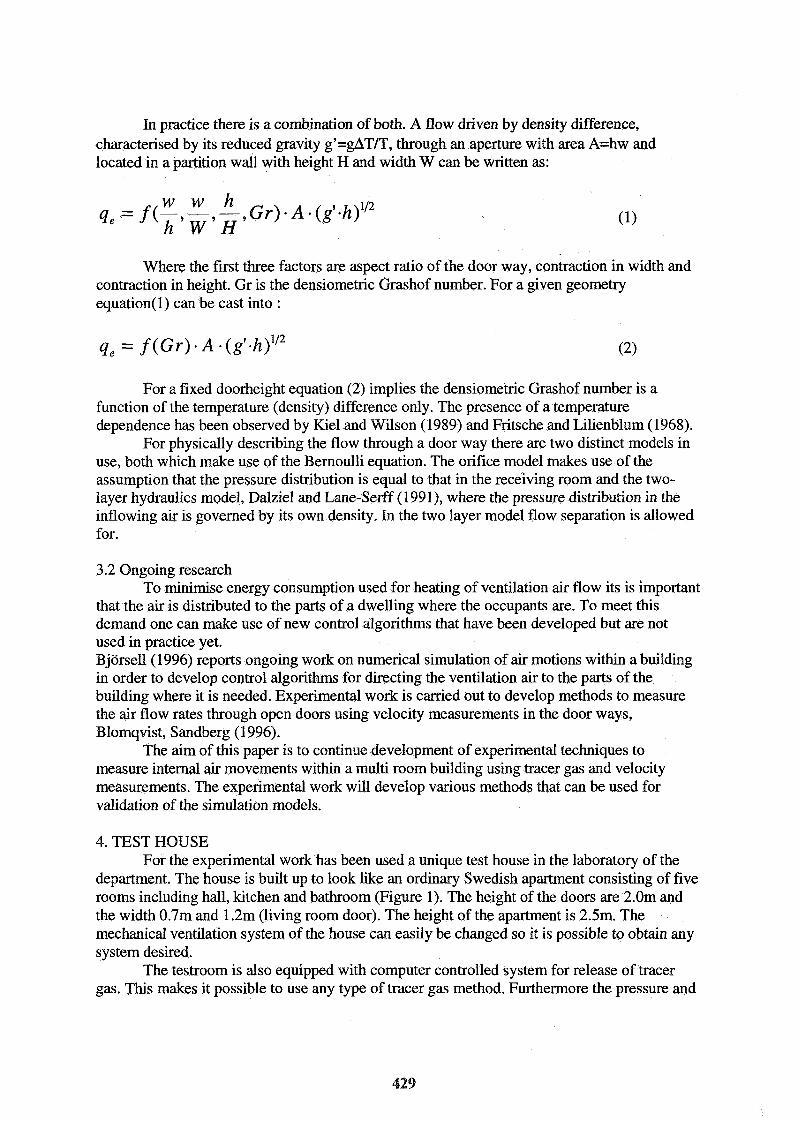
In practice there is a combination of both. A flow driven by density difference, characterised by its reduced gravity g'=gAT/T, through an aperture with area A=hw and located in a partition wall with height H and width W can be written as:
w w h 4, = f ( - 9 - - , - 9 ~ r ) - ~ . ( g ' - h ) 1 1 2 h W H
Where the first three factors are aspect ratio of the door way, contraction in width and contraction in height. Gr is the densiometric Grashof number. For a given geometry equation(1) can be cast into :
4, = f ( G r ) A . (g'-h)112
For a fixed doorheight equation (2) implies the densiometric Grashof number is a function of the temperature (density) difference only. The presence of a temperature dependence has been observed by Kiel and Wilson (1989) and Fritsche and Lilienblum (1968).
For physically describing the flow through a door way there are two distinct models in use, both which make use of the Bernoulli equation. The orifice model makes use of the assumption that the pressure distribution is equal to that in the receiving room and the two- layer hydraulics model, Dalziel and Lane-Serff (1 991), where the pressure distribution in the inflowing air is governed by its own density. In the two layer model flow separation is allowed for.
3.2 Ongoing research To minimise energy consumption used for heating of ventilation air flow its is important
that the air is distributed to the parts of a dwelling where the occupants are. To meet this demand one can make use of new control algorithms that have been developed but are not used in practice yet. Bjorsell(1996) reports ongoing work on numerical simulation of air motions within a building in order to develop control algorithms for directing the ventilation air to the parts of the building where it is needed. Experimental work is carried out to develop methods to measure the air flow rates through open doors using velocity measurements in the door ways, Blomqvist, Sandberg (1996).
The aim of this paper is to continue development of experimental techniques to measure internal air movements within a multi room building using tracer gas and velocity measurements. The experimental work will develop various methods that can be used for validation of the simulation models.
4. TEST HOUSE For the experimental work has been used a unique test house in the laboratory of the
department. The house is built up to look like an ordinary Swedish apartment consisting of five rooms including hall, kitchen and bathroom (Figure 1). The height of the doors are 2.0m and the width 0.7m and 1.2m (living room door). The height of the apartment is 2.5m. The mechanical ventilation system of the house can easily be changed so it is possible to obtain any system desired.
The testroom is also equipped with computer controlled system for release of tracer gas. This makes it possible to use any type of tracer gas method. Furthermore the pressure and
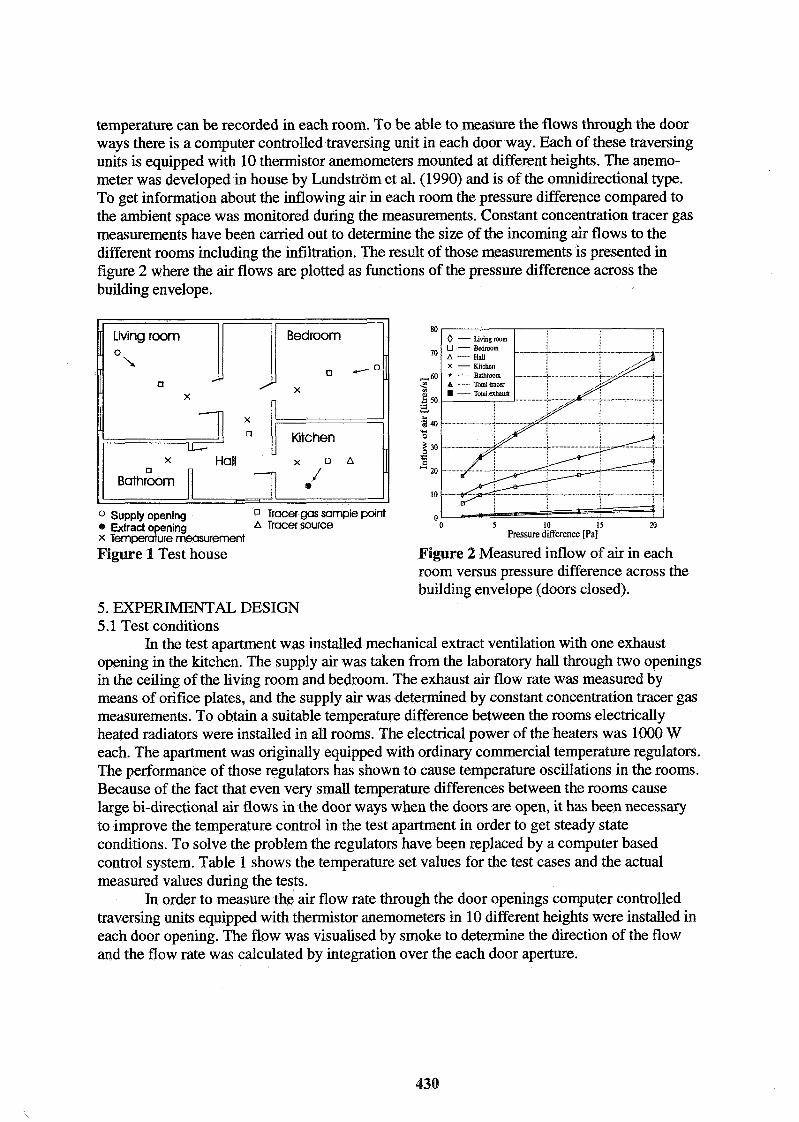
temperature can be recorded in each room. To be able to measure the flows through the door ways there is a computer controlled traversing unit in each door way. Each of these traversing units is equipped with 10 thermistor anemometers mounted at different heights. The anemo- meter was developed in house by Lundstrom et al. (1990) and is of the omnidirectional type. To get information about the inflowing air in each room the pressure difference compared to the ambient space was monitored during the measurements. Constant concentration tracer gas measurements have been carried out to determine the size of the incoming air flows to the different rooms including the infiltration. The result of those measurements is presented in figure 2 where the air flows are plotted as functions of the pressure difference across the building envelope.
Kitchen
x o A 1 O Supply opening 0 Tracer gas sample point
Extract opening A Tracer source x Ternmature measurement
0 5 10 15 20 Pressure difference [Pa]
Figure 1 Test house Figure 2 Measured inflow of air in each room versus pressure difference across the building envelope (doors closed).
5. EXPERIMENTAL DESIGN 5.1 Test conditions
In the test apartment was installed mechanical extract ventilation with one exhaust opening in the kitchen. The supply air was taken from the laboratory hall through two openings in the ceiling of the living room and bedroom. The exhaust air flow rate was measured by means of orifice plates, and the supply air was determined by constant concentration tracer gas measurements. To obtain a suitable temperature difference between the rooms electrically heated radiators were installed in all rooms. The electrical power of the heaters was 1000 W each. The apartment was originally equipped with ordinary commercial temperature regulators. The performance of those regulators has shown to cause temperature oscillations in the rooms. Because of the fact that even very small temperature differences between the rooms cause large bi-directional air flows in the door ways when the doors are open, it has been necessary to improve the temperature control in the test apartment in order to get steady state conditions. To solve the problem the regulators have been replaced by a computer based control system. Table 1 shows the temperature set values for the test cases and the actual measured values during the tests.
In order to measure the' air flow rate through the door openings computer controlled traversing units equipped with thermistor anemometers in 10 different heights were installed in each door opening. The flow was visualised by smoke to determine the direction of the flow and the flow rate was calculated by integration over the each door aperture.
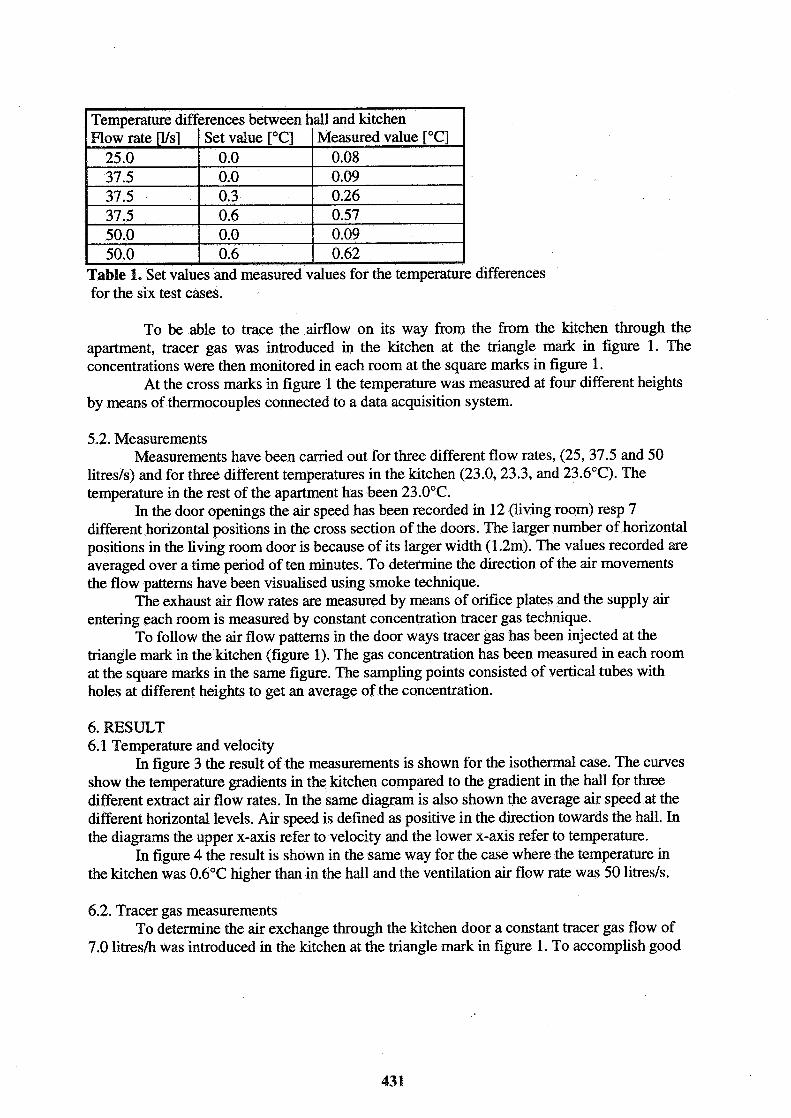
/ Temperature differences between hall and kitchen I
Table 1. Set values and measured values for the temperature differences for the six test cases.
To be able to trace the airflow on its way from the from the kitchen through the apartment, tracer gas was introduced in the kitchen at the triangle mark in figure 1. The concentrations were then monitored in each room at the square marks in figure 1.
At the cross marks in figure 1 the temperature was measured at four different heights by means of thermocouples connected to a data acquisition system.
5.2. Measurements Measurements have been carried out for three different flow rates, (25,37.5 and 50
litresls) and for three different temperatures in the kitchen (23.0,23.3, and 23.6"C). The temperature in the rest of the apartment has been 23.0°C.
In the door openings the air speed has been recorded in 12 (living room) resp 7 different horizontal positions in the cross section of the doors. The larger number of horizontal positions in the living room door is because of its larger width (1.2m). The values recorded are averaged over a time period of ten minutes. To determine the direction of the air movements the flow patterns have been visualised using smoke technique.
The exhaust air flow rates are measured by means of orifice plates and the supply air entering each room is measured by constant concentration tracer gas technique.
To follow the air flow patterns in the door ways tracer gas has been injected at the triangle mark in the kitchen (figure 1). The gas concentration has been measured in each room at the square marks in the same figure. The sampling points consisted of vertical tubes with holes at different heights to get an average of the concentration.
6. RESULT 6.1 Temperature and velocity
In figure 3 the result of the measurements is shown for the isothermal case. The curves show the temperature gradients in the kitchen compared to the gradient in the hall for three different extract air flow rates. In the same diagram is also shown the average air speed at the different horizontal levels. Air speed is defined as positive in the direction towards the hall. In the diagrams the upper x-axis refer to velocity and the lower x-axis refer to temperature.
In figure 4 the result is shown in the same way for the case where the temperature in the kitchen was 0.6"C higher than in the hall and the ventilation air flow rate was 50 litresls.
6.2. Tracer gas measurements To determine the air exchange through the kitchen door a constant tracer gas flow of
7.0 litresh was introduced in the kitchen at the triangle mark in figure 1. To accomplish good
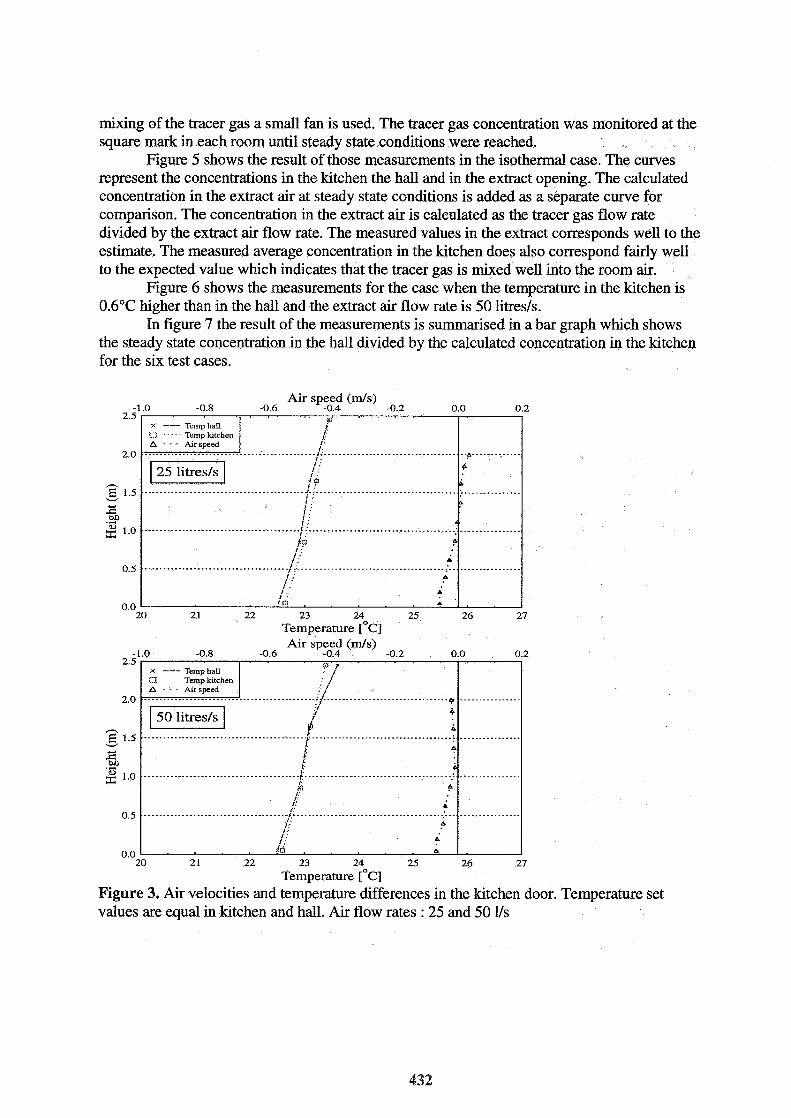
mixing of the tracer gas a small fan is used. The tracer gas concentration was monitored at the square mark in each room until steady state conditions were reached.
Figure 5 shows the result of those measurements in the isothermal case. The curves represent the concentrations in the kitchen the hall and in the extract opening. The calculated concentration in the extract air at steady state conditions is added as a separate curve for comparison. The concentration in the extract air is calculated as the tracer gas flow rate divided by the extract air flow rate. The measured values in the extract corresponds well to the estimate. The measured average concentration in the kitchen does also correspond fairly well to the expected value which indicates that the tracer gas is mixed well into the room air.
Figure 6 shows the measurements for the case when the temperature in the kitchen is 0.6"C higher than in the hall and the extract air flow rate is 50 litresis.
In figure 7 the result of the measurements is sumarised in a bar graph which shows the steady state concentration in the hall divided by the calculated concentration in the kitchen for the six test cases.
20 2 1 22 23 25 26 27 =.. Temperature [ C ] Air speed (mls)
-1 .O -0.8 -0.6 -0.4 -0.2 0.0 0.2 2.5
2.0
- E 1.5 V
2 00 .- ,- , .,
0.5
0.0 20 21 22 23 24 25 26 27
Temperature [OC]
Figure 3. Air velocities and temperature differences in the kitchen door. Temperature set values are equal in kitchen and hall. Air flow rates : 25 and 50 11s
X --- Temp hall (3 Temp klrchen A - - - Air speed
k i ' y ' /
: I : I .............................................. :I. .. ..............................*................. . / Vl +/ 4
a' ir ........................................... $ ..................................... :
I :: h
......................................... .I.. .................................... .,? $3 P
1. I
.................... ............. . i.'.. ..--: 1:' A
1 , A
!A , A
.................
................
................

7. DISCUSSION Using the orifice model and assuming parallel temperature distribution in the two
adjacent rooms the total flow through an opening caused by temperature difference can be written as:
Air speed ( d s ) -1.0 -0.8 -0.6 -0.4 -0.2 0.0 0.2
Where C is an experimentally determined coefficient. When a forced flow is imposed in one direction the minimum forced flow needed to in the mean get unidirectional flow in the opening can be written as:
Figure 8 shows the air flow caused by temperature difference in the kitchen door calculated using equation(4) and the coefficient C set to 0.15. The estimated flow at a temperature difference of O.l°C corresponds rather well with the result of the measurements shown in figure 3 where unidirectional flow has been obtained at a flow rate of 50 Us and the actual temperature difference has been =O.l°C. However, the tracer gas measurements on the same case (figure 7) show that the tracer gas concentration differs from zero in the hall which indicates that the flow is not completely unidirectional. This can be explained by turbulence effects causing time dependent air flow in both directions. It is obvious that even very small differences in temperature between rooms generates air flows which are large compared to the flows caused by the mechanical ventilation. As a comparison it can be mentioned that the Swedish building code prescribes a total forced ventilation flow
A.
P'
-.-.------..-.----..
-*--.-.--------.
2.5
2 0
n E 1.5 V
2 M . d .g 1.0
0 5
0.0 20 21 22 23 24 25 26 27
Temperature [OC]
Figure 4. Air velocities and temperature differences in kitchen door. Temperature set value is 0.6"C higher in kitchen. Air flow rate : 50 Ys.
X --- Temphall O . - . . Temp kitchen p . - a Air speed
I: 2 . . I I I
1 I .----...-.-----.---.--.----......----.-----. f-....-------' ' .---.--*.----*....------..-------&.------
I I I I :;< t a
1 .-..-.......----------.--------..-------.- d - . . . . . . . : - - - - . - . - . - . . . . - - - - - - . - . - - - - - . . . . / . - - - . . . . . . - - - - - 1 I ; 6 I I ' I : P .--.-..--.--.-----.-.--.--.......--------,--..- ,'.-------...-.--.---.--..-.----- ' 1 : f 2 A
I : j' : A
. ~ ~ ~ ~ ~ . - ~ ~ . ~ . ~ ~ ~ ~ ~ ~ ~ ~ . ~ . ~ ~ ~ ~ ~ ~ ~ ~ ~ ~ ~ ~ ~ . . L L L L ' L L L L L L L L L L L L L L L L L L L L L L L L L L L L L L L : ~ ~ ~ ~ ~ . I : ,! ; A
i ; A t i , ,A

0.0 05 1.0 1.5 2.0 2 5 3.0 3.5 4.0 4.5 5.0
Time [h]
0.0 0.5 1 .O 1.5 2.0 2.5 3.0 3.5 4.0
T~me [h]
Figure 5. Spread of tracer gas from kitchen for different air flow rates. Isothermal.
0.0 0.5 1 .O 1.5 2.0 2.5 3.0 3.5 4.0
Time [h]
Figure 6. Spread of tracer gas from kitchen. Temperature difference = 0.6"C
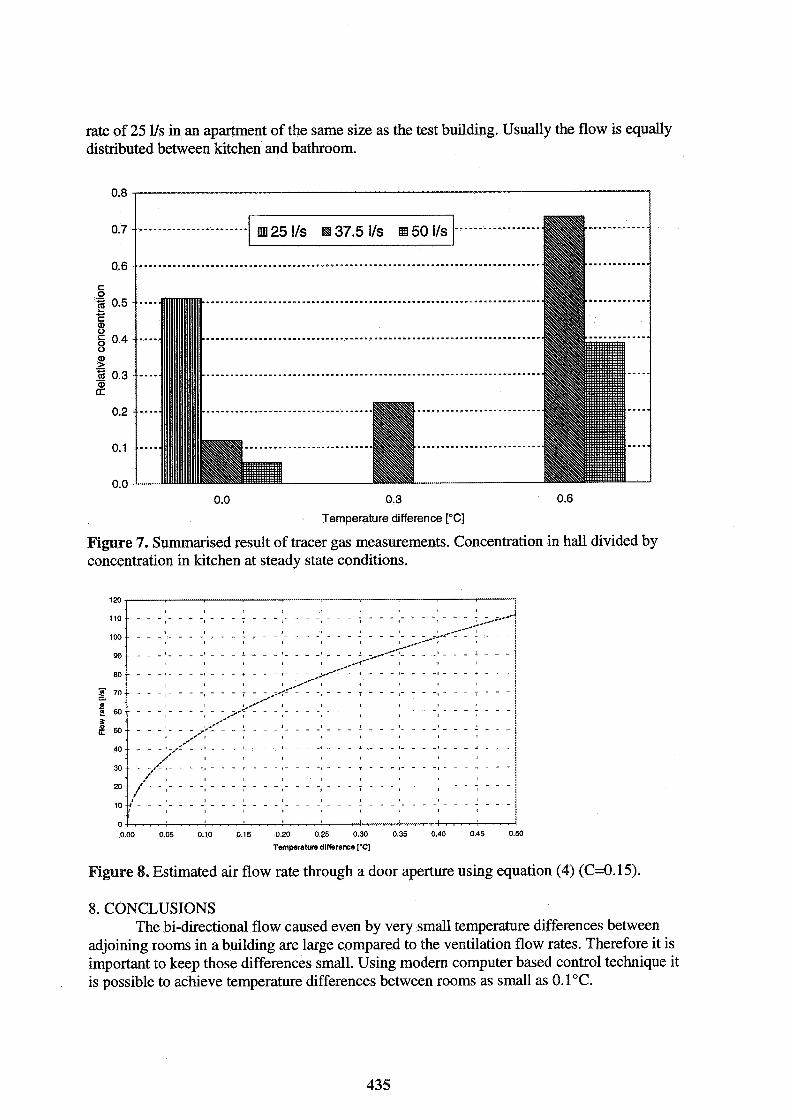
rate of 25 Vs in an apartment of the same size as the test building. Usually the flow is equally distributed between kitchen and bathroom.
............ -..-----------.-..-*.-. rm 25 11s N 37.5 Ils 1 ~ 5 0 11s - - - - - - - - - - - - - - - - -
............ ....................................................................................
............ ......................................................................
......................................................................
......................................................................
..........................
.......................... ...........................
0.3
Temperature difference ["C]
Figure 7. Surnrnarised result of tracer gas measurements. Concentration in hall divided by concentration in kitchen at steady state conditions.
OJ . . . . . . . . . . . . . . . . . . . . . . . . . . . . . . . . . . . . . . . . . . . . . . . . . + 0.00 0.05 0.10 0.15 0.20 025 0.30 0.35 0.40 0.45 0.50
Temperatwe difference ["C]
Figure 8. Estimated air flow rate through a door aperture using equation (4) (C=O. 15).
8. CONCLUSIONS The bi-directional flow caused even by very small temperature differences between
adjoining rooms in a building are large compared to the ventilation flow rates. Therefore it is important to keep those differences small. Using modern computer based control technique it is possible to achieve temperature differences between rooms as small as O.l°C.
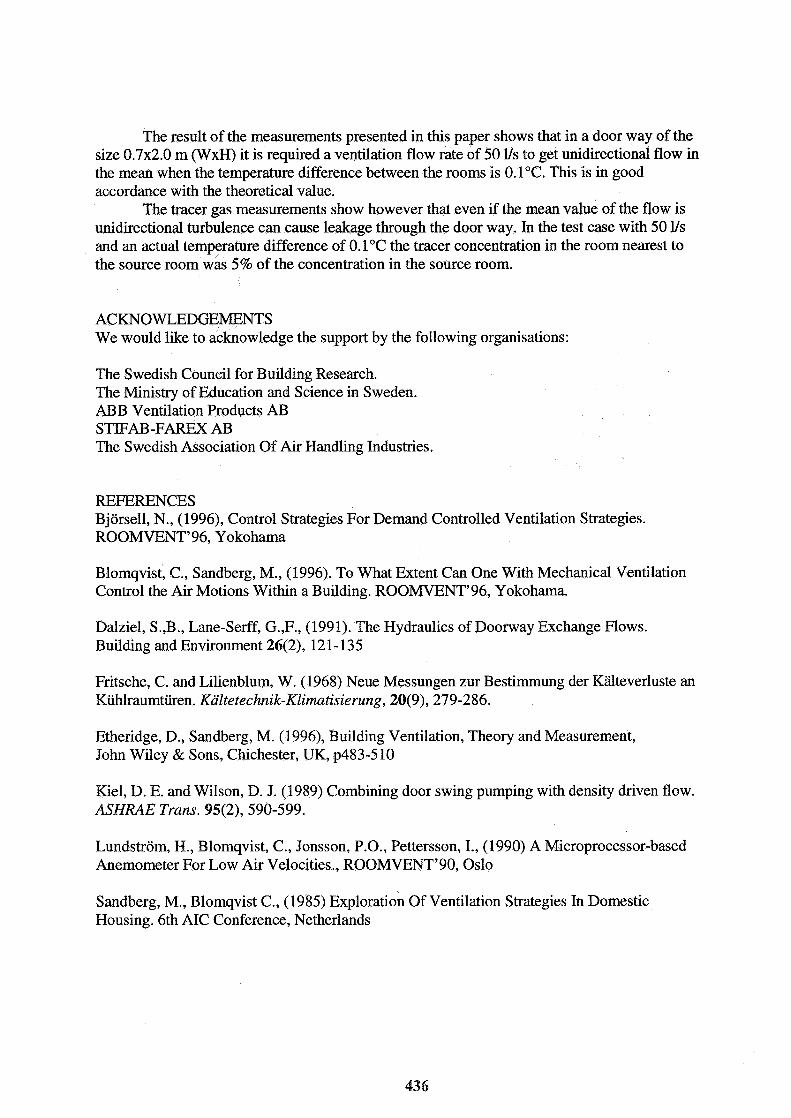
The result of the measurements presented in this paper shows that in a door way of the size 0.7x2.0 m (WxH) it is required a ventilation flow rate of 50 Vs to get unidirectional flow in the mean when the temperature difference between the rooms is O.l°C. This is in good accordance with the theoretical value.
The tracer gas measurements show however that even if the mean value of the flow is unidirectional turbulence can cause leakage through the door way. In the test case with 50 l/s and an actual temperature difference of O.l°C the tracer concentration in the room nearest to the source room was 5% of the concentration in the source room.
ACKNOWLEDGEMENTS We would like to acknowledge the support by the following organisations:
The Swedish Council for Building Research. The Ministry of Education and Science in Sweden. ABB Ventilation Products AB STIFAB-FAREX AB The Swedish Association Of Air Handling Industries.
REFERENCES Bjorsell, N., (1996), Control Strategies For Demand Controlled Ventilation Strategies. ROOMVENT'96, Yokohama
Blomqvist, C., Sandberg, M., (1996). To What Extent Can One With Mechanical Ventilation Control the Air Motions Within a Building. ROOMVENT'96, Yokohama.
Dalziel, S.,B., Lane-Serff, G.,F., (1991). The Hydraulics of Doorway Exchange Flows. Building and Environment 26(2), 12 1 - 135
Fritsche, C. and Lilienblum, W. (1968) Neue Messungen zur Bestirnmung der Kiilteverluste an Kiihlraumtiiren. Kaltetechnik-Klimatisierung, 20(9), 279-286.
Etheridge, D., Sandberg, M. (1996), Building Ventilation, Theory and Measurement, John Wiley & Sons, Chichester, UK, p483-510
Kiel, D. E. and Wilson, D. J. (1989) Combining door swing pumping with density driven flow. ASHRAE Trans. 95(2), 590-599.
Lundstrom, H., Blomqvist, C., Jonsson, P.O., Pettersson, I., (1990) A Microprocessor-based Anemometer For Low Air Velocities., ROOMVENT'90, Oslo
Sandberg, M., Blomqvist C., (1985) Exploration Of Ventilation Strategies In Domestic Housing. 6th AIC Conference, Netherlands
Related Documents


![The Association of Inter-Varsity Clubs AIVC] · PDF fileThe Association of Inter-Varsity Clubs [AIVC] ... The Association of Inter-Varsity Clubs [AIVC] Annual ... 10 been received](https://static.cupdf.com/doc/110x72/5ab831537f8b9ab62f8c57b5/the-association-of-inter-varsity-clubs-aivc-the-association-of-inter-varsity.jpg)