Straight forward Duke Energy 2002 Annual Report

Welcome message from author
This document is posted to help you gain knowledge. Please leave a comment to let me know what you think about it! Share it to your friends and learn new things together.
Transcript

Straight forwardDuke Energy
2002
Annual Report
526 South Church Street
Charlotte, NC 28202-1802
704.594.6200 www.duke-energy.com

STRAIGHTFORWARD
This has been a challenging year. A year of questions. This is a book of answers. Straightforward answers. What worked this year? What didn’t? In this defining year for the energy industry, what have we learned? And what is the strategy that will take us forward? We’ve been in this business almost a century now. Challenging years pass. Companies that face challenges head-on prevail. So we offer this – a frank appraisal of our year, and a strategic look forward.

3 Financial Highlights
4 Chairman’s Letter
10 Q&A with Company Leaders
20 Board of Directors
22 Governance / Management
23 Shareholder Information

FINANCIAL HIGHLIGHTS . . Years Ended December 31 . .
In millions, except where noted 2002 2001 2000
Operating revenuesa $ 15,663 $ 18,197 $ 15,342
Earnings before interest and taxes 2,869 4,256 4,014
Income before cumulative effect of change in accounting principle 1,034 1,994 1,776
Net income 1,034 1,898 1,776
Earnings available for common stockholders 1,021 1,884 1,757
COMMON STOCK DATAb
Weighted-average shares outstanding 836 767 736
Basic earnings per share (before cumulative effect of change in accounting principle) $ 1.22 $ 2.58 $ 2.39
Basic earnings per share 1.22 2.45 2.39
Dividends per share 1.10 1.10 1.10
CAPITALIZATION
Common equity 36% 41% 37%
Minority interests 5% 7% 9%
Preferred stock 1% 1% 1%
Trust preferred securities 3% 5% 5%
Total debt 55% 46% 48%
SEC fixed charges coverage 2.1 3.8 3.6
Total assets $ 60,966 $ 48,531 $ 58,232
Total debt 22,465 14,185 12,980
Cash flows from operating activities 4,530 4,357 2,011
Cash flows used in investing activities (6,809) (6,043) (4,716)
Cash flows from financing activities 2,846 1,354 2,714
OPERATING DATAc
Sales, GWhd 105,226 98,581 101,715
Natural Gas Transmission’s proportional throughput, TBtue 3,160 1,781 1,771
Natural gas marketed, TBtu/df 23.5 16.6 13.6
Electricity marketed and traded, GWhg 641,836 347,236 279,466
Field Services’ natural gas gathered and processed/transported, TBtu/d 8.3 8.6 7.6
Field Services’ natural gas liquids production, MBbl/d 391.9 397.2 358.5
a Revenues have been updated to show the impact of gross versus net presentation of revenues under the FinancialAccounting Standards Board’s EITF Issue No. 02-03. (For more information, see “New Accounting Standards” inNote 1 to the Consolidated Financial Statements, in Item 8 of SEC Form 10-K.)
b Year 2000 amounts are restated to reflect the two-for-one common stock split effective January 26, 2001.c Units of measure used are gigawatt-hours (GWh), trillion British thermal units (TBtu), trillion British thermal units per day
(TBtu/d) and thousand barrels per day (MBbl/d).d Includes Franchised Electric’s and International Energy’s statistics.e For 2002, includes volumes of Westcoast Energy Inc., acquired March 14, 2002.f Includes Duke Energy North America’s, International Energy’s and Field Services’ volumes.g Includes Duke Energy North America’s and International Energy’s volumes.

What happenedin 2002 and where do we gofrom here? ”
RICHARD B. PRIORY
CHAIRMAN OF THE BOARD
CHIEF EXECUTIVE OFFICER
“

P/ 5
TO OUR SHAREHOLDERS:
The year 2002 was one of enormous challenge – for our company, our industry and the economy at large. And it wasa year of disappointment for shareholders who have come to rely on Duke Energy’s ability to provide steady returns.
Our best efforts and outlook proved no match for the harsh realities of 2002: An economy of fits and starts, unprecedentedturmoil in the U.S. merchant energy sector, accelerating upheaval in both credit and equity markets, and an unrelentingbear market all combined to create the greatest crisis in investor confidence and public trust since the Depression.
External factors were certainly challenging. And while we marshaled all of our resources and knowledge to address thedynamic changes within our sector, we were not fully prepared to deal with eroding market conditions. Our forecasts for U.S. power supply and demand missed the mark, and collapsing markets left us long in power supply and overexposed to a dramatic drop in the price of electricity.
Our reported year-end earnings per share were $1.22, including the effect of certain charges related to ice storm damage,restructuring costs, and goodwill and asset impairments. Without those charges, ongoing earnings were $1.88 per share.Our stock price fell from a 52-week high of $39.80 to $19.54 at year-end. Total return to shareholders, including dividendspaid during the year and the decrease in our stock price, declined 48 percent in 2002.
If the law of gravity prevailed in 2002, so did the theory of relativity. Amid a landscape of fallen merchant energy providers,Duke Energy has fared comparatively well. We are among the few in our sector to retain investment-grade creditratings. Our Duke Power and Duke Energy Gas Transmission businesses provided reliable earnings and solid cashflow, helping compensate for the sharp downturn in our merchant energy business.
I’m proud of our staying power, our operational performance in the face of adversity, and our steadfast commitment tovalue creation. But there are no bragging rights in basic business survival – and we’re never content with “better than most.”So this letter and the commentary that follows will address what happened in 2002 – and, more importantly, what we’redoing to manage through the current economic and market weakness and ensure we are well positioned for the future.
WHAT HAPPENED IN 2002?
The young merchant energy sector, which had enjoyed an enormous upswing in previous years, experienced its firstmajor down cycle in 2002. The turn was stunning, swift and severe.
Some regions that had capacity shortfalls just a year ago experienced a rapid upsurge in supply. We had focused on thedevelopment activities of large, established generators, but we underestimated the build-out efforts of some smallerlocal and regional energy merchants. Rapid additions to generating capacity, coupled with the extended economicdownturn, resulted in a sharp decline in power margins and volatility.
In the wake of the Enron bankruptcy, credit rating agencies focused more intently on cash and coverage ratios for allcompanies, but particularly for the energy sector. As business conditions worsened, companies faced enormousincreases in their capital costs, and in many cases were shut out of the capital markets. The dramatic credit decline ofmany energy customers and wholesale market participants reduced the size, length and volume of energy transactionsin the marketplace.

P/ 6
Finally, regulatory uncertainty, changes in accounting standards and securities laws, investigations and litigation furtherdiscouraged investment and confidence in our sector. Moreover, this occurred in the context of an alarming crisis oftrust in business in general, brought on by accounting missteps and improprieties, allegations of business scandals andgrowing skepticism about the effectiveness of corporate governance.
All of these factors converged to create dramatic changes in the energy marketplace, and to substantially reduce the earnings opportunity for our merchant energy businesses Duke Energy North America (DENA) and Duke EnergyInternational (DEI). Our total reported earnings before interest and taxes (EBIT) of $2.87 billion fell $1.39 billionshort of 2001 EBIT of $4.26 billion. Ongoing 2002 EBIT (excluding one-time charges) was $3.62 billion, comparedto $4.34 billion in 2001 – primarily due to substantially lower results at DENA.
WHERE DO WE GO FROM HERE?
As eager as we are to put 2002 behind us, we’re realistic enough to know that we’ll be grappling with weak marketconditions through at least 2003. The slow pace of economic recovery, imbalance between electricity supply and demand,and regulatory and legal uncertainties facing our industry paint a sober view of the year ahead.
We therefore expect earnings per share of between $1.35 and $1.60 in 2003 (before one-time charges for the implementation of new required accounting standards).
We are committed to growing profits from our core regulated businesses. Duke Energy benefits from the balance within our portfolio between stable businesses like Duke Power and Duke EnergyGas Transmission – and the more cyclical merchant energy and Field Services businesses. These are supplemented bysmaller but healthy contributors like Crescent Resources, which delivers solid performance in fluctuating business cycles.While our regulated businesses are not immune to weakness in the economy, they are robust and are expected togenerate some 80 percent of our earnings in 2003.
Serving more than 2 million customers in North Carolina and South Carolina, Duke Power continued to provide a solidstream of earnings in 2002. The business delivered EBIT of $1.61 billion in 2002, just slightly down from 2001 EBIT of$1.63 billion. The stability of these earnings and cash flows is directly linked to Duke Power’s consistent, best-in-classperformance. Operational excellence was evident in our 2002 performance, with our three nuclear stations achieving anunprecedented level of productivity, and our fossil and hydroelectric plants reaching record levels of commercial availability.
We were pleased by the passage of North Carolina’s clean air legislation in 2002. Thanks to the hard work of thestate’s governor, legislators, regulators, environmentalists and electric utilities, a constructive plan was adopted thatallows us to recover the costs of installing additional environmental controls at our fossil-fueled generating stations.Most importantly, the new legislation will result in significantly reduced emission levels. The legislation will freeze Duke Power electricity rates at their current levels for the next five years, while maintaining the company’s stableearnings and cash flows.
Duke Energy Gas Transmission performed exceptionally well, contributing $1.17 billion in EBIT for 2002, a 92 percentincrease over 2001 EBIT of $608 million. We completed a major expansion of our gas transmission business with theacquisition of Westcoast Energy in Canada, which added significant gas pipeline, storage and field services capacity, aswell as a local distribution company serving 1.1 million residential customers. The transaction closed on March 14, 2002,and the Westcoast business contributed $416 million in EBIT for the year. We expect that contribution to increase as
P/ 7
we connect major supply basins with growing markets on both sides of the border. And responding to demand growthin key eastern U.S. markets, we undertook pipeline expansion projects to serve Florida, Tennessee, North Carolina,Virginia, Massachusetts, New York and New Jersey.
We are addressing issues in our merchant energy business.We are resolutely focused on reducing our exposure in the merchant energy business. After contributing $1.49 billionof EBIT in 2001, DENA contributed only $165 million of EBIT in 2002. We took decisive action last year – deferringconstruction projects, renegotiating the terms of our turbine purchases and halting most new development efforts.
We realigned and substantially reduced our merchant energy organization. And, by consolidating our North Americansales and marketing functions, we are gaining significant economies of scale. Additionally, we developed consistentpolicies, practices and systems, including enhanced controls to improve our monitoring and reporting capabilities.
While the wholesale energy industry is still reeling from the loss of so many participants, low market volatility and lowliquidity, we view sales and marketing as an integral aspect of a competitive energy marketplace. Our energy professionalsmarket energy commodities, manage risk, provide reliability and promote price transparency for our customers worldwide.
We are committed to preserving the value merchant energy provides – reliable power supply, competitive pricing andefficient, well-run plants. Going forward, there will be fewer but stronger suppliers in the merchant field – well capitalized,able to survive through market ups and downs, skilled in risk management, diversified to sustain earnings, with assetsto back their commitments. And Duke Energy intends to be at the head of the pack.
Just as merchant energy suffered in the U.S., international energy markets saw a downturn last year as well. DEI reportedan EBIT loss of $102 million for 2002, due primarily to goodwill and other asset impairments associated with changingmarket conditions in Europe and Latin America – and business decisions we made to respond to those conditions. We have exited the power trading business in Europe and we pulled back on development plans in Brazil. We areconcentrating our efforts this year on organic growth within our international business, emphasizing sales and marketingof capacity from our generation facilities and pipelines.
Discipline is our watchword for 2003. We are focused on cash generation and capital management, limiting discretionary spending and reducing debt. To provide the financial flexibility needed to manage through near-term cycles, we’ve reduced planned capital expenditures by more than half to $3 billion in 2003. We expect cash from operations and asset sales to fund ourcapital expenditures and dividends, reducing the need for outside financing.
For 76 consecutive years we have paid quarterly dividends on our common stock. Our dividend delivered a 5.8 percentyield in 2002, and our plans for 2003 fully support the dividend at its current level of $1.10 per share.
We will continue to divest non-strategic assets when we can capture value. In addition to power plant and pipelinesales in 2002, we sold two businesses – Duke Engineering & Services and DukeSolutions – to companies with strategiesbetter aligned with their capabilities.
We are reducing our workforce as we restructure to accommodate market changes and capture additional efficiencies.Consistent with the reductions, we’ve streamlined accountabilities and strengthened our focus on business operations.These changes are expected to reduce future costs by about $150 million annually.

P/ 8
We are maintaining a solid balance sheet.Despite a difficult 2002, we maintain a strong balance sheet and sound credit ratings, good cash flow, a diverseearnings base and solid risk management.
For the past two decades, we’ve demonstrated our commitment to maintaining the sound financial ratios that supporta solid credit rating. Even though our corporate ratings on unsecured debt were reduced in 2002, they remain amongthe strongest in the electric and gas sector.
Investors today are hungry for more detailed financial information, and we are striving to provide new levels oftransparency and context in our financial reporting. We are providing additional metrics associated with our salesand marketing operations, and new levels of detail related to cash flow, balance sheet and income statements inour quarterly and annual reporting.
We are accountable for our actions.Duke Energy’s resilience in trying times and in good times is as much an outcome of corporate character as corporateperformance. Integrity, trust, credibility and respect have been cornerstones of our company for nearly a century.And we are accountable for ensuring that any challenge to that foundation – any breach of ethics or misconduct – isaddressed swiftly and resolutely.
For me, one of the most disappointing events of the year was finding instances where we did not meet our own highstandards for conduct. We identified a small number of round-trip transactions that appear to have been conductedwith no legitimate business purpose. While those instances were isolated and immaterial to earnings or revenue, we were forceful and forthright in our response: We have taken appropriate disciplinary actions and instituted new levelsof control and accountability throughout our organization.
We have worked hard to reaffirm and communicate the values that Duke Energy stands for. Leadership sets the examplefor ethical conduct, and all employees are held accountable. Each year, every Duke Energy officer and employee reviewsour Code of Business Ethics as we recommit ourselves to preserving and building our company’s reputation.Additionally, each of our energy marketing and risk control professionals signs a statement acknowledging in detailtheir commodity trading responsibilities at Duke Energy.
Another issue that grabbed headlines in 2002 was an inquiry into specific Duke Power regulatory accounting entries.Our own review and an outside audit resulted in the identification of unintentional errors – and the need for improvedcommunication with the North Carolina and South Carolina utility commissions. Reconciling our conviction that we hadacted in good faith with the need to move forward, we reached a settlement agreement with both commissions, and arecooperating with the Department of Justice as they review this issue as well.
We were gratified at year-end by the decision of the U.S. District Court in the Southern District of New York to dismiss,in all respects, a number of class-action lawsuits regarding round-trip transactions. And we were also pleased when afederal judge in California dismissed a lawsuit filed by a Washington plaintiff against our company and other Californiagenerators, alleging antitrust and unfair business practices under California state law.
Let me be clear here: Duke Energy will not tolerate unethical business conduct. If we find instances of wrongdoing, we will take swift corrective action. We will be equally vigilant in defending our corporate character against false allegations, misconceptions and the potent dynamic of “headline risk.” We will continue to defend ourselves vigorouslyas we respond with facts and candor to questions about our operations, our principles and our character.

P/ 9
We call upon our deep and principled management capability.The right mix of skills and experience allowed us to redefine our corporate organization to respond to the market realities of 2002. The appointment of Fred Fowler to the role of Duke Energy’s president and chief operating officerwas a strong and definitive move by our Board of Directors. Fred brings tremendous operational leadership, financialrigor and a solid track record of delivering results in both key areas. Congratulations and our deepest thanks to Bill Coley, who retired in February as president of Duke Power and as a member of Duke Energy’s Board of Directors.Bill provided strong leadership within our company and our community over the course of a distinguished 37-yearcareer with the company. We wish him well.
These significant changes at the highest level of our company resulted in a number of positive moves within our operating businesses: Ruth Shaw succeeds Bill Coley as president of Duke Power; Tom O’Connor now serves as presidentof Duke Energy Gas Transmission; Rob Ladd is president of Duke Energy North America; Richard McGee continues aspresident of Duke Energy International; and Jimmy Mogg continues as chairman, president and CEO of Duke EnergyField Services. In making these changes and related realignments, we drew upon deep management bench strengthand the talent needed to move us forward with good direction and momentum.
We are governed by an engaged and exacting Board of Directors. As more stringent governance standards have been proposed on many different fronts, we are in compliance with current standards and intend to meet all future requirements.We welcome Michael Phelps to our board, and thank Dennis Hendrix and Harold Hook for their years of dedicated service.
We are focused on the future.2002 certainly taught us all the inherent dangers associated with a market bubble. It also brought renewed appreciationfor timeless attributes like real assets, cash flow, sustainable earnings, operational know-how, reliable performance andcustomer service. We were reminded of the value and safeguards that diversification brings to the portfolios of individualinvestors and to companies like Duke Energy. And we are more focused on clarity and candor in reporting andassessing corporate performance.
Duke Energy’s stock price will rebound, of that I am confident. Predicting a recovery date is more difficult. Triggers thatwill prompt the return of a robust energy marketplace include economic recovery, a narrowing of electricity reservemargins in the U.S., the restoration of financial liquidity to our sector, certainty around new and proposed accountingand governance standards, and the credit health of energy customers and partners.
2002 was a tremendously trying chapter in Duke Energy’s 99-year history. But it was prologue, not epilogue. We’vetaken decisive action to weather the current cycle and to be ready to act on the growth opportunities that will emerge.We are relying on the fundamentals: Unyielding business values and operating principles. Strong, consistent valuefrom core assets. Effective, conservative financial management. Solid, day-to-day execution. Reliable reporting drivennot only by the new rules of the road – but also by our best judgment and highest intentions.
Our industry is far too vital to suffer a prolonged crisis of confidence. Duke Energy is focused not only on pulling ourcompany through a tough time, but also on doing our part to restore order, accountability and honor to our critical sector.I hope that you will continue to stay the course with us, and I thank you for your confidence, which we work hardevery day to both re-earn and reward.
RICHARD B. PRIORY MARCH 12, 2003

FRED J. FOWLER
PRESIDENT
CHIEF OPERATING OFFICER
What actions are you taking to move the company forward? ”
Other energycompanies have pulled out of trading and marketing. Why are you still in? ”
With all the distractions, can you stay focusedon customers? ”
“ “ “
P/ 11
WE’RE DRAWING ON OUR CORE STRENGTHS – RELIABILITY, EFFICIENCY AND PRODUCTIVITY.
We’re responding to the current industry slump as we have to previous downturns in our industry and the economy –by focusing on productivity and efficiency throughout our operations, and by safely and reliably meeting customers’energy needs. My job as chief operating officer is to make sure that we not only maintain our record of operationalexcellence – we improve it.
In recent months, we’ve taken a hard look at costs across the enterprise. We’ve delayed projects and sold assets,and we’re reducing our workforce by nearly 2,000 to reflect current market realities. Many of those moves haveinvolved our competitive merchant energy business, where market conditions present the greatest challenges.
All indicators – excess supply, narrow spark spreads and difficult credit conditions – point to a slow recovery for merchant energy. Our 20 natural gas-fired merchant power plants are under-used in today’s oversupplied electricitymarket. But state-of-the-art technology, leveraged with nearly 100 years of power generation experience, puts ourmerchant generation fleet among the most efficient and well-run in the U.S. – a competitive advantage when theeconomy recovers and power demand catches up with supply.
Our regulated businesses provide stability going forward.The strong cash flows and steady growth of our regulated businesses will be the bedrock of our earnings for the foreseeable future. Duke Power and Duke Energy Gas Transmission are focused on maximizing profits by increasingproductivity and sales.
Duke Power continues to raise the bar for operational excellence. In 2002, the utility’s nuclear stations generatedmore electricity for the Carolinas than ever before – producing at more than 95 percent of their capacity, and at the lowest production cost ever. A higher capacity factor reflects fewer and shorter outages, boosting productivity. We do expect a lower nuclear capacity factor in 2003, as a result of planned maintenance and refueling outages.
The utility’s hydroelectric and fossil fleet achieved outstanding commercial availability of 98.3 percent in 2002.Combined with higher nuclear output, that availability helped meet more of the system’s power demand at less cost.The fossil/hydro plants met summer peak power demands, thanks to the company’s careful management of waterresources during the Carolinas’ worst drought in 100 years. And through prudent planning, the fleet maintainedsystem reliability while installing the latest environmental technology to reduce emissions at six of the utility’s eight coal-fired stations.
Innovation, commitment to customer service and an unwavering focus on safety and reliability have establishedDuke Energy Gas Transmission as an industry leader, and we are responding to the needs of our customers with newprojects and new ideas. Investment in new technologies and advanced preventive maintenance practices are furtherenhancing the reliability of our pipelines. Capacity in our wholly owned U.S. pipelines is nearly 95 percent contractedwith an average contract life of nine years. Union Gas, our distribution company in Ontario, continues to grow, addingmore than 20,000 new customers in 2002. This stable customer base and growing demand for reliable sources of natural gas strengthen our earnings base, cash flow and growth potential.

P/ 12
The sharing of expertise, capabilities and market knowledge among our diverse businesses, within regulatory limits,drives efficiencies to boost our bottom line. Here’s one example: We use small jet-engine-like turbines for both gascompression in our pipelines and gas-fired electric generation in remote areas around the globe. Operating teamsfrom our gas transmission business in Canada and our generation facilities in Ecuador, France and Australia saw a common interest. They worked out a plan to purchase maintenance services and spare parts for the turbines as afleet, saving an estimated 20 to 25 percent – millions of dollars – over the life of the equipment.
BUYING AND SELLING ENERGY IS AN IMPORTANT PART OF OUR BUSINESS.
The wholesale energy market is where we buy fuel for our power plants and sell their output. Our sales and marketingactivities allow us to buy energy at the lowest possible cost and sell it at the highest fair price, providing higher returnson our investment in merchant plants and other energy infrastructure.
And sales and marketing are critical to the efficient movement of energy in the wholesale marketplace. These activities bring reliable, fair-priced energy to our customers, when and where they need it, along with energy-relatedproducts and services.
Most of our market transactions are related to our assets, or conducted on behalf of our customers. We do little proprietary trading, which involves buying and selling energy commodities to profit from price fluctuations. In 2002,only about 10 percent of Duke Energy North America’s gross margin was the result of proprietary trading.
Some companies have exited the business, true, but we’re seeing new entrants, especially banks and oil companies.We welcome those new market participants, their confidence in this business and the liquidity they bring back to theenergy marketplace.
CUSTOMERS FACE THEIR OWN CHALLENGES, AND WE OFFER SOLUTIONS.
Most of our customers are facing the same economic pressures as we are. This presents a real opportunity to buildon our business relationships by helping new and existing customers manage their energy needs and costs.
We’re reaching for larger market share with wholesale customers, who look to Duke Energy for price risk managementand reliable energy supply.
For example, Duke Energy is saving the city of North Little Rock, Ark., a projected $2.2 million over five years, by reliably supplying its electricity needs at lower cost than competitors could offer. Our cost-efficient generation andmarketing capabilities combined to give us that competitive advantage.
On the retail side, Duke Power is ranked #1 for customer satisfaction in the TQS Research survey of large industrialand commercial customers of electric utilities, and consistently ranks first or second with residential customers on theAmerican Customer Satisfaction Index. Awards and surveys that put us at the top of the charts are in the nice-to-knowcategory, but our greatest satisfaction comes from knowing that we’re meeting our customers’ expectations.

P/ 13
Union Gas has launched a web-based system that enables its business customers to conduct energy transactionsonline. At Duke Power, we’re rolling out mobile meter reading to measure customer usage with pinpoint accuracy, in a fraction of the time and at less cost than manual reading.
When a December 2002 ice storm in the Carolinas left nearly 1.4 million customers in the cold and the dark, DukePower restored service to more than 150,000 customers per day – more than ever before. This dramatic restorationrate drew on our experience in previous storms: Following the devastation of Hurricane Hugo in 1989 we restoredpower to an average of 38,000 customers per day, and after a 1996 ice storm, 66,000 customers per day. Each timewe have learned valuable lessons about communicating with our customers as we work to safely restore their comfortand security.
One of the realities of the energy business is that many factors are beyond our control – like the weather and theeconomy. Our job is to effectively manage the factors we can control, and to make the best possible decisions to successfully guide our company through all kinds of conditions and market cycles. Driving us will be our operationalfocus, our commitment to customers and our belief in the future of competitive energy markets.

RICHARD J. OSBORNE
EXECUTIVE VICE PRESIDENT
CHIEF RISK OFFICER
Trading andmarketing scandalshave eroded trust in the energy industry. What are you doing to regainthat trust? ”
“
THE CRISIS IN CONFIDENCE IN ENERGY TRADING IS INDUSTRY-WIDE, AND REQUIRES
INDUSTRY LEADERSHIP.
Every company involved in energy trading and marketing is responsible for restoring market confidence and vitality.
As a founding member of the Committee of Chief Risk Officers (CCRO), Duke Energy is working with more than 30other companies to develop best practices for energy trading and marketing. These standards will make wholesaleenergy businesses easier for investors, customers and regulators to understand and compare, through better reportingof the risks and financial aspects of their operations.
The CCRO has identified best practices in a number of areas – corporate governance, financial controls, risk managementand measurement, including credit risk, and disclosures about trading and marketing operations. Duke Energy is alreadyin compliance with many of the CCRO’s recommendations; we’re in the process of implementing others, and reviewingour own practices against these new industry standards.
We’ve hardwired new control measures into our risk management and trading practices. We consolidated our risk management oversight functions to ensure a uniform approach and the application ofindustry best practices across all of our businesses, as we measure and monitor our exposure to both credit riskand energy commodity price risk.
Increasingly sophisticated risk limits allow us to better monitor our market exposures. We’re enhancing bothenergy and credit risk management by clarifying accountabilities, improving measurement criteria, and updating ourdocumentation and reporting practices. We’re implementing new risk management information systems to summarizeand capture data faster and more accurately, improving our ability to track results. And most importantly, while ourcorporate and business unit risk management professionals understand the technical and analytical aspects of riskmanagement, they also know that effective risk management means more than monitoring a series of measures andlimits – it means understanding the overall risk of an operation or position in a very practical sense.
We’ve also created a trade operations compliance group. This group studies trading rules and regulations, createspolicies and procedures, clarifies standards, provides training and monitors our operations for compliance.
If we find problems, we move quickly to fix them.“Round-trip” trades – simultaneous or prearranged transactions that lack a legitimate business purpose, and areconducted for the purpose of increasing volume or revenues – are against company policy. In response to a Securitiesand Exchange Commission investigation of energy companies’ trading practices, we conducted a thorough review of750,000 transactions going back to 1999, and uncovered 89 such transactions. The round-trip trades totaled lessthan one-third of one percent of our trading revenues for that period, and had no material impact on earnings.
We publicly reported the transactions, took appropriate disciplinary action and strengthened our controls.Governmental entities continue to review the practices of Duke Energy and other companies that trade energycommodities. This scrutiny should encourage a less risky, better controlled wholesale energy market.
Trading and marketing are the lifeblood of a healthy, competitive energy industry. But they are still somewhat newto the industry. We’re working from the inside out, calibrating our controls and policies, and from the outside in,collaborating with industry partners and regulatory bodies, to restore order and trust to this emerging business.
P/ 15

ROBERT P. BRACE
EXECUTIVE VICE PRESIDENT
CHIEF FINANCIAL OFFICER
What are you doingto strengthen thecompany’s financialposition? ”
How are you improving your financial transparency? ”
“ “

WE ARE TAKING A DISCIPLINED APPROACH, FOCUSING ON OPERATIONAL EFFICIENCY,
CASH GENERATION AND CAPITAL MANAGEMENT.
We are focused on cash generation, capital management, limiting discretionary spending and reducing our debt. Weissued $1 billion in equity in 2002 to enhance our balance sheet, and we’ve sold non-strategic businesses and assets.To improve cash flow, we’ve cut costs, significantly reduced capital spending and focused on the productivity andefficiency of our operations.
In 2003, we expect cash flow from operations, including divestitures, to more than adequately fund capital expendituresof approximately $3 billion and the approximately $1 billion needed for the yearly dividend of $1.10 per share. As ofyear-end 2002, we had nearly $2.9 billion in unused bank credit available, in addition to more than $850 million cashon hand.
In spite of our lowered credit ratings, we have been able to access the capital markets on favorable terms. In 2002,we borrowed at an average interest rate of 6.1 percent, which compares favorably to an average rate of approximately7 percent for our total debt portfolio.
WE ARE PROVIDING MORE INFORMATION SOONER, AND MAKING IT EASIER TO UNDERSTAND.
Summary cash flow and balance sheet information, for example, is now included with our quarterly earnings releasesand simultaneously posted to our Web site. And, we strongly support industry initiatives, legislative reforms andaccounting guidelines that bring more clarity to financial reporting.
Duke Energy is providing more detailed information to investors regarding its energy marketing and risk managementactivities – in fact, we were among the first to provide additional disclosures consistent with those recentlyrecommended by the energy industry’s Committee of Chief Risk Officers.
A Financial Accounting Standards Board task force recently ruled that companies could not recognize as earningsunrealized gains or losses on the future value of certain energy contracts prior to settling those contracts. That is,energy companies may no longer use “mark-to-market” accounting to recognize earnings on their income statements,except in certain limited cases. We applaud this ruling, as it removes the uncertainty inherent in applying mark-to-market accounting across the board, provides greater transparency and brings less volatility to earnings.
Another new accounting rule requires that energy companies report trading revenues on their income statements ona net basis instead of a gross basis. This change affects reported revenues, but it has no impact on the company’sprofitability or cash flows. Measures such as operating income, earnings per share and return on equity have not beenaffected by this new ruling.
Financial reporting, in my view, should present a fair and complete picture of a company’s financial health. Ourfinancial reports undergo rigorous management review and analysis, business by business, before they are published.During 2002, we improved this process to incorporate new requirements as a result of the Sarbanes-Oxley Act. Newsteps include more detailed discussions and documentation, and a corporate Disclosure Committee reviews ourfinancial reports before they are filed with the Securities and Exchange Commission. These activities are designedto ensure that our published financial reports continue to accurately, clearly and thoroughly reflect the financialcondition of Duke Energy and its businesses.
P/ 17

RICHARD W. BLACKBURN
EXECUTIVE VICE PRESIDENT
GENERAL COUNSEL
CHIEF ADMINISTRATIVE OFFICER
Your longstanding reputation has been challenged.What are you doingabout it? ”
New regulations andlegislation are changingcorporate governancepractices. How doesyour Board of Directors measure up? ”
“ “

OUR REPUTATION IS BUILT ON ACTIONS, NOT JUST WORDS.
The Duke Energy name has historically stood for integrity and fair play. That perception has been challenged. We’veworked hard and long to build our good name, and we intend to preserve it. Ethical conduct is, and always has been,a defining aspect of our company, and a key competitive advantage.
Earning the public trust is no easy task. It starts by making sure our house is in order.
We’ve taken a critical look at what we do, and how we do it. Our values – integrity, stewardship, inclusion, initiative,teamwork and accountability – are more than ideals posted on a wall. They’re the way we do business, from theboard room to the break room. We weave them into our corporate policies and procedures, into our very culture.They underlie contracts written for mutual benefit, as well as legal obligation. And they are key factors in the waywe recruit, select and train employees, and guide their performance.
Over the past year, we have reinforced with employees Duke Energy’s business values, emphasizing their relevanceto every task and decision. We’ve also updated our Code of Business Ethics, to clarify how the values apply in specificsituations. We’re not perfect – but we take prompt and decisive action if we find that our Code of Business Ethics hasbeen violated.
OUR BOARD OF DIRECTORS PROVIDES ETHICAL AND ACCOUNTABLE LEADERSHIP.
Mistrust of corporate governance due to real and perceived abuses has given rise to new legislation and regulation –in the energy industry and throughout the business world. Our corporate governance remains strong and accountable,and in compliance with recent reforms.
Even before the Sarbanes-Oxley Act was signed into law in 2002, Duke Energy’s policies and practices guardedagainst conflicts of interest, supported independent and involved oversight of management by the Board of Directors,and provided other safeguards now required by the legislation. For example, since 1993, Duke Energy has providedemployees with a telephone hotline to anonymously report suspected violations of law or of the company’s Code ofBusiness Ethics. And a recent policy change prohibits senior officers from using the company’s external auditor forany personal services.
We have further strengthened our policies and practices to reflect the requirements of the Sarbanes-Oxley Act.Duke Energy prohibits loans to executive officers, for instance, and this year the board’s Audit Committee will beginpre-approving all services provided by Duke Energy’s auditor.
New governance rules proposed by the New York Stock Exchange (NYSE), and under review by the Securities andExchange Commission, require that companies have written governance principles. We’ve had written principles since1998. In addition, we’ve had practices in place that reflect other NYSE proposed, but not yet required, standards.For example, the members of our Board of Directors’ Audit, Compensation and Corporate Governance Committeesare independent. And, the Corporate Governance Committee reviews directors’ and executive officers’ service onother boards for possible conflicts of interest, and to ensure they can adequately focus on their responsibilities toDuke Energy’s shareholders.
Duke Energy welcomes these constructive reforms. But what they say is true: “You can’t legislate morality.” There’sno substitute for a commitment to the ethical core of this company. Our board, our management, our employeesand our auditors are accountable for fulfilling both the spirit and the letter of the law. That’s the kind of responsibleperformance that will get our industry back on track.
P/ 19

P/ 20
BOARD OF DIRECTORS G. ALEX BERNHARDT, SR. 59
Chairman and Chief Executive Officer,
Bernhardt Furniture Company.
Audit Committee.
Director since 1991.
MAX LENNON 62
President, Education
and Research Services.
Chairman, Audit Committee.
Director since 1988.
RICHARD B. PRIORY 56
Chairman of the Board
and Chief Executive Officer.
Finance and Risk Management Committee.
Director since 1990.
ROBERT J. BROWN 68
Chairman and Chief Executive Officer,
B&C Associates Inc.
Audit Committee;
Corporate Governance Committee.
Director since 1994.
LEO E. LINBECK, JR. 68
Chairman of the Board, Linbeck Corporation.
Chairman, Compensation Committee;
Finance and Risk Management Committee.
Director since 1986.
BOARD OF DIRECTORS
Duke Energy’s Board of Directors is responsible for positively influencing shareholder value and enhancing thecompany’s reputation as a constructive force in the communities where it does business. The board is committedto strong governance practices, which provide a framework for timely response to issues affecting Duke Energyand its shareholders.

P/ 21
WILLIAM T. ESREY 63
Chairman and Chief Executive Officer,
Sprint Corporation.
Compensation Committee;
Finance and Risk Management Committee.
Director since 1985.
JAMES G. MARTIN 67
Corporate Vice President,
Carolinas HealthCare System.
Chairman, Corporate Governance Committee;
Compensation Committee.
Director since 1994.
ANN MAYNARD GRAY 57
Former President, Diversified
Publishing Group of ABC Inc.
Corporate Governance Committee;
Finance and Risk Management Committee.
Director since 1994.
MICHAEL E.J. PHELPS 55
Chairman, Duke Energy Canadian
Advisory Council.
Corporate Governance Committee;
Finance and Risk Management Committee.
Director since 2002.
JAMES T. RHODES 61
Retired Chairman, President
and Chief Executive Officer,
Institute of Nuclear Power Operations.
Audit Committee.
Director since 2001.
GEORGE DEAN JOHNSON, JR. 60
Chief Executive Officer and Director,
Extended Stay America Inc.
Chairman, Finance and Risk Management
Committee; Compensation Committee.
Director since 1986.
P/ 22
MANAGEMENT
RICHARD B. PRIORY Chairman and Chief Executive OfficerFRED J. FOWLER President and Chief Operating OfficerRICHARD W. BLACKBURN Executive Vice President, General Counsel and Chief Administrative OfficerROBERT P. BRACE Executive Vice President and Chief Financial OfficerRICHARD J. OSBORNE Executive Vice President and Chief Risk Officer
ROBERT B. EVANS Transition Executive, Energy ServicesROBERT T. LADD President, Duke Energy North AmericaRICHARD K. MCGEE President, Duke Energy InternationalJIMMY W. MOGG Chairman, President and CEO, Duke Energy Field ServicesA.R. MULLINAX Executive Vice President, Duke Energy Business ServicesTOM C. O’CONNOR President, Duke Energy Gas TransmissionRUTH G. SHAW President, Duke Power
GOVERNANCE
AUDIT COMMITTEE
The Audit Committee recommends to the Board of Directors the appointment of Duke Energy’s independent auditors;provides independent oversight for financial reporting and internal controls, the internal audit function and theindependent auditors; determines the independence of auditors; and makes recommendations on audit matters andinternal controls to the Board of Directors.
COMPENSATION COMMITTEE
The Compensation Committee sets the salaries and other compensation of all executive officers of Duke Energy,except the chairman of the board and chief executive officer. This committee makes recommendations to the Boardof Directors regarding the chairman and CEO’s salary and other compensation, without his presence or participation.The committee also makes recommendations to the Board of Directors on compensation for outside directors.
CORPORATE GOVERNANCE COMMITTEE
The Corporate Governance Committee considers matters related to corporate governance, and formulates andperiodically revises governance principles. It recommends the size and composition of the Board of Directors, withinthe limits of the Articles of Incorporation and By-Laws, and recommends potential successors to the chief executiveofficer. This committee also considers nominees recommended by shareholders for the Board of Directors.
FINANCE AND RISK MANAGEMENT COMMITTEE
The Finance and Risk Management Committee reviews Duke Energy’s financial and fiscal affairs, and makesrecommendations to the Board of Directors regarding dividends, financing and fiscal policies. It reviews the financialexposure of Duke Energy as well as mitigating strategies, and determines whether actions taken by management withrespect to financial matters are consistent with internal controls approved by the Audit Committee.
Complete Committee Charters, as well as Duke Energy’s Principles for Corporate Governance and Code of BusinessEthics, are available in the Investors section of www.duke-energy.com, under Corporate Information.
P/ 23
SHAREHOLDER INFORMATION
ANNUAL MEETING The 2003 Annual Meeting of Duke Energy Shareholders will be:Date: Thursday, April 24, 2003Time: 10 a.m.Place: O.J. Miller Auditorium, Energy Center
526 South Church StreetCharlotte, North Carolina 28202
SHAREHOLDER SERVICES Shareholders with questions about their stock accounts, legal transfer requirements,address changes, replacement dividend checks, replacement of lost certificates or other services should call(800) 488-3853 or (704) 382-3853. E-mail requests should be sent to [email protected]. Writtenrequests should be addressed to:
Investor RelationsDuke Energy CorporationP.O. Box 1005Charlotte, North Carolina 28201-1005
STOCK EXCHANGE LISTING Duke Energy’s common stock, first and refunding mortgage bonds, and certain issuesof preferred securities and senior notes are listed on the New York Stock Exchange. The company’s common stocktrading symbol is DUK.
WEB SITE ADDRESS www.duke-energy.com
INVESTORDIRECT CHOICE PLAN The InvestorDirect Choice Plan provides a simple and convenient way for interestedparties to purchase common stock directly through the company without incurring brokerage fees. Bank drafts formonthly purchases as well as a safekeeping option for depositing certificates into the plan are available. The plan alsoprovides for full reinvestment, direct deposit or cash payment of dividends.
FINANCIAL PUBLICATIONS Duke Energy will furnish to any shareholder, without charge, copies of the 2002 reporton SEC Form 10-K and the 2002 Statistical Supplement.
DUPLICATE MAILINGS You will receive duplicate mailings of annual reports, proxy statements and other shareholdermailings if your shares are registered in different accounts. If you receive such duplications, please call InvestorRelations for instructions on eliminating the duplicate mailings or combining your accounts.
TRANSFER AGENT AND REGISTRAR Duke Energy maintains shareholder records and acts as transfer agent andregistrar for the company’s common and preferred stock issues.
DIVIDEND PAYMENT Duke Energy has paid quarterly cash dividends on its common stock for 76 consecutive years.Dividends on common and preferred stock in 2003 are expected to be paid, subject to declaration by the Board ofDirectors, on March 17, June 16, September 16 and December 16.
BOND TRUSTEE If you have any questions regarding your bond account, call (800) 275-2048 or write to:JPMorgan Chase BankCorporate Trust ServicesP.O. Box 2320Dallas, Texas 75221-2320

We welcome your opinion on
Duke Energy’s 2002 Annual Report.
Please visit the Investors section of
www.duke-energy.com, where you
can view the online Annual Report
and provide feedback on both the print
and online versions via a reader survey.
Or send your written comments to:
Investor Relations
Duke Energy
P.O. Box 1005
Charlotte, NC 28201-1005.
Duke Energy is an equal opportunity employer. This report is published solely to inform shareholders and is not to be consideredan offer, or the solicitation of an offer, to buy or sell securities. This report was printed in the USA on recycled paper.
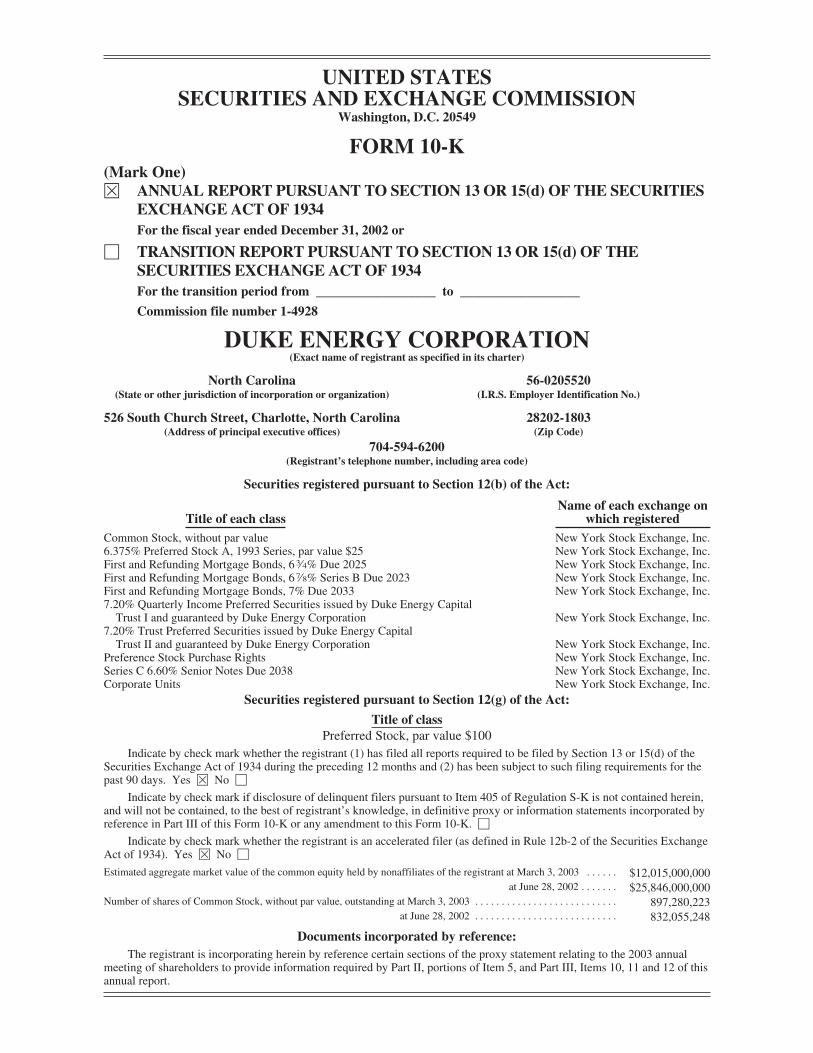
UNITED STATESSECURITIES AND EXCHANGE COMMISSION
Washington, D.C. 20549
FORM 10-K(Mark One)È ANNUAL REPORT PURSUANT TO SECTION 13 OR 15(d) OF THE SECURITIES
EXCHANGE ACTOF 1934For the fiscal year ended December 31, 2002 or
‘ TRANSITION REPORT PURSUANT TO SECTION 13 OR 15(d) OF THESECURITIES EXCHANGE ACTOF 1934For the transition period from __________________ to __________________
Commission file number 1-4928
DUKE ENERGY CORPORATION(Exact name of registrant as specified in its charter)
North Carolina 56-0205520(State or other jurisdiction of incorporation or organization) (I.R.S. Employer Identification No.)
526 South Church Street, Charlotte, North Carolina 28202-1803(Address of principal executive offices) (Zip Code)
704-594-6200(Registrant’s telephone number, including area code)
Securities registered pursuant to Section 12(b) of the Act:
Title of each className of each exchange on
which registeredCommon Stock, without par value New York Stock Exchange, Inc.6.375% Preferred Stock A, 1993 Series, par value $25 New York Stock Exchange, Inc.First and Refunding Mortgage Bonds, 63⁄4% Due 2025 New York Stock Exchange, Inc.First and Refunding Mortgage Bonds, 67⁄8% Series B Due 2023 New York Stock Exchange, Inc.First and Refunding Mortgage Bonds, 7% Due 2033 New York Stock Exchange, Inc.7.20% Quarterly Income Preferred Securities issued by Duke Energy CapitalTrust I and guaranteed by Duke Energy Corporation New York Stock Exchange, Inc.
7.20% Trust Preferred Securities issued by Duke Energy CapitalTrust II and guaranteed by Duke Energy Corporation New York Stock Exchange, Inc.
Preference Stock Purchase Rights New York Stock Exchange, Inc.Series C 6.60% Senior Notes Due 2038 New York Stock Exchange, Inc.Corporate Units New York Stock Exchange, Inc.
Securities registered pursuant to Section 12(g) of the Act:
Title of classPreferred Stock, par value $100
Indicate by check mark whether the registrant (1) has filed all reports required to be filed by Section 13 or 15(d) of theSecurities Exchange Act of 1934 during the preceding 12 months and (2) has been subject to such filing requirements for thepast 90 days. Yes È No ‘
Indicate by check mark if disclosure of delinquent filers pursuant to Item 405 of Regulation S-K is not contained herein,and will not be contained, to the best of registrant’s knowledge, in definitive proxy or information statements incorporated byreference in Part III of this Form 10-K or any amendment to this Form 10-K. ‘
Indicate by check mark whether the registrant is an accelerated filer (as defined in Rule 12b-2 of the Securities ExchangeAct of 1934). Yes È No ‘
Estimated aggregate market value of the common equity held by nonaffiliates of the registrant at March 3, 2003 . . . . . . $12,015,000,000at June 28, 2002 . . . . . . . $25,846,000,000
Number of shares of Common Stock, without par value, outstanding at March 3, 2003 . . . . . . . . . . . . . . . . . . . . . . . . . . . 897,280,223at June 28, 2002 . . . . . . . . . . . . . . . . . . . . . . . . . . . 832,055,248
Documents incorporated by reference:The registrant is incorporating herein by reference certain sections of the proxy statement relating to the 2003 annual
meeting of shareholders to provide information required by Part II, portions of Item 5, and Part III, Items 10, 11 and 12 of thisannual report.
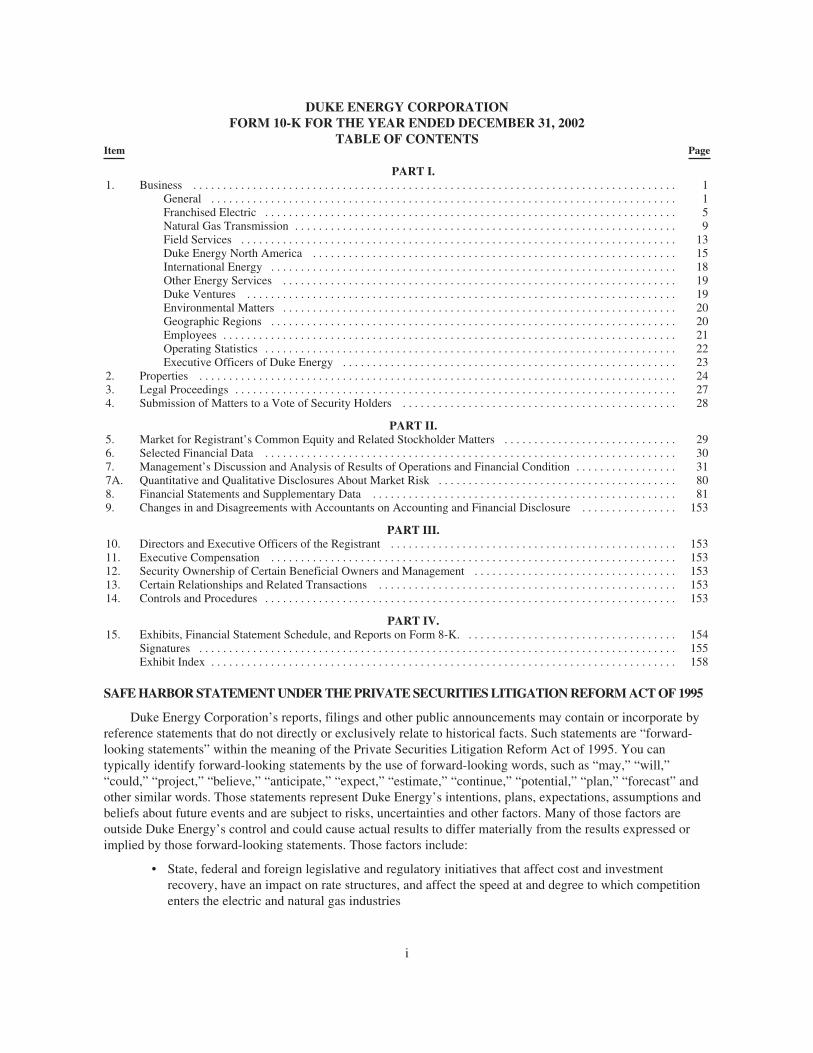
DUKE ENERGY CORPORATIONFORM 10-K FOR THE YEAR ENDED DECEMBER 31, 2002
TABLE OF CONTENTSItem Page
PART I.1. Business . . . . . . . . . . . . . . . . . . . . . . . . . . . . . . . . . . . . . . . . . . . . . . . . . . . . . . . . . . . . . . . . . . . . . . . . . . . . . . . . . 1
General . . . . . . . . . . . . . . . . . . . . . . . . . . . . . . . . . . . . . . . . . . . . . . . . . . . . . . . . . . . . . . . . . . . . . . . . . . . . . . 1Franchised Electric . . . . . . . . . . . . . . . . . . . . . . . . . . . . . . . . . . . . . . . . . . . . . . . . . . . . . . . . . . . . . . . . . . . . . 5Natural Gas Transmission . . . . . . . . . . . . . . . . . . . . . . . . . . . . . . . . . . . . . . . . . . . . . . . . . . . . . . . . . . . . . . . . 9Field Services . . . . . . . . . . . . . . . . . . . . . . . . . . . . . . . . . . . . . . . . . . . . . . . . . . . . . . . . . . . . . . . . . . . . . . . . . 13Duke Energy North America . . . . . . . . . . . . . . . . . . . . . . . . . . . . . . . . . . . . . . . . . . . . . . . . . . . . . . . . . . . . . 15International Energy . . . . . . . . . . . . . . . . . . . . . . . . . . . . . . . . . . . . . . . . . . . . . . . . . . . . . . . . . . . . . . . . . . . . 18Other Energy Services . . . . . . . . . . . . . . . . . . . . . . . . . . . . . . . . . . . . . . . . . . . . . . . . . . . . . . . . . . . . . . . . . . 19Duke Ventures . . . . . . . . . . . . . . . . . . . . . . . . . . . . . . . . . . . . . . . . . . . . . . . . . . . . . . . . . . . . . . . . . . . . . . . . 19Environmental Matters . . . . . . . . . . . . . . . . . . . . . . . . . . . . . . . . . . . . . . . . . . . . . . . . . . . . . . . . . . . . . . . . . . 20Geographic Regions . . . . . . . . . . . . . . . . . . . . . . . . . . . . . . . . . . . . . . . . . . . . . . . . . . . . . . . . . . . . . . . . . . . . 20Employees . . . . . . . . . . . . . . . . . . . . . . . . . . . . . . . . . . . . . . . . . . . . . . . . . . . . . . . . . . . . . . . . . . . . . . . . . . . . 21Operating Statistics . . . . . . . . . . . . . . . . . . . . . . . . . . . . . . . . . . . . . . . . . . . . . . . . . . . . . . . . . . . . . . . . . . . . . 22Executive Officers of Duke Energy . . . . . . . . . . . . . . . . . . . . . . . . . . . . . . . . . . . . . . . . . . . . . . . . . . . . . . . . 23
2. Properties . . . . . . . . . . . . . . . . . . . . . . . . . . . . . . . . . . . . . . . . . . . . . . . . . . . . . . . . . . . . . . . . . . . . . . . . . . . . . . . . 243. Legal Proceedings . . . . . . . . . . . . . . . . . . . . . . . . . . . . . . . . . . . . . . . . . . . . . . . . . . . . . . . . . . . . . . . . . . . . . . . . . . 274. Submission of Matters to a Vote of Security Holders . . . . . . . . . . . . . . . . . . . . . . . . . . . . . . . . . . . . . . . . . . . . . . 28
PART II.5. Market for Registrant’s Common Equity and Related Stockholder Matters . . . . . . . . . . . . . . . . . . . . . . . . . . . . . 296. Selected Financial Data . . . . . . . . . . . . . . . . . . . . . . . . . . . . . . . . . . . . . . . . . . . . . . . . . . . . . . . . . . . . . . . . . . . . . 307. Management’s Discussion and Analysis of Results of Operations and Financial Condition . . . . . . . . . . . . . . . . . 317A. Quantitative and Qualitative Disclosures About Market Risk . . . . . . . . . . . . . . . . . . . . . . . . . . . . . . . . . . . . . . . . 808. Financial Statements and Supplementary Data . . . . . . . . . . . . . . . . . . . . . . . . . . . . . . . . . . . . . . . . . . . . . . . . . . . 819. Changes in and Disagreements with Accountants on Accounting and Financial Disclosure . . . . . . . . . . . . . . . . 153
PART III.10. Directors and Executive Officers of the Registrant . . . . . . . . . . . . . . . . . . . . . . . . . . . . . . . . . . . . . . . . . . . . . . . . 15311. Executive Compensation . . . . . . . . . . . . . . . . . . . . . . . . . . . . . . . . . . . . . . . . . . . . . . . . . . . . . . . . . . . . . . . . . . . . 15312. Security Ownership of Certain Beneficial Owners and Management . . . . . . . . . . . . . . . . . . . . . . . . . . . . . . . . . . 15313. Certain Relationships and Related Transactions . . . . . . . . . . . . . . . . . . . . . . . . . . . . . . . . . . . . . . . . . . . . . . . . . . 15314. Controls and Procedures . . . . . . . . . . . . . . . . . . . . . . . . . . . . . . . . . . . . . . . . . . . . . . . . . . . . . . . . . . . . . . . . . . . . . 153
PART IV.15. Exhibits, Financial Statement Schedule, and Reports on Form 8-K. . . . . . . . . . . . . . . . . . . . . . . . . . . . . . . . . . . . 154
Signatures . . . . . . . . . . . . . . . . . . . . . . . . . . . . . . . . . . . . . . . . . . . . . . . . . . . . . . . . . . . . . . . . . . . . . . . . . . . . . . . . 155Exhibit Index . . . . . . . . . . . . . . . . . . . . . . . . . . . . . . . . . . . . . . . . . . . . . . . . . . . . . . . . . . . . . . . . . . . . . . . . . . . . . . 158
SAFEHARBORSTATEMENTUNDERTHEPRIVATESECURITIESLITIGATIONREFORMACTOF1995
Duke Energy Corporation’s reports, filings and other public announcements may contain or incorporate byreference statements that do not directly or exclusively relate to historical facts. Such statements are “forward-looking statements” within the meaning of the Private Securities Litigation Reform Act of 1995. You cantypically identify forward-looking statements by the use of forward-looking words, such as “may,” “will,”“could,” “project,” “believe,” “anticipate,” “expect,” “estimate,” “continue,” “potential,” “plan,” “forecast” andother similar words. Those statements represent Duke Energy’s intentions, plans, expectations, assumptions andbeliefs about future events and are subject to risks, uncertainties and other factors. Many of those factors areoutside Duke Energy’s control and could cause actual results to differ materially from the results expressed orimplied by those forward-looking statements. Those factors include:
• State, federal and foreign legislative and regulatory initiatives that affect cost and investmentrecovery, have an impact on rate structures, and affect the speed at and degree to which competitionenters the electric and natural gas industries
i
• The outcomes of litigation and regulatory investigations, proceedings or inquiries
• Industrial, commercial and residential growth in Duke Energy’s service territories
• The weather and other natural phenomena
• The timing and extent of changes in commodity prices, interest rates and foreign currency exchangerates
• General economic conditions, including any potential effects arising from terrorist attacks and anyconsequential hostilities or other hostilities
• Changes in environmental and other laws and regulations to which Duke Energy and its subsidiariesare subject or other external factors over which Duke Energy has no control
• The results of financing efforts, including Duke Energy’s ability to obtain financing on favorableterms, which can be affected by various factors, including Duke Energy’s credit ratings and generaleconomic conditions
• Lack of improvement or further declines in the market prices of equity securities and resultant cashfunding requirements for Duke Energy’s defined benefit pension plans
• The level of creditworthiness of counterparties to Duke Energy’s transactions
• The amount of collateral required to be posted from time to time in Duke Energy’s transactions
• Growth in opportunities for Duke Energy’s business units, including the timing and success of effortsto develop domestic and international power, pipeline, gathering, processing and other infrastructureprojects
• The performance of electric generation, pipeline and gas processing facilities
• The extent of success in connecting natural gas supplies to gathering and processing systems and inconnecting and expanding gas and electric markets and
• The effect of accounting pronouncements issued periodically by accounting standard-setting bodies
In light of these risks, uncertainties and assumptions, the events described in the forward-looking statementsmight not occur or might occur to a different extent or at a different time than Duke Energy has described. DukeEnergy undertakes no obligation to publicly update or revise any forward-looking statements, whether as a resultof new information, future events or otherwise.
ii
PART I.
Item 1. Business.
GENERAL
Duke Energy Corporation (collectively with its subsidiaries, Duke Energy), an integrated provider of energyand energy services, offers physical delivery and management of both electricity and natural gas throughout theU.S. and abroad. Duke Energy provides these and other services through the seven business segments describedbelow.
Franchised Electric generates, transmits, distributes and sells electricity in central and western NorthCarolina and western South Carolina. It conducts operations primarily through Duke Power and Nantahala Powerand Light. These electric operations are subject to the rules and regulations of the Federal Energy RegulatoryCommission (FERC), the North Carolina Utilities Commission (NCUC) and the Public Service Commission ofSouth Carolina (PSCSC).
Natural Gas Transmission provides transportation and storage of natural gas for customers throughout theEast Coast and Southern U.S. and in Canada. Natural Gas Transmission also provides distribution service toretail customers in Ontario and Western Canada, and gas gathering and processing services to customers inWestern Canada. Natural Gas Transmission does business primarily through Duke Energy Gas TransmissionCorporation. Duke Energy acquired Westcoast Energy Inc. (Westcoast) on March 14, 2002 (see Note 2 to theConsolidated Financial Statements, “Business Acquisitions and Dispositions”). Duke Energy Gas Transmission’snatural gas transmission and storage operations in the U.S. are subject to the FERC’s and the Texas RailroadCommission’s rules and regulations, while natural gas gathering, processing, transmission, distribution andstorage operations in Canada are subject to the rules and regulations of the National Energy Board, the OntarioEnergy Board and the British Columbia Utilities Commission.
Field Services gathers, compresses, treats, processes, transports, trades and markets, and stores natural gas;and produces, transports, trades and markets, and stores natural gas liquids (NGLs). It conducts operationsprimarily through Duke Energy Field Services, LLC (DEFS), which is approximately 30% owned byConocoPhillips and approximately 70% owned by Duke Energy. Field Services gathers natural gas fromproduction wellheads in Western Canada and 11 contiguous states in the U.S. Those systems serve major naturalgas-producing regions in the Western Canadian Sedimentary Basin, Rocky Mountain, Permian Basin, Mid-Continent and East Texas-Austin Chalk-North Louisiana areas, as well as onshore and offshore Gulf Coast areas.
Duke Energy North America (DENA) develops, operates and manages merchant power generation facilitiesand engages in commodity sales and services related to natural gas and electric power. DENA conducts businessthroughout the U.S. and Canada through Duke Energy North America, LLC and Duke Energy Trading andMarketing, LLC (DETM). DETM is approximately 40% owned by ExxonMobil Corporation and approximately60% owned by Duke Energy. Prior to April 1, 2002, the DENA business segment was combined with DukeEnergy Merchants Holdings, LLC (DEM) to form a segment called North American Wholesale Energy. In 2002,management combined DEM with the Other Energy Services segment. Previous periods have been reclassified toconform to the current presentation.
International Energy develops, operates and manages natural gas transportation and power generationfacilities, and engages in sales and marketing of natural gas and electric power outside the U.S. and Canada. Itconducts operations primarily through Duke Energy International, LLC (DEI) and its activities target powergeneration in Latin America, power generation and natural gas transmission in Asia-Pacific and natural gasmarketing in Northwest Europe.
1

Other Energy Services is composed of diverse energy businesses, operating primarily through DEM, Duke/Fluor Daniel (D/FD) and Energy Delivery Services (EDS). DEM engages in commodity buying and selling, andrisk management and financial services in non-regulated energy commodity markets other than physical naturalgas and power (such as petroleum products). D/FD provides comprehensive engineering, procurement,construction, commissioning and operating plant services for fossil-fueled electric power generating facilitiesworldwide. D/FD is a 50/50 partnership between Duke Energy and Fluor Enterprises, Inc., a wholly ownedsubsidiary of Fluor Corporation. EDS is an engineering, construction, maintenance and technical services firmspecializing in electric transmission and distribution lines and substation projects. It was formed in the secondquarter of 2002 from the transmission and distribution services component of Duke Engineering & Services, Inc.(DE&S). This component was excluded from the sale of DE&S to Framatome ANP, Inc. on May 1, 2002. OtherEnergy Services also retained other portions of DE&S that were not part of the sale, as well as a portion ofDukeSolutions, Inc. (DukeSolutions) that was not sold on May 1, 2002 to Ameresco, Inc. DE&S andDukeSolutions were included in Other Energy Services through the dates of their sales. (See Note 2 to theConsolidated Financial Statements, “Business Acquisitions and Dispositions,” for additional information on thesales of DE&S and DukeSolutions.)
Duke Ventures is composed of other diverse businesses, operating primarily through Crescent Resources,LLC (Crescent), DukeNet Communications, LLC (DukeNet) and Duke Capital Partners, LLC (DCP). Crescentdevelops high-quality commercial, residential and multi-family real estate projects and manages land holdings,primarily in the Southeastern and Southwestern U.S. DukeNet develops and manages fiber optic communicationssystems for wireless, local and long distance communications companies; and selected educational,governmental, financial and health care entities. DCP, a wholly owned merchant finance company, provides debtand equity capital and financial advisory services primarily to the energy industry. In March 2003, Duke Energyannounced that it will exit the merchant finance business at DCP in an orderly manner.
Duke Energy is a North Carolina corporation. Its principal executive offices are located at 526 SouthChurch Street, Charlotte, North Carolina 28202-1803. The telephone number is 704-594-6200. Additionalinformation about Duke Energy, including annual reports on Form 10-K, quarterly reports on Form 10-Q,current reports on Form 8-K and amendments to such reports, is available through Duke Energy’s web site athttp://www.duke-energy.com. Such reports are accessible at no charge through Duke Energy’s web site, and aremade available as soon as reasonably practicable after such material is filed with or furnished to the Securitiesand Exchange Commission.
Terms used to describe Duke Energy’s business are defined below.
Allowance for Funds Used During Construction. A non-cash accounting convention of regulatory utilitiesthat represents the estimated composite interest costs of debt and a return on equity funds used to financeconstruction. The allowance is capitalized in the property accounts and included in income.
Asset Optimization. The process of maximizing the returns on a portfolio of assets through the use ofhedging strategies involving energy contracts.
British Thermal Unit (Btu). A standard unit for measuring thermal energy or heat commonly used as agauge for the energy content of natural gas and other fuels.
Cubic Foot (cf). The most common unit of measurement of gas volume; the amount of natural gas requiredto fill a volume of one cubic foot under stated conditions of temperature, pressure and water vapor.
Decommissioning. The process of closing down a nuclear facility and reducing the residual radioactivity toa level that permits the release of the property and termination of the license. Nuclear power plants are requiredby the Nuclear Regulatory Commission to set aside funds for their decommissioning costs during operation.
2

Derivative. A contract in which its price is based on the value of underlying securities, equity indices, debtinstruments, commodities or other benchmarks. Often used to hedge risk, derivatives involve the trading of rightsor obligations, but not the direct transfer of property.
Distribution. The system of lines, transformers, switches and mains that connect electric and natural gastransmission systems to customers.
Estimated Available Production. Estimated physical generation capability of owned generation assets asadjusted for scheduled maintenance transmission availability and an estimate for unplanned outages.
Federal Energy Regulatory Commission (FERC). The U.S. agency that regulates the transportation ofelectricity and natural gas in interstate commerce and authorizes the buying and selling of energy commodities atmarket-based rates.
Forward Contract. A contract in which the buyer is obligated to take delivery, and the seller is obligated todeliver a fixed amount of a commodity at a predetermined price on a specified future date, at which timepayment is due in full.
Fractionation/Fractionate The process of separating liquid hydrocarbons from natural gas into propane,butane, ethane, etc.
Gathering System. Pipeline, processing and related facilities that access production and other sources ofnatural gas supplies for delivery to mainline transmission systems.
Generation. The process of transforming other forms of energy, such as nuclear or fossil fuels, intoelectricity. Also, the amount of electric energy produced, expressed in megawatt-hours.
Greenfield Development. The development of a new power generating facility on an undeveloped site.
Independent System Operator (ISO). An entity that ensures non-discriminatory access to a regionaltransmission system, providing all customers access to the power exchange and clearing all bilateral contractrequests for use of the electric transmission system. Also responsible for maintaining bulk electric systemreliability.
Integrated Logistics. The coordinated effort to optimally deliver physical product to the end user.
Light-off Fuel. Fuel oil used to light the coal prior to generating electricity.
Liquefied Natural Gas (LNG). Natural gas that has been converted to a liquid by cooling it to -260 degreesFahrenheit.
Liquid Market. A market in which selling and buying can be accomplished with minimal price change;such a market has a high level of trading activity and open interest.
Local Distribution Company (LDC). A company that obtains the major portion of its revenues from theoperations of a retail distribution system for the delivery of electricity or gas for ultimate consumption.
Logistics & Optimization. The act of maximizing physical positions through arbitrage, especially oncontractual assets such as storage, transportation, generation and transmission.
Mark-to-Market. The process whereby derivatives or energy trading contracts are adjusted to marketvalue, and the unrealized gain or loss is recognized in current earnings and on the balance sheet.
3

Natural Gas. A naturally occurring mixture of hydrocarbon and non-hydrocarbon gases found in porousgeological formations beneath the earth’s surface, often in association with petroleum. The principal constituentis methane.
Natural Gas Liquids (NGLs). Liquid hydrocarbons extracted during the processing of natural gas.Principal commercial NGLs include butanes, propane, natural gasoline and ethane.
No-notice Bundled Service. A pipeline delivery service which allows customers to receive or deliver gason demand without making prior nominations to meet service needs and without paying daily balancing andscheduling penalties.
Origination. Identification and execution of physical energy related transactions throughout the valuechain.
Peak Load. The amount of electricity required during periods of highest demand. Peak periods fluctuate byseason, generally occurring in the morning hours in winter and in late afternoon during the summer.
Regional Transmission Organization (RTO). An independent entity which is established to have“functional control” over utilities’ transmission systems, in order to expedite wholesale wheeling. FERCproposes to have RTOs or other independent transmission providers operate transmission systems in all regionsof the country.
Reliability Must Run. Generation that the California ISO determines is required to be on-line to meetapplicable reliability criteria requirements.
Throughput. The amount of natural gas or natural gas liquids transported through a pipeline system.
Tolling. Process whereby a party moves fuel to a power generator and receives kilowatt hours in return for apre-established fee.
Transmission System (Electric). An interconnected group of electric transmission lines and relatedequipment for moving or transferring electric energy in bulk between points of supply and points at which it istransformed for delivery over a distribution system to customers, or for delivery to other electric transmissionsystems.
Transmission System (Natural Gas). An interconnected group of natural gas pipelines and associatedfacilities for transporting natural gas in bulk between points of supply and delivery points to industrial customers,local distribution companies, or for delivery to other natural gas transmission systems.
Volatility. An annualized measure of the fluctuation in the price of an energy contract. Implied volatility isa measure of what the market values volatility to be, as reflected in the option’s price.
Watt. A measure of power production or usage equal to one joule per second.
The following sections describe the business and operations of each of Duke Energy’s business segments.(For more information on the operating outlook of Duke Energy and its segments, see “Management’sDiscussion and Analysis of Results of Operations and Financial Condition, Introduction—Business Strategy.”For financial information on Duke Energy’s business segments, see Note 3 to the Consolidated FinancialStatements, “Business Segments.”)
4
FRANCHISED ELECTRIC
Service Area and Customers
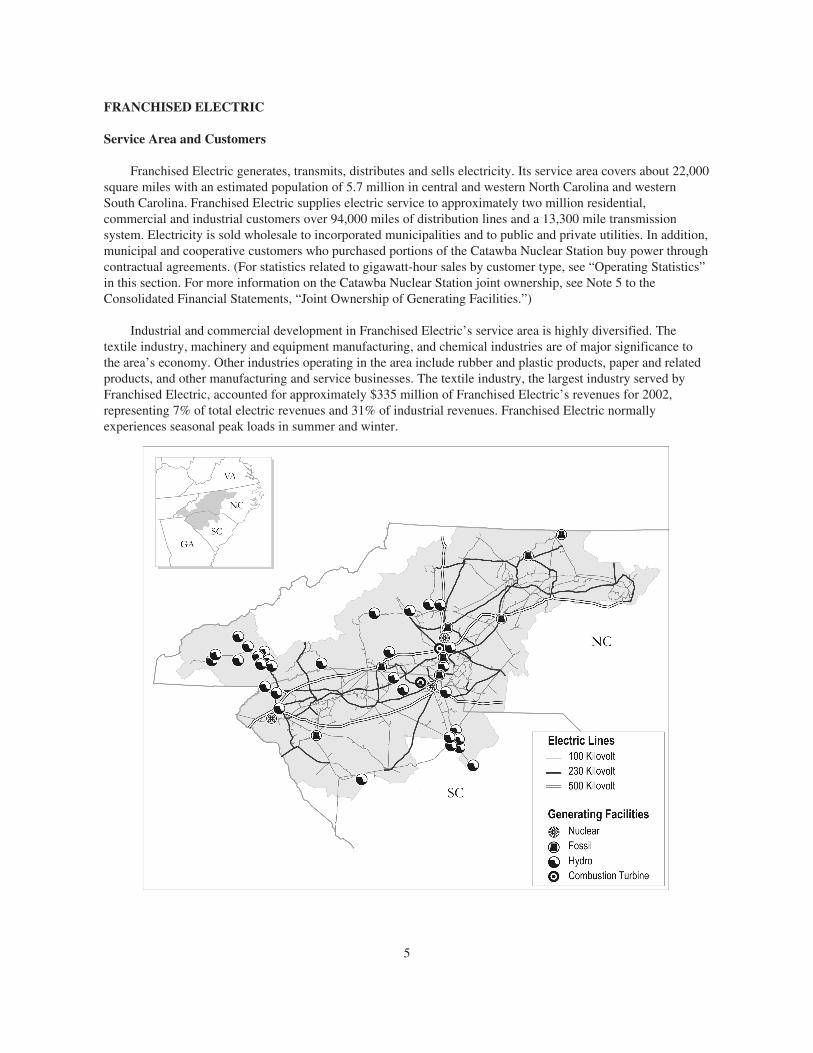
Franchised Electric generates, transmits, distributes and sells electricity. Its service area covers about 22,000square miles with an estimated population of 5.7 million in central and western North Carolina and westernSouth Carolina. Franchised Electric supplies electric service to approximately two million residential,commercial and industrial customers over 94,000 miles of distribution lines and a 13,300 mile transmissionsystem. Electricity is sold wholesale to incorporated municipalities and to public and private utilities. In addition,municipal and cooperative customers who purchased portions of the Catawba Nuclear Station buy power throughcontractual agreements. (For statistics related to gigawatt-hour sales by customer type, see “Operating Statistics”in this section. For more information on the Catawba Nuclear Station joint ownership, see Note 5 to theConsolidated Financial Statements, “Joint Ownership of Generating Facilities.”)
Industrial and commercial development in Franchised Electric’s service area is highly diversified. Thetextile industry, machinery and equipment manufacturing, and chemical industries are of major significance tothe area’s economy. Other industries operating in the area include rubber and plastic products, paper and relatedproducts, and other manufacturing and service businesses. The textile industry, the largest industry served byFranchised Electric, accounted for approximately $335 million of Franchised Electric’s revenues for 2002,representing 7% of total electric revenues and 31% of industrial revenues. Franchised Electric normallyexperiences seasonal peak loads in summer and winter.
5

Energy Capacity and Resources
Electric energy for Franchised Electric’s customers is generated by three nuclear generating stations with acombined net capacity of 5,020 megawatts (MW) (including Duke Energy’s 12.5% ownership in the CatawbaNuclear Station), eight coal-fired stations with a combined capacity of 7,699 MW, 31 hydroelectric stations(including two pumped-storage facilities) with a combined capacity of 2,806 MW and seven combustion turbinestations with a combined capacity of 2,135 MW. Energy and capacity are also supplied through contracts withother generators and purchased on the open market. Franchised Electric has interconnections and arrangementswith its neighboring utilities to facilitate planning, emergency assistance, exchange of capacity and energy, andreliability of power supply. Franchised Electric expects that additional construction, purchased power contractsand open market purchases will meet customers’ energy needs in the future. (For statistics on sources of electricenergy, see “Operating Statistics” in this section.)
Fuel Supply
Franchised Electric relies principally on coal and nuclear fuel for its generation of electric energy. Thefollowing table lists Franchised Electric’s sources of power and fuel costs for the three years ending December31, 2002.
Generation by Source(Percent)
Cost of Fuel per NetKilowatt-hour
Generated (Cents)
2002 2001 2000 2002 2001 2000
Coal . . . . . . . . . . . . . . . . . . . . . . . . . . . . . . . . . . . . . . . . . . . . . . . . . 51.2 50.9 50.9 1.54 1.48 1.29Nuclear(a) . . . . . . . . . . . . . . . . . . . . . . . . . . . . . . . . . . . . . . . . . . . . 48.3 48.6 48.1 0.42 0.42 0.42Oil and gas(b) . . . . . . . . . . . . . . . . . . . . . . . . . . . . . . . . . . . . . . . . . 0.1 0.2 0.5 11.89 11.48 7.32
All fuels (cost based on weighted average)(a) . . . . . . . . . . . . . . . . 99.6 99.7 99.5 1.01 0.98 0.91Hydroelectric(c) . . . . . . . . . . . . . . . . . . . . . . . . . . . . . . . . . . . . . . . 0.4 0.3 0.5
100.0 100.0 100.0
(a) Statistics related to nuclear generation and all fuels reflect Franchised Electric’s 12.5% ownership interest inthe Catawba Nuclear Station.
(b) Cost statistics include amounts for light-off fuel at Franchised Electric’s coal-fired stations.(c) Generating figures are net of output required to replenish pumped storage units during off-peak periods.
Coal. Franchised Electric meets its coal demand through purchase supply contracts and spot agreements.Large amounts of coal are obtained under supply contracts with mining operators who mine both undergroundand at the surface. Franchised Electric has an adequate supply of coal to fuel its current operations. Expirationdates for its supply contracts, which have price adjustment provisions, range from 2003 to 2005. Duke Energyexpects to renew these contracts or enter into similar contracts with other suppliers for the quantities and qualityof coal required. The coal purchased under these contracts is produced from mines in eastern Kentucky, southernWest Virginia and southwestern Virginia. Franchised Electric uses spot market purchases to meet coalrequirements not met by supply contracts.
The average sulfur content of coal purchased by Franchised Electric is approximately 1%. This satisfies thecurrent emission limitation for sulfur dioxide for existing facilities. (See Note 16 to the Consolidated FinancialStatements, “Commitments and Contingencies—Environmental,” for additional information regarding particulatematter.)
Nuclear. Developing nuclear generating fuel generally involves the mining and milling of uranium ore toproduce uranium concentrates, the conversion of uranium concentrates to uranium hexafluoride gas, enrichmentof that gas, and then the fabrication of the enriched uranium hexafluoride into usable fuel assemblies.
6
Franchised Electric has contracted for uranium materials and services required to fuel the Oconee, McGuireand Catawba Nuclear Stations. Uranium concentrates, conversion services and enrichment services are primarilymet through a diversified portfolio of long-term supply contracts. The contracts are diversified by supplier,country of origin and pricing. Franchised Electric staggers its contracting so that its portfolio of long-termcontracts covers the majority of its fuel requirements at Oconee, McGuire and Catawba in the near term, but sothat its level of coverage decreases each year into the future. Due to the technical complexities of changingsuppliers of fuel fabrication services, Franchised Electric generally sole sources these services to domesticsuppliers on a plant by plant basis using multi-year contracts.
Based upon current projections, Franchised Electric’s existing portfolio of contracts will meet therequirements of Oconee, McGuire and Catawba Nuclear Stations through the following years:
Nuclear StationUraniumMaterial
ConversionService
EnrichmentService
FabricationService
Oconee . . . . . . . . . . . . . . . . . . . . . . . . . . . . . . . . . . . . . . . . . . . . . . 2005 2005 2007 2006McGuire . . . . . . . . . . . . . . . . . . . . . . . . . . . . . . . . . . . . . . . . . . . . . 2005 2005 2007 2009Catawba . . . . . . . . . . . . . . . . . . . . . . . . . . . . . . . . . . . . . . . . . . . . . . 2005 2005 2007 2009
After the years indicated above, a portion of the fuel requirements at Oconee, McGuire and Catawba arecovered by long-term contracts. For requirements not covered under long-term contracts, Duke Energy believes itwill be able to renew contracts as they expire, or enter into similar contractual arrangements with other suppliersof nuclear fuel materials and services. Near-term requirements not met by long-term supply contracts have beenand are expected to be fulfilled with uranium spot market purchases.
Duke Power, a division of Duke Energy, has entered into a contract under which Duke Power has agreed toprepare the McGuire and Catawba nuclear reactors for use of mixed oxide fuel and to purchase mixed oxide fuelfor use in such reactors. Mixed oxide fuel is fabricated from the U.S. government’s surplus plutonium and issimilar to conventional uranium fuel. Before using the fuel, Duke Energy must apply for and obtain amendmentsto the facilities’ operating licenses from the Nuclear Regulatory Commission (NRC). (See Note 17 to theConsolidated Financial Statements, “Guarantees and Indemnifications,” for additional information.)
Insurance and Decommissioning
Duke Energy owns and operates the McGuire and Oconee Nuclear Stations and operates and has a partialownership interest in the Catawba Nuclear Station. The McGuire and Catawba Nuclear Stations have two nuclearreactors each and Oconee has three. Nuclear insurance includes: liability coverage; property, decontaminationand decommissioning coverage; and business interruption and/or extra expense coverage. The other joint ownersof the Catawba Nuclear Station reimburse Duke Energy for certain expenses associated with nuclear insurancepremiums. The Price-Anderson Act requires Duke Energy to insure against public liability claims resulting fromnuclear incidents to the full limit of liability, approximately $9.5 billion. (See Note 16 to the ConsolidatedFinancial Statements, “Commitments and Contingencies—Nuclear Insurance,” for more information.)
Estimated site-specific nuclear decommissioning costs, including the cost of decommissioning plantcomponents not subject to radioactive contamination, total approximately $1.9 billion stated in 1999 dollars,based on decommissioning studies completed in 1999 (studies are completed every five years). This includescosts related to Duke Energy’s 12.5% ownership in the Catawba Nuclear Station. The other joint owners of theCatawba Nuclear Station are responsible for decommissioning costs related to their ownership interests in thestation. (See Note 12 to the Consolidated Financial Statements, “Nuclear Decommissioning Costs,” for moreinformation.)
After spent fuel is removed from a nuclear reactor, it is cooled in a spent fuel pool at the nuclear station.Under provisions of the Nuclear Waste Policy Act of 1982, Duke Energy has contracted with the U.S.
7

Department of Energy (DOE) for the disposal of spent nuclear fuel. The DOE failed to begin accepting spentnuclear fuel on January 31, 1998, the date specified by the Nuclear Waste Policy Act and in Duke Energy’scontract with the DOE. In 1998, Duke Energy filed a claim with the U.S. Court of Federal Claims against theDOE related to the DOE’s failure to accept commercial spent nuclear fuel by the required date. Damages claimedin the lawsuit are based upon Duke Energy’s costs incurred as a result of the DOE’s partial material breach of itscontract, including the cost of securing additional spent fuel storage capacity. Duke Energy will continue tosafely manage its spent nuclear fuel until the DOE accepts it. Payments made to the DOE for disposal costs arebased on nuclear output and are included in the Consolidated Statements of Income as Fuel Used in ElectricGeneration.
Competition
Duke Energy continues to monitor electric industry restructuring and actively participates in regulatoryreform deliberations in North Carolina and South Carolina. However, movement toward retail deregulation inthese and other states has recently slowed. (For more information, see “Management’s Discussion and Analysisof Results of Operations and Financial Condition, Current Issues—Electric Competition.”)
Franchised Electric competes in some areas with government-owned power systems, municipally ownedelectric systems, rural electric cooperatives and other private utilities. By statute, the NCUC and the PSCSCassign all service areas outside municipalities in North Carolina and South Carolina to regulated electric utilitiesand rural electric cooperatives. Substantially all of the territory comprising Franchised Electric’s service area hasbeen assigned in this manner. In unassigned areas, Franchised Electric’s business remains subject to competition.A decision of the North Carolina Supreme Court limits, in some instances, the right of North Carolinamunicipalities to serve customers outside their corporate limits. In South Carolina, competition continuesbetween municipalities and other electric suppliers outside the municipalities’ corporate limits, subject to theregulation of the PSCSC. In addition, Franchised Electric continues to compete with natural gas providers.
Regulation
The NCUC and the PSCSC approve rates for retail electric sales within their respective states. The FERCapproves Franchised Electric’s rates for some electric sales to wholesale customers. (For more information onrate matters, see Note 4 to the Consolidated Financial Statements, “Regulatory Matters—Franchised Electric.”)The FERC, the NCUC and the PSCSC also have authority over the construction and operation of FranchisedElectric’s facilities. Certificates of public convenience and necessity issued by the FERC, the NCUC and thePSCSC authorize Franchised Electric to construct and operate its electric facilities, and to sell electricity to retailand wholesale customers. Prior approval from the NCUC and the PSCSC is required to issue securities.
NCUC, PSCSC and FERC regulations govern access to regulated electric customer data by non-regulatedentities, and services provided between regulated and non-regulated affiliated entities. These regulations affectDENA’s and Other Energy Services’ activities with Franchised Electric.
The Energy Policy Act of 1992 and the FERC’s subsequent rulemaking activities opened the wholesaleenergy market to competition. Open-access transmission for wholesale customers, as defined by the FERC’srules, provides energy suppliers, including Duke Energy, with opportunities to sell and deliver capacity andenergy at market-based prices. From the FERC’s open-access rule, Franchised Electric obtained the rights to sellcapacity and energy at market-based rates from its own assets, which also allows Franchised Electric to purchase,at attractive rates, a portion of its capacity and energy requirements resulting in lower overall costs to customers.Open access also provides Franchised Electric’s existing wholesale customers with competitive opportunities toseek other suppliers for their capacity and energy requirements.
In 1999 and 2000, the FERC issued its Order 2000 and Order 2000-A regarding Regional TransmissionOrganizations (RTOs). These orders set minimum characteristics and functions RTOs must meet, including
8

independent authority to establish the terms and conditions of transmission service over the facilities theycontrol. The orders provide for an open and flexible RTO structure to meet the needs of the market, and for thepossibility of incentive ratemaking and other benefits for transmission owners that participate.
As a result of these rulemakings, Duke Power and the franchised electric units of two other investor-ownedutilities, Progress Energy (formerly known as Carolina Power & Light Company) and South Carolina Electric &Gas Company, planned to establish GridSouth Transco, LLC (GridSouth), as an RTO responsible for thefunctional control of the companies’ combined transmission systems. As of December 31, 2002, Duke Energyhad invested $37 million in GridSouth, including carrying costs. This amount is included in Other RegulatoryAssets and Deferred Debits on the Consolidated Balance Sheets. The sponsors expected that GridSouth would besubstantially operational by the FERC’s Order 2000 “deadline” date of December 15, 2001. In March 2001,GridSouth received provisional approval from the FERC. However, in July 2001 the FERC ordered GridSouthand other utilities in the Southeast to join in a mediation to negotiate terms of a Southeastern RTO. It does notappear that the FERC will issue an order specifically based on that proceeding. In 2002, the GridSouth sponsorswithdrew their applications to the NCUC and the PSCSC for approval of the transfer of functional control oftheir electric transmission assets to GridSouth, and announced that development of the GridSouthimplementation project had been suspended until the sponsors have an opportunity to further consider regulatorycircumstances and the outcome of initiatives such as the FERC’s Notice of Proposed Rulemaking (NOPR) onStandard Market Design (SMD) and the RTO cost/benefit study initiated by the Southeastern Association ofRegulatory Utility Commissioners (SEARUC). The SEARUC cost/benefit study, issued in November 2002,states that under most scenarios neither RTOs nor SMDs provide net benefits to retail customers in the Southeastover the next few years. The final rule from the SMDNOPR is not expected to be issued until after July 2003.Duke Energy believes that more open wholesale electric markets will at some point provide benefits toconsumers and other market participants. Duke Energy continues to examine its specific options relative to RTOsin light of the existing complex regulatory environment. Management believes its investment in GridSouth isprobable of recovery.
Franchised Electric is subject to the NRC jurisdiction for the design, construction and operation of itsnuclear generating facilities. In 2000, the NRC renewed the operating license for Duke Energy’s three Oconeenuclear units through 2033 and 2034. Applications to renew the operating licenses for Duke Energy’s Catawbaand McGuire nuclear units were filed with the NRC in June 2001. These operating licenses currently expirebetween 2021 and 2026. Franchised Electric’s hydroelectric generating facilities are licensed by the FERC underPart I of the Federal Power Act, with license terms expiring from 2005 to 2036. The FERC has authority toextend hydroelectric generating licenses. Other hydroelectric facilities whose licenses expire between 2005 and2008 are in various stages of relicensing.
Franchised Electric is subject to the jurisdiction of the Environmental Protection Agency (EPA) and stateenvironmental agencies. (For a discussion of environmental regulation, see “Environmental Matters” in thissection.)
NATURAL GAS TRANSMISSION
Natural Gas Transmission provides transportation and storage of natural gas for customers throughout theEast Coast and Southern U.S. and in Canada. Natural Gas Transmission also provides distribution services toretail customers in Ontario and Western Canada, and gas gathering and processing service to customers inWestern Canada. Natural Gas Transmission does business primarily through Duke Energy Gas TransmissionCorporation. Duke Energy acquired Westcoast on March 14, 2002. (See Note 2 to the Consolidated FinancialStatements, “Business Acquisitions and Dispositions.”)
Natural Gas Transmission’s significant investments include Gulfstream Natural Gas System, LLC(Gulfstream), an interstate natural gas pipeline system owned and operated jointly by Duke Energy and TheWilliams Companies, Inc. The Gulfstream gas pipeline has a capacity of 1.1 billion cubic feet (Bcf) of natural
9

gas per day and transports gas from the Mobile Bay area, across the Gulf of Mexico, to growing gas markets insouth and central Florida. Gulfstream went in-service in May 2002.
Alliance Pipeline, in which Natural Gas Transmission owns a 23.6% equity interest, is a natural gastransmission pipeline with a daily transportation capacity of 1.3 Bcf of natural gas per day from northeasternBritish Columbia, through Alberta and Saskatchewan, to a terminus near Chicago, Illinois.
Vector Pipeline, in which Natural Gas Transmission owns a 30% equity interest, is a natural gastransmission pipeline from a point near Chicago, Illinois to Union Gas Limited’s (Union Gas) Dawn hub inOntario. The Vector Pipeline connects with the Alliance Pipeline and the Northern Border Pipeline near Chicago,Illinois and delivers gas into markets in Indiana, Michigan and Ontario. The Vector Pipeline has a capacity ofapproximately 1 Bcf per day.
10

For 2002, Natural Gas Transmission’s proportional throughput for its pipelines totaled 3,160 trillion Britishthermal units (TBtu), compared to 1,781 TBtu in 2001, a 77% increase mainly due to the Westcoast acquisition.This includes throughput on Natural Gas Transmission’s wholly owned U.S. and Canadian pipelines and itsproportional share of throughput on pipelines that are not wholly owned. (See natural gas delivery statistics under“Operating Statistics” in this section.) A majority of Natural Gas Transmission’s contracted transportationvolumes are under long-term firm service agreements with local distribution company (LDC) customers in thepipelines’ market areas. Firm transportation services are also provided to gas marketers, producers, otherpipelines, electric power generators and a variety of end-users. In addition, the pipelines provide both firm andinterruptible transportation to various customers on a short-term or seasonal basis. Demand on Natural GasTransmission’s pipeline systems is seasonal, with the highest throughput occurring during colder periods in thefirst and fourth calendar quarters. Natural Gas Transmission’s deliveries are in Canada (primarily the Westernand Atlantic regions of Canada, plus Ontario and Quebec), and the U.S. (primarily Connecticut, Maine,Massachusetts, Michigan, New Jersey, New York, Pennsylvania, Rhode Island, Tennessee and Virginia). NaturalGas Transmission provides distribution services through its Union Gas and Pacific Northern Gas (PNG)subsidiaries. Union Gas’ distribution service area encompasses approximately 400 communities and extendsthroughout northern Ontario from the Manitoba border to the North Bay/Muskoka area, through southern Ontariofrom Windsor to just west of Toronto, and across eastern Ontario from Port Hope to Cornwall. Union Gas’distribution system consists of approximately 20,000 miles of distribution lines serving approximately 1.17million residential, commercial and industrial customers. PNG serves approximately 39,000 customers in west-central and northeastern British Columbia.
Natural Gas Transmission’s pipeline systems consist of over 18,000 miles of transmission pipelines. Thepipeline systems receive natural gas from major North American producing regions for delivery to marketsprimarily in British Columbia, the Western U.S., Ontario, the Pacific Northwest, and the Mid-Atlantic,Southeastern and New England states. (For detailed descriptions of Natural Gas Transmission’s pipeline systems,see “Properties, Natural Gas Transmission.”)
11

Natural Gas Transmission, through Market Hub Partners (MHP), wholly owns natural gas salt cavernfacilities in south Texas and Louisiana with a total storage capacity of approximately 29 Bcf. MHP marketsnatural gas storage services to pipelines, LDCs, producers, end users and natural gas marketers. Texas EasternTransmission, LP (Texas Eastern) and East Tennessee Natural Gas (ETNG) also provide firm and interruptibleopen-access storage services. Storage is offered as a stand-alone unbundled service or as part of a no-noticebundled service with transportation. Texas Eastern has two joint-venture storage facilities in Pennsylvania andone wholly owned and operated storage field in Maryland. Texas Eastern’s certificated working capacity in thesethree fields is 75 Bcf. ETNG has a liquefied natural gas storage facility in Tennessee with a certificated workingcapacity of 1.2 Bcf. Union Gas owns approximately 150 Bcf of natural gas storage capacity in 20 undergroundfacilities located in depleted gas fields near Sarnia, Ontario.
Competition
Natural Gas Transmission’s pipeline, storage and field services businesses compete with other pipeline andstorage facilities in the transportation, processing and storage of natural gas. Natural Gas Transmission competesdirectly with other pipelines serving the Mid-Atlantic, Northeastern, Southeastern and Pacific Northwesternstates, Western Canada, Ontario and along Canada’s Atlantic coast. Natural Gas Transmission also competesdirectly with other natural gas storage facilities in south Texas, Louisiana and Ontario. The principal elements ofcompetition are rates, terms of service, and flexibility and reliability of service.
Union Gas’ sales to industrial customers are affected by economic conditions and the price of competitiveenergy sources. Most of Union Gas’ industrial and commercial customers, and a portion of residential customers,purchase their natural gas supply directly from suppliers or marketers. As Union Gas earns income from thedistribution of natural gas and not the sale of the natural gas commodity, the gas distribution margin is notaffected by the source of the customer’s gas supply.
Natural gas competes with other forms of energy available to Duke Energy’s customers and end-users,including electricity, coal and fuel oils. The primary competitive factor is price. Changes in the availability orprice of natural gas and other forms of energy, the level of business activity, conservation, legislation,governmental regulations, the capability to convert to alternative fuels, weather and other factors affect thedemand for natural gas in the areas served by Duke Energy.
Regulation
The FERC has authority to regulate rates and charges for natural gas transported or stored for U.S. interstatecommerce or sold by a natural gas company via interstate commerce for resale. (For more information on ratematters, see Note 4 to the Consolidated Financial Statements, “Regulatory Matters—Natural Gas Transmission.”)The FERC also has authority over the construction and operation of U.S. pipelines and related facilities used inthe transportation, storage and sale of natural gas in interstate commerce, including the extension, enlargement orabandonment of such facilities. Texas Eastern, Algonquin Gas Transmision Company (Algonquin), ETNG,Gulfstream, Alliance Pipeline, Vector Pipeline, MHP and Maritimes & Northeast Pipeline (M&N Pipeline) holdcertificates of public convenience and necessity issued by the FERC, authorizing them to construct and operatepipelines, facilities and related properties, and to transport and store natural gas via interstate commerce. TheMHP storage assets located in Texas are also subject to the Texas Railroad Commission’s rules and regulations.
As required by FERC Order 636, Natural Gas Transmission’s U.S. pipelines operate as open-accesstransporters of natural gas, providing unbundled firm and interruptible transportation and storage services on anequal basis for all gas supplies, whether purchased from the pipeline or from another gas supplier.
The FERC regulations govern access to regulated natural gas transmission customer data by non-regulatedentities and to services provided between regulated and non-regulated affiliated entities. These regulations affectthe activities of DENA with Natural Gas Transmission.
12

Natural Gas Transmission’s U.S. operations are subject to the jurisdiction of the EPA and stateenvironmental agencies. (For a discussion of environmental regulation, see “Environmental Matters” in thissection.) Natural Gas Transmission’s interstate natural gas pipelines are subject to the regulations of the U.S.Department of Transportation (DOT) concerning pipeline safety. DOT regulations have incorporated certainprovisions of the Natural Gas Pipeline Safety Act of 1968, which regulates gas pipeline and liquefied natural gasplant safety requirements. In addition, the DOT is developing regulations that will require pipelines to implementintegrity management programs, including more frequent inspections and other safety protections in areas wherethe consequences of potential pipeline accidents pose the greatest risk to people and their property. The PipelineSafety Improvement Act of 2002, which was enacted on December 17, 2002, establishes mandatory inspectionsof high-consequence areas for all U.S. oil and natural gas pipelines within 10 years.
The natural gas gathering, processing, transmission, storage and distribution operations in Canada aresubject to regulation by the National Energy Board and provincial agencies in Canada, such as the OntarioEnergy Board and the British Columbia Utilities Commission. These agencies have authorization similar to theFERC for setting rates, regulating the operations of facilities and construction of any additional facilities.
FIELD SERVICES
Field Services gathers, compresses, treats, processes, transports, trades and markets, and stores natural gas;and produces, transports, trades and markets, and stores NGLs. It conducts operations primarily through DEFS.Field Services gathers natural gas from production wellheads in Western Canada and 11 contiguous states in theU.S. Those systems serve major gas-producing regions in the Western Canadian Sedimentary Basin, RockyMountain, Permian Basin, Mid-Continent and East Texas-Austin Chalk-North Louisiana areas, as well asonshore and offshore Gulf Coast areas. Field Services owns and operates approximately 60,000 miles of naturalgas gathering systems with approximately 35,000 active receipt points. Field Services conducts its operationsprimarily through DEFS, which is approximately 30% owned by ConocoPhillips.
Duke Energy and ConocoPhillips are currently in discussions regarding possible changes to DEFS’ownership. Member interests in DEFS are currently held approximately 70% by Duke Energy and approximately30% by ConocoPhillips. The discussions are focused on a possible change in the ownership structure that wouldbe driven by the possible contribution by ConocoPhillips of certain midstream natural gas assets to DEFS. Thereis no certainty that these discussions will lead to a transaction in which ConocoPhillips would contribute theseassets to DEFS or what might be the terms of such a transaction.
Field Services’ natural gas processing operations separate raw natural gas that has been gathered on itssystems and third-party systems into condensate, NGLs and residue gas. Field Services processes the raw naturalgas at the 60 natural gas processing facilities that it owns and operates and at 11 third-party operated facilities inwhich it has an equity interest.
The NGLs separated from the raw natural gas are either sold and transported as NGL raw mix, or furtherseparated through a fractionation process into their individual components (ethane, propane, butanes and naturalgasoline) and then sold as components. Field Services fractionates NGL raw mix at 11 processing facilities that itowns and operates and at two third-party-operated facilities in which it has an equity interest. In addition, FieldServices operates a propane wholesale marketing business. Field Services sells NGLs to a variety of customersranging from large, multinational petrochemical and refining companies to small regional retail propanedistributors. Substantially all of its NGL sales are at market-based prices.
The residue gas separated from the raw natural gas is sold at market-based prices to marketers or end-users,including large industrial customers and natural gas and electric utilities serving individual consumers. FieldServices markets residue gas directly or through its wholly owned gas marketing company and its affiliates. FieldServices also stores residue gas at its 7.5 billion-cubic-foot natural gas storage facility.
13
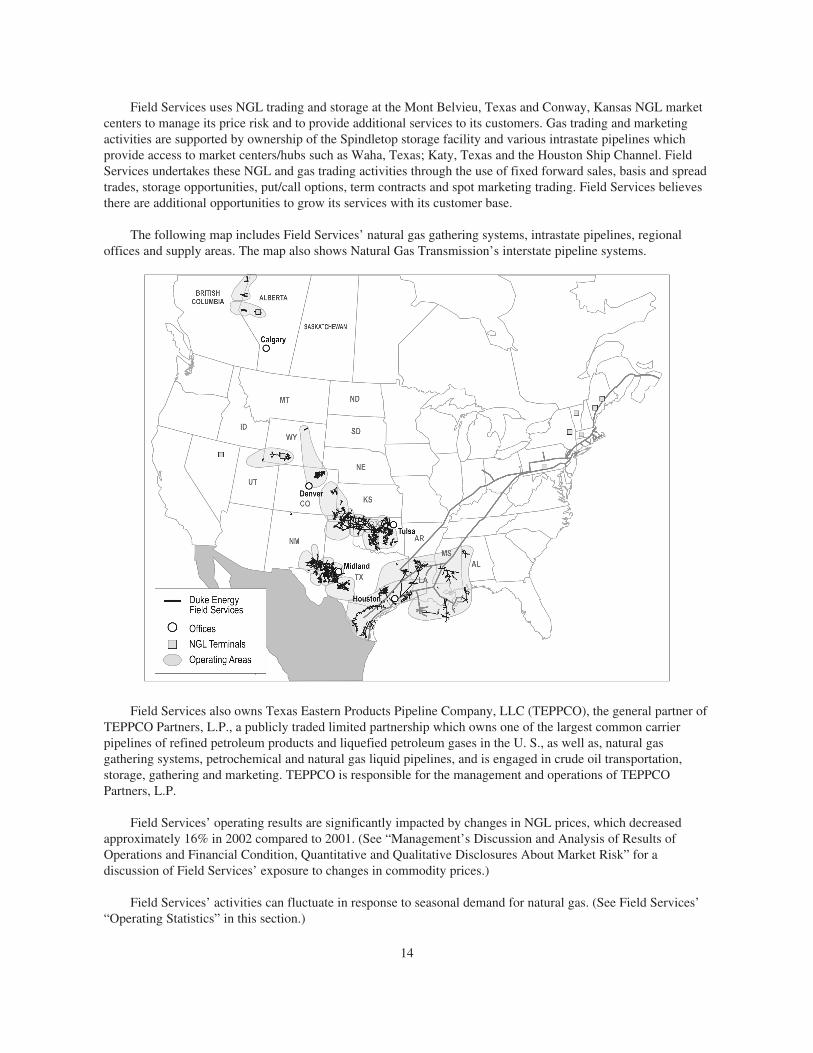
Field Services uses NGL trading and storage at the Mont Belvieu, Texas and Conway, Kansas NGL marketcenters to manage its price risk and to provide additional services to its customers. Gas trading and marketingactivities are supported by ownership of the Spindletop storage facility and various intrastate pipelines whichprovide access to market centers/hubs such as Waha, Texas; Katy, Texas and the Houston Ship Channel. FieldServices undertakes these NGL and gas trading activities through the use of fixed forward sales, basis and spreadtrades, storage opportunities, put/call options, term contracts and spot marketing trading. Field Services believesthere are additional opportunities to grow its services with its customer base.
The following map includes Field Services’ natural gas gathering systems, intrastate pipelines, regionaloffices and supply areas. The map also shows Natural Gas Transmission’s interstate pipeline systems.
Field Services also owns Texas Eastern Products Pipeline Company, LLC (TEPPCO), the general partner ofTEPPCO Partners, L.P., a publicly traded limited partnership which owns one of the largest common carrierpipelines of refined petroleum products and liquefied petroleum gases in the U. S., as well as, natural gasgathering systems, petrochemical and natural gas liquid pipelines, and is engaged in crude oil transportation,storage, gathering and marketing. TEPPCO is responsible for the management and operations of TEPPCOPartners, L.P.
Field Services’ operating results are significantly impacted by changes in NGL prices, which decreasedapproximately 16% in 2002 compared to 2001. (See “Management’s Discussion and Analysis of Results ofOperations and Financial Condition, Quantitative and Qualitative Disclosures About Market Risk” for adiscussion of Field Services’ exposure to changes in commodity prices.)
Field Services’ activities can fluctuate in response to seasonal demand for natural gas. (See Field Services’“Operating Statistics” in this section.)
14

Competition
Field Services competes with major integrated oil companies, major interstate and intrastate pipelines,national and local natural gas gatherers, and brokers, marketers and distributors for natural gas supplies, ingathering and processing natural gas and in marketing and transporting natural gas and NGLs. Competition fornatural gas supplies is based primarily on the reputation, efficiency and reliability of operations, the availabilityof gathering and transportation to high-demand markets, the pricing arrangement offered by the gatherer/processor and the ability of the gatherer/processor to obtain a satisfactory price for the producer’s residue gas andextracted NGLs. Competition for sales to customers is based primarily upon reliability, services offered, andprice of delivered natural gas and NGLs.
Regulation
The intrastate pipelines owned by Field Services are subject to state regulation. To the extent they provideservices under Section 311 of the Natural Gas Policy Act of 1978, they are also subject to FERC regulation.However, most of Field Services’ natural gas gathering activities are not subject to FERC regulation.
Field Services is subject to the jurisdiction of the EPA and state environmental agencies. (For moreinformation, see “Environmental Matters” in this section.) Some of Field Services’ operations are subject to thejurisdiction of the DOT and state transportation agencies. The regulations from these agencies, which incorporatecertain provisions of the Natural Gas Pipeline Safety Act, control the design, installation, testing, construction,operation, replacement and management of Field Services’ pipeline operations.
In addition, Field Services’ interstate natural gas pipelines are subject to the regulations of the DOTconcerning pipeline safety. The DOT is developing regulations that will require pipelines to implement integritymanagement programs, including more frequent inspections and other safety protections in areas where theconsequences of potential pipeline accidents pose the greatest risk to people and their property. The PipelineSafety Improvement Act of 2002, which was enacted on December 17, 2002, establishes mandatory inspectionsof high-consequence areas for all U.S. oil and natural gas pipelines within 10 years.
Field Services’ Canadian assets are regulated by the Alberta Energy and Utilities Board and the NationalEnergy Board.
DUKE ENERGY NORTH AMERICA
DENA develops, operates and manages merchant power generation facilities and engages in commoditysales and services related to natural gas and electric power. DENA conducts business throughout the U.S. andCanada through Duke Energy North America, LLC and DETM. DETM is approximately 40% owned byExxonMobil Corporation and approximately 60% owned by Duke Energy. Prior to April 1, 2002, the DENAbusiness segment was combined with DEM to form a segment called North American Wholesale Energy. In2002, management combined DEM with the Other Energy Services segment.
DENA is an integrated energy business that develops, owns and manages a portfolio of merchant generationfacilities. Through its portfolio management strategy, DENA invests and divests in selected markets asconditions warrant. DENA captures additional value by combining its project development, commercial and riskmanagement expertise with the technical and operational skills of other Duke Energy business units to build andmanage projects with maximum efficiency. DENA also supplies competitively priced energy, integrated logisticsand asset optimization services, as well as risk management products, to wholesale energy customers.
DENA currently owns or operates approximately 14,157 net MW of operating generation and hasapproximately 1,860 net MW of projects under construction, slated for completion to meet summer 2003 peak
15
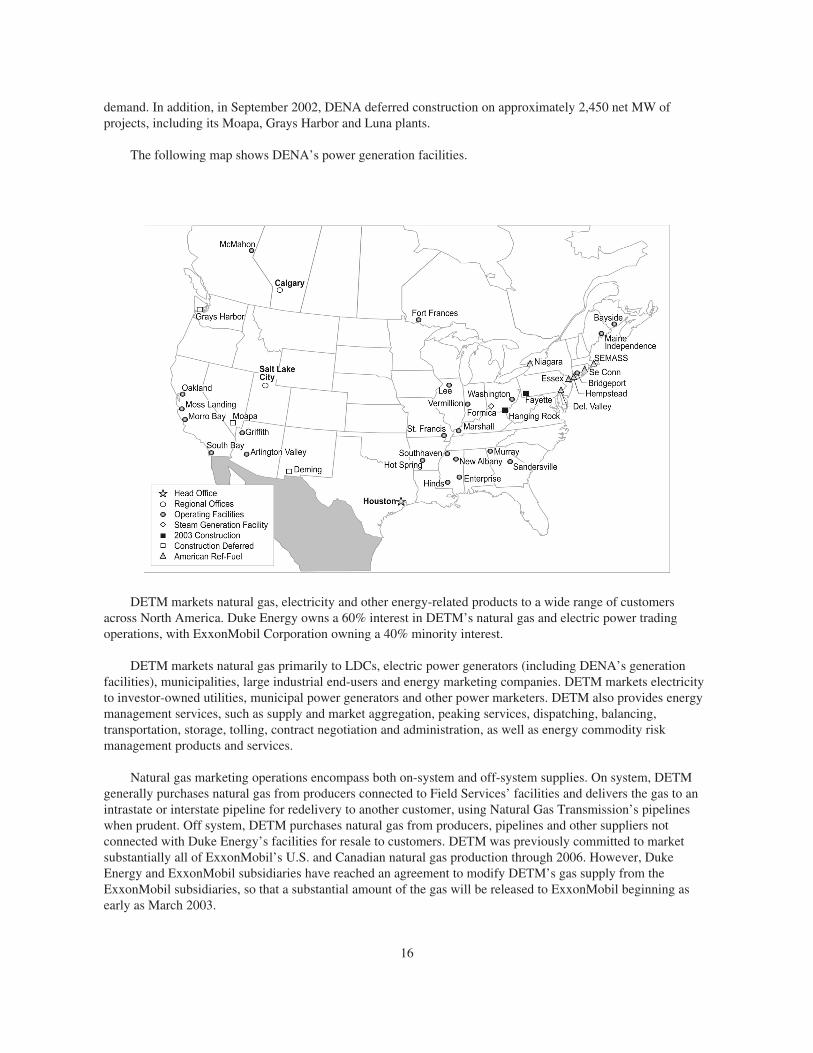
demand. In addition, in September 2002, DENA deferred construction on approximately 2,450 net MW ofprojects, including its Moapa, Grays Harbor and Luna plants.
The following map shows DENA’s power generation facilities.
DETM markets natural gas, electricity and other energy-related products to a wide range of customersacross North America. Duke Energy owns a 60% interest in DETM’s natural gas and electric power tradingoperations, with ExxonMobil Corporation owning a 40% minority interest.
DETM markets natural gas primarily to LDCs, electric power generators (including DENA’s generationfacilities), municipalities, large industrial end-users and energy marketing companies. DETM markets electricityto investor-owned utilities, municipal power generators and other power marketers. DETM also provides energymanagement services, such as supply and market aggregation, peaking services, dispatching, balancing,transportation, storage, tolling, contract negotiation and administration, as well as energy commodity riskmanagement products and services.
Natural gas marketing operations encompass both on-system and off-system supplies. On system, DETMgenerally purchases natural gas from producers connected to Field Services’ facilities and delivers the gas to anintrastate or interstate pipeline for redelivery to another customer, using Natural Gas Transmission’s pipelineswhen prudent. Off system, DETM purchases natural gas from producers, pipelines and other suppliers notconnected with Duke Energy’s facilities for resale to customers. DETM was previously committed to marketsubstantially all of ExxonMobil’s U.S. and Canadian natural gas production through 2006. However, DukeEnergy and ExxonMobil subsidiaries have reached an agreement to modify DETM’s gas supply from theExxonMobil subsidiaries, so that a substantial amount of the gas will be released to ExxonMobil beginning asearly as March 2003.
16

DETM’s electricity marketing operations involve purchasing electricity from third-party suppliers and fromDENA’s domestic generation facilities for resale to customers.
The vast majority of DETM’s portfolio of short-term and long-term sales agreements incorporates market-sensitive pricing terms. Long-term gas purchase agreements with producers also generally include market-sensitive pricing provisions. Purchase and sales commitments involving significant price and location risk aregenerally hedged with offsetting commitments and commodity futures, swaps and options. (For informationconcerning DETM’s risk-management activities, see “Management’s Discussion and Analysis of Results ofOperations and Financial Condition, Quantitative and Qualitative Disclosures About Market Risk” and Note 7 tothe Consolidated Financial Statements, “Derivative Instruments, Hedging Activities and Credit Risk.”)
DETM’s activities can fluctuate in response to seasonal demand for electricity, natural gas and other energy-related commodities. (See “Operating Statistics” in this section.)
Competition
DETM competes for natural gas supplies and in marketing natural gas, electricity and other energy-relatedcommodities. Competitors include major integrated oil companies, major interstate pipelines and their marketingaffiliates, brokers, marketers and distributors, electric utilities, certain financial institutions engaged incommodity trading and other domestic and international electric power and natural gas marketers. The price ofcommodities and services delivered, along with the quality and reliability of services provided, drive competitionin the energy marketing business.
DENA experiences substantial competition from utilities as well as other merchant electric generationcompanies in the U.S.
Regulation
Most of DENA’s and DETM’s operations are subject to market-based rate regulation. However, to theextent that DENA’s generating stations in California sell electricity to the California Independent SystemOperator under “reliability must run” agreements, those sales are made at FERC regulated rates.
DENA’s and DETM’s energy marketing activities are, in some circumstances, subject to the jurisdiction ofthe FERC. Current FERC policies permit DENA’s trading and marketing entities to market natural gas,electricity and other energy-related commodities at market-based rates, subject to FERC jurisdiction.
From June, 20, 2002 through October 30, 2002, the price at which DETM could sell wholesale electricity inthe Western Electricity Coordinating Council was subject to a floating price cap imposed by a FERC order.However, subject to the FERC’s approval, DETM could sell at prices in excess of the cap in effect at the time ifit provided justification. On October 31, 2002, the FERC imposed a soft price cap for the sale of energythroughout the Western Electricity Coordinating Council of $250 per MW hour.
Several legal and regulatory proceedings at the state and federal levels are ongoing related to DENA’sactivities in California during the electricity supply situation and related to trading activities. (See Note 16 to theConsolidated Financial Statements, “Commitments and Contingencies – Litigation – Western Power Disputes”for further discussion.)
The operation and maintenance of DENA’s power plants in California will be subject to regulation pursuantto rules that are currently being promulgated by state authorities. The new rules will purport to increase thereliability of the generation supply in California by setting maintenance standards and regulating when plantsmay be taken out of service for routine maintenance. Duke Energy does not believe that the new rules, whenfinalized, will have a material impact on the operation of its power plants in California.
17

DENA is subject to federal, state and local environmental regulations. (For a discussion of environmentalregulation, see “Environmental Matters” in this section.)
INTERNATIONAL ENERGY
International Energy develops, operates and manages natural gas transportation and power generationfacilities, and engages in sales and marketing of natural gas and electric power outside the U.S. and Canada. Itconducts operations primarily through DEI and its activities target power generation in Latin America, powergeneration and natural gas transmission in Asia-Pacific and natural gas marketing in Northwest Europe.
From its platform of assets, International Energy provides customers with energy supply at competitiveprices, manages the logistics associated with natural gas and power delivery, and offers services that allowcustomers to improve energy efficiency and hedge their commodity price exposure. International Energy’scustomers include retail distributors, electric utilities, independent power producers, large industrial companies,governments, gas and oil producers and mining operations. International Energy is committed to buildingintegrated regional businesses that provide customers with a full range of innovative and competitively pricedenergy services.
International Energy’s current strategy is focused on maximizing the returns and cash flow from its currentportfolio of energy businesses by creating organic growth through its sales and marketing efforts in all regions,optimizing the output and efficiency of its various facilities, controlling and reducing costs and divesting selectedassets.
International Energy owns, operates or has substantial interests in approximately 4,792 net MW ofgeneration facilities and 2,400 miles of pipeline systems in operation. The following map shows the locations ofInternational Energy’s worldwide energy facilities, including projects under construction or under contract. Thecapacities shown in the map are gross MW values, for net MW values see “Properties, International Energy.”
18

Competition and Regulation
International Energy’s operations are subject to country and region-specific market and competitionregulations. Commonly addressed regulatory issues include rules, rates and tariffs governing open andcompetitive access to gas and power transmission grids, rules for merchant power plant dispatch andremuneration, and rules that support the emergence of competitive gas and power trading and marketing.International Energy’s operations are subject to international environmental regulations. (See “EnvironmentalMatters” in this section.)
OTHER ENERGY SERVICES
Other Energy Services is composed of diverse energy businesses, operating primarily through DEM, D/FDand EDS. Prior to the sales of DE&S on May 1, 2002, and DukeSolutions on May 1, 2002, those businesses wereincluded in Other Energy Services. (For more information on the sales, see Note 2 to the Consolidated FinancialStatements, “Business Acquisitions and Dispositions.”) Other Energy Services also includes other portions ofDE&S and DukeSolutions that were not part of the sales.
DEM engages in commodity buying and selling, and risk management and financial services in non-regulated energy commodity markets other than physical natural gas and power (such as petroleum products).DEM’s activities can fluctuate in response to seasonal demand for other energy-related commodities.
D/FD, operating through several entities, provides full-service siting, permitting, licensing, engineering,procurement, construction, start-up, operating and maintenance services for fossil-fired plants, both domesticallyand internationally. Subsidiaries of Duke Energy and Fluor Enterprises, Inc. each own 50% of D/FD.
EDS is an engineering, construction, maintenance and technical services firm specializing in electrictransmission and distribution lines and substation projects. It was formed in the second quarter of 2002 from thetransmission and distribution services component of DE&S and was excluded from the sale of DE&S.
Competition and Regulation
DEM competes for other energy-related commodities. Competitors include major integrated oil companies,major interstate pipelines and their marketing affiliates, brokers and distributors. D/FD competes with majorcompanies who provide engineering, procurement, construction, start-up and maintenance services for fossilfueled power generation facilities. EDS’ competition includes companies that provide engineering, procurement,construction and maintenance services for transmission lines, distribution lines and substation facilities.
Other Energy Services is subject to the jurisdiction of the EPA and international, state and localenvironmental agencies. (For a discussion of environmental regulation, see “Environmental Matters” in thissection.)
DUKE VENTURES
Duke Ventures is composed of other diverse businesses, primarily operating through Crescent, DukeNet andDCP.
Crescent develops high-quality commercial, residential and multi-family real estate projects, and managesland holdings, primarily in the Southeastern and Southwestern U.S. On December 31, 2002, Crescent owned 2.6million square feet of commercial, industrial and retail space, with an additional 0.6 million square feet underconstruction. This portfolio included 1.3 million square feet of office space, 1.3 million square feet of warehousespace and 0.6 million square feet of retail space. Crescent’s residential developments include high-end countryclub and golf course communities, with individual lots sold to custom builders and tract developments sold to
19

national builders. In 2002, Crescent had six multi-family communities, including three operating properties andthree properties under development. On December 31, 2002, Crescent also managed approximately 129,000acres of land.
DukeNet provides telecommunications bandwidth capacity for industrial and commercial customers throughits fiber optic network. It owns and operates a fiber optic communications network centered in North Carolinaand South Carolina and is interconnected with a fiber optic communications network through affiliate agreementswith third parties.
DCP, a wholly owned merchant finance company, provides financing, investment banking and assetmanagement services to wholesale and commercial markets in the energy and real estate industries. In March2003, Duke Energy announced that it will exit the merchant finance business at DCP in an orderly manner.
ENVIRONMENTALMATTERS
Duke Energy is subject to international, federal, state and local regulations with regard to air and waterquality, hazardous and solid waste disposal and other environmental matters. Environmental regulations affectingDuke Energy include, but are not limited to:
• The Clean Air Act and the 1990 amendments to the Act, as well as state laws and regulationsimpacting air emissions, including State Implementation Plans related to existing and new nationalambient air quality standards for ozone. Owners and/or operators of air emissions sources areresponsible for obtaining permits and for annual compliance and reporting.
• The Federal Water Pollution Control Act which requires permits for facilities that discharge treatedwastewater into the environment.
• The Comprehensive Environmental Response, Compensation and Liability Act, which can requireany individual or entity that may have owned or operated a disposal site, as well as transporters orgenerators of hazardous wastes sent to such site, to share in remediation costs.
• The Solid Waste Disposal Act, as amended by the Resource Conservation and Recovery Act, whichrequires certain solid wastes, including hazardous wastes, to be managed pursuant to acomprehensive regulatory regime.
• The National Environmental Policy Act, which requires consideration of potential environmentalimpacts by federal agencies in their decisions, including siting approvals.
(For more information on environmental matters involving Duke Energy, including possible liability andcapital costs, see Note 16 to the Consolidated Financial Statements, “Commitments and Contingencies—Environmental.”)
Compliance with international, federal, state and local provisions regulating the discharge of materials intothe environment, or otherwise protecting the environment, is not expected to have a material adverse effect onthe competitive position, consolidated results of operations, cash flows or financial position of Duke Energy.
GEOGRAPHIC REGIONS
For a discussion of Duke Energy’s foreign operations and the risks associated with them, see“Management’s Discussion and Analysis of Results of Operations and Financial Condition, Quantitative andQualitative Disclosures About Market Risk—Foreign Currency Risk,” and Notes 3 and 7 to the ConsolidatedFinancial Statements, “Business Segments” and “Risk Management Instruments, Hedging Activities and CreditRisk.”
20
EMPLOYEES
On December 31, 2002, Duke Energy had approximately 22,000 employees. A total of 3,700 operating andmaintenance employees were represented by unions. This amount consists of the following:
• 1,421 employees represented by the International Brotherhood of Electrical Workers
• 1,187 employees represented by the Communications, Energy and Paperworkers of Canada
• 269 employees represented by the United Steel Workers of America
• 198 employees represented by the Canadian Pipeline Employees Association
• 99 employees represented by Sindicato de Trabajadores del Sector Electrico
• 85 employees represented by Sindicato de Trabajadores del Sector Petroquimico
• 81 employees represented by Sindicato dos Trabalhadores na Industria da Energia Hidroeletrica deIpaussu
• 79 employees represented by the Paper, Allied, Chemical and Energy Workers Union
• 77 employees represented by the International Union of Operating Engineers
• 34 employees represented by Asociacion del Personal Jerarquico del Agua y la Energia
• 29 employees represented by Sindicato dos Trabalhadores na Industria de Energia Eletrica deCampinas
• 28 employees represented by Sindicato Unico de Centrales de Generacion Canion del Pato
• 24 employees represented by Federacion Argentina de Trabajadores de Luz y Fuerza
• 23 employees represented by Sindicato Unico de Generacion Electrica Carhuaquero
• 21 employees represented by the United Association of Journeymen and Apprentices of thePlumbing and Pipe Fitting Industries of the U.S. and Canada
• 20 employees represented by Sindicato Corani
• 13 employees represented by Sindicato dos Trabalhadores nas Industrias de Energia Eletrica de SaoPaulo
• 12 employees represented by the National Distribution Union
21

OPERATING STATISTICS
Years Ended December 31,
2002 2001 2000 1999 1998
Franchised ElectricSources of Electric Energy, GWh(a)Generated—net output:Coal . . . . . . . . . . . . . . . . . . . . . . . . . . . . . . . . . . . . . . 43,561 41,796 43,526 41,306 42,164Nuclear . . . . . . . . . . . . . . . . . . . . . . . . . . . . . . . . . . . . 41,155 39,922 41,073 39,263 38,366Hydro . . . . . . . . . . . . . . . . . . . . . . . . . . . . . . . . . . . . . 317 224 394 638 1,714Oil and gas . . . . . . . . . . . . . . . . . . . . . . . . . . . . . . . . . 98 139 459 662 846
Total generation . . . . . . . . . . . . . . . . . . . . . . . . . . . 85,131 82,081 85,452 81,869 83,090Purchased power and net interchange . . . . . . . . . . . . 4,102 3,050 4,497 3,617 2,659
Total output . . . . . . . . . . . . . . . . . . . . . . . . . . . . . . 89,233 85,131 89,949 85,486 85,749Plus: Purchases from other Catawba joint owners . . . — — 150 1,233 1,656
Total sources of energy . . . . . . . . . . . . . . . . . . . . . 89,233 85,131 90,099 86,719 87,405Less: Line loss and company usage . . . . . . . . . . . . . . 5,450 5,446 5,333 5,171 5,394
Total GWh sales . . . . . . . . . . . . . . . . . . . . . . . . . . . 83,783 79,685 84,766 81,548 82,011
Electric Energy Sales, GWhResidential . . . . . . . . . . . . . . . . . . . . . . . . . . . . . . . . . 24,466 23,272 22,884 21,897 22,002General service . . . . . . . . . . . . . . . . . . . . . . . . . . . . . . 24,242 23,666 22,845 21,807 21,093Industrial . . . . . . . . . . . . . . . . . . . . . . . . . . . . . . . . . . .Textile . . . . . . . . . . . . . . . . . . . . . . . . . . . . . . . . . . . 8,443 8,829 10,819 11,201 11,981Other . . . . . . . . . . . . . . . . . . . . . . . . . . . . . . . . . . . . 17,816 18,074 18,952 18,704 18,668
Other energy and wholesale . . . . . . . . . . . . . . . . . . . . 8,706 6,979 8,671 7,715 8,933
Total GWh sales billed . . . . . . . . . . . . . . . . . . . . . . 83,673 80,820 84,171 81,324 82,677Unbilled GWh sales . . . . . . . . . . . . . . . . . . . . . . 110 (1,135) 595 224 (666)
Total GWh sales . . . . . . . . . . . . . . . . . . . . . . . 83,783 79,685 84,766 81,548 82,011
Natural Gas TransmissionProportional Throughput Volumes, TBtu(b)(c) . . . . . . . 3,160 1,781 1,771 1,893 1,459Field ServicesNatural Gas Gathered andProcessed/Transported, TBtu/d(d) . . . . . . . . . . . . . . . 8.3 8.6 7.6 5.1 3.6
NGL Production, MBbl/d(e) . . . . . . . . . . . . . . . . . . . . . 391.9 397.2 358.5 192.4 110.2Natural Gas Marketed, TBtu/d . . . . . . . . . . . . . . . . . . . . 1.6 1.6 0.7 0.5 0.4Average Natural Gas Price per MMBtu(f) . . . . . . . . . . . $ 3.22 $ 4.27 $ 3.89 $ 2.27 $ 2.11Average NGL Price per Gallon . . . . . . . . . . . . . . . . . . . $ 0.38 $ 0.45 $ 0.53 $ 0.34 $ 0.26Duke Energy North AmericaNatural Gas Marketed, TBtu/d . . . . . . . . . . . . . . . . . . . . 17.7 12.3 11.9 10.5 8.0Electricity Marketed and Traded, GWh . . . . . . . . . . . . . 546,245 334,517 275,258 109,634 98,991Duke Energy InternationalSales, GWh . . . . . . . . . . . . . . . . . . . . . . . . . . . . . . . . . . . 21,443 18,896 16,949 — —Natural Gas Marketed, TBtu/d . . . . . . . . . . . . . . . . . . . . 4.2 2.7 1.0 — —Electricity Marketed and Traded, GWh . . . . . . . . . . . . . 95,591 12,719 4,208 — —
(a) Gigawatt-hour(b) Trillion British thermal units(c) Includes throughput of Westcoast acquired March 14, 2002, and excludes throughput of pipelines sold in March 1999: 328 TBtu (1999);
1,141 TBtu (1998)(d) Trillion British thermal units per day(e) Thousand barrels per day(f) Million British thermal units
22
EXECUTIVE OFFICERS OF DUKE ENERGY
RICHARD B. PRIORY, 56, Chairman of the Board and Chief Executive Officer. Mr. Priory served asPresident and Chief Operating Officer from 1994 until he assumed the position of Chairman of the Board,President and Chief Executive Officer in 1997.
RICHARD W. BLACKBURN, 60, Executive Vice President, General Counsel, Chief Administrative Officerand Secretary. Mr. Blackburn was Executive Vice President, General Counsel and Secretary from 1997 untilassuming his present position in 2003.
ROBERT P. BRACE, 53, Executive Vice President and Chief Financial Officer. Mr. Brace joined DukeEnergy in 2000. Previously, he served as Group Finance Director of British Telecommunications plc starting in1993.
KEITH G. BUTLER, 42, Senior Vice President and Controller. Mr. Butler was named Senior Vice Presidentand Chief Financial Officer of Duke Energy Global and its affiliated companies in February 1998, Senior VicePresident and Chief Financial Officer of Duke Energy North America in July 1998, and Chief Operating Officerof DukeSolutions in September 1999 before he assumed his current position in August 2001.
FRED J. FOWLER, 57, President and Chief Operating Officer. Mr. Fowler assumed his current position inNovember 2002. Mr. Fowler served as Group Vice President of PanEnergy from 1996 until the PanEnergymerger in 1997, when he was named Group President, Energy Transmission.
DAVID L. HAUSER, 51, Senior Vice President and Treasurer. Mr. Hauser held various positions, includingController, at Duke Power before being named Senior Vice President, Global Asset Development in 1997. Hewas appointed to his current position in 1998.
RICHARD J. OSBORNE, 52, Executive Vice President and Chief Risk Officer. Mr. Osborne assumed hispresent position in May 2000. He previously served as Executive Vice President and Chief Financial Officer.Beginning in 1994, Mr. Osborne was Senior Vice President and Chief Financial Officer.
RUTH G. SHAW, 55, President, Duke Power. Ms. Shaw assumed her current position in February 2003. Ms.Shaw served as Senior Vice President, Corporate Resources, from 1994 until the PanEnergy merger in 1997,when she was named Executive Vice President and Chief Administrative Officer.
Executive officers are elected annually by the Board of Directors. They serve until the first meeting of theBoard of Directors following the annual meeting of shareholders and until their successors are duly elected.
There are no family relationships between any of the executive officers, nor any arrangement orunderstanding between any executive officer and any other person involved in officer selection.
23
Item 2. Properties.
FRANCHISED ELECTRIC
As of December 31, 2002, Franchised Electric operated three nuclear generating stations with a combinednet capacity of 5,020 MW (including a 12.5% ownership in the Catawba Nuclear Station), eight coal-firedstations with a combined capacity of 7,699 MW, 31 hydroelectric stations with a combined capacity of 2,806MW and seven combustion turbine stations with a combined capacity of 2,135 MW. All of the stations arelocated in North Carolina or South Carolina.
In addition, Franchised Electric owned, as of December 31, 2002, approximately 13,300 conductor miles ofelectric transmission lines, including 600 miles of 525 kilovolts, 2,600 miles of 230 kilovolts, 6,700 miles of 100to 161 kilovolts, and 3,400 miles of 13 to 66 kilovolts. Franchised Electric also owned approximately 94,000conductor miles of electric distribution lines, including 62,800 miles of rural overhead lines, 15,700 miles ofurban overhead lines, 8,400 miles of rural underground lines and 7,100 miles of urban underground lines. As ofDecember 31, 2002, the electric transmission and distribution systems had approximately 1,600 substations.
Substantially all of Franchised Electric’s electric plant in service is mortgaged under the indenture relatingto Duke Energy’s various series of First and Refunding Mortgage Bonds.
NATURAL GAS TRANSMISSION
Texas Eastern’s gas transmission system extends approximately 1,700 miles from producing fields in theGulf Coast region of Texas and Louisiana to Ohio, Pennsylvania, New Jersey and New York. It consists of twoparallel systems, one with three large-diameter parallel pipelines and the other with one to three large-diameterpipelines. Texas Eastern’s system consists of approximately 8,600 miles of pipeline and 73 compressor stations.
Texas Eastern also owns and operates two offshore Louisiana pipeline systems, which extend over 100miles into the Gulf of Mexico and include approximately 470 miles of Texas Eastern’s pipelines.
Algonquin’s transmission system connects with Texas Eastern’s facilities in New Jersey, and extendsapproximately 250 miles through New Jersey, New York, Connecticut, Rhode Island and Massachusetts. Thesystem consists of approximately 1,070 miles of pipeline with seven compressor stations.
ETNG’s transmission system crosses Texas Eastern’s system at two points in Tennessee and consists of twomainline systems totaling approximately 1,185 miles of pipeline in Tennessee and Virginia, with 18 compressorstations.
M&N Pipeline’s transmission system extends approximately 800 miles from producing fields in NovaScotia through New Brunswick, Maine, New Hampshire and Massachusetts. It has two compressor stations onthe system.
The British Columbia Pipeline System (BC Pipeline) consists of the field services division, with more than1,840 miles of gathering pipelines in British Columbia, Alberta, the Yukon Territory and the NorthwestTerritories, as well as 22 field compressor stations; four gas processing plants located in British Columbia at FortNelson, Taylor, Pine River and in the Sikanni area northwest of Fort St. John, with a total contractible capacity ofapproximately 1.8 Bcf of residue gas per day; and three elemental sulphur recovery plants located at Fort Nelson,Taylor and Pine River. The pipeline division has approximately 1,740 miles of transmission pipelines in BritishColumbia and Alberta, as well as 18 mainline compressor stations.
Union Gas owns and operates natural gas transmission, distribution and storage facilities in Ontario. UnionGas distributes natural gas to customers in northern, southwestern and eastern Ontario and provides storage,
24

transportation and related services to utilities and other industry participants in the gas markets of Ontario,Quebec and the Central and Eastern U.S. Union Gas’ underground natural gas storage facilities have a workingcapacity of approximately 150 Bcf in 20 underground facilities located in depleted gas fields. Its transmissionsystem consists of approximately 3,000 miles of pipeline and six mainline compressor stations. Union Gas’distribution service area encompasses approximately 400 communities. Its distribution system consists ofapproximately 20,000 miles of distribution lines serving approximately 1.17 million residential, commercial, andindustrial customers.
PNG is a gas transmission and distribution utility which serves customers in west-central and northeasternBritish Columbia of which Duke Energy owns 40% of the non-voting participating stock and 100% of the votingparticipating stock. PNG’s transmission system connects with the BC Pipeline system near Summit Lake, BritishColumbia and extends approximately 370 miles to the West Coast of British Columbia. In addition, PNG ownsand operates distribution facilities in various communities located throughout its service area.
MHP owns and operates two natural gas storage facilities: Moss Bluff and Egan. The Moss Bluff facilityconsists of three storage caverns located in Liberty and Chambers counties near Houston, Texas and has access tofive pipelines. The Egan facility consists of three storage caverns located in Acadia Parish in the south centralpart of Louisiana and has access to seven pipeline facilities.
(For a map showing natural gas transmission and storage properties and additional information on NaturalGas Transmission’s properties, see “Business, Natural Gas Transmission.”)
FIELD SERVICES
(For information and a map showing Field Services’ properties, see “Business, Field Services” earlier in thissection.)
25
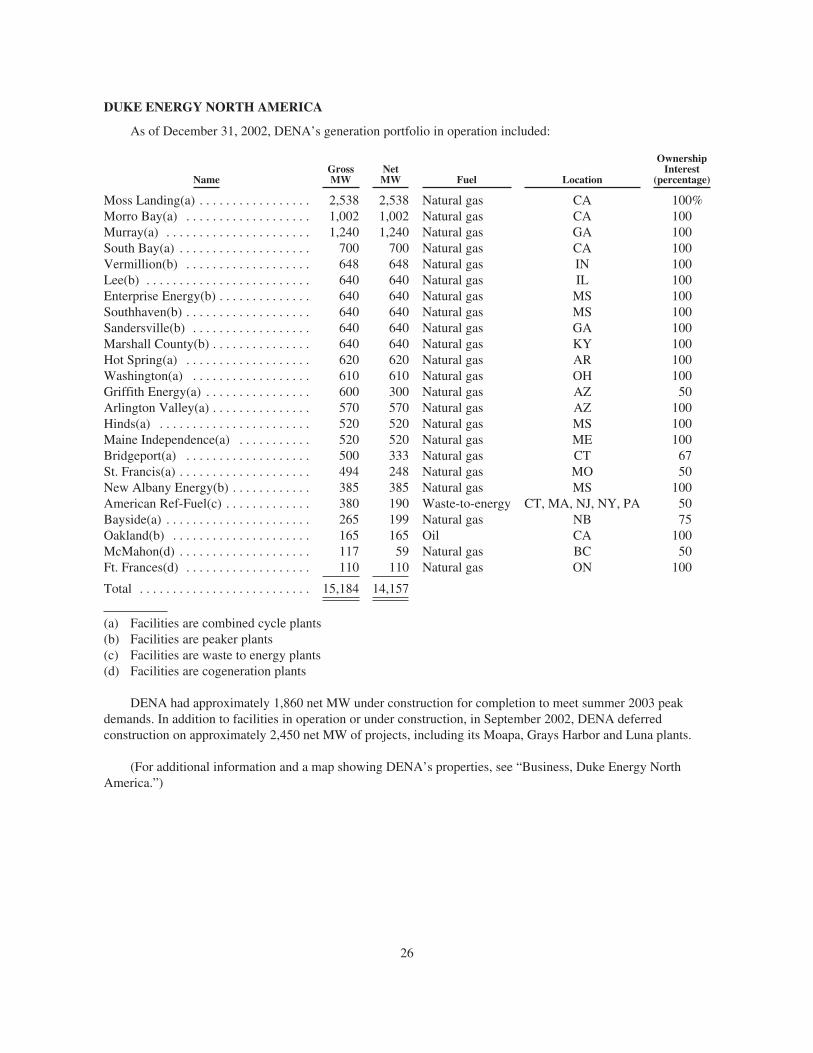
DUKE ENERGY NORTH AMERICA
As of December 31, 2002, DENA’s generation portfolio in operation included:
NameGrossMW
NetMW Fuel Location
OwnershipInterest
(percentage)
Moss Landing(a) . . . . . . . . . . . . . . . . . 2,538 2,538 Natural gas CA 100%Morro Bay(a) . . . . . . . . . . . . . . . . . . . 1,002 1,002 Natural gas CA 100Murray(a) . . . . . . . . . . . . . . . . . . . . . . 1,240 1,240 Natural gas GA 100South Bay(a) . . . . . . . . . . . . . . . . . . . . 700 700 Natural gas CA 100Vermillion(b) . . . . . . . . . . . . . . . . . . . 648 648 Natural gas IN 100Lee(b) . . . . . . . . . . . . . . . . . . . . . . . . . 640 640 Natural gas IL 100Enterprise Energy(b) . . . . . . . . . . . . . . 640 640 Natural gas MS 100Southhaven(b) . . . . . . . . . . . . . . . . . . . 640 640 Natural gas MS 100Sandersville(b) . . . . . . . . . . . . . . . . . . 640 640 Natural gas GA 100Marshall County(b) . . . . . . . . . . . . . . . 640 640 Natural gas KY 100Hot Spring(a) . . . . . . . . . . . . . . . . . . . 620 620 Natural gas AR 100Washington(a) . . . . . . . . . . . . . . . . . . 610 610 Natural gas OH 100Griffith Energy(a) . . . . . . . . . . . . . . . . 600 300 Natural gas AZ 50Arlington Valley(a) . . . . . . . . . . . . . . . 570 570 Natural gas AZ 100Hinds(a) . . . . . . . . . . . . . . . . . . . . . . . 520 520 Natural gas MS 100Maine Independence(a) . . . . . . . . . . . 520 520 Natural gas ME 100Bridgeport(a) . . . . . . . . . . . . . . . . . . . 500 333 Natural gas CT 67St. Francis(a) . . . . . . . . . . . . . . . . . . . . 494 248 Natural gas MO 50New Albany Energy(b) . . . . . . . . . . . . 385 385 Natural gas MS 100American Ref-Fuel(c) . . . . . . . . . . . . . 380 190 Waste-to-energy CT, MA, NJ, NY, PA 50Bayside(a) . . . . . . . . . . . . . . . . . . . . . . 265 199 Natural gas NB 75Oakland(b) . . . . . . . . . . . . . . . . . . . . . 165 165 Oil CA 100McMahon(d) . . . . . . . . . . . . . . . . . . . . 117 59 Natural gas BC 50Ft. Frances(d) . . . . . . . . . . . . . . . . . . . 110 110 Natural gas ON 100
Total . . . . . . . . . . . . . . . . . . . . . . . . . . 15,184 14,157
(a) Facilities are combined cycle plants(b) Facilities are peaker plants(c) Facilities are waste to energy plants(d) Facilities are cogeneration plants
DENA had approximately 1,860 net MW under construction for completion to meet summer 2003 peakdemands. In addition to facilities in operation or under construction, in September 2002, DENA deferredconstruction on approximately 2,450 net MW of projects, including its Moapa, Grays Harbor and Luna plants.
(For additional information and a map showing DENA’s properties, see “Business, Duke Energy NorthAmerica.”)
26

INTERNATIONAL ENERGY
As of December 31, 2002, International Energy’s generation portfolio in operation included:
NameGrossMW
NetMW Fuel Location
ApproximateOwnershipInterest
(percentage)
Paranapanema . . . . . . . . . . . . . . . . . . . . . 2,307 2,185 Hydro Brazil 95%Hidroelectrica Cerros Colorados . . . . . . . 576 523 Hydro/Natural gas Argentina 91Egenor . . . . . . . . . . . . . . . . . . . . . . . . . . . 529 528 Hydro/Diesel/HFO Peru 100Puncakjaya Power . . . . . . . . . . . . . . . . . . 385 330 Coal/Diesel Indonesia 86Acajutla . . . . . . . . . . . . . . . . . . . . . . . . . . 293 265 HFO/Diesel El Salvador 90Western Australia Power . . . . . . . . . . . . . 250 247 Natural Gas/Diesel Australia 100Electroquil . . . . . . . . . . . . . . . . . . . . . . . . 180 125 Diesel Ecuador 69DEI Guatemala y Cia . . . . . . . . . . . . . . . . 168 168 HFO/Diesel Guatemala 100Aquaytia . . . . . . . . . . . . . . . . . . . . . . . . . . 160 61 Natural Gas Peru 38Empressa Electrica Corani . . . . . . . . . . . . 126 63 Hydro Bolivia 50Glenbrook Power Station . . . . . . . . . . . . . 112 108 Natural Gas/Kiln Gases New Zealand 100Compagnie Thermique du Rouvray . . . . 103 103 Natural Gas France 100Bairnsdale . . . . . . . . . . . . . . . . . . . . . . . . 86 86 Natural Gas Australia 100
Total . . . . . . . . . . . . . . . . . . . . . . . . . . . . . 5,275 4,792
As of December 31, 2002, DEI had approximately 165 net MW under construction in Latin America andowned approximately 1,340 miles of pipeline systems in Australia. Additionally, DEI had an 11.84% ownershipinterest in 855 miles of pipeline systems in Australia and a 37.83% ownership interest in 190 miles of pipelinesystems in Peru. Also, as of December 31, 2002, DEI had a 25% indirect interest in National Methanol Company,which owns and operates a methanol and MTBE (methyl tertiary butyl ether) business in Jubail, Saudi Arabia. Inaddition, DEI had a 50% non-controlling ownership interest in the Campeche project, a natural gas compressionfacility in Mexico and a 30% indirect interest in the Cantarell project, a large nitrogen extraction facility inMexico.
(For additional information and a map showing International Energy’s properties, see “Business,International Energy.”)
DUKE VENTURES
(For information regarding Duke Ventures’ properties, see “Business, Duke Ventures” earlier in thissection.)
OTHER
None of the properties used in Duke Energy’s other business activities are considered material to DukeEnergy’s operations as a whole.
Item 3. Legal Proceedings.
For information regarding legal proceedings, including regulatory and environmental matters, see Note 4 tothe Consolidated Financial Statements, “Regulatory Matters—Franchised Electric” and Note 16 to theConsolidated Financial Statements, “Commitments and Contingencies—Litigation” and “Commitments andContingencies—Environmental.”
27

Item 4. Submission of Matters to a Vote of Security Holders.
No matters were submitted to a vote of Duke Energy’s security holders during the fourth quarter of 2002.
28
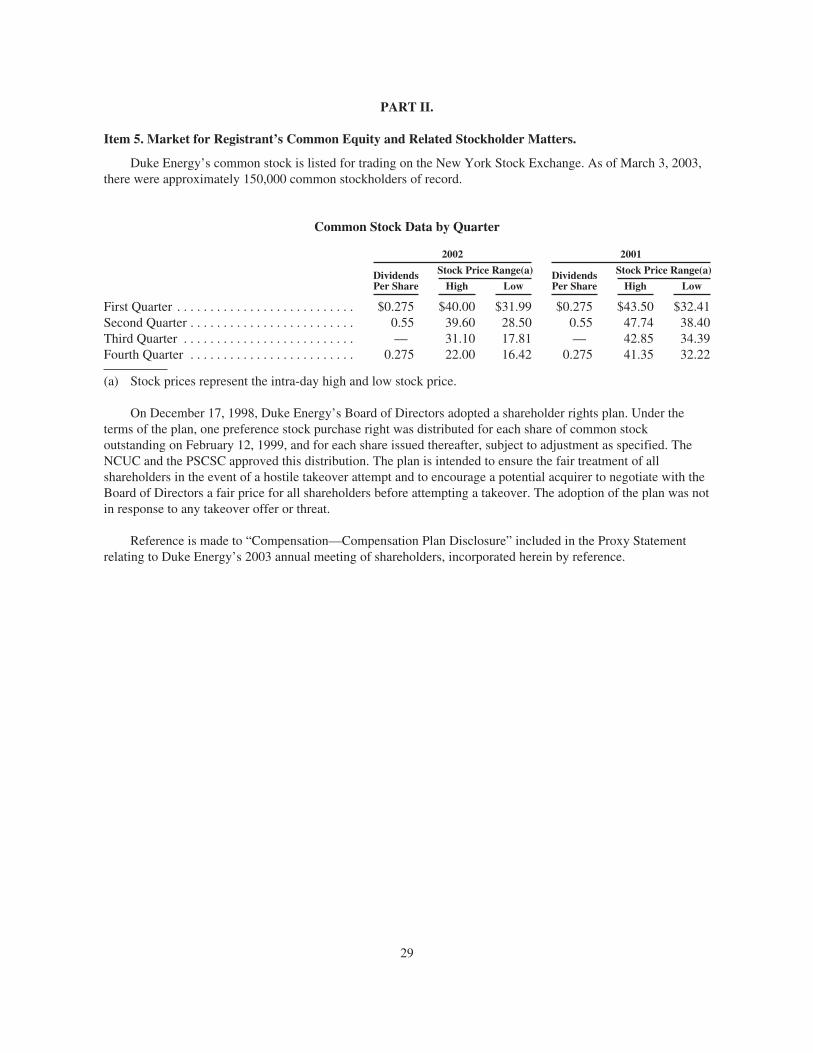
PART II.
Item 5. Market for Registrant’s Common Equity and Related Stockholder Matters.
Duke Energy’s common stock is listed for trading on the New York Stock Exchange. As of March 3, 2003,there were approximately 150,000 common stockholders of record.
Common Stock Data by Quarter
2002 2001
DividendsPer Share
Stock Price Range(a) DividendsPer Share
Stock Price Range(a)
High Low High Low
First Quarter . . . . . . . . . . . . . . . . . . . . . . . . . . . $0.275 $40.00 $31.99 $0.275 $43.50 $32.41Second Quarter . . . . . . . . . . . . . . . . . . . . . . . . . 0.55 39.60 28.50 0.55 47.74 38.40Third Quarter . . . . . . . . . . . . . . . . . . . . . . . . . . — 31.10 17.81 — 42.85 34.39Fourth Quarter . . . . . . . . . . . . . . . . . . . . . . . . . 0.275 22.00 16.42 0.275 41.35 32.22
(a) Stock prices represent the intra-day high and low stock price.
On December 17, 1998, Duke Energy’s Board of Directors adopted a shareholder rights plan. Under theterms of the plan, one preference stock purchase right was distributed for each share of common stockoutstanding on February 12, 1999, and for each share issued thereafter, subject to adjustment as specified. TheNCUC and the PSCSC approved this distribution. The plan is intended to ensure the fair treatment of allshareholders in the event of a hostile takeover attempt and to encourage a potential acquirer to negotiate with theBoard of Directors a fair price for all shareholders before attempting a takeover. The adoption of the plan was notin response to any takeover offer or threat.
Reference is made to “Compensation—Compensation Plan Disclosure” included in the Proxy Statementrelating to Duke Energy’s 2003 annual meeting of shareholders, incorporated herein by reference.
29
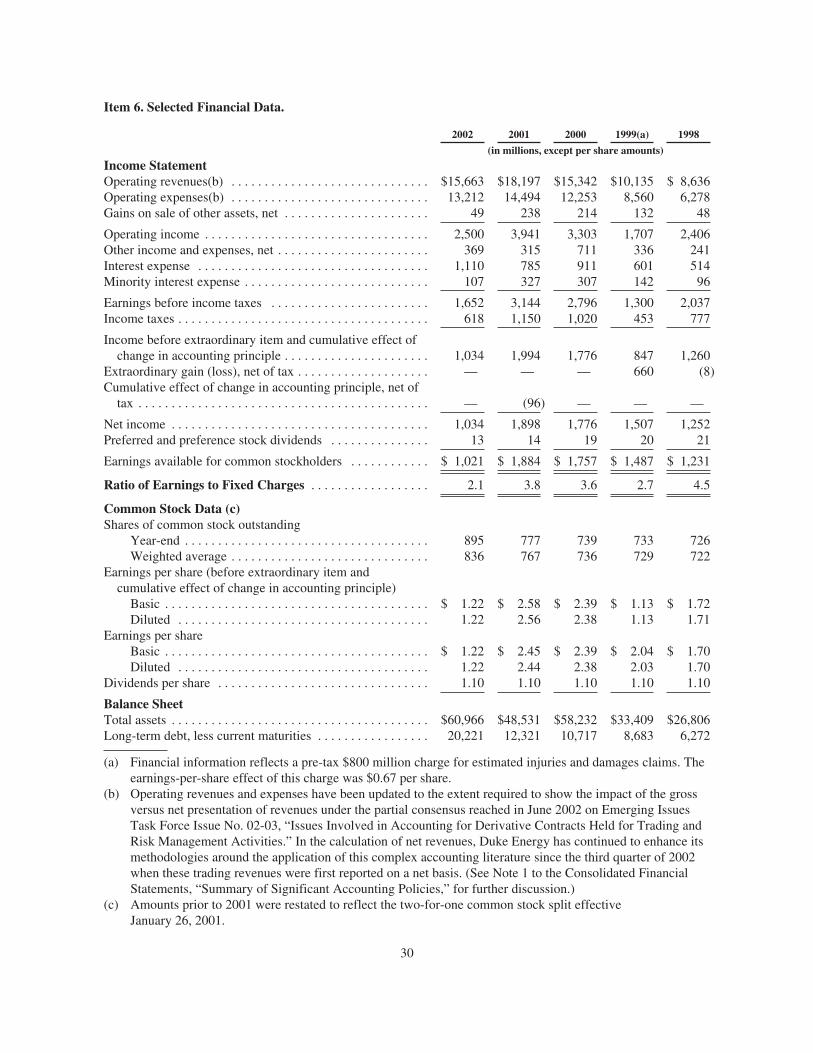
Item 6. Selected Financial Data.
2002 2001 2000 1999(a) 1998
(in millions, except per share amounts)
Income StatementOperating revenues(b) . . . . . . . . . . . . . . . . . . . . . . . . . . . . . . $15,663 $18,197 $15,342 $10,135 $ 8,636Operating expenses(b) . . . . . . . . . . . . . . . . . . . . . . . . . . . . . . 13,212 14,494 12,253 8,560 6,278Gains on sale of other assets, net . . . . . . . . . . . . . . . . . . . . . . 49 238 214 132 48
Operating income . . . . . . . . . . . . . . . . . . . . . . . . . . . . . . . . . . 2,500 3,941 3,303 1,707 2,406Other income and expenses, net . . . . . . . . . . . . . . . . . . . . . . . 369 315 711 336 241Interest expense . . . . . . . . . . . . . . . . . . . . . . . . . . . . . . . . . . . 1,110 785 911 601 514Minority interest expense . . . . . . . . . . . . . . . . . . . . . . . . . . . . 107 327 307 142 96
Earnings before income taxes . . . . . . . . . . . . . . . . . . . . . . . . 1,652 3,144 2,796 1,300 2,037Income taxes . . . . . . . . . . . . . . . . . . . . . . . . . . . . . . . . . . . . . . 618 1,150 1,020 453 777
Income before extraordinary item and cumulative effect ofchange in accounting principle . . . . . . . . . . . . . . . . . . . . . . 1,034 1,994 1,776 847 1,260
Extraordinary gain (loss), net of tax . . . . . . . . . . . . . . . . . . . . — — — 660 (8)Cumulative effect of change in accounting principle, net oftax . . . . . . . . . . . . . . . . . . . . . . . . . . . . . . . . . . . . . . . . . . . . — (96) — — —
Net income . . . . . . . . . . . . . . . . . . . . . . . . . . . . . . . . . . . . . . . 1,034 1,898 1,776 1,507 1,252Preferred and preference stock dividends . . . . . . . . . . . . . . . 13 14 19 20 21
Earnings available for common stockholders . . . . . . . . . . . . $ 1,021 $ 1,884 $ 1,757 $ 1,487 $ 1,231
Ratio of Earnings to Fixed Charges . . . . . . . . . . . . . . . . . . 2.1 3.8 3.6 2.7 4.5
Common Stock Data (c)Shares of common stock outstanding
Year-end . . . . . . . . . . . . . . . . . . . . . . . . . . . . . . . . . . . . . 895 777 739 733 726Weighted average . . . . . . . . . . . . . . . . . . . . . . . . . . . . . . 836 767 736 729 722
Earnings per share (before extraordinary item andcumulative effect of change in accounting principle)Basic . . . . . . . . . . . . . . . . . . . . . . . . . . . . . . . . . . . . . . . . $ 1.22 $ 2.58 $ 2.39 $ 1.13 $ 1.72Diluted . . . . . . . . . . . . . . . . . . . . . . . . . . . . . . . . . . . . . . 1.22 2.56 2.38 1.13 1.71
Earnings per shareBasic . . . . . . . . . . . . . . . . . . . . . . . . . . . . . . . . . . . . . . . . $ 1.22 $ 2.45 $ 2.39 $ 2.04 $ 1.70Diluted . . . . . . . . . . . . . . . . . . . . . . . . . . . . . . . . . . . . . . 1.22 2.44 2.38 2.03 1.70
Dividends per share . . . . . . . . . . . . . . . . . . . . . . . . . . . . . . . . 1.10 1.10 1.10 1.10 1.10
Balance SheetTotal assets . . . . . . . . . . . . . . . . . . . . . . . . . . . . . . . . . . . . . . . $60,966 $48,531 $58,232 $33,409 $26,806Long-term debt, less current maturities . . . . . . . . . . . . . . . . . 20,221 12,321 10,717 8,683 6,272
(a) Financial information reflects a pre-tax $800 million charge for estimated injuries and damages claims. Theearnings-per-share effect of this charge was $0.67 per share.
(b) Operating revenues and expenses have been updated to the extent required to show the impact of the grossversus net presentation of revenues under the partial consensus reached in June 2002 on Emerging IssuesTask Force Issue No. 02-03, “Issues Involved in Accounting for Derivative Contracts Held for Trading andRisk Management Activities.” In the calculation of net revenues, Duke Energy has continued to enhance itsmethodologies around the application of this complex accounting literature since the third quarter of 2002when these trading revenues were first reported on a net basis. (See Note 1 to the Consolidated FinancialStatements, “Summary of Significant Accounting Policies,” for further discussion.)
(c) Amounts prior to 2001 were restated to reflect the two-for-one common stock split effectiveJanuary 26, 2001.
30
Item 7. Management’s Discussion and Analysis of Results of Operations and Financial Condition
INTRODUCTION
Management’s Discussion and Analysis should be read in connection with the Consolidated FinancialStatements.
Business Segments. Duke Energy Corporation (collectively with its subsidiaries, Duke Energy), anintegrated provider of energy and energy services, offers physical delivery and management of both electricityand natural gas throughout the U.S. and abroad. Duke Energy provides these and other services through the sevenbusiness segments described below.
Franchised Electric generates, transmits, distributes and sells electricity in central and western NorthCarolina and western South Carolina. It conducts operations primarily through Duke Power and Nantahala Powerand Light. These electric operations are subject to the rules and regulations of the Federal Energy RegulatoryCommission (FERC), the North Carolina Utilities Commission (NCUC) and the Public Service Commission ofSouth Carolina (PSCSC).
Natural Gas Transmission provides transportation and storage of natural gas for customers throughout theEast Coast and Southern U.S., and in Canada. Natural Gas Transmission also provides distribution service toretail customers in Ontario and Western Canada and gas gathering and processing services to customers inWestern Canada. Natural Gas Transmission does business primarily through Duke Energy Gas TransmissionCorporation. Duke Energy acquired Westcoast Energy Inc. (Westcoast) on March 14, 2002 (see Note 2 to theConsolidated Financial Statements). Duke Energy Gas Transmission’s natural gas transmission and storageoperations in the U.S. are subject to the FERC’s and the Texas Railroad Commission’s rules and regulations,while natural gas gathering, processing, transmission, distribution and storage operations in Canada are subject tothe rules and regulations of the National Energy Board, the Ontario Energy Board and the British ColumbiaUtilities Commission.
Field Services gathers, compresses, treats, processes, transports, trades and markets, and stores natural gas;and produces, transports, trades and markets, and stores natural gas liquids (NGLs). It conducts operationsprimarily through Duke Energy Field Services, LLC (DEFS), which is approximately 30% owned byConocoPhillips and approximately 70% owned by Duke Energy. Field Services gathers natural gas fromproduction wellheads in Western Canada and 11 contiguous states in the U.S. Those systems serve major naturalgas-producing regions in the Western Canadian Sedimentary Basin, Rocky Mountain, Permian Basin, Mid-Continent and East Texas-Austin Chalk-North Louisiana areas, as well as onshore and offshore Gulf Coast areas.
Duke Energy North America (DENA) develops, operates and manages merchant power generation facilitiesand engages in commodity sales and services related to natural gas and electric power. DENA conducts businessthroughout the U.S. and Canada through Duke Energy North America, LLC and Duke Energy Trading andMarketing, LLC (DETM). DETM is approximately 40% owned by ExxonMobil Corporation and approximately60% owned by Duke Energy. Prior to April 1, 2002, the DENA business segment was combined with DukeEnergy Merchants Holdings, LLC (DEM) to form a segment called North American Wholesale Energy. In 2002,management combined DEM with the Other Energy Services segment. Previous periods have been reclassified toconform to the current presentation.
International Energy develops, operates and manages natural gas transportation and power generationfacilities, and engages in sales and marketing of natural gas and electric power outside the U.S. and Canada. Itconducts operations primarily through Duke Energy International, LLC and its activities target power generationin Latin America, power generation and natural gas transmission in Asia-Pacific and natural gas marketing inNorthwest Europe.
31
Other Energy Services is composed of diverse energy businesses, operating primarily through DEM, Duke/Fluor Daniel (D/FD) and Energy Delivery Services (EDS). DEM engages in commodity buying and selling, andrisk management and financial services in non-regulated energy commodity markets other than physical naturalgas and power (such as petroleum products). D/FD provides comprehensive engineering, procurement,construction, commissioning and operating plant services for fossil-fueled electric power generating facilitiesworldwide. D/FD is a 50/50 partnership between Duke Energy and Fluor Enterprises, Inc., a wholly ownedsubsidiary of Fluor Corporation. EDS is an engineering, construction, maintenance and technical services firmspecializing in electric transmission and distribution lines and substation projects. It was formed in the secondquarter of 2002 from the transmission and distribution services component of Duke Engineering & Services, Inc.(DE&S). This component was excluded from the sale of DE&S to Framatome ANP, Inc. on May 1, 2002. OtherEnergy Services also retained other portions of DE&S that were not part of the sale, as well as a portion ofDukeSolutions, Inc. (DukeSolutions) that was not sold on May 1, 2002 to Ameresco, Inc. DE&S andDukeSolutions were included in Other Energy Services through the date of their sales. (See Note 2 to theConsolidated Financial Statements for additional information on the sales of DE&S and DukeSolutions.)
Duke Ventures is composed of other diverse businesses, operating primarily through Crescent Resources,LLC (Crescent), DukeNet Communications, LLC (DukeNet) and Duke Capital Partners, LLC (DCP). Crescentdevelops high-quality commercial, residential and multi-family real estate projects, and manages land holdingsprimarily in the Southeastern and Southwestern U.S. DukeNet develops and manages fiber optic communicationssystems for wireless, local and long distance communications companies; and selected educational,governmental, financial and health care entities. DCP, a wholly owned merchant finance company, provides debtand equity capital and financial advisory services primarily to the energy industry. In March 2003, Duke Energyannounced that it will exit the merchant finance business at DCP in an orderly manner.
Business Strategy. Duke Energy’s business strategy is to develop integrated energy businesses in targetedregions where Duke Energy’s capabilities in developing energy assets; operating power plants, NGL plants andnatural gas pipelines; optimizing commercial operations; and managing risk can provide comprehensive energysolutions for customers and create value for shareholders.
The energy industry and Duke Energy are experiencing a number of challenges, including the substantialimbalance between supply and demand for electricity, the pace of economic recovery, and regulatory and legaluncertainties. In response to these current challenges, Duke Energy is focusing on reducing risks andrestructuring its business to be well positioned as the energy marketplace regains its health and vigor. DukeEnergy’s current goals include: positive net cash generation, investing in its strongest business sectors, sizing itsbusinesses to market realities, addressing merchant energy issues, strengthening relationships with customers,and reducing regulatory and legal uncertainty. Duke Energy’s business model provides diversification betweenstable, less cyclical businesses like Franchised Electric, Natural Gas Transmission and Duke Ventures and thetraditionally higher-growth and more cyclical energy merchant businesses like DENA, International Energy andField Services.
Franchised Electric continues to increase its customer base, maintain low costs and deliver high-qualitycustomer service in the Piedmont Carolinas. Expansion will primarily result from continued growth in theresidential and general service sectors, partially offset by a continuing decline in the textile industry. WhileFranchised Electric’s revenues are expected to grow, earnings are expected to remain consistent with 2002, asthis expected revenue growth and reduced operating expenses offset the increased amortization expenseassociated with the North Carolina Clean Air legislation. (See Note 16 to the Consolidated Financial Statementsfor additional information.)
Natural Gas Transmission plans to continue earnings growth by developing expanded services andincremental projects that meet increasing customer needs. Pipeline growth will be driven by customer expansionsin the current market area. Growth will also come from additions to the distribution customer base at Union GasLimited (Union Gas), a wholly owned subsidiary of Duke Energy and Westcoast, and through expansion of
32
natural gas storage. Earnings for 2003 will benefit from inclusion of a full year of Westcoast earnings and thecontinued emphasis on operational efficiency.
Field Services has developed significant size and scope in natural gas gathering and processing and NGLmarketing and plans to focus on organic growth.
DENA has invested in energy assets in U.S. and Canadian markets, and provides energy supply, structuredorigination, risk management and commercial optimization services to large energy customers, energyaggregators and other wholesale companies. Generation oversupply, low spark spreads and volatility, as well asthe lack of an economic recovery will delay good returns for the merchant energy business in the near term. Inresponse to market conditions, DENA will continue to seek opportunities to reduce the company’s exposure tomerchant energy, and may divest certain assets, in whole or in part, when value can be realized. DENA continuesto view the energy sales and marketing business as a vital component of a healthy wholesale energy marketplace,and its energy sales and marketing activity will be focused primarily on its asset positions.
International Energy’s current strategy is focused on maximizing the returns and cash flow from its currentportfolio of energy businesses by creating organic growth through its sales and marketing efforts in all regions,optimizing the output and efficiency of its various facilities, controlling and reducing costs and divesting selectedassets.
Other Energy Services will continue to provide customers with a variety of engineering, operating,procurement and construction services in areas related to energy assets.
Duke Ventures plans moderate growth, primarily through its real estate business by developing regionalopportunities and by applying extensive experience to new project development.
Duke Energy’s business strategy and growth expectations may vary significantly depending on manyfactors, including, but not limited to, the pace and direction of industry restructuring, regulatory constraints,acquisition and divestiture opportunities, market volatility and economic trends. However, Duke Energy’s growthexpectations do not rely on progress in deregulation in North Carolina and South Carolina.
RESULTS OF OPERATIONS
In 2002, earnings available for common stockholders were $1,021 million, or $1.22 per basic share,compared to $1,884 million, or $2.45 per basic share, in 2001. The decrease was due primarily to a 33% decreasein earnings before interest and taxes (EBIT), as described below, and a $325 million increase in interest expensedue primarily to the debt assumed in the acquisition of Westcoast. These changes were partially offset by theprior year’s one-time net-of-tax charge of $96 million, or $0.13 per basic share, related to the cumulative effectof a change in accounting principle for the January 1, 2001 adoption of Statement of Financial AccountingStandards (SFAS) No. 133, “Accounting for Derivative Instruments and Hedging Activities” (see Note 1 to theConsolidated Financial Statements). Also offsetting the decrease in earnings available for common stockholderswas a $220 million decrease in minority interest expense in 2002, as discussed in the following sections.
Earnings available for common stockholders increased $127 million in 2001 to $1,884 million, or $2.45 perbasic share, from 2000 earnings of $1,757 million, or $2.39 per basic share. The increase was due primarily to a6% increase in EBIT, as described below.
Earnings-per-share information provided above has been restated to reflect the two-for-one common stocksplit effective January 26, 2001. (See Note 18 to the Consolidated Financial Statements.)
33

Operating income for 2002 was $2,500 million, compared to $3,941 million in 2001 and $3,303 million in2000. EBIT was $2,869 million in 2002, $4,256 million in 2001 and $4,014 million in 2000. Operating incomeand EBIT are affected by the same fluctuations for Duke Energy and each of its business segments. (See Note 3to the Consolidated Financial Statements for more information on business segments.) The following table showsthe components of EBIT and reconciles EBIT to operating and net income.
Reconciliation of Operating Income and EBIT to Net Income (in millions)
Years Ended December 31,
2002 2001 2000
Operating income . . . . . . . . . . . . . . . . . . . . . . . . . . . . . . . . . . . . . . . . . . . . . . . . . . . . . . $2,500 $3,941 $3,303Other income and expenses . . . . . . . . . . . . . . . . . . . . . . . . . . . . . . . . . . . . . . . . . . . . . . 369 315 711
EBIT . . . . . . . . . . . . . . . . . . . . . . . . . . . . . . . . . . . . . . . . . . . . . . . . . . . . . . . . . . . . . . . . 2,869 4,256 4,014Interest expense . . . . . . . . . . . . . . . . . . . . . . . . . . . . . . . . . . . . . . . . . . . . . . . . . . . . . . . 1,110 785 911Minority interest expense . . . . . . . . . . . . . . . . . . . . . . . . . . . . . . . . . . . . . . . . . . . . . . . . 107 327 307
Earnings before income taxes . . . . . . . . . . . . . . . . . . . . . . . . . . . . . . . . . . . . . . . . . . . . 1,652 3,144 2,796Income taxes . . . . . . . . . . . . . . . . . . . . . . . . . . . . . . . . . . . . . . . . . . . . . . . . . . . . . . . . . . 618 1,150 1,020
Income before cumulative effect of change in accounting principle . . . . . . . . . . . . . . . 1,034 1,994 1,776Cumulative effect of change in accounting principle, net of tax . . . . . . . . . . . . . . . . . . — (96) —
Net income . . . . . . . . . . . . . . . . . . . . . . . . . . . . . . . . . . . . . . . . . . . . . . . . . . . . . . . . . . . $1,034 $1,898 $1,776
Total operating revenues for the year ended December 31, 2002 decreased $2,534 million to $15,663million from $18,197 for the year ended December 31, 2001. The decrease was due primarily to decreasedtrading and marketing net margins as a result of the negative impacts of a prolonged economic weakness, lowcommodity prices, continued low volatility levels, reduced spark spreads and decreased market liquidity. Thedecrease was also a result of decreased revenues on the sale of natural gas, NGLs and other petroleum products.The decrease was partially offset by increased transportation, storage and distribution revenue from assetsacquired or consolidated as part of the Westcoast acquisition in March 2002.
Total operating expenses for the year ended December 31, 2002 decreased $1,282 million to $13,212million from $14,494 million for the year ended December 31, 2001. The decrease was due primarily to areduction in expenses related to the purchases of natural gas, NGLs and other petroleum products. The decreasewas partially offset by increased operating expenses from assets acquired or consolidated as part of the Westcoastacquisition in March 2002, and various asset impairment and severance charges related to current marketconditions and strategic actions taken by management.
EBIT for the year ended December 31, 2002 decreased $1,387 million to $2,869 million from $4,256million for the year ended December 31, 2001. This decrease was due primarily to decreased trading andmarketing results. The decrease in EBIT was also impacted by various charges at several business units, such asasset impairments and severance costs, related to current market conditions and strategic actions taken bymanagement. The decrease in EBIT was also attributable to a decline in the average price realized for electricitygenerated by Duke Energy’s merchant plants. These decreases were partially offset by increased transportation,storage and distribution revenues from assets acquired or consolidated as a part of the acquisition of Westcoast inMarch 2002.
EBIT for the year ended December 31, 2001 increased $242 million to $4,256 million from $4,014 millionfor the year ended December 31, 2000. This increase was due primarily to increased trading and marketingmargins due to significant volatility in the marketplace during 2001. This increase was also attributable toincreased gains on the sales of Duke Energy’s interests in several generating facilities at DENA. The increase
34

was impacted, to a lesser extent, by increased earnings resulting from reporting a full year of operations in 2001as compared to 2000 for several operating facilities. The increase in EBIT was partially offset by decreasedearnings from electric revenues due to milder weather in the latter part of 2001 and decreased sales to industrialcustomers as a result of the slowing economy in 2001.
For a more detailed discussion of EBIT, see segment discussions below.
EBIT is the primary performance measure used by management to evaluate segment performance. On asegment basis, it includes all profits (both operating and non-operating) before deducting interest and taxes, andis net of the minority interest expense related to those profits. Management believes EBIT is a good indicator ofeach segment’s operating performance. As an indicator of Duke Energy’s operating performance, EBIT shouldnot be considered an alternative to, or more meaningful than, net income or cash flow as determined inaccordance with generally accepted accounting principles (GAAP). Duke Energy’s EBIT may not be comparableto a similarly titled measure of another company.
Management views the sale of operating assets and equity earnings from operating assets as importantsources of revenue for Duke Energy and its subsidiaries. Therefore, for internal management purposes, theseitems are reflected in segment revenues. For external reporting purposes, these items are excluded from revenuesand appropriately reflected in separate captions on the Consolidated Statements of Income.
Prior to April 1, 2002, the DENA business segment was combined with DEM to form a segment calledNorth American Wholesale Energy. During 2002, management combined DEM with the Other Energy Servicessegment. Previous periods have been restated to conform to the current presentation. Business segment EBIT issummarized in the following table, and detailed discussions follow.
EBIT by Business Segment (in millions)
Years Ended December 31,
2002 2001 2000
Franchised Electric . . . . . . . . . . . . . . . . . . . . . . . . . . . . . . . . . . . . . . . . . . . . . . . . . . . . . $1,608 $1,631 $1,820Natural Gas Transmission . . . . . . . . . . . . . . . . . . . . . . . . . . . . . . . . . . . . . . . . . . . . . . . 1,174 608 562Field Services . . . . . . . . . . . . . . . . . . . . . . . . . . . . . . . . . . . . . . . . . . . . . . . . . . . . . . . . . 126 336 311Duke Energy North America . . . . . . . . . . . . . . . . . . . . . . . . . . . . . . . . . . . . . . . . . . . . . 165 1,487 382International Energy . . . . . . . . . . . . . . . . . . . . . . . . . . . . . . . . . . . . . . . . . . . . . . . . . . . . (102) 286 341Other Energy Services . . . . . . . . . . . . . . . . . . . . . . . . . . . . . . . . . . . . . . . . . . . . . . . . . . 63 (149) (7)Duke Ventures . . . . . . . . . . . . . . . . . . . . . . . . . . . . . . . . . . . . . . . . . . . . . . . . . . . . . . . . 204 183 568Other Operations . . . . . . . . . . . . . . . . . . . . . . . . . . . . . . . . . . . . . . . . . . . . . . . . . . . . . . (406) (357) (194)EBIT attributable to minority interests . . . . . . . . . . . . . . . . . . . . . . . . . . . . . . . . . . . . . 37 231 231
Consolidated EBIT . . . . . . . . . . . . . . . . . . . . . . . . . . . . . . . . . . . . . . . . . . . . . . . . . . . . . $2,869 $4,256 $4,014
35
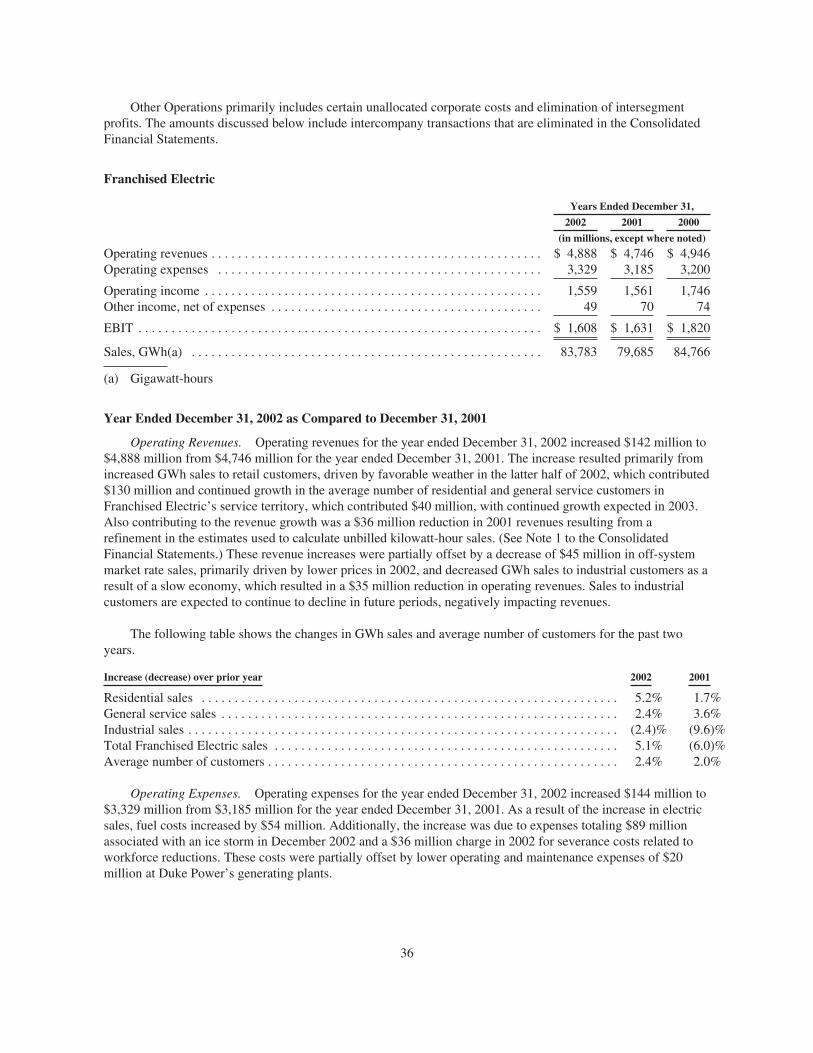
Other Operations primarily includes certain unallocated corporate costs and elimination of intersegmentprofits. The amounts discussed below include intercompany transactions that are eliminated in the ConsolidatedFinancial Statements.
Franchised Electric
Years Ended December 31,
2002 2001 2000
(in millions, except where noted)
Operating revenues . . . . . . . . . . . . . . . . . . . . . . . . . . . . . . . . . . . . . . . . . . . . . . . . . . $ 4,888 $ 4,746 $ 4,946Operating expenses . . . . . . . . . . . . . . . . . . . . . . . . . . . . . . . . . . . . . . . . . . . . . . . . . 3,329 3,185 3,200
Operating income . . . . . . . . . . . . . . . . . . . . . . . . . . . . . . . . . . . . . . . . . . . . . . . . . . . 1,559 1,561 1,746Other income, net of expenses . . . . . . . . . . . . . . . . . . . . . . . . . . . . . . . . . . . . . . . . . 49 70 74
EBIT . . . . . . . . . . . . . . . . . . . . . . . . . . . . . . . . . . . . . . . . . . . . . . . . . . . . . . . . . . . . . $ 1,608 $ 1,631 $ 1,820
Sales, GWh(a) . . . . . . . . . . . . . . . . . . . . . . . . . . . . . . . . . . . . . . . . . . . . . . . . . . . . . 83,783 79,685 84,766
(a) Gigawatt-hours
Year Ended December 31, 2002 as Compared to December 31, 2001
Operating Revenues. Operating revenues for the year ended December 31, 2002 increased $142 million to$4,888 million from $4,746 million for the year ended December 31, 2001. The increase resulted primarily fromincreased GWh sales to retail customers, driven by favorable weather in the latter half of 2002, which contributed$130 million and continued growth in the average number of residential and general service customers inFranchised Electric’s service territory, which contributed $40 million, with continued growth expected in 2003.Also contributing to the revenue growth was a $36 million reduction in 2001 revenues resulting from arefinement in the estimates used to calculate unbilled kilowatt-hour sales. (See Note 1 to the ConsolidatedFinancial Statements.) These revenue increases were partially offset by a decrease of $45 million in off-systemmarket rate sales, primarily driven by lower prices in 2002, and decreased GWh sales to industrial customers as aresult of a slow economy, which resulted in a $35 million reduction in operating revenues. Sales to industrialcustomers are expected to continue to decline in future periods, negatively impacting revenues.
The following table shows the changes in GWh sales and average number of customers for the past twoyears.
Increase (decrease) over prior year 2002 2001
Residential sales . . . . . . . . . . . . . . . . . . . . . . . . . . . . . . . . . . . . . . . . . . . . . . . . . . . . . . . . . . . . . . . 5.2% 1.7%General service sales . . . . . . . . . . . . . . . . . . . . . . . . . . . . . . . . . . . . . . . . . . . . . . . . . . . . . . . . . . . . 2.4% 3.6%Industrial sales . . . . . . . . . . . . . . . . . . . . . . . . . . . . . . . . . . . . . . . . . . . . . . . . . . . . . . . . . . . . . . . . . (2.4)% (9.6)%Total Franchised Electric sales . . . . . . . . . . . . . . . . . . . . . . . . . . . . . . . . . . . . . . . . . . . . . . . . . . . . 5.1% (6.0)%Average number of customers . . . . . . . . . . . . . . . . . . . . . . . . . . . . . . . . . . . . . . . . . . . . . . . . . . . . . 2.4% 2.0%
Operating Expenses. Operating expenses for the year ended December 31, 2002 increased $144 million to$3,329 million from $3,185 million for the year ended December 31, 2001. As a result of the increase in electricsales, fuel costs increased by $54 million. Additionally, the increase was due to expenses totaling $89 millionassociated with an ice storm in December 2002 and a $36 million charge in 2002 for severance costs related toworkforce reductions. These costs were partially offset by lower operating and maintenance expenses of $20million at Duke Power’s generating plants.
36

Other Income, Net of Eexpenses. Other income, net of expenses decreased $21 million in 2002 comparedto 2001 due primarily to a $19 million charge, net of an $8 million credit for property insurance, resulting fromthe settlement agreements reached with the NCUC and the PSCSC. (See Note 4 to the Consolidated FinancialStatements.)
EBIT. EBIT for the year ended December 31, 2002 decreased $23 million to $1,608 million from $1,631million for the year ended December 31, 2001 primarily as a result of increased operating expenses, includingcosts associated with an ice storm in December 2002, severance costs related to workforce reductions andcharges resulting from the settlement agreements reached by Duke Energy with the NCUC and the PSCSC. Theincrease in operating expenses was offset by increases in revenues as discussed above.
New Legislation. In June 2002, the state of North Carolina passed new clean air legislation that includesprovisions that freeze electric utility rates from June 20, 2002 (the effective date of the statute) to December 31,2007 (rate freeze period), subject to certain conditions, in order for North Carolina electric utilities, includingDuke Energy, to make significant reductions in emissions of sulfur dioxide and nitrogen oxides from the state’scoal-fired power plants over the next ten years. (See Note 16 to the Consolidated Financial Statements.)Management estimates Duke Energy’s cost of achieving the proposed emission reductions over the next ten yearsto be approximately $1.5 billion in total. Included in the legislation are provisions that allow electric utilities,including Duke Energy, to accelerate the recovery of these compliance costs by amortizing them over sevenyears.
Year Ended December 31, 2001 as Compared to December 31, 2000
Operating Revenues. Operating revenues for the year ended December 31, 2001 decreased $200 million to$4,746 million from $4,946 million for the year ended December 31, 2000. The decrease resulted primarily frommilder weather in Franchised Electric’s service territory during the latter part of 2001, which reduced operatingrevenues by $80 million, decreased sales to industrial customers as a result of the slowing economy whichreduced operating revenues by $60 million and reduced contractual sales to non-native load customers whichreduced operating revenue by $75 million. The 2001 results also included a $36 million reduction in unbilledrevenue receivables, resulting from a refinement in the estimates used to calculate unbilled kilowatt-hour sales.(See Note 1 to the Consolidated Financial Statements.) These decreases to operating revenues were slightly offsetby continued growth in the average number of residential and general service customers in Franchised Electric’sservice territory, which contributed $50 million.
Operating Expenses. Operating expenses for the year ended December 31, 2001 decreased slightly to$3,185 million from $3,200 million for the year ended December 31, 2000. This decrease was due primarily toreduced storm costs incurred in 2001 as compared to 2000 combined with an overall decrease in power deliveryoperation and maintenance expenses, partially offset by increased costs for nuclear and fossil-fueled plantoutages for repairs and maintenance.
EBIT. EBIT for the year ended December 31, 2001 decreased $189 million to $1,631 million from $1,820million for the year ended December 31, 2000, due primarily to decreased operating revenues. The primarydrivers of the reduced revenues were mild weather in Franchised Electric’s service territory during the latter partof 2001, decreased sales to industrial customers, which were a result of the slowing economy, and a reduction inunbilled revenue receivables, resulting from a refinement in the estimates used to calculate unbilled kilowatt-hour sales (see Note 1 to the Consolidated Financial Statements).
37

Natural Gas Transmission
Years Ended December 31,
2002 2001 2000
(in millions, except where noted)
Operating revenues . . . . . . . . . . . . . . . . . . . . . . . . . . . . . . . . . . . . . . . . . . . . . . . . . . $2,602 $1,105 $1,131Operating expenses . . . . . . . . . . . . . . . . . . . . . . . . . . . . . . . . . . . . . . . . . . . . . . . . . . 1,420 504 581
Operating income . . . . . . . . . . . . . . . . . . . . . . . . . . . . . . . . . . . . . . . . . . . . . . . . . . . 1,182 601 550Other income, net of expenses . . . . . . . . . . . . . . . . . . . . . . . . . . . . . . . . . . . . . . . . . 23 7 12Minority interest expense . . . . . . . . . . . . . . . . . . . . . . . . . . . . . . . . . . . . . . . . . . . . . 31 — —
EBIT . . . . . . . . . . . . . . . . . . . . . . . . . . . . . . . . . . . . . . . . . . . . . . . . . . . . . . . . . . . . . $1,174 $ 608 $ 562
Proportional throughput, TBtu(a) . . . . . . . . . . . . . . . . . . . . . . . . . . . . . . . . . . . . . . . 3,160 1,781 1,771
(a) Trillion British thermal units
Year Ended December 31, 2002 as Compared to December 31, 2001
Operating Revenues. Operating revenues for the year ended December 31, 2002 increased $1,497 millionto $2,602 million from $1,105 million for the year ended December 31, 2001. This increase resulted primarilyfrom increased transportation, storage, and distribution revenue of $1,419 million from assets acquired orconsolidated as a part of the Westcoast acquisition in March 2002. (See Note 2 to the Consolidated FinancialStatements.)
Revenues also increased $35 million due to business expansion projects. Operating revenues for 2002 alsoincluded a $28 million construction fee from an unconsolidated affiliate related to the successful completion ofGulfstream Natural Gas System, LLC (Gulfstream), a 581-mile pipeline system, 50% owned by Duke Energywhich went into service in May 2002. Also contributing to the increase in operating revenues for 2002 was a $32million gain on the sale of a portion of Natural Gas Transmission’s limited partnership units in Northern BorderPartners, LP.
Operating Expenses. Operating expenses for the year ended December 31, 2002 increased $916 million to$1,420 million from $504 million for the year ended December 31, 2001. This increase was due primarily toincremental operating expenses of $877 million related to the gas transmission, storage and distribution assetsacquired or consolidated in the Westcoast acquisition in March 2002. Operating expenses were impacted, to alesser extent, as a result of severance costs of $9 million associated with a workforce reduction in 2002 andincremental operating expenses associated with business expansion projects. Partially offsetting the increase inoperating expenses were the reversal of reserves of $25 million related to certain environmental issues that wereresolved in 2002 and reduced goodwill amortization of $14 million in 2002 as a result of the implementation ofSFAS No. 142, “Goodwill and Other Intangible Assets.”
Other Income, Net of Expenses. Other income, net of expenses increased $16 million in 2002 compared to2001 due in part to an increase in allowance for funds used during construction related to capital projects.
Minority Interest Expense. Minority interest expense for 2002 results from consolidating less than 100%owned subsidiaries acquired in the March 2002 acquisition of Westcoast.
EBIT. EBIT for the year ended December 31, 2002 increased $566 million to $1,174 million from $608million for the year ended December 31, 2001. As discussed above, this increase resulted primarily fromincremental EBIT related to assets acquired or consolidated as part of the acquisition of Westcoast in March2002. EBIT was also impacted by a construction fee from an unconsolidated affiliate related to the successfulcompletion of Gulfstream, and incremental earnings from Gulfstream which went into service in May 2002.
38
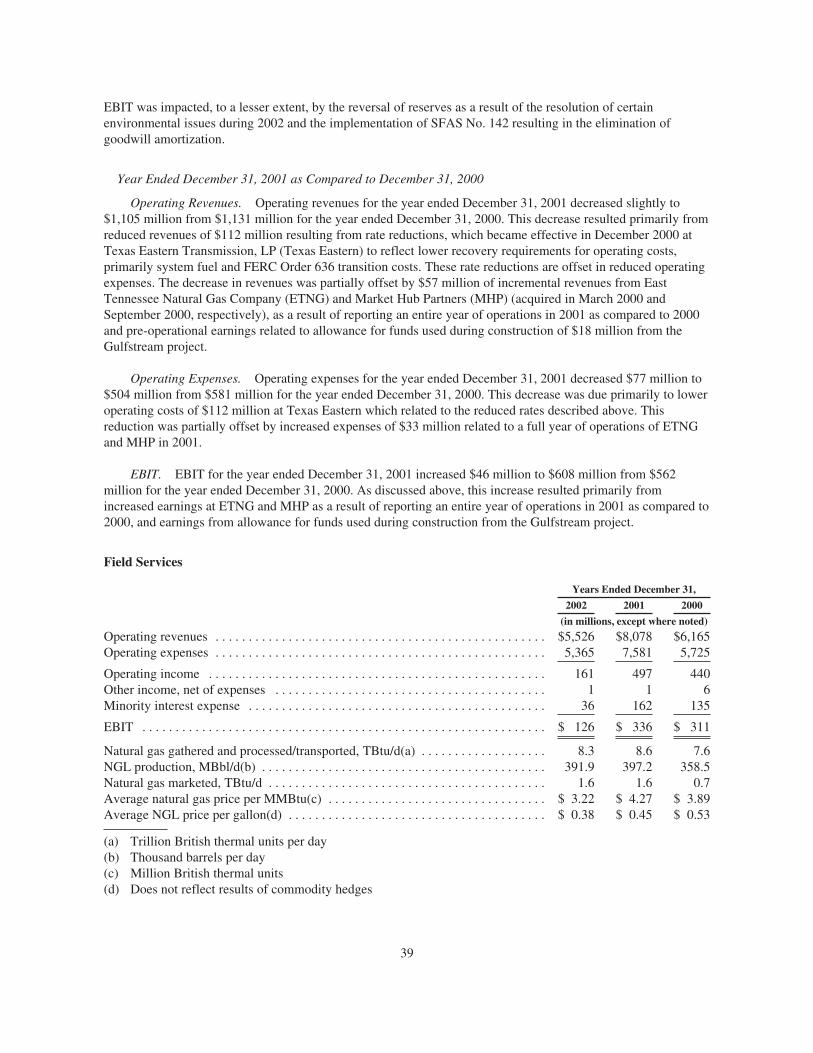
EBIT was impacted, to a lesser extent, by the reversal of reserves as a result of the resolution of certainenvironmental issues during 2002 and the implementation of SFAS No. 142 resulting in the elimination ofgoodwill amortization.
Year Ended December 31, 2001 as Compared to December 31, 2000
Operating Revenues. Operating revenues for the year ended December 31, 2001 decreased slightly to$1,105 million from $1,131 million for the year ended December 31, 2000. This decrease resulted primarily fromreduced revenues of $112 million resulting from rate reductions, which became effective in December 2000 atTexas Eastern Transmission, LP (Texas Eastern) to reflect lower recovery requirements for operating costs,primarily system fuel and FERC Order 636 transition costs. These rate reductions are offset in reduced operatingexpenses. The decrease in revenues was partially offset by $57 million of incremental revenues from EastTennessee Natural Gas Company (ETNG) and Market Hub Partners (MHP) (acquired in March 2000 andSeptember 2000, respectively), as a result of reporting an entire year of operations in 2001 as compared to 2000and pre-operational earnings related to allowance for funds used during construction of $18 million from theGulfstream project.
Operating Expenses. Operating expenses for the year ended December 31, 2001 decreased $77 million to$504 million from $581 million for the year ended December 31, 2000. This decrease was due primarily to loweroperating costs of $112 million at Texas Eastern which related to the reduced rates described above. Thisreduction was partially offset by increased expenses of $33 million related to a full year of operations of ETNGand MHP in 2001.
EBIT. EBIT for the year ended December 31, 2001 increased $46 million to $608 million from $562million for the year ended December 31, 2000. As discussed above, this increase resulted primarily fromincreased earnings at ETNG and MHP as a result of reporting an entire year of operations in 2001 as compared to2000, and earnings from allowance for funds used during construction from the Gulfstream project.
Field Services
Years Ended December 31,
2002 2001 2000
(in millions, except where noted)
Operating revenues . . . . . . . . . . . . . . . . . . . . . . . . . . . . . . . . . . . . . . . . . . . . . . . . . . $5,526 $8,078 $6,165Operating expenses . . . . . . . . . . . . . . . . . . . . . . . . . . . . . . . . . . . . . . . . . . . . . . . . . . 5,365 7,581 5,725
Operating income . . . . . . . . . . . . . . . . . . . . . . . . . . . . . . . . . . . . . . . . . . . . . . . . . . . 161 497 440Other income, net of expenses . . . . . . . . . . . . . . . . . . . . . . . . . . . . . . . . . . . . . . . . . 1 1 6Minority interest expense . . . . . . . . . . . . . . . . . . . . . . . . . . . . . . . . . . . . . . . . . . . . . 36 162 135
EBIT . . . . . . . . . . . . . . . . . . . . . . . . . . . . . . . . . . . . . . . . . . . . . . . . . . . . . . . . . . . . . $ 126 $ 336 $ 311
Natural gas gathered and processed/transported, TBtu/d(a) . . . . . . . . . . . . . . . . . . . 8.3 8.6 7.6NGL production, MBbl/d(b) . . . . . . . . . . . . . . . . . . . . . . . . . . . . . . . . . . . . . . . . . . . 391.9 397.2 358.5Natural gas marketed, TBtu/d . . . . . . . . . . . . . . . . . . . . . . . . . . . . . . . . . . . . . . . . . . 1.6 1.6 0.7Average natural gas price per MMBtu(c) . . . . . . . . . . . . . . . . . . . . . . . . . . . . . . . . . $ 3.22 $ 4.27 $ 3.89Average NGL price per gallon(d) . . . . . . . . . . . . . . . . . . . . . . . . . . . . . . . . . . . . . . . $ 0.38 $ 0.45 $ 0.53
(a) Trillion British thermal units per day(b) Thousand barrels per day(c) Million British thermal units(d) Does not reflect results of commodity hedges
39
Year Ended December 31, 2002 as Compared to December 31, 2001
Operating Revenues. Operating revenues for the year ended December 31, 2002 decreased $2,552 millionto $5,526 million from $8,078 million for the year ended December 31, 2001. The decrease was due primarily toa $2,509 million reduction in revenues on the sale of natural gas, natural gas liquids and other petroleumproducts, resulting primarily from a $1.05 per MMBtu decrease in natural gas price and a decrease in averageNGL prices of approximately $0.07 per gallon. Other factors contributing to lower operating revenues werereduced levels of natural gas gathered and processed/transported (throughput) of 0.3 TBtu per day, and adecreased trading and marketing net margin as a result of market conditions.
Operating Expenses. Operating expenses for the year ended December 31, 2002 decreased $2,216 millionto $5,365 million from $7,581 million for the year ended December 31, 2001. The decrease was due primarily toa $2,301 million reduction in expenses related to purchases of natural gas, natural liquids and other petroleumproducts resulting primarily from a decrease in average natural gas prices of $1.05 per MMBtu, a $0.07 pergallon decrease in average NGL prices and lower throughput levels. Partially offsetting these decreases wereincreases in operating and maintenance costs and general administrative costs of $113 million, resulting fromincreased maintenance on equipment, pipeline integrity and core business process improvements.
Additionally, Field Services recorded a $40 million charge ($28 million at Duke Energy’s 70% share) forasset impairments in the fourth quarter of 2002 as a result of periodic asset performance evaluations as requiredby the guidance of SFAS No.144, “Accounting for the Impairment or Disposal of Long-Term Assets.” (See Note9 to the Consolidated Financial Statements for additional information on asset impairment.) It was estimated inDecember 2002 that certain gas plants and gathering systems will continue to generate minimal or negative cashflows in future years. Based on the results of these analyses, Field Services determined that the carrying value ofthese assets was impaired and, accordingly, recorded a charge to reduce the carrying value to fair value.
Field Services also recorded, as part of its internal review of balance sheet accounts, approximately $53million of charges ($37 million at Duke Energy’s 70% share) in 2002, which may be related to corrections ofaccounting errors in prior periods. These adjustments were made in the following five categories: operatingexpense accruals; gas inventory valuations; gas imbalances; joint venture and investment account reconciliations;and other balance sheet accounts and are immaterial to Duke Energy’s reported results.
Minority Interest Expense. Minority interest at Field Services decreased $126 million in 2002 compared to2001 due primarily to decreased earnings from DEFS, Duke Energy’s joint venture with ConocoPhillips.
EBIT. EBIT for the year ended December 31, 2002 decreased $210 million to $126 million from $336million for the year ended December 31, 2001. This decrease was due primarily to the changes in commodityprices, increases in operating and general and administrative costs, and asset impairment charges.
Field Services revenues and expenses are significantly dependent on commodity prices such as NGL’s andnatural gas. Past and current trends in the price changes of these commodities may not be indicative of futuretrends. If negative market conditions persist over time and estimated cash flows over the lives of Field Services’individual assets do not exceed the carrying value of those individual assets, asset impairments may occur in thefuture under existing accounting rules. Furthermore, a change in management’s intent about the use of individualassets (held for use versus held for sale) could also impact an impairment analysis. At December 31, 2002, FieldServices had goodwill of $481 million and net property, plant and equipment of $4,642 million.
Duke Energy and ConocoPhillips are currently in discussions regarding possible changes to DEFS’ownership. Member interests in DEFS are currently held approximately 70% by Duke Energy and approximately30% by ConocoPhillips. The discussions are focused on a possible change in the ownership structure that wouldbe driven by the possible contribution by ConocoPhillips of certain midstream natural gas assets to DEFS. There
40
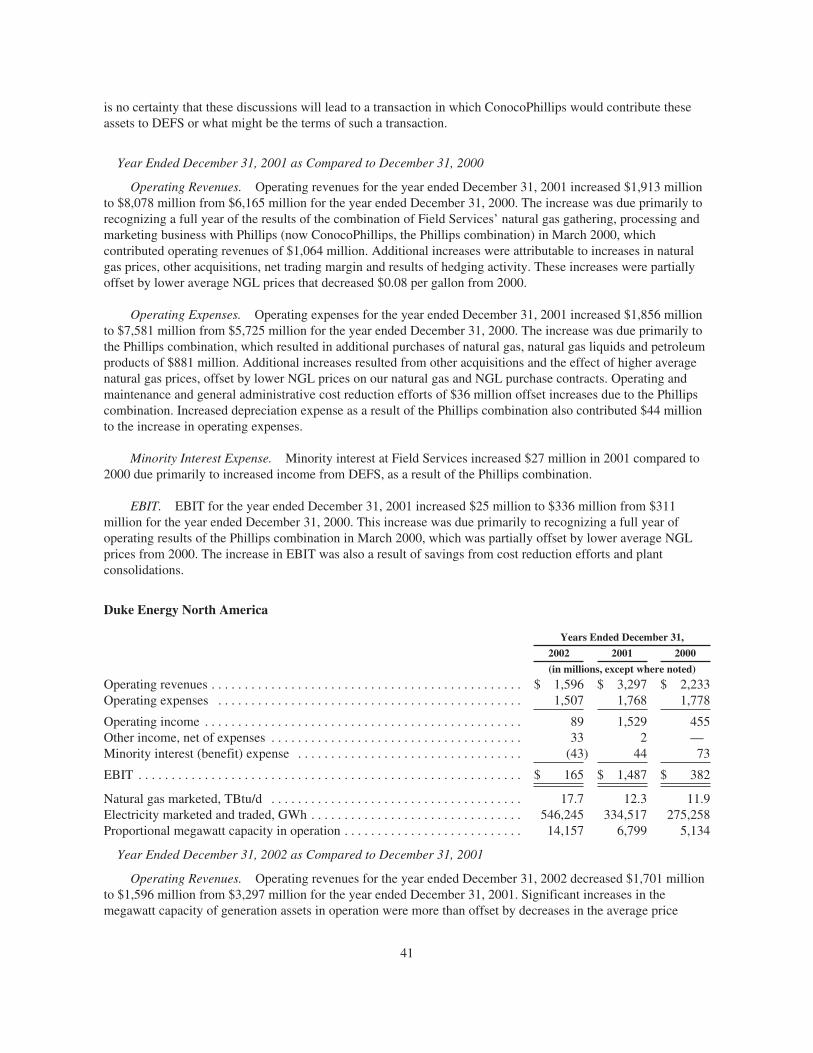
is no certainty that these discussions will lead to a transaction in which ConocoPhillips would contribute theseassets to DEFS or what might be the terms of such a transaction.
Year Ended December 31, 2001 as Compared to December 31, 2000
Operating Revenues. Operating revenues for the year ended December 31, 2001 increased $1,913 millionto $8,078 million from $6,165 million for the year ended December 31, 2000. The increase was due primarily torecognizing a full year of the results of the combination of Field Services’ natural gas gathering, processing andmarketing business with Phillips (now ConocoPhillips, the Phillips combination) in March 2000, whichcontributed operating revenues of $1,064 million. Additional increases were attributable to increases in naturalgas prices, other acquisitions, net trading margin and results of hedging activity. These increases were partiallyoffset by lower average NGL prices that decreased $0.08 per gallon from 2000.
Operating Expenses. Operating expenses for the year ended December 31, 2001 increased $1,856 millionto $7,581 million from $5,725 million for the year ended December 31, 2000. The increase was due primarily tothe Phillips combination, which resulted in additional purchases of natural gas, natural gas liquids and petroleumproducts of $881 million. Additional increases resulted from other acquisitions and the effect of higher averagenatural gas prices, offset by lower NGL prices on our natural gas and NGL purchase contracts. Operating andmaintenance and general administrative cost reduction efforts of $36 million offset increases due to the Phillipscombination. Increased depreciation expense as a result of the Phillips combination also contributed $44 millionto the increase in operating expenses.
Minority Interest Expense. Minority interest at Field Services increased $27 million in 2001 compared to2000 due primarily to increased income from DEFS, as a result of the Phillips combination.
EBIT. EBIT for the year ended December 31, 2001 increased $25 million to $336 million from $311million for the year ended December 31, 2000. This increase was due primarily to recognizing a full year ofoperating results of the Phillips combination in March 2000, which was partially offset by lower average NGLprices from 2000. The increase in EBIT was also a result of savings from cost reduction efforts and plantconsolidations.
Duke Energy North America
Years Ended December 31,
2002 2001 2000
(in millions, except where noted)
Operating revenues . . . . . . . . . . . . . . . . . . . . . . . . . . . . . . . . . . . . . . . . . . . . . . . $ 1,596 $ 3,297 $ 2,233Operating expenses . . . . . . . . . . . . . . . . . . . . . . . . . . . . . . . . . . . . . . . . . . . . . . 1,507 1,768 1,778
Operating income . . . . . . . . . . . . . . . . . . . . . . . . . . . . . . . . . . . . . . . . . . . . . . . . 89 1,529 455Other income, net of expenses . . . . . . . . . . . . . . . . . . . . . . . . . . . . . . . . . . . . . . 33 2 —Minority interest (benefit) expense . . . . . . . . . . . . . . . . . . . . . . . . . . . . . . . . . . (43) 44 73
EBIT . . . . . . . . . . . . . . . . . . . . . . . . . . . . . . . . . . . . . . . . . . . . . . . . . . . . . . . . . . $ 165 $ 1,487 $ 382
Natural gas marketed, TBtu/d . . . . . . . . . . . . . . . . . . . . . . . . . . . . . . . . . . . . . . 17.7 12.3 11.9Electricity marketed and traded, GWh . . . . . . . . . . . . . . . . . . . . . . . . . . . . . . . . 546,245 334,517 275,258Proportional megawatt capacity in operation . . . . . . . . . . . . . . . . . . . . . . . . . . . 14,157 6,799 5,134
Year Ended December 31, 2002 as Compared to December 31, 2001
Operating Revenues. Operating revenues for the year ended December 31, 2002 decreased $1,701 millionto $1,596 million from $3,297 million for the year ended December 31, 2001. Significant increases in themegawatt capacity of generation assets in operation were more than offset by decreases in the average price
41
realized for electricity generated, resulting in a reduction in operating revenue of $415 million. In addition,revenues decreased $1,017 million as a result of a decrease in the trading and marketing net margin. DENA’sresults reflect the negative impacts of a prolonged economic weakness, low commodity prices, continued lowvolatility levels (measures of the fluctuation in the prices of energy commodities or products), reduced sparkspreads (the difference between the value of electricity and the value of the gas required to generate theelectricity), and decreased market liquidity. These negative trends are expected to continue in 2003. Alsocontributing to the decrease in revenues were net gains of $229 million in 2001 from the sale of interests ingenerating facilities.
Operating Expenses. Operating expenses for the year ended December 31, 2002 decreased $261 million to$1,507 million from $1,768 million for the year ended December 31, 2001. The decrease was due primarily tolower incentive compensation expense of $300 million primarily related to trading activities, decreased bad debtexpense of $123 million, lower fuel costs of $88 million, and demolition reserves recorded in 2001 of $65million. Partially offsetting the decreases were higher depreciation expense of $89 million related to thecommencement of operations of nine generation facilities by mid-year 2002. Also offsetting the decreases wereasset impairment, severance, and other charges of $248 million related to current market conditions and strategicactions taken by management. These charges included provisions for the termination of certain turbines on orderand the write-down of other uninstalled turbines of $121 million, the write-off of site development costs(primarily in California) of $31 million, partial impairment of a merchant plant of $31 million, demobilizationcosts related to the deferral of three merchant power projects of $22 million, a charge of $24 million for thewrite-off of an information technology system, and severance costs of $19 million associated with work forcereductions. (See Note 9 to the Consolidated Financial Statements for additional information on assetimpairment.)
Other Income, Net of Expenses. Other income, net of expenses, increased $31 million in 2002 compared to2001. The increase was due primarily to settlements received on disputed items at two generating facilities andinterest income related to a note receivable associated with the sale of an interest in a generating facility.
Minority Interest (Benefit) Expense. Increased losses at DETM, DENA’s joint venture with Exxon MobilCorporation, resulted in an $87 million decrease in minority interest expense in 2002 as compared to 2001.
EBIT. EBIT for the year ended December 31, 2002 decreased $1,322 million to $165 million from $1,487million for the year ended December 31, 2001. The decrease was due primarily to those factors discussed above:decreased trading margins, a decrease in the average price realized on electric generation, a decrease in thenumber of generation facilities sold in 2002, and certain charges taken as a result of current market conditionsand strategic actions taken by management.
As a result of Duke Energy’s findings in the course of its investigation related to the Securities andExchange Commission’s (SEC) inquiry on “round trip” trades (see Note 16 to the Consolidated FinancialStatements—Commitments and Contingencies—Litigation, Trading Matters for additional information), DENAidentified accounting issues that justified adjustments which reduced its EBIT by $11 million during 2002. Anadditional $2 million charge was recorded in other Duke Energy business segments related to these findings.
If negative market conditions persist over time and estimated cash flows over the lives of DENA’sindividual assets do not exceed the carrying value of those individual assets, asset impairments may occur in thefuture under existing accounting rules. Furthermore, a change in management’s intent about the use of individualassets (held for use versus held for sale) could also impact an impairment analysis. At December 31, 2002,DENA had $254 million of goodwill ($154 million recorded at Other Operations) and $7,118 million in netproperty, plant and equipment.
Other Matters Impacting Future DENA Results. On October 31, 2002, the FERC imposed a soft price capfor the sale of energy throughout the Western Electricity Coordinating Council of $250 per megawatt hour.
42
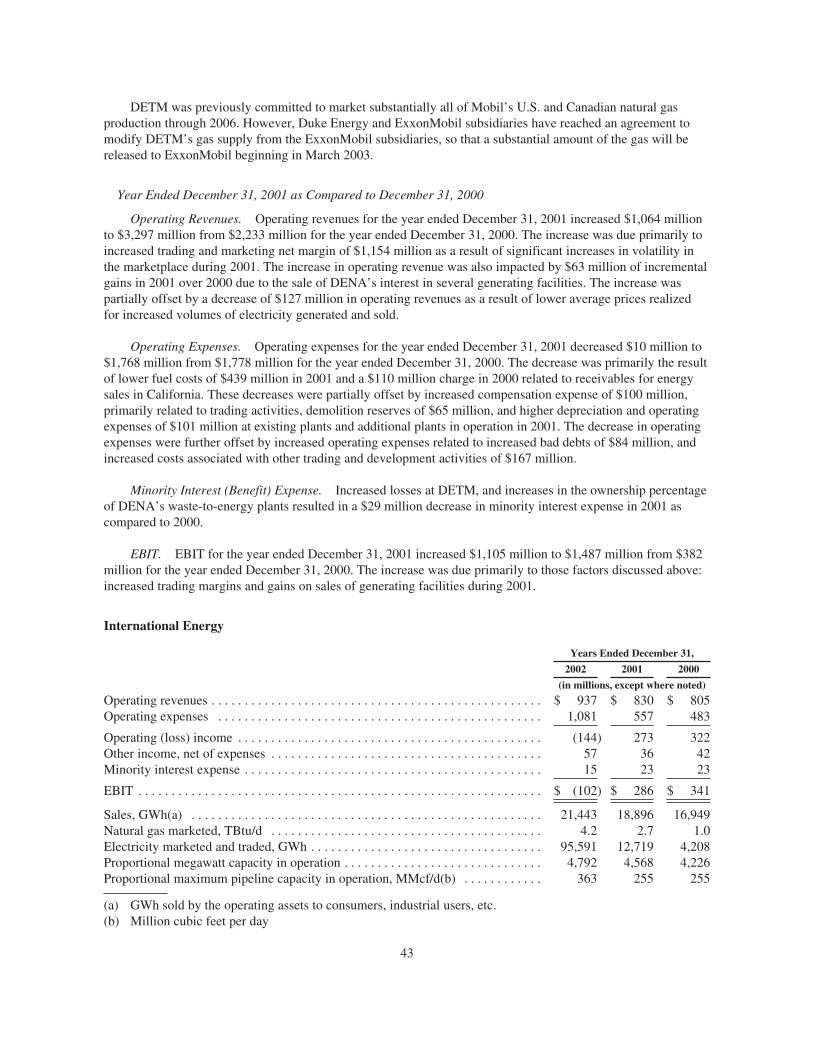
DETM was previously committed to market substantially all of Mobil’s U.S. and Canadian natural gasproduction through 2006. However, Duke Energy and ExxonMobil subsidiaries have reached an agreement tomodify DETM’s gas supply from the ExxonMobil subsidiaries, so that a substantial amount of the gas will bereleased to ExxonMobil beginning in March 2003.
Year Ended December 31, 2001 as Compared to December 31, 2000
Operating Revenues. Operating revenues for the year ended December 31, 2001 increased $1,064 millionto $3,297 million from $2,233 million for the year ended December 31, 2000. The increase was due primarily toincreased trading and marketing net margin of $1,154 million as a result of significant increases in volatility inthe marketplace during 2001. The increase in operating revenue was also impacted by $63 million of incrementalgains in 2001 over 2000 due to the sale of DENA’s interest in several generating facilities. The increase waspartially offset by a decrease of $127 million in operating revenues as a result of lower average prices realizedfor increased volumes of electricity generated and sold.
Operating Expenses. Operating expenses for the year ended December 31, 2001 decreased $10 million to$1,768 million from $1,778 million for the year ended December 31, 2000. The decrease was primarily the resultof lower fuel costs of $439 million in 2001 and a $110 million charge in 2000 related to receivables for energysales in California. These decreases were partially offset by increased compensation expense of $100 million,primarily related to trading activities, demolition reserves of $65 million, and higher depreciation and operatingexpenses of $101 million at existing plants and additional plants in operation in 2001. The decrease in operatingexpenses were further offset by increased operating expenses related to increased bad debts of $84 million, andincreased costs associated with other trading and development activities of $167 million.
Minority Interest (Benefit) Expense. Increased losses at DETM, and increases in the ownership percentageof DENA’s waste-to-energy plants resulted in a $29 million decrease in minority interest expense in 2001 ascompared to 2000.
EBIT. EBIT for the year ended December 31, 2001 increased $1,105 million to $1,487 million from $382million for the year ended December 31, 2000. The increase was due primarily to those factors discussed above:increased trading margins and gains on sales of generating facilities during 2001.
International Energy
Years Ended December 31,
2002 2001 2000
(in millions, except where noted)
Operating revenues . . . . . . . . . . . . . . . . . . . . . . . . . . . . . . . . . . . . . . . . . . . . . . . . . . $ 937 $ 830 $ 805Operating expenses . . . . . . . . . . . . . . . . . . . . . . . . . . . . . . . . . . . . . . . . . . . . . . . . . 1,081 557 483
Operating (loss) income . . . . . . . . . . . . . . . . . . . . . . . . . . . . . . . . . . . . . . . . . . . . . . (144) 273 322Other income, net of expenses . . . . . . . . . . . . . . . . . . . . . . . . . . . . . . . . . . . . . . . . . 57 36 42Minority interest expense . . . . . . . . . . . . . . . . . . . . . . . . . . . . . . . . . . . . . . . . . . . . . 15 23 23
EBIT . . . . . . . . . . . . . . . . . . . . . . . . . . . . . . . . . . . . . . . . . . . . . . . . . . . . . . . . . . . . . $ (102) $ 286 $ 341
Sales, GWh(a) . . . . . . . . . . . . . . . . . . . . . . . . . . . . . . . . . . . . . . . . . . . . . . . . . . . . . 21,443 18,896 16,949Natural gas marketed, TBtu/d . . . . . . . . . . . . . . . . . . . . . . . . . . . . . . . . . . . . . . . . . 4.2 2.7 1.0Electricity marketed and traded, GWh . . . . . . . . . . . . . . . . . . . . . . . . . . . . . . . . . . . 95,591 12,719 4,208Proportional megawatt capacity in operation . . . . . . . . . . . . . . . . . . . . . . . . . . . . . . 4,792 4,568 4,226Proportional maximum pipeline capacity in operation, MMcf/d(b) . . . . . . . . . . . . 363 255 255
(a) GWh sold by the operating assets to consumers, industrial users, etc.(b) Million cubic feet per day
43
Year Ended December 31, 2002 as Compared to December 31, 2001
Operating Revenues. Operating revenues for the year ended December 31, 2002 increased $107 million to$937 million from $830 million for the year ended December 31, 2001. The increase was primarily a result of thecombination of increased prices, and GWh’s sold at International Energy’s Latin American operating facilities,which resulted in increased revenues of $50 million. Additionally, revenues increased $65 million due to theoperating assets acquired and fully consolidated in Duke Energy’s financial statements as a result of theWestcoast acquisition in March 2002. Assets acquired in Guatemala during 2001 contributed additional revenuesof $36 million in 2002 as a result of reporting a full year of operations in 2002 compared to only two months in2001. These increases were partially offset by decreased revenues of $34 million from International Energy’sEuropean operations, which were negatively affected by lower trading margins and liquidity, and decreasedrevenues of $15 million as a result of lower sales volumes and commodity prices at International Energy’s liquidnatural gas business.
Operating Expenses. Operating expenses for the year ended December 31, 2002 increased $524 million to$1,081 million from $557 million for the year ended December 31, 2001. This increase was due partly tooperating expenses generated from certain assets as a result of the Westcoast acquisition in March 2002, whichcontributed $22 million of operating expenses. These assets were fully consolidated in the accompanyingfinancial statements subsequent to the acquisition date of March 14, 2002. In 2001, these assets were accountedfor under the equity method of accounting. The increase was also a result of $39 million of operating expensesrelated to increased fuel and transmission charges at the Latin American operating facilities and the effect ofreporting a full year of operations in 2002 for assets acquired in Guatemala during 2001, compared to only twomonths in 2001.
The increase in operating expenses was further impacted by a $194 million charge for impairment ofgoodwill for International Energy’s European trading and marketing business. The goodwill was originallyrecorded in connection with International Energy’s acquisition of Mobile Europe Gas Inc in 2000. Theimpairment was a result of Duke Energy’s revised market outlook for the European power and natural gas tradingmarkets. International Energy took additional impairment charges in 2002 of $109 million related to the write-offof project and site development costs in Brazil and International Energy’s Asia Pacific businesses, along with thewrite-down of uninstalled turbines and office relocation charges in Australia.
The increase in operating expenses was further impacted by $75 million as a result of reserve reversalsrelated to the Brazilian operations in 2001: the establishment of settlement provisions in 2002, primarilyrelated to rationing of water and power generation in Brazil: and various reserves related to InternationalEnergy’s liquefied natural gas contracts and Peru based businesses.
Other Income, Net of Expenses. Other income, net of expenses increased $21 million in 2002 compared to2001. The increase was primarily the result of an increase in interest income in International Energy’s LatinAmerican operations as a result of higher cash and cash equivalents balances.
EBIT. EBIT for the year ended December 31, 2002 decreased $388 million to a loss of $102 million fromincome of $286 million for the year ended December 31, 2001. This decrease was due primarily to variousimpairment charges related to International Energy’s revised market outlook for its European power and naturalgas trading markets, poor performance of its trading and marketing business in the weakened European powerand gas markets, and charges recorded as a result of the write-off of site development costs and the write-downof uninstalled turbines, primarily related to planned energy plants in Brazil. The decrease in EBIT was partiallyoffset by the positive effect of the Westcoast and Guatemala acquisitions.
If negative market conditions persist over time and estimated cash flows over the lives of InternationalEnergy’s individual assets do not exceed the carrying value of those individual assets, asset impairments may
44
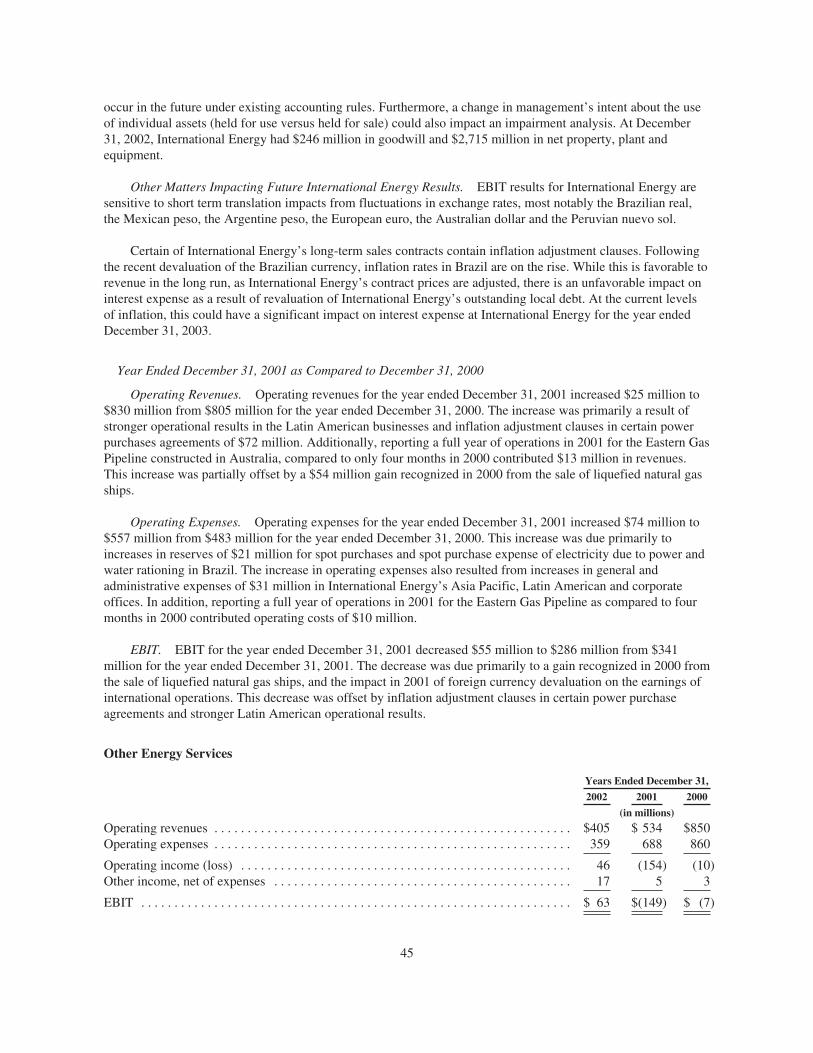
occur in the future under existing accounting rules. Furthermore, a change in management’s intent about the useof individual assets (held for use versus held for sale) could also impact an impairment analysis. At December31, 2002, International Energy had $246 million in goodwill and $2,715 million in net property, plant andequipment.
Other Matters Impacting Future International Energy Results. EBIT results for International Energy aresensitive to short term translation impacts from fluctuations in exchange rates, most notably the Brazilian real,the Mexican peso, the Argentine peso, the European euro, the Australian dollar and the Peruvian nuevo sol.
Certain of International Energy’s long-term sales contracts contain inflation adjustment clauses. Followingthe recent devaluation of the Brazilian currency, inflation rates in Brazil are on the rise. While this is favorable torevenue in the long run, as International Energy’s contract prices are adjusted, there is an unfavorable impact oninterest expense as a result of revaluation of International Energy’s outstanding local debt. At the current levelsof inflation, this could have a significant impact on interest expense at International Energy for the year endedDecember 31, 2003.
Year Ended December 31, 2001 as Compared to December 31, 2000
Operating Revenues. Operating revenues for the year ended December 31, 2001 increased $25 million to$830 million from $805 million for the year ended December 31, 2000. The increase was primarily a result ofstronger operational results in the Latin American businesses and inflation adjustment clauses in certain powerpurchases agreements of $72 million. Additionally, reporting a full year of operations in 2001 for the Eastern GasPipeline constructed in Australia, compared to only four months in 2000 contributed $13 million in revenues.This increase was partially offset by a $54 million gain recognized in 2000 from the sale of liquefied natural gasships.
Operating Expenses. Operating expenses for the year ended December 31, 2001 increased $74 million to$557 million from $483 million for the year ended December 31, 2000. This increase was due primarily toincreases in reserves of $21 million for spot purchases and spot purchase expense of electricity due to power andwater rationing in Brazil. The increase in operating expenses also resulted from increases in general andadministrative expenses of $31 million in International Energy’s Asia Pacific, Latin American and corporateoffices. In addition, reporting a full year of operations in 2001 for the Eastern Gas Pipeline as compared to fourmonths in 2000 contributed operating costs of $10 million.
EBIT. EBIT for the year ended December 31, 2001 decreased $55 million to $286 million from $341million for the year ended December 31, 2001. The decrease was due primarily to a gain recognized in 2000 fromthe sale of liquefied natural gas ships, and the impact in 2001 of foreign currency devaluation on the earnings ofinternational operations. This decrease was offset by inflation adjustment clauses in certain power purchaseagreements and stronger Latin American operational results.
Other Energy Services
Years Ended December 31,
2002 2001 2000
(in millions)
Operating revenues . . . . . . . . . . . . . . . . . . . . . . . . . . . . . . . . . . . . . . . . . . . . . . . . . . . . . . $405 $ 534 $850Operating expenses . . . . . . . . . . . . . . . . . . . . . . . . . . . . . . . . . . . . . . . . . . . . . . . . . . . . . . 359 688 860
Operating income (loss) . . . . . . . . . . . . . . . . . . . . . . . . . . . . . . . . . . . . . . . . . . . . . . . . . . 46 (154) (10)Other income, net of expenses . . . . . . . . . . . . . . . . . . . . . . . . . . . . . . . . . . . . . . . . . . . . . 17 5 3
EBIT . . . . . . . . . . . . . . . . . . . . . . . . . . . . . . . . . . . . . . . . . . . . . . . . . . . . . . . . . . . . . . . . . $ 63 $(149) $ (7)
45
Year Ended December 31, 2002 as Compared to December 31, 2001
Operating Revenues. Operating revenues for the year ended December 31, 2002 decreased $129 million to$405 million from $534 million for the year ended December 31, 2001. The decrease was due primarily to thesale of DE&S and DukeSolutions in 2002, resulting in a partial year of revenues compared to a full year in 2001.The sale of these entities resulted in a decrease of $339 million of operating revenues. The sale of DE&S toFramatome ANP, Inc. was completed on May 1, 2002, and the sale of DukeSolutions to Ameresco, Inc wascompleted on May 1, 2002. (See Note 2 to the Consolidated Financial Statements.)
Partially offsetting the decreases in revenues as a result of the sale transactions was increased equityearnings from D/FD of $75 million, as a result of D/FD completing a number of energy plants. Most of the plantswere constructed for DENA or Duke Power and therefore the related intercompany profit has been eliminatedwithin the Other Operations segment. (See Note 8 to the Consolidated Financial Statements for more informationon equity earnings and D/FD’s related party transactions.) EDS was formed in the second quarter of 2002, andcontributed $92 million in revenues. Revenues also increased by $39 million at DEM as a result of increasedtrading and marketing net margins in 2002, and the write-offs for Enron Corporation (Enron) and Agrifos in2001.
Operating Expenses. Operating expenses for the year ended December 31, 2002 decreased $329 million to$359 million from $688 million for the year ended December 31, 2001. The decrease was due primarily to thesale of DE&S and DukeSolutions in 2002, resulting in a partial year of expenses. The sale of these entitiesresulted in a decrease of $364 million in operating expenses. The decrease in operating expenses was partiallyoffset by a $77 million increase in operating expenses as a result of the formation of EDS in the second quarter of2002, and $17 million of severance charges in 2002 at D/FD due to the downturn in the domestic power industry.
EBIT. EBIT for the year ended December 31, 2002 increased $212 million to $63 million from a loss of$149 million for the year ended December 31, 2001. The increase was due primarily to the sale of portions of theDE&S and DukeSolutions entities in 2002, increased equity in earnings at D/FD, earnings generated from EDSand the DEM write-off for Enron and Agrifos in 2001.
Year Ended December 31, 2001 as Compared to December 31, 2000
Operating Revenues. Operating revenues for the year ended December 31, 2001 decreased $316 million to$534 million from $850 million for the year ended December 31, 2000. The decrease was due primarily to decreasedrevenues at Duke Solutions of $307 million due to decreased volumes and the cessation of retail commodity trading.The decrease in revenues was also a result of decreased trading and marketing net revenues at DEM of $186 milliondue to the write-offs for Enron and Agrifos in 2001, and DEM’s ownership interest in Canadian 88 Energy Corp. Thedecreases in revenues were partially offset by an increase in revenues of $110 million at DE&S due primarily toincreased business activity and a $62 million loss in 2000 related to a D/FD project.
Operating Expenses. Operating expenses for the year ended December 31, 2001 decreased $172 million to$688 million from $860 million for the year ended December 31, 2000. The decrease was due primarily todecreased expenses at DukeSolutions of $273 million due to the cessation of retail commodity trading. Thedecrease in expenses was partially offset by an increase in operating expenses of $57 million as a result ofincreased business activity at DE&S, and charges at DE&S and DukeSolutions of $36 million for goodwillimpairment.
EBIT. EBIT for the year ended December 31, 2001 decreased $142 million compared to the year endedDecember 31, 2000. The decrease was due primarily to the cessation of retail commodity trading at DukeSolutions, decreased trading and marketing net margins at DEM, and charges taken at DE&S and DukeSolutionsfor goodwill impairment. The decrease was partially offset by increased earnings at DE&S as a result of newbusiness activity.
46
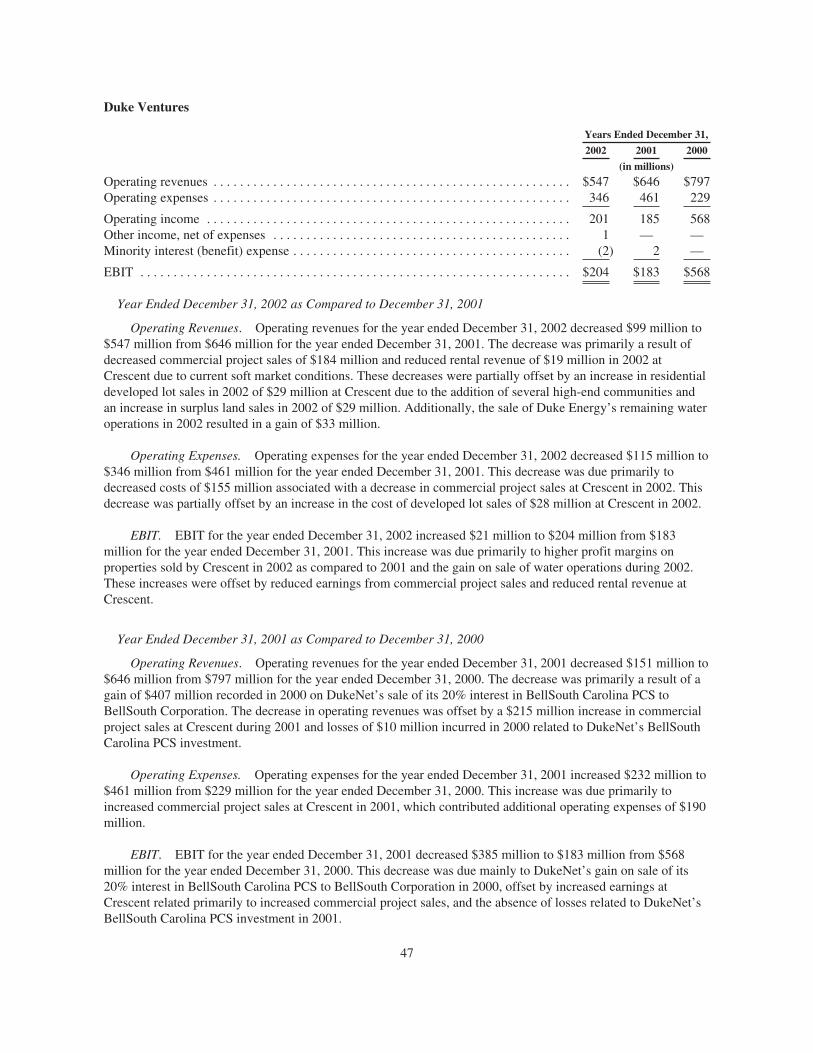
Duke Ventures
Years Ended December 31,
2002 2001 2000
(in millions)
Operating revenues . . . . . . . . . . . . . . . . . . . . . . . . . . . . . . . . . . . . . . . . . . . . . . . . . . . . . . $547 $646 $797Operating expenses . . . . . . . . . . . . . . . . . . . . . . . . . . . . . . . . . . . . . . . . . . . . . . . . . . . . . . 346 461 229
Operating income . . . . . . . . . . . . . . . . . . . . . . . . . . . . . . . . . . . . . . . . . . . . . . . . . . . . . . . 201 185 568Other income, net of expenses . . . . . . . . . . . . . . . . . . . . . . . . . . . . . . . . . . . . . . . . . . . . . 1 — —Minority interest (benefit) expense . . . . . . . . . . . . . . . . . . . . . . . . . . . . . . . . . . . . . . . . . . (2) 2 —
EBIT . . . . . . . . . . . . . . . . . . . . . . . . . . . . . . . . . . . . . . . . . . . . . . . . . . . . . . . . . . . . . . . . . $204 $183 $568
Year Ended December 31, 2002 as Compared to December 31, 2001
Operating Revenues. Operating revenues for the year ended December 31, 2002 decreased $99 million to$547 million from $646 million for the year ended December 31, 2001. The decrease was primarily a result ofdecreased commercial project sales of $184 million and reduced rental revenue of $19 million in 2002 atCrescent due to current soft market conditions. These decreases were partially offset by an increase in residentialdeveloped lot sales in 2002 of $29 million at Crescent due to the addition of several high-end communities andan increase in surplus land sales in 2002 of $29 million. Additionally, the sale of Duke Energy’s remaining wateroperations in 2002 resulted in a gain of $33 million.
Operating Expenses. Operating expenses for the year ended December 31, 2002 decreased $115 million to$346 million from $461 million for the year ended December 31, 2001. This decrease was due primarily todecreased costs of $155 million associated with a decrease in commercial project sales at Crescent in 2002. Thisdecrease was partially offset by an increase in the cost of developed lot sales of $28 million at Crescent in 2002.
EBIT. EBIT for the year ended December 31, 2002 increased $21 million to $204 million from $183million for the year ended December 31, 2001. This increase was due primarily to higher profit margins onproperties sold by Crescent in 2002 as compared to 2001 and the gain on sale of water operations during 2002.These increases were offset by reduced earnings from commercial project sales and reduced rental revenue atCrescent.
Year Ended December 31, 2001 as Compared to December 31, 2000
Operating Revenues. Operating revenues for the year ended December 31, 2001 decreased $151 million to$646 million from $797 million for the year ended December 31, 2000. The decrease was primarily a result of again of $407 million recorded in 2000 on DukeNet’s sale of its 20% interest in BellSouth Carolina PCS toBellSouth Corporation. The decrease in operating revenues was offset by a $215 million increase in commercialproject sales at Crescent during 2001 and losses of $10 million incurred in 2000 related to DukeNet’s BellSouthCarolina PCS investment.
Operating Expenses. Operating expenses for the year ended December 31, 2001 increased $232 million to$461 million from $229 million for the year ended December 31, 2000. This increase was due primarily toincreased commercial project sales at Crescent in 2001, which contributed additional operating expenses of $190million.
EBIT. EBIT for the year ended December 31, 2001 decreased $385 million to $183 million from $568million for the year ended December 31, 2000. This decrease was due mainly to DukeNet’s gain on sale of its20% interest in BellSouth Carolina PCS to BellSouth Corporation in 2000, offset by increased earnings atCrescent related primarily to increased commercial project sales, and the absence of losses related to DukeNet’sBellSouth Carolina PCS investment in 2001.
47

In March 2003, Duke Energy announced that it will exit the merchant finance business at DCP in an orderlymanner.
Other Operations
EBIT for Other Operations decreased $49 million in 2002 and $163 million in 2001. The decrease for 2002was due primarily to increased intercompany profits between Duke Energy’s segments which are eliminatedwithin the Other Operations segment. These intercompany profits are primarily a result of earnings at D/FD forenergy plants it has under construction or completed for DENA, and profits on gas contracts between DENA andNatural Gas Transmission. Partially offsetting the decrease were the expenses associated with increasedcontributions in 2001 to the Duke Energy Foundation (an independent, Internal Revenue Code section 501(c)(3)entity that funds Duke Energy’s charitable contributions) and mark-to-market losses in 2001 on corporatelymanaged energy risk positions used to hedge exposure to commodity prices.
The decrease for 2001 was due primarily to increased contributions to the Duke Energy Foundation, mark-to-market losses on corporately managed energy risk positions used to hedge exposure to commodity prices,increased unallocated corporate costs and an interest refund in 2000 from an Internal Revenue Agency Ruling.
Other Impacts on Earnings Available for Common Stockholders
Interest expense increased $325 million in 2002 as compared to 2001, due primarily to higher debt balancesresulting from debt assumed in, and issued with respect to, the acquisition of Westcoast and increased financingthroughout the corporation, partially offset by lower interest rates in 2002. In 2001 as compared to 2000, interestexpense decreased $126 million due primarily to lower interest rates.
Minority interest expense decreased $220 million in 2002 as compared to 2001 and increased $20 million in2001 as compared to 2000. Minority interest expense includes expense related to regular distributions onpreferred securities of Duke Energy and its subsidiaries. This expense decreased $31 million in 2002 ascompared to 2001 and increased $39 million in 2001 as compared to 2000. The decrease in 2002 was dueprimarily to lower distributions related to Catawba River Associates, LLC (Catawba). Beginning in October2002, subsequent costs associated with this financing have been classified as interest expense. (See FinancingCash Flows and Note 14 to the Consolidated Financial Statements for additional information related to Catawba.)
Minority interest expense as shown and discussed in the preceding business segment EBIT sections includesonly minority interest expense related to EBIT of Duke Energy’s joint ventures. It does not include minorityinterest expense related to interest and taxes of the joint ventures. Total minority interest expense related to thejoint ventures (including the portion related to interest and taxes) decreased $189 million in 2002 as compared to2001 and $19 million in 2001 as compared to 2000. The 2002 change was driven by decreased earnings at DETMand decreased earnings from DEFS. The 2001 decrease was due to changes in the ownership percentage ofDENA’s waste-to-energy plants and decreased earnings by DETM, offset slightly by increased minority interestexpense for DEFS as a result of the change in ownership due to the Phillips combination.
The effective tax rate increased to 37.4% in 2002 as compared to 36.6% in 2001 primarily as a result of anon-deductible goodwill write-off of $194 million for International Energy’s European trading and marketingbusiness and income tax reserves related to losses in Europe and South America, which may be unrealized in thefuture, offset by favorable foreign taxes due to the acquisition of regulated Westcoast entities; a benefit from achange in the federal tax law relating to the deduction of employee stock ownership plan dividends; and a statetax settlement finalized during 2002. The effective tax rate increased slightly to 36.6% in 2001 as compared to36.5% in 2000.
During 2001, Duke Energy recorded a one-time net-of-tax charge of $96 million related to the cumulativeeffect of a change in accounting principle for the January 1, 2001 adoption of SFAS No. 133. This charge related
48
to contracts that either did not meet the definition of a derivative under previous accounting guidance or do notqualify as hedge positions under new accounting requirements. (See Notes 1 and 7 to the Consolidated FinancialStatements.)
CRITICAL ACCOUNTING POLICIES
The selection and application of accounting policies is an important process that has developed as DukeEnergy’s operations change and accounting guidance evolves. Duke Energy has identified a number of criticalaccounting policies that require the use of significant estimates and judgments and have a material impact on itsconsolidated financial position and results of operations. Management bases its estimates and judgments onhistorical experience and on other various assumptions that they believe are reasonable at the time of application.The estimates and judgments may change as time passes and more information about Duke Energy’senvironment becomes available. If estimates and judgments are different than the actual amounts recorded,adjustments are made in subsequent periods to take into consideration the new information. Duke Energydiscusses each of its critical accounting policies, in addition to certain less significant accounting policies, withsenior members of management and the audit committee, as appropriate. Duke Energy’s critical accountingpolicies are listed below.
Risk Management Activities
Duke Energy uses two comprehensive accounting models for its risk management activities in reporting itsconsolidated financial position and results of operations as required by GAAP: a fair value model and an accrualmodel. For the three years ended December 31, 2002, the determination as to which model was appropriate wasprimarily based on accounting guidance issued by the Financial Accounting Standards Board (FASB) and theEmerging Issues Task Force (EITF). Effective January 1, 2003, Duke Energy adopted EITF Issue No. 02-03,“Issues Involved in Accounting for Derivative Contracts Held for Trading Purposes and for Contracts Involved inEnergy Trading and Risk Management Activities.” While the implementation of such guidance will changewhich accounting model is used for certain of Duke Energy’s transactions, the overall application of the modelremains the same.
The fair value model incorporates the use of mark-to-market (MTM) accounting. Under this method, anasset or liability is recognized at fair value on the Consolidated Balance Sheets and the change in the fair value ofthat asset or liability is recognized in Trading and Marketing Net Margin in the Consolidated Statements ofIncome during the current period. While DENA is the primary business segment that uses this accounting model,International Energy, Field Services, Other Energy Services and Franchised Electric also have certaintransactions subject to this model. Through December 31, 2002, Duke Energy applied MTM accounting to itsderivatives, unless subject to hedge accounting or the normal purchase and normal sale exemption (as describedbelow) and energy trading contracts, as defined by EITF Issue No. 98-10, “Accounting for Contracts Involved inEnergy Trading and Risk Management Activities.”
MTM accounting is applied within the context of an overall valuation framework. When available, quotedmarket prices are used to record a contract’s fair value. However, market values for energy trading contracts maynot be readily determinable because the duration of a contract exceeds the liquid activity in a particular market. Ifno active trading market exists for a commodity or for a contract’s duration, holders of these contracts mustcalculate fair value using internally developed valuation techniques or models. Key components used in thesevaluation techniques include price curves, volatility, correlation, interest rates and tenor. Of these components,volatility and correlation are the most subjective. Internally developed valuation techniques include the use ofinterpolation, extrapolation and fundamental analysis in the calculation of a contract’s fair value. All new andexisting transactions are valued using approved valuation techniques and market data, and discounted using aLondon Interbank Offered Rate (LIBOR) based interest rate. Valuation adjustments for performance and marketrisk, and administration costs are used to arrive at the fair value of the contract and the gain or loss ultimatelyrecognized in the Consolidated Statements of Income. While Duke Energy uses common industry practices to
49

develop its valuation techniques, changes in Duke Energy’s pricing methodologies or the underlying assumptionscould result in significantly different fair values and income recognition.
Validation of a contract’s calculated fair value is performed by the Risk Management Group. This groupperforms pricing model validation, back testing and stress testing of valuation techniques, and variables and priceforecasts. Validation of a contract’s fair value may be done by comparison to actual market activity andnegotiation of collateral requirements with third parties.
Often for a derivative instrument that is initially subject to MTM accounting, Duke Energy applies eitherhedge accounting or the normal purchase and normal sales exemption in accordance with SFAS No. 133. The useof hedge accounting and the normal purchase and normal sales exemption provide effectively for the use of theaccrual model. Under this model, there is no recognition in the Consolidated Statements of Income for changes inthe fair value of a contract until the service is provided or the associated delivery period occurs.
Hedge accounting treatment is used when Duke Energy contracts to buy or sell a commodity such as naturalgas at a fixed price for future delivery corresponding with anticipated physical sales or purchase of natural gas(cash flow hedge). In addition, hedge accounting treatment is used when Duke Energy holds firm commitmentsor asset positions and enters into transactions that “hedge” the risk that the price of natural gas or electricity maychange between the contract’s inception and the physical delivery date of the commodity (fair value hedge). Tothe extent that the fair value of the hedge instrument offsets the transaction being hedged, there is no impact tothe Consolidated Statements of Income prior to settlement of the hedge. However, as not all of Duke Energy’shedges relate to the exact location being hedged a certain degree of hedge ineffectiveness may be realized in theConsolidated Statements of Income.
The normal purchases and normal sales exemption, as provided in SFAS No. 133 and interpreted byDerivative Implementation Group (DIG) Issue C15, indicates that no recognition of the contract’s fair value inthe consolidated financial statements is required until settlement of the contract (in Duke Energy’s case, thedelivery of power). Duke Energy has applied this exemption for certain contracts involving the purchase and saleof power in future periods.
Regulatory Accounting
Duke Energy accounts for its regulated operations under the provisions of SFAS No. 71, “Accounting forthe Effects of Certain Types of Regulation.” As a result, Duke Energy records assets and liabilities that resultfrom the regulated ratemaking process that would not be recorded under GAAP for non-regulated entities.Regulatory assets generally represent incurred costs that have been deferred because they are probable of futurerecovery in customer rates. Regulatory liabilities generally represent obligations to make refunds to customersfor previous collections for costs that are not likely to be incurred. Management continually assesses whether theregulatory assets are probable of future recovery by considering factors such as applicable regulatory changes,recent rate orders to other regulated entities and the status of any pending or potential deregulation legislation.Management believes the existing regulatory assets are probable of recovery. This determination reflects thecurrent political and regulatory climate at the state, provincial and federal levels, and is subject to change in thefuture. If future recovery of costs ceases to be probable, the asset write-offs would be required to be recognizedin current period earnings. Total regulatory assets were $1,662 million as of December 31, 2002 and $1,368million as of December 31, 2001. (See Note 4 to the Consolidated Financial Statements.)
Depreciation Expense and Cost Capitalization Policies
Duke Energy has a significant investment in electric generation assets, as well as electric and natural gastransmission and distribution assets, including gathering and processing facilities. Duke Energy capitalizes allconstruction-related direct labor and material costs, as well as indirect construction costs. Indirect costs includegeneral engineering, taxes and the costs of certain funds used in construction. The cost of funds used in
50

construction represents estimated debt and equity costs of capital funds necessary to finance the construction ofnew regulated facilities and interest on debt for new unregulated facilities. After construction is completed, DukeEnergy is permitted to recover these costs for regulated facilities, plus a defined return, by including them in therate base and in the depreciation provision.
As discussed in the Notes to the Consolidated Financial Statements, depreciation on Duke Energy’s assets isgenerally computed using the straight-line method over the estimated useful life of the assets. The costs ofrenewals and betterments that extend the useful life of property, plant and equipment are also capitalized. Thecost of repairs, replacements and major maintenance projects is expensed as it is incurred.
Depreciation of regulatory assets is provided over the recovery period specified in the related legislation orregulatory agreements. Depreciation of non-regulatory assets is provided over the estimated useful life asdetermined by periodic studies and the technical expertise of internal consultants. The recovery period for non-regulatory assets ranges from 5 to 40 years.
The computation of depreciation expense requires judgment regarding the estimated useful lives and salvagevalue of assets. As circumstances warrant, depreciation estimates are reviewed to determine if any changes areneeded. Such changes could involve an increase or decrease in estimated useful lives or salvage values whichwould impact future depreciation expense.
Impairment of Long-lived Assets
Duke Energy evaluates the carrying value of long-lived assets, excluding goodwill, when circumstancesindicate the carrying value of those assets may not be recoverable under the guidance of SFAS No. 144. Forlong-lived assets Duke Energy determines the carrying amount is not recoverable if it exceeds the sum ofestimates of the undiscounted cash flows expected to result from the use and eventual disposition of the asset.Duke Energy considers various factors when determining if impairment tests are warranted, including but notlimited to:
• Significant adverse changes in legal factors or in the business climate;
• A current-period operating or cash flow loss combined with a history of operating or cash flowlosses, or a projection or forecast that demonstrates continuing losses associated with the use of along-lived asset;
• An accumulation of costs significantly in excess of the amount originally expected for the acquisitionor construction of a long-lived asset;
• Significant adverse changes in the extent or manner in which an asset is used or in its physicalcondition;
• A significant change in the market value of an asset; and
• A current expectation that, more likely than not, an asset will be sold or otherwise disposed of beforethe end of its estimated useful life.
In 2002, the merchant energy portion of Duke Energy’s business portfolio suffered from oversupply ofmerchant generation, low commodity pricing and volatility, and a steep decline in trading and marketing activity.These market challenges are continuing in 2003. As a result of the 2002 market conditions, Duke Energysuspended certain projects and abandoned other projects in this sector. The culmination of these events causedDuke Energy to evaluate the carrying values of its long-lived assets at DENA and International Energy. Thisanalysis resulted in a $31 million impairment charge at one of DENA’s merchant power facilities. Additionally,charges of approximately $242 million were also recorded in 2002 to write-off site development costs inCalifornia and Brazil and to partially write-down uninstalled turbines, as well as the termination of other turbines
51
on order. Also in 2002, a decision was made to abandon an information technology system at DENA resulting inthe write-off of approximately $24 million of previously capitalized software and related costs.
Judgment is exercised to estimate the future cash flows and the useful lives of these long-lived assets and todetermine management’s intent to use the assets. The sum of undiscounted cash flows is primarily dependent onforecasted commodity prices for sales of power and costs of fuel. Duke Energy incorporates current marketinformation as well as historical, fundamental analysis and other factors into its forecasted commodity prices.While commodity prices vary from time to time, the methodology used by Duke Energy provides the bestestimate of undiscounted cash flows over the long-lived asset’s life. Revenues from merchant generationfacilities are generally estimated by using probabilistic models that calculate the operating margin on the spreadbetween the forward power prices and the marginal cost to dispatch the facility. Other operating expenses,including future escalation provisions, are factored into the calculation as well. Duke Energy used a probability-weighted approach for developing estimates of future cash flows to test the recoverability of its merchantgeneration long-lived assets. The probability-weighted approach, as introduced by FASB Concepts No. 7, “UsingCash Flow Information and Present Value in Accounting Measurements” and encouraged by SFAS No. 144,considers the likelihood of possible outcomes. Under the probability-weighted approach, alternate courses ofaction being considered are assigned a probability assessment with the most likely scenarios weighted higher.Alternatives include potential disposal or operation for their remaining useful lives. A change in Duke Energy’sprobability assessment for each scenario could have a significant impact on the estimated future cash flows. If thecarrying value of the long-lived assets is not recoverable based on these estimated future cash flows, theimpairment loss is measured as the excess of the asset’s carrying value over its fair value. Management assessesthe fair value of the long-lived assets using commonly accepted techniques including, but not limited to, recentthird party comparable sales and discounted cash flow analysis.
Additionally, Duke Energy evaluated the long-lived assets at Field Services as a result of challengingmarket conditions, primarily lower NGL pricing in 2002. As a result, Field Services recorded $40 million inimpairment charges ($28 million at Duke Energy’s 70% share) in the fourth quarter of 2002 related to certainoperating assets.
Impairment of Goodwill
Duke Energy evaluates the impairment of goodwill under SFAS No. 142. The majority of Duke Energy’sgoodwill relates to the acquisition of Westcoast in March 2002 and was not impaired as of December 31, 2002.As required by SFAS No. 142, Duke Energy performs an annual goodwill impairment test and updates the test ifevents or circumstances occur that would more likely than not reduce the fair value of a reporting unit below itscarrying amount. As described above, certain sectors of Duke Energy, primarily merchant energy and FieldServices, are operating in challenging market conditions. In 2002 Duke Energy recorded a goodwill impairmentloss of $194 million related to International Energy’s European trading and marketing business. Significantchanges in the European market and recent operating results have adversely affected Duke Energy’s outlook forthis business unit. The exit of key market participants and a tightening of credit requirements are the primarydrivers of this revised outlook. To determine the amount of the impairment, management estimated the fair valueof the assets and operations using the present value of expected future cash flows of the reporting unit incomparison to its carrying value. As a result, substantially all of the goodwill related to the European operationswas written-off. There were no other goodwill impairments recorded in 2002. As the challenging marketconditions continue into 2003, in addition to performing the annual goodwill impairment analysis required bySFAS No. 142, management will continue to remain alert for any indicators that the fair value of a reporting unitcould be below book value and assess goodwill for impairment as appropriate.
As of the acquisition date, Duke Energy allocates goodwill to a reporting unit. Duke Energy defines areporting unit as an operating segment or one level below. (See Note 3 to the Consolidated Financial Statements.)
52

Revenue Recognition
Unbilled and Estimated Revenues. Revenues on sales of electricity are recognized when the service isprovided. Revenues from electric service provided but not yet billed are estimated each month based on thedifference between territorial load and the amount billed.
Revenues on sales of natural gas, natural gas transportation, storage and distribution as well as sales ofpetroleum products are recognized when the service is provided. Revenues related to these services provided butnot yet billed are estimated each month. These estimates are generally based on contract data, regulatoryinformation, preliminary measurements and allocations, estimated distribution usage based on historical dataadjusted for heating degree days, commodity prices and preliminary throughput measurements. Final bills for thecurrent month are billed and collected in the following month.
Percentage of Completion Contracts. Long-term contracts, primarily in Other Energy Services, areaccounted for using the percentage-of-completion method. Under the percentage-of-completion method, salesand gross profit are recognized as the work is performed based on the relationship between costs incurred andtotal estimated costs at completion. Sales and gross profit are adjusted prospectively for revisions in estimatedtotal contract costs and contract values. When the current estimates of total contract revenue and contract costindicate a loss, a provision for the entire loss on the contract is recorded in that period. The provision for the lossarises because estimated cost for the contract exceeds estimated revenue.
Trading and Marketing Revenues. Duke Energy is exposed to market risks associated with commodityprices and it engages in certain transactions to mitigate this exposure. Transactions that are carried out inconnection with trading activities are currently accounted for under the MTM accounting method as required byEITF Issue No. 98-10. Under this method, Duke Energy’s trading contracts are recorded at fair value. Prior tosettlement of any energy contract held for trading purposes, a favorable or unfavorable price movement isreported as Trading and Marketing Net Margin in the Consolidated Statements of Income. An offsetting amountis recorded as Unrealized Gains or Unrealized Losses on Mark-to-Market and Hedging Transactions in theConsolidated Balance Sheets. Prices used to determine fair value reflect management’s best estimatesconsidering various factors, including quoted market prices, when available, and modeling techniques. When acontract to sell or buy is physically settled, the fair value entries are reversed and the gross amounts invoiced tothe customer or due to the counterparty are included as Trading and Marketing Net Margin in the ConsolidatedStatements of Income. For financial settlement, the effect on the Consolidated Statements of Income is the sameas physical transactions. For all contracts, the unrealized gain or loss in the Consolidated Balance Sheets isreversed and classified as a receivable or payable account until collected.
In June 2002, the EITF reached a partial consensus on Issue No. 02-03. The EITF concluded that, effectivefor periods ending after July 15, 2002, mark-to-market gains and losses on energy trading contracts (includingthose to be physically settled) must be shown on a net basis in the Consolidated Statements of Income. DukeEnergy had previously chosen to report certain of its energy trading contracts on a gross basis, as sales inoperating revenues and to record the associated costs in operating expenses, in accordance with prevailingindustry practice. The amounts in the Consolidated Statements of Income have been reclassified to conform tothe 2002 presentation of recording all amounts on a net basis in operating revenues. In the calculation of netrevenues, Duke Energy has continued to enhance its methodologies around the application of this complexaccounting literature since the third quarter 2002 when these trading revenues were first reported on a net basis.(See Note 1 to the Consolidated Financial Statements for further discussion.)
In October 2002, the EITF, as part of their further deliberations on Issue No. 02-03, rescinded the consensusreached on Issue No. 98-10. As a result, all energy trading contracts that do not meet the definition of aderivative under SFAS No. 133, and trading inventories that previously had been recorded at fair values, will berecorded at their historical cost and reported on an accrual basis, resulting in the recognition of earnings or losses
53
at the time of contract settlement or termination. New non-derivative energy trading contracts entered into afterOctober 25, 2002 are accounted for under the accrual accounting basis. Non-derivative energy trading contractson the Consolidated Balance Sheets as of January 1, 2003 that existed on October 25, 2002 and tradinginventories that were recorded at fair values will be adjusted to historical cost via a net-of-tax and minorityinterest cumulative effect adjustment of $125 million to $175 million recorded as a reduction to first quarter 2003earnings.
The EITF also reached a consensus in October 2002 on Issue No. 02-03 that, effective for periods beginningafter December 15, 2002, gains and losses on all derivative instruments considered to be held for tradingpurposes should be shown on a net basis in the income statement. Gains and losses on non-derivative energytrading contracts should similarly be presented on a gross or net basis in connection with the guidance in IssueNo. 99-19, “Reporting Revenue Gross as a Principal versus Net as an Agent.” Upon application of thispresentation, comparative financial statements for prior periods should be reclassified to conform to theconsensus. Duke Energy is currently assessing the new net revenue presentation requirements, which will haveno impact on operating income or net income.
Pension
Duke Energy and its subsidiaries maintain a non-contributory defined benefit retirement plan. It covers mostU.S. employees using a cash balance formula. Under a cash balance formula, a plan participant accumulates aretirement benefit consisting of pay credits that are based upon a percentage (which may vary with age and yearsof service) of current eligible earnings and current interest credits. Duke Energy acquired Westcoast, includingits retirement plans, on March 14, 2002.
Duke Energy accounts for its defined benefit pension plan using SFAS No. 87, “Employers’ Accounting forPensions.” Under SFAS No. 87, pension income/expense is recognized on an accrual basis over employees’approximate service periods. For Duke Energy’s defined benefit pension plans, it recognized income of $27million in 2002, income of $9 million in 2001, and expense of $3 million in 2000. Duke Energy expects itspension expense to be approximately $2 million in 2003 primarily as a result of the increase in unrecognized netexperience loss and the decrease in the expected long-term rate of return on plan assets. The Westcoastretirement plans recognized pension expense of $7 million in 2002.
The fair value of Duke Energy’s plan assets decreased to $2,120 million as of September 30, 2002 from$2,470 million as of September 30, 2001. Lower investment returns, ongoing benefit payments and declininginterest rates have increased Duke Energy’s plan’s calculated under-funded status to $551 million as ofDecember 31, 2002 from $58 million as of December 31, 2001. Funding requirements for defined benefit plansare determined by government regulations, not SFAS No. 87. No contributions to the Duke Energy plan weremade in 2002, 2001 or 2000. Duke Energy does not anticipate making a contribution in 2003 for the 2002 planyear. Duke Energy anticipates that it will make a contribution to its plan in 2004 of approximately $100 millionfor the 2003 plan year. Duke Energy anticipates that it will make a contribution of approximately $10 million tothe Westcoast pension plans in 2003 for the 2003 plan year. Contributions for the 2004 plan year and beyondmay vary based on the actual return on the defined benefit pension plan’s assets, as well as other factors.
The calculation of pension expense and Duke Energy’s pension liability requires the use of assumptions.Changes in these assumptions can result in different expense and reported liability amounts, and future actualexperience can differ from the assumptions. Duke Energy believes that the two most critical assumptions are theexpected long-term rate of return on plan assets and the assumed discount rate.
Duke Energy assumed that its plan’s assets would generate a long-term rate of return of 9.25% as ofDecember 31, 2002, 2001 and 2000. For 2003, this rate has been lowered to 8.5%. If Duke Energy had used along-term rate of 8.5% in 2002, its pension income would have been lower by approximately $22 million, beforeincome taxes. Duke Energy developed its expected long-term rate of return assumption by evaluating input from
54

an outside actuary and pension trust consultants. Duke Energy’s expected long-term rate of return on plan assetsis based on a target allocation of 65% equities and 35% fixed income securities. Duke Energy’s allocation as ofDecember 31, 2002 approximated its targeted allocation. Duke Energy regularly reviews its actual assetallocation and periodically rebalances its investments to its targeted allocation when considered appropriate. Thelong-term rate of return for Westcoast is 7.75% for 2002 and 2003. This rate was established using actuarialconsultants appropriate for the region and investment strategy.
Duke Energy discounted its future pension obligations using a rate of 6.75% as of September 30, 2002,compared to 7.25% as of September 30, 2001 and 7.5% as of September 30, 2000. Duke Energy determines theappropriate discount based on the current rates earned on long-term bonds that receive one of the two highestratings given by a recognized rating agency. Lowering the discount rate by 0.25% (from 6.75% to 6.5%) woulddecrease Duke Energy’s estimated 2003 pension expense by approximately $4 million.
Future changes in plan asset returns, assumed discount rates and various other factors related to theparticipants in Duke Energy’s pension plans will impact Duke Energy’s future pension expense and liabilities.Management cannot predict with certainty what these factors will be in the future.
Contingencies
Duke Energy follows SFAS No. 5, “Accounting for Contingencies,” to determine accounting and disclosurerequirements for contingencies. Duke Energy operates in a highly regulated environment. Governmental bodiessuch as the FERC, the NCUC, the PSCSC, the SEC, the Internal Revenue Service, the Nuclear RegulatoryCommission (NRC), the Department of Labor, the Environmental Protection Agency and others have purviewover various aspects of Duke Energy’s business operations and public reporting. Reserves are established whenrequired in management’s judgment and disclosures are made when appropriate regarding litigation, assessments,credit worthiness of customers or counterparties, and self-insurance exposures, among others. (See Note 16 to theConsolidated Financial Statements for discussion of various contingencies.) The evaluation of thesecontingencies is performed by various specialists inside and outside of Duke Energy. Accounting forcontingencies requires significant judgment by management regarding the estimated probabilities and ranges ofexposure to potential liability. Management’s assessment of Duke Energy’s exposure to contingencies couldchange as new developments occur or more information becomes available. The outcome of the contingenciescould vary significantly and could materially impact the consolidated results of operations, cash flows andfinancial position of Duke Energy. Management has applied its best judgment in applying SFAS No. 5 to thesematters.
LIQUIDITY AND CAPITAL RESOURCES
As of December 31, 2002, Duke Energy had $857 million in cash and cash equivalents compared to $290million as of December 31, 2001. Duke Energy’s working capital was a $137 million deficit at December 31,2002, compared to a $854 million deficit as of December 31, 2001. Duke Energy relies upon cash flows fromoperations, as well as, borrowings and the sale of assets to fund its liquidity and capital requirements. A materialadverse change in operations or available financing may impact Duke Energy’s ability to fund its currentliquidity and capital resource requirements.
Operating Cash Flows
Net cash provided by operating activities was $4,530 million in 2002 compared to $4,357 million in 2001,an increase of $173 million. The increase in cash provided by operating activities was due primarily to highercash earnings plus changes in working capital from 2001. Although net income significantly decreased in 2002(see Results of Operation for further discussion) many of the items affecting net income were non-cash. Non-cash items affecting earnings included an increase in depreciation expense, primarily due to the acquisition ofWestcoast; non-cash impairment charges for goodwill (at International Energy), project sites (primarily atDENA) and property plant and equipment; and higher deferred tax expense.
55

Net cash provided by operating activities was $4,357 million in 2001 compared to $2,011 million in 2000,an increase of $2,346 million. The increase was due primarily to price movements in the energy commoditiesmarkets which have a direct impact on Duke Energy’s use and generation of cash from operations. Earningsincrease as natural gas and electricity prices move favorably with respect to contracts that Duke Energy holds. Inaddition, counterparties may be required to post collateral in cash or letters of credit if price moves benefit DukeEnergy. This mechanism has given Duke Energy use of the cash on a short-term basis. Conversely, negativeprice impacts reduce earnings and may require Duke Energy to post collateral with its counterparties. Cashcollateral posted by Duke Energy is included in Other Current Assets and cash collateral collected by DukeEnergy is included in Other Current Liabilities in the Consolidated Balance Sheets.
Duke Energy currently anticipates net cash provided by operating activities, plus the sale of assets, in 2003to be approximately $4,400 million. Achievement of these projected cash flows is subject to a number of factors,including, but not limited to, industry restructuring, regulatory constraints, acquisition and divestitureopportunities, market volatility, and economic trends.
Investing Cash Flows
Cash used in investing activities was $6,809 million in 2002 compared to $6,043 million in 2001, anincrease of $766 million. Additionally, cash used in investing activities was $6,043 million in 2001 compared to$4,716 million in 2000, an increase of $1,327 million. The primary use of cash for investing activities is capitaland investment expenditures, which are detailed by business segment in the following table.
Capital and Investment Expenditures by Business Segment (a)
Years Ended December 31,
2002 2001 2000
(in millions)
Franchised Electric . . . . . . . . . . . . . . . . . . . . . . . . . . . . . . . . . . . . . . . . . . . . . . . . . . . . . $1,269 $1,115 $ 661Natural Gas Transmission . . . . . . . . . . . . . . . . . . . . . . . . . . . . . . . . . . . . . . . . . . . . . . . 2,878 748 973Field Services . . . . . . . . . . . . . . . . . . . . . . . . . . . . . . . . . . . . . . . . . . . . . . . . . . . . . . . . . 309 587 376Duke Energy North America . . . . . . . . . . . . . . . . . . . . . . . . . . . . . . . . . . . . . . . . . . . . . 2,013 3,213 1,735International Energy . . . . . . . . . . . . . . . . . . . . . . . . . . . . . . . . . . . . . . . . . . . . . . . . . . . . 412 442 980Other Energy Services . . . . . . . . . . . . . . . . . . . . . . . . . . . . . . . . . . . . . . . . . . . . . . . . . . 32 72 230Duke Ventures . . . . . . . . . . . . . . . . . . . . . . . . . . . . . . . . . . . . . . . . . . . . . . . . . . . . . . . . 459 773 643Other Operations(b) . . . . . . . . . . . . . . . . . . . . . . . . . . . . . . . . . . . . . . . . . . . . . . . . . . . . (23) 90 36Cash acquired in acquisitions . . . . . . . . . . . . . . . . . . . . . . . . . . . . . . . . . . . . . . . . . . . . . (77) (17) (100)
Total consolidated . . . . . . . . . . . . . . . . . . . . . . . . . . . . . . . . . . . . . . . . . . . . . . . . . . . . . $7,272 $7,023 $5,534
(a) Amounts include the acquisition of Westcoast in 2002(b) Amounts include deferral in the consolidation of fifty percent of the profit earned by D/FD for the
construction of DENA’s merchant generation plants, which is associated with Duke Energy’s ownership,until the plant is sold as part of DENA’s portfolio management strategy.
Capital and investment expenditures increased $249 million in 2002 compared to 2001. The increase wasdue primarily to cash used in the acquisition of Westcoast of $1,707 million, net of cash acquired (see Note 2 tothe Consolidated Financial Statements) partially offset by decreases in capital expenditures and investmentexpenditures. Capital expenditures decreased when compared to 2001 due to a decrease in DENA’s investmentsin generating facilities, as a result of management’s revised outlook for the merchant energy portion of itsbusiness, and a decrease in acquisitions of minor businesses and assets when compared to 2001. These decreasesin capital expenditures were partially offset by an increase in plant construction costs at Franchised Electricprimarily due to expenditures related to environmental equipment at coal-fired plants and the Mill Creek
56
combustion turbine plant; and an increase in investments in property plant and equipment at Gas Transmissiondue to increased expansion projects in the Algonquin, ETNG, Texas Eastern and Westcoast systems, along withthe M&N Pipeline expansion costs after its consolidation in 2002. Investment activities also decreased whencompared to 2001, due primarily to reduced investments at Duke Ventures (primarily related to DCP) andNatural Gas Transmission’s 2001 investment in a 50% interest in Gulfstream.
Capital and investment expenditures increased $1,489 million in 2001 compared to 2000. The increasereflects additional expansion and development expenditures (primarily related to DENA’s generating facilities),construction of the Mill Creek combustion turbine plant, refurbishment and upgrades to existing assets (primarilyrelated to Franchised Electric), and minor acquisitions of businesses and assets. Also in 2001, Natural GasTransmission invested in a 50% interest in Gulfstream. These increases were partially offset by Natural GasTransmission’s acquisition of ETNG for approximately $390 million and of MHP for approximately $250million in cash, and International Energy’s approximately $280 million tender offer for Companhia de Geracaode Energia Elétrica Paranapanema (Paranapanema) in 2000.
Duke Energy’s projected 2003 capital and investment expenditures are approximately $3,000 million. DukeEnergy is focusing on reducing risk and restructuring its business for future success, including opportunities toreduce further the projected capital expenditures. Duke Energy will invest in its strongest business sectors withan overall focus on positive net cash generation. Based on this goal, over 60% of projected 2003 capitalexpenditures are projected to be allocated to Natural Gas Transmission and Franchised Electric. Total projectedcapital and investment expenditures include approximately $1,800 million for maintenance and upgrades ofexisting plants, pipelines, and infrastructure to serve load growth.
In June 2002, the state of North Carolina passed new clean air legislation that includes provisions that freezeelectric utility rates from June 20, 2002 (the effective date of the statute) to December 31, 2007 (rate freezeperiod), subject to certain conditions, in order for North Carolina electric utilities, including Duke Energy, tomake significant reductions in emissions of sulfur dioxide and nitrogen oxides from the state’s coal-fired powerplants. (See Note 16 to the Consolidated Financial Statements.) As part of this legislation Duke Energy willspend an estimated total of $1.5 billion over the next ten years to install pollution controls in its coal-fired plants.Duke Energy expects to incur approximately $17 million of total capital costs associated with this legislation in2003.
All projected capital and investment expenditures are subject to periodic review and revision and may varysignificantly depending on a number of factors, including, but not limited to, industry restructuring, regulatoryconstraints, acquisition opportunities, market volatility and economic trends.
Financing Cash Flows and Liquidity
Duke Energy’s consolidated capital structure as of December 31, 2002, including short-term debt, was 55%debt, 36% common equity, 5% minority interests, 3% trust preferred securities and 1% preferred stock. Fixedcharges coverage ratio, calculated using SEC guidelines, was 2.1 times for 2002, 3.8 times for 2001 and 3.6 timesfor 2000.
Duke Energy’s cash requirements for 2003 are expected to be funded by cash from operations, including thesale of assets, and to be adequate for funding capital expenditures, dividend payments and permanently retiring aportion of scheduled debt maturities. In addition, Duke Energy expects to access the capital markets as neededand also obtain some funding through common stock issuances in its InvestorDirect Choice Plan (a stockpurchase and dividend reinvestment plan) and employee benefit plans. The ability to access the capital markets isdependent upon market opportunities presented, among other factors. Duke Energy does not have any materialoff-balance sheet financing entities or structures, except for normal operating lease arrangements and guaranteecontracts (see Notes 16 and 17 to the Consolidated Financial Statements). Management believes Duke Energyhas adequate financial flexibility and resources to meet its future needs.
57
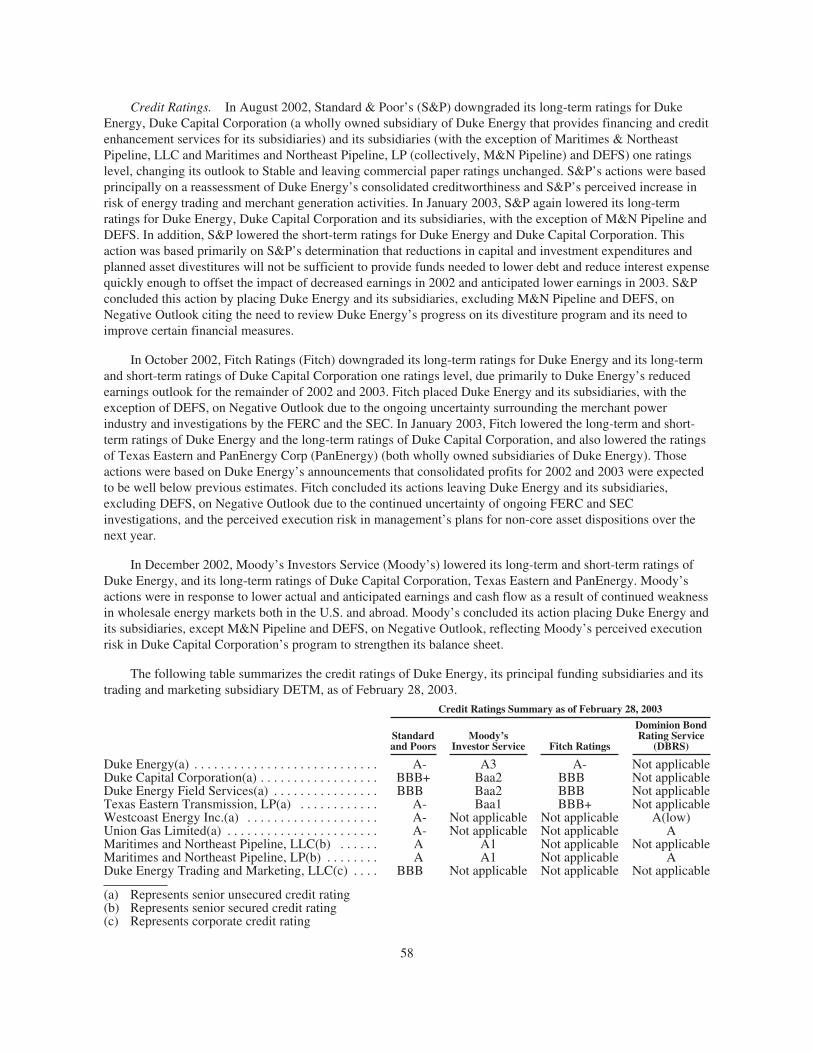
Credit Ratings. In August 2002, Standard & Poor’s (S&P) downgraded its long-term ratings for DukeEnergy, Duke Capital Corporation (a wholly owned subsidiary of Duke Energy that provides financing and creditenhancement services for its subsidiaries) and its subsidiaries (with the exception of Maritimes & NortheastPipeline, LLC and Maritimes and Northeast Pipeline, LP (collectively, M&N Pipeline) and DEFS) one ratingslevel, changing its outlook to Stable and leaving commercial paper ratings unchanged. S&P’s actions were basedprincipally on a reassessment of Duke Energy’s consolidated creditworthiness and S&P’s perceived increase inrisk of energy trading and merchant generation activities. In January 2003, S&P again lowered its long-termratings for Duke Energy, Duke Capital Corporation and its subsidiaries, with the exception of M&N Pipeline andDEFS. In addition, S&P lowered the short-term ratings for Duke Energy and Duke Capital Corporation. Thisaction was based primarily on S&P’s determination that reductions in capital and investment expenditures andplanned asset divestitures will not be sufficient to provide funds needed to lower debt and reduce interest expensequickly enough to offset the impact of decreased earnings in 2002 and anticipated lower earnings in 2003. S&Pconcluded this action by placing Duke Energy and its subsidiaries, excluding M&N Pipeline and DEFS, onNegative Outlook citing the need to review Duke Energy’s progress on its divestiture program and its need toimprove certain financial measures.
In October 2002, Fitch Ratings (Fitch) downgraded its long-term ratings for Duke Energy and its long-termand short-term ratings of Duke Capital Corporation one ratings level, due primarily to Duke Energy’s reducedearnings outlook for the remainder of 2002 and 2003. Fitch placed Duke Energy and its subsidiaries, with theexception of DEFS, on Negative Outlook due to the ongoing uncertainty surrounding the merchant powerindustry and investigations by the FERC and the SEC. In January 2003, Fitch lowered the long-term and short-term ratings of Duke Energy and the long-term ratings of Duke Capital Corporation, and also lowered the ratingsof Texas Eastern and PanEnergy Corp (PanEnergy) (both wholly owned subsidiaries of Duke Energy). Thoseactions were based on Duke Energy’s announcements that consolidated profits for 2002 and 2003 were expectedto be well below previous estimates. Fitch concluded its actions leaving Duke Energy and its subsidiaries,excluding DEFS, on Negative Outlook due to the continued uncertainty of ongoing FERC and SECinvestigations, and the perceived execution risk in management’s plans for non-core asset dispositions over thenext year.
In December 2002, Moody’s Investors Service (Moody’s) lowered its long-term and short-term ratings ofDuke Energy, and its long-term ratings of Duke Capital Corporation, Texas Eastern and PanEnergy. Moody’sactions were in response to lower actual and anticipated earnings and cash flow as a result of continued weaknessin wholesale energy markets both in the U.S. and abroad. Moody’s concluded its action placing Duke Energy andits subsidiaries, except M&N Pipeline and DEFS, on Negative Outlook, reflecting Moody’s perceived executionrisk in Duke Capital Corporation’s program to strengthen its balance sheet.
The following table summarizes the credit ratings of Duke Energy, its principal funding subsidiaries and itstrading and marketing subsidiary DETM, as of February 28, 2003.
Credit Ratings Summary as of February 28, 2003
Standardand Poors
Moody’sInvestor Service Fitch Ratings
Dominion BondRating Service
(DBRS)
Duke Energy(a) . . . . . . . . . . . . . . . . . . . . . . . . . . . . A- A3 A- Not applicableDuke Capital Corporation(a) . . . . . . . . . . . . . . . . . . BBB+ Baa2 BBB Not applicableDuke Energy Field Services(a) . . . . . . . . . . . . . . . . BBB Baa2 BBB Not applicableTexas Eastern Transmission, LP(a) . . . . . . . . . . . . A- Baa1 BBB+ Not applicableWestcoast Energy Inc.(a) . . . . . . . . . . . . . . . . . . . . A- Not applicable Not applicable A(low)Union Gas Limited(a) . . . . . . . . . . . . . . . . . . . . . . . A- Not applicable Not applicable AMaritimes and Northeast Pipeline, LLC(b) . . . . . . A A1 Not applicable Not applicableMaritimes and Northeast Pipeline, LP(b) . . . . . . . . A A1 Not applicable ADuke Energy Trading and Marketing, LLC(c) . . . . BBB Not applicable Not applicable Not applicable
(a) Represents senior unsecured credit rating(b) Represents senior secured credit rating(c) Represents corporate credit rating
58
Duke Energy’s credit ratings are dependent on, among other factors, the ability to generate sufficient cash tofund Duke Energy’s capital and investment expenditures and dividends, while strengthening the balance sheetthrough debt reductions. If, as a result of market conditions or other factors affecting Duke Energy’s business,Duke Energy is unable to execute its business plan, including disposition of non-core assets, or if Duke Energy’searnings outlook deteriorates, Duke Energy’s ratings could be further affected.
The impacts of the credit rating downgrades to date have been minimal on Duke Energy and its subsidiaries.If further downgrades were to occur and to the extent that these downgrades placed certain of the entities(primarily DETM and DEFS) below investment grade, there could be a negative impact on that entity’s workingcapital and terms of trade.
Significant Financing Activities. During 2002, Duke Energy issued $2,110 million of senior unsecurednotes: $750 million of 6.25% senior unsecured notes due in 2012, $250 million of floating rate (based on thethree-month LIBOR plus 0.35%) senior unsecured notes due in 2005, $250 million of 6.60% retail seniorunsecured notes due in 2022 (swapped to floating rate based on the three-month LIBOR), $350 million of 6.45%senior unsecured notes due in 2032, $110 million of 4.61% senior unsecured notes due in 2007 and $400 millionof 5.625% senior unsecured notes due in 2012. In addition, Duke Energy refinanced $250 million of seniorunsecured debt with a short-term private debt securities offering. The proceeds from these issuances were usedprimarily for general corporate purposes, to repay the $250 million of private debt securities, to redeem $100million of Duke Energy’s 7.5% Series B first and refunding mortgage bonds due in 2025, to repay commercialpaper and to repay a $600 million intercompany loan from Duke Capital Corporation.
In 2002, Duke Capital Corporation issued $500 million of 6.25% senior unsecured notes due in 2013 and$250 million of 6.75% senior unsecured notes due in 2032. In addition, Duke Capital Corporation, throughprivate placement transactions, issued $500 million of floating rate (based on the one-month LIBOR plus 0.65%)senior unsecured notes due in 2003 and $100 million of floating rate (based on the one-month LIBOR plus0.85%) senior unsecured notes due in 2004. The proceeds from these issuances were used for general corporatepurposes and to repay commercial paper. Additionally, Duke Capital Corporation decreased its note payable toD/FD by $286 million, to $282 million as of December 31, 2002. The weighted-average interest rate on this notefor 2002 was 2.5%. (See Notes 8 and 11 to the Consolidated Financial Statements.)
In 2002, a wholly owned subsidiary of Duke Energy, Duke Australia Pipeline Finance Pty Ltd., closed asyndicated bank debt facility for 900 million Australian dollars (U.S. $450 million) with various banks to fund itspipeline and power businesses in Australia. The facility includes a Duke Capital Corporation-guaranteed trancheand a non-recourse project finance tranche that is secured by liens over existing Australian pipeline assets.Proceeds from the project finance tranche were used to repay intercompany loans.
During 2002, Texas Eastern issued $300 million of 5.25% senior unsecured notes due in 2007 and $450million of 7.0% senior unsecured notes due in 2032. The proceeds from these issuances were used for generalcorporate purposes, including the repayment of debt which matured in 2002, and for pipeline expansion andmaintenance projects.
In 2002, Algonquin Gas Transmission Company, a wholly owned subsidiary of Duke Energy, through aprivate placement transaction, issued $300 million of 5.69% senior unsecured notes due in 2012. The proceedsfrom this issuance were used for general corporate purposes, including repayment of maturing debt and forpipeline expansion and maintenance projects.
In 2002, ETNG, a wholly owned subsidiary of Duke Energy, through a private placement transaction, issued$150 million of 5.71% senior unsecured notes due in 2012. The proceeds from this issuance were used forgeneral corporate purposes and for pipeline expansion and maintenance projects.
59

During 2002, Union Gas, issued 200 million Canadian dollars (U.S. $128 million) of 5.19% debentures duein 2007. The proceeds from this issuance were used for general corporate purposes, including repayment ofmaturing debt, repayment of commercial paper and funding of capital expenditures.
In February 2003, Duke Energy issued $500 million of 3.75% five-year first and refunding mortgage bondsdue in 2008 in a private placement transaction exempt from registration under Rule 144A of the Securities Act of1933, as amended (Securities Act). The bonds are subject to a registration agreement, whereby Duke Energy hasagreed to register an exchange with the holders of identical bonds under the Securities Act. The proceeds fromthis issuance were used to repay short-term debt, replace $100 million of Duke Energy’s first and refundingmortgage bonds that matured in February 2003, to repay approximately $200 million of an intercompany loanfrom Duke Capital Corporation and for general corporate purposes.
Additionally, Duke Energy redeemed all of its Auction Series A preferred stock during 2002. The totalredemption price was approximately $75 million.
In 2000, Catawba, a fully consolidated financing entity managed by a subsidiary of Duke Energy, issued$1,025 million of preferred member interests to a third-party investor. The proceeds from the non-controllinginvestor were reflected on the Consolidated Balance Sheets as Minority Interest in Financing Subsidiary andwere subsequently advanced to DE Power Generation, LLC (DEPG), a wholly owned subsidiary of DukeEnergy. In September 2002, Catawba distributed the receivable from DEPG to the preferred member, THORInvestors, LLC (THOR), which simultaneously withdrew its interest. As a result, the $1,025 million that DEPGpreviously owed to Catawba became an obligation to THOR and was reclassified on the 2002 ConsolidatedBalance Sheet to Long-term Debt. In October 2002, Duke Energy purchased the equity interests in THOR andeffectively reduced the debt to $994 million. Additionally, Duke Capital Corporation financially guaranteed the$994 million in return for certain modifications to the terms of the credit agreement.
On March 14, 2002, Duke Energy acquired Westcoast for approximately $8 billion, including theassumption of $4.7 billion of debt. The assumed debt consists of debt of Westcoast, Union Gas and variousproject entities that are wholly owned or consolidated by Duke Energy. The interest rates on the assumed debtrange from 1.8% to 15.0%, with maturity dates ranging from 2002 through 2031. In addition to the debt assumed,as of December 31, 2002, Westcoast and Union Gas had operating credit facilities of 450 million Canadiandollars (U.S. $285 million) and 600 million Canadian dollars (U.S. $380 million), respectively. Borrowingsunder the Union Gas credit facility are subject to and dependent on the senior unsecured rating of Union Gas,rated A by DBRS and A- by S&P as of February 28, 2003. For the Union Gas credit facility, no material adversechange can be declared if Union Gas maintains a rating of BBB or greater by either DBRS or S&P. Anyoutstanding debt would not become due and payable as a result of a change in its ratings.
In the transaction, a Duke Energy subsidiary acquired all of the outstanding common shares of Westcoast inexchange for approximately $1.7 billion in cash (net of cash acquired) and approximately 49.9 million shares ofDuke Energy common stock (including exchangeable shares of a Duke Energy Canadian subsidiary that aresubstantially equivalent to and exchangeable on a one-for-one basis for Duke Energy common stock). The valueof the Duke Energy common stock issued was approximately $1.7 billion and was determined based on theaverage market price of Duke Energy’s common shares over the two-day period before and after the terms of thetransaction became fixed, in accordance with EITF No. 99-12, “Determination of the Measurement Date for theMarket Price of Acquirer Securities Issued in a Purchase Business Combination.” Under prorating provisions ofthe acquisition agreement that ensured that approximately 50% of the total consideration was paid in cash and50% in stock, each common share of Westcoast entitled the holder to elect to receive 43.80 in Canadian dollars,or either 0.7711 of a share of Duke Energy common stock or of an exchangeable share of a Duke EnergyCanadian subsidiary, or a combination thereof. The cash portion of the consideration was funded with theproceeds from the issuance of $750 million in mandatory convertible securities in November 2001 (see Note 18to the Consolidated Financial Statements) along with incremental commercial paper. The commercial paper wasrepaid using the proceeds from a public offering of 54.5 million shares of common stock at $18.35 per share. The
60

shares from the public offering were issued in October 2002 and the proceeds were approximately $1.0 billion,before underwriting commissions and other offering expenses. The Westcoast acquisition was accounted forusing the purchase method of accounting, and goodwill totaling approximately $2.3 billion was recorded in thetransaction. (See Note 2 to the Consolidated Financial Statements.)
Credit Facilities and Related Borrowings. The following table summarizes Duke Energy’s credit facilitiesand related amounts outstanding as of December 31, 2002. The majority of the credit facilities supportcommercial paper programs. The issuance of commercial paper, letters of credit and other borrowings reducesthe amount available under the credit facilities. Amounts related to outstanding commercial paper and otherborrowings in the following table are included in the long-term debt table presented in Note 11 to theConsolidated Financial Statements.
61
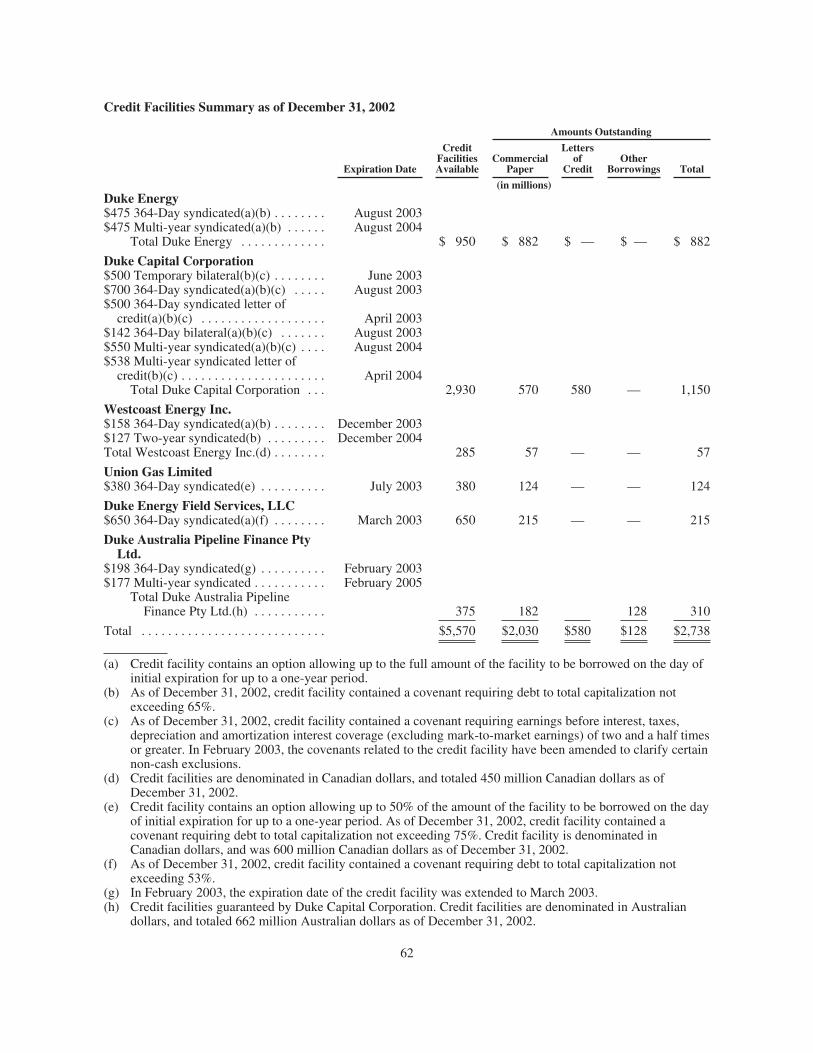
Credit Facilities Summary as of December 31, 2002
Expiration Date
CreditFacilitiesAvailable
Amounts Outstanding
CommercialPaper
Lettersof
CreditOther
Borrowings Total
(in millions)Duke Energy$475 364-Day syndicated(a)(b) . . . . . . . . August 2003$475 Multi-year syndicated(a)(b) . . . . . . August 2004
Total Duke Energy . . . . . . . . . . . . . $ 950 $ 882 $ — $ — $ 882
Duke Capital Corporation$500 Temporary bilateral(b)(c) . . . . . . . . June 2003$700 364-Day syndicated(a)(b)(c) . . . . . August 2003$500 364-Day syndicated letter ofcredit(a)(b)(c) . . . . . . . . . . . . . . . . . . . April 2003
$142 364-Day bilateral(a)(b)(c) . . . . . . . August 2003$550 Multi-year syndicated(a)(b)(c) . . . . August 2004$538 Multi-year syndicated letter ofcredit(b)(c) . . . . . . . . . . . . . . . . . . . . . . April 2004
Total Duke Capital Corporation . . . 2,930 570 580 — 1,150
Westcoast Energy Inc.$158 364-Day syndicated(a)(b) . . . . . . . . December 2003$127 Two-year syndicated(b) . . . . . . . . . December 2004Total Westcoast Energy Inc.(d) . . . . . . . . 285 57 — — 57
Union Gas Limited$380 364-Day syndicated(e) . . . . . . . . . . July 2003 380 124 — — 124
Duke Energy Field Services, LLC$650 364-Day syndicated(a)(f) . . . . . . . . March 2003 650 215 — — 215
Duke Australia Pipeline Finance PtyLtd.
$198 364-Day syndicated(g) . . . . . . . . . . February 2003$177 Multi-year syndicated . . . . . . . . . . . February 2005
Total Duke Australia PipelineFinance Pty Ltd.(h) . . . . . . . . . . . 375 182 128 310
Total . . . . . . . . . . . . . . . . . . . . . . . . . . . . $5,570 $2,030 $580 $128 $2,738
(a) Credit facility contains an option allowing up to the full amount of the facility to be borrowed on the day ofinitial expiration for up to a one-year period.
(b) As of December 31, 2002, credit facility contained a covenant requiring debt to total capitalization notexceeding 65%.
(c) As of December 31, 2002, credit facility contained a covenant requiring earnings before interest, taxes,depreciation and amortization interest coverage (excluding mark-to-market earnings) of two and a half timesor greater. In February 2003, the covenants related to the credit facility have been amended to clarify certainnon-cash exclusions.
(d) Credit facilities are denominated in Canadian dollars, and totaled 450 million Canadian dollars as ofDecember 31, 2002.
(e) Credit facility contains an option allowing up to 50% of the amount of the facility to be borrowed on the dayof initial expiration for up to a one-year period. As of December 31, 2002, credit facility contained acovenant requiring debt to total capitalization not exceeding 75%. Credit facility is denominated inCanadian dollars, and was 600 million Canadian dollars as of December 31, 2002.
(f) As of December 31, 2002, credit facility contained a covenant requiring debt to total capitalization notexceeding 53%.
(g) In February 2003, the expiration date of the credit facility was extended to March 2003.(h) Credit facilities guaranteed by Duke Capital Corporation. Credit facilities are denominated in Australian
dollars, and totaled 662 million Australian dollars as of December 31, 2002.
62

Existing bank credit facilities as of December 31, 2002 are not subject to minimum cash requirements. Inaddition, in October 2002, Duke Energy secured an option to borrow up to $500 million in February 2003 for aperiod ending no later than November 2003. In February 2003, this option was amended to allow Duke Energy toborrow up to $250 million between June 30, 2003 and August 29, 2003. Any amounts borrowed would be due nolater than March 31, 2004. Also, Duke Energy is currently maintaining a minimum cash position of $500 millionat Duke Capital Corporation to be used for short-term liquidity needs. This cash position is invested in highlyrated, liquid, short-term money market securities.
Duke Energy has approximately $3,700 million of credit facilities which mature in 2003. It is DukeEnergy’s intent to reduce its need for these facilities as the year progresses and thus resyndicate less than the total$3,700 million.
Duke Energy’s credit agreements contain various financial and other covenants. Failure to meet thosecovenants beyond applicable grace periods could result in acceleration of due dates of the borrowings and/ortermination of the agreements. As of December 31, 2002, Duke Energy was in compliance with those covenants.In addition, certain of the agreements contain cross-acceleration provisions that may allow acceleration ofpayments or termination of the agreements upon nonpayment or acceleration of other significant indebtedness ofthe applicable borrower or certain of its subsidiaries.
Other Financing Matters. As of December 31, 2002, Duke Energy and its subsidiaries had effective SECshelf registrations for up to $1,140 million in gross proceeds from debt and other securities. Subsequent toDecember 31, 2002, these SEC shelf registrations have been increased to $2,500 million. In addition, as ofDecember 31, 2002, Duke Energy had access to 950 million Canadian dollars (U.S. $602 million) availableunder Canadian shelf registrations for issuances in the Canadian market.
In 2000, Duke Energy issued $250 million of 7.125% senior unsecured bonds due in 2012, with a put optionthat gave investors the choice to put the bond to Duke Energy at par value in September 2002 or extend thematurity until 2012. In September 2002, Duke Energy refinanced the senior unsecured bonds with private debtsecurities and paid approximately $43 million to buy back the option to extend the maturity of the bonds. Theprivate debt securities were subsequently repaid in October 2002 by the issuance of $350 million of 6.45% seniorunsecured notes due in 2032. The cost of the option will be amortized over the life of the $350 million seniorunsecured notes.
In 2000, Duke Capital Corporation issued $150 million senior unsecured bonds due in 2003 that may berequired to be repaid if Duke Capital Corporation’s senior unsecured debt ratings fall below BBB at S&P or Baa2at Moody’s. Additionally, $21 million of Duke Energy’s senior unsecured notes which mature serially through2011 may be required to be repaid if Duke Energy’s senior unsecured debt ratings fall below BBB- at S&P orBaa3 at Moody’s, and $33 million of Duke Energy’s senior unsecured notes which mature serially through 2016may be required to be repaid if Duke Energy’s senior unsecured debt ratings fall below BBB at S&P or Baa2 atMoody’s. As of February 28, 2003, Duke Energy’s senior unsecured credit rating was A- at S&P and A3 atMoody’s, and Duke Capital Corporation’s senior unsecured credit rating was BBB+ at S&P and Baa2 atMoody’s.
Duke Energy’s Board of Directors adopted a dividend policy in 2000 that maintains dividends at the currentquarterly rate of $0.275 per share, subject to the discretion after determination of the Board of Directors. DukeEnergy has paid quarterly cash dividends for 76 consecutive years. Dividends on common and preferred stocks in2003 are expected to be paid on March 17, June 16, September 16 and December 16, subject to the discretion ofthe Board of Directors.
Duke Energy’s InvestorDirect Choice Plan, allows investors to reinvest dividends in new issuances ofcommon stock and to purchase common stock directly from Duke Energy. Issuances under this plan were $105million in 2002, $100 million in 2001 and $86 million in 2000.
63
Duke Energy also sponsors employee savings plans that cover substantially all employees. Issuances ofcommon stock under these plans were $188 million in 2002, $170 million in 2001 and $57 million in 2000. DukeEnergy also issues authorized but unissued shares of its common stock to meet other employee benefitrequirements. Issuances of common stock to meet other employee benefit requirements were approximately $50million to $60 million each year for 2002, 2001 and 2000. This practice is expected to continue in 2003. (SeeNotes 19 and 20 to the Consolidated Financial Statements for additional information on stock-basedcompensation and employee benefit plans.)
Additionally, no contributions to the Duke Energy defined benefit pension plan were made in 2002, 2001 or2000. Duke Energy does not anticipate making a contribution in 2003 for the 2002 plan year. Duke Energyanticipates that it will make a contribution to its non-contributory defined benefit pension plan in 2004 ofapproximately $100 million for the 2003 plan year. Duke Energy anticipates that it will make a contribution ofapproximately $10 million to the Westcoast pension plans in 2003 for the 2003 plan year. Contributions for the2004 plan year and beyond may vary based on the actual return on the defined benefit pension plan’s assets, aswell as other factors.
Contractual Obligations and Commercial Commitments
As part of its normal business, Duke Energy is a party to various financial guarantees, performanceguarantees and other contractual commitments to extend guarantees of credit and other assistance to varioussubsidiaries, investees and other third parties. These arrangements are largely entered into by Duke CapitalCorporation. To varying degrees, these guarantees involve elements of performance and credit risk, which are notincluded on the Consolidated Balance Sheets. The possibility of Duke Energy or Duke Capital Corporationhaving to honor its contingencies is largely dependent upon future operations of various subsidiaries, investeesand other third parties, or the occurrence of certain future events. Duke Energy would record a liability if eventsoccurred that required that one be established. (See Note 17 to the Consolidated Financial Statements for moreinformation on financial guarantees.)
In addition, Duke Energy enters into various fixed-price, non-cancelable commitments to purchase or sellpower (tolling arrangements or power purchase contracts), take-or-pay arrangements, transportation orthroughput agreements and other contracts that may or may not be recognized on the Consolidated BalanceSheets. Some of these arrangements may be recognized at market value on the Consolidated Balance Sheets astrading contracts or qualifying hedge positions included in Unrealized Gains or Losses on Mark-to-Market andHedging Transactions.
64

The following table summarizes Duke Energy’s contractual cash obligations for each of the years presented.
Contractual Cash Obligations
Payments Due
2003 2004 2005 2006 2007 Thereafter
(in millions)Long-term debt (a) . . . . . . . . . . . . . . . . . . . . . . . . . . . . . $1,315 $1,296 $2,713 $2,345 $ 707 $12,835Capital leases (a) . . . . . . . . . . . . . . . . . . . . . . . . . . . . . . 14 15 15 145 17 133Preferred securities (b) . . . . . . . . . . . . . . . . . . . . . . . . . 2 2 2 2 2 1,423Operating leases (c) . . . . . . . . . . . . . . . . . . . . . . . . . . . . 81 63 43 27 21 48Firm capacity payments (d) . . . . . . . . . . . . . . . . . . . . . . 632 418 364 298 236 1,298Purchase commitments (e) . . . . . . . . . . . . . . . . . . . . . . 668 376 272 151 113 402Other (f) . . . . . . . . . . . . . . . . . . . . . . . . . . . . . . . . . . . . . 309 8 3 1 1 —
Total contractual cash obligations . . . . . . . . . . . . . . . . . $3,021 $2,178 $3,412 $2,969 $1,097 $16,139
(a) See Note 11 to the Consolidated Financial Statements.(b) See Notes 13 and 15 to the Consolidated Financial Statements.(c) See Note 16 to the Consolidated Financial Statements.(d) Includes firm capacity payments that provide Duke Energy with uninterrupted firm access to natural gas
transportation and storage, electricity transmission capacity, and the option to convert natural gas toelectricity at third-party owned facilities (tolling arrangements) in some natural gas and power locationsthroughout North America. Also includes firm capacity payments under electric power agreements enteredinto to meet Duke Power native load requirements and firm transmission capacity on other systemspurchased for the transport of electricity sold at wholesale rates. Amounts exclude transmission capacitypurchased by the Duke Power wholesale merchant function on the Duke Power transmission system, whichis eliminated in consolidation.
(e) Amounts include purchase commitments for nuclear fuel supply contracts, power purchases, natural gas,coal, splitter agreements, terminaling fees for residual fuel, refined fuel and coal, and contracts for software,telephone, data and wireless services. Amounts also reflect Duke Energy’s renegotiated obligations as ofDecember 2002 to purchase gas-fired turbines, steam turbines and heat recovery steam generators (HRSG).Firm commitments under the turbine and HRSG purchase agreements are payable consistent with therespective delivery schedule of each project. Purchase agreements include milestone requirements by themanufacturer and provide Duke Energy with the ability to cancel the discrete purchase order commitment inexchange for a termination fee, which escalates over time.
(f) Amounts include engineering, procurement and construction costs for power generation facilities in NorthAmerica. Such amounts are payable to D/FD, a related party in which Duke Energy has a 50% equityinterest, and are excluded from the Consolidated Balance Sheets since Duke Energy accounts for D/FDusing the equity method of accounting. Amounts also include engineering, procurement and constructioncosts for power generation facilities in Guatemala.
The following table summarizes the commercial commitments in effect as of December 31, 2002 byexpiration date.
Commercial Commitments
TotalAmountsCommitted
Amount of Commitment Expiring EachPeriod
(see Note 17) 2003 2004 2005 2006 2007 Thereafter
(in millions)Guarantees of obligations of non-wholly owned affiliates . . $1,006 $400 $54 $ 2 $ 11 $3 $536Surety and bid bonds(a)(b) . . . . . . . . . . . . . . . . . . . . . . . . . 268 247 19 — — 2 —Letters of credit(b) . . . . . . . . . . . . . . . . . . . . . . . . . . . . . . . . 753 709 24 20
(a) Surety bonds are contractual agreements issued by a surety company and back up Duke Energy’sobligations to a third party. Bid bonds are issued to project owners and are subject to full or partial forfeiturefor failure to perform obligations arising from a successful bid.
(b) Includes obligations of consolidated subsidiaries.
65
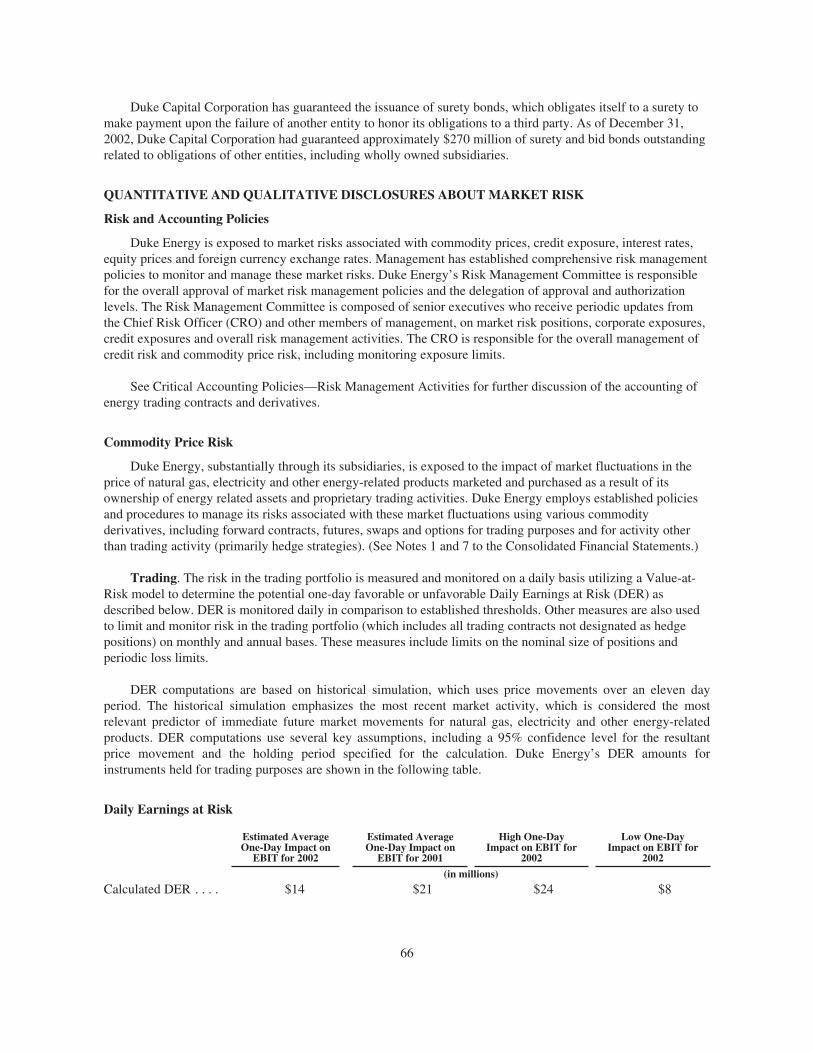
Duke Capital Corporation has guaranteed the issuance of surety bonds, which obligates itself to a surety tomake payment upon the failure of another entity to honor its obligations to a third party. As of December 31,2002, Duke Capital Corporation had guaranteed approximately $270 million of surety and bid bonds outstandingrelated to obligations of other entities, including wholly owned subsidiaries.
QUANTITATIVE AND QUALITATIVE DISCLOSURES ABOUTMARKET RISK
Risk and Accounting Policies
Duke Energy is exposed to market risks associated with commodity prices, credit exposure, interest rates,equity prices and foreign currency exchange rates. Management has established comprehensive risk managementpolicies to monitor and manage these market risks. Duke Energy’s Risk Management Committee is responsiblefor the overall approval of market risk management policies and the delegation of approval and authorizationlevels. The Risk Management Committee is composed of senior executives who receive periodic updates fromthe Chief Risk Officer (CRO) and other members of management, on market risk positions, corporate exposures,credit exposures and overall risk management activities. The CRO is responsible for the overall management ofcredit risk and commodity price risk, including monitoring exposure limits.
See Critical Accounting Policies—Risk Management Activities for further discussion of the accounting ofenergy trading contracts and derivatives.
Commodity Price Risk
Duke Energy, substantially through its subsidiaries, is exposed to the impact of market fluctuations in theprice of natural gas, electricity and other energy-related products marketed and purchased as a result of itsownership of energy related assets and proprietary trading activities. Duke Energy employs established policiesand procedures to manage its risks associated with these market fluctuations using various commodityderivatives, including forward contracts, futures, swaps and options for trading purposes and for activity otherthan trading activity (primarily hedge strategies). (See Notes 1 and 7 to the Consolidated Financial Statements.)
Trading. The risk in the trading portfolio is measured and monitored on a daily basis utilizing a Value-at-Risk model to determine the potential one-day favorable or unfavorable Daily Earnings at Risk (DER) asdescribed below. DER is monitored daily in comparison to established thresholds. Other measures are also usedto limit and monitor risk in the trading portfolio (which includes all trading contracts not designated as hedgepositions) on monthly and annual bases. These measures include limits on the nominal size of positions andperiodic loss limits.
DER computations are based on historical simulation, which uses price movements over an eleven dayperiod. The historical simulation emphasizes the most recent market activity, which is considered the mostrelevant predictor of immediate future market movements for natural gas, electricity and other energy-relatedproducts. DER computations use several key assumptions, including a 95% confidence level for the resultantprice movement and the holding period specified for the calculation. Duke Energy’s DER amounts forinstruments held for trading purposes are shown in the following table.
Daily Earnings at Risk
Estimated AverageOne-Day Impact on
EBIT for 2002
Estimated AverageOne-Day Impact on
EBIT for 2001
High One-DayImpact on EBIT for
2002
Low One-DayImpact on EBIT for
2002
(in millions)
Calculated DER . . . . $14 $21 $24 $8
66
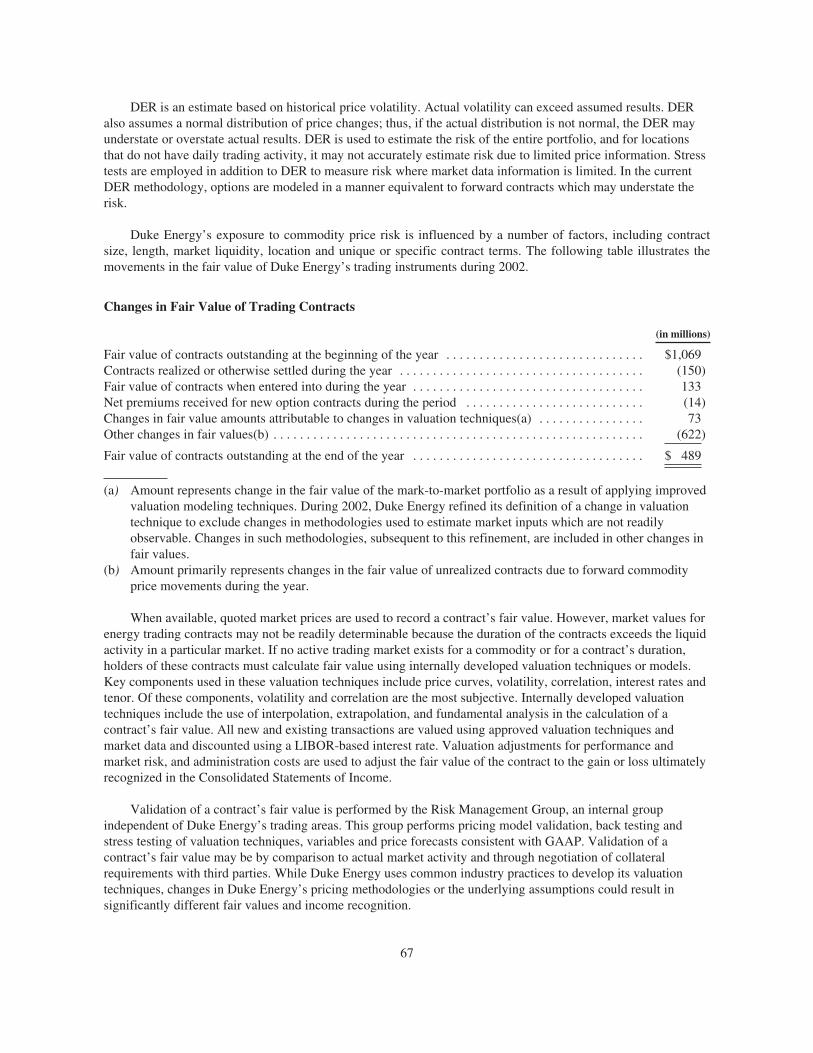
DER is an estimate based on historical price volatility. Actual volatility can exceed assumed results. DERalso assumes a normal distribution of price changes; thus, if the actual distribution is not normal, the DER mayunderstate or overstate actual results. DER is used to estimate the risk of the entire portfolio, and for locationsthat do not have daily trading activity, it may not accurately estimate risk due to limited price information. Stresstests are employed in addition to DER to measure risk where market data information is limited. In the currentDER methodology, options are modeled in a manner equivalent to forward contracts which may understate therisk.
Duke Energy’s exposure to commodity price risk is influenced by a number of factors, including contractsize, length, market liquidity, location and unique or specific contract terms. The following table illustrates themovements in the fair value of Duke Energy’s trading instruments during 2002.
Changes in Fair Value of Trading Contracts
(in millions)
Fair value of contracts outstanding at the beginning of the year . . . . . . . . . . . . . . . . . . . . . . . . . . . . . . $1,069Contracts realized or otherwise settled during the year . . . . . . . . . . . . . . . . . . . . . . . . . . . . . . . . . . . . . (150)Fair value of contracts when entered into during the year . . . . . . . . . . . . . . . . . . . . . . . . . . . . . . . . . . . 133Net premiums received for new option contracts during the period . . . . . . . . . . . . . . . . . . . . . . . . . . . (14)Changes in fair value amounts attributable to changes in valuation techniques(a) . . . . . . . . . . . . . . . . 73Other changes in fair values(b) . . . . . . . . . . . . . . . . . . . . . . . . . . . . . . . . . . . . . . . . . . . . . . . . . . . . . . . . (622)
Fair value of contracts outstanding at the end of the year . . . . . . . . . . . . . . . . . . . . . . . . . . . . . . . . . . . $ 489
(a) Amount represents change in the fair value of the mark-to-market portfolio as a result of applying improvedvaluation modeling techniques. During 2002, Duke Energy refined its definition of a change in valuationtechnique to exclude changes in methodologies used to estimate market inputs which are not readilyobservable. Changes in such methodologies, subsequent to this refinement, are included in other changes infair values.
(b) Amount primarily represents changes in the fair value of unrealized contracts due to forward commodityprice movements during the year.
When available, quoted market prices are used to record a contract’s fair value. However, market values forenergy trading contracts may not be readily determinable because the duration of the contracts exceeds the liquidactivity in a particular market. If no active trading market exists for a commodity or for a contract’s duration,holders of these contracts must calculate fair value using internally developed valuation techniques or models.Key components used in these valuation techniques include price curves, volatility, correlation, interest rates andtenor. Of these components, volatility and correlation are the most subjective. Internally developed valuationtechniques include the use of interpolation, extrapolation, and fundamental analysis in the calculation of acontract’s fair value. All new and existing transactions are valued using approved valuation techniques andmarket data and discounted using a LIBOR-based interest rate. Valuation adjustments for performance andmarket risk, and administration costs are used to adjust the fair value of the contract to the gain or loss ultimatelyrecognized in the Consolidated Statements of Income.
Validation of a contract’s fair value is performed by the Risk Management Group, an internal groupindependent of Duke Energy’s trading areas. This group performs pricing model validation, back testing andstress testing of valuation techniques, variables and price forecasts consistent with GAAP. Validation of acontract’s fair value may be by comparison to actual market activity and through negotiation of collateralrequirements with third parties. While Duke Energy uses common industry practices to develop its valuationtechniques, changes in Duke Energy’s pricing methodologies or the underlying assumptions could result insignificantly different fair values and income recognition.
67
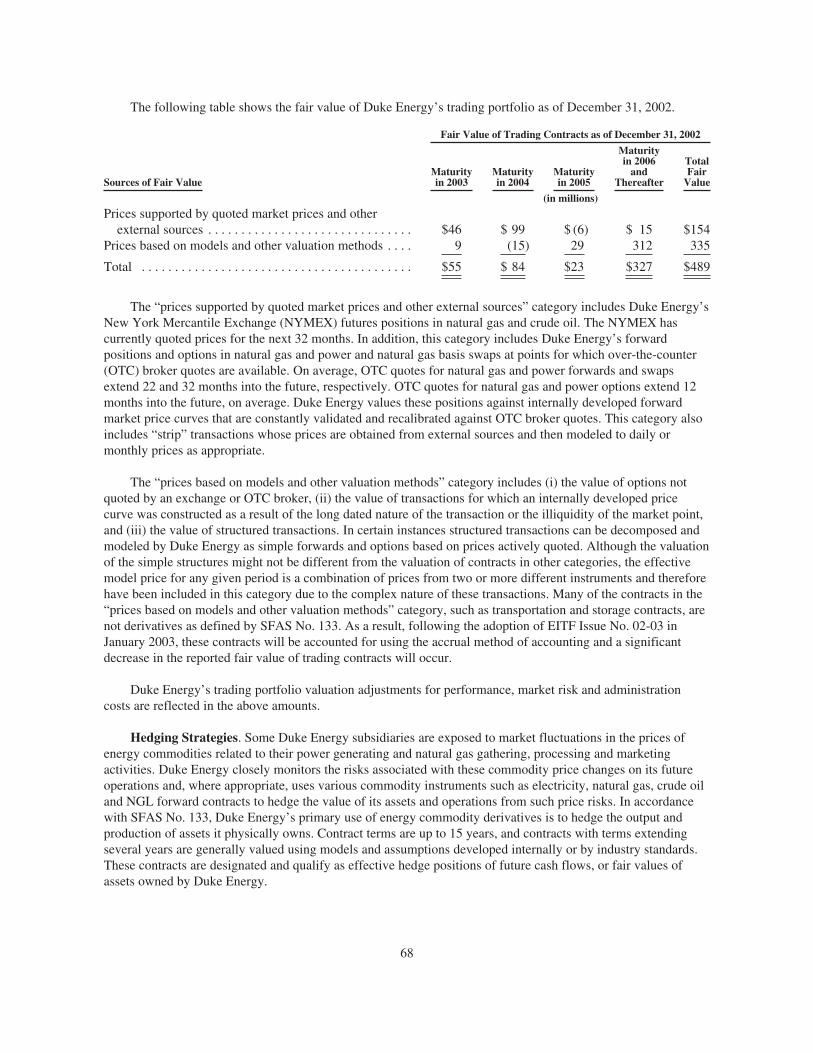
The following table shows the fair value of Duke Energy’s trading portfolio as of December 31, 2002.
Fair Value of Trading Contracts as of December 31, 2002
Sources of Fair ValueMaturityin 2003
Maturityin 2004
Maturityin 2005
Maturityin 2006and
Thereafter
TotalFairValue
(in millions)
Prices supported by quoted market prices and otherexternal sources . . . . . . . . . . . . . . . . . . . . . . . . . . . . . . . $46 $ 99 $ (6) $ 15 $154
Prices based on models and other valuation methods . . . . 9 (15) 29 312 335
Total . . . . . . . . . . . . . . . . . . . . . . . . . . . . . . . . . . . . . . . . . $55 $ 84 $23 $327 $489
The “prices supported by quoted market prices and other external sources” category includes Duke Energy’sNew York Mercantile Exchange (NYMEX) futures positions in natural gas and crude oil. The NYMEX hascurrently quoted prices for the next 32 months. In addition, this category includes Duke Energy’s forwardpositions and options in natural gas and power and natural gas basis swaps at points for which over-the-counter(OTC) broker quotes are available. On average, OTC quotes for natural gas and power forwards and swapsextend 22 and 32 months into the future, respectively. OTC quotes for natural gas and power options extend 12months into the future, on average. Duke Energy values these positions against internally developed forwardmarket price curves that are constantly validated and recalibrated against OTC broker quotes. This category alsoincludes “strip” transactions whose prices are obtained from external sources and then modeled to daily ormonthly prices as appropriate.
The “prices based on models and other valuation methods” category includes (i) the value of options notquoted by an exchange or OTC broker, (ii) the value of transactions for which an internally developed pricecurve was constructed as a result of the long dated nature of the transaction or the illiquidity of the market point,and (iii) the value of structured transactions. In certain instances structured transactions can be decomposed andmodeled by Duke Energy as simple forwards and options based on prices actively quoted. Although the valuationof the simple structures might not be different from the valuation of contracts in other categories, the effectivemodel price for any given period is a combination of prices from two or more different instruments and thereforehave been included in this category due to the complex nature of these transactions. Many of the contracts in the“prices based on models and other valuation methods” category, such as transportation and storage contracts, arenot derivatives as defined by SFAS No. 133. As a result, following the adoption of EITF Issue No. 02-03 inJanuary 2003, these contracts will be accounted for using the accrual method of accounting and a significantdecrease in the reported fair value of trading contracts will occur.
Duke Energy’s trading portfolio valuation adjustments for performance, market risk and administrationcosts are reflected in the above amounts.
Hedging Strategies. Some Duke Energy subsidiaries are exposed to market fluctuations in the prices ofenergy commodities related to their power generating and natural gas gathering, processing and marketingactivities. Duke Energy closely monitors the risks associated with these commodity price changes on its futureoperations and, where appropriate, uses various commodity instruments such as electricity, natural gas, crude oiland NGL forward contracts to hedge the value of its assets and operations from such price risks. In accordancewith SFAS No. 133, Duke Energy’s primary use of energy commodity derivatives is to hedge the output andproduction of assets it physically owns. Contract terms are up to 15 years, and contracts with terms extendingseveral years are generally valued using models and assumptions developed internally or by industry standards.These contracts are designated and qualify as effective hedge positions of future cash flows, or fair values ofassets owned by Duke Energy.
68
Duke Energy also engages in the economic hedging of other contractual assets such as transportation andstorage of gas. For the three years ended December 31, 2002, such hedging activity was not recorded pursuant toSFAS No. 133 because of the broad fair value accounting model in the FASB’s and the EITF’s rules during thatperiod. The hedge and the hedged item were both accounted for using MTM accounting. However, in connectionwith the adoption of EITF Issue No. 02-03 in January 2003, Duke Energy anticipates that many of these formerhedge relationships will be designated as hedges for accounting purposes in accordance withSFAS No. 133.
To the extent that the hedge instrument offsets the transaction being hedged, there is no impact to theConsolidated Statements of Income but changes in fair values will result in changes in the Consolidated BalanceSheets and the Consolidated Statements of Common Stockholders’ Equity and Comprehensive Income.Accordingly, assumptions and valuation techniques for these contracts have no impact on reported earnings orcash flows prior to settlement. The unrealized gains or losses on these contracts are deferred in OtherComprehensive Income (OCI) for cash flow hedges and included in Other Current or Noncurrent Assets orLiabilities on the Consolidated Balance Sheets for fair value hedges of firm commitments, in accordance withSFAS No. 133. Amounts deferred in OCI are realized in earnings concurrently with the transaction being hedged.(See Notes 1 and 7 to the Consolidated Financial Statements.) However, in instances where the hedging contractno longer qualifies for hedge accounting, amounts included in OCI through the date of de-designation remain inOCI until the underlying transaction actually occurs. The derivative contract (if continued as an open position)will be marked to market currently through earnings. Several factors influence the effectiveness of a hedgecontract, including counterparty credit risk and using contracts with different commodities or unmatched terms.Hedge effectiveness is monitored regularly and measured each month. To the extent hedge contracts are deemedineffective, as defined by SFAS No. 133, the impact may increase or decrease earnings.
In addition to the hedge contracts described above and recorded on the Consolidated Balance Sheets, DukeEnergy enters into other contracts that qualify for the normal purchases and sales exemption described inParagraph 10 of SFAS No. 133 and DIG Issue No. C15. These contracts, generally forward agreements to sellpower, bear the same counterparty credit risk as the hedge contracts described above. Under the same credit riskreduction guidelines used for other contracts, normal purchases and sales contracts are also subject to collateralrequirements. Income recognition and realization related to these contracts coincide with the physical delivery ofpower.
Based on a sensitivity analysis as of December 31, 2002, it was estimated that a difference of one cent pergallon in the average price of NGLs in 2003 would have a corresponding effect on EBIT of approximately $7million (at Duke Energy’s 70% ownership), after considering the effect of Duke Energy’s commodity hedgepositions. Comparatively, the same sensitivity analysis as of December 31, 2001 estimated that EBIT would havechanged by approximately $6 million in 2002. Based on a sensitivity analysis performed on DENA’s managedmerchant generation fleet and associated natural gas transportation contracts, with both modeled as options, a $1change in spark spread (defined as the price realized for power less the cost of fuel for that power) would not beexpected to have a material impact on EBIT for 2003 as of December 31, 2002, or 2002 as of December 31,2001. The effect on EBIT for 2003 or 2002 was also not expected to be material as of December 31, 2002 or2001 for exposures to other commodities’ price changes. These hypothetical calculations consider existing hedgepositions and estimated production levels, but do not consider other potential effects that might result from suchchanges in commodity prices.
69

North American Merchant Generation
As of December 31, 2002, the merchant generation facilities in North America owned or operated by DukeEnergy represented 12,734 net megawatts (MW), after considering other parties’ ownership interests. Thisexcludes 1,423 net MW, associated with facilities which are not currently managed directly by DENA. Facilitiesscheduled for completion during 2003 represent an additional 1,860 net MW. The managed merchant generationfleet total of 14,594 net MW (inclusive of the 1,860 net MW related to facilities scheduled for completion during2003), consists of 13 combined cycle units representing 10,361 net MW and seven simple cycle (peaker) unitsrepresenting 4,233 net MW. For more information on the North American merchant generation facilities, seePart I, Item 2—Properties.
As of December 31, 2002, the estimated available production from the merchant generation fleet for 2003was approximately 89 million megawatt hours (Mwh), which consists of approximately 70 million Mwh for thecombined cycle units and approximately 19 million Mwh for the peaker units. As of December 31, 2002,estimated production from the merchant generation fleet for 2003 was approximately 27 million Mwh for thecombined cycle units and approximately 1 million Mwh for the peaker units. As of December 31, 2002, theestimated production from the managed merchant generation fleet that was hedged was 102% for 2003, 79% for2004 and 64% for 2005 at average prices per Mwh of $51 for 2003, $44 for 2004 and $39 for 2005.
Credit Risk
Duke Energy’s principal customers for power and natural gas marketing and transportation services areindustrial end-users, marketers, local distribution companies and utilities located throughout the U.S., Canada,Asia Pacific, Europe and Latin America. Duke Energy has concentrations of receivables from natural gas andelectric utilities and their affiliates, as well as industrial customers and marketers throughout these regions. Theseconcentrations of customers may affect Duke Energy’s overall credit risk in that risk factors can negativelyimpact the credit quality of the entire sector. Where exposed to credit risk, Duke Energy analyzes thecounterparties’ financial condition prior to entering into an agreement, establishes credit limits and monitors theappropriateness of those limits on an ongoing basis.
Duke Energy frequently uses master collateral agreements to mitigate certain credit exposures, primarily inits trading and marketing operations. The collateral agreements provide for a counterparty to post cash or lettersof credit for exposure in excess of the established threshold. The threshold amount represents an unsecured creditlimit, determined in accordance with the corporate credit policy. The collateral agreement also provides that theinability to post collateral is sufficient cause to terminate a contract and liquidate all positions.
Natural Gas Transmission and Field Services also obtain cash or letters of credit from customers, whereappropriate, based on their financial analysis of the customer and the regulatory or contractual terms andconditions applicable to each transaction.
Collateral amounts held or posted may be fixed or may vary depending on the value of the underlyingcontracts and cover trading, normal purchases and normal sales, and hedging contracts outstanding. Duke Energymay be required to return certain held collateral and post additional collateral should price movements adverselyimpact the value of open contracts or positions. In many cases, Duke Energy’s and its counterparties’ publiclydisclosed credit ratings impact the amounts of additional collateral to be posted. Recent downgrades in DukeEnergy’s affiliates’ credit ratings resulted in Duke Energy posting more collateral with counterparties, and anyfurther downgrade could require the posting of additional collateral. Likewise, downgrades in credit ratings ofcounterparties could require counterparties to post additional collateral to Duke Energy. (See Liquidity andCapital Resources—Financing Cash Flows and Liquidity for additional discussion of downgrades.)
70

The change in market value of NYMEX-traded futures and options contracts requires daily cash settlementin margin accounts with brokers. Financial derivatives are generally cash settled periodically throughout thecontract term. However, these transactions are also generally subject to margin agreements with many of DukeEnergy’s counterparties.
Following the bankruptcy of Enron, Duke Energy terminated substantially all contracts with Enron. As aresult, in 2001 Duke Energy recorded, as a charge, a non-collateralized accounting exposure of $43 million. The$43 million non-collateralized accounting exposure was composed of charges of $24 million at Other EnergyServices, $12 million at DENA, $3 million at International Energy, $3 million at Field Services and $1 million atNatural Gas Transmission. These amounts were stated on a pre-tax basis as charges against the reportingsegment’s earnings in 2001.
Duke Energy’s claims made in the Enron bankruptcy case exceeded its non-collateralized accountingexposure. Bankruptcy claims that exceed this amount primarily relate to termination and settlement rights undernormal purchases and normal sales contracts where Enron was the counterparty.
Substantially all contracts with Enron were completed or terminated prior to December 31, 2001. DukeEnergy has continuing contractual relationships with certain Enron affiliates, which are not in bankruptcy. InBrazil, a power purchase agreement between a Duke Energy affiliate, Paranapanema, and Elektro Eletricidade eServicos S/A (Elektro), a distribution company approximately 100% owned by Enron, will expire December 31,2005. The contract was executed by Duke Energy’s predecessor in interest in Paranapanema, and obligatesParanapanema to provide energy to Elektro on an irrevocable basis for the contract period. In addition, apurchase/sale agreement expiring September 1, 2005 between a Duke Energy affiliate and Citrus TradingCorporation (Citrus), a joint venture between Enron and El Paso Corporation, continues to be in effect. Thecontract requires the Duke Energy affiliate to provide natural gas to Citrus. Citrus has provided a letter of creditin favor of Duke Energy to cover its obligations.
Interest Rate Risk
Duke Energy is exposed to risk resulting from changes in interest rates as a result of its issuance of variable-rate debt and commercial paper. Duke Energy manages its interest rate exposure by limiting its variable-rate andfixed-rate exposures to percentages of total capitalization and by monitoring the effects of market changes ininterest rates. Duke Energy also enters into financial derivative instruments, including, but not limited to, interestrate swaps, swaptions and U.S. Treasury lock agreements to manage and mitigate interest rate risk exposure. (SeeNotes 1, 7, 11, 13 and 15 to the Consolidated Financial Statements.)
Based on a sensitivity analysis as of December 31, 2002, it was estimated that if market interest ratesaverage 1% higher (lower) in 2003 than in 2002, earnings before income taxes would decrease (increase) byapproximately $55 million. Comparatively, based on a sensitivity analysis as of December 31, 2001, had interestrates averaged 1% higher (lower) in 2002 than in 2001, it was estimated that earnings before income taxes wouldhave decreased (increased) by approximately $57 million. These amounts include the effects of interest ratehedges and were determined by considering the impact of the hypothetical interest rates on the variable-ratesecurities outstanding as of December 31, 2002 and 2001. The decrease in interest rate sensitivity was primarilydue to the decrease in outstanding variable-rate commercial paper. If interest rates changed significantly,management would likely take actions to manage its exposure to the change. However, due to the uncertainty ofthe specific actions that would be taken and their possible effects, the sensitivity analysis assumes no changes inDuke Energy’s financial structure.
Equity Price Risk
Duke Energy maintains trust funds, as required by the NRC, to fund certain costs of nucleardecommissioning. (See Note 12 to the Consolidated Financial Statements.) As of December 31, 2002 and 2001,
71

these funds were invested primarily in domestic and international equity securities, fixed-rate, fixed-incomesecurities and cash and cash equivalents. Per NRC and Internal Revenue Service mandates, these funds may beused only for activities related to nuclear decommissioning. Those investments are exposed to price fluctuationsin equity markets and changes in interest rates. Because the accounting for nuclear decommissioning recognizesthat costs are recovered through Franchised Electric’s rates, fluctuations in equity prices or interest rates do notaffect consolidated results of operations or cash flows.
Duke Energy’s costs of providing non-contributory defined benefit retirement and postretirement benefitplans are dependent upon a number of factors, such as the rates of return on plan assets, discount rate, the rate ofincrease in health care costs and contributions made to the plans. The market value of Duke Energy’s definedbenefit retirement plan assets has been affected by declines in the equity market since 2000. As a result, atSeptember 30, 2002 (Duke Energy’s measurement date), Duke Energy’s pension plan obligation, excludingWestcoast, exceeded the value of the plan assets by $439 million and Duke Energy was therefore required torecognize a minimum liability as prescribed by SFAS No. 87 and SFAS No. 132, “Employers’ Disclosures aboutPensions and Postretirement Benefits,” of approximately $772 million, excluding Westcoast. The $772 millionpension liability was a combination of the $439 million excess obligation and $333 million in pre-paid pensionassets. The net pension liability as of December 31, 2002 is included in Other Deferred Credits and OtherLiabilities on the Consolidated Balance Sheets. The liability was recorded as a reduction to OCI, net of incometaxes, and did not affect net income for 2002. When the fair value of the plan assets exceeds the accumulatedbenefit obligations on the measurement date, the recorded liability will be reduced and OCI will be restored inthe Consolidated Balance Sheets. Also, Westcoast recorded a $22 million minimum pension liability as ofDecember 31, 2002.
Pension cost and cash funding requirements could increase in future years without a substantial recovery inthe equity markets. Funding requirements for defined benefit pension plans are determined by governmentregulations, not SFAS No. 87. Duke Energy anticipates that it will make a contribution to its defined benefitpension plan in 2004 of approximately $100 million for the 2003 plan year. Duke Energy anticipates that it willmake a contribution of approximately $10 million to the Westcoast pension plans in 2003 for the 2003 plan year.Contributions for the 2004 plan year and beyond may vary based on the actual return on the defined benefitpension plan’s assets, as well as other factors.
Foreign Currency Risk
Duke Energy is exposed to foreign currency risk from investments in international affiliates and businessesowned and operated in foreign countries. To mitigate risks associated with foreign currency fluctuations,contracts may be denominated in or indexed to the U.S. dollar and/or local inflation rates, or investments may behedged through debt denominated or issued in the foreign currency. Duke Energy may also use foreign currencyderivatives, where possible, to manage its risk related to foreign currency fluctuations. To monitor its currencyexchange rate risks, Duke Energy uses sensitivity analysis, which measures the impact of devaluation of theforeign currencies to which it has exposure.
As of December 31, 2002, Duke Energy’s primary foreign currency rate exposures were the Canadiandollar, the Brazilian real, the Peruvian nuevo sol, the Australian dollar, the El Salvadoran colon, the Europeaneuro and the Argentine peso. A 10% devaluation in the currency exchange rate in all of these foreign currencieswould be immaterial to Duke Energy’s Consolidated Statements of Income. The Consolidated Balance Sheetswould be negatively impacted by approximately $300 million currency translation through the cumulativetranslation adjustment in OCI.
In 1991, the Argentine peso was pegged to the U.S. dollar at a fixed 1:1 exchange ratio. In December 2001,the Argentine government imposed a restriction that limited cash withdrawals above a certain amount andforeign money transfers. Financial institutions were allowed to conduct limited activity, a holiday wasannounced, and currency exchange activity was essentially halted. The government also required that all
72
dollar-denominated contracts be converted to pesos. In January 2002, the Argentine government announced thecreation of a dual-currency system. Subsequently, however, the Argentine government changed to a managedfree-floating currency.
Duke Energy’s investment in Argentina was U.S. dollar functional as of December 31, 2001. Once afunctional currency determination has been made, that determination must be adhered to consistently, unlesssignificant changes in economic factors indicate that the entity’s functional currency has changed. The events inArgentina required a change. In January 2002, the functional currency of Duke Energy’s investment in Argentinachanged from the U.S. dollar to the Argentine peso. In compliance with SFAS No. 52, “Foreign CurrencyTranslation,” the change in functional currency was made prospectively. Management believes that the events inArgentina will have no material adverse effect on Duke Energy’s future consolidated results of operations, cashflows or financial position.
CURRENT ISSUES
Electric Competition. Wholesale Competition. The Energy Policy Act of 1992 and the FERC’s subsequentrulemaking activities opened the wholesale energy market to competition. Open-access transmission forwholesale customers, as defined by the FERC’s rules, provides energy suppliers, including Duke Energy, withopportunities to sell and deliver capacity and energy at market-based prices. From the FERC’s open-access rule,Franchised Electric obtained the rights to sell capacity and energy at market-based rates from its own assets,which also allows Franchised Electric to purchase, at attractive rates, a portion of its capacity and energyrequirements resulting in lower overall costs to customers. Open access also provides Franchised Electric’sexisting wholesale customers with competitive opportunities to seek other suppliers for their capacity and energyrequirements.
In 1999 and 2000, the FERC issued its Order 2000 and Order 2000-A regarding Regional TransmissionOrganizations (RTOs). These orders set minimum characteristics and functions RTOs must meet, includingindependent authority to establish the terms and conditions of transmission service over the facilities theycontrol. The orders provide for an open and flexible RTO structure to meet the needs of the market, and for thepossibility of incentive ratemaking and other benefits for transmission owners that participate.
As a result of these rulemakings, Duke Power and the franchised electric units of two other investor-ownedutilities, Progress Energy (formerly known as Carolina Power & Light Company) and South Carolina Electric &Gas Company, planned to establish GridSouth Transco, LLC (GridSouth), as an RTO responsible for the functionalcontrol of the companies’ combined transmission systems. As of December 31, 2002, Duke Energy had invested$37 million in GridSouth, including carrying costs. This amount is included in Other Regulatory Assets andDeferred Debits on the Consolidated Balance Sheets. The sponsors expected that GridSouth would be substantiallyoperational by the FERC’s Order 2000 “deadline” date of December 15, 2001. In March 2001, GridSouth receivedprovisional approval from the FERC. However, in July 2001 the FERC ordered GridSouth and other utilities in theSoutheast to join in a mediation to negotiate terms of a southeastern RTO. It does not appear that the FERC willissue an order specifically based on that proceeding. In 2002, the GridSouth sponsors withdrew their applications tothe NCUC and the PSCSC for approval of the transfer of functional control of their electric transmission assets toGridSouth, and announced that development of the GridSouth implementation project had been suspended until thesponsors have an opportunity to further consider regulatory circumstances and the outcome of initiatives such as theFERC’s Notice of Proposed Rulemaking (NOPR) on Standard Market Design (SMD) and the RTO cost/benefitstudy initiated by the Southeastern Association of Regulatory Utility Commissioners (SEARUC). The SEARUCcost/benefit study, issued in November 2002, states that under most scenarios neither RTOs nor SMDs provide netbenefits to retail customers in the Southeast over the next few years. The final rule from the SMD NOPR is notexpected to be issued until after July 2003. Duke Energy believes that more open wholesale electric markets will atsome point provide benefits to consumers and other market participants. Duke Energy continues to examine itsspecific options relative to RTOs in light of the existing complex regulatory environment. Management believes itsinvestment in GridSouth is probable of recovery.
73
Retail Competition. Currently, Franchised Electric operates as a vertically integrated, investor-owned utilitywith exclusive rights to supply electricity in a franchised service territory – a 22,000-square-mile service territoryin North and South Carolina. In its retail business, the NCUC and the PSCSC regulate Franchised Electric’sservice and rates. Any future implementation of retail deregulation or competition will likely impact all entitiesowning electric generating assets. Beginning in the late 1990’s, the NCUC and the PSCSC studied the merits ofrestructuring the electric utility industry in North and South Carolina respectively. In 1997, North Carolinapassed a bill that established a study commission, including legislators, customers, utilities and a member of anenvironmental group, to examine whether competition should be implemented in the state. In 2000, the NorthCarolina study commission unanimously approved a set of recommendations on electric restructuring andsubmitted a report containing these recommendations to the General Assembly. Among other things, the NorthCarolina report recommended retail deregulation beginning partially in 2005 and fully in 2006. However,legislation required to implement such recommendations was never introduced. In South Carolina, the SouthCarolina Senate established the Restructuring Task Force and the South Carolina House designated theSubcommittee on Utility Deregulation. Definitive dates for implementing retail deregulation were contemplated,but not established in South Carolina. There is currently no movement in South Carolina’s General Assembly tomove forward with the implementation of retail deregulation.
Currently, the electric utility industry is predominantly regulated on a basis designed to recover the cost ofproviding electric power to customers. If cost-based regulation were to be discontinued in the industry for anyreason, including competitive pressure on the cost-based prices of electricity, profits could be reduced andelectric utilities might be required to reduce their asset balances to reflect a market basis less than cost.Discontinuance of cost-based regulation would also require affected utilities to write-off their associatedregulatory assets. Duke Energy’s regulatory assets are included in the Consolidated Balance Sheets and theportion of these regulatory assets related to Franchised Electric is approximately $1.0 billion, including primarilypurchased capacity costs, deferred debt expense and deferred taxes related to regulatory assets. Duke Energy isrecovering substantially all of these regulatory assets through its current wholesale and retail electric rates andmay attempt to continue to recover these assets during any future transition to competition. In addition, DukeEnergy would seek to recover the costs of its electric generating facilities in excess of the market price of powerat the time of any future transition to competition.
Today, the pace of electricity restructuring varies quite substantially across the U.S. Duke Energy is activelyengaged in most markets, particularly those in which it owns assets. Duke Energy continues to believe thatwholesale competitive markets bring added value to consumers; therefore, Duke Energy supports the continuedrestructuring of wholesale electric markets through a disciplined, prudent transition to regional markets.Transforming the current regulated industry into efficient, competitive wholesale and retail electric markets is acomplex undertaking, and will continue to require careful planning and coordination between federal and stateregulators and other key stakeholders. The key to effective competition is fairness among customers, serviceproviders and investors. Duke Energy intends to continue to work with customers, legislators and regulators toaddress all the important issues. Management currently cannot predict the impact, if any, of these competitiveforces on future consolidated results of operations, cash flows or financial position.
Natural Gas Competition. Wholesale Competition. In 2000, the FERC issued Order 637, which revised itsregulations for the intended purpose of improving the competitiveness and efficiency of natural gas markets.Order 637 effects changes in capacity segmentation, rights of first refusal (ROFR), scheduling procedures, aswell as various reporting requirements intended to provide more transparent pricing information and permit moreeffective monitoring of the market. The FERC also required each interstate pipeline to submit individualcompliance filings to implement the requirements of Order 637. Several parties, including Duke Energy, filedappeals in the District of Columbia Court of Appeals seeking court review of various aspects of Order 637,including (i) the right of customers to segment their capacity rights in a manner that would allow both aforwardhaul and a backhaul transportation transaction to a single delivery point, and (ii) the ROFR granted toexisting customers the right to extend contracts beyond the end of the contract’s primary term. In 2002, theDistrict of Columbia Court of Appeals generally affirmed the Order but remanded certain issues to the FERC for
74
further disposition, including the forwardhaul/backhaul and ROFR issues. These matters are still under review bythe FERC. In addition to the Order 637 general rulemaking proceeding, Duke Energy’s interstate pipelines madeindividual tariff filings to comply with the requirements of Order 637. These individual compliance proceedingsare in different stages of the review approval and implementation process before the FERC. Managementbelieves that the implementation of Order 637 will have no material adverse effect on Duke Energy’s futureconsolidated results of operations, cash flows or financial position.
In addition, the FERC is continually proposing and implementing new rules and regulations affecting thosesegments of the natural gas industry, most notably interstate natural gas transmission companies that remainsubject to the FERC’s jurisdiction. These initiatives may also affect the intrastate transportation of gas undercertain circumstances. The stated purpose of these regulatory changes is to promote competition among thevarious sectors of the natural gas industry and these initiatives generally reflect more light-handed regulation ofthe natural gas industry.
Retail Competition. Changes in regulation to allow retail competition could affect Duke Energy’s naturalgas transportation contracts with local natural gas distribution companies. Since natural gas retail deregulation isin the very early stages of development, management believes the effects of this matter will have no materialadverse effect on Duke Energy’s future consolidated results of operations, cash flows or financial position.
OTHER CURRENT ISSUES
For information on other current issues related to Duke Energy, see the following Notes to the ConsolidatedFinancial Statements: Note 4, Franchised Electric, Natural Gas Transmission and Notices of ProposedRulemaking sections; Note 16, Environmental and Litigation sections.
New Accounting Standards. SFAS No. 142, “Goodwill and Other Intangible Assets.” Duke Energyadopted SFAS No. 142 as of January 1, 2002. SFAS No. 142 requires that goodwill no longer be amortized overan estimated useful life, as previously required. Instead, goodwill amounts are subject to fair value-basedimpairment assessments. Duke Energy did not recognize any material impairment due to the adoption of SFASNo. 142. (For material impairments subsequent to the adoption of SFAS No. 142, see Note 9 to the ConsolidatedFinancial Statements.) SFAS No. 142 also requires certain identifiable intangible assets to be recognizedseparately and amortized as appropriate upon adoption. No adjustments to intangibles were identified by DukeEnergy at adoption.
75
The following table shows what earnings available for common stockholders and earnings per share wouldhave been if amortization (including any related tax effects) related to goodwill that is no longer being amortizedhad been excluded from prior periods.
Goodwill—Adoption of SFAS No. 142
For the years ended December 31,
2002 2001 2000
(in millions, except per share amounts)Earnings available for common stockholders
Reported earnings available for common stockholders . . . . . . . . . . . . $1,021 $1,884 $1,757Add back: Goodwill amortization, net of tax . . . . . . . . . . . . . . . . . . . . — 75 56
Adjusted earnings available for common stockholders . . . . . . . . . . . . $1,021 $1,959 $1,813
Basic earnings per shareReported earnings per share . . . . . . . . . . . . . . . . . . . . . . . . . . . . . . . . . $ 1.22 $ 2.45 $ 2.39Goodwill amortization . . . . . . . . . . . . . . . . . . . . . . . . . . . . . . . . . . . . . — 0.10 0.08
Adjusted earnings per share . . . . . . . . . . . . . . . . . . . . . . . . . . . . . . . . . $ 1.22 $ 2.55 $ 2.47
Diluted earnings per shareReported earnings per share . . . . . . . . . . . . . . . . . . . . . . . . . . . . . . . . . $ 1.22 $ 2.44 $ 2.38Goodwill amortization . . . . . . . . . . . . . . . . . . . . . . . . . . . . . . . . . . . . . — 0.10 0.08
Adjusted earnings per share . . . . . . . . . . . . . . . . . . . . . . . . . . . . . . . . . $ 1.22 $ 2.54 $ 2.46
SFAS No. 144, “Accounting for the Impairment or Disposal of Long-Lived Assets.” Duke Energy adoptedSFAS No. 144 on January 1, 2002. The new rules supersede SFAS No. 121, “Accounting for the Impairment ofLong-Lived Assets and for Long-Lived Assets to Be Disposed Of.” The new rules retain many of thefundamental recognition and measurement provisions, but significantly change the criteria for classifying anasset as held-for-sale or as a discontinued operation. (For material impairment since the adoption of SFAS No.144, see Note 9 to the Consolidated Financial Statements.)
EITF Issue No. 02-03, “Issues Involved in Accounting for Derivative Contracts Held for Trading Purposesand for Contracts Involved in Energy Trading and Risk Management Activities.” In June 2002, the FASB’s EITFreached a partial consensus on Issue No. 02-03. The EITF concluded that, effective for periods ending after July15, 2002, mark-to-market gains and losses on energy trading contracts (including those to be physically settled)must be shown on a net basis in the Consolidated Statements of Income. Duke Energy had previously chosen toreport certain of its energy trading contracts on a gross basis, as sales in operating revenues, and to record theassociated costs in operating expenses, in accordance with prevailing industry practice. The amounts in theConsolidated Statements of Income for 2001 and 2000 have been reclassified to conform to the 2002 presentationof recording all amounts on a net basis in operating revenues. The following table shows the impact of changingfrom gross to net presentation for energy trading activities on Duke Energy’s revenues (offsetting adjustmentswere made to operating expenses resulting in no impact on operating income or net income).
Revenues—Implementation of Gross vs. Net Presentation in EITF Issue No. 02-03
For the years ended December 31,
2001 2000
(in millions)Total revenues before adjustment . . . . . . . . . . . . . . . . $ 59,106 $ 48,594Adjustment . . . . . . . . . . . . . . . . . . . . . . . . . . . . . . . . . (40,909) (33,252)
Revenues as reported . . . . . . . . . . . . . . . . . . . . . . . . . $ 18,197 $ 15,342
76

In the calculation of net revenues, Duke Energy has continued to enhance its methodologies around theapplication of this complex accounting literature since the third quarter 2002 when these trading revenueswere first reported on a net basis. (See Note 1 to the Consolidated Financial Statements for further discussion.)
In October 2002, the EITF, as part of their further deliberations on Issue No. 02-03, rescinded the consensusreached on Issue No. 98-10. As a result, all energy trading contracts that do not meet the definition of aderivative under SFAS No. 133, and trading inventories that previously had been recorded at fair values, will berecorded at their historical cost and reported on an accrual basis resulting in the recognition of earnings or lossesat the time of contract settlement or termination. New non-derivative energy trading contracts entered into afterOctober 25, 2002 are accounted for under the accrual accounting basis. Non-derivative energy trading contractson the Consolidated Balance Sheet as of January 1, 2003 that existed on October 25, 2002 and inventories thatwere recorded at fair values will be adjusted to historical cost via a net-of-tax and minority interest cumulativeeffect adjustment of $125 million to $175 million as a reduction to first quarter 2003 earnings.
The EITF also reached a consensus in October 2002 on Issue No. 02-03 that, effective for periods beginningafter December 15, 2002, gains and losses on all derivative instruments considered to be held for tradingpurposes should be shown on a net basis in the income statement. Gains and losses on non-derivative energytrading contracts should similarly be presented on a gross or net basis in connection with the guidance in IssueNo. 99-19, “Reporting Revenue Gross as a Principal versus Net as an Agent.” Upon application of thispresentation, comparative financial statements for prior periods should be reclassified to conform to theconsensus. As discussed above, gains and losses on all energy trading contracts are currently presented on a netbasis in the Consolidated Statements of Income. Duke Energy is currently assessing the new net revenuepresentation requirements, which will have no impact on operating income or net income.
SFAS No. 143, “Accounting for Asset Retirement Obligations.” In June 2001, the FASB issued SFAS No.143 which addresses financial accounting and reporting for obligations associated with the retirement of tangiblelong-lived assets and the associated asset retirement costs. The standard applies to legal obligations associatedwith the retirement of long-lived assets that result from the acquisition, construction, development and/or normaluse of the asset.
SFAS No. 143 requires that the fair value of a liability for an asset retirement obligation be recognized inthe period in which it is incurred, if a reasonable estimate of fair value can be made. The fair value of the liabilityis added to the carrying amount of the associated asset. This additional carrying amount is then depreciated overthe life of the asset. The liability increases due to the passage of time based on the time value of money until theobligation is settled.
Certain of Duke Energy’s regulated operations recognize some removal costs as a component ofdepreciation in accordance with regulatory treatment. While these amounts will remain in accumulateddepreciation, to the extent these amounts do not represent SFAS No. 143 legal retirement obligations, they willbe disclosed as part of the regulatory matters footnote upon adoption of SFAS No. 143.
SFAS No. 143 was effective for fiscal years beginning after June 15, 2002, and will be adopted by DukeEnergy in the first quarter of 2003. The implementation of the standard is expected to result in a net increase intotal assets of approximately $855 million, consisting primarily of an increase in net property, plant andequipment of approximately $198 million and an increase in regulatory assets of approximately $659 million.Liabilities are expected to increase by approximately $870 million, which primarily represents the establishmentof an asset retirement obligation liability of $1,589 million, reduced by the amount that was already recorded as anuclear decommissioning liability of $708 million. Substantially all of the obligations are related to the regulatedelectric operations. Accordingly, Duke Energy filed a request on January 10, 2003 with the NCUC to defer theincome statement effect of adopting SFAS No.143 for its regulated electric operations, and the accountingtreatment described above reflects management’s assumption that this request will be granted. Duke Energyanticipates making a similar application with the PSCSC by March 31, 2003. For obligations related to
77
non-regulated operations, a net-of-tax cumulative effect of a change in accounting principle adjustment ofapproximately $15 million is expected to be recorded in the first quarter of 2003, as a reduction in earnings.
SFAS No. 146, “Accounting for Costs Associated with Exit or Disposal Activities.” In June 2002, the FASBissued SFAS No. 146 which addresses accounting for restructuring and similar costs. SFAS No. 146 supersedesprevious accounting guidance, principally EITF Issue No. 94-3, “Liability Recognition for Certain EmployeeTermination Benefits and Other Costs to Exit an Activity (including Certain Costs Incurred in a Restructuring).”Duke Energy has adopted the provisions of SFAS No. 146 for any restructuring activities initiated afterDecember 31, 2002. SFAS No. 146 requires that the liability for costs associated with an exit or disposal activitybe recognized when the liability is incurred. Under EITF Issue No. 94-3, a liability for an exit cost wasrecognized on the date of Duke Energy’s commitment to an exit plan. SFAS No. 146 also establishes that theliability should initially be measured and recorded at fair value. Accordingly, SFAS No. 146 will affect thetiming of recognizing future restructuring costs as well as the amounts recognized.
SFAS No. 148, “Accounting for Stock-Based Compensation—Transition and Disclosure (an amendment ofFASB Statement No. 123).” In December 2002, the FASB issued SFAS No. 148, which amends SFAS No. 123,“Accounting for Stock-Based Compensation,” and provides alternative methods of transition for a voluntarychange to the fair value-based method of accounting for stock-based employee compensation. SFAS No. 148 alsoamends the disclosure requirements of SFAS No. 123 and APB Opinion No. 28, “Interim Financial Reporting,”to require prominent disclosures in both annual and interim financial statements about the method of accountingfor stock-based employee compensation and the effect of the method used on reported results. The provisions ofSFAS No. 148 are effective for financial statements for periods ending after December 15, 2002. (See Notes 1and 19 to the Consolidated Financial Statements for Stock-Based Compensation disclosures.)
FASB Interpretation No. 45 (FIN 45), “Guarantor’s Accounting and Disclosure Requirements forGuarantees, Including Indirect Guarantees of Indebtedness of Others.” In November 2002, the FASB issued FIN45 which requires a guarantor to recognize a liability for the fair value of the obligation it assumes under certainguarantees. Additionally, FIN 45 requires a guarantor to disclose certain aspects of each guarantee, or each groupof similar guarantees, including the nature of the guarantee, the maximum exposure under the guarantee, thecurrent carrying amount of any liability for the guarantee, and any recourse provisions allowing the guarantor torecover from third parties any amounts paid under the guarantee. The disclosure provisions of FIN 45 areeffective for financial statements for both interim and annual periods ending after December 15, 2002. (See Note17 to the Consolidated Financial Statements for additional information.) The fair value measurement provisionsof FIN 45 are to be applied on a prospective basis to guarantees issued or modified after December 31, 2002.
FASB Interpretation No. 46 (FIN 46), “Consolidation of Variable Interest Entities.” In January 2003, theFASB issued FIN 46 which requires an entity to consolidate a variable interest entity if it is the primarybeneficiary of the variable interest entity’s activities. The primary beneficiary is the party that absorbs a majorityof the expected losses, receives a majority of the expected residual returns, or both, of the variable interestentity’s activities. FIN 46 is applicable immediately to variable interest entities created, or interests in variableinterest entities obtained, after January 31, 2003. For those variable interest entities created, or interests invariable interest entities obtained, on or before January 31, 2003, FIN 46 is required to be applied in the firstfiscal year or interim period beginning after June 15, 2003. FIN 46 may be applied prospectively with acumulative-effect adjustment as of the date it is first applied, or by restating previously issued financialstatements with a cumulative-effect adjustment as of the beginning of the first year restated. FIN 46 also requirescertain disclosures of an entity’s relationship with variable interest entities. Duke Energy is currently assessingFIN 46 but does not anticipate that it will have a material impact on its consolidated results of operations, cashflows or financial position.
78
Subsequent Events
In October 2002, Duke Energy entered into a $244 million stock purchase agreement with National FuelGas Company, including the assumption of approximately $58 million in debt, under which it would acquireDuke Energy’s wholly owned Empire State Pipeline. This natural gas pipeline, which originates at the U.S./Canada border and extends into New York, was acquired by Duke Energy as part of the Westcoast acquisition inMarch 2002 (see Note 2 to the Consolidated Financial Statements). The sale to National Fuel Gas Companyclosed in February 2003.
In March 2003, Duke Energy announced that it will exit the merchant finance business at DCP in an orderlymanner. Duke Energy expects this exit to generate positive cash flow in 2003 and 2004.
For information on subsequent events related to litigation and contingencies refer to Note 4 to theConsolidated Financial Statements, Franchised Electric section and Note 16 to the Consolidated FinancialStatements, Litigation section. For information on subsequent events related to debt and other financing mattersrefer to Financing Cash Flows and Liquidity—Significant Financing Activities and Other Financing Matterssections.
Forward-Looking Statements. Duke Energy’s reports, filings and other public announcements maycontain or incorporate by reference statements that do not directly or exclusively relate to historical facts. Suchstatements are “forward-looking statements” within the meaning of the Private Securities Litigation Reform Actof 1995. You can typically identify forward-looking statements by the use of forward-looking words, such as“may,” “will,” “could,” “project,” “believe,” “anticipate,” “expect,” “estimate,” “continue,” “potential,” “plan,”“forecast” and other similar words. Those statements represent Duke Energy’s intentions, plans, expectations,assumptions and beliefs about future events and are subject to risks, uncertainties and other factors. Many ofthose factors are outside Duke Energy’s control and could cause actual results to differ materially from theresults expressed or implied by those forward-looking statements. Those factors include:
• State, federal and foreign legislative and regulatory initiatives that affect cost and investmentrecovery, have an impact on rate structures, and affect the speed at and degree to which competitionenters the electric and natural gas industries
• The outcomes of litigation and regulatory investigations, proceedings or inquiries
• Industrial, commercial and residential growth in Duke Energy’s service territories
• The weather and other natural phenomena
• The timing and extent of changes in commodity prices, interest rates and foreign currency exchangerates
• General economic conditions, including any potential effects arising from terrorist attacks and anyconsequential hostilities or other hostilities
• Changes in environmental and other laws and regulations to which Duke Energy and its subsidiariesare subject or other external factors over which Duke Energy has no control
• The results of financing efforts, including Duke Energy’s ability to obtain financing on favorableterms, which can be affected by various factors, including Duke Energy’s credit ratings and generaleconomic conditions
• Lack of improvement or further declines in the market prices of equity securities and resultant cashfunding requirements for Duke Energy’s defined benefit pension plans
• The level of creditworthiness of counterparties to Duke Energy’s transactions
• The amount of collateral required to be posted from time to time in Duke Energy’s transactions
79
• Growth in opportunities for Duke Energy’s business units, including the timing and success of effortsto develop domestic and international power, pipeline, gathering, processing and other infrastructureprojects
• The performance of electric generation, pipeline and gas processing facilities
• The extent of success in connecting natural gas supplies to gathering and processing systems and inconnecting and expanding gas and electric markets and
• The effect of accounting pronouncements issued periodically by accounting standard-setting bodies
In light of these risks, uncertainties and assumptions, the events described in the forward-looking statementsmight not occur or might occur to a different extent or at a different time than Duke Energy has described. DukeEnergy undertakes no obligation to publicly update or revise any forward-looking statements, whether as a resultof new information, future events or otherwise.
Item 7A. Quantitative and Qualitative Disclosures About Market Risk.
See “Management’s Discussion and Analysis of Results of Operations and Financial Condition, Quantitativeand Qualitative Disclosures About Market Risk.”
80

Item 8. Financial Statements and Supplementary Data.
DUKE ENERGY CORPORATION
Consolidated Statements Of Income
Years Ended December 31,
2002 2001 2000
(in millions, exceptper-share amounts)
Operating RevenuesSales of natural gas and petroleum products (Notes 1 and 7) . . . . . . . . . . . . . . . . . . . . . . . . . . . . . . . . . . . . . $ 4,870 $ 6,194 $ 4,877Generation, transmission and distribution of electricity (Notes 1 and 4) . . . . . . . . . . . . . . . . . . . . . . . . . . . . 7,040 7,195 7,488Transportation and storage of natural gas (Notes 1 and 4) . . . . . . . . . . . . . . . . . . . . . . . . . . . . . . . . . . . . . . . 1,560 994 1,045Trading and marketing net margin (Notes 1 and 7) . . . . . . . . . . . . . . . . . . . . . . . . . . . . . . . . . . . . . . . . . . . . 1,084 2,462 1,068Other . . . . . . . . . . . . . . . . . . . . . . . . . . . . . . . . . . . . . . . . . . . . . . . . . . . . . . . . . . . . . . . . . . . . . . . . . . . . . . . . 1,109 1,352 864
Total operating revenues . . . . . . . . . . . . . . . . . . . . . . . . . . . . . . . . . . . . . . . . . . . . . . . . . . . . . . . . . . . . . . . 15,663 18,197 15,342
Operating ExpensesNatural gas and petroleum products purchased (Note 1) . . . . . . . . . . . . . . . . . . . . . . . . . . . . . . . . . . . . . . . . 4,740 6,559 4,850Fuel used in electric generation (Notes 1 and 12) . . . . . . . . . . . . . . . . . . . . . . . . . . . . . . . . . . . . . . . . . . . . . . 1,606 1,583 1,943Net interchange and purchased power (Notes 1, 4 and 5) . . . . . . . . . . . . . . . . . . . . . . . . . . . . . . . . . . . . . . . 608 450 406Operation and maintenance (Notes 4 and 12) . . . . . . . . . . . . . . . . . . . . . . . . . . . . . . . . . . . . . . . . . . . . . . . . . 3,958 4,099 3,469Depreciation and amortization (Notes 1 and 5) . . . . . . . . . . . . . . . . . . . . . . . . . . . . . . . . . . . . . . . . . . . . . . . 1,571 1,336 1,167Property and other taxes . . . . . . . . . . . . . . . . . . . . . . . . . . . . . . . . . . . . . . . . . . . . . . . . . . . . . . . . . . . . . . . . . 535 431 418Impairment of goodwill (Notes 1 and 9) . . . . . . . . . . . . . . . . . . . . . . . . . . . . . . . . . . . . . . . . . . . . . . . . . . . . . 194 36 —
Total operating expenses . . . . . . . . . . . . . . . . . . . . . . . . . . . . . . . . . . . . . . . . . . . . . . . . . . . . . . . . . . . . . . . 13,212 14,494 12,253
Gains on Sale of Other Assets, net . . . . . . . . . . . . . . . . . . . . . . . . . . . . . . . . . . . . . . . . . . . . . . . . . . . . . . . . . . 49 238 214
Operating Income . . . . . . . . . . . . . . . . . . . . . . . . . . . . . . . . . . . . . . . . . . . . . . . . . . . . . . . . . . . . . . . . . . . . . . . 2,500 3,941 3,303
Other Income and ExpensesEquity in earnings of unconsolidated affiliates (Note 8) . . . . . . . . . . . . . . . . . . . . . . . . . . . . . . . . . . . . . . . . 220 168 103Gain on sale of equity investments . . . . . . . . . . . . . . . . . . . . . . . . . . . . . . . . . . . . . . . . . . . . . . . . . . . . . . . . . 32 — 407Other income and expenses, net . . . . . . . . . . . . . . . . . . . . . . . . . . . . . . . . . . . . . . . . . . . . . . . . . . . . . . . . . . . 117 147 201
Total other income and expenses . . . . . . . . . . . . . . . . . . . . . . . . . . . . . . . . . . . . . . . . . . . . . . . . . . . . . . . . 369 315 711
Interest Expense (Notes 7 and 11) . . . . . . . . . . . . . . . . . . . . . . . . . . . . . . . . . . . . . . . . . . . . . . . . . . . . . . . . . . 1,110 785 911Minority Interest Expense (Notes 13 and 14) . . . . . . . . . . . . . . . . . . . . . . . . . . . . . . . . . . . . . . . . . . . . . . . . . 107 327 307
Earnings Before Income Taxes . . . . . . . . . . . . . . . . . . . . . . . . . . . . . . . . . . . . . . . . . . . . . . . . . . . . . . . . . . . . 1,652 3,144 2,796Income Taxes (Notes 1 and 6) . . . . . . . . . . . . . . . . . . . . . . . . . . . . . . . . . . . . . . . . . . . . . . . . . . . . . . . . . . . . . . 618 1,150 1,020
Income Before Cumulative Effect of Change in Accounting Principle . . . . . . . . . . . . . . . . . . . . . . . . . . . . 1,034 1,994 1,776Cumulative Effect of Change in Accounting Principle, net of tax (Note 1) . . . . . . . . . . . . . . . . . . . . . . . . . — (96) —
Net Income . . . . . . . . . . . . . . . . . . . . . . . . . . . . . . . . . . . . . . . . . . . . . . . . . . . . . . . . . . . . . . . . . . . . . . . . . . . . . 1,034 1,898 1,776Preferred and Preference Stock Dividends (Note 15) . . . . . . . . . . . . . . . . . . . . . . . . . . . . . . . . . . . . . . . . . . 13 14 19
Earnings Available For Common Stockholders . . . . . . . . . . . . . . . . . . . . . . . . . . . . . . . . . . . . . . . . . . . . . . . $ 1,021 $ 1,884 $ 1,757
Common Stock Data (Note 1)Weighted-average shares outstanding . . . . . . . . . . . . . . . . . . . . . . . . . . . . . . . . . . . . . . . . . . . . . . . . . . . . . . . 836 767 736Earnings per share (before cumulative effect of change in accounting principle)Basic . . . . . . . . . . . . . . . . . . . . . . . . . . . . . . . . . . . . . . . . . . . . . . . . . . . . . . . . . . . . . . . . . . . . . . . . . . . . . . $ 1.22 $ 2.58 $ 2.39Diluted . . . . . . . . . . . . . . . . . . . . . . . . . . . . . . . . . . . . . . . . . . . . . . . . . . . . . . . . . . . . . . . . . . . . . . . . . . . . . $ 1.22 $ 2.56 $ 2.38
Earnings per shareBasic . . . . . . . . . . . . . . . . . . . . . . . . . . . . . . . . . . . . . . . . . . . . . . . . . . . . . . . . . . . . . . . . . . . . . . . . . . . . . . $ 1.22 $ 2.45 $ 2.39Diluted . . . . . . . . . . . . . . . . . . . . . . . . . . . . . . . . . . . . . . . . . . . . . . . . . . . . . . . . . . . . . . . . . . . . . . . . . . . . . $ 1.22 $ 2.44 $ 2.38
Dividends per share . . . . . . . . . . . . . . . . . . . . . . . . . . . . . . . . . . . . . . . . . . . . . . . . . . . . . . . . . . . . . . . . . . . . . $ 1.10 $ 1.10 $ 1.10
See Notes to Consolidated Financial Statements.
81
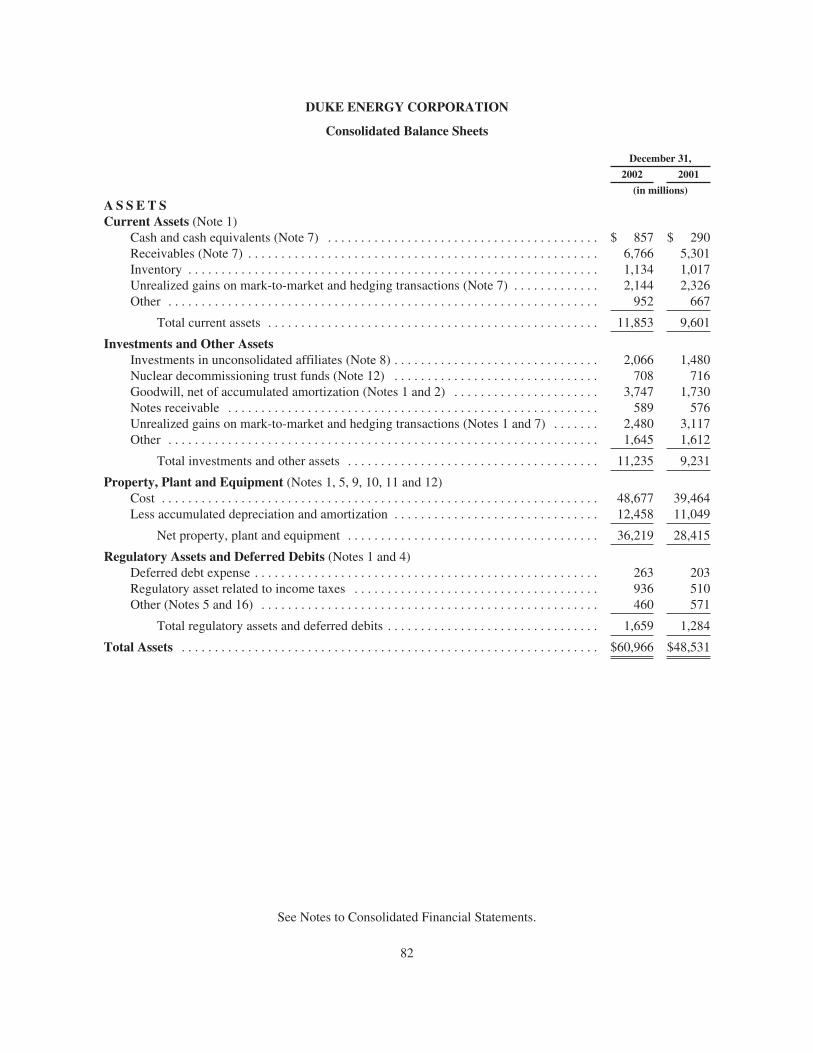
DUKE ENERGY CORPORATION
Consolidated Balance Sheets
December 31,
2002 2001
(in millions)
A S S E T SCurrent Assets (Note 1)
Cash and cash equivalents (Note 7) . . . . . . . . . . . . . . . . . . . . . . . . . . . . . . . . . . . . . . . . . $ 857 $ 290Receivables (Note 7) . . . . . . . . . . . . . . . . . . . . . . . . . . . . . . . . . . . . . . . . . . . . . . . . . . . . . 6,766 5,301Inventory . . . . . . . . . . . . . . . . . . . . . . . . . . . . . . . . . . . . . . . . . . . . . . . . . . . . . . . . . . . . . . 1,134 1,017Unrealized gains on mark-to-market and hedging transactions (Note 7) . . . . . . . . . . . . . 2,144 2,326Other . . . . . . . . . . . . . . . . . . . . . . . . . . . . . . . . . . . . . . . . . . . . . . . . . . . . . . . . . . . . . . . . . 952 667
Total current assets . . . . . . . . . . . . . . . . . . . . . . . . . . . . . . . . . . . . . . . . . . . . . . . . . . 11,853 9,601
Investments and Other AssetsInvestments in unconsolidated affiliates (Note 8) . . . . . . . . . . . . . . . . . . . . . . . . . . . . . . . 2,066 1,480Nuclear decommissioning trust funds (Note 12) . . . . . . . . . . . . . . . . . . . . . . . . . . . . . . . 708 716Goodwill, net of accumulated amortization (Notes 1 and 2) . . . . . . . . . . . . . . . . . . . . . . 3,747 1,730Notes receivable . . . . . . . . . . . . . . . . . . . . . . . . . . . . . . . . . . . . . . . . . . . . . . . . . . . . . . . . 589 576Unrealized gains on mark-to-market and hedging transactions (Notes 1 and 7) . . . . . . . 2,480 3,117Other . . . . . . . . . . . . . . . . . . . . . . . . . . . . . . . . . . . . . . . . . . . . . . . . . . . . . . . . . . . . . . . . . 1,645 1,612
Total investments and other assets . . . . . . . . . . . . . . . . . . . . . . . . . . . . . . . . . . . . . . 11,235 9,231
Property, Plant and Equipment (Notes 1, 5, 9, 10, 11 and 12)Cost . . . . . . . . . . . . . . . . . . . . . . . . . . . . . . . . . . . . . . . . . . . . . . . . . . . . . . . . . . . . . . . . . . 48,677 39,464Less accumulated depreciation and amortization . . . . . . . . . . . . . . . . . . . . . . . . . . . . . . . 12,458 11,049
Net property, plant and equipment . . . . . . . . . . . . . . . . . . . . . . . . . . . . . . . . . . . . . . 36,219 28,415
Regulatory Assets and Deferred Debits (Notes 1 and 4)Deferred debt expense . . . . . . . . . . . . . . . . . . . . . . . . . . . . . . . . . . . . . . . . . . . . . . . . . . . . 263 203Regulatory asset related to income taxes . . . . . . . . . . . . . . . . . . . . . . . . . . . . . . . . . . . . . 936 510Other (Notes 5 and 16) . . . . . . . . . . . . . . . . . . . . . . . . . . . . . . . . . . . . . . . . . . . . . . . . . . . 460 571
Total regulatory assets and deferred debits . . . . . . . . . . . . . . . . . . . . . . . . . . . . . . . . 1,659 1,284
Total Assets . . . . . . . . . . . . . . . . . . . . . . . . . . . . . . . . . . . . . . . . . . . . . . . . . . . . . . . . . . . . . . . $60,966 $48,531
See Notes to Consolidated Financial Statements.
82

DUKE ENERGY CORPORATION
Consolidated Balance Sheets—(Continued)
December 31,
2002 2001
(in millions)
L I A B I L I T I E S AND COMMON STOCKHOLDER S ' EQU I T YCurrent Liabilities
Accounts payable . . . . . . . . . . . . . . . . . . . . . . . . . . . . . . . . . . . . . . . . . . . . . . . . . . . . . . . $ 5,590 $ 4,231Notes payable and commercial paper (Notes 7 and 11) . . . . . . . . . . . . . . . . . . . . . . . . . . 915 1,603Taxes accrued (Note 1) . . . . . . . . . . . . . . . . . . . . . . . . . . . . . . . . . . . . . . . . . . . . . . . . . . . 156 443Interest accrued . . . . . . . . . . . . . . . . . . . . . . . . . . . . . . . . . . . . . . . . . . . . . . . . . . . . . . . . . 310 239Current maturities of long-term debt and preferred stock (Notes 11 and 15) . . . . . . . . . . 1,331 274Unrealized losses on mark-to-market and hedging transactions (Notes 1 and 7) . . . . . . . 1,918 1,519Other (Notes 1, 5, 6 and 16) . . . . . . . . . . . . . . . . . . . . . . . . . . . . . . . . . . . . . . . . . . . . . . . 1,770 2,146
Total current liabilities . . . . . . . . . . . . . . . . . . . . . . . . . . . . . . . . . . . . . . . . . . . . . . . 11,990 10,455
Long-term Debt (Notes 7 and 11) . . . . . . . . . . . . . . . . . . . . . . . . . . . . . . . . . . . . . . . . . . . . . . 20,221 12,321
Deferred Credits and Other Liabilities (Note 1)Deferred income taxes (Note 6) . . . . . . . . . . . . . . . . . . . . . . . . . . . . . . . . . . . . . . . . . . . . 4,834 4,307Investment tax credit (Note 6) . . . . . . . . . . . . . . . . . . . . . . . . . . . . . . . . . . . . . . . . . . . . . . 176 189Nuclear decommissioning costs externally funded (Note 12) . . . . . . . . . . . . . . . . . . . . . 708 716Unrealized losses on mark-to-market and hedging transactions (Note 7) . . . . . . . . . . . . 1,548 2,212Other (Notes 4, 5 and 16) . . . . . . . . . . . . . . . . . . . . . . . . . . . . . . . . . . . . . . . . . . . . . . . . . 3,076 1,755
Total deferred credits and other liabilities . . . . . . . . . . . . . . . . . . . . . . . . . . . . . . . . 10,342 9,179
Commitments and Contingencies (Notes 5, 12, 16 and 17)Guaranteed Preferred Beneficial Interests in Subordinated
Notes of Duke Energy Corporation or Subsidiaries (Notes 7 and 13) . . . . . . . . . . . . . 1,408 1,407
Minority Interest in Financing Subsidiary (Note 14) . . . . . . . . . . . . . . . . . . . . . . . . . . . . . . — 1,025
Minority Interests . . . . . . . . . . . . . . . . . . . . . . . . . . . . . . . . . . . . . . . . . . . . . . . . . . . . . . . . . . 1,904 1,221
Preferred and Preference Stock (Notes 7 and 15) . . . . . . . . . . . . . . . . . . . . . . . . . . . . . . . . .Preferred and preference stock with sinking fund requirements . . . . . . . . . . . . . . . . . . . . 23 25Preferred and preference stock without sinking fund requirements . . . . . . . . . . . . . . . . . 134 209
Total preferred and preference stock . . . . . . . . . . . . . . . . . . . . . . . . . . . . . . . . . . . . . 157 234
Common Stockholders’ Equity (Notes 1, 18 and 19) . . . . . . . . . . . . . . . . . . . . . . . . . . . . . .Common stock, no par, 2 billion shares authorized; 895 million and 777 million sharesoutstanding at December 31, 2002 and 2001, respectively . . . . . . . . . . . . . . . . . . . . . . 9,236 6,217
Retained earnings . . . . . . . . . . . . . . . . . . . . . . . . . . . . . . . . . . . . . . . . . . . . . . . . . . . . . . . 6,417 6,292Accumulated other comprehensive (loss) income . . . . . . . . . . . . . . . . . . . . . . . . . . . . . . (709) 180
Total common stockholders’ equity . . . . . . . . . . . . . . . . . . . . . . . . . . . . . . . . . . . . . 14,944 12,689
Total Liabilities and Common Stockholders’ Equity . . . . . . . . . . . . . . . . . . . . . . . . . . . . . $60,966 $48,531
See Notes to Consolidated Financial Statements.
83
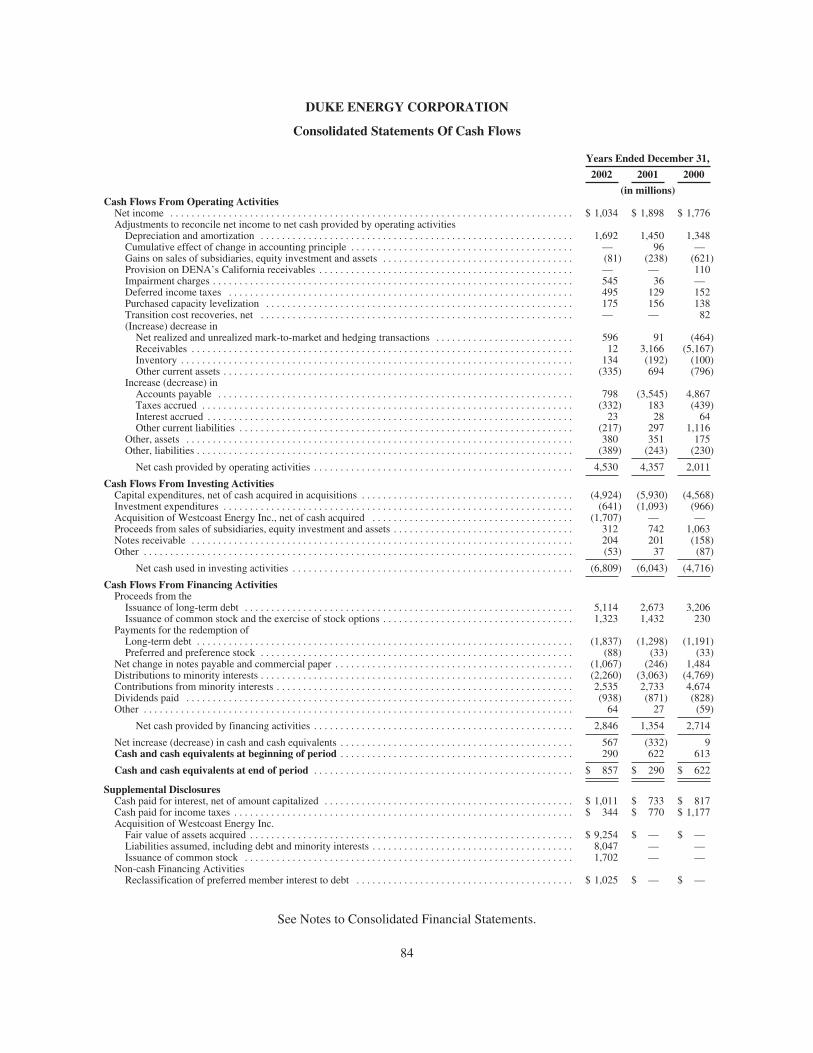
DUKE ENERGY CORPORATION
Consolidated Statements Of Cash Flows
Years Ended December 31,
2002 2001 2000
(in millions)Cash Flows From Operating ActivitiesNet income . . . . . . . . . . . . . . . . . . . . . . . . . . . . . . . . . . . . . . . . . . . . . . . . . . . . . . . . . . . . . . . . . . . . . . . . . . . . $ 1,034 $ 1,898 $ 1,776Adjustments to reconcile net income to net cash provided by operating activitiesDepreciation and amortization . . . . . . . . . . . . . . . . . . . . . . . . . . . . . . . . . . . . . . . . . . . . . . . . . . . . . . . . . . . 1,692 1,450 1,348Cumulative effect of change in accounting principle . . . . . . . . . . . . . . . . . . . . . . . . . . . . . . . . . . . . . . . . . . — 96 —Gains on sales of subsidiaries, equity investment and assets . . . . . . . . . . . . . . . . . . . . . . . . . . . . . . . . . . . . (81) (238) (621)Provision on DENA’s California receivables . . . . . . . . . . . . . . . . . . . . . . . . . . . . . . . . . . . . . . . . . . . . . . . . — — 110Impairment charges . . . . . . . . . . . . . . . . . . . . . . . . . . . . . . . . . . . . . . . . . . . . . . . . . . . . . . . . . . . . . . . . . . . . 545 36 —Deferred income taxes . . . . . . . . . . . . . . . . . . . . . . . . . . . . . . . . . . . . . . . . . . . . . . . . . . . . . . . . . . . . . . . . . 495 129 152Purchased capacity levelization . . . . . . . . . . . . . . . . . . . . . . . . . . . . . . . . . . . . . . . . . . . . . . . . . . . . . . . . . . 175 156 138Transition cost recoveries, net . . . . . . . . . . . . . . . . . . . . . . . . . . . . . . . . . . . . . . . . . . . . . . . . . . . . . . . . . . . — — 82(Increase) decrease inNet realized and unrealized mark-to-market and hedging transactions . . . . . . . . . . . . . . . . . . . . . . . . . . 596 91 (464)Receivables . . . . . . . . . . . . . . . . . . . . . . . . . . . . . . . . . . . . . . . . . . . . . . . . . . . . . . . . . . . . . . . . . . . . . . . . 12 3,166 (5,167)Inventory . . . . . . . . . . . . . . . . . . . . . . . . . . . . . . . . . . . . . . . . . . . . . . . . . . . . . . . . . . . . . . . . . . . . . . . . . . 134 (192) (100)Other current assets . . . . . . . . . . . . . . . . . . . . . . . . . . . . . . . . . . . . . . . . . . . . . . . . . . . . . . . . . . . . . . . . . . (335) 694 (796)
Increase (decrease) inAccounts payable . . . . . . . . . . . . . . . . . . . . . . . . . . . . . . . . . . . . . . . . . . . . . . . . . . . . . . . . . . . . . . . . . . . 798 (3,545) 4,867Taxes accrued . . . . . . . . . . . . . . . . . . . . . . . . . . . . . . . . . . . . . . . . . . . . . . . . . . . . . . . . . . . . . . . . . . . . . . (332) 183 (439)Interest accrued . . . . . . . . . . . . . . . . . . . . . . . . . . . . . . . . . . . . . . . . . . . . . . . . . . . . . . . . . . . . . . . . . . . . . 23 28 64Other current liabilities . . . . . . . . . . . . . . . . . . . . . . . . . . . . . . . . . . . . . . . . . . . . . . . . . . . . . . . . . . . . . . . (217) 297 1,116
Other, assets . . . . . . . . . . . . . . . . . . . . . . . . . . . . . . . . . . . . . . . . . . . . . . . . . . . . . . . . . . . . . . . . . . . . . . . . . 380 351 175Other, liabilities . . . . . . . . . . . . . . . . . . . . . . . . . . . . . . . . . . . . . . . . . . . . . . . . . . . . . . . . . . . . . . . . . . . . . . . (389) (243) (230)
Net cash provided by operating activities . . . . . . . . . . . . . . . . . . . . . . . . . . . . . . . . . . . . . . . . . . . . . . . . . 4,530 4,357 2,011
Cash Flows From Investing ActivitiesCapital expenditures, net of cash acquired in acquisitions . . . . . . . . . . . . . . . . . . . . . . . . . . . . . . . . . . . . . . . . (4,924) (5,930) (4,568)Investment expenditures . . . . . . . . . . . . . . . . . . . . . . . . . . . . . . . . . . . . . . . . . . . . . . . . . . . . . . . . . . . . . . . . . . (641) (1,093) (966)Acquisition of Westcoast Energy Inc., net of cash acquired . . . . . . . . . . . . . . . . . . . . . . . . . . . . . . . . . . . . . . (1,707) — —Proceeds from sales of subsidiaries, equity investment and assets . . . . . . . . . . . . . . . . . . . . . . . . . . . . . . . . . . 312 742 1,063Notes receivable . . . . . . . . . . . . . . . . . . . . . . . . . . . . . . . . . . . . . . . . . . . . . . . . . . . . . . . . . . . . . . . . . . . . . . . . 204 201 (158)Other . . . . . . . . . . . . . . . . . . . . . . . . . . . . . . . . . . . . . . . . . . . . . . . . . . . . . . . . . . . . . . . . . . . . . . . . . . . . . . . . . (53) 37 (87)
Net cash used in investing activities . . . . . . . . . . . . . . . . . . . . . . . . . . . . . . . . . . . . . . . . . . . . . . . . . . . . . (6,809) (6,043) (4,716)
Cash Flows From Financing ActivitiesProceeds from theIssuance of long-term debt . . . . . . . . . . . . . . . . . . . . . . . . . . . . . . . . . . . . . . . . . . . . . . . . . . . . . . . . . . . . . . 5,114 2,673 3,206Issuance of common stock and the exercise of stock options . . . . . . . . . . . . . . . . . . . . . . . . . . . . . . . . . . . . 1,323 1,432 230
Payments for the redemption ofLong-term debt . . . . . . . . . . . . . . . . . . . . . . . . . . . . . . . . . . . . . . . . . . . . . . . . . . . . . . . . . . . . . . . . . . . . . . . (1,837) (1,298) (1,191)Preferred and preference stock . . . . . . . . . . . . . . . . . . . . . . . . . . . . . . . . . . . . . . . . . . . . . . . . . . . . . . . . . . . (88) (33) (33)
Net change in notes payable and commercial paper . . . . . . . . . . . . . . . . . . . . . . . . . . . . . . . . . . . . . . . . . . . . . (1,067) (246) 1,484Distributions to minority interests . . . . . . . . . . . . . . . . . . . . . . . . . . . . . . . . . . . . . . . . . . . . . . . . . . . . . . . . . . . (2,260) (3,063) (4,769)Contributions from minority interests . . . . . . . . . . . . . . . . . . . . . . . . . . . . . . . . . . . . . . . . . . . . . . . . . . . . . . . . 2,535 2,733 4,674Dividends paid . . . . . . . . . . . . . . . . . . . . . . . . . . . . . . . . . . . . . . . . . . . . . . . . . . . . . . . . . . . . . . . . . . . . . . . . . (938) (871) (828)Other . . . . . . . . . . . . . . . . . . . . . . . . . . . . . . . . . . . . . . . . . . . . . . . . . . . . . . . . . . . . . . . . . . . . . . . . . . . . . . . . . 64 27 (59)
Net cash provided by financing activities . . . . . . . . . . . . . . . . . . . . . . . . . . . . . . . . . . . . . . . . . . . . . . . . . 2,846 1,354 2,714
Net increase (decrease) in cash and cash equivalents . . . . . . . . . . . . . . . . . . . . . . . . . . . . . . . . . . . . . . . . . . . . 567 (332) 9Cash and cash equivalents at beginning of period . . . . . . . . . . . . . . . . . . . . . . . . . . . . . . . . . . . . . . . . . . . . 290 622 613
Cash and cash equivalents at end of period . . . . . . . . . . . . . . . . . . . . . . . . . . . . . . . . . . . . . . . . . . . . . . . . . $ 857 $ 290 $ 622
Supplemental DisclosuresCash paid for interest, net of amount capitalized . . . . . . . . . . . . . . . . . . . . . . . . . . . . . . . . . . . . . . . . . . . . . . . $ 1,011 $ 733 $ 817Cash paid for income taxes . . . . . . . . . . . . . . . . . . . . . . . . . . . . . . . . . . . . . . . . . . . . . . . . . . . . . . . . . . . . . . . . $ 344 $ 770 $ 1,177Acquisition of Westcoast Energy Inc.Fair value of assets acquired . . . . . . . . . . . . . . . . . . . . . . . . . . . . . . . . . . . . . . . . . . . . . . . . . . . . . . . . . . . . . $ 9,254 $ — $ —Liabilities assumed, including debt and minority interests . . . . . . . . . . . . . . . . . . . . . . . . . . . . . . . . . . . . . . 8,047 — —Issuance of common stock . . . . . . . . . . . . . . . . . . . . . . . . . . . . . . . . . . . . . . . . . . . . . . . . . . . . . . . . . . . . . . 1,702 — —
Non-cash Financing ActivitiesReclassification of preferred member interest to debt . . . . . . . . . . . . . . . . . . . . . . . . . . . . . . . . . . . . . . . . . $ 1,025 $ — $ —
See Notes to Consolidated Financial Statements.
84
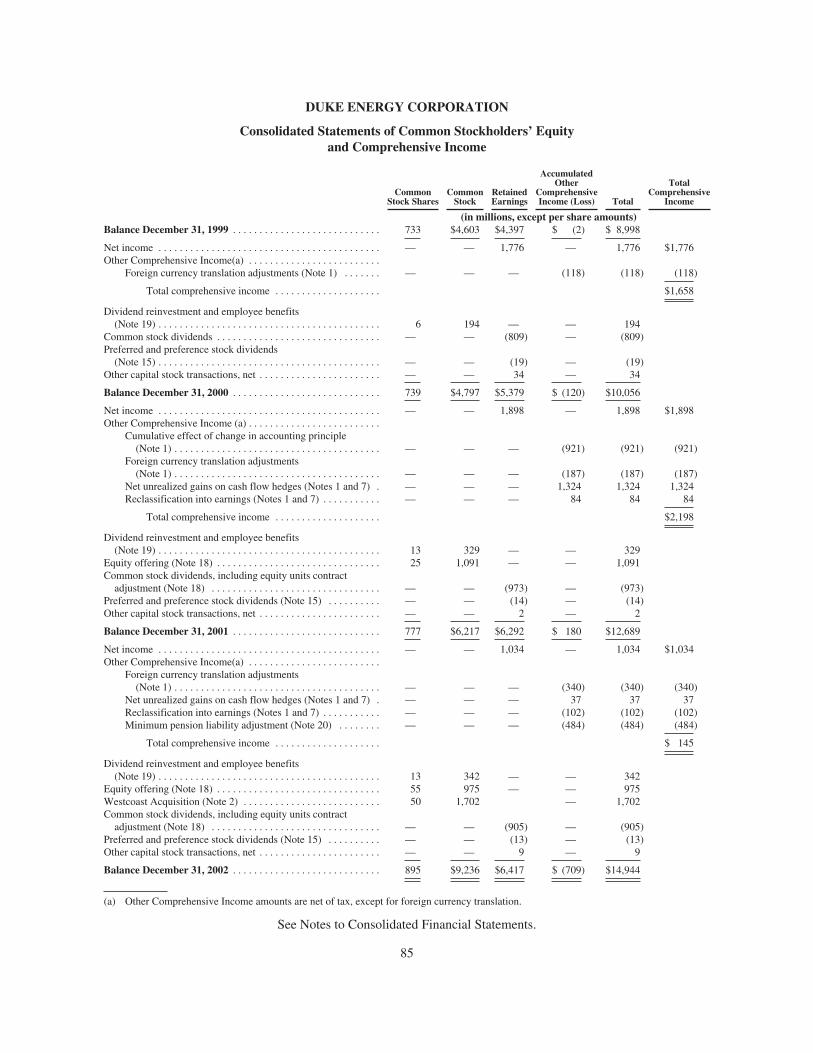
DUKE ENERGY CORPORATION
Consolidated Statements of Common Stockholders’ Equityand Comprehensive Income
CommonStock Shares
CommonStock
RetainedEarnings
AccumulatedOther
ComprehensiveIncome (Loss) Total
TotalComprehensive
Income
(in millions, except per share amounts)Balance December 31, 1999 . . . . . . . . . . . . . . . . . . . . . . . . . . . . 733 $4,603 $4,397 $ (2) $ 8,998
Net income . . . . . . . . . . . . . . . . . . . . . . . . . . . . . . . . . . . . . . . . . . — — 1,776 — 1,776 $1,776Other Comprehensive Income(a) . . . . . . . . . . . . . . . . . . . . . . . . .
Foreign currency translation adjustments (Note 1) . . . . . . . — — — (118) (118) (118)
Total comprehensive income . . . . . . . . . . . . . . . . . . . . $1,658
Dividend reinvestment and employee benefits(Note 19) . . . . . . . . . . . . . . . . . . . . . . . . . . . . . . . . . . . . . . . . . . 6 194 — — 194
Common stock dividends . . . . . . . . . . . . . . . . . . . . . . . . . . . . . . . — — (809) — (809)Preferred and preference stock dividends(Note 15) . . . . . . . . . . . . . . . . . . . . . . . . . . . . . . . . . . . . . . . . . . — — (19) — (19)
Other capital stock transactions, net . . . . . . . . . . . . . . . . . . . . . . . — — 34 — 34
Balance December 31, 2000 . . . . . . . . . . . . . . . . . . . . . . . . . . . . 739 $4,797 $5,379 $ (120) $10,056
Net income . . . . . . . . . . . . . . . . . . . . . . . . . . . . . . . . . . . . . . . . . . — — 1,898 — 1,898 $1,898Other Comprehensive Income (a) . . . . . . . . . . . . . . . . . . . . . . . . .
Cumulative effect of change in accounting principle(Note 1) . . . . . . . . . . . . . . . . . . . . . . . . . . . . . . . . . . . . . . . — — — (921) (921) (921)
Foreign currency translation adjustments(Note 1) . . . . . . . . . . . . . . . . . . . . . . . . . . . . . . . . . . . . . . . — — — (187) (187) (187)
Net unrealized gains on cash flow hedges (Notes 1 and 7) . — — — 1,324 1,324 1,324Reclassification into earnings (Notes 1 and 7) . . . . . . . . . . . — — — 84 84 84
Total comprehensive income . . . . . . . . . . . . . . . . . . . . $2,198
Dividend reinvestment and employee benefits(Note 19) . . . . . . . . . . . . . . . . . . . . . . . . . . . . . . . . . . . . . . . . . . 13 329 — — 329
Equity offering (Note 18) . . . . . . . . . . . . . . . . . . . . . . . . . . . . . . . 25 1,091 — — 1,091Common stock dividends, including equity units contractadjustment (Note 18) . . . . . . . . . . . . . . . . . . . . . . . . . . . . . . . . — — (973) — (973)
Preferred and preference stock dividends (Note 15) . . . . . . . . . . — — (14) — (14)Other capital stock transactions, net . . . . . . . . . . . . . . . . . . . . . . . — — 2 — 2
Balance December 31, 2001 . . . . . . . . . . . . . . . . . . . . . . . . . . . . 777 $6,217 $6,292 $ 180 $12,689
Net income . . . . . . . . . . . . . . . . . . . . . . . . . . . . . . . . . . . . . . . . . . — — 1,034 — 1,034 $1,034Other Comprehensive Income(a) . . . . . . . . . . . . . . . . . . . . . . . . .
Foreign currency translation adjustments(Note 1) . . . . . . . . . . . . . . . . . . . . . . . . . . . . . . . . . . . . . . . — — — (340) (340) (340)
Net unrealized gains on cash flow hedges (Notes 1 and 7) . — — — 37 37 37Reclassification into earnings (Notes 1 and 7) . . . . . . . . . . . — — — (102) (102) (102)Minimum pension liability adjustment (Note 20) . . . . . . . . — — — (484) (484) (484)
Total comprehensive income . . . . . . . . . . . . . . . . . . . . $ 145
Dividend reinvestment and employee benefits(Note 19) . . . . . . . . . . . . . . . . . . . . . . . . . . . . . . . . . . . . . . . . . . 13 342 — — 342
Equity offering (Note 18) . . . . . . . . . . . . . . . . . . . . . . . . . . . . . . . 55 975 — — 975Westcoast Acquisition (Note 2) . . . . . . . . . . . . . . . . . . . . . . . . . . 50 1,702 — 1,702Common stock dividends, including equity units contractadjustment (Note 18) . . . . . . . . . . . . . . . . . . . . . . . . . . . . . . . . — — (905) — (905)
Preferred and preference stock dividends (Note 15) . . . . . . . . . . — — (13) — (13)Other capital stock transactions, net . . . . . . . . . . . . . . . . . . . . . . . — — 9 — 9
Balance December 31, 2002 . . . . . . . . . . . . . . . . . . . . . . . . . . . . 895 $9,236 $6,417 $ (709) $14,944
(a) Other Comprehensive Income amounts are net of tax, except for foreign currency translation.
See Notes to Consolidated Financial Statements.
85

DUKE ENERGY CORPORATION
Notes To Consolidated Financial Statements
For the Years Ended December 31, 2002, 2001 and 2000
1. Summary of Significant Accounting Policies
Consolidation. The Consolidated Financial Statements include the accounts of Duke Energy Corporationand all majority-owned subsidiaries, after eliminating significant intercompany transactions and balances.Investments in businesses not controlled by Duke Energy Corporation, but over which it has significantinfluence, are accounted for using the equity method. (See Note 8 for additional information.)
Conformity with generally accepted accounting principles (GAAP) requires management to make estimatesand assumptions that affect the amounts reported in the financial statements and notes. Although these estimatesare based on management’s best available knowledge of current and expected future events, actual results couldbe different from those estimates.
In these Notes, “Duke Energy” refers to Duke Energy Corporation and its subsidiaries.
Cash and Cash Equivalents. All liquid investments with maturities of three months or less at the date ofpurchase are considered cash equivalents.
Inventory. Inventory, except inventory held for trading, consists primarily of materials and supplies, naturalgas and natural gas liquid (NGL) products held in storage for transmission, processing and sales commitments,and coal held for electric generation. This inventory is recorded at the lower of cost or market value, primarilyusing the average cost method. Inventory held for trading is marked to market.
Inventory is summarized as follows:
InventoryDecember 31,
2002 2001
(in millions)
Materials and supplies . . . . . . . . . . . . . . . . . . . . . . . . . . . . . . . . . . . . . . . . . . . . . . . . . . . . . . . . $ 873 $ 790Petroleum products . . . . . . . . . . . . . . . . . . . . . . . . . . . . . . . . . . . . . . . . . . . . . . . . . . . . . . . . . . 83 77Coal . . . . . . . . . . . . . . . . . . . . . . . . . . . . . . . . . . . . . . . . . . . . . . . . . . . . . . . . . . . . . . . . . . . . . . 77 134Gas stored underground . . . . . . . . . . . . . . . . . . . . . . . . . . . . . . . . . . . . . . . . . . . . . . . . . . . . . . 71 3Trading MTM inventory . . . . . . . . . . . . . . . . . . . . . . . . . . . . . . . . . . . . . . . . . . . . . . . . . . . . . . 16 —Gas used in operations . . . . . . . . . . . . . . . . . . . . . . . . . . . . . . . . . . . . . . . . . . . . . . . . . . . . . . . . 14 13
Total inventory . . . . . . . . . . . . . . . . . . . . . . . . . . . . . . . . . . . . . . . . . . . . . . . . . . . . . . . . . . . $1,134 $1,017
Accounting for Hedges and Trading Activities. All derivatives not qualifying for the normal purchasesand sales exemption under Statement of Financial Accounting Standards (SFAS) No. 133, “Accounting forDerivative Instruments and Hedging Activities,” and energy trading contracts as described in the FinancialAccounting Standards Board’s (FASB) Emerging Issues Task Force (EITF) Issue No. 98-10, “Accounting forContracts Involved in Energy Trading and Risk Management Activities,” are recorded on the ConsolidatedBalance Sheets at their fair value as Unrealized Gains or Unrealized Losses on Mark-to-Market and HedgingTransactions. On the date that swaps, futures, forwards, option contracts or other derivatives are entered into,Duke Energy designates the derivative as either held for trading (trading instrument); as a hedge of a forecastedtransaction or future cash flows (cash flow hedge); as a hedge of a recognized asset, liability or firm commitment(fair value hedge); as a normal purchase or sale contract; or leaves the derivative undesignated and marks it tomarket. All energy trading contracts, as defined by EITF Issue No. 98-10, are classified as trading instruments.
86

DUKE ENERGY CORPORATION
Notes To Consolidated Financial Statements — Continued
For hedge contracts, Duke Energy formally assesses, both at the hedge contract’s inception and on anongoing basis, whether the hedge contract is highly effective in offsetting changes in fair values or cash flows ofhedged items.
When available, quoted market prices or prices obtained through external sources are used to verify acontract’s fair value. For contracts with a delivery location or duration for which quoted market prices are notavailable, fair value is determined based on pricing models developed primarily from historical and expectedcorrelations with quoted market prices. As of December 31, 2002, 32% of the trading contracts’ fair value wasdetermined using market prices and other external sources and 68% was determined using pricing models. As ofDecember 31, 2001, 60% of the trading contracts’ fair value was determined using market prices and otherexternal sources and 40% was determined using pricing models.
Values are adjusted to reflect the potential impact of liquidating the positions held in an orderly manner overa reasonable time period under current conditions. Changes in market price and management estimates directlyaffect the estimated fair value of these contracts. Accordingly, it is probable that such estimates may change inthe near term.
Trading. Prior to settlement of any energy contract held for trading purposes, a favorable or unfavorableprice movement is reported as Trading and Marketing Net Margin in the Consolidated Statements of Income. Anoffsetting amount is recorded as Unrealized Gains or Unrealized Losses on Mark-to-Market and HedgingTransactions on the Consolidated Balance Sheets. When a contract to sell or buy is physically settled, the fairvalue entries are reversed and the gross amounts invoiced to the customer or due to the counterparty are includedas Trading and Marketing Net Margin in the Consolidated Statements of Income. For financial settlement, theeffect on the Consolidated Statements of Income is the same as physical transactions. For all contracts, theunrealized gain or loss on the Consolidated Balance Sheets is reversed and classified as a receivable or payableaccount until collected or paid. See the New Accounting Standards section below for a discussion of theimplications of the EITF Issue No. 02-03, “Issues Involved in Accounting for Derivative Contracts Held forTrading Purposes and Contracts Involved in Energy Trading and Risk Management Activities,” on theaccounting for trading activities subsequent to October 25, 2002.
Cash Flow Hedges. Changes in the fair value of a derivative designated and qualified as a cash flow hedgeare included in the Consolidated Statements of Common Stockholders’ Equity and Comprehensive Income asOther Comprehensive Income (OCI) until earnings are affected by the hedged item. Settlement amounts andineffective portions of cash flow hedges are removed from OCI and recorded in the Consolidated Statements ofIncome in the same accounts as the item being hedged. Duke Energy discontinues hedge accountingprospectively when it is determined that the derivative no longer qualifies as an effective hedge, or when it is nolonger probable that the hedged transaction will occur. When hedge accounting is discontinued because thederivative no longer qualifies as an effective hedge, the derivative continues to be carried on the ConsolidatedBalance Sheets at its fair value, with subsequent changes in its fair value recognized in current-period earnings.Gains and losses related to discontinued hedges that were previously accumulated in OCI will remain in OCIuntil the underlying contract is reflected in earnings, unless it is no longer probable that the hedged transactionwill occur. Gains and losses that were accumulated in OCI will be immediately recognized in current-periodearnings if it is no longer probable that the hedged transaction will occur.
Fair Value Hedges. Duke Energy enters into interest rate swaps to convert some of its fixed-rate long-termdebt to floating-rate long-term debt and designates such interest rate swaps as fair value hedges. Duke Energyalso enters into electricity derivative instruments such as swaps, futures and forwards to manage the fair valuerisk associated with some of its unrecognized firm commitments to sell generated power due to changes in the
87
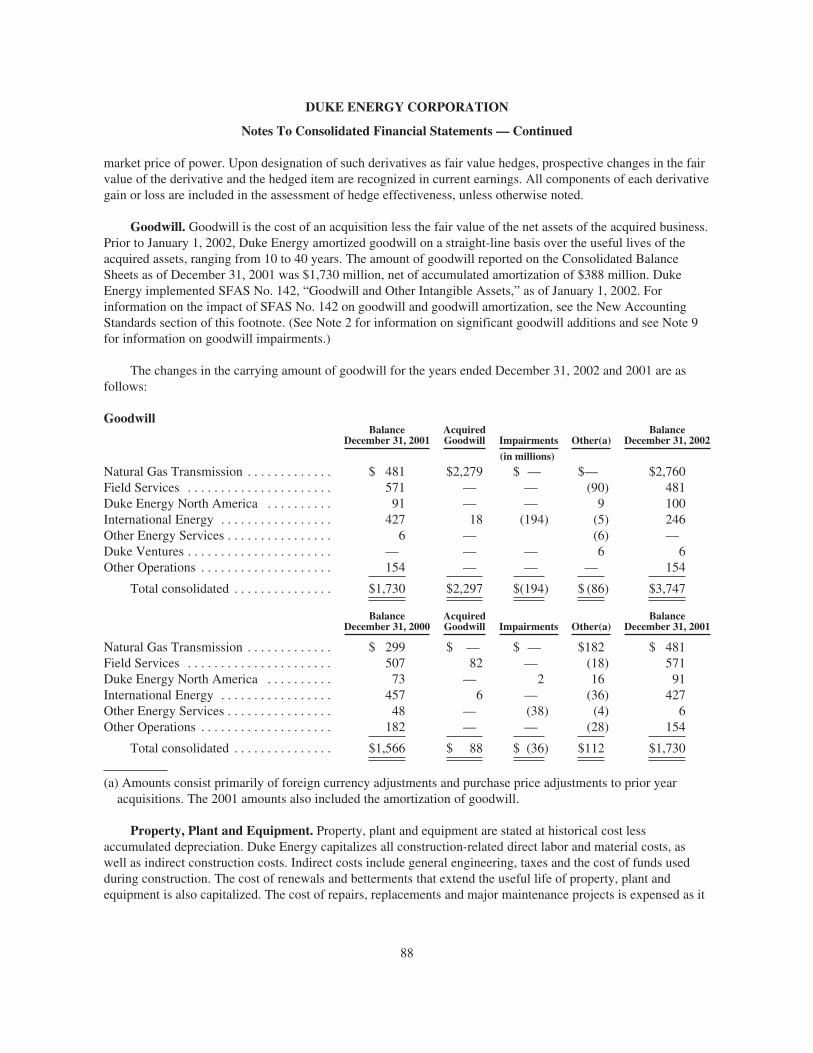
DUKE ENERGY CORPORATION
Notes To Consolidated Financial Statements — Continued
market price of power. Upon designation of such derivatives as fair value hedges, prospective changes in the fairvalue of the derivative and the hedged item are recognized in current earnings. All components of each derivativegain or loss are included in the assessment of hedge effectiveness, unless otherwise noted.
Goodwill. Goodwill is the cost of an acquisition less the fair value of the net assets of the acquired business.Prior to January 1, 2002, Duke Energy amortized goodwill on a straight-line basis over the useful lives of theacquired assets, ranging from 10 to 40 years. The amount of goodwill reported on the Consolidated BalanceSheets as of December 31, 2001 was $1,730 million, net of accumulated amortization of $388 million. DukeEnergy implemented SFAS No. 142, “Goodwill and Other Intangible Assets,” as of January 1, 2002. Forinformation on the impact of SFAS No. 142 on goodwill and goodwill amortization, see the New AccountingStandards section of this footnote. (See Note 2 for information on significant goodwill additions and see Note 9for information on goodwill impairments.)
The changes in the carrying amount of goodwill for the years ended December 31, 2002 and 2001 are asfollows:
GoodwillBalance
December 31, 2001AcquiredGoodwill Impairments Other(a)
BalanceDecember 31, 2002
(in millions)
Natural Gas Transmission . . . . . . . . . . . . . $ 481 $2,279 $ — $— $2,760Field Services . . . . . . . . . . . . . . . . . . . . . . 571 — — (90) 481Duke Energy North America . . . . . . . . . . 91 — — 9 100International Energy . . . . . . . . . . . . . . . . . 427 18 (194) (5) 246Other Energy Services . . . . . . . . . . . . . . . . 6 — (6) —Duke Ventures . . . . . . . . . . . . . . . . . . . . . . — — — 6 6Other Operations . . . . . . . . . . . . . . . . . . . . 154 — — — 154
Total consolidated . . . . . . . . . . . . . . . $1,730 $2,297 $(194) $ (86) $3,747
BalanceDecember 31, 2000
AcquiredGoodwill Impairments Other(a)
BalanceDecember 31, 2001
Natural Gas Transmission . . . . . . . . . . . . . $ 299 $ — $ — $182 $ 481Field Services . . . . . . . . . . . . . . . . . . . . . . 507 82 — (18) 571Duke Energy North America . . . . . . . . . . 73 — 2 16 91International Energy . . . . . . . . . . . . . . . . . 457 6 — (36) 427Other Energy Services . . . . . . . . . . . . . . . . 48 — (38) (4) 6Other Operations . . . . . . . . . . . . . . . . . . . . 182 — — (28) 154
Total consolidated . . . . . . . . . . . . . . . $1,566 $ 88 $ (36) $112 $1,730
(a) Amounts consist primarily of foreign currency adjustments and purchase price adjustments to prior yearacquisitions. The 2001 amounts also included the amortization of goodwill.
Property, Plant and Equipment. Property, plant and equipment are stated at historical cost lessaccumulated depreciation. Duke Energy capitalizes all construction-related direct labor and material costs, aswell as indirect construction costs. Indirect costs include general engineering, taxes and the cost of funds usedduring construction. The cost of renewals and betterments that extend the useful life of property, plant andequipment is also capitalized. The cost of repairs, replacements and major maintenance projects is expensed as it
88
DUKE ENERGY CORPORATION
Notes To Consolidated Financial Statements — Continued
is incurred. Depreciation is generally computed over the asset’s estimated useful life using the straight-linemethod. The composite weighted-average depreciation rates, excluding nuclear fuel, were 4.32% for 2002,4.01% for 2001 and 3.97% for 2000.
When Duke Energy retires its regulated property, plant and equipment, it charges the original cost plus thecost of retirement, less salvage, to accumulated depreciation and amortization. When it sells entire regulatedoperating units, or retires or sells non-regulated properties, the cost is removed from the property account and therelated accumulated depreciation and amortization accounts are reduced. Any gain or loss is recorded as income,unless otherwise required by the applicable regulatory body.
Impairment of Long-Lived Assets. Duke Energy reviews the recoverability of long-lived and intangibleassets, excluding goodwill, when circumstances indicate that the carrying amount of the asset may not berecoverable. This evaluation is based on various analyses, including undiscounted cash flow projections. Thecarrying amount is not recoverable if it exceeds the undiscounted sum of cash flows expected to result from theuse and eventual disposition of the asset. If the carrying value is not recoverable, the impairment loss is measuredas the excess of the asset’s carrying value over its fair value. (See Note 9 for additional information.)
As of the acquisition date, Duke Energy allocates goodwill to a reporting unit. Duke Energy defines areporting unit as an operating segment or one level below.
Goodwill is reviewed at least annually in accordance with SFAS No. 142.
Unamortized Debt Premium, Discount and Expense. Premiums, discounts and expenses incurred withthe issuance of outstanding long-term debt are amortized over the terms of the debt issues. Any call premiums orunamortized expenses associated with refinancing higher-cost debt obligations to finance regulated assets andoperations are amortized consistent with regulatory treatment of those items, where appropriate.
Environmental Expenditures. Duke Energy expenses environmental expenditures related to conditionscaused by past operations that do not generate current or future revenues. Environmental expenditures related tooperations that generate current or future revenues are expensed or capitalized, as appropriate. Liabilities arerecorded when environmental assessments and/or cleanups are probable and the costs can be reasonablyestimated.
Cost-Based Regulation. Duke Energy accounts for its regulated operations under the provisions of SFASNo. 71, “Accounting for the Effects of Certain Types of Regulation.” The economic effects of regulation canresult in a regulated company recording costs that have been or are expected to be allowed in the rate-settingprocess in a period different from the period in which the costs would be charged to expense by an unregulatedenterprise. Accordingly, Duke Energy records assets and liabilities that result from the regulated ratemakingprocess that would not be recorded under GAAP for non-regulated entities. These regulatory assets and liabilitiesare classified in the Consolidated Balance Sheets as Regulatory Assets and Deferred Debits, and Deferred Creditsand Other Liabilities. (See Note 4.) Duke Energy periodically evaluates the applicability of SFAS No. 71, andconsiders factors such as regulatory changes and the impact of competition. If cost-based regulation ends orcompetition increases, companies may have to reduce their asset balances to reflect a market basis less than cost,and write-off their associated regulatory assets and liabilities.
Stock-Based Compensation. Duke Energy accounts for its stock-based compensation arrangements underthe intrinsic value recognition and measurement principles of Accounting Principles Board (APB) Opinion No.25, “Accounting for Stock Issued to Employees,” and the FASB Interpretation No. 44, “Accounting for CertainTransactions Involving Stock Compensation (an Interpretation of APB Opinion No. 25).” Since the exerciseprice for all options granted under those plans was equal to the market value of the underlying common stock onthe date of grant, no compensation cost is recognized in the accompanying Consolidated Statements of Income.
89
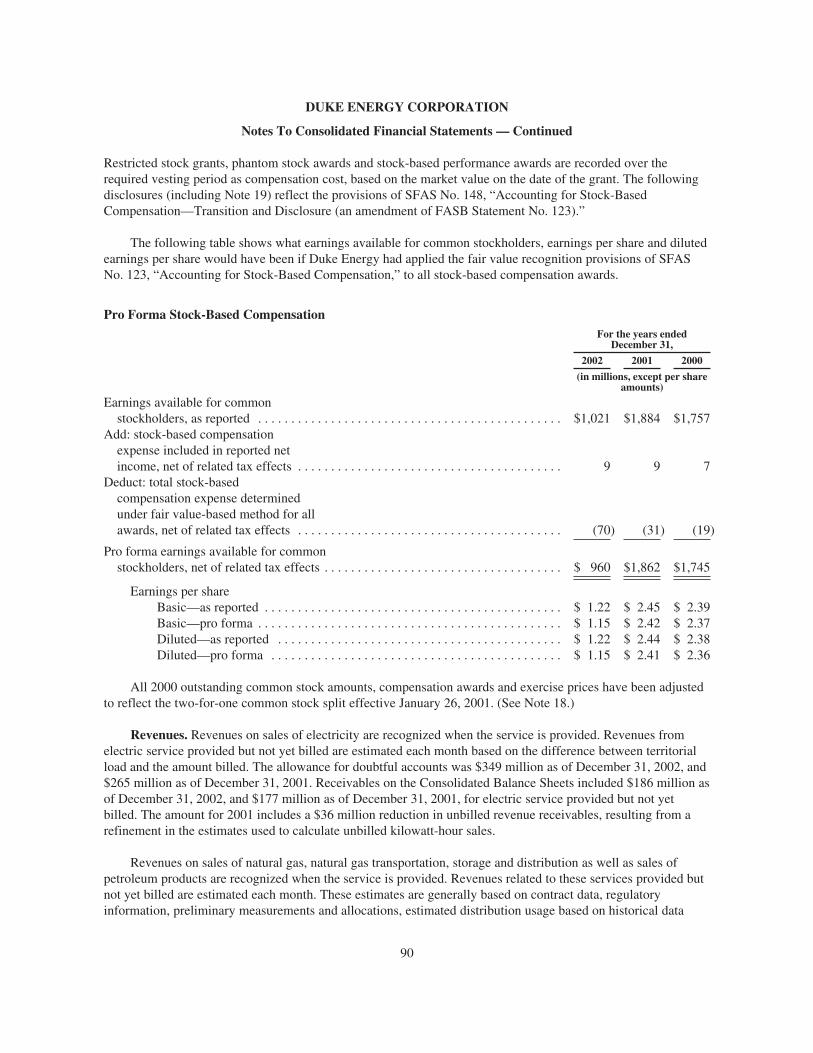
DUKE ENERGY CORPORATION
Notes To Consolidated Financial Statements — Continued
Restricted stock grants, phantom stock awards and stock-based performance awards are recorded over therequired vesting period as compensation cost, based on the market value on the date of the grant. The followingdisclosures (including Note 19) reflect the provisions of SFAS No. 148, “Accounting for Stock-BasedCompensation—Transition and Disclosure (an amendment of FASB Statement No. 123).”
The following table shows what earnings available for common stockholders, earnings per share and dilutedearnings per share would have been if Duke Energy had applied the fair value recognition provisions of SFASNo. 123, “Accounting for Stock-Based Compensation,” to all stock-based compensation awards.
Pro Forma Stock-Based CompensationFor the years ended
December 31,
2002 2001 2000
(in millions, except per shareamounts)
Earnings available for commonstockholders, as reported . . . . . . . . . . . . . . . . . . . . . . . . . . . . . . . . . . . . . . . . . . . . . . $1,021 $1,884 $1,757
Add: stock-based compensationexpense included in reported netincome, net of related tax effects . . . . . . . . . . . . . . . . . . . . . . . . . . . . . . . . . . . . . . . . 9 9 7
Deduct: total stock-basedcompensation expense determinedunder fair value-based method for allawards, net of related tax effects . . . . . . . . . . . . . . . . . . . . . . . . . . . . . . . . . . . . . . . . (70) (31) (19)
Pro forma earnings available for commonstockholders, net of related tax effects . . . . . . . . . . . . . . . . . . . . . . . . . . . . . . . . . . . . $ 960 $1,862 $1,745
Earnings per shareBasic—as reported . . . . . . . . . . . . . . . . . . . . . . . . . . . . . . . . . . . . . . . . . . . . . $ 1.22 $ 2.45 $ 2.39Basic—pro forma . . . . . . . . . . . . . . . . . . . . . . . . . . . . . . . . . . . . . . . . . . . . . . $ 1.15 $ 2.42 $ 2.37Diluted—as reported . . . . . . . . . . . . . . . . . . . . . . . . . . . . . . . . . . . . . . . . . . . $ 1.22 $ 2.44 $ 2.38Diluted—pro forma . . . . . . . . . . . . . . . . . . . . . . . . . . . . . . . . . . . . . . . . . . . . $ 1.15 $ 2.41 $ 2.36
All 2000 outstanding common stock amounts, compensation awards and exercise prices have been adjustedto reflect the two-for-one common stock split effective January 26, 2001. (See Note 18.)
Revenues. Revenues on sales of electricity are recognized when the service is provided. Revenues fromelectric service provided but not yet billed are estimated each month based on the difference between territorialload and the amount billed. The allowance for doubtful accounts was $349 million as of December 31, 2002, and$265 million as of December 31, 2001. Receivables on the Consolidated Balance Sheets included $186 million asof December 31, 2002, and $177 million as of December 31, 2001, for electric service provided but not yetbilled. The amount for 2001 includes a $36 million reduction in unbilled revenue receivables, resulting from arefinement in the estimates used to calculate unbilled kilowatt-hour sales.
Revenues on sales of natural gas, natural gas transportation, storage and distribution as well as sales ofpetroleum products are recognized when the service is provided. Revenues related to these services provided butnot yet billed are estimated each month. These estimates are generally based on contract data, regulatoryinformation, preliminary measurements and allocations, estimated distribution usage based on historical data
90

DUKE ENERGY CORPORATION
Notes To Consolidated Financial Statements — Continued
adjusted for heating degree days, commodity prices and preliminary throughput measurements. Final bills for thecurrent month are billed and collected in the following month. Receivables on the Consolidated Balance Sheetsincluded $204 million as of December 31, 2002, and $80 million as of December 31, 2001, for natural gastransportation, storage and distribution services provided but not yet billed.
Long-term contracts, primarily in the Other Energy Services segment, are accounted for using thepercentage-of-completion method. Under the percentage-of-completion method, sales and gross profit arerecognized as the work is performed, based on the relationship between costs incurred and total estimated costs atcompletion. Sales and gross profit are adjusted prospectively for revisions in estimated total contract costs andcontract values. When the current estimates of total contract revenue and contract cost indicate a loss, a provisionfor the entire loss on the contract is recorded in that period. The provision for the loss arises because estimatedcost for the contract exceeds estimated revenue.
See Accounting for Hedges and Trading Activities – Trading presented earlier in this footnote for discussionof accounting policies for the recognition of revenues related to trading activities.
Nuclear Fuel. Amortization of nuclear fuel is included in the Consolidated Statements of Income as FuelUsed in Electric Generation. The amortization is recorded using the units-of-production method.
Deferred Returns and Allowance for Funds Used During Construction (AFUDC). Deferred returns,recorded in accordance with SFAS No. 71, represent the estimated financing costs associated with fundingregulatory assets. These costs arise primarily from the funding of purchased capacity costs above levels collectedin rates. Deferred returns are non-cash items and are primarily recognized as an addition to purchased capacitycosts, which are included in Regulatory Assets and Deferred Debits on the Consolidated Balance Sheets, with anoffsetting credit to Other Income and Expenses, net. The amount of deferred returns included in Other Incomeand Expenses, net was $24 million in 2002, $43 million in 2001 and $50 million in 2000.
AFUDC represents the estimated debt and equity costs of capital funds necessary to finance the constructionof new regulated facilities. AFUDC is a non-cash item and is capitalized as a component of Property, Plant andEquipment cost, with offsetting credits to Other Income and Expenses, net and to Interest Expense. Afterconstruction is completed, Duke Energy is permitted to recover these costs, including a fair return, throughinclusion in the rate base and in the depreciation provision. The total amount of AFUDC included in OtherIncome and Expenses, net and Interest Expense was $82 million in 2002, $39 million in 2001 and $20 million in2000.
Rates used for capitalization of deferred returns and AFUDC by Duke Energy’s regulated operations arecalculated in compliance with GAAP rules.
Foreign Currency Translation. Duke Energy translates assets and liabilities for its internationaloperations, where the local currency is the functional currency, at year-end exchange rates. Revenues andexpenses are translated using average exchange rates during the year. Foreign Currency Translation Adjustmentsare included in the Consolidated Statements of Common Stockholders’ Equity and Comprehensive Income. Inthe financial statements for international operations, where the U.S. dollar is the functional currency, transactionsdenominated in the local currency have been remeasured in U.S. dollars. Remeasurement resulting from foreigncurrency gains and losses is included in the Consolidated Statements of Income.
Income Taxes. Duke Energy and its subsidiaries file a consolidated federal income tax return and other U.S.and foreign jurisdictional returns as required. Deferred income taxes have been provided for temporary
91

differences between the GAAP and tax carrying amounts of assets and liabilities. These differences createtaxable or tax-deductible amounts for future periods. Investment tax credits have been deferred and are beingamortized over the estimated useful lives of the related properties.
Excise and Other Pass-Through Taxes. Duke Energy generally presents revenues net of pass-throughtaxes on the Consolidated Statements of Income.
Earnings Per Common Share. Basic earnings per share is based on a weighted average of common sharesoutstanding. Diluted earnings per share reflects the potential dilution that could occur if securities or otheragreements to issue common stock, such as stock options, stock-based performance unit awards and phantomstock awards, were exercised or converted into common stock. The numerator for the calculation of both basicand diluted earnings per share is earnings available for common stockholders. The following table shows thedenominator for basic and diluted earnings per share.
Denominator for Earnings per Share2002 2001 2000
(in millions)
Denominator for basic earnings per share (weighted-averageshares outstanding)(a) . . . . . . . . . . . . . . . . . . . . . . . . . . . . . . . . . . . . . . . . . . . . . . . 836.1 767.5 735.7
Assumed exercise of dilutive securities orother agreements to issue common stock . . . . . . . . . . . . . . . . . . . . . . . . . . . . . . . . . 2.0 5.4 3.7
Denominator for diluted earnings per share . . . . . . . . . . . . . . . . . . . . . . . . . . . . . . . . . 838.1 772.9 739.4
(a) Increase in weighted-average shares from 2001 to 2002 due primarily to the acquisition of WestcoastEnergy Inc. on March 14, 2002 (see Note 2.) and the October 2002 equity issuance of 54.5 millionshares. (See Note 18.)
The 2000 common stock amounts have been adjusted to reflect the two-for-one common stock spliteffective January 26, 2001. (See Note 18.)
Options, performance awards and phantom stock awards to purchase approximately 31.4 million shares ofcommon stock as of December 31, 2002, 6.0 million shares as of December 31, 2001 and 3.3 million shares as ofDecember 31, 2000 were not included in the computation of diluted earnings per share because the optionexercise prices were greater than the average market price of the common shares during those periods.
Cumulative Effect of Change in Accounting Principle. Duke Energy adopted SFAS No. 133 as amendedand interpreted on January 1, 2001. In accordance with the transition provisions of SFAS No. 133, Duke Energyrecorded a net-of-tax cumulative effect adjustment of $96 million, or $0.13 per basic share, as a reduction inearnings. The net-of-tax cumulative effect adjustment reducing OCI and Common Stockholders’ Equity was$921 million. For the year ended December 31, 2001, Duke Energy reclassified as earnings $222 million oflosses from OCI for derivatives included in the transition adjustment related to hedge transactions that settled.The amount reclassified out of OCI will be different from the amount included in the transition adjustment due tomarket price changes since January 1, 2001.
92

DUKE ENERGY CORPORATION
Notes To Consolidated Financial Statements — Continued
Other Comprehensive Income (Loss). The components of and changes in other comprehensive income areas follows:
ForeignCurrency
Adjustments
NetUnrealizedGains onCash FlowHedges
MinimumPensionLiability
Adjustment
AccumulatedOther
ComprehensiveIncome (Loss)
(in millions)
Balance as of December 31, 1999 . . . . . . . . . . . . . . . . . . . . . $ (2) $ — $ — $ (2)Other comprehensive income changesduring the year . . . . . . . . . . . . . . . . . . . . . . . . . . . . . . . . . . (118) — — (118)
Balance as of December 31, 2000 . . . . . . . . . . . . . . . . . . . . . (120) — — (120)Other comprehensive income changesduring the year (net of taxes of $(291)) . . . . . . . . . . . . . . . (187) 487 — 300
Balance as of December 31, 2001 . . . . . . . . . . . . . . . . . . . . . (307) 487 — 180Other comprehensive income changesduring the year (net of taxes of $331)(a) . . . . . . . . . . . . . . (340) (65) (484) (889)
Balance as of December 31, 2002 . . . . . . . . . . . . . . . . . . . . . $(647) $422 $(484) $(709)
(a) 2002 net of taxes include $22 million for the net unrealized gain on cash flow hedges and $309 million forthe minimum pension liability adjustment.
New Accounting Standards. SFAS No. 142, “Goodwill and Other Intangible Assets.” Duke Energyadopted SFAS No. 142 as of January 1, 2002. SFAS No. 142 requires that goodwill no longer be amortized overan estimated useful life, as previously required. Instead, goodwill amounts are subject to fair value-basedimpairment assessments. Duke Energy did not recognize any material impairment due to the adoption of SFASNo. 142. (For material impairments subsequent to the adoption of SFAS No.142, see Note 9.) SFAS No. 142 alsorequires certain identifiable intangible assets to be recognized separately and amortized as appropriate uponadoption. No adjustments to intangibles were identified by Duke Energy at adoption.
93

DUKE ENERGY CORPORATION
Notes To Consolidated Financial Statements — Continued
The following table shows what earnings available for common stockholders and earnings per share wouldhave been if amortization (including any related tax effects) related to goodwill that is no longer being amortizedhad been excluded from prior periods. (See additional goodwill disclosures made earlier in this footnote.)
Goodwill—Adoption of SFAS No. 142For the years ended
December 31,
2002 2001 2000
(in millions, except per shareamounts)
Earnings available for common stockholdersReported earnings available for commonstockholders . . . . . . . . . . . . . . . . . . . . . . . . . . . . . . . . . . . . . . . . . . . . . . . . . . . . . . $1,021 $1,884 $1,757
Add back: Goodwill amortization, net of tax . . . . . . . . . . . . . . . . . . . . . . . . . . . . . . . — 75 56
Adjusted earnings available for commonstockholders . . . . . . . . . . . . . . . . . . . . . . . . . . . . . . . . . . . . . . . . . . . . . . . . . . . . . . $1,021 $1,959 $1,813
Basic earnings per shareReported earnings per share . . . . . . . . . . . . . . . . . . . . . . . . . . . . . . . . . . . . . . . . . . . . $ 1.22 $ 2.45 $ 2.39Goodwill amortization . . . . . . . . . . . . . . . . . . . . . . . . . . . . . . . . . . . . . . . . . . . . . . . . — 0.10 0.08
Adjusted earnings per share . . . . . . . . . . . . . . . . . . . . . . . . . . . . . . . . . . . . . . . . . . . . $ 1.22 $ 2.55 $ 2.47
Diluted earnings per shareReported earnings per share . . . . . . . . . . . . . . . . . . . . . . . . . . . . . . . . . . . . . . . . . . . . $ 1.22 $ 2.44 $ 2.38Goodwill amortization . . . . . . . . . . . . . . . . . . . . . . . . . . . . . . . . . . . . . . . . . . . . . . . . — 0.10 0.08
Adjusted earnings per share . . . . . . . . . . . . . . . . . . . . . . . . . . . . . . . . . . . . . . . . . . . . $ 1.22 $ 2.54 $ 2.46
SFAS No. 144, “Accounting for the Impairment or Disposal of Long-Lived Assets.” Duke Energy adoptedSFAS No. 144 on January 1, 2002. The new rules supersede SFAS No. 121, “Accounting for the Impairment ofLong-Lived Assets and for Long-Lived Assets to Be Disposed Of.” The new rules retain many of thefundamental recognition and measurement provisions, but significantly change the criteria for classifying anasset as held-for-sale or as a discontinued operation. (For material impairments since the adoption of SFAS No.144, see Note 9.)
94
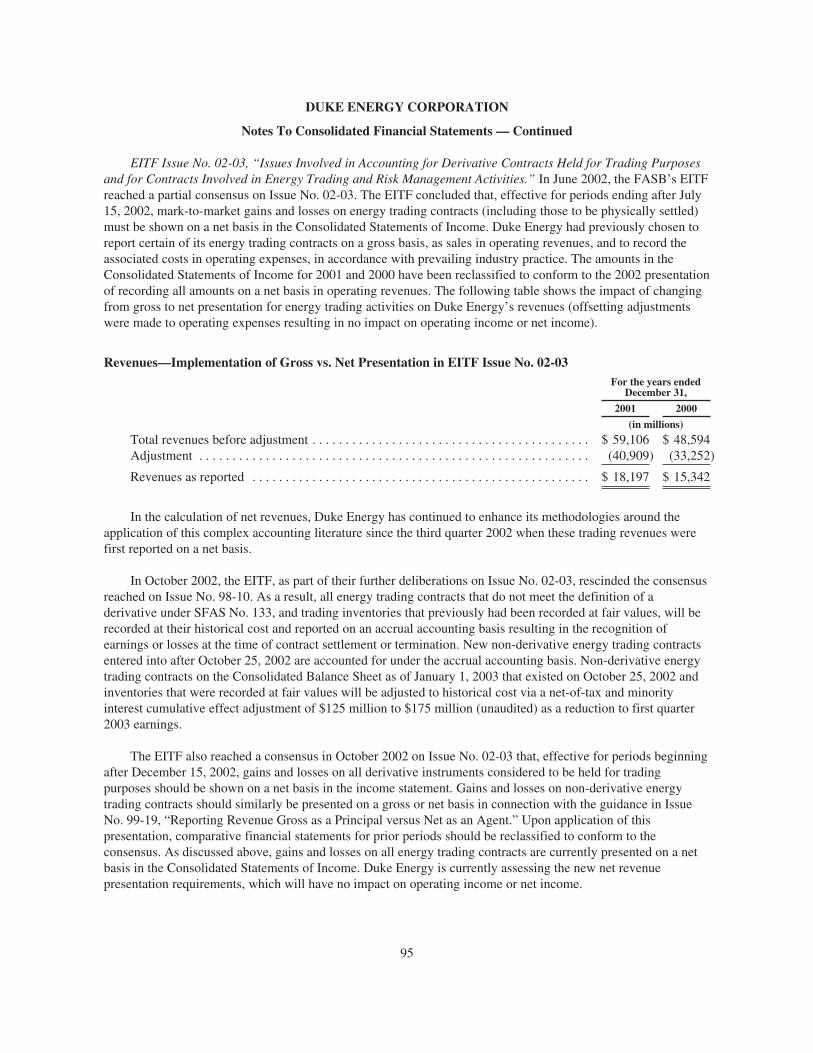
DUKE ENERGY CORPORATION
Notes To Consolidated Financial Statements — Continued
EITF Issue No. 02-03, “Issues Involved in Accounting for Derivative Contracts Held for Trading Purposesand for Contracts Involved in Energy Trading and Risk Management Activities.” In June 2002, the FASB’s EITFreached a partial consensus on Issue No. 02-03. The EITF concluded that, effective for periods ending after July15, 2002, mark-to-market gains and losses on energy trading contracts (including those to be physically settled)must be shown on a net basis in the Consolidated Statements of Income. Duke Energy had previously chosen toreport certain of its energy trading contracts on a gross basis, as sales in operating revenues, and to record theassociated costs in operating expenses, in accordance with prevailing industry practice. The amounts in theConsolidated Statements of Income for 2001 and 2000 have been reclassified to conform to the 2002 presentationof recording all amounts on a net basis in operating revenues. The following table shows the impact of changingfrom gross to net presentation for energy trading activities on Duke Energy’s revenues (offsetting adjustmentswere made to operating expenses resulting in no impact on operating income or net income).
Revenues—Implementation of Gross vs. Net Presentation in EITF Issue No. 02-03For the years ended
December 31,
2001 2000
(in millions)
Total revenues before adjustment . . . . . . . . . . . . . . . . . . . . . . . . . . . . . . . . . . . . . . . . . . $ 59,106 $ 48,594Adjustment . . . . . . . . . . . . . . . . . . . . . . . . . . . . . . . . . . . . . . . . . . . . . . . . . . . . . . . . . . . (40,909) (33,252)
Revenues as reported . . . . . . . . . . . . . . . . . . . . . . . . . . . . . . . . . . . . . . . . . . . . . . . . . . . $ 18,197 $ 15,342
In the calculation of net revenues, Duke Energy has continued to enhance its methodologies around theapplication of this complex accounting literature since the third quarter 2002 when these trading revenues werefirst reported on a net basis.
In October 2002, the EITF, as part of their further deliberations on Issue No. 02-03, rescinded the consensusreached on Issue No. 98-10. As a result, all energy trading contracts that do not meet the definition of aderivative under SFAS No. 133, and trading inventories that previously had been recorded at fair values, will berecorded at their historical cost and reported on an accrual accounting basis resulting in the recognition ofearnings or losses at the time of contract settlement or termination. New non-derivative energy trading contractsentered into after October 25, 2002 are accounted for under the accrual accounting basis. Non-derivative energytrading contracts on the Consolidated Balance Sheet as of January 1, 2003 that existed on October 25, 2002 andinventories that were recorded at fair values will be adjusted to historical cost via a net-of-tax and minorityinterest cumulative effect adjustment of $125 million to $175 million (unaudited) as a reduction to first quarter2003 earnings.
The EITF also reached a consensus in October 2002 on Issue No. 02-03 that, effective for periods beginningafter December 15, 2002, gains and losses on all derivative instruments considered to be held for tradingpurposes should be shown on a net basis in the income statement. Gains and losses on non-derivative energytrading contracts should similarly be presented on a gross or net basis in connection with the guidance in IssueNo. 99-19, “Reporting Revenue Gross as a Principal versus Net as an Agent.” Upon application of thispresentation, comparative financial statements for prior periods should be reclassified to conform to theconsensus. As discussed above, gains and losses on all energy trading contracts are currently presented on a netbasis in the Consolidated Statements of Income. Duke Energy is currently assessing the new net revenuepresentation requirements, which will have no impact on operating income or net income.
95
DUKE ENERGY CORPORATION
Notes To Consolidated Financial Statements — Continued
SFAS No. 143, “Accounting for Asset Retirement Obligations.” In June 2001, the FASB issued SFAS No.143 which addresses financial accounting and reporting for obligations associated with the retirement of tangiblelong-lived assets and the associated asset retirement costs. The standard applies to legal obligations associatedwith the retirement of long-lived assets that result from the acquisition, construction, development and/or normaluse of the asset.
SFAS No. 143 requires that the fair value of a liability for an asset retirement obligation be recognized inthe period in which it is incurred, if a reasonable estimate of fair value can be made. The fair value of the liabilityis added to the carrying amount of the associated asset. This additional carrying amount is then depreciated overthe life of the asset. The liability increases due to the passage of time based on the time value of money until theobligation is settled.
Certain of Duke Energy’s regulated operations recognize some removal costs as a component ofdepreciation in accordance with regulatory treatment. While these amounts will remain in accumulateddepreciation, to the extent these amounts do not represent SFAS No. 143 legal retirement obligations, they willbe disclosed as part of the regulatory matters footnote upon adoption of SFAS No. 143.
SFAS No. 143 was effective for fiscal years beginning after June 15, 2002, and will be adopted by DukeEnergy in the first quarter of 2003. The implementation of the standard is expected to result in a net increase intotal assets of approximately $855 million, consisting primarily of an increase in net property, plant andequipment of approximately $198 million and an increase in regulatory assets of approximately $659 million.Liabilities are expected to increase by approximately $870 million, which primarily represents the establishmentof an asset retirement obligation liability of $1,589 million, reduced by the amount that was already recorded as anuclear decommissioning liability of $708 million. Substantially all of the obligations are related to the regulatedelectric operations. Accordingly, Duke Energy filed a request on January 10, 2003 with the North CarolinaUtilities Commission (NCUC) to defer the income statement effect of adopting SFAS No.143 for its regulatedelectric operations, and the accounting treatment described above reflects management’s assumption that thisrequest will be granted. Duke Energy anticipates making a similar application with the Public ServiceCommission of South Carolina (PSCSC) by March 31, 2003. For obligations related to non-regulated operations,a net-of-tax cumulative effect of a change in accounting principle adjustment of approximately $15 million isexpected to be recorded in the first quarter of 2003, as a reduction in earnings.
SFAS No. 146, “Accounting for Costs Associated with Exit or Disposal Activities.” In June 2002, the FASBissued SFAS No. 146 which addresses accounting for restructuring and similar costs. SFAS No. 146 supersedesprevious accounting guidance, principally EITF Issue No. 94-3, “Liability Recognition for Certain EmployeeTermination Benefits and Other Costs to Exit an Activity (including Certain Costs Incurred in a Restructuring).”Duke Energy has adopted the provisions of SFAS No. 146 for any restructuring activities initiated afterDecember 31, 2002. SFAS No. 146 requires that the liability for costs associated with an exit or disposal activitybe recognized when the liability is incurred. Under EITF Issue No. 94-3, a liability for an exit cost wasrecognized on the date of Duke Energy’s commitment to an exit plan. SFAS No. 146 also establishes that theliability should initially be measured and recorded at fair value. Accordingly, SFAS No. 146 will affect thetiming of recognizing future restructuring costs as well as the amounts recognized.
SFAS No. 148, “Accounting for Stock-Based Compensation—Transition and Disclosure (an amendment ofFASB Statement No. 123).” In December 2002, the FASB issued SFAS No. 148, which amends SFAS No. 123,“Accounting for Stock-Based Compensation,” and provides alternative methods of transition for a voluntarychange to the fair value-based method of accounting for stock-based employee compensation. SFAS No. 148 alsoamends the disclosure requirements of SFAS No. 123 and APB Opinion No. 28, “Interim Financial Reporting,”
96
DUKE ENERGY CORPORATION
Notes To Consolidated Financial Statements — Continued
to require prominent disclosures in both annual and interim financial statements about the method of accountingfor stock-based employee compensation and the effect of the method used on reported results. The provisions ofSFAS No. 148 are effective for financial statements for periods ending after December 15, 2002. (See Stock-Based Compensation disclosures made earlier in this footnote.)
FASB Interpretation No. 45 (FIN 45), “Guarantor’s Accounting and Disclosure Requirements forGuarantees, Including Indirect Guarantees of Indebtedness of Others.” In November 2002, the FASB issued FIN45 which requires a guarantor to recognize a liability for the fair value of the obligation it assumes under certainguarantees. Additionally, FIN 45 requires a guarantor to disclose certain aspects of each guarantee, or each groupof similar guarantees, including the nature of the guarantee, the maximum exposure under the guarantee, thecurrent carrying amount of any liability for the guarantee, and any recourse provisions allowing the guarantor torecover from third parties any amounts paid under the guarantee. The disclosure provisions of FIN 45 areeffective for financial statements for both interim and annual periods ending after December 15, 2002. (See Note17 for additional information.) The fair value measurement provisions of FIN 45 are to be applied on aprospective basis to guarantees issued or modified after December 31, 2002.
FASB Interpretation No. 46 (FIN 46), “Consolidation of Variable Interest Entities.” In January 2003, theFASB issued FIN 46 which requires an entity to consolidate a variable interest entity if it is the primarybeneficiary of the variable interest entity’s activities. The primary beneficiary is the party that absorbs a majorityof the expected losses, receives a majority of the expected residual returns, or both, of the variable interestentity’s activities. FIN 46 is applicable immediately to variable interest entities created, or interests in variableinterest entities obtained, after January 31, 2003. For those variable interest entities created, or interests invariable interest entities obtained, on or before January 31, 2003, FIN 46 is required to be applied in the firstfiscal year or interim period beginning after June 15, 2003. FIN 46 may be applied prospectively with acumulative-effect adjustment as of the date it is first applied, or by restating previously issued financialstatements with a cumulative-effect adjustment as of the beginning of the first year restated. FIN 46 also requirescertain disclosures of an entity’s relationship with variable interest entities. Duke Energy is currently assessingFIN 46 but does not anticipate that it will have a material impact on its consolidated results of operations, cashflows or financial position.
Reclassifications. Certain prior period amounts have been reclassified to conform to current classifications.
2. Business Acquisitions and Dispositions
Business Acquisitions. Duke Energy consolidates assets and liabilities from acquisitions as of the purchasedate, and includes earnings from acquisitions in consolidated earnings after the purchase date. Assets acquiredand liabilities assumed are recorded at estimated fair values on the date of acquisition. The purchase price minusthe estimated fair value of the acquired assets and liabilities is recorded as goodwill. The allocation of thepurchase price may be adjusted if additional information on asset and liability valuations becomes availablewithin one year after the acquisition.
Acquisition of Westcoast Energy Inc. (Westcoast). On March 14, 2002, Duke Energy acquired Westcoast forapproximately $8 billion, including the assumption of $4.7 billion of debt. The assumed debt consists of debt ofWestcoast, Union Gas Limited (Union Gas) (a wholly owned subsidiary of Westcoast) and various projectentities that are wholly owned or consolidated by Duke Energy. The interest rates on the assumed debt rangefrom 1.8% to 15.0%, with maturity dates ranging from 2002 through 2031. Westcoast, headquartered in
97

DUKE ENERGY CORPORATION
Notes To Consolidated Financial Statements — Continued
Vancouver, British Columbia, is a North American energy company with interests in natural gas gathering,processing, transmission, storage and distribution, as well as power generation and international energybusinesses.
In the transaction, a Duke Energy subsidiary acquired all of the outstanding common shares of Westcoast inexchange for approximately $1.7 billion in cash (net of cash acquired) and approximately 49.9 million shares ofDuke Energy common stock (including exchangeable shares of a Duke Energy Canadian subsidiary that aresubstantially equivalent to and exchangeable on a one-for-one basis for Duke Energy common stock). The valueof the Duke Energy common stock issued was approximately $1.7 billion and was determined based on theaverage market price of Duke Energy’s common shares over the two-day period before and after the terms of thetransaction became fixed, in accordance with EITF No. 99-12, “Determination of the Measurement Date for theMarket Price of Acquirer Securities Issued in a Purchase Business Combination.” Under prorating provisions ofthe acquisition agreement that ensured that approximately 50% of the total consideration was paid in cash and50% in stock, each common share of Westcoast entitled the holder to elect to receive 43.80 in Canadian dollars,or either 0.7711 of a share of Duke Energy common stock or of an exchangeable share of a Duke EnergyCanadian subsidiary, or a combination thereof. The cash portion of the consideration was funded with theproceeds from the issuance of $750 million in mandatory convertible securities (Equity Units) in November 2001(see Note 18) along with incremental commercial paper. The commercial paper was repaid using the proceedsfrom the October 2002 public offering of Duke Energy Common Stock (see Note 18).
The acquisition of Westcoast was consistent with Duke Energy’s natural gas pipeline strategy to expand itsfootprint between key supply and market areas in North America. During its evaluation, Duke Energy identifiedrevenue enhancement opportunities through expansion projects and business integration, cost reductioninitiatives, and the divestiture of several non-strategic business lines and assets. These initiatives, when combinedwith the ongoing earnings contributions from Westcoast’s pipelines and distribution businesses, supported apurchase price in excess of the fair value of Westcoast’s assets, which resulted in the recognition of goodwill.The Westcoast acquisition was accounted for using the purchase method, and goodwill of approximately $2.3billion was recorded in the transaction, of which approximately $57 million is expected to be deductible forincome tax purposes. Of this amount, $52 million was allocated for tax purposes to Empire State Pipeline whichwas sold in February 2003 (see Note 22).
98
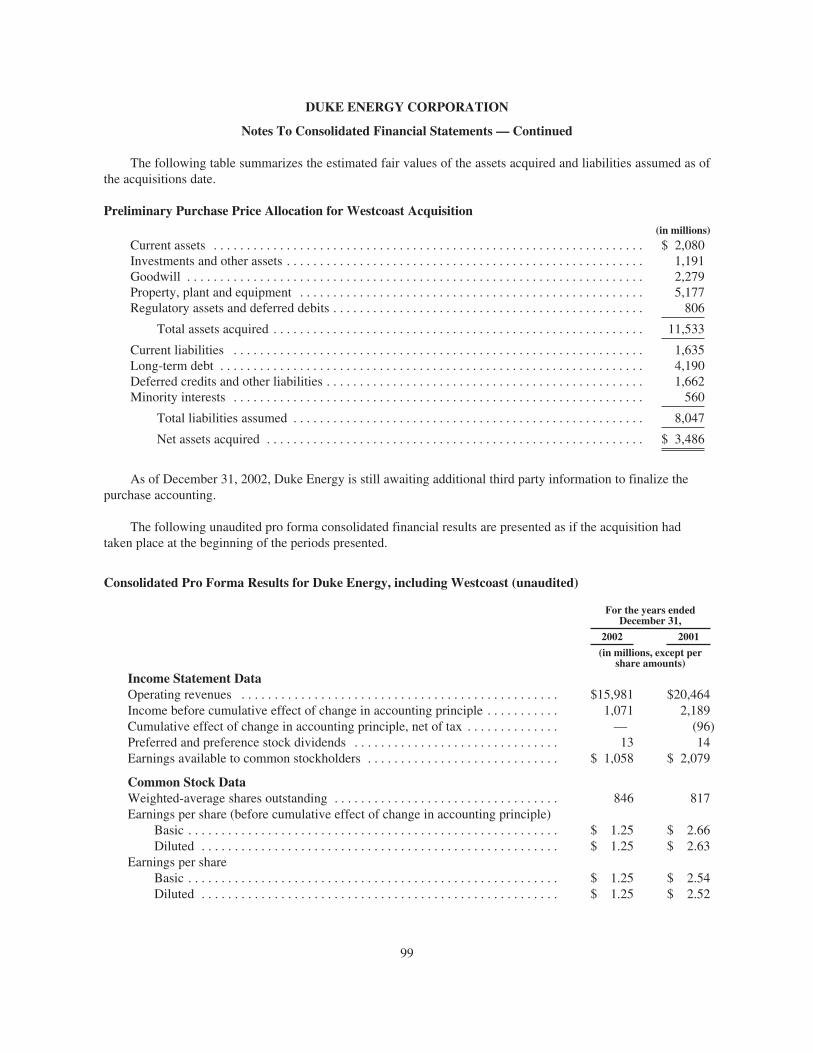
DUKE ENERGY CORPORATION
Notes To Consolidated Financial Statements — Continued
The following table summarizes the estimated fair values of the assets acquired and liabilities assumed as ofthe acquisitions date.
Preliminary Purchase Price Allocation for Westcoast Acquisition(in millions)
Current assets . . . . . . . . . . . . . . . . . . . . . . . . . . . . . . . . . . . . . . . . . . . . . . . . . . . . . . . . . . . . . . . . . $ 2,080Investments and other assets . . . . . . . . . . . . . . . . . . . . . . . . . . . . . . . . . . . . . . . . . . . . . . . . . . . . . . 1,191Goodwill . . . . . . . . . . . . . . . . . . . . . . . . . . . . . . . . . . . . . . . . . . . . . . . . . . . . . . . . . . . . . . . . . . . . . 2,279Property, plant and equipment . . . . . . . . . . . . . . . . . . . . . . . . . . . . . . . . . . . . . . . . . . . . . . . . . . . . 5,177Regulatory assets and deferred debits . . . . . . . . . . . . . . . . . . . . . . . . . . . . . . . . . . . . . . . . . . . . . . . 806
Total assets acquired . . . . . . . . . . . . . . . . . . . . . . . . . . . . . . . . . . . . . . . . . . . . . . . . . . . . . . . . 11,533
Current liabilities . . . . . . . . . . . . . . . . . . . . . . . . . . . . . . . . . . . . . . . . . . . . . . . . . . . . . . . . . . . . . . 1,635Long-term debt . . . . . . . . . . . . . . . . . . . . . . . . . . . . . . . . . . . . . . . . . . . . . . . . . . . . . . . . . . . . . . . . 4,190Deferred credits and other liabilities . . . . . . . . . . . . . . . . . . . . . . . . . . . . . . . . . . . . . . . . . . . . . . . . 1,662Minority interests . . . . . . . . . . . . . . . . . . . . . . . . . . . . . . . . . . . . . . . . . . . . . . . . . . . . . . . . . . . . . . 560
Total liabilities assumed . . . . . . . . . . . . . . . . . . . . . . . . . . . . . . . . . . . . . . . . . . . . . . . . . . . . . 8,047
Net assets acquired . . . . . . . . . . . . . . . . . . . . . . . . . . . . . . . . . . . . . . . . . . . . . . . . . . . . . . . . . $ 3,486
As of December 31, 2002, Duke Energy is still awaiting additional third party information to finalize thepurchase accounting.
The following unaudited pro forma consolidated financial results are presented as if the acquisition hadtaken place at the beginning of the periods presented.
Consolidated Pro Forma Results for Duke Energy, including Westcoast (unaudited)
For the years endedDecember 31,
2002 2001
(in millions, except pershare amounts)
Income Statement DataOperating revenues . . . . . . . . . . . . . . . . . . . . . . . . . . . . . . . . . . . . . . . . . . . . . . . . $15,981 $20,464Income before cumulative effect of change in accounting principle . . . . . . . . . . . 1,071 2,189Cumulative effect of change in accounting principle, net of tax . . . . . . . . . . . . . . — (96)Preferred and preference stock dividends . . . . . . . . . . . . . . . . . . . . . . . . . . . . . . . 13 14Earnings available to common stockholders . . . . . . . . . . . . . . . . . . . . . . . . . . . . . $ 1,058 $ 2,079
Common Stock DataWeighted-average shares outstanding . . . . . . . . . . . . . . . . . . . . . . . . . . . . . . . . . . 846 817Earnings per share (before cumulative effect of change in accounting principle)
Basic . . . . . . . . . . . . . . . . . . . . . . . . . . . . . . . . . . . . . . . . . . . . . . . . . . . . . . . . $ 1.25 $ 2.66Diluted . . . . . . . . . . . . . . . . . . . . . . . . . . . . . . . . . . . . . . . . . . . . . . . . . . . . . . $ 1.25 $ 2.63
Earnings per shareBasic . . . . . . . . . . . . . . . . . . . . . . . . . . . . . . . . . . . . . . . . . . . . . . . . . . . . . . . . $ 1.25 $ 2.54Diluted . . . . . . . . . . . . . . . . . . . . . . . . . . . . . . . . . . . . . . . . . . . . . . . . . . . . . . $ 1.25 $ 2.52
99

DUKE ENERGY CORPORATION
Notes To Consolidated Financial Statements — Continued
Dispositions. Duke Engineering & Services, Inc. (DE&S). On May 1, 2002, Duke Energy completed thesale of portions of its DE&S business unit to Framatome ANP, Inc. (a nuclear supplier) for $74 million. Someminor assets and two components of DE&S were not part of the sale and remain components of Other EnergyServices. Duke Energy established Energy Delivery Services (EDS) in the second quarter of 2002 from thetransmission and distribution services component of DE&S. EDS supplies electric transmission, distribution andsubstation services to customers. Duke Energy also retained its ownership interest in Duke COGEMA Stone &Webster, LLC (DCS), the prime contractor on the U.S. Department of Energy Mixed Oxide Fuel project.Operating results in 2002 include the pre-tax gain of $26 million on the sale of DE&S, or an after-tax gain of$0.02 per basic share.
DukeSolutions, Inc. (DukeSolutions). On May 1, 2002, Duke Energy completed the sale of portions ofDukeSolutions to Ameresco, Inc. for $6 million. The portions that were not sold remain a component of OtherEnergy Services. Operating results in 2002 include the pre-tax loss on the sale of DukeSolutions of $25 million,or an after-tax loss of $0.02 per basic share.
3. Business Segments
Duke Energy, an integrated provider of energy and energy services, offers physical delivery andmanagement of both electricity and natural gas throughout the U.S. and abroad. Duke Energy provides these andother services through seven business segments.
Franchised Electric generates, transmits, distributes and sells electricity in central and western NorthCarolina and western South Carolina. It conducts operations primarily through Duke Power and Nantahala Powerand Light. These electric operations are subject to the rules and regulations of the Federal Energy RegulatoryCommission (FERC), the NCUC and the PSCSC.
Natural Gas Transmission provides transportation and storage of natural gas for customers throughout theEast Coast and Southern U.S., and in Canada. Natural Gas Transmission also provides distribution service toretail customers in Ontario and Western Canada and gas gathering and processing services to customers inWestern Canada. Natural Gas Transmission does business primarily through Duke Energy Gas TransmissionCorporation. Duke Energy acquired Westcoast on March 14, 2002 (see Note 2). Duke Energy GasTransmission’s natural gas transmission and storage operations in the U.S. are subject to the FERC’s and theTexas Railroad Commission’s rules and regulations, while natural gas gathering, processing, transmission,distribution and storage operations in Canada are subject to the rules and regulations of the National EnergyBoard (NEB), the Ontario Energy Board (OEB) and the British Columbia Utilities Commission.
Field Services gathers, compresses, treats, processes, transports, trades and markets, and stores natural gas;and produces, transports, trades and markets, and stores NGLs. It conducts operations primarily through DukeEnergy Field Services, LLC (DEFS), which is approximately 30% owned by ConocoPhillips and approximately70% owned by Duke Energy. Field Services gathers natural gas from production wellheads in Western Canadaand 11 contiguous states in the U.S. Those systems serve major natural gas-producing regions in the WesternCanadian Sedimentary Basin, Rocky Mountain, Permian Basin, Mid-Continent and East Texas-Austin Chalk-North Louisiana areas, as well as onshore and offshore Gulf Coast areas.
Duke Energy North America (DENA) develops, operates and manages merchant power generation facilitiesand engages in commodity sales and services related to natural gas and electric power. DENA conducts businessthroughout the U.S. and Canada through Duke Energy North America, LLC and Duke Energy Trading andMarketing, LLC (DETM). DETM is approximately 40% owned by ExxonMobil Corporation and approximately
100
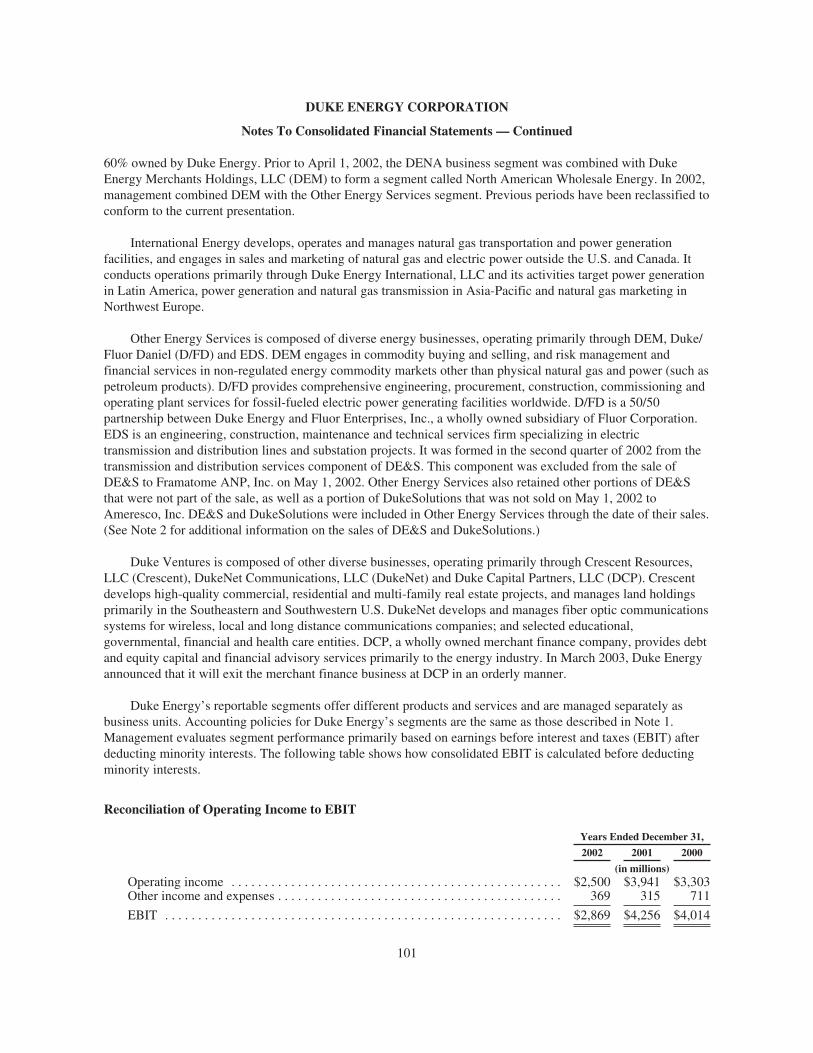
DUKE ENERGY CORPORATION
Notes To Consolidated Financial Statements — Continued
60% owned by Duke Energy. Prior to April 1, 2002, the DENA business segment was combined with DukeEnergy Merchants Holdings, LLC (DEM) to form a segment called North American Wholesale Energy. In 2002,management combined DEM with the Other Energy Services segment. Previous periods have been reclassified toconform to the current presentation.
International Energy develops, operates and manages natural gas transportation and power generationfacilities, and engages in sales and marketing of natural gas and electric power outside the U.S. and Canada. Itconducts operations primarily through Duke Energy International, LLC and its activities target power generationin Latin America, power generation and natural gas transmission in Asia-Pacific and natural gas marketing inNorthwest Europe.
Other Energy Services is composed of diverse energy businesses, operating primarily through DEM, Duke/Fluor Daniel (D/FD) and EDS. DEM engages in commodity buying and selling, and risk management andfinancial services in non-regulated energy commodity markets other than physical natural gas and power (such aspetroleum products). D/FD provides comprehensive engineering, procurement, construction, commissioning andoperating plant services for fossil-fueled electric power generating facilities worldwide. D/FD is a 50/50partnership between Duke Energy and Fluor Enterprises, Inc., a wholly owned subsidiary of Fluor Corporation.EDS is an engineering, construction, maintenance and technical services firm specializing in electrictransmission and distribution lines and substation projects. It was formed in the second quarter of 2002 from thetransmission and distribution services component of DE&S. This component was excluded from the sale ofDE&S to Framatome ANP, Inc. on May 1, 2002. Other Energy Services also retained other portions of DE&Sthat were not part of the sale, as well as a portion of DukeSolutions that was not sold on May 1, 2002 toAmeresco, Inc. DE&S and DukeSolutions were included in Other Energy Services through the date of their sales.(See Note 2 for additional information on the sales of DE&S and DukeSolutions.)
Duke Ventures is composed of other diverse businesses, operating primarily through Crescent Resources,LLC (Crescent), DukeNet Communications, LLC (DukeNet) and Duke Capital Partners, LLC (DCP). Crescentdevelops high-quality commercial, residential and multi-family real estate projects, and manages land holdingsprimarily in the Southeastern and Southwestern U.S. DukeNet develops and manages fiber optic communicationssystems for wireless, local and long distance communications companies; and selected educational,governmental, financial and health care entities. DCP, a wholly owned merchant finance company, provides debtand equity capital and financial advisory services primarily to the energy industry. In March 2003, Duke Energyannounced that it will exit the merchant finance business at DCP in an orderly manner.
Duke Energy’s reportable segments offer different products and services and are managed separately asbusiness units. Accounting policies for Duke Energy’s segments are the same as those described in Note 1.Management evaluates segment performance primarily based on earnings before interest and taxes (EBIT) afterdeducting minority interests. The following table shows how consolidated EBIT is calculated before deductingminority interests.
Reconciliation of Operating Income to EBIT
Years Ended December 31,
2002 2001 2000
(in millions)Operating income . . . . . . . . . . . . . . . . . . . . . . . . . . . . . . . . . . . . . . . . . . . . . . . . . . $2,500 $3,941 $3,303Other income and expenses . . . . . . . . . . . . . . . . . . . . . . . . . . . . . . . . . . . . . . . . . . . 369 315 711
EBIT . . . . . . . . . . . . . . . . . . . . . . . . . . . . . . . . . . . . . . . . . . . . . . . . . . . . . . . . . . . . $2,869 $4,256 $4,014
101
DUKE ENERGY CORPORATION
Notes To Consolidated Financial Statements — Continued
EBIT is the primary performance measure used by management to evaluate segment performance. On asegment basis, it includes all profits (both operating and non-operating) before deducting interest and taxes, andis net of the minority interest expense related to those profits. Management believes EBIT is a good indicator ofeach segment’s operating performance. As an indicator of Duke Energy’s operating performance, EBIT shouldnot be considered an alternative to, or more meaningful than, net income or cash flow as determined inaccordance with GAAP. Duke Energy’s EBIT may not be comparable to a similarly titled measure of anothercompany.
Management views the sale of operating assets and equity earnings from operating assets as importantsources of revenue for Duke Energy and its subsidiaries. Therefore, for internal management purposes, theseitems are reflected in segment revenues. For external reporting purposes, these items are excluded from revenuesand appropriately reflected in separate captions on the Consolidated Statements of Income.
In the accompanying table, EBIT includes the profit on intersegment sales at prices management believesare representative of arms’ length transactions. The table also provides information on segment assets, net ofintercompany advances, intercompany notes receivable, intercompany current assets, intercompany derivativeassets and investments in subsidiaries. Other Operations primarily includes certain unallocated costs.
102
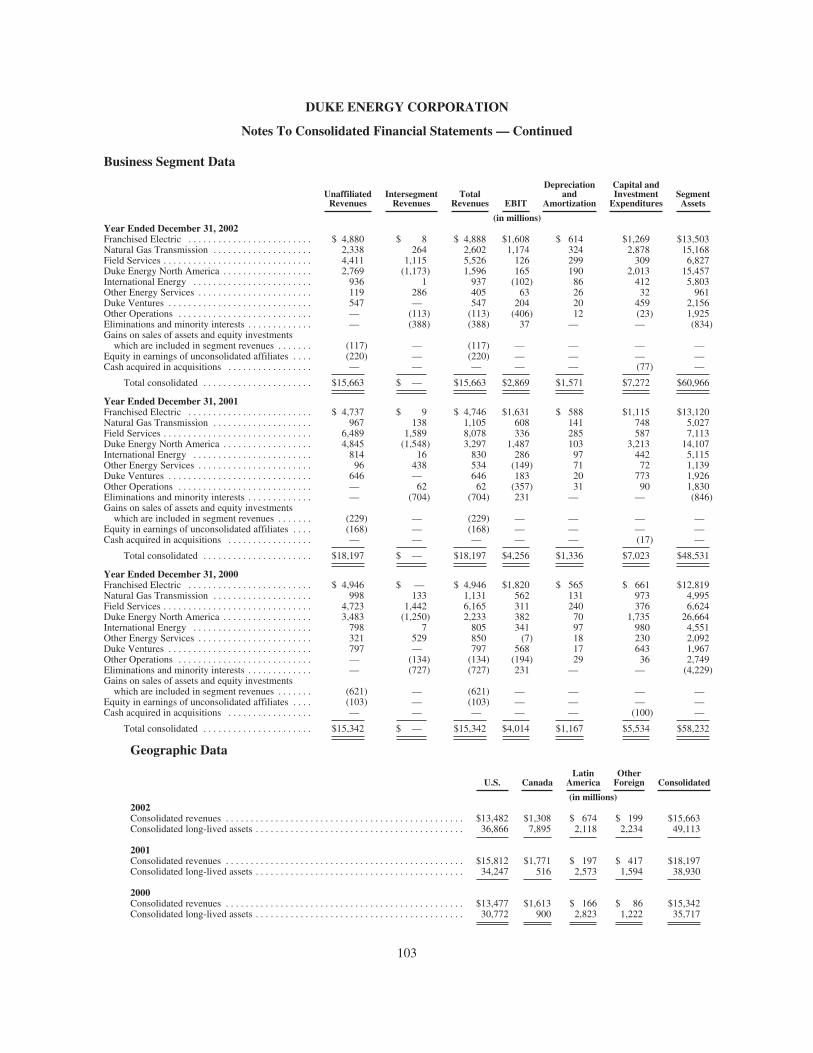
DUKE ENERGY CORPORATION
Notes To Consolidated Financial Statements — Continued
Business Segment Data
UnaffiliatedRevenues
IntersegmentRevenues
TotalRevenues EBIT
Depreciationand
Amortization
Capital andInvestmentExpenditures
SegmentAssets
(in millions)Year Ended December 31, 2002Franchised Electric . . . . . . . . . . . . . . . . . . . . . . . . . $ 4,880 $ 8 $ 4,888 $1,608 $ 614 $1,269 $13,503Natural Gas Transmission . . . . . . . . . . . . . . . . . . . . 2,338 264 2,602 1,174 324 2,878 15,168Field Services . . . . . . . . . . . . . . . . . . . . . . . . . . . . . . 4,411 1,115 5,526 126 299 309 6,827Duke Energy North America . . . . . . . . . . . . . . . . . . 2,769 (1,173) 1,596 165 190 2,013 15,457International Energy . . . . . . . . . . . . . . . . . . . . . . . . 936 1 937 (102) 86 412 5,803Other Energy Services . . . . . . . . . . . . . . . . . . . . . . . 119 286 405 63 26 32 961Duke Ventures . . . . . . . . . . . . . . . . . . . . . . . . . . . . . 547 — 547 204 20 459 2,156Other Operations . . . . . . . . . . . . . . . . . . . . . . . . . . . — (113) (113) (406) 12 (23) 1,925Eliminations and minority interests . . . . . . . . . . . . . — (388) (388) 37 — — (834)Gains on sales of assets and equity investmentswhich are included in segment revenues . . . . . . . (117) — (117) — — — —
Equity in earnings of unconsolidated affiliates . . . . (220) — (220) — — — —Cash acquired in acquisitions . . . . . . . . . . . . . . . . . — — — — — (77) —
Total consolidated . . . . . . . . . . . . . . . . . . . . . . $15,663 $ — $15,663 $2,869 $1,571 $7,272 $60,966
Year Ended December 31, 2001Franchised Electric . . . . . . . . . . . . . . . . . . . . . . . . . $ 4,737 $ 9 $ 4,746 $1,631 $ 588 $1,115 $13,120Natural Gas Transmission . . . . . . . . . . . . . . . . . . . . 967 138 1,105 608 141 748 5,027Field Services . . . . . . . . . . . . . . . . . . . . . . . . . . . . . . 6,489 1,589 8,078 336 285 587 7,113Duke Energy North America . . . . . . . . . . . . . . . . . . 4,845 (1,548) 3,297 1,487 103 3,213 14,107International Energy . . . . . . . . . . . . . . . . . . . . . . . . 814 16 830 286 97 442 5,115Other Energy Services . . . . . . . . . . . . . . . . . . . . . . . 96 438 534 (149) 71 72 1,139Duke Ventures . . . . . . . . . . . . . . . . . . . . . . . . . . . . . 646 — 646 183 20 773 1,926Other Operations . . . . . . . . . . . . . . . . . . . . . . . . . . . — 62 62 (357) 31 90 1,830Eliminations and minority interests . . . . . . . . . . . . . — (704) (704) 231 — — (846)Gains on sales of assets and equity investmentswhich are included in segment revenues . . . . . . . (229) — (229) — — — —
Equity in earnings of unconsolidated affiliates . . . . (168) — (168) — — — —Cash acquired in acquisitions . . . . . . . . . . . . . . . . . — — — — — (17) —
Total consolidated . . . . . . . . . . . . . . . . . . . . . . $18,197 $ — $18,197 $4,256 $1,336 $7,023 $48,531
Year Ended December 31, 2000Franchised Electric . . . . . . . . . . . . . . . . . . . . . . . . . $ 4,946 $ — $ 4,946 $1,820 $ 565 $ 661 $12,819Natural Gas Transmission . . . . . . . . . . . . . . . . . . . . 998 133 1,131 562 131 973 4,995Field Services . . . . . . . . . . . . . . . . . . . . . . . . . . . . . . 4,723 1,442 6,165 311 240 376 6,624Duke Energy North America . . . . . . . . . . . . . . . . . . 3,483 (1,250) 2,233 382 70 1,735 26,664International Energy . . . . . . . . . . . . . . . . . . . . . . . . 798 7 805 341 97 980 4,551Other Energy Services . . . . . . . . . . . . . . . . . . . . . . . 321 529 850 (7) 18 230 2,092Duke Ventures . . . . . . . . . . . . . . . . . . . . . . . . . . . . . 797 — 797 568 17 643 1,967Other Operations . . . . . . . . . . . . . . . . . . . . . . . . . . . — (134) (134) (194) 29 36 2,749Eliminations and minority interests . . . . . . . . . . . . . — (727) (727) 231 — — (4,229)Gains on sales of assets and equity investmentswhich are included in segment revenues . . . . . . . (621) — (621) — — — —
Equity in earnings of unconsolidated affiliates . . . . (103) — (103) — — — —Cash acquired in acquisitions . . . . . . . . . . . . . . . . . — — — — — (100) —
Total consolidated . . . . . . . . . . . . . . . . . . . . . . $15,342 $ — $15,342 $4,014 $1,167 $5,534 $58,232
Geographic Data
U.S. CanadaLatin
AmericaOtherForeign Consolidated
(in millions)2002Consolidated revenues . . . . . . . . . . . . . . . . . . . . . . . . . . . . . . . . . . . . . . . . . . . . . . . . $13,482 $1,308 $ 674 $ 199 $15,663Consolidated long-lived assets . . . . . . . . . . . . . . . . . . . . . . . . . . . . . . . . . . . . . . . . . . 36,866 7,895 2,118 2,234 49,113
2001Consolidated revenues . . . . . . . . . . . . . . . . . . . . . . . . . . . . . . . . . . . . . . . . . . . . . . . . $15,812 $1,771 $ 197 $ 417 $18,197Consolidated long-lived assets . . . . . . . . . . . . . . . . . . . . . . . . . . . . . . . . . . . . . . . . . . 34,247 516 2,573 1,594 38,930
2000Consolidated revenues . . . . . . . . . . . . . . . . . . . . . . . . . . . . . . . . . . . . . . . . . . . . . . . . $13,477 $1,613 $ 166 $ 86 $15,342Consolidated long-lived assets . . . . . . . . . . . . . . . . . . . . . . . . . . . . . . . . . . . . . . . . . . 30,772 900 2,823 1,222 35,717
103
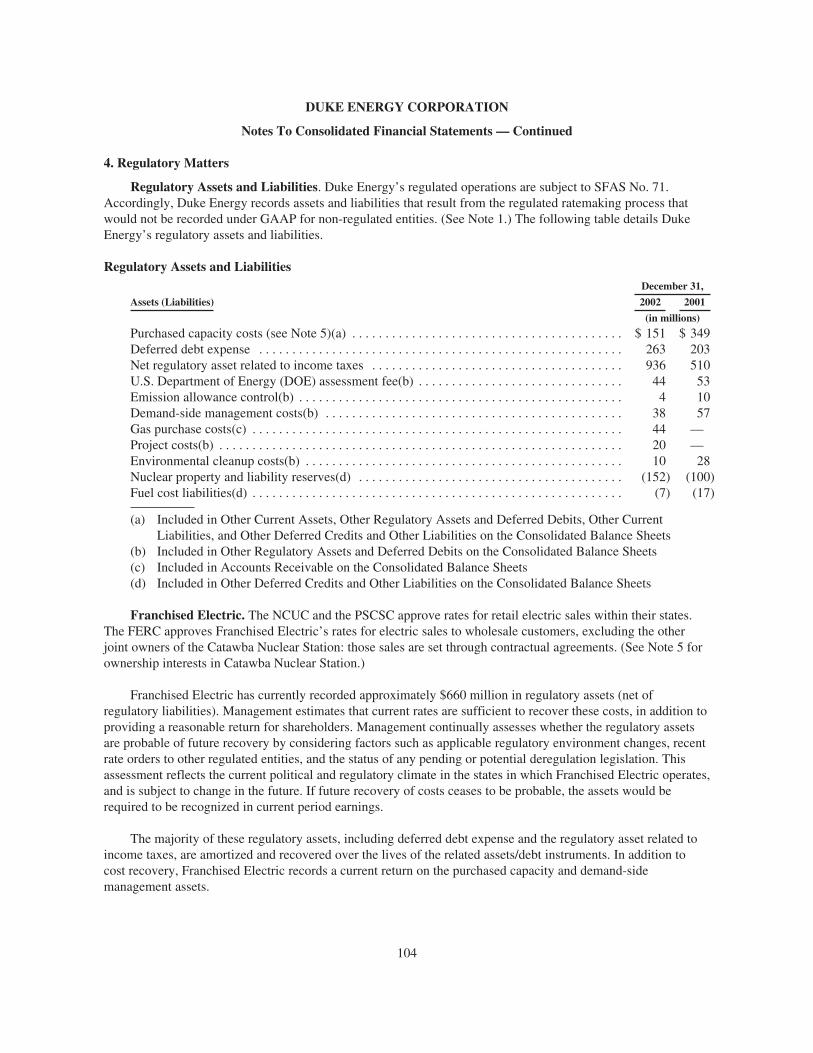
DUKE ENERGY CORPORATION
Notes To Consolidated Financial Statements — Continued
4. Regulatory Matters
Regulatory Assets and Liabilities. Duke Energy’s regulated operations are subject to SFAS No. 71.Accordingly, Duke Energy records assets and liabilities that result from the regulated ratemaking process thatwould not be recorded under GAAP for non-regulated entities. (See Note 1.) The following table details DukeEnergy’s regulatory assets and liabilities.
Regulatory Assets and LiabilitiesDecember 31,
Assets (Liabilities) 2002 2001
(in millions)
Purchased capacity costs (see Note 5)(a) . . . . . . . . . . . . . . . . . . . . . . . . . . . . . . . . . . . . . . . . . $ 151 $ 349Deferred debt expense . . . . . . . . . . . . . . . . . . . . . . . . . . . . . . . . . . . . . . . . . . . . . . . . . . . . . . . 263 203Net regulatory asset related to income taxes . . . . . . . . . . . . . . . . . . . . . . . . . . . . . . . . . . . . . . 936 510U.S. Department of Energy (DOE) assessment fee(b) . . . . . . . . . . . . . . . . . . . . . . . . . . . . . . . 44 53Emission allowance control(b) . . . . . . . . . . . . . . . . . . . . . . . . . . . . . . . . . . . . . . . . . . . . . . . . . 4 10Demand-side management costs(b) . . . . . . . . . . . . . . . . . . . . . . . . . . . . . . . . . . . . . . . . . . . . . 38 57Gas purchase costs(c) . . . . . . . . . . . . . . . . . . . . . . . . . . . . . . . . . . . . . . . . . . . . . . . . . . . . . . . . 44 —Project costs(b) . . . . . . . . . . . . . . . . . . . . . . . . . . . . . . . . . . . . . . . . . . . . . . . . . . . . . . . . . . . . . 20 —Environmental cleanup costs(b) . . . . . . . . . . . . . . . . . . . . . . . . . . . . . . . . . . . . . . . . . . . . . . . . 10 28Nuclear property and liability reserves(d) . . . . . . . . . . . . . . . . . . . . . . . . . . . . . . . . . . . . . . . . (152) (100)Fuel cost liabilities(d) . . . . . . . . . . . . . . . . . . . . . . . . . . . . . . . . . . . . . . . . . . . . . . . . . . . . . . . . (7) (17)
(a) Included in Other Current Assets, Other Regulatory Assets and Deferred Debits, Other CurrentLiabilities, and Other Deferred Credits and Other Liabilities on the Consolidated Balance Sheets
(b) Included in Other Regulatory Assets and Deferred Debits on the Consolidated Balance Sheets(c) Included in Accounts Receivable on the Consolidated Balance Sheets(d) Included in Other Deferred Credits and Other Liabilities on the Consolidated Balance Sheets
Franchised Electric. The NCUC and the PSCSC approve rates for retail electric sales within their states.The FERC approves Franchised Electric’s rates for electric sales to wholesale customers, excluding the otherjoint owners of the Catawba Nuclear Station: those sales are set through contractual agreements. (See Note 5 forownership interests in Catawba Nuclear Station.)
Franchised Electric has currently recorded approximately $660 million in regulatory assets (net ofregulatory liabilities). Management estimates that current rates are sufficient to recover these costs, in addition toproviding a reasonable return for shareholders. Management continually assesses whether the regulatory assetsare probable of future recovery by considering factors such as applicable regulatory environment changes, recentrate orders to other regulated entities, and the status of any pending or potential deregulation legislation. Thisassessment reflects the current political and regulatory climate in the states in which Franchised Electric operates,and is subject to change in the future. If future recovery of costs ceases to be probable, the assets would berequired to be recognized in current period earnings.
The majority of these regulatory assets, including deferred debt expense and the regulatory asset related toincome taxes, are amortized and recovered over the lives of the related assets/debt instruments. In addition tocost recovery, Franchised Electric records a current return on the purchased capacity and demand-sidemanagement assets.
104

DUKE ENERGY CORPORATION
Notes To Consolidated Financial Statements — Continued
Fuel costs are reviewed semiannually by the FERC and annually by the PSCSC, with provisions forreviewing those costs in base rates. The NCUC reviews fuel costs in rates annually and during general rate caseproceedings. All jurisdictions allow Duke Energy to adjust electric rates for past over- or under-recovery of fuelcosts. The difference between actual fuel costs incurred for electric operations and fuel costs recovered throughrates is reflected in revenues.
In 1999 and 2000, the FERC issued its Order 2000 and Order 2000-A regarding Regional TransmissionOrganizations (RTOs). These orders set minimum characteristics and functions RTOs must meet, includingindependent authority to establish the terms and conditions of transmission service over the facilities theycontrol. The orders provide for an open and flexible RTO structure to meet the needs of the market and for thepossibility of incentive ratemaking and other benefits for transmission owners that participate.
As a result of these rulemakings, Duke Power and the franchised electric units of two other investor-ownedutilities, Progress Energy (formerly known as Carolina Power & Light Company) and South Carolina Electric &Gas Company, planned to establish GridSouth Transco, LLC (GridSouth), as an RTO responsible for thefunctional control of the companies’ combined transmission systems. As of December 31, 2002, Duke Energyhad invested $37 million in GridSouth, including carrying costs. This amount is included in Other RegulatoryAssets and Deferred Debits on the Consolidated Balance Sheets. The sponsors expected that GridSouth would besubstantially operational by the FERC’s Order 2000 “deadline” date of December 15, 2001. In March 2001,GridSouth received provisional approval from the FERC. However, in July 2001 the FERC ordered GridSouthand other utilities in the Southeast to join in a mediation to negotiate terms of a southeastern RTO. It does notappear that the FERC will issue an order specifically based on that proceeding. In 2002, the GridSouth sponsorswithdrew their applications to the NCUC and the PSCSC for approval of the transfer of functional control oftheir electric transmission assets to GridSouth, and announced that development of the GridSouthimplementation project had been suspended until the sponsors have an opportunity to further consider regulatorycircumstances and the outcome of initiatives such as the FERC’s Notice of Proposed Rulemaking (NOPR) onStandard Market Design (SMD) and the RTO cost/benefit study initiated by the Southeastern Association ofRegulatory Utility Commissioners (SEARUC). The SEARUC cost/benefit study, issued in November 2002,states that under most scenarios neither RTOs nor SMDs provide net benefits to retail customers in the Southeastover the next few years. The final rule from the SMD NOPR is not expected to be issued until after July 2003.Duke Energy believes that more open wholesale electric markets will at some point provide benefits toconsumers and other market participants. Duke Energy continues to examine options relative to RTOs in light ofthe existing complex regulatory environment. Management believes its investment in GridSouth is probable ofrecovery.
In 2001, the NCUC and the PSCSC began a joint investigation, along with the Public Staff of the NCUC,regarding certain Duke Power regulatory accounting entries for 1998, including the classification of nuclearinsurance distributions. As part of their investigation, the NCUC and the PSCSC jointly engaged an independentfirm to conduct an accounting investigation of Duke Power’s accounting records for reporting periods from 1998through June 30, 2001. In 2002 Duke Power entered into a settlement agreement with the NCUC and the PSCSCin which the parties agreed to changes in the accounting primarily related to nuclear insurance distributions, aone-time $25 million credit to Duke Power’s deferred fuels account for the benefit of North Carolina and SouthCarolina customers, the reclassification of $50 million of a $58 million suspense account to a nuclear insuranceoperation reserve account and an additional $2 million adjustment to the nuclear insurance operation reserveaccount. The remaining $8 million in the suspense account was credited to income, resulting in a net $19 millionpre-tax charge in 2002. The Carolina Utilities Customer Association, a group that represents industrial customersin regulatory proceedings before the NCUC, has appealed the decision related to the settlement agreement to theNorth Carolina Court of Appeals. In addition, in February 2003, Duke Energy received a Western District of
105

DUKE ENERGY CORPORATION
Notes To Consolidated Financial Statements — Continued
North Carolina Grand Jury subpoena for documents related to the audit by the NCUC and the PSCSC of DukePower’s regulatory reporting from 1998 to 2000. Duke Energy intends to fully cooperate with the government inconnection with this investigation.
Natural Gas Transmission. The British Columbia Pipeline System (BC Pipeline) and the field servicesbusiness in western Canada have recorded approximately $479 million of regulatory assets related to deferredincome tax liabilities. Under the current NEB rate structure, income tax costs are recovered in rates based on thecurrent income tax payable and do not include accruals for deferred income tax. However, as income taxesbecome payable as a result of the reversal of timing differences that created the deferred income taxes, thetransportation and field services’ rates will be adjusted to recover these taxes.
Since most of these timing differences are related to property, plant and equipment costs, this recovery isexpected to occur over a 20 to 30 year period.
When evaluating the recoverability of these BC Pipeline and the field services’ regulatory assets,management takes into consideration the NEB regulatory environment, natural gas reserve estimates for reserveslocated, or expected to be located, near these assets, the ability to remain competitive in the markets served, andprojected demand growth estimates for the areas served by BC Pipeline and the field services business. Based oncurrent evaluation of these factors, management believes that recovery of these tax costs is probable over theperiods described above.
Union Gas (which provides gas distribution, transportation and storage services in Ontario, Canada) hasrates that are approved by the OEB. Rates for the sale of gas are adjusted quarterly, if required, to reflect updatedcommodity price forecasts. The difference between the approved and the actual cost of gas incurred in the currentperiod is deferred pending approval by the OEB. Gas purchase costs deferred by Union Gas as of December 31,2002 were $44 million, and are expected to be recovered from customers in 2003 and 2004. These amountsrepresent a direct flow-through of costs to customers and, therefore, no rate of return is earned on the deferredbalances. The OEB’s approval for recovery of these gas purchase costs focuses on a review of the prudence ofcosts incurred. Management believes that recovery of these costs is probable.
Texas Eastern Transmission, LP, which is primarily engaged in the interstate transportation and storage ofnatural gas, has recorded approximately $65 million of regulatory assets related to income taxes, loss onredeemed debt and environmental clean-up costs. Management believes that recovery of these costs is probable.
In 2000, the FERC issued Order 637, which revised its regulations for the intended purpose of improvingthe competitiveness and efficiency of natural gas markets. Order 637 effects changes in capacity segmentation,rights of first refusal (ROFR), scheduling procedures, as well as various reporting requirements intended toprovide more transparent pricing information and permit more effective monitoring of the market. The FERCalso required each interstate pipeline to submit individual compliance filings to implement the requirements ofOrder 637. Several parties, including Duke Energy, filed appeals in the District of Columbia Court of Appealsseeking court review of various aspects of Order 637, including (1) the right of customers to segment theircapacity rights in a manner that would allow both a forwardhaul and a backhaul transportation transaction to asingle delivery point, and (ii) the ROFR granted to existing customers to extend contracts beyond the end of thecontract’s primary term. In 2002, the District of Columbia Court of Appeals generally affirmed the Order butremanded certain issues to the FERC for further disposition, including the forwardhaul/backhaul and ROFRissues. These matters are still under review by the FERC. In addition to the Order 637 general rulemakingproceeding, Duke Energy’s interstate pipelines made individual tariff filings to comply with the requirements ofOrder 637, and these individual compliance proceedings are in different stages of the review, approval and
106
DUKE ENERGY CORPORATION
Notes To Consolidated Financial Statements — Continued
implementation process before the FERC. Management believes that the implementation of Order 637 will haveno material adverse effect on Duke Energy’s future consolidated results of operations, cash flows or financialposition.
In addition, the FERC is continually proposing and implementing new rules and regulations affecting thosesegments of the natural gas industry, most notably interstate natural gas transmission companies that remainsubject to the FERC’s jurisdiction. These initiatives may also affect the intrastate transportation of gas undercertain circumstances. The stated purpose of these regulatory changes is to promote competition among thevarious sectors of the natural gas industry and these initiatives generally reflect more light-handed regulation ofthe natural gas industry.
The process for OEB approval of Union Gas’ rates for 2003 is currently underway. A settlement agreementwas filed with the OEB on January 20, 2003. The agreement settled many financial and operating issues for2003, including a rate decrease of 2.3% effective January 1, 2003 pursuant to the pricing formula set by the OEBin its performance based regulation decision. The settlement agreement was approved by the OEB in February2003. A hearing was held before the NEB in February 2003 to resolve outstanding issues and a decision ispending.
During 2002, Union Gas applied to the OEB for a change to the OEB formula used to set the return on equity(ROE). The proposed methodology has the effect of increasing the ROE awarded to Union Gas effective January 1,2002. The OEB has decided to review the applications in a combined hearing that is expected to take place in thethird quarter of 2003. With the expiration of the Performance-Based Regulation (PBR) trial period at the end of2003, Union Gas plans on filing a cost of service rate application in the second quarter of 2003 to establish 2004rates and expects to file a proposal for second generation PBR for 2005 in the fourth quarter of 2004.
Management believes that the effects of these matters will have no material adverse effect on DukeEnergy’s future consolidated results of operations, cash flows or financial position.
Notices of Proposed Rulemaking (NOPR). NOPR on Standards of Conduct. In September 2001, the FERCissued a NOPR announcing they would substantially modify the current standards of conduct uniformlyapplicable to natural gas pipelines and electric transmitting public utilities currently subject to differingstandards. The proposal impacts how companies and their affiliates interact and share information by broadeningthe definition of “affiliate” covered by the standards of conduct. The NOPR also sought comment on whether thestandards of conduct should be broadened to include the separation of employees involved in the bundled retailelectric sales function from those in the transmission function, as the current standards only require thoseinvolved in wholesale marketing activities to be separated from the transmission function. Duke Energy filedextensive comments on the NOPR with the FERC in December 2001. In April 2002, the FERC Staff issued ananalysis of all comments received which reflected important progress in several areas. With regard to corporategovernance, however, the FERC Staff’s analysis recommended adoption of an automatic imputation rule whichcould impact parent company oversight of subsidiaries with transmission functions (pipeline and storagefunctions) and transmission functions within a single company that conducts both electric transmission andmarketing functions (such as Duke Power). A public conference was held in May 2002 to discuss the proposedrevisions to the gas and electric standards of conduct. Duke Energy filed supplemental comments with respect tothe FERC Staff’s analysis in June 2002. The FERC is expected to take further action on the NOPR in the firsthalf of 2003.
NOPR on Standard Market Design. In July 2002, the FERC approved a NOPR entitled Remedying UndueDiscrimination through Open Access Transmission Service and Standard Electricity Market Design (Standard
107

DUKE ENERGY CORPORATION
Notes To Consolidated Financial Statements — Continued
Market Design or SMD). The FERC has proposed to modify the open access transmission tariff and implementan SMD that would apply to RTOs and to individual utilities that have not yet joined an RTO. The FERCproposes to require each transmission owner to give an Independent Transmission Provider (ITP) operationalcontrol over the transmission owner’s facilities. These ITPs will file SMD tariffs for transmission and ancillaryservices, administer day-ahead and real-time markets, monitor and mitigate market power, perform long-termresource adequacy and participate in transmission planning and expansion on a regional basis.
Duke Energy filed comments on certain aspects of the NOPR in November 2002, and again in January2003, for those aspects of the filing for which the FERC chose to extend the comment deadline (e.g.,transmission planning and pricing, states role, resource adequacy and congestion revenue rights). The NOPRcontemplates implementation of SMD by 2004, although there are indications that the FERC expects theimplementation timetable to be delayed. The FERC has stated that they will issue a White Paper on the SMD inApril 2003. The White Paper is expected to reflect the evolution in the SMD discussion brought about by thevarious filed comments and testimony presented at technical conferences. No date for the final rule has been set.
5. Joint Ownership of Generating Facilities
Joint Ownership of Catawba Nuclear Station(a)Owner Ownership Interest
North Carolina Municipal Power Agency Number 1 . . . . . . . . . . . . . . . . . . . . . . . . . . . . . . . . . . 37.5%North Carolina Electric Membership Corporation . . . . . . . . . . . . . . . . . . . . . . . . . . . . . . . . . . . . 28.1%Duke Energy Corporation . . . . . . . . . . . . . . . . . . . . . . . . . . . . . . . . . . . . . . . . . . . . . . . . . . . . . 12.5%Piedmont Municipal Power Agency . . . . . . . . . . . . . . . . . . . . . . . . . . . . . . . . . . . . . . . . . . . . . . . 12.5%Saluda River Electric Cooperative, Inc. . . . . . . . . . . . . . . . . . . . . . . . . . . . . . . . . . . . . . . . . . . . . 9.4%
100.0%
(a) Facility operated by Duke Energy
As of December 31, 2002, $533 million of property, plant and equipment and $309 million of accumulateddepreciation and amortization represented Duke Energy’s undivided interest in Catawba Nuclear Station Units 1and 2. Duke Energy’s share of revenues and operating costs is included in the Consolidated Statements ofIncome.
Contractual agreements to purchase declining percentages of the station’s generating capacity and energythrough the year 2000 made purchased capacity costs subject to rate levelization and deferral. The cost ofcapacity purchased but not reflected in current rates is included in Other Current Assets, Other Regulatory Assetsand Deferred Debits, Other Current Liabilities, and Other Deferred Credits and Other Liabilities on theConsolidated Balance Sheets. Those costs were $151 million as of December 31, 2002 and $349 million as ofDecember 31, 2001. Duke Energy expects to recover the remaining accumulated balance, including returns onthe deferred balance, through 2004. The amounts levelized in rates are intended to recover total costs, includingdeferred returns, and are subject to adjustments, including final true-ups.
108
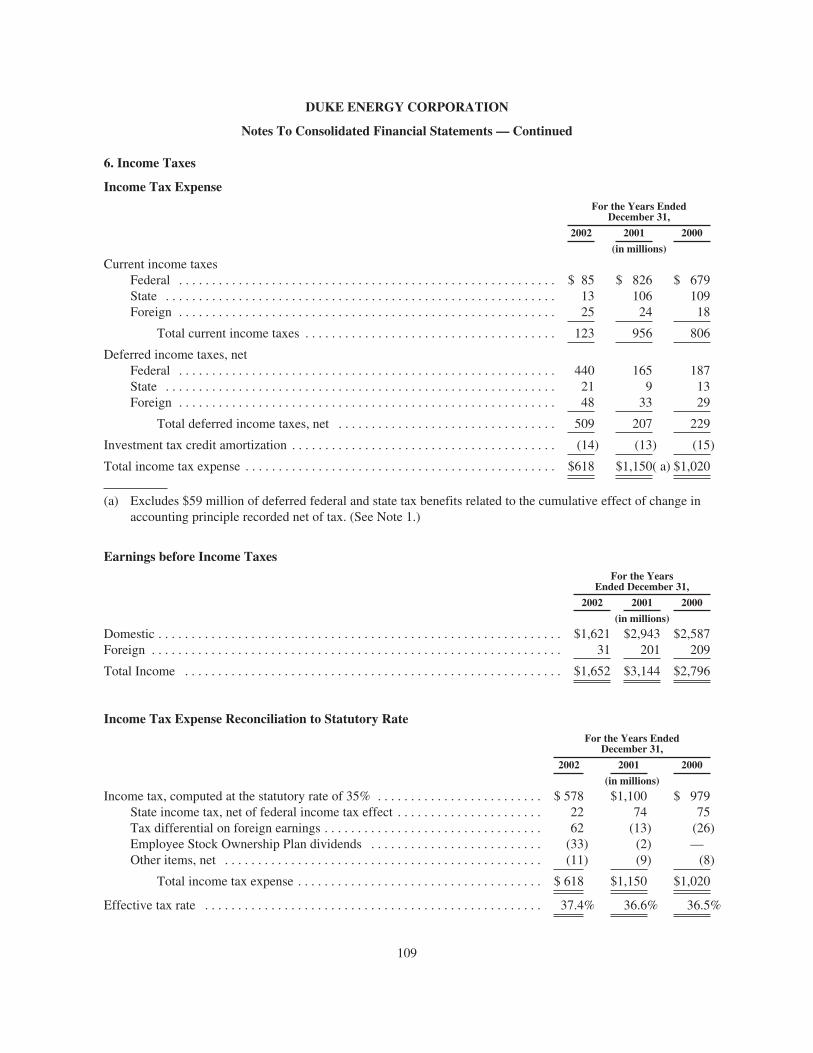
DUKE ENERGY CORPORATION
Notes To Consolidated Financial Statements — Continued
6. Income Taxes
Income Tax ExpenseFor the Years Ended
December 31,
2002 2001 2000
(in millions)
Current income taxesFederal . . . . . . . . . . . . . . . . . . . . . . . . . . . . . . . . . . . . . . . . . . . . . . . . . . . . . . . . . $ 85 $ 826 $ 679State . . . . . . . . . . . . . . . . . . . . . . . . . . . . . . . . . . . . . . . . . . . . . . . . . . . . . . . . . . . 13 106 109Foreign . . . . . . . . . . . . . . . . . . . . . . . . . . . . . . . . . . . . . . . . . . . . . . . . . . . . . . . . . 25 24 18
Total current income taxes . . . . . . . . . . . . . . . . . . . . . . . . . . . . . . . . . . . . . . 123 956 806
Deferred income taxes, netFederal . . . . . . . . . . . . . . . . . . . . . . . . . . . . . . . . . . . . . . . . . . . . . . . . . . . . . . . . . 440 165 187State . . . . . . . . . . . . . . . . . . . . . . . . . . . . . . . . . . . . . . . . . . . . . . . . . . . . . . . . . . . 21 9 13Foreign . . . . . . . . . . . . . . . . . . . . . . . . . . . . . . . . . . . . . . . . . . . . . . . . . . . . . . . . . 48 33 29
Total deferred income taxes, net . . . . . . . . . . . . . . . . . . . . . . . . . . . . . . . . . 509 207 229
Investment tax credit amortization . . . . . . . . . . . . . . . . . . . . . . . . . . . . . . . . . . . . . . . . (14) (13) (15)
Total income tax expense . . . . . . . . . . . . . . . . . . . . . . . . . . . . . . . . . . . . . . . . . . . . . . . $618 $1,150( a) $1,020
(a) Excludes $59 million of deferred federal and state tax benefits related to the cumulative effect of change inaccounting principle recorded net of tax. (See Note 1.)
Earnings before Income TaxesFor the Years
Ended December 31,
2002 2001 2000
(in millions)
Domestic . . . . . . . . . . . . . . . . . . . . . . . . . . . . . . . . . . . . . . . . . . . . . . . . . . . . . . . . . . . . . $1,621 $2,943 $2,587Foreign . . . . . . . . . . . . . . . . . . . . . . . . . . . . . . . . . . . . . . . . . . . . . . . . . . . . . . . . . . . . . . 31 201 209
Total Income . . . . . . . . . . . . . . . . . . . . . . . . . . . . . . . . . . . . . . . . . . . . . . . . . . . . . . . . . $1,652 $3,144 $2,796
Income Tax Expense Reconciliation to Statutory RateFor the Years Ended
December 31,
2002 2001 2000
(in millions)
Income tax, computed at the statutory rate of 35% . . . . . . . . . . . . . . . . . . . . . . . . . $ 578 $1,100 $ 979State income tax, net of federal income tax effect . . . . . . . . . . . . . . . . . . . . . . 22 74 75Tax differential on foreign earnings . . . . . . . . . . . . . . . . . . . . . . . . . . . . . . . . . 62 (13) (26)Employee Stock Ownership Plan dividends . . . . . . . . . . . . . . . . . . . . . . . . . . (33) (2) —Other items, net . . . . . . . . . . . . . . . . . . . . . . . . . . . . . . . . . . . . . . . . . . . . . . . . (11) (9) (8)
Total income tax expense . . . . . . . . . . . . . . . . . . . . . . . . . . . . . . . . . . . . . $ 618 $1,150 $1,020
Effective tax rate . . . . . . . . . . . . . . . . . . . . . . . . . . . . . . . . . . . . . . . . . . . . . . . . . . . 37.4% 36.6% 36.5%
109
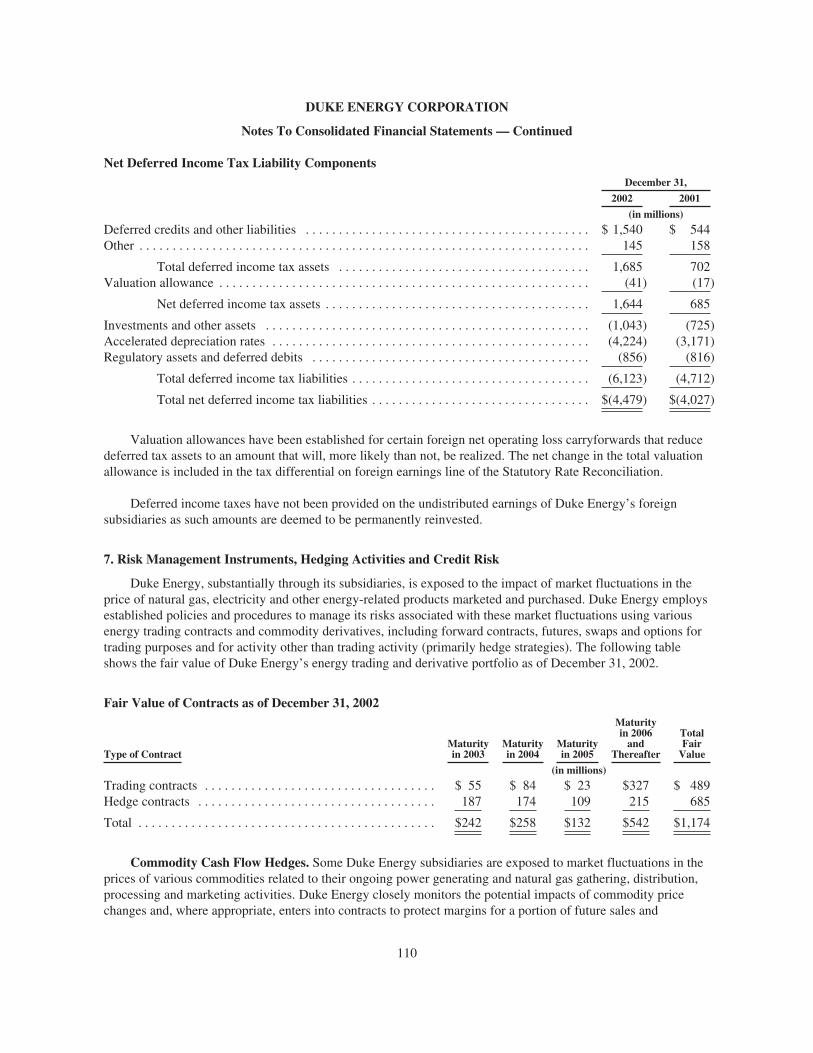
DUKE ENERGY CORPORATION
Notes To Consolidated Financial Statements — Continued
Net Deferred Income Tax Liability ComponentsDecember 31,
2002 2001
(in millions)
Deferred credits and other liabilities . . . . . . . . . . . . . . . . . . . . . . . . . . . . . . . . . . . . . . . . . . . $ 1,540 $ 544Other . . . . . . . . . . . . . . . . . . . . . . . . . . . . . . . . . . . . . . . . . . . . . . . . . . . . . . . . . . . . . . . . . . . . 145 158
Total deferred income tax assets . . . . . . . . . . . . . . . . . . . . . . . . . . . . . . . . . . . . . . 1,685 702Valuation allowance . . . . . . . . . . . . . . . . . . . . . . . . . . . . . . . . . . . . . . . . . . . . . . . . . . . . . . . . (41) (17)
Net deferred income tax assets . . . . . . . . . . . . . . . . . . . . . . . . . . . . . . . . . . . . . . . . 1,644 685
Investments and other assets . . . . . . . . . . . . . . . . . . . . . . . . . . . . . . . . . . . . . . . . . . . . . . . . . (1,043) (725)Accelerated depreciation rates . . . . . . . . . . . . . . . . . . . . . . . . . . . . . . . . . . . . . . . . . . . . . . . . (4,224) (3,171)Regulatory assets and deferred debits . . . . . . . . . . . . . . . . . . . . . . . . . . . . . . . . . . . . . . . . . . (856) (816)
Total deferred income tax liabilities . . . . . . . . . . . . . . . . . . . . . . . . . . . . . . . . . . . . (6,123) (4,712)
Total net deferred income tax liabilities . . . . . . . . . . . . . . . . . . . . . . . . . . . . . . . . . $(4,479) $(4,027)
Valuation allowances have been established for certain foreign net operating loss carryforwards that reducedeferred tax assets to an amount that will, more likely than not, be realized. The net change in the total valuationallowance is included in the tax differential on foreign earnings line of the Statutory Rate Reconciliation.
Deferred income taxes have not been provided on the undistributed earnings of Duke Energy’s foreignsubsidiaries as such amounts are deemed to be permanently reinvested.
7. Risk Management Instruments, Hedging Activities and Credit Risk
Duke Energy, substantially through its subsidiaries, is exposed to the impact of market fluctuations in theprice of natural gas, electricity and other energy-related products marketed and purchased. Duke Energy employsestablished policies and procedures to manage its risks associated with these market fluctuations using variousenergy trading contracts and commodity derivatives, including forward contracts, futures, swaps and options fortrading purposes and for activity other than trading activity (primarily hedge strategies). The following tableshows the fair value of Duke Energy’s energy trading and derivative portfolio as of December 31, 2002.
Fair Value of Contracts as of December 31, 2002
Type of ContractMaturityin 2003
Maturityin 2004
Maturityin 2005
Maturityin 2006and
Thereafter
TotalFairValue
(in millions)
Trading contracts . . . . . . . . . . . . . . . . . . . . . . . . . . . . . . . . . . . $ 55 $ 84 $ 23 $327 $ 489Hedge contracts . . . . . . . . . . . . . . . . . . . . . . . . . . . . . . . . . . . . 187 174 109 215 685
Total . . . . . . . . . . . . . . . . . . . . . . . . . . . . . . . . . . . . . . . . . . . . . $242 $258 $132 $542 $1,174
Commodity Cash Flow Hedges. Some Duke Energy subsidiaries are exposed to market fluctuations in theprices of various commodities related to their ongoing power generating and natural gas gathering, distribution,processing and marketing activities. Duke Energy closely monitors the potential impacts of commodity pricechanges and, where appropriate, enters into contracts to protect margins for a portion of future sales and
110

DUKE ENERGY CORPORATION
Notes To Consolidated Financial Statements — Continued
generation revenues. Duke Energy uses commodity instruments, such as swaps, futures, forwards and collaredoptions, as cash flow hedges for natural gas, electricity and NGL transactions. Duke Energy is hedging exposuresto the price variability of these commodities for a maximum of 15 years.
The ineffective portion of commodity cash flow hedges and the amount recognized for transactions that nolonger qualified as cash flow hedges were not material in 2002 or 2001. As of December 31, 2002, $179 millionof after-tax deferred net gains on derivative instruments related to commodity cash flow hedges wereaccumulated on the Consolidated Balance Sheet in a separate component of stockholders’ equity, in OCI, and areexpected to be recognized in earnings during the next 12 months as the hedged transactions occur. However, dueto the volatility of the commodities markets, the corresponding value in OCI will likely change prior to itsreclassification into earnings.
Commodity Fair Value Hedges. Some Duke Energy subsidiaries are exposed to changes in the fair valueof some unrecognized firm commitments to sell generated power or natural gas due to market fluctuations in theunderlying commodity prices. Duke Energy actively evaluates changes in the fair value of such unrecognizedfirm commitments due to commodity price changes and, where appropriate, uses various instruments to hedge itsmarket risk. These commodity instruments, such as swaps, futures and forwards, serve as fair value hedges forthe firm commitments associated with generated power and natural gas sales. Duke Energy is hedging exposuresto the market risk of such items for a maximum of 10 years. For 2002 and 2001, the ineffective portion ofcommodity fair value hedges was not material.
Trading Contracts. Duke Energy provides energy supply, structured origination, trading and marketing,risk management, and commercial optimization services to large energy customers, energy aggregators and otherwholesale companies. These services require Duke Energy to use natural gas, electricity, NGL and transportationcontracts that expose it to a variety of market risks. Duke Energy manages its trading exposure with policies thatlimit its market risk and require daily reporting of potential financial exposure to management. These policiesinclude statistical risk tolerance limits using historical price movements to calculate a daily earnings at riskmeasurement.
Interest Rate (Fair Value or Cash Flow) Hedges. Changes in interest rates expose Duke Energy to risk asa result of its issuance of variable-rate debt and commercial paper. Duke Energy manages its interest rateexposure by limiting its variable-rate and fixed-rate exposures to percentages of total capitalization and bymonitoring the effects of market changes in interest rates. Duke Energy also enters into financial derivativeinstruments, including, but not limited to, interest rate swaps, swaptions and U.S. Treasury lock agreements tomanage and mitigate interest rate risk exposure. Duke Energy’s existing interest rate derivative instruments andrelated ineffectiveness were not material to its consolidated results of operations, cash flows or financial positionin 2002 and 2001.
Interest Rate DerivativesDecember 31,
2002 2001
NotionalAmounts
FairValue
ContractsExpire
NotionalAmounts
FairValue
ContractsExpire
(dollars in millions)
Fixed-to-floating rate swaps . . . . . . . . . . . . . . . . . . $800 $ 80 2005-2028 $875 $ 20 2003-2019Cancelable fixed-to-floating rate swaps . . . . . . . . . 352 23 2014-2025 455 7 2014-2025Floating-to-fixed rate swaps . . . . . . . . . . . . . . . . . . 475 (30) 2013-2033 — — —International floating-to-fixed rate swaps . . . . . . . . 403 (29) 2003-2010 — — —
111

DUKE ENERGY CORPORATION
Notes To Consolidated Financial Statements — Continued
Gains and losses deferred in anticipation of planned financing transactions on interest rate swap derivativesare included in OCI and amortized over the life of the underlying debt once issued. These deferred gains andlosses were not material in 2002 or 2001. As a result of the interest rate swap contracts, interest expense for therelative notional amount is recognized at the weighted-average rates as depicted in the following table.
Weighted-Average Rates for Interest Rate SwapsFor the Years Ended
December 31,
2002 2001 2000
Fixed-to-floating rate swaps . . . . . . . . . . . . . . . . . . . . . . . . . . . . . . . . . . . . . . . . . . . . . . . . 3.05% 3.92% 6.50%Cancelable fixed-to-floating rate swaps . . . . . . . . . . . . . . . . . . . . . . . . . . . . . . . . . . . . . . . 2.16% 3.23% 5.09%International floating-to-fixed rate swaps . . . . . . . . . . . . . . . . . . . . . . . . . . . . . . . . . . . . . 3.71% — —Commercial paper swaps . . . . . . . . . . . . . . . . . . . . . . . . . . . . . . . . . . . . . . . . . . . . . . . . . . — — 6.11%Interest Rate Locks . . . . . . . . . . . . . . . . . . . . . . . . . . . . . . . . . . . . . . . . . . . . . . . . . . . . . . . 5.10% — —
Foreign Currency (Fair Value, Net Investment or Cash Flow) Hedges. Duke Energy is exposed toforeign currency risk from investments in international affiliates and businesses owned and operated in foreigncountries. To mitigate risks associated with foreign currency fluctuations, contracts may be denominated in orindexed to the U.S. dollar and/or local inflation rates, or investments may be hedged through debt denominatedor issued in the foreign currency. Duke Energy may also use foreign currency derivatives, where possible, tomanage its risk related to foreign currency fluctuations. To monitor its currency exchange rate risks, DukeEnergy uses sensitivity analysis, which measures the impact of devaluation of foreign currencies.
Financial Instruments. The fair value of financial instruments not currently carried at market value issummarized in the following table. Judgment is required in interpreting market data to develop the estimates offair value. Accordingly, the estimates determined as of December 31, 2002 and 2001, are not necessarilyindicative of the amounts Duke Energy could have realized in current markets.
Financial Instruments2002 2001
BookValue
ApproximateFair Value
BookValue
ApproximateFair Value
(in millions)
Long-term debt(a) . . . . . . . . . . . . . . . . . . . . . . . . . . . . . $21,550 $22,693 $12,582 $13,239Guaranteed preferred beneficial interests insubordinated notes of Duke Energy or subsidiaries . 1,408 1,466 1,407 1,440
Preferred stock(a) . . . . . . . . . . . . . . . . . . . . . . . . . . . . . 159 155 247 242
(a) Includes current maturities
The fair value of cash and cash equivalents, receivables, payables and commercial paper are not materiallydifferent from their carrying amounts because of the short-term nature of these instruments or because the statedrates approximate market rates.
Credit Risk. Duke Energy’s principal customers for power and natural gas marketing and transportationservices are industrial end-users, marketers, local distribution companies and utilities located throughout theU.S., Canada, Asia Pacific, Europe and Latin America. Duke Energy has concentrations of receivables fromnatural gas and electric utilities and their affiliates, as well as industrial customers and marketers throughout
112

DUKE ENERGY CORPORATION
Notes To Consolidated Financial Statements — Continued
these regions. These concentrations of customers may affect Duke Energy’s overall credit risk in that risk factorscan negatively impact the credit quality of the entire sector. Where exposed to credit risk, Duke Energy analyzesthe counterparties’ financial condition prior to entering into an agreement, establishes credit limits and monitorsthe appropriateness of those limits on an ongoing basis.
Duke Energy frequently uses master collateral agreements to mitigate certain credit exposures, primarily inits trading and marketing operations. The collateral agreements provide for a counterparty to post cash or lettersof credit for exposure in excess of the established threshold. The threshold amount represents an unsecured creditlimit, determined in accordance with the corporate credit policy. The collateral agreement also provides that theinability to post collateral is sufficient cause to terminate a contract and liquidate all positions.
Natural Gas Transmission and Field Services also obtain cash or letters of credit from customers, whereappropriate, based on their financial analysis of the customer and the regulatory or contractual terms andconditions applicable to each transaction.
Collateral amounts held or posted may be fixed or may vary depending on the value of the underlyingcontracts and cover trading, normal purchases and normal sales, and hedging contracts outstanding. Duke Energymay be required to return certain held collateral and post additional collateral should price movements adverselyimpact the value of open contracts or positions. In many cases, Duke Energy’s and its counterparties’ publiclydisclosed credit ratings impact the amounts of additional collateral to be posted. Recent downgrades in DukeEnergy’s affiliates’ credit ratings resulted in Duke Energy posting more collateral with counterparties and anyfurther downgrade could require the posting of additional collateral. Likewise, downgrades in credit ratings ofcounterparties could require counterparties to post additional collateral to Duke Energy.
The change in market value of New York Mercantile Exchange-traded futures and options contracts requiresdaily cash settlement in margin accounts with brokers. Financial derivatives are generally cash settledperiodically throughout the contract term. However, these transactions are also generally subject to marginagreements with many of Duke Energy’s counterparties.
Following the bankruptcy of Enron Corp., Duke Energy terminated substantially all contracts with EnronCorp. and its affiliated companies (collectively, Enron). As a result, in 2001 Duke Energy recorded as a charge, anon-collateralized accounting exposure of $43 million. The $43 million non-collateralized accounting exposurewas composed of charges of $24 million at Other Energy Services, $12 million at DENA, $3 million atInternational Energy, $3 million at Field Services and $1 million at Natural Gas Transmission. These amountswere stated on a pre-tax basis as charges against the reporting segment’s earnings in 2001.
Duke Energy’s claims made in the Enron bankruptcy case exceeded its non-collateralized accountingexposure. Bankruptcy claims that exceed this amount primarily relate to termination and settlement rights undernormal purchases and normal sales contracts where Enron was the counterparty.
Substantially all contracts with Enron were completed or terminated prior to December 31, 2001. DukeEnergy has continuing contractual relationships with certain Enron affiliates, which are not in bankruptcy. InBrazil, a power purchase agreement between a Duke Energy affiliate, Companhia de Geracao de EnergiaElectrica Paranapanema (Paranapanema), and Elektro Eletricidade e Servicos S/A (Elektro), a distributioncompany approximately 100% owned by Enron, will expire December 31, 2005. The contract was executed byDuke Energy’s predecessor in interest in Paranapanema, and obligates Paranapanema to provide energy toElektro on an irrevocable basis for the contract period. In addition, a purchase/sale agreement expiringSeptember 1, 2005 between a Duke Energy affiliate and Citrus Trading Corporation (Citrus), a joint venture
113
DUKE ENERGY CORPORATION
Notes To Consolidated Financial Statements — Continued
between Enron and El Paso Corporation, continues to be in effect. The contract requires the Duke Energyaffiliate to provide natural gas to Citrus. Citrus has provided a letter of credit in favor of Duke Energy to cover itsobligations.
8. Investment in Unconsolidated Affiliates and Related Party Transactions
Investments in domestic and international affiliates that are not controlled by Duke Energy, but over whichit has significant influence, are accounted for using the equity method. Those investments include undistributedearnings of $108 million in 2002 and $166 million in 2001. Duke Energy received distributions of $369 millionin 2002, $158 million in 2001 and $138 million in 2000 from those investments. Duke Energy’s share of netincome from these unconsolidated affiliates is reflected in the Consolidated Statements of Income as Equity inEarnings of Unconsolidated Affiliates.
Natural Gas Transmission. Investments primarily include a 50% interest in Gulfstream Natural GasSystem, LLC (Gulfstream), a 23.6% interest in Alliance Pipeline and a 30% interest in Vector Pipeline.Gulfstream is an interstate natural gas pipeline that extends from Mississippi and Alabama across the Gulf ofMexico to Florida. Although Duke Energy owns a significant portion of Gulfstream, it is not consolidated asDuke Energy does not hold a majority of voting control or bear a majority of the risk of loss or return. AlliancePipeline is an interstate natural gas pipeline that extends from eastern Canada to the Chicago, Illinois area.Vector Pipeline is a joint interstate natural gas pipeline that extends from the Chicago, Illinois area throughIndiana and Michigan and into Ontario, Canada.
Field Services. Investments primarily include a 21.1% ownership interest in TEPPCO Partners, LP, apublicly traded limited partnership which owns and operates a network of pipelines for refined products andcrude oil.
Duke Energy North America. Significant investments include a 50% interest in American Ref-FuelCompany, LLC and a 50% interest in Southwest Power Partners, LLC. American Ref-Fuel Company, LLC ownsand operates facilities that convert waste to energy. Southwest Power Partners, LLC is a gas-fired combined-cycle facility in Arizona that serves markets in Arizona, Nevada and California. Although Duke Energy owns asignificant portion of these investments, they are not consolidated as it was determined that control was notpresent.
International Energy. Significant investments include a 25% indirect interest in National MethanolCompany, which owns and operates a methanol and MTBE (methyl tertiary butyl ether) business in Jubail, SaudiArabia.
114
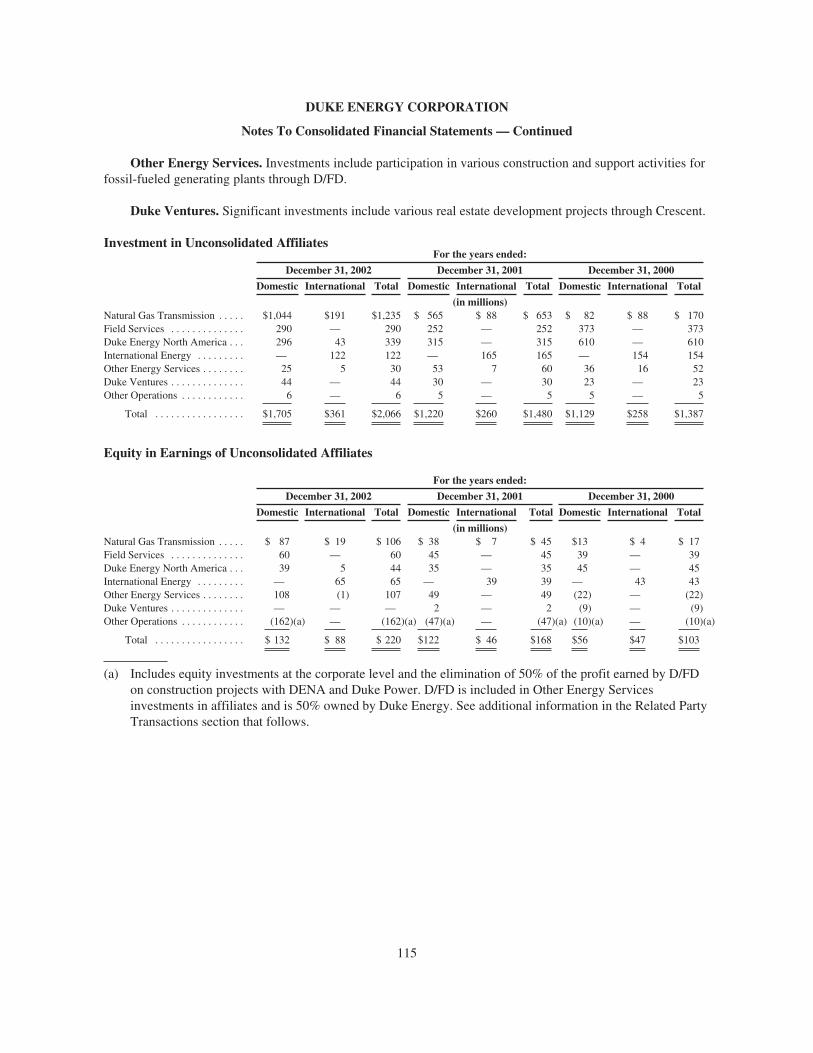
DUKE ENERGY CORPORATION
Notes To Consolidated Financial Statements — Continued
Other Energy Services. Investments include participation in various construction and support activities forfossil-fueled generating plants through D/FD.
Duke Ventures. Significant investments include various real estate development projects through Crescent.
Investment in Unconsolidated AffiliatesFor the years ended:
December 31, 2002 December 31, 2001 December 31, 2000
Domestic International Total Domestic International Total Domestic International Total
(in millions)Natural Gas Transmission . . . . . $1,044 $191 $1,235 $ 565 $ 88 $ 653 $ 82 $ 88 $ 170Field Services . . . . . . . . . . . . . . 290 — 290 252 — 252 373 — 373Duke Energy North America . . . 296 43 339 315 — 315 610 — 610International Energy . . . . . . . . . — 122 122 — 165 165 — 154 154Other Energy Services . . . . . . . . 25 5 30 53 7 60 36 16 52Duke Ventures . . . . . . . . . . . . . . 44 — 44 30 — 30 23 — 23Other Operations . . . . . . . . . . . . 6 — 6 5 — 5 5 — 5
Total . . . . . . . . . . . . . . . . . $1,705 $361 $2,066 $1,220 $260 $1,480 $1,129 $258 $1,387
Equity in Earnings of Unconsolidated Affiliates
For the years ended:
December 31, 2002 December 31, 2001 December 31, 2000
Domestic International Total Domestic International Total Domestic International Total
(in millions)Natural Gas Transmission . . . . . $ 87 $ 19 $ 106 $ 38 $ 7 $ 45 $13 $ 4 $ 17Field Services . . . . . . . . . . . . . . 60 — 60 45 — 45 39 — 39Duke Energy North America . . . 39 5 44 35 — 35 45 — 45International Energy . . . . . . . . . — 65 65 — 39 39 — 43 43Other Energy Services . . . . . . . . 108 (1) 107 49 — 49 (22) — (22)Duke Ventures . . . . . . . . . . . . . . — — — 2 — 2 (9) — (9)Other Operations . . . . . . . . . . . . (162)(a) — (162)(a) (47)(a) — (47)(a) (10)(a) — (10)(a)
Total . . . . . . . . . . . . . . . . . $ 132 $ 88 $ 220 $122 $ 46 $168 $56 $47 $103
(a) Includes equity investments at the corporate level and the elimination of 50% of the profit earned by D/FDon construction projects with DENA and Duke Power. D/FD is included in Other Energy Servicesinvestments in affiliates and is 50% owned by Duke Energy. See additional information in the Related PartyTransactions section that follows.
115

DUKE ENERGY CORPORATION
Notes To Consolidated Financial Statements — Continued
Summarized Combined Financial Information of Unconsolidated AffiliatesDecember 31,
2002 2001 2000
(in millions)
Balance SheetCurrent assets . . . . . . . . . . . . . . . . . . . . . . . . . . . . . . . . . . . . . . . . . . . . . . . $ 2,286 $ 1,239 $ 1,242Noncurrent assets . . . . . . . . . . . . . . . . . . . . . . . . . . . . . . . . . . . . . . . . . . . . 14,888 8,199 6,588Current liabilities . . . . . . . . . . . . . . . . . . . . . . . . . . . . . . . . . . . . . . . . . . . . (1,711) (1,202) (888)Noncurrent liabilities . . . . . . . . . . . . . . . . . . . . . . . . . . . . . . . . . . . . . . . . . (8,666) (4,400) (4,404)
Net assets . . . . . . . . . . . . . . . . . . . . . . . . . . . . . . . . . . . . . . . . . . . . . . . . . . $ 6,797 $ 3,836 $ 2,538
Income StatementOperating revenues . . . . . . . . . . . . . . . . . . . . . . . . . . . . . . . . . . . . . . . . . . $ 6,101 $ 5,202 $ 4,617Operating expenses . . . . . . . . . . . . . . . . . . . . . . . . . . . . . . . . . . . . . . . . . . 5,094 4,525 4,039Net income . . . . . . . . . . . . . . . . . . . . . . . . . . . . . . . . . . . . . . . . . . . . . . . . . 859 499 440
Related Party Transactions. Outstanding notes receivable from unconsolidated affiliates were $113million as of December 31, 2002 and $25 million as of December 31, 2001. Of the notes outstanding as ofDecember 31, 2002, $104 million related to a note from partners in a project in which International Energy had a30% ownership and the remaining $9 million related to notes that Crescent had with partners in two of its jointventures. These outstanding notes receivables had interest rates at or above current market rates.
In 2002, Duke Energy’s Natural Gas Transmission segment recognized $28 million in earnings for aconstruction fee received from an unconsolidated affiliate related to the successful completion of Gulfstream.(See project description in the Natural Gas Transmission section of this footnote.)
As a result of the Westcoast acquisition in 2002, Duke Energy became a partner in the Alliance Pipeline andVector Pipeline (see project descriptions in the Natural Gas Transmission section of this footnote). As a result ofcommitments required of Westcoast related to its original investment in these projects, Duke Energy alsoacquired commitments to pay for firm capacity on these pipelines. Payments for the year ended December 31,2002 totaled $30 million.
Duke Energy and Fluor Enterprises, Inc. formed the D/FD 50/50 partnership in 1989. The partnershipprovides full-service siting, permitting, licensing, engineering, procurement, construction, start-up, operating andmaintenance services for fossil-fired plants in the U.S. and internationally. D/FD is the primary builder ofDENA’s merchant generation plants currently under construction. D/FD also builds some plants for Duke Power.Fifty percent of the profit earned by D/FD for the construction of DENA’s merchant generation plants, which isassociated with Duke Energy’s ownership, is deferred in consolidation until the plant is sold as part of DENA’sportfolio management strategy. Or, once the plant becomes operational, the deferred profit is amortized over theplant’s useful life. Fifty percent of the profit earned by D/FD for operating and maintenance services, which isassociated with Duke Energy’s ownership, is eliminated in consolidation. For the year ended December 31, 2002,Duke Energy deferred profit of $159 million for D/FD construction contracts and eliminated profit of $3 millionfor operating and maintenance services. For the year ended December 31, 2001, Duke Energy deferred profit of$54 million for construction contracts and eliminated profit of $9 million for operating and maintenance services.For the year ended December 31, 2000, Duke Energy deferred profit of $16 million for construction contracts;there was no profit from operating and maintenance services to be eliminated in 2000. In addition, as part of theD/FD partnership agreement, excess cash is loaned at current market rates to Duke Energy and Fluor Enterprises,Inc. (See Note 11.)
116
DUKE ENERGY CORPORATION
Notes To Consolidated Financial Statements — Continued
In the normal course of business, Duke Energy’s consolidated subsidiaries enter into energy tradingcontracts or other derivatives with one another. On a separate company basis, each subsidiary accounts for suchcontracts as if it were transacted with a third party and records the contract using mark-to-market or accrualaccounting, as applicable. For example, DETM may enter into a contract to purchase natural gas storage fromDEFS. DEFS may record this contract using accrual accounting, while DETM may mark the contract to marketthrough its current earnings. In the consolidation process, the effects of this intercompany contract areeliminated, and not reflected in Duke Energy’s Consolidated Financial Statements. In all cases, energy tradingcontracts (and any resulting mark-to-market gains or losses) between consolidated subsidiaries are eliminated inthe consolidation process.
Also see Note 14, Minority Interest, and Note 17, Guarantees and Indemnifications, for additional relatedparty information.
9. Asset Impairments and Other Charges
Duke Energy evaluates its long-lived assets, excluding goodwill, for impairment under SFAS No. 144 (seeNote 1). SFAS No. 144 requires long-term assets to be reviewed for impairment whenever events or changes incircumstances indicate the carrying amount of the asset may not be recoverable. In 2002, the merchant energyportion of Duke Energy’s business portfolio suffered from oversupply of merchant generation, low commoditypricing and volatility, and a steep decline in trading and marketing activity. These market challenges arecontinuing in 2003. As a result of the 2002 market conditions, Duke Energy suspended certain projects andabandoned others in this sector. The culmination of these events caused Duke Energy to evaluate the carryingvalues of certain of its long-lived assets at DENA and International Energy.
This analysis resulted in a $31 million impairment charge at one of DENA’s merchant power facilities.Additionally, charges of approximately $242 million were also recorded in 2002 to write-off site developmentcosts in California and Brazil and to partially write-down uninstalled turbines, as well as, the termination of otherturbines on order. A two-step process was performed in testing the assets for impairment. The impairment lossrecorded was equal to the amount by which the carrying value exceeded the fair value of the assets. Fair valuewas based on prices for similar assets and a discounted cash flow analysis.
In 2002, a decision was made to abandon an information technology system at DENA resulting in the write-off of approximately $24 million of previously capitalized software and related costs.
During the fourth quarter of 2002, Field Services recorded impairments of approximately $40 million ($28million at Duke Energy’s 70% share) related to certain gas plants and gathering systems that have recentlygenerated cash flow losses. Field Services determined that the carrying value of these assets was impaired and,accordingly, wrote them down to their fair value. Fair value was determined based on estimates of sales valueand/or cash flow models.
Duke Energy evaluates its goodwill for impairment under SFAS No. 142 (see Note 1). In 2002, DukeEnergy recorded a goodwill impairment loss of $194 million related to International Energy’s European tradingand marketing business. Significant changes in the European market and recent operating results have adverselyaffected Duke Energy’s outlook for this business unit. The exit of key market participants and a tightening ofcredit requirements are the primary drivers of this revised outlook. The fair value of the European reporting unitwas estimated using the present value of expected future cash flows.
These impairments were recorded as charges to Operating Income in the Consolidated Statements of Income.
117

DUKE ENERGY CORPORATION
Notes To Consolidated Financial Statements — Continued
During 2002, Duke Energy reduced its workforce to align the business with current market conditions. DukeEnergy recorded charges totaling approximately $100 million related to these reductions. The charges wererecorded consistent with applicable accounting rules including EITF Issue No. 94-3 and SFAS No. 112,“Employers’ Accounting for Postemployment Benefits—An Amendment of FASB Statements No. 5 and 43.”Substantially all of these charges will be paid in 2003.
10. Property, Plant and Equipment
Net Property, Plant and EquipmentDecember 31,
2002 2001
(in millions)
Land . . . . . . . . . . . . . . . . . . . . . . . . . . . . . . . . . . . . . . . . . . . . . . . . . . . . . . . . . . . . . . . . . . . . $ 621 $ 575Plant
Electric generation, distribution and transmission . . . . . . . . . . . . . . . . . . . . . . . . . . . . . 23,842 19,792Natural gas transmission . . . . . . . . . . . . . . . . . . . . . . . . . . . . . . . . . . . . . . . . . . . . . . . . . 9,401 6,200Gathering and processing facilities . . . . . . . . . . . . . . . . . . . . . . . . . . . . . . . . . . . . . . . . 6,200 4,106Other buildings and improvements . . . . . . . . . . . . . . . . . . . . . . . . . . . . . . . . . . . . . . . . 1,398 1,350
Nuclear fuel . . . . . . . . . . . . . . . . . . . . . . . . . . . . . . . . . . . . . . . . . . . . . . . . . . . . . . . . . . . . . . 827 788Equipment . . . . . . . . . . . . . . . . . . . . . . . . . . . . . . . . . . . . . . . . . . . . . . . . . . . . . . . . . . . . . . . . 464 251Vehicles . . . . . . . . . . . . . . . . . . . . . . . . . . . . . . . . . . . . . . . . . . . . . . . . . . . . . . . . . . . . . . . . . 121 69Construction in process(a) . . . . . . . . . . . . . . . . . . . . . . . . . . . . . . . . . . . . . . . . . . . . . . . . . . . 4,057 5,068Other . . . . . . . . . . . . . . . . . . . . . . . . . . . . . . . . . . . . . . . . . . . . . . . . . . . . . . . . . . . . . . . . . . . . 1,746 1,265
Total property, plant and equipment . . . . . . . . . . . . . . . . . . . . . . . . . . . . . . . . . . . 48,677 39,464Total accumulated depreciation(b) . . . . . . . . . . . . . . . . . . . . . . . . . . . . . . . . . . . . . (12,458) (11,049)
Total net property, plant and equipment . . . . . . . . . . . . . . . . . . . . . . . . . . . . . . . . . $ 36,219 $ 28,415
(a) Includes $1,165 million as of December 31, 2002 related to three DENA merchant power plants for whichconstruction has been deferred.
(b) Includes accumulated amortization of nuclear fuel: $566 million for 2002 and $546 million for 2001.
Capitalized interest impact of $250 million for 2002, $167 million for 2001 and $67 million for 2000 isincluded in the Consolidated Statements of Income. (See Notes 1 and 12 for additional information on accountingpolicies related to property, plant and equipment, and nuclear decommissioning, respectively.)
118
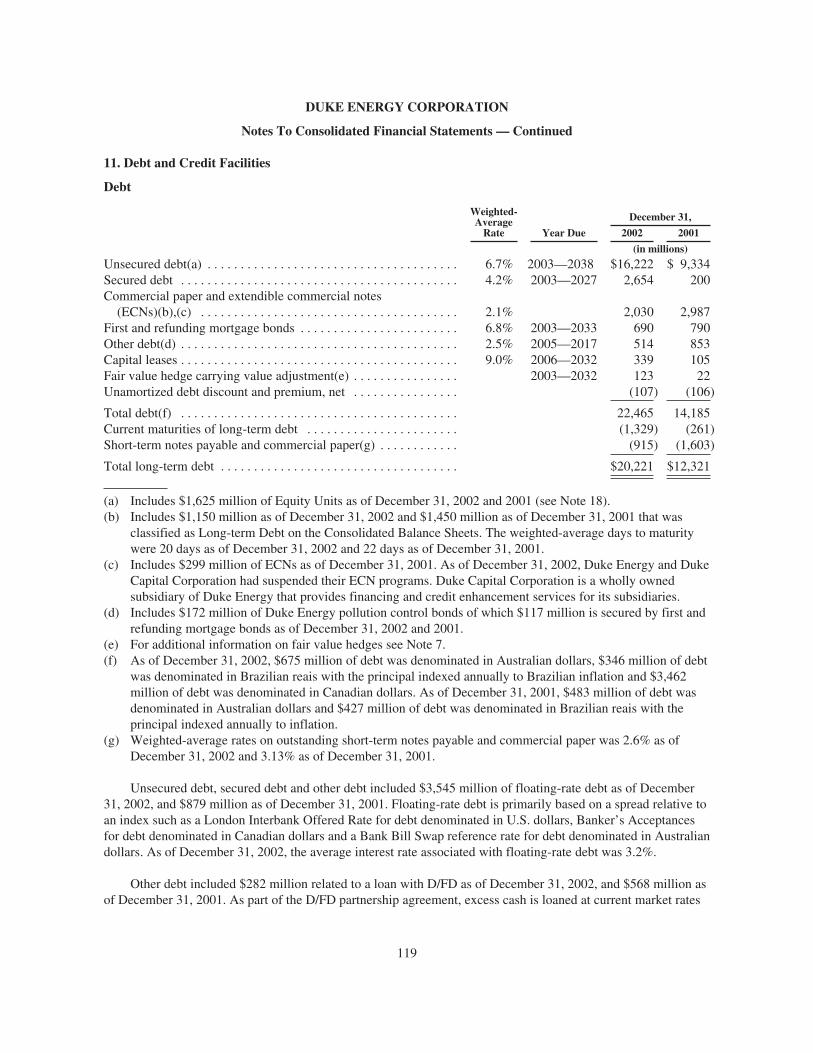
DUKE ENERGY CORPORATION
Notes To Consolidated Financial Statements — Continued
11. Debt and Credit Facilities
Debt
Weighted-AverageRate Year Due
December 31,
2002 2001
(in millions)
Unsecured debt(a) . . . . . . . . . . . . . . . . . . . . . . . . . . . . . . . . . . . . . . 6.7% 2003—2038 $16,222 $ 9,334Secured debt . . . . . . . . . . . . . . . . . . . . . . . . . . . . . . . . . . . . . . . . . . 4.2% 2003—2027 2,654 200Commercial paper and extendible commercial notes(ECNs)(b),(c) . . . . . . . . . . . . . . . . . . . . . . . . . . . . . . . . . . . . . . . 2.1% 2,030 2,987
First and refunding mortgage bonds . . . . . . . . . . . . . . . . . . . . . . . . 6.8% 2003—2033 690 790Other debt(d) . . . . . . . . . . . . . . . . . . . . . . . . . . . . . . . . . . . . . . . . . . 2.5% 2005—2017 514 853Capital leases . . . . . . . . . . . . . . . . . . . . . . . . . . . . . . . . . . . . . . . . . . 9.0% 2006—2032 339 105Fair value hedge carrying value adjustment(e) . . . . . . . . . . . . . . . . 2003—2032 123 22Unamortized debt discount and premium, net . . . . . . . . . . . . . . . . (107) (106)
Total debt(f) . . . . . . . . . . . . . . . . . . . . . . . . . . . . . . . . . . . . . . . . . . 22,465 14,185Current maturities of long-term debt . . . . . . . . . . . . . . . . . . . . . . . (1,329) (261)Short-term notes payable and commercial paper(g) . . . . . . . . . . . . (915) (1,603)
Total long-term debt . . . . . . . . . . . . . . . . . . . . . . . . . . . . . . . . . . . . $20,221 $12,321
(a) Includes $1,625 million of Equity Units as of December 31, 2002 and 2001 (see Note 18).(b) Includes $1,150 million as of December 31, 2002 and $1,450 million as of December 31, 2001 that was
classified as Long-term Debt on the Consolidated Balance Sheets. The weighted-average days to maturitywere 20 days as of December 31, 2002 and 22 days as of December 31, 2001.
(c) Includes $299 million of ECNs as of December 31, 2001. As of December 31, 2002, Duke Energy and DukeCapital Corporation had suspended their ECN programs. Duke Capital Corporation is a wholly ownedsubsidiary of Duke Energy that provides financing and credit enhancement services for its subsidiaries.
(d) Includes $172 million of Duke Energy pollution control bonds of which $117 million is secured by first andrefunding mortgage bonds as of December 31, 2002 and 2001.
(e) For additional information on fair value hedges see Note 7.(f) As of December 31, 2002, $675 million of debt was denominated in Australian dollars, $346 million of debt
was denominated in Brazilian reais with the principal indexed annually to Brazilian inflation and $3,462million of debt was denominated in Canadian dollars. As of December 31, 2001, $483 million of debt wasdenominated in Australian dollars and $427 million of debt was denominated in Brazilian reais with theprincipal indexed annually to inflation.
(g) Weighted-average rates on outstanding short-term notes payable and commercial paper was 2.6% as ofDecember 31, 2002 and 3.13% as of December 31, 2001.
Unsecured debt, secured debt and other debt included $3,545 million of floating-rate debt as of December31, 2002, and $879 million as of December 31, 2001. Floating-rate debt is primarily based on a spread relative toan index such as a London Interbank Offered Rate for debt denominated in U.S. dollars, Banker’s Acceptancesfor debt denominated in Canadian dollars and a Bank Bill Swap reference rate for debt denominated in Australiandollars. As of December 31, 2002, the average interest rate associated with floating-rate debt was 3.2%.
Other debt included $282 million related to a loan with D/FD as of December 31, 2002, and $568 million asof December 31, 2001. As part of the D/FD partnership agreement, excess cash is loaned at current market rates
119
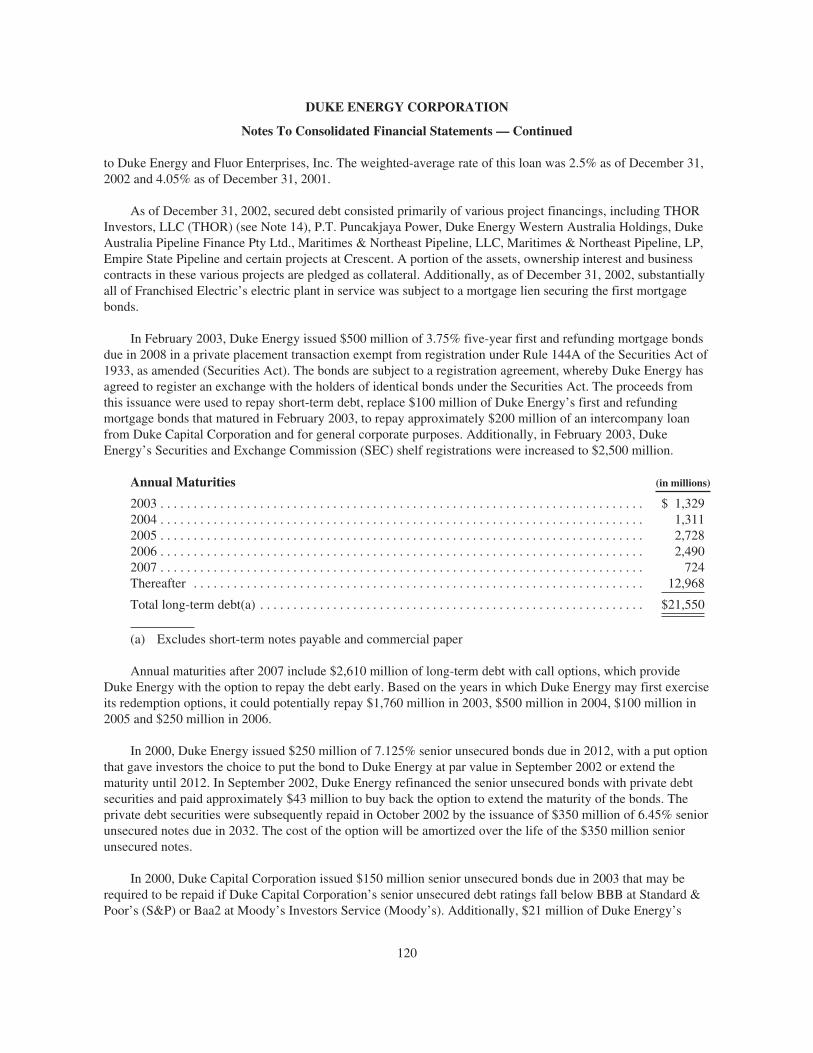
DUKE ENERGY CORPORATION
Notes To Consolidated Financial Statements — Continued
to Duke Energy and Fluor Enterprises, Inc. The weighted-average rate of this loan was 2.5% as of December 31,2002 and 4.05% as of December 31, 2001.
As of December 31, 2002, secured debt consisted primarily of various project financings, including THORInvestors, LLC (THOR) (see Note 14), P.T. Puncakjaya Power, Duke Energy Western Australia Holdings, DukeAustralia Pipeline Finance Pty Ltd., Maritimes & Northeast Pipeline, LLC, Maritimes & Northeast Pipeline, LP,Empire State Pipeline and certain projects at Crescent. A portion of the assets, ownership interest and businesscontracts in these various projects are pledged as collateral. Additionally, as of December 31, 2002, substantiallyall of Franchised Electric’s electric plant in service was subject to a mortgage lien securing the first mortgagebonds.
In February 2003, Duke Energy issued $500 million of 3.75% five-year first and refunding mortgage bondsdue in 2008 in a private placement transaction exempt from registration under Rule 144A of the Securities Act of1933, as amended (Securities Act). The bonds are subject to a registration agreement, whereby Duke Energy hasagreed to register an exchange with the holders of identical bonds under the Securities Act. The proceeds fromthis issuance were used to repay short-term debt, replace $100 million of Duke Energy’s first and refundingmortgage bonds that matured in February 2003, to repay approximately $200 million of an intercompany loanfrom Duke Capital Corporation and for general corporate purposes. Additionally, in February 2003, DukeEnergy’s Securities and Exchange Commission (SEC) shelf registrations were increased to $2,500 million.
Annual Maturities (in millions)
2003 . . . . . . . . . . . . . . . . . . . . . . . . . . . . . . . . . . . . . . . . . . . . . . . . . . . . . . . . . . . . . . . . . . . . . . . . . $ 1,3292004 . . . . . . . . . . . . . . . . . . . . . . . . . . . . . . . . . . . . . . . . . . . . . . . . . . . . . . . . . . . . . . . . . . . . . . . . . 1,3112005 . . . . . . . . . . . . . . . . . . . . . . . . . . . . . . . . . . . . . . . . . . . . . . . . . . . . . . . . . . . . . . . . . . . . . . . . . 2,7282006 . . . . . . . . . . . . . . . . . . . . . . . . . . . . . . . . . . . . . . . . . . . . . . . . . . . . . . . . . . . . . . . . . . . . . . . . . 2,4902007 . . . . . . . . . . . . . . . . . . . . . . . . . . . . . . . . . . . . . . . . . . . . . . . . . . . . . . . . . . . . . . . . . . . . . . . . . 724Thereafter . . . . . . . . . . . . . . . . . . . . . . . . . . . . . . . . . . . . . . . . . . . . . . . . . . . . . . . . . . . . . . . . . . . . 12,968
Total long-term debt(a) . . . . . . . . . . . . . . . . . . . . . . . . . . . . . . . . . . . . . . . . . . . . . . . . . . . . . . . . . . $21,550
(a) Excludes short-term notes payable and commercial paper
Annual maturities after 2007 include $2,610 million of long-term debt with call options, which provideDuke Energy with the option to repay the debt early. Based on the years in which Duke Energy may first exerciseits redemption options, it could potentially repay $1,760 million in 2003, $500 million in 2004, $100 million in2005 and $250 million in 2006.
In 2000, Duke Energy issued $250 million of 7.125% senior unsecured bonds due in 2012, with a put optionthat gave investors the choice to put the bond to Duke Energy at par value in September 2002 or extend thematurity until 2012. In September 2002, Duke Energy refinanced the senior unsecured bonds with private debtsecurities and paid approximately $43 million to buy back the option to extend the maturity of the bonds. Theprivate debt securities were subsequently repaid in October 2002 by the issuance of $350 million of 6.45% seniorunsecured notes due in 2032. The cost of the option will be amortized over the life of the $350 million seniorunsecured notes.
In 2000, Duke Capital Corporation issued $150 million senior unsecured bonds due in 2003 that may berequired to be repaid if Duke Capital Corporation’s senior unsecured debt ratings fall below BBB at Standard &Poor’s (S&P) or Baa2 at Moody’s Investors Service (Moody’s). Additionally, $21 million of Duke Energy’s
120
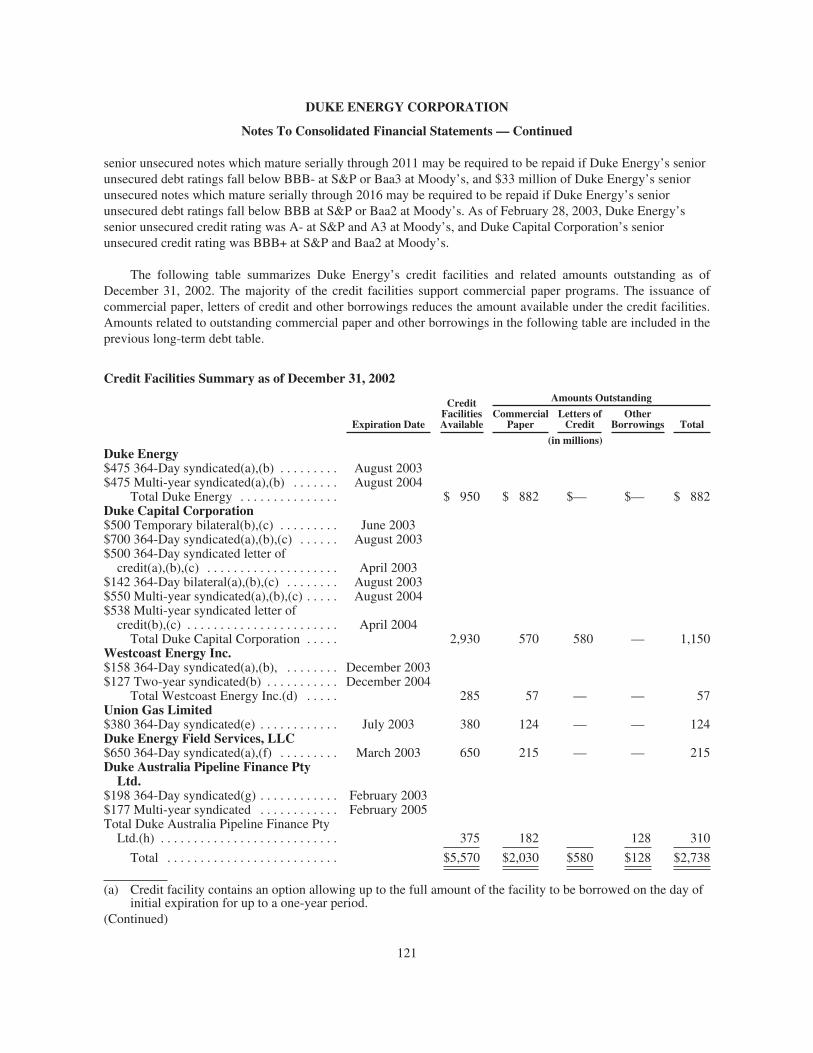
DUKE ENERGY CORPORATION
Notes To Consolidated Financial Statements — Continued
senior unsecured notes which mature serially through 2011 may be required to be repaid if Duke Energy’s seniorunsecured debt ratings fall below BBB- at S&P or Baa3 at Moody’s, and $33 million of Duke Energy’s seniorunsecured notes which mature serially through 2016 may be required to be repaid if Duke Energy’s seniorunsecured debt ratings fall below BBB at S&P or Baa2 at Moody’s. As of February 28, 2003, Duke Energy’ssenior unsecured credit rating was A- at S&P and A3 at Moody’s, and Duke Capital Corporation’s seniorunsecured credit rating was BBB+ at S&P and Baa2 at Moody’s.
The following table summarizes Duke Energy’s credit facilities and related amounts outstanding as ofDecember 31, 2002. The majority of the credit facilities support commercial paper programs. The issuance ofcommercial paper, letters of credit and other borrowings reduces the amount available under the credit facilities.Amounts related to outstanding commercial paper and other borrowings in the following table are included in theprevious long-term debt table.
Credit Facilities Summary as of December 31, 2002
Expiration Date
CreditFacilitiesAvailable
Amounts Outstanding
CommercialPaper
Letters ofCredit
OtherBorrowings Total
(in millions)Duke Energy$475 364-Day syndicated(a),(b) . . . . . . . . . August 2003$475 Multi-year syndicated(a),(b) . . . . . . . August 2004
Total Duke Energy . . . . . . . . . . . . . . . $ 950 $ 882 $— $— $ 882Duke Capital Corporation$500 Temporary bilateral(b),(c) . . . . . . . . . June 2003$700 364-Day syndicated(a),(b),(c) . . . . . . August 2003$500 364-Day syndicated letter ofcredit(a),(b),(c) . . . . . . . . . . . . . . . . . . . . April 2003
$142 364-Day bilateral(a),(b),(c) . . . . . . . . August 2003$550 Multi-year syndicated(a),(b),(c) . . . . . August 2004$538 Multi-year syndicated letter ofcredit(b),(c) . . . . . . . . . . . . . . . . . . . . . . . April 2004Total Duke Capital Corporation . . . . . 2,930 570 580 — 1,150
Westcoast Energy Inc.$158 364-Day syndicated(a),(b), . . . . . . . . December 2003$127 Two-year syndicated(b) . . . . . . . . . . . December 2004
Total Westcoast Energy Inc.(d) . . . . . 285 57 — — 57Union Gas Limited$380 364-Day syndicated(e) . . . . . . . . . . . . July 2003 380 124 — — 124Duke Energy Field Services, LLC$650 364-Day syndicated(a),(f) . . . . . . . . . March 2003 650 215 — — 215Duke Australia Pipeline Finance PtyLtd.
$198 364-Day syndicated(g) . . . . . . . . . . . . February 2003$177 Multi-year syndicated . . . . . . . . . . . . February 2005Total Duke Australia Pipeline Finance PtyLtd.(h) . . . . . . . . . . . . . . . . . . . . . . . . . . . 375 182 128 310
Total . . . . . . . . . . . . . . . . . . . . . . . . . . $5,570 $2,030 $580 $128 $2,738
(a) Credit facility contains an option allowing up to the full amount of the facility to be borrowed on the day ofinitial expiration for up to a one-year period.
(Continued)
121
DUKE ENERGY CORPORATION
Notes To Consolidated Financial Statements — Continued
(Continued from previous page)(b) As of December 31, 2002, credit facility contained a covenant requiring debt to total capitalization not
exceeding 65%.(c) As of December 31, 2002, credit facility contained a covenant requiring earnings before interest, taxes,
depreciation and amortization interest coverage (excluding mark-to-market earnings) of two and a half timesor greater. In February 2003, the covenants related to the credit facility have been amended to clarify certainnon-cash exclusions.
(d) Credit facilities are denominated in Canadian dollars, and totaled 450 million Canadian dollars as ofDecember 31, 2002.
(e) Credit facility contains an option allowing up to 50% of the amount of the facility to be borrowed on the dayof the initial expiration for up to a one-year period. As of December 31, 2002, credit facility contained acovenant requiring debt to total capitalization not exceeding 75%. Credit facility is denominated inCanadian dollars, and was 600 million Canadian dollars as of December 31, 2002.
(f) As of December 31, 2002, credit facility contained a covenant requiring debt to total capitalization notexceeding 53%.
(g) In February 2003, the expiration date of the credit facility was extended to March 2003.(h) Credit facilities guaranteed by Duke Capital Corporation. Credit facilities are denominated in Australian
dollars, and totaled 662 million Australian dollars as of December 31, 2002. Duke Australia PipelineFinance Pty Ltd. is a wholly owned subsidiary of Duke Energy.
Existing bank credit facilities as of December 31, 2002 are not subject to minimum cash requirements. Inaddition, in October 2002, Duke Energy secured an option to borrow up to $500 million in February 2003 for aperiod ending no later than November 2003. In February 2003, this option was amended to allow Duke Energy toborrow up to $250 million between June 30, 2003 and August 29, 2003. Any amounts borrowed would be due nolater than March 31, 2004. Also, Duke Energy is currently maintaining a minimum cash position of $500 millionat Duke Capital Corporation to be used for short-term liquidity needs. This cash position is invested in highlyrated, liquid, short-term money market securities.
Duke Energy has approximately $3,700 million of credit facilities which mature in 2003. It is DukeEnergy’s intent to reduce its need for these facilities as the year progresses and thus resyndicate less than the total$3,700 million.
Duke Energy’s credit agreements contain various financial and other covenants. Failure to meet thosecovenants beyond applicable grace periods could result in acceleration of due dates of the borrowings and/ortermination of the agreements. As of December 31, 2002, Duke Energy was in compliance with those covenants.In addition, certain of the agreements contain cross-acceleration provisions that may allow acceleration ofpayments or termination of the agreements upon nonpayment or acceleration of other significant indebtedness ofthe applicable borrower or certain of its subsidiaries.
12. Nuclear Decommissioning Costs
Nuclear Decommissioning Costs. Estimated site-specific nuclear decommissioning costs, including thecost of decommissioning plant components not subject to radioactive contamination, total approximately $1.9billion in 1999 dollars, based on decommissioning studies completed in 1999 (studies are completed every fiveyears). This includes costs related to Duke Energy’s 12.5% ownership in the Catawba Nuclear Station. The otherjoint owners of the Catawba Nuclear Station are responsible for decommissioning costs related to theirownership interests in the station. Both the NCUC and the PSCSC have allowed Duke Energy to recoverestimated decommissioning costs through retail rates over the expected remaining service periods of DukeEnergy’s nuclear stations.
122

DUKE ENERGY CORPORATION
Notes To Consolidated Financial Statements — Continued
The operating licenses for Duke Energy’s nuclear units are subject to extension. In 2000, Duke Energy wasgranted a license renewal for the Oconee Nuclear Station. The service period extension of the Oconee NuclearStation will not impact depreciation or nuclear decommissioning rates until the next depreciation anddecommissioning studies are completed and new rates can be approved by the NCUC and the PSCSC.Applications to renew the operating licenses for Duke Energy’s other nuclear units were filed with the NuclearRegulatory Commission (NRC) in June 2001. Duke Energy’s nuclear units are currently licensed as follows:
Operating Licenses for Nuclear Units
UnitExpiration
Year
McGuire 1 . . . . . . . . . . . . . . . . . . . . . . . . . . . . . . . . . . . . . . . . . . . . . . . . . . . . . . . . . 2021McGuire 2 . . . . . . . . . . . . . . . . . . . . . . . . . . . . . . . . . . . . . . . . . . . . . . . . . . . . . . . . . 2023Catawba 1 . . . . . . . . . . . . . . . . . . . . . . . . . . . . . . . . . . . . . . . . . . . . . . . . . . . . . . . . . 2024Catawba 2 . . . . . . . . . . . . . . . . . . . . . . . . . . . . . . . . . . . . . . . . . . . . . . . . . . . . . . . . . 2026Oconee 1 and 2 . . . . . . . . . . . . . . . . . . . . . . . . . . . . . . . . . . . . . . . . . . . . . . . . . . . . . 2033Oconee 3 . . . . . . . . . . . . . . . . . . . . . . . . . . . . . . . . . . . . . . . . . . . . . . . . . . . . . . . . . . 2034
During 2002, Duke Energy expensed approximately $59 million and contributed $56 million of cash toexternal funds for decommissioning costs, and accrued an additional $9 million to the internal reserve. During2001, Duke Energy expensed approximately $57 million, and contributed a corresponding amount of cash toexternal funds for decommissioning costs, and accrued an additional $8 million to the internal reserve. Nuclearunits are currently depreciated at an annual rate of 4.7%, of which 1.61% is for decommissioning. The balance ofthe external funds was $708 million as of December 31, 2002 and $716 million as of December 31, 2001. Theseamounts are reflected in the Consolidated Balance Sheets as Nuclear Decommissioning Trust Funds (asset) andNuclear Decommissioning Costs Externally Funded (liability). The balance of the internal reserve was $248million as of December 31, 2002 and $239 million as of December 31, 2001. These amounts are reflected in theConsolidated Balance Sheets as Accumulated Depreciation and Amortization.
The external decommissioning trust fund is invested primarily in domestic and international equitysecurities, fixed-rate, fixed-income securities and cash and cash equivalents. Per NRC and Internal RevenueService mandates, these funds may be used only for activities related to nuclear decommissioning. Thoseinvestments are exposed to price fluctuations in equity markets and changes in interest rates. Because theaccounting for nuclear decommissioning recognizes that costs are recovered through Franchised Electric’s rates,fluctuations in equity prices or interest rates do not affect consolidated results of operations or cash flows.Management believes that the decommissioning costs being recovered through rates, when coupled withexpected fund earnings, are sufficient to provide for the cost of decommissioning. (See discussion of SFAS No.143 under the New Accounting Standards section of Note 1 for a discussion of accounting for asset retirementobligations.)
A provision in the Energy Policy Act of 1992 established a fund for the decontamination anddecommissioning of the DOE’s uranium enrichment plants (the D&D Fund). Licensees are subject to an annualassessment for 15 years based on their pro rata share of past enrichment services. Lawsuits filed by Duke Energyand other utilities challenging the constitutionality of the D&D Fund have been dismissed. The annualassessment is recorded in the Consolidated Statements of Income as Fuel Used in Electric Generation. DukeEnergy has paid $107 million into the fund, including $11 million during 2002. The remaining liability and
123

DUKE ENERGY CORPORATION
Notes To Consolidated Financial Statements — Continued
regulatory assets of $44 million as of December 31, 2002 and $53 million as of December 31, 2001 are reflectedin the Consolidated Balance Sheets as Deferred Credits and Other Liabilities, and Regulatory Assets andDeferred Debits.
Spent Nuclear Fuel. Under provisions of the Nuclear Waste Policy Act of 1982, Duke Energy contractedwith the DOE for the disposal of spent nuclear fuel. The DOE failed to begin accepting spent nuclear fuel onJanuary 31, 1998, the date specified by the Nuclear Waste Policy Act and in Duke Energy’s contract with theDOE. In 1998, Duke Energy filed a claim with the U.S. Court of Federal Claims against the DOE related to theDOE’s failure to accept commercial spent nuclear fuel by the required date. Damages claimed in the lawsuit arebased upon Duke Energy’s costs incurred as a result of the DOE’s partial material breach of its contract,including the cost of securing additional spent fuel storage capacity. Duke Energy will continue to safely manageits spent nuclear fuel until the DOE accepts it. Payments made to the DOE for disposal costs are based on nuclearoutput and are included in the Consolidated Statements of Income as Fuel Used in Electric Generation.
13. Guaranteed Preferred Beneficial Interests in Subordinated Notes of Duke Energy or Subsidiaries
Duke Energy and Duke Capital Corporation have formed business trusts for which they own all the commonsecurities. The trusts issue and sell preferred securities and invest the gross proceeds in junior subordinated notesissued by the respective parent companies.
Trust Preferred SecuritiesDecember 31,
Issued Rate Due 2002 2001
(in millions)
1997 . . . . . . . . . . . . . . . . . . . . . . . . . . . . . . . . . . . . . . . . . . . . . 7.20% 2037 $ 350 $ 3501998 . . . . . . . . . . . . . . . . . . . . . . . . . . . . . . . . . . . . . . . . . . . . . 7.375% 2038 350 3501998 . . . . . . . . . . . . . . . . . . . . . . . . . . . . . . . . . . . . . . . . . . . . . 7.375% 2038 250 2501999 . . . . . . . . . . . . . . . . . . . . . . . . . . . . . . . . . . . . . . . . . . . . . 8.375% 2029 250 2501999 . . . . . . . . . . . . . . . . . . . . . . . . . . . . . . . . . . . . . . . . . . . . . 7.20% 2039 250 250Unamortized debt discount . . . . . . . . . . . . . . . . . . . . . . . . . . . . (42) (43)
$1,408 $1,407
The trust preferred securities represent preferred undivided beneficial interests in the assets of the respectivetrusts. Distribution payments on the preferred securities are guaranteed by the respective parent companies, butonly to the extent that the trust funds are legally and immediately available to make distributions. Dividendsrelated to the trust preferred securities were $108 million for 2002, 2001 and 2000, and have been included in theConsolidated Statements of Income as Minority Interest Expense.
14. Minority Interest
In 2000, Catawba River Associates, LLC (Catawba), a fully consolidated financing entity managed by asubsidiary of Duke Energy, issued $1,025 million of preferred member interests to a third-party investor.Catawba subsequently advanced the proceeds from the issuance to DE Power Generation, LLC (DEPG), awholly owned subsidiary of Duke Energy, which indirectly owns or leases six merchant power generationfacilities located in California, Maine and Indiana. Catawba was a limited liability company with a separateexistence and identity from its preferred members, and the assets of Catawba are separate and legally distinct
124
DUKE ENERGY CORPORATION
Notes To Consolidated Financial Statements — Continued
from Duke Energy. The preferred member interests received a quarterly preferred return equal to an adjustedfloating reference rate (approximately 2.85% for the full year ended December 31, 2002 and 5.20% for the fullyear ended December 31, 2001).
The purpose of the transaction was to reimburse Duke Energy for a portion of its prior investment in theDEPG assets through separate venture financing with third-party investors, not requiring direct recourse to thecredit of Duke Energy. The results of operations, cash flows and financial position of Catawba were consolidatedwith Duke Energy for financial reporting purposes. The preferred member interests were included in MinorityInterest in Financing Subsidiary on the 2001 Consolidated Balance Sheet, and the payments made with respect tothe preferred return were included in Minority Interest Expense on the 2001 Consolidated Statement of Incomeof Duke Energy. The initial term of the financing ends in September 2005 and is repayable at that time unlessextended by mutual consent.
In September 2002, Catawba distributed the receivable from DEPG to the preferred member, THOR, whichsimultaneously withdrew its interest. As a result, the $1,025 million that DEPG previously owed to Catawbabecame an obligation to THOR and was reclassified on the 2002 Consolidated Balance Sheet to Long-term Debt.In October 2002, Duke Energy purchased the equity interests in THOR and effectively reduced the debt to $994million. Additionally, Duke Capital Corporation financially guaranteed the $994 million in return for certainmodifications to the terms of the credit agreement.
In connection with the Westcoast acquisition on March 14, 2002 (see Note 2), Duke Energy assumed $411million of authorized and issued redeemable preferred and preference shares at Union Gas and Westcoast. Theseshares are included in Minority Interest on the Consolidated Balance Sheet as of December 31, 2002.
15. Preferred and Preference Stock at Duke Energy
The following tables detail the preferred and preference stock at Duke Energy. The preferred and preferencestock at Duke Energy’s subsidiaries is excluded from the discussions below as those amounts are included inMinority Interest on the Consolidated Balance Sheets (see Note 14).
Authorized Shares of Stock as of December 31, 2002 and 2001Par Value Shares
(in millions)
Preferred Stock . . . . . . . . . . . . . . . . . . . . . . . . . . . . . . . . . . . . . . . . . . . . . . . . . . . . . . . $100 12.5Preferred Stock A . . . . . . . . . . . . . . . . . . . . . . . . . . . . . . . . . . . . . . . . . . . . . . . . . . . . . $ 25 10.0Preference Stock . . . . . . . . . . . . . . . . . . . . . . . . . . . . . . . . . . . . . . . . . . . . . . . . . . . . . . $100 1.5
As of December 31, 2002 and 2001, there were no shares of preference stock outstanding at Duke Energy.
125
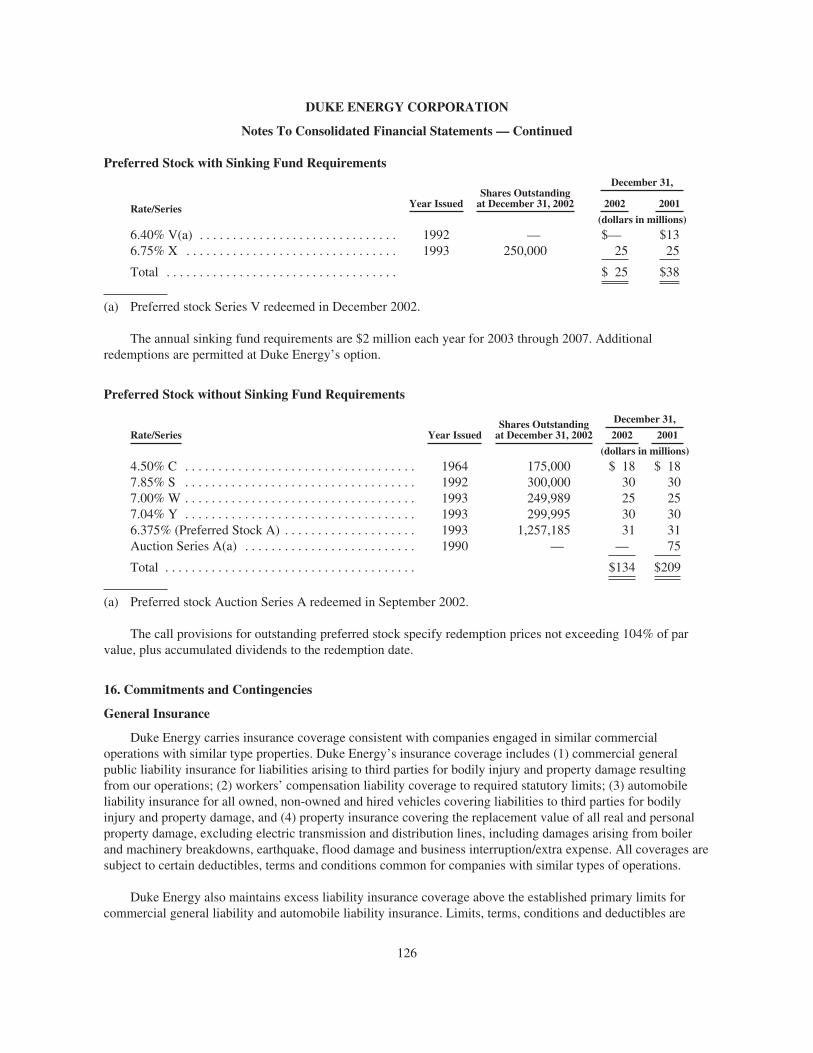
DUKE ENERGY CORPORATION
Notes To Consolidated Financial Statements — Continued
Preferred Stock with Sinking Fund Requirements
Rate/Series Year IssuedShares Outstandingat December 31, 2002
December 31,
2002 2001
(dollars in millions)
6.40% V(a) . . . . . . . . . . . . . . . . . . . . . . . . . . . . . . 1992 — $— $136.75% X . . . . . . . . . . . . . . . . . . . . . . . . . . . . . . . . 1993 250,000 25 25
Total . . . . . . . . . . . . . . . . . . . . . . . . . . . . . . . . . . . $ 25 $38
(a) Preferred stock Series V redeemed in December 2002.
The annual sinking fund requirements are $2 million each year for 2003 through 2007. Additionalredemptions are permitted at Duke Energy’s option.
Preferred Stock without Sinking Fund Requirements
Year IssuedShares Outstandingat December 31, 2002
December 31,
Rate/Series 2002 2001
(dollars in millions)
4.50% C . . . . . . . . . . . . . . . . . . . . . . . . . . . . . . . . . . . 1964 175,000 $ 18 $ 187.85% S . . . . . . . . . . . . . . . . . . . . . . . . . . . . . . . . . . . 1992 300,000 30 307.00% W . . . . . . . . . . . . . . . . . . . . . . . . . . . . . . . . . . . 1993 249,989 25 257.04% Y . . . . . . . . . . . . . . . . . . . . . . . . . . . . . . . . . . . 1993 299,995 30 306.375% (Preferred Stock A) . . . . . . . . . . . . . . . . . . . . 1993 1,257,185 31 31Auction Series A(a) . . . . . . . . . . . . . . . . . . . . . . . . . . 1990 — — 75
Total . . . . . . . . . . . . . . . . . . . . . . . . . . . . . . . . . . . . . . $134 $209
(a) Preferred stock Auction Series A redeemed in September 2002.
The call provisions for outstanding preferred stock specify redemption prices not exceeding 104% of parvalue, plus accumulated dividends to the redemption date.
16. Commitments and Contingencies
General Insurance
Duke Energy carries insurance coverage consistent with companies engaged in similar commercialoperations with similar type properties. Duke Energy’s insurance coverage includes (1) commercial generalpublic liability insurance for liabilities arising to third parties for bodily injury and property damage resultingfrom our operations; (2) workers’ compensation liability coverage to required statutory limits; (3) automobileliability insurance for all owned, non-owned and hired vehicles covering liabilities to third parties for bodilyinjury and property damage, and (4) property insurance covering the replacement value of all real and personalproperty damage, excluding electric transmission and distribution lines, including damages arising from boilerand machinery breakdowns, earthquake, flood damage and business interruption/extra expense. All coverages aresubject to certain deductibles, terms and conditions common for companies with similar types of operations.
Duke Energy also maintains excess liability insurance coverage above the established primary limits forcommercial general liability and automobile liability insurance. Limits, terms, conditions and deductibles are
126

DUKE ENERGY CORPORATION
Notes To Consolidated Financial Statements — Continued
comparable to those carried by other energy companies of similar size. The costs of Duke Energy’s generalinsurance coverage have increased significantly over the past year reflecting general conditions in the insurancemarkets.
Nuclear Insurance
Duke Energy owns and operates the McGuire and Oconee Nuclear Stations and operates and has a partialownership interest in the Catawba Nuclear Station. The McGuire and Catawba Nuclear Stations have two nuclearreactors each and Oconee has three. Nuclear insurance includes: liability coverage; property, decontaminationand decommissioning coverage; and business interruption and/or extra expense coverage. The other joint ownersof the Catawba Nuclear Station reimburse Duke Energy for certain expenses associated with nuclear insurancepremiums.
The Price-Anderson Act requires Duke Energy to insure against public liability claims resulting fromnuclear incidents to the full limit of liability, approximately $9.5 billion.
Primary Liability Insurance. Duke Energy has purchased the maximum available private primary liabilityinsurance, $200 million, as required by law. As of January 1, 2003, $300 million in private primary liabilityinsurance became available and Duke Energy purchased that amount along with a like amount to cover certainworker tort claims.
Excess Liability Insurance. This policy currently provides approximately $9.3 billion of coverage throughthe Price-Anderson Act’s mandatory industry-wide excess secondary insurance program of risk pooling. The$9.3 billion is the sum of the current potential cumulative retrospective premium assessments of $88 million perlicensed commercial nuclear reactor. This would be increased by $88 million for each additional commercialnuclear reactor licensed, or reduced by $88 million for nuclear reactors no longer operational and may beexempted from the risk pooling insurance program. Under this program, licensees could be assessed retrospectivepremiums to compensate for damages in the event of a nuclear incident at any licensed facility in the U.S. If suchan incident should occur and public liability damages exceed primary insurances, licensees may be assessed up to$88 million for each of their licensed reactors, payable at a rate not to exceed $10 million a year per licensedreactor for each incident. The $88 million is subject to indexing for inflation and may be subject to state premiumtaxes.
Duke Energy is a member of Nuclear Electric Insurance Limited (NEIL), which provides property andbusiness interruption insurance coverage for Duke Energy’s nuclear facilities under three policy programs:
Primary Property Insurance. This policy provides $500 million of primary property damage coverage foreach of Duke Energy’s nuclear facilities.
Excess Property Insurance. This policy provides excess property, decontamination and decommissioningliability insurance: $2.25 billion for the Catawba Nuclear Station and $2.0 billion each for the Oconee andMcGuire Nuclear Stations.
Business Interruption Insurance. This policy provides business interruption and/or extra expense coverageresulting from an accidental outage of a nuclear unit. Each McGuire and Catawba unit is insured for up toapproximately $4 million per week, and the Oconee units are insured for up to approximately $3 million perweek. Coverage amounts decline if more than one unit is involved in an accidental outage. Initial coveragebegins after a 12-week deductible period and continues at 100% for 52 weeks and 80% for the next 110 weeks.
127
DUKE ENERGY CORPORATION
Notes To Consolidated Financial Statements — Continued
If NEIL’s losses exceed its reserves for any of the above three programs, Duke Energy is liable forassessments of up to 10 times its annual premiums. The current potential maximum assessments are: PrimaryProperty Insurance—$35 million, Excess Property Insurance—$40 million and Business InterruptionInsurance—$29 million.
The other joint owners of the Catawba Nuclear Station are obligated to assume their pro rata share ofliability for retrospective premiums and other premium assessments resulting from the Price-Anderson Act’sexcess secondary insurance program of risk pooling, or the NEIL policies.
Environmental
Duke Energy is subject to international, federal, state and local regulations regarding air and water quality,hazardous and solid waste disposal and other environmental matters.
Remediation activities. Duke Energy and its affiliates are responsible for environmental remediation atvarious impacted properties or contaminated sites similar to others in the energy industry. These include someproperties that are part of ongoing Duke Energy operations, as well as sites formerly owned or used by DukeEnergy entities and sites owned by third parties. These matters typically involve management of contaminatedsoils and may involve ground water remediation. They are managed in conjunction with the relevant federal,state and local agencies. These sites or matters vary, for example, with respect to site conditions and location,remedial requirements, sharing of responsibility by other entities, and complexity. Certain matters can involvestatutory joint and several liability provisions, strict liability, or cost recovery or contribution actions, wherebyDuke Energy or its affiliates could potentially be held responsible for contamination caused by other parties. Insome instances, Duke Energy may share any liability associated with contamination with other potentiallyresponsible parties, and Duke Energy may benefit from insurance policies or contractual indemnities that coversome cleanup costs. All these sites generally are managed in the normal course of the respective business oraffiliate operations. Management believes that completion or resolution of these matters will have no materialadverse effect on consolidated results of operations, cash flows, or financial position.
Air Quality Control. In 1998, the Environmental Protection Agency (EPA) issued a final rule on regionalozone control that required 22 eastern states and the District of Columbia to revise their State ImplementationPlans (SIPs) to significantly reduce emissions of nitrogen oxide by May 1, 2003. The EPA rule was challenged incourt by various states, industry and other interests, including Duke Energy and the states of North Carolina andSouth Carolina. In 2000, the court upheld most aspects of the EPA rule. The same court subsequently extendedthe compliance deadline for implementation of emission reductions to May 31, 2004. Both North Carolina andSouth Carolina have revised their SIPs in response to the EPA’s 1998 rule, and the EPA has approved theserevisions. Duke Energy has incurred approximately $380 million in capital costs for emission controls through2002 for compliance with the EPA’s rule. Management estimates that Duke Energy’s remaining capitalexpenditures to complete the installation of emission controls needed to comply with the EPA’s rule will beapproximately $300 million. These remaining expenditures will be incurred through 2004.
In June 2002, the state of North Carolina passed new clean air legislation that includes provisions that freezeelectric utility rates from June 20, 2002 (the effective date of the statute) to December 31, 2007 (rate freezeperiod), subject to certain conditions, in order for North Carolina electric utilities, including Duke Energy, tomake significant reductions in emissions of sulfur dioxide and nitrogen oxides from the state’s coal-fired powerplants over the next ten years. Management estimates Duke Energy’s cost of achieving the proposed emissionreductions over the next ten years to be approximately $1.5 billion in total. Included in the legislation areprovisions that allow electric utilities, including Duke Energy, to accelerate the recovery of these compliance
128
DUKE ENERGY CORPORATION
Consolidated Balance Sheets — (Continued)
costs by amortizing them over seven years (2003-2009). During the rate freeze period, Duke Energy is expectedto recover 70% of the total estimated costs of plant improvements. In years six and seven of the recovery period,the NCUC will determine how any remaining costs will be recovered. Emission control retrofits needed tocomply with the new legislation are large technical, design and construction projects. These projects will bemanaged closely to ensure the continuation of reliable electric service to Duke Energy’s customers throughoutthe projects and upon their completion.
In 2000, the U.S. Justice Department, acting on behalf of the EPA, filed a complaint against Duke Energy inthe U.S. District Court in Greensboro, North Carolina, for alleged violations of the New Source Review (NSR)provisions of the Clean Air Act (CAA). The EPA claims that 29 projects performed at 25 of Duke Energy’s coal-fired units were major modifications, as defined in the CAA, and that Duke Energy violated the CAA’s NSRrequirements when it undertook those projects without obtaining permits and installing emission controls forsulfur dioxide, nitrogen oxide and particulate matter. The complaint asks the court to order Duke Energy to stopoperating the coal-fired units identified in the complaint, install additional emission controls and pay unspecifiedcivil penalties. This complaint is part of the EPA’s NSR enforcement initiative, in which the EPA claims thatutilities and others have committed widespread violations of the CAA permitting requirements for the past 25years. The EPA has sued, or issued notices of violation or investigative information requests, to at least 94 otherelectric utilities and cooperatives.
The EPA’s allegations run counter to previous EPA guidance regarding the applicability of the NSRpermitting requirements. Duke Energy, along with other utilities, has routinely undertaken the type of repair,replacement and maintenance projects that the EPA now claims are illegal. Duke Energy believes that all of itselectric generation units are properly permitted and have been properly maintained, and is defending itselfvigorously against these alleged violations. Trial is tentatively set for September 2003. The CAA authorizes civilpenalties of up to $27,500 per day per violation at each generating unit. Civil penalties, if ultimately imposed bythe court, and the cost of any required new pollution control equipment, if the court accepts the EPA’scontentions, could be substantial. The EPA’s final and proposed NSR reforms, published in 2002, have no directeffect on the status of Duke Energy’s lawsuit. Because these matters are in a preliminary stage, managementcannot estimate the effects of these matters on Duke Energy’s future consolidated results of operations, cashflows or financial position.
Global Climate Change. In 1997, the United Nations held negotiations in Kyoto, Japan, as part of anongoing process to address concerns over global warming and climate change. The resulting Kyoto Protocolprescribed greenhouse gas emission reductions among developed countries equivalent to five percent below their1990 aggregate emission levels. While the Kyoto Protocol does not mandate specific mitigation actions orapproaches, most participating developed nations understood an area of focus would be on reducing green housegas emissions at their sources, including, among other sources, fossil-fueled electric power generation andnatural gas operations. In 2001 President George W. Bush stated his opposition to the Kyoto Protocol, anddeclared that the U.S. will not ratify it. Australia, where Duke Energy has natural gas pipeline and some electricgeneration assets, has also declined to ratify the Kyoto Protocol.
Over 100 other countries have, however, ratified the Kyoto Protocol and it is possible that the agreementwill enter into force and effect if other nations follow suit. Canada, where Duke Energy owns and operates
129

DUKE ENERGY CORPORATION
Notes To Consolidated Financial Statements — Continued
natural gas pipeline assets, ratified the Kyoto Protocol in December 2002. If Russia were also to ratify the KyotoProtocol, then the treaty would enter into force and Canada would be obligated to reduce its average greenhousegas emissions to 6% below 1990 levels over the period 2008 to 2012. In anticipation of the entry into force of theKyoto Protocol, Canada is developing an implementation plan contemplating a mix of sector-specific measuresrequiring a range of mandatory business actions to achieve emissions reductions, as well as emissions capscoupled with an emissions trading system. Targets for emissions reductions under such a Canadian scheme couldbe established under negotiated covenants with industry sectors, including the oil and gas sector, whichencompasses most of Duke Energy’s Canadian natural gas pipeline assets. Should the Kyoto Protocol enter intoforce, and depending on the nature of policies and measures adopted by the Canadian government, it is possiblethat Duke Energy’s Canadian assets could be required to reduce its present emissions of greenhouse gases insome manner and/or to purchase emissions credits in the Canadian market or take other steps.
In these and other respects, the entry into force of the Kyoto Protocol, and the domestic policies andmeasures of countries participating in the treaty regime, could have far-reaching and significant implications forindustries in those countries, including their respective energy sectors. These developments could specificallyaffect Duke Energy operations in those countries that are participating in the Kyoto Protocol, like Canada. Itmight also provide new opportunities to companies, for example, in the natural gas sector or in emissions tradingand marketing arenas. There are also U.S. and Australian domestic or state-specific initiatives and proposals thatcould have analogous effects on segments of the energy sector on different scales. The outcome of thesediscussions and negotiations, like those occurring in Canada as described above, is highly uncertain, and DukeEnergy cannot estimate the effects these discussions and negotiations might have on future consolidated resultsof operations, cash flows or financial position. Duke Energy stays abreast of and engaged in the Kyoto Protocoldiscussions and related developments concerning the climate change issue, and will continue to assess andrespond to its potential implications for Duke Energy’s business operations in the U.S., Canada and around theworld.
Extended Environmental Activities, Accruals. Included in Other Current Liabilities and Other DeferredCredits and Other Liabilities were accruals related to extended environmental-related activities of $97 million atDecember 31, 2002 and $162 million at December 31, 2001. The accrual for extended environmental-relatedactivities represents Duke Energy’s provisions for costs associated with some of its current and former sites andcertain other environmental matters. Management believes that completion or resolution of these matters willhave no material adverse effect on consolidated results of operations, cash flows, or financial position.
Litigation
Western Power Disputes. California Litigation. Duke Energy, some of its subsidiaries and three current orformer executives have been named as defendants, along with numerous other corporate and individualdefendants, in one or more of a total of 15 lawsuits filed in California on behalf of purchasers of electricity in theState of California, with one suit filed on behalf of a Washington state electricity purchaser. Most of theselawsuits seek class-action certification and damages and other relief, as a result of the defendants’ allegedunlawful manipulation of the California wholesale electricity markets. These lawsuits generally allege that thedefendants manipulated the wholesale electricity markets in violation of state laws against unfair and unlawfulbusiness practices and, in some suits, in violation of state antitrust laws. Plaintiffs in these lawsuits seekaggregate damages of billions of dollars. The lawsuits seek the restitution and/or disgorgement of allegedunlawfully obtained revenues for sales of electricity and, in some lawsuits, an award of treble damages foralleged violations of state antitrust laws.
The first six of these lawsuits were filed in late 2000 through mid-2001 and were consolidated before asingle judge in San Diego. The plaintiffs in the six lawsuits filed a joint Master Amended Complaint in March2002, which added additional defendants. The claims against the additional defendants are similar to those in theoriginal complaints. In April 2002, some defendants, including Duke Energy, filed cross-complaints againstvarious market participants not named as defendants in the plaintiffs’ original and amended complaints. In May2002, certain cross-defendants removed these actions to federal court in San Diego.
130

DUKE ENERGY CORPORATION
Notes To Consolidated Financial Statements — Continued
The other nine of these 15 suits were filed in mid-to-late 2002. The state court suits have been removed tofederal court, and all suits have been transferred to federal court in San Diego for pre-trial consolidation with thepreviously filed six lawsuits. Various motions are pending before the courts, including motions concerning thejurisdiction of the courts and motions to dismiss claims of the parties. In December 2002, the court ordered theremand of the original six suits, and certain defendants and cross-defendants have appealed that ruling. InFebruary 2003, the Court of Appeals for the 9th Circuit issued an order accepting the appeal and stayed theremand order of the district court.
In January 2003, the federal court in San Diego granted the motion of the defendants to dismiss the suit filedby the Washington state plaintiff. The court ruled that the plaintiff’s state law claims, including alleged violationsof the California antitrust and unfair business practices laws, were barred on filed rate and federal preemptiongrounds.
In addition to the foregoing lawsuits, in March 2003 a California state court in Los Angeles unsealed alawsuit originally filed in August 2002 against numerous energy company defendants, including DETM. Theplaintiffs, seeking to act on behalf of the State of California under the False Claims Act, made claims similar tothose in other lawsuits alleging manipulation of the electricity market in California, and claims that defendants,conspiring to defraud state governmental entities, made “false records or statements.” The plaintiffs seekunspecified damages in the maximum amount allowed under the pertinent laws.
Related Oregon and Washington Litigation. In December 2002, plaintiffs filed class-action suits againstDuke Energy and numerous other energy companies in state court in Oregon and in federal court in Washingtonstate making allegations similar to those in the California suits. Plaintiffs allege they paid unreasonably highprices for electricity and/or natural gas during the time period from January 2000 to the present as a result ofdefendants’ activities which were fraudulent, negligent and in violation of each state’s business practices laws.Among other things, they seek damages, an order from the court prohibiting the defendants from engaging in thealleged unlawful acts complained of, and an accounting of the transactions entered into for the purchase and saleof wholesale energy.
Trade publications. In November 2002, the Lieutenant Governor of the State of California, on behalf ofhimself, the general public and taxpayers of California, filed a class-action suit against the publisher of naturalgas trade publications and numerous other defendants, including seven Duke Energy entities, in state court in LosAngeles, alleging that the defendants engaged in various unlawful acts, including artificially inflating the indexprices of natural gas reported in industry publications through collusive behavior, and have thereby violated statebusiness practices laws. The plaintiffs seek an order prohibiting the defendants from engaging in the actscomplained of, restitution, disgorgement of profits acquired through defendants’ alleged unlawful acts, an awardof civil fines, compensatory and punitive damages in unspecified amounts and other appropriate relief.
Other proceedings. In addition to the lawsuits, several investigations and regulatory proceedings at the stateand federal levels are looking into the causes of high wholesale electricity prices in the western U.S. during 2000and 2001. At the federal level, numerous proceedings are before the FERC. Some parties to those proceedingshave made claims for billions of dollars of refunds from sellers of wholesale electricity, including DETM. Someparties have also sought to revoke the authority of DETM and other DENA-affiliated electricity marketers to sellelectricity at market-based rates. The FERC is also conducting its own wholesale pricing investigation. As aresult, the FERC has ordered some sellers, including DETM, to refund, or to offset against outstanding accountsreceivable, amounts billed for electricity sales in excess of a FERC-established proxy price. In June 2001, DETMoffset approximately $20 million against amounts owed by the California Independent System Operator (CAISO)and the California Power Exchange (CalPX) for electricity sales during January and February 2001. This offsetreduced the $110 million reserve established in 2000 to $90 million. Since December 31, 2000, Duke Energy hasclosely managed the balance of doubtful receivables, and believes that the current pre-tax bad debt provision of$90 million is appropriate. No additional provisions for California receivables and market risk were recorded in2001 or 2002.
In December 2002, the presiding administrative law judge in the FERC refund proceedings issued hisproposed findings with respect to the mitigated market clearing price, including his preliminary determinations ofthe refund liability of each seller of electricity in the CAISO and CalPX. These proposed findings estimate that
131
DUKE ENERGY CORPORATION
Notes To Consolidated Financial Statements — Continued
DETM has refund liability of approximately $95 million in the aggregate to both the CAISO and CalPX. Thiswould be offset against the remaining receivables still owed to DETM by the CAISO and CalPX. The proposedfindings are the presiding judge’s estimates only, and are still subject to further recalculation and adoption by theFERC in connection with its ongoing wholesale pricing investigation. On March 3, 2003, various parties(including the California attorney general) filed at the FERC seeking modification of the FERC’s refund ordersalleging that DETM and others manipulated wholesale electricity prices in periods prior to the initial refundperiod. DETM is preparing a response to these allegations which is due to the FERC on March 20, 2003.
At the state level, the California Public Utilities Commission is conducting formal and informalinvestigations to determine if power plant operators in California, including some Duke Energy entities, haveimproperly “withheld,” either economically or physically, generation output from the market to manipulatemarket prices. In addition, the California State Senate formed a Select Committee to Investigate PriceManipulation of the Wholesale Energy Market (Select Committee). The Select Committee served a subpoena onDuke Energy and some of its subsidiaries seeking data concerning their California market activities. The SelectCommittee heard testimony from several witnesses but no one from Duke Energy has been subpoenaed to testify.
The California Attorney General is also conducting an investigation to determine if any market participantsengaged in illegal activity, including antitrust violations, in the course of their electricity sales into wholesalemarkets in the western U.S. The Attorneys General of Washington and Oregon are participating in the CaliforniaAttorney General’s investigation. The San Diego District Attorney is conducting a separate investigation intomarket activities and issued subpoenas to DETM and a DENA subsidiary.
The U.S. Attorney’s Office in San Francisco served a grand jury subpoena on Duke Energy in November2002 seeking, in general, information relating to possible manipulation of the electricity markets in California,including potential antitrust violations. As with the other ongoing investigations related to the Californiaelectricity markets, Duke Energy is cooperating with the U.S. Attorney’s Office in connection with itsinvestigation.
Sacramento Municipal Utility District (SMUD) and City of Burbank, California FERC Complaints. In July2002 and August 2002, respectively, the Sacramento Municipal Utility District and the City of Burbank,California filed complaints with the FERC against DETM and other providers of wholesale energy requestingthat the FERC mitigate alleged unjust and unreasonable prices in sales contracts entered into between DETM andthe complainants in the first quarter of 2001. The complainants, alleging that DETM had the ability to exercisemarket power, claim that the contract prices are unjust and unreasonable because they were entered into during aperiod that the FERC determined the western markets to be dysfunctional and uncompetitive and that the westernmarkets influenced their price. In support of their request to mitigate the contract price, the complainants rely onthe fact that the contract prices are higher than prices in the West following implementation of the FERC’s June2001 price mitigation plan. The complainants request the FERC to set “just and reasonable” contract rates and topromptly set a refund effective date. In September 2002, the FERC issued an order in the Sacramento mattersetting forth, in part, that the matter be set for an evidentiary hearing to be held in abeyance until the partiesengage in settlement negotiations and that a refund effective date of September 22, 2002 be established. DETMparticipated in settlement proceedings and reached a settlement with the SMUD in February 2003. In February2003, the SMUD filed to withdraw its FERC complaint against DETM. On March 10, 2003, the FERC issued anorder in the Burbank matter setting forth, in part, that the matter be set for an evidentiary hearing to be held inabeyance until the parties engage in settlement negotiations, and that a refund effective date of October 11, 2002be established.
Colorado River Commission of Nevada (CRCN) /Pioneer Companies (Pioneer). The State of Nevada,through the CRCN, filed an “interpleader” complaint in federal court in Nevada on July 9, 2002, against Pioneerand 13 vendors, including DETM, who entered into power transactions with the CRCN between January 1998
132
DUKE ENERGY CORPORATION
Notes To Consolidated Financial Statements — Continued
and the filing date of the suit. The CRCN alleges that it purchased power on behalf of Pioneer but that Pioneerhas disavowed its contractual liability to pay for certain of those power transactions. The CRCN asserts thatDETM and the other vendors may have claims for the value of their contracts with the CRCN in excess of $100million. The CRCN asks the court to assess the competing claims of the parties and distribute the assets which itseeks to deposit into the registry of the court (cash assets of approximately $35 million allegedly held forPioneer’s behalf as well as the value of electric power delivered or to be delivered on Pioneer’s behalf) and issueother appropriate orders to resolve the claims while prohibiting the institution or prosecution of otherproceedings affecting the claims at issue. DETM and certain other parties have filed motions to dismiss thecomplaint on various grounds. In February 2003, the court granted the motions of DETM and other interpleaderdefendants by dismissing the interpleader complaint in its entirety for lack of subject matter jurisdiction.
The Western Power Disputes are in their early stages. Duke Energy continues to evaluate the facts andasserted claims in the Western Power Disputes and intends to vigorously defend itself.
ExxonMobil Corporation Arbitration. In 2000, three Duke Energy subsidiaries initiated bindingarbitration against three Exxon Mobil Corporation subsidiaries (the ExxonMobil entities) concerning the parties’joint ownership of DETM and related affiliates (the Ventures). At issue was a buy-out right provision under thejoint venture agreements for these entities. If there is a material business dispute between the parties, which DukeEnergy alleged had occurred, the buy-out provision gives Duke Energy the right to purchase Exxon Mobil’s 40%interest in DETM. Exxon Mobil does not have a similar right under the joint venture agreements and once DukeEnergy exercises the buy-out right, each party has the right to “unwind” the buy-out under certain specificcircumstances. In December 2000, Duke Energy exercised its right to buy the Exxon Mobil entities’ interest inthe Ventures. Duke Energy claimed that refusal by the Exxon Mobil entities to honor the exercise was a breachof the buy-out right provision, and sought specific performance of the provision. Duke Energy also madeadditional claims against the Exxon Mobil entities for breach of the agreements governing the Ventures. ExxonMobil also asserted breach of contract claims against Duke Energy.
In December 2002, an arbitration panel issued a binding ruling against Exxon Mobil on its claims againstDuke Energy and granted Duke Energy favorable declaratory relief. Duke Energy has terminated the previouslyexercised buy-out provision.
Trading Matters. Since April 2002, 17 shareholder class-action lawsuits have been filed against DukeEnergy: 13 in the United States District Court for the Southern District of New York and four in the UnitedStates District Court for the Western District of North Carolina. The 13 lawsuits pending in New York wereconsolidated into one action and included as co-defendants Duke Energy executives and two investment bankingfirms. In December 2002, the New York court granted in all respects the defendants’ motion to dismiss theplaintiffs’ claims. The four lawsuits pending in North Carolina name as co-defendants Duke Energy executives.Two of the four North Carolina suits have been consolidated and involve claims under the Employee RetirementIncome and Security Act relating to Duke Energy’s Retirement Savings Plan. This consolidated action namesDuke Energy board members as co-defendants. In addition, Duke Energy has received three shareholderderivative notices demanding that it commence litigation against named executives and directors of Duke Energyfor alleged breaches of fiduciary duties and insider trading. Duke Energy’s response to the derivative demands isnot required until 90 days after receipt of written notice requesting a response.
The class-action lawsuits and the threatened shareholder derivative claims arise out of allegations that DukeEnergy improperly engaged in “round trip” trades which resulted in an alleged overstatement of revenues over athree-year period. The plaintiffs seek recovery of an unstated amount of compensatory damages, attorneys’ feesand costs for alleged violations of securities laws. In one of the lawsuits, the plaintiffs assert a common law fraud
133

DUKE ENERGY CORPORATION
Notes To Consolidated Financial Statements — Continued
claim and seek, in addition to compensatory damages, disgorgement and punitive damages. Duke Energy intendsto vigorously defend itself and its named executives and board members against these allegations.
In 2002, Duke Energy responded to information requests and subpoenas from the FERC, the SEC, and theCommodity Futures Trading Commission (CFTC), and to grand jury subpoenas issued by the U.S. Attorney’soffice in Houston, Texas. All information requests and subpoenas seek documents and information related totrading activities, including so-called “round-trip” trading. Duke Energy received notice in mid-October that theSEC formalized its investigation regarding “round-trip” trading. Duke Energy is cooperating with the respectivegovernmental agencies.
Duke Energy submitted a final report to the SEC based on a review of approximately 750,000 trades madeby various Duke Energy subsidiaries between January 1, 1999 and June 30, 2002. Outside counsel conducted anextensive review of trading, accounting and other records, with the assistance of Duke Energy senior legal,corporate risk management and accounting personnel. Duke Energy identified 28 “round-trip” transactions donefor the apparent purpose of increasing volumes on the Intercontinental Exchange and 61 “round-trip” transactionsdone at the direction of one of Duke Energy’s traders that did not have a legitimate business purpose and werecontrary to corporate policy.
As a result of the trading review, Duke Energy has taken appropriate disciplinary action and put in placeadditional risk management procedures to improve and strengthen the oversight and controls of its tradingoperations. Duke Energy has also reconfirmed to employees that engaging in simultaneous or prearrangedtransactions that lack a legitimate business purpose, or any trading activities that lack a legitimate businesspurpose, is against company policy.
As a result of Duke Energy’s findings in the course of its investigation related to the SEC inquiry on “round-trip” trades, DENA identified accounting issues that justified adjustments which reduced its operating income by$11 million during 2002. An additional $2 million charge was recorded in other Duke Energy business segmentsrelated to these findings. Duke Energy completed its analysis of such round-trip trades in 2002.
In October 2002, the FERC issued a data request to the “Largest North American Gas Marketers, AsMeasured by 2001 Physical Sales Volumes (Bcf/d),” including DETM. In general, the data request asks forinformation concerning natural gas price data that was submitted by the gas marketers to entities that publishnatural gas price indices. DETM responded to the FERC’s data request and is also responding to requests that theCFTC has made for similar information. Management is unable to predict what, if any, action the FERC and theCFTC will take with respect to these matters.
Sonatrach. Duke Energy LNG Sales, Inc. (Duke LNG) initiated arbitration proceedings againstSonatrach, the Algerian state-owned energy company, alleging that Sonatrach had breached its obligations by itsfailure to provide shipping under certain LNG Purchase and Transportation Agreements (the SonatrachAgreements) relating to Duke LNG’s purchase of liquefied natural gas (LNG) from Algeria and its transportationby LNG tanker to Lake Charles, Louisiana. In response to Duke LNG’s claims, Sonatrach, together with its LNGsales and marketing subsidiary, Sonatrading Amsterdam B.V. (Sonatrading), have claimed that Duke LNGrepudiated the Sonatrach Agreements as a result of, among other things, Duke LNG’s alleged failure to diligentlyseek commitments from customers, and to submit offers to Sonatrading based on such commitments, for thepurchase of LNG from Sonatrading. By virtue of Duke LNG’s alleged breaches, Sonatrach and Sonatrading seekto terminate the Sonatrach Agreements and to recover damages from Duke LNG. The final evidentiary hearing inthe liability phase of this arbitration was concluded in January 2003 in London. Briefing and oral argument onthis phase will be completed in March 2003, and a ruling from the panel on issues of liability is expected by latesummer 2003. The damages phase for this proceeding will be scheduled following the panel’s liability ruling.
134
DUKE ENERGY CORPORATION
Notes To Consolidated Financial Statements — Continued
Management believes that the final disposition of the Sonatrach proceedings will have no material adverse effecton the consolidated results of operations, cash flows or financial position.
Enron Bankruptcy. In December 2001, Enron filed for relief pursuant to Chapter 11 of the United StatesBankruptcy Code in the U.S. Bankruptcy Court for the Southern District of New York. Additional affiliates havefiled for bankruptcy since that date. Certain affiliates of Duke Energy engaged in transactions with various Enronentities prior to the bankruptcy filings. DETM was a member of the Official Committee of Unsecured Creditorsin the bankruptcy cases which are being jointly administered, but as of February 2003, DETM resigned from theOfficial Committee of Unsecured Creditors in the Enron bankruptcy case. Duke Energy has taken a reserve tooffset its exposure to Enron.
In mid-November 2002, various Enron trading entities demanded payment from DETM and DEM forcertain energy commodity sales transactions without regard to the set off rights of DETM and DEM anddemanded that DETM detail balances due under certain master trading agreements without regard to the set-offrights of DETM. On December 13, 2002, DETM and DEM filed an adversary proceeding against Enron, seeking,among other things, a declaration affirming each plaintiff’s right to set off its respective debts to Enron. Thecomplaint alleges that the Enron affiliates were operated by Enron as its alter ego and as components of a singletrading enterprise and that DETM and DEM should be permitted to exercise their respective rights of mutual set-off against the Enron trading enterprise under the Bankruptcy Code. The complaint also seeks the imposition of aconstructive trust so that any claims by Enron against DETM or DEM are subject to the respective set off rightsof DETM and DEM. Enron has filed a motion to dismiss, asserting that DETM and DEM are not entitled to therequested relief.
Management believes that the final disposition of the Enron bankruptcy will have no material adverse effecton the consolidated results of operations, cash flows or financial position.
Injuries and Damages Claims. Duke Energy has experienced numerous claims relating to damages forpersonal injuries alleged to have arisen from the exposure to or use of asbestos in connection with constructionand maintenance activities conducted by Duke Energy on its electric generation plants during the 1960s and1970s. During 1999, Duke Energy experienced a significant increase in the number of these claims. Thisincrease, coupled with its cumulative experience in claims received, prompted Duke Energy to conduct acomprehensive review which was completed in late 1999 and to record an $800 million accrual, to reflect thepurchase of a third-party insurance policy as well as estimated amounts for future claims not recoverable undersuch policy. The insurance policy, combined with amounts covered by self-insurance reserves, provides forclaims paid up to an aggregate of $1.6 billion. Duke Energy currently believes the estimated claims relating tothis exposure will not exceed such amount. While Duke Energy is uncertain as to the timing of when claims willbe received, portions of the estimated claims may not be received and paid for 30 or more years.
While Duke Energy has recorded an accrual related to this estimated liability, such estimates cannot bemade with certainty. Factors, such as the frequency and magnitude of claims, could result in changes in theestimates of the injuries and damages liability and insurance recoveries. Such changes could result in, over time,a difference from the amount currently reflected in the consolidated financial statements. However, due to DukeEnergy’s insurance program relating to this liability, management believes that any changes in the estimateswould not have a material adverse effect on consolidated results of operations, cash flows or financial position.
Other Litigation and Legal Proceedings. Duke Energy and its subsidiaries are involved in other legal, taxand regulatory proceedings before various courts, regulatory commissions and governmental agencies regarding
135
DUKE ENERGY CORPORATION
Notes To Consolidated Financial Statements — Continued
performance, contracts, royalty disputes, mismeasurement and mispayment claims (some of which are brought asclass actions), and other matters arising in the ordinary course of business, some of which involve substantialamounts. Management believes that the final disposition of these proceedings will have no material adverseeffect on consolidated results of operations, cash flows or financial position.
Other Commitments and Contingencies
As part of its normal business, Duke Energy is a party to various financial guarantees, performanceguarantees and other contractual commitments to extend guarantees of credit and other assistance to varioussubsidiaries, investees and other third parties. These arrangements are largely entered into by Duke CapitalCorporation. To varying degrees, these guarantees involve elements of performance and credit risk, which are notincluded on the Consolidated Balance Sheets. The possibility of Duke Energy or Duke Capital Corporationhaving to honor its contingencies is largely dependent upon future operations of various subsidiaries, investeesand other third parties, or the occurrence of certain future events. Duke Energy would record a reserve if eventsoccurred that required that one be established. (See Note 17.)
In addition, Duke Energy enters into various fixed-price, non-cancelable commitments to purchase or sellpower (tolling arrangements or power purchase contracts), take-or-pay arrangements, transportation orthroughput agreements and other contracts that may or may not be recognized on the Consolidated BalanceSheets. Some of these arrangements may be recognized at market value on the Consolidated Balance Sheets astrading contracts or qualifying hedge positions included in Unrealized Gains or Losses on Mark-to-Market andHedging Transactions.
The following table summarizes Duke Energy’s contractual cash obligations for the items listed below foreach of the years presented.
Contractual Cash ObligationsPayments Due
2003 2004 2005 2006 2007 Thereafter
(in millions)
Firm capacity payments(a) . . . . . . . . . . . . . . . . . . . . . . . . $ 632 $418 $364 $298 $236 $1,298Purchase commitments(b) . . . . . . . . . . . . . . . . . . . . . . . . . 668 376 272 151 113 402Other(c) . . . . . . . . . . . . . . . . . . . . . . . . . . . . . . . . . . . . . . . 309 8 3 1 1 —
Total contractual cash obligations(d) . . . . . . . . . . . . . . . . $1,609 $802 $639 $450 $350 $1,700
(a) Includes firm capacity payments that provide Duke Energy with uninterrupted firm access to natural gastransportation and storage, electricity transmission capacity, and the option to convert natural gas toelectricity at third-party owned facilities (tolling arrangements) in some natural gas and power locationsthroughout North America. Based on current estimates, the market value of underlying transportation,storage and electricity available under such arrangements (including related hedges) exceeds the discountedfair value of the capacity payments. Also includes firm capacity payments under electric power agreementsentered into to meet Duke Power native load requirements and firm transmission capacity on other systemspurchased for the transport of electricity sold at wholesale rates. Amounts exclude transmission capacitypurchased by the Duke Power wholesale merchant function on the Duke Power transmission system, whichis eliminated in consolidation.
(b) Amounts include purchase commitments for nuclear fuel supply contracts, power purchases, natural gas,coal, splitter agreements, terminaling fees for residual fuel, refined fuel and coal, and contracts for software,telephone, data and wireless services. Amounts also reflect Duke Energy’s renegotiated obligations as of
136

DUKE ENERGY CORPORATION
Notes To Consolidated Financial Statements — Continued
December 2002 to purchase gas-fired turbines, steam turbines and heat recovery steam generators (HRSG).Firm commitments under the turbine and HRSG purchase agreements are payable consistent with therespective delivery schedule of each project. Purchase agreements include milestone requirements by themanufacturer and provide Duke Energy with the ability to cancel the discrete purchase order commitment inexchange for a termination fee, which escalates over time.
(c) Amounts include engineering, procurement and construction costs for power generation facilities in NorthAmerica. Such amounts are payable to D/FD, a related party in which Duke Energy has a 50% equityinterest, and are excluded from the Consolidated Balance Sheets since Duke Energy accounts for D/FDusing the equity method of accounting. Amounts also include engineering, procurement and constructioncosts for power generation facilities in Guatemala.
(d) See Note 11 for debt obligations and below for lease obligations.
Leases
Duke Energy leases assets in several areas of its operations. Consolidated rental expense for operating leaseswas $133 million in 2002, $114 million in 2001 and $90 million in 2000. Future minimum rental payments underoperating leases consisted of the following as of December 31, 2002:
(in millions)
2003 . . . . . . . . . . . . . . . . . . . . . . . . . . . . . . . . . . . . . . . . . . . . . . . . . . . . . . . . . . . . . . . . . . . . . . . . . $ 812004 . . . . . . . . . . . . . . . . . . . . . . . . . . . . . . . . . . . . . . . . . . . . . . . . . . . . . . . . . . . . . . . . . . . . . . . . . 632005 . . . . . . . . . . . . . . . . . . . . . . . . . . . . . . . . . . . . . . . . . . . . . . . . . . . . . . . . . . . . . . . . . . . . . . . . . 432006 . . . . . . . . . . . . . . . . . . . . . . . . . . . . . . . . . . . . . . . . . . . . . . . . . . . . . . . . . . . . . . . . . . . . . . . . . 272007 . . . . . . . . . . . . . . . . . . . . . . . . . . . . . . . . . . . . . . . . . . . . . . . . . . . . . . . . . . . . . . . . . . . . . . . . . 21Thereafter . . . . . . . . . . . . . . . . . . . . . . . . . . . . . . . . . . . . . . . . . . . . . . . . . . . . . . . . . . . . . . . . . . . . 48
Total future minimum lease payments . . . . . . . . . . . . . . . . . . . . . . . . . . . . . . . . . . . . . . . . . . . . . . $283
17. Guarantees and Indemnifications
Duke Energy and certain of its subsidiaries have various financial and performance guarantees andindemnifications which are issued in the normal course of business. As discussed below, these contracts includeperformance guarantees, stand-by letters of credit, guarantees of debt, surety bonds, and indemnifications. DukeEnergy enters into these arrangements to facilitate a commercial transaction with a third party by enhancing thevalue of the transaction to the third party.
Mixed Oxide (MOX) Guarantees. DCS is the prime contractor to the DOE under a contract (the PrimeContract) in which DCS will design, construct, operate and deactivate a MOX fuel fabrication facility (MOXFFF). The domestic MOX fuel project was precipitated by the U.S. and the Russian Federation agreeing todispose of excess plutonium in their respective nuclear weapons programs through efforts to fabricate andirradiate MOX fuel in commercial nuclear reactors. As of December 31, 2002, Duke Energy, through its indirectwholly owned subsidiary, Duke Project Services Group, Inc. (DPSG), held a 40% ownership interest in DCS.Additionally, Duke Power has entered into a subcontract (the Duke Power Subcontract) under which Duke Powerhas agreed to prepare its McGuire and Catawba nuclear reactors (the Nuclear Reactors) for use of the MOX fueland to purchase MOX fuel produced at the MOX FFF for use in the Nuclear Reactors.
As required under the Prime Contract, DPSG and the other owners of DCS have issued a guarantee (theDOE Guarantee) pursuant to which the owners of DCS jointly and severally guarantee to DOE all of DCS’
137
DUKE ENERGY CORPORATION
Notes To Consolidated Financial Statements — Continued
payment and performance obligations under the Prime Contract. The Prime Contract consists of a “BaseContract” phase and three optional phases, with the DOE having the right to extend the term of the PrimeContract to cover the three optional phases on a sequential basis, subject to DCS and the DOE reachingagreement through good faith negotiations on certain remaining open terms applying to each of these optionphases. Each of the three option phases will be negotiated separately, as the time for exercising such option phasebecomes due under the Prime Contract. If the DOE does not exercise its right to extend the term of the PrimeContract to cover any or all of the optional phases, DCS’ performance obligations under the Prime Contract willend upon completion of the then current performance phase. The Base Contract phase covers the design of theMOX FFF and design modifications to the Nuclear Reactors. The Base Contract phase provides for DCS toreceive cost reimbursement plus a fixed fee. The first option phase includes construction and cold startup of theMOX FFF and modification of the Nuclear Reactors. The first option phase provides for DCS to receive costreimbursement plus an incentive fee. The second option phase provides for taking the MOX FFF from cold to hotstartup, operation of the MOX FFF, and irradiation of the MOX fuel in the Nuclear Reactors. The second optionphase provides for DCS to receive a cost reimbursement plus an incentive fee through hot startup and, thereafter,cost-sharing plus a fee. The third option phase provides for the deactivation of the MOX FFF. As of December31, 2002, DCS’ performance obligations under the Prime Contract extended only to the Base Contract phasesince the DOE has not yet exercised its option to extend the term of performance under the Prime Contract to thefirst option phase and DCS and the DOE have not yet agreed on all open terms and conditions applicable to suchphase.
Additionally, DPSG and the other owners of DCS have issued a guarantee (the Duke Power Guarantee)pursuant to which the owners of DCS jointly and severally guarantee to Duke Power all of DCS’ payment andperformance obligations under the Duke Power Subcontract or any other agreement between DCS and DukePower implementing the Prime Contract. The Duke Power Subcontract consists of a “Base Subcontract” phaseand two optional phases, with DCS having the right to extend each phase of the contract on a sequential basis,subject to Duke Power and DCS reaching agreement through good faith negotiations on certain remaining openterms applying to each of these option phases. Under the Base Subcontract phase, Duke Power will performtechnical and regulatory work required to prepare the Nuclear Reactors to use MOX fuel. The Base Subcontractphase provides for Duke Power to receive cost reimbursement plus a fixed fee. The first option phase providesfor modification to the Nuclear Reactors as well as additional technical and regulatory work. The first optionphase provides for Duke Power to receive cost reimbursement plus a fee. The second option phase provides forDuke Power to purchase from DCSMOX fuel produced at the MOX FFF for use in the Nuclear Reactors, atdiscounts to prices of equivalent uranium fuel, over a 15 year period commencing upon completion of the firstoption phase. As of December 31, 2002, DCS’ performance obligations under the Duke Power Subcontractextended only to the Base Subcontract phase since DCS has not yet exercised its option to extend the term ofperformance under the Duke Power Subcontract to the first option phase and DCS and Duke Power have not yetagreed on all open terms and conditions applicable to such phase.
The cost reimbursement nature of DCS’ commitment under the Prime Contract and the Duke PowerSubcontract limits the exposure of DCS. Credit risk to DCS is limited by the fact the Prime Contract is with theDOE, a U.S. governmental entity. DCS is under no obligation to perform any contract work under the PrimeContract before funds have been appropriated from the U.S. Congress.
Duke Energy is unable to estimate the maximum potential amount of future payments DPSG could berequired to make under the DOE Guarantee and the Duke Power Guarantee due to the uncertainty of whether:DOE will exercise its options under the Prime Contract, the parties to the Prime Contract and the Duke PowerSubcontract, respectively, will reach agreement on remaining open terms for each option phase under suchcontracts, and the U.S. Congress will authorize funding for DCS’ work under the Prime Contract. Any liability of
138

DUKE ENERGY CORPORATION
Notes To Consolidated Financial Statements — Continued
DPSG under the DOE Guarantee and the Duke Power Guarantee is directly related to and limited by the PrimeContract and the Duke Power Subcontract, respectively. DPSG also has recourse to the other owners of DCS forany amounts paid under the DOE Guarantee or the Duke Power Guarantee in excess of its proportionalownership percentage of DCS.
Other Guarantees and Indemnifications. Duke Capital Corporation has issued performance guarantees tocustomers and other third parties that guarantee the payment and performance of other parties, including certainunconsolidated entities. The maximum potential amount of future payments Duke Capital Corporation couldhave been required to make under these performance guarantees as of December 31, 2002 was approximately$575 million. Approximately $200 million of these performance guarantees expire between 2003 and 2004, withthe remaining performance guarantees not having a contractual expiration. Additionally, Duke CapitalCorporation has issued joint and several guarantees to certain of the D/FD project owners, which guarantee theperformance of D/FD under its engineering, procurement and construction (EPC) contracts and other contractualcommitments. These guarantees do not have a contractual expiration and do not have a stated maximum amountof future payments Duke Capital Corporation could be required to make under these performance guarantees.Additionally, Fluor Enterprises, Inc., as 50% owner in D/FD, has also issued similar joint and several guaranteesto the same D/FD project owners. In accordance with the D/FD partnership agreement, each of the partners to D/FD is responsible for 50% of any payments to be made under these guarantee contracts.
Westcoast has issued performance guarantees or indemnifications to third parties which guarantee theperformance of unconsolidated entities, such as equity method projects, and entities previously sold by Westcoastto third parties. These performance guarantees require Westcoast to make payment to the guaranteed third partyupon the failure of the unconsolidated entity to make payment under certain of its contractual obligations, such asdebt, purchase contracts and leases. The maximum potential amount of future payments Westcoast could havebeen required to make under these performance guarantees as of December 31, 2002 was approximately $325million. Of these guarantees, approximately $150 million expire in 2003 and approximately $25 million expirefrom 2004 to 2007. The remainder expire after 2007 or do not have a contractual expiration.
Stand-by letters of credit are conditional commitments issued to guarantee the performance of non-whollyowned entities to a third party or customer. Duke Capital Corporation and Westcoast have obligations to makepayment under these agreements and are triggered by the failure of the non-wholly owned entity to makepayment to the third party or customer according to the terms of the underlying contract. These contracts expirein various amounts between 2003 and 2004. The maximum potential amount of future payments Duke CapitalCorporation and Westcoast could have been required to make under these contracts as of December 31, 2002 wasapproximately $475 million. Related to these letters of credit, Duke Capital Corporation has received collateralfrom the non-wholly owned entities in the amount of approximately $250 million at December 31, 2002.
Duke Capital Corporation has guaranteed the issuance of surety bonds, which obligates itself to a surety tomake payment upon the failure of a non-wholly owned entity to honor its obligations to a third party. As ofDecember 31, 2002, Duke Capital Corporation had guaranteed approximately $175 million of surety bondsoutstanding related to obligations of non-wholly owned entities. These bonds expire in various amounts primarilybetween 2003 and 2004.
Field Services and Natural Gas Transmission have issued certain guarantees of debt associated with non-wholly owned entities. In the event that the non-wholly owned subsidiaries default on the debt payments, FieldServices or Natural Gas Transmission would be required to perform under the guarantees and make payment onthe outstanding debt balance of the non-wholly owned subsidiaries. As of December 31, 2002, Field Services wasthe guarantor of approximately $100 million of debt associated with non-wholly owned entities and Natural Gas
139

DUKE ENERGY CORPORATION
Notes To Consolidated Financial Statements — Continued
Transmission was the guarantor of approximately $5 million of debt associated with the non-wholly ownedentities. These guarantees expire in 2003 for Field Services and 2019 for Natural Gas Transmission.
Duke Energy has certain guarantees issued to customers or other third parties related to the payment orperformance obligations of certain entities that were previously wholly owned but which have been sold to thirdparties, such as DukeSolutions and DE&S. These guarantees are primarily related to payment of leaseobligations, debt obligations and performance guarantees related to goods and services provided. In connectionwith the sale of DE&S, Duke Energy has received back-to-back indemnification from the buyer indemnifyingDuke Energy for any amounts paid by Duke Energy related to the DE&S guarantees. In connection with the saleof DukeSolutions, Duke Energy received indemnification from the buyer for the first $2.5 million paid by DukeEnergy related to the DukeSolutions guarantees. Additionally, for certain performance guarantees, Duke Energyhas recourse to subcontractors involved in providing services to a customer. These guarantees have variousterms, ranging from 2003 to 2019 with others having no specific term. Duke Energy is unable to estimate thetotal maximum potential amount of future payments under these guarantees since most of the underlyingguaranteed agreements do not contain any limits on potential liability.
Duke Energy has entered into various indemnification agreements related to purchase and sale agreementsand other types of contractual agreements with vendors and other third parties. These indemnification agreementstypically cover environmental, tax, litigation and other matters, as well as breaches of representations, warrantiesand covenants set forth in these agreements. Typically, claims may be made by third parties under theseindemnification agreements for various periods of time depending on the nature of the claim. The maximumpotential exposure of Duke Energy under these indemnification agreements can range from a specified dollaramount to an unlimited amount depending on the nature of the claim and the particular transaction. Duke Energyis unable to estimate the total maximum potential amount of future payments under these indemnificationagreements due to several factors, including uncertainty as to whether claims will be made under theseindemnities.
18. Common Stock and Equity Offerings
In October 2002, Duke Energy issued 54.5 million shares of common stock at $18.35 in a public offering.The proceeds from the offering were approximately $1.0 billion, before underwriting commissions and otheroffering expenses, and were used to repay commercial paper previously issued to fund a portion of theconsideration for the Westcoast acquisition.
In March 2001, Duke Energy completed an offering of 25 million shares of common stock, priced at $38.98per share, before underwriting discount and other offering expenses. In addition, Duke Energy completed anoffering of approximately 31 million units of Equity Units, at $25 per unit, before underwriting discount andother offering expenses. Also in March 2001, the underwriters exercised options granted to them to purchase anadditional 3.75 million shares of common stock and four million Equity Units at the original issue prices, lessunderwriting discounts, to cover over-allotments made during the offerings. Total net proceeds from theofferings, approximately $1.9 billion, were used to repay short-term debt and for other corporate purposes. TheEquity Units consist of senior notes of Duke Capital Corporation, and purchase contracts obligating the investorsto purchase shares of Duke Energy’s common stock in 2004. The number of shares to be issued in 2004 will bebased on the price of the common stock at conversion. Using a “floor” conversion price of $38.98 per share,Duke Energy expects to issue no more than approximately 22.4 million shares of common stock related to thisEquity Units offering.
140

DUKE ENERGY CORPORATION
Notes To Consolidated Financial Statements — Continued
In November 2001, Duke Energy completed an offering of 30 million Equity Units, at $25 per unit, beforeunderwriting discount and other offering expenses. The net proceeds from the offering were approximately $731million. The Equity Units consist of senior notes of Duke Capital Corporation, and purchase contracts obligatingthe investors to purchase shares of Duke Energy’s common stock in 2004. The number of shares to be issued in2004 will be based on the price of the common stock at conversion. Using a “floor” conversion price of $40.125per share, Duke Energy expects to issue no more than approximately 18.7 million shares of common stockrelated to this Equity Units offering.
The Duke Capital Corporation senior notes that are part of the Equity Units are included in Long-term Debton the Consolidated Balance Sheets. (See Note 11.) The value of the forward purchase contracts associated withthe Equity Units was assumed to be zero at inception as the offerings were done at market prices. The return onthe Equity Units consists of interest on the debt component and a contract adjustment payment. The contractadjustment was recorded as a declared dividend and its present value was recorded in Other Current andNoncurrent Liabilities on the Consolidated Balance Sheets.
At Duke Energy’s Annual Meeting of Shareholders held on April 26, 2001, shareholders approved anamendment to the Articles of Incorporation to increase the authorized common stock from one billion to twobillion shares.
On December 20, 2000, Duke Energy announced a two-for-one common stock split effective January 26,2001, to shareholders of record on January 3, 2001. All 2000 outstanding share and per share amounts have beenrestated to reflect the stock split. Appropriate adjustments have been made in the exercise price and number ofshares subject to stock options, as well as in stock amounts and other employee benefit programs. Effective withthe stock split, the quarterly cash dividend rate on common stock is $0.275 per share.
19. Stock-Based Compensation
The following information regarding outstanding common stock shares and options reflects the two-for-onecommon stock split discussed in Note 18.
Duke Energy’s 1998 Long-term Incentive Plan, as amended (the 1998 Plan), reserved 60 million shares ofcommon stock for awards to employees and outside directors. Under the 1998 Plan, the exercise price of eachoption granted cannot be less than the market price of Duke Energy’s common stock on the date of grant and themaximum option term is 10 years. The vesting periods range from immediate to five years.
Upon the acquisition of Westcoast, Duke Energy converted all stock options outstanding under the 1989Westcoast Long-term Incentive Share Option Plan to Duke Energy Corporation stock options. Certain of theseoptions also provide for share appreciation rights under which the holder of a stock option may, in lieu ofexercising the option, exercise the share appreciation right. The exercise price of these options equals the marketprice on the date of grant and the maximum option term is 10 years. The vesting periods range from immediate tofour years.
141
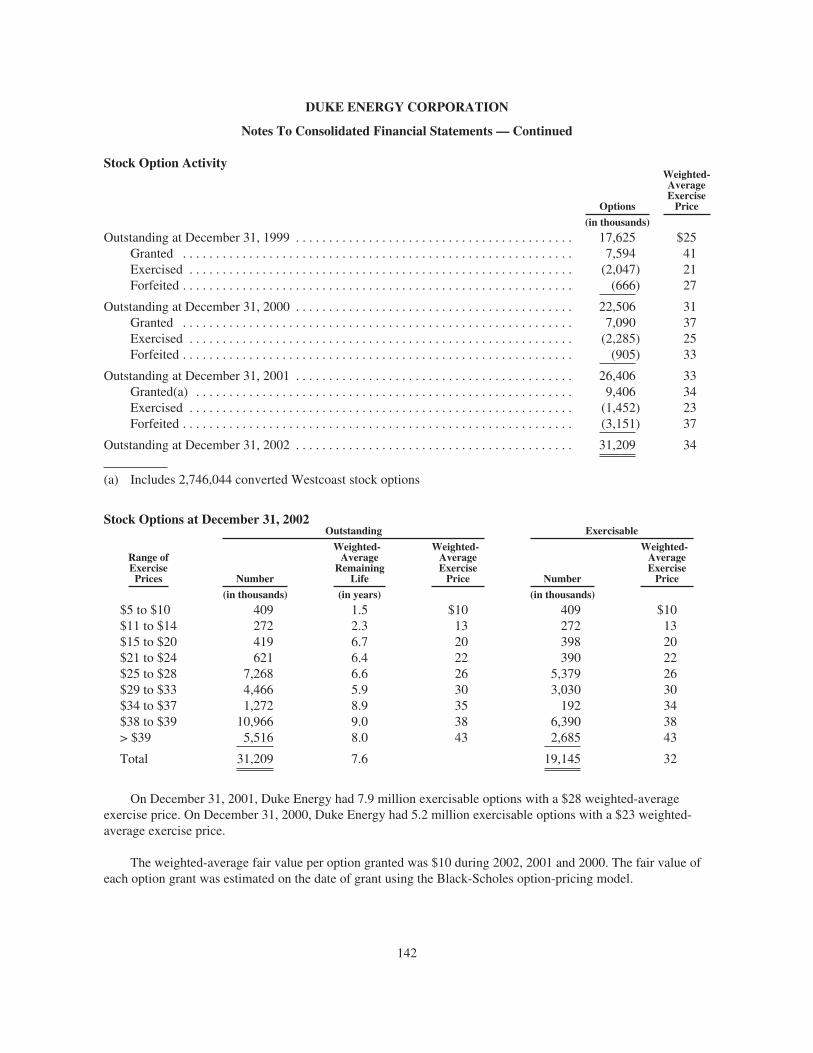
DUKE ENERGY CORPORATION
Notes To Consolidated Financial Statements — Continued
Stock Option Activity
Options
Weighted-AverageExercisePrice
(in thousands)
Outstanding at December 31, 1999 . . . . . . . . . . . . . . . . . . . . . . . . . . . . . . . . . . . . . . . . . . 17,625 $25Granted . . . . . . . . . . . . . . . . . . . . . . . . . . . . . . . . . . . . . . . . . . . . . . . . . . . . . . . . . . . 7,594 41Exercised . . . . . . . . . . . . . . . . . . . . . . . . . . . . . . . . . . . . . . . . . . . . . . . . . . . . . . . . . . (2,047) 21Forfeited . . . . . . . . . . . . . . . . . . . . . . . . . . . . . . . . . . . . . . . . . . . . . . . . . . . . . . . . . . . (666) 27
Outstanding at December 31, 2000 . . . . . . . . . . . . . . . . . . . . . . . . . . . . . . . . . . . . . . . . . . 22,506 31Granted . . . . . . . . . . . . . . . . . . . . . . . . . . . . . . . . . . . . . . . . . . . . . . . . . . . . . . . . . . . 7,090 37Exercised . . . . . . . . . . . . . . . . . . . . . . . . . . . . . . . . . . . . . . . . . . . . . . . . . . . . . . . . . . (2,285) 25Forfeited . . . . . . . . . . . . . . . . . . . . . . . . . . . . . . . . . . . . . . . . . . . . . . . . . . . . . . . . . . . (905) 33
Outstanding at December 31, 2001 . . . . . . . . . . . . . . . . . . . . . . . . . . . . . . . . . . . . . . . . . . 26,406 33Granted(a) . . . . . . . . . . . . . . . . . . . . . . . . . . . . . . . . . . . . . . . . . . . . . . . . . . . . . . . . . 9,406 34Exercised . . . . . . . . . . . . . . . . . . . . . . . . . . . . . . . . . . . . . . . . . . . . . . . . . . . . . . . . . . (1,452) 23Forfeited . . . . . . . . . . . . . . . . . . . . . . . . . . . . . . . . . . . . . . . . . . . . . . . . . . . . . . . . . . . (3,151) 37
Outstanding at December 31, 2002 . . . . . . . . . . . . . . . . . . . . . . . . . . . . . . . . . . . . . . . . . . 31,209 34
(a) Includes 2,746,044 converted Westcoast stock options
Stock Options at December 31, 2002Outstanding Exercisable
Range ofExercisePrices Number
Weighted-Average
RemainingLife
Weighted-AverageExercisePrice Number
Weighted-AverageExercisePrice
(in thousands) (in years) (in thousands)
$5 to $10 409 1.5 $10 409 $10$11 to $14 272 2.3 13 272 13$15 to $20 419 6.7 20 398 20$21 to $24 621 6.4 22 390 22$25 to $28 7,268 6.6 26 5,379 26$29 to $33 4,466 5.9 30 3,030 30$34 to $37 1,272 8.9 35 192 34$38 to $39 10,966 9.0 38 6,390 38> $39 5,516 8.0 43 2,685 43
Total 31,209 7.6 19,145 32
On December 31, 2001, Duke Energy had 7.9 million exercisable options with a $28 weighted-averageexercise price. On December 31, 2000, Duke Energy had 5.2 million exercisable options with a $23 weighted-average exercise price.
The weighted-average fair value per option granted was $10 during 2002, 2001 and 2000. The fair value ofeach option grant was estimated on the date of grant using the Black-Scholes option-pricing model.
142

DUKE ENERGY CORPORATION
Notes To Consolidated Financial Statements — Continued
Weighted-Average Assumptions for Option-Pricing2002 2001 2000
Stock dividend yield . . . . . . . . . . . . . . . . . . . . . . . . . . . . . . . . . . . . . . . . . . . 3.4% 3.4% 3.7%Expected stock price volatility . . . . . . . . . . . . . . . . . . . . . . . . . . . . . . . . . . . 29.9% 29.5% 25.1%Risk-free interest rates . . . . . . . . . . . . . . . . . . . . . . . . . . . . . . . . . . . . . . . . . 5.0% 5.0% 5.3%Expected option lives . . . . . . . . . . . . . . . . . . . . . . . . . . . . . . . . . . . . . . . . . . 7 years 7 years 7 years
The 1998 Plan allows for a maximum of six million shares of common stock to be issued under restrictedstock awards, performance awards and phantom stock awards. Performance awards granted under the 1998 Planvest over periods from three to seven years. Vesting can occur in year three, at the earliest if performance is met.Duke Energy awarded 16,000 shares (fair value of less than $1 million at grant dates) in 2002, 24,000 shares (fairvalue of approximately $1 million at grant dates) in 2001 and 225,000 shares (fair value of approximately $7million at grant dates) in 2000. Compensation expense for the performance awards is charged to earnings overthe vesting period, and totaled $4 million in 2002, $6 million in 2001 and $7 million in 2000.
Phantom stock awards granted under the 1998 Plan vest over periods from one to four years. Duke Energyawarded 54,430 shares (fair value of approximately $2 million at grant dates) in 2002, 457,700 shares (fair valueof approximately $17 million at grant dates) in 2001 and 168,500 shares (fair value of approximately $7 millionat grant dates) in 2000. Compensation expense for the phantom awards is charged to earnings over the vestingperiod, and totaled $10 million in 2002, $4 million in 2001 and was less than $1 million in 2000.
Restricted stock awards granted under the 1998 Plan vest over periods from one to five years. Duke Energyawarded 14,260 shares (fair value of less than $1 million at grant dates) in 2002, 74,005 shares (fair value ofapproximately $3 million at grant dates) in 2001 and 195,500 shares (fair value of approximately $5 million atgrant dates) in 2000. Compensation expense for restricted awards is charged to earnings over the vesting period,and totaled $2 million in 2002, $3 million in 2001 and $1 million in 2000.
Duke Energy’s 1996 Stock Incentive Plan (the 1996 Plan) allows four million shares of common stock forawards to employees. Restricted stock grants under the 1996 Plan vest over periods ranging from one to fiveyears. Duke Energy awarded no restricted shares in 2002. Duke Energy awarded 50,000 restricted shares (fairvalue of approximately $2 million at grant date) in 2001 and 99,026 restricted shares (fair value of approximately$3 million at grant dates) in 2000. Compensation expense for restricted awards is charged to earnings over thevesting period and totaled $1 million in 2002, $1 million in 2001 and $3 million in 2000.
20. Employee Benefit Plans
Duke Energy Retirement Plans. Duke Energy and its subsidiaries maintain a non-contributory definedbenefit retirement plan. It covers most U.S. employees using a cash balance formula. Under a cash balanceformula, a plan participant accumulates a retirement benefit consisting of pay credits that are based upon apercentage (which may vary with age and years of service) of current eligible earnings and current interestcredits.
Duke Energy’s policy is to fund amounts on an actuarial basis to provide assets sufficient to meet benefits tobe paid to plan participants. No contributions to the Duke Energy plan were necessary in 2002, 2001 or 2000.The net unrecognized transition asset, resulting from the implementation of accrual accounting, is amortized overapproximately 20 years. Investment gains or losses are amortized over five years.
143
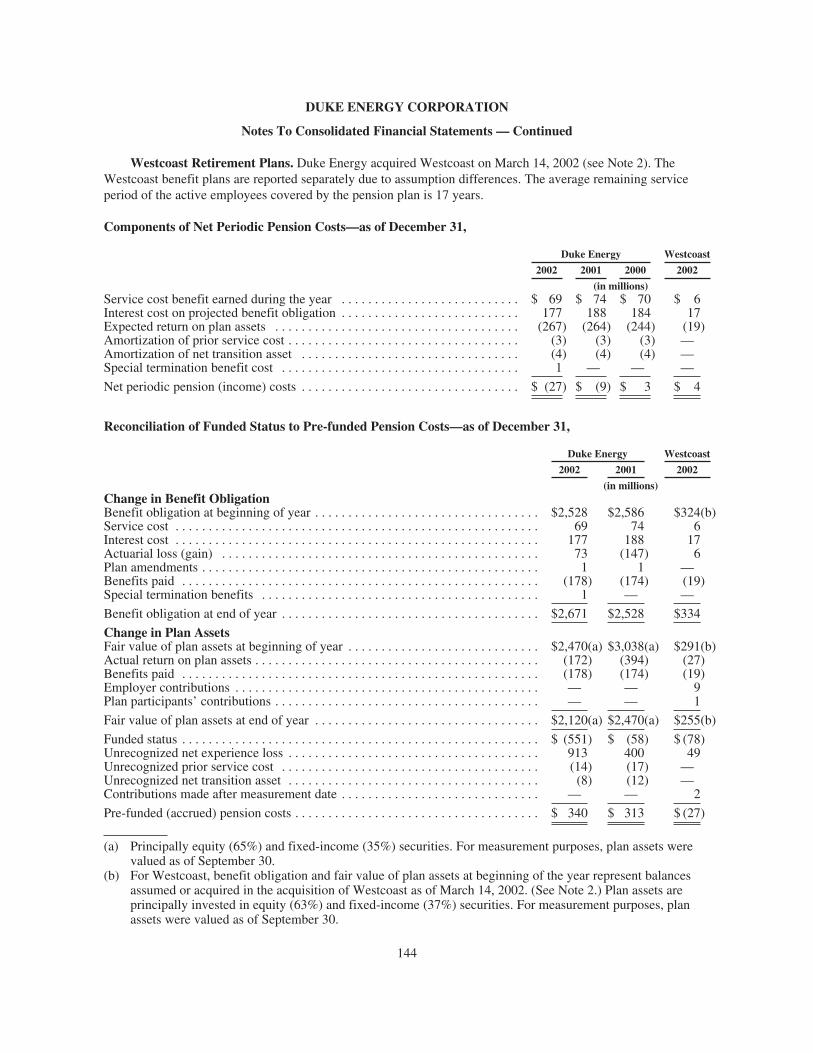
DUKE ENERGY CORPORATION
Notes To Consolidated Financial Statements — Continued
Westcoast Retirement Plans. Duke Energy acquired Westcoast on March 14, 2002 (see Note 2). TheWestcoast benefit plans are reported separately due to assumption differences. The average remaining serviceperiod of the active employees covered by the pension plan is 17 years.
Components of Net Periodic Pension Costs—as of December 31,
Duke Energy Westcoast
2002 2001 2000 2002
(in millions)Service cost benefit earned during the year . . . . . . . . . . . . . . . . . . . . . . . . . . . $ 69 $ 74 $ 70 $ 6Interest cost on projected benefit obligation . . . . . . . . . . . . . . . . . . . . . . . . . . . 177 188 184 17Expected return on plan assets . . . . . . . . . . . . . . . . . . . . . . . . . . . . . . . . . . . . . (267) (264) (244) (19)Amortization of prior service cost . . . . . . . . . . . . . . . . . . . . . . . . . . . . . . . . . . . (3) (3) (3) —Amortization of net transition asset . . . . . . . . . . . . . . . . . . . . . . . . . . . . . . . . . (4) (4) (4) —Special termination benefit cost . . . . . . . . . . . . . . . . . . . . . . . . . . . . . . . . . . . . 1 — — —
Net periodic pension (income) costs . . . . . . . . . . . . . . . . . . . . . . . . . . . . . . . . . $ (27) $ (9) $ 3 $ 4
Reconciliation of Funded Status to Pre-funded Pension Costs—as of December 31,
Duke Energy Westcoast
2002 2001 2002
(in millions)Change in Benefit ObligationBenefit obligation at beginning of year . . . . . . . . . . . . . . . . . . . . . . . . . . . . . . . . . . $2,528 $2,586 $324(b)Service cost . . . . . . . . . . . . . . . . . . . . . . . . . . . . . . . . . . . . . . . . . . . . . . . . . . . . . . . 69 74 6Interest cost . . . . . . . . . . . . . . . . . . . . . . . . . . . . . . . . . . . . . . . . . . . . . . . . . . . . . . . 177 188 17Actuarial loss (gain) . . . . . . . . . . . . . . . . . . . . . . . . . . . . . . . . . . . . . . . . . . . . . . . . 73 (147) 6Plan amendments . . . . . . . . . . . . . . . . . . . . . . . . . . . . . . . . . . . . . . . . . . . . . . . . . . . 1 1 —Benefits paid . . . . . . . . . . . . . . . . . . . . . . . . . . . . . . . . . . . . . . . . . . . . . . . . . . . . . . (178) (174) (19)Special termination benefits . . . . . . . . . . . . . . . . . . . . . . . . . . . . . . . . . . . . . . . . . . 1 — —
Benefit obligation at end of year . . . . . . . . . . . . . . . . . . . . . . . . . . . . . . . . . . . . . . . $2,671 $2,528 $334
Change in Plan AssetsFair value of plan assets at beginning of year . . . . . . . . . . . . . . . . . . . . . . . . . . . . . $2,470(a) $3,038(a) $291(b)Actual return on plan assets . . . . . . . . . . . . . . . . . . . . . . . . . . . . . . . . . . . . . . . . . . . (172) (394) (27)Benefits paid . . . . . . . . . . . . . . . . . . . . . . . . . . . . . . . . . . . . . . . . . . . . . . . . . . . . . . (178) (174) (19)Employer contributions . . . . . . . . . . . . . . . . . . . . . . . . . . . . . . . . . . . . . . . . . . . . . . — — 9Plan participants’ contributions . . . . . . . . . . . . . . . . . . . . . . . . . . . . . . . . . . . . . . . . — — 1
Fair value of plan assets at end of year . . . . . . . . . . . . . . . . . . . . . . . . . . . . . . . . . . $2,120(a) $2,470(a) $255(b)
Funded status . . . . . . . . . . . . . . . . . . . . . . . . . . . . . . . . . . . . . . . . . . . . . . . . . . . . . . $ (551) $ (58) $ (78)Unrecognized net experience loss . . . . . . . . . . . . . . . . . . . . . . . . . . . . . . . . . . . . . . 913 400 49Unrecognized prior service cost . . . . . . . . . . . . . . . . . . . . . . . . . . . . . . . . . . . . . . . (14) (17) —Unrecognized net transition asset . . . . . . . . . . . . . . . . . . . . . . . . . . . . . . . . . . . . . . (8) (12) —Contributions made after measurement date . . . . . . . . . . . . . . . . . . . . . . . . . . . . . . — — 2
Pre-funded (accrued) pension costs . . . . . . . . . . . . . . . . . . . . . . . . . . . . . . . . . . . . . $ 340 $ 313 $ (27)
(a) Principally equity (65%) and fixed-income (35%) securities. For measurement purposes, plan assets werevalued as of September 30.
(b) For Westcoast, benefit obligation and fair value of plan assets at beginning of the year represent balancesassumed or acquired in the acquisition of Westcoast as of March 14, 2002. (See Note 2.) Plan assets areprincipally invested in equity (63%) and fixed-income (37%) securities. For measurement purposes, planassets were valued as of September 30.
144
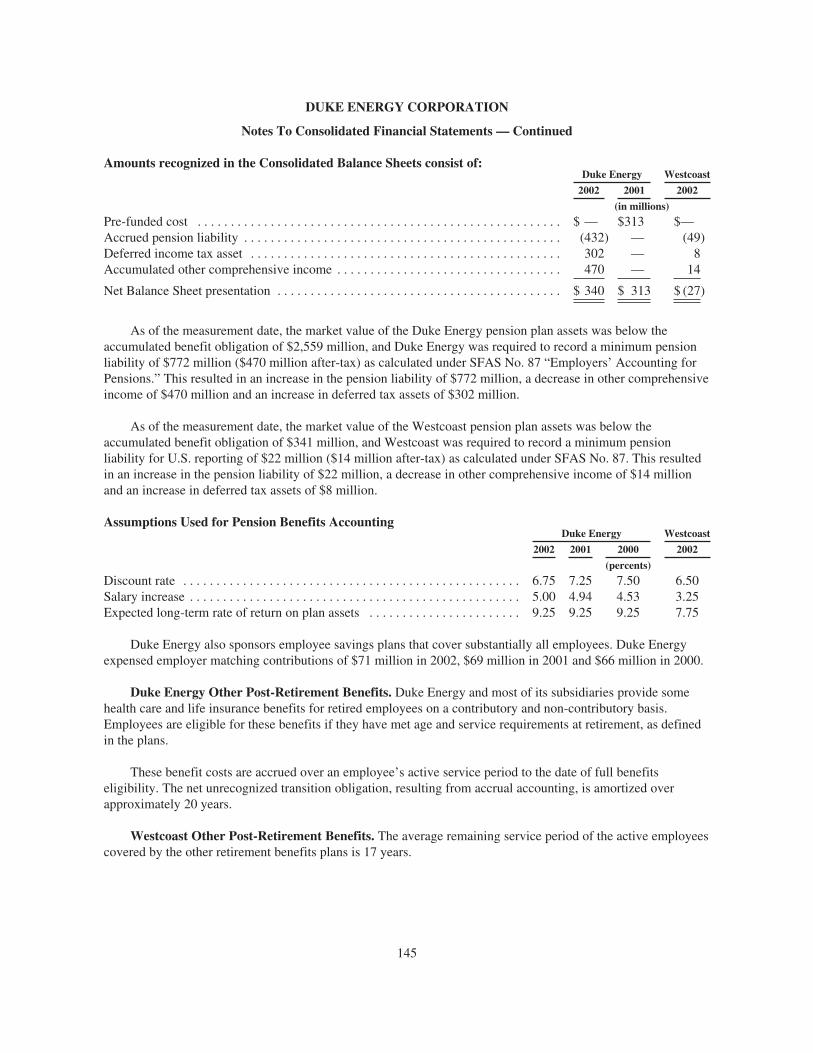
DUKE ENERGY CORPORATION
Notes To Consolidated Financial Statements — Continued
Amounts recognized in the Consolidated Balance Sheets consist of:Duke Energy Westcoast
2002 2001 2002
(in millions)
Pre-funded cost . . . . . . . . . . . . . . . . . . . . . . . . . . . . . . . . . . . . . . . . . . . . . . . . . . . . . . . $ — $313 $—Accrued pension liability . . . . . . . . . . . . . . . . . . . . . . . . . . . . . . . . . . . . . . . . . . . . . . . . (432) — (49)Deferred income tax asset . . . . . . . . . . . . . . . . . . . . . . . . . . . . . . . . . . . . . . . . . . . . . . . 302 — 8Accumulated other comprehensive income . . . . . . . . . . . . . . . . . . . . . . . . . . . . . . . . . . 470 — 14
Net Balance Sheet presentation . . . . . . . . . . . . . . . . . . . . . . . . . . . . . . . . . . . . . . . . . . . $ 340 $ 313 $ (27)
As of the measurement date, the market value of the Duke Energy pension plan assets was below theaccumulated benefit obligation of $2,559 million, and Duke Energy was required to record a minimum pensionliability of $772 million ($470 million after-tax) as calculated under SFAS No. 87 “Employers’ Accounting forPensions.” This resulted in an increase in the pension liability of $772 million, a decrease in other comprehensiveincome of $470 million and an increase in deferred tax assets of $302 million.
As of the measurement date, the market value of the Westcoast pension plan assets was below theaccumulated benefit obligation of $341 million, and Westcoast was required to record a minimum pensionliability for U.S. reporting of $22 million ($14 million after-tax) as calculated under SFAS No. 87. This resultedin an increase in the pension liability of $22 million, a decrease in other comprehensive income of $14 millionand an increase in deferred tax assets of $8 million.
Assumptions Used for Pension Benefits AccountingDuke Energy Westcoast
2002 2001 2000 2002
(percents)
Discount rate . . . . . . . . . . . . . . . . . . . . . . . . . . . . . . . . . . . . . . . . . . . . . . . . . . . 6.75 7.25 7.50 6.50Salary increase . . . . . . . . . . . . . . . . . . . . . . . . . . . . . . . . . . . . . . . . . . . . . . . . . . 5.00 4.94 4.53 3.25Expected long-term rate of return on plan assets . . . . . . . . . . . . . . . . . . . . . . . 9.25 9.25 9.25 7.75
Duke Energy also sponsors employee savings plans that cover substantially all employees. Duke Energyexpensed employer matching contributions of $71 million in 2002, $69 million in 2001 and $66 million in 2000.
Duke Energy Other Post-Retirement Benefits. Duke Energy and most of its subsidiaries provide somehealth care and life insurance benefits for retired employees on a contributory and non-contributory basis.Employees are eligible for these benefits if they have met age and service requirements at retirement, as definedin the plans.
These benefit costs are accrued over an employee’s active service period to the date of full benefitseligibility. The net unrecognized transition obligation, resulting from accrual accounting, is amortized overapproximately 20 years.
Westcoast Other Post-Retirement Benefits. The average remaining service period of the active employeescovered by the other retirement benefits plans is 17 years.
145

DUKE ENERGY CORPORATION
Notes To Consolidated Financial Statements — Continued
Components of Net Periodic Post-Retirement Benefit Costs—as of December 31,Duke Energy Westcoast
2002 2001 2000 2002
(in millions)
Service cost benefit earned during the year . . . . . . . . . . . . . . . . . . . . . . $ 5 $ 5 $ 5 $ 2Interest cost on accumulated post-retirement benefit obligation . . . . . . 50 44 43 2Expected return on plan assets . . . . . . . . . . . . . . . . . . . . . . . . . . . . . . . . (24) (24) (23) —Amortization of prior service cost . . . . . . . . . . . . . . . . . . . . . . . . . . . . . 1 1 1 —Amortization of net transition obligation . . . . . . . . . . . . . . . . . . . . . . . . 18 18 18 —Plan curtailments . . . . . . . . . . . . . . . . . . . . . . . . . . . . . . . . . . . . . . . . . . — (3) — —
Net periodic post-retirement benefit costs . . . . . . . . . . . . . . . . . . . . . . . $ 50 $ 41 $ 44 $ 4
Reconciliation of Funded Status to Accrued Post-Retirement Benefit CostsDuke Energy Westcoast
2002 2001 2002
(in millions)
Change in Benefit ObligationAccumulated post-retirement benefit obligation at beginning of year . . . . . . . . . . $ 712 $ 614 $ 45(b)Service cost . . . . . . . . . . . . . . . . . . . . . . . . . . . . . . . . . . . . . . . . . . . . . . . . . . . . . . . 5 5 2Interest cost . . . . . . . . . . . . . . . . . . . . . . . . . . . . . . . . . . . . . . . . . . . . . . . . . . . . . . . 50 44 2Plan participants’ contributions . . . . . . . . . . . . . . . . . . . . . . . . . . . . . . . . . . . . . . . 9 9 —Actuarial loss . . . . . . . . . . . . . . . . . . . . . . . . . . . . . . . . . . . . . . . . . . . . . . . . . . . . . 66 104 2Benefits paid . . . . . . . . . . . . . . . . . . . . . . . . . . . . . . . . . . . . . . . . . . . . . . . . . . . . . . (63) (61) (2)Plan curtailments . . . . . . . . . . . . . . . . . . . . . . . . . . . . . . . . . . . . . . . . . . . . . . . . . . — (3) —
Accumulated post-retirement benefit obligation at end of year . . . . . . . . . . . . . . . $ 779 $ 712 $ 49
Change in Plan AssetsFair value of plan assets at beginning of year . . . . . . . . . . . . . . . . . . . . . . . . . . . . $ 265(a) $ 325(a) $—Actual return on plan assets . . . . . . . . . . . . . . . . . . . . . . . . . . . . . . . . . . . . . . . . . . (21) (40) —Employer contributions . . . . . . . . . . . . . . . . . . . . . . . . . . . . . . . . . . . . . . . . . . . . . 37 32 2Plan participants’ contributions . . . . . . . . . . . . . . . . . . . . . . . . . . . . . . . . . . . . . . . 9 9 —Benefits paid . . . . . . . . . . . . . . . . . . . . . . . . . . . . . . . . . . . . . . . . . . . . . . . . . . . . . . (63) (61) (2)
Fair market value of plan assets at end of year . . . . . . . . . . . . . . . . . . . . . . . . . . . . $ 227(a) $ 265(a) $—
Funded status . . . . . . . . . . . . . . . . . . . . . . . . . . . . . . . . . . . . . . . . . . . . . . . . . . . . . $(552) $(447) $ (49)Employer contributions made after measurement date . . . . . . . . . . . . . . . . . . . . . 12 11 —Unrecognized net experience loss . . . . . . . . . . . . . . . . . . . . . . . . . . . . . . . . . . . . . 223 111 2Unrecognized prior service cost . . . . . . . . . . . . . . . . . . . . . . . . . . . . . . . . . . . . . . . 3 4 —Unrecognized transition obligation . . . . . . . . . . . . . . . . . . . . . . . . . . . . . . . . . . . . . 178 196 —
Accrued post-retirement benefit costs . . . . . . . . . . . . . . . . . . . . . . . . . . . . . . . . . . $(136) $(125) $ (47)
(a) Principally equity and fixed-income securities. For measurement purposes, plan assets were valued as ofSeptember 30.
(b) For Westcoast, benefit obligation at beginning of the year represents balances assumed in the acquisition ofWestcoast as of March 14, 2002. (See Note 2.)
146

DUKE ENERGY CORPORATION
Notes To Consolidated Financial Statements — Continued
Assumptions Used for Post-Retirement Benefits AccountingDuke Energy Westcoast
2002 2001 2000 2002
(percents)
Discount rate . . . . . . . . . . . . . . . . . . . . . . . . . . . . . . . . . . . . . . . . . . . . . . . . . . . . 6.75 7.25 7.50 6.50Salary increase . . . . . . . . . . . . . . . . . . . . . . . . . . . . . . . . . . . . . . . . . . . . . . . . . . 5.00 4.94 4.53 3.25Expected long-term rate of return on assets . . . . . . . . . . . . . . . . . . . . . . . . . . . . 9.25 9.25 9.25 —Assumed tax rate(a) . . . . . . . . . . . . . . . . . . . . . . . . . . . . . . . . . . . . . . . . . . . . . . 39.60 39.60 39.60 —
(a) Applicable to the health care portion of funded post-retirement benefits
For measurement purposes of the Duke Energy plan, the net per capita cost of covered health care benefitsfor participants who are not eligible for Medicare is assumed to have an initial annual rate of increase of 10.5%in 2002 that will gradually decrease to 6% in 2008. For participants who are eligible for Medicare, an initialannual rate of increase of 13.5% in 2002 will gradually decrease to 6% in 2011. Assumed health care cost trendrates have a significant effect on the amounts reported for the health care plans.
Sensitivity to Changes in Assumed Health Care Cost Trend Rates for Duke Energy Plan1-Percentage-Point Increase
1-Percentage-Point Decrease
(in millions)
Effect on total service and interest costs . . . . . . . . . . . . . . . . . . . . . . . . . . . . . . . . . . . $ 3 $ (3)Effect on post-retirement benefit obligation . . . . . . . . . . . . . . . . . . . . . . . . . . . . . . . . 51 (43)
For measurement purposes of the Westcoast plan, the net per capita cost of covered health care benefits foremployees are assumed to have an initial annual rate of increase of 10% in 2002 that will gradually decrease to5% in 2008. Assumed health care cost trend rates have a significant effect on the amounts reported for the healthcare plans.
Sensitivity to Changes in Assumed Health Care Cost Trend Rates for Westcoast Plan1-Percentage-Point Increase
1-Percentage-Point Decrease
(in millions)
Effect on total service and interest costs . . . . . . . . . . . . . . . . . . . . . . . . . . . . . . . . . . . $1 $(1)Effect on post-retirement benefit obligation . . . . . . . . . . . . . . . . . . . . . . . . . . . . . . . . 7 (6)
147

DUKE ENERGY CORPORATION
Notes To Consolidated Financial Statements — Continued
21. Quarterly Financial Data (Unaudited)
FirstQuarter
SecondQuarter
ThirdQuarter
FourthQuarter Total
(in millions, except per share data)2002Operating revenues . . . . . . . . . . . . . . . . . . . . . . . . . . . . . . . . . . . . . . . . . . . $3,227 $3,698 $3,982 $4,756 $15,663Operating income . . . . . . . . . . . . . . . . . . . . . . . . . . . . . . . . . . . . . . . . . . . . 682 889 536 393 2,500EBIT . . . . . . . . . . . . . . . . . . . . . . . . . . . . . . . . . . . . . . . . . . . . . . . . . . . . . . 761 1,047 668 393 2,869Net income (loss) . . . . . . . . . . . . . . . . . . . . . . . . . . . . . . . . . . . . . . . . . . . . 382 474 230 (52) 1,034Earnings (loss) per share . . . . . . . . . . . . . . . . . . . . . . . . . . . . . . . . . . . . . . .
Basic . . . . . . . . . . . . . . . . . . . . . . . . . . . . . . . . . . . . . . . . . . . . . . . . . . $ 0.48 $ 0.57 $ 0.27 $ (0.06) $ 1.22Diluted . . . . . . . . . . . . . . . . . . . . . . . . . . . . . . . . . . . . . . . . . . . . . . . . $ 0.48 $ 0.56 $ 0.27 $ (0.06) $ 1.22
2001Operating revenues . . . . . . . . . . . . . . . . . . . . . . . . . . . . . . . . . . . . . . . . . . . $5,553 $4,127 $4,552 $3,965 $18,197Operating income . . . . . . . . . . . . . . . . . . . . . . . . . . . . . . . . . . . . . . . . . . . . 1,177 823 1,414 527 3,941EBIT . . . . . . . . . . . . . . . . . . . . . . . . . . . . . . . . . . . . . . . . . . . . . . . . . . . . . . 1,254 902 1,529 571 4,256Income before cumulative effect of change in accounting principle . . . . . 554 419 796 225 1,994Net income . . . . . . . . . . . . . . . . . . . . . . . . . . . . . . . . . . . . . . . . . . . . . . . . . 458 419 796 225 1,898Earnings per share (before cumulative effect of change in accountingprinciple)Basic . . . . . . . . . . . . . . . . . . . . . . . . . . . . . . . . . . . . . . . . . . . . . . . . . . $ 0.74 $ 0.54 $ 1.02 $ 0.29 $ 2.58Diluted . . . . . . . . . . . . . . . . . . . . . . . . . . . . . . . . . . . . . . . . . . . . . . . . $ 0.73 $ 0.53 $ 1.01 $ 0.28 $ 2.56
Earnings per shareBasic . . . . . . . . . . . . . . . . . . . . . . . . . . . . . . . . . . . . . . . . . . . . . . . . . . $ 0.61 $ 0.54 $ 1.02 $ 0.29 $ 2.45Diluted . . . . . . . . . . . . . . . . . . . . . . . . . . . . . . . . . . . . . . . . . . . . . . . . $ 0.60 $ 0.53 $ 1.01 $ 0.28 $ 2.44
During the third quarter of 2002, Duke Energy recorded the following: charges at DENA for the terminationof certain turbines on order and the write-down of other uninstalled turbines of $121 million (see Note 9), thepartial write-off of site development costs (primarily in California) of $31 million (see Note 9), partialimpairment of a merchant plant of $31 million (see Note 9), and demobilization costs related to the deferral ofDENA merchant power projects of $12 million; charges of $91 million at International Energy for the write-offof site-development costs and the write-down of uninstalled turbines, primarily related to planned energy plantsin Brazil (see Note 9); and severance charges of $33 million for work force reductions.
During the fourth quarter of 2002, Duke Energy recorded the following: expenses at Franchised Electricassociated with a December 2002 ice storm of $89 million, and a charge of $19 million for settlements with theNCUC and PSCSC (see Note 4); charges at DENA for information technology systems write-offs of $24 million(see Note 9), and demobilization costs related to the deferral of DENA merchant power projects of $10 million;impairment of goodwill at International Energy’s European trading and marketing business of $194 million (seeNote 9); asset impairments at Field Services of $40 million ($28 million at Duke Energy’s 70% share) (see Note9); and severance charges of $70 million for work force reductions.
During the fourth quarter of 2001, Duke Energy recorded a $43 million provision for non-collateralizedaccounting exposure to Enron, as well as a $36 million reduction in unbilled revenue receivables resulting from arefinement in the estimates used to calculate unbilled kilowatt-hour sales.
22. Subsequent Events (Unaudited)
In October 2002, Duke Energy entered into a $244 million stock purchase agreement with National FuelGas Company, including the assumption of approximately $58 million in debt, under which it would acquireDuke Energy’s wholly owned Empire State Pipeline. This natural gas pipeline, which originates at the U.S./
148
DUKE ENERGY CORPORATION
Notes To Consolidated Financial Statements — Continued
Canada border and extends into New York, was acquired by Duke Energy as part of the Westcoast acquisition inMarch 2002 (see Note 2). The sale to National Fuel Gas Company closed in February 2003.
In March 2003, Duke Energy announced that it will exit the merchant finance business at DCP in an orderlymanner. Duke Energy expects the exit to generate positive cash flows in 2003 and 2004.
For information on subsequent events related to litigation and contingencies refer to Note 4, FranchisedElectric section and Note 16, Litigation section. For information on subsequent events related to debt and otherfinancing matters refer to Note 11.
149

DUKE ENERGY CORPORATION
SCHEDULE II—VALUATION AND QUALIFYING ACCOUNTS AND RESERVES
Additions
Balance atBeginningof Period
Charged toExpense
Charged toOther
Accounts Deductions(a)
Balance atEnd
of Period
(in millions)
December 31, 2002:Injuries and damages . . . . . . . . . . . . . . . . . . . . $ 459 $ 14 $ 5 $111 $ 367Allowance for doubtful accounts . . . . . . . . . . . 265 161 5 82 349Other(b) . . . . . . . . . . . . . . . . . . . . . . . . . . . . . . . 406 222 114(c) 229 513
$1,130 $397 $124 $422 $1,229
December 31, 2001:Injuries and damages . . . . . . . . . . . . . . . . . . . . . . . . $ 531 $ 31 $ 11 $114 $ 459Allowance for doubtful accounts . . . . . . . . . . . . . . . 200 160 4 99 265Other(b) . . . . . . . . . . . . . . . . . . . . . . . . . . . . . . . . . . . 377 201 84 256 406
$1,108 $392 $ 99(d) $469 $1,130
December 31, 2000:Injuries and damages . . . . . . . . . . . . . . . . . . . . $ 902 $ 18 $ 2 $391 $ 531Allowance for doubtful accounts . . . . . . . . . . . 43 165 8 16 200Other(b) . . . . . . . . . . . . . . . . . . . . . . . . . . . . . . . 317 40 97 77 377
$1,262 $223 $107(e) $484 $1,108
(a) Principally cash payments and reserve reversals.(b) Principally property insurance reserves and litigation and other reserves, included in Other Current
Liabilities, or Deferred Credits and Other Liabilities on the Consolidated Balance Sheets.(c) Includes the reclassification of $50 million of a $58 million suspense account to a nuclear insurance
operation account in accordance with a settlement agreement between Duke Power, the North CarolinaUtilities Commission and the Public Service Commission of South Carolina (see Note 4 to the ConsolidatedFinancial Statements, “Regulatory Matters”).
(d) Principally reserves for construction costs, and litigation and other reserves assumed in businessacquisitions.
(e) Principally litigation and other reserves assumed in business acquisitions.
150

INDEPENDENT AUDITORS’ REPORT
To the Board of Directors and Stockholders of Duke Energy Corporation:
We have audited the accompanying consolidated balance sheets of Duke Energy Corporation andsubsidiaries (Duke Energy) as of December 31, 2002 and 2001, and the related consolidated statements ofincome, common stockholders’ equity and comprehensive income, and cash flows for each of the three years inthe period ended December 31, 2002. Our audits also included the financial statement schedule listed in the Indexat Item 15. These financial statements and financial statement schedule are the responsibility of Duke Energy’smanagement. Our responsibility is to express an opinion on the financial statements and financial statementschedule based on our audits.
We conducted our audits in accordance with auditing standards generally accepted in the United States ofAmerica. Those standards require that we plan and perform the audit to obtain reasonable assurance aboutwhether the financial statements are free of material misstatement. An audit includes examining, on a test basis,evidence supporting the amounts and disclosures in the financial statements. An audit also includes assessing theaccounting principles used and significant estimates made by management, as well as evaluating the overallfinancial statement presentation. We believe that our audits provide a reasonable basis for our opinion.
In our opinion, such consolidated financial statements present fairly, in all material respects, the financialposition of Duke Energy as of December 31, 2002 and 2001, and the results of its operations and its cash flowsfor each of the three years in the period ended December 31, 2002, in conformity with accounting principlesgenerally accepted in the United States of America. Also, in our opinion, such financial statement schedule, whenconsidered in relation to the basic consolidated financial statements taken as a whole, presents fairly in allmaterial respects the information set forth therein.
As discussed in Note 1 to the consolidated financial statements, on January 1, 2001, Duke Energy adoptedStatement of Financial Accounting Standards No. 133, “Accounting for Derivative Instruments and HedgingActivities,” and on January 1, 2002, Duke Energy adopted Statement of Financial Accounting Standards No. 142,“Goodwill and Other Intangible Assets.”
/s/ DELOITTE & TOUCHE LLPDeloitte & Touche LLPCharlotte, North CarolinaMarch 12, 2003
151

RESPONSIBILITY FOR FINANCIAL STATEMENTS
The financial statements of Duke Energy Corporation (Duke Energy) are prepared by management, who areresponsible for their integrity and objectivity. The statements are prepared in conformity with generally acceptedaccounting principles in all material respects and necessarily include judgments and estimates of the expectedeffects of events and transactions that are currently being reported.
Duke Energy’s system of internal accounting control is designed to provide reasonable assurance that assetsare safeguarded and transactions are executed according to management’s authorization. Internal accountingcontrols also provide reasonable assurance that transactions are recorded properly, so that financial statementscan be prepared according to generally accepted accounting principles. In addition, accounting controls providereasonable assurance that errors or irregularities which could be material to the financial statements are preventedor are detected by employees within a timely period as they perform their assigned functions. Duke Energy’saccounting controls are continually reviewed for effectiveness. In addition, written policies, standards andprocedures, and an internal audit program augment Duke Energy’s accounting controls.
The Board of Directors pursues its oversight role for the financial statements through the audit committee,which is composed entirely of independent directors who are not employees of Duke Energy. The auditcommittee meets with management and internal auditors periodically to review accounting control issues and tomonitor each group’s discharge of its responsibilities. The audit committee also meets periodically with DukeEnergy’s independent auditors, Deloitte & Touche LLP. The independent auditors have free access to the auditcommittee and the Board of Directors to discuss internal accounting control, auditing and financial reportingmatters without the presence of management.
/s/ Keith G. ButlerKeith G. ButlerSenior Vice President and Controller
152

Item 9. Changes in and Disagreements with Accountants on Accounting and Financial Disclosure.
None.
PART III.
Item 10. Directors and Executive Officers of the Registrant.
Reference to “Executive Officers of Duke Energy” is included in “Item 1. Business” of this report. See “TheBoard of Directors,” “Information on the Board of Directors” and “Other Information” in the Proxy Statementrelating to Duke Energy’s 2003 annual meeting of shareholders, incorporated herein by reference.
Item 11. Executive Compensation.
See “Compensation” and “Information on the Board of Directors—Compensation of Directors” in the ProxyStatement relating to Duke Energy’s 2003 annual meeting of shareholders, incorporated herein by reference.
Item 12. Security Ownership of Certain Beneficial Owners and Management.
See “Beneficial Ownership” and “Equity Compensation Plan Table” in the Proxy Statement relating toDuke Energy’s 2003 annual meeting of shareholders, incorporated herein by reference.
Item 13. Certain Relationships and Related Transactions.
None.
Item 14. Controls and Procedures.
Duke Energy’s management, including the Chief Executive Officer and Chief Financial Officer, haveconducted an evaluation of the effectiveness of Duke Energy’s disclosure controls and procedures as defined inExchange Act Rule 13a-14 during January through March 2003. Based on that evaluation, the Chief ExecutiveOfficer and Chief Financial Officer concluded that the disclosure controls and procedures are effective inensuring that all material information required to be filed in this annual report has been made known to them in atimely fashion. The required information was effectively recorded, processed, summarized and reported withinthe time period necessary to prepare this annual report. Duke Energy’s disclosure controls and procedures areeffective in ensuring that information required to be disclosed in Duke Energy’s reports under the Exchange Actare accumulated and communicated to management, including the Chief Executive Officer and the ChiefFinancial Officer, as appropriate to allow timely decisions regarding required disclosure. There have been nosignificant changes in internal controls, or in factors that could significantly affect internal controls, subsequentto the date the Chief Executive Officer and Chief Financial Officer completed their evaluation.
In 2001, DEFS along with its external auditors, identified certain deficiencies in the design and operation ofits internal control procedures that were reportable control weaknesses. These control weaknesses related tobalance sheet reconciliations, including supervisory review of such reconciliations, gas imbalances, joint ventureaccounting, employee benefit accruals and revenue-related issues. In addition, there were identified weaknessesreported in the areas of risk management procedures, accounts receivable, revenue accrual and natural gas liquidaccounting. Throughout 2002, DEFS implemented internal control enhancements in each of the areas describedabove. These enhancements included improved systems and processes, implementation of accounting policiesrelated to gas imbalances and other enhancements related to joint venture accounting, risk managementprocedures, and revenue and natural gas liquids accounting.
153

PART IV.
Item 15. Exhibits, Financial Statement Schedule, and Reports on Form 8-K.
(a) Consolidated Financial Statements, Supplemental Financial Data and Supplemental Schedule includedin Part II of this annual report are as follows:
Consolidated Financial Statements
Consolidated Statements of Income for the Years Ended December 31, 2002, 2001 and 2000
Consolidated Statements of Cash Flows for the Years Ended December 31, 2002, 2001 and 2000
Consolidated Balance Sheets as of December 31, 2002 and 2001
Consolidated Statements of Common Stockholders’ Equity and Comprehensive Income for theYears Ended December 31, 2002, 2001 and 2000
Notes to the Consolidated Financial Statements
Quarterly Financial Data (unaudited, included in Note 21 to the Consolidated Financial Statements)
Consolidated Financial Statement Schedule II—Valuation and Qualifying Accounts and Reserves forthe Years Ended December 31, 2002, 2001 and 2000
Independent Auditors’ Report
All other schedules are omitted because they are not required, or because the required information isincluded in the Financial Statements or Notes.
(b) Reports on Form 8-K
Duke Energy filed no reports on Form 8-K during the fourth quarter of 2002.
(c) Exhibits—See Exhibit Index immediately following the signature page.
154
SIGNATURES
Pursuant to the requirements of Section 13 or 15(d) of the Securities Exchange Act of 1934, theregistrant has duly caused this report to be signed on its behalf by the undersigned, thereunto dulyauthorized.
Date: March 14, 2003 DUKE ENERGY CORPORATION(Registrant)
By: RICHARD B. PRIORY
Richard B. PrioryChairman of the Board
and Chief Executive Officer
Pursuant to the requirements of the Securities Exchange Act of 1934, this report has been signedbelow by the following persons on behalf of the registrant and in the capacities and on the date indicated.
(i) Principal executive officer:Richard B. Priory
Chairman of the Board and Chief Executive Officer
(ii) Principal financial officer:Robert P. Brace
Executive Vice President and Chief Financial Officer
(iii) Principal accounting officer:Keith G. Butler
Senior Vice President and Controller
(iv) All of the Directors:Richard B. PrioryG. Alex Bernhardt, Sr.Robert J. BrownWilliam T. EsreyAnn Maynard GrayGeorge Dean Johnson, Jr.Max LennonLeo E. Linbeck, Jr.James G. MartinMichael E.J. PhelpsJames T. Rhodes
Date: March 14, 2003
Robert P. Brace, by signing his name hereto, does hereby sign this document on behalf of the registrant andon behalf of each of the above-named persons pursuant to a power of attorney duly executed by the registrant andsuch persons, filed with the Securities and Exchange Commission as an exhibit hereto.
By: /s/ ROBERT P. BRACE
Attorney-In-Fact
155
CERTIFICATIONS
I, Robert P. Brace, certify that:
1. I have reviewed this annual report on Form 10-K of Duke Energy Corporation;
2. Based on my knowledge, this annual report does not contain any untrue statement of a material fact oromit to state a material fact necessary to make the statements made, in light of the circumstances underwhich such statements were made, not misleading with respect to the period covered by this annualreport;
3. Based on my knowledge, the financial statements, and other financial information included in thisannual report, fairly present in all material respects the financial condition, results of operations andcash flows of the registrant as of, and for, the periods presented in this annual report;
4. The registrant’s other certifying officers and I are responsible for establishing and maintainingdisclosure controls and procedures (as defined in Exchange Act Rules 13a-14 and 15d-14) for theregistrant and have:
a) designed such disclosure controls and procedures to ensure that material information relating to theregistrant, including its consolidated subsidiaries, is made known to us by others within thoseentities, particularly during the period in which this annual report is being prepared;
b) evaluated the effectiveness of the registrant’s disclosure controls and procedures as of a date within90 days prior to the filing date of this annual report (the “Evaluation Date”); and
c) presented in this annual report our conclusions about the effectiveness of the disclosure controlsand procedures based on our evaluation as of the Evaluation Date;
5. The registrant’s other certifying officers and I have disclosed, based on our most recent evaluation, tothe registrant’s auditors and the audit committee of registrant’s board of directors (or personsperforming the equivalent functions):
a) all significant deficiencies in the design or operation of internal controls which could adverselyaffect the registrant’s ability to record, process, summarize and report financial data and haveidentified for the registrant’s auditors any material weaknesses in internal controls; and
b) any fraud, whether or not material, that involves management or other employees who have asignificant role in the registrant’s internal controls; and
6. The registrant’s other certifying officers and I have indicated in this annual report whether there weresignificant changes in internal controls or in other factors that could significantly affect internalcontrols subsequent to the date of our most recent evaluation, including any corrective actions withregard to significant deficiencies and material weaknesses.
Date: March 14, 2003
/s/ ROBERT P. BRACE
Robert P. BraceExecutive Vice President and Chief Financial Officer
156

CERTIFICATIONS
I, Richard B. Priory, certify that:
1. I have reviewed this annual report on Form 10-K of Duke Energy Corporation;
2. Based on my knowledge, this annual report does not contain any untrue statement of a material fact oromit to state a material fact necessary to make the statements made, in light of the circumstances underwhich such statements were made, not misleading with respect to the period covered by this annualreport;
3. Based on my knowledge, the financial statements, and other financial information included in thisannual report, fairly present in all material respects the financial condition, results of operations andcash flows of the registrant as of, and for, the periods presented in this annual report;
4. The registrant’s other certifying officers and I are responsible for establishing and maintainingdisclosure controls and procedures (as defined in Exchange Act Rules 13a-14 and 15d-14) for theregistrant and have:
a) designed such disclosure controls and procedures to ensure that material information relating to theregistrant, including its consolidated subsidiaries, is made known to us by others within thoseentities, particularly during the period in which this annual report is being prepared;
b) evaluated the effectiveness of the registrant’s disclosure controls and procedures as of a date within90 days prior to the filing date of this annual report (the “Evaluation Date”); and
c) presented in this annual report our conclusions about the effectiveness of the disclosure controlsand procedures based on our evaluation as of the Evaluation Date;
5. The registrant’s other certifying officers and I have disclosed, based on our most recent evaluation, tothe registrant’s auditors and the audit committee of registrant’s board of directors (or personsperforming the equivalent functions):
a) all significant deficiencies in the design or operation of internal controls which could adverselyaffect the registrant’s ability to record, process, summarize and report financial data and haveidentified for the registrant’s auditors any material weaknesses in internal controls; and
b) any fraud, whether or not material, that involves management or other employees who have asignificant role in the registrant’s internal controls; and
6. The registrant’s other certifying officers and I have indicated in this annual report whether there weresignificant changes in internal controls or in other factors that could significantly affect internalcontrols subsequent to the date of our most recent evaluation, including any corrective actions withregard to significant deficiencies and material weaknesses.
Date: March 14, 2003
/s/ RICHARD B. PRIORY
Richard B. PrioryChairman of the Board and Chief Executive Officer
157
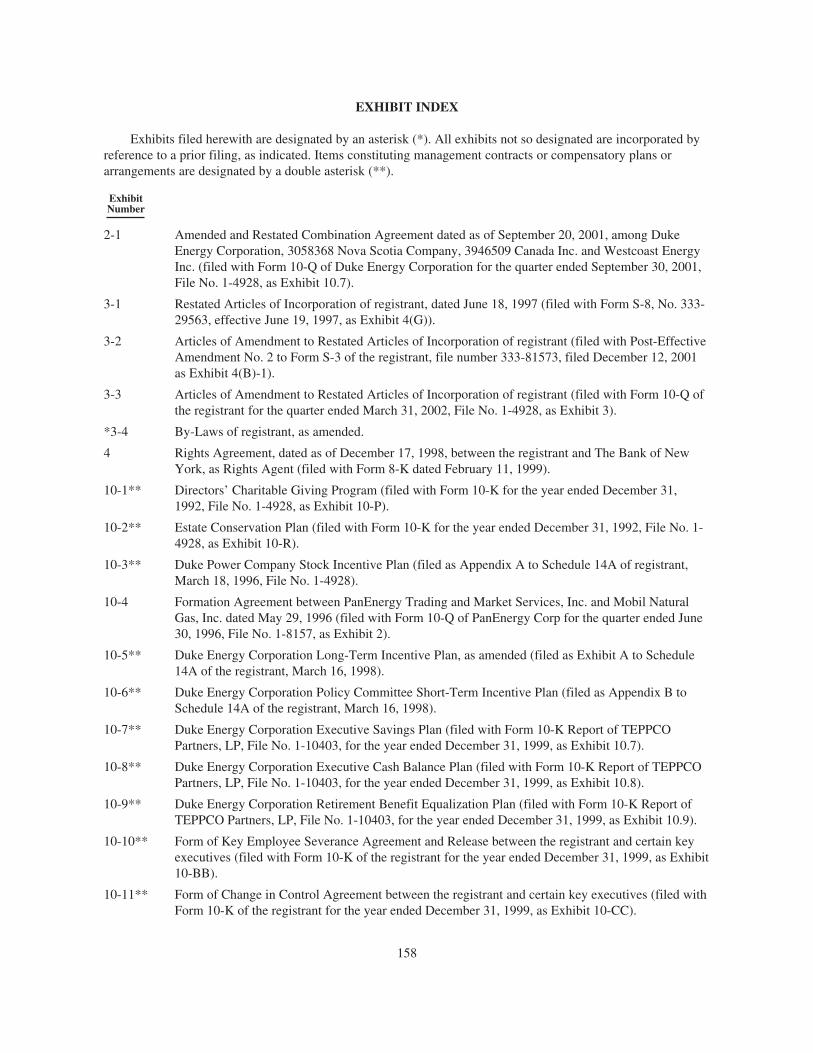
EXHIBIT INDEX
Exhibits filed herewith are designated by an asterisk (*). All exhibits not so designated are incorporated byreference to a prior filing, as indicated. Items constituting management contracts or compensatory plans orarrangements are designated by a double asterisk (**).
ExhibitNumber
2-1 Amended and Restated Combination Agreement dated as of September 20, 2001, among DukeEnergy Corporation, 3058368 Nova Scotia Company, 3946509 Canada Inc. and Westcoast EnergyInc. (filed with Form 10-Q of Duke Energy Corporation for the quarter ended September 30, 2001,File No. 1-4928, as Exhibit 10.7).
3-1 Restated Articles of Incorporation of registrant, dated June 18, 1997 (filed with Form S-8, No. 333-29563, effective June 19, 1997, as Exhibit 4(G)).
3-2 Articles of Amendment to Restated Articles of Incorporation of registrant (filed with Post-EffectiveAmendment No. 2 to Form S-3 of the registrant, file number 333-81573, filed December 12, 2001as Exhibit 4(B)-1).
3-3 Articles of Amendment to Restated Articles of Incorporation of registrant (filed with Form 10-Q ofthe registrant for the quarter ended March 31, 2002, File No. 1-4928, as Exhibit 3).
*3-4 By-Laws of registrant, as amended.
4 Rights Agreement, dated as of December 17, 1998, between the registrant and The Bank of NewYork, as Rights Agent (filed with Form 8-K dated February 11, 1999).
10-1** Directors’ Charitable Giving Program (filed with Form 10-K for the year ended December 31,1992, File No. 1-4928, as Exhibit 10-P).
10-2** Estate Conservation Plan (filed with Form 10-K for the year ended December 31, 1992, File No. 1-4928, as Exhibit 10-R).
10-3** Duke Power Company Stock Incentive Plan (filed as Appendix A to Schedule 14A of registrant,March 18, 1996, File No. 1-4928).
10-4 Formation Agreement between PanEnergy Trading and Market Services, Inc. and Mobil NaturalGas, Inc. dated May 29, 1996 (filed with Form 10-Q of PanEnergy Corp for the quarter ended June30, 1996, File No. 1-8157, as Exhibit 2).
10-5** Duke Energy Corporation Long-Term Incentive Plan, as amended (filed as Exhibit A to Schedule14A of the registrant, March 16, 1998).
10-6** Duke Energy Corporation Policy Committee Short-Term Incentive Plan (filed as Appendix B toSchedule 14A of the registrant, March 16, 1998).
10-7** Duke Energy Corporation Executive Savings Plan (filed with Form 10-K Report of TEPPCOPartners, LP, File No. 1-10403, for the year ended December 31, 1999, as Exhibit 10.7).
10-8** Duke Energy Corporation Executive Cash Balance Plan (filed with Form 10-K Report of TEPPCOPartners, LP, File No. 1-10403, for the year ended December 31, 1999, as Exhibit 10.8).
10-9** Duke Energy Corporation Retirement Benefit Equalization Plan (filed with Form 10-K Report ofTEPPCO Partners, LP, File No. 1-10403, for the year ended December 31, 1999, as Exhibit 10.9).
10-10** Form of Key Employee Severance Agreement and Release between the registrant and certain keyexecutives (filed with Form 10-K of the registrant for the year ended December 31, 1999, as Exhibit10-BB).
10-11** Form of Change in Control Agreement between the registrant and certain key executives (filed withForm 10-K of the registrant for the year ended December 31, 1999, as Exhibit 10-CC).
158

ExhibitNumber
10-12 Contribution Agreement by and among Phillips Petroleum Company, Duke Energy Corporation andDuke Energy Field Services LLC, dated as of December 16, 1999 (filed as Exhibit 2.1 to Form 8-Kof the registrant, filed December 30, 1999).
10-13 Governance Agreement by and among Phillips Petroleum Company, Duke Energy Corporation andDuke Energy Field Services LLC, dated as of December 16, 1999 (filed as Exhibit 2.2 to Form 8-Kof the registrant, filed December 30, 1999).
10-14 First Amendment to Contribution and Governance Agreement dated as of March 23, 2000 amongPhillips Petroleum Company, Duke Energy Corporation and Duke Energy Field Services, LLC(incorporated by reference to Exhibit 10.7 (b) to Registration Statement on Form S-1/A (RegistrationNo. 333-32502) of Duke Energy Field Services Corporation, filed on March 27, 2000).
10-15 Parent Company Agreement dated as of March 31, 2000 among Phillips Petroleum Company, DukeEnergy Corporation, Duke Energy Field Services, LLC and Duke Energy Field Services Corporation(incorporated by reference to Exhibit 10.10 to Registration Statement on Form S-1/A (RegistrationNo. 333-32502) of Duke Energy Field Services Corporation, filed on May 4, 2000).
10-16 Amended and Restated Limited Liability Company Agreement of Duke Energy Field Services, LLCby and between Phillips Gas Company and Duke Energy Field Services Corporation, dated as ofMarch 31, 2000 (filed as Exhibit 3.1 to Form 10 of Duke Energy Field Services LLC, File No. 000-31095, filed July 20, 2000).
10-17 First Amendment to the Parent Company Agreement dated as of May 25, 2000 among PhillipsPetroleum Company, Duke Energy Corporation, Duke Energy Field Services, LLC and Duke EnergyField Services Corporation (filed as Exhibit 10.8 (b) to Form 10 of Duke Energy Field Services LLC,File No. 000-31095, filed July 20, 2000).
*10-18 Limited Liability Company Agreement of Gulfstream Management & Operating Services, LLCdated as of February 1, 2001 between Duke Energy Gas Transmission Corporation and Williams GasPipeline Company.
*12 Computation of Ratio of Earnings to Fixed Charges.
*21 List of Subsidiaries.
*23(a) Independent Auditors’ Consent.
*24(a) Power of attorney authorizing Robert P. Brace and others to sign the annual report on behalf of theregistrant and certain of its directors and officers.
*24(b) Certified copy of resolution of the Board of Directors of the registrant authorizing power of attorney.
*99.1 Certification Pursuant to 18 U.S.C. Section 1350, as Adopted Pursuant to Section 906 of theSarbanes-Oxley Act of 2002.
*99.2 Certification Pursuant to 18 U.S.C. Section 1350, as Adopted Pursuant to Section 906 of theSarbanes-Oxley Act of 2002.
The total amount of securities of the registrant or its subsidiaries authorized under any instrument withrespect to long-term debt not filed as an exhibit does not exceed 10% of the total assets of the registrant and itssubsidiaries on a consolidated basis. The registrant agrees, upon request of the Securities and ExchangeCommission, to furnish copies of any or all of such instruments to it.
159

Straight forwardDuke Energy
2002
Annual Report
526 South Church Street
Charlotte, NC 28202-1802
704.594.6200 www.duke-energy.com
Related Documents