81 International Seminar on Infrastucture Development in Cluster Island Eastern Part of Indonesia, Baubau, Indonesia THE REAL WORLD DRIVING CYCLE OF MOTORCYCLE ON AN ARTERIAL URBAN ROUTE IN MAKASSAR - INDONESIA M. Andry Azis 1 , M. Isran Ramli 2 and S. Hamid Aly 3 ABSTRACT: The present paper attempts to understand the real world driving cycle of motorcycle on an arterial urban route in Makassar City, Indonesia. The arterial road is one of the important routes which connected the western part and eastern part of the city. This study carried out a survey to describe the motorcycle driving cycle on the route for each traffic direction in the three peak-hour periods of the traffic condition, i.e. morning peak, noon peak, and evening peak periods. The survey used a global position system (GPS) equipment in order to capture the motorcycle travel speed second by second. By using the GPS, the survey adopted the floating car survey method, where three times tracking were conducted for each traffic direction and peak-hour period. Furthermore, we analyzed eight parameters of the motorcycle driving behavior, i.e. average speed including all motorcycle behavior mode (V 1 ), average speed without idling mode (V 2 ), acceleration (A), deceleration (D), motorcycle spent time for cruise (C), percentage of acceleration (P a ), percentage of deceleration (P d ), percentage of cruise (P c ), and percentage of idling (P i ). The analysis results show that the diriving cycle of the motorcycle is dominated by the acceleration and the decelaration behavior mode, while the cruise behavoir mode is superior to the idling mode. In addition, the average speed of the motorcycle is only below 40 km/hour. These fenomena indicate that the motorcycle on the traffic situation in the route could be catgerozied as steady flow on the low average speeds. The results provide a basis for an extentesion survey of the motorcycle driving behavior in all urban arterial routes in Makassar city. We also expect that the results are useful in development an prediction model for motorcycle emission in further studies. Keywords: Real world driving cycle, motorcycle, urban arterial route, Makassar - Indonesia. INTRODUCTION The vehicle driving cycle is an important micro traffic behavior, which represent a speed–time sequenced profile developed for a certain road, route, specific area or city. In other words, the driving cycle is a sequence of vehicle operating conditions (idle, acceleration, steady state and deceleration) developed to represent typical pattern in an urban area. It is widely used to estimation transport air pollutant emissions and in the building of databases for building emission inventories (Aly et al., 2012; Saleh et al., 2009). For instance, driving cycles for light vehicle (LGV) are to enhance traffic management systems, estimating fuel consumption patterns and reduce transport impacts on health and environment (Tzirakis et al., 2006; Saleh, 2007; Hung et al., 2007; Aly et al., 2012). Regarding the major composition of motorcycle in Makassar City, Indonesia, approximately 70% - 80% (Zakaria et al., 2011; Henny et al., 2012; Hustim et al., 2012), the motorcycle driving cycle seems important to be grasp in order to improve traffic management systems and to estimate the motorcycle emission in the city. There are some previous researches addressed to the driving cycle of motorcycle. For example, Saleh et al. have developed the motorcycle driving cycle for Edinburg (2009), and Delhi (2010). As well as, Oanh et al. (2012) evaluated driving cycle of motorcycle in Hanoi. Furthermore, Kumar et al. (2011) and Oanh et al. (2012) estimated motorcycle emission based on the motorcycle driving cycle for Edinburg and Hanoi, respectively. According to the above background and the insight from the previous researches, this paper purposes to understand and to analyze the real world driving cycle of motorcycle on an urban arterial route in Makassar City, Indonesia. The rest of this paper is organized as follows. Section 2 describes the study methods such the route location, the equipment survey, and survey method of driving cycle, and the analysis method. Section 3 presents the results of the survey and of the parameters of the 1 Undergraduate Student, Hasanuddin University, [email protected], INDONESIA 2 Associate Professor, Hasanuddin University, [email protected], INDONESIA 3 Associate Professor, Hasanuddin University, [email protected], INDONESIA

14.the Real World Driving Cycle of Motorcycle (m.andry Azis)
Dec 02, 2015
PROCEEDINGS OF THE INTERNATIONAL SEMINAR ON INFRASTRUCTURE DEVELOPMENT 2013 “CLUSTER ISLAND IN EASTERN PART OF INDONESIA” (ISID 2013)
Welcome message from author
This document is posted to help you gain knowledge. Please leave a comment to let me know what you think about it! Share it to your friends and learn new things together.
Transcript

81
International Seminar on Infrastucture Development in Cluster
Island Eastern Part of Indonesia, Baubau, Indonesia
THE REAL WORLD DRIVING CYCLE OF MOTORCYCLE
ON AN ARTERIAL URBAN ROUTE IN MAKASSAR - INDONESIA
M. Andry Azis 1, M. Isran Ramli
2 and S. Hamid Aly
3
ABSTRACT: The present paper attempts to understand the real world driving cycle of motorcycle on an arterial urban
route in Makassar City, Indonesia. The arterial road is one of the important routes which connected the western part and
eastern part of the city. This study carried out a survey to describe the motorcycle driving cycle on the route for each
traffic direction in the three peak-hour periods of the traffic condition, i.e. morning peak, noon peak, and evening peak
periods. The survey used a global position system (GPS) equipment in order to capture the motorcycle travel speed
second by second. By using the GPS, the survey adopted the floating car survey method, where three times tracking
were conducted for each traffic direction and peak-hour period. Furthermore, we analyzed eight parameters of the
motorcycle driving behavior, i.e. average speed including all motorcycle behavior mode (V1), average speed without
idling mode (V2), acceleration (A), deceleration (D), motorcycle spent time for cruise (C), percentage of acceleration
(Pa), percentage of deceleration (Pd), percentage of cruise (Pc), and percentage of idling (Pi). The analysis results show
that the diriving cycle of the motorcycle is dominated by the acceleration and the decelaration behavior mode, while the
cruise behavoir mode is superior to the idling mode. In addition, the average speed of the motorcycle is only below 40
km/hour. These fenomena indicate that the motorcycle on the traffic situation in the route could be catgerozied as steady
flow on the low average speeds. The results provide a basis for an extentesion survey of the motorcycle driving
behavior in all urban arterial routes in Makassar city. We also expect that the results are useful in development an
prediction model for motorcycle emission in further studies.
Keywords: Real world driving cycle, motorcycle, urban arterial route, Makassar - Indonesia.
INTRODUCTION
The vehicle driving cycle is an important micro
traffic behavior, which represent a speed–time
sequenced profile developed for a certain road, route,
specific area or city. In other words, the driving cycle is
a sequence of vehicle operating conditions (idle,
acceleration, steady state and deceleration) developed to
represent typical pattern in an urban area. It is widely
used to estimation transport air pollutant emissions and
in the building of databases for building emission
inventories (Aly et al., 2012; Saleh et al., 2009). For
instance, driving cycles for light vehicle (LGV) are to
enhance traffic management systems, estimating fuel
consumption patterns and reduce transport impacts on
health and environment (Tzirakis et al., 2006; Saleh,
2007; Hung et al., 2007; Aly et al., 2012).
Regarding the major composition of motorcycle in
Makassar City, Indonesia, approximately 70% - 80%
(Zakaria et al., 2011; Henny et al., 2012; Hustim et al.,
2012), the motorcycle driving cycle seems important to
be grasp in order to improve traffic management systems
and to estimate the motorcycle emission in the city.
There are some previous researches addressed to the
driving cycle of motorcycle. For example, Saleh et al.
have developed the motorcycle driving cycle for
Edinburg (2009), and Delhi (2010). As well as, Oanh et
al. (2012) evaluated driving cycle of motorcycle in
Hanoi. Furthermore, Kumar et al. (2011) and Oanh et al.
(2012) estimated motorcycle emission based on the
motorcycle driving cycle for Edinburg and Hanoi,
respectively.
According to the above background and the insight
from the previous researches, this paper purposes to
understand and to analyze the real world driving cycle of
motorcycle on an urban arterial route in Makassar City,
Indonesia.
The rest of this paper is organized as follows. Section
2 describes the study methods such the route location,
the equipment survey, and survey method of driving
cycle, and the analysis method. Section 3 presents the
results of the survey and of the parameters of the
1 Undergraduate Student, Hasanuddin University, [email protected], INDONESIA 2 Associate Professor, Hasanuddin University, [email protected], INDONESIA 3 Associate Professor, Hasanuddin University, [email protected], INDONESIA

M. Andry AZIS, et al.
82
motorcycle driving cycle. The final section, Section 4
provides discussion related to the result and concludes
THE STUDY METHODS
The study methods consist of the route location, the
equipment survey, the survey method of driving cycle,
and the analysis method. We will explain these methods
in the following sub sections.
The Route Location of the Driving Cycle Survey
The study has chosen one of the important urban
arterial routes in Makassar City, Indonesia as target of
the survey location. The route, the red line as shown in
Fig. 1, is the main corridor which connected western part
and eastern part of the city. The route consists of two
urban arterial roads, i.e. Jl. Urip and Jl. Pettarani. The
length of each road is 2.5 km and 4.2 km respectively.
Both roads are categorized as six lanes and two direction
road type, which each direction is separated by physical
median in the middle of the roads. In the route, there is a
fly over facility that connect both roads each other and
also with two others roads.
The Tracking Route: Jl. Urip ? Jl. Pettarani
Fig. 1 The route of the driving cycle survey
The Equipments of the Driving Cycle Survey
The driving cycle survey uses a global position
system (GPS) equipment to track the driving behavior of
motorcycle along through the route. The GPS type which
used in this survey is Garmin Etrex 30 as shown in Fig.
21. This GPS is suitable to record the motorcycle speed
second by second in order to describe the driving cycle.
The other one of the main equipments for driving
cycle survey in this study is a motorcycle. The type of
the motorcycle which used in this study is Yamaha
Jupiter which has engine size 110 cc and year production
2011. Fig. 2b shows the visual of the motorcycle type.
The main reason in choosing the motorcycle type as the
vehicle test in this study is that the type is one of major
type motorcycles available in Makassar City.
a. GPS (Etrex 30) b. Motorcycle (Yamaha)
Fig. 2 Equipments driving cycle survey
The Survey Method for the Motorcycle Driving Cycle
The present study adopts a floating car survey
method using a vehicle test in order to capture the nature
of the traffic flow situation on the route. The method
results a floating car data (FCD), also known as floating
mobile data, is a method to determine the traffic speed
on the road network. It is based on the collection of
localization data, speed, directions of travel and time
information from mobile source in vehicles that are
being driven. These data are the essential source for
traffic information and for most intelligent transportation
systems (ITS). This means that every vehicle with an
active mobile source (such as GPS or hand-phone) acts
as a sensor for the road network. Based on these data,
traffic congestion can be identified, travel times, speed
second by second can be calculated, and traffic reports
can be rapidly generated.
Fig. 3 Tracking Results using GPS
By using the GPS and the motorcycle as the vehicle
test, we conducted the survey of the motorcycle driving
cycle on the route in October, 16th
, 2012. The tracking
survey is started from the starting point and finished at
the end point of the route location. The motorcyclist
drives the route at the natural speed of the surrounding
traffic, while at the same time the motorcyclist sets the
GPS to record the motorcycle speed second by second

The Real World Driving Cycle of Motorcycle
83
Spe
ed
(km
hr-1
) Sp
ee
d (k
mh
r-1)
Spe
ed
(km
hr-1
)
Spe
ed
(km
hr-1
) Sp
ee
d (k
mh
r-1)
Spe
ed
(km
hr-1
)
and the travel time over the route. The driver drives at
the ambient speed which the driver did not travel faster,
(overtaking more vehicles than overtook the test car), or
slower (being overtaken by more vehicles than were
overtaken by the test car) than the surrounding traffic.
The survey was repeated three times using the same
vehicle test for each traffic direction and for each peak
hour period of the traffic. We considered three peak hour
periods, i.e. morning peak, noon peak, and evening peak
periods to capture variation of the traffic situation.
The Data Analysis Method
In the data analysis, firstly, the data tracking are
transferred from GPS to a computer using mapping
software. Then, the data are tabulated in spreadsheet
analysis. Next, using the descriptive statistic, the driving
cycle is described, and eight parameters of the driving
cycle are analyzed. The eight parameters consist of
average speed including all motorcycle behavior mode
(V1), average speed without idling mode (V2),
60 60 Data Track-1
Data Track-2 50 Data Track-3 50
Data Track-1
Data Track-2
Data Track-3
40 40
30 30
20 20
10 10
0
0 100 200 300 400 500 600 700 800 900 1000
Time (Seconds)
0
0 100 200 300 400 500 600 700 800 900 1000
Time (Seconds)
a. Morning peak period for direction-A b. Morning peak period for direction-B
60 60
Data Track-1
Data Track-2
50 Data Track-3 50
Data Track-1
Data Track-2
Data Track-3
40 40
30 30
20 20
10 10
0
0 100 200 300 400 500 600 700 800 900 1000
Time (Seconds)
0
0 100 200 300 400 500 600 700 800 900 1000
Time (Seconds)
c. Noon peak period for direction-A d. Noon peak period for direction-B 60 60
Data Track-1 Data Track-2
50 Data Track-3 50
Data Track-1
Data Track-2
Data Track-3
40 40
30 30
20 20
10 10
0
0 100 200 300 400 500 600 700 800 900 1000
Time (Seconds)
0
0 100 200 300 400 500 600 700 800 900 1000
Time (Seconds)
e. Evening peak period for direction-A f. Evening peak period for direction-B
Fig. 4 The Driving cycle of motorcycle

M. Andry AZIS, et al.
84
acceleration (A), deceleration (D), motorcycle spent time
for cruise (C), percentage of acceleration (Pa),
percentage of deceleration (Pd), percentage of cruise (Pc),
and percentage of idling (Pi).
THE RESULTS
The Tracking Results using GPS
The data tracking which was transferred from GPS to
a computer using mapping software is shown visually in
Fig. 3. The figure shows the track point in second by
second along the route survey.
The Driving Cycle of Motorcycle
By using the data tracking, the figures of the
motorcycle driving cycles for each traffic direction and
each peak hour period were plotted as shown in Figure 4.
The driving cycle figures of the motorcycle show the
fluctuation of the motorcycle travel speed in second by
second along the route.
Figures 4 shows that mostly driving cycle on the
route are around 800 seconds until 900 seconds, except
the noon peak period for direction-B which achieved
around 1,000 seconds.
The Parameters of the Motorcycle Driving Cycle
In order to understand the behavior of the motorcycle
driving cycle, we have analyzed the eight parameters of
the motorcycle patterns. The analysis results are
presented in Table 1 and Fig. 5.
Table 1 shows that the average speed including all
motorcycle behavior mode (V1) and the average speed
without idling mode (V2) are around 24 kmhr-1
until 38
kmhr-1
. Both speeds mostly similar due to the percentage
of idling (Pi) of the driving cycle is very small as shown
in Fig. 5. In addition, the acceleration (A) and the
deceleration (D) are around 0.4 ms-2
until 0.6 ms-2
, while
the motorcycle spent time for cruise (C) for each period
and tarffic direction have 140 seconds for the smallest
value and 402 seconds for the largest value.
Table 1 Parameters of the motorcycle driving cycle on the arterial urban road in Makassar
Data V1 V2 D A C Pi Pd Pa Pc Track (Kmhr
-1) (Kmhr
-1) (ms
-2) (ms
-2) (Sec) (%) (%) (%) (%)
Morning peak period for direction-A
Track-1 37.53 37.92 0.57 0.48 167.0 0.16 33.54 40.25 26.05 Track-2 24.46 26.43 0.62 0.53 183.0 8.01 30.97 37.01 24.02 Track-3 32.27 33.08 0.64 0.52 131.0 0.40 36.71 45.21 17.68
Morning peak period for direction-B
Track-1 31.40 33.69 0.62 0.51 180.0 6.05 31.71 38.55 23.68 Track-2 30.17 30.52 0.59 0.51 175.0 1.01 35.82 41.01 22.15
Track-3 28.59 29.29 0.60 0.52 203.0 1.55 34.36 39.95 24.14 Noon peak period for direction-A
Track-1 34.94 37.72 0.66 0.53 140.0 6.26 32.64 40.24 20.86 Track-2 27.79 30.18 0.61 0.56 156.0 7.88 34.84 38.66 18.62
Track-3 30.12 30.12 0.62 0.60 213.0 3.81 34.01 35.15 27.03 Noon peak period for direction-B
Track-1 31.95 34.13 0.57 0.54 189.0 6.01 33.20 34.97 25.82 Track-2 20.02 19.98 0.57 0.53 264.0 2.09 34.36 37.34 26.22
Track-3 19.04 19.74 0.47 0.42 402.0 3.65 30.01 33.74 32.60 Evening peak period for direction-A
Track-1 33.22 33.52 0.55 0.52 157.0 0.73 36.90 39.39 22.99 Track-2 29.93 30.95 0.62 0.51 156.0 3.25 34.01 41.60 21.14
Track-3 27.23 29.38 0.69 0.54 181.0 7.02 31.31 40.12 21.55 Evening peak period for direction-B
Track-1 26.90 30.01 0.57 0.48 211.0 9.98 30.05 33.99 25.99 Track-2 26.10 26.87 0.60 0.54 220.0 3.61 32.93 37.02 26.44
Track-3 25.88 27.07 0.62 0.60 168.0 3.69 37.69 39.24 19.38
The Real World Driving Cycle of Motorcycle
85
Pe
rce
nta
ge T
ime
Spe
nt
Pe
rce
nta
ge T
ime
Spe
nt
Pe
rce
nta
ge T
ime
Sp
en
t
Pe
rce
nta
ge T
ime
Spe
nt
Pe
rce
nta
ge T
ime
Spe
nt
Pe
rce
nta
ge T
ime
Spe
nt
100%
80%
60%
40%
20%
0%
26.05 24.02 17.68
33.54 30.97 36.71
40.25 37.01 45.21
0.16 8.01 0.40
Track-1 Track-2 Track-3
Tracking Data
100%
80%
60%
40%
20%
0%
23.68 22.15 24.14
31.71 35.82 34.36
38.55 41.01 39.95
6.05 1.01 1.55
Track-1 Track-2 Track-3
Tracking Data
Cruise Deceleration Acceleration Idling Cruise Deceleration Acceleration Idling
100%
a. Morning peak period for direction-A b. Morning peak period for direction-B
100%
80%
60%
40%
20%
0%
20.86 18.62 27.03
32.64 34.84
34.01
40.24 38.66 35.15
6.26 7.88 3.81
Track-1 Track-2 Track-3
Tracking Data
80%
60%
40%
20%
0%
25.82 26.22 32.60
33.20 34.36
30.01
34.97 37.34 33.74
6.01 2.09 3.65
Track-1 Track-2 Track-3
Tracking Data
Cruise Deceleration Acceleration Idling Cruise Deceleration Acceleration Idling
100%
c. Noon peak period for direction-A d. Noon peak period for direction-B
100%
80%
60%
40%
20%
0%
22.99 21.14 21.55
36.90 34.01 31.31
39.39 41.60 40.12
0.73 3.25 7.02
Track-1 Track-2 Track-3
Tracking Data
80%
60%
40%
20%
0%
25.99 26.44 19.38
30.05 32.93 37.69
33.99 37.02 39.24
9.98 3.61 3.69
Track-1 Track-2 Track-3
Tracking Data
Cruise Deceleration Acceleration Idling Cruise Deceleration Acceleration Idling
e. Evening peak period for direction-A f. Evening peak period for direction-B
Fig. 5 The driving cycle of motorcycle
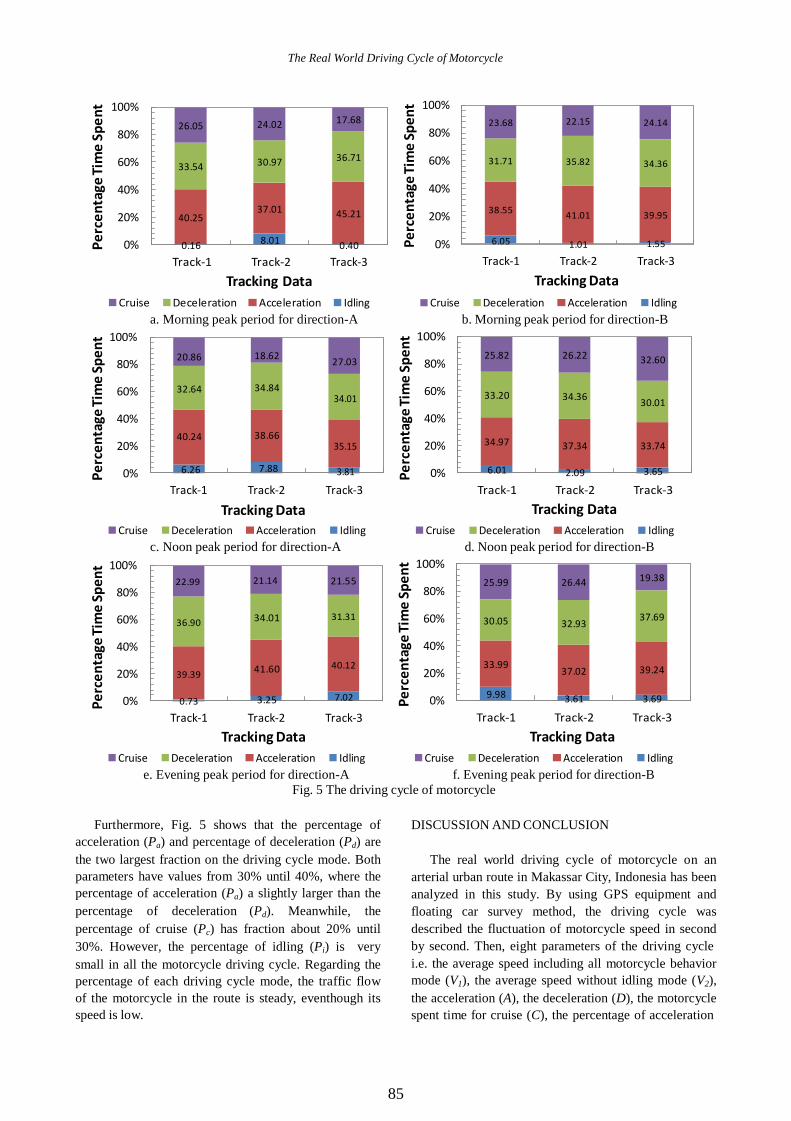
Furthermore, Fig. 5 shows that the percentage of
acceleration (Pa) and percentage of deceleration (Pd) are
the two largest fraction on the driving cycle mode. Both
parameters have values from 30% until 40%, where the
percentage of acceleration (Pa) a slightly larger than the
percentage of deceleration (Pd). Meanwhile, the
percentage of cruise (Pc) has fraction about 20% until
30%. However, the percentage of idling (Pi) is very
small in all the motorcycle driving cycle. Regarding the
percentage of each driving cycle mode, the traffic flow
of the motorcycle in the route is steady, eventhough its
speed is low.
DISCUSSION AND CONCLUSION
The real world driving cycle of motorcycle on an
arterial urban route in Makassar City, Indonesia has been
analyzed in this study. By using GPS equipment and
floating car survey method, the driving cycle was
described the fluctuation of motorcycle speed in second
by second. Then, eight parameters of the driving cycle
i.e. the average speed including all motorcycle behavior
mode (V1), the average speed without idling mode (V2),
the acceleration (A), the deceleration (D), the motorcycle
spent time for cruise (C), the percentage of acceleration

M. Andry AZIS, et al.
86
(Pa), the percentage of deceleration (Pd), the percentage
of cruise (Pc), and the percentage of idling (Pi) were
analyzed.
The analysis on data survey of the eight parameters
of the motorcycle driving cycle behavior shows that the
motorcycle has the average vehicle speed below 40
kmhr-1
, however the fraction of accelereration,
deceleration and cruise parameters dominated the driving
cycle. Overall, the fenomena of the motorcycle driving
cycle in the route could be catgerozied as steady flow on
the low average speeds. This results confirmed the
Hustim et al. (2012) research about the characteristic of
the heterogeneous traffic condition in Makassar City, as
well as Aly et al. (2012) research for the driving cycle of
passenger cars on an arterial road in the city.
In conclusion, the mototrcycle driving cycle on the
route provide a basis for an extentesion survey of the
motorcycle driving behavior in all urban arterial routes
in Makassar city. We also expect that the results are
useful in development an prediction model for
motorcycle emission in further studies.
REFERENCES
Abulebu, H., Ramli, M.I., and Harianto, T., (2012), A
Study on the Motorcycle Speed of One-Directional
Urban Roads in Makassar. Proceeding of the 15th
FSTPT International Symposium.
Aly, S.H., Selintung, M., Wunas, S., Sasmita, S.A., and Ramli, M.I., (2012), Running Vehicle Emission Factors of Vehicle Fleet in Makassar, Indonesia.
Proceeding of the 8th
International Symposium on Lowland Technology.
Hung, W.T., Tong, H.Y., Lee, C.P., (2007),
Development of a practical driving cycle construction
methodology: a case study in Hong Kong.
Transportation Research Part D 12, 115–128..
Hustim, M., and Fujimoto, K., (2012), Road Traffic
Noise under Heterogeneous Traffic Condition in
Makassar City, Indonesia. Journal of Habitat
Engineering and Design, Vol. 4, No. 1, pp. 109 – 118.
Kumar, R., Durai, B.K., Saleh, W., and Boswell, C.,
(2011), Comparison and evaluation of emissions for
different driving cycles of motorcycles: A note,
Transportation Research Part D, Vol. 16, pp. 61 – 64.
Oanh, N.T.K., Phuong, M.T.T., Permadi, D.A., (2012)
Analysis of motorcycle fleet in Hanoi for estimation
of air pollution emission and climate mitigation co-
benefit of technology implementation, Atmospheric
Environment, Vol. 59, pp. 438 – 448.
Saleh, W., (2007), Success and failure of travel demand
management: is congestion charging the way forward.
Transportation Research Part A 41, 611–614.
Saleh, W., Kumar, R., Kirby, H., and Kumar, P., (2009),
Real world driving cycle for motorcycles in
Edinburgh, Transportation Research, Part A, Vol. 26,
No. 4, pp. 315 - 330.
Saleh, W., Kumar, R., and Sharma, A., (2010) Driving
cycle for motorcycles in modern cities: Case studies
of Edinburgh and Delhi, World Journal of Science,
Technology & Sustainable Development, Vol. 7, No.
3, pp. 263 – 274.
Tzirakis, E., Pitsas, K., Zannikos, F., Stournas, S., (2006), Vehicle emissions and driving cycles: comparison of
the Athens driving cycle (ADC) with ECE-15 and
European driving cycle (ECE). Global NEST 8, 282–
290.
Zakaria, A., Aly, S.H., Ramli, M.I. (2011), Distribution
Model of Motorcycle Speed on Divided Roadway in
Makassar. Proceeding of the 14th
FSTPT
International Symposium.
Related Documents


